| OMB APPROVAL | |
OMB Number: 3235-0570
Expires: August 31, 2020
Estimated average burden hours per response: 20.6 |
UNITED STATES
SECURITIES AND EXCHANGE COMMISSION
Washington, D.C. 20549
FORM N-CSR
CERTIFIED SHAREHOLDER REPORT OF REGISTERED
MANAGEMENT INVESTMENT COMPANIES
| Investment Company Act file number | 811-22359 |
| Papp Investment Trust |
| (Exact name of registrant as specified in charter) |
| 2201 E. Camelback Road, Suite 227B Phoenix, Arizona | 85016 |
| (Address of principal executive offices) | (Zip code) |
Benjamin V. Mollozzi, Esq.
| Ultimus Fund Solutions, LLC 225 Pictoria Drive, Suite 450 Cincinnati, Ohio 45246 |
| (Name and address of agent for service) |
| Registrant's telephone number, including area code: | (602) 956-0980 |
| Date of fiscal year end: | November 30 | |
| Date of reporting period: | November 30, 2018 |
Form N-CSR is to be used by management investment companies to file reports with the Commission not later than 10 days after the transmission to stockholders of any report that is required to be transmitted to stockholders under Rule 30e-1 under the Investment Company Act of 1940 (17 CFR 270.30e-1). The Commission may use the information provided on Form N-CSR in its regulatory, disclosure review, inspection, and policymaking roles.
A registrant is required to disclose the information specified by Form N-CSR, and the Commission will make this information public. A registrant is not required to respond to the collection of information contained in Form N-CSR unless the Form displays a currently valid Office of Management and Budget ("OMB") control number. Please direct comments concerning the accuracy of the information collection burden estimate and any suggestions for reducing the burden to the Secretary, Securities and Exchange Commission, 450 Fifth Street, NW, Washington, DC 20549-0609. The OMB has reviewed this collection of information under the clearance requirements of 44 U.S.C. § 3507.
| Item 1. | Reports to Stockholders. |
Papp Investment Trust Papp Small & Mid-Cap Growth Fund
Annual Report
November 30, 2018
Investment Adviser L. Roy Papp & Associates, LLP Phoenix, AZ
Beginning on January 1, 2021, as permitted by regulations adopted by the U.S. Securities and Exchange Commission, paper copies of the Fund’s shareholder reports like this one will no longer be sent by mail, unless you specifically request paper copies of the reports from the Fund or from your financial intermediary, such as a broker-dealer or bank. Instead, the reports will be made available on a website, and you will be notified by mail each time a report is posted and provided with a website link to access the report.
If you already elected to receive shareholder reports electronically, you will not be affected by this change and you need not take any action. You may elect to receive shareholder reports and other communications from the Fund electronically by contacting the Fund at 1-877-370-7277 or, if you own these shares through a financial intermediary, by contacting your financial intermediary.
You may elect to receive all future reports in paper free of charge. You can inform the Fund that you wish to continue receiving paper copies of your shareholder reports by contacting the Fund at 1-877-370-7277. If you own shares through a financial intermediary, you may contact your financial intermediary or follow instructions included with this document to elect to continue to receive paper copies of your shareholder reports. Your election to receive reports in paper will apply to all Funds held with the Fund complex or at your financial intermediary. |

PAPP SMALL & MID-CAP GROWTH FUND | |
LETTER TO SHAREHOLDERS | December 31, 2018 |
Dear Fellow Shareholder,
We are writing to report on the performance results of the Papp Small & Mid-Cap Growth Fund (the “Fund”) for the fiscal year ended November 30, 2018. 2018 has been a year of mixed results for financial markets here in the U.S. During most of the year, the market advanced to new all-time highs, albeit with a few relatively short declines along the way. Beginning in October, we believe the markets entered a correction with sharp declines in October and a partial recovery in late November. December has seen widespread declines based on fears of the potential impact from the Federal Reserve having raised interest rates four times during 2018 and telegraphing approximately two more rate hikes in 2019. Investors are also concerned about the risks of a global trade war, particularly with China, and with dysfunction in the White House. Most economic data indicate that the U.S. economy is still growing at a good pace and this is likely to continue in 2019. Corporations have enjoyed very strong earnings growth in 2018 and are likely to see additional reasonable growth in 2019. Small and mid-cap companies have been uniquely hard hit so far during this correction, led by momentum growth stocks which the Fund tends to stay away from. Traditionally, small and mid-cap companies are somewhat less exposed to international trade than the large multinational U.S. companies. We remain confident in the health of the U.S. economy and in the prospects for the individual companies within the Fund.
For the year ended November 30, 2018, the Fund produced a total return of 8.81% as compared to the benchmark, the Russell MidCap® Growth Index (the “Benchmark”), which returned 5.32%. We told you last year we would be happy with mid-to-high single digit returns for the Fund in 2018, and we are delighted with the relative performance compared to the Benchmark particularly after very strong returns in 2017. In previous letters we indicated that in very strong performance years, the Fund would likely participate but often times not completely match the Benchmark. On the other hand, during more volatile times and in difficult market conditions, we would expect our quality and consistency bias to help protect in choppy or down markets. That is exactly what has happened this year and we are once again proud of our research department’s guidance for the Fund holdings to be able to navigate the more volatile conditions.
The Fund’s net asset value on November 30, 2018 was $22.47 per share up from $22.37 per share on November 30, 2017 (after adjusting for the $1.7306 dividend that was paid at the end of calendar year 2017).
After the close of the fiscal year on November 30, 2018, the Fund paid a capital gain distribution of 59.24 cents per share or 2.9% of the Fund’s net asset value on December 31, 2018. These distributions were due primarily to Fund holding C.R. Bard, Inc. being acquired by Becton, Dickinson and Company as well as selected position reductions for risk control. We attempt to manage the tax impact of the Fund’s portfolio, but it is difficult to avoid capital gains when Fund holdings are acquired.
1
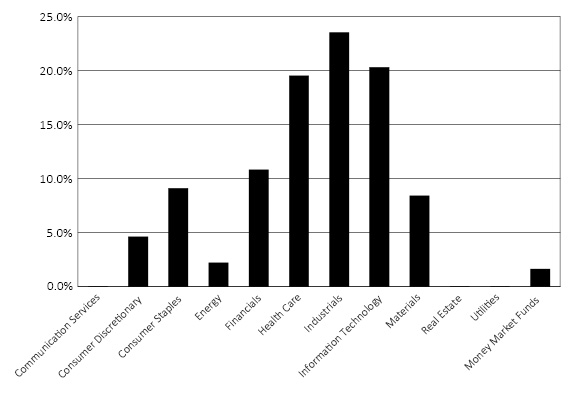
The Fund remains well diversified with 31 companies as of November 30, 2018. The Fund is normally fully invested and as of November 30, 2018 had 98.35% of its holdings invested in stocks, with the balance in a money market fund. The Fund is currently underweight relative to its Benchmark in the consumer discretionary and information technology sectors. The Fund is overweight in the industrials, consumer staples and health care sectors, which we believe continue to offer attractive relative valuations.
Turning to individual companies in the portfolio, performance was helped by PRA Health Sciences, Inc., a clinical trial outsourcing provider to biotech and pharmaceutical companies. The stock benefited from numerous quarterly reports showing above industry growth trends and was also helped by its addition to the S&P 500 Index. Leading spice manufacturer, McCormick & Company, Inc. and consumer staple company Church & Dwight, Co., Inc. were both up significantly, driven by strong core growth and contributions from acquisitions. O’Reilly Automotive, Inc. was also strong coming off a year in which shares were pressured from mild weather and competition concerns from ecommerce. The auto parts retailer posted multiple quarters of strong, same store sales growth which drove shares higher. We are particularly pleased that we retained the shares after a difficult time in 2017. Expeditors International of Washington, Inc., an international freight forwarder, enjoyed strong performance driven by solid operational execution and expense management along with good end-market demand.
Performance was held back this year by SEI Investments Co. which traded down in line with similar stocks leveraged to financial markets. The company continues to rollout important products that should eventually drive growth over a multiyear period. We remain confident in SEI. NXP Semiconductors declined after its proposed acquisition by Qualcomm Incorporated fell apart due to trade disputes between the U.S. and China. We continue to believe the company is well positioned, particularly in the automotive sector.
This year’s letter would not be complete without expanding on market conditions in December of 2018 after the close of our November 30, 2018 fiscal year. During December, financial markets began to price in recessionary prospects around the globe and even here in the U.S. The markets are concerned that higher interest rates, trade wars and dysfunction in Washington, D.C. will cause economic growth to slow dramatically or tip into recession. We continue to expect good economic growth here in the U.S. and at least modest growth in most other geographies. We believe this is a normal correction that may have a little longer duration than most due to the fact that we have not had much of a correction in the past three years.
As we look forward, valuations look much more attractive to us than they have for the past year and a half. We believe that the U.S. economy will do just fine even if the Federal Reserve raises rates twice in 2019, as we expect. We anticipate at least a partial resolution of the U.S.- China trade issues over the new few quarters which should improve investor sentiment.
2
In keeping with our long-term strategy, we still own high-quality growth stocks that should allow us to participate substantially in strong markets but protect in periods of volatility and weak markets. Once again, we would be happy with mid-to-high single digit returns for the Fund in fiscal year 2019.
All of us would be happy to answer any questions that you might have about the Fund. We invite you to call any of us at 1-800-421-0131. We wish you a happy, healthy, and prosperous new year.
Warmest regards,
|
|
Rosellen C. Papp, CFA | Harry Papp, CFA |
Co-Portfolio Manager | President |
December 31, 2018 | December 31, 2018 |


|
|
Brian Riordan, CFA | Greg Smith, CFA |
Co-Portfolio Manager | Assistant Portfolio Manager |
December 31, 2018 | December 31, 2018 |


Past performance is not predictive of future performance. Investment results and principal value will fluctuate so that shares, when redeemed, may be worth more or less than their original cost. Current performance may be higher or lower than the performance data quoted. Performance current through the most recent month end is available by calling 1-877-370-7277.
An investor should consider the investment objectives, risks, charges and expenses of the Fund carefully before investing. The Fund’s prospectus contains this and other important information. To obtain a copy of the Fund’s prospectus please call 1-877-370-7277 and a copy will be sent to you free of charge. Please read the prospectus carefully before you invest. The Fund is distributed by Ultimus Fund Distributors, LLC.
The Letter to Shareholders seeks to describe some of the Adviser’s current opinions and views of the financial markets. Although the Adviser believes it has a reasonable basis for any opinions or views expressed, actual results may differ, sometimes significantly so, from those expected or expressed.
3
PAPP SMALL & MID-CAP GROWTH FUND
PERFORMANCE INFORMATION
November 30, 2018 (Unaudited)
Comparison of the Change in Value of a $10,000 Investment in
the Papp Small & Mid-Cap Growth Fund versus
the Russell Midcap® Growth Index
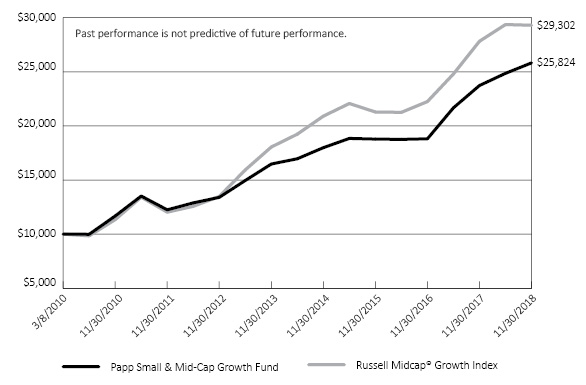
Average Annual Total Returns | ||||
One | Five | Since | ||
Papp Small & Mid-Cap Growth Fund(a) | 8.81% | 9.40% | 11.48% | |
Russell Midcap® Growth Index | 5.32% | 10.17% | 13.10% | |
(a) | The total returns shown do not reflect the deduction of taxes that a shareholder would pay on Fund distributions or the redemption of Fund shares. |
(b) | Commencement of operations was March 8, 2010. |
4
PAPP SMALL & MID-CAP GROWTH FUND
PORTFOLIO INFORMATION
November 30, 2018 (Unaudited)
Sector Diversification (% of Net Assets)
Top 10 Equity Holdings
Security Description | % of |
Mettler-Toledo International, Inc. | 6.0% |
PRA Health Sciences, Inc. | 5.7% |
Expeditors International of Washington, Inc. | 5.3% |
Ecolab, Inc. | 4.9% |
O'Reilly Automotive, Inc. | 4.6% |
IDEX Corporation | 4.6% |
AMETEK, Inc. | 4.5% |
ANSYS, Inc. | 4.4% |
McCormick & Company, Inc. | 3.9% |
Pegasystems, Inc. | 3.8% |
5
PAPP SMALL & MID-CAP GROWTH FUND | ||||||||
COMMON STOCKS — 95.4% | Shares | Value | ||||||
Consumer Discretionary — 4.6% | ||||||||
Specialty Retail — 4.6% | ||||||||
O'Reilly Automotive, Inc. (a) | 4,400 | $ | 1,525,832 | |||||
Consumer Staples — 9.1% | ||||||||
Food Products — 3.9% | ||||||||
McCormick & Company, Inc. | 8,700 | 1,305,000 | ||||||
Household Products — 5.2% | ||||||||
Church & Dwight Company, Inc. | 17,000 | 1,125,230 | ||||||
Clorox Company (The) | 3,500 | 579,670 | ||||||
| 1,704,900 | ||||||||
Energy — 2.2% | ||||||||
Oil, Gas & Consumable Fuels — 2.2% | ||||||||
Pioneer Natural Resources Company | 4,950 | 731,363 | ||||||
Financials — 10.8% | ||||||||
Banks — 1.6% | ||||||||
UMB Financial Corporation | 8,000 | 541,360 | ||||||
Capital Markets — 9.2% | ||||||||
FactSet Research Systems, Inc. | 5,100 | 1,195,899 | ||||||
SEI Investments Company | 13,400 | 719,580 | ||||||
T. Rowe Price Group, Inc. | 11,200 | 1,112,832 | ||||||
| 3,028,311 | ||||||||
Health Care — 16.5% | ||||||||
Health Care Equipment & Supplies — 4.8% | ||||||||
ResMed, Inc. | 5,300 | 592,487 | ||||||
Varex Imaging Corporation (a) | 2,920 | 76,942 | ||||||
Varian Medical Systems, Inc. (a) | 7,300 | 900,747 | ||||||
| 1,570,176 | ||||||||
Life Sciences Tools & Services — 11.7% | ||||||||
Mettler-Toledo International, Inc. (a) | 3,100 | 1,973,646 | ||||||
PRA Health Sciences, Inc. (a) | 16,200 | 1,891,188 | ||||||
| 3,864,834 | ||||||||
Industrials — 23.5% | ||||||||
Air Freight & Logistics — 5.3% | ||||||||
Expeditors International of Washington, Inc. | 23,000 | 1,750,070 | ||||||
6
PAPP SMALL & MID-CAP GROWTH FUND | ||||||||
COMMON STOCKS — 95.4% (Continued) | Shares | Value | ||||||
Industrials — 23.5% (Continued) | ||||||||
Electrical Equipment — 4.5% | ||||||||
AMETEK, Inc. | 20,100 | $ | 1,475,943 | |||||
Machinery — 10.4% | ||||||||
IDEX Corporation | 11,000 | 1,511,400 | ||||||
RBC Bearings, Inc. (a) | 4,950 | 757,449 | ||||||
Westinghouse Air Brake Technologies Corporation | 12,200 | 1,154,120 | ||||||
| 3,422,969 | ||||||||
Professional Services — 3.3% | ||||||||
CoStar Group, Inc. (a) | 2,900 | 1,071,231 | ||||||
Information Technology — 20.3% | ||||||||
Electronic Equipment, Instruments & Components — 2.9% | ||||||||
Trimble, Inc. (a) | 25,500 | 969,765 | ||||||
IT Services — 2.6% | ||||||||
Worldpay, Inc. - Class A (a) | 9,800 | 840,938 | ||||||
Semiconductors & Semiconductor Equipment — 6.6% | ||||||||
Analog Devices, Inc. | 11,200 | 1,029,504 | ||||||
NXP Semiconductors N.V. | 6,000 | 500,220 | ||||||
Silicon Laboratories, Inc. (a) | 7,100 | 627,427 | ||||||
| 2,157,151 | ||||||||
Software — 8.2% | ||||||||
ANSYS, Inc. (a) | 8,900 | 1,441,978 | ||||||
Pegasystems, Inc. | 23,400 | 1,263,366 | ||||||
| 2,705,344 | ||||||||
Materials — 8.4% | ||||||||
Chemicals — 8.4% | ||||||||
Ecolab, Inc. | 10,000 | 1,604,900 | ||||||
Scotts Miracle-Gro Company (The) | 7,600 | 577,448 | ||||||
Valvoline, Inc. | 27,000 | 569,430 | ||||||
| 2,751,778 | ||||||||
Total Common Stocks (Cost $16,208,543) | $ | 31,416,965 | ||||||
7
PAPP SMALL & MID-CAP GROWTH FUND | ||||||||
EXCHANGE-TRADED FUNDS — 2.9% | Shares | Value | ||||||
Health Care — 2.9% | ||||||||
Biotechnology — 2.9% | ||||||||
SPDR® S&P® Biotech ETF (Cost $700,907) | 11,800 | $ | 963,470 | |||||
| ||||||||
MONEY MARKET FUNDS — 1.7% | Shares | Value | ||||||
Fidelity Institutional Money Market Government Portfolio - Class I, 2.10% (b) (Cost $543,312) | 543,312 | $ | 543,312 | |||||
Total Investments at Value — 100.0% (Cost $17,452,762) | $ | 32,923,747 | ||||||
Other Assets in Excess of Liabilities — 0.0% (c) | 11,678 | |||||||
Net Assets — 100.0% | $ | 32,935,425 | ||||||
(a) | Non-income producing security. |
(b) | The rate shown is the 7-day effective yield as of November 30, 2018. |
(c) | Percentage rounds to less than 0.1%. |
See accompanying notes to financial statements. | |
8
PAPP SMALL & MID-CAP GROWTH FUND | ||||
ASSETS | ||||
Investments in securities: | ||||
At cost | $ | 17,452,762 | ||
At value (Note 2) | $ | 32,923,747 | ||
Dividends receivable | 32,588 | |||
Other assets | 10,192 | |||
TOTAL ASSETS | 32,966,527 | |||
LIABILITIES | ||||
Payable to Adviser (Note 4) | 19,152 | |||
Payable to administrator (Note 4) | 6,620 | |||
Other accrued expenses | 5,330 | |||
TOTAL LIABILITIES | 31,102 | |||
NET ASSETS | $ | 32,935,425 | ||
NET ASSETS CONSIST OF: | ||||
Paid-in capital | $ | 16,744,042 | ||
Accumulated earnings | 16,191,383 | |||
NET ASSETS | $ | 32,935,425 | ||
Shares of beneficial interest outstanding (unlimited number of shares authorized, no par value) | 1,465,949 | |||
Net asset value, offering price and redemption price per share (Note 2) | $ | 22.47 | ||
See accompanying notes to financial statements. |
9
PAPP SMALL & MID-CAP GROWTH FUND | ||||
INVESTMENT INCOME | ||||
Dividend income (Net of foreign tax of $340) | $ | 250,912 | ||
EXPENSES | ||||
Investment advisory fees (Note 4) | 319,465 | |||
Professional fees | 39,395 | |||
Fund accounting fees (Note 4) | 33,192 | |||
Registration and filing fees | 32,911 | |||
Administration fees (Note 4) | 31,946 | |||
Transfer agent fees (Note 4) | 15,000 | |||
Insurance expense | 10,420 | |||
Custody and bank service fees | 9,627 | |||
Trustees' fees (Note 4) | 6,800 | |||
Printing of shareholder reports | 4,792 | |||
Postage and supplies | 4,193 | |||
Other fees | 7,993 | |||
TOTAL EXPENSES | 515,734 | |||
Less fee reductions by the Adviser (Note 4) | (116,403 | ) | ||
NET EXPENSES | 399,331 | |||
NET INVESTMENT LOSS | (148,419 | ) | ||
REALIZED AND UNREALIZED GAINS ON INVESTMENTS | ||||
Net realized gains on investment transactions | 860,985 | |||
Net change in unrealized appreciation (depreciation) on investments | 1,916,393 | |||
NET REALIZED AND UNREALIZED GAINS ON INVESTMENTS | 2,777,378 | |||
NET INCREASE IN NET ASSETS FROM OPERATIONS | $ | 2,628,959 | ||
See accompanying notes to financial statements. |
10
PAPP SMALL & MID-CAP GROWTH FUND | ||||||||
| Year | Year | ||||||
FROM OPERATIONS | ||||||||
Net investment loss | $ | (148,419 | ) | $ | (129,855 | ) | ||
Net realized gains from investment transactions | 860,985 | 2,384,377 | ||||||
Net change in unrealized appreciation (depreciation) on investments | 1,916,393 | 4,222,443 | ||||||
Net increase in net assets from operations | 2,628,959 | 6,476,965 | ||||||
DISTRIBUTIONS TO SHAREHOLDERS (Note 2) | (2,380,121 | ) | — | |||||
CAPITAL SHARE TRANSACTIONS | ||||||||
Proceeds from shares sold | 1,065,518 | 793,200 | ||||||
Net asset value of shares issued in reinvestment of distributions to shareholders | 2,149,398 | — | ||||||
Payments for shares redeemed | (1,410,977 | ) | (1,454,918 | ) | ||||
Net increase (decrease) in net assets from capital share transactions | 1,803,939 | (661,718 | ) | |||||
TOTAL INCREASE IN NET ASSETS | 2,052,777 | 5,815,247 | ||||||
NET ASSETS | ||||||||
Beginning of year | 30,882,648 | 25,067,401 | ||||||
End of year | $ | 32,935,425 | $ | 30,882,648 | ||||
CAPITAL SHARE ACTIVITY | ||||||||
Shares sold | 48,029 | 40,414 | ||||||
Shares reinvested | 103,436 | — | ||||||
Shares redeemed | (65,871 | ) | (73,988 | ) | ||||
Net increase (decrease) in shares outstanding | 85,594 | (33,574 | ) | |||||
Shares outstanding at beginning of year | 1,380,355 | 1,413,929 | ||||||
Shares outstanding at end of year | 1,465,949 | 1,380,355 | ||||||
(a) | As of November 30, 2017, accumulated net investment loss was ($120,663). |
See accompanying notes to financial statements. | |
11
PAPP SMALL & MID-CAP GROWTH FUND | ||||||||||||||||||||
Per Share Data for a Share Outstanding Throughout Each Year: | ||||||||||||||||||||
| Year | Year | Year | Year | Year | |||||||||||||||
Net asset value at beginning of year | $ | 22.37 | $ | 17.73 | $ | 18.14 | $ | 17.92 | $ | 16.48 | ||||||||||
Income (loss) from investment operations: | ||||||||||||||||||||
Net investment loss | (0.10 | ) | (0.09 | ) | (0.04 | ) | (0.05 | ) | (0.07 | ) | ||||||||||
Net realized and unrealized gains on investments | 1.93 | 4.73 | 0.05 | 0.82 | 1.58 | |||||||||||||||
Total from investment operations | 1.83 | 4.64 | 0.01 | 0.77 | 1.51 | |||||||||||||||
Less distributions: | ||||||||||||||||||||
From net realized gains from investment transactions | (1.73 | ) | — | (0.42 | ) | (0.55 | ) | (0.07 | ) | |||||||||||
Net asset value at end of year | $ | 22.47 | $ | 22.37 | $ | 17.73 | $ | 18.14 | $ | 17.92 | ||||||||||
Total return (a) | 8.81 | % | 26.17 | % | 0.14 | % | 4.41 | % | 9.17 | % | ||||||||||
Net assets at end of year (000's) | $ | 32,935 | $ | 30,883 | $ | 25,067 | $ | 26,648 | $ | 25,342 | ||||||||||
Ratios/supplementary data: | ||||||||||||||||||||
Ratio of total expenses to average net assets (b) | 1.61 | % | 1.73 | % | 1.73 | % | 1.70 | % | 1.79 | % | ||||||||||
Ratio of net expenses to average net assets (b)(c) | 1.25 | % | 1.25 | % | 1.25 | % | 1.25 | % | 1.25 | % | ||||||||||
Ratio of net investment loss to average net assets (c)(d) | (0.46 | %) | (0.47 | %) | (0.19 | %) | (0.29 | %) | (0.42 | %) | ||||||||||
Portfolio turnover rate | 5 | % | 19 | % | 14 | % | 18 | % | 14 | % | ||||||||||
(a) | Total return is a measure of the change in value of an investment in the Fund over the periods covered. The returns shown do not reflect the deduction of taxes a shareholder would pay on Fund distributions, if any, or the redemption of Fund shares. Had the Adviser not reduced its fees, total returns would have been lower. |
(b) | The ratios of expenses to average net assets do not reflect the Fund’s proportionate share of expenses of the underlying investment companies in which the Fund invests. |
(c) | Ratio was determined after advisory fee reductions (Note 4). |
(d) | Recognition of net investment loss by the Fund is affected by the timing of the declaration of dividends by the underlying investment companies in which the Fund invests. |
See accompanying notes to financial statements. | |
12
PAPP SMALL & MID-CAP GROWTH FUND
NOTES TO FINANCIAL STATEMENTS
November 30, 2018
1. Organization
Papp Small & Mid-Cap Growth Fund (the “Fund”) is a diversified series of Papp Investment Trust (the “Trust”), an open-end investment company established as an Ohio business trust under a Declaration of Trust dated November 12, 2009.
The investment objective of the Fund is long-term capital growth.
2. Significant Accounting Policies
In August 2018, the U.S. Securities and Exchange Commission (the “SEC”) adopted regulations that eliminated or amended disclosure requirements that were redundant or outdated in light of changes in SEC requirements, accounting principles generally accepted in the United States of America (“GAAP”), International Financial Reporting Standards or changes in technology or the business environment. These regulations were effective November 5, 2018, and the Fund is complying with them effective with these financial statements.
The Fund follows accounting and reporting guidance under Financial Accounting Standards Board (“FASB”) Accounting Standards Codification (“ASC”) Topic 946, “Financial Services – Investment Companies.” The following is a summary of the Fund’s significant accounting policies used in preparation of its financial statements. These policies are in conformity with GAAP.
New accounting pronouncement – In August 2018, FASB issued Accounting Standards Update No. 2018-13 (“ASU 2018-13”), “Disclosure Framework – Changes to the Disclosure Requirements for Fair Value Measurement,” which amends the fair value measurement disclosure requirements of ASC Topic 820 (“ASC 820”), “Fair Value Measurement.” ASU 2018-13 includes new, eliminated, and modified disclosure requirements for ASC 820. In addition, ASU 2018-13 clarifies that materiality is an appropriate consideration when evaluating disclosure requirements. ASU 2018-13 is effective for fiscal years beginning after December 15, 2019, including interim periods therein. Early adoption is permitted and the Fund has adopted ASU 2018-13 with these financial statements.
Securities valuation – The Fund’s portfolio securities are valued at market value as of the close of regular trading on the New York Stock Exchange (the “NYSE”) (normally 4:00 p.m. Eastern time) on each business day the NYSE is open. Securities, including common stocks and exchange-traded funds (“ETFs”), listed on the NYSE or other exchanges are valued on the basis of their last sale price on the exchanges on which they are primarily traded. If there are no sales on that day, the securities are valued at the closing bid price on the NYSE or other primary exchange for that day. NASDAQ listed securities are valued at the NASDAQ Official Closing Price. If there are no sales on that day, the securities are
13
PAPP SMALL & MID-CAP GROWTH FUND
NOTES TO FINANCIAL STATEMENTS (Continued)
valued at the last bid price as reported by NASDAQ. Securities traded in the over-the-counter market are valued at the last reported sale price, if available, otherwise at the most recently quoted bid price. To the extent the Fund is invested in money market funds and other open-end investment companies, except for ETFs, that are registered under the Investment Company Act of 1940, as amended (the “1940 Act”), the Fund’s net asset value per share (“NAV”) is calculated based upon the NAVs reported by such registered open-end companies, and the prospectuses for these companies explain the circumstances under which they will use fair value pricing and the effects of using fair value pricing. When using a quoted price and when the market is considered active, the security will be classified as Level 1 within the fair value hierarchy (see below). In the event that market quotations are not readily available or are considered unreliable due to market or other events, securities and other assets are valued at fair value as determined in good faith in accordance with procedures adopted by the Board of Trustees and will be classified as Level 2 or 3 within the fair value hierarchy, depending on the inputs used. Factors for determining when portfolio investments are subject to fair value determination include, but are not limited to, the following: the spread between bid and asked prices is substantial; infrequency of sales; thinness of market; the size of reported trades; a temporary lapse in the provision of prices by any reliable pricing source; and actions of the securities or future markets, such as the suspension or limitation of trading.
GAAP establishes a single authoritative definition of fair value, sets out a framework for measuring fair value and requires additional disclosures about fair value measurements.
Various inputs are used in determining the value of the Fund’s investments. These inputs are summarized in the three broad levels listed below:
● | Level 1 – quoted prices in active markets for identical securities |
● | Level 2 – other significant observable inputs |
● | Level 3 – significant unobservable inputs |
The inputs or methodology used for valuing securities are not necessarily an indication of the risks associated with investing in those securities. The inputs used to measure fair value may fall into different levels of the fair value hierarchy. In such cases, for disclosure purposes, the level in the fair value hierarchy within which the fair value measurement falls in its entirety is determined based on the lowest level input that is significant to the fair value measurement.
14
PAPP SMALL & MID-CAP GROWTH FUND
NOTES TO FINANCIAL STATEMENTS (Continued)
The following is a summary of the inputs used to value the Fund’s investments as of November 30, 2018:
| Level 1 | Level 2 | Level 3 | Total | ||||||||||||
Common Stocks | $ | 31,416,965 | $ | — | $ | — | $ | 31,416,965 | ||||||||
Exchange-Traded Funds | 963,470 | — | — | 963,470 | ||||||||||||
Money Market Funds | 543,312 | — | — | 543,312 | ||||||||||||
Total | $ | 32,923,747 | $ | — | $ | — | $ | 32,923,747 | ||||||||
Refer to the Fund’s Schedule of Investments for a listing of the common stocks by industry type. As of November 30, 2018, the Fund did not hold derivative instruments or any assets or liabilities that were measured at fair value on a recurring basis using significant unobservable inputs (Level 3).
Share valuation – The NAV of the Fund is calculated daily by dividing the total value of the Fund’s assets, less liabilities, by the number of shares outstanding. The offering price and redemption price per share of the Fund is equal to the NAV.
Investment income – Dividend income is recorded on the ex-dividend date. Interest income is accrued as earned. Withholding taxes on foreign dividends have been recorded in accordance with the Fund’s understanding of the applicable country’s tax rules and rates.
Investment transactions – Investment transactions are accounted for on the trade date. Realized gains and losses on investments sold are determined on a specific identification basis.
Distributions to shareholders – Distributions arising from net investment income and net realized capital gains, if any, are paid to shareholders at least once each year. The amount of distributions from net investment income and net realized capital gains are determined in accordance with federal income tax regulations, which may differ from GAAP. Dividends and distributions to shareholders are recorded on the ex-dividend date. For the year ended November 30, 2018, the tax character of all distributions paid to shareholders was long-term capital gains. There were no distributions paid to shareholders during the year ended November 30, 2017. On December 31, 2018, a long-term capital gain distribution of $0.5924 per share was paid to shareholders of record on December 28, 2018.
Estimates – The preparation of financial statements in conformity with GAAP requires management to make estimates and assumptions that affect the reported amounts of assets and liabilities and disclosure of contingent assets and liabilities as of the date of the financial statements and the reported amounts of income and expenses during the reporting period. Actual results could differ from those estimates.
15
PAPP SMALL & MID-CAP GROWTH FUND
NOTES TO FINANCIAL STATEMENTS (Continued)
Federal income tax – The Fund has qualified and intends to continue to qualify each year as a “regulated investment company” under Subchapter M of the Internal Revenue Code of 1986, as amended (the “Code”). By so qualifying, the Fund will not be subject to federal income taxes to the extent that it distributes its net investment income and any net realized capital gains in accordance with the Code.
In order to avoid imposition of the excise tax applicable to regulated investment companies, it is also the Fund’s intention to declare as dividends in each calendar year at least 98% of its net investment income (earned during the calendar year) and 98.2% of its net realized capital gains (earned during the twelve months ended November 30) plus undistributed amounts from prior years.
The following information is computed on a tax basis for each item as of November 30, 2018:
Tax cost of portfolio investments | $ | 17,452,765 | ||
Gross unrealized appreciation | $ | 15,789,867 | ||
Gross unrealized depreciation | (318,885 | ) | ||
Net unrealized appreciation | 15,470,982 | |||
Undistributed long term capital gains | 860,967 | |||
Accumulated capital and other losses | (140,566 | ) | ||
Accumulated earnings | $ | 16,191,383 |
The difference between the federal income tax cost of portfolio investments and the financial statement cost of portfolio investments is due to certain timing differences in the recognition of capital gains or losses under income tax regulations and GAAP. These “book/tax” differences are temporary in nature and are primarily due to the tax deferral of losses on wash sales.
Qualified late year ordinary losses incurred after December 31, 2017 and within the taxable year are deemed to arise on the first day of the Fund’s next taxable year. For the year ended November 30, 2018, the Fund deferred $140,566 of late year ordinary losses to December 1, 2018 for federal income tax purposes.
For the year ended November 30, 2018, the Fund reclassified $128,516 of accumulated earnings against paid-in capital on the Statement of Assets and Liabilities. Such reclassification, the result of permanent differences between the financial statement and income tax reporting requirements, had no effect on the Fund’s net assets or NAV per share.
16
PAPP SMALL & MID-CAP GROWTH FUND
NOTES TO FINANCIAL STATEMENTS (Continued)
The Fund recognizes the tax benefits or expenses of uncertain tax positions only when the position is “more likely than not” to be sustained assuming examination by tax authorities. Management has reviewed the Fund’s tax positions taken on federal income tax returns for all open tax years (generally three years) and has concluded that no provision for unrecognized tax benefits or expenses is required in these financial statements and does not expect this to change over the next twelve months. The Fund identifies its major tax jurisdiction as U.S. Federal.
3. Investment Transactions
During the year ended November 30, 2018, cost of purchases and proceeds from sales of investment securities, other than short-term investments, were $1,544,637 and $1,504,596, respectively.
4. Transactions with Related Parties
Certain Trustees and officers of the Trust are directors and officers of L. Roy Papp & Associates, LLP (the “Adviser”) or of Ultimus Fund Solutions, LLC (“Ultimus”), the Fund’s administrator, transfer agent and fund accounting agent, and Ultimus Fund Distributors, LLC (the “Distributor”), the Fund’s principal underwriter. These Trustees and officers are not compensated by the Fund for their services as Trustees and officers of the Trust.
INVESTMENT ADVISORY AGREEMENT
The Fund’s investments are managed by the Adviser pursuant to the terms of an Investment Advisory Agreement. For its services, the Fund pays the Adviser an advisory fee, computed daily and paid monthly, at the annual rate of 1.00% of its average daily net assets.
The Adviser has contractually agreed to reduce its advisory fees and to reimburse the Fund’s operating expenses to the extent necessary so that the Fund’s annual ordinary operating expenses (excluding brokerage costs, taxes, interest, acquired fund fees and expenses and extraordinary expenses, if any) do not exceed an amount equal to 1.25% of its average daily net assets. This Expense Limitation Agreement (“ELA”) remains in effect until at least April 1, 2019. Accordingly, the Adviser reduced its advisory fees by $116,403 during the year ended November 30, 2018.
The ELA permits the Adviser to recover fee reductions and expense reimbursements made on behalf of the Fund, but only for a period of three years after such reductions or reimbursements were incurred and only if such recovery will not cause the Fund’s expense ratio to exceed the annual rate of 1.25%. As of November 30, 2018, the
17
PAPP SMALL & MID-CAP GROWTH FUND
NOTES TO FINANCIAL STATEMENTS (Continued)
Adviser may in the future recover fee reductions and expense reimbursements totaling $373,065. The Adviser may recover a portion of this amount no later than the dates as stated below:
November 30, 2019 | $ | 121,931 | ||
November 30, 2020 | 134,731 | |||
November 30, 2021 | 116,403 | |||
| $ | 373,065 |
OTHER SERVICE PROVIDERS
Ultimus provides administration, fund accounting and transfer agency services to the Fund. The Fund pays Ultimus fees in accordance with the agreements for such services. In addition, the Fund pays out-of-pocket expenses including but not limited to, postage, supplies and costs of pricing the Fund’s portfolio securities. The Distributor is a wholly-owned subsidiary of Ultimus. The Distributor is compensated by the Adviser (not the Fund) for acting as principal underwriter.
PLAN OF DISTRIBUTION
The Trust has adopted a plan of distribution (the “Plan”) pursuant to Rule 12b-1 under the 1940 Act. Under the Plan, the Fund may incur certain expenses related to the distribution of its shares. The annual limitation of payment of expenses pursuant to the Plan is 0.25% of the Fund’s average daily net assets. The Board of Trustees has not authorized the payment of any fees pursuant to the Plan until at least April 1, 2019.
TRUSTEE COMPENSATION
Each Trustee who is not an interested person of the Trust (“Independent Trustee”) receives from the Fund a fee of $500 for each Board meeting attended, except that the Chair of the Committee of Independent Trustees receives a fee of $700 for each Board meeting attended.
PRINCIPAL HOLDER OF FUND SHARES
As of November 30, 2018, the following shareholder owned of record 25% or more of the outstanding shares of the Fund:
NAME OF RECORD OWNER | % Ownership |
Charles Schwab & Company, Inc. (for the benefit of its customers) | 57% |
A beneficial owner of 25% or more of the Fund’s outstanding shares may be considered a controlling person. That shareholder’s vote could have a more significant effect on matters presented at a shareholders’ meeting.
18
PAPP SMALL & MID-CAP GROWTH FUND
NOTES TO FINANCIAL STATEMENTS (Continued)
5. Contingencies and Commitments
The Fund indemnifies the Trust’s officers and Trustees for certain liabilities that might arise from their performance of their duties to the Fund. Additionally, in the normal course of business the Fund enters into contracts that contain a variety of representations and warranties and which provide general indemnifications. The Fund’s maximum exposure under these arrangements is unknown, as this would involve future claims that may be made against the Fund that have not yet occurred. However, based on experience, the Fund expects the risk of loss to be remote.
6. Subsequent Events
The Fund is required to recognize in the financial statements the effects of all subsequent events that provide additional evidence about conditions that existed as of the date of the Statement of Assets and Liabilities. For non-recognized subsequent events that must be disclosed to keep the financial statements from being misleading, the Fund is required to disclose the nature of the event as well as an estimate of its financial effect, or a statement that such an estimate cannot be made. Management has evaluated subsequent events through the issuance of these financial statements and has noted no such events other than the long-term capital gain distribution paid on December 31, 2018 as noted in Note 2.
19
PAPP SMALL & MID-CAP GROWTH FUND |
To the Board of Trustees of Papp Investment Trust
and the Shareholders of Papp Small & Mid-Cap Growth Fund
Opinion on the Financial Statements
We have audited the accompanying statement of assets and liabilities of Papp Small & Mid-Cap Growth Fund, a series of shares of beneficial interest in Papp Investment Trust (the “Fund”), including the schedule of investments, as of November 30, 2018, and the related statement of operations for the year then ended, the statements of changes in net assets for each of the years in the two-year period then ended and the financial highlights for each of the years in the five-year period then ended, and the related notes (collectively referred to as the “financial statements”). In our opinion, the financial statements present fairly, in all material respects, the financial position of the Fund as of November 30, 2018, and the results of its operations for the year then ended, the changes in its net assets for each of the years in the two-year period then ended and its financial highlights for each of the years in the five-year period then ended, in conformity with accounting principles generally accepted in the United States of America.
Basis for Opinion
These financial statements are the responsibility of the Fund’s management. Our responsibility is to express an opinion on the Fund’s financial statements based on our audits. We are a public accounting firm registered with the Public Company Accounting Oversight Board (United States) (“PCAOB”) and are required to be independent with respect to the Fund in accordance with the U.S. federal securities law and the applicable rules and regulations of the Securities and Exchange Commission and the PCAOB.
We conducted our audits in accordance with the standards of the PCAOB. Those standards require that we plan and perform the audits to obtain reasonable assurance about whether the financial statements are free of material misstatement, whether due to error or fraud. The Fund is not required to have, nor were we engaged to perform, an audit of its internal control over financial reporting. As part of our audits we are required to obtain an understanding of internal control over financial reporting but not for the purpose of expressing an opinion on the effectiveness of the Fund’s internal control over financial reporting. Accordingly, we express no such opinion.
20
PAPP SMALL & MID-CAP GROWTH FUND |
Our audits included performing procedures to assess the risk of material misstatement of the financial statements, whether due to error or fraud, and performing procedures that respond to those risks. Such procedures include examining, on a test basis, evidence regarding the amounts and disclosures in the financial statements. Our procedures included confirmation of securities owned as of November 30, 2018 by correspondence with the custodian. Our audits also included evaluating the accounting principles used and significant estimates made by management, as well as evaluating the overall presentation of the financial statements. We believe that our audits provide a reasonable basis for our opinion.
| |
BBD, LLP |

We have served as the auditor of one or more of the Funds in the Papp Investment Trust since 2010.
Philadelphia, Pennsylvania
January 25, 2019
21
PAPP SMALL & MID-CAP GROWTH FUND |
We believe it is important for you to understand the impact of costs on your investment. As a shareholder of the Fund, you incur ongoing costs, including management fees and other operating expenses. The following examples are intended to help you understand your ongoing costs (in dollars) of investing in the Fund and to compare these costs with the ongoing costs of investing in other mutual funds.
A mutual fund’s ongoing costs are expressed as a percentage of its average net assets. This figure is known as the expense ratio. The expenses in the table below are based on an investment of $1,000 made at the beginning of the most recent period (June 1, 2018) and held until the end of the period (November 30, 2018).
The table below illustrates the Fund’s ongoing costs in two ways:
Actual fund return – This section helps you to estimate the actual expenses that you paid over the period. The “Ending Account Value” shown is derived from the Fund’s actual return, and the third column shows the dollar amount of operating expenses that would have been paid by an investor who started with $1,000 in the Fund. You may use the information here, together with the amount you invested, to estimate the expenses that you paid over the period.
To do so, simply divide your account value by $1,000 (for example, an $8,600 account value divided by $1,000 = 8.6), then multiply the result by the number given for the Fund under the heading “Expenses Paid During Period.”
Hypothetical 5% return – This section is intended to help you compare the Fund’s ongoing costs with those of other mutual funds. It assumes that the Fund had an annual return of 5% before expenses during the period shown, but that the expense ratio is unchanged. In this case, because the return used is not the Fund’s actual return, the results do not apply to your investment. The example is useful in making comparisons because the SEC requires all mutual funds to calculate expenses based on a 5% return. You can assess the Fund’s ongoing costs by comparing this hypothetical example with the hypothetical examples that appear in shareholder reports of other funds.
Note that expenses shown in the table are meant to highlight and help you compare ongoing costs only. The Fund does not charge transaction fees, such as purchase or redemption fees, nor does it carry a “sales load.”
The calculations assume no shares were bought or sold during the period. Your actual costs may have been higher or lower, depending on the amount of your investment and the timing of any purchases or redemptions.
22
PAPP SMALL & MID-CAP GROWTH FUND
ABOUT YOUR FUND’S EXPENSES (Unaudited) (Continued)
More information about the Fund’s expenses, including historical annual expense ratios, can be found in this report. For additional information on operating expenses and other shareholder costs, please refer to the Fund’s prospectus.
| Beginning | Ending | Expenses |
Based on Actual Fund Return | $1,000.00 | $1,038.80 | $6.39 |
Based on Hypothetical 5% Return (before expenses) | $1,000.00 | $1,018.80 | $6.33 |
* | Expenses are equal to the Fund’s annualized net expense ratio of 1.25% for the period, multiplied by the average account value over the period, multiplied by 183/365 (to reflect the one-half year period). |
23
PAPP SMALL & MID-CAP GROWTH FUND |
A description of the policies and procedures that the Fund uses to vote proxies relating to portfolio securities is available without charge upon request by calling toll-free 1-877-370-7277, or on the SEC’s website at http://www.sec.gov. Information regarding how the Fund voted proxies relating to portfolio securities during the most recent 12-month period ended June 30 is available without charge upon request by calling toll-free 1-877-370-7277, or on the SEC’s website at http://www.sec.gov.
The Trust files a complete listing of portfolio holdings for the Fund with the SEC as of the end of the first and third quarters of each fiscal year on Form N-Q. These filings are available upon request by calling 1-877-370-7277. Furthermore, you may obtain a copy of the filings on the SEC’s website at http://www.sec.gov.
FEDERAL TAX INFORMATION (Unaudited)
For the fiscal year ended November 30, 2018, the Fund designated $2,380,121 as long-term capital gain distributions subject to a maximum tax rate of 20%.
24
PAPP SMALL & MID-CAP GROWTH FUND
BOARD OF TRUSTEES AND EXECUTIVE OFFICERS (Unaudited)
The Board of Trustees has overall responsibility for management of the Trust’s affairs. The Trustees serve during the lifetime of the Trust and until its termination, or until death, resignation, retirement, or removal. The Trustees, in turn, elect the officers of the Trust to actively supervise its day-to-day operations. The officers have been elected for an annual term. The following are the Trustees and executive officers of the Trust:
Name, Address and | Position(s) Held | Principal Occupation(s) During | Number of |
Interested Trustees: | |||
*Harry A. Papp | President and Trustee since December 2011 | Managing Partner of L. Roy Papp & Associates, LLP | 1 |
*Rosellen C. Papp | Trustee since February 2010 | Partner and Research Director of L. Roy Papp & Associates, LLP | 1 |
Independent Trustees: | |||
Jean C. Bingham | Trustee since October 2016 | Retired; Vice President, GreenPoint Financial (a holding company providing banking and mortgage services) from 1993-2004; President, GreenPoint Credit (a wholly owned subsidiary of GreenPoint Financial) from 2003-2004 | 1 |
Cynthia P. Hubiak | Trustee since February 2010 | President and Chief Executive Officer, Arizona Society of CPAs | 1 |
Carolyn P. O’Malley | Trustee since February 2010 | Retired; Executive Director, Dorrance Family Foundation (a private foundation providing educational, conservation and other grants) from 2001-2009 | 1 |
* | Harry A. Papp and Rosellen C. Papp, as partners of the Adviser, are considered “interested persons” of the Trust within the meaning of Section 2(a)(19) of the 1940 Act. Harry A. Papp and Rosellen C. Papp are married. |
25
PAPP SMALL & MID-CAP GROWTH FUND
BOARD OF TRUSTEES AND EXECUTIVE OFFICERS (Unaudited) (Continued)
Name, Address and | Position(s) Held with Trust and Length of Time Served | Principal Occupation(s) During Past 5 Years |
Executive Officers: | ||
Brian M. Riordan, CFA | Vice President since February 2012 | Partner and Research Analyst of L. Roy Papp & Associates, LLP |
Gregory Smith, CFA | Vice President | Partner and Research Analyst of L. Roy Papp & Associates, LLP |
Robert G. Dorsey | Vice President since November 2009 | Managing Director of Ultimus Fund Solutions, LLC and Ultimus Fund Distributors, LLC |
Theresa M. Bridge | Treasurer since January 2013 | Vice President, Director of Financial Administration of Ultimus Fund Solutions, LLC |
Benjamin V. Mollozzi | Secretary since January 2019 | Attorney of Ultimus Fund Solutions, LLC and Ultimus Fund Distributors, LLC |
Julie A. Hein | Chief Compliance Officer since February 2010 | Partner and Chief Compliance Officer of L. Roy Papp & Associates, LLP |
Additional information about members of the Board and executive officers is available in the Fund’s Statement of Additional Information (“SAI”). To obtain a free copy of the SAI, please call 1-877-370-7277.
26
| Item 2. | Code of Ethics. |
As of the end of the period covered by this report, the registrant has adopted a code of ethics that applies to the registrant’s principal executive officer, principal financial officer, principal accounting officer or controller, or persons performing similar functions, regardless of whether these individuals are employed by the registrant or a third party. Pursuant to Item 13(a)(1), a copy of registrant’s code of ethics is filed as an exhibit to this Form N-CSR. During the period covered by this report, the code of ethics has not been amended, and the registrant has not granted any waivers, including implicit waivers, from the provisions of the code of ethics.
| Item 3. | Audit Committee Financial Expert. |
The registrant’s board of trustees has determined that the registrant has at least one audit committee financial expert serving on its audit committee. The name of the audit committee financial expert is Cynthia P. Hubiak. Ms. Hubiak is “independent” for purposes of this Item.
| Item 4. | Principal Accountant Fees and Services. |
| (a) | Audit Fees. The aggregate fees billed for professional services rendered by the principal accountant for the audit of the registrant’s annual financial statements or for services that are normally provided by the accountant in connection with statutory and regulatory filings or engagements were $12,500 and $12,500 with respect to the registrant’s fiscal years ended November 30, 2018 and 2017, respectively. |
| (b) | Audit-Related Fees. No fees were billed in the last fiscal year for assurance and related services by the principal accountant that are reasonably related to the performance of the audit of the registrant’s financial statements and are not reported under paragraph (a) of this Item. |
| (c) | Tax Fees. The aggregate fees billed for professional services rendered by the principal accountant for tax compliance, tax advice, and tax planning were $2,700 and $2,200 with respect to the registrant’s fiscal years ended November 30, 2018 and 2017, respectively. The services comprising these fees are the preparation of the registrant’s federal income and excise tax returns. |
| (d) | All Other Fees. No fees were billed in either of the last two fiscal years for products and services provided by the principal accountant, other than the services reported in paragraphs (a) through (c) of this Item. |
| (e)(1) | The audit committee has not adopted pre-approval policies and procedures described in paragraph (c)(7) of Rule 2-01 of Regulation S-X. |
| (e)(2) | None of the services described in paragraph (b) through (d) of this Item were approved by the audit committee pursuant to paragraph (c)(7)(i)(C) of Rule 2-01 of Regulation S-X. |
| (f) | Less than 50% of hours expended on the principal accountant’s engagement to audit the registrant’s financial statements for the most recent fiscal year were attributed to work performed by persons other than the principal accountant’s full-time, permanent employees. |
| (g) | During the fiscal years ended November 30, 2018 and 2017, aggregate non-audit fees of $2,700 and $2,200, respectively, were billed by the registrant’s principal accountant for services rendered to the registrant. No non-audit fees were billed in the last fiscal year by the registrant’s principal accountant for services rendered to the registrant’s investment adviser (not including any sub-adviser whose role is primarily portfolio management and is subcontracted with or overseen by another investment adviser), and any entity controlling, controlled by, or under common control with the adviser that provides ongoing services to the registrant. |
| (h) | The principal accountant has not provided any non-audit services to the registrant’s investment adviser (not including any sub-adviser whose role is primarily portfolio management and is subcontracted with or overseen by another investment adviser), and any entity controlling, controlled by, or under common control with the investment adviser that provides ongoing services to the registrant. |
| Item 5. | Audit Committee of Listed Registrants. |
Not applicable
| Item 6. | Schedule of Investments. |
| (a) | Not applicable [schedule filed with Item 1] |
| (b) | Not applicable |
| Item 7. | Disclosure of Proxy Voting Policies and Procedures for Closed-End Management Investment Companies. |
Not applicable
| Item 8. | Portfolio Managers of Closed-End Management Investment Companies. |
Not applicable
| Item 9. | Purchases of Equity Securities by Closed-End Management Investment Company and Affiliated Purchasers. |
Not applicable
| Item 10. | Submission of Matters to a Vote of Security Holders. |
The registrant’s Committee of Independent Trustees shall review shareholder recommendations to fill vacancies on the registrant’s board of trustees if such recommendations are submitted in writing, addressed to the Committee at the registrant’s offices and meet any minimum qualifications adopted by the Committee. The Committee may adopt, by resolution, a policy regarding its procedures for considering candidates for the board of trustees, including any recommended by shareholders.
| Item 11. | Controls and Procedures. |
(a) Based on their evaluation of the registrant’s disclosure controls and procedures (as defined in Rule 30a-3(c) under the Investment Company Act of 1940) as of a date within 90 days of the filing date of this report, the registrant’s principal executive officer and principal financial officer have concluded that such disclosure controls and procedures are reasonably designed and are operating effectively to ensure that material information relating to the registrant, including its consolidated subsidiaries, is made known to them by others within those entities, particularly during the period in which this report is being prepared, and that the information required in filings on Form N-CSR is recorded, processed, summarized, and reported on a timely basis.
(b) There were no changes in the registrant’s internal control over financial reporting (as defined in Rule 30a-3(d) under the Investment Company Act of 1940) that occurred during the second fiscal quarter of the period covered by this report that have materially affected, or are reasonably likely to materially affect, the registrant’s internal control over financial reporting.
| Item 12. | Disclosure of Securities Lending Activities for Closed-End Management Investment Companies. |
Not applicable
| Item 13. | Exhibits. |
File the exhibits listed below as part of this Form. Letter or number the exhibits in the sequence indicated.
(a)(1) Any code of ethics, or amendment thereto, that is the subject of the disclosure required by Item 2, to the extent that the registrant intends to satisfy the Item 2 requirements through filing of an exhibit: Attached hereto
(a)(2) A separate certification for each principal executive officer and principal financial officer of the registrant as required by Rule 30a-2(a) under the Act (17 CFR 270.30a-2(a)): Attached hereto
(a)(3) Any written solicitation to purchase securities under Rule 23c-1 under the Act (17 CFR 270.23c-1) sent or given during the period covered by the report by or on behalf of the registrant to 10 or more persons: Not applicable
(a)(4) Change in the registrant’s independent public accountants: Not applicable
(b) Certifications required by Rule 30a-2(b) under the Act (17 CFR 270.30a-2(b)): Attached hereto
| Exhibit 99.CODE ETH | Code of Ethics |
| Exhibit 99.CERT | Certifications required by Rule 30a-2(a) under the Act |
| Exhibit 99.906CERT | Certifications required by Rule 30a-2(b) under the Act |
SIGNATURES
Pursuant to the requirements of the Securities Exchange Act of 1934 and the Investment Company Act of 1940, the registrant has duly caused this report to be signed on its behalf by the undersigned, thereunto duly authorized.
| (Registrant) | Papp Investment Trust | ||
| By (Signature and Title)* | /s/ Harry A. Papp | ||
| Harry A. Papp, President | |||
| Date | February 4, 2019 | ||
| Pursuant to the requirements of the Securities Exchange Act of 1934 and the Investment Company Act of 1940, this report has been signed below by the following persons on behalf of the registrant and in the capacities and on the dates indicated. | |||
| By (Signature and Title)* | /s/ Harry A. Papp | ||
| Harry A. Papp, President | |||
| Date | February 4, 2019 | ||
| By (Signature and Title)* | /s/ Theresa M. Bridge | ||
| Theresa M. Bridge, Treasurer and Principal Financial Officer | |||
| Date | February 4, 2019 | ||
| * | Print the name and title of each signing officer under his or her signature. |