Class | Expense Ratios |
CLASS A | 5.42% |
CLASS C | 6.17 |
CLASS I | 5.10 |
CLASS W | 5.17 |
CLASS Y | 5.17 |
The expense ratios for Class A, C, W, and Y reflect contractual waivers and/or reimbursements of expenses by the Fund’s Manager. Some of these undertakings may be modified or terminated at any time, as indicated in the Fund’s prospectus. The “Financial Highlights” tables in the Fund’s financial statements, included in this report, also show the gross expense ratios, without such waivers or reimbursements, if applicable.
OPPENHEIMER STEELPATH MLP SELECT 40 FUND 11 |
STATEMENT OF INVESTMENTS November 30, 2016 |
Description | | Shares | | | Value | |
Master Limited Partnership Shares — 93.8% | |
Coal — 0.2% | |
Alliance Holdings GP LP | | | 289,386 | | | $ | 8,380,619 | |
| | | | | | | | | |
Diversified — 9.7% | |
Enterprise Products Partners LP | | | 4,613,856 | | | | 119,637,286 | |
ONEOK Partners LP | | | 1,518,742 | | | | 63,483,416 | |
Westlake Chemical Partners LP | | | 219,820 | | | | 4,616,220 | |
Williams Partners LP | | | 3,000,091 | | | | 109,503,321 | |
Total Diversified | | | | | | | 297,240,243 | |
| | | | | | | | | |
Gathering/Processing — 10.4% | |
American Midstream Partners LP | | | 46,475 | | | | 685,506 | |
Archrock Partners LP | | | 1,903,680 | | | | 30,344,659 | |
Crestwood Equity Partners LP | | | 346,805 | | | | 7,768,432 | |
CSI Compressco LP | | | 796,269 | | | | 7,962,690 | |
DCP Midstream Partners LP | | | 2,489,680 | | | | 86,217,618 | |
EnLink Midstream Partners LP | | | 238,890 | | | | 4,185,353 | |
Midcoast Energy Partners LP 1 | | | 1,339,510 | | | | 8,371,938 | |
PennTex Midstream Partners LP | | | 400,000 | | | | 6,296,000 | |
Summit Midstream Partners LP | | | 1,808,309 | | | | 40,596,537 | |
Western Gas Equity Partners LP | | | 612,788 | | | | 26,313,117 | |
Western Gas Partners LP | | | 1,752,838 | | | | 100,034,465 | |
Total Gathering/Processing | | | | | | | 318,776,315 | |
| | | | | | | | | |
Marine — 2.5% | |
GasLog Partners LP | | | 1,036,378 | | | | 21,090,292 | |
Golar LNG Partners LP | | | 1,697,358 | | | | 37,817,136 | |
Teekay LNG Partners LP | | | 1,194,702 | | | | 18,338,676 | |
Marine — 2.5% (Continued) | |
Teekay Offshore Partners LP | | | 180,955 | | | $ | 989,824 | |
Total Marine | | | | | | | 78,235,928 | |
| | | | | | | | | |
Natural Gas Pipelines — 26.5% | |
Antero Midstream Partners LP | | | 1,250,000 | | | | 35,212,500 | |
Cone Midstream Partners LP | | | 1,098,000 | | | | 24,485,400 | |
CrossAmerica Partners LP 1 | | | 772,716 | | | | 20,090,616 | |
Energy Transfer Equity LP | | | 7,340,635 | | | | 125,011,014 | |
Energy Transfer Partners LP | | | 3,847,502 | | | | 135,124,258 | |
EQT Midstream Partners LP | | | 1,020,139 | | | | 74,704,779 | |
Rice Midstream Partners LP 1 | | | 2,958,060 | | | | 63,746,193 | |
Spectra Energy Partners LP | | | 1,093,423 | | | | 46,459,543 | |
Tallgrass Energy GP LP | | | 2,423,040 | | | | 58,637,568 | |
Tallgrass Energy Partners LP | | | 2,677,374 | | | | 125,408,198 | |
TC Pipelines LP | | | 1,941,692 | | | | 103,200,930 | |
Total Natural Gas Pipelines | | | | | | | 812,080,999 | |
| | | | | | | | | |
Petroleum Transportation — 44.5% | |
Buckeye Partners LP | | | 2,003,402 | | | | 128,898,885 | |
Delek Logistics Partners LP | | | 457,743 | | | | 11,695,334 | |
Enbridge Energy Partners LP | | | 2,781,925 | | | | 68,713,547 | |
Genesis Energy LP | | | 4,317,601 | | | | 150,856,979 | |
Global Partners LP | | | 1,082,805 | | | | 17,108,319 | |
Holly Energy Partners LP 1 | | | 4,260,282 | | | | 137,436,697 | |
Magellan Midstream Partners LP | | | 1,676,339 | | | | 116,086,476 | |
MPLX LP | | | 4,089,498 | | | | 134,340,009 | |
NGL Energy Partners LP | | | 3,413,676 | | | | 63,323,690 | |
12 OPPENHEIMER STEELPATH MLP SELECT 40 FUND |
STATEMENT OF INVESTMENTS (Continued) |
Description | | Shares | | | Value | |
Petroleum Transportation — 44.5% (Continued) | |
NuStar Energy LP | | | 813,329 | | | $ | 38,828,326 | |
NuStar GP Holdings LLC | | | 1,834,567 | | | | 46,598,002 | |
PBF Logistics LP | | | 741,285 | | | | 13,824,965 | |
Plains All American Pipeline LP | | | 1,039,544 | | | | 34,252,975 | |
Shell Midstream Partners LP | | | 1,219,476 | | | | 33,633,148 | |
Sprague Resources LP | | | 99,300 | | | | 2,239,215 | |
Sunoco Logistics Partners LP | | | 5,195,324 | | | | 123,077,225 | |
Sunoco LP | | | 3,917,088 | | | | 94,401,821 | |
Tesoro Logistics LP | | | 1,669,936 | | | | 78,704,084 | |
TransMontaigne Partners LP 1 | | | 1,264,800 | | | | 53,741,352 | |
Western Refining Logistics LP | | | 850,000 | | | | 17,510,000 | |
Total Petroleum Transportation | | | | | | | 1,365,271,049 | |
| | | | | | | | | |
Total Master Limited Partnership Shares | |
(identified cost $2,483,049,479) | | | | 2,879,985,153 | |
| | | | | | | | | |
Common Stocks — 6.3% | |
Diversified — 2.6% | |
ONEOK, Inc. | | | 659,164 | | | | 36,207,879 | |
Williams Cos., Inc. | | | 1,425,770 | | | | 43,771,139 | |
Total Diversified | | | | | | | 79,979,018 | |
| | | | | | | | | |
Gathering/Processing — 3.6% | |
Targa Resources Corp. | | | 2,080,949 | | | | 110,893,772 | |
| | | | | | | | | |
Marine — 0.1% | |
Dorian LPG, Ltd. 2 | | | 242,090 | | | | 1,689,788 | |
| | | | | | | | | |
Total Common Stocks | |
(identified cost $190,972,529) | | | | 192,562,578 | |
Preferred Master Limited Partnership Shares — 1.3% | |
Petroleum Transportation — 1.3% | |
GPM Petroleum LP - Class A, 10.00% 1,4 | | | 2,000,000 | | | $ | 40,060,000 | |
| | | | | | | | | |
Total Preferred Master Limited Partnership Shares | |
(identified cost $36,858,168) | | | | 40,060,000 | |
| | | | | | | | | |
Private Investment in Public Equity — 0.7% | |
Natural Gas Pipelines — 0.7% | |
Rice Midstream Partners LP PIPE Units1,3 | | | 997,501 | | | | 19,820,345 | |
| | | | | | | | | |
Total Private Investment in Public Equity | |
(identified cost $21,209,863) | | | | 19,820,345 | |
| | | | | | | | | |
Total Investments — 102.1% (identified cost $2,732,090,039) | | | | 3,132,428,076 | |
Liabilities In Excess of Other Assets — (2.1)% | | | | (65,096,074 | ) |
Net Assets — 100.0% | | | $ | 3,067,332,002 | |
OPPENHEIMER STEELPATH MLP SELECT 40 FUND 13 |
STATEMENT OF INVESTMENTS (Continued) |
Footnotes to Statement of Investments
LLC — Limited Liability Company
LP — Limited Partnership
1. | Is or was an affiliate, as defined by the Investment Company Act of 1940, at or during the period ended November 30, 2016, by virtue of the Fund owning at least 5% of the voting securities of the issuer. Transactions during this period in which the issuer was an affiliate are as follows: |
| | Shares
November 30,
2015 | | | Gross
Additions | | | Gross
Reductions | | | Shares
November 30, 2016 | |
CrossAmerica Partners LPi | | | — | | | | 1,545,416 | | | | (772,700 | ) | | | 772,716 | |
GPM Petroleum LP | | | — | | | | 2,000,000 | | | | — | | | | 2,000,000 | |
Holly Energy Partners LP | | | 3,402,282 | | | | 858,000 | | | | — | | | | 4,260,282 | |
Midcoast Energy Partners LP | | | 1,339,510 | | | | — | | | | — | | | | 1,339,510 | |
Rice Midstream Partners LPi | | | 2,096,589 | | | | 861,471 | | | | — | | | | 2,958,060 | |
Rice Midstream Partners LP PIPE Unitsi | | | — | | | | 997,501 | | | | — | | | | 997,501 | |
TransMontaigne Partners LP | | | 670,254 | | | | 594,546 | | | | — | | | | 1,264,800 | |
| | | | | | | | | | | | | | | | | |
| | Value
November 30, 2016 | | | Distributions | | | Realized
Gain/(Loss) | | | | | |
CrossAmerica Partners LPi | | $ | 20,090,616 | | | $ | 2,312,343 | | | $ | (446,234 | ) | | | | |
GPM Petroleum LP | | | 40,060,000 | | | | 3,141,832 | | | | — | | | | | |
Holly Energy Partners LP | | | 137,436,697 | | | | 9,280,104 | | | | — | | | | | |
Midcoast Energy Partners LP | | | 8,371,938 | | | | 1,915,499 | | | | — | | | | | |
Rice Midstream Partners LPi | | | 63,746,193 | | | | 2,481,822 | | | | — | | | | | |
Rice Midstream Partners LP PIPE Unitsi | | | 19,820,345 | | | | 236,408 | | | | — | | | | | |
TransMontaigne Partners LP | | | 53,741,352 | | | | 3,035,443 | | | | — | | | | | |
| | | $ | 343,267,141 | | | $ | 22,403,451 | | | $ | (446,234 | ) | | | | |
| | i | Is not an affiliate as of November 30, 2016. Was an affiliate during the year ended November 30, 2016. |
3. | Represents securities sold under Rule 144A, which are exempt from registration under the Securities Act of 1933, as amended. These securities have been determined to be liquid under guidelines established by the Board of Trustees. These securities, acquired on October 7, 2016 for $21,446,272 amount to $19,820,345 or 0.7% of the Fund’s net assets as of November 30, 2016. |
4. | Restricted security. The aggregate value of restricted securities at period end was $40,060,000, which represents 1.3% of the Fund’s net assets. See Note 4 of the accompanying Notes. Information concerning restricted securities is as follows: |
Security | Acquisition Date | | Cost | | | Value | | | Unrealized Appreciation/(Depreciation) | |
GPM Petroleum LP | 1/12/2016 | | $ | 40,000,000 | | | $ | 40,060,000 | | | $ | 60,000 | |
See accompanying Notes to Financial Statements.
14 OPPENHEIMER STEELPATH MLP SELECT 40 FUND |
STATEMENT OF ASSETS AND LIABILITIES November 30, 2016 |
Assets: | | | |
Investments at value – see accompanying Statement of Investments: | | | |
Unaffiliated companies (cost $2,529,618,097) | | $ | 2,892,818,089 | |
Affiliated companies (cost $202,471,942) | | | 239,609,987 | |
| | | 3,132,428,076 | |
Receivable for beneficial interest sold | | | 7,317,981 | |
Prepaid expenses | | | 151,935 | |
Dividends receivable | | | 331,983 | |
Receivable for investments sold | | | 18,004,761 | |
Total assets | | | 3,158,234,736 | |
| | | | |
Liabilities: | | | | |
Deferred tax liability, net | | | 74,043,680 | |
Payable for investments purchased | | | 6,794,187 | |
Payable for beneficial interest redeemed | | | 4,122,596 | |
Due to custodian | | | 2,925,751 | |
Payable to Manager | | | 1,486,890 | |
Payable for distribution and service plan fees | | | 543,863 | |
Transfer agent fees payable | | | 496,585 | |
Trustees' fees payable | | | 24,175 | |
Borrowing expense payable | | | 16,628 | |
Other liabilities | | | 448,379 | |
Total liabilities | | | 90,902,734 | |
| | | | |
Net Assets | | $ | 3,067,332,002 | |
| | | | |
Composition of Net Assets | | | | |
Par value of shares of beneficial interest | | $ | 331,257 | |
Paid-in capital | | | 2,923,143,601 | |
Undistributed net investment loss, net of deferred taxes | | | (55,209,591 | ) |
Accumulated undistributed net realized losses on investments, net of deferred taxes | | | (53,308,380 | ) |
Net unrealized appreciation on investments, net of deferred taxes | | | 252,375,115 | |
Net Assets | | $ | 3,067,332,002 | |
OPPENHEIMER STEELPATH MLP SELECT 40 FUND 15 |
STATEMENT OF ASSETS AND LIABILITIES (Continued) |
Net Asset Value, Offering Price and Redemption Proceeds Per Share ($0.001 Par Value, Unlimited Shares Authorized) | | | |
Class A Shares: | | | |
Net asset value and redemption proceeds per share | | $ | 9.18 | |
Offering price per share (net asset value plus sales charge of 5.75% of offering price) | | $ | 9.74 | |
Class C Shares: | | | | |
Net asset value, offering price and redemption proceeds per share | | $ | 8.84 | |
Class I Shares: | | | | |
Net asset value, offering price and redemption proceeds per share | | $ | 9.43 | |
Class W Shares: | | | | |
Net asset value, offering price and redemption proceeds per share | | $ | 9.40 | |
Class Y Shares: | | | | |
Net asset value, offering price and redemption proceeds per share | | $ | 9.40 | |
Net Assets: | | | |
Class A shares | | $ | 631,417,357 | |
Class C shares | | | 517,869,491 | |
Class I shares | | | 313,324,805 | |
Class W shares | | | 6,707,854 | |
Class Y shares | | | 1,598,012,495 | |
Total Net Assets | | $ | 3,067,332,002 | |
| | | | | |
Shares Outstanding: | | | | |
Class A shares | | | 68,755,149 | |
Class C shares | | | 58,598,003 | |
Class I shares | | | 33,242,773 | |
Class W shares | | | 713,400 | |
Class Y shares | | | 169,947,640 | |
Total Shares Outstanding | | | 331,256,965 | |
See accompanying Notes to Financial Statements.
16 OPPENHEIMER STEELPATH MLP SELECT 40 FUND |
STATEMENT OF OPERATIONS For the Year Ended November 30, 2016 |
Investment Income | | | |
Distributions from: | | | |
Unaffiliated Master Limited Partnerships | | $ | 173,494,006 | |
Affiliated Master Limited Partnerships | | | 22,403,451 | |
Less return of capital on distributions from: | | | | |
Unaffiliated Master Limited Partnerships | | | (173,494,006 | ) |
Affiliated Master Limited Partnerships | | | (22,403,451 | ) |
Dividend income | | | 7,797,379 | |
Total investment income | | | 7,797,379 | |
| | | | |
Expenses | | | | |
Management fees | | | 19,031,026 | |
Distribution and service plan fees | | | | |
Class A | | | 1,483,379 | |
Class C | | | 4,689,753 | |
Transfer agent fees | | | | |
Class A | | | 1,305,374 | |
Class C | | | 1,031,747 | |
Class I | | | 71,187 | |
Class W | | | 20,571 | |
Class Y | | | 3,101,618 | |
Administrative fees | | | 647,902 | |
Borrowing fees | | | 552,174 | |
Registration fees | | | 254,345 | |
Legal, auditing, and other professional fees | | | 214,988 | |
Custody fees | | | 115,968 | |
Trustees' fees | | | 94,819 | |
Tax expense | | | 85,636 | |
Other | | | 44,799 | |
Total expenses, before waivers and deferred taxes | | | 32,745,286 | |
Less expense waivers | | | (3,014,707 | ) |
Net expenses, before deferred taxes | | | 29,730,579 | |
| | | | |
Net investment loss, before deferred taxes | | | (21,933,200 | ) |
Deferred tax benefit | | | 10,212,806 | |
Net investment loss, net of deferred taxes | | | (11,720,394 | ) |
| | | | |
Net Realized and Unrealized Gains on Investments: | | | | |
Net Realized Losses | | | | |
Investments from: | | | | |
Unaffiliated companies | | | (118,860,902 | ) |
Affiliated Companies | | | (446,234 | ) |
Deferred tax benefit | | | 43,785,719 | |
Net realized losses, net of deferred taxes | | | (75,521,417 | ) |
Net Change in Unrealized Appreciation | | | | |
Investments | | | 428,127,171 | |
Deferred tax expense | | | (157,122,672 | ) |
Net change in unrealized appreciation, net of deferred taxes | | | 271,004,499 | |
| | | | |
Net realized and unrealized gains on investments, net of deferred taxes | | | 195,483,082 | |
Change in net assets resulting from operations | | $ | 183,762,688 | |
See accompanying Notes to Financial Statements.
OPPENHEIMER STEELPATH MLP SELECT 40 FUND 17 |
STATEMENTS OF CHANGES IN NET ASSETS |
| | For the
Year Ended
November 30, 2016 | | | For the
Year Ended
November 30, 2015 | |
Operations | | | | | | |
Net investment loss, net of deferred taxes | | $ | (11,720,394 | ) | | $ | (7,104,407 | ) |
Net realized gains/(losses), net of deferred taxes | | | (75,521,417 | ) | | | 24,155,201 | |
Net change in unrealized appreciation/(depreciation), net of deferred taxes | | | 271,004,499 | | | | (684,613,488 | ) |
Change in net assets resulting from operations | | | 183,762,688 | | | | (667,562,694 | ) |
| | | | | | | | |
Distributions to Shareholders | | | | | | | | |
Distributions to shareholders from return of capital: | | | | | | | | |
Class A shares | | | (47,334,331 | ) | | | (48,012,809 | ) |
Class C shares | | | (38,813,705 | ) | | | (31,296,649 | ) |
Class I shares | | | (18,804,337 | ) | | | (9,700,275 | ) |
Class W shares | | | (685,522 | ) | | | (1,947,907 | ) |
Class Y shares | | | (110,561,896 | ) | | | (95,514,712 | ) |
Change in net assets resulting from distributions to shareholders | | | (216,199,791 | ) | | | (186,472,352 | ) |
| | | | | | | | |
Beneficial Interest Transactions | | | | | | | | |
Class A shares | | | 32,860,671 | | | | (44,928,862 | ) |
Class C shares | | | 77,425,235 | | | | 120,473,920 | |
Class I shares | | | 116,926,337 | | | | 175,938,184 | |
Class W shares | | | (10,900,819 | ) | | | (30,225,605 | ) |
Class Y shares | | | 233,362,480 | | | | 48,360,536 | |
Change in net assets resulting from beneficial interest transactions | | | 449,673,904 | | | | 269,618,173 | |
Change in net assets | | | 417,236,801 | | | | (584,416,873 | ) |
| | | | | | | | |
Net Assets | | | | | | | | |
Beginning of period | | | 2,650,095,201 | | | | 3,234,512,074 | |
End of period | | $ | 3,067,332,002 | | | $ | 2,650,095,201 | |
| | | | | | | | | |
Undistributed net investment loss, net of deferred taxes | | $ | (55,209,591 | ) | | $ | (43,489,197 | ) |
See accompanying Notes to Financial Statements.
18 OPPENHEIMER STEELPATH MLP SELECT 40 FUND |
Class A | | Year Ended November 30,
2016 | | | Year Ended November 30,
2015 | | | Year Ended November 28,
2014* | | | Year Ended November 29,
2013* | | | Year Ended November 30,
2012 | |
Per Share Operating Data | | | | | | | | | | | | | | | |
Net Asset Value, Beginning of Period | | $ | 9.35 | | | $ | 12.54 | | | $ | 11.99 | | | $ | 10.67 | | | $ | 10.56 | |
Income/(loss) from investment operations: | | | | | | | | | | | | | | | | | | | | |
Net investment loss1 | | | (0.05 | ) | | | (0.04 | ) | | | (0.09 | ) | | | (0.07 | ) | | | (0.07 | ) |
Return of capital1 | | | 0.41 | | | | 0.43 | | | | 0.44 | | | | 0.44 | | | | 0.43 | |
Net realized and unrealized gains/(losses) | | | 0.18 | | | | (2.87 | ) | | | 0.91 | | | | 1.66 | | | | 0.46 | |
Total from investment operations | | | 0.54 | | | | (2.48 | ) | | | 1.26 | | | | 2.03 | | | | 0.82 | |
Distributions to shareholders: | | | | | | | | | | | | | | | | | | | | |
Return of capital | | | (0.71 | ) | | | (0.71 | ) | | | (0.71 | ) | | | (0.71 | ) | | | (0.71 | ) |
Net asset value, end of period | | $ | 9.18 | | | $ | 9.35 | | | $ | 12.54 | | | $ | 11.99 | | | $ | 10.67 | |
| | | | | | | | | | | | | | | | | | | | |
Total Return, at Net Asset Value2 | | | 6.31 | % | | | (20.49 | %) | | | 10.59 | % | | | 19.32 | % | | | 7.87 | % |
| | | | | | | | | | | | | | | | | | | | |
Ratios /Supplemental Data | | | | | | | | | | | | | | | | | | | | |
Net assets, end of period (in thousands) | | $ | 631,417 | | | $ | 608,965 | | | $ | 872,216 | | | $ | 618,758 | | | $ | 207,631 | |
Ratio of Expenses to Average Net Assets: | | | | | | | | | |
Before (waivers) and deferred tax expense/(benefit) | | | 1.24 | % | | | 1.23 | % | | | 1.25 | % | | | 1.13 | % | | | 1.14 | % |
Expense (waivers) | | | (0.12 | %) | | | (0.11 | %) | | | (0.12 | %) | | | (0.01 | %) | | | (0.04 | %) |
Net of (waivers) and before deferred tax expense/(benefit) | | | 1.12 | %3 | | | 1.12 | %3 | | | 1.13 | %3 | | | 1.12 | %4 | | | 1.10 | % |
Deferred tax expense/(benefit)5,6 | | | 3.79 | % | | | (13.36 | %) | | | 5.19 | % | | | 8.42 | % | | | 4.14 | % |
Total expenses/(benefit) | | | 4.91 | % | | | (12.24 | %) | | | 6.32 | % | | | 9.54 | % | | | 5.24 | % |
| | | | | | | | | | | | | | | | | | | | | |
Ratio of Investment Loss to Average Net Assets: | | | | | | | | | |
Before (waivers) and deferred tax benefit/(expense) | | | (1.08 | %) | | | (0.83 | %) | | | (1.24 | %) | | | (0.94 | %) | | | (1.07 | %) |
Expense (waivers) | | | (0.12 | %) | | | (0.11 | %) | | | (0.12 | %) | | | (0.01 | %) | | | (0.04 | %) |
Net of expense (waivers) and before deferred tax benefit/(expense) | | | (0.96 | %) | | | (0.72 | %) | | | (1.12 | %) | | | (0.93 | %) | | | (1.03 | %) |
Deferred tax benefit6,7 | | | 0.38 | % | | | 0.32 | % | | | 0.41 | % | | | 0.33 | % | | | 0.35 | % |
Net investment loss | | | (0.58 | %) | | | (0.40 | %) | | | (0.71 | %) | | | (0.60 | %) | | | (0.68 | %) |
| | | | | | | | | | | | | | | | | | | | |
Portfolio turnover rate | | | 10 | % | | | 8 | % | | | 12 | % | | | 2 | % | | | 11 | % |
* | November 28, 2014 and November 29, 2013 represent the last business day of the Fund’s respective reporting periods. |
1. | Per share amounts calculated based on average shares outstanding during the period net of deferred tax expense/benefit. |
2. | Assumes an initial investment on the business day before the first day of the fiscal period, with all dividends and distributions reinvested in additional shares on the reinvestment date, and redemptions at the net asset value calculated on the last business day of the fiscal period. Sales charges are not reflected in the total returns. Total returns are not annualized for periods less than one full year. Returns do not reflect the deduction of taxes that a shareholder would pay on fund distributions or the redemption of fund shares. The returns do not include adjustments in accordance with generally accepted accounting principles required at the period end for financial reporting purposes. |
3. | Includes borrowing and franchise tax expense. Without borrowing and franchise tax expense, the net expense ratio would be 1.10%. |
4. | Includes franchise tax expense. Without franchise tax expense the net expense ratio would be 1.10%. |
5. | Deferred tax expense estimate for the ratio calculation is derived from the net investment income/loss, and realized and unrealized gains/losses. |
6. | Effective December 1, 2013 the deferred tax expense and deferred tax benefit are allocated based on average net assets. Prior to December 1, 2013 the deferred tax expense and deferred tax benefit were allocated based on specific class expenses. |
7. | Deferred tax benefit for the ratio calculation is derived from net investment income/loss only. |
See accompanying Notes to Financial Statements.
OPPENHEIMER STEELPATH MLP SELECT 40 FUND 19 |
FINANCIAL HIGHLIGHTS (Continued) |
Class C | | Year Ended November 30,
2016 | | | Year Ended November 30,
2015 | | | Year Ended November 28,
2014* | | | Year Ended November 29,
2013* | | | Year Ended November 30,
2012 | |
Per Share Operating Data | | | | | | | | | | | | | | | |
Net Asset Value, Beginning of Period | | $ | 9.09 | | | $ | 12.30 | | | $ | 11.87 | | | $ | 10.64 | | | $ | 10.58 | |
Income/(loss) from investment operations: | | | | | | | | | | | | | | | | | | | | |
Net investment loss1 | | | (0.13 | ) | | | (0.13 | ) | | | (0.18 | ) | | | (0.13 | ) | | | (0.12 | ) |
Return of capital1 | | | 0.41 | | | | 0.43 | | | | 0.44 | | | | 0.45 | | | | 0.46 | |
Net realized and unrealized gains/(losses) | | | 0.18 | | | | (2.80 | ) | | | 0.88 | | | | 1.62 | | | | 0.43 | |
Total from investment operations | | | 0.46 | | | | (2.50 | ) | | | 1.14 | | | | 1.94 | | | | 0.77 | |
Distributions to shareholders: | | | | | | | | | | | | | | | | | | | | |
Return of capital | | | (0.71 | ) | | | (0.71 | ) | | | (0.71 | ) | | | (0.71 | ) | | | (0.71 | ) |
Net asset value, end of period | | $ | 8.84 | | | $ | 9.09 | | | $ | 12.30 | | | $ | 11.87 | | | $ | 10.64 | |
| | | | | | | | | | | | | | | | | | | | |
Total Return, at Net Asset Value2 | | | 5.59 | % | | | (21.07 | %) | | | 9.66 | % | | | 18.51 | % | | | 7.36 | % |
| | | | | | | | | | | | | | | | | | | | |
Ratios /Supplemental Data | | | | | | | | | | | | | | | | | | | | |
Net assets, end of period (in thousands) | | $ | 517,869 | | | $ | 451,373 | | | $ | 475,459 | | | $ | 241,984 | | | $ | 123,372 | |
Ratio of Expenses to Average Net Assets: | | | | | | | | | | | | | |
Before (waivers) and deferred tax expense/(benefit) | | | 1.99 | % | | | 1.98 | % | | | 2.00 | % | | | 1.89 | % | | | 2.04 | % |
Expense (waivers) | | | (0.12 | %) | | | (0.11 | %) | | | (0.12 | %) | | | (0.01 | %) | | | (0.19 | %) |
Net of (waivers) and before deferred tax expense/(benefit) | | | 1.87 | %3 | | | 1.87 | %3 | | | 1.88 | %3 | | | 1.88 | %4 | | | 1.85 | % |
Deferred tax expense/(benefit)5,6 | | | 3.79 | % | | | (13.36 | %) | | | 5.19 | % | | | 6.84 | % | | | 3.88 | % |
Total expenses/(benefit) | | | 5.66 | % | | | (11.49 | %) | | | 7.07 | % | | | 8.72 | % | | | 5.73 | % |
| | | | | | | | | | | | | | | | | | | | | |
Ratio of Investment Loss to Average Net Assets: | | | | | | | | | | | | | |
Before (waivers) and deferred tax benefit | | | (2.01 | %) | | | (1.65 | %) | | | (2.01 | %) | | | (1.70 | %) | | | (1.96 | %) |
Expense (waivers) | | | (0.12 | %) | | | (0.11 | %) | | | (0.12 | %) | | | (0.01 | %) | | | (0.19 | %) |
Net of expense (waivers) and before deferred tax benefit | | | (1.89 | %) | | | (1.54 | %) | | | (1.89 | %) | | | (1.69 | %) | | | (1.77 | %) |
Deferred tax benefit6,7 | | | 0.38 | % | | | 0.39 | % | | | 0.41 | % | | | 0.62 | % | | | 0.63 | % |
Net investment loss | | | (1.51 | %) | | | (1.15 | %) | | | (1.48 | %) | | | (1.07 | %) | | | (1.14 | %) |
| | | | | | | | | | | | | | | | | | | | |
Portfolio turnover rate | | | 10 | % | | | 8 | % | | | 12 | % | | | 2 | % | | | 11 | % |
* | November 28, 2014 and November 29, 2013 represent the last business day of the Fund’s respective reporting periods. |
1. | Per share amounts calculated based on average shares outstanding during the period net of deferred tax expense/benefit. |
2. | Assumes an initial investment on the business day before the first day of the fiscal period, with all dividends and distributions reinvested in additional shares on the reinvestment date, and redemptions at the net asset value calculated on the last business day of the fiscal period. Sales charges are not reflected in the total returns. Total returns are not annualized for periods less than one full year. Returns do not reflect the deduction of taxes that a shareholder would pay on fund distributions or the redemption of fund shares. The returns do not include adjustments in accordance with generally accepted accounting principles required at the period end for financial reporting purposes. |
3. | Includes borrowing and franchise tax expense. Without borrowing and franchise tax expense, the net expense ratio would be 1.85%. |
4. | Includes franchise tax expense. Without franchise tax expense the net expense ratio would be 1.85%. |
5. | Deferred tax expense estimate for the ratio calculation is derived from the net investment income/loss, and realized and unrealized gains/losses. |
6. | Effective December 1, 2013 the deferred tax expense and deferred tax benefit are allocated based on average net assets. Prior to December 1, 2013 the deferred tax expense and deferred tax benefit were allocated based on specific class expenses. |
7. | Deferred tax benefit for the ratio calculation is derived from net investment income/loss only. |
See accompanying Notes to Financial Statements.
20 OPPENHEIMER STEELPATH MLP SELECT 40 FUND |
FINANCIAL HIGHLIGHTS (Continued) |
Class I | | Year Ended November 30,
2016 | | | Year Ended November 30,
2015 | | | Year Ended November 28,
2014* | | | Period Ended November 29,
2013*,1,2 | |
Per Share Operating Data | | | | | | | | | | | | |
Net Asset Value, Beginning of Period | | $ | 9.54 | | | $ | 12.74 | | | $ | 12.14 | | | $ | 12.20 | |
Income/(loss) from investment operations: | | | | | | | | | | | | | | | | |
Net investment income/(loss)3 | | | 0.01 | | | | 0.09 | | | | (0.05 | ) | | | (0.04 | ) |
Return of capital3 | | | 0.41 | | | | 0.43 | | | | 0.44 | | | | 0.00 | 4 |
Net realized and unrealized gains/(losses) | | | 0.18 | | | | (3.01 | ) | | | 0.92 | | | | 0.33 | |
Total from investment operations | | | 0.60 | | | | (2.49 | ) | | | 1.31 | | | | 0.29 | |
Distributions to shareholders: | | | | | | | | | | | | | | | | |
Return of capital | | | (0.71 | ) | | | (0.71 | ) | | | (0.71 | ) | | | (0.35 | ) |
Net asset value, end of period | | $ | 9.43 | | | $ | 9.54 | | | $ | 12.74 | | | $ | 12.14 | |
| | | | | | | | | | | | | | | | |
Total Return, at Net Asset Value5 | | | 6.83 | % | | | (20.25 | %) | | | 10.87 | % | | | 2.45 | % |
| | | | | | | | | | | | | | | | |
Ratios /Supplemental Data | | | | | | | | | | | | | | | | |
Net assets, end of period (in thousands) | | $ | 313,325 | | | $ | 193,494 | | | $ | 57,153 | | | $ | 53,247 | |
Ratio of Expenses to Average Net Assets:6 | | | | | | | | | |
Before deferred tax expense/(benefit) | | | 0.80 | %7 | | | 0.80 | %7 | | | 0.81 | %7 | | | 1.32 | %8 |
Deferred tax expense/(benefit)9,10 | | | 3.79 | % | | | (13.36 | %) | | | 5.19 | % | | | 0.96 | % |
Total expenses/(benefit) | | | 4.59 | % | | | (12.56 | %) | | | 6.00 | % | | | 2.28 | % |
| | | | | | | | | | | | | | | | | |
Ratio of Investment Income/(Loss) to Average Net Assets:6 | | | | | | | | | |
Before deferred tax benefit/(expense) | | | (0.29 | %) | | | 0.45 | % | | | (0.82 | %) | | | (1.32 | %) |
Deferred tax benefit10,11 | | | 0.38 | % | | | 0.39 | % | | | 0.41 | % | | | 0.46 | % |
Net investment income/(loss) | | | 0.09 | % | | | 0.84 | % | | | (0.41 | %) | | | (0.86 | %) |
| | | | | | | | | | | | | | | | |
Portfolio turnover rate | | | 10 | % | | | 8 | % | | | 12 | % | | | 2 | % |
* | November 28, 2014 and November 29, 2013 represent the last business day of the Fund’s respective reporting periods. |
1. | Shares commenced operations at the close of business June 28, 2013. |
2. | Effective June 28, 2013, Class I shares were renamed Class Y shares. See Note 1 of the Notes to Financial Statements for additional information. |
3. | Per share amounts calculated based on average shares outstanding during the period net of deferred tax expense/benefit. |
4. | Amount rounds to less than $0.005. |
5. | Assumes an initial investment on the business day before the first day of the fiscal period, with all dividends and distributions reinvested in additional shares on the reinvestment date, and redemptions at the net asset value calculated on the last business day of the fiscal period. Sales charges are not reflected in the total returns. Total returns are not annualized for periods less than one full year. Returns do not reflect the deduction of taxes that a shareholder would pay on fund distributions or the redemption of fund shares. The returns do not include adjustments in accordance with generally accepted accounting principles required at the period end for financial reporting purposes. |
6. | Annualized for less than full year. |
7. | Includes borrowing and franchise tax expense. Without borrowing and franchise tax expense, the net expense ratio would be 0.78%. |
8. | Includes franchise tax expense. Without franchise tax expense the net expense ratio would be 1.29%. |
9. | Deferred tax expense estimate for the ratio calculation is derived from the net investment income/loss, and realized and unrealized gains/losses. |
10. | Effective December 1, 2013 the deferred tax expense and deferred tax benefit are allocated based on average net assets. Prior to December 1, 2013 the deferred tax expense and deferred tax benefit were allocated based on specific class expenses. |
11. | Deferred tax benefit for the ratio calculation is derived from net investment income/loss only. |
See accompanying Notes to Financial Statements.
OPPENHEIMER STEELPATH MLP SELECT 40 FUND 21 |
FINANCIAL HIGHLIGHTS (Continued) |
Class W | | Year Ended November 30,
2016 | | | Year Ended November 30,
2015 | | | Year Ended November 28,
2014* | | | Year Ended November 29,
2013*,1 | | | Year Ended November 30,
2012 1 | |
Per Share Operating Data | | | | | | | | | | | | | | | |
Net Asset Value, Beginning of Period | | $ | 9.53 | | | $ | 12.74 | | | $ | 12.15 | | | $ | 10.77 | | | $ | 10.62 | |
Income/(loss) from investment operations: | | | | | | | | | | | | | | | | | | | | |
Net investment loss2 | | | (0.04 | ) | | | (0.06 | ) | | | (0.06 | ) | | | (0.05 | ) | | | (0.05 | ) |
Return of capital2 | | | 0.41 | | | | 0.43 | | | | 0.44 | | | | 0.42 | | | | 0.41 | |
Net realized and unrealized gains/(losses) | | | 0.21 | | | | (2.87 | ) | | | 0.92 | | | | 1.72 | | | | 0.50 | |
Total from investment operations | | | 0.58 | | | | (2.50 | ) | | | 1.30 | | | | 2.09 | | | | 0.86 | |
Distributions to shareholders: | | | | | | | | | | | | | | | | | | | | |
Return of capital | | | (0.71 | ) | | | (0.71 | ) | | | (0.71 | ) | | | (0.71 | ) | | | (0.71 | ) |
Net asset value, end of period | | $ | 9.40 | | | $ | 9.53 | | | $ | 12.74 | | | $ | 12.15 | | | $ | 10.77 | |
| | | | | | | | | | | | | | | | | | | | |
Total Return, at Net Asset Value3 | | | 6.62 | % | | | (20.33 | %) | | | 10.78 | % | | | 19.71 | % | | | 8.21 | % |
| | | | | | | | | | | | | | | | | | | | |
Ratios /Supplemental Data | | | | | | | | | | | | | | | | | | | | |
Net assets, end of period (in thousands) | | $ | 6,708 | | | $ | 19,391 | | | $ | 57,589 | | | $ | 58,357 | | | $ | 61,876 | |
Ratio of Expenses to Average Net Assets: | | | | | | | | | | | | | |
Before (waivers) and deferred tax expense/(benefit) | | | 0.99 | % | | | 0.98 | % | | | 1.00 | % | | | 0.87 | % | | | 0.90 | % |
Expense (waivers) | | | (0.12 | %) | | | (0.11 | %) | | | (0.12 | %) | | | (0.01 | %) | | | (0.05 | %) |
Net of (waivers) and before deferred tax expense/(benefit) | | | 0.87 | %4 | | | 0.87 | %4 | | | 0.88 | %4 | | | 0.86 | %5 | | | 0.85 | % |
Deferred tax expense/(benefit)6,7 | | | 3.79 | % | | | (13.36 | %) | | | 5.19 | % | | | 10.74 | % | | | 4.18 | % |
Total expenses/(benefit) | | | 4.66 | % | | | (12.49 | %) | | | 6.07 | % | | | 11.60 | % | | | 5.03 | % |
| | | | | | | | | | | | | | | | | | | | | |
Ratio of Investment Loss to Average Net Assets: | | | | | | | | | | | | | |
Before (waivers) and deferred tax benefit/(expense) | | | (1.00 | %) | | | (1.05 | %) | | | (1.02 | %) | | | (0.70 | %) | | | (0.83 | %) |
Expense (waivers) | | | (0.12 | %) | | | (0.11 | %) | | | (0.12 | %) | | | (0.01 | %) | | | (0.05 | %) |
Net of expense (waivers) and before deferred tax benefit/(expenses) | | | (0.88 | %) | | | (0.94 | %) | | | (0.90 | %) | | | (0.69 | %) | | | (0.78 | %) |
Deferred tax benefit7,8 | | | 0.38 | % | | | 0.39 | % | | | 0.41 | % | | | 0.25 | % | | | 0.26 | % |
Net investment loss | | | (0.50 | %) | | | (0.55 | %) | | | (0.49 | %) | | | (0.44 | %) | | | (0.52 | %) |
| | | | | | | | | | | | | | | | | | | | |
Portfolio turnover rate | | | 10 | % | | | 8 | % | | | 12 | % | | | 2 | % | | | 11 | % |
* | November 28, 2014 and November 29, 2013 represent the last business day of the Fund’s respective reporting periods. |
1. | Effective June 28, 2013, Class Y shares were renamed Class W shares. See Note 1 of the Notes to Financial Statements for additional information. |
2. | Per share amounts calculated based on average shares outstanding during the period net of deferred tax expense/benefit. |
3. | Assumes an initial investment on the business day before the first day of the fiscal period, with all dividends and distributions reinvested in additional shares on the reinvestment date, and redemptions at the net asset value calculated on the last business day of the fiscal period. Sales charges are not reflected in the total returns. Total returns are not annualized for periods less than one full year. Returns do not reflect the deduction of taxes that a shareholder would pay on fund distributions or the redemption of fund shares. The returns do not include adjustments in accordance with generally accepted accounting principles required at the period end for financial reporting purposes. |
4. | Includes borrowing and franchise tax expense. Without borrowing and franchise tax expense, the net expense ratio would be 0.85%. |
5. | Includes franchise tax expense. Without franchise tax expense the net expense ratio would be 0.85%. |
6. | Deferred tax expense estimate for the ratio calculation is derived from the net investment income/loss, and realized and unrealized gains/losses. |
7. | Effective December 1, 2013 the deferred tax expense and deferred tax benefit are allocated based on average net assets. Prior to December 1, 2013 the deferred tax expense and deferred tax benefit were allocated based on specific class expenses. |
8. | Deferred tax benefit for the ratio calculation is derived from net investment income/loss only. |
See accompanying Notes to Financial Statements.
22 OPPENHEIMER STEELPATH MLP SELECT 40 FUND |
FINANCIAL HIGHLIGHTS (Continued) |
Class Y | | Year Ended November 30,
2016 | | | Year Ended November 30,
2015 | | | Year Ended November 28,
2014* | | | Year Ended November 29,
2013*,1 | | | Year Ended November 30,
2012 1 | |
Per Share Operating Data | | | | | | | | | | | | | | | |
Net Asset Value, Beginning of Period | | $ | 9.53 | | | $ | 12.74 | | | $ | 12.15 | | | $ | 10.77 | | | $ | 10.63 | |
Income/(loss) from investment operations: | | | | | | | | | | | | | | | | | | | | |
Net investment loss2 | | | (0.01 | ) | | | (0.00 | )10 | | | (0.05 | ) | | | (0.05 | ) | | | (0.06 | ) |
Return of capital2 | | | 0.41 | | | | 0.43 | | | | 0.44 | | | | 0.43 | | | | 0.44 | |
Net realized and unrealized gains/(losses) | | | 0.18 | | | | (2.93 | ) | | | 0.91 | | | | 1.71 | | | | 0.47 | |
Total from investment operations | | | 0.58 | | | | (2.50 | ) | | | 1.30 | | | | 2.09 | | | | 0.85 | |
Distributions to shareholders: | | | | | | | | | | | | | | | | | | | | |
Return of capital | | | (0.71 | ) | | | (0.71 | ) | | | (0.71 | ) | | | (0.71 | ) | | | (0.71 | ) |
Net asset value, end of period | | $ | 9.40 | | | $ | 9.53 | | | $ | 12.74 | | | $ | 12.15 | | | $ | 10.77 | |
| | | | | | | | | | | | | | | | | | | | |
Total Return, at Net Asset Value3 | | | 6.62 | % | | | (20.33 | %) | | | 10.78 | % | | | 19.71 | % | | | 8.11 | % |
| | | | | | | | | | | | | | | | | | | | |
Ratios /Supplemental Data | | | | | | | | | | | | | | | | | | | | |
Net assets, end of period (in thousands) | | $ | 1,598,012 | | | $ | 1,376,872 | | | $ | 1,772,095 | | | $ | 1,375,128 | | | $ | 733,082 | |
Ratio of Expenses to Average Net Assets: | | | | | | | | | | | | | |
Before (waivers) and deferred tax expense/(benefit) | | | 0.99 | % | | | 0.98 | % | | | 1.00 | % | | | 0.88 | % | | | 0.88 | % |
Expense (waivers) | | | (0.12 | %) | | | (0.11 | %) | | | (0.12 | %) | | | (0.01 | %) | | | (0.03 | %) |
Net of (waivers) and before deferred tax expense/(benefit) | | | 0.87 | %4 | | | 0.87 | %4 | | | 0.88 | %4 | | | 0.87 | %5 | | | 0.85 | % |
Deferred tax expense/(benefit)6,7 | | | 3.79 | % | | | (13.36 | %) | | | 5.19 | % | | | 9.32 | % | | | 4.20 | % |
Total expenses/(benefit) | | | 4.66 | % | | | (12.49 | %) | | | 6.07 | % | | | 10.19 | % | | | 5.05 | % |
| | | | | | | | | | | | | | | | | | | | | |
Ratio of Investment Loss to Average Net Assets: | | | | | | | | | | | | | |
Before (waivers) and deferred tax benefit/(expense) | | | (0.59 | %) | | | (0.50 | %) | | | (0.96 | %) | | | (0.70 | %) | | | (0.81 | %) |
Expense (waivers) | | | (0.12 | %) | | | (0.11 | %) | | | (0.12 | %) | | | (0.01 | %) | | | (0.03 | %) |
Net of expense (waivers) and before deferred tax benefit/(expense) | | | (0.47 | %) | | | (0.39 | %) | | | (0.84 | %) | | | (0.69 | %) | | | (0.78 | %) |
Deferred tax benefit7,8 | | | 0.38 | % | | | 0.39 | % | | | 0.41 | % | | | 0.25 | % | | | 0.26 | % |
Net investment loss | | | (0.09 | %) | | | (0.00 | %)9 | | | (0.43 | %) | | | (0.44 | %) | | | (0.52 | %) |
| | | | | | | | | | | | | | | | | | | | |
Portfolio turnover rate | | | 10 | % | | | 8 | % | | | 12 | % | | | 2 | % | | | 11 | % |
* | November 28, 2014 and November 29, 2013 represent the last business day of the Fund’s respective reporting periods. |
1. | Effective June 28, 2013, Class I shares were renamed Class Y shares. See Note 1 of the Notes to Financial Statements for additional information. |
2. | Per share amounts calculated based on average shares outstanding during the period net of deferred tax expense/benefit. |
3. | Assumes an initial investment on the business day before the first day of the fiscal period, with all dividends and distributions reinvested in additional shares on the reinvestment date, and redemptions at the net asset value calculated on the last business day of the fiscal period. Sales charges are not reflected in the total returns. Total returns are not annualized for periods less than one full year. Returns do not reflect the deduction of taxes that a shareholder would pay on fund distributions or the redemption of fund shares. The returns do not include adjustments in accordance with generally accepted accounting principles required at the period end for financial reporting purposes. |
4. | Includes borrowing and franchise tax expense. Without borrowing and franchise tax expense, the net expense ratio would be 0.85%. |
5. | Includes franchise tax expense. Without franchise tax expense the net expense ratio would be 0.85%. |
6. | Deferred tax expense estimate for the ratio calculation is derived from the net investment income/loss, and realized and unrealized gains/losses. |
7. | Effective December 1, 2013 the deferred tax expense and deferred tax benefit are allocated based on average net assets. Prior to December 1, 2013 the deferred tax expense and deferred tax benefit were allocated based on specific class expenses. |
8. | Deferred tax benefit for the ratio calculation is derived from net investment income/loss only. |
See accompanying Notes to Financial Statements.
OPPENHEIMER STEELPATH MLP SELECT 40 FUND 23 |
NOTES TO FINANCIAL STATEMENTS |
1. Organization
Oppenheimer SteelPath MLP Select 40 Fund (the “Fund”), a separate series of Oppenheimer SteelPath MLP Funds Trust, is a diversified open-end management investment company registered under the Investment Company Act of 1940, as amended. The Fund’s investment objective is to seek total return. The Fund’s investment adviser is OFI SteelPath, Inc. (the “Adviser” or “Manager”), a wholly-owned subsidiary of OppenheimerFunds, Inc. (“OFI” or “Oppenheimer”).
The Fund offers Class A, Class C, Class I, Class W and Class Y shares. Effective June 28, 2013, Class I shares were renamed Class Y shares and Class Y shares were renamed Class W shares. Effective after August 30, 2013, Class W shares are no longer offered for purchase. Class A shares are sold at their offering price, which is normally net asset value plus a front-end sales charge. Effective June 28, 2013, although there is no initial sales charge on Class A purchases totaling $1 million or more, those Class A shares may be subject to a 1.00% contingent deferred sales charge (“CDSC”) if shares are redeemed within an 18-month “holding period” measured from the date of purchase. Class C shares are sold without a front-end sales charge but may be subject to a CDSC of 1.00% of the redemption proceeds if Class C shares are redeemed within one year of purchase. Class I shares are only available to eligible institutional investors. Class I shares are sold at net asset value per share without a sales charge or CDSC. An institutional investor that buys Class I shares for its customers’ accounts may impose charges on those accounts. Class Y shares are sold at net asset value per share without a sales charge directly to institutional investors that have special agreements with OppenheimerFunds Distributor, Inc. (the “Distributor”) for that purpose. They may include insurance companies, registered investment companies, employee benefit plans and section 529 plans, among others. An institutional investor that buys Class Y shares for its customers’ accounts may impose charges on those accounts. All classes of shares have identical rights and voting privileges with respect to the Fund in general and exclusive voting rights on matters that affect that class alone. Earnings, net assets and net asset value per share may differ due to each class having its own expenses, such as transfer and shareholder servicing agent fees and shareholder communications, directly attributable to that class. Class A and C shares have separate distribution and/or service plans under which they pay fees. Class I, W, and Y shares do not pay such fees.
The Fund is an investment company and accordingly follows the investment company accounting and reporting guidance of the Financial Accounting Standards Board (“FASB”) Accounting Standard Codification Topic 946 Financial Services- Investment Companies.
The following is a summary of significant accounting policies followed in the Fund’s preparation of financial statements in accordance with accounting principles generally accepted in the United States (“U.S. GAAP”).
24 OPPENHEIMER STEELPATH MLP SELECT 40 FUND |
NOTES TO FINANCIAL STATEMENTS (Continued) |
2. Significant Accounting Policies
Security Valuation. All investments in securities are recorded at their estimated fair value, as described in Note 3.
Allocation of Income, Expenses, Gains and Losses. Income, expenses (other than those attributable to a specific class), gains and losses are allocated on a daily basis to each class of shares based upon the relative proportion of net assets represented by such class. Operating expenses directly attributable to a specific class are charged against the operations of that class.
Dividends and Distributions to Shareholders. Dividends and distributions to shareholders, which are determined in accordance with income tax regulations and may differ from U.S. generally accepted accounting principles, are recorded on the ex-dividend date. Dividends, if any, are declared and distributed monthly for the Fund. The estimated characterization of the distributions paid will be either a qualified dividend or distribution (return of capital). This estimate is based on the Fund’s operating results during the period. It is anticipated that a significant portion of the distributions will be comprised of return of capital as a result of the tax character of cash distributions made by the Fund’s investments. The actual characterization of the distributions made during the period will not be determined until after the end of the fiscal year. The Fund will inform shareholders of the final tax character of the distributions on IRS Form 1099 DIV in February 2017. For the year ended November 30, 2016, the Fund distributions are expected to be comprised of 100% return of capital.
Return of Capital Estimates. Distributions received from the Fund’s investments in MLPs generally are comprised of income and return of capital. The Fund records investment income and return of capital based on estimates made at the time such distributions are received. Such estimates are based on historical information available from each MLP and other industry sources. These estimates may subsequently be revised based on information received from MLPs after their tax reporting periods are concluded. For the year ended November 30, 2016, the Fund estimated that 100% of the MLP distributions received would be treated as return of capital.
Investment Income. Dividend income is recorded on the ex-dividend date or upon ex-dividend notification in the case of certain foreign dividends where the ex-dividend date may have passed. Non-cash dividends included in dividend income, if any, are recorded at the fair value of the securities received. Interest income is recognized on an accrual basis. Discount and premium, which are included in interest income on the Statement of Operations, if applicable, are amortized or accreted daily.
Custodian Fees. “Custody fees” in the Statement of Operations may include interest expense incurred by the Fund on any cash overdrafts of its custodian account during the period. Such cash overdrafts may result from the effects of failed trades in portfolio securities and from cash outflows resulting from unanticipated shareholder redemption activity. The
OPPENHEIMER STEELPATH MLP SELECT 40 FUND 25 |
NOTES TO FINANCIAL STATEMENTS (Continued) |
2. Significant Accounting Policies (Continued)
Fund pays interest to its custodian on such cash overdrafts, to the extent they are not offset by positive cash balances maintained by the Fund, at a rate equal to the Federal Funds Rate plus 0.50%. The “Reduction to custodian expenses” line item, if applicable, represents earnings on cash balances maintained by the Fund during the period. Such interest expense and other custodian fees may be paid with these earnings.
Security Transactions. Security transactions are recorded on the trade date. Realized gains and losses on securities sold are determined using the basis of identified cost.
Indemnifications. The Fund’s organizational documents provide current and former trustees and officers with a limited indemnification against liabilities arising in connection with the performance of their duties to the Fund. In the normal course of business, the Fund may also enter into contracts that provide general indemnifications. The Fund’s maximum exposure under these arrangements is unknown as this would be dependent on future claims that may be made against the Fund. The risk of material loss from such claims is considered remote.
Federal Income Taxes. The Fund does not intend to qualify as a regulated investment company pursuant to Subchapter M of the Internal Revenue Code, but will rather be taxed as a corporation. As a corporation, the Fund is obligated to pay federal, state and local income tax on taxable income. Currently, the maximum marginal regular federal income tax rate for a corporation is 35 percent. Upon enactment, a change in the federal income tax rate could have a material impact to the Fund. The Fund may be subject to a 20 percent alternative minimum tax on its federal alternative minimum taxable income to the extent that its alternative minimum tax exceeds its regular federal income tax. The Fund is currently using an estimated rate of 1.7 percent for state and local tax, net of federal tax expense.
The Fund’s income tax provision consists of the following as of November 30, 2016:
Current tax expense (benefit) | | | |
Federal | | $ | — | |
State | | | — | |
Total current tax expense | | $ | — | |
| | | | | |
Deferred tax expense (benefit) | | | | |
Federal | | $ | 98,347,279 | |
State | | | 4,776,868 | |
Total deferred tax expense | | $ | 103,124,147 | |
26 OPPENHEIMER STEELPATH MLP SELECT 40 FUND |
NOTES TO FINANCIAL STATEMENTS (Continued) |
2. Significant Accounting Policies (Continued)
The reconciliation between the federal statutory income tax rate of 35% and the effective tax rate on net investment income (loss) and realized and unrealized gain (loss) follows:
| | Amount | | | Rate | |
Application of federal statutory income tax rate | | $ | 100,410,387 | | | | 35.00 | % |
State income taxes net of federal benefit | | | 4,877,076 | | | | 1.70 | % |
Effect of permanent differences | | | (2,163,316 | ) | | | (0.75 | %) |
Total income tax expense (benefit) | | $ | 103,124,147 | | | | 35.95 | % |
The Fund intends to invest its assets primarily in MLPs, which generally are treated as partnerships for federal income tax purposes. As a limited partner in the MLPs, the Fund reports its allocable share of the MLP’s taxable income in computing its own taxable income. The Fund’s tax expense or benefit will be included in the Statement of Operations based on the component of income or gains (losses) to which such expense or benefit relates. Deferred income taxes reflect the net tax effects of temporary differences between the carrying amounts of assets and liabilities for financial reporting purposes and the amounts used for income tax purposes. Such temporary differences are principally: (i) taxes on unrealized gains/(losses), which are attributable to the temporary difference between fair market value and tax basis, (ii) the net tax effects of temporary differences between the carrying amounts of assets and liabilities for financial reporting and income tax purposes and (iii) the net tax benefit of accumulated net operating losses and capital loss carryforwards. Deferred tax assets and liabilities are measured using effective tax rates expected to apply to taxable income in the years such temporary differences are realized or otherwise settled. To the extent the Fund has a deferred tax asset, consideration is given to whether or not a valuation allowance is required. A valuation allowance is required if, based on the evaluation criterion provided by ASC 740, Income Taxes (ASC 740), it is more-likely-than-not some portion or all of the deferred tax asset will not be realized. Among the factors considered in assessing the Fund’s valuation allowance are: the nature, frequency and severity of current and cumulative losses, forecasts of future profitability, the duration of the statutory carryforward periods, significant redemptions, and the associated risks that operating and capital loss carryforwards may expire unused.
At November 30, 2016, the Fund determined a valuation allowance was not required. In evaluating a valuation allowance on a portion of the deferred tax asset, significant consideration was given to the current and expected level of MLP distributions, unrealized gains and losses on MLP investments and the expiration dates for net operating losses and capital loss carryovers. Market cycles, the severity and duration of historical deferred tax assets and the impact of current and future redemptions were also considered. The Fund intends to assess whether a valuation allowance is required to offset some or all of any deferred tax asset balance in connection with the calculation of the Fund’s daily NAV; however, to the
OPPENHEIMER STEELPATH MLP SELECT 40 FUND 27 |
NOTES TO FINANCIAL STATEMENTS (Continued) |
2. Significant Accounting Policies (Continued)
extent the final valuation allowance differs from the estimates of the Fund used in calculating the Fund’s daily NAV, the application of such final valuation allowance in these Financial Statements could have a material impact on the Fund’s NAV. Through the consideration of these factors, the Fund has determined that it is more likely than not the deferred tax asset, net of the valuation allowance, if required, will be realized.
Unexpected significant decreases in cash distributions from the Fund’s MLP investments, significant declines in the fair value of its investments, significant redemptions or increased risk of expiring net operating losses or capital loss carryovers may change the Fund’s assessment regarding the recoverability of its deferred tax assets and may result in a change to the valuation allowance. Modifications of the valuation allowance could have a material impact on the Fund’s net asset value.
Components of the Fund’s deferred tax assets and liabilities as of November 30, 2016 are as follows:
Deferred tax assets: | | | |
Net operating loss carryforward (tax basis) | | $ | 190,460,705 | |
Capital loss carryforward (tax basis) | | | 40,614,150 | |
Book to tax differences - Income recognized from MLPs | | | 1,094,220 | |
Organizational costs | | | 7,648 | |
Total deferred tax asset | | | 232,176,723 | |
| | | | | |
Deferred tax liabilities: | | | | |
Net unrealized gains on investment securities (tax basis) | | | (306,220,403 | ) |
Total deferred tax liability | | | (306,220,403 | ) |
| | | | | |
Total net deferred tax asset/(liability) | | $ | (74,043,680 | ) |
The Fund may rely, to some extent, on information provided by the MLPs, which may not necessarily be timely, to estimate taxable income allocable to MLP units held in its portfolio, and to estimate its associated deferred tax liability or asset. Such estimates are made in good faith. From time to time, as new information becomes available, the Fund will modify its estimates or assumptions regarding its tax liability or asset.
The Fund’s policy is to classify interest and penalties associated with underpayment of federal and state income taxes, if any, as income tax expense on its Statement of Operations. As of November 30, 2016, the Fund does not have any interest or penalties associated with the underpayment of any income taxes.
28 OPPENHEIMER STEELPATH MLP SELECT 40 FUND |
NOTES TO FINANCIAL STATEMENTS (Continued) |
2. Significant Accounting Policies (Continued)
The Fund files income tax returns in the U.S. federal jurisdiction and various states. The Fund has reviewed all major jurisdictions and concluded that there is no significant impact on the Fund’s net assets and no tax liability resulting from unrecognized tax benefits relating to uncertain tax positions expected to be taken on its tax returns. Furthermore, management of the Fund is not aware of any uncertain tax positions for which it is reasonably possible that the total amount of unrecognized tax benefit will significantly change in the next 12 months.
At November 30, 2016, the Fund had net operating loss carryforwards for federal income tax purposes, which may be carried forward for 20 years, as follows:
Expiration Date | | | |
11/30/2030 | | $ | 525,993 | |
11/30/2031 | | | 11,179,881 | |
11/30/2032 | | | 33,698,662 | |
11/30/2033 | | | 63,882,188 | |
11/30/2034 | | | 129,986,547 | |
11/30/2035 | | | 153,875,403 | |
11/30/2036 | | | 125,817,103 | |
Total | | $ | 518,965,777 | |
At November 30, 2016, the Funds had net capital loss carryforwards for federal income tax purposes, which may be carried forward for 5 years, as follows:
Expiration Date | | | |
11/30/2021 | | | 110,665,259 | |
Total | | $ | 110,665,259 | |
At November 30, 2016, gross unrealized appreciation and depreciation of investments, based on cost for federal income tax purposes were as follows:
Cost of Investments | | $ | 2,301,371,175 | |
Gross Unrealized Appreciation | | $ | 1,049,704,859 | |
Gross Unrealized Depreciation | | | (218,647,958 | ) |
Net Unrealized Appreciation (Depreciation) on Investments | | $ | 831,056,901 | |
The difference between cost amounts for financial statement and federal income tax purposes is due primarily to timing differences in recognizing certain gains and losses in security transactions.
OPPENHEIMER STEELPATH MLP SELECT 40 FUND 29 |
NOTES TO FINANCIAL STATEMENTS (Continued) |
2. Significant Accounting Policies (Continued)
Use of Estimates. The preparation of financial statements in conformity with U.S. GAAP requires management to make estimates and assumptions that affect the reported amounts of assets and liabilities and disclosure of contingent assets and liabilities at the date of the financial statements and the reported amounts of increases and decreases in net assets from operations during the reporting period. Actual results could differ from those estimates.
3. Securities Valuation
The Fund calculates the net asset value of its shares as of the close of the New York Stock Exchange (the “Exchange”), normally 4:00 P.M. Eastern time, on each day the Exchange is open for trading, except in the case of a scheduled early closing of the Exchange, in which case the Fund will calculate net asset value of the shares as of the scheduled early closing time of the Exchange.
The Fund’s Board of Trustees (the “Board”) has adopted procedures for the valuation of the Fund’s securities and has delegated the day-to-day responsibility for valuation determinations under those procedures to the Adviser. The Adviser has established a Valuation Committee which is responsible for determining a “fair valuation” for any security for which market quotations are not “readily available.” The Valuation Committee’s fair valuation determinations are subject to review, approval and ratification by the Fund’s Board at its next regularly scheduled meeting covering the calendar quarter in which the fair valuation was determined.
Valuation Methods and Inputs
Securities are valued using unadjusted quoted market prices, when available, as supplied primarily by third party pricing services or dealers.
The following methodologies are used to determine the market value or the fair value of the types of securities described below:
Equity securities traded on a securities exchange (including exchange-traded derivatives other than futures and futures options) are valued based on the official closing price on the principal exchange on which the security is traded, as identified by the Manager, prior to the time when the Fund’s assets are valued. If the official closing price is unavailable, the security is valued at the last sale price on the principal exchange on which it is traded. If the official closing price or last sales price for a foreign security is not available, the security is valued at the mean between the bid and asked price per the exchange or, if not available from the exchange, obtained from two dealers. If bid and asked prices are not available from either the exchange or two dealers, the security is valued by using one of the following methodologies (listed in order of priority): (1) a bid from the exchange, (2) the mean between the bid and asked price as provided by a single dealer, or (3) a bid from a single dealer.
30 OPPENHEIMER STEELPATH MLP SELECT 40 FUND |
NOTES TO FINANCIAL STATEMENTS (Continued) |
3. Securities Valuation (Continued)
Shares of a registered investment company that are not traded on an exchange are valued at that investment company’s net asset value per share.
Corporate and government debt securities (of U.S. or foreign issuers) and municipal debt securities, event-linked bonds, loans, mortgage-backed securities, collateralized mortgage obligations, and asset-backed securities are valued at the mean between the “bid” and “asked” prices utilizing evaluated prices obtained from third party pricing services or broker-dealers who may use matrix pricing methods to determine the evaluated prices.
Short-term money market type debt securities are valued at the mean between the “bid” and “asked” prices utilizing evaluated prices obtained from third party pricing services or broker-dealers.
A description of the standard inputs that may generally be considered by the third party pricing vendors in determining their evaluated prices is provided below.
Security Type | | Standard inputs generally considered by third-party pricing vendors |
Corporate debt, government debt, municipal, mortgage-backed and asset-backed securities | | Reported trade data, broker-dealer price quotations, benchmark yields, issuer spreads on comparable securities, the credit quality, yield, maturity, and other appropriate factors. |
Loans | | Information obtained from market participants regarding reported trade data and broker-dealer price quotations. |
Event-linked bonds | | Information obtained from market participants regarding reported trade data and broker-dealer price quotations. |
If a market value or price cannot be determined for a security using the methodologies described above, or if, in the “good faith” opinion of the Adviser, the market value or price obtained does not constitute a “readily available market quotation,” or a significant event has occurred that would materially affect the value of the security, the security is fair valued either (i) by a standardized fair valuation methodology applicable to the security type or the significant event as previously approved by the Valuation Committee and the Fund’s Board or (ii) as determined in good faith by the Adviser’s Valuation Committee. The Valuation Committee considers all relevant facts that are reasonably available, through either public information or information available to the Adviser, when determining the fair value of a security. Fair value determinations by the Adviser are subject to review, approval and ratification by the Fund’s Board at its next regularly scheduled meeting covering the calendar quarter in which the fair valuation was determined. Those fair valuation standardized methodologies include, but are not limited to, valuing securities at the last sale price or initially at cost and subsequently
OPPENHEIMER STEELPATH MLP SELECT 40 FUND 31 |
NOTES TO FINANCIAL STATEMENTS (Continued) |
3. Securities Valuation (Continued)
adjusting the value based on: changes in company specific fundamentals, changes in an appropriate securities index, or changes in the value of similar securities which may be further adjusted for any discounts related to security-specific resale restrictions. When possible, such methodologies use observable market inputs such as unadjusted quoted prices of similar securities, observable interest rates, currency rates and yield curves. The methodologies used for valuing securities are not necessarily an indication of the risks associated with investing in those securities nor can it be assured that the Fund can obtain the fair value assigned to a security if it were to sell the security.
To assess the continuing appropriateness of security valuations, the Adviser, or its third party service provider who is subject to oversight by the Adviser, regularly compares prior day prices, prices on comparable securities, and sale prices to the current day prices and challenges those prices exceeding certain tolerance levels with the third party pricing service or broker source. For those securities valued by fair valuations, whether through a standardized fair valuation methodology or a fair valuation determination, the Valuation Committee reviews and affirms the reasonableness of the valuations based on such methodologies and fair valuation determinations on a regular basis after considering all relevant information that is reasonably available.
Classifications
Each investment asset or liability of the Fund is assigned a level at measurement date based on the significance and source of the inputs to its valuation. Various data inputs are used in determining the value of each of the Fund’s investments as of the reporting period end. These data inputs are categorized in the following hierarchy under applicable financial accounting standards:
| | 1) | Level 1-unadjusted quoted prices in active markets for identical assets or liabilities (including securities actively traded on a securities exchange) |
| | 2) | Level 2-inputs other than unadjusted quoted prices that are observable for the asset or liability (such as unadjusted quoted prices for similar assets and market corroborated inputs such as interest rates, prepayment speeds, credit risks, etc.) |
| | 3) | Level 3-significant unobservable inputs (including the Adviser’s own judgments about assumptions that market participants would use in pricing the asset or liability) |
32 OPPENHEIMER STEELPATH MLP SELECT 40 FUND |
NOTES TO FINANCIAL STATEMENTS (Continued) |
3. Securities Valuation (Continued)
The inputs used for valuing securities are not necessarily an indication of the risks associated with investing in those securities.
The table below categorizes amounts that are included in the Fund’s Statement of Assets and Liabilities as of November 30, 2016, based on valuation input level:
| | Level 1 —
Unadjusted Quoted Prices | | | Level 2 —
Other Significant Observable Inputs | | | Level 3 —
Significant Unobservable Inputs | | | Value | |
Assets Table | | | | | | | | | | | | |
Investments, at Value: | | | | | | | | | | | | |
Master Limited Partnership Shares* | | $ | 2,879,985,153 | | | $ | — | | | $ | — | | | $ | 2,879,985,153 | |
Common Stocks* | | | 192,562,578 | | | | — | | | | — | | | | 192,562,578 | |
Preferred Master Limited Partnership Shares* | | | — | | | | — | | | | 40,060,000 | | | | 40,060,000 | |
Private Investment in Public Equity* | | | — | | | | 19,820,345 | | | | — | | | | 19,820,345 | |
Total Assets | | $ | 3,072,547,731 | | | $ | 19,820,345 | | | $ | 40,060,000 | | | $ | 3,132,428,076 | |
* | For a detailed break-out of securities by major industry classification, please refer to the Statement of Investments. |
The following is a reconciliation of assets in which significant unobservable inputs (level 3) were used in determining fair value:
Beginning balance November 30, 2015 | | $ | — | |
Transfers into Level 3 during the period | | | — | |
Change in unrealized appreciation/(depreciation) | | | 3,201,832 | |
Total realized gain/(loss) | | | — | |
Purchases | | $ | 40,000,000 | |
Sales | | | — | |
Return of capital distributions | | | (3,141,832 | ) |
Transfers out of Level 3 during the period | | | — | |
Ending balance November 30, 2016 | | $ | 40,060,000 | |
The total change in unrealized appreciation/depreciation included in the Statement of Operations attributable to Level 3 investments still held at November 30, 2016 is $60,000.
The following table summarizes the valuation techniques and significant unobservable inputs used in determining fair value measurements for those investments classified as Level 3 as of November 30, 2016:
OPPENHEIMER STEELPATH MLP SELECT 40 FUND 33 |
NOTES TO FINANCIAL STATEMENTS (Continued) |
3. Securities Valuation (Continued)
Type of Security | | Values as of
November 30,
2016 | | Valuation
Technique | Unobservable
Input | | Range of
Unobservable
Inputs | | | Unobservable
Input Used | |
Preferred Master Limited Partnership Shares | | $ | 40,060,000 | | Discounted cash flow model | Illiquidity Discount | | | n/a | | | | 7 | %(a) |
| | | | | | | Estimated yield | | | 9.5% - 15.5 | % | | | 13.2 | %(a) |
Total | | $ | 40,060,000 | | | | | | | | | | | |
(a) | The Fund fair values certain preferred shares using a comparable company analysis model, which incorporates an illiquidity discount and the expected yield based on the average yield on comparable companies’ equity. Such security’s fair valuation could decrease (increase) significantly based on an increase (decrease) in the illiquidity discount. Such security’s fair valuation could decrease (increase) significantly based on an increase (decrease) in expected yields. |
The table below shows the transfers between Level 1 and Level 2. The Fund’s policy is to recognize transfers in and transfers out as of the beginning of the reporting period.
| | Transfers
into
Level 1* | | | Transfers
out of
Level 2* | |
Assets Table | | | | | | |
Investments, at Value: | | | | | | |
Master Limited Partnership Shares | | $ | 7,957,440 | | | $ | 7,957,440 | |
Total Assets | | $ | 7,957,440 | | | $ | 7,957,440 | |
* | Transfers from Level 2 to Level 1 are a result of a certain privately held security becoming freely tradeable and being priced using quoted prices from an active market. |
4. Investments and Risks
Equity Security Risk. Stocks and other equity securities fluctuate in price. The value of the Fund’s portfolio may be affected by changes in the equity markets generally. Equity markets may experience significant short-term volatility and may fall sharply at times. Different markets may behave differently from each other and U.S. equity markets may move in the opposite direction from one or more foreign stock markets. Adverse events in any part of the equity or fixed-income markets may have unexpected negative effects on other market segments.
34 OPPENHEIMER STEELPATH MLP SELECT 40 FUND |
NOTES TO FINANCIAL STATEMENTS (Continued) |
4. Investments and Risks (Continued)
The prices of individual equity securities generally do not all move in the same direction at the same time and a variety of factors can affect the price of a particular company’s securities. These factors may include, but are not limited to, poor earnings reports, a loss of customers, litigation against the company, general unfavorable performance of the company’s sector or industry, or changes in government regulations affecting the company or its industry.
Master Limited Partnerships (“MLPs”). Under normal circumstances, the Fund invests at least 80% of its net assets (plus the amount of borrowings for investment purposes) in the equity securities of MLPs.
MLPs issue common units that represent an equity ownership interest in a partnership and provide limited voting rights. MLP common units are registered with the Securities and Exchange Commission (“SEC”), and are freely tradable on securities exchanges such as the NYSE and the NASDAQ Stock Market (“NASDAQ”), or in the over-the-counter (“OTC”) market. An MLP consists of one or more general partners, who conduct the business, and one or more limited partners, who contribute capital. MLP common unit holders have a limited role in the partnership’s operations and management. The Fund, as a limited partner, normally would not be liable for the debts of the MLP beyond the amounts the Fund has contributed, but would not be shielded to the same extent that a shareholder of a corporation would be. In certain circumstances creditors of an MLP would have the right to seek return of capital distributed to a limited partner. This right of an MLP’s creditors would continue after the Fund sold its investment in the MLP.
Restricted Securities. At period end, investments in securities included issues that are restricted. A restricted security may have a contractual restriction on its resale and is valued under methods approved by the Board of Trustees as reflecting fair value. Securities that are restricted are marked with an applicable footnote on the Statement of Investments. Restricted securities are reported on a schedule following the Statement of Investments.
Concentration Risk. Under normal circumstances, the Fund invests at least 80% of its net assets (plus amounts of any borrowing for investment purposes) in the equity securities of MLPs. MLPs are subject to certain risks, such as supply and demand risk, depletion and exploration risk, commodity pricing risk, acquisition risk, and the risk associated with the hazards inherent in midstream energy industry activities. A substantial portion of the cash flow received by the Fund is derived from investment in equity securities of MLPs. The amount of cash that a MLP has available for distributions, and the tax character of such distributions, are dependent upon the amount of cash generated by the MLP’s operations.
OPPENHEIMER STEELPATH MLP SELECT 40 FUND 35 |
NOTES TO FINANCIAL STATEMENTS (Continued) |
5. Market Risk Factors
The Fund’s investments in securities and/or financial derivatives may expose the fund to various market risk factors:
Commodity Risk. Commodity risk relates to the change in value of commodities or commodity indexes as they relate to increases or decreases in the commodities market. Commodities are physical assets that have tangible properties. Examples of these types of assets are crude oil, heating oil, metals, livestock, and agricultural products.
Credit Risk. Credit risk relates to the ability of the issuer of debt to meet interest and principal payments, or both, as they come due. In general, lower-grade, higher-yield debt securities are subject to credit risk to a greater extent than lower-yield, higher-quality securities.
Equity Risk. Equity risk relates to the change in value of equity securities as they relate to increases or decreases in the general market.
Foreign Exchange Rate Risk. Foreign exchange rate risk relates to the change in the U.S. dollar value of a security held that is denominated in a foreign currency. The U.S. dollar value of a foreign currency denominated security will decrease as the dollar appreciates against the currency, while the U.S. dollar value will increase as the dollar depreciates against the currency.
Interest Rate Risk. Interest rate risk refers to the fluctuations in value of fixed-income securities resulting from the inverse relationship between price and yield. For example, an increase in general interest rates will tend to reduce the market value of already issued fixed-income investments, and a decline in general interest rates will tend to increase their value. In addition, debt securities with longer maturities, which tend to have higher yields, are subject to potentially greater fluctuations in value from changes in interest rates than obligations with shorter maturities.
Volatility Risk. Volatility risk refers to the magnitude of the movement, but not the direction of the movement, in a financial instrument’s price over a defined time period. Large increases or decreases in a financial instrument’s price over a relative time period typically indicate greater volatility risk, while small increases or decreases in its price typically indicate lower volatility risk.
36 OPPENHEIMER STEELPATH MLP SELECT 40 FUND |
NOTES TO FINANCIAL STATEMENTS (Continued) |
6. Shares of Beneficial Interest
The Fund has authorized an unlimited number of $0.001 par value shares of beneficial interest of each class. Transactions in shares of beneficial interest were as follows:
| | | Year Ended
November 30, 2016 | | | Year Ended
November 30, 2015 | |
| | | | | | | |
| | Shares | | | Amount | | | Shares | | | Amount | |
Class A | | | | | | | | | | | | |
Sold | | | 28,810,307 | | | $ | 251,292,498 | | | | 26,457,925 | | | $ | 293,880,469 | |
Dividends and/or distributions reinvested | | | 4,848,811 | | | | 42,909,131 | | | | 3,947,455 | | | | 43,185,991 | |
Redeemed | | | (30,048,645 | ) | | | (261,340,958 | ) | | | (34,830,470 | ) | | | (381,995,322 | ) |
Net Increase/(decrease) | | | 3,610,473 | | | $ | 32,860,671 | | | | (4,425,090 | ) | | $ | (44,928,862 | ) |
| | | | | | | | | | | | | | | | | |
Class C | | | | | | | | | | | | | | | | |
Sold | | | 19,788,955 | | | $ | 168,230,548 | | | | 19,724,746 | | | $ | 213,154,075 | |
Dividends and/or distributions reinvested | | | 4,377,630 | | | | 37,507,093 | | | | 2,846,979 | | | | 30,137,915 | |
Redeemed | | | (15,233,409 | ) | | | (128,312,406 | ) | | | (11,562,564 | ) | | | (122,818,069 | ) |
Net Increase | | | 8,933,176 | | | $ | 77,425,235 | | | | 11,009,161 | | | $ | 120,473,921 | |
| | | | | | | | | | | | | | | | |
Class I | | | | | | | | | | | | | | | | |
Sold | | | 24,135,985 | | | $ | 213,799,951 | | | | 16,302,264 | | | $ | 181,664,725 | |
Dividends and/or distributions reinvested | | | 1,869,307 | | | | 17,067,890 | | | | 641,682 | | | | 6,972,380 | |
Redeemed | | | (13,034,589 | ) | | | (113,941,504 | ) | | | (1,157,484 | ) | | | (12,698,921 | ) |
Net Increase | | | 12,970,703 | | | $ | 116,926,337 | | | | 15,786,462 | | | $ | 175,938,184 | |
| | | | | | | | | | | | | | | | |
Class W | | | | | | | | | | | | | | | | |
Sold | | | — | | | $ | — | | | | — | | | $ | — | |
Dividends and/or distributions reinvested | | | 77,300 | | | | 679,178 | | | | 171,309 | | | | 1,946,994 | |
Redeemed | | | (1,398,461 | ) | | | (11,579,997 | ) | | | (2,658,348 | ) | | | (32,172,599 | ) |
Net Decrease | | | (1,321,161 | ) | | $ | (10,900,819 | ) | | | (2,487,039 | ) | | $ | (30,225,605 | ) |
| | | | | | | | | | | | | | | | |
Class Y | | | | | | | | | | | | | | | | |
Sold | | | 99,929,271 | | | $ | 884,972,482 | | | | 77,919,940 | | | $ | 863,522,486 | |
Dividends and/or distributions reinvested | | | 10,825,544 | | | | 98,106,060 | | | | 7,786,093 | | | | 86,410,542 | |
Redeemed | | | (85,263,758 | ) | | | (749,716,062 | ) | | | (80,385,819 | ) | | | (901,572,492 | ) |
Net Increase | | | 25,491,057 | | | $ | 233,362,480 | | | | 5,320,214 | | | $ | 48,360,536 | |
OPPENHEIMER STEELPATH MLP SELECT 40 FUND 37 |
NOTES TO FINANCIAL STATEMENTS (Continued) |
7. Purchases and Sales of Securities
The aggregate cost of purchases and proceeds from sales of securities, other than short-term obligations, for the year ended November 30, 2016, were as follows:
| | Purchases | | | Sales | |
Investment securities | | $ | 822,453,292 | | | $ | 277,327,172 | |
8. Fees and Other Transactions with Affiliates
Management Fees. Under the investment advisory agreement, the Fund pays the Manager a management fee based on the daily net assets of the Fund at an annual rate as shown in the following table:
Net Assets up to $3 Billion | Net Assets Greater than
$3 Billion and up to $5 Billion | Net Assets in Excess of $5 Billion |
0.70% | 0.68% | 0.65% |
The Fund’s effective management fee for the year ended November 30, 2016 was 0.70% of average annual net assets before any applicable waivers.
Transfer Agent Fees. OFI Global (the “Transfer Agent”) serves as the transfer and shareholder servicing agent for the Fund. The Fund pays the Transfer Agent a fee based on annual net assets. Fees incurred with respect to these services are detailed in the Statement of Operations.
Sub-Transfer Agent Fees. The Transfer Agent has retained Shareholder Services, Inc., a wholly-owned subsidiary of OFI (the “Sub-Transfer Agent”), to provide the day-to-day transfer agent and shareholder servicing of the Fund. Under the Sub-Transfer Agency Agreement, the Transfer Agent pays the Sub-Transfer Agent an annual fee in monthly installments, equal to a percentage of the transfer agent fee collected by the Transfer Agent from the Fund, which shall be calculated after any applicable fee waivers. The fee paid to the Sub-Transfer Agent is paid by the Transfer Agent, not by the Fund.
Trustees’ Compensation. The Board has adopted a compensation deferral plan for independent trustees that enables trustees to elect to defer receipt of all or a portion of the annual compensation they are entitled to receive from the Fund. For purposes of determining the amount owed to the Trustee under the plan, deferred amounts are treated as though equal dollar amounts had been invested in shares of the Fund or in other Oppenheimer funds selected by the Trustee. The Fund purchases shares of the funds selected for deferral by the Trustee in amounts equal to his or her deemed investment, resulting in a Fund asset equal to the deferred compensation liability. Such assets are included as a component of
38 OPPENHEIMER STEELPATH MLP SELECT 40 FUND |
NOTES TO FINANCIAL STATEMENTS (Continued) |
8. Fees and Other Transactions with Affiliates (Continued)
“Other” within the asset section of the Statement of Assets and Liabilities, if applicable. Deferral of trustees’ fees under the plan will not affect the net assets of the Fund, and will not materially affect the Fund’s assets, liabilities or net investment income per share. Amounts will be deferred until distributed in accordance with the compensation deferral plan.
Distribution and Service Plan (12b-1) Fees. Under its General Distributor’s Agreement with the Fund, the Distributor acts as the Fund’s principal underwriter in the continuous public offering of the Fund’s classes of shares.
Service Plan for Class A Shares. The Fund has adopted a Service Plan (the “Plan”) for Class A shares under Rule 12b-1 of the Investment Company Act of 1940. Under the Plan, the Fund reimburses the Distributor for a portion of its costs incurred for services provided to accounts that hold Class A shares. Reimbursement is made periodically at an annual rate of up to 0.25% of the daily net assets of Class A shares of the Fund. The Distributor currently uses all of those fees to pay dealers, brokers, banks and other financial institutions periodically for providing personal service and maintenance of accounts of their customers that hold Class A shares. Any unreimbursed expenses the Distributor incurs with respect to Class A shares in any fiscal year cannot be recovered in subsequent periods. Fees incurred by the Fund under the Plan are detailed in the Statement of Operations.
Distribution and Service Plans for Class C Shares. The Fund has adopted Distribution and Service Plans (the “Plans”) for Class C shares under Rule 12b-1 of the Investment Company Act of 1940 to compensate the Distributor for distributing those share classes, maintaining accounts and providing shareholder services. Under the Plans, the Fund pays the Distributor an annual asset-based sales charge of 0.75% on Class C shares daily net assets. The Fund also pays a service fee under the Plans at an annual rate of 0.25% of daily net assets.
The Plan and Plans continue in effect from year to year only if the Fund’s Board votes annually to approve their continuance at an in person meeting called for that purpose. Fees incurred by the Fund under the Plans are detailed in the Statement of Operations.
OPPENHEIMER STEELPATH MLP SELECT 40 FUND 39 |
NOTES TO FINANCIAL STATEMENTS (Continued) |
8. Fees and Other Transactions with Affiliates (Continued)
Sales Charges. Front-end sales charges and CDSC do not represent expenses of the Fund. They are deducted from the proceeds of sales of Fund shares prior to investment or from redemption proceeds prior to remittance, as applicable. The sales charges retained by the Distributor from the sale of shares and the CDSC retained by the Distributor on the redemption of shares is shown in the following table for the period indicated.
Year Ended | | Class A Front-End Sales Charges Retained by Distributor | | | Class C Contingent Deferred Sales Charges Retained by Distributor | |
November 30, 2016 | | $ | 278,818 | | | $ | 79,925 | |
Waivers and Reimbursements of Expenses. The Manager has contractually agreed to limit fees and/or reimburse expenses of the Fund to the extent that the Fund’s total annual fund operating expenses (exclusive of interest, taxes, such as deferred tax expenses, brokerage commissions, acquired fund fees and expenses, dividend costs related to short sales, and litigation expense, if any) exceed 1.10% for Class A shares, 1.85% for Class C shares, 0.85% for Class W shares, and 0.85% for Class Y shares.
The Fund’s total annual operating expenses after fee waiver and/or expense reimbursement (“Net Expenses”) will be higher than these amounts to the extent that the Fund incurs expenses excluded from the expense cap. Because the Fund’s deferred income tax expense/(benefit) and borrowing fees are excluded from the expense cap, the Fund’s Net Expenses for each class of shares is increased/(decreased) by the amount of this expense. During the year ended November 30, 2016, the Manager reimbursed $722,508, $569,794, $11,751, and $1,710,654 for Class A, Class C, Class W, and Class Y respectively. This undertaking may not be modified or terminated until after one year from the date of the current prospectus, as indicated therein, unless approved by the Fund’s Board of Trustees.
The Manager can be reimbursed by the Fund within three years after the date the fee limitation and/or expense reimbursement has been made by the Manager, provided that such repayment does not cause the expenses of any class of the Fund to exceed the foregoing limits.
40 OPPENHEIMER STEELPATH MLP SELECT 40 FUND |
NOTES TO FINANCIAL STATEMENTS (Continued) |
8. Fees and Other Transactions with Affiliates (Continued)
The following table represents amounts eligible for recovery at November 30, 2016:
Eligible Expense Recoupment Expiring: | | | |
November 30, 2017 | | $ | 3,539,444 | |
November 30, 2018 | | | 3,233,228 | |
November 30, 2019 | | | 3,014,707 | |
During the year ended November 30, 2016, the Adviser did not recoup any expenses.
Related Party. The Interested Trustees and officers of the Fund are also officers or trustees of companies affiliated with the Manager, Distributor, and Transfer Agent.
9. Borrowing Agreement
The Fund, along with Oppenheimer SteelPath MLP Alpha Plus Fund, Oppenheimer SteelPath MLP Income Fund, and Oppenheimer SteelPath MLP Alpha Fund (collectively, the “Trust”), is a borrower in a $700 million revolving credit agreement (“Loan Agreement”) with a major lending institution (the “Lender”). The Fund is permitted to borrow up to the lesser of one-third of the Fund’s total assets, or the maximum amount permitted pursuant to the Fund’s investment limitations. The borrowing, if any, is fully collateralized throughout the term of the borrowing with securities or other assets of the Fund. The Fund is not liable for borrowings of other Funds in the Trust. Securities that have been pledged as collateral for the borrowing are indicated in the Statement of Investments.
Borrowings under the Loan Agreement are charged interest at a calculated rate computed by the Lender based on the one month LIBOR rate plus 0.65% per annum. An unused commitment fee at the rate of 0.125% per annum is charged for any undrawn portion of the credit facility, and each member of the Trust will pay its pro rata share of this fee. A facility fee of 0.20% was charged on the commitment amount, and each party of the Trust paid its pro rata share of this fee. The borrowing is due November 17, 2017, unless another date is mutually agreed upon by the parties of the Loan Agreement. For the period ended November 30, 2016, the Fund paid $552,174 in borrowing fees. The Fund did not utilize the facility during the period ended November 30, 2016.
OPPENHEIMER STEELPATH MLP SELECT 40 FUND 41 |
NOTES TO FINANCIAL STATEMENTS (Continued) |
10. Pending Litigation
In 2009, several putative class action lawsuits were filed and later consolidated before the U.S. District Court for the District of Colorado in connection with the investment performance of Oppenheimer Rochester California Municipal Fund (the “California Fund”), a fund advised by OppenheimerFunds, Inc. (“OFI”) – the parent company of the manager and distributed by OppenheimerFunds Distributor, Inc. (“OFDI”) . The plaintiffs asserted claims against OFI, OFDI and certain present and former trustees and officers of the California Fund under the federal securities laws, alleging, among other things, that the disclosure documents of the California Fund contained misrepresentations and omissions and the investment policies of the California Fund were not followed. An amended complaint and a motion to dismiss were filed, and in 2011, the court issued an order which granted in part and denied in part the defendants’ motion to dismiss. In October 2015, following a successful appeal by defendants and a subsequent hearing, the court granted plaintiffs’ motion for class certification and appointed class representatives and class counsel.
OFI and OFDI believe the suit is without merit; that it is premature to render any opinion as to the likelihood of an outcome unfavorable to them in the Suit; and that no estimate can yet be made as to the amount or range of any potential loss. Furthermore, OFI believes that the suit should not impair the ability of OFI or OFDI to perform their respective duties to the Fund and that the outcome of the suit should not have any material effect on the operations of any of the Oppenheimer funds.
42 OPPENHEIMER STEELPATH MLP SELECT 40 FUND |
REPORT OF INDEPENDENT REGISTERED PUBLIC ACCOUNTING FIRM |
To the Shareholders of Oppenheimer SteelPath MLP Select 40 Fund and
Board of Trustees of Oppenheimer SteelPath MLP Funds Trust
We have audited the accompanying statement of assets and liabilities, including the statement of investments, of Oppenheimer SteelPath MLP Select 40 Fund (the “Fund”), a series of Oppenheimer SteelPath MLP Funds Trust, as of November 30, 2016, and the related statement of operations for the year then ended, the statements of changes in net assets for each of the two years in the period then ended, and the financial highlights for each of the five years in the period then ended. These financial statements and financial highlights are the responsibility of the Fund’s management. Our responsibility is to express an opinion on these financial statements and financial highlights based on our audits.
We conducted our audits in accordance with the standards of the Public Company Accounting Oversight Board (United States). Those standards require that we plan and perform the audit to obtain reasonable assurance about whether the financial statements and financial highlights are free of material misstatement. An audit includes examining, on a test basis, evidence supporting the amounts and disclosures in the financial statements. Our procedures included confirmation of securities owned as of November 30, 2016, by correspondence with the custodian and brokers or by other auditing procedures as appropriate in the circumstances. An audit also includes assessing the accounting principles used and significant estimates made by management, as well as evaluating the overall financial statement presentation. We believe that our audits provide a reasonable basis for our opinion.
In our opinion, the financial statements and financial highlights referred to above present fairly, in all material respects, the financial position of Oppenheimer SteelPath MLP Select 40 Fund as of November 30, 2016, the results of its operations for the year then ended, the changes in its net assets for each of the two years in the period then ended, and the financial highlights for each of the five years in the period then ended, in conformity with accounting principles generally accepted in the United States of America.

COHEN & COMPANY, LTD.
Cleveland, Ohio
January 25, 2017
OPPENHEIMER STEELPATH MLP SELECT 40 FUND 43 |
BOARD APPROVAL OF THE FUND’S INVESTMENT
ADVISORY AGREEMENT Unaudited |
The Fund has entered into an investment advisory agreement (the “Agreement”) with OFI SteelPath, Inc. (“OFI SteelPath” or the “Manager”). Each year, the Board of Trustees (the “Board”), including a majority of the independent Trustees, is required to determine whether to approve the terms of the Agreement and the renewal thereof. The Investment Company Act of 1940, as amended, requires that the Board request and evaluate, and that the Manager provide, such information as may be reasonably necessary to evaluate the terms of the Agreement. The Board employs an independent consultant to prepare a report that provides information, including comparative information that the Board requests for that purpose. In addition to in-person meetings focused on this evaluation, the Board receives information throughout the year regarding Fund services, fees, expenses and performance.
The Manager and the independent consultant provided information to the Board on the following factors: (i) the nature, quality and extent of the Manager’s services, (ii) the comparative investment performance of the Fund and the Manager, (iii) the fees and expenses of the Fund, including comparative fee and expense information, (iv) the profitability of the Manager and its affiliates, including an analysis of the cost of providing services, (v) whether economies of scale are realized as the Fund grows and whether fee levels reflect these economies of scale for Fund investors and (vi) other benefits to the Manager from its relationship with the Fund. The Board was aware that there are alternatives to retaining the Manager.
Outlined below is a summary of the principal information considered by the Board as well as the Board’s conclusions.
Nature, Quality and Extent of Services. The Board considered information about the nature, quality and extent of the services provided to the Fund and information regarding the Manager’s key personnel who provide such services. The Manager’s duties include providing the Fund with the services of the portfolio managers and investment team, who provide research, analysis and other advisory services in regard to the Fund’s investments; and securities trading services. The Manager is responsible for oversight of third-party service providers; monitoring compliance with applicable Fund policies and procedures and adherence to the Fund’s investment restrictions; and risk management. The Manager is also responsible for providing certain administrative services to the Fund. Those services, some of which are performed by affiliates of the Manager, include providing and supervising all administrative and clerical personnel who are necessary in order to provide effective corporate administration for the Fund; compiling and maintaining records with respect to the Fund’s operations; preparing and filing reports required by the U.S. Securities and Exchange Commission; preparing periodic reports regarding the operations of the Fund for its shareholders; preparing proxy materials for shareholder meetings; and preparing the registration statements required by federal and state securities laws for the sale of the Fund’s shares. The Manager also provides the Fund with office space, facilities and equipment.
44 OPPENHEIMER STEELPATH MLP SELECT 40 FUND |
BOARD APPROVAL OF THE FUND’S INVESTMENT
ADVISORY AGREEMENT Unaudited / (Continued) |
The Board also considered the quality of the services provided and the quality of the Manager’s resources that are available to the Fund. In evaluating the Manager, the Board considered the history, reputation, qualification and background of the Manager, including its corporate parent, OppenheimerFunds, Inc. (“OFI”) and corporate affiliate, OFI Global Asset Management, Inc. (“OFI Global” and OFI and OFI Global are collectively referred to hereinafter as “OFI”), and the fact that OFI has over 50 years of experience as an investment adviser and that its assets under management rank it among the top mutual fund managers in the United States. The Board evaluated the Manager’s and OFI’s advisory, administrative, accounting, legal, compliance and risk management services, and information the Board has received regarding the experience and professional qualifications of the Manager’s and OFI’s key personnel and the size and functions of its staff. In its evaluation of the quality of the portfolio management services provided, the Board considered the experience of Stuart Cartner and Brian Watson, the portfolio managers for the Fund, and the Manager’s investment team and analysts. The Board members also considered the totality of their experiences with the Manager and OFI as trustees of the Fund and other funds advised by the Manager or OFI. The Board considered information regarding the quality of services provided by affiliates of the Manager, which the Board members have become knowledgeable about through their experiences with the Manager or OFI and in connection with the renewal of the Fund’s service agreements. The Board concluded, in light of the Manager’s and OFI’s experience, reputation, personnel, operations and resources that the Fund benefits from the services provided under the Agreement.
Investment Performance of the Manager and the Fund. Throughout the year, the Manager provided information on the investment performance of the Fund and the Manager, including comparative performance information. The Board also reviewed information, prepared by the Manager and by the independent consultant, comparing the Fund’s historical performance to relevant market indices and to the performance of other retail energy limited partnership funds. The Board noted that the Fund outperformed its category median for the one-, three- and five-year periods.
Fees and Expenses of the Fund. The Board reviewed the fees paid to the Manager and the other expenses borne by the Fund. The independent consultant provided comparative data in regard to the fees and expenses of the Fund and other retail energy limited partnership funds with comparable asset levels and distribution features. The Board noted that the Fund’s contractual management fee and its total expenses were lower than their respective peer group medians and category medians. The Board considered that the Manager has contractually agreed to waive fees and/or reimburse the Fund so that total expenses, as a percentage of average daily net assets, will not exceed the following annual rates: 1.10% for Class A shares, 1.85% for Class C shares, and 0.85% for Class Y shares and Class W shares. The fee limitation may not be amended or withdrawn prior to March 30, 2017, unless approved by the Board.
OPPENHEIMER STEELPATH MLP SELECT 40 FUND 45 |
BOARD APPROVAL OF THE FUND’S INVESTMENT
ADVISORY AGREEMENT Unaudited / (Continued) |
Economies of Scale and Profits Realized by the Manager. The Board considered information regarding the Manager’s costs in serving as the Fund’s investment adviser, including the costs associated with the personnel and systems necessary to manage the Fund, and information regarding the Manager’s profitability from its relationship with the Fund. The Board also considered that the Manager must be able to pay and retain experienced professional personnel at competitive rates to provide quality services to the Fund. The Board reviewed whether the Manager may realize economies of scale in managing and supporting the Fund. The Board noted that the Fund currently has management fee breakpoints, which are intended to share with Fund shareholders economies of scale that may exist as the Fund’s assets grow.
Other Benefits to the Manager. In addition to considering the profits realized by the Manager, the Board considered information that was provided regarding the direct and indirect benefits the Manager receives as a result of its relationship with the Fund, including compensation paid to the Manager’s affiliates and research provided to the Manager in connection with permissible brokerage arrangements (soft dollar arrangements).
Conclusions. These factors were also considered by the independent Trustees meeting separately from the full Board, assisted by experienced counsel to the Fund and to the independent Trustees. Fund counsel and the independent Trustees’ counsel are independent of the Manager within the meaning and intent of the Securities and Exchange Commission Rules.
Based on its review of the information it received and its evaluations described above, the Board, including a majority of the independent Trustees, decided to continue the Agreement through August 31, 2017. In arriving at its decision, the Board did not identify any factor or factors as being more important than others, but considered all of the above information, and considered the terms and conditions of the Agreement, including the management fees, in light of all the surrounding circumstances.
46 OPPENHEIMER STEELPATH MLP SELECT 40 FUND |
DISTRIBUTION SOURCES Unaudited |
For any distribution that took place over the last six months of the Fund’s reporting period, the table below details, on a per-share basis, the percentage of the Fund’s total distribution payment amount that was derived from the following sources: net income, net profit from the sale of securities, and other capital sources. This information is based upon income and capital gains using generally accepted accounting principles as of the date of each distribution. For certain securities, such as Master Limited Partnerships (“MLPs”), the percentages attributed to each category are estimated using historical information because the character of the amounts received from the MLPs in which the Fund invests is unknown until after the end of the calendar year. Because the Fund is actively managed, the relative amount of the Fund’s total distributions derived from various sources over the calendar year may change. Please note that this information should not be used for tax reporting purposes as the tax character of distributable income may differ from the amounts used for this notification. You will receive IRS tax forms in the first quarter of each calendar year detailing the actual amount of the taxable and non-taxable portion of distributions paid to you during the tax year.
For the most current information, please go to oppenheimerfunds.com. Select your Fund, then the ’Detailed’ tab; where ‘Dividends’ are shown, the Fund’s latest pay date will be followed by the sources of any distribution, updated daily.
Fund Name | Pay
Date | Net
Income | Net
Profit
from Sale | Other
Capital
Sources |
Oppenheimer SteelPath MLP Select 40 Fund | 6/10/16 | 0.0% | 0.0% | 100.0% |
Oppenheimer SteelPath MLP Select 40 Fund | 7/8/16 | 0.0% | 0.0% | 100.0% |
Oppenheimer SteelPath MLP Select 40 Fund | 8/5/16 | 0.0% | 0.0% | 100.0% |
Oppenheimer SteelPath MLP Select 40 Fund | 9/9/16 | 0.0% | 0.0% | 100.0% |
Oppenheimer SteelPath MLP Select 40 Fund | 10/7/16 | 0.0% | 0.0% | 100.0% |
Oppenheimer SteelPath MLP Select 40 Fund | 11/4/16 | 0.0% | 0.0% | 100.0% |
Oppenheimer SteelPath MLP Select 40 Fund | 11/25/16 | 0.0% | 0.0% | 100.0% |
OPPENHEIMER STEELPATH MLP SELECT 40 FUND 47 |
PORTFOLIO PROXY VOTING POLICIES AND PROCEDURES; UPDATES TO STATEMENTS OF INVESTMENTS Unaudited |
The Fund has adopted Portfolio Proxy Voting Policies and Procedures under which the Fund votes proxies relating to securities (“portfolio proxies”) held by the Fund. A description of the Fund’s Portfolio Proxy Voting Policies and Procedures is available (i) without charge, upon request, by calling the Fund toll-free at 1.800.CALL OPP (225.5677), (ii) on the Fund’s website at oppenheimerfunds.com, and (iii) on the SEC’s website at www.sec.gov. In addition, the Fund is required to file Form N-PX, with its complete proxy voting record for the 12 months ended June 30th, no later than August 31st of each year. The Fund’s voting record is available (i) without charge, upon request, by calling the Fund toll-free at 1.800.CALL OPP (225.5677), and (ii) in the Form N-PX filing on the SEC’s website at www.sec.gov.
The Fund files its complete schedule of portfolio holdings with the SEC for the first quarter and the third quarter of each fiscal year on Form N-Q. The Fund’s Form N-Q filings are available on the SEC’s website at www.sec.gov. Those forms may be reviewed and copied at the SEC’s Public Reference Room in Washington, D.C. Information on the operation of the Public Reference Room may be obtained by calling 1-800-SEC-0330.
Householding – Delivery of Shareholder Documents
This is to inform you about OppenheimerFunds’ “householding” policy. If more than one member of your household maintains an account in a particular fund, OppenheimerFunds will mail only one copy of the fund’s prospectus (or, if available, the fund’s summary prospectus), annual and semiannual report and privacy policy. The consolidation of these mailings, called householding, benefits your fund through reduced mailing expense, and benefits you by reducing the volume of mail you receive from OppenheimerFunds. Householding does not affect the delivery of your account statements.
Please note that we will continue to household these mailings for as long as you remain an OppenheimerFunds shareholder, unless you request otherwise. If you prefer to receive multiple copies of these materials, please call us at 1.800.CALL-OPP (225-5677). You may also notify us in writing or via email. We will begin sending you individual copies of the prospectus (or, if available, the summary prospectus), reports and privacy policy within 30 days of receiving your request to stop householding.
48 OPPENHEIMER STEELPATH MLP SELECT 40 FUND |
TRUSTEES AND OFFICERS Unaudited |
Name, Position(s) Held with the Trusts, Length of Service, Age | Principal Occupation(s) During the Past 5 Years; Other Trusteeships/Directorships Held; Number of Portfolios in the Fund Complex Currently Overseen |
INDEPENDENT TRUSTEES | The address of each Trustee in the chart below is 6803 S. Tucson Way, Centennial, Colorado 80112-3924. Each Trustee serves for an indefinite term, or until his or her resignation, retirement, death or removal. |
Robert J. Malone,
Chairman of the
Board of Trustees
(since 2016),
Trustee
(since 2012) Year of Birth: 1944 | Chairman - Colorado Market of MidFirst Bank (since January 2015); Chairman of the Board (2012-2016) and Director (August 2005-March 2016) of Jones International University (educational organization); Trustee of the Gallagher Family Foundation (non-profit organization) (2000-2015); Chairman, Chief Executive Officer and Director of Steele Street Bank Trust (commercial banking) (August 2003-January 2015); Board of Directors of Opera Colorado Foundation (non-profit organization) (2008-2012); Director of Colorado UpLIFT (charitable organization) (1986-2010); Director of Jones Knowledge, Inc. (2006-2010); Former Chairman of U.S. Bank-Colorado (subsidiary of U.S. Bancorp and formerly Colorado National Bank) (July 1996-April 1999); Director of Commercial Assets, Inc. (real estate investment trust) (1993-2000); Director of U.S. Exploration, Inc. (oil and gas exploration) (1997-February 2004); Chairman of the Board (1991-1994) and Trustee (1985-1994) of Regis University; and Chairman of the Board (1990-1991) and Trustee (1984-1999) of Young Presidents Organization. Oversees 46 portfolios in the OppenheimerFunds complex. Mr. Malone has served on the Boards of certain Oppenheimer funds since 2002, during which time he has become familiar with the Fund’s (and other Oppenheimer funds’) financial, accounting, regulatory and investment matters and has contributed to the Boards’ deliberations. |
Jon S. Fossel,
Trustee
(since 2012)
Year of Birth: 1942 | Chairman of the Board of Jack Creek Preserve Foundation (non-profit organization) (since March 2005); Director of Jack Creek Preserve Foundation (non-profit organization) (March 2005-December 2014); Chairman of the Board (2006-December 2011) and Director (June 2002-December 2011) of UNUMProvident (insurance company); Director of Northwestern Energy Corp. (public utility corporation) (November 2004-December 2009); Director of P.R. Pharmaceuticals (October 1999-October 2003); Director of Rocky Mountain Elk Foundation (non-profit organization) (February 1998-February 2003 and February 2005-February 2007); Chairman and Director (until October 1996) and President and Chief Executive Officer (until October 1995) of OppenheimerFunds, Inc.; President, Chief Executive Officer and Director of the following: Oppenheimer Acquisition Corp. (“OAC”) (parent holding company of OppenheimerFunds, Inc.), Shareholders Services, Inc. and Shareholder Financial Services, Inc. (until October 1995). Oversees 46 portfolios in the OppenheimerFunds complex. Mr. Fossel has served on the Boards of certain Oppenheimer funds since 1990, during which time he has become familiar with the Fund’s (and other Oppenheimer funds’) financial, accounting, regulatory and investment matters and has contributed to the Boards’ deliberations. |
OPPENHEIMER STEELPATH MLP SELECT 40 FUND 49 |
TRUSTEES AND OFFICERS Unaudited / (Continued) |
Richard F. Grabish,
Trustee
(since 2012)
Year of Birth: 1948 | Formerly Senior Vice President and Assistant Director of Sales and Marketing (March 1997-December 2007), Director (March 1987-December 2007) and Manager of Private Client Services (June 1985-June 2005) of A.G. Edwards & Sons, Inc. (broker/dealer and investment firm); Chairman and Chief Executive Officer of A.G. Edwards Trust Company, FSB (March 2001-December 2007); President and Vice Chairman of A.G. Edwards Trust Company, FSB (investment adviser) (April 1987-March 2001); President of A.G. Edwards Trust Company, FSB (investment adviser) (June 2005-December 2007). Oversees 46 portfolios in the OppenheimerFunds complex. Mr. Grabish has served on the Boards of certain Oppenheimer funds since 2001, during which time he has become familiar with the Fund’s (and other Oppenheimer funds’) financial, accounting, regulatory and investment matters and has contributed to the Boards’ deliberations. |
Beverly L. Hamilton,
Trustee
(since 2012)
Year of Birth: 1946 | Trustee of Monterey Institute for International Studies (educational organization) (2000-2014); Board Member of Middlebury College (educational organization) (December 2005-June 2011); Chairman (since 2010) of American Funds’ Emerging Markets Growth Fund, Inc. (mutual fund); Director of The California Endowment (philanthropic organization) (April 2002-April 2008); Director (February 2002-2005) and Chairman of Trustees (2006-2007) of the Community Hospital of Monterey Peninsula; Director (October 1991-2005) and Vice Chairman (2006-2009) of American Funds’ Emerging Markets Growth Fund, Inc. (mutual fund); President of ARCO Investment Management Company (February 1991-April 2000); Member of the investment committees of The Rockefeller Foundation (2001-2006) and The University of Michigan (since 2000); Advisor at Credit Suisse First Boston’s Sprout venture capital unit (venture capital fund) (1994-January 2005); Trustee of MassMutual Institutional Funds (investment company) (1996-June 2004); Trustee of MML Series Investment Fund (investment company) (April 1989-June 2004); Member of the investment committee of Hartford Hospital (2000-2003); and Advisor to Unilever (Holland) pension fund (2000-2003). Oversees 46 portfolios in the OppenheimerFunds complex. Ms. Hamilton has served on the Boards of certain Oppenheimer funds since 2002, during which time she has become familiar with the Fund’s (and other Oppenheimer funds’) financial, accounting, regulatory and investment matters and has contributed to the Boards’ deliberations. |
50 OPPENHEIMER STEELPATH MLP SELECT 40 FUND |
TRUSTEES AND OFFICERS Unaudited / (Continued) |
Victoria J. Herget,
Trustee
(since 2012)
Year of Birth: 1951 | Board Chair (2008-2015) and Director (2004-Present), United Educators (insurance company); Trustee (since 2000) and Chair (since 2010), Newberry Library (independent research library); Trustee, Mather LifeWays (senior living organization) (since 2001); Independent Director of the First American Funds (mutual fund family) (2003-2011); former Managing Director (1993-2001), Principal (1985-1993), Vice President (1978-1985) and Assistant Vice President (1973-1978) of Zurich Scudder Investments (investment adviser) (and its predecessor firms); Trustee (1992-2007), Chair of the Board of Trustees (1999-2007), Investment Committee Chair (1994-1999) and Investment Committee member (2007-2010) of Wellesley College; Trustee, BoardSource (non-profit organization) (2006-2009) and Chicago City Day School (K-8 School) (1994-2005). Oversees 46 portfolios in the OppenheimerFunds complex. Ms. Herget has served on the Boards of certain Oppenheimer funds since 2012, during which time she has become familiar with the Fund’s (and other Oppenheimer funds’) financial, accounting, regulatory and investment matters and has contributed to the Boards’ deliberations. |
F. William Marshall, Jr.,
Trustee
(since 2012)
Year of Birth: 1942 | Trustee Emeritus of Worcester Polytech Institute (WPI) (private university) (since 2009); Trustee of MassMutual Select Funds (formerly MassMutual Institutional Funds) (investment company) (1996-2015), MML Series Investment Fund (investment company) (1996-2015) and Mass Mutual Premier Funds (investment company) (January 2012-December 2015); President and Treasurer of the SIS Fund (private charitable fund) (January 1999-March 2011); Former Trustee of WPI (1985-2008); Former Chairman of the Board (2004-2006) and Former Chairman of the Investment Committee of WPI (1994-2008); Chairman of SIS Family Bank, F.S.B. (formerly SIS Bank) (commercial bank) (January 1999-July 1999); Executive Vice President of Peoples Heritage Financial Group, Inc. (commercial bank) (January 1999-July 1999); and Former President and Chief Executive Officer of SIS Bancorp. (1993-1999). Oversees 46 portfolios in the OppenheimerFunds complex. Mr. Marshall has served on the Boards of certain Oppenheimer funds since 2000, during which time he has become familiar with the Fund’s (and other Oppenheimer funds’) financial, accounting, regulatory and investment matters and has contributed to the Boards’ deliberations. |
Karen L. Stuckey,
Trustee
(since 2012)
Year of Birth: 1953 | Member (since May 2015) of Desert Mountain Community Foundation Advisory Board (non-profit organization); Partner (1990-2012) of PricewaterhouseCoopers LLP (professional services firm) (held various positions 1975-1990); Trustee (1992-2006), member of Executive, Nominating and Audit Committees and Chair of Finance Committee (1992-2006), and Emeritus Trustee (since 2006) of Lehigh University; and member, Women’s Investment Management Forum (professional organization) since inception. Oversees 46 portfolios in the OppenheimerFunds complex. Ms. Stuckey has served on the Boards of certain Oppenheimer funds since 2012, during which time she has become familiar with the Fund’s (and other Oppenheimer funds’) financial, accounting, regulatory and investment matters and has contributed to the Boards’ deliberations. |
OPPENHEIMER STEELPATH MLP SELECT 40 FUND 51 |
TRUSTEES AND OFFICERS Unaudited / (Continued) |
James D. Vaughn,
Trustee
(since 2012)
Year of Birth:1945 | Retired; former managing partner (1994-2001) of Denver office of Deloitte & Touche LLP, (held various positions 1969-1993); Trustee and Chairman of the Audit Committee of Schroder Funds (2003-2012); Board member and Chairman of Audit Committee of AMG National Trust Bank (since 2005); Trustee and Investment Committee member, University of South Dakota Foundation (since 1996); Board member, Audit Committee Member and past Board Chair, Junior Achievement (since 1993); former Board member, Mile High United Way, Boys and Girls Clubs, Boy Scouts, Colorado Business Committee for the Arts, Economic Club of Colorado and Metro Denver Network. Oversees 46 portfolios in the OppenheimerFunds complex. Mr. Vaughn has served on the Boards of certain Oppenheimer funds since 2012, during which time he has become familiar with the Fund’s (and other Oppenheimer funds’) financial, accounting, regulatory and investment matters and has contributed to the Boards’ deliberations. |
INTERESTED TRUSTEE AND OFFICER | Mr. Steinmetz is an “Interested Trustee” because he is affiliated with the Manager and OppenheimerFunds, Inc. by virtue of his positions as Chairman of OppenheimerFunds, Inc. and officer and director of OFI Global Asset Management, Inc. Both as a Trustee and as an officer, Mr. Steinmetz serves for an indefinite term, or until his resignation, retirement, death or removal. Mr. Steinmetz’s address is 225 Liberty Street, New York, New York 10281-1008. |
Arthur P. Steinmetz,
Trustee
(since 2015),
President and
Principal Executive Officer
(since 2014)
Year of Birth: 1958 | Chairman of OppenheimerFunds, Inc. (since January 2015); CEO and Chairman of OFI Global Asset Management, Inc. (since July 2014), President of OFI Global Asset Management, Inc. (since May 2013), a Director of OFI Global Asset Management, Inc. (since January 2013), Director of OppenheimerFunds, Inc. (since July 2014), President, Management Director and CEO of Oppenheimer Acquisition Corp. (OppenheimerFunds, Inc.’s parent holding company) (since July 2014), and President and Director of OFI SteelPath, Inc. (since January 2013). Chief Investment Officer of the OppenheimerFunds advisory entities from (January 2013-December 2013); Executive Vice President of OFI Global Asset Management, Inc. (January 2013-May 2013); Chief Investment Officer of OppenheimerFunds, Inc. (October 2010-December 2012); Chief Investment Officer, Fixed-Income, of OppenheimerFunds, Inc. (April 2009-October 2010); Executive Vice President of OppenheimerFunds, Inc. (October 2009-December 2012); Director of Fixed Income of OppenheimerFunds, Inc. (January 2009-April 2009); and a Senior Vice President of OppenheimerFunds, Inc. (March 1993-September 2009). An officer of 102 portfolios in the OppenheimerFunds complex. |
52 OPPENHEIMER STEELPATH MLP SELECT 40 FUND |
TRUSTEES AND OFFICERS Unaudited / (Continued) |
OTHER OFFICERS OF THE TRUSTS | The addresses of the Officers in the chart below are as follows: for Mss. Foxson and Picciotto, 225 Liberty Street, New York, New York 10281-1008; for Messrs. Cartner and Watson, 2100 McKinney Avenue, Dallas, TX 75201; and for Mr. Petersen, 6803 S. Tucson Way, Centennial, Colorado 80112-3924. Each Officer serves for an indefinite term or until his or her resignation, retirement, death or removal. |
Stuart Cartner,
Vice President
(since 2010) Year of Birth: 1961 | Senior Vice President and Senior Portfolio Manager of the Manager (since January 2014); Vice President of the Manager (2012-January 2014). A member and portfolio manager of SteelPath Fund Advisors, LLC (since its formation in 2009) and SteelPath Capital Management, LLC (since 2007). Vice President in the Private Wealth Management Division of Goldman, Sachs & Co (1988-2007). An officer of other portfolios in the OppenheimerFunds complex. |
Brian Watson,
Vice President
(since 2012) Year of Birth: 1974 | Senior Vice President and Senior Portfolio Manager of the Manager (since January 2014); Vice President of the Manager (2012-January 2014). Prior to joining the Manager, he was a member, portfolio manager and Director of Research of SteelPath Fund Advisors, LLC since its formation in 2009. A portfolio manager at Swank Capital LLC, a Dallas, Texas based investment firm (2005-2009). An officer of other portfolios in the OppenheimerFunds complex. |
Cynthia Lo Bessette,
Secretary and
Chief Legal Officer
(since 2016) Year of Birth: 1969 | Executive Vice President, General Counsel and Secretary of OFI Global Asset Management, Inc. (since February 2016); Chief Legal Officer of OppenheimerFunds, Inc. and the Distributor (since February 2016); Vice President, General Counsel and Secretary of Oppenheimer Acquisition Corp. (since February 2016); General Counsel of OFI SteelPath, Inc., VTL Associates, LLC and Index Management Solutions, LLC (since February 2016); Chief Legal Officer of OFI Global Institutional, Inc., HarbourView Asset Management Corporation, OFI Global Trust Company, Oppenheimer Real Asset Management, Inc., OFI Private Investments Inc., Shareholder Services, Inc. and Trinity Investment Management Corporation (since February 2016); Senior Vice President and Deputy General Counsel (March 2015-February 2016) and Executive Vice President, Vice President, Corporate Counsel (February 2012-March 2015) and Deputy Chief Legal Officer (April 2013-March 2015) of Jennison Associates LLC; Assistant General Counsel (April 2008-September 2009) and Deputy General Counsel (October 2009-February 2012) of Lord Abbett & Co. LLC. An officer of 102 portfolios in the OppenheimerFunds complex. |
Jennifer Foxson,
Vice President and
Chief Business Officer
(since 2014) Year of Birth: 1969 | Senior Vice President of OppenheimerFunds Distributor, Inc. (since June 2014); Vice President of OppenheimerFunds Distributor, Inc. (April 2006-June 2014); Vice President of OppenheimerFunds, Inc. (January 1998-March 2006); Assistant Vice President of OppenheimerFunds, Inc. (October 1991-December 1998). An officer of 102 portfolios in the OppenheimerFunds complex. |
OPPENHEIMER STEELPATH MLP SELECT 40 FUND 53 |
TRUSTEES AND OFFICERS Unaudited / (Continued) |
Mary Ann Picciotto,
Chief Compliance Officer and Chief Anti-Money Laundering Officer
(since 2014) Year of Birth: 1973 | Senior Vice President and Chief Compliance Officer of OFI Global Asset Management, Inc. (since March 2014); Chief Compliance Officer of OppenheimerFunds, Inc. , OFI SteelPath, Inc., OFI Global Trust Company, OFI Global Institutional, Inc., Oppenheimer Real Asset Management, Inc., OFI Private Investments, Inc., Harborview Asset Management Corporation, Trinity Investment Management Corporation, and Shareholder Services, Inc. (since March 2014); Managing Director of Morgan Stanley Investment Management Inc. and certain of its various affiliated entities; Chief Compliance Officer of various Morgan Stanley Funds (May 2010-January 2014); Chief Compliance Officer of Morgan Stanley Investment Management Inc. (April 2007-January 2014). An officer of 102 portfolios in the OppenheimerFunds complex. |
Brian S. Petersen,
Treasurer and
Principal Financial & Accounting Officer
(since 2016) Year of Birth: 1970 | Vice President of OFI Global Asset Management, Inc. (since January 2013); Vice President of OppenheimerFunds, Inc. (February 2007-December 2012); Assistant Vice President of OppenheimerFunds, Inc. (August 2002-2007). An officer of 102 portfolios in the OppenheimerFunds complex. |
The Fund’s Statement of Additional Information contains additional information about the Fund’s Trustees and Officers and is available without charge upon request, by calling 1.800.CALL OPP (225.5677).
54 OPPENHEIMER STEELPATH MLP SELECT 40 FUND |
OPPENHEIMER STEELPATH MLP SELECT 40 FUND |
Manager | | OFI SteelPath, Inc. |
| | | |
Distributor | | OppenheimerFunds Distributor, Inc. |
| | | |
Transfer and Shareholder Servicing Agent | | OFI Global Asset Management, Inc. |
| | | |
Sub-Transfer Agent | | Shareholder Services, Inc. |
| | | DBA OppenheimerFunds Services |
| | | |
| | | |
Independent Registered Public Accounting Firm | | Cohen & Company, Ltd. |
| | | |
Legal Counsel | | Ropes & Gray LLP |
© 2017 OppenheimerFunds, Inc. All rights reserved.
OPPENHEIMER STEELPATH MLP SELECT 40 FUND 55 |
As an Oppenheimer fund shareholder, you are entitled to know how we protect your personal information and how we limit its disclosure. Information Sources
We obtain nonpublic personal information about our shareholders from the following sources:
| | ● | Applications or other forms. |
| | ● | When you create a user ID and password for online account access. |
| | ● | When you enroll in eDocs Direct,SM our electronic document delivery service. |
| | ● | Your transactions with us, our affiliates or others. |
| | ● | Technologies on our website, including: “cookies” and web beacons, which are used to collect data on the pages you visit and the features you use. |
If you visit oppenheimerfunds.com and do not log on to the secure account information areas, we do not obtain any personal information about you. When you do log on to a secure area, we do obtain your user ID and password to identify you. We also use this information to provide you with products and services you have requested, to inform you about products and services that you may be interested in and assist you in other ways.
We do not collect personal information through our website unless you willingly provide it to us, either directly by email or in those areas of the website that request information. In order to update your personal information (including your mailing address, email address and phone number) you must first log on and visit your user profile.
If you have set your browser to warn you before accepting cookies, you will receive the warning message with each cookie. You can refuse cookies by turning them off in your browser. However, doing so may limit your access to certain sections of our website.
We use cookies to help us improve and manage our website. For example, cookies help us recognize new versus repeat visitors to the site, track the pages visited, and enable some special features on the website. This data helps us provide a better service for our website visitors.
Protection of Information
We do not disclose any nonpublic personal information (such as names on a customer list) about current or former customers to anyone, except as permitted by law.
Disclosure of Information
Copies of confirmations, account statements and other documents reporting activity in your fund accounts are made available to your financial advisor (as designated by you). We may also use details about you and your investments to help us, our financial service affiliates, or firms that jointly market their financial products and services with ours, to better serve
56 OPPENHEIMER STEELPATH MLP SELECT 40 FUND |
PRIVACY POLICY NOTICE (Continued) |
your investment needs or suggest educational material that may be of interest to you. If this requires us to provide you with an opportunity to “opt in” or “opt out” of such information sharing with a firm not affiliated with us, you will receive notification on how to do so, before any such sharing takes place.
Right of Refusal
We will not disclose your personal information to unaffiliated third parties (except as permitted by law), unless we first offer you a reasonable opportunity to refuse or “opt out” of such disclosure.
Internet Security and Encryption
In general, the email services provided by our website are encrypted and provide a secure and private means of communication with us. To protect your own privacy, confidential and/ or personal information should only be communicated via email when you are advised that you are using a secure website.
As a security measure, we do not include personal or account information in nonsecure emails, and we advise you not to send such information to us in nonsecure emails. Instead, you may take advantage of the secure features of our website to encrypt your email correspondence. To do this, you will need to use a browser that supports Secure Sockets Layer (SSL) protocol.
| | ● | All transactions, including redemptions, exchanges and purchases, are secured by SSL and 256-bit encryption. SSL is used to establish a secure connection between your PC and OppenheimerFunds’ server. It transmits information in an encrypted and scrambled format. |
| | ● | Encryption is achieved through an electronic scrambling technology that uses a “key” to code and then decode the data. Encryption acts like the cable converter box you may have on your television set. It scrambles data with a secret code so that no one can make sense of it while it is being transmitted. When the data reaches its destination, the same software unscrambles the data. |
| | ● | You can exit the secure area by closing your browser or, for added security, you can use the Log Out button before you close your browser. |
Other Security Measures
We maintain physical, electronic and procedural safeguards to protect your personal account information. Our employees and agents have access to that information only so that they may offer you products or provide services, for example, when responding to your account questions.
OPPENHEIMER STEELPATH MLP SELECT 40 FUND 57 |
PRIVACY POLICY NOTICE (Continued) |
How You Can Help
You can also do your part to keep your account information private and to prevent unauthorized transactions. If you obtain a user ID and password for your account, safeguard that information. Also, take special precautions when accessing your account on a computer used by others.
Who We Are
This joint notice describes the privacy policies of the Oppenheimer funds, OppenheimerFunds, Inc., each of its investment adviser subsidiaries, OppenheimerFunds Distributor, Inc. and OFI Global Trust Co. It applies to all Oppenheimer fund accounts you presently have, or may open in the future, using your Social Security number—whether or not you remain a shareholder of our funds. This notice was last updated as of November 2016. In the event it is updated or changed, we will post an updated notice on our website at oppenheimerfunds.com. If you have any questions about this privacy policy, email us by clicking on the Contact Us section of our website at oppenheimerfunds.com, write to us at P.O. Box 5270, Denver, CO 80217-5270, or call us at 800 CALL OPP (225 5677).
58 OPPENHEIMER STEELPATH MLP SELECT 40 FUND |
THIS PAGE INTENTIONALLY LEFT BLANK
OPPENHEIMER STEELPATH MLP SELECT 40 FUND 59 |
THIS PAGE INTENTIONALLY LEFT BLANK
60 OPPENHEIMER STEELPATH MLP SELECT 40 FUND |
THIS PAGE INTENTIONALLY LEFT BLANK
OPPENHEIMER STEELPATH MLP SELECT 40 FUND 61 |
THIS PAGE INTENTIONALLY LEFT BLANK
62 OPPENHEIMER STEELPATH MLP SELECT 40 FUND |
THIS PAGE INTENTIONALLY LEFT BLANK
OPPENHEIMER STEELPATH MLP SELECT 40 FUND 63 |

Fund Performance Discussion | 3 |
Top Holdings and Allocations | 7 |
Share Class Performance | 8 |
Fund Expenses | 10 |
Statement of Investments | 12 |
Statement of Assets and Liabilities | 14 |
Statement of Operations | 16 |
Statements of Changes in Net Assets | 17 |
Financial Highlights | 18 |
Notes to Financial Statements | 22 |
Report of Independent Registered Public Accounting Firm | 39 |
Board Approval of the Fund’s Investment Advisory Agreement | 41 |
Distribution Sources | 43 |
Portfolio Proxy Voting Policies and Procedures; Updates to Statements of Investments | 44 |
Trustees and Officers | 45 |
Privacy Policy Notice | 52 |
|
Class A Shares
AVERAGE ANNUAL TOTAL RETURNS AT 11/30/16
| | Class A Shares of the Fund | | |
| Without
Sales
Charge | With
Sales
Charge | S&P 500 Index | Alerian MLP Index |
1-Year | 5.25% | -0.82% | 8.06% | 9.28% |
5-Year | 3.71% | 2.49% | 14.45% | 2.51% |
Since Inception (3/31/10) | 5.07% | 4.15% | 12.29% | 6.58% |
Performance data quoted represents past performance, which does not guarantee future results. The investment return and principal value of an investment in the Fund will fluctuate so that an investor’s shares, when redeemed, may be worth more or less than their original cost. Fund returns include changes in share price, reinvested distributions, and a 5.75% maximum applicable sales charge except where “without sales charge” is indicated. Current performance may be lower or higher than the performance quoted. Returns do not consider capital gains or income taxes on an individual’s investment. For performance data current to the most recent month-end, visit oppenheimerfunds.com or call 1.800.CALL OPP (225.5677). See Fund prospectuses and summary prospectuses for more information on share classes and sales charges.
2 OPPENHEIMER STEELPATH MLP ALPHA FUND |
Fund Performance Discussion
The Fund’s Class A shares (without sales charge) produced a total return of 5.25% during the reporting period. In comparison, master limited partnerships (“MLPs”), as measured by the Alerian MLP Index (AMZ), provided a total return gain of 9.28%. Please note that the returns for the Alerian MLP Index are calculated pre-tax, while the Fund’s returns are calculated post corporate tax. During the same period, the S&P 500 Index produced a total return gain of 8.06%.
Over the twelve-month reporting period ended November 30, 2016, the midstream sector outperformed the broader markets as the lows of the current energy cycle appear to have been reached and the beginnings of a recovery appear to be unfolding. Late in the period, the Organization of Petroleum Exporting Countries (“OPEC”) provided a potential acceleration to the rebalancing of crude oil supply and demand by announcing formal plans to reduce its production to 32.5 million barrels of oil per day (MMbbls/d) by January 2017. Agreements with non-OPEC countries to provide additional support via another 0.6 MMbbls/d of supply reductions were also announced, most notably with Russia electing to reduce production by 0.3 MMbbls/d. The larger than expected supply reduction sent oil prices sharply higher and many energy equities even more so. This reduced supply from OPEC members will pull the consensus estimates for the 2017 oil market balance back firmly into an undersupplied position, thereby beginning the process of working down
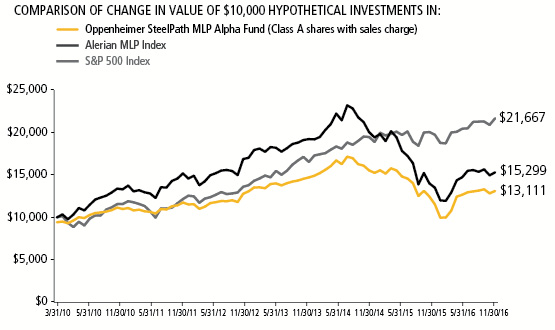
OPPENHEIMER STEELPATH MLP ALPHA FUND 3 |
global inventories. And, importantly for U.S. midstream investors, the OPEC cut helps reduce the market forces that were driving near-term U.S. production, and thus midstream throughput, lower. Further, we continue to believe that this energy down cycle has shifted the call on U.S.-sourced volumes higher over the medium-term. This improving fundamental commodity picture, combined with midstream valuations that remain below long-term averages, makes a compelling case for midstream investment.
Over the reporting period, we estimate approximately $26 billion of new equity supply entered the market through either secondary offerings, initial public offerings, or “at-the-market” programs in which primary units trade into the market anonymously throughout the normal trading day. This pace of equity issuance represents an increase from approximately $20 billion that was raised over the twelve month reporting period ended November 30, 2015. MLPs also raised approximately $23 billion of debt capital during the period. Most MLPs pay out the majority of excess cash flow as distributions to investors, and therefore must raise external capital to fund growth projects and to fund acquisitions.
MACRO REVIEW
West Texas Intermediate (WTI) crude oil prices ended the reporting period at $49.44 per barrel, up 19% from the prior year. Global crude prices, as measured by Brent crude oil, traded 13% higher over the reporting period. The crude oil price improvement appears linked to the continued moderation in U.S. crude production, healthy demand growth, and the aforementioned OPEC deal to reduce supply. Brent exited the period at a $1 per barrel premium to WTI, which is near the historic norm. However, this reversion represents a departure from the $8 to $9 per barrel Brent premium that has generally existed since 2009.
Henry Hub natural gas spot prices exited the period at $3.30 per million British thermal units (“mmbtu”), up 58% over the reporting period. Natural gas pricing has benefited from a long awaited realignment of supply-demand in which natural gas usage as a heating and electric generation fuel has increased as gas production volume growth has declined, and as increased exports have become a reality via both liquefied natural gas and new pipelines to Mexico.
Mont Belvieu NGL prices ended the reporting period at $23.92 per barrel, a 26% increase over the reporting period. All of the NGL purity products ended the period higher than the same time in the prior year. Frac spreads, a measure of natural gas processing economics, ended the period at $0.28 per gallon, up 4% over the reporting period. Generally, the greater the frac spread, the greater the incentive for producers to seek natural gas processing capacity.
The yield curve modestly flattened over the reporting period as short rates rose more than the yields on longer-dated maturities. The ten-year Treasury yield rose 18 basis points to end the period at 2.38%. The MLP yield spread at period-end, as
4 OPPENHEIMER STEELPATH MLP ALPHA FUND |
measured by the AMZ and the 10-year Treasury bond, narrowed by 115 basis points to 5.05%.
Over the reporting period, real estate investment trusts (“REITs”) and utilities, two competing yield-oriented equity asset classes, posted total returns of 5.65% (as measured by the Dow Jones Equity REIT Total Return Index) and 16.31% (as measured by the Dow Jones Utility Average Index), respectively, as compared to the AMZ’s 9.28% total return. Price to forward distributable cash flow (DCF), a commonly watched ratio within the MLP sector, increased over the period but remains below the ten-year average.
SUBSECTOR REVIEW
Performance among subsectors in the midstream, or energy infrastructure, MLP asset class varied for the reporting period. On average, the gathering and processing subsector provided the best performance over the period, buoyed by improving commodity prices supporting improved volumetric projections. The natural gas pipeline group followed as investors continued to express preference for long-haul natural gas pipelines, particularly those backed by utility demand pull.
The marine subsector experienced the weakest performance over the reporting period as several entities substantially reduced cash distributions to investors. The propane subsector also lagged over the reporting period as market participants appeared to rotate out of the subsector in favor of more traditional midstream names and as rising propane prices could result in some margin pressure in future periods.
FUND REVIEW
Key contributors to the Fund were Williams Partners, LP (WPZ) and Tallgrass Energy GP, LP (TEGP).
WPZ units outperformed over the period after the proposed merger with Energy Transfer was terminated in late June and the Williams enterprise subsequently focused on strengthening its balance sheet, improving liquidity, and preserving its investment grade credit rating. During the period The Williams Companies (WMB) began execution of plans to reinvest $1.7 billion into WPZ, its daughter partnership, via a private purchase of common units and a concurrently announced distribution reinvestment program (“DRIP”). The Williams family also announced a restructuring of gathering agreements that served to reduce counterparty risk and the sale of Canadian assets that raised $1 billion in cash proceeds.
TEGP units outperformed over the period as the general partner’s underlying operating partnership, Tallgrass Energy Partners (TEP), reaffirmed annual distribution growth guidance of at least 20% for the period of 2015 through 2017. Additionally, the partnership’s sponsor announced an agreement to acquire additional interests in the Rockies Express Pipeline, which aids longer-term growth prospects. Notably, TEGP’s board approved a $100 million buyback program of TEP or TEGP units.
OPPENHEIMER STEELPATH MLP ALPHA FUND 5 |
Key detractors from the Fund were Energy Transfer Equity LP (ETE) and The Williams Companies (WMB).
Both ETE and WMB units detracted from performance over the reporting period on investor concern over the planned merger of ETE and WMB. After the merger was terminated in late June, each entity executed measures to support their respective daughter partnerships, some at the expense of current parent cash flows. While the equity price performance of both entities lagged over the reporting period, each has recovered substantially from the lows.
Please note that significant decreases in cash distributions from the Fund’s MLP investments and/or significant declines in the fair value of its investments may impact the Fund’s assessment regarding the recoverability of certain deferred tax assets, which may result in the recording of a valuation allowance. If a valuation allowance is established, this could have a material impact on the Fund’s net asset value and results of operations for the period. The Fund had a valuation allowance in place for a portion of the reporting period, but did not have one in place at period end. See Note 2 of the Notes to Financial Statements for more information.
OUTLOOK
We believe we have seen the worst of this energy market down cycle. The rate of midstream growth will likely moderate from peak levels, but average distributions are still likely to grow. Midstream operators may also stand to benefit as they make more efficient use of their existing assets. We believe current market valuations underestimate the potential for renewed business growth going forward and remain optimistic on the sector’s prospects. For this reason, we believe MLPs continue to offer attractive total return potential based on the potential for price appreciation and stable or growing distribution streams.

| 
Stuart Cartner
Portfolio Manager
| | 
| 
Brian Watson, CFA
Portfolio Manager
|
6 OPPENHEIMER STEELPATH MLP ALPHA FUND |
Top Holdings and Allocations
TOP TEN MASTER LIMITED PARTNERSHIP HOLDINGS
TC Pipelines LP | 7.31% |
Energy Transfer Partners LP | 7.27% |
Enterprise Products Partners LP | 7.21% |
Magellan Midstream Partners LP | 6.97% |
Energy Transfer Equity LP | 6.77% |
Sunoco Logistics Partners LP | 6.44% |
Targa Resources Corp. | 5.81% |
MPLX LP | 5.18% |
Tallgrass Energy GP LP | 5.08% |
Williams Partners LP | 4.54% |
Portfolio holdings and allocations are subject to change. Percentages are as of November 30, 2016, and are based on net assets.
SECTOR ALLOCATION
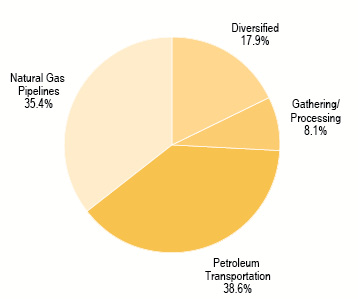
Portfolio holdings and allocations are subject to change. Percentages are as of November 30, 2016, and are based on the total value of investments.
OPPENHEIMER STEELPATH MLP ALPHA FUND 7 |
Share Class Performance
AVERAGE ANNUAL TOTAL RETURNS WITHOUT SALES CHARGE AS OF 11/30/16
| | Inception Date | 1-Year | 5-Year | Since Inception |
CLASS A (MLPAX) | 3/31/10 | 5.25% | 3.71% | 5.07% |
CLASS C (MLPGX) | 8/25/11 | 4.51% | 2.96% | 3.80% |
CLASS I (OSPAX) | 6/28/13 | 5.70% | N/A | -1.40% |
CLASS Y (MLPOX) | 3/31/10 | 5.48% | 3.97% | 5.35% |
AVERAGE ANNUAL TOTAL RETURNS WITH SALES CHARGE AS OF 11/30/16
| | Inception Date | 1-Year | 5-Year | Since Inception |
CLASS A (MLPAX) | 3/31/10 | -0.82% | 2.49% | 4.15% |
CLASS C (MLPGX) | 8/25/11 | 3.54% | 2.96% | 3.80% |
CLASS I (OSPAX) | 6/28/13 | 5.70% | N/A | -1.40% |
CLASS Y (MLPOX) | 3/31/10 | 5.48% | 3.97% | 5.35% |
Performance data quoted represents past performance, which does not guarantee future results. The investment return and principal value of an investment in the Fund will fluctuate so that an investor’s shares, when redeemed, may be worth more or less than their original cost. Current performance may be lower or higher than the performance quoted. Returns do not consider capital gains or income taxes on an individual’s investment. For performance data current to the most recent month-end, visit oppenheimerfunds.com or call 1.800.CALL OPP (225.5677). Fund returns include changes in share price, reinvested distributions, and the applicable sales charge: for Class A shares, the current maximum initial sales charge of 5.75%, and for Class C shares, the contingent deferred sales charge of 1% for the 1-year period. There is no sales charge for Class I or Class Y shares. See Fund prospectuses and summary prospectuses for more information on share classes and sales charges.
The Fund’s performance is compared to the performance of the S&P 500 Index and the Alerian MLP Index. The S&P 500 Index is a broad-based measure of domestic stock performance. The Alerian MLP Index is a composite of the 50 most prominent Master Limited Partnerships that provides investors with an unbiased, comprehensive benchmark for this emerging asset class. The Alerian MLP Index, which is calculated using a float-adjusted, capitalization-weighted methodology, is disseminated real-time on a total-return basis. The indices are unmanaged and cannot be purchased directly by investors. While index comparisons may be useful to provide a benchmark for the Fund’s performance, it must be noted that the Fund’s investments are not limited to the investments comprising the indices. Index performance includes reinvestment of income, but does not reflect transaction costs, fees, expenses or
8 OPPENHEIMER STEELPATH MLP ALPHA FUND |
taxes. Index performance is shown for illustrative purposes only as a benchmark for the Fund’s performance, and does not predict or depict performance of the Fund. The Fund’s performance reflects the effects of the Fund’s business and operating expenses.
The Fund’s investment strategy and focus can change over time. The mention of specific fund holdings does not constitute a recommendation by OppenheimerFunds, Inc. or its affiliates.
Before investing in any of the Oppenheimer funds, investors should carefully consider a fund’s investment objectives, risks, charges and expenses. Fund prospectuses and summary prospectuses contain this and other information about the funds, and may be obtained by asking your financial advisor, visiting oppenheimerfunds.com, or calling 1.800.CALL OPP (225.5677). Read prospectuses and summary prospectuses carefully before investing.
Shares of Oppenheimer funds are not deposits or obligations of any bank, are not guaranteed by any bank, are not insured by the FDIC or any other agency, and involve investment risks, including the possible loss of the principal amount invested.
OPPENHEIMER STEELPATH MLP ALPHA FUND 9 |
Fund Expenses
Fund Expenses. As a shareholder of the Fund, you incur two types of costs: (1) transaction costs, which may include sales charges (loads) on purchase payments, contingent deferred sales charges on redemptions; and (2) ongoing costs, including management fees; distribution and service fees; and other Fund expenses. These examples are intended to help you understand your ongoing costs (in dollars) of investing in the Fund and to compare these costs with the ongoing costs of investing in other mutual funds.
The examples are based on an investment of $1,000.00 invested at the beginning of the period and held for the entire 6-month period ended November 30, 2016.
Actual Expenses. The first section of the table provides information about actual account values and actual expenses. You may use the information in this section for the class of shares you hold, together with the amount you invested, to estimate the expense that you paid over the period. Simply divide your account value by $1,000.00 (for example, an $8,600.00 account value divided by $1,000.00 = 8.60), then multiply the result by the number in the first section under the heading entitled “Expenses Paid During 6 Months Ended November 30, 2016” to estimate the expenses you paid on your account during this period.
Hypothetical Example for Comparison Purposes. The second section of the table provides information about hypothetical account values and hypothetical expenses based on the Fund’s actual expense ratio for each class of shares, and an assumed rate of return of 5% per year for each class before expenses, which is not the actual return. The hypothetical account values and expenses may not be used to estimate the actual ending account balance or expenses you paid for the period. You may use this information to compare the ongoing costs of investing in the Fund and other funds. To do so, compare this 5% hypothetical example for the class of shares you hold with the 5% hypothetical examples that appear in the shareholder reports of the other funds.
Please note that the expenses shown in the table are meant to highlight your ongoing costs only and do not reflect any transactional costs, such as front-end or contingent deferred sales charges (loads). Therefore, the “hypothetical” section of the table is useful in comparing ongoing costs only, and will not help you determine the relative total costs of owning different funds. In addition, if these transactional costs were included, your costs would have been higher.
10 OPPENHEIMER STEELPATH MLP ALPHA FUND |
Actual | Beginning
Account
Value
June 1, 2016 | Ending
Account
Value
November 30,
2016 | Expenses
Paid During
6 Months Ended November 30,
2016 |
CLASS A | $ 1,000.00 | $ 1,035.70 | $ 28.21 |
CLASS C | 1,000.00 | 1,032.50 | 31.97 |
CLASS I | 1,000.00 | 1,039.40 | 26.51 |
CLASS Y | 1,000.00 | 1,037.20 | 26.96 |
Hypothetical
(5% return before expenses) | | | |
CLASS A | 1,000.00 | 997.29 | 27.68 |
CLASS C | 1,000.00 | 993.54 | 31.36 |
CLASS I | 1,000.00 | 999.00 | 25.99 |
CLASS Y | 1,000.00 | 998.53 | 26.45 |
Expenses are equal to the Fund’s annualized expense ratio for that class, multiplied by the average account value over the period, multiplied by 183/366 (to reflect the one-half year period). Those annualized expense ratios, excluding indirect expenses from affiliated funds, based on the 6-month period ended November 30, 2016 are as follows:
Class | Expense Ratios |
CLASS A | 5.54% |
CLASS C | 6.29 |
CLASS I | 5.20 |
CLASS Y | 5.29 |
The expense ratios for Class A, C, and Y reflect contractual waivers and/or reimbursements of expenses by the Fund’s Manager. Some of these undertakings may be modified or terminated at any time, as indicated in the Fund’s prospectus. The “Financial Highlights” tables in the Fund’s financial statements, included in this report, also show the gross expense ratios, without such waivers or reimbursements, if applicable.
OPPENHEIMER STEELPATH MLP ALPHA FUND 11 |
STATEMENT OF INVESTMENTS November 30, 2016 |
Description | | Shares | | | Value | |
Master Limited Partnership Shares — 83.2% | |
Diversified — 13.5% | | | | |
Enterprise Products Partners LP | | | 9,717,133 | | | $ | 251,965,259 | |
Westlake Chemical Partners LP 1 | | | 2,830,575 | | | | 59,442,075 | |
Williams Partners LP | | | 4,346,347 | | | | 158,641,665 | |
Total Diversified | | | | | | | 470,048,999 | |
| | | | | | | | | |
Gathering/Processing — 1.9% | | | | | |
Western Gas Partners LP | | | 1,170,025 | | | | 66,773,327 | |
| | | | | | | | | |
Natural Gas Pipelines — 31.0% | |
Energy Transfer Equity LP | | | 13,897,312 | | | | 236,671,224 | |
Energy Transfer Partners LP | | | 7,236,971 | | | | 254,162,424 | |
EQT Midstream Partners LP | | | 1,379,056 | | | | 100,988,271 | |
Rice Midstream Partners LP 1 | | | 168,500 | | | | 3,631,175 | |
Tallgrass Energy GP LP 1 | | | 7,338,310 | | | | 177,587,102 | |
Tallgrass Energy Partners LP | | | 1,196,392 | | | | 56,039,001 | |
TC Pipelines LP 1 | | | 4,803,969 | | | | 255,330,952 | |
Total Natural Gas Pipelines | | | | | | | 1,084,410,149 | |
| | | | | | | | | |
Petroleum Transportation — 36.8% | |
Buckeye Partners LP | | | 2,261,343 | | | | 145,494,809 | |
Genesis Energy LP | | | 3,462,854 | | | | 120,992,119 | |
Magellan Midstream Partners LP | | | 3,516,631 | | | | 243,526,697 | |
MPLX LP | | | 5,508,029 | | | | 180,938,753 | |
NuStar Energy LP | | | 565,528 | | | | 26,998,307 | |
NuStar GP Holdings LLC 1 | | | 2,341,638 | | | | 59,477,605 | |
Plains All American Pipeline LP | | | 4,228,235 | | | | 139,320,343 | |
Shell Midstream Partners LP | | | 1,067,130 | | | | 29,431,445 | |
Petroleum Transportation — 36.8% (Continued) | |
Sunoco Logistics Partners LP | | | 9,493,711 | | | $ | 224,906,013 | |
Tesoro Logistics LP | | | 1,559,540 | | | | 73,501,120 | |
TransMontaigne Partners LP 1 | | | 989,349 | | | | 42,037,439 | |
Total Petroleum Transportation | | | | | | | 1,286,624,650 | |
| | | | | | | | | |
Total Master Limited Partnership Shares | |
(identified cost $2,601,290,411) | | | | 2,907,857,125 | |
| | | | | | | | | |
Common Stocks — 9.4% | |
Diversified — 3.6% | | | | | | | | |
Williams Cos., Inc. | | | 4,074,988 | | | | 125,102,131 | |
| | | | | | | | | |
Gathering/Processing — 5.8% | | | | | |
Targa Resources Corp. | | | 3,809,516 | | | | 203,009,108 | |
| | | | | | | | | |
Total Common Stocks | | | | | |
(identified cost $327,934,081) | | | | 328,111,239 | |
| | | | | | | | | |
Private Investment in Public Equity — 2.7% | |
Natural Gas Pipelines — 2.7% | |
Rice Midstream Partners LP PIPE Units 1,2 | | | 4,788,003 | | | | 95,137,620 | |
| | | | | | | | | |
Total Private Investment in Public Equity | |
(identified cost $101,807,307) | | | | 95,137,620 | |
| | | | | | | | | |
Total Investments — 95.3% | | | | | |
(identified cost $3,031,031,799) | | | | 3,331,105,984 | |
Other Assets In Excess of Liabilities — 4.7% | | | | 163,284,486 | |
Net Assets — 100.0% | | | $ | 3,494,390,470 | |
12 OPPENHEIMER STEELPATH MLP ALPHA FUND |
STATEMENT OF INVESTMENTS (Continued) |
Footnotes to Statement of Investments
LLC — Limited Liability Company
LP — Limited Partnership
1. | Is or was an affiliate, as defined by the Investment Company Act of 1940, at or during the period ended November 30, 2016, by virtue of the Fund owning at least 5% of the voting securities of the issuer. Transactions during this period in which the issuer was an affiliate are as follows: |
| | Shares
November 30,
2015 | | | Gross
Additions | | | Gross
Reductions | | | Shares
November 30, 2016 | |
Nustar GP Holdings LLC | | | 2,707,359 | | | | 17,334 | | | | (383,055 | ) | | | 2,341,638 | |
Rice Midstream Partners LP | | | — | | | | 168,500 | | | | — | | | | 168,500 | |
Rice Midstream Partners LP PIPE Units | | | — | | | | 4,788,003 | | | | — | | | | 4,788,003 | |
Seadrill Partners LLCi | | | 7,385,604 | | | | — | | | | (7,385,604 | ) | | | — | |
Tallgrass Energy GP LP | | | 4,176,942 | | | | 4,585,449 | | | | (1,424,081 | ) | | | 7,338,310 | |
TC Pipelines LP | | | 4,458,844 | | | | 565,057 | | | | (219,932 | ) | | | 4,803,969 | |
TransMontaigne Partners LP | | | 1,282,597 | | | | — | | | | (293,248 | ) | | | 989,349 | |
Westlake Chemical Partners LP | | | — | | | | 2,901,596 | | | | (71,021 | ) | | | 2,830,575 | |
| | | | | | | | | | | | | | | | | |
| | Value
November 30, 2016 | | | Distributions | | | Realized
Gain/(Loss) | | | | | |
Nustar GP Holdings LLC | | $ | 59,477,605 | | | $ | 5,516,857 | | | $ | (2,312,598 | ) | | | | |
Rice Midstream Partners LP | | | 3,631,175 | | | | — | | | | — | | | | | |
Rice Midstream Partners LP PIPE Units | | | 95,137,620 | | | | 1,134,757 | | | | — | | | | | |
Seadrill Partners LLCi | | | — | | | | 594,342 | | | | (175,545,121 | ) | | | | |
Tallgrass Energy GP LP | | | 177,587,102 | | | | 6,163,161 | | | | 11,562,334 | | | | | |
TC Pipelines LP | | | 255,330,952 | | | | 16,750,523 | | | | 612,835 | | | | | |
TransMontaigne Partners LP | | | 42,037,439 | | | | 2,966,942 | | | | 6,422 | | | | | |
Westlake Chemical Partners LP | | | 59,442,075 | | | | 3,610,828 | | | | 148,757 | | | | | |
| | | $ | 692,643,968 | | | $ | 36,737,410 | | | $ | (165,527,371 | ) | | | | |
| | i | Is not an affiliate as of November 30, 2016. Was an affiliate during the year ended November 30, 2016. |
2. | Represents securities sold under Rule 144A, which are exempt from registration under the Securities Act of 1933, as amended. These securities have been determined to be liquid under guidelines established by the Board of Trustees. These securities, acquired on October 7, 2016 for $102,942,065 amount to $95,137,620 or 2.7% of the Fund’s net assets as of November 30, 2016. |
See accompanying Notes to Financial Statements.
OPPENHEIMER STEELPATH MLP ALPHA FUND 13 |
STATEMENT OF ASSETS AND LIABILITIES November 30, 2016 |
Assets: | | | |
Investments at value – see accompanying Statement of Investments: | | | |
Unaffiliated companies (cost $2,440,241,058) | | $ | 2,638,462,016 | |
Affiliated companies (cost $590,790,741) | | | 692,643,968 | |
| | | 3,331,105,984 | |
Deferred tax asset, net | | | 161,370,441 | |
Receivable for beneficial interest sold | | | 7,097,575 | |
Receivable for investments sold | | | 34,606,280 | |
Prepaid expenses | | | 126,456 | |
Dividends receivable | | | 156 | |
Total assets | | | 3,534,306,892 | |
| | | | |
Liabilities: | | | | |
Payable for investments purchased | | | 16,492,582 | |
Payable for beneficial interest redeemed | | | 10,898,135 | |
Due to custodian | | | 7,789,859 | |
Payable to Manager | | | 2,768,831 | |
Payable for distribution and service plan fees | | | 833,306 | |
Transfer agent fees payable | | | 598,479 | |
Trustees' fees payable | | | 28,297 | |
Borrowing expense payable | | | 19,028 | |
Other liabilities | | | 487,905 | |
Total liabilities | | | 39,916,422 | |
| | | | |
Net Assets | | $ | 3,494,390,470 | |
| | | | |
Composition of Net Assets | | | | |
Par value of shares of beneficial interest | | $ | 385,630 | |
Paid-in capital | | | 3,745,635,212 | |
Undistributed net investment loss, net of deferred taxes | | | (114,542,493 | ) |
Accumulated undistributed net realized losses on investments, net of deferred taxes | | | (326,138,135 | ) |
Net unrealized appreciation on investments, net of deferred taxes | | | 189,050,256 | |
Net Assets | | $ | 3,494,390,470 | |
14 OPPENHEIMER STEELPATH MLP ALPHA FUND |
STATEMENT OF ASSETS AND LIABILITIES (Continued) |
Net Asset Value, Offering Price and Redemption Proceeds Per Share ($0.001 Par Value, Unlimited Shares Authorized) | | | |
Class A Shares: | | | |
Net asset value and redemption proceeds per share | | $ | 9.05 | |
Offering price per share (net asset value plus sales charge of 5.75% of offering price) | | $ | 9.60 | |
Class C Shares: | | | | |
Net asset value, offering price and redemption proceeds per share | | $ | 8.69 | |
Class I Shares: | | | | |
Net asset value, offering price and redemption proceeds per share | | $ | 9.28 | |
Class Y Shares: | | | | |
Net asset value, offering price and redemption proceeds per share | | $ | 9.25 | |
Net Assets: | | | |
Class A shares | | $ | 1,073,056,754 | |
Class C shares | | | 772,962,549 | |
Class I shares | | | 99,430,998 | |
Class Y shares | | | 1,548,940,169 | |
Total Net Assets | | $ | 3,494,390,470 | |
| | | | | |
Shares Outstanding: | | | | |
Class A shares | | | 118,513,553 | |
Class C shares | | | 88,973,760 | |
Class I shares | | | 10,715,791 | |
Class Y shares | | | 167,426,913 | |
Total Shares Outstanding | | | 385,630,017 | |
See accompanying Notes to Financial Statements.
OPPENHEIMER STEELPATH MLP ALPHA FUND 15 |
STATEMENT OF OPERATIONS For the Year Ended November 30, 2016 |
Investment Income | | | |
Distributions from: | | | |
Unaffiliated Master Limited Partnerships | | $ | 173,862,977 | |
Affiliated Master Limited Partnerships | | | 36,737,410 | |
Less return of capital on distributions from: | | | | |
Unaffiliated Master Limited Partnerships | | | (173,862,977 | ) |
Affiliated Master Limited Partnerships | | | (36,737,410 | ) |
Dividend income | | | 11,432,740 | |
Total investment income | | | 11,432,740 | |
| | | | |
Expenses | | | | |
Management fees | | | 35,478,167 | |
Distribution and service plan fees | | | | |
Class A | | | 2,593,253 | |
Class C | | | 7,219,729 | |
Transfer agent fees | | | | |
Class A | | | 2,282,063 | |
Class C | | | 1,588,340 | |
Class I | | | 11,047 | |
Class Y | | | 3,153,396 | |
Administrative fees | | | 767,249 | |
Borrowing fees | | | 714,275 | |
Legal, auditing, and other professional fees | | | 209,225 | |
Custody fees | | | 162,146 | |
Registration fees | | | 160,191 | |
Trustees' fees | | | 87,823 | |
Tax expense | | | 81,139 | |
Other | | | 42,024 | |
Total expenses, before waivers and deferred taxes | | | 54,550,067 | |
Less expense waivers | | | (3,611,512 | ) |
Net expenses, before deferred taxes | | | 50,938,555 | |
| | | | |
Net investment loss, before deferred taxes | | | (39,505,815 | ) |
Deferred tax benefit | | | 17,793,757 | |
Net investment loss, net of deferred taxes | | | (21,712,058 | ) |
| | | | |
Net Realized and Unrealized Gains on Investments: | | | | |
Net Realized Gains/(Losses) | | | | |
Investments from: | | | | |
Unaffiliated companies | | | (328,920,250 | ) |
Affiliated companies | | | (165,527,371 | ) |
Deferred tax benefit | | | 181,289,585 | |
Net realized gains/(losses), net of deferred taxes | | | (313,158,036 | ) |
Net Change in Unrealized Appreciation | | | | |
Investments | | | 763,427,514 | |
Deferred tax expense | | | (281,123,465 | ) |
Net change in unrealized appreciation, net of deferred taxes | | | 482,304,049 | |
| | | | |
Net realized and unrealized gains on investments, net of deferred taxes | | | 169,146,013 | |
Change in net assets resulting from operations | | $ | 147,433,955 | |
See accompanying Notes to Financial Statements.
16 OPPENHEIMER STEELPATH MLP ALPHA FUND |
STATEMENTS OF CHANGES IN NET ASSETS |
| | For the
Year Ended November 30,
2016 | | | For the
Year Ended November 30,
2015 | |
Operations | | | | | | |
Net investment loss, net of deferred taxes | | $ | (21,712,058 | ) | | $ | (30,283,624 | ) |
Net realized losses, net of deferred taxes | | | (313,158,036 | ) | | | (73,170,877 | ) |
Net change in unrealized appreciation/(depreciation), net of deferred taxes | | | 482,304,049 | | | | (1,015,770,350 | ) |
Change in net assets resulting from operations | | | 147,433,955 | | | | (1,119,224,851 | ) |
| | | | | | | | |
Distributions to Shareholders | | | | | | | | |
Distributions to shareholders from return of capital: | | | | | | | | |
Class A shares | | | (83,067,958 | ) | | | (96,909,547 | ) |
Class C shares | | | (60,197,247 | ) | | | (59,632,051 | ) |
Class I shares | | | (3,184,331 | ) | | | (446,020 | ) |
Class Y shares | | | (112,993,001 | ) | | | (117,516,929 | ) |
Change in net assets resulting from distributions to shareholders | | | (259,442,537 | ) | | | (274,504,547 | ) |
| | | | | | | | |
Beneficial Interest Transactions | | | | | | | | |
Class A shares | | | (107,343,565 | ) | | | (217,577,787 | ) |
Class C shares | | | 20,072,272 | | | | 74,795,021 | |
Class I shares | | | 87,606,240 | | | | 8,872,758 | |
Class Y shares | | | 1,504,531 | | | | (13,709,563 | ) |
Change in net assets resulting from beneficial interest transactions | | | 1,839,478 | | | | (147,619,571 | ) |
Change in net assets | | | (110,169,104 | ) | | | (1,541,348,969 | ) |
| | | | | | | | |
Net Assets | | | | | | | | |
Beginning of period | | | 3,604,559,574 | | | | 5,145,908,543 | |
End of period | | $ | 3,494,390,470 | | | $ | 3,604,559,574 | |
| | | | | | | | | |
Undistributed net investment loss, net of deferred taxes | | $ | (114,542,493 | ) | | $ | (92,830,435 | ) |
See accompanying Notes to Financial Statements.
OPPENHEIMER STEELPATH MLP ALPHA FUND 17 |
Class A | | Year Ended November 30,
2016 | | | Year Ended November 30,
2015 | | | Year Ended November 28,
2014* | | | Year Ended November 29,
2013* | | | Year Ended November 30,
2012 | |
Per Share Operating Data | | | | | | | | | | | | | | | |
Net Asset Value, Beginning of Period | | $ | 9.32 | | | $ | 12.81 | | | $ | 12.04 | | | $ | 10.70 | | | $ | 10.38 | |
Income/(loss) from investment operations: | | | | | | | | | | | | | | | | | | | | |
Net investment loss1 | | | (0.06 | ) | | | (0.07 | ) | | | (0.12 | ) | | | (0.11 | ) | | | (0.10 | ) |
Return of capital1 | | | 0.35 | | | | 0.40 | | | | 0.42 | | | | 0.42 | | | | 0.41 | |
Net realized and unrealized gains/(losses) | | | 0.13 | | | | (3.13 | ) | | | 1.16 | | | | 1.72 | | | | 0.70 | |
Total from investment operations | | | 0.42 | | | | (2.80 | ) | | | 1.46 | | | | 2.03 | | | | 1.01 | |
Distributions to shareholders: | | | | | | | | | | | | | | | | | | | | |
Return of capital | | | (0.69 | ) | | | (0.69 | ) | | | (0.69 | ) | | | (0.69 | ) | | | (0.69 | ) |
Net asset value, end of period | | $ | 9.05 | | | $ | 9.32 | | | $ | 12.81 | | | $ | 12.04 | | | $ | 10.70 | |
| | | | | | | | | | | | | | | | | | | | |
Total Return, at Net Asset Value2 | | | 5.25 | % | | | (22.59 | %) | | | 12.26 | % | | | 19.29 | % | | | 9.93 | % |
| | | | | | | | | | | | | | | | | | | | | |
Ratios/Supplemental Data | | | | | | | | | | | | | | | | | | | | |
Net assets, end of period (in thousands) | | $ | 1,073,057 | | | $ | 1,226,012 | | | $ | 1,937,356 | | | $ | 1,154,926 | | | $ | 193,974 | |
Ratio of Expenses to Average Net Assets: | | | | | | | | | | | | | |
Before (waivers) and deferred tax expense/(benefit) | | | 1.64 | % | | | 1.63 | % | | | 1.65 | % | | | 1.55 | % | | | 1.58 | % |
Expense (waivers) | | | (0.11 | %) | | | (0.11 | %) | | | (0.12 | %) | | | (0.03 | %) | | | (0.08 | %) |
Net of (waivers) and before deferred tax expense/(benefit) | | | 1.53 | %3 | | | 1.52 | %3 | | | 1.53 | %3 | | | 1.52 | %4 | | | 1.50 | % |
Deferred tax expense/(benefit)5,6 | | | 2.54 | % | | | (14.45 | %) | | | 5.38 | % | | | 8.07 | % | | | 5.55 | % |
Total expenses/(benefit) | | | 4.07 | % | | | (12.93 | %) | | | 6.91 | % | | | 9.59 | % | | | 7.05 | % |
| | | | | | | | | | | | | | | | | | | | | |
Ratio of Investment Loss to Average Net Assets: | | | | | | | | | | | | | |
Before (waivers) and deferred tax benefit/(expense) | | | (1.32 | %) | | | (1.38 | %) | | | (1.57 | %) | | | (1.52 | %) | | | (1.57 | %) |
Expense (waivers) | | | (0.11 | %) | | | (0.11 | %) | | | (0.12 | %) | | | (0.03 | %) | | | (0.08 | %) |
Net of expense (waivers) and before deferred tax benefit/(expense) | | | (1.21 | %) | | | (1.27 | %) | | | (1.45 | %) | | | (1.49 | %) | | | (1.49 | %) |
Deferred tax benefit6,7 | | | 0.55 | % | | | 0.63 | % | | | 0.54 | % | | | 0.54 | % | | | 0.53 | % |
Net investment loss | | | (0.66 | %) | | | (0.64 | %) | | | (0.91 | %) | | | (0.95 | %) | | | (0.96 | %) |
| | | | | | | | | | | | | | | | | | | | |
Portfolio turnover rate | | | 35 | % | | | 36 | % | | | 17 | % | | | 9 | % | | | 15 | % |
* | November 28, 2014 and November 29, 2013 represent the last business day of the Fund’s respective reporting periods. |
1. | Per share amounts calculated based on average shares outstanding during the period net of deferred tax expense/benefit. |
2. | Assumes an initial investment on the business day before the first day of the fiscal period, with all dividends and distributions reinvested in additional shares on the reinvestment date, and redemptions at the net asset value calculated on the last business day of the fiscal period. Sales charges are not reflected in the total returns. Total returns are not annualized for periods less than one full year. Returns do not reflect the deduction of taxes that a shareholder would pay on fund distributions or the redemption of fund shares. The returns do not include adjustments in accordance with generally accepted accounting principles required at the period end for financial reporting purposes. |
3. | Includes borrowing and franchise tax expense. Without borrowing and franchise tax expense, the net expense ratio would be 1.50%. |
4. | Includes franchise tax expense. Without franchise tax expense the net expense ratio would be 1.50%. |
5. | Deferred tax expense estimate for the ratio calculation is derived from the net investment income/loss, and realized and unrealized gains/losses. |
6. | Effective December 1, 2013 the deferred tax expense and deferred tax benefit are allocated based on average net assets. Prior to December 1, 2013 the deferred tax expense and deferred tax benefit were allocated based on specific class expenses. |
7. | Deferred tax benefit for the ratio calculation is derived from net investment income/loss only. |
See accompanying Notes to Financial Statements.
18 OPPENHEIMER STEELPATH MLP ALPHA FUND |
FINANCIAL HIGHLIGHTS (Continued) |
Class C | | Year Ended November 30,
2016 | | | Year Ended November 30,
2015 | | | Year Ended November 28,
2014* | | | Year Ended November 29,
2013* | | | Year Ended November 30,
2012 | |
Per Share Operating Data | | | | | | | | | | | | | | | |
Net Asset Value, Beginning of Period | | $ | 9.04 | | | $ | 12.53 | | | $ | 11.89 | | | $ | 10.64 | | | $ | 10.40 | |
Income/(loss) from investment operations: | | | | | | | | | | | | | | | | | | | | |
Net investment loss1 | | | (0.13 | ) | | | (0.16 | ) | | | (0.22 | ) | | | (0.17 | ) | | | (0.15 | ) |
Return of capital1 | | | 0.35 | | | | 0.40 | | | | 0.42 | | | | 0.42 | | | | 0.44 | |
Net realized and unrealized gains/(losses) | | | 0.12 | | | | (3.04 | ) | | | 1.13 | | | | 1.69 | | | | 0.64 | |
Total from investment operations | | | 0.34 | | | | (2.80 | ) | | | 1.33 | | | | 1.94 | | | | 0.93 | |
Distributions to shareholders: | | | | | | | | | | | | | | | | | | | | |
Return of capital | | | (0.69 | ) | | | (0.69 | ) | | | (0.69 | ) | | | (0.69 | ) | | | (0.69 | ) |
Net asset value, end of period | | $ | 8.69 | | | $ | 9.04 | | | $ | 12.53 | | | $ | 11.89 | | | $ | 10.64 | |
| | | | | | | | | | | | | | | | | | | | |
Total Return, at Net Asset Value2 | | | 4.51 | % | | | (23.11 | %) | | | 11.30 | % | | | 18.54 | % | | | 9.12 | % |
| | | | | | | | | | | | | | | | | | | | | |
Ratios/Supplemental Data | | | | | | | | | | | | | | | | | | | | |
Net assets, end of period (in thousands) | | $ | 772,963 | | | $ | 783,886 | | | $ | 1,011,690 | | | $ | 451,351 | | | $ | 14,593 | |
Ratio of Expenses to Average Net Assets: | | | | | | | | | | | | | |
Before (waivers) and deferred tax expense/(benefit) | | | 2.39 | % | | | 2.38 | % | | | 2.40 | % | | | 2.30 | % | | | 2.63 | % |
Expense (waivers) | | | (0.11 | %) | | | (0.11 | %) | | | (0.12 | %) | | | (0.03 | %) | | | (0.38 | %) |
Net of (waivers) and before deferred tax expense/(benefit) | | | 2.28 | %3 | | | 2.27 | %3 | | | 2.28 | %3 | | | 2.27 | %4 | | | 2.25 | % |
Deferred tax expense/(benefit)5,6 | | | 2.54 | % | | | (14.45 | %) | | | 5.38 | % | | | 6.91 | % | | | 5.29 | % |
Total expenses/(benefit) | | | 4.82 | % | | | (12.18 | %) | | | 7.66 | % | | | 9.18 | % | | | 7.54 | % |
| | | | | | | | | | | | | | | | | | | | | |
Ratio of Investment Loss to Average Net Assets: | | | | | | | | | | | | | |
Before (waivers) and deferred tax benefit/(expense) | | | (2.27 | %) | | | (2.21 | %) | | | (2.34 | %) | | | (2.27 | %) | | | (2.63 | %) |
Expense (waivers) | | | (0.11 | %) | | | (0.11 | %) | | | (0.12 | %) | | | (0.03 | %) | | | (0.38 | %) |
Net of expense (waivers) and before deferred tax benefit/(expense) | | | (2.16 | %) | | | (2.10 | %) | | | (2.22 | %) | | | (2.24 | %) | | | (2.25 | %) |
Deferred tax benefit6,7 | | | 0.55 | % | | | 0.63 | % | | | 0.54 | % | | | 0.82 | % | | | 0.81 | % |
Net investment loss | | | (1.61 | %) | | | (1.47 | %) | | | (1.68 | %) | | | (1.42 | %) | | | (1.44 | %) |
| | | | | | | | | | | | | | | | | | | | |
Portfolio turnover rate | | | 35 | % | | | 36 | % | | | 17 | % | | | 9 | % | | | 15 | % |
* | November 28, 2014 and November 29, 2013 represent the last business day of the Fund’s respective reporting periods. |
1. | Per share amounts calculated based on average shares outstanding during the period net of deferred tax expense/benefit. |
2. | Assumes an initial investment on the business day before the first day of the fiscal period, with all dividends and distributions reinvested in additional shares on the reinvestment date, and redemptions at the net asset value calculated on the last business day of the fiscal period. Sales charges are not reflected in the total returns. Total returns are not annualized for periods less than one full year. Returns do not reflect the deduction of taxes that a shareholder would pay on fund distributions or the redemption of fund shares. The returns do not include adjustments in accordance with generally accepted accounting principles required at the period end for financial reporting purposes. |
3. | Includes borrowing and franchise tax expense. Without borrowing and franchise tax expense, the net expense ratio would be 2.25%. |
4. | Includes franchise tax expense. Without franchise tax expense the net expense ratio would be 2.25%. |
5. | Deferred tax expense estimate for the ratio calculation is derived from the net investment income/loss, and realized and unrealized gains/losses. |
6. | Effective December 1, 2013 the deferred tax expense and deferred tax benefit are allocated based on average net assets. Prior to December 1, 2013 the deferred tax expense and deferred tax benefit were allocated based on specific class expenses. |
7. | Deferred tax benefit for the ratio calculation is derived from net investment income/loss only. |
See accompanying Notes to Financial Statements.
OPPENHEIMER STEELPATH MLP ALPHA FUND 19 |
FINANCIAL HIGHLIGHTS (Continued) |
Class I | | Year Ended November 30,
2016 | | | Year Ended November 30,
2015 | | | Year Ended November 28,
2014* | | | Period Ended November 29,
2013*,1,2 | |
Per Share Operating Data | | | | | | | | | | | | |
Net Asset Value, Beginning of Period | | $ | 9.50 | | | $ | 12.99 | | | $ | 12.17 | | | $ | 12.15 | |
Income/(loss) from investment operations: | | | | | | | | | | | | | | | | |
Net investment income/(loss)3 | | | 0.09 | | | | (0.05 | ) | | | (0.12 | ) | | | (0.04 | ) |
Return of capital3 | | | 0.35 | | | | 0.40 | | | | 0.42 | | | | 0.19 | |
Net realized and unrealized gains/(losses) | | | 0.03 | | | | (3.15 | ) | | | 1.21 | | | | 0.21 | |
Total from investment operations | | | 0.47 | | | | (2.80 | ) | | | 1.51 | | | | 0.36 | |
Distributions to shareholders: | | | | | | | | | | | | | | | | |
Return of capital | | | (0.69 | ) | | | (0.69 | ) | | | (0.69 | ) | | | (0.34 | ) |
Net asset value, end of period | | $ | 9.28 | | | $ | 9.50 | | | $ | 12.99 | | | $ | 12.17 | |
| | | | | | | | | | | | | | | | |
Total Return, at Net Asset Value4 | | | 5.70 | % | | | (22.27 | %) | | | 12.55 | % | | | 3.05 | % |
| | | | | | | | | | | | | | | | | |
Ratios/Supplemental Data | | | | | | | | | | | | | | | | |
Net assets, end of period (in thousands) | | $ | 99,431 | | | $ | 9,722 | | | $ | 3,732 | | | $ | 73 | |
Ratio of Expenses to Average Net Assets:5 | | | | | | | | | |
Before deferred tax expense/(benefit) | | | 1.18 | %6 | | | 1.19 | %6 | | | 1.20 | %6 | | | 1.32 | %7 |
Deferred tax expense/(benefit)8,9 | | | 2.54 | % | | | (14.45 | %) | | | 5.38 | % | | | 4.51 | % |
Total expenses/(benefit) | | | 3.72 | % | | | (13.26 | %) | | | 6.58 | % | | | 5.83 | % |
| | | | | | | | | | | | | | | | | |
Ratio of Investment Income/(Loss) to Average Net Assets:5 | | | | | | | | | |
Before deferred tax benefit/(expense) | | | 0.45 | % | | | (1.12 | %) | | | (1.47 | %) | | | (1.29 | %) |
Deferred tax benefit9,10 | | | 0.55 | % | | | 0.63 | % | | | 0.54 | % | | | 0.46 | % |
Net investment income/(loss) | | | 1.00 | % | | | (0.49 | %) | | | (0.93 | %) | | | (0.83 | %) |
| | | | | | | | | | | | | | | | |
Portfolio turnover rate | | | 35 | % | | | 36 | % | | | 17 | % | | | 9 | % |
* | November 28, 2014 and November 29, 2013 represent the last business day of the Fund’s respective reporting periods. |
1. | Shares commenced operations at the close of business June 28, 2013. |
2. | Effective June 28, 2013, Class I shares were renamed Class Y shares. See Note 1 of the Notes to Financial Statements for additional information. |
3. | Per share amounts calculated based on average shares outstanding during the period net of deferred tax expense/benefit. |
4. | Assumes an initial investment on the business day before the first day of the fiscal period, with all dividends and distributions reinvested in additional shares on the reinvestment date, and redemptions at the net asset value calculated on the last business day of the fiscal period. Sales charges are not reflected in the total returns. Total returns are not annualized for periods less than one full year. Returns do not reflect the deduction of taxes that a shareholder would pay on fund distributions or the redemption of fund shares. The returns do not include adjustments in accordance with generally accepted accounting principles required at the period end for financial reporting purposes. |
5. | Annualized for less than full period. |
6. | Includes borrowing and franchise tax expense. Without borrowing and franchise tax expense, the net expense ratio would be 1.15%, 1.17% and 1.18% for the years ended November 30, 2016, November 30, 2015 and November 28, 2014, respectively. |
7. | Includes franchise tax expense. Without franchise tax expense the net expense ratio would be 1.06%. |
8. | Deferred tax expense estimate for the ratio calculation is derived from the net investment income/loss, and realized and unrealized gains/losses. |
9. | Effective December 1, 2013 the deferred tax expense and deferred tax benefit are allocated based on average net assets. Prior to December 1, 2013 the deferred tax expense and deferred tax benefit were allocated based on specific class expenses. |
10. | Deferred tax benefit for the ratio calculation is derived from net investment income/loss only. |
See accompanying Notes to Financial Statements.
20 OPPENHEIMER STEELPATH MLP ALPHA FUND |
FINANCIAL HIGHLIGHTS (Continued) |
Class Y | | Year Ended November 30,
2016 | | | Year Ended November 30,
2015 | | | Year Ended November 28,
2014* | | | Year Ended November 29,
2013*,1 | | | Year Ended November 30,
20121 | |
Per Share Operating Data | | | | | | | | | | | | | | | |
Net Asset Value, Beginning of Period | | $ | 9.49 | | | $ | 12.99 | | | $ | 12.18 | | | $ | 10.78 | | | $ | 10.43 | |
Income/(loss) from investment operations: | | | | | | | | | | | | | | | | | | | | |
Net investment loss2 | | | (0.02 | ) | | | (0.03 | ) | | | (0.07 | ) | | | (0.10 | ) | | | (0.09 | ) |
Return of capital2 | | | 0.35 | | | | 0.40 | | | | 0.42 | | | | 0.41 | | | | 0.40 | |
Net realized and unrealized gains/(losses) | | | 0.12 | | | | (3.18 | ) | | | 1.15 | | | | 1.78 | | | | 0.73 | |
Total from investment operations | | | 0.45 | | | | (2.81 | ) | | | 1.50 | | | | 2.09 | | | | 1.04 | |
Distributions to shareholders: | | | | | | | | | | | | | | | | | | | | |
Return of capital | | | (0.69 | ) | | | (0.69 | ) | | | (0.69 | ) | | | (0.69 | ) | | | (0.69 | ) |
Net asset value, end of period | | | 9.25 | | | $ | 9.49 | | | $ | 12.99 | | | $ | 12.18 | | | $ | 10.78 | |
| | | | | | | | | | | | | | | | | | | | |
Total Return, at Net Asset Value3 | | | 5.48 | % | | | (22.34 | %) | | | 12.46 | % | | | 19.72 | % | | | 10.18 | % |
| | | | | | | | | | | | | | | | | | | | | |
Ratios/Supplemental Data | | | | | | | | | | | | | | | | | | | | |
Net assets, end of period (in thousands) | | $ | 1,548,940 | | | $ | 1,584,939 | | | $ | 2,193,129 | | | $ | 1,218,475 | | | $ | 613,704 | |
Ratio of Expenses to Average Net Assets: | | | | | | | | | | | | | |
Before (waivers) and deferred tax expense/(benefit) | | | 1.39 | % | | | 1.38 | % | | | 1.40 | % | | | 1.29 | % | | | 1.29 | % |
Expense (waivers) | | | (0.11 | %) | | | (0.11 | %) | | | (0.12 | %) | | | (0.03 | %) | | | (0.04 | %) |
Net of (waivers) and before deferred tax expense/(benefit) | | | 1.28 | %4 | | | 1.27 | %4 | | | 1.28 | %4 | | | 1.26 | %5 | | | 1.25 | % |
Deferred tax expense/(benefit)6,7 | | | 2.54 | % | | | (14.45 | %) | | | 5.38 | % | | | 9.27 | % | | | 5.60 | % |
Total expenses/(benefit) | | | 3.82 | % | | | (13.18 | %) | | | 6.66 | % | | | 10.53 | % | | | 6.85 | % |
| | | | | | | | | | | | | | | | | | | | | |
Ratio of Investment Loss to Average Net Assets: | | | | | | | | | | | | | |
Before (waivers) and deferred tax benefit/(expense) | | | (0.92 | %) | | | (1.03 | %) | | | (1.21 | %) | | | (1.26 | %) | | | (1.29 | %) |
Expense (waivers) | | | (0.11 | %) | | | (0.11 | %) | | | (0.12 | %) | | | (0.03 | %) | | | (0.04 | %) |
Net of expense (waivers) and before deferred tax benefit/(expense) | | | (0.81 | %) | | | (0.92 | %) | | | (1.09 | %) | | | (1.23 | %) | | | (1.25 | %) |
Deferred tax benefit7,8 | | | 0.55 | % | | | 0.63 | % | | | 0.54 | % | | | 0.45 | % | | | 0.44 | % |
Net investment loss | | | (0.26 | %) | | | (0.29 | %) | | | (0.55 | %) | | | (0.78 | %) | | | (0.81 | %) |
| | | | | | | | | | | | | | | | | | | | |
Portfolio turnover rate | | | 35 | % | | | 36 | % | | | 17 | % | | | 9 | % | | | 15 | % |
* | November 28, 2014 and November 29, 2013 represent the last business day of the Fund’s respective reporting periods. |
1. | Effective June 28, 2013, Class I shares were renamed Class Y shares. See Note 1 of the Notes to Financial Statements for additional information. |
2. | Per share amounts calculated based on average shares outstanding during the period net of deferred tax expense/benefit. |
3. | Assumes an initial investment on the business day before the first day of the fiscal period, with all dividends and distributions reinvested in additional shares on the reinvestment date, and redemptions at the net asset value calculated on the last business day of the fiscal period. Sales charges are not reflected in the total returns. Total returns are not annualized for periods less than one full year. Returns do not reflect the deduction of taxes that a shareholder would pay on fund distributions or the redemption of fund shares. The returns do not include adjustments in accordance with generally accepted accounting principles required at the period end for financial reporting purposes. |
4. | Includes borrowing and franchise tax expense. Without borrowing and franchise tax expense, the net expense ratio would be 1.25%. |
5. | Includes franchise tax expense. Without franchise tax expense the net expense ratio would be 1.25%. |
6. | Deferred tax expense estimate for the ratio calculation is derived from the net investment income/loss, and realized and unrealized gains/losses. |
7. | Effective December 1, 2013 the deferred tax expense and deferred tax benefit are allocated based on average net assets. Prior to December 1, 2013 the deferred tax expense and deferred tax benefit were allocated based on specific class expenses. |
8. | Deferred tax benefit for the ratio calculation is derived from net investment income/loss only. |
See accompanying Notes to Financial Statements.
OPPENHEIMER STEELPATH MLP ALPHA FUND 21 |
NOTES TO FINANCIAL STATEMENTS |
1. Organization
Oppenheimer SteelPath MLP Alpha Fund (the “Fund”), a separate series of Oppenheimer SteelPath MLP Funds Trust, is a non-diversified open-end management investment company registered under the Investment Company Act of 1940, as amended. The Fund’s investment objective is to seek total return. The Fund’s investment adviser is OFI SteelPath, Inc. (the “Adviser” or “Manager”), a wholly-owned subsidiary of OppenheimerFunds, Inc. (“OFI” or “Oppenheimer”).
The Fund offers Class A, Class C, Class I, and Class Y shares. Effective June 28, 2013, Class I shares were renamed Class Y shares. Class A shares are sold at their offering price, which is normally net asset value plus a front-end sales charge. Effective June 28, 2013 although there is no initial sales charge on Class A purchases totaling $1 million or more, those Class A shares may be subject to a 1.00% contingent deferred sales charge (“CDSC”) if shares are redeemed within an 18-month “holding period” measured from the date of purchase. Class C shares are sold without a front-end sales charge but may be subject to a CDSC of 1.00% of the redemption proceeds if Class C shares are redeemed within one year of purchase. Class I shares are only available to eligible institutional investors. Class I shares are sold at net asset value per share without a sales charge or CDSC. An institutional investor that buys Class I shares for its customers’ accounts may impose charges on those accounts. Class Y shares are sold at net asset value per share without a sales charge directly to institutional investors that have special agreements with OppenheimerFunds Distributor, Inc. (the “Distributor) for that purpose. They may include insurance companies, registered investment companies, employee benefit plans and section 529 plans, among others. An institutional investor that buys Class Y shares for its customers’ accounts may impose charges on those accounts. All classes of shares have identical rights and voting privileges with respect to the Fund in general and exclusive voting rights on matters that affect that class alone. Earnings, net assets and net asset value per share may differ due to each class having its own expenses, such as transfer and shareholder servicing agent fees and shareholder communications, directly attributable to that class. Class A and C shares have separate distribution and/or service plans under which they pay fees. Class I and Y shares do not pay such fees.
The Fund is an investment company and accordingly follows the investment company accounting and reporting guidance of the Financial Accounting Standards Board (“FASB”) Accounting Standard Codification Topic 946 Financial Services- Investment Companies.
The following is a summary of significant accounting policies followed in the Fund’s preparation of financial statements in accordance with accounting principles generally accepted in the United States (“U.S. GAAP”).
22 OPPENHEIMER STEELPATH MLP ALPHA FUND |
NOTES TO FINANCIAL STATEMENTS (Continued) |
2. Significant Accounting Policies
Security valuation. All investments in securities are recorded at their estimated fair value, as described in Note 3.
Allocation of Income, Expenses, Gains and Losses. Income, expenses (other than those attributable to a specific class), gains and losses are allocated on a daily basis to each class of shares based upon the relative proportion of net assets represented by such class. Operating expenses directly attributable to a specific class are charged against the operations of that class.
Dividends and Distributions to Shareholders. Dividends and distributions to shareholders, which are determined in accordance with income tax regulations and may differ from U.S. generally accepted accounting principles, are recorded on the ex-dividend date. Dividends, if any, are declared and distributed monthly for the Fund. The estimated characterization of the distributions paid will be either a qualified dividend or distribution (return of capital). This estimate is based on the Fund’s operating results during the period. It is anticipated that a significant portion of the distributions will be comprised of return of capital as a result of the tax character of cash distributions made by the Fund’s investments. The actual characterization of the distributions made during the period will not be determined until after the end of the fiscal year. The Fund will inform shareholders of the final tax character of the distributions on IRS Form 1099 DIV in February 2017. For the year ended November 30, 2016, the Fund distributions are expected to be comprised of 100% return of capital.
Return of Capital Estimates. Distributions received from the Fund’s investments in MLPs generally are comprised of income and return of capital. The Fund records investment income and return of capital based on estimates made at the time such distributions are received. Such estimates are based on historical information available from each MLP and other industry sources. These estimates may subsequently be revised based on information received from MLPs after their tax reporting periods are concluded. For the year ended November 30, 2016, the Fund estimated that 100% of the MLP distributions received would be treated as return of capital.
Investment Income. Dividend income is recorded on the ex-dividend date or upon ex-dividend notification in the case of certain foreign dividends where the ex-dividend date may have passed. Non-cash dividends included in dividend income, if any, are recorded at the fair value of the securities received. Interest income is recognized on an accrual basis. Discount and premium, which are included in interest income on the Statement of Operations, if applicable, are amortized or accreted daily.
Custodian Fees. “Custody fees” in the Statement of Operations may include interest expense incurred by the Fund on any cash overdrafts of its custodian account during the period. Such cash overdrafts may result from the effects of failed trades in portfolio securities and from cash outflows resulting from unanticipated shareholder redemption activity. The
OPPENHEIMER STEELPATH MLP ALPHA FUND 23 |
NOTES TO FINANCIAL STATEMENTS (Continued) |
2. Significant Accounting Policies (Continued)
Fund pays interest to its custodian on such cash overdrafts, to the extent they are not offset by positive cash balances maintained by the Fund, at a rate equal to the Federal Funds Rate plus 0.50%. The “Reduction to custodian expenses” line item, if applicable, represents earnings on cash balances maintained by the Fund during the period. Such interest expense and other custodian fees may be paid with these earnings.
Security Transactions. Security transactions are recorded on the trade date. Realized gains and losses on securities sold are determined using the basis of identified cost.
Indemnifications. The Fund’s organizational documents provide current and former trustees and officers with a limited indemnification against liabilities arising in connection with the performance of their duties to the Fund. In the normal course of business, the Fund may also enter into contracts that provide general indemnifications. The Fund’s maximum exposure under these arrangements is unknown as this would be dependent on future claims that may be made against the Fund. The risk of material loss from such claims is considered remote.
Federal Income Taxes. The Fund does not intend to qualify as a regulated investment company pursuant to Subchapter M of the Internal Revenue Code, but will rather be taxed as a corporation. As a corporation, the Fund is obligated to pay federal, state and local income tax on taxable income. Currently, the maximum marginal regular federal income tax rate for a corporation is 35 percent. Upon enactment, a change in the federal income tax rate could have a material impact to the Fund. The Fund may be subject to a 20 percent alternative minimum tax on its federal alternative minimum taxable income to the extent that its alternative minimum tax exceeds its regular federal income tax. The Fund is currently using an estimated rate of 1.7 percent for state and local tax, net of federal tax expense.
The Fund’s income tax provision consists of the following as of November 30, 2016:
Current tax expense (benefit) | | | |
Federal | | $ | — | |
State | | | — | |
Total current tax expense | | $ | — | |
| | | | | |
Deferred tax expense (benefit) | | | | |
Federal | | $ | 77,627,185 | |
State | | | 4,412,938 | |
Total deferred tax expense | | $ | 82,040,123 | |
24 OPPENHEIMER STEELPATH MLP ALPHA FUND |
NOTES TO FINANCIAL STATEMENTS (Continued) |
2. Significant Accounting Policies (Continued)
The reconciliation between the federal statutory income tax rate of 35% and the effective tax rate on net investment income (loss) and realized and unrealized gain (loss) follows:
| | Amount | | | Rate | |
Application of federal statutory income tax rate | | $ | 80,315,926 | | | | 35.00 | % |
State income taxes net of federal benefit | | | 3,901,059 | | | | 1.70 | % |
Effect of state tax rate change | | | 642,475 | | | | 0.28 | % |
Effect of permanent differences | | | (2,819,337 | ) | | | (1.23 | %) |
Total income tax expense (benefit) | | $ | 82,040,123 | | | | 35.75 | % |
The Fund intends to invest its assets primarily in MLPs, which generally are treated as partnerships for federal income tax purposes. As a limited partner in the MLPs, the Fund reports its allocable share of the MLP’s taxable income in computing its own taxable income. The Fund’s tax expense or benefit will be included in the Statement of Operations based on the component of income or gains (losses) to which such expense or benefit relates. Deferred income taxes reflect the net tax effects of temporary differences between the carrying amounts of assets and liabilities for financial reporting purposes and the amounts used for income tax purposes. Such temporary differences are principally: (i) taxes on unrealized gains/(losses), which are attributable to the temporary difference between fair market value and tax basis, (ii) the net tax effects of temporary differences between the carrying amounts of assets and liabilities for financial reporting and income tax purposes and (iii) the net tax benefit of accumulated net operating losses and capital loss carryforwards. Deferred tax assets and liabilities are measured using effective tax rates expected to apply to taxable income in the years such temporary differences are realized or otherwise settled. To the extent the Fund has a deferred tax asset, consideration is given to whether or not a valuation allowance is required. A valuation allowance is required if, based on the evaluation criterion provided by ASC 740, Income Taxes (ASC 740), it is more-likely-than-not some portion or all of the deferred tax asset will not be realized. Among the factors considered in assessing the Fund’s valuation allowance are: the nature, frequency and severity of current and cumulative losses, forecasts of future profitability, the duration of the statutory carryforward periods, significant redemptions, and the associated risks that operating and capital loss carryforwards may expire unused.
At November 30, 2016, the Fund determined a valuation allowance was not required. In evaluating a valuation allowance on a portion of the deferred tax asset, significant consideration was given to the current and expected level of MLP distributions, unrealized gains and losses on MLP investments and the expiration dates for net operating losses and capital loss carryovers. Market cycles, the severity and duration of historical deferred tax assets and the impact of current and future redemptions were also considered. The Fund intends to assess whether a valuation allowance is required to offset some or all of any deferred tax asset balance in connection with the calculation of the Fund’s daily NAV; however, to the
OPPENHEIMER STEELPATH MLP ALPHA FUND 25 |
NOTES TO FINANCIAL STATEMENTS (Continued) |
2. Significant Accounting Policies (Continued)
extent the final valuation allowance differs from the estimates of the Fund used in calculating the Fund’s daily NAV, the application of such final valuation allowance in these Financial Statements could have a material impact on the Fund’s NAV. Through the consideration of these factors, the Fund has determined that it is more likely than not the deferred tax asset, net of the valuation allowance, if required, will be realized.
Unexpected significant decreases in cash distributions from the Fund’s MLP investments, significant declines in the fair value of its investments, significant redemptions or increased risk of expiring net operating losses or capital loss carryovers may change the Fund’s assessment regarding the recoverability of its deferred tax assets and may result in a change to the valuation allowance. Modifications of the valuation allowance could have a material impact on the Fund’s net asset value.
Components of the Fund’s deferred tax assets and liabilities as of November 30, 2016 are as follows:
Deferred tax assets: | | | |
Net operating loss carryforward (tax basis) | | $ | 155,676,320 | |
Capital loss carryforward (tax basis) | | | 286,712,630 | |
Book to tax differences - Income recognized from MLPs | | | 11,193,901 | |
Total deferred tax asset | | | 453,582,851 | |
| | | | | |
Deferred tax liabilities: | | | | |
Net unrealized gains on investment securities (tax basis) | | | (292,212,410 | ) |
Total deferred tax liability | | | (292,212,410 | ) |
| | | | | |
Total net deferred tax asset/(liability) | | $ | 161,370,441 | |
The Fund may rely, to some extent, on information provided by the MLPs, which may not necessarily be timely, to estimate taxable income allocable to MLP units held in its portfolio, and to estimate its associated deferred tax liability or asset. Such estimates are made in good faith. From time to time, as new information becomes available, the Fund will modify its estimates or assumptions regarding its tax liability or asset.
The Fund’s policy is to classify interest and penalties associated with underpayment of federal and state income taxes, if any, as income tax expense on its Statement of Operations. As of November 30, 2016, the Fund does not have any interest or penalties associated with the underpayment of any income taxes.
The Fund files income tax returns in the U.S. federal jurisdiction and various states. The Fund has reviewed all major jurisdictions and concluded that there is no significant impact on the Fund’s net assets and no tax liability resulting from unrecognized tax benefits relating to
26 OPPENHEIMER STEELPATH MLP ALPHA FUND |
NOTES TO FINANCIAL STATEMENTS (Continued) |
2. Significant Accounting Policies (Continued)
uncertain tax positions expected to be taken on its tax returns. Furthermore, management of the Fund is not aware of any uncertain tax positions for which it is reasonably possible that the total amount of unrecognized tax benefit will significantly change in the next 12 months.
At November 30, 2016, the Fund had net operating loss carryforwards for federal income tax purposes, which may be carried forward for 20 years, as follows:
Expiration Date | | | |
11/30/2030 | | $ | 1,194,164 | |
11/30/2031 | | | 7,264,183 | |
11/30/2032 | | | 34,906,904 | |
11/30/2033 | | | 59,435,302 | |
11/30/2034 | | | 89,553,891 | |
11/30/2035 | | | 148,345,011 | |
11/30/2036 | | | 83,486,702 | |
Total | | $ | 424,186,157 | |
At November 30, 2016, the Fund had net capital loss carryforwards for federal income tax purposes, which may be carried forward for 5 years, as follows:
Expiration Date | | | |
11/30/2020 | | $ | 201,946,664 | |
11/30/2021 | | | 579,286,660 | |
Total | | $ | 781,233,324 | |
At November 30, 2016, gross unrealized appreciation and depreciation of investments, based on cost for federal income tax purposes were as follows:
Cost of Investments | | $ | 2,532,934,397 | |
Gross Unrealized Appreciation | | $ | 1,040,605,954 | |
Gross Unrealized Depreciation | | | (242,434,367 | ) |
Net Unrealized Appreciation (Depreciation) on Investments | | $ | 798,171,587 | |
The difference between cost amounts for financial statement and federal income tax purposes is due primarily to timing differences in recognizing certain gains and losses in security transactions.
OPPENHEIMER STEELPATH MLP ALPHA FUND 27 |
NOTES TO FINANCIAL STATEMENTS (Continued) |
2. Significant Accounting Policies (Continued)
Use of Estimates. The preparation of financial statements in conformity with U.S. GAAP requires management to make estimates and assumptions that affect the reported amounts of assets and liabilities and disclosure of contingent assets and liabilities at the date of the financial statements and the reported amounts of increases and decreases in net assets from operations during the reporting period. Actual results could differ from those estimates.
3. Securities Valuation
The Fund calculates the net asset value of its shares as of 4:00 P.M. Eastern time, on each day the New York Stock Exchange (the “Exchange”) is open for trading, except in the case of a scheduled early closing of the Exchange, in which case the Fund will calculate net asset value of the shares as of the scheduled early closing time of the Exchange.
The Fund’s Board of Trustees (the “Board”) has adopted procedures for the valuation of the Fund’s securities and has delegated the day-to-day responsibility for valuation determinations under those procedures to the Adviser. The Adviser has established a Valuation Committee which is responsible for determining a “fair valuation” for any security for which market quotations are not “readily available.” The Valuation Committee’s fair valuation determinations are subject to review, approval and ratification by the Fund’s Board at its next regularly scheduled meeting covering the calendar quarter in which the fair valuation was determined.
Valuation Methods and Inputs
Securities are valued using unadjusted quoted market prices, when available, as supplied primarily by third party pricing services or dealers.
The following methodologies are used to determine the market value or the fair value of the types of securities described below:
Equity securities traded on a securities exchange (including exchange-traded derivatives other than futures and futures options) are valued based on the official closing price on the principal exchange on which the security is traded, as identified by the Manager, prior to the time when the Fund’s assets are valued. If the official closing price is unavailable, the security is valued at the last sale price on the principal exchange on which it is traded. If the official closing price or last sales price for a foreign security is not available, the security is valued at the mean between the bid and asked price per the exchange or, if not available from the exchange, obtained from two dealers. If bid and asked prices are not available from either the exchange or two dealers, the security is valued by using one of the following methodologies (listed in order of priority): (1) a bid from the exchange, (2) the mean between the bid and asked price as provided by a single dealer, or (3) a bid from a single dealer.
28 OPPENHEIMER STEELPATH MLP ALPHA FUND |
NOTES TO FINANCIAL STATEMENTS (Continued) |
3. Securities Valuation (Continued)
Shares of a registered investment company that are not traded on an exchange are valued at that investment company’s net asset value per share.
Corporate and government debt securities (of U.S. or foreign issuers) and municipal debt securities, event-linked bonds, loans, mortgage-backed securities, collateralized mortgage obligations, and asset-backed securities are valued at the mean between the “bid” and “asked” prices utilizing evaluated prices obtained from third party pricing services or broker-dealers who may use matrix pricing methods to determine the evaluated prices.
Short-term money market type debt securities are valued at the mean between the “bid” and “asked” prices utilizing evaluated prices obtained from third party pricing services or broker-dealers.
A description of the standard inputs that may generally be considered by the third party pricing vendors in determining their evaluated prices is provided below.
Security Type | | Standard inputs generally considered by third-party pricing vendors |
Corporate debt, government debt, municipal, mortgage-backed and asset-backed securities | | Reported trade data, broker-dealer price quotations, benchmark yields, issuer spreads on comparable securities, the credit quality, yield, maturity, and other appropriate factors. |
Loans | | Information obtained from market participants regarding reported trade data and broker-dealer price quotations. |
Event-linked bonds | | Information obtained from market participants regarding reported trade data and broker-dealer price quotations. |
If a market value or price cannot be determined for a security using the methodologies described above, or if, in the “good faith” opinion of the Manager, the market value or price obtained does not constitute a “readily available market quotation,” or a significant event has occurred that would materially affect the value of the security, the security is fair valued either (i) by a standardized fair valuation methodology applicable to the security type or the significant event as previously approved by the Valuation Committee and the Fund’s Board or (ii) as determined in good faith by the Manager’s Valuation Committee. The Valuation Committee considers all relevant facts that are reasonably available, through either public information or information available to the Manager, when determining the fair value of a security. Fair value determinations by the Manager are subject to review, approval and ratification by the Fund’s Board at its next regularly scheduled meeting covering the calendar quarter in which the fair valuation was determined. Those fair valuation
OPPENHEIMER STEELPATH MLP ALPHA FUND 29 |
NOTES TO FINANCIAL STATEMENTS (Continued) |
3. Securities Valuation (Continued)
standardized methodologies include, but are not limited to, valuing securities at the last sale price or initially at cost and subsequently adjusting the value based on: changes in company specific fundamentals, changes in an appropriate securities index, or changes in the value of similar securities which may be further adjusted for any discounts related to security-specific resale restrictions. When possible, such methodologies use observable market inputs such as unadjusted quoted prices of similar securities, observable interest rates, currency rates and yield curves. The methodologies used for valuing securities are not necessarily an indication of the risks associated with investing in those securities nor can it be assured that the Fund can obtain the fair value assigned to a security if it were to sell the security.
To assess the continuing appropriateness of security valuations, the Manager, or its third party service provider who is subject to oversight by the Manager, regularly compares prior day prices, prices on comparable securities, and sale prices to the current day prices and challenges those prices exceeding certain tolerance levels with the third party pricing service or broker source. For those securities valued by fair valuations, whether through a standardized fair valuation methodology or a fair valuation determination, the Valuation Committee reviews and affirms the reasonableness of the valuations based on such methodologies and fair valuation determinations on a regular basis after considering all relevant information that is reasonably available.
Classifications
Each investment asset or liability of the Fund is assigned a level at measurement date based on the significance and source of the inputs to its valuation. Various data inputs are used in determining the value of each of the Fund’s investments as of the reporting period end. These data inputs are categorized in the following hierarchy under applicable financial accounting standards:
| | 1) | Level 1-unadjusted quoted prices in active markets for identical assets or liabilities (including securities actively traded on a securities exchange) |
| | 2) | Level 2-inputs other than unadjusted quoted prices that are observable for the asset or liability (such as unadjusted quoted prices for similar assets and market corroborated inputs such as interest rates, prepayment speeds, credit risks, etc.) |
| | 3) | Level 3-significant unobservable inputs (including the Manager’s own judgments about assumptions that market participants would use in pricing the asset or liability). |
The inputs used for valuing securities are not necessarily an indication of the risks associated with investing in those securities.
30 OPPENHEIMER STEELPATH MLP ALPHA FUND |
NOTES TO FINANCIAL STATEMENTS (Continued) |
3. Securities Valuation (Continued)
The table below categorizes amounts that are included in the Fund’s Statement of Assets and Liabilities as of November 30, 2016, based on valuation input level:
| | Level 1 —
Unadjusted
Quoted Prices | | | Level 2 —
Other
Significant
Observable
Inputs | | | Level 3 —
Significant
Unobservable
Inputs | | | Value | |
Assets Table | | | | | | | | | | | | |
Investments, at Value: | | | | | | | | | | | | |
Master Limited Partnership Shares* | | $ | 2,907,857,125 | | | $ | — | | | $ | — | | | $ | 2,907,857,125 | |
Common Stocks* | | | 328,111,239 | | | | — | | | | — | | | | 328,111,239 | |
Private Investment in Public Equity* | | | — | | | | 95,137,620 | | | | — | | | | 95,137,620 | |
Total Assets | | $ | 3,235,968,364 | | | $ | 95,137,620 | | | $ | — | | | $ | 3,331,105,984 | |
* | For a detailed break-out of securities by major industry classification, please refer to the Statement of Investments. |
The Fund did not hold any Level 3 securities during the year ended November 30, 2016.
There have been no transfers between pricing levels for the Fund. It is the Fund’s policy to recognize transfers at the beginning of the reporting period.
4. Investments and Risks
Equity Security Risk. Stocks and other equity securities fluctuate in price. The value of the Fund’s portfolio may be affected by changes in the equity markets generally. Equity markets may experience significant short-term volatility and may fall sharply at times. Different markets may behave differently from each other and U.S. equity markets may move in the opposite direction from one or more foreign stock markets. Adverse events in any part of the equity or fixed-income markets may have unexpected negative effects on other market segments.
The prices of individual equity securities generally do not all move in the same direction at the same time and a variety of factors can affect the price of a particular company’s securities. These factors may include, but are not limited to, poor earnings reports, a loss of customers, litigation against the company, general unfavorable performance of the company’s sector or industry, or changes in government regulations affecting the company or its industry.
Master Limited Partnerships (“MLPs”). Under normal circumstances, the Fund invests at least 80% of its net assets (plus the amount of borrowings for investment purposes) in the equity securities of MLPs.
OPPENHEIMER STEELPATH MLP ALPHA FUND 31 |
NOTES TO FINANCIAL STATEMENTS (Continued) |
4. Investments and Risks (Continued)
MLPs issue common units that represent an equity ownership interest in a partnership and provide limited voting rights. MLP common units are registered with the Securities and Exchange Commission (“SEC”), and are freely tradable on securities exchanges such as the NYSE and the NASDAQ Stock Market (“NASDAQ”), or in the over-the-counter (“OTC”) market. An MLP consists of one or more general partners, who conduct the business, and one or more limited partners, who contribute capital. MLP common unit holders have a limited role in the partnership’s operations and management. The Fund, as a limited partner, normally would not be liable for the debts of the MLP beyond the amounts the Fund has contributed, but would not be shielded to the same extent that a shareholder of a corporation would be. In certain circumstances creditors of an MLP would have the right to seek return of capital distributed to a limited partner. This right of an MLP’s creditors would continue after the Fund sold its investment in the MLP.
Concentration Risk. Under normal circumstances, the Fund invests at least 80% of its net assets (plus the amount of any borrowing for investment purposes) in the equity securities of MLPs. MLPs are subject to certain risks, such as supply and demand risk, depletion and exploration risk, commodity pricing risk, acquisition risk, and the risk associated with the hazards inherent in midstream energy industry activities. A substantial portion of the cash flow received by the Fund is derived from investment in equity securities of MLPs. The amount of cash that a MLP has available for distributions, and the tax character of such distributions, are dependent upon the amount of cash generated by the MLP’s operations.
5. Market Risk Factors
The Fund’s investments in securities and/or financial derivatives may expose the Fund to various market risk factors:
Commodity Risk. Commodity risk relates to the change in value of commodities or commodity indexes as they relate to increases or decreases in the commodities market. Commodities are physical assets that have tangible properties. Examples of these types of assets are crude oil, heating oil, metals, livestock, and agricultural products.
Credit Risk. Credit risk relates to the ability of the issuer of debt to meet interest and principal payments, or both, as they come due. In general, lower-grade, higher-yield debt securities are subject to credit risk to a greater extent than lower-yield, higher-quality securities.
Equity Risk. Equity risk relates to the change in value of equity securities as they relate to increases or decreases in the general market.
32 OPPENHEIMER STEELPATH MLP ALPHA FUND |
NOTES TO FINANCIAL STATEMENTS (Continued) |
5. Market Risk Factors (Continued)
Foreign Exchange Rate Risk. Foreign exchange rate risk relates to the change in the U.S. dollar value of a security held that is denominated in a foreign currency. The U.S. dollar value of a foreign currency denominated security will decrease as the dollar appreciates against the currency, while the U.S. dollar value will increase as the dollar depreciates against the currency.
Interest Rate Risk. Interest rate risk refers to the fluctuations in value of fixed-income securities resulting from the inverse relationship between price and yield. For example, an increase in general interest rates will tend to reduce the market value of already issued fixed-income investments, and a decline in general interest rates will tend to increase their value. In addition, debt securities with longer maturities, which tend to have higher yields, are subject to potentially greater fluctuations in value from changes in interest rates than obligations with shorter maturities.
Volatility Risk. Volatility risk refers to the magnitude of the movement, but not the direction of the movement, in a financial instrument’s price over a defined time period. Large increases or decreases in a financial instrument’s price over a relative time period typically indicate greater volatility risk, while small increases or decreases in its price typically indicate lower volatility risk.
6. Shares of Beneficial Interest
The Fund has authorized an unlimited number of $0.001 par value shares of beneficial interest in each class. Transactions in shares of beneficial interest were as follows:
| | | Year Ended
November 30, 2016 | | | Year Ended
November 30, 2015 | |
| | | | | | | |
| | Shares | | | Amount | | | Shares | | | Amount | |
Class A | | | | | | | | | | | | |
Sold | | | 37,141,721 | | | $ | 306,695,302 | | | | 40,493,322 | | | $ | 464,279,090 | |
Dividends and/or distributions reinvested | | | 8,746,596 | | | | 74,466,025 | | | | 7,909,913 | | | | 87,522,247 | |
Redeemed | | | (58,851,485 | ) | | | (488,504,892 | ) | | | (68,189,396 | ) | | | (769,379,124 | ) |
Net Decrease | | | (12,963,168 | ) | | $ | (107,343,565 | ) | | | (19,786,161 | ) | | $ | (217,577,787 | ) |
OPPENHEIMER STEELPATH MLP ALPHA FUND 33 |
NOTES TO FINANCIAL STATEMENTS (Continued) |
6. Shares of Beneficial Interest (Continued)
| | | Year Ended
November 30, 2016 | | | Year Ended
November 30, 2015 | |
| | | | | | | |
| | Shares | | | Amount | | | Shares | | | Amount | |
Class C | | | | | | | | | | | | |
Sold | | | 22,176,519 | | | $ | 178,360,419 | | | | 24,316,022 | | | $ | 270,575,510 | |
Dividends and/or distributions reinvested | | | 7,080,415 | | | | 58,259,668 | | | | 5,380,628 | | | | 57,707,542 | |
Redeemed | | | (26,981,897 | ) | | | (216,547,815 | ) | | | (23,720,276 | ) | | | (253,488,031 | ) |
Net Increase | | | 2,275,037 | | | $ | 20,072,272 | | | | 5,976,374 | | | $ | 74,795,021 | |
| | | | | | | | | | | | | | | | |
Class I | | | | | | | | | | | | | | | | |
Sold | | | 10,505,137 | | | $ | 94,708,240 | | | | 1,726,126 | | | $ | 19,446,285 | |
Dividends and/or distributions reinvested | | | 345,881 | | | | 3,143,664 | | | | 40,882 | | | | 443,710 | |
Redeemed | | | (1,158,219 | ) | | | (10,245,664 | ) | | | (1,031,254 | ) | | | (11,017,237 | ) |
Net Increase | | | 9,692,799 | | | $ | 87,606,240 | | | | 735,754 | | | $ | 8,872,758 | |
| | | | | | | | | | | | | | | | |
Class Y | | | | | | | | | | | | | | | | |
Sold | | | 92,739,654 | | | $ | 771,561,708 | | | | 89,222,081 | | | $ | 1,020,574,628 | |
Dividends and/or distributions reinvested | | | 12,768,122 | | | | 111,263,903 | | | | 10,370,858 | | | | 116,640,045 | |
Redeemed | | | (105,102,540 | ) | | | (881,321,080 | ) | | | (101,423,091 | ) | | | (1,150,924,236 | ) |
Net Increase/(Decrease) | | | 405,236 | | | $ | 1,504,531 | | | | (1,830,152 | ) | | $ | (13,709,563 | ) |
7. Purchases and Sales of Securities
The aggregate cost of purchases and proceeds from sales of securities, other than short-term obligations, for the Year ended November 30, 2016, were as follows:
| | Purchases | | | Sales | |
Investment securities | | $ | 1,088,468,166 | | | $ | 1,186,387,521 | |
34 OPPENHEIMER STEELPATH MLP ALPHA FUND |
NOTES TO FINANCIAL STATEMENTS (Continued) |
8. Fees and Other Transactions with Affiliates
Management Fees. Under the investment advisory agreement, the Fund pays the Manager a management fee based on the daily net assets of the Fund at an annual rate as shown in the following table:
Net Assets up to $3 Billion | Net Assets Greater than
$3 Billion and up to $5 Billion | Net Assets in Excess of $5 Billion |
1.10% | 1.08% | 1.05% |
The Fund’s effective management fee for the year ended November 30, 2016 was 1.10% of average annual net assets before any applicable waivers.
Transfer Agent Fees. OFI Global (the “Transfer Agent”) serves as the transfer and shareholder servicing agent for the Fund. The Fund pays the Transfer Agent a fee based on annual net assets. Fees incurred with respect to these services are detailed in the Statement of Operations.
Sub-Transfer Agent Fees. The Transfer Agent has retained Shareholder Services, Inc., a wholly-owned subsidiary of OFI (the “Sub-Transfer Agent”), to provide the day-to-day transfer agent and shareholder servicing of the Fund. Under the Sub-Transfer Agency Agreement, the Transfer Agent pays the Sub-Transfer Agent an annual fee in monthly installments, equal to a percentage of the transfer agent fee collected by the Transfer Agent from the Fund, which shall be calculated after any applicable fee waivers. The fee paid to the Sub-Transfer Agent is paid by the Transfer Agent, not by the Fund.
Trustees’ Compensation. The Board has adopted a compensation deferral plan for independent trustees that enables trustees to elect to defer receipt of all or a portion of the annual compensation they are entitled to receive from the Fund. For purposes of determining the amount owed to the Trustee under the plan, deferred amounts are treated as though equal dollar amounts had been invested in shares of the Fund or in other Oppenheimer funds selected by the Trustee. The Fund purchases shares of the funds selected for deferral by the Trustee in amounts equal to his or her deemed investment, resulting in a Fund asset equal to the deferred compensation liability. Such assets are included as a component of “Other” within the asset section of the Statement of Assets and Liabilities, if applicable. Deferral of trustees’ fees under the plan will not affect the net assets of the Fund, and will not materially affect the Fund’s assets, liabilities or net investment income per share. Amounts will be deferred until distributed in accordance with the compensation deferral plan.
Distribution and Service Plan (12b-1) Fees. Under its General Distributor’s Agreement with the Fund, the Distributor acts as the Fund’s principal underwriter in the continuous public offering of the Fund’s classes of shares.
OPPENHEIMER STEELPATH MLP ALPHA FUND 35 |
NOTES TO FINANCIAL STATEMENTS (Continued) |
8. Fees and Other Transactions with Affiliates (Continued)
Service Plan for Class A Shares. The Fund has adopted a Service Plan (the “Plan”) for Class A shares under Rule 12b-1 of the Investment Company Act of 1940. Under the Plan, the Fund reimburses the Distributor for a portion of its costs incurred for services provided to accounts that hold Class A shares. Reimbursement is made periodically at an annual rate of up to 0.25% of the daily net assets of Class A shares of the Fund. The Distributor currently uses all of those fees to pay dealers, brokers, banks and other financial institutions periodically for providing personal service and maintenance of accounts of their customers that hold Class A shares. Any unreimbursed expenses the Distributor incurs with respect to Class A shares in any fiscal year cannot be recovered in subsequent periods. Fees incurred by the Fund under the Plan are detailed in the Statement of Operations.
Distribution and Service Plans for Class C Shares. The Fund has adopted Distribution and Service Plans (the “Plans”) for Class C shares under Rule 12b-1 of the Investment Company Act of 1940 to compensate the Distributor for distributing those share classes, maintaining accounts and providing shareholder services. Under the Plans, the Fund pays the Distributor an annual asset-based sales charge of 0.75% on Class C shares daily net assets. The Fund also pays a service fee under the Plans at an annual rate of 0.25% of daily net assets.
The Plan and Plans continue in effect from year to year only if the Fund’s Board votes annually to approve their continuance at an in person meeting called for that purpose. Fees incurred by the Fund under the Plans are detailed in the Statement of Operations.
Sales Charges. Front-end sales charges and contingent deferred sales charges (“CDSC”) do not represent expenses of the Fund. They are deducted from the proceeds of sales of Fund shares prior to investment or from redemption proceeds prior to remittance, as applicable. The sales charges retained by the Distributor from the sale of shares and the CDSC retained by the Distributor on the redemption of shares is shown in the following table for the period indicated.
Year Ended | | Class A Front-End Sales Charges Retained by Distributor | | | Class A Contingent Deferred Sales Charges Retained by Distributor | | | Class C Contingent Deferred Sales Charges Retained by Distributor | |
November 30, 2016 | | $ | 492,043 | | | $ | 29,915 | | | $ | 96,191 | |
Waivers and Reimbursements of Expenses. The Manager has contractually agreed to limit fees and/or reimburse expenses of the Fund to the extent that the Fund’s total annual fund operating expenses (exclusive of interest, taxes, such as deferred tax expenses,
36 OPPENHEIMER STEELPATH MLP ALPHA FUND |
NOTES TO FINANCIAL STATEMENTS (Continued) |
8. Fees and Other Transactions with Affiliates (Continued)
brokerage commissions, acquired fund fees and expenses, dividend costs related to short sales, and litigation expense, if any) exceed 1.50% for Class A shares, 2.25% for Class C shares, and 1.25% for Class Y shares.
The Fund’s total annual operating expenses after fee waiver and/or expense reimbursement (“Net Expenses”) will be higher than these amounts to the extent that the Fund incurs expenses excluded from the expense cap. Because the Fund’s deferred income tax expense/(benefit) and borrowing fees are excluded from the expense cap, the Fund’s Net Expenses for each class of shares is increased/(decreased) by the amount of this expense. During the year ended November 30, 2016, the Manager reimbursed $1,177,180, $816,992, and $1,617,340 for Class A, Class C, and Class Y, respectively. This undertaking may not be modified or terminated until after one year from the date of the current prospectus, as indicated therein, unless approved by the Fund’s Board.
The Manager can be reimbursed by the Fund within three years after the date the fee limitation and/or expense reimbursement has been made by the Manager, provided that such repayment does not cause the expenses of any class of the Fund to exceed the foregoing limits.
The following table represents amounts eligible for recovery at November 30, 2016:
Eligible Expense Recoupment Expiring: | | | |
November 30, 2017 | | $ | 4,876,625 | |
November 30, 2018 | | | 4,954,289 | |
November 30, 2019 | | | 3,611,512 | |
During the year ended November 30, 2016, the Adviser did not recoup any expenses.
Related Party. The Interested Trustees and officers of the Fund are also officers or trustees of companies affiliated with the Manager, Distributor, and Transfer Agent.
9. Borrowing Agreement
The Fund, along with Oppenheimer SteelPath MLP Alpha Plus Fund, Oppenheimer SteelPath MLP Income Fund, and Oppenheimer SteelPath MLP Select 40 Fund (collectively, the “Trust”), is a borrower in a $700 million revolving credit agreement (the “Loan Agreement”) with a major lending institution (the “Lender”). The Fund is permitted to borrow up to the lesser of one-third of the Fund’s total assets, or the maximum amount permitted pursuant to the Fund’s investment limitations. The borrowing, if any, is fully collateralized throughout the term of the borrowing with securities or other assets of the Fund. The Fund is not liable for borrowings of other Funds in the Trust. Securities that have been pledged as collateral for the borrowing are indicated in the Statement of Investments.
OPPENHEIMER STEELPATH MLP ALPHA FUND 37 |
NOTES TO FINANCIAL STATEMENTS (Continued) |
9. Borrowing Agreement (Continued)
Borrowings under the Loan Agreement are charged interest at a calculated rate computed by the Lender based on the one month LIBOR rate plus 0.65% per annum. An unused commitment fee at the rate of 0.125% per annum is charged for any undrawn portion of the credit facility, and each member of the Trust will pay its pro rata share of this fee. A facility fee of 0.20% was charged on the commitment amount, and each party of the Trust paid its pro rata share of this fee. The borrowing is due November 17, 2017, unless another date is mutually agreed upon by the parties of the Loan Agreement. For the year ended November 30, 2016, the Fund paid $714,275 in borrowing fees. The Fund did not utilize the facility during the year ended November 30, 2016.
10. Pending Litigation
In 2009, several putative class action lawsuits were filed and later consolidated before the U.S. District Court for the District of Colorado in connection with the investment performance of Oppenheimer Rochester California Municipal Fund (the “California Fund”), a fund advised by OppenheimerFunds, Inc. (“OFI”) – the parent company of the manager and distributed by OppenheimerFunds Distributor, Inc. (“OFDI”). The plaintiffs asserted claims against OFI, OFDI and certain present and former trustees and officers of the California Fund under the federal securities laws, alleging, among other things, that the disclosure documents of the California Fund contained misrepresentations and omissions and the investment policies of the California Fund were not followed. An amended complaint and a motion to dismiss were filed, and in 2011, the court issued an order which granted in part and denied in part the defendants’ motion to dismiss. In October 2015, following a successful appeal by defendants and a subsequent hearing, the court granted plaintiffs’ motion for class certification and appointed class representatives and class counsel.
OFI and OFDI believe the suit is without merit; that it is premature to render any opinion as to the likelihood of an outcome unfavorable to them in the Suit; and that no estimate can yet be made as to the amount or range of any potential loss. Furthermore, OFI believes that the suit should not impair the ability of OFI or OFDI to perform their respective duties to the Fund and that the outcome of the suit should not have any material effect on the operations of any of the Oppenheimer funds.
38 OPPENHEIMER STEELPATH MLP ALPHA FUND |
REPORT OF INDEPENDENT REGISTERED PUBLIC ACCOUNTING FIRM |
To the Shareholders of Oppenheimer SteelPath MLP Alpha Fund and
Board of Trustees of Oppenheimer SteelPath MLP Funds Trust
We have audited the accompanying statement of assets and liabilities, including the statement of investments, of Oppenheimer SteelPath MLP Alpha Fund (the “Fund”), a series of Oppenheimer SteelPath MLP Funds Trust, as of November 30, 2016, and the related statement of operations for the year then ended, the statements of changes in net assets for each of the two years in the period then ended, and the financial highlights for each of the five years in the period then ended. These financial statements and financial highlights are the responsibility of the Fund’s management. Our responsibility is to express an opinion on these financial statements and financial highlights based on our audits.
We conducted our audits in accordance with the standards of the Public Company Accounting Oversight Board (United States). Those standards require that we plan and perform the audit to obtain reasonable assurance about whether the financial statements and financial highlights are free of material misstatement. An audit includes examining, on a test basis, evidence supporting the amounts and disclosures in the financial statements. Our procedures included confirmation of securities owned as of November 30, 2016, by correspondence with the custodian and brokers or by other auditing procedures as appropriate in the circumstances. An audit also includes assessing the accounting principles used and significant estimates made by management, as well as evaluating the overall financial statement presentation. We believe that our audits provide a reasonable basis for our opinion.
In our opinion, the financial statements and financial highlights referred to above present fairly, in all material respects, the financial position of Oppenheimer SteelPath MLP Alpha Fund as of November 30, 2016, the results of its operations for the year then ended, the changes in its net assets for each of the two years in the period then ended, and the financial highlights for each of the five years in the period then ended, in conformity with accounting principles generally accepted in the United States of America.
COHEN & COMPANY, LTD.
Cleveland, Ohio
January 25, 2017
OPPENHEIMER STEELPATH MLP ALPHA FUND 39 |
BOARD APPROVAL OF THE FUND’S INVESTMENT
ADVISORY AGREEMENT Unaudited |
The Fund has entered into an investment advisory agreement (the “Agreement”) with OFI SteelPath, Inc. (“OFI SteelPath” or the “Manager”). Each year, the Board of Trustees (the “Board”), including a majority of the independent Trustees, is required to determine whether to approve the terms of the Agreement and the renewal thereof. The Investment Company Act of 1940, as amended, requires that the Board request and evaluate, and that the Manager provide, such information as may be reasonably necessary to evaluate the terms of the Agreement. The Board employs an independent consultant to prepare a report that provides information, including comparative information that the Board requests for that purpose. In addition to in-person meetings focused on this evaluation, the Board receives information throughout the year regarding Fund services, fees, expenses and performance.
The Manager and the independent consultant provided information to the Board on the following factors: (i) the nature, quality and extent of the Manager’s services, (ii) the comparative investment performance of the Fund and the Manager, (iii) the fees and expenses of the Fund, including comparative fee and expense information, (iv) the profitability of the Manager and its affiliates, including an analysis of the cost of providing services, (v) whether economies of scale are realized as the Fund grows and whether fee levels reflect these economies of scale for Fund investors and (vi) other benefits to the Manager from its relationship with the Fund. The Board was aware that there are alternatives to retaining the Manager.
Outlined below is a summary of the principal information considered by the Board as well as the Board’s conclusions.
Nature, Quality and Extent of Services. The Board considered information about the nature, quality and extent of the services provided to the Fund and information regarding the Manager’s key personnel who provide such services. The Manager’s duties include providing the Fund with the services of the portfolio managers and investment team, who provide research, analysis and other advisory services in regard to the Fund’s investments; and securities trading services. The Manager is responsible for oversight of third-party service providers; monitoring compliance with applicable Fund policies and procedures and adherence to the Fund’s investment restrictions; and risk management. The Manager is also responsible for providing certain administrative services to the Fund. Those services, some of which are performed by affiliates of the Manager, include providing and supervising all administrative and clerical personnel who are necessary in order to provide effective corporate administration for the Fund; compiling and maintaining records with respect to the Fund’s operations; preparing and filing reports required by the U.S. Securities and Exchange Commission; preparing periodic reports regarding the operations of the Fund for its shareholders; preparing proxy materials for shareholder meetings; and preparing the registration statements required by federal and state securities laws for the sale of the Fund’s shares. The Manager also provides the Fund with office space, facilities and equipment.
40 OPPENHEIMER STEELPATH MLP ALPHA FUND |
BOARD APPROVAL OF THE FUND’S INVESTMENT
ADVISORY AGREEMENT Unaudited / (Continued) |
The Board also considered the quality of the services provided and the quality of the Manager’s resources that are available to the Fund. In evaluating the Manager, the Board considered the history, reputation, qualification and background of the Manager, including its corporate parent, OppenheimerFunds, Inc. (“OFI”) and corporate affiliate, OFI Global Asset Management, Inc. (“OFI Global” and OFI and OFI Global are collectively referred to hereinafter as “OFI”), and the fact that OFI has over 50 years of experience as an investment adviser and that its assets under management rank it among the top mutual fund managers in the United States. The Board evaluated the Manager’s and OFI’s advisory, administrative, accounting, legal, compliance and risk management services, and information the Board has received regarding the experience and professional qualifications of the Manager’s and OFI’s key personnel and the size and functions of its staff. In its evaluation of the quality of the portfolio management services provided, the Board considered the experience of Stuart Cartner and Brian Watson, the portfolio managers for the Fund, and the Manager’s investment team and analysts. The Board members also considered the totality of their experiences with the Manager and OFI as trustees of the Fund and other funds advised by the Manager or OFI. The Board considered information regarding the quality of services provided by affiliates of the Manager, which the Board members have become knowledgeable about through their experiences with the Manager or OFI and in connection with the renewal of the Fund’s service agreements. The Board concluded, in light of the Manager’s and OFI’s experience, reputation, personnel, operations and resources that the Fund benefits from the services provided under the Agreement.
Investment Performance of the Manager and the Fund. Throughout the year, the Manager provided information on the investment performance of the Fund and the Manager, including comparative performance information. The Board also reviewed information, prepared by the Manager and the independent consultant, comparing the Fund’s historical performance to relevant market indices and to the performance of other retail energy limited partnership funds. The Board noted that the Fund outperformed its category median for the one- and three-year periods, and that it performed in line with its category median for the five-year period.
Fees and Expenses of the Fund. The Board reviewed the fees paid to the Manager and the other expenses borne by the Fund. The Board also considered the comparability of the fees charged and the services provided to the Fund to the fees and services for other clients or accounts advised by the Adviser. The independent consultant provided comparative data in regard to the fees and expenses of the Fund and other retail energy limited partnership funds with comparable asset levels and distribution features. The Board noted that the Fund’s contractual management fee was equal to its category median and one basis point higher than its peer group median and that the Fund’s total expenses, net of waivers, were one basis point lower than its category median and equal to its peer group median. The Board considered that the Fund’s contractual management fee includes both the advisory fee and the administrative fee, which contribute to the Fund’s costs and noted that the administrative
OPPENHEIMER STEELPATH MLP ALPHA FUND 41 |
BOARD APPROVAL OF THE FUND’S INVESTMENT
ADVISORY AGREEMENT Unaudited / (Continued) |
fee reflects the complex tax work associated with the Fund’s MLP investments. The Board considered that the Manager has contractually agreed to waive fees and/or reimburse the Fund so that total expenses, as a percentage of average daily net assets, will not exceed the following annual rates: 1.50% for Class A shares, 2.25% for Class C shares and 1.25% for Class Y shares. The fee limitation may not be amended or withdrawn prior to its expiration on March 30, 2017, unless approved by the Board.
Economies of Scale and Profits Realized by the Manager. The Board considered information regarding the Manager’s costs in serving as the Fund’s investment adviser, including the costs associated with the personnel and systems necessary to manage the Fund, and information regarding the Manager’s profitability from its relationship with the Fund. The Board also considered that the Manager must be able to pay and retain experienced professional personnel at competitive rates to provide quality services to the Fund. The Board reviewed whether the Manager may realize economies of scale in managing and supporting the Fund. The Board noted that the Fund currently has management fee breakpoints, which are intended to share with Fund shareholders economies of scale that may exist as the Fund’s assets grow.
Other Benefits to the Manager. In addition to considering the profits realized by the Manager, the Board considered information that was provided regarding the direct and indirect benefits the Manager receives as a result of its relationship with the Fund, including compensation paid to the Manager’s affiliates and research provided to the Manager in connection with permissible brokerage arrangements (soft dollar arrangements).
Conclusions. These factors were also considered by the independent Trustees meeting separately from the full Board, assisted by experienced counsel to the Fund and to the independent Trustees. Fund counsel and the independent Trustees’ counsel are independent of the Manager within the meaning and intent of the Securities and Exchange Commission Rules.
Based on its review of the information it received and its evaluations described above, the Board, including a majority of the independent Trustees, decided to continue the Agreement through August 31, 2017. In arriving at its decision, the Board did not identify any factor or factors as being more important than others, but considered all of the above information, and considered the terms and conditions of the Agreement, including the management fees, in light of all the surrounding circumstances.
42 OPPENHEIMER STEELPATH MLP ALPHA FUND |
DISTRIBUTION SOURCES Unaudited |
For any distribution that took place over the last six months of the Fund’s reporting period, the table below details, on a per-share basis, the percentage of the Fund’s total distribution payment amount that was derived from the following sources: net income, net profit from the sale of securities, and other capital sources. This information is based upon income and capital gains using generally accepted accounting principles as of the date of each distribution. For certain securities, such as Master Limited Partnerships (“MLPs”), the percentages attributed to each category are estimated using historical information because the character of the amounts received from the MLPs in which the Fund invests is unknown until after the end of the calendar year. Because the Fund is actively managed, the relative amount of the Fund’s total distributions derived from various sources over the calendar year may change. Please note that this information should not be used for tax reporting purposes as the tax character of distributable income may differ from the amounts used for this notification. You will receive IRS tax forms in the first quarter of each calendar year detailing the actual amount of the taxable and non-taxable portion of distributions paid to you during the tax year.
For the most current information, please go to oppenheimerfunds.com. Select your Fund, then the ’Detailed’ tab; where ‘Dividends’ are shown, the Fund’s latest pay date will be followed by the sources of any distribution, updated daily.
Fund Name | Pay
Date | Net
Income | Net
Profit
from Sale | Other
Capital
Sources |
Oppenheimer SteelPath MLP Alpha Fund | 6/10/16 | 0.0% | 0.0% | 100.0% |
Oppenheimer SteelPath MLP Alpha Fund | 7/8/16 | 0.0% | 0.0% | 100.0% |
Oppenheimer SteelPath MLP Alpha Fund | 8/5/16 | 0.0% | 0.0% | 100.0% |
Oppenheimer SteelPath MLP Alpha Fund | 9/9/16 | 0.0% | 0.0% | 100.0% |
Oppenheimer SteelPath MLP Alpha Fund | 10/7/16 | 0.0% | 0.0% | 100.0% |
Oppenheimer SteelPath MLP Alpha Fund | 11/4/16 | 0.0% | 0.0% | 100.0% |
Oppenheimer SteelPath MLP Alpha Fund | 11/25/16 | 0.0% | 0.0% | 100.0% |
OPPENHEIMER STEELPATH MLP ALPHA FUND 43 |
PORTFOLIO PROXY VOTING POLICIES AND PROCEDURES; UPDATES TO STATEMENTS OF INVESTMENTS Unaudited |
The Fund has adopted Portfolio Proxy Voting Policies and Procedures under which the Fund votes proxies relating to securities (“portfolio proxies”) held by the Fund. A description of the Fund’s Portfolio Proxy Voting Policies and Procedures is available (i) without charge, upon request, by calling the Fund toll-free at 1.800.CALL OPP (225.5677), (ii) on the Fund’s website at oppenheimerfunds.com, and (iii) on the SEC’s website at www.sec.gov. In addition, the Fund is required to file Form N-PX, with its complete proxy voting record for the 12 months ended June 30th, no later than August 31st of each year. The Fund’s voting record is available (i) without charge, upon request, by calling the Fund toll-free at 1.800.CALL OPP (225.5677), and (ii) in the Form N-PX filing on the SEC’s website at www.sec.gov.
The Fund files its complete schedule of portfolio holdings with the SEC for the first quarter and the third quarter of each fiscal year on Form N-Q. The Fund’s Form N-Q filings are available on the SEC’s website at www.sec.gov. Those forms may be reviewed and copied at the SEC’s Public Reference Room in Washington, D.C. Information on the operation of the Public Reference Room may be obtained by calling 1-800-SEC-0330.
Householding – Delivery of Shareholder Documents
This is to inform you about OppenheimerFunds’ “householding” policy. If more than one member of your household maintains an account in a particular fund, OppenheimerFunds will mail only one copy of the fund’s prospectus (or, if available, the fund’s summary prospectus), annual and semiannual report and privacy policy. The consolidation of these mailings, called householding, benefits your fund through reduced mailing expense, and benefits you by reducing the volume of mail you receive from OppenheimerFunds. Householding does not affect the delivery of your account statements.
Please note that we will continue to household these mailings for as long as you remain an OppenheimerFunds shareholder, unless you request otherwise. If you prefer to receive multiple copies of these materials, please call us at 1.800.CALL OPP (225-5677). You may also notify us in writing or via email. We will begin sending you individual copies of the prospectus (or, if available, the summary prospectus), reports and privacy policy within 30 days of receiving your request to stop householding.
44 OPPENHEIMER STEELPATH MLP ALPHA FUND |
TRUSTEES AND OFFICERS Unaudited |
Name, Position(s) Held with the Trusts, Length of Service, Age | Principal Occupation(s) During the Past 5 Years; Other Trusteeships/Directorships Held; Number of Portfolios in the Fund Complex Currently Overseen |
INDEPENDENT TRUSTEES | The address of each Trustee in the chart below is 6803 S. Tucson Way, Centennial, Colorado 80112-3924. Each Trustee serves for an indefinite term, or until his or her resignation, retirement, death or removal. |
Robert J. Malone,
Chairman of the
Board of Trustees
(since 2016),
Trustee
(since 2012) Year of Birth: 1944 | Chairman - Colorado Market of MidFirst Bank (since January 2015); Chairman of the Board (2012-2016) and Director (August 2005-March 2016) of Jones International University (educational organization); Trustee of the Gallagher Family Foundation (non-profit organization) (2000-2015); Chairman, Chief Executive Officer and Director of Steele Street Bank Trust (commercial banking) (August 2003-January 2015); Board of Directors of Opera Colorado Foundation (non-profit organization) (2008-2012); Director of Colorado UpLIFT (charitable organization) (1986-2010); Director of Jones Knowledge, Inc. (2006-2010); Former Chairman of U.S. Bank-Colorado (subsidiary of U.S. Bancorp and formerly Colorado National Bank) (July 1996-April 1999); Director of Commercial Assets, Inc. (real estate investment trust) (1993-2000); Director of U.S. Exploration, Inc. (oil and gas exploration) (1997-February 2004); Chairman of the Board (1991-1994) and Trustee (1985-1994) of Regis University; and Chairman of the Board (1990-1991) and Trustee (1984-1999) of Young Presidents Organization. Oversees 46 portfolios in the OppenheimerFunds complex. Mr. Malone has served on the Boards of certain Oppenheimer funds since 2002, during which time he has become familiar with the Fund’s (and other Oppenheimer funds’) financial, accounting, regulatory and investment matters and has contributed to the Boards’ deliberations. |
Jon S. Fossel,
Trustee
(since 2012)
Year of Birth: 1942 | Chairman of the Board of Jack Creek Preserve Foundation (non-profit organization) (since March 2005); Director of Jack Creek Preserve Foundation (non-profit organization) (March 2005-December 2014); Chairman of the Board (2006-December 2011) and Director (June 2002-December 2011) of UNUMProvident (insurance company); Director of Northwestern Energy Corp. (public utility corporation) (November 2004-December 2009); Director of P.R. Pharmaceuticals (October 1999-October 2003); Director of Rocky Mountain Elk Foundation (non-profit organization) (February 1998-February 2003 and February 2005-February 2007); Chairman and Director (until October 1996) and President and Chief Executive Officer (until October 1995) of OppenheimerFunds, Inc.; President, Chief Executive Officer and Director of the following: Oppenheimer Acquisition Corp. (“OAC”) (parent holding company of OppenheimerFunds, Inc.), Shareholders Services, Inc. and Shareholder Financial Services, Inc. (until October 1995). Oversees 46 portfolios in the OppenheimerFunds complex. Mr. Fossel has served on the Boards of certain Oppenheimer funds since 1990, during which time he has become familiar with the Fund’s (and other Oppenheimer funds’) financial, accounting, regulatory and investment matters and has contributed to the Boards’ deliberations. |
OPPENHEIMER STEELPATH MLP ALPHA FUND 45 |
TRUSTEES AND OFFICERS Unaudited / (Continued) |
Richard F. Grabish,
Trustee
(since 2012)
Year of Birth: 1948 | Formerly Senior Vice President and Assistant Director of Sales and Marketing (March 1997-December 2007), Director (March 1987-December 2007) and Manager of Private Client Services (June 1985-June 2005) of A.G. Edwards & Sons, Inc. (broker/dealer and investment firm); Chairman and Chief Executive Officer of A.G. Edwards Trust Company, FSB (March 2001-December 2007); President and Vice Chairman of A.G. Edwards Trust Company, FSB (investment adviser) (April 1987-March 2001); President of A.G. Edwards Trust Company, FSB (investment adviser) (June 2005-December 2007). Oversees 46 portfolios in the OppenheimerFunds complex. Mr. Grabish has served on the Boards of certain Oppenheimer funds since 2001, during which time he has become familiar with the Fund’s (and other Oppenheimer funds’) financial, accounting, regulatory and investment matters and has contributed to the Boards’ deliberations. |
Beverly L. Hamilton,
Trustee
(since 2012)
Year of Birth: 1946 | Trustee of Monterey Institute for International Studies (educational organization) (2000-2014); Board Member of Middlebury College (educational organization) (December 2005-June 2011); Chairman (since 2010) of American Funds’ Emerging Markets Growth Fund, Inc. (mutual fund); Director of The California Endowment (philanthropic organization) (April 2002-April 2008); Director (February 2002-2005) and Chairman of Trustees (2006-2007) of the Community Hospital of Monterey Peninsula; Director (October 1991-2005) and Vice Chairman (2006-2009) of American Funds’ Emerging Markets Growth Fund, Inc. (mutual fund); President of ARCO Investment Management Company (February 1991-April 2000); Member of the investment committees of The Rockefeller Foundation (2001-2006) and The University of Michigan (since 2000); Advisor at Credit Suisse First Boston’s Sprout venture capital unit (venture capital fund) (1994-January 2005); Trustee of MassMutual Institutional Funds (investment company) (1996-June 2004); Trustee of MML Series Investment Fund (investment company) (April 1989-June 2004); Member of the investment committee of Hartford Hospital (2000-2003); and Advisor to Unilever (Holland) pension fund (2000-2003). Oversees 46 portfolios in the OppenheimerFunds complex. Ms. Hamilton has served on the Boards of certain Oppenheimer funds since 2002, during which time she has become familiar with the Fund’s (and other Oppenheimer funds’) financial, accounting, regulatory and investment matters and has contributed to the Boards’ deliberations. |
46 OPPENHEIMER STEELPATH MLP ALPHA FUND |
TRUSTEES AND OFFICERS Unaudited / (Continued) |
Victoria J. Herget,
Trustee
(since 2012)
Year of Birth: 1951 | Board Chair (2008-2015) and Director (2004-Present), United Educators (insurance company); Trustee (since 2000) and Chair (since 2010), Newberry Library (independent research library); Trustee, Mather LifeWays (senior living organization) (since 2001); Independent Director of the First American Funds (mutual fund family) (2003-2011); former Managing Director (1993-2001), Principal (1985-1993), Vice President (1978-1985) and Assistant Vice President (1973-1978) of Zurich Scudder Investments (investment adviser) (and its predecessor firms); Trustee (1992-2007), Chair of the Board of Trustees (1999-2007), Investment Committee Chair (1994-1999) and Investment Committee member (2007-2010) of Wellesley College; Trustee, BoardSource (non-profit organization) (2006-2009) and Chicago City Day School (K-8 School) (1994-2005). Oversees 46 portfolios in the OppenheimerFunds complex. Ms. Herget has served on the Boards of certain Oppenheimer funds since 2012, during which time she has become familiar with the Fund’s (and other Oppenheimer funds’) financial, accounting, regulatory and investment matters and has contributed to the Boards’ deliberations. |
F. William Marshall, Jr.,
Trustee
(since 2012)
Year of Birth: 1942 | Trustee Emeritus of Worcester Polytech Institute (WPI) (private university) (since 2009); Trustee of MassMutual Select Funds (formerly MassMutual Institutional Funds) (investment company) (1996-2015), MML Series Investment Fund (investment company) (1996-2015) and Mass Mutual Premier Funds (investment company) (January 2012-December 2015); President and Treasurer of the SIS Fund (private charitable fund) (January 1999-March 2011); Former Trustee of WPI (1985-2008); Former Chairman of the Board (2004-2006) and Former Chairman of the Investment Committee of WPI (1994-2008); Chairman of SIS Family Bank, F.S.B. (formerly SIS Bank) (commercial bank) (January 1999-July 1999); Executive Vice President of Peoples Heritage Financial Group, Inc. (commercial bank) (January 1999-July 1999); and Former President and Chief Executive Officer of SIS Bancorp. (1993-1999). Oversees 46 portfolios in the OppenheimerFunds complex. Mr. Marshall has served on the Boards of certain Oppenheimer funds since 2000, during which time he has become familiar with the Fund’s (and other Oppenheimer funds’) financial, accounting, regulatory and investment matters and has contributed to the Boards’ deliberations. |
Karen L. Stuckey,
Trustee
(since 2012)
Year of Birth: 1953 | Member (since May 2015) of Desert Mountain Community Foundation Advisory Board (non-profit organization); Partner (1990-2012) of PricewaterhouseCoopers LLP (professional services firm) (held various positions 1975-1990); Trustee (1992-2006), member of Executive, Nominating and Audit Committees and Chair of Finance Committee (1992-2006), and Emeritus Trustee (since 2006) of Lehigh University; and member, Women’s Investment Management Forum (professional organization) since inception. Oversees 46 portfolios in the OppenheimerFunds complex. Ms. Stuckey has served on the Boards of certain Oppenheimer funds since 2012, during which time she has become familiar with the Fund’s (and other Oppenheimer funds’) financial, accounting, regulatory and investment matters and has contributed to the Boards’ deliberations. |
OPPENHEIMER STEELPATH MLP ALPHA FUND 47 |
TRUSTEES AND OFFICERS Unaudited / (Continued) |
James D. Vaughn,
Trustee
(since 2012)
Year of Birth:1945 | Retired; former managing partner (1994-2001) of Denver office of Deloitte & Touche LLP, (held various positions 1969-1993); Trustee and Chairman of the Audit Committee of Schroder Funds (2003-2012); Board member and Chairman of Audit Committee of AMG National Trust Bank (since 2005); Trustee and Investment Committee member, University of South Dakota Foundation (since 1996); Board member, Audit Committee Member and past Board Chair, Junior Achievement (since 1993); former Board member, Mile High United Way, Boys and Girls Clubs, Boy Scouts, Colorado Business Committee for the Arts, Economic Club of Colorado and Metro Denver Network. Oversees 46 portfolios in the OppenheimerFunds complex. Mr. Vaughn has served on the Boards of certain Oppenheimer funds since 2012, during which time he has become familiar with the Fund’s (and other Oppenheimer funds’) financial, accounting, regulatory and investment matters and has contributed to the Boards’ deliberations. |
INTERESTED TRUSTEE AND OFFICER | Mr. Steinmetz is an “Interested Trustee” because he is affiliated with the Manager and OppenheimerFunds, Inc. by virtue of his positions as Chairman of OppenheimerFunds, Inc. and officer and director of OFI Global Asset Management, Inc. Both as a Trustee and as an officer, Mr. Steinmetz serves for an indefinite term, or until his resignation, retirement, death or removal. Mr. Steinmetz’s address is 225 Liberty Street, New York, New York 10281-1008. |
Arthur P. Steinmetz,
Trustee
(since 2015),
President and Principal Executive Officer
(since 2014) Year of Birth: 1958 | Chairman of OppenheimerFunds, Inc. (since January 2015); CEO and Chairman of OFI Global Asset Management, Inc. (since July 2014), President of OFI Global Asset Management, Inc. (since May 2013), a Director of OFI Global Asset Management, Inc. (since January 2013), Director of OppenheimerFunds, Inc. (since July 2014), President, Management Director and CEO of Oppenheimer Acquisition Corp. (OppenheimerFunds, Inc.’s parent holding company) (since July 2014), and President and Director of OFI SteelPath, Inc. (since January 2013). Chief Investment Officer of the OppenheimerFunds advisory entities from (January 2013-December 2013); Executive Vice President of OFI Global Asset Management, Inc. (January 2013-May 2013); Chief Investment Officer of OppenheimerFunds, Inc. (October 2010-December 2012); Chief Investment Officer, Fixed-Income, of OppenheimerFunds, Inc. (April 2009-October 2010); Executive Vice President of OppenheimerFunds, Inc. (October 2009-December 2012); Director of Fixed Income of OppenheimerFunds, Inc. (January 2009-April 2009); and a Senior Vice President of OppenheimerFunds, Inc. (March 1993-September 2009). An officer of 102 portfolios in the OppenheimerFunds complex. |
48 OPPENHEIMER STEELPATH MLP ALPHA FUND |
TRUSTEES AND OFFICERS Unaudited / (Continued) |
OTHER OFFICERS OF THE TRUSTS | The addresses of the Officers in the chart below are as follows: for Mss. Foxson and Picciotto, 225 Liberty Street, New York, New York 10281-1008; for Messrs. Cartner and Watson, 2100 McKinney Avenue, Dallas, TX 75201; and for Mr. Petersen, 6803 S. Tucson Way, Centennial, Colorado 80112-3924. Each Officer serves for an indefinite term or until his or her resignation, retirement, death or removal. |
Stuart Cartner,
Vice President
(since 2010)
Year of Birth: 1961 | Senior Vice President and Senior Portfolio Manager of the Manager (since January 2014); Vice President of the Manager (2012-January 2014). A member and portfolio manager of SteelPath Fund Advisors, LLC (since its formation in 2009) and SteelPath Capital Management, LLC (since 2007). Vice President in the Private Wealth Management Division of Goldman, Sachs & Co (1988-2007). An officer of other portfolios in the OppenheimerFunds complex. |
Brian Watson,
Vice President
(since 2012)
Year of Birth: 1974 | Senior Vice President and Senior Portfolio Manager of the Manager (since January 2014); Vice President of the Manager (2012-January 2014). Prior to joining the Manager, he was a member, portfolio manager and Director of Research of SteelPath Fund Advisors, LLC since its formation in 2009. A portfolio manager at Swank Capital LLC, a Dallas, Texas based investment firm (2005-2009). An officer of other portfolios in the OppenheimerFunds complex. |
Cynthia Lo Bessette,
Secretary and
Chief Legal Officer
(since 2016) Year of Birth: 1969 | Executive Vice President, General Counsel and Secretary of OFI Global Asset Management, Inc. (since February 2016); Chief Legal Officer of OppenheimerFunds, Inc. and the Distributor (since February 2016); Vice President, General Counsel and Secretary of Oppenheimer Acquisition Corp. (since February 2016); General Counsel of OFI SteelPath, Inc., VTL Associates, LLC and Index Management Solutions, LLC (since February 2016); Chief Legal Officer of OFI Global Institutional, Inc., HarbourView Asset Management Corporation, OFI Global Trust Company, Oppenheimer Real Asset Management, Inc., OFI Private Investments Inc., Shareholder Services, Inc. and Trinity Investment Management Corporation (since February 2016); Senior Vice President and Deputy General Counsel (March 2015-February 2016) and Executive Vice President, Vice President, Corporate Counsel (February 2012-March 2015) and Deputy Chief Legal Officer (April 2013-March 2015) of Jennison Associates LLC; Assistant General Counsel (April 2008-September 2009) and Deputy General Counsel (October 2009-February 2012) of Lord Abbett & Co. LLC. An officer of 102 portfolios in the OppenheimerFunds complex. |
Jennifer Foxson,
Vice President and
Chief Business Officer
(since 2014) Year of Birth: 1969 | Senior Vice President of OppenheimerFunds Distributor, Inc. (since June 2014); Vice President of OppenheimerFunds Distributor, Inc. (April 2006-June 2014); Vice President of OppenheimerFunds, Inc. (January 1998-March 2006); Assistant Vice President of OppenheimerFunds, Inc. (October 1991-December 1998). An officer of 102 portfolios in the OppenheimerFunds complex. |
OPPENHEIMER STEELPATH MLP ALPHA FUND 49 |
TRUSTEES AND OFFICERS Unaudited / (Continued) |
Mary Ann Picciotto,
Chief Compliance Officer and Chief Anti-Money Laundering Officer
(since 2014) Year of Birth: 1973 | Senior Vice President and Chief Compliance Officer of OFI Global Asset Management, Inc. (since March 2014); Chief Compliance Officer of OppenheimerFunds, Inc. , OFI SteelPath, Inc., OFI Global Trust Company, OFI Global Institutional, Inc., Oppenheimer Real Asset Management, Inc., OFI Private Investments, Inc., Harborview Asset Management Corporation, Trinity Investment Management Corporation, and Shareholder Services, Inc. (since March 2014); Managing Director of Morgan Stanley Investment Management Inc. and certain of its various affiliated entities; Chief Compliance Officer of various Morgan Stanley Funds (May 2010-January 2014); Chief Compliance Officer of Morgan Stanley Investment Management Inc. (April 2007-January 2014). An officer of 102 portfolios in the OppenheimerFunds complex. |
Brian S. Petersen,
Treasurer and
Principal Financial & Accounting Officer
(since 2016) Year of Birth: 1970 | Vice President of OFI Global Asset Management, Inc. (since January 2013); Vice President of OppenheimerFunds, Inc. (February 2007-December 2012); Assistant Vice President of OppenheimerFunds, Inc. (August 2002-2007). An officer of 102 portfolios in the OppenheimerFunds complex. |
The Fund’s Statement of Additional Information contains additional information about the Fund’s Trustees and Officers and is available without charge upon request, by calling 1.800.CALL OPP (225.5677).
50 OPPENHEIMER STEELPATH MLP ALPHA FUND |
OPPENHEIMER STEELPATH MLP ALPHA FUND |
Manager | | OFI SteelPath, Inc. |
| | | |
Distributor | | OppenheimerFunds Distributor, Inc. |
| | | |
Transfer and Shareholder Servicing Agent | | OFI Global Asset Management, Inc. |
| | | |
Sub-Transfer Agent | | Shareholder Services, Inc. |
| | | DBA OppenheimerFunds Services |
| | | |
| | | |
Independent Registered Public Accounting Firm | | Cohen & Company, Ltd. |
| | | |
Legal Counsel | | Ropes & Gray LLP |
© 2017 OppenheimerFunds, Inc. All rights reserved.
OPPENHEIMER STEELPATH MLP ALPHA FUND 51 |
As an Oppenheimer fund shareholder, you are entitled to know how we protect your personal information and how we limit its disclosure. Information Sources
We obtain nonpublic personal information about our shareholders from the following sources:
| | ● | Applications or other forms. |
| | ● | When you create a user ID and password for online account access. |
| | ● | When you enroll in eDocs Direct,SM our electronic document delivery service. |
| | ● | Your transactions with us, our affiliates or others. |
| | ● | Technologies on our website, including: “cookies” and web beacons, which are used to collect data on the pages you visit and the features you use. |
If you visit oppenheimerfunds.com and do not log on to the secure account information areas, we do not obtain any personal information about you. When you do log on to a secure area, we do obtain your user ID and password to identify you. We also use this information to provide you with products and services you have requested, to inform you about products and services that you may be interested in and assist you in other ways.
We do not collect personal information through our website unless you willingly provide it to us, either directly by email or in those areas of the website that request information. In order to update your personal information (including your mailing address, email address and phone number) you must first log on and visit your user profile.
If you have set your browser to warn you before accepting cookies, you will receive the warning message with each cookie. You can refuse cookies by turning them off in your browser. However, doing so may limit your access to certain sections of our website.
We use cookies to help us improve and manage our website. For example, cookies help us recognize new versus repeat visitors to the site, track the pages visited, and enable some special features on the website. This data helps us provide a better service for our website visitors.
Protection of Information
We do not disclose any nonpublic personal information (such as names on a customer list) about current or former customers to anyone, except as permitted by law.
Disclosure of Information
Copies of confirmations, account statements and other documents reporting activity in your fund accounts are made available to your financial advisor (as designated by you). We may also use details about you and your investments to help us, our financial service affiliates, or firms that jointly market their financial products and services with ours, to better serve
52 OPPENHEIMER STEELPATH MLP ALPHA FUND |
PRIVACY POLICY NOTICE (Continued) |
your investment needs or suggest educational material that may be of interest to you. If this requires us to provide you with an opportunity to “opt in” or “opt out” of such information sharing with a firm not affiliated with us, you will receive notification on how to do so, before any such sharing takes place.
Right of Refusal
We will not disclose your personal information to unaffiliated third parties (except as permitted by law), unless we first offer you a reasonable opportunity to refuse or “opt out” of such disclosure.
Internet Security and Encryption
In general, the email services provided by our website are encrypted and provide a secure and private means of communication with us. To protect your own privacy, confidential and/ or personal information should only be communicated via email when you are advised that you are using a secure website.
As a security measure, we do not include personal or account information in nonsecure emails, and we advise you not to send such information to us in nonsecure emails. Instead, you may take advantage of the secure features of our website to encrypt your email correspondence. To do this, you will need to use a browser that supports Secure Sockets Layer (SSL) protocol.
| | ● | All transactions, including redemptions, exchanges and purchases, are secured by SSL and 256-bit encryption. SSL is used to establish a secure connection between your PC and OppenheimerFunds’ server. It transmits information in an encrypted and scrambled format. |
| | ● | Encryption is achieved through an electronic scrambling technology that uses a “key” to code and then decode the data. Encryption acts like the cable converter box you may have on your television set. It scrambles data with a secret code so that no one can make sense of it while it is being transmitted. When the data reaches its destination, the same software unscrambles the data. |
| | ● | You can exit the secure area by closing your browser or, for added security, you can use the Log Out button before you close your browser. |
Other Security Measures
We maintain physical, electronic and procedural safeguards to protect your personal account information. Our employees and agents have access to that information only so that they may offer you products or provide services, for example, when responding to your account questions.
OPPENHEIMER STEELPATH MLP ALPHA FUND 53 |
PRIVACY POLICY NOTICE (Continued) |
How You Can Help
You can also do your part to keep your account information private and to prevent unauthorized transactions. If you obtain a user ID and password for your account, safeguard that information. Also, take special precautions when accessing your account on a computer used by others.
Who We Are
This joint notice describes the privacy policies of the Oppenheimer funds, OppenheimerFunds, Inc., each of its investment adviser subsidiaries, OppenheimerFunds Distributor, Inc. and OFI Global Trust Co. It applies to all Oppenheimer fund accounts you presently have, or may open in the future, using your Social Security number—whether or not you remain a shareholder of our funds. This notice was last updated as of November 2016. In the event it is updated or changed, we will post an updated notice on our website at oppenheimerfunds.com. If you have any questions about this privacy policy, email us by clicking on the Contact Us section of our website at oppenheimerfunds.com, write to us at P.O. Box 5270, Denver, CO 80217-5270, or call us at 1.800.CALL OPP (225 5677).
54 OPPENHEIMER STEELPATH MLP ALPHA FUND |
THIS PAGE INTENTIONALLY LEFT BLANK
OPPENHEIMER STEELPATH MLP ALPHA FUND 55 |


Fund Performance Discussion | 3 |
Top Holdings and Allocations | 7 |
Share Class Performance | 8 |
Fund Expenses | 10 |
Statement of Investments | 12 |
Statement of Assets and Liabilities | 16 |
Statement of Operations | 18 |
Statements of Changes in Net Assets | 19 |
Financial Highlights | 20 |
Notes to Financial Statements | 24 |
Report of Independent Registered Public Accounting Firm | 43 |
Board Approval of the Fund’s Investment Advisory Agreement | 44 |
Distribution Sources | 47 |
Portfolio Proxy Voting Policies and Procedures; Updates to Statements of Investments | 48 |
Trustees and Officers | 49 |
Privacy Policy Notice | 56 |
|
Class A Shares
AVERAGE ANNUAL TOTAL RETURNS AT 11/30/16
| | Class A Shares of the Fund | | |
| Without
Sales
Charge | With
Sales
Charge | S&P 500 Index | Alerian MLP Index |
1-Year | 7.29% | 1.18% | 8.06% | 9.28% |
5-Year | 2.12% | 0.92% | 14.45% | 2.51% |
Since Inception (3/31/10) | 3.68% | 2.76% | 12.29% | 6.58% |
Performance data quoted represents past performance, which does not guarantee future results. The investment return and principal value of an investment in the Fund will fluctuate so that an investor’s shares, when redeemed, may be worth more or less than their original cost. Fund returns include changes in share price, reinvested distributions, and a 5.75% maximum applicable sales charge except where “without sales charge” is indicated. Current performance may be lower or higher than the performance quoted. Returns do not consider capital gains or income taxes on an individual’s investment. For performance data current to the most recent month-end, visit oppenheimerfunds.com or call 1.800.CALL OPP (225.5677). See Fund prospectuses and summary prospectuses for more information on share classes and sales charges.
2 OPPENHEIMER STEELPATH MLP INCOME FUND |
Fund Performance Discussion
The Fund’s Class A shares (without sales charge) produced a total return of 7.29% during the reporting period. In comparison, master limited partnerships (“MLPs”), as measured by the Alerian MLP Index (AMZ), provided a total return gain of 9.28%. Please note that the returns for the Alerian MLP Index are calculated pre-tax, while the Fund’s returns are calculated post corporate tax. During the same period, the S&P 500 Index produced a total return gain of 8.06%.
Over the twelve-month reporting period ended November 30, 2016, the midstream sector outperformed the broader markets as the lows of the current energy cycle appear to have been reached and the beginnings of a recovery appear to be unfolding. Late in the period, the Organization of Petroleum Exporting Countries (“OPEC”) provided a potential acceleration to the rebalancing of crude oil supply and demand by announcing formal plans to reduce its production to 32.5 million barrels of oil per day (MMbbls/d) by January 2017. Agreements with non-OPEC countries to provide additional support via another 0.6 MMbbls/d of supply reductions were also announced, most notably with Russia electing to reduce production by 0.3 MMbbls/d. The larger than expected supply reduction sent oil prices sharply higher and many energy equities even more so. This reduced supply from OPEC members will pull the consensus estimates for the 2017 oil market balance back firmly into an undersupplied position, thereby beginning the process of working down
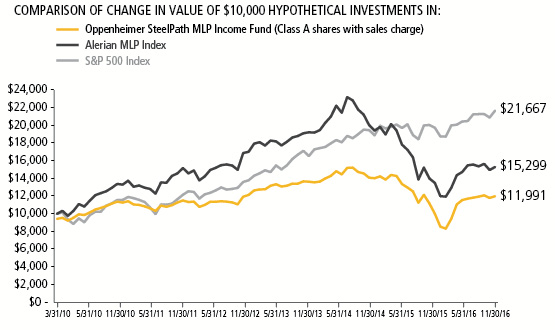
OPPENHEIMER STEELPATH MLP INCOME FUND 3 |
global inventories. And, importantly for U.S. midstream investors, the OPEC cut helps reduce the market forces that were driving near-term U.S. production, and thus midstream throughput, lower. Further, we continue to believe that this energy down cycle has shifted the call on U.S.-sourced volumes higher over the medium-term. This improving fundamental commodity picture, combined with midstream valuations that remain below long-term averages, makes a compelling case for midstream investment.
Over the reporting period, we estimate approximately $26 billion of new equity supply entered the market through either secondary offerings, initial public offerings, or “at-the-market” programs in which primary units trade into the market anonymously throughout the normal trading day. This pace of equity issuance represents an increase from approximately $20 billion that was raised over the twelve month reporting period ended November 30, 2015. MLPs also raised approximately $23 billion of debt capital during the period. Most MLPs pay out the majority of excess cash flow as distributions to investors, and therefore must raise external capital to fund growth projects and to fund acquisitions.
MACRO REVIEW
West Texas Intermediate (WTI) crude oil prices ended the reporting period at $49.44 per barrel, up 19% from the prior year. Global crude prices, as measured by Brent crude oil, traded 13% higher over the reporting period. The crude oil price improvement appears linked to the continued moderation in U.S. crude production, healthy demand growth, and the aforementioned OPEC deal to reduce supply. Brent exited the period at a $1 per barrel premium to WTI, which is near the historic norm. However, this reversion represents a departure from the $8 to $9 per barrel Brent premium that has generally existed since 2009.
Henry Hub natural gas spot prices exited the period at $3.30 per million British thermal units (“mmbtu”), up 58% over the reporting period. Natural gas pricing has benefited from a long awaited realignment of supply-demand in which natural gas usage as a heating and electric generation fuel has increased as gas production volume growth has declined, and as increased exports have become a reality via both liquefied natural gas and new pipelines to Mexico.
Mont Belvieu NGL prices ended the reporting period at $23.92 per barrel, a 26% increase over the reporting period. All of the NGL purity products ended the period higher than the same time in the prior year. Frac spreads, a measure of natural gas processing economics, ended the period at $0.28 per gallon, up 4% over the reporting period. Generally, the greater the frac spread, the greater the incentive for producers to seek natural gas processing capacity.
The yield curve modestly flattened over the reporting period as short rates rose more than the yields on longer-dated maturities. The ten-year Treasury yield rose 18 basis points to end the period at 2.38%.
4 OPPENHEIMER STEELPATH MLP INCOME FUND |
The MLP yield spread at period-end, as measured by the AMZ and the 10-year Treasury bond, narrowed by 115 basis points to 5.05%.
Over the reporting period, real estate investment trusts (“REITs”) and utilities, two competing yield-oriented equity asset classes, posted total returns of 5.65% (as measured by the Dow Jones Equity REIT Total Return Index) and 16.31% (as measured by the Dow Jones Utility Average Index), respectively, as compared to the AMZ’s 9.28% total return. Price to forward distributable cash flow (DCF), a commonly watched ratio within the MLP sector, increased over the period but remains below the ten-year average.
SUBSECTOR REVIEW
Performance among subsectors in the midstream, or energy infrastructure, MLP asset class varied for the reporting period. On average, the gathering and processing subsector provided the best performance over the period, buoyed by improving commodity prices supporting improved volumetric projections. The natural gas pipeline group followed as investors continued to express preference for long-haul natural gas pipelines, particularly those backed by utility demand pull.
The marine subsector experienced the weakest performance over the reporting period as several entities substantially reduced cash distributions to investors. The propane subsector also lagged over the reporting period as market participants appeared to rotate out of the subsector in favor of more traditional midstream names and as rising propane prices could result in some margin pressure in future periods.
FUND REVIEW
Key contributors to the Fund were NuStar Energy LP (NS) and ONEOK Partners, LP (OKS).
NuStar units contributed positively to the portfolio during the period as the partnership continued to deliver robust financial results supported by a strong portfolio of contractual agreements. Investor comfort with the partnership’s cash flow generation ability and attractive yield likely contributed to the outperformance during the period.
OKS units performed well over the period, benefiting from processing margin improvements and after aggressively converting much of its commodity-exposed contracts to a fee-based business. Sentiment also improved among market participants regarding forward-looking ethane recoveries.
Key detractors from the Fund were Teekay LNG Partners LP (TGP) and Sunoco LP (SUN).
TGP units experienced declines early in the reporting period after announcing an unexpected distribution reduction. TGP’s decision to change its dividend payout philosophy was unexpected as the company’s operating performance has continued to be very resilient. TGP’s heavily contracted fleet of LNG
OPPENHEIMER STEELPATH MLP INCOME FUND 5 |
carriers generate cash flows that are largely insulated from near-term movements in commodity prices.
SUN units underperformed over the period as investor concern increased over the partnership’s elevated leverage metrics following a series of significant acquisitions. We believe the partnership’s diverse geographic footprint and focus on the resilient fuel distribution business should provide the potential for steady long-term operational performance.
Please note that significant decreases in cash distributions from the Fund’s MLP investments and/or significant declines in the fair value of its investments may impact the Fund’s assessment regarding the recoverability of certain deferred tax assets, which may result in the recording of a valuation allowance. If a valuation allowance is established, this could have a material impact on the Fund’s net asset value and results of operations for the period. The Fund had a valuation allowance in place for a portion of the reporting period, but did not have one in place at period end. See Note 2 of the Notes to Financial Statements for more information.
OUTLOOK
We believe we have seen the worst of this energy market down cycle. The rate of midstream growth will likely moderate from peak levels, but average distributions are still likely to grow. Midstream operators may also stand to benefit as they make more efficient use of their existing assets. We believe current market valuations underestimate the potential for renewed business growth going forward and remain optimistic on the sector’s prospects. For this reason, we believe MLPs continue to offer attractive total return potential based on the potential for price appreciation and stable or growing distribution streams.
|
Stuart Cartner
Portfolio Manager
| |
|
Brian Watson, CFA
Portfolio Manager
|
6 OPPENHEIMER STEELPATH MLP INCOME FUND |
Top Holdings and Allocations
TOP TEN MASTER LIMITED PARTNERSHIP HOLDINGS
Energy Transfer Partners LP | 7.58% |
NuStar Energy LP | 6.78% |
Williams Partners LP | 6.34% |
Enbridge Energy Partners LP | 6.03% |
EnLink Midstream Partners LP | 5.39% |
Targa Resources Corp. | 4.72% |
Sunoco LP | 4.32% |
NGL Energy Partners LP | 4.31% |
DCP Midstream Partners LP | 4.21% |
ONEOK Partners LP | 3.85% |
Portfolio holdings and allocations are subject to change. Percentages are as of November 30, 2016, and are based on net assets.
SECTOR ALLOCATION

Portfolio holdings and allocations are subject to change. Percentages are as of November 30, 2016, and are based on the total value of investments.
OPPENHEIMER STEELPATH MLP INCOME FUND 7 |
Share Class Performance
AVERAGE ANNUAL TOTAL RETURNS WITHOUT SALES CHARGE AS OF 11/30/16
| | Inception Date | 1-Year | 5-Year | Since Inception |
Class A (MLPDX) | 3/31/10 | 7.29% | 2.12% | 3.68% |
Class C (MLPRX) | 6/10/11 | 6.44% | 1.37% | 1.01% |
Class I (OSPMX) | 6/28/13 | 7.68% | N/A | -2.39% |
Class Y (MLPZX) | 3/31/10 | 7.56% | 2.39% | 3.92% |
AVERAGE ANNUAL TOTAL RETURNS WITH SALES CHARGE AS OF 11/30/16
| | Inception Date | 1-Year | 5-Year | Since Inception |
Class A (MLPDX) | 3/31/10 | 1.18% | 0.92% | 2.76% |
Class C (MLPRX) | 6/10/11 | 5.49% | 1.37% | 1.01% |
Class I (OSPMX) | 6/28/13 | 7.68% | N/A | -2.39% |
Class Y (MLPZX) | 3/31/10 | 7.56% | 2.39% | 3.92% |
Performance data quoted represents past performance, which does not guarantee future results. The investment return and principal value of an investment in the Fund will fluctuate so that an investor’s shares, when redeemed, may be worth more or less than their original cost. Current performance may be lower or higher than the performance quoted. Returns do not consider capital gains or income taxes on an individual’s investment. For performance data current to the most recent month-end, visit oppenheimerfunds.com or call 1.800.CALL OPP (225.5677). Fund returns include changes in share price, reinvested distributions, and the applicable sales charge: for Class A shares, the current maximum initial sales charge of 5.75%, and for Class C shares, the contingent deferred sales charge of 1% for the 1-year period. There is no sales charge for Class I or Class Y shares. See Fund prospectuses and summary prospectuses for more information on share classes and sales charges.
The Fund’s performance is compared to the performance of the S&P 500 Index and the Alerian MLP Index. The S&P 500 Index is a broad-based measure of domestic stock performance. The Alerian MLP Index is a composite of the 50 most prominent Master Limited Partnerships that provides investors with an unbiased, comprehensive benchmark for this emerging asset class. The Alerian MLP Index, which is calculated using a float-adjusted, capitalization-weighted methodology, is disseminated real-time on a total-return basis. The indices are unmanaged and cannot be purchased directly by investors. While index comparisons may be useful to provide a benchmark for the Fund’s performance, it must be noted that the Fund’s investments are not limited to the investments comprising the indices. Index performance includes reinvestment of income, but does not reflect transaction costs, fees, expenses or
8 OPPENHEIMER STEELPATH MLP INCOME FUND |
taxes. Index performance is shown for illustrative purposes only as a benchmark for the Fund’s performance, and does not predict or depict performance of the Fund. The Fund’s performance reflects the effects of the Fund’s business and operating expenses.
The Fund’s investment strategy and focus can change over time. The mention of specific fund holdings does not constitute a recommendation by OppenheimerFunds, Inc. or its affiliates.
Before investing in any of the Oppenheimer funds, investors should carefully consider a fund’s investment objectives, risks, charges and expenses. Fund prospectuses and summary prospectuses contain this and other information about the funds, and may be obtained by asking your financial advisor, visiting oppenheimerfunds.com, or calling 1.800.CALL OPP (225.5677). Read prospectuses and summary prospectuses carefully before investing.
Shares of Oppenheimer funds are not deposits or obligations of any bank, are not guaranteed by any bank, are not insured by the FDIC or any other agency, and involve investment risks, including the possible loss of the principal amount invested.
OPPENHEIMER STEELPATH MLP INCOME FUND 9 |
Fund Expenses
Fund Expenses. As a shareholder of the Fund, you incur two types of costs: (1) transaction costs, which may include sales charges (loads) on purchase payments, contingent deferred sales charges on redemptions; and (2) ongoing costs, including management fees; distribution and service fees; and other Fund expenses. These examples are intended to help you understand your ongoing costs (in dollars) of investing in the Fund and to compare these costs with the ongoing costs of investing in other mutual funds.
The examples are based on an investment of $1,000.00 invested at the beginning of the period and held for the entire 6-month period ended November 30, 2016.
Actual Expenses. The first section of the table provides information about actual account values and actual expenses. You may use the information in this section for the class of shares you hold, together with the amount you invested, to estimate the expense that you paid over the period. Simply divide your account value by $1,000.00 (for example, an $8,600.00 account value divided by $1,000.00 = 8.60), then multiply the result by the number in the first section under the heading entitled “Expenses Paid During 6 Months Ended November 30, 2016” to estimate the expenses you paid on your account during this period.
Hypothetical Example for Comparison Purposes. The second section of the table provides information about hypothetical account values and hypothetical expenses based on the Fund’s actual expense ratio for each class of shares, and an assumed rate of return of 5% per year for each class before expenses, which is not the actual return. The hypothetical account values and expenses may not be used to estimate the actual ending account balance or expenses you paid for the period. You may use this information to compare the ongoing costs of investing in the Fund and other funds. To do so, compare this 5% hypothetical example for the class of shares you hold with the 5% hypothetical examples that appear in the shareholder reports of the other funds.
Please note that the expenses shown in the table are meant to highlight your ongoing costs only and do not reflect any transactional costs, such as front-end or contingent deferred sales charges (loads). Therefore, the “hypothetical” section of the table is useful in comparing ongoing costs only, and will not help you determine the relative total costs of owning different funds. In addition, if these transactional costs were included, your costs would have been higher.
10 OPPENHEIMER STEELPATH MLP INCOME FUND |
Actual | Beginning
Account
Value
June 1, 2016 | Ending
Account
Value
November 30,
2016 | Expenses
Paid During
6 Months Ended
November 30,
2016 |
CLASS A | $ 1,000.00 | $ 1,037.90 | $ 21.72 |
CLASS C | 1,000.00 | 1,033.90 | 25.49 |
CLASS I | 1,000.00 | 1,041.00 | 19.98 |
CLASS Y | 1,000.00 | 1,039.80 | 20.46 |
Hypothetical
(5% return before expenses) | | | |
CLASS A | 1,000.00 | 1,003.68 | 21.36 |
CLASS C | 1,000.00 | 999.93 | 25.06 |
CLASS I | 1,000.00 | 1,005.42 | 19.63 |
CLASS Y | 1,000.00 | 1,004.94 | 20.11 |
Expenses are equal to the Fund’s annualized expense ratio for that class, multiplied by the average account value over the period, multiplied by 183/366 (to reflect the one-half year period). Those annualized expense ratios, excluding indirect expenses from affiliated funds, based on the 6-month period ended November 30, 2016 are as follows:
Class | Expense Ratios |
CLASS A | 4.26% |
CLASS C | 5.01 |
CLASS I | 3.92 |
CLASS Y | 4.01 |
The expense ratios for Class A, C, and Y reflect contractual waivers and/or reimbursements of expenses by the Fund’s Manager. Some of these undertakings may be modified or terminated at any time, as indicated in the Fund’s prospectus. The “Financial Highlights” tables in the Fund’s financial statements, included in this report, also show the gross expense ratios, without such waivers or reimbursements, if applicable.
OPPENHEIMER STEELPATH MLP INCOME FUND 11 |
STATEMENT OF INVESTMENTS November 30, 2016 |
Description | | Shares | | | Value | |
Master Limited Partnership Shares — 87.1% | |
Diversified — 10.2% | |
ONEOK Partners LP | | | 3,466,246 | | | $ | 144,889,083 | |
Williams Partners LP | | | 6,527,465 | | | | 238,252,472 | |
Total Diversified | | | | | | | 383,141,555 | |
| | | | | | | | | |
Gathering/Processing — 23.7% | |
American Midstream Partners LP 1 | | | 5,113,930 | | | | 75,430,468 | |
Archrock Partners LP 1 | | | 5,234,394 | | | | 83,436,240 | |
Crestwood Equity Partners LP 1 | | | 4,592,151 | | | | 102,864,183 | |
CSI Compressco LP 1 | | | 2,008,585 | | | | 20,085,850 | |
DCP Midstream Partners LP | | | 4,572,146 | | | | 158,333,416 | |
EnLink Midstream Partners LP | | | 11,558,054 | | | | 202,497,106 | |
Midcoast Energy Partners LP 1 | | | 3,100,729 | | | | 19,379,556 | |
Sanchez Production Partners LP 1 | | | 1,739,905 | | | | 19,138,955 | |
Southcross Energy Partners LP 1 | | | 1,313,278 | | | | 1,707,261 | |
Summit Midstream Partners LP 1 | | | 5,320,030 | | | | 119,434,674 | |
USA Compression Partners LP 1 | | | 4,621,112 | | | | 82,856,538 | |
Western Gas Partners LP | | | 100,000 | | | | 5,707,000 | |
Total Gathering/Processing | | | | | | | 890,871,247 | |
| | | | | | | | | |
Marine — 4.3% | | | | | | | | |
GasLog Partners LP | | | 699,041 | | | | 14,225,484 | |
Golar LNG Partners LP | | | 2,395,841 | | | | 53,379,338 | |
Hoegh LNG Partners LP | | | 488,242 | | | | 9,227,774 | |
KNOT Offshore Partners LP 1 | | | 1,103,652 | | | | 24,059,614 | |
Teekay LNG Partners LP | | | 3,646,835 | | | | 55,978,917 | |
Teekay Offshore Partners LP | | | 772,279 | | | | 4,224,366 | |
Total Marine | | | | | | | 161,095,493 | |
Natural Gas Pipelines — 11.6% | |
CrossAmerica Partners LP 1 | | | 1,809,700 | | | $ | 47,052,200 | |
Energy Transfer Partners LP | | | 8,113,236 | | | | 284,936,838 | |
TC Pipelines LP | | | 1,984,746 | | | | 105,489,250 | |
Total Natural Gas Pipelines | | | | | | | 437,478,288 | |
| | | | | | | | | |
Petroleum Transportation — 34.0% | |
Arc Logistics Partners LP 1 | | | 1,896,477 | | | | 27,973,036 | |
Blueknight Energy Partners LP | | | 1,741,034 | | | | 11,490,824 | |
Buckeye Partners LP | | | 1,644,213 | | | | 105,788,664 | |
Enbridge Energy Partners LP | | | 9,171,828 | | | | 226,544,152 | |
Genesis Energy LP | | | 500,000 | | | | 17,470,000 | |
Global Partners LP 1 | | | 2,414,606 | | | | 38,150,775 | |
Holly Energy Partners LP | | | 1,821,271 | | | | 58,754,202 | |
Martin Midstream Partners LP 1 | | | 5,637,184 | | | | 95,832,128 | |
NGL Energy Partners LP 1 | | | 8,728,872 | | | | 161,920,576 | |
NuStar Energy LP 1 | | | 5,340,776 | | | | 254,968,646 | |
NuStar GP Holdings LLC | | | 100,000 | | | | 2,540,000 | |
Sprague Resources LP 1 | | | 1,530,958 | | | | 34,523,103 | |
Sunoco LP 1 | | | 8,054,250 | | | | 194,107,425 | |
Sunoco Logistics Partners LP | | | 1,500,000 | | | | 35,535,000 | |
USD Partners LP 1 | | | 750,975 | | | | 10,663,845 | |
Total Petroleum Transportation | | | | | | | 1,276,262,376 | |
12 OPPENHEIMER STEELPATH MLP INCOME FUND |
STATEMENT OF INVESTMENTS (Continued) |
Description | | Shares | | | Value | |
Propane — 3.3% | | | | | | |
Amerigas Partners LP | | | 775,336 | | | $ | 34,797,080 | |
Ferrellgas Partners LP | | | 2,193,319 | | | | 12,194,853 | |
Suburban Propane Partners LP | | | 2,756,082 | | | | 78,079,803 | |
Total Propane | | | | | | | 125,071,736 | |
| | | | | | | | | |
Total Master Limited Partnership Shares | |
(identified cost $3,350,138,633) | | | | 3,273,920,695 | |
| | | | | | | | | |
Common Stocks — 6.3% | |
Gathering/Processing — 4.7% | |
Targa Resources Corp. | | | 3,332,810 | | | | 177,605,445 | |
| | | | | | | | | |
Petroleum Transportation — 1.6% | |
Enbridge Energy Management LLC 2 | | | 2,410,645 | | | | 60,217,904 | |
| | | | | | | | | |
Total Common Stocks | | | | | |
(identified cost $116,530,718) | | | | 237,823,349 | |
| | | | | | | | | |
Preferred Master Limited Partnership Shares — 1.6% | |
Gathering/Processing — 0.4% | |
CSI Compressco LP - Series A, 11.00% 1,4 | | | 1,312,336 | | | | 14,881,890 | |
| | | | | | | | | |
Marine — 0.4% | | | | | | | | |
Teekay Offshore Partners LP, 7.25% | | | 716,185 | | | | 14,037,226 | |
| | | | | | | | | |
Petroleum Transportation — 0.8% | |
GPM Petroleum LP - Class A, 10.00% 1,4 | | | 1,500,000 | | | | 30,045,000 | |
| | | | | | | | | |
Total Preferred Master Limited Partnership Shares | |
(identified cost $55,951,036) | | | | 58,964,116 | |
Short-Term Investment — 0.2% | |
Money Market — 0.2% | |
Fidelity Treasury Portfolio, Institutional Class, 0.270% 3 | | | 7,641,748 | | | | 7,641,748 | |
| | | | | | | | | |
Total Short-Term Investment | | | | | |
(identified cost $7,641,748) | | | | 7,641,748 | |
| | | | | | | | | |
Total Investments — 95.2% | |
(identified cost $3,530,262,135) | | | | 3,578,349,908 | |
Other Assets In Excess of Liabilities — 4.8% | | | | 181,645,572 | |
Net Assets — 100.0% | | | $ | 3,759,992,480 | |
OPPENHEIMER STEELPATH MLP INCOME FUND 13 |
STATEMENT OF INVESTMENTS (Continued) |
Footnotes to Statement of Investments
LLC — Limited Liability Company
LP — Limited Partnership
1. | Is or was an affiliate, as defined by the Investment Company Act of 1940, at or during the period ended November 30, 2016, by virtue of the Fund owning at least 5% of the voting securities of the issuer. Transactions during this period in which the issuer was an affiliate are as follows: |
| | Shares
November 30,
2015 | | | Gross
Additions | | | Gross
Reductions | | | Shares
November 30, 2016 | |
American Midstream Partners LP | | | 2,958,930 | | | | 2,155,000 | | | | — | | | | 5,113,930 | |
Arc Logistic Partners LP | | | 1,846,477 | | | | 50,000 | | | | — | | | | 1,896,477 | |
Archrock Partners LP | | | 5,163,704 | | | | 70,690 | | | | — | | | | 5,234,394 | |
Crestwood Equity Partners LP | | | 3,358,453 | | | | 3,471,718 | | | | (2,238,020 | ) | | | 4,592,151 | |
CrossAmerica Partners LP | | | 1,545,416 | | | | 1,809,700 | | | | (1,545,416 | ) | | | 1,809,700 | |
CSI Compressco LP | | | 1,708,611 | | | | 299,974 | | | | — | | | | 2,008,585 | |
CSI Compressco LP - Preferred | | | — | | | | 1,312,336 | | | | — | | | | 1,312,336 | |
Global Partners LP | | | 1,955,665 | | | | 596,291 | | | | (137,350 | ) | | | 2,414,606 | |
GPM Petroleum LP | | | — | | | | 1,500,000 | | | | — | | | | 1,500,000 | |
KNOT Offshore Partners LP | | | 1,053,652 | | | | 50,000 | | | | — | | | | 1,103,652 | |
Martin Midstream Partners LP | | | 3,523,563 | | | | 2,113,621 | | | | — | | | | 5,637,184 | |
Midcoast Energy Partners LP | | | 3,100,729 | | | | — | | | | — | | | | 3,100,729 | |
NGL Energy Partners LP | | | 3,177,844 | | | | 5,551,028 | | | | — | | | | 8,728,872 | |
Nustar Energy LP | | | 5,365,811 | | | | 400,000 | | | | (425,035 | ) | | | 5,340,776 | |
Sanchez Production Partners LP | | | — | | | | 1,739,905 | | | | — | | | | 1,739,905 | |
Southcross Energy Partners LP i | | | 1,713,278 | | | | — | | | | (400,000 | ) | | | 1,313,278 | |
Sprague Resources LP | | | 1,530,958 | | | | — | | | | — | | | | 1,530,958 | |
Summit Midstream Partners LP | | | 2,004,405 | | | | 3,315,625 | | | | — | | | | 5,320,030 | |
Sunoco LP | | | 616,123 | | | | 7,438,127 | | | | — | | | | 8,054,250 | |
Teekay LNG Partners LP i | | | 5,912,154 | | | | 100,000 | | | | (2,365,319 | ) | | | 3,646,835 | |
USA Compression Partners LP | | | 3,429,769 | | | | 1,191,343 | | | | — | | | | 4,621,112 | |
USD Partners LP | | | 700,975 | | | | 50,000 | | | | — | | | | 750,975 | |
14 OPPENHEIMER STEELPATH MLP INCOME FUND |
STATEMENT OF INVESTMENTS (Continued) |
| | Value | | | Distributions | | | Realized
Gain/(Loss) | |
American Midstream Partners LP | | $ | 75,430,468 | | | $ | 6,157,020 | | | $ | — | |
Arc Logistic Partners LP | | | 27,973,036 | | | | 3,271,800 | | | | — | |
Archrock Partners LP | | | 83,436,240 | | | | 7,412,550 | | | | — | |
Crestwood Equity Partners LP | | | 102,864,183 | | | | 11,397,151 | | | | (135,534,998 | ) |
CrossAmerica Partners LP | | | 47,052,200 | | | | 2,379,300 | | | | 5,162,451 | |
CSI Compressco LP | | | 20,085,850 | | | | 2,806,483 | | | | — | |
CSI Compressco LP - Preferred | | | 14,881,890 | | | | — | | | | — | |
Global Partners LP | | | 38,150,775 | | | | 3,591,702 | | | | (2,810,613 | ) |
GPM Petroleum LP | | | 30,045,000 | | | | 2,356,469 | | | | — | |
KNOT Offshore Partners LP | | | 24,059,614 | | | | 2,217,596 | | | | — | |
Martin Midstream Partners LP | | | 95,832,128 | | | | 11,462,274 | | | | — | |
Midcoast Energy Partners LP | | | 19,379,556 | | | | 4,434,042 | | | | — | |
NGL Energy Partners LP | | | 161,920,576 | | | | 11,291,140 | | | | — | |
Nustar Energy LP | | | 254,968,646 | | | | 21,859,599 | | | | (9,293,677 | ) |
Sanchez Production Partners LP | | | 19,138,955 | | | | — | | | | — | |
Southcross Energy Partners LP i | | | 1,707,261 | | | | — | | | | (6,152,301 | ) |
Sprague Resources LP | | | 34,523,103 | | | | 3,306,869 | | | | — | |
Summit Midstream Partners LP | | | 119,434,674 | | | | 8,112,799 | | | �� | — | |
Sunoco LP | | | 194,107,425 | | | | 12,956,343 | | | | — | |
Teekay LNG Partners LP i | | | 55,978,917 | | | | 2,293,130 | | | | (63,590,256 | ) |
USA Compression Partners LP | | | 82,856,538 | | | | 7,854,220 | | | | — | |
USD Partners LP | | | 10,663,845 | | | | 888,839 | | | | — | |
| | | $ | 1,514,490,880 | | | $ | 126,049,326 | | | $ | (212,219,394 | ) |
| | i | Is not an affiliate as of November 30, 2016. Was an affiliate during the year ended November 30, 2016. |
3. | Variable rate security; the coupon rate represents the rate at November 30, 2016. |
4. | Restricted security. The aggregate value of restricted securities at period end was $44,926,890, which represents 1.2% of the Fund’s net assets. See Note 4 of the accompanying Notes. Information concerning restricted securities is as follows: |
Security | Acquisition
Date | | Cost | | | Value | | | Unrealized Appreciation/ (Depreciation) | |
CSI Compressco LP - Preferred | 8/8/2016 | | $ | 15,000,000 | | | $ | 14,881,890 | | | $ | (118,110 | ) |
GPM Petroleum LP | 1/12/2016 | | $ | 30,000,000 | | | $ | 30,045,000 | | | $ | 45,000 | |
See accompanying Notes to Financial Statements.
OPPENHEIMER STEELPATH MLP INCOME FUND 15 |
STATEMENT OF ASSETS AND LIABILITIES November 30, 2016 |
Assets | | | |
Investments at value – see accompanying Statement of Investments: | | | |
Unaffiliated companies (cost $1,982,428,733) | | $ | 2,121,545,206 | |
Affiliated companies (cost $1,547,833,402) | | | 1,456,804,702 | |
| | | 3,578,349,908 | |
Deferred tax asset, net | | | 187,091,144 | |
Receivable for beneficial interest sold | | | 11,285,833 | |
Dividends receivable | | | 6,234 | |
Prepaid expenses | | | 210,274 | |
Receivable for investments sold | | | 16,200,715 | |
Total assets | | | 3,793,144,108 | |
| | | | |
Liabilities: | | | | |
Payable for investments purchased | | | 23,009,070 | |
Payable for beneficial interest redeemed | | | 4,997,408 | |
Payable to Manager | | | 2,455,989 | |
Payable for distribution and service plan fees | | | 1,301,615 | |
Transfer agent fees payable | | | 660,941 | |
Trustees' fees payable | | | 28,669 | |
Borrowing expense payable | | | 20,252 | |
Other liabilities | | | 677,684 | |
Total liabilities | | | 33,151,628 | |
| | | | |
Net Assets | | $ | 3,759,992,480 | |
| | | | |
Composition of Net Assets | | | | |
Par value of shares of beneficial interest | | $ | 508,807 | |
Paid-in capital | | | 4,083,079,619 | |
Undistributed net investment loss, net of deferred taxes | | | (122,784,814 | ) |
Accumulated undistributed net realized losses on investments, net of deferred taxes | | | (317,595,831 | ) |
Net unrealized appreciation on investments, net of deferred taxes | | | 116,784,699 | |
Net Assets | | $ | 3,759,992,480 | |
16 OPPENHEIMER STEELPATH MLP INCOME FUND |
STATEMENT OF ASSETS AND LIABILITIES (Continued) |
Net Asset Value, Offering Price and Redemption Proceeds Per Share ($0.001 Par Value, Unlimited Shares Authorized) | | | |
Class A Shares: | | | |
Net asset value and redemption proceeds per share | | $ | 7.47 | |
Offering price per share (net asset value plus sales charge of 5.75% of offering price) | | $ | 7.93 | |
Class C Shares: | | | | |
Net asset value, offering price and redemption proceeds per share | | $ | 7.12 | |
Class I Shares: | | | | |
Net asset value, offering price and redemption proceeds per share | | $ | 7.66 | |
Class Y Shares: | | | | |
Net asset value, offering price and redemption proceeds per share | | | 7.63 | |
| | | | | |
Net Assets: | | | | |
Class A shares | | $ | 1,681,229,625 | |
Class C shares | | | 1,199,208,300 | |
Class I shares | | | 20,111,736 | |
Class Y shares | | | 859,442,819 | |
Total Net Assets | | $ | 3,759,992,480 | |
| | | | | |
Shares Outstanding: | | | | |
Class A shares | | | 225,095,643 | |
Class C shares | | | 168,441,575 | |
Class I shares | | | 2,626,997 | |
Class Y shares | | | 112,642,879 | |
Total Shares Outstanding | | | 508,807,094 | |
See accompanying Notes to Financial Statements.
OPPENHEIMER STEELPATH MLP INCOME FUND 17 |
STATEMENT OF OPERATIONS For the Year Ended November 30, 2016 |
Investment Income | | | |
Distributions from: | | | |
Unaffiliated Master Limited Partnerships | | $ | 160,035,533 | |
Affiliated Master Limited Partnerships | | | 126,049,326 | |
Less return of capital on distributions from: | | | | |
Unaffiliated Master Limited Partnerships | | | (160,035,533 | ) |
Affiliated Master Limited Partnerships | | | (126,049,326 | ) |
Dividend income | | | 8,927,352 | |
Total investment income | | | 8,927,352 | |
| | | | |
Expenses | | | | |
Management fees | | | 29,376,209 | |
Distribution and service plan fees | | | | |
Class A | | | 3,461,819 | |
Class C | | | 10,227,672 | |
Transfer agent fees | | | | |
Class A | | | 3,046,401 | |
Class C | | | 2,250,088 | |
Class I | | | 1,777 | |
Class Y | | | 1,497,753 | |
Administrative fees | | | 735,862 | |
Borrowing fees | | | 659,039 | |
Registration fees | | | 227,569 | |
Legal, auditing, and other professional fees | | | 226,381 | |
Custody fees | | | 143,351 | |
Tax expense | | | 96,351 | |
Trustees' fees | | | 81,618 | |
Other | | | 35,862 | |
Total expenses, before waivers and deferred taxes | | | 52,067,752 | |
Less expense waivers | | | (3,593,107 | ) |
Net expenses, before deferred taxes | | | 48,474,645 | |
| | | | |
Net investment loss, before deferred taxes | | | (39,547,293 | ) |
Deferred tax benefit | | | 9,911,858 | |
Net investment loss, net of deferred taxes | | | (29,635,435 | ) |
| | | | |
Net Realized and Unrealized Gains/(Losses) on Investments: | | | | |
Net Realized Gains/(Losses) | | | | |
Investments from: | | | | |
Unaffiliated companies | | | (287,131,776 | ) |
Affiliated companies | | | (212,219,394 | ) |
Deferred tax benefit | | | 98,689,438 | |
Net realized losses, net of deferred taxes | | | (400,661,732 | ) |
Net Change in Unrealized Appreciation | | | | |
Investments | | | 852,226,275 | |
Deferred tax expense | | | (172,654,232 | ) |
Net change in unrealized appreciation, net of deferred taxes | | | 679,572,043 | |
| | | | |
Net realized and unrealized gains on investments, net of deferred taxes | | | 278,910,311 | |
Change in net assets resulting from operations | | $ | 249,274,876 | |
See accompanying Notes to Financial Statements.
18 OPPENHEIMER STEELPATH MLP INCOME FUND |
STATEMENTS OF CHANGES IN NET ASSETS |
| | For the
Year Ended
November 30, 2016 | | | For the
Year Ended
November 30, 2015 | |
Operations | | | | | | |
Net investment loss, net of deferred taxes | | $ | (29,635,435 | ) | | $ | (34,920,062 | ) |
Net realized gains/(losses) on investments, net of deferred taxes | | | (400,661,732 | ) | | | 40,061,596 | |
Net change in unrealized appreciation/(depreciation), net of deferred taxes | | | 679,572,043 | | | | (1,053,087,938 | ) |
Change in net assets resulting from operations | | | 249,274,876 | | | | (1,047,946,404 | ) |
| | | | | | | | |
Distributions to Shareholders | | | | | | | | |
Distributions to shareholders from return of capital: | | | | | | | | |
Class A shares | | | (153,936,794 | ) | | | (143,148,149 | ) |
Class C shares | | | (118,262,435 | ) | | | (119,784,470 | ) |
Class I shares | | | (715,882 | ) | | | (17,578 | ) |
Class Y shares | | | (74,346,616 | ) | | | (68,347,631 | ) |
Change in net assets resulting from distributions to shareholders | | | (347,261,727 | ) | | | (331,297,828 | ) |
| | | | | | | | |
Beneficial Interest Transactions | | | | | | | | |
Class A shares | | | 357,458,026 | | | | (165,789,024 | ) |
Class C shares | | | 157,347,884 | | | | (109,079,027 | ) |
Class I shares | | | 20,453,290 | | | | (15,061 | ) |
Class Y shares | | | 191,230,622 | | | | (25,064,755 | ) |
Change in net assets resulting from beneficial interest transactions | | | 726,489,822 | | | | (299,947,867 | ) |
Change in net assets | | | 628,502,971 | | | | (1,679,192,099 | ) |
| | | | | | | | |
Net Assets | | | | | | | | |
Beginning of period | | | 3,131,489,509 | | | | 4,810,681,608 | |
End of period | | $ | 3,759,992,480 | | | $ | 3,131,489,509 | |
| | | | | | | | | |
Undistributed net investment loss, net of deferred taxes | | $ | (122,784,814 | ) | | $ | (93,149,379 | ) |
See accompanying Notes to Financial Statements.
OPPENHEIMER STEELPATH MLP INCOME FUND 19 |
Class A | | Year Ended November 30,
2016 | | | Year Ended November 30,
2015 | | | Year Ended November 28,
2014* | | | Year Ended November 29,
2013* | | | Year Ended November 30,
2012 | |
Per Share Operating Data | | | | | | | | | | | | | | | |
Net Asset Value, Beginning of Period | | $ | 7.78 | | | $ | 11.01 | | | $ | 10.86 | | | $ | 9.83 | | | $ | 10.14 | |
Income/(loss) from investment operations: | | | | | | | | | | | | | | | | | | | | |
Net investment loss1 | | | (0.05 | ) | | | (0.06 | ) | | | (0.09 | ) | | | (0.09 | ) | | | (0.09 | ) |
Return of capital1 | | | 0.41 | | | | 0.48 | | | | 0.48 | | | | 0.49 | | | | 0.48 | |
Net realized and unrealized gains/(losses) | | | 0.11 | | | | (2.87 | ) | | | 0.54 | | | | 1.41 | | | | 0.08 | |
Total from investment operations | | | 0.47 | | | | (2.45 | ) | | | 0.93 | | | | 1.81 | | | | 0.47 | |
Distributions to shareholders: | | | | | | | | | | | | | | | | | | | | |
Return of capital | | | (0.78 | ) | | | (0.78 | ) | | | (0.78 | ) | | | (0.78 | ) | | | (0.70 | ) |
Income | | | — | | | | — | | | | — | | | | — | | | | (0.08 | ) |
Total distributions to shareholders | | | (0.78 | ) | | | (0.78 | ) | | | (0.78 | ) | | | (0.78 | ) | | | (0.78 | ) |
Net asset value, end of period | | $ | 7.47 | | | $ | 7.78 | | | $ | 11.01 | | | $ | 10.86 | | | $ | 9.83 | |
| | | | | | | | | | | | | | | | | | | | |
Total Return, at Net Asset Value2 | | | 7.29 | % | | | (23.32 | %) | | | 8.66 | % | | | 18.79 | % | | | 4.61 | % |
| | | | | | | | | | | | | | | | | | | | | |
Ratios /Supplemental Data | | | | | | | | | | | | | | | | | | | | |
Net assets, end of period (in thousands) | | $ | 1,681,230 | | | $ | 1,355,597 | | | $ | 2,116,790 | | | $ | 1,452,182 | | | $ | 333,544 | |
Ratio of Expenses to Average Net Assets: | | | | | | | | | | | | | |
Before (waivers) and deferred tax expense/(benefit) | | | 1.49 | % | | | 1.49 | % | | | 1.50 | % | | | 1.42 | % | | | 1.51 | % |
Expense (waivers) | | | (0.12 | %) | | | (0.11 | %) | | | (0.12 | %) | | | (0.07 | %) | | | (0.16 | %) |
Net of (waivers) and before deferred tax expense/(benefit) | | | 1.37 | %3 | | | 1.38 | %3 | | | 1.38 | %3 | | | 1.35 | %4 | | | 1.35 | % |
Deferred tax expense/(benefit)5,6 | | | 2.07 | % | | | (12.85 | %) | | | 4.38 | % | | | 6.97 | % | | | 2.02 | % |
Total expenses/(benefit) | | | 3.44 | % | | | (11.47 | %) | | | 5.76 | % | | | 8.32 | % | | | 3.37 | % |
| | | | | | | | | | | | | | | | | | | | | |
Ratio of Investment Loss to Average Net Assets: | | | | | | | | | | | | | |
Before (waivers) and deferred tax benefit/(expense) | | | (1.09 | %) | | | (1.22 | %) | | | (1.41 | %) | | | (1.32 | %) | | | (1.51 | %) |
Expense (waivers) | | | (0.12 | %) | | | (0.11 | %) | | | (0.12 | %) | | | (0.07 | %) | | | (0.16 | %) |
Net of expense (waivers) and before deferred tax benefit/(expense) | | | (0.97 | %) | | | (1.11 | %) | | | (1.29 | %) | | | (1.25 | %) | | | (1.35 | %) |
Deferred tax benefit6,7 | | | 0.32 | % | | | 0.54 | % | | | 0.56 | % | | | 0.45 | % | | | 0.47 | % |
Net investment loss | | | (0.65 | %) | | | (0.57 | %) | | | (0.73 | %) | | | (0.80 | %) | | | (0.88 | %) |
| | | | | | | | | | | | | | | | | | | | |
Portfolio turnover rate | | | 22 | % | | | 18 | % | | | 14 | % | | | 4 | % | | | 29 | % |
* | November 28, 2014 and November 29, 2013 represent the last business day of the Fund’s respective reporting periods. |
1. | Per share amounts calculated based on average shares outstanding during the period net of deferred tax expense/benefit. |
2. | Assumes an initial investment on the business day before the first day of the fiscal period, with all dividends and distributions reinvested in additional shares on the reinvestment date, and redemptions at the net asset value calculated on the last business day of the fiscal period. Sales charges are not reflected in the total returns. Total returns are not annualized for periods less than one full year. Returns do not reflect the deduction of taxes that a shareholder would pay on fund distributions or the redemption of fund shares. The returns do not include adjustments in accordance with generally accepted accounting principles required at the period end for financial reporting purposes. |
3. | Includes borrowing and franchise tax expense. Without borrowing and franchise tax expense, the net expense ratio would be 1.35%. |
4. | Includes franchise tax expense. Without franchise tax expense the net expense ratio would be 1.35%. |
5. | Deferred tax expense estimate for the ratio calculation is derived from the net investment income/loss, and realized and unrealized gains/losses. |
6. | Effective December 1, 2013 the deferred tax expense and deferred tax benefit are allocated based on average net assets. Prior to December 1, 2013 the deferred tax expense and deferred tax benefit were allocated based on specific class expenses. |
7. | Deferred tax benefit for the ratio calculation is derived from net investment income/loss only. |
See accompanying Notes to Financial Statements.
20 OPPENHEIMER STEELPATH MLP INCOME FUND |
FINANCIAL HIGHLIGHTS (Continued) |
Class C | | Year Ended November 30,
2016 | | | Year Ended November 30,
2015 | | | Year Ended November 28,
2014* | | | Year Ended November 29,
2013* | | | Year Ended November 30,
2012 | |
Per Share Operating Data | | | | | | | | | | | | | | | |
Net Asset Value, Beginning of Period | | $ | 7.51 | | | $ | 10.73 | | | $ | 10.68 | | | $ | 9.75 | | | $ | 10.13 | |
Income/(loss) from investment operations: | | | | | | | | | | | | | | | | | | | | |
Net investment loss1 | | | (0.12 | ) | | | (0.15 | ) | | | (0.17 | ) | | | (0.14 | ) | | | (0.13 | ) |
Return of capital1 | | | 0.41 | | | | 0.48 | | | | 0.48 | | | | 0.50 | | | | 0.51 | |
Net realized and unrealized gains/(losses) | | | 0.10 | | | | (2.77 | ) | | | 0.52 | | | | 1.35 | | | | 0.02 | |
Total from investment operations | | | 0.39 | | | | (2.44 | ) | | | 0.83 | | | | 1.71 | | | | 0.40 | |
Distributions to shareholders: | | | | | | | | | | | | | | | | | | | | |
Return of capital | | | (0.78 | ) | | | (0.78 | ) | | | (0.78 | ) | | | (0.78 | ) | | | (0.70 | ) |
Income | | | — | | | | — | | | | — | | | | — | | | | (0.08 | ) |
Total distributions to shareholders | | | (0.78 | ) | | | (0.78 | ) | | | (0.78 | ) | | | (0.78 | ) | | | (0.78 | ) |
Net asset value, end of period | | $ | 7.12 | | | $ | 7.51 | | | $ | 10.73 | | | $ | 10.68 | | | $ | 9.75 | |
| | | | | | | | | | | | | | | | | | | | |
Total Return, at Net Asset Value2 | | | 6.44 | % | | | (23.85 | %) | | | 7.84 | % | | | 17.88 | % | | | 3.89 | % |
| | | | | | | | | | | | | | | | | | | | | |
Ratios /Supplemental Data | | | | | | | | | | | | | | | | | | | | |
Net assets, end of period (in thousands) | | $ | 1,199,208 | | | $ | 1,096,028 | | | $ | 1,701,552 | | | $ | 869,041 | | | $ | 36,764 | |
Ratio of Expenses to Average Net Assets: | | | | | | | | | | | | | |
Before (waivers) and deferred tax expense/(benefit) | | | 2.24 | % | | | 2.24 | % | | | 2.25 | % | | | 2.18 | % | | | 2.37 | % |
Expense (waivers) | | | (0.12 | %) | | | (0.11 | %) | | | (0.12 | %) | | | (0.07 | %) | | | (0.27 | %) |
Net of (waivers) and before deferred tax expense/(benefit) | | | 2.12 | %3 | | | 2.13 | %3 | | | 2.13 | %3 | | | 2.11 | %4 | | | 2.10 | % |
Deferred tax expense/(benefit)5,6 | | | 2.07 | % | | | (12.85 | %) | | | 4.38 | % | | | 5.39 | % | | | 1.78 | % |
Total expenses/(benefit) | | | 4.19 | % | | | (10.72 | %) | | | 6.51 | % | | | 7.50 | % | | | 3.88 | % |
| | | | | | | | | | | | | | | | | | | | | |
Ratio of Investment Loss to Average Net Assets: | | | | | | | | | | | | | |
Before (waivers) and deferred tax benefit/(expense) | | | (2.28 | %) | | | (2.21 | %) | | | (2.21 | %) | | | (2.08 | %) | | | (2.37 | %) |
Expense (waivers) | | | (0.12 | %) | | | (0.11 | %) | | | (0.12 | %) | | | (0.07 | %) | | | (0.27 | %) |
Net of expense (waivers) and before deferred tax benefit/(expense) | | | (2.16 | %) | | | (2.10 | %) | | | (2.09 | %) | | | (2.01 | %) | | | (2.10 | %) |
Deferred tax benefit6,7 | | | 0.32 | % | | | 0.54 | % | | | 0.56 | % | | | 0.73 | % | | | 0.75 | % |
Net investment loss | | | (1.84 | %) | | | (1.56 | %) | | | (1.53 | %) | | | (1.28 | %) | | | (1.35 | %) |
| | | | | | | | | | | | | | | | | | | | |
Portfolio turnover rate | | | 22 | % | | | 18 | % | | | 14 | % | | | 4 | % | | | 29 | % |
* | November 28, 2014 and November 29, 2013 represent the last business day of the Fund’s respective reporting periods. |
1. | Per share amounts calculated based on average shares outstanding during the period net of deferred tax expense/benefit. |
2. | Assumes an initial investment on the business day before the first day of the fiscal period, with all dividends and distributions reinvested in additional shares on the reinvestment date, and redemptions at the net asset value calculated on the last business day of the fiscal period. Sales charges are not reflected in the total returns. Total returns are not annualized for periods less than one full year. Returns do not reflect the deduction of taxes that a shareholder would pay on fund distributions or the redemption of fund shares. The returns do not include adjustments in accordance with generally accepted accounting principles required at the period end for financial reporting purposes. |
3. | Includes borrowing and franchise tax expense. Without borrowing and franchise tax expense, the net expense ratio would be 2.10%. |
4. | Includes franchise tax expense. Without franchise tax expense the net expense ratio would be 2.10%. |
5. | Deferred tax expense estimate for the ratio calculation is derived from the net investment income/loss, and realized and unrealized gains/losses. |
6. | Effective December 1, 2013 the deferred tax expense and deferred tax benefit are allocated based on average net assets. Prior to December 1, 2013 the deferred tax expense and deferred tax benefit were allocated based on specific class expenses. |
7. | Deferred tax benefit for the ratio calculation is derived from net investment income/loss only. |
See accompanying Notes to Financial Statements.
OPPENHEIMER STEELPATH MLP INCOME FUND 21 |
FINANCIAL HIGHLIGHTS (Continued) |
Class I | | Year Ended November 30,
2016 | | | Year Ended November 30,
2015 | | | Year Ended November 28,
2014* | | | Period Ended November 29,
2013*,1,2 | |
Per Share Operating Data | | | | | | | | | | | | |
Net Asset Value, Beginning of Period | | $ | 7.93 | | | $ | 11.17 | | | $ | 10.97 | | | $ | 11.15 | |
Income/(loss) from investment operations: | | | | | | | | | | | | | | | | |
Net investment income/(loss)3 | | | 0.16 | | | | (0.03 | ) | | | 0.01 | | | | (0.03 | ) |
Return of capital3 | | | 0.41 | | | | 0.48 | | | | 0.48 | | | | 0.22 | |
Net realized and unrealized gains/(losses) | | | (0.06 | ) | | | (2.91 | ) | | | 0.49 | | | | 0.02 | |
Total from investment operations | | | 0.51 | | | | (2.46 | ) | | | 0.98 | | | | 0.21 | |
Distributions to shareholders: | | | | | | | | | | | | | | | | |
Return of capital | | | (0.78 | ) | | | (0.78 | ) | | | (0.78 | ) | | | (0.39 | ) |
Net asset value, end of period | | $ | 7.66 | | | $ | 7.93 | | | $ | 11.17 | | | $ | 10.97 | |
| | | | | | | | | | | | | | | | |
Total Return, at Net Asset Value4 | | | 7.68 | % | | | (23.06 | %) | | | 9.04 | % | | | 1.90 | % |
| | | | | | | | | | | | | | | | | |
Ratios /Supplemental Data | | | | | | | | | | | | | | | | |
Net assets, end of period (in thousands) | | $ | 20,112 | | | $ | 235 | | | $ | 331 | | | $ | 113 | |
Ratio of Expenses to Average Net Assets:5 | | | | | | | | | |
Before deferred tax expense/(benefit) | | | 1.01 | %6 | | | 1.05 | %6 | | | 1.05 | %6 | | | 1.16 | %7 |
Deferred tax expense/(benefit)8,9 | | | 2.07 | % | | | (12.85 | %) | | | 4.38 | % | | | 2.23 | % |
Total expenses/(benefit) | | | 3.08 | % | | | (11.80 | %) | | | 5.43 | % | | | 3.39 | % |
| | | | | | | | | | | | | | | | | |
Ratio of Investment Income/(Loss) to Average Net Assets:5 | | | | | | | | | |
Before deferred tax benefit/(expense) | | | 1.69 | % | | | (0.88 | %) | | | (0.45 | %) | | | (1.05 | %) |
Deferred tax benefit9,10 | | | 0.32 | % | | | 0.54 | % | | | 0.56 | % | | | 0.37 | % |
Net investment income/(loss) | | | 2.01 | % | | | (0.34 | %) | | | 0.11 | % | | | (0.68 | %) |
| | | | | | | | | | | | | | | | |
Portfolio turnover rate | | | 22 | % | | | 18 | % | | | 14 | % | | | 4 | % |
* | November 28, 2014 and November 29, 2013 represent the last business day of the Fund’s respective reporting periods. |
1. | Shares commenced operations at the close of business June 28, 2013. |
2. | Effective June 28, 2013, Class I shares were renamed Class Y shares. See Note 1 of the Notes to Financial Statements for additional information. |
3. | Per share amounts calculated based on average shares outstanding during the period net of deferred tax expense/benefit. |
4. | Assumes an initial investment on the business day before the first day of the fiscal period, with all dividends and distributions reinvested in additional shares on the reinvestment date, and redemptions at the net asset value calculated on the last business day of the fiscal period. Sales charges are not reflected in the total returns. Total returns are not annualized for periods less than one full year. Returns do not reflect the deduction of taxes that a shareholder would pay on fund distributions or the redemption of fund shares. The returns do not include adjustments in accordance with generally accepted accounting principles required at the period end for financial reporting purposes. |
5. | Annualized for less than full year. |
6. | Includes borrowing and franchise tax expense. Without borrowing and franchise tax expense, the net expense ratio would be 0.99%, 1.02%, and 1.02% for the year ended November 30, 2016, November 30, 2015, and November 28, 2014, respectively. |
7. | Includes franchise tax expense. Without franchise tax expense the net expense ratio would be 1.14%. |
8. | Deferred tax expense estimate for the ratio calculation is derived from the net investment income/loss, and realized and unrealized gains/losses. |
9. | Effective December 1, 2013 the deferred tax expense and deferred tax benefit are allocated based on average net assets. Prior to December 1, 2013 the deferred tax expense and deferred tax benefit were allocated based on specific class expenses. |
10. | Deferred tax benefit for the ratio calculation is derived from net investment income/loss only. |
See accompanying Notes to Financial Statements.
22 OPPENHEIMER STEELPATH MLP INCOME FUND |
FINANCIAL HIGHLIGHTS (Continued) |
Class Y | | Year Ended November 30,
2016 | | | Year Ended November 30,
2015 | | | Year Ended November 28,
2014* | | | Year Ended November 29,
2013*,1 | | | Year Ended November 30,
2012 1 | |
Per Share Operating Data | | | | | | | | | | | | | | | |
Net Asset Value, Beginning of Period | | $ | 7.91 | | | $ | 11.15 | | | $ | 10.97 | | | $ | 9.89 | | | $ | 10.17 | |
Income/(loss) from investment operations: | | | | | | | | | | | | | | | | | | | | |
Net investment loss2 | | | (0.02 | ) | | | (0.02 | ) | | | (0.04 | ) | | | (0.07 | ) | | | (0.07 | ) |
Return of capital2 | | | 0.41 | | | | 0.48 | | | | 0.48 | | | | 0.49 | | | | 0.49 | |
Net realized and unrealized gains/(losses) | | | 0.11 | | | | (2.92 | ) | | | 0.52 | | | | 1.44 | | | | 0.08 | |
Total from investment operations | | | 0.50 | | | | (2.46 | ) | | | 0.96 | | | | 1.86 | | | | 0.50 | |
Distributions to shareholders: | | | | | | | | | | | | | | | | | | | | |
Return of capital | | | (0.78 | ) | | | (0.78 | ) | | | (0.78 | ) | | | (0.78 | ) | | | (0.70 | ) |
Income | | | — | | | | — | | | | — | | | | — | | | | (0.08 | ) |
Total distributions to shareholders | | | (0.78 | ) | | | (0.78 | ) | | | (0.78 | ) | | | (0.78 | ) | | | (0.78 | ) |
Net asset value, end of period | | $ | 7.63 | | | $ | 7.91 | | | $ | 11.15 | | | $ | 10.97 | | | $ | 9.89 | |
| | | | | | | | | | | | | | | | | | | | |
Total Return, at Net Asset Value3 | | | 7.56 | % | | | (23.11 | %) | | | 8.85 | % | | | 19.19 | % | | | 4.89 | % |
| | | | | | | | | | | | | | | | | | | | | |
Ratios /Supplemental Data | | | | | | | | | | | | | | | | | | | | |
Net assets, end of period (in thousands) | | $ | 859,443 | | | $ | 679,630 | | | $ | 992,009 | | | $ | 535,124 | | | $ | 134,481 | |
Ratio of Expenses to Average Net Assets: | | | | | | | | | | | | | |
Before (waivers) and deferred tax expense/(benefit) | | | 1.24 | % | | | 1.24 | % | | | 1.24 | % | | | 1.18 | % | | | 1.27 | % |
Expense (waivers) | | | (0.12 | %) | | | (0.11 | %) | | | (0.12 | %) | | | (0.07 | %) | | | (0.17 | %) |
Net of (waivers) and before deferred tax expense/(benefit) | | | 1.12 | %4 | | | 1.13 | %4 | | | 1.12 | %4 | | | 1.11 | %5 | | | 1.10 | % |
Deferred tax expense/(benefit)6,7 | | | 2.07 | % | | | (12.85 | %) | | | 4.38 | % | | | 6.68 | % | | | 2.10 | % |
Total expenses/(benefit) | | | 3.19 | % | | | (11.72 | %) | | | 5.50 | % | | | 7.79 | % | | | 3.20 | % |
| | | | | | | | | | | | | | | | | | | | | |
Ratio of Investment Loss to Average Net Assets: | | | | | | | | | | | | | |
Before (waivers) and deferred tax benefit/(expense) | | | (0.72 | %) | | | (0.81 | %) | | | (1.01 | %) | | | (1.08 | %) | | | (1.27 | %) |
Expense (waivers) | | | (0.12 | %) | | | (0.11 | %) | | | (0.12 | %) | | | (0.07 | %) | | | (0.17 | %) |
Net of expense (waivers) and before deferred tax benefit/(expense) | | | (0.60 | %) | | | (0.70 | %) | | | (0.89 | %) | | | (1.01 | %) | | | (1.10 | %) |
Deferred tax benefit7,8 | | | 0.32 | % | | | 0.54 | % | | | 0.56 | % | | | 0.37 | % | | | 0.38 | % |
Net investment loss | | | (0.28 | %) | | | (0.16 | %) | | | (0.33 | %) | | | (0.64 | %) | | | (0.72 | %) |
| | | | | | | | | | | | | | | | | | | | |
Portfolio turnover rate | | | 22 | % | | | 18 | % | | | 14 | % | | | 4 | % | | | 29 | % |
* | November 28, 2014 and November 29, 2013 represent the last business day of the Fund’s respective reporting periods. |
1. | Effective June 28, 2013, Class I shares were renamed Class Y shares. See Note 1 of the Notes to Financial Statements for additional information. |
2. | Per share amounts calculated based on average shares outstanding during the period net of deferred tax expense/benefit. |
3. | Assumes an initial investment on the business day before the first day of the fiscal period, with all dividends and distributions reinvested in additional shares on the reinvestment date, and redemptions at the net asset value calculated on the last business day of the fiscal period. Sales charges are not reflected in the total returns. Total returns are not annualized for periods less than one full year. Returns do not reflect the deduction of taxes that a shareholder would pay on fund distributions or the redemption of fund shares. The returns do not include adjustments in accordance with generally accepted accounting principles required at the period end for financial reporting purposes. |
4. | Includes borrowing and franchise tax expense. Without borrowing and franchise tax expense, the net expense ratio would be 1.10%. |
5. | Includes franchise tax expense. Without franchise tax expense the net expense ratio would be 1.10%. |
6. | Deferred tax expense estimate for the ratio calculation is derived from the net investment income/loss, and realized and unrealized gains/losses. |
7. | Effective December 1, 2013 the deferred tax expense and deferred tax benefit are allocated based on average net assets. Prior to December 1, 2013 the deferred tax expense and deferred tax benefit were allocated based on specific class expenses. |
8. | Deferred tax benefit for the ratio calculation is derived from net investment income/loss only. |
See accompanying Notes to Financial Statements.
OPPENHEIMER STEELPATH MLP INCOME FUND 23 |
NOTES TO FINANCIAL STATEMENTS |
1. Organization
Oppenheimer SteelPath MLP Income Fund (the “Fund”), a separate series of Oppenheimer SteelPath MLP Funds Trust, is a non-diversified open-end management investment company registered under the Investment Company Act of 1940, as amended. The Fund’s investment objective is to seek total return. The Fund’s investment adviser is OFI SteelPath, Inc. (the “Adviser” or “Manager”), a wholly-owned subsidiary of OppenheimerFunds, Inc. (“OFI” or “Oppenheimer”).
The Fund offers Class A, Class C, Class I, and Class Y shares. Effective as of January 25, 2016, the Fund is open to new investors, subject to the terms described in the Prospectus dated March 28, 2016, as supplemented. Effective June 28, 2013, Class I shares were renamed Class Y shares. Class A shares are sold at their offering price, which is normally net asset value plus a front-end sales charge. Effective June 28, 2013 although there is no initial sales charge on Class A purchases totaling $1 million or more, those Class A shares may be subject to a 1.00% contingent deferred sales charge (“CDSC”) if shares are redeemed within an 18-month “holding period” measured from the date of purchase. Class C shares are sold without a front-end sales charge but may be subject to a CDSC of 1.00% of the redemption proceeds if Class C shares are redeemed within one year of purchase. Class I shares are only available to eligible institutional investors. Class I shares are sold at net asset value per share without a sales charge or CDSC. An institutional investor that buys Class I shares for its customers’ accounts may impose charges on those accounts. Class Y shares are sold at net asset value per share without a sales charge directly to institutional investors that have special agreements with OppenheimerFunds Distributor, Inc. (the “Distributor”) for that purpose. They may include insurance companies, registered investment companies, employee benefit plans and section 529 plans, among others. An institutional investor that buys Class Y shares for its customers’ accounts may impose charges on those accounts. All classes of shares have identical rights and voting privileges with respect to the Fund in general and exclusive voting rights on matters that affect that class alone. Earnings, net assets and net asset value per share may differ due to each class having its own expenses, such as transfer and shareholder servicing agent fees and shareholder communications, directly attributable to that class. Class A and C shares have separate distribution and/or service plans under which they pay fees. Class I and Y shares do not pay such fees.
The Fund is an investment company and accordingly follows the investment company accounting and reporting guidance of the Financial Accounting Standards Board (“FASB”) Accounting Standard Codification Topic 946 Financial Services- Investment Companies.
The following is a summary of significant accounting policies followed in the Fund’s preparation of financial statements in accordance with accounting principles generally accepted in the United States (“U.S. GAAP”).
24 OPPENHEIMER STEELPATH MLP INCOME FUND |
NOTES TO FINANCIAL STATEMENTS (Continued) |
2. Significant Accounting Policies
Security Valuation. All investments in securities are recorded at their estimated fair value, as described in Note 3.
Allocation of Income, Expenses, Gains and Losses. Income, expenses (other than those attributable to a specific class), gains and losses are allocated on a daily basis to each class of shares based upon the relative proportion of net assets represented by such class. Operating expenses directly attributable to a specific class are charged against the operations of that class.
Dividends and Distributions to Shareholders. Dividends and distributions to shareholders, which are determined in accordance with income tax regulations and may differ from U.S. generally accepted accounting principles, are recorded on the ex-dividend date. Dividends, if any, are declared and distributed monthly for the Fund. The estimated characterization of the distributions paid will be either a qualified dividend or distribution (return of capital). This estimate is based on the Fund’s operating results during the period. It is anticipated that a significant portion of the distributions will be comprised of return of capital as a result of the tax character of cash distributions made by the Fund’s investments. The actual characterization of the distributions made during the period will not be determined until after the end of the fiscal year. The Fund will inform shareholders of the final tax character of the distributions on IRS Form 1099 DIV in February 2017. For the year ended November 30, 2016, the Fund distributions are expected to be comprised of 100% return of capital.
Return of Capital Estimates. Distributions received from the Fund’s investments in MLPs generally are comprised of income and return of capital. The Fund records investment income and return of capital based on estimates made at the time such distributions are received. Such estimates are based on historical information available from each MLP and other industry sources. These estimates may subsequently be revised based on information received from MLPs after their tax reporting periods are concluded. For the year ended November 30, 2016, the Fund estimated that 100% of the MLP distributions received would be treated as return of capital.
Investment Income. Dividend income is recorded on the ex-dividend date or upon ex-dividend notification in the case of certain foreign dividends where the ex-dividend date may have passed. Non-cash dividends included in dividend income, if any, are recorded at the fair value of the securities received. Interest income is recognized on an accrual basis. Discount and premium, which are included in interest income on the Statement of Operations, if applicable, are amortized or accreted daily.
Custodian Fees. “Custody fees” in the Statement of Operations may include interest expense incurred by the Fund on any cash overdrafts of its custodian account during the period. Such cash overdrafts may result from the effects of failed trades in portfolio securities and from cash outflows resulting from unanticipated shareholder redemption activity. The
OPPENHEIMER STEELPATH MLP INCOME FUND 25 |
NOTES TO FINANCIAL STATEMENTS (Continued) |
2. Significant Accounting Policies (Continued)
Fund pays interest to its custodian on such cash overdrafts, to the extent they are not offset by positive cash balances maintained by the Fund, at a rate equal to the Federal Funds Rate plus 0.50%. The “Reduction to custodian expenses” line item, if applicable, represents earnings on cash balances maintained by the Fund during the period. Such interest expense and other custodian fees may be paid with these earnings.
Security Transactions. Security transactions are recorded on the trade date. Realized gains and losses on securities sold are determined using the basis of identified cost.
Indemnifications. The Fund’s organizational documents provide current and former trustees and officers with a limited indemnification against liabilities arising in connection with the performance of their duties to the Fund. In the normal course of business, the Fund may also enter into contracts that provide general indemnifications. The Fund’s maximum exposure under these arrangements is unknown as this would be dependent on future claims that may be made against the Fund. The risk of material loss from such claims is considered remote.
Federal Income Taxes. The Fund does not intend to qualify as a regulated investment company pursuant to Subchapter M of the Internal Revenue Code, but will rather be taxed as a corporation. As a corporation, the Fund is obligated to pay federal, state and local income tax on taxable income. Currently, the maximum marginal regular federal income tax rate for a corporation is 35 percent. Upon enactment, a change in the federal income tax rate could have a material impact to the Fund. The Fund may be subject to a 20 percent alternative minimum tax on its federal alternative minimum taxable income to the extent that its alternative minimum tax exceeds its regular federal income tax. The Fund is currently using an estimated rate of 1.5 percent for state and local tax, net of federal tax expense.
The Fund’s income tax provision consists of the following as of November 30, 2016:
Current tax expense/(benefit) | | | |
Federal | | $ | — | |
State | | | — | |
Total current tax expense | | $ | — | |
| | | | | |
Deferred tax expense/(benefit) | | | | |
Federal | | $ | 59,059,269 | |
State | | | 4,993,667 | |
Total deferred tax expense | | $ | 64,052,936 | |
26 OPPENHEIMER STEELPATH MLP INCOME FUND |
NOTES TO FINANCIAL STATEMENTS (Continued) |
2. Significant Accounting Policies (Continued)
The reconciliation between the federal statutory income tax rate of 35% and the effective tax rate on net investment income (loss) and realized and unrealized gain (loss) follows:
| | Amount | | | Rate | |
Application of federal statutory income tax rate | | $ | 109,664,735 | | | | 35.00 | % |
State income taxes net of federal benefit | | | 4,699,917 | | | | 1.50 | % |
Effect of state tax rate change | | | 2,462,555 | | | | 0.79 | % |
Effect of permanent differences | | | (273,458 | ) | | | (0.09 | %) |
Change in valuation allowance | | | (52,500,813 | ) | | | (16.76 | %) |
Total income tax expense (benefit) | | $ | 64,052,936 | | | | 20.44 | % |
For the year ended November 30, 2016 the Fund’s effective tax rate of 20.44% (net expense) differed from the combined federal and state statutory tax rate of 36.5% (net expense) mainly due to the change in valuation allowance primarily as a result of the change in unrealized appreciation.
The Fund intends to invest its assets primarily in MLPs, which generally are treated as partnerships for federal income tax purposes. As a limited partner in the MLPs, the Fund reports its allocable share of the MLP’s taxable income in computing its own taxable income. The Fund’s tax expense or benefit will be included in the Statement of Operations based on the component of income or gains (losses) to which such expense or benefit relates. Deferred income taxes reflect the net tax effects of temporary differences between the carrying amounts of assets and liabilities for financial reporting purposes and the amounts used for income tax purposes. Such temporary differences are principally: (i) taxes on unrealized gains/(losses), which are attributable to the temporary difference between fair market value and tax basis, (ii) the net tax effects of temporary differences between the carrying amounts of assets and liabilities for financial reporting and income tax purposes and (iii) the net tax benefit of accumulated net operating losses and capital loss carryforwards. Deferred tax assets and liabilities are measured using effective tax rates expected to apply to taxable income in the years such temporary differences are realized or otherwise settled. To the extent the Fund has a deferred tax asset, consideration is given to whether or not a valuation allowance is required. A valuation allowance is required if, based on the evaluation criterion provided by ASC 740, Income Taxes (ASC 740), it is more-likely-than-not some portion or all of the deferred tax asset will not be realized. Among the factors considered in assessing the Fund’s valuation allowance are: the nature, frequency and severity of current and cumulative losses, forecasts of future profitability, the duration of the statutory carryforward periods, significant redemptions, and the associated risks that operating and capital loss carryforwards may expire unused.
OPPENHEIMER STEELPATH MLP INCOME FUND 27 |
NOTES TO FINANCIAL STATEMENTS (Continued) |
2. Significant Accounting Policies (Continued)
At November 30, 2016, the Fund determined a valuation allowance was not required. In evaluating a valuation allowance on a portion of the deferred tax asset, significant consideration was given to the current and expected level of MLP distributions, unrealized gains and losses on MLP investments and the expiration dates for net operating losses and capital loss carryovers. Market cycles, the severity and duration of historical deferred tax assets and the impact of current and future redemptions were also considered. The Fund intends to assess whether a valuation allowance is required to offset some or all of any deferred tax asset balance in connection with the calculation of the Fund’s daily NAV; however, to the extent the final valuation allowance differs from the estimates of the Fund used in calculating the Fund’s daily NAV, the application of such final valuation allowance in these Financial Statements could have a material impact on the Fund’s NAV. Through the consideration of these factors, the Fund has determined that it is more likely than not the deferred tax asset, net of the valuation allowance, if required, will be realized.
Unexpected significant decreases in cash distributions from the Fund’s MLP investments, significant declines in the fair value of its investments, significant redemptions, or increased risk of expiring net operating losses or capital loss carryovers may change the Fund’s assessment regarding the recoverability of its deferred tax assets and may result in a change to the valuation allowance. Modifications of the valuation allowance could have a material impact on the Fund’s net asset value.
Components of the Fund’s deferred tax assets and liabilities as of November 30, 2016 are as follows:
Deferred tax assets: | | | |
Net operating loss carryforward (tax basis) | | $ | 204,091,121 | |
Capital loss carryforward (tax basis) | | | 192,089,996 | |
Book to tax differences - Income recognized from MLPs | | | 5,115,697 | |
Total deferred tax asset | | | 401,296,814 | |
| | | | | |
Deferred tax liabilities: | | | | |
Net unrealized gains on investment securities (tax basis) | | $ | (214,205,670 | ) |
Total deferred tax liability | | | (214,205,670 | ) |
| | | | | |
Total net deferred tax asset/(liability) | | $ | 187,091,144 | |
The Fund may rely, to some extent, on information provided by the MLPs, which may not necessarily be timely, to estimate taxable income allocable to MLP units held in its portfolio, and to estimate its associated deferred tax liability or asset. Such estimates are made in good faith. From time to time, as new information becomes available, the Fund will modify its estimates or assumptions regarding its tax liability or asset.
28 OPPENHEIMER STEELPATH MLP INCOME FUND |
NOTES TO FINANCIAL STATEMENTS (Continued) |
2. Significant Accounting Policies (Continued)
The Fund’s policy is to classify interest and penalties associated with underpayment of federal and state income taxes, if any, as income tax expense on its Statement of Operations. As of November 30, 2016, the Fund does not have any interest or penalties associated with the underpayment of any income taxes.
The Fund files income tax returns in the U.S. federal jurisdiction and various states. The Fund has reviewed all major jurisdictions and concluded that there is no significant impact on the Fund’s net assets and no tax liability resulting from unrecognized tax benefits relating to uncertain tax positions expected to be taken on its tax returns. Furthermore, management of the Fund is not aware of any uncertain tax positions for which it is reasonably possible that the total amount of unrecognized tax benefit will significantly change in the next 12 months.
At November 30, 2016, the Fund had net operating loss carryforwards for federal income tax purposes, which may be carried forward for 20 years, as follows:
Expiration Date | | | |
11/30/2030 | | $ | 3,877 | |
11/30/2031 | | | 4,997,354 | |
11/30/2032 | | | 7,401,746 | |
11/30/2033 | | | 47,597,832 | |
11/30/2034 | | | 159,225,802 | |
11/30/2035 | | | 258,885,745 | |
11/30/2036 | | | 81,041,405 | |
Total | | $ | 559,153,761 | |
At November 30, 2016, the Fund had net capital loss carryforwards for federal income tax purposes, which may be carried forward for 5 years, as follows:
Expiration Date | | | |
11/30/2021 | | $ | 526,273,960 | |
Total | | $ | 526,273,960 | |
At November 30, 2016, gross unrealized appreciation and depreciation of investments, based on cost for federal income tax purposes were as follows:
Cost of Investments | | $ | 2,986,293,026 | |
Gross Unrealized Appreciation | | $ | 883,074,319 | |
Gross Unrealized Depreciation | | | (291,017,437 | ) |
Net Unrealized Appreciation (Depreciation) on Investments | | $ | 592,056,882 | |
OPPENHEIMER STEELPATH MLP INCOME FUND 29 |
NOTES TO FINANCIAL STATEMENTS (Continued) |
2. Significant Accounting Policies (Continued)
The difference between cost amounts for financial statement and federal income tax purposes is due primarily to timing differences in recognizing certain gains and losses in security transactions.
Use of Estimates. The preparation of financial statements in conformity with U.S. GAAP requires management to make estimates and assumptions that affect the reported amounts of assets and liabilities and disclosure of contingent assets and liabilities at the date of the financial statements and the reported amounts of increases and decreases in net assets from operations during the reporting period. Actual results could differ from those estimates.
3. Securities Valuation
The Fund calculates the net asset value of its shares as of 4:00 P.M. Eastern time, on each day the New York Stock Exchange (the “Exchange”) is open for trading, except in the case of a scheduled early closing of the Exchange, in which case the Fund will calculate net asset value of the shares as of the scheduled early closing time of the Exchange.
The Fund’s Board of Trustees (the “Board”) has adopted procedures for the valuation of the Fund’s securities and has delegated the day-to-day responsibility for valuation determinations under those procedures to the Adviser. The Adviser has established a Valuation Committee which is responsible for determining a “fair valuation” for any security for which market quotations are not “readily available.” The Valuation Committee’s fair valuation determinations are subject to review, approval and ratification by the Fund’s Board at its next regularly scheduled meeting covering the calendar quarter in which the fair valuation was determined.
Valuation Methods and Inputs
Securities are valued using unadjusted quoted market prices, when available, as supplied primarily by third party pricing services or dealers.
The following methodologies are used to determine the market value or the fair value of the types of securities described below:
Equity securities traded on a securities exchange (including exchange-traded derivatives other than futures and futures options) are valued based on the official closing price on the principal exchange on which the security is traded, as identified by the Manager, prior to the time when the Fund’s assets are valued. If the official closing price is unavailable, the security is valued at the last sale price on the principal exchange on which it is traded. If the official closing price or last sales price for a foreign security is not available, the security is valued at the mean between the bid and asked price per the exchange or, if not available from the exchange, obtained from two dealers. If bid and asked prices are not available from either the exchange or two dealers,
30 OPPENHEIMER STEELPATH MLP INCOME FUND |
NOTES TO FINANCIAL STATEMENTS (Continued) |
3. Securities Valuation (Continued)
the security is valued by using one of the following methodologies (listed in order of priority): (1) a bid from the exchange, (2) the mean between the bid and asked price as provided by a single dealer, or (3) a bid from a single dealer.
Shares of a registered investment company that are not traded on an exchange are valued at that investment company’s net asset value per share.
Corporate and government debt securities (of U.S. or foreign issuers) and municipal debt securities, event-linked bonds, loans, mortgage-backed securities, collateralized mortgage obligations, and asset-backed securities are valued at the mean between the “bid” and “asked” prices utilizing evaluated prices obtained from third party pricing services or broker-dealers who may use matrix pricing methods to determine the evaluated prices.
Short-term money market type debt securities are valued at the mean between the “bid” and “asked” prices utilizing evaluated prices obtained from third party pricing services or broker-dealers.
A description of the standard inputs that may generally be considered by the third party pricing vendors in determining their evaluated prices is provided below.
Security Type | | Standard inputs generally considered by third-party pricing vendors |
Corporate debt, government debt, municipal, mortgage-backed and asset-backed securities | | Reported trade data, broker-dealer price quotations, benchmark yields, issuer spreads on comparable securities, the credit quality, yield, maturity, and other appropriate factors. |
Loans | | Information obtained from market participants regarding reported trade data and broker-dealer price quotations. |
Event-linked bonds | | Information obtained from market participants regarding reported trade data and broker-dealer price quotations. |
If a market value or price cannot be determined for a security using the methodologies described above, or if, in the “good faith” opinion of the Adviser, the market value or price obtained does not constitute a “readily available market quotation,” or a significant event has occurred that would materially affect the value of the security, the security is fair valued either (i) by a standardized fair valuation methodology applicable to the security type or the significant event as previously approved by the Valuation Committee and the Fund’s Board or (ii) as determined in good faith by the Adviser’s Valuation Committee. The Valuation Committee considers all relevant facts that are reasonably available, through either public information or
OPPENHEIMER STEELPATH MLP INCOME FUND 31 |
NOTES TO FINANCIAL STATEMENTS (Continued) |
3. Securities Valuation (Continued)
information available to the Adviser, when determining the fair value of a security. Fair value determinations by the Adviser are subject to review, approval and ratification by the Fund’s Board at its next regularly scheduled meeting covering the calendar quarter in which the fair valuation was determined. Those fair valuation standardized methodologies include, but are not limited to, valuing securities at the last sale price or initially at cost and subsequently adjusting the value based on: changes in company specific fundamentals, changes in an appropriate securities index, or changes in the value of similar securities which may be further adjusted for any discounts related to security-specific resale restrictions. When possible, such methodologies use observable market inputs such as unadjusted quoted prices of similar securities, observable interest rates, currency rates and yield curves. The methodologies used for valuing securities are not necessarily an indication of the risks associated with investing in those securities nor can it be assured that the Fund can obtain the fair value assigned to a security if it were to sell the security.
To assess the continuing appropriateness of security valuations, the Adviser, or its third party service provider who is subject to oversight by the Adviser, regularly compares prior day prices, prices on comparable securities, and sale prices to the current day prices and challenges those prices exceeding certain tolerance levels with the third party pricing service or broker source. For those securities valued by fair valuations, whether through a standardized fair valuation methodology or a fair valuation determination, the Valuation Committee reviews and affirms the reasonableness of the valuations based on such methodologies and fair valuation determinations on a regular basis after considering all relevant information that is reasonably available.
Classifications
Each investment asset or liability of the Fund is assigned a level at measurement date based on the significance and source of the inputs to its valuation. Various data inputs are used in determining the value of each of the Fund’s investments as of the reporting period end. These data inputs are categorized in the following hierarchy under applicable financial accounting standards:
| | 1) | Level 1-unadjusted quoted prices in active markets for identical assets or liabilities (including securities actively traded on a securities exchange) |
| | 2) | Level 2-inputs other than unadjusted quoted prices that are observable for the asset or liability (such as unadjusted quoted prices for similar assets and market corroborated inputs such as interest rates, prepayment speeds, credit risks, etc.) |
| | 3) | Level 3-significant unobservable inputs (including the Adviser’s own judgments about assumptions that market participants would use in pricing the asset or liability) |
32 OPPENHEIMER STEELPATH MLP INCOME FUND |
NOTES TO FINANCIAL STATEMENTS (Continued) |
3. Securities Valuation (Continued)
The inputs used for valuing securities are not necessarily an indication of the risks associated with investing in those securities.
The table below categorizes amounts that are included in the Fund’s Statement of Assets and Liabilities as of November 30, 2016 based on valuation input level:
| | Level 1 — Unadjusted Quoted Prices | | | Level 2 —
Other Significant Observable Inputs | | | Level 3 —
Significant Unobservable Inputs | | | Value | |
Assets Table | | | | | | | | | | | | |
Investments, at Value: | | | | | | | | | | | | |
Master Limited Partnership Shares* | | $ | 3,273,920,695 | | | $ | — | | | $ | — | | | $ | 3,273,920,695 | |
Common Stocks* | | | 237,823,349 | | | | — | | | | — | | | | 237,823,349 | |
Preferred Master Limited Partnership Shares* | | | 14,037,226 | | | | — | | | | 44,926,890 | | | | 58,964,116 | |
Short Term Investment | | | 7,641,748 | | | | — | | | | — | | | | 7,641,748 | |
Total Assets | | $ | 3,533,423,018 | | | $ | — | | | $ | 44,926,890 | | | $ | 3,578,349,908 | |
* | For a detailed break-out of securities by major industry classification, please refer to the Statement of Investments. |
Following is a reconciliation of assets in which significant unobservable inputs (Level 3) were used in determining value:
Beginning balance November 30, 2015 | | $ | — | |
Transfers into Level 3 during the period | | | — | |
Change in unrealized appreciation/(depreciation) | | | 2,283,359 | |
Total realized gain/(loss) | | | — | |
Purchases | | | 45,000,000 | |
Sales | | | — | |
Return of capital distributions | | | (2,356,469 | ) |
Transfers out of Level 3 during the period | | | — | |
Ending balance November 30, 2016 | | $ | 44,926,890 | |
The total change in unrealized appreciation/depreciation included in the Statement of Operations attributable to Level 3 investments still held at November 30, 2016 is $(73,110).
OPPENHEIMER STEELPATH MLP INCOME FUND 33 |
NOTES TO FINANCIAL STATEMENTS (Continued) |
3. Securities Valuation (Continued)
The following table summarizes the valuation techniques and significant unobservable inputs used in determining fair value measurements for those investments classified as Level 3 as of November 30, 2016:
Type of Investment | | Values as of
November 30,
2016 | | Valuation
Technique | Unobservable
Input | | Range of
Unobservable
Inputs | | | Unobservable
Input Used | |
Preferred Master Limited Partnership Shares | | $ | 14,881,890 | | Discounted Cash Flow Model | Estimated yield | | | 8.1% - 13.2 | % | | | 11.4 | %(a) |
| | | | | | | Illiquidity Discount | | | N/A | | | | 7 | %(a) |
| | | | 30,045,000 | | Discounted Cash Flow Model | Estimated yield | | | 9.5% - 15.5 | % | | | 13.2 | %(b) |
| | | | | | | Illiquidity Discount | | | N/A | | | | 7 | %(b) |
Total | | $ | 44,926,890 | | | | | | | | | | | |
(a) | The Fund fair values certain preferred shares using a discounted cash flow model which values the shares at the expected value of common units to be received in PIK conversion based on: the current price of the common shares (observable), the 20-day volume weighted average price (VWAP) of the common shares (observable), the 3-day volume weighted average price of the common shares (observable), and a discount rate, which is derived from the estimated yield and an illiquidity discount. Such security’s fair valuation could decrease (increase) significantly based on an increase (decrease) in the illiquidity discount. Such security’s fair valuation could increase (decrease) significantly based on an increase (decrease) in expected yields. |
(b) | The Fund fair values certain preferred shares using a discounted cash flow model, which incorporates an illiquidity discount and the expected yield based on the average yield on comparable companies’ equity. Such security’s fair valuation could decrease (increase) significantly based on an increase (decrease) in the illiquidity discount. Such security’s fair valuation could decrease (increase) significantly based on an increase (decrease) in expected yields. |
There have been no transfers between pricing levels for the Fund. It is the Fund’s policy to recognize transfers at the beginning of the reporting period.
34 OPPENHEIMER STEELPATH MLP INCOME FUND |
NOTES TO FINANCIAL STATEMENTS (Continued) |
4. Investments and Risks
Equity Security Risk. Stocks and other equity securities fluctuate in price. The value of the Fund’s portfolio may be affected by changes in the equity markets generally. Equity markets may experience significant short-term volatility and may fall sharply at times. Different markets may behave differently from each other and U.S. equity markets may move in the opposite direction from one or more foreign stock markets. Adverse events in any part of the equity or fixed-income markets may have unexpected negative effects on other market segments.
The prices of individual equity securities generally do not all move in the same direction at the same time and a variety of factors can affect the price of a particular company’s securities. These factors may include, but are not limited to, poor earnings reports, a loss of customers, litigation against the company, general unfavorable performance of the company’s sector or industry, or changes in government regulations affecting the company or its industry.
Master Limited Partnerships (“MLPs”). Under normal circumstances, the Fund invests at least 80% of its net assets (plus the amount of borrowings for investment purposes) in the equity securities of MLPs.
MLPs issue common units that represent an equity ownership interest in a partnership and provide limited voting rights. MLP common units are registered with the Securities and Exchange Commission (“SEC”), and are freely tradable on securities exchanges such as the NYSE and the NASDAQ Stock Market (“NASDAQ”), or in the over-the-counter (“OTC”) market. An MLP consists of one or more general partners, who conduct the business, and one or more limited partners, who contribute capital. MLP common unit holders have a limited role in the partnership’s operations and management. The Fund, as a limited partner, normally would not be liable for the debts of the MLP beyond the amounts the Fund has contributed, but would not be shielded to the same extent that a shareholder of a corporation would be. In certain circumstances creditors of an MLP would have the right to seek return of capital distributed to a limited partner. This right of an MLP’s creditors would continue after the Fund sold its investment in the MLP.
Restricted Securities. At period end, investments in securities included issues that are restricted. A restricted security may have a contractual restriction on its resale and is valued under methods approved by the Board of Trustees as reflecting fair value. Securities that are restricted are marked with an applicable footnote on the Statement of Investments. Restricted securities are reported on a schedule following the Statement of Investments.
Concentration Risk. Under normal circumstances, the Fund invests at least 80% of its net assets (plus the amount of any borrowing for investment purposes) in the equity securities of MLPs. MLPs are subject to certain risks, such as supply and demand risk, depletion and exploration risk, commodity pricing risk, acquisition risk, and the risk associated with the hazards inherent in midstream energy industry activities. A substantial portion of the cash
OPPENHEIMER STEELPATH MLP INCOME FUND 35 |
NOTES TO FINANCIAL STATEMENTS (Continued) |
4. Investments and Risks (Continued)
flow received by the Fund is derived from investment in equity securities of MLPs. The amount of cash that a MLP has available for distributions, and the tax character of such distributions, are dependent upon the amount of cash generated by the MLP’s operations.
5. Market Risk Factors
The Fund’s investments in securities and/or financial derivatives may expose the Fund to various market risk factors:
Commodity Risk. Commodity risk relates to the change in value of commodities or commodity indexes as they relate to increases or decreases in the commodities market. Commodities are physical assets that have tangible properties. Examples of these types of assets are crude oil, heating oil, metals, livestock, and agricultural products.
Credit Risk. Credit risk relates to the ability of the issuer of debt to meet interest and principal payments, or both, as they come due. In general, lower-grade, higher-yield debt securities are subject to credit risk to a greater extent than lower-yield, higher-quality securities.
Equity Risk. Equity risk relates to the change in value of equity securities as they relate to increases or decreases in the general market.
Foreign Exchange Rate Risk. Foreign exchange rate risk relates to the change in the U.S. dollar value of a security held that is denominated in a foreign currency. The U.S. dollar value of a foreign currency denominated security will decrease as the dollar appreciates against the currency, while the U.S. dollar value will increase as the dollar depreciates against the currency.
Interest Rate Risk. Interest rate risk refers to the fluctuations in value of fixed-income securities resulting from the inverse relationship between price and yield. For example, an increase in general interest rates will tend to reduce the market value of already issued fixed-income investments, and a decline in general interest rates will tend to increase their value. In addition, debt securities with longer maturities, which tend to have higher yields, are subject to potentially greater fluctuations in value from changes in interest rates than obligations with shorter maturities.
Volatility Risk. Volatility risk refers to the magnitude of the movement, but not the direction of the movement, in a financial instrument’s price over a defined time period. Large increases or decreases in a financial instrument’s price over a relative time period typically indicate greater volatility risk, while small increases or decreases in its price typically indicate lower volatility risk.
36 OPPENHEIMER STEELPATH MLP INCOME FUND |
NOTES TO FINANCIAL STATEMENTS (Continued) |
6. Shares of Beneficial Interest
The Fund has authorized an unlimited number of $0.001 par value shares of beneficial interest of each class. Transactions in shares of beneficial interest were as follows:
| | | Year Ended
November 30, 2016 | | | Year Ended
November 30, 2015 | |
| | | | | | | |
| | Shares | | | Amount | | | Shares | | | Amount | |
Class A | | | | | | | | | | | | |
Sold | | | 99,080,823 | | | $ | 688,572,838 | | | | 35,380,577 | | | $ | 348,141,667 | |
Dividends and/or distributions reinvested | | | 19,124,478 | | | | 134,212,798 | | | | 13,058,047 | | | | 123,846,156 | |
Redeemed | | | (67,332,630 | ) | | | (465,327,610 | ) | | | (66,506,535 | ) | | | (637,776,847 | ) |
Net Increase/(Decrease) | | | 50,872,671 | | | $ | 357,458,026 | | | | (18,067,911 | ) | | $ | (165,789,024 | ) |
| | | | | | | | | | | | | | | | |
Class C | | | | | | | | | | | | | | | | |
Sold | | | 44,246,838 | | | $ | 297,646,619 | | | | 15,795,255 | | | $ | 153,334,034 | |
Dividends and/or distributions reinvested | | | 16,703,083 | | | | 111,919,047 | | | | 12,311,750 | | | | 113,080,215 | |
Redeemed | | | (38,483,394 | ) | | | (252,217,782 | ) | | | (40,704,320 | ) | | | (375,493,276 | ) |
Net Increase/(Decrease) | | | 22,466,527 | | | $ | 157,347,884 | | | | (12,597,315 | ) | | $ | (109,079,027 | ) |
| | | | | | | | | | | | | | | | |
Class I | | | | | | | | | | | | | | | | |
Sold | | | 2,596,857 | | | $ | 20,445,968 | | | | 19,560 | | | $ | 183,775 | |
Dividends and/or distributions reinvested | | | 75,809 | | | | 580,892 | | | | 1,788 | | | | 16,866 | |
Redeemed | | | (75,276 | ) | | | (573,570 | ) | | | (21,409 | ) | | | (215,702 | ) |
Net Increase/(Decrease) | | | 2,597,390 | | | $ | 20,453,290 | | | | (61 | ) | | $ | (15,061 | ) |
| | | | | | | | | | | | | | | | |
Class Y | | | | | | | | | | | | | | | | |
Sold | | | 63,838,365 | | | $ | 445,760,663 | | | | 36,697,084 | | | $ | 358,015,218 | |
Dividends and/or distributions reinvested | | | 10,220,369 | | | | 73,088,148 | | | | 7,008,979 | | | | 67,280,120 | |
Redeemed | | | (47,312,989 | ) | | | (327,618,189 | ) | | | (46,759,236 | ) | | | (450,360,093 | ) |
Net Increase/(Decrease) | | | 26,745,745 | | | $ | 191,230,622 | | | | (3,053,173 | ) | | $ | (25,064,755 | ) |
OPPENHEIMER STEELPATH MLP INCOME FUND 37 |
NOTES TO FINANCIAL STATEMENTS (Continued) |
7. Purchases and Sales of Securities
The aggregate cost of purchases and proceeds from sales of securities, other than short-term obligations, for the year ended November 30, 2016, were as follows:
| | Purchases | | | Sales | |
Investment securities | | $ | 1,288,005,086 | | | $ | 650,181,461 | |
8. Fees and Other Transactions with Affiliates
Management Fees. Under the investment advisory agreement, the Fund pays the Manager a management fee based on the daily net assets of the Fund at an annual rate as shown in the following table:
Net Assets up to $3 Billion | Net Assets Greater than
$3 Billion and up to $5 Billion | Net Assets in Excess of $5 Billion |
0.95% | 0.93% | 0.90% |
The Fund’s effective management fee for the year ended November 30, 2016 was 0.95% of average annual net assets before any applicable waivers.
Transfer Agent Fees. OFI Global (the “Transfer Agent”) serves as the transfer and shareholder servicing agent for the Fund. The Fund pays the Transfer Agent a fee based on annual net assets. Fees incurred with respect to these services are detailed in the Statement of Operations.
Sub-Transfer Agent Fees. The Transfer Agent has retained Shareholder Services, Inc., a wholly-owned subsidiary of OFI (the “Sub-Transfer Agent”), to provide the day-to-day transfer agent and shareholder servicing of the Fund. Under the Sub-Transfer Agency Agreement, the Transfer Agent pays the Sub-Transfer Agent an annual fee in monthly installments, equal to a percentage of the transfer agent fee collected by the Transfer Agent from the Fund, which shall be calculated after any applicable fee waivers. The fee paid to the Sub-Transfer Agent is paid by the Transfer Agent, not by the Fund.
Trustees’ Compensation. The Board has adopted a compensation deferral plan for independent trustees that enables trustees to elect to defer receipt of all or a portion of the annual compensation they are entitled to receive from the Fund. For purposes of determining the amount owed to the Trustee under the plan, deferred amounts are treated as though equal dollar amounts had been invested in shares of the Fund or in other Oppenheimer funds selected by the Trustee. The Fund purchases shares of the funds selected for deferral by the Trustee in amounts equal to his or her deemed investment, resulting in a Fund asset equal to the deferred compensation liability. Such assets are included as a component of
38 OPPENHEIMER STEELPATH MLP INCOME FUND |
NOTES TO FINANCIAL STATEMENTS (Continued) |
8. Fees and Other Transactions with Affiliates (Continued)
“Other” within the asset section of the Statement of Assets and Liabilities, if applicable. Deferral of trustees’ fees under the plan will not affect the net assets of the Fund, and will not materially affect the Fund’s assets, liabilities or net investment income per share. Amounts will be deferred until distributed in accordance with the compensation deferral plan.
Distribution and Service Plan (12b-1) Fees. Under its General Distributor’s Agreement with the Fund, the Distributor acts as the Fund’s principal underwriter in the continuous public offering of the Fund’s classes of shares.
Service Plan for Class A Shares. The Fund has adopted a Service Plan (the “Plan”) for Class A shares under Rule 12b-1 of the Investment Company Act of 1940. Under the Plan, the Fund reimburses the Distributor for a portion of its costs incurred for services provided to accounts that hold Class A shares. Reimbursement is made periodically at an annual rate of up to 0.25% of the daily net assets of Class A shares of the Fund. The Distributor currently uses all of those fees to pay dealers, brokers, banks and other financial institutions periodically for providing personal service and maintenance of accounts of their customers that hold Class A shares. Any unreimbursed expenses the Distributor incurs with respect to Class A shares in any fiscal year cannot be recovered in subsequent periods. Fees incurred by the Fund under the Plan are detailed in the Statement of Operations.
Distribution and Service Plans for Class C Shares. The Fund has adopted Distribution and Service Plans (the “Plans”) for Class C shares under Rule 12b-1 of the Investment Company Act of 1940 to compensate the Distributor for distributing those share classes, maintaining accounts and providing shareholder services. Under the Plans, the Fund pays the Distributor an annual asset-based sales charge of 0.75% on Class C shares daily net assets. The Fund also pays a service fee under the Plans at an annual rate of 0.25% of daily net assets.
The Plan and Plans continue in effect from year to year only if the Fund’s Board votes annually to approve their continuance at an in person meeting called for that purpose. Fees incurred by the Fund under the Plans are detailed in the Statement of Operations.
OPPENHEIMER STEELPATH MLP INCOME FUND 39 |
NOTES TO FINANCIAL STATEMENTS (Continued) |
8. Fees and Other Transactions with Affiliates (Continued)
Sales Charges. Front-end sales charges and CDSC do not represent expenses of the Fund. They are deducted from the proceeds of sales of Fund shares prior to investment or from redemption proceeds prior to remittance, as applicable. The sales charges retained by the Distributor from the sale of shares and the CDSC retained by the Distributor on the redemption of shares is shown in the following table for the period indicated.
Year Ended | | Class A Front-End Sales Charges Retained by Distributor | | | Class A Contingent Deferred Sales Charges Retained by Distributor | | | Class C Contingent Deferred Sales Charges Retained by Distributor | |
November 30, 2016 | | $ | 2,371,164 | | | $ | 6,858 | | | $ | 83,096 | |
Waivers and Reimbursements of Expenses. The Manager has contractually agreed to limit fees and/or reimburse expenses of the Fund to the extent that the Fund’s total annual fund operating expenses (exclusive of interest, taxes, such as deferred tax expenses, brokerage commissions, acquired fund fees and expenses, dividend costs related to short sales, and litigation expense, if any) exceed 1.35% for Class A shares, 2.10% for Class C shares, and 1.10% for Class Y shares.
The Fund’s total annual operating expenses after fee waiver and/or expense reimbursement (“Net Expenses”) will be higher than these amounts to the extent that the Fund incurs expenses excluded from the expense cap. Because the Fund’s deferred income tax expense/(benefit) and borrowing fees are excluded from the expense cap, the Fund’s Net Expenses for each class of shares is increased/(decreased) by the amount of this expense. During the year ended November 30, 2016, the Manager reimbursed $1,608,024, $1,194,846, and $790,237 for Class A, Class C, and Class Y, respectively. This undertaking may not be modified or terminated until after one year from the date of the current prospectus, as indicated therein, unless approved by the Fund’s Board of Trustees.
The Manager can be reimbursed by the Fund within three years after the date the fee limitation and/or expense reimbursement has been made by the Manager, provided that such repayment does not cause the expenses of any class of the Fund to exceed the foregoing limits.
The following table represents amounts eligible for recovery at November 30, 2016:
Eligible Expense Recoupment Expiring: | | | |
November 30, 2017 | | $ | 4,687,900 | |
November 30, 2018 | | | 4,433,066 | |
November 30, 2019 | | | 3,593,107 | |
40 OPPENHEIMER STEELPATH MLP INCOME FUND |
NOTES TO FINANCIAL STATEMENTS (Continued) |
8. Fees and Other Transactions with Affiliates (Continued)
During the year ended November 30, 2016, the Adviser did not recoup any expenses.
Related Party. The Interested Trustees and officers of the Fund are also officers or trustees of companies affiliated with the Manager, Distributor, and Transfer Agent.
9. Borrowing Agreement
The Fund, along with Oppenheimer SteelPath MLP Alpha Plus Fund, Oppenheimer SteelPath MLP Alpha Fund, and Oppenheimer SteelPath MLP Select 40 Fund (collectively, the “Trust”), is a borrower in a $700 million revolving credit agreement (the “Loan Agreement”) with a major lending institution (the “Lender”). The Fund is permitted to borrow up to the lesser of one-third of the Fund’s total assets, or the maximum amount permitted pursuant to the Fund’s investment limitations. The borrowing, if any, is fully collateralized throughout the term of the borrowing with securities or other assets of the Fund. The Fund is not liable for borrowings of other Funds in the Trust. Securities that have been pledged as collateral for the borrowing are indicated in the Statement of Investments.
Borrowings under the Loan Agreement are charged interest at a calculated rate computed by the Lender based on the one month LIBOR rate plus 0.65% per annum. An unused commitment fee at the rate of 0.125% per annum is charged for any undrawn portion of the credit facility, and each member of the Trust will pay its pro rata share of this fee. A facility fee of 0.20% was charged on the commitment amount, and each party of the Trust paid its pro rata share of this fee. The borrowing is due November 17, 2017, unless another date is mutually agreed upon by the parties of the Loan Agreement. For the year ended November 30, 2016, the Fund paid $659,039 in borrowing fees. The Fund did not utilize the facility during the year ended November 30, 2016.
10. Pending Litigation
In 2009, several putative class action lawsuits were filed and later consolidated before the U.S. District Court for the District of Colorado in connection with the investment performance of Oppenheimer Rochester California Municipal Fund (the “California Fund”), a fund advised by OppenheimerFunds, Inc. (“OFI”) – the parent company of the manager and distributed by OppenheimerFunds Distributor, Inc. (“OFDI”). The plaintiffs asserted claims against OFI, OFDI and certain present and former trustees and officers of the California Fund under the federal securities laws, alleging, among other things, that the disclosure documents of the California Fund contained misrepresentations and omissions and the investment policies of the California Fund were not followed. An amended complaint and a motion to dismiss were filed, and in 2011, the court issued an order which granted in part and denied in part the
OPPENHEIMER STEELPATH MLP INCOME FUND 41 |
NOTES TO FINANCIAL STATEMENTS (Continued) |
10. Pending Litigation (Continued)
defendants’ motion to dismiss. In October 2015, following a successful appeal by defendants and a subsequent hearing, the court granted plaintiffs’ motion for class certification and appointed class representatives and class counsel.
OFI and OFDI believe the suit is without merit; that it is premature to render any opinion as to the likelihood of an outcome unfavorable to them in the Suit; and that no estimate can yet be made as to the amount or range of any potential loss. Furthermore, OFI believes that the suit should not impair the ability of OFI or OFDI to perform their respective duties to the Fund and that the outcome of the suit should not have any material effect on the operations of any of the Oppenheimer funds.
42 OPPENHEIMER STEELPATH MLP INCOME FUND |
REPORT OF INDEPENDENT REGISTERED PUBLIC
ACCOUNTING FIRM |
To the Shareholders of Oppenheimer SteelPath MLP Income Fund and
Board of Trustees of Oppenheimer SteelPath MLP Funds Trust
We have audited the accompanying statement of assets and liabilities, including the statement of investments, of Oppenheimer SteelPath MLP Income Fund (the “Fund”), a series of Oppenheimer SteelPath MLP Funds Trust, as of November 30, 2016, and the related statement of operations for the year then ended, the statements of changes in net assets for each of the two years in the period then ended, and the financial highlights for each of the five years in the period then ended. These financial statements and financial highlights are the responsibility of the Fund’s management. Our responsibility is to express an opinion on these financial statements and financial highlights based on our audits.
We conducted our audits in accordance with the standards of the Public Company Accounting Oversight Board (United States). Those standards require that we plan and perform the audit to obtain reasonable assurance about whether the financial statements and financial highlights are free of material misstatement. An audit includes examining, on a test basis, evidence supporting the amounts and disclosures in the financial statements. Our procedures included confirmation of securities owned as of November 30, 2016, by correspondence with the custodian and brokers or by other auditing procedures as appropriate in the circumstances. An audit also includes assessing the accounting principles used and significant estimates made by management, as well as evaluating the overall financial statement presentation. We believe that our audits provide a reasonable basis for our opinion.
In our opinion, the financial statements and financial highlights referred to above present fairly, in all material respects, the financial position of Oppenheimer SteelPath MLP Income Fund as of November 30, 2016, the results of its operations for the year then ended, the changes in its net assets for each of the two years in the period then ended, and the financial highlights for each of the five years in the period then ended, in conformity with accounting principles generally accepted in the United States of America.

COHEN & COMPANY, LTD.
Cleveland, Ohio
January 25, 2017
OPPENHEIMER STEELPATH MLP INCOME FUND 43 |
BOARD APPROVAL OF THE FUND’S INVESTMENT
ADVISORY AGREEMENT Unaudited |
The Fund has entered into an investment advisory agreement (the “Agreement”) with OFI SteelPath, Inc. (“OFI SteelPath” or the “Manager”). Each year, the Board of Trustees (the “Board”), including a majority of the independent Trustees, is required to determine whether to approve the terms of the Agreement and the renewal thereof. The Investment Company Act of 1940, as amended, requires that the Board request and evaluate, and that the Manager provide, such information as may be reasonably necessary to evaluate the terms of the Agreement. The Board employs an independent consultant to prepare a report that provides information, including comparative information that the Board requests for that purpose. In addition to in-person meetings focused on this evaluation, the Board receives information throughout the year regarding Fund services, fees, expenses and performance.
The Manager and the independent consultant provided information to the Board on the following factors: (i) the nature, quality and extent of the Manager’s services, (ii) the comparative investment performance of the Fund and the Manager, (iii) the fees and expenses of the Fund, including comparative fee and expense information, (iv) the profitability of the Manager and its affiliates, including an analysis of the cost of providing services, (v) whether economies of scale are realized as the Fund grows and whether fee levels reflect these economies of scale for Fund investors and (vi) other benefits to the Manager from its relationship with the Fund. The Board was aware that there are alternatives to retaining the Manager.
Outlined below is a summary of the principal information considered by the Board as well as the Board’s conclusions.
Nature, Quality and Extent of Services. The Board considered information about the nature, quality and extent of the services provided to the Fund and information regarding the Manager’s key personnel who provide such services. The Manager’s duties include providing the Fund with the services of the portfolio managers and investment team, who provide research, analysis and other advisory services in regard to the Fund’s investments; and securities trading services. The Manager is responsible for oversight of third-party service providers; monitoring compliance with applicable Fund policies and procedures and adherence to the Fund’s investment restrictions; and risk management. The Manager is also responsible for providing certain administrative services to the Fund. Those services, some of which are performed by affiliates of the Manager, include providing and supervising all administrative and clerical personnel who are necessary in order to provide effective corporate administration for the Fund; compiling and maintaining records with respect to the Fund’s operations; preparing and filing reports required by the U.S. Securities and Exchange Commission; preparing periodic reports regarding the operations of the Fund for its shareholders; preparing proxy materials for shareholder meetings; and preparing the registration statements required by federal and state securities laws for the sale of the Fund’s shares. The Manager also provides the Fund with office space, facilities and equipment.
44 OPPENHEIMER STEELPATH MLP INCOME FUND |
BOARD APPROVAL OF THE FUND’S INVESTMENT
ADVISORY AGREEMENT Unaudited / (Continued) |
The Board also considered the quality of the services provided and the quality of the Manager’s resources that are available to the Fund. In evaluating the Manager, the Board considered the history, reputation, qualification and background of the Manager, including its corporate parent, OppenheimerFunds, Inc. (“OFI”) and corporate affiliate, OFI Global Asset Management, Inc. (“OFI Global” and OFI and OFI Global are collectively referred to hereinafter as “OFI”), and the fact that OFI has over 50 years of experience as an investment adviser and that its assets under management rank it among the top mutual fund managers in the United States. The Board evaluated the Manager’s and OFI’s advisory, administrative, accounting, legal, compliance and risk management services, and information the Board has received regarding the experience and professional qualifications of the Manager’s and OFI’s key personnel and the size and functions of its staff. In its evaluation of the quality of the portfolio management services provided, the Board considered the experience of Stuart Cartner and Brian Watson, the portfolio managers for the Fund, and the Manager’s investment team and analysts. The Board members also considered the totality of their experiences with the Manager and OFI as trustees of the Fund and other funds advised by the Manager or OFI. The Board considered information regarding the quality of services provided by affiliates of the Manager, which the Board members have become knowledgeable about through their experiences with the Manager or OFI and in connection with the renewal of the Fund’s service agreements. The Board concluded, in light of the Manager’s and OFI’s experience, reputation, personnel, operations and resources that the Fund benefits from the services provided under the Agreement.
Investment Performance of the Manager and the Fund. Throughout the year, the Manager provided information on the investment performance of the Fund and the Manager, including comparative performance information. The Board also reviewed information, prepared by the Manager and by the independent consultant, comparing the Fund’s historical performance to relevant market indices and to the performance of other retail energy limited partnership funds. The Board noted that the Fund outperformed its category median for the one- and three-year periods and underperformed its category median for the five-year period.
Fees and Expenses of the Fund. The Board reviewed the fees paid to the Manager and the other expenses borne by the Fund. The Board also considered the comparability of the fees charged and the services provided to the Fund to the fees and services for other clients or accounts advised by the Adviser. The independent consultant provided comparative data in regard to the fees and expenses of the Fund and other retail energy limited partnership funds with comparable asset levels and distribution features. The Board noted that the Fund’s contractual management fee and total expenses were lower than their respective peer group medians and category medians. The Board considered that the Manager has contractually agreed to waive fees and/or reimburse the Fund so that total expenses, as a percentage of average daily net assets, will not exceed the following annual rates: 1.35% for Class A shares, 2.10% for Class C shares and 1.10% for Class Y shares. The fee limitation may not be amended or withdrawn prior to its expiration on March 30, 2017, unless approved by the Board.
OPPENHEIMER STEELPATH MLP INCOME FUND 45 |
BOARD APPROVAL OF THE FUND’S INVESTMENT
ADVISORY AGREEMENT Unaudited / (Continued) |
Economies of Scale and Profits Realized by the Manager. The Board considered information regarding the Manager’s costs in serving as the Fund’s investment adviser, including the costs associated with the personnel and systems necessary to manage the Fund, and information regarding the Manager’s profitability from its relationship with the Fund. The Board also considered that the Manager must be able to pay and retain experienced professional personnel at competitive rates to provide quality services to the Fund. The Board reviewed whether the Manager may realize economies of scale in managing and supporting the Fund. The Board noted that the Fund currently has management fee breakpoints, which are intended to share with Fund shareholders economies of scale that may exist as the Fund’s assets grow.
Other Benefits to the Manager. In addition to considering the profits realized by the Manager, the Board considered information that was provided regarding the direct and indirect benefits the Manager receives as a result of its relationship with the Fund, including compensation paid to the Manager’s affiliates and research provided to the Manager in connection with permissible brokerage arrangements (soft dollar arrangements).
Conclusions. These factors were also considered by the independent Trustees meeting separately from the full Board, assisted by experienced counsel to the Fund and to the independent Trustees. Fund counsel and the independent Trustees’ counsel are independent of the Manager within the meaning and intent of the Securities and Exchange Commission Rules.
Based on its review of the information it received and its evaluations described above, the Board, including a majority of the independent Trustees, decided to continue the Agreement through August 31, 2017. In arriving at its decision, the Board did not identify any factor or factors as being more important than others, but considered all of the above information, and considered the terms and conditions of the Agreement, including the management fees, in light of all the surrounding circumstances.
46 OPPENHEIMER STEELPATH MLP INCOME FUND |
DISTRIBUTION SOURCES Unaudited |
For any distribution that took place over the last six months of the Fund’s reporting period, the table below details, on a per-share basis, the percentage of the Fund’s total distribution payment amount that was derived from the following sources: net income, net profit from the sale of securities, and other capital sources. This information is based upon income and capital gains using generally accepted accounting principles as of the date of each distribution. For certain securities, such as Master Limited Partnerships (“MLPs”), the percentages attributed to each category are estimated using historical information because the character of the amounts received from the MLPs in which the Fund invests is unknown until after the end of the calendar year. Because the Fund is actively managed, the relative amount of the Fund’s total distributions derived from various sources over the calendar year may change. Please note that this information should not be used for tax reporting purposes as the tax character of distributable income may differ from the amounts used for this notification. You will receive IRS tax forms in the first quarter of each calendar year detailing the actual amount of the taxable and non-taxable portion of distributions paid to you during the tax year.
For the most current information, please go to oppenheimerfunds.com. Select your Fund, then the ’Detailed’ tab; where ‘Dividends’ are shown, the Fund’s latest pay date will be followed by the sources of any distribution, updated daily.
Fund Name | Pay
Date | Net
Income | Net
Profit
from Sale | Other
Capital
Sources |
Oppenheimer SteelPath MLP Income Fund | 6/10/16 | 0.0% | 0.0% | 100.0% |
Oppenheimer SteelPath MLP Income Fund | 7/8/16 | 0.0% | 0.0% | 100.0% |
Oppenheimer SteelPath MLP Income Fund | 8/5/16 | 0.0% | 0.0% | 100.0% |
Oppenheimer SteelPath MLP Income Fund | 9/9/16 | 0.0% | 0.0% | 100.0% |
Oppenheimer SteelPath MLP Income Fund | 10/7/16 | 0.0% | 0.0% | 100.0% |
Oppenheimer SteelPath MLP Income Fund | 11/4/16 | 0.0% | 0.0% | 100.0% |
Oppenheimer SteelPath MLP Income Fund | 11/25/16 | 0.0% | 0.0% | 100.0% |
OPPENHEIMER STEELPATH MLP INCOME FUND 47 |
PORTFOLIO PROXY VOTING POLICIES AND PROCEDURES; UPDATES TO STATEMENTS OF INVESTMENTS Unaudited |
The Fund has adopted Portfolio Proxy Voting Policies and Procedures under which the Fund votes proxies relating to securities (“portfolio proxies”) held by the Fund. A description of the Fund’s Portfolio Proxy Voting Policies and Procedures is available (i) without charge, upon request, by calling the Fund toll-free at 1.800.CALL OPP (225.5677), (ii) on the Fund’s website at oppenheimerfunds.com, and (iii) on the SEC’s website at www.sec.gov. In addition, the Fund is required to file Form N-PX, with its complete proxy voting record for the 12 months ended June 30th, no later than August 31st of each year. The Fund’s voting record is available (i) without charge, upon request, by calling the Fund toll-free at 1.800.CALL OPP (225.5677), and (ii) in the Form N-PX filing on the SEC’s website at www.sec.gov.
The Fund files its complete schedule of portfolio holdings with the SEC for the first quarter and the third quarter of each fiscal year on Form N-Q. The Fund’s Form N-Q filings are available on the SEC’s website at www.sec.gov. Those forms may be reviewed and copied at the SEC’s Public Reference Room in Washington, D.C. Information on the operation of the Public Reference Room may be obtained by calling 1-800-SEC-0330.
Householding – Delivery of Shareholder Documents
This is to inform you about OppenheimerFunds’ “householding” policy. If more than one member of your household maintains an account in a particular fund, OppenheimerFunds will mail only one copy of the fund’s prospectus (or, if available, the fund’s summary prospectus), annual and semiannual report and privacy policy. The consolidation of these mailings, called householding, benefits your fund through reduced mailing expense, and benefits you by reducing the volume of mail you receive from OppenheimerFunds. Householding does not affect the delivery of your account statements.
Please note that we will continue to household these mailings for as long as you remain an OppenheimerFunds shareholder, unless you request otherwise. If you prefer to receive multiple copies of these materials, please call us at 1.800.CALL OPP (225 5677). You may also notify us in writing or via email. We will begin sending you individual copies of the prospectus (or, if available, the summary prospectus), reports and privacy policy within 30 days of receiving your request to stop householding.
48 OPPENHEIMER STEELPATH MLP INCOME FUND |
TRUSTEES AND OFFICERS Unaudited |
Name, Position(s) Held with the Trusts, Length of Service, Age | Principal Occupation(s) During the Past 5 Years; Other Trusteeships/Directorships Held; Number of Portfolios in the Fund Complex Currently Overseen |
INDEPENDENT TRUSTEES | The address of each Trustee in the chart below is 6803 S. Tucson Way, Centennial, Colorado 80112-3924. Each Trustee serves for an indefinite term, or until his or her resignation, retirement, death or removal. |
Robert J. Malone, Chairman of the
Board of Trustees (since 2016), Trustee (since 2012) Year of Birth: 1944 | Chairman - Colorado Market of MidFirst Bank (since January 2015); Chairman of the Board (2012-2016) and Director (August 2005-March 2016) of Jones International University (educational organization); Trustee of the Gallagher Family Foundation (non-profit organization) (2000-2015); Chairman, Chief Executive Officer and Director of Steele Street Bank Trust (commercial banking) (August 2003-January 2015); Board of Directors of Opera Colorado Foundation (non-profit organization) (2008-2012); Director of Colorado UpLIFT (charitable organization) (1986-2010); Director of Jones Knowledge, Inc. (2006-2010); Former Chairman of U.S. Bank-Colorado (subsidiary of U.S. Bancorp and formerly Colorado National Bank) (July 1996-April 1999); Director of Commercial Assets, Inc. (real estate investment trust) (1993-2000); Director of U.S. Exploration, Inc. (oil and gas exploration) (1997-February 2004); Chairman of the Board (1991-1994) and Trustee (1985-1994) of Regis University; and Chairman of the Board (1990-1991) and Trustee (1984-1999) of Young Presidents Organization. Oversees 46 portfolios in the OppenheimerFunds complex. Mr. Malone has served on the Boards of certain Oppenheimer funds since 2002, during which time he has become familiar with the Fund’s (and other Oppenheimer funds’) financial, accounting, regulatory and investment matters and has contributed to the Boards’ deliberations. |
Jon S. Fossel, Trustee (since 2012) Year of Birth: 1942 | Chairman of the Board of Jack Creek Preserve Foundation (non-profit organization) (since March 2005); Director of Jack Creek Preserve Foundation (non-profit organization) (March 2005-December 2014); Chairman of the Board (2006-December 2011) and Director (June 2002-December 2011) of UNUMProvident (insurance company); Director of Northwestern Energy Corp. (public utility corporation) (November 2004-December 2009); Director of P.R. Pharmaceuticals (October 1999-October 2003); Director of Rocky Mountain Elk Foundation (non-profit organization) (February 1998-February 2003 and February 2005-February 2007); Chairman and Director (until October 1996) and President and Chief Executive Officer (until October 1995) of OppenheimerFunds, Inc.; President, Chief Executive Officer and Director of the following: Oppenheimer Acquisition Corp. (“OAC”) (parent holding company of OppenheimerFunds, Inc.), Shareholders Services, Inc. and Shareholder Financial Services, Inc. (until October 1995). Oversees 46 portfolios in the OppenheimerFunds complex. Mr. Fossel has served on the Boards of certain Oppenheimer funds since 1990, during which time he has become familiar with the Fund’s (and other Oppenheimer funds’) financial, accounting, regulatory and investment matters and has contributed to the Boards’ deliberations. |
OPPENHEIMER STEELPATH MLP INCOME FUND 49 |
TRUSTEES AND OFFICERS Unaudited / (Continued) |
Richard F. Grabish, Trustee (since 2012) Year of Birth: 1948 | Formerly Senior Vice President and Assistant Director of Sales and Marketing (March 1997-December 2007), Director (March 1987-December 2007) and Manager of Private Client Services (June 1985-June 2005) of A.G. Edwards & Sons, Inc. (broker/dealer and investment firm); Chairman and Chief Executive Officer of A.G. Edwards Trust Company, FSB (March 2001-December 2007); President and Vice Chairman of A.G. Edwards Trust Company, FSB (investment adviser) (April 1987-March 2001); President of A.G. Edwards Trust Company, FSB (investment adviser) (June 2005-December 2007). Oversees 46 portfolios in the OppenheimerFunds complex. Mr. Grabish has served on the Boards of certain Oppenheimer funds since 2001, during which time he has become familiar with the Fund’s (and other Oppenheimer funds’) financial, accounting, regulatory and investment matters and has contributed to the Boards’ deliberations. |
Beverly L. Hamilton, Trustee (since 2012) Year of Birth: 1946 | Trustee of Monterey Institute for International Studies (educational organization) (2000-2014); Board Member of Middlebury College (educational organization) (December 2005-June 2011); Chairman (since 2010) of American Funds’ Emerging Markets Growth Fund, Inc. (mutual fund); Director of The California Endowment (philanthropic organization) (April 2002-April 2008); Director (February 2002-2005) and Chairman of Trustees (2006-2007) of the Community Hospital of Monterey Peninsula; Director (October 1991-2005) and Vice Chairman (2006-2009) of American Funds’ Emerging Markets Growth Fund, Inc. (mutual fund); President of ARCO Investment Management Company (February 1991-April 2000); Member of the investment committees of The Rockefeller Foundation (2001-2006) and The University of Michigan (since 2000); Advisor at Credit Suisse First Boston’s Sprout venture capital unit (venture capital fund) (1994-January 2005); Trustee of MassMutual Institutional Funds (investment company) (1996-June 2004); Trustee of MML Series Investment Fund (investment company) (April 1989-June 2004); Member of the investment committee of Hartford Hospital (2000-2003); and Advisor to Unilever (Holland) pension fund (2000-2003). Oversees 46 portfolios in the OppenheimerFunds complex. Ms. Hamilton has served on the Boards of certain Oppenheimer funds since 2002, during which time she has become familiar with the Fund’s (and other Oppenheimer funds’) financial, accounting, regulatory and investment matters and has contributed to the Boards’ deliberations. |
50 OPPENHEIMER STEELPATH MLP INCOME FUND |
TRUSTEES AND OFFICERS Unaudited / (Continued) |
Victoria J. Herget, Trustee (since 2012) Year of Birth:1951 | Board Chair (2008-2015) and Director (2004-Present), United Educators (insurance company); Trustee (since 2000) and Chair (since 2010), Newberry Library (independent research library); Trustee, Mather LifeWays (senior living organization) (since 2001); Independent Director of the First American Funds (mutual fund family) (2003-2011); former Managing Director (1993-2001), Principal (1985-1993), Vice President (1978-1985) and Assistant Vice President (1973-1978) of Zurich Scudder Investments (investment adviser) (and its predecessor firms); Trustee (1992-2007), Chair of the Board of Trustees (1999-2007), Investment Committee Chair (1994-1999) and Investment Committee member (2007-2010) of Wellesley College; Trustee, BoardSource (non-profit organization) (2006-2009) and Chicago City Day School (K-8 School) (1994-2005). Oversees 46 portfolios in the OppenheimerFunds complex. Ms. Herget has served on the Boards of certain Oppenheimer funds since 2012, during which time she has become familiar with the Fund’s (and other Oppenheimer funds’) financial, accounting, regulatory and investment matters and has contributed to the Boards’ deliberations. |
F. William Marshall, Jr., Trustee (since 2012) Year of Birth: 1942 | Trustee Emeritus of Worcester Polytech Institute (WPI) (private university) (since 2009); Trustee of MassMutual Select Funds (formerly MassMutual Institutional Funds) (investment company) (1996-2015), MML Series Investment Fund (investment company) (1996-2015) and Mass Mutual Premier Funds (investment company) (January 2012-December 2015); President and Treasurer of the SIS Fund (private charitable fund) (January 1999-March 2011); Former Trustee of WPI (1985-2008); Former Chairman of the Board (2004-2006) and Former Chairman of the Investment Committee of WPI (1994-2008); Chairman of SIS Family Bank, F.S.B. (formerly SIS Bank) (commercial bank) (January 1999-July 1999); Executive Vice President of Peoples Heritage Financial Group, Inc. (commercial bank) (January 1999-July 1999); and Former President and Chief Executive Officer of SIS Bancorp. (1993-1999). Oversees 46 portfolios in the OppenheimerFunds complex. Mr. Marshall has served on the Boards of certain Oppenheimer funds since 2000, during which time he has become familiar with the Fund’s (and other Oppenheimer funds’) financial, accounting, regulatory and investment matters and has contributed to the Boards’ deliberations. |
Karen L. Stuckey, Trustee (since 2012) Year of Birth: 1953 | Member (since May 2015) of Desert Mountain Community Foundation Advisory Board (non-profit organization); Partner (1990-2012) of PricewaterhouseCoopers LLP (professional services firm) (held various positions 1975-1990); Trustee (1992-2006), member of Executive, Nominating and Audit Committees and Chair of Finance Committee (1992-2006), and Emeritus Trustee (since 2006) of Lehigh University; and member, Women’s Investment Management Forum (professional organization) since inception. Oversees 46 portfolios in the OppenheimerFunds complex. Ms. Stuckey has served on the Boards of certain Oppenheimer funds since 2012, during which time she has become familiar with the Fund’s (and other Oppenheimer funds’) financial, accounting, regulatory and investment matters and has contributed to the Boards’ deliberations. |
OPPENHEIMER STEELPATH MLP INCOME FUND 51 |
TRUSTEES AND OFFICERS Unaudited / (Continued) |
James D. Vaughn, Trustee (since 2012) Year of Birth:1945 | Retired; former managing partner (1994-2001) of Denver office of Deloitte & Touche LLP, (held various positions 1969-1993); Trustee and Chairman of the Audit Committee of Schroder Funds (2003-2012); Board member and Chairman of Audit Committee of AMG National Trust Bank (since 2005); Trustee and Investment Committee member, University of South Dakota Foundation (since 1996); Board member, Audit Committee Member and past Board Chair, Junior Achievement (since 1993); former Board member, Mile High United Way, Boys and Girls Clubs, Boy Scouts, Colorado Business Committee for the Arts, Economic Club of Colorado and Metro Denver Network. Oversees 46 portfolios in the OppenheimerFunds complex. Mr. Vaughn has served on the Boards of certain Oppenheimer funds since 2012, during which time he has become familiar with the Fund’s (and other Oppenheimer funds’) financial, accounting, regulatory and investment matters and has contributed to the Boards’ deliberations. |
INTERESTED TRUSTEE AND OFFICER | Mr. Steinmetz is an “Interested Trustee” because he is affiliated with the Manager and OppenheimerFunds, Inc. by virtue of his positions as Chairman of OppenheimerFunds, Inc. and officer and director of OFI Global Asset Management, Inc. Both as a Trustee and as an officer, Mr. Steinmetz serves for an indefinite term, or until his resignation, retirement, death or removal. Mr. Steinmetz’s address is 225 Liberty Street, New York, New York 10281-1008. |
Arthur P. Steinmetz, Trustee (since 2015), President and
Principal Executive Officer (since 2014) Year of Birth: 1958 | Chairman of OppenheimerFunds, Inc. (since January 2015); CEO and Chairman of OFI Global Asset Management, Inc. (since July 2014), President of OFI Global Asset Management, Inc. (since May 2013), a Director of OFI Global Asset Management, Inc. (since January 2013), Director of OppenheimerFunds, Inc. (since July 2014), President, Management Director and CEO of Oppenheimer Acquisition Corp. (OppenheimerFunds, Inc.’s parent holding company) (since July 2014), and President and Director of OFI SteelPath, Inc. (since January 2013). Chief Investment Officer of the OppenheimerFunds advisory entities from (January 2013-December 2013); Executive Vice President of OFI Global Asset Management, Inc. (January 2013-May 2013); Chief Investment Officer of OppenheimerFunds, Inc. (October 2010-December 2012); Chief Investment Officer, Fixed-Income, of OppenheimerFunds, Inc. (April 2009-October 2010); Executive Vice President of OppenheimerFunds, Inc. (October 2009-December 2012); Director of Fixed Income of OppenheimerFunds, Inc. (January 2009-April 2009); and a Senior Vice President of OppenheimerFunds, Inc. (March 1993-September 2009). An officer of 102 portfolios in the OppenheimerFunds complex. |
52 OPPENHEIMER STEELPATH MLP INCOME FUND |
TRUSTEES AND OFFICERS Unaudited / (Continued) |
OTHER OFFICERS OF THE TRUSTS | The addresses of the Officers in the chart below are as follows: for Mss. Foxson and Picciotto, 225 Liberty Street, New York, New York 10281-1008; for Messrs. Cartner and Watson, 2100 McKinney Avenue, Dallas, TX 75201; and for Mr. Petersen, 6803 S. Tucson Way, Centennial, Colorado 80112-3924. Each Officer serves for an indefinite term or until his or her resignation, retirement, death or removal. |
Stuart Cartner, Vice President (since 2010) Year of Birth: 1961 | Senior Vice President and Senior Portfolio Manager of the Manager (since January 2014); Vice President of the Manager (2012-January 2014). A member and portfolio manager of SteelPath Fund Advisors, LLC (since its formation in 2009) and SteelPath Capital Management, LLC (since 2007). Vice President in the Private Wealth Management Division of Goldman, Sachs & Co (1988-2007). An officer of other portfolios in the OppenheimerFunds complex. |
Brian Watson, Vice President (since 2012) Year of Birth: 1974 | Senior Vice President and Senior Portfolio Manager of the Manager (since January 2014); Vice President of the Manager (2012-January 2014). Prior to joining the Manager, he was a member, portfolio manager and Director of Research of SteelPath Fund Advisors, LLC since its formation in 2009. A portfolio manager at Swank Capital LLC, a Dallas, Texas based investment firm (2005-2009). An officer of other portfolios in the OppenheimerFunds complex. |
Cynthia Lo Bessette, Secretary and
Chief Legal Officer (since 2016) Year of Birth: 1969 | Executive Vice President, General Counsel and Secretary of OFI Global Asset Management, Inc. (since February 2016); Chief Legal Officer of the OppenheimerFunds, Inc. and the Distributor (since February 2016); Vice President, General Counsel and Secretary of Oppenheimer Acquisition Corp. (since February 2016); General Counsel of OFI SteelPath, Inc., VTL Associates, LLC and Index Management Solutions, LLC (since February 2016); Chief Legal Officer of OFI Global Institutional, Inc., HarbourView Asset Management Corporation, OFI Global Trust Company, Oppenheimer Real Asset Management, Inc., OFI Private Investments Inc., Shareholder Services, Inc. and Trinity Investment Management Corporation (since February 2016); Senior Vice President and Deputy General Counsel (March 2015-February 2016) and Executive Vice President, Vice President, Corporate Counsel (February 2012-March 2015) and Deputy Chief Legal Officer (April 2013-March 2015) of Jennison Associates LLC; Assistant General Counsel (April 2008-September 2009) and Deputy General Counsel (October 2009-February 2012) of Lord Abbett & Co. LLC. An officer of 102 portfolios in the OppenheimerFunds complex. |
Jennifer Foxson, Vice President and
Chief Business Officer (since 2014) Year of Birth: 1969 | Senior Vice President of OppenheimerFunds Distributor, Inc. (since June 2014); Vice President of OppenheimerFunds Distributor, Inc. (April 2006-June 2014); Vice President of OppenheimerFunds, Inc. (January 1998-March 2006); Assistant Vice President of OppenheimerFunds, Inc. (October 1991-December 1998). An officer of 102 portfolios in the OppenheimerFunds complex. |
OPPENHEIMER STEELPATH MLP INCOME FUND 53 |
TRUSTEES AND OFFICERS Unaudited / (Continued) |
Mary Ann Picciotto, Chief Compliance Officer and Chief Anti-Money Laundering Officer (since 2014) Year of Birth: 1973 | Senior Vice President and Chief Compliance Officer of OFI Global Asset Management, Inc. (since March 2014); Chief Compliance Officer of OppenheimerFunds, Inc. , OFI SteelPath, Inc., OFI Global Trust Company, OFI Global Institutional, Inc., Oppenheimer Real Asset Management, Inc., OFI Private Investments, Inc., Harborview Asset Management Corporation, Trinity Investment Management Corporation, and Shareholder Services, Inc. (since March 2014); Managing Director of Morgan Stanley Investment Management Inc. and certain of its various affiliated entities; Chief Compliance Officer of various Morgan Stanley Funds (May 2010-January 2014); Chief Compliance Officer of Morgan Stanley Investment Management Inc. (April 2007-January 2014). An officer of 102 portfolios in the OppenheimerFunds complex. |
Brian S. Petersen, Treasurer and
Principal Financial &
Accounting Officer (since 2016) Year of Birth: 1970 | Vice President of OFI Global Asset Management, Inc. (since January 2013); Vice President of OppenheimerFunds, Inc. (February 2007-December 2012); Assistant Vice President of OppenheimerFunds, Inc. (August 2002-2007). An officer of 102 portfolios in the OppenheimerFunds complex. |
The Fund’s Statement of Additional Information contains additional information about the Fund’s Trustees and Officers and is available without charge upon request, by calling 1.800.CALL OPP (225.5677).
54 OPPENHEIMER STEELPATH MLP INCOME FUND |
OPPENHEIMER STEELPATH MLP INCOME FUND |
Manager | | OFI SteelPath, Inc. |
| | |
Distributor | | OppenheimerFunds Distributor, Inc. |
| | |
Transfer and Shareholder Servicing Agent | | OFI Global Asset Management, Inc. |
| | | |
Sub-Transfer Agent | | Shareholder Services, Inc. |
| | | DBA OppenheimerFunds Services |
| | | |
Independent Registered Public Accounting Firm | | Cohen & Company, Ltd. |
| | | |
Legal Counsel | | Ropes & Gray LLP |
| | | |
© 2017 OppenheimerFunds, Inc. All rights reserved.
OPPENHEIMER STEELPATH MLP INCOME FUND 55 |
As an Oppenheimer fund shareholder, you are entitled to know how we protect your personal information and how we limit its disclosure. Information Sources
We obtain nonpublic personal information about our shareholders from the following sources:
| | ● | Applications or other forms. |
| | ● | When you create a user ID and password for online account access. |
| | ● | When you enroll in eDocs Direct,SM our electronic document delivery service. |
| | ● | Your transactions with us, our affiliates or others. |
| | ● | Technologies on our website, including: “cookies” and web beacons, which are used to collect data on the pages you visit and the features you use. |
If you visit oppenheimerfunds.com and do not log on to the secure account information areas, we do not obtain any personal information about you. When you do log on to a secure area, we do obtain your user ID and password to identify you. We also use this information to provide you with products and services you have requested, to inform you about products and services that you may be interested in and assist you in other ways.
We do not collect personal information through our website unless you willingly provide it to us, either directly by email or in those areas of the website that request information. In order to update your personal information (including your mailing address, email address and phone number) you must first log on and visit your user profile.
If you have set your browser to warn you before accepting cookies, you will receive the warning message with each cookie. You can refuse cookies by turning them off in your browser. However, doing so may limit your access to certain sections of our website.
We use cookies to help us improve and manage our website. For example, cookies help us recognize new versus repeat visitors to the site, track the pages visited, and enable some special features on the website. This data helps us provide a better service for our website visitors.
Protection of Information
We do not disclose any nonpublic personal information (such as names on a customer list) about current or former customers to anyone, except as permitted by law.
56 OPPENHEIMER STEELPATH MLP INCOME FUND |
PRIVACY POLICY NOTICE (Continued) |
Disclosure of Information
Copies of confirmations, account statements and other documents reporting activity in your fund accounts are made available to your financial advisor (as designated by you). We may also use details about you and your investments to help us, our financial service affiliates, or firms that jointly market their financial products and services with ours, to better serve your investment needs or suggest educational material that may be of interest to you. If this requires us to provide you with an opportunity to “opt in” or “opt out” of such information sharing with a firm not affiliated with us, you will receive notification on how to do so, before any such sharing takes place.
Right of Refusal
We will not disclose your personal information to unaffiliated third parties (except as permitted by law), unless we first offer you a reasonable opportunity to refuse or “opt out” of such disclosure.
Internet Security and Encryption
In general, the email services provided by our website are encrypted and provide a secure and private means of communication with us. To protect your own privacy, confidential and/ or personal information should only be communicated via email when you are advised that you are using a secure website.
As a security measure, we do not include personal or account information in nonsecure emails, and we advise you not to send such information to us in nonsecure emails. Instead, you may take advantage of the secure features of our website to encrypt your email correspondence. To do this, you will need to use a browser that supports Secure Sockets Layer (SSL) protocol.
| | ● | All transactions, including redemptions, exchanges and purchases, are secured by SSL and 256-bit encryption. SSL is used to establish a secure connection between your PC and OppenheimerFunds’ server. It transmits information in an encrypted and scrambled format. |
| | ● | Encryption is achieved through an electronic scrambling technology that uses a “key” to code and then decode the data. Encryption acts like the cable converter box you may have on your television set. It scrambles data with a secret code so that no one can make sense of it while it is being transmitted. When the data reaches its destination, the same software unscrambles the data. |
| | ● | You can exit the secure area by closing your browser or, for added security, you can use the Log Out button before you close your browser. |
OPPENHEIMER STEELPATH MLP INCOME FUND 57 |
PRIVACY POLICY NOTICE (Continued) |
Other Security Measures
We maintain physical, electronic and procedural safeguards to protect your personal account information. Our employees and agents have access to that information only so that they may offer you products or provide services, for example, when responding to your account questions.
How You Can Help
You can also do your part to keep your account information private and to prevent unauthorized transactions. If you obtain a user ID and password for your account, safeguard that information. Also, take special precautions when accessing your account on a computer used by others.
Who We Are
This joint notice describes the privacy policies of the Oppenheimer funds, OppenheimerFunds, Inc., each of its investment adviser subsidiaries, OppenheimerFunds Distributor, Inc. and OFI Global Trust Co. It applies to all Oppenheimer fund accounts you presently have, or may open in the future, using your Social Security number—whether or not you remain a shareholder of our funds. This notice was last updated as of November 2016. In the event it is updated or changed, we will post an updated notice on our website at oppenheimerfunds.com. If you have any questions about this privacy policy, email us by clicking on the Contact Us section of our website at oppenheimerfunds.com, write to us at P.O. Box 5270, Denver, CO 80217-5270, or call us at 1.800.CALL OPP (225 5677).
58 OPPENHEIMER STEELPATH MLP INCOME FUND |
THIS PAGE INTENTIONALLY LEFT BLANK
OPPENHEIMER STEELPATH MLP INCOME FUND 59 |
THIS PAGE INTENTIONALLY LEFT BLANK
60 OPPENHEIMER STEELPATH MLP INCOME FUND |
THIS PAGE INTENTIONALLY LEFT BLANK
OPPENHEIMER STEELPATH MLP INCOME FUND 61 |
THIS PAGE INTENTIONALLY LEFT BLANK
62 OPPENHEIMER STEELPATH MLP INCOME FUND |
THIS PAGE INTENTIONALLY LEFT BLANK
OPPENHEIMER STEELPATH MLP INCOME FUND 63 |

Fund Performance Discussion | 3 |
Top Holdings and Allocations | 7 |
Share Class Performance | 8 |
Fund Expenses | 10 |
Statement of Investments | 12 |
Statement of Assets and Liabilities | 14 |
Statement of Operations | 16 |
Statements of Changes in Net Assets | 17 |
Statement of Cash Flows | 18 |
Financial Highlights | 19 |
Notes to Financial Statements | 23 |
Report of Independent Registered Public Accounting Firm | 40 |
Board Approval of the Fund’s Investment Advisory Agreement | 41 |
Distribution Sources | 44 |
Portfolio Proxy Voting Policies and Procedures; Updates to Statements of Investments | 45 |
Trustees and Officers | 46 |
Privacy Policy Notice | 53 |
|
Class A Shares
AVERAGE ANNUAL TOTAL RETURNS AT 11/30/16
| | Class A Shares of the Fund | | |
| Without
Sales
Charge | With
Sales
Charge | S&P 500 Index | Alerian MLP Index |
1-Year | 6.66% | 0.46% | 8.06% | 9.28% |
Since Inception (2/6/12) | 1.20% | -0.04% | 13.18% | 0.75% |
Performance data quoted represents past performance, which does not guarantee future results. The investment return and principal value of an investment in the Fund will fluctuate so that an investor’s shares, when redeemed, may be worth more or less than their original cost. Fund returns include changes in share price, reinvested distributions, and a 5.75% maximum applicable sales charge except where “without sales charge” is indicated. Current performance may be lower or higher than the performance quoted. Returns do not consider capital gains or income taxes on an individual’s investment. For performance data current to the most recent month-end, visit oppenheimerfunds.com or call 1.800.CALL OPP (225.5677). See Fund prospectuses and summary prospectuses for more information on share classes and sales charges.
2 OPPENHEIMER STEELPATH MLP ALPHA PLUS FUND |
Fund Performance Discussion
The Fund’s Class A shares (without sales charge) produced a total return of 6.66% during the reporting period. In comparison, master limited partnerships (“MLPs”), as measured by the Alerian MLP Index (AMZ), provided a total return gain of 9.28%. Please note that the returns for the Alerian MLP Index are calculated pre-tax, while the Fund’s returns are calculated post corporate tax. During the same period, the S&P 500 Index produced a total return gain of 8.06%.
Over the twelve-month reporting period ended November 30, 2016, the midstream sector outperformed the broader markets as the lows of the current energy cycle appear to have been reached and the beginnings of a recovery appear to be unfolding. Late in the period, the Organization of Petroleum Exporting Countries (“OPEC”) provided a potential acceleration to the rebalancing of crude oil supply and demand by announcing formal plans to reduce its production to 32.5 million barrels of oil per day (MMbbls/d) by January 2017. Agreements with non-OPEC countries to provide additional support via another 0.6 MMbbls/d of supply reductions were also announced, most notably with Russia electing to reduce production by 0.3 MMbbls/d. The larger than expected supply reduction sent oil prices sharply higher and many energy equities even more so. This reduced supply from OPEC members will pull the consensus estimates for the 2017 oil market balance back firmly
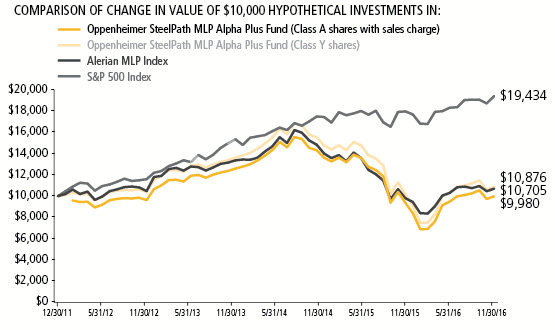
OPPENHEIMER STEELPATH MLP ALPHA PLUS FUND 3 |
into an undersupplied position, thereby beginning the process of working down global inventories. And, importantly for U.S. midstream investors, the OPEC cut helps reduce the market forces that were driving near-term U.S. production, and thus midstream throughput, lower. Further, we continue to believe that this energy down cycle has shifted the call on U.S.-sourced volumes higher over the medium-term. This improving fundamental commodity picture, combined with midstream valuations that remain below long-term averages, makes a compelling case for midstream investment.
Over the reporting period, we estimate approximately $26 billion of new equity supply entered the market through either secondary offerings, initial public offerings, or “at-the-market” programs in which primary units trade into the market anonymously throughout the normal trading day. This pace of equity issuance represents an increase from approximately $20 billion that was raised over the twelve month reporting period ended November 30, 2015. MLPs also raised approximately $23 billion of debt capital during the period. Most MLPs pay out the majority of excess cash flow as distributions to investors, and therefore must raise external capital to fund growth projects and to fund acquisitions.
MACRO REVIEW
West Texas Intermediate (WTI) crude oil prices ended the reporting period at $49.44 per barrel, up 19% from the prior year. Global crude prices, as measured by Brent crude oil, traded 13% higher over the reporting period. The crude oil price improvement appears linked to the continued moderation in U.S. crude production, healthy demand growth, and the aforementioned OPEC deal to reduce supply. Brent exited the period at a $1 per barrel premium to WTI, which is near the historic norm. However, this reversion represents a departure from the $8 to $9 per barrel Brent premium that has generally existed since 2009.
Henry Hub natural gas spot prices exited the period at $3.30 per million British thermal units (“mmbtu”), up 58% over the reporting period. Natural gas pricing has benefited from a long awaited realignment of supply-demand in which natural gas usage as a heating and electric generation fuel has increased as gas production volume growth has declined, and as increased exports have become a reality via both liquefied natural gas and new pipelines to Mexico.
Mont Belvieu NGL prices ended the reporting period at $23.92 per barrel, a 26% increase over the reporting period. All of the NGL purity products ended the period higher than the same time in the prior year. Frac spreads, a measure of natural gas processing economics, ended the period at $0.28 per gallon, up 4% over the reporting period. Generally, the greater the frac spread, the greater the incentive for producers to seek natural gas processing capacity.
The yield curve modestly flattened over the reporting period as short rates rose more than the yields on longer-dated maturities. The ten-year Treasury yield rose 18 basis points to end the period at 2.38%. The MLP yield spread at period-end, as
4 OPPENHEIMER STEELPATH MLP ALPHA PLUS FUND |
measured by the AMZ and the 10-year Treasury bond, narrowed by 115 basis points to 5.05%.
Over the reporting period, real estate investment trusts (“REITs”) and utilities, two competing yield-oriented equity asset classes, posted total returns of 5.65% (as measured by the Dow Jones Equity REIT Total Return Index) and 16.31% (as measured by the Dow Jones Utility Average Index), respectively, as compared to the AMZ’s 9.28% total return. Price to forward distributable cash flow (DCF), a commonly watched ratio within the MLP sector, increased over the period but remains below the ten-year average.
SUBSECTOR REVIEW
Performance among subsectors in the midstream, or energy infrastructure, MLP asset class varied for the reporting period. On average, the gathering and processing subsector provided the best performance over the period, buoyed by improving commodity prices supporting improved volumetric projections. The natural gas pipeline group followed as investors continued to express preference for long-haul natural gas pipelines, particularly those backed by utility demand pull.
The marine subsector experienced the weakest performance over the reporting period as several entities substantially reduced cash distributions to investors. The propane subsector also lagged over the reporting period as market participants appeared to rotate out of the subsector in favor of more traditional midstream names and as rising propane prices could result in some margin pressure in future periods.
FUND REVIEW
Key contributors to the Fund were Williams Partners, LP (WPZ) and Tallgrass Energy GP, LP (TEGP).
WPZ units outperformed over the period after the proposed merger with Energy Transfer was terminated in late June and the Williams enterprise subsequently focused on strengthening its balance sheet, improving liquidity, and preserving its investment grade credit rating. During the period The Williams Companies (WMB) began execution of plans to reinvest $1.7 billion into WPZ, its daughter partnership, via a private purchase of common units and a concurrently announced distribution reinvestment program (“DRIP”). The Williams family also announced a restructuring of gathering agreements that served to reduce counterparty risk and the sale of Canadian assets that raised $1 billion in cash proceeds.
TEGP units outperformed over the period as the general partner’s underlying operating partnership, Tallgrass Energy Partners (TEP), reaffirmed annual distribution growth guidance of at least 20% for the period of 2015 through 2017. Additionally, the partnership’s sponsor announced an agreement to acquire additional interests in the Rockies Express Pipeline, which aids longer-term growth prospects. Notably, TEGP’s board approved a $100 million buyback program of TEP or TEGP units.
OPPENHEIMER STEELPATH MLP ALPHA PLUS FUND 5 |
Key detractors from the Fund were Energy Transfer Equity LP (ETE) and The Williams Companies (WMB).
Both ETE and WMB units detracted from performance over the reporting period on investor concern over the planned merger of ETE and WMB. After the merger was terminated in late June, each entity executed measures to support their respective daughter partnerships, some at the expense of current parent cash flows. While the equity price performance of both entities lagged over the reporting period, each has recovered substantially from the lows.
Separately, the Fund also obtains leverage through borrowing, which did not produce a significant impact to its performance this reporting period. Please note that to the extent the Fund obtains leverage through borrowing, there will be the potential for greater gains and the risk of magnified losses.
Please note that significant decreases in cash distributions from the Fund’s MLP investments and/or significant declines in the fair value of its investments may impact the Fund’s assessment regarding the recoverability of certain deferred tax assets, which may result in the recording of a valuation allowance. If a valuation allowance is established, this could have a material impact on the Fund’s net asset value and results of operations for the period. The Fund had a valuation allowance in place throughout the entire reporting period. See Note 2 of the Notes to Financial Statements for more information.
OUTLOOK
We believe we have seen the worst of this energy market down cycle. The rate of midstream growth will likely moderate from peak levels, but average distributions are still likely to grow. Midstream operators may also stand to benefit as they make more efficient use of their existing assets. We believe current market valuations underestimate the potential for renewed business growth going forward and remain optimistic on the sector’s prospects. For this reason, we believe MLPs continue to offer attractive total return potential based on the potential for price appreciation and stable or growing distribution streams.
|
Stuart Cartner
Portfolio Manager
| |
|
Brian Watson, CFA
Portfolio Manager
|
6 OPPENHEIMER STEELPATH MLP ALPHA PLUS FUND |
Top Holdings and Allocations
TOP TEN MASTER LIMITED PARTNERSHIP HOLDINGS
TC Pipelines LP | 9.46% |
Energy Transfer Partners LP | 9.41% |
Enterprise Products Partners LP | 9.32% |
Magellan Midstream Partners LP | 9.00% |
Energy Transfer Equity LP | 8.76% |
Sunoco Logistics Partners LP | 8.36% |
Targa Resources Corp. | 7.52% |
MPLX LP | 6.69% |
Tallgrass Energy GP LP | 6.57% |
Williams Partners LP | 5.87% |
Portfolio holdings and allocations are subject to change. Percentages are as of November 30, 2016, and are based on net assets.
SECTOR ALLOCATION
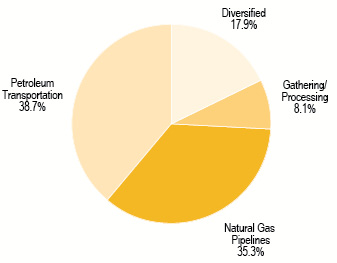
Portfolio holdings and allocations are subject to change. Percentages are as of November 30, 2016, and are based on the total value of investments.
OPPENHEIMER STEELPATH MLP ALPHA PLUS FUND 7 |
Share Class Performance
AVERAGE ANNUAL TOTAL RETURNS WITHOUT SALES CHARGE AS OF 11/30/16
| | Inception Date | 1-Year | Since Inception |
Class A (MLPLX) | 2/6/12 | 6.66% | 1.20% |
Class C (MLPMX) | 5/22/12 | 5.91% | 1.40% |
Class I (OSPPX) | 6/28/13 | 7.21% | -4.68% |
Class Y (MLPNX) | 12/30/11 | 6.96% | 1.72% |
AVERAGE ANNUAL TOTAL RETURNS WITH SALES CHARGE AS OF 11/30/16
| | Inception Date | 1-Year | Since Inception |
Class A (MLPLX) | 2/6/12 | 0.46% | -0.04% |
Class C (MLPMX) | 5/22/12 | 4.94% | 1.40% |
Class I (OSPPX) | 6/28/13 | 7.21% | -4.68% |
Class Y (MLPNX) | 12/30/11 | 6.96% | 1.72% |
Performance data quoted represents past performance, which does not guarantee future results. The investment return and principal value of an investment in the Fund will fluctuate so that an investor’s shares, when redeemed, may be worth more or less than their original cost. Current performance may be lower or higher than the performance quoted. Returns do not consider capital gains or income taxes on an individual’s investment. For performance data current to the most recent month-end, visit oppenheimerfunds.com or call 1.800.CALL OPP (225.5677). Fund returns include changes in share price, reinvested distributions, and the applicable sales charge: for Class A shares, the current maximum initial sales charge of 5.75%, and for Class C shares, the contingent deferred sales charge of 1% for the 1-year period. There is no sales charge for Class I or Class Y shares. See Fund prospectuses and summary prospectuses for more information on share classes and sales charges.
The Fund’s performance is compared to the performance of the S&P 500 Index and the Alerian MLP Index. The S&P 500 Index is a broad-based measure of domestic stock performance. The Alerian MLP Index is a composite of the 50 most prominent Master Limited Partnerships that provides investors with an unbiased, comprehensive benchmark for this emerging asset class. The Alerian MLP Index, which is calculated using a float-adjusted, capitalization-weighted methodology, is disseminated real-time on a total-return basis. The indices are unmanaged and cannot be purchased directly by investors. While index comparisons may be useful to provide a benchmark for the Fund’s performance, it must be noted that the Fund’s investments are not limited to the investments comprising the indices. Index performance includes reinvestment of income, but does not reflect transaction costs, fees, expenses or
8 OPPENHEIMER STEELPATH MLP ALPHA PLUS FUND |
taxes. Index performance is shown for illustrative purposes only as a benchmark for the Fund’s performance, and does not predict or depict performance of the Fund. The Fund’s performance reflects the effects of the Fund’s business and operating expenses.
The Fund’s investment strategy and focus can change over time. The mention of specific fund holdings does not constitute a recommendation by OppenheimerFunds, Inc. or its affiliates.
Before investing in any of the Oppenheimer funds, investors should carefully consider a fund’s investment objectives, risks, charges and expenses. Fund prospectuses and summary prospectuses contain this and other information about the funds, and may be obtained by asking your financial advisor, visiting oppenheimerfunds.com, or calling 1.800.CALL OPP (225.5677). Read prospectuses and summary prospectuses carefully before investing.
Shares of Oppenheimer funds are not deposits or obligations of any bank, are not guaranteed by any bank, are not insured by the FDIC or any other agency, and involve investment risks, including the possible loss of the principal amount invested.
OPPENHEIMER STEELPATH MLP ALPHA PLUS FUND 9 |
Fund Expenses
Fund Expenses. As a shareholder of the Fund, you incur two types of costs: (1) transaction costs, which may include sales charges (loads) on purchase payments, contingent deferred sales charges on redemptions; and (2) ongoing costs, including management fees; distribution and service fees; and other Fund expenses. These examples are intended to help you understand your ongoing costs (in dollars) of investing in the Fund and to compare these costs with the ongoing costs of investing in other mutual funds.
The examples are based on an investment of $1,000.00 invested at the beginning of the period and held for the entire 6-month period ended November 30, 2016.
Actual Expenses. The first section of the table provides information about actual account values and actual expenses. You may use the information in this section for the class of shares you hold, together with the amount you invested, to estimate the expense that you paid over the period. Simply divide your account value by $1,000.00 (for example, an $8,600.00 account value divided by $1,000.00 = 8.60), then multiply the result by the number in the first section under the heading entitled “Expenses Paid During 6 Months Ended November 30, 2016” to estimate the expenses you paid on your account during this period.
Hypothetical Example for Comparison Purposes. The second section of the table provides information about hypothetical account values and hypothetical expenses based on the Fund’s actual expense ratio for each class of shares, and an assumed rate of return of 5% per year for each class before expenses, which is not the actual return. The hypothetical account values and expenses may not be used to estimate the actual ending account balance or expenses you paid for the period. You may use this information to compare the ongoing costs of investing in the Fund and other funds. To do so, compare this 5% hypothetical example for the class of shares you hold with the 5% hypothetical examples that appear in the shareholder reports of the other funds.
Please note that the expenses shown in the table are meant to highlight your ongoing costs only and do not reflect any transactional costs, such as front-end or contingent deferred sales charges (loads). Therefore, the “hypothetical” section of the table is useful in comparing ongoing costs only, and will not help you determine the relative total costs of owning different funds. In addition, if these transactional costs were included, your costs would have been higher.
10 OPPENHEIMER STEELPATH MLP ALPHA PLUS FUND |
Actual | Beginning
Account
Value
June 1, 2016 | Ending
Account
Value
November 30,
2016 | Expenses
Paid During
6 Months Ended
November 30,
2016 |
CLASS A | $ 1,000.00 | $ 1,051.30 | $ 28.03 |
CLASS C | 1,000.00 | 1,047.50 | 31.83 |
CLASS I | 1,000.00 | 1,053.00 | 25.78 |
CLASS Y | 1,000.00 | 1,051.80 | 26.73 |
Hypothetical
(5% return before expenses) | | | |
CLASS A | 1,000.00 | 997.67 | 27.30 |
CLASS C | 1,000.00 | 993.91 | 30.99 |
CLASS I | 1,000.00 | 999.89 | 25.11 |
CLASS Y | 1,000.00 | 998.95 | 26.04 |
Expenses are equal to the Fund’s annualized expense ratio for that class, multiplied by the average account value over the period, multiplied by 183/366 (to reflect the one-half year period). Those annualized expense ratios, excluding indirect expenses from affiliated funds, based on the 6-month period ended November 30, 2016 are as follows:
Class | Expense Ratios |
CLASS A | 5.47% |
CLASS C | 6.22 |
CLASS I | 5.02 |
CLASS Y | 5.21 |
OPPENHEIMER STEELPATH MLP ALPHA PLUS FUND 11 |
STATEMENT OF INVESTMENTS November 30, 2016 |
Description | | Shares | | | Value | |
Master Limited Partnership Shares — 107.6% | |
Diversified — 17.4% | |
Enterprise Products Partners LP 1 | | | 905,037 | | | $ | 23,467,609 | |
Westlake Chemical Partners LP 1 | | | 266,679 | | | | 5,600,259 | |
Williams Partners LP 1 | | | 404,751 | | | | 14,773,412 | |
Total Diversified | | | | | | | 43,841,280 | |
| | | | | | | | | |
Gathering/Processing — 2.5% | |
Western Gas Partners LP 1 | | | 108,722 | | | | 6,204,764 | |
| | | | | | | | | |
Natural Gas Pipelines — 40.1% | |
Energy Transfer Equity LP 1 | | | 1,294,934 | | | | 22,052,726 | |
Energy Transfer Partners LP 1 | | | 674,694 | | | | 23,695,253 | |
EQT Midstream Partners LP 1 | | | 128,593 | | | | 9,416,865 | |
Rice Midstream Partners LP | | | 15,600 | | | | 336,180 | |
Tallgrass Energy GP LP 1 | | | 683,815 | | | | 16,548,323 | |
Tallgrass Energy Partners LP 1 | | | 111,334 | | | | 5,214,885 | |
TC Pipelines LP 1 | | | 448,012 | | | | 23,811,838 | |
Total Natural Gas Pipelines | | | | | | | 101,076,070 | |
Petroleum Transportation — 47.6% | |
Buckeye Partners LP 1 | | | 210,557 | | | $ | 13,547,237 | |
Genesis Energy LP 1 | | | 322,860 | | | | 11,280,728 | |
Magellan Midstream Partners LP 1 | | | 327,247 | | | | 22,661,855 | |
MPLX LP 1 | | | 513,137 | | | | 16,856,551 | |
NuStar Energy LP 1 | | | 52,638 | | | | 2,512,938 | |
NuStar GP Holdings LLC 1 | | | 219,002 | | | | 5,562,651 | |
Plains All American Pipeline LP 1 | | | 393,303 | | | | 12,959,334 | |
Shell Midstream Partners LP 1 | | | 99,518 | | | | 2,744,706 | |
Sunoco Logistics Partners LP 1 | | | 888,827 | | | | 21,056,312 | |
Tesoro Logistics LP 1 | | | 145,615 | | | | 6,862,835 | |
TransMontaigne Partners LP 1 | | | 92,110 | | | | 3,913,754 | |
Total Petroleum Transportation | | | | | | | 119,958,901 | |
| | | | | | | | | |
Total Master Limited Partnership Shares | |
(identified cost $264,059,477) | | | | 271,081,015 | |
| | | | | | | | | |
Common Stocks — 12.2% | |
Diversified — 4.7% | |
Williams Cos., Inc. 1 | | | 379,865 | | | | 11,661,855 | |
| | | | | | | | | |
Gathering/Processing — 7.5% | |
Targa Resources Corp. 1 | | | 355,337 | | | | 18,935,909 | |
| | | | | | | | | |
Total Common Stocks | |
(identified cost $29,788,010) | | | | 30,597,764 | |
12 OPPENHEIMER STEELPATH MLP ALPHA PLUS FUND |
STATEMENT OF INVESTMENTS (Continued) |
Description | | Shares | | | Value | |
Private Investment in Public Equity — 3.4% | |
Natural Gas Pipelines — 3.4% | |
Rice Midstream Partners LP PIPE Units 2 | | | 433,913 | | | $ | 8,621,852 | |
| | | | | | | | | |
Total Private Investment in Public Equity | |
(identified cost $9,226,292) | | | | 8,621,852 | |
| | | | | | | | | |
Total Investments — 123.2% | |
(identified cost $303,073,779) | | | | 310,300,631 | |
Liabilities In Excess of Other Assets — (23.2)% | | | | (58,462,029 | ) |
Net Assets — 100.0% | | | $ | 251,838,602 | |
Footnotes to Statement of Investments
LLC — Limited Liability Company
LP — Limited Partnership
1 | As of November 30, 2016, all or a portion of the security has been pledged as collateral for a Fund loan. The value of the securities in the pledged account totaled $154,489,686 as of November 30, 2016. See Note 9 of the Notes to Financial Statements for additional information. |
2 | Represents securities sold under Rule 144A, which are exempt from registration under the Securities Act of 1933, as amended. These securities have been determined to be liquid under guidelines established by the Board of Trustees. These securities, acquired on October 7, 2016 for $9,329,130 amount to $8,621,852 or 3.4% of the Fund’s net assets as of November 30, 2016. |
See accompanying Notes to Financial Statements.
OPPENHEIMER STEELPATH MLP ALPHA PLUS FUND 13 |
STATEMENT OF ASSETS AND LIABILITIES November 30, 2016 |
Assets: | | | |
Investments at value (cost $303,073,779) – see accompanying Statement of Investments: | | $ | 310,300,631 | |
Deferred tax asset, net | | | 15,118,834 | |
Receivable for beneficial interest sold | | | 415,562 | |
Prepaid expenses | | | 40,220 | |
Dividends receivable | | | 42 | |
Receivable for investments sold | | | 3,265,068 | |
Total assets | | | 329,140,357 | |
| | | | |
Liabilities: | | | | |
Payable on borrowing (See note 9) | | | 74,000,000 | |
Payable for investments purchased | | | 1,552,984 | |
Due to custodian | | | 585,330 | |
Payable for beneficial interest redeemed | | | 573,123 | |
Payable to Manager | | | 253,156 | |
Interest expense payable | | | 69,116 | |
Payable for distribution and service plan fees | | | 64,726 | |
Transfer agent fees payable | | | 44,486 | |
Borrowing expense payable | | | 12,195 | |
Trustees' fees payable | | | 4,285 | |
Other liabilities | | | 142,354 | |
Total liabilities | | | 77,301,755 | |
| | | | |
Net Assets | | $ | 251,838,602 | |
| | | | |
Composition of Net Assets | | | | |
Par value of shares of beneficial interest | | $ | 32,682 | |
Paid-in capital | | | 320,633,764 | |
Undistributed net investment loss, net of deferred taxes | | | (13,535,769 | ) |
Accumulated undistributed net realized losses on investments, net of deferred taxes | | | (58,754,458 | ) |
Net unrealized appreciation on investments, net of deferred taxes | | | 3,462,383 | |
Net Assets | | $ | 251,838,602 | |
14 OPPENHEIMER STEELPATH MLP ALPHA PLUS FUND |
STATEMENT OF ASSETS AND LIABILITIES (Continued) |
Net Asset Value, Offering Price and Redemption Proceeds Per Share ($0.001 Par Value, Unlimited Shares Authorized) | | | |
Class A Shares: | | | |
Net asset value and redemption proceeds per share | | $ | 7.73 | |
Offering price per share (net asset value plus sales charge of 5.75% of offering price) | | $ | 8.20 | |
Class C Shares: | | | | |
Net asset value, offering price and redemption proceeds per share | | $ | 7.44 | |
Class I Shares: | | | | |
Net asset value, offering price and redemption proceeds per share | | $ | 7.89 | |
Class Y Shares: | | | | |
Net asset value, offering price and redemption proceeds per share | | $ | 7.85 | |
Net Assets: | | | |
Class A shares | | $ | 125,026,005 | |
Class C shares | | | 49,473,666 | |
Class I shares | | | 451,138 | |
Class Y shares | | | 76,887,793 | |
Total Net Assets | | $ | 251,838,602 | |
| | | | | |
Shares Outstanding: | | | | |
Class A shares | | | 16,180,436 | |
Class C shares | | | 6,652,368 | |
Class I shares | | | 57,208 | |
Class Y shares | | | 9,791,641 | |
Total Shares Outstanding | | | 32,681,653 | |
See accompanying Notes to Financial Statements.
OPPENHEIMER STEELPATH MLP ALPHA PLUS FUND 15 |
STATEMENT OF OPERATIONS For the Year Ended November 30, 2016 |
Investment Income | | | |
Distributions from Master Limited Partnerships | | $ | 18,687,287 | |
Less return of capital on distributions from Master Limited Partnerships: | | | (18,687,287 | ) |
Dividend income | | | 977,777 | |
Total investment income | | | 977,777 | |
| | | | |
Expenses | | | | |
Management fees | | | 2,758,624 | |
Distribution and service plan fees | | | | |
Class A | | | 256,845 | |
Class C | | | 421,382 | |
Transfer agent fees | | | | |
Class A | | | 226,023 | |
Class C | | | 92,704 | |
Class I | | | 124 | |
Class Y | | | 165,879 | |
Borrowing fees | | | 374,604 | |
Legal, auditing, and other professional fees | | | 166,260 | |
Registration fees | | | 119,552 | |
Administrative fees | | | 62,814 | |
Custody fees | | | 19,625 | |
Trustees' fees | | | 15,385 | |
Other | | | 19,292 | |
Net expenses, before interest expense from payable on borrowing and deferred taxes | | | 4,669,113 | |
Interest expense from payable on borrowing | | | 802,050 | |
Net expenses, before deferred taxes | | | 5,501,163 | |
| | | | |
Net investment loss, before deferred taxes | | | (4,523,386 | ) |
Deferred tax benefit | | | 751,659 | |
Net investment loss, net of deferred taxes | | | (3,771,727 | ) |
| | | | |
Net Realized and Unrealized Gains on Investments: | | | | |
Net Realized Losses | | | | |
Investments | | | (42,302,079 | ) |
Deferred tax benefit | | | 5,953,943 | |
Net realized losses, net of deferred taxes | | | (36,348,136 | ) |
Net Change in Unrealized Appreciation | | | | |
Investments | | | 63,545,425 | |
Deferred tax expense | | | (9,099,841 | ) |
Net change in unrealized appreciation, net of deferred taxes | | | 54,445,584 | |
| | | | |
Net realized and unrealized gains on investments, net of deferred taxes | | | 18,097,448 | |
Change in net assets resulting from operations | | $ | 14,325,721 | |
See accompanying Notes to Financial Statements.
16 OPPENHEIMER STEELPATH MLP ALPHA PLUS FUND |
STATEMENTS OF CHANGES IN NET ASSETS |
| | For the
Year Ended November 30,
2016 | | | For the
Year Ended November 30,
2015 | |
Operations | | | | | | |
Net investment loss, net of deferred taxes | | $ | (3,771,727 | ) | | $ | (4,192,729 | ) |
Net realized losses on investments, net of deferred taxes | | | (36,348,136 | ) | | | (24,119,353 | ) |
Net change in unrealized appreciation/(depreciation) on investments, net of deferred taxes | | | 54,445,584 | | | | (93,860,483 | ) |
Change in net assets resulting from operations | | | 14,325,721 | | | | (122,172,565 | ) |
| | | | | | | | |
Distributions to Shareholders | | | | | | | | |
Distributions to shareholders from return of capital: | | | | | | | | |
Class A shares | | | (9,504,509 | ) | | | (8,653,829 | ) |
Class C shares | | | (3,998,014 | ) | | | (3,185,111 | ) |
Class I shares | | | (37,499 | ) | | | (13,896 | ) |
Class Y shares | | | (6,731,205 | ) | | | (6,682,154 | ) |
Change in net assets resulting from distributions to shareholders | | | (20,271,227 | ) | | | (18,534,990 | ) |
| | | | | | | | |
Beneficial Interest Transactions | | | | | | | | |
Class A shares | | | 35,004,880 | | | | (59,826,567 | ) |
Class C shares | | | 10,912,544 | | | | 5,727,926 | |
Class I shares | | | 118,193 | | | | 273,969 | |
Class Y shares | | | (8,060,847 | ) | | | 21,075,913 | |
Change in net assets resulting from beneficial interest transactions | | | 37,974,770 | | | | (32,748,759 | ) |
Change in net assets | | | 32,029,264 | | | | (173,456,314 | ) |
| | | | | | | | |
Net Assets | | | | | | | | |
Beginning of period | | | 219,809,338 | | | | 393,265,652 | |
End of period | | $ | 251,838,602 | | | $ | 219,809,338 | |
| | | | | | | | | |
Undistributed net investment loss, net of deferred taxes | | $ | (13,535,769 | ) | | $ | (9,764,042 | ) |
See accompanying Notes to Financial Statements.
OPPENHEIMER STEELPATH MLP ALPHA PLUS FUND 17 |
STATEMENT OF CASH FLOWS For the Year Ended November 30, 2016 |
Cash flows from operating activities | | | |
Net increase in net assets resulting from operations | | $ | 14,325,721 | |
Non cash items included in operations | | | | |
Deferred income taxes | | | 2,394,239 | |
Adjustments to reconcile net increase in net assets resulting from operations to net cash used in operating activities: | | | | |
Purchases of long-term portfolio investments | | | (175,030,591 | ) |
Sales of long-term portfolio investments | | | 120,347,211 | |
Sales of short-term portfolio investments, net | | | 10,505,936 | |
Distributions from Master Limited Partnerships | | | 18,644,027 | |
Decrease in prepaid expenses | | | 357,357 | |
Decrease in dividends receivable | | | 7 | |
Increase in payable to Manager | | | 23,132 | |
Increase in payable for investments purchased | | | 1,552,984 | |
Increase in receivable for investments sold | | | (3,222,031 | ) |
Increase in other liabilities | | | 27,392 | |
Increase in payable for distribution and service plan fees | | | 12,206 | |
Increase in transfer agent fees payable | | | 4,048 | |
Decrease in trustees' fees payable | | | (1,328 | ) |
Increase in interest expense payable | | | 57,408 | |
Decrease in borrowing expense payable | | | (6,164 | ) |
Net realized loss on investments | | | 42,302,079 | |
Net change in accumulated unrealized appreciation on investments | | | (63,545,425 | ) |
Net cash used in operating activities | | | (31,251,792 | ) |
| | | | |
Cash flows from financing activities | | | | |
Proceeds from shares sold, net of receivable for beneficial interest sold | | | 152,325,294 | |
Payment of shares redeemed, net of payable for beneficial interest redeemed | | | (132,315,853 | ) |
Distributions paid to shareholders, net of reinvestments | | | (1,342,979 | ) |
Proceeds from borrowing | | | 42,400,000 | |
Payments on borrowing | | | (30,400,000 | ) |
Bank overdraft, due to custodian | | | 585,330 | |
Net cash provided by financing activities | | | 31,251,792 | |
| | | | |
Net change in cash | | | — | |
Cash at beginning of period | | | — | |
Cash at end of period | | $ | — | |
Supplemental disclosure of cash flow information:
Cash paid on interest of $744,642.
Non-cash financing activities not included consist of reinvestment of dividends and distributions of $18,928,248.
See accompanying Notes to the Financial Statements.
18 OPPENHEIMER STEELPATH MLP ALPHA PLUS FUND |
Class A | | Year Ended November 30,
2016 | | | Year Ended November 30,
2015 | | | Year Ended November 28,
2014* | | | Year Ended November 29,
2013* | | | Period Ended November 30,
2012 1 | |
Per Share Operating Data | | | | | | | | | | | | | | | |
Net Asset Value, Beginning of Period | | $ | 7.95 | | | $ | 12.95 | | | $ | 11.77 | | | $ | 9.93 | | | $ | 10.14 | |
Income/(loss) from investment operations: | | | | | | | | | | | | | | | | | | | | |
Net investment loss2 | | | (0.11 | ) | | | (0.15 | ) | | | (0.21 | ) | | | (0.17 | ) | | | (0.14 | ) |
Return of capital2 | | | 0.39 | | | | 0.50 | | | | 0.55 | | | | 0.54 | | | | 0.46 | |
Net realized and unrealized gains/(losses) | | | 0.16 | | | | (4.69 | ) | | | 1.50 | | | | 2.13 | | | | 0.12 | |
Total from investment operations | | | 0.44 | | | | (4.34 | ) | | | 1.84 | | | | 2.50 | | | | 0.44 | |
Distributions to shareholders: | | | | | | | | | | | | | | | | | | | | |
Return of capital | | | (0.66 | ) | | | (0.66 | ) | | | (0.66 | ) | | | (0.66 | ) | | | (0.65 | ) |
Net asset value, end of period | | $ | 7.73 | | | $ | 7.95 | | | $ | 12.95 | | | $ | 11.77 | | | $ | 9.93 | |
| | | | | | | | | | | | | | | | | | | | |
Total Return, at Net Asset Value3 | | | 6.66 | % | | | (34.68 | %) | | | 15.77 | % | | | 25.59 | % | | | 4.56 | % |
| | | | | | | | | | | | | | | | | | | | | |
Ratios /Supplemental Data | | | | | | | | | | | | | | | | | | | | |
Net assets, end of period (in thousands) | | $ | 125,026 | | | $ | 88,832 | | | $ | 214,846 | | | $ | 108,563 | | | $ | 6,915 | |
Ratio of Expenses to Average Net Assets:4 | | | | | | | | | | | | | | | | | |
Before recoupment/(waivers) and deferred tax expense/(benefit) | | | 2.43 | % | | | 2.30 | % | | | 2.40 | % | | | 2.45 | % | | | 9.02 | % |
Expense recoupment/(waivers) | | | — | % | | | — | % | | | 0.12 | % | | | (0.05 | %) | | | (6.42 | %) |
Net of recoupment/(waivers) and before deferred tax expense/(benefit) | | | 2.43 | %5 | | | 2.30 | %5 | | | 2.52 | %5 | | | 2.40 | %5 | | | 2.60 | %6 |
Deferred tax expense/(benefit)7,8 | | | 1.09 | % | | | (12.67 | %) | | | 5.54 | % | | | 8.38 | % | | | 4.04 | % |
Total expenses/(benefit) | | | 3.52 | % | | | (10.37 | %) | | | 8.06 | % | | | 10.78 | % | | | 6.64 | % |
| | | | | | | | | | | | | | | | | | | | | |
Ratio of Investment Loss to Average Net Assets:4 | | | | | | | | | | | | | | | | | |
Before recoupment/(waivers) and deferred tax benefit/(expense) | | | (1.84 | %) | | | (2.04 | %) | | | (2.35 | %) | | | (2.40 | %) | | | (9.02 | %) |
Expense recoupment/(waivers) | | | — | % | | | — | % | | | 0.12 | % | | | (0.05 | %) | | | (6.42 | %) |
Net of expense recoupment/(waivers) and before deferred tax benefit/(expense) | | | (1.84 | %) | | | (2.04 | %) | | | (2.47 | %) | | | (2.35 | %) | | | (2.60 | %) |
Deferred tax benefit8,9 | | | 0.34 | % | | | 0.67 | % | | | 0.88 | % | | | 0.87 | % | | | 0.97 | % |
Net investment loss | | | (1.50 | %) | | | (1.37 | %) | | | (1.59 | %) | | | (1.48 | %) | | | (1.63 | %) |
| | | | | | | | | | | | | | | | | | | | |
Portfolio turnover rate | | | 45 | % | | | 39 | % | | | 21 | % | | | 15 | % | | | 69 | % |
* | November 28, 2014 and November 29, 2013 represent the last business day of the Fund’s respective reporting periods. |
1. | Shares commenced operations at the close of business February 6, 2012. |
2. | Per share amounts calculated based on average shares outstanding during the period net of deferred tax expense/benefit. |
3. | Assumes an initial investment on the business day before the first day of the fiscal period, with all dividends and distributions reinvested in additional shares on the reinvestment date, and redemptions at the net asset value calculated on the last business day of the fiscal period. Sales charges are not reflected in the total returns. Total returns are not annualized for periods less than one full year. Returns do not reflect the deduction of taxes that a shareholder would pay on fund distributions or the redemption of fund shares. The returns do not include adjustments in accordance with generally accepted accounting principles required at the period end for financial reporting purposes. |
4. | Annualized for less than full period. |
5. | Includes interest, borrowing and franchise tax expense. Without interest, borrowing and franchise tax expense, the net expense ratio would be 1.90%, 1.86%, 1.99% and 2.00%, for the years ended November 30, 2016, November 30, 2015, November 28, 2014 and November 29, 2013, respectively. |
6. | Includes interest expense. Without interest expense the net expense ratio would be 2.00%. |
7. | Deferred tax expense estimate for the ratio calculation is derived from the net investment income/loss, and realized and unrealized gains/losses. |
8. | Effective December 1, 2013 the deferred tax expense and deferred tax benefit are allocated based on average net assets. Prior to December 1, 2013 the deferred tax expense and deferred tax benefit were allocated based on specific class expenses. |
9. | Deferred tax benefit for the ratio calculation is derived from net investment income/loss only. |
See accompanying Notes to Financial Statements.
OPPENHEIMER STEELPATH MLP ALPHA PLUS FUND 19 |
FINANCIAL HIGHLIGHTS (Continued) |
Class C | | Year Ended November 30,
2016 | | | Year Ended November 30,
2015 | | | Year Ended November 28,
2014* | | | Year Ended November 29,
2013* | | | Period Ended November 30,
2012 1 | |
Per Share Operating Data | | | | | | | | | | | | | | | |
Net Asset Value, Beginning of Period | | $ | 7.73 | | | $ | 12.71 | | | $ | 11.64 | | | $ | 9.91 | | | $ | 9.45 | |
Income/(loss) from investment operations: | | | | | | | | | | | | | | | | | | | | |
Net investment loss2 | | | (0.18 | ) | | | (0.22 | ) | | | (0.28 | ) | | | (0.22 | ) | | | (0.11 | ) |
Return of capital2 | | | 0.39 | | | | 0.50 | | | | 0.55 | | | | 0.55 | | | | 0.28 | |
Net realized and unrealized gains/(losses) | | | 0.16 | | | | (4.60 | ) | | | 1.46 | | | | 2.06 | | | | 0.62 | |
Total from investment operations | | | 0.37 | | | | (4.32 | ) | | | 1.73 | | | | 2.39 | | | | 0.79 | |
Distributions to shareholders: | | | | | | | | | | | | | | | | | | | | |
Return of capital | | | (0.66 | ) | | | (0.66 | ) | | | (0.66 | ) | | | (0.66 | ) | | | (0.33 | ) |
Net asset value, end of period | | $ | 7.44 | | | $ | 7.73 | | | $ | 12.71 | | | $ | 11.64 | | | $ | 9.91 | |
| | | | | | | | | | | | | | | | | | | | |
Total Return, at Net Asset Value3 | | | 5.91 | % | | | (35.20 | %) | | | 14.98 | % | | | 24.50 | % | | | 8.39 | % |
| | | | | | | | | | | | | | | | | | | | | |
Ratios /Supplemental Data | | | | | | | | | | | | | | | | | | | | |
Net assets, end of period (in thousands) | | $ | 49,474 | | | $ | 38,816 | | | $ | 57,070 | | | $ | 16,317 | | | $ | 604 | |
Ratio of Expenses to Average Net Assets:4 | | | | | | | | | | | | | | | | | | | | |
Before recoupment/(waivers) and deferred tax expense/(benefit) | | | 3.18 | % | | | 3.05 | % | | | 3.15 | % | | | 3.20 | % | | | 11.88 | % |
Expense recoupment/(waivers) | | | — | % | | | — | % | | | 0.12 | % | | | (0.05 | %) | | | (8.57 | %) |
Net of recoupment/(waivers) and before deferred tax expense/(benefit) | | | 3.18 | %5 | | | 3.05 | %5 | | | 3.27 | %5 | | | 3.15 | %5 | | | 3.31 | %6 |
Deferred tax expense/(benefit)7,8 | | | 1.09 | % | | | (12.67 | %) | | | 5.54 | % | | | 8.16 | % | | | 4.16 | % |
Total expenses/(benefit) | | | 4.27 | % | | | (9.62 | %) | | | 8.81 | % | | | 11.31 | % | | | 7.47 | % |
| | | | | | | | | | | | | | | | | | | | | |
Ratio of Investment Loss to Average Net Assets:4 | | | | | | | | | | | | | | | | | |
Before recoupment/(waivers) and deferred tax benefit/(expense) | | | (2.91 | %) | | | (2.76 | %) | | | (2.94 | %) | | | (3.15 | %) | | | (11.88 | %) |
Expense recoupment/(waivers) | | | — | % | | | — | % | | | 0.12 | % | | | (0.05 | %) | | | (8.57 | %) |
Net of expense recoupment/(waivers) and before deferred tax benefit/(expense) | | | (2.91 | %) | | | (2.76 | %) | | | (3.06 | %) | | | (3.10 | %) | | | (3.31 | %) |
Deferred tax benefit8,9 | | | 0.34 | % | | | 0.67 | % | | | 0.88 | % | | | 1.14 | % | | | 1.23 | % |
Net investment loss | | | (2.57 | %) | | | (2.09 | %) | | | (2.18 | %) | | | (1.96 | %) | | | (2.08 | %) |
| | | | | | | | | | | | | | | | | | | | |
Portfolio turnover rate | | | 45 | % | | | 39 | % | | | 21 | % | | | 15 | % | | | 69 | % |
* | November 28, 2014 and November 29, 2013 represent the last business day of the Fund’s respective reporting periods. |
1. | Shares commenced operations at the close of business May 22, 2012. |
2. | Per share amounts calculated based on average shares outstanding during the period net of deferred tax expense/benefit. |
3. | Assumes an initial investment on the business day before the first day of the fiscal period, with all dividends and distributions reinvested in additional shares on the reinvestment date, and redemptions at the net asset value calculated on the last business day of the fiscal period. Sales charges are not reflected in the total returns. Total returns are not annualized for periods less than one full year. Returns do not reflect the deduction of taxes that a shareholder would pay on fund distributions or the redemption of fund shares. The returns do not include adjustments in accordance with generally accepted accounting principles required at the period end for financial reporting purposes. |
4. | Annualized for less than full year. |
5. | Includes interest, borrowing and franchise tax expense. Without interest, borrowing and franchise tax expense, the net expense ratio would be 2.65%, 2.61%, 2.74% and 2.75%, for the years ended November 30, 2016, November 30, 2015, November 28, 2014 and November 29, 2013, respectively. |
6. | Includes interest expense. Without interest expense the net expense ratio would be 2.75%. |
7. | Deferred tax expense estimate for the ratio calculation is derived from the net investment income/loss, and realized and unrealized gains/losses. |
8. | Effective December 1, 2013 the deferred tax expense and deferred tax benefit are allocated based on average net assets. Prior to December 1, 2013 the deferred tax expense and deferred tax benefit were allocated based on specific class expenses. |
9. | Deferred tax benefit for the ratio calculation is derived from net investment income/loss only. |
See accompanying Notes to Financial Statements.
20 OPPENHEIMER STEELPATH MLP ALPHA PLUS FUND |
FINANCIAL HIGHLIGHTS (Continued) |
Class I | | Year Ended November 30,
2016 | | | Year Ended November 30,
2015 | | | Year Ended November 28,
2014* | | | Period Ended November 29,
2013*,1,2 | |
Per Share Operating Data | | | | | | | | | | | | |
Net Asset Value, Beginning of Period | | $ | 8.06 | | | $ | 13.06 | | | $ | 11.81 | | | $ | 11.71 | |
Income/(loss) from investment operations: | | | | | | | | | | | | | | | | |
Net investment income/(loss)3 | | | (0.07 | ) | | | (0.06 | ) | | | 0.02 | | | | (0.06 | ) |
Return of capital3 | | | 0.39 | | | | 0.50 | | | | 0.55 | | | | 0.23 | |
Net realized and unrealized gains/(losses) | | | 0.17 | | | | (4.78 | ) | | | 1.34 | | | | 0.26 | |
Total from investment operations | | | 0.49 | | | | (4.34 | ) | | | 1.91 | | | | 0.43 | |
Distributions to shareholders: | | | | | | | | | | | | | | | | |
Return of capital | | | (0.66 | ) | | | (0.66 | ) | | | (0.66 | ) | | | (0.33 | ) |
Net asset value, end of period | | $ | 7.89 | | | $ | 8.06 | | | $ | 13.06 | | | $ | 11.81 | |
| | | | | | | | | | | | | | | | |
Total Return, at Net Asset Value4 | | | 7.21 | % | | | (34.39 | %) | | | 16.32 | % | | | 3.71 | % |
| | | | | | | | | | | | | | | | | |
Ratios /Supplemental Data | | | | | | | | | | | | | | | | |
Net assets, end of period (in thousands) | | $ | 451 | | | $ | 338 | | | $ | 160 | | | $ | 10 | |
Ratio of Expenses to Average Net Assets:5 | | | | | | | | | | | | | | | | |
Before (waivers) and deferred tax expense/(benefit) | | | 2.00 | % | | | 1.86 | % | | | 2.00 | % | | | 2.38 | % |
Expense (waivers) | | | — | % | | | — | % | | | — | % | | | (0.23 | %) |
Net of (waivers) and before deferred tax expense/(benefit) | | | 2.00 | %6 | | | 1.86 | %6 | | | 2.00 | %6 | | | 2.15 | %6 |
Deferred tax expense/(benefit)7,8 | | | 1.09 | % | | | (12.67 | %) | | | 5.54 | % | | | 21.06 | % |
Total expenses/(benefit) | | | 3.09 | % | | | (10.81 | %) | | | 7.54 | % | | | 23.21 | % |
| | | | | | | | | | | | | | | | | |
Ratio of Investment Income/(Loss) to Average Net Assets:5 | | | | | | | | | | | | | | |
Before (waivers) and deferred tax benefit/(expense) | | | (1.35 | %) | | | (1.23 | %) | | | (0.74 | %) | | | (2.33 | %) |
Expense (waivers) | | | — | % | | | — | % | | | — | % | | | (0.23 | %) |
Net of expense (waivers) and before deferred tax benefit/(expense) | | | (1.35 | %) | | | (1.23 | %) | | | (0.74 | %) | | | (2.10 | %) |
Deferred tax benefit8,9 | | | 0.34 | % | | | 0.67 | % | | | 0.88 | % | | | 0.77 | % |
Net investment income/(loss) | | | (1.01 | %) | | | (0.56 | %) | | | 0.14 | % | | | (1.33 | %) |
| | | | | | | | | | | | | | | | |
Portfolio turnover rate | | | 45 | % | | | 39 | % | | | 21 | % | | | 15 | % |
* | November 28, 2014 and November 29, 2013 represent the last business day of the Fund’s respective reporting periods. |
1. | Shares commenced operations at the close of business June 28, 2013. |
2. | Effective June 28, 2013, Class I shares were renamed Class Y shares. See Note 1 of the Notes to Financial Statements for additional information. |
3. | Per share amounts calculated based on average shares outstanding during the period net of deferred tax expense/benefit. |
4. | Assumes an initial investment on the business day before the first day of the fiscal period, with all dividends and distributions reinvested in additional shares on the reinvestment date, and redemptions at the net asset value calculated on the last business day of the fiscal period. Sales charges are not reflected in the total returns. Total returns are not annualized for periods less than one full year. Returns do not reflect the deduction of taxes that a shareholder would pay on fund distributions or the redemption of fund shares. The returns do not include adjustments in accordance with generally accepted accounting principles required at the period end for financial reporting purposes. |
5. | Annualized for less than full year. |
6. | Includes interest, borrowing and franchise tax expense. Without interest, borrowing and franchise tax expense, the net expense ratio would be 1.47%, 1.42%, 1.47% and 1.75%, for the years ended November 30, 2016, November 30, 2015, November 28, 2014 and the period ended November 29, 2013, respectively. |
7. | Deferred tax expense estimate for the ratio calculation is derived from the net investment income/loss, and realized and unrealized gains/losses. |
8. | Effective December 1, 2013 the deferred tax expense and deferred tax benefit are allocated based on average net assets. Prior to December 1, 2013 the deferred tax expense and deferred tax benefit were allocated based on specific class expenses. |
9. | Deferred tax benefit for the ratio calculation is derived from net investment income/loss only. |
See accompanying Notes to Financial Statements.
OPPENHEIMER STEELPATH MLP ALPHA PLUS FUND 21 |
FINANCIAL HIGHLIGHTS (Continued) |
Class Y | | Year Ended November 30,
2016 | | | Year Ended November 30,
2015 | | | Year Ended November 28,
2014* | | | Year Ended November 29,
2013*,1 | | | Period Ended November 30,
2012 1,2 | |
Per Share Operating Data | | | | | | | | | | | | | | | |
Net Asset Value, Beginning of Period | | $ | 8.04 | | | $ | 13.07 | | | $ | 11.84 | | | $ | 9.96 | | | $ | 10.00 | |
Income/(loss) from investment operations: | | | | | | | | | | | | | | | | | | | | |
Net investment loss3 | | | (0.11 | ) | | | (0.10 | ) | | | (0.14 | ) | | | (0.15 | ) | | | (0.12 | ) |
Return of capital3 | | | 0.39 | | | | 0.50 | | | | 0.55 | | | | 0.54 | | | | 0.48 | |
Net realized and unrealized gains/(losses) | | | 0.19 | | | | (4.77 | ) | | | 1.48 | | | | 2.15 | | | | 0.25 | |
Total from investment operations | | | 0.47 | | | | (4.37 | ) | | | 1.89 | | | | 2.54 | | | | 0.61 | |
Distributions to shareholders: | | | | | | | | | | | | | | | | | | | | |
Return of capital | | | (0.66 | ) | | | (0.66 | ) | | | (0.66 | ) | | | (0.66 | ) | | | (0.65 | ) |
Net asset value, end of period | | $ | 7.85 | | | $ | 8.04 | | | $ | 13.07 | | | $ | 11.84 | | | $ | 9.96 | |
| | | | | | | | | | | | | | | | | | | | |
Total Return, at Net Asset Value4 | | | 6.96 | % | | | (34.59 | %) | | | 16.11 | % | | | 25.92 | % | | | 6.33 | % |
| | | | | | | | | | | | | | | | | | | | | |
Ratios /Supplemental Data | | | | | | | | | | | | | | | | | | | | |
Net assets, end of period (in thousands) | | $ | 76,888 | | | $ | 91,824 | | | $ | 121,190 | | | $ | 49,776 | | | $ | 1,604 | |
Ratio of Expenses to Average Net Assets:5 | | | | | | | | | | | | | | | | | | | | |
Before recoupment/(waivers) and deferred tax expense/(benefit) | | | 2.19 | % | | | 2.05 | % | | | 2.15 | % | | | 2.20 | % | | | 24.82 | % |
Expense recoupment/(waivers) | | | — | % | | | — | % | | | 0.12 | % | | | (0.05 | %) | | | (22.71 | %) |
Net of recoupment/(waivers) and before deferred tax expense/(benefit) | | | 2.19 | %6 | | | 2.05 | %6 | | | 2.27 | %6 | | | 2.15 | %6 | | | 2.11 | %7 |
Deferred tax expense/(benefit)8,9 | | | 1.09 | % | | | (12.67 | %) | | | 5.54 | % | | | 8.43 | % | | | (2.88 | %) |
Total expenses/(benefit) | | | 3.28 | % | | | (10.62 | %) | | | 7.81 | % | | | 10.58 | % | | | (0.77 | %) |
| | | | | | | | | | | | | | | | | | | | | |
Ratio of Investment Loss to Average Net Assets:5 | | | | | | | | | | | | | | | | |
Before recoupment/(waivers) and deferred tax benefit/(expense) | | | (1.92 | %) | | | (1.56 | %) | | | (1.82 | %) | | | (2.15 | %) | | | (24.82 | %) |
Expense recoupment/(waivers) | | | — | % | | | — | % | | | 0.12 | % | | | (0.05 | %) | | | (22.71 | %) |
Net of expense recoupment/(waivers) and before deferred tax benefit/(expense) | | | (1.92 | %) | | | (1.56 | %) | | | (1.94 | %) | | | (2.10 | %) | | | (2.11 | %) |
Deferred tax benefit9,10 | | | 0.34 | % | | | 0.67 | % | | | 0.88 | % | | | 0.78 | % | | | 0.79 | % |
Net investment loss | | | (1.58 | %) | | | (0.89 | %) | | | (1.06 | %) | | | (1.32 | %) | | | (1.32 | %) |
| | | | | | | | | | | | | | | | | | | | |
Portfolio turnover rate | | | 45 | % | | | 39 | % | | | 21 | % | | | 15 | % | | | 69 | % |
* | November 28, 2014 and November 29, 2013 represent the last business day of the Fund’s respective reporting periods. |
1. | Effective June 28, 2013, Class I shares were renamed Class Y shares. See Note 1 of the Notes to Financial Statements for additional information. |
2. | The net asset value for the beginning of the period close of business December 30, 2011 (Commencement of Operations) through November 30, 2012 represents the initial contribution per share of $10. |
3. | Per share amounts calculated based on average shares outstanding during the period net of deferred tax expense/benefit. |
4. | Assumes an initial investment on the business day before the first day of the fiscal period, with all dividends and distributions reinvested in additional shares on the reinvestment date, and redemptions at the net asset value calculated on the last business day of the fiscal period. Sales charges are not reflected in the total returns. Total returns are not annualized for periods less than one full year. Returns do not reflect the deduction of taxes that a shareholder would pay on fund distributions or the redemption of fund shares. The returns do not include adjustments in accordance with generally accepted accounting principles required at the period end for financial reporting purposes. |
5. | Annualized for less than full year. |
6. | Includes interest, borrowing and franchise tax expense. Without interest, borrowing and franchise tax expense, the net expense ratio would be 1.66%, 1.61%, 1.74% and 1.75%, for the years ended November 30, 2016, November 30, 2015, November 28, 2014, and November 29, 2013, respectively. |
7. | Includes interest expense. Without interest expense the net expense ratio would be 1.75%. |
8. | Deferred tax expense estimate for the ratio calculation is derived from the net investment income/loss, and realized and unrealized gains/losses. |
9. | Effective December 1, 2013 the deferred tax expense and deferred tax benefit are allocated based on average net assets. Prior to December 1, 2013 the deferred tax expense and deferred tax benefit were allocated based on specific class expenses. |
10. | Deferred tax benefit for the ratio calculation is derived from net investment income/loss only. |
See accompanying Notes to Financial Statements.
22 OPPENHEIMER STEELPATH MLP ALPHA PLUS FUND |
NOTES TO FINANCIAL STATEMENTS |
1. Organization
Oppenheimer SteelPath MLP Alpha Plus Fund (the “Fund”), a separate series of Oppenheimer SteelPath MLP Funds Trust, is a non-diversified open-end management investment company registered under the Investment Company Act of 1940, as amended. The Fund’s investment objective is to seek total return. The Fund’s investment adviser is OFI SteelPath, Inc. (the “Adviser” or “Manager”), a wholly-owned subsidiary of OppenheimerFunds, Inc. (“OFI” or “Oppenheimer”).
The Fund offers Class A, Class C, Class I, and Class Y shares. Effective June 28, 2013, Class I shares were renamed Class Y shares. Class A shares are sold at their offering price, which is normally net asset value plus a front-end sales charge. Effective June 28, 2013 although there is no initial sales charge on Class A purchases totaling $1 million or more, those Class A shares may be subject to a 1.00% contingent deferred sales charge (”CDSC”) if shares are redeemed within an 18-month “holding period” measured from the date of purchase. Class C shares are sold without a front-end sales charge but may be subject to a CDSC of 1.00% of the redemption proceeds if Class C shares are redeemed within one year of purchase. Class I shares are only available to eligible institutional investors. Class I shares are sold at net asset value per share without a sales charge or CDSC. An institutional investor that buys Class I shares for its customers’ accounts may impose charges on those accounts. Class Y shares are sold at net asset value per share without a sales charge directly to institutional investors that have special agreements with OppenheimerFunds Distributor, Inc. (the “Distributor”) for that purpose. They may include insurance companies, registered investment companies, employee benefit plans and section 529 plans, among others. An institutional investor that buys Class Y shares for its customers’ accounts may impose charges on those accounts. All classes of shares have identical rights and voting privileges with respect to the Fund in general and exclusive voting rights on matters that affect that class alone. Earnings, net assets and net asset value per share may differ due to each class having its own expenses, such as transfer and shareholder servicing agent fees and shareholder communications, directly attributable to that class. Class A and C shares have separate distribution and/or service plans under which they pay fees. Class I and Y shares do not pay such fees.
The Fund is an investment company and accordingly follows the investment company accounting and reporting guidance of the Financial Accounting Standards Board (“FASB”) Accounting Standard Codification Topic 946 Financial Services- Investment Companies.
The following is a summary of significant accounting policies followed in the Fund’s preparation of financial statements in accordance with accounting principles generally accepted in the United States (“U.S. GAAP”).
OPPENHEIMER STEELPATH MLP ALPHA PLUS FUND 23 |
NOTES TO FINANCIAL STATEMENTS (Continued) |
2. Significant Accounting Policies
Security Valuation. All investments in securities are recorded at their estimated fair value, as described in Note 3.
Allocation of Income, Expenses, Gains and Losses. Income, expenses (other than those attributable to a specific class), gains and losses are allocated on a daily basis to each class of shares based upon the relative proportion of net assets represented by such class. Operating expenses directly attributable to a specific class are charged against the operations of that class.
Dividends and Distributions to Shareholders. Dividends and distributions to shareholders, which are determined in accordance with income tax regulations and may differ from U.S. generally accepted accounting principles, are recorded on the ex-dividend date. Dividends, if any, are declared and distributed monthly for the Fund. The estimated characterization of the distributions paid will be either a qualified dividend or distribution (return of capital). This estimate is based on the Fund’s operating results during the period. It is anticipated that a significant portion of the distributions will be comprised of return of capital as a result of the tax character of cash distributions made by the Fund’s investments. The actual characterization of the distributions made during the period will not be determined until after the end of the fiscal year. The Fund will inform shareholders of the final tax character of the distributions on IRS Form 1099 DIV in February 2017. For the year ended November 30, 2016, the Fund distributions are expected to be comprised of 100% return of capital.
Return of Capital Estimates. Distributions received from the Fund’s investments in MLPs generally are comprised of income and return of capital. The Fund records investment income and return of capital based on estimates made at the time such distributions are received. Such estimates are based on historical information available from each MLP and other industry sources. These estimates may subsequently be revised based on information received from MLPs after their tax reporting periods are concluded. For the year ended November 30, 2016, the Fund estimated that 100% of the MLP distributions received would be treated as return of capital.
Investment Income. Dividend income is recorded on the ex-dividend date or upon ex-dividend notification in the case of certain foreign dividends where the ex-dividend date may have passed. Non-cash dividends included in dividend income, if any, are recorded at the fair value of the securities received. Interest income is recognized on an accrual basis. Discount and premium, which are included in interest income on the Statement of Operations, if applicable, are amortized or accreted daily.
Custodian Fees. “Custody fees” in the Statement of Operations may include interest expense incurred by the Fund on any cash overdrafts of its custodian account during the period. Such cash overdrafts may result from the effects of failed trades in portfolio securities and from cash outflows resulting from unanticipated shareholder redemption activity. The
24 OPPENHEIMER STEELPATH MLP ALPHA PLUS FUND |
NOTES TO FINANCIAL STATEMENTS (Continued) |
2. Significant Accounting Policies (Continued)
Fund pays interest to its custodian on such cash overdrafts, to the extent they are not offset by positive cash balances maintained by the Fund, at a rate equal to the Federal Funds Rate plus 0.50%. The “Reduction to custodian expenses” line item, if applicable, represents earnings on cash balances maintained by the Fund during the period. Such interest expense and other custodian fees may be paid with these earnings.
Security Transactions. Security transactions are recorded on the trade date. Realized gains and losses on securities sold are determined using the basis of identified cost.
Indemnifications. The Fund’s organizational documents provide current and former trustees and officers with a limited indemnification against liabilities arising in connection with the performance of their duties to the Fund. In the normal course of business, the Fund may also enter into contracts that provide general indemnifications. The Fund’s maximum exposure under these arrangements is unknown as this would be dependent on future claims that may be made against the Fund. The risk of material loss from such claims is considered remote.
Federal Income Taxes. The Fund does not intend to qualify as a regulated investment company pursuant to Subchapter M of the Internal Revenue Code, but will rather be taxed as a corporation. As a corporation, the Fund is obligated to pay federal, state and local income tax on taxable income. Currently, the maximum marginal regular federal income tax rate for a corporation is 35 percent. Upon enactment, a change in the federal income tax rate could have a material impact to the Fund. The Fund may be subject to a 20 percent alternative minimum tax on its federal alternative minimum taxable income to the extent that its alternative minimum tax exceeds its regular federal income tax. The Fund is currently using an estimated rate of 1.7 percent for state and local tax, net of federal tax expense.
The Fund’s income tax provision consists of the following as of November 30, 2016:
Current tax expense (benefit) | | | |
Federal | | $ | — | |
State | | | — | |
Total current tax expense | | $ | — | |
| | | | | |
Deferred tax expense (benefit) | | | | |
Federal | | $ | 2,187,331 | |
State | | | 206,908 | |
Total deferred tax expense | | $ | 2,394,239 | |
OPPENHEIMER STEELPATH MLP ALPHA PLUS FUND 25 |
NOTES TO FINANCIAL STATEMENTS (Continued) |
2. Significant Accounting Policies (Continued)
The reconciliation between the federal statutory income tax rate of 35% and the effective tax rate on net investment income (loss) and realized and unrealized gain (loss) follows:
| | Amount | | | Rate | |
Application of federal statutory income tax rate | | $ | 5,851,985 | | | | 35.00 | % |
State income taxes net of federal benefit | | | 284,239 | | | | 1.70 | % |
Effect of state tax rate change | | | 100,667 | | | | 0.60 | % |
Effect of permanent differences | | | (77,350 | ) | | | (0.46 | %) |
Change in valuation allowance | | | (3,765,302 | ) | | | (22.52 | %) |
Total income tax expense (benefit) | | $ | 2,394,239 | | | | 14.32 | % |
For the year ended November 30, 2016 the Fund’s effective tax rate of 14.32% (net expense) differed from the combined federal and state statutory tax rate of 36.70% (net expense) mainly due to the change in valuation allowance primarily as a result of the change in unrealized appreciation.
The Fund intends to invest its assets primarily in MLPs, which generally are treated as partnerships for federal income tax purposes. As a limited partner in the MLPs, the Fund reports its allocable share of the MLP’s taxable income in computing its own taxable income. The Fund’s tax expense or benefit will be included in the Statement of Operations based on the component of income or gains (losses) to which such expense or benefit relates. Deferred income taxes reflect the net tax effects of temporary differences between the carrying amounts of assets and liabilities for financial reporting purposes and the amounts used for income tax purposes. Such temporary differences are principally: (i) taxes on unrealized gains/(losses), which are attributable to the temporary difference between fair market value and tax basis, (ii) the net tax effects of temporary differences between the carrying amounts of assets and liabilities for financial reporting and income tax purposes and (iii) the net tax benefit of accumulated net operating losses and capital loss carryforwards. Deferred tax assets and liabilities are measured using effective tax rates expected to apply to taxable income in the years such temporary differences are realized or otherwise settled. To the extent the Fund has a deferred tax asset, consideration is given to whether or not a valuation allowance is required. A valuation allowance is required if, based on the evaluation criterion provided by ASC 740, Income Taxes (ASC 740), it is more-likely-than-not some portion or all of the deferred tax asset will not be realized. Among the factors considered in assessing the Fund’s valuation allowance are: the nature, frequency and severity of current and cumulative losses, forecasts of future profitability, the duration of the statutory carryforward periods, significant redemptions, and the associated risks that operating and capital loss carryforwards may expire unused.
26 OPPENHEIMER STEELPATH MLP ALPHA PLUS FUND |
NOTES TO FINANCIAL STATEMENTS (Continued) |
2. Significant Accounting Policies (Continued)
At November 30, 2016, the Fund determined a valuation allowance was required. In implementing a valuation allowance on a portion of the deferred tax asset, significant consideration was given to the current and expected level of MLP distributions, unrealized gains and losses on MLP investments and the expiration dates for net operating losses and capital loss carryovers. Market cycles, the severity and duration of historical deferred tax assets and the impact of current and future redemptions were also considered. Through the consideration of these factors, the Fund has determined that it is more likely than not the deferred tax asset, net of the valuation allowance, will be realized.
Unexpected significant decreases in cash distributions from the Fund’s MLP investments, significant declines in the fair value of its investments, significant redemptions, or increased risk of expiring net operating losses or capital loss carryovers may change the Fund’s assessment regarding the recoverability of its deferred tax assets and may result in a change to the valuation allowance. Modifications of the valuation allowance could have a material impact on the Fund’s net asset value.
Components of the Fund’s deferred tax assets and liabilities as of November 30, 2016 are as follows:
Deferred tax assets: | | | |
Net operating loss carryforward (tax basis) | | $ | 13,124,432 | |
Capital loss carryforward (tax basis) | | | 32,996,530 | |
Book to tax differences - Income recognized from MLPs | | | 697,667 | |
Valuation allowance | | | (16,329,331 | ) |
Total deferred tax asset | | | 30,489,298 | |
| | | | | |
Deferred tax liabilities: | | | | |
Net unrealized gains on investment securities (tax basis) | | | (15,370,464 | ) |
Total deferred tax liability | | | (15,370,464 | ) |
| | | | | |
Total net deferred tax asset/(liability) | | $ | 15,118,834 | |
The Fund may rely, to some extent, on information provided by the MLPs, which may not necessarily be timely, to estimate taxable income allocable to MLP units held in its portfolio, and to estimate its associated deferred tax liability or asset. Such estimates are made in good faith. From time to time, as new information becomes available, the Fund will modify its estimates or assumptions regarding its tax liability or asset.
OPPENHEIMER STEELPATH MLP ALPHA PLUS FUND 27 |
NOTES TO FINANCIAL STATEMENTS (Continued) |
2. Significant Accounting Policies (Continued)
The Fund’s policy is to classify interest and penalties associated with underpayment of federal and state income taxes, if any, as income tax expense on its Statement of Operations. As of November 30, 2016, the Fund does not have any interest or penalties associated with the underpayment of any income taxes.
The Fund files income tax returns in the U.S. federal jurisdiction and various states. The Fund has reviewed all major jurisdictions and concluded that there is no significant impact on the Fund’s net assets and no tax liability resulting from unrecognized tax benefits relating to uncertain tax positions expected to be taken on its tax returns. Furthermore, management of the Fund is not aware of any uncertain tax positions for which it is reasonably possible that the total amount of unrecognized tax benefit will significantly change in the next 12 months.
At November 30, 2016, the Fund had net operating loss carryforwards for federal income tax purposes, which may be carried forward for 20 years, as follows:
Expiration Date | | | |
11/30/2032 | | $ | 30,185 | |
11/30/2033 | | | 2,160,318 | |
11/30/2034 | | | 12,911,167 | |
11/30/2035 | | | 6,544,238 | |
11/30/2036 | | | 14,115,488 | |
Total | | $ | 35,761,396 | |
At November 30, 2016, the Fund had net capital loss carryforwards for federal income tax purposes, which may be carried forward for 5 years, as follows:
Expiration Date | | | |
11/30/2020 | | $ | 43,028,252 | |
11/30/2021 | | | 46,880,550 | |
Total | | $ | 89,908,802 | |
At November 30, 2016, gross unrealized appreciation and depreciation of investments, based on cost for federal income tax purposes were as follows:
Cost of Investments | | $ | 268,239,877 | |
Gross Unrealized Appreciation | | $ | 63,784,324 | |
Gross Unrealized Depreciation | | | (21,723,570 | ) |
Net Unrealized Appreciation (Depreciation) on Investments | | $ | 42,060,754 | |
28 OPPENHEIMER STEELPATH MLP ALPHA PLUS FUND |
NOTES TO FINANCIAL STATEMENTS (Continued) |
2. Significant Accounting Policies (Continued)
The difference between cost amounts for financial statement and federal income tax purposes is due primarily to timing differences in recognizing certain gains and losses in security transactions.
Use of Estimates. The preparation of financial statements in conformity with U.S. GAAP requires management to make estimates and assumptions that affect the reported amounts of assets and liabilities and disclosure of contingent assets and liabilities at the date of the financial statements and the reported amounts of increases and decreases in net assets from operations during the reporting period. Actual results could differ from those estimates.
3. Securities Valuation
The Fund calculates the net asset value of its shares as of 4:00 P.M. Eastern time, on each day the New York Stock Exchange (the “Exchange”) is open for trading, except in the case of a scheduled early closing of the Exchange, in which case the Fund will calculate net asset value of the shares as of the scheduled early closing time of the Exchange.
The Fund’s Board of Trustees (the “Board”) has adopted procedures for the valuation of the Fund’s securities and has delegated the day-to-day responsibility for valuation determinations under those procedures to the Adviser. The Adviser has established a Valuation Committee which is responsible for determining a “fair valuation” for any security for which market quotations are not “readily available.” The Valuation Committee’s fair valuation determinations are subject to review, approval and ratification by the Fund’s Board at its next regularly scheduled meeting covering the calendar quarter in which the fair valuation was determined.
Valuation Methods and Inputs
Securities are valued using unadjusted quoted market prices, when available, as supplied primarily by third party pricing services or dealers.
The following methodologies are used to determine the market value or the fair value of the types of securities described below:
Equity securities traded on a securities exchange (including exchange-traded derivatives other than futures and futures options) are valued based on the official closing price on the principal exchange on which the security is traded, as identified by the Manager, prior to the time when the Fund’s assets are valued. If the official closing price is unavailable, the security is valued at the last sale price on the principal exchange on which it is traded. If the official closing price or last sales price for a foreign security is not available, the security is valued at the mean between the bid and asked price per the exchange or, if not available from the exchange, obtained from two dealers. If bid and asked prices are not available from either the
OPPENHEIMER STEELPATH MLP ALPHA PLUS FUND 29 |
NOTES TO FINANCIAL STATEMENTS (Continued) |
3. Securities Valuation (Continued)
exchange or two dealers, the security is valued by using one of the following methodologies (listed in order of priority): (1) a bid from the exchange, (2) the mean between the bid and asked price as provided by a single dealer, or (3) a bid from a single dealer.
Shares of a registered investment company that are not traded on an exchange are valued at that investment company’s net asset value per share.
Corporate and government debt securities (of U.S. or foreign issuers) and municipal debt securities, event-linked bonds, loans, mortgage-backed securities, collateralized mortgage obligations, and asset-backed securities are valued at the mean between the “bid” and “asked” prices utilizing evaluated prices obtained from third party pricing services or broker-dealers who may use matrix pricing methods to determine the evaluated prices.
Short-term money market type debt securities are valued at the mean between the “bid” and “asked” prices utilizing evaluated prices obtained from third party pricing services or broker-dealers.
A description of the standard inputs that may generally be considered by the third party pricing vendors in determining their evaluated prices is provided below.
Security Type | | Standard inputs generally considered by third-party pricing vendors |
Corporate debt, government debt, municipal, mortgage-backed and asset-backed securities | | Reported trade data, broker-dealer price quotations, benchmark yields, issuer spreads on comparable securities, the credit quality, yield, maturity, and other appropriate factors. |
Loans | | Information obtained from market participants regarding reported trade data and broker-dealer price quotations. |
Event-linked bonds | | Information obtained from market participants regarding reported trade data and broker-dealer price quotations. |
If a market value or price cannot be determined for a security using the methodologies described above, or if, in the “good faith” opinion of the Adviser, the market value or price obtained does not constitute a “readily available market quotation,” or a significant event has occurred that would materially affect the value of the security, the security is fair valued either (i) by a standardized fair valuation methodology applicable to the security type or the significant event as previously approved by the Valuation Committee and the Fund’s Board or (ii) as determined in good faith by the Adviser’s Valuation Committee. The Valuation Committee considers all relevant facts that are reasonably available, through either public information or information available to the Adviser, when determining the fair value of a security. Fair value determinations by the Adviser are subject
30 OPPENHEIMER STEELPATH MLP ALPHA PLUS FUND |
NOTES TO FINANCIAL STATEMENTS (Continued) |
3. Securities Valuation (Continued)
to review, approval and ratification by the Fund’s Board at its next regularly scheduled meeting covering the calendar quarter in which the fair valuation was determined. Those fair valuation standardized methodologies include, but are not limited to, valuing securities at the last sale price or initially at cost and subsequently adjusting the value based on: changes in company specific fundamentals, changes in an appropriate securities index, or changes in the value of similar securities which may be further adjusted for any discounts related to security-specific resale restrictions. When possible, such methodologies use observable market inputs such as unadjusted quoted prices of similar securities, observable interest rates, currency rates and yield curves. The methodologies used for valuing securities are not necessarily an indication of the risks associated with investing in those securities nor can it be assured that the Fund can obtain the fair value assigned to a security if it were to sell the security.
To assess the continuing appropriateness of security valuations, the Adviser, or its third party service provider who is subject to oversight by the Adviser, regularly compares prior day prices, prices on comparable securities, and sale prices to the current day prices and challenges those prices exceeding certain tolerance levels with the third party pricing service or broker source. For those securities valued by fair valuations, whether through a standardized fair valuation methodology or a fair valuation determination, the Valuation Committee reviews and affirms the reasonableness of the valuations based on such methodologies and fair valuation determinations on a regular basis after considering all relevant information that is reasonably available.
Classifications
Each investment asset or liability of the Fund is assigned a level at measurement date based on the significance and source of the inputs to its valuation. Various data inputs are used in determining the value of each of the Fund’s investments as of the reporting period end. These data inputs are categorized in the following hierarchy under applicable financial accounting standards:
| | 1) | Level 1-unadjusted quoted prices in active markets for identical assets or liabilities (including securities actively traded on a securities exchange) |
| | 2) | Level 2-inputs other than unadjusted quoted prices that are observable for the asset or liability (such as unadjusted quoted prices for similar assets and market corroborated inputs such as interest rates, prepayment speeds, credit risks, etc.) |
| | 3) | Level 3-significant unobservable inputs (including the Adviser’s own judgments about assumptions that market participants would use in pricing the asset or liability) |
The inputs used for valuing securities are not necessarily an indication of the risks associated with investing in those securities.
OPPENHEIMER STEELPATH MLP ALPHA PLUS FUND 31 |
NOTES TO FINANCIAL STATEMENTS (Continued) |
3. Securities Valuation (Continued)
The table below categorizes amounts that are included in the Fund’s Statement of Assets and Liabilities as of November 30, 2016, based on valuation input level:
| | Level 1 — Unadjusted Quoted Prices | | | Level 2 —
Other Significant Observable Inputs | | | Level 3 —
Significant Unobservable Inputs | | | Value | |
Assets Table | | | | | | | | | | | | |
Investments, at Value: | | | | | | | | | | | | |
Master Limited Partnership Shares* | | $ | 271,081,015 | | | $ | — | | | $ | — | | | $ | 271,081,015 | |
Common Stocks* | | | 30,597,764 | | | | — | | | | — | | | | 30,597,764 | |
Private Investment in Public Equity* | | | — | | | | 8,621,852 | | | | — | | | | 8,621,852 | |
Total Assets | | $ | 301,678,779 | | | $ | 8,621,852 | | | $ | — | | | $ | 310,300,631 | |
* | For a detailed break-out of securities by major industry classification, please refer to the Statement of Investments. |
The Fund did not hold any Level 3 securities during the year ended November 30, 2016.
There have been no transfers between pricing levels for the Fund. It is the Fund’s policy to recognize transfers at the beginning of the reporting period.
4. Investments and Risks
Equity Security Risk. Stocks and other equity securities fluctuate in price. The value of the Fund’s portfolio may be affected by changes in the equity markets generally. Equity markets may experience significant short-term volatility and may fall sharply at times. Different markets may behave differently from each other and U.S. equity markets may move in the opposite direction from one or more foreign stock markets. Adverse events in any part of the equity or fixed-income markets may have unexpected negative effects on other market segments.
The prices of individual equity securities generally do not all move in the same direction at the same time and a variety of factors can affect the price of a particular company’s securities. These factors may include, but are not limited to, poor earnings reports, a loss of customers, litigation against the company, general unfavorable performance of the company’s sector or industry, or changes in government regulations affecting the company or its industry.
Master Limited Partnerships (“MLPs”). Under normal circumstances, the Fund invests at least 80% of its net assets (plus the amount of borrowings for investment purposes) in the equity securities of MLPs.
32 OPPENHEIMER STEELPATH MLP ALPHA PLUS FUND |
NOTES TO FINANCIAL STATEMENTS (Continued) |
4. Investments and Risks (Continued)
MLPs issue common units that represent an equity ownership interest in a partnership and provide limited voting rights. MLP common units are registered with the Securities and Exchange Commission (“SEC”), and are freely tradable on securities exchanges such as the NYSE and the NASDAQ Stock Market (“NASDAQ”), or in the over-the-counter (“OTC”) market. An MLP consists of one or more general partners, who conduct the business, and one or more limited partners, who contribute capital. MLP common unit holders have a limited role in the partnership’s operations and management. The Fund, as a limited partner, normally would not be liable for the debts of the MLP beyond the amounts the Fund has contributed, but would not be shielded to the same extent that a shareholder of a corporation would be. In certain circumstances creditors of an MLP would have the right to seek return of capital distributed to a limited partner. This right of an MLP’s creditors would continue after the Fund sold its investment in the MLP.
Concentration Risk. Under normal circumstances, the Fund invests at least 80% of its net assets (plus the amount of borrowing for investment purposes) in the equity securities of MLPs. MLPs are subject to certain risks, such as supply and demand risk, depletion and exploration risk, commodity pricing risk, acquisition risk, and the risk associated with the hazards inherent in midstream energy industry activities. A substantial portion of the cash flow received by the Fund is derived from investment in equity securities of MLPs. The amount of cash that a MLP has available for distributions, and the tax character of such distributions, are dependent upon the amount of cash generated by the MLP’s operations.
5. Market Risk Factors
The Fund’s investments in securities and/or financial derivatives may expose the fund to various market risk factors:
Commodity Risk. Commodity risk relates to the change in value of commodities or commodity indexes as they relate to increases or decreases in the commodities market. Commodities are physical assets that have tangible properties. Examples of these types of assets are crude oil, heating oil, metals, livestock, and agricultural products.
Credit Risk. Credit risk relates to the ability of the issuer of debt to meet interest and principal payments, or both, as they come due. In general, lower-grade, higher-yield debt securities are subject to credit risk to a greater extent than lower-yield, higher-quality securities.
Equity Risk. Equity risk relates to the change in value of equity securities as they relate to increases or decreases in the general market.
OPPENHEIMER STEELPATH MLP ALPHA PLUS FUND 33 |
NOTES TO FINANCIAL STATEMENTS (Continued) |
5. Market Risk Factors (Continued)
Foreign Exchange Rate Risk. Foreign exchange rate risk relates to the change in the U.S. dollar value of a security held that is denominated in a foreign currency. The U.S. dollar value of a foreign currency denominated security will decrease as the dollar appreciates against the currency, while the U.S. dollar value will increase as the dollar depreciates against the currency.
Interest Rate Risk. Interest rate risk refers to the fluctuations in value of fixed-income securities resulting from the inverse relationship between price and yield. For example, an increase in general interest rates will tend to reduce the market value of already issued fixed-income investments, and a decline in general interest rates will tend to increase their value. In addition, debt securities with longer maturities, which tend to have higher yields, are subject to potentially greater fluctuations in value from changes in interest rates than obligations with shorter maturities.
Volatility Risk. Volatility risk refers to the magnitude of the movement, but not the direction of the movement, in a financial instrument’s price over a defined time period. Large increases or decreases in a financial instrument’s price over a relative time period typically indicate greater volatility risk, while small increases or decreases in its price typically indicate lower volatility risk.
6. Shares of Beneficial Interest
The Fund has authorized an unlimited number of $0.001 par value shares of beneficial interest of each class. Transactions in shares of beneficial interest were as follows:
| | | Year Ended
November 30, 2016 | | | Year Ended
November 30, 2015 | |
| | | | | | | |
| | Shares | | | Amount | | | Shares | | | Amount | |
Class A | | | | | | | | | | | | |
Sold | | | 9,486,980 | | | $ | 64,880,713 | | | | 5,867,260 | | | $ | 64,328,097 | |
Dividends and/or distributions reinvested | | | 1,199,254 | | | | 8,561,036 | | | | 744,701 | | | | 7,981,348 | |
Redeemed | | | (5,684,870 | ) | | | (38,436,869 | ) | | | (12,023,046 | ) | | | (132,136,012 | ) |
Net Increase/(Decrease) | | | 5,001,364 | | | $ | 35,004,880 | | | | (5,411,085 | ) | | $ | (59,826,567 | ) |
| | | | | | | | | | | | | | | | |
Class C | | | | | | | | | | | | | | | | |
Sold | | | 3,067,774 | | | $ | 20,881,354 | | | | 1,995,683 | | | $ | 21,153,732 | |
Dividends and/or distributions reinvested | | | 523,447 | | | | 3,626,967 | | | | 271,579 | | | | 2,782,564 | |
Redeemed | | | (1,960,663 | ) | | | (13,595,777 | ) | | | (1,735,960 | ) | | | (18,208,370 | ) |
Net Increase | | | 1,630,558 | | | $ | 10,912,544 | | | | 531,302 | | | $ | 5,727,926 | |
34 OPPENHEIMER STEELPATH MLP ALPHA PLUS FUND |
NOTES TO FINANCIAL STATEMENTS (Continued) |
6. Shares of Beneficial Interest (Continued)
| | | Year Ended
November 30, 2016 | | | Year Ended
November 30, 2015 | |
| | Shares | | | Amount | | | Shares | | | Amount | |
Class I | | | | | | | | | | | | |
Sold | | | 22,421 | | | $ | 163,159 | | | | 38,622 | | | $ | 376,489 | |
Dividends and/or distributions reinvested | | | 5,136 | | | | 36,929 | | | | 1,277 | | | | 13,327 | |
Redeemed | | | (12,234 | ) | | | (81,895 | ) | | | (10,254 | ) | | | (115,847 | ) |
Net Increase | | | 15,323 | | | $ | 118,193 | | | | 29,645 | | | $ | 273,969 | |
| | | | | | | | | | | | | | | | |
Class Y | | | | | | | | | | | | | | | | |
Sold | | | 9,457,670 | | | $ | 65,227,823 | | | | 11,368,761 | | | $ | 17,991,973 | |
Dividends and/or distributions reinvested | | | 936,704 | | | | 6,703,316 | | | | 625,256 | | | | 6,669,471 | |
Redeemed | | | (12,018,296 | ) | | | (79,991,986 | ) | | | (9,854,201 | ) | | | (103,585,531 | ) |
Net Increase/(Decrease) | | | (1,623,922 | ) | | $ | (8,060,847 | ) | | | 2,139,816 | | | $ | 21,075,913 | |
7. Purchases and Sales of Securities
The aggregate cost of purchases and proceeds from sales of securities, other than short-term obligations, for the year ended November 30, 2016, were as follows:
| | Purchases | | | Sales | |
Investment securities | | $ | 175,030,591 | | | $ | 120,347,211 | |
8. Fees and Other Transactions with Affiliates
Management Fees. Under the investment advisory agreement, the Fund pays the Manager a management fee based on the daily net assets of the Fund at an annual rate as shown in the following table:
Net Assets up to $3 Billion | Net Assets Greater than
$3 Billion and up to $5 Billion | Net Assets in Excess of $5 Billion |
1.25% | 1.23% | 1.20% |
The Fund’s effective management fee for the year ended November 30, 2016 was 1.25% of average annual net assets before any applicable waivers.
OPPENHEIMER STEELPATH MLP ALPHA PLUS FUND 35 |
NOTES TO FINANCIAL STATEMENTS (Continued) |
8. Fees and Other Transactions with Affiliates (Continued)
Transfer Agent Fees. OFI Global (the “Transfer Agent”) serves as the transfer and shareholder servicing agent for the Fund. The Fund pays the Transfer Agent a fee based on annual net assets. Fees incurred with respect to these services are detailed in the Statement of Operations.
Sub-Transfer Agent Fees. The Transfer Agent has retained Shareholder Services, Inc., a wholly-owned subsidiary of OFI (the “Sub-Transfer Agent”), to provide the day-to-day transfer agent and shareholder servicing of the Fund. Under the Sub-Transfer Agency Agreement, the Transfer Agent pays the Sub-Transfer Agent an annual fee in monthly installments, equal to a percentage of the transfer agent fee collected by the Transfer Agent from the Fund, which shall be calculated after any applicable fee waivers. The fee paid to the Sub-Transfer Agent is paid by the Transfer Agent, not by the Fund.
Trustees’ Compensation. The Board has adopted a compensation deferral plan for independent trustees that enables trustees to elect to defer receipt of all or a portion of the annual compensation they are entitled to receive from the Fund. For purposes of determining the amount owed to the Trustee under the plan, deferred amounts are treated as though equal dollar amounts had been invested in shares of the Fund or in other Oppenheimer funds selected by the Trustee. The Fund purchases shares of the funds selected for deferral by the Trustee in amounts equal to his or her deemed investment, resulting in a Fund asset equal to the deferred compensation liability. Such assets are included as a component of “Other” within the asset section of the Statement of Assets and Liabilities, if applicable. Deferral of trustees’ fees under the plan will not affect the net assets of the Fund, and will not materially affect the Fund’s assets, liabilities or net investment income per share. Amounts will be deferred until distributed in accordance with the compensation deferral plan.
Distribution and Service Plan (12b-1) Fees. Under its General Distributor’s Agreement with the Fund, the Distributor acts as the Fund’s principal underwriter in the continuous public offering of the Fund’s classes of shares.
Service Plan for Class A Shares. The Fund has adopted a Service Plan (the “Plan”) for Class A shares under Rule 12b-1 of the Investment Company Act of 1940. Under the Plan, the Fund reimburses the Distributor for a portion of its costs incurred for services provided to accounts that hold Class A shares. Reimbursement is made periodically at an annual rate of up to 0.25% of the daily net assets of Class A shares of the Fund. The Distributor currently uses all of those fees to pay dealers, brokers, banks and other financial institutions periodically for providing personal service and maintenance of accounts of their customers that hold Class A shares. Any unreimbursed expenses the Distributor incurs with respect to Class A shares in any fiscal year cannot be recovered in subsequent periods. Fees incurred by the Fund under the Plan are detailed in the Statement of Operations.
36 OPPENHEIMER STEELPATH MLP ALPHA PLUS FUND |
NOTES TO FINANCIAL STATEMENTS (Continued) |
8. Fees and Other Transactions with Affiliates (Continued)
Distribution and Service Plans for Class C Shares. The Fund has adopted Distribution and Service Plans (the “Plans”) for Class C shares under Rule 12b-1 of the Investment Company Act of 1940 to compensate the Distributor for distributing those share classes, maintaining accounts and providing shareholder services. Under the Plans, the Fund pays the Distributor an annual asset-based sales charge of 0.75% on Class C shares daily net assets. The Fund also pays a service fee under the Plans at an annual rate of 0.25% of daily net assets.
The Plan and Plans continue in effect from year to year only if the Fund’s Board votes annually to approve their continuance at an in person meeting called for that purpose. Fees incurred by the Fund under the Plans are detailed in the Statement of Operations.
Sales Charges. Front-end sales charges and CDSC do not represent expenses of the Fund. They are deducted from the proceeds of sales of Fund shares prior to investment or from redemption proceeds prior to remittance, as applicable. The sales charges retained by the Distributor from the sale of shares and the CDSC retained by the Distributor on the redemption of shares is shown in the following table for the period indicated.
Year Ended | | Class A Front-End Sales Charges Retained by Distributor | | | Class C Contingent Deferred Sales Charges Retained by Distributor | |
November 30, 2016 | | $ | 50,740 | | | $ | 7,177 | |
Waivers and Reimbursements of Expenses. The Manager has contractually agreed to limit fees and/or reimburse expenses of the Fund to the extent that the Fund’s total annual fund operating expenses (exclusive of interest, taxes, such as deferred tax expenses, brokerage commissions, acquired fund fees and expenses, dividend costs related to short sales, litigation expense, if any) exceed 2.00% for Class A shares, 2.75% for Class C shares, and 1.75% for Class Y shares. The Fund’s total annual operating expenses after fee waiver and/or expense reimbursement (“Net Expenses”) will be higher than these amounts to the extent that the Fund incurs expenses excluded from the expense cap. Because the Fund’s deferred income tax expense/(benefit), borrowing fees, and interest expense are excluded from the expense cap, the Fund’s Net Expenses for each class of shares is increased/(decreased) by the amount of these expenses. This undertaking may not be modified or terminated until after one year from the date of the current prospectus, as indicated therein, unless approved by the Trust’s Board of Trustees.
OPPENHEIMER STEELPATH MLP ALPHA PLUS FUND 37 |
NOTES TO FINANCIAL STATEMENTS (Continued) |
8. Fees and Other Transactions with Affiliates (Continued)
The Manager can be reimbursed by the Fund within three years after the date the fee limitation and/or expense reimbursement has been made by the Manager, provided that such repayment does not cause the expenses of any class of the Fund to exceed the foregoing limits.
During the year ended November 30, 2016, the Adviser did not waive any expenses and does not have any previously waived expenses eligible for recovery.
Related Party. The Interested Trustees and officers of the Fund are also officers or trustees of companies affiliated with the Manager, Distributor, and Transfer Agent.
9. Borrowing Agreement
The Fund, along with Oppenheimer SteelPath MLP Alpha Fund, Oppenheimer SteelPath MLP Income Fund, and Oppenheimer SteelPath MLP Select 40 Fund (collectively, the “Trust”), is a borrower in a $700 million revolving credit agreement (the “Loan Agreement”) with a major lending institution (the “Lender”). The Fund is permitted to borrow up to the lesser of one-third of the Fund’s total assets, or the maximum amount permitted pursuant to the Fund’s investment limitations. Amounts borrowed under the Loan Agreement, if any, are invested by the Fund under the direction of the Manager consistent with the Fund’s investment objective and policies, and as such, the related investments are subject to normal market fluctuations and investment risks, including the risk of loss due to a decline in value. The borrowing, if any, is fully collateralized throughout the term of the borrowing with securities or other assets of the Fund. The Fund is not liable for borrowings of other Funds in the Trust. Securities that have been pledged as collateral for the borrowing are indicated in the Statement of Investments.
Borrowings under the Loan Agreement are charged interest at a calculated rate computed by the Lender based on the one month LIBOR rate plus 0.65% per annum. An unused commitment fee at the rate of 0.125% per annum is charged for any undrawn portion of the credit facility, and each member of the Trust will pay its pro rata share of this fee. A facility fee of 0.20% was charged on the commitment amount, and each party of the Trust paid its pro rata share of this fee. The borrowing is due November 17, 2017, unless another date is mutually agreed upon by the parties of the Loan Agreement. For the year ended November 30, 2016, the Fund paid $374,604 in borrowing fees. The payable on borrowing balance and interest rate at November 30, 2016 was $74,000,000 and 1.27%, respectively.
38 OPPENHEIMER STEELPATH MLP ALPHA PLUS FUND |
NOTES TO FINANCIAL STATEMENTS (Continued) |
9. Borrowing Agreement (Continued)
Information related to the borrowings under the Loan Agreement for the year ended November 30, 2016, is as follows:
Average
Interest
Rate | | | Average
Loan
Balance | | | Number
of Days
Outstanding | | | Interest
Expense
Incurred | | | Maximum Amount
Borrowed During
the Period | |
| | 1.13 | % | | $ | 59,433,333 | | | | 366 | | | $ | 802,050 | | | $ | 74,000,000 | |
10. Pending Litigation
In 2009, several putative class action lawsuits were filed and later consolidated before the U.S. District Court for the District of Colorado in connection with the investment performance of Oppenheimer Rochester California Municipal Fund (the “California Fund”), a fund advised by OppenheimerFunds, Inc. (“OFI”) – the parent company of the manager and distributed by OppenheimerFunds Distributor, Inc. (“OFDI”) . The plaintiffs asserted claims against OFI, OFDI and certain present and former trustees and officers of the California Fund under the federal securities laws, alleging, among other things, that the disclosure documents of the California Fund contained misrepresentations and omissions and the investment policies of the California Fund were not followed. An amended complaint and a motion to dismiss were filed, and in 2011, the court issued an order which granted in part and denied in part the defendants’ motion to dismiss. In October 2015, following a successful appeal by defendants and a subsequent hearing, the court granted plaintiffs’ motion for class certification and appointed class representatives and class counsel.
OFI and OFDI believe the suit is without merit; that it is premature to render any opinion as to the likelihood of an outcome unfavorable to them in the Suit; and that no estimate can yet be made as to the amount or range of any potential loss. Furthermore, OFI believes that the suit should not impair the ability of OFI or OFDI to perform their respective duties to the Fund and that the outcome of the suit should not have any material effect on the operations of any of the Oppenheimer funds.
OPPENHEIMER STEELPATH MLP ALPHA PLUS FUND 39 |
REPORT OF INDEPENDENT REGISTERED PUBLIC ACCOUNTING FIRM |
To the Shareholders of Oppenheimer SteelPath MLP Alpha Plus Fund and
Board of Trustees of Oppenheimer SteelPath MLP Funds Trust
We have audited the accompanying statement of assets and liabilities, including the statement of investments, of Oppenheimer SteelPath MLP Alpha Plus Fund (the “Fund”), a series of Oppenheimer SteelPath MLP Funds Trust, as of November 30, 2016, and the related statements of operations and cash flows for the year then ended, the statements of changes in net assets for each of the two years in the period then ended, and the financial highlights for each of the five periods in the period then ended. These financial statements and financial highlights are the responsibility of the Fund’s management. Our responsibility is to express an opinion on these financial statements and financial highlights based on our audits.
We conducted our audits in accordance with the standards of the Public Company Accounting Oversight Board (United States). Those standards require that we plan and perform the audit to obtain reasonable assurance about whether the financial statements and financial highlights are free of material misstatement. An audit includes examining, on a test basis, evidence supporting the amounts and disclosures in the financial statements. Our procedures included confirmation of securities owned as of November 30, 2016, by correspondence with the custodian and brokers or by other auditing procedures as appropriate in the circumstances. An audit also includes assessing the accounting principles used and significant estimates made by management, as well as evaluating the overall financial statement presentation. We believe that our audits provide a reasonable basis for our opinion.
In our opinion, the financial statements and financial highlights referred to above present fairly, in all material respects, the financial position of Oppenheimer SteelPath MLP Alpha Plus Fund as of November 30, 2016, the results of its operations and its cash flows for the year then ended, the changes in its net assets for each of the two years in the period then ended, and the financial highlights for each of the five periods in the period then ended, in conformity with accounting principles generally accepted in the United States of America.
COHEN & COMPANY, LTD.
Cleveland, Ohio
January 25, 2017
40 OPPENHEIMER STEELPATH MLP ALPHA PLUS FUND |
BOARD APPROVAL OF THE FUND’S INVESTMENT
ADVISORY AGREEMENT Unaudited |
The Fund has entered into an investment advisory agreement (the “Agreement”) with OFI SteelPath, Inc. (“OFI SteelPath” or the “Manager”). Each year, the Board of Trustees (the “Board”), including a majority of the independent Trustees, is required to determine whether to approve the terms of the Agreement and the renewal thereof. The Investment Company Act of 1940, as amended, requires that the Board request and evaluate, and that the Manager provide, such information as may be reasonably necessary to evaluate the terms of the Agreement. The Board employs an independent consultant to prepare a report that provides information, including comparative information that the Board requests for that purpose. In addition to in-person meetings focused on this evaluation, the Board receives information throughout the year regarding Fund services, fees, expenses and performance.
The Manager and the independent consultant provided information to the Board on the following factors: (i) the nature, quality and extent of the Manager’s services, (ii) the comparative investment performance of the Fund and the Manager, (iii) the fees and expenses of the Fund, including comparative fee and expense information, (iv) the profitability of the Manager and its affiliates, including an analysis of the cost of providing services, (v) whether economies of scale are realized as the Fund grows and whether fee levels reflect these economies of scale for Fund investors and (vi) other benefits to the Manager from its relationship with the Fund. The Board was aware that there are alternatives to retaining the Manager.
Outlined below is a summary of the principal information considered by the Board as well as the Board’s conclusions.
Nature, Quality and Extent of Services. The Board considered information about the nature, quality and extent of the services provided to the Fund and information regarding the Manager’s key personnel who provide such services. The Manager’s duties include providing the Fund with the services of the portfolio managers and investment team, who provide research, analysis and other advisory services in regard to the Fund’s investments; and securities trading services. The Manager is responsible for oversight of third-party service providers; monitoring compliance with applicable Fund policies and procedures and adherence to the Fund’s investment restrictions; and risk management. The Manager is also responsible for providing certain administrative services to the Fund. Those services, some of which are performed by affiliates of the Manager, include providing and supervising all administrative and clerical personnel who are necessary in order to provide effective corporate administration for the Fund; compiling and maintaining records with respect to the Fund’s operations; preparing and filing reports required by the U.S. Securities and Exchange Commission; preparing periodic reports regarding the operations of the Fund for its shareholders; preparing proxy materials for shareholder meetings; and preparing the registration statements required by federal and state securities laws for the sale of the Fund’s shares. The Manager also provides the Fund with office space, facilities and equipment.
OPPENHEIMER STEELPATH MLP ALPHA PLUS FUND 41 |
BOARD APPROVAL OF THE FUND’S INVESTMENT
ADVISORY AGREEMENT Unaudited / (Continued) |
The Board also considered the quality of the services provided and the quality of the Manager’s resources that are available to the Fund. In evaluating the Manager, the Board considered the history, reputation, qualification and background of the Manager, including its corporate parent, OppenheimerFunds, Inc. (“OFI”) and corporate affiliate, OFI Global Asset Management, Inc. (“OFI Global” and OFI and OFI Global are collectively referred to hereinafter as “OFI”), and the fact that OFI has over 50 years of experience as an investment adviser and that its assets under management rank it among the top mutual fund managers in the United States. The Board evaluated the Manager’s and OFI’s advisory, administrative, accounting, legal, compliance and risk management services, and information the Board has received regarding the experience and professional qualifications of the Manager’s and OFI’s key personnel and the size and functions of its staff. In its evaluation of the quality of the portfolio management services provided, the Board considered the experience of Stuart Cartner and Brian Watson, the portfolio managers for the Fund, and the Manager’s investment team and analysts. The Board members also considered the totality of their experiences with the Manager and OFI as trustees of the Fund and other funds advised by the Manager or OFI. The Board considered information regarding the quality of services provided by affiliates of the Manager, which the Board members have become knowledgeable about through their experiences with the Manager or OFI and in connection with the renewal of the Fund’s service agreements. The Board concluded, in light of the Manager’s and OFI’s experience, reputation, personnel, operations and resources that the Fund benefits from the services provided under the Agreement.
Investment Performance of the Manager and the Fund. Throughout the year, the Manager provided information on the investment performance of the Fund and the Manager, including comparative performance information. The Board also reviewed information, prepared by the Manager and by the independent consultant, comparing the Fund’s historical performance to relevant market indices and to the performance of other retail energy limited partnership funds. The Board noted that the Fund’s performance for the three-year period was equal to that of its performance category median, although its performance for the one-year period was lower than its performance category median. The Board considered the Manager’s assertion that energy markets continued to struggle throughout 2015 under a historically sharp and prolonged crude oil price correction and, as a result, the debt and equity capital markets for energy companies experienced severe disruption. The Board noted the Fund’s performance has improved since February 2016, and that the Fund outperformed its category for the year-to-date period ended June 30, 2016.
Fees and Expenses of the Fund. The Board reviewed the fees paid to the Manager and the other expenses borne by the Fund. The independent consultant provided comparative data in regard to the fees and expenses of the Fund and other retail energy limited partnership funds with comparable asset levels and distribution features. The Board noted that the Fund’s contractual management fee was higher than its peer group median and category median. The Board also noted that the Fund’s total expenses were higher than its peer group median and category median. The Board considered that the Fund’s contractual management fee includes
42 OPPENHEIMER STEELPATH MLP ALPHA PLUS FUND |
BOARD APPROVAL OF THE FUND’S INVESTMENT
ADVISORY AGREEMENT Unaudited / (Continued) |
both the advisory fee and the administrative fee, which contribute to the Fund’s costs and noted that the administrative fee reflects the complex tax work associated with the Fund’s master limited partnership (“MLP”) investments. The Board further considered that the Fund strategically employs leverage to attempt to enhance returns and to seek to offset the deferred tax expenses. The Board also considered management’s assertion that the Fund ranks poorly within its peer group, since other funds in the group do not employ leverage as an investment technique. In this regard, the Board considered the Manager’s assertion that closed-end funds that invest in MLPs and employ leverage provide a more appropriate comparison, and noted that the Fund’s total expense ratio is the lowest among the top five (ranked by assets under management) closed-end, levered, MLP funds. The Board noted that the Manager has contractually agreed to waive fees and/or reimburse the Fund so that total expenses, as a percentage of average daily net assets, will not exceed the following annual rates: 2.00% for Class A shares, 2.75% for Class C shares and 1.75% for Class Y shares. The fee limitation may not be amended or withdrawn prior to its expiration on March 30, 2017, unless approved by the Board.
Economies of Scale and Profits Realized by the Manager. The Board considered information regarding the Manager’s costs in serving as the Fund’s investment adviser, including the costs associated with the personnel and systems necessary to manage the Fund, and information regarding the Manager’s profitability from its relationship with the Fund. The Board also considered that the Manager must be able to pay and retain experienced professional personnel at competitive rates to provide quality services to the Fund. The Board reviewed whether the Manager may realize economies of scale in managing and supporting the Fund. The Board noted that the Fund currently has management fee breakpoints, which are intended to share with Fund shareholders economies of scale that may exist as the Fund’s assets grow.
Other Benefits to the Manager. In addition to considering the profits realized by the Manager, the Board considered information that was provided regarding the direct and indirect benefits the Manager receives as a result of its relationship with the Fund, including compensation paid to the Manager’s affiliates and research provided to the Manager in connection with permissible brokerage arrangements (soft dollar arrangements).
Conclusions. These factors were also considered by the independent Trustees meeting separately from the full Board, assisted by experienced counsel to the Fund and to the independent Trustees. Fund counsel and the independent Trustees’ counsel are independent of the Manager within the meaning and intent of the Securities and Exchange Commission Rules.
Based on its review of the information it received and its evaluations described above, the Board, including a majority of the independent Trustees, decided to continue the Agreement through August 31, 2017. In arriving at its decision, the Board did not identify any factor or factors as being more important than others, but considered all of the above information, and considered the terms and conditions of the Agreement, including the management fees, in light of all the surrounding circumstances.
OPPENHEIMER STEELPATH MLP ALPHA PLUS FUND 43 |
DISTRIBUTION SOURCES Unaudited |
For any distribution that took place over the last six months of the Fund’s reporting period, the table below details, on a per-share basis, the percentage of the Fund’s total distribution payment amount that was derived from the following sources: net income, net profit from the sale of securities, and other capital sources. This information is based upon income and capital gains using generally accepted accounting principles as of the date of each distribution. For certain securities, such as Master Limited Partnerships (���MLPs”), the percentages attributed to each category are estimated using historical information because the character of the amounts received from the MLPs in which the Fund invests is unknown until after the end of the calendar year. Because the Fund is actively managed, the relative amount of the Fund’s total distributions derived from various sources over the calendar year may change. Please note that this information should not be used for tax reporting purposes as the tax character of distributable income may differ from the amounts used for this notification. You will receive IRS tax forms in the first quarter of each calendar year detailing the actual amount of the taxable and non-taxable portion of distributions paid to you during the tax year.
For the most current information, please go to oppenheimerfunds.com. Select your Fund, then the ’Detailed’ tab; where ‘Dividends’ are shown, the Fund’s latest pay date will be followed by the sources of any distribution, updated daily.
Fund Name | Pay
Date | Net
Income | Net
Profit
from Sale | Other
Capital
Sources |
Oppenheimer SteelPath MLP Alpha Plus Fund | 6/10/16 | 0.0% | 0.0% | 100.0% |
Oppenheimer SteelPath MLP Alpha Plus Fund | 7/8/16 | 0.0% | 0.0% | 100.0% |
Oppenheimer SteelPath MLP Alpha Plus Fund | 8/5/16 | 0.0% | 0.0% | 100.0% |
Oppenheimer SteelPath MLP Alpha Plus Fund | 9/9/16 | 0.0% | 0.0% | 100.0% |
Oppenheimer SteelPath MLP Alpha Plus Fund | 10/7/16 | 0.0% | 0.0% | 100.0% |
Oppenheimer SteelPath MLP Alpha Plus Fund | 11/4/16 | 0.0% | 0.0% | 100.0% |
Oppenheimer SteelPath MLP Alpha Plus Fund | 11/25/16 | 0.0% | 0.0% | 100.0% |
44 OPPENHEIMER STEELPATH MLP ALPHA PLUS FUND |
PORTFOLIO PROXY VOTING POLICIES AND PROCEDURES; UPDATES TO STATEMENTS OF INVESTMENTS Unaudited |
The Fund has adopted Portfolio Proxy Voting Policies and Procedures under which the Fund votes proxies relating to securities (“portfolio proxies”) held by the Fund. A description of the Fund’s Portfolio Proxy Voting Policies and Procedures is available (i) without charge, upon request, by calling the Fund toll-free at 1.800.CALL OPP (225.5677), (ii) on the Fund’s website at oppenheimerfunds.com, and (iii) on the SEC’s website at www.sec.gov. In addition, the Fund is required to file Form N-PX, with its complete proxy voting record for the 12 months ended June 30th, no later than August 31st of each year. The Fund’s voting record is available (i) without charge, upon request, by calling the Fund toll-free at 1.800.CALL OPP (225.5677), and (ii) in the Form N-PX filing on the SEC’s website at www.sec.gov.
The Fund files its complete schedule of portfolio holdings with the SEC for the first quarter and the third quarter of each fiscal year on Form N-Q. The Fund’s Form N-Q filings are available on the SEC’s website at www.sec.gov. Those forms may be reviewed and copied at the SEC’s Public Reference Room in Washington, D.C. Information on the operation of the Public Reference Room may be obtained by calling 1-800-SEC-0330.
Householding – Delivery of Shareholder Documents
This is to inform you about OppenheimerFunds’ “householding” policy. If more than one member of your household maintains an account in a particular fund, OppenheimerFunds will mail only one copy of the fund’s prospectus (or, if available, the fund’s summary prospectus), annual and semiannual report and privacy policy. The consolidation of these mailings, called householding, benefits your fund through reduced mailing expense, and benefits you by reducing the volume of mail you receive from OppenheimerFunds. Householding does not affect the delivery of your account statements.
Please note that we will continue to household these mailings for as long as you remain an OppenheimerFunds shareholder, unless you request otherwise. If you prefer to receive multiple copies of these materials, please call us at 1.800.CALL OPP (225-5677). You may also notify us in writing or via email. We will begin sending you individual copies of the prospectus (or, if available, the summary prospectus), reports and privacy policy within 30 days of receiving your request to stop householding.
OPPENHEIMER STEELPATH MLP ALPHA PLUS FUND 45 |
TRUSTEES AND OFFICERS Unaudited |
Name, Position(s) Held with the Trusts, Length of Service, Age | Principal Occupation(s) During the Past 5 Years; Other Trusteeships/Directorships Held; Number of Portfolios in the Fund Complex Currently Overseen |
INDEPENDENT TRUSTEES | The address of each Trustee in the chart below is 6803 S. Tucson Way, Centennial, Colorado 80112-3924. Each Trustee serves for an indefinite term, or until his or her resignation, retirement, death or removal. |
Robert J. Malone, Chairman of the
Board of Trustees (since 2016), Trustee (since 2012) Year of Birth: 1944 | Chairman - Colorado Market of MidFirst Bank (since January 2015); Chairman of the Board (2012-2016) and Director (August 2005-March 2016) of Jones International University (educational organization); Trustee of the Gallagher Family Foundation (non-profit organization) (2000-2015); Chairman, Chief Executive Officer and Director of Steele Street Bank Trust (commercial banking) (August 2003-January 2015); Board of Directors of Opera Colorado Foundation (non-profit organization) (2008-2012); Director of Colorado UpLIFT (charitable organization) (1986-2010); Director of Jones Knowledge, Inc. (2006-2010); Former Chairman of U.S. Bank-Colorado (subsidiary of U.S. Bancorp and formerly Colorado National Bank) (July 1996-April 1999); Director of Commercial Assets, Inc. (real estate investment trust) (1993-2000); Director of U.S. Exploration, Inc. (oil and gas exploration) (1997-February 2004); Chairman of the Board (1991-1994) and Trustee (1985-1994) of Regis University; and Chairman of the Board (1990-1991) and Trustee (1984-1999) of Young Presidents Organization. Oversees 46 portfolios in the OppenheimerFunds complex. Mr. Malone has served on the Boards of certain Oppenheimer funds since 2002, during which time he has become familiar with the Fund’s (and other Oppenheimer funds’) financial, accounting, regulatory and investment matters and has contributed to the Boards’ deliberations. |
Jon S. Fossel, Trustee (since 2012) Year of Birth: 1942 | Chairman of the Board of Jack Creek Preserve Foundation (non-profit organization) (since March 2005); Director of Jack Creek Preserve Foundation (non-profit organization) (March 2005-December 2014); Chairman of the Board (2006-December 2011) and Director (June 2002-December 2011) of UNUMProvident (insurance company); Director of Northwestern Energy Corp. (public utility corporation) (November 2004-December 2009); Director of P.R. Pharmaceuticals (October 1999-October 2003); Director of Rocky Mountain Elk Foundation (non-profit organization) (February 1998-February 2003 and February 2005-February 2007); Chairman and Director (until October 1996) and President and Chief Executive Officer (until October 1995) of OppenheimerFunds, Inc.; President, Chief Executive Officer and Director of the following: Oppenheimer Acquisition Corp. (“OAC”) (parent holding company of OppenheimerFunds, Inc.), Shareholders Services, Inc. and Shareholder Financial Services, Inc. (until October 1995). Oversees 46 portfolios in the OppenheimerFunds complex. Mr. Fossel has served on the Boards of certain Oppenheimer funds since 1990, during which time he has become familiar with the Fund’s (and other Oppenheimer funds’) financial, accounting, regulatory and investment matters and has contributed to the Boards’ deliberations. |
46 OPPENHEIMER STEELPATH MLP ALPHA PLUS FUND |
TRUSTEES AND OFFICERS Unaudited / (Continued) |
Richard F. Grabish, Trustee (since 2012) Year of Birth: 1948 | Formerly Senior Vice President and Assistant Director of Sales and Marketing (March 1997-December 2007), Director (March 1987-December 2007) and Manager of Private Client Services (June 1985-June 2005) of A.G. Edwards & Sons, Inc. (broker/dealer and investment firm); Chairman and Chief Executive Officer of A.G. Edwards Trust Company, FSB (March 2001-December 2007); President and Vice Chairman of A.G. Edwards Trust Company, FSB (investment adviser) (April 1987-March 2001); President of A.G. Edwards Trust Company, FSB (investment adviser) (June 2005-December 2007). Oversees 46 portfolios in the OppenheimerFunds complex. Mr. Grabish has served on the Boards of certain Oppenheimer funds since 2001, during which time he has become familiar with the Fund’s (and other Oppenheimer funds’) financial, accounting, regulatory and investment matters and has contributed to the Boards’ deliberations. |
Beverly L. Hamilton, Trustee (since 2012) Year of Birth: 1946 | Trustee of Monterey Institute for International Studies (educational organization) (2000-2014); Board Member of Middlebury College (educational organization) (December 2005-June 2011); Chairman (since 2010) of American Funds’ Emerging Markets Growth Fund, Inc. (mutual fund); Director of The California Endowment (philanthropic organization) (April 2002-April 2008); Director (February 2002-2005) and Chairman of Trustees (2006-2007) of the Community Hospital of Monterey Peninsula; Director (October 1991-2005) and Vice Chairman (2006-2009) of American Funds’ Emerging Markets Growth Fund, Inc. (mutual fund); President of ARCO Investment Management Company (February 1991-April 2000); Member of the investment committees of The Rockefeller Foundation (2001-2006) and The University of Michigan (since 2000); Advisor at Credit Suisse First Boston’s Sprout venture capital unit (venture capital fund) (1994-January 2005); Trustee of MassMutual Institutional Funds (investment company) (1996-June 2004); Trustee of MML Series Investment Fund (investment company) (April 1989-June 2004); Member of the investment committee of Hartford Hospital (2000-2003); and Advisor to Unilever (Holland) pension fund (2000-2003). Oversees 46 portfolios in the OppenheimerFunds complex. Ms. Hamilton has served on the Boards of certain Oppenheimer funds since 2002, during which time she has become familiar with the Fund’s (and other Oppenheimer funds’) financial, accounting, regulatory and investment matters and has contributed to the Boards’ deliberations. |
OPPENHEIMER STEELPATH MLP ALPHA PLUS FUND 47 |
TRUSTEES AND OFFICERS Unaudited / (Continued) |
Victoria J. Herget, Trustee (since 2012) Year of Birth:1951 | Board Chair (2008-2015) and Director (2004-Present), United Educators (insurance company); Trustee (since 2000) and Chair (since 2010), Newberry Library (independent research library); Trustee, Mather LifeWays (senior living organization) (since 2001); Independent Director of the First American Funds (mutual fund family) (2003-2011); former Managing Director (1993-2001), Principal (1985-1993), Vice President (1978-1985) and Assistant Vice President (1973-1978) of Zurich Scudder Investments (investment adviser) (and its predecessor firms); Trustee (1992-2007), Chair of the Board of Trustees (1999-2007), Investment Committee Chair (1994-1999) and Investment Committee member (2007-2010) of Wellesley College; Trustee, BoardSource (non-profit organization) (2006-2009) and Chicago City Day School (K-8 School) (1994-2005). Oversees 46 portfolios in the OppenheimerFunds complex. Ms. Herget has served on the Boards of certain Oppenheimer funds since 2012, during which time she has become familiar with the Fund’s (and other Oppenheimer funds’) financial, accounting, regulatory and investment matters and has contributed to the Boards’ deliberations. |
F. William Marshall, Jr., Trustee (since 2012) Year of Birth: 1942 | Trustee Emeritus of Worcester Polytech Institute (WPI) (private university) (since 2009); Trustee of MassMutual Select Funds (formerly MassMutual Institutional Funds) (investment company) (1996-2015), MML Series Investment Fund (investment company) (1996-2015) and Mass Mutual Premier Funds (investment company) (January 2012-December 2015); President and Treasurer of the SIS Fund (private charitable fund) (January 1999-March 2011); Former Trustee of WPI (1985-2008); Former Chairman of the Board (2004-2006) and Former Chairman of the Investment Committee of WPI (1994-2008); Chairman of SIS Family Bank, F.S.B. (formerly SIS Bank) (commercial bank) (January 1999-July 1999); Executive Vice President of Peoples Heritage Financial Group, Inc. (commercial bank) (January 1999-July 1999); and Former President and Chief Executive Officer of SIS Bancorp. (1993-1999). Oversees 46 portfolios in the OppenheimerFunds complex. Mr. Marshall has served on the Boards of certain Oppenheimer funds since 2000, during which time he has become familiar with the Fund’s (and other Oppenheimer funds’) financial, accounting, regulatory and investment matters and has contributed to the Boards’ deliberations. |
Karen L. Stuckey, Trustee (since 2012) Year of Birth: 1953 | Member (since May 2015) of Desert Mountain Community Foundation Advisory Board (non-profit organization); Partner (1990-2012) of PricewaterhouseCoopers LLP (professional services firm) (held various positions 1975-1990); Trustee (1992-2006), member of Executive, Nominating and Audit Committees and Chair of Finance Committee (1992-2006), and Emeritus Trustee (since 2006) of Lehigh University; and member, Women’s Investment Management Forum (professional organization) since inception. Oversees 46 portfolios in the OppenheimerFunds complex. Ms. Stuckey has served on the Boards of certain Oppenheimer funds since 2012, during which time she has become familiar with the Fund’s (and other Oppenheimer funds’) financial, accounting, regulatory and investment matters and has contributed to the Boards’ deliberations. |
48 OPPENHEIMER STEELPATH MLP ALPHA PLUS FUND |
TRUSTEES AND OFFICERS Unaudited / (Continued) |
James D. Vaughn, Trustee (since 2012) Year of Birth:1945 | Retired; former managing partner (1994-2001) of Denver office of Deloitte & Touche LLP, (held various positions 1969-1993); Trustee and Chairman of the Audit Committee of Schroder Funds (2003-2012); Board member and Chairman of Audit Committee of AMG National Trust Bank (since 2005); Trustee and Investment Committee member, University of South Dakota Foundation (since 1996); Board member, Audit Committee Member and past Board Chair, Junior Achievement (since 1993); former Board member, Mile High United Way, Boys and Girls Clubs, Boy Scouts, Colorado Business Committee for the Arts, Economic Club of Colorado and Metro Denver Network. Oversees 46 portfolios in the OppenheimerFunds complex. Mr. Vaughn has served on the Boards of certain Oppenheimer funds since 2012, during which time he has become familiar with the Fund’s (and other Oppenheimer funds’) financial, accounting, regulatory and investment matters and has contributed to the Boards’ deliberations. |
INTERESTED TRUSTEE AND OFFICER | Mr. Steinmetz is an “Interested Trustee” because he is affiliated with the Manager and OppenheimerFunds, Inc. by virtue of his positions as Chairman of OppenheimerFunds, Inc. and officer and director of OFI Global Asset Management, Inc. Both as a Trustee and as an officer, Mr. Steinmetz serves for an indefinite term, or until his resignation, retirement, death or removal. Mr. Steinmetz’s address is 225 Liberty Street, New York, New York 10281-1008 |
Arthur P. Steinmetz, Trustee (since 2015), President and
Principal Executive Officer (since 2014) Year of Birth: 1958 | Chairman of OppenheimerFunds, Inc. (since January 2015); CEO and Chairman of OFI Global Asset Management, Inc. (since July 2014), President of OFI Global Asset Management, Inc. (since May 2013), a Director of OFI Global Asset Management, Inc. (since January 2013), Director of OppenheimerFunds, Inc. (since July 2014), President, Management Director and CEO of Oppenheimer Acquisition Corp. (OppenheimerFunds, Inc.’s parent holding company) (since July 2014), and President and Director of OFI SteelPath, Inc. (since January 2013). Chief Investment Officer of the OppenheimerFunds advisory entities from (January 2013-December 2013); Executive Vice President of OFI Global Asset Management, Inc. (January 2013-May 2013); Chief Investment Officer of OppenheimerFunds, Inc. (October 2010-December 2012); Chief Investment Officer, Fixed-Income, of OppenheimerFunds, Inc. (April 2009-October 2010); Executive Vice President of OppenheimerFunds, Inc. (October 2009-December 2012); Director of Fixed Income of OppenheimerFunds, Inc. (January 2009-April 2009); and a Senior Vice President of OppenheimerFunds, Inc. (March 1993-September 2009). An officer of 102 portfolios in the OppenheimerFunds complex. |
OPPENHEIMER STEELPATH MLP ALPHA PLUS FUND 49 |
TRUSTEES AND OFFICERS Unaudited / (Continued) |
OTHER OFFICERS OF THE TRUSTS | The addresses of the Officers in the chart below are as follows: for Mss. Foxson and Picciotto, 225 Liberty Street, New York, New York 10281-1008; for Messrs. Cartner and Watson, 2100 McKinney Avenue, Dallas, TX 75201; and for Mr. Petersen, 6803 S. Tucson Way, Centennial, Colorado 80112-3924. Each Officer serves for an indefinite term or until his or her resignation, retirement, death or removal. |
Stuart Cartner, Vice President (since 2010) Year of Birth: 1961 | Senior Vice President and Senior Portfolio Manager of the Manager (since January 2014); Vice President of the Manager (2012-January 2014). A member and portfolio manager of SteelPath Fund Advisors, LLC (since its formation in 2009) and SteelPath Capital Management, LLC (since 2007). Vice President in the Private Wealth Management Division of Goldman, Sachs & Co (1988-2007). An officer of other portfolios in the OppenheimerFunds complex. |
Brian Watson, Vice President (since 2012) Year of Birth: 1974 | Senior Vice President and Senior Portfolio Manager of the Manager (since January 2014); Vice President of the Manager (2012-January 2014). Prior to joining the Manager, he was a member, portfolio manager and Director of Research of SteelPath Fund Advisors, LLC since its formation in 2009. A portfolio manager at Swank Capital LLC, a Dallas, Texas based investment firm (2005-2009). An officer of other portfolios in the OppenheimerFunds complex. |
Cynthia Lo Bessette, Secretary and
Chief Legal Officer (since 2016) Year of Birth: 1969 | Executive Vice President, General Counsel and Secretary of OFI Global Asset Management, Inc. (since February 2016); Chief Legal Officer of OppenheimerFunds, Inc. and the Distributor (since February 2016); Vice President, General Counsel and Secretary of Oppenheimer Acquisition Corp. (since February 2016); General Counsel of OFI SteelPath, Inc., VTL Associates, LLC and Index Management Solutions, LLC (since February 2016); Chief Legal Officer of OFI Global Institutional, Inc., HarbourView Asset Management Corporation, OFI Global Trust Company, Oppenheimer Real Asset Management, Inc., OFI Private Investments Inc., Shareholder Services, Inc. and Trinity Investment Management Corporation (since February 2016); Senior Vice President and Deputy General Counsel (March 2015-February 2016) and Executive Vice President, Vice President, Corporate Counsel (February 2012-March 2015) and Deputy Chief Legal Officer (April 2013-March 2015) of Jennison Associates LLC; Assistant General Counsel (April 2008-September 2009) and Deputy General Counsel (October 2009-February 2012) of Lord Abbett & Co. LLC. An officer of 102 portfolios in the OppenheimerFunds complex. |
Jennifer Foxson, Vice President and Chief Business Officer (since 2014) Year of Birth: 1969 | Senior Vice President of OppenheimerFunds Distributor, Inc. (since June 2014); Vice President of OppenheimerFunds Distributor, Inc. (April 2006-June 2014); Vice President of OppenheimerFunds, Inc. (January 1998-March 2006); Assistant Vice President of OppenheimerFunds, Inc. (October 1991-December 1998). An officer of 102 portfolios in the OppenheimerFunds complex. |
50 OPPENHEIMER STEELPATH MLP ALPHA PLUS FUND |
TRUSTEES AND OFFICERS Unaudited / (Continued) |
Mary Ann Picciotto, Chief Compliance Officer and Chief Anti-Money Laundering Officer (since 2014) Year of Birth: 1973 | Senior Vice President and Chief Compliance Officer of OFI Global Asset Management, Inc. (since March 2014); Chief Compliance Officer of OppenheimerFunds, Inc. , OFI SteelPath, Inc., OFI Global Trust Company, OFI Global Institutional, Inc., Oppenheimer Real Asset Management, Inc., OFI Private Investments, Inc., Harborview Asset Management Corporation, Trinity Investment Management Corporation, and Shareholder Services, Inc. (since March 2014); Managing Director of Morgan Stanley Investment Management Inc. and certain of its various affiliated entities; Chief Compliance Officer of various Morgan Stanley Funds (May 2010-January 2014); Chief Compliance Officer of Morgan Stanley Investment Management Inc. (April 2007-January 2014). An officer of 102 portfolios in the OppenheimerFunds complex. |
Brian S. Petersen, Treasurer and
Principal Financial & Accounting Officer (since 2016) Year of Birth: 1970 | Vice President of OFI Global Asset Management, Inc. (since January 2013); Vice President of OppenheimerFunds, Inc. (February 2007-December 2012); Assistant Vice President of OppenheimerFunds, Inc. (August 2002-2007). An officer of 102 portfolios in the OppenheimerFunds complex. |
The Fund’s Statement of Additional Information contains additional information about the Fund’s Trustees and Officers and is available without charge upon request, by calling 1.800.CALL OPP (225.5677).
OPPENHEIMER STEELPATH MLP ALPHA PLUS FUND 51 |
OPPENHEIMER STEELPATH MLP ALPHA PLUS FUND |
Manager | | OFI SteelPath, Inc. |
| | |
Distributor | | OppenheimerFunds Distributor, Inc. |
| | |
Transfer and Shareholder Servicing Agent | | OFI Global Asset Management, Inc. |
| | | |
Sub-Transfer Agent | | Shareholder Services, Inc. |
| | | DBA OppenheimerFunds Services |
| | | |
Independent Registered Public Accounting Firm | | Cohen & Company, Ltd. |
| | | |
Legal Counsel | | Ropes & Gray LLP |
| | | |
© 2017 OppenheimerFunds, Inc. All rights reserved.
52 OPPENHEIMER STEELPATH MLP ALPHA PLUS FUND |
As an Oppenheimer fund shareholder, you are entitled to know how we protect your personal information and how we limit its disclosure. Information Sources
We obtain nonpublic personal information about our shareholders from the following sources:
| | ● | Applications or other forms. |
| | ● | When you create a user ID and password for online account access. |
| | ● | When you enroll in eDocs Direct,SM our electronic document delivery service. |
| | ● | Your transactions with us, our affiliates or others. |
| | ● | Technologies on our website, including: “cookies” and web beacons, which are used to collect data on the pages you visit and the features you use. |
If you visit oppenheimerfunds.com and do not log on to the secure account information areas, we do not obtain any personal information about you. When you do log on to a secure area, we do obtain your user ID and password to identify you. We also use this information to provide you with products and services you have requested, to inform you about products and services that you may be interested in and assist you in other ways.
We do not collect personal information through our website unless you willingly provide it to us, either directly by email or in those areas of the website that request information. In order to update your personal information (including your mailing address, email address and phone number) you must first log on and visit your user profile.
If you have set your browser to warn you before accepting cookies, you will receive the warning message with each cookie. You can refuse cookies by turning them off in your browser. However, doing so may limit your access to certain sections of our website.
We use cookies to help us improve and manage our website. For example, cookies help us recognize new versus repeat visitors to the site, track the pages visited, and enable some special features on the website. This data helps us provide a better service for our website visitors.
Protection of Information
We do not disclose any nonpublic personal information (such as names on a customer list) about current or former customers to anyone, except as permitted by law.
Disclosure of Information
Copies of confirmations, account statements and other documents reporting activity in your fund accounts are made available to your financial advisor (as designated by you). We may also use details about you and your investments to help us, our financial service affiliates, or firms that jointly market their financial products and services with ours, to better serve
OPPENHEIMER STEELPATH MLP ALPHA PLUS FUND 53 |
PRIVACY POLICY NOTICE (Continued) |
your investment needs or suggest educational material that may be of interest to you. If this requires us to provide you with an opportunity to “opt in” or “opt out” of such information sharing with a firm not affiliated with us, you will receive notification on how to do so, before any such sharing takes place.
Right of Refusal
We will not disclose your personal information to unaffiliated third parties (except as permitted by law), unless we first offer you a reasonable opportunity to refuse or “opt out” of such disclosure.
Internet Security and Encryption
In general, the email services provided by our website are encrypted and provide a secure and private means of communication with us. To protect your own privacy, confidential and/ or personal information should only be communicated via email when you are advised that you are using a secure website.
As a security measure, we do not include personal or account information in nonsecure emails, and we advise you not to send such information to us in nonsecure emails. Instead, you may take advantage of the secure features of our website to encrypt your email correspondence. To do this, you will need to use a browser that supports Secure Sockets Layer (SSL) protocol.
| | ● | All transactions, including redemptions, exchanges and purchases, are secured by SSL and 256-bit encryption. SSL is used to establish a secure connection between your PC and OppenheimerFunds’ server. It transmits information in an encrypted and scrambled format. |
| | ● | Encryption is achieved through an electronic scrambling technology that uses a “key” to code and then decode the data. Encryption acts like the cable converter box you may have on your television set. It scrambles data with a secret code so that no one can make sense of it while it is being transmitted. When the data reaches its destination, the same software unscrambles the data. |
| | ● | You can exit the secure area by closing your browser or, for added security, you can use the Log Out button before you close your browser. |
Other Security Measures
We maintain physical, electronic and procedural safeguards to protect your personal account information. Our employees and agents have access to that information only so that they may offer you products or provide services, for example, when responding to your account questions.
54 OPPENHEIMER STEELPATH MLP ALPHA PLUS FUND |
PRIVACY POLICY NOTICE (Continued) |
How You Can Help
You can also do your part to keep your account information private and to prevent unauthorized transactions. If you obtain a user ID and password for your account, safeguard that information. Also, take special precautions when accessing your account on a computer used by others.
Who We Are
This joint notice describes the privacy policies of the Oppenheimer funds, OppenheimerFunds, Inc., each of its investment adviser subsidiaries, OppenheimerFunds Distributor, Inc. and OFI Global Trust Co. It applies to all Oppenheimer fund accounts you presently have, or may open in the future, using your Social Security number—whether or not you remain a shareholder of our funds. This notice was last updated as of November 2016. In the event it is updated or changed, we will post an updated notice on our website at oppenheimerfunds.com. If you have any questions about this privacy policy, email us by clicking on the Contact Us section of our website at oppenheimerfunds.com, write to us at P.O. Box 5270, Denver, CO 80217-5270, or call us at 1.800.CALL OPP (225 5677).
OPPENHEIMER STEELPATH MLP ALPHA PLUS FUND 55 |

Item 2. Code of Ethics.
The registrant has adopted a code of ethics that applies to the registrant’s principal executive officer, principal financial officer, principal accounting officer or controller or persons performing similar functions.
Item 3. Audit Committee Financial Expert.
The Board of Trustees of the registrant has determined that Joanne Pace, the Chairman of the Board’s Audit Committee, is the audit committee financial expert and that Ms. Pace is “independent” for purposes of this Item 3.
Item 4. Principal Accountant Fees and Services.
| (a)-(d) | The registrant has engaged its principal accountant to perform audit services, audit-related services, tax services and other services during the last fiscal year. The registrant commenced operations on March 31, 2010. Therefore, the following information is provided for the years ending November 30, 2015, and November 30, 2016. |
“Audit services” refer to performing an audit of the registrant’s annual financial statements or services that are normally provided by accountant in connection with statutory and regulatory filings or engagements for that year. “Audit-related services” refer to the assurance and related services by the principal accountant that are reasonably related to the performance of the audit. “Tax services” refer to professional services rendered by the principal accountant for review of federal tax forms and other tax compliance, tax advice, and tax planning. “Other services” refer to professional services rendered by the principal accountant for certain review of the registrant’s registration statement.
| | FYE 11/30/2015 | FYE 11/30/2016 |
| Audit Fees | $106,000 | $122,000 |
| Audit-Related Fees | $0 | $0 |
| Tax Fees | $46,000 | $48,000 |
| All Other Fees | $0 | $0 |
| (e)(1) | During its regularly scheduled periodic meetings, the registrant’s audit committee will pre-approve all audit, audit-related, tax and other services to be provided by the principal accountants of the registrant. |
The audit committee has delegated pre-approval authority to its Chairman for any subsequent new engagements that arise between regularly scheduled meeting dates provided that any fees such pre-approved are presented to the audit committee at its next regularly scheduled meeting.
Under applicable laws, pre-approval of non-audit services may be waived provided that: 1) the aggregate amount of all such services provided constitutes no more than five percent of the total amount of fees paid by the registrant to its principal accountant during the fiscal year in which services are provided 2) such services were not recognized by the registrant at the time of engagement as non-audit services and 3) such services are promptly brought to the attention of the audit committee of the registrant and approved prior to the completion of the audit.
| (e)(2) | The percentage of fees billed by Cohen & Company, Ltd. applicable to non-audit services pursuant to waiver of pre-approval requirement were as follows: |
| | FYE 11/30/2015 | FYE 11/30/2016 |
| Audit-Related Fees | 0% | 0% |
| Tax Fees | 0% | 0% |
| All Other Fees | 0% | 0% |
| (f) | All of the principal accountant’s hours spent on auditing the registrant’s financial statements were attributed to work performed by full-time permanent employees of the principal accountant. |
| (g) | The following table indicates the aggregate non-audit fees billed by the registrant’s accountant for services to the registrant and to the registrant’s investment adviser, and any entity controlling, controlled by, or under common control with the registrant’s adviser that provides ongoing services to the registrant for the last year. |
| | FYE 11/30/2015 | FYE 11/30/2016 |
| Registrant | $46,000 | $48,000 |
| Registrant’s Investment Adviser | $0 | $0 |
| (h) | The registrant’s audit committee of the board of Trustees has considered whether the provision of non-audit services that were rendered to the registrant’s investment adviser, and any entity controlling, controlled by, or under common control with the investment adviser that provides ongoing services to the registrant that were not pre-approved pursuant to paragraph (c)(7)(ii) of Rule 2-01 of Regulation S-X is compatible with maintaining the principal accountant’s independence. No such services were rendered. |
Item 5. Audit Committee of Listed Registrants.
Not applicable.
Item 6. Schedule of Investments.
a) Not applicable. The complete schedule of investments is included in Item 1 of this Form N-CSR.
b) Not applicable.
Item 7. Disclosure of Proxy Voting Policies and Procedures for Closed-End Management Investment Companies.
Not applicable.
Item 8. Portfolio Managers of Closed-End Management Investment Companies.
Not applicable.
Item 9. Purchases of Equity Securities by Closed-End Management Investment Company and Affiliated Purchasers.
Not applicable.
Item 10. Submission of Matters to a Vote of Security Holders.
The Registrant’s Governance Committee Provisions with Respect to Nominations of Directors/Trustees to the Respective Boards
Not applicable.
Item 11. Controls and Procedures.
| (a) | Based on their evaluation of the registrant’s disclosure controls and procedures (as defined in rule 30a-3(c) under the Investment Company Act of 1940 (17 CFR 270.30a-3(c)) as of 11/30/2016, the registrant’s principal executive officer and principal financial officer found the registrant’s disclosure controls and procedures to provide reasonable assurances that information required to be disclosed by the registrant in the reports that it files under the Securities Exchange Act of 1934 (a) is accumulated and communicated to registrant’s management, including its principal executive officer and principal financial officer, to allow timely decisions regarding required disclosure, and (b) is recorded, processed, summarized and reported, within the time periods specified in the rules and forms adopted by the U.S. Securities and Exchange Commission. |
| (b) | There were no changes in the Registrant’s internal control over financial reporting (as defined in Rule 30a-3(d) under the Act) that occurred during the Registrant’s second fiscal quarter of the period covered by this report that materially affected, or were reasonably likely to materially affect, the Registrant’s internal control over financial reporting. |
Item 12. Exhibits
| (a)(1) | Any code of ethics or amendment thereto, that is the subject of the disclosure required by Item 2, to the extent that the registrant intends to satisfy Item 2 requirements through filing exhibit. |
Filed herewith.
| (2) | A separate certification for each principal executive and principal financial officer pursuant to Section 302 of the Sarbanes-Oxley Act of 2002. Filed herewith. |
| (b) | Certification pursuant to Section 906 of the Sarbanes-Oxley Act of 2002. Filed herewith. |
SIGNATURES
Pursuant to the requirements of the Securities Exchange Act of 1934 and the Investment Company Act of 1940, the registrant has duly caused this report to be signed on its behalf by the undersigned, thereunto duly authorized.
Oppenheimer SteelPath MLP Funds Trust
| /s/ Arthur P. Steinmetz | |
| By: Arthur P. Steinmetz | |
| Principal Executive Officer | |
Date: 1/13/2017 | |
Pursuant to the requirements of the Securities Exchange Act of 1934 and the Investment Company Act of 1940, this report has been signed below by the following persons on behalf of the registrant and in the capacities and on the date indicated.
| /s/ Arthur P. Steinmetz | |
| By: Arthur P. Steinmetz | |
| Principal Executive Officer | |
Date: 1/13/2017 | |
| | |
| /s/ Brian Petersen | |
| By: Brian Petersen | |
| Principal Financial Officer | |
Date: 1/13/2017 | |