| Description | | Shares | | | Value | |
| Gathering/Processing — 0.3% | |
| Targa Resources Corp. | | | 72,030 | | | $ | 8,221,504 | |
| Total Gathering/Processing | | | | | | | 8,221,504 | |
| | | | | | | | | |
| Marine — 1.5% | |
Dorian LPG, Ltd. 2 | | | 242,090 | | | | 3,290,003 | |
| GasLog, Ltd. | | | 1,813,211 | | | | 31,985,042 | |
| Teekay Offshore Partners LP | | | 577,861 | | | | 14,856,806 | |
| Total Marine | | | | | | | 50,131,851 | |
| | | | | | | | | |
| Total Common Stock | |
| (identified cost $179,576,097) | | | | 167,186,415 | |
| | | | | | | | | |
| Short-Term Investments — 1.4% | |
| Money Market — 1.4% | |
Fidelity Treasury Portfolio , 0.010% 3 | | | 46,551,067 | | | | 46,551,067 | |
| | | | | | | | | |
| Total Short-Term Investments | |
| (identified cost $46,551,067) | | | | 46,551,067 | |
| | | | | | | | | |
| Total Investments — 109.6% | |
| (identified cost $2,486,729,285) | | | | 3,543,987,262 | |
| Liabilities In Excess of Other Assets — (9.6)% | | | | (309,475,188 | ) |
| Net Assets — 100.0% | | | $ | 3,234,512,074 | |
STATEMENT OF INVESTMENTS (Continued)
Footnotes to Statement of Investments
LLC — Limited Liability Company
LP — Limited Partnership
| * | November 28, 2014 and November 29, 2013 represent the last business day of the Fund’s annual period. See Note 2 of the accompanying notes. |
| 1. | Is or was an affiliate, as defined by the Investment Company Act of 1940, at or during the year ended November 28, 2014, by virtue of the Fund owning at least 5% of the voting securities of the issuer. Transactions during this year in which the issuer was an affiliate are as follows: |
| | | Shares
November 29, 2013* | | | Gross
Additions | | | Gross
Reductions | | | Shares
November 28, 2014* | |
| GasLog Partners LP | | | — | | | | 1,068,222 | | | | 31,844 | | | | 1,036,378 | |
| Midcoast Energy Partners LP | | | 638,689 | | | | 752,495 | | | | 51,674 | | | | 1,339,510 | |
| Sunoco LP | | | — | | | | 2,109,818 | | | | 23,310 | | | | 2,086,508 | |
| | | Value | | | Distributions | | | Realized
Gain/(Loss) | | | | | |
| GasLog Partners LP | | $ | 26,479,48 | | | $ | 409,246 | | | $ | (182,821 | ) | | | | |
| Midcoast Energy Partners LP | | | 20,628,454 | | | | 1,503,919 | | | | 3,403 | | | | | |
| Sunoco LP | | | 97,982,416 | | | | 1,800,890 | | | | (316,700 | ) | | | | |
| 3. | Variable rate security; the coupon rate represents the rate at November 28, 2014. |
See accompanying Notes to Financial Statements.
STATEMENT OF
ASSETS AND LIABILITIES November 28, 2014*
| Assets | | | |
| Investments at value – see accompanying Statement of Investments: | | | |
| Unaffiliated companies (cost $2,337,613,443) | | $ | 3,398,896,934 | |
| Affiliated companies (cost $149,115,842) | | | 145,090,328 | |
| | | | 3,543,987,262 | |
| Dividends receivable | | | 252,788 | |
| Receivable for investments sold | | | 71,341,293 | |
| Receivable for beneficial interest sold | | | 21,339,176 | |
| Prepaid expenses | | | 129,919 | |
| Total assets | | | 3,637,050,438 | |
| | | | | |
| Liabilities: | | | | |
| Payable for beneficial interest redeemed | | | 18,792,317 | |
| Payable for investments purchased | | | 11,928,043 | |
| Deferred tax liability | | | 368,624,040 | |
| Payable to Manager | | | 1,534,633 | |
| Payable for distribution and service plan fees, Class A | | | 183,793 | |
| Payable for distribution and service plan fees, Class C | | | 396,613 | |
| Borrowing expense payable | | | 10,013 | |
| Transfer agent fees payable | | | 591,841 | |
| Trustees' fees payable | | | 29,144 | |
| Other liabilities | | | 447,927 | |
| Total liabilities | | | 402,538,364 | |
| | | | | |
| Net Assets | | $ | 3,234,512,074 | |
| | | | | |
| Composition of Net Assets | | | | |
| Par value of shares of beneficial interest | | $ | 256,369 | |
| Paid-in capital | | | 2,606,598,555 | |
| Undistributed net investment loss, net of deferred taxes | | | (36,384,790 | ) |
| Accumulated undistributed net realized losses on investments, net of deferred taxes | | | (1,942,164 | ) |
| Net unrealized appreciation on investments, net of deferred taxes | | | 665,984,104 | |
| Net Assets | | $ | 3,234,512,074 | |
STATEMENT OF
ASSETS AND LIABILITIES (Continued)
Net Asset Value, Offering Price and Redemption Proceeds Per Share
($0.001 Par Value, Unlimited Shares Authorized) | | | |
| Class A Shares: | | | |
| Net asset value and redemption proceeds per share | | $ | 12.54 | |
| Offering price per share (net asset value plus sales charge of 5.75% of offering price) | | $ | 13.31 | |
| Class C Shares: | | | | |
| Net asset value, offering price and redemption proceeds per share | | $ | 12.30 | |
| Class I Shares: | | | | |
| Net asset value, offering price and redemption proceeds per share | | $ | 12.74 | |
| Class W Shares: | | | | |
| Net asset value, offering price and redemption proceeds per share | | $ | 12.74 | |
| Class Y Shares: | | | | |
| Net asset value, offering price and redemption proceeds per share | | $ | 12.74 | |
| Net Assets: | | | |
| Class A shares | | $ | 872,215,963 | |
| Class C shares | | | 475,459,378 | |
| Class I shares | | | 57,153,133 | |
| Class W shares | | | 57,588,864 | |
| Class Y shares | | | 1,772,094,736 | |
| Total Net Assets | | $ | 3,234,512,074 | |
| | | | | |
| Shares Outstanding: | | | | |
| Class A shares | | | 69,569,766 | |
| Class C shares | | | 38,655,666 | |
| Class I shares | | | 4,485,608 | |
| Class W shares | | | 4,521,600 | |
| Class Y shares | | | 139,136,369 | |
| Total Shares Outstanding | | | 256,369,009 | |
| * | November 28, 2014 represents the last business day of the Fund’s annual period. See Note 2 of the accompanying Notes. |
See accompanying Notes to Financial Statements.
STATEMENT OF
OPERATIONS For the Year Ended November 28, 2014*
| Investment Income | | | |
| Distributions from Master Limited Partnerships from: | | | |
| Unaffiliated Master Limited Partnerships | | $ | 158,737,665 | |
| Affiliated Master Limited Partnerships | | | 3,714,055 | |
| Less return of capital on distributions from: | | | | |
| Unaffiliated Master Limited Partnerships | | | (158,737,665 | ) |
| Affiliated Master Limited Partnerships | | | (3,714,055 | ) |
| Dividend income | | | 445,216 | |
| Total investment income | | | 445,216 | |
| | | | | |
| Expenses | | | | |
| Management fees | | | 20,827,275 | |
| Distribution and service plan fees | | | | |
| Class A | | | 1,990,467 | |
| Class C | | | 3,756,596 | |
| Transfer agent fees | | | | |
| Class A | | | 1,751,611 | |
| Class C | | | 826,451 | |
| Class I | | | 18,045 | |
| Class W | | | 132,402 | |
| Class Y | | | 3,703,603 | |
| Administrative fees | | | 601,436 | |
| Tax expense | | | 413,401 | |
| Borrowing fees | | | 373,603 | |
| Custody fees | | | 147,301 | |
| Trustees' fees | | | 109,188 | |
| Other | | | 712,632 | |
| Total expenses, before waivers and deferred taxes | | | 35,364,011 | |
| Less expense waivers | | | (3,539,444 | ) |
| Net expenses, before deferred taxes | | | 31,824,567 | |
| | | | | |
| Net investment loss, before deferred taxes | | | (31,379,351 | ) |
| Deferred tax benefit | | | 12,067,693 | |
| Net investment loss, net of deferred taxes | | | (19,311,658 | ) |
| | | | | |
| Net Realized and Unrealized Gains on Investments: | | | | |
| Net Realized Gains/Losses | | | | |
| Investments from | | | | |
| Unaffiliated companies | | | 19,597,718 | |
| Affiliated companies | | | (496,118 | ) |
| Deferred tax expense | | | (7,476,365 | ) |
| Net realized gains, net of deferred taxes | | | 11,625,235 | |
| Net Change in Unrealized Appreciation/Depreciation | | | | |
| Investments | | | 428,299,109 | |
| Deferred tax expense | | | (159,099,490 | ) |
| Net change in unrealized appreciation, net of deferred taxes | | | 269,199,619 | |
| | | | | |
| Net realized and unrealized gains on investments, net of deferred taxes | | | 280,824,854 | |
| Change in net assets resulting from operations | | $ | 261,513,196 | |
| * | November 28, 2014 represents the last business day of the Fund’s annual period. See Note 2 of the accompanying Notes. |
See accompanying Notes to Financial Statements.
STATEMENTS OF CHANGES IN NET ASSETS
| | | For the
Year Ended
November 28, 2014* | | | For the
Year Ended
November 29, 2013* | |
| Operations | | | | | | |
| Net investment loss, net of deferred taxes | | $ | (19,311,658 | ) | | $ | (8,988,522 | ) |
| Net realized gains (losses) on investments, net of deferred taxes | | | 11,625,235 | | | | (1,265,135 | ) |
| Net change in unrealized appreciation on investments, net of deferred taxes | | | 269,199,619 | | | | 269,880,948 | |
| Change in net assets resulting from operations | | | 261,513,196 | | | | 259,627,291 | |
| | | | | | | | | |
| Distributions to Shareholders | | | | | | | | |
| Distributions to shareholders from return of capital: | | | | | | | | |
| Class A shares | | | (44,764,653 | ) | | | (27,231,386 | ) |
| Class C shares | | | (21,619,844 | ) | | | (7,731,208 | ) |
| Class I shares** | | | (3,268,073 | ) | | | (349 | ) |
| Class W shares*** | | | (3,264,121 | ) | | | (4,019,883 | ) |
| Class Y shares*** | | | (92,155,175 | ) | | | (66,161,020 | ) |
| Change in net assets resulting from distributions to shareholders | | | (165,071,866 | ) | | | (105,143,846 | ) |
| | | | | | | | | |
| Beneficial Interest Transactions | | | | | | | | |
| Class A shares | | | 227,330,355 | | | | 378,464,409 | |
| Class C shares | | | 229,130,723 | | | | 212,931,498 | |
| Class I shares** | | | 712,252 | | | | 52,451,721 | |
| Class W shares*** | | | (3,691,911 | ) | | | (11,924,950 | ) |
| Class Y shares*** | | | 337,114,352 | | | | 535,108,441 | |
| Change in net assets resulting from beneficial interest transactions | | | 790,595,771 | | | | 1,167,031,119 | |
| Change in net assets | | | 887,037,101 | | | | 1,321,514,564 | |
| | | | | | | | | |
| Net Assets | | | | | | | | |
| Beginning of period | | | 2,347,474,973 | | | | 1,025,960,409 | |
| End of period | | $ | 3,234,512,074 | | | $ | 2,347,474,973 | |
| | | | | | | | | |
| Undistributed net investment loss, net of deferred taxes | | $ | (36,384,790 | ) | | $ | (17,073,132 | ) |
| * | November 28, 2014 and November 29, 2013 represent the last business day of the Fund’s annual period. See Note 2 of the accompanying Notes. |
| ** | Class I shares commenced operations at the close of business June 28, 2013. |
| *** | Effective June 28, 2013, Class I shares were renamed Class Y shares and Class Y shares were renamed Class W shares. See Note 1 of the Notes to Financial Statements for additional information. |
See accompanying Notes to Financial Statements.
FINANCIAL HIGHLIGHTS
| Class A | | Year Ended November 28,
2014* | | | Year Ended November 29,
2013* | | | Year Ended November 30,
2012 | | | Year Ended November 30,
2011 | | | Period Ended November 30,
2010 1 | |
| Per Share Operating Data | | | | | | | | | | | | | | | |
| Net Asset Value, Beginning of Period | | $ | 11.99 | | | $ | 10.67 | | | $ | 10.56 | | | $ | 10.74 | | | $ | 10.00 | |
| Income/(loss) from investment operations: | | | | | | | | | | | | | | | | | | | | |
Net investment loss 2 | | | (0.09 | ) | | | (0.07 | ) | | | (0.07 | ) | | | (0.07 | ) | | | (0.03 | ) |
Return of capital 2 | | | 0.44 | | | | 0.44 | | | | 0.43 | | | | 0.44 | | | | 0.30 | |
| Net realized and unrealized gains | | | 0.91 | | | | 1.66 | | | | 0.46 | | | | 0.14 | | | | 0.96 | |
| Total from investment operations | | | 1.26 | | | | 2.03 | | | | 0.82 | | | | 0.51 | | | | 1.23 | |
| Distributions to shareholders: | | | | | | | | | | | | | | | | | | | | |
| Return of capital | | | (0.71 | ) | | | (0.71 | ) | | | (0.71 | ) | | | (0.69 | ) | | | (0.49 | ) |
| Net asset value, end of period | | $ | 12.54 | | | $ | 11.99 | | | $ | 10.67 | | | $ | 10.56 | | | $ | 10.74 | |
| | | | | | | | | | | | | | | | | | | | | |
Total Return, at Net Asset Value 3 | | | 10.59 | % | | | 19.32 | % | | | 7.87 | % | | | 4.85 | % | | | 12.63 | % |
| | | | | | | | | | | | | | | | | | | | | |
| Ratios /Supplemental Data | | | | | | | | | | | | | | | | | | | | |
| Net assets, end of period (in thousands) | | $ | 872,216 | | | $ | 618,758 | | | $ | 207,631 | | | $ | 114,930 | | | $ | 45,575 | |
Ratio of Expenses to Average Net Assets: 4 | | | | | | | | | | | | | | | | | |
| Before (waivers) and deferred tax expense | | | 1.25 | % | | | 1.13 | % | | | 1.14 | % | | | 1.23 | % | | | 1.45 | % |
| Expense (waivers) | | | (0.12 | %) | | | (0.01 | %) | | | (0.04 | %) | | | (0.13 | %) | | | (0.35 | %) |
| Net of (waivers) and before deferred tax expense | | | 1.13 | %5 | | | 1.12 | %6 | | | 1.10 | % | | | 1.10 | % | | | 1.10 | % |
Deferred tax expense 7,8 | | | 5.19 | % | | | 8.42 | % | | | 4.14 | % | | | 1.94 | % | | | 14.65 | % |
| Total expenses | | | 6.32 | % | | | 9.54 | % | | | 5.24 | % | | | 3.04 | % | | | 15.75 | % |
| | | | | | | | | | | | | | | | | | | | | |
Ratio of Investment Loss to Average Net Assets: 4 | | | | | | | | | | | | | | | | | |
| Before (waivers) and deferred tax expense | | | (1.24 | %) | | | (0.94 | %) | | | (1.07 | %) | | | (1.23 | %) | | | (1.08 | %) |
| Expense (waivers) | | | (0.12 | %) | | | (0.01 | %) | | | (0.04 | %) | | | (0.13 | %) | | | (0.35 | %) |
| Net of (waivers) and before deferred tax expense | | | (1.12 | %) | | | (0.93 | %) | | | (1.03 | %) | | | (1.10 | %) | | | (0.73 | %) |
Deferred tax benefit 8,9 | | | 0.41 | % | | | 0.33 | % | | | 0.35 | % | | | 0.41 | % | | | 0.29 | % |
| Net investment loss | | | (0.71 | %) | | | (0.60 | %) | | | (0.68 | %) | | | (0.69 | %) | | | (0.44 | %) |
| | | | | | | | | | | | | | | | | | | | | |
| Portfolio turnover rate | | | 12 | % | | | 2 | % | | | 11 | % | | | 10 | % | | | 15 | % |
| * | November 28, 2014 and November 29, 2013 represent the last business day of the Fund’s respective reporting periods. See Note 2 of the accompanying Notes. |
| 1. | The net asset value for the beginning of the period close of business March 31, 2010 (Commencement of Operations) through November 30, 2010 represents the initial contribution per share of $10. |
| 2. | Per share amounts calculated based on average shares outstanding during the period. |
| 3. | Assumes an initial investment on the business day before the first day of the fiscal period, with all dividends and distributions reinvested in additional shares on the reinvestment date, and redemptions at the net asset value calculated on the last business day of the fiscal period. Sales charges are not reflected in the total returns. Total returns are not annualized for periods less than one full year. Returns do not reflect the deduction of taxes that a shareholder would pay on fund distributions or the redemption of fund shares. |
| 4. | Annualized for less than full period. |
| 5. | Includes borrowing and franchise tax expense. Without borrowing and franchise tax expense, the net asset expense ratio would be 1.10%. |
| 6. | Includes franchise tax expense. Without franchisetax expense, the net expense ratio would be 1.10%. |
| 7. | Deferred tax expense estimate for the ratio calculation is derived from the net investment income/loss, and realized and unrealized gains/losses. |
| 8. | Effective December 1, 2013 the deferred tax expense and deferred tax benefit are allocated based on average net assets. Prior to December 1, 2013 the deferred tax expense and deferred tax benefit were allocated based on specific class expenses. |
| 9. | Deferred tax benefit for the ratio calculation is derived from net investment income/loss only. |
See accompanying Notes to Financial Statements.
FINANCIAL HIGHLIGHTS (Continued)
| Class C | | Year Ended November 28,
2014* | | | Year Ended November 29,
2013* | | | Year Ended November 30,
2012 | | | Period Ended November 30,
2011 1 | |
| Per Share Operating Data | | | | | | | | | | | | |
| Net Asset Value, Beginning of Period | | $ | 11.87 | | | $ | 10.64 | | | $ | 10.58 | | | $ | 10.90 | |
| Income/(loss) from investment operations: | | | | | | | | | | | | | | | | |
Net investment loss 2 | | | (0.18 | ) | | | (0.13 | ) | | | (0.12 | ) | | | (0.05 | ) |
Return of capital 2 | | | 0.44 | | | | 0.45 | | | | 0.46 | | | | 0.22 | |
| Net realized and unrealized gains/(losses) | | | 0.88 | | | | 1.62 | | | | 0.43 | | | | (0.14 | ) |
| Total from investment operations | | | 1.14 | | | | 1.94 | | | | 0.77 | | | | 0.03 | |
| Distributions to shareholders: | | | | | | | | | | | | | | | | |
| Return of capital | | | (0.71 | ) | | | (0.71 | ) | | | (0.71 | ) | | | (0.35 | ) |
| Net asset value, end of period | | $ | 12.30 | | | $ | 11.87 | | | $ | 10.64 | | | $ | 10.58 | |
| | | | | | | | | | | | | | | | | |
Total Return, at Net Asset Value 3 | | | 9.66 | % | | | 18.51 | % | | | 7.36 | % | | | 0.33 | % |
| | | | | | | | | | | | | | | | | |
| Ratios /Supplemental Data | | | | | | | | | | | | | | | | |
| Net assets, end of period (in thousands) | | $ | 475,459 | | | $ | 241,984 | | | $ | 123,372 | | | $ | 2,895 | |
Ratio of Expenses to Average Net Assets: 4 | | | | | | | | | | | | | | | | |
| Before (waivers) and deferred tax expense | | | 2.00 | % | | | 1.89 | % | | | 2.04 | % | | | 4.29 | % |
| Expense (waivers) | | | (0.12 | %) | | | (0.01 | %) | | | (0.19 | %) | | | (2.44 | %) |
| Net of (waivers) and before deferred tax expense | | | 1.88 | %5 | | | 1.88 | %6 | | | 1.85 | % | | | 1.85 | % |
Deferred tax expense 7,8 | | | 5.19 | % | | | 6.84 | % | | | 3.88 | % | | | 0.82 | % |
| Total expenses | | | 7.07 | % | | | 8.72 | % | | | 5.73 | % | | | 2.67 | % |
| | | | | | | | | | | | | | | | | |
Ratio of Investment Loss to Average Net Assets: 4 | | | | | | | | | | | | | | | | |
| Before (waivers) and deferred tax expense | | | (2.01 | %) | | | (1.70 | %) | | | (1.96 | %) | | | (4.29 | %) |
| Expense (waivers) | | | (0.12 | %) | | | (0.01 | %) | | | (0.19 | %) | | | (2.44 | %) |
| Net of (waivers) and before deferred tax expense | | | (1.89 | %) | | | (1.69 | %) | | | (1.77 | %) | | | (1.85 | %) |
Deferred tax benefit 8,9 | | | 0.41 | % | | | 0.62 | % | | | 0.63 | % | | | 0.69 | % |
| Net investment loss | | | (1.48 | %) | | | (1.07 | %) | | | (1.14 | %) | | | (1.16 | %) |
| | | | | | | | | | | | | | | | | |
| Portfolio turnover rate | | | 12 | % | | | 2 | % | | | 11 | % | | | 10 | % |
| * | November 28, 2014 and November 29, 2013 represent the last business day of the Fund’s respective reporting periods. See Note 2 of the accompanying Notes. |
| 1. | Shares commenced operations at the close of business July 14, 2011. |
| 2. | Per share amounts calculated based on average shares outstanding during the period. |
| 3. | Assumes an initial investment on the business day before the first day of the fiscal period, with all dividends and distributions reinvested in additional shares on the reinvestment date, and redemptions at the net asset value calculated on the last business day of the fiscal period. Sales charges are not reflected in the total returns. Total returns are not annualized for periods less than one full year. Returns do not reflect the deduction of taxes that a shareholder would pay on fund distributions or the redemption of fund shares. |
| 4. | Annualized for less than full period. |
| 5. | Includes borrowing and franchise tax expense. Without borrowing and franchise tax expense, the net asset expense ratio would be 1.85%. |
| 6. | Includes franchise tax expense. Without franchise tax expense, the net expense ratio would be 1.85%. |
| 7. | Deferred tax expense estimate for the ratio calculation is derived from the net investment income/loss, and realized and unrealized gains/losses. |
| 8. | Effective December 1, 2013 the deferred tax expense and deferred tax benefit are allocated based on average net assets. Prior to December 1, 2013 the deferred tax expense and deferred tax benefit were allocated based on specific class expenses. |
| 9. | Deferred tax benefit for the ratio calculation is derived from net investment income/loss only. |
See accompanying Notes to Financial Statements.
FINANCIAL HIGHLIGHTS (Continued)
| Class I | | Year Ended November 28,
2014* | | | Period Ended November 29,
2013*,1,2 | |
| Per Share Operating Data | | | | | | |
| Net Asset Value, Beginning of Period | | $ | 12.14 | | | $ | 12.20 | |
| Income/(loss) from investment operations: | | | | | | | | |
Net investment loss 3 | | | (0.05 | ) | | | (0.04 | ) |
Return of capital 3 | | | 0.44 | | | | 0.00 | 4 |
| Net realized and unrealized gains | | | 0.92 | | | | 0.33 | |
| Total from investment operations | | | 1.31 | | | | 0.29 | |
| Distributions to shareholders: | | | | | | | | |
| Return of capital | | | (0.71 | ) | | | (0.35 | ) |
| Net Asset Value, End of Period | | $ | 12.74 | | | $ | 12.14 | |
| | | | | | | | | |
Total Return, at Net Asset Value 5 | | | 10.87 | % | | | 2.45 | % |
| | | | | | | | | |
| Ratios /Supplemental Data | | | | | | | | |
| Net assets, end of period (in thousands) | | $ | 57,153 | | | $ | 53,247 | |
Ratio of Expenses to Average Net Assets: 6 | | | | | | | | |
| Before deferred tax expense | | | 0.81 | %7 | | | 1.32 | %8 |
Deferred tax expense 9,10 | | | 5.19 | % | | | 0.96 | % |
| Total expenses | | | 6.00 | % | | | 2.28 | % |
| | | | | | | | | |
Ratio of Investment Loss to Average Net Assets: 6 | | | | | | | | |
| Before deferred tax expense | | | (0.82 | %) | | | (1.32 | %) |
Deferred tax benefit 10,11 | | | 0.41 | % | | | 0.46 | % |
| Net investment loss | | | (0.41 | %) | | | (0.86 | %) |
| | | | | | | | | |
| Portfolio turnover rate | | | 12 | % | | | 2 | % |
| * | November 28, 2014 and November 29, 2013 represent the last business day of the Fund’s respective reporting periods. See Note 2 of the accompanying Notes. |
| 1. | Shares commenced operations at the close of business June 28, 2013. |
| 2. | Effective June 28, 2013, Class I shares were renamed Class Y shares. See Note 1 of the Notes to Financial Statements for additional information. |
| 3. | Per share amounts calculated based on average shares outstanding during the period. |
| 4. | Amount rounds to less than $0.005. |
| 5. | Assumes an initial investment on the business day before the first day of the fiscal period, with all dividends and distributions reinvested in additional shares on the reinvestment date, and redemptions at the net asset value calculated on the last business day of the fiscal period. Total returns are not annualized for periods less than one full year. Returns do not reflect the deduction of taxes that a shareholder would pay on fund distributions or the redemption of fund shares. |
| 6. | Annualized for less than full period. |
| 7. | Includes borrowing and franchise tax expense. Without borrowing and franchise tax expense, the net asset expense ratio would be 0.78%. |
| 8. | Includes franchise tax expense. Without franchise tax expense, the net expense ratio would be 1.29%. |
| 9. | Deferred tax expense estimate for the ratio calculation is derived from the net investment income/loss, and realized and unrealized gains/losses. |
| 10. | Effective December 1, 2013 the deferred tax expense and deferred tax benefit are allocated based on average net assets. Prior to December 1, 2013 the deferred tax expense and deferred tax benefit were allocated based on specific class expenses. |
| 11. | Deferred tax benefit for the ratio calculation is derived from net investment income/loss only. |
See accompanying Notes to Financial Statements.
FINANCIAL HIGHLIGHTS (Continued)
| Class W | | Year Ended November 28,
2014* | | | Year Ended November 29,
2013*,1 | | | Year Ended November 30,
2012 1 | | | Year Ended November 30,
2011 1 | | | Period Ended November 30,
2010 1,2 | |
| Per Share Operating Data | | | | | | | | | | | | | | | |
| Net Asset Value, Beginning of Period | | $ | 12.15 | | | $ | 10.77 | | | $ | 10.62 | | | $ | 10.78 | | | $ | 10.00 | |
| Income/(loss) from investment operations: | | | | | | | | | | | | | | | | | | | | |
Net investment loss 3 | | | (0.06 | ) | | | (0.05 | ) | | | (0.05 | ) | | | (0.06 | ) | | | (0.02 | ) |
Return of capital 3 | | | 0.44 | | | | 0.42 | | | | 0.41 | | | | 0.41 | | | | 0.27 | |
| Net realized and unrealized gains | | | 0.92 | | | | 1.72 | | | | 0.50 | | | | 0.18 | | | | 1.02 | |
| Total from investment operations | | | 1.30 | | | | 2.09 | | | | 0.86 | | | | 0.53 | | | | 1.27 | |
| Distributions to shareholders: | | | | | | | | | | | | | | | | | | | | |
| Return of capital | | | (0.71 | ) | | | (0.71 | ) | | | (0.71 | ) | | | (0.69 | ) | | | (0.49 | ) |
| Net asset value, end of period | | $ | 12.74 | | | $ | 12.15 | | | $ | 10.77 | | | $ | 10.62 | | | $ | 10.78 | |
| | | | | | | | | | | | | | | | | | | | | |
Total Return, at Net Asset Value 4 | | | 10.78 | % | | | 19.71 | % | | | 8.21 | % | | | 5.02 | % | | | 13.04 | |
| | | | | | | | | | | | | | | | | | | | | |
| Ratios /Supplemental Data | | | | | | | | | | | | | | | | | | | | |
| Net assets, end of period (in thousands) | | $ | 57,589 | | | $ | 58,357 | | | $ | 61,876 | | | $ | 89,244 | | | $ | 96,020 | |
Ratio of Expenses to Average Net Assets: 5 | | | | | | | | | | | | | | | | | |
| Before (waivers) and deferred tax expense | | | 1.00 | % | | | 0.87 | % | | | 0.90 | % | | | 0.97 | % | | | 1.11 | % |
| Expense (waivers) | | | (0.12 | %) | | | (0.01 | %) | | | (0.05 | %) | | | (0.12 | %) | | | (0.26 | %) |
| Net of (waivers) and before deferred tax expense | | | 0.88 | %6 | | | 0.86 | %7 | | | 0.85 | % | | | 0.85 | % | | | 0.85 | % |
Deferred tax expense 8,9 | | | 5.19 | % | | | 10.74 | % | | | 4.18 | % | | | 1.88 | % | | | 15.06 | % |
| Total expenses | | | 6.07 | % | | | 11.60 | % | | | 5.03 | % | | | 2.73 | % | | | 15.91 | % |
| | | | | | | | | | | | | | | | | | | | | |
Ratio of Investment Loss to Average Net Assets: 5 | | | | | | | | | | | | | | | | | |
| Before (waivers) and deferred tax expense | | | (1.02 | %) | | | (0.70 | %) | | | (0.83 | %) | | | (0.96 | %) | | | (0.76 | %) |
| Expense (waivers) | | | (0.12 | %) | | | (0.01 | %) | | | (0.05 | %) | | | (0.12 | %) | | | (0.26 | %) |
| Net of (waivers) and before deferred tax expense | | | (0.90 | %) | | | (0.69 | %) | | | (0.78 | %) | | | (0.84 | %) | | | (0.50 | %) |
Deferred tax benefit 9,10 | | | 0.41 | % | | | 0.25 | % | | | 0.26 | % | | | 0.31 | % | | | 0.20 | % |
| Net investment loss | | | (0.49 | %) | | | (0.44 | %) | | | (0.52 | %) | | | (0.53 | %) | | | (0.30 | %) |
| | | | | | | | | | | | | | | | | | | | | |
| Portfolio turnover rate | | | 12 | % | | | 2 | % | | | 11 | % | | | 10 | % | | | 15 | % |
| * | November 28, 2014 and November 29, 2013 represent the last business day of the Fund’s respective reporting periods. See Note 2 of the accompanying Notes. |
| 1. | Effective June 28, 2013, Class Y shares were renamed Class W shares. See Note 1 of the Notes to Financial Statements for additional information. |
| 2. | The net asset value for the beginning of the period close of business March 31, 2010 (Commencement of Operations) through November 30, 2010 represents the initial contribution per share of $10. |
| 3. | Per share amounts calculated based on average shares outstanding during the period. |
| 4. | Assumes an initial investment on the business day before the first day of the fiscal period, with all dividends and distributions reinvested in additional shares on the reinvestment date, and redemptions at the net asset value calculated on the last business day of the fiscal period. Total returns are not annualized for periods less than one full year. Returns do not reflect the deduction of taxes that a shareholder would pay on fund distributions or the redemption of fund shares. |
| 5. | Annualized for less than full period. |
| 6. | Includes borrowing and franchise tax expense. Without borrowing and franchise tax expense, the net expense ratio would be 0.85%. |
| 7. | Includes franchise tax expense. Without franchise tax expense the net expense ratio would be 0.85%. |
| 8. | Deferred tax expense estimate for the ratio calculation is derived from the net investment income/loss, and realized and unrealized gains/losses. |
| 9. | Effective December 1, 2013 the deferred tax expense and deferred tax benefit are allocated based on average net assets. Prior to December 1, 2013 the deferred tax expense and deferred tax benefit were allocated based on specific class expenses. |
| 10. | Deferred tax benefit for the ratio calculation is derived from net investment income/loss only. |
See accompanying Notes to Financial Statements.
FINANCIAL HIGHLIGHTS (Continued)
| Class Y | | Year Ended November 28,
2014* | | | Year Ended November 29,
2013*,1 | | | Year Ended November 30,
2012 1 | | | Year Ended November 30,
2011 1 | | | Period Ended November 30,
2010 1,2 | |
| Per Share Operating Data | | | | | | | | | | | | | | | |
| Net Asset Value, Beginning of Period | | $ | 12.15 | | | $ | 10.77 | | | $ | 10.63 | | | $ | 10.78 | | | $ | 10.00 | |
| Income/(loss) from investment operations: | | | | | | | | | | | | | | | | | | | | |
Net investment loss 3 | | | (0.05 | ) | | | (0.05 | ) | | | (0.06 | ) | | | (0.06 | ) | | | (0.02 | ) |
Return of capital 3 | | | 0.44 | | | | 0.43 | | | | 0.44 | | | | 0.43 | | | | 0.30 | |
| Net realized and unrealized gains | | | 0.91 | | | | 1.71 | | | | 0.47 | | | | 0.17 | | | | 0.99 | |
| Total from investment operations | | | 1.30 | | | | 2.09 | | | | 0.85 | | | | 0.54 | | | | 1.27 | |
| Distributions to shareholders: | | | | | | | | | | | | | | | | | | | | |
| Return of capital | | | (0.71 | ) | | | (0.71 | ) | | | (0.71 | ) | | | (0.69 | ) | | | (0.49 | ) |
| Net asset value, end of period | | $ | 12.74 | | | $ | 12.15 | | | $ | 10.77 | | | $ | 10.63 | | | $ | 10.78 | |
| | | | | | | | | | | | | | | | | | | | | |
Total Return, at Net Asset Value 4 | | | 10.78 | % | | | 19.71 | % | | | 8.11 | % | | | 5.12 | % | | | 13.04 | % |
| | | | | | | | | | | | | | | | | | | | | |
| Ratios /Supplemental Data | | | | | | | | | | | | | | | | | | | | |
| Net assets, end of period (in thousands) | | $ | 1,772,095 | | | $ | 1,375,128 | | | $ | 733,082 | | | $ | 455,321 | | | $ | 186,270 | |
Ratio of Expenses to Average Net Assets: 5 | | | | | | | | | | | | | | | | | |
| Before (waivers) and deferred tax expense | | | 1.00 | % | | | 0.88 | % | | | 0.88 | % | | | 0.97 | % | | | 1.52 | % |
| Expense (waivers) | | | (0.12 | %) | | | (0.01 | %) | | | (0.03 | %) | | | (0.12 | %) | | | (0.71 | %) |
| Net of (waivers) and before deferred tax expense | | | 0.88 | %6 | | | 0.87 | %7 | | | 0.85 | % | | | 0.85 | % | | | 0.81 | % |
Deferred tax expense 8,9 | | | 5.19 | % | | | 9.32 | % | | | 4.20 | % | | | 2.18 | % | | | 14.52 | % |
| Total expenses | | | 6.07 | % | | | 10.19 | % | | | 5.05 | % | | | 3.03 | % | | | 15.33 | % |
| | | | | | | | | | | | | | | | | | | | | |
Ratio of Investment Loss to Average Net Assets: 5 | | | | | | | | | | | | | | | | | |
| Before (waivers) and deferred tax expense | | | (0.96 | %) | | | (0.70 | %) | | | (0.81 | %) | | | (0.97 | %) | | | (1.19 | %) |
| Expense (waivers) | | | (0.12 | %) | | | (0.01 | %) | | | (0.03 | %) | | | (0.12 | %) | | | (0.71 | %) |
| Net of (waivers) and before deferred tax expense | | | (0.84 | %) | | | (0.69 | %) | | | (0.78 | %) | | | (0.85 | %) | | | (0.48 | %) |
Deferred tax benefit 9,10 | | | 0.41 | % | | | 0.25 | % | | | 0.26 | % | | | 0.31 | % | | | 0.19 | % |
| Net investment loss | | | (0.43 | %) | | | (0.44 | %) | | | (0.52 | %) | | | (0.54 | %) | | | (0.29 | %) |
| | | | | | | | | | | | | | | | | | | | | |
| Portfolio turnover rate | | | 12 | % | | | 2 | % | | | 11 | % | | | 10 | % | | | 15 | % |
| * | November 28, 2014 and November 29, 2013 represent the last business day of the Fund’s respective reporting periods. See Note 2 of the accompanying Notes. |
| 1. | Effective June 28, 2013, Class I shares were renamed Class Y shares. See Note 1 of the Notes to Financial Statements for additional information. |
| 2. | The net asset value for the beginning of the period close of business March 31, 2010 (Commencement of Operations) through November 30, 2010 represents the initial contribution per share of $10. |
| 3. | Per share amounts calculated based on average shares outstanding during the period. |
| 4. | Assumes an initial investment on the business day before the first day of the fiscal period, with all dividends and distributions reinvested in additional shares on the reinvestment date, and redemptions at the net asset value calculated on the last business day of the fiscal period. Total returns are not annualized for periods less than one full year. Returns do not reflect the deduction of taxes that a shareholder would pay on fund distributions or the redemption of fund shares. |
| 5. | Annualized for less than full period. |
| 6. | Includes borrowing and franchise tax expense. Without borrowing and franchise tax expense, the net expense ratio would be 0.85%. |
| 7. | Includes franchise tax expense. Without franchise tax expense the net expense ratio would be 0.85%. |
| 8. | Deferred tax expense estimate for the ratio calculation is derived from the net investment income/loss, and realized and unrealized gains/losses. |
| 9. | Effective December 1, 2013 the deferred tax expense and deferred tax benefit are allocated based on average net assets. Prior to December 1, 2013 the deferred tax expense and deferred tax benefit were allocated based on specific class expenses. |
| 10. | Deferred tax benefit for the ratio calculation is derived from net investment income/loss only. |
See accompanying Notes to Financial Statements.
NOTES TO FINANCIAL STATEMENTS
Oppenheimer SteelPath MLP Select 40 Fund (the “Fund”), a separate series of Oppenheimer SteelPath MLP Funds Trust, is a diversified open-end management investment company registered under the Investment Company Act of 1940, as amended. The Fund’s investment objective is to seek total return. The Fund’s investment adviser is OFI SteelPath, Inc. (the “Adviser” or “Manager”), a wholly-owned subsidiary of OppenheimerFunds, Inc. (“OFI” or “Oppenheimer”).
The Fund offers Class A, Class C, Class I, Class W and Class Y shares. Effective June 28, 2013, Class I shares were renamed Class Y shares and Class Y shares were renamed Class W shares. Effective after August 30, 2013, Class W shares are no longer offered for purchase. Class A shares are sold at their offering price, which is normally net asset value plus a front-end sales charge. Effective June 28, 2013, although there is no initial sales charge on Class A purchases totaling $1 million or more, those Class A shares may be subject to a 1.00% contingent deferred sales charge if shares are redeemed within an 18-month “holding period” measured from the date of purchase. Class C shares are sold, without a front-end sales charge but may be subject to a contingent deferred sales charge (“CDSC”) of 1.00% of the redemption proceeds if Class C shares are redeemed within one year of purchase. Class I shares are only available to eligible institutional investors. Class I shares are sold at net asset value per share without a sales charge or CDSC. An institutional investor that buys Class I shares for its customers’ accounts may impose charges on those accounts. Class Y shares are sold at net asset value per share without a sales charge directly to institutional investors that have special agreements with the Distributor for that purpose. They may include insurance companies, registered investment companies, employee benefit plans and section 529 plans, among others. An institutional investor that buys Class Y shares for its customers’ accounts may impose charges on those accounts. All classes of shares have identical rights and voting privileges with respect to the Fund in general and exclusive voting rights on matters that affect that class alone. Earnings, net assets and net asset value per share may differ due to each class having its own expenses, such as transfer and shareholder servicing agent fees and shareholder communications, directly attributable to that class. Class A and C shares have separate distribution and/or service plans under which they pay fees. Class I, W, and Y shares do not pay such fees.
2. Significant Accounting Policies
Security Valuation. All investments in securities are recorded at their estimated fair value, as described in note 3.
Equity Security Risk. Stocks and other equity securities fluctuate in price. The value of the Fund’s portfolio may be affected by changes in the equity markets generally. Equity markets may experience significant short-term volatility and may fall sharply at times. Different markets may behave differently from each other and U.S. equity markets may move in the opposite direction from one or more foreign stock markets.
NOTES TO FINANCIAL STATEMENTS (Continued)
2. Significant Accounting Policies (Continued)
The prices of individual equity securities generally do not all move in the same direction at the same time and a variety of factors can affect the price of a particular company’s securities. These factors may include, but are not limited to, poor earnings reports, a loss of customers, litigation against the company, general unfavorable performance of the company’s sector or industry, or changes in government regulations affecting the company or its industry.
Master Limited Partnerships (“MLPs”). Under normal circumstances, the Fund invests at least 80% of its net assets (plus the amount of borrowings for investment purposes) in the equity securities of MLPs. The Fund seeks to achieve its investment objective by normally investing substantially all of its net assets in the equity securities of a minimum of 40 MLPs.
MLPs issue common units that represent an equity ownership interest in a partnership and provide limited voting rights. MLP common units are registered with the Securities and Exchange Commission (“SEC”), and are freely tradable on securities exchanges such as the NYSE and the NASDAQ Stock Market (“NASDAQ”), or in the over-the-counter (“OTC”) market. An MLP consists of one or more general partners, who conduct the business, and one or more limited partners, who contribute capital. MLP common unit holders have a limited role in the partnership’s operations and management. The Fund, as a limited partner, normally would not be liable for the debts of the MLP beyond the amounts the Fund has contributed, but would not be shielded to the same extent that a shareholder of a corporation would be.
In certain circumstances creditors of an MLP would have the right to seek return of capital distributed to a limited partner. This right of an MLP’s creditors would continue after the Fund sold its investment in the MLP.
Concentration Risk. Under normal circumstances, the Fund invests at least 80% of its net assets in the equity securities of MLPs. MLPs are subject to certain risks, such as supply and demand risk, depletion and exploration risk, commodity pricing risk, acquisition risk, and the risk associated with the hazards inherent in midstream energy industry activities. A substantial portion of the cash flow received by the Fund is derived from investment in equity securities of MLPs. The amount of cash that a MLP has available for distributions, and the tax character of such distributions, are dependent upon the amount of cash generated by the MLP’s operations.
Annual Periods. The last day of the Fund’s annual period was the last day the New York Stock Exchange was open for trading. The Fund’s financial statements have been presented through that date to maintain consistency with the Fund’s net asset value calculations used for shareholder transactions.
NOTES TO FINANCIAL STATEMENTS (Continued)
2. Significant Accounting Policies (Continued)
Allocation of Income, Expenses, Gains and Losses. Income, expenses (other than those attributable to a specific class), gains and losses are allocated on a daily basis to each class of shares based upon the relative proportion of net assets represented by such class. Operating expenses directly attributable to a specific class are charged against the operations of that class.
Federal Income Taxes.
The Fund does not intend to qualify as a regulated investment company pursuant to Subchapter M of the Internal Revenue Code, but will rather be taxed as a corporation. As a corporation, the Fund is obligated to pay federal, state and local income tax on taxable income. Currently, the maximum marginal regular federal income tax rate for a corporation is 35%. The Fund may be subject to a 20% alternative minimum tax on its federal alternative minimum taxable income to the extent that its alternative minimum tax exceeds its regular federal income tax. The Fund is currently using an estimated rate of 2.0% for state and local tax, net of federal tax benefit.
The Fund’s income tax provision consists of the following as of November 28, 2014:
| Current tax expense (benefit) | | | |
| Federal | | $ | — | |
| State | | | — | |
| Total current tax expense | | $ | — | |
| | | | | |
| Deferred tax expense (benefit) | | | | |
| Federal | | $ | 141,156,046 | |
| State | | | 13,352,116 | |
| Total deferred tax expense | | $ | 154,508,162 | |
The reconciliation between the federal statutory income tax rate of 35% and the effective tax rate on net investment income (loss) and realized and unrealized gain (loss) follows:
| | | Amount | |
| Application of statutory income tax rate | | $ | 145,607,475 | |
| State income taxes net of federal benefit | | | 8,320,427 | |
| Effect of state tax rate change | | | 580,260 | |
| Total income tax expense | | $ | 154,508,162 | |
The Fund intends to invest its assets primarily in MLPs, which generally are treated as partnerships for federal income tax purposes. As a limited partner in the MLPs, the Fund reports its allocable share of the MLP’s taxable income in computing its own taxable income.
NOTES TO FINANCIAL STATEMENTS (Continued)
2. Significant Accounting Policies (Continued)
The Fund’s tax expense or benefit will be included in the Statement of Operations based on the component of income or gains (losses) to which such expense or benefit relates. Deferred income taxes reflect the net tax effects of temporary differences between the carrying amounts of assets and liabilities for financial reporting purposes and the amounts used for income tax purposes. Such temporary differences are principally: (i) taxes on unrealized gains/(losses), which are attributable to the temporary difference between fair market value and tax basis, (ii) the net tax effects of temporary differences between the carrying amounts of assets and liabilities for financial reporting and income tax purposes and (iii) the net tax benefit of accumulated net operating losses and capital loss carryforwards. Deferred tax assets and liabilities are measured using effective tax rates expected to apply to taxable income in the years such temporary differences are realized or otherwise settled. To the extent the Fund has a deferred tax asset, consideration is given to whether or not a valuation allowance is required. A valuation allowance is required if based on the evaluation criterion provided by ASC 740, Income Taxes (ASC 740) that it is more-likely-than-not that some portion or all of the deferred tax asset will not be realized. Among the factors considered in assessing the Fund’s valuation allowance: the nature, frequency and severity of current and cumulative losses, forecasts of future profitability, the duration of the statutory carryforward periods and the associated risks that operating and capital loss carryforwards may expire unused. At November 28, 2014, the Fund determined a valuation allowance was not required. From time to time, as new information becomes available, the Fund will modify its estimates or assumptions regarding the deferred tax liability or asset.
Components of the Fund’s deferred tax assets and liabilities as of November 28, 2014 are as follows:
| Deferred tax assets: | | | |
| Net operating loss carryforward (tax basis) | | $ | 92,166,987 | |
| Capital loss carryforward (tax basis) | | | — | |
| Organizational Costs | | | 9,575 | |
| Total net deferred tax asset | | | 92,176,562 | |
| | | | | |
| Deferred tax liabilities: | | | | |
| Net unrealized gains on investment securities (tax basis) | | | (460,800,602 | ) |
| Total net deferred tax asset/(liability) | | $ | (368,624,040 | ) |
Unexpected significant decreases in cash distributions from the Fund’s MLP investments or significant declines in the fair value of its investments may change the Fund’s assessment regarding the recoverability of its deferred tax assets and may result in a valuation allowance. If a valuation allowance is required to reduce any deferred tax asset in the future, it could have a material impact on the Fund’s net asset value and results of operations in the period it is recorded.
NOTES TO FINANCIAL STATEMENTS (Continued)
2. Significant Accounting Policies (Continued)
The Fund may rely, to some extent, on information provided by the MLPs, which may not necessarily be timely, to estimate taxable income allocable to MLP units held in its portfolio, and to estimate its associated deferred tax liability or asset. Such estimates are made in good faith. From time to time, as new information becomes available, the Fund will modify its estimates or assumptions regarding its tax liability or asset.
The Fund’s policy is to classify interest and penalties associated with underpayment of federal and state income taxes, if any, as income tax expense on its Statement of Operations. For the year ended November 28, 2014, the Fund does not have any interest or penalties associated with the underpayment of any income taxes.
The Fund files income tax returns in the U.S. federal jurisdiction and various states. Tax years (2010–2013) remain open and subject to examination by tax jurisdictions. The Fund has reviewed all major jurisdictions and concluded that there is no significant impact on the Fund’s net assets and no tax liability resulting from unrecognized tax benefits relating to uncertain tax positions expected to be taken on its tax returns. Furthermore, management of the Fund is not aware of any tax positions for which it is reasonably possible that the total amount of unrecognized tax benefit will significantly change in the next 12 months.
At November 28, 2014, the Fund had net operating loss carryforwards for federal income tax purposes, which may be carried forward for 20 years, as follows:
| Expiration Date | | | |
| 11/30/2030 | | $ | 525,993 | |
| 11/30/2031 | | | 11,179,881 | |
| 11/30/2032 | | | 33,698,662 | |
| 11/30/2033 | | | 63,882,188 | |
| 11/30/2034 | | | 139,813,241 | |
| Total | | $ | 249,099,965 | |
During the year ended November 28, 2014, the Fund utilized $24,907,164 of capital loss carryforwards.
At November 28, 2014, gross unrealized appreciation and depreciation of investments, based on cost for federal income tax purposes were as follows:
| Cost of Investments | | $ | 2,294,833,927 | |
| Gross Unrealized Appreciation | | $ | 1,315,700,217 | |
| Gross Unrealized Depreciation | | | (66,546,882 | ) |
| Net Unrealized Appreciation (Depreciation) on Investments | | $ | 1,249,153,335 | |
NOTES TO FINANCIAL STATEMENTS (Continued)
2. Significant Accounting Policies (Continued)
The difference between cost amounts for financial statement and federal income tax purposes is due primarily to timing differences in recognizing certain gains and losses in security transactions.
Dividends and Distributions to Shareholders. Dividends and distributions to shareholders, which are determined in accordance with income tax regulations and may differ from U.S. generally accepted accounting principles, are recorded on the ex-dividend date. Dividends, if any, are declared and distributed quarterly for the Fund. The estimated characterization of the distributions paid will be either a qualified dividend or distribution (return of capital). This estimate is based on the Fund’s operating results during the period. It is anticipated that a significant portion of the distributions will be comprised of return of capital as a result of the tax character of cash distributions made by the Fund’s investments. The actual characterization of the distributions made during the period will not be determined until after the end of the fiscal year. The Fund will inform shareholders of the final tax character of the distributions on IRS Form DIV in February 2015. For the year ended November 28, 2014, the Fund distributions are expected to be comprised of 100% return of capital.
Return of Capital Estimates. Distributions received from the Fund’s investments in MLPs generally are comprised of income and return of capital. The Fund records investment income and return of capital based on estimates made at the time such distributions are received. Such estimates are based on historical information available from each MLP and other industry sources. These estimates may subsequently be revised based on information received from MLPs after their tax reporting periods are concluded. For the year ended November 28, 2014, the Fund estimated that 100% of the MLP distributions received would be treated as return of capital.
Investment Income. Dividend income is recorded on the ex-dividend date or upon ex-dividend notification in the case of certain foreign dividends where the ex-dividend date may have passed. Non-cash dividends included in dividend income, if any, are recorded at the fair value of the securities received. Interest income is recognized on an accrual basis. Discount and premium, which are included in interest income on the Statement of Operations, if applicable, are amortized or accreted daily.
Custodian Fees. “Custody fees” in the Statement of Operations may include interest expense incurred by the Fund on any cash overdrafts of its custodian account during the period. Such cash overdrafts may result from the effects of failed trades in portfolio securities and from cash outflows resulting from unanticipated shareholder redemption activity. The Fund pays interest to its custodian on such cash overdrafts, to the extent they are not offset by positive cash balances maintained by the Fund, at a rate equal to the Federal Funds Rate plus 0.015%. The “Reduction to custodian expenses” line item, if applicable, represents earnings on cash balances maintained by the Fund during the period. Such interest expense and other custodian fees may be paid with these earnings.
NOTES TO FINANCIAL STATEMENTS (Continued)
2. Significant Accounting Policies (Continued)
Security Transactions. Security transactions are recorded on the trade date. Realized gains and losses on securities sold are determined using the last in, first out method.
Indemnifications. The Fund’s organizational documents provide current and former trustees and officers with a limited indemnification against liabilities arising in connection with the performance of their duties to the Fund. In the normal course of business, the Fund may also enter into contracts that provide general indemnifications. The Fund’s maximum exposure under these arrangements is unknown as this would be dependent on future claims that may be made against the Fund. The risk of material loss from such claims is considered remote.
Other. The preparation of financial statements in conformity with accounting principles generally accepted in the United States of America requires management to make estimates and assumptions that affect the reported amounts of assets and liabilities and disclosure of contingent assets and liabilities at the date of the financial statements and the reported amounts of increases and decreases in net assets from operations during the reporting period. Actual results could differ from those estimates.
The Fund calculates the net asset value of its shares as of the close of the New York Stock Exchange (the “Exchange”), normally 4:00 P.M. Eastern time, on each day the Exchange is open for trading.
The Fund’s Board of Trustees (the “Board”) has adopted procedures for the valuation of the Fund’s securities and has delegated the day-to-day responsibility for valuation determinations under those procedures to the Adviser. The Adviser has established a Valuation Committee which is responsible for determining a “fair valuation” for any security for which market quotations are not “readily available.” The Valuation Committee’s fair valuation determinations are subject to review, approval and ratification by the Fund’s Board at its next regularly scheduled meeting covering the calendar quarter in which the fair valuation was determined.
Valuation Methods and Inputs
Securities are valued using unadjusted quoted market prices, when available, as supplied primarily by third party pricing services or dealers.
The following methodologies are used to determine the market value or the fair value of the types of securities described below:
Securities traded on a registered U.S. securities exchange (including exchange-traded derivatives other than futures and futures options) are valued based on the last sale price of the security reported on the principal exchange on which it is traded, prior to the time when the Fund’s assets are valued. In the absence of a sale, the security is valued at the last sale price on the prior trading day, if it is within the spread of the current day’s closing “bid” and “asked” prices, and if not, at the
NOTES TO FINANCIAL STATEMENTS (Continued)
3. Securities Valuation (Continued)
current day’s closing bid price. A security of a foreign issuer traded on a foreign exchange but not listed on a registered U.S. securities exchange is valued based on the last sale price on the principal exchange on which the security is traded, as identified by the third party pricing service used by the Adviser, prior to the time when the Fund’s assets are valued. If the last sale price is unavailable, the security is valued at the most recent official closing price on the principal exchange on which it is traded. If the last sales price or official closing price for a foreign security is not available, the security is valued at the mean between the bid and asked price per the exchange or, if not available from the exchange, obtained from two dealers. If bid and asked prices are not available from either the exchange or two dealers, the security is valued by using one of the following methodologies (listed in order of priority); (1) using a bid from the exchange, (2) the mean between the bid and asked price as provided by a single dealer, or (3) a bid from a single dealer.
Shares of a registered investment company that are not traded on an exchange are valued at that investment company’s net asset value per share.
Corporate and government debt securities (of U.S. or foreign issuers) and municipal debt securities, event-linked bonds, loans, mortgage-backed securities, collateralized mortgage obligations, and asset-backed securities are valued at the mean between the “bid” and “asked” prices utilizing evaluated prices obtained from third party pricing services or broker-dealers who may use matrix pricing methods to determine the evaluated prices.
Short-term money market type debt securities with a remaining maturity of sixty days or less are valued at cost adjusted by the amortization of discount or premium to maturity (amortized cost), which approximates market value. Short-term debt securities with a remaining maturity in excess of sixty days are valued at the mean between the “bid” and “asked” prices utilizing evaluated prices obtained from third party pricing services or broker-dealers.
A description of the standard inputs that may generally be considered by the third party pricing vendors in determining their evaluated prices is provided below.
| Security Type | | Standard inputs generally considered by third-party pricing vendors |
| Corporate debt, government debt, municipal, mortgage-backed and asset-backed securities | | Reported trade data, broker-dealer price quotations, benchmark yields, issuer spreads on comparable securities, the credit quality, yield, maturity, and other appropriate factors. |
| Loans | | Information obtained from market participants regarding reported trade data and broker-dealer price quotations. |
| Event-linked bonds | | Information obtained from market participants regarding reported trade data and broker-dealer price quotations. |
NOTES TO FINANCIAL STATEMENTS (Continued)
3. Securities Valuation (Continued)
If a market value or price cannot be determined for a security using the methodologies described above, or if, in the “good faith” opinion of the Adviser, the market value or price obtained does not constitute a “readily available market quotation,” or a significant event has occurred that would materially affect the value of the security, the security is fair valued either (i) by a standardized fair valuation methodology applicable to the security type or the significant event as previously approved by the Valuation Committee and the Fund’s Board or (ii) as determined in good faith by the Adviser’s Valuation Committee. The Valuation Committee considers all relevant facts that are reasonably available, through either public information or information available to the Adviser, when determining the fair value of a security. Fair value determinations by the Adviser are subject to review, approval and ratification by the Fund’s Board at its next regularly scheduled meeting covering the calendar quarter in which the fair valuation was determined. Those fair valuation standardized methodologies include, but are not limited to, valuing securities at the last sale price or initially at cost and subsequently adjusting the value based on: changes in company specific fundamentals, changes in an appropriate securities index, or changes in the value of similar securities which may be further adjusted for any discounts related to security-specific resale restrictions. When possible, such methodologies use observable market inputs such as unadjusted quoted prices of similar securities, observable interest rates, currency rates and yield curves. The methodologies used for valuing securities are not necessarily an indication of the risks associated with investing in those securities nor can it be assured that the Fund can obtain the fair value assigned to a security if it were to sell the security.
To assess the continuing appropriateness of security valuations, the Adviser, or its third party service provider who is subject to oversight by the Adviser, regularly compares prior day prices, prices on comparable securities, and sale prices to the current day prices and challenges those prices exceeding certain tolerance levels with the third party pricing service or broker source. For those securities valued by fair valuations, whether through a standardized fair valuation methodology or a fair valuation determination, the Valuation Committee reviews and affirms the reasonableness of the valuations based on such methodologies and fair valuation determinations on a regular basis after considering all relevant information that is reasonably available.
Classifications
Each investment asset or liability of the Fund is assigned a level at measurement date based on the significance and source of the inputs to its valuation. Various data inputs are used in determining the value of each of the Fund’s investments as of the reporting period end. These data inputs are categorized in the following hierarchy under applicable financial accounting standards:
| 1) | Level 1-unadjusted quoted prices in active markets for identical assets or liabilities (including securities actively traded on a securities exchange) |
| 2) | Level 2-inputs other than unadjusted quoted prices that are observable for the asset or liability (such as unadjusted quoted prices for similar assets and market corroborated inputs such as interest rates, prepayment speeds, credit risks, etc.) |
NOTES TO FINANCIAL STATEMENTS (Continued)
3. Securities Valuation (Continued)
| 3) | Level 3-significant unobservable inputs (including the Adviser’s own judgments about assumptions that market participants would use in pricing the asset or liability). |
The inputs used for valuing securities are not necessarily an indication of the risks associated with investing in those securities.
The table below categorizes amounts that are included in the Fund’s Statement of Assets and Liabilities as of November 28, 2014, based on valuation input level:
| | Level 1 — Unadjusted Quoted Prices | | Level 2 —
Other Significant Observable Inputs | | Level 3 —
Significant Unobservable Inputs | | Value | |
| Assets Table | | | | | | | | |
| Investments, at Value: | | | | | | | | |
| Master Limited Partnership Shares* | | $ | 3,330,249,780 | | | $ | — | | | $ | — | | | $ | 3,330,249,780 | |
| Common Stock* | | | 167,186,415 | | | | — | | | | — | | | | 167,186,415 | |
| Short Term Investments | | | 46,551,067 | | | | — | | | | — | | | | 46,551,067 | |
| Total Assets | | $ | 3,543,987,262 | | | $ | — | | | $ | — | | | $ | 3,543,987,262 | |
| * | For a detailed break-out of securities by major industry classification, please refer to the Statement of Investments. |
The Fund did not hold any Level 3 securities during the year ended November 28, 2014.
There have been no transfers between pricing levels for the Fund. It is the Fund’s policy to recognize transfers at the end of the reporting period.
4. Shares of Beneficial Interest
The Fund has authorized an unlimited number of $0.001 par value shares of beneficial interest of each class. Transactions in shares of beneficial interest were as follows:
| | | Year Ended
November 28, 2014 | | | Year/Period Ended
November 29, 2013 | |
| | | Shares | | | Amount | | | Shares | | | Amount | |
| Class A | | | | | | | | | | | | |
| Sold | | | 37,495,383 | | | $ | 476,083,095 | | | | 46,443,714 | | | $ | 545,897,085 | |
| Dividends and/or distributions reinvested | | | 3,221,615 | | | | 40,559,714 | | | | 2,013,112 | | | | 23,687,640 | |
| Redeemed | | | (22,732,097 | ) | | | (289,312,454 | ) | | | (16,326,274 | ) | | | (191,120,316 | ) |
| Net Increase | | | 17,984,901 | | | $ | 227,330,355 | | | | 32,130,552 | | | $ | 378,464,409 | |
| | | | | | | | | | | | | | | | | |
NOTES TO FINANCIAL STATEMENTS (Continued)
4. Shares of Beneficial Interest (Continued)
| | Year Ended
November 28, 2014 | | | Year/Period Ended
November 29, 2013 | |
| | | Shares | | | Amount | | | Shares | | | Amount | |
| Class C | | | | | | | | | | | | | | | | |
| Sold | | | 19,706,367 | | | $ | 247,543,016 | | | | 18,324,433 | | | $ | 214,410,911 | |
| Dividends and/or distributions reinvested | | | 1,667,683 | | | | 20,704,844 | | | | 543,625 | | | | 6,378,564 | |
| Redeemed | | | (3,111,469 | ) | | | (39,117,137 | ) | | | (671,581 | ) | | | (7,857,977 | ) |
| Net Increase | | | 18,262,581 | | | $ | 229,130,723 | | | | 18,196,477 | | | $ | 212,931,498 | |
| | | | | | | | | | | | | | | | | |
| Class I* | | | | | | | | | | | | | | | | |
| Sold | | | 637,602 | | | $ | 8,008,990 | | | | 4,385,555 | | | $ | 52,451,519 | |
| Dividends and/or distributions reinvested | | | 201,909 | | | | 2,568,560 | | | | 17 | | | | 202 | |
| Redeemed | | | (739,475 | ) | | | (9,865,298 | ) | | | — | | | | — | |
| Net Increase | | | 100,036 | | | $ | 712,252 | | | | 4,385,572 | | | $ | 52,451,721 | |
| | | | | | | | | | | | | | | | | |
| Class W** | | | | | | | | | | | | | | | | |
| Sold | | | — | | | $ | — | | | | 1,241,790 | | | $ | 13,897,141 | |
| Dividends and/or distributions reinvested | | | 256,026 | | | | 3,264,121 | | | | 298,578 | | | | 3,522,836 | |
| Redeemed | | | (539,288 | ) | | | (6,956,032 | ) | | | (2,479,235 | ) | | | (29,344,927 | ) |
| Net Decrease | | | (283,262 | ) | | $ | (3,691,911 | ) | | | (938,867 | ) | | $ | (11,924,950 | ) |
| | | | | | | | | | | | | | | | | |
| Class Y*** | | | | | | | | | | | | | | | | |
| Sold | | | 61,840,371 | | | $ | 801,123,485 | | | | 65,039,170 | | | $ | 768,338,292 | |
| Dividends and/or distributions reinvested | | | 6,549,536 | | | | 83,633,225 | | | | 4,964,950 | | | | 58,890,029 | |
| Redeemed | | | (42,468,872 | ) | | | (547,642,358 | ) | | | (24,836,905 | ) | | | (292,119,880 | ) |
| Net Increase | | | 25,921,035 | | | $ | 337,114,352 | | | | 45,167,215 | | | $ | 535,108,441 | |
| * | Class I commenced operations at the close of business June 28, 2013. |
| ** | Effective June 28, 2013, Class Y Shares were renamed Class W Shares. See Note 1 of the Notes to Financial Statements for additional information. |
| *** | Effective June 28, 2013, Class I shares were renamed Class Y shares. See Note 1 of the Notes to Financial Statements for additional information. |
NOTES TO FINANCIAL STATEMENTS (Continued)
5. Purchases and Sales of Securities
The aggregate cost of purchases and proceeds from sales of securities, other than short-term obligations, for the year ended November 28, 2014, were as follows:
| | | Purchases | | | Sales | |
| Investment securities | | $ | 1,102,638,311 | | | $ | 382,124,526 | |
6. Fees and Other Transactions with Affiliates
Management Fees. Under the investment advisory agreement, the Fund pays the Manager a management fee based on the daily net assets of the Fund at an annual rate as shown in the following table:
| Net Assets up to $3 Billion | Net Assets Greater than $3 Billion and up to $5 Billion | Net Assets in Excess of $5 Billion |
| 0.70% | 0.68% | 0.65% |
The Fund’s management fee for the fiscal year ended November 28, 2014 was 0.70% of average annual net assets before any applicable waivers.
Waivers and Reimbursements of Expenses. The Manager has contractually agreed to limit fees and/or reimburse expenses of the Fund to the extent that the Fund’s total annual fund operating expenses (exclusive of interest, taxes, such as deferred tax expenses, brokerage commissions, acquired fund fees and expenses, dividend costs related to short sales, and extraordinary expenses, such as litigation expense, if any) exceed 1.10% for Class A shares, 1.85% for Class C shares, 0.85% for Class W shares, and 0.85% for Class Y shares. The Fund’s total annual operating expenses after fee waiver and/or expense reimbursement (“Net Expenses”) will be higher than these amounts to the extent that the Fund incurs expenses excluded from the expense cap. Because the Fund’s deferred income tax expense is excluded from the expense cap, the Fund’s Net Expenses for each class of shares is increased by the amount of this expense. During the year ended November 28, 2014, the Manager reimbursed $966,622, $456,067, $73,066 and $2,043,689 for Class A, Class C, Class W, and Class Y, respectively. This undertaking may not be modified or terminated until after one year from the date of the current prospectus, as indicated therein, unless approved by the Fund’s Board of Trustees.
The Manager can be reimbursed by the Fund within three years after the date the fee limitation and/or expense reimbursement has been made by the Manager, provided that such repayment does not cause the expenses of any class of the Fund to exceed the foregoing limits.
NOTES TO FINANCIAL STATEMENTS (Continued)
6. Fees and Other Transactions with Affiliates (Continued)
The following table represents amounts eligible for recovery at November 28, 2014:
| Eligible expense recoupment expiring: | | | |
| November 30, 2015 | | $ | 322,719 | |
| November 30, 2016 | | | 178,756 | |
| November 28, 2017 | | | 3,539,444 | |
During the year ended November 28, 2014, the Adviser did not recoup any expenses.
Trustees’ Compensation. The Board has adopted a compensation deferral plan for independent trustees that enables trustees to elect to defer receipt of all or a portion of the annual compensation they are entitled to receive from the Fund. For purposes of determining the amount owed to the Trustee under the plan, deferred amounts are treated as though equal dollar amounts had been invested in shares of the Fund or in other Oppenheimer funds selected by the Trustee. The Fund purchases shares of the funds selected for deferral by the Trustee in amounts equal to his or her deemed investment, resulting in a Fund asset equal to the deferred compensation liability. Such assets are included as a component of “Other” within the asset section of the Statement of Assets and Liabilities, if applicable. Deferral of trustees’ fees under the plan will not affect the net assets of the Fund, and will not materially affect the Fund’s assets, liabilities or net investment income per share. Amounts will be deferred until distributed in accordance with the compensation deferral plan.
Distribution and Service Plan (12b-1) Fees. Under its General Distributor’s Agreement with the Fund, OppenheimerFunds Distributor, Inc. (the “Distributor”) acts as the Fund’s principal underwriter in the continuous public offering of the Fund’s classes of shares.
Service Plan for Class A Shares. The Fund has adopted a Service Plan (the “Plan”) for Class A shares under Rule 12b-1 of the Investment Company Act of 1940. Under the Plan, the Fund reimburses the Distributor for a portion of its costs incurred for services provided to accounts that hold Class A shares. Reimbursement is made periodically at an annual rate of up to 0.25% of the daily net assets of Class A shares of the Fund. The Distributor currently uses all of those fees to pay dealers, brokers, banks and other financial institutions periodically for providing personal service and maintenance of accounts of their customers that hold Class A shares. Any unreimbursed expenses the Distributor incurs with respect to Class A shares in any fiscal year cannot be recovered in subsequent periods. Fees incurred by the Fund under the Plan are detailed in the Statement of Operations.
Distribution and Service Plans for Class C Shares. The Fund has adopted Distribution and Service Plans (the “Plans”) for Class C shares under Rule 12b-1 of the Investment Company Act of 1940 to compensate the Distributor for distributing those share classes, maintaining accounts and providing shareholder services. Under the Plans, the Fund pays
NOTES TO FINANCIAL STATEMENTS (Continued)
6. Fees and Other Transactions with Affiliates (Continued)
the Distributor an annual asset-based sales charge of 0.75% on Class C shares daily net assets. The Fund also pays a service fee under the Plans at an annual rate of 0.25% of daily net assets.
The Plan and Plans continue in effect from year to year only if the Fund’s Board votes annually to approve their continuance at an in person meeting called for that purpose. Fees incurred by the Fund under the Plans are detailed in the Statement of Operations.
Transfer Agent Fees. OFI Global (the “Transfer Agent”) serves as the transfer and shareholder servicing agent for the Fund. The Fund pays the Transfer Agent a fee based on annual net assets. Fees incurred with respect to these services are detailed in the Statement of Operations.
Sub-Transfer Agent Fees. The Transfer Agent has retained Shareholder Services, Inc., a wholly-owned subsidiary of OFI (the “Sub-Transfer Agent”), to provide the day-to-day transfer agent and shareholder servicing of the Fund. Under the Sub-Transfer Agency Agreement, the Transfer Agent pays the Sub-Transfer Agent an annual fee in monthly installments, equal to a percentage of the transfer agent fee collected by the Transfer Agent from the Fund, which shall be calculated after any applicable fee waivers. The fee paid to the Sub-Transfer Agent is paid by the Transfer Agent, not by the Fund.
Sales Charges. Front-end sales charges and contingent deferred sales charges (“CDSC”) do not represent expenses of the Fund. They are deducted from the proceeds of sales of Fund shares prior to investment or from redemption proceeds prior to remittance, as applicable. The sales charges retained by the Distributor from the sale of shares and the CDSC retained by the Distributor on the redemption of shares is shown in the following table for the period indicated.
| Year Ended | | Class A Front-End Sales Charges Retained by Distributor | | | Class C Contingent Deferred Sales Charges Retained by Distributor | |
| November 28, 2014 | | $ | 650,640 | | | $ | 71,699 | |
Related Party. The Interested Trustees and officers of the Fund are also officers or trustees of companies affiliated with the Manager, Distributor, and Transfer Agent.
NOTES TO FINANCIAL STATEMENTS (Continued)
Effective September 11, 2014, the Fund, along with Oppenheimer SteelPath MLP Alpha Fund, Oppenheimer SteelPath MLP Alpha Plus Fund, and Oppenheimer SteelPath MLP Income Fund (collectively, the “Trust”), is a borrower in a $650 million revolving credit agreement with Citibank, N.A. (“Citi Loan Agreement”). The Fund is permitted to borrow up to the lesser of one-third of the Fund’s total assets, or the maximum amount permitted pursuant to the Fund’s investment limitations. Amounts borrowed under the Citi Loan Agreement, if any, are invested by the Fund under the direction of the Manager consistent with the Fund’s investment objective and policies, and as such, the related investments are subject to normal market fluctuations and investment risks, including the risk of loss due to a decline in value. The borrowing, if any, is fully collateralized throughout the term of the borrowing with securities or other assets of the Fund. The Fund is not liable for borrowings of other Funds in the Trust. Securities that have been pledged as collateral for the borrowing are indicated in the Statement of Investments.
Borrowings under the Citi Loan Agreement are charged interest at a calculated rate computed by Citibank based on the three month LIBOR rate plus 0.80% per annum. An unused commitment fee at the rate of 0.10% per annum is charged for any undrawn portion of the credit facility, and each member of the Trust will pay its pro rata share of this fee. A facility fee of 0.27% was charged on the commitment amount, and each party of the Trust paid its pro rata share of this fee. The borrowing is due September 11, 2015, unless another date is mutually agreed upon by the parties of the Citi Loan Agreement. For the annual period ended November 28, 2014, the Fund paid $373,603 in borrowing fees. The Fund did not have any borrowing for the year ended November 28, 2014.
In 2009, seven class action lawsuits were filed in the U.S. District Court for the District of Colorado against OppenheimerFunds, Inc. (“OFI”), OppenheimerFunds Distributor, Inc., the Fund’s principal underwriter and distributor (the “Distributor”), and certain funds (but not including the Fund) advised by OFI Global Asset Management, Inc. and distributed by the Distributor (the “Defendant Funds”). The lawsuits also named as defendants certain officers and current and former trustees of the respective Defendant Funds. The lawsuits raised claims under federal securities laws and alleged, among other things, that the disclosure documents of the respective Defendant Funds contained misrepresentations and omissions and that the respective Defendant Funds’ investment policies were not followed. The plaintiffs in these actions sought unspecified damages, equitable relief and awards of attorneys’ fees and litigation expenses. The Defendant Funds’ Boards of Trustees also engaged counsel to represent the Funds and the present and former Independent Trustees named in those suits. In March 2014, the parties in six of these lawsuits executed stipulations and agreements of settlement resolving those actions. In July 2014, the court entered an order and final judgment approving the settlements as fair, reasonable and adequate. The settlements do
NOTES TO FINANCIAL STATEMENTS (Continued)
8. Pending Litigation (Continued)
not resolve a seventh outstanding lawsuit relating to Oppenheimer Rochester California Municipal Fund (the “California Fund Suit”). OFI believes the California Fund Suit is without legal merit and is defending the suit vigorously. While it is premature to render any opinion as to the outcome in the California Fund Suit, or whether any costs that OFI may bear in defending the California Fund Suit might not be reimbursed by insurance, OFI believes the California Fund Suit should not impair the ability of OFI or the Distributor to perform their respective duties to the Fund, and that the outcome of the California Fund Suit should not have any material effect on the operations of any of the Oppenheimer Funds.
REPORT OF INDEPENDENT REGISTERED PUBLIC ACCOUNTING FIRM
To the Shareholders of Oppenheimer SteelPath MLP Select 40 Fund and
Board of Trustees of Oppenheimer SteelPath MLP Funds Trust
We have audited the accompanying statement of assets and liabilities, including the statement of investments, of Oppenheimer SteelPath MLP Select 40 Fund (the “Fund”), a series of Oppenheimer SteelPath MLP Funds Trust, as of November 28, 2014, and the related statement of operations for the year then ended, the statements of changes in net assets for each of the two years in the period then ended, and the financial highlights for each of the five periods in the period then ended. These financial statements and financial highlights are the responsibility of the Fund’s management. Our responsibility is to express an opinion on these financial statements and financial highlights based on our audits.
We conducted our audits in accordance with the standards of the Public Company Accounting Oversight Board (United States). Those standards require that we plan and perform the audit to obtain reasonable assurance about whether the financial statements and financial highlights are free of material misstatement. An audit includes examining, on a test basis, evidence supporting the amounts and disclosures in the financial statements. Our procedures included confirmation of securities owned as of November 28, 2014, by correspondence with the custodian and brokers or by other auditing procedures as appropriate in the circumstances. An audit also includes assessing the accounting principles used and significant estimates made by management, as well as evaluating the overall financial statement presentation. We believe that our audits provide a reasonable basis for our opinion.
In our opinion, the financial statements and financial highlights referred to above present fairly, in all material respects, the financial position of Oppenheimer SteelPath MLP Select 40 Fund as of November 28, 2014, the results of its operations for the year then ended, the changes in its net assets for each of the two years in the period then ended, and the financial highlights for each of the five periods in the period then ended, in conformity with accounting principles generally accepted in the United States of America.
COHEN FUND AUDIT SERVICES, LTD.
Cleveland, Ohio
January 27, 2015
BOARD APPROVAL OF THE FUND’S INVESTMENT ADVISORY AGREEMENT Unaudited
The Fund has entered into an investment advisory agreement (the “Agreement”) with OFI SteelPath, Inc. (“OFI SteelPath” or the “Manager”). Each year, the Board of Trustees (the “Board”), including a majority of the independent Trustees, is required to determine whether to renew the Agreement. The Investment Company Act of 1940, as amended, requires that the Board request and evaluate, and that the Manager provide, such information as may be reasonably necessary to evaluate the terms of the Agreement. The Board employs an independent consultant to prepare a report that provides information, including comparative information that the Board requests for that purpose. In addition to in-person meetings focused on this evaluation, the Board receives information throughout the year regarding Fund services, fees, expenses and performance.
The Manager and the independent consultant provided information to the Board on the following factors: (i) the nature, quality and extent of the Manager’s services, (ii) the investment performance of the Fund and the Manager, (iii) the fees and expenses of the Fund, including comparative expense information, (iv) the profitability of the Manager and its affiliates, including an analysis of the cost of providing services, (v) whether economies of scale are realized as the Fund grows and whether fee levels reflect these economies of scale for Fund investors and (vi) other benefits to the Manager from its relationship with the Fund. The Board was aware that there are alternatives to retaining the Manager.
Outlined below is a summary of the principal information considered by the Board as well as the Board’s conclusions.
Nature, Quality and Extent of Services. The Board considered information about the nature, quality and extent of the services provided to the Fund and information regarding the Manager’s key personnel who provide such services. The Manager’s duties include providing research, analysis and other advisory services in regard to the Fund’s investments; securities trading services; oversight of third-party service providers; monitoring compliance with applicable Fund policies and procedures and adherence to the Fund’s investment restrictions; and risk management. The Manager is responsible for providing certain administrative services to the Fund as well. Those services, some of which are performed by affiliates of the Manager, include providing and supervising all administrative and clerical personnel who are necessary in order to provide effective corporate administration for the Fund; compiling and maintaining records with respect to the Fund’s operations; preparing and filing reports required by the Securities and Exchange Commission; preparing periodic reports regarding the operations of the Fund for its shareholders; preparing proxy materials for shareholder meetings; and preparing the registration statements required by Federal and state securities laws for the sale of the Fund’s shares. The Manager also provides the Fund with office space, facilities and equipment.
BOARD APPROVAL OF THE FUND’S INVESTMENT ADVISORY AGREEMENT Unaudited / (Continued)
The Board also considered the quality of the services provided and the quality of the Manager’s resources that are available to the Fund. In evaluating the Manager, the Board considered the history, reputation, qualification and background of the Manager, including its corporate parent, OppenheimerFunds, Inc. (“OFI”) and corporate affiliate, OFI Global Asset Management, Inc. (“OFI Global” and OFI and OFI Global are collectively referred to hereinafter as “OFI”), and the fact that OFI had over 50 years of experience as an investment adviser and that its assets rank among the top mutual fund managers in the United States. The Board evaluated the Manager’s and OFI’s advisory, administrative, accounting, legal, compliance services and risk management, and information the Board has received regarding the experience and professional qualifications of the Manager’s and OFI’s key personnel and the size and functions of its staff. In its evaluation of the quality of the portfolio management services provided, the Board considered the experience of Stuart Cartner and Brian Watson, the portfolio managers for the Fund, and the Manager’s investment team and analysts. The Board members also considered the totality of their experiences with the Manager and OFI as trustees of the Fund and other funds advised by the Manager or OFI. The Board considered information regarding the quality of services provided by affiliates of the Manager, which its members have become knowledgeable about in connection with the renewal of the Fund’s service agreements. The Board concluded, in light of the Manager’s and OFI’s experience, reputation, personnel, operations and resources that the Fund benefits from the services provided under the Agreement.
Investment Performance of the Manager and the Fund. Throughout the year, the Manager provided information on the investment performance of the Fund and the Manager, including comparative performance information. The Board also reviewed information, prepared by the Manager and by the independent consultant, comparing the Fund’s historical performance to relevant market indices and to the performance of other retail equity energy funds. The Board noted that the Fund underperformed its category median for the one-year period, but that it outperformed its category median for the three-year period.
Costs of Services by the Manager. The Board reviewed the fees paid to the Manager and the other expenses borne by the Fund. The independent consultant provided comparative data in regard to the fees and expenses of the Fund and other retail equity energy funds with comparable asset levels and distribution features. The Board noted that the Fund’s contractual management fee and its total expenses were lower than their respective peer group medians and category medians and that both ranked in the first quintile. The Board also considered that within the total asset range of $1 billion to $2 billion, the Fund’s effective management fee was lower than its peer group median and category median. The Board considered that the Manager has contractually agreed to limit the Fund’s total operating expenses to 1.10% for Class A shares, 1.85% for Class C shares, 0.85% for Class Y shares and Class W shares. The fee limitation may not be amended or terminated prior to March 29, 2015, unless approved by the Board.
BOARD APPROVAL OF THE FUND’S INVESTMENT ADVISORY AGREEMENT Unaudited / (Continued)
Economies of Scale and Profits Realized by the Manager. The Board considered information regarding the Manager’s costs in serving as the Fund’s investment adviser, including the costs associated with the personnel and systems necessary to manage the Fund, and information regarding the Manager’s profitability from its relationship with the Fund. The Board reviewed whether the Manager may realize economies of scale in managing and supporting the Fund. The Board noted that the Fund currently has management fee breakpoints, which are intended to share with Fund shareholders economies of scale that may exist as the Fund’s assets grow.
Other Benefits to the Manager. In addition to considering the profits realized by the Manager, the Board considered information that was provided regarding the direct and indirect benefits the Manager receives as a result of its relationship with the Fund, including compensation paid to the Manager’s affiliates and research provided to the Manager in connection with permissible brokerage arrangements (soft dollar arrangements). The Board also considered that the Manager must be able to pay and retain experienced professional personnel at competitive rates to provide quality services to the Fund.
Conclusions. These factors were also considered by the independent Trustees meeting separately from the full Board, assisted by experienced counsel to the Fund and to the independent Trustees. Fund counsel and the independent Trustees’ counsel are independent of the Manager within the meaning and intent of the Securities and Exchange Commission Rules.
Based on its review of the information it received and its evaluations described above, the Board, including a majority of the independent Trustees, decided to continue the Agreement through August 31, 2015. In arriving at its decision, the Board did not identify any factor or factors as being more important than others, but considered all of the above information, and considered the terms and conditions of the Agreement, including the management fees, in light of all the surrounding circumstances.
PORTFOLIO PROXY VOTING POLICIES AND PROCEDURES; UPDATES TO STATEMENTS OF INVESTMENTS Unaudited
The Fund has adopted Portfolio Proxy Voting Policies and Procedures under which the Fund votes proxies relating to securities (“portfolio proxies”) held by the Fund. A description of the Fund’s Portfolio Proxy Voting Policies and Procedures is available (i) without charge, upon request, by calling the Fund toll-free at 1.800.CALL.OPP (225.5677), (ii) on the Fund’s website at oppenheimerfunds.com, and (iii) on the SEC’s website at www.sec.gov. In addition, the Fund is required to file Form N-PX, with its complete proxy voting record for the 12 months ended June 30th, no later than August 31st of each year. The Fund’s voting record is available (i) without charge, upon request, by calling the Fund toll-free at 1.800.CALL.OPP (225.5677), and (ii) in the Form N-PX filing on the SEC’s website at www.sec.gov.
The Fund files its complete schedule of portfolio holdings with the SEC for the first quarter and the third quarter of each fiscal year on Form N-Q. The Fund’s Form N-Q filings are available on the SEC’s website at www.sec.gov. Those forms may be reviewed and copied at the SEC’s Public Reference Room in Washington, D.C. Information on the operation of the Public Reference Room may be obtained by calling 1-800-SEC-0330.
Householding – Delivery of Shareholder Documents
This is to inform you about OppenheimerFunds’ “householding” policy. If more than one member of your household maintains an account in a particular fund, OppenheimerFunds will mail only one copy of the fund’s prospectus (or, if available, the fund’s summary prospectus), annual and semiannual report and privacy policy. The consolidation of these mailings, called householding, benefits your fund through reduced mailing expense, and benefits you by reducing the volume of mail you receive from OppenheimerFunds. Householding does not affect the delivery of your account statements.
Please note that we will continue to household these mailings for as long as you remain an OppenheimerFunds shareholder, unless you request otherwise. If you prefer to receive multiple copies of these materials, please call us at 1.800.CALL.OPP (225-5677). You may also notify us in writing or via email. We will begin sending you individual copies of the prospectus (or, if available, the summary prospectus), reports and privacy policy within 30 days of receiving your request to stop householding.
TRUSTEES AND OFFICERS Unaudited
| Name, Position(s) Held with the Trusts, Length of Service, Age | Principal Occupation(s) During the Past 5 Years; Other Trusteeships/ Directorships Held; Number of Portfolios in the Fund Complex Currently Overseen |
| INDEPENDENT TRUSTEES | The address of each Trustee in the chart below is 6803 S. Tucson Way, Centennial, Colorado 80112-3924. Each Trustee serves for an indefinite term, or until his or her resignation, retirement, death or removal. |
Sam Freedman, Chairman of the
Board of Trustees
and Trustee
(since 2012)
Year of Birth: 1940 | Director of Colorado UpLIFT (charitable organization) (since September 1984). Mr. Freedman held several positions with OppenheimerFunds, Inc. and with subsidiary or affiliated companies of OppenheimerFunds, Inc. (until October 1994). Oversees 38 portfolios in the OppenheimerFunds complex. Mr. Freedman has served on the Boards of certain Oppenheimer funds since 1996, during which time he has become familiar with the Fund’s (and other Oppenheimer funds’) financial, accounting, regulatory and investment matters and has contributed to the Boards’ deliberations. |
Jon S. Fossel, Trustee
(since 2012)
Year of Birth: 1942 | Chairman of the Board (2006-December 2011) and Director (June 2002-December 2011) of UNUMProvident (insurance company); Director of Northwestern Energy Corp. (public utility corporation) (November 2004-December 2009); Director of P.R. Pharmaceuticals (October 1999-October 2003); Director of Rocky Mountain Elk Foundation (non-profit organization) (February 1998-February 2003 and February 2005-February 2007); Chairman and Director (until October 1996) and President and Chief Executive Officer (until October 1995) of OppenheimerFunds, Inc.; President, Chief Executive Officer and Director of the following: Oppenheimer Acquisition Corp. (“OAC”) (parent holding company of the OppenheimerFunds, Inc.), Shareholders Services, Inc. and Shareholder Financial Services, Inc. (until October 1995). Oversees 38 portfolios in the OppenheimerFunds complex. Mr. Fossel has served on the Boards of certain Oppenheimer funds since 1990, during which time he has become familiar with the Fund’s (and other Oppenheimer funds’) financial, accounting, regulatory and investment matters and has contributed to the Boards’ deliberations. |
TRUSTEES AND OFFICERS Unaudited / (Continued)
Richard F. Grabish, Trustee (since 2012) Year of Birth: 1948 | Formerly Senior Vice President and Assistant Director of Sales and Marketing (March 1997-December 2007), Director (March 1987-December 2007) and Manager of Private Client Services (June 1985-June 2005) of A.G. Edwards & Sons, Inc. (broker/dealer and investment firm); Chairman and Chief Executive Officer of A.G. Edwards Trust Company, FSB (March 2001-December 2007); President and Vice Chairman of A.G. Edwards Trust Company, FSB (investment adviser) (April 1987-March 2001); President of A.G. Edwards Trust Company, FSB (investment adviser) (June 2005-December 2007). Oversees 38 portfolios in the OppenheimerFunds complex. Mr. Grabish has served on the Boards of certain Oppenheimer funds since 2001, during which time he has become familiar with the Fund’s (and other Oppenheimer funds’) financial, accounting, regulatory and investment matters and has contributed to the Boards’ deliberations. |
Beverly L. Hamilton, Trustee (since 2012) Year of Birth: 1946 | Trustee of Monterey Institute for International Studies (educational organization) (since February 2000); Board Member of Middlebury College (educational organization) (December 2005-June 2011); Chairman (since 2010) of American Funds' Emerging Markets Growth Fund, Inc. (mutual fund); Director of The California Endowment (philanthropic organization) (April 2002-April 2008); Director (February 2002-2005) and Chairman of Trustees (2006-2007) of the Community Hospital of Monterey Peninsula; Director (October 1991-2005); Vice Chairman (2006-2009) of American Funds' Emerging Markets Growth Fund, Inc. (mutual fund); President of ARCO Investment Management Company (February 1991-April 2000); Member of the investment committees of The Rockefeller Foundation (2001-2006) and The University of Michigan (since 2000); Advisor at Credit Suisse First Boston's Sprout venture capital unit (venture capital fund) (1994-January 2005); Trustee of MassMutual Institutional Funds (investment company) (1996-June 2004); Trustee of MML Series Investment Fund (investment company) (April 1989-June 2004); Member of the investment committee of Hartford Hospital (2000-2003); and Advisor to Unilever (Holland) pension fund (2000-2003). Oversees 38 portfolios in the OppenheimerFunds complex. Ms. Hamilton has served on the Boards of certain Oppenheimer funds since 2002, during which time she has become familiar with the Fund’s (and other Oppenheimer funds’) financial, accounting, regulatory and investment matters and has contributed to the Boards’ deliberations. |
TRUSTEES AND OFFICERS Unaudited / (Continued)
Brian W. Wixted, Treasurer and Principal Financial & Accounting Officer (since 2012) Year of Birth: 1959 | Senior Vice President of OFI Global Asset Management, Inc. (since January 2013); Treasurer of OppenheimerFunds, Inc., HarbourView Asset Management Corporation, Shareholder Financial Services, Inc., Shareholder Services, Inc., and Oppenheimer Real Asset Management, Inc. (March 1999-June 2008), OFI Private Investments, Inc. (March 2000-June 2008), OppenheimerFunds International Ltd. and OppenheimerFunds plc (since May 2000), OFI Institutional Asset Management, Inc. (November 2000-June 2008), and OppenheimerFunds Legacy Program (charitable trust program established by OppenheimerFunds, Inc.) (June 2003-December 2011); Treasurer and Chief Financial Officer of OFI Trust Company (since May 2000); Assistant Treasurer of Oppenheimer Acquisition Corporation (March 1999-June 2008). An officer of 91 portfolios in the OppenheimerFunds complex. |
The Fund’s Statement of Additional Information contains additional information about the Fund’s Trustees and Officers and is available without charge upon request, by calling 1.800.CALL OPP (225.5677).
OPPENHEIMER STEELPATH MLP SELECT 40 FUND
| Manager | | OFI SteelPath, Inc. |
| | | |
| Distributor | | OppenheimerFunds Distributor, Inc. |
| | | |
| Transfer and Shareholder Servicing Agent | | OFI Global Asset Management, Inc. |
| | | |
| Sub-Transfer Agent | | Shareholder Services, Inc. |
| | | DBA OppenheimerFunds Services |
| | | |
| Independent Registered Public Accounting Firm | | Cohen Fund Audit Services, Ltd. |
| | | |
| Counsel | | K&L Gates LLP |
© 2015 OppenheimerFunds, Inc. All rights reserved.
PRIVACY POLICY NOTICE
As an Oppenheimer fund shareholder, you are entitled to know how we protect your personal information and how we limit its disclosure.
Information Sources
We obtain nonpublic personal information about our shareholders from the following sources:
| • | Applications or other forms |
| • | When you create a user ID and password for online account access |
| • | When you enroll in eDocs Direct, our electronic document delivery service |
| • | Your transactions with us, our affiliates or others |
| • | A software program on our website, often referred to as a “cookie,” which indicates which parts of our site you’ve visited |
| • | When you set up challenge questions to reset your password online |
If you visit oppenheimerfunds.com and do not log on to the secure account information areas, we do not obtain any personal information about you. When you do log on to a secure area, we do obtain your user ID and password to identify you. We also use this information to provide you with products and services you have requested, to inform you about products and services that you may be interested in and assist you in other ways.
We do not collect personal information through our website unless you willingly provide it to us, either directly by email or in those areas of the website that request information. In order to update your personal information (including your mailing address, email address and phone number) you must first log on and visit your user profile.
If you have set your browser to warn you before accepting cookies, you will receive the warning message with each cookie. You can refuse cookies by turning them off in your browser. However, doing so may limit your access to certain sections of our website.
We use cookies to help us improve and manage our website. For example, cookies help us recognize new versus repeat visitors to the site, track the pages visited, and enable some special features on the website. This data helps us provide a better service for our website visitors.
Protection of Information
We do not disclose any non-public personal information (such as names on a customer list) about current or former customers to anyone, except as permitted by law.
PRIVACY POLICY NOTICE (Continued)
Disclosure of Information
Copies of confirmations, account statements and other documents reporting activity in your fund accounts are made available to your financial adviser (as designated by you). We may also use details about you and your investments to help us, our financial service affiliates, or firms that jointly market their financial products and services with ours, to better serve your investment needs or suggest financial services or educational material that may be of interest to you. If this requires us to provide you with an opportunity to “opt in” or “opt out” of such information sharing with a firm not affiliated with us, you will receive notification on how to do so, before any such sharing takes place.
Right of Refusal
We will not disclose your personal information to unaffiliated third parties (except as permitted by law), unless we first offer you a reasonable opportunity to refuse or “opt out” of such disclosure.
Internet Security and Encryption
In general, the email services provided by our website are encrypted and provide a secure and private means of communication with us. To protect your own privacy, confidential and/or personal information should only be communicated via email when you are advised that you are using a secure website.
As a security measure, we do not include personal or account information in non-secure emails, and we advise you not to send such information to us in non-secure emails. Instead, you may take advantage of the secure features of our website to encrypt your email correspondence. To do this, you will need to use a browser that supports Secure Sockets Layer (SSL) protocol.
We do not guarantee or warrant that any part of our website, including files available for download, are free of viruses or other harmful code. It is your responsibility to take appropriate precautions, such as use of an anti-virus software package, to protect your computer hardware and software.
| • | All transactions, including redemptions, exchanges and purchases, are secured by SSL and 128-bit encryption. SSL is used to establish a secure connection between your PC and OppenheimerFunds’ server. It transmits information in an encrypted and scrambled format. |
| • | Encryption is achieved through an electronic scrambling technology that uses a “key” to code and then decode the data. Encryption acts like the cable converter box you may have on your television set. It scrambles data with a secret code so that no one can make sense of it while it is being transmitted. When the data reaches its destination, the same software unscrambles the data. |
| • | You can exit the secure area by either closing your browser, or for added security, you can use the Log Out button before you close your browser. |
PRIVACY POLICY NOTICE (Continued)
Other Security Measures
We maintain physical, electronic and procedural safeguards to protect your personal account information. Our employees and agents have access to that information only so that they may offer you products or provide services, for example, when responding to your account questions.
How You Can Help
You can also do your part to keep your account information private and to prevent unauthorized transactions. If you obtain a user ID and password for your account, do not allow it to be used by anyone else. Also, take special precautions when accessing your account on a computer used by others.
Who We Are
This joint notice describes the privacy policies of the Oppenheimer funds, OppenheimerFunds, Inc., each of its investment adviser subsidiaries, OppenheimerFunds Distributor, Inc. and OFI Global Trust Co. It applies to all Oppenheimer fund accounts you presently have, or may open in the future, using your Social Security number - whether or not you remain a shareholder of our funds. This notice was last updated November 2014. In the event it is updated or changed, we will post an updated notice on our website at oppenheimerfunds.com. If you have any questions about this privacy policy, write to us at P.O. Box 5270, Denver, CO 80217-5270, email us by clicking on the Contact Us section of our website at oppenheimerfunds.com or call us at 1.800.CALL OPP (225.5677).
THIS PAGE INTENTIONALLY LEFT BLANK
THIS PAGE INTENTIONALLY LEFT BLANK
| Fund Performance Discussion | 3 |
| Top Holdings and Allocations | 8 |
| Share Class Performance | 9 |
| Fund Expenses | 11 |
| Statement of Investments | 13 |
| Statement of Assets and Liabilities | 15 |
| Statement of Operations | 17 |
| Statements of Changes in Net Assets | 18 |
| Financial Highlights | 19 |
| Notes to Financial Statements | 23 |
| Report of Independent Registered Public Accounting Firm | 39 |
| Board Approval of the Fund’s Investment Advisory Agreement | 40 |
| Portfolio Proxy Voting Policies and Procedures; Updates to Statements of Investments | 43 |
| Trustees and Officers | 44 |
| Privacy Policy Notice | 53 |
Class A Shares
AVERAGE ANNUAL TOTAL RETURNS AT 11/28/14*
| | Class A Shares of the Fund | | |
| | Without
Sales
Charge | With
Sales
Charge | S&P 500 Index | Alerian MLP Index |
| 1-Year | 12.26% | 5.84% | 16.86% | 12.87% |
| Since Inception (3/31/10) | 12.14 | 10.73 | 15.40 | 17.49 |
Performance data quoted represents past performance, which does not guarantee future results. The investment return and principal value of an investment in the Fund will fluctuate so that an investor’s shares, when redeemed, may be worth more or less than their original cost. Fund returns include changes in share price, reinvested distributions, and a 5.75% maximum applicable sales charge except where “without sales charge” is indicated. Current performance may be lower or higher than the performance quoted. Returns do not consider capital gains or income taxes on an individual’s investment. For performance data current to the most recent month-end, visit oppenheimerfunds.com or call 1.800.CALL.OPP (225.5677).
| * | November 28, 2014, was the last business day of the Fund’s fiscal year. See Note 2 of the accompanying Notes to Financial Statements. Index returns are calculated through November 30, 2014. |
Fund Performance Discussion
The Fund’s Class A shares (without sales charge) produced a total return of 12.26% during the reporting period. In comparison, master limited partnerships (MLPs), as measured by the Alerian MLP Index (AMZ), provided a total return of 12.87%. Please note that the returns for the Alerian MLP Index are calculated pre-tax, while the Fund’s returns are calculated post corporate tax. During the same period, the S&P 500 Index produced a total return of 16.86%.
Over the twelve-month reporting period ended November 30, 2014, the MLP sector underperformed the broader markets. Notably, MLPs outperformed the S&P 500 Index for most of the period before declining during October and November in correlation with a sharp pullback in crude oil prices. A low-yield versus high-yield characteristic appeared to dominate performance differentiation for the first half of 2014, but this theme was less of a contributing factor during the latter part of the reporting period. Below average yielding MLPs typically reflect expectations for rapid distribution growth, while MLPs with above average yields are generally thought to hold more limited growth prospects. During the first half of 2014, the price performance of MLPs with yields that were below the group average, or faster growers, beat the price performance of MLPs with above average yields, or slower growers, by an average of 16.7%. During the third quarter, the below average yielding names only beat the above average yielding MLPs by 0.5%. More
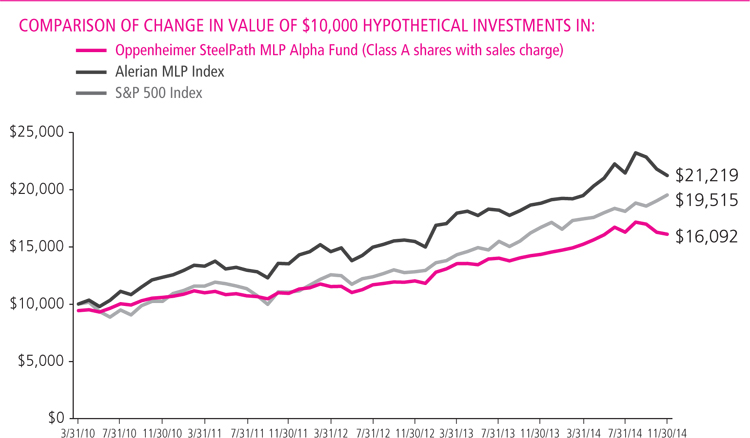
accurately, however, the yield, or growth, characteristic appeared to carry less influence late in the period than sub-sector membership and company-specific factors.
Over the reporting period, approximately $35 billion of new equity supply entered the market through either secondary offerings, initial public offerings, or through “at-the-market” programs in which primary units trade into the market anonymously throughout the normal trading day. This pace of equity issuance represents an increased rate from the roughly $26 billion raised over the twelve month reporting period ended November 30, 2013. MLPs also raised approximately $23 billion of debt capital during the period. Most MLPs pay out the majority of excess cash flow as distributions to investors, and thereby must raise external capital to fund growth projects.
MACRO REVIEW
West Texas Intermediate (WTI) crude oil prices ended the reporting period at $61.15 per barrel, down 29% from the end of November 2013. Global crude prices traded 36% lower over the reporting period, with continuing political and social turmoil in the Middle East offset by rising production, a stronger U.S. dollar, and weakening economic outlooks late in the period. Domestically, regional crude pricing differentials continued to exhibit fluctuations, with West Texas pricing exhibiting the greatest weakness early in the period, before narrowing significantly late in the period.
Henry Hub natural gas spot prices rose 12% to end the period at $4.24 per million British thermal units (mmbtu). A combination of continued rising natural gas production, and moderate summer electric demand due to a cooler than normal summer, largely replenished natural gas storage levels after the cold winter left natural gas storage levels at eleven year lows. With storage levels now only marginally below historic levels, we believe fear of elevated natural gas price volatility over the 2014-2015 winter has waned.
Mont Belvieu natural gas liquids (NGL) prices ended the reporting period at $29.74 per barrel, down 30% from the end of November 2013. All of the NGL purity product prices ended the period lower than the same time in the prior year. As a result natural gas processing economics weakened over the period, which may impact certain midstream providers, depending on the contract structure of their processing agreements.
The yield curve flattened over the reporting period as short rates held steady, medium-term rates rose, and longer-dated yields declined. The ten-year Treasury yield fell 58 basis points to end the period at 2.17%. The MLP yield spread at period-end, as measured by the AMZ and the 10-year Treasury bond, widened by 41 basis points to 3.53%.
Over the reporting period, real estate investment trusts (REITs) and utilities, two competing yield-oriented equity asset classes, posted total returns of 27.22% (as measured by the Dow Jones Equity All REIT Total Return Index) and 27.88% (as
measured by the Dow Jones Utility Average Index), respectively, outperforming the AMZ’s 12.87% total return. We believe this performance differential is the result of REITs and utilities benefiting from the low interest rate environment, while the performance of MLP equities was impacted by the sharp crude oil price decline. Among MLPs, sector valuation statistics remained little changed over the period, as equity price performance was offset by increased growth expectations. Price to forward distributable cash flow (DCF), a commonly watched ratio, widened modestly above the ten-year average but within the historic range, reflecting the sector’s robust growth potential. We continue to believe that the visibility of energy infrastructure growth opportunities supports above average valuations.
SUBSECTOR REVIEW
Most subsectors in the midstream, or energy infrastructure, MLP asset class delivered positive performance for the reporting period. On average, the diversified names provided the best performance over the period as these larger names benefited from commodity and activity diversity, as well as mergers and acquisitions (M&A) activity. The natural gas pipeline group followed with performance benefiting from a less volatile natural gas price, stable production volumes, and M&A activity. The petroleum product and crude oil subsector also delivered strong performance as it continued to benefit from the U.S. energy renaissance in the production of crude oil.
Consistent with the trends we saw in the previous reporting period, those asset classes with greater exposure to commodity prices delivered less favorable performance over the period. Weakness within the coal subsector likely reflects, we believe, continued market concern over the outlook for coal pricing in the face of abundant and cheap natural gas as a competing electric generating fuel and the potential for even greater regulatory pressure on the use of coal. Upstream MLPs, including those active in exploration and production and oilfield services and supply, suffered as crude oil prices peaked mid-2014 and underwent sharp downward moves late in the period. Also among the weakest subsectors for the period were the marine MLPs, where weakness was also influenced by the decline in crude oil prices and its perceived impact of oil supply growth and transportation.
FUND REVIEW
Key contributors to the Fund’s performance were Energy Transfer Equity, LP (ETE) and TC Pipelines, LP (TCP).
ETE units outperformed the AMZ for the reporting period, benefiting from the momentum favoring low-yielding, high growth names and bolstered by M&A activity and new growth project announcements at its subsidiary partnerships: Energy Transfer Partners (ETP), Regency Energy Partners (RGP), Sunoco Logistics Partners (SXL), and Sunoco, LP (SUN). Unit price strength during the reporting period was also supported by ETE’s seventh consecutive quarterly distribution increase.
TCP units outperformed the AMZ late in the period as the market began to anticipate higher distribution growth as its parent, TransCanada, restated its intent to drop down all of its U.S. natural gas pipeline assets to TCP. TransCanada recently announced that it will complete the dropdown of its minority interest in two pipelines to TCP in the first quarter 2015. TCP has also benefited recently from its lack of exposure to oil.
Key detractors from the Fund’s performance were Seadrill Partners LLC (SDLP) and El Paso Pipeline Partners, LP (EPB).
SDLP units were impacted as falling crude oil prices late in the reporting period induced a risk-off mentality in the market, and consequently a flight to more defensively-positioned, large-cap securities. At the same time, a cyclical slow-down in the offshore drilling industry has seen SDLP trade in sympathy with spot-exposed peers. To note, SDLP has no material exposure to underlying spot rates until 2017 due to contracts with investment-grade counterparties.
EPB’s modest distribution growth guidance for 2014 and flat distribution growth guidance for 2015 and 2016 drove price weakness early in the period as several rate case settlements and weak contract renewals offset the positive contribution of several planned acquisitions. Performance was bolstered in August when Kinder Morgan, Inc. (KMI) announced its plans to acquire and consolidate its family of MLPs, including EPB. The acquisitions were completed in late November 2014.
OUTLOOK
We believe the price correction in crude oil, should it continue, will serve to moderate crude oil production growth rates in aggregate but that the impact for the majority of midstream focused MLPs will be modest. Further, after the sector’s recent trading weakness we believe basic valuation metrics exited 2014 well within historical averages and provide an opportunity to earn a reasonable return on investment for those businesses positioned appropriately. Importantly, we believe that despite near-term price weakness and the likely moderation in growth trends for certain basins, the long-term production trends associated with the North American energy renaissance remain in place and are supportive of midstream assets generally.
It is also important to highlight that many businesses utilizing the MLP structure today are not related to energy infrastructure. A number of non-midstream businesses have entered the public markets utilizing the MLP structure. Clearly, an oil and gas producer, a refinery, or an oilfield services provider, whether organized as a corporation or MLP, will experience the underlying margin and business trends of those industries. Therefore, while we believe recent price weakness may represent an attractive entry point for those MLPs positioned to perform well despite recent commodity price weakness, investors should consider carefully the fundamental exposure presented by each specific MLP before committing capital.
Top Holdings and Allocations*
TOP TEN MASTER LIMITED PARTNERSHIP HOLDINGS
| Enterprise Products Partners LP | 8.82% |
| Magellan Midstream Partners LP | 7.53% |
| Plains All American Pipeline LP | 6.97% |
| Energy Transfer Equity LP | 6.82% |
| Sunoco Logistics Partners LP | 6.78% |
| Regency Energy Partners LP | 6.16% |
| Access Midstream Partners LP | 5.47% |
| TC Pipelines LP | 5.44% |
| Buckeye Partners LP | 4.88% |
| MarkWest Energy Partners LP | 4.36% |
Portfolio holdings and allocations are subject to change. Percentages are as of November 28, 2014, and based on net assets.
SECTOR ALLOCATION
Portfolio holdings and allocations are subject to change. Percentages are as of November 28, 2014, and based on the total value of investments.
| * | November 28,2014 was the last business day of the Fund’s fiscal year. See Note 2 of the accompanying Notes to Financial Statements. |
Share Class Performance
AVERAGE ANNUAL TOTAL RETURNS WITHOUT SALES CHARGE AS OF 11/28/14*
| | Inception Date | 1-Year | Since Inception |
| Class A (MLPAX) | 3/31/10 | 12.26% | 12.14% |
| Class C (MLPGX) | 8/25/11 | 11.30% | 13.55% |
| Class I (OSPAX) | 6/28/13 | 12.55% | 10.96%** |
| Class Y (MLPOX) | 3/31/10 | 12.46% | 12.43%** |
AVERAGE ANNUAL TOTAL RETURNS WITH SALES CHARGE AS OF 11/28/14*
| | Inception Date | 1-Year | Since Inception |
| Class A (MLPAX) | 3/31/10 | 5.84% | 10.73% |
| Class C (MLPGX) | 8/25/11 | 10.30% | 13.55% |
| Class I (OSPAX) | 6/28/13 | 12.55% | 10.96%** |
| Class Y (MLPOX) | 3/31/10 | 12.46% | 12.43%** |
| * | November 28, 2014, was the last business day of the Fund’s fiscal year. See Note 2 of the accompanying Notes to Financial Statements. Index returns are calculated through November 30, 2014. |
| ** | Effective June 28, 2013, Class I shares were renamed Class Y shares. See Note 1 of the Notes to Financial Statements for additional information. |
Performance data quoted represents past performance, which does not guarantee future results. The investment return and principal value of an investment in the Fund will fluctuate so that an investor’s shares, when redeemed, may be worth more or less than their original cost. Current performance may be lower or higher than the performance quoted. Returns do not consider capital gains or income taxes on an individual’s investment. For performance data current to the most recent month-end, visit oppenheimerfunds.com or call 1.800.CALL.OPP (225.5677). Fund returns include changes in share price, reinvested distributions, and the applicable sales charge: for Class A shares, the current maximum initial sales charge of 5.75%; and for Class C, the contingent deferred sales charge of 1% for the 1-year period. There is no sales charge for Class I or Class Y shares.
The Fund’s performance is compared to the performance of the S&P 500 Index, and the Alerian MLP Index. The S&P 500 Index is an index of large-capitalization equity securities that is a measure of the general domestic stock market. The Alerian MLP Index is a composite of the 50 most prominent Master Limited Partnerships that provides investors with an unbiased, comprehensive benchmark for this emerging asset class. The index, which is calculated using a float-adjusted, capitalization-weighted methodology, is disseminated real-time on a total-return basis (AMZX). The indices are unmanaged and cannot be purchased directly by investors. While index comparisons may be useful to provide a benchmark for the Fund’s
performance, it must be noted that the Fund’s investments are not limited to the investments comprising the indices. Index performance includes reinvestment of income, but does not reflect transaction costs, fees, expenses or taxes. Index performance is shown for illustrative purposes only as a benchmark for the Fund’s performance, and does not predict or depict performance of the Fund. The Fund’s performance reflects the effects of the Fund’s business and operating expenses.
The Fund’s investment strategy and focus can change over time. The mention of specific fund holdings does not constitute a recommendation by OppenheimerFunds, Inc. or its affiliates.
Before investing in any of the Oppenheimer funds, investors should carefully consider a fund’s investment objectives, risks, charges and expenses. Fund prospectuses and summary prospectuses contain this and other information about the funds, and may be obtained by asking your financial adviser, visiting oppenheimerfunds.com, or calling 1.800.CALL.OPP (225.5677). Read prospectuses and summary prospectuses carefully before investing.
Shares of Oppenheimer funds are not deposits or obligations of any bank, are not guaranteed by any bank, are not insured by the FDIC or any other agency, and involve investment risks, including the possible loss of the principal amount invested.
Fund Expenses
Fund Expenses. As a shareholder of the Fund, you incur two types of costs: (1) transaction costs, which may include sales charges (loads) on purchase payments, contingent deferred sales charges on redemptions; and (2) ongoing costs, including management fees; distribution and service fees; and other Fund expenses. These examples are intended to help you understand your ongoing costs (in dollars) of investing in the Fund and to compare these costs with the ongoing costs of investing in other mutual funds.
The examples are based on an investment of $1,000.00 invested at the beginning of the period and held for the entire 6-month period ended November 28, 2014.
Actual Expenses. The first section of the table provides information about actual account values and actual expenses. You may use the information in this section for the class of shares you hold, together with the amount you invested, to estimate the expense that you paid over the period. Simply divide your account value by $1,000.00 (for example, an $8,600.00 account value divided by $1,000.00 = 8.60), then multiply the result by the number in the first section under the heading entitled “Expenses Paid During Period” to estimate the expenses you paid on your account during this period.
Hypothetical Example for Comparison Purposes. The second section of the table provides information about hypothetical account values and hypothetical expenses based on the Fund’s actual expense ratio for each class of shares, and an assumed rate of return of 5% per year for each class before expenses, which is not the actual return. The hypothetical account values and expenses may not be used to estimate the actual ending account balance or expenses you paid for the period. You may use this information to compare the ongoing costs of investing in the Fund and other funds. To do so, compare this 5% hypothetical example for the class of shares you hold with the 5% hypothetical examples that appear in the shareholder reports of the other funds.
Please note that the expenses shown in the table are meant to highlight your ongoing costs only and do not reflect any transactional costs, such as front-end or contingent deferred sales charges (loads). Therefore, the “hypothetical” section of the table is useful in comparing ongoing costs only, and will not help you determine the relative total costs of owning different funds. In addition, if these transactional costs were included, your costs would have been higher.
| Actual | Beginning
Account
Value
June 1, 2014 | Ending
Account
Value
November 28, 2014 | Expenses
Paid During
6 Months Ended November 28, 2014* |
| Class A | $1,000.00 | $1,003.20 | $7.67 |
| Class C | 1,000.00 | 999.30 | 11.41 |
| Class I | 1,000.00 | 1,003.90 | 6.17 |
| Class Y | 1,000.00 | 1,004.70 | 6.42 |
| | | | |
Hypothetical
(5% return before expenses) | | | |
| Class A | 1,000.00 | 1,017.34 | 7.73 |
| Class C | 1,000.00 | 1,013.58 | 11.49 |
| Class I | 1,000.00 | 1,018.84 | 6.22 |
| Class Y | 1,000.00 | 1,018.59 | 6.47 |
Expenses are equal to the Fund’s annualized expense ratio for that class, multiplied by the average account value over the period, multiplied by 181/365 (to reflect the one-half year period). Those annualized expense ratios, excluding indirect expenses from affiliated funds, and tax expense, based on the 6-month period ended November 28, 2014 are as follows:
| Class | Expense Ratios* |
| Class A | 1.54% |
| Class C | 2.29 |
| Class I | 1.23 |
| Class Y | 1.29 |
| * | For the 6-month period ended November 28, 2014, the Fund’s deferred tax liability decreased resulting in a deferred tax benefit for the period. This benefit was excluded from this example. |
The expense ratios for Class A, C, and Y reflect contractual waivers and/or reimbursements of expenses by the Fund’s Manager. Some of these undertakings may be modified or terminated at any time, as indicated in the Fund’s prospectus. The “Financial Highlights” tables in the Fund’s financial statements, included in this report, also show the gross expense ratios, without such waivers or reimbursements, if applicable.
STATEMENT OF INVESTMENTS November 28, 2014*
| Description | | Shares | | | Value | |
| Master Limited Partnership Shares — 101.8% | |
| Diversified — 10.8% | |
| Enterprise Products Partners LP | | | 12,150,735 | | | $ | 453,708,445 | |
| ONEOK Partners LP | | | 2,347,789 | | | | 103,490,539 | |
| Total Diversified | | | | | | | 557,198,984 | |
| | | | | | | | | |
| Gathering/Processing — 26.0% | |
| Access Midstream Partners LP | | | 4,491,346 | | | | 281,517,567 | |
| Atlas Pipeline Partners LP | | | 281,008 | | | | 9,228,303 | |
| DCP Midstream Partners LP | | | 3,836,639 | | | | 183,813,374 | |
| MarkWest Energy Partners LP | | | 3,157,384 | | | | 224,363,707 | |
| Regency Energy Partners LP | | | 11,129,200 | | | | 317,070,908 | |
| Summit Midstream Partners LP | | | 1,202,872 | | | | 54,610,389 | |
| Targa Resources Partners LP | | | 3,215,662 | | | | 176,314,747 | |
| Western Gas Partners LP | | | 1,255,120 | | | | 89,025,662 | |
| Total Gathering/Processing | | | | | | | 1,335,944,657 | |
| | | | | | | | | |
| Marine — 2.4% | |
Seadrill Partners LLC 1 | | | 7,335,129 | | | | 124,110,383 | |
| | | | | | | | | |
| Natural Gas Pipelines — 21.1% | |
| Energy Transfer Equity LP | | | 5,909,908 | | | | 350,989,436 | |
| Energy Transfer Partners LP | | | 2,739,649 | | | | 178,542,925 | |
| EQT Midstream Partners LP | | | 1,962,533 | | | | 164,146,260 | |
| Spectra Energy Partners LP | | | 2,076,607 | | | | 112,074,480 | |
TC Pipelines LP 1 | | | 3,888,829 | | | | 279,956,800 | |
| Total Natural Gas Pipelines | | | | | | | 1,085,709,901 | |
| Description | | Shares | | | Value | |
| Petroleum Transportation — 41.5% | |
| Buckeye Partners LP | | | 3,265,286 | | | $ | 251,002,535 | |
| Genesis Energy LP | | | 2,427,749 | | | | 106,893,788 | |
| Holly Energy Partners LP | | | 2,586,058 | | | | 87,020,852 | |
| Magellan Midstream Partners LP | | | 4,673,819 | | | | 387,412,857 | |
NGL Energy Partners LP 1 | | | 4,702,783 | | | | 164,127,127 | |
| NuStar Energy LP | | | 246,365 | | | | 13,796,440 | |
NuStar GP Holdings LLC 1 | | | 2,524,858 | | | | 86,754,121 | |
| Plains All American Pipeline LP | | | 6,972,690 | | | | 358,744,900 | |
Shell Midstream Partners LP 1,2 | | | 4,412,311 | | | | 161,137,598 | |
| Sunoco Logistics Partners LP | | | 7,250,128 | | | | 349,021,162 | |
| Tesoro Logistics LP | | | 2,088,107 | | | | 119,585,888 | |
TransMontaigne Partners LP 1 | | | 1,386,234 | | | | 51,165,897 | |
| Total Petroleum Transportation | | | | | | | 2,136,663,165 | |
| | | | | | | | | |
| Total Master Limited Partnership Shares | |
| (identified cost $4,079,288,023) | | | | 5,239,627,090 | |
| | | | | | | | | |
| Common Stock — 5.7% | |
| Diversified — 5.4% | |
| ONEOK, Inc. | | | 2,552,908 | | | | 138,265,497 | |
| Williams Cos., Inc. | | | 2,657,745 | | | | 137,538,304 | |
| Total Diversified | | | | | | | 275,803,801 | |
| | | | | | | | | |
| Gathering/Processing — 0.3% | | | | | |
| Targa Resources Corp. | | | 135,637 | | | | 15,481,607 | |
| Total Gathering/Processing | | | | | | | 15,481,607 | |
| | | | | | | | | |
| Total Common Stock | |
| (identified cost $306,442,088) | | | | 291,285,408 | |
STATEMENT OF INVESTMENTS (Continued)
| Description | | Shares | | | Value | |
| Short-Term Investments — 1.2% | |
| Money Market — 1.2% | |
Fidelity Treasury Portfolio, 0.010%3 | | | 64,121,686 | | | $ | 64,121,686 | |
| | | | | | | | | |
| Total Short-Term Investments | |
| (identified cost $64,121,686) | | | | 64,121,686 | |
| | | | | | | | | |
| Total Investments — 108.7% | |
| (identified cost $4,449,851,797) | | | | 5,595,034,184 | |
| Liabilities In Excess of Other Assets — (8.7)% | | | | (449,125,641 | ) |
| Net Assets -— 100.0% | | | $ | 5,145,908,543 | |
Footnotes to Statement of Investments
| * | November 28, 2014 and November 29, 2013 represent the last business day of the Fund’s annual period. See Note 2 of the accompanying notes. |
LLC — Limited Liability Company
LP — Limited Partnership
| 1. | Is or was an affiliate, as defined by the Investment Company Act of 1940, at or during the year ended November 28, 2014, by virtue of the Fund owning at least 5% of the voting securities of the issuer. Transactions during this year in which the issuer was an affiliate are as follows: |
| | | Shares
November 29, 2013* | | | Gross
Additions | | | Gross
Reductions | | | Shares
November 28, 2014* | |
Holly Energy Partners LP i | | | 3,241,053 | | | | — | | | | (654,995 | ) | | | 2,586,058 | |
| NGL Energy Partners LP | | | 1,920,000 | | | | 2,812,856 | | | | 30,073 | | | | 4,702,783 | |
| Nustar GP Holdings LLC | | | — | | | | 2,524,858 | | | | — | | | | 2,524,858 | |
| Seadrill Partners LLC | | | — | | | | 7,335,129 | | | | — | | | | 7,335,129 | |
| Shell Midstream Partners LP | | | — | | | | 4,412,311 | | | | — | | | | 4,412,311 | |
| TC Pipelines LP | | | 3,098,783 | | | | 1,987,529 | | | | 1,197,483 | | | | 3,888,829 | |
| TransMontaigne Partners LP | | | 1,596,745 | | | | 77,156 | | | | 287,667 | | | | 1,386,234 | |
| | | Value | | | Distributions | | | Realized
Gain/(Loss) | | | | | |
Holly Energy Partners LP i | | $ | 87,020,852 | | | $ | 6,367,989 | | | $ | 981,835 | | | | | |
| NGL Energy Partners LP | | | 164,127,127 | | | | 7,377,938 | | | | (139,106 | ) | | | | |
| Nustar GP Holdings LLC | | | 86,754,121 | | | | 3,355,247 | | | | — | | | | | |
| Seadrill Partners LLC | | | 124,110,383 | | | | 11,727,135 | | | | — | | | | | |
| Shell Midstream Partners LP | | | 161,137,598 | | | | — | | | | — | | | | | |
| TC Pipelines LP | | | 279,956,800 | | | | 14,798,139 | | | | 33,638,765 | | | | | |
| TransMontaigne Partners LP | | | 51,165,897 | | | | 4,108,015 | | | | 729,849 | | | | | |
| i | An affiliate as of November 29, 2013. Is not an affiliate as of November 28, 2014. |
| 3. | Variable rate security; the coupon rate represents the rate at November 28, 2014. |
See accompanying Notes to Financial Statements.
STATEMENT OF
ASSETS AND LIABILITIES November 28, 2014*
| Assets | | | |
| Investments at value – see accompanying Statement of Investments: | | | |
| Unaffiliated companies (cost $3,653,606,071) | | $ | 4,727,782,258 | |
| Affiliated companies (cost $796,245,726) | | | 867,251,926 | |
| | | | 5,595,034,184 | |
| Dividends receivable | | | 230 | |
| Receivable for beneficial interest sold | | | 15,846,234 | |
| Prepaid expenses | | | 202,800 | |
| Total assets | | | 5,611,083,448 | |
| | | | | |
| Liabilities: | | | | |
| Borrowing expense payable | | | 15,760 | |
| Payable for beneficial interest redeemed | | | 10,484,501 | |
| Payable for investments purchased | | | 26,436,224 | |
| Deferred tax liability | | | 421,139,830 | |
| Payable to Manager | | | 4,076,387 | |
| Payable for distribution and service plan fees, Class A | | | 404,918 | |
| Payable for distribution and service plan fees, Class C | | | 840,482 | |
| Transfer agent fees payable | | | 945,947 | |
| Trustees' fees payable | | | 33,615 | |
| Other liabilities | | | 797,241 | |
| Total liabilities | | | 465,174,905 | |
| | | | | |
| Net Assets | | $ | 5,145,908,543 | |
| | | | | |
| Composition of Net Assets | | | | |
| Par value of shares of beneficial interest | | $ | 401,124 | |
| Paid-in capital | | | 4,425,346,895 | |
| Undistributed net investment loss, net of deferred taxes | | | (62,546,811 | ) |
| Accumulated undistributed net realized gains on investments, net of deferred taxes | | | 60,190,778 | |
| Net unrealized appreciation on investments, net of deferred taxes | | | 722,516,557 | |
| Net Assets | | $ | 5,145,908,543 | |
STATEMENT OF
ASSETS AND LIABILITIES (Continued)
Net Asset Value, Offering Price and Redemption Proceeds Per Share
($0.001 Par Value, Unlimited Shares Authorized) | | | | |
| Class A Shares: | | | | |
| Net asset value and redemption proceeds per share | | $ | 12.81 | |
| Offering price per share (net asset value plus sales charge of 5.75% of offering price) | | $ | 13.59 | |
| Class C Shares: | | | | |
| Net asset value, offering price and redemption proceeds per share | | $ | 12.53 | |
| Class I Shares: | | | | |
| Net asset value, offering price and redemption proceeds per share | | $ | 12.99 | |
| Class Y Shares: | | | | |
| Net asset value, offering price and redemption proceeds per share | | $ | 12.99 | |
| Net Assets: | | | |
| Class A shares | | $ | 1,937,356,070 | |
| Class C shares | | | 1,011,690,495 | |
| Class I shares | | | 3,732,484 | |
| Class Y shares | | | 2,193,129,494 | |
| Total Net Assets | | $ | 5,145,908,543 | |
| | | | | |
| Shares Outstanding: | | | | |
| Class A shares | | | 151,262,882 | |
| Class C shares | | | 80,722,349 | |
| Class I shares | | | 287,238 | |
| Class Y shares | | | 168,851,829 | |
| Total Shares Outstanding | | | 401,124,298 | |
| * | November 28, 2014 represents the last business day of the Fund’s annual period. See Note 2 of the accompanying Notes. |
See accompanying Notes to Financial Statements.
STATEMENT OF
OPERATIONS For the Year Ended November 28, 2014*
| Investment Income | | | |
| Distributions from Master Limited Partnerships from: | | | |
| Unaffiliated Master Limited Partnerships | | $ | 163,356,905 | |
| Affiliated Master Limited Partnerships | | | 47,734,463 | |
| Less return of capital on distributions from: | | | | |
| Unaffiliated Master Limited Partnerships | | | (163,356,905 | ) |
| Affiliated Master Limited Partnerships | | | (47,734,463 | ) |
| Dividend income | | | 5,007,343 | |
| Total investment income | | | 5,007,343 | |
| | | | | |
| Expenses | | | | |
| Management fees | | | 45,342,329 | |
| Distribution and service plan fees | | | | |
| Class A | | | 4,117,239 | |
| Class C | | | 7,497,518 | |
| Transfer agent fees | | | | |
| Class A | | | 3,623,171 | |
| Class C | | | 1,649,454 | |
| Class I | | | 619 | |
| Class Y | | | 3,837,604 | |
| Administrative fees | | | 855,381 | |
| Borrowing fees | | | 545,654 | |
| Tax expense | | �� | 538,311 | |
| Custody fees | | | 217,492 | |
| Trustees' fees | | | 150,518 | |
| Other | | | 988,360 | |
| Total expenses, before waivers and deferred taxes | | | 69,363,650 | |
| Less expense waivers | | | (4,876,625 | ) |
| Net expenses, before deferred taxes | | | 64,487,025 | |
| | | | | |
| Net investment loss, before deferred taxes | | | (59,479,682 | ) |
| Deferred tax benefit | | | 22,229,543 | |
| Net investment loss, net of deferred taxes | | | (37,250,139 | ) |
| | | | | |
| Net Realized and Unrealized Gains on Investments: | | | | |
| Net Realized Gains | | | | |
| Investments from | | | | |
| Unaffiliated companies | | | 61,175,446 | |
| Affiliated companies | | | 35,211,343 | |
| Deferred tax expense | | | (35,848,266 | ) |
| Net realized gains, net of deferred taxes | | | 60,538,523 | |
| Net Change in Unrealized Appreciation | | | | |
| Investments | | | 567,100,475 | |
| Deferred tax expense | | | (209,260,074 | ) |
| Net change in unrealized appreciation, net of deferred taxes | | | 357,840,401 | |
| | | | | |
| Net realized and unrealized gains on investments, net of deferred taxes | | | 418,378,924 | |
| Change in net assets resulting from operations | | $ | 381,128,785 | |
| * | November 28, 2014 represents the last business day of the Fund’s annual period. See Note 2 of the accompanying Notes. |
See accompanying Notes to Financial Statements.
STATEMENTS OF CHANGES IN NET ASSETS
| | | For the
Year Ended
November 28,
2014* | | | For the
Year Ended November 29,
2013* | |
| Operations | | | | | | |
| Net investment loss, net of deferred taxes | | $ | (37,250,139 | ) | | $ | (15,850,044 | ) |
| Net realized gains on investments, net of deferred taxes | | | 60,538,523 | | | | 6,815,579 | |
| Net change in unrealized appreciation on investments, net of deferred taxes | | | 357,840,401 | | | | 260,382,194 | |
| Change in net assets resulting from operations | | | 381,128,785 | | | | 251,347,729 | |
| | | | | | | | | |
| Distributions to Shareholders | | | | | | | | |
| Distributions to shareholders from return of capital: | | | | | | | | |
| Class A shares | | | (89,283,741 | ) | | | (39,827,246 | ) |
| Class C shares | | | (41,840,486 | ) | | | (13,511,634 | ) |
| Class I shares** | | | (103,441 | ) | | | (1,172 | ) |
| Class Y shares*** | | | (93,789,109 | ) | | | (52,845,117 | ) |
| Change in net assets resulting from distributions to shareholders | | | (225,016,777 | ) | | | (106,185,169 | ) |
| | | | | | | | | |
| Beneficial Interest Transactions | | | | | | | | |
| Class A shares | | | 709,283,850 | | | | 914,243,183 | |
| Class C shares | | | 544,979,649 | | | | 427,444,980 | |
| Class I shares** | | | 3,602,104 | | | | 72,596 | |
| Class Y shares*** | | | 907,105,177 | | | | 515,630,734 | |
| Change in net assets resulting from beneficial interest transactions | | | 2,164,970,780 | | | | 1,857,391,493 | |
| Change in net assets | | | 2,321,082,788 | | | | 2,002,554,053 | |
| | | | | | | | | |
| Net Assets | | | | | | | | |
| Beginning of period | | | 2,824,825,755 | | | | 822,271,702 | |
| End of period | | $ | 5,145,908,543 | | | $ | 2,824,825,755 | |
| | | | | | | | | |
| Undistributed net investment loss, net of deferred taxes | | $ | (62,546,811 | ) | | $ | (25,296,672 | ) |
| * | November 28, 2014 and November 29, 2013 represent the last business day of the Fund’s respective reporting periods. See Note 2 of the accompanying Notes. |
| ** | Class I shares commenced operations at the close of business June 28, 2013. |
| *** | Effective June 28, 2013, Class I shares were renamed Class Y shares. See Note 1 of the Notes to Financial Statements for additional information. |
See accompanying Notes to Financial Statements.
FINANCIAL HIGHLIGHTS
| Class A | | Year Ended November 28,
2014* | | | Year Ended November 29,
2013* | | | Year Ended November 30,
2012 | | | Year Ended November 30,
2011 | | | Period Ended November 30,
2010 1 | |
| Per Share Operating Data | | | | | | | | | | | | | | | |
| Net Asset Value, Beginning of Period | | $ | 12.04 | | | $ | 10.70 | | | $ | 10.38 | | | $ | 10.71 | | | $ | 10.00 | |
| Income/(loss) from investment operations: | | | | | | | | | | | | | | | | | | | | |
Net investment loss 2 | | | (0.12 | ) | | | (0.11 | ) | | | (0.10 | ) | | | (0.10 | ) | | | (0.05 | ) |
Return of capital 2 | | | 0.42 | | | | 0.42 | | | | 0.41 | | | | 0.43 | | | | 0.28 | |
| Net realized and unrealized gains | | | 1.16 | | | | 1.72 | | | | 0.70 | | | | 0.02 | | | | 0.97 | |
| Total from investment operations | | | 1.46 | | | | 2.03 | | | | 1.01 | | | | 0.35 | | | | 1.20 | |
| Distributions to shareholders: | | | | | | | | | | | | | | | | | | | | |
| Return of capital | | | (0.69 | ) | | | (0.69 | ) | | | (0.69 | ) | | | (0.68 | ) | | | (0.49 | ) |
| Net asset value, end of period | | $ | 12.81 | | | $ | 12.04 | | | $ | 10.70 | | | $ | 10.38 | | | $ | 10.71 | |
| | | | | | | | | | | | | | | | | | | | | |
Total Return, at Net Asset Value 3 | | | 12.26 | % | | | 19.29 | % | | | 9.93 | % | | | 3.32 | % | | | 12.24 | % |
| | | | | | | | | | | | | | | | | | | | | |
| Ratios /Supplemental Data | | | | | | | | | | | | | | | | | | | | |
| Net assets, end of period (in thousands) | | $ | 1,937,356 | | | $ | 1,154,926 | | | $ | 193,974 | | | $ | 108,422 | | | $ | 31,525 | |
Ratio of Expenses to Average Net Assets: 4 | | | | | | | | | | | | | | | | | |
| Before (waivers) and deferred tax expense | | | 1.65 | % | | | 1.55 | % | | | 1.58 | % | | | 1.67 | % | | | 1.94 | % |
| Expense (waivers) | | | (0.12 | %) | | | (0.03 | %) | | | (0.08 | %) | | | (0.17 | %) | | | (0.44 | %) |
| Net of (waivers) and before deferred tax expense | | | 1.53 | %5 | | | 1.52 | %6 | | | 1.50 | % | | | 1.50 | % | | | 1.50 | % |
Deferred tax expense 7,8 | | | 5.38 | % | | | 8.07 | % | | | 5.55 | % | | | 1.68 | % | | | 12.93 | % |
| Total expenses | | | 6.91 | % | | | 9.59 | % | | | 7.05 | % | | | 3.18 | % | | | 14.43 | % |
| | | | | | | | | | | | | | | | | | | | | |
Ratio of Investment Loss to Average Net Assets: 4 | | | | | | | | | | | | | | | | | |
| Before (waivers) and deferred tax expense | | | (1.57 | %) | | | (1.52 | %) | | | (1.57 | %) | | | (1.67 | %) | | | (1.59 | %) |
| Expense (waivers) | | | (0.12 | %) | | | (0.03 | %) | | | (0.08 | %) | | | (0.17 | %) | | | (0.44 | %) |
| Net of (waivers) and before deferred tax expense | | | (1.45 | %) | | | (1.49 | %) | | | (1.49 | %) | | | (1.50 | %) | | | (1.15 | %) |
Deferred tax benefit 8,9 | | | 0.54 | % | | | 0.54 | % | | | 0.53 | % | | | 0.56 | % | | | 0.46 | % |
| Net investment loss | | | (0.91 | %) | | | (0.95 | %) | | | (0.96 | %) | | | (0.94 | %) | | | (0.69 | %) |
| | | | | | | | | | | | | | | | | | | | | |
| Portfolio turnover rate | | | 17 | % | | | 9 | % | | | 15 | % | | | 14 | % | | | 7 | % |
| * | November 28, 2014 and November 29, 2013 represent the last business day of the Fund’s respective reporting periods. See Note 2 of the accompanying Notes. |
| 1. | The net asset value for the beginning of the period close of business March 31, 2010 (Commencement of Operations) through November 30, 2010 represents the initial contribution per share of $10. |
| 2. | Per share amounts calculated based on average shares outstanding during the period. |
| 3. | Assumes an initial investment on the business day before the first day of the fiscal period, with all dividends and distributions reinvested in additional shares on the reinvestment date, and redemptions at the net asset value calculated on the last business day of the fiscal period. Sales charges are not reflected in the total returns. Total returns are not annualized for periods less than one full year. Returns do not reflect the deduction of taxes that a shareholder would pay on fund distributions or the redemption of fund shares. |
| 4. | Annualized for less than full period. |
| 5. | Includes borrowing and franchise tax expense. Without borrowing and franchise tax expense, the net expense ratio would be 1.50%. |
| 6. | Includes franchise tax expense. Without franchise tax expense the net expense ratio would be 1.50%. |
| 7. | Deferred tax expense estimate for the ratio calculation is derived from the net investment income/loss, and realized and unrealized gains/losses. |
| 8. | Effective December 1, 2013 the deferred tax expense and deferred tax benefit are allocated based on average net assets. Prior to December 1, 2013 the deferred tax expense and deferred tax benefit were allocated based on specific class expenses. |
| 9. | Deferred tax benefit for the ratio calculation is derived from net investment income/loss only. |
See accompanying Notes to Financial Statements.
FINANCIAL HIGHLIGHTS (Continued)
| Class C | | Year Ended November 28,
2014* | | | Year Ended November 29,
2013* | | | Year Ended November 30,
2012 | | | Period Ended November 30,
2011 1 | |
| Per Share Operating Data | | | | | | | | | | | | |
| Net Asset Value, Beginning of Period | | $ | 11.89 | | | $ | 10.64 | | | $ | 10.40 | | | $ | 10.05 | |
| Income/(loss) from investment operations: | | | | | | | | | | | | | | | | |
Net investment loss 2 | | | (0.22 | ) | | | (0.17 | ) | | | (0.15 | ) | | | (0.04 | ) |
Return of capital 2 | | | 0.42 | | | | 0.42 | | | | 0.44 | | | | 0.14 | |
| Net realized and unrealized gains | | | 1.13 | | | | 1.69 | | | | 0.64 | | | | 0.42 | |
| Total from investment operations | | | 1.33 | | | | 1.94 | | | | 0.93 | | | | 0.52 | |
| Distributions to shareholders: | | | | | | | | | | | | | | | | |
| Return of capital | | | (0.69 | ) | | | (0.69 | ) | | | (0.69 | ) | | | (0.17 | ) |
| Net asset value, end of period | | $ | 12.53 | | | $ | 11.89 | | | $ | 10.64 | | | $ | 10.40 | |
| | | | | | | | | | | | | | | | | |
Total Return, at Net Asset Value 3 | | | 11.30 | % | | | 18.54 | % | | | 9.12 | % | | | 5.19 | % |
| | | | | | | | | | | | | | | | | |
| Ratios /Supplemental Data | | | | | | | | | | | | | | | | |
| Net assets, end of period (in thousands) | | $ | 1,011,690 | | | $ | 451,351 | | | $ | 14,593 | | | $ | 316 | |
Ratio of Expenses to Average Net Assets: 4 | | | | | | | | | | | | | | | | |
| Before (waivers) and deferred tax expense | | | 2.40 | % | | | 2.30 | % | | | 2.63 | % | | | 22.80 | % |
| Expense (waivers) | | | (0.12 | %) | | | (0.03 | %) | | | (0.38 | %) | | | (20.55 | %) |
| Net of (waivers) and before deferred tax expense | | | 2.28 | %5 | | | 2.27 | %6 | | | 2.25 | % | | | 2.25 | % |
Deferred tax expense 7,8 | | | 5.38 | % | | | 6.91 | % | | | 5.29 | % | | | 12.37 | % |
| Total expenses | | | 7.66 | % | | | 9.18 | % | | | 7.54 | % | | | 14.62 | % |
| | | | | | | | | | | | | | | | | |
Ratio of Investment Loss to Average Net Assets: 4 | | | | | | | | | | | | | | | | |
| Before (waivers) and deferred tax expense | | | (2.34 | %) | | | (2.27 | %) | | | (2.63 | %) | | | (22.80 | %) |
| Expense (waivers) | | | (0.12 | %) | | | (0.03 | %) | | | (0.38 | %) | | | (20.55 | %) |
| Net of (waivers) and before deferred tax expense | | | (2.22 | %) | | | (2.24 | %) | | | (2.25 | %) | | | (2.25 | %) |
Deferred tax benefit 8,9 | | | 0.54 | % | | | 0.82 | % | | | 0.81 | % | | | 0.84 | % |
| Net investment loss | | | (1.68 | %) | | | (1.42 | %) | | | (1.44 | %) | | | (1.41 | %) |
| | | | | | | | | | | | | | | | | |
| Portfolio turnover rate | | | 17 | % | | | 9 | % | | | 15 | % | | | 14 | % |
| * | November 28, 2014 and November 29, 2013 represent the last business day of the Fund’s respective reporting periods. See Note 2 of the accompanying Notes. |
| 1. | Shares commenced operations at the close of business August 25, 2011. |
| 2. | Per share amounts calculated based on average shares outstanding during the period. |
| 3. | Assumes an initial investment on the business day before the first day of the fiscal period, with all dividends and distributions reinvested in additional shares on the reinvestment date, and redemptions at the net asset value calculated on the last business day of the fiscal period. Sales charges are not reflected in the total returns. Total returns are not annualized for periods less than one full year. Returns do not reflect the deduction of taxes that a shareholder would pay on fund distributions or the redemption of fund shares. |
| 4. | Annualized for less than full period. |
| 5. | Includes borrowing and franchise tax expense. Without borrowing and franchise tax expense, the net expense ratio would be 2.25%. |
| 6. | Includes franchise tax expense. Without franchise tax expense the net expense ratio would be 2.25%. |
| 7. | Deferred tax expense estimate for the ratio calculation is derived from the net investment income/loss, and realized and unrealized gains/losses. |
| 8. | Effective December 1, 2013 the deferred tax expense and deferred tax benefit are allocated based on average net assets. Prior to December 1, 2013 the deferred tax expense and deferred tax benefit were allocated based on specific class expenses. |
| 9. | Deferred tax benefit for the ratio calculation is derived from net investment income/loss only. |
See accompanying Notes to Financial Statements.
FINANCIAL HIGHLIGHTS (Continued)
| Class I | | Year Ended November 28,
2014* | | | Period Ended November 29,
2013*,1,2 | |
| Per Share Operating Data | | | | | | |
| Net Asset Value, Beginning of Period | | $ | 12.17 | | | $ | 12.15 | |
| Income/(loss) from investment operations: | | | | | | | | |
Net investment loss 3 | | | (0.12 | ) | | | (0.04 | ) |
Return of capital 3 | | | 0.42 | | | | 0.19 | |
| Net realized and unrealized gains | | | 1.21 | | | | 0.21 | |
| Total from investment operations | | | 1.51 | | | | 0.36 | |
| Distributions to shareholders: | | | | | | | | |
| Return of capital | | | (0.69 | ) | | | (0.34 | ) |
| Net asset value, end of period | | $ | 12.99 | | | $ | 12.17 | |
| | | | | | | | | |
Total Return, at Net Asset Value 4 | | | 12.55 | % | | | 3.05 | % |
| | | | | | | | | |
| Ratios /Supplemental Data | | | | | | | | |
| Net assets, end of period (in thousands) | | $ | 3,732 | | | $ | 73 | |
Ratio of Expenses to Average Net Assets: 5 | | | | | | | | |
| Before deferred tax expense | | | 1.20 | %6 | | | 1.32 | %7 |
Deferred tax expense 8,9 | | | 5.38 | % | | | 4.51 | % |
| Total expenses | | | 6.58 | % | | | 5.83 | % |
| | | | | | | | | |
Ratio of Investment Loss to Average Net Assets: 5 | | | | | | | | |
| Before deferred tax expense | | | (1.47 | %) | | | (1.29 | %) |
Deferred tax benefit 9,10 | | | 0.54 | % | | | 0.46 | % |
| Net investment loss | | | (0.93 | %) | | | (0.83 | %) |
| | | | | | | | | |
| Portfolio turnover rate | | | 17 | % | | | 9 | % |
| * | November 28, 2014 and November 29, 2013 represent the last business day of the Fund’s respective reporting periods. See Note 2 of the accompanying Notes. |
| 1. | Shares commenced operations at the close of business June 28, 2013. |
| 2. | Effective June 28, 2013, Class I shares were renamed Class Y shares. See Note 1 of the Notes to Financial Statements for additional information. |
| 3. | Per share amounts calculated based on average shares outstanding during the period. |
| 4. | Assumes an initial investment on the business day before the first day of the fiscal period, with all dividends and distributions reinvested in additional shares on the reinvestment date, and redemptions at the net asset value calculated on the last business day of the fiscal period. Total returns are not annualized for periods less than one full year. Returns do not reflect the deduction of taxes that a shareholder would pay on fund distributions or the redemption of fund shares. |
| 5. | Annualized for less than full period. |
| 6. | Includes borrowing and franchise tax expense. Without borrowing and franchise tax expense, the net expense ratio would be 1.18%. |
| 7. | Includes franchise tax expense. Without franchise tax expense the net expense ratio would be 1.06%. |
| 8. | Deferred tax expense estimate for the ratio calculation is derived from the net investment income/loss, and realized and unrealized gains/losses. |
| 9. | Effective December 1, 2013 the deferred tax expense and deferred tax benefit are allocated based on average net assets. Prior to December 1, 2013 the deferred tax expense and deferred tax benefit were allocated based on specific class expenses. |
| 10. | Deferred tax benefit for the ratio calculation is derived from net investment income/loss only. |
See accompanying Notes to Financial Statements.
FINANCIAL HIGHLIGHTS (Continued)
| Class Y | | Year Ended November 28,
2014* | | | Year Ended November 29,
2013*,1 | | | Year Ended November 30,
2012 1 | | | Year Ended November 30,
2011 1 | | | Period Ended November 30,
2010 1,2 | |
| Per Share Operating Data | | | | | | | | | | | | | | | |
| Net Asset Value, Beginning of Period | | $ | 12.18 | | | $ | 10.78 | | | $ | 10.43 | | | $ | 10.73 | | | $ | 10.00 | |
| Income/(loss) from investment operations: | | | | | | | | | | | | | | | | | | | | |
Net investment loss 3 | | | (0.07 | ) | | | (0.10 | ) | | | (0.09 | ) | | | (0.08 | ) | | | (0.04 | ) |
Return of capital 3 | | | 0.42 | | | | 0.41 | | | | 0.40 | | | | 0.42 | | | | 0.27 | |
| Net realized and unrealized gains | | | 1.15 | | | | 1.78 | | | | 0.73 | | | | 0.04 | | | | 0.99 | |
| Total from investment operations | | | 1.50 | | | | 2.09 | | | | 1.04 | | | | 0.38 | | | | 1.22 | |
| Distributions to shareholders: | | | | | | | | | | | | | | | | | | | | |
| Return of capital | | | (0.69 | ) | | | (0.69 | ) | | | (0.69 | ) | | | (0.68 | ) | | | (0.49 | ) |
| Net asset value, end of period | | $ | 12.99 | | | $ | 12.18 | | | $ | 10.78 | | | $ | 10.43 | | | $ | 10.73 | |
| | | | | | | | | | | | | | | | | | | | | |
Total Return, at Net Asset Value 4 | | | 12.46 | % | | | 19.72 | % | | | 10.18 | % | | | 3.60 | % | | | 12.44 | % |
| | | | | | | | | | | | | | | | | | | | | |
| Ratios /Supplemental Data | | | | | | | | | | | | | | | | | | | | |
| Net assets, end of period (in thousands) | | $ | 2,193,129 | | | $ | 1,218,475 | | | $ | 613,704 | | | $ | 452,154 | | | $ | 168,652 | |
Ratio of Expenses to Average Net Assets: 5 | | | | | | | | | | | | | | | | | |
| Before (waivers) and deferred tax expense | | | 1.40 | % | | | 1.29 | % | | | 1.29 | % | | | 1.37 | % | | | 1.54 | % |
| Expense (waivers) | | | (0.12 | %) | | | (0.03 | %) | | | (0.04 | %) | | | (0.12 | %) | | | (0.29 | %) |
| Net of (waivers) and before deferred tax expense | | | 1.28 | %6 | | | 1.26 | %7 | | | 1.25 | % | | | 1.25 | % | | | 1.25 | % |
Deferred tax expense 8,9 | | | 5.38 | % | | | 9.27 | % | | | 5.60 | % | | | 0.75 | % | | | 13.14 | % |
| Total expenses | | | 6.66 | % | | | 10.53 | % | | | 6.85 | % | | | 2.00 | % | | | 14.39 | % |
| | | | | | | | | | | | | | | | | | | | | |
Ratio of Investment Loss to Average Net Assets: 5 | | | | | | | | | | | | | | | | | |
| Before (waivers) and deferred tax expense | | | (1.21 | %) | | | (1.26 | %) | | | (1.29 | %) | | | (1.37 | %) | | | (1.20 | %) |
| Expense (waivers) | | | (0.12 | %) | | | (0.03 | %) | | | (0.04 | %) | | | (0.12 | %) | | | (0.29 | %) |
| Net of (waivers) and before deferred tax expense | | | (1.09 | %) | | | (1.23 | %) | | | (1.25 | %) | | | (1.25 | %) | | | (0.91 | %) |
Deferred tax benefit 9,10 | | | 0.54 | % | | | 0.45 | % | | | 0.44 | % | | | 0.46 | % | | | 0.36 | % |
| Net investment loss | | | (0.55 | %) | | | (0.78 | %) | | | (0.81 | %) | | | (0.79 | %) | | | (0.55 | %) |
| | | | | | | | | | | | | | | | | | | | | |
| Portfolio turnover rate | | | 17 | % | | | 9 | % | | | 15 | % | | | 14 | % | | | 7 | % |
| * | November 28, 2014 and November 29, 2013 represent the last business day of the Fund’s respective reporting periods. See Note 2 of the accompanying Notes. |
| 1. | Effective June 28, 2013, Class I shares were renamed Class Y shares. See Note 1 of the Notes to Financial Statements for additional information. |
| 2. | The net asset value for the beginning of the period close of business March 31, 2010 (Commencement of Operations) through November 30, 2010 represents the initial contribution per share of $10. |
| 3. | Per share amounts calculated based on average shares outstanding during the period. |
| 4. | Assumes an initial investment on the business day before the first day of the fiscal period, with all dividends and distributions reinvested in additional shares on the reinvestment date, and redemptions at the net asset value calculated on the last business day of the fiscal period. Total returns are not annualized for periods less than one full year. Returns do not reflect the deduction of taxes that a shareholder would pay on fund distributions or the redemption of fund shares. |
| 5. | Annualized for less than full period. |
| 6. | Includes borrowing and franchise tax expense. Without borrowing and franchise tax expense, the net expense ratio would be 1.25%. |
| 7. | Includes franchise tax expense. Without franchise tax expense the net expense ratio would be 1.25%. |
| 8. | Deferred tax expense estimate for the ratio calculation is derived from the net investment income/loss, and realized and unrealized gains/losses. |
| 9. | Effective December 1, 2013 the deferred tax expense and deferred tax benefit are allocated based on average net assets. Prior to December 1, 2013 the deferred tax expense and deferred tax benefit were allocated based on specific class expenses. |
| 10. | Deferred tax benefit for the ratio calculation is derived from net investment income/loss only. |
See accompanying Notes to Financial Statements.
NOTES TO FINANCIAL STATEMENTS
Oppenheimer SteelPath MLP Alpha Fund (the “Fund”), a separate series of Oppenheimer SteelPath MLP Funds Trust, is a non-diversified open-end management investment company registered under the Investment Company Act of 1940, as amended. The Fund’s investment objective is to seek total return. The Fund’s investment adviser is OFI SteelPath, Inc. (the “Adviser” or “Manager”), a wholly-owned subsidiary of OppenheimerFunds, Inc. (“OFI” or “Oppenheimer”).
The Fund offers Class A, Class C, Class I, and Class Y shares. Effective June 28, 2013, Class I shares were renamed Class Y shares. Class A shares are sold at their offering price, which is normally net asset value plus a front-end sales charge. Effective June 28, 2013 although there is no initial sales charge on Class A purchases totaling $1 million or more, those Class A shares may be subject to a 1.00% contingent deferred sales charge if shares are redeemed within an 18-month “holding period” measured from the date of purchase. Class C shares are sold, without a front-end sales charge but may be subject to a contingent deferred sales charge (“CDSC”) of 1.00% of the redemption proceeds if Class C shares are redeemed within one year of purchase. Class I shares are only available to eligible institutional investors. Class I shares are sold at net asset value per share without a sales charge or CDSC. An institutional investor that buys Class I shares for its customers’ accounts may impose charges on those accounts. Class Y shares are sold at net asset value per share without a sales charge directly to institutional investors that have special agreements with the Distributor for that purpose. They may include insurance companies, registered investment companies, employee benefit plans and section 529 plans, among others. An institutional investor that buys Class Y shares for its customers’ accounts may impose charges on those accounts. All classes of shares have identical rights and voting privileges with respect to the Fund in general and exclusive voting rights on matters that affect that class alone. Earnings, net assets and net asset value per share may differ due to each class having its own expenses, such as transfer and shareholder servicing agent fees and shareholder communications, directly attributable to that class. Class A and C shares have separate distribution and/or service plans under which they pay fees. Class I and Y shares do not pay such fees.
2. Significant Accounting Policies
Security valuation. All investments in securities are recorded at their estimated fair value, as described in note 3.
Equity Security Risk. Stocks and other equity securities fluctuate in price. The value of the Fund’s portfolio may be affected by changes in the equity markets generally. Equity markets may experience significant short-term volatility and may fall sharply at times. Different markets may behave differently from each other and U.S. equity markets may move in the opposite direction from one or more foreign stock markets.
NOTES TO FINANCIAL STATEMENTS (Continued)
2. Significant Accounting Policies (Continued)
The prices of individual equity securities generally do not all move in the same direction at the same time and a variety of factors can affect the price of a particular company’s securities. These factors may include, but are not limited to, poor earnings reports, a loss of customers, litigation against the company, general unfavorable performance of the company’s sector or industry, or changes in government regulations affecting the company or its industry.
Master Limited Partnerships (“MLPs”). Under normal circumstances, the Fund invests at least 80% of its net assets (plus the amount of borrowings for investment purposes) in the equity securities of MLPs.
MLPs issue common units that represent an equity ownership interest in a partnership and provide limited voting rights. MLP common units are registered with the Securities and Exchange Commission (“SEC”), and are freely tradable on securities exchanges such as the NYSE and the NASDAQ Stock Market (“NASDAQ”), or in the over-the-counter (“OTC”) market. An MLP consists of one or more general partners, who conduct the business, and one or more limited partners, who contribute capital. MLP common unit holders have a limited role in the partnership’s operations and management. The Fund, as a limited partner, normally would not be liable for the debts of the MLP beyond the amounts the Fund has contributed, but would not be shielded to the same extent that a shareholder of a corporation would be. In certain circumstances creditors of an MLP would have the right to seek return of capital distributed to a limited partner. This right of an MLP’s creditors would continue after the Fund sold its investment in the MLP.
Concentration Risk. Under normal circumstances, the Fund invests at least 80% of its net assets in the equity securities of MLPs. MLPs are subject to certain risks, such as supply and demand risk, depletion and exploration risk, commodity pricing risk, acquisition risk, and the risk associated with the hazards inherent in midstream energy industry activities. A substantial portion of the cash flow received by the Fund is derived from investment in equity securities of MLPs. The amount of cash that a MLP has available for distributions, and the tax character of such distributions, are dependent upon the amount of cash generated by the MLP’s operations.
Annual Periods. The last day of the Fund’s annual period was the last day the New York Stock Exchange was open for trading. The Fund’s financial statements have been presented through that date to maintain consistency with the Fund’s net asset value calculations used for shareholder transactions.
Allocation of Income, Expenses, Gains and Losses. Income, expenses (other than those attributable to a specific class), gains and losses are allocated on a daily basis to each class of shares based upon the relative proportion of net assets represented by such class. Operating expenses directly attributable to a specific class are charged against the operations of that class.
NOTES TO FINANCIAL STATEMENTS (Continued)
2. Significant Accounting Policies (Continued)
Federal Income Taxes.
The Fund does not intend to qualify as a regulated investment company pursuant to Subchapter M of the Internal Revenue Code, but will rather be taxed as a corporation. As a corporation, the Fund is obligated to pay federal, state and local income tax on taxable income. Currently, the maximum marginal regular federal income tax rate for a corporation is 35%. The Fund may be subject to a 20% alternative minimum tax on its federal alternative minimum taxable income to the extent that its alternative minimum tax exceeds its regular federal income tax. The Fund is currently using an estimated rate of 1.9% for state and local tax, net of federal tax benefit.
The Fund’s income tax provision consists of the following as of November 28, 2014:
| Current tax expense (benefit) | | | |
| Federal | | $ | — | |
| State | | | — | |
| Total current tax expense | | $ | — | |
| | | | | |
| Deferred tax expense (benefit) | | | | |
| Federal | | $ | 205,241,776 | |
| State | | | 17,637,021 | |
| Total deferred tax expense | | $ | 222,878,797 | |
The reconciliation between the federal statutory income tax rate of 35% and the effective tax rate on net investment income (loss) and realized and unrealized gain (loss) follows:
| | | Amount | |
| Application of statutory income tax rate | | $ | 211,402,653 | |
| State income taxes net of federal benefit | | | 11,476,144 | |
| Total income tax expense | | $ | 222,878,797 | |
The Fund intends to invest its assets primarily in MLPs, which generally are treated as partnerships for federal income tax purposes. As a limited partner in the MLPs, the Fund reports its allocable share of the MLP’s taxable income in computing its own taxable income. The Fund’s tax expense or benefit will be included in the Statement of Operations based on the component of income or gains (losses) to which such expense or benefit relates. Deferred income taxes reflect the net tax effects of temporary differences between the carrying amounts of assets and liabilities for financial reporting purposes and the amounts used for income tax purposes. Such temporary differences are principally: (i) taxes on unrealized gains/(losses), which are attributable to the temporary difference between fair market value and tax basis, (ii) the net tax effects of temporary differences between the carrying amounts of assets
NOTES TO FINANCIAL STATEMENTS (Continued)
2. Significant Accounting Policies (Continued)
and liabilities for financial reporting and income tax purposes and (iii) the net tax benefit of accumulated net operating losses and capital loss carryforwards. Deferred tax assets and liabilities are measured using effective tax rates expected to apply to taxable income in the years such temporary differences are realized or otherwise settled. To the extent the Fund has a deferred tax asset, consideration is given to whether or not a valuation allowance is required. A valuation allowance is required if based on the evaluation criterion provided by ASC 740, Income Taxes (ASC 740) that it is more-likely-than-not that some portion or all of the deferred tax asset will not be realized. Among the factors considered in assessing the Fund’s valuation allowance: the nature, frequency and severity of current and cumulative losses, forecasts of future profitability, the duration of the statutory carryforward periods and the associated risks that operating and capital loss carryforwards may expire unused. At November 28, 2014, the Fund determined a valuation allowance was not required. From time to time, as new information becomes available, the Fund will modify its estimates or assumptions regarding the deferred tax liability or asset.
Components of the Fund’s deferred tax assets and liabilities as of November 28, 2014, are as follows:
| Deferred tax assets: | | | |
| Net operating loss carryforward (tax basis) | | $ | 70,082,098 | |
| Capital loss carryforward (tax basis) | | | — | |
| | | | | |
| Deferred tax liabilities: | | | | |
| Net unrealized gains on investment securities (tax basis) | | | (491,221,928 | ) |
| Total net deferred tax asset/(liability) | | $ | (421,139,830 | ) |
Unexpected significant decreases in cash distributions from the Fund’s MLP investments or significant declines in the fair value of its investments may change the Fund’s assessment regarding the recoverability of its deferred tax assets and may result in a valuation allowance. If a valuation allowance is required to reduce any deferred tax asset in the future, it could have a material impact on the Fund’s net asset value and results of operations in the period it is recorded.
The Fund may rely, to some extent, on information provided by the MLPs, which may not necessarily be timely, to estimate taxable income allocable to MLP units held in its portfolio, and to estimate its associated deferred tax liability or asset. Such estimates are made in good faith. From time to time, as new information becomes available, the Fund will modify its estimates or assumptions regarding its tax liability or asset.
NOTES TO FINANCIAL STATEMENTS (Continued)
2. Significant Accounting Policies (Continued)
The Fund’s policy is to classify interest and penalties associated with underpayment of federal and state income taxes, if any, as income tax expense on its Statement of Operations. For the year ended November 28, 2014, the Fund does not have any interest or penalties associated with the underpayment of any income taxes.
The Fund files income tax returns in the U.S. federal jurisdiction and various states. Tax years (2010–2013) remain open and subject to examination by tax jurisdictions. The Fund has reviewed all major jurisdictions and concluded that there is no significant impact on the Fund’s net assets and no tax liability resulting from unrecognized tax benefits relating to uncertain tax positions expected to be taken on its tax returns. Furthermore, management of the Fund is not aware of any tax positions for which it is reasonably possible that the total amount of unrecognized tax benefit will significantly change in the next 12 months.
At November 28, 2014, the Fund had net operating loss carryforwards for federal income tax purposes, which may be carried forward for 20 years, as follows:
| Expiration Date | | | |
| 11/30/2030 | | $ | 1,194,164 | |
| 11/30/2031 | | | 7,264,183 | |
| 11/30/2032 | | | 34,906,904 | |
| 11/30/2033 | | | 59,435,302 | |
| 11/30/2034 | | | 87,123,831 | |
| Total | | $ | 189,924,384 | |
During the year ended November 28, 2014, the Fund utilized $5,159,601 of capital loss carryforwards.
At November 28, 2014, gross unrealized appreciation and depreciation of investments, based on cost for federal income tax purposes were as follows:
| Cost of Investments | | $ | 4,262,565,606 | |
| Gross Unrealized Appreciation | | $ | 1,501,422,478 | |
| Gross Unrealized Depreciation | | | (168,953,900 | ) |
| Net Unrealized Appreciation (Depreciation) on Investments | | $ | 1,332,468,578 | |
The difference between cost amounts for financial statement and federal income tax purposes is due primarily to timing differences in recognizing certain gains and losses in security transactions.
NOTES TO FINANCIAL STATEMENTS (Continued)
2. Significant Accounting Policies (Continued)
Dividends and Distributions to Shareholders. Dividends and distributions to shareholders, which are determined in accordance with income tax regulations and may differ from U.S. generally accepted accounting principles, are recorded on the ex-dividend date. Dividends, if any, are declared and distributed quarterly for the Fund. The estimated characterization of the distributions paid will be either a qualified dividend or distribution (return of capital). This estimate is based on the Fund’s operating results during the period. It is anticipated that a significant portion of the distributions will be comprised of return of capital as a result of the tax character of cash distributions made by the Fund’s investments. The actual characterization of the distributions made during the period will not be determined until after the end of the fiscal year. The Fund will inform shareholders of the final tax character of the distributions on IRS Form DIV in February 2015. For the year ended November 28, 2014, the Fund distributions are expected to be comprised of 100% return of capital.
Return of Capital Estimates. Distributions received from the Fund’s investments in MLPs generally are comprised of income and return of capital. The Fund records investment income and return of capital based on estimates made at the time such distributions are received. Such estimates are based on historical information available from each MLP and other industry sources. These estimates may subsequently be revised based on information received from MLPs after their tax reporting periods are concluded. For the year ended November 28, 2014, the Fund estimated that 100% of the MLP distributions received would be treated as return of capital.
Investment Income. Dividend income is recorded on the ex-dividend date or upon ex-dividend notification in the case of certain foreign dividends where the ex-dividend date may have passed. Non-cash dividends included in dividend income, if any, are recorded at the fair value of the securities received. Interest income is recognized on an accrual basis. Discount and premium, which are included in interest income on the Statement of Operations, if applicable, are amortized or accreted daily.
Custodian Fees. “Custody fees” in the Statement of Operations may include interest expense incurred by the Fund on any cash overdrafts of its custodian account during the period. Such cash overdrafts may result from the effects of failed trades in portfolio securities and from cash outflows resulting from unanticipated shareholder redemption activity. The Fund pays interest to its custodian on such cash overdrafts, to the extent they are not offset by positive cash balances maintained by the Fund, at a rate equal to the Federal Funds Rate plus 0.015%. The “Reduction to custodian expenses” line item, if applicable, represents earnings on cash balances maintained by the Fund during the period. Such interest expense and other custodian fees may be paid with these earnings.
Security Transactions. Security transactions are recorded on the trade date. Realized gains and losses on securities sold are determined using the last in, first out method.
NOTES TO FINANCIAL STATEMENTS (Continued)
2. Significant Accounting Policies (Continued)
Indemnifications. The Fund’s organizational documents provide current and former trustees and officers with a limited indemnification against liabilities arising in connection with the performance of their duties to the Fund. In the normal course of business, the Fund may also enter into contracts that provide general indemnifications. The Fund’s maximum exposure under these arrangements is unknown as this would be dependent on future claims that may be made against the Fund. The risk of material loss from such claims is considered remote.
Other. The preparation of financial statements in conformity with accounting principles generally accepted in the United States of America requires management to make estimates and assumptions that affect the reported amounts of assets and liabilities and disclosure of contingent assets and liabilities at the date of the financial statements and the reported amounts of increases and decreases in net assets from operations during the reporting period. Actual results could differ from those estimates.
The Fund calculates the net asset value of its shares as of the close of the New York Stock Exchange (the “Exchange”), normally 4:00 P.M. Eastern time, on each day the Exchange is open for trading.
The Fund’s Board of Trustees (the “Board”) has adopted procedures for the valuation of the Fund’s securities and has delegated the day-to-day responsibility for valuation determinations under those procedures to the Adviser. The Adviser has established a Valuation Committee which is responsible for determining a “fair valuation” for any security for which market quotations are not “readily available.” The Valuation Committee’s fair valuation determinations are subject to review, approval and ratification by the Fund’s Board at its next regularly scheduled meeting covering the calendar quarter in which the fair valuation was determined.
Valuation Methods and Inputs
Securities are valued using unadjusted quoted market prices, when available, as supplied primarily by third party pricing services or dealers.
The following methodologies are used to determine the market value or the fair value of the types of securities described below:
Securities traded on a registered U.S. securities exchange (including exchange-traded derivatives other than futures and futures options) are valued based on the last sale price of the security reported on the principal exchange on which it is traded, prior to the time when the Fund’s assets are valued. In the absence of a sale, the security is valued at the last sale price on the prior trading day, if it is within the spread of the current day’s closing “bid” and “asked” prices, and if not, at the current day’s closing bid price. A security of a foreign issuer traded on a foreign exchange but not listed on a registered U.S. securities exchange is
NOTES TO FINANCIAL STATEMENTS (Continued)
3. Securities Valuation (Continued)
valued based on the last sale price on the principal exchange on which the security is traded, as identified by the third party pricing service used by the Manager, prior to the time when the Fund’s assets are valued. If the last sale price is unavailable, the security is valued at the most recent official closing price on the principal exchange on which it is traded. If the last sales price or official closing price for a foreign security is not available, the security is valued at the mean between the bid and asked price per the exchange or, if not available from the exchange, obtained from two dealers. If bid and asked prices are not available from either the exchange or two dealers, the security is valued by using one of the following methodologies (listed in order of priority); (1) using a bid from the exchange, (2) the mean between the bid and asked price as provided by a single dealer, or (3) a bid from a single dealer.
Shares of a registered investment company that are not traded on an exchange are valued at that investment company’s net asset value per share.
Corporate and government debt securities (of U.S. or foreign issuers) and municipal debt securities, event-linked bonds, loans, mortgage-backed securities, collateralized mortgage obligations, and asset-backed securities are valued at the mean between the “bid” and “asked” prices utilizing evaluated prices obtained from third party pricing services or broker-dealers who may use matrix pricing methods to determine the evaluated prices.
Short-term money market type debt securities with a remaining maturity of sixty days or less are valued at cost adjusted by the amortization of discount or premium to maturity (amortized cost), which approximates market value. Short-term debt securities with a remaining maturity in excess of sixty days are valued at the mean between the “bid” and “asked” prices utilizing evaluated prices obtained from third party pricing services or broker-dealers.
A description of the standard inputs that may generally be considered by the third party pricing vendors in determining their evaluated prices is provided below.
| Security Type | | Standard inputs generally considered by third-party pricing vendors |
| Corporate debt, government debt, municipal, mortgage-backed and asset-backed securities | | Reported trade data, broker-dealer price quotations, benchmark yields, issuer spreads on comparable securities, the credit quality, yield, maturity, and other appropriate factors. |
| Loans | | Information obtained from market participants regarding reported trade data and broker-dealer price quotations. |
| Event-linked bonds | | Information obtained from market participants regarding reported trade data and broker-dealer price quotations. |
NOTES TO FINANCIAL STATEMENTS (Continued)
3. Securities Valuation (Continued)
If a market value or price cannot be determined for a security using the methodologies described above, or if, in the “good faith” opinion of the Manager, the market value or price obtained does not constitute a “readily available market quotation,” or a significant event has occurred that would materially affect the value of the security, the security is fair valued either (i) by a standardized fair valuation methodology applicable to the security type or the significant event as previously approved by the Valuation Committee and the Fund’s Board or (ii) as determined in good faith by the Manager’s Valuation Committee. The Valuation Committee considers all relevant facts that are reasonably available, through either public information or information available to the Manager, when determining the fair value of a security. Fair value determinations by the Manager are subject to review, approval and ratification by the Fund’s Board at its next regularly scheduled meeting covering the calendar quarter in which the fair valuation was determined. Those fair valuation standardized methodologies include, but are not limited to, valuing securities at the last sale price or initially at cost and subsequently adjusting the value based on: changes in company specific fundamentals, changes in an appropriate securities index, or changes in the value of similar securities which may be further adjusted for any discounts related to security-specific resale restrictions. When possible, such methodologies use observable market inputs such as unadjusted quoted prices of similar securities, observable interest rates, currency rates and yield curves. The methodologies used for valuing securities are not necessarily an indication of the risks associated with investing in those securities nor can it be assured that the Fund can obtain the fair value assigned to a security if it were to sell the security.
To assess the continuing appropriateness of security valuations, the Manager, or its third party service provider who is subject to oversight by the Manager, regularly compares prior day prices, prices on comparable securities, and sale prices to the current day prices and challenges those prices exceeding certain tolerance levels with the third party pricing service or broker source. For those securities valued by fair valuations, whether through a standardized fair valuation methodology or a fair valuation determination, the Valuation Committee reviews and affirms the reasonableness of the valuations based on such methodologies and fair valuation determinations on a regular basis after considering all relevant information that is reasonably available.
Classifications
Each investment asset or liability of the Fund is assigned a level at measurement date based on the significance and source of the inputs to its valuation. Various data inputs are used in determining the value of each of the Fund’s investments as of the reporting period end. These data inputs are categorized in the following hierarchy under applicable financial accounting standards:
| 1) | Level 1-unadjusted quoted prices in active markets for identical assets or liabilities (including securities actively traded on a securities exchange) |
NOTES TO FINANCIAL STATEMENTS (Continued)
3. Securities Valuation (Continued)
| 2) | Level 2-inputs other than unadjusted quoted prices that are observable for the asset or liability (such as unadjusted quoted prices for similar assets and market corroborated inputs such as interest rates, prepayment speeds, credit risks, etc.) |
| 3) | Level 3-significant unobservable inputs (including the Manager’s own judgments about assumptions that market participants would use in pricing the asset or liability). |
The inputs used for valuing securities are not necessarily an indication of the risks associated with investing in those securities.
The table below categorizes amounts that are included in the Fund’s Statement of Assets and Liabilities as of November 28, 2014, based on valuation input level:
| | | Level 1 — Unadjusted Quoted Prices | | | Level 2 —
Other Significant Observable Inputs | | | Level 3 —
Significant Unobservable Inputs | | | Value | |
| Assets Table | | | | | | | | | | | | |
| Investments, at Value: | | | | | | | | | | | | |
| Master Limited Partnership Shares* | | $ | 5,239,627,090 | | | $ | — | | | $ | — | | | $ | 5,239,627,090 | |
| Common Stock* | | | 291,285,408 | | | | — | | | | — | | | | 291,285,408 | |
| Short Term Investments | | | 64,121,686 | | | | — | | | | — | | | | 64,121,686 | |
| Total Assets | | $ | 5,595,034,184 | | | $ | — | | | $ | — | | | $ | 5,595,034,184 | |
| * | For a detailed break-out of securities by major industry classification, please refer to the Statement of Investments. |
The Fund did not hold any Level 3 securities during the year ended November 28, 2014.
There have been no transfers between pricing levels for the Fund. It’s the Fund’s policy to recognize transfers at the end of the reporting period.
NOTES TO FINANCIAL STATEMENTS (Continued)
4. Shares of Beneficial Interest
The Fund has authorized an unlimited number of $0.001 par value shares of beneficial interest of each class. Transactions in shares of beneficial interest were as follows:
| | | Year Ended
November 28, 2014 | | | Year/Period Ended
November 29, 2013 | |
| | | Shares | | | Amount | | �� | Shares | | | Amount | |
| Class A | | | | | | | | | | | | |
| Sold | | | 91,900,805 | | | $ | 1,189,138,025 | | | | 88,089,334 | | | $ | 1,036,253,199 | |
| Dividends and/or distributions reinvested | | | 6,374,407 | | | | 81,566,285 | | | | 2,873,478 | | | | 34,010,758 | |
| Redeemed | | | (42,899,152 | ) | | | (561,420,460 | ) | | | (13,208,270 | ) | | | (156,020,774 | ) |
| Net increase | | | 55,376,060 | | | $ | 709,283,850 | | | | 77,754,542 | | | $ | 914,243,183 | |
| | | | | | | | | | | | | | | | | |
| Class C | | | | | | | | | | | | | | | | |
| Sold | | | 45,617,005 | | | $ | 582,283,759 | | | | 36,764,251 | | | $ | 429,380,031 | |
| Dividends and/or distributions reinvested | | | 3,204,488 | | | | 40,326,173 | | | | 961,272 | | | | 11,308,385 | |
| Redeemed | | | (6,070,379 | ) | | | (77,630,283 | ) | | | (1,125,537 | ) | | | (13,243,436 | ) |
| Net increase | | | 42,751,114 | | | $ | 544,979,649 | | | | 36,599,986 | | | $ | 427,444,980 | |
| | | | | | | | | | | | | | | | | |
| Class I* | | | | | | | | | | | | | | | | |
| Sold | | | 479,350 | | | $ | 6,187,593 | | | | 5,966 | | | $ | 71,928 | |
| Dividends and/or distributions reinvested | | | 7,904 | | | | 101,787 | | | | 56 | | | | 668 | |
| Redeemed | | | (206,038 | ) | | | (2,687,276 | ) | | | - | | | | - | |
| Net increase | | | 281,216 | | | $ | 3,602,104 | | | | 6,022 | | | $ | 72,596 | |
| | | | | | | | | | | | | | | | | |
| Class Y** | | | | | | | | | | | | | | | | |
| Sold | | | 90,382,567 | | | $ | 1,190,559,996 | | | | 58,752,034 | | | $ | 698,036,661 | |
| Dividends and/or distributions reinvested | | | 7,191,977 | | | | 93,239,959 | | | | 4,044,823 | | | | 48,067,003 | |
| Redeemed | | | (28,795,752 | ) | | | (376,694,778 | ) | | | (19,642,616 | ) | | | (230,472,930 | ) |
| Net increase | | | 68,778,792 | | | $ | 907,105,177 | | | | 43,154,241 | | | $ | 515,630,734 | |
| * | Class I commenced operations at the close of business June 28, 2013. |
| ** | Effective June 28, 2013, Class I shares were renamed Class Y shares. See note 1 of the Notes to Financial Statements for additional information. |
NOTES TO FINANCIAL STATEMENTS (Continued)
5. Purchases and Sales of Securities
The aggregate cost of purchases and proceeds from sales of securities, other than short-term obligations, for the year ended November 28, 2014, were as follows:
| | | Purchases | | | Sales | |
| Investment securities | | $ | 2,882,447,964 | | | $ | 781,602,791 | |
6. Fees and Other Transactions with Affiliates
Management Fees. Under the investment advisory agreement, the Fund pays the Manager a management fee based on the daily net assets of the Fund at an annual rate as shown in the following table:
| Net Assets up to $3 Billion | Net Assets Greater than
$3 Billion and up to $5 Billion | Net Assets in Excess of $5 Billion |
| 1.10% | 1.08% | 1.05% |
The Fund’s management fee for the fiscal year ended November 28, 2014 and was 1.09% of average annual net assets before any applicable waivers.
Waivers and Reimbursements of Expenses. The Manager has contractually agreed to limit fees and/or reimburse expenses of the Fund to the extent that the Fund’s total annual fund operating expenses (exclusive of interest, taxes, such as deferred tax expenses, brokerage commissions, acquired fund fees and expenses, dividend costs related to short sales, and extraordinary expenses, such as litigation expense, if any) exceed 1.50% for Class A shares, 2.25% for Class C shares, and 1.25% for Class Y shares. The Fund’s total annual operating expenses after fee waiver and/or expense reimbursement (“Net Expenses”) will be higher than these amounts to the extent that the Fund incurs expenses excluded from the expense cap. Because the Fund’s deferred income tax expense is excluded from the expense cap, the Fund’s Net Expenses for each class of shares is increased by the amount of this expense. During the year ended November 28, 2014, the Manager reimbursed $1,939,477, $882,956, and $2,054,192 for Class A, Class C, and Class Y, respectively. This undertaking may not be modified or terminated until after one year from the date of the current prospectus, as indicated therein, unless approved by the Fund’s Board of Trustees.
The Manager can be reimbursed by the Fund within three years after the date the fee limitation and/or expense reimbursement has been made by the Manager, provided that such repayment does not cause the expenses of any class of the Fund to exceed the foregoing limits.
NOTES TO FINANCIAL STATEMENTS (Continued)
6. Fees and Other Transactions with Affiliates (Continued)
The following table represents amounts eligible for recovery at November 28, 2014:
| Eligible expense recoupment expiring: | | | |
| November 30, 2015 | | $ | 374,961 | |
| November 30, 2016 | | | 494,767 | |
| November 28, 2017 | | | 4,876,625 | |
During the year ended November 28, 2014, the Adviser did not recoup any expenses.
Trustees’ Compensation. The Board has adopted a compensation deferral plan for independent trustees that enables trustees to elect to defer receipt of all or a portion of the annual compensation they are entitled to receive from the Fund. For purposes of determining the amount owed to the Trustee under the plan, deferred amounts are treated as though equal dollar amounts had been invested in shares of the Fund or in other Oppenheimer funds selected by the Trustee. The Fund purchases shares of the funds selected for deferral by the Trustee in amounts equal to his or her deemed investment, resulting in a Fund asset equal to the deferred compensation liability. Such assets are included as a component of “Other” within the asset section of the Statement of Assets and Liabilities, if applicable. Deferral of trustees’ fees under the plan will not affect the net assets of the Fund, and will not materially affect the Fund’s assets, liabilities or net investment income per share. Amounts will be deferred until distributed in accordance with the compensation deferral plan.
Distribution and Service Plan (12b-1) Fees. Under its General Distributor’s Agreement with the Fund, OppenheimerFunds Distributor, Inc. (the “Distributor”) acts as the Fund’s principal underwriter in the continuous public offering of the Fund’s classes of shares.
Service Plan for Class A Shares. The Fund has adopted a Service Plan (the “Plan”) for Class A shares under Rule 12b-1 of the Investment Company Act of 1940. Under the Plan, the Fund reimburses the Distributor for a portion of its costs incurred for services provided to accounts that hold Class A shares. Reimbursement is made periodically at an annual rate of up to 0.25% of the daily net assets of Class A shares of the Fund. The Distributor currently uses all of those fees to pay dealers, brokers, banks and other financial institutions periodically for providing personal service and maintenance of accounts of their customers that hold Class A shares. Any unreimbursed expenses the Distributor incurs with respect to Class A shares in any fiscal year cannot be recovered in subsequent periods. Fees incurred by the Fund under the Plan are detailed in the Statement of Operations.
NOTES TO FINANCIAL STATEMENTS (Continued)
6. Fees and Other Transactions with Affiliates (Continued)
Distribution and Service Plans for Class C Shares. The Fund has adopted Distribution and Service Plans (the “Plans”) for Class C shares under Rule 12b-1 of the Investment Company Act of 1940 to compensate the Distributor for distributing those share classes, maintaining accounts and providing shareholder services. Under the Plans, the Fund pays the Distributor an annual asset-based sales charge of 0.75% on Class C shares daily net assets. The Fund also pays a service fee under the Plans at an annual rate of 0.25% of daily net assets.
The Plan and Plans continue in effect from year to year only if the Fund’s Board votes annually to approve their continuance at an in person meeting called for that purpose. Fees incurred by the Fund under the Plans are detailed in the Statement of Operations.
Transfer Agent Fees. OFI Global (the “Transfer Agent”) serves as the transfer and shareholder servicing agent for the Fund. The Fund pays the Transfer Agent a fee based on annual net assets. Fees incurred with respect to these services are detailed in the Statement of Operations.
Sub-Transfer Agent Fees. The Transfer Agent has retained Shareholder Services, Inc., a wholly-owned subsidiary of OFI (the “Sub-Transfer Agent”), to provide the day-to-day transfer agent and shareholder servicing of the Fund. Under the Sub-Transfer Agency Agreement, the Transfer Agent pays the Sub-Transfer Agent an annual fee in monthly installments, equal to a percentage of the transfer agent fee collected by the Transfer Agent from the Fund, which shall be calculated after any applicable fee waivers. The fee paid to the Sub-Transfer Agent is paid by the Transfer Agent, not by the Fund.
Sales Charges. Front-end sales charges and contingent deferred sales charges (“CDSC”) do not represent expenses of the Fund. They are deducted from the proceeds of sales of Fund shares prior to investment or from redemption proceeds prior to remittance, as applicable. The sales charges retained by the Distributor from the sale of shares and the CDSC retained by the Distributor on the redemption of shares is shown in the following table for the period indicated.
| Year Ended | | Class A Front-End Sales Charges Retained by Distributor | | | Class A Contingent Deferred Sales Charges Retained by Distributor | | | Class C Contingent Deferred Sales Charges Retained by Distributor | |
| November 28, 2014 | | $ | 2,038,059 | | | $ | 25,133 | | | $ | 128,732 | |
Related Party. The Interested Trustees and officers of the Fund are also officers or trustees of companies affiliated with the Manager, Distributor, and Transfer Agent.
NOTES TO FINANCIAL STATEMENTS (Continued)
Effective September 11, 2014, the Fund, along with Oppenheimer SteelPath MLP Alpha Plus Fund, Oppenheimer SteelPath MLP Income Fund, and Oppenheimer SteelPath MLP Select 40 Fund (collectively, the “Trust”), is a borrower in a $650 million revolving credit agreement with Citibank, N.A. (“Citi Loan Agreement”). The Fund is permitted to borrow up to the lesser of one-third of the Fund’s total assets, or the maximum amount permitted pursuant to the Fund’s investment limitations. Amounts borrowed under the Citi Loan Agreement, if any, are invested by the Fund under the direction of the Manager consistent with the Fund’s investment objective and policies, and as such, the related investments are subject to normal market fluctuations and investment risks, including the risk of loss due to a decline in value. The borrowing, if any, is fully collateralized throughout the term of the borrowing with securities or other assets of the Fund. The Fund is not liable for borrowings of other Funds in the Trust. Securities that have been pledged as collateral for the borrowing are indicated in the Statement of Investments.
Borrowings under the Citi Loan Agreement are charged interest at a calculated rate computed by Citibank based on the three month LIBOR rate plus 0.80% per annum. An unused commitment fee at the rate of 0.10% per annum is charged for any undrawn portion of the credit facility, and each member of the Trust will pay its pro rata share of this fee. A facility fee of 0.27% was charged on the commitment amount, and each party of the Trust paid its pro rata share of this fee. The borrowing is due September 11, 2015, unless another date is mutually agreed upon by the parties of the Citi Loan Agreement. For the annual period ended November 28, 2014, the Fund paid $545,654 in borrowing fees. The Fund did not have any borrowing for the year ended November 28, 2014.
In 2009, seven class action lawsuits were filed in the U.S. District Court for the District of Colorado against OppenheimerFunds, Inc. (“OFI”), OppenheimerFunds Distributor, Inc., the Fund’s principal underwriter and distributor (the “Distributor”), and certain funds (but not including the Fund) advised by OFI Global Asset Management, Inc. and distributed by the Distributor (the “Defendant Funds”). The lawsuits also named as defendants certain officers and current and former trustees of the respective Defendant Funds. The lawsuits raised claims under federal securities laws and alleged, among other things, that the disclosure documents of the respective Defendant Funds contained misrepresentations and omissions and that the respective Defendant Funds’ investment policies were not followed. The plaintiffs in these actions sought unspecified damages, equitable relief and awards of attorneys’ fees and litigation expenses. The Defendant Funds’ Boards of Trustees also engaged counsel to represent the Funds and the present and former Independent Trustees named in those suits. In March 2014, the parties in six of these lawsuits executed stipulations and agreements of settlement resolving those actions. In July 2014, the court entered an order and final judgment approving the settlements as fair, reasonable and adequate. The settlements do
NOTES TO FINANCIAL STATEMENTS (Continued)
8. Pending Litigation (Continued)
not resolve a seventh outstanding lawsuit relating to Oppenheimer Rochester California Municipal Fund (the “California Fund Suit”). OFI believes the California Fund Suit is without legal merit and is defending the suit vigorously. While it is premature to render any opinion as to the outcome in the California Fund Suit, or whether any costs that OFI may bear in defending the California Fund Suit might not be reimbursed by insurance, OFI believes the California Fund Suit should not impair the ability of OFI or the Distributor to perform their respective duties to the Fund, and that the outcome of the California Fund Suit should not have any material effect on the operations of any of the Oppenheimer Funds.
REPORT OF INDEPENDENT REGISTERED PUBLIC ACCOUNTING FIRM
To the Shareholders of Oppenheimer SteelPath MLP Alpha Fund and
Board of Trustees of Oppenheimer SteelPath MLP Funds Trust
We have audited the accompanying statement of assets and liabilities, including the statement of investments, of Oppenheimer SteelPath MLP Alpha Fund (the “Fund”), a series of Oppenheimer SteelPath MLP Funds Trust, as of November 28, 2014, and the related statement of operations for the year then ended, the statements of changes in net assets for each of the two years in the period then ended, and the financial highlights for each of the five periods in the period then ended. These financial statements and financial highlights are the responsibility of the Fund’s management. Our responsibility is to express an opinion on these financial statements and financial highlights based on our audits.
We conducted our audits in accordance with the standards of the Public Company Accounting Oversight Board (United States). Those standards require that we plan and perform the audit to obtain reasonable assurance about whether the financial statements and financial highlights are free of material misstatement. An audit includes examining, on a test basis, evidence supporting the amounts and disclosures in the financial statements. Our procedures included confirmation of securities owned as of November 28, 2014, by correspondence with the custodian and brokers or by other auditing procedures as appropriate in the circumstances. An audit also includes assessing the accounting principles used and significant estimates made by management, as well as evaluating the overall financial statement presentation. We believe that our audits provide a reasonable basis for our opinion.
In our opinion, the financial statements and financial highlights referred to above present fairly, in all material respects, the financial position of Oppenheimer SteelPath MLP Alpha Fund as of November 28, 2014, the results of its operations for the year then ended, the changes in its net assets for each of the two years in the period then ended, and the financial highlights for each of the five periods in the period then ended, in conformity with accounting principles generally accepted in the United States of America.

COHEN FUND AUDIT SERVICES, LTD.
Cleveland, Ohio
January 27, 2015
BOARD APPROVAL OF THE FUND’S INVESTMENT ADVISORY AGREEMENT Unaudited
The Fund has entered into an investment advisory agreement (the “Agreement”) with OFI SteelPath, Inc. (“OFI SteelPath” or the “Manager”). Each year, the Board of Trustees (the “Board”), including a majority of the independent Trustees, is required to determine whether to renew the Agreement. The Investment Company Act of 1940, as amended, requires that the Board request and evaluate, and that the Manager provide, such information as may be reasonably necessary to evaluate the terms of the Agreement. The Board employs an independent consultant to prepare a report that provides information, including comparative information that the Board requests for that purpose. In addition to in-person meetings focused on this evaluation, the Board receives information throughout the year regarding Fund services, fees, expenses and performance.
The Manager and the independent consultant provided information to the Board on the following factors: (i) the nature, quality and extent of the Manager’s services, (ii) the investment performance of the Fund and the Manager, (iii) the fees and expenses of the Fund, including comparative expense information, (iv) the profitability of the Manager and its affiliates, including an analysis of the cost of providing services, (v) whether economies of scale are realized as the Fund grows and whether fee levels reflect these economies of scale for Fund investors and (vi) other benefits to the Manager from its relationship with the Fund. The Board was aware that there are alternatives to retaining the Manager.
Outlined below is a summary of the principal information considered by the Board as well as the Board’s conclusions.
Nature, Quality and Extent of Services. The Board considered information about the nature, quality and extent of the services provided to the Fund and information regarding the Manager’s key personnel who provide such services. The Manager’s duties include providing research, analysis and other advisory services in regard to the Fund’s investments; securities trading services; oversight of third-party service providers; monitoring compliance with applicable Fund policies and procedures and adherence to the Fund’s investment restrictions; and risk management. The Manager is responsible for providing certain administrative services to the Fund as well. Those services, some of which are performed by affiliates of the Manager, include providing and supervising all administrative and clerical personnel who are necessary in order to provide effective corporate administration for the Fund; compiling and maintaining records with respect to the Fund’s operations; preparing and filing reports required by the Securities and Exchange Commission; preparing periodic reports regarding the operations of the Fund for its shareholders; preparing proxy materials for shareholder meetings; and preparing the registration statements required by Federal and state securities laws for the sale of the Fund’s shares. The Manager also provides the Fund with office space, facilities and equipment.
BOARD APPROVAL OF THE FUND’S INVESTMENT ADVISORY AGREEMENT Unaudited / (Continued)
The Board also considered the quality of the services provided and the quality of the Manager’s resources that are available to the Fund. In evaluating the Manager, the Board considered the history, reputation, qualification and background of the Manager, including its corporate parent, OppenheimerFunds, Inc. (“OFI”) and corporate affiliate, OFI Global Asset Management, Inc. (“OFI Global” and OFI and OFI Global are collectively referred to hereinafter as “OFI”), and the fact that OFI had over 50 years of experience as an investment adviser and that its assets rank among the top mutual fund managers in the United States. The Board evaluated the Manager’s and OFI’s advisory, administrative, accounting, legal, compliance services and risk management, and information the Board has received regarding the experience and professional qualifications of the Manager’s and OFI’s key personnel and the size and functions of its staff. In its evaluation of the quality of the portfolio management services provided, the Board considered the experience of Stuart Cartner and Brian Watson, the portfolio managers for the Fund, and the Manager’s investment team and analysts. The Board members also considered the totality of their experiences with the Manager and OFI as trustees of the Fund and other funds advised by the Manager or OFI. The Board considered information regarding the quality of services provided by affiliates of the Manager, which its members have become knowledgeable about in connection with the renewal of the Fund’s service agreements. The Board concluded, in light of the Manager’s and OFI’s experience, reputation, personnel, operations and resources that the Fund benefits from the services provided under the Agreement.
Investment Performance of the Manager and the Fund. Throughout the year, the Manager provided information on the investment performance of the Fund and the Manager, including comparative performance information. The Board also reviewed information, prepared by the Manager and the independent consultant, comparing the Fund’s historical performance to relevant market indices and to the performance of other retail equity energy funds. The Board noted that the Fund slightly underperformed its category median for the one-year period, but that it outperformed its category median for the three-year period.
Costs of Services by the Manager. The Board reviewed the fees paid to the Manager and the other expenses borne by the Fund. The independent consultant provided comparative data in regard to the fees and expenses of the Fund and other retail equity energy funds with comparable asset levels and distribution features. The Board noted that the Fund’s contractual management fee was higher than its peer group median and category median and that the Fund’s total expenses were equal to its peer group median and category median. The Board considered that the Fund’s contractual management fee includes both the advisory fee and the administrative fee, which contribute to the Fund’s costs and noted that the administrative fee reflects the complex tax work associated with the Fund’s MLP investments. The Board also considered that within the total asset range of $1 billion to $2 billion, the Fund’s effective management fee was higher than its peer group median and category median. The Board considered that the Manager has contractually agreed to limit the Fund’s
BOARD APPROVAL OF THE FUND’S INVESTMENT ADVISORY AGREEMENT Unaudited / (Continued)
total operating expenses to 1.50% for Class A shares, 2.25% for Class C shares and 1.25% for Class Y shares. The fee limitation may not be amended or terminated prior to March 29, 2015, unless approved by the Board.
Economies of Scale and Profits Realized by the Manager. The Board considered information regarding the Manager’s costs in serving as the Fund’s investment adviser, including the costs associated with the personnel and systems necessary to manage the Fund, and information regarding the Manager’s profitability from its relationship with the Fund. The Board reviewed whether the Manager may realize economies of scale in managing and supporting the Fund. The Board noted that the Fund currently has management fee breakpoints, which are intended to share with Fund shareholders economies of scale that may exist as the Fund’s assets grow.
Other Benefits to the Manager. In addition to considering the profits realized by the Manager, the Board considered information that was provided regarding the direct and indirect benefits the Manager receives as a result of its relationship with the Fund, including compensation paid to the Manager’s affiliates and research provided to the Manager in connection with permissible brokerage arrangements (soft dollar arrangements). The Board also considered that the Manager must be able to pay and retain experienced professional personnel at competitive rates to provide quality services to the Fund.
Conclusions. These factors were also considered by the independent Trustees meeting separately from the full Board, assisted by experienced counsel to the Fund and to the independent Trustees. Fund counsel and the independent Trustees’ counsel are independent of the Manager within the meaning and intent of the Securities and Exchange Commission Rules.
Based on its review of the information it received and its evaluations described above, the Board, including a majority of the independent Trustees, decided to continue the Agreement through August 31, 2015. In arriving at its decision, the Board did not identify any factor or factors as being more important than others, but considered all of the above information, and considered the terms and conditions of the Agreement, including the management fees, in light of all the surrounding circumstances.
PORTFOLIO PROXY VOTING POLICIES AND PROCEDURES; UPDATES TO STATEMENTS OF INVESTMENTS Unaudited
The Fund has adopted Portfolio Proxy Voting Policies and Procedures under which the Fund votes proxies relating to securities (“portfolio proxies”) held by the Fund. A description of the Fund’s Portfolio Proxy Voting Policies and Procedures is available (i) without charge, upon request, by calling the Fund toll-free at 1.800.CALL OPP (225.5677), (ii) on the Fund’s website at oppenheimerfunds.com, and (iii) on the SEC’s website at www.sec.gov. In addition, the Fund is required to file Form N-PX, with its complete proxy voting record for the 12 months ended June 30th, no later than August 31st of each year. The Fund’s voting record is available (i) without charge, upon request, by calling the Fund toll-free at 1.800.CALL OPP (225.5677), and (ii) in the Form N-PX filing on the SEC’s website at www.sec.gov.
The Fund files its complete schedule of portfolio holdings with the SEC for the first quarter and the third quarter of each fiscal year on Form N-Q. The Fund’s Form N-Q filings are available on the SEC’s website at www.sec.gov. Those forms may be reviewed and copied at the SEC’s Public Reference Room in Washington, D.C. Information on the operation of the Public Reference Room may be obtained by calling 1-800-SEC-0330.
Householding – Delivery of Shareholder Documents
This is to inform you about OppenheimerFunds’ “householding” policy. If more than one member of your household maintains an account in a particular fund, OppenheimerFunds will mail only one copy of the fund’s prospectus (or, if available, the fund’s summary prospectus), annual and semiannual report and privacy policy. The consolidation of these mailings, called householding, benefits your fund through reduced mailing expense, and benefits you by reducing the volume of mail you receive from OppenheimerFunds. Householding does not affect the delivery of your account statements.
Please note that we will continue to household these mailings for as long as you remain an OppenheimerFunds shareholder, unless you request otherwise. If you prefer to receive multiple copies of these materials, please call us at 1.800.CALL-OPP (225-5677). You may also notify us in writing or via email. We will begin sending you individual copies of the prospectus (or, if available, the summary prospectus), reports and privacy policy within 30 days of receiving your request to stop householding.
TRUSTEES AND OFFICERS Unaudited
| Name, Position(s) Held with the Trusts, Length of Service, Age | Principal Occupation(s) During the Past 5 Years;
Other Trusteeships/Directorships Held; Number of Portfolios in the Fund Complex Currently Overseen |
| INDEPENDENT TRUSTEES | The address of each Trustee in the chart below is 6803 S. Tucson Way, Centennial, Colorado 80112-3924. Each Trustee serves for an indefinite term, or until his or her resignation, retirement, death or removal. |
Sam Freedman,
Chairman of the
Board of Trustees
and Trustee
(since 2012)
Year of Birth: 1940 | Director of Colorado UpLIFT (charitable organization) (since September 1984). Mr. Freedman held several positions with OppenheimerFunds, Inc. and with subsidiary or affiliated companies of OppenheimerFunds, Inc. (until October 1994). Oversees 38 portfolios in the OppenheimerFunds complex. Mr. Freedman has served on the Boards of certain Oppenheimer funds since 1996, during which time he has become familiar with the Fund’s (and other Oppenheimer funds’) financial, accounting, regulatory and investment matters and has contributed to the Boards’ deliberations. |
Jon S. Fossel,
Trustee
(since 2012)
Year of Birth: 1942 | Chairman of the Board (2006-December 2011) and Director (June 2002-December 2011) of UNUMProvident (insurance company); Director of Northwestern Energy Corp. (public utility corporation) (November 2004-December 2009); Director of P.R. Pharmaceuticals (October 1999-October 2003); Director of Rocky Mountain Elk Foundation (non-profit organization) (February 1998-February 2003 and February 2005-February 2007); Chairman and Director (until October 1996) and President and Chief Executive Officer (until October 1995) of OppenheimerFunds, Inc.; President, Chief Executive Officer and Director of the following: Oppenheimer Acquisition Corp. (“OAC”) (parent holding company of the OppenheimerFunds, Inc.), Shareholders Services, Inc. and Shareholder Financial Services, Inc. (until October 1995). Oversees 38 portfolios in the OppenheimerFunds complex. Mr. Fossel has served on the Boards of certain Oppenheimer funds since 1990, during which time he has become familiar with the Fund’s (and other Oppenheimer funds’) financial, accounting, regulatory and investment matters and has contributed to the Boards’ deliberations. |
TRUSTEES AND OFFICERS Unaudited / (Continued)
Richard F. Grabish,
Trustee
(since 2012)
Year of Birth: 1948 | Formerly Senior Vice President and Assistant Director of Sales and Marketing (March 1997-December 2007), Director (March 1987-December 2007) and Manager of Private Client Services (June 1985-June 2005) of A.G. Edwards & Sons, Inc. (broker/dealer and investment firm); Chairman and Chief Executive Officer of A.G. Edwards Trust Company, FSB (March 2001-December 2007); President and Vice Chairman of A.G. Edwards Trust Company, FSB (investment adviser) (April 1987-March 2001); President of A.G. Edwards Trust Company, FSB (investment adviser) (June 2005-December 2007). Oversees 38 portfolios in the OppenheimerFunds complex. Mr. Grabish has served on the Boards of certain Oppenheimer funds since 2001, during which time he has become familiar with the Fund’s (and other Oppenheimer funds’) financial, accounting, regulatory and investment matters and has contributed to the Boards’ deliberations. |
Beverly L. Hamilton,
Trustee
(since 2012)
Year of Birth: 1946 | Trustee of Monterey Institute for International Studies (educational organization) (since February 2000); Board Member of Middlebury College (educational organization) (December 2005-June 2011); Chairman (since 2010) of American Funds' Emerging Markets Growth Fund, Inc. (mutual fund); Director of The California Endowment (philanthropic organization) (April 2002-April 2008); Director (February 2002-2005) and Chairman of Trustees (2006-2007) of the Community Hospital of Monterey Peninsula; Director (October 1991-2005); Vice Chairman (2006-2009) of American Funds' Emerging Markets Growth Fund, Inc. (mutual fund); President of ARCO Investment Management Company (February 1991-April 2000); Member of the investment committees of The Rockefeller Foundation (2001-2006) and The University of Michigan (since 2000); Advisor at Credit Suisse First Boston's Sprout venture capital unit (venture capital fund) (1994-January 2005); Trustee of MassMutual Institutional Funds (investment company) (1996-June 2004); Trustee of MML Series Investment Fund (investment company) (April 1989-June 2004); Member of the investment committee of Hartford Hospital (2000-2003); and Advisor to Unilever (Holland) pension fund (2000-2003). Oversees 38 portfolios in the OppenheimerFunds complex. Ms. Hamilton has served on the Boards of certain Oppenheimer funds since 2002, during which time she has become familiar with the Fund’s (and other Oppenheimer funds’) financial, accounting, regulatory and investment matters and has contributed to the Boards’ deliberations. |
TRUSTEES AND OFFICERS Unaudited / (Continued)
Victoria J. Herget,
Trustee
(since 2012)
Year of Birth: 1951 | Independent Director of the First American Funds (mutual fund family) (2003-2011); former Managing Director (1993-2001), Principal (1985-1993), Vice President (1978-1985) and Assistant Vice President (1973-1978) of Zurich Scudder Investments (and its predecessor firms); Board Chair (2008-Present) and Director (2004-Present), United Educators (insurance company); Trustee (1992-2007), Chair of the Board of Trustees (1999-2007), Investment Committee Chair (1994-1999) and Investment Committee member (2007-2010) of Wellesley College; Trustee (since 2000) and Chair (since 2010), Newberry Library; Trustee, Mather LifeWays (since 2001); Trustee, BoardSource (2006-2009) and Chicago City Day School (1994-2005). Oversees 38 portfolios in the OppenheimerFunds complex. Ms. Herget has served on the Boards of certain Oppenheimer funds since 2012, during which time she has become familiar with the Fund's (and other Oppenheimer funds') financial, accounting, regulatory and investment matters and has contributed to the Boards' deliberations. |
Robert J. Malone,
Trustee
(since 2012)
Year of Birth: 1944 | Chairman of the Board (since 2012) and Director (since August 2005) of Jones International University (educational organization) (since August 2005); Chairman, Chief Executive Officer and Director of Steele Street Bank Trust (commercial banking) (since August 2003); Trustee of the Gallagher Family Foundation (non-profit organization) (since 2000); Board of Directors of Opera Colorado Foundation (non-profit organization) (2008-2012); Director of Colorado UpLIFT (charitable organization) (1986-2010); Director of Jones Knowledge, Inc. (2006-2010); Former Chairman of U.S. Bank-Colorado (subsidiary of U.S. Bancorp and formerly Colorado National Bank) (July 1996-April 1999); Director of Commercial Assets, Inc. (real estate investment trust) (1993-2000); Director of U.S. Exploration, Inc. (oil and gas exploration) (1997-February 2004); Chairman of the Board (1991-1994) and Trustee (1985-1994) of Regis University; and Chairman of the Board (1990-1991 and Trustee (1984-1999) of Young Presidents Organization. Oversees 38 portfolios in the OppenheimerFunds complex. Mr. Malone has served on the Boards of certain Oppenheimer funds since 2002, during which time he has become familiar with the Fund’s (and other Oppenheimer funds’) financial, accounting, regulatory and investment matters and has contributed to the Boards’ deliberations. |
TRUSTEES AND OFFICERS Unaudited / (Continued)
F. William Marshall, Jr.,
Trustee
(since 2012)
Year of Birth: 1942 | Trustee Emeritus of Worcester Polytech Institute (WPI) (private university) (since 2009); Trustee of MassMutual Select Funds (formerly MassMutual Institutional Funds) (investment company) (since 1996), MML Series Investment Fund (investment company) (since 1996) and Mass Mutual Premier Funds (investment company) (since January 2012); President and Treasurer of the SIS Fund (private charitable fund) (January 1999 – March 2011); Former Trustee of WPI (1985-2008); Former Chairman of the Board (2004-2006) and Former Chairman of the Investment Committee of WPI (1994-2008); Chairman of SIS & Family Bank, F.S.B. (formerly SIS Bank) (commercial bank) (January 1999-July 1999); Executive Vice President of Peoples Heritage Financial Group, Inc. (commercial bank) (January 1999-July 1999); and Former President and Chief Executive Officer of SIS Bancorp. (1993-1999). Oversees 42 portfolios in the OppenheimerFunds complex. Mr. Marshall has served on the Boards of certain Oppenheimer funds since 2000, during which time he has become familiar with the Fund’s (and other Oppenheimer funds’) financial, accounting, regulatory and investment matters and has contributed to the Boards’ deliberations. |
Karen L. Stuckey,
Trustee
(since 2012)
Year of Birth: 1953 | Partner (1990-2012) of PricewaterhouseCoopers LLP (held various positions 1975-1990); Emeritus Trustee (since 2006), Trustee (1992-2006) and member of Executive, Nominating and Audit Committees and Chair of Finance Committee of Lehigh University; and member, Women's Investment Management Forum since inception. Oversees 38 portfolios in the OppenheimerFunds complex. Ms. Stuckey has served on the Boards of certain Oppenheimer funds since 2012, during which time she has become familiar with the Fund's (and other Oppenheimer funds') financial, accounting, regulatory and investment matters and has contributed to the Boards' deliberations. |
James D. Vaughn,
Trustee
(since 2012)
Year of Birth:1945 | Retired; former managing partner (1994-2001) of Denver office of Deloitte & Touche LLP, (held various positions 1969-1993); Trustee and Chairman of the Audit Committee of Schroder Funds (2003-2012); Board member and Chairman of Audit Committee of AMG National Trust Bank (since 2005); Trustee and Investment Committee member, University of South Dakota Foundation (since 1996); Board member, Audit Committee Member and past Board Chair, Junior Achievement (since 1993); former Board member, Mile High United Way, Boys and Girls Clubs, Boy Scouts, Colorado Business Committee for the Arts, Economic Club of Colorado and Metro Denver Network. Oversees 38 portfolios in the OppenheimerFunds complex. Mr. Vaughn has served on the Boards of certain Oppenheimer funds since 2012, during which time he has become familiar with the Fund's (and other Oppenheimer funds') financial, accounting, regulatory and investment matters and has contributed to the Boards' deliberations. |
TRUSTEES AND OFFICERS Unaudited / (Continued)
| INTERESTED TRUSTEE | Mr. Glavin is an "Interested Trustee" because he is affiliated with the Manager and OppenheimerFunds, Inc. by virtue of his positions as director of the Manager, and as a shareholder of OppenheimerFunds, Inc.’s parent company. As a Trustee, he serves for an indefinite term, or until his resignation, retirement, death or removal. Mr. Glavin's address is 225 Liberty Street, 11th Floor, New York, New York 10281-1008. |
William F. Glavin, Jr.,
Trustee
(since 2012)
Year of Birth: 1958 | Chairman of OppenheimerFunds, Inc. (July 2014-December 2014 and December 2009-December 2012) and Director of OppenheimerFunds, Inc. (since January 2009); Chairman, Director and Chief Executive Officer (January 2013-June 2014) of OFI Global Asset Management, Inc.; President of OFI Global Asset Management, Inc. (January 2013-May 2013); Chief Executive Officer (January 2009-December 2012); President of OppenheimerFunds, Inc. (May 2009-December 2012); Management Director (June 2009-June 2014), President (December 2009-June 2014) and Chief Executive Officer (January 2011-June 2014) of Oppenheimer Acquisition Corp. (“OAC”) (OppenheimerFunds, Inc.’s parent holding company); Director of Oppenheimer Real Asset Management, Inc. (March 2010-June 2014); Executive Vice President (March 2006-February 2009) and Chief Operating Officer (July 2007-February 2009) of Massachusetts Mutual Life Insurance Company (OAC’s parent company); Director (May 2004-March 2006) and Chief Operating Officer and Chief Compliance Officer (May 2004-January 2005), President (January 2005-March 2006) and Chief Executive Officer (June 2005-March 2006) of Babson Capital Management LLC; Director (March 2005-March 2006), President (May 2003-March 2006) and Chief Compliance Officer (July 2005-March 2006) of Babson Capital Securities, Inc. (a broker-dealer); President (May 2003-March 2006) of Babson Investment Company, Inc.; Director (May 2004-August 2006) of Babson Capital Europe Limited; Director (May 2004-October 2006) of Babson Capital Guernsey Limited; Director (May 2004-March 2006) of Babson Capital Management LLC; Non-Executive Director (March 2005-March 2007) of Baring Asset Management Limited; Director (February 2005-June 2006) Baring Pension Trustees Limited; Director and Treasurer (December 2003-November 2006) of Charter Oak Capital Management, Inc.; Director (May 2006-September 2006) of C.M. Benefit Insurance Company; Director (May 2008-June 2009) and Executive Vice President (June 2007-July 2009) of C.M. Life Insurance Company; President (March 2006-May 2007) of MassMutual Assignment Company; Director (January 2005-December 2006), Deputy Chairman (March 2005-December 2006) and President (February 2005-March 2005) of MassMutual Holdings (Bermuda) Limited; Director (May 2008-June 2009) and Executive Vice President (June 2007-July 2009) of MML Bay State Life Insurance Company; Chief Executive Officer and President (April 2007-January 2009) of MML Distributors, LLC; and Chairman (March 2006-December 2008) and Chief Executive Officer (May 2007-December 2008) of MML Investors Services, Inc. An officer of 91 portfolios in the OppenheimerFunds complex. Mr. Glavin has served on the Boards of certain Oppenheimer funds since December 2009, during which time he has become familiar with the Fund’s (and other Oppenheimer funds’) financial, accounting, regulatory and investment matters and has contributed to the Boards’ deliberations. |
TRUSTEES AND OFFICERS Unaudited / (Continued)
OTHER OFFICERS
OF THE TRUSTS | The addresses of the Officers in the chart below are as follows: for Mr. Steinmetz, Gabinet, Mss. Sexton and Picciotto, 225 Liberty Street, New York, New York 10281-1008; for Messrs. Cartner and Watson, 2100 McKinney Avenue, Dallas, TX 75201; and for Mr. Wixted, 6803 S. Tucson Way, Centennial, Colorado 80112-3924. Each Officer serves for an indefinite term or until his or her resignation, retirement, death or removal. |
Stuart Cartner,
Vice President
(since 2010)
Year of Birth: 1961 | Senior Vice President and Senior Portfolio Manager of the Manager (since January 2014); Vice President of the Manager (2012-January 2014). A member and portfolio manager of SteelPath Fund Advisors, LLC (since its formation in 2009) and SteelPath Capital Management, LLC (since 2007). Vice President in the Private Wealth Management Division of Goldman, Sachs & Co (1988-2007). An officer of other portfolios in the OppenheimerFunds complex. |
Brian Watson,
Vice President
(since 2012)
Year of Birth: 1974 | Senior Vice President and Senior Portfolio Manager of the Manager (since January 2014); Vice President of the Manager (2012-January 2014). Prior to joining OFI Global Asset Management, Inc., he was a member, portfolio manager and Director of Research of SteelPath Fund Advisors, LLC since its formation in 2009. A portfolio manager at Swank Capital LLC, a Dallas, Texas based investment firm (2005-2009). An officer of other portfolios in the OppenheimerFunds complex. |
Arthur P. Steinmetz,
President and Principal Executive Officer
(since 2014)
Year of Birth: 1958 | Chairman of OppenheimerFunds, Inc. (since January 2015); CEO and Chairman of OFI Global Asset Management, Inc. (since July 2014), President of OFI Global Asset Management, Inc. (since May 2013), a Director of OFI Global Asset Management, Inc. (since January 2013), Director of OppenheimerFunds, Inc. (since July 2014), President, Management Director and CEO of Oppenheimer Acquisition Corp. (OppenheimerFunds, Inc.’s parent holding company) (since July 2014), and President and Director of the Manager (since January 2013). Chief Investment Officer of the OppenheimerFunds advisory entities from (January 2013-December 2013); Executive Vice President of OFI Global Asset Management, Inc. (January 2013-May 2013); Chief Investment Officer of OppenheimerFunds, Inc. (October 2010-December 2012); Chief Investment Officer, Fixed-Income, of OppenheimerFunds, Inc. (April 2009-October 2010); Executive Vice President of OppenheimerFunds, Inc. (October 2009-December 2012); Director of Fixed Income of OppenheimerFunds, Inc. (January 2009-April 2009); and a Senior Vice President of OppenheimerFunds, Inc. (March 1993-September 2009). An officer of 91 portfolios in the OppenheimerFunds complex. |
TRUSTEES AND OFFICERS Unaudited / (Continued)
Arthur S. Gabinet, Secretary and
Chief Legal Officer
(since 2012)
Year of Birth: 1958 | Executive Vice President, Secretary and General Counsel of OFI Global Asset Management, Inc. (since January 2013); General Counsel of the Manager (since January 2013); Executive Vice President (May 2010-December 2012) and General Counsel (since January 2011) of OppenheimerFunds, Inc.; General Counsel of the Distributor (since January 2011); General Counsel of Centennial Asset Management Corporation (January 2011-December 2012); Executive Vice President (January 2011-December 2012) and General Counsel of HarbourView Asset Management Corporation (since January 2011); Assistant Secretary (since January 2011) and Director (since January 2011) of OppenheimerFunds International Ltd. and OppenheimerFunds plc; Director of Oppenheimer Real Asset Management, Inc. (January 2011-December 2012) and General Counsel (since January 2011); Executive Vice President (January 2011-December 2011) and General Counsel of Shareholder Financial Services, Inc. and Shareholder Services, Inc. (since January 2011); Executive Vice President (January 2011-December 2012) and General Counsel of OFI Private Investments Inc. (since January 2011); Vice President of OppenheimerFunds Legacy Program (January 2011-December 2011); Executive Vice President (January 2011-December 2012) and General Counsel of OFI Institutional Asset Management, Inc. (since January 2011); General Counsel, Asset Management of OppenheimerFunds, Inc. (May 2010-December 2010); Principal, The Vanguard Group (November 2005-April 2010); District Administrator, U.S. Securities and Exchange Commission (January 2003-October 2005). An officer of 91 portfolios in the OppenheimerFunds complex. |
Jennifer Sexton,
Vice President and
Chief Business Officer
(since 2014)
Year of Birth: 1969 | Senior Vice President of OppenheimerFunds Distributor, Inc. (since June 2014); Vice President of OppenheimerFunds Distributor, Inc. (April 2006-June 2014); Vice President of OppenheimerFunds, Inc. (January 1998-March 2006); Assistant Vice President of OppenheimerFunds, Inc. (October 1991-December 1998). An officer of 91 portfolios in the OppenheimerFunds complex. |
Mary Ann Picciotto,
Chief Compliance Officer and Chief Anti-Money Laundering Officer
(since 2014)
Year of Birth: 1973 | Senior Vice President and Chief Compliance Officer of OFI Global Asset Management, Inc. (since March 2014); Chief Compliance Officer of OppenheimerFunds, Inc., the Manager, OFI Global Trust Company, OFI Global Institutional, Inc., Oppenheimer Real Asset Management, Inc., OFI Private Investments, Inc., Harborview Asset Management Corporation, Trinity Investment Management Corporation, and Shareholder Services, Inc. (since March 2014); Managing Director of Morgan Stanley Investment Management Inc. and certain of its various affiliated entities; Chief Compliance Officer of various Morgan Stanley Funds (May 2010-January 2014); Chief Compliance Officer of Morgan Stanley Investment Management Inc. (April 2007-January 2014). An officer of 91 portfolios in the OppenheimerFunds complex. |
TRUSTEES AND OFFICERS Unaudited / (Continued)
Brian W. Wixted,
Treasurer and
Principal Financial & Accounting Officer
(since 2012)
Year of Birth: 1959 | Senior Vice President of OFI Global Asset Management, Inc. (since January 2013); Treasurer of OppenheimerFunds, Inc., HarbourView Asset Management Corporation, Shareholder Financial Services, Inc., Shareholder Services, Inc., and Oppenheimer Real Asset Management, Inc. (March 1999-June 2008), OFI Private Investments, Inc. (March 2000-June 2008), OppenheimerFunds International Ltd. and OppenheimerFunds plc (since May 2000), OFI Institutional Asset Management, Inc. (November 2000-June 2008), and OppenheimerFunds Legacy Program (charitable trust program established by OppenheimerFunds, Inc.) (June 2003-December 2011); Treasurer and Chief Financial Officer of OFI Trust Company (since May 2000); Assistant Treasurer of Oppenheimer Acquisition Corporation (March 1999-June 2008). An officer of 91 portfolios in the OppenheimerFunds complex. |
The Fund’s Statement of Additional Information contains additional information about the Fund’s Trustees and Officers and is available without charge upon request, by calling 1.800.CALL OPP (225.5677).
OPPENHEIMER STEELPATH MLP ALPHA FUND
| Manager | | OFI SteelPath, Inc. |
| | | |
| Distributor | | OppenheimerFunds Distributor, Inc. |
| | | |
| Transfer and Shareholder Servicing Agent | | OFI Global Asset Management, Inc. |
| | | |
| Sub-Transfer Agent | | Shareholder Services, Inc. |
| | | DBA OppenheimerFunds Services |
| | | |
| Independent Registered Public Accounting Firm | | Cohen Fund Audit Services, Ltd. |
| | | |
| Legal Counsel | | K&L Gates LLP |
© 2015 OppenheimerFunds, Inc. All rights reserved.
PRIVACY POLICY NOTICE
As an Oppenheimer fund shareholder, you are entitled to know how we protect your personal information and how we limit its disclosure.
Information Sources
We obtain nonpublic personal information about our shareholders from the following sources:
| • | Applications or other forms |
| • | When you create a user ID and password for online account access |
| • | When you enroll in eDocs Direct, our electronic document delivery service |
| • | Your transactions with us, our affiliates or others |
| • | A software program on our website, often referred to as a “cookie,” which indicates which parts of our site you’ve visited |
| • | When you set up challenge questions to reset your password online |
If you visit oppenheimerfunds.com and do not log on to the secure account information areas, we do not obtain any personal information about you. When you do log on to a secure area, we do obtain your user ID and password to identify you. We also use this information to provide you with products and services you have requested, to inform you about products and services that you may be interested in and assist you in other ways.
We do not collect personal information through our website unless you willingly provide it to us, either directly by email or in those areas of the website that request information. In order to update your personal information (including your mailing address, email address and phone number) you must first log on and visit your user profile.
If you have set your browser to warn you before accepting cookies, you will receive the warning message with each cookie. You can refuse cookies by turning them off in your browser. However, doing so may limit your access to certain sections of our website.
We use cookies to help us improve and manage our website. For example, cookies help us recognize new versus repeat visitors to the site, track the pages visited, and enable some special features on the website. This data helps us provide a better service for our website visitors.
Protection of Information
We do not disclose any non-public personal information (such as names on a customer list) about current or former customers to anyone, except as permitted by law.
PRIVACY POLICY NOTICE (Continued)
Disclosure of Information
Copies of confirmations, account statements and other documents reporting activity in your fund accounts are made available to your financial adviser (as designated by you). We may also use details about you and your investments to help us, our financial service affiliates, or firms that jointly market their financial products and services with ours, to better serve your investment needs or suggest financial services or educational material that may be of interest to you. If this requires us to provide you with an opportunity to “opt in” or “opt out” of such information sharing with a firm not affiliated with us, you will receive notification on how to do so, before any such sharing takes place.
Right of Refusal
We will not disclose your personal information to unaffiliated third parties (except as permitted by law), unless we first offer you a reasonable opportunity to refuse or “opt out” of such disclosure.
Internet Security and Encryption
In general, the email services provided by our website are encrypted and provide a secure and private means of communication with us. To protect your own privacy, confidential and/or personal information should only be communicated via email when you are advised that you are using a secure website.
As a security measure, we do not include personal or account information in non-secure emails, and we advise you not to send such information to us in non-secure emails. Instead, you may take advantage of the secure features of our website to encrypt your email correspondence. To do this, you will need to use a browser that supports Secure Sockets Layer (SSL) protocol.
We do not guarantee or warrant that any part of our website, including files available for download, are free of viruses or other harmful code. It is your responsibility to take appropriate precautions, such as use of an anti-virus software package, to protect your computer hardware and software.
| • | All transactions, including redemptions, exchanges and purchases, are secured by SSL and 128-bit encryption. SSL is used to establish a secure connection between your PC and OppenheimerFunds’ server. It transmits information in an encrypted and scrambled format. |
| • | Encryption is achieved through an electronic scrambling technology that uses a “key” to code and then decode the data. Encryption acts like the cable converter box you may have on your television set. It scrambles data with a secret code so that no one can make sense of it while it is being transmitted. When the data reaches its destination, the same software unscrambles the data. |
| • | You can exit the secure area by either closing your browser, or for added security, you can use the Log Out button before you close your browser. |
PRIVACY POLICY NOTICE (Continued)
Other Security Measures
We maintain physical, electronic and procedural safeguards to protect your personal account information. Our employees and agents have access to that information only so that they may offer you products or provide services, for example, when responding to your account questions.
How You Can Help
You can also do your part to keep your account information private and to prevent unauthorized transactions. If you obtain a user ID and password for your account, do not allow it to be used by anyone else. Also, take special precautions when accessing your account on a computer used by others.
Who We Are
This joint notice describes the privacy policies of the Oppenheimer funds, OppenheimerFunds, Inc., each of its investment adviser subsidiaries, OppenheimerFunds Distributor, Inc. and OFI Global Trust Co. It applies to all Oppenheimer fund accounts you presently have, or may open in the future, using your Social Security number - whether or not you remain a shareholder of our funds. This notice was last updated November 2014. In the event it is updated or changed, we will post an updated notice on our website at oppenheimerfunds.com. If you have any questions about this privacy policy, write to us at P.O. Box 5270, Denver, CO 80217-5270, email us by clicking on the Contact Us section of our website at oppenheimerfunds.com or call us at 1.800.CALL OPP (225.5677).
| Fund Performance Discussion | 3 |
| Top Holdings and Allocations | 8 |
| Share Class Performance | 9 |
| Fund Expenses | 11 |
| Statement of Investments | 13 |
| Statement of Assets and Liabilities | 17 |
| Statement of Operations | 19 |
| Statements of Changes in Net Assets | 20 |
| Financial Highlights | 21 |
| Notes to Financial Statements | 25 |
| Report of Independent Registered Public Accounting Firm | 41 |
| Board Approval of the Fund’s Investment Advisory Agreement | 42 |
| Portfolio Proxy Voting Policies and Procedures; Updates to Statements of Investments | 45 |
| Trustees and Officers | 46 |
| Privacy Policy Notice | 55 |
Class A Shares
AVERAGE ANNUAL TOTAL RETURNS AT 11/28/14*
| | Class A Shares of the Fund | | |
| | Without
Sales
Charge | With
Sales
Charge | S&P 500 Index | Alerian MLP Index |
| 1-Year | 8.66% | 2.43% | 16.86% | 12.87% |
| Since Inception (3/31/10) | 9.79 | 8.40 | 15.40 | 17.49 |
Performance data quoted represents past performance, which does not guarantee future results. The investment return and principal value of an investment in the Fund will fluctuate so that an investor’s shares, when redeemed, may be worth more or less than their original cost. Fund returns include changes in share price, reinvested distributions, and a 5.75% maximum applicable sales charge except where “without sales charge” is indicated. Current performance may be lower or higher than the performance quoted. Returns do not consider capital gains or income taxes on an individual’s investment. For performance data current to the most recent month-end, visit oppenheimerfunds.com or call 1.800.CALL.OPP (225.5677).
| * | November 28, 2014, was the last business day of the Fund’s annual period. See Note 2 of the accompanying Notes to Financial Statements. Index returns are calculated through November 30, 2014. |
Fund Performance Discussion
The Fund’s Class A shares (without sales charge) produced a total return of 8.66% during the reporting period. In comparison, master limited partnerships (MLPs), as measured by the Alerian MLP Index (AMZ), provided a total return of 12.87%. Please note that the returns for the Alerian MLP Index are calculated pre-tax, while the Fund’s returns are calculated post corporate tax. During the same period, the S&P 500 Index produced a total return of 16.86%.
Over the twelve-month reporting period ended November 30, 2014, the MLP sector underperformed the broader markets. Notably, MLPs outperformed the S&P 500 Index for most of the period before declining during October and November in correlation with a sharp pullback in crude oil prices. A low-yield versus high-yield characteristic appeared to dominate performance differentiation for the first half of 2014, but this theme was less of a contributing factor during the latter part of the reporting period. Below average yielding MLPs typically reflect expectations for rapid distribution growth, while MLPs with above average yields are generally thought to hold more limited growth prospects. During the first half of 2014, the price performance of MLPs with yields that were below the group average, or faster growers, beat the price performance of MLPs with above average yields, or slower growers, by an average of 16.7%. During the third quarter, the below average yielding names only beat the above average yielding MLPs by 0.5%. More
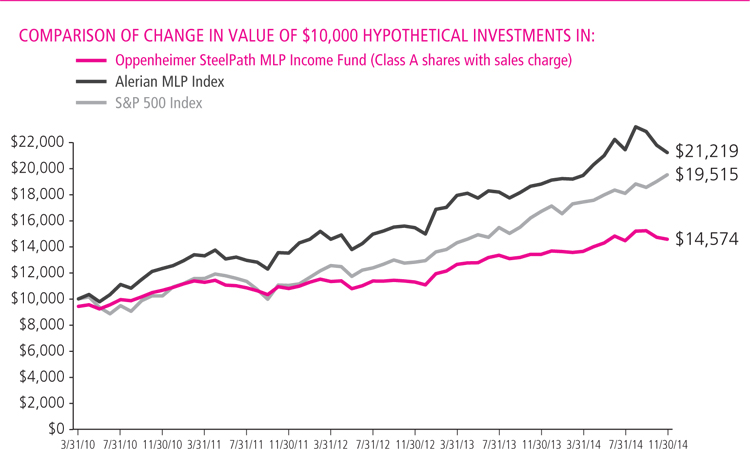
accurately, however, the yield, or growth, characteristic appeared to carry less influence late in the period than sub-sector membership and company-specific factors.
Over the reporting period, approximately $35 billion of new equity supply entered the market through either secondary offerings, initial public offerings, or through “at-the-market” programs in which primary units trade into the market anonymously throughout the normal trading day. This pace of equity issuance represents an increased rate from the roughly $26 billion raised over the twelve month reporting period ended November 30, 2013. MLPs also raised approximately $23 billion of debt capital during the period. Most MLPs pay out the majority of excess cash flow as distributions to investors, and thereby must raise external capital to fund growth projects.
MACRO REVIEW
West Texas Intermediate (WTI) crude oil prices ended the reporting period at $61.15 per barrel, down 29% from the end of November 2013. Global crude prices traded 36% lower over the reporting period, with continuing political and social turmoil in the Middle East offset by rising production, a stronger U.S. dollar, and weakening economic outlooks late in the period. Domestically, regional crude pricing differentials continued to exhibit fluctuations, with West Texas pricing exhibiting the greatest weakness early in the period, before narrowing significantly late in the period.
Henry Hub natural gas spot prices rose 12% to end the period at $4.24 per million British thermal units (mmbtu). A combination of continued rising natural gas production, and moderate summer electric demand due to a cooler than normal summer, largely replenished natural gas storage levels after the cold winter left natural gas storage levels at eleven year lows. With storage levels now only marginally below historic levels, we believe fear of elevated natural gas price volatility over the 2014-2015 winter has waned.
Mont Belvieu natural gas liquids (NGL) prices ended the reporting period at $29.74 per barrel, down 30% from the end of November 2013. All of the NGL purity product prices ended the period lower than the same time in the prior year. As a result natural gas processing economics weakened over the period, which may impact certain midstream providers, depending on the contract structure of their processing agreements.
The yield curve flattened over the reporting period as short rates held steady, medium-term rates rose, and longer-dated yields declined. The ten-year Treasury yield fell 58 basis points to end the period at 2.17%. The MLP yield spread at period-end, as measured by the AMZ and the 10-year Treasury bond, widened by 41 basis points to 3.53%.
Over the reporting period, real estate investment trusts (REITs) and utilities, two competing yield-oriented equity asset classes, posted total returns of 27.22% (as measured by the Dow Jones Equity All REIT Total Return Index) and 27.88% (as measured by the Dow Jones Utility Average Index), respectively, outperforming the AMZ’s 12.87% total return. We believe this performance differential is the result of REITs and utilities benefiting from the low interest rate environment, while the performance of MLP equities was impacted by the sharp crude oil price decline. Among MLPs, sector valuation statistics remained little changed over the period, as equity price performance was offset by increased growth expectations. Price to forward distributable cash flow (DCF), a commonly watched ratio, widened modestly above the ten-year average but within the historic range, reflecting the sector’s robust growth potential. We continue to believe that the visibility of energy infrastructure growth opportunities supports above average valuations.
SUBSECTOR REVIEW
Most subsectors in the midstream, or energy infrastructure, MLP asset class delivered positive performance for the reporting period. On average, the diversified names provided the best performance over the period as these larger names benefited from commodity and activity diversity, as well as mergers and acquisitions (M&A) activity. The natural gas pipeline group followed with performance benefiting from a less volatile natural gas price, stable production volumes, and M&A activity. The petroleum product and crude oil subsector also delivered strong performance as it continued to benefit from the U.S. energy renaissance in the production of crude oil.
Consistent with the trends we saw in the previous reporting period, those asset classes with greater exposure to commodity prices delivered less favorable performance over the period. Weakness within the coal subsector likely reflects, we believe, continued market concern over the outlook for coal pricing in the face of abundant and cheap natural gas as a competing electric generating fuel and the potential for even greater regulatory pressure on the use of coal. Upstream MLPs, including those active in exploration and production and oilfield services and supply, suffered as crude oil prices peaked mid-2014 and underwent sharp downward moves late in the period. Also among the weakest subsectors for the period were the marine MLPs, where weakness was also influenced by the decline in crude oil prices and its perceived impact of oil supply growth and transportation.
FUND REVIEW
Key contributors to the Fund’s performance were El Paso Pipeline Partners, LP (EPB) and Enbridge Energy Partners, LP (EEP).
EPB’s modest distribution growth guidance for 2014 and flat distribution growth guidance for 2015 and 2016 drove price weakness early in the period as several rate case settlements and weak contract renewals offset the positive contribution of several planned acquisitions. Performance was bolstered in August when Kinder
Morgan, Inc. (KMI) announced its plans to acquire and consolidate its family of MLPs, including EPB. The acquisitions were completed in late November 2014.
EEP’s unit price benefited from a favorable incentive distribution rights (IDR) restructuring and strong volume and revenue growth in its liquids pipeline business. Further, the partnership’s sponsor, Enbridge, Inc. (ENB), recently announced a restructuring that could accelerate dropdowns into EEP and drive higher-than-expected distribution growth.
Key detractors from the Fund’s performance were Boardwalk Pipeline Partners, LP (BWP) and Seadrill Partners, LLC (SDLP).
In conjunction with BWP’s 2013 fourth quarter financial results, the partnership announced its intention to cut its distribution by 81%; this distribution cut was largely unexpected and resulted in a significant price reaction. The partnership had been contending with the challenging re-contracting environment faced by many natural gas pipeline operators over recent years but its decision to dramatically cut its distribution appeared to be primarily driven by a decision to self-finance its capital investment program rather than forced by financial distress. Notably, the partnership expects 4x cash flow coverage going forward: well in excess of a sector average of just above 1x. We believe the partnership’s decision reflects a significant departure from traditional sector participant behavior.
SDLP units were impacted as falling crude oil prices late in the reporting period induced a risk-off mentality in the market, and consequently a flight to more defensively-positioned, large-cap securities. At the same time, a cyclical slow-down in the offshore drilling industry has seen SDLP trade in sympathy with spot-exposed peers. To note, SDLP has no material exposure to underlying spot rates until 2017 due to contracts with investment-grade counterparties.
OUTLOOK
We believe the price correction in crude oil, should it continue, will serve to moderate crude oil production growth rates in aggregate but that the impact for the majority of midstream focused MLPs will be modest. Further, after the sector’s recent trading weakness we believe basic valuation metrics exited 2014 well within historical averages and provide an opportunity to earn a reasonable return on investment for those businesses positioned appropriately. Importantly, we believe that despite near-term price weakness and the likely moderation in growth trends for certain basins, the long-term production trends associated with the North American energy renaissance remain in place and are supportive of midstream assets generally.
It is also important to highlight that many businesses utilizing the MLP structure today are not related to energy infrastructure. A number of non-midstream businesses have entered the public markets utilizing the MLP structure. Clearly, an oil and gas producer, a refinery, or an oilfield services provider, whether organized as a corporation or MLP, will experience the underlying margin and business trends of those industries. Therefore, while we believe recent price weakness may represent an attractive entry point for those MLPs positioned to perform well despite recent commodity price weakness, investors should consider carefully the fundamental exposure presented by each specific MLP before committing capital.
Top Holdings and Allocations*
TOP TEN MASTER LIMITED PARTNERSHIP HOLDINGS
| Energy Transfer Partners LP | 9.21% |
| Enbridge Energy Partners LP | 8.68% |
| Regency Energy Partners LP | 7.76% |
| Williams Partners LP | 7.71% |
| NuStar Energy LP | 7.06% |
| TC Pipelines LP | 5.72% |
| Crestwood Midstream Partners LP | 5.09% |
| Buckeye Partners LP | 4.10% |
| Teekay LNG Partners LP | 3.84% |
| EnLink Midstream Partners LP | 3.33% |
Portfolio holdings and allocations are subject to change. Percentages are as of November 28, 2014, and based on net assets.
SECTOR ALLOCATION
Portfolio holdings and allocations are subject to change. Percentages are as of November 28, 2014, and based on the total value of investments.
| * | November 28, 2014, was the last business day of the Fund’s fiscal year. See Note 2 of the accompanying Notes to Financial Statements. |
Share Class Performance
AVERAGE ANNUAL TOTAL RETURNS WITHOUT SALES CHARGE AS OF 11/28/2014*
| | Inception Date | 1-Year | Since Inception |
| Class A (MLPDX) | 3/31/10 | 8.66% | 9.79% |
| Class C (MLPRX) | 6/10/11 | 7.84% | 7.93% |
| Class I (OSPMX) | 6/28/13 | 9.04% | 7.68%** |
| Class Y (MLPZX) | 3/31/10 | 8.85% | 10.04%** |
AVERAGE ANNUAL TOTAL RETURNS WITH SALES CHARGE AS OF 11/28/2014*
| | Inception Date | 1-Year | Since Inception |
| Class A (MLPDX) | 3/31/10 | 2.43% | 8.40% |
| Class C (MLPRX) | 6/10/11 | 6.84% | 7.93% |
| Class I (OSPMX) | 6/28/13 | 9.04% | 7.68%** |
| Class Y (MLPZX) | 3/31/10 | 8.85% | 10.04%** |
| * | November 28, 2014, was the last business day of the Fund’s annual period. See Note 2 of the accompanying Notes to Financial Statements. Index returns are calculated through November 30, 2014. |
| ** | Effective June 28, 2013, Class I shares were renamed Class Y shares. See Note 1 of the Notes to Financial Statements for additional information. |
Performance data quoted represents past performance, which does not guarantee future results. The investment return and principal value of an investment in the Fund will fluctuate so that an investor’s shares, when redeemed, may be worth more or less than their original cost. Current performance may be lower or higher than the performance quoted. Returns do not consider capital gains or income taxes on an individual’s investment. For performance data current to the most recent month-end, visit oppenheimerfunds.com or call 1.800.CALL.OPP (225.5677). Fund returns include changes in share price, reinvested distributions, and the applicable sales charge: for Class A shares, the current maximum initial sales charge of 5.75%; and for Class C, the contingent deferred sales charge of 1% for the 1-year period. There is no sales charge for Class I or Class Y shares.
The Fund’s performance is compared to the performance of the S&P 500 Index, and the Alerian MLP Index. The S&P 500 Index is an index of large-capitalization equity securities that is a measure of the general domestic stock market. The Alerian MLP Index is a composite of the 50 most prominent Master Limited Partnerships that provides investors with an unbiased, comprehensive benchmark for this emerging asset class. The index, which is calculated using a float-adjusted, capitalization-weighted methodology, is disseminated real-time on a total-return basis (AMZX). The indices are unmanaged and cannot be purchased directly by investors. While index comparisons may be useful to provide a benchmark for the Fund’s
performance, it must be noted that the Fund’s investments are not limited to the investments comprising the indices. Index performance includes reinvestment of income, but does not reflect transaction costs, fees, expenses or taxes. Index performance is shown for illustrative purposes only as a benchmark for the Fund’s performance, and does not predict or depict performance of the Fund. The Fund’s performance reflects the effects of the Fund’s business and operating expenses.
The Fund’s investment strategy and focus can change over time. The mention of specific fund holdings does not constitute a recommendation by OppenheimerFunds, Inc. or its affiliates.
Before investing in any of the Oppenheimer funds, investors should carefully consider a fund’s investment objectives, risks, charges and expenses. Fund prospectuses and summary prospectuses contain this and other information about the funds, and may be obtained by asking your financial adviser, visiting oppenheimerfunds.com, or calling 1.800.CALL.OPP (225.5677). Read prospectuses and summary prospectuses carefully before investing.
Shares of Oppenheimer funds are not deposits or obligations of any bank, are not guaranteed by any bank, are not insured by the FDIC or any other agency, and involve investment risks, including the possible loss of the principal amount invested.
Fund Expenses
Fund Expenses. As a shareholder of the Fund, you incur two types of costs: (1) transaction costs, which may include sales charges (loads) on purchase payments, contingent deferred sales charges on redemptions; and (2) ongoing costs, including management fees; distribution and service fees; and other Fund expenses. These examples are intended to help you understand your ongoing costs (in dollars) of investing in the Fund and to compare these costs with the ongoing costs of investing in other mutual funds.
The examples are based on an investment of $1,000.00 invested at the beginning of the period and held for the entire 6-month period ended November 28, 2014.
Actual Expenses. The first section of the table provides information about actual account values and actual expenses. You may use the information in this section for the class of shares you hold, together with the amount you invested, to estimate the expense that you paid over the period. Simply divide your account value by $1,000.00 (for example, an $8,600.00 account value divided by $1,000.00 = 8.60), then multiply the result by the number in the first section under the heading entitled “Expenses Paid During Period” to estimate the expenses you paid on your account during this period.
Hypothetical Example for Comparison Purposes. The second section of the table provides information about hypothetical account values and hypothetical expenses based on the Fund’s actual expense ratio for each class of shares, and an assumed rate of return of 5% per year for each class before expenses, which is not the actual return. The hypothetical account values and expenses may not be used to estimate the actual ending account balance or expenses you paid for the period. You may use this information to compare the ongoing costs of investing in the Fund and other funds. To do so, compare this 5% hypothetical example for the class of shares you hold with the 5% hypothetical examples that appear in the shareholder reports of the other funds.
Please note that the expenses shown in the table are meant to highlight your ongoing costs only and do not reflect any transactional costs, such as front-end or contingent deferred sales charges (loads). Therefore, the “hypothetical” section of the table is useful in comparing ongoing costs only, and will not help you determine the relative total costs of owning different funds. In addition, if these transactional costs were included, your costs would have been higher.
| Actual | Beginning
Account
Value
June 1, 2014 | Ending
Account
Value
November 28,
2014 | Expenses
Paid During
6 Months Ended
November 28,
2014 |
| Class A | $1,000.00 | $1,020.20 | $16.77 |
| Class C | 1,000.00 | 1,016.00 | 20.51 |
| Class I | 1,000.00 | 1,021.70 | 15.20 |
| Class Y | 1,000.00 | 1,020.90 | 15.50 |
| | | | |
Hypothetical
(5% return before expenses) | | | |
| Class A | 1,000.00 | 1,008.40 | 16.67 |
| Class C | 1,000.00 | 1,004.65 | 20.40 |
| Class I | 1,000.00 | 1,009.96 | 15.11 |
| Class Y | 1,000.00 | 1,009.66 | 15.41 |
Expenses are equal to the Fund’s annualized expense ratio for that class, multiplied by the average account value over the period, multiplied by 181/365 (to reflect the one-half year period). Those annualized expense ratios, excluding indirect expenses from affiliated funds, and deferred tax expense, based on the 6-month period ended November 28, 2014 are as follows:
| Class | Expense Ratios |
| Class A | 3.31% |
| Class C | 4.06 |
| Class I | 3.00 |
| Class Y | 3.06 |
The expense ratios for Class A, C, and Y reflect contractual waivers and/or reimbursements of expenses by the Fund’s Manager. Some of these undertakings may be modified or terminated at any time, as indicated in the Fund’s prospectus. The “Financial Highlights” tables in the Fund’s financial statements, included in this report, also show the gross expense ratios, without such waivers or reimbursements, if applicable.
STATEMENT OF INVESTMENTS November 28, 2014*
| Description | | Shares | | | Value | |
| Master Limited Partnership Shares — 94.1% | |
| Coal — 0.1% | | | | |
| Foresight Energy LP | | | 378,580 | | | $ | 6,663,008 | |
| | | | | | | | | |
| Diversified — 8.4% | | | | | | | | |
| ONEOK Partners LP | | | 737,888 | | | | 32,526,103 | |
| Williams Partners LP | | | 7,169,931 | | | | 370,972,230 | |
| Total Diversified | | | | | | | 403,498,333 | |
| | | | | | | | | |
| Gathering/Processing — 24.0% | |
American Midstream Partners LP 1 | | | 1,170,862 | | | | 26,133,640 | |
Compressco Partners LP 1 | | | 1,668,990 | | | | 34,097,466 | |
Crestwood Midstream Partners LP 1 | | | 12,195,607 | | | | 244,887,788 | |
| EnLink Midstream Partners LP | | | 5,747,331 | | | | 160,293,061 | |
Exterran Partners LP 1 | | | 5,163,704 | | | | 127,646,763 | |
Midcoast Energy Partners LP 1 | | | 3,100,729 | | | | 47,751,227 | |
| Regency Energy Partners LP | | | 13,104,727 | | | | 373,353,672 | |
Southcross Energy Partners LP 1 | | | 2,414,581 | | | | 42,110,293 | |
| Targa Resources Partners LP | | | 570,751 | | | | 31,294,277 | |
USA Compression Partners LP 1 | | | 3,429,769 | | | | 65,165,611 | |
| Total Gathering/Processing | | | | | | | 1,152,733,798 | |
| | | | | | | | | |
| Marine — 7.5% | | | | | | | | |
| Dynagas LNG Partners LP | | | 792,184 | | | | 14,188,016 | |
| GasLog Partners LP | | | 227,928 | | | | 5,823,560 | |
| Golar LNG Partners LP | | | 1,337,789 | | | | 44,013,258 | |
KNOT Offshore Partners LP 1 | | | 1,005,136 | | | | 22,233,608 | |
| Seadrill Partners LLC | | | 2,538,663 | | | | 42,954,178 | |
| Description | | Shares | | | Value | |
| Marine — 7.5% (Continued) | | | | |
Teekay LNG Partners LP 1 | | | 5,135,083 | | | $ | 184,965,690 | |
| Teekay Offshore Partners LP | | | 1,911,030 | | | | 49,132,581 | |
| Total Marine | | | | | | | 363,310,891 | |
| | | | | | | | | |
| Natural Gas Pipelines — 17.9% | |
CrossAmerica Partners LP 1 | | | 1,545,416 | | | | 51,014,182 | |
| Energy Transfer Equity LP | | | 1,546,332 | | | | 91,836,657 | |
| Energy Transfer Partners LP | | | 6,796,703 | | | | 442,941,135 | |
TC Pipelines LP 1 | | | 3,821,552 | | | | 275,113,529 | |
| Total Natural Gas Pipelines | | | | | | | 860,905,503 | |
| | | | | | | | | |
| Petroleum Transportation — 29.4% | |
Arc Logistics Partners LP 1 | | | 1,605,368 | | | | 35,318,096 | |
| Buckeye Partners LP | | | 2,567,808 | | | | 197,387,401 | |
| Enbridge Energy Partners LP | | | 11,135,998 | | | | 417,599,925 | |
Global Partners LP 1 | | | 1,855,665 | | | | 77,566,797 | |
| Holly Energy Partners LP | | | 1,332,362 | | | | 44,833,981 | |
Martin Midstream Partners LP 1 | | | 3,523,563 | | | | 123,430,412 | |
| NGL Energy Partners LP | | | 3,027,844 | | | | 105,671,756 | |
NuStar Energy LP 1 | | | 6,066,052 | | | | 339,698,912 | |
Sprague Resources LP 1 | | | 1,530,958 | | | | 34,400,626 | |
| TransMontaigne Partners LP | | | 560,614 | | | | 20,692,263 | |
USD Partners LP 1,2 | | | 603,060 | | | | 9,003,686 | |
| World Point Terminals LP | | | 399,798 | | | | 7,584,168 | |
| Total Petroleum Transportation | | | | | | | 1,413,188,023 | |
STATEMENT OF INVESTMENTS (Continued)
| Description | | Shares | | | Value | |
| Propane — 6.8% | | | | | | |
| Amerigas Partners LP | | | 2,306,756 | | | $ | 106,549,060 | |
| Ferrellgas Partners LP | | | 3,819,865 | | | | 106,039,452 | |
| Suburban Propane Partners LP | | | 2,512,889 | | | | 113,080,005 | |
| Total Propane | | | | | | | 325,668,517 | |
| | | | | | | | | |
| Total Master Limited Partnership Shares | |
| (identified cost $3,756,632,567) | | | | 4,525,968,073 | |
| | | | | | | | | |
| Common Stock — 2.0% | |
| Diversified — 0.6% | | | | | | | | |
| Abengoa Yield PLC | | | 1,067,750 | | | | 30,110,550 | |
| | | | | | | | | |
| Petroleum Transportation — 1.4% | |
Enbridge Energy Management LLC 2 | | | 1,806,621 | | | | 65,761,007 | |
| | | | | | | | | |
| Total Common Stock | | | | | |
| (identified cost $76,729,478) | | | | 95,871,557 | |
| | | | | | | | | |
| Preferred Stock — 0.4% | |
| Marine — 0.4% | | | | | | | | |
| Teekay Offshore Partners, 7.25% | | | 766,550 | | | | 18,512,183 | |
| | | | | | | | | |
| Total Preferred Stocks | | | | | |
| (identified cost $19,163,750) | | | | 18,512,183 | |
| | | | | | | | | |
| Private Investment in Public Equity — 0.3% | |
| Gathering/Processing — 0.3% | | | | | |
American Midstream Pipe Units 3 | | | 898,468 | | | | 17,430,279 | |
| | | | | | | | | |
| Total Private Investment in Public Equity | |
| (identified cost $23,187,213) | | | | 17,430,279 | |
| Description | | Shares | | | Value | |
| Short-Term Investments — 2.7% | |
| Money Market — 2.7% | | | | |
Fidelity Treasury Portfolio , 0.010% 4 | | | 129,203,168 | | | $ | 129,203,168 | |
| | | | | | | | | |
| Total Short-Term Investments | |
| (identified cost $129,203,168) | | | | 129,203,168 | |
| | | | | | | | | |
| Total Investments — 99.5% | |
| (identified cost $4,004,916,176) | | | | 4,786,985,260 | |
| Other Assets In Excess of Liabilities — 0.5% | | | | 23,696,348 | |
| Net Assets — 100.0% | | | $ | 4,810,681,608 | |
STATEMENT OF INVESTMENTS (Continued)
Footnotes to Statement of Investments
LLC — Limited Liability Company
LP — Limited Partnership
| * | November 28, 2014 and November 29, 2013 represent the last business day of the Fund’s annual period. See Note 2 of the accompanying notes. |
| 1. | Is or was an affiliate, as defined by the Investment Company Act of 1940, at or during the year ended November 28, 2014, by virtue of the Fund owning at least 5% of the voting securities of the issuer. Transactions during this year in which the issuer was an affiliate are as follows: |
| | | Shares
November 29, 2013* | | | Gross
Additions | | | Gross
Reductions | | | Shares
November 28, 2014* | |
| American Midstream Partners LP | | | 693,030 | | | | 477,832 | | | | — | | | | 1,170,862 | |
| Arc Logistic Partners LP | | | 1,029,058 | | | | 576,310 | | | | — | | | | 1,605,368 | |
| Compressco Partners LP | | | 462,160 | | | | 1,239,000 | | | | (32,170 | ) | | | 1,668,990 | |
| Crestwood Midstream Partners LP | | | 7,219,221 | | | | 4,976,386 | | | | — | | | | 12,195,607 | |
CrossAmerica Partners LPi | | | 1,127,152 | | | | 418,264 | | | | — | | | | 1,545,416 | |
EnLink Midstream Partners LPii | | | 5,747,331 | | | | — | | | | — | | | | 5,747,331 | |
| Exterran Partners LP | | | 4,159,600 | | | | 1,004,104 | | | | — | | | | 5,163,704 | |
| Global Partners LP | | | 1,855,665 | | | | — | | | | — | | | | 1,855,665 | |
| KNOT Offshore Partners LP | | | 313,760 | | | | 691,376 | | | | — | | | | 1,005,136 | |
| Martin Midstream Partners LP | | | 2,415,455 | | | | 1,108,108 | | | | — | | | | 3,523,563 | |
| Midcoast Energy Partners LP | | | 2,728,741 | | | | 371,988 | | | | — | | | | 3,100,729 | |
| Nustar Energy LP | | | 1,354,619 | | | | 4,711,433 | | | | — | | | | 6,066,052 | |
| Southcross Energy Partners LP | | | 1,744,310 | | | | 670,271 | | | | — | | | | 2,414,581 | |
| Sprague Resources LP | | | 493,500 | | | | 1,037,458 | | | | — | | | | 1,530,958 | |
| TC Pipelines LP | | | 3,513,024 | | | | 308,528 | | | | — | | | | 3,821,552 | |
| Teekay LNG Partners LP | | | 2,432,084 | | | | 2,702,999 | | | | — | | | | 5,135,083 | |
| USA Compression Partners LP | | | 2,650,571 | | | | 779,198 | | | | — | | | | 3,429,769 | |
| USD Partners LP | | | — | | | | 603,060 | | | | — | | | | 603,060 | |
| | | Value | | | Distributions | | | Realized
Gain/(Loss) | | | | | |
| American Midstream Partners LP | | $ | 26,133,640 | | | $ | 2,022,791 | | | $ | — | | | | | |
| Arc Logistic Partners LP | | | 35,318,096 | | | | 2,184,900 | | | | — | | | | | |
| Compressco Partners LP | | | 34,097,466 | | | | 1,355,846 | | | | 354,902 | | | | | |
| Crestwood Midstream Partners LP | | | 244,887,788 | | | | 15,810,089 | | | | — | | | | | |
CrossAmerica Partners LPi | | | 51,014,182 | | | | — | | | | — | | | | | |
EnLink Midstream Partners LPii | | | 160,293,061 | | | | 8,362,367 | | | | — | | | | | |
| Exterran Partners LP | | | 127,646,763 | | | | 10,681,514 | | | | — | | | | | |
| Global Partners LP | | | 77,566,797 | | | | 4,690,193 | | | | — | | | | | |
| KNOT Offshore Partners LP | | | 22,233,608 | | | | 1,033,167 | | | | — | | | | | |
| Martin Midstream Partners LP | | | 123,430,412 | | | | 9,971,624 | | | | — | | | | | |
| Midcoast Energy Partners LP | | | 47,751,227 | | | | 3,539,296 | | | | — | | | | | |
| Nustar Energy LP | | | 339,698,912 | | | | 17,844,846 | | | | — | | | | | |
| Southcross Energy Partners LP | | | 42,110,293 | | | | 3,166,198 | | | | — | | | | | |
| Sprague Resources LP | | | 34,400,626 | | | | 1,769,915 | | | | — | | | | | |
| TC Pipelines LP | | | 275,113,529 | | | | 12,546,412 | | | | — | | | | | |
| Teekay LNG Partners LP | | | 184,965,690 | | | | 9,321,104 | | | | — | | | | | |
| USA Compression Partners LP | | | 65,165,611 | | | | 5,956,503 | | | | — | | | | | |
| USD Partners LP | | | 9,003,686 | | | | — | | | | — | | | | | |
STATEMENT OF INVESTMENTS (Continued)
| i. | Name change from Lehigh Gas Partners LP effective October 6, 2014. |
| ii. | Name change from Crosstex Energy LP effective March 10, 2014. Is not an affiliate as of November 28, 2014. |
| 3. | Represents securities sold under Rule 144A, which are exempt from registration under the Securities Act of 1933, as amended. These securities have been determined to be liquid under the guidelines established by the Board of Trustees. These securities amount to $17,430,279 or 0.3% of the Fund’s net assets as of November 28, 2014. |
| 4. | Variable rate security; the coupon rate represents the rate at November 28, 2014. |
See accompanying Notes to Financial Statements.
STATEMENT OF
ASSETS AND LIABILITIES November 28, 2014*
| Assets | | | |
| Investments at value – see accompanying Statement of Investments: | | | |
| Unaffiliated companies (cost $2,455,818,169) | | $ | 3,046,446,934 | |
| Affiliated companies (cost $1,549,098,007) | | | 1,740,538,326 | |
| | | | 4,786,985,260 | |
| Dividends receivable | | | 710,242 | |
| Receivable for beneficial interest sold | | | 19,915,355 | |
| Receivable for investments sold | | | 326,667,263 | |
| Prepaid expenses | | | 165,999 | |
| Total assets | | | 5,134,441,119 | |
| | | | | |
| Liabilities: | | | | |
| Borrowing expense payable | | | 14,665 | |
| Payable for beneficial interest redeemed | | | 19,856,100 | |
| Payable for investments purchased | | | 10,367,432 | |
| Deferred tax liability | | | 284,502,608 | |
| Payable to Manager | | | 3,194,054 | |
| Payable for distribution and service plan fees | | | 1,851,058 | |
| Payable for income distribution | | | 2,290,446 | |
| Transfer agent fees payable | | | 880,224 | |
| Trustees' fees payable | | | 30,912 | |
| Other liabilities | | | 775,012 | |
| Total liabilities | | | 323,762,511 | |
| | | | | |
| Net Assets | | $ | 4,810,681,608 | |
| | | | | |
| Composition of Net Assets | | | | |
| Par value of shares of beneficial interest | | $ | 439,843 | |
| Paid-in capital | | | 4,335,166,183 | |
| Undistributed net investment loss, net of deferred taxes | | | (58,229,317 | ) |
| Accumulated undistributed net realized gains on investments, net of deferred taxes | | | 43,004,305 | |
| Net unrealized appreciation on investments, net of deferred taxes | | | 490,300,594 | |
| Net Assets | | $ | 4,810,681,608 | |
| | | | | |
| Net Asset Value, Offering Price and Redemption Proceeds Per Share ($0.001 Par Value, Unlimited Shares Authorized) | | | | |
| Class A Shares: | | | | |
| Net asset value and redemption proceeds per share | | $ | 11.01 | |
| Offering price per share (net asset value plus sales charge of 5.75% of offering price) | | $ | 11.68 | |
| Class C Shares: | | | | |
| Net asset value, offering price and redemption proceeds per share | | $ | 10.73 | |
| Class I Shares: | | | | |
| Net asset value, offering price and redemption proceeds per share | | $ | 11.17 | |
| Class Y Shares: | | | | |
| Net asset value, offering price and redemption proceeds per share | | $ | 11.15 | |
STATEMENT OF
ASSETS AND LIABILITIES (Continued)
| Net Assets: | | | |
| Class A shares | | $ | 2,116,789,624 | |
| Class C shares | | | 1,701,551,600 | |
| Class I shares | | | 331,341 | |
| Class Y shares | | | 992,009,043 | |
| Total Net Assets | | $ | 4,810,681,608 | |
| | | | | |
| Shares Outstanding: | | | | |
| Class A shares | | | 192,290,883 | |
| Class C shares | | | 158,572,363 | |
| Class I shares | | | 29,668 | |
| Class Y shares | | | 88,950,307 | |
| Total Shares Outstanding | | | 439,843,221 | |
| * | November 28, 2014 represents the last business day of the Fund’s annual period. See Note 2 of the accompanying Notes. |
See accompanying Notes to Financial Statements.
STATEMENT OF
OPERATIONS For the Year Ended November 28, 2014*
| Investment Income | | | |
| Distributions from Master Limited Partnerships from: | | | |
| Unaffiliated Master Limited Partnerships | | $ | 159,502,937 | |
| Affiliated Master Limited Partnerships | | | 110,256,765 | |
| Less return of capital on distributions from: | | | | |
| Unaffiliated Master Limited Partnerships | | | (159,502,937 | ) |
| Affiliated Master Limited Partnerships | | | (110,256,765 | ) |
| Dividend income (net of foreign withholding tax of $31,627) | | | 3,910,582 | |
| Total investment income | | | 3,910,582 | |
| | | | | |
| Expenses | | | | |
| Management fees | | | 37,391,921 | |
| Distribution and service plan fees | | | | |
| Class A | | | 4,669,514 | |
| Class C | | | 13,160,604 | |
| Transfer agent fees | | | | |
| Class A | | | 4,109,172 | |
| Class C | | | 2,895,333 | |
| Class I | | | 51 | |
| Class Y | | | 1,698,584 | |
| Tax expense | | | 517,977 | |
| Administrative fees | | | 816,699 | |
| Borrowing fees | | | 502,764 | |
| Custody fees | | | 197,081 | |
| Trustees' fees | | | 147,522 | |
| Other | | | 914,249 | |
| Total expenses, before waivers and deferred taxes | | | 67,021,471 | |
| Less expense waivers | | | (4,687,900 | ) |
| Net expenses, before deferred taxes | | | 62,333,571 | |
| | | | | |
| Net investment loss, before deferred taxes | | | (58,422,989 | ) |
| Deferred tax benefit | | | 22,153,096 | |
| Net investment loss, net of deferred taxes | | | (36,269,893 | ) |
| | | | | |
| Net Realized and Unrealized Gains on Investments: | | | | |
| Net Realized Gains/(Losses) | | | | |
| Investments from | | | | |
| Unaffiliated companies | | | 66,340,117 | |
| Affiliated companies | | | 354,902 | |
| Deferred tax expense | | | (25,058,957 | ) |
| Net realized gains, net of deferred taxes | | | 41,636,062 | |
| Net Change in Unrealized Appreciation | | | | |
| Investments | | | 450,838,692 | |
| Deferred tax expense | | | (170,467,854 | ) |
| Net change in unrealized appreciation, net of deferred taxes | | | 280,370,838 | |
| | | | | |
| Net realized and unrealized gains on investments, net of deferred taxes | | | 322,006,900 | |
| Change in net assets resulting from operations | | $ | 285,737,007 | |
| * | November 28, 2014 represents the last business day of the Fund’s annual period. See Note 2 of the accompanying Notes. |
See accompanying Notes to Financial Statements.
STATEMENTS OF CHANGES IN NET ASSETS
| | | For the
Year Ended
November 28, 2014* | | | For the
Year Ended
November 29, 2013* | |
| Operations | | | | | | |
| Net investment loss, net of deferred taxes | | $ | (36,269,893 | ) | | $ | (13,494,584 | ) |
| Net realized gain/loss on investments, net of deferred taxes | | | 41,636,062 | | | | (5,208,622 | ) |
| Net change in unrealized appreciation on investments, net of deferred taxes | | | 280,370,838 | | | | 187,685,709 | |
| Change in net assets resulting from operations | | | 285,737,007 | | | | 168,982,503 | |
| | | | | | | | | |
| Distributions to Shareholders | | | | | | | | |
| Distributions to shareholders from return of capital: | | | | | | | | |
| Class A shares | | | (131,858,031 | ) | | | (62,917,173 | ) |
| Class C shares | | | (96,172,803 | ) | | | (32,091,774 | ) |
| Class I shares | | | (12,451 | ) | | | (2,144 | ) |
| Class Y shares | | | (54,384,943 | ) | | | (21,656,010 | ) |
| Change in net assets resulting from distributions to shareholders | | | (282,428,228 | ) | | | (116,667,101 | ) |
| | | | | | | | | |
| Beneficial Interest Transactions | | | | | | | | |
| Class A shares | | | 650,338,375 | | | | 1,080,780,582 | |
| Class C shares | | | 844,607,021 | | | | 828,751,322 | |
| Class I shares | | | 226,204 | | | | 112,026 | |
| Class Y shares | | | 455,741,298 | | | | 389,711,482 | |
| Change in net assets resulting from beneficial interest transactions | | | 1,950,912,898 | | | | 2,299,355,412 | |
| Change in net assets | | | 1,954,221,677 | | | | 2,351,670,814 | |
| | | | | | | | | |
| Net Assets | | | | | | | | |
| Beginning of period | | | 2,856,459,931 | | | | 504,789,117 | |
| End of period | | $ | 4,810,681,608 | | | $ | 2,856,459,931 | |
| | | | | | | | | |
| Undistributed net investment loss, net of deferred taxes | | $ | (58,229,317 | ) | | $ | (21,959,424 | ) |
| * | November 28, 2014 and November 29, 2013 represent the last business day of the Funds’ annual period. See Note 2 of the accompanying Notes. |
See accompanying Notes to Financial Statements.
FINANCIAL HIGHLIGHTS
| Class A | | Year Ended November 28,
2014* | | | Year Ended November 29,
2013* | | | Year Ended November 30,
2012 | | | Year Ended November 30,
2011 | | | Period Ended November 30,
2010 1 | |
| Per Share Operating Data | | | | | | | | | | | | | | | |
| Net Asset Value, Beginning of Period | | $ | 10.86 | | | $ | 9.83 | | | $ | 10.14 | | | $ | 10.83 | | | $ | 10.00 | |
| Income/(loss) from investment operations: | | | | | | | | | | | | | | | | | | | | |
Net investment loss 2 | | | (0.09 | ) | | | (0.09 | ) | | | (0.09 | ) | | | (0.09 | ) | | | (0.04 | ) |
Return of capital 2 | | | 0.48 | | | | 0.49 | | | | 0.48 | | | | 0.47 | | | | 0.31 | |
| Net realized and unrealized gains/(losses) | | | 0.54 | | | | 1.41 | | | | 0.08 | | | | (0.24 | ) | | | 1.00 | |
| Total from investment operations | | | 0.93 | | | | 1.81 | | | | 0.47 | | | | 0.14 | | | | 1.27 | |
| Distributions to shareholders: | | | | | | | | | | | | | | | | | | | | |
| Return of capital | | | (0.78 | ) | | | (0.78 | ) | | | (0.70 | ) | | | (0.83 | ) | | | (0.44 | ) |
| Income | | | — | | | | — | | | | (0.08 | ) | | | — | | | | — | |
| Total distributions to shareholders | | | (0.78 | ) | | | (0.78 | ) | | | (0.78 | ) | | | (0.83 | ) | | | (0.44 | ) |
| Net asset value, end of period | | $ | 11.01 | | | $ | 10.86 | | | $ | 9.83 | | | $ | 10.14 | | | $ | 10.83 | |
| | | | | | | | | | | | | | | | | | | | | |
Total Return, at Net Asset Value 3 | | | 8.66 | % | | | 18.79 | % | | | 4.61 | % | | | 1.27 | % | | | 13.10 | % |
| | | | | | | | | | | | | | | | | | | | | |
| Ratios /Supplemental Data | | | | | | | | | | | | | | | | | | | | |
| Net assets, end of period (in thousands) | | $ | 2,116,790 | | | $ | 1,452,182 | | | $ | 333,544 | | | $ | 172,056 | | | $ | 58,464 | |
Ratio of Expenses to Average Net Assets: 4 | | | | | | | | | | | | | | | | | |
| Before (waivers) and deferred tax expense | | | 1.50 | % | | | 1.42 | % | | | 1.51 | % | | | 1.62 | % | | | 1.93 | % |
| Expense (waivers) | | | (0.12 | %) | | | (0.07 | %) | | | (0.16 | %) | | | (0.27 | %) | | | (0.58 | %) |
| Net of (waivers) and before deferred tax expense | | | 1.38 | %5 | | | 1.35 | %6 | | | 1.35 | % | | | 1.35 | % | | | 1.35 | % |
Deferred tax expense 7,8 | | | 4.38 | % | | | 6.97 | % | | | 2.02 | % | | | (0.77 | %) | | | 17.05 | % |
| Total expenses | | | 5.76 | % | | | 8.32 | % | | | 3.37 | % | | | 0.58 | % | | | 18.40 | % |
| | | | | | | | | | | | | | | | | | | | | |
Ratio of Investment Loss to Average Net Assets: 4 | | | | | | | | | | | | | | | | | |
| Before (waivers) and deferred tax expense | | | (1.41 | %) | | | (1.32 | %) | | | (1.51 | %) | | | (1.61 | %) | | | (1.54 | %) |
| Expense (waivers) | | | (0.12 | %) | | | (0.07 | %) | | | (0.16 | %) | | | (0.27 | %) | | | (0.58 | %) |
| Net of (waivers) and before deferred tax expense | | | (1.29 | %) | | | (1.25 | %) | | | (1.35 | %) | | | (1.34 | %) | | | (0.96 | %) |
Deferred tax benefit 8,9 | | | 0.56 | % | | | 0.45 | % | | | 0.47 | % | | | 0.50 | % | | | 0.39 | % |
| Net investment loss | | | (0.73 | %) | | | (0.80 | %) | | | (0.88 | %) | | | (0.84 | %) | | | (0.57 | %) |
| | | | | | | | | | | | | | | | | | | | | |
| Portfolio turnover rate | | | 14 | % | | | 4 | % | | | 29 | % | | | 24 | % | | | 15 | % |
| * | November 28, 2014 and November 29, 2013 represent the last business day of the Fund’s respective reporting periods. See Note 2 of the accompanying Notes. |
| 1. | The net asset value for the beginning of the period close of business March 31, 2010 (Commencement of Operations) through November 30, 2010 represents the initial contribution per share of $10. |
| 2. | Per share amounts calculated based on average shares outstanding during the period. |
| 3. | Assumes an initial investment on the business day before the first day of the fiscal period, with all dividends and distributions reinvested in additional shares on the reinvestment date, and redemptions at the net asset value calculated on the last business day of the fiscal period. Sales charges are not reflected in the total returns. Total returns are not annualized for periods less than one full year. Returns do not reflect the deduction of taxes that a shareholder would pay on fund distributions or the redemption of fund shares. |
| 4. | Annualized for less than full period. |
| 5. | Includes borrowing and franchise tax expense. Without borrowing and franchise tax expense, the net expense ratio would be 1.35%. |
| 6. | Includes franchise tax expense. Without franchise tax expense the net expense ratio would be 1.35%. |
| 7. | Deferred tax expense estimate for the ratio calculation is derived from the net investment income/loss, and realized and unrealized gains/losses. |
| 8. | Effective December 1, 2013 the deferred tax expense and deferred tax benefit are allocated based on average net assets. Prior to December 1, 2013 the deferred tax expense and deferred tax benefit were allocated based on specific class expenses. |
| 9. | Deferred tax benefit for the ratio calculation is derived from net investment income/loss only. |
See accompanying Notes to Financial Statements.
FINANCIAL HIGHLIGHTS (Continued)
| Class C | | Year Ended November 28,
2014* | | | Year Ended November 29,
2013* | | | Year Ended November 30,
2012 | | | Period Ended November 30,
2011 1 | |
| Per Share Operating Data | | | | | | | | | | | | |
| Net Asset Value, Beginning of Period | | $ | 10.68 | | | $ | 9.75 | | | $ | 10.13 | | | $ | 10.66 | |
| Income/(loss) from investment operations: | | | | | | | | | | | | | | | | |
Net investment loss 2 | | | (0.17 | ) | | | (0.14 | ) | | | (0.13 | ) | | | (0.06 | ) |
Return of capital 2 | | | 0.48 | | | | 0.50 | | | | 0.51 | | | | 0.26 | |
| Net realized and unrealized gains/(losses) | | | 0.52 | | | | 1.35 | | | | 0.02 | | | | (0.34 | ) |
| Total from investment operations | | | 0.83 | | | | 1.71 | | | | 0.40 | | | | (0.14 | ) |
| Distributions to shareholders: | | | | | | | | | | | | | | | | |
| Return of capital | | | (0.78 | ) | | | (0.78 | ) | | | (0.70 | ) | | | (0.39 | ) |
| Income | | | — | | | | — | | | | (0.08 | ) | | | — | |
| Total distributions to shareholders | | | (0.78 | ) | | | (0.78 | ) | | | (0.78 | ) | | | (0.39 | ) |
| Net asset value, end of period | | $ | 10.73 | | | $ | 10.68 | | | $ | 9.75 | | | $ | 10.13 | |
| | | | | | | | | | | | | | | | | |
Total Return, at Net Asset Value 3 | | | 7.84 | % | | | 17.88 | % | | | 3.89 | % | | | (1.31 | %) |
| | | | | | | | | | | | | | | | | |
| Ratios /Supplemental Data | | | | | | | | | | | | | | | | |
| Net assets, end of period (in thousands) | | $ | 1,701,552 | | | $ | 869,041 | | | $ | 36,764 | | | $ | 2,826 | |
Ratio of Expenses to Average Net Assets: 4 | | | | | | | | | | | | | | | | |
| Before (waivers) and deferred tax expense | | | 2.25 | % | | | 2.18 | % | | | 2.37 | % | | | 4.44 | % |
| Expense (waivers) | | | (0.12 | %) | | | (0.07 | %) | | | (0.27 | %) | | | (2.34 | %) |
| Net of (waivers) and before deferred tax expense | | | 2.13 | %5 | | | 2.11 | %6 | | | 2.10 | % | | | 2.10 | % |
Deferred tax expense 7,8 | | | 4.38 | % | | | 5.39 | % | | | 1.78 | % | | | (1.31 | %) |
| Total expenses | | | 6.51 | % | | | 7.50 | % | | | 3.88 | % | | | 0.79 | % |
| | | | | | | | | | | | | | | | | |
Ratio of Investment Loss to Average Net Assets: 4 | | | | | | | | | | | | | | | | |
| Before (waivers) and deferred tax expense | | | (2.21 | %) | | | (2.08 | %) | | | (2.37 | %) | | | (4.44 | %) |
| Expense (waivers) | | | (0.12 | %) | | | (0.07 | %) | | | (0.27 | %) | | | (2.34 | %) |
| Net of (waivers) and before deferred tax expense | | | (2.09 | %) | | | (2.01 | %) | | | (2.10 | %) | | | (2.10 | %) |
Deferred tax benefit 8,9 | | | 0.56 | % | | | 0.73 | % | | | 0.75 | % | | | 0.79 | % |
| Net investment loss | | | (1.53 | %) | | | (1.28 | %) | | | (1.35 | %) | | | (1.31 | %) |
| | | | | | | | | | | | | | | | | |
| Portfolio turnover rate | | | 14 | % | | | 4 | % | | | 29 | % | | | 24 | % |
| * | November 28, 2014 and November 29, 2013 represent the last business day of the Fund’s respective reporting periods. See Note 2 of the accompanying Notes. |
| 1. | Shares commenced operations at the close of business June 10, 2011. |
| 2. | Per share amounts calculated based on average shares outstanding during the period. |
| 3. | Assumes an initial investment on the business day before the first day of the fiscal period, with all dividends and distributions reinvested in additional shares on the reinvestment date, and redemptions at the net asset value calculated on the last business day of the fiscal period. Sales charges are not reflected in the total returns. Total returns are not annualized for periods less than one full year. Returns do not reflect the deduction of taxes that a shareholder would pay on fund distributions or the redemption of fund shares. |
| 4. | Annualized for less than full period. |
| 5. | Includes borrowing and franchise tax expense. Without borrowing and franchise tax expense, the net expense ratio would be 2.10%. |
| 6. | Includes franchise tax expense. Without franchise tax expense the net expense ratio would be 2.10%. |
| 7. | Deferred tax expense estimate for the ratio calculation is derived from the net investment income/loss, and realized and unrealized gains/losses. |
| 8. | Effective December 1, 2013 the deferred tax expense and deferred tax benefit are allocated based on average net assets. Prior to December 1, 2013 the deferred tax expense and deferred tax benefit were allocated based on specific class expenses. |
| 9. | Deferred tax benefit for the ratio calculation is derived from net investment income/loss only. |
See accompanying Notes to Financial Statements.
FINANCIAL HIGHLIGHTS (Continued)
| Class I | | Year Ended November 28,
2014* | | | Period Ended November 29,
2013*, 1, 2 | |
| Per Share Operating Data | | | | | | |
| Net Asset Value, Beginning of Period | | $ | 10.97 | | | $ | 11.15 | |
| Income/(loss) from investment operations: | | | | | | | | |
Net investment income/(loss) 3 | | | 0.01 | | | | (0.03 | ) |
Return of capital 3 | | | 0.48 | | | | 0.22 | |
| Net realized and unrealized gains | | | 0.49 | | | | 0.02 | |
| Total from investment operations | | | 0.98 | | | | 0.21 | |
| Distributions to shareholders: | | | | | | | | |
| Return of capital | | | (0.78 | ) | | | (0.39 | ) |
| Net asset value, end of period | | $ | 11.17 | | | $ | 10.97 | |
| | | | | | | | | |
Total Return, at Net Asset Value 4 | | | 9.04 | % | | | 1.90 | % |
| | | | | | | | | |
| Ratios/Supplemental Data | | | | | | | | |
| Net assets, end of period (in thousands) | | $ | 331 | | | $ | 113 | |
Ratio of Expenses to Average Net Assets: 5 | | | | | | | | |
| Before deferred tax expense | | | 1.05 | %6 | | | 1.16 | %7 |
Deferred tax expense 8,9 | | | 4.38 | % | | | 2.23 | % |
| Total expenses | | | 5.43 | % | | | 3.39 | % |
| | | | | | | | | |
Ratio of Investment Loss to Average Net Assets: 5 | | | | | | | | |
| Before deferred tax expense | | | (0.45 | %) | | | (1.05 | %) |
Deferred tax benefit 9,10 | | | 0.56 | % | | | 0.37 | % |
| Net investment income/(loss) | | | 0.11 | % | | | (0.68 | %) |
| | | | | | | | | |
| Portfolio turnover rate | | | 14 | % | | | 4 | % |
| * | November 28, 2014 and November 29, 2013 represent the last business day of the Fund’s respective reporting periods. See Note 2 of the accompanying Notes. |
| 1. | Effective June 28, 2013, Class I shares were renamed Class Y shares. See Note 1 of the Notes to Financial Statements for additional information. |
| 2. | Shares commenced operations at the close of business June 28, 2013. |
| 3. | Per share amounts calculated based on average shares outstanding during the period. |
| 4. | Assumes an initial investment on the business day before the first day of the fiscal period, with all dividends and distributions reinvested in additional shares on the reinves1tment date, and redemptions at the net asset value calculated on the last business day of the fiscal period. Total returns are not annualized for periods less than one full year. Returns do not reflect the deduction of taxes that a shareholder would pay on fund distributions or the redemption of fund shares. |
| 5. | Annualized for less than full period. |
| 6. | Includes borrowing and franchise tax expense. Without borrowing and franchise tax expense, the net asset expense ratio would be 1.02%. |
| 7. | Includes franchise tax expense. Without franchise tax expense, the net expense ratio would be 1.14%. |
| 8. | Deferred tax expense estimate for the ratio calculation is derived from the net investment income/loss, and realized and unrealized gains/losses. |
| 9. | Effective December 1, 2013 the deferred tax expense and deferred tax benefit are allocated based on average net assets. Prior to December 1, 2013 the deferred tax expense and deferred tax benefit were allocated based on specific class expenses. |
| 10. | Deferred tax benefit for the ratio calculation is derived from net investment income/loss only. |
See accompanying Notes to Financial Statements.
FINANCIAL HIGHLIGHTS (Continued)
| Class Y | | Year Ended November 28,
2014* | | | Year Ended November 29,
2013*, 1 | | | Year Ended November 30,
2012 1 | | | Year Ended November 30,
2011 1 | | | Period Ended November 30,
2010 1,2 | |
| Per Share Operating Data | | | | | | | | | | | | | | | |
| Net Asset Value, Beginning of Period | | $ | 10.97 | | | $ | 9.89 | | | $ | 10.17 | | | $ | 10.84 | | | $ | 10.00 | |
| Income/(loss) from investment operations: | | | | | | | | | | | | | | | | | | | | |
Net investment loss 3 | | | (0.04 | ) | | | (0.07 | ) | | | (0.07 | ) | | | (0.08 | ) | | | (0.03 | ) |
Return of capital 3 | | | 0.48 | | | | 0.49 | | | | 0.49 | | | | 0.47 | | | | 0.29 | |
| Net realized and unrealized gains/(losses) | | | 0.52 | | | | 1.44 | | | | 0.08 | | | | (0.23 | ) | | | 1.02 | |
| Total from investment operations | | | 0.96 | | | | 1.86 | | | | 0.50 | | | | 0.16 | | | | 1.28 | |
| Distributions to shareholders: | | | | | | | | | | | | | | | | | | | | |
| Return of capital | | | (0.78 | ) | | | (0.78 | ) | | | (0.70 | ) | | | (0.83 | ) | | | (0.44 | ) |
| Income | | | — | | | | — | | | | (0.08 | ) | | | — | | | | — | |
| Total distributions to shareholders | | | (0.78 | ) | | | (0.78 | ) | | | (0.78 | ) | | | (0.83 | ) | | | (0.44 | ) |
| Net asset value, end of period | | $ | 11.15 | | | $ | 10.97 | | | $ | 9.89 | | | $ | 10.17 | | | $ | 10.84 | |
| | | | | | | | | | | | | | | | | | | | | |
Total Return, at Net Asset Value 4 | | | 8.85 | % | | | 19.19 | % | | | 4.89 | % | | | 1.46 | % | | | 13.20 | % |
| Ratios /Supplemental Data | | | | | | | | | | | | | | | | | | | | |
| Net assets, end of period (in thousands) | | $ | 992,009 | | | $ | 535,124 | | | $ | 134,481 | | | $ | 84,506 | | | $ | 68,368 | |
Ratio of Expenses to Average Net Assets: 5 | | | | | | | | | | | | | | | | | |
| Before (waivers) and deferred tax expense | | | 1.24 | % | | | 1.18 | % | | | 1.27 | % | | | 1.37 | % | | | 1.62 | % |
| Expense (waivers) | | | (0.12 | %) | | | (0.07 | %) | | | (0.17 | %) | | | (0.27 | %) | | | (0.52 | %) |
| Net of (waivers) and before deferred tax expense | | | 1.12 | %6 | | | 1.11 | %7 | | | 1.10 | % | | | 1.10 | % | | | 1.10 | % |
Deferred tax expense 8,9 | | | 4.38 | % | | | 6.68 | % | | | 2.10 | % | | | (0.65 | %) | | | 17.22 | % |
| Total expenses | | | 5.50 | % | | | 7.79 | % | | | 3.20 | % | | | 0.45 | % | | | 18.32 | % |
| | | | | | | | | | | | | | | | | | | | | |
Ratio of Investment Loss to Average Net Assets: 5 | | | | | | | | | | | | | | | | | |
| Before (waivers) and deferred tax expense | | | (1.01 | %) | | | (1.08 | %) | | | (1.27 | %) | | | (1.37 | %) | | | (1.24 | %) |
| Expense (waivers) | | | (0.12 | %) | | | (0.07 | %) | | | (0.17 | %) | | | (0.27 | %) | | | (0.52 | %) |
| Net of (waivers) and before deferred tax expense | | | (0.89 | %) | | | (1.01 | %) | | | (1.10 | %) | | | (1.10 | %) | | | (0.72 | %) |
Deferred tax benefit 9,10 | | | 0.56 | % | | | 0.37 | % | | | 0.38 | % | | | 0.41 | % | | | 0.29 | % |
| Net investment loss | | | (0.33 | %) | | | (0.64 | %) | | | (0.72 | %) | | | (0.69 | %) | | | (0.43 | %) |
| Portfolio turnover rate | | | 14 | % | | | 4 | % | | | 29 | % | | | 24 | % | | | 15 | % |
| * | November 28, 2014 and November 29, 2013 represent the last business day of the Fund’s respective reporting periods. See Note 2 of the accompanying Notes. |
| 1. | Effective June 28, 2013, Class I shares were renamed Class Y shares. See Note 1 of the Notes to Financial Statements for additional information. |
| 2. | The net asset value for the beginning of the period close of business March 31, 2010 (Commencement of Operations) through November 30, 2010 represents the initial contribution per share of $10. |
| 3. | Per share amounts calculated based on average shares outstanding during the period. |
| 4. | Assumes an initial investment on the business day before the first day of the fiscal period, with all dividends and distributions reinvested in additional shares on the reinvestment date, and redemptions at the net asset value calculated on the last business day of the fiscal period. Total returns are not annualized for periods less than one full year. Returns do not reflect the deduction of taxes that a shareholder would pay on fund distributions or the redemption of fund shares. |
| 5. | Annualized for less than full period. |
| 6. | Includes borrowing and franchise tax expense. Without borrowing and franchise tax expense, the net asset expense ratio would be 1.10%. |
| 7. | Includes franchise tax expense. Without franchise tax expense, the net expense ratio would be 1.10%. |
| 8. | Deferred tax expense estimate for the ratio calculation is derived from the net investment income/loss, and realized and unrealized gains/losses. |
| 9. | Effective December 1, 2013 the deferred tax expense and deferred tax benefit are allocated based on average net assets. Prior to December 1, 2013 the deferred tax expense and deferred tax benefit were allocated based on specific class expenses. |
| 10. | Deferred tax benefit for the ratio calculation is derived from net investment income/loss only. |
See accompanying Notes to Financial Statements.
NOTES TO FINANCIAL STATEMENTS
Oppenheimer SteelPath MLP Income Fund (the “Fund”), a separate series of Oppenheimer SteelPath MLP Funds Trust, is a non-diversified open-end management investment company registered under the Investment Company Act of 1940, as amended. The Fund’s investment objective is to seek total return. The Fund’s investment adviser is OFI SteelPath, Inc. (the “Adviser” or “Manager”), a wholly-owned subsidiary of OppenheimerFunds, Inc. (“OFI” or “Oppenheimer”).
The Fund offers Class A, Class C, Class I, and Class Y shares. Effective June 28, 2013, Class I shares were renamed Class Y shares. Class A shares are sold at their offering price, which is normally net asset value plus a front-end sales charge. Effective June 28, 2013 although there is no initial sales charge on Class A purchases totaling $1 million or more, those Class A shares may be subject to a 1.00% contingent deferred sales charge if shares are redeemed within an 18-month “holding period” measured from the date of purchase. Class C shares are sold, without a front-end sales charge but may be subject to a contingent deferred sales charge (“CDSC”) of 1.00% of the redemption proceeds if Class C shares are redeemed within one year of purchase. Class I shares are only available to eligible institutional investors. Class I shares are sold at net asset value per share without a sales charge or CDSC. An institutional investor that buys Class I shares for its customers’ accounts may impose charges on those accounts. Class Y shares are sold at net asset value per share without a sales charge directly to institutional investors that have special agreements with the Distributor for that purpose. They may include insurance companies, registered investment companies, employee benefit plans and section 529 plans, among others. An institutional investor that buys Class Y shares for its customers’ accounts may impose charges on those accounts. All classes of shares have identical rights and voting privileges with respect to the Fund in general and exclusive voting rights on matters that affect that class alone. Earnings, net assets and net asset value per share may differ due to each class having its own expenses, such as transfer and shareholder servicing agent fees and shareholder communications, directly attributable to that class. Class A and C shares have separate distribution and/or service plans under which they pay fees. Class I and Y shares do not pay such fees.
2. Significant Accounting Policies
Security Valuation. All investments in securities are recorded at their estimated fair value, as described in note 3.
Equity Security Risk. Stocks and other equity securities fluctuate in price. The value of the Fund’s portfolio may be affected by changes in the equity markets generally. Equity markets may experience significant short-term volatility and may fall sharply at times. Different markets may behave differently from each other and U.S. equity markets may move in the opposite direction from one or more foreign stock markets.
NOTES TO FINANCIAL STATEMENTS (Continued)
2. Significant Accounting Policies (Continued)
The prices of individual equity securities generally do not all move in the same direction at the same time and a variety of factors can affect the price of a particular company’s securities. These factors may include, but are not limited to, poor earnings reports, a loss of customers, litigation against the company, general unfavorable performance of the company’s sector or industry, or changes in government regulations affecting the company or its industry.
Master Limited Partnerships (“MLPs”). Under normal circumstances, the Fund invests at least 80% of its net assets (plus the amount of borrowings for investment purposes) in the equity securities of MLPs.
MLPs issue common units that represent an equity ownership interest in a partnership and provide limited voting rights. MLP common units are registered with the Securities and Exchange Commission (“SEC”), and are freely tradable on securities exchanges such as the NYSE and the NASDAQ Stock Market (“NASDAQ”), or in the over-the-counter (“OTC”) market. An MLP consists of one or more general partners, who conduct the business, and one or more limited partners, who contribute capital. MLP common unit holders have a limited role in the partnership’s operations and management. The Fund, as a limited partner, normally would not be liable for the debts of the MLP beyond the amounts the Fund has contributed, but would not be shielded to the same extent that a shareholder of a corporation would be. In certain circumstances creditors of an MLP would have the right to seek return of capital distributed to a limited partner. This right of an MLP’s creditors would continue after the Fund sold its investment in the MLP.
Concentration Risk. Under normal circumstances, the Fund invests at least 80% of its net assets in the equity securities of MLPs. MLPs are subject to certain risks, such as supply and demand risk, depletion and exploration risk, commodity pricing risk, acquisition risk, and the risk associated with the hazards inherent in midstream energy industry activities. A substantial portion of the cash flow received by the Fund is derived from investment in equity securities of MLPs. The amount of cash that a MLP has available for distributions, and the tax character of such distributions, are dependent upon the amount of cash generated by the MLP’s operations.
Annual Periods. The last day of the Fund’s annual periods was the last day the New York Stock Exchange was open for trading. The Fund’s financial statements have been presented through that date to maintain consistency with the Fund’s net asset value calculations used for shareholder transactions.
Allocation of Income, Expenses, Gains and Losses. Income, expenses (other than those attributable to a specific class), gains and losses are allocated on a daily basis to each class of shares based upon the relative proportion of net assets represented by such class. Operating expenses directly attributable to a specific class are charged against the operations of that class.
NOTES TO FINANCIAL STATEMENTS (Continued)
2. Significant Accounting Policies (Continued)
Federal Income Taxes.
The Fund does not intend to qualify as a regulated investment company pursuant to Subchapter M of the Internal Revenue Code, but will rather be taxed as a corporation. As a corporation, the Fund is obligated to pay federal, state and local income tax on taxable income. Currently, the maximum marginal regular federal income tax rate for a corporation is 35%. The Fund may be subject to a 20% alternative minimum tax on its federal alternative minimum taxable income to the extent that its alternative minimum tax exceeds its regular federal income tax. The Fund is currently using an estimated rate of 2.3% for state and local tax, net of federal tax benefit.
The Fund’s income tax provision consists of the following as of November 28, 2014:
| Current tax expense (benefit) | | | |
| Federal | | $ | — | |
| State | | | — | |
| Total current tax expense | | $ | — | |
| | | | | |
| Deferred tax expense (benefit) | | | | |
| Federal | | $ | 154,995,780 | |
| State | | | 18,377,935 | |
| Total deferred tax expense | | $ | 173,373,715 | |
The reconciliation between the federal statutory income tax rate of 35% and the effective tax rate on net investment income (loss) and realized and unrealized gain (loss) follows:
| | | Amount | |
| Application of statutory income tax rate | | $ | 160,688,753 | |
| State income taxes net of federal benefit | | | 10,559,547 | |
| Effect of state tax rate change | | | 2,125,415 | |
| Total income tax expense | | $ | 173,373,715 | |
The Fund intends to invest its assets primarily in MLPs, which generally are treated as partnerships for federal income tax purposes. As a limited partner in the MLPs, the Fund reports its allocable share of the MLP’s taxable income in computing its own taxable income. The Fund’s tax expense or benefit will be included in the Statement of Operations based on the component of income or gains (losses) to which such expense or benefit relates. Deferred income taxes reflect the net tax effects of temporary differences between the carrying amounts of assets and liabilities for financial reporting purposes and the amounts used for income tax purposes. Such temporary differences are principally: (i) taxes on unrealized gains/(losses), which are attributable to the temporary difference between fair market value and tax
NOTES TO FINANCIAL STATEMENTS (Continued)
2. Significant Accounting Policies (Continued)
basis, (ii) the net tax effects of temporary differences between the carrying amounts of assets and liabilities for financial reporting and income tax purposes and (iii) the net tax benefit of accumulated net operating losses and capital loss carryforwards. Deferred tax assets and liabilities are measured using effective tax rates expected to apply to taxable income in the years such temporary differences are realized or otherwise settled. To the extent the Fund has a deferred tax asset, consideration is given to whether or not a valuation allowance is required. A valuation allowance is required if based on the evaluation criterion provided by ASC 740, Income Taxes (ASC 740) that it is more-likely-than-not that some portion or all of the deferred tax asset will not be realized. Among the factors considered in assessing the Fund’s valuation allowance: the nature, frequency and severity of current and cumulative losses, forecasts of future profitability, the duration of the statutory carryforward periods and the associated risks that operating and capital loss carryforwards may expire unused. At November 28, 2014, the Fund determined a valuation allowance was not required. From time to time, as new information becomes available, the Fund will modify its estimates or assumptions regarding the deferred tax liability or asset.
Components of the Fund’s deferred tax assets and liabilities as of November 28, 2014 are as follows:
| Deferred tax assets: | | | |
| Net operating loss carryforward (tax basis) | | $ | 82,537,448 | |
| Capital loss carryforward (tax basis) | | | — | |
| | | | | |
| Deferred tax liabilities: | | | | |
| Net unrealized gains on investment securities (tax basis) | | | (367,040,056 | ) |
| Total net deferred tax asset/(liability) | | $ | (284,502,608 | ) |
Unexpected significant decreases in cash distributions from the Fund’s MLP investments or significant declines in the fair value of its investments may change the Fund’s assessment regarding the recoverability of its deferred tax assets and may result in a valuation allowance. If a valuation allowance is required to reduce any deferred tax asset in the future, it could have a material impact on the Fund’s net asset value and results of operations in the period it is recorded.
The Fund may rely, to some extent, on information provided by the MLPs, which may not necessarily be timely, to estimate taxable income allocable to MLP units held in its portfolio, and to estimate its associated deferred tax liability or asset. Such estimates are made in good faith. From time to time, as new information becomes available, the Fund will modify its estimates or assumptions regarding its tax liability or asset.
NOTES TO FINANCIAL STATEMENTS (Continued)
2. Significant Accounting Policies (Continued)
The Fund’s policy is to classify interest and penalties associated with underpayment of federal and state income taxes, if any, as income tax expense on its Statement of Operations. For the year ended November 28, 2014, the Fund does not have any interest or penalties associated with the underpayment of any income taxes.
The Fund files income tax returns in the U.S. federal jurisdiction and various states. Tax years (2010–2013) remain open and subject to examination by tax jurisdictions. The Fund has reviewed all major jurisdictions and concluded that there is no significant impact on the Fund’s net assets and no tax liability resulting from unrecognized tax benefits relating to uncertain tax positions expected to be taken on its tax returns. Furthermore, management of the Fund is not aware of any tax positions for which it is reasonably possible that the total amount of unrecognized tax benefit will significantly change in the next 12 months.
At November 28, 2014, the Fund had net operating loss carryforwards for federal income tax purposes, which may be carried forward for 20 years, as follows:
| Expiration Date | | | |
| 11/30/2030 | | $ | 3,877 | |
| 11/30/2031 | | | 4,997,354 | |
| 11/30/2032 | | | 7,401,746 | |
| 11/30/2033 | | | 47,597,832 | |
| 11/30/2034 | | | 161,279,215 | |
| Total | | $ | 221,280,024 | |
During the year ended November 28, 2014, the Fund utilized $6,261,965 of capital loss carryforwards.
At November 28, 2014, gross unrealized appreciation and depreciation of investments, based on cost for federal income tax purposes were as follows:
| Cost of Investments | | $ | 3,806,310,327 | |
| Gross Unrealized Appreciation | | $ | 1,103,349,907 | |
| Gross Unrealized Depreciation | | | (122,674,974 | ) |
| Net Unrealized Appreciation (Depreciation) on Investments | | $ | 980,674,933 | |
The difference between cost amounts for financial statement and federal income tax purposes is due primarily to timing differences in recognizing certain gains and losses in security transactions.
NOTES TO FINANCIAL STATEMENTS (Continued)
2. Significant Accounting Policies (Continued)
Dividends and Distributions to Shareholders. Dividends and distributions to shareholders, which are determined in accordance with income tax regulations and may differ from U.S. generally accepted accounting principles, are recorded on the ex-dividend date. Dividends, if any, are declared and distributed monthly for the Fund. The estimated characterization of the distributions paid will be either a qualified dividend or distribution (return of capital). This estimate is based on the Fund’s operating results during the period. It is anticipated that a significant portion of the distributions will be comprised of return of capital as a result of the tax character of cash distributions made by the Fund’s investments. The actual characterization of the distributions made during the period will not be determined until after the end of the fiscal year. The Fund will inform shareholders of the final tax character of the distributions on IRS Form DIV in February 2015. For the year ended November 28, 2014, the Fund distributions are expected to be comprised of 100% return of capital.
Return of Capital Estimates. Distributions received from the Funds’ investments in MLPs generally are comprised of income and return of capital. The Fund records investment income and return of capital based on estimates made at the time such distributions are received. Such estimates are based on historical information available from each MLP and other industry sources. These estimates may subsequently be revised based on information received from MLPs after their tax reporting periods are concluded. For the year ended November 28, 2014, the Fund estimated that 100% of the MLP distributions received would be treated as return of capital.
Investment Income. Dividend income is recorded on the ex-dividend date or upon ex-dividend notification in the case of certain foreign dividends where the ex-dividend date may have passed. Non-cash dividends included in dividend income, if any, are recorded at the fair value of the securities received. Interest income is recognized on an accrual basis. Discount and premium, which are included in interest income on the Statement of Operations, if applicable, are amortized or accreted daily.
Custodian Fees. “Custody fees” in the Statement of Operations may include interest expense incurred by the Fund on any cash overdrafts of its custodian account during the period. Such cash overdrafts may result from the effects of failed trades in portfolio securities and from cash outflows resulting from unanticipated shareholder redemption activity. The Fund pays interest to its custodian on such cash overdrafts, to the extent they are not offset by positive cash balances maintained by the Fund, at a rate equal to the Federal Funds Rate plus 0.015%. The “Reduction to custodian expenses” line item, if applicable, represents earnings on cash balances maintained by the Fund during the period. Such interest expense and other custodian fees may be paid with these earnings.
Security Transactions. Security transactions are recorded on the trade date. Realized gains and losses on securities sold are determined using the last in, first out method.
NOTES TO FINANCIAL STATEMENTS (Continued)
2. Significant Accounting Policies (Continued)
Indemnifications. The Fund’s organizational documents provide current and former trustees and officers with a limited indemnification against liabilities arising in connection with the performance of their duties to the Fund. In the normal course of business, the Fund may also enter into contracts that provide general indemnifications. The Fund’s maximum exposure under these arrangements is unknown as this would be dependent on future claims that may be made against the Fund. The risk of material loss from such claims is considered remote.
Other. The preparation of financial statements in conformity with accounting principles generally accepted in the United States of America requires management to make estimates and assumptions that affect the reported amounts of assets and liabilities and disclosure of contingent assets and liabilities at the date of the financial statements and the reported amounts of increases and decreases in net assets from operations during the reporting period. Actual results could differ from those estimates.
The Fund calculates the net asset value of its shares as of the close of the New York Stock Exchange (the “Exchange”), normally 4:00 P.M. Eastern time, on each day the Exchange is open for trading.
The Fund’s Board of Trustees (the “Board”) has adopted procedures for the valuation of the Fund’s securities and has delegated the day-to-day responsibility for valuation determinations under those procedures to the Adviser. The Adviser has established a Valuation Committee which is responsible for determining a “fair valuation” for any security for which market quotations are not “readily available.” The Valuation Committee’s fair valuation determinations are subject to review, approval and ratification by the Fund’s Board at its next regularly scheduled meeting covering the calendar quarter in which the fair valuation was determined.
Valuation Methods and Inputs
Securities are valued using unadjusted quoted market prices, when available, as supplied primarily by third party pricing services or dealers.
The following methodologies are used to determine the market value or the fair value of the types of securities described below:
Securities traded on a registered U.S. securities exchange (including exchange-traded derivatives other than futures and futures options) are valued based on the last sale price of the security reported on the principal exchange on which it is traded, prior to the time when the Fund’s assets are valued. In the absence of a sale, the security is valued at the last sale price on the prior trading day, if it is within the spread of the current day’s closing “bid” and “asked” prices, and if not, at the current day’s closing bid price. A security of a foreign issuer traded on a foreign exchange but not listed on a registered U.S. securities exchange is valued based on the last sale price on the principal exchange on which the security is traded,
NOTES TO FINANCIAL STATEMENTS (Continued)
3. Securities Valuation (Continued)
as identified by the third party pricing service used by the Adviser, prior to the time when the Fund’s assets are valued. If the last sale price is unavailable, the security is valued at the most recent official closing price on the principal exchange on which it is traded. If the last sales price or official closing price for a foreign security is not available, the security is valued at the mean between the bid and asked price per the exchange or, if not available from the exchange, obtained from two dealers. If bid and asked prices are not available from either the exchange or two dealers, the security is valued by using one of the following methodologies (listed in order of priority); (1) using a bid from the exchange, (2) the mean between the bid and asked price as provided by a single dealer, or (3) a bid from a single dealer.
Shares of a registered investment company that are not traded on an exchange are valued at that investment company’s net asset value per share.
Corporate and government debt securities (of U.S. or foreign issuers) and municipal debt securities, event-linked bonds, loans, mortgage-backed securities, collateralized mortgage obligations, and asset-backed securities are valued at the mean between the “bid” and “asked” prices utilizing evaluated prices obtained from third party pricing services or broker-dealers who may use matrix pricing methods to determine the evaluated prices.
Short-term money market type debt securities with a remaining maturity of sixty days or less are valued at cost adjusted by the amortization of discount or premium to maturity (amortized cost), which approximates market value. Short-term debt securities with a remaining maturity in excess of sixty days are valued at the mean between the “bid” and “asked” prices utilizing evaluated prices obtained from third party pricing services or broker-dealers.
A description of the standard inputs that may generally be considered by the third party pricing vendors in determining their evaluated prices is provided below.
| Security Type | | Standard inputs generally considered by third-party pricing vendors |
| Corporate debt, government debt, municipal, mortgage-backed and asset-backed securities | | Reported trade data, broker-dealer price quotations, benchmark yields, issuer spreads on comparable securities, the credit quality, yield, maturity, and other appropriate factors. |
| Loans | | Information obtained from market participants regarding reported trade data and broker-dealer price quotations. |
| Event-linked bonds | | Information obtained from market participants regarding reported trade data and broker-dealer price quotations. |
NOTES TO FINANCIAL STATEMENTS (Continued)
3. Securities Valuation (Continued)
If a market value or price cannot be determined for a security using the methodologies described above, or if, in the “good faith” opinion of the Adviser, the market value or price obtained does not constitute a “readily available market quotation,” or a significant event has occurred that would materially affect the value of the security, the security is fair valued either (i) by a standardized fair valuation methodology applicable to the security type or the significant event as previously approved by the Valuation Committee and the Fund’s Board or (ii) as determined in good faith by the Adviser’s Valuation Committee. The Valuation Committee considers all relevant facts that are reasonably available, through either public information or information available to the Adviser, when determining the fair value of a security. Fair value determinations by the Adviser are subject to review, approval and ratification by the Fund’s Board at its next regularly scheduled meeting covering the calendar quarter in which the fair valuation was determined. Those fair valuation standardized methodologies include, but are not limited to, valuing securities at the last sale price or initially at cost and subsequently adjusting the value based on: changes in company specific fundamentals, changes in an appropriate securities index, or changes in the value of similar securities which may be further adjusted for any discounts related to security-specific resale restrictions. When possible, such methodologies use observable market inputs such as unadjusted quoted prices of similar securities, observable interest rates, currency rates and yield curves. The methodologies used for valuing securities are not necessarily an indication of the risks associated with investing in those securities nor can it be assured that the Fund can obtain the fair value assigned to a security if it were to sell the security.
To assess the continuing appropriateness of security valuations, the Adviser, or its third party service provider who is subject to oversight by the Adviser, regularly compares prior day prices, prices on comparable securities, and sale prices to the current day prices and challenges those prices exceeding certain tolerance levels with the third party pricing service or broker source. For those securities valued by fair valuations, whether through a standardized fair valuation methodology or a fair valuation determination, the Valuation Committee reviews and affirms the reasonableness of the valuations based on such methodologies and fair valuation determinations on a regular basis after considering all relevant information that is reasonably available.
Classifications
Each investment asset or liability of the Fund is assigned a level at measurement date based on the significance and source of the inputs to its valuation. Various data inputs are used in determining the value of each of the Fund’s investments as of the reporting period end. These data inputs are categorized in the following hierarchy under applicable financial accounting standards:
| 1) | Level 1-unadjusted quoted prices in active markets for identical assets or liabilities (including securities actively traded on a securities exchange) |
NOTES TO FINANCIAL STATEMENTS (Continued)
3. Securities Valuation (Continued)
| 2) | Level 2-inputs other than unadjusted quoted prices that are observable for the asset or liability (such as unadjusted quoted prices for similar assets and market corroborated inputs such as interest rates, prepayment speeds, credit risks, etc.) |
| 3) | Level 3-significant unobservable inputs (including the Adviser’s own judgments about assumptions that market participants would use in pricing the asset or liability). |
The inputs used for valuing securities are not necessarily an indication of the risks associated with investing in those securities.
The table below categorizes amounts that are included in the Fund’s Statement of Assets and Liabilities as of November 28, 2014 based on valuation input level:
| | | Level 1 — Unadjusted Quoted Prices | | | Level 2 —
Other Significant Observable Inputs | | | Level 3 —
Significant Unobservable Inputs | | | Value | |
| Assets Table | | | | | | | | | | | | |
| Investments, at Value: | | | | | | | | | | | | |
| Master Limited Partnership Shares* | | $ | 4,525,968,073 | | | $ | — | | | $ | — | | | $ | 4,525,968,073 | |
| Common Stock* | | | 95,871,557 | | | | — | | | | — | | | | 95,871,557 | |
| Preferred Stock* | | | 18,512,183 | | | | — | | | | — | | | | 18,512,183 | |
| Private Investment in Public Equity* | | | — | | | | 17,430,279 | | | | — | | | | 17,430,279 | |
| Short Term Investments | | | 129,203,168 | | | | — | | | | — | | | | 129,203,168 | |
| Total Assets | | $ | 4,769,554,981 | | | $ | 17,430,279 | | | $ | — | | | $ | 4,786,985,260 | |
| * | For a detailed break-out of securities by major industry classification, please refer to the Statement of Investments. |
The Fund did not hold any Level 3 securities during the year ended November 28, 2014.
There have been no transfers between pricing levels for the Fund. It is the Fund’s policy to recognize transfers at the end of the reporting period.
NOTES TO FINANCIAL STATEMENTS (Continued)
4. Shares of Beneficial Interest
The Fund has authorized an unlimited number of $0.001 par value shares of beneficial interest of each class. Transactions in shares of beneficial interest were as follows:
| | | Year Ended
November 28, 2014 | | | Year/Period Ended
November 29, 2013 | |
| | | Shares | | | Amount | | | Shares | | | Amount | |
| Class A | | | | | | | | | | | | |
| Sold | | | 99,450,209 | | | $ | 1,108,580,142 | | | | 117,510,304 | | | $ | 1,270,519,892 | |
| Dividends and/or distributions reinvested | | | 10,364,067 | | | | 115,786,812 | | | | 4,344,726 | | | | 46,776,056 | |
| Redeemed | | | (51,245,257 | ) | | | (574,028,579 | ) | | | (22,070,867 | ) | | | (236,515,366 | ) |
| Net increase | | | 58,569,019 | | | $ | 650,338,375 | | | | 99,784,163 | | | $ | 1,080,780,582 | |
| | | | | | | | | | | | | | | | | |
| Class C | | | | | | | | | | | | | | | | |
| Sold | | | 85,333,602 | | | $ | 933,674,113 | | | | 77,467,656 | | | $ | 827,488,848 | |
| Dividends and/or distributions reinvested | | | 8,236,392 | | | | 90,167,100 | | | | 2,087,393 | | | | 22,272,213 | |
| Redeemed | | | (16,358,921 | ) | | | (179,234,192 | ) | | | (1,965,065 | ) | | | (21,009,739 | ) |
| Net increase | | | 77,211,073 | | | $ | 844,607,021 | | | | 77,589,984 | | | $ | 828,751,322 | |
| | | | | | | | | | | | | | | | | |
| Class I* | | | | | | | | | | | | | | | | |
| Sold | | | 18,445 | | | $ | 215,414 | | | | 10,088 | | | $ | 110,000 | |
| Dividends and/or distributions reinvested | | | 1,034 | | | | 11,739 | | | | 185 | | | | 2,026 | |
| Redeemed | | | (84 | ) | | | (949 | ) | | | — | | | | — | |
| Net increase | | | 19,395 | | | $ | 226,204 | | | | 10,273 | | | $ | 112,026 | |
| | | | | | | | | | | | | | | | | |
| Class Y** | | | | | | | | | | | | | | | | |
| Sold | | | 54,672,901 | | | $ | 619,345,640 | | | | 43,952,454 | | | $ | 479,650,333 | |
| Dividends and/or distributions reinvested | | | 4,734,294 | | | | 53,594,402 | | | | 1,590,680 | | | | 17,305,065 | |
| Redeemed | | | (19,256,354 | ) | | | (217,198,744 | ) | | | (10,336,556 | ) | | | (107,243,916 | ) |
| Net increase | | | 40,150,841 | | | $ | 455,741,298 | | | | 35,206,578 | | | $ | 389,711,482 | |
| * | Class I commenced operations at the close of business June 28, 2013. |
| ** | Effective June 28, 2013, Class I shares were renamed Class Y shares. See Note 1 of the Notes to Financial Statements for additional information. |
NOTES TO FINANCIAL STATEMENTS (Continued)
5. Purchases and Sales of Securities
The aggregate cost of purchases and proceeds from sales of securities, other than short-term obligations, for the year ended November 28, 2014, were as follows:
| | | Purchases | | | Sales | |
| Investment securities | | $ | 2,092,536,776 | | | $ | 581,600,072 | |
6. Fees and Other Transactions with Affiliates
Management Fees. Under the investment advisory agreement, the Fund pays the Manager a management fee based on the daily net assets of the Fund at an annual rate as shown in the following table:
| Net Assets up to $3 Billion | Net Assets Greater than
$3 Billion and up to $5 Billion | Net Assets in Excess of $5 Billion |
| 0.95% | 0.93% | 0.90% |
The Fund’s management fee for the fiscal year ended November 28, 2014 was 0.95% of average annual net assets before any applicable waivers.
Waivers and Reimbursements of Expenses. The Manager has contractually agreed to limit fees and/or reimburse expenses of the Fund to the extent that the Fund’s total annual fund operating expenses (exclusive of interest, taxes, such as deferred tax expenses, brokerage commissions, acquired fund fees and expenses, dividend costs related to short sales, and extraordinary expenses, such as litigation expense, if any) exceed 1.35% for Class A shares, 2.10% for Class C shares, and 1.10% for Class Y shares. The Fund’s total annual operating expenses after fee waiver and/or expense reimbursement (“Net Expenses”) will be higher than these amounts to the extent that the Fund incurs expenses excluded from the expense cap. Because the Fund’s deferred income tax expense is excluded from the expense cap, the Fund’s Net Expenses for each class of shares is increased by the amount of this expense. During the year ended November 28, 2014, the Manager reimbursed $2,213,408, $1,559,567, and $914,925 for Class A, Class C, and Class Y, respectively.
The Manager can be reimbursed by the Fund within three years after the date the fee limitation and/or expense reimbursement has been made by the Manager, provided that such repayment does not cause the expenses of any class of the Fund to exceed the foregoing limits. This undertaking may not be modified or terminated until after one year from the date of the current prospectus, as indicated therein, unless approved by the Fund’s Board of Trustees.
NOTES TO FINANCIAL STATEMENTS (Continued)
6. Fees and Other Transactions with Affiliates (Continued)
The following table represents amounts eligible for recovery at November 28, 2014:
| Eligible expense recoupment expiring: | | | |
| November 30, 2015 | | $ | 683,544 | |
| November 30, 2016 | | | 1,006,421 | |
| November 30, 2017 | | | 4,687,900 | |
During the year ended November 28, 2014, the Adviser did not recoup any expenses.
Trustees’ Compensation. The Board has adopted a compensation deferral plan for independent trustees that enables trustees to elect to defer receipt of all or a portion of the annual compensation they are entitled to receive from the Fund. For purposes of determining the amount owed to the Trustee under the plan, deferred amounts are treated as though equal dollar amounts had been invested in shares of the Fund or in other Oppenheimer funds selected by the Trustee. The Fund purchases shares of the funds selected for deferral by the Trustee in amounts equal to his or her deemed investment, resulting in a Fund asset equal to the deferred compensation liability. Such assets are included as a component of “Other” within the asset section of the Statement of Assets and Liabilities, if applicable. Deferral of trustees’ fees under the plan will not affect the net assets of the Fund, and will not materially affect the Fund’s assets, liabilities or net investment income per share. Amounts will be deferred until distributed in accordance with the compensation deferral plan.
Distribution and Service Plan (12b-1) Fees. Under its General Distributor’s Agreement with the Fund, OppenheimerFunds Distributor, Inc. (the “Distributor”) acts as the Fund’s principal underwriter in the continuous public offering of the Fund’s classes of shares.
Service Plan for Class A Shares. The Fund has adopted a Service Plan (the “Plan”) for Class A shares under Rule 12b-1 of the Investment Company Act of 1940. Under the Plan, the Fund reimburses the Distributor for a portion of its costs incurred for services provided to accounts that hold Class A shares. Reimbursement is made periodically at an annual rate of up to 0.25% of the daily net assets of Class A shares of the Fund. The Distributor currently uses all of those fees to pay dealers, brokers, banks and other financial institutions periodically for providing personal service and maintenance of accounts of their customers that hold Class A shares. Any unreimbursed expenses the Distributor incurs with respect to Class A shares in any fiscal year cannot be recovered in subsequent periods. Fees incurred by the Fund under the Plan are detailed in the Statement of Operations.
NOTES TO FINANCIAL STATEMENTS (Continued)
6. Fees and Other Transactions with Affiliates (Continued)
Distribution and Service Plans for Class C Shares. The Fund has adopted Distribution and Service Plans (the “Plans”) for Class C shares under Rule 12b-1 of the Investment Company Act of 1940 to compensate the Distributor for distributing those share classes, maintaining accounts and providing shareholder services. Under the Plans, the Fund pays the Distributor an annual asset-based sales charge of 0.75% on Class C shares daily net assets. The Fund also pays a service fee under the Plans at an annual rate of 0.25% of daily net assets.
The Plan and Plans continue in effect from year to year only if the Fund’s Board votes annually to approve their continuance at an in person meeting called for that purpose. Fees incurred by the Fund under the Plans are detailed in the Statement of Operations.
Transfer Agent Fees. OFI Global (the “Transfer Agent”) serves as the transfer and shareholder servicing agent for the Fund. The Fund pays the Transfer Agent a fee based on annual net assets. Fees incurred with respect to these services are detailed in the Statement of Operations.
Sub-Transfer Agent Fees. The Transfer Agent has retained Shareholder Services, Inc., a wholly-owned subsidiary of OFI (the “Sub-Transfer Agent”), to provide the day-to-day transfer agent and shareholder servicing of the Fund. Under the Sub-Transfer Agency Agreement, the Transfer Agent pays the Sub-Transfer Agent an annual fee in monthly installments, equal to a percentage of the transfer agent fee collected by the Transfer Agent from the Fund, which shall be calculated after any applicable fee waivers. The fee paid to the Sub-Transfer Agent is paid by the Transfer Agent, not by the Fund.
Sales Charges. Front-end sales charges and contingent deferred sales charges (“CDSC”) do not represent expenses of the Fund. They are deducted from the proceeds of sales of Fund shares prior to investment or from redemption proceeds prior to remittance, as applicable. The sales charges retained by the Distributor from the sale of shares and the CDSC retained by the Distributor on the redemption of shares is shown in the following table for the period indicated.
| Year Ended | | Class A Front-End Sales Charges Retained by Distributor | | | Class A Contingent Deferred Sales Charges Retained by Distributor | | | Class C Contingent Deferred Sales Charges Retained by Distributor | |
| November 28, 2014 | | $ | 3,540,914 | | | $ | 36,231 | | | $ | 275,100 | |
Related Party. The Interested Trustees and officers of the Fund are also officers or trustees of companies affiliated with the Manager, Distributor, and Transfer Agent.
NOTES TO FINANCIAL STATEMENTS (Continued)
Effective September 11, 2014, the Fund, along with Oppenheimer SteelPath MLP Alpha Fund, Oppenheimer SteelPath MLP Alpha Plus Fund, and Oppenheimer SteelPath MLP Select 40 Fund (collectively, the “Trust”), is a borrower in a $650 million revolving credit agreement with Citibank, N.A. (“Citi Loan Agreement”). The Fund is permitted to borrow up to the lesser of one-third of the Fund’s total assets, or the maximum amount permitted pursuant to the Fund’s investment limitations. Amounts borrowed under the Citi Loan Agreement, if any, are invested by the Fund under the direction of the Manager consistent with the Fund’s investment objective and policies, and as such, the related investments are subject to normal market fluctuations and investment risks, including the risk of loss due to a decline in value. The borrowing, if any, is fully collateralized throughout the term of the borrowing with securities or other assets of the Fund. The Fund is not liable for borrowings of other Funds in the Trust. Securities that have been pledged as collateral for the borrowing are indicated in the Statement of Investments.
Borrowings under the Citi Loan Agreement are charged interest at a calculated rate computed by Citibank based on the three month LIBOR rate plus 0.80% per annum. An unused commitment fee at the rate of 0.10% per annum is charged for any undrawn portion of the credit facility, and each member of the Trust will pay its pro rata share of this fee. A facility fee of 0.27% was charged on the commitment amount, and each party of the Trust paid its pro rata share of this fee. The borrowing is due September 11, 2015, unless another date is mutually agreed upon by the parties of the Citi Loan Agreement. For the annual period ended November 28, 2014 the Fund paid $502,764 in borrowing fees. The Fund did not have any borrowing for the year ended November 28, 2014.
In 2009, seven class action lawsuits were filed in the U.S. District Court for the District of Colorado against OppenheimerFunds, Inc. (“OFI”), OppenheimerFunds Distributor, Inc., the Fund’s principal underwriter and distributor (the “Distributor”), and certain funds (but not including the Fund) advised by OFI Global Asset Management, Inc. and distributed by the Distributor (the “Defendant Funds”). The lawsuits also named as defendants certain officers and current and former trustees of the respective Defendant Funds. The lawsuits raised claims under federal securities laws and alleged, among other things, that the disclosure documents of the respective Defendant Funds contained misrepresentations and omissions and that the respective Defendant Funds’ investment policies were not followed. The plaintiffs in these actions sought unspecified damages, equitable relief and awards of attorneys’ fees and litigation expenses. The Defendant Funds’ Boards of Trustees also engaged counsel to represent the Funds and the present and former Independent Trustees named in those suits. In March 2014, the parties in six of these lawsuits executed stipulations and agreements of settlement resolving those actions. In July 2014, the court entered an order and final judgment approving the settlements as fair, reasonable and adequate. The settlements do
NOTES TO FINANCIAL STATEMENTS (Continued)
8. Pending Litigation (Continued)
not resolve a seventh outstanding lawsuit relating to Oppenheimer Rochester California Municipal Fund (the “California Fund Suit”). OFI believes the California Fund Suit is without legal merit and is defending the suit vigorously. While it is premature to render any opinion as to the outcome in the California Fund Suit, or whether any costs that OFI may bear in defending the California Fund Suit might not be reimbursed by insurance, OFI believes the California Fund Suit should not impair the ability of OFI or the Distributor to perform their respective duties to the Fund, and that the outcome of the California Fund Suit should not have any material effect on the operations of any of the Oppenheimer Funds.
REPORT OF INDEPENDENT REGISTERED PUBLIC ACCOUNTING FIRM
To the Shareholders of Oppenheimer SteelPath MLP Income Fund and
Board of Trustees of Oppenheimer SteelPath MLP Funds Trust
We have audited the accompanying statement of assets and liabilities, including the statement of investments, of Oppenheimer SteelPath MLP Income Fund (the “Fund”), a series of Oppenheimer SteelPath MLP Funds Trust, as of November 28, 2014, and the related statement of operations for the year then ended, the statements of changes in net assets for each of the two years in the period then ended, and the financial highlights for each of the five periods in the period then ended. These financial statements and financial highlights are the responsibility of the Fund’s management. Our responsibility is to express an opinion on these financial statements and financial highlights based on our audits.
We conducted our audits in accordance with the standards of the Public Company Accounting Oversight Board (United States). Those standards require that we plan and perform the audit to obtain reasonable assurance about whether the financial statements and financial highlights are free of material misstatement. An audit includes examining, on a test basis, evidence supporting the amounts and disclosures in the financial statements. Our procedures included confirmation of securities owned as of November 28, 2014, by correspondence with the custodian and brokers or by other auditing procedures as appropriate in the circumstances. An audit also includes assessing the accounting principles used and significant estimates made by management, as well as evaluating the overall financial statement presentation. We believe that our audits provide a reasonable basis for our opinion.
In our opinion, the financial statements and financial highlights referred to above present fairly, in all material respects, the financial position of Oppenheimer SteelPath MLP Income Fund as of November 28, 2014, the results of its operations for the year then ended, the changes in its net assets for each of the two years in the period then ended, and the financial highlights for each of the five periods in the period then ended, in conformity with accounting principles generally accepted in the United States of America.
COHEN FUND AUDIT SERVICES, LTD.
Cleveland, Ohio
January 27, 2015
BOARD APPROVAL OF THE FUND’S INVESTMENT ADVISORY AGREEMENT Unaudited
The Fund has entered into an investment advisory agreement (the “Agreement”) with OFI SteelPath, Inc. (“OFI SteelPath” or the “Manager”). Each year, the Board of Trustees (the “Board”), including a majority of the independent Trustees, is required to determine whether to renew the Agreement. The Investment Company Act of 1940, as amended, requires that the Board request and evaluate, and that the Manager provide, such information as may be reasonably necessary to evaluate the terms of the Agreement. The Board employs an independent consultant to prepare a report that provides information, including comparative information that the Board requests for that purpose. In addition to in-person meetings focused on this evaluation, the Board receives information throughout the year regarding Fund services, fees, expenses and performance.
The Manager and the independent consultant provided information to the Board on the following factors: (i) the nature, quality and extent of the Manager’s services, (ii) the investment performance of the Fund and the Manager, (iii) the fees and expenses of the Fund, including comparative expense information, (iv) the profitability of the Manager and its affiliates, including an analysis of the cost of providing services, (v) whether economies of scale are realized as the Fund grows and whether fee levels reflect these economies of scale for Fund investors and (vi) other benefits to the Manager from its relationship with the Fund. The Board was aware that there are alternatives to retaining the Manager.
Outlined below is a summary of the principal information considered by the Board as well as the Board’s conclusions.
Nature, Quality and Extent of Services. The Board considered information about the nature, quality and extent of the services provided to the Fund and information regarding the Manager’s key personnel who provide such services. The Manager’s duties include providing research, analysis and other advisory services in regard to the Fund’s investments; securities trading services; oversight of third-party service providers; monitoring compliance with applicable Fund policies and procedures and adherence to the Fund’s investment restrictions; and risk management. The Manager is responsible for providing certain administrative services to the Fund as well. Those services, some of which are performed by affiliates of the Manager, include providing and supervising all administrative and clerical personnel who are necessary in order to provide effective corporate administration for the Fund; compiling and maintaining records with respect to the Fund’s operations; preparing and filing reports required by the Securities and Exchange Commission; preparing periodic reports regarding the operations of the Fund for its shareholders; preparing proxy materials for shareholder meetings; and preparing the registration statements required by Federal and state securities laws for the sale of the Fund’s shares. The Manager also provides the Fund with office space, facilities and equipment.
BOARD APPROVAL OF THE FUND’S INVESTMENT ADVISORY AGREEMENT Unaudited / (Continued)
The Board also considered the quality of the services provided and the quality of the Manager’s resources that are available to the Fund. In evaluating the Manager, the Board considered the history, reputation, qualification and background of the Manager, including its corporate parent, OppenheimerFunds, Inc. (“OFI”) and corporate affiliate, OFI Global Asset Management, Inc. (“OFI Global” and OFI and OFI Global are collectively referred to hereinafter as “OFI”), and the fact that OFI had over 50 years of experience as an investment adviser and that its assets rank among the top mutual fund managers in the United States. The Board evaluated the Manager’s and OFI’s advisory, administrative, accounting, legal, compliance services and risk management, and information the Board has received regarding the experience and professional qualifications of the Manager’s and OFI’s key personnel and the size and functions of its staff. In its evaluation of the quality of the portfolio management services provided, the Board considered the experience of Stuart Cartner and Brian Watson, the portfolio managers for the Fund, and the Manager’s investment team and analysts. The Board members also considered the totality of their experiences with the Manager and OFI as trustees of the Fund and other funds advised by the Manager or OFI. The Board considered information regarding the quality of services provided by affiliates of the Manager, which its members have become knowledgeable about in connection with the renewal of the Fund’s service agreements. The Board concluded, in light of the Manager’s and OFI’s experience, reputation, personnel, operations and resources that the Fund benefits from the services provided under the Agreement.
Investment Performance of the Manager and the Fund. Throughout the year, the Manager provided information on the investment performance of the Fund and the Manager, including comparative performance information. The Board also reviewed information, prepared by the Manager and by the independent consultant, comparing the Fund’s historical performance to relevant market indices and to the performance of other retail equity energy funds. The Board noted that the Fund’s performance was equal to its category median for the one-year period and that the Fund outperformed its category median for the three-year period.
Costs of Services by the Manager. The Board reviewed the fees paid to the Manager and the other expenses borne by the Fund. The independent consultant provided comparative data in regard to the fees and expenses of the Fund and other retail equity energy funds with comparable asset levels and distribution features. The Board noted that the Fund’s contractual management fee and total expenses were lower than their respective peer group medians and category medians. The Board also considered that within the total asset range of $1 billion to $2 billion, the Fund’s effective management fee was equal to its peer group median and category median. The Board considered that the Manager has contractually agreed to limit the Fund’s total operating expenses to 1.35% for Class A shares, 2.10% for Class C shares and 1.10% for Class Y shares. The fee limitation may not be amended or terminated prior to March 29, 2015, unless approved by the Board.
BOARD APPROVAL OF THE FUND’S INVESTMENT ADVISORY AGREEMENT Unaudited / (Continued)
Economies of Scale and Profits Realized by the Manager. The Board considered information regarding the Manager’s costs in serving as the Fund’s investment adviser, including the costs associated with the personnel and systems necessary to manage the Fund, and information regarding the Manager’s profitability from its relationship with the Fund. The Board reviewed whether the Manager may realize economies of scale in managing and supporting the Fund. The Board noted that the Fund currently has management fee breakpoints, which are intended to share with Fund shareholders economies of scale that may exist as the Fund’s assets grow.
Other Benefits to the Manager. In addition to considering the profits realized by the Manager, the Board considered information that was provided regarding the direct and indirect benefits the Manager receives as a result of its relationship with the Fund, including compensation paid to the Manager’s affiliates and research provided to the Manager in connection with permissible brokerage arrangements (soft dollar arrangements). The Board also considered that the Manager must be able to pay and retain experienced professional personnel at competitive rates to provide quality services to the Fund.
Conclusions. These factors were also considered by the independent Trustees meeting separately from the full Board, assisted by experienced counsel to the Fund and to the independent Trustees. Fund counsel and the independent Trustees’ counsel are independent of the Manager within the meaning and intent of the Securities and Exchange Commission Rules.
Based on its review of the information it received and its evaluations described above, the Board, including a majority of the independent Trustees, decided to continue the Agreement through August 31, 2015. In arriving at its decision, the Board did not identify any factor or factors as being more important than others, but considered all of the above information, and considered the terms and conditions of the Agreement, including the management fees, in light of all the surrounding circumstances.
PORTFOLIO PROXY VOTING POLICIES AND PROCEDURES; UPDATES TO STATEMENTS OF INVESTMENTS Unaudited
The Fund has adopted Portfolio Proxy Voting Policies and Procedures under which the Fund votes proxies relating to securities (“portfolio proxies”) held by the Fund. A description of the Fund’s Portfolio Proxy Voting Policies and Procedures is available (i) without charge, upon request, by calling the Fund toll-free at 1.800.CALL OPP (225.5677), (ii) on the Fund’s website at oppenheimerfunds.com, and (iii) on the SEC’s website at www.sec.gov. In addition, the Fund is required to file Form N-PX, with its complete proxy voting record for the 12 months ended June 30th, no later than August 31st of each year. The Fund’s voting record is available (i) without charge, upon request, by calling the Fund toll-free at 1.800.CALL OPP (225.5677), and (ii) in the Form N-PX filing on the SEC’s website at www.sec.gov.
The Fund files its complete schedule of portfolio holdings with the SEC for the first quarter and the third quarter of each fiscal year on Form N-Q. The Fund’s Form N-Q filings are available on the SEC’s website at www.sec.gov. Those forms may be reviewed and copied at the SEC’s Public Reference Room in Washington, D.C. Information on the operation of the Public Reference Room may be obtained by calling 1-800-SEC-0330.
Householding – Delivery of Shareholder Documents
This is to inform you about OppenheimerFunds’ “householding” policy. If more than one member of your household maintains an account in a particular fund, OppenheimerFunds will mail only one copy of the fund’s prospectus (or, if available, the fund’s summary prospectus), annual and semiannual report and privacy policy. The consolidation of these mailings, called householding, benefits your fund through reduced mailing expense, and benefits you by reducing the volume of mail you receive from OppenheimerFunds. Householding does not affect the delivery of your account statements.
Please note that we will continue to household these mailings for as long as you remain an OppenheimerFunds shareholder, unless you request otherwise. If you prefer to receive multiple copies of these materials, please call us at 1.800.CALL-OPP (225-5677). You may also notify us in writing or via email. We will begin sending you individual copies of the prospectus (or, if available, the summary prospectus), reports and privacy policy within 30 days of receiving your request to stop householding.
TRUSTEES AND OFFICERS Unaudited
| Name, Position(s) Held with the Trusts, Length of Service, Age | Principal Occupation(s) During the Past 5 Years; Other Trusteeships/Directorships Held; Number of Portfolios in the Fund Complex Currently Overseen |
| INDEPENDENT TRUSTEES | The address of each Trustee in the chart below is 6803 S. Tucson Way, Centennial, Colorado 80112-3924. Each Trustee serves for an indefinite term, or until his or her resignation, retirement, death or removal. |
Sam Freedman, Chairman of the Board of Trustees and Trustee (since 2012) Year of Birth: 1940 | Director of Colorado UpLIFT (charitable organization) (since September 1984). Mr. Freedman held several positions with OppenheimerFunds, Inc. and with subsidiary or affiliated companies of OppenheimerFunds, Inc. (until October 1994). Oversees 38 portfolios in the OppenheimerFunds complex. Mr. Freedman has served on the Boards of certain Oppenheimer funds since 1996, during which time he has become familiar with the Fund’s (and other Oppenheimer funds’) financial, accounting, regulatory and investment matters and has contributed to the Boards’ deliberations. |
Jon S. Fossel, Trustee (since 2012) Year of Birth: 1942 | Chairman of the Board (2006-December 2011) and Director (June 2002-December 2011) of UNUMProvident (insurance company); Director of Northwestern Energy Corp. (public utility corporation) (November 2004-December 2009); Director of P.R. Pharmaceuticals (October 1999-October 2003); Director of Rocky Mountain Elk Foundation (non-profit organization) (February 1998-February 2003 and February 2005-February 2007); Chairman and Director (until October 1996) and President and Chief Executive Officer (until October 1995) of OppenheimerFunds, Inc.; President, Chief Executive Officer and Director of the following: Oppenheimer Acquisition Corp. (“OAC”) (parent holding company of the OppenheimerFunds, Inc.), Shareholders Services, Inc. and Shareholder Financial Services, Inc. (until October 1995). Oversees 38 portfolios in the OppenheimerFunds complex. Mr. Fossel has served on the Boards of certain Oppenheimer funds since 1990, during which time he has become familiar with the Fund’s (and other Oppenheimer funds’) financial, accounting, regulatory and investment matters and has contributed to the Boards’ deliberations. |
TRUSTEES AND OFFICERS Unaudited / (Continued)
Richard F. Grabish, Trustee (since 2012) Year of Birth: 1948 | Formerly Senior Vice President and Assistant Director of Sales and Marketing (March 1997-December 2007), Director (March 1987-December 2007) and Manager of Private Client Services (June 1985-June 2005) of A.G. Edwards & Sons, Inc. (broker/dealer and investment firm); Chairman and Chief Executive Officer of A.G. Edwards Trust Company, FSB (March 2001-December 2007); President and Vice Chairman of A.G. Edwards Trust Company, FSB (investment adviser) (April 1987-March 2001); President of A.G. Edwards Trust Company, FSB (investment adviser) (June 2005-December 2007). Oversees 38 portfolios in the OppenheimerFunds complex. Mr. Grabish has served on the Boards of certain Oppenheimer funds since 2001, during which time he has become familiar with the Fund’s (and other Oppenheimer funds’) financial, accounting, regulatory and investment matters and has contributed to the Boards’ deliberations. |
Beverly L. Hamilton, Trustee (since 2012) Year of Birth: 1946 | Trustee of Monterey Institute for International Studies (educational organization) (since February 2000); Board Member of Middlebury College (educational organization) (December 2005-June 2011); Chairman (since 2010) of American Funds’ Emerging Markets Growth Fund, Inc. (mutual fund); Director of The California Endowment (philanthropic organization) (April 2002-April 2008); Director (February 2002-2005) and Chairman of Trustees (2006-2007) of the Community Hospital of Monterey Peninsula; Director (October 1991-2005); Vice Chairman (2006-2009) of American Funds’ Emerging Markets Growth Fund, Inc. (mutual fund); President of ARCO Investment Management Company (February 1991-April 2000); Member of the investment committees of The Rockefeller Foundation (2001-2006) and The University of Michigan (since 2000); Advisor at Credit Suisse First Boston’s Sprout venture capital unit (venture capital fund) (1994-January 2005); Trustee of MassMutual Institutional Funds (investment company) (1996-June 2004); Trustee of MML Series Investment Fund (investment company) (April 1989-June 2004); Member of the investment committee of Hartford Hospital (2000-2003); and Advisor to Unilever (Holland) pension fund (2000-2003). Oversees 38 portfolios in the OppenheimerFunds complex. Ms. Hamilton has served on the Boards of certain Oppenheimer funds since 2002, during which time she has become familiar with the Fund’s (and other Oppenheimer funds’) financial, accounting, regulatory and investment matters and has contributed to the Boards’ deliberations. |
TRUSTEES AND OFFICERS Unaudited / (Continued)
Victoria J. Herget, Trustee (since 2012) Year of Birth:1951 | Independent Director of the First American Funds (mutual fund family) (2003-2011); former Managing Director (1993-2001), Principal (1985-1993), Vice President (1978-1985) and Assistant Vice President (1973-1978) of Zurich Scudder Investments (and its predecessor firms); Board Chair (2008-Present) and Director (2004-Present), United Educators (insurance company); Trustee (1992-2007), Chair of the Board of Trustees (1999-2007), Investment Committee Chair (1994-1999) and Investment Committee member (2007-2010) of Wellesley College; Trustee (since 2000) and Chair (since 2010), Newberry Library; Trustee, Mather LifeWays (since 2001); Trustee, BoardSource (2006-2009) and Chicago City Day School (1994-2005). Oversees 38 portfolios in the OppenheimerFunds complex. Ms. Herget has served on the Boards of certain Oppenheimer funds since 2012, during which time she has become familiar with the Fund’s (and other Oppenheimer funds’) financial, accounting, regulatory and investment matters and has contributed to the Boards’ deliberations. |
Robert J. Malone, Trustee (since 2012) Year of Birth: 1944 | Chairman of the Board (since 2012) and Director (since August 2005) of Jones International University (educational organization) (since August 2005); Chairman, Chief Executive Officer and Director of Steele Street Bank Trust (commercial banking) (since August 2003); Trustee of the Gallagher Family Foundation (non-profit organization) (since 2000); Board of Directors of Opera Colorado Foundation (non-profit organization) (2008-2012); Director of Colorado UpLIFT (charitable organization) (1986-2010); Director of Jones Knowledge, Inc. (2006-2010); Former Chairman of U.S. Bank-Colorado (subsidiary of U.S. Bancorp and formerly Colorado National Bank) (July 1996-April 1999); Director of Commercial Assets, Inc. (real estate investment trust) (1993-2000); Director of U.S. Exploration, Inc. (oil and gas exploration) (1997-February 2004); Chairman of the Board (1991-1994) and Trustee (1985-1994) of Regis University; and Chairman of the Board (1990-1991 and Trustee (1984-1999) of Young Presidents Organization. Oversees 38 portfolios in the OppenheimerFunds complex. Mr. Malone has served on the Boards of certain Oppenheimer funds since 2002, during which time he has become familiar with the Fund’s (and other Oppenheimer funds’) financial, accounting, regulatory and investment matters and has contributed to the Boards’ deliberations. |
TRUSTEES AND OFFICERS Unaudited / (Continued)
F. William Marshall, Jr., Trustee (since 2012) Year of Birth: 1942 | Trustee Emeritus of Worcester Polytech Institute (WPI) (private university) (since 2009); Trustee of MassMutual Select Funds (formerly MassMutual Institutional Funds) (investment company) (since 1996), MML Series Investment Fund (investment company) (since 1996) and Mass Mutual Premier Funds (investment company) (since January 2012); President and Treasurer of the SIS Fund (private charitable fund) (January 1999 – March 2011); Former Trustee of WPI (1985-2008); Former Chairman of the Board (2004-2006) and Former Chairman of the Investment Committee of WPI (1994-2008); Chairman of SIS & Family Bank, F.S.B. (formerly SIS Bank) (commercial bank) (January 1999-July 1999); Executive Vice President of Peoples Heritage Financial Group, Inc. (commercial bank) (January 1999-July 1999); and Former President and Chief Executive Officer of SIS Bancorp. (1993-1999). Oversees 42 portfolios in the OppenheimerFunds complex. Mr. Marshall has served on the Boards of certain Oppenheimer funds since 2000, during which time he has become familiar with the Fund’s (and other Oppenheimer funds’) financial, accounting, regulatory and investment matters and has contributed to the Boards’ deliberations. |
Karen L. Stuckey, Trustee (since 2012) Year of Birth: 1953 | Partner (1990-2012) of PricewaterhouseCoopers LLP (held various positions 1975-1990); Emeritus Trustee (since 2006), Trustee (1992-2006) and member of Executive, Nominating and Audit Committees and Chair of Finance Committee of Lehigh University; and member, Women’s Investment Management Forum since inception. Oversees 38 portfolios in the OppenheimerFunds complex. Ms. Stuckey has served on the Boards of certain Oppenheimer funds since 2012, during which time she has become familiar with the Fund’s (and other Oppenheimer funds’) financial, accounting, regulatory and investment matters and has contributed to the Boards’ deliberations. |
James D. Vaughn, Trustee (since 2012) Year of Birth:1945 | Retired; former managing partner (1994-2001) of Denver office of Deloitte & Touche LLP, (held various positions 1969-1993); Trustee and Chairman of the Audit Committee of Schroder Funds (2003-2012); Board member and Chairman of Audit Committee of AMG National Trust Bank (since 2005); Trustee and Investment Committee member, University of South Dakota Foundation (since 1996); Board member, Audit Committee Member and past Board Chair, Junior Achievement (since 1993); former Board member, Mile High United Way, Boys and Girls Clubs, Boy Scouts, Colorado Business Committee for the Arts, Economic Club of Colorado and Metro Denver Network. Oversees 38 portfolios in the OppenheimerFunds complex. Mr. Vaughn has served on the Boards of certain Oppenheimer funds since 2012, during which time he has become familiar with the Fund’s (and other Oppenheimer funds’) financial, accounting, regulatory and investment matters and has contributed to the Boards’ deliberations. |
TRUSTEES AND OFFICERS Unaudited / (Continued)
| INTERESTED TRUSTEE | Mr. Glavin is an “Interested Trustee” because he is affiliated with the Manager and OppenheimerFunds, Inc. by virtue of his positions as director of the Manager, and as a shareholder of OppenheimerFunds, Inc.’s parent company. As a Trustee, he serves for an indefinite term, or until his resignation, retirement, death or removal. Mr. Glavin’s address is 225 Liberty Street, 11th Floor, New York, New York 10281-1008. |
William F. Glavin, Jr., Trustee (since 2012) Year of Birth: 1958 | Chairman of OppenheimerFunds, Inc. (July 2014-December 2014 and December 2009-December 2012) and Director of OppenheimerFunds, Inc. (since January 2009); Chairman, Director and Chief Executive Officer (January 2013-June 2014) of OFI Global Asset Management, Inc.; President of OFI Global Asset Management, Inc. (January 2013-May 2013); Chief Executive Officer (January 2009-December 2012); President of OppenheimerFunds, Inc. (May 2009-December 2012); Management Director (June 2009-June 2014), President (December 2009-June 2014) and Chief Executive Officer (January 2011-June 2014) of Oppenheimer Acquisition Corp. (“OAC”) (OppenheimerFunds, Inc.’s parent holding company); Director of Oppenheimer Real Asset Management, Inc. (March 2010-June 2014); Executive Vice President (March 2006-February 2009) and Chief Operating Officer (July 2007-February 2009) of Massachusetts Mutual Life Insurance Company (OAC’s parent company); Director (May 2004-March 2006) and Chief Operating Officer and Chief Compliance Officer (May 2004-January 2005), President (January 2005-March 2006) and Chief Executive Officer (June 2005-March 2006) of Babson Capital Management LLC; Director (March 2005-March 2006), President (May 2003-March 2006) and Chief Compliance Officer (July 2005-March 2006) of Babson Capital Securities, Inc. (a broker-dealer); President (May 2003-March 2006) of Babson Investment Company, Inc.; Director (May 2004-August 2006) of Babson Capital Europe Limited; Director (May 2004-October 2006) of Babson Capital Guernsey Limited; Director (May 2004-March 2006) of Babson Capital Management LLC; Non-Executive Director (March 2005-March 2007) of Baring Asset Management Limited; Director (February 2005-June 2006) Baring Pension Trustees Limited; Director and Treasurer (December 2003-November 2006) of Charter Oak Capital Management, Inc.; Director (May 2006-September 2006) of C.M. Benefit Insurance Company; Director (May 2008-June 2009) and Executive Vice President (June 2007-July 2009) of C.M. Life Insurance Company; President (March 2006-May 2007) of MassMutual Assignment Company; Director (January 2005-December 2006), Deputy Chairman (March 2005-December 2006) and President (February 2005-March 2005) of MassMutual Holdings (Bermuda) Limited; Director (May 2008-June 2009) and Executive Vice President (June 2007-July 2009) of MML Bay State Life Insurance Company; Chief Executive Officer and President (April 2007-January 2009) of MML Distributors, LLC; and Chairman (March 2006-December 2008) and Chief Executive Officer (May 2007-December 2008) of MML Investors Services, Inc. An officer of 91 portfolios in the OppenheimerFunds complex. Mr. Glavin has served on the Boards of certain Oppenheimer funds since December 2009, during which time he has become familiar with the Fund’s (and other Oppenheimer funds’) financial, accounting, regulatory and investment matters and has contributed to the Boards’ deliberations. |
TRUSTEES AND OFFICERS Unaudited / (Continued)
| OTHER OFFICERS OF THE TRUSTS | The addresses of the Officers in the chart below are as follows: for Mr. Steinmetz, Gabinet, Mss. Sexton and Picciotto, 225 Liberty Street, New York, New York 10281-1008; for Messrs. Cartner and Watson, 2100 McKinney Avenue, Dallas, TX 75201; and for Mr. Wixted, 6803 S. Tucson Way, Centennial, Colorado 80112-3924. Each Officer serves for an indefinite term or until his or her resignation, retirement, death or removal. |
Stuart Cartner, Vice President (since 2010) Year of Birth: 1961 | Senior Vice President and Senior Portfolio Manager of the Manager (since January 2014); Vice President of the Manager (2012-January 2014). A member and portfolio manager of SteelPath Fund Advisors, LLC (since its formation in 2009) and SteelPath Capital Management, LLC (since 2007). Vice President in the Private Wealth Management Division of Goldman, Sachs & Co (1988-2007). An officer of other portfolios in the OppenheimerFunds complex. |
Brian Watson, Vice President (since 2012) Year of Birth: 1974 | Senior Vice President and Senior Portfolio Manager of the Manager (since January 2014); Vice President of the Manager (2012-January 2014). Prior to joining OFI Global Asset Management, Inc., he was a member, portfolio manager and Director of Research of SteelPath Fund Advisors, LLC since its formation in 2009. A portfolio manager at Swank Capital LLC, a Dallas, Texas based investment firm (2005-2009). An officer of other portfolios in the OppenheimerFunds complex. |
Arthur P. Steinmetz, President and Principal Executive Officer (since 2014) Year of Birth: 1958 | Chairman of OppenheimerFunds, Inc. (since January 2015); CEO and Chairman of OFI Global Asset Management, Inc. (since July 2014), President of OFI Global Asset Management, Inc. (since May 2013), a Director of OFI Global Asset Management, Inc. (since January 2013), Director of OppenheimerFunds, Inc. (since July 2014), President, Management Director and CEO of Oppenheimer Acquisition Corp. (OppenheimerFunds, Inc.’s parent holding company) (since July 2014), and President and Director of the Manager (since January 2013). Chief Investment Officer of the OppenheimerFunds advisory entities from (January 2013-December 2013); Executive Vice President of OFI Global Asset Management, Inc. (January 2013-May 2013); Chief Investment Officer of OppenheimerFunds, Inc. (October 2010-December 2012); Chief Investment Officer, Fixed-Income, of OppenheimerFunds, Inc. (April 2009-October 2010); Executive Vice President of OppenheimerFunds, Inc. (October 2009-December 2012); Director of Fixed Income of OppenheimerFunds, Inc. (January 2009-April 2009); and a Senior Vice President of OppenheimerFunds, Inc. (March 1993-September 2009). An officer of 91 portfolios in the OppenheimerFunds complex. |
TRUSTEES AND OFFICERS Unaudited / (Continued)
Arthur S. Gabinet, Secretary and Chief Legal Officer (since 2012) Year of Birth: 1958 | Executive Vice President, Secretary and General Counsel of OFI Global Asset Management, Inc. (since January 2013); General Counsel of the Manager (since January 2013); Executive Vice President (May 2010-December 2012) and General Counsel (since January 2011) of OppenheimerFunds, Inc.; General Counsel of the Distributor (since January 2011); General Counsel of Centennial Asset Management Corporation (January 2011-December 2012); Executive Vice President (January 2011-December 2012) and General Counsel of HarbourView Asset Management Corporation (since January 2011); Assistant Secretary (since January 2011) and Director (since January 2011) of OppenheimerFunds International Ltd. and OppenheimerFunds plc; Director of Oppenheimer Real Asset Management, Inc. (January 2011-December 2012) and General Counsel (since January 2011); Executive Vice President (January 2011-December 2011) and General Counsel of Shareholder Financial Services, Inc. and Shareholder Services, Inc. (since January 2011); Executive Vice President (January 2011-December 2012) and General Counsel of OFI Private Investments Inc. (since January 2011); Vice President of OppenheimerFunds Legacy Program (January 2011-December 2011); Executive Vice President (January 2011-December 2012) and General Counsel of OFI Institutional Asset Management, Inc. (since January 2011); General Counsel, Asset Management of OppenheimerFunds, Inc. (May 2010-December 2010); Principal, The Vanguard Group (November 2005-April 2010); District Administrator, U.S. Securities and Exchange Commission (January 2003-October 2005). An officer of 91 portfolios in the OppenheimerFunds complex. |
Jennifer Sexton, Vice President and Chief Business Officer (since 2014) Year of Birth: 1969 | Senior Vice President of OppenheimerFunds Distributor, Inc. (since June 2014); Vice President of OppenheimerFunds Distributor, Inc. (April 2006-June 2014); Vice President of OppenheimerFunds, Inc. (January 1998-March 2006); Assistant Vice President of OppenheimerFunds, Inc. (October 1991-December 1998). An officer of 91 portfolios in the OppenheimerFunds complex. |
Mary Ann Picciotto, Chief Compliance Officer and Chief Anti-Money Laundering Officer (since 2014) Year of Birth: 1973 | Senior Vice President and Chief Compliance Officer of OFI Global Asset Management, Inc. (since March 2014); Chief Compliance Officer of OppenheimerFunds, Inc., the Manager, OFI Global Trust Company, OFI Global Institutional, Inc., Oppenheimer Real Asset Management, Inc., OFI Private Investments, Inc., Harborview Asset Management Corporation, Trinity Investment Management Corporation, and Shareholder Services, Inc. (since March 2014); Managing Director of Morgan Stanley Investment Management Inc. and certain of its various affiliated entities; Chief Compliance Officer of various Morgan Stanley Funds (May 2010-January 2014); Chief Compliance Officer of Morgan Stanley Investment Management Inc. (April 2007-January 2014). An officer of 91 portfolios in the OppenheimerFunds complex. |
TRUSTEES AND OFFICERS Unaudited / (Continued)
Brian W. Wixted, Treasurer and Principal Financial & Accounting Officer (since 2012) Year of Birth: 1959 | Senior Vice President of OFI Global Asset Management, Inc. (since January 2013); Treasurer of OppenheimerFunds, Inc., HarbourView Asset Management Corporation, Shareholder Financial Services, Inc., Shareholder Services, Inc., and Oppenheimer Real Asset Management, Inc. (March 1999-June 2008), OFI Private Investments, Inc. (March 2000-June 2008), OppenheimerFunds International Ltd. and OppenheimerFunds plc (since May 2000), OFI Institutional Asset Management, Inc. (November 2000-June 2008), and OppenheimerFunds Legacy Program (charitable trust program established by OppenheimerFunds, Inc.) (June 2003-December 2011); Treasurer and Chief Financial Officer of OFI Trust Company (since May 2000); Assistant Treasurer of Oppenheimer Acquisition Corporation (March 1999-June 2008). An officer of 91 portfolios in the OppenheimerFunds complex. |
The Fund’s Statement of Additional Information contains additional information about the Fund’s Trustees and Officers and is available without charge upon request, by calling 1.800.CALL OPP (225.5677).
OPPENHEIMER STEELPATH MLP INCOME FUND
| Manager | | OFI SteelPath, Inc. |
| | | |
| Distributor | | OppenheimerFunds Distributor, Inc. |
| | | |
| Transfer and Shareholder Servicing Agent | | OFI Global Asset Management, Inc. |
| | | |
| Sub-Transfer Agent | | Shareholder Services, Inc. |
| | | DBA OppenheimerFunds Services |
| | | |
| Independent Registered Public Accounting Firm | | Cohen Fund Audit Services, Ltd. |
| | | |
| Legal Counsel | | K&L Gates LLP |
© 2015 OppenheimerFunds, Inc. All rights reserved.
The financial statements included herein have been taken from the records of the Fund without examination of those records by the independent registered public accounting firm.
PRIVACY POLICY NOTICE
As an Oppenheimer fund shareholder, you are entitled to know how we protect your personal information and how we limit its disclosure.
Information Sources
We obtain nonpublic personal information about our shareholders from the following sources:
| • | Applications or other forms |
| • | When you create a user ID and password for online account access |
| • | When you enroll in eDocs Direct, our electronic document delivery service |
| • | Your transactions with us, our affiliates or others |
| • | A software program on our website, often referred to as a “cookie,” which indicates which parts of our site you’ve visited |
| • | When you set up challenge questions to reset your password online |
If you visit oppenheimerfunds.com and do not log on to the secure account information areas, we do not obtain any personal information about you. When you do log on to a secure area, we do obtain your user ID and password to identify you. We also use this information to provide you with products and services you have requested, to inform you about products and services that you may be interested in and assist you in other ways.
We do not collect personal information through our website unless you willingly provide it to us, either directly by email or in those areas of the website that request information. In order to update your personal information (including your mailing address, email address and phone number) you must first log on and visit your user profile.
If you have set your browser to warn you before accepting cookies, you will receive the warning message with each cookie. You can refuse cookies by turning them off in your browser. However, doing so may limit your access to certain sections of our website.
We use cookies to help us improve and manage our website. For example, cookies help us recognize new versus repeat visitors to the site, track the pages visited, and enable some special features on the website. This data helps us provide a better service for our website visitors.
Protection of Information
We do not disclose any non-public personal information (such as names on a customer list) about current or former customers to anyone, except as permitted by law.
PRIVACY POLICY NOTICE (Continued)
Disclosure of Information
Copies of confirmations, account statements and other documents reporting activity in your fund accounts are made available to your financial adviser (as designated by you). We may also use details about you and your investments to help us, our financial service affiliates, or firms that jointly market their financial products and services with ours, to better serve your investment needs or suggest financial services or educational material that may be of interest to you. If this requires us to provide you with an opportunity to “opt in” or “opt out” of such information sharing with a firm not affiliated with us, you will receive notification on how to do so, before any such sharing takes place.
Right of Refusal
We will not disclose your personal information to unaffiliated third parties (except as permitted by law), unless we first offer you a reasonable opportunity to refuse or “opt out” of such disclosure.
Internet Security and Encryption
In general, the email services provided by our website are encrypted and provide a secure and private means of communication with us. To protect your own privacy, confidential and/or personal information should only be communicated via email when you are advised that you are using a secure website.
As a security measure, we do not include personal or account information in non-secure emails, and we advise you not to send such information to us in non-secure emails. Instead, you may take advantage of the secure features of our website to encrypt your email correspondence. To do this, you will need to use a browser that supports Secure Sockets Layer (SSL) protocol.
We do not guarantee or warrant that any part of our website, including files available for download, are free of viruses or other harmful code. It is your responsibility to take appropriate precautions, such as use of an anti-virus software package, to protect your computer hardware and software.
| • | All transactions, including redemptions, exchanges and purchases, are secured by SSL and 128-bit encryption. SSL is used to establish a secure connection between your PC and OppenheimerFunds’ server. It transmits information in an encrypted and scrambled format. |
| • | Encryption is achieved through an electronic scrambling technology that uses a “key” to code and then decode the data. Encryption acts like the cable converter box you may have on your television set. It scrambles data with a secret code so that no one can make sense of it while it is being transmitted. When the data reaches its destination, the same software unscrambles the data. |
| • | You can exit the secure area by either closing your browser, or for added security, you can use the Log Out button before you close your browser. |
PRIVACY POLICY NOTICE (Continued)
Other Security Measures
We maintain physical, electronic and procedural safeguards to protect your personal account information. Our employees and agents have access to that information only so that they may offer you products or provide services, for example, when responding to your account questions.
How You Can Help
You can also do your part to keep your account information private and to prevent unauthorized transactions. If you obtain a user ID and password for your account, do not allow it to be used by anyone else. Also, take special precautions when accessing your account on a computer used by others.
Who We Are
This joint notice describes the privacy policies of the Oppenheimer funds, OppenheimerFunds, Inc., each of its investment adviser subsidiaries, OppenheimerFunds Distributor, Inc. and OFI Global Trust Co. It applies to all Oppenheimer fund accounts you presently have, or may open in the future, using your Social Security number - whether or not you remain a shareholder of our funds. This notice was last updated November 2014. In the event it is updated or changed, we will post an updated notice on our website at oppenheimerfunds.com. If you have any questions about this privacy policy, write to us at P.O. Box 5270, Denver, CO 80217-5270, email us by clicking on the Contact Us section of our website at oppenheimerfunds.com or call us at 1.800.CALL.OPP (225.5677).
THIS PAGE INTENTIONALLY LEFT BLANK
THIS PAGE INTENTIONALLY LEFT BLANK
| Fund Performance Discussion | 3 |
| Top Holdings and Allocations | 8 |
| Share Class Performance | 9 |
| Fund Expenses | 11 |
| Statement of Investments | 13 |
| Statement of Assets and Liabilities | 15 |
| Statement of Operations | 17 |
| Statements of Changes in Net Assets | 18 |
| Statement of Cash Flows | 19 |
| Financial Highlights | 20 |
| Notes to Financial Statements | 24 |
| Report of Independent Registered Public Accounting Firm | 40 |
| Board Approval of the Fund’s Investment Advisory Agreement | 41 |
| Portfolio Proxy Voting Policies and Procedures; Updates to Statements of Investments | 44 |
| Trustees and Officers | 45 |
| Privacy Policy Notice | 54 |
Class A Shares
AVERAGE ANNUAL TOTAL RETURNS AT 11/28/14*
| | Class A Shares of the Fund | | |
| | Without
Sales
Charge | With
Sales
Charge | S&P 500 Index | Alerian MLP Index |
| 1-Year | 15.77% | 9.10% | 16.86% | 12.87% |
| Since Inception (2/6/12) | 16.04 | 13.62 | 19.07 | 13.76 |
Performance data quoted represents past performance, which does not guarantee future results. The investment return and principal value of an investment in the Fund will fluctuate so that an investor’s shares, when redeemed, may be worth more or less than their original cost. Fund returns include changes in share price, reinvested distributions, and a 5.75% maximum applicable sales charge except where “without sales charge” is indicated. Current performance may be lower or higher than the performance quoted. Returns do not consider capital gains or income taxes on an individual’s investment. For performance data current to the most recent month-end, visit oppenheimerfunds.com or call 1.800.CALL.OPP (225.5677).
| * | November 28, 2014, was the last business day of the Fund’s fiscal year. See Note 2 of the accompanying Notes to Financial Statements. Index returns are calculated through November 30, 2014. |
Fund Performance Discussion
The Fund’s Class A shares (without sales charge) produced a total return of 15.77% during the reporting period. In comparison, master limited partnerships (MLPs), as measured by the Alerian MLP Index (AMZ), provided a total return of 12.87%. Please note that the returns for the Alerian MLP Index are calculated pre-tax, while the Fund’s returns are calculated post corporate tax. During the same period, the S&P 500 Index produced a total return of 16.86%.
Over the twelve-month reporting period ended November 30, 2014, the MLP sector underperformed the broader markets. Notably, MLPs outperformed the S&P 500 Index for most of the period before declining during October and November in correlation with a sharp pullback in crude oil prices. A low-yield versus high-yield characteristic appeared to dominate performance differentiation for the first half of 2014, but this theme was less of a contributing factor during the latter part of the reporting period. Below average yielding MLPs typically reflect expectations for rapid distribution growth, while MLPs with above average yields are generally thought to hold more limited growth prospects. During the first half of 2014, the price performance of MLPs with yields that were below the group average, or faster growers, beat the price performance of MLPs with above average yields, or
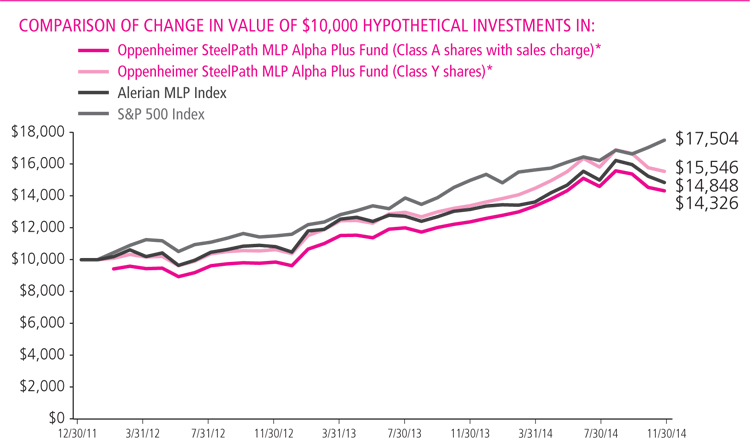
| * | Class A shares incepted on 2/6/12. Effective June 28, 2013 Class I shares, which incepted on 12/30/11, were renamed Class Y shares. See Note 2 of the Notes to Financial Statements for additional information. |
slower growers, by an average of 16.7%. During the third quarter, the below average yielding names only beat the above average yielding MLPs by 0.5%. More accurately, however, the yield, or growth, characteristic appeared to carry less influence late in the period than sub-sector membership and company-specific factors.
Over the reporting period, approximately $35 billion of new equity supply entered the market through either secondary offerings, initial public offerings, or through “at-the-market” programs in which primary units trade into the market anonymously throughout the normal trading day. This pace of equity issuance represents an increased rate from the roughly $26 billion raised over the twelve month reporting period ended November 30, 2013. MLPs also raised approximately $23 billion of debt capital during the period. Most MLPs pay out the majority of excess cash flow as distributions to investors, and thereby must raise external capital to fund growth projects.
MACRO REVIEW
West Texas Intermediate (WTI) crude oil prices ended the reporting period at $61.15 per barrel, down 29% from the end of November 2013. Global crude prices traded 36% lower over the reporting period, with continuing political and social turmoil in the Middle East offset by rising production, a stronger U.S. dollar, and weakening economic outlooks late in the period. Domestically, regional crude pricing differentials continued to exhibit fluctuations, with West Texas pricing exhibiting the greatest weakness early in the period, before narrowing significantly late in the period.
Henry Hub natural gas spot prices rose 12% to end the period at $4.24 per million British thermal units (mmbtu). A combination of continued rising natural gas production, and moderate summer electric demand due to a cooler than normal summer, largely replenished natural gas storage levels after the cold winter left natural gas storage levels at eleven year lows. With storage levels now only marginally below historic levels, we believe fear of elevated natural gas price volatility over the 2014-2015 winter has waned.
Mont Belvieu natural gas liquids (NGL) prices ended the reporting period at $29.74 per barrel, down 30% from the end of November 2013. All of the NGL purity product prices ended the period lower than the same time in the prior year. As a result natural gas processing economics weakened over the period, which may impact certain midstream providers, depending on the contract structure of their processing agreements.
The yield curve flattened over the reporting period as short rates held steady, medium-term rates rose, and longer-dated yields declined. The ten-year Treasury yield fell 58 basis points to end the period at 2.17%. The MLP yield spread at period-end, as measured by the AMZ and the 10-year Treasury bond, widened by 41 basis points to 3.53%.
Over the reporting period, real estate investment trusts (REITs) and utilities, two competing yield-oriented equity asset
classes, posted total returns of 27.22% (as measured by the Dow Jones Equity All REIT Total Return Index) and 27.88% (as measured by the Dow Jones Utility Average Index), respectively, outperforming the AMZ’s 12.87% total return. We believe this performance differential is the result of REITs and utilities benefiting from the low interest rate environment, while the performance of MLP equities was impacted by the sharp crude oil price decline. Among MLPs, sector valuation statistics remained little changed over the period, as equity price performance was offset by increased growth expectations. Price to forward distributable cash flow (DCF), a commonly watched ratio, widened modestly above the ten-year average but within the historic range, reflecting the sector’s robust growth potential. We continue to believe that the visibility of energy infrastructure growth opportunities supports above average valuations.
SUBSECTOR REVIEW
Most subsectors in the midstream, or energy infrastructure, MLP asset class delivered positive performance for the reporting period. On average, the diversified names provided the best performance over the period as these larger names benefited from commodity and activity diversity, as well as mergers and acquisitions (M&A) activity. The natural gas pipeline group followed with performance benefiting from a less volatile natural gas price, stable production volumes, and M&A activity. The petroleum product and crude oil subsector also delivered strong performance as it continued to benefit from the U.S. energy renaissance in the production of crude oil.
Consistent with the trends we saw in the previous reporting period, those asset classes with greater exposure to commodity prices delivered less favorable performance over the period. Weakness within the coal subsector likely reflects, we believe, continued market concern over the outlook for coal pricing in the face of abundant and cheap natural gas as a competing electric generating fuel and the potential for even greater regulatory pressure on the use of coal. Upstream MLPs, including those active in exploration and production and oilfield services and supply, suffered as crude oil prices peaked mid-2014 and underwent sharp downward moves late in the period. Also among the weakest subsectors for the period were the marine MLPs, where weakness was also influenced by the decline in crude oil prices and its perceived impact of oil supply growth and transportation.
FUND REVIEW
Key contributors to the Fund’s performance were Energy Transfer Equity, LP (ETE) and TC Pipelines, LP (TCP).
ETE units outperformed the AMZ for the reporting period, benefiting from the momentum favoring low-yielding, high growth names and bolstered by M&A activity and new growth project announcements at its subsidiary partnerships: Energy Transfer Partners (ETP), Regency Energy Partners (RGP), Sunoco Logistics Partners (SXL), and Sunoco, LP (SUN). Unit price strength
during the reporting period was also supported by ETE’s seventh consecutive quarterly distribution increase.
TCP units outperformed the AMZ late in the period as the market began to anticipate higher distribution growth as its parent, TransCanada, restated its intent to drop down all of its U.S. natural gas pipeline assets to TCP. TransCanada recently announced that it will complete the dropdown of its minority interest in two pipelines to TCP in the first quarter 2015. TCP has also benefited recently from its lack of exposure to oil.
Key detractors from the Fund’s performance were Seadrill Partners LLC (SDLP) and El Paso Pipeline Partners, LP (EPB).
SDLP units were impacted as falling crude oil prices late in the reporting period induced a risk-off mentality in the market, and consequently a flight to more defensively-positioned, large-cap securities. At the same time, a cyclical slow-down in the offshore drilling industry has seen SDLP trade in sympathy with spot-exposed peers. To note, SDLP has no material exposure to underlying spot rates until 2017 due to contracts with investment-grade counterparties.
EPB’s modest distribution growth guidance for 2014 and flat distribution growth guidance for 2015 and 2016 drove price weakness early in the period as several rate case settlements and weak contract renewals offset the positive contribution of several planned acquisitions. Performance was bolstered in August when Kinder Morgan, Inc. (KMI) announced its plans to acquire and consolidate its family of MLPs, including EPB. The acquisitions were completed in late November 2014.
Separately, the Fund also obtains leverage through borrowing, which contributed positively to its performance this reporting period. Please note that to the extent the Fund obtains leverage through borrowing, there will be the potential for greater gains and the risk of magnified losses.
OUTLOOK
We believe the price correction in crude oil, should it continue, will serve to moderate crude oil production growth rates in aggregate but that the impact for the majority of midstream focused MLPs will be modest. Further, after the sector’s recent trading weakness we believe basic valuation metrics exited 2014 well within historical averages and provide an opportunity to earn a reasonable return on investment for those businesses positioned appropriately. Importantly, we believe that despite near-term price weakness and the likely moderation in growth trends for certain basins, the long-term production trends associated with the North American energy renaissance remain in place and are supportive of midstream assets generally.
It is also important to highlight that many businesses utilizing the MLP structure today are not related to energy infrastructure. A number of non-midstream businesses have entered the public markets utilizing the MLP structure. Clearly, an oil
and gas producer, a refinery, or an oilfield services provider, whether organized as a corporation or MLP, will experience the underlying margin and business trends of those industries. Therefore, while we believe recent price weakness may represent an attractive entry point for those MLPs positioned to perform well despite recent commodity price weakness, investors should consider carefully the fundamental exposure presented by each specific MLP before committing capital.
Top Holdings and Allocations*
TOP TEN MASTER LIMITED PARTNERSHIP HOLDINGS
| Enterprise Products Partners LP | 11.82% |
| Magellan Midstream Partners LP | 10.17% |
| Plains All American Pipeline LP | 9.35% |
| Energy Transfer Equity LP | 9.21% |
| Sunoco Logistics Partners LP | 9.15% |
| Regency Energy Partners LP | 8.26% |
| Access Midstream Partners LP | 7.33% |
| TC Pipelines LP | 7.29% |
| Buckeye Partners LP | 6.59% |
| MarkWest Energy Partners LP | 5.89% |
Portfolio holdings and allocations are subject to change. Percentages are as of November 28, 2014, and are based on net assets.
SECTOR ALLOCATION
Portfolio holdings and allocations are subject to change. Percentages are as of November 28, 2014, and are based on the total market value of investments.
| * | November 28, 2014, was the last business day of the Fund’s fiscal year. See Note 2 of the accompanying Notes to Financial Statements. |
Share Class Performance
AVERAGE ANNUAL TOTAL RETURNS WITHOUT SALES CHARGE AS OF 11/28/14*
| | Inception Date | 1-Year | Since Inception |
| Class A (MLPLX) | 2/6/12 | 15.77% | 16.04% |
| Class C (MLPMX) | 5/22/12 | 14.98% | 19.00% |
| Class I (OSPPX) | 6/28/13 | 16.32% | 14.08%** |
| Class Y (MLPNX) | 12/30/11 | 16.11% | 16.31%** |
AVERAGE ANNUAL TOTAL RETURNS WITH SALES CHARGE AS OF 11/28/14*
| | Inception Date | 1-Year | Since Inception |
| Class A (MLPLX) | 2/6/12 | 9.10% | 13.62% |
| Class C (MLPMX) | 5/22/12 | 13.98% | 19.00% |
| Class I (OSPPX) | 6/28/13 | 16.32% | 14.08%** |
| Class Y (MLPNX) | 12/30/11 | 16.11% | 16.31%** |
| * | November 28, 2014, was the last business day of the Fund’s fiscal year. See Note 2 of the accompanying Notes to Financial Statements. Index returns are calculated through November 30, 2014. |
| ** | Effective June 28, 2013, Class I shares were renamed Class Y shares. See Note 1 of the Notes to Financial Statements for additional information. |
Performance data quoted represents past performance, which does not guarantee future results. The investment return and principal value of an investment in the Fund will fluctuate so that an investor’s shares, when redeemed, may be worth more or less than their original cost. Current performance may be lower or higher than the performance quoted. Returns do not consider capital gains or income taxes on an individual’s investment. For performance data current to the most recent month-end, visit oppenheimerfunds.com or call 1.800.CALL.OPP (225.5677). Fund returns include changes in share price, reinvested distributions, and the applicable sales charge: for Class A shares, the current maximum initial sales charge of 5.75%; and for Class C shares, the contingent deferred sales charge of 1% for the 1-year period. There is no sales charge for Class I or Class Y shares.
The Fund’s performance is compared to the performance of the S&P 500 Index, and the Alerian MLP Index. The S&P 500 Index is an index of large-capitalization equity securities that is a measure of the general domestic stock market. The Alerian MLP Index is a composite of the 50 most prominent Master Limited Partnerships that provides investors with an unbiased, comprehensive benchmark for this emerging asset class. The index, which is calculated using a float-adjusted, capitalization-weighted methodology, is disseminated real-time on a total-return basis (AMZX). The indices are unmanaged and cannot be purchased directly by investors. While index comparisons may be useful to provide a benchmark for the Fund’s
performance, it must be noted that the Fund’s investments are not limited to the investments comprising the indices. Index performance includes reinvestment of income, but does not reflect transaction costs, fees, expenses or taxes. Index performance is shown for illustrative purposes only as a benchmark for the Fund’s performance, and does not predict or depict performance of the Fund. The Fund’s performance reflects the effects of the Fund’s business and operating expenses.
The Fund’s investment strategy and focus can change over time. The mention of specific fund holdings does not constitute a recommendation by OppenheimerFunds, Inc. or its affiliates.
Before investing in any of the Oppenheimer funds, investors should carefully consider a fund’s investment objectives, risks, charges and expenses. Fund prospectuses and summary prospectuses contain this and other information about the funds, and may be obtained by asking your financial adviser, visiting oppenheimerfunds.com, or calling 1.800.CALL.OPP (225.5677). Read prospectuses and summary prospectuses carefully before investing.
Shares of Oppenheimer funds are not deposits or obligations of any bank, are not guaranteed by any bank, are not insured by the FDIC or any other agency, and involve investment risks, including the possible loss of the principal amount invested.
Fund Expenses
Fund Expenses. As a shareholder of the Fund, you incur two types of costs: (1) transaction costs, which may include sales charges (loads) on purchase payments, contingent deferred sales charges on redemptions; and (2) ongoing costs, including management fees; distribution and service fees; and other Fund expenses. These examples are intended to help you understand your ongoing costs (in dollars) of investing in the Fund and to compare these costs with the ongoing costs of investing in other mutual funds.
The examples are based on an investment of $1,000.00 invested at the beginning of the period and held for the entire 6-month period ended November 28, 2014.
Actual Expenses. The first section of the table provides information about actual account values and actual expenses. You may use the information in this section for the class of shares you hold, together with the amount you invested, to estimate the expense that you paid over the period. Simply divide your account value by $1,000.00 (for example, an $8,600.00 account value divided by $1,000.00 = 8.60), then multiply the result by the number in the first section under the heading entitled “Expenses Paid During Period” to estimate the expenses you paid on your account during this period.
Hypothetical Example for Comparison Purposes. The second section of the table provides information about hypothetical account values and hypothetical expenses based on the Fund’s actual expense ratio for each class of shares, and an assumed rate of return of 5% per year for each class before expenses, which is not the actual return. The hypothetical account values and expenses may not be used to estimate the actual ending account balance or expenses you paid for the period. You may use this information to compare the ongoing costs of investing in the Fund and other funds. To do so, compare this 5% hypothetical example for the class of shares you hold with the 5% hypothetical examples that appear in the shareholder reports of the other funds.
Please note that the expenses shown in the table are meant to highlight your ongoing costs only and do not reflect any transactional costs, such as front-end or contingent deferred sales charges (loads). Therefore, the “hypothetical” section of the table is useful in comparing ongoing costs only, and will not help you determine the relative total costs of owning different funds. In addition, if these transactional costs were included, your costs would have been higher.
| Actual | Beginning
Account
Value
June 1, 2014 | Ending
Account
Value
November 28,
2014 | Expenses
Paid During
6 Months Ended
November 28,
2014* |
| Class A | $1,000.00 | $999.60 | $12.92 |
| Class C | 1,000.00 | 995.70 | 16.57 |
| Class I | 1,000.00 | 1,002.60 | 10.01 |
| Class Y | 1,000.00 | 1,001.10 | 11.67 |
| | | | |
Hypothetical
(5% return before expenses) | | | |
| Class A | 1,000.00 | 1,012.07 | 13.01 |
| Class C | 1,000.00 | 1,008.39 | 16.67 |
| Class I | 1,000.00 | 1,015.01 | 10.07 |
| Class Y | 1,000.00 | 1,013.34 | 11.74 |
Expenses are equal to the Fund’s annualized expense ratio for that class, multiplied by the average account value over the period, multiplied by 181/365 (to reflect the one-half year period). Those annualized expense ratios, excluding indirect expenses from affiliated funds, and tax expense, based on the 6-month period ended November 28, 2014 are as follows:
| Class | Expense Ratios* |
| CLASS A | 2.58% |
| CLASS C | 3.31 |
| CLASS I | 1.99 |
| CLASS Y | 2.33 |
| * | For the 6-month period ended November 28, 2014, the Fund’s deferred tax liability decreased resulting in a deferred tax benefit for the period. This benefit was excluded from this example. |
The expense ratios for Class A, C, and Y reflect contractual waivers and/or reimbursements of expenses by the Fund’s Manager. Some of these undertakings may be modified or terminated at any time, as indicated in the Fund’s prospectus. The “Financial Highlights” tables in the Fund’s financial statements, included in this report, also show the gross expense ratios, without such waivers or reimbursements, if applicable.
STATEMENT OF INVESTMENTS November 28, 2014*
| Description | | Shares | | | Value | |
| Master Limited Partnership Shares — 136.8% | |
| Diversified — 14.5% | | | | |
Enterprise Products Partners LP 1 | | | 1,245,024 | | | $ | 46,489,196 | |
ONEOK Partners LP 1 | | | 242,593 | | | | 10,693,499 | |
| Total Diversified | | | | | | | 57,182,695 | |
| | | | | | | | | |
| Gathering/Processing — 34.8% | |
Access Midstream Partners LP 1 | | | 459,806 | | | | 28,820,640 | |
| Atlas Pipeline Partners LP | | | 28,690 | | | | 942,180 | |
DCP Midstream Partners LP 1 | | | 384,392 | | | | 18,416,221 | |
MarkWest Energy Partners LP 1 | | | 325,720 | | | | 23,145,663 | |
Regency Energy Partners LP 1 | | | 1,140,646 | | | | 32,497,005 | |
Summit Midstream Partners LP 1 | | | 124,186 | | | | 5,638,044 | |
Targa Resources Partners LP 1 | | | 329,428 | | | | 18,062,537 | |
Western Gas Partners LP 1 | | | 128,771 | | | | 9,133,727 | |
| Total Gathering/Processing | | | | | | | 136,656,017 | |
| | | | | | | | | |
| Marine — 3.3% | | | | | | | | |
Seadrill Partners LLC 1 | | | 759,005 | | | | 12,842,365 | |
| | | | | | | | | |
| Natural Gas Pipelines — 28.4% | |
Energy Transfer Equity LP 1 | | | 609,753 | | | | 36,213,231 | |
Energy Transfer Partners LP 1 | | | 283,025 | | | | 18,444,739 | |
EQT Midstream Partners LP 1 | | | 201,121 | | | | 16,821,760 | |
Spectra Energy Partners LP 1 | | | 214,733 | | | | 11,589,140 | |
| Description | | Shares | | | Value | |
| Natural Gas Pipelines — 28.4% (Continued) | |
TC Pipelines LP 1 | | 398,079 | | | $ | 28,657,707 | |
| Total Natural Gas Pipelines | | | | | | 111,726,577 | |
| | | | | | | | |
| Petroleum Transportation — 55.8% | |
Buckeye Partners LP 1 | | 336,888 | | | | 25,896,580 | |
Genesis Energy LP 1 | | 248,489 | | | | 10,940,971 | |
Holly Energy Partners LP 1 | | 264,085 | | | | 8,886,460 | |
Magellan Midstream Partners LP 1 | | 482,585 | | | | 40,001,471 | |
NGL Energy Partners LP 1 | | 485,224 | | | | 16,934,318 | |
NuStar Energy LP 1 | | 25,202 | | | | 1,411,312 | |
NuStar GP Holdings LLC 1 | | 254,120 | | | | 8,731,563 | |
Plains All American Pipeline LP 1 | | 714,424 | | | | 36,757,115 | |
Shell Midstream Partners LP 1,2 | | 455,557 | | | | 16,636,942 | |
Sunoco Logistics Partners LP 1 | | 747,706 | | | | 35,994,567 | |
Tesoro Logistics LP 1 | | 212,372 | | | | 12,162,544 | |
TransMontaigne Partners LP 1 | | 142,499 | | | | 5,259,638 | |
| Total Petroleum Transportation | | | | | | 219,613,481 | |
| | | | | | | | |
| Total Master Limited Partnership Shares | |
| (identified cost $468,075,276) | | | | 538,021,135 | |
| | | | | | | | |
| Common Stock — 7.4% | |
| Diversified — 7.2% | | | | | | | |
ONEOK, Inc. 1 | | 261,104 | | | | 14,141,393 | |
Williams Cos., Inc. 1 | | 272,186 | | | | 14,085,625 | |
| Total Diversified | | | | | | 28,227,018 | |
STATEMENT OF INVESTMENTS (Continued)
| Description | | Shares | | | Value | |
| Gathering/Processing — 0.2% | | | | |
| Targa Resources Corp. | | | 8,240 | | | $ | 940,514 | |
| Total Gathering/Processing | | | | | | | 940,514 | |
| | | | | | | | | |
| Total Common Stock | | | | | |
| (identified cost $31,162,076) | | | | 29,167,532 | |
| | | | | | | | | |
| Total Investments — 144.2% | | | | | |
| (identified cost $499,237,352) | | | | 567,188,667 | |
| Liabilities In Excess of Other Assets — (44.2)% | | | | (173,923,015 | ) |
| Net Assets — 100.0% | | | $ | 393,265,652 | |
Footnotes to Statement of Investments
| * | November 28, 2014 represents the last business day of the Fund’s annual period. See Note 2 of the accompanying notes. |
LLC — Limited Liability Company
LP — Limited Partnership
| 1. | As of November 28, 2014, all or a portion of the security has been pledged as collateral for a Fund loan. The value of the securities in the pledged account totaled $292,009,365 as of November 28, 2014. See Note 7 of the Notes to Financial Statements for additional information. |
See accompanying Notes to Financial Statements.
STATEMENT OF
ASSETS AND LIABILITIES November 28, 2014*
| Assets | | | |
| Investments at value (cost $499,237,352) – see accompanying Statement of Investments: | | $ | 567,188,667 | |
| Cash collateral for borrowing | | | 3,497,293 | |
| Dividends receivable | | | 45 | |
| Receivable for beneficial interest sold | | | 1,160,543 | |
| Prepaid expenses | | | 45,939 | |
| Total assets | | | 571,892,487 | |
| | | | | |
| Liabilities: | | | | |
| Interest expense payable | | | 123,503 | |
| Borrowing expense payable | | | 510 | |
| Payable for beneficial interest redeemed | | | 653,068 | |
| Payable for investments purchased | | | 364,671 | |
| Due to Custodian | | | 3,958,939 | |
| Deferred tax liability | | | 22,817,767 | |
| Payable to Manager | | | 416,600 | |
| Payable for distribution and service plan fees | | | 93,894 | |
| Payable on borrowing (See Note 7) | | | 150,003,005 | |
| Transfer agent fees payable | | | 73,332 | |
| Trustees' fees payable | | | 4,947 | |
| Other liabilities | | | 116,599 | |
| Total liabilities | | | 178,626,835 | |
| | | | | |
| Net Assets | | $ | 393,265,652 | |
| | | | | |
| Composition of Net Assets | | | | |
| Par value of shares of beneficial interest | | $ | 30,369 | |
| Paid-in capital | | | 354,216,283 | |
| Undistributed net investment loss, net of deferred taxes | | | (5,571,313 | ) |
| Accumulated undistributed net realized gains on investments, net of deferred taxes | | | 1,713,031 | |
| Net unrealized appreciation on investments, net of deferred taxes | | | 42,877,282 | |
| Net Assets | | $ | 393,265,652 | |
STATEMENT OF
ASSETS AND LIABILITIES (Continued)
Net Asset Value, Offering Price and Redemption Proceeds Per Share ($0.001 Par Value, Unlimited Shares Authorized) | | | | |
| Class A Shares: | | | | |
| Net asset value and redemption proceeds per share | | $ | 12.95 | |
| Offering price per share (net asset value plus sales charge of 5.75% of offering price) | | $ | 13.74 | |
| Class C Shares: | | | | |
| Net asset value, offering price and redemption proceeds per share | | $ | 12.71 | |
| Class I Shares: | | | | |
| Net asset value, offering price and redemption proceeds per share | | $ | 13.06 | |
| Class Y Shares: | | | | |
| Net asset value, offering price and redemption proceeds per share | | $ | 13.07 | |
| Net Assets: | | | |
| Class A shares | | $ | 214,846,322 | |
| Class C shares | | | 57,069,712 | |
| Class I shares | | | 159,894 | |
| Class Y shares | | | 121,189,724 | |
| Total Net Assets | | $ | 393,265,652 | |
| | | | | |
| Shares Outstanding: | | | | |
| Class A shares | | | 16,590,157 | |
| Class C shares | | | 4,490,508 | |
| Class I shares | | | 12,240 | |
| Class Y shares | | | 9,275,747 | |
| Total Shares Outstanding | | | 30,368,652 | |
| * | November 28, 2014 represents the last business day of the Fund’s annual period. See Note 2 of the accompanying Notes. |
See accompanying Notes to Financial Statements.
STATEMENT OF
OPERATIONS For the Year Ended November 28, 2014*
| Investment Income | | | |
| Distributions from Master Limited Partnerships | | $ | 19,115,450 | |
| Less return of capital on distributions | | | (19,115,450 | ) |
| Dividend income | | | 455,738 | |
| Total investment income | | | 455,738 | |
| | | | | |
| Expenses | | | | |
| Management fees | | | 3,592,848 | |
| Distribution and service plan fees | | | | |
| Class A | | | 406,106 | |
| Class C | | | 375,529 | |
| Transfer agent fees | | | | |
| Class A | | | 357,373 | |
| Class C | | | 82,616 | |
| Class I | | | 14 | |
| Class Y | | | 192,252 | |
| Tax expense | | | 30,196 | |
| Administrative fees | | | 60,637 | |
| Borrowing fees | | | 446,137 | |
| Custody fees | | | 41,127 | |
| Trustees' fees | | | 21,014 | |
| Other | | | 292,171 | |
| Total expenses, before recoupment and deferred taxes | | | 5,898,020 | |
| Plus expense recoupment | | | 358,414 | |
| Net expenses, before interest expense from payable on borrowing and deferred taxes | | | 6,256,434 | |
| Interest expense from payable on borrowing | | | 1,050,190 | |
| Net expenses, before deferred taxes | | | 7,306,624 | |
| | | | | |
| Net investment loss, before deferred taxes | | | (6,850,886 | ) |
| Deferred tax benefit | | | 2,527,899 | |
| Net investment loss, net of deferred taxes | | | (4,322,987 | ) |
| | | | | |
| Net Realized and Unrealized Gains on Investments: | | | | |
| Net Realized Gains | | | | |
| Investments | | | 2,807,128 | |
| Deferred tax expense | | | (1,035,753 | ) |
| Net realized gains, net of deferred taxes | | | 1,771,375 | |
| Net Change in Unrealized Appreciation | | | | |
| Investments | | | 47,163,138 | |
| Deferred tax expense | | | (17,403,197 | ) |
| Net change in unrealized appreciation, net of deferred taxes | | | 29,759,941 | |
| | | | | |
| Net realized and unrealized gains on investments, net of deferred taxes | | | 31,531,316 | |
| Change in net assets resulting from operations | | $ | 27,208,329 | |
| * | November 28, 2014 represents the last business day of the Fund’s annual period. See Note 2 of the accompanying Notes. |
See accompanying Notes to Financial Statements.
STATEMENTS OF CHANGES IN NET ASSETS
| | | For the
Year Ended
November 28, 2014* | | | For the
Year Ended
November 29, 2013* | |
| Operations | | | | | | |
| Net investment loss, net of deferred taxes | | $ | (4,322,987 | ) | | $ | (1,206,120 | ) |
| Net realized gains (losses) on investments, net of deferred taxes | | | 1,771,375 | | | | (12,844 | ) |
| Net change in unrealized appreciation on investments, net of deferred taxes | | | 29,759,941 | | | | 12,945,898 | |
| Change in net assets resulting from operations | | | 27,208,329 | | | | 11,726,934 | |
| | | | | | | | | |
| Distributions to Shareholders | | | | | | | | |
| Distributions to shareholders from return of capital: | | | | | | | | |
| Class A shares | | | (8,285,117 | ) | | | (3,263,118 | ) |
| Class C shares | | | (2,001,525 | ) | | | (437,003 | ) |
| Class I shares** | | | (2,885 | ) | | | (3,091 | ) |
| Class Y shares*** | | | (4,542,310 | ) | | | (1,546,992 | ) |
| Change in net assets resulting from distributions to shareholders | | | (14,831,837 | ) | | | (5,250,204 | ) |
| | | | | | | | | |
| Beneficial Interest Transactions | | | | | | | | |
| Class A shares | | | 98,701,447 | | | | 97,764,613 | |
| Class C shares | | | 40,122,697 | | | | 15,275,558 | |
| Class I shares** | | | 153,052 | | | | 13,648 | |
| Class Y shares*** | | | 67,244,578 | | | | 46,014,214 | |
| Change in net assets resulting from beneficial interest transactions | | | 206,221,774 | | | | 159,068,033 | |
| Change in net assets | | | 218,598,266 | | | | 165,544,763 | |
| | | | | | | | | |
| Net Assets | | | | | | | | |
| Beginning of period | | | 174,667,386 | | | | 9,122,623 | |
| End of period | | $ | 393,265,652 | | | $ | 174,667,386 | |
| | | | | | | | | |
| Undistributed net investment loss, net of deferred taxes | | $ | (5,571,313 | ) | | $ | (1,248,326 | ) |
| * | November 28, 2014 and November 29, 2013 represent the last business day of the Funds’ respective reporting periods. See Note 2 of the accompanying Notes. |
| ** | Class I shares commenced operations at the close of business June 28, 2013. |
| *** | Effective June 28, 2013, Class I shares were renamed Class Y shares. See Note 1 of the Notes to Financial Statements for additional information. |
See accompanying Notes to Financial Statements.
STATEMENT OF
CASH FLOWS For the Year Ended November 28, 2014*
| Cash flows from operating activities | | | |
| Net increase in net assets resulting from operations | | $ | 27,208,329 | |
| Non cash items included in operations: | | | | |
| Deferred income taxes | | | 15,911,051 | |
| Adjustments to reconcile net increase in net assets resulting from operations to net cash used in operating activities: | | | | |
| Purchases of long-term portfolio investments | | | (381,146,003 | ) |
| Sales of long-term portfolio investments | | | 86,221,870 | |
| Sales of short-term portfolio investments, net | | | 474,127 | |
| Distributions from Master Limited Partnerships | | | 19,115,450 | |
| Increase in cash collateral for borrowing | | | (3,497,293 | ) |
| Increase in prepaid expenses | | | (981 | ) |
| Increase in dividends receivable | | | (23 | ) |
| Increase in payable to Manager | | | 235,006 | |
| Decrease in payable for investments purchased | | | (4,542,847 | ) |
| Increase in transfer agent fees payable | | | 40,953 | |
| Increase in trustees’ fees payable | | | 4,176 | |
| Increase in other liabilities | | | 18,496 | |
| Increase in payable for distribution and service plan fees | | | 59,606 | |
| Increase in interest expense payable | | | 70,661 | |
| Increase in borrowing expense payable | | | 510 | |
| Net realized gain on investments | | | (2,807,128 | ) |
| Net change in accumulated unrealized appreciation on investments | | | (47,163,138 | ) |
| Net cash used in operating activities | | | (289,797,178 | ) |
| | | | | |
| Cash flows from financing activities | | | | |
| Proceeds from shares sold, net of receivable for beneficial interest sold | | | 302,735,130 | |
| Payment of shares redeemed, net of payable for beneficial interest redeemed | | | (110,198,379 | ) |
| Distributions paid to shareholders, net of reinvestments | | | (745,404 | ) |
| Net increase in use of line of credit | | | 92,503,005 | |
| Bank overdraft, due to Custodian | | | 3,958,939 | |
| Net cash provided by financing activities | | | 288,253,291 | |
| | | | | |
| Net change in cash | | | (1,543,887 | ) |
| Cash at beginning of period | | | 1,543,887 | |
| Cash at end of period | | $ | 0 | |
| * | November 28, 2014 represents the last business day of the Fund’s annual period. See Note 2 of the accompanying Notes. |
Supplemental disclosure of cash flow information:
Cash paid for interest of $979,529.
Non-cash financing activities not included consist of reinvestment of dividends and distributions of $14,086,433.
See accompanying Notes to Financial Statements.
| Class A | | Year Ended November 28,
2014* | | | Year Ended November 29,
2013 | | | Period Ended November 30,
2012 1 | |
| Per Share Operating Data | | | | | | | | | |
| Net Asset Value, Beginning of Period | | $ | 11.77 | | | $ | 9.93 | | | $ | 10.14 | |
| Income/(loss) from investment operations: | | | | | | | | | | | | |
Net investment loss 2 | | | (0.21 | ) | | | (0.17 | ) | | | (0.14 | ) |
Return of capital 2 | | | 0.55 | | | | 0.54 | | | | 0.46 | |
| Net realized and unrealized gains | | | 1.50 | | | | 2.13 | | | | 0.12 | |
| Total from investment operations | | | 1.84 | | | | 2.50 | | | | 0.44 | |
| Distributions to shareholders: | | | | | | | | | | | | |
| Return of capital | | | (0.66 | ) | | | (0.66 | ) | | | (0.65 | ) |
| Net asset value, end of period | | $ | 12.95 | | | $ | 11.77 | | | $ | 9.93 | |
| | | | | | | | | | | | | |
Total Return, at Net Asset Value 3 | | | 15.77 | % | | | 25.59 | % | | | 4.56 | % |
| | | | | | | | | | | | | |
| Ratios /Supplemental Data | | | | | | | | | | | | |
| Net assets, end of period (in thousands) | | $ | 214,846 | | | $ | 108,563 | | | $ | 6,915 | |
Ratio of Expenses to Average Net Assets: 4 | | | | | | | | | | | | |
| Before recoupment/(waivers) and deferred tax expense | | | 2.40 | % | | | 2.45 | % | | | 9.02 | % |
| Expense recoupment/(waivers) | | | 0.12 | % | | | (0.05 | %) | | | (6.42 | %) |
| Net of recoupment/(waivers) and before deferred tax expense | | | 2.52 | %5 | | | 2.40 | %5 | | | 2.60 | %6 |
Deferred tax expense 7,9 | | | 5.54 | % | | | 8.38 | % | | | 4.04 | % |
| Total expenses | | | 8.06 | % | | | 10.78 | % | | | 6.64 | % |
| | | | | | | | | | | | | |
Ratio of Investment Loss to Average Net Assets: 4 | | | | | | | | | | | | |
| Before recoupment/(waivers) and deferred tax expense | | | (2.35 | %) | | | (2.40 | %) | | | (9.02 | %) |
| Expense recoupment/(waivers) | | | 0.12 | % | | | (0.05 | %) | | | (6.42 | %) |
| Net of recoupment/(waivers) and before deferred tax expense | | | (2.47 | %) | | | (2.35 | %) | | | (2.60 | %) |
Deferred tax benefit 8,9 | | | 0.88 | % | | | 0.87 | % | | | 0.97 | % |
| Net investment loss | | | (1.59 | %) | | | (1.48 | %) | | | (1.63 | %) |
| | | | | | | | | | | | | |
| Portfolio turnover rate | | | 21 | % | | | 15 | % | | | 69 | % |
| * | November 28, 2014 and November 29, 2013 represent the last business day of the Fund’s fiscal year. See Note 2 of the accompanying Notes. |
| 1. | Shares commenced operations at the close of business February 6, 2012. |
| 2. | Per share amounts calculated based on average shares outstanding during the period. |
| 3. | Assumes an initial investment on the business day before the first day of the fiscal period, with all dividends and distributions reinvested in additional shares on the reinvestment date, and redemptions at the net asset value calculated on the last business day of the fiscal period. Sales charges are not reflected in the total returns. Total returns are not annualized for periods less than one full year. Returns do not reflect the deduction of taxes that a shareholder would pay on fund distributions or the redemption of fund shares. |
| 4. | Annualized for less than full period. |
| 5. | Includes interest, borrowing, and franchise tax expense. Without interest, borrowing, and franchise tax expense, the net asset expense ratio would be 1.99% and 2.00%, for the years ended 2014 and 2013, respectively. |
| 6. | Includes interest expense. Without interest expense, the net expense ratio would be 2.00%. |
| 7. | Deferred tax expense estimate for the ratio calculation is derived from the net investment income/loss, and realized and unrealized gains/losses. |
| 8. | Deferred tax benefit for the ratio calculation is derived from net investment income/loss only. |
| 9. | Effective December 1, 2013 the deferred tax expense and deferred tax benefit are allocated based on average net assets. Prior to December 1, 2013 the deferred tax expense and deferred tax benefit were allocated based on specific class expenses. |
See accompanying Notes to Financial Statements
| Class C | | Year Ended November 28,
2014* | | | Year Ended November 29,
2013* | | | Period Ended November 30,
2012 1 | |
| Per Share Operating Data | | | | | | | | | |
| Net Asset Value, Beginning of Period | | $ | 11.64 | | | $ | 9.91 | | | $ | 9.45 | |
| Income/(loss) from investment operations: | | | | | | | | | | | | |
Net investment loss 2 | | | (0.28 | ) | | | (0.22 | ) | | | (0.11 | ) |
Return of capital 2 | | | 0.55 | | | | 0.55 | | | | 0.28 | |
| Net realized and unrealized gains | | | 1.46 | | | | 2.06 | | | | 0.62 | |
| Total from investment operations | | | 1.73 | | | | 2.39 | | | | 0.79 | |
| Distributions to shareholders: | | | | | | | | | | | | |
| Return of capital | | | (0.66 | ) | | | (0.66 | ) | | | (0.33 | ) |
| Net asset value, end of period | | $ | 12.71 | | | $ | 11.64 | | | $ | 9.91 | |
| | | | | | | | | | | | | |
Total Return, at Net Asset Value 3 | | | 14.98 | % | | | 24.50 | % | | | 8.39 | % |
| | | | | | | | | | | | | |
| Ratios /Supplemental Data | | | | | | | | | | | | |
| Net assets, end of period (in thousands) | | $ | 57,070 | | | $ | 16,317 | | | $ | 604 | |
Ratio of Expenses to Average Net Assets: 4 | | | | | | | | | | | | |
| Before recoupment/(waivers) and deferred tax expense | | | 3.15 | % | | | 3.20 | % | | | 11.88 | % |
| Expense recoupment/(waivers) | | | 0.12 | % | | | (0.05 | %) | | | (8.57 | %) |
| Net of recoupment/(waivers) and before deferred tax expense | | | 3.27 | %5 | | | 3.15 | %5 | | | 3.31 | %6 |
Deferred tax expense 7,9 | | | 5.54 | % | | | 8.16 | % | | | 4.16 | % |
| Total expenses | | | 8.81 | % | | | 11.31 | % | | | 7.47 | % |
| | | | | | | | | | | | | |
Ratio of Investment Loss to Average Net Assets: 4 | | | | | | | | | | | | |
| Before recoupment/(waivers) and deferred tax expense | | | (2.94 | %) | | | (3.15 | %) | | | (11.88 | %) |
| Expense recoupment/(waivers) | | | 0.12 | % | | | (0.05 | %) | | | (8.57 | %) |
| Net of recoupment/(waivers) and before deferred tax expense | | | (3.06 | %) | | | (3.10 | %) | | | (3.31 | %) |
Deferred tax benefit 8,9 | | | 0.88 | % | | | 1.14 | % | | | 1.23 | % |
| Net investment loss | | | (2.18 | %) | | | (1.96 | %) | | | (2.08 | %) |
| | | | | | | | | | | | | |
| Portfolio turnover rate | | | 21 | % | | | 15 | % | | | 69 | % |
| * | November 28, 2014 and November 29, 2013 represent the last business day of the Fund’s fiscal year. See Note 2 of the accompanying Notes. |
| 1. | Shares commenced operations at the close of business May 22, 2012. |
| 2. | Per share amounts calculated based on average shares outstanding during the period. |
| 3. | Assumes an initial investment on the business day before the first day of the fiscal period, with all dividends and distributions reinvested in additional shares on the reinvestment date, and redemptions at the net asset value calculated on the last business day of the fiscal period. Sales charges are not reflected in the total returns. Total returns are not annualized for periods less than one full year. Returns do not reflect the deduction of taxes that a shareholder would pay on fund distributions or the redemption of fund shares. |
| 4. | Annualized for less than full period. |
| 5. | Includes interest, borrowing, and franchise tax expense. Without interest, borrowing, and franchise tax expense, the net asset expense ratio would be 2.74% and 2.75%, for the years ended 2014 and 2013, respectively. |
| 6. | Includes interest expense. Without interest expense, the net expense ratio would be 2.75%. |
| 7. | Deferred tax expense estimate for the ratio calculation is derived from the net investment income/loss, and realized and unrealized gains/losses. |
| 8. | Deferred tax benefit for the ratio calculation is derived from net investment income/loss only. |
| 9. | Effective December 1, 2013 the deferred tax expense and deferred tax benefit are allocated based on average net assets. Prior to December 1, 2013 the deferred tax expense and deferred tax benefit were allocated based on specific class expenses. |
See accompanying Notes to Financial Statements.
| Class I | | Year Ended November 28,
2014* | | | Period Ended November 29,
2013*,1,2 | |
| Per Share Operating Data | | | | | | |
| Net Asset Value, Beginning of Period | | $ | 11.81 | | | $ | 11.71 | |
| Income/(loss) from investment operations: | | | | | | | | |
Net investment income/(loss) 3 | | | 0.02 | | | | (0.06 | ) |
Return of capital 3 | | | 0.55 | | | | 0.23 | |
| Net realized and unrealized gains | | | 1.34 | | | | 0.26 | |
| Total from investment operations | | | 1.91 | | | | 0.43 | |
| Distributions to shareholders: | | | | | | | | |
| Return of capital | | | (0.66 | ) | | | (0.33 | ) |
| Net asset value, end of period | | $ | 13.06 | | | $ | 11.81 | |
| | | | | | | | | |
Total Return, at Net Asset Value 4 | | | 16.32 | % | | | 3.71 | % |
| | | | | | | | | |
| Ratios /Supplemental Data | | | | | | | | |
| Net assets, end of period (in thousands) | | $ | 160 | | | $ | 10 | |
Ratio of Expenses to Average Net Assets: 5 | | | | | | | | |
| Before (waivers) deferred tax expense | | | 2.00 | % | | | 2.38 | % |
| Expense (waivers) | | | — | % | | | (0.23 | %) |
| Net of (waivers) and before deferred tax expense | | | 2.00 | %6 | | | 2.15 | %6 |
Deferred tax expense 7,9 | | | 5.54 | % | | | 21.06 | % |
| Total expenses | | | 7.54 | % | | | 23.21 | % |
| | | | | | | | | |
Ratio of Investment Loss to Average Net Assets: 5 | | | | | | | | |
| Before (waivers) and deferred tax expense | | | (0.74 | %) | | | (2.33 | %) |
| Expense (waivers) | | | — | % | | | (0.23 | %) |
| Net of (waivers) and before deferred tax expense | | | (0.74 | %) | | | (2.10 | %) |
Deferred tax benefit 8,9 | | | 0.88 | % | | | 0.77 | % |
| Net investment income (loss) | | | 0.14 | % | | | (1.33 | %) |
| | | | | | | | | |
| Portfolio turnover rate | | | 21 | % | | | 15 | % |
| * | November 28, 2014 and November 29, 2013 represent the last business day of the Fund’s fiscal year. See Note 2 of the accompanying Notes. |
| 1. | Shares commenced operations at the close of business June 28, 2013. |
| 2. | Effective June 28, 2013, Class I shares were renamed Class Y shares. See Note 1 of the Notes to Financial Statements for additional information. |
| 3. | Per share amounts calculated based on average shares outstanding during the period. |
| 4. | Assumes an initial investment on the business day before the first day of the fiscal period, with all dividends and distributions reinvested in additional shares on the reinvestment date, and redemptions at the net asset value calculated on the last business day of the fiscal period. Total returns are not annualized for periods less than one full year. Returns do not reflect the deduction of taxes that a shareholder would pay on fund distributions or the redemption of fund shares. |
| 5. | Annualized for less than full period. |
| 6. | Includes interest, borrowing, and franchise tax expense. Without interest, borrowing, and franchise tax expense, the net asset expense ratio would be 1.47% and 1.75%, for the years ended 2014 and 2013, respectively. |
| 7. | Deferred tax expense estimate for the ratio calculation is derived from the net investment income/loss, and realized and unrealized gains/losses. |
| 8. | Deferred tax benefit for the ratio calculation is derived from net investment income/loss only. |
| 9. | Effective December 1, 2013 the deferred tax expense and deferred tax benefit are allocated based on average net assets. Prior to December 1, 2013 the deferred tax expense and deferred tax benefit were allocated based on specific class expenses. |
See accompanying Notes to Financial Statements.
| Class Y | | Year Ended November 28,
2014* | | | Year Ended November 29,
2013*,1 | | | Period Ended November 30,
2012 1,2 | |
| Per Share Operating Data | | | | | | | | | |
| Net Asset Value, Beginning of Period | | $ | 11.84 | | | $ | 9.96 | | | $ | 10.00 | |
| Income/(loss) from investment operations: | | | | | | | | | | | | |
Net investment loss 3 | | | (0.14 | ) | | | (0.15 | ) | | | (0.12 | ) |
Return of capital 3 | | | 0.55 | | | | 0.54 | | | | 0.48 | |
| Net realized and unrealized gains | | | 1.48 | | | | 2.15 | | | | 0.25 | |
| Total from investment operations | | | 1.89 | | | | 2.54 | | | | 0.61 | |
| Distributions to shareholders: | | | | | | | | | | | | |
| Return of capital | | | (0.66 | ) | | | (0.66 | ) | | | (0.65 | ) |
| Net asset value, end of period | | $ | 13.07 | | | $ | 11.84 | | | $ | 9.96 | |
| | | | | | | | | | | | | |
Total Return, at Net Asset Value 4 | | | 16.11 | % | | | 25.92 | % | | | 6.33 | % |
| | | | | | | | | | | | | |
| Ratios /Supplemental Data | | | | | | | | | | | | |
| Net assets, end of period (in thousands) | | $ | 121,190 | | | $ | 49,776 | | | $ | 1,604 | |
Ratio of Expenses to Average Net Assets: 5 | | | | | | | | | | | | |
| Before recoupment/(waivers) and deferred tax expense | | | 2.15 | % | | | 2.20 | % | | | 24.82 | % |
| Expense recoupment/(waivers) | | | 0.12 | % | | | (0.05 | %) | | | (22.71 | %) |
| Net of recoupment/(waivers) and before deferred tax expense | | | 2.27 | %6 | | | 2.15 | %6 | | | 2.11 | %7 |
Deferred tax expense 8,9 | | | 5.54 | % | | | 8.43 | % | | | (2.88 | %) |
| Total expenses | | | 7.81 | % | | | 10.58 | % | | | (0.77 | %) |
| | | | | | | | | | | | | |
Ratio of Investment Loss to Average Net Assets: 5 | | | | | | | | | | | | |
| Before recoupment/(waivers) and deferred tax expense | | | (1.82 | %) | | | (2.15 | %) | | | (24.82 | %) |
| Expense recoupment/(waivers) | | | 0.12 | % | | | (0.05 | %) | | | (22.71 | %) |
| Net of recoupment/(waivers) and before deferred tax expense | | | (1.94 | %) | | | (2.10 | %) | | | (2.11 | %) |
Deferred tax benefit 9,10 | | | 0.88 | % | | | 0.78 | % | | | 0.79 | % |
| Net investment loss | | | (1.06 | %) | | | (1.32 | %) | | | (1.32 | %) |
| | | | | | | | | | | | | |
| Portfolio turnover rate | | | 21 | % | | | 15 | % | | | 69 | % |
| * | November 28, 2014 and November 29, 2013 represent the last business day of the Fund’s fiscal year. See Note 2 of the accompanying Notes. |
| 1. | Effective June 28, 2013, Class I shares were renamed Class Y shares. See Note 1 of the Notes to Financial Statements for additional information. |
| 2. | The net asset value for the beginning of the period close of business December 30, 2011 (Commencement of Operations) through November 30, 2012 represents the initial contribution per share of $10. |
| 3. | Per share amounts calculated based on average shares outstanding during the period. |
| 4. | Assumes an initial investment on the business day before the first day of the fiscal period, with all dividends and distributions reinvested in additional shares on the reinvestment date, and redemptions at the net asset value calculated on the last business day of the fiscal period. Total returns are not annualized for periods less than one full year. Returns do not reflect the deduction of taxes that a shareholder would pay on fund distributions or the redemption of fund shares. |
| 5. | Annualized for less than full period. |
| 6. | Includes interest, borrowing, and franchise tax expense. Without interest, borrowing, and franchise tax expense, the net asset expense ratio would be 1.74% and 1.75%, for the years ended 2014 and 2013, respectively. |
| 7. | Includes interest expense. Without interest expense, the net ratio would be 1.75%. |
| 8. | Deferred tax expense estimate for the ratio calculation is derived from the net investment income/loss, and realized and unrealized gains/losses. |
| 9. | Effective December 1, 2013 the deferred tax expense and deferred tax benefit are allocated based on average net assets. Prior to December 1, 2013 the deferred tax expense and deferred tax benefit were allocated based on specific class expenses. |
| 10. | Deferred tax benefit for the ratio calculation is derived from net investment income/loss only. |
See accompanying Notes to Financial Statements.
NOTES TO FINANCIAL STATEMENTS
Oppenheimer SteelPath MLP Alpha Plus Fund (the “Fund”), a separate series of Oppenheimer SteelPath MLP Funds Trust, is a non-diversified open-end management investment company registered under the Investment Company Act of 1940, as amended. The Fund’s investment objective is to seek total return. The Fund’s investment adviser is OFI SteelPath, Inc. (the “Adviser” or “Manager”), a wholly-owned subsidiary of OppenheimerFunds, Inc. (“OFI” or “Oppenheimer”).
The Fund offers Class A, Class C, Class I, and Class Y shares. Effective June 28, 2013, Class I shares were renamed Class Y shares. Class A shares are sold at their offering price, which is normally net asset value plus a front-end sales charge. Effective June 28, 2013 although there is no initial sales charge on Class A purchases totaling $1 million or more, those Class A shares may be subject to a 1.00% contingent deferred sales charge if shares are redeemed within an 18-month “holding period” measured from the date of purchase. Class C shares are sold, without a front-end sales charge but may be subject to a contingent deferred sales charge (“CDSC”) of 1.00% of the redemption proceeds if Class C shares are redeemed within one year of purchase. Class I shares are only available to eligible institutional investors. Class I shares are sold at net asset value per share without a sales charge or CDSC. An institutional investor that buys Class I shares for its customers’ accounts may impose charges on those accounts. Class Y shares are sold at net asset value per share without a sales charge directly to institutional investors that have special agreements with the Distributor for that purpose. They may include insurance companies, registered investment companies, employee benefit plans and section 529 plans, among others. An institutional investor that buys Class Y shares for its customers’ accounts may impose charges on those accounts. All classes of shares have identical rights and voting privileges with respect to the Fund in general and exclusive voting rights on matters that affect that class alone. Earnings, net assets and net asset value per share may differ due to each class having its own expenses, such as transfer and shareholder servicing agent fees and shareholder communications, directly attributable to that class. Class A and C shares have separate distribution and/or service plans under which they pay fees. Class I and Y shares do not pay such fees.
2. Significant Accounting Policies
Security Valuation. All investments in securities are recorded at their estimated fair value, as described in note 3.
Equity Security Risk. Stocks and other equity securities fluctuate in price. The value of the Fund’s portfolio may be affected by changes in the equity markets generally. Equity markets may experience significant short-term volatility and may fall sharply at times. Different markets may behave differently from each other and U.S. equity markets may move in the opposite direction from one or more foreign stock markets.
NOTES TO FINANCIAL STATEMENTS (Continued)
2. Significant Accounting Policies (Continued)
The prices of individual equity securities generally do not all move in the same direction at the same time and a variety of factors can affect the price of a particular company’s securities. These factors may include, but are not limited to, poor earnings reports, a loss of customers, litigation against the company, general unfavorable performance of the company’s sector or industry, or changes in government regulations affecting the company or its industry.
Master Limited Partnerships (“MLPs”). Under normal circumstances, the Fund invests at least 80% of its net assets (plus the amount of any borrowings for investment purposes) in the equity securities of MLPs.
MLPs issue common units that represent an equity ownership interest in a partnership and provide limited voting rights. MLP common units are registered with the Securities and Exchange Commission (“SEC”), and are freely tradable on securities exchanges such as the NYSE and the NASDAQ Stock Market (“NASDAQ”), or in the over-the-counter (“OTC”) market. An MLP consists of one or more general partners, who conduct the business, and one or more limited partners, who contribute capital. MLP common unit holders have a limited role in the partnership’s operations and management. The Fund, as a limited partner, normally would not be liable for the debts of the MLP beyond the amounts the Fund has contributed, but would not be shielded to the same extent that a shareholder of a corporation would be. In certain circumstances creditors of an MLP would have the right to seek return of capital distributed to a limited partner. This right of an MLP’s creditors would continue after the Fund sold its investment in the MLP.
Concentration Risk. Under normal circumstances, the Fund invests at least 80% of its net assets in the equity securities of MLPs. MLPs are subject to certain risks, such as supply and demand risk, depletion and exploration risk, commodity pricing risk, acquisition risk, and the risk associated with the hazards inherent in midstream energy industry activities. A substantial portion of the cash flow received by the Fund is derived from investment in equity securities of MLPs. The amount of cash that a MLP has available for distributions, and the tax character of such distributions, are dependent upon the amount of cash generated by the MLP’s operations.
Annual Periods. The last day of the Fund’s annual period was the last day the New York Stock Exchange was open for trading. The Fund’s financial statements have been presented through that date to maintain consistency with the Fund’s net asset value calculations used for shareholder transactions.
Allocation of Income, Expenses, Gains and Losses. Income, expenses (other than those attributable to a specific class), gains and losses are allocated on a daily basis to each class of shares based upon the relative proportion of net assets represented by such class. Operating expenses directly attributable to a specific class are charged against the operations of that class.
NOTES TO FINANCIAL STATEMENTS (Continued)
2. Significant Accounting Policies (Continued)
Federal Income Taxes.
The Fund does not intend to qualify as a regulated investment company pursuant to Subchapter M of the Internal Revenue Code, but will rather be taxed as a corporation. As a corporation, the Fund is obligated to pay federal, state and local income tax on taxable income. Currently, the maximum marginal regular federal income tax rate for a corporation is 35%. The Fund may be subject to a 20% alternative minimum tax on its federal alternative minimum taxable income to the extent that its alternative minimum tax exceeds its regular federal income tax. The Fund is currently using an estimated rate of 1.9% for state and local tax, net of federal tax benefit.
The Fund’s income tax provision consists of the following as of November 28, 2014:
| Current tax expense (benefit) | | | |
| Federal | | $ | — | |
| State | | | — | |
| Total current tax expense | | $ | — | |
| | | | | |
| Deferred tax expense (benefit) | | | | |
| Federal | | $ | 14,651,965 | |
| State | | | 1,259,086 | |
| Total deferred tax expense | | $ | 15,911,051 | |
The reconciliation between the federal statutory income tax rate of 35% and the effective tax rate on net investment income (loss) and realized and unrealized gain (loss) follows:
| | | Amount | |
| Application of statutory income tax rate | | $ | 15,091,783 | |
| State income taxes net of federal benefit | | | 819,268 | |
| Total income tax expense | | $ | 15,911,051 | |
The Fund intends to invest its assets primarily in MLPs, which generally are treated as partnerships for federal income tax purposes. As a limited partner in the MLPs, the Fund reports its allocable share of the MLP’s taxable income in computing its own taxable income. The Fund’s tax expense or benefit will be included in the Statement of Operations based on the component of income or gains (losses) to which such expense or benefit relates. Deferred income taxes reflect the net tax effects of temporary differences between the carrying amounts of assets and liabilities for financial reporting purposes and the amounts used for income tax purposes. Such temporary differences are principally: (i) taxes on unrealized gains/(losses), which are attributable to the temporary difference between fair market value and tax basis, (ii) the net tax effects of temporary differences between the carrying amounts of assets
NOTES TO FINANCIAL STATEMENTS (Continued)
2. Significant Accounting Policies (Continued)
and liabilities for financial reporting and income tax purposes and (iii) the net tax benefit of accumulated net operating losses and capital loss carryforwards. Deferred tax assets and liabilities are measured using effective tax rates expected to apply to taxable income in the years such temporary differences are realized or otherwise settled. To the extent the Fund has a deferred tax asset, consideration is given to whether or not a valuation allowance is required. A valuation allowance is required if based on the evaluation criterion provided by ASC 740, Income Taxes (ASC 740) that it is more-likely-than-not that some portion or all of the deferred tax asset will not be realized. Among the factors considered in assessing the Fund’s valuation allowance: the nature, frequency and severity of current and cumulative losses, forecasts of future profitability, the duration of the statutory carryforward periods and the associated risks that operating and capital loss carryforwards may expire unused. At November 28, 2014, the Fund determined a valuation allowance was not required. From time to time, as new information becomes available, the Fund will modify its estimates or assumptions regarding the deferred tax liability or asset.
Components of the Fund’s deferred tax assets and liabilities as of November 28, 2014 are as follows:
| Deferred tax assets: | | | |
| Net operating loss carryforward (tax basis) | | $ | 5,665,102 | |
| Capital loss carryforward (tax basis) | | | — | |
| | | | | |
| Deferred tax liabilities: | | | | |
| Net unrealized gains on investment securities (tax basis) | | | (28,482,869 | ) |
| Total net deferred tax asset/(liability) | | $ | (22,817,767 | ) |
Unexpected significant decreases in cash distributions from the Fund’s MLP investments or significant declines in the fair value of its investments may change the Fund’s assessment regarding the recoverability of its deferred tax assets and may result in a valuation allowance. If a valuation allowance is required to reduce any deferred tax asset in the future, it could have a material impact on the Fund’s net asset value and results of operations in the period it is recorded.
The Fund may rely, to some extent, on information provided by the MLPs, which may not necessarily be timely, to estimate taxable income allocable to MLP units held in its portfolio, and to estimate its associated deferred tax liability or asset. Such estimates are made in good faith. From time to time, as new information becomes available, the Fund will modify its estimates or assumptions regarding its tax liability or asset.
NOTES TO FINANCIAL STATEMENTS (Continued)
2. Significant Accounting Policies (Continued)
The Fund’s policy is to classify interest and penalties associated with underpayment of federal and state income taxes, if any, as income tax expense on its Statement of Operations. For the year ended November 28, 2014, the Fund does not have any interest or penalties associated with the underpayment of any income taxes.
The Fund files income tax returns in the U.S. federal jurisdiction and various states. All tax years since inception remain open and subject to examination by tax jurisdictions. The Fund has reviewed all major jurisdictions and concluded that there is no significant impact on the Fund’s net assets and no tax liability resulting from unrecognized tax benefits relating to uncertain tax positions expected to be taken on its tax returns. Furthermore, management of the Fund is not aware of any tax positions for which it is reasonably possible that the total amount of unrecognized tax benefit will significantly change in the next 12 months.
At November 28, 2014, the Fund had net operating loss carryforwards for federal income tax purposes, which may be carried forward for 20 years, as follows:
| Expiration Date | | | |
| 11/30/2032 | | $ | 30,185 | |
| 11/30/2033 | | | 2,168,061 | |
| 11/30/2034 | | | 13,154,333 | |
| Total | | $ | 15,352,579 | |
During the year ended November 28, 2014, the Fund utilized $39,170 of capital loss carryforward.
At November 28, 2014, gross unrealized appreciation and depreciation of investments, based on cost for federal income tax purposes were as follows:
| Cost of Investments | | $ | 489,888,284 | |
| Gross Unrealized Appreciation | | $ | 100,108,222 | |
| Gross Unrealized Depreciation | | | (22,807,839 | ) |
| Net Unrealized Appreciation (Depreciation) on Investments | | $ | 77,300,383 | |
The difference between cost amounts for financial statement and federal income tax purposes is due primarily to timing differences in recognizing certain gains and losses in security transactions.
Dividends and Distributions to Shareholders. Dividends and distributions to shareholders, which are determined in accordance with income tax regulations and may differ from U.S. generally accepted accounting principles, are recorded on the ex-dividend date. Dividends, if any, are declared and distributed quarterly for the Fund. The estimated characterization of the distributions paid will be either a qualified dividend or distribution
NOTES TO FINANCIAL STATEMENTS (Continued)
2. Significant Accounting Policies (Continued)
(return of capital). This estimate is based on the Fund’s operating results during the period. It is anticipated that a significant portion of the distributions will be comprised of return of capital as a result of the tax character of cash distributions made by the Fund’s investments. The actual characterization of the distributions made during the period will not be determined until after the end of the fiscal year. The Fund will inform shareholders of the final tax character of the distributions on IRS Form DIV in February 2015. For the year ended November 28, 2014, the Fund distributions are expected to be comprised of 100% return of capital.
Return of Capital Estimates. Distributions received from the Fund’s investments in MLPs generally are comprised of income and return of capital. The Fund records investment income and return of capital based on estimates made at the time such distributions are received. Such estimates are based on historical information available from each MLP and other industry sources. These estimates may subsequently be revised based on information received from MLPs after their tax reporting periods are concluded. For the year ended November 28, 2014, the Fund estimated that 100% of the MLP distributions received would be treated as return of capital.
Investment Income. Dividend income is recorded on the ex-dividend date or upon ex-dividend notification in the case of certain foreign dividends where the ex-dividend date may have passed. Non-cash dividends included in dividend income, if any, are recorded at the fair value of the securities received. Interest income is recognized on an accrual basis. Discount and premium, which are included in interest income on the Statement of Operations, if applicable, are amortized or accreted daily.
Custodian Fees. “Custody fees” in the Statement of Operations may include interest expense incurred by the Fund on any cash overdrafts of its custodian account during the period. Such cash overdrafts may result from the effects of failed trades in portfolio securities and from cash outflows resulting from unanticipated shareholder redemption activity. The Fund pays interest to its custodian on such cash overdrafts, to the extent they are not offset by positive cash balances maintained by the Fund, at a rate equal to the Federal Funds Rate plus 0.015%. The “Reduction to custodian expenses” line item, if applicable, represents earnings on cash balances maintained by the Fund during the period. Such interest expense and other custodian fees may be paid with these earnings.
Security Transactions. Security transactions are recorded on the trade date. Realized gains and losses on securities sold are determined using the last in, first out method.
Indemnifications. The Fund’s organizational documents provide current and former trustees and officers with a limited indemnification against liabilities arising in connection with the performance of their duties to the Fund. In the normal course of business, the Fund may also
NOTES TO FINANCIAL STATEMENTS (Continued)
2. Significant Accounting Policies (Continued)
enter into contracts that provide general indemnifications. The Fund’s maximum exposure under these arrangements is unknown as this would be dependent on future claims that may be made against the Fund. The risk of material loss from such claims is considered remote.
Other. The preparation of financial statements in conformity with accounting principles generally accepted in the United States of America requires management to make estimates and assumptions that affect the reported amounts of assets and liabilities and disclosure of contingent assets and liabilities at the date of the financial statements and the reported amounts of increases and decreases in net assets from operations during the reporting period. Actual results could differ from those estimates.
The Fund calculates the net asset value of its shares as of the close of the New York Stock Exchange (the “Exchange”), normally 4:00 P.M. Eastern time, on each day the Exchange is open for trading.
The Fund’s Board of Trustees (the “Board”) has adopted procedures for the valuation of the Fund’s securities and has delegated the day-to-day responsibility for valuation determinations under those procedures to the Adviser. The Adviser has established a Valuation Committee which is responsible for determining a “fair valuation” for any security for which market quotations are not “readily available.” The Valuation Committee’s fair valuation determinations are subject to review, approval and ratification by the Fund’s Board at its next regularly scheduled meeting covering the calendar quarter in which the fair valuation was determined.
Valuation Methods and Inputs
Securities are valued using unadjusted quoted market prices, when available, as supplied primarily by third party pricing services or dealers.
The following methodologies are used to determine the market value or the fair value of the types of securities described below:
Securities traded on a registered U.S. securities exchange (including exchange-traded derivatives other than futures and futures options) are valued based on the last sale price of the security reported on the principal exchange on which it is traded, prior to the time when the Fund’s assets are valued. In the absence of a sale, the security is valued at the last sale price on the prior trading day, if it is within the spread of the current day’s closing “bid” and “asked” prices, and if not, at the current day’s closing bid price. A security of a foreign issuer traded on a foreign exchange but not listed on a registered U.S. securities exchange is valued based on the last sale price on the principal exchange on which the security is traded, as identified by the third party pricing service used by the Adviser, prior to the time when
NOTES TO FINANCIAL STATEMENTS (Continued)
3. Securities Valuation (Continued)
the Fund’s assets are valued. If the last sale price is unavailable, the security is valued at the most recent official closing price on the principal exchange on which it is traded. If the last sales price or official closing price for a foreign security is not available, the security is valued at the mean between the bid and asked price per the exchange or, if not available from the exchange, obtained from two dealers. If bid and asked prices are not available from either the exchange or two dealers, the security is valued by using one of the following methodologies (listed in order of priority); (1) using a bid from the exchange, (2) the mean between the bid and asked price as provided by a single dealer, or (3) a bid from a single dealer.
Shares of a registered investment company that are not traded on an exchange are valued at that investment company’s net asset value per share.
Corporate and government debt securities (of U.S. or foreign issuers) and municipal debt securities, event-linked bonds, loans, mortgage-backed securities, collateralized mortgage obligations, and asset-backed securities are valued at the mean between the “bid” and “asked” prices utilizing evaluated prices obtained from third party pricing services or broker-dealers who may use matrix pricing methods to determine the evaluated prices.
Short-term money market type debt securities with a remaining maturity of sixty days or less are valued at cost adjusted by the amortization of discount or premium to maturity (amortized cost), which approximates market value. Short-term debt securities with a remaining maturity in excess of sixty days are valued at the mean between the “bid” and “asked” prices utilizing evaluated prices obtained from third party pricing services or broker-dealers.
A description of the standard inputs that may generally be considered by the third party pricing vendors in determining their evaluated prices is provided below.
| Security Type | | Standard inputs generally considered by third-party pricing vendors |
| Corporate debt, government debt, municipal, mortgage-backed and asset-backed securities | | Reported trade data, broker-dealer price quotations, benchmark yields, issuer spreads on comparable securities, the credit quality, yield, maturity, and other appropriate factors. |
| Loans | | Information obtained from market participants regarding reported trade data and broker-dealer price quotations. |
| Event-linked bonds | | Information obtained from market participants regarding reported trade data and broker-dealer price quotations. |
NOTES TO FINANCIAL STATEMENTS (Continued)
3. Securities Valuation (Continued)
If a market value or price cannot be determined for a security using the methodologies described above, or if, in the “good faith” opinion of the Adviser, the market value or price obtained does not constitute a “readily available market quotation,” or a significant event has occurred that would materially affect the value of the security, the security is fair valued either (i) by a standardized fair valuation methodology applicable to the security type or the significant event as previously approved by the Valuation Committee and the Fund’s Board or (ii) as determined in good faith by the Adviser’s Valuation Committee. The Valuation Committee considers all relevant facts that are reasonably available, through either public information or information available to the Adviser, when determining the fair value of a security. Fair value determinations by the Adviser are subject to review, approval and ratification by the Fund’s Board at its next regularly scheduled meeting covering the calendar quarter in which the fair valuation was determined. Those fair valuation standardized methodologies include, but are not limited to, valuing securities at the last sale price or initially at cost and subsequently adjusting the value based on: changes in company specific fundamentals, changes in an appropriate securities index, or changes in the value of similar securities which may be further adjusted for any discounts related to security-specific resale restrictions. When possible, such methodologies use observable market inputs such as unadjusted quoted prices of similar securities, observable interest rates, currency rates and yield curves. The methodologies used for valuing securities are not necessarily an indication of the risks associated with investing in those securities nor can it be assured that the Fund can obtain the fair value assigned to a security if it were to sell the security.
To assess the continuing appropriateness of security valuations, the Adviser, or its third party service provider who is subject to oversight by the Adviser, regularly compares prior day prices, prices on comparable securities, and sale prices to the current day prices and challenges those prices exceeding certain tolerance levels with the third party pricing service or broker source. For those securities valued by fair valuations, whether through a standardized fair valuation methodology or a fair valuation determination, the Valuation Committee reviews and affirms the reasonableness of the valuations based on such methodologies and fair valuation determinations on a regular basis after considering all relevant information that is reasonably available.
Classifications
Each investment asset or liability of the Fund is assigned a level at measurement date based on the significance and source of the inputs to its valuation. Various data inputs are used in determining the value of each of the Fund’s investments as of the reporting period end. These data inputs are categorized in the following hierarchy under applicable financial accounting standards:
1) Level 1-unadjusted quoted prices in active markets for identical assets or liabilities (including securities actively traded on a securities exchange)
NOTES TO FINANCIAL STATEMENTS (Continued)
3. Securities Valuation (Continued)
2) Level 2-inputs other than unadjusted quoted prices that are observable for the asset or liability (such as unadjusted quoted prices for similar assets and market corroborated inputs such as interest rates, prepayment speeds, credit risks, etc.)
3) Level 3-significant unobservable inputs (including the Adviser’s own judgments about assumptions that market participants would use in pricing the asset or liability).
The inputs used for valuing securities are not necessarily an indication of the risks associated with investing in those securities.
The table below categorizes amounts that are included in the Fund’s Statement of Assets and Liabilities as of November 28, 2014, based on valuation input level:
| | | Level 1 — Unadjusted Quoted Prices | | | Level 2 —
Other Significant Observable Inputs | | | Level 3 —
Significant Unobservable Inputs | | | Value | |
| Assets Table | | | | | | | | | | | | |
| Investments, at Value: | | | | | | | | | | | | |
| Master Limited Partnership Shares* | | $ | 538,021,135 | | | $ | — | | | $ | — | | | $ | 538,021,135 | |
| Common Stock* | | | 29,167,532 | | | | — | | | | — | | | | 29,167,532 | |
| Total Assets | | $ | 567,188,667 | | | $ | — | | | $ | — | | | $ | 567,188,667 | |
* For a detailed break-out of securities by major industry classification, please refer to the Statement of Investments.
The Fund did not hold any Level 3 securities during the year ended November 28, 2014.
There have been no transfers between pricing levels for the Fund. It is the Fund’s policy to recognize transfers at the end of the reporting period.
NOTES TO FINANCIAL STATEMENTS (Continued)
4. Shares of Beneficial Interest
The Fund has authorized an unlimited number of $0.001 par value shares of beneficial interest of each class. Transactions in shares of beneficial interest were as follows:
| | | Year Ended
November 28, 2014 | | | Year/Period Ended
November 29, 2013 | |
| | | Shares | | | Amount | | | Shares | | | Amount | |
| Class A | | | | | | | | | | | | |
| Sold | | | 13,779,392 | | | $ | 179,671,308 | | | | 9,870,147 | | | $ | 112,879,763 | |
| Dividends and/or distributions reinvested | | | 606,675 | | | | 7,838,937 | | | | 254,665 | | | | 2,937,922 | |
| Redeemed | | | (7,022,926 | ) | | | (88,808,798 | ) | | | (1,594,005 | ) | | | (18,053,072 | ) |
| Net increase | | | 7,363,141 | | | $ | 98,701,447 | | | | 8,530,807 | | | $ | 97,764,613 | |
| | | | | | | | | | | | | | | | | |
| Class C | | | | | | | | | | | | | | | | |
| Sold | | | 3,319,100 | | | $ | 43,106,424 | | | | 1,335,377 | | | $ | 15,213,202 | |
| Dividends and/or distributions reinvested | | | 133,973 | | | | 1,710,001 | | | | 30,489 | | | | 349,347 | |
| Redeemed | | | (364,107 | ) | | | (4,693,728 | ) | | | (25,290 | ) | | | (286,991 | ) |
| Net increase | | | 3,088,966 | | | $ | 40,122,697 | | | | 1,340,576 | | | $ | 15,275,558 | |
| | | | | | | | | | | | | | | | | |
| Class I* | | | | | | | | | | | | | | | | |
| Sold | | | 11,929 | | | $ | 160,745 | | | | 9,342 | | | $ | 111,345 | |
| Dividends and/or distributions reinvested | | | 175 | | | | 2,316 | | | | 253 | | | | 2,949 | |
| Redeemed | | | (730 | ) | | | (10,009 | ) | | | (8,729 | ) | | | (100,646 | ) |
| Net increase | | | 11,374 | | | $ | 153,052 | | | | 866 | | | $ | 13,648 | |
| | | | | | | | | | | | | | | | | |
| Class Y** | | | | | | | | | | | | | | | | |
| Sold | | | 6,048,300 | | | $ | 79,938,934 | | | | 4,162,763 | | | $ | 47,375,899 | |
| Dividends and/or distributions reinvested | | | 348,449 | | | | 4,535,179 | | | | 122,858 | | | | 1,424,711 | |
| Redeemed | | | (1,326,469 | ) | | | (17,229,535 | ) | | | (241,145 | ) | | | (2,786,396 | ) |
| Net increase | | | 5,070,280 | | | $ | 67,244,578 | | | | 4,044,476 | | | $ | 46,014,214 | |
* Class I commenced operations at the close of business June 28, 2013.
** Effective June 28, 2013, Class I shares were renamed Class Y shares. See note 1 of the notes to Financial Statements for additional /information.
NOTES TO FINANCIAL STATEMENTS (Continued)
5. Purchases and Sales of Securities
The aggregate cost of purchases and proceeds from sales of securities, other than short-term obligations, for the year ended November 28, 2014, were as follows:
| | | Purchases | | | Sales | |
| Investment securities | | $ | 381,146,003 | | | $ | 86,221,870 | |
6. Fees and Other Transactions with Affiliates
Management Fees. Under the investment advisory agreement, the Fund pays the Manager a management fee based on the daily net assets of the Fund at an annual rate as shown in the following table:
| Net Assets up to $3 Billion | Net Assets Greater than
$3 Billion and up to $5 Billion | Net Assets in Excess of $5 Billion |
| 1.25% | 1.23% | 1.20% |
The Fund’s management fee for the fiscal year ended November 28, 2014, was 1.25% of average annual net assets before any applicable waivers.
Waivers and Reimbursements of Expenses. The Manager has contractually agreed to limit fees and/or reimburse expenses of the Fund to the extent that the Fund’s total annual fund operating expenses (exclusive of interest, taxes, such as deferred tax expenses, brokerage commissions, acquired fund fees and expenses, dividend costs related to short sales, and extraordinary expenses, such as litigation expense, if any) exceed 2.00% for Class A shares, 2.75% for Class C shares, and 1.75% for Class Y shares. The Fund’s total annual operating expenses after fee waiver and/or expense reimbursement (“Net Expenses”) will be higher than these amounts to the extent that the Fund incurs expenses excluded from the expense cap. Because the Fund’s deferred income tax expense and interest expense are excluded from the expense cap, the Fund’s Net Expenses for each class of shares is increased by the amount of these expenses. This undertaking may not be modified or terminated until after one year from the date of the current prospectus, as indicated therein, unless approved by the Trust’s Board of Trustees.
The Manager can be reimbursed by the Fund within three years after the date the fee limitation and/or expense reimbursement has been made by the Manager, provided that such repayment does not cause the expenses of any class of the Fund to exceed the foregoing limits.
During the year ended November 28, 2014, the Adviser recouped $202,600, $46,831, and $108,983 for Class A, Class C, and Class Y, respectively in previously waived expenses and does not have any additional amounts eligible for recovery.
NOTES TO FINANCIAL STATEMENTS (Continued)
6. Fees and Other Transactions with Affiliates (Continued)
Trustees’ Compensation. The Board has adopted a compensation deferral plan for independent trustees that enables trustees to elect to defer receipt of all or a portion of the annual compensation they are entitled to receive from the Fund. For purposes of determining the amount owed to the Trustee under the plan, deferred amounts are treated as though equal dollar amounts had been invested in shares of the Fund or in other Oppenheimer funds selected by the Trustee. The Fund purchases shares of the funds selected for deferral by the Trustee in amounts equal to his or her deemed investment, resulting in a Fund asset equal to the deferred compensation liability. Such assets are included as a component of “Other” within the asset section of the Statement of Assets and Liabilities, if applicable. Deferral of trustees’ fees under the plan will not affect the net assets of the Fund, and will not materially affect the Fund’s assets, liabilities or net investment income per share. Amounts will be deferred until distributed in accordance with the compensation deferral plan.
Distribution and Service Plan (12b-1) Fees. Under its General Distributor’s Agreement with the Fund, OppenheimerFunds Distributor, Inc. (the “Distributor”) acts as the Fund’s principal underwriter in the continuous public offering of the Fund’s classes of shares.
Service Plan for Class A Shares. The Fund has adopted a Service Plan (the “Plan”) for Class A shares under Rule 12b-1 of the Investment Company Act of 1940. Under the Plan, the Fund reimburses the Distributor for a portion of its costs incurred for services provided to accounts that hold Class A shares. Reimbursement is made periodically at an annual rate of up to 0.25% of the daily net assets of Class A shares of the Fund. The Distributor currently uses all of those fees to pay dealers, brokers, banks and other financial institutions periodically for providing personal service and maintenance of accounts of their customers that hold Class A shares. Any unreimbursed expenses the Distributor incurs with respect to Class A shares in any fiscal year cannot be recovered in subsequent periods. Fees incurred by the Fund under the Plan are detailed in the Statement of Operations.
Distribution and Service Plans for Class C Shares. The Fund has adopted Distribution and Service Plans (the “Plans”) for Class C shares under Rule 12b-1 of the Investment Company Act of 1940 to compensate the Distributor for distributing those share classes, maintaining accounts and providing shareholder services. Under the Plans, the Fund pays the Distributor an annual asset-based sales charge of 0.75% on Class C shares daily net assets. The Fund also pays a service fee under the Plans at an annual rate of 0.25% of daily net assets.
The Plan and Plans continue in effect from year to year only if the Fund’s Board votes annually to approve their continuance at an in person meeting called for that purpose. Fees incurred by the Fund under the Plans are detailed in the Statement of Operations.
NOTES TO FINANCIAL STATEMENTS (Continued)
6. Fees and Other Transactions with Affiliates (Continued)
Transfer Agent Fees. OFI Global (the “Transfer Agent”) serves as the transfer and shareholder servicing agent for the Fund. The Fund pays the Transfer Agent a fee based on annual net assets. Fees incurred for each class with respect to these services are detailed in the Statement of Operations.
Sub-Transfer Agent Fees. The Transfer Agent has retained Shareholder Services, Inc., a wholly-owned subsidiary of OFI (the “Sub-Transfer Agent”), to provide the day-to-day transfer agent and shareholder servicing of the Fund. Under the Sub-Transfer Agency Agreement, the Transfer Agent pays the Sub-Transfer Agent an annual fee in monthly installments, equal to a percentage of the transfer agent fee collected by the Transfer Agent from the Fund, which shall be calculated after any applicable fee waivers. The fee paid to the Sub-Transfer Agent is paid by the Transfer Agent, not by the Fund.
Sales Charges. Front-end sales charges and contingent deferred sales charges (“CDSC”) do not represent expenses of the Fund. They are deducted from the proceeds of sales of Fund shares prior to investment or from redemption proceeds prior to remittance, as applicable. The sales charges retained by the Distributor from the sale of shares and the CDSC retained by the Distributor on the redemption of shares is shown in the following table for the period indicated.
| Year Ended | | Class A Front-End Sales Charges Retained by Distributor | | | Class A Contingent Deferred Sales Charges Retained by Distributor | | | Class C Contingent Deferred Sales Charges Retained by Distributor | |
| November 28, 2014 | | $ | 170,166 | | | $ | 1,091 | | | $ | 6,264 | |
Related Party. The Interested Trustees and officers of the Fund are also officers or trustees of companies affiliated with the Manager, Distributor, and Transfer Agent.
Effective September 11, 2014, the Fund, along with Oppenheimer SteelPath MLP Alpha Fund, Oppenheimer SteelPath MLP Income Fund, and Oppenheimer SteelPath MLP Select 40 Fund (collectively, the “Trust”), is a borrower in a $650 million revolving credit agreement with Citibank, N.A. (“Citi Loan Agreement”). The Fund is permitted to borrow up to the lesser of one-third of the Fund’s total assets, or the maximum amount permitted pursuant to the Fund’s investment limitations. Amounts borrowed under the Citi Loan Agreement, if any, are invested by the Fund under the direction of the Manager consistent with the Fund’s investment objective and policies, and as such, the related investments are subject to
NOTES TO FINANCIAL STATEMENTS (Continued)
7. Borrowing Agreement (Continued)
normal market fluctuations and investment risks, including the risk of loss due to a decline in value. The borrowing, if any, is fully collateralized throughout the term of the borrowing with securities or other assets of the Fund. The Fund is not liable for borrowings of other Funds in the Trust. Securities that have been pledged as collateral for the borrowing are indicated in the Statement of Investments.
Borrowings under the Citi Loan Agreement are charged interest at a calculated rate computed by Citibank based on the three month LIBOR rate plus 0.80% per annum. An unused commitment fee at the rate of 0.10% per annum is charged for any undrawn portion of the credit facility, and each member of the Trust will pay its pro rata share of this fee. A facility fee of 0.27% was charged on the commitment amount, and each party of the Trust paid its pro rata share of this fee. The borrowing is due September 11, 2015, unless another date is mutually agreed upon by the parties of the Citi Loan Agreement. For the annual period ended November 28, 2014, the Fund paid $446,137 in borrowing fees. The payable on borrowing balance and interest rate at November 28, 2014 was $105,003,005 and 1.03%, respectively.
Prior to September 11, 2014 the Fund had a $104.7 million revolving credit agreement with Bank of America, N.A. (“BOA Loan Agreement”). The Fund was permitted to borrow up to the lesser of one-third of the Fund’s total assets, or the maximum amount permitted pursuant to the Fund’s investment limitations. Amounts borrowed under the BOA Loan Agreement were invested by the Fund under the direction of the Manager, consistent with the Fund’s investment objectives and policies, and as such are subject to normal market fluctuations and investment risks, including the risk of loss due to a decline in value. The borrowing was fully collateralized throughout the term of the borrowing with securities or other assets of the Fund.
Borrowings under the BOA Loan Agreement were charged interest at a calculated rate computed by Bank of America based on the one month LIBOR rate plus 0.90% per annum. A commitment fee at the rate of 0.10% per annum was charged for any undrawn portion of the credit facility.
Information related to the borrowings under the Citi Loan Agreement and BOA Loan Agreement for the year ended November 28, 2014, is as follows:
Average
Interest
Rate | | | Average
Loan
Balance | | | Number
of Days
Outstanding | | | Interest
Expense
Incurred | | | Maximum Amount Borrowed During
the Period | |
| | 1.05 | % | | $ | 97,446,256 | | | | 365 | | | $ | 1,050,190 | | | $ | 150,003,005 | |
NOTES TO FINANCIAL STATEMENTS (Continued)
In 2009, seven class action lawsuits were filed in the U.S. District Court for the District of Colorado against OppenheimerFunds, Inc. (“OFI”), OppenheimerFunds Distributor, Inc., the Fund’s principal underwriter and distributor (the “Distributor”), and certain funds (but not including the Fund) advised by OFI Global Asset Management, Inc. and distributed by the Distributor (the “Defendant Funds”). The lawsuits also named as defendants certain officers and current and former trustees of the respective Defendant Funds. The lawsuits raised claims under federal securities laws and alleged, among other things, that the disclosure documents of the respective Defendant Funds contained misrepresentations and omissions and that the respective Defendant Funds’ investment policies were not followed. The plaintiffs in these actions sought unspecified damages, equitable relief and awards of attorneys’ fees and litigation expenses. The Defendant Funds’ Boards of Trustees also engaged counsel to represent the Funds and the present and former Independent Trustees named in those suits. In March 2014, the parties in six of these lawsuits executed stipulations and agreements of settlement resolving those actions. In July 2014, the court entered an order and final judgment approving the settlements as fair, reasonable and adequate. The settlements do not resolve a seventh outstanding lawsuit relating to Oppenheimer Rochester California Municipal Fund (the “California Fund Suit”). OFI believes the California Fund Suit is without legal merit and is defending the suit vigorously. While it is premature to render any opinion as to the outcome in the California Fund Suit, or whether any costs that OFI may bear in defending the California Fund Suit might not be reimbursed by insurance, OFI believes the California Fund Suit should not impair the ability of OFI or the Distributor to perform their respective duties to the Fund, and that the outcome of the California Fund Suit should not have any material effect on the operations of any of the Oppenheimer Funds.
REPORT OF INDEPENDENT REGISTERED PUBLIC ACCOUNTING FIRM
To the Shareholders of Oppenheimer SteelPath MLP Alpha Plus Fund and
Board of Trustees of Oppenheimer SteelPath MLP Funds Trust
We have audited the accompanying statement of assets and liabilities, including the statement of investments, of Oppenheimer SteelPath MLP Alpha Plus Fund (the “Fund”), a series of Oppenheimer SteelPath MLP Funds Trust, as of November 28, 2014, and the related statements of operations and cash flows for the year then ended, the statements of changes in net assets for each of the two years in the period then ended, and the financial highlights for each of the three periods in the period then ended. These financial statements and financial highlights are the responsibility of the Fund’s management. Our responsibility is to express an opinion on these financial statements and financial highlights based on our audits.
We conducted our audits in accordance with the standards of the Public Company Accounting Oversight Board (United States). Those standards require that we plan and perform the audit to obtain reasonable assurance about whether the financial statements and financial highlights are free of material misstatement. An audit includes examining, on a test basis, evidence supporting the amounts and disclosures in the financial statements. Our procedures included confirmation of securities owned as of November 28, 2014, by correspondence with the custodian and brokers. An audit also includes assessing the accounting principles used and significant estimates made by management, as well as evaluating the overall financial statement presentation. We believe that our audits provide a reasonable basis for our opinion.
In our opinion, the financial statements and financial highlights referred to above present fairly, in all material respects, the financial position of Oppenheimer SteelPath MLP Alpha Plus Fund as of November 28, 2014, the results of its operations and its cash flows for the year then ended, the changes in its net assets for each of the two years in the period then ended, and the financial highlights for each of the three periods in the period then ended, in conformity with accounting principles generally accepted in the United States of America.
COHEN FUND AUDIT SERVICES, LTD.
Cleveland, Ohio
January 27, 2015
BOARD APPROVAL OF THE FUND’S INVESTMENT ADVISORY AGREEMENT Unaudited
The Fund has entered into an investment advisory agreement (the “Agreement”) with OFI SteelPath, Inc. (“OFI SteelPath” or the “Manager”). Each year, the Board of Trustees (the “Board”), including a majority of the independent Trustees, is required to determine whether to renew the Agreement. The Investment Company Act of 1940, as amended, requires that the Board request and evaluate, and that the Manager provide, such information as may be reasonably necessary to evaluate the terms of the Agreement. The Board employs an independent consultant to prepare a report that provides information, including comparative information that the Board requests for that purpose. In addition to in-person meetings focused on this evaluation, the Board receives information throughout the year regarding Fund services, fees, expenses and performance.
The Manager and the independent consultant provided information to the Board on the following factors: (i) the nature, quality and extent of the Manager’s services, (ii) the investment performance of the Fund and the Manager, (iii) the fees and expenses of the Fund, including comparative expense information, (iv) the profitability of the Manager and its affiliates, including an analysis of the cost of providing services, (v) whether economies of scale are realized as the Fund grows and whether fee levels reflect these economies of scale for Fund investors and (vi) other benefits to the Manager from its relationship with the Fund. The Board was aware that there are alternatives to retaining the Manager.
Outlined below is a summary of the principal information considered by the Board as well as the Board’s conclusions.
Nature, Quality and Extent of Services. The Board considered information about the nature, quality and extent of the services provided to the Fund and information regarding the Manager’s key personnel who provide such services. The Manager’s duties include providing research, analysis and other advisory services in regard to the Fund’s investments; securities trading services; oversight of third-party service providers; monitoring compliance with applicable Fund policies and procedures and adherence to the Fund’s investment restrictions; and risk management. The Manager is responsible for providing certain administrative services to the Fund as well. Those services, some of which are performed by affiliates of the Manager, include providing and supervising all administrative and clerical personnel who are necessary in order to provide effective corporate administration for the Fund; compiling and maintaining records with respect to the Fund’s operations; preparing and filing reports required by the Securities and Exchange Commission; preparing periodic reports regarding the operations of the Fund for its shareholders; preparing proxy materials for shareholder meetings; and preparing the registration statements required by Federal and state securities laws for the sale of the Fund’s shares. The Manager also provides the Fund with office space, facilities and equipment.
BOARD APPROVAL OF THE FUND’S INVESTMENT ADVISORY AGREEMENT Unaudited / (Continued)
The Board also considered the quality of the services provided and the quality of the Manager’s resources that are available to the Fund. In evaluating the Manager, the Board considered the history, reputation, qualification and background of the Manager, including its corporate parent, OppenheimerFunds, Inc. (“OFI”) and corporate affiliate, OFI Global Asset Management, Inc. (“OFI Global” and OFI and OFI Global are collectively referred to hereinafter as “OFI”), and the fact that OFI had over 50 years of experience as an investment adviser and that its assets rank among the top mutual fund managers in the United States. The Board evaluated the Manager’s and OFI’s advisory, administrative, accounting, legal, compliance services and risk management, and information the Board has received regarding the experience and professional qualifications of the Manager’s and OFI’s key personnel and the size and functions of its staff. In its evaluation of the quality of the portfolio management services provided, the Board considered the experience of Stuart Cartner and Brian Watson, the portfolio managers for the Fund, and the Manager’s investment team and analysts. The Board members also considered the totality of their experiences with the Manager and OFI as trustees of the Fund and other funds advised by the Manager or OFI. The Board considered information regarding the quality of services provided by affiliates of the Manager, which its members have become knowledgeable about in connection with the renewal of the Fund’s service agreements. The Board concluded, in light of the Manager’s and OFI’s experience, reputation, personnel, operations and resources that the Fund benefits from the services provided under the Agreement.
Investment Performance of the Manager and the Fund. Throughout the year, the Manager provided information on the investment performance of the Fund and the Manager, including comparative performance information. The Board also reviewed information, prepared by the Manager and by the independent consultant, comparing the Fund’s historical performance to relevant market indices and to the performance of other retail equity energy funds. The Board noted that the Fund outperformed its category median and ranked in the first quintile for the one-year period.
Costs of Services by the Manager. The Board reviewed the fees paid to the Manager and the other expenses borne by the Fund. The independent consultant provided comparative data in regard to the fees and expenses of the Fund and other retail equity energy funds with comparable asset levels and distribution features. The Board noted that the Fund’s contractual management fee was higher than its peer group median and category median. The Board also noted that the Fund’s total expenses were higher than its peer group median and category median. The Board considered that the Fund’s contractual management fee includes both the advisory fee and the administrative fee, which contribute to the Fund’s costs and noted that the administrative fee reflects the complex tax work associated with the Fund’s MLP investments. The Board considered that within the total asset range of $50 million to $100 million, the Fund’s effective management fee was higher than its peer group median and category median. The Board also considered that the Fund strategically employs leverage to attempt to enhance returns and to seek to offset the deferred tax expenses. The
BOARD APPROVAL OF THE FUND’S INVESTMENT ADVISORY AGREEMENT Unaudited / (Continued)
Board also considered Management’s assertion that the Fund ranks poorly within its peer group as other funds in the group do not employ leverage; however, the Board noted that the Fund’s performance is competitive. The Board noted that the Manager has contractually agreed to limit the Fund’s total operating expenses to 2.00% for Class A shares, 2.75% for Class C shares and 1.75% for Class Y shares. The fee limitation may not be amended or terminated prior to March 29, 2015, unless approved by the Board.
Economies of Scale and Profits Realized by the Manager. The Board considered information regarding the Manager’s costs in serving as the Fund’s investment adviser, including the costs associated with the personnel and systems necessary to manage the Fund, and information regarding the Manager’s profitability from its relationship with the Fund. The Board reviewed whether the Manager may realize economies of scale in managing and supporting the Fund. The Board noted that the Fund currently has management fee breakpoints, which are intended to share with Fund shareholders economies of scale that may exist as the Fund’s assets grow.
Other Benefits to the Manager. In addition to considering the profits realized by the Manager, the Board considered information that was provided regarding the direct and indirect benefits the Manager receives as a result of its relationship with the Fund, including compensation paid to the Manager’s affiliates and research provided to the Manager in connection with permissible brokerage arrangements (soft dollar arrangements). The Board also considered that the Manager must be able to pay and retain experienced professional personnel at competitive rates to provide quality services to the Fund.
Conclusions. These factors were also considered by the independent Trustees meeting separately from the full Board, assisted by experienced counsel to the Fund and to the independent Trustees. Fund counsel and the independent Trustees’ counsel are independent of the Manager within the meaning and intent of the Securities and Exchange Commission Rules.
Based on its review of the information it received and its evaluations described above, the Board, including a majority of the independent Trustees, decided to continue the Agreement through August 31, 2015. In arriving at its decision, the Board did not identify any factor or factors as being more important than others, but considered all of the above information, and considered the terms and conditions of the Agreement, including the management fees, in light of all the surrounding circumstances.
PORTFOLIO PROXY VOTING POLICIES AND PROCEDURES; UPDATES TO STATEMENTS OF INVESTMENTS Unaudited
The Fund has adopted Portfolio Proxy Voting Policies and Procedures under which the Fund votes proxies relating to securities (“portfolio proxies”) held by the Fund. A description of the Fund’s Portfolio Proxy Voting Policies and Procedures is available (i) without charge, upon request, by calling the Fund toll-free at 1.800.CALL OPP (225.5677), (ii) on the Fund’s website at oppenheimerfunds.com, and (iii) on the SEC’s website at www.sec.gov. In addition, the Fund is required to file Form N-PX, with its complete proxy voting record for the 12 months ended June 30th, no later than August 31st of each year. The Fund’s voting record is available (i) without charge, upon request, by calling the Fund toll-free at 1.800.CALL OPP (225.5677), and (ii) in the Form N-PX filing on the SEC’s website at www.sec.gov.
The Fund files its complete schedule of portfolio holdings with the SEC for the first quarter and the third quarter of each fiscal year on Form N-Q. The Fund’s Form N-Q filings are available on the SEC’s website at www.sec.gov. Those forms may be reviewed and copied at the SEC’s Public Reference Room in Washington, D.C. Information on the operation of the Public Reference Room may be obtained by calling 1-800-SEC-0330.
Householding – Delivery of Shareholder Documents
This is to inform you about OppenheimerFunds’ “householding” policy. If more than one member of your household maintains an account in a particular fund, OppenheimerFunds will mail only one copy of the fund’s prospectus (or, if available, the fund’s summary prospectus), annual and semiannual report and privacy policy. The consolidation of these mailings, called householding, benefits your fund through reduced mailing expense, and benefits you by reducing the volume of mail you receive from OppenheimerFunds. Householding does not affect the delivery of your account statements.
Please note that we will continue to household these mailings for as long as you remain an OppenheimerFunds shareholder, unless you request otherwise. If you prefer to receive multiple copies of these materials, please call us at 1.800.CALL-OPP (225-5677). You may also notify us in writing or via email. We will begin sending you individual copies of the prospectus (or, if available, the summary prospectus), reports and privacy policy within 30 days of receiving your request to stop householding.
TRUSTEES AND OFFICERS Unaudited
| Name, Position(s) Held with the Trusts, Length of Service, Age | Principal Occupation(s) During the Past 5 Years; Other Trusteeships/Directorships Held; Number of Portfolios in the Fund Complex Currently Overseen |
| INDEPENDENT TRUSTEES | The address of each Trustee in the chart below is 6803 S. Tucson Way, Centennial, Colorado 80112-3924. Each Trustee serves for an indefinite term, or until his or her resignation, retirement, death or removal. |
Sam Freedman, Chairman of the Board of Trustees and Trustee (since 2012) Year of Birth: 1940 | Director of Colorado UpLIFT (charitable organization) (since September 1984). Mr. Freedman held several positions with OppenheimerFunds, Inc. and with subsidiary or affiliated companies of OppenheimerFunds, Inc. (until October 1994). Oversees 38 portfolios in the OppenheimerFunds complex. Mr. Freedman has served on the Boards of certain Oppenheimer funds since 1996, during which time he has become familiar with the Fund’s (and other Oppenheimer funds’) financial, accounting, regulatory and investment matters and has contributed to the Boards’ deliberations. |
Jon S. Fossel, Trustee (since 2012) Year of Birth: 1942 | Chairman of the Board (2006-December 2011) and Director (June 2002-December 2011) of UNUMProvident (insurance company); Director of Northwestern Energy Corp. (public utility corporation) (November 2004-December 2009); Director of P.R. Pharmaceuticals (October 1999-October 2003); Director of Rocky Mountain Elk Foundation (non-profit organization) (February 1998-February 2003 and February 2005-February 2007); Chairman and Director (until October 1996) and President and Chief Executive Officer (until October 1995) of OppenheimerFunds, Inc.; President, Chief Executive Officer and Director of the following: Oppenheimer Acquisition Corp. (“OAC”) (parent holding company of the OppenheimerFunds, Inc.), Shareholders Services, Inc. and Shareholder Financial Services, Inc. (until October 1995). Oversees 38 portfolios in the OppenheimerFunds complex. Mr. Fossel has served on the Boards of certain Oppenheimer funds since 1990, during which time he has become familiar with the Fund’s (and other Oppenheimer funds’) financial, accounting, regulatory and investment matters and has contributed to the Boards’ deliberations. |
TRUSTEES AND OFFICERS Unaudited / (Continued)
Richard F. Grabish, Trustee (since 2012) Year of Birth: 1948 | Formerly Senior Vice President and Assistant Director of Sales and Marketing (March 1997-December 2007), Director (March 1987-December 2007) and Manager of Private Client Services (June 1985-June 2005) of A.G. Edwards & Sons, Inc. (broker/dealer and investment firm); Chairman and Chief Executive Officer of A.G. Edwards Trust Company, FSB (March 2001-December 2007); President and Vice Chairman of A.G. Edwards Trust Company, FSB (investment adviser) (April 1987-March 2001); President of A.G. Edwards Trust Company, FSB (investment adviser) (June 2005-December 2007). Oversees 38 portfolios in the OppenheimerFunds complex. Mr. Grabish has served on the Boards of certain Oppenheimer funds since 2001, during which time he has become familiar with the Fund’s (and other Oppenheimer funds’) financial, accounting, regulatory and investment matters and has contributed to the Boards’ deliberations. |
Beverly L. Hamilton, Trustee (since 2012) Year of Birth: 1946 | Trustee of Monterey Institute for International Studies (educational organization) (since February 2000); Board Member of Middlebury College (educational organization) (December 2005-June 2011); Chairman (since 2010) of American Funds’ Emerging Markets Growth Fund, Inc. (mutual fund); Director of The California Endowment (philanthropic organization) (April 2002-April 2008); Director (February 2002-2005) and Chairman of Trustees (2006-2007) of the Community Hospital of Monterey Peninsula; Director (October 1991-2005); Vice Chairman (2006-2009) of American Funds’ Emerging Markets Growth Fund, Inc. (mutual fund); President of ARCO Investment Management Company (February 1991-April 2000); Member of the investment committees of The Rockefeller Foundation (2001-2006) and The University of Michigan (since 2000); Advisor at Credit Suisse First Boston’s Sprout venture capital unit (venture capital fund) (1994-January 2005); Trustee of MassMutual Institutional Funds (investment company) (1996-June 2004); Trustee of MML Series Investment Fund (investment company) (April 1989-June 2004); Member of the investment committee of Hartford Hospital (2000-2003); and Advisor to Unilever (Holland) pension fund (2000-2003). Oversees 38 portfolios in the OppenheimerFunds complex. Ms. Hamilton has served on the Boards of certain Oppenheimer funds since 2002, during which time she has become familiar with the Fund’s (and other Oppenheimer funds’) financial, accounting, regulatory and investment matters and has contributed to the Boards’ deliberations. |
TRUSTEES AND OFFICERS Unaudited / (Continued)
Victoria J. Herget, Trustee (since 2012) Year of Birth: 1951 | Independent Director of the First American Funds (mutual fund family) (2003-2011); former Managing Director (1993-2001), Principal (1985-1993), Vice President (1978-1985) and Assistant Vice President (1973-1978) of Zurich Scudder Investments (and its predecessor firms); Board Chair (2008-Present) and Director (2004-Present), United Educators (insurance company); Trustee (1992-2007), Chair of the Board of Trustees (1999-2007), Investment Committee Chair (1994-1999) and Investment Committee member (2007-2010) of Wellesley College; Trustee (since 2000) and Chair (since 2010), Newberry Library; Trustee, Mather LifeWays (since 2001); Trustee, BoardSource (2006-2009) and Chicago City Day School (1994-2005). Oversees 38 portfolios in the OppenheimerFunds complex. Ms. Herget has served on the Boards of certain Oppenheimer funds since 2012, during which time she has become familiar with the Fund’s (and other Oppenheimer funds’) financial, accounting, regulatory and investment matters and has contributed to the Boards’ deliberations. |
Robert J. Malone, Trustee (since 2012) Year of Birth: 1944 | Chairman of the Board (since 2012) and Director (since August 2005) of Jones International University (educational organization) (since August 2005); Chairman, Chief Executive Officer and Director of Steele Street Bank Trust (commercial banking) (since August 2003); Trustee of the Gallagher Family Foundation (non-profit organization) (since 2000); Board of Directors of Opera Colorado Foundation (non-profit organization) (2008-2012); Director of Colorado UpLIFT (charitable organization) (1986-2010); Director of Jones Knowledge, Inc. (2006-2010); Former Chairman of U.S. Bank-Colorado (subsidiary of U.S. Bancorp and formerly Colorado National Bank) (July 1996-April 1999); Director of Commercial Assets, Inc. (real estate investment trust) (1993-2000); Director of U.S. Exploration, Inc. (oil and gas exploration) (1997-February 2004); Chairman of the Board (1991-1994) and Trustee (1985-1994) of Regis University; and Chairman of the Board (1990-1991 and Trustee (1984-1999) of Young Presidents Organization. Oversees 38 portfolios in the OppenheimerFunds complex. Mr. Malone has served on the Boards of certain Oppenheimer funds since 2002, during which time he has become familiar with the Fund’s (and other Oppenheimer funds’) financial, accounting, regulatory and investment matters and has contributed to the Boards’ deliberations. |
TRUSTEES AND OFFICERS Unaudited / (Continued)
F. William Marshall, Jr., Trustee (since 2012) Year of Birth: 1942 | Trustee Emeritus of Worcester Polytech Institute (WPI) (private university) (since 2009); Trustee of MassMutual Select Funds (formerly MassMutual Institutional Funds) (investment company) (since 1996), MML Series Investment Fund (investment company) (since 1996) and Mass Mutual Premier Funds (investment company) (since January 2012); President and Treasurer of the SIS Fund (private charitable fund) (January 1999 – March 2011); Former Trustee of WPI (1985-2008); Former Chairman of the Board (2004-2006) and Former Chairman of the Investment Committee of WPI (1994-2008); Chairman of SIS & Family Bank, F.S.B. (formerly SIS Bank) (commercial bank) (January 1999-July 1999); Executive Vice President of Peoples Heritage Financial Group, Inc. (commercial bank) (January 1999-July 1999); and Former President and Chief Executive Officer of SIS Bancorp. (1993-1999). Oversees 42 portfolios in the OppenheimerFunds complex. Mr. Marshall has served on the Boards of certain Oppenheimer funds since 2000, during which time he has become familiar with the Fund’s (and other Oppenheimer funds’) financial, accounting, regulatory and investment matters and has contributed to the Boards’ deliberations. |
Karen L. Stuckey, Trustee (since 2012) Year of Birth: 1953 | Partner (1990-2012) of PricewaterhouseCoopers LLP (held various positions 1975-1990); Emeritus Trustee (since 2006), Trustee (1992-2006) and member of Executive, Nominating and Audit Committees and Chair of Finance Committee of Lehigh University; and member, Women’s Investment Management Forum since inception. Oversees 38 portfolios in the OppenheimerFunds complex. Ms. Stuckey has served on the Boards of certain Oppenheimer funds since 2012, during which time she has become familiar with the Fund’s (and other Oppenheimer funds’) financial, accounting, regulatory and investment matters and has contributed to the Boards’ deliberations. |
James D. Vaughn, Trustee (since 2012) Year of Birth:1945 | Retired; former managing partner (1994-2001) of Denver office of Deloitte & Touche LLP, (held various positions 1969-1993); Trustee and Chairman of the Audit Committee of Schroder Funds (2003-2012); Board member and Chairman of Audit Committee of AMG National Trust Bank (since 2005); Trustee and Investment Committee member, University of South Dakota Foundation (since 1996); Board member, Audit Committee Member and past Board Chair, Junior Achievement (since 1993); former Board member, Mile High United Way, Boys and Girls Clubs, Boy Scouts, Colorado Business Committee for the Arts, Economic Club of Colorado and Metro Denver Network. Oversees 38 portfolios in the OppenheimerFunds complex. Mr. Vaughn has served on the Boards of certain Oppenheimer funds since 2012, during which time he has become familiar with the Fund’s (and other Oppenheimer funds’) financial, accounting, regulatory and investment matters and has contributed to the Boards’ deliberations. |
TRUSTEES AND OFFICERS Unaudited / (Continued)
| INTERESTED TRUSTEE | Mr. Glavin is an “Interested Trustee” because he is affiliated with the Manager and OppenheimerFunds, Inc. by virtue of his positions as director of the Manager, and as a shareholder of OppenheimerFunds, Inc.’s parent company. As a Trustee, he serves for an indefinite term, or until his resignation, retirement, death or removal. Mr. Glavin’s address is 225 Liberty Street, 11th Floor, New York, New York 10281-1008. |
William F. Glavin, Jr., Trustee
(since 2012) Year of Birth: 1958 | Chairman of OppenheimerFunds, Inc. (July 2014-December 2014 and December 2009-December 2012) and Director of OppenheimerFunds, Inc. (since January 2009); Chairman, Director and Chief Executive Officer (January 2013-June 2014) of OFI Global Asset Management, Inc.; President of OFI Global Asset Management, Inc. (January 2013-May 2013); Chief Executive Officer (January 2009-December 2012); President of OppenheimerFunds, Inc. (May 2009-December 2012); Management Director (June 2009-June 2014), President (December 2009-June 2014) and Chief Executive Officer (January 2011-June 2014) of Oppenheimer Acquisition Corp. (“OAC”) (OppenheimerFunds, Inc.’s parent holding company); Director of Oppenheimer Real Asset Management, Inc. (March 2010-June 2014); Executive Vice President (March 2006-February 2009) and Chief Operating Officer (July 2007-February 2009) of Massachusetts Mutual Life Insurance Company (OAC’s parent company); Director (May 2004-March 2006) and Chief Operating Officer and Chief Compliance Officer (May 2004-January 2005), President (January 2005-March 2006) and Chief Executive Officer (June 2005-March 2006) of Babson Capital Management LLC; Director (March 2005-March 2006), President (May 2003-March 2006) and Chief Compliance Officer (July 2005-March 2006) of Babson Capital Securities, Inc. (a broker-dealer); President (May 2003-March 2006) of Babson Investment Company, Inc.; Director (May 2004-August 2006) of Babson Capital Europe Limited; Director (May 2004-October 2006) of Babson Capital Guernsey Limited; Director (May 2004-March 2006) of Babson Capital Management LLC; Non-Executive Director (March 2005-March 2007) of Baring Asset Management Limited; Director (February 2005-June 2006) Baring Pension Trustees Limited; Director and Treasurer (December 2003-November 2006) of Charter Oak Capital Management, Inc.; Director (May 2006-September 2006) of C.M. Benefit Insurance Company; Director (May 2008-June 2009) and Executive Vice President (June 2007-July 2009) of C.M. Life Insurance Company; President (March 2006-May 2007) of MassMutual Assignment Company; Director (January 2005-December 2006), Deputy Chairman (March 2005-December 2006) and President (February 2005-March 2005) of MassMutual Holdings (Bermuda) Limited; Director (May 2008-June 2009) and Executive Vice President (June 2007-July 2009) of MML Bay State Life Insurance Company; Chief Executive Officer and President (April 2007-January 2009) of MML Distributors, LLC; and Chairman (March 2006-December 2008) and Chief Executive Officer (May 2007-December 2008) of MML Investors Services, Inc. An officer of 91 portfolios in the OppenheimerFunds complex. Mr. Glavin has served on the Boards of certain Oppenheimer funds since December 2009, during which time he has become familiar with the Fund’s (and other Oppenheimer funds’) financial, accounting, regulatory and investment matters and has contributed to the Boards’ deliberations. |
TRUSTEES AND OFFICERS Unaudited / (Continued)
| OTHER OFFICERS OF THE TRUSTS | The addresses of the Officers in the chart below are as follows: for Mr. Steinmetz, Gabinet, Mss. Sexton and Picciotto, 225 Liberty Street, New York, New York 10281-1008; for Messrs. Cartner and Watson, 2100 McKinney Avenue, Dallas, TX 75201; and for Mr. Wixted, 6803 S. Tucson Way, Centennial, Colorado 80112-3924. Each Officer serves for an indefinite term or until his or her resignation, retirement, death or removal. |
Stuart Cartner, Vice President (since 2010) Year of Birth: 1961 | Senior Vice President and Senior Portfolio Manager of the Manager (since January 2014); Vice President of the Manager (2012-January 2014). A member and portfolio manager of SteelPath Fund Advisors, LLC (since its formation in 2009) and SteelPath Capital Management, LLC (since 2007). Vice President in the Private Wealth Management Division of Goldman, Sachs & Co (1988-2007). An officer of other portfolios in the OppenheimerFunds complex. |
Brian Watson, Vice President (since 2012) Year of Birth: 1974 | Senior Vice President and Senior Portfolio Manager of the Manager (since January 2014); Vice President of the Manager (2012-January 2014). Prior to joining OFI Global Asset Management, Inc., he was a member, portfolio manager and Director of Research of SteelPath Fund Advisors, LLC since its formation in 2009. A portfolio manager at Swank Capital LLC, a Dallas, Texas based investment firm (2005-2009). An officer of other portfolios in the OppenheimerFunds complex. |
Arthur P. Steinmetz, President and Principal Executive Officer (since 2014) Year of Birth: 1958 | Chairman of OppenheimerFunds, Inc. (since January 2015); CEO and Chairman of OFI Global Asset Management, Inc. (since July 2014), President of OFI Global Asset Management, Inc. (since May 2013), a Director of OFI Global Asset Management, Inc. (since January 2013), Director of OppenheimerFunds, Inc. (since July 2014), President, Management Director and CEO of Oppenheimer Acquisition Corp. (OppenheimerFunds, Inc.’s parent holding company) (since July 2014), and President and Director of the Manager (since January 2013). Chief Investment Officer of the OppenheimerFunds advisory entities from (January 2013-December 2013); Executive Vice President of OFI Global Asset Management, Inc. (January 2013-May 2013); Chief Investment Officer of OppenheimerFunds, Inc. (October 2010-December 2012); Chief Investment Officer, Fixed-Income, of OppenheimerFunds, Inc. (April 2009-October 2010); Executive Vice President of OppenheimerFunds, Inc. (October 2009-December 2012); Director of Fixed Income of OppenheimerFunds, Inc. (January 2009-April 2009); and a Senior Vice President of OppenheimerFunds, Inc. (March 1993-September 2009). An officer of 91 portfolios in the OppenheimerFunds complex.0 |
TRUSTEES AND OFFICERS Unaudited / (Continued)
Arthur S. Gabinet, Secretary and Chief Legal Officer (since 2012) Year of Birth: 1958 | Executive Vice President, Secretary and General Counsel of OFI Global Asset Management, Inc. (since January 2013); General Counsel of the Manager (since January 2013); Executive Vice President (May 2010-December 2012) and General Counsel (since January 2011) of OppenheimerFunds, Inc.; General Counsel of the Distributor (since January 2011); General Counsel of Centennial Asset Management Corporation (January 2011-December 2012); Executive Vice President (January 2011-December 2012) and General Counsel of HarbourView Asset Management Corporation (since January 2011); Assistant Secretary (since January 2011) and Director (since January 2011) of OppenheimerFunds International Ltd. and OppenheimerFunds plc; Director of Oppenheimer Real Asset Management, Inc. (January 2011-December 2012) and General Counsel (since January 2011); Executive Vice President (January 2011-December 2011) and General Counsel of Shareholder Financial Services, Inc. and Shareholder Services, Inc. (since January 2011); Executive Vice President (January 2011-December 2012) and General Counsel of OFI Private Investments Inc. (since January 2011); Vice President of OppenheimerFunds Legacy Program (January 2011-December 2011); Executive Vice President (January 2011-December 2012) and General Counsel of OFI Institutional Asset Management, Inc. (since January 2011); General Counsel, Asset Management of OppenheimerFunds, Inc. (May 2010-December 2010); Principal, The Vanguard Group (November 2005-April 2010); District Administrator, U.S. Securities and Exchange Commission (January 2003-October 2005). An officer of 91 portfolios in the OppenheimerFunds complex. |
Jennifer Sexton, Vice President and Chief Business Officer (since 2014) Year of Birth: 1969 | Senior Vice President of OppenheimerFunds Distributor, Inc. (since June 2014); Vice President of OppenheimerFunds Distributor, Inc. (April 2006-June 2014); Vice President of OppenheimerFunds, Inc. (January 1998-March 2006); Assistant Vice President of OppenheimerFunds, Inc. (October 1991-December 1998). An officer of 91 portfolios in the OppenheimerFunds complex. |
Mary Ann Picciotto, Chief Compliance Officer and Chief Anti-Money Laundering Officer (since 2014) Year of Birth: 1973 | Senior Vice President and Chief Compliance Officer of OFI Global Asset Management, Inc. (since March 2014); Chief Compliance Officer of OppenheimerFunds, Inc., the Manager, OFI Global Trust Company, OFI Global Institutional, Inc., Oppenheimer Real Asset Management, Inc., OFI Private Investments, Inc., Harborview Asset Management Corporation, Trinity Investment Management Corporation, and Shareholder Services, Inc. (since March 2014); Managing Director of Morgan Stanley Investment Management Inc. and certain of its various affiliated entities; Chief Compliance Officer of various Morgan Stanley Funds (May 2010-January 2014); Chief Compliance Officer of Morgan Stanley Investment Management Inc. (April 2007-January 2014). An officer of 91 portfolios in the OppenheimerFunds complex. |
TRUSTEES AND OFFICERS Unaudited / (Continued)
Brian W. Wixted, Treasurer and Principal Financial & Accounting Officer (since 2012) Year of Birth: 1959 | Senior Vice President of OFI Global Asset Management, Inc. (since January 2013); Treasurer of OppenheimerFunds, Inc., HarbourView Asset Management Corporation, Shareholder Financial Services, Inc., Shareholder Services, Inc., and Oppenheimer Real Asset Management, Inc. (March 1999-June 2008), OFI Private Investments, Inc. (March 2000-June 2008), OppenheimerFunds International Ltd. and OppenheimerFunds plc (since May 2000), OFI Institutional Asset Management, Inc. (November 2000-June 2008), and OppenheimerFunds Legacy Program (charitable trust program established by OppenheimerFunds, Inc.) (June 2003-December 2011); Treasurer and Chief Financial Officer of OFI Trust Company (since May 2000); Assistant Treasurer of Oppenheimer Acquisition Corporation (March 1999-June 2008). An officer of 91 portfolios in the OppenheimerFunds complex. |
The Fund’s Statement of Additional Information contains additional information about the Fund’s Trustees and Officers and is available without charge upon request, by calling 1.800.CALL OPP (225.5677).
OPPENHEIMER STEELPATH MLP ALPHA PLUS FUND
| Manager | | OFI SteelPath, Inc. |
| | | |
| Distributor | | OppenheimerFunds Distributor, Inc. |
| | | |
| Transfer and Shareholder Servicing Agent | | OFI Global Asset Management, Inc. |
| | | |
| Sub-Transfer Agent | | Shareholder Services, Inc. |
| | | DBA OppenheimerFunds Services |
| | | |
| Independent Registered Public Accounting Firm | | Cohen Fund Audit Services, Ltd. |
| | | |
| Counsel | | K&L Gates LLP |
© 2015 OppenheimerFunds, Inc. All rights reserved.
The financial statements included herein have been taken from the records of the Fund without examination of those records by the independent registered public accounting firm.
PRIVACY POLICY NOTICE
As an Oppenheimer fund shareholder, you are entitled to know how we protect your personal information and how we limit its disclosure.
Information Sources
We obtain nonpublic personal information about our shareholders from the following sources:
• Applications or other forms
• When you create a user ID and password for online account access
• When you enroll in eDocs Direct, our electronic document delivery service
• Your transactions with us, our affiliates or others
• A software program on our website, often referred to as a “cookie,” which indicates which parts of our site you’ve visited
• When you set up challenge questions to reset your password online
If you visit oppenheimerfunds.com and do not log on to the secure account information areas, we do not obtain any personal information about you. When you do log on to a secure area, we do obtain your user ID and password to identify you. We also use this information to provide you with products and services you have requested, to inform you about products and services that you may be interested in and assist you in other ways.
We do not collect personal information through our website unless you willingly provide it to us, either directly by email or in those areas of the website that request information. In order to update your personal information (including your mailing address, email address and phone number) you must first log on and visit your user profile.
If you have set your browser to warn you before accepting cookies, you will receive the warning message with each cookie. You can refuse cookies by turning them off in your browser. However, doing so may limit your access to certain sections of our website.
We use cookies to help us improve and manage our website. For example, cookies help us recognize new versus repeat visitors to the site, track the pages visited, and enable some special features on the website. This data helps us provide a better service for our website visitors.
Protection of Information
We do not disclose any non-public personal information (such as names on a customer list) about current or former customers to anyone, except as permitted by law.
PRIVACY POLICY NOTICE (Continued)
Disclosure of Information
Copies of confirmations, account statements and other documents reporting activity in your fund accounts are made available to your financial adviser (as designated by you). We may also use details about you and your investments to help us, our financial service affiliates, or firms that jointly market their financial products and services with ours, to better serve your investment needs or suggest financial services or educational material that may be of interest to you. If this requires us to provide you with an opportunity to “opt in” or “opt out” of such information sharing with a firm not affiliated with us, you will receive notification on how to do so, before any such sharing takes place.
Right of Refusal
We will not disclose your personal information to unaffiliated third parties (except as permitted by law), unless we first offer you a reasonable opportunity to refuse or “opt out” of such disclosure.
Internet Security and Encryption
In general, the email services provided by our website are encrypted and provide a secure and private means of communication with us. To protect your own privacy, confidential and/or personal information should only be communicated via email when you are advised that you are using a secure website.
As a security measure, we do not include personal or account information in non-secure emails, and we advise you not to send such information to us in non-secure emails. Instead, you may take advantage of the secure features of our website to encrypt your email correspondence. To do this, you will need to use a browser that supports Secure Sockets Layer (SSL) protocol.
We do not guarantee or warrant that any part of our website, including files available for download, are free of viruses or other harmful code. It is your responsibility to take appropriate precautions, such as use of an anti-virus software package, to protect your computer hardware and software.
• All transactions, including redemptions, exchanges and purchases, are secured by SSL and 128-bit encryption. SSL is used to establish a secure connection between your PC and OppenheimerFunds’ server. It transmits information in an encrypted and scrambled format.
• Encryption is achieved through an electronic scrambling technology that uses a “key” to code and then decode the data. Encryption acts like the cable converter box you may have on your television set. It scrambles data with a secret code so that no one can make sense of it while it is being transmitted. When the data reaches its destination, the same software unscrambles the data.
• You can exit the secure area by either closing your browser, or for added security, you can use the Log Out button before you close your browser.
PRIVACY POLICY NOTICE (Continued)
Other Security Measures
We maintain physical, electronic and procedural safeguards to protect your personal account information. Our employees and agents have access to that information only so that they may offer you products or provide services, for example, when responding to your account questions.
How You Can Help
You can also do your part to keep your account information private and to prevent unauthorized transactions. If you obtain a user ID and password for your account, do not allow it to be used by anyone else. Also, take special precautions when accessing your account on a computer used by others.
Who We Are
This joint notice describes the privacy policies of the Oppenheimer funds, OppenheimerFunds, Inc., each of its investment adviser subsidiaries, OppenheimerFunds Distributor, Inc. and OFI Global Trust Co. It applies to all Oppenheimer fund accounts you presently have, or may open in the future, using your Social Security number - whether or not you remain a shareholder of our funds. This notice was last updated November 2014. In the event it is updated or changed, we will post an updated notice on our website at oppenheimerfunds.com. If you have any questions about this privacy policy, write to us at P.O. Box 5270, Denver, CO 80217-5270, email us by clicking on the Contact Us section of our website at oppenheimerfunds.com or call us at 1.800.CALL.OPP (225.5677).
THIS PAGE INTENTIONALLY LEFT BLANK
THIS PAGE INTENTIONALLY LEFT BLANK
THIS PAGE INTENTIONALLY LEFT BLANK

Item 2. Code of Ethics.
Amended and Restated Joint Code of Ethics of the Registrant and SteelPath Capital Management LLC, SteelPath Fund Advisors LLC, The SteelPath MLP Funds Trust: Previously filed with Post-Effective Amendment No. 2 to the Registration Statement of SteelPath MLP Funds Trust (Reg. No. 333-163614), (5/27/11), and incorporated herein by reference.
Item 3. Audit Committee Financial Expert.
The Board of Trustees of the registrant has determined that F. William Marshall, Jr., the Chairman of the Board’s Audit Committee, is the audit committee financial expert and that Mr. Marshall is “independent” for purposes of this Item 3.
Item 4. Principal Accountant Fees and Services.
| (a)-(d) | The registrant has engaged its principal accountant to perform audit services, audit-related services, tax services and other services during the last fiscal year. The registrant commenced operations on March 31, 2010. Therefore, the following information is provided for the years ending November 30, 2013, and November 30, 2014. |
“Audit services” refer to performing an audit of the registrant’s annual financial statements or services that are normally provided by accountant in connection with statutory and regulatory filings or engagements for that year. “Audit-related services” refer to the assurance and related services by the principal accountant that are reasonably related to the performance of the audit. “Tax services” refer to professional services rendered by the principal accountant for review of federal tax forms and other tax compliance, tax advice, and tax planning. “Other services” refer to professional services rendered by the principal accountant for certain review of the registrant’s registration statement.
| | FYE 11/30/2013 | FYE 11/30/2014 |
| Audit Fees | $102,000 | $104,000 |
| Audit-Related Fees | $0 | $0 |
| Tax Fees | $58,357 | $46,000 |
| All Other Fees | $500 | $0 |
| (e)(1) | During its regularly scheduled periodic meetings, the registrant’s audit committee will pre-approve all audit, audit-related, tax and other services to be provided by the principal accountants of the registrant. |
The audit committee has delegated pre-approval authority to its Chairman for any subsequent new engagements that arise between regularly scheduled meeting dates provided that any fees such pre-approved are presented to the audit committee at its next regularly scheduled meeting.
Under applicable laws, pre-approval of non-audit services may be waived provided that: 1) the aggregate amount of all such services provided constitutes no more than five percent of the total amount of fees paid by the registrant to its principal accountant during the fiscal year in which services are provided 2) such services were not recognized by the registrant at the time of engagement as non-audit services and 3) such services are promptly brought to the attention of the audit committee of the registrant and approved prior to the completion of the audit.
| (e)(2) | The percentage of fees billed by Cohen Fund Audit Services, Ltd. applicable to non-audit services pursuant to waiver of pre-approval requirement were as follows: |
| | FYE 11/30/2013 | FYE 11/30/2014 |
| Audit-Related Fees | 0% | 0% |
| Tax Fees | 0% | 0% |
| All Other Fees | 0% | 0% |
| (f) | All of the principal accountant’s hours spent on auditing the registrant’s financial statements were attributed to work performed by full-time permanent employees of the principal accountant. |
| (g) | The following table indicates the aggregate non-audit fees billed by the registrant’s accountant for services to the registrant and to the registrant’s investment adviser, and any entity controlling, controlled by, or under common control with the registrant’s adviser that provides ongoing services to the registrant for the last year. |
| | FYE 11/30/2013 | FYE 11/30/2014 |
| Registrant | $58,857 | $46,000 |
| Registrant’s Investment Adviser | $0 | $0 |
| (h) | The registrant’s audit committee of the board of Trustees has considered whether the provision of non-audit services that were rendered to the registrant’s investment adviser, and any entity controlling, controlled by, or under common control with the investment adviser that provides ongoing services to the registrant that were not pre-approved pursuant to paragraph (c)(7)(ii) of Rule 2-01 of Regulation S-X is compatible with maintaining the principal accountant’s independence. No such services were rendered. |
Item 5. Audit Committee of Listed Registrants.
Not applicable.
Item 6. Schedule of Investments.
a) Not applicable. The complete schedule of investments is included in Item 1 of this Form N-CSR.
b) Not applicable.
Item 7. Disclosure of Proxy Voting Policies and Procedures for Closed-End Management Investment Companies.
Not applicable.
Item 8. Portfolio Managers of Closed-End Management Investment Companies.
Not applicable.
Item 9. Purchases of Equity Securities by Closed-End Management Investment Company and Affiliated Purchasers.
Not applicable.
Item 10. Submission of Matters to a Vote of Security Holders.
The Registrant’s Governance Committee Provisions with Respect to Nominations of Directors/Trustees to the Respective Boards
Not applicable.
Item 11. Controls and Procedures.
| (a) | Based on their evaluation of the registrant’s disclosure controls and procedures (as defined in rule 30a-3(c) under the Investment Company Act of 1940 (17 CFR 270.30a-3(c)) as of 11/30/2014, the registrant’s principal executive officer and principal financial officer found the registrant’s disclosure controls and procedures to provide reasonable assurances that information required to be disclosed by the registrant in the reports that it files under the Securities Exchange Act of 1934 (a) is accumulated and communicated to registrant’s management, including its principal executive officer and principal financial officer, to allow timely decisions regarding required disclosure, and (b) is recorded, processed, summarized and reported, within the time periods specified in the rules and forms adopted by the U.S. Securities and Exchange Commission. |
| (b) | There were no changes in the Registrant’s internal control over financial reporting (as defined in Rule 30a-3(d) under the Act) that occurred during the Registrant’s second fiscal quarter of the period covered by this report that materially affected, or were reasonably likely to materially affect, the Registrant’s internal control over financial reporting. |
Item 12. Exhibits
| (a)(1) | Any code of ethics or amendment thereto, that is the subject of the disclosure required by Item 2, to the extent that the registrant intends to satisfy Item 2 requirements through filing exhibit. |
Filed herewith.
| (2) | A separate certification for each principal executive and principal financial officer pursuant to Section 302 of the Sarbanes-Oxley Act of 2002. Filed herewith. |
| (b) | Certification pursuant to Section 906 of the Sarbanes-Oxley Act of 2002. Filed herewith. |
SIGNATURES
Pursuant to the requirements of the Securities Exchange Act of 1934 and the Investment Company Act of 1940, the registrant has duly caused this report to be signed on its behalf by the undersigned, thereunto duly authorized.
Oppenheimer SteelPath MLP Funds Trust
| /s/ Arthur P. Steinmetz | |
| By: Arthur P. Steinmetz | |
| Principal Executive Officer | |
| Date: | 1/14/2015 | |
| | |
| Pursuant to the requirements of the Securities Exchange Act of 1934 and the Investment Company Act of 1940, this report has been signed below by the following persons on behalf of the registrant and in the capacities and on the date indicated. |
| | |
| /s/ Arthur P. Steinmetz | |
| By: Arthur P. Steinmetz | |
| Principal Executive Officer | |
| Date: | 1/14/2015 | |
| | |
| /s/ Brian W. Wixted | |
| By: Brian W. Wixted | |
| Principal Financial Officer | |
| Date: | 1/14/2015 | |