The following is a copy of the report transmitted to shareholders pursuant to Rule 30e-1 under the Investment Company Act of 1940 (17 CFR 270.30e-1).

Table of Contents
Fund Performance Discussion | 3 |
Top Holdings and Allocations | 7 |
Share Class Performance | 8 |
Fund Expenses | 10 |
Statement of Investments | 12 |
Statement of Assets and Liabilities | 15 |
Statement of Operations | 17 |
Statements of Changes in Net Assets | 18 |
Financial Highlights | 19 |
Notes to Financial Statements | 24 |
Distribution Sources | 41 |
Portfolio Proxy Voting Policies and Procedures; Updates to Statements of Investments | 42 |
Trustees and Officers | 43 |
Privacy Policy Notice | 44 |
|
Class A Shares
AVERAGE ANNUAL TOTAL RETURNS AT 5/31/17
| | Class A Shares of the Fund | | |
| | Without Sales Charge | With
Sales Charge | S&P 500 Index | Alerian MLP Index |
6-Month | 1.88% | -3.98% | 10.81% | 2.28% |
1-Year | 5.82% | -0.23% | 17.47% | 6.24% |
5-Year | 4.24% | 3.02% | 15.42% | 2.57% |
Since Inception (3/31/10) | 5.29% | 4.43% | 13.00% | 6.45% |
Performance data quoted represents past performance, which does not guarantee future results.The investment return and principal value of an investment in the Fund will fluctuate so that an investor’s shares, when redeemed, may be worth more or less than their original cost. Fund returns include changes in share price, reinvested distributions, and a 5.75% maximum applicable sales charge except where “without sales charge” is indicated. Current performance may be lower or higher than the performance quoted. Returns do not consider capital gains or income taxes on an individual’s investment. Returns for periods of less than one year are cumulative and not annualized. For performance data current to the most recent month-end, visit oppenheimerfunds.com or call 1.800.CALL OPP (225.5677). See Fund prospectuses and summary prospectuses for more information on share classes and sales charges.
2 OPPENHEIMER STEELPATH MLP SELECT 40 FUND |
Fund Performance Discussion
The Fund’s Class A shares (without sales charge) produced a total return of 1.88% during the reporting period. In comparison, master limited partnerships (“MLPs”), as measured by the Alerian MLP Index (AMZ), provided a total return gain of 2.28%. Please note that the returns for the Alerian MLP Index are calculated pre-tax, while the Fund’s returns are calculated post corporate tax, which contributed partially to the Fund’s underperformance this reporting period. This generally has a negative impact on the Fund’s performance versus the Index in up markets, and a positive impact on performance in down markets. During the same period, the S&P 500 Index produced a total return gain of 10.81%.
Over the six-month reporting period ended May 31, 2017, the midstream sector underperformed the broader markets as the correlation of price performance between midstream equities and crude oil remained elevated over the period. While the sector performed well early in the period, subsequent crude oil price weakness was accompanied by midstream price weakness. This crude oil price weakness appeared to stem primarily from continued U.S. inventory builds as well as fears that U.S. shale producers were ramping production more quickly than previously anticipated. Interestingly, while a quicker than expected resurgence of U.S. shale production may serve to temper the crude price recovery, we believe midstream assets should benefit through the resultant volume improvements regardless.
The influence of Washington remained topical over the period. In contrast to the challenging energy regulatory environment of the prior presidential administration, President Trump signed multiple midstream related executive orders in late January designed to expedite current and future midstream projects. Two orders were individually specific to the Keystone XL and Dakota Access Pipelines, each directing respective authorities to take all actions necessary and appropriate to facilitate the implementation of the projects. Additionally, President Trump signed an order to expedite the review and approval of high priority infrastructure projects. Separately, three large natural gas pipeline projects, representing a collective $7.5 billion of growth capital spending, received Federal Energy Regulatory Commission (FERC) approval in early February, just ahead of FERC’s loss of a quorum due to the resignation of a FERC commissioner. While at the end of the reporting period the commission still lacked a quorum to vote on project approvals, President Trump had made nominations to fill two of the three vacancies. However, Commissioner Colette Honorable has also announced her intention to not seek another term when her current seat expires in June, but that she is willing to stay on until the end of the year, awaiting her replacement.
OPPENHEIMER STEELPATH MLP SELECT 40 FUND 3 |
Over the reporting period, we estimate approximately $15 billion of new equity supply entered the market through either secondary offerings, initial public offerings, or “at-the-market” programs in which primary units trade into the market anonymously throughout the normal trading day. This pace of equity issuance represents an increase from approximately $11 billion that was raised over the six month reporting period ended May 31, 2016. Midstream companies also raised approximately $15 billion of debt capital during the period. Most MLPs pay out the majority of excess cash flow as distributions to investors, and therefore must raise external capital to fund growth projects and to fund acquisitions.
MACRO REVIEW
West Texas Intermediate (WTI) crude oil prices ended the reporting period at $47.66 per barrel, down 4% over the reporting period. Global crude prices, as measured by Brent crude oil, traded 2% higher over the reporting period. As previously noted, the crude oil price decline appeared to stem primarily from continued U.S. inventory builds as well as fears that U.S. shale producers were ramping up production more quickly than previously anticipated. Brent exited the period at a $3 per barrel premium to WTI, which is near the historic norm. However, this reversion represents a departure from the $8 to $9 per barrel Brent premium present from 2009 to 2015.
Henry Hub natural gas spot prices exited the period at $3.20 per million British thermal units (“mmbtu”), down 3% over the reporting period, while up 52% from the year-ago period. Natural gas pricing has benefited from a long awaited realignment of supply-demand in which natural gas usage as a heating and electric generation fuel has increased as gas production volume growth has moderated, and as increased exports have become a reality via both liquefied natural gas and new pipelines to Mexico.
Mont Belvieu natural gas liquids (“NGL”) prices ended the reporting period at $24.13 per barrel, a 1% decline over the reporting period. Pricing for NGL purity products varied, with ethane and propane trading higher over the period while butane, isobutene, and natural gasoline prices declined. Frac spreads, a measure of natural gas processing economics, ended the period at $0.30 per gallon, up 8% over the reporting period. Generally, the greater the frac spread, the greater the incentive for producers to seek natural gas processing capacity.
The yield curve flattened over the reporting period as short rates increased while the yields on longer-dated maturities declined. The ten-year Treasury yield declined 18 basis points to end the period at 2.20%. The MLP yield spread at period-end, as measured by the AMZ and the 10-year Treasury bond, widened by 17 basis points to 5.22%.
Over the reporting period, real estate investment trusts (“REITs”) and utilities, two competing yield-oriented equity asset classes, posted total returns of 7.50% (as measured by the Dow Jones Equity REIT Total Return Index) and 16.86% (as measured by the Dow Jones Utility Average
4 OPPENHEIMER STEELPATH MLP SELECT 40 FUND |
Index), respectively, as compared to the AMZ’s 2.28% total return. Price to forward distributable cash flow (DCF), a commonly watched ratio within the MLP sector, declined over the period ending well below the ten-year average.
SUBSECTOR REVIEW
Performance among subsectors in the midstream, or energy infrastructure, MLP asset class varied for the reporting period. On average, the gathering and processing subsector provided the best performance over the period, buoyed by improved volumetric projections. The natural gas pipeline group followed as investors continued to express preference for the safety of long-haul natural gas pipelines, particularly those backed by utility demand pull.
The upstream subsector experienced the weakest performance over the reporting period as these entities’ cash flows were directly impacted by commodity price weakness over the period. The coal subsector also lagged over the reporting period as domestic coal pricing generally weakened through the reporting period.
FUND REVIEW
Key contributors to the Fund’s performance were Sunoco LP (SUN) and ONEOK Partners, LP (OKS).
SUN units outperformed over the period after announcing the $3.3 billion divestiture of its convenience store business and its intent to use the proceeds to delever. We believe SUN’s diverse geographic footprint and focus on the resilient fuel distribution business should provide for steady long-term operational performance.
OKS outperformed over the period following an announcement that the partnership and its sponsor, ONEOK, Inc. (OKE) would merge, eliminate incentive distribution rights (“IDRs”), and enhance dividend growth prospects. As a result of the transaction, ONEOK provided dividend growth expectations of 9% to 11% annually through 2021.
Key detractors from the Fund’s performance were NGL Energy Partners, LP (NGL) and Enbridge Energy Partners, LP (EEP).
NGL units underperformed over the period after the partnership reduced its earnings before interest, tax, depreciation and amortization (“EBITDA”) guidance and deferred plans to begin raising its cash distribution by nine months. NGL operates within several midstream subsectors including crude oil and refined products logistics as well as retail propane and water solutions. Strength in NGL’s water business has been offset by warmer winter weather weighing on the retail propane business and challenging market conditions in some portions of the partnership’s refiner products and crude marketing businesses.
EEP underperformed over the period as the company provided disappointing financial projections for the upcoming fiscal year followed by a reduction
OPPENHEIMER STEELPATH MLP SELECT 40 FUND 5 |
of its cash distribution. Enbridge Inc. (ENB), EEP’s sponsor, provided some modest support, acquiring EPP’s underperforming natural gas business and allowing EEP to simplify its capital structure and modify the incentive distribution mechanism. Following this strategic realignment, we believe EEP is better positioned to benefit from its large network of crude oil pipelines in the U.S. and Canada, most of which benefit from strong contractual cash flow regardless of commodity prices or throughput volumes.
Please note that significant decreases in cash distributions from the Fund’s MLP investments and/or significant declines in the fair value of its investments may impact the Fund’s assessment regarding the recoverability of certain deferred tax assets, which may result in the recording of a valuation allowance. If a valuation allowance is established, this could have a material impact on the Fund’s net asset value and results of operations for the period. The Fund had a valuation allowance in place for a portion of the reporting period, but did not have one in place at period end. See Note 2 of the Notes to Financial Statements for more information.
OUTLOOK
We continue to believe we have seen the worst of this energy market down cycle. In our opinion, the rate of midstream growth will likely moderate from peak levels, but average distributions are still likely to grow. We expect midstream operators to benefit from the reflation of domestic hydrocarbon production and the more efficient use of existing assets going forward, in contrast to the widespread need to construct new assets over the first years of shale production growth. We believe current market valuations underestimate the potential for renewed business growth going forward and we remain optimistic on the sector’s prospects. Consequently, we believe midstream MLPs continue to offer attractive total return potential based on the potential for price appreciation and stable or growing distribution streams.
6 OPPENHEIMER STEELPATH MLP SELECT 40 FUND |
Top Holdings and Allocations
TOP TEN MASTER LIMITED PARTNERSHIP HOLDINGS
Energy Transfer Partners LP | 6.42% |
Energy Transfer Equity LP | 4.75% |
Genesis Energy LP | 4.49% |
MPLX LP | 4.47% |
Holly Energy Partners LP | 4.15% |
Tallgrass Energy Partners LP | 4.00% |
Magellan Midstream Partners LP | 4.00% |
TC Pipelines LP | 3.98% |
Enterprise Products Partners LP | 3.89% |
Buckeye Partners LP | 3.87% |
Portfolio holdings and allocations are subject to change. Percentages are as of May 31, 2017, and based on net assets.
SECTOR ALLOCATION
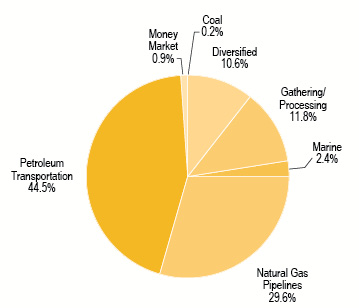
Portfolio holdings and allocations are subject to change. Percentages are as of May 31, 2017, and based on the total value of investments.
OPPENHEIMER STEELPATH MLP SELECT 40 FUND 7 |
Share Class Performance
AVERAGE ANNUAL TOTAL RETURNS WITHOUT SALES CHARGE AS OF 5/31/17
| | Inception Date | 6-Month | 1-Year | 5-Year | Since Inception |
Class A (MLPFX) | 3/31/2010 | 1.88% | 5.82% | 4.24% | 5.29% |
Class C (MLPEX) | 7/14/2011 | 1.38% | 4.98% | 3.47% | 2.89% |
Class I (OSPSX) | 6/28/2013 | 1.93% | 6.23% | N/A | -0.35% |
Class W (MLPYX) | 3/31/2010 | 1.94% | 6.02% | 4.49% | 5.57% |
Class Y (MLPTX) | 3/31/2010 | 1.94% | 6.02% | 4.49% | 5.57% |
AVERAGE ANNUAL TOTAL RETURNS WITH SALES CHARGE AS OF 5/31/17
| | Inception Date | 6-Month | 1-Year | 5-Year | Since Inception |
Class A (MLPFX) | 3/31/2010 | -3.98% | -0.23% | 3.02% | 4.43% |
Class C (MLPEX) | 6/10/2011 | 0.39% | 4.00% | 3.47% | 2.89% |
Class I (OSPSX) | 6/28/2013 | 1.93% | 6.23% | N/A | -0.35% |
Class W (MLPYX) | 3/31/2010 | 1.94% | 6.02% | 4.49% | 5.57% |
Class Y (MLPTX) | 3/31/2010 | 1.94% | 6.02% | 4.49% | 5.57% |
Performance data quoted represents past performance, which does not guarantee future results.The investment return and principal value of an investment in the Fund will fluctuate so that an investor’s shares, when redeemed, may be worth more or less than their original cost. Current performance may be lower or higher than the performance quoted. Returns do not consider capital gains or income taxes on an individual’s investment. For performance data current to the most recent month-end, visit oppenheimerfunds.com or call 1.800.CALL OPP (225.5677). Fund returns include changes in share price, reinvested distributions, and the applicable sales charge: for Class A shares, the current maximum initial sales charge of 5.75%, and for Class C shares, the contingent deferred sales charge of 1% for the 1-year period. There is no sales charge for Class I, Class W, or Class Y shares. Returns for periods of less than one year are cumulative and not annualized. See Fund prospectuses and summary prospectuses for more information on share classes and sales charges.
The Fund’s performance is compared to the performance of the S&P 500 Index and the Alerian MLP Index. The S&P 500 Index is a broad-based measure of domestic stock performance. The Alerian MLP Index is a composite of the 50 most prominent Master Limited Partnerships that provides investors with an unbiased, comprehensive benchmark for this emerging asset class. The index, which is calculated using a float-adjusted, capitalization-weighted methodology, is disseminated real-time on a total-return basis. The indices are unmanaged and cannot be purchased directly by investors. While index comparisons may be useful to provide a benchmark for the Fund’s performance, it must be noted that the Fund’s investments are not
8 OPPENHEIMER STEELPATH MLP SELECT 40 FUND |
limited to the investments comprising the indices. Index performance includes reinvestment of income, but does not reflect transaction costs, fees, expenses or taxes. Index performance is shown for illustrative purposes only as a benchmark for the Fund’s performance, and does not predict or depict performance of the Fund. The Fund’s performance reflects the effects of the Fund’s business and operating expenses.
The Fund’s investment strategy and focus can change over time. The mention of specific fund holdings does not constitute a recommendation by OppenheimerFunds, Inc. or its affiliates.
Before investing in any of the Oppenheimer funds, investors should carefully consider a fund’s investment objectives, risks, charges and expenses. Fund prospectuses and summary prospectuses contain this and other information about the funds, and may be obtained by asking your financial advisor, visiting oppenheimerfunds.com, or calling 1.800.CALL OPP (225.5677). Read prospectuses and summary prospectuses carefully before investing.
Shares of Oppenheimer funds are not deposits or obligations of any bank, are not guaranteed by any bank, are not insured by the FDIC or any other agency, and involve investment risks, including the possible loss of the principal amount invested.
OPPENHEIMER STEELPATH MLP SELECT 40 FUND 9 |
Fund Expenses
Fund Expenses. As a shareholder of the Fund, you incur two types of costs: (1) transaction costs, which may include sales charges (loads) on purchase payments, contingent deferred sales charges on redemptions; and (2) ongoing costs, including management fees; distribution and service fees; and other Fund expenses. These examples are intended to help you understand your ongoing costs (in dollars) of investing in the Fund and to compare these costs with the ongoing costs of investing in other mutual funds.
The examples are based on an investment of $1,000.00 invested at the beginning of the period and held for the entire 6-month period ended May 31, 2017.
Actual Expenses. The first section of the table provides information about actual account values and actual expenses. You may use the information in this section for the class of shares you hold, together with the amount you invested, to estimate the expense that you paid over the period. Simply divide your account value by $1,000.00 (for example, an $8,600.00 account value divided by $1,000.00 = 8.60), then multiply the result by the number in the first section under the heading entitled “Expenses Paid During 6 Months Ended May 31, 2017” to estimate the expenses you paid on your account during this period.
Hypothetical Example for Comparison Purposes. The second section of the table provides information about hypothetical account values and hypothetical expenses based on the Fund’s actual expense ratio for each class of shares, and an assumed rate of return of 5% per year for each class before expenses, which is not the actual return. The hypothetical account values and expenses may not be used to estimate the actual ending account balance or expenses you paid for the period. You may use this information to compare the ongoing costs of investing in the Fund and other funds. To do so, compare this 5% hypothetical example for the class of shares you hold with the 5% hypothetical examples that appear in the shareholder reports of the other funds.
Please note that the expenses shown in the table are meant to highlight your ongoing costs only and do not reflect any transactional costs, such as front-end or contingent deferred sales charges (loads). Therefore, the “hypothetical” section of the table is useful in comparing ongoing costs only, and will not help you determine the relative total costs of owning different funds. In addition, if these transactional costs were included, your costs would have been higher.
10 OPPENHEIMER STEELPATH MLP SELECT 40 FUND |
Actual | Beginning
Account
Value
December 1, 2016 | Ending
Account
Value
May 31, 2017 | Expenses
Paid During
6 Months Ended
May 31, 2017 |
CLASS A | $ 1,000.00 | $ 1,018.80 | $ 14.54 |
CLASS C | 1,000.00 | 1,013.80 | 18.27 |
CLASS I | 1,000.00 | 1,019.30 | 12.88 |
CLASS W | 1,000.00 | 1,019.40 | 13.29 |
CLASS Y | 1,000.00 | 1,019.40 | 13.30 |
| | | | |
Hypothetical
(5% return before expenses) | | | |
CLASS A | 1,000.00 | 1,010.59 | 14.48 |
CLASS C | 1,000.00 | 1,006.85 | 18.21 |
CLASS I | 1,000.00 | 1,012.24 | 12.84 |
CLASS W | 1,000.00 | 1,011.84 | 13.24 |
CLASS Y | 1,000.00 | 1,011.83 | 13.25 |
Expenses are equal to the Fund’s annualized expense ratio for that class, multiplied by the average account value over the period, multiplied by 182/365 (to reflect the one-half year period). Those annualized expense ratios, excluding indirect expenses from affiliated funds, based on the 6-month period ended May 31, 2017 are as follows:
Class | Expense Ratios |
CLASS A | 2.89% |
CLASS C | 3.64 |
CLASS I | 2.56 |
CLASS W | 2.64 |
CLASS Y | 2.64 |
The expense ratios for Class A, C, W, and Y reflect contractual waivers and/or reimbursements of expenses by the Fund’s Manager and Transfer Agent. Some of these undertakings may be modified or terminated at any time, as indicated in the Fund’s prospectus. The “Financial Highlights” tables in the Fund’s financial statements, included in this report, also show the gross expense ratios, without such waivers or reimbursements, if applicable.
OPPENHEIMER STEELPATH MLP SELECT 40 FUND 11 |
STATEMENT OF INVESTMENTS May 31, 2017 / Unaudited |
Description | | Shares | | | Value | |
Master Limited Partnership Shares — 92.3% | |
Coal — 0.3% | |
Alliance Holdings GP LP | | | 285,916 | | | $ | 8,094,282 | |
| | | | | | | | | |
Diversified — 10.1% | |
Enterprise Products Partners LP | | | 4,742,256 | | | | 127,139,883 | |
Hess Midstream Partners LP | | | 703,810 | | | | 16,356,544 | |
ONEOK Partners LP | | | 1,337,077 | | | | 65,396,436 | |
Westlake Chemical Partners LP | | | 217,180 | | | | 5,277,474 | |
Williams Partners LP | | | 2,949,621 | | | | 115,536,655 | |
Total Diversified | | | | | | | 329,706,992 | |
| | | | | | | | | |
Gathering/Processing — 8.6% | |
Antero Midstream GP LP | | | 1,313,475 | | | | 29,001,528 | |
Antero Midstream Partners LP | | | 1,871,060 | | | | 64,813,518 | |
Archrock Partners LP | | | 2,003,680 | | | | 31,037,003 | |
Crestwood Equity Partners LP | | | 342,645 | | | | 7,846,570 | |
CSI Compressco LP | | | 786,709 | | | | 4,326,900 | |
PennTex Midstream Partners LP | | | 395,200 | | | | 7,876,336 | |
Summit Midstream Partners LP | | | 1,781,669 | | | | 41,156,554 | |
Western Gas Partners LP | | | 1,726,868 | | | | 96,238,354 | |
Total Gathering/Processing | | | | | | | 282,296,763 | |
| | | | | | | | | |
Marine — 1.4% | |
GasLog Partners LP | | | 1,297,868 | | | | 28,423,309 | |
Teekay LNG Partners LP | | | 1,190,702 | | | | 18,098,671 | |
Total Marine | | | | | | | 46,521,980 | |
| | | | | | | | | |
Natural Gas Pipelines — 27.2% | |
Cone Midstream Partners LP | | | 1,081,860 | | | $ | 22,967,888 | |
CrossAmerica Partners LP | | | 869,446 | | | | 20,892,787 | |
Energy Transfer Equity LP | | | 9,105,645 | | | | 155,160,191 | |
Energy Transfer Partners LP | | | 9,644,389 | | | | 209,861,915 | |
EQT Midstream Partners LP | | | 1,004,929 | | | | 74,123,563 | |
Rice Midstream Partners LP 1 | | | 4,185,105 | | | | 102,576,924 | |
Spectra Energy Partners LP | | | 999,403 | | | | 43,114,245 | |
Tallgrass Energy Partners LP | | | 2,637,344 | | | | 130,812,262 | |
TC Pipelines LP | | | 2,313,002 | | | | 130,152,623 | |
Total Natural Gas Pipelines | | | | | | | 889,662,398 | |
| | | | | | | | | |
Petroleum Transportation — 44.7% | |
Buckeye Partners LP | | | 1,973,432 | | | | 126,299,648 | |
DCP Midstream LP | | | 2,452,890 | | | | 82,858,624 | |
Enbridge Energy Partners LP | | | 2,981,335 | | | | 49,370,908 | |
Genesis Energy LP | | | 4,703,601 | | | | 146,705,315 | |
Global Partners LP | | | 1,066,845 | | | | 20,003,344 | |
Holly Energy Partners LP 1 | | | 4,143,307 | | | | 135,734,737 | |
Magellan Midstream Partners LP | | | 1,799,479 | | | | 130,624,181 | |
MPLX LP | | | 4,422,778 | | | | 146,172,813 | |
NGL Energy Partners LP | | | 4,652,566 | | | | 63,274,897 | |
NuStar Energy LP | | | 1,187,745 | | | | 54,137,417 | |
NuStar GP Holdings LLC 1 | | | 3,745,872 | | | | 97,205,378 | |
Plains All American Pipeline LP | | | 726,714 | | | | 19,243,387 | |
Plains GP Holdings LP, Class A | | | 929,910 | | | | 24,800,700 | |
Shell Midstream Partners LP | | | 840,666 | | | | 25,077,067 | |
Sunoco LP | | | 3,919,078 | | | | 116,866,906 | |
12 OPPENHEIMER STEELPATH MLP SELECT 40 FUND |
STATEMENT OF INVESTMENTS Unaudited / (Continued) |
Description | | Shares | | | Value | |
Petroleum Transportation — 44.7% (Continued) | |
Tesoro Logistics LP | | | 1,602,604 | | | $ | 84,905,960 | |
TransMontaigne Partners LP 1 | | | 2,324,321 | | | | 96,575,537 | |
VTTI Energy Partners LP | | | 985,040 | | | | 19,208,280 | |
Western Refining Logistics LP | | | 836,840 | | | | 20,669,948 | |
Total Petroleum Transportation | | | | | | | 1,459,735,047 | |
| | | | | | | | | |
Total Master Limited Partnership Shares | |
(identified cost $2,568,456,180) | | | | 3,016,017,462 | |
| | | | | | | | | |
Common Stock — 8.1% | |
Diversified — 0.9% | |
ONEOK, Inc. | | | 552,454 | | | | 27,445,915 | |
| | | | | | | | | |
Gathering/Processing — 2.8% | |
Targa Resources Corp. | | | 2,009,639 | | | | 92,302,719 | |
| | | | | | | | | |
Marine — 1.0% | |
Golar LNG Partners LP | | | 1,672,048 | | | | 33,039,668 | |
Teekay Offshore Partners LP | | | 102,500 | | | | 320,825 | |
Total Marine | | | | | | | 33,360,493 | |
| | | | | | | | | |
Natural Gas Pipelines — 3.4% | |
Tallgrass Energy GP LP 1 | | | 4,272,806 | | | | 110,110,211 | |
| | | | | | | | | |
Total Common Stock | |
(identified cost $246,108,350) | | | | 263,219,338 | |
| | | | | | | | | |
Preferred Master Limited Partnership Shares — 1.9% | |
Gathering/Processing — 0.7% | |
Crestwood Equity Partners LP, 9.25% 2 | | | 2,802,385 | | | $ | 22,643,271 | |
| | | | | | | | | |
Petroleum Transportation — 1.2% | |
GPM Petroleum LP, 10.00% 1,2 | | | 2,000,000 | | | | 40,720,000 | |
| | | | | | | | | |
Total Preferred Master Limited Partnership Shares | |
(identified cost $61,654,175) | | | | 63,363,271 | |
| | | | | | | | | |
Short-Term Investments — 0.9% | |
Money Market — 0.9% | |
Fidelity Treasury Portfolio, Institutional Class, 0.633% 3 | | $ | 29,678,995 | | | | 29,678,995 | |
| | | | | | | | | |
Total Short-Term Investments | |
(identified cost $29,678,995) | | | | 29,678,995 | |
| | | | | | | | | |
Total Investments — 103.2% (identified cost $2,905,897,700) | | | | 3,372,279,066 | |
Liabilities In Excess of Other Assets — (3.2)% | | | | (104,576,977 | ) |
Net Assets — 100.0% | | | $ | 3,267,702,089 | |
OPPENHEIMER STEELPATH MLP SELECT 40 FUND 13 |
STATEMENT OF INVESTMENTS Unaudited / (Continued) |
Footnotes to Statement of Investments
LLC — Limited Liability Company
LP — Limited Partnership
1. | Is or was an affiliate, as defined by the Investment Company Act of 1940, at or during the period ended May 31, 2017, by virtue of the Fund owning at least 5% of the voting securities of the issuer. Transactions during this period in which the issuer was an affiliate are as follows: |
| | | Shares
November 30,
2016 | | | Gross
Additions | | | Gross
Reductions | | | Shares
May 31, 2017 | |
GPM Petroleum LP | | | 2,000,000 | | | | — | | | | — | | | | 2,000,000 | |
Holly Energy Partners LP | | | 4,260,282 | | | | — | | | | (116,975 | ) | | | 4,143,307 | |
Midcoast Energy Partners LPi | | | 1,339,510 | | | | — | | | | (1,339,510 | ) | | | — | |
NuStar GP Holdings LLC | | | 1,834,567 | | | | 1,917,305 | | | | (6,000 | ) | | | 3,745,872 | |
Rice Midstream Partners LP | | | 2,958,060 | | | | 1,290,875 | | | | (63,830 | ) | | | 4,185,105 | |
Tallgrass Energy GP LP | | | 2,423,040 | | | | 1,901,666 | | | | (51,900 | ) | | | 4,272,806 | |
TransMontaigne Partners LP | | | 1,264,800 | | | | 1,087,751 | | | | (28,230 | ) | | | 2,324,321 | |
| | | | | | | | | | | | | | | | | |
| | | Value
May 31, 2017 | | | Distributions | | | Realized
Gain/(Loss) | | | | | |
GPM Petroleum LP | | $ | 40,720,000 | | | $ | 1,953,956 | | | $ | — | | | | | |
Holly Energy Partners LP | | | 135,734,737 | | | | 5,156,972 | | | | 3,065,702 | | | | | |
Midcoast Energy Partners LPi | | | — | | | | 478,875 | | | | (8,368,463 | ) | | | | |
NuStar GP Holdings LLC | | | 97,205,378 | | | | 3,123,089 | | | | 79,197 | | | | | |
Rice Midstream Partners LP | | | 102,576,924 | | | | 2,155,834 | | | | 628,187 | | | | | |
Tallgrass Energy GP LP | | | 110,110,211 | | | | 2,028,133 | | | | 13,594 | | | | | |
TransMontaigne Partners LP | | | 96,575,537 | | | | 2,583,141 | | | | 602,964 | | | | | |
| | | $ | 582,922,787 | | | $ | 17,480,000 | | | $ | (3,978,819 | ) | | | | |
| | i | Not an affiliate on May 31, 2017 was an affiliate during period ended May 31, 2017. |
2. | Restricted security. The aggregate value of restricted securities at period end was $63,363,271, which represents 1.9% of the Fund’s net assets. See the accompanying Notes. Information concerning restricted securities is as follows: |
Security | Acquisition Date | | Cost | | | Value | | | Unrealized Appreciation/(Depreciation) | |
Crestwood Equity Partners LP - Preferred | 3/2/2017-5/15/2017 | | $ | 27,261,832 | | | $ | 22,643,271 | | | $ | (4,618,561 | ) |
GPM Petroleum LP | 1/12/2016 | | | 40,000,000 | | | | 40,720,000 | | | | 720,000 | |
3. | Variable rate security; the coupon rate represents the rate at May 31, 2017 |
See accompanying Notes to Financial Statements.
14 OPPENHEIMER STEELPATH MLP SELECT 40 FUND |
STATEMENT OF ASSETS AND LIABILITIES May 31, 2017 / Unaudited |
Assets: | | | |
Investments at value – see accompanying Statement of Investments: | | | |
Unaffiliated companies (cost $2,427,013,137) | | $ | 2,789,356,279 | |
Affiliated companies (cost $478,884,563) | | | 582,922,787 | |
| | | 3,372,279,066 | |
Receivable for beneficial interest sold | | | 6,195,655 | |
Prepaid expenses | | | 226,020 | |
Dividends receivable | | | 11,421 | |
Total assets | | | 3,378,712,162 | |
| | | | | |
Liabilities: | | | | |
Deferred tax liability, net | | | 103,354,642 | |
Payable for beneficial interest redeemed | | | 4,303,368 | |
Payable to Manager | | | 1,724,355 | |
Payable for distribution and service plan fees | | | 588,121 | |
Transfer agent fees payable | | | 518,376 | |
Payable for investments purchased | | | 143,740 | |
Trustees' fees payable | | | 23,675 | |
Borrowing expense payable | | | 17,724 | |
Other liabilities | | | 336,072 | |
Total liabilities | | | 111,010,073 | |
| | | | | |
Net Assets | | $ | 3,267,702,089 | |
| | | | | |
Composition of Net Assets | | | | |
Par value of shares of beneficial interest | | $ | 356,808 | |
Paid-in capital | | | 3,073,258,604 | |
Undistributed net investment loss, net of deferred taxes | | | (64,745,709 | ) |
Accumulated undistributed net realized losses on investments, net of deferred taxes | | | (35,348,156 | ) |
Net unrealized appreciation on investments, net of deferred taxes | | | 294,180,542 | |
Net Assets | | $ | 3,267,702,089 | |
OPPENHEIMER STEELPATH MLP SELECT 40 FUND 15 |
STATEMENT OF ASSETS AND LIABILITIES Unaudited / (Continued) |
Net Asset Value, Offering Price and Redemption Proceeds Per Share ($0.001 Par Value, Unlimited Shares Authorized) | | | |
Class A Shares: | | | |
Net asset value and redemption proceeds per share | | $ | 9.07 | |
Offering price per share (net asset value plus sales charge of 5.75% of offering price) | | $ | 9.62 | |
Class C Shares: | | | | |
Net asset value, offering price and redemption proceeds per share | | $ | 8.68 | |
Class I Shares: | | | | |
Net asset value, offering price and redemption proceeds per share | | $ | 9.33 | |
Class W Shares: | | | | |
Net asset value, offering price and redemption proceeds per share | | $ | 9.30 | |
Class Y Shares: | | | | |
Net asset value, offering price and redemption proceeds per share | | $ | 9.30 | |
Net Assets: | | | |
Class A shares | | $ | 540,390,500 | |
Class C shares | | | 537,831,384 | |
Class I shares | | | 415,913,057 | |
Class W shares | | | 6,171,512 | |
Class Y shares | | | 1,767,395,636 | |
Total Net Assets | | $ | 3,267,702,089 | |
| | | | | |
Shares Outstanding: | | | | |
Class A shares | | | 59,602,267 | |
Class C shares | | | 61,951,807 | |
Class I shares | | | 44,584,587 | |
Class W shares | | | 663,493 | |
Class Y shares | | | 190,005,585 | |
Total Shares Outstanding | | | 356,807,739 | |
See accompanying Notes to Financial Statements.
16 OPPENHEIMER STEELPATH MLP SELECT 40 FUND |
STATEMENT OF OPERATIONS
For the Six Months Ended May 31, 2017 / Unaudited |
Investment Income | | | |
Distributions from: | | | |
Unaffiliated Master Limited Partnerships | | $ | 90,689,276 | |
Affiliated Master Limited Partnerships | | | 17,480,000 | |
Less return of capital on distributions from: | | | | |
Unaffiliated Master Limited Partnerships | | | (90,689,276 | ) |
Affiliated Master Limited Partnerships | | | (17,480,000 | ) |
Dividend income | | | 2,737,363 | |
Total investment income | | | 2,737,363 | |
| | | | | |
Expenses | | | | |
Management fees | | | 11,498,900 | |
Distribution and service plan fees | | | | |
Class A | | | 802,376 | |
Class C | | | 2,745,268 | |
Transfer agent fees | | | | |
Class A | | | 707,929 | |
Class C | | | 604,106 | |
Class I | | | 54,671 | |
Class W | | | 7,330 | |
Class Y | | | 1,903,152 | |
Administrative fees | | | 341,857 | |
Tax expense | | | 118,580 | |
Borrowing fees | | | 102,073 | |
Registration fees | | | 99,480 | |
Legal, auditing, and other professional fees | | | 97,902 | |
Custody fees | | | 67,907 | |
Trustees' fees | | | 46,281 | |
Other | | | 46,830 | |
Total expenses, before waivers and deferred taxes | | | 19,244,642 | |
Less expense waivers | | | (1,631,263 | ) |
Net expenses, before deferred taxes | | | 17,613,379 | |
| | | | | |
Net investment loss, before deferred taxes | | | (14,876,016 | ) |
Deferred tax benefit | | | 5,339,898 | |
Net investment loss, net of deferred taxes | | | (9,536,118 | ) |
| | | | | |
Net Realized and Unrealized Gains on Investments: | | | | |
Net Realized Gains | | | | |
Investments from: | | | | |
Unaffiliated companies | | | 32,352,001 | |
Affiliated companies | | | (3,978,819 | ) |
Deferred tax expense | | | (10,412,958 | ) |
Net realized gains, net of deferred taxes | | | 17,960,224 | |
Net Change in Unrealized Appreciation | | | | |
Investments | | | 66,043,329 | |
Deferred tax expense | | | (24,237,902 | ) |
Net change in unrealized appreciation, net of deferred taxes | | | 41,805,427 | |
| | | | | |
Net realized and unrealized gains on investments, net of deferred taxes | | | 59,765,651 | |
Change in net assets resulting from operations | | $ | 50,229,533 | |
See accompanying Notes to Financial Statements.
OPPENHEIMER STEELPATH MLP SELECT 40 FUND 17 |
STATEMENTS OF CHANGES IN NET ASSETS |
| | For the Six
Months Ended
May 31, 2017
(Unaudited) | | | For the
Year Ended
November 30, 2016 | |
Operations | | | | | | |
Net investment loss, net of deferred taxes | | $ | (9,536,118 | ) | | $ | (11,720,394 | ) |
Net realized gains/(losses), net of deferred taxes | | | 17,960,224 | | | | (75,521,417 | ) |
Net change in unrealized appreciation, net of deferred taxes | | | 41,805,427 | | | | 271,004,499 | |
Change in net assets resulting from operations | | | 50,229,533 | | | | 183,762,688 | |
| | | | | | | | | |
Distributions to Shareholders | | | | | | | | |
Distributions to shareholders from return of capital: | | | | | | | | |
Class A shares | | | (20,265,572 | ) | | | (47,334,331 | ) |
Class C shares | | | (17,764,616 | ) | | | (38,813,705 | ) |
Class I shares | | | (11,028,308 | ) | | | (18,804,337 | ) |
Class W shares | | | (201,389 | ) | | | (685,522 | ) |
Class Y shares | | | (52,344,522 | ) | | | (110,561,896 | ) |
Change in net assets resulting from distributions to shareholders | | | (101,604,407 | ) | | | (216,199,791 | ) |
| | | | | | | | | |
Beneficial Interest Transactions | | | | | | | | |
Class A shares | | | (83,838,724 | ) | | | 32,860,671 | |
Class C shares | | | 30,916,440 | | | | 77,425,235 | |
Class I shares | | | 111,083,100 | | | | 116,926,337 | |
Class W shares | | | (483,806 | ) | | | (10,900,819 | ) |
Class Y shares | | | 194,067,951 | | | | 233,362,480 | |
Change in net assets resulting from beneficial interest transactions | | | 251,744,961 | | | | 449,673,904 | |
Change in net assets | | | 200,370,087 | | | | 417,236,801 | |
| | | | | | | | | |
Net Assets | | | | | | | | |
Beginning of period | | | 3,067,332,002 | | | | 2,650,095,201 | |
End of period | | $ | 3,267,702,089 | | | $ | 3,067,332,002 | |
| | | | | | | | | |
Undistributed net investment loss, net of deferred taxes | | $ | (64,745,709 | ) | | $ | (55,209,591 | ) |
See accompanying Notes to Financial Statements.
18 OPPENHEIMER STEELPATH MLP SELECT 40 FUND |
Class A | | Six Months
Ended
May 31,
2017
(Unaudited) | | | Year Ended November 30,
2016 | | | Year Ended November 30,
2015 | | | Year Ended November 28,
2014* | | | Year Ended November 29,
2013* | | | Year Ended November 30,
2012 | |
Per Share Operating Data | | | | | | | | | | | | | | | | | | |
Net Asset Value, Beginning of Period | | $ | 9.18 | | | $ | 9.35 | | | $ | 12.54 | | | $ | 11.99 | | | $ | 10.67 | | | $ | 10.56 | |
Income/(loss) from investment operations: | | | | | | | | | | | | | | | | | | | | | | | | |
Net investment loss1 | | | (0.03 | ) | | | (0.05 | ) | | | (0.04 | ) | | | (0.09 | ) | | | (0.07 | ) | | | (0.07 | ) |
Return of capital1 | | | 0.20 | | | | 0.41 | | | | 0.43 | | | | 0.44 | | | | 0.44 | | | | 0.43 | |
Net realized and unrealized gains/(losses) | | | 0.01 | | | | 0.18 | | | | (2.87 | ) | | | 0.91 | | | | 1.66 | | | | 0.46 | |
Total from investment operations | | | 0.18 | | | | 0.54 | | | | (2.48 | ) | | | 1.26 | | | | 2.03 | | | | 0.82 | |
Distributions to shareholders: | | | | | | | | | | | | | | | | | | | | | | | | |
Return of capital | | | (0.29 | ) | | | (0.71 | ) | | | (0.71 | ) | | | (0.71 | ) | | | (0.71 | ) | | | (0.71 | ) |
Net asset value, end of period | | $ | 9.07 | | | $ | 9.18 | | | $ | 9.35 | | | $ | 12.54 | | | $ | 11.99 | | | $ | 10.67 | |
| | | | | | | | | | | | | | | | | | | | | | | | | |
Total Return, at Net Asset Value2 | | | 1.88 | % | | | 6.31 | % | | | (20.49 | %) | | | 10.59 | % | | | 19.32 | % | | | 7.87 | % |
| | | | | | | | | | | | | | | | | | | | | | | | | |
Ratios /Supplemental Data | | | | | | | | | | | | | | | | | | | | | | | | |
Net assets, end of period (in thousands) | | $ | 540,390 | | | $ | 631,417 | | | $ | 608,965 | | | $ | 872,216 | | | $ | 618,758 | | | $ | 207,631 | |
Ratio of Expenses to Average Net Assets:3 | | | | | | | | | |
Before (waivers) and deferred tax expense/(benefit) | | | 1.22 | % | | | 1.24 | % | | | 1.23 | % | | | 1.25 | % | | | 1.13 | % | | | 1.14 | % |
Expense (waivers) | | | (0.11 | %) | | | (0.12 | %) | | | (0.11 | %) | | | (0.12 | %) | | | (0.01 | %) | | | (0.04 | %) |
Net of (waivers) and before deferred tax expense/(benefit) | | | 1.11 | %4 | | | 1.12 | %4 | | | 1.12 | %4 | | | 1.13 | %4 | | | 1.12 | %5 | | | 1.10 | % |
Deferred tax expense/(benefit)6,7 | | | 1.78 | % | | | 3.79 | % | | | (13.36 | %) | | | 5.19 | % | | | 8.42 | % | | | 4.14 | % |
Total expenses/(benefit) | | | 2.89 | % | | | 4.91 | % | | | (12.24 | %) | | | 6.32 | % | | | 9.54 | % | | | 5.24 | % |
| | | | | | | | | | | | | | | | | | | | | | | | | |
Ratio of Investment Loss to Average Net Assets:3 | | | | | | | | | |
Before (waivers) and deferred tax benefit/(expense) | | | (1.15 | %) | | | (1.08 | %) | | | (0.83 | %) | | | (1.24 | %) | | | (0.94 | %) | | | (1.07 | %) |
Expense (waivers) | | | (0.11 | %) | | | (0.12 | %) | | | (0.11 | %) | | | (0.12 | %) | | | (0.01 | %) | | | (0.04 | %) |
Net of expense (waivers) and before deferred tax benefit/(expense) | | | (1.04 | %) | | | (0.96 | %) | | | (0.72 | %) | | | (1.12 | %) | | | (0.93 | %) | | | (1.03 | %) |
Deferred tax benefit7,8 | | | 0.32 | % | | | 0.38 | % | | | 0.32 | % | | | 0.41 | % | | | 0.33 | % | | | 0.35 | % |
Net investment loss | | | (0.72 | %) | | | (0.58 | %) | | | (0.40 | %) | | | (0.71 | %) | | | (0.60 | %) | | | (0.68 | %) |
| | | | | | | | | | | | | | | | | | | | | | | | | |
Portfolio turnover rate | | | 8 | % | | | 10 | % | | | 8 | % | | | 12 | % | | | 2 | % | | | 11 | % |
* | November 28, 2014 and November 29, 2013 represent the last business day of the Fund’s respective reporting periods. |
1. | Per share amounts calculated based on average shares outstanding during the period net of deferred tax expense/benefit. |
2. | Assumes an initial investment on the business day before the first day of the fiscal period, with all dividends and distributions reinvested in additional shares on the reinvestment date, and redemptions at the net asset value calculated on the last business day of the fiscal period. Sales charges are not reflected in the total returns. Total returns are not annualized for periods less than one full year. Returns do not reflect the deduction of taxes that a shareholder would pay on fund distributions or the redemption of fund shares. The returns do not include adjustments in accordance with generally accepted accounting principles required at the period end for financial reporting purposes. |
3. | Annualized for less than full period. |
4. | Includes borrowing and franchise tax expense. Without borrowing and franchise tax expense, the net expense ratio would be 1.10%. |
5. | Includes franchise tax expense. Without franchise tax expense the net expense ratio would be 1.10%. |
6. | Deferred tax expense estimate for the ratio calculation is derived from the net investment income/loss, and realized and unrealized gains/losses. |
7. | Effective December 1, 2013 the deferred tax expense and deferred tax benefit are allocated based on average net assets. Prior to December 1, 2013 the deferred tax expense and deferred tax benefit were allocated based on specific class expenses. |
8. | Deferred tax benefit for the ratio calculation is derived from net investment income/loss only. |
See accompanying Notes to Financial Statements.
OPPENHEIMER STEELPATH MLP SELECT 40 FUND 19 |
FINANCIAL HIGHLIGHTS (Continued) |
Class C | | Six Months
Ended
May 31,
2017
(Unaudited) | | | Year Ended November 30,
2016 | | | Year Ended November 30,
2015 | | | Year Ended November 28,
2014* | | | Year Ended November 29,
2013* | | | Year Ended November 30,
2012 | |
Per Share Operating Data | | | | | | | | | | | | | | | | | | |
Net Asset Value, Beginning of Period | | $ | 8.84 | | | $ | 9.09 | | | $ | 12.30 | | | $ | 11.87 | | | $ | 10.64 | | | $ | 10.58 | |
Income/(loss) from investment operations: | | | | | | | | | | | | | | | | | | | | | | | | |
Net investment loss1 | | | (0.08 | ) | | | (0.13 | ) | | | (0.13 | ) | | | (0.18 | ) | | | (0.13 | ) | | | (0.12 | ) |
Return of capital1 | | | 0.20 | | | | 0.41 | | | | 0.43 | | | | 0.44 | | | | 0.45 | | | | 0.46 | |
Net realized and unrealized gains/(losses) | | | 0.01 | | | | 0.18 | | | | (2.80 | ) | | | 0.88 | | | | 1.62 | | | | 0.43 | |
Total from investment operations | | | 0.13 | | | | 0.46 | | | | (2.50 | ) | | | 1.14 | | | | 1.94 | | | | 0.77 | |
Distributions to shareholders: | | | | | | | | | | | | | | | | | | | | | | | | |
Return of capital | | | (0.29 | ) | | | (0.71 | ) | | | (0.71 | ) | | | (0.71 | ) | | | (0.71 | ) | | | (0.71 | ) |
Net asset value, end of period | | $ | 8.68 | | | $ | 8.84 | | | $ | 9.09 | | | $ | 12.30 | | | $ | 11.87 | | | $ | 10.64 | |
| | | | | | | | | | | | | | | | | | | | | | | | | |
Total Return, at Net Asset Value2 | | | 1.38 | % | | | 5.59 | % | | | (21.07 | %) | | | 9.66 | % | | | 18.51 | % | | | 7.36 | % |
| | | | | | | | | | | | | | | | | | | | | | | | | |
Ratios /Supplemental Data | | | | | | | | | | | | | | | | | | | | | | | | |
Net assets, end of period (in thousands) | | $ | 537,831 | | | $ | 517,869 | | | $ | 451,373 | | | $ | 475,459 | | | $ | 241,984 | | | $ | 123,372 | |
Ratio of Expenses to Average Net Assets:3 | | | | | | | | | | | | | |
Before (waivers) and deferred tax expense/(benefit) | | | 1.97 | % | | | 1.99 | % | | | 1.98 | % | | | 2.00 | % | | | 1.89 | % | | | 2.04 | % |
Expense (waivers) | | | (0.11 | %) | | | (0.12 | %) | | | (0.11 | %) | | | (0.12 | %) | | | (0.01 | %) | | | (0.19 | %) |
Net of (waivers) and before deferred tax expense/(benefit) | | | 1.86 | %4 | | | 1.87 | %4 | | | 1.87 | %4 | | | 1.88 | %4 | | | 1.88 | %5 | | | 1.85 | % |
Deferred tax expense/(benefit)6,7 | | | 1.78 | % | | | 3.79 | % | | | (13.36 | %) | | | 5.19 | % | | | 6.84 | % | | | 3.88 | % |
Total expenses/(benefit) | | | 3.64 | % | | | 5.66 | % | | | (11.49 | %) | | | 7.07 | % | | | 8.72 | % | | | 5.73 | % |
| | | | | | | | | | | | | | | | | | | | | | | | | |
Ratio of Investment Loss to Average Net Assets:3 | | | | | | | | | | | | | |
Before (waivers) and deferred tax benefit | | | (2.15 | %) | | | (2.01 | %) | | | (1.65 | %) | | | (2.01 | %) | | | (1.70 | %) | | | (1.96 | %) |
Expense (waivers) | | | (0.11 | %) | | | (0.12 | %) | | | (0.11 | %) | | | (0.12 | %) | | | (0.01 | %) | | | (0.19 | %) |
Net of expense (waivers) and before deferred tax benefit | | | (2.04 | %) | | | (1.89 | %) | | | (1.54 | %) | | | (1.89 | %) | | | (1.69 | %) | | | (1.77 | %) |
Deferred tax benefit7,8 | | | 0.32 | % | | | 0.38 | % | | | 0.39 | % | | | 0.41 | % | | | 0.62 | % | | | 0.63 | % |
Net investment loss | | | (1.72 | %) | | | (1.51 | %) | | | (1.15 | %) | | | (1.48 | %) | | | (1.07 | %) | | | (1.14 | %) |
| | | | | | | | | | | | | | | | | | | | | | | | | |
Portfolio turnover rate | | | 8 | % | | | 10 | % | | | 8 | % | | | 12 | % | | | 2 | % | | | 11 | % |
* | November 28, 2014 and November 29, 2013 represent the last business day of the Fund’s respective reporting periods. |
1. | Per share amounts calculated based on average shares outstanding during the period net of deferred tax expense/benefit. |
2. | Assumes an initial investment on the business day before the first day of the fiscal period, with all dividends and distributions reinvested in additional shares on the reinvestment date, and redemptions at the net asset value calculated on the last business day of the fiscal period. Sales charges are not reflected in the total returns. Total returns are not annualized for periods less than one full year. Returns do not reflect the deduction of taxes that a shareholder would pay on fund distributions or the redemption of fund shares. The returns do not include adjustments in accordance with generally accepted accounting principles required at the period end for financial reporting purposes. |
3. | Annualized for less than full period. |
4. | Includes borrowing and franchise tax expense. Without borrowing and franchise tax expense, the net expense ratio would be 1.85%. |
5. | Includes franchise tax expense. Without franchise tax expense the net expense ratio would be 1.85%. |
6. | Deferred tax expense estimate for the ratio calculation is derived from the net investment income/loss, and realized and unrealized gains/losses. |
7. | Effective December 1, 2013 the deferred tax expense and deferred tax benefit are allocated based on average net assets. Prior to December 1, 2013 the deferred tax expense and deferred tax benefit were allocated based on specific class expenses. |
8. | Deferred tax benefit for the ratio calculation is derived from net investment income/loss only. |
See accompanying Notes to Financial Statements.
20 OPPENHEIMER STEELPATH MLP SELECT 40 FUND |
FINANCIAL HIGHLIGHTS (Continued) |
Class I | | Six Months
Ended
May 31,
2017
(Unaudited) | | | Year Ended November 30,
2016 | | | Year Ended November 30,
2015 | | | Year Ended November 28,
2014* | | | Period Ended November 29,
2013*,1,2 | |
Per Share Operating Data | | | | | | | | | | | | | | | |
Net Asset Value, Beginning of Period | | $ | 9.43 | | | $ | 9.54 | | | $ | 12.74 | | | $ | 12.14 | | | $ | 12.20 | |
Income/(loss) from investment operations: | | | | | | | | | | | | | | | | | | | | |
Net investment income/(loss)3 | | | 0.00 | 4 | | | 0.01 | | | | 0.09 | | | | (0.05 | ) | | | (0.04 | ) |
Return of capital3 | | | 0.20 | | | | 0.41 | | | | 0.43 | | | | 0.44 | | | | 0.00 | 4 |
Net realized and unrealized gains/(losses) | | | (0.01 | ) | | | 0.18 | | | | (3.01 | ) | | | 0.92 | | | | 0.33 | |
Total from investment operations | | | 0.19 | | | | 0.60 | | | | (2.49 | ) | | | 1.31 | | | | 0.29 | |
Distributions to shareholders: | | | | | | | | | | | | | | | | | | | | |
Return of capital | | | (0.29 | ) | | | (0.71 | ) | | | (0.71 | ) | | | (0.71 | ) | | | (0.35 | ) |
Net asset value, end of period | | $ | 9.33 | | | $ | 9.43 | | | $ | 9.54 | | | $ | 12.74 | | | $ | 12.14 | |
| | | | | | | | | | | | | | | | | | | | | |
Total Return, at Net Asset Value5 | | | 1.93 | % | | | 6.83 | % | | | (20.25 | %) | | | 10.87 | % | | | 2.45 | % |
| | | | | | | | | | | | | | | | | | | | | |
Ratios /Supplemental Data | | | | | | | | | | | | | | | | | | | | |
Net assets, end of period (in thousands) | | $ | 415,913 | | | $ | 313,325 | | | $ | 193,494 | | | $ | 57,153 | | | $ | 53,247 | |
Ratio of Expenses to Average Net Assets:6 | | | | | | | | | |
Before deferred tax expense/(benefit) | | | 0.78 | %7 | | | 0.80 | %8 | | | 0.80 | %8 | | | 0.81 | %8 | | | 1.32 | %9 |
Deferred tax expense/(benefit)10,11 | | | 1.78 | % | | | 3.79 | % | | | (13.36 | %) | | | 5.19 | % | | | 0.96 | % |
Total expenses/(benefit) | | | 2.56 | % | | | 4.59 | % | | | (12.56 | %) | | | 6.00 | % | | | 2.28 | % |
| | | | | | | | | | | | | | | | | | | | | |
Ratio of Investment Income/(Loss) to Average Net Assets:6 | | | | | | | | | |
Before deferred tax benefit/(expense) | | | (0.42 | %) | | | (0.29 | %) | | | 0.45 | % | | | (0.82 | %) | | | (1.32 | %) |
Deferred tax benefit11,12 | | | 0.32 | % | | | 0.38 | % | | | 0.39 | % | | | 0.41 | % | | | 0.46 | % |
Net investment loss | | | (0.10 | %) | | | 0.09 | % | | | 0.84 | % | | | (0.41 | %) | | | (0.86 | %) |
| | | | | | | | | | | | | | | | | | | | | |
Portfolio turnover rate | | | 8 | % | | | 10 | % | | | 8 | % | | | 12 | % | | | 2 | % |
* | November 28, 2014 and November 29, 2013 represent the last business day of the Fund’s respective reporting periods. |
1. | Shares commenced operations at the close of business June 28, 2013. |
2. | Effective June 28, 2013, Class I shares were renamed Class Y shares. See Note 1 of the Notes to Financial Statements for additional information. |
3. | Per share amounts calculated based on average shares outstanding during the period net of deferred tax expense/benefit. |
4. | Amount rounds to less than $0.005. |
5. | Assumes an initial investment on the business day before the first day of the fiscal period, with all dividends and distributions reinvested in additional shares on the reinvestment date, and redemptions at the net asset value calculated on the last business day of the fiscal period. Sales charges are not reflected in the total returns. Total returns are not annualized for periods less than one full year. Returns do not reflect the deduction of taxes that a shareholder would pay on fund distributions or the redemption of fund shares. The returns do not include adjustments in accordance with generally accepted accounting principles required at the period end for financial reporting purposes. |
6. | Annualized for less than full period. |
7. | Includes borrowing and franchise tax expense. Without borrowing and franchise tax expense, the net expense ratio would be 0.77%. |
8. | Includes borrowing and franchise tax expense. Without borrowing and franchise tax expense, the net expense ratio would be 0.78%. |
9. | Includes franchise tax expense. Without franchise tax expense the net expense ratio would be 1.29%. |
10. | Deferred tax expense estimate for the ratio calculation is derived from the net investment income/loss, and realized and unrealized gains/losses. |
11. | Effective December 1, 2013 the deferred tax expense and deferred tax benefit are allocated based on average net assets. Prior to December 1, 2013 the deferred tax expense and deferred tax benefit were allocated based on specific class expenses. |
12. | Deferred tax benefit for the ratio calculation is derived from net investment income/loss only. |
See accompanying Notes to Financial Statements.
OPPENHEIMER STEELPATH MLP SELECT 40 FUND 21 |
FINANCIAL HIGHLIGHTS (Continued) |
Class W | | Six Months
Ended
May 31,
2017
(Unaudited) | | | Year Ended November 30,
2016 | | | Year Ended November 30,
2015 | | | Year Ended November 28,
2014* | | | Year Ended November 29,
2013*,1 | | | Year Ended November 30,
2012 1 | |
Per Share Operating Data | | | | | | | | | | | | | | | | | | |
Net Asset Value, Beginning of Period | | $ | 9.40 | | | $ | 9.53 | | | $ | 12.74 | | | $ | 12.15 | | | $ | 10.77 | | | $ | 10.62 | |
Income/(loss) from investment operations: | | | | | | | | | | | | | | | | | | | | | | | | |
Net investment loss2 | | | (0.02 | ) | | | (0.04 | ) | | | (0.06 | ) | | | (0.06 | ) | | | (0.05 | ) | | | (0.05 | ) |
Return of capital2 | | | 0.20 | | | | 0.41 | | | | 0.43 | | | | 0.44 | | | | 0.42 | | | | 0.41 | |
Net realized and unrealized gains/(losses) | | | 0.01 | | | | 0.21 | | | | (2.87 | ) | | | 0.92 | | | | 1.72 | | | | 0.50 | |
Total from investment operations | | | 0.19 | | | | 0.58 | | | | (2.50 | ) | | | 1.30 | | | | 2.09 | | | | 0.86 | |
Distributions to shareholders: | | | | | | | | | | | | | | | | | | | | | | | | |
Return of capital | | | (0.29 | ) | | | (0.71 | ) | | | (0.71 | ) | | | (0.71 | ) | | | (0.71 | ) | | | (0.71 | ) |
Net asset value, end of period | | $ | 9.30 | | | $ | 9.40 | | | $ | 9.53 | | | $ | 12.74 | | | $ | 12.15 | | | $ | 10.77 | |
| | | | | | | | | | | | | | | | | | | | | | | | | |
Total Return, at Net Asset Value3 | | | 1.94 | % | | | 6.62 | % | | | (20.33 | %) | | | 10.78 | % | | | 19.71 | % | | | 8.21 | % |
| | | | | | | | | | | | | | | | | | | | | | | | | |
Ratios /Supplemental Data | | | | | | | | | | | | | | | | | | | | | | | | |
Net assets, end of period (in thousands) | | $ | 6,172 | | | $ | 6,708 | | | $ | 19,391 | | | $ | 57,589 | | | $ | 58,357 | | | $ | 61,876 | |
Ratio of expenses to average net assets:4 | | | | | | | | | | | | | |
Before (waivers) and deferred tax expense/(benefit) | | | 0.97 | % | | | 0.99 | % | | | 0.98 | % | | | 1.00 | % | | | 0.87 | % | | | 0.90 | % |
Expense (waivers) | | | (0.11 | %) | | | (0.12 | %) | | | (0.11 | %) | | | (0.12 | %) | | | (0.01 | %) | | | (0.05 | %) |
Net of (waivers) and before deferred tax expense/(benefit) | | | 0.86 | %5 | | | 0.87 | %5 | | | 0.87 | %5 | | | 0.88 | %5 | | | 0.86 | %6 | | | 0.85 | % |
Deferred tax expense/(benefit)7,8 | | | 1.78 | % | | | 3.79 | % | | | (13.36 | %) | | | 5.19 | % | | | 10.74 | % | | | 4.18 | % |
Total expenses/(benefit) | | | 2.64 | % | | | 4.66 | % | | | (12.49 | %) | | | 6.07 | % | | | 11.60 | % | | | 5.03 | % |
| | | | | | | | | | | | | | | | | | | | | | | | | |
Ratio of Investment Loss to Average Net Assets:4 | | | | | | | | | | | | | |
Before (waivers) and deferred tax benefit/(expense) | | | (0.79 | %) | | | (1.00 | %) | | | (1.05 | %) | | | (1.02 | %) | | | (0.70 | %) | | | (0.83 | %) |
Expense (waivers) | | | (0.11 | %) | | | (0.12 | %) | | | (0.11 | %) | | | (0.12 | %) | | | (0.01 | %) | | | (0.05 | %) |
Net of expense (waivers) and before deferred tax benefit/(expense) | | | (0.68 | %) | | | (0.88 | %) | | | (0.94 | %) | | | (0.90 | %) | | | (0.69 | %) | | | (0.78 | %) |
Deferred tax benefit8,9 | | | 0.32 | % | | | 0.38 | % | | | 0.39 | % | | | 0.41 | % | | | 0.25 | % | | | 0.26 | % |
Net investment loss | | | (0.36 | %) | | | (0.50 | %) | | | (0.55 | %) | | | (0.49 | %) | | | (0.44 | %) | | | (0.52 | %) |
| | | | | | | | | | | | | | | | | | | | | | | | | |
Portfolio turnover rate | | | 8 | % | | | 10 | % | | | 8 | % | | | 12 | % | | | 2 | % | | | 11 | % |
* | November 28, 2014 and November 29, 2013 represent the last business day of the Fund’s respective reporting periods. |
1. | Effective June 28, 2013, Class Y shares were renamed Class W shares. See Note 1 of the Notes to Financial Statements for additional information. |
2. | Per share amounts calculated based on average shares outstanding during the period net of deferred tax expense/benefit. |
3. | Assumes an initial investment on the business day before the first day of the fiscal period, with all dividends and distributions reinvested in additional shares on the reinvestment date, and redemptions at the net asset value calculated on the last business day of the fiscal period. Sales charges are not reflected in the total returns. Total returns are not annualized for periods less than one full year. Returns do not reflect the deduction of taxes that a shareholder would pay on fund distributions or the redemption of fund shares. The returns do not include adjustments in accordance with generally accepted accounting principles required at the period end for financial reporting purposes. |
4. | Annualized for less than a full period. |
5. | Includes borrowing and franchise tax expense. Without borrowing and franchise tax expense, the net expense ratio would be 0.85%. |
6. | Includes franchise tax expense. Without franchise tax expense the net expense ratio would be 0.85%. |
7. | Deferred tax expense estimate for the ratio calculation is derived from the net investment income/loss, and realized and unrealized gains/losses. |
8. | Effective December 1, 2013 the deferred tax expense and deferred tax benefit are allocated based on average net assets. Prior to December 1, 2013 the deferred tax expense and deferred tax benefit were allocated based on specific class expenses. |
9. | Deferred tax benefit for the ratio calculation is derived from net investment income/loss only. |
See accompanying Notes to Financial Statements.
22 OPPENHEIMER STEELPATH MLP SELECT 40 FUND |
FINANCIAL HIGHLIGHTS (Continued) |
Class Y | | Six Months
Ended
May 31,
2017
(Unaudited) | | | Year Ended November 30,
2016 | | | Year Ended November 30,
2015 | | | Year Ended November 28,
2014* | | | Year Ended November 29,
2013*,1 | | | Year Ended November 30,
2012 1 | |
Per Share Operating Data | | | | | | | | | | | | | | | | | | |
Net Asset Value, Beginning of Period | | $ | 9.40 | | | $ | 9.53 | | | $ | 12.74 | | | $ | 12.15 | | | $ | 10.77 | | | $ | 10.63 | |
Income/(loss) from investment operations: | | | | | | | | | | | | | | | | | | | | | | | | |
Net investment loss2 | | | (0.01 | ) | | | (0.01 | ) | | | (0.00 | )3 | | | (0.05 | ) | | | (0.05 | ) | | | (0.06 | ) |
Return of capital2 | | | 0.20 | | | | 0.41 | | | | 0.43 | | | | 0.44 | | | | 0.43 | | | | 0.44 | |
Net realized and unrealized gains/(losses) | | | 0.00 | 3 | | | 0.18 | | | | (2.93 | ) | | | 0.91 | | | | 1.71 | | | | 0.47 | |
Total from investment operations | | | 0.19 | | | | 0.58 | | | | (2.50 | ) | | | 1.30 | | | | 2.09 | | | | 0.85 | |
Distributions to shareholders: | | | | | | | | | | | | | | | | | | | | | | | | |
Return of capital | | | (0.29 | ) | | | (0.71 | ) | | | (0.71 | ) | | | (0.71 | ) | | | (0.71 | ) | | | (0.71 | ) |
Net asset value, end of period | | $ | 9.30 | | | $ | 9.40 | | | $ | 9.53 | | | $ | 12.74 | | | $ | 12.15 | | | $ | 10.77 | |
| | | | | | | | | | | | | | | | | | | | | | | | | |
Total Return, at Net Asset Value4 | | | 1.94 | % | | | 6.62 | % | | | (20.33 | %) | | | 10.78 | % | | | 19.71 | % | | | 8.11 | % |
| | | | | | | | | | | | | | | | | | | | | | | | | |
Ratios /Supplemental Data | | | | | | | | | | | | | | | | | | | | | | | | |
Net assets, end of period (in thousands) | | $ | 1,767,396 | | | $ | 1,598,012 | | | $ | 1,376,872 | | | $ | 1,772,095 | | | $ | 1,375,128 | | | $ | 733,082 | |
Ratio of Expenses to Average Net Assets:5 | | | | | | | | | | | | | |
Before (waivers) and deferred tax expense/(benefit) | | | 0.97 | % | | | 0.99 | % | | | 0.98 | % | | | 1.00 | % | | | 0.88 | % | | | 0.88 | % |
Expense (waivers) | | | (0.11 | %) | | | (0.12 | %) | | | (0.11 | %) | | | (0.12 | %) | | | (0.01 | %) | | | (0.03 | %) |
Net of (waivers) and before deferred tax expense/(benefit) | | | 0.86 | %6 | | | 0.87 | %6 | | | 0.87 | %6 | | | 0.88 | %6 | | | 0.87 | %7 | | | 0.85 | % |
Deferred tax expense/(benefit)8,9 | | | 1.78 | % | | | 3.79 | % | | | (13.36 | %) | | | 5.19 | % | | | 9.32 | % | | | 4.20 | % |
Total expenses/(benefit) | | | 2.64 | % | | | 4.66 | % | | | (12.49 | %) | | | 6.07 | % | | | 10.19 | % | | | 5.05 | % |
| | | | | | | | | | | | | | | | | | | | | | | | | |
Ratio of Investment Loss to Average Net Assets:5 | | | | | | | | | | | | | |
Before (waivers) and deferred tax benefit/(expense) | | | (0.70 | %) | | | (0.59 | %) | | | (0.50 | %) | | | (0.96 | %) | | | (0.70 | %) | | | (0.81 | %) |
Expense (waivers) | | | (0.11 | %) | | | (0.12 | %) | | | (0.11 | %) | | | (0.12 | %) | | | (0.01 | %) | | | (0.03 | %) |
Net of expense (waivers) and before deferred tax benefit/(expense) | | | (0.59 | %) | | | (0.47 | %) | | | (0.39 | %) | | | (0.84 | %) | | | (0.69 | %) | | | (0.78 | %) |
Deferred tax benefit9,10 | | | 0.32 | % | | | 0.38 | % | | | 0.39 | % | | | 0.41 | % | | | 0.25 | % | | | 0.26 | % |
Net investment loss | | | (0.27 | %) | | | (0.09 | %) | | | 0.00 | %11 | | | (0.43 | %) | | | (0.44 | %) | | | (0.52 | %) |
| | | | | | | | | | | | | | | | | | | | | | | | | |
Portfolio turnover rate | | | 8 | % | | | 10 | % | | | 8 | % | | | 12 | % | | | 2 | % | | | 11 | % |
* | November 28, 2014 and November 29, 2013 represent the last business day of the Fund’s respective reporting periods. |
1. | Effective June 28, 2013, Class I shares were renamed Class Y shares. See Note 1 of the Notes to Financial Statements for additional information. |
2. | Per share amounts calculated based on average shares outstanding during the period net of deferred tax expense/benefit. |
4. | Assumes an initial investment on the business day before the first day of the fiscal period, with all dividends and distributions reinvested in additional shares on the reinvestment date, and redemptions at the net asset value calculated on the last business day of the fiscal period. Sales charges are not reflected in the total returns. Total returns are not annualized for periods less than one full year. Returns do not reflect the deduction of taxes that a shareholder would pay on fund distributions or the redemption of fund shares. The returns do not include adjustments in accordance with generally accepted accounting principles required at the period end for financial reporting purposes. |
5. | Annualized for less than a full period |
6. | Includes borrowing and franchise tax expense. Without borrowing and franchise tax expense, the net expense ratio would be 0.85%. |
7. | Includes franchise tax expense. Without franchise tax expense the net expense ratio would be 0.85%. |
8. | Deferred tax expense estimate for the ratio calculation is derived from the net investment income/loss, and realized and unrealized gains/losses. |
9. | Effective December 1, 2013 the deferred tax expense and deferred tax benefit are allocated based on average net assets. Prior to December 1, 2013 the deferred tax expense and deferred tax benefit were allocated based on specific class expenses. |
10. | Deferred tax benefit for the ratio calculation is derived from net investment income/loss only. |
See accompanying Notes to Financial Statements.
OPPENHEIMER STEELPATH MLP SELECT 40 FUND 23 |
NOTES TO FINANCIAL STATEMENTS Unaudited |
1. Organization
Oppenheimer SteelPath MLP Select 40 Fund (the “Fund”), a separate series of Oppenheimer SteelPath MLP Funds Trust, is a diversified open-end management investment company registered under the Investment Company Act of 1940, as amended. The Fund’s investment objective is to seek total return. The Fund’s investment adviser is OFI SteelPath, Inc. (the “Adviser” or “Manager”), a wholly-owned subsidiary of OppenheimerFunds, Inc. (“OFI” or “Oppenheimer”).
The Fund offers Class A, Class C, Class I, Class W and Class Y shares. Effective June 28, 2013, Class I shares were renamed Class Y shares and Class Y shares were renamed Class W shares. Effective after August 30, 2013, Class W shares are no longer offered for purchase. Class A shares are sold at their offering price, which is normally net asset value plus a front-end sales charge. Effective June 28, 2013, although there is no initial sales charge on Class A purchases totaling $1 million or more, those Class A shares may be subject to a 1.00% contingent deferred sales charge (“CDSC”) if shares are redeemed within an 18-month holding period measured from the date of purchase. Class C shares are sold without a front-end sales charge but may be subject to a CDSC of 1.00% of the redemption proceeds if Class C shares are redeemed within one year of purchase. Class I shares are only available to eligible institutional investors. Class I shares are sold at net asset value per share without a sales charge or CDSC. An institutional investor that buys Class I shares for its customers’ accounts may impose charges on those accounts. Class Y shares are sold at net asset value per share without a sales charge directly to institutional investors that have special agreements with OppenheimerFunds Distributor, Inc. (the “Distributor” or “OFDI”) for that purpose. They may include insurance companies, registered investment companies, employee benefit plans and section 529 plans, among others. An institutional investor that buys Class Y shares for its customers’ accounts may impose charges on those accounts. All classes of shares have identical rights and voting privileges with respect to the Fund in general and exclusive voting rights on matters that affect that class alone. Earnings, net assets and net asset value per share may differ due to each class having its own expenses, such as transfer and shareholder servicing agent fees and shareholder communications, directly attributable to that class. Class A and C shares have separate distribution and/or service plans under which they pay fees. Class I, W, and Y shares do not pay such fees.
The Fund is an investment company and accordingly follows the investment company accounting and reporting guidance of the Financial Accounting Standards Board (“FASB”) Accounting Standard Codification Topic 946 Financial Services- Investment Companies.
The following is a summary of significant accounting policies followed in the Fund’s preparation of financial statements in accordance with accounting principles generally accepted in the United States (“U.S. GAAP”).
24 OPPENHEIMER STEELPATH MLP SELECT 40 FUND |
NOTES TO FINANCIAL STATEMENTS Unaudited / (Continued) |
2. Significant Accounting Policies
Security Valuation. All investments in securities are recorded at their estimated fair value, as described in Note 3.
Allocation of Income, Expenses, Gains and Losses. Income, expenses (other than those attributable to a specific class), gains and losses are allocated on a daily basis to each class of shares based upon the relative proportion of net assets represented by such class. Operating expenses directly attributable to a specific class are charged against the operations of that class.
Dividends and Distributions to Shareholders. Dividends and distributions to shareholders, which are determined in accordance with income tax regulations and may differ from U.S. GAAP, are recorded on the ex-dividend date. The Fund’s dividend distribution policy is intended to provide monthly distributions to its shareholders at a rate that over time is similar to the distribution rate the Fund receives from the master limited partnerships (”MLPs”) in which it invests. The Fund generally pays out dividends that over time approximate the distributions received from the Fund’s portfolio investments based on, among other considerations, distributions the Fund actually received from portfolio investments, distributions it would have received if it had been fully invested at all times, and estimated future cash flows. Such dividends are not tied to the Fund’s investment income and may not represent yield or investment return on the Fund’s portfolio. To the extent that the dividends paid exceed the distributions the Fund receives from its underlying investments, the Fund’s assets will be reduced. The Fund’s tendency to pay out a consistent dividend may change, and the Fund’s level of distributions may increase or decrease.
The estimated characterization of the distributions paid will be either a qualified dividend or distribution (return of capital). This estimate is based on the Fund’s operating results during the period. It is anticipated that a significant portion of the distributions will be comprised of return of capital as a result of the tax character of cash distributions made by the Fund’s investments. The actual characterization of the distributions made during the period will not be determined until after the end of the fiscal year. The Fund will inform shareholders of the final tax character of the distributions on IRS Form 1099 DIV in February 2018. For the six months ended May 31, 2017, the Fund distributions are expected to be comprised of 100% return of capital.
Return of Capital Estimates. Distributions received from the Fund’s investments in MLPs generally are comprised of income and return of capital. The Fund records investment income and return of capital based on estimates made at the time such distributions are received. Such estimates are based on historical information available from each MLP and other industry sources. These estimates may subsequently be revised based on information received from MLPs after their tax reporting periods are concluded. For the six months ended May 31, 2017, the Fund estimated that 100% of the MLP distributions received would be treated as return of capital.
OPPENHEIMER STEELPATH MLP SELECT 40 FUND 25 |
NOTES TO FINANCIAL STATEMENTS Unaudited / (Continued) |
2. Significant Accounting Policies (Continued)
Investment Income. Dividend income is recorded on the ex-dividend date or upon ex-dividend notification in the case of certain foreign dividends where the ex-dividend date may have passed. Non-cash dividends included in dividend income, if any, are recorded at the fair value of the securities received. Interest income, if any, is recognized on an accrual basis. Discount and premium, which are included in interest income on the Statement of Operations, if applicable, are amortized or accreted daily.
Custodian Fees. “Custody fees” in the Statement of Operations may include interest expense incurred by the Fund on any cash overdrafts of its custodian account during the period. Such cash overdrafts may result from the effects of failed trades in portfolio securities and from cash outflows resulting from unanticipated shareholder redemption activity. The Fund pays interest to its custodian on such cash overdrafts, to the extent they are not offset by positive cash balances maintained by the Fund, at a rate equal to the Federal Funds Rate plus 0.50%. The “Reduction to custodian expenses” line item, if applicable, represents earnings on cash balances maintained by the Fund during the period. Such interest expense and other custodian fees may be paid with these earnings.
Security Transactions. Security transactions are recorded on the trade date. Realized gains and losses on securities sold are determined using the basis of identified cost.
Indemnifications. The Fund’s organizational documents provide current and former trustees and officers with a limited indemnification against liabilities arising in connection with the performance of their duties to the Fund. In the normal course of business, the Fund may also enter into contracts that provide general indemnifications. The Fund’s maximum exposure under these arrangements is unknown as this would be dependent on future claims that may be made against the Fund. The risk of material loss from such claims is considered remote.
Federal Income Taxes. The Fund does not intend to qualify as a regulated investment company pursuant to Subchapter M of the Internal Revenue Code, but will rather be taxed as a corporation. As a corporation, the Fund is obligated to pay federal, state and local income tax on taxable income. Currently, the maximum marginal regular federal income tax rate for a corporation is 35 percent. Upon enactment, a change in the federal income tax rate could have a material impact to the Fund. The Fund may be subject to a 20 percent alternative minimum tax on its federal alternative minimum taxable income to the extent that its alternative minimum tax exceeds its regular federal income tax. The Fund is currently using an estimated rate of 1.7 percent for state and local tax, net of federal tax expense.
26 OPPENHEIMER STEELPATH MLP SELECT 40 FUND |
NOTES TO FINANCIAL STATEMENTS Unaudited / (Continued) |
2. Significant Accounting Policies (Continued)
The Fund’s income tax provision consists of the following as of May 31, 2017:
Current tax expense (benefit) | | | |
Federal | | $ | — | |
State | | | — | |
Total current tax expense | | $ | — | |
| | | | | |
Deferred tax expense (benefit) | | | | |
Federal | | $ | 27,953,233 | |
State | | | 1,357,729 | |
Total deferred tax expense | | $ | 29,310,962 | |
The reconciliation between the federal statutory income tax rate of 35% and the effective tax rate on net investment income (loss) and realized and unrealized gain (loss) follows:
| | Amount | | | Rate | |
Application of statutory income tax rate | | $ | 27,839,174 | | | | 35.00 | % |
State income taxes net of federal benefit | | | 1,352,188 | | | | 1.70 | % |
Effect of permanent differences | | | 119,600 | | | | 0.15 | % |
Total income tax expense (benefit) | | $ | 29,310,962 | | | | 36.85 | % |
The Fund intends to invest its assets primarily in MLPs, which generally are treated as partnerships for federal income tax purposes. As a limited partner in the MLPs, the Fund reports its allocable share of the MLPs’ taxable income in computing its own taxable income. The Fund’s tax expense or benefit is included in the Statement of Operations based on the component of income or gains (losses) to which such expense or benefit relates. Deferred income taxes reflect the net tax effects of temporary differences between the carrying amounts of assets and liabilities for financial reporting purposes and the amounts used for income tax purposes. Such temporary differences are principally: (i) taxes on unrealized gains/(losses), which are attributable to the temporary difference between fair market value and tax basis, (ii) the net tax effects of temporary differences between the carrying amounts of assets and liabilities for financial reporting and income tax purposes and (iii) the net tax benefit of accumulated net operating losses and capital loss carryforwards. Deferred tax assets and liabilities are measured using effective tax rates expected to apply to taxable income in the years such temporary differences are realized or otherwise settled. To the extent the Fund has a deferred tax asset, consideration is given to whether or not a valuation allowance is required. A valuation allowance is required if, based on the evaluation criterion provided by ASC 740, Income Taxes, it is more-likely-than-not some portion or all of the deferred tax asset will not be realized.
OPPENHEIMER STEELPATH MLP SELECT 40 FUND 27 |
NOTES TO FINANCIAL STATEMENTS Unaudited / (Continued) |
2. Significant Accounting Policies (Continued)
At May 31, 2017, the Fund determined a valuation allowance was not required. In evaluating a valuation allowance on a portion of the deferred tax asset, significant consideration was given to the current and expected level of MLP distributions, unrealized gains and losses on MLP investments and the expiration dates for net operating losses and capital loss carryovers. Market cycles, the severity and duration of historical deferred tax assets and the impact of current and future redemptions were also considered. The Fund intends to assess whether a valuation allowance is required to offset some or all of any deferred tax asset balance in connection with the calculation of the Fund’s daily NAV; however, to the extent the final valuation allowance differs from the estimates of the Fund used in calculating the Fund’s daily NAV, the application of such final valuation allowance in these Financial Statements could have a material impact on the Fund’s NAV. Through the consideration of these factors, the Fund has determined that it is more likely than not the deferred tax asset, net of the valuation allowance, if required, will be realized.
Unexpected significant decreases in cash distributions from the Fund’s MLP investments, significant declines in the fair value of its investments, significant redemptions or increased risk of expiring net operating losses or capital loss carryovers may change the Fund’s assessment regarding the recoverability of its deferred tax assets and may result in a change to the valuation allowance. Modifications of the valuation allowance could have a material impact on the Fund’s net asset value.
Components of the Fund’s deferred tax assets and liabilities as of May 31, 2017 are as follows:
Deferred tax assets: | | | |
Net operating loss carryforward (tax basis) | | $ | 240,360,677 | |
Capital loss carryforward (tax basis) | | | 15,639,494 | |
Organizational Costs | | | 6,723 | |
Total deferred tax asset | | | 256,006,894 | |
| | | | | |
Deferred tax liabilities: | | | | |
Net unrealized gains on investment securities (tax basis) | | | (359,361,536 | ) |
Total deferred tax liability | | | (359,361,536 | ) |
| | | | | |
Total net deferred tax asset/(liability) | | $ | (103,354,642 | ) |
The Fund may rely, to some extent, on information provided by the MLPs, which may not necessarily be timely, to estimate taxable income allocable to MLP units held in its portfolio, and to estimate its associated deferred tax liability or asset. Such estimates are made in good faith. From time to time, as new information becomes available, the Fund will modify its estimates or assumptions regarding its tax liability or asset.
28 OPPENHEIMER STEELPATH MLP SELECT 40 FUND |
NOTES TO FINANCIAL STATEMENTS Unaudited / (Continued) |
2. Significant Accounting Policies (Continued)
The Fund’s policy is to classify interest and penalties associated with underpayment of federal and state income taxes, if any, as income tax expense on its Statement of Operations. As of May 31, 2017, the Fund does not have any interest or penalties associated with the underpayment of any income taxes.
The Fund files income tax returns in the U.S. federal jurisdiction and various states. The Fund has reviewed all major jurisdictions and concluded that there is no significant impact on the Fund’s net assets and no tax liability resulting from unrecognized tax benefits relating to uncertain tax positions expected to be taken on its tax returns. Furthermore, management of the Fund is not aware of any uncertain tax positions for which it is reasonably possible that the total amount of unrecognized tax benefit will significantly change in the next 12 months.
At May 31, 2017, the Fund had net operating loss carryforwards for federal income tax purposes, which may be carried forward for 20 years, as follows:
Expiration Date | | | |
11/30/2030 | | $ | 525,993 | |
11/30/2031 | | | 11,179,881 | |
11/30/2032 | | | 33,698,662 | |
11/30/2033 | | | 63,882,188 | |
11/30/2034 | | | 129,986,547 | |
11/30/2035 | | | 153,875,403 | |
11/30/2036 | | | 116,663,919 | |
11/30/2037 | | | 145,121,132 | |
Total | | $ | 654,933,725 | |
At May 31, 2017, the Fund had net capital loss carryforwards for federal income tax purposes, which may be carried forward for 5 years, as follows:
Expiration Date | | | |
11/30/2021 | | | 42,614,424 | |
Total | | $ | 42,614,424 | |
During the period ended May 31, 2017, the Fund utilized $77,801,709 of capital loss carryforward.
At May 31, 2017, gross unrealized appreciation and depreciation of investments, based on cost for federal income tax purposes were as follows:
Cost of Investments | | $ | 2,398,438,902 | |
Gross Unrealized Appreciation | | $ | 1,141,808,681 | |
Gross Unrealized Depreciation | | | (167,968,517 | ) |
Net Unrealized Appreciation (Depreciation) on Investments | | $ | 973,840,164 | |
OPPENHEIMER STEELPATH MLP SELECT 40 FUND 29 |
NOTES TO FINANCIAL STATEMENTS Unaudited / (Continued) |
2. Significant Accounting Policies (Continued)
The difference between cost amounts for financial statement and federal income tax purposes is due primarily to timing differences in recognizing certain gains and losses in security transactions.
Use of Estimates. The preparation of financial statements in conformity with accounting principles generally accepted in the United States of America requires management to make estimates and assumptions that affect the reported amounts of assets and liabilities and disclosure of contingent assets and liabilities at the date of the financial statements and the reported amounts of increases and decreases in net assets from operations during the reporting period. Actual results could differ from those estimates.
Recent Accounting Pronouncement. In October 2016, the Securities and Exchange Commission (“SEC”) adopted amendments to rules under the Investment Company Act of 1940 (“final rules”) intended to modernize the reporting and disclosure of information by registered investment companies. The final rules amend Regulation S-X and require funds to provide standardized, enhanced derivative disclosure in fund financial statements in a format designed for individual investors. The amendments to Regulation S-X also update the disclosures for other investments and investments in, and advances to affiliates and amend the rules regarding the general form and content of fund financial statements. The compliance date for the amendments to Regulation S-X is August 1, 2017. OFI Global Asset Management, Inc., a wholly-owned subsidiary of OFI, (“OFI Global”) is currently evaluating the amendments and their impact, if any, on the Fund’s financial statements.
3. Securities Valuation
The Fund calculates the net asset value of its shares as of 4:00 P.M. Eastern time, on each day the New York Stock Exchange (the “Exchange”) is open for trading, except in the case of a scheduled early closing of the Exchange, in which case the Fund will calculate net asset value of the shares as of the scheduled early closing time of the Exchange.
The Fund’s Board of Trustees (the “Board”) has adopted procedures for the valuation of the Fund’s securities and has delegated the day-to-day responsibility for valuation determinations under those procedures to the Manager. The Manager has established a Valuation Committee which is responsible for determining a fair valuation for any security for which market quotations are not readily available. The Valuation Committee’s fair valuation determinations are subject to review, approval and ratification by the Fund’s Board at its next regularly scheduled meeting covering the calendar quarter in which the fair valuation was determined.
Valuation Methods and Inputs
Securities are valued primarily using unadjusted quoted market prices, when available, as supplied by third party pricing services or broker-dealers.
30 OPPENHEIMER STEELPATH MLP SELECT 40 FUND |
NOTES TO FINANCIAL STATEMENTS Unaudited / (Continued) |
3. Securities Valuation (Continued)
The following methodologies are used to determine the market value or the fair value of the types of securities described below:
Equity securities traded on a securities exchange (including exchange-traded derivatives other than futures and futures options) are valued based on the official closing price on the principal exchange on which the security is traded, as identified by the Manager, prior to the time when the Fund’s assets are valued. If the official closing price is unavailable, the security is valued at the last sale price on the principal exchange on which it is traded, or if no sales occurred, the security is valued at the mean between the quoted bid and asked prices. Over-the-counter equity securities are valued at the last published sale price, or if no sales occurred, at the mean between the quoted bid and asked prices.
Shares of a registered investment company that are not traded on an exchange are valued at that investment company’s net asset value per share.
Securities for which market quotations are not readily available or a significant event has occurred that would materially affect the value of the security, are fair valued either (i) by a standardized fair valuation methodology applicable to the security type or the significant event as previously approved by the Valuation Committee and the Fund’s Board or (ii) as determined in good faith by the Manager’s Valuation Committee. The Valuation Committee considers all relevant facts that are reasonably available, through either public information or information available to the Manager, when determining the fair value of a security. Those standardized fair valuation methodologies include, but are not limited to, valuing securities at the last sale price or initially at cost and subsequently adjusting the value based on: changes in company specific fundamentals, changes in an appropriate securities index, or changes in the value of similar securities which may be further adjusted for any discounts related to security-specific resale restrictions. When possible, such methodologies use observable market inputs such as unadjusted quoted prices of similar securities, observable interest rates, currency rates and yield curves. The methodologies used for valuing securities are not necessarily an indication of the risks associated with investing in those securities nor can it be assured that the Fund can obtain the fair value assigned to a security if it were to sell the security.
To assess the continuing appropriateness of security valuations the Manager regularly compares prior day prices and sale prices to the current day prices and challenges those prices exceeding certain tolerance levels with the third party pricing service or broker source. For those securities valued by fair valuations, whether through a standardized fair valuation methodology or a fair valuation determination, the Valuation Committee reviews and affirms the reasonableness of the valuations based on such methodologies and fair valuation determinations on a regular basis after considering all relevant information that is reasonably available.
OPPENHEIMER STEELPATH MLP SELECT 40 FUND 31 |
NOTES TO FINANCIAL STATEMENTS Unaudited / (Continued) |
3. Securities Valuation (Continued)
Classifications
Each investment asset or liability of the Fund is assigned a level at measurement date based on the significance and source of the inputs to its valuation. Various data inputs may be used in determining the value of each of the Fund’s investments as of the reporting period end. These data inputs are categorized in the following hierarchy under applicable financial accounting standards:
| | 1) | Level 1-unadjusted quoted prices in active markets for identical assets or liabilities (including securities actively traded on a securities exchange) |
| | 2) | Level 2-inputs other than unadjusted quoted prices that are observable for the asset or liability (such as unadjusted quoted prices for similar assets and market corroborated inputs such as interest rates, prepayment speeds, credit risks, etc.) |
| | 3) | Level 3-significant unobservable inputs (including the Manager’s own judgments about assumptions that market participants would use in pricing the asset or liability) |
The inputs used for valuing securities are not necessarily an indication of the risks associated with investing in those securities.
The Fund classifies each of its investments in investment companies which are publicly offered as Level 1. Investment companies that are not publicly offered, if any, are measured using net asset value.
The table below categorizes amounts that are included in the Fund’s Statement of Assets and Liabilities as of May 31, 2017, based on valuation input level:
| | Level 1 —
Unadjusted Quoted Prices | | | Level 2 —
Other Significant Observable Inputs | | | Level 3 —
Significant Unobservable Inputs | | | Value | |
Assets Table | | | | | | | | | | | | |
Investments, at Value: | | | | | | | | | | | | |
Master Limited Partnership Shares* | | $ | 3,016,017,462 | | | $ | — | | | $ | — | | | $ | 3,016,017,462 | |
Common Stocks* | | | 263,219,338 | | | | — | | | | — | | | | 263,219,338 | |
Preferred Master Limited Partnership Shares* | | | — | | | | — | | | | 63,363,271 | | | | 63,363,271 | |
Money Market | | | 29,678,995 | | | | | | | | | | | | 29,678,995 | |
Total Assets | | $ | 3,308,915,795 | | | $ | — | | | $ | 63,363,271 | | | $ | 3,372,279,066 | |
* | For a detailed break-out of securities by major industry classification, please refer to the Statement of Investments. |
32 OPPENHEIMER STEELPATH MLP SELECT 40 FUND |
NOTES TO FINANCIAL STATEMENTS Unaudited / (Continued) |
3. Securities Valuation (Continued)
The following is a reconciliation of assets in which significant unobservable inputs (Level 3) were used in determining value:
Beginning balance November 30, 2016 | | $ | 40,060,000 | |
Transfers into Level 3 during the period | | | — | |
Change in unrealized appreciation/(depreciation) | | | (1,492,737 | ) |
Total realized gain/(loss) | | | — | |
Purchases | | | 27,261,832 | |
Sales | | | — | |
Return of capital distributions | | | (2,465,824 | ) |
Transfers out of Level 3 during the period | | | — | |
Ending balance May 31, 2017 | | $ | 63,363,271 | |
The total change in unrealized appreciation/depreciation included in the Statement of Operations attributable to Level 3 investments still held at May 31, 2017 is $(3,958,561).
The following table summarizes the valuation techniques and significant unobservable inputs used in determining fair value measurements for those investments classified as Level 3 as of May 31, 2017:
Assets Table Investments, at Value: | | Value as of May 31,
2017 | | Valuation Technique | Unobservable input | | Range of Unobservable Inputs | | | Unobservable Input Used | |
Preferred Stocks | | $ | 40,720,000 | | Discounted Cash Flow Model | Illiquidity Discount | | | n/a | | | | 7 | %(a) |
| | | | | | | Estimated Yield | | | 10.5% - 11.1 | % | | | 10.8 | %(a) |
| | | | 22,643,271 | | Discounted Cash Flow Model | Annual Illiquidity Discount | | | n/a | | | | 10 | %(b) |
| | | | | | | Estimated Yield | | | n/a | | | | 8.64 | %(b) |
Total | | $ | 63,363,271 | | | | | | | | | | | |
(a) | The Fund fair values certain preferred shares using a discounted cash flow model, which incorporates an illiquidity discount and the expected yield based on the average yield on comparable companies’ equity. Such security’s fair valuation could decrease (increase) significantly based on an increase (decrease) in the illiquidity discount. Such security’s fair valuation could increase (decrease) significantly based on an increase (decrease) in expected yields. |
(b) | The Fund fair values certain preferred shares using a discounted cash flow model, which incorporates an illiquidity discount and an estimated yield based on a recent transaction. Such security’s fair valuation could decrease (increase) significantly based on an increase (decrease) in the illiquidity discount. Such security’s fair valuation could increase (decrease) significantly based on an increase (decrease) in estimated yields. |
OPPENHEIMER STEELPATH MLP SELECT 40 FUND 33 |
NOTES TO FINANCIAL STATEMENTS Unaudited / (Continued) |
3. Securities Valuation (Continued)
The table below shows the transfers between Level 1 and Level 2. The Fund’s policy is to recognize transfers out as of the beginning of the reporting period.
| | Transfers
into
Level 1* | | | Transfers
out of
Level 2* | |
Assets Table | | | | | | |
Investments, at Value: | | | | | | |
Private Investment in Public Entity | | $ | — | | | $ | (19,351,519 | ) |
Master Limited Partnership Shares | | | 19,351,519 | | | | | |
Total Assets | | $ | 19,351,519 | | | $ | (19,351,519 | ) |
* | Transfers from Level 2 to Level 1 are a result of a certain privately held security becoming freely tradeable and being priced using quoted prices from an active market. |
4. Investments and Risks
Equity Security Risk. Stocks and other equity securities fluctuate in price. The value of the Fund’s portfolio may be affected by changes in the equity markets generally. Equity markets may experience significant short-term volatility and may fall sharply at times. Different markets may behave differently from each other and U.S. equity markets may move in the opposite direction from one or more foreign stock markets. Adverse events in any part of the equity or fixed-income markets may have unexpected negative effects on other market segments.
The prices of individual equity securities generally do not all move in the same direction at the same time and a variety of factors can affect the price of a particular company’s securities. These factors may include, but are not limited to, poor earnings reports, a loss of customers, litigation against the company, general unfavorable performance of the company’s sector or industry, or changes in government regulations affecting the company or its industry.
Master Limited Partnerships. MLPs issue common units that represent an equity ownership interest in a partnership and provide limited voting rights. MLP common units are registered with the Securities and Exchange Commission (“SEC”), and are freely tradable on securities exchanges such as the NYSE and the NASDAQ Stock Market (“NASDAQ”), or in the over-the-counter market. An MLP consists of one or more general partners, who conduct the business, and one or more limited partners, who contribute capital. MLP common unit holders have a limited role in the partnership’s operations and management. The Fund, as a limited partner, normally would not be liable for the debts of the MLP beyond the amounts the Fund has contributed, but would not be shielded to the same extent that a shareholder
34 OPPENHEIMER STEELPATH MLP SELECT 40 FUND |
NOTES TO FINANCIAL STATEMENTS Unaudited / (Continued) |
4. Investments and Risks (Continued)
of a corporation would be. In certain circumstances creditors of an MLP would have the right to seek return of capital distributed to a limited partner. This right of an MLP’s creditors would continue after the Fund sold its investment in the MLP.
MLPs are generally treated as publicly traded partnerships for federal income tax purposes. Any modification to federal income tax laws and related interpretations could cause a material decrease in the value of an MLP.
Restricted Securities. At period end, investments in securities included issues that are restricted. A restricted security may have a contractual restriction on its resale and is valued under methods approved by the Board of Trustees as reflecting fair value. Securities that are restricted are marked with an applicable footnote on the Statement of Investments. Restricted securities are reported on a schedule following the Statement of Investments.
Concentration Risk. Under normal circumstances, the Fund invests at least 80% of its net assets (plus the amount of any borrowing for investment purposes) in the equity securities of MLPs, the majority of which operate in the energy and/or natural resources sector. MLPs are subject to certain risks, such as supply and demand risk, depletion and exploration risk, commodity pricing risk, acquisition risk, and the risk associated with the hazards inherent in midstream energy industry activities. A substantial portion of the cash flow received by the Fund is derived from investment in equity securities of MLPs. The amount of cash that a MLP has available for distributions, and the tax character of such distributions, are dependent upon the amount of cash generated by the MLP’s operations.
5. Shares of Beneficial Interest
The Fund has authorized an unlimited number of $0.001 par value shares of beneficial interest in each class. Transactions in shares of beneficial interest were as follows:
| | | Six Months Ended May 31, 2017 | | | Year Ended
November 30, 2016 | |
| | Shares | | | Amount | | | Shares | | | Amount | |
Class A | | | | | | | | | | | | |
Sold | | | 10,548,005 | | | $ | 100,681,926 | | | | 28,810,307 | | | $ | 251,292,498 | |
Dividends and/or distributions reinvested | | | 1,953,627 | | | | 18,679,511 | | | | 4,848,811 | | | | 42,909,131 | |
Redeemed | | | (21,654,514 | ) | | | (203,200,161 | ) | | | (30,048,645 | ) | | | (261,340,958 | ) |
Net Increase/(Decrease) | | | (9,152,882 | ) | | $ | (83,838,724 | ) | | | 3,610,473 | | | $ | 32,860,671 | |
OPPENHEIMER STEELPATH MLP SELECT 40 FUND 35 |
NOTES TO FINANCIAL STATEMENTS Unaudited / (Continued) |
5. Shares of Beneficial Interest (Continued)
| | | Six Months Ended
May 31, 2017 | | | Year Ended
November 30, 2016 | |
| | | | | | | |
| | Shares | | | Amount | | | Shares | | | Amount | |
Class C | | | | | | | | | | | | |
Sold | | | 7,705,050 | | | $ | 70,471,038 | | | | 19,788,955 | | | $ | 168,230,548 | |
Dividends and/or distributions reinvested | | | 1,878,615 | | | | 17,237,706 | | | | 4,377,630 | | | | 37,507,093 | |
Redeemed | | | (6,229,861 | ) | | | (56,792,304 | ) | | | (15,233,409 | ) | | | (128,312,406 | ) |
Net Increase | | | 3,353,804 | | | $ | 30,916,440 | | | | 8,933,176 | | | $ | 77,425,235 | |
| | | | | | | | | | | | | | | | |
Class I | | | | | | | | | | | | | | | | |
Sold | | | 15,436,875 | | | $ | 151,152,917 | | | | 24,135,985 | | | $ | 213,799,951 | |
Dividends and/or distributions reinvested | | | 1,069,703 | | | | 10,503,171 | | | | 1,869,307 | | | | 17,067,890 | |
Redeemed | | | (5,164,764 | ) | | | (50,572,988 | ) | | | (13,034,589 | ) | | | (113,941,504 | ) |
Net Increase | | | 11,341,814 | | | $ | 111,083,100 | | | | 12,970,703 | | | $ | 116,926,337 | |
| | | | | | | | | | | | | | | | |
Class W | | | | | | | | | | | | | | | | |
Sold | | | — | | | $ | — | | | | — | | | $ | — | |
Dividends and/or distributions reinvested | | | 20,429 | | | | 200,352 | | | | 77,300 | | | | 679,178 | |
Redeemed | | | (70,336 | ) | | | (684,158 | ) | | | (1,398,461 | ) | | | (11,579,997 | ) |
Net Decrease | | | (49,907 | ) | | $ | (483,806 | ) | | | (1,321,161 | ) | | $ | (10,900,819 | ) |
| | | | | | | | | | | | | | | | |
Class Y | | | | | | | | | | | | | | | | |
Sold | | | 48,667,015 | | | $ | 472,015,917 | | | | 99,929,271 | | | $ | 884,972,482 | |
Dividends and/or distributions reinvested | | | 4,812,420 | | | | 47,164,293 | | | | 10,825,544 | | | | 98,106,060 | |
Redeemed | | | (33,421,490 | ) | | | (325,112,259 | ) | | | (85,263,758 | ) | | | (749,716,062 | ) |
Net Increase | | | 20,057,945 | | | $ | 194,067,951 | | | | 25,491,057 | | | $ | 233,362,480 | |
6. Purchases and Sales of Securities
The aggregate cost of purchases and proceeds from sales of securities, other than short-term obligations, for the six months ended May 31, 2017, were as follows:
| | | Purchases | | | Sales | |
Investment securities | | $ | 506,754,190 | | | $ | 272,592,528 | |
36 OPPENHEIMER STEELPATH MLP SELECT 40 FUND |
NOTES TO FINANCIAL STATEMENTS Unaudited / (Continued) |
7. Fees and Other Transactions with Affiliates
Management Fees. Under the investment advisory agreement, the Fund pays the Manager a management fee based on the daily net assets of the Fund at an annual rate as shown in the following table:
Net Assets up to $3 Billion | Net Assets Greater than
$3 Billion and up to $5 Billion | Net Assets in Excess of $5 Billion |
0.70% | 0.68% | 0.65% |
The Fund’s effective management fee for the six months ended May 31, 2017 was 0.70% of average annual net assets before any applicable waivers.
Transfer Agent Fees. OFI Global (the “Transfer Agent”) serves as the transfer and shareholder servicing agent for the Fund. The Fund pays the Transfer Agent a fee based on average net assets. Fees incurred with respect to these services are detailed in the Statement of Operations.
Sub-Transfer Agent Fees. The Transfer Agent has retained Shareholder Services, Inc., a wholly-owned subsidiary of OFI (the “Sub-Transfer Agent”), to provide the day-to-day transfer agent and shareholder servicing of the Fund. Under the Sub-Transfer Agency Agreement, the Transfer Agent pays the Sub-Transfer Agent an annual fee in monthly installments, equal to a percentage of the transfer agent fee collected by the Transfer Agent from the Fund, which shall be calculated after any applicable fee waivers. The fee paid to the Sub-Transfer Agent is paid by the Transfer Agent, not by the Fund.
Trustees’ Compensation. The Board has adopted a compensation deferral plan for independent trustees that enables trustees to elect to defer receipt of all or a portion of the annual compensation they are entitled to receive from the Fund. For purposes of determining the amount owed to the Trustee under the plan, deferred amounts are treated as though equal dollar amounts had been invested in shares of the Fund or in other Oppenheimer funds selected by the Trustee. The Fund purchases shares of the funds selected for deferral by the Trustee in amounts equal to his or her deemed investment, resulting in a Fund asset equal to the deferred compensation liability. Such assets are included as a component of “Other” within the asset section of the Statement of Assets and Liabilities, if applicable. Deferral of trustees’ fees under the plan will not affect the net assets of the Fund, and will not materially affect the Fund’s assets, liabilities or net investment income per share. Amounts will be deferred until distributed in accordance with the compensation deferral plan.
Distribution and Service Plan (12b-1) Fees. Under its General Distributor’s Agreement with the Fund, the Distributor acts as the Fund’s principal underwriter in the continuous public offering of the Fund’s classes of shares.
Service Plan for Class A Shares. The Fund has adopted a Service Plan (the “Plan”) for Class A shares under Rule 12b-1 of the Investment Company Act of 1940. Under the Plan, the Fund reimburses the Distributor for a portion of its costs incurred for services provided to accounts that hold Class A shares. Reimbursement is made periodically at an annual
OPPENHEIMER STEELPATH MLP SELECT 40 FUND 37 |
NOTES TO FINANCIAL STATEMENTS Unaudited / (Continued) |
7. Fees and Other Transactions with Affiliates (Continued)
rate of up to 0.25% of the daily net assets of Class A shares of the Fund. The Distributor currently uses all of those fees to pay dealers, brokers, banks and other financial institutions periodically for providing personal service and maintenance of accounts of their customers that hold Class A shares. Any unreimbursed expenses the Distributor incurs with respect to Class A shares in any fiscal year cannot be recovered in subsequent periods. Fees incurred by the Fund under the Plan are detailed in the Statement of Operations.
Distribution and Service Plans for Class C Shares. The Fund has adopted Distribution and Service Plans (the “Plans”) for Class C shares under Rule 12b-1 of the Investment Company Act of 1940 to compensate the Distributor for distributing those share classes, maintaining accounts and providing shareholder services. Under the Plans, the Fund pays the Distributor an annual asset-based sales charge of 0.75% on Class C shares daily net assets. The Fund also pays a service fee under the Plans at an annual rate of 0.25% of daily net assets.
The Plan and Plans continue in effect from year to year only if the Fund’s Board votes annually to approve their continuance at an in person meeting called for that purpose. Fees incurred by the Fund under the Plans are detailed in the Statement of Operations.
Sales Charges. Front-end sales charges and contingent deferred sales charges (“CDSC”) do not represent expenses of the Fund. They are deducted from the proceeds of sales of Fund shares prior to investment or from redemption proceeds prior to remittance, as applicable. The sales charges retained by the Distributor from the sale of shares and the CDSC retained by the Distributor on the redemption of shares is shown in the following table for the period indicated.
Six Months Ended | | Class A Front-End Sales Charges Retained by Distributor | | | Class A Contingent Deferred Sales Charges Retained by Distributor | | | Class C Contingent Deferred Sales Charges Retained by Distributor | |
May 31, 2017 | | $ | 156,335 | | | $ | 10,577 | | | $ | 24,357 | |
Waivers and Reimbursements of Expenses. The Manager has contractually agreed to limit fees and/or reimburse expenses of the Fund to the extent that the Fund’s total annual fund operating expenses (exclusive of interest, taxes, such as deferred tax expenses, brokerage commissions, acquired fund fees and expenses, dividend costs related to short sales, and litigation expense, if any) exceed 1.10% for Class A shares, 1.85% for Class C shares, 0.85% for Class W shares, and 0.85% for Class Y shares.
The Fund’s total annual operating expenses after fee waiver and/or expense reimbursement (“Net Expenses”) will be higher than these amounts to the extent that the Fund incurs expenses excluded from the expense cap. Because the Fund’s deferred income tax expense/
38 OPPENHEIMER STEELPATH MLP SELECT 40 FUND |
NOTES TO FINANCIAL STATEMENTS Unaudited / (Continued) |
7. Fees and Other Transactions with Affiliates (Continued)
(benefit) is excluded from the expense cap, the Fund’s Net Expenses for each class of shares is increased/(decreased) by the amount of this expense. During the six months ended May 31, 2017, the Manager reimbursed $319,536, $271,316, $3,318, and $852,745 for Class A, Class C, Class W, and Class Y respectively. This undertaking may not be modified or terminated until after one year from the date of the current prospectus, as indicated therein, unless approved by the Fund’s Board.
The Manager can be reimbursed by the Fund within three years after the date the fee limitation and/or expense reimbursement has been made by the Manager, provided that such repayment does not cause the expenses of any class of the Fund to exceed the foregoing limits.
The following table represents amounts eligible for recovery at May 31, 2017:
Eligible Expense Recoupment Expiring: | | | |
November 30, 2017 | | $ | 3,539,444 | |
November 30, 2018 | | | 3,233,228 | |
November 30, 2019 | | | 3,014,707 | |
November 30, 2020 | | | 1,446,915 | |
During the six months ended May 31, 2017, the Manager did not recoup any expenses.
Effective January 1, 2017, the Transfer Agent has voluntarily agreed to waive fees and/or reimburse Fund expenses in an amount equal to 0.015% of average annual net assets for Classes A, C, W and Y.
During the reporting period, the Transfer Agent waived fees and/or reimbursed the Fund for transfer agent and shareholder servicing agent fees as follows:
Class A | | $ | 40,227 | |
Class C | | | 34,533 | |
Class W | | | 415 | |
Class Y | | | 109,173 | |
This fee waiver and/or reimbursement may be terminated at any time.
Related Party. The Interested Trustees and officers of the Fund are also officers or trustees of companies affiliated with the Manager, Distributor, and Transfer Agent.
Cross Trades. The Fund is permitted to purchase and sell securities from and to other Funds managed by the Manager or OFI Global (“cross-trade”) pursuant to “Cross-Trading” Procedures adopted by the Fund’s Board of Trustees. These procedures are designed to ensure that any cross-trade of securities by the Fund from or to another fund that is or could be considered an affiliate of the Fund under certain limited circumstances by virtue of having a
OPPENHEIMER STEELPATH MLP SELECT 40 FUND 39 |
NOTES TO FINANCIAL STATEMENTS Unaudited / (Continued) |
7. Fees and Other Transactions with Affiliates (Continued)
common investment adviser, common Officer, or common Trustee complies with Rule 17a-7 of the 1940 Act. Further, as defined under these procedures, each cross-trade is effected at the current market price.
During the period the Fund had $234,659,660 in purchases and $50,000,314 in sales considered cross-trades, resulting in $18,570,358 of tax adjusted realized gain/(loss).
8. Borrowing Agreement
The Fund, along with Oppenheimer SteelPath MLP Alpha Plus Fund, Oppenheimer SteelPath MLP Income Fund, and Oppenheimer SteelPath MLP Alpha Fund (collectively, the “Trust”), is a borrower in a $700 million revolving credit agreement (the “Loan Agreement”) with a major lending institution (the “Lender”). The Fund is permitted to borrow up to the lesser of one-third of the Fund’s total assets, or the maximum amount permitted pursuant to the Fund’s investment limitations. As the Loan Agreement is not available exclusively to the Fund, the Fund may not be able to borrow all of its requested amounts at any given time. Amounts borrowed under the Loan Agreement, if any, are invested by the Fund under the direction of the Manager consistent with the Fund’s investment objective and policies, and as such, the related investments are subject to normal market fluctuations and investment risks, including the risk of loss due to a decline in value. The borrowing, if any, is fully collateralized throughout the term of the borrowing with securities or other assets of the Fund. The Fund is not liable for borrowings of other funds in the Trust. Securities that have been pledged as collateral for the borrowing are indicated in the Statement of Investments.
Borrowings under the Loan Agreement are charged interest at a calculated rate computed by the Lender based on the one month LIBOR rate plus 0.65% per annum. An unused commitment fee at the rate of 0.125% per annum is charged for any undrawn portion of the credit facility, and each member of the Trust will pay its pro rata share of this fee. A facility fee of 0.20% was charged on the commitment amount, and each party of the Trust paid its pro rata share of this fee. The borrowing is due November 17, 2017, unless another date is mutually agreed upon by the parties of the Loan Agreement. For the period ended May 31, 2017, the Fund paid $102,073 in borrowing fees. The Fund did not utilize the facility during the period ended May 31, 2017.
40 OPPENHEIMER STEELPATH MLP SELECT 40 FUND |
DISTRIBUTION SOURCES Unaudited |
For any distribution that took place over the last six months of the Fund’s reporting period, the table below details on a per-share basis the percentage of the Fund’s total distribution payment amount that was derived from the following sources: net income, net profit from the sale of securities, and other capital sources. Other capital sources represent a return of capital. A return of capital may occur, for example, when some or all of the money that you invested in the Fund is paid back to you. A return of capital distribution does not necessarily reflect the Fund’s investment performance and should not be confused with “yield” or “income.” You should not draw any conclusions about each Fund’s investment performance from the amounts of these distributions. This information is based upon income and capital gains using generally accepted accounting principles as of the date of each distribution. For certain securities, such as Master Limited Partnerships (“MLPs”), the percentages attributed to each category are estimated using historical information because the character of the amounts received from the MLPs in which the Fund invests is unknown until after the end of the calendar year. Because the Fund is actively managed, the relative amount of the Fund’s total distributions derived from various sources over the calendar year may change. Please note that this information should not be used for tax reporting purposes as the tax character of distributable income may differ from the amounts used for this notification. You will receive IRS tax forms in the first quarter of each calendar year detailing the actual amount of the taxable and non-taxable portion of distributions paid to you during the tax year.
For the most current information, please go to oppenheimerfunds.com. Select your Fund, then the ’Detailed’ tab; where ‘Dividends’ are shown, the Fund’s latest pay date will be followed by the sources of any distribution, updated daily.
Fund Name | Pay
Date | Net
Income | Net
Profit
from Sale | Other
Capital
Sources |
Oppenheimer SteelPath MLP Select 40 Fund | 1/6/17 | 0.0% | 0.0% | 100.0% |
Oppenheimer SteelPath MLP Select 40 Fund | 2/7/17 | 0.0% | 0.0% | 100.0% |
Oppenheimer SteelPath MLP Select 40 Fund | 3/7/17 | 0.0% | 0.0% | 100.0% |
Oppenheimer SteelPath MLP Select 40 Fund | 4/5/17 | 0.0% | 0.0% | 100.0% |
Oppenheimer SteelPath MLP Select 40 Fund | 5/5/17 | 0.0% | 0.0% | 100.0% |
OPPENHEIMER STEELPATH MLP SELECT 40 FUND 41 |
PORTFOLIO PROXY VOTING POLICIES AND PROCEDURES; UPDATES TO STATEMENTS OF INVESTMENTS Unaudited |
The Fund has adopted Portfolio Proxy Voting Policies and Procedures under which the Fund votes proxies relating to securities (“portfolio proxies”) held by the Fund. A description of the Fund’s Portfolio Proxy Voting Policies and Procedures is available (i) without charge, upon request, by calling the Fund toll-free at 1.800.CALL OPP (225.5677), (ii) on the Fund’s website at oppenheimerfunds.com, and (iii) on the SEC’s website at www.sec.gov. In addition, the Fund is required to file Form N-PX, with its complete proxy voting record for the 12 months ended June 30th, no later than August 31st of each year. The Fund’s voting record is available (i) without charge, upon request, by calling the Fund toll-free at 1.800.CALL OPP (225.5677), and (ii) in the Form N-PX filing on the SEC’s website at www.sec.gov.
The Fund files its complete schedule of portfolio holdings with the SEC for the first quarter and the third quarter of each fiscal year on Form N-Q. The Fund’s Form N-Q filings are available on the SEC’s website at www.sec.gov. Those forms may be reviewed and copied at the SEC’s Public Reference Room in Washington, D.C. Information on the operation of the Public Reference Room may be obtained by calling 1-800-SEC-0330.
Householding – Delivery of Shareholder Documents
This is to inform you about OppenheimerFunds’ “householding” policy. If more than one member of your household maintains an account in a particular fund, OppenheimerFunds will mail only one copy of the fund’s prospectus (or, if available, the fund’s summary prospectus), annual and semiannual report and privacy policy. The consolidation of these mailings, called householding, benefits your fund through reduced mailing expense, and benefits you by reducing the volume of mail you receive from OppenheimerFunds. Householding does not affect the delivery of your account statements.
Please note that we will continue to household these mailings for as long as you remain an OppenheimerFunds shareholder, unless you request otherwise. If you prefer to receive multiple copies of these materials, please call us at 1.800.CALL-OPP (225-5677). You may also notify us in writing or via email. We will begin sending you individual copies of the prospectus (or, if available, the summary prospectus), reports and privacy policy within 30 days of receiving your request to stop householding.
42 OPPENHEIMER STEELPATH MLP SELECT 40 FUND |
OPPENHEIMER STEELPATH MLP SELECT 40 FUND |
| Trustees and Officers | | Robert J. Malone, Chairman of the Board of Trustees and Trustee Jon S. Fossel, Trustee Richard F. Grabish, Trustee Beverly L. Hamilton, Trustee Victoria J. Herget, Trustee F. William Marshall, Jr., Trustee Karen L. Stuckey, Trustee James D. Vaughn, Trustee Arthur P. Steinmetz, Trustee, President and Principal Executive Officer Stuart Cartner, Vice President Brian Watson, Vice President Cynthia Lo Bessette, Secretary and Chief Legal Officer Jennifer Foxson, Vice President and Chief Business Officer Mary Ann Picciotto, Chief Compliance Officer and Chief Anti-Money Laundering Officer Brian S. Petersen, Treasurer and Principal Financial & Accounting Officer |
| | | |
Manager | | OFI SteelPath, Inc. |
| | | |
Distributor | | OppenheimerFunds Distributor, Inc. |
| | | |
Transfer and Shareholder Servicing Agent | | OFI Global Asset Management, Inc. |
| | | |
Sub-Transfer Agent | | Shareholder Services, Inc. |
| | | DBA OppenheimerFunds Services |
| | | |
| | | |
Independent Registered Public Accounting Firm | | Cohen & Company, Ltd. |
| | | |
Legal Counsel | | Ropes & Gray LLP |
© 2017 OppenheimerFunds, Inc. All rights reserved.
OPPENHEIMER STEELPATH MLP SELECT 40 FUND 43 |
As an Oppenheimer fund shareholder, you are entitled to know how we protect your personal information and how we limit its disclosure. Information Sources
We obtain nonpublic personal information about our shareholders from the following sources:
| | ● | Applications or other forms. |
| | ● | When you create a user ID and password for online account access. |
| | ● | When you enroll in eDocs Direct,SM our electronic document delivery service. |
| | ● | Your transactions with us, our affiliates or others. |
| | ● | Technologies on our website, including: “cookies” and web beacons, which are used to collect data on the pages you visit and the features you use. |
If you visit oppenheimerfunds.com and do not log on to the secure account information areas, we do not obtain any personal information about you. When you do log on to a secure area, we do obtain your user ID and password to identify you. We also use this information to provide you with products and services you have requested, to inform you about products and services that you may be interested in and assist you in other ways.
We do not collect personal information through our website unless you willingly provide it to us, either directly by email or in those areas of the website that request information. In order to update your personal information (including your mailing address, email address and phone number) you must first log on and visit your user profile.
If you have set your browser to warn you before accepting cookies, you will receive the warning message with each cookie. You can refuse cookies by turning them off in your browser. However, doing so may limit your access to certain sections of our website.
We use cookies to help us improve and manage our website. For example, cookies help us recognize new versus repeat visitors to the site, track the pages visited, and enable some special features on the website. This data helps us provide a better service for our website visitors.
Protection of Information
We do not disclose any nonpublic personal information (such as names on a customer list) about current or former customers to anyone, except as permitted by law.
Disclosure of Information
Copies of confirmations, account statements and other documents reporting activity in your fund accounts are made available to your financial advisor (as designated by you). We may also use details about you and your investments to help us, our financial service affiliates, or firms that jointly market their financial products and services with ours, to better serve
44 OPPENHEIMER STEELPATH MLP SELECT 40 FUND |
PRIVACY POLICY NOTICE (Continued) |
your investment needs or suggest educational material that may be of interest to you. If this requires us to provide you with an opportunity to “opt in” or “opt out” of such information sharing with a firm not affiliated with us, you will receive notification on how to do so, before any such sharing takes place.
Right of Refusal
We will not disclose your personal information to unaffiliated third parties (except as permitted by law), unless we first offer you a reasonable opportunity to refuse or “opt out” of such disclosure.
Internet Security and Encryption
In general, the email services provided by our website are encrypted and provide a secure and private means of communication with us. To protect your own privacy, confidential and/ or personal information should only be communicated via email when you are advised that you are using a secure website.
As a security measure, we do not include personal or account information in nonsecure emails, and we advise you not to send such information to us in nonsecure emails. Instead, you may take advantage of the secure features of our website to encrypt your email correspondence. To do this, you will need to use a browser that supports Secure Sockets Layer (SSL) protocol.
| | ● | All transactions, including redemptions, exchanges and purchases, are secured by SSL and 256-bit encryption. SSL is used to establish a secure connection between your PC and OppenheimerFunds’ server. It transmits information in an encrypted and scrambled format. |
| | ● | Encryption is achieved through an electronic scrambling technology that uses a “key” to code and then decode the data. Encryption acts like the cable converter box you may have on your television set. It scrambles data with a secret code so that no one can make sense of it while it is being transmitted. When the data reaches its destination, the same software unscrambles the data. |
| | ● | You can exit the secure area by closing your browser or, for added security, you can use the Log Out button before you close your browser. |
Other Security Measures
We maintain physical, electronic and procedural safeguards to protect your personal account information. Our employees and agents have access to that information only so that they may offer you products or provide services, for example, when responding to your account questions.
OPPENHEIMER STEELPATH MLP SELECT 40 FUND 45 |
PRIVACY POLICY NOTICE (Continued) |
How You Can Help
You can also do your part to keep your account information private and to prevent unauthorized transactions. If you obtain a user ID and password for your account, safeguard that information. Also, take special precautions when accessing your account on a computer used by others.
Who We Are
This joint notice describes the privacy policies of the Oppenheimer funds, OppenheimerFunds, Inc., each of its investment adviser subsidiaries, OppenheimerFunds Distributor, Inc. and OFI Global Trust Co. It applies to all Oppenheimer fund accounts you presently have, or may open in the future, using your Social Security number—whether or not you remain a shareholder of our funds. This notice was last updated as of November 2016. In the event it is updated or changed, we will post an updated notice on our website at oppenheimerfunds.com. If you have any questions about this privacy policy, email us by clicking on the Contact Us section of our website at oppenheimerfunds.com, write to us at P.O. Box 5270, Denver, CO 80217-5270, or call us at 800 CALL OPP (225 5677).
46 OPPENHEIMER STEELPATH MLP SELECT 40 FUND |
THIS PAGE INTENTIONALLY LEFT BLANK
OPPENHEIMER STEELPATH MLP SELECT 40 FUND 47 |


Table of Contents
Fund Performance Discussion | 3 |
Top Holdings and Allocations | 7 |
Share Class Performance | 8 |
Fund Expenses | 10 |
Statement of Investments | 12 |
Statement of Assets and Liabilities | 14 |
Statement of Operations | 16 |
Statements of Changes in Net Assets | 17 |
Financial Highlights | 18 |
Notes to Financial Statements | 22 |
Distribution Sources | 39 |
Portfolio Proxy Voting Policies and Procedures; Updates to Statements of Investments | 40 |
Trustees and Officers | 41 |
Privacy Policy Notice | 42 |
|
Class A Shares
AVERAGE ANNUAL TOTAL RETURNS AT 5/31/17
| | Class A Shares of the Fund | | |
| | Without
Sales Charge | With
Sales Charge | S&P 500 Index | Alerian MLP Index |
6-Month | 1.09% | -4.70% | 10.81% | 2.28% |
1-Year | 4.71% | -1.34% | 17.47% | 6.24% |
5-Year | 3.79% | 2.57% | 15.42% | 2.57% |
Since Inception (3/31/10) | 4.87% | 4.01% | 13.00% | 6.45% |
Performance data quoted represents past performance, which does not guarantee future results. The investment return and principal value of an investment in the Fund will fluctuate so that an investor’s shares, when redeemed, may be worth more or less than their original cost. Fund returns include changes in share price, reinvested distributions, and a 5.75% maximum applicable sales charge except where “without sales charge” is indicated. Current performance may be lower or higher than the performance quoted. Returns do not consider capital gains or income taxes on an individual’s investment. Returns for periods of less than one year are cumulative and not annualized. For performance data current to the most recent month-end, visit oppenheimerfunds.com or call 1.800.CALL OPP (225.5677). See Fund prospectuses and summary prospectuses for more information on share classes and sales charges.
2 OPPENHEIMER STEELPATH MLP ALPHA FUND |
Fund Performance Discussion
The Fund’s Class A shares (without sales charge) produced a total return of 1.09% during the reporting period. In comparison, master limited partnerships (“MLPs”), as measured by the Alerian MLP Index (AMZ), provided a total return gain of 2.28%. Please note that the returns for the Alerian MLP Index are calculated pre-tax, while the Fund’s returns are calculated post corporate tax, which contributed partially to the Fund’s underperformance this reporting period. This generally has a negative impact on the Fund’s performance versus the Index in up markets, and a positive impact on performance in down markets. During the same period, the S&P 500 Index produced a total return gain of 10.81%.
Over the six-month reporting period ended May 31, 2017, the midstream sector underperformed the broader markets as the correlation of price performance between midstream equities and crude oil remained elevated over the period. While the sector performed well early in the period, subsequent crude oil price weakness was accompanied by midstream price weakness. This crude oil price weakness appeared to stem primarily from continued U.S. inventory builds as well as fears that U.S. shale producers were ramping production more quickly than previously anticipated. Interestingly, while a quicker than expected resurgence of U.S. shale production may serve to temper the crude price recovery, we believe midstream assets should benefit through the resultant volume improvements regardless.
The influence of Washington remained topical over the period. In contrast to the challenging energy regulatory environment of the prior presidential administration, President Trump signed multiple midstream related executive orders in late January designed to expedite current and future midstream projects. Two orders were individually specific to the Keystone XL and Dakota Access Pipelines, each directing respective authorities to take all actions necessary and appropriate to facilitate the implementation of the projects. Additionally, President Trump signed an order to expedite the review and approval of high priority infrastructure projects. Separately, three large natural gas pipeline projects, representing a collective $7.5 billion of growth capital spending, received Federal Energy Regulatory Commission (FERC) approval in early February, just ahead of FERC’s loss of a quorum due to the resignation of a FERC commissioner. While at the end of the reporting period the commission still lacked a quorum to vote on project approvals, President Trump had made nominations to fill two of the three vacancies. However, Commissioner Colette Honorable has also announced her intention to not seek another term when her current seat expires in June, but that she is willing to stay on until the end of the year, awaiting her replacement.
OPPENHEIMER STEELPATH MLP ALPHA FUND 3 |
Over the reporting period, we estimate approximately $15 billion of new equity supply entered the market through either secondary offerings, initial public offerings, or “at-the-market” programs in which primary units trade into the market anonymously throughout the normal trading day. This pace of equity issuance represents an increase from approximately $11 billion that was raised over the six month reporting period ended May 31, 2016. Midstream companies also raised approximately $15 billion of debt capital during the period. Most MLPs pay out the majority of excess cash flow as distributions to investors, and therefore must raise external capital to fund growth projects and to fund acquisitions.
MACRO REVIEW
West Texas Intermediate (WTI) crude oil prices ended the reporting period at $47.66 per barrel, down 4% over the reporting period. Global crude prices, as measured by Brent crude oil, traded 2% higher over the reporting period. As previously noted, the crude oil price decline appeared to stem primarily from continued U.S. inventory builds as well as fears that U.S. shale producers were ramping up production more quickly than previously anticipated. Brent exited the period at a $3 per barrel premium to WTI, which is near the historic norm. However, this reversion represents a departure from the $8 to $9 per barrel Brent premium present from 2009 to 2015.
Henry Hub natural gas spot prices exited the period at $3.20 per million British thermal units (“mmbtu”), down 3% over the reporting period, while up 52% from the year-ago period. Natural gas pricing has benefited from a long awaited realignment of supply-demand in which natural gas usage as a heating and electric generation fuel has increased as gas production volume growth has moderated, and as increased exports have become a reality via both liquefied natural gas and new pipelines to Mexico.
Mont Belvieu natural gas liquids (“NGL”) prices ended the reporting period at $24.13 per barrel, a 1% decline over the reporting period. Pricing for NGL purity products varied, with ethane and propane trading higher over the period while butane, isobutene, and natural gasoline prices declined. Frac spreads, a measure of natural gas processing economics, ended the period at $0.30 per gallon, up 8% over the reporting period. Generally, the greater the frac spread, the greater the incentive for producers to seek natural gas processing capacity.
The yield curve flattened over the reporting period as short rates increased while the yields on longer-dated maturities declined. The ten-year Treasury yield declined 18 basis points to end the period at 2.20%. The MLP yield spread at period-end, as measured by the AMZ and the 10-year Treasury bond, widened by 17 basis points to 5.22%.
Over the reporting period, real estate investment trusts (“REITs”) and utilities, two competing yield-oriented equity asset classes, posted total returns of 7.50% (as measured by the Dow Jones Equity REIT Total Return Index) and 16.86% (as measured by the Dow Jones Utility Average
4 OPPENHEIMER STEELPATH MLP ALPHA FUND |
Index), respectively, as compared to the AMZ’s 2.28% total return. Price to forward distributable cash flow (DCF), a commonly watched ratio within the MLP sector, declined over the period ending well below the ten-year average.
SUBSECTOR REVIEW
Performance among subsectors in the midstream, or energy infrastructure, MLP asset class varied for the reporting period. On average, the gathering and processing subsector provided the best performance over the period, buoyed by improved volumetric projections. The natural gas pipeline group followed as investors continued to express preference for the safety of long-haul natural gas pipelines, particularly those backed by utility demand pull.
The upstream subsector experienced the weakest performance over the reporting period as these entities’ cash flows were directly impacted by commodity price weakness over the period. The coal subsector also lagged over the reporting period as domestic coal pricing generally weakened through the reporting period.
FUND REVIEW
Key contributors to the Fund’s performance were TC Pipelines, LP (TCP) and Tallgrass Energy GP, LP (TEGP).
TCP units outperformed over the period, during which the partnership announced plans to acquire its sponsor’s interest in the Iroquois Gas Transmission System and an interest in the Portland Natural Gas Transmission System. Additionally, TCP’s sponsor, TransCanada Corp (TRP), closed its acquisition of Columbia Pipeline Partners (CPPL). We believe that TRP may offer some or all of these assets to TCP in the future, further improving TCP’s growth backlog.
TEGP units outperformed over the period as the general partner’s underlying operating partnership, Tallgrass Energy Partners (TEP), announced better than expected operating and financial results as well as new long-term contracts on the Rockies Express Pipeline. TEGP management expects to grow its distribution by 30% to 40% over 2017.
Key detractors from the Fund’s performance were Targa Resources Corp (TRGP) and Plains All American Pipeline (PAA).
TRGP shares underperformed over the reporting period after reporting weaker than expected results for the first quarter of 2017. During the reporting period, TRGP announced an acquisition that is expected to enhance its already substantial footprint in the premier Permian basin while also facilitating TRGP’s entry into crude gathering activities in the play.
PAA units underperformed over the period as headwinds in its Supply & Logistics segment resulted in operational performance that was below market expectations. Despite continued headwinds in the first half of 2017, Plains is expecting improvement in fee-based volumes and margins during the second half of 2017 and
OPPENHEIMER STEELPATH MLP ALPHA FUND 5 |
into 2018. With its significant asset footprint in the Permian basin, Plains is expected to be one of the primary beneficiaries of continued production growth in the basin.
Please note that significant decreases in cash distributions from the Fund’s MLP investments and/or significant declines in the fair value of its investments may impact the Fund’s assessment regarding the recoverability of certain deferred tax assets, which may result in the recording of a valuation allowance. If a valuation allowance is established, this could have a material impact on the Fund’s net asset value and results of operations for the period. The Fund had a valuation allowance in place for a portion of the reporting period, but did not have one in place at period end. See Note 2 of the Notes to Financial Statements for more information.
OUTLOOK
We continue to believe we have seen the worst of this energy market down cycle. In our opinion, the rate of midstream growth will likely moderate from peak levels, but average distributions are still likely to grow. We expect midstream operators to benefit from the reflation of domestic hydrocarbon production and the more efficient use of existing assets going forward, in contrast to the widespread need to construct new assets over the first years of shale production growth. We believe current market valuations underestimate the potential for renewed business growth going forward and we remain optimistic on the sector’s prospects. Consequently, we believe midstream MLPs continue to offer attractive total return potential based on the potential for price appreciation and stable or growing distribution streams.
6 OPPENHEIMER STEELPATH MLP ALPHA FUND |
Top Holdings and Allocations
TOP TEN MASTER LIMITED PARTNERSHIP HOLDINGS
Energy Transfer Partners LP | 11.22% |
Enterprise Products Partners LP | 7.89% |
TC Pipelines LP | 7.53% |
Energy Transfer Equity LP | 7.50% |
Magellan Midstream Partners LP | 7.25% |
MPLX LP | 6.70% |
Targa Resources Corp. | 6.65% |
Tallgrass Energy GP LP | 4.72% |
Williams Partners LP | 4.71% |
Buckeye Partners LP | 4.10% |
Portfolio holdings and allocations are subject to change. Percentages are as of May 31, 2017, and are based on net assets.
SECTOR ALLOCATION
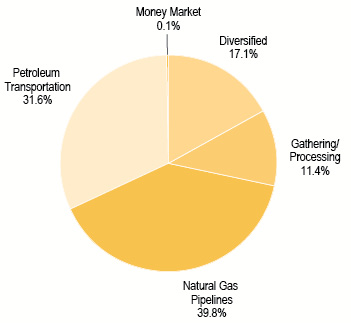
Portfolio holdings and allocations are subject to change. Percentages are as of May 31, 2017, and are based on the total market value of investments.
OPPENHEIMER STEELPATH MLP ALPHA FUND 7 |
Share Class Performance
AVERAGE ANNUAL TOTAL RETURNS WITHOUT SALES CHARGE AS OF 5/31/17
| | Inception Date | 6-Month | 1-Year | 5-Year | Since Inception |
CLASS A (MLPAX) | 3/31/2010 | 1.09% | 4.71% | 3.79% | 4.87% |
CLASS C (MLPGX) | 8/25/2011 | 0.55% | 3.82% | 2.99% | 3.56% |
CLASS I (OSPAX) | 6/28/2013 | 1.17% | 5.16% | N/A | -0.93% |
CLASS Y (MLPOX) | 3/31/2010 | 1.18% | 4.95% | 4.04% | 5.14% |
AVERAGE ANNUAL TOTAL RETURNS WITH SALES CHARGE AS OF 5/31/17
| | Inception Date | 6-Month | 1-Year | 5-Year | Since Inception |
CLASS A (MLPAX) | 3/31/2010 | -4.70% | -1.34% | 2.57% | 4.01% |
CLASS C (MLPGX) | 8/25/2011 | -0.42% | 2.86% | 2.99% | 3.56% |
CLASS I (OSPAX) | 6/28/2013 | 1.17% | 5.16% | N/A | -0.93% |
CLASS Y (MLPOX) | 3/31/2010 | 1.18% | 4.95% | 4.04% | 5.14% |
Performance data quoted represents past performance, which does not guarantee future results. The investment return and principal value of an investment in the Fund will fluctuate so that an investor’s shares, when redeemed, may be worth more or less than their original cost. Current performance may be lower or higher than the performance quoted. Returns do not consider capital gains or income taxes on an individual’s investment. For performance data current to the most recent month-end, visit oppenheimerfunds.com or call 1.800.CALL OPP (225.5677). Fund returns include changes in share price, reinvested distributions, and the applicable sales charge: for Class A shares, the current maximum initial sales charge of 5.75%, and for Class C shares, the contingent deferred sales charge of 1% for the 1-year period. There is no sales charge for Class I or Class Y shares. Returns for periods of less than one year are cumulative and not annualized. See Fund prospectuses and summary prospectuses for more information on share classes and sales charges.
The Fund’s performance is compared to the performance of the S&P 500 Index and the Alerian MLP Index. The S&P 500 Index is a broad-based measure of domestic stock performance. The Alerian MLP Index is a composite of the 50 most prominent Master Limited Partnerships that provides investors with an unbiased, comprehensive benchmark for this emerging asset class. The index, which is calculated using a float-adjusted, capitalization-weighted methodology, is disseminated real-time on a total-return basis. The indices are unmanaged and cannot be purchased directly by investors. While index comparisons may be useful to provide a benchmark for the Fund’s performance, it must be noted that the Fund’s investments are not limited to the investments comprising the indices. Index performance includes reinvestment of income, but does not reflect transaction costs, fees, expenses or taxes. Index performance
8 OPPENHEIMER STEELPATH MLP ALPHA FUND |
is shown for illustrative purposes only as a benchmark for the Fund’s performance, and does not predict or depict performance of the Fund. The Fund’s performance reflects the effects of the Fund’s business and operating expenses.
The Fund’s investment strategy and focus can change over time. The mention of specific fund holdings does not constitute a recommendation by OppenheimerFunds, Inc. or its affiliates.
Before investing in any of the Oppenheimer funds, investors should carefully consider a fund’s investment objectives, risks, charges and expenses. Fund prospectuses and summary prospectuses contain this and other information about the funds, and may be obtained by asking your financial advisor, visiting oppenheimerfunds.com, or calling 1.800.CALL OPP (225.5677). Read prospectuses and summary prospectuses carefully before investing.
Shares of Oppenheimer funds are not deposits or obligations of any bank, are not guaranteed by any bank, are not insured by the FDIC or any other agency, and involve investment risks, including the possible loss of the principal amount invested.
OPPENHEIMER STEELPATH MLP ALPHA FUND 9 |
Fund Expenses
Fund Expenses. As a shareholder of the Fund, you incur two types of costs: (1) transaction costs, which may include sales charges (loads) on purchase payments, contingent deferred sales charges on redemptions; and (2) ongoing costs, including management fees; distribution and service fees; and other Fund expenses. These examples are intended to help you understand your ongoing costs (in dollars) of investing in the Fund and to compare these costs with the ongoing costs of investing in other mutual funds.
The examples are based on an investment of $1,000.00 invested at the beginning of the period and held for the entire 6-month period ended May 31, 2017.
Actual Expenses. The first section of the table provides information about actual account values and actual expenses. You may use the information in this section for the class of shares you hold, together with the amount you invested, to estimate the expense that you paid over the period. Simply divide your account value by $1,000.00 (for example, an $8,600.00 account value divided by $1,000.00 = 8.60), then multiply the result by the number in the first section under the heading entitled “Expenses Paid During 6 Months Ended May 31, 2017” to estimate the expenses you paid on your account during this period.
Hypothetical Example for Comparison Purposes. The second section of the table provides information about hypothetical account values and hypothetical expenses based on the Fund’s actual expense ratio for each class of shares, and an assumed rate of return of 5% per year for each class before expenses, which is not the actual return. The hypothetical account values and expenses may not be used to estimate the actual ending account balance or expenses you paid for the period. You may use this information to compare the ongoing costs of investing in the Fund and other funds. To do so, compare this 5% hypothetical example for the class of shares you hold with the 5% hypothetical examples that appear in the shareholder reports of the other funds.
Please note that the expenses shown in the table are meant to highlight your ongoing costs only and do not reflect any transactional costs, such as front-end or contingent deferred sales charges (loads). Therefore, the “hypothetical” section of the table is useful in comparing ongoing costs only, and will not help you determine the relative total costs of owning different funds. In addition, if these transactional costs were included, your costs would have been higher.
10 OPPENHEIMER STEELPATH MLP ALPHA FUND |
Actual | Beginning
Account
Value
December 1, 2016 | Ending
Account
Value
May 31, 2017 | Expenses
Paid During
6 Months Ended May 31, 2017 |
CLASS A | $ 1,000.00 | $ 1,010.90 | $ 13.40 |
CLASS C | 1,000.00 | 1,005.50 | 17.12 |
CLASS I | 1,000.00 | 1,011.70 | 11.74 |
CLASS Y | 1,000.00 | 1,011.80 | 12.16 |
| | | | |
Hypothetical
(5% return before expenses) | | | |
CLASS A | 1,000.00 | 1,011.68 | 13.40 |
CLASS C | 1,000.00 | 1,007.93 | 17.14 |
CLASS I | 1,000.00 | 1,013.33 | 11.75 |
CLASS Y | 1,000.00 | 1,012.92 | 12.16 |
Expenses are equal to the Fund’s annualized expense ratio for that class, multiplied by the average account value over the period, multiplied by 182/365 (to reflect the one-half year period). Those annualized expense ratios, excluding indirect expenses from affiliated funds, based on the 6-month period ended May 31, 2017 are as follows:
Class | Expense Ratios |
CLASS A | 2.67% |
CLASS C | 3.42 |
CLASS I | 2.34 |
CLASS Y | 2.42 |
The expense ratios for Class A, C, and Y reflect contractual waivers and/or reimbursements of expenses by the Fund’s Manager and Transfer Agent. Some of these undertakings may be modified or terminated at any time, as indicated in the Fund’s prospectus. The “Financial Highlights” tables in the Fund’s financial statements, included in this report, also show the gross expense ratios, without such waivers or reimbursements, if applicable.
OPPENHEIMER STEELPATH MLP ALPHA FUND 11 |
STATEMENT OF INVESTMENTS May 31, 2017 / Unaudited |
Description | | Shares | | | Value | |
Master Limited Partnership Shares — 82.5% | |
Diversified — 14.3% | |
Enterprise Products Partners LP | | | 10,031,150 | | | $ | 268,935,132 | |
Westlake Chemical Partners LP 1 | | | 2,460,450 | | | | 59,788,935 | |
Williams Partners LP | | | 4,100,031 | | | | 160,598,214 | |
Total Diversified | | | | | | | 489,322,281 | |
| | | | | | | | | |
Gathering/Processing — 4.3% | |
Antero Midstream GP LP | | | 3,970,662 | | | | 87,672,217 | |
Western Gas Partners LP | | | 1,056,465 | | | | 58,876,794 | |
Total Gathering/Processing | | | | | | | 146,549,011 | |
| | | | | | | | | |
Natural Gas Pipelines — 33.5% | |
Energy Transfer Equity LP | | | 15,004,580 | | | | 255,678,043 | |
Energy Transfer Partners LP 1 | | | 17,576,299 | | | | 382,460,266 | |
EQT Midstream Partners LP | | | 1,254,116 | | | | 92,503,596 | |
Rice Midstream Partners LP 1 | | | 5,043,988 | | | | 123,628,146 | |
Tallgrass Energy Partners LP | | | 667,368 | | | | 33,101,453 | |
TC Pipelines LP 1 | | | 4,560,096 | | | | 256,596,602 | |
Total Natural Gas Pipelines | | | | | | | 1,143,968,106 | |
| | | | | | | | | |
Petroleum Transportation — 30.4% | |
Buckeye Partners LP | | | 2,181,690 | | | | 139,628,160 | |
Genesis Energy LP | | | 3,475,502 | | | | 108,400,907 | |
Magellan Midstream Partners LP | | | 3,404,874 | | | | 247,159,804 | |
MPLX LP | | | 6,906,877 | | | | 228,272,285 | |
Phillips 66 Partners LP | | | 1,962,425 | | | | 97,179,286 | |
Plains All American Pipeline LP | | | 3,678,128 | | | | 97,396,830 | |
Petroleum Transportation — 30.4% (Continued) | |
Plains GP Holdings LP, Class A | | | 4,359,600 | | | $ | 116,270,532 | |
Tesoro Logistics LP | | | 11,289 | | | | 598,091 | |
Total Petroleum Transportation | | | | | | | 1,034,905,895 | |
| | | | | | | | | |
Total Master Limited Partnership Shares | |
(identified cost $2,627,374,502) | | | | 2,814,745,293 | |
| | | | | | | | | |
Common Stock — 13.5% | |
Diversified — 2.1% | | | | | | | | |
Williams Cos., Inc. | | | 2,543,872 | | | | 72,754,739 | |
| | | | | | | | | |
Gathering/Processing — 6.7% | |
Targa Resources Corp. | | | 4,934,980 | | | | 226,663,631 | |
| | | | | | | | | |
Natural Gas Pipelines — 4.7% | |
Tallgrass Energy GP LP 1 | | | 6,237,580 | | | | 160,742,437 | |
| | | | | | | | | |
Total Common Stock | | | | | |
(identified cost $405,475,256) | | | | 460,160,807 | |
| | | | | | | | | |
Short-Term Investments — 0.1% | |
Money Market — 0.1% | |
Fidelity Treasury Portfolio, Institutional Class, 0.633%2 | | | 1,914,555 | | | | 1,914,555 | |
| | | | | | | | | |
Total Short-Term Investments | | | | | |
(identified cost $1,914,555) | | | | 1,914,555 | |
| | | | | | | | | |
Total Investments — 96.1% | |
(identified cost $3,034,764,313) | | | | 3,276,820,655 | |
Other Assets In Excess of Liabilities — 3.9% | | | | 131,927,101 | |
Net Assets — 100.0% | | | $ | 3,408,747,756 | |
12 OPPENHEIMER STEELPATH MLP ALPHA FUND |
STATEMENT OF INVESTMENTS Unaudited / (Continued) |
Footnotes to Statement of Investments
LLC — Limited Liability Company
LP — Limited Partnership
1. | Is or was an affiliate, as defined by the Investment Company Act of 1940, at or during the period ended May 31, 2017, by virtue of the Fund owning at least 5% of the voting securities of the issuer. Transactions during this period in which the issuer was an affiliate are as follows: |
| | | Shares
November 30,
2016 | | | Gross
Additions | | | Gross
Reductions | | | Shares
May 31, 2017 | |
Energy Transfer Partners LP i, ii | | | 9,493,711 | | | | 12,556,709 | | | | (4,474,121 | ) | | | 17,576,299 | |
Nustar GP Holdings LLC i | | | 2,341,638 | | | | — | | | | (2,341,638 | ) | | | — | |
Rice Midstream Partners LP | | | 168,500 | | | | 5,324,132 | | | | (448,644 | ) | | | 5,043,988 | |
Rice Midstream Partners LP PIPE Units i | | | 4,788,003 | | | | — | | | | (4,788,003 | ) | | | — | |
Tallgrass Energy GP LP | | | 7,338,310 | | | | 276,946 | | | | (1,377,676 | ) | | | 6,237,580 | |
TC Pipelines LP | | | 4,803,969 | | | | 136,439 | | | | (380,312 | ) | | | 4,560,096 | |
TransMontaigne Partners LP i | | | 989,349 | | | | — | | | | (989,349 | ) | | | — | |
Westlake Chemical Partners LP | | | 2,830,575 | | | | 137,029 | | | | (507,154 | ) | | | 2,460,450 | |
| | | | | | | | | | | | | | | | | |
| | | Value
May 31, 2017 | | | Distributions | | | Realized
Gain/(Loss) | | | | | |
Energy Transfer Partners LP i, ii | | $ | 382,460,266 | | | $ | 16,481,934 | | | $ | 26,074,496 | | | | | |
Nustar GP Holdings LLC i | | | — | | | | 1,251,425 | | | | (604,512 | ) | | | | |
Rice Midstream Partners LP | | | 123,628,146 | | | | 2,733,327 | | | | 1,288,588 | | | | | |
Rice Midstream Partners LP PIPE Units i | | | — | | | | — | | | | — | | | | | |
Tallgrass Energy GP LP | | | 160,742,437 | | | | 3,866,811 | | | | 32,810 | | | | | |
TC Pipelines LP | | | 256,596,602 | | | | 9,073,335 | | | | 12,604,336 | | | | | |
TransMontaigne Partners LP i | | | — | | | | 699,966 | | | | 17,723,243 | | | | | |
Westlake Chemical Partners LP | | | 59,788,935 | | | | 1,764,173 | | | | 4,848,294 | | | | | |
| | | $ | 983,216,386 | | | $ | 35,870,971 | | | $ | 61,967,255 | | | | | |
| | i | Is not an affiliate as of May 31, 2017. Was an affiliate during the period ended May 31, 2017. |
| | ii | Acquired by Sunoco Logistics Partners LP April 28, 2017. Name changed from Sunoco Logistic Partners LP effective May 1, 2017. |
2. | Variable rate security; the coupon rate represents the rate at May 31, 2017. |
See accompanying Notes to Financial Statements.
OPPENHEIMER STEELPATH MLP ALPHA FUND 13 |
STATEMENT OF ASSETS AND LIABILITIES May 31, 2017 / Unaudited |
Assets: | | | |
Investments at value – see accompanying Statement of Investments: | | | |
Unaffiliated companies (cost $2,053,780,102) | | $ | 2,293,604,269 | |
Affiliated companies (cost $980,984,211) | | | 983,216,386 | |
| | | 3,276,820,655 | |
Deferred tax asset, net | | | 140,495,850 | |
Receivable for beneficial interest sold | | | 3,851,691 | |
Receivable for investments sold | | | 8,027,141 | |
Prepaid expenses | | | 193,831 | |
Dividends receivable | | | 3,920 | |
Total assets | | | 3,429,393,088 | |
| | | | | |
Liabilities: | | | | |
Payable for beneficial interest redeemed | | | 11,606,680 | |
Payable for investments purchased | | | 4,237,284 | |
Payable to Manager | | | 2,990,560 | |
Payable for distribution and service plan fees | | | 828,649 | |
Transfer agent fees payable | | | 588,408 | |
Trustees' fees payable | | | 30,089 | |
Borrowing expense payable | | | 18,682 | |
Other liabilities | | | 344,980 | |
Total liabilities | | | 20,645,332 | |
| | | | | |
Net Assets | | $ | 3,408,747,756 | |
| | | | | |
Composition of Net Assets | | | | |
Par value of shares of beneficial interest | | $ | 383,012 | |
Paid-in capital | | | 3,622,356,139 | |
Undistributed net investment loss, net of deferred taxes | | | (130,471,774 | ) |
Accumulated undistributed net realized losses on investments, net of deferred taxes | | | (235,844,582 | ) |
Net unrealized appreciation on investments, net of deferred taxes | | | 152,324,961 | |
Net Assets | | $ | 3,408,747,756 | |
14 OPPENHEIMER STEELPATH MLP ALPHA FUND |
STATEMENT OF ASSETS AND LIABILITIES Unaudited / (Continued) |
Net Asset Value, Offering Price and Redemption Proceeds Per Share ($0.001 Par Value, Unlimited Shares Authorized) | | | |
Class A Shares: | | | |
Net asset value and redemption proceeds per share | | $ | 8.88 | |
Offering price per share (net asset value plus sales charge of 5.75% of offering price) | | $ | 9.42 | |
Class C Shares: | | | | |
Net asset value, offering price and redemption proceeds per share | | $ | 8.47 | |
Class I Shares: | | | | |
Net asset value, offering price and redemption proceeds per share | | $ | 9.12 | |
Class Y Shares: | | | | |
Net asset value, offering price and redemption proceeds per share | | $ | 9.09 | |
Net Assets: | | | |
Class A shares | | $ | 804,699,786 | |
Class C shares | | | 730,271,933 | |
Class I shares | | | 151,939,618 | |
Class Y shares | | | 1,721,836,419 | |
Total Net Assets | | $ | 3,408,747,756 | |
| | | | | |
Shares Outstanding: | | | | |
Class A shares | | | 90,658,900 | |
Class C shares | | | 86,186,022 | |
Class I shares | | | 16,661,581 | |
Class Y shares | | | 189,505,494 | |
Total Shares Outstanding | | | 383,011,997 | |
See accompanying Notes to Financial Statements.
OPPENHEIMER STEELPATH MLP ALPHA FUND 15 |
STATEMENT OF OPERATIONS
For the Six Months Ended May 31, 2017 / Unaudited |
Investment Income | | | |
Distributions from: | | | |
Unaffiliated Master Limited Partnerships | | $ | 70,428,433 | |
Affiliated Master Limited Partnerships | | | 35,870,971 | |
Less return of capital on distributions from: | | | | |
Unaffiliated Master Limited Partnerships | | | (70,428,433 | ) |
Affiliated Master Limited Partnerships | | | (35,870,971 | ) |
Dividend income | | | 1,784,697 | |
Total investment income | | | 1,784,697 | |
| | | | | |
Expenses | | | | |
Management fees | | | 19,727,457 | |
Distribution and service plan fees | | | | |
Class A | | | 1,318,494 | |
Class C | | | 3,918,706 | |
Transfer agent fees | | | | |
Class A | | | 1,163,767 | |
Class C | | | 862,128 | |
Class I | | | 20,508 | |
Class Y | | | 1,781,329 | |
Administrative fees | | | 372,983 | |
Tax expense | | | 125,049 | |
Borrowing fees | | | 111,761 | |
Legal, auditing, and other professional fees | | | 111,659 | |
Custody fees | | | 94,384 | |
Registration fees | | | 56,485 | |
Trustees’ fees | | | 53,365 | |
Other | | | 66,165 | |
Total expenses, before waivers and deferred taxes | | | 29,784,240 | |
Less expense waivers | | | (1,887,111 | ) |
Net expenses, before deferred taxes | | | 27,897,129 | |
| | | | | |
Net investment loss, before deferred taxes | | | (26,112,432 | ) |
Deferred tax benefit | | | 10,183,151 | |
Net investment loss, net of deferred taxes | | | (15,929,281 | ) |
| | | | | |
Net Realized and Unrealized Gains/Losses on Investments: | | | | |
Net Realized Gains/Losses | | | | |
Investments from: | | | | |
Unaffiliated companies | | | 80,676,588 | |
Affiliated companies | | | 61,967,255 | |
Deferred tax expense | | | (52,350,290 | ) |
Net realized gains, net of deferred taxes | | | 90,293,553 | |
Net Change in Unrealized Appreciation | | | | |
Investments | | | (58,017,843 | ) |
Deferred tax benefit | | | 21,292,548 | |
Net change in unrealized appreciation, net of deferred taxes | | | (36,725,295 | ) |
| | | | | |
Net realized and unrealized gains on investments, net of deferred taxes | | | 53,568,258 | |
Change in net assets resulting from operations | | $ | 37,638,977 | |
See accompanying Notes to Financial Statements.
16 OPPENHEIMER STEELPATH MLP ALPHA FUND |
STATEMENTS OF CHANGES IN NET ASSETS |
| | | For the Six Months Ended May 31, 2017 (Unaudited) | | | For the
Year Ended November 30,
2016 | |
Operations | | | | | | |
Net investment loss, net of deferred taxes | | $ | (15,929,281 | ) | | $ | (21,712,058 | ) |
Net realized gains / losses, net of deferred taxes | | | 90,293,553 | | | | (313,158,036 | ) |
Net change in unrealized appreciation/(depreciation), net of deferred taxes | | | (36,725,295 | ) | | | 482,304,049 | |
Change in net assets resulting from operations | | | 37,638,977 | | | | 147,433,955 | |
| | | | | | | | | |
Distributions to Shareholders | | | | | | | | |
Distributions to shareholders from return of capital: | | | | | | | | |
Class A shares | | | (32,685,161 | ) | | | (83,067,958 | ) |
Class C shares | | | (24,712,233 | ) | | | (60,197,247 | ) |
Class I shares | | | (4,055,155 | ) | | | (3,184,331 | ) |
Class Y shares | | | (47,122,720 | ) | | | (112,993,001 | ) |
Change in net assets resulting from distributions to shareholders | | | (108,575,269 | ) | | | (259,442,537 | ) |
| | | | | | | | | |
Beneficial Interest Transactions | | | | | | | | |
Class A shares | | | (252,645,199 | ) | | | (107,343,565 | ) |
Class C shares | | | (24,546,690 | ) | | | 20,072,272 | |
Class I shares | | | 56,641,675 | | | | 87,606,240 | |
Class Y shares | | | 205,843,792 | | | | 1,504,531 | |
Change in net assets resulting from beneficial interest transactions | | | (14,706,422 | ) | | | 1,839,478 | |
Change in net assets | | | (85,642,714 | ) | | | (110,169,104 | ) |
| | | | | | | | | |
Net Assets | | | | | | | | |
Beginning of period | | | 3,494,390,470 | | | | 3,604,559,574 | |
End of period | | $ | 3,408,747,756 | | | $ | 3,494,390,470 | |
| | | | | | | | | |
Undistributed net investment loss, net of deferred taxes | | $ | (130,471,774 | ) | | $ | (114,542,493 | ) |
See accompanying Notes to Financial Statements.
OPPENHEIMER STEELPATH MLP ALPHA FUND 17 |
Class A | | Six Months Ended
May 31, 2017 (Unaudited) | | | Year Ended November 30,
2016 | | | Year Ended November 30,
2015 | | | Year Ended November 28,
2014* | | | Year Ended November 29,
2013* | | | Year Ended November 30,
2012 | |
Per Share Operating Data | | | | | | | | | | | | | | | | | | |
Net Asset Value, Beginning of Period | | $ | 9.05 | | | $ | 9.32 | | | $ | 12.81 | | | $ | 12.04 | | | $ | 10.70 | | | $ | 10.38 | |
Income/(loss) from investment operations: | | | | | | | | | | | | | | | | | | | | | | | | |
Net investment loss1 | | | (0.04 | ) | | | (0.06 | ) | | | (0.07 | ) | | | (0.12 | ) | | | (0.11 | ) | | | (0.10 | ) |
Return of capital1 | | | 0.17 | | | | 0.35 | | | | 0.40 | | | | 0.42 | | | | 0.42 | | | | 0.41 | |
Net realized and unrealized gains/(losses) | | | (0.02 | ) | | | 0.13 | | | | (3.13 | ) | | | 1.16 | | | | 1.72 | | | | 0.70 | |
Total from investment operations | | | 0.11 | | | | 0.42 | | | | (2.80 | ) | | | 1.46 | | | | 2.03 | | | | 1.01 | |
Distributions to shareholders: | | | | | | | | | | | | | | | | | | | | | | | | |
Return of capital | | | (0.28 | ) | | | (0.69 | ) | | | (0.69 | ) | | | (0.69 | ) | | | (0.69 | ) | | | (0.69 | ) |
Net asset value, end of period | | $ | 8.88 | | | $ | 9.05 | | | $ | 9.32 | | | $ | 12.81 | | | $ | 12.04 | | | $ | 10.70 | |
| | | | | | | | | | | | | | | | | | | | | | | | |
Total Return, at Net Asset Value2 | | | 1.09 | % | | | 5.25 | % | | | (22.59 | %) | | | 12.26 | % | | | 19.29 | % | | | 9.93 | % |
| | | | | | | | | | | | | | | | | | | | | | | | | |
Ratios/Supplemental Data | | | | | | | | | | | | | | | | | | | | | | | | |
Net assets, end of period (in thousands) | | $ | 804,700 | | | $ | 1,073,057 | | | $ | 1,226,012 | | | $ | 1,937,356 | | | $ | 1,154,926 | | | $ | 193,974 | |
Ratio of Expenses to Average Net Assets:3 | | | | | | | | | | | | | |
Before (waivers) and deferred tax expense/(benefit) | | | 1.62 | % | | | 1.64 | % | | | 1.63 | % | | | 1.65 | % | | | 1.55 | % | | | 1.58 | % |
Expense (waivers) | | | (0.11 | %) | | | (0.11 | %) | | | (0.11 | %) | | | (0.12 | %) | | | (0.03 | %) | | | (0.08 | %) |
Net of (waivers) and before deferred tax expense/(benefit) | | | 1.51 | %4 | | | 1.53 | %4 | | | 1.52 | %4 | | | 1.53 | %4 | | | 1.52 | %5 | | | 1.50 | % |
Deferred tax expense/(benefit)6,7 | | | 1.16 | % | | | 2.54 | % | | | (14.45 | %) | | | 5.38 | % | | | 8.07 | % | | | 5.55 | % |
Total expenses/(benefit) | | | 2.67 | % | | | 4.07 | % | | | (12.93 | %) | | | 6.91 | % | | | 9.59 | % | | | 7.05 | % |
| | | | | | | | | | | | | | | | | | | | | | | | | |
Ratio of Investment Loss to Average Net Assets:3 | | | | | | | | | | | | | |
Before (waivers) and deferred tax benefit/(expense) | | | (1.60 | %) | | | (1.32 | %) | | | (1.38 | %) | | | (1.57 | %) | | | (1.52 | %) | | | (1.57 | %) |
Expense (waivers) | | | (0.11 | %) | | | (0.11 | %) | | | (0.11 | %) | | | (0.12 | %) | | | (0.03 | %) | | | (0.08 | %) |
Net of expense (waivers) and before deferred tax benefit/(expense) | | | (1.49 | %) | | | (1.21 | %) | | | (1.27 | %) | | | (1.45 | %) | | | (1.49 | %) | | | (1.49 | %) |
Deferred tax benefit7,8 | | | 0.56 | % | | | 0.55 | % | | | 0.63 | % | | | 0.54 | % | | | 0.54 | % | | | 0.53 | % |
Net investment loss | | | (0.93 | %) | | | (0.66 | %) | | | (0.64 | %) | | | (0.91 | %) | | | (0.95 | %) | | | (0.96 | %) |
| | | | | | | | | | | | | | | | | | | | | | | | |
Portfolio turnover rate | | | 24 | % | | | 35 | % | | | 36 | % | | | 17 | % | | | 9 | % | | | 15 | % |
* | November 28, 2014 and November 29, 2013 represent the last business day of the Fund’s respective reporting periods. |
1. | Per share amounts calculated based on average shares outstanding during the period net of deferred tax expense/benefit. |
2. | Assumes an initial investment on the business day before the first day of the fiscal period, with all dividends and distributions reinvested in additional shares on the reinvestment date, and redemptions at the net asset value calculated on the last business day of the fiscal period. Sales charges are not reflected in the total returns. Total returns are not annualized for periods less than one full year. Returns do not reflect the deduction of taxes that a shareholder would pay on fund distributions or the redemption of fund shares. The returns do not include adjustments in accordance with generally accepted accounting principles required at the period end for financial reporting purposes. |
3. | Annualized for less than a full period. |
4. | Includes borrowing and franchise tax expense. Without borrowing and franchise tax expense, the net expense ratio would be 1.50%. |
5. | Includes franchise tax expense. Without franchise tax expense the net expense ratio would be 1.50%. |
6. | Deferred tax expense estimate for the ratio calculation is derived from the net investment income/loss, and realized and unrealized gains/losses. |
7. | Effective December 1, 2013 the deferred tax expense and deferred tax benefit are allocated based on average net assets. Prior to December 1, 2013 the deferred tax expense and deferred tax benefit were allocated based on specific class expenses. |
8. | Deferred tax benefit for the ratio calculation is derived from net investment income/loss only. |
See accompanying Notes to Financial Statements.
18 OPPENHEIMER STEELPATH MLP ALPHA FUND |
FINANCIAL HIGHLIGHTS (Continued) |
Class C | | Six Months Ended
May 31, 2017 (Unaudited) | | | Year Ended November 30,
2016 | | | Year Ended November 30,
2015 | | | Year Ended November 28,
2014* | | | Year Ended November 29,
2013* | | | Year Ended November 30,
2012 | |
Per Share Operating Data | | | | | | | | | | | | | | | | | | |
Net Asset Value, Beginning of Period | | $ | 8.69 | | | $ | 9.04 | | | $ | 12.53 | | | $ | 11.89 | | | $ | 10.64 | | | $ | 10.40 | |
Income/(loss) from investment operations: | | | | | | | | | | | | | | | | | | | | | | | | |
Net investment loss1 | | | (0.08 | ) | | | (0.13 | ) | | | (0.16 | ) | | | (0.22 | ) | | | (0.17 | ) | | | (0.15 | ) |
Return of capital1 | | | 0.17 | | | | 0.35 | | | | 0.40 | | | | 0.42 | | | | 0.42 | | | | 0.44 | |
Net realized and unrealized gains/(losses) | | | (0.03 | ) | | | 0.12 | | | | (3.04 | ) | | | 1.13 | | | | 1.69 | | | | 0.64 | |
Total from investment operations | | | 0.06 | | | | 0.34 | | | | (2.80 | ) | | | 1.33 | | | | 1.94 | | | | 0.93 | |
Distributions to shareholders: | | | | | | | | | | | | | | | | | | | | | | | | |
Return of capital | | | (0.28 | ) | | | (0.69 | ) | | | (0.69 | ) | | | (0.69 | ) | | | (0.69 | ) | | | (0.69 | ) |
Net asset value, end of period | | $ | 8.47 | | | $ | 8.69 | | | $ | 9.04 | | | $ | 12.53 | | | $ | 11.89 | | | $ | 10.64 | |
| | | | | | | | | | | | | | | | | | | | | | | | |
Total Return, at Net Asset Value2 | | | 0.55 | % | | | 4.51 | % | | | (23.11 | %) | | | 11.30 | % | | | 18.54 | % | | | 9.12 | % |
| | | | | | | | | | | | | | | | | | | | | | | | | |
Ratios/Supplemental Data | | | | | | | | | | | | | | | | | | | | | | | | |
Net assets, end of period (in thousands) | | $ | 730,272 | | | $ | 772,963 | | | $ | 783,886 | | | $ | 1,011,690 | | | $ | 451,351 | | | $ | 14,593 | |
Ratio of Expenses to Average Net Assets:3 | | | | | | | | | | | | | |
Before (waivers) and deferred tax expense/(benefit) | | | 2.37 | % | | | 2.39 | % | | | 2.38 | % | | | 2.40 | % | | | 2.30 | % | | | 2.63 | % |
Expense (waivers) | | | (0.11 | %) | | | (0.11 | %) | | | (0.11 | %) | | | (0.12 | %) | | | (0.03 | %) | | | (0.38 | %) |
Net of (waivers) and before deferred tax expense/(benefit) | | | 2.26 | %4 | | | 2.28 | %4 | | | 2.27 | %4 | | | 2.28 | %4 | | | 2.27 | %5 | | | 2.25 | % |
Deferred tax expense/(benefit)6,7 | | | 1.16 | % | | | 2.54 | % | | | (14.45 | %) | | | 5.38 | % | | | 6.91 | % | | | 5.29 | % |
Total expenses/(benefit) | | | 3.42 | % | | | 4.82 | % | | | (12.18 | %) | | | 7.66 | % | | | 9.18 | % | | | 7.54 | % |
| | | | | | | | | | | | | | | | | | | | | | | | | |
Ratio of Investment Loss to Average Net Assets:3 | | | | | | | | | | | | | |
Before (waivers) and deferred tax benefit/(expense) | | | (2.56 | %) | | | (2.27 | %) | | | (2.21 | %) | | | (2.34 | %) | | | (2.27 | %) | | | (2.63 | %) |
Expense (waivers) | | | (0.11 | %) | | | (0.11 | %) | | | (0.11 | %) | | | (0.12 | %) | | | (0.03 | %) | | | (0.38 | %) |
Net of expense (waivers) and before deferred tax benefit/(expense) | | | (2.45 | %) | | | (2.16 | %) | | | (2.10 | %) | | | (2.22 | %) | | | (2.24 | %) | | | (2.25 | %) |
Deferred tax benefit7,8 | | | 0.56 | % | | | 0.55 | % | | | 0.63 | % | | | 0.54 | % | | | 0.82 | % | | | 0.81 | % |
Net investment loss | | | (1.89 | %) | | | (1.61 | %) | | | (1.47 | %) | | | (1.68 | %) | | | (1.42 | %) | | | (1.44 | %) |
| | | | | | | | | | | | | | | | | | | | | | | | |
Portfolio turnover rate | | | 24 | % | | | 35 | % | | | 36 | % | | | 17 | % | | | 9 | % | | | 15 | % |
* | November 28, 2014 and November 29, 2013 represent the last business day of the Fund’s respective reporting periods. |
1. | Per share amounts calculated based on average shares outstanding during the period net of deferred tax expense/benefit. |
2. | Assumes an initial investment on the business day before the first day of the fiscal period, with all dividends and distributions reinvested in additional shares on the reinvestment date, and redemptions at the net asset value calculated on the last business day of the fiscal period. Sales charges are not reflected in the total returns. Total returns are not annualized for periods less than one full year. Returns do not reflect the deduction of taxes that a shareholder would pay on fund distributions or the redemption of fund shares. The returns do not include adjustments in accordance with generally accepted accounting principles required at the period end for financial reporting purposes. |
3. | Annualized for less than a full period. |
4. | Includes borrowing and franchise tax expense. Without borrowing and franchise tax expense, the net expense ratio would be 2.25%. |
5. | Includes franchise tax expense. Without franchise tax expense the net expense ratio would be 2.25%. |
6. | Deferred tax expense estimate for the ratio calculation is derived from the net investment income/loss, and realized and unrealized gains/losses. |
7. | Effective December 1, 2013 the deferred tax expense and deferred tax benefit are allocated based on average net assets. Prior to December 1, 2013 the deferred tax expense and deferred tax benefit were allocated based on specific class expenses. |
8. | Deferred tax benefit for the ratio calculation is derived from net investment income/loss only. |
See accompanying Notes to Financial Statements.
OPPENHEIMER STEELPATH MLP ALPHA FUND 19 |
FINANCIAL HIGHLIGHTS (Continued) |
Class I | | Six Months Ended
May 31, 2017 (Unaudited) | | | Year Ended November 30,
2016 | | | Year Ended November 30,
2015 | | | Year Ended November 28,
2014* | | | Period Ended November 29,
2013*,1,2 | |
Per Share Operating Data | | | | | | | | | | | | | | | |
Net Asset Value, Beginning of Period | | $ | 9.28 | | | $ | 9.50 | | | $ | 12.99 | | | $ | 12.17 | | | $ | 12.15 | |
Income/(loss) from investment operations: | | | | | | | | | | | | | | | | | | | | |
Net investment income/(loss)3 | | | (0.00 | )4 | | | 0.09 | | | | (0.05 | ) | | | (0.12 | ) | | | (0.04 | ) |
Return of capital3 | | | 0.17 | | | | 0.35 | | | | 0.40 | | | | 0.42 | | | | 0.19 | |
Net realized and unrealized gains/(losses) | | | (0.05 | ) | | | 0.03 | | | | (3.15 | ) | | | 1.21 | | | | 0.21 | |
Total from investment operations | | | 0.12 | | | | 0.47 | | | | (2.80 | ) | | | 1.51 | | | | 0.36 | |
Distributions to shareholders: | | | | | | | | | | | | | | | | | | | | |
Return of capital | | | (0.28 | ) | | | (0.69 | ) | | | (0.69 | ) | | | (0.69 | ) | | | (0.34 | ) |
Net asset value, end of period | | $ | 9.12 | | | $ | 9.28 | | | $ | 9.50 | | | $ | 12.99 | | | $ | 12.17 | |
| | | | | | | | | | | | | | | | | | | | |
Total Return, at Net Asset Value5 | | | 1.17 | % | | | 5.70 | % | | | (22.27 | %) | | | 12.55 | % | | | 3.05 | % |
| | | | | | | | | | | | | | | | | | | | | |
Ratios/Supplemental Data | | | | | | | | | | | | | | | | | | | | |
Net assets, end of period (in thousands) | | $ | 151,940 | | | $ | 99,431 | | | $ | 9,722 | | | $ | 3,732 | | | $ | 73 | |
Ratio of Expenses to Average Net Assets:6 | | | | | | | | | |
Before deferred tax expense/(benefit) | | | 1.18 | %7 | | | 1.18 | %7 | | | 1.19 | %7 | | | 1.20 | %7 | | | 1.32 | %8 |
Deferred tax expense/(benefit)9,10 | | | 1.16 | % | | | 2.54 | % | | | (14.45 | %) | | | 5.38 | % | | | 4.51 | % |
Total expenses/(benefit) | | | 2.34 | % | | | 3.72 | % | | | (13.26 | %) | | | 6.58 | % | | | 5.83 | % |
| | | | | | | | | | | | | | | | | | | | | |
Ratio of Investment Loss to Average Net Assets:6 | | | | | | | | | |
Before deferred tax benefit/(expense) | | | (0.47 | %) | | | 0.45 | % | | | (1.12 | %) | | | (1.47 | %) | | | (1.29 | %) |
Deferred tax benefit10,11 | | | 0.56 | % | | | 0.55 | % | | | 0.63 | % | | | 0.54 | % | | | 0.46 | % |
Net investment income/(loss) | | | 0.09 | % | | | 1.00 | % | | | (0.49 | %) | | | (0.93 | %) | | | (0.83 | %) |
| | | | | | | | | | | | | | | | | | | | |
Portfolio turnover rate | | | 24 | % | | | 35 | % | | | 36 | % | | | 17 | % | | | 9 | % |
* | November 28, 2014 and November 29, 2013 represent the last business day of the Fund’s respective reporting periods. |
1. | Shares commenced operations at the close of business June 28, 2013. |
2. | Effective June 28, 2013, Class I shares were renamed Class Y shares. See Note 1 of the Notes to Financial Statements for additional information. |
3. | Per share amounts calculated based on average shares outstanding during the period net of deferred tax expense/benefit. |
5. | Assumes an initial investment on the business day before the first day of the fiscal period, with all dividends and distributions reinvested in additional shares on the reinvestment date, and redemptions at the net asset value calculated on the last business day of the fiscal period. Sales charges are not reflected in the total returns. Total returns are not annualized for periods less than one full year. Returns do not reflect the deduction of taxes that a shareholder would pay on fund distributions or the redemption of fund shares. The returns do not include adjustments in accordance with generally accepted accounting principles required at the period end for financial reporting purposes. |
6. | Annualized for less than full period. |
7. | Includes borrowing and franchise tax expense. Without borrowing and franchise tax expense, the net expense ratio would be 1.17%, 1.15%, 1.17% and 1.18% for the periods ended May 31, 2017, November 30, 2016, November 30, 2015 and November 28, 2014, respectively. |
8. | Includes franchise tax expense. Without franchise tax expense the net expense ratio would be 1.06%. |
9. | Deferred tax expense estimate for the ratio calculation is derived from the net investment income/loss, and realized and unrealized gains/losses. |
10. | Effective December 1, 2013 the deferred tax expense and deferred tax benefit are allocated based on average net assets. Prior to December 1, 2013 the deferred tax expense and deferred tax benefit were allocated based on specific class expenses. |
11. | Deferred tax benefit for the ratio calculation is derived from net investment income/loss only. |
See accompanying Notes to Financial Statements.
20 OPPENHEIMER STEELPATH MLP ALPHA FUND |
FINANCIAL HIGHLIGHTS (Continued) |
Class Y | | Six Months Ended
May 31, 2017 (Unaudited) | | | Year Ended November 30,
2016 | | | Year Ended November 30,
2015 | | | Year Ended November 28,
2014* | | | Year Ended November 29,
2013*,1 | | | Year Ended November 30,
20121 | |
Per Share Operating Data | | | | | | | | | | | | | | | | | | |
Net Asset Value, Beginning of Period | | $ | 9.25 | | | $ | 9.49 | | | $ | 12.99 | | | $ | 12.18 | | | $ | 10.78 | | | $ | 10.43 | |
Income/(loss) from investment operations: | | | | | | | | | | | | | | | | | | | | | | | | |
Net investment loss2 | | | (0.02 | ) | | | (0.02 | ) | | | (0.03 | ) | | | (0.07 | ) | | | (0.10 | ) | | | (0.09 | ) |
Return of capital2 | | | 0.17 | | | | 0.35 | | | | 0.40 | | | | 0.42 | | | | 0.41 | | | | 0.40 | |
Net realized and unrealized gains/(losses) | | | (0.03 | ) | | | 0.12 | | | | (3.18 | ) | | | 1.15 | | | | 1.78 | | | | 0.73 | |
Total from investment operations | | | 0.12 | | | | 0.45 | | | | (2.81 | ) | | | 1.50 | | | | 2.09 | | | | 1.04 | |
Distributions to shareholders: | | | | | | | | | | | | | | | | | | | | | | | | |
Return of capital | | | (0.28 | ) | | | (0.69 | ) | | | (0.69 | ) | | | (0.69 | ) | | | (0.69 | ) | | | (0.69 | ) |
Net asset value, end of period | | $ | 9.09 | | | | 9.25 | | | $ | 9.49 | | | $ | 12.99 | | | $ | 12.18 | | | $ | 10.78 | |
| | | | | | | | | | | | | | | | | | | | | | | | |
Total Return, at Net Asset Value3 | | | 1.18 | % | | | 5.48 | % | | | (22.34 | %) | | | 12.46 | % | | | 19.72 | % | | | 10.18 | % |
| | | | | | | | | | | | | | | | | | | | | | | | | |
Ratios/Supplemental Data | | | | | | | | | | | | | | | | | | | | | | | | |
Net assets, end of period (in thousands) | | $ | 1,721,836 | | | $ | 1,548,940 | | | $ | 1,584,939 | | | $ | 2,193,129 | | | $ | 1,218,475 | | | $ | 613,704 | |
Ratio of Expenses to Average Net Assets:4 | | | | | | | | | | | | | |
Before (waivers) and deferred tax expense/(benefit) | | | 1.37 | % | | | 1.39 | % | | | 1.38 | % | | | 1.40 | % | | | 1.29 | % | | | 1.29 | % |
Expense (waivers) | | | (0.11 | %) | | | (0.11 | %) | | | (0.11 | %) | | | (0.12 | %) | | | (0.03 | %) | | | (0.04 | %) |
Net of (waivers) and before deferred tax expense/(benefit) | | | 1.26 | %5 | | | 1.28 | %5 | | | 1.27 | %5 | | | 1.28 | %5 | | | 1.26 | %6 | | | 1.25 | % |
Deferred tax expense/(benefit)7,8 | | | 1.16 | % | | | 2.54 | % | | | (14.45 | %) | | | 5.38 | % | | | 9.27 | % | | | 5.60 | % |
Total expenses/(benefit) | | | 2.42 | % | | | 3.82 | % | | | (13.18 | %) | | | 6.66 | % | | | 10.53 | % | | | 6.85 | % |
| | | | | | | | | | | | | | | | | | | | | | | | | |
Ratio of Investment Loss to Average Net Assets:4 | | | | | | | | | | | | | |
Before (waivers) and deferred tax benefit/(expense) | | | (1.13 | %) | | | (0.92 | %) | | | (1.03 | %) | | | (1.21 | %) | | | (1.26 | %) | | | (1.29 | %) |
Expense (waivers) | | | (0.11 | %) | | | (0.11 | %) | | | (0.11 | %) | | | (0.12 | %) | | | (0.03 | %) | | | (0.04 | %) |
Net of expense (waivers) and before deferred tax benefit/(expense) | | | (1.02 | %) | | | (0.81 | %) | | | (0.92 | %) | | | (1.09 | %) | | | (1.23 | %) | | | (1.25 | %) |
Deferred tax benefit8,9 | | | 0.56 | % | | | 0.55 | % | | | 0.63 | % | | | 0.54 | % | | | 0.45 | % | | | 0.44 | % |
Net investment loss | | | (0.46 | %) | | | (0.26 | %) | | | (0.29 | %) | | | (0.55 | %) | | | (0.78 | %) | | | (0.81 | %) |
| | | | | | | | | | | | | | | | | | | | | | | | |
Portfolio turnover rate | | | 24 | % | | | 35 | % | | | 36 | % | | | 17 | % | | | 9 | % | | | 15 | % |
* | November 28, 2014 and November 29, 2013 represent the last business day of the Fund’s respective reporting periods. |
1. | Effective June 28, 2013, Class I shares were renamed Class Y shares. See Note 1 of the Notes to Financial Statements for additional information. |
2. | Per share amounts calculated based on average shares outstanding during the period net of deferred tax expense/benefit. |
3. | Assumes an initial investment on the business day before the first day of the fiscal period, with all dividends and distributions reinvested in additional shares on the reinvestment date, and redemptions at the net asset value calculated on the last business day of the fiscal period. Sales charges are not reflected in the total returns. Total returns are not annualized for periods less than one full year. Returns do not reflect the deduction of taxes that a shareholder would pay on fund distributions or the redemption of fund shares. The returns do not include adjustments in accordance with generally accepted accounting principles required at the period end for financial reporting purposes. |
4. | Annualized for less than a full period. |
5. | Includes borrowing and franchise tax expense. Without borrowing and franchise tax expense, the net expense ratio would be 1.25%. |
6. | Includes franchise tax expense. Without franchise tax expense the net expense ratio would be 1.25%. |
7. | Deferred tax expense estimate for the ratio calculation is derived from the net investment income/loss, and realized and unrealized gains/losses. |
8. | Effective December 1, 2013 the deferred tax expense and deferred tax benefit are allocated based on average net assets. Prior to December 1, 2013 the deferred tax expense and deferred tax benefit were allocated based on specific class expenses. |
9. | Deferred tax benefit for the ratio calculation is derived from net investment income/loss only. |
See accompanying Notes to Financial Statements.
OPPENHEIMER STEELPATH MLP ALPHA FUND 21 |
NOTES TO FINANCIAL STATEMENTS Unaudited |
1. Organization
Oppenheimer SteelPath MLP Alpha Fund (the “Fund”), a separate series of Oppenheimer SteelPath MLP Funds Trust, is a non-diversified open-end management investment company registered under the Investment Company Act of 1940, as amended. The Fund’s investment objective is to seek total return. The Fund’s investment adviser is OFI SteelPath, Inc. (the “Adviser” or “Manager”), a wholly-owned subsidiary of OppenheimerFunds, Inc. (“OFI” or “Oppenheimer”).
The Fund offers Class A, Class C, Class I, and Class Y shares. Effective June 28, 2013, Class I shares were renamed Class Y shares. Class A shares are sold at their offering price, which is normally net asset value plus a front-end sales charge. Effective June 28, 2013 although there is no initial sales charge on Class A purchases totaling $1 million or more, those Class A shares may be subject to a 1.00% contingent deferred sales charge (“CDSC”) if shares are redeemed within an 18-month holding period measured from the date of purchase. Class C shares are sold without a front-end sales charge but may be subject to a CDSC of 1.00% of the redemption proceeds if Class C shares are redeemed within one year of purchase. Class I shares are only available to eligible institutional investors. Class I shares are sold at net asset value per share without a sales charge or CDSC. An institutional investor that buys Class I shares for its customers’ accounts may impose charges on those accounts. Class Y shares are sold at net asset value per share without a sales charge directly to institutional investors that have special agreements with OppenheimerFunds Distributor, Inc. (the “Distributor” or “OFDI”) for that purpose. They may include insurance companies, registered investment companies, employee benefit plans and section 529 plans, among others. An institutional investor that buys Class Y shares for its customers’ accounts may impose charges on those accounts. All classes of shares have identical rights and voting privileges with respect to the Fund in general and exclusive voting rights on matters that affect that class alone. Earnings, net assets and net asset value per share may differ due to each class having its own expenses, such as transfer and shareholder servicing agent fees and shareholder communications, directly attributable to that class. Class A and C shares have separate distribution and/or service plans under which they pay fees. Class I and Y shares do not pay such fees.
The Fund is an investment company and accordingly follows the investment company accounting and reporting guidance of the Financial Accounting Standards Board (“FASB”) Accounting Standard Codification Topic 946 Financial Services- Investment Companies.
The following is a summary of significant accounting policies followed in the Fund’s preparation of financial statements in accordance with accounting principles generally accepted in the United States (“U.S. GAAP”).
22 OPPENHEIMER STEELPATH MLP ALPHA FUND |
NOTES TO FINANCIAL STATEMENTS Unaudited / (Continued) |
2. Significant Accounting Policies
Security Valuation. All investments in securities are recorded at their estimated fair value, as described in Note 3.
Allocation of Income, Expenses, Gains and Losses. Income, expenses (other than those attributable to a specific class), gains and losses are allocated on a daily basis to each class of shares based upon the relative proportion of net assets represented by such class. Operating expenses directly attributable to a specific class are charged against the operations of that class.
Dividends and Distributions to Shareholders. Dividends and distributions to shareholders, which are determined in accordance with income tax regulations and may differ from U.S. GAAP, are recorded on the ex-dividend date. The Fund’s dividend distribution policy is intended to provide monthly distributions to its shareholders at a rate that over time is similar to the distribution rate the Fund receives from the master limited partnerships (”MLPs”) in which it invests. The Fund generally pays out dividends that over time approximate the distributions received from the Fund’s portfolio investments based on, among other considerations, distributions the Fund actually received from portfolio investments, distributions it would have received if it had been fully invested at all times, and estimated future cash flows. Such dividends are not tied to the Fund’s investment income and may not represent yield or investment return on the Fund’s portfolio. To the extent that the dividends paid exceed the distributions the Fund receives from its underlying investments, the Fund’s assets will be reduced. The Fund’s tendency to pay out a consistent dividend may change, and the Fund’s level of distributions may increase or decrease.
The estimated characterization of the distributions paid will be either a qualified dividend or distribution (return of capital). This estimate is based on the Fund’s operating results during the period. It is anticipated that a significant portion of the distributions will be comprised of return of capital as a result of the tax character of cash distributions made by the Fund’s investments. The actual characterization of the distributions made during the period will not be determined until after the end of the fiscal year. The Fund will inform shareholders of the final tax character of the distributions on IRS Form 1099 DIV in February 2018. For the six months ended May 31, 2017, the Fund distributions are expected to be comprised of 100% return of capital.
Return of Capital Estimates. Distributions received from the Fund’s investments in MLPs generally are comprised of income and return of capital. The Fund records investment income and return of capital based on estimates made at the time such distributions are received. Such estimates are based on historical information available from each MLP and other industry sources. These estimates may subsequently be revised based on information received from MLPs after their tax reporting periods are concluded. For the six months ended May 31, 2017, the Fund estimated that 100% of the MLP distributions received would be treated as return of capital.
OPPENHEIMER STEELPATH MLP ALPHA FUND 23 |
NOTES TO FINANCIAL STATEMENTS Unaudited / (Continued) |
2. Significant Accounting Policies
Investment Income. Dividend income is recorded on the ex-dividend date or upon ex-dividend notification in the case of certain foreign dividends where the ex-dividend date may have passed. Non-cash dividends included in dividend income, if any, are recorded at the fair value of the securities received. Interest income, if any, is recognized on an accrual basis. Discount and premium, which are included in interest income on the Statement of Operations, if applicable, are amortized or accreted daily.
Custodian Fees. “Custody fees” in the Statement of Operations may include interest expense incurred by the Fund on any cash overdrafts of its custodian account during the period. Such cash overdrafts may result from the effects of failed trades in portfolio securities and from cash outflows resulting from unanticipated shareholder redemption activity. The Fund pays interest to its custodian on such cash overdrafts, to the extent they are not offset by positive cash balances maintained by the Fund, at a rate equal to the Federal Funds Rate plus 0.50%. The “Reduction to custodian expenses” line item, if applicable, represents earnings on cash balances maintained by the Fund during the period. Such interest expense and other custodian fees may be paid with these earnings.
Security Transactions. Security transactions are recorded on the trade date. Realized gains and losses on securities sold are determined using the basis of identified cost.
Indemnifications. The Fund’s organizational documents provide current and former trustees and officers with a limited indemnification against liabilities arising in connection with the performance of their duties to the Fund. In the normal course of business, the Fund may also enter into contracts that provide general indemnifications. The Fund’s maximum exposure under these arrangements is unknown as this would be dependent on future claims that may be made against the Fund. The risk of material loss from such claims is considered remote.
Federal Income Taxes. The Fund does not intend to qualify as a regulated investment company pursuant to Subchapter M of the Internal Revenue Code, but will rather be taxed as a corporation. As a corporation, the Fund is obligated to pay federal, state and local income tax on taxable income. Currently, the maximum marginal regular federal income tax rate for a corporation is 35 percent. Upon enactment, a change in the federal income tax rate could have a material impact to the Fund. The Fund may be subject to a 20 percent alternative minimum tax on its federal alternative minimum taxable income to the extent that its alternative minimum tax exceeds its regular federal income tax. The Fund is currently using an estimated rate of 1.7 percent for state and local tax, net of federal tax expense.
24 OPPENHEIMER STEELPATH MLP ALPHA FUND |
NOTES TO FINANCIAL STATEMENTS Unaudited / (Continued) |
2. Significant Accounting Policies
The Fund’s income tax provision consists of the following as of May 31, 2017:
Current tax expense (benefit) | | | |
Federal | | $ | — | |
State | | | — | |
Total current tax expense | | $ | — | |
| | | | | |
Deferred tax expense (benefit) | | | | |
Federal | | $ | 19,907,648 | |
State | | | 966,943 | |
Total deferred tax expense | | $ | 20,874,591 | |
The reconciliation between the federal statutory income tax rate of 35% and the effective tax rate on net investment income (loss) and realized and unrealized gain (loss) follows:
| | | Amount | | | Rate | |
Application of statutory income tax rate | | $ | 20,479,748 | | | | 35.00 | % |
State income taxes net of federal benefit | | | 994,730 | | | | 1.70 | % |
Effect of permanent differences | | | (599,887 | ) | | | (1.03 | %) |
Total income tax expense (benefit) | | $ | 20,874,591 | | | | 35.67 | % |
The Fund intends to invest its assets primarily in MLPs, which generally are treated as partnerships for federal income tax purposes. As a limited partner in the MLPs, the Fund reports its allocable share of the MLP’s taxable income in computing its own taxable income. The Fund’s tax expense or benefit is included in the Statement of Operations based on the component of income or gains (losses) to which such expense or benefit relates. Deferred income taxes reflect the net tax effects of temporary differences between the carrying amounts of assets and liabilities for financial reporting purposes and the amounts used for income tax purposes. Such temporary differences are principally: (i) taxes on unrealized gains/(losses), which are attributable to the temporary difference between fair market value and tax basis, (ii) the net tax effects of temporary differences between the carrying amounts of assets and liabilities for financial reporting and income tax purposes and (iii) the net tax benefit of accumulated net operating losses and capital loss carryforwards. Deferred tax assets and liabilities are measured using effective tax rates expected to apply to taxable income in the years such temporary differences are realized or otherwise settled. To the extent the Fund has a deferred tax asset, consideration is given to whether or not a valuation allowance is required. A valuation allowance is required if, based on the evaluation criterion provided by ASC 740, Income Taxes, it is more-likely-than-not some portion or all of the deferred tax asset will not be realized.
OPPENHEIMER STEELPATH MLP ALPHA FUND 25 |
NOTES TO FINANCIAL STATEMENTS Unaudited / (Continued) |
2. Significant Accounting Policies
At May 31, 2017, the Fund determined a valuation allowance was not required. In evaluating a valuation allowance on a portion of the deferred tax asset, significant consideration was given to the current and expected level of MLP distributions, unrealized gains and losses on MLP investments and the expiration dates for net operating losses and capital loss carryovers. Market cycles, the severity and duration of historical deferred tax assets and the impact of current and future redemptions were also considered. The Fund intends to assess whether a valuation allowance is required to offset some or all of any deferred tax asset balance in connection with the calculation of the Fund’s daily NAV; however, to the extent the final valuation allowance differs from the estimates of the Fund used in calculating the Fund’s daily NAV, the application of such final valuation allowance in these Financial Statements could have a material impact on the Fund’s NAV. Through the consideration of these factors, the Fund has determined that it is more likely than not the deferred tax asset, net of the valuation allowance, if required, will be realized.
Unexpected significant decreases in cash distributions from the Fund’s MLP investments, significant declines in the fair value of its investments, significant redemptions or increased risk of expiring net operating losses or capital loss carryovers may change the Fund’s assessment regarding the recoverability of its deferred tax assets and may result in a change to the valuation allowance. Modifications of the valuation allowance could have a material impact on the Fund’s net asset value.
Components of the Fund’s deferred tax assets and liabilities as of May 31, 2017 are as follows:
Deferred tax assets: | | | |
Net operating loss carryforward (tax basis) | | $ | 267,819,674 | |
Capital loss carryforward (tax basis) | | | 127,922,017 | |
Total deferred tax asset | | | 395,741,691 | |
| | | | | |
Deferred tax liabilities: | | | | |
Net unrealized gains on investment securities (tax basis) | | | (255,245,841 | ) |
Total deferred tax liability | | | (255,245,841 | ) |
| | | | | |
Total net deferred tax asset/(liability) | | $ | 140,495,850 | |
The Fund may rely, to some extent, on information provided by the MLPs, which may not necessarily be timely, to estimate taxable income allocable to MLP units held in its portfolio, and to estimate its associated deferred tax liability or asset. Such estimates are made in good faith. From time to time, as new information becomes available, the Fund will modify its estimates or assumptions regarding its tax liability or asset.
26 OPPENHEIMER STEELPATH MLP ALPHA FUND |
NOTES TO FINANCIAL STATEMENTS Unaudited / (Continued) |
2. Significant Accounting Policies
The Fund’s policy is to classify interest and penalties associated with underpayment of federal and state income taxes, if any, as income tax expense on its Statement of Operations. As of May 31, 2017, the Fund does not have any interest or penalties associated with the underpayment of any income taxes.
The Fund files income tax returns in the U.S. federal jurisdiction and various states. The Fund has reviewed all major jurisdictions and concluded that there is no significant impact on the Fund’s net assets and no tax liability resulting from unrecognized tax benefits relating to uncertain tax positions expected to be taken on its tax returns. Furthermore, management of the Fund is not aware of any uncertain tax positions for which it is reasonably possible that the total amount of unrecognized tax benefit will significantly change in the next 12 months.
At May 31, 2017, the Fund had net operating loss carryforwards for federal income tax purposes, which may be carried forward for 20 years, as follows:
Expiration Date | | | |
11/30/2030 | | $ | 1,194,164 | |
11/30/2031 | | | 7,264,183 | |
11/30/2032 | | | 34,906,904 | |
11/30/2033 | | | 59,435,302 | |
11/30/2034 | | | 89,553,891 | |
11/30/2035 | | | 148,345,011 | |
11/30/2036 | | | 201,995,745 | |
11/30/2037 | | | 187,058,681 | |
Total | | $ | 729,753,881 | |
At May 31, 2017, the Fund had net capital loss carryforwards for federal income tax purposes, which may be carried forward for 5 years, as follows:
Expiration Date | | | |
11/30/2021 | | $ | 348,561,353 | |
Total | | $ | 348,561,353 | |
During the period ended May 31, 2017, the Fund utilized $325,008,496 of capital loss carryforward.
OPPENHEIMER STEELPATH MLP ALPHA FUND 27 |
NOTES TO FINANCIAL STATEMENTS Unaudited / (Continued) |
2. Significant Accounting Policies
At May 31, 2017, gross unrealized appreciation and depreciation of investments, based on cost for federal income tax purposes were as follows:
Cost of Investments | | $ | 2,581,150,399 | |
Gross Unrealized Appreciation | | $ | 878,045,364 | |
Gross Unrealized Depreciation | | | (182,375,108 | ) |
Net Unrealized Appreciation (Depreciation) on Investments | | $ | 695,670,256 | |
The difference between cost amounts for financial statement and federal income tax purposes is due primarily to timing differences in recognizing certain gains and losses in security transactions.
Use of Estimates. The preparation of financial statements in conformity with accounting principles generally accepted in the United States of America requires management to make estimates and assumptions that affect the reported amounts of assets and liabilities and disclosure of contingent assets and liabilities at the date of the financial statements and the reported amounts of increases and decreases in net assets from operations during the reporting period. Actual results could differ from those estimates.
Recent Accounting Pronouncement. In October 2016, the Securities and Exchange Commission (“SEC”) adopted amendments to rules under the Investment Company Act of 1940 (“final rules”) intended to modernize the reporting and disclosure of information by registered investment companies. The final rules amend Regulation S-X and require funds to provide standardized, enhanced derivative disclosure in fund financial statements in a format designed for individual investors. The amendments to Regulation S-X also update the disclosures for other investments and investments in, and advances to affiliates and amend the rules regarding the general form and content of fund financial statements. The compliance date for the amendments to Regulation S-X is August 1, 2017. OFI Global Asset Management, Inc., a wholly-owned subsidiary of OFI, (“OFI Global”), is currently evaluating the amendments and their impact, if any, on the Fund’s financial statements.
3. Securities Valuation
The Fund calculates the net asset value of its shares as of 4:00 P.M. Eastern time, on each day the New York Stock Exchange (the “Exchange”) is open for trading, except in the case of a scheduled early closing of the Exchange, in which case the Fund will calculate net asset value of the shares as of the scheduled early closing time of the Exchange.
The Fund’s Board of Trustees (the “Board”) has adopted procedures for the valuation of the Fund’s securities and has delegated the day-to-day responsibility for valuation determinations under those procedures to the Manager. The Manager has established a Valuation Committee
28 OPPENHEIMER STEELPATH MLP ALPHA FUND |
NOTES TO FINANCIAL STATEMENTS Unaudited / (Continued) |
3. Securities Valuation (Continued)
which is responsible for determining a fair valuation for any security for which market quotations are not readily available. The Valuation Committee’s fair valuation determinations are subject to review, approval and ratification by the Fund’s Board at its next regularly scheduled meeting covering the calendar quarter in which the fair valuation was determined.
Valuation Methods and Inputs
Securities are valued primarily using unadjusted quoted market prices, when available, as supplied by third party pricing services or broker-dealers.
The following methodologies are used to determine the market value or the fair value of the types of securities described below:
Equity securities traded on a securities exchange (including exchange-traded derivatives other than futures and futures options) are valued based on the official closing price on the principal exchange on which the security is traded, as identified by the Manager, prior to the time when the Fund’s assets are valued. If the official closing price is unavailable, the security is valued at the last sale price on the principal exchange on which it is traded, or if no sales occurred, the security is valued at the mean between the quoted bid and asked prices. Over-the-counter equity securities are valued at the last published sale price, or if no sales occurred, at the mean between the quoted bid and asked prices.
Shares of a registered investment company that are not traded on an exchange are valued at that investment company’s net asset value per share.
Securities for which market quotations are not readily available or a significant event has occurred that would materially affect the value of the security, are fair valued either (i) by a standardized fair valuation methodology applicable to the security type or the significant event as previously approved by the Valuation Committee and the Fund’s Board or (ii) as determined in good faith by the Manager’s Valuation Committee. The Valuation Committee considers all relevant facts that are reasonably available, through either public information or information available to the Manager, when determining the fair value of a security. Those standardized fair valuation methodologies include, but are not limited to, valuing securities at the last sale price or initially at cost and subsequently adjusting the value based on: changes in company specific fundamentals, changes in an appropriate securities index, or changes in the value of similar securities which may be further adjusted for any discounts related to security-specific resale restrictions. When possible, such methodologies use observable market inputs such as unadjusted quoted prices of similar securities, observable interest rates, currency rates and yield curves. The methodologies used for valuing securities are not necessarily an indication of the risks associated with investing in those securities nor can it be assured that the Fund can obtain the fair value assigned to a security if it were to sell the security.
OPPENHEIMER STEELPATH MLP ALPHA FUND 29 |
NOTES TO FINANCIAL STATEMENTS Unaudited / (Continued) |
3. Securities Valuation (Continued)
To assess the continuing appropriateness of security valuations, the Manager regularly compares prior day prices and sale prices to the current day prices and challenges those prices exceeding certain tolerance levels with the third party pricing service or broker source. For those securities valued by fair valuations, whether through a standardized fair valuation methodology or a fair valuation determination, the Valuation Committee reviews and affirms the reasonableness of the valuations based on such methodologies and fair valuation determinations on a regular basis after considering all relevant information that is reasonably available.
Classifications
Each investment asset or liability of the Fund is assigned a level at measurement date based on the significance and source of the inputs to its valuation. Various data inputs may be used in determining the value of each of the Fund’s investments as of the reporting period end. These data inputs are categorized in the following hierarchy under applicable financial accounting standards:
| | 1) | Level 1-unadjusted quoted prices in active markets for identical assets or liabilities (including securities actively traded on a securities exchange) |
| | 2) | Level 2-inputs other than unadjusted quoted prices that are observable for the asset or liability (such as unadjusted quoted prices for similar assets and market corroborated inputs such as interest rates, prepayment speeds, credit risks, etc.) |
| | 3) | Level 3-significant unobservable inputs (including the Manager’s own judgments about assumptions that market participants would use in pricing the asset or liability). |
The inputs used for valuing securities are not necessarily an indication of the risks associated with investing in those securities.
The Fund classifies each of its investments in investment companies which are publicly offered as Level 1. Investment companies that are not publicly offered, if any, are measured using net asset value.
30 OPPENHEIMER STEELPATH MLP ALPHA FUND |
NOTES TO FINANCIAL STATEMENTS Unaudited / (Continued) |
3. Securities Valuation (Continued)
The table below categorizes amounts that are included in the Fund’s Statement of Assets and Liabilities as of May 31, 2017, based on valuation input level:
| | | Level 1 —
Unadjusted
Quoted Prices | | | Level 2 —
Other
Significant
Observable
Inputs | | | Level 3 —
Significant
Unobservable
Inputs | | | Value | |
Assets Table | | | | | | | | | | | | |
Investments, at Value: | | | | | | | | | | | | |
Master Limited Partnership Shares* | | $ | 2,814,745,293 | | | $ | — | | | $ | — | | | $ | 2,814,745,293 | |
Common Stocks* | | | 460,160,807 | | | | — | | | | — | | | | 460,160,807 | |
Short-Term Investments | | | 1,914,555 | | | | — | | | | — | | | | 1,914,555 | |
Total Assets | | $ | 3,276,820,655 | | | $ | — | | | $ | — | | | $ | 3,276,820,655 | |
* | For a detailed break-out of securities by major industry classification, please refer to the Statement of Investments. |
The table below shows the transfers between Level 1 and Level 2. The Fund’s policy is to recognize transfers in and transfers out as of the beginning of the reporting period.
| | | Transfers
into
Level 1* | | | Transfers
out of
Level 2* | |
Assets Table | | | | | | |
Investments, at Value: | | | | | | |
Master Limited Partnership Shares | | $ | 92,887,258 | | | $ | 92,887,258 | |
Total Assets | | $ | 92,887,258 | | | $ | 92,887,258 | |
* | Transfers from Level 2 to Level 1 are a result of a certain privately held security becoming freely tradeable and being priced using quoted prices from an active market. |
The Fund did not hold any Level 3 securities during the six months ended May 31, 2017.
4. Investments and Risks
Equity Security Risk. Stocks and other equity securities fluctuate in price. The value of the Fund’s portfolio may be affected by changes in the equity markets generally. Equity markets may experience significant short-term volatility and may fall sharply at times. Different markets may behave differently from each other and U.S. equity markets may move in the opposite direction from one or more foreign stock markets. Adverse events in any part of the equity or fixed-income markets may have unexpected negative effects on other market segments.
OPPENHEIMER STEELPATH MLP ALPHA FUND 31 |
NOTES TO FINANCIAL STATEMENTS Unaudited / (Continued) |
4. Investments and Risks (Continued)
The prices of individual equity securities generally do not all move in the same direction at the same time and a variety of factors can affect the price of a particular company’s securities. These factors may include, but are not limited to, poor earnings reports, a loss of customers, litigation against the company, general unfavorable performance of the company’s sector or industry, or changes in government regulations affecting the company or its industry.
Master Limited Partnerships. MLPs issue common units that represent an equity ownership interest in a partnership and provide limited voting rights. MLP common units are registered with the Securities and Exchange Commission (“SEC”), and are freely tradable on securities exchanges such as the NYSE and the NASDAQ Stock Market (“NASDAQ”), or in the over-the-counter market. An MLP consists of one or more general partners, who conduct the business, and one or more limited partners, who contribute capital. MLP common unit holders have a limited role in the partnership’s operations and management. The Fund, as a limited partner, normally would not be liable for the debts of the MLP beyond the amounts the Fund has contributed, but would not be shielded to the same extent that a shareholder of a corporation would be. In certain circumstances creditors of an MLP would have the right to seek return of capital distributed to a limited partner. This right of an MLP’s creditors would continue after the Fund sold its investment in the MLP.
MLPs are generally treated as publicly traded partnerships for federal income tax purposes. Any modification to federal income tax laws and related interpretations could cause a material decrease in the value of an MLP.
Concentration Risk. Under normal circumstances, the Fund invests at least 80% of its net assets (plus the amount of any borrowing for investment purposes) in the equity securities of MLPs, the majority of which operate in the energy and/or natural resources sector. MLPs are subject to certain risks, such as supply and demand risk, depletion and exploration risk, commodity pricing risk, acquisition risk, and the risk associated with the hazards inherent in midstream energy industry activities. A substantial portion of the cash flow received by the Fund is derived from investment in equity securities of MLPs. The amount of cash that a MLP has available for distributions, and the tax character of such distributions, are dependent upon the amount of cash generated by the MLP’s operations.
32 OPPENHEIMER STEELPATH MLP ALPHA FUND |
NOTES TO FINANCIAL STATEMENTS Unaudited / (Continued) |
5. Shares of Beneficial Interest
The Fund has authorized an unlimited number of $0.001 par value shares of beneficial interest in each class. Transactions in shares of beneficial interest were as follows:
| | | For the
Six Months Ended
May 31, 2017 | | | Year Ended
November 30, 2016 | |
| | | | | | | |
| | | Shares | | | Amount | | | Shares | | | Amount | |
Class A | | | | | | | | | | | | |
Sold | | | 10,673,581 | | | $ | 100,026,806 | | | | 37,141,721 | | | $ | 306,695,302 | |
Dividends and/or distributions reinvested | | | 3,177,512 | | | | 29,851,819 | | | | 8,746,596 | | | | 74,466,025 | |
Redeemed | | | (41,705,746 | ) | | | (382,523,824 | ) | | | (58,851,485 | ) | | | (488,504,892 | ) |
Net Increase/(Decrease) | | | (27,854,653 | ) | | $ | (252,645,199 | ) | | | (12,963,168 | ) | | $ | (107,343,565 | ) |
| | | | | | | | | | | | | | | | | |
Class C | | | | | | | | | | | | | | | | |
Sold | | | 6,661,686 | | | $ | 59,489,874 | | | | 22,176,519 | | | $ | 178,360,419 | |
Dividends and/or distributions reinvested | | | 2,671,530 | | | | 24,031,536 | | | | 7,080,415 | | | | 58,259,668 | |
Redeemed | | | (12,120,954 | ) | | | (108,068,100 | ) | | | (26,981,897 | ) | | | (216,547,815 | ) |
Net Increase/(Decrease) | | | (2,787,738 | ) | | $ | (24,546,690 | ) | | | 2,275,037 | | | $ | 20,072,272 | |
| | | | | | | | | | | | | | | | | |
Class I | | | | | | | | | | | | | | | | |
Sold | | | 6,923,416 | | | $ | 65,867,959 | | | | 10,505,137 | | | $ | 94,708,240 | |
Dividends and/or distributions reinvested | | | 417,980 | | | | 4,029,056 | | | | 345,881 | | | | 3,143,664 | |
Redeemed | | | (1,395,606 | ) | | | (13,255,340 | ) | | | (1,158,219 | ) | | | (10,245,664 | ) |
Net Increase | | | 5,945,790 | | | $ | 56,641,675 | | | | 9,692,799 | | | $ | 87,606,240 | |
| | | | | | | | | | | | | | | | | |
Class Y | | | | | | | | | | | | | | | | |
Sold | | | 51,581,711 | | | $ | 485,502,661 | | | | 92,739,654 | | | $ | 771,561,708 | |
Dividends and/or distributions reinvested | | | 4,815,359 | | | | 46,289,560 | | | | 12,768,122 | | | | 111,263,903 | |
Redeemed | | | (34,318,489 | ) | | | (325,948,429 | ) | | | (105,102,540 | ) | | | (881,321,080 | ) |
Net Increase | | | 22,078,581 | | | $ | 205,843,792 | | | | 405,236 | | | $ | 1,504,531 | |
OPPENHEIMER STEELPATH MLP ALPHA FUND 33 |
NOTES TO FINANCIAL STATEMENTS Unaudited / (Continued) |
6. Purchases and Sales of Securities
The aggregate cost of purchases and proceeds from sales of securities, other than short-term obligations, for the six months ended May 31, 2017, were as follows:
| | | Purchases | | | Sales | |
Investment securities | | $ | 852,345,675 | | | $ | 881,811,741 | |
7. Fees and Other Transactions with Affiliates
Management Fees. Under the investment advisory agreement, the Fund pays the Manager a management fee based on the daily net assets of the Fund at an annual rate as shown in the following table:
Net Assets up to $3 Billion | Net Assets Greater than
$3 Billion and up to $5 Billion | Net Assets in Excess of $5 Billion |
1.10% | 1.08% | 1.05% |
The Fund’s effective management fee for the six months ended May 31, 2017 was 1.10% of average annual net assets before any applicable waivers.
Transfer Agent Fees. OFI Global (the “Transfer Agent”) serves as the transfer and shareholder servicing agent for the Fund. The Fund pays the Transfer Agent a fee based on average net assets. Fees incurred with respect to these services are detailed in the Statement of Operations.
Sub-Transfer Agent Fees. The Transfer Agent has retained Shareholder Services, Inc., a wholly-owned subsidiary of OFI (the “Sub-Transfer Agent”), to provide the day-to-day transfer agent and shareholder servicing of the Fund. Under the Sub-Transfer Agency Agreement, the Transfer Agent pays the Sub-Transfer Agent an annual fee in monthly installments, equal to a percentage of the transfer agent fee collected by the Transfer Agent from the Fund, which shall be calculated after any applicable fee waivers. The fee paid to the Sub-Transfer Agent is paid by the Transfer Agent, not by the Fund.
Trustees’ Compensation. The Board has adopted a compensation deferral plan for independent trustees that enables trustees to elect to defer receipt of all or a portion of the annual compensation they are entitled to receive from the Fund. For purposes of determining the amount owed to the Trustee under the plan, deferred amounts are treated as though equal dollar amounts had been invested in shares of the Fund or in other Oppenheimer funds selected by the Trustee. The Fund purchases shares of the funds selected for deferral by the Trustee in amounts equal to his or her deemed investment, resulting in a Fund asset equal to the deferred compensation liability. Such assets are included as a component of “Other” within the asset section of the Statement of Assets and Liabilities, if applicable.
34 OPPENHEIMER STEELPATH MLP ALPHA FUND |
NOTES TO FINANCIAL STATEMENTS Unaudited / (Continued) |
7. Fees and Other Transactions with Affiliates (Continued)
Deferral of trustees’ fees under the plan will not affect the net assets of the Fund, and will not materially affect the Fund’s assets, liabilities or net investment income per share. Amounts will be deferred until distributed in accordance with the compensation deferral plan.
Distribution and Service Plan (12b-1) Fees. Under its General Distributor’s Agreement with the Fund, the Distributor acts as the Fund’s principal underwriter in the continuous public offering of the Fund’s classes of shares.
Service Plan for Class A Shares. The Fund has adopted a Service Plan (the “Plan”) for Class A shares under Rule 12b-1 of the Investment Company Act of 1940. Under the Plan, the Fund reimburses the Distributor for a portion of its costs incurred for services provided to accounts that hold Class A shares. Reimbursement is made periodically at an annual rate of up to 0.25% of the daily net assets of Class A shares of the Fund. The Distributor currently uses all of those fees to pay dealers, brokers, banks and other financial institutions periodically for providing personal service and maintenance of accounts of their customers that hold Class A shares. Any unreimbursed expenses the Distributor incurs with respect to Class A shares in any fiscal year cannot be recovered in subsequent periods. Fees incurred by the Fund under the Plan are detailed in the Statement of Operations.
Distribution and Service Plans for Class C Shares. The Fund has adopted Distribution and Service Plans (the “Plans”) for Class C shares under Rule 12b-1 of the Investment Company Act of 1940 to compensate the Distributor for distributing those share classes, maintaining accounts and providing shareholder services. Under the Plans, the Fund pays the Distributor an annual asset-based sales charge of 0.75% on Class C shares daily net assets. The Fund also pays a service fee under the Plans at an annual rate of 0.25% of daily net assets.
The Plan and Plans continue in effect from year to year only if the Fund’s Board votes annually to approve their continuance at an in person meeting called for that purpose. Fees incurred by the Fund under the Plans are detailed in the Statement of Operations.
OPPENHEIMER STEELPATH MLP ALPHA FUND 35 |
NOTES TO FINANCIAL STATEMENTS Unaudited / (Continued) |
7. Fees and Other Transactions with Affiliates (Continued)
Sales Charges. Front-end sales charges and contingent deferred sales charges (“CDSC”) do not represent expenses of the Fund. They are deducted from the proceeds of sales of Fund shares prior to investment or from redemption proceeds prior to remittance, as applicable. The sales charges retained by the Distributor from the sale of shares and the CDSC retained by the Distributor on the redemption of shares is shown in the following table for the period indicated.
Six Months Ended | | Class A Front-End Sales Charges Retained by Distributor | | | Class A Contingent Deferred Sales Charges Retained by Distributor | | | Class C Contingent Deferred Sales Charges Retained by Distributor | |
May 31, 2017 | | $ | 195,534 | | | $ | 8,686 | | | $ | 30,354 | |
Waivers and Reimbursements of Expenses. The Manager has contractually agreed to limit fees and/or reimburse expenses of the Fund to the extent that the Fund’s total annual fund operating expenses (exclusive of interest, taxes, such as deferred tax expenses, brokerage commissions, acquired fund fees and expenses, dividend costs related to short sales, and litigation expense, if any) exceed 1.50% for Class A shares, 2.25% for Class C shares, and 1.25% for Class Y shares. The Fund’s total annual operating expenses after fee waiver and/or expense reimbursement (“Net Expenses”) will be higher than these amounts to the extent that the Fund incurs expenses excluded from the expense cap. Because the Fund’s deferred income tax expense/(benefit) is excluded from the expense cap, the Fund’s Net Expenses for each class of shares is increased/(decreased) by the amount of this expense. During the six months ended May 31, 2017, the Manager reimbursed $513,040, $378,653, and $779,305 for Class A, Class C, and Class Y, respectively. This undertaking may not be modified or terminated until after one year from the date of the current prospectus, as indicated therein, unless approved by the Fund’s Board.
The Manager can be reimbursed by the Fund within three years after the date the fee limitation and/or expense reimbursement has been made by the Manager, provided that such repayment does not cause the expenses of any class of the Fund to exceed the foregoing limits.
36 OPPENHEIMER STEELPATH MLP ALPHA FUND |
NOTES TO FINANCIAL STATEMENTS Unaudited / (Continued) |
7. Fees and Other Transactions with Affiliates (Continued)
The following table represents amounts eligible for recovery at May 31, 2017:
Eligible Expense Recoupment Expiring: | | | |
November 30, 2017 | | $ | 4,876,625 | |
November 30, 2018 | | | 4,954,289 | |
November 30, 2019 | | | 3,611,512 | |
November 30, 2020 | | | 1,670,998 | |
During the six months ended May 31, 2017, the Manager did not recoup any expenses.
Effective January 1, 2017, the Transfer Agent has voluntarily agreed to waive fees and/or reimburse Fund expenses in an amount equal to 0.015% of average annual net assets for Classes A, C and Y.
During the reporting period, the Transfer Agent waived fees and/or reimbursed the Fund for transfer agent and shareholder servicing agent fees as follows:
Class A | | $ | 65,640 | |
Class C | | | 48,890 | |
Class Y | | | 101,583 | |
This fee waiver and/or reimbursement may be terminated at any time.
Related Party. The Interested Trustees and officers of the Fund are also officers or trustees of companies affiliated with the Manager, Distributor, and Transfer Agent.
Cross Trades. The Fund is permitted to purchase and sell securities from and to other Funds managed by the Manager or OFI Global (“cross-trade”) pursuant to “Cross-Trading” Procedures adopted by the Fund’s Board of Trustees. These procedures are designed to ensure that any cross-trade of securities by the Fund from or to another fund that is or could be considered an affiliate of the Fund under certain limited circumstances by virtue of having a common investment adviser, common Officer, or common Trustee complies with Rule 17a-7 of the 1940 Act. Further, as defined under these procedures, each cross-trade is effected at the current market price.
During the period the Fund had $28,616,208 in purchases and $311,772,150 in sales considered cross-trades, resulting in $30,980,523 of tax adjusted realized gain/(loss).
OPPENHEIMER STEELPATH MLP ALPHA FUND 37 |
NOTES TO FINANCIAL STATEMENTS Unaudited / (Continued) |
8. Borrowing Agreement
The Fund, along with Oppenheimer SteelPath MLP Alpha Plus Fund, Oppenheimer SteelPath MLP Income Fund, and Oppenheimer SteelPath MLP Select 40 Fund (collectively, the “Trust”), is a borrower in a $700 million revolving credit agreement (the “Loan Agreement”) with a major lending institution (the “Lender”). The Fund is permitted to borrow up to the lesser of one-third of the Fund’s total assets, or the maximum amount permitted pursuant to the Fund’s investment limitations. As the Loan Agreement is not available exclusively to the Fund, the Fund may not be able to borrow all of its requested amounts at any given time. Amounts borrowed under the Loan Agreement, if any, are invested by the Fund under the direction of the Manager consistent with the Fund’s investment objective and policies, and as such, the related investments are subject to normal market fluctuations and investment risks, including the risk of loss due to a decline in value. The borrowing, if any, is fully collateralized throughout the term of the borrowing with securities or other assets of the Fund. The Fund is not liable for borrowings of other funds in the Trust. Securities that have been pledged as collateral for the borrowing are indicated in the Statement of Investments.
Borrowings under the Loan Agreement are charged interest at a calculated rate computed by the Lender based on the one month LIBOR rate plus 0.65% per annum. An unused commitment fee at the rate of 0.125% per annum is charged for any undrawn portion of the credit facility, and each member of the Trust will pay its pro rata share of this fee. A facility fee of 0.20% was charged on the commitment amount, and each party of the Trust paid its pro rata share of this fee. The borrowing is due November 17, 2017, unless another date is mutually agreed upon by the parties of the Loan Agreement. For the six months ended May 31, 2017, the Fund paid $111,761 in borrowing fees. The Fund did not utilize the facility during the six months ended May 31, 2017.
38 OPPENHEIMER STEELPATH MLP ALPHA FUND |
DISTRIBUTION SOURCES Unaudited |
For any distribution that took place over the last six months of the Fund’s reporting period, the table below details on a per-share basis the percentage of the Fund’s total distribution payment amount that was derived from the following sources: net income, net profit from the sale of securities, and other capital sources. Other capital sources represent a return of capital. A return of capital may occur, for example, when some or all of the money that you invested in the Fund is paid back to you. A return of capital distribution does not necessarily reflect the Fund’s investment performance and should not be confused with “yield” or “income.” You should not draw any conclusions about each Fund’s investment performance from the amounts of these distributions. This information is based upon income and capital gains using generally accepted accounting principles as of the date of each distribution. For certain securities, such as Master Limited Partnerships (“MLPs”), the percentages attributed to each category are estimated using historical information because the character of the amounts received from the MLPs in which the Fund invests is unknown until after the end of the calendar year. Because the Fund is actively managed, the relative amount of the Fund’s total distributions derived from various sources over the calendar year may change. Please note that this information should not be used for tax reporting purposes as the tax character of distributable income may differ from the amounts used for this notification. You will receive IRS tax forms in the first quarter of each calendar year detailing the actual amount of the taxable and non-taxable portion of distributions paid to you during the tax year.
For the most current information, please go to oppenheimerfunds.com. Select your Fund, then the ’Detailed’ tab; where ‘Dividends’ are shown, the Fund’s latest pay date will be followed by the sources of any distribution, updated daily.
Fund Name | Pay
Date | Net
Income | Net
Profit
from Sale | Other
Capital
Sources |
Oppenheimer SteelPath MLP Alpha Fund | 1/6/17 | 0.0% | 0.0% | 100.0% |
Oppenheimer SteelPath MLP Alpha Fund | 2/7/17 | 0.0% | 0.0% | 100.0% |
Oppenheimer SteelPath MLP Alpha Fund | 3/7/17 | 0.0% | 0.0% | 100.0% |
Oppenheimer SteelPath MLP Alpha Fund | 4/5/17 | 0.0% | 0.0% | 100.0% |
Oppenheimer SteelPath MLP Alpha Fund | 5/5/17 | 0.0% | 0.0% | 100.0% |
OPPENHEIMER STEELPATH MLP ALPHA FUND 39 |
PORTFOLIO PROXY VOTING POLICIES AND PROCEDURES; UPDATES TO STATEMENTS OF INVESTMENTS Unaudited |
The Fund has adopted Portfolio Proxy Voting Policies and Procedures under which the Fund votes proxies relating to securities (“portfolio proxies”) held by the Fund. A description of the Fund’s Portfolio Proxy Voting Policies and Procedures is available (i) without charge, upon request, by calling the Fund toll-free at 1.800.CALL OPP (225.5677), (ii) on the Fund’s website at oppenheimerfunds.com, and (iii) on the SEC’s website at www.sec.gov. In addition, the Fund is required to file Form N-PX, with its complete proxy voting record for the 12 months ended June 30th, no later than August 31st of each year. The Fund’s voting record is available (i) without charge, upon request, by calling the Fund toll-free at 1.800.CALL OPP (225.5677), and (ii) in the Form N-PX filing on the SEC’s website at www.sec.gov.
The Fund files its complete schedule of portfolio holdings with the SEC for the first quarter and the third quarter of each fiscal year on Form N-Q. The Fund’s Form N-Q filings are available on the SEC’s website at www.sec.gov. Those forms may be reviewed and copied at the SEC’s Public Reference Room in Washington, D.C. Information on the operation of the Public Reference Room may be obtained by calling 1-800-SEC-0330.
Householding – Delivery of Shareholder Documents
This is to inform you about OppenheimerFunds’ “householding” policy. If more than one member of your household maintains an account in a particular fund, OppenheimerFunds will mail only one copy of the fund’s prospectus (or, if available, the fund’s summary prospectus), annual and semiannual report and privacy policy. The consolidation of these mailings, called householding, benefits your fund through reduced mailing expense, and benefits you by reducing the volume of mail you receive from OppenheimerFunds. Householding does not affect the delivery of your account statements.
Please note that we will continue to household these mailings for as long as you remain an OppenheimerFunds shareholder, unless you request otherwise. If you prefer to receive multiple copies of these materials, please call us at 1.800.CALL-OPP (225-5677). You may also notify us in writing or via email. We will begin sending you individual copies of the prospectus (or, if available, the summary prospectus), reports and privacy policy within 30 days of receiving your request to stop householding.
40 OPPENHEIMER STEELPATH MLP ALPHA FUND |
OPPENHEIMER STEELPATH MLP ALPHA FUND |
Trustees and Officers | | Robert J. Malone, Chairman of the Board of Trustees and Trustee |
| | | Jon S. Fossel, Trustee |
| | | Richard F. Grabish, Trustee |
| | | Beverly L. Hamilton, Trustee |
| | | Victoria J. Herget, Trustee |
| | | F. William Marshall, Jr., Trustee |
| | | Karen L. Stuckey, Trustee |
| | | James D. Vaughn, Trustee |
| | | Arthur P. Steinmetz, Trustee, President and Principal Executive Officer |
| | | Stuart Cartner, Vice President |
| | | Brian Watson, Vice President |
| | | Cynthia Lo Bessette, Secretary and Chief Legal Officer |
| | | Jennifer Foxson, Vice President and Chief Business Officer |
| | | Mary Ann Picciotto, Chief Compliance Officer and Chief Anti-Money Laundering Officer |
| | | Brian S. Petersen, Treasurer and Principal Financial & Accounting Officer |
| | | |
Manager | | OFI SteelPath, Inc. |
| | | |
Distributor | | OppenheimerFunds Distributor, Inc. |
| | | |
Transfer and Shareholder Servicing Agent | | OFI Global Asset Management, Inc. |
| | | |
Sub-Transfer Agent | | Shareholder Services, Inc. |
| | | DBA OppenheimerFunds Services |
| | | |
| | | |
Independent Registered Public Accounting Firm | | Cohen & Company, Ltd. |
| | | |
Legal Counsel | | Ropes & Gray LLP |
© 2017 OppenheimerFunds, Inc. All rights reserved.
OPPENHEIMER STEELPATH MLP ALPHA FUND 41 |
As an Oppenheimer fund shareholder, you are entitled to know how we protect your personal information and how we limit its disclosure. Information Sources
We obtain nonpublic personal information about our shareholders from the following sources:
| | ● | Applications or other forms. |
| | ● | When you create a user ID and password for online account access. |
| | ● | When you enroll in eDocs Direct,SM our electronic document delivery service. |
| | ● | Your transactions with us, our affiliates or others. |
| | ● | Technologies on our website, including: “cookies” and web beacons, which are used to collect data on the pages you visit and the features you use. |
If you visit oppenheimerfunds.com and do not log on to the secure account information areas, we do not obtain any personal information about you. When you do log on to a secure area, we do obtain your user ID and password to identify you. We also use this information to provide you with products and services you have requested, to inform you about products and services that you may be interested in and assist you in other ways.
We do not collect personal information through our website unless you willingly provide it to us, either directly by email or in those areas of the website that request information. In order to update your personal information (including your mailing address, email address and phone number) you must first log on and visit your user profile.
If you have set your browser to warn you before accepting cookies, you will receive the warning message with each cookie. You can refuse cookies by turning them off in your browser. However, doing so may limit your access to certain sections of our website.
We use cookies to help us improve and manage our website. For example, cookies help us recognize new versus repeat visitors to the site, track the pages visited, and enable some special features on the website. This data helps us provide a better service for our website visitors.
Protection of Information
We do not disclose any nonpublic personal information (such as names on a customer list) about current or former customers to anyone, except as permitted by law.
42 OPPENHEIMER STEELPATH MLP ALPHA FUND |
PRIVACY POLICY NOTICE (Continued) |
Disclosure of Information
Copies of confirmations, account statements and other documents reporting activity in your fund accounts are made available to your financial advisor (as designated by you). We may also use details about you and your investments to help us, our financial service affiliates, or firms that jointly market their financial products and services with ours, to better serve your investment needs or suggest educational material that may be of interest to you. If this requires us to provide you with an opportunity to “opt in” or “opt out” of such information sharing with a firm not affiliated with us, you will receive notification on how to do so, before any such sharing takes place.
Right of Refusal
We will not disclose your personal information to unaffiliated third parties (except as permitted by law), unless we first offer you a reasonable opportunity to refuse or “opt out” of such disclosure.
Internet Security and Encryption
In general, the email services provided by our website are encrypted and provide a secure and private means of communication with us. To protect your own privacy, confidential and/ or personal information should only be communicated via email when you are advised that you are using a secure website.
As a security measure, we do not include personal or account information in nonsecure emails, and we advise you not to send such information to us in nonsecure emails. Instead, you may take advantage of the secure features of our website to encrypt your email correspondence. To do this, you will need to use a browser that supports Secure Sockets Layer (SSL) protocol.
| | ● | All transactions, including redemptions, exchanges and purchases, are secured by SSL and 256-bit encryption. SSL is used to establish a secure connection between your PC and OppenheimerFunds’ server. It transmits information in an encrypted and scrambled format. |
| | ● | Encryption is achieved through an electronic scrambling technology that uses a “key” to code and then decode the data. Encryption acts like the cable converter box you may have on your television set. It scrambles data with a secret code so that no one can make sense of it while it is being transmitted. When the data reaches its destination, the same software unscrambles the data. |
| | ● | You can exit the secure area by closing your browser or, for added security, you can use the Log Out button before you close your browser. |
OPPENHEIMER STEELPATH MLP ALPHA FUND 43 |
PRIVACY POLICY NOTICE (Continued) |
Other Security Measures
We maintain physical, electronic and procedural safeguards to protect your personal account information. Our employees and agents have access to that information only so that they may offer you products or provide services, for example, when responding to your account questions.
How You Can Help
You can also do your part to keep your account information private and to prevent unauthorized transactions. If you obtain a user ID and password for your account, safeguard that information. Also, take special precautions when accessing your account on a computer used by others.
Who We Are
This joint notice describes the privacy policies of the Oppenheimer funds, OppenheimerFunds, Inc., each of its investment adviser subsidiaries, OppenheimerFunds Distributor, Inc. and OFI Global Trust Co. It applies to all Oppenheimer fund accounts you presently have, or may open in the future, using your Social Security number—whether or not you remain a shareholder of our funds. This notice was last updated as of November 2016. In the event it is updated or changed, we will post an updated notice on our website at oppenheimerfunds.com. If you have any questions about this privacy policy, email us by clicking on the Contact Us section of our website at oppenheimerfunds.com, write to us at P.O. Box 5270, Denver, CO 80217-5270, or call us at 800 CALL OPP (225 5677).
44 OPPENHEIMER STEELPATH MLP ALPHA FUND |
THIS PAGE INTENTIONALLY LEFT BLANK
OPPENHEIMER STEELPATH MLP ALPHA FUND 45 |
THIS PAGE INTENTIONALLY LEFT BLANK
46 OPPENHEIMER STEELPATH MLP ALPHA FUND |
THIS PAGE INTENTIONALLY LEFT BLANK
OPPENHEIMER STEELPATH MLP ALPHA FUND 47 |

Table of Contents
Fund Performance Discussion | 3 |
Top Holdings and Allocations | 7 |
Share Class Performance | 8 |
Fund Expenses | 10 |
Statement of Investments | 12 |
Statement of Assets and Liabilities | 16 |
Statement of Operations | 18 |
Statements of Changes in Net Assets | 19 |
Financial Highlights | 20 |
Notes to Financial Statements | 24 |
Distribution Sources | 42 |
Portfolio Proxy Voting Policies and Procedures; Updates to Statements of Investments | 43 |
Trustees and Officers | 44 |
Privacy Policy Notice | 45 |
|
Class A Shares
AVERAGE ANNUAL TOTAL RETURNS AT 5/31/17
| | Class A Shares of the Fund | | |
| | Without
Sales Charge | With
Sales Charge | S&P 500 Index | Alerian MLP Index |
6-Month | -0.09% | -5.89% | 10.81% | 2.28% |
1-Year | 3.69% | -2.32% | 17.47% | 6.24% |
5-Year | 2.13% | 0.92% | 15.42% | 2.57% |
Since Inception (3/31/10) | 3.40% | 2.55% | 13.00% | 6.45% |
Performance data quoted represents past performance, which does not guarantee future results. The investment return and principal value of an investment in the Fund will fluctuate so that an investor’s shares, when redeemed, may be worth more or less than their original cost. Fund returns include changes in share price, reinvested distributions, and a 5.75% maximum applicable sales charge except where “without sales charge” is indicated. Current performance may be lower or higher than the performance quoted. Returns do not consider capital gains or income taxes on an individual’s investment. Returns for periods of less than one year are cumulative and not annualized. For performance data current to the most recent month-end, visit oppenheimerfunds.com or call 1.800.CALL OPP (225.5677). See Fund prospectuses and summary prospectuses for more information on share classes and sales charges.
2 OPPENHEIMER STEELPATH MLP INCOME FUND |
Fund Performance Discussion
The Fund’s Class A shares (without sales charge) produced a total return of -0.09% during the reporting period. In comparison, master limited partnerships (“MLPs”), as measured by the Alerian MLP Index (AMZ), provided a total return gain of 2.28%. Please note that the returns for the Alerian MLP Index are calculated pre-tax, while the Fund’s returns are calculated post corporate tax, which contributed partially to the Fund’s underperformance this reporting period. This generally has a negative impact on the Fund’s performance versus the Index in up markets, and a positive impact on performance in down markets. During the same period, the S&P 500 Index produced a total return gain of 10.81%.
Over the six-month reporting period ended May 31, 2017, the midstream sector underperformed the broader markets as the correlation of price performance between midstream equities and crude oil remained elevated over the period. While the sector performed well early in the period, subsequent crude oil price weakness was accompanied by midstream price weakness. This crude oil price weakness appeared to stem primarily from continued U.S. inventory builds as well as fears that U.S. shale producers were ramping production more quickly than previously anticipated. Interestingly, while a quicker than expected resurgence of U.S. shale production may serve to temper the crude price recovery, we believe midstream assets should benefit through the resultant volume improvements regardless.
The influence of Washington remained topical over the period. In contrast to the challenging energy regulatory environment of the prior presidential administration, President Trump signed multiple midstream related executive orders in late January designed to expedite current and future midstream projects. Two orders were individually specific to the Keystone XL and Dakota Access Pipelines, each directing respective authorities to take all actions necessary and appropriate to facilitate the implementation of the projects. Additionally, President Trump signed an order to expedite the review and approval of high priority infrastructure projects. Separately, three large natural gas pipeline projects, representing a collective $7.5 billion of growth capital spending, received Federal Energy Regulatory Commission (FERC) approval in early February, just ahead of FERC’s loss of a quorum due to the resignation of a FERC commissioner. While at the end of the reporting period the commission still lacked a quorum to vote on project approvals, President Trump had made nominations to fill two of the three vacancies. However, Commissioner Colette Honorable has also announced her intention to not seek another term when her current seat expires in June, but that she is willing to stay on until the end of the year, awaiting her replacement.
OPPENHEIMER STEELPATH MLP INCOME FUND 3 |
Over the reporting period, we estimate approximately $15 billion of new equity supply entered the market through either secondary offerings, initial public offerings, or “at-the-market” programs in which primary units trade into the market anonymously throughout the normal trading day. This pace of equity issuance represents an increase from approximately $11 billion that was raised over the six month reporting period ended May 31, 2016. Midstream companies also raised approximately $15 billion of debt capital during the period. Most MLPs pay out the majority of excess cash flow as distributions to investors, and therefore must raise external capital to fund growth projects and to fund acquisitions.
MACRO REVIEW
West Texas Intermediate (WTI) crude oil prices ended the reporting period at $47.66 per barrel, down 4% over the reporting period. Global crude prices, as measured by Brent crude oil, traded 2% higher over the reporting period. As previously noted, the crude oil price decline appeared to stem primarily from continued U.S. inventory builds as well as fears that U.S. shale producers were ramping up production more quickly than previously anticipated. Brent exited the period at a $3 per barrel premium to WTI, which is near the historic norm. However, this reversion represents a departure from the $8 to $9 per barrel Brent premium present from 2009 to 2015.
Henry Hub natural gas spot prices exited the period at $3.20 per million British thermal units (“mmbtu”), down 3% over the reporting period, while up 52% from the year-ago period. Natural gas pricing has benefited from a long awaited realignment of supply-demand in which natural gas usage as a heating and electric generation fuel has increased as gas production volume growth has moderated, and as increased exports have become a reality via both liquefied natural gas and new pipelines to Mexico.
Mont Belvieu natural gas liquids (“NGL”) prices ended the reporting period at $24.13 per barrel, a 1% decline over the reporting period. Pricing for NGL purity products varied, with ethane and propane trading higher over the period while butane, isobutene, and natural gasoline prices declined. Frac spreads, a measure of natural gas processing economics, ended the period at $0.30 per gallon, up 8% over the reporting period. Generally, the greater the frac spread, the greater the incentive for producers to seek natural gas processing capacity.
The yield curve flattened over the reporting period as short rates increased while the yields on longer-dated maturities declined. The ten-year Treasury yield declined 18 basis points to end the period at 2.20%. The MLP yield spread at period-end, as measured by the AMZ and the 10-year Treasury bond, widened by 17 basis points to 5.22%.
Over the reporting period, real estate investment trusts (“REITs”) and utilities, two competing yield-oriented equity asset classes, posted total returns of 7.50% (as measured by the Dow Jones Equity REIT Total Return Index) and 16.86% (as measured by the Dow Jones Utility Average
4 OPPENHEIMER STEELPATH MLP INCOME FUND |
Index), respectively, as compared to the AMZ’s 2.28% total return. Price to forward distributable cash flow (DCF), a commonly watched ratio within the MLP sector, declined over the period ending well below the ten-year average.
SUBSECTOR REVIEW
Performance among subsectors in the midstream, or energy infrastructure, MLP asset class varied for the reporting period. On average, the gathering and processing subsector provided the best performance over the period, buoyed by improved volumetric projections. The natural gas pipeline group followed as investors continued to express preference for the safety of long-haul natural gas pipelines, particularly those backed by utility demand pull.
The upstream subsector experienced the weakest performance over the reporting period as these entities’ cash flows were directly impacted by commodity price weakness over the period. The coal subsector also lagged over the reporting period as domestic coal pricing generally weakened through the reporting period.
FUND REVIEW
Key contributors to the Fund’s performance were Sunoco LP (SUN) and Williams Partners, LP (WMB).
SUN units outperformed over the period after announcing the $3.3 billion divestiture of its convenience store business and its intent to use the proceeds to delever. We believe SUN’s diverse geographic footprint and focus on the resilient fuel distribution business should provide for steady long-term operational performance.
WPZ outperformed over the period after the partnership and its parent, The Williams Companies (WMB), announced a plan to restore long-term sustainable growth by eliminating WPZ’s incentive distribution rights (“IDRs”) and also enabling significant debt reduction via an upfront equity capital infusion and more than $2 billion of asset monetization. As a result of the transactions, WPZ expects to target annual distribution growth of 5% to 7% over the next several years while maintaining distribution coverage of 1.2x over 2017 and in excess of 1.1x thereafter.
Key detractors from the Fund’s performance were Enbridge Energy Partners LP (EEP) and NGL Energy Partners, LP (NGL).
EEP underperformed over the period as the company provided disappointing financial projections for the upcoming fiscal year followed by a reduction of its cash distribution. Enbridge Inc. (ENB), EEP’s sponsor, provided some modest support, acquiring EEP’s underperforming natural gas business and allowing EEP to simplify its capital structure and modify the incentive distribution mechanism. Following this strategic realignment, we believe EEP is better positioned to benefit from its large network of crude oil pipelines in the U.S. and Canada, most of which
OPPENHEIMER STEELPATH MLP INCOME FUND 5 |
benefit from strong contractual cash flow regardless of commodity prices or throughput volumes.
NGL units underperformed over the period after the partnership reduced its earnings before interest, tax, depreciation and amortization (“EBITDA”) guidance and deferred plans to begin raising its cash distribution by nine months. NGL operates within several midstream subsectors including crude oil and refined products logistics as well as retail propane and water solutions. Strength in NGL’s water business has been offset by warmer winter weather weighing on the retail propane business and challenging market conditions in some portions of the partnership’s refiner products and crude marketing businesses.
Please note that significant decreases in cash distributions from the Fund’s MLP investments and/or significant declines in the fair value of its investments may impact the Fund’s assessment regarding the recoverability of certain deferred tax assets, which may result in the recording of a valuation allowance. If a valuation allowance is established, this could have a material impact on the Fund’s net asset value and results of operations for the period. The Fund had a valuation allowance in place for a portion of the reporting period, but did not have one in place at period end. See Note 2 of the Notes to Financial Statements for more information.
OUTLOOK
We continue to believe we have seen the worst of this energy market down cycle. In our opinion, the rate of midstream growth will likely moderate from peak levels, but average distributions are still likely to grow. We expect midstream operators to benefit from the reflation of domestic hydrocarbon production and the more efficient use of existing assets going forward, in contrast to the widespread need to construct new assets over the first years of shale production growth. We believe current market valuations underestimate the potential for renewed business growth going forward and we remain optimistic on the sector’s prospects. Consequently, we believe midstream MLPs continue to offer attractive total return potential based on the potential for price appreciation and stable or growing distribution streams.
6 OPPENHEIMER STEELPATH MLP INCOME FUND |
Top Holdings and Allocations
TOP TEN MASTER LIMITED PARTNERSHIP HOLDINGS
Energy Transfer Partners LP | 10.26% |
Sunoco LP | 7.11% |
NuStar Energy LP | 6.46% |
EnLink Midstream Partners LP | 5.08% |
Genesis Energy LP | 4.14% |
DCP Midstream LP | 4.04% |
Enbridge Energy Partners LP | 3.93% |
Summit Midstream Partners LP | 3.62% |
Williams Partners LP | 3.50% |
NGL Energy Partners LP | 3.34% |
Portfolio holdings and allocations are subject to change. Percentages are as of May 31, 2017, and are based on net assets.
SECTOR ALLOCATION
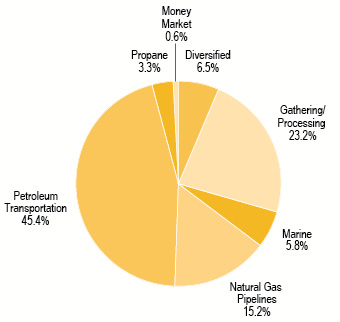
Portfolio holdings and allocations are subject to change. Percentages are as of May 31, 2017, and are based on the total market value of investments.
OPPENHEIMER STEELPATH MLP INCOME FUND 7 |
Share Class Performance
AVERAGE ANNUAL TOTAL RETURNS WITHOUT SALES CHARGE AS OF 5/31/17
| | Inception Date | 6-Month | 1-Year | 5-Year | Since Inception |
Class A (MLPDX) | 3/31/2010 | -0.09% | 3.69% | 2.13% | 3.40% |
Class C (MLPRX) | 6/10/2011 | -0.53% | 2.84% | 1.35% | 0.84% |
Class I (OSPMX) | 6/28/2013 | 0.04% | 4.15% | N/A | -2.08% |
Class Y (MLPZX) | 3/31/2010 | 0.04% | 4.02% | 2.38% | 3.65% |
AVERAGE ANNUAL TOTAL RETURNS WITH SALES CHARGE AS OF 5/31/17
| | Inception Date | 6-Month | 1-Year | 5-Year | Since Inception |
Class A (MLPDX) | 3/31/2010 | -5.89% | -2.32% | 0.92% | 2.55% |
Class C (MLPRX) | 6/10/2011 | -1.48% | 1.92% | 1.35% | 0.84% |
Class I (OSPMX) | 6/28/2013 | 0.04% | 4.15% | N/A | -2.08% |
Class Y (MLPZX) | 3/31/2010 | 0.04% | 4.02% | 2.38% | 3.65% |
Performance data quoted represents past performance, which does not guarantee future results.The investment return and principal value of an investment in the Fund will fluctuate so that an investor’s shares, when redeemed, may be worth more or less than their original cost. Current performance may be lower or higher than the performance quoted. Returns do not consider capital gains or income taxes on an individual’s investment. For performance data current to the most recent month-end, visit oppenheimerfunds.com or call 1.800.CALL OPP (225.5677). Fund returns include changes in share price, reinvested distributions, and the applicable sales charge: for Class A shares, the current maximum initial sales charge of 5.75%, and for Class C shares, the contingent deferred sales charge of 1% for the 1-year period. There is no sales charge for Class I or Class Y shares. Returns for periods of less than one year are cumulative and not annualized. See Fund prospectuses and summary prospectuses for more information on share classes and sales charges.
The Fund’s performance is compared to the performance of the S&P 500 Index and the Alerian MLP Index. The S&P 500 Index is a broad-based measure of domestic stock performance. The Alerian MLP Index is a composite of the 50 most prominent Master Limited Partnerships that provides investors with an unbiased, comprehensive benchmark for this emerging asset class. The index, which is calculated using a float-adjusted, capitalization-weighted methodology, is disseminated real-time on a total-return basis. The indices are unmanaged and cannot be purchased directly by investors. While index comparisons may be useful to provide a benchmark for the Fund’s performance, it must be noted that the Fund’s investments are not limited to the investments comprising the indices. Index performance includes reinvestment of income, but does not reflect transaction costs, fees, expenses or taxes. Index performance
8 OPPENHEIMER STEELPATH MLP INCOME FUND |
is shown for illustrative purposes only as a benchmark for the Fund’s performance, and does not predict or depict performance of the Fund. The Fund’s performance reflects the effects of the Fund’s business and operating expenses.
The Fund’s investment strategy and focus can change over time. The mention of specific fund holdings does not constitute a recommendation by OppenheimerFunds, Inc. or its affiliates.
Before investing in any of the Oppenheimer funds, investors should carefully consider a fund’s investment objectives, risks, charges and expenses. Fund prospectuses and summary prospectuses contain this and other information about the funds, and may be obtained by asking your financial advisor, visiting oppenheimerfunds.com, or calling 1.800.CALL OPP (225.5677). Read prospectuses and summary prospectuses carefully before investing.
Shares of Oppenheimer funds are not deposits or obligations of any bank, are not guaranteed by any bank, are not insured by the FDIC or any other agency, and involve investment risks, including the possible loss of the principal amount invested.
OPPENHEIMER STEELPATH MLP INCOME FUND 9 |
Fund Expenses
Fund Expenses. As a shareholder of the Fund, you incur two types of costs: (1) transaction costs, which may include sales charges (loads) on purchase payments, contingent deferred sales charges on redemptions; and (2) ongoing costs, including management fees; distribution and service fees; and other Fund expenses. These examples are intended to help you understand your ongoing costs (in dollars) of investing in the Fund and to compare these costs with the ongoing costs of investing in other mutual funds.
The examples are based on an investment of $1,000.00 invested at the beginning of the period and held for the entire 6-month period ended May 31, 2017.
Actual Expenses. The first section of the table provides information about actual account values and actual expenses. You may use the information in this section for the class of shares you hold, together with the amount you invested, to estimate the expense that you paid over the period. Simply divide your account value by $1,000.00 (for example, an $8,600.00 account value divided by $1,000.00 = 8.60), then multiply the result by the number in the first section under the heading entitled “Expenses Paid During 6 Months Ended May 31, 2017” to estimate the expenses you paid on your account during this period.
Hypothetical Example for Comparison Purposes. The second section of the table provides information about hypothetical account values and hypothetical expenses based on the Fund’s actual expense ratio for each class of shares, and an assumed rate of return of 5% per year for each class before expenses, which is not the actual return. The hypothetical account values and expenses may not be used to estimate the actual ending account balance or expenses you paid for the period. You may use this information to compare the ongoing costs of investing in the Fund and other funds. To do so, compare this 5% hypothetical example for the class of shares you hold with the 5% hypothetical examples that appear in the shareholder reports of the other funds.
Please note that the expenses shown in the table are meant to highlight your ongoing costs only and do not reflect any transactional costs, such as front-end or contingent deferred sales charges (loads). Therefore, the “hypothetical” section of the table is useful in comparing ongoing costs only, and will not help you determine the relative total costs of owning different funds. In addition, if these transactional costs were included, your costs would have been higher.
10 OPPENHEIMER STEELPATH MLP INCOME FUND |
Actual | Beginning
Account
Value
December 1, 2016 | Ending
Account
Value
May 31, 2017 | Expenses
Paid During
6 Months Ended
May 31, 2017* |
CLASS A | $ 1,000.00 | $ 999.10 | $ 6.78 |
CLASS C | 1,000.00 | 994.70 | 10.50 |
CLASS I | 1,000.00 | 1,000.40 | 5.13 |
CLASS Y | 1,000.00 | 1,000.40 | 5.54 |
| | | | |
Hypothetical
(5% return before expenses) | | | |
CLASS A | 1,000.00 | 1,018.21 | 6.85 |
CLASS C | 1,000.00 | 1,014.47 | 10.60 |
CLASS I | 1,000.00 | 1,019.87 | 5.18 |
CLASS Y | 1,000.00 | 1,019.46 | 5.60 |
Expenses are equal to the Fund’s annualized expense ratio for that class, multiplied by the average account value over the period, multiplied by 182/365 (to reflect the one-half year period). Those annualized expense ratios, excluding indirect expenses from affiliated funds, based on the 6-month period ended May 31, 2017 are as follows:
Class | Expense Ratios* |
CLASS A | 1.36% |
CLASS C | 2.11 |
CLASS I | 1.03 |
CLASS Y | 1.11 |
* | For the 6-month period ended May 31, 2017, the Fund’s deferred tax liability decreased resulting in a deferred tax benefit for the period. This benefit was excluded from this example. |
The expense ratios for Class A, C, and Y reflect contractual waivers and/or reimbursements of expenses by the Fund’s Manager and Transfer Agent. Some of these undertakings may be modified or terminated at any time, as indicated in the Fund’s prospectus. The “Financial Highlights” tables in the Fund’s financial statements, included in this report, also show the gross expense ratios, without such waivers or reimbursements, if applicable.
OPPENHEIMER STEELPATH MLP INCOME FUND 11 |
STATEMENT OF INVESTMENTS May 31, 2017 / Unaudited |
Description | | Shares | | | Value | |
Master Limited Partnership Shares — 86.5% | |
Diversified — 6.2% | | | | | | |
ONEOK Partners LP | | | 2,136,118 | | | $ | 104,477,531 | |
Williams Partners LP | | | 3,495,597 | | | | 136,922,535 | |
Total Diversified | | | | | | | 241,400,066 | |
| | | | | | | | | |
Gathering/Processing — 19.1% | |
American Midstream Partners LP 1 | | | 5,864,789 | | | | 70,670,708 | |
Archrock Partners LP 1 | | | 5,334,394 | | | | 82,629,763 | |
Crestwood Equity Partners LP 1 | | | 5,192,151 | | | | 118,900,258 | |
CSI Compressco LP 1 | | | 2,195,057 | | | | 12,072,814 | |
EnLink Midstream Partners LP | | | 11,708,054 | | | | 198,685,676 | |
Sanchez Production Partners LP 1 | | | 1,739,905 | | | | 24,097,684 | |
Summit Midstream Partners LP 1 | | | 6,118,030 | | | | 141,326,493 | |
USA Compression Partners LP 1 | | | 6,298,263 | | | | 96,804,302 | |
Total Gathering/Processing | | | | | | | 745,187,698 | |
| | | | | | | | | |
Marine — 2.3% | | | | | | | | |
GasLog Partners LP | | | 1,175,291 | | | | 25,738,873 | |
Hoegh LNG Partners LP | | | 488,242 | | | | 9,325,422 | |
Teekay LNG Partners LP | | | 3,746,835 | | | | 56,951,892 | |
Total Marine | | | | | | | 92,016,187 | |
| | | | | | | | | |
Natural Gas Pipelines — 14.5% | |
CrossAmerica Partners LP 1 | | | 2,215,600 | | | | 53,240,868 | |
Energy Transfer Partners LP | | | 18,441,355 | | | | 401,283,875 | |
TC Pipelines LP | | | 1,984,746 | | | | 111,681,658 | |
Total Natural Gas Pipelines | | | | | | | 566,206,401 | |
| | | | | | | | | |
Petroleum Transportation — 41.3% | |
Arc Logistics Partners LP 1 | | | 1,896,477 | | | $ | 26,873,079 | |
Blueknight Energy Partners LP 1 | | | 2,007,434 | | | | 13,951,666 | |
Buckeye Partners LP | | | 1,644,213 | | | | 105,229,632 | |
DCP Midstream LP | | | 4,672,146 | | | | 157,825,092 | |
Delek Logistics Partners LP | | | 457,743 | | | | 13,869,613 | |
Enbridge Energy Partners LP | | | 9,271,828 | | | | 153,541,472 | |
Genesis Energy LP | | | 5,194,500 | | | | 162,016,455 | |
Global Partners LP 1 | | | 2,946,378 | | | | 55,244,587 | |
Holly Energy Partners LP | | | 1,821,271 | | | | 59,664,838 | |
Martin Midstream Partners LP 1 | | | 6,406,253 | | | | 116,593,805 | |
NGL Energy Partners LP 1 | | | 9,609,672 | | | | 130,691,539 | |
NuStar Energy LP 1 | | | 5,540,776 | | | | 252,548,570 | |
NuStar GP Holdings LLC | | | 700,000 | | | | 18,165,000 | |
PBF Logistics LP | | | 893,588 | | | | 17,514,325 | |
Sprague Resources LP 1 | | | 1,630,258 | | | | 41,490,066 | |
Sunoco LP 1 | | | 9,318,350 | | | | 277,873,197 | |
USD Partners LP | | | 750,975 | | | | 10,138,162 | |
Total Petroleum Transportation | | | | | | | 1,613,231,098 | |
| | | | | | | | | |
Propane — 3.1% | | | | | | | | |
Amerigas Partners LP | | | 775,336 | | | | 34,378,398 | |
Suburban Propane Partners LP 1 | | | 3,761,282 | | | | 88,916,707 | |
Total Propane | | | | | | | 123,295,105 | |
| | | | | | | | | |
Total Master Limited Partnership Shares | |
(identified cost $3,336,924,633) | | | | 3,381,336,555 | |
12 OPPENHEIMER STEELPATH MLP INCOME FUND |
STATEMENT OF INVESTMENTS Unaudited / (Continued) |
Description | | Shares | | | Value | |
Common Stock — 6.0% | |
Gathering/Processing — 2.1% | |
Targa Resources Corp. | | | 1,734,710 | | | $ | 79,675,230 | |
| | | | | | | | | |
Marine — 2.9% | | | | | | | | |
Golar LNG Partners LP 1 | | | 3,686,241 | | | | 72,840,122 | |
KNOT Offshore Partners LP 1 | | | 1,803,652 | | | | 38,237,422 | |
Teekay Offshore Partners LP | | | 443,843 | | | | 1,389,229 | |
Total Marine | | | | | | | 112,466,773 | |
| | | | | | | | | |
Petroleum Transportation — 1.0% | |
Enbridge Energy Management LLC 2 | | | 2,521,485 | | | | 40,545,475 | |
| | | | | | | | | |
Total Common Stock | |
(identified cost $240,103,564) | | | | 232,687,478 | |
| | | | | | | | | |
Preferred Master Limited Partnership Shares — 2.2% | |
Gathering/Processing — 1.0% | |
Crestwood Equity Partners LP, 9.25% 1,3 | | | 2,802,386 | | | | 22,643,279 | |
CSI Compressco LP - Series A, 11.00% 1,3 | | | 1,269,399 | | | | 15,029,685 | |
Total Gathering/Processing | | | | | | | 37,672,964 | |
| | | | | | | | | |
Marine — 0.3% | | | | | | | | |
Teekay Offshore Partners LP, 7.25% | | | 696,248 | | | | 12,797,038 | |
| | | | | | | | | |
Petroleum Transportation — 0.9% | |
Blueknight Energy Partners LP, 11.00% 1 | | | 801,393 | | | $ | 6,347,033 | |
GPM Petroleum LP, 10.00% 1,3 | | | 1,500,000 | | | | 30,540,000 | |
Total Petroleum Transportation | | | | | | | 36,887,033 | |
| | | | | | | | | |
Total Preferred Master Limited Partnership Shares | |
(identified cost $84,987,147) | | | | 87,357,035 | |
| | | | | | | | | |
Short-Term Investments — 0.6% | |
Money Market — 0.6% | |
Fidelity Treasury Portfolio, Institutional Class, 0.633% 4 | | | 24,381,593 | | | | 24,381,593 | |
| | | | | | | | | |
Total Short-Term Investments | |
(identified cost $24,381,593) | | | | 24,381,593 | |
| | | | | | | | | |
Total Investments — 95.3% | |
(identified cost $3,686,396,937) | | | | 3,725,762,661 | |
Other Assets In Excess of Liabilities — 4.7% | | | | 183,520,399 | |
Net Assets — 100.0% | | | $ | 3,909,283,060 | |
OPPENHEIMER STEELPATH MLP INCOME FUND 13 |
STATEMENT OF INVESTMENTS Unaudited / (Continued) |
Footnotes to Statement of Investments
LLC — Limited Liability Company
LP — Limited Partnership
1. | Is or was an affiliate, as defined by the Investment Company Act of 1940, at or during the period ended May 31, 2017, by virtue of the Fund owning at least 5% of the voting securities of the issuer. Transactions during this period in which the issuer was an affiliate are as follows: |
| | | Shares
November 30,
2016 | | | Gross
Additions | | | Gross
Reductions | | | Shares
May 31, 2017 | |
American Midstream Partners LP | | | 5,113,930 | | | | 750,859 | | | | — | | | | 5,864,789 | |
Arc Logistic Partners LP | | | 1,896,477 | | | | — | | | | — | | | | 1,896,477 | |
Archrock Partners LP | | | 5,234,394 | | | | 100,000 | | | | — | | | | 5,334,394 | |
Blueknight Energy Partners LP | | | 1,741,034 | | | | 266,400 | | | | — | | | | 2,007,434 | |
Blueknight Energy Partners LP - Preferred | | | — | | | | 801,393 | | | | — | | | | 801,393 | |
Crestwood Equity Partners LP | | | 4,592,151 | | | | 600,000 | | | | — | | | | 5,192,151 | |
Crestwood Equity Partners LP - Preferred | | | — | | | | 2,802,386 | | | | — | | | | 2,802,386 | |
CrossAmerica Partners LP | | | 1,809,700 | | | | 405,900 | | | | — | | | | 2,215,600 | |
CSI Compressco LP | | | 2,008,585 | | | | 186,472 | | | | — | | | | 2,195,057 | |
CSI Compressco LP - Preferred | | | 1,312,336 | | | | 94,014 | | | | (136,951 | ) | | | 1,269,399 | |
Global Partners LP | | | 2,414,606 | | | | 531,772 | | | | — | | | | 2,946,378 | |
Golar LNG Partners LP | | | 2,395,841 | | | | 1,290,400 | | | | — | | | | 3,686,241 | |
GPM Petroleum LP | | | 1,500,000 | | | | — | | | | — | | | | 1,500,000 | |
KNOT Offshore Partners LP | | | 1,103,652 | | | | 700,000 | | | | — | | | | 1,803,652 | |
Martin Midstream Partners LP | | | 5,637,184 | | | | 769,069 | | | | — | | | | 6,406,253 | |
Midcoast Energy Partners LP i | | | 3,100,729 | | | | — | | | | (3,100,729 | ) | | | — | |
NGL Energy Partners LP | | | 8,728,872 | | | | 880,800 | | | | — | | | | 9,609,672 | |
Nustar Energy LP | | | 5,340,776 | | | | 200,000 | | | | — | | | | 5,540,776 | |
Sanchez Production Partners LP | | | 1,739,905 | | | | — | | | | — | | | | 1,739,905 | |
Sprague Resources LP | | | 1,530,958 | | | | 99,300 | | | | — | | | | 1,630,258 | |
Suburban Propane Partners LP | | | 2,756,082 | | | | 1,005,200 | | | | — | | | | 3,761,282 | |
Summit Midstream Partners LP | | | 5,320,030 | | | | 798,000 | | | | — | | | | 6,118,030 | |
Sunoco LP | | | 8,054,250 | | | | 1,264,100 | | | | — | | | | 9,318,350 | |
USA Compression Partners LP | | | 4,621,112 | | | | 1,677,151 | | | | — | | | | 6,298,263 | |
USD Partners LP i | | | 750,975 | | | | — | | | | — | | | | 750,975 | |
14 OPPENHEIMER STEELPATH MLP INCOME FUND |
STATEMENT OF INVESTMENTS Unaudited / (Continued) |
| | | Value
May 31, 2017 | | | Distributions | | | Realized
Gain/(Loss) | | |
American Midstream Partners LP | | $ | 70,670,708 | | | $ | 4,657,769 | | | $ | — | | |
Arc Logistic Partners LP | | | 26,873,079 | | | | 1,668,900 | | | | — | | |
Archrock Partners LP | | | 82,629,763 | | | | 3,012,105 | | | | — | | |
Blueknight Energy Partners LP | | | 13,951,666 | | | | 572,528 | | | | — | | |
Blueknight Energy Partners LP - Preferred | | | 6,347,033 | | | | 143,249 | | | | — | | |
Crestwood Equity Partners LP | | | 118,900,258 | | | | 6,224,383 | | | | — | | |
Crestwood Equity Partners LP -
Preferred | | | 22,643,279 | | | | 511,868 | | | | — | | |
CrossAmerica Partners LP | | | 53,240,868 | | | | 2,472,431 | | | | — | | |
CSI Compressco LP | | | 12,072,814 | | | | 1,155,937 | | | | 66,384 | | |
CSI Compressco LP - Preferred | | | 15,029,685 | | | | 1,074,580 | | | | — | | |
Global Partners LP | | | 55,244,587 | | | | 2,725,400 | | | | — | | |
Golar LNG Partners LP | | | 72,840,122 | | | | 3,781,666 | | | | — | | |
GPM Petroleum LP | | | 30,540,000 | | | | 1,465,373 | | | | — | | |
KNOT Offshore Partners LP | | | 38,237,422 | | | | 1,875,798 | | | | — | | |
Martin Midstream Partners LP | | | 116,593,805 | | | | 6,221,719 | | | | — | | |
Midcoast Energy Partners LP i | | | — | | | | 1,108,511 | | | | (17,271,524 | ) | |
NGL Energy Partners LP | | | 130,691,539 | | | | 7,230,032 | | | | — | | |
Nustar Energy LP | | | 252,548,570 | | | | 11,915,299 | | | | — | | |
Sanchez Production Partners LP | | | 24,097,684 | | | | 1,511,108 | | | | — | | |
Sprague Resources LP | | | 41,490,066 | | | | 1,850,056 | | | | — | | |
Suburban Propane Partners LP | | | 88,916,707 | | | | 6,498,776 | | | | — | | |
Summit Midstream Partners LP | | | 141,326,493 | | | | 7,035,735 | | | | — | | |
Sunoco LP | | | 277,873,197 | | | | 15,343,321 | | | | — | | |
USA Compression Partners LP | | | 96,804,302 | | | | 6,481,926 | | | | — | | |
USD Partners LP i | | | 10,138,162 | | | | 499,398 | | | | — | | |
| | | $ | 1,799,701,809 | | | $ | 97,037,868 | | | $ | (17,205,140 | ) | |
| | i | Is not an affiliate as of May 31, 2017, was an affiliate during the period ended May 31, 2017. |
3. | Restricted security. The aggregate value of restricted securities at period end was $68,212,964, which represents 1.7% of the Fund’s net assets. See the accompanying Notes. Information concerning restricted securities is as follows: |
Security | Acquisition
Date | | Cost | | | Value | | | Unrealized Appreciation/ (Depreciation) | |
Crestwood Equity Partners LP - Preferred | 3/2/2017-5/15/2017 | | $ | 27,261,841 | | | $ | 22,643,279 | | | $ | (4,618,562 | ) |
CSI Compressco LP - Preferred | 8/8/2016-3/31/2017 | | $ | 14,509,231 | | | $ | 15,029,685 | | | $ | 520,454 | |
GPM Petroleum LP | 1/12/2016 | | $ | 30,000,000 | | | $ | 30,540,000 | | | $ | 540,000 | |
4 | Variable rate security; the coupon rate represents the rate at May 31, 2017. |
See accompanying Notes to Financial Statements.
OPPENHEIMER STEELPATH MLP INCOME FUND 15 |
STATEMENT OF ASSETS AND LIABILITIES May 31, 2017 / Unaudited |
Assets: | | | |
Investments at value – see accompanying Statement of Investments: | | | |
Unaffiliated companies (cost $1,401,608,695) | | $ | 1,926,060,852 | |
Affiliated companies (cost $2,284,788,242) | | | 1,799,701,809 | |
| | | 3,725,762,661 | |
Deferred tax asset, net | | | 193,713,079 | |
Receivable for beneficial interest sold | | | 4,995,431 | |
Dividends receivable | | | 7,452 | |
Prepaid expenses | | | 323,598 | |
Total assets | | | 3,924,802,221 | |
| | | | | |
Liabilities: | | | | |
Payable for beneficial interest redeemed | | | 9,756,592 | |
Payable to Manager | | | 2,902,469 | |
Payable for distribution and service plan fees | | | 1,428,901 | |
Transfer agent fees payable, net of voluntary waiver | | | 695,162 | |
Payable for investments purchased | | | 141,345 | |
Trustees' fees payable | | | 24,172 | |
Borrowing expense payable | | | 21,371 | |
Other liabilities | | | 549,149 | |
Total liabilities | | | 15,519,161 | |
| | | | | |
Net Assets | | $ | 3,909,283,060 | |
| | | | | |
Composition of Net Assets | | | | |
Par value of shares of beneficial interest | | $ | 551,192 | |
Paid-in capital | | | 4,247,012,467 | |
Undistributed net investment loss, net of deferred taxes | | | (141,271,276 | ) |
Accumulated undistributed net realized losses on investments, net of deferred taxes | | | (308,255,521 | ) |
Net unrealized appreciation on investments, net of deferred taxes | | | 111,246,198 | |
Net Assets | | $ | 3,909,283,060 | |
16 OPPENHEIMER STEELPATH MLP INCOME FUND |
STATEMENT OF ASSETS AND LIABILITIES Unaudited / (Continued) |
Net Asset Value, Offering Price and Redemption Proceeds Per Share ($0.001 Par Value, Unlimited Shares Authorized) | | | |
Class A Shares: | | | |
Net asset value and redemption proceeds per share | | $ | 7.17 | |
Offering price per share (net asset value plus sales charge of 5.75% of offering price) | | $ | 7.61 | |
Class C Shares: | | | | |
Net asset value, offering price and redemption proceeds per share | | $ | 6.80 | |
Class I Shares: | | | | |
Net asset value, offering price and redemption proceeds per share | | $ | 7.37 | |
Class Y Shares: | | | | |
Net asset value, offering price and redemption proceeds per share | | $ | 7.34 | |
| | | | | |
Net Assets: | | | | |
Class A shares | | $ | 1,641,163,940 | |
Class C shares | | | 1,218,411,533 | |
Class I shares | | | 19,223,507 | |
Class Y shares | | | 1,030,484,080 | |
Total Net Assets | | $ | 3,909,283,060 | |
| | | | | |
Shares Outstanding: | | | | |
Class A shares | | | 228,888,168 | |
Class C shares | | | 179,308,922 | |
Class I shares | | | 2,608,330 | |
Class Y shares | | | 140,386,489 | |
Total Shares Outstanding | | | 551,191,909 | |
See accompanying Notes to Financial Statements.
OPPENHEIMER STEELPATH MLP INCOME FUND 17 |
STATEMENT OF OPERATIONS
For the Six Months Ended May 31, 2017 / Unaudited |
Investment Income | | | |
Distributions from: | | | |
Unaffiliated Master Limited Partnerships | | $ | 69,843,120 | |
Affiliated Master Limited Partnerships | | | 97,037,868 | |
Less return of capital on distributions from: | | | | |
Unaffiliated Master Limited Partnerships | | | (69,843,120 | ) |
Affiliated Master Limited Partnerships | | | (97,037,868 | ) |
Dividend income | | | 3,736,571 | |
Total investment income | | | 3,736,571 | |
| | | | | |
Expenses | | | | |
Management fees | | | 19,073,343 | |
Distribution and service plan fees | | | | |
Class A | | | 2,237,500 | |
Class C | | | 6,355,519 | |
Transfer agent fees | | | | |
Class A | | | 1,972,755 | |
Class C | | | 1,398,247 | |
Class I | | | 3,112 | |
Class Y | | | 1,047,375 | |
Administrative fees | | | 417,765 | |
Borrowing fees | | | 125,273 | |
Tax expense | | | 114,332 | |
Legal, auditing, and other professional fees | | | 107,688 | |
Registration fees | | | 106,888 | |
Custody fees | | | 74,641 | |
Trustees' fees | | | 52,044 | |
Other | | | 51,209 | |
Total expenses, before waivers and deferred taxes | | | 33,137,691 | |
Less expense waivers | | | (2,107,432 | ) |
Net expenses, before deferred taxes | | | 31,030,259 | |
| | | | | |
Net investment loss, before deferred taxes | | | (27,293,688 | ) |
Deferred tax benefit | | | 8,807,226 | |
Net investment loss, net of deferred taxes | | | (18,486,462 | ) |
| | | | | |
Net Realized and Unrealized Gains/Losses on Investments: | | | | |
Net Realized Gains / Losses | | | | |
Investments from: | | | | |
Unaffiliated companies | | | 31,914,289 | |
Affiliated companies | | | (17,205,140 | ) |
Deferred tax expense | | | (5,368,839 | ) |
Net realized gains, net of deferred taxes | | | 9,340,310 | |
Net Change in Unrealized Appreciation | | | | |
Investments | | | (8,722,049 | ) |
Deferred tax benefit | | | 3,183,548 | |
Net change in unrealized appreciation, net of deferred taxes | | | (5,538,501 | ) |
| | | | | |
Net realized and unrealized gains on investments, net of deferred taxes | | | 3,801,809 | |
Change in net assets resulting from operations | | $ | (14,684,653 | ) |
See accompanying Notes to Financial Statements.
18 OPPENHEIMER STEELPATH MLP INCOME FUND |
STATEMENTS OF CHANGES IN NET ASSETS |
| | | For the Six
Months Ended
May 31, 2017
(Unaudited) | | | For the
Year Ended
November 30, 2016 | |
Operations | | | | | | |
Net investment loss, net of deferred taxes | | $ | (18,486,462 | ) | | $ | (29,635,435 | ) |
Net realized gains/(losses) on investments, net of deferred taxes | | | 9,340,310 | | | | (400,661,732 | ) |
Net change in unrealized appreciation/(depreciation), net of deferred taxes | | | (5,538,501 | ) | | | 679,572,043 | |
Change in net assets resulting from operations | | | (14,684,653 | ) | | | 249,274,876 | |
| | | | | | | | | |
Distributions to Shareholders | | | | | | | | |
Distributions to shareholders from return of capital: | | | | | | | | |
Class A shares | | | (73,521,553 | ) | | | (153,936,794 | ) |
Class C shares | | | (54,277,844 | ) | | | (118,262,435 | ) |
Class I shares | | | (842,016 | ) | | | (715,882 | ) |
Class Y shares | | | (37,321,026 | ) | | | (74,346,616 | ) |
Change in net assets resulting from distributions to shareholders | | | (165,962,439 | ) | | | (347,261,727 | ) |
| | | | | | | | | |
Beneficial Interest Transactions | | | | | | | | |
Class A shares | | | 35,479,627 | | | | 357,458,026 | |
Class C shares | | | 80,500,911 | | | | 157,347,884 | |
Class I shares | | | (9,162 | ) | | | 20,453,290 | |
Class Y shares | | | 213,966,296 | | | | 191,230,622 | |
Change in net assets resulting from beneficial interest transactions | | | 329,937,672 | | | | 726,489,822 | |
Change in net assets | | | 149,290,580 | | | | 628,502,971 | |
| | | | | | | | | |
Net Assets | | | | | | | | |
Beginning of period | | | 3,759,992,480 | | | | 3,131,489,509 | |
End of period | | $ | 3,909,283,060 | | | $ | 3,759,992,480 | |
| | | | | | | | | |
Undistributed net investment loss, net of deferred taxes | | $ | (141,271,276 | ) | | $ | (122,784,814 | ) |
See accompanying Notes to Financial Statements.
OPPENHEIMER STEELPATH MLP INCOME FUND 19 |
Class A | | Six Months Ended
May 31, 2017 (Unaudited) | | | Year Ended November 30,
2016 | | | Year Ended November 30,
2015 | | | Year Ended November 28,
2014* | | | Year Ended November 29,
2013* | | | Year Ended November 30,
2012 | |
Per Share Operating Data | | | | | | | | | | | | | | | | | | |
Net Asset Value, Beginning of Period | | $ | 7.47 | | | $ | 7.78 | | | $ | 11.01 | | | $ | 10.86 | | | $ | 9.83 | | | $ | 10.14 | |
Income/(loss) from investment operations: | | | | | | | | | | | | | | | | | | | | | | | | |
Net investment loss1 | | | (0.02 | ) | | | (0.05 | ) | | | (0.06 | ) | | | (0.09 | ) | | | (0.09 | ) | | | (0.09 | ) |
Return of capital1 | | | 0.20 | | | | 0.41 | | | | 0.48 | | | | 0.48 | | | | 0.49 | | | | 0.48 | |
Net realized and unrealized gains/(losses) | | | (0.17 | ) | | | 0.11 | | | | (2.87 | ) | | | 0.54 | | | | 1.41 | | | | 0.08 | |
Total from investment operations | | | 0.01 | | | | 0.47 | | | | (2.45 | ) | | | 0.93 | | | | 1.81 | | | | 0.47 | |
Distributions to shareholders: | | | | | | | | | | | | | | | | | | | | | | | | |
Return of capital | | | (0.31 | ) | | | (0.78 | ) | | | (0.78 | ) | | | (0.78 | ) | | | (0.78 | ) | | | (0.70 | ) |
Income | | | — | | | | — | | | | — | | | | — | | | | — | | | | (0.08 | ) |
Total distributions to shareholders | | | (0.31 | ) | | | (0.78 | ) | | | (0.78 | ) | | | (0.78 | ) | | | (0.78 | ) | | | (0.78 | ) |
Net asset value, end of period | | $ | 7.17 | | | $ | 7.47 | | | $ | 7.78 | | | $ | 11.01 | | | $ | 10.86 | | | $ | 9.83 | |
| | | | | | | | | | | | | | | | | | | | | | | | |
Total Return, at Net Asset Value2 | | | (0.09 | %) | | | 7.29 | % | | | (23.32 | %) | | | 8.66 | % | | | 18.79 | % | | | 4.61 | % |
| | | | | | | | | | | | | | | | | | | | | | | | | |
Ratios /Supplemental Data | | | | | | | | | | | | | | | | | | | | | | | | |
Net assets, end of period (in thousands) | | $ | 1,641,164 | | | $ | 1,681,230 | | | $ | 1,355,597 | | | $ | 2,116,790 | | | $ | 1,452,182 | | | $ | 333,544 | |
Ratio of Expenses to Average Net Assets:3 | | | | | | | | | | | | | |
Before (waivers) and deferred tax expense/(benefit) | | | 1.47 | % | | | 1.49 | % | | | 1.49 | % | | | 1.50 | % | | | 1.42 | % | | | 1.51 | % |
Expense (waivers) | | | (0.11 | %) | | | (0.12 | %) | | | (0.11 | %) | | | (0.12 | %) | | | (0.07 | %) | | | (0.16 | %) |
Net of (waivers) and before deferred tax expense/(benefit) | | | 1.36 | %4 | | | 1.37 | %4 | | | 1.38 | %4 | | | 1.38 | %4 | | | 1.35 | %5 | | | 1.35 | % |
Deferred tax expense/(benefit)6,7 | | | (0.33 | %) | | | 2.07 | % | | | (12.85 | %) | | | 4.38 | % | | | 6.97 | % | | | 2.02 | % |
Total expenses/(benefit) | | | 1.03 | % | | | 3.44 | % | | | (11.47 | %) | | | 5.76 | % | | | 8.32 | % | | | 3.37 | % |
| | | | | | | | | | | | | | | | | | | | | | | | | |
Ratio of Investment Loss to Average Net Assets:3 | | | | | | | | | | | | | |
Before (waivers) and deferred tax benefit/(expense) | | | (1.16 | %) | | | (1.09 | %) | | | (1.22 | %) | | | (1.41 | %) | | | (1.32 | %) | | | (1.51 | %) |
Expense (waivers) | | | (0.11 | %) | | | (0.12 | %) | | | (0.11 | %) | | | (0.12 | %) | | | (0.07 | %) | | | (0.16 | %) |
Net of expense (waivers) and before deferred tax benefit/(expense) | | | (1.05 | %) | | | (0.97 | %) | | | (1.11 | %) | | | (1.29 | %) | | | (1.25 | %) | | | (1.35 | %) |
Deferred tax benefit7,8 | | | 0.44 | % | | | 0.32 | % | | | 0.54 | % | | | 0.56 | % | | | 0.45 | % | | | 0.47 | % |
Net investment loss | | | (0.61 | %) | | | (0.65 | %) | | | (0.57 | %) | | | (0.73 | %) | | | (0.80 | %) | | | (0.88 | %) |
| | | | | | | | | | | | | | | | | | | | | | | | |
Portfolio turnover rate | | | 9 | % | | | 22 | % | | | 18 | % | | | 14 | % | | | 4 | % | | | 29 | % |
* | November 28, 2014 and November 29, 2013 represent the last business day of the Fund’s respective reporting periods. |
1. | Per share amounts calculated based on average shares outstanding during the period net of deferred tax expense/benefit. |
2. | Assumes an initial investment on the business day before the first day of the fiscal period, with all dividends and distributions reinvested in additional shares on the reinvestment date, and redemptions at the net asset value calculated on the last business day of the fiscal period. Sales charges are not reflected in the total returns. Total returns are not annualized for periods less than one full year. Returns do not reflect the deduction of taxes that a shareholder would pay on fund distributions or the redemption of fund shares. The returns do not include adjustments in accordance with generally accepted accounting principles required at the period end for financial reporting purposes. |
3. | Annualized for less than a full period. |
4. | Includes borrowing and franchise tax expense. Without borrowing and franchise tax expense, the net expense ratio would be 1.35%. |
5. | Includes franchise tax expense. Without franchise tax expense the net expense ratio would be 1.35%. |
6. | Deferred tax expense estimate for the ratio calculation is derived from the net investment income/loss, and realized and unrealized gains/losses. |
7. | Effective December 1, 2013 the deferred tax expense and deferred tax benefit are allocated based on average net assets. Prior to December 1, 2013 the deferred tax expense and deferred tax benefit were allocated based on specific class expenses. |
8. | Deferred tax benefit for the ratio calculation is derived from net investment income/loss only. |
See accompanying Notes to Financial Statements.
20 OPPENHEIMER STEELPATH MLP INCOME FUND |
FINANCIAL HIGHLIGHTS (Continued) |
Class C | | Six Months Ended
May 31, 2017 (Unaudited) | | | Year Ended November 30,
2016 | | | Year Ended November 30,
2015 | | | Year Ended November 28,
2014* | | | Year Ended November 29,
2013* | | | Year Ended November 30,
2012 | |
Per Share Operating Data | | | | | | | | | | | | | | | | | | |
Net Asset Value, Beginning of Period | | $ | 7.12 | | | $ | 7.51 | | | $ | 10.73 | | | $ | 10.68 | | | $ | 9.75 | | | $ | 10.13 | |
Income/(loss) from investment operations: | | | | | | | | | | | | | | | | | | | | | | | | |
Net investment loss1 | | | (0.07 | ) | | | (0.12 | ) | | | (0.15 | ) | | | (0.17 | ) | | | (0.14 | ) | | | (0.13 | ) |
Return of capital1 | | | 0.20 | | | | 0.41 | | | | 0.48 | | | | 0.48 | | | | 0.50 | | | | 0.51 | |
Net realized and unrealized gains/(losses) | | | (0.14 | ) | | | 0.10 | | | | (2.77 | ) | | | 0.52 | | | | 1.35 | | | | 0.02 | |
Total from investment operations | | | (0.01 | ) | | | 0.39 | | | | (2.44 | ) | | | 0.83 | | | | 1.71 | | | | 0.40 | |
Distributions to shareholders: | | | | | | | | | | | | | | | | | | | | | | | | |
Return of capital | | | (0.31 | ) | | | (0.78 | ) | | | (0.78 | ) | | | (0.78 | ) | | | (0.78 | ) | | | (0.70 | ) |
Income | | | — | | | | — | | | | — | | | | — | | | | — | | | | (0.08 | ) |
Total distributions to shareholders | | | (0.31 | ) | | | (0.78 | ) | | | (0.78 | ) | | | (0.78 | ) | | | (0.78 | ) | | | (0.78 | ) |
Net asset value, end of period | | $ | 6.80 | | | $ | 7.12 | | | $ | 7.51 | | | $ | 10.73 | | | $ | 10.68 | | | $ | 9.75 | |
| | | | | | | | | | | | | | | | | | | | | | | | |
Total Return, at Net Asset Value2 | | | (0.53 | %) | | | 6.44 | % | | | (23.85 | %) | | | 7.84 | % | | | 17.88 | % | | | 3.89 | % |
| | | | | | | | | | | | | | | | | | | | | | | | | |
Ratios /Supplemental Data | | | | | | | | | | | | | | | | | | | | | | | | |
Net assets, end of period (in thousands) | | $ | 1,218,412 | | | $ | 1,199,208 | | | $ | 1,096,028 | | | $ | 1,701,552 | | | $ | 869,041 | | | $ | 36,764 | |
Ratio of Expenses to Average Net Assets:3 | | | | | | | | | | | | | |
Before (waivers) and deferred tax expense/(benefit) | | | 2.22 | % | | | 2.24 | % | | | 2.24 | % | | | 2.25 | % | | | 2.18 | % | | | 2.37 | % |
Expense (waivers) | | | (0.11 | %) | | | (0.12 | %) | | | (0.11 | %) | | | (0.12 | %) | | | (0.07 | %) | | | (0.27 | %) |
Net of (waivers) and before deferred tax expense/(benefit) | | | 2.11 | %4 | | | 2.12 | %4 | | | 2.13 | %4 | | | 2.13 | %4 | | | 2.11 | %5 | | | 2.10 | % |
Deferred tax expense/(benefit)6,7 | | | (0.33 | %) | | | 2.07 | % | | | (12.85 | %) | | | 4.38 | % | | | 5.39 | % | | | 1.78 | % |
Total expenses/(benefit) | | | 1.78 | % | | | 4.19 | % | | | (10.72 | %) | | | 6.51 | % | | | 7.50 | % | | | 3.88 | % |
| | | | | | | | | | | | | | | | | | | | | | | | | |
Ratio of Investment Loss to Average Net Assets:3 | | | | | | | | | | | | | |
Before (waivers) and deferred tax benefit/(expense) | | | (2.39 | %) | | | (2.28 | %) | | | (2.21 | %) | | | (2.21 | %) | | | (2.08 | %) | | | (2.37 | %) |
Expense (waivers) | | | (0.11 | %) | | | (0.12 | %) | | | (0.11 | %) | | | (0.12 | %) | | | (0.07 | %) | | | (0.27 | %) |
Net of expense (waivers) and before deferred tax benefit/(expense) | | | (2.28 | %) | | | (2.16 | %) | | | (2.10 | %) | | | (2.09 | %) | | | (2.01 | %) | | | (2.10 | %) |
Deferred tax benefit7,8 | | | 0.44 | % | | | 0.32 | % | | | 0.54 | % | | | 0.56 | % | | | 0.73 | % | | | 0.75 | % |
Net investment loss | | | (1.84 | %) | | | (1.84 | %) | | | (1.56 | %) | | | (1.53 | %) | | | (1.28 | %) | | | (1.35 | %) |
| | | | | | | | | | | | | | | | | | | | | | | | |
Portfolio turnover rate | | | 9 | % | | | 22 | % | | | 18 | % | | | 14 | % | | | 4 | % | | | 29 | % |
* | November 28, 2014 and November 29, 2013 represent the last business day of the Fund’s respective reporting periods. |
1. | Per share amounts calculated based on average shares outstanding during the period net of deferred tax expense/benefit. |
2. | Assumes an initial investment on the business day before the first day of the fiscal period, with all dividends and distributions reinvested in additional shares on the reinvestment date, and redemptions at the net asset value calculated on the last business day of the fiscal period. Sales charges are not reflected in the total returns. Total returns are not annualized for periods less than one full year. Returns do not reflect the deduction of taxes that a shareholder would pay on fund distributions or the redemption of fund shares. The returns do not include adjustments in accordance with generally accepted accounting principles required at the period end for financial reporting purposes. |
3. | Annualized for less than a full period. |
4. | Includes borrowing and franchise tax expense. Without borrowing and franchise tax expense, the net expense ratio would be 2.10%. |
5. | Includes franchise tax expense. Without franchise tax expense the net expense ratio would be 2.10%. |
6. | Deferred tax expense estimate for the ratio calculation is derived from the net investment income/loss, and realized and unrealized gains/losses. |
7. | Effective December 1, 2013 the deferred tax expense and deferred tax benefit are allocated based on average net assets. Prior to December 1, 2013 the deferred tax expense and deferred tax benefit were allocated based on specific class expenses. |
8. | Deferred tax benefit for the ratio calculation is derived from net investment income/loss only. |
See accompanying Notes to Financial Statements.
OPPENHEIMER STEELPATH MLP INCOME FUND 21 |
FINANCIAL HIGHLIGHTS (Continued) |
Class I | | Six Months Ended
May 31, 2017 (Unaudited) | | | Year Ended November 30,
2016 | | | Year Ended November 30,
2015 | | | Year Ended November 28,
2014* | | | Period Ended November 29,
2013*,1,2 | |
Per Share Operating Data | | | | | | | | | | | | | | | |
Net Asset Value, Beginning of Period | | $ | 7.66 | | | $ | 7.93 | | | $ | 11.17 | | | $ | 10.97 | | | $ | 11.15 | |
Income/(loss) from investment operations: | | | | | | | | | | | | | | | | | | | | |
Net investment income/(loss)3 | | | 0.00 | 4 | | | 0.16 | | | | (0.03 | ) | | | 0.01 | | | | (0.03 | ) |
Return of capital3 | | | 0.20 | | | | 0.41 | | | | 0.48 | | | | 0.48 | | | | 0.22 | |
Net realized and unrealized gains/(losses) | | | (0.18 | ) | | | (0.06 | ) | | | (2.91 | ) | | | 0.49 | | | | 0.02 | |
Total from investment operations | | | 0.02 | | | | 0.51 | | | | (2.46 | ) | | | 0.98 | | | | 0.21 | |
Distributions to shareholders: | | | | | | | | | | | | | | | | | | | | |
Return of capital | | | (0.31 | ) | | | (0.78 | ) | | | (0.78 | ) | | | (0.78 | ) | | | (0.39 | ) |
Net asset value, end of period | | $ | 7.37 | | | $ | 7.66 | | | $ | 7.93 | | | $ | 11.17 | | | $ | 10.97 | |
| | | | | | | | | | | | | | | | | | | | |
Total Return, at Net Asset Value5 | | | 0.04 | % | | | 7.68 | % | | | (23.06 | %) | | | 9.04 | % | | | 1.90 | % |
| | | | | | | | | | | | | | | | | | | | | |
Ratios /Supplemental Data | | | | | | | | | | | | | | | | | | | | |
Net assets, end of period (in thousands) | | $ | 19,223 | | | $ | 20,112 | | | $ | 235 | | | $ | 331 | | | $ | 113 | |
Ratio of Expenses to Average Net Assets:6 | | | | | | | | | |
Before deferred tax expense/(benefit) | | | 1.03 | %7 | | | 1.01 | %7 | | | 1.05 | %7 | | | 1.05 | %7 | | | 1.16 | %8 |
Deferred tax expense/(benefit)9,10 | | | (0.33 | %) | | | 2.07 | % | | | (12.85 | %) | | | 4.38 | % | | | 2.23 | % |
Total expenses/(benefit) | | | 0.70 | % | | | 3.08 | % | | | (11.80 | %) | | | 5.43 | % | | | 3.39 | % |
| | | | | | | | | | | | | | | | | | | | | |
Ratio of Investment Gain/(Loss) to Average Net Assets:6 | | | | | | | | | |
Before deferred tax benefit/(expense) | | | (0.40 | %) | | | 1.69 | % | | | (0.88 | %) | | | (0.45 | %) | | | (1.05 | %) |
Deferred tax benefit10,11 | | | 0.44 | % | | | 0.32 | % | | | 0.54 | % | | | 0.56 | % | | | 0.37 | % |
Net investment income/(loss) | | | 0.04 | % | | | 2.01 | % | | | (0.34 | %) | | | 0.11 | % | | | (0.68 | %) |
| | | | | | | | | | | | | | | | | | | | |
Portfolio turnover rate | | | 9 | % | | | 22 | % | | | 18 | % | | | 14 | % | | | 4 | % |
* | November 28, 2014 and November 29, 2013 represent the last business day of the Fund’s respective reporting periods. |
1. | Shares commenced operations at the close of business June 28, 2013. |
2. | Effective June 28, 2013, Class I shares were renamed Class Y shares. See Note 1 of the Notes to Financial Statements for additional information. |
3. | Per share amounts calculated based on average shares outstanding during the period net of deferred tax expense/benefit. |
4. | Rounds to less than $0.005 a share. |
5. | Assumes an initial investment on the business day before the first day of the fiscal period, with all dividends and distributions reinvested in additional shares on the reinvestment date, and redemptions at the net asset value calculated on the last business day of the fiscal period. Sales charges are not reflected in the total returns. Total returns are not annualized for periods less than one full year. Returns do not reflect the deduction of taxes that a shareholder would pay on fund distributions or the redemption of fund shares. The returns do not include adjustments in accordance with generally accepted accounting principles required at the period end for financial reporting purposes. |
6. | Annualized for less than full period. |
7. | Includes borrowing and franchise tax expense. Without borrowing and franchise tax expense, the net expense ratio would be 1.02%, 0.99%, 1.02%, and 1.02% for the periods ended May 31, 2017, November 30, 2016, November 30, 2015, and November 28, 2014, respectively. |
8. | Includes franchise tax expense. Without franchise tax expense the net expense ratio would be 1.14%. |
9. | Deferred tax expense estimate for the ratio calculation is derived from the net investment income/loss, and realized and unrealized gains/losses. |
10. | Effective December 1, 2013 the deferred tax expense and deferred tax benefit are allocated based on average net assets. Prior to December 1, 2013 the deferred tax expense and deferred tax benefit were allocated based on specific class expenses. |
11. | Deferred tax benefit for the ratio calculation is derived from net investment income/loss only. |
See accompanying Notes to Financial Statements.
22 OPPENHEIMER STEELPATH MLP INCOME FUND |
FINANCIAL HIGHLIGHTS (Continued) |
Class Y | | Six Months Ended
May 31, 2017 (Unaudited) | | | Year Ended November 30,
2016 | | | Year Ended November 30,
2015 | | | Year Ended November 28,
2014* | | | Year Ended November 29,
2013*,1 | | | Year Ended November 30,
2012 1 | |
Per Share Operating Data | | | | | | | | | | | | | | | | | | |
Net Asset Value, Beginning of Period | | $ | 7.63 | | | $ | 7.91 | | | $ | 11.15 | | | $ | 10.97 | | | $ | 9.89 | | | $ | 10.17 | |
Income/(loss) from investment operations: | | | | | | | | | | | | | | | | | | | | | | | | |
Net investment loss2 | | | (0.01 | ) | | | (0.02 | ) | | | (0.02 | ) | | | (0.04 | ) | | | (0.07 | ) | | | (0.07 | ) |
Return of capital2 | | | 0.20 | | | | 0.41 | | | | 0.48 | | | | 0.48 | | | | 0.49 | | | | 0.49 | |
Net realized and unrealized gains/(losses) | | | (0.17 | ) | | | 0.11 | | | | (2.92 | ) | | | 0.52 | | | | 1.44 | | | | 0.08 | |
Total from investment operations | | | 0.02 | | | | 0.50 | | | | (2.46 | ) | | | 0.96 | | | | 1.86 | | | | 0.50 | |
Distributions to shareholders: | | | | | | | | | | | | | | | | | | | | | | | | |
Return of capital | | | (0.31 | ) | | | (0.78 | ) | | | (0.78 | ) | | | (0.78 | ) | | | (0.78 | ) | | | (0.70 | ) |
Income | | | — | | | | — | | | | — | | | | — | | | | — | | | | (0.08 | ) |
Total distributions to shareholders | | | (0.31 | ) | | | (0.78 | ) | | | (0.78 | ) | | | (0.78 | ) | | | (0.78 | ) | | | (0.78 | ) |
Net asset value, end of period | | $ | 7.34 | | | $ | 7.63 | | | $ | 7.91 | | | $ | 11.15 | | | $ | 10.97 | | | $ | 9.89 | |
| | | | | | | | | | | | | | | | | | | | | | | | |
Total Return, at Net Asset Value3 | | | 0.04 | % | | | 7.56 | % | | | (23.11 | %) | | | 8.85 | % | | | 19.19 | % | | | 4.89 | % |
| | | | | | | | | | | | | | | | | | | | | | | | | |
Ratios /Supplemental Data | | | | | | | | | | | | | | | | | | | | | | | | |
Net assets, end of period (in thousands) | | $ | 1,030,484 | | | $ | 859,443 | | | $ | 679,630 | | | $ | 992,009 | | | $ | 535,124 | | | $ | 134,481 | |
Ratio of Expenses to Average Net Assets:4 | | | | | | | | | | | | | |
Before (waivers) and deferred tax expense/(benefit) | | | 1.22 | % | | | 1.24 | % | | | 1.24 | % | | | 1.24 | % | | | 1.18 | % | | | 1.27 | % |
Expense (waivers) | | | (0.11 | %) | | | (0.12 | %) | | | (0.11 | %) | | | (0.12 | %) | | | (0.07 | %) | | | (0.17 | %) |
Net of (waivers) and before deferred tax expense/(benefit) | | | 1.11 | %5 | | | 1.12 | %5 | | | 1.13 | %5 | | | 1.12 | %5 | | | 1.11 | %6 | | | 1.10 | % |
Deferred tax expense/(benefit)7,8 | | | (0.33 | %) | | | 2.07 | % | | | (12.85 | %) | | | 4.38 | % | | | 6.68 | % | | | 2.10 | % |
Total expenses/(benefit) | | | 0.78 | % | | | 3.19 | % | | | (11.72 | %) | | | 5.50 | % | | | 7.79 | % | | | 3.20 | % |
| | | | | | | | | | | | | | | | | | | | | | | | | |
Ratio of Investment Loss to Average Net Assets:4 | | | | | | | | | | | | | |
Before (waivers) and deferred tax benefit/(expense) | | | (0.81 | %) | | | (0.72 | %) | | | (0.81 | %) | | | (1.01 | %) | | | (1.08 | %) | | | (1.27 | %) |
Expense (waivers) | | | (0.11 | %) | | | (0.12 | %) | | | (0.11 | %) | | | (0.12 | %) | | | (0.07 | %) | | | (0.17 | %) |
Net of expense (waivers) and before deferred tax benefit/(expense) | | | (0.70 | %) | | | (0.60 | %) | | | (0.70 | %) | | | (0.89 | %) | | | (1.01 | %) | | | (1.10 | %) |
Deferred tax benefit8,9 | | | 0.44 | % | | | 0.32 | % | | | 0.54 | % | | | 0.56 | % | | | 0.37 | % | | | 0.38 | % |
Net investment loss | | | (0.26 | %) | | | (0.28 | %) | | | (0.16 | %) | | | (0.33 | %) | | | (0.64 | %) | | | (0.72 | %) |
| | | | | | | | | | | | | | | | | | | | | | | | |
Portfolio turnover rate | | | 9 | % | | | 22 | % | | | 18 | % | | | 14 | % | | | 4 | % | | | 29 | % |
* | November 28, 2014 and November 29, 2013 represent the last business day of the Fund’s respective reporting periods. |
1. | Effective June 28, 2013, Class I shares were renamed Class Y shares. See Note 1 of the Notes to Financial Statements for additional information. |
2. | Per share amounts calculated based on average shares outstanding during the period net of deferred tax expense/benefit. |
3. | Assumes an initial investment on the business day before the first day of the fiscal period, with all dividends and distributions reinvested in additional shares on the reinvestment date, and redemptions at the net asset value calculated on the last business day of the fiscal period. Sales charges are not reflected in the total returns. Total returns are not annualized for periods less than one full year. Returns do not reflect the deduction of taxes that a shareholder would pay on fund distributions or the redemption of fund shares. The returns do not include adjustments in accordance with generally accepted accounting principles required at the period end for financial reporting purposes. |
4. | Annualized for less than a full period. |
5. | Includes borrowing and franchise tax expense. Without borrowing and franchise tax expense, the net expense ratio would be 1.10%. |
6. | Includes franchise tax expense. Without franchise tax expense the net expense ratio would be 1.10%. |
7. | Deferred tax expense estimate for the ratio calculation is derived from the net investment income/loss, and realized and unrealized gains/losses. |
8. | Effective December 1, 2013 the deferred tax expense and deferred tax benefit are allocated based on average net assets. Prior to December 1, 2013 the deferred tax expense and deferred tax benefit were allocated based on specific class expenses. |
9. | Deferred tax benefit for the ratio calculation is derived from net investment income/loss only. |
See accompanying Notes to Financial Statements.
OPPENHEIMER STEELPATH MLP INCOME FUND 23 |
NOTES TO FINANCIAL STATEMENTS Unaudited |
1. Organization
Oppenheimer SteelPath MLP Income Fund (the “Fund”), a separate series of Oppenheimer SteelPath MLP Funds Trust, is a non-diversified open-end management investment company registered under the Investment Company Act of 1940, as amended. The Fund’s investment objective is to seek total return. The Fund’s investment adviser is OFI SteelPath, Inc. (the “Adviser” or “Manager”), a wholly-owned subsidiary of OppenheimerFunds, Inc. (“OFI” or “Oppenheimer”).
The Fund offers Class A, Class C, Class I, and Class Y shares. Effective June 28, 2013, Class I shares were renamed Class Y shares. Class A shares are sold at their offering price, which is normally net asset value plus a front-end sales charge. Effective June 28, 2013 although there is no initial sales charge on Class A purchases totaling $1 million or more, those Class A shares may be subject to a 1.00% contingent deferred sales charge (“CDSC”) if shares are redeemed within an 18-month holding period measured from the date of purchase. Class C shares are sold without a front-end sales charge but may be subject to a CDSC of 1.00% of the redemption proceeds if Class C shares are redeemed within one year of purchase. Class I shares are only available to eligible institutional investors. Class I shares are sold at net asset value per share without a sales charge or CDSC. An institutional investor that buys Class I shares for its customers’ accounts may impose charges on those accounts. Class Y shares are sold at net asset value per share without a sales charge directly to institutional investors that have special agreements with OppenheimerFunds Distributor, Inc. (the “Distributor” or “OFDI”) for that purpose. They may include insurance companies, registered investment companies, employee benefit plans and section 529 plans, among others. An institutional investor that buys Class Y shares for its customers’ accounts may impose charges on those accounts. All classes of shares have identical rights and voting privileges with respect to the Fund in general and exclusive voting rights on matters that affect that class alone. Earnings, net assets and net asset value per share may differ due to each class having its own expenses, such as transfer and shareholder servicing agent fees and shareholder communications, directly attributable to that class. Class A and C shares have separate distribution and/or service plans under which they pay fees. Class I and Y shares do not pay such fees.
The Fund is an investment company and accordingly follows the investment company accounting and reporting guidance of the Financial Accounting Standards Board (“FASB”) Accounting Standard Codification Topic 946 Financial Services- Investment Companies.
The following is a summary of significant accounting policies followed in the Fund’s preparation of financial statements in accordance with accounting principles generally accepted in the United States (“U.S. GAAP”).
24 OPPENHEIMER STEELPATH MLP INCOME FUND |
NOTES TO FINANCIAL STATEMENTS Unaudited / (Continued) |
2. Significant Accounting Policies
Security Valuation. All investments in securities are recorded at their estimated fair value, as described in Note 3.
Allocation of Income, Expenses, Gains and Losses. Income, expenses (other than those attributable to a specific class), gains and losses are allocated on a daily basis to each class of shares based upon the relative proportion of net assets represented by such class. Operating expenses directly attributable to a specific class are charged against the operations of that class.
Dividends and Distributions to Shareholders. Dividends and distributions to shareholders, which are determined in accordance with income tax regulations and may differ from U.S. GAAP, are recorded on the ex-dividend date. The Fund���s dividend distribution policy is intended to provide monthly distributions to its shareholders at a rate that over time is similar to the distribution rate the Fund receives from the master limited partnerships (”MLPs”) in which it invests. The Fund generally pays out dividends that over time approximate the distributions received from the Fund’s portfolio investments based on, among other considerations, distributions the Fund actually received from portfolio investments, distributions it would have received if it had been fully invested at all times, and estimated future cash flows. Such dividends are not tied to the Fund’s investment income and may not represent yield or investment return on the Fund’s portfolio. To the extent that the dividends paid exceed the distributions the Fund receives from its underlying investments, the Fund’s assets will be reduced. The Fund’s tendency to pay out a consistent dividend may change, and the Fund’s level of distributions may increase or decrease.
The estimated characterization of the distributions paid will be either a qualified dividend or distribution (return of capital). This estimate is based on the Fund’s operating results during the period. It is anticipated that a significant portion of the distributions will be comprised of return of capital as a result of the tax character of cash distributions made by the Fund’s investments. The actual characterization of the distributions made during the period will not be determined until after the end of the fiscal year. The Fund will inform shareholders of the final tax character of the distributions on IRS Form 1099 DIV in February 2018. For the six months ended May 31, 2017, the Fund distributions are expected to be comprised of 100% return of capital.
Return of Capital Estimates. Distributions received from the Fund’s investments in MLPs generally are comprised of income and return of capital. The Fund records investment income and return of capital based on estimates made at the time such distributions are received. Such estimates are based on historical information available from each MLP and other industry sources. These estimates may subsequently be revised based on information received from MLPs after their tax reporting periods are concluded. For the six months ended May 31, 2017, the Fund estimated that 100% of the MLP distributions received would be treated as return of capital.
OPPENHEIMER STEELPATH MLP INCOME FUND 25 |
NOTES TO FINANCIAL STATEMENTS Unaudited / (Continued) |
2. Significant Accounting Policies (Continued)
Investment Income. Dividend income is recorded on the ex-dividend date or upon ex-dividend notification in the case of certain foreign dividends where the ex-dividend date may have passed. Non-cash dividends included in dividend income, if any, are recorded at the fair value of the securities received. Interest income, if any, is recognized on an accrual basis. Discount and premium, which are included in interest income on the Statement of Operations, if applicable, are amortized or accreted daily.
Custodian Fees. “Custody fees” in the Statement of Operations may include interest expense incurred by the Fund on any cash overdrafts of its custodian account during the period. Such cash overdrafts may result from the effects of failed trades in portfolio securities and from cash outflows resulting from unanticipated shareholder redemption activity. The Fund pays interest to its custodian on such cash overdrafts, to the extent they are not offset by positive cash balances maintained by the Fund, at a rate equal to the Federal Funds Rate plus 0.50%. The “Reduction to custodian expenses” line item, if applicable, represents earnings on cash balances maintained by the Fund during the period. Such interest expense and other custodian fees may be paid with these earnings.
Security Transactions. Security transactions are recorded on the trade date. Realized gains and losses on securities sold are determined using the basis of identified cost.
Indemnifications. The Fund’s organizational documents provide current and former trustees and officers with a limited indemnification against liabilities arising in connection with the performance of their duties to the Fund. In the normal course of business, the Fund may also enter into contracts that provide general indemnifications. The Fund’s maximum exposure under these arrangements is unknown as this would be dependent on future claims that may be made against the Fund. The risk of material loss from such claims is considered remote.
Federal Income Taxes. The Fund does not intend to qualify as a regulated investment company pursuant to Subchapter M of the Internal Revenue Code, but will rather be taxed as a corporation. As a corporation, the Fund is obligated to pay federal, state and local income tax on taxable income. Currently, the maximum marginal regular federal income tax rate for a corporation is 35 percent. Upon enactment, a change in the federal income tax rate could have a material impact to the Fund. The Fund may be subject to a 20 percent alternative minimum tax on its federal alternative minimum taxable income to the extent that its alternative minimum tax exceeds its regular federal income tax. The Fund is currently using an estimated rate of 1.7 percent for state and local tax, net of federal tax expense.
26 OPPENHEIMER STEELPATH MLP INCOME FUND |
NOTES TO FINANCIAL STATEMENTS Unaudited / (Continued) |
2. Significant Accounting Policies (Continued)
The Fund’s income tax provision consists of the following as of May 31, 2017:
Current tax expense/(benefit) | | | |
Federal | | $ | — | |
State | | | — | |
Total current tax expense | | $ | — | |
| | | | | |
Deferred tax expense/(benefit) | | | | |
Federal | | $ | (6,349,801 | ) |
State | | | (272,134 | ) |
Total deferred tax expense | | $ | (6,621,935 | ) |
The reconciliation between the federal statutory income tax rate of 35% and the effective tax rate on net investment income (loss) and realized and unrealized gain (loss) follows:
| | | Amount | | | Rate | |
Application of statutory income tax rate | | $ | (7,457,307 | ) | | | 35.00 | % |
State income taxes net of federal benefit | | | (319,599 | ) | | | 1.50 | % |
Effect of permanent differences | | | 1,154,971 | | | | (5.42 | %) |
Total income tax expense (benefit) | | $ | (6,621,935 | ) | | | 31.08 | % |
The Fund intends to invest its assets primarily in MLPs, which generally are treated as partnerships for federal income tax purposes. As a limited partner in the MLPs, the Fund reports its allocable share of the MLPs’ taxable income in computing its own taxable income. The Fund’s tax expense or benefit is included in the Statement of Operations based on the component of income or gains (losses) to which such expense or benefit relates. Deferred income taxes reflect the net tax effects of temporary differences between the carrying amounts of assets and liabilities for financial reporting purposes and the amounts used for income tax purposes. Such temporary differences are principally: (i) taxes on unrealized gains/(losses), which are attributable to the temporary difference between fair market value and tax basis, (ii) the net tax effects of temporary differences between the carrying amounts of assets and liabilities for financial reporting and income tax purposes and (iii) the net tax benefit of accumulated net operating losses and capital loss carryforwards. Deferred tax assets and liabilities are measured using effective tax rates expected to apply to taxable income in the years such temporary differences are realized or otherwise settled. To the extent the Fund has a deferred tax asset, consideration is given to whether or not a valuation allowance is required. A valuation allowance is required if, based on the evaluation criterion provided by ASC 740, Income Taxes, it is more-likely-than-not some portion or all of the deferred tax asset will not be realized.
OPPENHEIMER STEELPATH MLP INCOME FUND 27 |
NOTES TO FINANCIAL STATEMENTS Unaudited / (Continued) |
2. Significant Accounting Policies (Continued)
At May 31, 2017, the Fund determined a valuation allowance was not required. In evaluating a valuation allowance on a portion of the deferred tax asset, significant consideration was given to the current and expected level of MLP distributions, unrealized gains and losses on MLP investments and the expiration dates for net operating losses and capital loss carryovers. Market cycles, the severity and duration of historical deferred tax assets and the impact of current and future redemptions were also considered. The Fund intends to assess whether a valuation allowance is required to offset some or all of any deferred tax asset balance in connection with the calculation of the Fund’s daily NAV; however, to the extent the final valuation allowance differs from the estimates of the Fund used in calculating the Fund’s daily NAV, the application of such final valuation allowance in these Financial Statements could have a material impact on the Fund’s NAV. Through the consideration of these factors, the Fund has determined that it is more likely than not the deferred tax asset, net of the valuation allowance, if required, will be realized.
Unexpected significant decreases in cash distributions from the Fund’s MLP investments, significant declines in the fair value of its investments, significant redemptions or increased risk of expiring net operating losses or capital loss carryovers may change the Fund’s assessment regarding the recoverability of its deferred tax assets and may result in a change to the valuation allowance. Modifications of the valuation allowance could have a material impact on the Fund’s net asset value.
Components of the Fund’s deferred tax assets and liabilities as of May 31, 2017 are as follows:
Deferred tax assets: | | | |
Net operating loss carryforward (tax basis) | | $ | 327,078,565 | |
Capital loss carryforward (tax basis) | | | 120,788,710 | |
Total deferred tax asset | | | 447,867,275 | |
| | | | | |
Deferred tax liabilities: | | | | |
Net unrealized gains on investment securities (tax basis) | | $ | (254,154,196 | ) |
Total deferred tax liability | | | (254,154,196 | ) |
| | | | | |
Total net deferred tax asset/(liability) | | $ | 193,713,079 | |
The Fund may rely, to some extent, on information provided by the MLPs, which may not necessarily be timely, to estimate taxable income allocable to MLP units held in its portfolio, and to estimate its associated deferred tax liability or asset. Such estimates are made in good faith. From time to time, as new information becomes available, the Fund will modify its estimates or assumptions regarding its tax liability or asset.
28 OPPENHEIMER STEELPATH MLP INCOME FUND |
NOTES TO FINANCIAL STATEMENTS Unaudited / (Continued) |
2. Significant Accounting Policies (Continued)
The Fund’s policy is to classify interest and penalties associated with underpayment of federal and state income taxes, if any, as income tax expense on its Statement of Operations. As of May 31, 2017, the Fund does not have any interest or penalties associated with the underpayment of any income taxes.
The Fund files income tax returns in the U.S. federal jurisdiction and various states. The Fund has reviewed all major jurisdictions and concluded that there is no significant impact on the Fund’s net assets and no tax liability resulting from unrecognized tax benefits relating to uncertain tax positions expected to be taken on its tax returns. Furthermore, management of the Fund is not aware of any uncertain tax positions for which it is reasonably possible that the total amount of unrecognized tax benefit will significantly change in the next 12 months.
At May 31, 2017, the Fund had net operating loss carryforwards for federal income tax purposes, which may be carried forward for 20 years, as follows:
Expiration Date | | | |
11/30/2030 | | $ | 3,877 | |
11/30/2031 | | | 4,997,354 | |
11/30/2032 | | | 7,401,746 | |
11/30/2033 | | | 47,597,832 | |
11/30/2034 | | | 159,225,802 | |
11/30/2035 | | | 258,885,745 | |
11/30/2036 | | | 138,497,613 | |
11/30/2037 | | | 279,495,689 | |
Total | | $ | 896,105,658 | |
At May 31, 2017, the Fund had net capital loss carryforwards for federal income tax purposes, which may be carried forward for 5 years, as follows:
Expiration Date | | | |
11/30/2021 | | $ | 330,927,971 | |
Total | | $ | 330,927,971 | |
During the period ended May 31, 2017 the Fund utilized $141,390,862 of capital loss carryforward.
OPPENHEIMER STEELPATH MLP INCOME FUND 29 |
NOTES TO FINANCIAL STATEMENTS Unaudited / (Continued) |
2. Significant Accounting Policies (Continued)
At May 31, 2017, gross unrealized appreciation and depreciation of investments, based on cost for federal income tax purposes were as follows:
Cost of Investments | | $ | 3,027,669,290 | |
Gross Unrealized Appreciation | | $ | 931,340,801 | |
Gross Unrealized Depreciation | | | (233,247,430 | ) |
Net Unrealized Appreciation (Depreciation) on Investments | | $ | 698,093,371 | |
The difference between cost amounts for financial statement and federal income tax purposes is due primarily to timing differences in recognizing certain gains and losses in security transactions.
Use of Estimates. The preparation of financial statements in conformity with accounting principles generally accepted in the United States of America requires management to make estimates and assumptions that affect the reported amounts of assets and liabilities and disclosure of contingent assets and liabilities at the date of the financial statements and the reported amounts of increases and decreases in net assets from operations during the reporting period. Actual results could differ from those estimates.
Recent Accounting Pronouncement. In October 2016, the Securities and Exchange Commission (“SEC”) adopted amendments to rules under the Investment Company Act of 1940 (“final rules”) intended to modernize the reporting and disclosure of information by registered investment companies. The final rules amend Regulation S-X and require funds to provide standardized, enhanced derivative disclosure in fund financial statements in a format designed for individual investors. The amendments to Regulation S-X also update the disclosures for other investments and investments in, and advances to affiliates and amend the rules regarding the general form and content of fund financial statements. The compliance date for the amendments to Regulation S-X is August 1, 2017. OFI Global Asset Mangement, Inc., a wholly-owned subsidiary of OFI, (“OFI Global”) is currently evaluating the amendments and their impact, if any, on the Fund’s financial statements.
3. Securities Valuation
The Fund calculates the net asset value of its shares as of 4:00 P.M. Eastern time, on each day the New York Stock Exchange (the “Exchange”) is open for trading, except in the case of a scheduled early closing of the Exchange, in which case the Fund will calculate net asset value of the shares as of the scheduled early closing time of the Exchange.
The Fund’s Board of Trustees (the “Board”) has adopted procedures for the valuation of the Fund’s securities and has delegated the day-to-day responsibility for valuation determinations under those procedures to the Manager. The Manager has established a Valuation Committee
30 OPPENHEIMER STEELPATH MLP INCOME FUND |
NOTES TO FINANCIAL STATEMENTS Unaudited / (Continued) |
3. Securities Valuation (Continued)
which is responsible for determining a fair valuation for any security for which market quotations are not readily available. The Valuation Committee’s fair valuation determinations are subject to review, approval and ratification by the Fund’s Board at its next regularly scheduled meeting covering the calendar quarter in which the fair valuation was determined.
Valuation Methods and Inputs
Securities are valued primarily using unadjusted quoted market prices, when available, as supplied by third party pricing services or broker-dealers.
The following methodologies are used to determine the market value or the fair value of the types of securities described below:
Equity securities traded on a securities exchange (including exchange-traded derivatives other than futures and futures options) are valued based on the official closing price on the principal exchange on which the security is traded, as identified by the Manager, prior to the time when the Fund’s assets are valued. If the official closing price is unavailable, the security is valued at the last sale price on the principal exchange on which it is traded, or if no sales occurred, the security is valued at the mean between the quoted bid and asked prices. Over-the-counter equity securities are valued at the last published sale price, or if no sales occurred, at the mean between the quoted bid and asked prices.
Shares of a registered investment company that are not traded on an exchange are valued at that investment company’s net asset value per share.
Securities for which market quotations are not readily available or a significant event has occurred that would materially affect the value of the security, are fair valued either (i) by a standardized fair valuation methodology applicable to the security type or the significant event as previously approved by the Valuation Committee and the Fund’s Board or (ii) as determined in good faith by the Manager’s Valuation Committee. The Valuation Committee considers all relevant facts that are reasonably available, through either public information or information available to the Manager, when determining the fair value of a security. Those standardized methodologies include, but are not limited to, valuing securities at the last sale price or initially at cost and subsequently adjusting the value based on: changes in company specific fundamentals, changes in an appropriate securities index, or changes in the value of similar securities which may be further adjusted for any discounts related to security-specific resale restrictions. When possible, such methodologies use observable market inputs such as unadjusted quoted prices of similar securities, observable interest rates, currency rates and yield curves. The methodologies used for valuing securities are not necessarily an indication of the risks associated with investing in those securities nor can it be assured that the Fund can obtain the fair value assigned to a security if it were to sell the security.
OPPENHEIMER STEELPATH MLP INCOME FUND 31 |
NOTES TO FINANCIAL STATEMENTS Unaudited / (Continued) |
3. Securities Valuation (Continued)
To assess the continuing appropriateness of security valuations the Manager regularly compares prior day prices, and sale prices to the current day prices and challenges those prices exceeding certain tolerance levels with the third party pricing service or broker source. For those securities valued by fair valuations, whether through a standardized fair valuation methodology or a fair valuation determination, the Valuation Committee reviews and affirms the reasonableness of the valuations based on such methodologies and fair valuation determinations on a regular basis after considering all relevant information that is reasonably available.
Classifications
Each investment asset or liability of the Fund is assigned a level at measurement date based on the significance and source of the inputs to its valuation. Various data inputs may be used in determining the value of each of the Fund’s investments as of the reporting period end. These data inputs are categorized in the following hierarchy under applicable financial accounting standards:
| | 1) | Level 1-unadjusted quoted prices in active markets for identical assets or liabilities (including securities actively traded on a securities exchange) |
| | 2) | Level 2-inputs other than unadjusted quoted prices that are observable for the asset or liability (such as unadjusted quoted prices for similar assets and market corroborated inputs such as interest rates, prepayment speeds, credit risks, etc.) |
| | 3) | Level 3-significant unobservable inputs (including the Manager’s own judgments about assumptions that market participants would use in pricing the asset or liability) |
The inputs used for valuing securities are not necessarily an indication of the risks associated with investing in those securities.
The Fund classifies each of its investments in investment companies which are publicly offered as Level 1. Investment companies that are not publicly offered, if any, are measured using net asset value.
32 OPPENHEIMER STEELPATH MLP INCOME FUND |
NOTES TO FINANCIAL STATEMENTS Unaudited / (Continued) |
3. Securities Valuation (Continued)
The table below categorizes amounts that are included in the Fund’s Statement of Assets and Liabilities as of May 31, 2017, based on valuation input level:
| | | Level 1 — Unadjusted Quoted Prices | | | Level 2 —
Other Significant Observable Inputs | | | Level 3 —
Significant Unobservable Inputs | | | Value | |
Assets Table | | | | | | | | | | | | |
Investments, at Value: | | | | | | | | | | | | |
Master Limited Partnership Shares* | | $ | 3,381,336,555 | | | $ | — | | | $ | — | | | $ | 3,381,336,555 | |
Common Stocks* | | | 232,687,478 | | | | — | | | | — | | | | 232,687,478 | |
Preferred Master Limited Partnership Shares* | | | 19,144,071 | | | | — | | | | 68,212,964 | | | | 87,357,035 | |
Short Term Investment | | | 24,381,593 | | | | — | | | | — | | | | 24,381,593 | |
Total Assets | | $ | 3,657,549,697 | | | $ | — | | | $ | 68,212,964 | | | $ | 3,725,762,661 | |
* | For a detailed break-out of securities by major industry classification, please refer to the Statement of Investments. |
The following is a reconciliation of assets in which significant unobservable inputs (level 3) were used in determining fair value:
Beginning balance November 30, 2016 | | $ | 44,926,890 | |
Transfers into Level 3 during the period | | | — | |
Change in unrealized appreciation/(depreciation) | | | (433,177 | ) |
Total realized gain/(loss) | | | — | |
Purchases | | | 28,336,421 | |
Sales | | | (1,565,349 | ) |
Return of capital distributions | | | (3,051,821 | ) |
Transfers out of Level 3 during the period | | | — | |
Ending balance May 31, 2017 | | $ | 68,212,964 | |
The total change in unrealized appreciation/depreciation included in the Statement of Operations attributable to Level 3 investments still held at May 31, 2017 is ($3,484,998).
OPPENHEIMER STEELPATH MLP INCOME FUND 33 |
NOTES TO FINANCIAL STATEMENTS Unaudited / (Continued) |
3. Securities Valuation (Continued)
The following table summarizes the valuation techniques and significant unobservable inputs used in determining fair value measurements for those investments classified as Level 3 as of May 31, 2017:
Assets Table | | Value as of May 31, 2017 | | Valuation Technique | Unobservable input | | Range of Unobservable Inputs | | | Unobservable Input Used | |
Investments, at Value: | | | | | | | | | | | |
Preferred Stocks | | $ | 15,029,685 | | Discounted Cash Flow Model | Illiquidity Discount | | | N/A | | | | 7 | %(a) |
| | | | | | | Estimated Yield | | | 7.5% - 12.7 | % | | | 10.1 | %(a) |
| | | | 30,540,000 | | Discounted Cash Flow Model | Illiquidity Discount | | | N/A | | | | 7 | %(b) |
| | | | | | | Estimated Yield | | | 10.5% - 11.1 | % | | | 10.8 | %(b) |
| | | | 22,643,279 | | Discounted Cash Flow Model | Annual Illiquidity Discount | | | N/A | | | | 10 | %(c) |
| | | | | | | Estimated Yield | | | N/A | | | | 8.64 | %(c) |
Total | | $ | 68,212,964 | | | | | | | | | | | |
(a) | The Fund fair values certain preferred shares using a discounted cash flow model which values the shares at the expected value of common units to be received in PIK conversion based on: the current price of the common shares (observable), the 20-day volume weighted average price (VWAP) of the common shares (observable), the 3-day volume weighted average price of the common shares (observable), and a discount rate, which is derived from the estimated yield and an illiquidity discount. Such security’s fair valuation could decrease (increase) significantly based on an increase (decrease) in the illiquidity discount. Such security’s fair valuation could increase (decrease) significantly based on an increase (decrease) in expected yields. |
(b) | The Fund fair values certain preferred shares using a discounted cash flow model, which incorporates an illiquidity discount and the expected yield based on the average yield on comparable companies’ equity. Such security’s fair valuation could decrease (increase) significantly based on an increase (decrease) in the illiquidity discount. Such security’s fair valuation could increase (decrease) significantly based on an increase (decrease) in expected yields. |
(c) | The Fund fair values certain preferred shares using a discounted cash flow model, which incorporates an illiquidity discount and an estimated yield based on a recent transaction. Such security’s fair valuation could decrease (increase) significantly based on an increase (decrease) in the illiquidity discount. Such security’s fair valuation could increase (decrease) significantly based on an increase (decrease) in estimated yields. |
There have been no transfers between pricing levels for the Fund. It is the Fund’s policy to recognize transfers at the beginning of the reporting period.
34 OPPENHEIMER STEELPATH MLP INCOME FUND |
NOTES TO FINANCIAL STATEMENTS Unaudited / (Continued) |
4. Investments and Risks
Equity Security Risk. Stocks and other equity securities fluctuate in price. The value of the Fund’s portfolio may be affected by changes in the equity markets generally. Equity markets may experience significant short-term volatility and may fall sharply at times. Different markets may behave differently from each other and U.S. equity markets may move in the opposite direction from one or more foreign stock markets. Adverse events in any part of the equity or fixed-income markets may have unexpected negative effects on other market segments.
The prices of individual equity securities generally do not all move in the same direction at the same time and a variety of factors can affect the price of a particular company’s securities. These factors may include, but are not limited to, poor earnings reports, a loss of customers, litigation against the company, general unfavorable performance of the company’s sector or industry, or changes in government regulations affecting the company or its industry.
Master Limited Partnerships. MLPs issue common units that represent an equity ownership interest in a partnership and provide limited voting rights. MLP common units are registered with the Securities and Exchange Commission (“SEC”), and are freely tradable on securities exchanges such as the NYSE and the NASDAQ Stock Market (“NASDAQ”), or in the over-the-counter market. An MLP consists of one or more general partners, who conduct the business, and one or more limited partners, who contribute capital. MLP common unit holders have a limited role in the partnership’s operations and management. The Fund, as a limited partner, normally would not be liable for the debts of the MLP beyond the amounts the Fund has contributed, but would not be shielded to the same extent that a shareholder of a corporation would be. In certain circumstances creditors of an MLP would have the right to seek return of capital distributed to a limited partner. This right of an MLP’s creditors would continue after the Fund sold its investment in the MLP.
MLPs are generally treated as publicly traded partnerships for federal income tax purposes. Any modification to federal income tax laws and related interpretations could cause a material decrease in the value of an MLP.
Restricted Securities. At period end, investments in securities included issues that are restricted. A restricted security may have a contractual restriction on its resale and is valued under methods approved by the Board of Trustees as reflecting fair value. Securities that are restricted are marked with an applicable footnote on the Statement of Investments. Restricted securities are reported on a schedule following the Statement of Investments.
Concentration Risk. Under normal circumstances, the Fund invests at least 80% of its net assets (plus the amount of any borrowing for investment purposes) in the equity securities of MLPs, the majority of which operate in the energy and/or natural resources sector. MLPs are subject to certain risks, such as supply and demand risk, depletion and exploration risk, commodity pricing risk, acquisition risk, and the risk associated with the hazards inherent in
OPPENHEIMER STEELPATH MLP INCOME FUND 35 |
NOTES TO FINANCIAL STATEMENTS Unaudited / (Continued) |
4. Investments and Risks (Continued)
midstream energy industry activities. A substantial portion of the cash flow received by the Fund is derived from investment in equity securities of MLPs. The amount of cash that a MLP has available for distributions, and the tax character of such distributions, are dependent upon the amount of cash generated by the MLP’s operations.
5. Shares of Beneficial Interest
The Fund has authorized an unlimited number of $0.001 par value shares of beneficial interest in each class. Transactions in shares of beneficial interest were as follows:
| | | Six Months Ended
May 31, 2017 | | | Year Ended
November 30, 2016 | |
| | | | | | | |
| | | Shares | | | Amount | | | Shares | | | Amount | |
Class A | | | | | | | | | | | | |
Sold | | | 45,077,232 | | | $ | 345,163,078 | | | $ | 99,080,823 | | | $ | 688,572,838 | |
Dividends and/or distributions reinvested | | | 8,460,020 | | | | 64,652,567 | | | | 19,124,478 | | | | 134,212,798 | |
Redeemed | | | (49,744,727 | ) | | | (374,336,018 | ) | | | (67,332,630 | ) | | | (465,327,610 | ) |
Net Increase | | | 3,792,525 | | | $ | 35,479,627 | | | $ | 50,872,671 | | | $ | 357,458,026 | |
| | | | | | | | | | | | | | | | | |
Class C | | | | | | | | | | | | | | | | |
Sold | | | 24,199,470 | | | $ | 176,340,163 | | | | 44,246,838 | | | $ | 297,646,619 | |
Dividends and/or distributions reinvested | | | 7,110,546 | | | | 51,631,679 | | | | 16,703,083 | | | | 111,919,047 | |
Redeemed | | | (20,442,669 | ) | | | (147,470,931 | ) | | | (38,483,394 | ) | | | (252,217,782 | ) |
Net Increase | | | 10,867,347 | | | $ | 80,500,911 | | | | 22,466,527 | | | $ | 157,347,884 | |
| | | | | | | | | | | | | | | | | |
Class I | | | | | | | | | | | | | | | | |
Sold | | | 843,210 | | | $ | 6,698,822 | | | | 2,596,857 | | | $ | 20,445,968 | |
Dividends and/or distributions reinvested | | | 80,033 | | | | 629,019 | | | | 75,809 | | | | 580,892 | |
Redeemed | | | (941,910 | ) | | | (7,337,003 | ) | | | (75,276 | ) | | | (573,570 | ) |
Net Increase/(Decrease) | | | (18,667 | ) | | $ | (9,162 | ) | | | 2,597,390 | | | $ | 20,453,290 | |
| | | | | | | | | | | | | | | | | |
Class Y | | | | | | | | | | | | | | | | |
Sold | | | 49,810,338 | | | $ | 384,219,398 | | | | 63,838,365 | | | $ | 445,760,663 | |
Dividends and/or distributions reinvested | | | 4,690,392 | | | | 36,674,524 | | | | 10,220,369 | | | | 73,088,148 | |
Redeemed | | | (26,757,120 | ) | | | (206,927,626 | ) | | | (47,312,989 | ) | | | (327,618,189 | ) |
Net Increase | | | 27,743,610 | | | $ | 213,966,296 | | | | 26,745,745 | | | $ | 191,230,622 | |
36 OPPENHEIMER STEELPATH MLP INCOME FUND |
NOTES TO FINANCIAL STATEMENTS Unaudited / (Continued) |
6. Purchases and Sales of Securities
The aggregate cost of purchases and proceeds from sales of securities, other than short-term obligations, for the six months ended May 31, 2017, were as follows:
| | | Purchases | | | Sales | |
Investment securities | | $ | 631,583,623 | | | $ | 335,576,819 | |
7. Fees and Other Transactions with Affiliates
Management Fees. Under the investment advisory agreement, the Fund pays the Manager a management fee based on the daily net assets of the Fund at an annual rate as shown in the following table:
Net Assets up to $3 Billion | Net Assets Greater than
$3 Billion and up to $5 Billion | Net Assets in Excess of $5 Billion |
0.95% | 0.93% | 0.90% |
The Fund’s effective management fee for the six months ended May 31, 2017 was 0.94% of average annual net assets before any applicable waivers.
Transfer Agent Fees. OFI Global (the “Transfer Agent”) serves as the transfer and shareholder servicing agent for the Fund. The Fund pays the Transfer Agent a fee based on average net assets. Fees incurred with respect to these services are detailed in the Statement of Operations.
Sub-Transfer Agent Fees. The Transfer Agent has retained Shareholder Services, Inc., a wholly-owned subsidiary of OFI (the “Sub-Transfer Agent”), to provide the day-to-day transfer agent and shareholder servicing of the Fund. Under the Sub-Transfer Agency Agreement, the Transfer Agent pays the Sub-Transfer Agent an annual fee in monthly installments, equal to a percentage of the transfer agent fee collected by the Transfer Agent from the Fund, which shall be calculated after any applicable fee waivers. The fee paid to the Sub-Transfer Agent is paid by the Transfer Agent, not by the Fund.
Trustees’ Compensation. The Board has adopted a compensation deferral plan for independent trustees that enables trustees to elect to defer receipt of all or a portion of the annual compensation they are entitled to receive from the Fund. For purposes of determining the amount owed to the Trustee under the plan, deferred amounts are treated as though equal dollar amounts had been invested in shares of the Fund or in other Oppenheimer funds selected by the Trustee. The Fund purchases shares of the funds selected for deferral by the Trustee in amounts equal to his or her deemed investment, resulting in a Fund asset equal to the deferred compensation liability. Such assets are included as a component of
OPPENHEIMER STEELPATH MLP INCOME FUND 37 |
NOTES TO FINANCIAL STATEMENTS Unaudited / (Continued) |
7. Fees and Other Transactions with Affiliates (Continued)
“Other” within the asset section of the Statement of Assets and Liabilities, if applicable. Deferral of trustees’ fees under the plan will not affect the net assets of the Fund, and will not materially affect the Fund’s assets, liabilities or net investment income per share. Amounts will be deferred until distributed in accordance with the compensation deferral plan.
Distribution and Service Plan (12b-1) Fees. Under its General Distributor’s Agreement with the Fund, the Distributor acts as the Fund’s principal underwriter in the continuous public offering of the Fund’s classes of shares.
Service Plan for Class A Shares. The Fund has adopted a Service Plan (the “Plan”) for Class A shares under Rule 12b-1 of the Investment Company Act of 1940. Under the Plan, the Fund reimburses the Distributor for a portion of its costs incurred for services provided to accounts that hold Class A shares. Reimbursement is made periodically at an annual rate of up to 0.25% of the daily net assets of Class A shares of the Fund. The Distributor currently uses all of those fees to pay dealers, brokers, banks and other financial institutions periodically for providing personal service and maintenance of accounts of their customers that hold Class A shares. Any unreimbursed expenses the Distributor incurs with respect to Class A shares in any fiscal year cannot be recovered in subsequent periods. Fees incurred by the Fund under the Plan are detailed in the Statement of Operations.
Distribution and Service Plans for Class C Shares. The Fund has adopted Distribution and Service Plans (the “Plans”) for Class C shares under Rule 12b-1 of the Investment Company Act of 1940 to compensate the Distributor for distributing those share classes, maintaining accounts and providing shareholder services. Under the Plans, the Fund pays the Distributor an annual asset-based sales charge of 0.75% on Class C shares daily net assets. The Fund also pays a service fee under the Plans at an annual rate of 0.25% of daily net assets.
The Plan and Plans continue in effect from year to year only if the Fund’s Board votes annually to approve their continuance at an in person meeting called for that purpose. Fees incurred by the Fund under the Plans are detailed in the Statement of Operations.
Sales Charges. Front-end sales charges and contingent deferred sales charges (“CDSC”) do not represent expenses of the Fund. They are deducted from the proceeds of sales of Fund shares prior to investment or from redemption proceeds prior to remittance, as applicable.
38 OPPENHEIMER STEELPATH MLP INCOME FUND |
NOTES TO FINANCIAL STATEMENTS Unaudited / (Continued) |
7. Fees and Other Transactions with Affiliates (Continued)
The sales charges retained by the Distributor from the sale of shares and the CDSC retained by the Distributor on the redemption of shares is shown in the following table for the period indicated.
Six Months Ended | | Class A Front-End Sales Charges Retained by Distributor | | | Class A Contingent Deferred Sales Charges Retained by Distributor | | | Class C Contingent Deferred Sales Charges Retained by Distributor | |
May 31, 2017 | | $ | 1,049,752 | | | $ | 17,658 | | | $ | 70,997 | |
Waivers and Reimbursements of Expenses. The Manager has contractually agreed to limit fees and/or reimburse expenses of the Fund to the extent that the Fund’s total annual fund operating expenses (exclusive of interest, taxes, such as deferred tax expenses, brokerage commissions, acquired fund fees and expenses, dividend costs related to short sales, and litigation expense, if any) exceed 1.35% for Class A shares, 2.10% for Class C shares, and 1.10% for Class Y shares. The Fund’s total annual operating expenses after fee waiver and/or expense reimbursement (“Net Expenses”) will be higher than these amounts to the extent that the Fund incurs expenses excluded from the expense cap. Because the Fund’s deferred income tax expense/(benefit) is excluded from the expense cap, the Fund’s Net Expenses for each class of shares is increased/(decreased) by the amount of this expense. During the six months ended May 31, 2017, the Manager reimbursed $828,765, $587,727, and $438,076 for Class A, Class C, and Class Y, respectively. This undertaking may not be modified or terminated until after one year from the date of the current prospectus, as indicated therein, unless approved by the Fund’s Board.
The Manager can be reimbursed by the Fund within three years after the date the fee limitation and/or expense reimbursement has been made by the Manager, provided that such repayment does not cause the expenses of any class of the Fund to exceed the foregoing limits.
The following table represents amounts eligible for recovery at May 31, 2017:
Eligible Expense Recoupment Expiring: | | | |
November 30, 2017 | | $ | 4,687,900 | |
November 30, 2018 | | | 4,433,066 | |
November 30, 2019 | | | 3,593,107 | |
November 30, 2020 | | | 1,854,568 | |
During the six months ended May 31, 2017, the Manager did not recoup any expenses.
OPPENHEIMER STEELPATH MLP INCOME FUND 39 |
NOTES TO FINANCIAL STATEMENTS Unaudited / (Continued) |
7. Fees and Other Transactions with Affiliates (Continued)
Effective January 1, 2017, the Transfer Agent has voluntarily agreed to waive fees and/or reimburse Fund expenses in an amount equal to 0.015% of average annual net assets for Classes A, C, and Y.
During the reporting period, the Transfer Agent waived fees and/or reimbursed the Fund for transfer agent and shareholder servicing agent fees as follows:
Class A | | $ | 112,763 | |
Class C | | | 79,815 | |
Class Y | | | 60,286 | |
This fee waiver and/or reimbursement may be terminated at any time.
Related Party. The Interested Trustees and officers of the Fund are also officers or trustees of companies affiliated with the Manager, Distributor, and Transfer Agent.
Cross Trades. The Fund is permitted to purchase and sell securities from and to other Funds managed by the Manager or OFI Global (“cross-trade”) pursuant to “Cross-Trading” Procedures adopted by the Fund’s Board of Trustees. These procedures are designed to ensure that any cross-trade of securities by the Fund from or to another fund that is or could be considered an affiliate of the Fund under certain limited circumstances by virtue of having a common investment adviser, common Officer, or common Trustee complies with Rule 17a-7 of the 1940 Act. Further, as defined under these procedures, each cross-trade is effected at the current market price.
During the period the Fund had $177,260,151 in purchases and $50,915,000 in sales considered cross-trades, resulting in ($6,705,370) of tax adjusted realized gain/(loss).
8. Borrowing Agreement
The Fund, along with Oppenheimer SteelPath MLP Alpha Plus Fund, Oppenheimer SteelPath MLP Alpha Fund, and Oppenheimer SteelPath MLP Select 40 Fund (collectively, the “Trust”), is a borrower in a $700 million revolving credit agreement (the “Loan Agreement”) with a major lending institution (the “Lender”). The Fund is permitted to borrow up to the lesser of one-third of the Fund’s total assets, or the maximum amount permitted pursuant to the Fund’s investment limitations. As the Loan Agreement is not available exclusively to the Fund, the Fund may not be able to borrow all of its requested amounts at any given time. Amounts borrowed under the Loan Agreement, if any, are invested by the Fund under the direction of the Manager consistent with the Fund’s investment objective and policies, and as such, the related investments are subject to normal market fluctuations and investment risks, including the risk of loss due to a decline in value. The borrowing, if any, is fully collateralized
40 OPPENHEIMER STEELPATH MLP INCOME FUND |
NOTES TO FINANCIAL STATEMENTS Unaudited / (Continued) |
8. Borrowing Agreement (Continued)
throughout the term of the borrowing with securities or other assets of the Fund. The Fund is not liable for borrowings of other funds in the Trust. Securities that have been pledged as collateral for the borrowing are indicated in the Statement of Investments.
Borrowings under the Loan Agreement are charged interest at a calculated rate computed by the Lender based on the one month LIBOR rate plus 0.65% per annum. An unused commitment fee at the rate of 0.125% per annum is charged for any undrawn portion of the credit facility, and each member of the Trust will pay its pro rata share of this fee. A facility fee of 0.20% was charged on the commitment amount, and each party of the Trust paid its pro rata share of this fee. The borrowing is due November 17, 2017, unless another date is mutually agreed upon by the parties of the Loan Agreement. For the period ended May 31, 2017, the Fund paid $125,273 in borrowing fees. The Fund did not utilize the facility during the period ended May 31, 2017.
OPPENHEIMER STEELPATH MLP INCOME FUND 41 |
DISTRIBUTION SOURCES Unaudited |
For any distribution that took place over the last six months of the Fund’s reporting period, the table below details on a per-share basis the percentage of the Fund’s total distribution payment amount that was derived from the following sources: net income, net profit from the sale of securities, and other capital sources. Other capital sources represent a return of capital. A return of capital may occur, for example, when some or all of the money that you invested in the Fund is paid back to you. A return of capital distribution does not necessarily reflect the Fund’s investment performance and should not be confused with “yield” or “income.” You should not draw any conclusions about each Fund’s investment performance from the amounts of these distributions. This information is based upon income and capital gains using generally accepted accounting principles as of the date of each distribution. For certain securities, such as Master Limited Partnerships (“MLPs”), the percentages attributed to each category are estimated using historical information because the character of the amounts received from the MLPs in which the Fund invests is unknown until after the end of the calendar year. Because the Fund is actively managed, the relative amount of the Fund’s total distributions derived from various sources over the calendar year may change. Please note that this information should not be used for tax reporting purposes as the tax character of distributable income may differ from the amounts used for this notification. You will receive IRS tax forms in the first quarter of each calendar year detailing the actual amount of the taxable and non-taxable portion of distributions paid to you during the tax year.
For the most current information, please go to oppenheimerfunds.com. Select your Fund, then the ’Detailed’ tab; where ‘Dividends’ are shown, the Fund’s latest pay date will be followed by the sources of any distribution, updated daily.
Fund Name | Pay
Date | Net
Income | Net
Profit
from Sale | Other
Capital
Sources |
Oppenheimer SteelPath MLP Income Fund | 1/6/17 | 0.0% | 0.0% | 100.0% |
Oppenheimer SteelPath MLP Income Fund | 2/7/17 | 0.0% | 0.0% | 100.0% |
Oppenheimer SteelPath MLP Income Fund | 3/7/17 | 0.0% | 0.0% | 100.0% |
Oppenheimer SteelPath MLP Income Fund | 4/5/17 | 0.0% | 0.0% | 100.0% |
Oppenheimer SteelPath MLP Income Fund | 5/5/17 | 0.0% | 0.0% | 100.0% |
42 OPPENHEIMER STEELPATH MLP INCOME FUND |
PORTFOLIO PROXY VOTING POLICIES AND PROCEDURES; UPDATES TO STATEMENTS OF INVESTMENTS Unaudited |
The Fund has adopted Portfolio Proxy Voting Policies and Procedures under which the Fund votes proxies relating to securities (“portfolio proxies”) held by the Fund. A description of the Fund’s Portfolio Proxy Voting Policies and Procedures is available (i) without charge, upon request, by calling the Fund toll-free at 1.800.CALL OPP (225.5677), (ii) on the Fund’s website at oppenheimerfunds.com, and (iii) on the SEC’s website at www.sec.gov. In addition, the Fund is required to file Form N-PX, with its complete proxy voting record for the 12 months ended June 30th, no later than August 31st of each year. The Fund’s voting record is available (i) without charge, upon request, by calling the Fund toll-free at 1.800.CALL OPP (225.5677), and (ii) in the Form N-PX filing on the SEC’s website at www.sec.gov.
The Fund files its complete schedule of portfolio holdings with the SEC for the first quarter and the third quarter of each fiscal year on Form N-Q. The Fund’s Form N-Q filings are available on the SEC’s website at www.sec.gov. Those forms may be reviewed and copied at the SEC’s Public Reference Room in Washington, D.C. Information on the operation of the Public Reference Room may be obtained by calling 1-800-SEC-0330.
Householding – Delivery of Shareholder Documents
This is to inform you about OppenheimerFunds’ “householding” policy. If more than one member of your household maintains an account in a particular fund, OppenheimerFunds will mail only one copy of the fund’s prospectus (or, if available, the fund’s summary prospectus), annual and semiannual report and privacy policy. The consolidation of these mailings, called householding, benefits your fund through reduced mailing expense, and benefits you by reducing the volume of mail you receive from OppenheimerFunds. Householding does not affect the delivery of your account statements.
Please note that we will continue to household these mailings for as long as you remain an OppenheimerFunds shareholder, unless you request otherwise. If you prefer to receive multiple copies of these materials, please call us at 1.800.CALL-OPP (225-5677). You may also notify us in writing or via email. We will begin sending you individual copies of the prospectus (or, if available, the summary prospectus), reports and privacy policy within 30 days of receiving your request to stop householding.
OPPENHEIMER STEELPATH MLP INCOME FUND 43 |
OPPENHEIMER STEELPATH MLP INCOME FUND |
Trustees and Officers | | Robert J. Malone, Chairman of the Board of Trustees and Trustee |
| | | Jon S. Fossel, Trustee |
| | | Richard F. Grabish, Trustee |
| | | Beverly L. Hamilton, Trustee |
| | | Victoria J. Herget, Trustee |
| | | F. William Marshall, Jr., Trustee |
| | | Karen L. Stuckey, Trustee |
| | | James D. Vaughn, Trustee |
| | | Arthur P. Steinmetz, Trustee, President and Principal Executive Officer |
| | | Stuart Cartner, Vice President |
| | | Brian Watson, Vice President |
| | | Cynthia Lo Bessette, Secretary and Chief Legal Officer |
| | | Jennifer Foxson, Vice President and Chief Business Officer |
| | | Mary Ann Picciotto, Chief Compliance Officer
and Chief Anti-Money Laundering Officer |
| | | Brian S. Petersen, Treasurer and Principal Financial & Accounting Officer |
| | | |
Manager | | OFI SteelPath, Inc. |
| | | |
Distributor | | OppenheimerFunds Distributor, Inc. |
| | | |
Transfer and Shareholder Servicing Agent | | OFI Global Asset Management, Inc. |
| | | |
Sub-Transfer Agent | | Shareholder Services, Inc. |
| | | DBA OppenheimerFunds Services |
| | | |
Independent Registered Public Accounting Firm | | Cohen & Company, Ltd. |
| | | |
Legal Counsel | | Ropes & Gray LLP |
© 2017 OppenheimerFunds, Inc. All rights reserved.
44 OPPENHEIMER STEELPATH MLP INCOME FUND |
As an Oppenheimer fund shareholder, you are entitled to know how we protect your personal information and how we limit its disclosure. Information Sources
We obtain nonpublic personal information about our shareholders from the following sources:
| | ● | Applications or other forms. |
| | ● | When you create a user ID and password for online account access. |
| | ● | When you enroll in eDocs Direct,SM our electronic document delivery service. |
| | ● | Your transactions with us, our affiliates or others. |
| | ● | Technologies on our website, including: “cookies” and web beacons, which are used to collect data on the pages you visit and the features you use. |
If you visit oppenheimerfunds.com and do not log on to the secure account information areas, we do not obtain any personal information about you. When you do log on to a secure area, we do obtain your user ID and password to identify you. We also use this information to provide you with products and services you have requested, to inform you about products and services that you may be interested in and assist you in other ways.
We do not collect personal information through our website unless you willingly provide it to us, either directly by email or in those areas of the website that request information. In order to update your personal information (including your mailing address, email address and phone number) you must first log on and visit your user profile.
If you have set your browser to warn you before accepting cookies, you will receive the warning message with each cookie. You can refuse cookies by turning them off in your browser. However, doing so may limit your access to certain sections of our website.
We use cookies to help us improve and manage our website. For example, cookies help us recognize new versus repeat visitors to the site, track the pages visited, and enable some special features on the website. This data helps us provide a better service for our website visitors.
Protection of Information
We do not disclose any nonpublic personal information (such as names on a customer list) about current or former customers to anyone, except as permitted by law.
OPPENHEIMER STEELPATH MLP INCOME FUND 45 |
PRIVACY POLICY NOTICE (Continued) |
Disclosure of Information
Copies of confirmations, account statements and other documents reporting activity in your fund accounts are made available to your financial advisor (as designated by you). We may also use details about you and your investments to help us, our financial service affiliates, or firms that jointly market their financial products and services with ours, to better serve your investment needs or suggest educational material that may be of interest to you. If this requires us to provide you with an opportunity to “opt in” or “opt out” of such information sharing with a firm not affiliated with us, you will receive notification on how to do so, before any such sharing takes place.
Right of Refusal
We will not disclose your personal information to unaffiliated third parties (except as permitted by law), unless we first offer you a reasonable opportunity to refuse or “opt out” of such disclosure.
Internet Security and Encryption
In general, the email services provided by our website are encrypted and provide a secure and private means of communication with us. To protect your own privacy, confidential and/ or personal information should only be communicated via email when you are advised that you are using a secure website.
As a security measure, we do not include personal or account information in nonsecure emails, and we advise you not to send such information to us in nonsecure emails. Instead, you may take advantage of the secure features of our website to encrypt your email correspondence. To do this, you will need to use a browser that supports Secure Sockets Layer (SSL) protocol.
| | ● | All transactions, including redemptions, exchanges and purchases, are secured by SSL and 256-bit encryption. SSL is used to establish a secure connection between your PC and OppenheimerFunds’ server. It transmits information in an encrypted and scrambled format. |
| | ● | Encryption is achieved through an electronic scrambling technology that uses a “key” to code and then decode the data. Encryption acts like the cable converter box you may have on your television set. It scrambles data with a secret code so that no one can make sense of it while it is being transmitted. When the data reaches its destination, the same software unscrambles the data. |
| | ● | You can exit the secure area by closing your browser or, for added security, you can use the Log Out button before you close your browser. |
46 OPPENHEIMER STEELPATH MLP INCOME FUND |
PRIVACY POLICY NOTICE (Continued) |
Other Security Measures
We maintain physical, electronic and procedural safeguards to protect your personal account information. Our employees and agents have access to that information only so that they may offer you products or provide services, for example, when responding to your account questions.
How You Can Help
You can also do your part to keep your account information private and to prevent unauthorized transactions. If you obtain a user ID and password for your account, safeguard that information. Also, take special precautions when accessing your account on a computer used by others.
Who We Are
This joint notice describes the privacy policies of the Oppenheimer funds, OppenheimerFunds, Inc., each of its investment adviser subsidiaries, OppenheimerFunds Distributor, Inc. and OFI Global Trust Co. It applies to all Oppenheimer fund accounts you presently have, or may open in the future, using your Social Security number—whether or not you remain a shareholder of our funds. This notice was last updated as of November 2016. In the event it is updated or changed, we will post an updated notice on our website at oppenheimerfunds.com. If you have any questions about this privacy policy, email us by clicking on the Contact Us section of our website at oppenheimerfunds.com, write to us at P.O. Box 5270, Denver, CO 80217-5270, or call us at 800 CALL OPP (225 5677).
OPPENHEIMER STEELPATH MLP INCOME FUND 47 |


Table of Contents
Fund Performance Discussion | 3 |
Top Holdings and Allocations | 7 |
Share Class Performance | 8 |
Fund Expenses | 10 |
Statement of Investments | 12 |
Statement of Assets and Liabilities | 14 |
Statement of Operations | 16 |
Statements of Changes in Net Assets | 17 |
Statement of Cash Flows | 18 |
Financial Highlights | 19 |
Notes to Financial Statements | 23 |
Distribution Sources | 39 |
Portfolio Proxy Voting Policies and Procedures; Updates to Statements of Investments | 40 |
Trustees and Officers | 41 |
Privacy Policy Notice | 42 |
|
Class A Shares
AVERAGE ANNUAL TOTAL RETURNS AT 5/31/17
| | Class A Shares of the Fund | | |
| | Without
Sales Charge | With
Sales Charge | S&P 500 Index | Alerian MLP Index |
6-Month | 1.40% | -4.41% | 10.81% | 2.28% |
1-Year | 6.60% | 0.48% | 17.47% | 6.24% |
5-Year | 2.51% | 1.30% | 15.42% | 2.57% |
Since Inception (2/6/12) | 1.35% | 0.22% | 14.05% | 1.11% |
Performance data quoted represents past performance, which does not guarantee future results. The investment return and principal value of an investment in the Fund will fluctuate so that an investor’s shares, when redeemed, may be worth more or less than their original cost. Fund returns include changes in share price, reinvested distributions, and a 5.75% maximum applicable sales charge except where “without sales charge” is indicated. Current performance may be lower or higher than the performance quoted. Returns do not consider capital gains or income taxes on an individual’s investment. Returns for periods of less than one year are cumulative and not annualized. For performance data current to the most recent month-end, visit oppenheimerfunds.com or call 1.800.CALL OPP (225.5677). See Fund prospectuses and summary prospectuses for more information on share classes and sales charges.
2 OPPENHEIMER STEELPATH MLP ALPHA PLUS FUND |
Fund Performance Discussion
The Fund’s Class A shares (without sales charge) produced a total return of 1.40% during the reporting period. In comparison, master limited partnerships (“MLPs”), as measured by the Alerian MLP Index (AMZ), provided a total return gain of 2.28%. Please note that the returns for the Alerian MLP Index are calculated pre-tax, while the Fund’s returns are calculated post corporate tax, which contributed partially to the Fund’s underperformance this reporting period. This generally has a negative impact on the Fund’s performance versus the Index in up markets, and a positive impact on performance in down markets. During the same period, the S&P 500 Index produced a total return gain of 10.81%.
Over the six-month reporting period ended May 31, 2017, the midstream sector underperformed the broader markets as the correlation of price performance between midstream equities and crude oil remained elevated over the period. While the sector performed well early in the period, subsequent crude oil price weakness was accompanied by midstream price weakness. This crude oil price weakness appeared to stem primarily from continued U.S. inventory builds as well as fears that U.S. shale producers were ramping production more quickly than previously anticipated. Interestingly, while a quicker than expected resurgence of U.S. shale production may serve to temper the crude price recovery, we believe midstream assets should benefit through the resultant volume improvements regardless.
The influence of Washington remained topical over the period. In contrast to the challenging energy regulatory environment of the prior presidential administration, President Trump signed multiple midstream related executive orders in late January designed to expedite current and future midstream projects. Two orders were individually specific to the Keystone XL and Dakota Access Pipelines, each directing respective authorities to take all actions necessary and appropriate to facilitate the implementation of the projects. Additionally, President Trump signed an order to expedite the review and approval of high priority infrastructure projects. Separately, three large natural gas pipeline projects, representing a collective $7.5 billion of growth capital spending, received Federal Energy Regulatory Commission (FERC) approval in early February, just ahead of FERC’s loss of a quorum due to the resignation of a FERC commissioner. While at the end of the reporting period the commission still lacked a quorum to vote on project approvals, President Trump had made nominations to fill two of the three vacancies. However, Commissioner Colette Honorable has also announced her intention to not seek another term when her current seat expires in June, but that she is willing to stay on until the end of the year, awaiting her replacement.
OPPENHEIMER STEELPATH MLP ALPHA PLUS FUND 3 |
Over the reporting period, we estimate approximately $15 billion of new equity supply entered the market through either secondary offerings, initial public offerings, or “at-the-market” programs in which primary units trade into the market anonymously throughout the normal trading day. This pace of equity issuance represents an increase from approximately $11 billion that was raised over the six month reporting period ended May 31, 2016. Midstream companies also raised approximately $15 billion of debt capital during the period. Most MLPs pay out the majority of excess cash flow as distributions to investors, and therefore must raise external capital to fund growth projects and to fund acquisitions.
MACRO REVIEW
West Texas Intermediate (WTI) crude oil prices ended the reporting period at $47.66 per barrel, down 4% over the reporting period. Global crude prices, as measured by Brent crude oil, traded 2% higher over the reporting period. As previously noted, the crude oil price decline appeared to stem primarily from continued U.S. inventory builds as well as fears that U.S. shale producers were ramping up production more quickly than previously anticipated. Brent exited the period at a $3 per barrel premium to WTI, which is near the historic norm. However, this reversion represents a departure from the $8 to $9 per barrel Brent premium present from 2009 to 2015.
Henry Hub natural gas spot prices exited the period at $3.20 per million British thermal units (“mmbtu”), down 3% over the reporting period, while up 52% from the year-ago period. Natural gas pricing has benefited from a long awaited realignment of supply-demand in which natural gas usage as a heating and electric generation fuel has increased as gas production volume growth has moderated, and as increased exports have become a reality via both liquefied natural gas and new pipelines to Mexico.
Mont Belvieu natural gas liquids (“NGL”) prices ended the reporting period at $24.13 per barrel, a 1% decline over the reporting period. Pricing for NGL purity products varied, with ethane and propane trading higher over the period while butane, isobutene, and natural gasoline prices declined. Frac spreads, a measure of natural gas processing economics, ended the period at $0.30 per gallon, up 8% over the reporting period. Generally, the greater the frac spread, the greater the incentive for producers to seek natural gas processing capacity.
The yield curve flattened over the reporting period as short rates increased while the yields on longer-dated maturities declined. The ten-year Treasury yield declined 18 basis points to end the period at 2.20%. The MLP yield spread at period-end, as measured by the AMZ and the 10-year Treasury bond, widened by 17 basis points to 5.22%.
Over the reporting period, real estate investment trusts (“REITs”) and utilities, two competing yield-oriented equity asset classes, posted total returns of 7.50% (as measured by the Dow Jones Equity REIT Total Return Index) and 16.86% (as measured by the Dow Jones Utility Average Index), respectively, as compared to the
4 OPPENHEIMER STEELPATH MLP ALPHA PLUS FUND |
AMZ’s 2.28% total return. Price to forward distributable cash flow (DCF), a commonly watched ratio within the MLP sector, declined over the period ending well below the ten-year average.
SUBSECTOR REVIEW
Performance among subsectors in the midstream, or energy infrastructure, MLP asset class varied for the reporting period. On average, the gathering and processing subsector provided the best performance over the period, buoyed by improved volumetric projections. The natural gas pipeline group followed as investors continued to express preference for the safety of long-haul natural gas pipelines, particularly those backed by utility demand pull.
The upstream subsector experienced the weakest performance over the reporting period as these entities’ cash flows were directly impacted by commodity price weakness over the period. The coal subsector also lagged over the reporting period as domestic coal pricing generally weakened through the reporting period.
FUND REVIEW
Key contributors to the Fund’s performance were TC Pipelines, LP (TCP) and Tallgrass Energy GP, LP (TEGP).
TCP units outperformed over the period, during which the partnership announced plans to acquire its sponsor’s interest in the Iroquois Gas Transmission System and an interest in the Portland Natural Gas Transmission System. Additionally, TCP’s sponsor, TransCanada Corp (TRP), closed its acquisition of Columbia Pipeline Partners (CPPL). We believe that TRP may offer some or all of these assets to TCP in the future, further improving TCP’s growth backlog.
TEGP units outperformed over the period as the general partner’s underlying operating partnership, Tallgrass Energy Partners (TEP), announced better than expected operating and financial results as well as new long-term contracts on the Rockies Express Pipeline. TEGP management expects to grow its distribution by 30% to 40% over 2017.
Key detractors from the Fund’s performance were Targa Resources Corp (TRGP) and Plains All American Pipeline (PAA).
TRGP shares underperformed over the reporting period after reporting weaker than expected results for the first quarter of 2017. During the reporting period, TRGP announced an acquisition that is expected to enhance its already substantial footprint in the premier Permian basin while also facilitating TRGP’s entry into crude gathering activities in the play.
PAA units underperformed over the period as headwinds in its Supply & Logistics segment resulted in operational performance that was below market expectations. Despite continued headwinds in the first half of 2017, Plains is expecting improvement in fee-based volumes and margins during the second half of 2017 and into 2018. With its significant asset
OPPENHEIMER STEELPATH MLP ALPHA PLUS FUND 5 |
footprint in the Permian basin, Plains is expected to be one of the primary beneficiaries of continued production growth in the basin.
Separately, the Fund also obtains leverage through borrowing, which did not produce a significant impact to its performance this reporting period. Please note that to the extent the Fund obtains leverage through borrowing, there will be the potential for greater gains and the risk of magnified losses.
Please note that significant decreases in cash distributions from the Fund’s MLP investments and/or significant declines in the fair value of its investments may impact the Fund’s assessment regarding the recoverability of certain deferred tax assets, which may result in the recording of a valuation allowance. If a valuation allowance is established, this could have a material impact on the Fund’s net asset value and results of operations for the period. The Fund had a valuation allowance in place throughout the entire reporting period. See Note 2 of the Notes to Financial Statements for more information.
OUTLOOK
We continue to believe we have seen the worst of this energy market down cycle. In our opinion, the rate of midstream growth will likely moderate from peak levels, but average distributions are still likely to grow. We expect midstream operators to benefit from the reflation of domestic hydrocarbon production and the more efficient use of existing assets going forward, in contrast to the widespread need to construct new assets over the first years of shale production growth. We believe current market valuations underestimate the potential for renewed business growth going forward and we remain optimistic on the sector’s prospects. Consequently, we believe midstream MLPs continue to offer attractive total return potential based on the potential for price appreciation and stable or growing distribution streams.
6 OPPENHEIMER STEELPATH MLP ALPHA PLUS FUND |
Top Holdings and Allocations
TOP TEN MASTER LIMITED PARTNERSHIP HOLDINGS
Energy Transfer Partners LP | 14.77% |
Enterprise Products Partners LP | 10.29% |
Energy Transfer Equity LP | 9.97% |
TC Pipelines LP | 9.90% |
Magellan Midstream Partners LP | 9.48% |
MPLX LP | 8.72% |
Targa Resources Corp. | 8.71% |
Williams Partners LP | 6.29% |
Tallgrass Energy GP LP | 6.28% |
Buckeye Partners LP | 5.25% |
Portfolio holdings and allocations are subject to change. Percentages are as of May 31, 2017, and are based on net assets.
SECTOR ALLOCATION
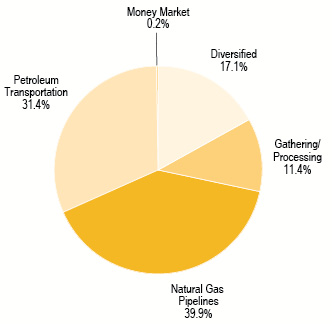
Portfolio holdings and allocations are subject to change. Percentages are as of May 31, 2017, and are based on the total market value of investments.
OPPENHEIMER STEELPATH MLP ALPHA PLUS FUND 7 |
Share Class Performance
AVERAGE ANNUAL TOTAL RETURNS WITHOUT SALES CHARGE AS OF 5/31/17
| | Inception Date | 6-Month | 1-Year | 5-Year | Since Inception |
Class A (MLPLX) | 2/6/2012 | 1.40% | 6.60% | 2.51% | 1.35% |
Class C (MLPMX) | 5/22/2012 | 1.04% | 5.85% | 1.76% | 1.47% |
Class I (OSPPX) | 6/28/2013 | 1.63% | 7.01% | N/A | -3.70% |
Class Y (MLPNX) | 12/30/2011 | 1.63% | 6.90% | 2.80% | 1.87% |
AVERAGE ANNUAL TOTAL RETURNS WITH SALES CHARGE AS OF 5/31/17
| | Inception Date | 6-Month | 1-Year | 5-Year | Since Inception |
Class A (MLPLX) | 2/6/2012 | -4.41% | 0.48% | 1.30% | 0.22% |
Class C (MLPMX) | 5/22/2012 | 0.07% | 4.87% | 1.76% | 1.47% |
Class I (OSPPX) | 6/28/2013 | 1.63% | 7.01% | N/A | -3.70% |
Class Y (MLPNX) | 12/30/2011 | 1.63% | 6.90% | 2.80% | 1.87% |
Performance data quoted represents past performance, which does not guarantee future results. The investment return and principal value of an investment in the Fund will fluctuate so that an investor’s shares, when redeemed, may be worth more or less than their original cost. Current performance may be lower or higher than the performance quoted. Returns do not consider capital gains or income taxes on an individual’s investment. For performance data current to the most recent month-end, visit oppenheimerfunds.com or call 1.800.CALL OPP (225.5677). Fund returns include changes in share price, reinvested distributions, and the applicable sales charge: for Class A shares, the current maximum initial sales charge of 5.75%, and for Class C shares, the contingent deferred sales charge of 1% for the 1-year period. There is no sales charge for Class I or Class Y shares. Returns for periods of less than one year are cumulative and not annualized. See Fund prospectuses and summary prospectuses for more information on share classes and sales charges.
The Fund’s performance is compared to the performance of the S&P 500 Index and the Alerian MLP Index. The S&P 500 Index is a broad-based measure of domestic stock performance. The Alerian MLP Index is a composite of the 50 most prominent Master Limited Partnerships that provides investors with an unbiased, comprehensive benchmark for this emerging asset class. The index, which is calculated using a float-adjusted, capitalization-weighted methodology, is disseminated real-time on a total-return basis. The indices are unmanaged and cannot be purchased directly by investors. While index comparisons may be useful to provide a benchmark for the Fund’s performance, it must be noted that the Fund’s investments are not limited to the investments comprising the indices. Index performance includes reinvestment of income, but does not reflect transaction costs, fees, expenses or taxes. Index performance
8 OPPENHEIMER STEELPATH MLP ALPHA PLUS FUND |
is shown for illustrative purposes only as a benchmark for the Fund’s performance, and does not predict or depict performance of the Fund. The Fund’s performance reflects the effects of the Fund’s business and operating expenses.
The Fund’s investment strategy and focus can change over time. The mention of specific fund holdings does not constitute a recommendation by OppenheimerFunds, Inc. or its affiliates.
Before investing in any of the Oppenheimer funds, investors should carefully consider a fund’s investment objectives, risks, charges and expenses. Fund prospectuses and summary prospectuses contain this and other information about the funds, and may be obtained by asking your financial advisor, visiting oppenheimerfunds.com, or calling 1.800.CALL OPP (225.5677). Read prospectuses and summary prospectuses carefully before investing.
Shares of Oppenheimer funds are not deposits or obligations of any bank, are not guaranteed by any bank, are not insured by the FDIC or any other agency, and involve investment risks, including the possible loss of the principal amount invested.
OPPENHEIMER STEELPATH MLP ALPHA PLUS FUND 9 |
Fund Expenses
Fund Expenses. As a shareholder of the Fund, you incur two types of costs: (1) transaction costs, which may include sales charges (loads) on purchase payments, contingent deferred sales charges on redemptions; and (2) ongoing costs, including management fees; distribution and service fees; and other Fund expenses. These examples are intended to help you understand your ongoing costs (in dollars) of investing in the Fund and to compare these costs with the ongoing costs of investing in other mutual funds.
The examples are based on an investment of $1,000.00 invested at the beginning of the period and held for the entire 6-month period ended May 31, 2017.
Actual Expenses. The first section of the table provides information about actual account values and actual expenses. You may use the information in this section for the class of shares you hold, together with the amount you invested, to estimate the expense that you paid over the period. Simply divide your account value by $1,000.00 (for example, an $8,600.00 account value divided by $1,000.00 = 8.60), then multiply the result by the number in the first section under the heading entitled “Expenses Paid During 6 Months Ended May 31, 2017” to estimate the expenses you paid on your account during this period.
Hypothetical Example for Comparison Purposes. The second section of the table provides information about hypothetical account values and hypothetical expenses based on the Fund’s actual expense ratio for each class of shares, and an assumed rate of return of 5% per year for each class before expenses, which is not the actual return. The hypothetical account values and expenses may not be used to estimate the actual ending account balance or expenses you paid for the period. You may use this information to compare the ongoing costs of investing in the Fund and other funds. To do so, compare this 5% hypothetical example for the class of shares you hold with the 5% hypothetical examples that appear in the shareholder reports of the other funds.
Please note that the expenses shown in the table are meant to highlight your ongoing costs only and do not reflect any transactional costs, such as front-end or contingent deferred sales charges (loads). Therefore, the “hypothetical” section of the table is useful in comparing ongoing costs only, and will not help you determine the relative total costs of owning different funds. In addition, if these transactional costs were included, your costs would have been higher.
10 OPPENHEIMER STEELPATH MLP ALPHA PLUS FUND |
Actual | Beginning
Account
Value
December 1, 2016 | Ending
Account
Value
May 31, 2017* | Expenses
Paid During
6 Months Ended
May 31, 2017* |
CLASS A | $ 1,000.00 | $ 1,014.00 | $ 11.63 |
CLASS C | 1,000.00 | 1,010.40 | 15.42 |
CLASS I | 1,000.00 | 1,016.30 | 9.54 |
CLASS Y | 1,000.00 | 1,016.30 | 10.43 |
| | | | |
Hypothetical
(5% return before expenses) | | | |
CLASS A | 1,000.00 | 1,013.45 | 11.62 |
CLASS C | 1,000.00 | 1,009.66 | 15.41 |
CLASS I | 1,000.00 | 1,015.53 | 9.54 |
CLASS Y | 1,000.00 | 1,014.65 | 10.42 |
Expenses are equal to the Fund’s annualized expense ratio for that class, multiplied by the average account value over the period, multiplied by 182/365 (to reflect the one-half year period). Those annualized expense ratios, excluding indirect expenses from affiliated funds, based on the 6-month period ended May 31, 2017 are as follows:
Class | Expense Ratios* |
CLASS A | 2.32% |
CLASS C | 3.08 |
CLASS I | 1.90 |
CLASS Y | 2.07 |
* | For the 6-month period ended may 31, 2017, the Fund’s deferred tax liability decreased resulting in a deferred tax benefit for the period. This benefit was excluded from this example. |
The expense ratios for Class A, C, and Y reflect voluntary waivers of expenses by the Fund’s Transfer Agent. Some of these undertakings may be modified or terminated at any time, as indicated in the Fund’s prospectus. The “Financial Highlights” tables in the Fund’s financial statements, included in this report, also show the gross expense ratios, without such waivers or reimbursements, if applicable.
OPPENHEIMER STEELPATH MLP ALPHA PLUS FUND 11 |
STATEMENT OF INVESTMENTS May 31, 2017 / Unaudited |
Description | | Shares | | | Value | |
Master Limited Partnership Shares — 108.7% | |
Diversified — 18.9% | |
Enterprise Products Partners LP 1 | | | 980,242 | | | $ | 26,280,288 | |
Westlake Chemical Partners LP 1 | | | 242,566 | | | | 5,894,354 | |
Williams Partners LP 1 | | | 409,645 | | | | 16,045,794 | |
Total Diversified | | | | | | | 48,220,436 | |
| | | | | | | | | |
Gathering/Processing — 5.7% | |
Antero Midstream GP LP 1 | | | 397,610 | | | | 8,779,229 | |
Western Gas Partners LP 1 | | | 104,348 | | | | 5,815,314 | |
Total Gathering/Processing | | | | | | | 14,594,543 | |
| | | | | | | | | |
Natural Gas Pipelines — 44.4% | |
Energy Transfer Equity LP 1 | | | 1,493,253 | | | | 25,445,031 | |
Energy Transfer Partners LP 1 | | | 1,733,370 | | | | 37,718,120 | |
EQT Midstream Partners LP 1 | | | 124,800 | | | | 9,205,248 | |
Rice Midstream Partners LP 1 | | | 499,921 | | | | 12,253,064 | |
Tallgrass Energy Partners LP 1 | | | 66,904 | | | | 3,318,439 | |
TC Pipelines LP 1 | | | 449,119 | | | | 25,271,926 | |
Total Natural Gas Pipelines | | | | | | | 113,211,828 | |
| | | | | | | | | |
Petroleum Transportation — 39.7% | |
Buckeye Partners LP 1 | | | 209,464 | | | $ | 13,405,696 | |
Genesis Energy LP 1 | | | 346,854 | | | | 10,818,376 | |
Magellan Midstream Partners LP 1 | | | 333,354 | | | | 24,198,167 | |
MPLX LP 1 | | | 673,877 | | | | 22,271,635 | |
Phillips 66 Partners LP 1 | | | 195,200 | | | | 9,666,304 | |
Plains All American Pipeline LP 1 | | | 365,214 | | | | 9,670,867 | |
Plains GP Holdings LP, Class A 1 | | | 426,100 | | | | 11,364,087 | |
Tesoro Logistics LP | | | 1,100 | | | | 58,278 | |
Total Petroleum Transportation | | | | | | | 101,453,410 | |
| | | | | | | | | |
Total Master Limited Partnership Shares | |
(identified cost $272,067,060) | | | | 277,480,217 | |
| | | | | | | | | |
Common Stock — 17.8% | |
Diversified — 2.8% | | | | | | | | |
Williams Cos., Inc. 1 | | | 250,168 | | | | 7,154,805 | |
| | | | | | | | | |
Gathering/Processing — 8.7% | |
Targa Resources Corp. 1 | | | 484,040 | | | | 22,231,957 | |
| | | | | | | | | |
Natural Gas Pipelines — 6.3% | |
Tallgrass Energy GP LP 1 | | | 622,070 | | | | 16,030,744 | |
| | | | | | | | | |
Total Common Stock | | | | | |
(identified cost $38,286,455) | | | | 45,417,506 | |
12 OPPENHEIMER STEELPATH MLP ALPHA PLUS FUND |
STATEMENT OF INVESTMENTS Unaudited / (Continued) |
Description | | Shares | | | Value | |
Short-Term Investments — 0.2% | |
Money Market — 0.2% | |
Fidelity Treasury Portfolio, Institutional Class, 0.633% 2 | | | 549,532 | | | $ | 549,532 | |
| | | | | | | | | |
Total Short-Term Investments | | | | | |
(identified cost $549,532) | | | | 549,532 | |
| | | | | | | | | |
Total Investments — 126.7% | | | | | |
(identified cost $310,903,047) | | | | 323,447,255 | |
Liabilities In Excess of Other Assets — (26.7)% | | | | (68,160,589 | ) |
Net Assets — 100.0% | | | $ | 255,286,666 | |
Footnotes to Statement of Investments
LP — Limited Partnership
1 | As of May 31, 2017, all or a portion of the security has been pledged as collateral for a Fund loan. The market value of the securities in the pledged account totaled $174,578,500 as of May 31, 2017. The loan agreement requires continuous collateral whether the loan has a balance or not. See Note 8 of the Notes to Financial Statements for additional information. |
2 | Variable rate security; the coupon rate represents the rate at May 31, 2017. |
See accompanying Notes to Financial Statements.
OPPENHEIMER STEELPATH MLP ALPHA PLUS FUND 13 |
STATEMENT OF ASSETS AND LIABILITIES May 31, 2017 / Unaudited |
Assets: | | | |
Investments at value (cost $310,903,047) – see accompanying Statement of Investments: | | $ | 323,447,255 | |
Deferred tax asset, net | | | 15,316,140 | |
Receivable for beneficial interest sold | | | 314,808 | |
Prepaid expenses | | | 73,781 | |
Dividends receivable | | | 1,557 | |
Receivable for investments sold | | | 120,605 | |
Total assets | | | 339,274,146 | |
| | | | | |
Liabilities: | | | | |
Payable on borrowing (See note 9) | | | 82,500,000 | |
Payable for investments purchased | | | 470,946 | |
Payable for beneficial interest redeemed | | | 338,525 | |
Payable to Manager | | | 283,678 | |
Interest expense payable | | | 130,309 | |
Payable for distribution and service plan fees | | | 71,360 | |
Transfer agent fees payable | | | 46,439 | |
Trustees' fees payable | | | 4,533 | |
Other liabilities | | | 141,690 | |
Total liabilities | | | 83,987,480 | |
| | | | | |
Net Assets | | $ | 255,286,666 | |
| | | | | |
Composition of Net Assets | | | | |
Par value of shares of beneficial interest | | $ | 33,689 | |
Paid-in capital | | | 320,714,700 | |
Undistributed net investment loss, net of deferred taxes | | | (16,775,351 | ) |
Accumulated undistributed net realized losses on investments, net of deferred taxes | | | (57,752,943 | ) |
Net unrealized appreciation on investments, net of deferred taxes | | | 9,066,571 | |
Net Assets | | $ | 255,286,666 | |
14 OPPENHEIMER STEELPATH MLP ALPHA PLUS FUND |
STATEMENT OF ASSETS AND LIABILITIES Unaudited / (Continued) |
Net Asset Value, Offering Price and Redemption Proceeds Per Share ($0.001 Par Value, Unlimited Shares Authorized) | | | |
Class A Shares: | | | |
Net asset value and redemption proceeds per share | | $ | 7.59 | |
Offering price per share (net asset value plus sales charge of 5.75% of offering price) | | $ | 8.05 | |
Class C Shares: | | | | |
Net asset value, offering price and redemption proceeds per share | | $ | 7.27 | |
Class I Shares: | | | | |
Net asset value, offering price and redemption proceeds per share | | $ | 7.77 | |
Class Y Shares: | | | | |
Net asset value, offering price and redemption proceeds per share | | $ | 7.73 | |
Net Assets: | | | |
Class A shares | | $ | 96,486,415 | |
Class C shares | | | 54,599,761 | |
Class I shares | | | 563,099 | |
Class Y shares | | | 103,637,391 | |
Total Net Assets | | $ | 255,286,666 | |
| | | | | |
Shares Outstanding: | | | | |
Class A shares | | | 12,704,136 | |
Class C shares | | | 7,507,612 | |
Class I shares | | | 72,447 | |
Class Y shares | | | 13,404,768 | |
Total Shares Outstanding | | | 33,688,963 | |
See accompanying Notes to Financial Statements.
OPPENHEIMER STEELPATH MLP ALPHA PLUS FUND 15 |
STATEMENT OF OPERATIONS
For the Six Months Ended May 31, 2017 / Unaudited |
Investment Income | | | |
Distributions from Master Limited Partnerships | | $ | 10,744,516 | |
Less return of capital on distributions from Master Limited Partnerships: | | | (10,744,516 | ) |
Dividend income | | | 184,555 | |
Total investment income | | | 184,555 | |
| | | | | |
Expenses | | | | |
Management fees | | | 1,714,920 | |
Distribution and service plan fees | | | | |
Class A | | | 157,785 | |
Class C | | | 283,017 | |
Transfer agent fees | | | | |
Class A | | | 140,048 | |
Class C | | | 62,287 | |
Class I | | | 79 | |
Class Y | | | 98,907 | |
Legal, auditing, and other professional fees | | | 62,556 | |
Administrative fees | | | 33,532 | |
Registration fees | | | 32,388 | |
Custody fees | | | 10,830 | |
Trustees' fees | | | 7,699 | |
Other | | | 24,508 | |
Net expenses, before interest expense from payable on borrowing and deferred taxes | | | 2,628,556 | |
Interest expense from payable on borrowing | | | 672,108 | |
Net expenses, before waivers and deferred taxes | | | 3,300,664 | |
Less waivers | | | (17,313 | ) |
Net expenses, before deferred taxes | | | 3,283,351 | |
| | | | | |
Net investment loss, before deferred taxes | | | (3,098,796 | ) |
Deferred tax expense | | | (140,786 | ) |
Net investment loss, net of deferred taxes | | | (3,239,582 | ) |
| | | | | |
Net Realized and Unrealized Gains on Investments: | | | | |
Net Realized Gains | | | | |
Investments | | | 950,255 | |
Deferred tax benefit | | | 51,260 | |
Net realized gains, net of deferred taxes | | | 1,001,515 | |
Net Change in Unrealized Appreciation | | | | |
Investments | | | 5,317,356 | |
Deferred tax benefit | | | 286,832 | |
Net change in unrealized appreciation, net of deferred taxes | | | 5,604,188 | |
| | | | | |
Net realized and unrealized gains on investments, net of deferred taxes | | | 6,605,703 | |
Change in net assets resulting from operations | | $ | 3,366,121 | |
See accompanying Notes to Financial Statements.
16 OPPENHEIMER STEELPATH MLP ALPHA PLUS FUND |
STATEMENTS OF CHANGES IN NET ASSETS |
| | | For the Six Months Ended
May 31, 2017 (Unaudited) | | | For the
Year Ended November 30,
2016 | |
Operations | | | | | | |
Net investment loss, net of deferred taxes | | $ | (3,239,582 | ) | | $ | (3,771,727 | ) |
Net realized gains/(losses) on investments, net of deferred taxes | | | 1,001,515 | | | | (36,348,136 | ) |
Net change in unrealized appreciation on investments, net of deferred taxes | | | 5,604,188 | | | | 54,445,584 | |
Change in net assets resulting from operations | | | 3,366,121 | | | | 14,325,721 | |
| | | | | | | | | |
Distributions to Shareholders | | | | | | | | |
Distributions to shareholders from return of capital: | | | | | | | | |
Class A shares | | | (4,239,908 | ) | | | (9,504,509 | ) |
Class C shares | | | (1,951,121 | ) | | | (3,998,014 | ) |
Class I shares | | | (17,125 | ) | | | (37,499 | ) |
Class Y shares | | | (2,877,450 | ) | | | (6,731,205 | ) |
Change in net assets resulting from distributions to shareholders | | | (9,085,604 | ) | | | (20,271,227 | ) |
| | | | | | | | | |
Beneficial Interest Transactions | | | | | | | | |
Class A shares | | | (27,927,654 | ) | | | 35,004,880 | |
Class C shares | | | 7,121,889 | | | | 10,912,544 | |
Class I shares | | | 129,729 | | | | 118,193 | |
Class Y shares | | | 29,843,583 | | | | (8,060,847 | ) |
Change in net assets resulting from beneficial interest transactions | | | 9,167,547 | | | | 37,974,770 | |
Change in net assets | | | 3,448,064 | | | | 32,029,264 | |
| | | | | | | | | |
Net Assets | | | | | | | | |
Beginning of period | | | 251,838,602 | | | | 219,809,338 | |
End of period | | $ | 255,286,666 | | | $ | 251,838,602 | |
| | | | | | | | | |
Undistributed net investment loss, net of deferred taxes | | $ | (16,775,351 | ) | | $ | (13,535,769 | ) |
See accompanying Notes to Financial Statements.
OPPENHEIMER STEELPATH MLP ALPHA PLUS FUND 17 |
STATEMENT OF CASH FLOWS
For the Six Months Ended May 31, 2017 / Unaudited |
Cash flows from operating activities | | | |
Net increase in net assets resulting from operations | | $ | 3,366,121 | |
Non cash items included in operations: | | | | |
Deferred income taxes | | | (197,306 | ) |
Adjustments to reconcile net increase in net assets resulting from operations to net cash used in operating activities: | | | | |
Purchases of long-term portfolio investments | | | (99,236,848 | ) |
Sales of long-term portfolio investments | | | 82,061,879 | |
Purchase of short-term portfolio investments, net | | | (549,532 | ) |
Distributions from Master Limited Partnerships | | | 10,845,488 | |
Increase in prepaid expenses | | | (33,561 | ) |
Increase in receivable for dividends | | | (1,515 | ) |
Increase in payable to Manager | | | 30,522 | |
Decrease in payable for investments purchased | | | (1,082,038 | ) |
Decrease in receivable for investments sold | | | 3,144,463 | |
Decrease in other liabilities | | | (664 | ) |
Increase in payable for distribution and service fees payable | | | 6,634 | |
Increase in transfer agent fees payable | | | 1,953 | |
Increase in trustees' fees payable | | | 248 | |
Increase in interest expense payable | | | 61,193 | |
Decrease in borrowing expense payable | | | (12,195 | ) |
Net realized gain on investments | | | (950,255 | ) |
Net change in accumulated unrealized appreciation on investments | | | (5,317,356 | ) |
Net cash used in operating activities | | | (7,862,769 | ) |
| | | | | |
Cash flows from financing activities | | | | |
Proceeds from shares sold, net of receivable for beneficial interest sold | | | 86,789,562 | |
Payment of shares redeemed, net of payable for beneficial interest redeemed | | | (86,246,192 | ) |
Distributions paid to shareholders, net of reinvestments | | | (595,271 | ) |
Proceeds from borrowing | | | 16,000,000 | |
Payments on borrowing | | | (7,500,000 | ) |
Payments to custodian for bank overdraft | | | (585,330 | ) |
Net cash provided by financing activities | | | 7,862,769 | |
| | | | | |
Net change in cash | | | — | |
Cash at beginning of period | | | — | |
Cash at end of period | | $ | — | |
Supplemental disclosure of cash flow information:
Cash paid on interest of $670,157.
Non-cash financing activities not included consist of reinvestment of dividends and distributions of $8,490,333.
See accompanying Notes to the Financial Statements.
18 OPPENHEIMER STEELPATH MLP ALPHA PLUS FUND |
Class A | | Six Months Ended
May 31, 2017 (Unaudited) | | | Year Ended November 30,
2016 | | | Year Ended November 30,
2015 | | | Year Ended November 28,
2014* | | | Year Ended November 29,
2013* | | | Period Ended November 30,
2012 1 | |
Per Share Operating Data | | | | | | | | | | | | | | | | | | |
Net Asset Value, Beginning of Period | | $ | 7.73 | | | $ | 7.95 | | | $ | 12.95 | | | $ | 11.77 | | | $ | 9.93 | | | $ | 10.14 | |
Income/(loss) from investment operations: | | | | | | | | | | | | | | | | | | | | | | | | |
Net investment loss2 | | | (0.10 | ) | | | (0.11 | ) | | | (0.15 | ) | | | (0.21 | ) | | | (0.17 | ) | | | (0.14 | ) |
Return of capital2 | | | 0.21 | | | | 0.39 | | | | 0.50 | | | | 0.55 | | | | 0.54 | | | | 0.46 | |
Net realized and unrealized gains/(losses) | | | 0.19 | | | | 0.16 | | | | (4.69 | ) | | | 1.50 | | | | 2.13 | | | | 0.12 | |
Total from investment operations | | | 0.30 | | | | 0.44 | | | | (4.34 | ) | | | 1.84 | | | | 2.50 | | | | 0.44 | |
Distributions to shareholders: | | | | | | | | | | | | | | | | | | | | | | | | |
Return of capital | | | (0.66 | ) | | | (0.66 | ) | | | (0.66 | ) | | | (0.66 | ) | | | (0.66 | ) | | | (0.65 | ) |
Net asset value, end of period | | $ | 7.37 | | | $ | 7.73 | | | $ | 7.95 | | | $ | 12.95 | | | $ | 11.77 | | | $ | 9.93 | |
| | | | | | | | | | | | | | | | | | | | | | | | |
Total Return, at Net Asset Value3 | | | 1.40 | % | | | 6.66 | % | | | (34.68 | %) | | | 15.77 | % | | | 25.59 | % | | | 4.56 | % |
| | | | | | | | | | | | | | | | | | | | | | | | | |
Ratios /Supplemental Data | | | | | | | | | | | | | | | | | | | | | | | | |
Net assets, end of period (in thousands) | | $ | 96,486 | | | $ | 125,026 | | | $ | 88,832 | | | $ | 214,846 | | | $ | 108,563 | | | $ | 6,915 | |
Ratio of Expenses to Average Net Assets:4 | | | | | | | | | | | | | | | | | | | | | |
Before recoupment/(waivers) and deferred tax expense/(benefit) | | | 2.33 | % | | | 2.43 | % | | | 2.30 | % | | | 2.40 | % | | | 2.45 | % | | | 9.02 | % |
Expense recoupment/(waivers) | | | (0.01 | %) | | | — | % | | | — | % | | | 0.12 | % | | | (0.05 | %) | | | (6.42 | %) |
Net of recoupment/(waivers) and before deferred tax expense/(benefit) | | | 2.32 | %5 | | | 2.43 | %5 | | | 2.30 | %5 | | | 2.52 | %5 | | | 2.40 | %5 | | | 2.60 | %6 |
Deferred tax expense/(benefit)7,8 | | | (0.14 | %) | | | 1.09 | % | | | (12.67 | %) | | | 5.54 | % | | | 8.38 | % | | | 4.04 | % |
Total expenses/(benefit) | | | 2.18 | % | | | 3.52 | % | | | (10.37 | %) | | | 8.06 | % | | | 10.78 | % | | | 6.64 | % |
| | | | | | | | | | | | | | | | | | | | | | | | | |
Ratio of Investment Loss to Average Net Assets:4 | | | | | | | | | | | | | | | | | | | | | |
Before recoupment/(waivers) and deferred tax benefit/(expense) | | | (2.23 | %) | | | (1.84 | %) | | | (2.04 | %) | | | (2.35 | %) | | | (2.40 | %) | | | (9.02 | %) |
Expense recoupment/(waivers) | | | (0.01 | %) | | | — | % | | | — | % | | | 0.12 | % | | | (0.05 | %) | | | (6.42 | %) |
Net of expense recoupment/(waivers) and before deferred tax benefit/(expense) | | | (2.22 | %) | | | (1.84 | %) | | | (2.04 | %) | | | (2.47 | %) | | | (2.35 | %) | | | (2.60 | %) |
Deferred tax benefit/(expense)8,9 | | | (0.10 | %) | | | 0.34 | % | | | 0.67 | % | | | 0.88 | % | | | 0.87 | % | | | 0.97 | % |
Net investment loss | | | (2.32 | %) | | | (1.50 | %) | | | (1.37 | %) | | | (1.59 | %) | | | (1.48 | %) | | | (1.63 | %) |
| | | | | | | | | | | | | | | | | | | | | | | | |
Portfolio turnover rate | | | 24 | % | | | 45 | % | | | 39 | % | | | 21 | % | | | 15 | % | | | 69 | % |
* | November 28, 2014 and November 29, 2013 represent the last business day of the Fund’s respective reporting periods. |
1. | Shares commenced operations at the close of business February 6, 2012. |
2. | Per share amounts calculated based on average shares outstanding during the period net of deferred tax expense/benefit. |
3. | Assumes an initial investment on the business day before the first day of the fiscal period, with all dividends and distributions reinvested in additional shares on the reinvestment date, and redemptions at the net asset value calculated on the last business day of the fiscal period. Sales charges are not reflected in the total returns. Total returns are not annualized for periods less than one full year. Returns do not reflect the deduction of taxes that a shareholder would pay on fund distributions or the redemption of fund shares. The returns do not include adjustments in accordance with generally accepted accounting principles required at the period end for financial reporting purposes. |
4. | Annualized for less than full period. |
5. | Includes interest, borrowing and franchise tax expense. Without interest, borrowing and franchise tax expense, the net expense ratio would be 1.83%, 1.90%, 1.86%, 1.99% and 2.00%, for the period ended May 31, 2017, November 30, 2016 November 30, 2015, November 28, 2014 and November 29, 2013, respectively. |
6. | Includes interest expense. Without interest expense the net expense ratio would be 2.00%. |
7. | Deferred tax expense estimate for the ratio calculation is derived from the net investment income/loss, and realized and unrealized gains/losses. |
8. | Effective December 1, 2013 the deferred tax expense and deferred tax benefit are allocated based on average net assets. Prior to December 1, 2013 the deferred tax expense and deferred tax benefit were allocated based on specific class expenses. |
9. | Deferred tax benefit for the ratio calculation is derived from net investment income/loss only. |
See accompanying Notes to Financial Statements.
OPPENHEIMER STEELPATH MLP ALPHA PLUS FUND 19 |
FINANCIAL HIGHLIGHTS (Continued) |
Class C | | Six Months Ended
May 31, 2017 (Unaudited) | | | Year Ended November 30,
2016 | | | Year Ended November 30,
2015 | | | Year Ended November 28,
2014* | | | Year Ended November 29,
2013* | | | Period Ended November 30,
2012 1 | |
Per Share Operating Data | | | | | | | | | | | | | | | | | | |
Net Asset Value, Beginning of Period | | $ | 7.44 | | | $ | 7.73 | | | $ | 12.71 | | | $ | 11.64 | | | $ | 9.91 | | | $ | 9.45 | |
Income/(loss) from investment operations: | | | | | | | | | | | | | | | | | | | | | | | | |
Net investment loss2 | | | (0.13 | ) | | | (0.18 | ) | | | (0.22 | ) | | | (0.28 | ) | | | (0.22 | ) | | | (0.11 | ) |
Return of capital2 | | | 0.21 | | | | 0.39 | | | | 0.50 | | | | 0.55 | | | | 0.55 | | | | 0.28 | |
Net realized and unrealized gains/(losses) | | | 0.12 | | | | 0.16 | | | | (4.60 | ) | | | 1.46 | | | | 2.06 | | | | 0.62 | |
Total from investment operations | | | 0.20 | | | | 0.37 | | | | (4.32 | ) | | | 1.73 | | | | 2.39 | | | | 0.79 | |
Distributions to shareholders: | | | | | | | | | | | | | | | | | | | | | | | | |
Return of capital | | | (0.66 | ) | | | (0.66 | ) | | | (0.66 | ) | | | (0.66 | ) | | | (0.66 | ) | | | (0.33 | ) |
Net asset value, end of period | | $ | 6.98 | | | $ | 7.44 | | | $ | 7.73 | | | $ | 12.71 | | | $ | 11.64 | | | $ | 9.91 | |
| | | | | | | | | | | | | | | | | | | | | | | | |
Total Return, at Net Asset Value3 | | | 1.04 | % | | | 5.91 | % | | | (35.20 | %) | | | 14.98 | % | | | 24.50 | % | | | 8.39 | % |
| | | | | | | | | | | | | | | | | | | | | | | | | |
Ratios /Supplemental Data | | | | | | | | | | | | | | | | | | | | | | | | |
Net assets, end of period (in thousands) | | $ | 54,600 | | | $ | 49,474 | | | $ | 38,816 | | | $ | 57,070 | | | $ | 16,317 | | | $ | 604 | |
Ratio of Expenses to Average Net Assets:4 | | | | | | | | | | | | | | | | | | | | | |
Before recoupment/(waivers) and deferred tax expense/(benefit) | | | 3.09 | % | | | 3.18 | % | | | 3.05 | % | | | 3.15 | % | | | 3.20 | % | | | 11.88 | % |
Expense recoupment/(waivers) | | | (0.01 | %) | | | — | % | | | — | % | | | 0.12 | % | | | (0.05 | %) | | | (8.57 | %) |
Net of recoupment/(waivers) and before deferred tax expense/(benefit) | | | 3.08 | %5 | | | 3.18 | %5 | | | 3.05 | %5 | | | 3.27 | %5 | | | 3.15 | %5 | | | 3.31 | %6 |
Deferred tax expense/(benefit)7,8 | | | (0.14 | %) | | | 1.09 | % | | | (12.67 | %) | | | 5.54 | % | | | 8.16 | % | | | 4.16 | % |
Total expenses/(benefit) | | | 2.94 | % | | | 4.27 | % | | | (9.62 | %) | | | 8.81 | % | | | 11.31 | % | | | 7.47 | % |
| | | | | | | | | | | | | | | | | | | | | | | | | |
Ratio of Investment Loss to Average Net Assets:4 | | | | | | | | | | | | | | | | | | | | | |
Before recoupment/(waivers) and deferred tax benefit/(expense) | | | (3.20 | %) | | | (2.91 | %) | | | (2.76 | %) | | | (2.94 | %) | | | (3.15 | %) | | | (11.88 | %) |
Expense recoupment/(waivers) | | | (0.01 | %) | | | — | % | | | — | % | | | 0.12 | % | | | (0.05 | %) | | | (8.57 | %) |
Net of expense recoupment/(waivers) and before deferred tax benefit/(expense) | | | (3.19 | %) | | | (2.91 | %) | | | (2.76 | %) | | | (3.06 | %) | | | (3.10 | %) | | | (3.31 | %) |
Deferred tax benefit/(expense)8,9 | | | (0.10 | %) | | | 0.34 | % | | | 0.67 | % | | | 0.88 | % | | | 1.14 | % | | | 1.23 | % |
Net investment loss | | | (3.29 | %) | | | (2.57 | %) | | | (2.09 | %) | | | (2.18 | %) | | | (1.96 | %) | | | (2.08 | %) |
| | | | | | | | | | | | | | | | | | | | | | | | |
Portfolio turnover rate | | | 24 | % | | | 45 | % | | | 39 | % | | | 21 | % | | | 15 | % | | | 69 | % |
* | November 28, 2014 and November 29, 2013 represent the last business day of the Fund’s respective reporting periods. |
1. | Shares commenced operations at the close of business May 22, 2012. |
2. | Per share amounts calculated based on average shares outstanding during the period. |
3. | Assumes an initial investment on the business day before the first day of the fiscal period, with all dividends and distributions reinvested in additional shares on the reinvestment date, and redemptions at the net asset value calculated on the last business day of the fiscal period. Sales charges are not reflected in the total returns. Total returns are not annualized for periods less than one full year. Returns do not reflect the deduction of taxes that a shareholder would pay on fund distributions or the redemption of fund shares. The returns do not include adjustments in accordance with generally accepted accounting principles required at the period end for financial reporting purposes. |
4. | Annualized for less than full period. |
5. | Includes interest, borrowing and franchise tax expense. Without interest, borrowing and franchise tax expense, the net expense ratio would be 2.59%, 2.65%, 2.61%, 2.74% and 2.75%, for the period ended May 31, 2017, November 30, 2016, November 30, 2015, November 28, 2014 and November 29, 2013, respectively. |
6. | Includes interest expense. Without interest expense the net expense ratio would be 2.75%. |
7. | Deferred tax expense estimate for the ratio calculation is derived from the net investment income/loss, and realized and unrealized gains/losses. |
8. | Effective December 1, 2013 the deferred tax expense and deferred tax benefit are allocated based on average net assets. Prior to December 1, 2013 the deferred tax expense and deferred tax benefit were allocated based on specific class expenses. |
9. | Deferred tax benefit for the ratio calculation is derived from net investment income/loss only. |
See accompanying Notes to Financial Statements.
20 OPPENHEIMER STEELPATH MLP ALPHA PLUS FUND |
FINANCIAL HIGHLIGHTS (Continued) |
Class I | | Six Months Ended
May 31, 2017 (Unaudited) | | | Year Ended November 30,
2016 | | | Year Ended November 30,
2015 | | | Year Ended November 28,
2014* | | | Period Ended November 29,
2013*,1,2 | |
Per Share Operating Data | | | | | | | | | | | | | | | |
Net Asset Value, Beginning of Period | | $ | 7.89 | | | $ | 8.06 | | | $ | 13.06 | | | $ | 11.81 | | | $ | 11.71 | |
Income/(loss) from investment operations: | | | | | | | | | | | | | | | | | | | | |
Net investment income/(loss)3 | | | (0.07 | ) | | | (0.07 | ) | | | (0.06 | ) | | | 0.02 | | | | (0.06 | ) |
Return of capital3 | | | 0.21 | | | | 0.39 | | | | 0.50 | | | | 0.55 | | | | 0.23 | |
Net realized and unrealized gains/(losses) | | | 0.23 | | | | 0.17 | | | | (4.78 | ) | | | 1.34 | | | | 0.26 | |
Total from investment operations | | | 0.37 | | | | 0.49 | | | | (4.34 | ) | | | 1.91 | | | | 0.43 | |
Distributions to shareholders: | | | | | | | | | | | | | | | | | | | | |
Return of capital | | | (0.66 | ) | | | (0.66 | ) | | | (0.66 | ) | | | (0.66 | ) | | | (0.33 | ) |
Net asset value, end of period | | $ | 7.60 | | | $ | 7.89 | | | $ | 8.06 | | | $ | 13.06 | | | $ | 11.81 | |
| | | | | | | | | | | | | | | | | | | | |
Total Return, at Net Asset Value4 | | | 1.63 | % | | | 7.21 | % | | | (34.39 | %) | | | 16.32 | % | | | 3.71 | % |
| | | | | | | | | | | | | | | | | | | | | |
Ratios /Supplemental Data | | | | | | | | | | | | | | | | | | | | |
Net assets, end of period (in thousands) | | $ | 563 | | | $ | 451 | | | $ | 338 | | | $ | 160 | | | $ | 10 | |
Ratio of Expenses to Average Net Assets:5 | | | | | | | | | | | | | | | | | | | | |
Before (waivers) and deferred tax expense/(benefit) | | | 1.90 | % | | | 2.00 | % | | | 1.86 | % | | | 2.00 | % | | | 2.38 | % |
Expense (waivers) | | | — | % | | | — | % | | | — | % | | | — | % | | | (0.23 | %) |
Net of (waivers) and before deferred tax expense/(benefit) | | | 1.90 | %6 | | | 2.00 | %6 | | | 1.86 | %6 | | | 2.00 | %6 | | | 2.15 | %6 |
Deferred tax expense/(benefit)7,8 | | | (0.14 | %) | | | 1.09 | % | | | (12.67 | %) | | | 5.54 | % | | | 21.06 | % |
Total expenses/(benefit) | | | 1.76 | % | | | 3.09 | % | | | (10.81 | %) | | | 7.54 | % | | | 23.21 | % |
| | | | | | | | | | | | | | | | | | | | | |
Ratio of Investment Loss to Average Net Assets:5 | | | | | | | | | | | | | | | | | | | | |
Before (waivers) and deferred tax benefit/(expense) | | | (1.48 | %) | | | (1.35 | %) | | | (1.23 | %) | | | (0.74 | %) | | | (2.33 | %) |
Expense (waivers) | | | — | % | | | — | % | | | — | % | | | — | % | | | (0.23 | %) |
Net of expense (waivers) and before deferred tax benefit/(expense) | | | (1.48 | %) | | | (1.35 | %) | | | (1.23 | %) | | | (0.74 | %) | | | (2.10 | %) |
Deferred tax benefit/(expense)8,9 | | | (0.10 | %) | | | 0.34 | % | | | 0.67 | % | | | 0.88 | % | | | 0.77 | % |
Net investment income/(loss) | | | (1.58 | %) | | | (1.01 | %) | | | (0.56 | %) | | | 0.14 | % | | | (1.33 | %) |
| | | | | | | | | | | | | | | | | | | | |
Portfolio turnover rate | | | 24 | % | | | 45 | % | | | 39 | % | | | 21 | % | | | 15 | % |
* | November 28, 2014 and November 29, 2013 represent the last business day of the Fund’s respective reporting periods. |
1. | Shares commenced operations at the close of business June 28, 2013. |
2. | Effective June 28, 2013, Class I shares were renamed Class Y shares. See Note 1 of the Notes to Financial Statements for additional information. |
3. | Per share amounts calculated based on average shares outstanding during the period. |
4. | Assumes an initial investment on the business day before the first day of the fiscal period, with all dividends and distributions reinvested in additional shares on the reinvestment date, and redemptions at the net asset value calculated on the last business day of the fiscal period. Sales charges are not reflected in the total returns. Total returns are not annualized for periods less than one full year. Returns do not reflect the deduction of taxes that a shareholder would pay on fund distributions or the redemption of fund shares. The returns do not include adjustments in accordance with generally accepted accounting principles required at the period end for financial reporting purposes. |
5. | Annualized for less than full period. |
6. | Includes interest, borrowing and franchise tax expense. Without interest, borrowing and franchise tax expense, the net expense ratio would be 1.41%, 1.47%, 1.42%, 1.47% and 1.75%, for the period ended May 31, 2017, November 30, 2016, November 30, 2015, November 28, 2014 and November 29, 2013, respectively. |
7. | Deferred tax expense estimate for the ratio calculation is derived from the net investment income/loss, and realized and unrealized gains/losses. |
8. | Effective December 1, 2013 the deferred tax expense and deferred tax benefit are allocated based on average net assets. Prior to December 1, 2013 the deferred tax expense and deferred tax benefit were allocated based on specific class expenses. |
9. | Deferred tax benefit for the ratio calculation is derived from net investment income/loss only. |
See accompanying Notes to Financial Statements.
OPPENHEIMER STEELPATH MLP ALPHA PLUS FUND 21 |
FINANCIAL HIGHLIGHTS (Continued) |
Class Y | | Six Months Ended
May 31, 2017 (Unaudited) | | | Year Ended November 30,
2016 | | | Year Ended November 30,
2015 | | | Year Ended November 28,
2014* | | | Year Ended November 29,
2013*,1 | | | Period Ended November 30,
2012 1,2 | |
Per Share Operating Data | | | | | | | | | | | | | | | | | | |
Net Asset Value, Beginning of Period | | $ | 7.85 | | | $ | 8.04 | | | $ | 13.07 | | | $ | 11.84 | | | $ | 9.96 | | | $ | 10.00 | |
Income/(loss) from investment operations: | | | | | | | | | | | | | | | | | | | | | | | | |
Net investment loss3 | | | (0.07 | ) | | | (0.11 | ) | | | (0.10 | ) | | | (0.14 | ) | | | (0.15 | ) | | | (0.12 | ) |
Return of capital3 | | | 0.21 | | | | 0.39 | | | | 0.50 | | | | 0.55 | | | | 0.54 | | | | 0.48 | |
Net realized and unrealized gains/(losses) | | | 0.21 | | | | 0.19 | | | | (4.77 | ) | | | 1.48 | | | | 2.15 | | | | 0.25 | |
Total from investment operations | | | 0.35 | | | | 0.47 | | | | (4.37 | ) | | | 1.89 | | | | 2.54 | | | | 0.61 | |
Distributions to shareholders: | | | | | | | | | | | | | | | | | | | | | | | | |
Return of capital | | | (0.66 | ) | | | (0.66 | ) | | | (0.66 | ) | | | (0.66 | ) | | | (0.66 | ) | | | (0.65 | ) |
Net asset value, end of period | | $ | 7.54 | | | $ | 7.85 | | | $ | 8.04 | | | $ | 13.07 | | | $ | 11.84 | | | $ | 9.96 | |
| | | | | | | | | | | | | | | | | | | | | | | | |
Total Return, at Net Asset Value4 | | | 1.63 | % | | | 6.96 | % | | | (34.59 | %) | | | 16.11 | % | | | 25.92 | % | | | 6.33 | % |
| | | | | | | | | | | | | | | | | | | | | | | | | |
Ratios /Supplemental Data | | | | | | | | | | | | | | | | | | | | | | | | |
Net assets, end of period (in thousands) | | $ | 103,637 | | | $ | 76,888 | | | $ | 91,824 | | | $ | 121,190 | | | $ | 49,776 | | | $ | 1,604 | |
Ratio of Expenses to Average Net Assets:5 | | | | | | | | | | | | | | | | | | | | | |
Before recoupment/(waivers) and deferred tax expense/(benefit) | | | 2.08 | % | | | 2.19 | % | | | 2.05 | % | | | 2.15 | % | | | 2.20 | % | | | 24.82 | % |
Expense recoupment/(waivers) | | | (0.01 | %) | | | — | % | | | — | % | | | 0.12 | % | | | (0.05 | %) | | | (22.71 | %) |
Net of recoupment/(waivers) and before deferred tax expense/(benefit) | | | 2.07 | %6 | | | 2.19 | %6 | | | 2.05 | %6 | | | 2.27 | %6 | | | 2.15 | %6 | | | 2.11 | %7 |
Deferred tax expense/(benefit)8,9 | | | (0.14 | %) | | | 1.09 | % | | | (12.67 | %) | | | 5.54 | % | | | 8.43 | % | | | (2.88 | %) |
Total expenses/(benefit) | | | 1.93 | % | | | 3.28 | % | | | (10.62 | %) | | | 7.81 | % | | | 10.58 | % | | | (0.77 | %) |
| | | | | | | | | | | | | | | | | | | | | | | | | |
Ratio of Investment Loss to Average Net Assets:4 | | | | | | | | | | | | | | | | | | | | | |
Before recoupment/(waivers) and deferred tax benefit/(expense) | | | (1.51 | %) | | | (1.92 | %) | | | (1.56 | %) | | | (1.82 | %) | | | (2.15 | %) | | | (24.82 | %) |
Expense recoupment/(waivers) | | | (0.01 | %) | | | — | % | | | — | % | | | 0.12 | % | | | (0.05 | %) | | | (22.71 | %) |
Net of expense recoupment/(waivers) and before deferred tax benefit/(expense) | | | (1.50 | %) | | | (1.92 | %) | | | (1.56 | %) | | | (1.94 | %) | | | (2.10 | %) | | | (2.11 | %) |
Deferred tax benefit/(expense)9,10 | | | (0.10 | %) | | | 0.34 | % | | | 0.67 | % | | | 0.88 | % | | | 0.78 | % | | | 0.79 | % |
Net investment loss | | | (1.60 | %) | | | (1.58 | %) | | | (0.89 | %) | | | (1.06 | %) | | | (1.32 | %) | | | (1.32 | %) |
| | | | | | | | | | | | | | | | | | | | | | | | |
Portfolio turnover rate | | | 24 | % | | | 45 | % | | | 39 | % | | | 21 | % | | | 15 | % | | | 69 | % |
* | November 28, 2014 and November 29, 2013 represent the last business day of the Fund’s respective reporting periods. |
1. | Effective June 28, 2013, Class I shares were renamed Class Y shares. See Note 1 of the Notes to Financial Statements for additional information. |
2. | The net asset value for the beginning of the period close of business December 30, 2011 (Commencement of Operations) through November 30, 2012 represents the initial contribution per share of $10. |
3. | Per share amounts calculated based on average shares outstanding during the period. |
4. | Assumes an initial investment on the business day before the first day of the fiscal period, with all dividends and distributions reinvested in additional shares on the reinvestment date, and redemptions at the net asset value calculated on the last business day of the fiscal period. Sales charges are not reflected in the total returns. Total returns are not annualized for periods less than one full year. Returns do not reflect the deduction of taxes that a shareholder would pay on fund distributions or the redemption of fund shares. The returns do not include adjustments in accordance with generally accepted accounting principles required at the period end for financial reporting purposes. |
5. | Annualized for less than full period. |
6. | Includes interest, borrowing and franchise tax expense. Without interest, borrowing and franchise tax expense, the net expense ratio would be 1.59%, 1.66%, 1.61%, 1.74% and 1.75%, for the period ended May 31, 2017, November 30, 2016, November 30, 2015, November 28, 2014, and November 29, 2013, respectively. |
7. | Includes interest expense. Without interest expense the net expense ratio would be 1.75%. |
8. | Deferred tax expense estimate for the ratio calculation is derived from the net investment income/loss, and realized and unrealized gains/losses. |
9. | Effective December 1, 2013 the deferred tax expense and deferred tax benefit are allocated based on average net assets. Prior to December 1, 2013 the deferred tax expense and deferred tax benefit were allocated based on specific class expenses. |
10. | Deferred tax benefit for the ratio calculation is derived from net investment income/loss only. |
See accompanying Notes to Financial Statements.
22 OPPENHEIMER STEELPATH MLP ALPHA PLUS FUND |
NOTES TO FINANCIAL STATEMENTS Unaudited |
1. Organization
Oppenheimer SteelPath MLP Alpha Plus Fund (the “Fund”), a separate series of Oppenheimer SteelPath MLP Funds Trust, is a non-diversified open-end management investment company registered under the Investment Company Act of 1940, as amended. The Fund’s investment objective is to seek total return. The Fund’s investment adviser is OFI SteelPath, Inc. (the “Adviser” or “Manager”), a wholly-owned subsidiary of OppenheimerFunds, Inc. (“OFI” or “Oppenheimer”).
The Fund offers Class A, Class C, Class I, and Class Y shares. Effective June 28, 2013, Class I shares were renamed Class Y shares. Class A shares are sold at their offering price, which is normally net asset value plus a front-end sales charge. Effective June 28, 2013 although there is no initial sales charge on Class A purchases totaling $1 million or more, those Class A shares may be subject to a 1.00% contingent deferred sales charge (”CDSC”) if shares are redeemed within an 18-month holding period measured from the date of purchase. Class C shares are sold without a front-end sales charge but may be subject to a CDSC of 1.00% of the redemption proceeds if Class C shares are redeemed within one year of purchase. Class I shares are only available to eligible institutional investors. Class I shares are sold at net asset value per share without a sales charge or CDSC. An institutional investor that buys Class I shares for its customers’ accounts may impose charges on those accounts. Class Y shares are sold at net asset value per share without a sales charge directly to institutional investors that have special agreements with OppenheimerFunds Distributor, Inc. (the “Distributor” or “OFDI”) for that purpose. They may include insurance companies, registered investment companies, employee benefit plans and section 529 plans, among others. An institutional investor that buys Class Y shares for its customers’ accounts may impose charges on those accounts. All classes of shares have identical rights and voting privileges with respect to the Fund in general and exclusive voting rights on matters that affect that class alone. Earnings, net assets and net asset value per share may differ due to each class having its own expenses, such as transfer and shareholder servicing agent fees and shareholder communications, directly attributable to that class. Class A and C shares have separate distribution and/or service plans under which they pay fees. Class I and Y shares do not pay such fees.
The Fund is an investment company and accordingly follows the investment company accounting and reporting guidance of the Financial Accounting Standards Board (“FASB”) Accounting Standard Codification Topic 946 Financial Services- Investment Companies.
The following is a summary of significant accounting policies followed in the Fund’s preparation of financial statements in accordance with accounting principles generally accepted in the United States (“U.S. GAAP”).
OPPENHEIMER STEELPATH MLP ALPHA PLUS FUND 23 |
NOTES TO FINANCIAL STATEMENTS Unaudited / (Continued) |
2. Significant Accounting Policies
Security Valuation. All investments in securities are recorded at their estimated fair value, as described in Note 3.
Allocation of Income, Expenses, Gains and Losses. Income, expenses (other than those attributable to a specific class), gains and losses are allocated on a daily basis to each class of shares based upon the relative proportion of net assets represented by such class. Operating expenses directly attributable to a specific class are charged against the operations of that class.
Dividends and Distributions to Shareholders. Dividends and distributions to shareholders, which are determined in accordance with income tax regulations and may differ from U.S. GAAP, are recorded on the ex-dividend date. The Fund’s dividend distribution policy is intended to provide monthly distributions to its shareholders at a rate that over time is similar to the distribution rate the Fund receives from the master limited partnerships (”MLPs”) in which it invests. The Fund generally pays out dividends that over time approximate the distributions received from the Fund’s portfolio investments based on, among other considerations, distributions the Fund actually received from portfolio investments, distributions it would have received if it had been fully invested at all times, and estimated future cash flows. Such dividends are not tied to the Fund’s investment income and may not represent yield or investment return on the Fund’s portfolio. To the extent that the dividends paid exceed the distributions the Fund receives from its underlying investments, the Fund’s assets will be reduced. The Fund’s tendency to pay out a consistent dividend may change, and the Fund’s level of distributions may increase or decrease.
The estimated characterization of the distributions paid will be either a qualified dividend or distribution (return of capital). This estimate is based on the Fund’s operating results during the period. It is anticipated that a significant portion of the distributions will be comprised of return of capital as a result of the tax character of cash distributions made by the Fund’s investments. The actual characterization of the distributions made during the period will not be determined until after the end of the fiscal year. The Fund will inform shareholders of the final tax character of the distributions on IRS Form 1099 DIV in February 2018. For the six months ended May 31, 2017, the Fund distributions are expected to be comprised of 100% return of capital.
Return of Capital Estimates. Distributions received from the Fund’s investments in MLPs generally are comprised of income and return of capital. The Fund records investment income and return of capital based on estimates made at the time such distributions are received. Such estimates are based on historical information available from each MLP and other industry sources. These estimates may subsequently be revised based on information received from MLPs after their tax reporting periods are concluded. For the six months ended May 31, 2017, the Fund estimated that 100% of the MLP distributions received would be treated as return of capital.
24 OPPENHEIMER STEELPATH MLP ALPHA PLUS FUND |
NOTES TO FINANCIAL STATEMENTS Unaudited / (Continued) |
2. Significant Accounting Policies (Continued)
Investment Income. Dividend income is recorded on the ex-dividend date or upon ex-dividend notification in the case of certain foreign dividends where the ex-dividend date may have passed. Non-cash dividends included in dividend income, if any, are recorded at the fair value of the securities received. Interest income, if any, is recognized on an accrual basis. Discount and premium, which are included in interest income on the Statement of Operations, if applicable, are amortized or accreted daily.
Custodian Fees. “Custody fees” in the Statement of Operations may include interest expense incurred by the Fund on any cash overdrafts of its custodian account during the period. Such cash overdrafts may result from the effects of failed trades in portfolio securities and from cash outflows resulting from unanticipated shareholder redemption activity. The Fund pays interest to its custodian on such cash overdrafts, to the extent they are not offset by positive cash balances maintained by the Fund, at a rate equal to the Federal Funds Rate plus 0.50%. The “Reduction to custodian expenses” line item, if applicable, represents earnings on cash balances maintained by the Fund during the period. Such interest expense and other custodian fees may be paid with these earnings.
Security Transactions. Security transactions are recorded on the trade date. Realized gains and losses on securities sold are determined using the basis of identified cost.
Indemnifications. The Fund’s organizational documents provide current and former trustees and officers with a limited indemnification against liabilities arising in connection with the performance of their duties to the Fund. In the normal course of business, the Fund may also enter into contracts that provide general indemnifications. The Fund’s maximum exposure under these arrangements is unknown as this would be dependent on future claims that may be made against the Fund. The risk of material loss from such claims is considered remote.
Federal Income Taxes. The Fund does not intend to qualify as a regulated investment company pursuant to Subchapter M of the Internal Revenue Code, but will rather be taxed as a corporation. As a corporation, the Fund is obligated to pay federal, state and local income tax on taxable income. Currently, the maximum marginal regular federal income tax rate for a corporation is 35 percent. Upon enactment, a change in the federal income tax rate could have a material impact to the Fund. The Fund may be subject to a 20 percent alternative minimum tax on its federal alternative minimum taxable income to the extent that its alternative minimum tax exceeds its regular federal income tax. The Fund is currently using an estimated rate of 1.7 percent for state and local tax, net of federal tax expense.
OPPENHEIMER STEELPATH MLP ALPHA PLUS FUND 25 |
NOTES TO FINANCIAL STATEMENTS Unaudited / (Continued) |
2. Significant Accounting Policies (Continued)
The Fund’s income tax provision consists of the following as of May 31, 2017:
Current tax expense (benefit) | | | |
Federal | | $ | — | |
State | | | — | |
Total current tax expense | | $ | — | |
| | | | | |
Deferred tax expense (benefit) | | | | |
Federal | | $ | (188,166 | ) |
State | | | (9,140 | ) |
Total deferred tax expense | | $ | (197,306 | ) |
The reconciliation between the federal statutory income tax rate of 35% and the effective tax rate on net investment income (loss) and realized and unrealized gain (loss) follows:
| | | Amount | | | Rate | |
Application of statutory income tax rate | | $ | 1,109,083 | | | | 35.00 | % |
State income taxes net of federal benefit | | | 53,870 | | | | 1.70 | % |
Effect of permanent differences | | | (26,370 | ) | | | (0.83 | %) |
Change in valuation allowance | | | (1,333,889 | ) | | | (42.09 | %) |
Total income tax expense (benefit) | | $ | (197,306 | ) | | | (6.22 | %) |
For the period ended May 31, 2017 the Fund’s effective tax rate of 6.22% (net benefit) differed from the combined federal and state statutory tax rate of 36.70% (net expense) mainly due to the change in valuation allowance primarily as a result of the change in unrealized appreciation.
The Fund intends to invest its assets primarily in MLPs, which generally are treated as partnerships for federal income tax purposes. As a limited partner in the MLPs, the Fund reports its allocable share of the MLPs’ taxable income in computing its own taxable income. The Fund’s tax expense or benefit is included in the Statement of Operations based on the component of income or gains (losses) to which such expense or benefit relates. Deferred income taxes reflect the net tax effects of temporary differences between the carrying amounts of assets and liabilities for financial reporting purposes and the amounts used for income tax purposes. Such temporary differences are principally: (i) taxes on unrealized gains/(losses), which are attributable to the temporary difference between fair market value and tax basis, (ii) the net tax effects of temporary differences between the carrying amounts of assets and liabilities for financial reporting and income tax purposes and (iii) the net tax benefit of accumulated net operating losses and capital loss carryforwards. Deferred tax assets and liabilities are measured using effective tax rates expected to apply to taxable income in the
26 OPPENHEIMER STEELPATH MLP ALPHA PLUS FUND |
NOTES TO FINANCIAL STATEMENTS Unaudited / (Continued) |
2. Significant Accounting Policies (Continued)
years such temporary differences are realized or otherwise settled. To the extent the Fund has a deferred tax asset, consideration is given to whether or not a valuation allowance is required. A valuation allowance is required if, based on the evaluation criterion provided by ASC 740, Income Taxes, it is more-likely-than-not some portion or all of the deferred tax asset will not be realized.
At May 31, 2017, the Fund determined a valuation allowance was required. In implementing a valuation allowance on a portion of the deferred tax asset, significant consideration was given to the current and expected level of MLP distributions, unrealized gains and losses on MLP investments and the expiration dates for net operating losses and capital loss carryovers. Market cycles, the severity and duration of historical deferred tax assets and the impact of current and future redemptions were also considered. Through the consideration of these factors, the Fund has determined that it is more likely than not the deferred tax asset, net of the valuation allowance, will be realized.
Unexpected significant decreases in cash distributions from the Fund’s MLP investments, significant declines in the fair value of its investments, significant redemptions, or increased risk of expiring net operating losses or capital loss carryovers may change the Fund’s assessment regarding the recoverability of its deferred tax assets and may result in a change to the valuation allowance. Modifications of the valuation allowance could have a material impact on the Fund’s net asset value.
Components of the Fund’s deferred tax assets and liabilities as of May 31, 2017 are as follows:
Deferred tax assets: | | | |
Net operating loss carryforward (tax basis) | | $ | 24,072,221 | |
Capital loss carryforward (tax basis) | | | 23,710,425 | |
Valuation allowance | | | (14,995,442 | ) |
Total deferred tax asset | | | 32,787,204 | |
| | | | | |
Deferred tax liabilities: | | | | |
Net unrealized gains on investment securities (tax basis) | | | (17,471,065 | ) |
Total deferred tax liability | | | (17,471,065 | ) |
| | | | | |
Total net deferred tax asset/(liability) | | $ | 15,316,139 | |
OPPENHEIMER STEELPATH MLP ALPHA PLUS FUND 27 |
NOTES TO FINANCIAL STATEMENTS Unaudited / (Continued) |
2. Significant Accounting Policies (Continued)
The Fund may rely, to some extent, on information provided by the MLPs, which may not necessarily be timely, to estimate taxable income allocable to MLP units held in its portfolio, and to estimate its associated deferred tax liability or asset. Such estimates are made in good faith. From time to time, as new information becomes available, the Fund will modify its estimates or assumptions regarding its tax liability or asset.
The Fund’s policy is to classify interest and penalties associated with underpayment of federal and state income taxes, if any, as income tax expense on its Statement of Operations. As of May 31, 2017, the Fund does not have any interest or penalties associated with the underpayment of any income taxes.
The Fund files income tax returns in the U.S. federal jurisdiction and various states. The Fund has reviewed all major jurisdictions and concluded that there is no significant impact on the Fund’s net assets and no tax liability resulting from unrecognized tax benefits relating to uncertain tax positions expected to be taken on its tax returns. Furthermore, management of the Fund is not aware of any uncertain tax positions for which it is reasonably possible that the total amount of unrecognized tax benefit will significantly change in the next 12 months.
At May 31, 2017, the Fund had net operating loss carryforwards for federal income tax purposes, which may be carried forward for 20 years, as follows:
Expiration Date | | | |
11/30/2032 | | $ | 30,185 | |
11/30/2033 | | | 2,160,318 | |
11/30/2034 | | | 12,911,167 | |
11/30/2035 | | | 6,544,238 | |
11/30/2036 | | | 24,370,349 | |
11/30/2037 | | | 19,575,625 | |
Total | | $ | 65,591,882 | |
At May 31, 2017, the Fund had net capital loss carryforwards for federal income tax purposes, which may be carried forward for 5 years, as follows:
Expiration Date | | | |
11/30/2020 | | $ | 28,028,871 | |
11/30/2021 | | | 36,577,191 | |
Total | | $ | 64,606,062 | |
During the period ended May 31, 2017, the Fund utilized $14,999,381 of capital loss carryforward.
28 OPPENHEIMER STEELPATH MLP ALPHA PLUS FUND |
NOTES TO FINANCIAL STATEMENTS Unaudited / (Continued) |
2. Significant Accounting Policies (Continued)
At May 31, 2017, gross unrealized appreciation and depreciation of investments, based on cost for federal income tax purposes were as follows:
Cost of Investments | | $ | 275,798,843 | |
Gross Unrealized Appreciation | | $ | 64,915,413 | |
Gross Unrealized Depreciation | | | (17,267,001 | ) |
Net Unrealized Appreciation (Depreciation) on Investments | | $ | 47,648,412 | |
The difference between cost amounts for financial statement and federal income tax purposes is due primarily to timing differences in recognizing certain gains and losses in security transactions.
Use of Estimates. The preparation of financial statements in conformity with accounting principles generally accepted in the United States of America requires management to make estimates and assumptions that affect the reported amounts of assets and liabilities and disclosure of contingent assets and liabilities at the date of the financial statements and the reported amounts of increases and decreases in net assets from operations during the reporting period. Actual results could differ from those estimates.
Recent Accounting Pronouncement. In October 2016, the Securities and Exchange Commission (“SEC”) adopted amendments to rules under the Investment Company Act of 1940 (“final rules”) intended to modernize the reporting and disclosure of information by registered investment companies. The final rules amend Regulation S-X and require funds to provide standardized, enhanced derivative disclosure in fund financial statements in a format designed for individual investors. The amendments to Regulation S-X also update the disclosures for other investments and investments in, and advances to affiliates and amend the rules regarding the general form and content of fund financial statements. The compliance date for the amendments to Regulation S-X is August 1, 2017. OFI Global Asset Management, Inc., a wholly-owned subsidiary of OFI, (”OFI Global”) is currently evaluating the amendments and their impact, if any, on the Fund’s financial statements.
3. Securities Valuation
The Fund calculates the net asset value of its shares as of 4:00 P.M. Eastern time, on each day the New York Stock Exchange (the “Exchange”) is open for trading, except in the case of a scheduled early closing of the Exchange, in which case the Fund will calculate net asset value of the shares as of the scheduled early closing time of the Exchange.
The Fund’s Board of Trustees (the “Board”) has adopted procedures for the valuation of the Fund’s securities and has delegated the day-to-day responsibility for valuation determinations under those procedures to the Manager. The Manager has established a Valuation Committee which is responsible for determining a fair valuation for any security for which market
OPPENHEIMER STEELPATH MLP ALPHA PLUS FUND 29 |
NOTES TO FINANCIAL STATEMENTS Unaudited / (Continued) |
3. Securities Valuation (Continued)
quotations are not readily available. The Valuation Committee’s fair valuation determinations are subject to review, approval and ratification by the Fund’s Board at its next regularly scheduled meeting covering the calendar quarter in which the fair valuation was determined.
Valuation Methods and Inputs
Securities are valued primarily using unadjusted quoted market prices, when available, as supplied by third party pricing services or broker-dealers.
The following methodologies are used to determine the market value or the fair value of the types of securities described below:
Equity securities traded on a securities exchange (including exchange-traded derivatives other than futures and futures options) are valued based on the official closing price on the principal exchange on which the security is traded, as identified by the Manager, prior to the time when the Fund’s assets are valued. If the official closing price is unavailable, the security is valued at the last sale price on the principal exchange on which it is traded, or if no sales occurred, the security is valued at the mean between the quoted bid and asked prices. Over-the-counter equity securities are valued at the last published sale price, or if no sales occurred, at the mean between the quoted bid and asked prices.
Shares of a registered investment company that are not traded on an exchange are valued at that investment company’s net asset value per share.
Securities for which market quotations are not readily available, or a significant event has occurred that would materially affect the value of the security, are fair valued either (i) by a standardized fair valuation methodology applicable to the security type or the significant event as previously approved by the Valuation Committee and the Fund’s Board or (ii) as determined in good faith by the Manager’s Valuation Committee. The Valuation Committee considers all relevant facts that are reasonably available, through either public information or information available to the Manager, when determining the fair value of a security. Those standardized fair valuation methodologies include, but are not limited to, valuing securities at the last sale price or initially at cost and subsequently adjusting the value based on: changes in company specific fundamentals, changes in an appropriate securities index, or changes in the value of similar securities which may be further adjusted for any discounts related to security-specific resale restrictions. When possible, such methodologies use observable market inputs such as unadjusted quoted prices of similar securities, observable interest rates, currency rates and yield curves. The methodologies used for valuing securities are not necessarily an indication of the risks associated with investing in those securities nor can it be assured that the Fund can obtain the fair value assigned to a security if it were to sell the security.
30 OPPENHEIMER STEELPATH MLP ALPHA PLUS FUND |
NOTES TO FINANCIAL STATEMENTS Unaudited / (Continued) |
3. Securities Valuation (Continued)
To assess the continuing appropriateness of security valuations, the Adviser regularly compares prior day prices and sale prices to the current day prices and challenges those prices exceeding certain tolerance levels with the third party pricing service or broker source. For those securities valued by fair valuations, whether through a standardized fair valuation methodology or a fair valuation determination, the Valuation Committee reviews and affirms the reasonableness of the valuations based on such methodologies and fair valuation determinations on a regular basis after considering all relevant information that is reasonably available.
Classifications
Each investment asset or liability of the Fund is assigned a level at measurement date based on the significance and source of the inputs to its valuation. Various data inputs may be used in determining the value of each of the Fund’s investments as of the reporting period end. These data inputs are categorized in the following hierarchy under applicable financial accounting standards:
| | 1) | Level 1-unadjusted quoted prices in active markets for identical assets or liabilities (including securities actively traded on a securities exchange) |
| | 2) | Level 2-inputs other than unadjusted quoted prices that are observable for the asset or liability (such as unadjusted quoted prices for similar assets and market corroborated inputs such as interest rates, prepayment speeds, credit risks, etc.) |
| | 3) | Level 3-significant unobservable inputs (including the Manager’s own judgments about assumptions that market participants would use in pricing the asset or liability) |
The inputs used for valuing securities are not necessarily an indication of the risks associated with investing in those securities.
The Fund classifies each of its investments in investment companies which are publicly offered as Level 1. Investment companies that are not publicly offered, if any, are measured using net asset value.
OPPENHEIMER STEELPATH MLP ALPHA PLUS FUND 31 |
NOTES TO FINANCIAL STATEMENTS Unaudited / (Continued) |
3. Securities Valuation (Continued)
The table below categorizes amounts that are included in the Fund’s Statement of Assets and Liabilities as of May 31, 2017, based on valuation input level:
| | | Level 1 — Unadjusted Quoted Prices | | | Level 2 —
Other Significant Observable Inputs | | | Level 3 —
Significant Unobservable Inputs | | | Value | |
Assets Table | | | | | | | | | | | | |
Investments, at Value: | | | | | | | | | | | | |
Master Limited Partnership Shares* | | $ | 277,480,217 | | | $ | — | | | $ | — | | | $ | 277,480,217 | |
Common Stocks* | | | 45,417,506 | | | | — | | | | — | | | | 45,417,506 | |
Short-Term Investment* | | | 549,532 | | | | — | | | | — | | | | 549,532 | |
Total Assets | | $ | 323,447,255 | | | $ | — | | | $ | — | | | $ | 323,447,255 | |
* | For a detailed break-out of securities by major industry classification, please refer to the Statement of Investments. |
The Fund did not hold any Level 3 securities during the period ended May 31, 2017.
There have been no transfers between pricing levels for the Fund. It is the Fund’s policy to recognize transfers at the beginning of the reporting period.
4. Investments and Risks
Equity Security Risk. Stocks and other equity securities fluctuate in price. The value of the Fund’s portfolio may be affected by changes in the equity markets generally. Equity markets may experience significant short-term volatility and may fall sharply at times. Different markets may behave differently from each other and U.S. equity markets may move in the opposite direction from one or more foreign stock markets. Adverse events in any part of the equity or fixed-income markets may have unexpected negative effects on other market segments.
The prices of individual equity securities generally do not all move in the same direction at the same time and a variety of factors can affect the price of a particular company’s securities. These factors may include, but are not limited to, poor earnings reports, a loss of customers, litigation against the company, general unfavorable performance of the company’s sector or industry, or changes in government regulations affecting the company or its industry.
Master Limited Partnerships. MLPs issue common units that represent an equity ownership interest in a partnership and provide limited voting rights. MLP common units are registered with the Securities and Exchange Commission (“SEC”), and are freely tradable on securities exchanges such as the NYSE and the NASDAQ Stock Market (“NASDAQ”), or in
32 OPPENHEIMER STEELPATH MLP ALPHA PLUS FUND |
NOTES TO FINANCIAL STATEMENTS Unaudited / (Continued) |
4. Investments and Risks (Continued)
the over-the-counter market. An MLP consists of one or more general partners, who conduct the business, and one or more limited partners, who contribute capital. MLP common unit holders have a limited role in the partnership’s operations and management. The Fund, as a limited partner, normally would not be liable for the debts of the MLP beyond the amounts the Fund has contributed, but would not be shielded to the same extent that a shareholder of a corporation would be. In certain circumstances creditors of an MLP would have the right to seek return of capital distributed to a limited partner. This right of an MLP’s creditors would continue after the Fund sold its investment in the MLP.
MLPs are generally treated as publicly traded partnerships for federal income tax purposes. Any modification to federal income tax laws and related interpretations could cause a material decrease in the value of an MLP.
Concentration Risk. Under normal circumstances, the Fund invests at least 80% of its net assets (plus the amount of borrowing for investment purposes) in the equity securities of MLPs, the majority of which operate in the energy and/or natural resources sector. MLPs are subject to certain risks, such as supply and demand risk, depletion and exploration risk, commodity pricing risk, acquisition risk, and the risk associated with the hazards inherent in midstream energy industry activities. A substantial portion of the cash flow received by the Fund is derived from investment in equity securities of MLPs. The amount of cash that a MLP has available for distributions, and the tax character of such distributions, are dependent upon the amount of cash generated by the MLP’s operations.
5. Shares of Beneficial Interest
The Fund has authorized an unlimited number of $0.001 par value shares of beneficial interest of each class. Transactions in shares of beneficial interest were as follows:
| | | For the
Six Months Ended
May 31, 2017 | | | Year Ended
November 30, 2016 | |
| | | | | | | |
| | | Shares | | | Amount | | | Shares | | | Amount | |
Class A | | | | | | | | | | | | |
Sold | | | 2,569,198 | | | $ | 21,384,940 | | | | 9,486,980 | | | $ | 64,880,713 | |
Dividends and/or distributions reinvested | | | 452,332 | | | | 3,839,968 | | | | 1,199,254 | | | | 8,561,036 | |
Redeemed | | | (6,497,830 | ) | | | (53,152,562 | ) | | | (5,684,870 | ) | | | (38,436,869 | ) |
Net Increase/(Decrease) | | | (3,476,300 | ) | | $ | (27,927,654 | ) | | | 5,001,364 | | | $ | 35,004,880 | |
OPPENHEIMER STEELPATH MLP ALPHA PLUS FUND 33 |
NOTES TO FINANCIAL STATEMENTS Unaudited / (Continued) |
5. Shares of Beneficial Interest (Continued)
| | | For the
Six Months Ended
May 31, 2017 | | | Year Ended
November 30, 2016 | |
| | | | | | | |
| | | Shares | | | Amount | | | Shares | | | Amount | |
Class C | | | | | | | | | | | | |
Sold | | | 1,502,777 | | | $ | 12,240,754 | | | | 3,067,774 | | | $ | 20,881,354 | |
Dividends and/or distributions reinvested | | | 217,797 | | | | 1,773,523 | | | | 523,447 | | | | 3,626,967 | |
Redeemed | | | (865,330 | ) | | | (6,892,388 | ) | | | (1,960,663 | ) | | | (13,595,777 | ) |
Net Increase | | | 855,244 | | | $ | 7,121,889 | | | | 1,630,558 | | | $ | 10,912,544 | |
| | | | | | | | | | | | | | | | | |
Class I | | | | | | | | | | | | | | | | |
Sold | | | 20,918 | | | $ | 180,416 | | | | 22,421 | | | $ | 163,159 | |
Dividends and/or distributions reinvested | | | 1,949 | | | | 16,888 | | | | 5,136 | | | | 36,929 | |
Redeemed | | | (7,628 | ) | | | (67,575 | ) | | | (12,234 | ) | | | (81,895 | ) |
Net Increase | | | 15,239 | | | $ | 129,729 | | | | 15,323 | | | $ | 118,193 | |
| | | | | | | | | | | | | | | | | |
Class Y | | | | | | | | | | | | | | | | |
Sold | | | 6,373,430 | | | $ | 52,882,698 | | | | 9,457,670 | | | $ | 65,227,823 | |
Dividends and/or distributions reinvested | | | 330,923 | | | | 2,859,954 | | | | 936,704 | | | | 6,703,316 | |
Redeemed | | | (3,091,226 | ) | | | (25,899,069 | ) | | | (12,018,296 | ) | | | (79,991,986 | ) |
Net Increase/(Decrease) | | | 3,613,127 | | | $ | 29,843,583 | | | | (1,623,922 | ) | | $ | (8,060,847 | ) |
6. Purchases and Sales of Securities
The aggregate cost of purchases and proceeds from sales of securities, other than short-term obligations, for the six months ended May 31, 2017, were as follows:
| | | Purchases | | | Sales | |
Investment securities | | $ | 99,236,848 | | | $ | 82,061,879 | |
34 OPPENHEIMER STEELPATH MLP ALPHA PLUS FUND |
NOTES TO FINANCIAL STATEMENTS Unaudited / (Continued) |
7. Fees and Other Transactions with Affiliates
Management Fees. Under the investment advisory agreement, the Fund pays the Manager a management fee based on the daily net assets of the Fund at an annual rate as shown in the following table:
Net Assets up to $3 Billion | Net Assets Greater than
$3 Billion and up to $5 Billion | Net Assets in Excess of $5 Billion |
1.25% | 1.23% | 1.20% |
The Fund’s effective management fee for the six months ended May 31, 2017 was 1.25% of average annual net assets before any applicable waivers.
Transfer Agent Fees. OFI Global (the “Transfer Agent”) serves as the transfer and shareholder servicing agent for the Fund. The Fund pays the Transfer Agent a fee based on average net assets. Fees incurred with respect to these services are detailed in the Statement of Operations.
Sub-Transfer Agent Fees. The Transfer Agent has retained Shareholder Services, Inc., a wholly-owned subsidiary of OFI (the “Sub-Transfer Agent”), to provide the day-to-day transfer agent and shareholder servicing of the Fund. Under the Sub-Transfer Agency Agreement, the Transfer Agent pays the Sub-Transfer Agent an annual fee in monthly installments, equal to a percentage of the transfer agent fee collected by the Transfer Agent from the Fund, which shall be calculated after any applicable fee waivers. The fee paid to the Sub-Transfer Agent is paid by the Transfer Agent, not by the Fund.
Trustees’ Compensation. The Board has adopted a compensation deferral plan for independent trustees that enables trustees to elect to defer receipt of all or a portion of the annual compensation they are entitled to receive from the Fund. For purposes of determining the amount owed to the Trustee under the plan, deferred amounts are treated as though equal dollar amounts had been invested in shares of the Fund or in other Oppenheimer funds selected by the Trustee. The Fund purchases shares of the funds selected for deferral by the Trustee in amounts equal to his or her deemed investment, resulting in a Fund asset equal to the deferred compensation liability. Such assets are included as a component of “Other” within the asset section of the Statement of Assets and Liabilities, if applicable. Deferral of trustees’ fees under the plan will not affect the net assets of the Fund, and will not materially affect the Fund’s assets, liabilities or net investment income per share. Amounts will be deferred until distributed in accordance with the compensation deferral plan.
Distribution and Service Plan (12b-1) Fees. Under its General Distributor’s Agreement with the Fund, the Distributor acts as the Fund’s principal underwriter in the continuous public offering of the Fund’s classes of shares.
Service Plan for Class A Shares. The Fund has adopted a Service Plan (the “Plan”) for Class A shares under Rule 12b-1 of the Investment Company Act of 1940. Under the Plan, the Fund reimburses the Distributor for a portion of its costs incurred for services provided to accounts that hold Class A shares. Reimbursement is made periodically at an annual
OPPENHEIMER STEELPATH MLP ALPHA PLUS FUND 35 |
NOTES TO FINANCIAL STATEMENTS Unaudited / (Continued) |
7. Fees and Other Transactions with Affiliates (Continued)
rate of up to 0.25% of the daily net assets of Class A shares of the Fund. The Distributor currently uses all of those fees to pay dealers, brokers, banks and other financial institutions periodically for providing personal service and maintenance of accounts of their customers that hold Class A shares. Any unreimbursed expenses the Distributor incurs with respect to Class A shares in any fiscal year cannot be recovered in subsequent periods. Fees incurred by the Fund under the Plan are detailed in the Statement of Operations.
Distribution and Service Plans for Class C Shares. The Fund has adopted Distribution and Service Plans (the “Plans”) for Class C shares under Rule 12b-1 of the Investment Company Act of 1940 to compensate the Distributor for distributing those share classes, maintaining accounts and providing shareholder services. Under the Plans, the Fund pays the Distributor an annual asset-based sales charge of 0.75% on Class C shares daily net assets. The Fund also pays a service fee under the Plans at an annual rate of 0.25% of daily net assets.
The Plan and Plans continue in effect from year to year only if the Fund’s Board votes annually to approve their continuance at an in person meeting called for that purpose. Fees incurred by the Fund under the Plans are detailed in the Statement of Operations.
Sales Charges. Front-end sales charges and contingent deferred sales charges (“CDSC”) do not represent expenses of the Fund. They are deducted from the proceeds of sales of Fund shares prior to investment or from redemption proceeds prior to remittance, as applicable. The sales charges retained by the Distributor from the sale of shares and the CDSC retained by the Distributor on the redemption of shares is shown in the following table for the period indicated.
Six Months Ended | | Class A Front-End Sales Charges Retained by Distributor | | | Class A Contingent Deferred Sales Charges Retained by Distributor | | | Class C Contingent Deferred Sales Charges Retained by Distributor | |
May 31, 2017 | | $ | 24,523 | | | $ | 244 | | | $ | 4,880 | |
Waivers and Reimbursements of Expenses. The Manager has contractually agreed to limit fees and/or reimburse expenses of the Fund to the extent that the Fund’s total annual fund operating expenses (exclusive of interest, taxes, such as deferred tax expenses, brokerage commissions, acquired fund fees and expenses, dividend costs related to short sales, litigation expense, if any) exceed 2.00% for Class A shares, 2.75% for Class C shares, and 1.75% for Class Y shares. The Fund’s total annual operating expenses after fee waiver and/or expense reimbursement (“Net Expenses”) will be higher than these amounts to the extent that the Fund incurs expenses excluded from the expense cap. Because the Fund’s deferred income tax expense/(benefit) and interest expense are excluded from the expense cap, the Fund’s Net
36 OPPENHEIMER STEELPATH MLP ALPHA PLUS FUND |
NOTES TO FINANCIAL STATEMENTS Unaudited / (Continued) |
7. Fees and Other Transactions with Affiliates (Continued)
Expenses for each class of shares is increased/(decreased) by the amount of these expenses. This undertaking may not be modified or terminated until after one year from the date of the current prospectus, as indicated therein, unless approved by the Trust’s Board.
The Manager can be reimbursed by the Fund within three years after the date the fee limitation and/or expense reimbursement has been made by the Manager, provided that such repayment does not cause the expenses of any class of the Fund to exceed the foregoing limits.
Effective January 1, 2017, the Transfer Agent has voluntarily agreed to waive fees and/or reimburse Fund expenses in an amount equal to 0.015% of average annual net assets for Classes A, C and Y.
During the reporting period, the Transfer Agent waived fees and/or reimbursed the Fund for transfer agent and shareholder servicing agent fees as follows:
Class A | | $ | 7,916 | |
Class C | | | 3,609 | |
Class Y | | | 5,788 | |
This fee waiver and/or reimbursement may be terminated at any time.
During the six months ended May 31, 2017, the Adviser did not waive any recoupable expenses and does not have any previously waived expenses eligible for recovery.
Related Party. The Interested Trustees and officers of the Fund are also officers or trustees of companies affiliated with the Manager, Distributor, and Transfer Agent.
Cross Trades. The Fund is permitted to purchase and sell securities from and to other Funds managed by the Manager or OFI Global (“cross-trade”) pursuant to “Cross-Trading” Procedures adopted by the Fund’s Board of Trustees. These procedures are designed to ensure that any cross-trade of securities by the Fund from or to another fund that is or could be considered an affiliate of the Fund under certain limited circumstances by virtue of having a common investment adviser, common Officer, or common Trustee complies with Rule 17a-7 of the 1940 Act. Further, as defined under these procedures, each cross-trade is effected at the current market price.
During the period the Fund had $3,255,067 in purchases and $30,216,316 in sales considered cross-trades, resulting in $1,574,293 of tax adjusted realized gain/(loss).
OPPENHEIMER STEELPATH MLP ALPHA PLUS FUND 37 |
NOTES TO FINANCIAL STATEMENTS Unaudited / (Continued) |
8. Borrowing Agreement
The Fund, along with Oppenheimer SteelPath MLP Alpha Fund, Oppenheimer SteelPath MLP Income Fund, and Oppenheimer SteelPath MLP Select 40 Fund (collectively, the “Trust”), is a borrower in a $700 million revolving credit agreement (the “Loan Agreement”) with a major lending institution (the “Lender”). The Fund is permitted to borrow up to the lesser of one-third of the Fund’s total assets, or the maximum amount permitted pursuant to the Fund’s investment limitations. As the Loan Agreement is not available exclusively to the Fund, the Fund may not be able to borrow all of its requested amounts at any given time. Amounts borrowed under the Loan Agreement, if any, are invested by the Fund under the direction of the Manager consistent with the Fund’s investment objective and policies, and as such, the related investments are subject to normal market fluctuations and investment risks, including the risk of loss due to a decline in value. The borrowing, if any, is fully collateralized throughout the term of the borrowing with securities or other assets of the Fund. The Fund is not liable for borrowings of other funds in the Trust. Securities that have been pledged as collateral for the borrowing are indicated in the Statement of Investments.
Borrowings under the Loan Agreement are charged interest at a calculated rate computed by the Lender based on the one month LIBOR rate plus 0.65% per annum. An unused commitment fee at the rate of 0.125% per annum is charged for any undrawn portion of the credit facility, and each member of the Trust will pay its pro rata share of this fee. A facility fee of 0.20% was charged on the commitment amount, and each party of the Trust paid its pro rata share of this fee. The borrowing is due November 17, 2017, unless another date is mutually agreed upon by the parties of the Loan Agreement. For the six months ended May 31, 2017, the Fund paid $50,579 in borrowing fees. The Fund’s payable on borrowing balance and interest at May 31, 2017 was $82,500,000 and 1.25%, respectively.
Information related to the Fund’s borrowings under the Loan Agreement and Citi Loan Agreement for the six months ended May 31, 2017, is as follows:
Average
Interest
Rate | | | Average
Loan
Balance | | | Number
of Days
Outstanding | | | Interest
Expense
Incurred | | | Maximum Amount
Borrowed During
the Period | |
| | 1.49 | % | | $ | 83,354,396 | | | | 182 | | | $ | 621,376 | | | $ | 90,000,000 | |
38 OPPENHEIMER STEELPATH MLP ALPHA PLUS FUND |
DISTRIBUTION SOURCES Unaudited |
For any distribution that took place over the last six months of the Fund’s reporting period, the table below details on a per-share basis the percentage of the Fund’s total distribution payment amount that was derived from the following sources: net income, net profit from the sale of securities, and other capital sources. Other capital sources represent a return of capital. A return of capital may occur, for example, when some or all of the money that you invested in the Fund is paid back to you. A return of capital distribution does not necessarily reflect the Fund’s investment performance and should not be confused with “yield” or “income.” You should not draw any conclusions about each Fund’s investment performance from the amounts of these distributions. This information is based upon income and capital gains using generally accepted accounting principles as of the date of each distribution. For certain securities, such as Master Limited Partnerships (“MLPs”), the percentages attributed to each category are estimated using historical information because the character of the amounts received from the MLPs in which the Fund invests is unknown until after the end of the calendar year. Because the Fund is actively managed, the relative amount of the Fund’s total distributions derived from various sources over the calendar year may change. Please note that this information should not be used for tax reporting purposes as the tax character of distributable income may differ from the amounts used for this notification. You will receive IRS tax forms in the first quarter of each calendar year detailing the actual amount of the taxable and non-taxable portion of distributions paid to you during the tax year.
For the most current information, please go to oppenheimerfunds.com. Select your Fund, then the ’Detailed’ tab; where ‘Dividends’ are shown, the Fund’s latest pay date will be followed by the sources of any distribution, updated daily.
Fund Name | Pay
Date | Net
Income | Net
Profit
from Sale | Other
Capital
Sources |
Oppenheimer SteelPath MLP Alpha Plus Fund | 1/6/17 | 0.0% | 0.0% | 100.0% |
Oppenheimer SteelPath MLP Alpha Plus Fund | 2/7/17 | 0.0% | 0.0% | 100.0% |
Oppenheimer SteelPath MLP Alpha Plus Fund | 3/7/17 | 0.0% | 0.0% | 100.0% |
Oppenheimer SteelPath MLP Alpha Plus Fund | 4/5/17 | 0.0% | 0.0% | 100.0% |
Oppenheimer SteelPath MLP Alpha Plus Fund | 5/5/17 | 0.0% | 0.0% | 100.0% |
OPPENHEIMER STEELPATH MLP ALPHA PLUS FUND 39 |
PORTFOLIO PROXY VOTING POLICIES AND PROCEDURES; UPDATES TO STATEMENTS OF INVESTMENTS Unaudited |
The Fund has adopted Portfolio Proxy Voting Policies and Procedures under which the Fund votes proxies relating to securities (“portfolio proxies”) held by the Fund. A description of the Fund’s Portfolio Proxy Voting Policies and Procedures is available (i) without charge, upon request, by calling the Fund toll-free at 1.800.CALL OPP (225.5677), (ii) on the Fund’s website at oppenheimerfunds.com, and (iii) on the SEC’s website at www.sec.gov. In addition, the Fund is required to file Form N-PX, with its complete proxy voting record for the 12 months ended June 30th, no later than August 31st of each year. The Fund’s voting record is available (i) without charge, upon request, by calling the Fund toll-free at 1.800.CALL OPP (225.5677), and (ii) in the Form N-PX filing on the SEC’s website at www.sec.gov.
The Fund files its complete schedule of portfolio holdings with the SEC for the first quarter and the third quarter of each fiscal year on Form N-Q. The Fund’s Form N-Q filings are available on the SEC’s website at www.sec.gov. Those forms may be reviewed and copied at the SEC’s Public Reference Room in Washington, D.C. Information on the operation of the Public Reference Room may be obtained by calling 1-800-SEC-0330.
Householding – Delivery of Shareholder Documents
This is to inform you about OppenheimerFunds’ “householding” policy. If more than one member of your household maintains an account in a particular fund, OppenheimerFunds will mail only one copy of the fund’s prospectus (or, if available, the fund’s summary prospectus), annual and semiannual report and privacy policy. The consolidation of these mailings, called householding, benefits your fund through reduced mailing expense, and benefits you by reducing the volume of mail you receive from OppenheimerFunds. Householding does not affect the delivery of your account statements.
Please note that we will continue to household these mailings for as long as you remain an OppenheimerFunds shareholder, unless you request otherwise. If you prefer to receive multiple copies of these materials, please call us at 1.800.CALL-OPP (225-5677). You may also notify us in writing or via email. We will begin sending you individual copies of the prospectus (or, if available, the summary prospectus), reports and privacy policy within 30 days of receiving your request to stop householding.
40 OPPENHEIMER STEELPATH MLP ALPHA PLUS FUND |
OPPENHEIMER STEELPATH MLP ALPHA PLUS FUND |
Trustees and Officers | | Robert J. Malone, Chairman of the Board of Trustees and Trustee |
| | | Jon S. Fossel, Trustee |
| | | Richard F. Grabish, Trustee |
| | | Beverly L. Hamilton, Trustee |
| | | Victoria J. Herget, Trustee |
| | | F. William Marshall, Jr., Trustee |
| | | Karen L. Stuckey, Trustee |
| | | James D. Vaughn, Trustee |
| | | Arthur P. Steinmetz, Trustee, President and Principal Executive Officer |
| | | Stuart Cartner, Vice President |
| | | Brian Watson, Vice President |
| | | Cynthia Lo Bessette, Secretary and Chief Legal Officer |
| | | Jennifer Foxson, Vice President and Chief Business Officer |
| | | Mary Ann Picciotto, Chief Compliance Officer and Chief Anti-Money Laundering Officer |
| | | Brian S. Petersen, Treasurer and Principal Financial & Accounting Officer |
| | | |
Manager | | OFI SteelPath, Inc. |
| | | |
Distributor | | OppenheimerFunds Distributor, Inc. |
| | | |
Transfer and Shareholder Servicing Agent | | OFI Global Asset Management, Inc. |
| | | |
Sub-Transfer Agent | | Shareholder Services, Inc. |
| | | DBA OppenheimerFunds Services |
| | | |
Independent Registered Public Accounting Firm | | Cohen & Company, LTD. |
| | | |
Legal Counsel | | Ropes & Gray LLP |
© 2017 OppenheimerFunds, Inc. All rights reserved.
OPPENHEIMER STEELPATH MLP ALPHA PLUS FUND 41 |
As an Oppenheimer fund shareholder, you are entitled to know how we protect your personal information and how we limit its disclosure. Information Sources
We obtain nonpublic personal information about our shareholders from the following sources:
| | ● | Applications or other forms. |
| | ● | When you create a user ID and password for online account access. |
| | ● | When you enroll in eDocs Direct,SM our electronic document delivery service. |
| | ● | Your transactions with us, our affiliates or others. |
| | ● | Technologies on our website, including: “cookies” and web beacons, which are used to collect data on the pages you visit and the features you use. |
If you visit oppenheimerfunds.com and do not log on to the secure account information areas, we do not obtain any personal information about you. When you do log on to a secure area, we do obtain your user ID and password to identify you. We also use this information to provide you with products and services you have requested, to inform you about products and services that you may be interested in and assist you in other ways.
We do not collect personal information through our website unless you willingly provide it to us, either directly by email or in those areas of the website that request information. In order to update your personal information (including your mailing address, email address and phone number) you must first log on and visit your user profile.
If you have set your browser to warn you before accepting cookies, you will receive the warning message with each cookie. You can refuse cookies by turning them off in your browser. However, doing so may limit your access to certain sections of our website.
We use cookies to help us improve and manage our website. For example, cookies help us recognize new versus repeat visitors to the site, track the pages visited, and enable some special features on the website. This data helps us provide a better service for our website visitors.
Protection of Information
We do not disclose any nonpublic personal information (such as names on a customer list) about current or former customers to anyone, except as permitted by law.
Disclosure of Information
Copies of confirmations, account statements and other documents reporting activity in your fund accounts are made available to your financial advisor (as designated by you). We may also use details about you and your investments to help us, our financial service affiliates, or firms that jointly market their financial products and services with ours, to better serve
42 OPPENHEIMER STEELPATH MLP ALPHA PLUS FUND |
PRIVACY POLICY NOTICE (Continued) |
your investment needs or suggest educational material that may be of interest to you. If this requires us to provide you with an opportunity to “opt in” or “opt out” of such information sharing with a firm not affiliated with us, you will receive notification on how to do so, before any such sharing takes place.
Right of Refusal
We will not disclose your personal information to unaffiliated third parties (except as permitted by law), unless we first offer you a reasonable opportunity to refuse or “opt out” of such disclosure.
Internet Security and Encryption
In general, the email services provided by our website are encrypted and provide a secure and private means of communication with us. To protect your own privacy, confidential and/ or personal information should only be communicated via email when you are advised that you are using a secure website.
As a security measure, we do not include personal or account information in nonsecure emails, and we advise you not to send such information to us in nonsecure emails. Instead, you may take advantage of the secure features of our website to encrypt your email correspondence. To do this, you will need to use a browser that supports Secure Sockets Layer (SSL) protocol.
| | ● | All transactions, including redemptions, exchanges and purchases, are secured by SSL and 256-bit encryption. SSL is used to establish a secure connection between your PC and OppenheimerFunds’ server. It transmits information in an encrypted and scrambled format. |
| | ● | Encryption is achieved through an electronic scrambling technology that uses a “key” to code and then decode the data. Encryption acts like the cable converter box you may have on your television set. It scrambles data with a secret code so that no one can make sense of it while it is being transmitted. When the data reaches its destination, the same software unscrambles the data. |
| | ● | You can exit the secure area by closing your browser or, for added security, you can use the Log Out button before you close your browser. |
Other Security Measures
We maintain physical, electronic and procedural safeguards to protect your personal account information. Our employees and agents have access to that information only so that they may offer you products or provide services, for example, when responding to your account questions.
OPPENHEIMER STEELPATH MLP ALPHA PLUS FUND 43 |
PRIVACY POLICY NOTICE (Continued) |
How You Can Help
You can also do your part to keep your account information private and to prevent unauthorized transactions. If you obtain a user ID and password for your account, safeguard that information. Also, take special precautions when accessing your account on a computer used by others.
Who We Are
This joint notice describes the privacy policies of the Oppenheimer funds, OppenheimerFunds, Inc., each of its investment adviser subsidiaries, OppenheimerFunds Distributor, Inc. and OFI Global Trust Co. It applies to all Oppenheimer fund accounts you presently have, or may open in the future, using your Social Security number—whether or not you remain a shareholder of our funds. This notice was last updated as of November 2016. In the event it is updated or changed, we will post an updated notice on our website at oppenheimerfunds.com. If you have any questions about this privacy policy, email us by clicking on the Contact Us section of our website at oppenheimerfunds.com, write to us at P.O. Box 5270, Denver, CO 80217-5270, or call us at 800 CALL OPP (225 5677).
44 OPPENHEIMER STEELPATH MLP ALPHA PLUS FUND |
THIS PAGE INTENTIONALLY LEFT BLANK
OPPENHEIMER STEELPATH MLP ALPHA PLUS FUND 45 |
THIS PAGE INTENTIONALLY LEFT BLANK
46 OPPENHEIMER STEELPATH MLP ALPHA PLUS FUND |
THIS PAGE INTENTIONALLY LEFT BLANK
OPPENHEIMER STEELPATH MLP ALPHA PLUS FUND 47 |

Not applicable to semi-annual reports.
Not applicable to semi-annual reports.
Not applicable to semi-annual reports.
Not applicable.
Item 6. Schedule of Investments.
a) Not applicable. The complete schedule of investments is included in Item 1 of this Form N-CSR.
b) Not applicable.
Not applicable.
Not applicable.
Not applicable.
Item 10. Submission of Matters to a Vote of Security Holders.
Not applicable.
Item 12. Exhibits
Filed herewith.
Pursuant to the requirements of the Securities Exchange Act of 1934 and the Investment Company Act of 1940, the registrant has duly caused this report to be signed on its behalf by the undersigned, thereunto duly authorized.
Pursuant to the requirements of the Securities Exchange Act of 1934 and the Investment Company Act of 1940, this report has been signed below by the following persons on behalf of the registrant and in the capacities and on the date indicated.