UNITED STATES
SECURITIES AND EXCHANGE COMMISSION
Washington, D.C. 20549
FORM N-CSR
CERTIFIED SHAREHOLDER REPORT OF REGISTERED
MANAGEMENT INVESTMENT COMPANIES
Investment Company Act File Number 811-22363
Oppenheimer SteelPath MLP Funds Trust
(Exact name of registrant as specified in charter)
6803 S. Tucson Way
Centennial, Colorado 80112-3924
(Address of principal executive offices) (Zip Code)
Cynthia Lo Bessette
OFI SteelPath, Inc.
225 Liberty Street
New York, New York 10281-1008
(Name and address of agent for service)
Registrant's telephone number, including area code: (303) 768-3200
Date of fiscal year end: November 30
Date of reporting period: May 31, 2018
Item 1. Reports to Stockholders.
The following is a copy of the report transmitted to shareholders pursuant to Rule 30e-1 under the Investment Company Act of 1940 (17 CFR 270.30e-1).

Table of Contents
Fund Performance Discussion | 3 |
Top Holdings and Allocations | 7 |
Share Class Performance | 8 |
Fund Expenses | 10 |
Statement of Investments | 12 |
Statement of Assets and Liabilities | 16 |
Statement of Operations | 18 |
Statements of Changes in Net Assets | 19 |
Financial Highlights | 20 |
Notes to Financial Statements | 25 |
Distribution Sources | 43 |
Portfolio Proxy Voting Policies and Procedures; Updates to Statement of Investments | 44 |
Trustees and Officers | 45 |
Privacy Policy Notice | 46 |
Class A Shares
AVERAGE ANNUAL TOTAL RETURNS AT 5/31/18
| | Class A Shares of the Fund | | |
| Without Sales Charge | With
Sales Charge | S&P 500 Index | Alerian MLP Index |
6-Month | 1.97% | -3.92% | 3.16% | 5.71% |
1-Year | -3.91% | -9.40% | 14.38% | -3.71% |
5-Year | -0.64% | -1.81% | 12.98% | -3.20% |
Since Inception (3/31/10) | 4.12% | 3.37% | 13.17% | 5.15% |
Performance data quoted represents past performance, which does not guarantee future results. The investment return and principal value of an investment in the Fund will fluctuate so that an investor’s shares, when redeemed, may be worth more or less than their original cost. Fund returns include changes in share price, reinvested distributions, and a 5.75% maximum applicable sales charge except where “without sales charge” is indicated. Current performance may be lower or higher than the performance quoted. Returns do not consider capital gains or income taxes on an individual’s investment. Returns for periods of less than one year are cumulative and not annualized. For performance data current to the most recent month-end, visit oppenheimerfunds.com or call 1.800.CALL OPP (225.5677). See Fund prospectuses and summary prospectuses for more information on share classes and sales charges.
2 OPPENHEIMER STEELPATH MLP SELECT 40 FUND |
Fund Performance Discussion
The Fund’s Class A shares (without sales charge) produced a total return of 1.97% during the reporting period. In comparison, master limited partnerships (“MLPs”), as measured by the Alerian MLP Index (AMZ), provided a total return gain of 5.71%. During the same period, the S&P 500 Index produced a total return gain of 3.16%.
Over the six-month reporting period ended May 31, 2018, the midstream sector outperformed the broader markets despite facing headwinds presented by the U.S. Federal Energy Regulatory Commission (FERC), which announced changes related to pipeline tariffs in reaction to a federal court’s previous remand that cost-of-service tariffs on interstate natural gas and oil pipelines owned by MLPs would no longer receive an income tax allowance (ITA). This shift in FERC’s long-held position caused significant market confusion and volatility across the sector. While on the whole the sector overcame the initial widespread weakness, the value of the equities of select industry participants with the largest portfolios of FERC-regulated assets remain diminished at period end.
The need for additional midstream infrastructure to service growing volumes from the Permian basin became even more acute over the reporting period as production growth has exceeded even the most aggressive of previous industry predictions and appears set to overwhelm the energy infrastructure capacity bringing that crude oil and natural gas out of the basin. While there are multiple new-build pipelines and expansions in-progress, we believe that the long construction times required for these projects mean that meaningful relief is unlikely to come until mid-2019, at the earliest. As such, we expect that Permian producers without sufficient takeaway capacity will experience significantly worse pricing than peers with access to pipeline capacity. Some disadvantaged producers may slow their production growth until in-basin pricing recovers. Importantly, we believe certain midstream operators should enjoy both short-term and long-term benefits. Obviously, midstream operators are currently enjoying and we expect that they will continue to enjoy the full utilization of their assets servicing the basin. Some operators may also capture wide short-term marketing margins. Over the long-term, midstream operators may benefit from an increased desire by producers to commit to existing or new capacity that can earn a transportation fee for an extended period.
Over the reporting period, we estimate approximately $7 billion of new equity supply entered the market through secondary offerings, initial public offerings, preferred offerings, or “at-the-market” programs in which primary units trade into the market anonymously throughout the normal trading day. This pace of equity
OPPENHEIMER STEELPATH MLP SELECT 40 FUND 3 |
issuance represents a sharp decrease from approximately $15 billion that was raised over the six month reporting period ended May 31, 2017. Midstream companies also raised approximately $20 billion of debt capital during the period. Most MLPs pay out substantial distributions to investors and, therefore, often raise external capital to fund larger growth projects or acquisitions.
The Tax Cuts and Jobs Act of 2017, enacted on December 22, 2017, reduced the Fund’s Federal income tax rate from 35% to 21%. We view a reduction in the corporate tax rate as a significant long-term positive for the C-Corp fund structure, and the immediate impact was an increase of the Fund’s Net Asset Value due to the required remeasuring of the Fund’s accumulated deferred tax liabilities, as of the enactment date, using the new 21% rate.
MACRO REVIEW
West Texas Intermediate (“WTI”) crude oil prices ended the reporting period at $67.07 per barrel, up 17% over the reporting period. Global crude prices, as measured by Brent crude oil, traded 26% higher over the reporting period. Brent exited the period at a $10.55 per barrel premium to WTI, as the aforementioned Permian capacity constraints also began to weigh on WTI pricing, relative to international levels, as more barrels are pushed from the Permian to Cushing, OK, where WTI pricing is set.
Henry Hub natural gas spot prices exited the period at $2.89 per million British thermal units (“mmbtu”), down 2% over the reporting period, and down 4% from the year-ago period. Natural gas pricing appears to have settled into a relatively narrow trading band as supply and demand dynamics have balanced with heating and electric generation demand stabilizing to weather-dependent levels, production volume growth increasing, and increasing liquefied natural gas exports.
Mont Belvieu natural gas liquids (“NGL”) prices ended the reporting period at $29.61 per barrel, a 7% increase over the reporting period. Pricing for NGL purity products varied, with ethane, isobutane, and natural gasoline trading higher over the period while butane and propane prices declined. Frac spreads, a measure of natural gas processing economics, ended the period at $0.49 per gallon, down 8% over the reporting period. Generally, the greater the frac spread, the greater the incentive for producers to seek natural gas processing capacity.
The yield curve flattened over the reporting period as short-term rates increased more than the yields on longer-dated maturities. The ten-year Treasury yield increased 45 basis points to end the period at 2.86%. The MLP yield spread at period-end, as measured by the AMZ and the 10-year Treasury bond, narrowed by 60 basis points to 5.12%.
Over the reporting period, real estate investment trusts (“REITs”) and utilities, two competing yield-oriented equity asset classes, posted total return losses of 3.11% (as measured by the Dow Jones Equity REIT Total Return Index) and 8.28% (as measured by the Dow Jones Utility Average Index), respectively, as compared to the AMZ’s 5.71% total return gain. Price
4 OPPENHEIMER STEELPATH MLP SELECT 40 FUND |
to forward distributable cash flow (DCF), a commonly watched ratio within the MLP sector, declined over the period, ending well below the ten-year average.
SUBSECTOR REVIEW
Performance among subsectors in the midstream, or energy infrastructure, MLP asset class varied for the reporting period. On average, sector participants focused on compression provided the best performance over the period, as strength in demand for compression services has driven increased asset utilization and pricing increases. The gathering and processing subsector followed, buoyed by improved volumetric projections.
The natural gas pipeline subsector experienced the weakest performance over the reporting period as these entities’ prospective cash flows were directly impacted by the FERC changes related to cost-of-service tariffs on interstate pipelines owned by MLPs. The propane subsector also lagged over the reporting period as winter demand proved fleeting and due to idiosyncratic factors at select subsector members.
FUND REVIEW
Key contributors to the Fund’s performance were Energy Transfer Partners, LP (ETP) and ONEOK Inc. (OKE).
ETP outperformed over the period as its robust portfolio of natural gas processing assets benefited from the recent expansion of processing facilities. In addition, its Permian and Marcellus/Utica assets have been seeing increasing activity that is expected to drive cash flow growth.
OKE outperformed over the period after announcing plans for a large Rockies/Mid-Continent NGL pipeline in January, additional plans for a new Mid-Continent/Gulf Coast NGL pipeline, a new NGL fractionator at Mont Belvieu, and a new natural gas processing plant in North Dakota. Importantly, despite the added $2.3 billion of capital spending, OKE noted that it does not expect to issue additional equity in 2018 and well into 2019. OKE operates a diversified portfolio of predominately fee-based assets that it expects to generate 9% to 11% annualized distribution growth through 2021.
Key detractors from the Fund’s performance were TC Pipelines, LP (TCP) and Buckeye Partners, LP (BPL).
TCP units underperformed over the period following FERC changes related to cost-of-service tariffs on interstate natural gas and liquids pipelines owned by MLPs. Despite this concern, we believe the ultimate outcome is likely far more nuanced and any revenue impact much less widespread than the initial market reaction.
BPL underperformed over the period as market participants expressed heightened concerns related to storage re-contracting and following the FERC changes. BPL operates a portfolio of strategic, long-lived infrastructure assets that generates highly-stable, fee-based cash flows. Despite the
OPPENHEIMER STEELPATH MLP SELECT 40 FUND 5 |
recent headwinds, the partnership still maintains distribution coverage of approximately 1.0x, and we believe that it has manageable capital needs, and continues to find growth opportunities that enhance its core asset base.
Please note that significant decreases in cash distributions from the Fund’s MLP investments and/or significant declines in the value of its investments may impact the Fund’s assessment regarding the recoverability of certain deferred tax assets, which may result in the recording of a valuation allowance. If a valuation allowance is established, this could have a material impact on the Fund’s net asset value and results of operations for the period. The Fund did not have a valuation allowance in place during the reporting period. See Note 2 of the Notes to Financial Statements for more information.
OUTLOOK
We believe midstream equity valuations are attractive and sector participants have improved their positioning for the future. While the AMZ is above the cyclical low, it remains at levels present before the shale production renaissance. Notably, this is occurring at a time when many MLPs have reached or are approaching a self-funding level of retained cash flows and the industry’s heaviest capital spending obligations appear to be in the past. Accordingly, we believe the stage is setting for a realignment of business and equity fundamentals, positioning the sector well for long-term investors seeking an attractive blend of current income, moderate growth, and, presently, attractive valuations.

| 
Stuart Cartner
Portfolio Manager
| | 
| 
Brian Watson, CFA
Portfolio Manager
|
6 OPPENHEIMER STEELPATH MLP SELECT 40 FUND |
Top Holdings and Allocations
TOP TEN MASTER LIMITED PARTNERSHIP AND RELATED ENTITIES HOLDINGS
Energy Transfer Partners LP | 5.68% |
Enterprise Products Partners LP | 5.25% |
Energy Transfer Equity LP | 5.10% |
MPLX LP | 4.86% |
Magellan Midstream Partners LP | 4.39% |
Targa Resources Corp. | 4.33% |
Holly Energy Partners LP | 4.32% |
Tallgrass Energy GP LP | 4.08% |
Genesis Energy LP | 4.04% |
Buckeye Partners LP | 3.91% |
Portfolio holdings and allocations are subject to change. Percentages are as of May 31, 2018, and are based on net assets. For more current Fund holdings, please visit oppenheimerfunds.com.
SECTOR ALLOCATION
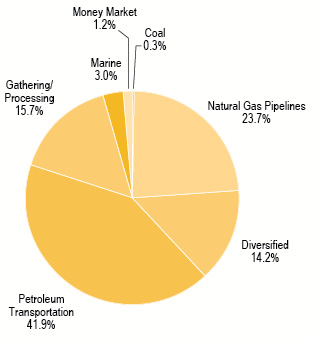
Portfolio holdings and allocations are subject to change. Percentages are as of May 31, 2018, and are based on the total market value of investments. For more current Fund holdings, please visit oppenheimerfunds.com.
OPPENHEIMER STEELPATH MLP SELECT 40 FUND 7 |
Share Class Performance
AVERAGE ANNUAL TOTAL RETURNS WITHOUT SALES CHARGE AS OF 5/31/18
| Inception Date | 6-Month | 1-Year | 5-Year | Since Inception |
Class A (MLPFX) | 3/31/10 | 1.97% | -3.91% | -0.64% | 4.12% |
Class C (MLPEX) | 7/14/11 | 1.55% | -4.57% | -1.38% | 1.77% |
Class I (OSPSX) | 6/28/13 | 2.15% | -3.57% | N/A | -1.01% |
Class W (MLPYX) | 3/31/10 | 2.04% | -3.58% | -0.37% | 4.41% |
Class Y (MLPTX) | 3/31/10 | 2.04% | -3.58% | -0.37% | 4.41% |
AVERAGE ANNUAL TOTAL RETURNS WITH SALES CHARGE AS OF 5/31/18
| Inception Date | 6-Month | 1-Year | 5-Year | Since Inception |
Class A (MLPFX) | 3/31/10 | -3.92% | -9.40% | -1.81% | 3.37% |
Class C (MLPEX) | 7/14/11 | 0.57% | -5.45% | -1.38% | 1.77% |
Class I (OSPSX) | 6/28/13 | 2.15% | -3.57% | N/A | -1.01% |
Class W (MLPYX) | 3/31/10 | 2.04% | -3.58% | -0.37% | 4.41% |
Class Y (MLPTX) | 3/31/10 | 2.04% | -3.58% | -0.37% | 4.41% |
Performance data quoted represents past performance, which does not guarantee future results. The investment return and principal value of an investment in the Fund will fluctuate so that an investor’s shares, when redeemed, may be worth more or less than their original cost. Current performance may be lower or higher than the performance quoted. Returns do not consider capital gains or income taxes on an individual’s investment. For performance data current to the most recent month-end, visit oppenheimerfunds.com or call 1.800.CALL OPP (225.5677). Fund returns include changes in share price, reinvested distributions, and the applicable sales charge: for Class A shares, the current maximum initial sales charge of 5.75%, and for Class C shares, the contingent deferred sales charge of 1% for the 1-year period. There is no sales charge for Class I, Class W, or Class Y shares. Returns for periods of less than one year are cumulative and not annualized. See Fund prospectuses and summary prospectuses for more information on share classes and sales charges.
The Fund’s performance is compared to the performance of the S&P 500 Index and the Alerian MLP Index. The S&P 500 Index is a capitalization-weighted index of 500 stocks intended to be a representative sample of leading companies in leading industries within the U.S. economy. The Alerian MLP Index is a float-adjusted, capitalization-weighted index measuring master limited partnerships, whose constituents represent approximately 85% of total float-adjusted market capitalization. The returns for the S&P 500 Index and Alerian MLP Index are calculated pre-tax, while the Fund’s returns are calculated post corporate tax. The indices are unmanaged and cannot be purchased directly by investors. While index comparisons may be
8 OPPENHEIMER STEELPATH MLP SELECT 40 FUND |
useful to provide a benchmark for the Fund’s performance, it must be noted that the Fund’s investments are not limited to the investments comprising the indices. Index performance includes reinvestment of income, but does not reflect transaction costs, fees, expenses or taxes. Index performance is shown for illustrative purposes only as a benchmark for the Fund’s performance, and does not predict or depict performance of the Fund. The Fund’s performance reflects the effects of the Fund’s business and operating expenses.
The Fund’s investment strategy and focus can change over time. The mention of specific fund holdings does not constitute a recommendation by OppenheimerFunds, Inc. or its affiliates.
The views in the Fund Performance Discussion represent the opinions of this Fund’s portfolio managers and are not intended as investment advice or to predict or depict the performance of any investment. These views are as of the close of business on May 31, 2018, and are subject to change based on subsequent developments. The Fund’s portfolio and strategies are subject to change.
Before investing in any of the Oppenheimer funds, investors should carefully consider a fund’s investment objectives, risks, charges and expenses. Fund prospectuses and summary prospectuses contain this and other information about the funds, and may be obtained by asking your financial advisor, visiting oppenheimerfunds.com, or calling 1.800.CALL OPP (225.5677). Read prospectuses and summary prospectuses carefully before investing.
Shares of Oppenheimer funds are not deposits or obligations of any bank, are not guaranteed by any bank, are not insured by the FDIC or any other agency, and involve investment risks, including the possible loss of the principal amount invested.
OPPENHEIMER STEELPATH MLP SELECT 40 FUND 9 |
Fund Expenses
Fund Expenses. As a shareholder of the Fund, you incur two types of costs: (1) transaction costs, which may include sales charges (loads) on purchase payments, contingent deferred sales charges on redemptions; and (2) ongoing costs, including management fees; distribution and service fees; and other Fund expenses. These examples are intended to help you understand your ongoing costs (in dollars) of investing in the Fund and to compare these costs with the ongoing costs of investing in other mutual funds.
The examples are based on an investment of $1,000.00 invested at the beginning of the period and held for the entire 6-month period ended May 31, 2018.
Actual Expenses. The first section of the table provides information about actual account values and actual expenses. You may use the information in this section for the class of shares you hold, together with the amount you invested, to estimate the expense that you paid over the period. Simply divide your account value by $1,000.00 (for example, an $8,600.00 account value divided by $1,000.00 = 8.60), then multiply the result by the number in the first section under the heading entitled “Expenses Paid During 6 Months Ended May 31, 2018” to estimate the expenses you paid on your account during this period.
Hypothetical Example for Comparison Purposes. The second section of the table provides information about hypothetical account values and hypothetical expenses based on the Fund’s actual expense ratio for each class of shares, and an assumed rate of return of 5% per year for each class before expenses, which is not the actual return. The hypothetical account values and expenses may not be used to estimate the actual ending account balance or expenses you paid for the period. You may use this information to compare the ongoing costs of investing in the Fund and other funds. To do so, compare this 5% hypothetical example for the class of shares you hold with the 5% hypothetical examples that appear in the shareholder reports of the other funds.
Please note that the expenses shown in the table are meant to highlight your ongoing costs only and do not reflect any transactional costs, such as front-end or contingent deferred sales charges (loads). Therefore, the “hypothetical” section of the table is useful in comparing ongoing costs only, and will not help you determine the relative total costs of owning different funds. In addition, if these transactional costs were included, your costs would have been higher.
10 OPPENHEIMER STEELPATH MLP SELECT 40 FUND |
Actual | Beginning
Account
Value
December 1, 2017 | Ending
Account
Value
May 31, 2018 | Expenses
Paid During
6 Months Ended
May 31, 2018 |
CLASS A | $ 1,000.00 | $ 1,019.70 | $ 11.75 |
CLASS C | 1,000.00 | 1,015.50 | 15.50 |
CLASS I | 1,000.00 | 1,021.50 | 10.16 |
CLASS W | 1,000.00 | 1,020.40 | 10.48 |
CLASS Y | 1,000.00 | 1,020.40 | 10.49 |
| | | | |
Hypothetical
(5% return before expenses) | | | |
CLASS A | 1,000.00 | 1,013.37 | 11.71 |
CLASS C | 1,000.00 | 1,009.62 | 15.45 |
CLASS I | 1,000.00 | 1,014.95 | 10.12 |
CLASS W | 1,000.00 | 1,014.63 | 10.45 |
CLASS Y | 1,000.00 | 1,014.61 | 10.46 |
Expenses are equal to the Fund’s annualized expense ratio for that class, multiplied by the average account value over the period, multiplied by 182/365 (to reflect the one-half year period). Those annualized expense ratios, excluding indirect expenses from affiliated funds, and tax expense, based on the 6-month period ended May 31, 2018 are as follows:
Class | Expense Ratios |
CLASS A | 2.33% |
CLASS C | 3.08 |
CLASS I | 2.02 |
CLASS W | 2.08 |
CLASS Y | 2.08 |
The expense ratios for Class A, C, W, and Y reflect contractual and/or voluntary waivers and/or reimbursements of expenses by the Fund’s Manager and Transfer Agent. Some of these undertakings may be modified or terminated at any time, as indicated in the Fund’s prospectus. The “Financial Highlights” tables in the Fund’s financial statements, included in this report, also show the gross expense ratios, without such waivers or reimbursements, if applicable.
OPPENHEIMER STEELPATH MLP SELECT 40 FUND 11 |
STATEMENT OF INVESTMENTS May 31, 2018 / Unaudited |
| Description | | Shares | | Value |
| MLP Investments and Related Entities — 93.5% |
| Coal — 0.2% | | | | |
| Alliance Holdings GP LP | | | 279,616 | | | $ | 7,932,706 | |
| | | | | | | | | |
| Diversified — 10.6% |
| Enterprise Products Partners LP | | | 6,031,384 | | | | 174,306,997 | |
| Hess Midstream Partners LP | | | 479,810 | | | | 10,056,818 | |
Westlake Chemical Partners LP 1 | | | 2,329,021 | | | | 54,149,738 | |
| Williams Partners LP | | | 2,829,521 | | | | 112,614,936 | |
| Total Diversified | | | | | | | 351,128,489 | |
| | | | | | | | | |
| Gathering/Processing — 15.0% |
| Antero Midstream GP LP | | | 2,346,275 | | | | 45,165,794 | |
| Antero Midstream Partners LP | | | 1,668,425 | | | | 50,469,856 | |
Archrock, Inc. 1 | | | 7,089,017 | | | | 81,878,146 | |
| Crestwood Equity Partners LP | | | 534,845 | | | | 17,970,792 | |
| CSI Compressco LP | | | 818,809 | | | | 4,822,785 | |
| Summit Midstream Partners LP | | | 1,743,269 | | | | 28,328,121 | |
| Targa Resources Corp. | | | 2,956,181 | | | | 143,759,082 | |
| Western Gas Partners LP | | | 2,406,823 | | | | 124,360,545 | |
| Total Gathering/Processing | | | | | | | 496,755,121 | |
| | | | | | | | | |
| Marine — 3.0% | | | | | | | | |
GasLog Partners LP 2 | | | 1,269,792 | | | | 31,046,414 | |
Golar LNG Partners LP 2 | | | 1,635,848 | | | | 27,433,171 | |
Teekay LNG Partners LP 2 | | | 2,331,730 | | | | 40,338,929 | |
Teekay Offshore Partners LP 2 | | | 100,500 | | | | 271,350 | |
| Total Marine | | | | | | | 99,089,864 | |
| | | | | | | | | |
| Natural Gas Pipelines — 23.8% |
| CNX Midstream Partners LP | | | 1,058,560 | | | | 19,837,414 | |
| Energy Transfer Equity LP | | | 9,803,625 | | | | 169,406,640 | |
| Energy Transfer Partners LP | | | 9,942,690 | | | | 188,811,683 | |
| EQT Midstream Partners LP | | | 747,879 | | | | 41,754,084 | |
Rice Midstream Partners LP 1 | | | 4,218,912 | | | | 77,923,305 | |
Tallgrass Energy GP LP 1 | | | 6,306,714 | | | | 135,657,418 | |
| Tallgrass Energy Partners LP | | | 2,588,644 | | | | 113,046,084 | |
| TC Pipelines LP | | | 1,858,842 | | | | 45,207,037 | |
| Total Natural Gas Pipelines | | | | | | | 791,643,665 | |
| | | | | | | | | |
| Petroleum Transportation — 40.9% |
| Andeavor Logistics LP | | | 1,651,143 | | | | 70,834,035 | |
| Buckeye Partners LP | | | 3,606,916 | | | | 130,029,322 | |
| DCP Midstream LP | | | 1,991,990 | | | | 83,484,301 | |
| Enbridge Energy Partners LP | | | 3,289,585 | | | | 32,402,412 | |
| Genesis Energy LP | | | 6,114,701 | | | | 134,278,834 | |
| Global Partners LP | | | 1,043,745 | | | | 18,108,976 | |
| Holly Energy Partners LP | | | 4,882,288 | | | | 143,441,621 | |
| Magellan Midstream Partners LP | | | 2,084,229 | | | | 145,687,607 | |
| MPLX LP | | | 4,498,678 | | | | 161,547,527 | |
| NGL Energy Partners LP | | | 4,929,037 | | | | 52,740,696 | |
| NuStar Energy LP | | | 1,760,545 | | | | 43,027,720 | |
NuStar GP Holdings LLC 1 | | | 3,665,040 | | | | 50,027,796 | |
| Plains All American Pipeline LP | | | 1,142,650 | | | | 26,852,275 | |
| Plains GP Holdings LP, Class A | | | 1,136,950 | | | | 27,934,861 | |
| Shell Midstream Partners LP | | | 1,819,766 | | | | 40,744,561 | |
| Sunoco LP | | | 3,907,978 | | | | 103,952,215 | |
12 OPPENHEIMER STEELPATH MLP SELECT 40 FUND |
STATEMENT OF INVESTMENTS Unaudited / (Continued) |
| Description | | Shares | | Value |
| Petroleum Transportation — 40.9% (Continued) |
TransMontaigne Partners LP 1 | | | 2,400,299 | | | $ | 92,939,577 | |
| Total Petroleum Transportation | | | | | | | 1,358,034,336 | |
| | | | | | | | | |
| Total MLP Investments and Related Entities |
| (identified cost $2,920,971,949) | | | | | | | 3,104,584,181 | |
| | | | | | | | | |
| Common Stock — 3.7% |
| Diversified — 3.7% | | | | | | | | |
| ONEOK, Inc. | | | 1,795,024 | | | | 122,348,836 | |
| | | | | | | | | |
| Total Common Stock | | | | | | | | |
| (identified cost $96,773,534) | | | | | | | 122,348,836 | |
| | | | | | | | | |
| Preferred MLP Investments and Related Entities — 2.0% |
| Gathering/Processing — 0.8% |
Crestwood Equity Partners LP, 9.25% 3,4,5 | | | 2,867,200 | | | | 28,127,232 | |
| | | | | | | | | |
| Petroleum Transportation — 1.2% |
GPM Petroleum LP, 10.00% 1,3,4 | | | 2,000,000 | | | | 40,080,000 | |
| | | | | | | | | |
| Total Preferred MLP Investments and Related Entities |
| (identified cost $56,010,409) | | | | | | | 68,207,232 | |
| | | | | | | | | |
| Short-Term Investment — 1.2% |
| Money Market — 1.2% |
Fidelity Treasury Portfolio, Institutional Class, 1.62% 6 | | | 39,161,183 | | | | 39,161,183 | |
| | | | | | | | | |
| Total Short-Term Investment |
| (identified cost $39,161,183) | | | | | | | 39,161,183 | |
| | | | | | | | | |
| Total Investments — 100.4% |
| (identified cost $3,112,917,075) | | | | | | | 3,334,301,432 | |
| Liabilities In Excess of Other Assets — (0.4)% | | | | | | | (12,908,311 | ) |
| Net Assets — 100.0% | | | | | | $ | 3,321,393,121 | |
OPPENHEIMER STEELPATH MLP SELECT 40 FUND 13 |
STATEMENT OF INVESTMENTS Unaudited / (Continued) |
Footnotes to Statement of Investments
GP — General Partnership
LLC — Limited Liability Company
LP — Limited Partnership
1. | Is or was an affiliate, as defined by the Investment Company Act of 1940, at or during the period ended May 31, 2018, by virtue of the Fund owning at least 5% of the voting securities of the issuer. Transactions during this period in which the issuer was an affiliate are as follows: |
| Shares
November 30,
2017 | Gross
Additions | Gross
Reductions | Shares
May 31, 2018 |
MLP Investments and Related Entities | | |
Archrock Inc. | — | 7,089,017 | — | 7,089,017 |
NuStar GP Holdings LLC | 3,722,772 | — | (57,732) | 3,665,040 |
Rice Midstream Partners LP i | 4,286,998 | — | (68,086) | 4,218,912 |
Tallgrass Energy GP LP | 5,397,214 | 1,057,000 | (147,500) | 6,306,714 |
TransMontaigne Partners LP | 2,310,021 | 126,078 | (35,800) | 2,400,299 |
Westlake Chemical Partners | 923,180 | 1,417,541 | (11,700) | 2,329,021 |
Preferred MLP Investments and Related Entities | | |
GPM Petroleum LP - Preferred ii | 2,000,000 | — | — | 2,000,000 |
| | | | | Dividends and Distributions | | | | |
| | | Value
May 31, 2018 | | Return of Capital | | Capital Gains | | Income | | Realized
Gain/(Loss) | | Change in
Unrealized
Gain/(Loss) |
| MLP Investments and Related Entities | | | | | | | | |
| Archrock Inc. | | $ | 81,878,146 | | | $ | 425,157 | | | $ | — | | | $ | — | | | $ | — | | | $ | 3,814,821 | |
| NuStar GP Holdings LLC | | | 50,027,796 | | | | 3,212,251 | | | | — | | | | — | | | | (61,830 | ) | | | (50,587 | ) |
Rice Midstream Partners LP i | | | 77,923,305 | | | | 2,520,795 | | | | — | | | | — | | | | 306,932 | | | | (7,769,569 | ) |
| Tallgrass Energy GP LP | | | 135,657,418 | | | | 5,266,886 | | | | — | | | | — | | | | (449,780 | ) | | | (1,814,245 | ) |
| TransMontaigne Partners LP | | | 92,939,577 | | | | 2,675,382 | | | | 911,336 | | | | — | | | | 472,503 | | | | 1,333,842 | |
| Westlake Chemical Partners | | | 54,149,738 | | | | 1,157,257 | | | | — | | | | — | | | | 1,183 | | | | (19,034,906 | ) |
| Preferred MLP Investments and Related Entities | | | | | | | | | | | | | | | | | | | | | | | | |
GPM Petroleum LP - Preferred ii | | | 40,080,000 | | | | 1,867,297 | | | | — | | | | — | | | | — | | | | 1,247,297 | |
| | | $ | 532,655,980 | | | $ | 17,125,025 | | | $ | 911,336 | | | $ | — | | | $ | 269,008 | | | $ | (22,273,347 | ) |
i. | Is not an affiliate as of May 31, 2018. Was an affiliate during the period ended May 31, 2018. |
ii. | An affiliate due to the Manager sitting on the board. |
14 OPPENHEIMER STEELPATH MLP SELECT 40 FUND |
STATEMENT OF INVESTMENTS Unaudited / (Continued) |
2. | Foreign security denominated in U.S. dollars. |
3. | Restricted security. The aggregate value of restricted securities at period end was $68,207,232, which represents 2.1% of the Fund’s net assets. See Note 4 of the accompanying Notes. Information concerning restricted securities is as follows: |
| Security | | Acquisition Date | | Cost | | Value | | Unrealized Appreciation/ (Depreciation) |
| Crestwood Equity Partners LP - Preferred | | 3/2/2017 – 8/14/2017 | | $ | 24,934,166 | | | $ | 28,127,232 | | | $ | 3,193,066 | |
| GPM Petroleum LP - Preferred | | 1/12/2016 | | | 31,076,243 | | | | 40,080,000 | | | | 9,003,757 | |
4. | The value of this security was determined using significant unobservable inputs. See Note 3 of accompanying Notes. |
5. | Represents securities sold under 144A, which are exempt from registration under the Securities Act of 1933, as amended. These securities amount to $28,127,232 or 0.8% of the Fund’s net assets at period end. |
6. | Rate shown is the 7-day yield at period end. |
See accompanying Notes to Financial Statements.
OPPENHEIMER STEELPATH MLP SELECT 40 FUND 15 |
STATEMENT OF ASSETS AND LIABILITIES May 31, 2018 / Unaudited |
| Assets: | | |
| Investments at value – see accompanying Statement of Investments: | | |
| Unaffiliated companies (cost $2,642,140,979) | | $ | 2,879,568,757 | |
| Affiliated companies (cost $470,776,096) | | | 454,732,675 | |
| | | | 3,334,301,432 | |
| Receivable for beneficial interest sold | | | 5,058,617 | |
| Prepaid expenses | | | 306,652 | |
| Dividends receivable | | | 47,217 | |
| Total assets | | | 3,339,713,918 | |
| | | | | |
| Liabilities: | | | | |
| Deferred tax liability, net | | | 11,997,421 | |
| Payable for beneficial interest redeemed | | | 2,585,170 | |
| Payable to Manager | | | 1,693,494 | |
| Payable for investments purchased | | | 770,362 | |
| Payable for distribution and service plan fees | | | 485,498 | |
| Transfer agent fees payable, net of voluntary waiver | | | 459,296 | |
| Borrowing expense payable | | | 52,625 | |
| Trustees' fees payable | | | 10,491 | |
| Other liabilities | | | 266,440 | |
| Total liabilities | | | 18,320,797 | |
| | | | | |
| Net Assets | | $ | 3,321,393,121 | |
| | | | | |
| Composition of Net Assets | | | | |
| Par value of shares of beneficial interest | | $ | 408,487 | |
| Paid-in capital | | | 3,306,071,203 | |
| Undistributed net investment loss, net of deferred taxes | | | (147,191,544 | ) |
| Accumulated undistributed net realized losses on investments, net of deferred taxes | | | (6,854,143 | ) |
| Net unrealized appreciation on investments, net of deferred taxes | | | 168,959,118 | |
| Net Assets | | $ | 3,321,393,121 | |
16 OPPENHEIMER STEELPATH MLP SELECT 40 FUND |
STATEMENT OF ASSETS AND LIABILITIES Unaudited / (Continued) |
| Net Asset Value, Offering Price and Redemption Proceeds Per Share ($0.001 Par Value, Unlimited Shares Authorized) | | |
| Class A Shares: | | |
| Net asset value and redemption proceeds per share | | $ | 8.01 | |
| Offering price per share (net asset value plus sales charge of 5.75% of offering price) | | $ | 8.50 | |
| Class C Shares: | | | | |
| Net asset value, offering price and redemption proceeds per share | | $ | 7.58 | |
| Class I Shares: | | | | |
| Net asset value, offering price and redemption proceeds per share | | $ | 8.29 | |
| Class W Shares: | | | | |
| Net asset value, offering price and redemption proceeds per share | | $ | 8.26 | |
| Class Y Shares: | | | | |
| Net asset value, offering price and redemption proceeds per share | | $ | 8.26 | |
| Net Assets: | | |
| Class A shares | | $ | 448,006,049 | |
| Class C shares | | | 469,038,511 | |
| Class I shares | | | 568,601,736 | |
| Class W shares | | | 2,312,397 | |
| Class Y shares | | | 1,833,434,428 | |
| Total Net Assets | | $ | 3,321,393,121 | |
| Shares Outstanding: | | | | |
| Class A shares | | | 55,898,279 | |
| Class C shares | | | 61,843,124 | |
| Class I shares | | | 68,556,045 | |
| Class W shares | | | 279,789 | |
| Class Y shares | | | 221,910,010 | |
| Total Shares Outstanding | | | 408,487,247 | |
See accompanying Notes to Financial Statements.
OPPENHEIMER STEELPATH MLP SELECT 40 FUND 17 |
STATEMENT OF OPERATIONS
For the Six Months Ended May 31, 2018 / Unaudited |
| Investment Income | | |
| Distributions and dividends | | $ | 132,211,511 | |
| Less return of capital on distributions and dividends ($17,125,025 from affiliates) | | | (120,719,465 | ) |
| Less return of capital on distributions and dividends in excess of cost basis ($911,336 from affiliates) | | | (9,973,894 | ) |
| Total investment income | | | 1,518,152 | |
| | | | | |
| Expenses | | | | |
| Management fees | | | 11,210,130 | |
| Distribution and service plan fees | | | | |
| Class A | | | 567,645 | |
| Class C | | | 2,365,941 | |
| Transfer agent fees | | | | |
| Class A | | | 454,217 | |
| Class C | | | 471,687 | |
| Class I | | | 76,670 | |
| Class W | | | 3,303 | |
| Class Y | | | 1,758,070 | |
| Borrowing fees | | | 401,237 | |
| Administrative fees | | | 384,637 | |
| Legal, auditing, and other professional fees | | | 154,581 | |
| Tax expense | | | 120,529 | |
| Custody fees | | | 116,431 | |
| Registration fees | | | 116,083 | |
| Trustees' fees | | | 36,557 | |
| Other | | | 37,636 | |
| Total expenses, before waivers and deferred taxes | | | 18,275,354 | |
| Less expense waivers | | | (1,357,834 | ) |
| Net expenses, before deferred taxes | | | 16,917,520 | |
| | | | | |
| Net investment loss, before deferred taxes | | | (15,399,368 | ) |
| Deferred tax expense | | | (13,075,595 | ) |
| Net investment loss, net of deferred taxes | | | (28,474,963 | ) |
| | | | | |
| Net Realized and Unrealized Gains/(Losses) on Investments: | | | | |
| Net Realized Gains/(Losses) | | | | |
| Investments from: | | | | |
| Unaffiliated companies (net return of capital in excess of cost basis of $9,062,558) | | | (3,597,503 | ) |
| Affiliated companies (net return of capital in excess of cost basis of $911,336) | | | 269,008 | |
| Deferred tax expense | | | (2,125,882 | ) |
| Net realized losses, net of deferred taxes | | | (5,454,377 | ) |
| Net Change in Unrealized Appreciation/(Depreciation) | | | | |
| Investments from: | | | | |
| Unaffiliated companies | | | 116,008,402 | |
| Affiliated companies | | | (22,273,347 | ) |
| Deferred tax expense | | | (4,071,109 | ) |
| Net change in unrealized appreciation/(depreciation), net of deferred taxes | | | 89,663,946 | |
| | | | | |
| Net realized and unrealized gains/(losses) on investments, net of deferred taxes | | | 84,209,569 | |
| Change in net assets resulting from operations | | $ | 55,734,606 | |
See accompanying Notes to Financial Statements.
18 OPPENHEIMER STEELPATH MLP SELECT 40 FUND |
STATEMENTS OF CHANGES IN NET ASSETS |
| | | For the Six
Months Ended
May 31, 2018
(Unaudited) | | For the
Year Ended
November 30, 2017 |
| Operations | | | | |
| Net investment loss, net of deferred taxes | | $ | (28,474,963 | ) | | $ | (17,409,858 | ) |
| Net realized gains/(losses), net of deferred taxes | | | (5,454,377 | ) | | | 51,908,614 | |
| Net change in unrealized appreciation/(depreciation), net of deferred taxes | | | 89,663,946 | | | | (173,079,943 | ) |
| Change in net assets resulting from operations | | | 55,734,606 | | | | (138,581,187 | ) |
| | | | | | | | | |
| Distributions to Shareholders | | | | | | | | |
| Distributions to shareholders from return of capital: | | | | | | | | |
| Class A shares | | | (16,438,527 | ) | | | (36,328,608 | ) |
| Class C shares | | | (18,032,308 | ) | | | (35,383,926 | ) |
| Class I shares | | | (18,108,350 | ) | | | (25,565,358 | ) |
| Class W shares | | | (111,224 | ) | | | (370,965 | ) |
| Class Y shares | | | (62,541,908 | ) | | | (109,744,905 | ) |
| Distributions to shareholders from return of capital: | | | (115,232,317 | ) | | | (207,393,762 | ) |
| | | | | | | | | |
| Distributions to shareholders from income: | | | | | | | | |
| Class A shares | | | — | | | | (8,074,711 | ) |
| Class C shares | | | — | | | | (7,864,737 | ) |
| Class I shares | | | — | | | | (5,682,378 | ) |
| Class W shares | | | — | | | | (82,454 | ) |
| Class Y shares | | | — | | | | (24,392,852 | ) |
| Distributions to shareholders from income: | | | — | | | | (46,097,132 | ) |
| Change in net assets resulting from distributions to shareholders | | | (115,232,317 | ) | | | (253,490,894 | ) |
| | | | | | | | | |
| Beneficial Interest Transactions | | | | | | | | |
| Class A shares | | | (10,445,579 | ) | | | (103,998,868 | ) |
| Class C shares | | | 385,800 | | | | 29,662,550 | |
| Class I shares | | | 107,758,721 | | | | 208,483,920 | |
| Class W shares | | | (2,496,523 | ) | | | (1,176,519 | ) |
| Class Y shares | | | 168,892,143 | | | | 308,565,266 | |
| Change in net assets resulting from beneficial interest transactions | | | 264,094,562 | | | | 441,536,349 | |
| Change in net assets | | | 204,596,851 | | | | 49,464,268 | |
| | | | | | | | | |
| Net Assets | | | | | | | | |
| Beginning of period | | | 3,116,796,270 | | | | 3,067,332,002 | |
| End of period | | $ | 3,321,393,121 | | | $ | 3,116,796,270 | |
| | | | | | | | | |
| Undistributed net investment loss, net of deferred taxes | | $ | (147,191,544 | ) | | $ | (118,716,581 | ) |
See accompanying Notes to Financial Statements.
OPPENHEIMER STEELPATH MLP SELECT 40 FUND 19 |
| Class A | | Six Months
Ended
May 31,
2018
(Unaudited) | | Year Ended November 30,
2017 | | Year Ended November 30,
2016 | | Year Ended November 30,
2015 | | Year Ended November 28,
2014* | | Year Ended November 29,
2013* |
| Per Share Operating Data | | | | | | | | | | | | |
| Net Asset Value, Beginning of Period | | $ | 8.15 | | | $ | 9.18 | | | $ | 9.35 | | | $ | 12.54 | | | $ | 11.99 | | | $ | 10.67 | |
| Income/(loss) from investment operations: | | | | | | | | | | | | | | | | | | | | | | | | |
Net investment loss1 | | | (0.08 | ) | | | (0.06 | ) | | | (0.05 | ) | | | (0.04 | ) | | | (0.09 | ) | | | (0.07 | ) |
Return of capital1 | | | 0.24 | | | | 0.40 | | | | 0.41 | | | | 0.43 | | | | 0.44 | | | | 0.44 | |
| Net realized and unrealized gains/(losses) | | | (0.01 | ) | | | (0.66 | ) | | | 0.18 | | | | (2.87 | ) | | | 0.91 | | | | 1.66 | |
| Total from investment operations | | | 0.15 | | | | (0.32 | ) | | | 0.54 | | | | (2.48 | ) | | | 1.26 | | | | 2.03 | |
| Distributions to shareholders: | | | | | | | | | | | | | | | | | | | | | | | | |
| Return of capital | | | (0.29 | ) | | | (0.58 | ) | | | (0.71 | ) | | | (0.71 | ) | | | (0.71 | ) | | | (0.71 | ) |
| Income | | | — | | | | (0.13 | ) | | | — | | | | — | | | | — | | | | — | |
| Total distributions to shareholders | | | (0.29 | ) | | | (0.71 | ) | | | (0.71 | ) | | | (0.71 | ) | | | (0.71 | ) | | | (0.71 | ) |
| Net asset value, end of period | | $ | 8.01 | | | $ | 8.15 | | | $ | 9.18 | | | $ | 9.35 | | | $ | 12.54 | | | $ | 11.99 | |
| | | | | | | | | | | | | | | | | | | | | | | | | |
Total Return, at Net Asset Value 2 | | | 1.97 | % | | | (4.00 | %) | | | 6.31 | % | | | (20.49 | %) | | | 10.59 | % | | | 19.32 | % |
| | | | | | | | | | | | | | | | | | | | | | | | | |
| Ratios /Supplemental Data | | | | | | | | | | | | | | | | | | | | | | | | |
| Net assets, end of period (in thousands) | | $ | 448,006 | | | $ | 466,445 | | | $ | 631,417 | | | $ | 608,965 | | | $ | 872,216 | | | $ | 618,758 | |
Ratio of Expenses to Average Net Assets:9 | | | | | | | | | | | | | | | | | | | | | |
| Before (waivers) and deferred tax expense/(benefit) | | | 1.23 | % | | | 1.23 | % | | | 1.24 | % | | | 1.23 | % | | | 1.25 | % | | | 1.13 | % |
| Expense (waivers) | | | (0.10 | %)8 | | | (0.12 | %)8 | | | (0.12 | %) | | | (0.11 | %) | | | (0.12 | %) | | | (0.01 | %) |
| Net of (waivers) and before deferred tax expense/(benefit) | | | 1.13 | %3 | | | 1.11 | %3 | | | 1.12 | %3 | | | 1.12 | %3 | | | 1.13 | %3 | | | 1.12 | %4 |
Deferred tax expense/(benefit)5,6 | | | 1.20 | % | | | (2.49 | %) | | | 3.79 | % | | | (13.36 | %) | | | 5.19 | % | | | 8.42 | % |
| Total expenses/(benefit) | | | 2.33 | % | | | (1.38 | %) | | | 4.91 | % | | | (12.24 | %) | | | 6.32 | % | | | 9.54 | % |
| | | | | | | | | | | | | | | | | | | | | | | | | |
Ratio of Investment Loss to Average Net Assets:9 | | | | | | | | | | | | | | | | | | | | |
| Before (waivers) and deferred tax benefit/(expense) | | | (1.37 | %) | | | (1.16 | %) | | | (1.08 | %) | | | (0.83 | %) | | | (1.24 | %) | | | (0.94 | %) |
| Expense (waivers) | | | (0.10 | %)8 | | | (0.12 | %)8 | | | (0.12 | %) | | | (0.11 | %) | | | (0.12 | %) | | | (0.01 | %) |
| Net of expense (waivers) and before deferred tax benefit/(expense) | | | (1.27 | %) | | | (1.04 | %) | | | (0.96 | %) | | | (0.72 | %) | | | (1.12 | %) | | | (0.93 | %) |
Deferred tax benefit/(expense)6,7 | | | (0.81 | %) | | | 0.34 | % | | | 0.38 | % | | | 0.32 | % | | | 0.41 | % | | | 0.33 | % |
| Net investment loss | | | (2.08 | %) | | | (0.70 | %) | | | (0.58 | %) | | | (0.40 | %) | | | (0.71 | %) | | | (0.60 | %) |
| | | | | | | | | | | | | | | | | | | | | | | | | |
| Portfolio turnover rate | | | 7 | % | | | 13 | % | | | 10 | % | | | 8 | % | | | 12 | % | | | 2 | % |
* | November 28, 2014 and November 29, 2013 represent the last business day of the Fund’s respective reporting periods. |
1. | Per share net investment loss is calculated based on average shares outstanding during the period net of deferred tax expense/benefit. Per share return of capital is calculated based on average shares during the period net of deferred tax expense/benefit estimated at the combined Federal and State statutory income tax rate (see Note 2). |
2. | Assumes an initial investment on the business day before the first day of the fiscal period, with all dividends and distributions reinvested in additional shares on the reinvestment date, and redemptions at the net asset value calculated on the last business day of the fiscal period. Sales charges are not reflected in the total returns. Total returns are not annualized for periods less than one full year. Returns do not reflect the deduction of taxes that a shareholder would pay on fund distributions or the redemption of fund shares. The returns do not include adjustments in accordance with generally accepted accounting principles required at the period end for financial reporting purposes. |
3. | Includes borrowing and franchise tax expense. Without borrowing and franchise tax expense, the net expense ratio would be 1.10%. |
4. | Includes franchise tax expense. Without franchise tax expense the net expense ratio would be 1.10%. |
5. | Deferred tax expense estimate for the ratio calculation is derived from the net investment income/loss, and realized and unrealized gains/losses. |
6. | Effective December 1, 2013 the deferred tax expense and deferred tax benefit are allocated based on average net assets. Prior to December 1, 2013 the deferred tax expense and deferred tax benefit were allocated based on specific class expenses. |
7. | Deferred tax benefit for the ratio calculation, when applicable, is derived from net investment income/loss only. |
8. | Includes voluntary Transfer Agent waiver of 0.015% effective January 1, 2017, to December 31, 2017 (See Note 7). |
9. | Annualized for less than a full period. |
See accompanying Notes to Financial Statements.
20 OPPENHEIMER STEELPATH MLP SELECT 40 FUND |
FINANCIAL HIGHLIGHTS (Continued) |
| Class C | | Six Months
Ended
May 31,
2018
(Unaudited) | | Year Ended November 30,
2017 | | Year Ended November 30,
2016 | | Year Ended November 30,
2015 | | Year Ended November 28,
2014* | | Year Ended November 29,
2013* |
| Per Share Operating Data | | | | | | | | | | | | |
| Net Asset Value, Beginning of Period | | $ | 7.76 | | | $ | 8.84 | | | $ | 9.09 | | | $ | 12.30 | | | $ | 11.87 | | | $ | 10.64 | |
| Income/(loss) from investment operations: | | | | | | | | | | | | | | | | | | | | | | | | |
Net investment loss1 | | | (0.12 | ) | | | (0.15 | ) | | | (0.13 | ) | | | (0.13 | ) | | | (0.18 | ) | | | (0.13 | ) |
Return of capital1 | | | 0.24 | | | | 0.40 | | | | 0.41 | | | | 0.43 | | | | 0.44 | | | | 0.45 | |
| Net realized and unrealized gains/(losses) | | | (0.01 | ) | | | (0.62 | ) | | | 0.18 | | | | (2.80 | ) | | | 0.88 | | | | 1.62 | |
| Total from investment operations | | | 0.11 | | | | (0.37 | ) | | | 0.46 | | | | (2.50 | ) | | | 1.14 | | | | 1.94 | |
| Distributions to shareholders: | | | | | | | | | | | | | | | | | | | | | | | | |
| Return of capital | | | (0.29 | ) | | | (0.58 | ) | | | (0.71 | ) | | | (0.71 | ) | | | (0.71 | ) | | | (0.71 | ) |
| Income | | | — | | | | (0.13 | ) | | | — | | | | — | | | | — | | | | — | |
| Total distributions to shareholders | | | (0.29 | ) | | | (0.71 | ) | | | (0.71 | ) | | | (0.71 | ) | | | (0.71 | ) | | | (0.71 | ) |
| Net asset value, end of period | | $ | 7.58 | | | $ | 7.76 | | | $ | 8.84 | | | $ | 9.09 | | | $ | 12.30 | | | $ | 11.87 | |
| | | | | | | | | | | | | | | | | | | | | | | | | |
Total Return, at Net Asset Value 2 | | | 1.55 | % | | | (4.74 | %) | | | 5.59 | % | | | (21.07 | %) | | | 9.66 | % | | | 18.51 | % |
| | | | | | | | | | | | | | | | | | | | | | | | | |
| Ratios /Supplemental Data | | | | | | | | | | | | | | | | | | | | | | | | |
| Net assets, end of period (in thousands) | | $ | 469,039 | | | $ | 479,457 | | | $ | 517,869 | | | $ | 451,373 | | | $ | 475,459 | | | $ | 241,984 | |
Ratio of Expenses to Average Net Assets:9 | | | | | | | | | | | | | | | | | | | | | |
| Before (waivers) and deferred tax expense/(benefit) | | | 1.98 | % | | | 1.98 | % | | | 1.99 | % | | | 1.98 | % | | | 2.00 | % | | | 1.89 | % |
| Expense (waivers) | | | (0.10 | %)8 | | | (0.12 | %)8 | | | (0.12 | %) | | | (0.11 | %) | | | (0.12 | %) | | | (0.01 | %) |
| Net of (waivers) and before deferred tax expense/(benefit) | | | 1.88 | %3 | | | 1.86 | %3 | | | 1.87 | %3 | | | 1.87 | %3 | | | 1.88 | %3 | | | 1.88 | %4 |
Deferred tax expense/(benefit)5,6 | | | 1.20 | % | | | (2.49 | %) | | | 3.79 | % | | | (13.36 | %) | | | 5.19 | % | | | 6.84 | % |
| Total expenses/(benefit) | | | 3.08 | % | | | (0.63 | %) | | | 5.66 | % | | | (11.49 | %) | | | 7.07 | % | | | 8.72 | % |
| | | | | | | | | | | | | | | | | | | | | | | | | |
Ratio of Investment Loss to Average Net Assets:9 | | | | | | | | | | | | | | | | | | | | | |
| Before (waivers) and deferred tax benefit/(expense) | | | (2.49 | %) | | | (2.21 | %) | | | (2.01 | %) | | | (1.65 | %) | | | (2.01 | %) | | | (1.70 | %) |
| Expense (waivers) | | | (0.10 | %)8 | | | (0.12 | %)8 | | | (0.12 | %) | | | (0.11 | %) | | | (0.12 | %) | | | (0.01 | %) |
| Net of expense (waivers) and before deferred tax benefit/(expense) | | | (2.39 | %) | | | (2.09 | %) | | | (1.89 | %) | | | (1.54 | %) | | | (1.89 | %) | | | (1.69 | %) |
Deferred tax benefit/(expense)6,7 | | | (0.81 | %) | | | 0.34 | % | | | 0.38 | % | | | 0.39 | % | | | 0.41 | % | | | 0.62 | % |
| Net investment loss | | | (3.20 | %) | | | (1.75 | %) | | | (1.51 | %) | | | (1.15 | %) | | | (1.48 | %) | | | (1.07 | %) |
| | | | | | | | | | | | | | | | | | | | | | | | | |
| Portfolio turnover rate | | | 7 | % | | | 13 | % | | | 10 | % | | | 8 | % | | | 12 | % | | | 2 | % |
* | November 28, 2014 and November 29, 2013 represent the last business day of the Fund’s respective reporting periods. |
1. | Per share net investment loss is calculated based on average shares outstanding during the period net of deferred tax expense/benefit. Per share return of capital is calculated based on average shares during the period net of deferred tax expense/benefit estimated at the combined Federal and State statutory income tax rate (see Note 2). |
2. | Assumes an initial investment on the business day before the first day of the fiscal period, with all dividends and distributions reinvested in additional shares on the reinvestment date, and redemptions at the net asset value calculated on the last business day of the fiscal period. Sales charges are not reflected in the total returns. Total returns are not annualized for periods less than one full year. Returns do not reflect the deduction of taxes that a shareholder would pay on fund distributions or the redemption of fund shares. The returns do not include adjustments in accordance with generally accepted accounting principles required at the period end for financial reporting purposes. |
3. | Includes borrowing and franchise tax expense. Without borrowing and franchise tax expense, the net expense ratio would be 1.85%. |
4. | Includes franchise tax expense. Without franchise tax expense the net expense ratio would be 1.85%. |
5. | Deferred tax expense estimate for the ratio calculation is derived from the net investment income/loss, and realized and unrealized gains/losses. |
6. | Effective December 1, 2013 the deferred tax expense and deferred tax benefit are allocated based on average net assets. Prior to December 1, 2013 the deferred tax expense and deferred tax benefit were allocated based on specific class expenses. |
7. | Deferred tax benefit for the ratio calculation, when applicable, is derived from net investment income/loss only. |
8. | Includes voluntary Transfer Agent waiver of 0.015% effective January 1, 2017, to December 31, 2017 (See Note 7). |
9. | Annualized for less than a full period. |
See accompanying Notes to Financial Statements.
OPPENHEIMER STEELPATH MLP SELECT 40 FUND 21 |
FINANCIAL HIGHLIGHTS (Continued) |
| Class I | | Six Months
Ended
May 31,
2018
(Unaudited) | | Year Ended November 30,
2017 | | Year Ended November 30,
2016 | | Year Ended November 30,
2015 | | Year Ended November 28,
2014* | | Period Ended November 29,
2013*,1,2 |
| Per Share Operating Data | | | | | | | | | | | | |
| Net Asset Value, Beginning of Period | | $ | 8.41 | | | $ | 9.43 | | | $ | 9.54 | | | $ | 12.74 | | | $ | 12.14 | | | $ | 12.20 | |
| Income/(loss) from investment operations: | | | | | | | | | | | | | | | | | | | | | | | | |
Net investment income/(loss)3 | | | (0.05 | ) | | | (0.01 | ) | | | 0.01 | | | | 0.09 | | | | (0.05 | ) | | | (0.04 | ) |
Return of capital3 | | | 0.24 | | | | 0.40 | | | | 0.41 | | | | 0.43 | | | | 0.44 | | | | 0.004 | |
| Net realized and unrealized gains/(losses) | | | (0.02 | ) | | | (0.70 | ) | | | 0.18 | | | | (3.01 | ) | | | 0.92 | | | | 0.33 | |
| Total from investment operations | | | 0.17 | | | | (0.31 | ) | | | 0.60 | | | | (2.49 | ) | | | 1.31 | | | | 0.29 | |
| Distributions to shareholders: | | | | | | | | | | | | | | | | | | | | | | | | |
| Return of capital | | | (0.29 | ) | | | (0.58 | ) | | | (0.71 | ) | | | (0.71 | ) | | | (0.71 | ) | | | (0.35 | ) |
| Income | | | — | | | | (0.13 | ) | | | — | | | | — | | | | — | | | | — | |
| Total distributions to shareholders | | | (0.29 | ) | | | (0.71 | ) | | | (0.71 | ) | | | (0.71 | ) | | | (0.71 | ) | | | (0.35 | ) |
| Net asset value, end of period | | $ | 8.29 | | | $ | 8.41 | | | $ | 9.43 | | | $ | 9.54 | | | $ | 12.74 | | | $ | 12.14 | |
| | | | | | | | | | | | | | | | | | | | | | | | | |
Total Return, at Net Asset Value 5 | | | 2.15 | % | | | (3.78 | %) | | | 6.83 | % | | | (20.25 | %) | | | 10.87 | % | | | 2.45 | % |
| | | | | | | | | | | | | | | | | | | | | | | | | |
| Ratios /Supplemental Data | | | | | | | | | | | | | | | | | | | | | | | | |
| Net assets, end of period (in thousands) | | $ | 568,602 | | | $ | 467,945 | | | $ | 313,325 | | | $ | 193,494 | | | $ | 57,153 | | | $ | 53,247 | |
Ratio of Expenses to Average Net Assets:6 | | | | | | | | | | | | | | | | | | | | |
| Before deferred tax expense/(benefit) | | | 0.82 | %7 | | | 0.79 | %7 | | | 0.80 | %7 | | | 0.80 | %7 | | | 0.81 | %7 | | | 1.32 | %8 |
Deferred tax expense/(benefit)9,10 | | | 1.20 | % | | | (2.49 | %) | | | 3.79 | % | | | (13.36 | %) | | | 5.19 | % | | | 0.96 | % |
| Total expenses/(benefit) | | | 2.02 | % | | | (1.70 | %) | | | 4.59 | % | | | (12.56 | %) | | | 6.00 | % | | | 2.28 | % |
| | | | | | | | | | | | | | | | | | | | | | | | | |
Ratio of Investment Income/(Loss) to Average Net Assets:6 | | | | | | | | | | | | | | | | | | | |
| Before deferred tax benefit/(expense) | | | (0.49 | %) | | | (0.44 | %) | | | (0.29 | %) | | | 0.45 | % | | | (0.82 | %) | | | (1.32 | %) |
Deferred tax benefit/(expense)10,11 | | | (0.81 | %) | | | 0.34 | % | | | 0.38 | % | | | 0.39 | % | | | 0.41 | % | | | 0.46 | % |
| Net investment income/(loss) | | | (1.30 | %) | | | (0.10 | %) | | | 0.09 | % | | | 0.84 | % | | | (0.41 | %) | | | (0.86 | %) |
| | | | | | | | | | | | | | | | | | | | | | | | | |
| Portfolio turnover rate | | | 7 | % | | | 13 | % | | | 10 | % | | | 8 | % | | | 12 | % | | | 2 | % |
* | November 28, 2014 and November 29, 2013 represent the last business day of the Fund’s respective reporting periods. |
1. | Shares commenced operations at the close of business June 28, 2013. |
2. | Effective June 28, 2013, Class I shares were renamed Class Y shares. See Note 1 of the Notes to Financial Statements for additional information. |
3. | Per share net investment loss is calculated based on average shares outstanding during the period net of deferred tax expense/benefit. Per share return of capital is calculated based on average shares during the period net of deferred tax expense/benefit estimated at the combined Federal and State statutory income tax rate (see Note 2). |
4. | Amount rounds to less than $0.005. |
5. | Assumes an initial investment on the business day before the first day of the fiscal period, with all dividends and distributions reinvested in additional shares on the reinvestment date, and redemptions at the net asset value calculated on the last business day of the fiscal period. Sales charges are not reflected in the total returns. Total returns are not annualized for periods less than one full year. Returns do not reflect the deduction of taxes that a shareholder would pay on fund distributions or the redemption of fund shares. The returns do not include adjustments in accordance with generally accepted accounting principles required at the period end for financial reporting purposes. |
6. | Annualized for less than full period. |
7. | Includes borrowing and franchise tax expense. Without borrowing and franchise tax expense, the net expense ratio would be 0.79%, 0.77%., 0.78%, 0.78%, 0.78%, for the periods ended May 31, 2018, November 30, 2017, November 30, 2016, November 30, 2015, and November 28, 2014, respectively. |
8. | Includes franchise tax expense. Without franchise tax expense the net expense ratio would be 1.29%. |
9. | Deferred tax expense estimate for the ratio calculation is derived from the net investment income/loss, and realized and unrealized gains/losses. |
10. | Effective December 1, 2013 the deferred tax expense and deferred tax benefit are allocated based on average net assets. Prior to December 1, 2013 the deferred tax expense and deferred tax benefit were allocated based on specific class expenses. |
11. | Deferred tax benefit for the ratio calculation, when applicable, is derived from net investment income/loss only. |
See accompanying Notes to Financial Statements.
22 OPPENHEIMER STEELPATH MLP SELECT 40 FUND |
FINANCIAL HIGHLIGHTS (Continued) |
| Class W | | Six Months
Ended
May 31,
2018
(Unaudited) | | Year Ended November 30,
2017 | | Year Ended November 30,
2016 | | Year Ended November 30,
2015 | | Year Ended November 28,
2014* | |
Year Ended November 29,
2013*,1
|
| Per Share Operating Data | | | | | | | | | | | | |
| Net Asset Value, Beginning of Period | | $ | 8.39 | | | $ | 9.40 | | | $ | 9.53 | | | $ | 12.74 | | | $ | 12.15 | | | $ | 10.77 | |
| Income/(loss) from investment operations: | | | | | | | | | | | | | | | | | | | | | | | | |
Net investment loss2 | | | (0.09 | ) | | | (0.03 | ) | | | (0.04 | ) | | | (0.06 | ) | | | (0.06 | ) | | | (0.05 | ) |
Return of capital2 | | | 0.24 | | | | 0.40 | | | | 0.41 | | | | 0.43 | | | | 0.44 | | | | 0.42 | |
| Net realized and unrealized gains/(losses) | | | 0.01 | | | | (0.67 | ) | | | 0.21 | | | | (2.87 | ) | | | 0.92 | | | | 1.72 | |
| Total from investment operations | | | 0.16 | | | | (0.30 | ) | | | 0.58 | | | | (2.50 | ) | | | 1.30 | | | | 2.09 | |
| Distributions to shareholders: | | | | | | | | | | | | | | | | | | | | | | | | |
| Return of capital | | | (0.29 | ) | | | (0.58 | ) | | | (0.71 | ) | | | (0.71 | ) | | | (0.71 | ) | | | (0.71 | ) |
| Income | | | — | | | | (0.13 | ) | | | — | | | | — | | | | — | | | | — | |
| Total distributions to shareholders | | | (0.29 | ) | | | (0.71 | ) | | | (0.71 | ) | | | (0.71 | ) | | | (0.71 | ) | | | (0.71 | ) |
| Net asset value, end of period | | $ | 8.26 | | | $ | 8.39 | | | $ | 9.40 | | | $ | 9.53 | | | $ | 12.74 | | | $ | 12.15 | |
| | | | | | | | | | | | | | | | | | | | | | | | | |
Total Return, at Net Asset Value 3 | | | 2.04 | % | | | (3.68 | %) | | | 6.62 | % | | | (20.33 | %) | | | 10.78 | % | | | 19.71 | % |
| | | | | | | | | | | | | | | | | | | | | | | | | |
| Ratios /Supplemental Data | | | | | | | | | | | | | | | | | | | | | | | | |
| Net assets, end of period (in thousands) | | $ | 2,312 | | | $ | 4,919 | | | $ | 6,708 | | | $ | 19,391 | | | $ | 57,589 | | | $ | 58,357 | |
Ratio of Expenses to Average Net Assets:10 | | | | | | | | | | | | | | | | | | | | |
| Before (waivers) and deferred tax expense/(benefit) | | | 0.98 | % | | | 0.98 | % | | | 0.99 | % | | | 0.98 | % | | | 1.00 | % | | | 0.87 | % |
| Expense (waivers) | | | (0.10 | %)9 | | | (0.12 | %)9 | | | (0.12 | %) | | | (0.11 | %) | | | (0.12 | %) | | | (0.01 | %) |
| Net of (waivers) and before deferred tax expense/(benefit) | | | 0.88 | %4 | | | 0.86 | %4 | | | 0.87 | %4 | | | 0.87 | %4 | | | 0.88 | %4 | | | 0.86 | %5 |
Deferred tax expense/(benefit)6,7 | | | 1.20 | % | | | (2.49 | %) | | | 3.79 | % | | | (13.36 | %) | | | 5.19 | % | | | 10.74 | % |
| Total expenses/(benefit) | | | 2.08 | % | | | (1.63 | %) | | | 4.66 | % | | | (12.49 | %) | | | 6.07 | % | | | 11.60 | % |
| | | | | | | | | | | | | | | | | | | | | | | | | |
Ratio of Investment Loss to Average Net Assets:10 | | | | | | | | | | | | | | | | | | | | |
| Before (waivers) and deferred tax benefit/(expense) | | | (1.40 | %) | | | (0.80 | %) | | | (1.00 | %) | | | (1.05 | %) | | | (1.02 | %) | | | (0.70 | %) |
| Expense (waivers) | | | (0.10 | %)9 | | | (0.12 | %)9 | | | (0.12 | %) | | | (0.11 | %) | | | (0.12 | %) | | | (0.01 | %) |
| Net of expense (waivers) and before deferred tax benefit/(expense) | | | (1.30 | %) | | | (0.68 | %) | | | (0.88 | %) | | | (0.94 | %) | | | (0.90 | %) | | | (0.69 | %) |
Deferred tax benefit/(expense)7,8 | | | (0.81 | %) | | | 0.34 | % | | | 0.38 | % | | | 0.39 | % | | | 0.41 | % | | | 0.25 | % |
| Net investment loss | | | (2.11 | %) | | | (0.34 | %) | | | (0.50 | %) | | | (0.55 | %) | | | (0.49 | %) | | | (0.44 | %) |
| | | | | | | | | | | | | | | | | | | | | | | | | |
| Portfolio turnover rate | | | 7 | % | | | 13 | % | | | 10 | % | | | 8 | % | | | 12 | % | | | 2 | % |
* | November 28, 2014 and November 29, 2013 represent the last business day of the Fund’s respective reporting periods. |
1. | Effective June 28, 2013, Class Y shares were renamed Class W shares. See Note 1 of the Notes to Financial Statements for additional information. |
2. | Per share net investment loss is calculated based on average shares outstanding during the period net of deferred tax expense/benefit. Per share return of capital is calculated based on average shares during the period net of deferred tax expense/benefit estimated at the combined Federal and State statutory income tax rate (see Note 2). |
3. | Assumes an initial investment on the business day before the first day of the fiscal period, with all dividends and distributions reinvested in additional shares on the reinvestment date, and redemptions at the net asset value calculated on the last business day of the fiscal period. Sales charges are not reflected in the total returns. Total returns are not annualized for periods less than one full year. Returns do not reflect the deduction of taxes that a shareholder would pay on fund distributions or the redemption of fund shares. The returns do not include adjustments in accordance with generally accepted accounting principles required at the period end for financial reporting purposes. |
4. | Includes borrowing and franchise tax expense. Without borrowing and franchise tax expense, the net expense ratio would be 0.85%. |
5. | Includes franchise tax expense. Without franchise tax expense the net expense ratio would be 0.85%. |
6. | Deferred tax expense estimate for the ratio calculation is derived from the net investment income/loss, and realized and unrealized gains/losses. |
7. | Effective December 1, 2013 the deferred tax expense and deferred tax benefit are allocated based on average net assets. Prior to December 1, 2013 the deferred tax expense and deferred tax benefit were allocated based on specific class expenses. |
8. | Deferred tax benefit for the ratio calculation, when applicable, is derived from net investment income/loss only. |
9. | Includes voluntary Transfer Agent waiver of 0.015% effective January 1, 2017, to December 31, 2017 (See Note 7). |
10. | Annualized for less than a full period. |
See accompanying Notes to Financial Statements.
OPPENHEIMER STEELPATH MLP SELECT 40 FUND 23 |
FINANCIAL HIGHLIGHTS (Continued) |
| Class Y | | Six Months
Ended
May 31,
2018
(Unaudited) | | Year Ended November 30,
2017 | | Year Ended November 30,
2016 | | Year Ended November 30,
2015 | | Year Ended November 28,
2014* | |
Year Ended November 29,
2013*,1
|
| Per Share Operating Data | | | | | | | | | | | | |
| Net Asset Value, Beginning of Period | | $ | 8.39 | | | $ | 9.40 | | | $ | 9.53 | | | $ | 12.74 | | | $ | 12.15 | | | $ | 10.77 | |
| Income/(loss) from investment operations: | | | | | | | | | | | | | | | | | | | | | | | | |
Net investment loss2 | | | (0.06 | ) | | | (0.02 | ) | | | (0.01 | ) | | | (0.00 | )3 | | | (0.05 | ) | | | (0.05 | ) |
Return of capital2 | | | 0.24 | | | | 0.40 | | | | 0.41 | | | | 0.43 | | | | 0.44 | | | | 0.43 | |
| Net realized and unrealized gains/(losses) | | | (0.02 | ) | | | (0.68 | ) | | | 0.18 | | | | (2.93 | ) | | | 0.91 | | | | 1.71 | |
| Total from investment operations | | | 0.16 | | | | (0.30 | ) | | | 0.58 | | | | (2.50 | ) | | | 1.30 | | | | 2.09 | |
| Distributions to shareholders: | | | | | | | | | | | | | | | | | | | | | | | | |
| Return of capital | | | (0.29 | ) | | | (0.58 | ) | | | (0.71 | ) | | | (0.71 | ) | | | (0.71 | ) | | | (0.71 | ) |
| Income | | | — | | | | (0.13 | ) | | | — | | | | — | | | | — | | | | — | |
| Total distributions to shareholders | | | (0.29 | ) | | | (0.71 | ) | | | (0.71 | ) | | | (0.71 | ) | | | (0.71 | ) | | | (0.71 | ) |
| Net asset value, end of period | | $ | 8.26 | | | $ | 8.39 | | | $ | 9.40 | | | $ | 9.53 | | | $ | 12.74 | | | $ | 12.15 | |
| | | | | | | | | | | | | | | | | | | | | | | | | |
Total Return, at Net Asset Value 4 | | | 2.04 | % | | | (3.68 | %) | | | 6.62 | % | | | (20.33 | %) | | | 10.78 | % | | | 19.71 | % |
| | | | | | | | | | | | | | | | | | | | | | | | | |
| Ratios /Supplemental Data | | | | | | | | | | | | | | | | | | | | | | | | |
| Net assets, end of period (in thousands) | | $ | 1,833,434 | | | $ | 1,698,030 | | | $ | 1,598,012 | | | $ | 1,376,872 | | | $ | 1,772,095 | | | $ | 1,375,128 | |
Ratio of Expenses to Average Net Assets:12 | | | | | | | | | | | | | | | | | | | | | |
| Before (waivers) and deferred tax expense/(benefit) | | | 0.98 | % | | | 0.98 | % | | | 0.99 | % | | | 0.98 | % | | | 1.00 | % | | | 0.88 | % |
| Expense (waivers) | | | (0.10 | %)11 | | | (0.12 | %)11 | | | (0.12 | %) | | | (0.11 | %) | | | (0.12 | %) | | | (0.01 | %) |
| Net of (waivers) and before deferred tax expense/(benefit) | | | 0.88 | %5 | | | 0.86 | %5 | | | 0.87 | %5 | | | 0.87 | %5 | | | 0.88 | %5 | | | 0.87 | %6 |
Deferred tax expense/(benefit)7,8 | | | 1.20 | % | | | (2.49 | %) | | | 3.79 | % | | | (13.36 | %) | | | 5.19 | % | | | 9.32 | % |
| Total expenses/(benefit) | | | 2.08 | % | | | (1.63 | %) | | | 4.66 | % | | | (12.49 | %) | | | 6.07 | % | | | 10.19 | % |
| | | | | | | | | | | | | | | | | | | | | | | | | |
Ratio of Investment Loss to Average Net Assets:12 | | | | | | | | | | | | | | | | | | | | |
| Before (waivers) and deferred tax benefit/(expense) | | | (0.79 | %) | | | (0.66 | %) | | | (0.59 | %) | | | (0.50 | %) | | | (0.96 | %) | | | (0.70 | %) |
| Expense (waivers) | | | (0.10 | %)11 | | | (0.12 | %)11 | | | (0.12 | %) | | | (0.11 | %) | | | (0.12 | %) | | | (0.01 | %) |
| Net of expense (waivers) and before deferred tax benefit/(expense) | | | (0.69 | %) | | | (0.54 | %) | | | (0.47 | %) | | | (0.39 | %) | | | (0.84 | %) | | | (0.69 | %) |
Deferred tax benefit/(expense)8,9 | | | (0.81 | %) | | | 0.34 | % | | | 0.38 | % | | | 0.39 | % | | | 0.41 | % | | | 0.25 | % |
| Net investment loss | | | (1.50 | %) | | | (0.20 | %) | | | (0.09 | %) | | | (0.00 | %)10 | | | (0.43 | %) | | | (0.44 | %) |
| | | | | | | | | | | | | | | | | | | | | | | | | |
| Portfolio turnover rate | | | 7 | % | | | 13 | % | | | 10 | % | | | 8 | % | | | 12 | % | | | 2 | % |
* | November 28, 2014 and November 29, 2013 represent the last business day of the Fund’s respective reporting periods. |
1. | Effective June 28, 2013, Class I shares were renamed Class Y shares. See Note 1 of the Notes to Financial Statements for additional information. |
2. | Per share net investment loss is calculated based on average shares outstanding during the period net of deferred tax expense/benefit. Per share return of capital is calculated based on average shares during the period net of deferred tax expense/benefit estimated at the combined Federal and State statutory income tax rate (see Note 2). |
4. | Assumes an initial investment on the business day before the first day of the fiscal period, with all dividends and distributions reinvested in additional shares on the reinvestment date, and redemptions at the net asset value calculated on the last business day of the fiscal period. Sales charges are not reflected in the total returns. Total returns are not annualized for periods less than one full year. Returns do not reflect the deduction of taxes that a shareholder would pay on fund distributions or the redemption of fund shares. The returns do not include adjustments in accordance with generally accepted accounting principles required at the period end for financial reporting purposes. |
5. | Includes borrowing and franchise tax expense. Without borrowing and franchise tax expense, the net expense ratio would be 0.85%. |
6. | Includes franchise tax expense. Without franchise tax expense the net expense ratio would be 0.85%. |
7. | Deferred tax expense estimate for the ratio calculation is derived from the net investment income/loss, and realized and unrealized gains/losses. |
8. | Effective December 1, 2013 the deferred tax expense and deferred tax benefit are allocated based on average net assets. Prior to December 1, 2013 the deferred tax expense and deferred tax benefit were allocated based on specific class expenses. |
9. | Deferred tax benefit for the ratio calculation, when applicable, is derived from net investment income/loss only. |
11. | Includes voluntary Transfer Agent waiver of 0.015% effective January 1, 2017, to December 31, 2017 (See Note 7). |
12. | Annualized for less than a full period. |
See accompanying Notes to Financial Statements.
24 OPPENHEIMER STEELPATH MLP SELECT 40 FUND |
NOTES TO FINANCIAL STATEMENTS Unaudited |
1. Organization
Oppenheimer SteelPath MLP Select 40 Fund (the “Fund”), a separate series of Oppenheimer SteelPath MLP Funds Trust, is a diversified open-end management investment company registered under the Investment Company Act of 1940, as amended. The Fund’s investment objective is to seek total return. The Fund’s investment adviser is OFI SteelPath, Inc. (the “Adviser” or “Manager”), a wholly-owned subsidiary of OppenheimerFunds, Inc. (“OFI” or “Oppenheimer”).
The Fund offers Class A, Class C, Class I, Class W and Class Y shares. Effective June 28, 2013, Class I shares were renamed Class Y shares and Class Y shares were renamed Class W shares. Effective after August 30, 2013, Class W shares are no longer offered for purchase. Class A shares are sold at their offering price, which is normally net asset value plus a front-end sales charge. Effective June 28, 2013, although there is no initial sales charge on Class A purchases totaling $1 million or more, those Class A shares may be subject to a 1.00% contingent deferred sales charge (“CDSC”) if shares are redeemed within an 18-month holding period measured from the date of purchase. Class C shares are sold without a front-end sales charge but may be subject to a CDSC of 1.00% of the redemption proceeds if Class C shares are redeemed within one year of purchase. Class I shares are only available to eligible institutional investors. Class I shares are sold at net asset value per share without a sales charge or CDSC. An institutional investor that buys Class I shares for its customers’ accounts may impose charges on those accounts. Class Y shares are sold at net asset value per share without a sales charge directly to institutional investors that have special agreements with OppenheimerFunds Distributor, Inc. (the “Distributor” or “OFDI”) for that purpose. They may include insurance companies, registered investment companies, employee benefit plans and section 529 plans, among others. An institutional investor that buys Class Y shares for its customers’ accounts may impose charges on those accounts. All classes of shares have identical rights and voting privileges with respect to the Fund in general and exclusive voting rights on matters that affect that class alone. Earnings, net assets and net asset value per share may differ due to each class having its own expenses, such as transfer and shareholder servicing agent fees and shareholder communications, directly attributable to that class. Class A and C shares have separate distribution and/or service plans under which they pay fees. Class I, W, and Y shares do not pay such fees.
The Fund is an investment company and accordingly follows the investment company accounting and reporting guidance of the Financial Accounting Standards Board (“FASB”) Accounting Standards Codification Topic 946 Financial Services- Investment Companies.
The following is a summary of significant accounting policies followed in the Fund’s preparation of financial statements in accordance with accounting principles generally accepted in the United States (“U.S. GAAP”).
OPPENHEIMER STEELPATH MLP SELECT 40 FUND 25 |
NOTES TO FINANCIAL STATEMENTS Unaudited / (Continued) |
2. Significant Accounting Policies
Security Valuation. All investments in securities are recorded at their estimated fair value, as described in Note 3.
Allocation of Income, Expenses, Gains and Losses. Income, expenses (other than those attributable to a specific class), gains and losses are allocated on a daily basis to each class of shares based upon the relative proportion of net assets represented by such class. Operating expenses directly attributable to a specific class are charged against the operations of that class.
Dividends and Distributions to Shareholders. Dividends and distributions to shareholders, which are determined in accordance with income tax regulations and may differ from U.S. GAAP, are recorded on the ex-dividend date. The Fund’s dividend distribution policy is intended to provide monthly distributions to its shareholders at a rate that over time is similar to the distribution rate the Fund receives from the master limited partnerships (”MLPs”) in which it invests. The Fund generally pays out dividends that over time approximate the distributions received from the Fund’s portfolio investments based on, among other considerations, distributions the Fund actually received from portfolio investments, distributions it would have received if it had been fully invested at all times, and estimated future cash flows. Such dividends are not tied to the Fund’s investment income and may not represent yield or investment return on the Fund’s portfolio. To the extent that the dividends paid exceed the distributions the Fund receives from its underlying investments, the Fund’s assets will be reduced. The Fund’s tendency to pay out a consistent dividend may change, and the Fund’s level of distributions may increase or decrease.
The estimated characterization of the distributions paid will be either a qualified dividend or distribution (return of capital). This estimate is based on the Fund’s operating results during the period. The actual characterization of the distributions made during the period will not be determined until after the end of the fiscal year. The Fund will inform shareholders of the final tax character of the distributions on IRS Form 1099 DIV in February 2019.
Return of Capital Estimates. Distributions received from the Fund’s investments in MLPs generally are comprised of income and return of capital. Any return of capital estimates in excess of cost basis are classified as realized gain. The Fund records investment income and return of capital based on estimates made at the time such distributions are received. Such estimates are based on historical information available from each MLP and other industry sources. These estimates may subsequently be revised based on information received from MLPs after their tax reporting periods are concluded.
Investment Income. Dividend income is recorded on the ex-dividend date or upon ex-dividend notification in the case of certain foreign dividends where the ex-dividend date may have passed. Non-cash dividends included in dividend income, if any, are recorded at
26 OPPENHEIMER STEELPATH MLP SELECT 40 FUND |
NOTES TO FINANCIAL STATEMENTS Unaudited / (Continued) |
2. Significant Accounting Policies (Continued)
the fair value of the securities received. Interest income, if any, is recognized on an accrual basis. Discount and premium, which are included in interest income on the Statement of Operations, if applicable, are amortized or accreted daily.
Custodian Fees. “Custody fees” in the Statement of Operations may include interest expense incurred by the Fund on any cash overdrafts of its custodian account during the period. Such cash overdrafts may result from the effects of failed trades in portfolio securities and from cash outflows resulting from unanticipated shareholder redemption activity. The Fund pays interest to its custodian on such cash overdrafts, to the extent they are not offset by positive cash balances maintained by the Fund, at a rate equal to the Federal Funds Rate plus 1.50%. The “Reduction to custodian expenses” line item, if applicable, represents earnings on cash balances maintained by the Fund during the period. Such interest expense and other custodian fees may be paid with these earnings.
Security Transactions. Security transactions are recorded on the trade date. Realized gains and losses on securities sold are determined using the basis of identified cost.
Indemnifications. The Fund’s organizational documents provide current and former trustees and officers with a limited indemnification against liabilities arising in connection with the performance of their duties to the Fund. In the normal course of business, the Fund may also enter into contracts that provide general indemnifications. The Fund’s maximum exposure under these arrangements is unknown as this would be dependent on future claims that may be made against the Fund. The risk of material loss from such claims is considered remote.
Federal Income Taxes. The Fund does not intend to qualify as a regulated investment company pursuant to Subchapter M of the Internal Revenue Code, but will rather be taxed as a corporation. As a corporation, the Fund is obligated to pay federal, state and local income tax on taxable income. During the period ended May 31, 2018, the maximum marginal regular federal income tax rate for a corporation was reduced from 35 percent to 21 percent with the enactment of H.R. 1, Tax Cuts and Jobs Act (the “TCJA”), which was enacted on December 22, 2017. Any other future changes in the federal income tax rate could have a material impact to the Fund.
The Fund is currently using an estimated rate of 2.0 percent for state and local tax, net of federal tax expense.
The alternative minimum tax requirements were repealed under the TCJA for tax years beginning after December 31, 2017, and the prior alternative minimum tax rate was reduced to zero as of January 1, 2018. Any past alternative minimum taxes paid by the fund do qualify for substantial refundability under the TCJA with AMT credit carryforwards becoming partially refundable prior to, or fully refundable for tax years beginning in 2021.
OPPENHEIMER STEELPATH MLP SELECT 40 FUND 27 |
NOTES TO FINANCIAL STATEMENTS Unaudited / (Continued) |
2. Significant Accounting Policies (Continued)
The Fund’s income tax provision consists of the following as of May 31, 2018:
| Current tax expense (benefit) | | |
| Federal | | $ | — | |
| State | | | — | |
| Total current tax expense | | $ | — | |
| | | | | |
| Deferred tax expense (benefit) | | | | |
| Federal | | $ | 17,596,709 | |
| State | | | 1,675,877 | |
| Total deferred tax expense | | $ | 19,272,586 | |
The reconciliation between the federal statutory income tax rate of 21% and the tax effect on net investment income (loss) and realized and unrealized gain (loss) follows:
| | | Amount | | | % Effect |
| Application of Federal statutory income tax rate | | $ | 15,751,511 | | | | 21.00 | % |
| State income taxes net of federal benefit | | | 1,500,144 | | | | 2.00 | % |
| Effect of tax rate change | | | 273,891 | | | | 0.37 | % |
| Effect of permanent differences | | | 1,747,040 | | | | 2.33 | % |
| Total income tax expense (benefit) | | $ | 19,272,586 | | | | 25.70 | % |
For the period ended May 31, 2018 the Fund’s tax effect on net investment income (loss) and realized and unrealized gain (loss) of 25.70% (net expenses) differed from the combined federal and state statutory tax rate of 23.00% (net expenses) due in large part to the new 21% federal tax rate, enacted by the TCJA as of December 22, 2017 (date of enactment). The change to the federal tax rate required the remeasurement of accumulated tax liabilities as of the date of enactment. The aggregate impact of this change, in addition to the change to tax liabilities due to unrealized appreciation subsequent to the date of enactment, is being recorded in the period ended May 31, 2018.
The Fund intends to invest its assets primarily in MLP Investments, which generally are treated as partnerships for federal income tax purposes. As a limited partner in the MLP Investments, the Fund reports its allocable share of the MLP Investments’ taxable income in computing its own taxable income. The Fund’s tax expense or benefit is included in the Statement of Operations based on the component of income or gains (losses) to which such expense or benefit relates. Deferred income taxes reflect the net tax effects of temporary differences between the carrying amounts of assets and liabilities for financial reporting purposes and the amounts used for income tax purposes. Such temporary differences are principally: (i) taxes on unrealized gains/(losses), which are attributable to the temporary difference between fair market value and tax basis, (ii) the net tax effects of temporary differences between the carrying amounts of assets and liabilities for financial reporting and income tax purposes and (iii) the net tax benefit of accumulated net operating losses
28 OPPENHEIMER STEELPATH MLP SELECT 40 FUND |
NOTES TO FINANCIAL STATEMENTS Unaudited / (Continued) |
2. Significant Accounting Policies (Continued)
and capital loss carryforwards. Deferred tax assets and liabilities are measured using effective tax rates expected to apply to taxable income in the years such temporary differences are realized or otherwise settled. To the extent the Fund has a deferred tax asset, consideration is given to whether or not a valuation allowance is required. A valuation allowance is required if, based on the evaluation criterion provided by ASC 740, Income Taxes, it is more-likely-than-not some portion or all of the deferred tax asset will not be realized.
At May 31, 2018, the Fund determined a valuation allowance was not required. In evaluating a valuation allowance on a portion of the deferred tax asset, significant consideration was given to the current and expected level of MLP distributions, unrealized gains and losses on MLP investments and the expiration dates for net operating losses and capital loss carryovers. Market cycles, the severity and duration of historical deferred tax assets and the impact of current and future redemptions were also considered. Additionally, various tax law changes resulting from the enactment of the TCJA were considered by the Fund in assessing the recoverability of its deferred tax assets. Specifically, the TCJA eliminated the net operating loss carryback ability and replaced the 20 year carryforward period with an indefinite carryforward period for any net operating losses arising in tax years ending after December 31, 2017. The TCJA also established a limitation for any net operating losses generated in tax years beginning after December 31, 2017 to the lesser of the aggregate of available net operating losses or 80% of taxable income before any net operating loss utilization. Through the consideration of these factors, the Fund has determined that it is more likely than not the deferred tax asset, net of the valuation allowance, will be realized.
Unexpected significant decreases in cash distributions from the Fund’s MLP investments, significant declines in the fair value of its investments, significant redemptions or increased risk of expiring net operating losses or capital loss carryovers may change the Fund’s assessment regarding the recoverability of its deferred tax assets and may result in a change to the valuation allowance. Modifications of the valuation allowance could have a material impact on the Fund’s net asset value.
Components of the Fund’s deferred tax assets and liabilities as of May 31, 2018 are as follows:
| Deferred tax assets: | | |
| Net operating loss carryforward (tax basis) - Federal | | $ | 138,029,410 | |
| Net operating loss carryforward (tax basis) - State | | | 12,915,624 | |
| Capital loss carryforward (tax basis) | | | 22,830,662 | |
| Organizational Costs | | | 3,634 | |
| Total deferred tax asset | | | 173,779,330 | |
| | | | | |
| Deferred tax liabilities: | | | | |
| Net unrealized gains on investment securities (tax basis) | | | (185,776,751 | ) |
| Total deferred tax liability | | | (185,776,751 | ) |
| | | | | |
| Total net deferred tax asset/(liability) | | $ | (11,997,421 | ) |
OPPENHEIMER STEELPATH MLP SELECT 40 FUND 29 |
NOTES TO FINANCIAL STATEMENTS Unaudited / (Continued) |
2. Significant Accounting Policies (Continued)
The Fund may rely, to some extent, on information provided by the MLPs, which may not necessarily be timely, to estimate taxable income allocable to MLP units held in its portfolio, and to estimate its associated deferred tax liability or asset. Such estimates are made in good faith. From time to time, as new information becomes available, the Fund will modify its estimates or assumptions regarding its tax liability or asset.
The Fund’s policy is to classify interest and penalties associated with underpayment of federal and state income taxes, if any, as income tax expense on its Statement of Operations. As of May 31, 2018, the Fund does not have any interest or penalties associated with the underpayment of any income taxes.
The Fund files income tax returns in the U.S. federal jurisdiction and various states. The Fund has reviewed all major jurisdictions and concluded that there is no significant impact on the Fund’s net assets and no tax liability resulting from unrecognized tax benefits relating to uncertain tax positions expected to be taken on its tax returns. Furthermore, management of the Fund is not aware of any uncertain tax positions for which it is reasonably possible that the total amount of unrecognized tax benefit will significantly change in the next 12 months.
At May 31, 2018, the Fund had net operating loss carryforwards for federal income tax purposes, as follows:
| Expiration date for expiring net operating loss carryforwards: | | |
| 11/30/2030 | | $ | 525,993 | |
| 11/30/2031 | | | 11,179,881 | |
| 11/30/2032 | | | 33,698,662 | |
| 11/30/2033 | | | 63,882,188 | |
| 11/30/2034 | | | 129,986,547 | |
| 11/30/2035 | | | 153,875,403 | |
| 11/30/2036 | | | 116,663,848 | |
| 11/30/2037 | | | 10,501,541 | |
| Total expiring net operating loss carryforwards | | $ | 520,314,063 | |
| | | | | |
| Total non-expiring net operating loss carryforwards | | $ | 135,968,693 | |
| | | | | |
| Total net operating loss carryforwards | | $ | 656,282,756 | |
30 OPPENHEIMER STEELPATH MLP SELECT 40 FUND |
NOTES TO FINANCIAL STATEMENTS Unaudited / (Continued) |
2. Significant Accounting Policies (Continued)
At May 31, 2018, the Fund had net capital loss carryforwards for federal income tax purposes, which may be carried forward for 5 years, as follows:
| Expiration Date | | |
| 11/30/2021 | | $ | 88,592,773 | |
| 11/30/2023 | | | 10,670,973 | |
| Total | | $ | 99,263,746 | |
At May 31, 2018, gross unrealized appreciation and depreciation of investments, based on cost for federal income tax purposes were as follows:
| Cost of Investments | | $ | 2,532,123,795 | |
| Gross Unrealized Appreciation | | $ | 1,031,854,286 | |
| Gross Unrealized Depreciation | | | (229,676,649 | ) |
| Net Unrealized Appreciation (Depreciation) on Investments | | $ | 802,177,637 | |
The difference between cost amounts for financial statement and federal income tax purposes is due primarily to timing differences in recognizing certain gains and losses in security transactions.
Use of Estimates. The preparation of financial statements in conformity with accounting principles generally accepted in the United States of America requires management to make estimates and assumptions that affect the reported amounts of assets and liabilities and disclosure of contingent assets and liabilities at the date of the financial statements and the reported amounts of increases and decreases in net assets from operations during the reporting period. Actual results could differ from those estimates.
3. Securities Valuation
The Fund calculates the net asset value of its shares as of 4:00 P.M. Eastern time, on each day the New York Stock Exchange (the “Exchange”) is open for trading, except in the case of a scheduled early closing of the Exchange, in which case the Fund will calculate net asset value of the shares as of the scheduled early closing time of the Exchange.
The Fund’s Board of Trustees (the “Board”) has adopted procedures for the valuation of the Fund’s securities and has delegated the day-to-day responsibility for valuation determinations under those procedures to the Manager. The Manager has established a Valuation Committee which is responsible for determining a fair valuation for any security for which market quotations are not readily available. The Valuation Committee’s fair valuation determinations are subject to review, approval and ratification by the Fund’s Board at least quarterly or more frequently, if necessary.
OPPENHEIMER STEELPATH MLP SELECT 40 FUND 31 |
NOTES TO FINANCIAL STATEMENTS Unaudited / (Continued) |
3. Securities Valuation (Continued)
Valuation Methods and Inputs
Securities are valued primarily using unadjusted quoted market prices, when available, as supplied by third party pricing services or broker-dealers.
The following methodologies are used to determine the market value or the fair value of the types of securities described below:
Equity securities traded on a securities exchange (including exchange-traded derivatives other than futures and futures options) are valued based on the official closing price on the principal exchange on which the security is traded, as identified by the Manager, prior to the time when the Fund’s assets are valued. If the official closing price is unavailable, the security is valued at the last sale price on the principal exchange on which it is traded, or if no sales occurred, the security is valued at the mean between the quoted bid and asked prices. Over-the-counter equity securities are valued at the last published sale price, or if no sales occurred, at the mean between the quoted bid and asked prices.
Shares of a registered investment company that are not traded on an exchange are valued at that investment company’s net asset value per share.
Securities for which market quotations are not readily available or a significant event has occurred that would materially affect the value of the security, are fair valued either (i) by a standardized fair valuation methodology applicable to the security type or the significant event as previously approved by the Valuation Committee and the Fund’s Board or (ii) as determined in good faith by the Manager’s Valuation Committee. The Valuation Committee considers all relevant facts that are reasonably available, through either public information or information available to the Manager, when determining the fair value of a security. Those standardized fair valuation methodologies include, but are not limited to, valuing securities at the last sale price or initially at cost and subsequently adjusting the value based on: changes in company specific fundamentals, changes in an appropriate securities index, or changes in the value of similar securities which may be further adjusted for any discounts related to security-specific resale restrictions. When possible, such methodologies use observable market inputs such as unadjusted quoted prices of similar securities, observable interest rates, currency rates and yield curves. The methodologies used for valuing securities are not necessarily an indication of the risks associated with investing in those securities nor can it be assured that the Fund can obtain the fair value assigned to a security if it were to sell the security.
To assess the continuing appropriateness of security valuations, the Manager regularly compares prior day prices and sale prices to the current day prices and challenges those prices exceeding certain tolerance levels with a third party pricing service or broker source. For those securities valued by fair valuations, whether through a standardized fair valuation methodology or a fair valuation determination, the Valuation Committee reviews and affirms the reasonableness of the valuations based on such methodologies and fair valuation determinations on a regular basis after considering all relevant information that is reasonably available.
32 OPPENHEIMER STEELPATH MLP SELECT 40 FUND |
NOTES TO FINANCIAL STATEMENTS Unaudited / (Continued) |
3. Securities Valuation (Continued)
Classifications
Each investment asset or liability of the Fund is assigned a level at measurement date based on the significance and source of the inputs to its valuation. Various data inputs may be used in determining the value of each of the Fund’s investments as of the reporting period end. These data inputs are categorized in the following hierarchy under applicable financial accounting standards:
| | 1) | Level 1-unadjusted quoted prices in active markets for identical assets or liabilities (including securities actively traded on a securities exchange) |
| | 2) | Level 2-inputs other than unadjusted quoted prices that are observable for the asset or liability (such as unadjusted quoted prices for similar assets and market corroborated inputs such as interest rates, prepayment speeds, credit risks, etc.) |
| | 3) | Level 3-significant unobservable inputs (including the Manager’s own judgments about assumptions that market participants would use in pricing the asset or liability) |
The inputs used for valuing securities are not necessarily an indication of the risks associated with investing in those securities.
The Fund classifies each of its investments in investment companies which are publicly offered as Level 1. Investment companies that are not publicly offered, if any, are classified as Level 2 in the fair value hierarchy.
The table below categorizes amounts that are included in the Fund’s Statement of Assets and Liabilities at period end based on valuation input level:
| | Level 1 —
Unadjusted Quoted Prices | | | Level 2 —
Other Significant Observable Inputs | | | Level 3 —
Significant Unobservable Inputs | | | Value | |
| Assets Table | | | | | | | | |
| Investments, at Value: | | | | | | | | |
| MLP Investments and Related Entities | | $ | 3,104,584,181 | | | $ | — | | | $ | — | | | $ | 3,104,584,181 | |
| Common Stock* | | | 122,348,836 | | | | — | | | | — | | | | 122,348,836 | |
| Preferred MLP Investments and Related Entities | | | — | | | | — | | | | 68,207,232 | | | | 68,207,232 | |
| Short-Term Investment | | | 39,161,183 | | | | — | | | | — | | | | 39,161,183 | |
| Total Assets | | $ | 3,326,094,200 | | | $ | — | | | $ | 68,207,232 | | | $ | 3,334,301,432 | |
* | For a detailed break-out of securities by major industry classification, please refer to the Statement of Investments. |
OPPENHEIMER STEELPATH MLP SELECT 40 FUND 33 |
NOTES TO FINANCIAL STATEMENTS Unaudited / (Continued) |
3. Securities Valuation (Continued)
For the reporting period, there were no transfers between levels.
The following is a reconciliation of assets in which significant unobservable inputs (Level 3) were used in determining fair value:
| Beginning balance November 30, 2017 | | $ | 63,866,976 | |
| Transfers into Level 3 during the period | | | — | |
| Change in unrealized appreciation/(depreciation) | | | 7,418,085 | |
| Total realized gain/(loss) | | | — | |
| Purchases | | | — | |
| Sales | | | — | |
| Return of capital distributions | | | (3,077,829 | ) |
| Transfers out of Level 3 during the period | | | — | |
| Ending balance May 31, 2018 | | $ | 68,207,232 | |
The total change in unrealized appreciation/depreciation included in the Statement of Operations attributable to Level 3 investments still held at May 31, 2018 is $7,418,085.
The following table summarizes the valuation techniques and significant unobservable inputs used in determining fair value measurements for those investments classified as Level 3 as of May 31, 2018:
| Assets Table Investments, at Value: | | Value as of
May 31, 2018 | | | Valuation
Technique | | Unobservable
Input | | Range of
Unobservable
Inputs | | Unobservable
Input Used |
| Preferred Stocks | | $ | 40,080,000 | | | Discounted Cash Flow Model | | Illiquidity Discount | | n/a | | | 7 | %(a) |
| | | | | | | | | Estimated Yield | | 12.1% - 12.7% | | | 12.4 | %(a) |
| | | | 28,127,232 | | | Discounted Cash Flow Model | | Transaction Spread | | n/a | | | 20.465 | %(b) |
| | | | | | | | | Benchmark Spread | | n/a | | | 2.297 | %(b) |
| | | | | | | | | Treasury Yield | | n/a | | | 2.975 | %(b) |
| Total | | $ | 68,207,232 | | | | | | | | | | | |
(a) | The Fund fair values certain preferred shares using a discounted cash flow model, which incorporates an illiquidity discount and the expected yield based on the average yield on comparable companies’ equity. Such security’s fair valuation could decrease (increase) significantly based on an increase (decrease) in the illiquidity discount. Such security’s fair valuation could increase (decrease) significantly based on an increase (decrease) in expected yields. |
(b) | The Fund fair values certain preferred shares using a discounted cash flow model, which incorporates an implied yield based on the transaction spread (based on yields at purchase), benchmark spread and Treasury yield. Such security’s fair valuation could decrease (increase) significantly based on an increase (decrease) in the transaction spread, benchmark spread, or treasury yield. |
34 OPPENHEIMER STEELPATH MLP SELECT 40 FUND |
NOTES TO FINANCIAL STATEMENTS Unaudited / (Continued) |
4. Investments and Risks
Equity Security Risk. Stocks and other equity securities fluctuate in price. The value of the Fund’s portfolio may be affected by changes in the equity markets generally. Equity markets may experience significant short-term volatility and may fall sharply at times. Different markets may behave differently from each other and U.S. equity markets may move in the opposite direction from one or more foreign stock markets. Adverse events in any part of the equity or fixed-income markets may have unexpected negative effects on other market segments.
The prices of individual equity securities generally do not all move in the same direction at the same time and a variety of factors can affect the price of a particular company’s securities. These factors may include, but are not limited to, poor earnings reports, a loss of customers, litigation against the company, general unfavorable performance of the company’s sector or industry, or changes in government regulations affecting the company or its industry.
Master Limited Partnerships. MLPs issue common units that represent an equity ownership interest in a partnership and provide limited voting rights. MLP common units are registered with the Securities and Exchange Commission (“SEC”), and are freely tradable on securities exchanges such as the NYSE and the NASDAQ Stock Market (“NASDAQ”), or in the over-the-counter market. An MLP consists of one or more general partners, who conduct the business, and one or more limited partners, who contribute capital. MLP common unit holders have a limited role in the partnership’s operations and management. The Fund, as a limited partner, normally would not be liable for the debts of the MLP beyond the amounts the Fund has contributed, but would not be shielded to the same extent that a shareholder of a corporation would be. In certain circumstances creditors of an MLP would have the right to seek return of capital distributed to a limited partner. This right of an MLP’s creditors would continue after the Fund sold its investment in the MLP.
MLPs are generally treated as publicly traded partnerships for federal income tax purposes. Any modification to federal income tax laws and related interpretations could cause a material decrease in the value of an MLP.
Restricted Securities. At period end, investments in securities included issues that are restricted. A restricted security may have a contractual restriction on its resale and is valued under methods approved by the Board as reflecting fair value. Securities that are restricted are marked with an applicable footnote on the Statement of Investments. Restricted securities are reported on a schedule following the Statement of Investments.
Concentration Risk. Under normal circumstances, the Fund invests at least 80% of its net assets (plus the amount of any borrowings for investment purposes) in master limited partnership (“MLP”) investments of issuers that are engaged in the transportation, storage, processing, refining, marketing, exploration, production, and mining of minerals and natural resources. The Fund’s MLP investments may include, but are not limited to: MLPs structured
OPPENHEIMER STEELPATH MLP SELECT 40 FUND 35 |
NOTES TO FINANCIAL STATEMENTS Unaudited / (Continued) |
4. Investments and Risks (Continued)
as limited partnerships (“LPs”) or limited liability companies (“LLCs”); MLPs that are taxed as “C” corporations; businesses that operate and have the economic characteristics of MLPs but are organized and taxed as “C” corporations; securities issued by MLP affiliates; and private investments in public equities (“PIPEs”) issued by MLPs. MLPs are subject to certain risks, such as supply and demand risk, depletion and exploration risk, commodity pricing risk, acquisition risk, and the risk associated with the hazards inherent in midstream energy industry activities. A substantial portion of the cash flow received by the Fund is derived from investment in equity securities of MLPs. The amount of cash that a MLP has available for distributions, and the tax character of such distributions, are dependent upon the amount of cash generated by the MLP’s operations.
5. Shares of Beneficial Interest
The Fund has authorized an unlimited number of $0.001 par value shares of beneficial interest in each class. Transactions in shares of beneficial interest were as follows:
| | | Six Months Ended
May 31, 2018
(Unaudited) | | | Year Ended
November 30, 2017 | |
| | | Shares | | | Amount | | | Shares | | | Amount | |
| Class A | | | | | | | | | | | | | | | | |
| Sold | | | 10,451,314 | | | $ | 85,562,677 | | | | 20,321,149 | | | $ | 184,714,185 | |
| Dividends and/or distributions reinvested | | | 2,008,873 | | | | 15,971,570 | | | | 4,687,713 | | | | 42,262,632 | |
| Redeemed | | | (13,772,612 | ) | | | (111,979,826 | ) | | | (36,553,307 | ) | | | (330,975,685 | ) |
| Net decrease | | | (1,312,425 | ) | | $ | (10,445,579 | ) | | | (11,544,445 | ) | | $ | (103,998,868 | ) |
| | | | | | | | | | | | | | | | | |
| Class C | | | | | | | | | | | | | | | | |
| Sold | | | 7,867,450 | | | $ | 60,964,705 | | | | 13,970,444 | | | $ | 121,978,985 | |
| Dividends and/or distributions reinvested | | | 2,368,324 | | | | 17,853,239 | | | | 4,947,177 | | | | 42,488,530 | |
| Redeemed | | | (10,180,972 | ) | | | (78,432,144 | ) | | | (15,727,302 | ) | | | (134,804,965 | ) |
| Net increase | | | 54,802 | | | $ | 385,800 | | | | 3,190,319 | | | $ | 29,662,550 | |
36 OPPENHEIMER STEELPATH MLP SELECT 40 FUND |
NOTES TO FINANCIAL STATEMENTS Unaudited / (Continued) |
5. Shares of Beneficial Interest (Continued)
| | | | Six Months Ended
May 31, 2018
(Unaudited) | | | Year Ended
November 30, 2017 | |
| | | Shares | | | Amount | | | Shares | | | Amount | |
| Class I | | | | | | | | |
| Sold | | | 27,160,891 | | | $ | 225,600,353 | | | | 34,489,733 | | | $ | 319,874,879 | |
| Dividends and/or distributions reinvested | | | 1,984,678 | | | | 16,271,447 | | | | 3,212,070 | | | | 29,493,004 | |
| Redeemed | | | (16,203,211 | ) | | | (134,113,079 | ) | | | (15,330,889 | ) | | | (140,883,963 | ) |
| Net increase | | | 12,942,358 | | | $ | 107,758,721 | | | | 22,370,914 | | | $ | 208,483,920 | |
| | | | | | | | | | | | | | | | | |
| Class W | | | | | | | | | | | | | | | | |
| Sold | | | — | | | $ | — | | | | — | | | $ | — | |
| Dividends and/or distributions reinvested | | | 13,339 | | | | 110,126 | | | | 48,688 | | | | 450,846 | |
| Redeemed | | | (320,157 | ) | | | (2,606,649 | ) | | | (175,481 | ) | | | (1,627,365 | ) |
| Net decrease | | | (306,818 | ) | | $ | (2,496,523 | ) | | | (126,793 | ) | | $ | (1,176,519 | ) |
| | | | | | | | | | | | | | | | | |
| Class Y | | | | | | | | | | | | | | | | |
| Sold | | | 71,054,378 | | | $ | 599,379,021 | | | | 97,891,376 | | | $ | 909,914,269 | |
| Dividends and/or distributions reinvested | | | 7,188,812 | | | | 58,765,582 | | | | 13,359,249 | | | | 122,766,730 | |
| Redeemed | | | (58,831,961 | ) | | | (489,252,460 | ) | | | (78,699,484 | ) | | | (724,115,733 | ) |
| Net increase | | | 19,411,229 | | | $ | 168,892,143 | | | | 32,551,141 | | | $ | 308,565,266 | |
6. Purchases and Sales of Securities
The aggregate cost of purchases and proceeds from sales of securities, other than short-term obligations, for the six months ended May 31, 2018, were as follows:
| | | Purchases | | | Sales | |
| Investment securities | | $ | 441,537,158 | | | $ | 231,042,440 | |
OPPENHEIMER STEELPATH MLP SELECT 40 FUND 37 |
NOTES TO FINANCIAL STATEMENTS Unaudited / (Continued) |
7. Fees and Other Transactions with Affiliates
Management Fees. Under the investment advisory agreement, the Fund pays the Manager a management fee based on the daily net assets of the Fund at an annual rate as shown in the following table:
Net Assets up to $3 Billion | Net Assets Greater than
$3 Billion and up to $5 Billion | Net Assets in Excess of $5 Billion |
0.70% | 0.68% | 0.65% |
The Fund’s effective management fee for the six months ended May 31, 2018 was 0.70% of average annual net assets before any applicable waivers.
Transfer Agent Fees. OFI Global Asset Management, Inc. (the “Transfer Agent”) serves as the transfer and shareholder servicing agent for the Fund. The Fund pays the Transfer Agent a fee based on average net assets. Fees incurred with respect to these services are detailed in the Statement of Operations.
Sub-Transfer Agent Fees. The Transfer Agent has retained Shareholder Services, Inc., a wholly-owned subsidiary of OFI (the “Sub-Transfer Agent”), to provide the day-to-day transfer agent and shareholder servicing of the Fund. Under the Sub-Transfer Agency Agreement, the Transfer Agent pays the Sub-Transfer Agent an annual fee in monthly installments, equal to a percentage of the transfer agent fee collected by the Transfer Agent from the Fund, which shall be calculated after any applicable fee waivers. The fee paid to the Sub-Transfer Agent is paid by the Transfer Agent, not by the Fund.
Trustees’ Compensation. The Board has adopted a compensation deferral plan for independent trustees that enables trustees to elect to defer receipt of all or a portion of the annual compensation they are entitled to receive from the Fund. For purposes of determining the amount owed to the Trustee under the plan, deferred amounts are treated as though equal dollar amounts had been invested in shares of the Fund or in other Oppenheimer funds selected by the Trustee. The Fund purchases shares of the funds selected for deferral by the Trustee in amounts equal to his or her deemed investment, resulting in a Fund asset equal to the deferred compensation liability. Such assets are included as a component of “Other” within the asset section of the Statement of Assets and Liabilities, if applicable. Deferral of trustees’ fees under the plan will not affect the net assets of the Fund, and will not materially affect the Fund’s assets, liabilities or net investment income per share. Amounts will be deferred until distributed in accordance with the compensation deferral plan.
Distribution and Service Plan (12b-1) Fees. Under its General Distributor’s Agreement with the Fund, the Distributor acts as the Fund’s principal underwriter in the continuous public offering of the Fund’s classes of shares.
38 OPPENHEIMER STEELPATH MLP SELECT 40 FUND |
NOTES TO FINANCIAL STATEMENTS Unaudited / (Continued) |
7. Fees and Other Transactions with Affiliates (Continued)
Distribution and Service Plan for Class A Shares. The Fund has adopted a Distribution and Service Plan (the “Plan”) for Class A shares under Rule 12b-1 of the Investment Company Act of 1940 that compensates the Distributor for a portion of the costs in connection with the distribution of shares, maintaining accounts and providing services to Class A shareholders. Under the Plan, the Fund makes these payments quarterly at an annual rate of up to 0.25% of the daily net assets of Class A shares of the Fund. The Distributor currently uses all of those fees to pay dealers, brokers, banks and other financial intermediaries for providing services related to the distribution of shares, personal service and maintenance of accounts of their customers that hold Class A shares. Any unreimbursed expenses the Distributor incurs with respect to Class A shares in any fiscal year cannot be recovered in subsequent periods. Fees incurred by the Fund under the Plan are detailed in the Statement of Operations.
Distribution and Service Plans for Class C Shares. The Fund has adopted a Distribution and Service Plans (the “Plans”) for Class C shares under Rule 12b-1 of the Investment Company Act of 1940 to compensate the Distributor for distributing that share class, maintaining accounts and providing shareholder services. Under the Plans, the Fund pays the Distributor an annual asset-based sales charge of 0.75% on Class C shares’ daily net assets. The Fund also pays a service fee under the Plans at an annual rate of 0.25% of Class C shares’ daily net assets.
The Distribution and Service Plans for Class A and C shares continue in effect from year to year only if the Fund’s Board votes annually to approve their continuance at an in-person meeting called for that purpose. Fees incurred by the Fund under the Plans are detailed in the Statement of Operations.
Sales Charges. Front-end sales charges and contingent deferred sales charges (“CDSC”) do not represent expenses of the Fund. They are deducted from the proceeds of sales of Fund shares prior to investment or from redemption proceeds prior to remittance, as applicable. The sales charges retained by the Distributor from the sale of shares and the CDSC retained by the Distributor on the redemption of shares are shown in the following table for the period indicated.
| Six Months Ended | | Class A Front-End Sales Charges Retained by Distributor | | Class A Contingent Deferred Sales Charges Retained by Distributor | | Class C Contingent Deferred Sales Charges Retained by Distributor |
May 31, 2018 | | | $ | 106,151 | | | $ | 12,521 | | | $ | 39,362 | |
OPPENHEIMER STEELPATH MLP SELECT 40 FUND 39 |
NOTES TO FINANCIAL STATEMENTS Unaudited / (Continued) |
7. Fees and Other Transactions with Affiliates (Continued)
Waivers and Reimbursements of Expenses. The Manager has contractually agreed to limit fees and/or reimburse expenses of the Fund to the extent that the Fund’s total annual fund operating expenses (exclusive of interest, taxes, such as deferred tax expenses, brokerage commissions, acquired fund fees and expenses, dividend costs related to short sales, and other unusual expenses such as litigation expense, if any) exceed 1.10% for Class A shares, 1.85% for Class C shares, 0.85% for Class W shares, and 0.85% for Class Y shares.
The Fund’s total annual operating expenses after fee waiver and/or expense reimbursement (“Net Expenses”) will be higher than these amounts to the extent that the Fund incurs expenses excluded from the expense cap. Because the Fund’s deferred income tax expense/(benefit) and interest expense are excluded from the expense cap, the Fund’s Net Expenses for each class of shares is increased/(decreased) by the amount of this expense. During the six months ended May 31, 2018, the Manager reimbursed $223,636, $232,229, $866,278, and $1,649 for Class A, Class C, Class W, and Class Y respectively. This undertaking may not be modified or terminated until after one year from the date of the current prospectus, as indicated therein, unless approved by the Fund’s Board.
The Manager and/or Transfer Agent can be reimbursed by the Fund within three years after the date the fee limitation and/or expense reimbursement has been made by the Manager and/or Transfer Agent, provided that such repayment does not cause the expenses of any class of the Fund to exceed the foregoing limits.
The following table represents amounts eligible for recovery at May 31, 2018:
| Eligible Expense Recoupment Expiring: | | |
| November 30, 2018 | | $ | 3,233,228 | |
| November 30, 2019 | | | 3,014,707 | |
| November 30, 2020 | | | 2,937,778 | |
| November 30, 2021 | | | 1,323,792 | |
During the six months ended May 31, 2018, the Manager and/or Transfer Agent did not recoup any expenses.
Effective January 1, 2017 until December 31, 2017, the Transfer Agent has voluntarily agreed to waive fees and/or reimburse Fund expenses in an amount equal to 0.015% of average annual net assets for Classes A, C, W and Y.
40 OPPENHEIMER STEELPATH MLP SELECT 40 FUND |
NOTES TO FINANCIAL STATEMENTS Unaudited / (Continued) |
7. Fees and Other Transactions with Affiliates (Continued)
During the reporting period, the Transfer Agent waived fees and/or reimbursed the Fund for transfer agent and shareholder servicing agent fees as follows:
| Class A | | $ | 6,025 | |
| Class C | | | 6,187 | |
| Class W | | | 21,776 | |
| Class Y | | | 54 | |
This expense limitation was removed effective December 31, 2017. Amounts previously waived are not eligible for recoupment.
Related Party. The Interested Trustee and officers of the Fund is also an officers or trustee of companies affiliated with the Manager, Distributor, and Transfer Agent.
Cross Trades. The Fund is permitted to purchase and sell securities from and to other Funds managed by the Manager or OFI Global (“cross-trade”) pursuant to “Cross-Trading” Procedures adopted by the Fund’s Board. These procedures are designed to ensure that any cross-trade of securities between a Fund and another account or private fund that is an affiliate of the Fund solely by virtue of having a common investment adviser, common trustee/director, or common officer complies with Rule 17a-7 under the 1940 Act. Further, as defined under these procedures, each cross-trade is effected at the current market price.
During the period the Fund had $84,082,746 in purchases and $45,799,730 in sales considered cross-trades, resulting in $(29,857,857) of realized gain/(loss).
8. Borrowing Agreement
The Fund, along with Oppenheimer SteelPath MLP Alpha Plus Fund, Oppenheimer SteelPath MLP Income Fund, and Oppenheimer SteelPath MLP Alpha Fund (collectively, the “Trust”), is a borrower in a $700 million revolving credit agreement (the “Loan Agreement”) with a major lending institution (the “Lender”). The Fund is permitted to borrow up to the lesser of one-third of the Fund’s total assets, or the maximum amount permitted pursuant to the Fund’s investment limitations. As the Loan Agreement is not available exclusively to the Fund, the Fund may not be able to borrow all of its requested amounts at any given time. Amounts borrowed under the Loan Agreement, if any, are invested by the Fund under the direction of the Manager consistent with the Fund’s investment objective and policies, and as such, the related investments are subject to normal market fluctuations and investment risks, including the risk of loss due to a decline in value. The borrowing, if any, is fully collateralized throughout the term of the borrowing with securities or other assets of the Fund. The Fund is not liable for borrowings of other Funds in the Trust. Securities that have been pledged as collateral for the borrowing are indicated in the Statement of Investments.
OPPENHEIMER STEELPATH MLP SELECT 40 FUND 41 |
NOTES TO FINANCIAL STATEMENTS Unaudited / (Continued) |
8. Borrowing Agreement (Continued)
Borrowings under the Loan Agreement are charged interest at a calculated rate computed by the Lender based on the one month LIBOR rate plus 0.75% per annum. An unused commitment fee at the rate of 0.30% per annum is charged for any undrawn portion of the credit facility, and each member of the Trust will pay its pro rata share of this fee. A facility fee of 0.10% was charged on the commitment amount, and each party of the Trust paid its pro rata share of this fee. The borrowing is due November 16, 2018, unless another date is mutually agreed upon by the parties of the Loan Agreement. For the six months ended May 31, 2018, the Fund paid $401,237 in borrowing fees. The Fund did not utilize the facility during the six months ended May 31, 2018.
42 OPPENHEIMER STEELPATH MLP SELECT 40 FUND |
DISTRIBUTION SOURCES Unaudited |
For any distribution that took place over the last six months of the Fund’s reporting period, the table below details on a per-share basis the percentage of the Fund’s total distribution payment amount that was derived from the following sources: net income, net profit from the sale of securities, and other capital sources. Other capital sources represent a return of capital. A return of capital may occur, for example, when some or all of the money that you invested in the Fund is paid back to you. A return of capital distribution does not necessarily reflect the Fund’s investment performance and should not be confused with “yield” or “income.” You should not draw any conclusions about the Fund’s investment performance from the amounts of these distributions. This information is based upon income and capital gains using generally accepted accounting principles as of the date of each distribution. If the Fund (or an underlying fund in which the Fund invests) invests in real estate investment trusts (REITs) and/or master limited partnerships (MLPs), the percentages attributed to each category are estimated using historical information because the character of the amounts received from the REITs and/or MLPs in which the Fund (or underlying fund) invests is unknown until after the end of the calendar year. Because the Fund is actively managed, the relative amount of the Fund’s total distributions derived from various sources over the calendar year may change. Please note that this information should not be used for tax reporting purposes as the tax character of distributable income may differ from the amounts used for this notification. You will receive IRS tax forms in the first quarter of each calendar year detailing the actual amount of the taxable and non-taxable portion of distributions paid to you during the tax year.
For the most current information, please go to oppenheimerfunds.com. Select your Fund, and scroll down to the ‘Dividends’ table under ‘Analytics’. The Fund’s latest distribution information will be followed by the sources of any distribution, updated daily.
Fund Name | Pay
Date | Net
Income | Net
Profit
from Sale | Other
Capital
Sources |
Oppenheimer SteelPath MLP Select 40 Fund | 1/5/18 | 0.0% | 0.0% | 100.0% |
Oppenheimer SteelPath MLP Select 40 Fund | 2/9/18 | 0.0% | 0.0% | 100.0% |
Oppenheimer SteelPath MLP Select 40 Fund | 3/9/18 | 0.0% | 0.0% | 100.0% |
Oppenheimer SteelPath MLP Select 40 Fund | 4/6/18 | 0.0% | 0.0% | 100.0% |
Oppenheimer SteelPath MLP Select 40 Fund | 5/4/18 | 0.0% | 0.0% | 100.0% |
OPPENHEIMER STEELPATH MLP SELECT 40 FUND 43 |
PORTFOLIO PROXY VOTING POLICIES AND PROCEDURES; UPDATES TO STATEMENT OF INVESTMENTS Unaudited |
The Fund has adopted Portfolio Proxy Voting Policies and Procedures under which the Fund votes proxies relating to securities (“portfolio proxies”) held by the Fund. A description of the Fund’s Portfolio Proxy Voting Policies and Procedures is available (i) without charge, upon request, by calling the Fund toll-free at 1.800.CALL OPP (225.5677), (ii) on the Fund’s website at oppenheimerfunds.com, and (iii) on the SEC’s website at www.sec.gov. In addition, the Fund is required to file Form N-PX, with its complete proxy voting record for the 12 months ended June 30th, no later than August 31st of each year. The Fund’s voting record is available (i) without charge, upon request, by calling the Fund toll-free at 1.800.CALL OPP (225.5677), and (ii) in the Form N-PX filing on the SEC’s website at www.sec.gov.
The Fund files its complete schedule of portfolio holdings with the SEC for the first quarter and the third quarter of each fiscal year on Form N-Q. The Fund’s Form N-Q filings are available on the SEC’s website at www.sec.gov. Those forms may be reviewed and copied at the SEC’s Public Reference Room in Washington, D.C. Information on the operation of the Public Reference Room may be obtained by calling 1-800-SEC-0330.
Householding – Delivery of Shareholder Documents
This is to inform you about OppenheimerFunds’ “householding” policy. If more than one member of your household maintains an account in a particular fund, OppenheimerFunds will mail only one copy of the fund’s prospectus (or, if available, the fund’s summary prospectus), annual and semiannual report and privacy policy. The consolidation of these mailings, called householding, benefits your fund through reduced mailing expense, and benefits you by reducing the volume of mail you receive from OppenheimerFunds. Householding does not affect the delivery of your account statements.
Please note that we will continue to household these mailings for as long as you remain an OppenheimerFunds shareholder, unless you request otherwise. If you prefer to receive multiple copies of these materials, please call us at 1.800.CALL-OPP (225-5677). You may also notify us in writing or via email. We will begin sending you individual copies of the prospectus (or, if available, the summary prospectus), reports and privacy policy within 30 days of receiving your request to stop householding.
44 OPPENHEIMER STEELPATH MLP SELECT 40 FUND |
OPPENHEIMER STEELPATH MLP SELECT 40 FUND |
Trustees and Officers | | Robert J. Malone, Chairman of the Board of Trustees and Trustee |
| | | Andrew J. Donohue, Trustee |
| | | Richard F. Grabish, Trustee |
| | | Beverly L. Hamilton, Trustee |
| | | Victoria J. Herget, Trustee |
| | | Karen L. Stuckey, Trustee |
| | | James D. Vaughn, Trustee |
| | | Arthur P. Steinmetz, Trustee, President and Principal Executive Officer |
| | | Stuart Cartner, Vice President |
| | | Brian Watson, Vice President |
| | | Cynthia Lo Bessette, Secretary and Chief Legal Officer |
| | | Jennifer Foxson, Vice President and Chief Business Officer |
| | | Mary Ann Picciotto, Chief Compliance Officer
and Chief Anti-Money Laundering Officer |
| | | Brian S. Petersen, Treasurer and Principal Financial & Accounting Officer |
| | | |
Manager | | OFI SteelPath, Inc. |
Distributor | | OppenheimerFunds Distributor, Inc. |
Transfer and Shareholder Servicing Agent | | OFI Global Asset Management, Inc. |
Sub-Transfer Agent | | Shareholder Services, Inc. |
| | | DBA OppenheimerFunds Services |
Independent Registered Public Accounting Firm | | Cohen & Company, Ltd. |
Legal Counsel | | Ropes & Gray LLP |
The financial statements included herein have been taken from the records of the Fund without examination of those records by the independent registered public accounting firm.
© 2018 OppenheimerFunds, Inc. All rights reserved.
OPPENHEIMER STEELPATH MLP SELECT 40 FUND 45 |
As an Oppenheimer fund shareholder, you are entitled to know how we protect your personal information and how we limit its disclosure.
Information Sources
We obtain nonpublic personal information about our shareholders from the following sources:
| | ● | Applications or other forms. |
| | ● | When you create a user ID and password for online account access. |
| | ● | When you enroll in eDocs Direct,SM our electronic document delivery service. |
| | ● | Your transactions with us, our affiliates or others. |
| | ● | Technologies on our website, including: “cookies” and web beacons, which are used to collect data on the pages you visit and the features you use. |
If you visit oppenheimerfunds.com and do not log on to the secure account information areas, we do not obtain any personal information about you. When you do log on to a secure area, we do obtain your user ID and password to identify you. We also use this information to provide you with products and services you have requested, to inform you about products and services that you may be interested in and assist you in other ways.
We do not collect personal information through our website unless you willingly provide it to us, either directly by email or in those areas of the website that request information. In order to update your personal information (including your mailing address, email address and phone number) you must first log on and visit your user profile.
If you have set your browser to warn you before accepting cookies, you will receive the warning message with each cookie. You can refuse cookies by turning them off in your browser. However, doing so may limit your access to certain sections of our website.
We use cookies to help us improve and manage our website. For example, cookies help us recognize new versus repeat visitors to the site, track the pages visited, and enable some special features on the website. This data helps us provide better service for our website visitors.
Protection of Information
We do not disclose any nonpublic personal information (such as names on a customer list) about current or former customers to anyone, except as permitted by law.
46 OPPENHEIMER STEELPATH MLP SELECT 40 FUND |
PRIVACY POLICY NOTICE (Continued) |
Disclosure of Information
Copies of confirmations, account statements and other documents reporting activity in your fund accounts are made available to your financial advisor (as designated by you). We may also use details about you and your investments to help us, our financial service affiliates, or firms that jointly market their financial products and services with ours, to better serve your investment needs or suggest educational material that may be of interest to you. If this requires us to provide you with an opportunity to “opt in” or “opt out” of such information sharing with a firm not affiliated with us, you will receive notification on how to do so, before any such sharing takes place.
Right of Refusal
We will not disclose your personal information to unaffiliated third parties (except as permitted by law), unless we first offer you a reasonable opportunity to refuse or “opt out” of such disclosure.
Internet Security and Encryption
In general, the email services provided by our website are encrypted and provide a secure and private means of communication with us. To protect your own privacy, confidential and/ or personal information should only be communicated via email when you are advised that you are using a secure website.
As a security measure, we do not include personal or account information in nonsecure emails, and we advise you not to send such information to us in nonsecure emails. Instead, you may take advantage of the secure features of our website to encrypt your email correspondence. To do this, you will need to use a browser that supports Secure Sockets Layer (SSL) protocol.
| | ● | All transactions conducted via our websites, including redemptions, exchanges and purchases, are secured by the highest encryption standards available. SSL is used to establish a secure connection between your PC and OppenheimerFunds’ server. It transmits information in an encrypted and scrambled format. |
| | ● | Encryption is achieved through an electronic scrambling technology that uses a “key” to code and then decode the data. Encryption acts like the cable converter box you may have on your television set. It scrambles data with a secret code so that no one can make sense of it while it is being transmitted. When the data reaches its destination, the same software unscrambles the data. |
| | ● | You can exit the secure area by closing your browser or, for added security, you can use the Log Out button before you close your browser. |
OPPENHEIMER STEELPATH MLP SELECT 40 FUND 47 |
PRIVACY POLICY NOTICE (Continued) |
Other Security Measures
We maintain physical, electronic and procedural safeguards to protect your personal account information. Our employees and agents have access to that information only so that they may offer you products or provide services, for example, when responding to your account questions.
How You Can Help
You can also do your part to keep your account information private and to prevent unauthorized transactions. If you obtain a user ID and password for your account, safeguard that information. Strengthening your online credentials–your online security profile–typically your user name, password, and security questions and answers, can be one of your most important lines of defense on the Internet. For additional information on how you can help prevent identity theft, visit https:// www.oppenheimerfunds.com/security.
Who We Are
This joint notice describes the privacy policies of the Oppenheimer funds, OppenheimerFunds, Inc., each of its investment adviser subsidiaries, OppenheimerFunds Distributor, Inc. and OFI Global Trust Co. It applies to all Oppenheimer fund accounts you presently have, or may open in the future, using your Social Security number—whether or not you remain a shareholder of our funds. This notice was last updated as of November 2017. In the event it is updated or changed, we will post an updated notice on our website at oppenheimerfunds.com. If you have any questions about this privacy policy, email us by clicking on the Contact Us section of our website at oppenheimerfunds.com, write to us at P.O. Box 5270, Denver, CO 80217-5270, or call us at 800 CALL OPP (225 5677).
48 OPPENHEIMER STEELPATH MLP SELECT 40 FUND |
THIS PAGE INTENTIONALLY LEFT BLANK
OPPENHEIMER STEELPATH MLP SELECT 40 FUND 49 |
THIS PAGE INTENTIONALLY LEFT BLANK
50 OPPENHEIMER STEELPATH MLP SELECT 40 FUND |
THIS PAGE INTENTIONALLY LEFT BLANK
OPPENHEIMER STEELPATH MLP SELECT 40 FUND 51 |
THIS PAGE INTENTIONALLY LEFT BLANK
52 OPPENHEIMER STEELPATH MLP SELECT 40 FUND |
THIS PAGE INTENTIONALLY LEFT BLANK
OPPENHEIMER STEELPATH MLP SELECT 40 FUND 53 |
THIS PAGE INTENTIONALLY LEFT BLANK
54 OPPENHEIMER STEELPATH MLP SELECT 40 FUND |
THIS PAGE INTENTIONALLY LEFT BLANK
OPPENHEIMER STEELPATH MLP SELECT 40 FUND 55 |

Table of Contents
Fund Performance Discussion | 3 |
Top Holdings and Allocations | 7 |
Share Class Performance | 8 |
Fund Expenses | 10 |
Statement of Investments | 12 |
Statement of Assets and Liabilities | 14 |
Statement of Operations | 16 |
Statements of Changes in Net Assets | 17 |
Financial Highlights | 18 |
Notes to Financial Statements | 22 |
Distribution Sources | 38 |
Portfolio Proxy Voting Policies and Procedures; Updates to Statement of Investments | 39 |
Trustees and Officers | 40 |
Privacy Policy Notice | 41 |
Class A Shares
AVERAGE ANNUAL TOTAL RETURNS AT 5/31/18
| | Class A Shares of the Fund | | |
| Without
Sales Charge | With
Sales Charge | S&P
500 Index | Alerian
MLP Index |
6-Month | 0.77% | -5.00% | 3.16% | 5.71% |
1-Year | -8.08% | -13.35% | 14.38% | -3.71% |
5-Year | -1.93% | -3.09% | 12.98% | -3.20% |
Since Inception (3/31/10) | 3.19% | 2.45% | 13.17% | 5.15% |
Performance data quoted represents past performance, which does not guarantee future results. The investment return and principal value of an investment in the Fund will fluctuate so that an investor’s shares, when redeemed, may be worth more or less than their original cost. Fund returns include changes in share price, reinvested distributions, and a 5.75% maximum applicable sales charge except where “without sales charge” is indicated. Current performance may be lower or higher than the performance quoted. Returns do not consider capital gains or income taxes on an individual’s investment. Returns for periods of less than one year are cumulative and not annualized. For performance data current to the most recent month-end, visit oppenheimerfunds.com or call 1.800.CALL OPP (225.5677). See Fund prospectuses and summary prospectuses for more information on share classes and sales charges.
2 OPPENHEIMER STEELPATH MLP ALPHA FUND |
Fund Performance Discussion
The Fund’s Class A shares (without sales charge) produced a total return of 0.77% during the reporting period. In comparison, master limited partnerships (“MLPs”), as measured by the Alerian MLP Index (AMZ), provided a total return gain of 5.71%. During the same period, the S&P 500 Index produced a total return gain of 3.16%.
Over the six-month reporting period ended May 31, 2018, the midstream sector outperformed the broader markets despite facing headwinds presented by the U.S. Federal Energy Regulatory Commission (FERC), which announced changes related to pipeline tariffs in reaction to a federal court’s previous remand that cost-of-service tariffs on interstate natural gas and oil pipelines owned by MLPs would no longer receive an income tax allowance (ITA). This shift in FERC’s long-held position caused significant market confusion and volatility across the sector. While on the whole the sector overcame the initial widespread weakness, the value of the equities of select industry participants with the largest portfolios of FERC-regulated assets remain diminished at period end.
The need for additional midstream infrastructure to service growing volumes from the Permian basin became even more acute over the reporting period as production growth has exceeded even the most aggressive of previous industry predictions and appears set to overwhelm the energy infrastructure capacity bringing that crude oil and natural gas out of the basin. While there are multiple new-build pipelines and expansions in-progress, we believe that the long construction times required for these projects mean that meaningful relief is unlikely to come until mid-2019, at the earliest. As such, we expect that Permian producers without sufficient takeaway capacity will experience significantly worse pricing than peers with access to pipeline capacity. Some disadvantaged producers may slow their production growth until in-basin pricing recovers. Importantly, we believe certain midstream operators should enjoy both short-term and long-term benefits. Obviously, midstream operators are currently enjoying and we expect that they will continue to enjoy the full utilization of their assets servicing the basin. Some operators may also capture wide short-term marketing margins. Over the long-term, midstream operators may benefit from an increased desire by producers to commit to existing or new capacity that can earn a transportation fee for an extended period.
Over the reporting period, we estimate approximately $7 billion of new equity supply entered the market through secondary offerings, initial public offerings, preferred offerings, or “at-the-market” programs in which primary units trade into the market anonymously throughout the normal trading day. This pace of equity
OPPENHEIMER STEELPATH MLP ALPHA FUND 3 |
issuance represents a sharp decrease from approximately $15 billion that was raised over the six month reporting period ended May 31, 2017. Midstream companies also raised approximately $20 billion of debt capital during the period. Most MLPs pay out substantial distributions to investors and, therefore, often raise external capital to fund larger growth projects or acquisitions.
The Tax Cuts and Jobs Act of 2017, enacted on December 22, 2017, reduced the Fund’s Federal income tax rate from 35% to 21%. While we view a reduction in the corporate tax rate as a significant long-term positive for the C-Corp fund structure, the immediate impact was a reduction in the Fund’s Net Asset Value due to the required remeasuring of the Fund’s accumulated deferred tax assets, as of the enactment date, using the new 21% rate.
MACRO REVIEW
West Texas Intermediate (“WTI”) crude oil prices ended the reporting period at $67.07 per barrel, up 17% over the reporting period. Global crude prices, as measured by Brent crude oil, traded 26% higher over the reporting period. Brent exited the period at a $10.55 per barrel premium to WTI, as the aforementioned Permian capacity constraints also began to weigh on WTI pricing, relative to international levels, as more barrels are pushed from the Permian to Cushing, OK, where WTI pricing is set.
Henry Hub natural gas spot prices exited the period at $2.89 per million British thermal units (“mmbtu”), down 2% over the reporting period, and down 4% from the year-ago period. Natural gas pricing appears to have settled into a relatively narrow trading band as supply and demand dynamics have balanced with heating and electric generation demand stabilizing to weather-dependent levels, production volume growth increasing, and increasing liquefied natural gas exports.
Mont Belvieu natural gas liquids (“NGL”) prices ended the reporting period at $29.61 per barrel, a 7% increase over the reporting period. Pricing for NGL purity products varied, with ethane, isobutane, and natural gasoline trading higher over the period while butane and propane prices declined. Frac spreads, a measure of natural gas processing economics, ended the period at $0.49 per gallon, down 8% over the reporting period. Generally, the greater the frac spread, the greater the incentive for producers to seek natural gas processing capacity.
The yield curve flattened over the reporting period as short-term rates increased more than the yields on longer-dated maturities. The ten-year Treasury yield increased 45 basis points to end the period at 2.86%. The MLP yield spread at period-end, as measured by the AMZ and the 10-year Treasury bond, narrowed by 60 basis points to 5.12%.
Over the reporting period, real estate investment trusts (“REITs”) and utilities, two competing yield-oriented equity asset classes, posted total return losses of 3.11% (as measured by the Dow Jones Equity REIT Total Return Index) and 8.28% (as measured by the Dow Jones Utility Average Index), respectively, as compared
4 OPPENHEIMER STEELPATH MLP ALPHA FUND |
to the AMZ’s 5.71% total return gain. Price to forward distributable cash flow (DCF), a commonly watched ratio within the MLP sector, declined over the period, ending well below the ten-year average.
SUBSECTOR REVIEW
Performance among subsectors in the midstream, or energy infrastructure, MLP asset class varied for the reporting period. On average, sector participants focused on compression provided the best performance over the period, as strength in demand for compression services has driven increased asset utilization and pricing increases. The gathering and processing subsector followed, buoyed by improved volumetric projections.
The natural gas pipeline subsector experienced the weakest performance over the reporting period as these entities’ prospective cash flows were directly impacted by the FERC changes related to cost-of-service tariffs on interstate pipelines owned by MLPs. The propane subsector also lagged over the reporting period as winter demand proved fleeting and due to idiosyncratic factors at select subsector members.
FUND REVIEW
Key contributors to the Fund’s performance were Enterprise Products Partners, LP (EPD) and Energy Transfer Partners, LP (ETP).
EPD outperformed over the period as underlying business fundamentals continued to improve and as multiple large scale growth projects were placed into service or nearing completion. Additionally, EPD continued to benefit from increased market participant focus on partnerships without incentive distribution rights (“IDRs”) and modest equity capital needs.
ETP outperformed over the period as its robust portfolio of natural gas processing assets benefited from the recent expansion of processing facilities. In addition, its Permian and Marcellus/Utica assets have been seeing increasing activity that is expected to drive cash flow growth.
Key detractors from the Fund’s performance were TC Pipelines, LP (TCP) and Buckeye Partners, LP (BPL).
TCP units underperformed over the period following FERC changes related to cost-of-service tariffs on interstate natural gas and liquids pipelines owned by MLPs. Despite this concern, we believe the ultimate outcome is likely far more nuanced and any revenue impact much less widespread than the initial market reaction.
BPL underperformed over the period as market participants expressed heightened concerns related to storage re-contracting and following the FERC changes. BPL operates a portfolio of strategic, long-lived infrastructure assets that generates highly-stable, fee-based cash flows. Despite the recent headwinds, the partnership still maintains distribution coverage of approximately 1.0x, and we believe that it has manageable capital needs, and continues to find growth opportunities that enhance its core asset base.
OPPENHEIMER STEELPATH MLP ALPHA FUND 5 |
Please note that significant decreases in cash distributions from the Fund’s MLP investments and/or significant declines in the value of its investments may impact the Fund’s assessment regarding the recoverability of certain deferred tax assets, which may result in the recording of a valuation allowance. If a valuation allowance is established, this could have a material impact on the Fund’s net asset value and results of operations for the period. The Fund had a valuation allowance in place during the reporting period and at period end. See Note 2 of the Notes to Financial Statements for more information.
OUTLOOK
We believe midstream equity valuations are attractive and sector participants have improved their positioning for the future. While the AMZ is above the cyclical low, it remains at levels present before the shale production renaissance. Notably, this is occurring at a time when many MLPs have reached or are approaching a self-funding level of retained cash flows and the industry’s heaviest capital spending obligations appear to be in the past. Accordingly, we believe the stage is setting for a realignment of business and equity fundamentals, positioning the sector well for long-term investors seeking an attractive blend of current income, moderate growth, and, presently, attractive valuations.

| 
Stuart Cartner
Portfolio Manager
| 
| 
Brian Watson, CFA
Portfolio Manager
|
6 OPPENHEIMER STEELPATH MLP ALPHA FUND |
Top Holdings and Allocations
TOP TEN MASTER LIMITED PARTNERSHIP AND RELATED ENTITIES HOLDINGS
Enterprise Products Partners LP | 10.85% |
Energy Transfer Partners LP | 10.11% |
Energy Transfer Equity LP | 8.43% |
MPLX LP | 8.14% |
Targa Resources Corp. | 7.23% |
Magellan Midstream Partners LP | 7.00% |
Tallgrass Energy GP LP | 5.82% |
Williams Partners LP | 5.69% |
Buckeye Partners LP | 5.13% |
Williams Cos., Inc. | 3.79% |
Portfolio holdings and allocations are subject to change. Percentages are as of May 31, 2018, and are based on net assets. For more current Fund holdings, please visit oppenheimerfunds.com.
SECTOR ALLOCATION
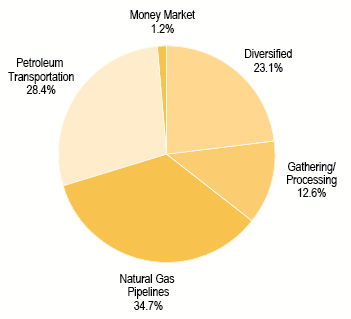
Portfolio holdings and allocations are subject to change. Percentages are as of May 31, 2018, and are based on the total market value of investments. For more current Fund holdings, please visit oppenheimerfunds.com.
OPPENHEIMER STEELPATH MLP ALPHA FUND 7 |
Share Class Performance
AVERAGE ANNUAL TOTAL RETURNS WITHOUT SALES CHARGE AS OF 5/31/18
| | Inception Date | 6-Month | 1-Year | 5-Year | Since Inception |
CLASS A (MLPAX) | 3/31/10 | 0.77% | -8.08% | -1.93% | 3.19% |
CLASS C (MLPGX) | 8/25/11 | 0.39% | -8.73% | -2.68% | 1.65% |
CLASS I (OSPAX) | 6/28/13 | 1.00% | -7.74% | N/A | -2.35% |
CLASS Y (MLPOX) | 3/31/10 | 0.88% | -7.88% | -1.70% | 3.45% |
AVERAGE ANNUAL TOTAL RETURNS WITH SALES CHARGE AS OF 5/31/18
| | Inception Date | 6-Month | 1-Year | 5-Year | Since Inception |
CLASS A (MLPAX) | 3/31/10 | -5.00% | -13.35% | -3.09% | 2.45% |
CLASS C (MLPGX) | 8/25/11 | -0.57% | -9.57% | -2.68% | 1.65% |
CLASS I (OSPAX) | 6/28/13 | 1.00% | -7.74% | N/A | -2.35% |
CLASS Y (MLPOX) | 3/31/10 | 0.88% | -7.88% | -1.70% | 3.45% |
Performance data quoted represents past performance, which does not guarantee future results. The investment return and principal value of an investment in the Fund will fluctuate so that an investor’s shares, when redeemed, may be worth more or less than their original cost. Current performance may be lower or higher than the performance quoted. Returns do not consider capital gains or income taxes on an individual’s investment. For performance data current to the most recent month-end, visit oppenheimerfunds.com or call 1.800.CALL OPP (225.5677). Fund returns include changes in share price, reinvested distributions, and the applicable sales charge: for Class A shares, the current maximum initial sales charge of 5.75%, and for Class C shares, the contingent deferred sales charge of 1% for the 1-year period. There is no sales charge for Class I or Class Y shares. Returns for periods of less than one year are cumulative and not annualized. See Fund prospectuses and summary prospectuses for more information on share classes and sales charges.
The Fund’s performance is compared to the performance of the S&P 500 Index and the Alerian MLP Index. The S&P 500 Index is a capitalization-weighted index of 500 stocks intended to be a representative sample of leading companies in leading industries within the U.S. economy. The Alerian MLP Index is a float-adjusted, capitalization-weighted index measuring master limited partnerships, whose constituents represent approximately 85% of total float-adjusted market capitalization. The returns for the S&P 500 Index and Alerian MLP Index are calculated pre-tax, while the Fund’s returns are calculated post corporate tax. The indices are unmanaged and cannot be purchased directly by investors. While index comparisons may be useful to provide a benchmark for the Fund’s performance, it must be noted that the Fund’s investments are not limited to the investments comprising the indices. Index performance
8 OPPENHEIMER STEELPATH MLP ALPHA FUND |
includes reinvestment of income, but does not reflect transaction costs, fees, expenses or taxes. Index performance is shown for illustrative purposes only as a benchmark for the Fund’s performance, and does not predict or depict performance of the Fund. The Fund’s performance reflects the effects of the Fund’s business and operating expenses.
The Fund’s investment strategy and focus can change over time. The mention of specific fund holdings does not constitute a recommendation by OppenheimerFunds, Inc. or its affiliates.
The views in the Fund Performance Discussion represent the opinions of this Fund’s portfolio managers and are not intended as investment advice or to predict or depict the performance of any investment. These views are as of the close of business on May 31, 2018, and are subject to change based on subsequent developments. The Fund’s portfolio and strategies are subject to change.
Before investing in any of the Oppenheimer funds, investors should carefully consider a fund’s investment objectives, risks, charges and expenses. Fund prospectuses and summary prospectuses contain this and other information about the funds, and may be obtained by asking your financial advisor, visiting oppenheimerfunds.com, or calling 1.800.CALL OPP (225.5677). Read prospectuses and summary prospectuses carefully before investing.
Shares of Oppenheimer funds are not deposits or obligations of any bank, are not guaranteed by any bank, are not insured by the FDIC or any other agency, and involve investment risks, including the possible loss of the principal amount invested.
OPPENHEIMER STEELPATH MLP ALPHA FUND 9 |
Fund Expenses
Fund Expenses. As a shareholder of the Fund, you incur two types of costs: (1) transaction costs, which may include sales charges (loads) on purchase payments, contingent deferred sales charges on redemptions; and (2) ongoing costs, including management fees; distribution and service fees; and other Fund expenses. These examples are intended to help you understand your ongoing costs (in dollars) of investing in the Fund and to compare these costs with the ongoing costs of investing in other mutual funds.
The examples are based on an investment of $1,000.00 invested at the beginning of the period and held for the entire 6-month period ended May 31, 2018.
Actual Expenses. The first section of the table provides information about actual account values and actual expenses. You may use the information in this section for the class of shares you hold, together with the amount you invested, to estimate the expense that you paid over the period. Simply divide your account value by $1,000.00 (for example, an $8,600.00 account value divided by $1,000.00 = 8.60), then multiply the result by the number in the first section under the heading entitled “Expenses Paid During 6 Months Ended May 31, 2018” to estimate the expenses you paid on your account during this period.
Hypothetical Example for Comparison Purposes. The second section of the table provides information about hypothetical account values and hypothetical expenses based on the Fund’s actual expense ratio for each class of shares, and an assumed rate of return of 5% per year for each class before expenses, which is not the actual return. The hypothetical account values and expenses may not be used to estimate the actual ending account balance or expenses you paid for the period. You may use this information to compare the ongoing costs of investing in the Fund and other funds. To do so, compare this 5% hypothetical example for the class of shares you hold with the 5% hypothetical examples that appear in the shareholder reports of the other funds.
Please note that the expenses shown in the table are meant to highlight your ongoing costs only and do not reflect any transactional costs, such as front-end or contingent deferred sales charges (loads). Therefore, the “hypothetical” section of the table is useful in comparing ongoing costs only, and will not help you determine the relative total costs of owning different funds. In addition, if these transactional costs were included, your costs would have been higher.
10 OPPENHEIMER STEELPATH MLP ALPHA FUND |
Actual | Beginning
Account Value
December 1, 2017 | Ending
Account Value
May 31, 2018 | Expenses
Paid During
6 Months Ended
May 31, 2018 |
CLASS A | $ 1,000.00 | $ 1,007.70 | $ 33.05 |
CLASS C | 1,000.00 | 1,003.90 | 36.75 |
CLASS I | 1,000.00 | 1,010.00 | 31.54 |
| CLASS Y | 1,000.00 | 1,008.80 | 31.82 |
Hypothetical
(5% return before expenses) | | | |
CLASS A | 1,000.00 | 992.07 | 32.80 |
CLASS C | 1,000.00 | 988.32 | 36.47 |
CLASS I | 1,000.00 | 993.62 | 31.28 |
CLASS Y | 1,000.00 | 993.32 | 31.58 |
Expenses are equal to the Fund’s annualized expense ratio for that class, multiplied by the average account value over the period, multiplied by 182/365 (to reflect the one-half year period). Those annualized expense ratios, excluding indirect expenses from affiliated funds, and tax expense, based on the 6-month period ended May 31, 2018 are as follows:
Class | Expense Ratios |
CLASS A | 6.60% |
CLASS C | 7.36 |
CLASS I | 6.29 |
CLASS Y | 6.35 |
The expense ratios for Class A, C, and Y reflect contractual and/or voluntary waivers and/or reimbursements of expenses by the Fund’s Manager and Transfer Agent. Some of these undertakings may be modified or terminated at any time, as indicated in the Fund’s prospectus. The “Financial Highlights” tables in the Fund’s financial statements, included in this report, also show the gross expense ratios, without such waivers or reimbursements, if applicable.
OPPENHEIMER STEELPATH MLP ALPHA FUND 11 |
STATEMENT OF INVESTMENTS May 31, 2018 / Unaudited |
| Description | | Shares | | | Value | |
| MLP Investments and Related Entities — 92.0% |
| Diversified — 18.6% |
| Enterprise Products Partners LP | | | 9,120,404 | | | $ | 263,579,676 | |
Westlake Chemical Partners LP 1 | | | 2,206,802 | | | | 51,308,146 | |
| Williams Partners LP | | | 3,472,293 | | | | 138,197,261 | |
| Total Diversified | | | | | | | 453,085,083 | |
| | | | | | | | | |
| Gathering/Processing — 12.2% |
| Antero Midstream GP LP | | | 3,964,500 | | | | 76,316,625 | |
| Targa Resources Corp. | | | 3,612,264 | | | | 175,664,399 | |
| Western Gas Partners LP | | | 888,078 | | | | 45,886,990 | |
| Total Gathering/Processing | | | | | | | 297,868,014 | |
| | | | | | | | | |
| Natural Gas Pipelines — 33.7% |
| Energy Transfer Equity LP | | | 11,848,357 | | | | 204,739,609 | |
| Energy Transfer Partners LP | | | 12,934,533 | | | | 245,626,782 | |
| EQT Midstream Partners LP | | | 1,275,606 | | | | 71,217,083 | |
| Rice Midstream Partners LP | | | 3,108,736 | | | | 57,418,354 | |
Tallgrass Energy GP LP 1 | | | 6,579,009 | | | | 141,514,483 | |
| Tallgrass Energy Partners LP | | | 597,795 | | | | 26,105,708 | |
TC Pipelines LP 1 | | | 2,939,022 | | | | 71,477,015 | |
| Total Natural Gas Pipelines | | | | | | | 818,099,034 | |
| | | | | | | | | |
| Petroleum Transportation — 27.5% |
| Buckeye Partners LP | | | 3,455,035 | | | | 124,554,012 | |
| Genesis Energy LP | | | 1,065,320 | | | | 23,394,427 | |
| Magellan Midstream Partners LP | | | 2,432,425 | | | | 170,026,508 | |
| MPLX LP | | | 5,505,398 | | | | 197,698,842 | |
| Phillips 66 Partners LP | | | 1,259,446 | | | | 65,869,026 | |
| Plains All American Pipeline LP | | | 1,796,904 | | | | 42,227,244 | |
| Petroleum Transportation — 27.5% (Continued) |
| Plains GP Holdings LP, Class A | | | 1,775,639 | | | $ | 43,627,450 | |
| Total Petroleum Transportation | | | | | | | 667,397,509 | |
| | | | | | | | | |
| Total MLP Investments and Related Entities |
| (identified cost $2,207,149,072) | | | | | | | 2,236,449,640 | |
| | | | | | | | | |
| Common Stock — 3.8% |
| Diversified — 3.8% |
| Williams Cos., Inc. | | | 3,429,309 | | | | 92,111,240 | |
| | | | | | | | | |
| Total Common Stock | | | | | | | | |
| (identified cost $109,958,434) | | | | | | | 92,111,240 | |
| | | | | | | | | |
| Short-Term Investments — 1.2% |
| Money Market — 1.2% |
| Fidelity Treasury Portfolio, Institutional Class, 1.597% | | | 28,636,737 | | | | 28,636,737 | |
| | | | | | | | | |
| Total Short-Term Investments |
| (identified cost $28,636,737) | | | | | | | 28,636,737 | |
| | | | | | | | | |
| Total Investments — 97.0% | | | | | | | | |
| (identified cost $2,345,744,243) | | | | | | | 2,357,197,617 | |
| Other Assets In Excess of Liabilities — 3.0% | | | | | | | 72,289,850 | |
| Net Assets -— 100.0% | | | | | | $ | 2,429,487,467 | |
12 OPPENHEIMER STEELPATH MLP ALPHA FUND |
STATEMENT OF INVESTMENTS Unaudited / (Continued) |
Footnotes to Statement of Investments
GP — General Partnership
LP — Limited Partnership
1. | Is or was an affiliate, as defined by the Investment Company Act of 1940, at or during the period ended May 31, 2018, by virtue of the Fund owning at least 5% of the voting securities of the issuer. Transactions during this period in which the issuer was an affiliate are as follows: |
| | | Shares
November 30,
2017 | | | Gross
Additions | | | Gross
Reductions | | | Shares
May 31, 2018 | |
| MLP Investments and Related Entities | | | | | | | | | |
| Tallgrass Energy GP LP | | | 5,451,112 | | | | 1,546,576 | | | | (418,679 | ) | | | 6,579,009 | |
TC Pipelines LP i | | | 3,320,336 | | | | 743,338 | | | | (1,124,652 | ) | | | 2,939,022 | |
| Westlake Chemical Partners LP | | | 2,687,407 | | | | 50,520 | | | | (531,125 | ) | | | 2,206,802 | |
| | | | | | Distributions and Dividends | | | | | | | |
| | | Value
May 31, 2018 | | | Return of
Capital | | | Capital Gains | | | Income | | | Realized
Gain/(Loss) | | | Change in
Unrealized
Gain/(Loss) | |
| MLP Investments and Related Entities | | | | | | | | | | | | | | | |
| Tallgrass Energy GP LP | | $ | 141,514,483 | | | $ | 5,099,525 | | | $ | — | | | $ | — | | | $ | (519,632 | ) | | $ | 149,347 | |
TC Pipelines LP i | | | 71,477,015 | | | | 5,938,448 | | | | — | | | | — | | | | (14,909,140 | ) | | | (74,916,255 | ) |
| Westlake Chemical Partners LP | | | 51,308,146 | | | | 1,876,181 | | | | — | | | | — | | | | 1,585,469 | | | | 3,620,362 | |
| | | $ | 264,299,644 | | | $ | 12,914,154 | | | $ | — | | | $ | — | | | $ | (13,843,303 | ) | | $ | (71,146,546 | ) |
| | i | Is not an affiliate on May 31, 2018. Was an affiliate during period ended May 31, 2018. |
See accompanying Notes to Financial Statements.
OPPENHEIMER STEELPATH MLP ALPHA FUND 13 |
STATEMENT OF ASSETS AND LIABILITIES May 31, 2018 / Unaudited |
| Assets: | | | |
| Investments at value – see accompanying Statement of Investments: | | | |
| Unaffiliated companies (cost $2,175,055,298) | | $ | 2,164,374,988 | |
| Affiliated companies (cost $170,688,945) | | | 192,822,629 | |
| | | | 2,357,197,617 | |
| Deferred tax asset, net | | | 75,921,819 | |
| Receivable for beneficial interest sold | | | 3,070,605 | |
| Prepaid expenses | | | 289,996 | |
| Dividends receivable | | | 20,598 | |
| Total assets | | | 2,436,500,635 | |
| Liabilities: | | | | |
| Payable for beneficial interest redeemed | | | 3,609,985 | |
| Payable to Manager | | | 2,027,856 | |
| Payable for distribution and service plan fees | | | 540,670 | |
| Transfer agent fees payable, net of voluntary waiver | | | 373,304 | |
| Trustees' fees payable | | | 25,007 | |
| Borrowing expense payable | | | 39,054 | |
| Other liabilities | | | 397,292 | |
| Total liabilities | | | 7,013,168 | |
| Net Assets | | $ | 2,429,487,467 | |
| Composition of Net Assets | | | | |
| Par value of shares of beneficial interest | | $ | 322,101 | |
| Paid-in capital | | | 3,160,605,663 | |
| Undistributed net investment loss, net of deferred taxes | | | (474,076,989 | ) |
| Accumulated undistributed net realized losses on investments, net of deferred taxes | | | (138,183,295 | ) |
| Net unrealized depreciation on investments, net of deferred taxes | | | (119,180,013 | ) |
| Net Assets | | $ | 2,429,487,467 | |
14 OPPENHEIMER STEELPATH MLP ALPHA FUND |
STATEMENT OF ASSETS AND LIABILITIES Unaudited / (Continued) |
| Net Asset Value, Offering Price and Redemption Proceeds Per Share ($0.001 Par Value, Unlimited Shares Authorized) | | | |
| Class A Shares: | | | |
| Net asset value and redemption proceeds per share | | $ | 7.52 | |
| Offering price per share (net asset value plus sales charge of 5.75% of offering price) | | $ | 7.98 | |
| Class C Shares: | | | | |
| Net asset value, offering price and redemption proceeds per share | | $ | 7.09 | |
| Class I Shares: | | | | |
| Net asset value, offering price and redemption proceeds per share | | $ | 7.77 | |
| Class Y Shares: | | | | |
| Net asset value, offering price and redemption proceeds per share | | $ | 7.73 | |
| Net Assets: | | | |
| Class A shares | | $ | 567,300,971 | |
| Class C shares | | | 502,072,124 | |
| Class I shares | | | 168,593,529 | |
| Class Y shares | | | 1,191,520,843 | |
| Total Net Assets | | $ | 2,429,487,467 | |
| Shares Outstanding: | | | | |
| Class A shares | | | 75,461,727 | |
| Class C shares | | | 70,800,704 | |
| Class I shares | | | 21,709,050 | |
| Class Y shares | | | 154,129,775 | |
| Total Shares Outstanding | | | 322,101,256 | |
See accompanying Notes to Financial Statements.
OPPENHEIMER STEELPATH MLP ALPHA FUND 15 |
STATEMENT OF OPERATIONS
For the Six Months Ended May 31, 2018 / Unaudited |
| Investment Income | | | |
| Distributions and dividends | | $ | 91,648,041 | |
| Less return of capital on distributions and dividends ($12,914,154 from affiliates) | | | (89,454,986 | ) |
| Total investment income | | | 2,193,055 | |
| Expenses | | | | |
| Management fees | | | 14,136,427 | |
| Distribution and service plan fees | | | | |
| Class A | | | 742,674 | |
| Class C | | | 2,672,268 | |
| Transfer agent fees | | | | |
| Class A | | | 595,539 | |
| Class C | | | 533,347 | |
| Class I | | | 23,185 | |
| Class Y | | | 1,281,589 | |
| Borrowing fees | | | 329,813 | |
| Administrative fees | | | 308,476 | |
| Legal, auditing, and other professional fees | | | 148,584 | |
| Custody fees | | | 143,587 | |
| Registration fees | | | 76,637 | |
| Tax expense | | | 56,106 | |
| Trustees' fees | | | 38,990 | |
| Other | | | 38,824 | |
| Total expenses, before waivers and deferred taxes | | | 21,126,046 | |
| Less expense waivers | | | (1,309,474 | ) |
| Net expenses, before deferred taxes | | | 19,816,572 | |
| Net investment loss, before deferred taxes | | | (17,623,517 | ) |
| Deferred tax expense | | | (39,756,695 | ) |
| Net investment loss, net of deferred taxes | | | (57,380,212 | ) |
| Net Realized and Unrealized Gains/Losses on Investments: | | | | |
| Net Realized Losses | | | | |
| Investments from: | | | | |
| Unaffiliated companies | | | (63,554,458 | ) |
| Affiliated companies | | | (13,843,303 | ) |
| Deferred tax expense | | | (56,370,072 | ) |
| Net realized losses, net of deferred taxes | | | (133,767,833 | ) |
| Net Change in Unrealized Appreciation/(Depreciation) | | | | |
| Investments from: | | | | |
| Unaffiliated companies | | | 244,702,039 | |
| Affiliated companies | | | (71,146,546 | ) |
| Deferred tax benefit | | | 31,097,975 | |
| Net change in unrealized appreciation/(depreciation), net of deferred taxes | | | 204,653,468 | |
| Net realized and unrealized gains / (losses) on investments, net of deferred taxes | | | 70,885,635 | |
| Change in net assets resulting from operations | | $ | 13,505,423 | |
See accompanying Notes to Financial Statements.
16 OPPENHEIMER STEELPATH MLP ALPHA FUND |
STATEMENTS OF CHANGES IN NET ASSETS |
| | | For the Six
Months Ended
May 31, 2018
(Unaudited) | | | For the
Year Ended
November 30,
2017 | |
| Operations | | | | | | |
| Net investment loss, net of deferred taxes | | $ | (57,380,212 | ) | | $ | (52,670,183 | ) |
| Net realized gains/(losses), net of deferred taxes | | | (133,767,833 | ) | | | 321,722,673 | |
| Net change in unrealized appreciation/(depreciation), net of deferred taxes | | | 204,653,468 | | | | (512,883,737 | ) |
| Change in net assets resulting from operations | | | 13,505,423 | | | | (243,831,247 | ) |
| Distributions to Shareholders | | | | | | | | |
| Distributions to shareholders from return of capital: | | | | | | | | |
| Class A shares | | | (21,111,315 | ) | | | — | |
| Class C shares | | | (19,975,027 | ) | | | — | |
| Class I shares | | | (5,360,821 | ) | | | — | |
| Class Y shares | | | (44,334,682 | ) | | | — | |
| Distributions to shareholders from return of capital: | | | (90,781,845 | ) | | | — | |
| Distributions to shareholders from income: | | | | | | | | |
| Class A shares | | | — | | | | (65,056,166 | ) |
| Class C shares | | | — | | | | (55,952,576 | ) |
| Class I shares | | | — | | | | (10,861,151 | ) |
| Class Y shares | | | — | | | | (117,614,208 | ) |
| Distributions to shareholders from income: | | | — | | | | (249,484,101 | ) |
| Change in net assets resulting from distributions to shareholders | | | (90,781,845 | ) | | | (249,484,101 | ) |
| Beneficial Interest Transactions | | | | | | | | |
| Class A shares | | | (40,456,179 | ) | | | (334,984,829 | ) |
| Class C shares | | | (47,361,869 | ) | | | (93,652,275 | ) |
| Class I shares | | | 23,509,309 | | | | 72,813,168 | |
| Class Y shares | | | (146,949,803 | ) | | | 72,771,245 | |
| Change in net assets resulting from beneficial interest transactions | | | (211,258,542 | ) | | | (283,052,691 | ) |
| Change in net assets | | | (288,534,964 | ) | | | (776,368,039 | ) |
| Net Assets | | | | | | | | |
| Beginning of period | | | 2,718,022,431 | | | | 3,494,390,470 | |
| End of period | | $ | 2,429,487,467 | | | $ | 2,718,022,431 | |
| | | | | | | | | |
| Undistributed net investment loss, net of deferred taxes | | $ | (474,076,989 | ) | | $ | (416,696,777 | ) |
See accompanying Notes to Financial Statements.
OPPENHEIMER STEELPATH MLP ALPHA FUND 17 |
| Class A | | Six Months Ended
May 31, 2018 (Unaudited) | | | Year Ended November 30,
2017 | | | Year Ended November 30,
2016 | | | Year Ended November 30,
2015 | | | Year Ended November 28,
2014* | | | Year Ended November 29,
2013* | |
| Per Share Operating Data | | | | | | | | | | | | | | | | | | |
| Net Asset Value, Beginning of Period | | $ | 7.74 | | | $ | 9.05 | | | $ | 9.32 | | | $ | 12.81 | | | $ | 12.04 | | | $ | 10.70 | |
| Income/(loss) from investment operations: | | | | | | | | | | | | | | | | | | | | | | | | |
Net investment loss1 | | | (0.17 | ) | | | (0.14 | ) | | | (0.06 | ) | | | (0.07 | ) | | | (0.12 | ) | | | (0.11 | ) |
Return of capital1 | | | 0.21 | | | | 0.35 | | | | 0.35 | | | | 0.40 | | | | 0.42 | | | | 0.42 | |
| Net realized and unrealized gains/(losses) | | | 0.01 | | | | (0.86 | ) | | | 0.13 | | | | (3.13 | ) | | | 1.16 | | | | 1.72 | |
| Total from investment operations | | | 0.05 | | | | (0.65 | ) | | | 0.42 | | | | (2.80 | ) | | | 1.46 | | | | 2.03 | |
| Distributions to shareholders: | | | | | | | | | | | | | | | | | | | | | | | | |
| Return of capital | | | (0.27 | ) | | | — | | | | (0.69 | ) | | | (0.69 | ) | | | (0.69 | ) | | | (0.69 | ) |
| Income | | | — | | | | (0.66 | ) | | | — | | | | — | | | | — | | | | — | |
| Total distributions to shareholders | | | (0.27 | ) | | | (0.66 | ) | | | (0.69 | ) | | | (0.69 | ) | | | (0.69 | ) | | | (0.69 | ) |
| Net asset value, end of period | | $ | 7.52 | | | $ | 7.74 | | | $ | 9.05 | | | $ | 9.32 | | | $ | 12.81 | | | $ | 12.04 | |
Total Return, at Net Asset Value2 | | | 0.77 | % | | | (7.78 | %) | | | 5.25 | % | | | (22.59 | %) | | | 12.26 | % | | | 19.29 | % |
| Ratios/Supplemental Data | | | | | | | | | | | | | | | | | | | | | | | | |
| Net assets, end of period (in thousands) | | $ | 567,301 | | | $ | 625,062 | | | $ | 1,073,057 | | | $ | 1,226,012 | | | $ | 1,937,356 | | | $ | 1,154,926 | |
Ratio of Expenses to Average Net Assets:9 | | | | | | | | | | | | | | | | | | | | | | | | |
| Before (waivers) and deferred/current tax expense/(benefit) | | | 1.64 | % | | | 1.63 | % | | | 1.64 | % | | | 1.63 | % | | | 1.65 | % | | | 1.55 | % |
| Expense (waivers) | | | (0.11 | %)3 | | | (0.12 | %)3 | | | (0.11 | %) | | | (0.11 | %) | | | (0.12 | %) | | | (0.03 | %) |
| Net of (waivers) and before deferred/current tax expense/(benefit) | | | 1.53 | %4 | | | 1.51 | %4 | | | 1.53 | %4 | | | 1.52 | %4 | | | 1.53 | %4 | | | 1.52 | %5 |
Deferred/current tax expense/(benefit)6,7 | | | 5.07 | % | | | 0.70 | % | | | 2.54 | % | | | (14.45 | %) | | | 5.38 | % | | | 8.07 | % |
| Total expenses/(benefit) | | | 6.60 | % | | | 2.21 | % | | | 4.07 | % | | | (12.93 | %) | | | 6.91 | % | | | 9.59 | % |
Ratio of Investment Loss to Average Net Assets:9 | | | | | | | | | | | | | | | | | | | | | | | | |
| Before (waivers) and deferred tax benefit/(expense) | | | (1.49 | %) | | | (1.59 | %) | | | (1.32 | %) | | | (1.38 | %) | | | (1.57 | %) | | | (1.52 | %) |
| Expense (waivers) | | | (0.11 | %)3 | | | (0.12 | %)3 | | | (0.11 | %) | | | (0.11 | %) | | | (0.12 | %) | | | (0.03 | %) |
| Net of expense (waivers) and before deferred tax benefit/(expense) | | | (1.38 | %) | | | (1.47 | %) | | | (1.21 | %) | | | (1.27 | %) | | | (1.45 | %) | | | (1.49 | %) |
Deferred tax benefit/(expense)7,8 | | | (3.10 | %) | | | (0.11 | %) | | | 0.55 | % | | | 0.63 | % | | | 0.54 | % | | | 0.54 | % |
| Net investment loss | | | (4.48 | %) | | | (1.58 | %) | | | (0.66 | %) | | | (0.64 | %) | | | (0.91 | %) | | | (0.95 | %) |
| | | | | | | | | | | | | | | | | | | | | | | | | |
| Portfolio turnover rate | | | 13 | % | | | 37 | % | | | 35 | % | | | 36 | % | | | 17 | % | | | 9 | % |
* | November 28, 2014 and November 29, 2013 represent the last business day of the Fund’s respective reporting periods. |
1. | Per share net investment loss is calculated based on average shares outstanding during the period net of deferred tax expense/benefit. Per share return of capital is calculated based on average shares during the period net of deferred tax expense/benefit estimated at the combined Federal and State statutory income tax rate (see Note 2). |
2. | Assumes an initial investment on the business day before the first day of the fiscal period, with all dividends and distributions reinvested in additional shares on the reinvestment date, and redemptions at the net asset value calculated on the last business day of the fiscal period. Sales charges are not reflected in the total returns. Total returns are not annualized for periods less than one full year. Returns do not reflect the deduction of taxes that a shareholder would pay on fund distributions or the redemption of fund shares. The returns do not include adjustments in accordance with generally accepted accounting principles required at the period end for financial reporting purposes. |
3. | Includes voluntary Transfer Agent waiver of 0.015% effective January 1, 2017 to December 31, 2017 (See Note 7). |
4. | Includes borrowing and franchise tax expense. Without borrowing and franchise tax expense, the net expense ratio would be 1.50%. |
5. | Includes franchise tax expense. Without franchise tax expense the net expense ratio would be 1.50%. |
6. | Deferred tax expense estimate for the ratio calculation is derived from the net investment income/loss, and realized and unrealized gains/losses. |
7. | Effective December 1, 2013 the deferred tax expense and deferred tax benefit are allocated based on average net assets. Prior to December 1, 2013 the deferred tax expense and deferred tax benefit were allocated based on specific class expenses. |
8. | Deferred tax benefit for the ratio calculation, when applicable, is derived from net investment income/loss only. |
9. | Annualized less than a full period. |
See accompanying Notes to Financial Statements.
18 OPPENHEIMER STEELPATH MLP ALPHA FUND |
FINANCIAL HIGHLIGHTS (Continued) |
| Class C | | Six Months Ended
May 31, 2018 (Unaudited) | | | Year Ended November 30,
2017 | | | Year Ended November 30,
2016 | | | Year Ended November 30,
2015 | | | Year Ended November 28,
2014* | | | Year Ended November 29,
2013* | |
| Per Share Operating Data | | | | | | | | | | | | | | | | | | |
| Net Asset Value, Beginning of Period | | $ | 7.34 | | | $ | 8.69 | | | $ | 9.04 | | | $ | 12.53 | | | $ | 11.89 | | | $ | 10.64 | |
| Income/(loss) from investment operations: | | | | | | | | | | | | | | | | | | | | | | | | |
Net investment loss1 | | | (0.20 | ) | | | (0.22 | ) | | | (0.13 | ) | | | (0.16 | ) | | | (0.22 | ) | | | (0.17 | ) |
Return of capital1 | | | 0.21 | | | | 0.35 | | | | 0.35 | | | | 0.40 | | | | 0.42 | | | | 0.42 | |
| Net realized and unrealized gains/(losses) | | | 0.01 | | | | (0.82 | ) | | | 0.12 | | | | (3.04 | ) | | | 1.13 | | | | 1.69 | |
| Total from investment operations | | | 0.02 | | | | (0.69 | ) | | | 0.34 | | | | (2.80 | ) | | | 1.33 | | | | 1.94 | |
| Distributions to shareholders: | | | | | | | | | | | | | | | | | | | | | | | | |
| Return of capital | | | (0.27 | ) | | | — | | | | (0.69 | ) | | | (0.69 | ) | | | (0.69 | ) | | | (0.69 | ) |
| Income | | | — | | | | (0.66 | ) | | | — | | | | — | | | | — | | | | — | |
| Total distributions to shareholders | | | (0.27 | ) | | | (0.66 | ) | | | (0.69 | ) | | | (0.69 | ) | | | (0.69 | ) | | | (0.69 | ) |
| Net asset value, end of period | | $ | 7.09 | | | $ | 7.34 | | | $ | 8.69 | | | $ | 9.04 | | | $ | 12.53 | | | $ | 11.89 | |
Total Return, at Net Asset Value2 | | | 0.39 | % | | | (8.59 | %) | | | 4.51 | % | | | (23.11 | %) | | | 11.30 | % | | | 18.54 | % |
| Ratios/Supplemental Data | | | | | | | | | | | | | | | | | | | | | | | | |
| Net assets, end of period (in thousands) | | $ | 502,072 | | | $ | 568,380 | | | $ | 772,963 | | | $ | 783,886 | | | $ | 1,011,690 | | | $ | 451,351 | |
| Ratio of Expenses to Average Net Assets:9 | | | | | | | | | | | | | | | | | | | | | | | | |
| Before (waivers) and deferred/current tax expense/(benefit) | | | 2.39 | % | | | 2.38 | % | | | 2.39 | % | | | 2.38 | % | | | 2.40 | % | | | 2.30 | % |
| Expense (waivers) | | | (0.11 | %)3 | | | (0.12 | %)3 | | | (0.11 | %) | | | (0.11 | %) | | | (0.12 | %) | | | (0.03 | %) |
| Net of (waivers) and before deferred/current tax expense/(benefit) | | | 2.28 | %4 | | | 2.26 | %4 | | | 2.28 | %4 | | | 2.27 | %4 | | | 2.28 | %4 | | | 2.27 | %5 |
Deferred/current tax expense/(benefit)6,7 | | | 5.07 | % | | | 0.70 | % | | | 2.54 | % | | | (14.45 | %) | | | 5.38 | % | | | 6.91 | % |
| Total expenses/(benefit) | | | 7.35 | % | | | 2.96 | % | | | 4.82 | % | | | (12.18 | %) | | | 7.66 | % | | | 9.18 | % |
| Ratio of Investment Loss to Average Net Assets:9 | | | | | | | | | | | | | | | | | | | | | | | | |
| Before (waivers) and deferred tax benefit/(expense) | | | (2.64 | %) | | | (2.62 | %) | | | (2.27 | %) | | | (2.21 | %) | | | (2.34 | %) | | | (2.27 | %) |
| Expense (waivers) | | | (0.11 | %)3 | | | (0.12 | %)3 | | | (0.11 | %) | | | (0.11 | %) | | | (0.12 | %) | | | (0.03 | %) |
| Net of expense (waivers) and before deferred tax benefit/(expense) | | | (2.53 | %) | | | (2.50 | %) | | | (2.16 | %) | | | (2.10 | %) | | | (2.22 | %) | | | (2.24 | %) |
Deferred tax benefit/(expense)7,8 | | | (3.10 | %) | | | (0.11 | %) | | | 0.55 | % | | | 0.63 | % | | | 0.54 | % | | | 0.82 | % |
| Net investment loss | | | (5.63 | %) | | | (2.61 | %) | | | (1.61 | %) | | | (1.47 | %) | | | (1.68 | %) | | | (1.42 | %) |
| Portfolio turnover rate | | | 13 | % | | | 37 | % | | | 35 | % | | | 36 | % | | | 17 | % | | | 9 | % |
* | November 28, 2014 and November 29, 2013 represent the last business day of the Fund’s respective reporting periods. |
1. | Per share net investment loss is calculated based on average shares outstanding during the period net of deferred tax expense/benefit. Per share return of capital is calculated based on average shares during the period net of deferred tax expense/benefit estimated at the combined Federal and State statutory income tax rate (see Note 2). |
2. | Assumes an initial investment on the business day before the first day of the fiscal period, with all dividends and distributions reinvested in additional shares on the reinvestment date, and redemptions at the net asset value calculated on the last business day of the fiscal period. Sales charges are not reflected in the total returns. Total returns are not annualized for periods less than one full year. Returns do not reflect the deduction of taxes that a shareholder would pay on fund distributions or the redemption of fund shares. The returns do not include adjustments in accordance with generally accepted accounting principles required at the period end for financial reporting purposes. |
3. | Includes voluntary Transfer Agent waiver of 0.015% effective January 1, 2017 to December 31, 2017 (See Note 7). |
4. | Includes borrowing and franchise tax expense. Without borrowing and franchise tax expense, the net expense ratio would be 2.25%. |
5. | Includes franchise tax expense. Without franchise tax expense the net expense ratio would be 2.25%. |
6. | Deferred tax expense estimate for the ratio calculation is derived from the net investment income/loss, and realized and unrealized gains/losses. |
7. | Effective December 1, 2013 the deferred tax expense and deferred tax benefit are allocated based on average net assets. Prior to December 1, 2013 the deferred tax expense and deferred tax benefit were allocated based on specific class expenses. |
8. | Deferred tax benefit for the ratio calculation, when applicable, is derived from net investment income/loss only. |
9. | Annualized for less than a full period. |
See accompanying Notes to Financial Statements.
OPPENHEIMER STEELPATH MLP ALPHA FUND 19 |
FINANCIAL HIGHLIGHTS (Continued) |
| Class I | | Six Months Ended
May 31, 2018 (Unaudited) | | | Year Ended November 30,
2017 | | | Year Ended November 30,
2016 | | | Year Ended November 30,
2015 | | | Year Ended November 28,
2014* | | | Period Ended November 29,
2013*,1,2 | |
| Per Share Operating Data | | | | | | | | | | | | | | | | | | |
| Net Asset Value, Beginning of Period | | $ | 7.97 | | | $ | 9.28 | | | $ | 9.50 | | | $ | 12.99 | | | $ | 12.17 | | | $ | 12.15 | |
| Income/(loss) from investment operations: | | | | | | | | | | | | | | | | | | | | | | | | |
Net investment income/(loss)3 | | | (0.15 | ) | | | (0.07 | ) | | | 0.09 | | | | (0.05 | ) | | | (0.12 | ) | | | (0.04 | ) |
Return of capital3 | | | 0.21 | | | | 0.35 | | | | 0.35 | | | | 0.40 | | | | 0.42 | | | | 0.19 | |
| Net realized and unrealized gains/(losses) | | | 0.01 | | | | (0.93 | ) | | | 0.03 | | | | (3.15 | ) | | | 1.21 | | | | 0.21 | |
| Total from investment operations | | | 0.07 | | | | (0.65 | ) | | | 0.47 | | | | (2.80 | ) | | | 1.51 | | | | 0.36 | |
| Distributions to shareholders: | | | | | | | | | | | | | | | | | | | | | | | | |
| Return of capital | | | (0.27 | ) | | | — | | | | (0.69 | ) | | | (0.69 | ) | | | (0.69 | ) | | | (0.34 | ) |
| Income | | | — | | | | (0.66 | ) | | | — | | | | — | | | | — | | | | — | |
| Total distributions to shareholders | | | (0.27 | ) | | | (0.66 | ) | | | (0.69 | ) | | | (0.69 | ) | | | (0.69 | ) | | | (0.34 | ) |
| Net asset value, end of period | | $ | 7.77 | | | $ | 7.97 | | | $ | 9.28 | | | $ | 9.50 | | | $ | 12.99 | | | $ | 12.17 | |
Total Return, at Net Asset Value4 | | | 1.00 | % | | | (7.58 | %) | | | 5.70 | % | | | (22.27 | %) | | | 12.55 | % | | | 3.05 | % |
| | | | | | | | | | | | | | | | | | | | | | | | | |
| Ratios/Supplemental Data | | | | | | | | | | | | | | | | | | | | | | | | |
| Net assets, end of period (in thousands) | | $ | 168,594 | | | $ | 147,825 | | | $ | 99,431 | | | $ | 9,722 | | | $ | 3,732 | | | $ | 73 | |
| Ratio of Expenses to Average Net Assets:5 | | | | | | | | | | | | | | | | | | | | | | | | |
| Before deferred/current tax expense/(benefit) | | | 1.22 | %6 | | | 1.19 | %6 | | | 1.18 | %6 | | | 1.19 | %6 | | | 1.20 | %6 | | | 1.32 | %7 |
Deferred/current tax expense/(benefit)8,9 | | | 5.07 | % | | | 0.70 | % | | | 2.54 | % | | | (14.45 | %) | | | 5.38 | % | | | 4.51 | % |
| Total expenses/(benefit) | | | 6.29 | % | | | 1.89 | % | | | 3.72 | % | | | (13.26 | %) | | | 6.58 | % | | | 5.83 | % |
| Ratio of Investment Loss to Average Net Assets:5 | | | | | | | | | | | | | | | | | | | | | | | | |
| Before deferred tax benefit/(expense) | | | (0.68 | %) | | | (0.72 | %) | | | 0.45 | % | | | (1.12 | %) | | | (1.47 | %) | | | (1.29 | %) |
Deferred tax benefit/(expense)9,10 | | | (3.10 | %) | | | (0.11 | %) | | | 0.55 | % | | | 0.63 | % | | | 0.54 | % | | | 0.46 | % |
| Net investment income/(loss) | | | (3.78 | %) | | | (0.83 | %) | | | 1.00 | % | | | (0.49 | %) | | | (0.93 | %) | | | (0.83 | %) |
| Portfolio turnover rate | | | 13 | % | | | 37 | % | | | 35 | % | | | 36 | % | | | 17 | % | | | 9 | % |
* | November 28, 2014 and November 29, 2013 represent the last business day of the Fund’s respective reporting periods. |
1. | Shares commenced operations at the close of business June 28, 2013. |
2. | Effective June 28, 2013, Class I shares were renamed Class Y shares. See Note 1 of the Notes to Financial Statements for additional information. |
3. | Per share net investment loss is calculated based on average shares outstanding during the period net of deferred tax expense/benefit. Per share return of capital is calculated based on average shares during the period net of deferred tax expense/benefit estimated at the combined Federal and State statutory income tax rate (see Note 2). |
4. | Assumes an initial investment on the business day before the first day of the fiscal period, with all dividends and distributions reinvested in additional shares on the reinvestment date, and redemptions at the net asset value calculated on the last business day of the fiscal period. Sales charges are not reflected in the total returns. Total returns are not annualized for periods less than one full year. Returns do not reflect the deduction of taxes that a shareholder would pay on fund distributions or the redemption of fund shares. The returns do not include adjustments in accordance with generally accepted accounting principles required at the period end for financial reporting purposes. |
5. | Annualized for less than full period. |
6. | Includes borrowing and franchise tax expense. Without borrowing and franchise tax expense, the net expense ratio would be 1.19%, 1.18%, 1.15%, 1.17% and 1.18% for the periods ended May 31, 2018, November 30, 2017, November 30, 2016, November 30, 2015 and November 28, 2014, respectively. |
7. | Includes franchise tax expense. Without franchise tax expense the net expense ratio would be 1.06%. |
8. | Deferred tax expense estimate for the ratio calculation is derived from the net investment income/loss, and realized and unrealized gains/losses. |
9. | Effective December 1, 2013 the deferred tax expense and deferred tax benefit are allocated based on average net assets. Prior to December 1, 2013 the deferred tax expense and deferred tax benefit were allocated based on specific class expenses. |
10. | Deferred tax benefit for the ratio calculation, when applicable, is derived from net investment income/loss only. |
See accompanying Notes to Financial Statements.
20 OPPENHEIMER STEELPATH MLP ALPHA FUND |
FINANCIAL HIGHLIGHTS (Continued) |
| Class Y | | Six Months Ended
May 31, 2018 (Unaudited) | | | Year Ended November 30,
2017 | | | Year Ended November 30,
2016 | | | Year Ended November 30,
2015 | | | Year Ended November 28,
2014* | | | Year Ended November 29,
2013*,1 | |
| Per Share Operating Data | | | | | | | | | | | | | | | | | | |
| Net Asset Value, Beginning of Period | | $ | 7.94 | | | $ | 9.25 | | | $ | 9.49 | | | $ | 12.99 | | | $ | 12.18 | | | $ | 10.78 | |
| Income/(loss) from investment operations: | | | | | | | | | | | | | | | | | | | | | | | | |
Net investment loss2 | | | (0.16 | ) | | | (0.10 | ) | | | (0.02 | ) | | | (0.03 | ) | | | (0.07 | ) | | | (0.10 | ) |
Return of capital2 | | | 0.21 | | | | 0.35 | | | | 0.35 | | | | 0.40 | | | | 0.42 | | | | 0.41 | |
| Net realized and unrealized gains/(losses) | | | 0.01 | | | | (0.90 | ) | | | 0.12 | | | | (3.18 | ) | | | 1.15 | | | | 1.78 | |
| Total from investment operations | | | 0.06 | | | | (0.65 | ) | | | 0.45 | | | | (2.81 | ) | | | 1.50 | | | | 2.09 | |
| Distributions to shareholders: | | | | | | | | | | | | | | | | | | | | | | | | |
| Return of capital | | | (0.27 | ) | | | — | | | | (0.69 | ) | | | (0.69 | ) | | | (0.69 | ) | | | (0.69 | ) |
| Income | | | — | | | | (0.66 | ) | | | — | | | | — | | | | — | | | | — | |
| Total distributions to shareholders | | | (0.27 | ) | | | (0.66 | ) | | | (0.69 | ) | | | (0.69 | ) | | | (0.69 | ) | | | (0.69 | ) |
| Net asset value, end of period | | $ | 7.73 | | | $ | 7.94 | | | | 9.25 | | | $ | 9.49 | | | $ | 12.99 | | | $ | 12.18 | |
Total Return, at Net Asset Value3 | | | 0.88 | % | | | (7.61 | %) | | | 5.48 | % | | | (22.34 | %) | | | 12.46 | % | | | 19.72 | % |
| Ratios/Supplemental Data | | | | | | | | | | | | | | | | | | | | | | | | |
| Net assets, end of period (in thousands) | | $ | 1,191,521 | | | $ | 1,376,755 | | | $ | 1,548,940 | | | $ | 1,584,939 | | | $ | 2,193,129 | | | $ | 1,218,475 | |
Ratio of Expenses to Average Net Assets:10 | | | | | | | | | | | | | | | | | | | | | |
| Before (waivers) and deferred/current tax expense/(benefit) | | | 1.39 | % | | | 1.38 | % | | | 1.39 | % | | | 1.38 | % | | | 1.40 | % | | | 1.29 | % |
| Expense (waivers) | | | (0.11 | %)4 | | | (0.12 | %)4 | | | (0.11 | %) | | | (0.11 | %) | | | (0.12 | %) | | | (0.03 | %) |
| Net of (waivers) and before deferred/current tax expense/(benefit) | | | 1.28 | %5 | | | 1.26 | %5 | | | 1.28 | %5 | | | 1.27 | %5 | | | 1.28 | %5 | | | 1.26 | %6 |
Deferred/current tax expense/(benefit)7,8 | | | 5.07 | % | | | 0.70 | % | | | 2.54 | % | | | (14.45 | %) | | | 5.38 | % | | | 9.27 | % |
| Total expenses/(benefit) | | | 6.35 | % | | | 1.96 | % | | | 3.82 | % | | | (13.18 | %) | | | 6.66 | % | | | 10.53 | % |
| | | | | | | | | | | | | | | | | | | | | | | | | |
Ratio of Investment Loss to Average Net Assets:10 | | | | | | | | | | | | | | | | | | | | | |
| Before (waivers) and deferred tax benefit/(expense) | | | (1.09 | %) | | | (1.17 | %) | | | (0.92 | %) | | | (1.03 | %) | | | (1.21 | %) | | | (1.26 | %) |
| Expense (waivers) | | | (0.11 | %)4 | | | (0.12 | %)4 | | | (0.11 | %) | | | (0.11 | %) | | | (0.12 | %) | | | (0.03 | %) |
| Net of expense (waivers) and before deferred tax benefit/(expense) | | | (0.98 | %) | | | (1.05 | %) | | | (0.81 | %) | | | (0.92 | %) | | | (1.09 | %) | | | (1.23 | %) |
Deferred tax benefit/(expense)8,9 | | | (3.10 | %) | | | (0.11 | %) | | | 0.55 | % | | | 0.63 | % | | | 0.54 | % | | | 0.45 | % |
| Net investment loss | | | (4.08 | %) | | | (1.16 | %) | | | (0.26 | %) | | | (0.29 | %) | | | (0.55 | %) | | | (0.78 | %) |
| Portfolio turnover rate | | | 13 | % | | | 37 | % | | | 35 | % | | | 36 | % | | | 17 | % | | | 9 | % |
* | November 28, 2014 and November 29, 2013 represent the last business day of the Fund’s respective reporting periods. |
1. | Effective June 28, 2013, Class I shares were renamed Class Y shares. See Note 1 of the Notes to Financial Statements for additional information. |
2. | Per share net investment loss is calculated based on average shares outstanding during the period net of deferred tax expense/benefit. Per share return of capital is calculated based on average shares during the period net of deferred tax expense/benefit estimated at the combined Federal and State statutory income tax rate (see Note 2). |
3. | Assumes an initial investment on the business day before the first day of the fiscal period, with all dividends and distributions reinvested in additional shares on the reinvestment date, and redemptions at the net asset value calculated on the last business day of the fiscal period. Sales charges are not reflected in the total returns. Total returns are not annualized for periods less than one full year. Returns do not reflect the deduction of taxes that a shareholder would pay on fund distributions or the redemption of fund shares. The returns do not include adjustments in accordance with generally accepted accounting principles required at the period end for financial reporting purposes. |
4. | Includes voluntary Transfer Agent waiver of 0.015% effective January 1, 2017 to December 31, 2017 (See Note 7). |
5. | Includes borrowing and franchise tax expense. Without borrowing and franchise tax expense, the net expense ratio would be 1.25%. |
6. | Includes franchise tax expense. Without franchise tax expense the net expense ratio would be 1.25%. |
7. | Deferred tax expense estimate for the ratio calculation is derived from the net investment income/loss, and realized and unrealized gains/losses. |
8. | Effective December 1, 2013 the deferred tax expense and deferred tax benefit are allocated based on average net assets. Prior to December 1, 2013 the deferred tax expense and deferred tax benefit were allocated based on specific class expenses. |
9. | Deferred tax benefit for the ratio calculation, when applicable, is derived from net investment income/loss only. |
10. | Annualized for less than a full period. |
See accompanying Notes to Financial Statements.
OPPENHEIMER STEELPATH MLP ALPHA FUND 21 |
NOTES TO FINANCIAL STATEMENTS Unaudited |
1. Organization
Oppenheimer SteelPath MLP Alpha Fund (the “Fund”), a separate series of Oppenheimer SteelPath MLP Funds Trust, is a non-diversified open-end management investment company registered under the Investment Company Act of 1940, as amended. The Fund’s investment objective is to seek total return. The Fund’s investment adviser is OFI SteelPath, Inc. (the “Adviser” or “Manager”), a wholly-owned subsidiary of OppenheimerFunds, Inc. (“OFI” or “Oppenheimer”).
The Fund offers Class A, Class C, Class I, and Class Y shares. Effective June 28, 2013, Class I shares were renamed Class Y shares. Class A shares are sold at their offering price, which is normally net asset value plus a front-end sales charge. Effective June 28, 2013 although there is no initial sales charge on Class A purchases totaling $1 million or more, those Class A shares may be subject to a 1.00% contingent deferred sales charge (“CDSC”) if shares are redeemed within an 18-month holding period measured from the date of purchase. Class C shares are sold without a front-end sales charge but may be subject to a CDSC of 1.00% of the redemption proceeds if Class C shares are redeemed within one year of purchase. Class I shares are only available to eligible institutional investors. Class I shares are sold at net asset value per share without a sales charge or CDSC. An institutional investor that buys Class I shares for its customers’ accounts may impose charges on those accounts. Class Y shares are sold at net asset value per share without a sales charge directly to institutional investors that have special agreements with OppenheimerFunds Distributor, Inc. (the “Distributor” or “OFDI”) for that purpose. They may include insurance companies, registered investment companies, employee benefit plans and section 529 plans, among others. An institutional investor that buys Class Y shares for its customers’ accounts may impose charges on those accounts. All classes of shares have identical rights and voting privileges with respect to the Fund in general and exclusive voting rights on matters that affect that class alone. Earnings, net assets and net asset value per share may differ due to each class having its own expenses, such as transfer and shareholder servicing agent fees and shareholder communications, directly attributable to that class. Class A and C shares have separate distribution and/or service plans under which they pay fees. Class I and Y shares do not pay such fees.
The Fund is an investment company and accordingly follows the investment company accounting and reporting guidance of the Financial Accounting Standards Board (“FASB”) Accounting Standards Codification Topic 946 Financial Services- Investment Companies.
The following is a summary of significant accounting policies followed in the Fund’s preparation of financial statements in accordance with accounting principles generally accepted in the United States (“U.S. GAAP”).
22 OPPENHEIMER STEELPATH MLP ALPHA FUND |
NOTES TO FINANCIAL STATEMENTS Unaudited / (Continued) |
2. Significant Accounting Policies
Security Valuation. All investments in securities are recorded at their estimated fair value, as described in Note 3.
Allocation of Income, Expenses, Gains and Losses. Income, expenses (other than those attributable to a specific class), gains and losses are allocated on a daily basis to each class of shares based upon the relative proportion of net assets represented by such class. Operating expenses directly attributable to a specific class are charged against the operations of that class.
Dividends and Distributions to Shareholders. Dividends and distributions to shareholders, which are determined in accordance with income tax regulations and may differ from U.S. GAAP, are recorded on the ex-dividend date. The Fund’s dividend distribution policy is intended to provide monthly distributions to its shareholders at a rate that over time is similar to the distribution rate the Fund receives from the master limited partnerships (”MLPs”) in which it invests. The Fund generally pays out dividends that over time approximate the distributions received from the Fund’s portfolio investments based on, among other considerations, distributions the Fund actually received from portfolio investments, distributions it would have received if it had been fully invested at all times, and estimated future cash flows. Such dividends are not tied to the Fund’s investment income and may not represent yield or investment return on the Fund’s portfolio. To the extent that the dividends paid exceed the distributions the Fund receives from its underlying investments, the Fund’s assets will be reduced. The Fund’s tendency to pay out a consistent dividend may change, and the Fund’s level of distributions may increase or decrease.
The estimated characterization of the distributions paid will be either a qualified dividend or distribution (return of capital). This estimate is based on the Fund’s operating results during the period. The actual characterization of the distributions made during the period will not be determined until after the end of the fiscal year. The Fund will inform shareholders of the final tax character of the distributions on IRS Form 1099 DIV in February 2019.
Return of Capital Estimates. Distributions received from the Fund’s investments in MLPs generally are comprised of income and return of capital. Any return of capital estimates in excess of cost basis are classified as realized gain. The Fund records investment income and return of capital based on estimates made at the time such distributions are received. Such estimates are based on historical information available from each MLP and other industry sources. These estimates may subsequently be revised based on information received from MLPs after their tax reporting periods are concluded.
Investment Income. Dividend income is recorded on the ex-dividend date or upon ex-dividend notification in the case of certain foreign dividends where the ex-dividend date may have passed. Non-cash dividends included in dividend income, if any, are recorded at
OPPENHEIMER STEELPATH MLP ALPHA FUND 23 |
NOTES TO FINANCIAL STATEMENTS Unaudited / (Continued) |
2. Significant Accounting Policies (Continued)
the fair value of the securities received. Interest income, if any, is recognized on an accrual basis. Discount and premium, which are included in interest income on the Statement of Operations, if applicable, are amortized or accreted daily.
Custodian Fees. “Custody fees” in the Statement of Operations may include interest expense incurred by the Fund on any cash overdrafts of its custodian account during the period. Such cash overdrafts may result from the effects of failed trades in portfolio securities and from cash outflows resulting from unanticipated shareholder redemption activity. The Fund pays interest to its custodian on such cash overdrafts, to the extent they are not offset by positive cash balances maintained by the Fund, at a rate equal to the Federal Funds Rate plus 1.50%. The “Reduction to custodian expenses” line item, if applicable, represents earnings on cash balances maintained by the Fund during the period. Such interest expense and other custodian fees may be paid with these earnings.
Security Transactions. Security transactions are recorded on the trade date. Realized gains and losses on securities sold are determined using the basis of identified cost.
Indemnifications. The Fund’s organizational documents provide current and former trustees and officers with a limited indemnification against liabilities arising in connection with the performance of their duties to the Fund. In the normal course of business, the Fund may also enter into contracts that provide general indemnifications. The Fund’s maximum exposure under these arrangements is unknown as this would be dependent on future claims that may be made against the Fund. The risk of material loss from such claims is considered remote.
Federal Income Taxes. The Fund does not intend to qualify as a regulated investment company pursuant to Subchapter M of the Internal Revenue Code, but will rather be taxed as a corporation. As a corporation, the Fund is obligated to pay federal, state and local income tax on taxable income. During the period ended May 31, 2018, the maximum marginal regular federal income tax rate for a corporation was reduced from 35 percent to 21 percent with the enactment of H.R. 1, Tax Cuts and Jobs Act (the “TCJA”), which was enacted on December 22, 2017. Any other future changes in the federal income tax rate could have a material impact to the Fund.
The Fund is currently using an estimated rate of 2.0 percent for state and local tax, net of federal tax expense.
The alternative minimum tax requirements were repealed under the TCJA for tax years beginning after December 31, 2017, and the prior alternative minimum tax rate was reduced to zero as of January 1, 2018. Any past alternative minimum taxes paid by the fund do qualify for substantial refundability under the TCJA with AMT credit carryforwards becoming partially refundable prior to, or fully refundable for tax years beginning in 2021.
24 OPPENHEIMER STEELPATH MLP ALPHA FUND |
NOTES TO FINANCIAL STATEMENTS Unaudited / (Continued) |
2. Significant Accounting Policies (Continued)
The Fund’s income tax provision consists of the following as of May 31, 2018:
| Current tax expense/(benefit) | | | |
| Federal | | $ | — | |
| State | | | — | |
| Total current tax expense | | $ | — | |
| Deferred tax expense/(benefit) | | | | |
| Federal | | $ | 59,374,115 | |
| State | | | 5,654,677 | |
| Total deferred tax expense | | $ | 65,028,792 | |
The reconciliation between the federal statutory income tax rate of 21% and the tax effect on net investment income (loss) and realized and unrealized gain (loss) follows:
| | | Amount | | | % Effect | |
| Application of Federal statutory income tax rate | | $ | 16,492,185 | | | | 21.00 | % |
| State income taxes net of federal benefit | | | 1,570,685 | | | | 2.00 | % |
| Effect of tax rate change | | | 86,141,939 | | | | 109.69 | % |
| Effect of permanent differences | | | 2,934,557 | | | | 3.74 | % |
| Change in valuation allowance | | | (42,110,574 | ) | | | (53.62 | %) |
| Total income tax expense (benefit) | | $ | 65,028,792 | | | | 82.81 | % |
For the period ended May 31, 2018 the Fund’s tax effect on net investment income (loss) and realized and unrealized gain (loss) of 82.81% (net expenses) differed from the combined federal and state statutory tax rate of 23.00% (net expenses) due in large part to the new 21% federal tax rate, enacted by the TCJA as of December 22, 2017 (date of enactment). The change to the federal tax rate required the remeasurement of accumulated tax assets and the valuation allowance in place as of the date of enactment resulting in the recognition of additional current period deferred tax expense. The aggregate impact of this change is being entirely recorded during the period ended May 31, 2018 resulting in an increase to the effective tax rate when deferred tax expense is reflected as a percentage of the Fund’s current period operations.
The Fund intends to invest its assets primarily in MLP Investments, which generally are treated as partnerships for federal income tax purposes. As a limited partner in the MLP Investments, the Fund reports its allocable share of the MLP Investments’ taxable income in computing its own taxable income. The Fund’s tax expense or benefit is included in the Statement of Operations based on the component of income or gains (losses) to which such expense or benefit relates. Deferred income taxes reflect the net tax effects of temporary differences
OPPENHEIMER STEELPATH MLP ALPHA FUND 25 |
NOTES TO FINANCIAL STATEMENTS Unaudited / (Continued) |
2. Significant Accounting Policies (Continued)
between the carrying amounts of assets and liabilities for financial reporting purposes and the amounts used for income tax purposes. Such temporary differences are principally: (i) taxes on unrealized gains/(losses), which are attributable to the temporary difference between fair market value and tax basis, (ii) the net tax effects of temporary differences between the carrying amounts of assets and liabilities for financial reporting and income tax purposes and (iii) the net tax benefit of accumulated net operating losses and capital loss carryforwards. Deferred tax assets and liabilities are measured using effective tax rates expected to apply to taxable income in the years such temporary differences are realized or otherwise settled. To the extent the Fund has a deferred tax asset, consideration is given to whether or not a valuation allowance is required. A valuation allowance is required if, based on the evaluation criterion provided by ASC 740, Income Taxes, it is more-likely-than-not some portion or all of the deferred tax asset will not be realized.
At May 31, 2018, the Fund determined a valuation allowance was required. In implementing a valuation allowance on a portion of the deferred tax asset, significant consideration was given to the current and expected level of MLP distributions, unrealized gains and losses on MLP investments and the expiration dates for net operating losses and capital loss carryovers. Market cycles, the severity and duration of historical deferred tax assets and the impact of current and future redemptions were also considered. Additionally, various tax law changes resulting from the enactment of the TCJA were considered by the Fund in assessing the recoverability of its deferred tax assets. Specifically, the TCJA eliminated the net operating loss carryback ability and replaced the 20 year carryforward period with an indefinite carryforward period for any net operating losses arising in tax years ending after December 31, 2017. The TCJA also established a limitation for any net operating losses generated in tax years beginning after December 31, 2017 to the lesser of the aggregate of available net operating losses or 80% of taxable income before any net operating loss utilization. Through the consideration of these factors, the Fund has determined that it is more likely than not the deferred tax asset, net of the valuation allowance, will be realized.
Unexpected significant decreases in cash distributions from the Fund’s MLP investments, significant declines in the fair value of its investments, significant redemptions or increased risk of expiring net operating losses or capital loss carryovers may change the Fund’s assessment regarding the recoverability of its deferred tax assets and may result in a change to the valuation allowance. Modifications of the valuation allowance could have a material impact on the Fund’s net asset value.
26 OPPENHEIMER STEELPATH MLP ALPHA FUND |
NOTES TO FINANCIAL STATEMENTS Unaudited / (Continued) |
2. Significant Accounting Policies (Continued)
Components of the Fund’s deferred tax assets and liabilities as of May 31, 2018 are as follows:
| Deferred tax assets: | | | |
| Net operating loss carryforward (tax basis) – Federal | | $ | 79,823,430 | |
| Net operating loss carryforward (tax basis) – State | | | 11,976,940 | |
| Minimum tax credit carryforward – Federal | | | 3,015,619 | |
| Capital loss carryforward (tax basis) | | | 113,657,416 | |
| Valuation allowance | | | (62,614,287 | ) |
| Total deferred tax asset | | | 145,859,119 | |
| | | | | |
| Deferred tax liabilities: | | | | |
| Net unrealized gains on investment securities (tax basis) | | | (69,937,299 | ) |
| Total deferred tax liability | | | (69,937,299 | ) |
| | | | | |
| Total net deferred tax asset/(liability) | | $ | 75,921,819 | |
The Fund may rely, to some extent, on information provided by the MLPs, which may not necessarily be timely, to estimate taxable income allocable to MLP units held in its portfolio, and to estimate its associated deferred tax liability or asset. Such estimates are made in good faith. From time to time, as new information becomes available, the Fund will modify its estimates or assumptions regarding its tax liability or asset.
The Fund’s policy is to classify interest and penalties associated with underpayment of federal and state income taxes, if any, as income tax expense on its Statement of Operations. As of May 31, 2018, the Fund does not have any interest or penalties associated with the underpayment of any income taxes.
The Fund files income tax returns in the U.S. federal jurisdiction and various states. The Fund has reviewed all major jurisdictions and concluded that there is no significant impact on the Fund’s net assets and no tax liability resulting from unrecognized tax benefits relating to uncertain tax positions expected to be taken on its tax returns. Furthermore, management of the Fund is not aware of any uncertain tax positions for which it is reasonably possible that the total amount of unrecognized tax benefit will significantly change in the next 12 months.
OPPENHEIMER STEELPATH MLP ALPHA FUND 27 |
NOTES TO FINANCIAL STATEMENTS Unaudited / (Continued) |
2. Significant Accounting Policies (Continued)
At May 31, 2018, the Fund had net operating loss carryforwards for federal income tax purposes, as follows:
| Expiration date for expiring net operating loss carryforwards: | | | |
| 11/30/2035 | | $ | 140,984,502 | |
| 11/30/2036 | | | 201,995,745 | |
| Total expiring net operating loss carryforwards | | $ | 34,2980,247 | |
| | | | | |
| Total non-expiring net operating loss carryforwards | | $ | 56,151,794 | |
| | | | | |
| Total net operating loss carryforwards | | $ | 399,132,041 | |
At May 31, 2018, the Fund had net capital loss carryforwards for federal income tax purposes, which may be carried forward for 5 years, as follows:
| Expiration Date | | | |
| 11/30/2021 | | $ | 406,293,272 | |
| 11/30/2023 | | | 87,869,405 | |
| Total | | $ | 494,162,677 | |
At May 31, 2018, gross unrealized appreciation and depreciation of investments, based on cost for federal income tax purposes were as follows:
| Cost of Investments | | $ | 2,053,403,655 | |
| Gross Unrealized Appreciation | | $ | 502,538,815 | |
| Gross Unrealized Depreciation | | | (198,744,853 | ) |
| Net Unrealized Appreciation (Depreciation) on Investments | | $ | 303,793,962 | |
The difference between cost amounts for financial statement and federal income tax purposes is due primarily to timing differences in recognizing certain gains and losses in security transactions.
Use of Estimates. The preparation of financial statements in conformity with accounting principles generally accepted in the United States of America requires management to make estimates and assumptions that affect the reported amounts of assets and liabilities and disclosure of contingent assets and liabilities at the date of the financial statements and the reported amounts of increases and decreases in net assets from operations during the reporting period. Actual results could differ from those estimates.
28 OPPENHEIMER STEELPATH MLP ALPHA FUND |
NOTES TO FINANCIAL STATEMENTS Unaudited / (Continued) |
3. Securities Valuation
The Fund calculates the net asset value of its shares as of 4:00 P.M. Eastern time, on each day the New York Stock Exchange (the “Exchange”) is open for trading, except in the case of a scheduled early closing of the Exchange, in which case the Fund will calculate net asset value of the shares as of the scheduled early closing time of the Exchange.
The Fund’s Board of Trustees (the “Board”) has adopted procedures for the valuation of the Fund’s securities and has delegated the day-to-day responsibility for valuation determinations under those procedures to the Manager. The Manager has established a Valuation Committee which is responsible for determining a fair valuation for any security for which market quotations are not readily available. The Valuation Committee’s fair valuation determinations are subject to review, approval and ratification by the Fund’s Board at least quarterly or more frequently, if necessary.
Valuation Methods and Inputs
Securities are valued primarily using unadjusted quoted market prices, when available, as supplied by third party pricing services or broker-dealers.
The following methodologies are used to determine the market value or the fair value of the types of securities described below:
Equity securities traded on a securities exchange (including exchange-traded derivatives other than futures and futures options) are valued based on the official closing price on the principal exchange on which the security is traded, as identified by the Manager, prior to the time when the Fund’s assets are valued. If the official closing price is unavailable, the security is valued at the last sale price on the principal exchange on which it is traded, or if no sales occurred, the security is valued at the mean between the quoted bid and asked prices. Over-the-counter equity securities are valued at the last published sale price, or if no sales occurred, at the mean between the quoted bid and asked prices.
Shares of a registered investment company that are not traded on an exchange are valued at that investment company’s net asset value per share.
Securities for which market quotations are not readily available or a significant event has occurred that would materially affect the value of the security, are fair valued either (i) by a standardized fair valuation methodology applicable to the security type or the significant event as previously approved by the Valuation Committee and the Fund’s Board or (ii) as determined in good faith by the Manager’s Valuation Committee. The Valuation Committee considers all relevant facts that are reasonably available, through either public information or information available to the Manager, when determining the fair value of a security. Those standardized fair valuation methodologies include, but are not limited to, valuing securities at the last sale price or initially at cost and subsequently adjusting the value based on: changes in company specific fundamentals, changes in an appropriate securities index, or changes in the value of similar securities which may be further adjusted for any discounts related to security-specific resale restrictions. When possible, such methodologies use observable market inputs such as unadjusted quoted prices of similar securities, observable interest rates,
OPPENHEIMER STEELPATH MLP ALPHA FUND 29 |
NOTES TO FINANCIAL STATEMENTS Unaudited / (Continued) |
3. Securities Valuation (Continued)
currency rates and yield curves. The methodologies used for valuing securities are not necessarily an indication of the risks associated with investing in those securities nor can it be assured that the Fund can obtain the fair value assigned to a security if it were to sell the security.
Classifications
Each investment asset or liability of the Fund is assigned a level at measurement date based on the significance and source of the inputs to its valuation. Various data inputs may be used in determining the value of each of the Fund’s investments as of the reporting period end. These data inputs are categorized in the following hierarchy under applicable financial accounting standards:
| | 1) | Level 1-unadjusted quoted prices in active markets for identical assets or liabilities (including securities actively traded on a securities exchange) |
| | 2) | Level 2-inputs other than unadjusted quoted prices that are observable for the asset or liability (such as unadjusted quoted prices for similar assets and market corroborated inputs such as interest rates, prepayment speeds, credit risks, etc.) |
| | 3) | Level 3-significant unobservable inputs (including the Manager’s own judgments about assumptions that market participants would use in pricing the asset or liability) |
The inputs used for valuing securities are not necessarily an indication of the risks associated with investing in those securities.
The Fund classifies each of its investments in investment companies which are publicly offered as Level 1. Investment companies that are not publicly offered, if any, are classified as Level 2 in the fair value hierarchy.
The table below categorizes amounts that are included in the Fund’s Statement of Assets and Liabilities at period end based on valuation input level:
| | | Level 1 —
Unadjusted
Quoted Prices | | | Level 2 —
Other
Significant
Observable
Inputs | | | Level 3 —
Significant
Unobservable
Inputs | | | Value | |
| Assets Table | | | | | | | | | | | | |
| Investments, at Value: | | | | | | | | | | | | |
| MLP Investments and Related Entities* | | $ | 2,236,449,640 | | | $ | — | | | $ | — | | | $ | 2,236,449,640 | |
| Common Stock* | | | 92,111,240 | | | | — | | | | — | | | | 92,111,240 | |
| Short-Term Investment | | | 28,636,737 | | | | — | | | | — | | | | 28,636,737 | |
| Total Assets | | $ | 2,357,197,617 | | | $ | — | | | $ | — | | | $ | 2,357,197,617 | |
* | For a detailed break-out of securities by major industry classification, please refer to the Statement of Investments. |
30 OPPENHEIMER STEELPATH MLP ALPHA FUND |
NOTES TO FINANCIAL STATEMENTS Unaudited / (Continued) |
3. Securities Valuation (Continued)
The Fund did not hold any Level 3 securities during the six months ended May 31, 2018.
For the reporting period, there were no transfers between levels.
4. Investments and Risks
Equity Security Risk. Stocks and other equity securities fluctuate in price. The value of the Fund’s portfolio may be affected by changes in the equity markets generally. Equity markets may experience significant short-term volatility and may fall sharply at times. Different markets may behave differently from each other and U.S. equity markets may move in the opposite direction from one or more foreign stock markets. Adverse events in any part of the equity or fixed-income markets may have unexpected negative effects on other market segments.
The prices of individual equity securities generally do not all move in the same direction at the same time and a variety of factors can affect the price of a particular company’s securities. These factors may include, but are not limited to, poor earnings reports, a loss of customers, litigation against the company, general unfavorable performance of the company’s sector or industry, or changes in government regulations affecting the company or its industry.
Master Limited Partnerships. MLPs issue common units that represent an equity ownership interest in a partnership and provide limited voting rights. MLP common units are registered with the Securities and Exchange Commission (“SEC”), and are freely tradable on securities exchanges such as the NYSE and the NASDAQ Stock Market (“NASDAQ”), or in the over-the-counter market. An MLP consists of one or more general partners, who conduct the business, and one or more limited partners, who contribute capital. MLP common unit holders have a limited role in the partnership’s operations and management. The Fund, as a limited partner, normally would not be liable for the debts of the MLP beyond the amounts the Fund has contributed, but would not be shielded to the same extent that a shareholder of a corporation would be. In certain circumstances creditors of an MLP would have the right to seek return of capital distributed to a limited partner. This right of an MLP’s creditors would continue after the Fund sold its investment in the MLP.
MLPs are generally treated as publicly traded partnerships for federal income tax purposes. Any modification to federal income tax laws and related interpretations could cause a material decrease in the value of an MLP.
Concentration Risk. Under normal circumstances, the Fund invests at least 80% of its net assets (plus the amount of any borrowings for investment purposes) in master limited partnership (“MLP”) investments of issuers that are engaged in the transportation, storage, processing, refining, marketing, exploration, production, and mining of minerals and natural resources. The Fund’s MLP investments may include, but are not limited to: MLPs structured
OPPENHEIMER STEELPATH MLP ALPHA FUND 31 |
NOTES TO FINANCIAL STATEMENTS Unaudited / (Continued) |
4. Investments and Risks (Continued)
as limited partnerships (“LPs”) or limited liability companies (“LLCs”); MLPs that are taxed as “C” corporations; businesses that operate and have the economic characteristics of MLPs but are organized and taxed as “C” corporations; securities issued by MLP affiliates; and private investments in public equities (“PIPEs”) issued by MLPs. MLPs are subject to certain risks, such as supply and demand risk, depletion and exploration risk, commodity pricing risk, acquisition risk, and the risk associated with the hazards inherent in midstream energy industry activities. A substantial portion of the cash flow received by the Fund is derived from investment in equity securities of MLPs. The amount of cash that a MLP has available for distributions, and the tax character of such distributions, are dependent upon the amount of cash generated by the MLP’s operations.
5. Shares of Beneficial Interest
The Fund has authorized an unlimited number of $0.001 par value shares of beneficial interest of each class. Transactions in shares of beneficial interest were as follows:
| | | For the
Six Months Ended
May 31, 2018
(Unaudited) | | | Year Ended
November 30, 2017 | |
| | | Shares | | | Amount | | | Shares | | | Amount | |
| Class A | | | | | | | | | | | | |
| Sold | | | 10,693,559 | | | $ | 83,047,980 | | | | 20,588,550 | | | $ | 182,306,059 | |
| Dividends and/or distributions reinvested | | | 2,767,313 | | | | 20,620,174 | | | | 6,949,875 | | | | 61,412,977 | |
| Redeemed | | | (18,775,280 | ) | | | (144,124,333 | ) | | | (65,275,843 | ) | | | (578,703,865 | ) |
| Net decrease | | | (5,314,408 | ) | | $ | (40,456,179 | ) | | | (37,737,418 | ) | | $ | (334,984,829 | ) |
| Class C | | | | | | | | | | | | | | | | |
| Sold | | | 5,831,055 | | | $ | 43,194,993 | | | | 11,212,094 | | | $ | 95,627,701 | |
| Dividends and/or distributions reinvested | | | 2,809,555 | | | | 19,798,105 | | | | 6,562,469 | | | | 55,000,167 | |
| Redeemed | | | (15,252,437 | ) | | | (110,354,967 | ) | | | (29,335,792 | ) | | | (244,280,143 | ) |
| Net decrease | | | (6,611,827 | ) | | $ | (47,361,869 | ) | | | (11,561,229 | ) | | $ | (93,652,275 | ) |
32 OPPENHEIMER STEELPATH MLP ALPHA FUND |
NOTES TO FINANCIAL STATEMENTS Unaudited / (Continued) |
5. Shares of Beneficial Interest (Continued)
| | | For the
Six Months Ended
May 31, 2018
(Unaudited) | | | Year Ended
November 30, 2017 | |
| | | Shares | | | Amount | | | Shares | | | Amount | |
| Class I | | | | | | | | | | | | |
| Sold | | | 9,020,139 | | | $ | 70,310,623 | | | | 11,355,912 | | | $ | 103,969,519 | |
| Dividends and/or distributions reinvested | | | 696,703 | | | | 5,331,203 | | | | 1,206,048 | | | | 10,796,969 | |
| Redeemed | | | (6,549,379 | ) | | | (52,132,517 | ) | | | (4,736,164 | ) | | | (41,953,320 | ) |
| Net increase | | | 3,167,463 | | | $ | 23,509,309 | | | | 7,825,796 | | | $ | 72,813,168 | |
| Class Y | | | | | | | | | | | | | | | | |
| Sold | | | 33,270,181 | | | $ | 264,132,431 | | | | 83,287,340 | | | $ | 756,158,446 | |
| Dividends and/or distributions reinvested | | | 5,714,437 | | | | 43,748,079 | | | | 12,949,572 | | | | 116,001,899 | |
| Redeemed | | | (58,252,358 | ) | | | (454,830,313 | ) | | | (90,266,310 | ) | | | (799,389,100 | ) |
| Net increase/(decrease) | | | (19,267,740 | ) | | $ | (146,949,803 | ) | | | 5,970,602 | | | $ | 72,771,245 | |
6. Purchases and Sales of Securities
The aggregate cost of purchases and proceeds from sales of securities, other than short-term obligations, for the six months ended May 31, 2018, were as follows:
| | | Purchases | | | Sales | |
| Investment securities | | $ | 315,214,712 | | | $ | 569,826,163 | |
7. Fees and Other Transactions with Affiliates
Management Fees. Under the investment advisory agreement, the Fund pays the Manager a management fee based on the daily net assets of the Fund at an annual rate as shown in the following table:
Net Assets up to $3 Billion | Net Assets Greater than
$3 Billion and up to $5 Billion | Net Assets in Excess of $5 Billion |
1.10% | 1.08% | 1.05% |
The Fund’s effective management fee for the six months ended May 31, 2018 was 1.10% of average annual net assets before any applicable waivers.
OPPENHEIMER STEELPATH MLP ALPHA FUND 33 |
NOTES TO FINANCIAL STATEMENTS Unaudited / (Continued) |
7. Fees and Other Transactions with Affiliates (Continued)
Transfer Agent Fees. OFI Global Asset Management, Inc. (the “Transfer Agent”) serves as the transfer and shareholder servicing agent for the Fund. The Fund pays the Transfer Agent a fee based on average net assets. Fees incurred with respect to these services are detailed in the Statement of Operations.
Sub-Transfer Agent Fees. The Transfer Agent has retained Shareholder Services, Inc., a wholly-owned subsidiary of OFI (the “Sub-Transfer Agent”), to provide the day-to-day transfer agent and shareholder servicing of the Fund. Under the Sub-Transfer Agency Agreement, the Transfer Agent pays the Sub-Transfer Agent an annual fee in monthly installments, equal to a percentage of the transfer agent fee collected by the Transfer Agent from the Fund, which shall be calculated after any applicable fee waivers. The fee paid to the Sub-Transfer Agent is paid by the Transfer Agent, not by the Fund.
Trustees’ Compensation. The Board has adopted a compensation deferral plan for independent trustees that enables trustees to elect to defer receipt of all or a portion of the annual compensation they are entitled to receive from the Fund. For purposes of determining the amount owed to the Trustee under the plan, deferred amounts are treated as though equal dollar amounts had been invested in shares of the Fund or in other Oppenheimer funds selected by the Trustee. The Fund purchases shares of the funds selected for deferral by the Trustee in amounts equal to his or her deemed investment, resulting in a Fund asset equal to the deferred compensation liability. Such assets are included as a component of “Other” within the asset section of the Statement of Assets and Liabilities, if applicable. Deferral of trustees’ fees under the plan will not affect the net assets of the Fund, and will not materially affect the Fund’s assets, liabilities or net investment income per share. Amounts will be deferred until distributed in accordance with the compensation deferral plan.
Distribution and Service Plan (12b-1) Fees. Under its General Distributor’s Agreement with the Fund, the Distributor acts as the Fund’s principal underwriter in the continuous public offering of the Fund’s classes of shares.
Distribution and Service Plan for Class A Shares. The Fund has adopted a Distribution and Service Plan (the “Plan”) for Class A shares under Rule 12b-1 of the Investment Company Act of 1940 that compensates the Distributor for a portion of the costs in connection with the distribution of shares, maintaining accounts and providing services to Class A shareholders. Under the Plan, the Fund makes these payments quarterly at an annual rate of up to 0.25% of the daily net assets of Class A shares of the Fund. The Distributor currently uses all of those fees to pay dealers, brokers, banks and other financial intermediaries for providing services related to the distribution of shares, personal service and maintenance of accounts of their customers that hold Class A shares. Any unreimbursed expenses the Distributor incurs with respect to Class A shares in any fiscal year cannot be recovered in subsequent periods. Fees incurred by the Fund under the Plan are detailed in the Statement of Operations.
34 OPPENHEIMER STEELPATH MLP ALPHA FUND |
NOTES TO FINANCIAL STATEMENTS Unaudited / (Continued) |
7. Fees and Other Transactions with Affiliates (Continued)
Distribution and Service Plans for Class C Shares. The Fund has adopted a Distribution and Service Plans (the “Plans”) for Class C shares under Rule 12b-1 of the Investment Company Act of 1940 to compensate the Distributor for distributing that share class, maintaining accounts and providing shareholder services. Under the Plans, the Fund pays the Distributor an annual asset-based sales charge of 0.75% on Class C shares’ daily net assets. The Fund also pays a service fee under the Plans at an annual rate of 0.25% of Class C shares’ daily net assets.
The Distribution and Service Plans for Class A and C shares continue in effect from year to year only if the Fund’s Board votes annually to approve their continuance at an in-person meeting called for that purpose. Fees incurred by the Fund under the Plans are detailed in the Statement of Operations.
Sales Charges. Front-end sales charges and contingent deferred sales charges (“CDSC”) do not represent expenses of the Fund. They are deducted from the proceeds of sales of Fund shares prior to investment or from redemption proceeds prior to remittance, as applicable. The sales charges retained by the Distributor from the sale of shares and the CDSC retained by the Distributor on the redemption of shares are shown in the following table for the period indicated.
| Six Months Ended | | | Class A Front-End Sales Charges Retained by Distributor | | | Class A Contingent Deferred Sales Charges Retained by Distributor | | | Class C Contingent Deferred Sales Charges Retained by Distributor | |
May 31, 2018 | | | $ | 105,542 | | | $ | 22,243 | | | $ | 29,635 | |
Waivers and Reimbursements of Expenses. The Manager has contractually agreed to limit fees and/or reimburse expenses of the Fund to the extent that the Fund’s total annual fund operating expenses (exclusive of interest, taxes, such as deferred tax expenses, brokerage commissions, acquired fund fees and expenses, dividend costs related to short sales, and other unusual expenses such as litigation expense, if any) exceed 1.50% for Class A shares, 2.25% for Class C shares, and 1.25% for Class Y shares.
The Fund’s total annual operating expenses after fee waiver and/or expense reimbursement (“Net Expenses”) will be higher than these amounts to the extent that the Fund incurs expenses excluded from the expense cap. Because the Fund’s deferred income tax expense/(benefit) and interest expense are excluded from the expense cap, the Fund’s Net Expenses for each class of shares is increased/(decreased) by the amount of this expense. During the six months ended May 31, 2018, the Manager reimbursed $315,178, $282,264, and $678,927,
OPPENHEIMER STEELPATH MLP ALPHA FUND 35 |
NOTES TO FINANCIAL STATEMENTS Unaudited / (Continued) |
7. Fees and Other Transactions with Affiliates (Continued)
for Class A, Class C, and Class Y, respectively. This undertaking may not be modified or terminated until after one year from the date of the current prospectus, as indicated therein, unless approved by the Fund’s Board.
The Manager and/or Transfer Agent can be reimbursed by the Fund within three years after the date the fee limitation and/or expense reimbursement has been made by the Manager and/or Transfer Agent, provided that such repayment does not cause the expenses of any class of the Fund to exceed the foregoing limits.
The following table represents amounts eligible for recovery at November 30, 2017:
| Eligible Expense Recoupment Expiring: | | | |
| November 30, 2018 | | $ | 4,954,289 | |
| November 30, 2019 | | | 3,611,512 | |
| November 30, 2020 | | | 3,318,704 | |
| November 30, 2021 | | | 1,276,369 | |
During the six months ended May 31, 2018, the Manager and/or Transfer Agent did not recoup any expenses.
Effective January 1, 2017 until December 31, 2017, the Transfer Agent has voluntarily agreed to waive fees and/or reimburse Fund expenses in an amount equal to 0.015% of average annual net assets for Classes A, C, and Y.
During the reporting period, the Transfer Agent waived fees and/or reimbursed the Fund for transfer agent and shareholder servicing agent fees as follows:
| Class A | | $ | 8,109 | |
| Class C | | | 7,332 | |
| Class Y | | | 17,664 | |
This expense limitation was removed effective December 31, 2017. Amounts previously waived are not eligible for recoupment.
Related Party. The Interested Trustee and officers of the Fund is also an officers or trustee of companies affiliated with the Manager, Distributor, and Transfer Agent.
Cross Trades. The Fund is permitted to purchase and sell securities from and to other Funds managed by the Manager or OFI Global (“cross-trade”) pursuant to “Cross-Trading” Procedures adopted by the Fund’s Board. These procedures are designed to ensure that any cross-trade of securities between a Fund and another account or private fund that is an
36 OPPENHEIMER STEELPATH MLP ALPHA FUND |
NOTES TO FINANCIAL STATEMENTS Unaudited / (Continued) |
7. Fees and Other Transactions with Affiliates (Continued)
affiliate of the Fund solely by virtue of having a common investment adviser, common trustee/director, or common officer complies with Rule 17a-7 under the 1940 Act. Further, as defined under these procedures, each cross-trade is effected at the current market price.
During the period the Fund had $8,429,644 in purchases and $59,147,108 in sales considered cross-trades, resulting in $(24,932,236) of realized gain/(loss).
8. Borrowing Agreement
The Fund, along with Oppenheimer SteelPath MLP Alpha Plus Fund, Oppenheimer SteelPath MLP Income Fund, and Oppenheimer SteelPath MLP Select 40 Fund (collectively, the “Trust”), is a borrower in a $700 million revolving credit agreement (the “Loan Agreement”) with a major lending institution (the “Lender”). The Fund is permitted to borrow up to the lesser of one-third of the Fund’s total assets, or the maximum amount permitted pursuant to the Fund’s investment limitations. As the Loan Agreement is not available exclusively to the Fund, the Fund may not be able to borrow all of its requested amounts at any given time. Amounts borrowed under the Loan Agreement, if any, are invested by the Fund under the direction of the Manager consistent with the Fund’s investment objective and policies, and as such, the related investments are subject to normal market fluctuations and investment risks, including the risk of loss due to a decline in value. The borrowing, if any, is fully collateralized throughout the term of the borrowing with securities or other assets of the Fund. The Fund is not liable for borrowings of other Funds in the Trust. Securities that have been pledged as collateral for the borrowing are indicated in the Statement of Investments.
Borrowings under the Loan Agreement are charged interest at a calculated rate computed by the Lender based on the one month LIBOR rate plus 0.75% per annum. An unused commitment fee at the rate of 0.30% per annum is charged for any undrawn portion of the credit facility, and each member of the Trust will pay its pro rata share of this fee. A facility fee of 0.10% was charged on the commitment amount, and each party of the Trust paid its pro rata share of this fee. The borrowing is due November 16, 2018, unless another date is mutually agreed upon by the parties of the Loan Agreement. For the six months ended May 31, 2018, the Fund paid $329,813 in borrowing fees. The Fund did not utilize the facility during the six months ended May 31, 2018.
OPPENHEIMER STEELPATH MLP ALPHA FUND 37 |
DISTRIBUTION SOURCES Unaudited |
For any distribution that took place over the last six months of the Fund’s reporting period, the table below details on a per-share basis the percentage of the Fund’s total distribution payment amount that was derived from the following sources: net income, net profit from the sale of securities, and other capital sources. Other capital sources represent a return of capital. A return of capital may occur, for example, when some or all of the money that you invested in the Fund is paid back to you. A return of capital distribution does not necessarily reflect the Fund’s investment performance and should not be confused with “yield” or “income.” You should not draw any conclusions about the Fund’s investment performance from the amounts of these distributions. This information is based upon income and capital gains using generally accepted accounting principles as of the date of each distribution. If the Fund (or an underlying fund in which the Fund invests) invests in real estate investment trusts (REITs) and/or master limited partnerships (MLPs), the percentages attributed to each category are estimated using historical information because the character of the amounts received from the REITs and/or MLPs in which the Fund (or underlying fund) invests is unknown until after the end of the calendar year. Because the Fund is actively managed, the relative amount of the Fund’s total distributions derived from various sources over the calendar year may change. Please note that this information should not be used for tax reporting purposes as the tax character of distributable income may differ from the amounts used for this notification. You will receive IRS tax forms in the first quarter of each calendar year detailing the actual amount of the taxable and non-taxable portion of distributions paid to you during the tax year.
For the most current information, please go to oppenheimerfunds.com. Select your Fund, and scroll down to the ‘Dividends’ table under ‘Analytics’. The Fund’s latest distribution information will be followed by the sources of any distribution, updated daily.
Fund Name | Pay
Date | Net
Income | Net
Profit
from Sale | Other
Capital
Sources |
Oppenheimer SteelPath MLP Alpha Fund | 1/5/18 | 0.0% | 0.0% | 100.0% |
Oppenheimer SteelPath MLP Alpha Fund | 2/9/18 | 0.0% | 0.0% | 100.0% |
Oppenheimer SteelPath MLP Alpha Fund | 3/9/18 | 0.0% | 0.0% | 100.0% |
Oppenheimer SteelPath MLP Alpha Fund | 4/6/18 | 0.0% | 0.0% | 100.0% |
Oppenheimer SteelPath MLP Alpha Fund | 5/4/18 | 0.0% | 0.0% | 100.0% |
38 OPPENHEIMER STEELPATH MLP ALPHA FUND |
PORTFOLIO PROXY VOTING POLICIES AND PROCEDURES; UPDATES TO STATEMENT OF INVESTMENTS Unaudited |
The Fund has adopted Portfolio Proxy Voting Policies and Procedures under which the Fund votes proxies relating to securities (“portfolio proxies”) held by the Fund. A description of the Fund’s Portfolio Proxy Voting Policies and Procedures is available (i) without charge, upon request, by calling the Fund toll-free at 1.800.CALL OPP (225.5677), (ii) on the Fund’s website at oppenheimerfunds.com, and (iii) on the SEC’s website at www.sec.gov. In addition, the Fund is required to file Form N-PX, with its complete proxy voting record for the 12 months ended June 30th, no later than August 31st of each year. The Fund’s voting record is available (i) without charge, upon request, by calling the Fund toll-free at 1.800.CALL OPP (225.5677), and (ii) in the Form N-PX filing on the SEC’s website at www.sec.gov.
The Fund files its complete schedule of portfolio holdings with the SEC for the first quarter and the third quarter of each fiscal year on Form N-Q. The Fund’s Form N-Q filings are available on the SEC’s website at www.sec.gov. Those forms may be reviewed and copied at the SEC’s Public Reference Room in Washington, D.C. Information on the operation of the Public Reference Room may be obtained by calling 1-800-SEC-0330.
Householding – Delivery of Shareholder Documents
This is to inform you about OppenheimerFunds’ “householding” policy. If more than one member of your household maintains an account in a particular fund, OppenheimerFunds will mail only one copy of the fund’s prospectus (or, if available, the fund’s summary prospectus), annual and semiannual report and privacy policy. The consolidation of these mailings, called householding, benefits your fund through reduced mailing expense, and benefits you by reducing the volume of mail you receive from OppenheimerFunds. Householding does not affect the delivery of your account statements.
Please note that we will continue to household these mailings for as long as you remain an OppenheimerFunds shareholder, unless you request otherwise. If you prefer to receive multiple copies of these materials, please call us at 1.800.CALL-OPP (225-5677). You may also notify us in writing or via email. We will begin sending you individual copies of the prospectus (or, if available, the summary prospectus), reports and privacy policy within 30 days of receiving your request to stop householding.
OPPENHEIMER STEELPATH MLP ALPHA FUND 39 |
OPPENHEIMER STEELPATH MLP ALPHA FUND |
Trustees and Officers | | Robert J. Malone, Chairman of the Board of Trustees and Trustee |
| | | Andrew J. Donohue, Trustee |
| | | Richard F. Grabish, Trustee |
| | | Beverly L. Hamilton, Trustee |
| | | Victoria J. Herget, Trustee |
| | | Karen L. Stuckey, Trustee |
| | | James D. Vaughn, Trustee |
| | | Arthur P. Steinmetz, Trustee, President and Principal Executive Officer |
| | | Stuart Cartner, Vice President |
| | | Brian Watson, Vice President |
| | | Cynthia Lo Bessette, Secretary and Chief Legal Officer |
| | | Jennifer Foxson, Vice President and Chief Business Officer |
| | | Mary Ann Picciotto, Chief Compliance Officer and Chief Anti-Money Laundering Officer |
| | | Brian S. Petersen, Treasurer and Principal Financial & Accounting Officer |
| | | |
Manager | | OFI SteelPath, Inc. |
| | | |
Distributor | | OppenheimerFunds Distributor, Inc. |
| | | |
Transfer and Shareholder Servicing Agent | | OFI Global Asset Management, Inc. |
| | | |
Sub-Transfer Agent | | Shareholder Services, Inc. |
| | | DBA OppenheimerFunds Services |
| | | |
Independent Registered Public Accounting Firm | | Cohen & Company, Ltd. |
| | | |
Legal Counsel | | Ropes & Gray LLP |
The financial statements included herein have been taken from the records of the Fund without examination of those records by the independent registered public accounting firm.
© 2018 OppenheimerFunds, Inc. All rights reserved.
40 OPPENHEIMER STEELPATH MLP ALPHA FUND |
As an Oppenheimer fund shareholder, you are entitled to know how we protect your personal information and how we limit its disclosure.
Information Sources
We obtain nonpublic personal information about our shareholders from the following sources:
| | ● | Applications or other forms. |
| | ● | When you create a user ID and password for online account access. |
| | ● | When you enroll in eDocs Direct,SM our electronic document delivery service. |
| | ● | Your transactions with us, our affiliates or others. |
| | ● | Technologies on our website, including: “cookies” and web beacons, which are used to collect data on the pages you visit and the features you use. |
If you visit oppenheimerfunds.com and do not log on to the secure account information areas, we do not obtain any personal information about you. When you do log on to a secure area, we do obtain your user ID and password to identify you. We also use this information to provide you with products and services you have requested, to inform you about products and services that you may be interested in and assist you in other ways.
We do not collect personal information through our website unless you willingly provide it to us, either directly by email or in those areas of the website that request information. In order to update your personal information (including your mailing address, email address and phone number) you must first log on and visit your user profile.
If you have set your browser to warn you before accepting cookies, you will receive the warning message with each cookie. You can refuse cookies by turning them off in your browser. However, doing so may limit your access to certain sections of our website.
We use cookies to help us improve and manage our website. For example, cookies help us recognize new versus repeat visitors to the site, track the pages visited, and enable some special features on the website. This data helps us provide better service for our website visitors.
Protection of Information
We do not disclose any nonpublic personal information (such as names on a customer list) about current or former customers to anyone, except as permitted by law.
OPPENHEIMER STEELPATH MLP ALPHA FUND 41 |
PRIVACY POLICY NOTICE (Continued) |
Disclosure of Information
Copies of confirmations, account statements and other documents reporting activity in your fund accounts are made available to your financial advisor (as designated by you). We may also use details about you and your investments to help us, our financial service affiliates, or firms that jointly market their financial products and services with ours, to better serve your investment needs or suggest educational material that may be of interest to you. If this requires us to provide you with an opportunity to “opt in” or “opt out” of such information sharing with a firm not affiliated with us, you will receive notification on how to do so, before any such sharing takes place.
Right of Refusal
We will not disclose your personal information to unaffiliated third parties (except as permitted by law), unless we first offer you a reasonable opportunity to refuse or “opt out” of such disclosure.
Internet Security and Encryption
In general, the email services provided by our website are encrypted and provide a secure and private means of communication with us. To protect your own privacy, confidential and/ or personal information should only be communicated via email when you are advised that you are using a secure website.
As a security measure, we do not include personal or account information in nonsecure emails, and we advise you not to send such information to us in nonsecure emails. Instead, you may take advantage of the secure features of our website to encrypt your email correspondence. To do this, you will need to use a browser that supports Secure Sockets Layer (SSL) protocol.
| | ● | All transactions conducted via our websites, including redemptions, exchanges and purchases, are secured by the highest encryption standards available. SSL is used to establish a secure connection between your PC and OppenheimerFunds’ server. It transmits information in an encrypted and scrambled format. |
| | ● | Encryption is achieved through an electronic scrambling technology that uses a “key” to code and then decode the data. Encryption acts like the cable converter box you may have on your television set. It scrambles data with a secret code so that no one can make sense of it while it is being transmitted. When the data reaches its destination, the same software unscrambles the data. |
| | ● | You can exit the secure area by closing your browser or, for added security, you can use the Log Out button before you close your browser. |
42 OPPENHEIMER STEELPATH MLP ALPHA FUND |
PRIVACY POLICY NOTICE (Continued) |
Other Security Measures
We maintain physical, electronic and procedural safeguards to protect your personal account information. Our employees and agents have access to that information only so that they may offer you products or provide services, for example, when responding to your account questions.
How You Can Help
You can also do your part to keep your account information private and to prevent unauthorized transactions. If you obtain a user ID and password for your account, safeguard that information. Strengthening your online credentials—your online security profile—typically your user name, password, and security questions and answers, can be one of your most important lines of defense on the Internet. For additional information on how you can help prevent identity theft, visit https:// www.oppenheimerfunds.com/security.
Who We Are
This joint notice describes the privacy policies of the Oppenheimer funds, OppenheimerFunds, Inc., each of its investment adviser subsidiaries, OppenheimerFunds Distributor, Inc. and OFI Global Trust Co. It applies to all Oppenheimer fund accounts you presently have, or may open in the future, using your Social Security number—whether or not you remain a shareholder of our funds. This notice was last updated as of November 2017. In the event it is updated or changed, we will post an updated notice on our website at oppenheimerfunds.com. If you have any questions about this privacy policy, email us by clicking on the Contact Us section of our website at oppenheimerfunds.com, write to us at P.O. Box 5270, Denver, CO 80217-5270, or call us at 800 CALL OPP (225 5677).
OPPENHEIMER STEELPATH MLP ALPHA FUND 43 |
THIS PAGE INTENTIONALLY LEFT BLANK
44 OPPENHEIMER STEELPATH MLP ALPHA FUND |
THIS PAGE INTENTIONALLY LEFT BLANK
OPPENHEIMER STEELPATH MLP ALPHA FUND 45 |
THIS PAGE INTENTIONALLY LEFT BLANK
46 OPPENHEIMER STEELPATH MLP ALPHA FUND |
THIS PAGE INTENTIONALLY LEFT BLANK
OPPENHEIMER STEELPATH MLP ALPHA FUND 47 |

Table of Contents
Fund Performance Discussion | 3 |
Top Holdings and Allocations | 7 |
Share Class Performance | 8 |
Fund Expenses | 10 |
Statement of Investments | 12 |
Statement of Assets and Liabilities | 17 |
Statement of Operations | 19 |
Statements of Changes in Net Assets | 20 |
Financial Highlights | 21 |
Notes to Financial Statements | 25 |
Distribution Sources | 43 |
Portfolio Proxy Voting Policies and Procedures; Updates to Statement of Investments | 44 |
Trustees and Officers | 45 |
Privacy Policy Notice | 46 |
Class A Shares
AVERAGE ANNUAL TOTAL RETURNS AT 5/31/18
| | Class A Shares of the Fund | | |
| Without
Sales
Charge | With
Sales
Charge | S&P 500 Index | Alerian MLP Index |
6-Month | 0.03% | -5.74% | 3.16% | 5.71% |
1-Year | -5.79% | -11.23% | 14.38% | -3.71% |
5-Year | -2.44% | -3.60% | 12.98% | -3.20% |
Since Inception (3/31/10) | 2.23% | 1.49% | 13.17% | 5.15% |
Performance data quoted represents past performance, which does not guarantee future results. The investment return and principal value of an investment in the Fund will fluctuate so that an investor’s shares, when redeemed, may be worth more or less than their original cost. Fund returns include changes in share price, reinvested distributions, and a 5.75% maximum applicable sales charge except where “without sales charge” is indicated. Current performance may be lower or higher than the performance quoted. Returns do not consider capital gains or income taxes on an individual’s investment. Returns for periods of less than one year are cumulative and not annualized. For performance data current to the most recent month-end, visit oppenheimerfunds.com or call 1.800.CALL OPP (225.5677). See Fund prospectuses and summary prospectuses for more information on share classes and sales charges.
2 OPPENHEIMER STEELPATH MLP INCOME FUND |
Fund Performance Discussion
The Fund’s Class A shares (without sales charge) produced a total return of 0.03% during the reporting period. In comparison, master limited partnerships (“MLPs”), as measured by the Alerian MLP Index (AMZ), provided a total return gain of 5.71%. During the same period, the S&P 500 Index produced a total return gain of 3.16%.
Over the six-month reporting period ended May 31, 2018, the midstream sector outperformed the broader markets despite facing headwinds presented by the U.S. Federal Energy Regulatory Commission (FERC), which announced changes related to pipeline tariffs in reaction to a federal court’s previous remand that cost-of-service tariffs on interstate natural gas and oil pipelines owned by MLPs would no longer receive an income tax allowance (ITA). This shift in FERC’s long-held position caused significant market confusion and volatility across the sector. While on the whole the sector overcame the initial widespread weakness, the value of the equities of select industry participants with the largest portfolios of FERC-regulated assets remain diminished at period end.
The need for additional midstream infrastructure to service growing volumes from the Permian basin became even more acute over the reporting period as production growth has exceeded even the most aggressive of previous industry predictions and appears set to overwhelm the energy infrastructure capacity bringing that crude oil and natural gas out of the basin. While there are multiple new-build pipelines and expansions in-progress, we believe that the long construction times required for these projects mean that meaningful relief is unlikely to come until mid-2019, at the earliest. As such, we expect that Permian producers without sufficient takeaway capacity will experience significantly worse pricing than peers with access to pipeline capacity. Some disadvantaged producers may slow their production growth until in-basin pricing recovers. Importantly, we believe certain midstream operators should enjoy both short-term and long-term benefits. Obviously, midstream operators are currently enjoying and we expect that they will continue to enjoy the full utilization of their assets servicing the basin. Some operators may also capture wide short-term marketing margins. Over the long-term, midstream operators may benefit from an increased desire by producers to commit to existing or new capacity that can earn a transportation fee for an extended period.
Over the reporting period, we estimate approximately $7 billion of new equity supply entered the market through secondary offerings, initial public offerings, preferred offerings, or “at-the-market” programs in which primary units trade into the market anonymously throughout the normal trading day. This pace of equity issuance represents a sharp decrease from approximately $15 billion that was raised
OPPENHEIMER STEELPATH MLP INCOME FUND 3 |
over the six month reporting period ended May 31, 2017. Midstream companies also raised approximately $20 billion of debt capital during the period. Most MLPs pay out substantial distributions to investors and, therefore, often raise external capital to fund larger growth projects or acquisitions.
The Tax Cuts and Jobs Act of 2017, enacted on December 22, 2017, reduced the Fund’s Federal income tax rate from 35% to 21%. While we view a reduction in the corporate tax rate as a significant long-term positive for the C-Corp fund structure, the immediate impact was a reduction in the Fund’s Net Asset Value due to the required remeasuring of the Fund’s accumulated deferred tax assets, as of the enactment date, using the new 21% rate.
MACRO REVIEW
West Texas Intermediate (“WTI”) crude oil prices ended the reporting period at $67.07 per barrel, up 17% over the reporting period. Global crude prices, as measured by Brent crude oil, traded 26% higher over the reporting period. Brent exited the period at a $10.55 per barrel premium to WTI, as the aforementioned Permian capacity constraints also began to weigh on WTI pricing, relative to international levels, as more barrels are pushed from the Permian to Cushing, OK, where WTI pricing is set.
Henry Hub natural gas spot prices exited the period at $2.89 per million British thermal units (“mmbtu”), down 2% over the reporting period, and down 4% from the year-ago period. Natural gas pricing appears to have settled into a relatively narrow trading band as supply and demand dynamics have balanced with heating and electric generation demand stabilizing to weather-dependent levels, production volume growth increasing, and increasing liquefied natural gas exports.
Mont Belvieu natural gas liquids (“NGL”) prices ended the reporting period at $29.61 per barrel, a 7% increase over the reporting period. Pricing for NGL purity products varied, with ethane, isobutane, and natural gasoline trading higher over the period while butane and propane prices declined. Frac spreads, a measure of natural gas processing economics, ended the period at $0.49 per gallon, down 8% over the reporting period. Generally, the greater the frac spread, the greater the incentive for producers to seek natural gas processing capacity.
The yield curve flattened over the reporting period as short-term rates increased more than the yields on longer-dated maturities. The ten-year Treasury yield increased 45 basis points to end the period at 2.86%. The MLP yield spread at period-end, as measured by the AMZ and the 10-year Treasury bond, narrowed by 60 basis points to 5.12%.
Over the reporting period, real estate investment trusts (“REITs”) and utilities, two competing yield-oriented equity asset classes, posted total return losses of 3.11% (as measured by the Dow Jones Equity REIT Total Return Index) and 8.28% (as measured by the Dow Jones Utility Average Index), respectively, as compared to the AMZ’s 5.71% total return gain. Price to forward distributable cash flow (DCF),
4 OPPENHEIMER STEELPATH MLP INCOME FUND |
a commonly watched ratio within the MLP sector, declined over the period, ending well below the ten-year average.
SUBSECTOR REVIEW
Performance among subsectors in the midstream, or energy infrastructure, MLP asset class varied for the reporting period. On average, sector participants focused on compression provided the best performance over the period, as strength in demand for compression services has driven increased asset utilization and pricing increases. The gathering and processing subsector followed, buoyed by improved volumetric projections.
The natural gas pipeline subsector experienced the weakest performance over the reporting period as these entities’ prospective cash flows were directly impacted by the FERC changes related to cost-of-service tariffs on interstate pipelines owned by MLPs. The propane subsector also lagged over the reporting period as winter demand proved fleeting and due to idiosyncratic factors at select subsector members.
FUND REVIEW
Key contributors to the Fund’s performance were Energy Transfer Partners, LP (ETP) and Crestwood Equity Partners, LP (CEQP).
ETP outperformed over the period as its robust portfolio of natural gas processing assets benefited from the recent expansion of processing facilities. In addition, its Permian and Marcellus/Utica assets have been seeing increasing activity that is expected to drive cash flow growth.
CEQP units outperformed over the period, benefitting from a resurgence of activity in the Bakken Shale, strong growth in the Permian Basin, and the expectation for the partnership’s addition to the Alerian MLP Infrastructure Index (AMZI), which was confirmed subsequent to the reporting period.
Key detractors from the Fund’s performance were TC Pipelines, LP (TCP) and Enbridge Energy Partners LP (EEP).
TCP units underperformed over the period following FERC changes related to cost-of-service tariffs on interstate natural gas and liquids pipelines owned by MLPs. Despite this concern, we believe the ultimate outcome is likely far more nuanced and any revenue impact much less widespread than the initial market reaction.
EEP also underperformed over the period following the FERC changes. As a result of the changes, EEP’s sponsor, Enbridge Inc. (NYSE: ENB), announced that it would buy-in all of its sponsored vehicles, which include EEP, Spectra Energy Partners LP (NYSE: SEP), and Enbridge Income Fund Holding (TSX: ENF). The proposed EEP buy-in is subject to an ongoing review and approval by an EEP special committee.
Please note that significant decreases in cash distributions from the Fund’s MLP investments and/or significant declines in the value of its investments may impact the Fund’s assessment regarding the recoverability of certain deferred tax
OPPENHEIMER STEELPATH MLP INCOME FUND 5 |
assets, which may result in the recording of a valuation allowance. If a valuation allowance is established, this could have a material impact on the Fund’s net asset value and results of operations for the period. The Fund had a valuation allowance in place during the reporting period and at period end. See Note 2 of the Notes to Financial Statements for more information.
OUTLOOK
We believe midstream equity valuations are attractive and sector participants have improved their positioning for the future. While the AMZ is above the cyclical low, it remains at levels present before the shale production renaissance. Notably, this is occurring at a time when many MLPs have reached or are approaching a self-funding level of retained cash flows and the industry’s heaviest capital spending obligations appear to be in the past. Accordingly, we believe the stage is setting for a realignment of business and equity fundamentals, positioning the sector well for long-term investors seeking an attractive blend of current income, moderate growth, and, presently, attractive valuations.

| 
Stuart Cartner
Portfolio Manager
| | 
| 
Brian Watson, CFA
Portfolio Manager
|
6 OPPENHEIMER STEELPATH MLP INCOME FUND |
Top Holdings and Allocations
TOP TEN MASTER LIMITED PARTNERSHIP AND RELATED ENTITIES HOLDINGS
Energy Transfer Partners LP | 10.92% |
Sunoco LP | 7.40% |
Genesis Energy LP | 5.66% |
EnLink Midstream Partners LP | 5.43% |
NuStar Energy LP | 5.12% |
Crestwood Equity Partners LP | 5.10% |
USA Compression Partners LP | 4.86% |
Buckeye Partners LP | 4.46% |
DCP Midstream LP | 4.13% |
NGL Energy Partners LP | 3.62% |
Portfolio holdings and allocations are subject to change. Percentages are as of May 31, 2018, and are based on net assets. For more current Fund holdings, please visit oppenheimerfunds.com.
SECTOR ALLOCATION
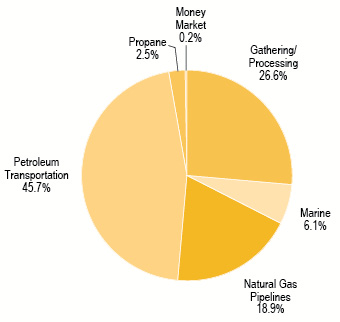
Portfolio holdings and allocations are subject to change. Percentages are as of May 31, 2018, and are based on the total market value of investments. For more current Fund holdings, please visit oppenheimerfunds.com.
OPPENHEIMER STEELPATH MLP INCOME FUND 7 |
Share Class Performance
AVERAGE ANNUAL TOTAL RETURNS WITHOUT SALES CHARGE AS OF 5/31/18
| | Inception Date | 6-Month | 1-Year | 5-Year | Since Inception |
Class A (MLPDX) | 3/31/10 | 0.03% | -5.79% | -2.44% | 2.23% |
Class C (MLPRX) | 6/10/11 | -0.31% | -6.45% | -3.18% | -0.24% |
Class I (OSPMX) | 6/28/13 | 0.19% | -5.48% | N/A | -2.78% |
Class Y (MLPZX) | 3/31/10 | 0.03% | -5.65% | -2.23% | 2.47% |
AVERAGE ANNUAL TOTAL RETURNS WITH SALES CHARGE AS OF 5/31/18
| | Inception Date | 6-Month | 1-Year | 5-Year | Since Inception |
Class A (MLPDX) | 3/31/10 | -5.74% | -11.23% | -3.60% | 1.49% |
Class C (MLPRX) | 6/10/11 | -1.26% | -7.28% | -3.18% | -0.24% |
Class I (OSPMX) | 6/28/13 | 0.19% | -5.48% | N/A | -2.78% |
Class Y (MLPZX) | 3/31/10 | 0.03% | -5.65% | -2.23% | 2.47% |
Performance data quoted represents past performance, which does not guarantee future results. The investment return and principal value of an investment in the Fund will fluctuate so that an investor’s shares, when redeemed, may be worth more or less than their original cost. Current performance may be lower or higher than the performance quoted. Returns do not consider capital gains or income taxes on an individual’s investment. For performance data current to the most recent month-end, visit oppenheimerfunds.com or call 1.800.CALL OPP (225.5677). Fund returns include changes in share price, reinvested distributions, and the applicable sales charge: for Class A shares, the current maximum initial sales charge of 5.75%, and for Class C shares, the contingent deferred sales charge of 1% for the 1-year period. There is no sales charge for Class I or Class Y shares. Returns for periods of less than one year are cumulative and not annualized. See Fund prospectuses and summary prospectuses for more information on share classes and sales charges.
The Fund’s performance is compared to the performance of the S&P 500 Index and the Alerian MLP Index. The S&P 500 Index is a capitalization-weighted index of 500 stocks intended to be a representative sample of leading companies in leading industries within the U.S. economy. The Alerian MLP Index is a float-adjusted, capitalization-weighted index measuring master limited partnerships, whose constituents represent approximately 85% of total float-adjusted market capitalization. The returns for the S&P 500 Index and Alerian MLP Index are calculated pre-tax, while the Fund’s returns are calculated post corporate tax. The indices are unmanaged and cannot be purchased directly by investors. While index comparisons may be useful to provide a benchmark for the Fund’s performance, it must be noted that the Fund’s investments are not limited to the investments comprising the indices. Index performance
8 OPPENHEIMER STEELPATH MLP INCOME FUND |
includes reinvestment of income, but does not reflect transaction costs, fees, expenses or taxes. Index performance is shown for illustrative purposes only as a benchmark for the Fund’s performance, and does not predict or depict performance of the Fund. The Fund’s performance reflects the effects of the Fund’s business and operating expenses.
The Fund’s investment strategy and focus can change over time. The mention of specific fund holdings does not constitute a recommendation by OppenheimerFunds, Inc. or its affiliates.
The views in the Fund Performance Discussion represent the opinions of this Fund’s portfolio managers and are not intended as investment advice or to predict or depict the performance of any investment. These views are as of the close of business on May 31, 2018, and are subject to change based on subsequent developments. The Fund’s portfolio and strategies are subject to change.
Before investing in any of the Oppenheimer funds, investors should carefully consider a fund’s investment objectives, risks, charges and expenses. Fund prospectuses and summary prospectuses contain this and other information about the funds, and may be obtained by asking your financial advisor, visiting oppenheimerfunds.com, or calling 1.800.CALL OPP (225.5677). Read prospectuses and summary prospectuses carefully before investing.
Shares of Oppenheimer funds are not deposits or obligations of any bank, are not guaranteed by any bank, are not insured by the FDIC or any other agency, and involve investment risks, including the possible loss of the principal amount invested.
OPPENHEIMER STEELPATH MLP INCOME FUND 9 |
Fund Expenses
Fund Expenses. As a shareholder of the Fund, you incur two types of costs: (1) transaction costs, which may include sales charges (loads) on purchase payments, contingent deferred sales charges on redemptions; and (2) ongoing costs, including management fees; distribution and service fees; and other Fund expenses. These examples are intended to help you understand your ongoing costs (in dollars) of investing in the Fund and to compare these costs with the ongoing costs of investing in other mutual funds.
The examples are based on an investment of $1,000.00 invested at the beginning of the period and held for the entire 6-month period ended May 31, 2018.
Actual Expenses. The first section of the table provides information about actual account values and actual expenses. You may use the information in this section for the class of shares you hold, together with the amount you invested, to estimate the expense that you paid over the period. Simply divide your account value by $1,000.00 (for example, an $8,600.00 account value divided by $1,000.00 = 8.60), then multiply the result by the number in the first section under the heading entitled “Expenses Paid During 6 Months Ended May 31, 2018” to estimate the expenses you paid on your account during this period.
Hypothetical Example for Comparison Purposes. The second section of the table provides information about hypothetical account values and hypothetical expenses based on the Fund’s actual expense ratio for each class of shares, and an assumed rate of return of 5% per year for each class before expenses, which is not the actual return. The hypothetical account values and expenses may not be used to estimate the actual ending account balance or expenses you paid for the period. You may use this information to compare the ongoing costs of investing in the Fund and other funds. To do so, compare this 5% hypothetical example for the class of shares you hold with the 5% hypothetical examples that appear in the shareholder reports of the other funds.
Please note that the expenses shown in the table are meant to highlight your ongoing costs only and do not reflect any transactional costs, such as front-end or contingent deferred sales charges (loads). Therefore, the “hypothetical” section of the table is useful in comparing ongoing costs only, and will not help you determine the relative total costs of owning different funds. In addition, if these transactional costs were included, your costs would have been higher.
10 OPPENHEIMER STEELPATH MLP INCOME FUND |
Actual | Beginning
Account
Value
December 1, 2017 | Ending
Account
Value
May 31, 2018 | Expenses
Paid During
6 Months Ended
May 31, 2018 |
CLASS A | $ 1,000.00 | $ 1,000.30 | $ 29.52 |
CLASS C | 1,000.00 | 996.90 | 33.21 |
CLASS I | 1,000.00 | 1,001.90 | 27.95 |
CLASS Y | 1,000.00 | 1,000.30 | 28.28 |
Hypothetical
(5% return before expenses) | | | |
CLASS A | 1,000.00 | 995.48 | 29.45 |
CLASS C | 1,000.00 | 991.74 | 33.13 |
CLASS I | 1,000.00 | 997.08 | 27.88 |
CLASS Y | 1,000.00 | 996.73 | 28.23 |
Expenses are equal to the Fund’s annualized expense ratio for that class, multiplied by the average account value over the period, multiplied by 182/365 (to reflect the one-half year period). Those annualized expense ratios, excluding indirect expenses from affiliated funds, and tax expense, based on the 6-month period ended May 31, 2018 are as follows:
Class | Expense Ratios |
CLASS A | 5.92% |
CLASS C | 6.67 |
CLASS I | 5.60 |
CLASS Y | 5.67 |
The expense ratios for Class A, C, and Y reflect contractual and/or voluntary waivers and/or reimbursements of expenses by the Fund’s Manager, and Transfer Agent. Some of these undertakings may be modified or terminated at any time, as indicated in the Fund’s prospectus. The “Financial Highlights” tables in the Fund’s financial statements, included in this report, also show the gross expense ratios, without such waivers or reimbursements, if applicable.
OPPENHEIMER STEELPATH MLP INCOME FUND 11 |
STATEMENT OF INVESTMENTS May 31, 2018 / Unaudited |
| Description | | Shares | | Value |
| MLP Investments and Related Entities — 91.7% |
| Gathering/Processing — 24.2% |
American Midstream Partners LP 1 | | | 6,227,012 | | | $ | 65,694,977 | |
| Archrock, Inc. | | | 3,950,064 | | | | 45,623,239 | |
Crestwood Equity Partners LP 1 | | | 5,102,251 | | | | 171,435,634 | |
CSI Compressco LP 1 | | | 3,262,800 | | | | 19,217,892 | |
| EnLink Midstream Partners LP | | | 10,660,521 | | | | 182,294,909 | |
Sanchez Midstream Partners LP 1 | | | 1,758,705 | | | | 20,928,589 | |
Summit Midstream Partners LP 1 | | | 6,665,830 | | | | 108,319,737 | |
| Targa Resources Corp. | | | 745,910 | | | | 36,273,603 | |
USA Compression Partners LP 1 | | | 8,794,640 | | | | 163,316,465 | |
| Total Gathering/Processing | | | | | | | 813,105,045 | |
| | | | | | | | | |
| Marine — 5.4% | | | | | | | | |
GasLog Partners LP 2 | | | 1,165,291 | | | | 28,491,365 | |
Golar LNG Partners LP 1,2 | | | 3,654,823 | | | | 61,291,382 | |
Hoegh LNG Partners LP 2 | | | 484,142 | | | | 8,375,657 | |
KNOT Offshore Partners LP 1,2 | | | 1,788,152 | | | | 37,551,192 | |
Teekay LNG Partners LP 2 | | | 2,614,935 | | | | 45,238,375 | |
Teekay Offshore Partners LP 2 | | | 440,043 | | | | 1,188,116 | |
| Total Marine | | | | | | | 182,136,087 | |
| | | | | | | | | |
| Natural Gas Pipelines — 18.0% |
CrossAmerica Partners LP 1 | | | 3,596,076 | | | | 62,068,272 | |
| Energy Transfer Partners LP | | | 19,317,355 | | | | 366,836,571 | |
| Tallgrass Energy Partners LP | | | 1,683,000 | | | | 73,496,610 | |
TC Pipelines LP 1 | | | 4,182,119 | | | | 101,709,134 | |
| Total Natural Gas Pipelines | | | | | | | 604,110,587 | |
| | | | | | | | | |
| Petroleum Transportation — 41.7% |
Blueknight Energy Partners LP 1 | | | 2,140,334 | | | | 7,919,236 | |
| Buckeye Partners LP | | | 4,152,603 | | | | 149,701,338 | |
| DCP Midstream LP | | | 3,309,752 | | | | 138,711,707 | |
| Delek Logistics Partners LP | | | 453,843 | | | | 13,342,984 | |
| Enbridge Energy Partners LP | | | 9,231,218 | | | | 90,927,497 | |
Genesis Energy LP 1 | | | 8,665,274 | | | | 190,289,417 | |
Global Partners LP 1 | | | 3,281,379 | | | | 56,931,926 | |
| Holly Energy Partners LP | | | 1,321,964 | | | | 38,839,302 | |
Martin Midstream Partners LP 1 | | | 6,451,633 | | | | 97,419,658 | |
NGL Energy Partners LP 1 | | | 11,364,586 | | | | 121,601,070 | |
NuStar Energy LP 1 | | | 7,043,514 | | | | 172,143,482 | |
| NuStar GP Holdings LLC | | | 694,100 | | | | 9,474,465 | |
| PBF Logistics LP | | | 985,940 | | | | 19,768,097 | |
Sprague Resources LP 1 | | | 1,635,016 | | | | 38,749,879 | |
Sunoco LP 1 | | | 9,339,784 | | | | 248,438,255 | |
| USD Partners LP | | | 744,575 | | | | 8,339,240 | |
| Total Petroleum Transportation | | | | | | | 1,402,597,553 | |
12 OPPENHEIMER STEELPATH MLP INCOME FUND |
STATEMENT OF INVESTMENTS Unaudited / (Continued) |
| Description | | Shares | | Value |
| Propane — 2.4% | | | | |
| Amerigas Partners LP | | | 338,758 | | | $ | 14,014,419 | |
Suburban Propane Partners LP 1 | | | 2,843,401 | | | | 66,564,017 | |
| Total Propane | | | | | | | 80,578,436 | |
| | | | | | | | | |
| Total MLP Investments and Related Entities |
| (identified cost $3,304,339,976) | | | | | | | 3,082,527,708 | |
| | | | | | | | | |
| Common Stock — 0.8% |
| Petroleum Transportation — 0.8% |
Enbridge Energy Management LLC 3 | | | 2,787,516 | | | | 26,481,406 | |
| | | | | | | | | |
| Total Common Stock |
| (identified cost $25,610,714) | | | | | | | 26,481,406 | |
| | | | | | | | | |
| Preferred MLP Investments and Related Entities — 2.6% |
| Gathering/Processing — 1.2% |
Crestwood Equity Partners LP, 9.25% 1,4,5,6 | | | 2,867,201 | | | | 28,127,242 | |
CSI Compressco LP - Series A, 11.00% 1,4,5,7 | | | 899,957 | | | | 11,258,466 | |
| Total Gathering/Processing | | | | | | | 39,385,708 | |
| | | | | | | | | |
| Marine — 0.4% | | | | | | | | |
Teekay Offshore Partners LP, 7.25% 2 | | | 592,198 | | | | 12,424,314 | |
| | | | | | | | | |
| Petroleum Transportation — 1.0% |
Blueknight Energy Partners LP, 11.00% 1 | | | 799,993 | | | | 5,079,956 | |
GPM Petroleum LP, 10.00% 1,4,5 | | | 1,500,000 | | | | 30,060,000 | |
| Total Petroleum Transportation | | | | | | | 35,139,956 | |
| | | | | | | | | |
| Total Preferred MLP Investments and Related Entities |
| (identified cost $71,527,020) | | | | | | | 86,949,978 | |
| | | | | | | | | |
| Short-Term Investment — 0.2% |
| Money Market — 0.2% | | | | | | | | |
| Fidelity Treasury Portfolio, Institutional Class, 1.62% | | | 6,399,517 | | | | 6,399,517 | |
| | | | | | | | | |
| Total Short-Term Investment | | | | | | | | |
| (identified cost $6,399,517) | | | | | | | 6,399,517 | |
| | | | | | | | | |
| Total Investments — 95.3% | | | | | | | | |
| (identified cost $3,407,877,227) | | | | | | | 3,202,358,609 | |
| Other Assets In Excess of Liabilities — 4.7% | | | | | | | 156,742,111 | |
| Net Assets — 100.0% | | | | | | $ | 3,359,100,720 | |
OPPENHEIMER STEELPATH MLP INCOME FUND 13 |
STATEMENT OF INVESTMENTS Unaudited / (Continued) |
Footnotes to Statement of Investments
GP — General Partnership
LLC — Limited Liability Company
LP — Limited Partnership
1 | Is or was an affiliate, as defined by the Investment Company Act of 1940, at or during the period ended May 31, 2018, by virtue of the Fund owning at least 5% of the voting securities of the issuer. Transactions during this period in which the issuer was an affiliate are as follows: |
| Shares
November 30,
2017 | Gross
Additions | Gross
Reductions | Shares
May 31,
2018 |
MLP Investments and Related Entities | | | |
American Midstream Partners LP | 6,057,986 | 220,626 | (51,600) | 6,227,012 |
Arc Logistic Partners LP i | 1,896,477 | — | (1,896,477) | — |
Archrock Partners Lp i | 5,367,394 | — | (5,367,394) | — |
Blueknight Energy Partners LP | 2,007,434 | 150,000 | (17,100) | 2,140,334 |
Crestwood Equity Partners LP | 5,297,451 | — | (195,200) | 5,102,251 |
CrossAmerica Partners LP | 2,301,394 | 1,314,382 | (19,700) | 3,596,076 |
CSI Compressco LP | 2,624,674 | 660,026 | (21,900) | 3,262,800 |
Genesis Energy LP | 7,374,500 | 1,353,774 | (63,000) | 8,665,274 |
Global Partners LP | 2,946,378 | 360,101 | (25,100) | 3,281,379 |
Golar LNG Partners LP | 3,686,241 | — | (31,418) | 3,654,823 |
KNOT Offshore Partners LP | 1,803,652 | — | (15,500) | 1,788,152 |
Martin Midstream Partners LP | 6,406,253 | 100,000 | (54,620) | 6,451,633 |
NGL Energy Partners LP | 10,050,472 | 1,400,000 | (85,886) | 11,364,586 |
Nustar Energy LP | 5,540,776 | 1,550,000 | (47,262) | 7,043,514 |
Sanchez Midstream Partners LP | 1,773,905 | — | (15,200) | 1,758,705 |
Sprague Resources LP | 1,649,116 | — | (14,100) | 1,635,016 |
Suburban Propane Partners LP i | 2,801,658 | 450,000 | (408,257) | 2,843,401 |
Summit Midstream Partners LP | 6,118,030 | 600,000 | (52,200) | 6,665,830 |
Sunoco LP | 9,218,350 | 200,000 | (78,566) | 9,339,784 |
USA Compression Partners LP | 6,498,263 | 2,351,877 | (55,500) | 8,794,640 |
Preferred MLP Investments and Related Entities | | |
Blueknight Energy Partners LP - Preferred | 801,393 | — | (1,400) | 799,993 |
Crestwood Equity Partners LP - Preferred | 2,867,201 | — | — | 2,867,201 |
CSI Compressco LP - Preferred | 1,181,904 | 61,147 | (343,094) | 899,957 |
GPM Petroleum LP - Preferred ii | 1,500,000 | — | — | 1,500,000 |
14 OPPENHEIMER STEELPATH MLP INCOME FUND |
STATEMENT OF INVESTMENTS Unaudited / (Continued) |
| | | | | Distributions and Dividends | | | | |
| | | Value
May 31,
2018 | | Return of Capital | | Capital Gains | | Income | | Realized
Gain/(Loss) | | Change in Unrealized
Gain/(Loss) |
| MLP Investments and Related Entities | | | | |
| American Midstream Partners LP | | $ | 65,694,977 | | | $ | 3,247,609 | | | $ | 1,707,659 | | | $ | — | | | $ | (68,398 | ) | | $ | (5,197,921 | ) |
Arc Logistic Partners LP i | | | — | | | | — | | | | — | | | | — | | | | 6,884,280 | | | | (6,753,133 | ) |
Archrock Partners LP i | | | — | | | | 1,231,584 | | | | 285,036 | | | | — | | | | (17,308,338 | ) | | | 41,481,164 | |
| Blueknight Energy Partners LP | | | 7,919,236 | | | | 591,697 | | | | — | | | | — | | | | (9,193 | ) | | | (2,560,696 | ) |
| Crestwood Equity Partners LP | | | 171,435,634 | | | | 6,272,701 | | | | — | | | | — | | | | 638,884 | | | | 55,927,328 | |
| CrossAmerica Partners LP | | | 62,068,272 | | | | 3,318,732 | | | | — | | | | — | | | | 68,214 | | | | (14,531,678 | ) |
| CSI Compressco LP | | | 19,217,892 | | | | 585,236 | | | | 545,754 | | | | — | | | | (108,828 | ) | | | 3,183,373 | |
| Genesis Energy LP | | | 190,289,417 | | | | 8,667,287 | | | | — | | | | — | | | | 159,766 | | | | 12,063,609 | |
| Global Partners LP | | | 56,931,926 | | | | 2,560,204 | | | | 141,978 | | | | — | | | | 255,053 | | | | 2,243,617 | |
| Golar LNG Partners LP | | | 61,291,382 | | | | 2,852,442 | | | | — | | | | 1,368,879 | | | | (115,474 | ) | | | (7,595,351 | ) |
| KNOT Offshore Partners LP | | | 37,551,192 | | | | 965,805 | | | | — | | | | 893,873 | | | | 6,452 | | | | 3,855,420 | |
| Martin Midstream Partners LP | | | 97,419,658 | | | | 6,218,801 | | | | 132,832 | | | | — | | | | 24,672 | | | | 16,677,152 | |
| NGL Energy Partners LP | | | 121,601,070 | | | | 8,045,377 | | | | — | | | | — | | | | (228,968 | ) | | | (11,172,122 | ) |
| Nustar Energy LP | | | 172,143,482 | | | | 9,965,322 | | | | 36,184 | | | | — | | | | 225,532 | | | | (13,083,442 | ) |
| Sanchez Midstream Partners LP | | | 20,928,590 | | | | 1,585,648 | | | | — | | | | — | | | | — | | | | 18,166,909 | |
| Sprague Resources LP | | | 38,749,879 | | | | 2,109,171 | | | | — | | | | — | | | | 193,922 | | | | 1,008,352 | |
Suburban Propane Partners LP i | | | 66,564,017 | | | | 3,493,081 | | | | — | | | | — | | | | (1,247,227 | ) | | | 1,736,820 | |
| Summit Midstream Partners LP | | | 108,319,738 | | | | 7,133,194 | | | | — | | | | — | | | | (365,582 | ) | | | (8,831,438 | ) |
| Sunoco LP | | | 248,438,254 | | | | 15,089,783 | | | | — | | | | — | | | | (186,490 | ) | | | (10,019,522 | ) |
| USA Compression Partners LP | | | 163,316,465 | | | | 7,461,827 | | | | 145,045 | | | | — | | | | 470,307 | | | | 17,680,855 | |
| Preferred MLP Investments and Related Entities | | | | | | | | | | | | | | | | | | | | | | | | |
| Blueknight Energy Partners LP - Preferred | | | 5,079,956 | | | | 285,998 | | | | — | | | | — | | | | — | | | | 4,874,599 | |
| Crestwood Equity Partners LP - Preferred | | | 28,127,242 | | | | 1,210,532 | | | | — | | | | — | | | | — | | | | 6,170,790 | |
| CSI Compressco LP - Preferred | | | 11,258,466 | | | | 698,910 | | | | — | | | | — | | | | — | | | | 1,790,887 | |
GPM Petroleum LP - Preferred ii | | | 30,060,000 | | | | 1,546,240 | | | | — | | | | — | | | | — | | | | 1,081,240 | |
| | | $ | 1,784,406,745 | | | $ | 95,137,181 | | | $ | 2,994,488 | | | $ | 2,262,752 | | | $ | (10,711,416 | ) | | $ | 108,196,812 | |
i | Is not an affiliate as of May 31, 2018. Was an affiliate during the period ended May 31, 2018. |
ii | An affiliate due to the Manager sitting on the board. |
OPPENHEIMER STEELPATH MLP INCOME FUND 15 |
STATEMENT OF INVESTMENTS Unaudited / (Continued) |
2 | Foreign security denominated in U.S. Dollars. |
4 | Restricted security. The aggregate value of restricted securities at period end was $69,445,708, which represents 2.1% of the Fund’s net assets. See Note 4 of the accompanying Notes. Information concerning restricted securities is as follows: |
| Security | | Acquisition Date | | Cost | | | Value | | | Unrealized Appreciation/ (Depreciation) | |
| Crestwood Equity Partners LP - Preferred | | 3/2/2017 – 8/14/2017 | | $ | 24,934,175 | | | $ | 28,127,242 | | | $ | 3,193,067 | |
| CSI Compressco LP - Preferred | | 8/8/2016 – 2/13/2018 | | | 8,368,738 | | | | 11,258,466 | | | | 2,889,728 | |
| GPM Petroleum LP - Preferred | | 1/12/2016 | | | 23,161,416 | | | | 30,060,000 | | | | 6,898,584 | |
5 | The value of this security was determined using significant unobservable inputs. See Note 3 of accompanying Notes. |
6 | Represents securities sold under 144A, which are exempt from registration under the Securities Act of 1933, as amended. These securities amount to $28,127,242 or 0.8% of the Fund’s net assets at period end. |
7 | Interest of dividend paid in kind, when applicable. |
8 | Rate shown is the 7-day yield at period end. |
See accompanying Notes to Financial Statements.
16 OPPENHEIMER STEELPATH MLP INCOME FUND |
STATEMENT OF ASSETS AND LIABILITIES May 31, 2018 / Unaudited |
| Assets: | | |
| Investments at value – see accompanying Statement of Investments: | | |
| Unaffiliated companies (cost $1,604,352,457) | | $ | 1,484,515,880 | |
| Affiliated companies (cost $1,803,524,770) | | | 1,717,842,729 | |
| | | | 3,202,358,609 | |
| Deferred tax asset, net | | | 167,901,585 | |
| Receivable for beneficial interest sold | | | 3,031,992 | |
| Prepaid expenses | | | 340,922 | |
| Dividends receivable | | | 15,489 | |
| Receivable for investments sold | | | 3,336,478 | |
| Total assets | | | 3,376,985,075 | |
| | | | | |
| Liabilities: | | | | |
| Payable for investments purchased | | | 11,226,273 | |
| Payable to Manager | | | 2,378,529 | |
| Payable for beneficial interest redeemed | | | 2,221,203 | |
| Payable for distribution and service plan fees | | | 1,108,230 | |
| Transfer agent fees payable, net of voluntary waiver | | | 540,741 | |
| Borrowing expense payable | | | 53,465 | |
| Trustees' fees payable | | | 18,576 | |
| Other liabilities | | | 337,338 | |
| Total liabilities | | | 17,884,355 | |
| | | | | |
| Net Assets | | $ | 3,359,100,720 | |
| | | | | |
| Composition of Net Assets | | | | |
| Par value of shares of beneficial interest | | $ | 559,546 | |
| Paid-in capital | | | 3,985,379,599 | |
| Undistributed net investment loss, net of deferred taxes | | | (283,549,059 | ) |
| Accumulated undistributed net realized losses on investments, net of deferred taxes | | | (260,919,353 | ) |
| Net unrealized depreciation on investments, net of deferred taxes | | | (82,370,013 | ) |
| Net Assets | | $ | 3,359,100,720 | |
OPPENHEIMER STEELPATH MLP INCOME FUND 17 |
STATEMENT OF ASSETS AND LIABILITIES Unaudited / (Continued) |
| Net Asset Value, Offering Price and Redemption Proceeds Per Share ($0.001 Par Value, Unlimited Shares Authorized) | | |
| Class A Shares: | | |
| Net asset value and redemption proceeds per share | | $ | 6.08 | |
| Offering price per share (net asset value plus sales charge of 5.75% of offering price) | | $ | 6.45 | |
| Class C Shares: | | | | |
| Net asset value, offering price and redemption proceeds per share | | $ | 5.68 | |
| Class I Shares: | | | | |
| Net asset value, offering price and redemption proceeds per share | | $ | 6.29 | |
| Class Y Shares: | | | | |
| Net asset value, offering price and redemption proceeds per share | | $ | 6.25 | |
| | | | | |
| Net Assets: | | | | |
| Class A shares | | $ | 1,427,717,904 | |
| Class C shares | | | 972,149,319 | |
| Class I shares | | | 25,911,858 | |
| Class Y shares | | | 933,321,639 | |
| Total Net Assets | | $ | 3,359,100,720 | |
| | | | | |
| Shares Outstanding: | | | | |
| Class A shares | | | 234,957,281 | |
| Class C shares | | | 171,210,973 | |
| Class I shares | | | 4,122,670 | |
| Class Y shares | | | 149,255,428 | |
| Total Shares Outstanding | | | 559,546,352 | |
See accompanying Notes to Financial Statements.
18 OPPENHEIMER STEELPATH MLP INCOME FUND |
STATEMENT OF OPERATIONS
For the Six Months Ended May 31, 2018 / Unaudited |
| Investment Income | | |
| Distributions and dividends | | $ | 171,434,898 | |
| Less return of capital on distributions and dividends ($95,137,181 from affiliates) | | | (163,353,012 | ) |
| Less return of capital on distributions and dividends in excess of cost basis ($2,994,488 from affiliates) | | | (5,381,651 | ) |
| Total investment income ($2,262,752 from affiliates) | | | 2,700,235 | |
| | | | | |
| Expenses | | | | |
| Management fees | | | 16,073,828 | |
| Distribution and service plan fees | | | | |
| Class A | | | 1,790,850 | |
| Class C | | | 5,023,654 | |
| Transfer agent fees | | | | |
| Class A | | | 1,432,172 | |
| Class C | | | 1,002,116 | |
| Class I | | | 3,740 | |
| Class Y | | | 923,385 | |
| Borrowing fees | | | 430,918 | |
| Administrative fees | | | 405,638 | |
| Tax expense | | | 208,473 | |
| Legal, auditing, and other professional fees | | | 162,941 | |
| Custody fees | | | 112,137 | |
| Registration fees | | | 93,716 | |
| Trustees' fees | | | 47,323 | |
| Other | | | 43,385 | |
| Total expenses, before waivers and deferred taxes | | | 27,754,276 | |
| Less expense waivers | | | (1,652,900 | ) |
| Net expenses, before deferred taxes | | | 26,101,376 | |
| | | | | |
| Net investment loss, before deferred taxes | | | (23,401,141 | ) |
| Deferred tax expense | | | (43,026,385 | ) |
| Net investment loss, net of deferred taxes | | | (66,427,526 | ) |
| | | | | |
| Net Realized and Unrealized Gains/(Losses) on Investments: | | | | |
| Net Realized Gains/(Losses) | | | | |
| Investments from: | | | | |
| Unaffiliated companies (net return of capital in excess of cost basis of $2,387,163) | | | 37,264,211 | |
| Affiliated companies (net return of capital in excess of cost basis of $2,994,488) | | | (10,711,416 | ) |
| Deferred tax expense | | | (28,690,336 | ) |
| Net realized losses, net of deferred taxes | | | (2,137,541 | ) |
| Net Change in Unrealized Appreciation/(Depreciation) | | | | |
| Investments from: | | | | |
| Unaffiliated companies | | | (43,364,006 | ) |
| Affiliated companies | | | 108,196,812 | |
| Deferred tax expense | | | (5,033,725 | ) |
| Net change in unrealized appreciation/(depreciation), net of deferred taxes | | | 59,799,081 | |
| | | | | |
| Net realized and unrealized gains/(losses) on investments, net of deferred taxes | | | 57,661,540 | |
| Change in net assets resulting from operations | | $ | (8,765,986 | ) |
See accompanying Notes to Financial Statements.
OPPENHEIMER STEELPATH MLP INCOME FUND 19 |
STATEMENTS OF CHANGES IN NET ASSETS |
| | | For the Six
Months Ended
May 31, 2018
(Unaudited) | | For the
Year Ended
November 30, 2017 |
| Operations | | | | |
| Net investment loss, net of deferred taxes | | $ | (66,427,526 | ) | | $ | (42,361,117 | ) |
| Net realized gains/(losses), net of deferred taxes | | | (2,137,541 | ) | | | 58,814,019 | |
| Net change in unrealized appreciation/(depreciation), net of deferred taxes | | | 59,799,081 | | | | (258,953,793 | ) |
| Change in net assets resulting from operations | | | (8,765,986 | ) | | | (242,500,891 | ) |
| | | | | | | | | |
| Distributions to Shareholders | | | | | | | | |
| Distributions to shareholders from return of capital: | | | | | | | | |
| Class A shares | | | (65,692,790 | ) | | | (143,269,737 | ) |
| Class C shares | | | (48,994,425 | ) | | | (107,915,184 | ) |
| Class I shares | | | (1,115,395 | ) | | | (1,863,906 | ) |
| Class Y shares | | | (41,316,058 | ) | | | (81,729,622 | ) |
| Distributions to shareholders from return of capital: | | | (157,118,668 | ) | | | (334,778,449 | ) |
| | | | | | | | | |
| Distributions to shareholders from income: | | | | | | | | |
| Class A shares | | | — | | | | (22,243,162 | ) |
| Class C shares | | | — | | | | (16,754,234 | ) |
| Class I shares | | | — | | | | (289,378 | ) |
| Class Y shares | | | — | | | | (12,688,828 | ) |
| Distributions to shareholders from income: | | | — | | | | (51,975,602 | ) |
| Change in net assets resulting from distributions to shareholders | | | (157,118,668 | ) | | | (386,754,051 | ) |
| | | | | | | | | |
| Beneficial Interest Transactions | | | | | | | | |
| Class A shares | | | 12,135,278 | | | | 64,133,015 | |
| Class C shares | | | (18,874,945 | ) | | | 50,715,646 | |
| Class I shares | | | 2,845,680 | | | | 7,559,960 | |
| Class Y shares | | | 39,409,819 | | | | 236,323,383 | |
| Change in net assets resulting from beneficial interest transactions | | | 35,515,832 | | | | 358,732,004 | |
| Change in net assets | | | (130,368,822 | ) | | | (270,522,938 | ) |
| | | | | | | | | |
| Net Assets | | | | | | | | |
| Beginning of period | | | 3,489,469,542 | | | | 3,759,992,480 | |
| End of period | | $ | 3,359,100,720 | | | $ | 3,489,469,542 | |
| | | | | | | | | |
| Undistributed net investment loss, net of deferred taxes | | $ | (283,549,059 | ) | | $ | (217,121,533 | ) |
See accompanying Notes to Financial Statements.
20 OPPENHEIMER STEELPATH MLP INCOME FUND |
| Class A | | Six Months
Ended
May 31,
2018
(Unaudited) | | Year Ended November 30,
2017 | | Year Ended November 30,
2016 | | Year Ended November 30,
2015 | | Year Ended November 28,
2014* | | Year Ended November 29,
2013* |
| Per Share Operating Data | | | | | | | | | | | | |
| Net Asset Value, Beginning of Period | | $ | 6.37 | | | $ | 7.47 | | | $ | 7.78 | | | $ | 11.01 | | | $ | 10.86 | | | $ | 9.83 | |
| Income/(loss) from investment operations: | | | | | | | | | | | | | | | | | | | | | | | | |
Net investment loss1 | | | (0.11 | ) | | | (0.06 | ) | | | (0.05 | ) | | | (0.06 | ) | | | (0.09 | ) | | | (0.09 | ) |
Return of capital1 | | | 0.23 | | | | 0.39 | | | | 0.41 | | | | 0.48 | | | | 0.48 | | | | 0.49 | |
| Net realized and unrealized gains/(losses) | | | (0.14 | ) | | | (0.72 | ) | | | 0.11 | | | | (2.87 | ) | | | 0.54 | | | | 1.41 | |
| Total from investment operations | | | (0.02 | ) | | | (0.39 | ) | | | 0.47 | | | | (2.45 | ) | | | 0.93 | | | | 1.81 | |
| Distributions to shareholders: | | | | | | | | | | | | | | | | | | | | | | | | |
| Return of capital | | | (0.27 | ) | | | (0.62 | ) | | | (0.78 | ) | | | (0.78 | ) | | | (0.78 | ) | | | (0.78 | ) |
| Income | | | — | | | | (0.09 | ) | | | — | | | | — | | | | — | | | | — | |
| Total distributions to shareholders | | | (0.27 | ) | | | (0.71 | ) | | | (0.78 | ) | | | (0.78 | ) | | | (0.78 | ) | | | (0.78 | ) |
| Net asset value, end of period | | $ | 6.08 | | | $ | 6.37 | | | $ | 7.47 | | | $ | 7.78 | | | $ | 11.01 | | | $ | 10.86 | |
| | | | | | | | | | | | | | | | | | | | | | | | | |
Total Return, at Net Asset Value2 | | | 0.03 | % | | | (5.91 | %) | | | 7.29 | % | | | (23.32 | %) | | | 8.66 | % | | | 18.79 | % |
| | | | | | | | | | | | | | | | | | | | | | | | | |
| Ratios /Supplemental Data | | | | | | | | | | | | | | | | | | | | | | | | |
| Net assets, end of period (in thousands) | | $ | 1,427,718 | | | $ | 1,482,395 | | | $ | 1,681,230 | | | $ | 1,355,597 | | | $ | 2,116,790 | | | $ | 1,452,182 | |
Ratio of Expenses to Average Net Assets:9 | | | | | | | | | | | | | | | | | | | | |
| Before (waivers) and deferred tax expense/(benefit) | | | 1.49 | % | | | 1.47 | % | | | 1.49 | % | | | 1.49 | % | | | 1.50 | % | | | 1.42 | % |
| Expense (waivers) | | | (0.10 | %)8 | | | (0.11 | %)8 | | | (0.12 | %) | | | (0.11 | %) | | | (0.12 | %) | | | (0.07 | %) |
| Net of (waivers) and before deferred tax expense/(benefit) | | | 1.39 | %3 | | | 1.36 | %3 | | | 1.37 | %3 | | | 1.38 | %3 | | | 1.38 | %3 | | | 1.35 | %4 |
Deferred tax expense/(benefit)5,6 | | | 4.53 | % | | | (1.47 | %) | | | 2.07 | % | | | (12.85 | %) | | | 4.38 | % | | | 6.97 | % |
| Total expenses/(benefit) | | | 5.92 | % | | | (0.11 | %) | | | 3.44 | % | | | (11.47 | %) | | | 5.76 | % | | | 8.32 | % |
| | | | | | | | | | | | | | | | | | | | | | | | | |
Ratio of Investment Loss to Average Net Assets:9 | | | | | | | | | | | | | | | | | | | | | |
| Before (waivers) and deferred tax benefit/(expense) | | | (1.21 | %) | | | (1.11 | %) | | | (1.09 | %) | | | (1.22 | %) | | | (1.41 | %) | | | (1.32 | %) |
| Expense (waivers) | | | (0.10 | %)8 | | | (0.11 | %)8 | | | (0.12 | %) | | | (0.11 | %) | | | (0.12 | %) | | | (0.07 | %) |
| Net of expense (waivers) and before deferred tax benefit/(expense) | | | (1.11 | %) | | | (1.00 | %) | | | (0.97 | %) | | | (1.11 | %) | | | (1.29 | %) | | | (1.25 | %) |
Deferred tax benefit/(expense)6,7 | | | (2.54 | %) | | | 0.21 | % | | | 0.32 | % | | | 0.54 | % | | | 0.56 | % | | | 0.45 | % |
| Net investment loss | | | (3.65 | %) | | | (0.79 | %) | | | (0.65 | %) | | | (0.57 | %) | | | (0.73 | %) | | | (0.80 | %) |
| | | | | | | | | | | | | | | | | | | | | | | | | |
| Portfolio turnover rate | | | 14 | % | | | 17 | % | | | 22 | % | | | 18 | % | | | 14 | % | | | 4 | % |
* | November 28, 2014 and November 29, 2013 represent the last business day of the Fund’s respective reporting periods. |
1. | Per share net investment loss is calculated based on average shares outstanding during the period net of deferred tax expense/benefit. Per share return of capital is calculated based on average shares during the period net of deferred tax expense/benefit estimated at the combined Federal and State statutory income tax rate (see Note 2). |
2. | Assumes an initial investment on the business day before the first day of the fiscal period, with all dividends and distributions reinvested in additional shares on the reinvestment date, and redemptions at the net asset value calculated on the last business day of the fiscal period. Sales charges are not reflected in the total returns. Total returns are not annualized for periods less than one full year. Returns do not reflect the deduction of taxes that a shareholder would pay on fund distributions or the redemption of fund shares. The returns do not include adjustments in accordance with generally accepted accounting principles required at the period end for financial reporting purposes. |
3. | Includes borrowing and franchise tax expense. Without borrowing and franchise tax expense, the net expense ratio would be 1.35%. |
4. | Includes franchise tax expense. Without franchise tax expense the net expense ratio would be 1.35%. |
5. | Deferred tax expense estimate for the ratio calculation is derived from the net investment income/loss, and realized and unrealized gains/losses. |
6. | Effective December 1, 2013 the deferred tax expense and deferred tax benefit are allocated based on average net assets. Prior to December 1, 2013 the deferred tax expense and deferred tax benefit were allocated based on specific class expenses. |
7. | Deferred tax benefit for the ratio calculation, when applicable, is derived from net investment income/loss only. |
8. | Includes voluntary Transfer Agent waiver of 0.015% effective January 1, 2017 to December 31, 2017 (see Note 7). |
9 | Annualized for less than a full period. |
See accompanying Notes to Financial Statements.
OPPENHEIMER STEELPATH MLP INCOME FUND 21 |
FINANCIAL HIGHLIGHTS (Continued) |
| Class C | | Six Months
Ended
May 31,
2018
(Unaudited) | | Year Ended November 30,
2017 | | Year Ended November 30,
2016 | | Year Ended November 30,
2015 | | Year Ended November 28,
2014* | | Year Ended November 29,
2013* |
| Per Share Operating Data | | | | | | | | | | | | |
| Net Asset Value, Beginning of Period | | $ | 5.99 | | | $ | 7.12 | | | $ | 7.51 | | | $ | 10.73 | | | $ | 10.68 | | | $ | 9.75 | |
| Income/(loss) from investment operations: | | | | | | | | | | | | | | | | | | | | | | | | |
Net investment loss1 | | | (0.15 | ) | | | (0.14 | ) | | | (0.12 | ) | | | (0.15 | ) | | | (0.17 | ) | | | (0.14 | ) |
Return of capital1 | | | 0.23 | | | | 0.39 | | | | 0.41 | | | | 0.48 | | | | 0.48 | | | | 0.50 | |
| Net realized and unrealized gains/(losses) | | | (0.12 | ) | | | (0.67 | ) | | | 0.10 | | | | (2.77 | ) | | | 0.52 | | | | 1.35 | |
| Total from investment operations | | | (0.04 | ) | | | (0.42 | ) | | | 0.39 | | | | (2.44 | ) | | | 0.83 | | | | 1.71 | |
| Distributions to shareholders: | | | | | | | | | | | | | | | | | | | | | | | | |
| Return of capital | | | (0.27 | ) | | | (0.62 | ) | | | (0.78 | ) | | | (0.78 | ) | | | (0.78 | ) | | | (0.78 | ) |
| Income | | | — | | | | (0.09 | ) | | | — | | | | — | | | | — | | | | — | |
| Total distributions to shareholders | | | (0.27 | ) | | | (0.71 | ) | | | (0.78 | ) | | | (0.78 | ) | | | (0.78 | ) | | | (0.78 | ) |
| Net asset value, end of period | | $ | 5.68 | | | $ | 5.99 | | | $ | 7.12 | | | $ | 7.51 | | | $ | 10.73 | | | $ | 10.68 | |
| | | | | | | | | | | | | | | | | | | | | | | | | |
Total Return, at Net Asset Value2 | | | (0.31 | %) | | | (6.65 | %) | | | 6.44 | % | | | (23.85 | %) | | | 7.84 | % | | | 17.88 | % |
| | | | | | | | | | | | | | | | | | | | | | | | | |
| Ratios /Supplemental Data | | | | | | | | | | | | | | | | | | | | | | | | |
| Net assets, end of period (in thousands) | | $ | 972,149 | | | $ | 1,046,385 | | | $ | 1,199,208 | | | $ | 1,096,028 | | | $ | 1,701,552 | | | $ | 869,041 | |
Ratio of Expenses to Average Net Assets:9 | | | | | | | | | | | | | | | | | | | | | |
| Before (waivers) and deferred tax expense/(benefit) | | | 2.24 | % | | | 2.22 | % | | | 2.24 | % | | | 2.24 | % | | | 2.25 | % | | | 2.18 | % |
| Expense (waivers) | | | (0.10 | %)8 | | | (0.11 | %)8 | | | (0.12 | %) | | | (0.11 | %) | | | (0.12 | %) | | | (0.07 | %) |
| Net of (waivers) and before deferred tax expense/(benefit) | | | 2.14 | %3 | | | 2.11 | %3 | | | 2.12 | %3 | | | 2.13 | %3 | | | 2.13 | %3 | | | 2.11 | %4 |
Deferred tax expense/(benefit)5,6 | | | 4.53 | % | | | (1.47 | %) | | | 2.07 | % | | | (12.85 | %) | | | 4.38 | % | | | 5.39 | % |
| Total expenses/(benefit) | | | 6.67 | % | | | 0.64 | % | | | 4.19 | % | | | (10.72 | %) | | | 6.51 | % | | | 7.50 | % |
| | | | | | | | | | | | | | | | | | | | | | | | | |
Ratio of Investment Loss to Average Net Assets:9 | | | | | | | | | | | | | | | | | | | | |
| Before (waivers) and deferred tax benefit/(expense) | | | (2.65 | %) | | | (2.39 | %) | | | (2.28 | %) | | | (2.21 | %) | | | (2.21 | %) | | | (2.08 | %) |
| Expense (waivers) | | | (0.10 | %)8 | | | (0.11 | %)8 | | | (0.12 | %) | | | (0.11 | %) | | | (0.12 | %) | | | (0.07 | %) |
| Net of expense (waivers) and before deferred tax benefit/(expense) | | | (2.55 | %) | | | (2.28 | %) | | | (2.16 | %) | | | (2.10 | %) | | | (2.09 | %) | | | (2.01 | %) |
Deferred tax benefit/(expense)6,7 | | | (2.54 | %) | | | 0.21 | % | | | 0.32 | % | | | 0.54 | % | | | 0.56 | % | | | 0.73 | % |
| Net investment loss | | | (5.09 | %) | | | (2.07 | %) | | | (1.84 | %) | | | (1.56 | %) | | | (1.53 | %) | | | (1.28 | %) |
| | | | | | | | | | | | | | | | | | | | | | | | | |
| Portfolio turnover rate | | | 14 | % | | | 17 | % | | | 22 | % | | | 18 | % | | | 14 | % | | | 4 | % |
* | November 28, 2014 and November 29, 2013 represent the last business day of the Fund’s respective reporting periods. |
1. | Per share net investment loss is calculated based on average shares outstanding during the period net of deferred tax expense/benefit. Per share return of capital is calculated based on average shares during the period net of deferred tax expense/benefit estimated at the combined Federal and State statutory income tax rate (see Note 2). |
2. | Assumes an initial investment on the business day before the first day of the fiscal period, with all dividends and distributions reinvested in additional shares on the reinvestment date, and redemptions at the net asset value calculated on the last business day of the fiscal period. Sales charges are not reflected in the total returns. Total returns are not annualized for periods less than one full year. Returns do not reflect the deduction of taxes that a shareholder would pay on fund distributions or the redemption of fund shares. The returns do not include adjustments in accordance with generally accepted accounting principles required at the period end for financial reporting purposes. |
3. | Includes borrowing and franchise tax expense. Without borrowing and franchise tax expense, the net ratio would be 2.10%. |
4. | Includes franchise tax expense. Without franchise tax expense the net expense ratio would be 2.10%. |
5. | Deferred tax expense estimate for the ratio calculation is derived from the net investment income/loss, and realized and unrealized gains/losses. |
6. | Effective December 1, 2013 the deferred tax expense and deferred tax benefit are allocated based on average net assets. Prior to December 1, 2013 the deferred tax expense and deferred tax benefit were allocated based on specific class expenses. |
7. | Deferred tax benefit for the ratio calculation, when applicable, is derived from net investment income/loss only. |
8. | Includes voluntary Transfer Agent waiver of 0.015% effective January 1, 2017 to December 31, 2017 (see Note 7). |
9 | Annualized for less than a full period. |
See accompanying Notes to Financial Statements.
22 OPPENHEIMER STEELPATH MLP INCOME FUND |
FINANCIAL HIGHLIGHTS (Continued) |
| Class I | | Six Months
Ended
May 31,
2018
(Unaudited) | | Year Ended November 30,
2017 | | Year Ended November 30,
2016 | | Year Ended November 30,
2015 | | Year Ended November 28,
2014* | | Period Ended November 29,
2013*,1,2 |
| Per Share Operating Data | | | | | | | | | | | | |
| Net Asset Value, Beginning of Period | | $ | 6.57 | | | $ | 7.66 | | | $ | 7.93 | | | $ | 11.17 | | | $ | 10.97 | | | $ | 11.15 | |
| Income/(loss) from investment operations: | | | | | | | | | | | | | | | | | | | | | | | | |
Net investment income/(loss)3 | | | (0.09 | ) | | | 0.004 | | | | 0.16 | | | | (0.03 | ) | | | 0.01 | | | | (0.03 | ) |
Return of capital3 | | | 0.23 | | | | 0.39 | | | | 0.41 | | | | 0.48 | | | | 0.48 | | | | 0.22 | |
| Net realized and unrealized gains/(losses) | | | (0.15 | ) | | | (0.77 | ) | | | (0.06 | ) | | | (2.91 | ) | | | 0.49 | | | | 0.02 | |
| Total from investment operations | | | (0.01 | ) | | | (0.38 | ) | | | 0.51 | | | | (2.46 | ) | | | 0.98 | | | | 0.21 | |
| Distributions to shareholders: | | | | | | | | | | | | | | | | | | | | | | | | |
| Return of capital | | | (0.27 | ) | | | (0.62 | ) | | | (0.78 | ) | | | (0.78 | ) | | | (0.78 | ) | | | (0.39 | ) |
| Income | | | — | | | | (0.09 | ) | | | — | | | | — | | | | — | | | | — | |
| Total distributions to shareholders | | | (0.27 | ) | | | (0.71 | ) | | | (0.78 | ) | | | (0.78 | ) | | | (0.78 | ) | | | (0.39 | ) |
| Net asset value, end of period | | $ | 6.29 | | | $ | 6.57 | | | $ | 7.66 | | | $ | 7.93 | | | $ | 11.17 | | | $ | 10.97 | |
| | | | | | | | | | | | | | | | | | | | | | | | | |
Total Return, at Net Asset Value5 | | | 0.19 | % | | | (5.61 | %) | | | 7.68 | % | | | (23.06 | %) | | | 9.04 | % | | | 1.90 | % |
| | | | | | | | | | | | | | | | | | | | | | | | | |
| Ratios /Supplemental Data | | | | | | | | | | | | | | | | | | | | | | | | |
| Net assets, end of period (in thousands) | | $ | 25,912 | | | $ | 24,103 | | | $ | 20,112 | | | $ | 235 | | | $ | 331 | | | $ | 113 | |
Ratio of Expenses to Average Net Assets:6 | | | | | | | | | | | | | | | | | | | | | |
| Before deferred tax expense/(benefit) | | | 1.07 | %7 | | | 1.03 | %7 | | | 1.01 | %7 | | | 1.05 | %7 | | | 1.05 | %7 | | | 1.16 | %8 |
Deferred tax expense/(benefit)9,10 | | | 4.53 | % | | | (1.47 | %) | | | 2.07 | % | | | (12.85 | %) | | | 4.38 | % | | | 2.23 | % |
| Total expenses/(benefit) | | | 5.60 | % | | | (0.44 | %) | | | 3.08 | % | | | (11.80 | %) | | | 5.43 | % | | | 3.39 | % |
| | | | | | | | | | | | | | | | | | | | | | | | | |
Ratio of Investment Gain/(Loss) to Average Net Assets:6 | | | | | | | | | | | | | | | | | | | |
| Before deferred tax benefit/(expense) | | | (0.42 | %) | | | (0.21 | %) | | | 1.69 | % | | | (0.88 | %) | | | (0.45 | %) | | | (1.05 | %) |
Deferred tax benefit/(expense)10,11 | | | (2.54 | %) | | | 0.21 | % | | | 0.32 | % | | | 0.54 | % | | | 0.56 | % | | | 0.37 | % |
| Net investment income/(loss) | | | (2.96 | %) | | | 0.00 | %12 | | | 2.01 | % | | | (0.34 | %) | | | 0.11 | % | | | (0.68 | %) |
| | | | | | | | | | | | | | | | | | | | | | | | | |
| Portfolio turnover rate | | | 14 | % | | | 17 | % | | | 22 | % | | | 18 | % | | | 14 | % | | | 4 | % |
* | November 28, 2014 and November 29, 2013 represent the last business day of the Fund’s respective reporting periods. |
1. | Shares commenced operations at the close of business June 28, 2013. |
2. | Effective June 28, 2013, Class I shares were renamed Class Y shares. See Note 1 of the Notes to Financial Statements for additional information. |
3. | Per share net investment loss is calculated based on average shares outstanding during the period net of deferred tax expense/benefit. Per share return of capital is calculated based on average shares during the period net of deferred tax expense/benefit estimated at the combined Federal and State statutory income tax rate (see Note 2). |
4. | Rounds to less than $0.005. |
5. | Assumes an initial investment on the business day before the first day of the fiscal period, with all dividends and distributions reinvested in additional shares on the reinvestment date, and redemptions at the net asset value calculated on the last business day of the fiscal period. Sales charges are not reflected in the total returns. Total returns are not annualized for periods less than one full year. Returns do not reflect the deduction of taxes that a shareholder would pay on fund distributions or the redemption of fund shares. The returns do not include adjustments in accordance with generally accepted accounting principles required at the period end for financial reporting purposes. |
6. | Annualized for less than full year. |
7. | Includes borrowing and franchise tax expense. Without borrowing and franchise tax expense, the net expense ratio would be 1.03%, 1.02%, 0.99%, 1.02%, and 1.02% for the periods ended May 31, 2018, November 30, 2017, November 30, 2016, November 30, 2015, and November 28, 2014, respectively |
8. | Includes franchise tax expense. Without franchise tax expense the net expense ratio would be 1.14%. |
9. | Deferred tax expense estimate for the ratio calculation is derived from the net investment income/loss, and realized and unrealized gains/losses. |
10. | Effective December 1, 2013 the deferred tax expense and deferred tax benefit are allocated based on average net assets. Prior to December 1, 2013 the deferred tax expense and deferred tax benefit were allocated based on specific class expenses. |
11. | Deferred tax benefit for the ratio calculation, when applicable, is derived from net investment income/loss only. |
See accompanying Notes to Financial Statements.
OPPENHEIMER STEELPATH MLP INCOME FUND 23 |
FINANCIAL HIGHLIGHTS (Continued) |
| Class Y | | Six Months
Ended
May 31,
2018
(Unaudited) | | Year Ended November 30,
2017 | | Year Ended November 30,
2016 | | Year Ended November 30,
2015 | | Year Ended November 28,
2014* | | Year Ended November 29,
2013*,1 |
| Per Share Operating Data | | | | | | | | | | | | |
| Net Asset Value, Beginning of Period | | $ | 6.54 | | | $ | 7.63 | | | $ | 7.91 | | | $ | 11.15 | | | $ | 10.97 | | | $ | 9.89 | |
| Income/(loss) from investment operations: | | | | | | | | | | | | | | | | | | | | | | | | |
Net investment loss2 | | | (0.10 | ) | | | (0.03 | ) | | | (0.02 | ) | | | (0.02 | ) | | | (0.04 | ) | | | (0.07 | ) |
Return of capital2 | | | 0.23 | | | | 0.39 | | | | 0.41 | | | | 0.48 | | | | 0.48 | | | | 0.49 | |
| Net realized and unrealized gains/(losses) | | | (0.15 | ) | | | (0.74 | ) | | | 0.11 | | | | (2.92 | ) | | | 0.52 | | | | 1.44 | |
| Total from investment operations | | | (0.02 | ) | | | (0.38 | ) | | | 0.50 | | | | (2.46 | ) | | | 0.96 | | | | 1.86 | |
| Distributions to shareholders: | | | | | | | | | | | | | | | | | | | | | | | | |
| Return of capital | | | (0.27 | ) | | | (0.62 | ) | | | (0.78 | ) | | | (0.78 | ) | | | (0.78 | ) | | | (0.78 | ) |
| Income | | | — | | | | (0.09 | ) | | | — | | | | — | | | | — | | | | — | |
| Total distributions to shareholders | | | (0.27 | ) | | | (0.71 | ) | | | (0.78 | ) | | | (0.78 | ) | | | (0.78 | ) | | | (0.78 | ) |
| Net asset value, end of period | | $ | 6.25 | | | $ | 6.54 | | | $ | 7.63 | | | $ | 7.91 | | | $ | 11.15 | | | $ | 10.97 | |
| | | | | | | | | | | | | | | | | | | | | | | | | |
Total Return, at Net Asset Value3 | | | 0.03 | % | | | (5.64 | %) | | | 7.56 | % | | | (23.11 | %) | | | 8.85 | % | | | 19.19 | % |
| | | | | | | | | | | | | | | | | | | | | | | | | |
| Ratios /Supplemental Data | | | | | | | | | | | | | | | | | | | | | | | | |
| Net assets, end of period (in thousands) | | $ | 933,322 | | | $ | 936,587 | | | $ | 859,443 | | | $ | 679,630 | | | $ | 992,009 | | | $ | 535,124 | |
Ratio of Expenses to Average Net Assets:10 | | | | | | | | | | | | | | | | | | | | |
| Before (waivers) and deferred tax expense/(benefit) | | | 1.24 | % | | | 1.22 | % | | | 1.24 | % | | | 1.24 | % | | | 1.24 | % | | | 1.18 | % |
| Expense (waivers) | | | (0.10 | %)9 | | | (0.11 | %)9 | | | (0.12 | %) | | | (0.11 | %) | | | (0.12 | %) | | | (0.07 | %) |
| Net of (waivers) and before deferred tax expense/(benefit) | | | 1.14 | %4 | | | 1.11 | %4 | | | 1.12 | %4 | | | 1.13 | %4 | | | 1.12 | %4 | | | 1.11 | %5 |
Deferred tax expense/(benefit)6,7 | | | 4.53 | % | | | (1.47 | %) | | | 2.07 | % | | | (12.85 | %) | | | 4.38 | % | | | 6.68 | % |
| Total expenses/(benefit) | | | 5.67 | % | | | (0.36 | %) | | | 3.19 | % | | | (11.72 | %) | | | 5.50 | % | | | 7.79 | % |
| | | | | | | | | | | | | | | | | | | | | | | | | |
Ratio of Investment Loss to Average Net Assets:10 | | | | | | | | | | | | | | | | | | | | |
| Before (waivers) and deferred tax benefit/(expense) | | | (0.66 | %) | | | (0.71 | %) | | | (0.72 | %) | | | (0.81 | %) | | | (1.01 | %) | | | (1.08 | %) |
| Expense (waivers) | | | (0.10 | %)9 | | | (0.11 | %)9 | | | (0.12 | %) | | | (0.11 | %) | | | (0.12 | %) | | | (0.07 | %) |
| Net of expense (waivers) and before deferred tax benefit/(expense) | | | (0.56 | %) | | | (0.60 | %) | | | (0.60 | %) | | | (0.70 | %) | | | (0.89 | %) | | | (1.01 | %) |
Deferred tax benefit/(expense)7,8 | | | (2.54 | %) | | | 0.21 | % | | | 0.32 | % | | | 0.54 | % | | | 0.56 | % | | | 0.37 | % |
| Net investment loss | | | (3.10 | %) | | | (0.39 | %) | | | (0.28 | %) | | | (0.16 | %) | | | (0.33 | %) | | | (0.64 | %) |
| | | | | | | | | | | | | | | | | | | | | | | | | |
| Portfolio turnover rate | | | 14 | % | | | 17 | % | | | 22 | % | | | 18 | % | | | 14 | % | | | 4 | % |
* | November 28, 2014 and November 29, 2013 represent the last business day of the Fund’s respective reporting periods. |
1. | Effective June 28, 2013, Class I shares were renamed Class Y shares. See Note 1 of the Notes to Financial Statements for additional information. |
2. | Per share net investment loss is calculated based on average shares outstanding during the period net of deferred tax expense/benefit. Per share return of capital is calculated based on average shares during the period net of deferred tax expense/benefit estimated at the combined Federal and State statutory income tax rate (see Note 2). |
3. | Assumes an initial investment on the business day before the first day of the fiscal period, with all dividends and distributions reinvested in additional shares on the reinvestment date, and redemptions at the net asset value calculated on the last business day of the fiscal period. Sales charges are not reflected in the total returns. Total returns are not annualized for periods less than one full year. Returns do not reflect the deduction of taxes that a shareholder would pay on fund distributions or the redemption of fund shares. The returns do not include adjustments in accordance with generally accepted accounting principles required at the period end for financial reporting purposes. |
4. | Includes borrowing and franchise tax expense. Without borrowing and franchise tax expense, the net expense ratio would be 1.10%. |
5. | Includes franchise tax expense. Without franchise tax expense the net expense ratio would be 1.10%. |
6. | Deferred tax expense estimate for the ratio calculation is derived from the net investment income/loss, and realized and unrealized gains/losses. |
7. | Effective December 1, 2013 the deferred tax expense and deferred tax benefit are allocated based on average net assets. Prior to December 1, 2013 the deferred tax expense and deferred tax benefit were allocated based on specific class expenses. |
8. | Deferred tax benefit for the ratio calculation, when applicable, is derived from net investment income/loss only. |
9. | Includes voluntary Transfer Agent waiver of 0.015% effective January 1, 2017 to December 31, 2017 (see Note 7). |
10. | Annualized for less than a full period. |
See accompanying Notes to Financial Statements.
24 OPPENHEIMER STEELPATH MLP INCOME FUND |
NOTES TO FINANCIAL STATEMENTS Unaudited |
1. Organization
Oppenheimer SteelPath MLP Income Fund (the “Fund”), a separate series of Oppenheimer SteelPath MLP Funds Trust, is a non-diversified open-end management investment company registered under the Investment Company Act of 1940, as amended. The Fund’s investment objective is to seek total return. The Fund’s investment adviser is OFI SteelPath, Inc. (the “Adviser” or “Manager”), a wholly-owned subsidiary of OppenheimerFunds, Inc. (“OFI” or “Oppenheimer”).
The Fund offers Class A, Class C, Class I, and Class Y shares. Effective June 28, 2013, Class I shares were renamed Class Y shares. Class A shares are sold at their offering price, which is normally net asset value plus a front-end sales charge. Effective June 28, 2013 although there is no initial sales charge on Class A purchases totaling $1 million or more, those Class A shares may be subject to a 1.00% contingent deferred sales charge (“CDSC”) if shares are redeemed within an 18-month holding period measured from the date of purchase. Class C shares are sold without a front-end sales charge but may be subject to a CDSC of 1.00% of the redemption proceeds if Class C shares are redeemed within one year of purchase. Class I shares are only available to eligible institutional investors. Class I shares are sold at net asset value per share without a sales charge or CDSC. An institutional investor that buys Class I shares for its customers’ accounts may impose charges on those accounts. Class Y shares are sold at net asset value per share without a sales charge directly to institutional investors that have special agreements with OppenheimerFunds Distributor, Inc. (the “Distributor” or “OFDI”) for that purpose. They may include insurance companies, registered investment companies, employee benefit plans and section 529 plans, among others. An institutional investor that buys Class Y shares for its customers’ accounts may impose charges on those accounts. All classes of shares have identical rights and voting privileges with respect to the Fund in general and exclusive voting rights on matters that affect that class alone. Earnings, net assets and net asset value per share may differ due to each class having its own expenses, such as transfer and shareholder servicing agent fees and shareholder communications, directly attributable to that class. Class A and C shares have separate distribution and/or service plans under which they pay fees. Class I and Y shares do not pay such fees.
The Fund is an investment company and accordingly follows the investment company accounting and reporting guidance of the Financial Accounting Standards Board (“FASB”) Accounting Standards Codification Topic 946 Financial Services- Investment Companies.
The following is a summary of significant accounting policies followed in the Fund’s preparation of financial statements in accordance with accounting principles generally accepted in the United States (“U.S. GAAP”).
OPPENHEIMER STEELPATH MLP INCOME FUND 25 |
NOTES TO FINANCIAL STATEMENTS Unaudited / (Continued) |
2. Significant Accounting Policies
Security Valuation. All investments in securities are recorded at their estimated fair value, as described in Note 3.
Allocation of Income, Expenses, Gains and Losses. Income, expenses (other than those attributable to a specific class), gains and losses are allocated on a daily basis to each class of shares based upon the relative proportion of net assets represented by such class. Operating expenses directly attributable to a specific class are charged against the operations of that class.
Dividends and Distributions to Shareholders. Dividends and distributions to shareholders, which are determined in accordance with income tax regulations and may differ from U.S. GAAP, are recorded on the ex-dividend date. The Fund’s dividend distribution policy is intended to provide monthly distributions to its shareholders at a rate that over time is similar to the distribution rate the Fund receives from the master limited partnerships (”MLPs”) in which it invests. The Fund generally pays out dividends that over time approximate the distributions received from the Fund’s portfolio investments based on, among other considerations, distributions the Fund actually received from portfolio investments, distributions it would have received if it had been fully invested at all times, and estimated future cash flows. Such dividends are not tied to the Fund’s investment income and may not represent yield or investment return on the Fund’s portfolio. To the extent that the dividends paid exceed the distributions the Fund receives from its underlying investments, the Fund’s assets will be reduced. The Fund’s tendency to pay out a consistent dividend may change, and the Fund’s level of distributions may increase or decrease.
The estimated characterization of the distributions paid will be either a qualified dividend or distribution (return of capital). This estimate is based on the Fund’s operating results during the period. The actual characterization of the distributions made during the period will not be determined until after the end of the fiscal year. The Fund will inform shareholders of the final tax character of the distributions on IRS Form 1099 DIV in February 2019.
Return of Capital Estimates. Distributions received from the Fund’s investments in MLPs generally are comprised of income and return of capital. Any return of capital estimates in excess of cost basis are classified as realized gain. The Fund records investment income and return of capital based on estimates made at the time such distributions are received. Such estimates are based on historical information available from each MLP and other industry sources. These estimates may subsequently be revised based on information received from MLPs after their tax reporting periods are concluded.
Investment Income. Dividend income is recorded on the ex-dividend date or upon ex-dividend notification in the case of certain foreign dividends where the ex-dividend date may have passed. Non-cash dividends included in dividend income, if any, are recorded at
26 OPPENHEIMER STEELPATH MLP INCOME FUND |
NOTES TO FINANCIAL STATEMENTS Unaudited / (Continued) |
2. Significant Accounting Policies (Continued)
the fair value of the securities received. Interest income, if any, is recognized on an accrual basis. Discount and premium, which are included in interest income on the Statement of Operations, if applicable, are amortized or accreted daily.
Custodian Fees. “Custody fees” in the Statement of Operations may include interest expense incurred by the Fund on any cash overdrafts of its custodian account during the period. Such cash overdrafts may result from the effects of failed trades in portfolio securities and from cash outflows resulting from unanticipated shareholder redemption activity. The Fund pays interest to its custodian on such cash overdrafts, to the extent they are not offset by positive cash balances maintained by the Fund, at a rate equal to the Federal Funds Rate plus 1.50%. The “Reduction to custodian expenses” line item, if applicable, represents earnings on cash balances maintained by the Fund during the period. Such interest expense and other custodian fees may be paid with these earnings.
Security Transactions. Security transactions are recorded on the trade date. Realized gains and losses on securities sold are determined using the basis of identified cost.
Indemnifications. The Fund’s organizational documents provide current and former trustees and officers with a limited indemnification against liabilities arising in connection with the performance of their duties to the Fund. In the normal course of business, the Fund may also enter into contracts that provide general indemnifications. The Fund’s maximum exposure under these arrangements is unknown as this would be dependent on future claims that may be made against the Fund. The risk of material loss from such claims is considered remote.
Federal Income Taxes. The Fund does not intend to qualify as a regulated investment company pursuant to Subchapter M of the Internal Revenue Code, but will rather be taxed as a corporation. As a corporation, the Fund is obligated to pay federal, state and local income tax on taxable income. During the period ended May 31, 2018, the maximum marginal regular federal income tax rate for a corporation was reduced from 35 percent to 21 percent with the enactment of H.R. 1, Tax Cuts and Jobs Act (the “TCJA”) , which was enacted on December 22, 2017. Any other future changes in the federal income tax rate could have a material impact to the Fund.
The Fund is currently using an estimated rate of 1.9 percent for state and local tax, net of federal tax expense.
The alternative minimum tax requirements were repealed under the TCJA for tax years beginning after December 31, 2017, and the prior alternative minimum tax rate was reduced to zero as of January 1, 2018. Any past alternative minimum taxes paid by the fund do qualify for substantial refundability under the TCJA with AMT credit carryforwards becoming partially refundable prior to, or fully refundable for tax years beginning in 2021.
OPPENHEIMER STEELPATH MLP INCOME FUND 27 |
NOTES TO FINANCIAL STATEMENTS Unaudited / (Continued) |
2. Significant Accounting Policies (Continued)
The Fund’s income tax provision consists of the following as of May 31, 2018:
| Current tax expense/(benefit) | | |
| Federal | | $ | — | |
| State | | | — | |
| Total current tax expense | | $ | — | |
| | | | | |
| Deferred tax expense/(benefit) | | | | |
| Federal | | $ | 69,941,376 | |
| State | | | 6,809,070 | |
| Total deferred tax expense | | $ | 76,750,446 | |
The reconciliation between the federal statutory income tax rate of 21% and the tax effect on net investment income (loss) and realized and unrealized gain (loss) follows:
| | | Amount | | % Effect |
| Application of Federal statutory income tax rate | | $ | 14,276,737 | | | | 21.00 | % |
| State income taxes net of federal benefit | | | 1,291,705 | | | | 1.90 | % |
| Effect of permanent differences | | | (328,545 | ) | | | (0.48 | %) |
| Effect of tax rate change | | | 110,639,211 | | | | 162.74 | % |
| Change in valuation allowance | | | (49,128,662 | ) | | | (72.26 | %) |
| Total income tax expense (benefit) | | $ | 76,750,446 | | | | 112.90 | % |
For the period ended May 31, 2018 the Fund’s tax effect on net investment income (loss) and realized and unrealized gain (loss) of 112.90% (net expenses) differed from the combined federal and state statutory tax rate of 22.90% (net expenses) due in large part to the new 21% federal tax rate, enacted by the TCJA as of December 22, 2017 (date of enactment). The change to the federal tax rate required the remeasurement of accumulated tax assets and the valuation allowance in place as of the date of enactment resulting in the recognition of additional current period deferred tax expense. The aggregate impact of this change is being entirely recorded during the period ended May 31, 2018 resulting in an increase to the effective tax rate when deferred tax expense is reflected as a percentage of the Fund’s current period operations.
The Fund intends to invest its assets primarily in MLP Investments, which generally are treated as partnerships for federal income tax purposes. As a limited partner in the MLP Investments, the Fund reports its allocable share of the MLP Investments’ taxable income in computing its own taxable income. The Fund’s tax expense or benefit is included in the Statement of Operations based on the component of income or gains (losses) to which such expense or benefit relates. Deferred income taxes reflect the net tax effects of temporary differences
28 OPPENHEIMER STEELPATH MLP INCOME FUND |
NOTES TO FINANCIAL STATEMENTS Unaudited / (Continued) |
2. Significant Accounting Policies (Continued)
between the carrying amounts of assets and liabilities for financial reporting purposes and the amounts used for income tax purposes. Such temporary differences are principally: (i) taxes on unrealized gains/(losses), which are attributable to the temporary difference between fair market value and tax basis, (ii) the net tax effects of temporary differences between the carrying amounts of assets and liabilities for financial reporting and income tax purposes and (iii) the net tax benefit of accumulated net operating losses and capital loss carryforwards. Deferred tax assets and liabilities are measured using effective tax rates expected to apply to taxable income in the years such temporary differences are realized or otherwise settled. To the extent the Fund has a deferred tax asset, consideration is given to whether or not a valuation allowance is required. A valuation allowance is required if, based on the evaluation criterion provided by ASC 740, Income Taxes, it is more-likely-than-not some portion or all of the deferred tax asset will not be realized.
At May 31, 2018, the Fund determined a valuation allowance was required. In implementing a valuation allowance on a portion of the deferred tax asset, significant consideration was given to the current and expected level of MLP distributions, unrealized gains and losses on MLP investments and the expiration dates for net operating losses and capital loss carryovers. Market cycles, the severity and duration of historical deferred tax assets and the impact of current and future redemptions were also considered. Additionally, various tax law changes resulting from the enactment of the TCJA were considered by the Fund in assessing the recoverability of its deferred tax assets. Specifically, the TCJA eliminated the net operating loss carryback ability and replaced the 20 year carryforward period with an indefinite carryforward period for any net operating losses arising in tax years ending after December 31, 2017. The TCJA also established a limitation for any net operating losses generated in tax years beginning after December 31, 2017 to the lesser of the aggregate of available net operating losses or 80% of taxable income before any net operating loss utilization. Through the consideration of these factors, the Fund has determined that it is more likely than not the deferred tax asset, net of the valuation allowance, will be realized.
Unexpected significant decreases in cash distributions from the Fund’s MLP investments, significant declines in the fair value of its investments, significant redemptions, or increased risk of expiring net operating losses or capital loss carryovers may change the Fund’s assessment regarding the recoverability of its deferred tax assets and may result in a change to the valuation allowance. Modifications of the valuation allowance could have a material impact on the Fund’s net asset value.
OPPENHEIMER STEELPATH MLP INCOME FUND 29 |
NOTES TO FINANCIAL STATEMENTS Unaudited / (Continued) |
2. Significant Accounting Policies (Continued)
Components of the Fund’s deferred tax assets and liabilities as of May 31, 2018 are as follows:
| Deferred tax assets: | | |
| Net operating loss carryforward (tax basis) - Federal | | $ | 199,154,221 | |
| Net operating loss carryforward (tax basis) - State | | | 13,038,259 | |
| Capital loss carryforward (tax basis) | | | 90,848,437 | |
| Valuation allowance | | | (2,938,854 | ) |
| Total deferred tax asset | | | 300,102,063 | |
| | | | | |
| Deferred tax liabilities: | | | | |
| Net unrealized gains on investment securities (tax basis) | | $ | (132,200,478 | ) |
| Total deferred tax liability | | | (132,200,478 | ) |
| | | | | |
| Total net deferred tax asset/(liability) | | $ | 167,901,585 | |
The Fund may rely, to some extent, on information provided by the MLPs, which may not necessarily be timely, to estimate taxable income allocable to MLP units held in its portfolio, and to estimate its associated deferred tax liability or asset. Such estimates are made in good faith. From time to time, as new information becomes available, the Fund will modify its estimates or assumptions regarding its tax liability or asset.
The Fund’s policy is to classify interest and penalties associated with underpayment of federal and state income taxes, if any, as income tax expense on its Statement of Operations. As of May 31, 2018, the Fund does not have any interest or penalties associated with the underpayment of any income taxes.
The Fund files income tax returns in the U.S. federal jurisdiction and various states. The Fund has reviewed all major jurisdictions and concluded that there is no significant impact on the Fund’s net assets and no tax liability resulting from unrecognized tax benefits relating to uncertain tax positions expected to be taken on its tax returns. Furthermore, management of the Fund is not aware of any uncertain tax positions for which it is reasonably possible that the total amount of unrecognized tax benefit will significantly change in the next 12 months.
30 OPPENHEIMER STEELPATH MLP INCOME FUND |
NOTES TO FINANCIAL STATEMENTS Unaudited / (Continued) |
2. Significant Accounting Policies (Continued)
At May 31, 2018, the Fund had net operating loss carryforwards for federal income tax purposes, as follows:
| Expiration date for expiring net operating loss carryforwards: | | |
| 11/30/2030 | | $ | 3,877 | |
| 11/30/2031 | | | 4,997,354 | |
| 11/30/2032 | | | 7,401,746 | |
| 11/30/2033 | | | 47,597,832 | |
| 11/30/2034 | | | 159,225,802 | |
| 11/30/2035 | | | 258,888,745 | |
| 11/30/2036 | | | 144,231,370 | |
| 11/30/2037 | | | 63,880,432 | |
| Total expiring net operating loss carryforwards | | $ | 686,224,158 | |
| | | | | |
| Total non-expiring net operating loss carryforwards | | $ | 240,380,558 | |
| | | | | |
| Total net operating loss carryforwards | | $ | 926,604,716 | |
At May 31, 2018, the Fund had net capital loss carryforwards for federal income tax purposes, which may be carried forward for 5 years, as follows:
| Expiration Date | | |
| 11/30/2021 | | $ | 396,718,067 | |
| Total | | $ | 396,718,067 | |
During the six months ended May 31, 2018, the Fund utilized $36,471,574 of capital loss carryforward.
At May 31, 2018, gross unrealized appreciation and depreciation of investments, based on cost for federal income tax purposes were as follows:
| Cost of Investments | | $ | 2,623,003,127 | |
| Gross Unrealized Appreciation | | $ | 825,380,076 | |
| Gross Unrealized Depreciation | | | (246,024,594 | ) |
| Net Unrealized Appreciation (Depreciation) on Investments | | $ | 579,355,482 | |
The difference between cost amounts for financial statement and federal income tax purposes is due primarily to timing differences in recognizing certain gains and losses in security transactions.
OPPENHEIMER STEELPATH MLP INCOME FUND 31 |
NOTES TO FINANCIAL STATEMENTS Unaudited / (Continued) |
2. Significant Accounting Policies (Continued)
Use of Estimates. The preparation of financial statements in conformity with accounting principles generally accepted in the United States of America requires management to make estimates and assumptions that affect the reported amounts of assets and liabilities and disclosure of contingent assets and liabilities at the date of the financial statements and the reported amounts of increases and decreases in net assets from operations during the reporting period. Actual results could differ from those estimates.
3. Securities Valuation
The Fund calculates the net asset value of its shares as of 4:00 P.M. Eastern time, on each day the New York Stock Exchange (the “Exchange”) is open for trading, except in the case of a scheduled early closing of the Exchange, in which case the Fund will calculate net asset value of the shares as of the scheduled early closing time of the Exchange.
The Fund’s Board of Trustees (the “Board”) has adopted procedures for the valuation of the Fund’s securities and has delegated the day-to-day responsibility for valuation determinations under those procedures to the Manager. The Manager has established a Valuation Committee which is responsible for determining a “fair valuation” for any security for which market quotations are not “readily available.” The Valuation Committee’s fair valuation determinations are subject to review, approval and ratification by the Fund’s Board at least quarterly or more frequently, if necessary.
Valuation Methods and Inputs
Securities are valued primarily using unadjusted quoted market prices, when available, as supplied by third party pricing services or broker-dealers.
The following methodologies are used to determine the market value or the fair value of the types of securities described below:
Equity securities traded on a securities exchange (including exchange-traded derivatives other than futures and futures options) are valued based on the official closing price on the principal exchange on which the security is traded, as identified by the Manager, prior to the time when the Fund’s assets are valued. If the official closing price is unavailable, the security is valued at the last sale price on the principal exchange on which it is traded, or if no sales occurred, the security is valued at the mean between the quoted bid and asked prices. Over-the-counter equity securities are valued at the last published sale price, or if no sales occurred, at the mean between the quoted bid and asked prices.
Shares of a registered investment company that are not traded on an exchange are valued at that investment company’s net asset value per share.
32 OPPENHEIMER STEELPATH MLP INCOME FUND |
NOTES TO FINANCIAL STATEMENTS Unaudited / (Continued) |
3. Securities Valuation (Continued)
Securities for which market quotations are not readily available or a significant event has occurred that would materially affect the value of the security, are fair valued either (i) by a standardized fair valuation methodology applicable to the security type or the significant event as previously approved by the Valuation Committee and the Fund’s Board or (ii) as determined in good faith by the Manager’s Valuation Committee. The Valuation Committee considers all relevant facts that are reasonably available, through either public information or information available to the Manager, when determining the fair value of a security. Those standardized fair valuation methodologies include, but are not limited to, valuing securities at the last sale price or initially at cost and subsequently adjusting the value based on: changes in company specific fundamentals, changes in an appropriate securities index, or changes in the value of similar securities which may be further adjusted for any discounts related to security-specific resale restrictions. When possible, such methodologies use observable market inputs such as unadjusted quoted prices of similar securities, observable interest rates, currency rates and yield curves. The methodologies used for valuing securities are not necessarily an indication of the risks associated with investing in those securities nor can it be assured that the Fund can obtain the fair value assigned to a security if it were to sell the security.
To assess the continuing appropriateness of security valuations the Manager regularly compares prior day prices and sale prices to the current day prices and challenges those prices exceeding certain tolerance levels with a third party pricing service or broker source. For those securities valued by fair valuations, whether through a standardized fair valuation methodology or a fair valuation determination, the Valuation Committee reviews and affirms the reasonableness of the valuations based on such methodologies and fair valuation determinations on a regular basis after considering all relevant information that is reasonably available.
Classifications
Each investment asset or liability of the Fund is assigned a level at measurement date based on the significance and source of the inputs to its valuation. Various data inputs may be used in determining the value of each of the Fund’s investments as of the reporting period end. These data inputs are categorized in the following hierarchy under applicable financial accounting standards:
| | 1) | Level 1-unadjusted quoted prices in active markets for identical assets or liabilities (including securities actively traded on a securities exchange) |
| | 2) | Level 2-inputs other than unadjusted quoted prices that are observable for the asset or liability (such as unadjusted quoted prices for similar assets and market corroborated inputs such as interest rates, prepayment speeds, credit risks, etc.) |
| | 3) | Level 3-significant unobservable inputs (including the Manager’s own judgments about assumptions that market participants would use in pricing the asset or liability). |
OPPENHEIMER STEELPATH MLP INCOME FUND 33 |
NOTES TO FINANCIAL STATEMENTS Unaudited / (Continued) |
3. Securities Valuation (Continued)
The inputs used for valuing securities are not necessarily an indication of the risks associated with investing in those securities.
The Fund classifies each of its investments in investment companies which are publicly offered as Level 1. Investment companies that are not publicly offered, if any, are classified as Level 2 in the fair value hierarchy.
The table below categorizes amounts that are included in the Fund’s Statement of Assets and Liabilities at period end based on valuation input level:
| | | Level 1 — Unadjusted Quoted Prices | | Level 2 —
Other Significant Observable Inputs | | Level 3 —
Significant Unobservable Inputs | | Value |
| Assets Table | | | | | | | | |
| Investments, at Value: | | | | | | | | |
| MLP Investments and Related Entities* | | $ | 3,082,527,708 | | | $ | — | | | $ | — | | | $ | 3,082,527,708 | |
| Common Stock* | | | 26,481,406 | | | | — | | | | — | | | | 26,481,406 | |
| Preferred MLP Investments and Related Entities* | | | 17,504,270 | | | | — | | | | 69,445,708 | | | | 86,949,978 | |
| Short-Term Investment | | | 6,399,517 | | | | | | | | | | | | 6,399,517 | |
| Total Assets | | $ | 3,132,912,901 | | | $ | — | | | $ | 69,445,708 | | | $ | 3,202,358,609 | |
* | For a detailed break-out of securities by major industry classification, please refer to the Statement of Investments. |
For the reporting period, there were no transfers between levels.
The following is a reconciliation of assets in which significant unobservable inputs (Level 3) were used in determining fair value:
| Beginning balance November 30, 2017 | | $ | 66,692,929 | |
| Transfers into Level 3 during the period | | | — | |
| Change in unrealized appreciation/(depreciation) | | | 9,042,917 | |
| Total realized gain/(loss) | | | — | |
| Purchases | | | — | |
| Payment in kind from distributions | | | 698,910 | |
| Sales | | | — | |
| Conversion to common shares, at cost | | | (3,533,366 | ) |
| Return of capital distributions | | | (3,445,682 | ) |
| Transfers out of Level 3 during the period | | | — | |
| Ending balance May 31, 2018 | | $ | 69,445,708 | |
34 OPPENHEIMER STEELPATH MLP INCOME FUND |
NOTES TO FINANCIAL STATEMENTS Unaudited / (Continued) |
4. Investments and Risks
The total change in unrealized appreciation/depreciation included in the Statement of Operations attributable to Level 3 investments still held at May 31, 2018 is $5,975,430.
The following table summarizes the valuation techniques and significant unobservable inputs used in determining fair value measurements for those investments classified as Level 3 as of May 31, 2018:
| Assets Table Investments, at Value: | | Value as of May 31, 2018 | | | Valuation Technique | | Unobservable input | | Range of Unobservable Inputs | | Unobservable Input Used |
| Preferred Stocks | | $ | 11,258,466 | | | Discounted Cash Flow Model | | Illiquidity Discount | | n/a | | | 7 | %(a) |
| | | | | | | | | Estimated Yield | | 10.3%-13.4% | | | 12 | %(a) |
| | | | 30,060,000 | | | Discounted Cash Flow Model | | Illiquidity Discount | | n/a | | | 7 | %(b) |
| | | | | | | | | Estimated Yield | | 12.1% - 12.7% | | | 12.4 | %(b) |
| | | | 28,127,242 | | | Discounted Cash Flow Model | | Transaction Spread | | n/a | | | 20.465 | %(c) |
| | | | | | | | | Benchmark Spread | | n/a | | | 2.297 | %(c) |
| | | | | | | | | Treasury Yield | | n/a | | | 2.975 | %(c) |
| Total | | $ | 69,445,708 | | | | | | | | | | | |
(a) | The Fund fair values certain preferred shares using a discounted cash flow model which values the shares at the expected value of common units to be received in PIK conversion based on: the current price of the common shares (observable), the 20-day volume weighted average price (VWAP) of the common shares (observable), the 3-day volume weighted average price of the common shares (observable), and a discount rate, which is derived from the estimated yield and an illiquidity discount. Such security’s fair valuation could decrease (increase) significantly based on an increase (decrease) in the illiquidity discount. Such security’s fair valuation could decrease (increase) significantly based on a decrease (increase) in expected yields. |
(b) | The Fund fair values certain preferred shares using a discounted cash flow model, which incorporates an illiquidity discount and the expected yield based on the average yield on comparable companies’ equity. Such security’s fair valuation could decrease (increase) significantly based on an increase (decrease) in the illiquidity discount. Such security’s fair valuation could decrease (increase) significantly based on a decrease (increase) in expected yields. |
(c) | The Fund fair values certain preferred shares using a discounted cash flow model, which incorporates an implied yield based on the transaction spread (based on yields at purchase), benchmark spread and Treasury yield. Such security’s fair valuation could decrease (increase) significantly based on an increase (decrease) in the transaction spread, benchmark spread, or treasury yield. |
OPPENHEIMER STEELPATH MLP INCOME FUND 35 |
NOTES TO FINANCIAL STATEMENTS Unaudited / (Continued) |
4. Investments and Risks (Continued)
Equity Security Risk. Stocks and other equity securities fluctuate in price. The value of the Fund’s portfolio may be affected by changes in the equity markets generally. Equity markets may experience significant short-term volatility and may fall sharply at times. Different markets may behave differently from each other and U.S. equity markets may move in the opposite direction from one or more foreign stock markets. Adverse events in any part of the equity or fixed-income markets may have unexpected negative effects on other market segments.
The prices of individual equity securities generally do not all move in the same direction at the same time and a variety of factors can affect the price of a particular company’s securities. These factors may include, but are not limited to, poor earnings reports, a loss of customers, litigation against the company, general unfavorable performance of the company’s sector or industry, or changes in government regulations affecting the company or its industry.
Master Limited Partnerships. MLPs issue common units that represent an equity ownership interest in a partnership and provide limited voting rights. MLP common units are registered with the Securities and Exchange Commission (“SEC”), and are freely tradable on securities exchanges such as the NYSE and the NASDAQ Stock Market (“NASDAQ”), or in the over-the-counter market. An MLP consists of one or more general partners, who conduct the business, and one or more limited partners, who contribute capital. MLP common unit holders have a limited role in the partnership’s operations and management. The Fund, as a limited partner, normally would not be liable for the debts of the MLP beyond the amounts the Fund has contributed, but would not be shielded to the same extent that a shareholder of a corporation would be. In certain circumstances creditors of an MLP would have the right to seek return of capital distributed to a limited partner. This right of an MLP’s creditors would continue after the Fund sold its investment in the MLP.
MLPs are generally treated as publicly traded partnerships for federal income tax purposes. Any modification to federal income tax laws and related interpretations could cause a material decrease in the value of an MLP.
Restricted Securities. At period end, investments in securities included issues that are restricted. A restricted security may have a contractual restriction on its resale and is valued under methods approved by the Board as reflecting fair value. Securities that are restricted are marked with an applicable footnote on the Statement of Investments. Restricted securities are reported on a schedule following the Statement of Investments.
Concentration Risk. Under normal circumstances, the Fund invests at least 80% of its net assets (plus the amount of any borrowings for investment purposes) in master limited partnership (“MLP”) investments of issuers that are engaged in the transportation, storage, processing, refining, marketing, exploration, production, and mining of minerals and natural resources. The Fund’s MLP investments may include, but are not limited to: MLPs structured
36 OPPENHEIMER STEELPATH MLP INCOME FUND |
NOTES TO FINANCIAL STATEMENTS Unaudited / (Continued) |
4. Investments and Risks (Continued)
as limited partnerships (“LPs”) or limited liability companies (“LLCs”); MLPs that are taxed as “C” corporations; businesses that operate and have the economic characteristics of MLPs but are organized and taxed as “C” corporations; securities issued by MLP affiliates; and private investments in public equities (“PIPEs”) issued by MLPs. MLPs are subject to certain risks, such as supply and demand risk, depletion and exploration risk, commodity pricing risk, acquisition risk, and the risk associated with the hazards inherent in midstream energy industry activities. A substantial portion of the cash flow received by the Fund is derived from investment in equity securities of MLPs. The amount of cash that an MLP has available for distributions, and the tax character of such distributions, are dependent upon the amount of cash generated by the MLP’s operations.
5. Shares of Beneficial Interest
The Fund has authorized an unlimited number of $0.001 par value shares of beneficial interest of each class. Transactions in shares of beneficial interest were as follows:
| | | Six Months Ended
May 31, 2018 | | Year Ended
November 30, 2017 |
| | | Shares | | Amount | | Shares | | Amount |
| Class A | | | | | | | | |
| Sold | | | 32,393,101 | | | $ | 201,168,107 | | | | 76,648,986 | | | $ | 562,027,068 | |
| Dividends and/or distributions | | | | | | | | | | | | | | | | |
| Reinvested | | | 10,090,832 | | | | 60,860,970 | | | | 20,834,596 | | | | 148,605,318 | |
| Redeemed | | | (40,317,688 | ) | | | (249,893,799 | ) | | | (89,788,189 | ) | | | (646,499,371 | ) |
| Net Increase | | | 2,166,245 | | | $ | 12,135,278 | | | | 7,695,393 | | | $ | 64,133,015 | |
| | | | | | | | | | | | | | | | | |
| Class C | | | | | | | | | | | | | | | | |
| Sold | | | 16,038,694 | | | $ | 94,909,646 | | | | 37,695,717 | | | $ | 263,475,818 | |
| Dividends and/or distributions | | | | | | | | | | | | | | | | |
| Reinvested | | | 8,461,262 | | | | 47,842,007 | | | | 17,820,248 | | | | 120,281,808 | |
| Redeemed | | | (27,937,359 | ) | | | (161,626,598 | ) | | | (49,309,164 | ) | | | (333,041,980 | ) |
| Net Increase/(Decrease) | | | (3,437,403 | ) | | $ | (18,874,945 | ) | | | 6,206,801 | | | $ | 50,715,646 | |
| | | | | | | | | | | | | | | | | |
| Class I | | | | | | | | | | | | | | | | |
| Sold | | | 734,980 | | | $ | 4,694,122 | | | | 2,298,743 | | | $ | 17,027,108 | |
| Dividends and/or distributions | | | | | | | | | | | | | | | | |
| Reinvested | | | 152,339 | | | | 946,511 | | | | 231,076 | | | | 1,680,290 | |
| Redeemed | | | (435,369 | ) | | | (2,794,953 | ) | | | (1,486,096 | ) | | | (11,147,438 | ) |
| Net Increase | | | 451,950 | | | $ | 2,845,680 | | | | 1,043,723 | | | $ | 7,559,960 | |
OPPENHEIMER STEELPATH MLP INCOME FUND 37 |
NOTES TO FINANCIAL STATEMENTS Unaudited / (Continued) |
5. Shares of Beneficial Interest (Continued)
| | | Six Months Ended
May 31, 2018 | | Year Ended
November 30, 2017 |
| | | Shares | | Amount | | Shares | | Amount |
| Class Y | | | | | | | | |
| Sold | | | 35,161,741 | | | $ | 226,159,659 | | | | 76,083,142 | | | $ | 568,884,555 | |
| Dividends and/or distributions | | | | | | | | | | | | | | | | |
| Reinvested | | | 6,606,906 | | | | 40,947,595 | | | | 12,814,559 | | | | 93,199,143 | |
| Redeemed | | | (35,798,945 | ) | | | (227,697,435 | ) | | | (58,254,854 | ) | | | (425,760,315 | ) |
| Net Increase | | | 5,969,702 | | | $ | 39,409,819 | | | | 30,642,847 | | | $ | 236,323,383 | |
6. Purchases and Sales of Securities
The aggregate cost of purchases and proceeds from sales of securities, other than short-term obligations, for the six months ended May 31, 2018, were as follows:
| | | Purchases | | Sales |
| Investment securities | | $ | 441,272,083 | | | $ | 440,059,304 | |
7. Fees and Other Transactions with Affiliates
Management Fees. Under the investment advisory agreement, the Fund pays the Manager a management fee based on the daily net assets of the Fund at an annual rate as shown in the following table:
Net Assets up to $3 Billion | Net Assets Greater than
$3 Billion and up to $5 Billion | Net Assets in Excess of $5 Billion |
0.95% | 0.93% | 0.90% |
The Fund’s effective management fee for the six months ended May 31, 2018 was 0.95% of average annual net assets before any applicable waivers.
Transfer Agent Fees. OFI Global Asset Management, Inc. (the “Transfer Agent”) serves as the transfer and shareholder servicing agent for the Fund. The Fund pays the Transfer Agent a fee based on average net assets. Fees incurred with respect to these services are detailed in the Statement of Operations.
Sub-Transfer Agent Fees. The Transfer Agent has retained Shareholder Services, Inc., a wholly-owned subsidiary of OFI (the “Sub-Transfer Agent”), to provide the day-to-day transfer agent and shareholder servicing of the Fund. Under the Sub-Transfer Agency Agreement, the
38 OPPENHEIMER STEELPATH MLP INCOME FUND |
NOTES TO FINANCIAL STATEMENTS Unaudited / (Continued) |
7. Fees and Other Transactions with Affiliates (Continued)
Transfer Agent pays the Sub-Transfer Agent an annual fee in monthly installments, equal to a percentage of the transfer agent fee collected by the Transfer Agent from the Fund, which shall be calculated after any applicable fee waivers. The fee paid to the Sub-Transfer Agent is paid by the Transfer Agent, not by the Fund.
Trustees’ Compensation. The Board has adopted a compensation deferral plan for independent trustees that enables trustees to elect to defer receipt of all or a portion of the annual compensation they are entitled to receive from the Fund. For purposes of determining the amount owed to the Trustee under the plan, deferred amounts are treated as though equal dollar amounts had been invested in shares of the Fund or in other Oppenheimer funds selected by the Trustee. The Fund purchases shares of the funds selected for deferral by the Trustee in amounts equal to his or her deemed investment, resulting in a Fund asset equal to the deferred compensation liability. Such assets are included as a component of “Other” within the asset section of the Statement of Assets and Liabilities, if applicable. Deferral of trustees’ fees under the plan will not affect the net assets of the Fund, and will not materially affect the Fund’s assets, liabilities or net investment income per share. Amounts will be deferred until distributed in accordance with the compensation deferral plan.
Distribution and Service Plan (12b-1) Fees. Under its General Distributor’s Agreement with the Fund, the Distributor acts as the Fund’s principal underwriter in the continuous public offering of the Fund’s classes of shares.
Distribution and Service Plan for Class A Shares. The Fund has adopted a Distribution and Service Plan (the “Plan”) for Class A shares under Rule 12b-1 of the Investment Company Act of 1940 that compensates the Distributor for a portion of the costs in connection with the distribution of shares, maintaining accounts and providing services to Class A shareholders. Under the Plan, the Fund makes these payments quarterly at an annual rate of up to 0.25% of the daily net assets of Class A shares of the Fund. The Distributor currently uses all of those fees to pay dealers, brokers, banks and other financial intermediaries for providing services related to the distribution of shares, personal service and maintenance of accounts of their customers that hold Class A shares. Any unreimbursed expenses the Distributor incurs with respect to Class A shares in any fiscal year cannot be recovered in subsequent periods. Fees incurred by the Fund under the Plan are detailed in the Statement of Operations.
Distribution and Service Plans for Class C Shares. The Fund has adopted a Distribution and Service Plans (the “Plans”) for Class C shares under Rule 12b-1 of the Investment Company Act of 1940 to compensate the Distributor for distributing that share class, maintaining accounts and providing shareholder services. Under the Plans, the Fund pays the Distributor an annual asset-based sales charge of 0.75% on Class C shares’ daily net assets. The Fund also pays a service fee under the Plans at an annual rate of 0.25% of Class C shares’ daily net assets.
OPPENHEIMER STEELPATH MLP INCOME FUND 39 |
NOTES TO FINANCIAL STATEMENTS Unaudited / (Continued) |
7. Fees and Other Transactions with Affiliates (Continued)
The Distribution and Service Plans for Class A and C shares continue in effect from year to year only if the Fund’s Board votes annually to approve their continuance at an in-person meeting called for that purpose. Fees incurred by the Fund under the Plans are detailed in the Statement of Operations.
Sales Charges. Front-end sales charges and contingent deferred sales charges (“CDSC”) do not represent expenses of the Fund. They are deducted from the proceeds of sales of Fund shares prior to investment or from redemption proceeds prior to remittance, as applicable. The sales charges retained by the Distributor from the sale of shares and the CDSC retained by the Distributor on the redemption of shares are shown in the following table for the period indicated.
| Six Months Ended | | Class A
Front-End
Sales Charges
Retained
by Distributor | | | Class A Contingent
Deferred Sales Charges
Retained by Distributor | | | Class C Contingent
Deferred Sales Charges
Retained by Distributor | |
May 31, 2018 | | | $ | 582,473 | | | $ | 51,587 | | | $ | 85,313 | |
Waivers and Reimbursements of Expenses. The Manager has contractually agreed to limit fees and/or reimburse expenses of the Fund to the extent that the Fund’s total annual fund operating expenses (exclusive of interest, taxes, such as deferred tax expenses, brokerage commissions, acquired fund fees and expenses, dividend costs related to short sales, and other unusual expense such as litigation expense, if any) exceed 1.35% for Class A shares, 2.10% for Class C shares, and 1.10% for Class Y shares. The Fund’s total annual operating expenses after fee waiver and/or expense reimbursement (“Net Expenses”) will be higher than these amounts to the extent that the Fund incurs expenses excluded from the expense cap. Because the Fund’s deferred income tax expense/(benefit) and interest expense are excluded from the expense cap, the Fund’s Net Expenses for each class of shares is increased/(decreased) by the amount of this expense. During the six months ended May 31, 2018, the Manager reimbursed $686,081, 480,258, and $441,924 for Class A, Class C, and Class Y, respectively. This undertaking may not be modified or terminated until after one year from the date of the current prospectus, as indicated therein, unless approved by the Fund’s Board.
The Manager and/or Transfer Agent can be reimbursed by the Fund within three years after the date the fee limitation and/or expense reimbursement has been made by the Manager and/or Transfer Agent, provided that such repayment does not cause the expenses of any class of the Fund to exceed the foregoing limits.
40 OPPENHEIMER STEELPATH MLP INCOME FUND |
NOTES TO FINANCIAL STATEMENTS Unaudited / (Continued) |
7. Fees and Other Transactions with Affiliates (Continued)
The following table represents amounts eligible for recovery at May 31, 2018:
| Eligible Expense Recoupment Expiring: | | |
| November 30, 2018 | | $ | 4,433,066 | |
| November 30, 2019 | | | 3,593,107 | |
| November 30, 2020 | | | 3,700,354 | |
| November 30, 2021 | | | 1,608,263 | |
During the six months ended May 31, 2018, the Manager and/or Transfer Agent did not recoup any expenses.
Effective January 1, 2017 until December 31, 2017, the Transfer Agent has voluntarily agreed to waive fees and/or reimburse Fund expenses in an amount equal to 0.015% of average annual net assets for Classes A, C, and Y.
During the reporting period, the Transfer Agent waived fees and/or reimbursed the Fund for transfer agent and shareholder servicing agent fees as follows:
| Class A | | $ | 19,087 | |
| Class C | | | 13,472 | |
| Class Y | | | 12,078 | |
This expense limitation was removed effective December 31, 2017. Amounts previously waived are not eligible for recoupment.
Related Party. The Interested Trustee and officers of the Fund is also an officers or trustee of companies affiliated with the Manager, Distributor, and Transfer Agent.
Cross Trades. The Fund is permitted to purchase and sell securities from and to other Funds managed by the Manager or OFI Global (“cross-trade”) pursuant to “Cross-Trading” Procedures adopted by the Fund’s Board. These procedures are designed to ensure that any cross-trade of securities between a Fund and another account or private fund that is an affiliate of the Fund solely by virtue of having a common investment adviser, common trustee/director, or common officer complies with Rule 17a-7 under the 1940 Act. Further, as defined under these procedures, each cross-trade is effected at the current market price.
During the period the Fund had $83,124,372 in purchases and $66,324,068 in sales considered cross-trades, resulting in ($12,369,860) of realized gain/(loss).
OPPENHEIMER STEELPATH MLP INCOME FUND 41 |
NOTES TO FINANCIAL STATEMENTS Unaudited / (Continued) |
8. Borrowing Agreement
The Fund, along with Oppenheimer SteelPath MLP Alpha Plus Fund, Oppenheimer SteelPath MLP Alpha Fund, and Oppenheimer SteelPath MLP Select 40 Fund (collectively, the “Trust”), is a borrower in a $700 million revolving credit agreement (the “Loan Agreement”) with a major lending institution (the “Lender”). The Fund is permitted to borrow up to the lesser of one-third of the Fund’s total assets, or the maximum amount permitted pursuant to the Fund’s investment limitations. As the Loan Agreement is not available exclusively to the Fund, the Fund may not be able to borrow all of its requested amounts at any given time. Amounts borrowed under the Loan Agreement, if any, are invested by the Fund under the direction of the Manager consistent with the Fund’s investment objective and policies, and as such, the related investments are subject to normal market fluctuations and investment risks, including the risk of loss due to a decline in value. The borrowing, if any, is fully collateralized throughout the term of the borrowing with securities or other assets of the Fund. The Fund is not liable for borrowings of other Funds in the Trust. Securities that have been pledged as collateral for the borrowing are indicated in the Statement of Investments.
Borrowings under the Loan Agreement are charged interest at a calculated rate computed by the Lender based on the one month LIBOR rate plus 0.75% per annum. An unused commitment fee at the rate of 0.30% per annum is charged for any undrawn portion of the credit facility, and each member of the Trust will pay its pro rata share of this fee. A facility fee of 0.10% was charged on the commitment amount, and each party of the Trust paid its pro rata share of this fee. The borrowing is due November 16, 2018, unless another date is mutually agreed upon by the parties of the Loan Agreement. For the six months ended May 31, 2018, the Fund paid $430,918 in borrowing fees. The Fund did not utilize the facility during the six months ended May 31, 2018.
42 OPPENHEIMER STEELPATH MLP INCOME FUND |
DISTRIBUTION SOURCES Unaudited |
For any distribution that took place over the last six months of the Fund’s reporting period, the table below details on a per-share basis the percentage of the Fund’s total distribution payment amount that was derived from the following sources: net income, net profit from the sale of securities, and other capital sources. Other capital sources represent a return of capital. A return of capital may occur, for example, when some or all of the money that you invested in the Fund is paid back to you. A return of capital distribution does not necessarily reflect the Fund’s investment performance and should not be confused with “yield” or “income.” You should not draw any conclusions about the Fund’s investment performance from the amounts of these distributions. This information is based upon income and capital gains using generally accepted accounting principles as of the date of each distribution. If the Fund (or an underlying fund in which the Fund invests) invests in real estate investment trusts (REITs) and/or master limited partnerships (MLPs), the percentages attributed to each category are estimated using historical information because the character of the amounts received from the REITs and/or MLPs in which the Fund (or underlying fund) invests is unknown until after the end of the calendar year. Because the Fund is actively managed, the relative amount of the Fund’s total distributions derived from various sources over the calendar year may change. Please note that this information should not be used for tax reporting purposes as the tax character of distributable income may differ from the amounts used for this notification. You will receive IRS tax forms in the first quarter of each calendar year detailing the actual amount of the taxable and non-taxable portion of distributions paid to you during the tax year.
For the most current information, please go to oppenheimerfunds.com. Select your Fund, and scroll down to the ‘Dividends’ table under ‘Analytics’. The Fund’s latest distribution information will be followed by the sources of any distribution, updated daily.
Fund Name | Pay
Date | Net
Income | Net
Profit
from Sale | Other
Capital
Sources |
Oppenheimer SteelPath MLP Income Fund | 1/5/18 | 0.0% | 0.0% | 100.0% |
Oppenheimer SteelPath MLP Income Fund | 2/9/18 | 0.0% | 0.0% | 100.0% |
Oppenheimer SteelPath MLP Income Fund | 3/9/18 | 0.0% | 0.0% | 100.0% |
Oppenheimer SteelPath MLP Income Fund | 4/6/18 | 0.0% | 0.0% | 100.0% |
Oppenheimer SteelPath MLP Income Fund | 5/4/18 | 0.0% | 0.0% | 100.0% |
OPPENHEIMER STEELPATH MLP INCOME FUND 43 |
PORTFOLIO PROXY VOTING POLICIES AND PROCEDURES; UPDATES TO STATEMENT OF INVESTMENTS Unaudited |
The Fund has adopted Portfolio Proxy Voting Policies and Procedures under which the Fund votes proxies relating to securities (“portfolio proxies”) held by the Fund. A description of the Fund’s Portfolio Proxy Voting Policies and Procedures is available (i) without charge, upon request, by calling the Fund toll-free at 1.800.CALL OPP (225.5677), (ii) on the Fund’s website at oppenheimerfunds.com, and (iii) on the SEC’s website at www.sec.gov. In addition, the Fund is required to file Form N-PX, with its complete proxy voting record for the 12 months ended June 30th, no later than August 31st of each year. The Fund’s voting record is available (i) without charge, upon request, by calling the Fund toll-free at 1.800.CALL OPP (225.5677), and (ii) in the Form N-PX filing on the SEC’s website at www.sec.gov.
The Fund files its complete schedule of portfolio holdings with the SEC for the first quarter and the third quarter of each fiscal year on Form N-Q. The Fund’s Form N-Q filings are available on the SEC’s website at www.sec.gov. Those forms may be reviewed and copied at the SEC’s Public Reference Room in Washington, D.C. Information on the operation of the Public Reference Room may be obtained by calling 1-800-SEC-0330.
Householding – Delivery of Shareholder Documents
This is to inform you about OppenheimerFunds’ “householding” policy. If more than one member of your household maintains an account in a particular fund, OppenheimerFunds will mail only one copy of the fund’s prospectus (or, if available, the fund’s summary prospectus), annual and semiannual report and privacy policy. The consolidation of these mailings, called householding, benefits your fund through reduced mailing expense, and benefits you by reducing the volume of mail you receive from OppenheimerFunds. Householding does not affect the delivery of your account statements.
Please note that we will continue to household these mailings for as long as you remain an OppenheimerFunds shareholder, unless you request otherwise. If you prefer to receive multiple copies of these materials, please call us at 1.800.CALL-OPP (225-5677). You may also notify us in writing or via email. We will begin sending you individual copies of the prospectus (or, if available, the summary prospectus), reports and privacy policy within 30 days of receiving your request to stop householding.
44 OPPENHEIMER STEELPATH MLP INCOME FUND |
OPPENHEIMER STEELPATH MLP INCOME FUND |
Trustees and Officers | | Robert J. Malone, Chairman of the Board of Trustees and Trustee |
| | | Andrew J. Donohue, Trustee |
| | | Richard F. Grabish, Trustee |
| | | Beverly L. Hamilton, Trustee |
| | | Victoria J. Herget, Trustee |
| | | Karen L. Stuckey, Trustee |
| | | James D. Vaughn, Trustee |
| | | Arthur P. Steinmetz, Trustee, President and Principal Executive Officer |
| | | Stuart Cartner, Vice President |
| | | Brian Watson, Vice President |
| | | Cynthia Lo Bessette, Secretary and Chief Legal Officer |
| | | Jennifer Foxson, Vice President and Chief Business Officer |
| | | Mary Ann Picciotto, Chief Compliance Officer
and Chief Anti-Money Laundering Officer |
| | | Brian S. Petersen, Treasurer and Principal Financial & Accounting Officer |
| | | |
Manager | | OFI SteelPath, Inc. |
Distributor | | OppenheimerFunds Distributor, Inc. |
Transfer and Shareholder Servicing Agent | | OFI Global Asset Management, Inc. |
Sub-Transfer Agent | | Shareholder Services, Inc. |
| | | DBA OppenheimerFunds Services |
Independent Registered Public Accounting Firm | | Cohen & Company, Ltd. |
Legal Counsel | | Ropes & Gray LLP |
The financial statements included herein have been taken from the records of the Fund without examination of those records by the independent registered public accounting firm.
© 2018 OppenheimerFunds, Inc. All rights reserved.
OPPENHEIMER STEELPATH MLP INCOME FUND 45 |
As an Oppenheimer fund shareholder, you are entitled to know how we protect your personal information and how we limit its disclosure. Information Sources
Information Sources
We obtain nonpublic personal information about our shareholders from the following sources:
| | ● | Applications or other forms. |
| | ● | When you create a user ID and password for online account access. |
| | ● | When you enroll in eDocs Direct,SM our electronic document delivery service. |
| | ● | Your transactions with us, our affiliates or others. |
| | ● | Technologies on our website, including: “cookies” and web beacons, which are used to collect data on the pages you visit and the features you use. |
If you visit oppenheimerfunds.com and do not log on to the secure account information areas, we do not obtain any personal information about you. When you do log on to a secure area, we do obtain your user ID and password to identify you. We also use this information to provide you with products and services you have requested, to inform you about products and services that you may be interested in and assist you in other ways.
We do not collect personal information through our website unless you willingly provide it to us, either directly by email or in those areas of the website that request information. In order to update your personal information (including your mailing address, email address and phone number) you must first log on and visit your user profile.
If you have set your browser to warn you before accepting cookies, you will receive the warning message with each cookie. You can refuse cookies by turning them off in your browser. However, doing so may limit your access to certain sections of our website.
We use cookies to help us improve and manage our website. For example, cookies help us recognize new versus repeat visitors to the site, track the pages visited, and enable some special features on the website. This data helps us provide better service for our website visitors.
Protection of Information
We do not disclose any nonpublic personal information (such as names on a customer list) about current or former customers to anyone, except as permitted by law.
46 OPPENHEIMER STEELPATH MLP INCOME FUND |
PRIVACY POLICY NOTICE (Continued) |
Disclosure of Information
Copies of confirmations, account statements and other documents reporting activity in your fund accounts are made available to your financial advisor (as designated by you). We may also use details about you and your investments to help us, our financial service affiliates, or firms that jointly market their financial products and services with ours, to better serve your investment needs or suggest educational material that may be of interest to you. If this requires us to provide you with an opportunity to “opt in” or “opt out” of such information sharing with a firm not affiliated with us, you will receive notification on how to do so, before any such sharing takes place.
Right of Refusal
We will not disclose your personal information to unaffiliated third parties (except as permitted by law), unless we first offer you a reasonable opportunity to refuse or “opt out” of such disclosure.
Internet Security and Encryption
In general, the email services provided by our website are encrypted and provide a secure and private means of communication with us. To protect your own privacy, confidential and/ or personal information should only be communicated via email when you are advised that you are using a secure website.
As a security measure, we do not include personal or account information in nonsecure emails, and we advise you not to send such information to us in nonsecure emails. Instead, you may take advantage of the secure features of our website to encrypt your email correspondence. To do this, you will need to use a browser that supports Secure Sockets Layer (SSL) protocol.
| | ● | All transactions conducted via our websites, including redemptions, exchanges and purchases, are secured by the highest encryption standards available. SSL is used to establish a secure connection between your PC and OppenheimerFunds’ server. It transmits information in an encrypted and scrambled format. |
| | ● | Encryption is achieved through an electronic scrambling technology that uses a “key” to code and then decode the data. Encryption acts like the cable converter box you may have on your television set. It scrambles data with a secret code so that no one can make sense of it while it is being transmitted. When the data reaches its destination, the same software unscrambles the data. |
| | ● | You can exit the secure area by closing your browser or, for added security, you can use the Log Out button before you close your browser. |
OPPENHEIMER STEELPATH MLP INCOME FUND 47 |
PRIVACY POLICY NOTICE (Continued) |
Other Security Measures
We maintain physical, electronic and procedural safeguards to protect your personal account information. Our employees and agents have access to that information only so that they may offer you products or provide services, for example, when responding to your account questions.
How You Can Help
You can also do your part to keep your account information private and to prevent unauthorized transactions. If you obtain a user ID and password for your account, safeguard that information. Strengthening your online credentials–your online security profile–typically your user name, password, and security questions and answers, can be one of your most important lines of defense on the Internet. For additional information on how you can help prevent identity theft, visit https:// www.oppenheimerfunds.com/security.
Who We Are
This joint notice describes the privacy policies of the Oppenheimer funds, OppenheimerFunds, Inc., each of its investment adviser subsidiaries, OppenheimerFunds Distributor, Inc. and OFI Global Trust Co. It applies to all Oppenheimer fund accounts you presently have, or may open in the future, using your Social Security number—whether or not you remain a shareholder of our funds. This notice was last updated as of November 2017. In the event it is updated or changed, we will post an updated notice on our website at oppenheimerfunds.com. If you have any questions about this privacy policy, email us by clicking on the Contact Us section of our website at oppenheimerfunds.com, write to us at P.O. Box 5270, Denver, CO 80217-5270, or call us at 800 CALL OPP (225 5677).
48 OPPENHEIMER STEELPATH MLP INCOME FUND |
THIS PAGE INTENTIONALLY LEFT BLANK
OPPENHEIMER STEELPATH MLP INCOME FUND 49 |
THIS PAGE INTENTIONALLY LEFT BLANK
50 OPPENHEIMER STEELPATH MLP INCOME FUND |
THIS PAGE INTENTIONALLY LEFT BLANK
OPPENHEIMER STEELPATH MLP INCOME FUND 51 |


Table of Contents
Fund Performance Discussion | 3 |
Top Holdings and Allocations | 7 |
Share Class Performance | 8 |
Fund Expenses | 10 |
Statement of Investments | 12 |
Statement of Assets and Liabilities | 14 |
Statement of Operations | 16 |
Statements of Changes in Net Assets | 17 |
Statement of Cash Flows | 18 |
Financial Highlights | 19 |
Notes to Financial Statements | 23 |
Distribution Sources | 39 |
Portfolio Proxy Voting Policies and Procedures; Updates to Statement of Investments | 40 |
Trustees and Officers | 41 |
Privacy Policy Notice | 42 |
Class A Shares
AVERAGE ANNUAL TOTAL RETURNS AT 5/31/18
| | Class A Shares of the Fund | | |
| Without
Sales Charge | With
Sales Charge | S&P
500 Index | Alerian
MLP Index |
6-Month | 2.27% | -3.57% | 3.16% | 5.71% |
1-Year | -10.60% | -15.71% | 14.38% | -3.71% |
5-Year | -4.48% | -5.61% | 12.98% | -3.20% |
Since Inception (2/6/12) | -0.64% | -1.57% | 14.10% | 0.33% |
Performance data quoted represents past performance, which does not guarantee future results. The investment return and principal value of an investment in the Fund will fluctuate so that an investor’s shares, when redeemed, may be worth more or less than their original cost. Fund returns include changes in share price, reinvested distributions, and a 5.75% maximum applicable sales charge except where “without sales charge” is indicated. Current performance may be lower or higher than the performance quoted. Returns do not consider capital gains or income taxes on an individual’s investment. Returns for periods of less than one year are cumulative and not annualized. For performance data current to the most recent month-end, visit oppenheimerfunds.com or call 1.800.CALL OPP (225.5677). See Fund prospectuses and summary prospectuses for more information on share classes and sales charges.
2 OPPENHEIMER STEELPATH MLP ALPHA PLUS FUND |
Fund Performance Discussion
The Fund’s Class A shares (without sales charge) produced a total return of 2.27% during the reporting period. In comparison, master limited partnerships (“MLPs”), as measured by the Alerian MLP Index (AMZ), provided a total return gain of 5.71%. During the same period, the S&P 500 Index produced a total return gain of 3.16%.
Over the six-month reporting period ended May 31, 2018, the midstream sector outperformed the broader markets despite facing headwinds presented by the U.S. Federal Energy Regulatory Commission (FERC), which announced changes related to pipeline tariffs in reaction to a federal court’s previous remand that cost-of-service tariffs on interstate natural gas and oil pipelines owned by MLPs would no longer receive an income tax allowance (ITA). This shift in FERC’s long-held position caused significant market confusion and volatility across the sector. While on the whole the sector overcame the initial widespread weakness, the value of the equities of select industry participants with the largest portfolios of FERC-regulated assets remain diminished at period end.
The need for additional midstream infrastructure to service growing volumes from the Permian basin became even more acute over the reporting period as production growth has exceeded even the most aggressive of previous industry predictions and appears set to overwhelm the energy infrastructure capacity bringing that crude oil and natural gas out of the basin. While there are multiple new-build pipelines and expansions in-progress, we believe that the long construction times required for these projects mean that meaningful relief is unlikely to come until mid-2019, at the earliest. As such, we expect that Permian producers without sufficient takeaway capacity will experience significantly worse pricing than peers with access to pipeline capacity. Some disadvantaged producers may slow their production growth until in-basin pricing recovers. Importantly, we believe certain midstream operators should enjoy both short-term and long-term benefits. Obviously, midstream operators are currently enjoying and we expect that they will continue to enjoy the full utilization of their assets servicing the basin. Some operators may also capture wide short-term marketing margins. Over the long-term, midstream operators may benefit from an increased desire by producers to commit to existing or new capacity that can earn a transportation fee for an extended period.
Over the reporting period, we estimate approximately $7 billion of new equity supply entered the market through secondary offerings, initial public offerings, preferred offerings, or “at-the-market” programs in which primary units trade into the market anonymously throughout the normal trading day. This pace of equity
OPPENHEIMER STEELPATH MLP ALPHA PLUS FUND 3 |
issuance represents a sharp decrease from approximately $15 billion that was raised over the six month reporting period ended May 31, 2017. Midstream companies also raised approximately $20 billion of debt capital during the period. Most MLPs pay out substantial distributions to investors and, therefore, often raise external capital to fund larger growth projects or acquisitions.
The Tax Cuts and Jobs Act of 2017, enacted on December 22, 2017, reduced the Fund’s Federal income tax rate from 35% to 21%. While we view a reduction in the corporate tax rate as a significant long-term positive for the C-Corp fund structure, the immediate impact was a reduction in the Fund’s Net Asset Value due to the required remeasuring of the Fund’s accumulated deferred tax assets, as of the enactment date, using the new 21% rate.
MACRO REVIEW
West Texas Intermediate (“WTI”) crude oil prices ended the reporting period at $67.07 per barrel, up 17% over the reporting period. Global crude prices, as measured by Brent crude oil, traded 26% higher over the reporting period. Brent exited the period at a $10.55 per barrel premium to WTI, as the aforementioned Permian capacity constraints also began to weigh on WTI pricing, relative to international levels, as more barrels are pushed from the Permian to Cushing, OK, where WTI pricing is set.
Henry Hub natural gas spot prices exited the period at $2.89 per million British thermal units (“mmbtu”), down 2% over the reporting period, and down 4% from the year-ago period. Natural gas pricing appears to have settled into a relatively narrow trading band as supply and demand dynamics have balanced with heating and electric generation demand stabilizing to weather-dependent levels, production volume growth increasing, and increasing liquefied natural gas exports.
Mont Belvieu natural gas liquids (“NGL”) prices ended the reporting period at $29.61 per barrel, a 7% increase over the reporting period. Pricing for NGL purity products varied, with ethane, isobutane, and natural gasoline trading higher over the period while butane and propane prices declined. Frac spreads, a measure of natural gas processing economics, ended the period at $0.49 per gallon, down 8% over the reporting period. Generally, the greater the frac spread, the greater the incentive for producers to seek natural gas processing capacity.
The yield curve flattened over the reporting period as short-term rates increased more than the yields on longer-dated maturities. The ten-year Treasury yield increased 45 basis points to end the period at 2.86%. The MLP yield spread at period-end, as measured by the AMZ and the 10-year Treasury bond, narrowed by 60 basis points to 5.12%.
Over the reporting period, real estate investment trusts (“REITs”) and utilities, two competing yield-oriented equity asset classes, posted total return losses of 3.11% (as measured by the Dow Jones Equity REIT Total Return Index) and 8.28% (as measured by the Dow Jones Utility Average Index), respectively, as compared to the AMZ’s 5.71% total return gain. Price to forward distributable cash flow (DCF),
4 OPPENHEIMER STEELPATH MLP ALPHA PLUS FUND |
a commonly watched ratio within the MLP sector, declined over the period, ending well below the ten-year average.
SUBSECTOR REVIEW
Performance among subsectors in the midstream, or energy infrastructure, MLP asset class varied for the reporting period. On average, sector participants focused on compression provided the best performance over the period, as strength in demand for compression services has driven increased asset utilization and pricing increases. The gathering and processing subsector followed, buoyed by improved volumetric projections.
The natural gas pipeline subsector experienced the weakest performance over the reporting period as these entities’ prospective cash flows were directly impacted by the FERC changes related to cost-of-service tariffs on interstate pipelines owned by MLPs. The propane subsector also lagged over the reporting period as winter demand proved fleeting and due to idiosyncratic factors at select subsector members.
FUND REVIEW
Key contributors to the Fund’s performance were Enterprise Products Partners, LP (EPD) and Energy Transfer Partners, LP (ETP).
EPD outperformed over the period as underlying business fundamentals continued to improve and as multiple large scale growth projects were placed into service or nearing completion. Additionally, EPD continued to benefit from increased market participant focus on partnerships without incentive distribution rights (“IDRs”) and modest equity capital needs.
ETP outperformed over the period as its robust portfolio of natural gas processing assets benefited from the recent expansion of processing facilities. In addition, its Permian and Marcellus/Utica assets have been seeing increasing activity that is expected to drive cash flow growth.
Key detractors from the Fund’s performance were TC Pipelines, LP (TCP) and Buckeye Partners, LP (BPL).
TCP units underperformed over the period following FERC changes related to cost-of-service tariffs on interstate natural gas and liquids pipelines owned by MLPs. Despite this concern, we believe the ultimate outcome is likely far more nuanced and any revenue impact much less widespread than the initial market reaction.
BPL underperformed over the period as market participants expressed heightened concerns related to storage re-contracting and following the FERC changes. BPL operates a portfolio of strategic, long-lived infrastructure assets that generates highly-stable, fee-based cash flows. Despite the recent headwinds, the partnership still maintains distribution coverage of approximately 1.0x, and we believe that it has manageable capital needs, and continues to find growth opportunities that enhance its core asset base.
OPPENHEIMER STEELPATH MLP ALPHA PLUS FUND 5 |
Separately, the Fund also obtains leverage through borrowing, which had a positive impact on performance this reporting period. Please note that to the extent the Fund obtains leverage through borrowing, there will be the potential for greater gains and the risk of magnified losses.
Please note that significant decreases in cash distributions from the Fund’s MLP investments and/or significant declines in the value of its investments may impact the Fund’s assessment regarding the recoverability of certain deferred tax assets, which may result in the recording of a valuation allowance. If a valuation allowance is established, this could have a material impact on the Fund’s net asset value and results of operations for the period. The Fund had a valuation allowance in place throughout the entire reporting period. See Note 2 of the Notes to Financial Statements for more information.
OUTLOOK
We believe midstream equity valuations are attractive and sector participants have improved their positioning for the future. While the AMZ is above the cyclical low, it remains at levels present before the shale production renaissance. Notably, this is occurring at a time when many MLPs have reached or are approaching a self-funding level of retained cash flows and the industry’s heaviest capital spending obligations appear to be in the past. Accordingly, we believe the stage is setting for a realignment of business and equity fundamentals, positioning the sector well for long-term investors seeking an attractive blend of current income, moderate growth, and, presently, attractive valuations.

| 
Stuart Cartner
Portfolio Manager
| 
| 
Brian Watson, CFA
Portfolio Manager
|
6 OPPENHEIMER STEELPATH MLP ALPHA PLUS FUND |
Top Holdings and Allocations
TOP TEN MASTER LIMITED PARTNERSHIP AND RELATED ENTITIES HOLDINGS
Enterprise Products Partners LP | 14.38% |
Energy Transfer Partners LP | 13.37% |
Energy Transfer Equity LP | 11.13% |
MPLX LP | 10.78% |
Targa Resources Corp. | 9.59% |
Magellan Midstream Partners LP | 9.27% |
Tallgrass Energy GP LP | 7.72% |
Williams Partners LP | 7.54% |
Buckeye Partners LP | 6.80% |
Williams Cos., Inc. | 5.02% |
Portfolio holdings and allocations are subject to change. Percentages are as of May 31, 2018, and are based on net assets. For more current Fund holdings, please visit oppenheimerfunds.com.
SECTOR ALLOCATION
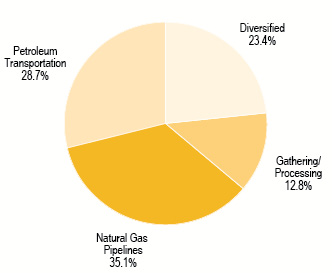
Portfolio holdings and allocations are subject to change. Percentages are as of May 31, 2018, and are based on the total market value of investments. For more current Fund holdings, please visit oppenheimerfunds.com.
OPPENHEIMER STEELPATH MLP ALPHA PLUS FUND 7 |
Share Class Performance
AVERAGE ANNUAL TOTAL RETURNS WITHOUT SALES CHARGE AS OF 5/31/18
| | Inception Date | 6-Month | 1-Year | 5-Year | Since Inception |
Class A (MLPLX) | 2/6/12 | 2.27% | -10.60% | -4.48% | -0.64% |
Class C (MLPMX) | 5/22/12 | 2.05% | -11.23% | -5.18% | -0.76% |
Class I (OSPPX) | 6/28/13 | 2.68% | -10.20% | N/A | -5.06% |
Class Y (MLPNX) | 12/30/11 | 2.54% | -10.39% | -4.23% | -0.15% |
AVERAGE ANNUAL TOTAL RETURNS WITH SALES CHARGE AS OF 5/31/18
| | Inception Date | 6-Month | 1-Year | 5-Year | Since Inception |
Class A (MLPLX) | 2/6/12 | -3.57% | -15.71% | -5.61% | -1.57% |
Class C (MLPMX) | 5/22/12 | 1.07% | -12.03% | -5.18% | -0.76% |
Class I (OSPPX) | 6/28/13 | 2.68% | -10.20% | N/A | -5.06% |
Class Y (MLPNX) | 12/30/11 | 2.54% | -10.39% | -4.23% | -0.15% |
Performance data quoted represents past performance, which does not guarantee future results. The investment return and principal value of an investment in the Fund will fluctuate so that an investor’s shares, when redeemed, may be worth more or less than their original cost. Current performance may be lower or higher than the performance quoted. Returns do not consider capital gains or income taxes on an individual’s investment. For performance data current to the most recent month-end, visit oppenheimerfunds.com or call 1.800.CALL OPP (225.5677). Fund returns include changes in share price, reinvested distributions, and the applicable sales charge: for Class A shares, the current maximum initial sales charge of 5.75%, and for Class C shares, the contingent deferred sales charge of 1% for the 1-year period. There is no sales charge for Class I or Class Y shares. Returns for periods of less than one year are cumulative and not annualized. See Fund prospectuses and summary prospectuses for more information on share classes and sales charges.
The Fund’s performance is compared to the performance of the S&P 500 Index and the Alerian MLP Index. The S&P 500 Index is a capitalization-weighted index of 500 stocks intended to be a representative sample of leading companies in leading industries within the U.S. economy. The Alerian MLP Index is a float-adjusted, capitalization-weighted index measuring master limited partnerships, whose constituents represent approximately 85% of total float-adjusted market capitalization. The returns for the S&P 500 Index and Alerian MLP Index are calculated pre-tax, while the Fund’s returns are calculated post corporate tax. The indices are unmanaged and cannot be purchased directly by investors. While index comparisons may be useful to provide a benchmark for the Fund’s performance, it must be noted that the Fund’s investments are not limited to the investments comprising the indices. Index performance
8 OPPENHEIMER STEELPATH MLP ALPHA PLUS FUND |
includes reinvestment of income, but does not reflect transaction costs, fees, expenses or taxes. Index performance is shown for illustrative purposes only as a benchmark for the Fund’s performance, and does not predict or depict performance of the Fund. The Fund’s performance reflects the effects of the Fund’s business and operating expenses.
The Fund’s investment strategy and focus can change over time. The mention of specific fund holdings does not constitute a recommendation by OppenheimerFunds, Inc. or its affiliates.
The views in the Fund Performance Discussion represent the opinions of this Fund’s portfolio managers and are not intended as investment advice or to predict or depict the performance of any investment. These views are as of the close of business on May 31, 2018, and are subject to change based on subsequent developments. The Fund’s portfolio and strategies are subject to change.
Before investing in any of the Oppenheimer funds, investors should carefully consider a fund’s investment objectives, risks, charges and expenses. Fund prospectuses and summary prospectuses contain this and other information about the funds, and may be obtained by asking your financial advisor, visiting oppenheimerfunds.com, or calling 1.800.CALL OPP (225.5677). Read prospectuses and summary prospectuses carefully before investing.
Shares of Oppenheimer funds are not deposits or obligations of any bank, are not guaranteed by any bank, are not insured by the FDIC or any other agency, and involve investment risks, including the possible loss of the principal amount invested.
OPPENHEIMER STEELPATH MLP ALPHA PLUS FUND 9 |
Fund Expenses
Fund Expenses. As a shareholder of the Fund, you incur two types of costs: (1) transaction costs, which may include sales charges (loads) on purchase payments, contingent deferred sales charges on redemptions; and (2) ongoing costs, including management fees; distribution and service fees; and other Fund expenses. These examples are intended to help you understand your ongoing costs (in dollars) of investing in the Fund and to compare these costs with the ongoing costs of investing in other mutual funds.
The examples are based on an investment of $1,000.00 invested at the beginning of the period and held for the entire 6-month period ended May 31, 2018.
Actual Expenses. The first section of the table provides information about actual account values and actual expenses. You may use the information in this section for the class of shares you hold, together with the amount you invested, to estimate the expense that you paid over the period. Simply divide your account value by $1,000.00 (for example, an $8,600.00 account value divided by $1,000.00 = 8.60), then multiply the result by the number in the first section under the heading entitled “Expenses Paid During 6 Months Ended May 31, 2018” to estimate the expenses you paid on your account during this period.
Hypothetical Example for Comparison Purposes. The second section of the table provides information about hypothetical account values and hypothetical expenses based on the Fund’s actual expense ratio for each class of shares, and an assumed rate of return of 5% per year for each class before expenses, which is not the actual return. The hypothetical account values and expenses may not be used to estimate the actual ending account balance or expenses you paid for the period. You may use this information to compare the ongoing costs of investing in the Fund and other funds. To do so, compare this 5% hypothetical example for the class of shares you hold with the 5% hypothetical examples that appear in the shareholder reports of the other funds.
Please note that the expenses shown in the table are meant to highlight your ongoing costs only and do not reflect any transactional costs, such as front-end or contingent deferred sales charges (loads). Therefore, the “hypothetical” section of the table is useful in comparing ongoing costs only, and will not help you determine the relative total costs of owning different funds. In addition, if these transactional costs were included, your costs would have been higher.
10 OPPENHEIMER STEELPATH MLP ALPHA PLUS FUND |
Actual | Beginning
Account Value
December 1, 2017 | Ending
Account Value
May 31, 2018 | Expenses
Paid During
6 Months Ended
May 31, 2018 |
CLASS A | $ 1,000.00 | $ 1,022.70 | $ 23.96 |
CLASS C | 1,000.00 | 1,020.50 | 27.74 |
CLASS I | 1,000.00 | 1,026.80 | 21.97 |
CLASS Y | 1,000.00 | 1,025.40 | 22.75 |
Hypothetical
(5% return before expenses) | | | |
CLASS A | 1,000.00 | 1,001.31 | 23.71 |
CLASS C | 1,000.00 | 997.54 | 27.42 |
CLASS I | 1,000.00 | 1,003.32 | 21.71 |
CLASS Y | 1,000.00 | 1,002.54 | 22.49 |
Expenses are equal to the Fund’s annualized expense ratio for that class, multiplied by the average account value over the period, multiplied by 182/365 (to reflect the one-half year period). Those annualized expense ratios, excluding indirect expenses from affiliated funds, and tax expense, based on the 6-month period ended May 31, 2018 are as follows:
Class | Expense Ratios |
CLASS A | 4.75% |
CLASS C | 5.51 |
CLASS I | 4.35 |
CLASS Y | 4.50 |
The expense ratios for Class A, C, and Y reflect voluntary waivers and/or reimbursement of expenses by the Fund’s Transfer Agent. Some of these undertakings may be modified or terminated at any time, as indicated in the Fund’s prospectus. The “Financial Highlights” tables in the Fund’s financial statements, included in this report, also show the gross expense ratios, without such waivers, if applicable.
OPPENHEIMER STEELPATH MLP ALPHA PLUS FUND 11 |
STATEMENT OF INVESTMENTS May 31, 2018 / Unaudited |
| Description | | Shares | | | Value | |
| MLP Investments and Related Entities — 121.9% |
| Diversified — 24.7% | | | |
Enterprise Products Partners LP 1 | | | 1,047,982 | | | $ | 30,286,680 | |
Westlake Chemical Partners LP 1 | | | 253,466 | | | | 5,893,084 | |
Williams Partners LP 1 | | | 398,817 | | | | 15,872,917 | |
| Total Diversified | | | | | | | 52,052,681 | |
| | | | | | | | | |
| Gathering/Processing — 16.2% |
Antero Midstream GP LP 1 | | | 455,350 | | | | 8,765,488 | |
Targa Resources Corp. 1 | | | 415,153 | | | | 20,188,890 | |
Western Gas Partners LP 1 | | | 102,002 | | | | 5,270,443 | |
| Total Gathering/Processing | | | | | | | 34,224,821 | |
| | | | | | | | | |
| Natural Gas Pipelines — 44.6% |
Energy Transfer Equity LP 1 | | | 1,357,126 | | | | 23,451,137 | |
Energy Transfer Partners LP 1 | | | 1,482,669 | | | | 28,155,875 | |
EQT Midstream Partners LP 1 | | | 146,512 | | | | 8,179,765 | |
Rice Midstream Partners LP 1 | | | 357,060 | | | | 6,594,898 | |
Tallgrass Energy GP LP 1 | | | 755,644 | | | | 16,253,903 | |
Tallgrass Energy Partners LP 1 | | | 68,661 | | | | 2,998,426 | |
TC Pipelines LP 1 | | | 337,567 | | | | 8,209,629 | |
| Total Natural Gas Pipelines | | | | | | | 93,843,633 | |
| | | | | | | | | |
| Petroleum Transportation — 36.4% |
Buckeye Partners LP 1 | | | 397,485 | | | $ | 14,329,334 | |
Genesis Energy LP 1 | | | 122,359 | | | | 2,687,004 | |
Magellan Midstream Partners LP 1 | | | 279,381 | | | | 19,528,732 | |
MPLX LP 1 | | | 632,333 | | | | 22,707,078 | |
Phillips 66 Partners LP 1 | | | 144,656 | | | | 7,565,509 | |
Plains All American Pipeline LP 1 | | | 206,387 | | | | 4,850,094 | |
Plains GP Holdings LP, Class A 1 | | | 203,861 | | | | 5,008,865 | |
| Total Petroleum Transportation | | | | | | | 76,676,616 | |
| | | | | | | | | |
| Total MLP Investments and Related Entities |
| (identified cost $256,752,276) | | | | | | | 256,797,751 | |
| | | | | | | | | |
| Common Stock — 5.0% |
| Diversified — 5.0% | | | | | | | | |
Williams Cos., Inc. 1 | | | 393,589 | | | | 10,571,801 | |
| | | | | | | | | |
| Total Common Stock | | | | | | | | |
| (identified cost $11,471,326) | | | | | | | 10,571,801 | |
| | | | | | | | | |
| Total Investments — 126.9% | | | | | | | | |
| (identified cost $268,223,602) | | | | | | | 267,369,552 | |
| Liabilities In Excess of Other Assets — (26.9)% | | | | | | | (56,749,037 | ) |
| Net Assets — 100.0% | | | | | | $ | 210,620,515 | |
12 OPPENHEIMER STEELPATH MLP ALPHA PLUS FUND |
STATEMENT OF INVESTMENTS Unaudited / (Continued) |
Footnotes to Statement of Investments
GP — General Partnership
LP — Limited Partnership
1 | As of May 31, 2018, all or a portion of the security has been pledged as collateral for a Fund loan. The market value of the securities in the pledged account totaled $169,591,590 as of May 31, 2018. The loan agreement requires continuous collateral whether the loan has a balance or not. See Note 8 of the Notes to Financial Statements for additional information. |
See accompanying Notes to Financial Statements.
OPPENHEIMER STEELPATH MLP ALPHA PLUS FUND 13 |
STATEMENT OF ASSETS AND LIABILITIES May 31, 2018 / Unaudited |
| Assets: | | | |
| Investments at value (cost $268,223,602) – see accompanying Statement of Investments: | | $ | 267,369,552 | |
| Deferred tax asset, net | | | 10,622,669 | |
| Receivable for beneficial interest sold | | | 195,413 | |
| Prepaid expenses | | | 124,688 | |
| Cash used for borrowing | | | 60,000 | |
| Dividends receivable | | | 221 | |
| Receivable for investments sold | | | 2,770,333 | |
| Total assets | | | 281,142,876 | |
|
| Liabilities: | | | | |
| Payable on borrowing (See note 9) | | | 67,000,000 | |
| Due to custodian | | | 2,775,608 | |
| Payable to Manager | | | 221,472 | |
| Payable for beneficial interest redeemed | | | 154,027 | |
| Interest expense payable | | | 169,631 | |
| Payable for distribution and service plan fees | | | 58,496 | |
| Transfer agent fees payable, net of voluntary waiver | | | 34,393 | |
| Trustees' fees payable | | | 3,763 | |
| Borrowing expense payable | | | 966 | |
| Other liabilities | | | 104,005 | |
| Total liabilities | | | 70,522,361 | |
|
| Composition of Net Assets | | | | |
| Par value of shares of beneficial interest | | $ | 34,462 | |
| Paid-in capital | | | 311,802,479 | |
| Undistributed net investment loss, net of deferred taxes | | | (41,526,215 | ) |
| Accumulated undistributed net realized losses on investments, net of deferred taxes | | | (80,868,171 | ) |
| Net unrealized appreciation on investments, net of deferred taxes | | | 21,177,960 | |
| Net Assets | | $ | 210,620,515 | |
14 OPPENHEIMER STEELPATH MLP ALPHA PLUS FUND |
STATEMENT OF ASSETS AND LIABILITIES Unaudited / (Continued) |
| Net Asset Value, Offering Price and Redemption Proceeds Per Share ($0.001 Par Value, Unlimited Shares Authorized) | | | |
| Class A Shares: | | | |
| Net asset value and redemption proceeds per share | | $ | 6.14 | |
| Offering price per share (net asset value plus sales charge of 5.75% of offering price) | | $ | 6.51 | |
| Class C Shares: | | | | |
| Net asset value, offering price and redemption proceeds per share | | $ | 5.81 | |
| Class I Shares: | | | | |
| Net asset value, offering price and redemption proceeds per share | | $ | 6.33 | |
| Class Y Shares: | | | | |
| Net asset value, offering price and redemption proceeds per share | | $ | 6.28 | |
| Net Assets: | | | |
| Class A shares | | $ | 73,855,034 | |
| Class C shares | | | 51,516,579 | |
| Class I shares | | | 1,156,065 | |
| Class Y shares | | | 84,092,837 | |
| Total Net Assets | | $ | 210,620,515 | |
| Shares Outstanding: | | | | |
| Class A shares | | | 12,022,608 | |
| Class C shares | | | 8,868,338 | |
| Class I shares | | | 182,733 | |
| Class Y shares | | | 13,387,958 | |
| Total Shares Outstanding | | | 34,461,637 | |
See accompanying Notes to Financial Statements.
OPPENHEIMER STEELPATH MLP ALPHA PLUS FUND 15 |
STATEMENT OF OPERATIONS
For the Six Months Ended May 31, 2018 / Unaudited |
| Investment Income | | | |
| Distributions and Dividends | | $ | 10,276,025 | |
| Less return of capital on distributions and dividends | | | (10,032,352 | ) |
| Total investment income | | | 243,673 | |
|
| Expenses | | | | |
| Management fees | | | 1,326,492 | |
| Distribution and service plan fees | | | | |
| Class A | | | 96,368 | |
| Class C | | | 234,292 | |
| Transfer agent fees | | | | |
| Class A | | | 77,585 | |
| Class C | | | 46,695 | |
| Class I | | | 152 | |
| Class Y | | | 86,248 | |
| Legal, auditing, and other professional fees | | | 96,041 | |
| Registration fees | | | 43,224 | |
| Administrative fees | | | 30,713 | |
| Custody fees | | | 14,104 | |
| Trustees' fees | | | 5,942 | |
| Borrowing fees | | | 76,741 | |
| Other | | | 15,211 | |
| Net expenses, before interest expense from payable on borrowing and deferred taxes | | | 2,149,808 | |
| Interest expense from payable on borrowing | | | 964,198 | |
| Net expenses, before waivers and deferred taxes | | | 3,114,006 | |
| Less waivers | | | (2,755 | ) |
| Net expenses, before deferred taxes | | | 3,111,251 | |
|
| Net investment loss, before deferred taxes | | | (2,867,578 | ) |
| Deferred tax expense | | | (8,322,077 | ) |
| Net investment loss, net of deferred taxes | | | (11,189,655 | ) |
|
| Net Realized and Unrealized Gains/(Losses) on Investments: | | | | |
| Net Realized Losses | | | | |
| Investments | | | (8,368,870 | ) |
| Deferred tax expense | | | (22,251,731 | ) |
| Net realized losses, net of deferred taxes | | | (30,620,601 | ) |
| Net Change in Unrealized Appreciation/(Depreciation) | | | | |
| Investments | | | 19,286,385 | |
| Deferred tax benefit | | | 28,580,096 | |
| Net change in unrealized appreciation/(depreciation), net of deferred taxes | | | 47,866,481 | |
|
| Net realized and unrealized gains/(losses) on investments, net of deferred taxes | | | 17,245,880 | |
| Change in net assets resulting from operations | | $ | 6,056,225 | |
See accompanying Notes to Financial Statements.
16 OPPENHEIMER STEELPATH MLP ALPHA PLUS FUND |
STATEMENTS OF CHANGES IN NET ASSETS |
| | | For the Six
Months Ended
May 31, 2018
(Unaudited) | | | For the Year
Ended November
30, 2017 | |
| Operations | | | | | | |
| Net investment loss, net of deferred taxes | | $ | (11,189,655 | ) | | $ | (6,521,711 | ) |
| Net realized gains/(losses), net of deferred taxes | | | (30,620,601 | ) | | | 8,506,888 | |
| Net change in unrealized appreciation/(depreciation), net of deferred taxes | | | 47,866,481 | | | | (30,150,904 | ) |
| Change in net assets resulting from operations | | | 6,056,225 | | | | (28,165,727 | ) |
|
| Distributions to Shareholders | | | | | | | | |
| Distributions to shareholders from return of capital: | | | | | | | | |
| Class A shares | | | (3,370,655 | ) | | | (4,742,853 | ) |
| Class C shares | | | (2,120,965 | ) | | | (2,552,952 | ) |
| Class I shares | | | (44,651 | ) | | | (29,788 | ) |
| Class Y shares | | | (3,685,900 | ) | | | (4,243,810 | ) |
| Distributions to shareholders from return of capital: | | | (9,222,171 | ) | | | (11,569,403 | ) |
| | | | | | | | | |
| Distributions to shareholders from income: | | | | | | | | |
| Class A shares | | | — | | | | (4,213,889 | ) |
| Class C shares | | | — | | | | (2,268,224 | ) |
| Class I shares | | | — | | | | (26,465 | ) |
| Class Y shares | | | — | | | | (3,770,502 | ) |
| Distributions to shareholders from income: | | | — | | | | (10,279,080 | ) |
| Change in net assets resulting from distributions to shareholders | | | (9,222,171 | ) | | | (21,848,483 | ) |
|
| Beneficial Interest Transactions | | | | | | | | |
| Class A shares | | | (1,653,234 | ) | | | (30,955,691 | ) |
| Class C shares | | | 6,926,677 | | | | 7,099,339 | |
| Class I shares | | | 249,510 | | | | 590,713 | |
| Class Y shares | | | (334,692 | ) | | | 30,039,447 | |
| Change in net assets resulting from beneficial interest transactions | | | 5,188,261 | | | | 6,773,808 | |
| Change in net assets | | | 2,022,315 | | | | (43,240,402 | ) |
|
| Net Assets | | | | | | | | |
| Beginning of period | | | 208,598,200 | | | | 251,838,602 | |
| End of period | | $ | 210,620,515 | | | $ | 208,598,200 | |
| | | | | | | | | |
| Undistributed net investment loss, net of deferred taxes | | $ | (41,526,215 | ) | | $ | (30,336,560 | ) |
See accompanying Notes to Financial Statements.
OPPENHEIMER STEELPATH MLP ALPHA PLUS FUND 17 |
STATEMENT OF CASH FLOWS
For the Six Months Ended May 31, 2018 / Unaudited |
| Cash flows from operating activities | | | |
| Net increase in net assets resulting from operations | | $ | 6,056,225 | |
| Non cash items included in operations: | | | | |
| Deferred income taxes | | | 1,993,712 | |
| Adjustments to reconcile net increase in net assets resulting from operations to net cash provided by operating activities: | | | | |
| Purchases of long-term portfolio investments | | | (54,479,344 | ) |
| Sales of long-term portfolio investments | | | 57,551,154 | |
| Sales of short-term portfolio investments, net | | | 561,277 | |
| Distributions from Master Limited Partnerships | | | 10,032,352 | |
| Decrease in prepaid expenses | | | 43,243 | |
| Increase in cash collateral for borrowing | | | (60,000 | ) |
| Decrease in receivable for dividends | | | 2,057 | |
| Increase in receivable for investments sold | | | (1,348,740 | ) |
| Decrease in current tax liability | | | (93,378 | ) |
| Increase in payable to Manager | | | 1,980 | |
| Decrease in other liabilities | | | (53,369 | ) |
| Increase in payable for distribution and service fees payable | | | 4,794 | |
| Decrease in transfer agent fees payable | | | (1,484 | ) |
| Decrease in trustees' fees payable | | | (321 | ) |
| Increase in interest expense payable | | | 112,173 | |
| Decrease in borrowing expense payable | | | (6,441 | ) |
| Net realized loss on investments | | | 8,368,870 | |
| Net change in accumulated unrealized appreciation on investments | | | (19,286,385 | ) |
| Net cash provided by operating activities | | | 9,398,375 | |
|
| Cash flows from financing activities | | | | |
| Proceeds from shares sold, net of receivable for beneficial interest sold | | | 45,332,601 | |
| Payment of shares redeemed, net of payable for beneficial interest redeemed | | | (49,207,915 | ) |
| Distributions paid to shareholders, net of reinvestments | | | (367,369 | ) |
| Proceeds from borrowing | | | 5,000,000 | |
| Payments on borrowing | | | (13,000,000 | ) |
| Net cash used in financing activities | | | (12,242,683 | ) |
|
| Net change in cash | | | (2,844,308 | ) |
| Cash at beginning of period | | | 68,700 | |
| Cash at end of period | | $ | (2,775,608 | ) |
Supplemental disclosure of cash flow information:
Cash paid on interest of $852,025.
Non-cash financing activities not included consist of reinvestment of dividends and distributions of $8,854,802.
See accompanying Notes to the Financial Statements.
18 OPPENHEIMER STEELPATH MLP ALPHA PLUS FUND |
| Class A | | Six Months
Ended
May 31, 2018
(Unaudited) | | | Year Ended
November
30, 2017 | | | Year Ended
November
30, 2016 | | | Year Ended
November
30, 2015 | | | Year Ended
November
28, 2014* | | | Year Ended
November
29, 2013* | |
| Per Share Operating Data | | | | | | | | | | | | | | | | | | |
| Net Asset Value, Beginning of Period | | $ | 6.28 | | | $ | 7.73 | | | $ | 7.95 | | | $ | 12.95 | | | $ | 11.77 | | | $ | 9.93 | |
| Income/(loss) from investment operations: | | | | | | | | | | | | | | | | | | | | | | | | |
Net investment loss1 | | | (0.33 | ) | | | (0.20 | ) | | | (0.11 | ) | | | (0.15 | ) | | | (0.21 | ) | | | (0.17 | ) |
Return of capital1 | | | 0.23 | | | | 0.40 | | | | 0.39 | | | | 0.50 | | | | 0.55 | | | | 0.54 | |
| Net realized and unrealized gains/(losses) | | | 0.23 | | | | (0.99 | ) | | | 0.16 | | | | (4.69 | ) | | | 1.50 | | | | 2.13 | |
| Total from investment operations | | | 0.13 | | | | (0.79 | ) | | | 0.44 | | | | (4.34 | ) | | | 1.84 | | | | 2.50 | |
| Distributions to shareholders: | | | | | | | | | | | | | | | | | | | | | | | | |
| Return of capital | | | (0.27 | ) | | | (0.35 | ) | | | (0.66 | ) | | | (0.66 | ) | | | (0.66 | ) | | | (0.66 | ) |
| Income | | | — | | | | (0.31 | ) | | | — | | | | — | | | | — | | | | — | |
| Total distributions to shareholders | | | (0.27 | ) | | | (0.66 | ) | | | (0.66 | ) | | | (0.66 | ) | | | (0.66 | ) | | | (0.66 | ) |
| Net asset value, end of period | | $ | 6.14 | | | $ | 6.28 | | | $ | 7.73 | | | $ | 7.95 | | | $ | 12.95 | | | $ | 11.77 | |
| | | | | | | | | | | | | | | | | | | | | | | | | |
Total Return, at Net Asset Value 2 | | | 2.27 | % | | | (11.36 | %) | | | 6.66 | % | | | (34.68 | %) | | | 15.77 | % | | | 25.59 | % |
| | | | | | | | | | | | | | | | | | | | | | | | | |
| Ratios /Supplemental Data | | | | | | | | | | | | | | | | | | | | | | | | |
| Net assets, end of period (in thousands) | | $ | 73,855 | | | $ | 77,082 | | | $ | 125,026 | | | $ | 88,832 | | | $ | 214,846 | | | $ | 108,563 | |
Ratio of Expenses to Average Net Assets:9 | | | | | | | | | | | | | | | | | | | | | | | | |
| Before recoupment/(waivers) and deferred/current tax expense/(benefit) | | | 2.87 | % | | | 2.42 | % | | | 2.43 | % | | | 2.30 | % | | | 2.40 | % | | | 2.45 | % |
| Expense recoupment/(waivers) | | | — | %3,4 | | | (0.01 | %)3 | | | — | % | | | — | % | | | 0.12 | % | | | (0.05 | %) |
| Net of recoupment/(waivers) and before deferred/current tax expense/(benefit) | | | 2.87 | %5 | | | 2.41 | %5 | | | 2.43 | %5 | | | 2.30 | %5 | | | 2.52 | %5 | | | 2.40 | %5 |
Deferred/current tax expense/(benefit)6,7 | | | 1.88 | % | | | 1.02 | % | | | 1.09 | % | | | (12.67 | %) | | | 5.54 | % | | | 8.38 | % |
| Total expenses/(benefit) | | | 4.75 | % | | | 3.43 | % | | | 3.52 | % | | | (10.37 | %) | | | 8.06 | % | | | 10.78 | % |
| | | | | | | | | | | | | | | | | | | | | | | | | |
Ratio of Investment Loss to Average Net Assets:9 | | | | | | | | | | | | | | | | | | | | | | | | |
| Before recoupment/(waivers) and deferred tax expense/(benefit) | | | (2.64 | %) | | | (2.33 | %) | | | (1.84 | %) | | | (2.04 | %) | | | (2.35 | %) | | | (2.40 | %) |
| Expense recoupment/(waivers) | | | — | %3,4 | | | (0.01 | %)3 | | | — | % | | | — | % | | | 0.12 | % | | | (0.05 | %) |
| Net of expense recoupment/(waivers) and before deferred tax expense/(benefit) | | | (2.64 | %) | | | (2.32 | %) | | | (1.84 | %) | | | (2.04 | %) | | | (2.47 | %) | | | (2.35 | %) |
Deferred tax benefit/(expense)7,8 | | | (7.85 | %) | | | (0.20 | %) | | | 0.34 | % | | | 0.67 | % | | | 0.88 | % | | | 0.87 | % |
| Net investment loss | | | (10.49 | %) | | | (2.52 | %) | | | (1.50 | %) | | | (1.37 | %) | | | (1.59 | %) | | | (1.48 | %) |
| | | | | | | | | | | | | | | | | | | | | | | | | |
| Portfolio turnover rate | | | 20 | % | | | 46 | % | | | 45 | % | | | 39 | % | | | 21 | % | | | 15 | % |
* | November 28, 2014 and November 29, 2013 represent the last business day of the Fund’s respective reporting periods. |
1. | Per share net investment loss is calculated based on average shares outstanding during the period net of deferred tax expense/benefit. Per share return of capital is calculated based on average shares during the period net of deferred tax expense/benefit estimated at the combined Federal and State statutory income tax rate (see Note 2). |
2. | Assumes an initial investment on the business day before the first day of the fiscal period, with all dividends and distributions reinvested in additional shares on the reinvestment date, and redemptions at the net asset value calculated on the last business day of the fiscal period. Sales charges are not reflected in the total returns. Total returns are not annualized for periods less than one full year. Returns do not reflect the deduction of taxes that a shareholder would pay on fund distributions or the redemption of fund shares. The returns do not include adjustments in accordance with generally accepted accounting principles required at the period end for financial reporting purposes. |
3. | Includes voluntary Transfer Agent waiver of 0.015% effective January 1, 2017 to December 31, 2017 (See Note 7). |
5. | Includes interest, borrowing and franchise tax expense. Without interest, borrowing and franchise tax expense, the net expense ratio would be 1.89%, 1.83% 1.90%, 1.86%, 1.99% and 2.00%, for the periods ended May 31, 2018, November 30, 2017, November 30, 2016, November 30, 2015, November 28, 2014 and November 29, 2013, respectively. |
6. | Deferred tax expense estimate for the ratio calculation is derived from the net investment income/loss, and realized and unrealized gains/losses. |
7. | Effective December 1, 2013 the deferred tax expense and deferred tax benefit are allocated based on average net assets. Prior to December 1, 2013 the deferred tax expense and deferred tax benefit were allocated based on specific class expenses. |
8. | Deferred tax benefit for the ratio calculation, when applicable, is derived from net investment income/loss only. |
9. | Annualized for less than a full period. |
See accompanying Notes to Financial Statements.
OPPENHEIMER STEELPATH MLP ALPHA PLUS FUND 19 |
FINANCIAL HIGHLIGHTS (Continued) |
| Class C | | Six Months
Ended May
31, 2018
(Unaudited) | | | Year Ended
November
30, 2017 | | | Year Ended
November
30, 2016 | | | Year Ended
November
30, 2015 | | | Year Ended
November
28, 2014* | | | Year Ended
November
29, 2013* | |
| Per Share Operating Data | | | | | | | | | | | | | | | | | | |
| Net Asset Value, Beginning of Period | | $ | 5.97 | | | $ | 7.44 | | | $ | 7.73 | | | $ | 12.71 | | | $ | 11.64 | | | $ | 9.91 | |
| Income/(loss) from investment operations: | | | | | | | | | | | | | | | | | | | | | | | | |
Net investment loss1 | | | (0.34 | ) | | | (0.27 | ) | | | (0.18 | ) | | | (0.22 | ) | | | (0.28 | ) | | | (0.22 | ) |
Return of capital1 | | | 0.23 | | | | 0.40 | | | | 0.39 | | | | 0.50 | | | | 0.55 | | | | 0.55 | |
| Net realized and unrealized gains/(losses) | | | 0.22 | | | | (0.94 | ) | | | 0.16 | | | | (4.60 | ) | | | 1.46 | | | | 2.06 | |
| Total from investment operations | | | 0.11 | | | | (0.81 | ) | | | 0.37 | | | | (4.32 | ) | | | 1.73 | | | | 2.39 | |
| Distributions to shareholders: | | | | | | | | | | | | | | | | | | | | | | | | |
| Return of capital | | | (0.27 | ) | | | (0.35 | ) | | | (0.66 | ) | | | (0.66 | ) | | | (0.66 | ) | | | (0.66 | ) |
| Income | | | — | | | | (0.31 | ) | | | — | | | | — | | | | — | | | | — | |
| Total distributions to shareholders | | | (0.27 | ) | | | (0.66 | ) | | | (0.66 | ) | | | (0.66 | ) | | | (0.66 | ) | | | (0.66 | ) |
| Net asset value, end of period | | $ | 5.81 | | | $ | 5.97 | | | $ | 7.44 | | | $ | 7.73 | | | $ | 12.71 | | | $ | 11.64 | |
| | | | | | | | | | | | | | | | | | | | | | | | | |
Total Return, at Net Asset Value 2 | | | 2.05 | % | | | (12.10 | %) | | | 5.91 | % | | | (35.20 | %) | | | 14.98 | % | | | 24.50 | % |
| | | | | | | | | | | | | | | | | | | | | | | | | |
| Ratios /Supplemental Data | | | | | | | | | | | | | | | | | | | | | | | | |
| Net assets, end of period (in thousands) | | $ | 51,517 | | | $ | 44,804 | | | $ | 49,474 | | | $ | 38,816 | | | $ | 57,070 | | | $ | 16,317 | |
Ratio of Expenses to Average Net Assets:9 | | | | | | | | | | | | | | | | | | | | | | | | |
| Before recoupment/(waivers) and deferred/current tax expense/(benefit) | | | 3.62 | % | | | 3.19 | % | | | 3.18 | % | | | 3.05 | % | | | 3.15 | % | | | 3.20 | % |
| Expense recoupment/(waivers) | | | — | %3,4 | | | (0.01 | %)3 | | | — | % | | | — | % | | | 0.12 | % | | | (0.05 | %) |
| Net of recoupment/(waivers) and before deferred/current tax expense/(benefit) | | | 3.62 | %5 | | | 3.18 | %5 | | | 3.18 | %5 | | | 3.05 | %5 | | | 3.27 | %5 | | | 3.15 | %5 |
Deferred/current tax expense/(benefit)6,7 | | | 1.88 | % | | | 1.02 | % | | | 1.09 | % | | | (12.67 | %) | | | 5.54 | % | | | 8.16 | % |
| Total expenses/(benefit) | | | 5.50 | % | | | 4.20 | % | | | 4.27 | % | | | (9.62 | %) | | | 8.81 | % | | | 11.31 | % |
| | | | | | | | | | | | | | | | | | | | | | | | | |
| Ratio of Investment Loss to Average Net Assets:9 | | | | | | | | | | | | | | | | | | | | | | | | |
| Before recoupment/(waivers) and deferred tax expense | | | (3.67 | %) | | | (3.44 | %) | | | (2.91 | %) | | | (2.76 | %) | | | (2.94 | %) | | | (3.15 | %) |
| Expense recoupment/(waivers) | | | — | %3,4 | | | (0.01 | %)3 | | | — | % | | | — | % | | | 0.12 | % | | | (0.05 | %) |
| Net of expense recoupment/(waivers) and before deferred tax expense/(benefit) | | | (3.67 | %) | | | (3.43 | %) | | | (2.91 | %) | | | (2.76 | %) | | | (3.06 | %) | | | (3.10 | %) |
Deferred tax benefit/(expense)7,8 | | | (7.85 | %) | | | (0.20 | %) | | | 0.34 | % | | | 0.67 | % | | | 0.88 | % | | | 1.14 | % |
| Net investment loss | | | (11.52 | %) | | | (3.63 | %) | | | (2.57 | %) | | | (2.09 | %) | | | (2.18 | %) | | | (1.96 | %) |
| | | | | | | | | | | | | | | | | | | | | | | | | |
| Portfolio turnover rate | | | 20 | % | | | 46 | % | | | 45 | % | | | 39 | % | | | 21 | % | | | 15 | % |
* | November 28, 2014 and November 29, 2013 represent the last business day of the Fund’s respective reporting periods. |
1. | Per share net investment loss is calculated based on average shares outstanding during the period net of deferred tax expense/benefit. Per share return of capital is calculated based on average shares during the period net of deferred tax expense/benefit estimated at the combined Federal and State statutory income tax rate (see Note 2). |
2. | Assumes an initial investment on the business day before the first day of the fiscal period, with all dividends and distributions reinvested in additional shares on the reinvestment date, and redemptions at the net asset value calculated on the last business day of the fiscal period. Sales charges are not reflected in the total returns. Total returns are not annualized for periods less than one full year. Returns do not reflect the deduction of taxes that a shareholder would pay on fund distributions or the redemption of fund shares. The returns do not include adjustments in accordance with generally accepted accounting principles required at the period end for financial reporting purposes. |
3. | Includes voluntary Transfer Agent waiver of 0.015% effective January 1, 2017 to December 31, 2017 (See Note 7). |
5. | Includes interest, borrowing and franchise tax expense. Without interest, borrowing and franchise tax expense, the net expense ratio would be 2.64%, 2.60% 2.65%, 2.61%, 2.74% and 2.75%, for the periods ended May 31, 2018, November 30, 2017, November 30, 2016, November 30, 2015, November 28, 2014 and November 29, 2013, respectively. |
6. | Deferred tax expense estimate for the ratio calculation is derived from the net investment income/loss, and realized and unrealized gains/losses. |
7. | Effective December 1, 2013 the deferred tax expense and deferred tax benefit are allocated based on average net assets. Prior to December 1, 2013 the deferred tax expense and deferred tax benefit were allocated based on specific class expenses. |
8. | Deferred tax benefit for the ratio calculation, when applicable, is derived from net investment income/loss only. |
9. | Annualized for less than a full period. |
See accompanying Notes to Financial Statements.
20 OPPENHEIMER STEELPATH MLP ALPHA PLUS FUND |
FINANCIAL HIGHLIGHTS (Continued) |
| Class I | | Six Months
Ended May
31, 2018
(Unaudited) | | | Year Ended
November
30, 2017 | | | Year Ended
November
30, 2016 | | | Year Ended
November
30, 2015 | | | Year Ended
November
28, 2014* | | | Period Ended
November
29, 2013*,1,2 | |
| Per Share Operating Data | | | | | | | | | | | | | | | | | | |
| Net Asset Value, Beginning of Period | | $ | 6.44 | | | $ | 7.89 | | | $ | 8.06 | | | $ | 13.06 | | | $ | 11.81 | | | $ | 11.71 | |
| Income/(loss) from investment operations: | | | | | | | | | | | | | | | | | | | | | | | | |
Net investment income/(loss)3 | | | (0.33 | ) | | | (0.14 | ) | | | (0.07 | ) | | | (0.06 | ) | | | 0.02 | | | | (0.06 | ) |
Return of capital3 | | | 0.23 | | | | 0.40 | | | | 0.39 | | | | 0.50 | | | | 0.55 | | | | 0.23 | |
| Net realized and unrealized gains/(losses) | | | 0.26 | | | | (1.05 | ) | | | 0.17 | | | | (4.78 | ) | | | 1.34 | | | | 0.26 | |
| Total from investment operations | | | 0.16 | | | | (0.79 | ) | | | 0.49 | | | | (4.34 | ) | | | 1.91 | | | | 0.43 | |
| Distributions to shareholders: | | | | | | | | | | | | | | | | | | | | | | | | |
| Return of capital | | | (0.27 | ) | | | (0.35 | ) | | | (0.66 | ) | | | (0.66 | ) | | | (0.66 | ) | | | (0.33 | ) |
| Income | | | — | | | | (0.31 | ) | | | — | | | | — | | | | — | | | | — | |
| Total distributions to shareholders | | | (0.27 | ) | | | (0.66 | ) | | | (0.66 | ) | | | (0.66 | ) | | | (0.66 | ) | | | (0.33 | ) |
| Net asset value, end of period | | $ | 6.33 | | | $ | 6.44 | | | $ | 7.89 | | | $ | 8.06 | | | $ | 13.06 | | | $ | 11.81 | |
| | | | | | | | | | | | | | | | | | | | | | | | | |
Total Return, at Net Asset Value 4 | | | 2.68 | % | | | (11.12 | %) | | | 7.21 | % | | | (34.39 | %) | | | 16.32 | % | | | 3.71 | % |
| | | | | | | | | | | | | | | | | | | | | | | | | |
| Ratios /Supplemental Data | | | | | | | | | | | | | | | | | | | | | | | | |
| Net assets, end of period (in thousands) | | $ | 1,156 | | | $ | 896 | | | $ | 451 | | | $ | 338 | | | $ | 160 | | | $ | 10 | |
Ratio of Expenses to Average Net Assets:9 | | | | | | | | | | | | | | | | | | | | | | | | |
| Before (waivers) and deferred/current tax expense/(benefit) | | | 2.47 | % | | | 2.03 | % | | | 2.00 | % | | | 1.86 | % | | | 2.00 | % | | | 2.38 | % |
| Expense (waivers) | | | — | % | | | — | % | | | — | % | | | — | % | | | — | % | | | (0.23 | %) |
| Net of (waivers) and before deferred tax expense/(benefit) | | | 2.47 | %5 | | | 2.03 | %5 | | | 2.00 | %5 | | | 1.86 | %5 | | | 2.00 | %5 | | | 2.15 | %5 |
Deferred/current tax expense/(benefit)6,7 | | | 1.88 | % | | | 1.02 | % | | | 1.09 | % | | | (12.67 | %) | | | 5.54 | % | | | 21.06 | % |
| Total expenses/(benefit) | | | 4.35 | % | | | 3.05 | % | | | 3.09 | % | | | (10.81 | %) | | | 7.54 | % | | | 23.21 | % |
| | | | | | | | | | | | | | | | | | | | | | | | | |
Ratio of Investment Income/(Loss) to Average Net Assets:9 | | | | | | | | | | | | | | | | | | | | | | | | |
| Before (waivers) and deferred tax expense/(benefit) | | | (2.45 | %) | | | (1.60 | %) | | | (1.35 | %) | | | (1.23 | %) | | | (0.74 | %) | | | (2.33 | %) |
| Expense (waivers) | | | — | % | | | — | % | | | — | % | | | — | % | | | — | % | | | (0.23 | %) |
| Net of expense (waivers) and before deferred tax expense/(benefit) | | | (2.45 | %) | | | (1.60 | %) | | | (1.35 | %) | | | (1.23 | %) | | | (0.74 | %) | | | (2.10 | %) |
Deferred tax benefit/(expense)7,8 | | | (7.85 | %) | | | (0.20 | %) | | | 0.34 | % | | | 0.67 | % | | | 0.88 | % | | | 0.77 | % |
| Net investment income/(loss) | | | (10.30 | %) | | | (1.80 | %) | | | (1.01 | %) | | | (0.56 | %) | | | 0.14 | % | | | (1.33 | %) |
| | | | | | | | | | | | | | | | | | | | | | | | | |
| Portfolio turnover rate | | | 20 | % | | | 46 | % | | | 45 | % | | | 39 | % | | | 21 | % | | | 15 | % |
* | November 28, 2014 and November 29, 2013 represent the last business day of the Fund’s respective reporting periods. |
1. | Shares commenced operations at the close of business June 28, 2013. |
2. | Effective June 28, 2013, Class I shares were renamed Class Y shares. See Note 1 of the Notes to Financial Statements for additional information. |
3. | Per share net investment loss is calculated based on average shares outstanding during the period net of deferred tax expense/benefit. Per share return of capital is calculated based on average shares during the period net of deferred tax expense/benefit estimated at the combined Federal and State statutory income tax rate (see Note 2). |
4. | Assumes an initial investment on the business day before the first day of the fiscal period, with all dividends and distributions reinvested in additional shares on the reinvestment date, and redemptions at the net asset value calculated on the last business day of the fiscal period. Sales charges are not reflected in the total returns. Total returns are not annualized for periods less than one full year. Returns do not reflect the deduction of taxes that a shareholder would pay on fund distributions or the redemption of fund shares. The returns do not include adjustments in accordance with generally accepted accounting principles required at the period end for financial reporting purposes. |
5. | Includes interest, borrowing and franchise tax expense. Without interest, borrowing and franchise tax expense, the net expense ratio would be 1.49%, 1.45% 1.47%, 1.42%, 1.47% and 1.75%, for the periods ended May 31, 2018, November 30, 2017, November 30, 2016, November 30, 2015, November 28, 2014 and November 29, 2013, respectively. |
6. | Deferred tax expense estimate for the ratio calculation is derived from the net investment income/loss, and realized and unrealized gains/losses. |
7. | Effective December 1, 2013 the deferred tax expense and deferred tax benefit are allocated based on average net assets. Prior to December 1, 2013 the deferred tax expense and deferred tax benefit were allocated based on specific class expenses. |
8. | Deferred tax benefit for the ratio calculation, when applicable, is derived from net investment income/loss only. |
9. | Annualized for less than full period. |
See accompanying Notes to Financial Statements.
OPPENHEIMER STEELPATH MLP ALPHA PLUS FUND 21 |
FINANCIAL HIGHLIGHTS (Continued) |
| Class Y | | Six Months
Ended May
31, 2018
(Unaudited) | | | Year Ended
November
30, 2017 | | | Year Ended
November
30, 2016 | | | Year Ended
November
30, 2015 | | | Year Ended
November
28, 2014* | | | Year Ended
November
29, 2013*,1 | |
| Per Share Operating Data | | | | | | | | | | | | | | | | | | |
| Net Asset Value, Beginning of Period | | $ | 6.40 | | | $ | 7.85 | | | $ | 8.04 | | | $ | 13.07 | | | $ | 11.84 | | | $ | 9.96 | |
| Income/(loss) from investment operations: | | | | | | | | | | | | | | | | | | | | | | | | |
Net investment loss2 | | | (0.32 | ) | | | (0.16 | ) | | | (0.11 | ) | | | (0.10 | ) | | | (0.14 | ) | | | (0.15 | ) |
Return of capital2 | | | 0.23 | | | | 0.40 | | | | 0.39 | | | | 0.50 | | | | 0.55 | | | | 0.54 | |
| Net realized and unrealized gains/(losses) | | | 0.24 | | | | (1.03 | ) | | | 0.19 | | | | (4.77 | ) | | | 1.48 | | | | 2.15 | |
| Total from investment operations | | | 0.15 | | | | (0.79 | ) | | | 0.47 | | | | (4.37 | ) | | | 1.89 | | | | 2.54 | |
| Distributions to shareholders: | | | | | | | | | | | | | | | | | | | | | | | | |
| Return of capital | | | (0.27 | ) | | | (0.35 | ) | | | (0.66 | ) | | | (0.66 | ) | | | (0.66 | ) | | | (0.66 | ) |
| Income | | | — | | | | (0.31 | ) | | | | | | | | | | | | | | | | |
| Total distributions to shareholders | | | (0.27 | ) | | | (0.66 | ) | | | (0.66 | ) | | | (0.66 | ) | | | (0.66 | ) | | | (0.66 | ) |
| Net asset value, end of period | | $ | 6.28 | | | $ | 6.40 | | | $ | 7.85 | | | $ | 8.04 | | | $ | 13.07 | | | $ | 11.84 | |
| | | | | | | | | | | | | | | | | | | | | | | | | |
Total Return, at Net Asset Value 3 | | | 2.54 | % | | | (11.18 | %) | | | 6.96 | % | | | (34.59 | %) | | | 16.11 | % | | | 25.92 | % |
| | | | | | | | | | | | | | | | | | | | | | | | | |
| Ratios /Supplemental Data | | | | | | | | | | | | | | | | | | | | | | | | |
| Net assets, end of period (in thousands) | | $ | 84,093 | | | $ | 85,816 | | | $ | 76,888 | | | $ | 91,824 | | | $ | 121,190 | | | $ | 49,776 | |
Ratio of Expenses to Average Net Assets:10 | | | | | | | | | | | | | | | | | | | | | | | | |
| Before recoupment/(waivers) and deferred/current tax expense/(benefit) | | | 2.62 | % | | | 2.20 | % | | | 2.19 | % | | | 2.05 | % | | | 2.15 | % | | | 2.20 | % |
| Expense recoupment/(waivers) | | | — | %4,5 | | | (0.01 | %)4 | | | — | % | | | — | % | | | 0.12 | % | | | (0.05 | %) |
| Net of recoupment/(waivers) and before deferred/current tax expense/(benefit) | | | 2.62 | %6 | | | 2.19 | %6 | | | 2.19 | %6 | | | 2.05 | %6 | | | 2.27 | %6 | | | 2.15 | %6 |
Deferred/current tax expense/(benefit)7,8 | | | 1.88 | % | | | 1.02 | % | | | 1.09 | % | | | (12.67 | %) | | | 5.54 | % | | | 8.43 | % |
| Total expenses/(benefit) | | | 4.50 | % | | | 3.21 | % | | | 3.28 | % | | | (10.62 | %) | | | 7.81 | % | | | 10.58 | % |
| | | | | | | | | | | | | | | | | | | | | | | | | |
Ratio of Investment Loss to Average Net Assets:10 | | | | | | | | | | | | | | | | | | | | | | | | |
| Before recoupment/(waivers) and deferred tax expense/(benefit) | | | (2.25 | %) | | | (1.84 | %) | | | (1.92 | %) | | | (1.56 | %) | | | (1.82 | %) | | | (2.15 | %) |
| Expense recoupment/(waivers) | | | — | %4,5 | | | (0.01 | %)4 | | | — | % | | | — | % | | | 0.12 | % | | | (0.05 | %) |
| Net of expense recoupment/(waivers) and before deferred tax expense/(benefit) | | | (2.25 | %) | | | (1.83 | %) | | | (1.92 | %) | | | (1.56 | %) | | | (1.94 | %) | | | (2.10 | %) |
Deferred tax benefit/(expense)8,9 | | | (7.85 | %) | | | (0.20 | %) | | | 0.34 | % | | | 0.67 | % | | | 0.88 | % | | | 0.78 | % |
| Net investment loss | | | (10.10 | %) | | | (2.03 | %) | | | (1.58 | %) | | | (0.89 | %) | | | (1.06 | %) | | | (1.32 | %) |
| | | | | | | | | | | | | | | | | | | | | | | | | |
| Portfolio turnover rate | | | 20 | % | | | 46 | % | | | 45 | % | | | 39 | % | | | 21 | % | | | 15 | % |
* | November 28, 2014 and November 29, 2013 represent the last business day of the Fund’s respective reporting periods. |
1. | Effective June 28, 2013, Class I shares were renamed Class Y shares. See Note 1 of the Notes to Financial Statements for additional information. |
2. | Per share net investment loss is calculated based on average shares outstanding during the period net of deferred tax expense/benefit. Per share return of capital is calculated based on average shares during the period net of deferred tax expense/benefit estimated at the combined Federal and State statutory income tax rate (see Note 2). |
3. | Assumes an initial investment on the business day before the first day of the fiscal period, with all dividends and distributions reinvested in additional shares on the reinvestment date, and redemptions at the net asset value calculated on the last business day of the fiscal period. Sales charges are not reflected in the total returns. Total returns are not annualized for periods less than one full year. Returns do not reflect the deduction of taxes that a shareholder would pay on fund distributions or the redemption of fund shares. The returns do not include adjustments in accordance with generally accepted accounting principles required at the period end for financial reporting purposes. |
4. | Includes voluntary Transfer Agent waiver of 0.015% effective January 1, 2017 to December 31, 2017 (See Note 7). |
6. | Includes interest, borrowing and franchise tax expense. Without interest, borrowing and franchise tax expense, the net expense ratio would be 1.64%, 1.61% 1.66%, 1.61%, 1.74% and 1.75%, for the periods ended May 31, 2018, November 30, 2017, November 30, 2016, November 30, 2015, November 28, 2014, and November 29, 2013, respectively. |
7. | Deferred tax expense estimate for the ratio calculation is derived from the net investment income/loss, and realized and unrealized gains/losses. |
8. | Effective December 1, 2013 the deferred tax expense and deferred tax benefit are allocated based on average net assets. Prior to December 1, 2013 the deferred tax expense and deferred tax benefit were allocated based on specific class expenses. |
9. | Deferred tax benefit for the ratio calculation is derived from net investment income/loss only. |
10. | Annualized for less than a full period. |
See accompanying Notes to Financial Statements.
22 OPPENHEIMER STEELPATH MLP ALPHA PLUS FUND |
NOTES TO FINANCIAL STATEMENTS Unaudited |
1. Organization
Oppenheimer SteelPath MLP Alpha Plus Fund (the “Fund”), a separate series of Oppenheimer SteelPath MLP Funds Trust, is a non-diversified open-end management investment company registered under the Investment Company Act of 1940, as amended. The Fund’s investment objective is to seek total return. The Fund’s investment adviser is OFI SteelPath, Inc. (the “Adviser” or “Manager”), a wholly-owned subsidiary of OppenheimerFunds, Inc. (“OFI” or “Oppenheimer”).
The Fund offers Class A, Class C, Class I, and Class Y shares. Effective June 28, 2013, Class I shares were renamed Class Y shares. Class A shares are sold at their offering price, which is normally net asset value plus a front-end sales charge. Effective June 28, 2013 although there is no initial sales charge on Class A purchases totaling $1 million or more, those Class A shares may be subject to a 1.00% contingent deferred sales charge (”CDSC”) if shares are redeemed within an 18-month “holding period” measured from the date of purchase. Class C shares are sold without a front-end sales charge but may be subject to a CDSC of 1.00% of the redemption proceeds if Class C shares are redeemed within one year of purchase. Class I shares are only available to eligible institutional investors. Class I shares are sold at net asset value per share without a sales charge or CDSC. An institutional investor that buys Class I shares for its customers’ accounts may impose charges on those accounts. Class Y shares are sold at net asset value per share without a sales charge directly to institutional investors that have special agreements with OppenheimerFunds Distributor, Inc. (the “Distributor” or “OFDI”) for that purpose. They may include insurance companies, registered investment companies, employee benefit plans and section 529 plans, among others. An institutional investor that buys Class Y shares for its customers’ accounts may impose charges on those accounts. All classes of shares have identical rights and voting privileges with respect to the Fund in general and exclusive voting rights on matters that affect that class alone. Earnings, net assets and net asset value per share may differ due to each class having its own expenses, such as transfer and shareholder servicing agent fees and shareholder communications, directly attributable to that class. Class A and C shares have separate distribution and/or service plans under which they pay fees. Class I and Y shares do not pay such fees.
The Fund is an investment company and accordingly follows the investment company accounting and reporting guidance of the Financial Accounting Standards Board (“FASB”) Accounting Standards Codification Topic 946 Financial Services- Investment Companies.
The following is a summary of significant accounting policies followed in the Fund’s preparation of financial statements in accordance with accounting principles generally accepted in the United States (“U.S. GAAP”).
OPPENHEIMER STEELPATH MLP ALPHA PLUS FUND 23 |
NOTES TO FINANCIAL STATEMENTS Unaudited / (Continued) |
2. Significant Accounting Policies
Security Valuation. All investments in securities are recorded at their estimated fair value, as described in Note 3.
Allocation of Income, Expenses, Gains and Losses. Income, expenses (other than those attributable to a specific class), gains and losses are allocated on a daily basis to each class of shares based upon the relative proportion of net assets represented by such class. Operating expenses directly attributable to a specific class are charged against the operations of that class.
Dividends and Distributions to Shareholders. Dividends and distributions to shareholders, which are determined in accordance with income tax regulations and may differ from U.S. GAAP, are recorded on the ex-dividend date. The Fund’s dividend distribution policy is intended to provide monthly distributions to its shareholders at a rate that over time is similar to the distribution rate the Fund receives from the master limited partnerships (”MLPs”) in which it invests. The Fund generally pays out dividends that over time approximate the distributions received from the Fund’s portfolio investments based on, among other considerations, distributions the Fund actually received from portfolio investments, distributions it would have received if it had been fully invested at all times, and estimated future cash flows. Such dividends are not tied to the Fund’s investment income and may not represent yield or investment return on the Fund’s portfolio. To the extent that the dividends paid exceed the distributions the Fund receives from its underlying investments, the Fund’s assets will be reduced. The Fund’s tendency to pay out a consistent dividend may change, and the Fund’s level of distributions may increase or decrease.
The estimated characterization of the distributions paid will be either a qualified dividend or distribution (return of capital). This estimate is based on the Fund’s operating results during the period. The actual characterization of the distributions made during the period will not be determined until after the end of the fiscal year. The Fund will inform shareholders of the final tax character of the distributions on IRS Form 1099 DIV in February 2019.
Return of Capital Estimates. Distributions received from the Fund’s investments in MLPs generally are comprised of income and return of capital. Any return of capital estimates in excess of cost basis are classified as realized gain. The Fund records investment income and return of capital based on estimates made at the time such distributions are received. Such estimates are based on historical information available from each MLP and other industry sources. These estimates may subsequently be revised based on information received from MLPs after their tax reporting periods are concluded.
Investment Income. Dividend income is recorded on the ex-dividend date or upon ex-dividend notification in the case of certain foreign dividends where the ex-dividend date may have passed. Non-cash dividends included in dividend income, if any, are recorded at
24 OPPENHEIMER STEELPATH MLP ALPHA PLUS FUND |
NOTES TO FINANCIAL STATEMENTS Unaudited / (Continued) |
2. Significant Accounting Policies (Continued)
the fair value of the securities received. Interest income, if any, is recognized on an accrual basis. Discount and premium, which are included in interest income on the Statement of Operations, if applicable, are amortized or accreted daily.
Custodian Fees. “Custody fees” in the Statement of Operations may include interest expense incurred by the Fund on any cash overdrafts of its custodian account during the period. Such cash overdrafts may result from the effects of failed trades in portfolio securities and from cash outflows resulting from unanticipated shareholder redemption activity. The Fund pays interest to its custodian on such cash overdrafts, to the extent they are not offset by positive cash balances maintained by the Fund, at a rate equal to the Federal Funds Rate plus 1.50%. The “Reduction to custodian expenses” line item, if applicable, represents earnings on cash balances maintained by the Fund during the period. Such interest expense and other custodian fees may be paid with these earnings.
Security Transactions. Security transactions are recorded on the trade date. Realized gains and losses on securities sold are determined using the basis of identified cost.
Indemnifications. The Fund’s organizational documents provide current and former trustees and officers with a limited indemnification against liabilities arising in connection with the performance of their duties to the Fund. In the normal course of business, the Fund may also enter into contracts that provide general indemnifications. The Fund’s maximum exposure under these arrangements is unknown as this would be dependent on future claims that may be made against the Fund. The risk of material loss from such claims is considered remote.
Federal Income Taxes. The Fund does not intend to qualify as a regulated investment company pursuant to Subchapter M of the Internal Revenue Code, but will rather be taxed as a corporation. As a corporation, the Fund is obligated to pay federal, state and local income tax on taxable income. During the period ended May 31, 2018, the maximum marginal regular federal income tax rate for a corporation was reduced from 35 percent to 21 percent with the enactment of H.R. 1, Tax Cuts and Jobs Act (the “TCJA”), which was enacted on December 22, 2017. Any other future changes in the federal income tax rate could have a material impact to the Fund.
The Fund is currently using an estimated rate of 2.0 percent for state and local tax, net of federal tax expense.
The alternative minimum tax requirements were repealed under the TCJA for tax years beginning after December 31, 2017, and the prior alternative minimum tax rate was reduced to zero as of January 1, 2018. Any past alternative minimum taxes paid by the fund do qualify for substantial refundability under the TCJA with AMT credit carryforwards becoming partially refundable prior to, or fully refundable for tax years beginning in 2021.
OPPENHEIMER STEELPATH MLP ALPHA PLUS FUND 25 |
NOTES TO FINANCIAL STATEMENTS Unaudited / (Continued) |
2. Significant Accounting Policies (Continued)
The Fund’s income tax provision consists of the following as of May 31, 2018:
| Current tax expense (benefit) | | | |
| Federal | | $ | — | |
| State | | | — | |
| Total current tax expense | | $ | — | |
| | | | | |
| Deferred tax expense (benefit) | | | | |
| Federal | | $ | 1,820,345 | |
| State | | | 173,367 | |
| Total deferred tax expense | | $ | 1,993,712 | |
The reconciliation between the federal statutory income tax rate of 21% and the tax effect on net investment income (loss) and realized and unrealized gain (loss) follows:
| | | Amount | | | % Effect | |
| Application of Federal statutory income tax rate | | $ | 1,690,486 | | | | 21.00 | % |
| State income taxes net of federal benefit | | | 160,998 | | | | 2.00 | % |
| Effect of permanent differences | | | 171,759 | | | | 2.13 | % |
| Effect of tax rate change | | | 14,894,254 | | | | 185.02 | % |
| Change in valuation allowance | | | (14,923,785 | ) | | | (185.39 | %) |
| Total income tax expense (benefit) | | $ | 1,993,712 | | | | 24.76 | % |
For the period ended May 31, 2018 the Fund’s tax effect on net investment income (loss) and realized and unrealized gain (loss) of 24.76% (net expenses) differed from the combined federal and state statutory tax rate of 23.00% (net expenses) due in large part to the new 21% federal tax rate, enacted by the TCJA as of December 22, 2017 (date of enactment). The change to the federal tax rate required the remeasurement of accumulated tax assets and the valuation allowance in place as of the date of enactment resulting in the recognition of additional current period deferred tax expense. The aggregate impact of this change is being entirely recorded during the period ended May 31, 2018 resulting in an increase to the effective tax rate when deferred tax expense is reflected as a percentage of the Fund’s current period operations.
The Fund intends to invest its assets primarily in MLP Investments, which generally are treated as partnerships for federal income tax purposes. As a limited partner in the MLP Investments, the Fund reports its allocable share of the MLP Investments’ taxable income in computing its own taxable income. The Fund’s tax expense or benefit is included in the Statement of Operations based on the component of income or gains (losses) to which such expense or benefit relates. Deferred income taxes reflect the net tax effects of temporary differences
26 OPPENHEIMER STEELPATH MLP ALPHA PLUS FUND |
NOTES TO FINANCIAL STATEMENTS Unaudited / (Continued) |
2. Significant Accounting Policies (Continued)
between the carrying amounts of assets and liabilities for financial reporting purposes and the amounts used for income tax purposes. Such temporary differences are principally: (i) taxes on unrealized gains/(losses), which are attributable to the temporary difference between fair market value and tax basis, (ii) the net tax effects of temporary differences between the carrying amounts of assets and liabilities for financial reporting and income tax purposes and (iii) the net tax benefit of accumulated net operating losses and capital loss carryforwards. Deferred tax assets and liabilities are measured using effective tax rates expected to apply to taxable income in the years such temporary differences are realized or otherwise settled. To the extent the Fund has a deferred tax asset, consideration is given to whether or not a valuation allowance is required. A valuation allowance is required if, based on the evaluation criterion provided by ASC 740, Income Taxes, it is more-likely-than-not some portion or all of the deferred tax asset will not be realized.
At May 31, 2018, the Fund determined a valuation allowance was required. In implementing a valuation allowance on a portion of the deferred tax asset, significant consideration was given to the current and expected level of MLP distributions, unrealized gains and losses on MLP investments and the expiration dates for net operating losses and capital loss carryovers. Market cycles, the severity and duration of historical deferred tax assets and the impact of current and future redemptions were also considered. Additionally, various tax law changes resulting from the enactment of the TCJA were considered by the Fund in assessing the recoverability of its deferred tax assets. Specifically, the TCJA eliminated the net operating loss carryback ability and replaced the 20 year carryforward period with an indefinite carryforward period for any net operating losses arising in tax years ending after December 31, 2017. The TCJA also established a limitation for any net operating losses generated in tax years beginning after December 31, 2017 to the lesser of the aggregate of available net operating losses or 80% of taxable income before any net operating loss utilization. Through the consideration of these factors, the Fund has determined that it is more likely than not the deferred tax asset, net of the valuation allowance, will be realized.
Unexpected significant decreases in cash distributions from the Fund’s MLP investments, significant declines in the fair value of its investments, significant redemptions, or increased risk of expiring net operating losses or capital loss carryovers may change the Fund’s assessment regarding the recoverability of its deferred tax assets and may result in a change to the valuation allowance. Modifications of the valuation allowance could have a material impact on the Fund’s net asset value.
OPPENHEIMER STEELPATH MLP ALPHA PLUS FUND 27 |
NOTES TO FINANCIAL STATEMENTS Unaudited / (Continued) |
2. Significant Accounting Policies (Continued)
Components of the Fund’s deferred tax assets and liabilities as of May 31, 2018 are as follows:
| Deferred tax assets: | | | |
| Net operating loss carryforward (tax basis) – Federal | | $ | 10,413,047 | |
| Net operating loss carryforward (tax basis) – State | | | 1,228,301 | |
| Minimum tax credit carryforward - Federal | | | 93,378 | |
| Capital loss carryforward (tax basis) | | | 18,265,627 | |
| Valuation allowance | | | (13,333,535 | ) |
| Total deferred tax asset | | | 16,666,818 | |
| | | | | |
| Deferred tax liabilities: | | | | |
| Net unrealized gains on investment securities (tax basis) | | | (6,044,149 | ) |
| Total deferred tax liability | | | (6,044,149 | ) |
| | | | | |
| Total net deferred tax asset/(liability) | | $ | 10,662,669 | |
The Fund may rely, to some extent, on information provided by the MLPs, which may not necessarily be timely, to estimate taxable income allocable to MLP units held in its portfolio, and to estimate its associated deferred tax liability or asset. Such estimates are made in good faith. From time to time, as new information becomes available, the Fund will modify its estimates or assumptions regarding its tax liability or asset.
The Fund’s policy is to classify interest and penalties associated with underpayment of federal and state income taxes, if any, as income tax expense on its Statement of Operations. As of May 31, 2018, the Fund does not have any interest or penalties associated with the underpayment of any income taxes.
The Fund files income tax returns in the U.S. federal jurisdiction and various states. The Fund has reviewed all major jurisdictions and concluded that there is no significant impact on the Fund’s net assets and no tax liability resulting from unrecognized tax benefits relating to uncertain tax positions expected to be taken on its tax returns. Furthermore, management of the Fund is not aware of any uncertain tax positions for which it is reasonably possible that the total amount of unrecognized tax benefit will significantly change in the next 12 months.
28 OPPENHEIMER STEELPATH MLP ALPHA PLUS FUND |
NOTES TO FINANCIAL STATEMENTS Unaudited / (Continued) |
2. Significant Accounting Policies (Continued)
At May 31, 2018, the Fund had net operating loss carryforwards for federal income tax purposes as follows:
| Expiration date for expiring net operating loss carryforwards | | | |
| 11/30/2034 | | $ | 4,301,182 | |
| 11/30/2035 | | | 6,563,833 | |
| 11/30/2036 | | | 24,350,754 | |
| Total expiring net operating loss carryforwards $35,215,769 | | $ | 35,215,769 | |
| | | | | |
| Total non-expiring net operating loss carryforwards | | $ | 15,398,784 | |
| | | | | |
| Total net operating loss carryforwards | | $ | 50,614,553 | |
At May 31, 2018, the Fund had net capital loss carryforwards for federal income tax purposes, which may be carried forward for 5 years, as follows:
| Expiration Date | | | |
| 11/30/2020 | | $ | 36,312,075 | |
| 11/30/2021 | | | 36,577,191 | |
| 11/30/2023 | | | 6,526,505 | |
| Total | | $ | 79,415,771 | |
At May 31, 2018, gross unrealized appreciation and depreciation of investments, based on cost for federal income tax purposes were as follows:
| Cost of Investments | | $ | 241,065,064 | |
| Gross Unrealized Appreciation | | $ | 48,384,180 | |
| Gross Unrealized Depreciation | | | (22,079,692 | ) |
| Net Unrealized Appreciation (Depreciation) on Investments | | $ | 26,304,488 | |
The difference between cost amounts for financial statement and federal income tax purposes is due primarily to timing differences in recognizing certain gains and losses in security transactions.
Use of Estimates. The preparation of financial statements in conformity with accounting principles generally accepted in the United States of America requires management to make estimates and assumptions that affect the reported amounts of assets and liabilities and disclosure of contingent assets and liabilities at the date of the financial statements and the reported amounts of increases and decreases in net assets from operations during the reporting period. Actual results could differ from those estimates.
OPPENHEIMER STEELPATH MLP ALPHA PLUS FUND 29 |
NOTES TO FINANCIAL STATEMENTS Unaudited / (Continued) |
3. Securities Valuation
The Fund calculates the net asset value of its shares as of 4:00 P.M. Eastern time, on each day the New York Stock Exchange (the “Exchange”) is open for trading, except in the case of a scheduled early closing of the Exchange, in which case the Fund will calculate net asset value of the shares as of the scheduled early closing time of the Exchange.
The Fund’s Board of Trustees (the “Board”) has adopted procedures for the valuation of the Fund’s securities and has delegated the day-to-day responsibility for valuation determinations under those procedures to the Manager. The Manager has established a Valuation Committee which is responsible for determining a fair valuation for any security for which market quotations are not readily available. The Valuation Committee’s fair valuation determinations are subject to review, approval and ratification by the Fund’s Board at least quarterly or more frequently, if necessary.
Valuation Methods and Inputs
Securities are valued primarily using unadjusted quoted market prices, when available, as supplied by third party pricing services or broker-dealers.
The following methodologies are used to determine the market value or the fair value of the types of securities described below:
Equity securities traded on a securities exchange (including exchange-traded derivatives other than futures and futures options) are valued based on the official closing price on the principal exchange on which the security is traded, as identified by the Manager, prior to the time when the Fund’s assets are valued. If the official closing price is unavailable, the security is valued at the last sale price on the principal exchange on which it is traded, or if no sales occurred, the security is valued at the mean between the quoted bid and asked prices. Over-the-counter equity securities are valued at the last published sale price, or if no sales occurred, at the mean between the quoted bid and asked prices.
Shares of a registered investment company that are not traded on an exchange are valued at that investment company’s net asset value per share.
Securities for which market quotations are not readily available or a significant event has occurred that would materially affect the value of the security, are fair valued either (i) by a standardized fair valuation methodology applicable to the security type or the significant event as previously approved by the Valuation Committee and the Fund’s Board or (ii) as determined in good faith by the Manager’s Valuation Committee. The Valuation Committee considers all relevant facts that are reasonably available, through either public information or information available to the Manager, when determining the fair value of a security. Those standardized fair valuation methodologies include, but are not limited to, valuing securities at the last sale price or initially at cost and subsequently adjusting the value based on: changes in company specific fundamentals, changes in an appropriate securities index, or changes in the value of similar securities which may be further adjusted for any discounts related to security-specific resale restrictions. When possible, such methodologies use observable
30 OPPENHEIMER STEELPATH MLP ALPHA PLUS FUND |
NOTES TO FINANCIAL STATEMENTS Unaudited / (Continued) |
3. Securities Valuation (Continued)
market inputs such as unadjusted quoted prices of similar securities, observable interest rates, currency rates and yield curves. The methodologies used for valuing securities are not necessarily an indication of the risks associated with investing in those securities nor can it be assured that the Fund can obtain the fair value assigned to a security if it were to sell the security.
Classifications
Each investment asset or liability of the Fund is assigned a level at measurement date based on the significance and source of the inputs to its valuation. Various data inputs may be used in determining the value of each of the Fund’s investments as of the reporting period end. These data inputs are categorized in the following hierarchy under applicable financial accounting standards:
| | 1) | Level 1-unadjusted quoted prices in active markets for identical assets or liabilities (including securities actively traded on a securities exchange) |
| | 2) | Level 2-inputs other than unadjusted quoted prices that are observable for the asset or liability (such as unadjusted quoted prices for similar assets and market corroborated inputs such as interest rates, prepayment speeds, credit risks, etc.) |
| | 3) | Level 3-significant unobservable inputs (including the Manager’s own judgments about assumptions that market participants would use in pricing the asset or liability) |
The inputs used for valuing securities are not necessarily an indication of the risks associated with investing in those securities.
The Fund classifies each of its investments in investment companies which are publicly offered as Level 1. Investment companies that are not publicly offered, if any, are classified as Level 2 in the fair value hierarchy.
The table below categorizes amounts that are included in the Fund’s Statement of Assets and Liabilities at period end based on valuation input level:
| | | Level 1 —
Unadjusted
Quoted Prices | | | Level 2 —
Other Significant
Observable Inputs | | | Level 3 —
Significant
Unobservable Inputs | | | Value | |
| Assets Table | | | | | | | | | | | | |
| Investments, at Value: | | | | | | | | | | | | |
| MLP Investments and Related Entities* | | $ | 256,797,751 | | | $ | — | | | $ | — | | | $ | 256,797,751 | |
| Common Stock* | | | 10,571,801 | | | | — | | | | — | | | | 10,571,801 | |
| Total Assets | | $ | 267,369,552 | | | $ | — | | | $ | — | | | $ | 267,369,552 | |
* | For a detailed break-out of securities by major industry classification, please refer to the Statement of Investments. |
OPPENHEIMER STEELPATH MLP ALPHA PLUS FUND 31 |
NOTES TO FINANCIAL STATEMENTS Unaudited / (Continued) |
3. Securities Valuation (Continued)
The Fund did not hold any Level 3 securities during the six months ended May 31, 2018.
For the reporting period, there were no transfers between levels.
4. Investments and Risks
Equity Security Risk. Stocks and other equity securities fluctuate in price. The value of the Fund’s portfolio may be affected by changes in the equity markets generally. Equity markets may experience significant short-term volatility and may fall sharply at times. Different markets may behave differently from each other and U.S. equity markets may move in the opposite direction from one or more foreign stock markets. Adverse events in any part of the equity or fixed-income markets may have unexpected negative effects on other market segments.
The prices of individual equity securities generally do not all move in the same direction at the same time and a variety of factors can affect the price of a particular company’s securities. These factors may include, but are not limited to, poor earnings reports, a loss of customers, litigation against the company, general unfavorable performance of the company’s sector or industry, or changes in government regulations affecting the company or its industry.
Master Limited Partnerships. MLPs issue common units that represent an equity ownership interest in a partnership and provide limited voting rights. MLP common units are registered with the Securities and Exchange Commission (“SEC”), and are freely tradable on securities exchanges such as the NYSE and the NASDAQ Stock Market (“NASDAQ”), or in the over-the-counter market. An MLP consists of one or more general partners, who conduct the business, and one or more limited partners, who contribute capital. MLP common unit holders have a limited role in the partnership’s operations and management. The Fund, as a limited partner, normally would not be liable for the debts of the MLP beyond the amounts the Fund has contributed, but would not be shielded to the same extent that a shareholder of a corporation would be. In certain circumstances creditors of an MLP would have the right to seek return of capital distributed to a limited partner. This right of an MLP’s creditors would continue after the Fund sold its investment in the MLP.
MLPs are generally treated as publicly traded partnerships for federal income tax purposes. Any modification to federal income tax laws and related interpretations could cause a material decrease in the value of an MLP.
Concentration Risk. Under normal circumstances, the Fund invests at least 80% of its net assets (plus the amount of any borrowings for investment purposes) in master limited partnership (“MLP”) investments of issuers that are engaged in the transportation, storage, processing, refining, marketing, exploration, production, and mining of minerals and natural resources. The Fund’s MLP investments may include, but are not limited to: MLPs structured as limited partnerships (“LPs”) or limited liability companies (“LLCs”); MLPs that are taxed
32 OPPENHEIMER STEELPATH MLP ALPHA PLUS FUND |
NOTES TO FINANCIAL STATEMENTS Unaudited / (Continued) |
4. Investments and Risks (Continued)
as “C” corporations; businesses that operate and have the economic characteristics of MLPs but are organized and taxed as “C” corporations; securities issued by MLP affiliates; and private investments in public equities (“PIPEs”) issued by MLPs. MLPs are subject to certain risks, such as supply and demand risk, depletion and exploration risk, commodity pricing risk, acquisition risk, and the risk associated with the hazards inherent in midstream energy industry activities. A substantial portion of the cash flow received by the Fund is derived from investment in equity securities of MLPs. The amount of cash that a MLP has available for distributions, and the tax character of such distributions, are dependent upon the amount of cash generated by the MLP’s operations.
5. Shares of Beneficial Interest
The Fund has authorized an unlimited number of $0.001 par value shares of beneficial interest of each class. Transactions in shares of beneficial interest were as follows:
| | | Six Months Ended
May 31, 2018 (Unaudited) | | | Year Ended
November 30, 2017 | |
| | | Shares | | | Amount | | | Shares | | | Amount | |
| Class A | | | | | | | | | | | | |
| Sold | | | 1,583,476 | | | $ | 10,029,790 | | | | 4,083,018 | | | $ | 31,884,864 | |
| Dividends and/or distributions reinvested | | | 524,536 | | | | 3,181,314 | | | | 1,093,055 | | | | 8,291,137 | |
| Redeemed | | | (2,368,840 | ) | | | (14,864,338 | ) | | | (9,073,073 | ) | | | (71,131,692 | ) |
| Net Decrease | | | (260,828 | ) | | $ | (1,653,234 | ) | | | (3,897,000 | ) | | $ | (30,955,691 | ) |
| Class C | | | | | | | | | | | | | | | | |
| Sold | | | 1,993,860 | | | $ | 10,825,887 | | | | 2,158,787 | | | $ | 16,571,994 | |
| Dividends and/or distributions reinvested | | | 339,567 | | | | 1,948,773 | | | | 617,027 | | | | 4,418,196 | |
| Redeemed | | | (969,451 | ) | | | (5,847,983 | ) | | | (1,923,820 | ) | | | (13,890,851 | ) |
| Net Increase | | | 1,363,976 | | | $ | 6,926,677 | | | | 851,994 | | | $ | 7,099,339 | |
| Class I | | | | | | | | | | | | | | | | |
| Sold | | | 96,510 | | | $ | 646,043 | | | | 95,393 | | | $ | 692,659 | |
| Dividends and/or distributions reinvested | | | 7,163 | | | | 44,414 | | | | 7,469 | | | | 55,683 | |
| Redeemed | | | (60,021 | ) | | | (440,947 | ) | | | (20,989 | ) | | | (157,629 | ) |
| Net Increase | | | 43,652 | | | $ | 249,510 | | | | 81,873 | | | $ | 590,713 | |
OPPENHEIMER STEELPATH MLP ALPHA PLUS FUND 33 |
NOTES TO FINANCIAL STATEMENTS Unaudited / (Continued) |
5. Shares of Beneficial Interest (Continued)
| | | Six Months Ended
May 31, 2018 (Unaudited) | | | Year Ended
November 30, 2017 | |
| | | Shares | | | Amount | | | Shares | | | Amount | |
| Class Y | | | | | | | | | | | | |
| Sold | | | 3,702,408 | | | $ | 23,728,922 | | | | 10,151,403 | | | $ | 79,694,479 | |
| Dividends and/or distributions reinvested | | | 594,248 | | | | 3,680,301 | | | | 1,055,946 | | | | 7,988,266 | |
| Redeemed | | | (4,312,270 | ) | | | (27,743,915 | ) | | | (7,595,418 | ) | | | (57,643,298 | ) |
| Net (Decrease)/Increase | | | (15,614 | ) | | $ | (334,692 | ) | | | 3,611,931 | | | $ | 30,039,447 | |
6. Purchases and Sales of Securities
The aggregate cost of purchases and proceeds from sales of securities, other than short-term obligations, for the six months ended May 31, 2018, were as follows:
| | | Purchases | | | Sales | |
| Investment securities | | $ | 54,479,344 | | | $ | 57,551,154 | |
7. Fees and Other Transactions with Affiliates
Management Fees. Under the investment advisory agreement, the Fund pays the Manager a management fee based on the daily net assets of the Fund at an annual rate as shown in the following table:
Net Assets
up to $3 Billion | Net Assets Greater than
$3 Billion and up to $5 Billion | Net Assets
in Excess of $5 Billion |
1.25% | 1.23% | 1.20% |
The Fund’s effective management fee for the six months ended May 31, 2018 was 1.25% of average annual net assets before any applicable waivers.
Transfer Agent Fees. OFI Global Asset Management, Inc. (the “Transfer Agent”) serves as the transfer and shareholder servicing agent for the Fund. The Fund pays the Transfer Agent a fee based on average net assets. Fees incurred with respect to these services are detailed in the Statement of Operations.
Sub-Transfer Agent Fees. The Transfer Agent has retained Shareholder Services, Inc., a wholly-owned subsidiary of OFI (the “Sub-Transfer Agent”), to provide the day-to-day transfer agent and shareholder servicing of the Fund. Under the Sub-Transfer Agency Agreement, the
34 OPPENHEIMER STEELPATH MLP ALPHA PLUS FUND |
NOTES TO FINANCIAL STATEMENTS Unaudited / (Continued) |
7. Fees and Other Transactions with Affiliates (Continued)
Transfer Agent pays the Sub-Transfer Agent an annual fee in monthly installments, equal to a percentage of the transfer agent fee collected by the Transfer Agent from the Fund, which shall be calculated after any applicable fee waivers. The fee paid to the Sub-Transfer Agent is paid by the Transfer Agent, not by the Fund.
Trustees’ Compensation. The Board has adopted a compensation deferral plan for independent trustees that enables trustees to elect to defer receipt of all or a portion of the annual compensation they are entitled to receive from the Fund. For purposes of determining the amount owed to the Trustee under the plan, deferred amounts are treated as though equal dollar amounts had been invested in shares of the Fund or in other Oppenheimer funds selected by the Trustee. The Fund purchases shares of the funds selected for deferral by the Trustee in amounts equal to his or her deemed investment, resulting in a Fund asset equal to the deferred compensation liability. Such assets are included as a component of “Other” within the asset section of the Statement of Assets and Liabilities, if applicable. Deferral of trustees’ fees under the plan will not affect the net assets of the Fund, and will not materially affect the Fund’s assets, liabilities or net investment income per share. Amounts will be deferred until distributed in accordance with the compensation deferral plan.
Distribution and Service Plan (12b-1) Fees. Under its General Distributor’s Agreement with the Fund, the Distributor acts as the Fund’s principal underwriter in the continuous public offering of the Fund’s classes of shares.
Distribution and Service Plan for Class A Shares. The Fund has adopted a Distribution and Service Plan (the “Plan”) for Class A shares under Rule 12b-1 of the Investment Company Act of 1940 that compensates the Distributor for a portion of the costs in connection with the distribution of shares, maintaining accounts and providing services to Class A shareholders. Under the Plan, the Fund makes these payments quarterly at an annual rate of up to 0.25% of the daily net assets of Class A shares of the Fund. The Distributor currently uses all of those fees to pay dealers, brokers, banks and other financial intermediaries for providing services related to the distribution of shares, personal service and maintenance of accounts of their customers that hold Class A shares. Any unreimbursed expenses the Distributor incurs with respect to Class A shares in any fiscal year cannot be recovered in subsequent periods. Fees incurred by the Fund under the Plan are detailed in the Statement of Operations.
Distribution and Service Plans for Class C Shares. The Fund has adopted a Distribution and Service Plans (the “Plans”) for Class C shares under Rule 12b-1 of the Investment Company Act of 1940 to compensate the Distributor for distributing that share class, maintaining accounts and providing shareholder services. Under the Plans, the Fund pays the Distributor an annual asset-based sales charge of 0.75% on Class C shares’ daily net assets. The Fund also pays a service fee under the Plans at an annual rate of 0.25% of Class C shares’ daily net assets.
OPPENHEIMER STEELPATH MLP ALPHA PLUS FUND 35 |
NOTES TO FINANCIAL STATEMENTS Unaudited / (Continued) |
7. Fees and Other Transactions with Affiliates (Continued)
The Distribution and Service Plans for Class A and C shares continue in effect from year to year only if the Fund’s Board votes annually to approve their continuance at an in person meeting called for that purpose. Fees incurred by the Fund under the Plans are detailed in the Statement of Operations.
Sales Charges. Front-end sales charges and contingent deferred sales charges (“CDSC”) do not represent expenses of the Fund. They are deducted from the proceeds of sales of Fund shares prior to investment or from redemption proceeds prior to remittance, as applicable. The sales charges retained by the Distributor from the sale of shares and the CDSC retained by the Distributor on the redemption of shares are shown in the following table for the period indicated.
| Six Months Ended | | | Class A Front-End
Sales Charges
Retained by
Distributor | | | Class A Contingent
Deferred Sales
Charges Retained
by Distributor | | | Class C Contingent
Deferred Sales
Charges Retained
by Distributor | |
May 31, 2018 | | | $ | 9,893 | | | $ | 545 | | | $ | 2,114 | |
Waivers and Reimbursements of Expenses. The Manager has contractually agreed to limit fees and/or reimburse expenses of the Fund to the extent that the Fund’s total annual fund operating expenses (exclusive of interest, taxes, such as deferred tax expenses, brokerage commissions, acquired fund fees and expenses, dividend costs related to short sales, and other unusual expenses such as litigation expense, if any) exceed 2.00% for Class A shares, 2.75% for Class C shares, and 1.75% for Class Y shares. The Fund’s total annual operating expenses after fee waiver and/or expense reimbursement (“Net Expenses”) will be higher than these amounts to the extent that the Fund incurs expenses excluded from the expense cap. Because the Fund’s deferred income tax expense/(benefit) and interest expense are excluded from the expense cap, the Fund’s Net Expenses for each class of shares is increased/(decreased) by the amount of these expenses. This undertaking may not be modified or terminated until after one year from the date of the current prospectus, as indicated therein, unless approved by the Fund’s Board.
The Manager and/or Transfer Agent can be reimbursed by the Fund within three years after the date the fee limitation and/or expense reimbursement has been made by the Manager and/or Transfer Agent, provided that such repayment does not cause the expenses of any class of the Fund to exceed the foregoing limits.
During the six months ended May 31, 2018, the Manager did not waive any expenses and does not have any previously waived expenses eligible for recovery.
36 OPPENHEIMER STEELPATH MLP ALPHA PLUS FUND |
NOTES TO FINANCIAL STATEMENTS Unaudited / (Continued) |
7. Fees and Other Transactions with Affiliates (Continued)
Effective January 1, 2017 until December 31, 2017, the Transfer Agent has voluntarily agreed to waive fees and/or reimburse Fund expenses in an amount equal to 0.015% of average annual net assets for Classes A, C, and Y.
During the reporting period, the Transfer Agent waived fees and/or reimbursed the Fund for transfer agent and shareholder servicing agent fees as follows:
| Class A | | $ | 1,027 | |
| Class C | | | 593 | |
| Class Y | | | 1,135 | |
This expense limitation was removed effective December 31, 2017. Amounts previously waived are not eligible for recoupment.
Related Party. The Interested Trustee and officers of the Fund is also an officers or trustee of companies affiliated with the Manager, Distributor, and Transfer Agent.
Cross Trades. The Fund is permitted to purchase and sell securities from and to other Funds managed by the Manager or OFI Global (“cross-trade”) pursuant to “Cross-Trading” Procedures adopted by the Fund’s Board. These procedures are designed to ensure that any cross-trade of securities between a Fund and another account or private fund that is an affiliate of the Fund solely by virtue of having a common investment adviser, common trustee/director, or common officer complies with Rule 17a-7 under the 1940 Act. Further, as defined under these procedures, each cross-trade is effected at the current market price.
During the period the Fund had $814,494 in purchases and $5,292,614 in sales considered cross-trades, resulting in $(1,685,964) of realized gain/(loss).
8. Borrowing Agreement
The Fund, along with Oppenheimer SteelPath MLP Alpha Fund, Oppenheimer SteelPath MLP Income Fund, and Oppenheimer SteelPath MLP Select 40 Fund (collectively, the “Trust”), is a borrower in a $700 million revolving credit agreement (the “Loan Agreement”) with a major lending institution (the “Lender”). The Fund is permitted to borrow up to the lesser of one-third of the Fund’s total assets, or the maximum amount permitted pursuant to the Fund’s investment limitations. As the Loan Agreement is not available exclusively to the Fund, the Fund may not be able to borrow all of its requested amounts at any given time. Amounts borrowed under the Loan Agreement, if any, are invested by the Fund under the direction of the Manager consistent with the Fund’s investment objective and policies, and as such, the related investments are subject to normal market fluctuations and investment risks, including the risk of loss due to a decline in value. The borrowing, if any, is fully collateralized
OPPENHEIMER STEELPATH MLP ALPHA PLUS FUND 37 |
NOTES TO FINANCIAL STATEMENTS Unaudited / (Continued) |
8. Borrowing Agreement (Continued)
throughout the term of the borrowing with securities or other assets of the Fund. The Fund is not liable for borrowings of other Funds in the Trust. Securities that have been pledged as collateral for the borrowing are indicated in the Statement of Investments.
Borrowings under the Loan Agreement are charged interest at a calculated rate computed by the Lender based on the one month LIBOR rate plus 0.75% per annum. An unused commitment fee at the rate of 0.30% per annum is charged for any undrawn portion of the credit facility, and each member of the Trust will pay its pro rata share of this fee. A facility fee of 0.10% was charged on the commitment amount, and each party of the Trust paid its pro rata share of this fee. The borrowing is due November 16, 2018, unless another date is mutually agreed upon by the parties of the Loan Agreement. For six months ended May 31, 2018, the Fund paid $76,741 in borrowing fees. The Fund’s payable on borrowing balance and interest at May 31, 2018 was $67,000,000 and 2.66%, respectively.
Information related to the Fund’s borrowings under the Loan Agreement and Citi Loan Agreement for the six months ended May 31, 2018, is as follows:
Average
Interest
Rate | | | Average
Loan
Balance | | | Number
of Days
Outstanding | | | Interest
Expense
Incurred | | | Maximum Amount
Borrowed During
the Period | |
| | 1.21 | % | | $ | 71,280,220 | | | | 182 | | | $ | 964,198 | | | $ | 77,000,000 | |
38 OPPENHEIMER STEELPATH MLP ALPHA PLUS FUND |
DISTRIBUTION SOURCES Unaudited |
For any distribution that took place over the last six months of the Fund’s reporting period, the table below details on a per-share basis the percentage of the Fund’s total distribution payment amount that was derived from the following sources: net income, net profit from the sale of securities, and other capital sources. Other capital sources represent a return of capital. A return of capital may occur, for example, when some or all of the money that you invested in the Fund is paid back to you. A return of capital distribution does not necessarily reflect the Fund’s investment performance and should not be confused with “yield” or “income.” You should not draw any conclusions about the Fund’s investment performance from the amounts of these distributions. This information is based upon income and capital gains using generally accepted accounting principles as of the date of each distribution. If the Fund (or an underlying fund in which the Fund invests) invests in real estate investment trusts (REITs) and/or master limited partnerships (MLPs), the percentages attributed to each category are estimated using historical information because the character of the amounts received from the REITs and/or MLPs in which the Fund (or underlying fund) invests is unknown until after the end of the calendar year. Because the Fund is actively managed, the relative amount of the Fund’s total distributions derived from various sources over the calendar year may change. Please note that this information should not be used for tax reporting purposes as the tax character of distributable income may differ from the amounts used for this notification. You will receive IRS tax forms in the first quarter of each calendar year detailing the actual amount of the taxable and non-taxable portion of distributions paid to you during the tax year.
For the most current information, please go to oppenheimerfunds.com. Select your Fund, and scroll down to the ‘Dividends’ table under ‘Analytics’. The Fund’s latest distribution information will be followed by the sources of any distribution, updated daily.
Fund Name | Pay
Date | Net
Income | Net
Profit
from Sale | Other
Capital
Sources |
Oppenheimer SteelPath MLP Alpha Plus Fund | 1/5/18 | 0.0% | 0.0% | 100.0% |
Oppenheimer SteelPath MLP Alpha Plus Fund | 2/9/18 | 0.0% | 0.0% | 100.0% |
Oppenheimer SteelPath MLP Alpha Plus Fund | 3/9/18 | 0.0% | 0.0% | 100.0% |
Oppenheimer SteelPath MLP Alpha Plus Fund | 4/6/18 | 0.0% | 0.0% | 100.0% |
Oppenheimer SteelPath MLP Alpha Plus Fund | 5/4/18 | 0.0% | 0.0% | 100.0% |
OPPENHEIMER STEELPATH MLP ALPHA PLUS FUND 39 |
PORTFOLIO PROXY VOTING POLICIES AND PROCEDURES; UPDATES TO STATEMENT OF INVESTMENTS Unaudited |
The Fund has adopted Portfolio Proxy Voting Policies and Procedures under which the Fund votes proxies relating to securities (“portfolio proxies”) held by the Fund. A description of the Fund’s Portfolio Proxy Voting Policies and Procedures is available (i) without charge, upon request, by calling the Fund toll-free at 1.800.CALL OPP (225.5677), (ii) on the Fund’s website at oppenheimerfunds.com, and (iii) on the SEC’s website at www.sec.gov. In addition, the Fund is required to file Form N-PX, with its complete proxy voting record for the 12 months ended June 30th, no later than August 31st of each year. The Fund’s voting record is available (i) without charge, upon request, by calling the Fund toll-free at 1.800.CALL OPP (225.5677), and (ii) in the Form N-PX filing on the SEC’s website at www.sec.gov.
The Fund files its complete schedule of portfolio holdings with the SEC for the first quarter and the third quarter of each fiscal year on Form N-Q. The Fund’s Form N-Q filings are available on the SEC’s website at www.sec.gov. Those forms may be reviewed and copied at the SEC’s Public Reference Room in Washington, D.C. Information on the operation of the Public Reference Room may be obtained by calling 1-800-SEC-0330.
Householding – Delivery of Shareholder Documents
This is to inform you about OppenheimerFunds’ “householding” policy. If more than one member of your household maintains an account in a particular fund, OppenheimerFunds will mail only one copy of the fund’s prospectus (or, if available, the fund’s summary prospectus), annual and semiannual report and privacy policy. The consolidation of these mailings, called householding, benefits your fund through reduced mailing expense, and benefits you by reducing the volume of mail you receive from OppenheimerFunds. Householding does not affect the delivery of your account statements.
Please note that we will continue to household these mailings for as long as you remain an OppenheimerFunds shareholder, unless you request otherwise. If you prefer to receive multiple copies of these materials, please call us at 1.800.CALL-OPP (225-5677). You may also notify us in writing or via email. We will begin sending you individual copies of the prospectus (or, if available, the summary prospectus), reports and privacy policy within 30 days of receiving your request to stop householding.
40 OPPENHEIMER STEELPATH MLP ALPHA PLUS FUND |
OPPENHEIMER STEELPATH MLP ALPHA PLUS FUND |
Trustees and Officers | | Robert J. Malone, Chairman of the Board of Trustees and Trustee |
| | | Andrew J. Donohue, Trustee |
| | | Richard F. Grabish, Trustee |
| | | Beverly L. Hamilton, Trustee |
| | | Victoria J. Herget, Trustee |
| | | Karen L. Stuckey, Trustee |
| | | James D. Vaughn, Trustee |
| | | Arthur P. Steinmetz, Trustee, President and Principal Executive Officer |
| | | Stuart Cartner, Vice President |
| | | Brian Watson, Vice President |
| | | Cynthia Lo Bessette, Secretary and Chief Legal Officer |
| | | Jennifer Foxson, Vice President and Chief Business Officer |
| | | Mary Ann Picciotto, Chief Compliance Officer
and Chief Anti-Money Laundering Officer |
| | | Brian S. Petersen, Treasurer and Principal Financial & Accounting Officer |
| | | |
Manager | | OFI SteelPath, Inc. |
| | | |
Distributor | | OppenheimerFunds Distributor, Inc. |
| | | |
Transfer and Shareholder Servicing Agent | | OFI Global Asset Management, Inc. |
| | | |
Sub-Transfer Agent | | Shareholder Services, Inc. |
| | | DBA OppenheimerFunds Services |
| | | |
Independent Registered Public Accounting Firm | | Cohen & Company, Ltd. |
| | | |
Legal Counsel | | Ropes & Gray LLP |
| | | |
The financial statements included herein have been taken from the records of the Fund without examination of those records by the independent registered public accounting firm.
© 2018 OppenheimerFunds, Inc. All rights reserved.
OPPENHEIMER STEELPATH MLP ALPHA PLUS FUND 41 |
As an Oppenheimer fund shareholder, you are entitled to know how we protect your personal information and how we limit its disclosure.
Information Sources
We obtain nonpublic personal information about our shareholders from the following sources:
| | ● | Applications or other forms. |
| | ● | When you create a user ID and password for online account access. |
| | ● | When you enroll in eDocs Direct,SM our electronic document delivery service. |
| | ● | Your transactions with us, our affiliates or others. |
| | ● | Technologies on our website, including: “cookies” and web beacons, which are used to collect data on the pages you visit and the features you use. |
If you visit oppenheimerfunds.com and do not log on to the secure account information areas, we do not obtain any personal information about you. When you do log on to a secure area, we do obtain your user ID and password to identify you. We also use this information to provide you with products and services you have requested, to inform you about products and services that you may be interested in and assist you in other ways.
We do not collect personal information through our website unless you willingly provide it to us, either directly by email or in those areas of the website that request information. In order to update your personal information (including your mailing address, email address and phone number) you must first log on and visit your user profile.
If you have set your browser to warn you before accepting cookies, you will receive the warning message with each cookie. You can refuse cookies by turning them off in your browser. However, doing so may limit your access to certain sections of our website.
We use cookies to help us improve and manage our website. For example, cookies help us recognize new versus repeat visitors to the site, track the pages visited, and enable some special features on the website. This data helps us provide better service for our website visitors.
Protection of Information
We do not disclose any nonpublic personal information (such as names on a customer list) about current or former customers to anyone, except as permitted by law.
Disclosure of Information
Copies of confirmations, account statements and other documents reporting activity in your fund accounts are made available to your financial advisor (as designated by you). We may also use details about you and your investments to help us, our financial service affiliates,
42 OPPENHEIMER STEELPATH MLP ALPHA PLUS FUND |
PRIVACY POLICY NOTICE (Continued) |
or firms that jointly market their financial products and services with ours, to better serve your investment needs or suggest educational material that may be of interest to you. If this requires us to provide you with an opportunity to “opt in” or “opt out” of such information sharing with a firm not affiliated with us, you will receive notification on how to do so, before any such sharing takes place.
Right of Refusal
We will not disclose your personal information to unaffiliated third parties (except as permitted by law), unless we first offer you a reasonable opportunity to refuse or “opt out” of such disclosure.
Internet Security and Encryption
In general, the email services provided by our website are encrypted and provide a secure and private means of communication with us. To protect your own privacy, confidential and/ or personal information should only be communicated via email when you are advised that you are using a secure website.
As a security measure, we do not include personal or account information in nonsecure emails, and we advise you not to send such information to us in nonsecure emails. Instead, you may take advantage of the secure features of our website to encrypt your email correspondence. To do this, you will need to use a browser that supports Secure Sockets Layer (SSL) protocol.
| | ● | All transactions conducted via our websites, including redemptions, exchanges and purchases, are secured by the highest encryption standards available. SSL is used to establish a secure connection between your PC and OppenheimerFunds’ server. It transmits information in an encrypted and scrambled format. |
| | ● | Encryption is achieved through an electronic scrambling technology that uses a “key” to code and then decode the data. Encryption acts like the cable converter box you may have on your television set. It scrambles data with a secret code so that no one can make sense of it while it is being transmitted. When the data reaches its destination, the same software unscrambles the data. |
| | ● | You can exit the secure area by closing your browser or, for added security, you can use the Log Out button before you close your browser. |
Other Security Measures
We maintain physical, electronic and procedural safeguards to protect your personal account information. Our employees and agents have access to that information only so that they may offer you products or provide services, for example, when responding to your account questions.
OPPENHEIMER STEELPATH MLP ALPHA PLUS FUND 43 |
PRIVACY POLICY NOTICE (Continued) |
How You Can Help
You can also do your part to keep your account information private and to prevent unauthorized transactions. If you obtain a user ID and password for your account, safeguard that information. Strengthening your online credentials–your online security profile–typically your user name, password, and security questions and answers, can be one of your most important lines of defense on the Internet. For additional information on how you can help prevent identity theft, visit https:// www.oppenheimerfunds.com/security.
Who We Are
This joint notice describes the privacy policies of the Oppenheimer funds, OppenheimerFunds, Inc., each of its investment adviser subsidiaries, OppenheimerFunds Distributor, Inc. and OFI Global Trust Co. It applies to all Oppenheimer fund accounts you presently have, or may open in the future, using your Social Security number—whether or not you remain a shareholder of our funds. This notice was last updated as of November 2017. In the event it is updated or changed, we will post an updated notice on our website at oppenheimerfunds.com. If you have any questions about this privacy policy, email us by clicking on the Contact Us section of our website at oppenheimerfunds.com, write to us at P.O. Box 5270, Denver, CO 80217-5270, or call us at 800 CALL OPP (225 5677).
44 OPPENHEIMER STEELPATH MLP ALPHA PLUS FUND |
THIS PAGE INTENTIONALLY LEFT BLANK
OPPENHEIMER STEELPATH MLP ALPHA PLUS FUND 45 |
THIS PAGE INTENTIONALLY LEFT BLANK
46 OPPENHEIMER STEELPATH MLP ALPHA PLUS FUND |
THIS PAGE INTENTIONALLY LEFT BLANK
OPPENHEIMER STEELPATH MLP ALPHA PLUS FUND 47 |

Item 2. Code of Ethics.
Not applicable to semi-annual reports.
Item 3. Audit Committee Financial Expert.
Not applicable to semi-annual reports.
Item 4. Principal Accountant Fees and Services.
Not applicable to semi-annual reports.
Item 5. Audit Committee of Listed Registrants.
Not applicable.
Item 6. Schedule of Investments.
a) Not applicable. The complete schedule of investments is included in Item 1 of this Form N-CSR.
b) Not applicable.
Item 7. Disclosure of Proxy Voting Policies and Procedures for Closed-End Management Investment Companies.
Not applicable.
Item 8. Portfolio Managers of Closed-End Management Investment Companies.
Not applicable.
Item 9. Purchases of Equity Securities by Closed-End Management Investment Company and Affiliated Purchasers.
Not applicable.
Item 10. Submission of Matters to a Vote of Security Holders.
The Registrant’s Governance Committee Provisions with Respect to Nominations of Directors/Trustees to the Respective Boards
Not applicable.
Item 11. Controls and Procedures.
| (a) | Based on their evaluation of the registrant’s disclosure controls and procedures (as defined in rule 30a-3(c) under the Investment Company Act of 1940 (17 CFR 270.30a-3(c)) as of 5/31/2018, the registrant’s principal executive officer and principal financial officer found the registrant’s disclosure controls and procedures to provide reasonable assurances that information required to be disclosed by the registrant in the reports that it files under the Securities Exchange Act of 1934 (a) is accumulated and communicated to registrant’s management, including its principal executive officer and principal financial officer, to allow timely decisions regarding required disclosure, and (b) is recorded, processed, summarized and reported, within the time periods specified in the rules and forms adopted by the U.S. Securities and Exchange Commission. |
| (b) | There were no changes in the Registrant’s internal control over financial reporting (as defined in Rule 30a-3(d) under the Act) that occurred during the Registrant’s second fiscal quarter of the period covered by this report that materially affected, or were reasonably likely to materially affect, the Registrant’s internal control over financial reporting. |
Item 12. Exhibits
| (a)(1) | Any code of ethics or amendment thereto, that is the subject of the disclosure required by Item 2, to the extent that the registrant intends to satisfy Item 2 requirements through filing exhibit. |
Filed herewith.
| (2) | A separate certification for each principal executive and principal financial officer pursuant to Section 302 of the Sarbanes-Oxley Act of 2002. Filed herewith. |
| (b) | Certification pursuant to Section 906 of the Sarbanes-Oxley Act of 2002. Filed herewith. |
SIGNATURES
Pursuant to the requirements of the Securities Exchange Act of 1934 and the Investment Company Act of 1940, the registrant has duly caused this report to be signed on its behalf by the undersigned, thereunto duly authorized.
| Oppenheimer SteelPath MLP Funds Trust | |
| | | |
| /s/ Arthur P. Steinmetz | |
| By: Arthur P. Steinmetz | |
| Principal Executive Officer | |
| Date: | 7/27/2018 | |
Pursuant to the requirements of the Securities Exchange Act of 1934 and the Investment Company Act of 1940, this report has been signed below by the following persons on behalf of the registrant and in the capacities and on the date indicated.
| /s/ Arthur P. Steinmetz | |
| By: Arthur P. Steinmetz | |
| Principal Executive Officer | |
| Date: | 7/27/2018 | |
| | | |
| /s/ Brian Petersen | |
| By: Brian Petersen | |
| Principal Financial Officer | |
| Date: | 7/27/2018 | |