UNITED STATES
SECURITIES AND EXCHANGE COMMISSION
Washington, D.C. 20549
FORM N-CSR
CERTIFIED SHAREHOLDER REPORT OF REGISTERED
MANAGEMENT INVESTMENT COMPANIES
Investment Company Act file number 811- 22733
John Hancock Exchange-Traded Fund Trust
(Exact name of registrant as specified in charter)
601 Congress Street, Boston, Massachusetts 02210
(Address of principal executive offices) (Zip code)
Salvatore Schiavone
Treasurer
601 Congress Street
Boston, Massachusetts 02210
(Name and address of agent for service)
Registrant's telephone number, including area code: 617-663-4497
| Date of fiscal year end: | April 30 |
| Date of reporting period: | October 31, 2015 |
ITEM 1. SHAREHOLDERS REPORT.
John Hancock


A message to shareholders
Dear shareholder,
Welcome to John Hancock Investments, and thank you for investing in a John Hancock Multifactor exchange-traded fund (ETF). At John Hancock Investments, we take a different approach to managing money on behalf of our shareholders. We build funds based on investor needs, then search the world to find proven portfolio teams with specialized expertise in those strategies. We were pleased to team up with Dimensional Fund Advisors LP—a company regarded as one of the pioneers in strategic beta investing*—to create a suite of passively managed ETFs. Each of our John Hancock Multifactor ETFs seeks to track a custom index built upon decades of academic research into the factors that drive higher expected returns: smaller capitalizations, lower valuations, and higher profitability.
This inaugural report to shareholders covers a very brief period of performance due to the fact that your ETF was launched shortly before the midpoint of its fiscal year. In this abbreviated report, your fund's portfolio managers will discuss the construction of the fund's underlying index, provide a review of the current market environment, and give a description of performance achieved so far. The next report you receive will cover the full period from the fund's inception to the end of its fiscal year on April 30, 2016.
We know you have many choices when it comes to your investments, and we appreciate the opportunity to earn the trust you've placed in John Hancock Investments.
Sincerely,

Andrew G. Arnott
President and Chief Executive Officer
John Hancock Investments
This commentary reflects the CEO's views as of October 31, 2015. They are subject to change at any time. For more up-to-date information, you can visit our website at jhinvestments.com.
| * | Strategic beta investing ETFs seek to improve upon cap-weighted strategies by tracking a custom index that combines active management insight with the discipline of a rules-based approach. |
John Hancock
Multifactor Technology ETF
Table of contents
| 2 | Your fund at a glance | |
| 4 | Discussion of fund performance | |
| 8 | Premium/discount analysis | |
| 9 | Your expenses | |
| 11 | Fund's investments | |
| 15 | Financial statements | |
| 18 | Financial highlights | |
| 19 | Notes to financial statements | |
| 22 | Evaluation of advisory and subadvisory agreements by the Board of Trustees | |
| 27 | More information |
1
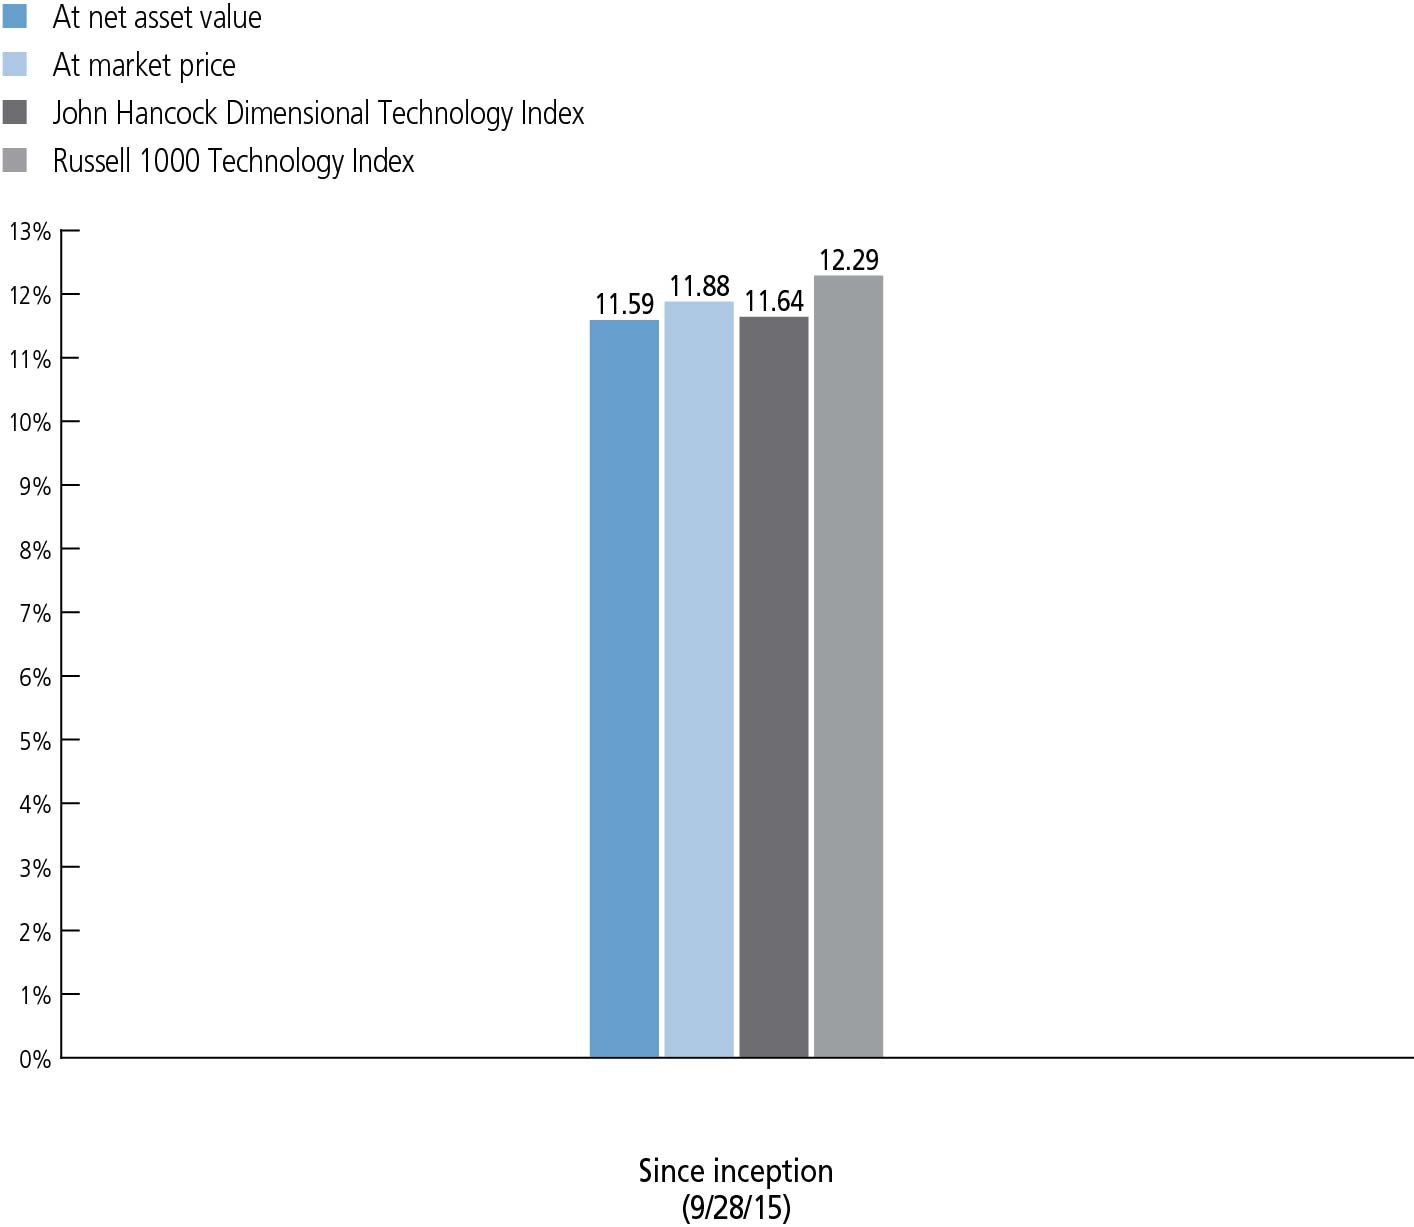
INVESTMENT OBJECTIVE
The fund seeks to provide investment results that closely correspond, before fees and expenses, to the performance of the John Hancock Dimensional Technology Index.
TOTAL RETURNS AS OF 10/31/15 (%)
Market performance is determined using the closing price of the fund on its primary exchange, the NYSE Arca, at 4 P.M., Eastern time; your returns may differ if you traded shares at other times during the day. The net asset value is calculated by dividing the total value of all the securities in the fund's portfolio plus cash, interest, and receivables, minus any liabilities, by the number of fund shares outstanding.
The John Hancock Dimensional Technology Index comprises securities in the technology sector within the U.S. Universe whose market capitalizations are larger than that of the 1001st largest U.S. company at the time of reconstitution. Stocks that compose the Index include those that may be considered medium or smaller capitalization company stocks. The Index is reconstituted and rebalanced on a semiannual basis. The technology sector is composed of companies in areas such as the creation, development or provision of software, hardware, internet services, database management, information technology consulting and services, data processing, or semi-conductors. The U.S. Universe is defined as a free float-adjusted market-capitalization-weighted portfolio of U.S. operating companies listed on the New York Stock Exchange (NYSE), NYSE MKT LLC, NASDAQ Global Market, or such other securities exchanges deemed appropriate in accordance with the rules-based methodology that is maintained by Dimensional Fund Advisors LP.
The Russell 1000 Technology Index tracks stocks in the technology sector of the Russell 1000 Index
It is not possible to invest directly in an index. Index figures do not reflect expenses or sales charges, which would result in lower returns.
The past performance shown here reflects reinvested distributions and the beneficial effect of any expense reductions, and does not guarantee future results. Returns for periods shorter than one year are cumulative. Shares will fluctuate in value and, when sold or redeemed, may be worth more or less than their original cost. Current performance may be lower or higher than the performance cited, and can be found at jhinvestments.com or by calling 800-225-5291. For further information on the fund's objectives, risks, and strategy, see the fund's prospectus.
2
PERFORMANCE HIGHLIGHTS OVER THE PERIOD
Risk assets rebounded
Following a challenging summer, equity markets around the world bounced back; fixed-income asset returns were more subdued, as many bond sectors ended the period roughly where they started.
Smaller-cap stocks trailed larger peers
Relative to the capitalization-weighted Russell 1000 Technology Index, the fund's smaller-cap bias hindered results as larger caps led the way during the period.
Value-oriented shares lagged growth counterparts
The fund emphasizes shares with lower price-to-book ratios; during the period, this value tilt also weighed on results relative to the broad market.
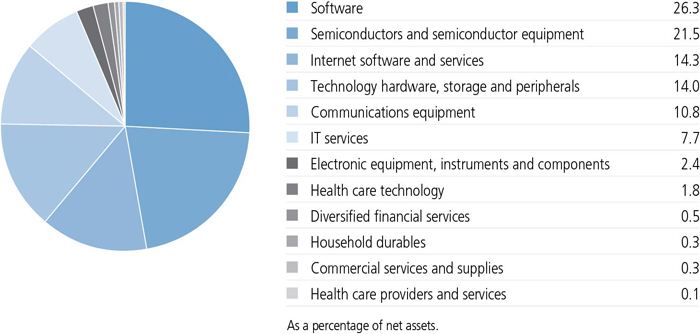
INDUSTRY COMPOSITION AS OF 10/31/15 (%)
A note about risks
The prices of medium and smaller company stocks can change more frequently and dramatically than those of large companies. Value stocks may underperform other segments of the market. The value of a company's equity securities is subject to changes in the company's financial condition and overall market and economic conditions. Because the fund may focus on particular sectors of the economy, its performance may depend on the performance of those sectors, and investments focused in one sector may fluctuate more dramatically than investments in a wider variety of sectors. Exchange-traded fund shares are bought and sold through exchange trading at market price (not NAV), and are not individually redeemed from the fund. Due to various factors, shares may trade at a premium or discount to their NAV in the secondary market, and the fund's holdings and returns may deviate from those of its index. These variations may be greater when markets are volatile or subject to unusual conditions. Errors in the construction or calculation of the fund's index may occur from time to time. Brokerage commissions will reduce returns. Please see the fund's prospectus for additional risks.
3

Lukas J. Smart, CFA
Portfolio Manager
Dimensional Fund Advisors LP
Would you tell us about your investment philosophy and how it drives the composition of this new exchange-traded fund (ETF)?
Research has shown that there are differences in expected returns among securities. At Dimensional Fund Advisors, we've identified four characteristics, or dimensions, of expected returns—the overall market, company size, relative price, and profitability—that academic research has shown to account for most of the variation in asset returns over time.
The market dimension reflects the excess return over the risk-free rate that market participants demand for investing in a broadly diversified portfolio of equity securities without any style or market capitalization bias. That premium is called the equity premium.
The company size dimension reflects the excess return that investors demand for investing in small-capitalization stocks relative to large-capitalization stocks. The premium associated with this dimension is the small-cap, or size, premium.
The relative price dimension reflects the excess return that investors expect from investing in low relative price, or value, stocks (as measured, for instance, by their price-to-book ratios) in comparison with high relative price, or growth, stocks. The premium associated with this dimension is the value premium.
Finally, the profitability dimension provides a way to discern the expected returns of companies with similar price-driven characteristics. If two companies trade at the same relative price, the one with higher profitability should have a higher expected return. We call this the profitability premium.
Relative to a commercial cap-weighted measure of the market, we believe that incorporating these dimensions of expected returns into an investment strategy offers the potential for outperformance
4
What was the market environment like during the period?
The abbreviated period from inception on September 28, 2015, through October 31, 2015, followed a difficult and volatile summer for equities. However, stock markets around the world subsequently snapped back for a sharp rebound, posting high single-digit percentage returns in some cases.
Broadly speaking, materials, energy, and technology equity shares were particularly strong, while utilities—often viewed as a safe-haven sector of the stock market—generated more modest results. U.S. equities led most major markets, outpacing both emerging markets and developed markets abroad as a group. Larger-capitalization stocks outpaced smaller caps, and growth-oriented shares outpaced their value counterparts during this relatively short time period.
TOP 10 HOLDINGS AS OF 10/31/15 (%)
| Microsoft Corp. | 6.8 |
| Apple, Inc. | 5.9 |
| Alphabet, Inc., Class A | 5.9 |
| Intel Corp. | 5.1 |
| Cisco Systems, Inc. | 3.9 |
| Oracle Corp. | 3.4 |
| IBM Corp. | 2.9 |
| Facebook, Inc., Class A | 2.8 |
| QUALCOMM, Inc. | 2.4 |
| HP, Inc. | 1.6 |
| TOTAL | 40.7 |
| As a percentage of net assets. | |
| Cash and cash equivalents are not included. | |
5
How did the fund perform during this abbreviated period?
The fund generated an 11.59% return on a net asset value (NAV) basis, which was closely in line with the custom benchmark it's intended to track, the John Hancock Dimensional Technology Index, which was up 11.64%.
Our approach generally results in the fund broadly maintaining relatively high weightings in securities of smaller-cap issuers and in those trading at lower relative prices in relation to their book values. In the weightings of individual positions, we also place greater emphasis on companies with higher profitability.
The fund trailed the Russell 1000 Technology Index, a commercial cap-weighted benchmark we use as a proxy for the information technology sector of the U.S. stock market. On balance, the fund's emphasis on smaller and lower relative price shares worked against it during this time period.
The premiums associated with the dimensions we've identified are unpredictable. For this reason, we believe the best way to invest is to structure broadly diversified portfolios with a consistent focus on the desired dimensions, seeking to capture the expected premiums associated with them.
While we would expect small to outperform large and value to outperform growth over an extended time horizon, any given trading day, month, or year can prove otherwise, and that's okay. Patience and persistence are key ingredients to success in our style of investing.
How was the fund positioned at the close of the period?
In keeping with our long-term investment approach, the fund generally held higher weights in low-relative-price stocks and equities with smaller market capitalization while emphasizing companies with higher profitability relative to commercial cap-weighted indexes.
The fund's largest absolute exposures were to the software, semiconductors and semiconductor equipment, and Internet software and services industries of the technology sector.
The fund was broadly diversified across the sector with more than 100 different information
6
technology names. Top holdings included Microsoft Corp., Apple, Inc., and Alphabet, Inc. (Google's parent company). The fund's weighted average market capitalization was $145 billion, its price-to-book ratio was 3.4, and its price-to-earnings ratio was 19.0.
MANAGED BY
| | Lukas J. Smart, CFA On the fund since inception Investing since 2003 |
 | Joel P. Schneider On the fund since inception Investing since 2011 |
![]()
7
ETF shares are bought and sold through exchange trading at market price—not net asset value (NAV)—and are not individually redeemed from the fund. Due to various factors, shares may trade at a premium or discount to their NAV in the secondary market. If a shareholder purchases shares at a time when the market price is at a premium to the NAV or sells shares at a time when the market price is at a discount to the NAV, the shareholder may sustain losses. Additionally due to various factors, a fund's holdings and returns may deviate from those of its index. These variations may be greater when markets are volatile or subject to unusual conditions.
A premium exists when the closing market price is trading above NAV, while a discount indicates that the closing market price is trading below NAV. The differences are expressed as basis points, with one basis point equaling 1/100 of 1%.
The chart below presents information about the differences between the fund's daily closing market price and the fund's NAV. The closing market price is the daily closing price as reported on the NYSE Arca, Inc., the fund's primary listing exchange. Data presented represents past performance and cannot be used to predict future results.
Period Ended October 31, 2015
| Closing price below NAV | Closing price above or equal to NAV | |||||||
| Basis point differential | Number of days | % of Total days | Number of days | % of Total days | ||||
| 0 - < 25 | 12 | 50.00% | 9 | 37.50% | ||||
| 25 - < 50 | 1 | 4.17% | 1 | 4.17% | ||||
| 50 - < 75 | 1 | 4.16% | — | — | ||||
| 75 - < 100 | — | — | — | — | ||||
| 100 or Above | — | — | — | — | ||||
| Total | 14 | 58.33% | 10 | 41.67% | ||||
8
These examples are intended to help you understand your ongoing operating expenses of investing in the fund so you can compare these costs with the ongoing costs of investing in
other funds.
Understanding fund expenses
As a shareholder of the fund, you incur two types of costs:
| • | Transaction costs, which may include creation and redemption fees or brokerage charges. |
| • | Ongoing operating expenses, including management fees and other fund expenses. |
We are presenting only your ongoing operating expenses here.
Actual expenses/actual returns
This example is intended to provide information about the fund's actual ongoing operating expenses, and is based on the fund's actual return. It assumes an account value of $1,000.00 on September 28, 2015, with the same investment held until October 31, 2015.
| Account value on 9-28-2015 | Ending value on 10-31-2015 | Expenses paid during period ended 10-31-20151 | Annualized expense ratio | |
| $1,000.00 | $1,115.90 | $0.48 | 0.50% |
Together with the value of your account, you may use this information to estimate the operating expenses that you paid over the period. Simply divide your account value at October 31, 2015, by $1,000.00, then multiply it by the "expenses paid" from the table above. For example, for an account value of $8,600.00, the operating expenses should be calculated as follows:

9
Hypothetical example for comparison purposes
This table allows you to compare the fund's ongoing operating expenses with those of any other fund. It provides an example of the fund's hypothetical account values and hypothetical expenses based on the fund's actual expense ratio and an assumed 5% annualized return before expenses (which is not the fund's actual return). It assumes an account value of $1,000.00 on May 1, 2015, with the same investment held until October 31, 2015. Look in any other fund shareholder report to find its hypothetical example and you will be able to compare these expenses. Please remember that these hypothetical account values and expenses may not be used to estimate the actual ending account balance or expenses you paid for the period.
| Account value on 5-1-2015 | Ending value on 10-31-2015 | Expenses paid during period ended 10-31-20152 | Annualized expense ratio | |
| $1,000.00 | $1,022.60 | $2.54 | 0.50% |
Remember, these examples do not include any transaction costs. The fund charges a transaction fee per creation unit to those creating or redeeming creation units, and those buying or selling shares in the secondary market will incur customary brokerage commissions and charges. Therefore, these examples will not help you to determine the relative total costs of owning different funds. If transaction costs were included, your expenses would have been higher. See the prospectus for details regarding transaction costs.
| 1 | The inception date for the fund is 9-28-15. Expenses are equal to the fund's annualized expense ratio, multiplied by the average account value over the period, multiplied by 33/366 (to reflect the period). |
| 2 | Expenses are equal to the fund's annualized expense ratio, multiplied by the average account value over the period, multiplied by 184/366 (to reflect the one-half year period). |
10
Fund's investments
| As of 10-31-15 (unaudited) | ||||||||||||||
| Shares | Value | |||||||||||||
| Common stocks 100.0% | $13,621,432 | |||||||||||||
| (Cost $12,765,865) | ||||||||||||||
| Consumer discretionary 0.3% | 42,919 | |||||||||||||
| Household durables 0.3% | ||||||||||||||
| Garmin, Ltd. | 1,210 | 42,919 | ||||||||||||
| Financials 0.5% | 72,500 | |||||||||||||
| Diversified financial services 0.5% | ||||||||||||||
| FactSet Research Systems, Inc. | 414 | 72,500 | ||||||||||||
| Health care 1.9% | 255,149 | |||||||||||||
| Health care providers and services 0.1% | ||||||||||||||
| Premier, Inc., Class A (I) | 260 | 8,791 | ||||||||||||
| Health care technology 1.8% | ||||||||||||||
| athenahealth, Inc. (I) | 230 | 35,064 | ||||||||||||
| Cerner Corp. (I) | 2,564 | 169,968 | ||||||||||||
| IMS Health Holdings, Inc. (I) | 1,220 | 33,208 | ||||||||||||
| Veeva Systems, Inc., Class A (I) | 320 | 8,118 | ||||||||||||
| Industrials 0.3% | 38,409 | |||||||||||||
| Commercial services and supplies 0.3% | ||||||||||||||
| Pitney Bowes, Inc. | 1,860 | 38,409 | ||||||||||||
| Information technology 97.0% | 13,212,455 | |||||||||||||
| Communications equipment 10.8% | ||||||||||||||
| Arista Networks, Inc. (I) | 251 | 16,192 | ||||||||||||
| ARRIS Group, Inc. (I) | 1,644 | 46,459 | ||||||||||||
| Brocade Communications Systems, Inc. | 4,454 | 46,411 | ||||||||||||
| Cisco Systems, Inc. | 18,263 | 526,888 | ||||||||||||
| CommScope Holding Company, Inc. (I) | 1,600 | 51,888 | ||||||||||||
| EchoStar Corp., Class A (I) | 470 | 21,070 | ||||||||||||
| F5 Networks, Inc. (I) | 670 | 73,834 | ||||||||||||
| Harris Corp. | 1,200 | 94,956 | ||||||||||||
| Juniper Networks, Inc. | 3,834 | 120,349 | ||||||||||||
| Motorola Solutions, Inc. | 1,134 | 79,346 | ||||||||||||
| Palo Alto Networks, Inc. (I) | 380 | 61,180 | ||||||||||||
| QUALCOMM, Inc. | 5,465 | 324,730 | ||||||||||||
| Electronic equipment, instruments and components 2.4% | ||||||||||||||
| CDW Corp. | 1,490 | 66,588 | ||||||||||||
| Corning, Inc. | 10,902 | 202,777 | ||||||||||||
| Fitbit, Inc., Class A (I) | 330 | 13,378 | ||||||||||||
| Ingram Micro, Inc., Class A | 1,520 | 45,266 | ||||||||||||
| Shares | Value | |||||||||||||
| Information technology (continued) | ||||||||||||||
| Internet software and services 14.3% | ||||||||||||||
| Akamai Technologies, Inc. (I) | 1,694 | $103,029 | ||||||||||||
| Alphabet, Inc., Class A (I) | 1,085 | 800,068 | ||||||||||||
| Alphabet, Inc., Class C (I) | 100 | 71,081 | ||||||||||||
| eBay, Inc. (I) | 6,248 | 174,319 | ||||||||||||
| Facebook, Inc., Class A (I) | 3,761 | 383,509 | ||||||||||||
| GoDaddy, Inc., Class A (I) | 120 | 3,298 | ||||||||||||
| InterActiveCorp | 920 | 61,649 | ||||||||||||
| j2 Global, Inc. | 500 | 38,775 | ||||||||||||
| MercadoLibre, Inc. | 260 | 25,576 | ||||||||||||
| Pandora Media, Inc. (I) | 754 | 8,679 | ||||||||||||
| Rackspace Hosting, Inc. (I) | 1,490 | 38,517 | ||||||||||||
| Twitter, Inc. (I) | 1,250 | 35,575 | ||||||||||||
| VeriSign, Inc. (I) | 880 | 70,928 | ||||||||||||
| Yahoo!, Inc. (I) | 3,764 | 134,074 | ||||||||||||
| IT services 7.7% | ||||||||||||||
| Amdocs, Ltd. | 1,620 | 96,503 | ||||||||||||
| Cognizant Technology Solutions Corp., Class A (I) | 2,744 | 186,894 | ||||||||||||
| Computer Sciences Corp. | 1,524 | 101,483 | ||||||||||||
| DST Systems, Inc. | 440 | 53,746 | ||||||||||||
| EPAM Systems, Inc. (I) | 210 | 16,244 | ||||||||||||
| Gartner, Inc. (I) | 850 | 77,070 | ||||||||||||
| IBM Corp. | 2,787 | 390,403 | ||||||||||||
| Sabre Corp. | 1,190 | 34,891 | ||||||||||||
| Syntel, Inc. (I) | 350 | 16,464 | ||||||||||||
| Teradata Corp. (I) | 1,340 | 37,667 | ||||||||||||
| VeriFone Systems, Inc. (I) | 1,224 | 36,891 | ||||||||||||
| Semiconductors and semiconductor equipment 21.5% | ||||||||||||||
| Altera Corp. | 2,070 | 108,779 | ||||||||||||
| Analog Devices, Inc. | 2,974 | 178,797 | ||||||||||||
| Applied Materials, Inc. | 5,508 | 92,369 | ||||||||||||
| Atmel Corp. | 4,214 | 32,026 | ||||||||||||
| Avago Technologies, Ltd. | 1,010 | 124,361 | ||||||||||||
| Broadcom Corp., Class A | 2,454 | 126,136 | ||||||||||||
| Cavium, Inc. (I) | 270 | 19,157 | ||||||||||||
| Cypress Semiconductor Corp. (I) | 2,854 | 30,081 | ||||||||||||
| Freescale Semiconductor, Ltd. (I) | 784 | 26,256 | ||||||||||||
| Intel Corp. | 20,474 | 693,250 | ||||||||||||
| KLA-Tencor Corp. | 1,660 | 111,419 | ||||||||||||
| Lam Research Corp. | 1,500 | 114,885 | ||||||||||||
| Linear Technology Corp. | 2,174 | 96,569 | ||||||||||||
| Marvell Technology Group, Ltd. | 4,484 | 36,814 | ||||||||||||
| Maxim Integrated Products, Inc. | 2,734 | 112,039 | ||||||||||||
| Shares | Value | |||||||||||||
| Information technology (continued) | ||||||||||||||
| Semiconductors and semiconductor equipment (continued) | ||||||||||||||
| Microchip Technology, Inc. | 2,294 | $110,777 | ||||||||||||
| Micron Technology, Inc. (I) | 7,208 | 119,364 | ||||||||||||
| NVIDIA Corp. | 4,624 | 131,183 | ||||||||||||
| ON Semiconductor Corp. (I) | 5,428 | 59,708 | ||||||||||||
| Qorvo, Inc. (I) | 1,334 | 58,603 | ||||||||||||
| Skyworks Solutions, Inc. | 1,810 | 139,804 | ||||||||||||
| SunEdison, Inc. (I) | 1,310 | 9,563 | ||||||||||||
| Teradyne, Inc. | 2,434 | 47,512 | ||||||||||||
| Texas Instruments, Inc. | 3,834 | 217,464 | ||||||||||||
| Xilinx, Inc. | 2,864 | 136,384 | ||||||||||||
| Software 26.3% | ||||||||||||||
| Activision Blizzard, Inc. | 5,874 | 204,180 | ||||||||||||
| Adobe Systems, Inc. (I) | 1,430 | 126,784 | ||||||||||||
| ANSYS, Inc. (I) | 710 | 67,670 | ||||||||||||
| Aspen Technology, Inc. (I) | 690 | 28,559 | ||||||||||||
| Autodesk, Inc. (I) | 1,560 | 86,096 | ||||||||||||
| CA, Inc. | 4,144 | 114,830 | ||||||||||||
| Cadence Design Systems, Inc. (I) | 2,430 | 53,995 | ||||||||||||
| CDK Global, Inc. | 1,272 | 63,333 | ||||||||||||
| Citrix Systems, Inc. (I) | 1,330 | 109,193 | ||||||||||||
| Electronic Arts, Inc. (I) | 2,400 | 172,968 | ||||||||||||
| FireEye, Inc. (I) | 831 | 21,731 | ||||||||||||
| Fortinet, Inc. (I) | 820 | 28,175 | ||||||||||||
| Guidewire Software, Inc. (I) | 430 | 25,039 | ||||||||||||
| Intuit, Inc. | 1,190 | 115,942 | ||||||||||||
| Manhattan Associates, Inc. (I) | 650 | 47,353 | ||||||||||||
| Microsoft Corp. | 17,563 | 924,512 | ||||||||||||
| NetSuite, Inc. (I) | 190 | 16,163 | ||||||||||||
| Nuance Communications, Inc. (I) | 2,700 | 45,819 | ||||||||||||
| Oracle Corp. | 12,015 | 466,663 | ||||||||||||
| PTC, Inc. (I) | 1,184 | 41,961 | ||||||||||||
| Qlik Technologies, Inc. (I) | 450 | 14,117 | ||||||||||||
| Red Hat, Inc. (I) | 1,270 | 100,470 | ||||||||||||
| salesforce.com, Inc. (I) | 1,214 | 94,340 | ||||||||||||
| ServiceNow, Inc. (I) | 734 | 59,931 | ||||||||||||
| Solera Holdings, Inc. | 670 | 36,622 | ||||||||||||
| Splunk, Inc. (I) | 610 | 34,258 | ||||||||||||
| SS&C Technologies Holdings, Inc. | 670 | 49,681 | ||||||||||||
| Symantec Corp. | 7,958 | 163,935 | ||||||||||||
| Synopsys, Inc. (I) | 1,540 | 76,969 | ||||||||||||
| Tableau Software, Inc., Class A (I) | 250 | 20,990 | ||||||||||||
| The Ultimate Software Group, Inc. (I) | 210 | 42,914 | ||||||||||||
| Tyler Technologies, Inc. (I) | 230 | 39,183 | ||||||||||||
| Shares | Value | |||||||||||||
| Information technology (continued) | ||||||||||||||
| Software (continued) | ||||||||||||||
| Verint Systems, Inc. (I) | 460 | $21,887 | ||||||||||||
| VMware, Inc., Class A (I) | 350 | 21,053 | ||||||||||||
| Workday, Inc., Class A (I) | 530 | 41,854 | ||||||||||||
| Technology hardware, storage and peripherals 14.0% | ||||||||||||||
| Apple, Inc. | 6,778 | 809,971 | ||||||||||||
| EMC Corp. | 8,528 | 223,604 | ||||||||||||
| HP, Inc. (I) | 8,318 | 224,253 | ||||||||||||
| NCR Corp. (I) | 1,774 | 47,188 | ||||||||||||
| NetApp, Inc. | 3,150 | 107,100 | ||||||||||||
| SanDisk Corp. | 2,434 | 187,418 | ||||||||||||
| Seagate Technology PLC | 3,224 | 122,705 | ||||||||||||
| Western Digital Corp. | 2,830 | 189,101 | ||||||||||||
| Yield (%) | Shares | Value | ||||||||||||
| Short-term investments 0.0 % | ||||||||||||||
| (Cost $2,973) | ||||||||||||||
| Money market funds 0.0% | 2,973 | |||||||||||||
| State Street Institutional Liquid Reserves Fund | 0.1451(Y | ) | 2,973 | $2,973 | ||||||||||
| Total investments (Cost $12,768,838)† 100.0% | $13,624,405 | |||||||||||||
| Other assets and liabilities, net 0.0% | $1,909 | |||||||||||||
| Total net assets 100.0% | $13,626,314 | |||||||||||||
| The percentage shown for each investment category is the total value of the category as a percentage of the net assets of the fund. | ||||||||||||||
| Key to Security Abbreviations and Legend | ||||||||||||||
| (I) | Non-income producing security. | |||||||||||||
| (Y) | The rate shown is the annualized seven-day yield as of 10-31-15. | |||||||||||||
| † | At 10-31-15, the aggregate cost of investment securities for federal income tax purposes was $12,768,838. Net unrealized appreciation aggregated $855,567, of which $942,983 related to appreciated investment securities and $87,416 related to depreciated investment securities. | |||||||||||||
Financial statements
STATEMENT OF ASSETS AND LIABILITIES 10-31-15 (unaudited)
| Assets | |||||||||||||
| Investments, at value (Cost $12,768,838) | $13,624,405 | ||||||||||||
| Receivable for fund shares sold | 2,762,742 | ||||||||||||
| Dividends receivable | 1,165 | ||||||||||||
| Receivable due from advisor | 6,745 | ||||||||||||
| Other receivables and prepaid expenses | 4,277 | ||||||||||||
| Total assets | 16,399,334 | ||||||||||||
| Liabilities | |||||||||||||
| Payable for investments purchased | 2,761,655 | ||||||||||||
| Payable to affiliates | |||||||||||||
| Accounting and legal services fees | 11 | ||||||||||||
| Other liabilities and accrued expenses | 11,354 | ||||||||||||
| Total liabilities | 2,773,020 | ||||||||||||
| Net assets | $13,626,314 | ||||||||||||
| Net assets consist of | |||||||||||||
| Paid-in capital | $12,767,866 | ||||||||||||
| Undistributed net investment income | 2,623 | ||||||||||||
| Accumulated net realized gain (loss) on investments | 258 | ||||||||||||
| Net unrealized appreciation (depreciation) on investments | 855,567 | ||||||||||||
| Net assets | $13,626,314 | ||||||||||||
| Net asset value per share | |||||||||||||
| Based on net asset values and shares outstanding-the fund has an unlimited number of shares authorized with no par value | |||||||||||||
| Net assets | $13,626,314 | ||||||||||||
| Shares outstanding | 500,000 | ||||||||||||
| Net asset value per share | $27.25 | ||||||||||||
STATEMENT OF OPERATIONS For the period ended 10-31-15 (unaudited)1
| Investment income | |||||||||||||||||||||||||||||||||
| Dividends | $6,691 | ||||||||||||||||||||||||||||||||
| Total investment income | 6,691 | ||||||||||||||||||||||||||||||||
| Expenses | |||||||||||||||||||||||||||||||||
| Investment management fees | 3,661 | ||||||||||||||||||||||||||||||||
| Accounting and legal services fees | 138 | ||||||||||||||||||||||||||||||||
| Transfer agent fees | 1,062 | ||||||||||||||||||||||||||||||||
| Printing and postage | 1,246 | ||||||||||||||||||||||||||||||||
| Professional fees | 5,288 | ||||||||||||||||||||||||||||||||
| Custodian fees | 1,768 | ||||||||||||||||||||||||||||||||
| Registration and filing fees | 998 | ||||||||||||||||||||||||||||||||
| Other | 825 | ||||||||||||||||||||||||||||||||
| Total expenses | 14,986 | ||||||||||||||||||||||||||||||||
| Less expense reductions | (10,918 | ) | |||||||||||||||||||||||||||||||
| Net expenses | 4,068 | ||||||||||||||||||||||||||||||||
| Net investment income | 2,623 | ||||||||||||||||||||||||||||||||
| Realized and unrealized gain (loss) | |||||||||||||||||||||||||||||||||
| Net realized gain (loss) on investments | 258 | ||||||||||||||||||||||||||||||||
| Change in net unrealized appreciation (depreciation) of investments | 855,567 | ||||||||||||||||||||||||||||||||
| Net realized and unrealized gain | 855,825 | ||||||||||||||||||||||||||||||||
| Increase in net assets from operations | $858,448 | ||||||||||||||||||||||||||||||||
| 1 | Period from 9-28-15 (commencement of operations) to 10-31-15. | ||||||||||||||||||||||
STATEMENT OF CHANGES IN NET ASSETS
| Period ended 10-31-151 | |||||||||||||||||
| (unaudited) | |||||||||||||||||
| Increase (decrease) in net assets | |||||||||||||||||
| From operations | |||||||||||||||||
| Net investment income | $2,623 | ||||||||||||||||
| Net realized gain | 258 | ||||||||||||||||
| Change in net unrealized appreciation (depreciation) | 855,567 | ||||||||||||||||
| Increase in net assets resulting from operations | 858,448 | ||||||||||||||||
| From fund share transactions | |||||||||||||||||
| Shares issued | 12,767,866 | ||||||||||||||||
| Total from fund share transactions | 12,767,866 | ||||||||||||||||
| Total increase | 13,626,314 | ||||||||||||||||
| Net assets | |||||||||||||||||
| Beginning of period | — | ||||||||||||||||
| End of period | $13,626,314 | ||||||||||||||||
| Undistributed net investment income | $2,623 | ||||||||||||||||
| Share activity | |||||||||||||||||
| Shares issued | 500,000 | ||||||||||||||||
| End of period | 500,000 | ||||||||||||||||
| 1 | Period from 9-28-15 (commencement of operations) to 10-31-15. | ||||||||||||||||||||||
Financial highlights
| Period ended | 10-31-15 | 1 | |||||||||||||||||||||||||||||||||||||||
| Per share operating performance | |||||||||||||||||||||||||||||||||||||||||
| Net asset value, beginning of period | $24.42 | ||||||||||||||||||||||||||||||||||||||||
| Net investment income2 | 0.01 | ||||||||||||||||||||||||||||||||||||||||
| Net realized and unrealized gain on investments | 2.82 | ||||||||||||||||||||||||||||||||||||||||
| Total from investment operations | 2.83 | ||||||||||||||||||||||||||||||||||||||||
| Net asset value, end of period | $27.25 | ||||||||||||||||||||||||||||||||||||||||
| Total return (%)3 | 11.59 | 4 | |||||||||||||||||||||||||||||||||||||||
| Ratios and supplemental data | |||||||||||||||||||||||||||||||||||||||||
| Net assets, end of period (in millions) | $14 | ||||||||||||||||||||||||||||||||||||||||
| Ratios (as a percentage of average net assets): | |||||||||||||||||||||||||||||||||||||||||
| Expenses before reductions | 1.84 | 5 | |||||||||||||||||||||||||||||||||||||||
| Expenses including reductions | 0.50 | 5 | |||||||||||||||||||||||||||||||||||||||
| Net investment income | 0.32 | 5 | |||||||||||||||||||||||||||||||||||||||
| Portfolio turnover (%)6 | — | 7 | |||||||||||||||||||||||||||||||||||||||
| 1 | Period from 9-28-15 (commencement of operations) to 10-31-15. Unaudited. | |||||||||||||||||||||||||||||||||||||
| 2 | Based on average daily shares outstanding. | |||||||||||||||||||||||||||||||||||||
| 3 | Total returns would have been lower had certain expenses not been reduced during the period. | |||||||||||||||||||||||||||||||||||||
| 4 | Not annualized. | |||||||||||||||||||||||||||||||||||||
| 5 | Annualized. | |||||||||||||||||||||||||||||||||||||
| 6 | Portfolio turnover rate excludes securities received or delivered from in-kind transactions. | |||||||||||||||||||||||||||||||||||||
| 7 | Less than 1%. | |||||||||||||||||||||||||||||||||||||
Note 1 — Organization
John Hancock Multifactor Technology ETF (the fund) is a series of the John Hancock Exchange-Traded Fund Trust (the Trust), an open-end management investment company organized as a Massachusetts business trust and registered under the Investment Company Act of 1940, as amended (the 1940 Act). The investment objective of the fund is to seek to provide investment results that closely correspond, before fees and expenses, to the performance of the John Hancock Dimensional Technology Index. The John Hancock Dimensional Technology Index comprises securities in the technology sector within the U.S. Universe whose market capitalizations are larger than that of the 1001st largest U.S. company at the time of reconstitution.
The fund commenced operations on September 28, 2015.
Note 2 — Significant accounting policies
The financial statements have been prepared in conformity with accounting principles generally accepted in the United States of America (US GAAP), which require management to make certain estimates and assumptions as of the date of the financial statements. Actual results could differ from those estimates and those differences could be significant. The fund qualifies as an investment company under Topic 946 of Accounting Standards Codification of US GAAP.
Events or transactions occurring after the end of the fiscal period through the date that the financial statements were issued have been evaluated in the preparation of the financial statements. The following summarizes the significant accounting policies of the fund:
Security valuation. Investments are stated at value as of the close of regular trading on the New York Stock Exchange (NYSE), normally at 4:00 p.m., Eastern Time. In order to value the securities, the fund uses the following valuation techniques: Equity securities held by the fund are valued at the last sale price or official closing price on the exchange where the security was acquired or most likely will be sold. In the event there were no sales during the day or closing prices are not available, the securities are valued using the last available bid price. Investments by the fund in open-end mutual funds are valued at their respective net asset values each business day. Other portfolio securities and assets, for which reliable market quotations are not readily available, are valued at fair value as determined in good faith by the fund's Pricing Committee following procedures established by the Board of Trustees. The frequency with which these fair valuation procedures are used cannot be predicted and fair value of securities may differ significantly from the value that would have been used had a ready market for such securities existed.
The fund uses a three-tier hierarchy to prioritize the pricing assumptions, referred to as inputs, used in valuation techniques to measure fair value. Level 1 includes securities valued using quoted prices in active markets for identical securities. Level 2 includes securities valued using other significant observable inputs. Observable inputs may include quoted prices for similar securities, interest rates, prepayment speeds and credit risk. Prices for securities valued using these inputs are received from independent pricing vendors and brokers and are based on an evaluation of the inputs described. Level 3 includes securities valued using significant unobservable inputs when market prices are not readily available or reliable, including the fund's own assumptions in determining the fair value of investments. Factors used in determining value may include market or issuer specific events or trends, changes in interest rates and credit quality. The inputs or methodology used for valuing securities are not necessarily an indication of the risks associated with investing in those securities. Changes in valuation techniques and related inputs may result in transfers into or out of an assigned level within the disclosure hierarchy.
As of October 31, 2015, all investments are categorized as Level 1 under the hierarchy described above.
Security transactions and related investment income. Investment security transactions are accounted for on a trade date plus one basis for daily net asset value calculations. However, for financial reporting purposes, investment transactions are reported on trade date. Dividend income is recorded on the ex-date, except for dividends of foreign securities where the dividend may not be known until after the ex-date. In those cases, dividend income, net of withholding taxes, is recorded when the fund becomes aware of the dividends. Gains and losses on securities sold are determined on the basis of identified cost and may include proceeds from litigation.
19
Overdrafts. Pursuant to the custodian agreement, the fund's custodian may, in its discretion, advance funds to the fund to make properly authorized payments. When such payments result in an overdraft, the fund is obligated to repay the custodian for any overdraft, including any costs or expenses associated with the overdraft. The custodian may have a lien, security interest or security entitlement in any fund property that is not otherwise segregated or pledged, to the maximum extent permitted by law, to the extent of any overdraft.
Expenses. Within the John Hancock group of funds complex, expenses that are directly attributable to an individual fund are allocated to such fund. Expenses that are not readily attributable to a specific fund are allocated among all funds in an equitable manner, taking into consideration, among other things, the nature and type of expense and the fund's relative net assets. Expense estimates are accrued in the period to which they relate and adjustments are made when actual amounts are known.
Federal income taxes. The fund intends to qualify as a regulated investment company by complying with the applicable provisions of the Internal Revenue Code and will not be subject to federal income tax on taxable income that is distributed to shareholders. Therefore, no federal income tax provision is required.
Distribution of income and gains. Distributions to shareholders from net investment income and net realized gains, if any, are recorded on the ex-date. The fund will declare and pay dividends semiannually from net investment income, if any. Capital gain distributions, if any, are typically distributed annually.
Such distributions, on a tax basis, are determined in conformity with income tax regulations, which may differ from US GAAP.
Capital accounts within the financial statements are adjusted for permanent book-tax differences. These adjustments have no impact on net assets or the results of operations. Temporary book-tax differences, if any, will reverse in a subsequent period.
Note 3 — Guarantees and indemnifications
Under the Trust's organizational documents, its Officers and Trustees are indemnified against certain liabilities arising out of the performance of their duties to the Trust, including the fund. Additionally, in the normal course of business, the fund enters into contracts with service providers that contain general indemnification clauses. The fund's maximum exposure under these arrangements is unknown, as this would involve future claims that may be made against the fund that have not yet occurred. The risk of material loss from such claims is considered remote.
Note 4 — Fees and transactions with affiliates
John Hancock Advisers, LLC (the Advisor) serves as investment advisor for the fund. The Advisor is an indirect, wholly owned subsidiary of Manulife Financial Corporation (MFC).
Management fee. The fund has an investment management agreement with the Advisor under which the fund pays a monthly management fee to the Advisor, equivalent on an annual basis, to the sum of: (a) 0.450% of the first $300 million of the fund's average daily net assets; and (b) 0.420% of the fund's average daily net assets in excess of $300 million. The Advisor has a subadvisory agreement with Dimensional Fund Advisors LP. The fund is not responsible for payment of the subadvisory fees.
The Advisor has contractually agreed to waive a portion of its management fee and/or reimburse expenses for certain funds of the John Hancock group of funds complex, including the fund (the participating portfolios). This waiver is based upon aggregate net assets of all the participating portfolios. The amount of the reimbursement is calculated daily and allocated among all the participating portfolios in proportion to the daily net assets of each fund. During the period ended October 31, 2015, this waiver amounted to 0.01% of the fund's average net assets (on an annualized basis). This arrangement may be amended or terminated at any time by the Advisor upon notice to the fund and with the approval of the Board of Trustees.
The Advisor has contractually agreed to reduce its management fee or, if necessary, make payment to the fund, in an amount equal to the amount by which expenses of the fund exceed 0.50% of average annual net assets (on an annualized basis). Expenses means all the expenses of the fund, excluding (a) taxes, (b) brokerage commissions, (c) interest expense, (d)
20
litigation and indemnification expenses and other extraordinary expenses not incurred in the ordinary course of the fund's business, (e) borrowing costs, (f) prime brokerage fees, (g) acquired fund fees, and (h) short dividend expenses. The expense limitation expires on August 31, 2017, unless renewed by mutual agreement of the fund and the Advisor based on a determination that this is appropriate under the circumstances at that time.
For the period ended October 31, 2015, the expense reductions described above amounted to $10,918.
The investment management fees, including the impact of the waivers and reimbursements as described above, incurred for the period ended October 31, 2015 were equivalent to a net annual effective rate of 0.00% of the fund's average daily net assets.
Accounting and legal services. Pursuant to a service agreement, the fund reimburses the Advisor for all expenses associated with providing the administrative, financial, legal, accounting and recordkeeping services to the fund, including the preparation of all tax returns, periodic reports to shareholders and regulatory reports, among other services. These accounting and legal services fees incurred for the period ended October 31, 2015 amounted to an annual rate of 0.02% of the fund's average daily net assets.
Trustee expenses. The fund compensates each Trustee who is not an employee of the Advisor or its affiliates. The costs of paying Trustee compensation and expenses are allocated to each fund based on its net assets relative to other funds within the John Hancock group of funds complex.
Note 5 — Capital share transactions
The fund will issue and redeem shares at net asset value (NAV) only in a large specified number of shares, each called a "creation unit," or multiples thereof, that consist of 50,000 shares. Only authorized participants may engage in creation or redemption transactions directly with the fund. Such transactions generally take place when an authorized participant deposits into the fund a designated portfolio of securities (including any portion of such securities for which cash may be substituted) and a specified amount of cash approximating the holdings of the fund in exchange for a specified number of creation units. Authorized participants pay a transaction fee to the custodian when purchasing and redeeming creation units of a fund. The transaction fee is used to defray the costs associated with the issuance and redemption of creation units. Individual shares of the fund may only be purchased and sold in secondary market transactions through brokers. Secondary market transactions may be subject to brokerage commissions. Shares of the fund are listed and traded on the NYSE Arca, Inc., shares trade at market prices rather than NAV, and may trade at a price greater than or less than NAV.
Affiliates of the fund owned 92% of shares outstanding on October 31, 2015.
Note 6 — Purchase and sale of securities
Purchases and sales of securities, other than in-kind transactions and short-term securities, amounted to $31,835 and $15,307, respectively, for the period ended October 31, 2015. Securities received and delivered from in-kind transactions aggregated $12,749,078 and $0, respectively, for the period ended October 31, 2015.
Note 7 — Industry or sector risk
The fund generally invests a large percentage of its assets in one or more particular industries or sectors of the economy. If a large percentage of the fund's assets are economically tied to a single or small number of industries or sectors of the economy, the fund will be less diversified than a more broadly diversified fund, and it may cause the fund to underperform if that industry or sector underperforms. In addition, focusing on a particular industry or sector may make the fund's net asset value more volatile. Further, a fund that invests in particular industries or sectors is particularly susceptible to the impact of market, economic, regulatory and other factors affecting those industries or sectors.
21
EVALUATION OF ADVISORY AND SUBADVISORY AGREEMENTS BY THE BOARD OF TRUSTEES
Approval of Advisory and Subadvisory Agreements
At in-person meetings held on June 23-25, 2015, the Board of Trustees (the Board) of John Hancock Exchange-Traded Fund Trust (the Trust), including all of the Trustees who are not considered to be interested persons of the Trust under the Investment Company Act of 1940, as amended (the 1940 Act) (the Independent Trustees), approved the John Hancock Multifactor Technology ETF (the New Fund).
This section describes the evaluation by the Board of:
| (a) | an advisory agreement between the Trust and John Hancock Advisers, LLC (the Advisor) (the Advisory Agreement); and | |
| (b) | a subadvisory agreement between the Advisor and Dimensional Fund Advisors LP (the Subadvisor) with respect to the New Fund (the Subadvisory Agreement). |
In considering the Advisory Agreement and the Subadvisory Agreement with respect to the New Fund, the Board received in advance of the meetings a variety of materials relating to the New Fund, the Advisor and the Subadvisor, including comparative expense information for a peer group of similar exchange-traded funds and a broader universe of exchange-traded funds, simulated performance information of the New Fund's underlying index (Underlying Index) as compared to applicable benchmarks, and other information provided by the Advisor and the Subadvisor regarding the nature, extent, and quality of services to be provided by the Advisor and the Subadvisor under their respective Agreements, as well as information regarding the Advisor's anticipated profitability in connection with its proposed relationship to the New Fund and any compensation paid to affiliates of the Advisor. The Board also took into account discussions with management and information provided to the Board members at prior meetings with respect to the services provided by the Advisor and the Subadvisor to other John Hancock Funds (the Funds), including quarterly performance reports prepared by management containing reviews of investment results, and periodic presentations from the Subadvisor with respect to the other Funds that it manages. The Board also considered the nature, quality, and extent of the non-advisory services, if any, to be provided to the New Fund by the Advisor and/or its affiliates, including administrative services. The Board members also took into account information with respect to the New Fund presented at their March 10-12, 2015 in-person meeting.
Throughout the process, the Board asked questions of and were afforded the opportunity to request additional information from management. The Board is assisted by legal counsel for the Trust, and the Independent Trustees were also separately assisted by independent legal counsel throughout the process. The Independent Trustees also received a memorandum from their independent legal counsel discussing the legal standards for their consideration of the proposed Advisory Agreement and Subadvisory Agreement and discussed the proposed Advisory Agreement and Subadvisory Agreement in private sessions with their independent legal counsel at which no representatives of management were present.
Approval of Advisory Agreement
In approving the Advisory Agreement with respect to the New Fund, the Board, including the Independent Trustees, considered a variety of factors, including those discussed below. The Board also considered other factors (including conditions and trends prevailing generally in the economy, the securities markets and the industry) and did not treat any single factor as determinative, and each Trustee may have attributed different weights to different factors. The Board members' conclusions may have been based in part on their consideration of the advisory and subadvisory arrangements for other Funds in prior years.
Nature, extent, and quality of services. Among the information received by the Board from the Advisor relating to the nature, extent and quality of services to be provided to the New Fund, the Board considered information provided by the Advisor relating to its operations and personnel, descriptions of its organizational and management structure, and information regarding the Advisor's compliance and regulatory history. The Board members also noted that, on a regular basis, they receive and review information from the Funds' Chief Compliance Officer (CCO) regarding the Funds' compliance policies
22
and procedures established pursuant to Rule 38a-1 under the 1940 Act. The Board considered the investment strategy and Underlying Index of the New Fund. The Board also considered the Advisor's risk management processes. The Board considered that the Advisor would be responsible for the management of the day-to-day operations of the New Fund, including but not limited to, general supervision of and coordination of the services to be provided by the Subadvisor, and also would be responsible for monitoring and reviewing the activities of the Subadvisor and other third-party service providers, including the New Fund's distributor.
In considering the nature, extent and quality of the services to be provided by the Advisor, the Trustees also took into account their knowledge of the Advisor's management of other Funds and the quality of the performance of the Advisor's duties with respect to other Funds, through Board meetings, discussions and reports during the preceding year and through each Trustee's experience as a trustee of the other trusts in the complex.
In the course of its deliberations regarding the Advisory Agreement, the Board members considered, among other things:
| (a) | the skills and competency with which the Advisor has in the past managed the Funds' affairs and its subadvisory relationships, including those with the Subadvisor, the Advisor's oversight and monitoring of the Subadvisor's investment performance and compliance programs, such as the Subadvisor's compliance with fund policies and objectives; review of brokerage matters, including with respect to trade allocation and best execution; and the Advisor's timeliness in responding to performance issues; | ||
| (b) | the background, qualifications, and skills of the Advisor's personnel; | ||
| (c) | the Advisor's compliance policies and procedures and its responsiveness to regulatory changes and fund industry developments; | ||
| (d) | the Advisor's administrative capabilities, including its ability to supervise the other service providers for the Funds; | ||
| (e) | the financial condition of the Advisor and whether it has the financial wherewithal to provide a high level and quality of services to the New Fund; and | ||
| (f) | the Advisor's reputation and experience in serving as an investment advisor to the Funds, and the benefit to shareholders of investing in funds that are part of a family of funds offering a variety of investments. |
The Board concluded that the Advisor may reasonably be expected to provide a high quality of services under the Advisory Agreement with respect to the New Fund.
Investment performance. In connection with its consideration of the Advisory Agreement, the Board considered, the New Fund's investment strategy and processes, including the fact that the New Fund will seek performance that closely corresponds to its Underlying Index, which was developed by, and will be maintained, by, the Subadvisor. The Board also considered the simulated performance of the New Fund's Underlying Index as compared to applicable benchmarks.
Fees and Expenses. The Board reviewed comparative information including, among other data, the New Fund's anticipated management fees and total net expenses as compared to similarly situated exchange-traded funds deemed to be comparable to the New Fund.
The Board took into account management's discussion of the New Fund's anticipated expenses. The Board noted that the Advisor does not currently manage other funds or institutional accounts with the same or similar strategies proposed for the New Fund.
The Board took into account management's discussion with respect to the proposed advisory/subadvisory fee structure, including the amount of the advisory fee to be retained by the Advisor after payment of the subadvisory fees. The Board also noted that the Advisor, and not the New Fund, would be responsible for paying the subadvisory fees and that such fees are negotiated at arm's length with respect to the Subadvisor. The Board also noted that the Advisor has contractually agreed to waive fees and/or reimburse expenses with respect to the New Fund for a specified period. The Board concluded that the
23
advisory fees to be paid by the New Fund are reasonable in relation to the nature, extent and quality of the services expected to be provided.
Profitability/Indirect Benefits. In considering the costs of the services to be provided and the profits to be realized by the Advisor and its affiliates from the Advisor's relationship with the New Fund, the Board:
| (a) | noted that because the New Fund was not yet in existence, no actual revenue, cost or profitability data was available for the Board to review; | ||
| (b) | reviewed and considered information presented by the Advisor regarding the advisory fees and advisory spreads prior to distribution, operations and overhead for the New Fund; | ||
| (c) | noted that the Advisor will derive reputational and other indirect benefits from providing advisory services to the New Fund; | ||
| (d) | noted that the subadvisory fee for the New Fund will be paid by Advisor and is negotiated at arm's length; | ||
| (e) | noted that the Advisor will also pay the Subadvisor a license fee in connection with the New Fund's use of the Underlying Index; and | ||
(f) | considered that the Advisor should be entitled to earn a reasonable level of profits in exchange for the level of services it will provide to the New Fund and the entrepreneurial risk that it assumes as Advisor. |
Based upon its review, the Board concluded that the anticipated level of profitability, if any, of the Advisor and its affiliates from their relationship with the New Fund is reasonable and not excessive.
Economies of Scale. In considering the extent to which economies of scale would be realized if the New Fund grows and whether fee levels reflect these economies of scale for the benefit of fund shareholders, the Board:
| (a) | considered that the Advisor has contractually agreed to waive a portion of its management fee and/or reimburse or pay operating expenses of the New Fund to reduce operating expenses for a specified period of time; | ||
| (b) | reviewed the New Fund's advisory fee structure and concluded that: (i) the New Fund's fee structure contains breakpoints at the subadvisory fee level and that such breakpoints are reflected as breakpoints in the advisory fees for the New Fund; and (ii) although economies of scale cannot be measured with precision, these arrangements permit shareholders of the New Fund to benefit from economies of scale if the New Fund grows. The Board also took into account management's discussion of the New Fund's advisory fee structure; and | ||
| (c) | the Board also considered the potential effect of the New Fund's future growth in size on its performance and fees. The Board also noted that if the New Fund's assets increase over time, the New Fund may realize other economies of scale and the Board would consider whether additional breakpoints would be appropriate at that time. |
Approval of Subadvisory Agreement
In making its determination with respect to approval of the Subadvisory Agreement, the Board reviewed:
| (a) | information relating to the Subadvisor's business, including current subadvisory services (to other funds in the John Hancock family of funds); | ||||||||||
| (b) | the simulated performance of the Underlying Index developed by the Subadvisor as compared to applicable benchmarks; |
24
| (c) | the proposed advisory fee and total expense ratio for the New Fund, including any breakpoints, and comparable fee information prepared by an independent third party provider of fund data; and | ||||||||||
| (d) | information relating to the nature and scope of any material relationships and their significance to the New Fund's Advisor and Subadvisor. |
Nature, Extent, and Quality of Services. With respect to the services to be provided by the Subadvisor, the Board members received and reviewed information provided to the Board by the Subadvisor with respect to the New Fund and took into account information presented throughout the past year with respect to Funds in the complex managed by the Advisor and subadvised by the Subadvisor. In this regard, the Board members considered the Subadvisor's current level of staffing and its overall resources, as well as considered information relating to the Subadvisor's compensation program. The Board members reviewed the Subadvisor's history and investment experience, as well as information regarding the qualifications, background, and responsibilities of the Subadvisor's investment and compliance personnel who will provide services to the New Fund. The Board members also considered the Subadvisor's risk assessment and monitoring processes. The Board members noted that the Advisor conducts regular periodic reviews of the Subadvisor and its operations in regard to the Funds, including regarding investment processes and organizational and staffing matters. The Board members also noted that the Funds' CCO and his staff conduct regular, periodic compliance reviews with the Subadvisor and present reports to the Independent Trustees regarding the same, which include evaluating the regulatory compliance systems of the Subadvisor and procedures reasonably designed by it to assure compliance with the federal securities laws. The Board members also took into account the financial condition of the Subadvisor.
The Board considered the Subadvisor's investment processes and philosophies. The Board took into account that the New Fund will seek performance that closely corresponds to its Underlying Index, which was developed by, and will be maintained, by, the Subadvisor.
Subadvisor compensation. In considering the cost of services to be provided by the Subadvisor, the Board noted that the fees under the Subadvisory Agreement are paid by the Advisor and not the New Fund. The Board members also considered information and took into account any other potential conflicts of interests the Advisor might have in connection with the Subadvisory Agreement.
The Board also relied on the ability of the Advisor to negotiate the Subadvisory Agreement with the Subadvisor, which is not affiliated with the Advisor, and the fees thereunder at arm's length. As a result, the costs of the services to be provided and the profits to be realized by the Subadvisor from its relationship with the Trust were not a factor in the Board's consideration of the Subadvisory Agreement.
The Board also received information regarding the nature and scope (including their significance to the Advisor and its affiliates and to the Subadvisor) of any material relationships with respect to the Subadvisor, which include arrangements in which the Subadvisor will serve as the index provider for the New Fund and for other exchange-traded funds in the complex, as well as arrangements in which the Subadvisor or its affiliates provide advisory, or management services in connection with financial products sponsored by the Advisor or its affiliates, and may include other registered investment companies, including other exchange-traded funds, a 529 education savings plan, managed separate accounts and exempt group annuity contracts sold to qualified plans.
In addition, the Board considered other potential indirect benefits that the Subadvisor and its affiliates may receive from the Subadvisor's relationship with the New Fund, such as the opportunity to provide advisory services to additional John Hancock Funds and reputational benefits.
Subadvisory fees. The Board considered that the New Fund will pay advisory fees to the Advisor and that, in turn, the Advisor will pay subadvisory fees to the Subadvisor. The Board considered the New Fund's advisory fees and total expense ratio as compared to similarly situated exchange-traded funds deemed to be comparable to the New Fund. The Board also considered that the Subadvisor receives additional compensation from the Advisor in connection with its role as index provider for the New Fund.
25
Subadvisor performance. The Board considered the New Fund's investment strategy and processes, including the fact that the New Fund will seek performance that closely corresponds to its Underlying Index and that its Underlying Index has been developed by, and will be maintained by, the Subadvisor. The Board also considered simulated performance of the Underlying Index as compared to applicable benchmarks. The Board noted the Advisor's expertise and resources in monitoring the performance, investment style and risk-adjusted performance of the Subadvisor. The Board was mindful of the Advisor's focus on the Subadvisor's performance.
The Board's decision to approve the Subadvisory Agreement was based on a number of determinations, including the following:
| (1) | The Subadvisor has extensive experience and demonstrated skills as a manager, and currently subadvises other Funds in the complex and the Board is generally satisfied with the Subadvisor's management of these Funds, and may reasonably be expected to provide a high quality of investment management services to the New Fund; | |
| (2) | the proposed subadvisory fees are reasonable in relation to the level and quality of services to be provided; and | |
| (3) | subadvisory fee breakpoints are reflected as breakpoints in the advisory fees for the New Fund in order to permit shareholders to benefit from economies of scale if and as the New Fund grows. | |
| * * * | ||
Based on the Board's evaluation of all factors that it deemed to be material, including those factors described above, and assisted by the advice of independent legal counsel, the Board, including the Independent Trustees, concluded that approval of the Advisory Agreement and the Subadvisory Agreement would be in the best interest of the New Fund and its shareholders. Accordingly, the Board, and the Independent Trustees voting separately, approved the Advisory Agreement and Subadvisory Agreement.
26
Trustees James M. Oates, Chairperson Officers Andrew G. Arnott John J. Danello Francis V. Knox, Jr. Charles A. Rizzo Salvatore Schiavone | Investment advisor John Hancock Advisers, LLC Subadvisor Dimensional Fund Advisors LP Principal distributor Foreside Fund Services, LLC Custodian State Street Bank and Trust Company Transfer agent State Street Bank and Trust Company Legal counsel Dechert LLP Stock symbol NYSE Arca: JHMT |
*Member of the Audit Committee
†Non-Independent Trustee
The fund's proxy voting policies and procedures, as well as the fund proxy voting record for the most recent twelve-month period ended June 30, are available free of charge on the Securities and Exchange Commission (SEC) website at sec.gov or on our website.
The fund's complete list of portfolio holdings, for the first and third fiscal quarters, is filed with the SEC on Form N-Q. The fund's Form N-Q is available on our website and the SEC's website, sec.gov, and can be reviewed and copied (for a fee) at the SEC's Public Reference Room in Washington, DC. Call 800-SEC-0330 to receive information on the operation of the SEC's Public Reference Room.
We make this information on your fund, as well as monthly portfolio holdings, and other fund details available on our website at jhinvestments.com/etf or by calling 800-225-5291.
| You can also contact us: | |||
| 800-225-5291 jhinvestments.com/etf | Regular mail: John Hancock Signature Services, Inc. | Express mail: John Hancock Signature Services, Inc. | |
27
John Hancock family of funds
DOMESTIC EQUITY FUNDS Balanced Blue Chip Growth Classic Value Disciplined Value Disciplined Value Mid Cap Equity Income Fundamental All Cap Core Fundamental Large Cap Core Fundamental Large Cap Value Large Cap Equity New Opportunities Select Growth Small Cap Equity Small Cap Value Small Company Strategic Growth U.S. Equity U.S. Global Leaders Growth Value Equity GLOBAL/INTERNATIONAL FUNDS Disciplined Value International Emerging Markets Emerging Markets Equity Global Equity Global Shareholder Yield Greater China Opportunities International Core International Growth International Small Company International Value Equity | INCOME FUNDS Bond California Tax-Free Income Core High Yield Emerging Markets Debt Floating Rate Income Focused High Yield Global Income Government Income High Yield Municipal Bond Income Investment Grade Bond Money Market Short Duration Credit Opportunities Spectrum Income Strategic Income Opportunities Tax-Free Bond ALTERNATIVE/SPECIALTY FUNDS Absolute Return Currency Alternative Asset Allocation Enduring Assets Financial Industries Global Absolute Return Strategies Global Conservative Absolute Return Global Real Estate Natural Resources Redwood Regional Bank Seaport Technical Opportunities |
The fund's investment objectives, risks, charges, and expenses are included in the prospectus and should be considered carefully before investing. For a prospectus, contact your financial professional, call
John Hancock Investments at 800-225-5291, or visit the fund's website at jhinvestments.com. Please read the prospectus carefully before investing or sending money.
ASSET ALLOCATION PORTFOLIOS Income Allocation Fund Lifestyle Aggressive Portfolio Lifestyle Balanced Portfolio Lifestyle Conservative Portfolio Lifestyle Growth Portfolio Lifestyle Moderate Portfolio Retirement Choices Portfolios (2010-2055) Retirement Living Portfolios (2010-2055) Retirement Living II Portfolios (2010-2055) EXCHANGE-TRADED FUNDS John Hancock Multifactor Consumer Discretionary ETF John Hancock Multifactor Financials ETF John Hancock Multifactor Healthcare ETF John Hancock Multifactor Large Cap ETF John Hancock Multifactor Mid Cap ETF John Hancock Multifactor Technology ETF CLOSED-END FUNDS Financial Opportunities Hedged Equity & Income Income Securities Trust Investors Trust Preferred Income Preferred Income II Preferred Income III Premium Dividend Tax-Advantaged Dividend Income Tax-Advantaged Global Shareholder Yield |
"As an investment firm,
upholding the proud
tradition of John Hancock
comes down to one thing:
putting shareholders
first. We believe that if
our shareholders are
successful, then we will
be successful."
Andrew G. Arnott
President and Chief Executive Officer
John Hancock Investments
John Hancock Multifactor ETF shares are bought and sold at market price (not NAV), and are not individually redeemed from the fund. Brokerage commissions will reduce returns.
John Hancock ETFs are distributed by Foreside Fund Services, LLC, and are subadvised by Dimensional Fund Advisors LP. Foreside is not affiliated with John Hancock Funds, LLC or Dimensional Fund Advisors LP.
Dimensional Fund Advisors LP receives compensation from John Hancock in connection with licensing rights to the John Hancock Dimensional indexes. Dimensional Fund Advisors LP does not sponsor, endorse, or sell, and makes no representation as to the advisability of investing in, John Hancock Multifactor ETFs (Multifactor ETFs). Neither John Hancock Advisers, LLC nor Dimensional Fund Advisors LP guarantees the accuracy and/or the completeness of the John Hancock Dimensional Indexes (the "Indexes") or any data included therein, and neither John Hancock Advisers, LLC nor Dimensional Fund Advisors LP shall have any liability for any errors, omissions, or interruptions therein. Neither John Hancock Advisers, LLC nor Dimensional Fund Advisors LP makes any warranty, express or implied, as to results to be obtained by the Multifactor ETFs, owners of the shares of the Multifactor ETFs or any other person or entity from the use of the Indexes, trading based on the Indexes, or any data included therein, either in connection with the Multifactor ETFs or for any other use. Neither John Hancock Advisers, LLC nor Dimensional Fund Advisors LP makes any express or implied warranties, and expressly disclaim all warranties of merchantability or fitness for a particular purpose or use with respect to the Indexes or any data included therein. Without limiting any of the foregoing, in no event shall either John Hancock Advisers, LLC or Dimensional Fund Advisors LP have any liability for any special, punitive, direct, indirect or consequential damages (including lost profits) arising out of matters relating to the use of the Indexes, even if notified of the possibility of such damages.
John Hancock Investments
A trusted brand
John Hancock Investments is a premier asset manager representing
one of America's most trusted brands, with a heritage of financial
stewardship dating back to 1862. Helping our shareholders pursue
their financial goals is at the core of everything we do. It's why we
support the role of professional financial advice and operate with the
highest standards of conduct and integrity.
A better way to invest
We build funds based on investor needs, then search the world to find
proven portfolio teams with specialized expertise in those strategies.
As a manager of managers, we apply vigorous oversight to ensure that
they continue to meet our uncompromising standards and serve the
best interests of our shareholders.
Results for investors
Our unique approach to asset management enables us to provide
a diverse set of investments backed by some of the world's best
managers, along with strong risk-adjusted returns across asset classes.

 | John Hancock Investments 601 Congress Street n Boston, MA 02210 800-225-5291 n jhinvestments.com/etf | |
| This report is for the information of the shareholders of John Hancock Multifactor Technology ETF. It is not authorized for distribution to prospective investors unless preceded or accompanied by a prospectus. | ||
MF260298 JHAN-2015-12-23-0163 | 800SA 10/15 12/15 | |
John Hancock
A message to shareholders
Dear shareholder,
Welcome to John Hancock Investments, and thank you for investing in a John Hancock Multifactor exchange-traded fund (ETF). At John Hancock Investments, we take a different approach to managing money on behalf of our shareholders. We build funds based on investor needs, then search the world to find proven portfolio teams with specialized expertise in those strategies. We were pleased to team up with Dimensional Fund Advisors LP—a company regarded as one of the pioneers in strategic beta investing*—to create a suite of passively managed ETFs. Each of our John Hancock Multifactor ETFs seeks to track a custom index built upon decades of academic research into the factors that drive higher expected returns: smaller capitalizations, lower valuations, and higher profitability.
This inaugural report to shareholders covers a very brief period of performance due to the fact that your ETF was launched shortly before the midpoint of its fiscal year. In this abbreviated report, your fund's portfolio managers will discuss the construction of the fund's underlying index, provide a review of the current market environment, and give a description of performance achieved so far. The next report you receive will cover the full period from the fund's inception to the end of its fiscal year on April 30, 2016.
We know you have many choices when it comes to your investments, and we appreciate the opportunity to earn the trust you've placed in John Hancock Investments.
Sincerely,
Andrew G. Arnott
President and Chief Executive Officer
John Hancock Investments
This commentary reflects the CEO's views as of October 31, 2015. They are subject to change at any time. For more up-to-date information, you can visit our website at jhinvestments.com.
| * | Strategic beta investing ETFs seek to improve upon cap-weighted strategies by tracking a custom index that combines active management insight with the discipline of a rules-based approach. |
John Hancock
Multifactor Financials ETF
Table of contents
| 2 | Your fund at a glance | |
| 4 | Discussion of fund performance | |
| 8 | Premium/discount analysis | |
| 9 | Your expenses | |
| 11 | Fund's investments | |
| 16 | Financial statements | |
| 19 | Financial highlights | |
| 20 | Notes to financial statements | |
| 23 | Evaluation of advisory and subadvisory agreements by the Board of Trustees | |
| 28 | More information |
1
INVESTMENT OBJECTIVE
The fund seeks to provide investment results that closely correspond, before fees and expenses, to the performance of the John Hancock Dimensional Financials Index.
TOTAL RETURNS AS OF 10/31/15 (%)
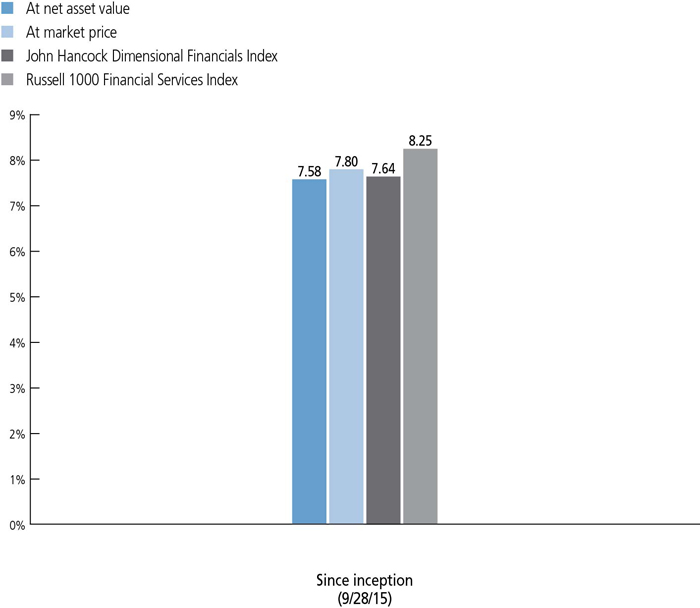
Market performance is determined using the closing price of the fund on its primary exchange, the NYSE Arca, at 4 P.M., Eastern time; your returns may differ if you traded shares at other times during the day. The net asset value is calculated by dividing the total value of all the securities in the fund's portfolio plus cash, interest, and receivables, minus any liabilities, by the number of fund shares outstanding.
The John Hancock Dimensional Financials Index comprises securities in the financial sector within the U.S. Universe whose market capitalizations are larger than that of the 1001st largest U.S. company at the time of reconstitution. Stocks that compose the Index include those that may be considered medium or smaller capitalization company stocks. The Index is reconstituted and rebalanced on a semiannual basis. The financials sector is composed of companies in areas such as banking, savings and loans, insurance, consumer finance, investment brokerage, asset management, or other diverse financial services. The U.S. Universe is defined as a free float-adjusted market-capitalization-weighted portfolio of U.S. operating companies listed on the New York Stock Exchange (NYSE), NYSE MKT LLC, NASDAQ Global Market, or such other securities exchanges deemed appropriate in accordance with the rules-based methodology that is maintained by Dimensional Fund Advisors LP.
The Russell 1000 Financial Services Index comprises securities classified in the financial services sector of the large cap U.S. equity market.
It is not possible to invest directly in an index. Index figures do not reflect expenses or sales charges, which would result in lower returns.
The past performance shown here reflects reinvested distributions and the beneficial effect of any expense reductions, and does not guarantee future results. Returns for periods shorter than one year are cumulative. Shares will fluctuate in value and, when sold or redeemed, may be worth more or less than their original cost. Current performance may be lower or higher than the performance cited, and can be found at jhinvestments.com or by calling 800-225-5291. For further information on the fund's objectives, risks, and strategy, see the fund's prospectus.
2
PERFORMANCE HIGHLIGHTS OVER THE PERIOD
Risk assets rebounded
Following a challenging summer, equity markets around the world bounced back; fixed-income asset returns were more subdued, as many bond sectors ended the period roughly where they started.
Smaller-cap stocks trailed larger peers
Relative to the capitalization-weighted Russell 1000 Financial Services Index, the fund's smaller-cap bias hindered results as larger caps led the way during the period.
Value-oriented shares lagged growth counterparts
The fund emphasizes shares with lower price-to-book ratios; during the period, this value tilt also weighed on results relative to the broad market.
INDUSTRY COMPOSITION AS OF 10/31/15 (%)
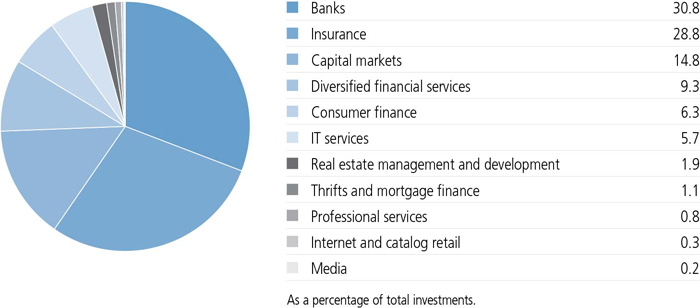
A note about risks
The prices of medium and smaller company stocks can change more frequently and dramatically than those of large companies. Value stocks may underperform other segments of the market. The value of a company's equity securities is subject to changes in the company's financial condition and overall market and economic conditions. Because the fund may focus on particular sectors of the economy, its performance may depend on the performance of those sectors, and investments focused in one sector may fluctuate more dramatically than investments in a wider variety of sectors. Exchange-traded fund shares are bought and sold through exchange trading at market price (not NAV), and are not individually redeemed from the fund. Due to various factors, shares may trade at a premium or discount to their NAV in the secondary market, and the fund's holdings and returns may deviate from those of its index. These variations may be greater when markets are volatile or subject to unusual conditions. Errors in the construction or calculation of the fund's index may occur from time to time. Brokerage commissions will reduce returns. Please see the fund's prospectus for additional risks.
3
Lukas J. Smart, CFA
Portfolio Manager
Dimensional Fund Advisors LP
Would you tell us about your investment philosophy and how it drives the composition of this new exchange-traded fund (ETF)?
Research has shown that there are differences in expected returns among securities. At Dimensional Fund Advisors, we've identified four characteristics, or dimensions, of expected returns—the overall market, company size, relative price, and profitability—that academic research has shown to account for most of the variation in asset returns over time.
The market dimension reflects the excess return over the risk-free rate that market participants demand for investing in a broadly diversified portfolio of equity securities without any style or market capitalization bias. That premium is called the equity premium.
The company size dimension reflects the excess return that investors demand for investing in small-capitalization stocks relative to large-capitalization stocks. The premium associated with this dimension is the small-cap premium.
The relative price dimension reflects the excess return that investors expect from investing in low relative price, or value, stocks (as measured, for instance, by their price-to-book ratios) in comparison to high relative price, or growth, stocks. The premium associated with this dimension is the value premium.
Finally, the profitability dimension provides a way to discern the expected returns of companies with similar price-driven characteristics. If two companies trade at the same relative price, the one with higher profitability should have a higher expected return. We refer to this as the profitability premium.
4
Relative to a commercial cap-weighted measure of the market, we believe that incorporating these dimensions of expected returns into an investment strategy offers the potential for outperformance over time, and an ETF is a vehicle well suited to our systematic and transparent investment approach. The custom benchmark we developed, the John Hancock Dimensional Financials Index, is designed to capture these dimensions over time, and the fund, in turn, is designed to track the custom benchmark.
What was the market environment like during the period?
The period from inception on September 28, 2015, through October 31, 2015, followed a difficult and volatile summer for equities. However, stock markets around the world subsequently snapped back for a sharp rebound, posting high single-digit percentage returns in some cases.
Broadly speaking, materials, energy, and information technology equity shares were particularly strong, while utilities—often viewed as a safe-haven sector of the stock market—generated more modest results. U.S. equities led most major markets, outpacing both emerging markets and developed markets abroad as a group. Larger-capitalization stocks outpaced smaller caps, and growth-oriented shares outpaced their value counterparts during this relatively short time period.
TOP 10 HOLDINGS AS OF 10/31/15 (%)
| Wells Fargo & Company | 4.0 |
| JPMorgan Chase & Co. | 4.0 |
| Berkshire Hathaway, Inc., Class B | 3.9 |
| Bank of America Corp. | 3.5 |
| Citigroup, Inc. | 3.2 |
| Visa, Inc., Class A | 3.0 |
| MasterCard, Inc., Class A | 2.0 |
| American International Group, Inc. | 1.9 |
| Capital One Financial Corp. | 1.9 |
| The Allstate Corp. | 1.8 |
| TOTAL | 29.2 |
| As a percentage of total investments. | |
| Cash and cash equivalents are not included. | |
5
How did the fund perform during this abbreviated period?
The fund generated a 7.58% return on a net asset value (NAV) basis, which was closely in line with the custom benchmark it's intended to track, the John Hancock Dimensional Financials Index.
Our approach results in the fund broadly maintaining relatively high weightings in securities of smaller-cap issuers and in those trading at lower relative prices in relation to their book values. In the weightings of individual positions, we also place greater emphasis on companies that have demonstrated higher profitability.
The fund trailed the Russell 1000 Financial Services Index, a commercial cap-weighted benchmark we use as a proxy for the financials sector of the U.S. stock market. On balance, our emphasis on smaller and lower relative price shares worked against the portfolio during this truncated time period.
The premiums associated with the dimensions we've identified are unpredictable. For this reason, we believe the best way to invest is to structure broadly diversified portfolios with a consistent focus on the desired dimensions, seeking to capture the expected premiums associated with them.
We would expect smaller to outperform larger capitalizations and value to outperform growth shares over an extended time horizon, but any given trading day, month, or year can prove otherwise, and that's okay. Patience and persistence are key ingredients to success in our style of investing.
How was the fund positioned at the close of the period?
In keeping with our long-term investment approach, the fund generally held higher weights in low-relative-price stocks and equities with smaller market capitalization while emphasizing companies with higher profitability relative to commercial cap-weighted indexes.
The fund's largest absolute exposures were to the banks, insurance, and capital markets industries. The fund had representation in different industries across the sector, and held more than 100
6
different financial service names at the end of the period. Top holdings included Wells Fargo & Company, JPMorgan Chase & Co., and Berkshire Hathaway, Inc. The fund's weighted average market capitalization was $71 billion, its price-to-book ratio was 1.3, and its price-to-earnings ratio was 13.9.
MANAGED BY
| | Lukas J. Smart, CFA On the fund since inception Investing since 2003 |
| | Joel P. Schneider On the fund since inception Investing since 2011 |
![]()
7
ETF shares are bought and sold through exchange trading at market price—not net asset value (NAV)—and are not individually redeemed from the fund. Due to various factors, shares may trade at a premium or discount to their NAV in the secondary market. If a shareholder purchases shares at a time when the market price is at a premium to the NAV or sells shares at a time when the market price is at a discount to the NAV, the shareholder may sustain losses. Additionally due to various factors, a fund's holdings and returns may deviate from those of its index. These variations may be greater when markets are volatile or subject to unusual conditions.
A premium exists when the closing market price is trading above NAV, while a discount indicates that the closing market price is trading below NAV. The differences are expressed as basis points, with one basis point equaling 1/100 of 1%.
The chart below presents information about the differences between the fund's daily closing market price and the fund's NAV. The closing market price is the daily closing price as reported on the NYSE Arca, Inc., the fund's primary listing exchange. Data presented represents past performance and cannot be used to predict future results.
Period Ended October 31, 2015
| Closing price below NAV | Closing price above or equal to NAV | |||||||
| Basis point differential | Number of days | % of Total days | Number of days | % of Total days | ||||
| 0 - < 25 | 10 | 41.67% | 10 | 41.67% | ||||
| 25 - < 50 | 1 | 4.17% | 1 | 4.17% | ||||
| 50 - < 75 | — | — | — | — | ||||
| 75 - < 100 | 1 | 4.16% | 1 | 4.16% | ||||
| 100 or Above | — | — | — | — | ||||
| Total | 12 | 50.00% | 12 | 50.00% | ||||
8
These examples are intended to help you understand your ongoing operating expenses of investing in the fund so you can compare these costs with the ongoing costs of investing in
other funds.
Understanding fund expenses
As a shareholder of the fund, you incur two types of costs:
| • | Transaction costs, which may include creation and redemption fees or brokerage charges. |
| • | Ongoing operating expenses, including management fees and other fund expenses. |
We are presenting only your ongoing operating expenses here.
Actual expenses/actual returns
This example is intended to provide information about the fund's actual ongoing operating expenses, and is based on the fund's actual return. It assumes an account value of $1,000.00 on September 28, 2015, with the same investment held until October 31, 2015.
| Account value on 9-28-2015 | Ending value on 10-31-2015 | Expenses paid during period ended 10-31-20151 | Annualized expense ratio | |
| $1,000.00 | $1,075.80 | $0.47 | 0.50% |
Together with the value of your account, you may use this information to estimate the operating expenses that you paid over the period. Simply divide your account value at October 31, 2015, by $1,000.00, then multiply it by the "expenses paid" from the table above. For example, for an account value of $8,600.00, the operating expenses should be calculated as follows:
9
Hypothetical example for comparison purposes
This table allows you to compare the fund's ongoing operating expenses with those of any other fund. It provides an example of the fund's hypothetical account values and hypothetical expenses based on the fund's actual expense ratio and an assumed 5% annualized return before expenses (which is not the fund's actual return). It assumes an account value of $1,000.00 on May 1, 2015, with the same investment held until October 31, 2015. Look in any other fund shareholder report to find its hypothetical example and you will be able to compare these expenses. Please remember that these hypothetical account values and expenses may not be used to estimate the actual ending account balance or expenses you paid for the period.
| Account value on 5-1-2015 | Ending value on 10-31-2015 | Expenses paid during period ended 10-31-20152 | Annualized expense ratio | |
| $1,000.00 | $1,022.60 | $2.54 | 0.50% |
Remember, these examples do not include any transaction costs. The fund charges a transaction fee per creation unit to those creating or redeeming creation units, and those buying or selling shares in the secondary market will incur customary brokerage commissions and charges. Therefore, these examples will not help you to determine the relative total costs of owning different funds. If transaction costs were included, your expenses would have been higher. See the prospectus for details regarding transaction costs.
| 1 | The inception date for the fund is 9-28-15. Expenses are equal to the fund's annualized expense ratio, multiplied by the average account value over the period, multiplied by 33/366 (to reflect the period). |
| 2 | Expenses are equal to the fund's annualized expense ratio, multiplied by the average account value over the period, multiplied by 184/366 (to reflect the one-half year period). |
10
Fund's investments
| As of 10-31-15 (unaudited) | |||||||||||
| Shares | Value | ||||||||||
| Common stocks 100.2% | $13,140,621 | ||||||||||
| (Cost $12,594,584) | |||||||||||
| Consumer discretionary 0.5% | 63,162 | ||||||||||
| Internet and catalog retail 0.3% | |||||||||||
| Liberty Ventures, Series A (I) | 917 | 39,954 | |||||||||
| Media 0.2% | |||||||||||
| Liberty Broadband Corp., Series A (I) | 110 | 6,002 | |||||||||
| Liberty Broadband Corp., Series C (I) | 320 | 17,206 | |||||||||
| Financials 93.2% | 12,219,301 | ||||||||||
| Banks 30.8% | |||||||||||
| Bank of America Corp. | 27,788 | 466,283 | |||||||||
| Bank of the Ozarks, Inc. | 440 | 22,009 | |||||||||
| BankUnited, Inc. | 620 | 23,052 | |||||||||
| BB&T Corp. | 3,257 | 120,998 | |||||||||
| BOK Financial Corp. | 230 | 15,451 | |||||||||
| CIT Group, Inc. | 1,810 | 77,830 | |||||||||
| Citigroup, Inc. | 7,827 | 416,162 | |||||||||
| Citizens Financial Group, Inc. | 2,885 | 70,106 | |||||||||
| City National Corp. | 420 | 37,632 | |||||||||
| Comerica, Inc. | 1,520 | 65,968 | |||||||||
| Commerce Bancshares, Inc. | 870 | 39,629 | |||||||||
| Cullen/Frost Bankers, Inc. | 490 | 33,536 | |||||||||
| East West Bancorp, Inc. | 1,200 | 48,468 | |||||||||
| Fifth Third Bancorp | 7,673 | 146,171 | |||||||||
| First Horizon National Corp. | 950 | 13,471 | |||||||||
| First Niagara Financial Group, Inc. | 1,690 | 17,492 | |||||||||
| First Republic Bank | 1,050 | 68,576 | |||||||||
| Huntington Bancshares, Inc. | 7,894 | 86,597 | |||||||||
| Investors Bancorp, Inc. | 1,930 | 24,144 | |||||||||
| JPMorgan Chase & Co. | 8,087 | 519,590 | |||||||||
| KeyCorp | 7,210 | 89,548 | |||||||||
| M&T Bank Corp. | 1,010 | 121,049 | |||||||||
| PacWest Bancorp | 620 | 27,925 | |||||||||
| People's United Financial, Inc. | 2,812 | 44,851 | |||||||||
| Prosperity Bancshares, Inc. | 330 | 16,955 | |||||||||
| Regions Financial Corp. | 12,852 | 120,166 | |||||||||
| Signature Bank (I) | 344 | 51,228 | |||||||||
| SunTrust Banks, Inc. | 4,972 | 206,437 | |||||||||
| SVB Financial Group (I) | 420 | 51,269 | |||||||||
| Synovus Financial Corp. | 874 | 27,645 | |||||||||
| The PNC Financial Services Group, Inc. | 1,581 | 142,701 | |||||||||
| U.S. Bancorp | 5,098 | 215,034 | |||||||||
| Shares | Value | ||||||||||
| Financials (continued) | |||||||||||
| Banks (continued) | |||||||||||
| Umpqua Holdings Corp. | 1,360 | $22,712 | |||||||||
| Webster Financial Corp. | 348 | 12,911 | |||||||||
| Wells Fargo & Company | 9,745 | 527,594 | |||||||||
| Zions Bancorporation | 1,730 | 49,772 | |||||||||
| Capital markets 14.8% | |||||||||||
| Affiliated Managers Group, Inc. (I) | 410 | 73,907 | |||||||||
| Ameriprise Financial, Inc. | 1,490 | 171,886 | |||||||||
| BlackRock, Inc. | 267 | 93,976 | |||||||||
| E*TRADE Financial Corp. (I) | 2,110 | 60,156 | |||||||||
| Eaton Vance Corp. | 1,130 | 40,804 | |||||||||
| Federated Investors, Inc., Class B | 990 | 30,423 | |||||||||
| Franklin Resources, Inc. | 1,740 | 70,922 | |||||||||
| Invesco, Ltd. | 2,750 | 91,218 | |||||||||
| Legg Mason, Inc. | 850 | 38,038 | |||||||||
| LPL Financial Holdings, Inc. | 570 | 24,282 | |||||||||
| Morgan Stanley | 3,520 | 116,054 | |||||||||
| Northern Trust Corp. | 1,780 | 125,294 | |||||||||
| Northstar Asset Management, Inc. | 530 | 7,754 | |||||||||
| Raymond James Financial, Inc. | 1,050 | 57,866 | |||||||||
| SEI Investments Company | 1,290 | 66,848 | |||||||||
| State Street Corp. | 1,500 | 103,500 | |||||||||
| Stifel Financial Corp. (I) | 100 | 4,443 | |||||||||
| T. Rowe Price Group, Inc. | 1,680 | 127,042 | |||||||||
| TD Ameritrade Holding Corp. | 2,090 | 72,042 | |||||||||
| The Bank of New York Mellon Corp. | 4,596 | 191,423 | |||||||||
| The Charles Schwab Corp. | 4,040 | 123,301 | |||||||||
| The Goldman Sachs Group, Inc. | 1,187 | 222,563 | |||||||||
| Waddell & Reed Financial, Inc., Class A | 760 | 28,074 | |||||||||
| Consumer finance 6.3% | |||||||||||
| Ally Financial, Inc. (I) | 5,841 | 116,353 | |||||||||
| American Express Company | 2,400 | 175,824 | |||||||||
| Capital One Financial Corp. | 3,099 | 244,511 | |||||||||
| Credit Acceptance Corp. (I) | 60 | 11,345 | |||||||||
| Discover Financial Services | 2,608 | 146,622 | |||||||||
| LendingClub Corp. (I) | 920 | 13,046 | |||||||||
| Navient Corp. | 2,922 | 38,541 | |||||||||
| Santander Consumer USA Holdings, Inc. (I) | 952 | 17,146 | |||||||||
| SLM Corp. (I) | 4,564 | 32,222 | |||||||||
| Springleaf Holdings, Inc. (I) | 380 | 17,826 | |||||||||
| Synchrony Financial (I) | 510 | 15,688 | |||||||||
| Diversified financial services 9.4% | |||||||||||
| Berkshire Hathaway, Inc., Class B (I) | 3,810 | 518,232 | |||||||||
| CBOE Holdings, Inc. | 650 | 43,576 | |||||||||
| Shares | Value | ||||||||||
| Financials (continued) | |||||||||||
| Diversified financial services (continued) | |||||||||||
| CME Group, Inc. | 1,071 | $101,177 | |||||||||
| Intercontinental Exchange, Inc. | 380 | 95,912 | |||||||||
| Leucadia National Corp. | 1,920 | 38,419 | |||||||||
| MarketAxess Holdings, Inc. | 210 | 21,275 | |||||||||
| McGraw Hill Financial, Inc. | 1,170 | 108,389 | |||||||||
| Moody's Corp. | 1,202 | 115,584 | |||||||||
| MSCI, Inc. | 940 | 62,980 | |||||||||
| The NASDAQ OMX Group, Inc. | 930 | 53,838 | |||||||||
| Voya Financial, Inc. | 1,660 | 67,346 | |||||||||
| Insurance 28.9% | |||||||||||
| ACE, Ltd. | 1,139 | 129,322 | |||||||||
| Aflac, Inc. | 2,020 | 128,775 | |||||||||
| Alleghany Corp. (I) | 143 | 70,967 | |||||||||
| Allied World Assurance Company Holdings AG | 920 | 33,451 | |||||||||
| American Financial Group, Inc. | 760 | 54,864 | |||||||||
| American International Group, Inc. | 4,012 | 252,997 | |||||||||
| AmTrust Financial Services, Inc. | 232 | 15,827 | |||||||||
| Aon PLC | 1,091 | 101,801 | |||||||||
| Arch Capital Group, Ltd. (I) | 870 | 65,154 | |||||||||
| Arthur J. Gallagher & Company | 1,180 | 51,601 | |||||||||
| Assurant, Inc. | 630 | 51,364 | |||||||||
| Assured Guaranty, Ltd. | 1,960 | 53,782 | |||||||||
| Axis Capital Holdings, Ltd. | 900 | 48,600 | |||||||||
| Brown & Brown, Inc. | 1,120 | 36,142 | |||||||||
| Cincinnati Financial Corp. | 1,120 | 67,458 | |||||||||
| CNA Financial Corp. | 280 | 10,237 | |||||||||
| CNO Financial Group, Inc. | 1,790 | 34,386 | |||||||||
| Endurance Specialty Holdings, Ltd. | 410 | 25,883 | |||||||||
| Erie Indemnity Company, Class A, Class A | 240 | 20,990 | |||||||||
| Everest Re Group, Ltd. | 370 | 65,849 | |||||||||
| First American Financial Corp. | 730 | 27,835 | |||||||||
| FNF Group | 1,740 | 61,387 | |||||||||
| Lincoln National Corp. | 2,380 | 127,354 | |||||||||
| Loews Corp. | 1,700 | 61,982 | |||||||||
| Markel Corp. (I) | 80 | 69,440 | |||||||||
| Marsh & McLennan Companies, Inc. | 2,078 | 115,828 | |||||||||
| MetLife, Inc. | 2,674 | 134,716 | |||||||||
| Old Republic International Corp. | 2,050 | 36,982 | |||||||||
| PartnerRe, Ltd. | 440 | 61,160 | |||||||||
| Principal Financial Group, Inc. | 2,770 | 138,943 | |||||||||
| Prudential Financial, Inc. | 1,700 | 140,250 | |||||||||
| Reinsurance Group of America, Inc. | 580 | 52,339 | |||||||||
| RenaissanceRe Holdings, Ltd. | 380 | 41,659 | |||||||||
| Shares | Value | ||||||||||
| Financials (continued) | |||||||||||
| Insurance (continued) | |||||||||||
| StanCorp Financial Group, Inc. | 277 | $31,777 | |||||||||
| Symetra Financial Corp. | 390 | 12,375 | |||||||||
| The Allstate Corp. | 3,786 | 234,278 | |||||||||
| The Chubb Corp. | 920 | 119,002 | |||||||||
| The Hanover Insurance Group, Inc. | 280 | 23,590 | |||||||||
| The Hartford Financial Services Group, Inc. | 4,902 | 226,767 | |||||||||
| The Progressive Corp. | 4,790 | 158,693 | |||||||||
| The Travelers Companies, Inc. | 1,781 | 201,057 | |||||||||
| Torchmark Corp. | 950 | 55,110 | |||||||||
| Unum Group | 2,110 | 73,112 | |||||||||
| Validus Holdings, Ltd. | 840 | 37,212 | |||||||||
| W.R. Berkley Corp. | 1,010 | 56,388 | |||||||||
| White Mountains Insurance Group, Ltd. | 40 | 31,600 | |||||||||
| Willis Group Holdings PLC | 1,080 | 48,179 | |||||||||
| XL Group PLC | 2,260 | 86,061 | |||||||||
| Real estate management and development 1.9% | |||||||||||
| CBRE Group, Inc., Class A (I) | 2,410 | 89,845 | |||||||||
| Forest City Enterprises, Inc., Class A (I) | 1,310 | 28,951 | |||||||||
| Jones Lang LaSalle, Inc. | 370 | 61,683 | |||||||||
| Realogy Holdings Corp. (I) | 1,150 | 44,965 | |||||||||
| The Howard Hughes Corp. (I) | 180 | 22,244 | |||||||||
| Thrifts and mortgage finance 1.1% | |||||||||||
| Hudson City Bancorp, Inc. | 4,420 | 44,730 | |||||||||
| MGIC Investment Corp. (I) | 2,050 | 19,270 | |||||||||
| New York Community Bancorp, Inc. | 3,480 | 57,490 | |||||||||
| Radian Group, Inc. | 1,354 | 19,592 | |||||||||
| TFS Financial Corp. | 420 | 7,375 | |||||||||
| Industrials 0.8% | 108,062 | ||||||||||
| Professional services 0.8% | |||||||||||
| Equifax, Inc. | 1,014 | 108,062 | |||||||||
| Information technology 5.7% | 750,096 | ||||||||||
| Internet software and services 0.0% | |||||||||||
| Zillow Group, Inc., Class A (I) | 210 | 6,470 | |||||||||
| IT services 5.7% | |||||||||||
| Black Knight Financial Services, Inc., Class A (I) | 60 | 2,162 | |||||||||
| MasterCard, Inc., Class A | 2,681 | 265,392 | |||||||||
| The Western Union Company | 4,532 | 87,241 | |||||||||
| Visa, Inc., Class A | 5,012 | 388,831 | |||||||||
| Total investments (Cost $12,594,584)† 100.2% | $13,140,621 | ||||||||||
| Other assets and liabilities, net (0.2%) | ($29,836 | ) | |||||||||
| Total net assets 100.0% | $13,110,785 | ||||||||||
| The percentage shown for each investment category is the total value of the category as a percentage of the net assets of the fund. | |||||||||||
| Key to Security Abbreviations and Legend | |||||||||||
| (I) | Non-income producing security. | ||||||||||
| † | At 10-31-15, the aggregate cost of investment securities for federal income tax purposes was $12,594,584. Net unrealized appreciation aggregated $546,037, of which $573,910 related to appreciated investment securities and $27,873 related to depreciated investment securities. | ||||||||||
Financial statements
STATEMENT OF ASSETS AND LIABILITIES 10-31-15 (unaudited)
| Assets | |||||||||||||
| Investments, at value (Cost $12,594,584) | $13,140,621 | ||||||||||||
| Receivable for fund shares sold | 2,670,928 | ||||||||||||
| Dividends receivable | 8,916 | ||||||||||||
| Receivable due from advisor | 6,871 | ||||||||||||
| Other receivables and prepaid expenses | 4,277 | ||||||||||||
| Total assets | 15,831,613 | ||||||||||||
| Liabilities | |||||||||||||
| Due to custodian | 538 | ||||||||||||
| Payable for investments purchased | 2,709,488 | ||||||||||||
| Payable to affiliates | |||||||||||||
| Accounting and legal services fees | 7 | ||||||||||||
| Other liabilities and accrued expenses | 10,795 | ||||||||||||
| Total liabilities | 2,720,828 | ||||||||||||
| Net assets | $13,110,785 | ||||||||||||
| Net assets consist of | |||||||||||||
| Paid-in capital | $12,557,293 | ||||||||||||
| Undistributed net investment income | 6,195 | ||||||||||||
| Accumulated net realized gain (loss) on investments | 1,260 | ||||||||||||
| Net unrealized appreciation (depreciation) on investments | 546,037 | ||||||||||||
| Net assets | $13,110,785 | ||||||||||||
| Net asset value per share | |||||||||||||
| Based on net asset values and shares outstanding-the fund has an unlimited number of shares authorized with no par value | |||||||||||||
| Net assets | $13,110,785 | ||||||||||||
| Shares outstanding | 500,000 | ||||||||||||
| Net asset value per share | $26.22 | ||||||||||||
STATEMENT OF OPERATIONS For the period ended 10-31-15 (unaudited)1
| Investment income | |||||||||||||||||||||||||||||||||
| Dividends | $10,133 | ||||||||||||||||||||||||||||||||
| Total investment income | 10,133 | ||||||||||||||||||||||||||||||||
| Expenses | |||||||||||||||||||||||||||||||||
| Investment management fees | 3,544 | ||||||||||||||||||||||||||||||||
| Accounting and legal services fees | 134 | ||||||||||||||||||||||||||||||||
| Transfer agent fees | 1,062 | ||||||||||||||||||||||||||||||||
| Printing and postage | 1,246 | ||||||||||||||||||||||||||||||||
| Professional fees | 5,288 | ||||||||||||||||||||||||||||||||
| Custodian fees | 1,768 | ||||||||||||||||||||||||||||||||
| Registration and filing fees | 998 | ||||||||||||||||||||||||||||||||
| Other | 825 | ||||||||||||||||||||||||||||||||
| Total expenses | 14,865 | ||||||||||||||||||||||||||||||||
| Less expense reductions | (10,927 | ) | |||||||||||||||||||||||||||||||
| Net expenses | 3,938 | ||||||||||||||||||||||||||||||||
| Net investment income | 6,195 | ||||||||||||||||||||||||||||||||
| Realized and unrealized gain (loss) | |||||||||||||||||||||||||||||||||
| Net realized gain (loss) on investments | 1,260 | ||||||||||||||||||||||||||||||||
| Change in net unrealized appreciation (depreciation) of investments | 546,037 | ||||||||||||||||||||||||||||||||
| Net realized and unrealized gain | 547,297 | ||||||||||||||||||||||||||||||||
| Increase in net assets from operations | $553,492 | ||||||||||||||||||||||||||||||||
| 1 | Period from 9-28-15 (commencement of operations) to 10-31-15. | ||||||||||||||||||||||
STATEMENT OF CHANGES IN NET ASSETS
| Period ended 10-31-151 | |||||||||||||||||
| (unaudited) | |||||||||||||||||
| Increase (decrease) in net assets | |||||||||||||||||
| From operations | |||||||||||||||||
| Net investment income | $6,195 | ||||||||||||||||
| Net realized gain | 1,260 | ||||||||||||||||
| Change in net unrealized appreciation (depreciation) | 546,037 | ||||||||||||||||
| Increase in net assets resulting from operations | 553,492 | ||||||||||||||||
| From fund share transactions | |||||||||||||||||
| Shares issued | 12,557,293 | ||||||||||||||||
| Total from fund share transactions | 12,557,293 | ||||||||||||||||
| Total increase | 13,110,785 | ||||||||||||||||
| Net assets | |||||||||||||||||
| Beginning of period | — | ||||||||||||||||
| End of period | $13,110,785 | ||||||||||||||||
| Undistributed net investment income | $6,195 | ||||||||||||||||
| Share activity | |||||||||||||||||
| Shares issued | 500,000 | ||||||||||||||||
| End of period | 500,000 | ||||||||||||||||
| �� | |||||||||||||||||||||||
| 1 | Period from 9-28-15 (commencement of operations) to 10-31-15. | ||||||||||||||||||||||
Financial highlights
| Period ended | 10-31-15 | 1 | |||||||||||||||||||||||||||||||||||||||
| Per share operating performance | |||||||||||||||||||||||||||||||||||||||||
| Net asset value, beginning of period | $24.37 | ||||||||||||||||||||||||||||||||||||||||
| Net investment income2 | 0.02 | ||||||||||||||||||||||||||||||||||||||||
| Net realized and unrealized gain on investments | 1.83 | ||||||||||||||||||||||||||||||||||||||||
| Total from investment operations | 1.85 | ||||||||||||||||||||||||||||||||||||||||
| Net asset value, end of period | $26.22 | ||||||||||||||||||||||||||||||||||||||||
| Total return (%)3 | 7.58 | 4 | |||||||||||||||||||||||||||||||||||||||
| Ratios and supplemental data | |||||||||||||||||||||||||||||||||||||||||
| Net assets, end of period (in millions) | $13 | ||||||||||||||||||||||||||||||||||||||||
| Ratios (as a percentage of average net assets): | |||||||||||||||||||||||||||||||||||||||||
| Expenses before reductions | 1.89 | 5 | |||||||||||||||||||||||||||||||||||||||
| Expenses including reductions | 0.50 | 5 | |||||||||||||||||||||||||||||||||||||||
| Net investment income | 0.79 | 5 | |||||||||||||||||||||||||||||||||||||||
| Portfolio turnover (%)6 | 1 | ||||||||||||||||||||||||||||||||||||||||
| 1 | Period from 9-28-15 (commencement of operations) to 10-31-15. Unaudited. | |||||||||||||||||||||||||||||||||||||
| 2 | Based on average daily shares outstanding. | |||||||||||||||||||||||||||||||||||||
| 3 | Total returns would have been lower had certain expenses not been reduced during the period. | |||||||||||||||||||||||||||||||||||||
| 4 | Not annualized. | |||||||||||||||||||||||||||||||||||||
| 5 | Annualized. | |||||||||||||||||||||||||||||||||||||
| 6 | Portfolio turnover rate excludes securities received or delivered from in-kind transactions. | |||||||||||||||||||||||||||||||||||||
Note 1 — Organization
John Hancock Multifactor Financials ETF (the fund) is a series of the John Hancock Exchange-Traded Fund Trust (the Trust), an open-end management investment company organized as a Massachusetts business trust and registered under the Investment Company Act of 1940, as amended (the 1940 Act). The investment objective of the fund is to seek to provide investment results that closely correspond, before fees and expenses, to the performance of the John Hancock Dimensional Financials Index. The John Hancock Dimensional Financials Index comprises securities in the financial sector within the U.S. Universe whose market capitalizations are larger than that of the 1001st largest U.S. company at the time of reconstitution.
The fund commenced operations on September 28, 2015.
Note 2 — Significant accounting policies
The financial statements have been prepared in conformity with accounting principles generally accepted in the United States of America (US GAAP), which require management to make certain estimates and assumptions as of the date of the financial statements. Actual results could differ from those estimates and those differences could be significant. The fund qualifies as an investment company under Topic 946 of Accounting Standards Codification of US GAAP.
Events or transactions occurring after the end of the fiscal period through the date that the financial statements were issued have been evaluated in the preparation of the financial statements. The following summarizes the significant accounting policies of the fund:
Security valuation. Investments are stated at value as of the close of regular trading on the New York Stock Exchange (NYSE), normally at 4:00 p.m., Eastern Time. In order to value the securities, the fund uses the following valuation techniques: Equity securities held by the fund are valued at the last sale price or official closing price on the exchange where the security was acquired or most likely will be sold. In the event there were no sales during the day or closing prices are not available, the securities are valued using the last available bid price. Other portfolio securities and assets, for which reliable market quotations are not readily available, are valued at fair value as determined in good faith by the fund's Pricing Committee following procedures established by the Board of Trustees. The frequency with which these fair valuation procedures are used cannot be predicted and fair value of securities may differ significantly from the value that would have been used had a ready market for such securities existed.
The fund uses a three-tier hierarchy to prioritize the pricing assumptions, referred to as inputs, used in valuation techniques to measure fair value. Level 1 includes securities valued using quoted prices in active markets for identical securities. Level 2 includes securities valued using other significant observable inputs. Observable inputs may include quoted prices for similar securities, interest rates, prepayment speeds and credit risk. Prices for securities valued using these inputs are received from independent pricing vendors and brokers and are based on an evaluation of the inputs described. Level 3 includes securities valued using significant unobservable inputs when market prices are not readily available or reliable, including the fund's own assumptions in determining the fair value of investments. Factors used in determining value may include market or issuer specific events or trends, changes in interest rates and credit quality. The inputs or methodology used for valuing securities are not necessarily an indication of the risks associated with investing in those securities. Changes in valuation techniques and related inputs may result in transfers into or out of an assigned level within the disclosure hierarchy.
As of October 31, 2015, all investments are categorized as Level 1 under the hierarchy described above.
Security transactions and related investment income. Investment security transactions are accounted for on a trade date plus one basis for daily net asset value calculations. However, for financial reporting purposes, investment transactions are reported on trade date. Dividend income is recorded on the ex-date, except for dividends of foreign securities where the dividend may not be known until after the ex-date. In those cases, dividend income, net of withholding taxes, is recorded when the fund becomes aware of the dividends. Gains and losses on securities sold are determined on the basis of identified cost and may include proceeds from litigation.
Overdrafts. Pursuant to the custodian agreement, the fund's custodian may, in its discretion, advance funds to the fund to make properly authorized payments. When such payments result in an overdraft, the fund is obligated to repay the custodian
20
for any overdraft, including any costs or expenses associated with the overdraft. The custodian may have a lien, security interest or security entitlement in any fund property that is not otherwise segregated or pledged, to the maximum extent permitted by law, to the extent of any overdraft.
Expenses. Within the John Hancock group of funds complex, expenses that are directly attributable to an individual fund are allocated to such fund. Expenses that are not readily attributable to a specific fund are allocated among all funds in an equitable manner, taking into consideration, among other things, the nature and type of expense and the fund's relative net assets. Expense estimates are accrued in the period to which they relate and adjustments are made when actual amounts are known.
Federal income taxes. The fund intends to qualify as a regulated investment company by complying with the applicable provisions of the Internal Revenue Code and will not be subject to federal income tax on taxable income that is distributed to shareholders. Therefore, no federal income tax provision is required.
Distribution of income and gains. Distributions to shareholders from net investment income and net realized gains, if any, are recorded on the ex-date. The fund will declare and pay dividends semiannually from net investment income, if any. Capital gain distributions, if any, are typically distributed annually.
Such distributions, on a tax basis, are determined in conformity with income tax regulations, which may differ from US GAAP.
Capital accounts within the financial statements are adjusted for permanent book-tax differences. These adjustments have no impact on net assets or the results of operations. Temporary book-tax differences, if any, will reverse in a subsequent period.
Note 3 — Guarantees and indemnifications
Under the Trust's organizational documents, its Officers and Trustees are indemnified against certain liabilities arising out of the performance of their duties to the Trust, including the fund. Additionally, in the normal course of business, the fund enters into contracts with service providers that contain general indemnification clauses. The fund's maximum exposure under these arrangements is unknown, as this would involve future claims that may be made against the fund that have not yet occurred. The risk of material loss from such claims is considered remote.
Note 4 — Fees and transactions with affiliates
John Hancock Advisers, LLC (the Advisor) serves as investment advisor for the fund. The Advisor is an indirect, wholly owned subsidiary of Manulife Financial Corporation (MFC).
Management fee. The fund has an investment management agreement with the Advisor under which the fund pays a monthly management fee to the Advisor, equivalent on an annual basis, to the sum of: (a) 0.450% of the first $300 million of the fund's average daily net assets; and (b) 0.420% of the fund's average daily net assets in excess of $300 million. The Advisor has a subadvisory agreement with Dimensional Fund Advisors LP. The fund is not responsible for payment of the subadvisory fees.
The Advisor has contractually agreed to waive a portion of its management fee and/or reimburse expenses for certain funds of the John Hancock group of funds complex, including the fund (the participating portfolios). This waiver is based upon aggregate net assets of all the participating portfolios. The amount of the reimbursement is calculated daily and allocated among all the participating portfolios in proportion to the daily net assets of each fund. During the period ended October 31, 2015, this waiver amounted to 0.01% of the fund's average net assets (on an annualized basis). This arrangement may be amended or terminated at any time by the Advisor upon notice to the fund and with the approval of the Board of Trustees.
The Advisor has contractually agreed to reduce its management fee or, if necessary, make payment to the fund, in an amount equal to the amount by which expenses of the fund exceed 0.50% of average annual net assets (on an annualized basis). Expenses means all the expenses of the fund, excluding (a) taxes, (b) brokerage commissions, (c) interest expense, (d) litigation and indemnification expenses and other extraordinary expenses not incurred in the ordinary course of the fund's business, (e) borrowing costs, (f) prime brokerage fees, (g) acquired fund fees, and (h) short dividend expenses. The expense
21
limitation expires on August 31, 2017, unless renewed by mutual agreement of the fund and the Advisor based on a determination that this is appropriate under the circumstances at that time.
For the period ended October 31, 2015, the expense reductions described above amounted to $10,927.
The investment management fees, including the impact of the waivers and reimbursements as described above, incurred for the period ended October 31, 2015 were equivalent to a net annual effective rate of 0.00% of the fund's average daily net assets.
Accounting and legal services. Pursuant to a service agreement, the fund reimburses the Advisor for all expenses associated with providing the administrative, financial, legal, accounting and recordkeeping services to the fund, including the preparation of all tax returns, periodic reports to shareholders and regulatory reports, among other services. These accounting and legal services fees incurred for the period ended October 31, 2015 amounted to an annual rate of 0.02% of the fund's average daily net assets.
Trustee expenses. The fund compensates each Trustee who is not an employee of the Advisor or its affiliates. The costs of paying Trustee compensation and expenses are allocated to each fund based on its net assets relative to other funds within the John Hancock group of funds complex.
Note 5 — Capital share transactions
The fund will issue and redeem shares at net asset value (NAV) only in a large specified number of shares, each called a "creation unit," or multiples thereof, that consist of 50,000 shares. Only authorized participants may engage in creation or redemption transactions directly with the fund. Such transactions generally take place when an authorized participant deposits into the fund a designated portfolio of securities (including any portion of such securities for which cash may be substituted) and a specified amount of cash approximating the holdings of the fund in exchange for a specified number of creation units. Authorized participants pay a transaction fee to the custodian when purchasing and redeeming creation units of a fund. The transaction fee is used to defray the costs associated with the issuance and redemption of creation units. Individual shares of the fund may only be purchased and sold in secondary market transactions through brokers. Secondary market transactions may be subject to brokerage commissions. Shares of the fund are listed and traded on the NYSE Arca, Inc., shares trade at market prices rather than NAV, and may trade at a price greater than or less than NAV.
Affiliates of the fund owned 92% of shares outstanding on October 31, 2015.
Note 6 — Purchase and sale of securities
Purchases and sales of securities, other than in-kind transactions and short-term securities, amounted to $144,880 and $105,709, respectively, for the period ended October 31, 2015. Securities received and delivered from in-kind transactions aggregated $12,554,153 and $0, respectively, for the period ended October 31, 2015.
Note 7 — Industry or sector risk
The fund generally invests a large percentage of its assets in one or more particular industries or sectors of the economy. If a large percentage of the fund's assets are economically tied to a single or small number of industries or sectors of the economy, the fund will be less diversified than a more broadly diversified fund, and it may cause the fund to underperform if that industry or sector underperforms. In addition, focusing on a particular industry or sector may make the fund's net asset value more volatile. Further, a fund that invests in particular industries or sectors is particularly susceptible to the impact of market, economic, regulatory and other factors affecting those industries or sectors. Financial services companies can be hurt by economic declines, changes in interest rates regulatory and market impacts.
22
EVALUATION OF ADVISORY AND SUBADVISORY AGREEMENTS BY THE BOARD OF TRUSTEES
Approval of Advisory and Subadvisory Agreements
At in-person meetings held on June 23-25, 2015, the Board of Trustees (the Board) of John Hancock Exchange-Traded Fund Trust (the Trust), including all of the Trustees who are not considered to be interested persons of the Trust under the Investment Company Act of 1940, as amended (the 1940 Act) (the Independent Trustees), approved the John Hancock Multifactor Financials ETF (the New Fund).
This section describes the evaluation by the Board of:
| (a) | an advisory agreement between the Trust and John Hancock Advisers, LLC (the Advisor) (the Advisory Agreement); and | |
| (b) | a subadvisory agreement between the Advisor and Dimensional Fund Advisors LP (the Subadvisor) with respect to the New Fund (the Subadvisory Agreement). |
In considering the Advisory Agreement and the Subadvisory Agreement with respect to the New Fund, the Board received in advance of the meetings a variety of materials relating to the New Fund, the Advisor and the Subadvisor, including comparative expense information for a peer group of similar exchange-traded funds and a broader universe of exchange-traded funds, simulated performance information of the New Fund's underlying index (Underlying Index) as compared to applicable benchmarks, and other information provided by the Advisor and the Subadvisor regarding the nature, extent, and quality of services to be provided by the Advisor and the Subadvisor under their respective Agreements, as well as information regarding the Advisor's anticipated profitability in connection with its proposed relationship to the New Fund and any compensation paid to affiliates of the Advisor. The Board also took into account discussions with management and information provided to the Board members at prior meetings with respect to the services provided by the Advisor and the Subadvisor to other John Hancock Funds (the Funds), including quarterly performance reports prepared by management containing reviews of investment results, and periodic presentations from the Subadvisor with respect to the other Funds that it manages. The Board also considered the nature, quality, and extent of the non-advisory services, if any, to be provided to the New Fund by the Advisor and/or its affiliates, including administrative services. The Board members also took into account information with respect to the New Fund presented at their March 10-12, 2015 in-person meeting.
Throughout the process, the Board asked questions of and were afforded the opportunity to request additional information from management. The Board is assisted by legal counsel for the Trust, and the Independent Trustees were also separately assisted by independent legal counsel throughout the process. The Independent Trustees also received a memorandum from their independent legal counsel discussing the legal standards for their consideration of the proposed Advisory Agreement and Subadvisory Agreement and discussed the proposed Advisory Agreement and Subadvisory Agreement in private sessions with their independent legal counsel at which no representatives of management were present.
Approval of Advisory Agreement
In approving the Advisory Agreement with respect to the New Fund, the Board, including the Independent Trustees, considered a variety of factors, including those discussed below. The Board also considered other factors (including conditions and trends prevailing generally in the economy, the securities markets and the industry) and did not treat any single factor as determinative, and each Trustee may have attributed different weights to different factors. The Board members' conclusions may have been based in part on their consideration of the advisory and subadvisory arrangements for other Funds in prior years.
Nature, extent, and quality of services. Among the information received by the Board from the Advisor relating to the nature, extent and quality of services to be provided to the New Fund, the Board considered information provided by the Advisor relating to its operations and personnel, descriptions of its organizational and management structure, and information regarding the Advisor's compliance and regulatory history. The Board members also noted that, on a regular basis, they receive and review information from the Funds' Chief Compliance Officer (CCO) regarding the Funds' compliance policies
23
and procedures established pursuant to Rule 38a-1 under the 1940 Act. The Board considered the investment strategy and Underlying Index of the New Fund. The Board also considered the Advisor's risk management processes. The Board considered that the Advisor would be responsible for the management of the day-to-day operations of the New Fund, including but not limited to, general supervision and coordination of the services to be provided by the Subadvisor, and also would be responsible for monitoring and reviewing the activities of the Subadvisor and other third-party service providers, including the New Fund's distributor.
In considering the nature, extent and quality of the services to be provided by the Advisor, the Trustees also took into account their knowledge of the Advisor's management of other Funds and the quality of the performance of the Advisor's duties with respect to other Funds, through Board meetings, discussions and reports during the preceding year and through each Trustee's experience as a trustee of the other trusts in the complex.
In the course of its deliberations regarding the Advisory Agreement, the Board members considered, among other things:
| (a) | the skills and competency with which the Advisor has in the past managed the Funds' affairs and its subadvisory relationships, including those with the Subadvisor, the Advisor's oversight and monitoring of the Subadvisor's investment performance and compliance programs, such as the Subadvisor's compliance with fund policies and objectives; review of brokerage matters, including with respect to trade allocation and best execution; and the Advisor's timeliness in responding to performance issues; | ||
| (b) | the background, qualifications, and skills of the Advisor's personnel; | ||
| (c) | the Advisor's compliance policies and procedures and its responsiveness to regulatory changes and fund industry developments; | ||
| (d) | the Advisor's administrative capabilities, including its ability to supervise the other service providers for the Funds; | ||
| (e) | the financial condition of the Advisor and whether it has the financial wherewithal to provide a high level and quality of services to the New Fund; and | ||
| (f) | the Advisor's reputation and experience in serving as an investment advisor to the Funds, and the benefit to shareholders of investing in funds that are part of a family of funds offering a variety of investments. |
The Board concluded that the Advisor may reasonably be expected to provide a high quality of services under the Advisory Agreement with respect to the New Fund.
Investment performance. In connection with its consideration of the Advisory Agreement, the Board considered, the New Fund's investment strategy and processes, including the fact that the New Fund will seek performance that closely corresponds to its Underlying Index, which was developed by, and will be maintained, by, the Subadvisor. The Board also considered the simulated performance of the New Fund's Underlying Index as compared to applicable benchmarks.
Fees and Expenses. The Board reviewed comparative information including, among other data, the New Fund's anticipated total net expenses as compared to similarly situated exchange-traded funds deemed to be comparable to the New Fund.
The Board took into account management's discussion of the New Fund's anticipated expenses. The Board noted that the Advisor does not currently manage other funds or institutional accounts with the same or similar strategies proposed for the New Fund.
The Board took into account management's discussion with respect to the proposed advisory/subadvisory fee structure, including the amount of the advisory fee to be retained by the Advisor after payment of the subadvisory fees. The Board also noted that the Advisor, and not the New Fund, would be responsible for paying the subadvisory fees and that such fees are negotiated at arm's length with respect to the Subadvisor. The Board also noted that the Advisor has contractually agreed to waive fees and/or reimburse expenses with respect to the New Fund for a specified period. The Board concluded that the advisory fees to be paid by the New Fund are reasonable in relation to the nature, extent and quality of the services expected to be provided.
24
Profitability/Indirect Benefits. In considering the costs of the services to be provided and the profits to be realized by the Advisor and its affiliates from the Advisor's relationship with the New Fund, the Board:
| (a) | noted that because the New Fund was not yet in existence, no actual revenue, cost or profitability data was available for the Board to review; | ||
| (b) | reviewed and considered information presented by the Advisor regarding the advisory fees and advisory spreads prior to distribution, operations and overhead for the New Fund; | ||
| (c) | noted that the Advisor will derive reputational and other indirect benefits from providing advisory services to the New Fund; | ||
| (d) | noted that the subadvisory fee for the New Fund will be paid by Advisor and is negotiated at arm's length; | ||
| (e) | noted that the Advisor will also pay the Subadvisor a license fee in connection with the New Fund's use of the Underlying Index; and | ||
| (f) | considered that the Advisor should be entitled to earn a reasonable level of profits in exchange for the level of services it will provide to the New Fund and the entrepreneurial risk that it assumes as Advisor. |
Based upon its review, the Board concluded that the anticipated level of profitability, if any, of the Advisor and its affiliates from their relationship with the New Fund is reasonable and not excessive.
Economies of Scale. In considering the extent to which economies of scale would be realized if the New Fund grows and whether fee levels reflect these economies of scale for the benefit of fund shareholders, the Board:
| (a) | considered that the Advisor has contractually agreed to waive a portion of its management fee and/or reimburse or pay operating expenses of the New Fund to reduce operating expenses for a specified period of time; | ||
| (b) | reviewed the New Fund's advisory fee structure and concluded that: (i) the New Fund's fee structure contains breakpoints at the subadvisory fee level and that such breakpoints are reflected as breakpoints in the advisory fees for the New Fund; and (ii) although economies of scale cannot be measured with precision, these arrangements permit shareholders of the New Fund to benefit from economies of scale if the New Fund grows. The Board also took into account management's discussion of the New Fund's advisory fee structure; and | ||
| (c) | the Board also considered the potential effect of the New Fund's future growth in size on its performance and fees. The Board also noted that if the New Fund's assets increase over time, the New Fund may realize other economies of scale and the Board would consider whether additional breakpoints would be appropriate at that time. |
Approval of Subadvisory Agreement
In making its determination with respect to approval of the Subadvisory Agreement, the Board reviewed:
| (a) | information relating to the Subadvisor's business, including current subadvisory services (to other funds in the John Hancock family of funds); | ||
| (b) | the simulated performance of the Underlying Index developed by the Subadvisor as compared to applicable benchmarks; | ||
| (c) | the proposed advisory fee and total expense ratio for the New Fund, including any breakpoints; and | ||
| (d) | information relating to the nature and scope of any material relationships and their significance to the New Fund's Advisor and Subadvisor. |
25
Nature, Extent, and Quality of Services. With respect to the services to be provided by the Subadvisor, the Board members received and reviewed information provided to the Board by the Subadvisor with respect to the New Fund and took into account information presented throughout the past year with respect to Funds in the complex managed by the Advisor and subadvised by the Subadvisor. In this regard, the Board members considered the Subadvisor's current level of staffing and its overall resources, as well as considered information relating to the Subadvisor's compensation program. The Board members reviewed the Subadvisor's history and investment experience, as well as information regarding the qualifications, background, and responsibilities of the Subadvisor's investment and compliance personnel who will provide services to the New Fund. The Board members also considered the Subadvisor's risk assessment and monitoring processes. The Board members noted that the Advisor conducts regular periodic reviews of the Subadvisor and its operations in regard to the Funds, including regarding investment processes and organizational and staffing matters. The Board members also noted that the Funds' CCO and his staff conduct regular, periodic compliance reviews with the Subadvisor and present reports to the Independent Trustees regarding the same, which include evaluating the regulatory compliance systems of the Subadvisor and procedures reasonably designed by it to assure compliance with the federal securities laws. The Board members also took into account the financial condition of the Subadvisor.
The Board considered the Subadvisor's investment processes and philosophies. The Board took into account that the New Fund will seek performance that closely corresponds to its Underlying Index, which was developed by, and will be maintained, by, the Subadvisor.
Subadvisor compensation. In considering the cost of services to be provided by the Subadvisor, the Board noted that the fees under the Subadvisory Agreement are paid by the Advisor and not the New Fund. The Board members also considered information and took into account any other potential conflicts of interests the Advisor might have in connection with the Subadvisory Agreement.
The Board also relied on the ability of the Advisor to negotiate the Subadvisory Agreement with the Subadvisor, which is not affiliated with the Advisor, and the fees thereunder at arm's length. As a result, the costs of the services to be provided and the profits to be realized by the Subadvisor from its relationship with the Trust were not a factor in the Board's consideration of the Subadvisory Agreement.
The Board also received information regarding the nature and scope (including their significance to the Advisor and its affiliates and to the Subadvisor) of any material relationships with respect to the Subadvisor, which include arrangements in which the Subadvisor will serve as the index provider for the New Fund and for other exchange-traded funds in the complex, as well as arrangements in which the Subadvisor or its affiliates provide advisory, or management services in connection with financial products sponsored by the Advisor or its affiliates, and may include other registered investment companies, including other exchange-traded funds, a 529 education savings plan, managed separate accounts and exempt group annuity contracts sold to qualified plans.
In addition, the Board considered other potential indirect benefits that the Subadvisor and its affiliates may receive from the Subadvisor's relationship with the New Fund, such as the opportunity to provide advisory services to additional John Hancock Funds and reputational benefits.
Subadvisory fees. The Board considered that the New Fund will pay advisory fees to the Advisor and that, in turn, the Advisor will pay subadvisory fees to the Subadvisor. The Board considered the New Fund's advisory fees and total expense ratio as compared to similarly situated exchange-traded funds deemed to be comparable to the New Fund. The Board also considered that the Subadvisor receives additional compensation from the Advisor in connection with its role as index provider for the New Fund.
Subadvisor performance. The Board considered the New Fund's investment strategy and processes, including the fact that the New Fund will seek performance that closely corresponds to its Underlying Index and that its Underlying Index has been developed by, and will be maintained by, the Subadvisor. The Board also considered simulated performance of the Underlying Index as compared to applicable benchmarks. The Board noted the Advisor's expertise and resources in monitoring the
26
performance, investment style and risk-adjusted performance of the Subadvisor. The Board was mindful of the Advisor's focus on the Subadvisor's performance.
The Board's decision to approve the Subadvisory Agreement was based on a number of determinations, including the following:
| (1) | The Subadvisor has extensive experience and demonstrated skills as a manager, and currently subadvises other Funds in the complex and the Board is generally satisfied with the Subadvisor's management of these Funds, and may reasonably be expected to provide a high quality of investment management services to the New Fund; | |
| (2) | the proposed subadvisory fees are reasonable in relation to the level and quality of services to be provided; and | |
| (3) | subadvisory fee breakpoints are reflected as breakpoints in the advisory fees for the New Fund in order to permit shareholders to benefit from economies of scale if and as the New Fund grows. | |
| * * * | ||
Based on the Board's evaluation of all factors that it deemed to be material, including those factors described above, and assisted by the advice of independent legal counsel, the Board, including the Independent Trustees, concluded that approval of the Advisory Agreement and the Subadvisory Agreement would be in the best interest of the New Fund and its shareholders. Accordingly, the Board, and the Independent Trustees voting separately, approved the Advisory Agreement and Subadvisory Agreement.
27
Trustees James M. Oates, Chairperson Officers Andrew G. Arnott John J. Danello Francis V. Knox, Jr. Charles A. Rizzo Salvatore Schiavone | Investment advisor John Hancock Advisers, LLC Subadvisor Dimensional Fund Advisors LP Principal distributor Foreside Fund Services, LLC Custodian State Street Bank and Trust Company Transfer agent State Street Bank and Trust Company Legal counsel Dechert LLP Stock symbol NYSE Arca: JHMF |
*Member of the Audit Committee
†Non-Independent Trustee
The fund's proxy voting policies and procedures, as well as the fund proxy voting record for the most recent twelve-month period ended June 30, are available free of charge on the Securities and Exchange Commission (SEC) website at sec.gov or on our website.
The fund's complete list of portfolio holdings, for the first and third fiscal quarters, is filed with the SEC on Form N-Q. The fund's Form N-Q is available on our website and the SEC's website, sec.gov, and can be reviewed and copied (for a fee) at the SEC's Public Reference Room in Washington, DC. Call 800-SEC-0330 to receive information on the operation of the SEC's Public Reference Room.
We make this information on your fund, as well as monthly portfolio holdings, and other fund details available on our website at jhinvestments.com/etf or by calling 800-225-5291.
| You can also contact us: | |||
| 800-225-5291 jhinvestments.com/etf | Regular mail: John Hancock Signature Services, Inc. | Express mail: John Hancock Signature Services, Inc. | |
28
John Hancock family of funds
DOMESTIC EQUITY FUNDS Balanced Blue Chip Growth Classic Value Disciplined Value Disciplined Value Mid Cap Equity Income Fundamental All Cap Core Fundamental Large Cap Core Fundamental Large Cap Value Large Cap Equity New Opportunities Select Growth Small Cap Equity Small Cap Value Small Company Strategic Growth U.S. Equity U.S. Global Leaders Growth Value Equity GLOBAL/INTERNATIONAL FUNDS Disciplined Value International Emerging Markets Emerging Markets Equity Global Equity Global Shareholder Yield Greater China Opportunities International Core International Growth International Small Company International Value Equity | INCOME FUNDS Bond California Tax-Free Income Core High Yield Emerging Markets Debt Floating Rate Income Focused High Yield Global Income Government Income High Yield Municipal Bond Income Investment Grade Bond Money Market Short Duration Credit Opportunities Spectrum Income Strategic Income Opportunities Tax-Free Bond ALTERNATIVE/SPECIALTY FUNDS Absolute Return Currency Alternative Asset Allocation Enduring Assets Financial Industries Global Absolute Return Strategies Global Conservative Absolute Return Global Real Estate Natural Resources Redwood Regional Bank Seaport Technical Opportunities |
The fund's investment objectives, risks, charges, and expenses are included in the prospectus and should be considered carefully before investing. For a prospectus, contact your financial professional, call
John Hancock Investments at 800-225-5291, or visit the fund's website at jhinvestments.com. Please read the prospectus carefully before investing or sending money.
ASSET ALLOCATION PORTFOLIOS Income Allocation Fund Lifestyle Aggressive Portfolio Lifestyle Balanced Portfolio Lifestyle Conservative Portfolio Lifestyle Growth Portfolio Lifestyle Moderate Portfolio Retirement Choices Portfolios (2010-2055) Retirement Living Portfolios (2010-2055) Retirement Living II Portfolios (2010-2055) EXCHANGE-TRADED FUNDS John Hancock Multifactor Consumer Discretionary ETF John Hancock Multifactor Financials ETF John Hancock Multifactor Healthcare ETF John Hancock Multifactor Large Cap ETF John Hancock Multifactor Mid Cap ETF John Hancock Multifactor Technology ETF CLOSED-END FUNDS Financial Opportunities Hedged Equity & Income Income Securities Trust Investors Trust Preferred Income Preferred Income II Preferred Income III Premium Dividend Tax-Advantaged Dividend Income Tax-Advantaged Global Shareholder Yield |
"As an investment firm,
upholding the proud
tradition of John Hancock
comes down to one thing:
putting shareholders
first. We believe that if
our shareholders are
successful, then we will
be successful."
Andrew G. Arnott
President and Chief Executive Officer
John Hancock Investments
John Hancock Multifactor ETF shares are bought and sold at market price (not NAV), and are not individually redeemed from the fund. Brokerage commissions will reduce returns.
John Hancock ETFs are distributed by Foreside Fund Services, LLC, and are subadvised by Dimensional Fund Advisors LP. Foreside is not affiliated with John Hancock Funds, LLC or Dimensional Fund Advisors LP.
Dimensional Fund Advisors LP receives compensation from John Hancock in connection with licensing rights to the John Hancock Dimensional indexes. Dimensional Fund Advisors LP does not sponsor, endorse, or sell, and makes no representation as to the advisability of investing in, John Hancock Multifactor ETFs (Multifactor ETFs). Neither John Hancock Advisers, LLC nor Dimensional Fund Advisors LP guarantees the accuracy and/or the completeness of the John Hancock Dimensional Indexes (the "Indexes") or any data included therein, and neither John Hancock Advisers, LLC nor Dimensional Fund Advisors LP shall have any liability for any errors, omissions, or interruptions therein. Neither John Hancock Advisers, LLC nor Dimensional Fund Advisors LP makes any warranty, express or implied, as to results to be obtained by the Multifactor ETFs, owners of the shares of the Multifactor ETFs or any other person or entity from the use of the Indexes, trading based on the Indexes, or any data included therein, either in connection with the Multifactor ETFs or for any other use. Neither John Hancock Advisers, LLC nor Dimensional Fund Advisors LP makes any express or implied warranties, and expressly disclaim all warranties of merchantability or fitness for a particular purpose or use with respect to the Indexes or any data included therein. Without limiting any of the foregoing, in no event shall either John Hancock Advisers, LLC or Dimensional Fund Advisors LP have any liability for any special, punitive, direct, indirect or consequential damages (including lost profits) arising out of matters relating to the use of the Indexes, even if notified of the possibility of such damages.
John Hancock Investments
A trusted brand
John Hancock Investments is a premier asset manager representing
one of America's most trusted brands, with a heritage of financial
stewardship dating back to 1862. Helping our shareholders pursue
their financial goals is at the core of everything we do. It's why we
support the role of professional financial advice and operate with the
highest standards of conduct and integrity.
A better way to invest
We build funds based on investor needs, then search the world to find
proven portfolio teams with specialized expertise in those strategies.
As a manager of managers, we apply vigorous oversight to ensure that
they continue to meet our uncompromising standards and serve the
best interests of our shareholders.
Results for investors
Our unique approach to asset management enables us to provide
a diverse set of investments backed by some of the world's best
managers, along with strong risk-adjusted returns across asset classes.
| | John Hancock Investments 601 Congress Street n Boston, MA 02210 800-225-5291 n jhinvestments.com/etf | |
| This report is for the information of the shareholders of John Hancock Multifactor Financials ETF. It is not authorized for distribution to prospective investors unless preceded or accompanied by a prospectus. | ||
MF260294 JHAN-2015-12-23-0159 | 810SA 10/15 12/15 | |
John Hancock
A message to shareholders
Dear shareholder,
Welcome to John Hancock Investments, and thank you for investing in a John Hancock Multifactor exchange-traded fund (ETF). At John Hancock Investments, we take a different approach to managing money on behalf of our shareholders. We build funds based on investor needs, then search the world to find proven portfolio teams with specialized expertise in those strategies. We were pleased to team up with Dimensional Fund Advisors LP—a company regarded as one of the pioneers in strategic beta investing*—to create a suite of passively managed ETFs. Each of our John Hancock Multifactor ETFs seeks to track a custom index built upon decades of academic research into the factors that drive higher expected returns: smaller capitalizations, lower valuations, and higher profitability.
This inaugural report to shareholders covers a very brief period of performance due to the fact that your ETF was launched shortly before the midpoint of its fiscal year. In this abbreviated report, your fund's portfolio managers will discuss the construction of the fund's underlying index, provide a review of the current market environment, and give a description of performance achieved so far. The next report you receive will cover the full period from the fund's inception to the end of its fiscal year on April 30, 2016.
We know you have many choices when it comes to your investments, and we appreciate the opportunity to earn the trust you've placed in John Hancock Investments.
Sincerely,
Andrew G. Arnott
President and Chief Executive Officer
John Hancock Investments
This commentary reflects the CEO's views as of October 31, 2015. They are subject to change at any time. For more up-to-date information, you can visit our website at jhinvestments.com.
| * | Strategic beta investing ETFs seek to improve upon cap-weighted strategies by tracking a custom index that combines active management insight with the discipline of a rules-based approach. |
John Hancock
Multifactor Healthcare ETF
Table of contents
| 2 | Your fund at a glance | |
| 4 | Discussion of fund performance | |
| 8 | Premium/discount analysis | |
| 9 | Your expenses | |
| 11 | Fund's investments | |
| 14 | Financial statements | |
| 17 | Financial highlights | |
| 18 | Notes to financial statements | |
| 21 | Evaluation of advisory and subadvisory agreements by the Board of Trustees | |
| 26 | More information |
1
INVESTMENT OBJECTIVE
The fund seeks to provide investment results that closely correspond, before fees and expenses, to the performance of the John Hancock Dimensional Healthcare Index.
TOTAL RETURNS AS OF 10/31/15 (%)
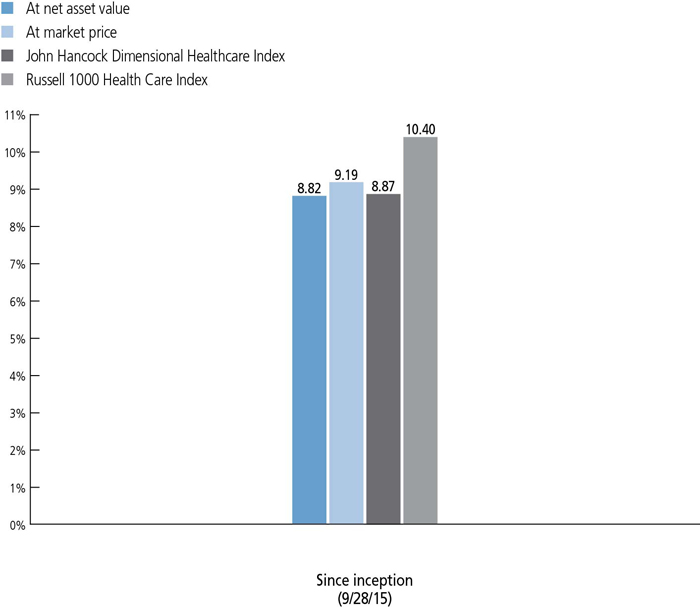
Market performance is determined using the closing price of the fund on its primary exchange, the NYSE Arca, at 4 P.M., Eastern time; your returns may differ if you traded shares at other times during the day. The net asset value is calculated by dividing the total value of all the securities in the fund's portfolio plus cash, interest, and receivables, minus any liabilities, by the number of fund shares outstanding.
The John Hancock Dimensional Healthcare Index comprises securities in the healthcare sector within the U.S. Universe whose market capitalizations are in the top 1000 U.S. companies at the time of reconstitution. The Index is reconstituted and rebalanced on a semiannual basis. Stocks that compose the Index include those that may be considered medium or smaller capitalization company stocks. The healthcare sector is composed of companies in areas such as the manufacture of healthcare equipment and supplies, biotechnology, home or long-term healthcare facilities, hospitals, pharmaceuticals, or the provision of basic healthcare services. The U.S. Universe is defined as a free float-adjusted market-capitalization-weighted portfolio of U.S. operating companies listed on the New York Stock Exchange (NYSE), NYSE MKT LLC, NASDAQ Global Market, or such other securities exchanges deemed appropriate in accordance with the rules-based methodology that is maintained by Dimensional Fund Advisors LP.
The Russell 1000 Healthcare Index comprises securities within the Health Care sector in the Russell 1000 Index.
It is not possible to invest directly in an index. Index figures do not reflect expenses or sales charges, which would result in lower returns.
The past performance shown here reflects reinvested distributions and the beneficial effect of any expense reductions, and does not guarantee future results. Returns for periods shorter than one year are cumulative. Shares will fluctuate in value and, when sold or redeemed, may be worth more or less than their original cost. Current performance may be lower or higher than the performance cited, and can be found at jhinvestments.com or by calling 800-225-5291. For further information on the fund's objectives, risks, and strategy, see the fund's prospectus.
2
PERFORMANCE HIGHLIGHTS OVER THE PERIOD
Risk assets rebounded
Following a challenging summer, equity markets around the world bounced back; fixed-income asset returns were more subdued, as many bond sectors ended the period roughly where they started.
Smaller-cap stocks trailed larger peers
Relative to the capitalization-weighted Russell 1000 Healthcare Index, the fund's smaller-cap bias hindered results as larger caps led the way during the period.
Value-oriented shares lagged growth counterparts
The fund emphasizes shares with lower price-to-book ratios; during the period, this value tilt also weighed on results relative to the broad market.
INDUSTRY COMPOSITION AS OF 10/31/15 (%)
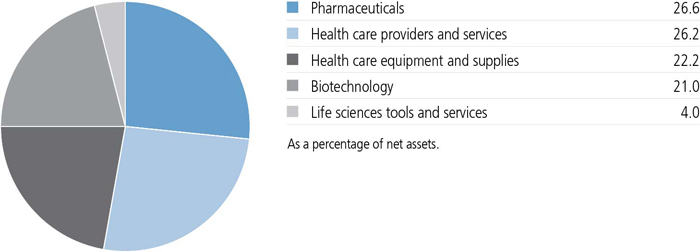
A note about risks
The prices of medium and smaller company stocks can change more frequently and dramatically than those of large companies. Value stocks may underperform other segments of the market. The value of a company's equity securities is subject to changes in the company's financial condition and overall market and economic conditions. Because the fund may focus on particular sectors of the economy, its performance may depend on the performance of those sectors, and investments focused in one sector may fluctuate more dramatically than investments in a wider variety of sectors. Exchange-traded fund shares are bought and sold through exchange trading at market price (not NAV), and are not individually redeemed from the fund. Due to various factors, shares may trade at a premium or discount to their NAV in the secondary market, and the fund's holdings and returns may deviate from those of its index. These variations may be greater when markets are volatile or subject to unusual conditions. Errors in the construction or calculation of the fund's index may occur from time to time. Brokerage commissions will reduce returns. Please see the fund's prospectus for additional risks.
3
Lukas J. Smart, CFA
Portfolio Manager
Dimensional Fund Advisors LP
Would you tell us about your investment philosophy and how it drives the composition of this new exchange-traded fund (ETF)?
Research has shown that there are differences in expected returns among securities. At Dimensional Fund Advisors, we've identified four characteristics, or dimensions, of expected returns—the overall market, company size, relative price, and profitability—that academic research has shown to account for most of the variation in asset returns over time.
The market dimension reflects the excess return over the risk-free rate that market participants demand for investing in a broadly diversified portfolio of equity securities without any style or market capitalization bias. That premium is called the equity premium.
The company size dimension reflects the excess return that investors demand for investing in small-capitalization stocks relative to large-capitalization stocks. The premium associated with this dimension is the small-cap premium.
The relative price dimension reflects the excess return that investors expect from investing in low relative price (as measured, for instance, by their price-to-book ratios) in comparison with high relative price stocks. The premium associated with this dimension is the value premium.
Finally, the profitability dimension provides a way to discern the expected returns of companies with similar price-driven characteristics. If two companies trade at the same relative price, the one with higher profitability should have a higher expected return. We refer to this as the profitability premium.
4
Relative to a commercial cap-weighted measure of the market, we believe that incorporating these dimensions of expected returns into an investment strategy offers the potential for outperformance over time, and an ETF is a vehicle well suited to our systematic and transparent investment approach. The custom benchmark we developed, the John Hancock Dimensional Healthcare Index, is designed to capture these dimensions over time, and the fund, in turn, is designed to track the custom benchmark.
What was the market environment like during the period?
The period from inception on September 28, 2015, through October 31, 2015, followed a difficult and volatile summer for equities. However, stock markets around the world subsequently snapped back for a sharp rebound, posting high single-digit percentage returns in some cases.
Broadly speaking, materials, energy, and technology equity shares were particularly strong, while utilities—often viewed as a safe-haven sector of the stock market—generated more modest results. U.S. equities led most major markets, outpacing both emerging markets and developed
TOP 10 HOLDINGS AS OF 10/31/15 (%)
| Pfizer, Inc. | 5.7 |
| Johnson & Johnson | 5.4 |
| Merck & Company, Inc. | 4.3 |
| Gilead Sciences, Inc. | 3.7 |
| UnitedHealth Group, Inc. | 3.5 |
| Amgen, Inc. | 3.4 |
| Allergan PLC | 2.6 |
| Medtronic PLC | 2.4 |
| Celgene Corp. | 2.2 |
| Baxter International, Inc. | 2.1 |
| TOTAL | 35.3 |
| As a percentage of net assets. | |
| Cash and cash equivalents are not included. | |
5
How did the fund perform during this abbreviated period?
The fund generated an 8.82% return on a net asset value (NAV) basis, which was closely in line with the custom benchmark it's intended to track, the John Hancock Dimensional Healthcare Index.
Our approach results in the fund broadly maintaining relatively high weightings in securities of smaller-cap issuers and in those trading at lower relative prices in relation to their book values. In the weightings of individual positions, we also place greater emphasis on companies that have demonstrated higher profitability.
The fund lagged the Russell 1000 Healthcare Index, a commercial cap-weighted benchmark we can use as a proxy for the healthcare sector of the U.S. stock market. On balance, our emphasis on smaller and lower relative price shares worked against the fund during this time period.
The premiums associated with the dimensions we've identified are unpredictable. For this reason, we believe the best way to invest is to structure broadly diversified portfolios with a consistent focus on the desired dimensions, seeking to capture the expected premiums associated with them.
We would expect smaller to outperform larger capitalizations and value to outperform growth shares over an extended time horizon; any given trading day, month, or year can prove otherwise, and that's okay. Patience and persistence are key ingredients to success in our style of investing.
How was the fund positioned at the close of the period?
In keeping with our long-term investment approach, the fund generally held higher weights in low-relative-price stocks and equities with smaller market capitalization while emphasizing companies with higher profitability relative to commercial cap-weighted indexes.
The fund's largest absolute exposures were to the pharmaceuticals and healthcare providers and
6
services industries. The fund had representation across the industries within the sector and held more than 100 different healthcare names as of the end of the period. Top holdings included Pfizer, Inc., Johnson & Johnson, and Merck & Company. The fund's weighted average market capitalization was $75 billion, its price-to-book ratio was 3.3, and its price-to-earnings ratio was 20.8.
MANAGED BY
| | Lukas J. Smart, CFA On the fund since inception Investing since 2003 |
| | Joel P. Schneider On the fund since inception Investing since 2011 |
![]()
7
ETF shares are bought and sold through exchange trading at market price—not net asset value (NAV)—and are not individually redeemed from the fund. Due to various factors, shares may trade at a premium or discount to their NAV in the secondary market. If a shareholder purchases shares at a time when the market price is at a premium to the NAV or sells shares at a time when the market price is at a discount to the NAV, the shareholder may sustain losses. Additionally due to various factors, a fund's holdings and returns may deviate from those of its index. These variations may be greater when markets are volatile or subject to unusual conditions.
A premium exists when the closing market price is trading above NAV, while a discount indicates that the closing market price is trading below NAV. The differences are expressed as basis points, with one basis point equaling 1/100 of 1%.
The chart below presents information about the differences between the fund's daily closing market price and the fund's NAV. The closing market price is the daily closing price as reported on the NYSE Arca, Inc., the fund's primary listing exchange. Data presented represents past performance and cannot be used to predict future results.
Period Ended October 31, 2015
| Closing price below NAV | Closing price above or equal to NAV | |||||||
| Basis point differential | Number of days | % of Total days | Number of days | % of Total days | ||||
| 0 - < 25 | 5 | 20.83% | 10 | 41.66% | ||||
| 25 - < 50 | 4 | 16.67% | 2 | 8.33% | ||||
| 50 - < 75 | 1 | 4.17% | 1 | 4.17% | ||||
| 75 - < 100 | — | — | — | — | ||||
| 100 or Above | — | — | 1 | 4.17% | ||||
| Total | 10 | 41.67% | 14 | 58.33% | ||||
8
These examples are intended to help you understand your ongoing operating expenses of investing in the fund so you can compare these costs with the ongoing costs of investing in
other funds.
Understanding fund expenses
As a shareholder of the fund, you incur two types of costs:
| • | Transaction costs, which may include creation and redemption fees or brokerage charges. |
| • | Ongoing operating expenses, including management fees and other fund expenses. |
We are presenting only your ongoing operating expenses here.
Actual expenses/actual returns
This example is intended to provide information about the fund's actual ongoing operating expenses, and is based on the fund's actual return. It assumes an account value of $1,000.00 on September 28, 2015, with the same investment held until October 31, 2015.
| Account value on 9-28-2015 | Ending value on 10-31-2015 | Expenses paid during period ended 10-31-20151 | Annualized expense ratio | |
| $1,000.00 | $1,088.20 | $0.47 | 0.50% |
Together with the value of your account, you may use this information to estimate the operating expenses that you paid over the period. Simply divide your account value at October 31, 2015, by $1,000.00, then multiply it by the "expenses paid" from the table above. For example, for an account value of $8,600.00, the operating expenses should be calculated as follows:
9
Hypothetical example for comparison purposes
This table allows you to compare the fund's ongoing operating expenses with those of any other fund. It provides an example of the fund's hypothetical account values and hypothetical expenses based on the fund's actual expense ratio and an assumed 5% annualized return before expenses (which is not the fund's actual return). It assumes an account value of $1,000.00 on May 1, 2015, with the same investment held until October 31, 2015. Look in any other fund shareholder report to find its hypothetical example and you will be able to compare these expenses. Please remember that these hypothetical account values and expenses may not be used to estimate the actual ending account balance or expenses you paid for the period.
| Account value on 5-1-2015 | Ending value on 10-31-2015 | Expenses paid during period ended 10-31-20152 | Annualized expense ratio | |
| $1,000.00 | $1,022.60 | $2.54 | 0.50% |
Remember, these examples do not include any transaction costs. The fund charges a transaction fee per creation unit to those creating or redeeming creation units, and those buying or selling shares in the secondary market will incur customary brokerage commissions and charges. Therefore, these examples will not help you to determine the relative total costs of owning different funds. If transaction costs were included, your expenses would have been higher. See the prospectus for details regarding transaction costs.
| 1 | The inception date for the fund is 9-28-15. Expenses are equal to the fund's annualized expense ratio, multiplied by the average account value over the period, multiplied by 33/366 (to reflect the period). |
| 2 | Expenses are equal to the fund's annualized expense ratio, multiplied by the average account value over the period, multiplied by 184/366 (to reflect the one-half year period). |
10
Fund's investments
| As of 10-31-15 (unaudited) | |||||||||||
| Shares | Value | ||||||||||
| Common stocks 100.0% | $13,018,335 | ||||||||||
| (Cost $12,299,145) | |||||||||||
| Health care 100.0% | 13,018,335 | ||||||||||
| Biotechnology 21.0% | |||||||||||
| AbbVie, Inc. | 4,504 | 268,213 | |||||||||
| ACADIA Pharmaceuticals, Inc. (I) | 300 | 10,446 | |||||||||
| Alexion Pharmaceuticals, Inc. (I) | 641 | 112,816 | |||||||||
| Alkermes PLC (I) | 920 | 66,166 | |||||||||
| Alnylam Pharmaceuticals, Inc. (I) | 380 | 32,661 | |||||||||
| Amgen, Inc. | 2,821 | 446,226 | |||||||||
| Anacor Pharmaceuticals, Inc. (I) | 140 | 15,737 | |||||||||
| Baxalta, Inc. | 1,730 | 59,616 | |||||||||
| Biogen, Inc. (I) | 760 | 220,788 | |||||||||
| BioMarin Pharmaceutical, Inc. (I) | 840 | 98,314 | |||||||||
| Bluebird Bio, Inc. (I) | 170 | 13,112 | |||||||||
| Celgene Corp. (I) | 2,370 | 290,823 | |||||||||
| Cepheid, Inc. (I) | 374 | 12,492 | |||||||||
| Dyax Corp. (I) | 540 | 14,866 | |||||||||
| Gilead Sciences, Inc. | 4,414 | 477,286 | |||||||||
| Incyte Corp. (I) | 1,290 | 151,614 | |||||||||
| Intercept Pharmaceuticals, Inc. (I) | 74 | 11,633 | |||||||||
| Intrexon Corp. (I) | 230 | 7,728 | |||||||||
| Isis Pharmaceuticals, Inc. (I) | 620 | 29,853 | |||||||||
| Juno Therapeutics, Inc. (I) | 280 | 14,493 | |||||||||
| Medivation, Inc. (I) | 790 | 33,227 | |||||||||
| Neurocrine Biosciences, Inc. (I) | 320 | 15,709 | |||||||||
| OPKO Health, Inc. (I) | 1,722 | 16,273 | |||||||||
| Regeneron Pharmaceuticals, Inc. (I) | 230 | 128,200 | |||||||||
| Seattle Genetics, Inc. (I) | 580 | 24,064 | |||||||||
| Ultragenyx Pharmaceutical, Inc. (I) | 120 | 11,922 | |||||||||
| United Therapeutics Corp. (I) | 420 | 61,585 | |||||||||
| Vertex Pharmaceuticals, Inc. (I) | 700 | 87,318 | |||||||||
| Health care equipment and supplies 22.2% | |||||||||||
| Abbott Laboratories | 4,994 | 223,731 | |||||||||
| ABIOMED, Inc. (I) | 140 | 10,312 | |||||||||
| Alere, Inc. (I) | 660 | 30,439 | |||||||||
| Align Technology, Inc. (I) | 540 | 35,348 | |||||||||
| Baxter International, Inc. | 7,418 | 277,359 | |||||||||
| Becton, Dickinson and Company | 990 | 141,095 | |||||||||
| Boston Scientific Corp. (I) | 11,428 | 208,904 | |||||||||
| C.R. Bard, Inc. | 814 | 151,689 | |||||||||
| DENTSPLY International, Inc. | 1,320 | 80,322 | |||||||||
| Shares | Value | ||||||||||
| Health care (continued) | |||||||||||
| Health care equipment and supplies (continued) | |||||||||||
| DexCom, Inc. (I) | 370 | $30,828 | |||||||||
| Edwards Lifesciences Corp. (I) | 990 | 155,579 | |||||||||
| Hologic, Inc. (I) | 2,774 | 107,798 | |||||||||
| IDEXX Laboratories, Inc. (I) | 990 | 67,934 | |||||||||
| Intuitive Surgical, Inc. (I) | 288 | 143,021 | |||||||||
| Medtronic PLC | 4,164 | 307,803 | |||||||||
| ResMed, Inc. | 1,154 | 66,482 | |||||||||
| Sirona Dental Systems, Inc. (I) | 540 | 58,930 | |||||||||
| St. Jude Medical, Inc. | 3,104 | 198,066 | |||||||||
| STERIS Corp. | 530 | 39,724 | |||||||||
| Stryker Corp. | 1,360 | 130,043 | |||||||||
| Teleflex, Inc. | 400 | 53,200 | |||||||||
| The Cooper Companies, Inc. | 400 | 60,944 | |||||||||
| Varian Medical Systems, Inc. (I) | 1,214 | 95,335 | |||||||||
| West Pharmaceutical Services, Inc. | 630 | 37,806 | |||||||||
| Zimmer Biomet Holdings, Inc. | 1,654 | 172,959 | |||||||||
| Health care providers and services 26.2% | |||||||||||
| Acadia Healthcare Company, Inc. (I) | 410 | 25,178 | |||||||||
| Aetna, Inc. | 2,224 | 255,271 | |||||||||
| AmerisourceBergen Corp. | 1,140 | 110,021 | |||||||||
| Amsurg Corp. (I) | 570 | 39,951 | |||||||||
| Anthem, Inc. | 1,565 | 217,770 | |||||||||
| Brookdale Senior Living, Inc. (I) | 1,470 | 30,738 | |||||||||
| Cardinal Health, Inc. | 1,934 | 158,975 | |||||||||
| Centene Corp. (I) | 1,180 | 70,186 | |||||||||
| Cigna Corp. | 1,430 | 191,677 | |||||||||
| Community Health Systems, Inc. (I) | 1,840 | 51,594 | |||||||||
| DaVita HealthCare Partners, Inc. (I) | 2,080 | 161,221 | |||||||||
| Envision Healthcare Holdings, Inc. (I) | 1,640 | 46,248 | |||||||||
| Express Scripts Holding Company (I) | 2,640 | 228,043 | |||||||||
| HCA Holdings, Inc. (I) | 1,294 | 89,014 | |||||||||
| Health Net, Inc. (I) | 630 | 40,484 | |||||||||
| HealthSouth Corp. | 960 | 33,437 | |||||||||
| Henry Schein, Inc. (I) | 890 | 135,022 | |||||||||
| Humana, Inc. | 890 | 158,981 | |||||||||
| Laboratory Corp. of America Holdings (I) | 1,080 | 132,559 | |||||||||
| LifePoint Health, Inc. (I) | 410 | 28,241 | |||||||||
| McKesson Corp. | 824 | 147,331 | |||||||||
| MEDNAX, Inc. (I) | 1,044 | 73,571 | |||||||||
| Molina Healthcare, Inc. (I) | 360 | 22,320 | |||||||||
| Patterson Companies, Inc. | 1,060 | 50,244 | |||||||||
| Quest Diagnostics, Inc. | 2,000 | 135,900 | |||||||||
| Team Health Holdings, Inc. (I) | 720 | 42,962 | |||||||||
| Shares | Value | ||||||||||
| Health care (continued) | |||||||||||
| Health care providers and services (continued) | |||||||||||
| Tenet Healthcare Corp. (I) | 1,320 | $41,408 | |||||||||
| UnitedHealth Group, Inc. | 3,834 | 451,566 | |||||||||
| Universal Health Services, Inc., Class B | 1,313 | 160,304 | |||||||||
| VCA, Inc. (I) | 740 | 40,530 | |||||||||
| WellCare Health Plans, Inc. (I) | 400 | 35,440 | |||||||||
| Life sciences tools and services 4.0% | |||||||||||
| Bio-Rad Laboratories, Inc., Class A (I) | 210 | 29,291 | |||||||||
| Bio-Techne Corp. | 310 | 27,342 | |||||||||
| Charles River Laboratories International, Inc. (I) | 320 | 20,877 | |||||||||
| Illumina, Inc. (I) | 590 | 84,535 | |||||||||
| PAREXEL International Corp. (I) | 570 | 35,978 | |||||||||
| Quintiles Transnational Holdings, Inc. (I) | 550 | 35,008 | |||||||||
| Thermo Fisher Scientific, Inc. | 1,320 | 172,630 | |||||||||
| VWR Corp. (I) | 390 | 10,729 | |||||||||
| Waters Corp. (I) | 850 | 108,630 | |||||||||
| Pharmaceuticals 26.6% | |||||||||||
| Akorn, Inc. (I) | 570 | 15,242 | |||||||||
| Allergan PLC (I) | 1,080 | 333,148 | |||||||||
| Bristol-Myers Squibb Company | 3,934 | 259,447 | |||||||||
| Catalent, Inc. (I) | 860 | 22,859 | |||||||||
| Eli Lilly & Company | 2,484 | 202,620 | |||||||||
| Endo International PLC (I) | 1,484 | 89,025 | |||||||||
| Horizon Pharma PLC (I) | 730 | 11,476 | |||||||||
| Jazz Pharmaceuticals PLC (I) | 560 | 76,877 | |||||||||
| Johnson & Johnson | 7,014 | 708,624 | |||||||||
| Mallinckrodt PLC (I) | 1,030 | 67,640 | |||||||||
| Merck & Company, Inc. | 10,338 | 565,075 | |||||||||
| Mylan NV (I) | 1,824 | 80,420 | |||||||||
| Perrigo Company PLC | 700 | 110,418 | |||||||||
| Pfizer, Inc. | 21,877 | 739,880 | |||||||||
| Zoetis, Inc. | 4,314 | 185,545 | |||||||||
| Total investments (Cost $12,299,145)† 100.0% | $13,018,335 | ||||||||||
| Other assets and liabilities, net 0.0% | $2,619 | ||||||||||
| Total net assets 100.0% | $13,020,954 | ||||||||||
| The percentage shown for each investment category is the total value of the category as a percentage of the net assets of the fund. | |||||||||||
| Key to Security Abbreviations and Legend | |||||||||||
| (I) | Non-income producing security. | ||||||||||
| † | At 10-31-15, the aggregate cost of investment securities for federal income tax purposes was $12,299,145. Net unrealized appreciation aggregated $719,190, of which $802,930 related to appreciated investment securities and $83,740 related to depreciated investment securities. | ||||||||||
Financial statements
STATEMENT OF ASSETS AND LIABILITIES 10-31-15 (unaudited)
| Assets | |||||||||||||||
| Investments, at value (Cost $12,299,145) | $13,018,335 | ||||||||||||||
| Receivable for investments sold | 5,225 | ||||||||||||||
| Receivable for fund shares sold | 2,611,388 | ||||||||||||||
| Dividends receivable | 3,265 | ||||||||||||||
| Receivable due from advisor | 6,913 | ||||||||||||||
| Other receivables and prepaid expenses | 4,277 | ||||||||||||||
| Total assets | 15,649,403 | ||||||||||||||
| Liabilities | |||||||||||||||
| Due to custodian | 3,234 | ||||||||||||||
| Payable for investments purchased | 2,613,855 | ||||||||||||||
| Payable to affiliates | |||||||||||||||
| Accounting and legal services fees | 7 | ||||||||||||||
| Other liabilities and accrued expenses | 11,353 | ||||||||||||||
| Total liabilities | 2,628,449 | ||||||||||||||
| Net assets | $13,020,954 | ||||||||||||||
| Net assets consist of | |||||||||||||||
| Paid-in capital | $12,301,149 | ||||||||||||||
| Undistributed net investment income | 884 | ||||||||||||||
| Accumulated net realized gain (loss) on investments | (269 | ) | |||||||||||||
| Net unrealized appreciation (depreciation) on investments | 719,190 | ||||||||||||||
| Net assets | $13,020,954 | ||||||||||||||
| Net asset value per share | |||||||||||||||
| Based on net asset values and shares outstanding-the fund has an unlimited number of shares authorized with no par value | |||||||||||||||
| Net assets | $13,020,954 | ||||||||||||||
| Shares outstanding | 500,000 | ||||||||||||||
| Net asset value per share | $26.04 | ||||||||||||||
STATEMENT OF OPERATIONS For the period ended 10-31-15 (unaudited)1
| Investment income | |||||||||||||||||||||||||||||||||
| Dividends | $4,774 | ||||||||||||||||||||||||||||||||
| Total investment income | 4,774 | ||||||||||||||||||||||||||||||||
| Expenses | |||||||||||||||||||||||||||||||||
| Investment management fees | 3,501 | ||||||||||||||||||||||||||||||||
| Accounting and legal services fees | 132 | ||||||||||||||||||||||||||||||||
| Transfer agent fees | 1,062 | ||||||||||||||||||||||||||||||||
| Printing and postage | 1,246 | ||||||||||||||||||||||||||||||||
| Professional fees | 5,288 | ||||||||||||||||||||||||||||||||
| Custodian fees | 1,768 | ||||||||||||||||||||||||||||||||
| Registration and filing fees | 998 | ||||||||||||||||||||||||||||||||
| Other | 825 | ||||||||||||||||||||||||||||||||
| Total expenses | 14,820 | ||||||||||||||||||||||||||||||||
| Less expense reductions | (10,930 | ) | |||||||||||||||||||||||||||||||
| Net expenses | 3,890 | ||||||||||||||||||||||||||||||||
| Net investment income | 884 | ||||||||||||||||||||||||||||||||
| Realized and unrealized gain (loss) | |||||||||||||||||||||||||||||||||
| Net realized gain (loss) on investments | (269 | ) | |||||||||||||||||||||||||||||||
| Change in net unrealized appreciation (depreciation) of investments | 719,190 | ||||||||||||||||||||||||||||||||
| Net realized and unrealized gain | 718,921 | ||||||||||||||||||||||||||||||||
| Increase in net assets from operations | $719,805 | ||||||||||||||||||||||||||||||||
| 1 | Period from 9-28-15 (commencement of operations) to 10-31-15. | ||||||||||||||||||||||
STATEMENT OF CHANGES IN NET ASSETS
| Period ended 10-31-151 | |||||||||||||||||
| (unaudited) | |||||||||||||||||
| Increase (decrease) in net assets | |||||||||||||||||
| From operations | |||||||||||||||||
| Net investment income | $884 | ||||||||||||||||
| Net realized loss | (269 | ) | |||||||||||||||
| Change in net unrealized appreciation (depreciation) | 719,190 | ||||||||||||||||
| Increase in net assets resulting from operations | 719,805 | ||||||||||||||||
| From fund share transactions | |||||||||||||||||
| Shares issued | 12,301,149 | ||||||||||||||||
| Total from fund share transactions | 12,301,149 | ||||||||||||||||
| Total increase | 13,020,954 | ||||||||||||||||
| Net assets | |||||||||||||||||
| Beginning of period | — | ||||||||||||||||
| End of period | $13,020,954 | ||||||||||||||||
| Undistributed net investment income | $884 | ||||||||||||||||
| Share activity | |||||||||||||||||
| Shares issued | 500,000 | ||||||||||||||||
| End of period | 500,000 | ||||||||||||||||
| 1 | Period from 9-28-15 (commencement of operations) to 10-31-15. | ||||||||||||||||||||||
Financial highlights
| Period ended | 10-31-15 | 1 | |||||||||||||||||||||||||||||||||||||||
| Per share operating performance | |||||||||||||||||||||||||||||||||||||||||
| Net asset value, beginning of period | $23.93 | ||||||||||||||||||||||||||||||||||||||||
| Net investment income2 | — | 3 | |||||||||||||||||||||||||||||||||||||||
| Net realized and unrealized gain on investments | 2.11 | ||||||||||||||||||||||||||||||||||||||||
| Total from investment operations | 2.11 | ||||||||||||||||||||||||||||||||||||||||
| Net asset value, end of period | $26.04 | ||||||||||||||||||||||||||||||||||||||||
| Total return (%)4 | 8.82 | 5 | |||||||||||||||||||||||||||||||||||||||
| Ratios and supplemental data | |||||||||||||||||||||||||||||||||||||||||
| Net assets, end of period (in millions) | $13 | ||||||||||||||||||||||||||||||||||||||||
| Ratios (as a percentage of average net assets): | |||||||||||||||||||||||||||||||||||||||||
| Expenses before reductions | 1.91 | 6 | |||||||||||||||||||||||||||||||||||||||
| Expenses including reductions | 0.50 | 6 | |||||||||||||||||||||||||||||||||||||||
| Net investment income | 0.11 | 6 | |||||||||||||||||||||||||||||||||||||||
| Portfolio turnover (%)7 | — | 8 | |||||||||||||||||||||||||||||||||||||||
| 1 | Period from 9-28-15 (commencement of operations) to 10-31-15. Unaudited. | |||||||||||||||||||||||||||||||||||||
| 2 | Based on average daily shares outstanding. | |||||||||||||||||||||||||||||||||||||
| 3 | Less than $0.005 per share. | |||||||||||||||||||||||||||||||||||||
| 4 | Total returns would have been lower had certain expenses not been reduced during the period. | |||||||||||||||||||||||||||||||||||||
| 5 | Not annualized. | |||||||||||||||||||||||||||||||||||||
| 6 | Annualized. | |||||||||||||||||||||||||||||||||||||
| 7 | Portfolio turnover rate excludes securities received or delivered from in-kind transactions. | |||||||||||||||||||||||||||||||||||||
| 8 | Less than 1%. | |||||||||||||||||||||||||||||||||||||
Note 1 — Organization
John Hancock Multifactor Healthcare ETF (the fund) is a series of the John Hancock Exchange-Traded Fund Trust (the Trust), an open-end management investment company organized as a Massachusetts business trust and registered under the Investment Company Act of 1940, as amended (the 1940 Act). The investment objective of the fund is to seek to provide investment results that closely correspond, before fees and expenses, to the performance of the John Hancock Dimensional Healthcare Index. The John Hancock Dimensional Healthcare Index comprises securities in the healthcare sector within the U.S. Universe whose market capitalizations are in the top 1000 U.S. companies at the time of reconstitution.
The fund commenced operations on September 28, 2015.
Note 2 — Significant accounting policies
The financial statements have been prepared in conformity with accounting principles generally accepted in the United States of America (US GAAP), which require management to make certain estimates and assumptions as of the date of the financial statements. Actual results could differ from those estimates and those differences could be significant. The fund qualifies as an investment company under Topic 946 of Accounting Standards Codification of US GAAP.
Events or transactions occurring after the end of the fiscal period through the date that the financial statements were issued have been evaluated in the preparation of the financial statements. The following summarizes the significant accounting policies of the fund:
Security valuation. Investments are stated at value as of the close of regular trading on the New York Stock Exchange (NYSE), normally at 4:00 p.m., Eastern Time. In order to value the securities, the fund uses the following valuation techniques: Equity securities held by the fund are valued at the last sale price or official closing price on the exchange where the security was acquired or most likely will be sold. In the event there were no sales during the day or closing prices are not available, the securities are valued using the last available bid price. Other portfolio securities and assets, for which reliable market quotations are not readily available, are valued at fair value as determined in good faith by the fund's Pricing Committee following procedures established by the Board of Trustees. The frequency with which these fair valuation procedures are used cannot be predicted and fair value of securities may differ significantly from the value that would have been used had a ready market for such securities existed.
The fund uses a three-tier hierarchy to prioritize the pricing assumptions, referred to as inputs, used in valuation techniques to measure fair value. Level 1 includes securities valued using quoted prices in active markets for identical securities. Level 2 includes securities valued using other significant observable inputs. Observable inputs may include quoted prices for similar securities, interest rates, prepayment speeds and credit risk. Prices for securities valued using these inputs are received from independent pricing vendors and brokers and are based on an evaluation of the inputs described. Level 3 includes securities valued using significant unobservable inputs when market prices are not readily available or reliable, including the fund's own assumptions in determining the fair value of investments. Factors used in determining value may include market or issuer specific events or trends, changes in interest rates and credit quality. The inputs or methodology used for valuing securities are not necessarily an indication of the risks associated with investing in those securities. Changes in valuation techniques and related inputs may result in transfers into or out of an assigned level within the disclosure hierarchy.
As of October 31, 2015, all investments are categorized as Level 1 under the hierarchy described above.
Security transactions and related investment income. Investment security transactions are accounted for on a trade date plus one basis for daily net asset value calculations. However, for financial reporting purposes, investment transactions are reported on trade date. Dividend income is recorded on the ex-date, except for dividends of foreign securities where the dividend may not be known until after the ex-date. In those cases, dividend income, net of withholding taxes, is recorded when the fund becomes aware of the dividends. Gains and losses on securities sold are determined on the basis of identified cost and may include proceeds from litigation.
Overdrafts. Pursuant to the custodian agreement, the fund's custodian may, in its discretion, advance funds to the fund to make properly authorized payments. When such payments result in an overdraft, the fund is obligated to repay the custodian
18
for any overdraft, including any costs or expenses associated with the overdraft. The custodian may have a lien, security interest or security entitlement in any fund property that is not otherwise segregated or pledged, to the maximum extent permitted by law, to the extent of any overdraft.
Expenses. Within the John Hancock group of funds complex, expenses that are directly attributable to an individual fund are allocated to such fund. Expenses that are not readily attributable to a specific fund are allocated among all funds in an equitable manner, taking into consideration, among other things, the nature and type of expense and the fund's relative net assets. Expense estimates are accrued in the period to which they relate and adjustments are made when actual amounts are known.
Federal income taxes. The fund intends to qualify as a regulated investment company by complying with the applicable provisions of the Internal Revenue Code and will not be subject to federal income tax on taxable income that is distributed to shareholders. Therefore, no federal income tax provision is required.
Distribution of income and gains. Distributions to shareholders from net investment income and net realized gains, if any, are recorded on the ex-date. The fund will declare and pay dividends semiannually from net investment income, if any. Capital gain distributions, if any, are typically distributed annually.
Such distributions, on a tax basis, are determined in conformity with income tax regulations, which may differ from US GAAP.
Capital accounts within the financial statements are adjusted for permanent book-tax differences. These adjustments have no impact on net assets or the results of operations. Temporary book-tax differences, if any, will reverse in a subsequent period.
Note 3 — Guarantees and indemnifications
Under the Trust's organizational documents, its Officers and Trustees are indemnified against certain liabilities arising out of the performance of their duties to the Trust, including the fund. Additionally, in the normal course of business, the fund enters into contracts with service providers that contain general indemnification clauses. The fund's maximum exposure under these arrangements is unknown, as this would involve future claims that may be made against the fund that have not yet occurred. The risk of material loss from such claims is considered remote.
Note 4 — Fees and transactions with affiliates
John Hancock Advisers, LLC (the Advisor) serves as investment advisor for the fund. The Advisor is an indirect, wholly owned subsidiary of Manulife Financial Corporation (MFC).
Management fee. The fund has an investment management agreement with the Advisor under which the fund pays a monthly management fee to the Advisor, equivalent on an annual basis, to the sum of: (a) 0.450% of the first $300 million of the fund's average daily net assets; and (b) 0.420% of the fund's average daily net assets in excess of $300 million. The Advisor has a subadvisory agreement with Dimensional Fund Advisors LP. The fund is not responsible for payment of the subadvisory fees.
The Advisor has contractually agreed to waive a portion of its management fee and/or reimburse expenses for certain funds of the John Hancock group of funds complex, including the fund (the participating portfolios). This waiver is based upon aggregate net assets of all the participating portfolios. The amount of the reimbursement is calculated daily and allocated among all the participating portfolios in proportion to the daily net assets of each fund. During the period ended October 31, 2015, this waiver amounted to 0.01% of the fund's average net assets (on an annualized basis). This arrangement may be amended or terminated at any time by the Advisor upon notice to the fund and with the approval of the Board of Trustees.
The Advisor has contractually agreed to reduce its management fee or, if necessary, make payment to the fund, in an amount equal to the amount by which expenses of the fund exceed 0.50% of average annual net assets (on an annualized basis). Expenses means all the expenses of the fund, excluding (a) taxes, (b) brokerage commissions, (c) interest expense, (d) litigation and indemnification expenses and other extraordinary expenses not incurred in the ordinary course of the fund's business, (e) borrowing costs, (f) prime brokerage fees, (g) acquired fund fees, and (h) short dividend expenses. The expense
19
limitation expires on August 31, 2017, unless renewed by mutual agreement of the fund and the Advisor based on a determination that this is appropriate under the circumstances at that time.
For the period ended October 31, 2015, the expense reductions described above amounted to $10,930.
The investment management fees, including the impact of the waivers and reimbursements as described above, incurred for the period ended October 31, 2015 were equivalent to a net annual effective rate of 0.00% of the fund's average daily net assets.
Accounting and legal services. Pursuant to a service agreement, the fund reimburses the Advisor for all expenses associated with providing the administrative, financial, legal, accounting and recordkeeping services to the fund, including the preparation of all tax returns, periodic reports to shareholders and regulatory reports, among other services. These accounting and legal services fees incurred for the period ended October 31, 2015 amounted to an annual rate of 0.02% of the fund's average daily net assets.
Trustee expenses. The fund compensates each Trustee who is not an employee of the Advisor or its affiliates. The costs of paying Trustee compensation and expenses are allocated to each fund based on its net assets relative to other funds within the John Hancock group of funds complex.
Note 5 — Capital share transactions
The fund will issue and redeem shares at net asset value (NAV) only in a large specified number of shares, each called a "creation unit," or multiples thereof, that consist of 50,000 shares. Only authorized participants may engage in creation or redemption transactions directly with the fund. Such transactions generally take place when an authorized participant deposits into the fund a designated portfolio of securities (including any portion of such securities for which cash may be substituted) and a specified amount of cash approximating the holdings of the fund in exchange for a specified number of creation units. Authorized participants pay a transaction fee to the custodian when purchasing and redeeming creation units of a fund. The transaction fee is used to defray the costs associated with the issuance and redemption of creation units. Individual shares of the fund may only be purchased and sold in secondary market transactions through brokers. Secondary market transactions may be subject to brokerage commissions. Shares of the fund are listed and traded on the NYSE Arca, Inc., shares trade at market prices rather than NAV, and may trade at a price greater than or less than NAV.
Affiliates of the fund owned 92% of shares outstanding on October 31, 2015.
Note 6 — Purchase and sale of securities
Purchases and sales of securities, other than in-kind transactions and short-term securities, amounted to $8,376 and $14,369, respectively, for the period ended October 31, 2015. Securities received and delivered from in-kind transactions aggregated $12,305,407 and $0, respectively, for the period ended October 31, 2015.
Note 7 — Industry or sector risk
The fund generally invests a large percentage of its assets in one or more particular industries or sectors of the economy. If a large percentage of the fund's assets are economically tied to a single or small number of industries or sectors of the economy, the fund will be less diversified than a more broadly diversified fund, and it may cause the fund to underperform if that industry or sector underperforms. In addition, focusing on a particular industry or sector may make the fund's net asset value more volatile. Further, a fund that invests in particular industries or sectors is particularly susceptible to the impact of market, economic, regulatory and other factors affecting those industries or sectors.
20
EVALUATION OF ADVISORY AND SUBADVISORY AGREEMENTS BY THE BOARD OF TRUSTEES
Approval of Advisory and Subadvisory Agreements
At in-person meetings held on June 23-25, 2015, the Board of Trustees (the Board) of John Hancock Exchange-Traded Fund Trust (the Trust), including all of the Trustees who are not considered to be interested persons of the Trust under the Investment Company Act of 1940, as amended (the 1940 Act) (the Independent Trustees), approved the John Hancock Multifactor Healthcare ETF (the New Fund).
This section describes the evaluation by the Board of:
| (a) | an advisory agreement between the Trust and John Hancock Advisers, LLC (the Advisor) (the Advisory Agreement); and | |
| (b) | a subadvisory agreement between the Advisor and Dimensional Fund Advisors LP (the Subadvisor) with respect to the New Fund (the Subadvisory Agreement). |
In considering the Advisory Agreement and the Subadvisory Agreement with respect to the New Fund, the Board received in advance of the meetings a variety of materials relating to the New Fund, the Advisor and the Subadvisor, including comparative expense information for a peer group of similar exchange-traded funds and a broader universe of exchange-traded funds, simulated performance information of the New Fund's underlying index (Underlying Index) as compared to applicable benchmarks, and other information provided by the Advisor and the Subadvisor regarding the nature, extent, and quality of services to be provided by the Advisor and the Subadvisor under their respective Agreements, as well as information regarding the Advisor's anticipated profitability in connection with its proposed relationship to the New Fund and any compensation paid to affiliates of the Advisor. The Board also took into account discussions with management and information provided to the Board members at prior meetings with respect to the services provided by the Advisor and the Subadvisor to other John Hancock Funds (the Funds), including quarterly performance reports prepared by management containing reviews of investment results, and periodic presentations from the Subadvisor with respect to the other Funds that it manages. The Board also considered the nature, quality, and extent of the non-advisory services, if any, to be provided to the New Fund by the Advisor and/or its affiliates, including administrative services. The Board members also took into account information with respect to the New Fund presented at their March 10-12, 2015 in-person meeting.
Throughout the process, the Board asked questions of and were afforded the opportunity to request additional information from management. The Board is assisted by legal counsel for the Trust, and the Independent Trustees were also separately assisted by independent legal counsel throughout the process. The Independent Trustees also received a memorandum from their independent legal counsel discussing the legal standards for their consideration of the proposed Advisory Agreement and Subadvisory Agreement and discussed the proposed Advisory Agreement and Subadvisory Agreement in private sessions with their independent legal counsel at which no representatives of management were present.
Approval of Advisory Agreement
In approving the Advisory Agreement with respect to the New Fund, the Board, including the Independent Trustees, considered a variety of factors, including those discussed below. The Board also considered other factors (including conditions and trends prevailing generally in the economy, the securities markets and the industry) and did not treat any single factor as determinative, and each Trustee may have attributed different weights to different factors. The Board members' conclusions may have been based in part on their consideration of the advisory and subadvisory arrangements for other Funds in prior years.
Nature, extent, and quality of services. Among the information received by the Board from the Advisor relating to the nature, extent and quality of services to be provided to the New Fund, the Board considered information provided by the Advisor relating to its operations and personnel, descriptions of its organizational and management structure, and information regarding the Advisor's compliance and regulatory history. The Board members also noted that, on a regular basis, they receive and review information from the Funds' Chief Compliance Officer (CCO) regarding the Funds' compliance policies
21
and procedures established pursuant to Rule 38a-1 under the 1940 Act. The Board considered the investment strategy and Underlying Index of the New Fund. The Board also considered the Advisor's risk management processes. The Board considered that the Advisor would be responsible for the management of the day-to-day operations of the New Fund, including but not limited to, general supervision and coordination of the services to be provided by the Subadvisor, and also would be responsible for monitoring and reviewing the activities of the Subadvisor and other third-party service providers, including the New Fund's distributor.
In considering the nature, extent and quality of the services to be provided by the Advisor, the Trustees also took into account their knowledge of the Advisor's management of other Funds and the quality of the performance of the Advisor's duties with respect to other Funds, through Board meetings, discussions and reports during the preceding year and through each Trustee's experience as a trustee of the other trusts in the complex.
In the course of its deliberations regarding the Advisory Agreement, the Board members considered, among other things:
| (a) | the skills and competency with which the Advisor has in the past managed the Funds' affairs and its subadvisory relationships, including those with the Subadvisor, the Advisor's oversight and monitoring of the Subadvisor's investment performance and compliance programs, such as the Subadvisor's compliance with fund policies and objectives; review of brokerage matters, including with respect to trade allocation and best execution; and the Advisor's timeliness in responding to performance issues; | ||
| (b) | the background, qualifications, and skills of the Advisor's personnel; | ||
| (c) | the Advisor's compliance policies and procedures and its responsiveness to regulatory changes and fund industry developments; | ||
| (d) | the Advisor's administrative capabilities, including its ability to supervise the other service providers for the Funds; | ||
| (e) | the financial condition of the Advisor and whether it has the financial wherewithal to provide a high level and quality of services to the New Fund; and | ||
| (f) | the Advisor's reputation and experience in serving as an investment advisor to the Funds, and the benefit to shareholders of investing in funds that are part of a family of funds offering a variety of investments. |
The Board concluded that the Advisor may reasonably be expected to provide a high quality of services under the Advisory Agreement with respect to the New Fund.
Investment performance. In connection with its consideration of the Advisory Agreement, the Board considered, the New Fund's investment strategy and processes, including the fact that the New Fund will seek performance that closely corresponds to its Underlying Index, which was developed by, and will be maintained, by, the Subadvisor. The Board also considered the simulated performance of the New Fund's Underlying Index as compared to applicable benchmarks.
Fees and Expenses. The Board reviewed comparative information including, among other data, the New Fund's anticipated total net expenses as compared to similarly situated exchange-traded funds deemed to be comparable to the New Fund.
The Board took into account management's discussion of the New Fund's anticipated expenses. The Board noted that the Advisor does not currently manage other funds or institutional accounts with the same or similar strategies proposed for the New Fund.
The Board took into account management's discussion with respect to the proposed advisory/subadvisory fee structure, including the amount of the advisory fee to be retained by the Advisor after payment of the subadvisory fees. The Board also noted that the Advisor, and not the New Fund, would be responsible for paying the subadvisory fees and that such fees are negotiated at arm's length with respect to the Subadvisor. The Board also noted that the Advisor has contractually agreed to waive fees and/or reimburse expenses with respect to the New Fund for a specified period. The Board concluded that the advisory fees to be paid by the New Fund are reasonable in relation to the nature, extent and quality of the services expected to be provided.
22
Profitability/Indirect Benefits. In considering the costs of the services to be provided and the profits to be realized by the Advisor and its affiliates from the Advisor's relationship with the New Fund, the Board:
| (a) | noted that because the New Fund was not yet in existence, no actual revenue, cost or profitability data was available for the Board to review; | ||
| (b) | reviewed and considered information presented by the Advisor regarding the advisory fees and advisory spreads prior to distribution, operations and overhead for the New Fund; | ||
| (c) | noted that the Advisor will derive reputational and other indirect benefits from providing advisory services to the New Fund; | ||
| (d) | noted that the subadvisory fee for the New Fund will be paid by Advisor and is negotiated at arm's length; | ||
| (e) | noted that the Advisor will also pay the Subadvisor a license fee in connection with the New Fund's use of the Underlying Index; and | ||
| (f) | considered that the Advisor should be entitled to earn a reasonable level of profits in exchange for the level of services it will provide to the New Fund and the entrepreneurial risk that it assumes as Advisor. |
Based upon its review, the Board concluded that the anticipated level of profitability, if any, of the Advisor and its affiliates from their relationship with the New Fund is reasonable and not excessive.
Economies of Scale. In considering the extent to which economies of scale would be realized if the New Fund grows and whether fee levels reflect these economies of scale for the benefit of fund shareholders, the Board:
| (a) | considered that the Advisor has contractually agreed to waive a portion of its management fee and/or reimburse or pay operating expenses of the New Fund to reduce operating expenses for a specified period of time; | ||
| (b) | reviewed the New Fund's advisory fee structure and concluded that: (i) the New Fund's fee structure contains breakpoints at the subadvisory fee level and that such breakpoints are reflected as breakpoints in the advisory fees for the New Fund; and (ii) although economies of scale cannot be measured with precision, these arrangements permit shareholders of the New Fund to benefit from economies of scale if the New Fund grows. The Board also took into account management's discussion of the New Fund's advisory fee structure; and | ||
| (c) | the Board also considered the potential effect of the New Fund's future growth in size on its performance and fees. The Board also noted that if the New Fund's assets increase over time, the New Fund may realize other economies of scale and the Board would consider whether additional breakpoints would be appropriate at that time. |
Approval of Subadvisory Agreement
In making its determination with respect to approval of the Subadvisory Agreement, the Board reviewed:
| (a) | information relating to the Subadvisor's business, including current subadvisory services (to other funds in the John Hancock family of funds); | ||
| (b) | the simulated performance of the Underlying Index developed by the Subadvisor as compared to applicable benchmarks; | ||
| (c) | the proposed advisory fee and total expense ratio for the New Fund, including any breakpoints; and | ||
| (d) | information relating to the nature and scope of any material relationships and their significance to the New Fund's Advisor and Subadvisor. |
23
Nature, Extent, and Quality of Services. With respect to the services to be provided by the Subadvisor, the Board members received and reviewed information provided to the Board by the Subadvisor with respect to the New Fund and took into account information presented throughout the past year with respect to Funds in the complex managed by the Advisor and subadvised by the Subadvisor. In this regard, the Board members considered the Subadvisor's current level of staffing and its overall resources, as well as considered information relating to the Subadvisor's compensation program. The Board members reviewed the Subadvisor's history and investment experience, as well as information regarding the qualifications, background, and responsibilities of the Subadvisor's investment and compliance personnel who will provide services to the New Fund. The Board members also considered the Subadvisor's risk assessment and monitoring processes. The Board members noted that the Advisor conducts regular periodic reviews of the Subadvisor and its operations in regard to the Funds, including regarding investment processes and organizational and staffing matters. The Board members also noted that the Funds' CCO and his staff conduct regular, periodic compliance reviews with the Subadvisor and present reports to the Independent Trustees regarding the same, which include evaluating the regulatory compliance systems of the Subadvisor and procedures reasonably designed by it to assure compliance with the federal securities laws. The Board members also took into account the financial condition of the Subadvisor.
The Board considered the Subadvisor's investment processes and philosophies. The Board took into account that the New Fund will seek performance that closely corresponds to its Underlying Index, which was developed by, and will be maintained, by, the Subadvisor.
Subadvisor compensation. In considering the cost of services to be provided by the Subadvisor, the Board noted that the fees under the Subadvisory Agreement are paid by the Advisor and not the New Fund. The Board members also considered information and took into account any other potential conflicts of interests the Advisor might have in connection with the Subadvisory Agreement.
The Board also relied on the ability of the Advisor to negotiate the Subadvisory Agreement with the Subadvisor, which is not affiliated with the Advisor, and the fees thereunder at arm's length. As a result, the costs of the services to be provided and the profits to be realized by the Subadvisor from its relationship with the Trust were not a factor in the Board's consideration of the Subadvisory Agreement.
The Board also received information regarding the nature and scope (including their significance to the Advisor and its affiliates and to the Subadvisor) of any material relationships with respect to the Subadvisor, which include arrangements in which the Subadvisor will serve as the index provider for the New Fund and for other exchange-traded funds in the complex, as well as arrangements in which the Subadvisor or its affiliates provide advisory, or management services in connection with financial products sponsored by the Advisor or its affiliates, and may include other registered investment companies, including other exchange-traded funds, a 529 education savings plan, managed separate accounts and exempt group annuity contracts sold to qualified plans.
In addition, the Board considered other potential indirect benefits that the Subadvisor and its affiliates may receive from the Subadvisor's relationship with the New Fund, such as the opportunity to provide advisory services to additional John Hancock Funds and reputational benefits.
Subadvisory fees. The Board considered that the New Fund will pay advisory fees to the Advisor and that, in turn, the Advisor will pay subadvisory fees to the Subadvisor. The Board considered the New Fund's advisory fees and total expense ratio. The Board also considered that the Subadvisor receives additional compensation from the Advisor in connection with its role as index provider for the New Fund.
Subadvisor performance. The Board considered the New Fund's investment strategy and processes, including the fact that the New Fund will seek performance that closely corresponds to its Underlying Index and that its Underlying Index has been developed by, and will be maintained by, the Subadvisor. The Board also considered simulated performance of the Underlying Index as compared to applicable benchmarks. The Board noted the Advisor's expertise and resources in monitoring the performance, investment style and risk-adjusted performance of the Subadvisor. The Board was mindful of the Advisor's focus on the Subadvisor's performance.
24
The Board's decision to approve the Subadvisory Agreement was based on a number of determinations, including the following:
| (1) | The Subadvisor has extensive experience and demonstrated skills as a manager, and currently subadvises other Funds in the complex and the Board is generally satisfied with the Subadvisor's management of these Funds, and may reasonably be expected to provide a high quality of investment management services to the New Fund; | |
| (2) | the proposed subadvisory fees are reasonable in relation to the level and quality of services to be provided; and | |
| (3) | subadvisory fee breakpoints are reflected as breakpoints in the advisory fees for the New Fund in order to permit shareholders to benefit from economies of scale if and as the New Fund grows. | |
| * * * | ||
Based on the Board's evaluation of all factors that it deemed to be material, including those factors described above, and assisted by the advice of independent legal counsel, the Board, including the Independent Trustees, concluded that approval of the Advisory Agreement and the Subadvisory Agreement would be in the best interest of the New Fund and its shareholders. Accordingly, the Board, and the Independent Trustees voting separately, approved the Advisory Agreement and Subadvisory Agreement.
25
Trustees James M. Oates, Chairperson Officers Andrew G. Arnott John J. Danello Francis V. Knox, Jr. Charles A. Rizzo Salvatore Schiavone | Investment advisor John Hancock Advisers, LLC Subadvisor Dimensional Fund Advisors LP Principal distributor Foreside Fund Services, LLC Custodian State Street Bank and Trust Company Transfer agent State Street Bank and Trust Company Legal counsel Dechert LLP Stock symbol NYSE Arca: JHMH |
*Member of the Audit Committee
†Non-Independent Trustee
The fund's proxy voting policies and procedures, as well as the fund proxy voting record for the most recent twelve-month period ended June 30, are available free of charge on the Securities and Exchange Commission (SEC) website at sec.gov or on our website.
The fund's complete list of portfolio holdings, for the first and third fiscal quarters, is filed with the SEC on Form N-Q. The fund's Form N-Q is available on our website and the SEC's website, sec.gov, and can be reviewed and copied (for a fee) at the SEC's Public Reference Room in Washington, DC. Call 800-SEC-0330 to receive information on the operation of the SEC's Public Reference Room.
We make this information on your fund, as well as monthly portfolio holdings, and other fund details available on our website at jhinvestments.com/etf or by calling 800-225-5291.
| You can also contact us: | |||
| 800-225-5291 jhinvestments.com/etf | Regular mail: John Hancock Signature Services, Inc. | Express mail: John Hancock Signature Services, Inc. | |
26
John Hancock family of funds
DOMESTIC EQUITY FUNDS Balanced Blue Chip Growth Classic Value Disciplined Value Disciplined Value Mid Cap Equity Income Fundamental All Cap Core Fundamental Large Cap Core Fundamental Large Cap Value Large Cap Equity New Opportunities Select Growth Small Cap Equity Small Cap Value Small Company Strategic Growth U.S. Equity U.S. Global Leaders Growth Value Equity GLOBAL/INTERNATIONAL FUNDS Disciplined Value International Emerging Markets Emerging Markets Equity Global Equity Global Shareholder Yield Greater China Opportunities International Core International Growth International Small Company International Value Equity | INCOME FUNDS Bond California Tax-Free Income Core High Yield Emerging Markets Debt Floating Rate Income Focused High Yield Global Income Government Income High Yield Municipal Bond Income Investment Grade Bond Money Market Short Duration Credit Opportunities Spectrum Income Strategic Income Opportunities Tax-Free Bond ALTERNATIVE/SPECIALTY FUNDS Absolute Return Currency Alternative Asset Allocation Enduring Assets Financial Industries Global Absolute Return Strategies Global Conservative Absolute Return Global Real Estate Natural Resources Redwood Regional Bank Seaport Technical Opportunities |
The fund's investment objectives, risks, charges, and expenses are included in the prospectus and should be considered carefully before investing. For a prospectus, contact your financial professional, call
John Hancock Investments at 800-225-5291, or visit the fund's website at jhinvestments.com. Please read the prospectus carefully before investing or sending money.
ASSET ALLOCATION PORTFOLIOS Income Allocation Fund Lifestyle Aggressive Portfolio Lifestyle Balanced Portfolio Lifestyle Conservative Portfolio Lifestyle Growth Portfolio Lifestyle Moderate Portfolio Retirement Choices Portfolios (2010-2055) Retirement Living Portfolios (2010-2055) Retirement Living II Portfolios (2010-2055) EXCHANGE-TRADED FUNDS John Hancock Multifactor Consumer Discretionary ETF John Hancock Multifactor Financials ETF John Hancock Multifactor Healthcare ETF John Hancock Multifactor Large Cap ETF John Hancock Multifactor Mid Cap ETF John Hancock Multifactor Technology ETF CLOSED-END FUNDS Financial Opportunities Hedged Equity & Income Income Securities Trust Investors Trust Preferred Income Preferred Income II Preferred Income III Premium Dividend Tax-Advantaged Dividend Income Tax-Advantaged Global Shareholder Yield |
"As an investment firm,
upholding the proud
tradition of John Hancock
comes down to one thing:
putting shareholders
first. We believe that if
our shareholders are
successful, then we will
be successful."
Andrew G. Arnott
President and Chief Executive Officer
John Hancock Investments
John Hancock Multifactor ETF shares are bought and sold at market price (not NAV), and are not individually redeemed from the fund. Brokerage commissions will reduce returns.
John Hancock ETFs are distributed by Foreside Fund Services, LLC, and are subadvised by Dimensional Fund Advisors LP. Foreside is not affiliated with John Hancock Funds, LLC or Dimensional Fund Advisors LP.
Dimensional Fund Advisors LP receives compensation from John Hancock in connection with licensing rights to the John Hancock Dimensional indexes. Dimensional Fund Advisors LP does not sponsor, endorse, or sell, and makes no representation as to the advisability of investing in, John Hancock Multifactor ETFs (Multifactor ETFs). Neither John Hancock Advisers, LLC nor Dimensional Fund Advisors LP guarantees the accuracy and/or the completeness of the John Hancock Dimensional Indexes (the "Indexes") or any data included therein, and neither John Hancock Advisers, LLC nor Dimensional Fund Advisors LP shall have any liability for any errors, omissions, or interruptions therein. Neither John Hancock Advisers, LLC nor Dimensional Fund Advisors LP makes any warranty, express or implied, as to results to be obtained by the Multifactor ETFs, owners of the shares of the Multifactor ETFs or any other person or entity from the use of the Indexes, trading based on the Indexes, or any data included therein, either in connection with the Multifactor ETFs or for any other use. Neither John Hancock Advisers, LLC nor Dimensional Fund Advisors LP makes any express or implied warranties, and expressly disclaim all warranties of merchantability or fitness for a particular purpose or use with respect to the Indexes or any data included therein. Without limiting any of the foregoing, in no event shall either John Hancock Advisers, LLC or Dimensional Fund Advisors LP have any liability for any special, punitive, direct, indirect or consequential damages (including lost profits) arising out of matters relating to the use of the Indexes, even if notified of the possibility of such damages.
John Hancock Investments
A trusted brand
John Hancock Investments is a premier asset manager representing
one of America's most trusted brands, with a heritage of financial
stewardship dating back to 1862. Helping our shareholders pursue
their financial goals is at the core of everything we do. It's why we
support the role of professional financial advice and operate with the
highest standards of conduct and integrity.
A better way to invest
We build funds based on investor needs, then search the world to find
proven portfolio teams with specialized expertise in those strategies.
As a manager of managers, we apply vigorous oversight to ensure that
they continue to meet our uncompromising standards and serve the
best interests of our shareholders.
Results for investors
Our unique approach to asset management enables us to provide
a diverse set of investments backed by some of the world's best
managers, along with strong risk-adjusted returns across asset classes.
| | John Hancock Investments 601 Congress Street n Boston, MA 02210 800-225-5291 n jhinvestments.com/etf | |
| This report is for the information of the shareholders of John Hancock Multifactor Healthcare ETF. It is not authorized for distribution to prospective investors unless preceded or accompanied by a prospectus. | ||
MF260295 JHAN-2015-12-23-0160 | 820SA 10/15 12/15 | |
John Hancock
A message to shareholders
Dear shareholder,
Welcome to John Hancock Investments, and thank you for investing in a John Hancock Multifactor exchange-traded fund (ETF). At John Hancock Investments, we take a different approach to managing money on behalf of our shareholders. We build funds based on investor needs, then search the world to find proven portfolio teams with specialized expertise in those strategies. We were pleased to team up with Dimensional Fund Advisors LP—a company regarded as one of the pioneers in strategic beta investing*—to create a suite of passively managed ETFs. Each of our John Hancock Multifactor ETFs seeks to track a custom index built upon decades of academic research into the factors that drive higher expected returns: smaller capitalizations, lower valuations, and higher profitability.
This inaugural report to shareholders covers a very brief period of performance due to the fact that your ETF was launched shortly before the midpoint of its fiscal year. In this abbreviated report, your fund's portfolio managers will discuss the construction of the fund's underlying index, provide a review of the current market environment, and give a description of performance achieved so far. The next report you receive will cover the full period from the fund's inception to the end of its fiscal year on April 30, 2016.
We know you have many choices when it comes to your investments, and we appreciate the opportunity to earn the trust you've placed in John Hancock Investments.
Sincerely,
Andrew G. Arnott
President and Chief Executive Officer
John Hancock Investments
This commentary reflects the CEO's views as of October 31, 2015. They are subject to change at any time. For more up-to-date information, you can visit our website at jhinvestments.com.
| * | Strategic beta investing ETFs seek to improve upon cap-weighted strategies by tracking a custom index that combines active management insight with the discipline of a rules-based approach. |
John Hancock
Multifactor Consumer Discretionary ETF
Table of contents
| 2 | Your fund at a glance | |
| 4 | Discussion of fund performance | |
| 8 | Premium/discount analysis | |
| 9 | Your expenses | |
| 11 | Fund's investments | |
| 16 | Financial statements | |
| 19 | Financial highlights | |
| 20 | Notes to financial statements | |
| 23 | Evaluation of advisory and subadvisory agreements by the Board of Trustees | |
| 28 | More information |
1
INVESTMENT OBJECTIVE
The fund seeks to provide investment results that closely correspond, before fees and expenses, to the performance of the John Hancock Dimensional Consumer Discretionary Index.
TOTAL RETURNS AS OF 10/31/15 (%)
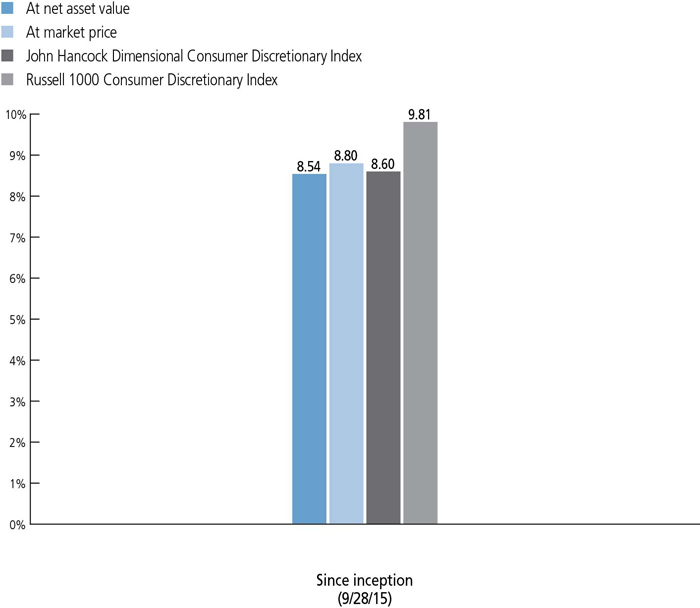
Market performance is determined using the closing price of the fund on its primary exchange, the NYSE Arca, at 4 P.M., Eastern time; your returns may differ if you traded shares at other times during the day. The net asset value is calculated by dividing the total value of all the securities in the fund's portfolio plus cash, interest, and receivables, minus any liabilities, by the number of fund shares outstanding.
The John Hancock Dimensional Consumer Discretionary Index comprises securities in the consumer discretionary sector within the U.S. Universe whose market capitalizations are in the top 1000 U.S. companies at the time of reconstitution. The Index is reconstituted and rebalanced on a semiannual basis. Stocks that compose the Index include those that may be considered medium or smaller capitalization company stocks. The consumer discretionary sector is composed of companies in areas such as restaurants, media, consumer retail, leisure equipment and products, hotels, apparel, automobiles, and consumer durable goods. The U.S. Universe is defined as a free float-adjusted market-capitalization-weighted portfolio of U.S. operating companies listed on the New York Stock Exchange (NYSE), NYSE MKT LLC, NASDAQ Global Market, or such other securities exchanges deemed appropriate in accordance with the rules-based methodology that is maintained by Dimensional Fund Advisors LP.
Russell 1000 Consumer Discretionary Index comprises securities within the Consumer Discretionary sector in the Russell 1000 Index.
It is not possible to invest directly in an index. Index figures do not reflect expenses or sales charges, which would result in lower returns.
The past performance shown here reflects reinvested distributions and the beneficial effect of any expense reductions, and does not guarantee future results. Returns for periods shorter than one year are cumulative. Shares will fluctuate in value and, when sold or redeemed, may be worth more or less than their original cost. Current performance may be lower or higher than the performance cited, and can be found at jhinvestments.com or by calling 800-225-5291. For further information on the fund's objectives, risks, and strategy, see the fund's prospectus.
2
PERFORMANCE HIGHLIGHTS OVER THE PERIOD
Risk assets rebounded
Following a challenging summer, equity markets around the world bounced back; fixed-income asset returns were more subdued, as many bond sectors ended the period roughly where they started.
Smaller-cap stocks trailed larger peers
Relative to the capitalization-weighted Russell 1000 Consumer Discretionary Index, the fund's smaller-cap bias hindered results as larger caps led the way during the period.
Value-oriented shares lagged growth counterparts
The fund emphasizes shares with lower price-to-book ratios; during the period, this value tilt also weighed on results relative to the broad market.
INDUSTRY COMPOSITION AS OF 10/31/15 (%)

A note about risks
The prices of medium and smaller company stocks can change more frequently and dramatically than those of large companies. Value stocks may underperform other segments of the market. The value of a company's equity securities is subject to changes in the company's financial condition and overall market and economic conditions. Because the fund may focus on particular sectors of the economy, its performance may depend on the performance of those sectors, and investments focused in one sector may fluctuate more dramatically than investments in a wider variety of sectors. Exchange-traded fund shares are bought and sold through exchange trading at market price (not NAV), and are not individually redeemed from the fund. Due to various factors, shares may trade at a premium or discount to their NAV in the secondary market, and the fund's holdings and returns may deviate from those of its index. These variations may be greater when markets are volatile or subject to unusual conditions. Errors in the construction or calculation of the fund's index may occur from time to time. Brokerage commissions will reduce returns. Please see the fund's prospectus for additional risks.
3
Lukas J. Smart, CFA
Portfolio Manager
Dimensional Fund Advisors LP
Would you tell us about your investment philosophy and how it drives the composition of this new exchange-traded fund (ETF)?
Research has shown that there are differences in expected returns among securities. At Dimensional Fund Advisors, we've identified four characteristics, or dimensions, of expected returns—the overall market, company size, relative price, and profitability—that academic research has shown to account for most of the variation in asset returns over time.
The market dimension reflects the excess return over the risk-free rate that market participants demand for investing in a broadly diversified portfolio of equity securities without any style or market capitalization bias. That premium is called the equity premium or equity risk premium.
The company size dimension reflects the excess return that investors demand for investing in small-capitalization stocks relative to large-capitalization stocks. The premium associated with this dimension is the small-cap, or size, premium.
The relative price dimension reflects the excess return that investors expect from investing in low relative price, or value, stocks (as measured, for instance, by their price-to-book ratios) in comparison with high relative price, or growth, stocks. The premium associated with this dimension is the value premium.
Finally, the profitability dimension provides a way to discern the expected returns of companies with similar price-driven characteristics. If two companies trade at the same relative price, the one with higher profitability should have a higher expected return. We refer to this as the profitability premium.
Relative to a commercial cap-weighted measure of the market, we believe that incorporating these dimensions of expected returns into an investment strategy offers the potential for outperformance
4
What was the market environment like during the period?
The period from inception on September 28, 2015, through October 31, 2015, followed a difficult and volatile summer for equities. However, stock markets around the world subsequently snapped back for a sharp rebound, posting high single-digit percentage returns in some cases.
Broadly speaking, materials, energy, and technology equity shares were particularly strong, while utilities—often viewed as a safe-haven sector of the stock market—generated more modest results. U.S. equities led most major markets, outpacing both emerging markets and developed markets abroad as a group. Larger-capitalization stocks outpaced smaller caps, and growth-oriented shares outpaced their value counterparts during this relatively short time period.
TOP 10 HOLDINGS AS OF 10/31/15 (%)
| Amazon.com, Inc. | 4.0 |
| Comcast Corp., Class A | 3.5 |
| The Walt Disney Company | 3.4 |
| The Home Depot, Inc. | 3.2 |
| McDonald's Corp. | 2.5 |
| Starbucks Corp. | 1.7 |
| Delphi Automotive PLC | 1.7 |
| NIKE, Inc., Class B | 1.7 |
| Lowe's Companies, Inc. | 1.6 |
| Macy's, Inc. | 1.5 |
| TOTAL | 24.8 |
| As a percentage of net assets. | |
| Cash and cash equivalents are not included. | |
5
How did the fund perform during this abbreviated period?
The fund generated an 8.54% return on a net asset value (NAV) basis, which was slightly below the custom benchmark it's intended to track, the John Hancock Dimensional Consumer Discretionary Index.
Our approach results in the fund broadly maintaining relatively high weightings in securities of smaller-cap issuers and in those trading at lower relative prices in relation to their book values. In the weightings of individual positions, we also place greater emphasis on companies that have demonstrated higher profitability.
The fund trailed the Russell 1000 Consumer Discretionary Index, a commercial cap-weighted benchmark we use as a proxy for the consumer discretionary portion of the U.S. stock market. On balance, our emphasis on smaller and lower relative price shares worked against the fund during this time period.
The premiums associated with the dimensions we've identified are unpredictable. For this reason, we believe the best way to invest is to structure broadly diversified portfolios with a consistent focus on the desired dimensions, seeking to capture the expected premiums associated with them.
We would expect smaller to outperform larger capitalizations and value to outperform growth shares over an extended time horizon; any given trading day, month, or year can prove otherwise, and that's okay. Patience and persistence are key ingredients to success in our style of investing.
How was the fund positioned at the close of the period?
In keeping with our long-term investment approach, the fund generally held higher weights in low-relative-price stocks and equities with smaller market capitalization while emphasizing companies with higher profitability relative to commercial cap-weighted indexes.
The fund's largest absolute exposures were to the media; specialty retail; and hotels, restaurants, and leisure industries of the consumer discretionary sector.
The fund was broadly diversified across the sector with more than 100 different consumer
6
discretionary names. Top holdings included Amazon.com, Inc., Comcast Corp., and The Walt Disney Company. The fund's weighted average market capitalization was $53 billion, its price-to-book ratio was 3.6, and its price-to-earnings ratio was 20.1.
MANAGED BY
| | Lukas J. Smart, CFA On the fund since inception Investing since 2003 |
| | Joel P. Schneider On the fund since inception Investing since 2011 |
![]()
7
ETF shares are bought and sold through exchange trading at market price—not net asset value (NAV)—and are not individually redeemed from the fund. Due to various factors, shares may trade at a premium or discount to their NAV in the secondary market. If a shareholder purchases shares at a time when the market price is at a premium to the NAV or sells shares at a time when the market price is at a discount to the NAV, the shareholder may sustain losses. Additionally due to various factors, a fund's holdings and returns may deviate from those of its index. These variations may be greater when markets are volatile or subject to unusual conditions.
A premium exists when the closing market price is trading above NAV, while a discount indicates that the closing market price is trading below NAV. The differences are expressed as basis points, with one basis point equaling 1/100 of 1%.
The chart below presents information about the differences between the fund's daily closing market price and the fund's NAV. The closing market price is the daily closing price as reported on the NYSE Arca, Inc., the fund's primary listing exchange. Data presented represents past performance and cannot be used to predict future results.
Period Ended October 31, 2015
| Closing price below NAV | Closing price above or equal to NAV | |||||||
| Basis point differential | Number of days | % of Total days | Number of days | % of Total days | ||||
| 0 - < 25 | 14 | 58.33% | 7 | 29.17% | ||||
| 25 - < 50 | 1 | 4.17% | — | — | ||||
| 50 - < 75 | — | — | 2 | 8.33% | ||||
| 75 - < 100 | — | — | — | — | ||||
| 100 or Above | — | — | — | — | ||||
| Total | 15 | 62.50% | 9 | 37.50% | ||||
8
These examples are intended to help you understand your ongoing operating expenses of investing in the fund so you can compare these costs with the ongoing costs of investing in
other funds.
Understanding fund expenses
As a shareholder of the fund, you incur two types of costs:
| • | Transaction costs, which may include creation and redemption fees or brokerage charges. |
| • | Ongoing operating expenses, including management fees and other fund expenses. |
We are presenting only your ongoing operating expenses here.
Actual expenses/actual returns
This example is intended to provide information about the fund's actual ongoing operating expenses, and is based on the fund's actual return. It assumes an account value of $1,000.00 on September 28, 2015, with the same investment held until October 31, 2015.
| Account value on 9-28-2015 | Ending value on 10-31-2015 | Expenses paid during period ended 10-31-20151 | Annualized expense ratio | |
| $1,000.00 | $1,085.40 | $0.47 | 0.50% |
Together with the value of your account, you may use this information to estimate the operating expenses that you paid over the period. Simply divide your account value at October 31, 2015, by $1,000.00, then multiply it by the "expenses paid" from the table above. For example, for an account value of $8,600.00, the operating expenses should be calculated as follows:
9
Hypothetical example for comparison purposes
This table allows you to compare the fund's ongoing operating expenses with those of any other fund. It provides an example of the fund's hypothetical account values and hypothetical expenses based on the fund's actual expense ratio and an assumed 5% annualized return before expenses (which is not the fund's actual return). It assumes an account value of $1,000.00 on May 1, 2015, with the same investment held until October 31, 2015. Look in any other fund shareholder report to find its hypothetical example and you will be able to compare these expenses. Please remember that these hypothetical account values and expenses may not be used to estimate the actual ending account balance or expenses you paid for the period.
| Account value on 5-1-2015 | Ending value on 10-31-2015 | Expenses paid during period ended 10-31-20152 | Annualized expense ratio | |
| $1,000.00 | $1,022.60 | $2.54 | 0.50% |
Remember, these examples do not include any transaction costs. The fund charges a transaction fee per creation unit to those creating or redeeming creation units, and those buying or selling shares in the secondary market will incur customary brokerage commissions and charges. Therefore, these examples will not help you to determine the relative total costs of owning different funds. If transaction costs were included, your expenses would have been higher. See the prospectus for details regarding transaction costs.
| 1 | The inception date for the fund is 9-28-2015. Expenses are equal to the fund's annualized expense ratio, multiplied by the average account value over the period, multiplied by 33/366 (to reflect the period). |
| 2 | Expenses are equal to the fund's annualized expense ratio, multiplied by the average account value over the period, multiplied by 184/366 (to reflect the one-half year period). |
10
Fund's investments
| As of 10-31-15 (unaudited) | ||||||||||||||
| Shares | Value | |||||||||||||
| Common stocks 100.0% | $13,131,576 | |||||||||||||
| (Cost $12,457,701) | ||||||||||||||
| Consumer discretionary 99.9% | 13,122,544 | |||||||||||||
| Auto components 5.9% | ||||||||||||||
| Autoliv, Inc. | 730 | 88,505 | ||||||||||||
| BorgWarner, Inc. | 1,800 | 77,076 | ||||||||||||
| Delphi Automotive PLC | 2,680 | 222,949 | ||||||||||||
| Gentex Corp. | 2,130 | 34,911 | ||||||||||||
| Johnson Controls, Inc. | 2,534 | 114,486 | ||||||||||||
| Lear Corp. | 760 | 95,046 | ||||||||||||
| The Goodyear Tire & Rubber Company | 2,790 | 91,624 | ||||||||||||
| Visteon Corp. (I) | 420 | 45,809 | ||||||||||||
| Automobiles 3.7% | ||||||||||||||
| Ford Motor Company | 12,854 | 190,368 | ||||||||||||
| General Motors Company | 4,250 | 148,368 | ||||||||||||
| Harley-Davidson, Inc. | 1,950 | 96,428 | ||||||||||||
| Tesla Motors, Inc. (I) | 220 | 45,525 | ||||||||||||
| Distributors 1.3% | ||||||||||||||
| Genuine Parts Company | 1,240 | 112,542 | ||||||||||||
| LKQ Corp. (I) | 1,910 | 56,555 | ||||||||||||
| Diversified consumer services 1.7% | ||||||||||||||
| Bright Horizons Family Solutions, Inc. (I) | 180 | 11,524 | ||||||||||||
| Graham Holdings Company, Class B | 50 | 27,624 | ||||||||||||
| H&R Block, Inc. | 2,590 | 96,503 | ||||||||||||
| Service Corp. International | 2,110 | 59,629 | ||||||||||||
| ServiceMaster Global Holdings, Inc. (I) | 960 | 34,224 | ||||||||||||
| Hotels, restaurants and leisure 15.0% | ||||||||||||||
| ARAMARK | 1,710 | 51,899 | ||||||||||||
| Brinker International, Inc. | 690 | 31,402 | ||||||||||||
| Buffalo Wild Wings, Inc. (I) | 120 | 18,512 | ||||||||||||
| Carnival Corp. | 1,920 | 103,834 | ||||||||||||
| Chipotle Mexican Grill, Inc. (I) | 220 | 140,851 | ||||||||||||
| Cracker Barrel Old Country Store, Inc. | 200 | 27,492 | ||||||||||||
| Darden Restaurants, Inc. | 880 | 54,463 | ||||||||||||
| Domino's Pizza, Inc. | 330 | 35,201 | ||||||||||||
| Dunkin' Brands Group, Inc. | 860 | 35,613 | ||||||||||||
| Extended Stay America, Inc. | 400 | 7,680 | ||||||||||||
| Hilton Worldwide Holdings, Inc. | 1,774 | 44,332 | ||||||||||||
| International Game Technology PLC | 570 | 9,245 | ||||||||||||
| Las Vegas Sands Corp. | 1,020 | 50,500 | ||||||||||||
| Marriott International, Inc., Class A | 1,250 | 95,975 | ||||||||||||
| McDonald's Corp. | 2,930 | 328,893 | ||||||||||||
| Shares | Value | |||||||||||||
| Consumer discretionary (continued) | ||||||||||||||
| Hotels, restaurants and leisure (continued) | ||||||||||||||
| MGM Resorts International (I) | 3,390 | $78,614 | ||||||||||||
| Norwegian Cruise Line Holdings, Ltd. (I) | 850 | 54,077 | ||||||||||||
| Panera Bread Company, Class A (I) | 240 | 42,569 | ||||||||||||
| Royal Caribbean Cruises, Ltd. | 1,280 | 125,882 | ||||||||||||
| Six Flags Entertainment Corp. | 640 | 33,306 | ||||||||||||
| Starbucks Corp. | 3,650 | 228,381 | ||||||||||||
| Starwood Hotels & Resorts Worldwide, Inc. | 1,320 | 105,428 | ||||||||||||
| Vail Resorts, Inc. | 260 | 29,684 | ||||||||||||
| Wyndham Worldwide Corp. | 1,130 | 91,926 | ||||||||||||
| Wynn Resorts, Ltd. | 394 | 27,560 | ||||||||||||
| Yum! Brands, Inc. | 1,670 | 118,420 | ||||||||||||
| Household durables 6.1% | ||||||||||||||
| D.R. Horton, Inc. | 2,610 | 76,838 | ||||||||||||
| Harman International Industries, Inc. | 490 | 53,880 | ||||||||||||
| Jarden Corp. (I) | 1,370 | 61,376 | ||||||||||||
| Leggett & Platt, Inc. | 1,120 | 50,434 | ||||||||||||
| Lennar Corp., Class A | 1,310 | 65,592 | ||||||||||||
| Lennar Corp., Class B | 70 | 2,901 | ||||||||||||
| Mohawk Industries, Inc. (I) | 470 | 91,885 | ||||||||||||
| Newell Rubbermaid, Inc. | 2,240 | 95,043 | ||||||||||||
| NVR, Inc. (I) | 40 | 65,510 | ||||||||||||
| PulteGroup, Inc. | 2,464 | 45,165 | ||||||||||||
| Tempur Sealy International, Inc. (I) | 440 | 34,250 | ||||||||||||
| Toll Brothers, Inc. (I) | 1,250 | 44,963 | ||||||||||||
| Whirlpool Corp. | 700 | 112,098 | ||||||||||||
| Internet and catalog retail 8.1% | ||||||||||||||
| Amazon.com, Inc. (I) | 830 | 519,497 | ||||||||||||
| Expedia, Inc. | 830 | 113,129 | ||||||||||||
| HSN, Inc. | 280 | 17,318 | ||||||||||||
| Liberty Interactive Corp., Series A (I) | 3,724 | 101,926 | ||||||||||||
| Netflix, Inc. (I) | 700 | 75,866 | ||||||||||||
| The Priceline Group, Inc. (I) | 122 | 177,417 | ||||||||||||
| TripAdvisor, Inc. (I) | 790 | 66,186 | ||||||||||||
| Leisure products 1.8% | ||||||||||||||
| Brunswick Corp. | 650 | 34,977 | ||||||||||||
| Hasbro, Inc. | 1,020 | 78,367 | ||||||||||||
| Mattel, Inc. | 2,744 | 67,448 | ||||||||||||
| Polaris Industries, Inc. | 490 | 55,047 | ||||||||||||
| Media 22.4% | ||||||||||||||
| AMC Networks, Inc., Class A (I) | 400 | 29,556 | ||||||||||||
| Cablevision Systems Corp., Class A | 1,690 | 55,077 | ||||||||||||
| CBS Corp., Class B | 1,770 | 82,340 | ||||||||||||
| Shares | Value | |||||||||||||
| Consumer discretionary (continued) | ||||||||||||||
| Media (continued) | ||||||||||||||
| Charter Communications, Inc., Class A (I) | 670 | $127,930 | ||||||||||||
| Cinemark Holdings, Inc. | 980 | 34,731 | ||||||||||||
| Comcast Corp., Class A | 7,414 | 464,265 | ||||||||||||
| Comcast Corp., Special Class A | 1,432 | 89,801 | ||||||||||||
| Discovery Communications, Inc., Series A (I) | 1,800 | 52,992 | ||||||||||||
| Discovery Communications, Inc., Series C (I) | 1,030 | 28,346 | ||||||||||||
| DISH Network Corp., Class A (I) | 1,260 | 79,342 | ||||||||||||
| Liberty Global PLC, Series A (I) | 1,510 | 67,225 | ||||||||||||
| Liberty Global PLC, Series C (I) | 2,390 | 101,910 | ||||||||||||
| Liberty Media Corp., Series A (I) | 2,340 | 95,378 | ||||||||||||
| Lions Gate Entertainment Corp. | 590 | 22,992 | ||||||||||||
| Live Nation Entertainment, Inc. (I) | 950 | 25,916 | ||||||||||||
| MSG Networks, Inc. (I) | 530 | 10,876 | ||||||||||||
| News Corp., Class A | 2,570 | 39,578 | ||||||||||||
| News Corp., Class B | 730 | 11,300 | ||||||||||||
| Omnicom Group, Inc. | 2,590 | 194,043 | ||||||||||||
| Scripps Networks Interactive, Inc., Class A | 830 | 49,866 | ||||||||||||
| Sirius XM Holdings, Inc. (I) | 16,444 | 67,092 | ||||||||||||
| Starz, Class A (I) | 1,010 | 33,845 | ||||||||||||
| TEGNA, Inc. | 2,410 | 65,166 | ||||||||||||
| The Interpublic Group of Companies, Inc. | 3,590 | 82,319 | ||||||||||||
| The Madison Square Garden Company, Class A (I) | 178 | 31,773 | ||||||||||||
| The Walt Disney Company | 3,950 | 449,273 | ||||||||||||
| Time Warner Cable, Inc. | 882 | 167,051 | ||||||||||||
| Time Warner, Inc. | 2,160 | 162,734 | ||||||||||||
| Twenty-First Century Fox, Inc., Class A | 3,514 | 107,845 | ||||||||||||
| Twenty-First Century Fox, Inc., Class B | 1,130 | 34,894 | ||||||||||||
| Viacom, Inc. | 50 | 2,567 | ||||||||||||
| Viacom, Inc., Class B | 1,650 | 81,362 | ||||||||||||
| Multiline retail 7.1% | ||||||||||||||
| Burlington Stores, Inc. (I) | 480 | 23,078 | ||||||||||||
| Dillard's, Inc., Class A | 290 | 25,949 | ||||||||||||
| Dollar General Corp. | 2,520 | 170,780 | ||||||||||||
| Dollar Tree, Inc. (I) | 1,830 | 119,847 | ||||||||||||
| Kohl's Corp. | 2,320 | 106,998 | ||||||||||||
| Macy's, Inc. | 3,844 | 195,967 | ||||||||||||
| Nordstrom, Inc. | 1,460 | 95,207 | ||||||||||||
| Target Corp. | 2,460 | 189,863 | ||||||||||||
| Specialty retail 20.6% | ||||||||||||||
| Advance Auto Parts, Inc. | 680 | 134,932 | ||||||||||||
| American Eagle Outfitters, Inc. | 1,160 | 17,725 | ||||||||||||
| AutoNation, Inc. (I) | 750 | 47,393 | ||||||||||||
| Shares | Value | |||||||||||||
| Consumer discretionary (continued) | ||||||||||||||
| Specialty retail (continued) | ||||||||||||||
| AutoZone, Inc. (I) | 200 | $156,882 | ||||||||||||
| Bed Bath & Beyond, Inc. (I) | 1,790 | 106,738 | ||||||||||||
| Best Buy Company, Inc. | 2,880 | 100,886 | ||||||||||||
| Cabela's, Inc. (I) | 370 | 14,493 | ||||||||||||
| CarMax, Inc. (I) | 1,490 | 87,925 | ||||||||||||
| Dick's Sporting Goods, Inc. | 880 | 39,204 | ||||||||||||
| Foot Locker, Inc. | 1,300 | 88,075 | ||||||||||||
| GameStop Corp., Class A | 1,120 | 51,598 | ||||||||||||
| GNC Holdings, Inc., Class A | 800 | 23,800 | ||||||||||||
| L Brands, Inc. | 940 | 90,221 | ||||||||||||
| Lowe's Companies, Inc. | 2,920 | 215,584 | ||||||||||||
| O'Reilly Automotive, Inc. (I) | 500 | 138,130 | ||||||||||||
| Office Depot, Inc. (I) | 3,320 | 25,298 | ||||||||||||
| Penske Automotive Group, Inc. | 350 | 17,094 | ||||||||||||
| Restoration Hardware Holdings, Inc. (I) | 200 | 20,618 | ||||||||||||
| Ross Stores, Inc. | 3,770 | 190,687 | ||||||||||||
| Sally Beauty Holdings, Inc. (I) | 1,040 | 24,450 | ||||||||||||
| Signet Jewelers, Ltd. | 370 | 55,848 | ||||||||||||
| Staples, Inc. | 4,810 | 62,482 | ||||||||||||
| The Gap, Inc. | 2,504 | 68,159 | ||||||||||||
| The Home Depot, Inc. | 3,414 | 422,107 | ||||||||||||
| The Michaels Companies, Inc. (I) | 400 | 9,352 | ||||||||||||
| The TJX Companies, Inc. | 2,140 | 156,627 | ||||||||||||
| Tiffany & Company | 790 | 65,128 | ||||||||||||
| Tractor Supply Company | 1,110 | 102,553 | ||||||||||||
| Ulta Salon Cosmetics & Fragrance, Inc. (I) | 490 | 85,240 | ||||||||||||
| Urban Outfitters, Inc. (I) | 980 | 28,028 | ||||||||||||
| Williams-Sonoma, Inc. | 814 | 60,033 | ||||||||||||
| Textiles, apparel and luxury goods 6.2% | ||||||||||||||
| Carter's, Inc. | 470 | 42,714 | ||||||||||||
| Coach, Inc. | 1,194 | 37,253 | ||||||||||||
| Columbia Sportswear Company | 170 | 9,325 | ||||||||||||
| Hanesbrands, Inc. | 3,280 | 104,763 | ||||||||||||
| Lululemon Athletica, Inc. (I) | 720 | 35,402 | ||||||||||||
| Michael Kors Holdings, Ltd. (I) | 1,430 | 55,255 | ||||||||||||
| NIKE, Inc., Class B | 1,670 | 218,820 | ||||||||||||
| PVH Corp. | 620 | 56,389 | ||||||||||||
| Ralph Lauren Corp. | 570 | 63,139 | ||||||||||||
| Skechers U.S.A., Inc., Class A (I) | 597 | 18,626 | ||||||||||||
| Under Armour, Inc., Class A (I) | 900 | 85,572 | ||||||||||||
| VF Corp. | 1,220 | 82,374 | ||||||||||||
| Shares | Value | |||||||||||||
| Financials 0.1% | $9,032 | |||||||||||||
| Diversified financial services 0.1% | ||||||||||||||
| Morningstar, Inc. | 110 | 9,032 | ||||||||||||
| Yield (%) | Shares | Value | ||||||||||||
| Short-term investments 0.0 % | ||||||||||||||
| (Cost $2,691) | ||||||||||||||
| Money market funds 0.0% | 2,691 | |||||||||||||
| State Street Institutional Liquid Reserves Fund | 0.1451(Y | ) | 2,691 | $2,691 | ||||||||||
| Total investments (Cost $12,460,392)† 100.0% | $13,134,267 | |||||||||||||
| Other assets and liabilities, net 0.0% | $5,254 | |||||||||||||
| Total net assets 100.0% | $13,139,521 | |||||||||||||
| The percentage shown for each investment category is the total value of the category as a percentage of the net assets of the fund. | ||||||||||||||
| Key to Security Abbreviations and Legend | ||||||||||||||
| (I) | Non-income producing security. | |||||||||||||
| (Y) | The rate shown is the annualized seven-day yield as of 10-31-15. | |||||||||||||
| † | At 10-31-15, the aggregate cost of investment securities for federal income tax purposes was $12,460,392. Net unrealized appreciation aggregated $673,875, of which $788,049 related to appreciated investment securities and $114,174 related to depreciated investment securities. | |||||||||||||
Financial statements
STATEMENT OF ASSETS AND LIABILITIES 10-31-15 (unaudited)
| Assets | |||||||||||||
| Investments, at value (Cost $12,460,392) | $13,134,267 | ||||||||||||
| Receivable for fund shares sold | 2,620,546 | ||||||||||||
| Dividends receivable | 4,044 | ||||||||||||
| Receivable due from advisor | 6,871 | ||||||||||||
| Other receivables and prepaid expenses | 4,280 | ||||||||||||
| Total assets | 15,770,008 | ||||||||||||
| Liabilities | |||||||||||||
| Payable for investments purchased | 2,619,124 | ||||||||||||
| Payable to affiliates | |||||||||||||
| Accounting and legal services fees | 8 | ||||||||||||
| Other liabilities and accrued expenses | 11,355 | ||||||||||||
| Total liabilities | 2,630,487 | ||||||||||||
| Net assets | $13,139,521 | ||||||||||||
| Net assets consist of | |||||||||||||
| Paid-in capital | $12,458,720 | ||||||||||||
| Undistributed net investment income | 6,926 | ||||||||||||
| Net unrealized appreciation (depreciation) on investments | 673,875 | ||||||||||||
| Net assets | $13,139,521 | ||||||||||||
| Net asset value per share | |||||||||||||
| Based on net asset values and shares outstanding-the fund has an unlimited number of shares authorized with no par value | |||||||||||||
| Net assets | $13,139,521 | ||||||||||||
| Shares outstanding | 500,000 | ||||||||||||
| Net asset value per share | $26.28 | ||||||||||||
STATEMENT OF OPERATIONS For the period ended 10-31-15 (unaudited)1
| Investment income | |||||||||||||||||||||||||||||||||
| Dividends | $10,860 | ||||||||||||||||||||||||||||||||
| Total investment income | 10,860 | ||||||||||||||||||||||||||||||||
| Expenses | |||||||||||||||||||||||||||||||||
| Investment management fees | 3,540 | ||||||||||||||||||||||||||||||||
| Accounting and legal services fees | 134 | ||||||||||||||||||||||||||||||||
| Transfer agent fees | 1,062 | ||||||||||||||||||||||||||||||||
| Printing and postage | 1,246 | ||||||||||||||||||||||||||||||||
| Professional fees | 5,288 | ||||||||||||||||||||||||||||||||
| Custodian fees | 1,768 | ||||||||||||||||||||||||||||||||
| Registration and filing fees | 998 | ||||||||||||||||||||||||||||||||
| Other | 825 | ||||||||||||||||||||||||||||||||
| Total expenses | 14,861 | ||||||||||||||||||||||||||||||||
| Less expense reductions | (10,927 | ) | |||||||||||||||||||||||||||||||
| Net expenses | 3,934 | ||||||||||||||||||||||||||||||||
| Net investment income | 6,926 | ||||||||||||||||||||||||||||||||
| Realized and unrealized gain (loss) | |||||||||||||||||||||||||||||||||
| Change in net unrealized appreciation (depreciation) of investments | 673,875 | ||||||||||||||||||||||||||||||||
| Net realized and unrealized gain | 673,875 | ||||||||||||||||||||||||||||||||
| Increase in net assets from operations | $680,801 | ||||||||||||||||||||||||||||||||
| 1 | Period from 9-28-15 (commencement of operations) to 10-31-15. | ||||||||||||||||||||||
STATEMENT OF CHANGES IN NET ASSETS
| Period ended 10-31-151 | |||||||||||||||||
| (unaudited) | |||||||||||||||||
| Increase (decrease) in net assets | |||||||||||||||||
| From operations | |||||||||||||||||
| Net investment income | $6,926 | ||||||||||||||||
| Change in net unrealized appreciation (depreciation) | 673,875 | ||||||||||||||||
| Increase in net assets resulting from operations | 680,801 | ||||||||||||||||
| From fund share transactions | |||||||||||||||||
| Shares issued | 12,458,720 | ||||||||||||||||
| Total from fund share transactions | 12,458,720 | ||||||||||||||||
| Total increase | 13,139,521 | ||||||||||||||||
| Net assets | |||||||||||||||||
| Beginning of period | — | ||||||||||||||||
| End of period | $13,139,521 | ||||||||||||||||
| Undistributed net investment income | $6,926 | ||||||||||||||||
| Share activity | |||||||||||||||||
| Shares issued | 500,000 | ||||||||||||||||
| End of period | 500,000 | ||||||||||||||||
| 1 | Period from 9-28-15 (commencement of operations) to 10-31-15. | ||||||||||||||||||||||
Financial highlights
| Period ended | 10-31-15 | 1 | |||||||||||||||||||||||||||||||||||||||
| Per share operating performance | |||||||||||||||||||||||||||||||||||||||||
| Net asset value, beginning of period | $24.21 | ||||||||||||||||||||||||||||||||||||||||
| Net investment income2 | 0.02 | ||||||||||||||||||||||||||||||||||||||||
| Net realized and unrealized gain on investments | 2.05 | ||||||||||||||||||||||||||||||||||||||||
| Total from investment operations | 2.07 | ||||||||||||||||||||||||||||||||||||||||
| Net asset value, end of period | $26.28 | ||||||||||||||||||||||||||||||||||||||||
| Total return (%)3 | 8.54 | 4 | |||||||||||||||||||||||||||||||||||||||
| Ratios and supplemental data | |||||||||||||||||||||||||||||||||||||||||
| Net assets, end of period (in millions) | $13 | ||||||||||||||||||||||||||||||||||||||||
| Ratios (as a percentage of average net assets): | |||||||||||||||||||||||||||||||||||||||||
| Expenses before reductions | 1.89 | 5 | |||||||||||||||||||||||||||||||||||||||
| Expenses including reductions | 0.50 | 5 | |||||||||||||||||||||||||||||||||||||||
| Net investment income | 0.88 | 5 | |||||||||||||||||||||||||||||||||||||||
| Portfolio turnover (%)6 | — | ||||||||||||||||||||||||||||||||||||||||
| 1 | Period from 9-28-15 (commencement of operations) to 10-31-15. Unaudited. | |||||||||||||||||||||||||||||||||||||
| 2 | Based on average daily shares outstanding. | |||||||||||||||||||||||||||||||||||||
| 3 | Total returns would have been lower had certain expenses not been reduced during the period. | |||||||||||||||||||||||||||||||||||||
| 4 | Not annualized. | |||||||||||||||||||||||||||||||||||||
| 5 | Annualized. | |||||||||||||||||||||||||||||||||||||
| 6 | Portfolio turnover rate excludes securities received or delivered from in-kind transactions. | |||||||||||||||||||||||||||||||||||||
Note 1 — Organization
John Hancock Multifactor Consumer Discretionary ETF (the fund) is a series of the John Hancock Exchange-Traded Fund Trust (the Trust), an open-end management investment company organized as a Massachusetts business trust and registered under the Investment Company Act of 1940, as amended (the 1940 Act). The investment objective of the fund is to seek to provide investment results that closely correspond, before fees and expenses, to the performance of the John Hancock Dimensional Consumer Discretionary Index. The John Hancock Dimensional Consumer Discretionary Index comprises securities in the consumer discretionary sector within the U.S. Universe whose market capitalizations are in the top 1000 U.S. companies at the time of reconstitution.
The fund commenced operations on September 28, 2015.
Note 2 — Significant accounting policies
The financial statements have been prepared in conformity with accounting principles generally accepted in the United States of America (US GAAP), which require management to make certain estimates and assumptions as of the date of the financial statements. Actual results could differ from those estimates and those differences could be significant. The fund qualifies as an investment company under Topic 946 of Accounting Standards Codification of US GAAP.
Events or transactions occurring after the end of the fiscal period through the date that the financial statements were issued have been evaluated in the preparation of the financial statements. The following summarizes the significant accounting policies of the fund:
Security valuation. Investments are stated at value as of the close of regular trading on the New York Stock Exchange (NYSE), normally at 4:00 p.m., Eastern Time. In order to value the securities, the fund uses the following valuation techniques: Equity securities held by the fund are valued at the last sale price or official closing price on the exchange where the security was acquired or most likely will be sold. In the event there were no sales during the day or closing prices are not available, the securities are valued using the last available bid price. Investments by the fund in open-end mutual funds are valued at their respective net asset values each business day. Other portfolio securities and assets, for which reliable market quotations are not readily available, are valued at fair value as determined in good faith by the fund's Pricing Committee following procedures established by the Board of Trustees. The frequency with which these fair valuation procedures are used cannot be predicted and fair value of securities may differ significantly from the value that would have been used had a ready market for such securities existed.
The fund uses a three-tier hierarchy to prioritize the pricing assumptions, referred to as inputs, used in valuation techniques to measure fair value. Level 1 includes securities valued using quoted prices in active markets for identical securities. Level 2 includes securities valued using other significant observable inputs. Observable inputs may include quoted prices for similar securities, interest rates, prepayment speeds and credit risk. Prices for securities valued using these inputs are received from independent pricing vendors and brokers and are based on an evaluation of the inputs described. Level 3 includes securities valued using significant unobservable inputs when market prices are not readily available or reliable, including the fund's own assumptions in determining the fair value of investments. Factors used in determining value may include market or issuer specific events or trends, changes in interest rates and credit quality. The inputs or methodology used for valuing securities are not necessarily an indication of the risks associated with investing in those securities. Changes in valuation techniques and related inputs may result in transfers into or out of an assigned level within the disclosure hierarchy.
As of October 31, 2015, all investments are categorized as Level 1 under the hierarchy described above.
Security transactions and related investment income. Investment security transactions are accounted for on a trade date plus one basis for daily net asset value calculations. However, for financial reporting purposes, investment transactions are reported on trade date. Dividend income is recorded on the ex-date, except for dividends of foreign securities where the dividend may not be known until after the ex-date. In those cases, dividend income, net of withholding taxes, is recorded when the fund becomes aware of the dividends. Gains and losses on securities sold are determined on the basis of identified cost and may include proceeds from litigation.
20
Overdrafts. Pursuant to the custodian agreement, the fund's custodian may, in its discretion, advance funds to the fund to make properly authorized payments. When such payments result in an overdraft, the fund is obligated to repay the custodian for any overdraft, including any costs or expenses associated with the overdraft. The custodian may have a lien, security interest or security entitlement in any fund property that is not otherwise segregated or pledged, to the maximum extent permitted by law, to the extent of any overdraft.
Expenses. Within the John Hancock group of funds complex, expenses that are directly attributable to an individual fund are allocated to such fund. Expenses that are not readily attributable to a specific fund are allocated among all funds in an equitable manner, taking into consideration, among other things, the nature and type of expense and the fund's relative net assets. Expense estimates are accrued in the period to which they relate and adjustments are made when actual amounts are known.
Federal income taxes. The fund intends to qualify as a regulated investment company by complying with the applicable provisions of the Internal Revenue Code and will not be subject to federal income tax on taxable income that is distributed to shareholders. Therefore, no federal income tax provision is required.
Distribution of income and gains. Distributions to shareholders from net investment income and net realized gains, if any, are recorded on the ex-date. The fund will declare and pay dividends semiannually from net investment income, if any. Capital gain distributions, if any, are typically distributed annually.
Such distributions, on a tax basis, are determined in conformity with income tax regulations, which may differ from US GAAP.
Capital accounts within the financial statements are adjusted for permanent book-tax differences. These adjustments have no impact on net assets or the results of operations. Temporary book-tax differences, if any, will reverse in a subsequent period.
Note 3 — Guarantees and indemnifications
Under the Trust's organizational documents, its Officers and Trustees are indemnified against certain liabilities arising out of the performance of their duties to the Trust, including the fund. Additionally, in the normal course of business, the fund enters into contracts with service providers that contain general indemnification clauses. The fund's maximum exposure under these arrangements is unknown, as this would involve future claims that may be made against the fund that have not yet occurred. The risk of material loss from such claims is considered remote.
Note 4 — Fees and transactions with affiliates
John Hancock Advisers, LLC (the Advisor) serves as investment advisor for the fund. The Advisor is an indirect, wholly owned subsidiary of Manulife Financial Corporation (MFC).
Management fee. The fund has an investment management agreement with the Advisor under which the fund pays a monthly management fee to the Advisor, equivalent on an annual basis, to the sum of: (a) 0.450% of the first $300 million of the fund's average daily net assets; and (b) 0.420% of the fund's average daily net assets in excess of $300 million. The Advisor has a subadvisory agreement with Dimensional Fund Advisors LP. The fund is not responsible for payment of the subadvisory fees.
The Advisor has contractually agreed to waive a portion of its management fee and/or reimburse expenses for certain funds of the John Hancock group of funds complex, including the fund (the participating portfolios). This waiver is based upon aggregate net assets of all the participating portfolios. The amount of the reimbursement is calculated daily and allocated among all the participating portfolios in proportion to the daily net assets of each fund. During the period ended October 31, 2015, this waiver amounted to 0.01% of the fund's average net assets (on an annualized basis). This arrangement may be amended or terminated at any time by the Advisor upon notice to the fund and with the approval of the Board of Trustees.
The Advisor has contractually agreed to reduce its management fee or, if necessary, make payment to the fund, in an amount equal to the amount by which expenses of the fund exceed 0.50% of average annual net assets (on an annualized basis). Expenses means all the expenses of the fund, excluding (a) taxes, (b) brokerage commissions, (c) interest expense, (d)
21
litigation and indemnification expenses and other extraordinary expenses not incurred in the ordinary course of the fund's business, (e) borrowing costs, (f) prime brokerage fees, (g) acquired fund fees, and (h) short dividend expenses. The expense limitation expires on August 31, 2017, unless renewed by mutual agreement of the fund and the Advisor based on a determination that this is appropriate under the circumstances at that time.
For the period ended October 31, 2015, the expense reductions described above amounted to $10,927.
The investment management fees, including the impact of the waivers and reimbursements as described above, incurred for the period ended October 31, 2015 were equivalent to a net annual effective rate of 0.00% of the fund's average daily net assets.
Accounting and legal services. Pursuant to a service agreement, the fund reimburses the Advisor for all expenses associated with providing the administrative, financial, legal, accounting and recordkeeping services to the fund, including the preparation of all tax returns, periodic reports to shareholders and regulatory reports, among other services. These accounting and legal services fees incurred for the period ended October 31, 2015 amounted to an annual rate of 0.02% of the fund's average daily net assets.
Trustee expenses. The fund compensates each Trustee who is not an employee of the Advisor or its affiliates. The costs of paying Trustee compensation and expenses are allocated to each fund based on its net assets relative to other funds within the John Hancock group of funds complex.
Note 5 — Capital share transactions
The fund will issue and redeem shares at net asset value (NAV) only in a large specified number of shares, each called a "creation unit," or multiples thereof, that consist of 50,000 shares. Only authorized participants may engage in creation or redemption transactions directly with the fund. Such transactions generally take place when an authorized participant deposits into the fund a designated portfolio of securities (including any portion of such securities for which cash may be substituted) and a specified amount of cash approximating the holdings of the fund in exchange for a specified number of creation units. Authorized participants pay a transaction fee to the custodian when purchasing and redeeming creation units of a fund. The transaction fee is used to defray the costs associated with the issuance and redemption of creation units. Individual shares of the fund may only be purchased and sold in secondary market transactions through brokers. Secondary market transactions may be subject to brokerage commissions. Shares of the fund are listed and traded on the NYSE Arca, Inc., shares trade at market prices rather than NAV, and may trade at a price greater than or less than NAV.
Affiliates of the fund owned 92% of shares outstanding on October 31, 2015.
Note 6 — Purchase and sale of securities
Purchases and sales of securities, other than in-kind transactions and short-term securities, amounted to $2,760 and $0, respectively, for the period ended October 31, 2015. Securities received and delivered from in-kind transactions aggregated $12,454,941 and $0, respectively, for the period ended October 31, 2015.
Note 7 — Industry or sector risk
The fund generally invests a large percentage of its assets in one or more particular industries or sectors of the economy. If a large percentage of the fund's assets are economically tied to a single or small number of industries or sectors of the economy, the fund will be less diversified than a more broadly diversified fund, and it may cause the fund to underperform if that industry or sector underperforms. In addition, focusing on a particular industry or sector may make the fund's net asset value more volatile. Further, a fund that invests in particular industries or sectors is particularly susceptible to the impact of market, economic, regulatory and other factors affecting those industries or sectors.
22
EVALUATION OF ADVISORY AND SUBADVISORY AGREEMENTS BY THE BOARD OF TRUSTEES
Approval of Advisory and Subadvisory Agreements
At in-person meetings held on June 23-25, 2015, the Board of Trustees (the Board) of John Hancock Exchange-Traded Fund Trust (the Trust), including all of the Trustees who are not considered to be interested persons of the Trust under the Investment Company Act of 1940, as amended (the 1940 Act) (the Independent Trustees), approved the John Hancock Multifactor Consumer Discretionary ETF (the New Fund).
This section describes the evaluation by the Board of:
| (a) | an advisory agreement between the Trust and John Hancock Advisers, LLC (the Advisor) (the Advisory Agreement); and | |
| (b) | a subadvisory agreement between the Advisor and Dimensional Fund Advisors LP (the Subadvisor) with respect to the New Fund (the Subadvisory Agreement). |
In considering the Advisory Agreement and the Subadvisory Agreement with respect to the New Fund, the Board received in advance of the meetings a variety of materials relating to the New Fund, the Advisor and the Subadvisor, including comparative expense information for a peer group of similar exchange-traded funds and a broader universe of exchange-traded funds, simulated performance information of the New Fund's underlying index (Underlying Index) as compared to applicable benchmarks, and other information provided by the Advisor and the Subadvisor regarding the nature, extent, and quality of services to be provided by the Advisor and the Subadvisor under their respective Agreements, as well as information regarding the Advisor's anticipated profitability in connection with its proposed relationship to the New Fund and any compensation paid to affiliates of the Advisor. The Board also took into account discussions with management and information provided to the Board members at prior meetings with respect to the services provided by the Advisor and the Subadvisor to other John Hancock Funds (the Funds), including quarterly performance reports prepared by management containing reviews of investment results, and periodic presentations from the Subadvisor with respect to the other Funds that it manages. The Board also considered the nature, quality, and extent of the non-advisory services, if any, to be provided to the New Fund by the Advisor and/or its affiliates, including administrative services. The Board members also took into account information with respect to the New Fund presented at their March 10-12, 2015 in-person meeting.
Throughout the process, the Board asked questions of and were afforded the opportunity to request additional information from management. The Board is assisted by legal counsel for the Trust, and the Independent Trustees were also separately assisted by independent legal counsel throughout the process. The Independent Trustees also received a memorandum from their independent legal counsel discussing the legal standards for their consideration of the proposed Advisory Agreement and Subadvisory Agreement and discussed the proposed Advisory Agreement and Subadvisory Agreement in private sessions with their independent legal counsel at which no representatives of management were present.
Approval of Advisory Agreement
In approving the Advisory Agreement with respect to the New Fund, the Board, including the Independent Trustees, considered a variety of factors, including those discussed below. The Board also considered other factors (including conditions and trends prevailing generally in the economy, the securities markets and the industry) and did not treat any single factor as determinative, and each Trustee may have attributed different weights to different factors. The Board members' conclusions may have been based in part on their consideration of the advisory and subadvisory arrangements for other Funds in prior years.
Nature, extent, and quality of services. Among the information received by the Board from the Advisor relating to the nature, extent and quality of services to be provided to the New Fund, the Board considered information provided by the Advisor relating to its operations and personnel, descriptions of its organizational and management structure, and information regarding the Advisor's compliance and regulatory history. The Board members also noted that, on a regular basis, they receive and review information from the Funds' Chief Compliance Officer (CCO) regarding the Funds' compliance policies
23
and procedures established pursuant to Rule 38a-1 under the 1940 Act. The Board considered the investment strategy and Underlying Index of the New Fund. The Board also considered the Advisor's risk management processes. The Board considered that the Advisor would be responsible for the management of the day-to-day operations of the New Fund, including but not limited to, general supervision and coordination of the services to be provided by the Subadvisor, and also would be responsible for monitoring and reviewing the activities of the Subadvisor and other third-party service providers, including the New Fund's distributor.
In considering the nature, extent and quality of the services to be provided by the Advisor, the Trustees also took into account their knowledge of the Advisor's management of other Funds and the quality of the performance of the Advisor's duties with respect to other Funds, through Board meetings, discussions and reports during the preceding year and through each Trustee's experience as a trustee of the other trusts in the complex.
In the course of its deliberations regarding the Advisory Agreement, the Board members considered, among other things:
| (a) | the skills and competency with which the Advisor has in the past managed the Funds' affairs and its subadvisory relationships, including those with the Subadvisor, the Advisor's oversight and monitoring of the Subadvisor's investment performance and compliance programs, such as the Subadvisor's compliance with fund policies and objectives; review of brokerage matters, including with respect to trade allocation and best execution; and the Advisor's timeliness in responding to performance issues; | ||
| (b) | the background, qualifications, and skills of the Advisor's personnel; | ||
| (c) | the Advisor's compliance policies and procedures and its responsiveness to regulatory changes and fund industry developments; | ||
| (d) | the Advisor's administrative capabilities, including its ability to supervise the other service providers for the Funds; | ||
| (e) | the financial condition of the Advisor and whether it has the financial wherewithal to provide a high level and quality of services to the New Fund; and | ||
| (f) | the Advisor's reputation and experience in serving as an investment advisor to the Funds, and the benefit to shareholders of investing in funds that are part of a family of funds offering a variety of investments. |
The Board concluded that the Advisor may reasonably be expected to provide a high quality of services under the Advisory Agreement with respect to the New Fund.
Investment performance. In connection with its consideration of the Advisory Agreement, the Board considered, the New Fund's investment strategy and processes, including the fact that the New Fund will seek performance that closely corresponds to its Underlying Index, which was developed by, and will be maintained, by, the Subadvisor. The Board also considered the simulated performance of the New Fund's Underlying Index as compared to applicable benchmarks.
Fees and Expenses. The Board reviewed comparative information including, among other data, the New Fund's anticipated total net expenses as compared to similarly situated exchange-traded funds deemed to be comparable to the New Fund.
The Board took into account management's discussion of the New Fund's anticipated expenses. The Board noted that the Advisor does not currently manage other funds or institutional accounts with the same or similar strategies proposed for the New Fund.
The Board took into account management's discussion with respect to the proposed advisory/subadvisory fee structure, including the amount of the advisory fee to be retained by the Advisor after payment of the subadvisory fees. The Board also noted that the Advisor, and not the New Fund, would be responsible for paying the subadvisory fees and that such fees are negotiated at arm's length with respect to the Subadvisor. The Board also noted that the Advisor has contractually agreed to waive fees and/or reimburse expenses with respect to the New Fund for a specified period. The Board concluded that the advisory fees to be paid by the New Fund are reasonable in relation to the nature, extent and quality of the services expected to be provided.
24
Profitability/Indirect Benefits. In considering the costs of the services to be provided and the profits to be realized by the Advisor and its affiliates from the Advisor's relationship with the New Fund, the Board:
| (a) | noted that because the New Fund was not yet in existence, no actual revenue, cost or profitability data was available for the Board to review; | ||
| (b) | reviewed and considered information presented by the Advisor regarding the advisory fees and advisory spreads prior to distribution, operations and overhead for the New Fund; | ||
| (c) | noted that the Advisor will derive reputational and other indirect benefits from providing advisory services to the New Fund; | ||
| (d) | noted that the subadvisory fee for the New Fund will be paid by Advisor and is negotiated at arm's length; | ||
| (e) | noted that the Advisor will also pay the Subadvisor a license fee in connection with the New Fund's use of the Underlying Index; and | ||
| (f) | considered that the Advisor should be entitled to earn a reasonable level of profits in exchange for the level of services it will provide to the New Fund and the entrepreneurial risk that it assumes as Advisor. |
Based upon its review, the Board concluded that the anticipated level of profitability, if any, of the Advisor and its affiliates from their relationship with the New Fund is reasonable and not excessive.
Economies of Scale. In considering the extent to which economies of scale would be realized if the New Fund grows and whether fee levels reflect these economies of scale for the benefit of fund shareholders, the Board:
| (a) | considered that the Advisor has contractually agreed to waive a portion of its management fee and/or reimburse or pay operating expenses of the New Fund to reduce operating expenses for a specified period of time; | ||
| (b) | reviewed the New Fund's advisory fee structure and concluded that: (i) the New Fund's fee structure contains breakpoints at the subadvisory fee level and that such breakpoints are reflected as breakpoints in the advisory fees for the New Fund; and (ii) although economies of scale cannot be measured with precision, these arrangements permit shareholders of the New Fund to benefit from economies of scale if the New Fund grows. The Board also took into account management's discussion of the New Fund's advisory fee structure; and | ||
| (c) | the Board also considered the potential effect of the New Fund's future growth in size on its performance and fees. The Board also noted that if the New Fund's assets increase over time, the New Fund may realize other economies of scale and the Board would consider whether additional breakpoints would be appropriate at that time. |
Approval of Subadvisory Agreement
In making its determination with respect to approval of the Subadvisory Agreement, the Board reviewed:
| (a) | information relating to the Subadvisor's business, including current subadvisory services (to other funds in the John Hancock family of funds); | ||
| (b) | the simulated performance of the Underlying Index developed by the Subadvisor as compared to applicable benchmarks; | ||
| (c) | the proposed advisory fee and total expense ratio for the New Fund, including any breakpoints; and | ||
| (d) | information relating to the nature and scope of any material relationships and their significance to the New Fund's Advisor and Subadvisor. |
25
Nature, Extent, and Quality of Services. With respect to the services to be provided by the Subadvisor, the Board members received and reviewed information provided to the Board by the Subadvisor with respect to the New Fund and took into account information presented throughout the past year with respect to Funds in the complex managed by the Advisor and subadvised by the Subadvisor. In this regard, the Board members considered the Subadvisor's current level of staffing and its overall resources, as well as considered information relating to the Subadvisor's compensation program. The Board members reviewed the Subadvisor's history and investment experience, as well as information regarding the qualifications, background, and responsibilities of the Subadvisor's investment and compliance personnel who will provide services to the New Fund. The Board members also considered the Subadvisor's risk assessment and monitoring processes. The Board members noted that the Advisor conducts regular periodic reviews of the Subadvisor and its operations in regard to the Funds, including regarding investment processes and organizational and staffing matters. The Board members also noted that the Funds' CCO and his staff conduct regular, periodic compliance reviews with the Subadvisor and present reports to the Independent Trustees regarding the same, which include evaluating the regulatory compliance systems of the Subadvisor and procedures reasonably designed by it to assure compliance with the federal securities laws. The Board members also took into account the financial condition of the Subadvisor.
The Board considered the Subadvisor's investment processes and philosophies. The Board took into account that the New Fund will seek performance that closely corresponds to its Underlying Index, which was developed by, and will be maintained, by, the Subadvisor.
Subadvisor compensation. In considering the cost of services to be provided by the Subadvisor, the Board noted that the fees under the Subadvisory Agreement are paid by the Advisor and not the New Fund. The Board members also considered information and took into account any other potential conflicts of interests the Advisor might have in connection with the Subadvisory Agreement.
The Board also relied on the ability of the Advisor to negotiate the Subadvisory Agreement with the Subadvisor, which is not affiliated with the Advisor, and the fees thereunder at arm's length. As a result, the costs of the services to be provided and the profits to be realized by the Subadvisor from its relationship with the Trust were not a factor in the Board's consideration of the Subadvisory Agreement.
The Board also received information regarding the nature and scope (including their significance to the Advisor and its affiliates and to the Subadvisor) of any material relationships with respect to the Subadvisor, which include arrangements in which the Subadvisor will serve as the index provider for the New Fund and for other exchange-traded funds in the complex, as well as arrangements in which the Subadvisor or its affiliates provide advisory, or management services in connection with financial products sponsored by the Advisor or its affiliates, and may include other registered investment companies, including other exchange-traded funds, a 529 education savings plan, managed separate accounts and exempt group annuity contracts sold to qualified plans.
In addition, the Board considered other potential indirect benefits that the Subadvisor and its affiliates may receive from the Subadvisor's relationship with the New Fund, such as the opportunity to provide advisory services to additional John Hancock Funds and reputational benefits.
Subadvisory fees. The Board considered that the New Fund will pay advisory fees to the Advisor and that, in turn, the Advisor will pay subadvisory fees to the Subadvisor. The Board considered the New Fund's advisory fees and total expense ratio. The Board also considered that the Subadvisor receives additional compensation from the Advisor in connection with its role as index provider for the New Fund.
Subadvisor performance. The Board considered the New Fund's investment strategy and processes, including the fact that the New Fund will seek performance that closely corresponds to its Underlying Index and that its Underlying Index has been developed by, and will be maintained by, the Subadvisor. The Board also considered simulated performance of the Underlying Index as compared to applicable benchmarks. The Board noted the Advisor's expertise and resources in monitoring the performance, investment style and risk-adjusted performance of the Subadvisor. The Board was mindful of the Advisor's focus on the Subadvisor's performance.
26
The Board's decision to approve the Subadvisory Agreement was based on a number of determinations, including the following:
| (1) | The Subadvisor has extensive experience and demonstrated skills as a manager, and currently subadvises other Funds in the complex and the Board is generally satisfied with the Subadvisor's management of these Funds, and may reasonably be expected to provide a high quality of investment management services to the New Fund; | |
| (2) | the proposed subadvisory fees are reasonable in relation to the level and quality of services to be provided; and | |
| (3) | subadvisory fee breakpoints are reflected as breakpoints in the advisory fees for the New Fund in order to permit shareholders to benefit from economies of scale if and as the New Fund grows. | |
| * * * | ||
Based on the Board's evaluation of all factors that it deemed to be material, including those factors described above, and assisted by the advice of independent legal counsel, the Board, including the Independent Trustees, concluded that approval of the Advisory Agreement and the Subadvisory Agreement would be in the best interest of the New Fund and its shareholders. Accordingly, the Board, and the Independent Trustees voting separately, approved the Advisory Agreement and Subadvisory Agreement.
27
Trustees James M. Oates, Chairperson Officers Andrew G. Arnott John J. Danello Francis V. Knox, Jr. Charles A. Rizzo Salvatore Schiavone | Investment advisor John Hancock Advisers, LLC Subadvisor Dimensional Fund Advisors LP Principal distributor Foreside Fund Services, LLC Custodian State Street Bank and Trust Company Transfer agent State Street Bank and Trust Company Legal counsel Dechert LLP Stock symbol NYSE Arca: JHMC |
*Member of the Audit Committee
†Non-Independent Trustee
The fund's proxy voting policies and procedures, as well as the fund proxy voting record for the most recent twelve-month period ended June 30, are available free of charge on the Securities and Exchange Commission (SEC) website at sec.gov or on our website.
The fund's complete list of portfolio holdings, for the first and third fiscal quarters, is filed with the SEC on Form N-Q. The fund's Form N-Q is available on our website and the SEC's website, sec.gov, and can be reviewed and copied (for a fee) at the SEC's Public Reference Room in Washington, DC. Call 800-SEC-0330 to receive information on the operation of the SEC's Public Reference Room.
We make this information on your fund, as well as monthly portfolio holdings, and other fund details available on our website at jhinvestments.com/etf or by calling 800-225-5291.
| You can also contact us: | |||
| 800-225-5291 jhinvestments.com/etf | Regular mail: John Hancock Signature Services, Inc. | Express mail: John Hancock Signature Services, Inc. | |
28
John Hancock family of funds
DOMESTIC EQUITY FUNDS Balanced Blue Chip Growth Classic Value Disciplined Value Disciplined Value Mid Cap Equity Income Fundamental All Cap Core Fundamental Large Cap Core Fundamental Large Cap Value Large Cap Equity New Opportunities Select Growth Small Cap Equity Small Cap Value Small Company Strategic Growth U.S. Equity U.S. Global Leaders Growth Value Equity GLOBAL/INTERNATIONAL FUNDS Disciplined Value International Emerging Markets Emerging Markets Equity Global Equity Global Shareholder Yield Greater China Opportunities International Core International Growth International Small Company International Value Equity | INCOME FUNDS Bond California Tax-Free Income Core High Yield Emerging Markets Debt Floating Rate Income Focused High Yield Global Income Government Income High Yield Municipal Bond Income Investment Grade Bond Money Market Short Duration Credit Opportunities Spectrum Income Strategic Income Opportunities Tax-Free Bond ALTERNATIVE/SPECIALTY FUNDS Absolute Return Currency Alternative Asset Allocation Enduring Assets Financial Industries Global Absolute Return Strategies Global Conservative Absolute Return Global Real Estate Natural Resources Redwood Regional Bank Seaport Technical Opportunities |
The fund's investment objectives, risks, charges, and expenses are included in the prospectus and should be considered carefully before investing. For a prospectus, contact your financial professional, call
John Hancock Investments at 800-225-5291, or visit the fund's website at jhinvestments.com. Please read the prospectus carefully before investing or sending money.
ASSET ALLOCATION PORTFOLIOS Income Allocation Fund Lifestyle Aggressive Portfolio Lifestyle Balanced Portfolio Lifestyle Conservative Portfolio Lifestyle Growth Portfolio Lifestyle Moderate Portfolio Retirement Choices Portfolios (2010-2055) Retirement Living Portfolios (2010-2055) Retirement Living II Portfolios (2010-2055) EXCHANGE-TRADED FUNDS John Hancock Multifactor Consumer Discretionary ETF John Hancock Multifactor Financials ETF John Hancock Multifactor Healthcare ETF John Hancock Multifactor Large Cap ETF John Hancock Multifactor Mid Cap ETF John Hancock Multifactor Technology ETF CLOSED-END FUNDS Financial Opportunities Hedged Equity & Income Income Securities Trust Investors Trust Preferred Income Preferred Income II Preferred Income III Premium Dividend Tax-Advantaged Dividend Income Tax-Advantaged Global Shareholder Yield |
"As an investment firm,
upholding the proud
tradition of John Hancock
comes down to one thing:
putting shareholders
first. We believe that if
our shareholders are
successful, then we will
be successful."
Andrew G. Arnott
President and Chief Executive Officer
John Hancock Investments
John Hancock Multifactor ETF shares are bought and sold at market price (not NAV), and are not individually redeemed from the fund. Brokerage commissions will reduce returns.
John Hancock ETFs are distributed by Foreside Fund Services, LLC, and are subadvised by Dimensional Fund Advisors LP. Foreside is not affiliated with John Hancock Funds, LLC or Dimensional Fund Advisors LP.
Dimensional Fund Advisors LP receives compensation from John Hancock in connection with licensing rights to the John Hancock Dimensional indexes. Dimensional Fund Advisors LP does not sponsor, endorse, or sell, and makes no representation as to the advisability of investing in, John Hancock Multifactor ETFs (Multifactor ETFs). Neither John Hancock Advisers, LLC nor Dimensional Fund Advisors LP guarantees the accuracy and/or the completeness of the John Hancock Dimensional Indexes (the "Indexes") or any data included therein, and neither John Hancock Advisers, LLC nor Dimensional Fund Advisors LP shall have any liability for any errors, omissions, or interruptions therein. Neither John Hancock Advisers, LLC nor Dimensional Fund Advisors LP makes any warranty, express or implied, as to results to be obtained by the Multifactor ETFs, owners of the shares of the Multifactor ETFs or any other person or entity from the use of the Indexes, trading based on the Indexes, or any data included therein, either in connection with the Multifactor ETFs or for any other use. Neither John Hancock Advisers, LLC nor Dimensional Fund Advisors LP makes any express or implied warranties, and expressly disclaim all warranties of merchantability or fitness for a particular purpose or use with respect to the Indexes or any data included therein. Without limiting any of the foregoing, in no event shall either John Hancock Advisers, LLC or Dimensional Fund Advisors LP have any liability for any special, punitive, direct, indirect or consequential damages (including lost profits) arising out of matters relating to the use of the Indexes, even if notified of the possibility of such damages.
John Hancock Investments
A trusted brand
John Hancock Investments is a premier asset manager representing
one of America's most trusted brands, with a heritage of financial
stewardship dating back to 1862. Helping our shareholders pursue
their financial goals is at the core of everything we do. It's why we
support the role of professional financial advice and operate with the
highest standards of conduct and integrity.
A better way to invest
We build funds based on investor needs, then search the world to find
proven portfolio teams with specialized expertise in those strategies.
As a manager of managers, we apply vigorous oversight to ensure that
they continue to meet our uncompromising standards and serve the
best interests of our shareholders.
Results for investors
Our unique approach to asset management enables us to provide
a diverse set of investments backed by some of the world's best
managers, along with strong risk-adjusted returns across asset classes.
| | John Hancock Investments 601 Congress Street n Boston, MA 02210 800-225-5291 n jhinvestments.com/etf | |
| This report is for the information of the shareholders of John Hancock Multifactor Consumer Discretionary ETF. It is not authorized for distribution to prospective investors unless preceded or accompanied by a prospectus. | ||
MF260293 JHAN-2015-12-23-0158 | 830SA 10/15 12/15 | |
John Hancock

A message to shareholders
Dear shareholder,
Welcome to John Hancock Investments, and thank you for investing in a John Hancock Multifactor exchange-traded fund (ETF). At John Hancock Investments, we take a different approach to managing money on behalf of our shareholders. We build funds based on investor needs, then search the world to find proven portfolio teams with specialized expertise in those strategies. We were pleased to team up with Dimensional Fund Advisors LP—a company regarded as one of the pioneers in strategic beta investing*—to create a suite of passively managed ETFs. Each of our John Hancock Multifactor ETFs seeks to track a custom index built upon decades of academic research into the factors that drive higher expected returns: smaller capitalizations, lower valuations, and higher profitability.
This inaugural report to shareholders covers a very brief period of performance due to the fact that your ETF was launched shortly before the midpoint of its fiscal year. In this abbreviated report, your fund's portfolio managers will discuss the construction of the fund's underlying index, provide a review of the current market environment, and give a description of performance achieved so far. The next report you receive will cover the full period from the fund's inception to the end of its fiscal year on April 30, 2016.
We know you have many choices when it comes to your investments, and we appreciate the opportunity to earn the trust you've placed in John Hancock Investments.
Sincerely,
Andrew G. Arnott
President and Chief Executive Officer
John Hancock Investments
This commentary reflects the CEO's views as of October 31, 2015. They are subject to change at any time. For more up-to-date information, you can visit our website at jhinvestments.com.
| * | Strategic beta investing ETFs seek to improve upon cap-weighted strategies by tracking a custom index that combines active management insight with the discipline of a rules-based approach. |
John Hancock
Multifactor Mid Cap ETF
Table of contents
| 2 | Your fund at a glance | |
| 4 | Discussion of fund performance | |
| 8 | Premium/discount analysis | |
| 9 | Your expenses | |
| 11 | Fund's investments | |
| 30 | Financial statements | |
| 33 | Financial highlights | |
| 34 | Notes to financial statements | |
| 37 | Evaluation of advisory and subadvisory agreements by the Board of Trustees | |
| 42 | More information |
1
INVESTMENT OBJECTIVE
The fund seeks to provide investment results that closely correspond, before fees and expenses, to the performance of the John Hancock Dimensional Mid Cap Index.
TOTAL RETURNS AS OF 10/31/15 (%)
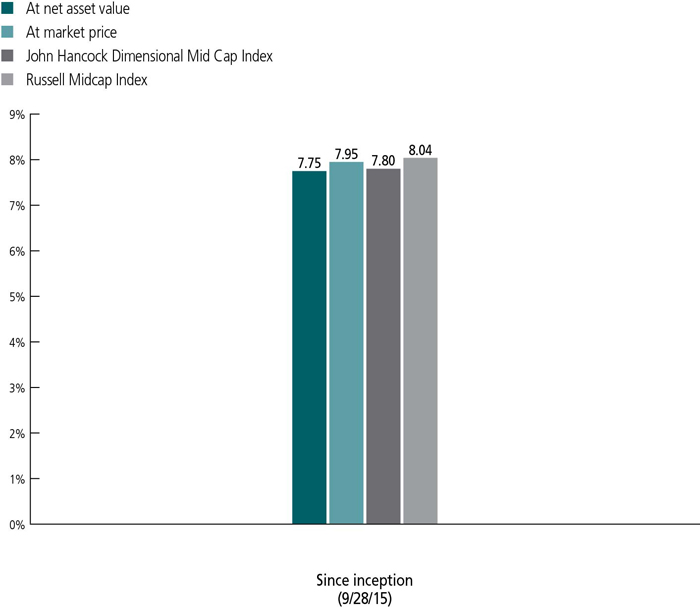
Market performance is determined using the closing price of the fund on its primary exchange, the NYSE Arca, at 4 P.M., Eastern time; your returns may differ if you traded shares at other times during the day. The net asset value is calculated by dividing the total value of all the securities in the fund's portfolio plus cash, interest, and receivables, minus any liabilities, by the number of fund shares outstanding.
The John Hancock Dimensional Mid Cap Index is designed to comprise a subset of securities in the U.S. Universe issued by companies whose market capitalizations are between the 200th and 951st largest U.S. company at the time of reconstitution. The Index is reconstituted and rebalanced on a semiannual basis. The U.S. Universe is defined as a free float-adjusted market-capitalization-weighted portfolio of U.S. operating companies listed on the New York Stock Exchange (NYSE), NYSE MKT LLC, NASDAQ Global Market, or such other securities exchanges deemed appropriate in accordance with the rules-based methodology that is maintained by Dimensional Fund Advisors LP.
The Russell Midcap Index comprises approximately 800 of the smallest securities of the mid-cap segment of the U.S. companies.
It is not possible to invest directly in an index. Index figures do not reflect expenses or sales charges, which would result in lower returns.
The past performance shown here reflects reinvested distributions and the beneficial effect of any expense reductions, and does not guarantee future results. Returns for periods shorter than one year are cumulative. Shares will fluctuate in value and, when sold or redeemed, may be worth more or less than their original cost. Current performance may be lower or higher than the performance cited, and can be found at jhinvestments.com or by calling 800-225-5291. For further information on the fund's objectives, risks, and strategy, see the fund's prospectus.
2
PERFORMANCE HIGHLIGHTS OVER THE PERIOD
Risk assets rebounded
Following a challenging summer, equity markets around the world bounced back; fixed-income asset returns were more subdued, as many bond sectors ended the period roughly where they started.
Smaller-cap stocks trailed larger peers
Relative to the capitalization-weighted Russell Midcap Index, the fund's smaller-cap bias hindered results as larger caps led the way during the period.
Mid-cap value-oriented shares finished in line with growth counterparts
There was little dispersion between the Russell Midcap Value and Midcap Growth Indexes, which had a negligible effect on the fund's performance during this abbreviated time period.
SECTOR COMPOSITION AS OF 10/31/15 (%)
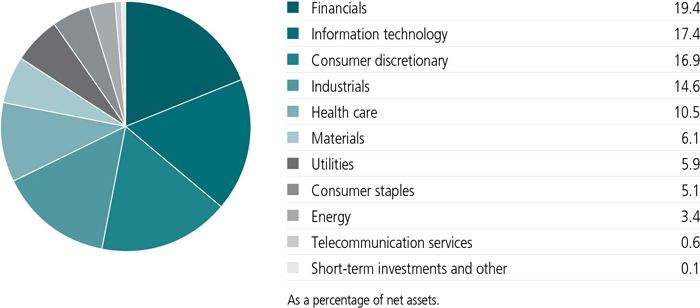
A note about risks
The stock prices of midsize companies can change more frequently and dramatically than those of large companies. Value stocks may underperform other segments of the market. The value of a company's equity securities is subject to changes in the company's financial condition and overall market and economic conditions. Exchange-traded fund shares are bought and sold through exchange trading at market price (not NAV), and are not individually redeemed from the fund. Due to various factors, shares may trade at a premium or discount to their NAV in the secondary market, and the fund's holdings and returns may deviate from those of its index. These variations may be greater when markets are volatile or subject to unusual conditions. Errors in the construction or calculation of the fund's index may occur from time to time. Brokerage commissions will reduce returns. Please see the fund's prospectus for additional risks.
3
Lukas J. Smart, CFA
Portfolio Manager
Dimensional Fund Advisors LP
Would you tell us about your investment philosophy and how it drives the composition of this new exchange-traded fund (ETF)?
Research has shown that there are differences in expected returns among securities. At Dimensional Fund Advisors, we've identified four characteristics, or dimensions, of expected returns—the overall market, company size, relative price, and profitability—that academic research has shown to account for most of the variation in asset returns over time.
The market dimension reflects the excess return over the risk-free rate that market participants demand for investing in a broadly diversified portfolio of equity securities without any style or market capitalization bias. That premium is called the equity premium.
The company size dimension reflects the excess return that investors demand for investing in small-capitalization stocks relative to large-capitalization stocks. The premium associated with this dimension is the small-cap, or size, premium.
The relative price dimension reflects the excess return that investors expect from investing in low relative price, or value, stocks (as measured, for instance, by their price-to-book ratios) in comparison with high relative price, or growth, stocks. The premium associated with this dimension is the value premium.
Finally, the profitability dimension provides a way to discern the expected returns of companies with similar price-driven characteristics. If two companies trade at the same relative price, the one with higher profitability should have a higher expected return. This is called the profitability premium.
Relative to a commercial cap-weighted measure of the market, we believe that incorporating these dimensions of expected returns into an investment strategy offers the potential for outperformance
4
What was the market environment like during the period?
The abbreviated period from inception on September 28, 2015, through October 31, 2015, followed a difficult and volatile summer for equities. However, stock markets around the world subsequently snapped back for a sharp rebound, posting high single-digit percentage returns in some cases.
Broadly speaking, materials, energy, and technology equity shares were particularly strong, while utilities—often viewed as a safe-haven sector of the stock market—generated more modest results. U.S. equities led most major markets, outpacing both emerging markets and developed markets abroad as a group. Large-capitalization stocks outpaced mid and small caps, and growth-oriented shares outpaced their value counterparts during this relatively short time period.
TOP 10 HOLDINGS AS OF 10/31/15 (%)
| Fiserv, Inc. | 0.5 |
| AutoZone, Inc. | 0.4 |
| Ross Stores, Inc. | 0.4 |
| Dr. Pepper Snapple Group, Inc. | 0.4 |
| Western Digital Corp. | 0.4 |
| Xcel Energy, Inc. | 0.4 |
| Lear Corp. | 0.4 |
| DaVita HealthCare Partners, Inc. | 0.4 |
| Cerner Corp. | 0.4 |
| Universal Health Services, Inc., Class B | 0.4 |
| TOTAL | 4.1 |
| As a percentage of net assets. | |
| Cash and cash equivalents are not included. | |
5
How did the fund perform during this abbreviated period?
The fund generated a 7.75% return on a net asset value (NAV) basis, which was slightly behind the custom benchmark it's intended to track, the John Hancock Dimensional Mid Cap Index, which was up 7.80%.
Our approach generally results in the fund broadly maintaining relatively high weightings in securities of smaller-cap issuers and in those trading at lower relative prices in relation to their book values. In the weightings of individual positions, we also place greater emphasis on companies with higher profitability.
The fund lagged the Russell Mid Cap Index, up 8.04%, a commercial cap-weighted benchmark we use as a proxy for the middle portion of the U.S. stock market. The fund's emphasis on smaller shares relative to the cap-weighted benchmark worked against it during this time period. The cap-weighted benchmark held larger shares above the fund's mid-cap-size ceiling, which outperformed the smaller-capitalization shares held by the fund during the period.
The premiums associated with the dimensions we've identified are unpredictable. For this reason, we believe the best way to invest is to structure broadly diversified portfolios with a consistent focus on the desired dimensions, seeking to capture the expected premiums associated with them.
While we would expect small to outperform large and value to outperform growth over an extended time horizon, any given trading day, month, or year can prove otherwise, and that's okay. Patience and persistence are key ingredients to success in our style of investing.
How was the fund positioned at the close of the period?
In keeping with our long-term investment approach, the fund generally held higher weights in low-relative-price stocks and equities with smaller market capitalization while emphasizing companies with higher profitability relative to commercial cap-weighted indexes.
The fund's largest absolute exposures were to the financials, information technology, and consumer discretionary sectors.
6
The fund was broadly diversified across more than 600 names. The fund's weighted average market capitalization was $10 billion, its price-to-book ratio was 2.3, and its price-to-earnings ratio was 19.1.
MANAGED BY
| | Lukas J. Smart, CFA On the fund since inception Investing since 2003 |
| | Joel P. Schneider On the fund since inception Investing since 2011 |
![]()
7
ETF shares are bought and sold through exchange trading at market price—not net asset value (NAV)—and are not individually redeemed from the fund. Due to various factors, shares may trade at a premium or discount to their NAV in the secondary market. If a shareholder purchases shares at a time when the market price is at a premium to the NAV or sells shares at a time when the market price is at a discount to the NAV, the shareholder may sustain losses. Additionally due to various factors, a fund's holdings and returns may deviate from those of its index. These variations may be greater when markets are volatile or subject to unusual conditions.
A premium exists when the closing market price is trading above NAV, while a discount indicates that the closing market price is trading below NAV. The differences are expressed as basis points, with one basis point equaling 1/100 of 1%.
The chart below presents information about the differences between the fund's daily closing market price and the fund's NAV. The closing market price is the daily closing price as reported on the NYSE Arca, Inc., the fund's primary listing exchange. Data presented represents past performance and cannot be used to predict future results.
Period Ended October 31, 2015
| Closing price below NAV | Closing price above or equal to NAV | |||||||
| Basis point differential | Number of days | % of Total days | Number of days | % of Total days | ||||
| 0 - < 25 | 10 | 41.67% | 10 | 41.67% | ||||
| 25 - < 50 | 1 | 4.17% | 1 | 4.17% | ||||
| 50 - < 75 | 1 | 4.16% | — | — | ||||
| 75 - < 100 | — | — | 1 | 4.16% | ||||
| 100 or Above | — | — | — | — | ||||
| Total | 12 | 50.00% | 12 | 50.00% | ||||
8
These examples are intended to help you understand your ongoing operating expenses of investing in the fund so you can compare these costs with the ongoing costs of investing in
other funds.
Understanding fund expenses
As a shareholder of the fund, you incur two types of costs:
| • | Transaction costs, which may include creation and redemption fees or brokerage charges. |
| • | Ongoing operating expenses, including management fees and other fund expenses. |
We are presenting only your ongoing operating expenses here.
Actual expenses/actual returns
This example is intended to provide information about the fund's actual ongoing operating expenses, and is based on the fund's actual return. It assumes an account value of $1,000.00 on September 28, 2015, with the same investment held until October 31, 2015.
| Account value on 9-28-2015 | Ending value on 10-31-2015 | Expenses paid during period ended 10-31-20151 | Annualized expense ratio | |
| $1,000.00 | $1,077.50 | $0.42 | 0.45% |
Together with the value of your account, you may use this information to estimate the operating expenses that you paid over the period. Simply divide your account value at October 31, 2015, by $1,000.00, then multiply it by the "expenses paid" from the table above. For example, for an account value of $8,600.00, the operating expenses should be calculated as follows:
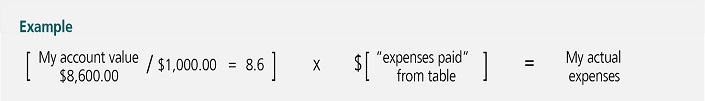
9
Hypothetical example for comparison purposes
This table allows you to compare the fund's ongoing operating expenses with those of any other fund. It provides an example of the fund's hypothetical account values and hypothetical expenses based on the fund's actual expense ratio and an assumed 5% annualized return before expenses (which is not the fund's actual return). It assumes an account value of $1,000.00 on May 1, 2015, with the same investment held until October 31, 2015. Look in any other fund shareholder report to find its hypothetical example and you will be able to compare these expenses. Please remember that these hypothetical account values and expenses may not be used to estimate the actual ending account balance or expenses you paid for the period.
| Account value on 5-1-2015 | Ending value on 10-31-2015 | Expenses paid during period ended 10-31-20152 | Annualized expense ratio | |
| $1,000.00 | $1,022.90 | $2.29 | 0.45% |
Remember, these examples do not include any transaction costs. The fund charges a transaction fee per creation unit to those creating or redeeming creation units, and those buying or selling shares in the secondary market will incur customary brokerage commissions and charges. Therefore, these examples will not help you to determine the relative total costs of owning different funds. If transaction costs were included, your expenses would have been higher. See the prospectus for details regarding transaction costs.
| 1 | The inception date for the fund is 9-28-2015. Expenses are equal to the fund's annualized expense ratio, multiplied by the average account value over the period, multiplied by 33/366 (to reflect the period). |
| 2 | Expenses are equal to the fund's annualized expense ratio, multiplied by the average account value over the period, multiplied by 184/366 (to reflect the one-half year period). |
10
Fund's investments
| As of 10-31-15 (unaudited) | ||||||||||||||
| Shares | Value | |||||||||||||
| Common stocks 99.9% | $13,075,662 | |||||||||||||
| (Cost $12,498,351) | ||||||||||||||
| Consumer discretionary 16.9% | 2,204,909 | |||||||||||||
| Auto components 1.6% | ||||||||||||||
| Autoliv, Inc. | 280 | 33,947 | ||||||||||||
| BorgWarner, Inc. | 540 | 23,123 | ||||||||||||
| Delphi Automotive PLC | 360 | 29,948 | ||||||||||||
| Gentex Corp. | 974 | 15,964 | ||||||||||||
| Lear Corp. | 410 | 51,275 | ||||||||||||
| The Goodyear Tire & Rubber Company | 1,240 | 40,722 | ||||||||||||
| Visteon Corp. (I) | 180 | 19,633 | ||||||||||||
| Automobiles 0.2% | ||||||||||||||
| Harley-Davidson, Inc. | 590 | 29,176 | ||||||||||||
| Distributors 0.5% | ||||||||||||||
| Genuine Parts Company | 440 | 39,934 | ||||||||||||
| LKQ Corp. (I) | 660 | 19,543 | ||||||||||||
| Diversified consumer services 0.6% | ||||||||||||||
| Bright Horizons Family Solutions, Inc. (I) | 50 | 3,201 | ||||||||||||
| Graham Holdings Company, Class B | 15 | 8,287 | ||||||||||||
| H&R Block, Inc. | 830 | 30,926 | ||||||||||||
| Service Corp. International | 900 | 25,434 | ||||||||||||
| ServiceMaster Global Holdings, Inc. (I) | 290 | 10,339 | ||||||||||||
| Hotels, restaurants and leisure 2.2% | ||||||||||||||
| ARAMARK | 590 | 17,907 | ||||||||||||
| Buffalo Wild Wings, Inc. (I) | 8 | 1,234 | ||||||||||||
| Chipotle Mexican Grill, Inc. (I) | 60 | 38,414 | ||||||||||||
| Cracker Barrel Old Country Store, Inc. | 10 | 1,375 | ||||||||||||
| Darden Restaurants, Inc. | 270 | 16,710 | ||||||||||||
| Domino's Pizza, Inc. | 140 | 14,934 | ||||||||||||
| Dunkin' Brands Group, Inc. | 320 | 13,251 | ||||||||||||
| Extended Stay America, Inc. | 180 | 3,456 | ||||||||||||
| Hyatt Hotels Corp., Class A (I) | 50 | 2,520 | ||||||||||||
| Marriott International, Inc., Class A | 120 | 9,214 | ||||||||||||
| MGM Resorts International (I) | 1,020 | 23,654 | ||||||||||||
| Norwegian Cruise Line Holdings, Ltd. (I) | 240 | 15,269 | ||||||||||||
| Panera Bread Company, Class A (I) | 100 | 17,737 | ||||||||||||
| Royal Caribbean Cruises, Ltd. | 340 | 33,439 | ||||||||||||
| Six Flags Entertainment Corp. | 190 | 9,888 | ||||||||||||
| Starwood Hotels & Resorts Worldwide, Inc. | 370 | 29,552 | ||||||||||||
| Vail Resorts, Inc. | 60 | 6,850 | ||||||||||||
| Wyndham Worldwide Corp. | 380 | 30,913 | ||||||||||||
| Shares | Value | |||||||||||||
| Consumer discretionary (continued) | ||||||||||||||
| Household durables 2.4% | ||||||||||||||
| D.R. Horton, Inc. | 910 | $26,790 | ||||||||||||
| Garmin, Ltd. | 290 | 10,286 | ||||||||||||
| Harman International Industries, Inc. | 210 | 23,092 | ||||||||||||
| Jarden Corp. (I) | 430 | 19,264 | ||||||||||||
| Leggett & Platt, Inc. | 550 | 24,767 | ||||||||||||
| Lennar Corp., Class A | 480 | 24,034 | ||||||||||||
| Lennar Corp., Class B | 30 | 1,243 | ||||||||||||
| Mohawk Industries, Inc. (I) | 160 | 31,280 | ||||||||||||
| Newell Rubbermaid, Inc. | 704 | 29,871 | ||||||||||||
| NVR, Inc. (I) | 20 | 32,755 | ||||||||||||
| PulteGroup, Inc. | 1,020 | 18,697 | ||||||||||||
| Tempur Sealy International, Inc. (I) | 100 | 7,784 | ||||||||||||
| Toll Brothers, Inc. (I) | 540 | 19,424 | ||||||||||||
| Whirlpool Corp. | 257 | 41,156 | ||||||||||||
| Internet and catalog retail 0.7% | ||||||||||||||
| Expedia, Inc. | 200 | 27,260 | ||||||||||||
| Liberty Interactive Corp., Series A (I) | 1,320 | 36,128 | ||||||||||||
| Liberty Ventures, Series A (I) | 312 | 13,594 | ||||||||||||
| TripAdvisor, Inc. (I) | 230 | 19,269 | ||||||||||||
| Leisure products 0.6% | ||||||||||||||
| Brunswick Corp. | 280 | 15,067 | ||||||||||||
| Hasbro, Inc. | 300 | 23,049 | ||||||||||||
| Mattel, Inc. | 1,050 | 25,809 | ||||||||||||
| Polaris Industries, Inc. | 180 | 20,221 | ||||||||||||
| Media 2.0% | ||||||||||||||
| AMC Networks, Inc., Class A (I) | 150 | 11,084 | ||||||||||||
| Cablevision Systems Corp., Class A | 790 | 25,746 | ||||||||||||
| Charter Communications, Inc., Class A (I) | 130 | 24,822 | ||||||||||||
| Cinemark Holdings, Inc. | 410 | 14,530 | ||||||||||||
| Liberty Broadband Corp., Series A (I) | 40 | 2,182 | ||||||||||||
| Liberty Broadband Corp., Series C (I) | �� | 130 | 6,990 | |||||||||||
| Liberty Media Corp., Series A (I) | 260 | 10,598 | ||||||||||||
| Liberty Media Corp., Series C (I) | 250 | 9,788 | ||||||||||||
| Lions Gate Entertainment Corp. | 220 | 8,573 | ||||||||||||
| Live Nation Entertainment, Inc. (I) | 420 | 11,458 | ||||||||||||
| MSG Networks, Inc., Class A (I) | 234 | 4,802 | ||||||||||||
| News Corp., Class A | 960 | 14,784 | ||||||||||||
| News Corp., Class B | 290 | 4,489 | ||||||||||||
| Scripps Networks Interactive, Inc., Class A | 230 | 13,818 | ||||||||||||
| Starz, Class A (I) | 140 | 4,691 | ||||||||||||
| TEGNA, Inc. | 1,510 | 40,830 | ||||||||||||
| The Interpublic Group of Companies, Inc. | 1,400 | 32,102 | ||||||||||||
| The Madison Square Garden Company, Class A (I) | 78 | 13,923 | ||||||||||||
| Shares | Value | |||||||||||||
| Consumer discretionary (continued) | ||||||||||||||
| Multiline retail 0.9% | ||||||||||||||
| Burlington Stores, Inc. (I) | 160 | $7,693 | ||||||||||||
| Dillard's, Inc., Class A | 120 | 10,738 | ||||||||||||
| Dollar Tree, Inc. (I) | 640 | 41,914 | ||||||||||||
| Kohl's Corp. | 550 | 25,366 | ||||||||||||
| Nordstrom, Inc. | 430 | 28,040 | ||||||||||||
| Specialty retail 3.9% | ||||||||||||||
| Advance Auto Parts, Inc. | 226 | 44,845 | ||||||||||||
| AutoNation, Inc. (I) | 300 | 18,957 | ||||||||||||
| AutoZone, Inc. (I) | 70 | 54,909 | ||||||||||||
| Bed Bath & Beyond, Inc. (I) | 380 | 22,659 | ||||||||||||
| Best Buy Company, Inc. | 720 | 25,222 | ||||||||||||
| CarMax, Inc. (I) | 530 | 31,275 | ||||||||||||
| Dick's Sporting Goods, Inc. | 410 | 18,266 | ||||||||||||
| Foot Locker, Inc. | 400 | 27,100 | ||||||||||||
| GameStop Corp., Class A | 530 | 24,417 | ||||||||||||
| GNC Holdings, Inc., Class A | 340 | 10,115 | ||||||||||||
| Office Depot, Inc. (I) | 1,300 | 9,906 | ||||||||||||
| Penske Automotive Group, Inc. | 160 | 7,814 | ||||||||||||
| Restoration Hardware Holdings, Inc. (I) | 70 | 7,216 | ||||||||||||
| Ross Stores, Inc. | 1,080 | 54,626 | ||||||||||||
| Sally Beauty Holdings, Inc. (I) | 420 | 9,874 | ||||||||||||
| Signet Jewelers, Ltd. | 79 | 11,924 | ||||||||||||
| Staples, Inc. | 1,289 | 16,744 | ||||||||||||
| The Gap, Inc. | 76 | 2,069 | ||||||||||||
| The Michaels Companies, Inc. (I) | 150 | 3,507 | ||||||||||||
| Tiffany & Company | 240 | 19,786 | ||||||||||||
| Tractor Supply Company | 310 | 28,641 | ||||||||||||
| Ulta Salon Cosmetics & Fragrance, Inc. (I) | 150 | 26,094 | ||||||||||||
| Urban Outfitters, Inc. (I) | 410 | 11,726 | ||||||||||||
| Williams-Sonoma, Inc. | 340 | 25,075 | ||||||||||||
| Textiles, apparel and luxury goods 1.3% | ||||||||||||||
| Carter's, Inc. | 190 | 17,267 | ||||||||||||
| Coach, Inc. | 440 | 13,728 | ||||||||||||
| Columbia Sportswear Company | 60 | 3,291 | ||||||||||||
| Hanesbrands, Inc. | 1,060 | 33,856 | ||||||||||||
| Lululemon Athletica, Inc. (I) | 240 | 11,801 | ||||||||||||
| Michael Kors Holdings, Ltd. (I) | 270 | 10,433 | ||||||||||||
| PVH Corp. | 190 | 17,281 | ||||||||||||
| Ralph Lauren Corp. | 180 | 19,939 | ||||||||||||
| Skechers U.S.A., Inc., Class A (I) | 149 | 4,649 | ||||||||||||
| Under Armour, Inc., Class A (I) | 340 | 32,327 | ||||||||||||
| Shares | Value | |||||||||||||
| Consumer staples 5.1% | $663,406 | |||||||||||||
| Beverages 1.1% | ||||||||||||||
| Brown-Forman Corp., Class A | 10 | 1,148 | ||||||||||||
| Brown-Forman Corp., Class B | 264 | 28,032 | ||||||||||||
| Coca-Cola Enterprises, Inc. | 650 | 33,371 | ||||||||||||
| Dr. Pepper Snapple Group, Inc. | 600 | 53,622 | ||||||||||||
| Molson Coors Brewing Company, Class B | 340 | 29,954 | ||||||||||||
| Food and staples retailing 0.3% | ||||||||||||||
| Casey's General Stores, Inc. | 70 | 7,435 | ||||||||||||
| Rite Aid Corp. (I) | 2,260 | 17,809 | ||||||||||||
| Whole Foods Market, Inc. | 474 | 14,201 | ||||||||||||
| Food products 2.8% | ||||||||||||||
| Blue Buffalo Pet Products Inc (I) | 50 | 897 | ||||||||||||
| Bunge, Ltd. | 340 | 24,806 | ||||||||||||
| Campbell Soup Company | 370 | 18,792 | ||||||||||||
| ConAgra Foods, Inc. | 890 | 36,090 | ||||||||||||
| Flowers Foods, Inc. | 730 | 19,710 | ||||||||||||
| Hormel Foods Corp. | 380 | 25,669 | ||||||||||||
| Ingredion, Inc. | 370 | 35,172 | ||||||||||||
| Keurig Green Mountain, Inc. | 140 | 7,105 | ||||||||||||
| McCormick & Company, Inc. | 320 | 26,874 | ||||||||||||
| Mead Johnson Nutrition Company | 63 | 5,166 | ||||||||||||
| Pilgrim's Pride Corp. | 250 | 4,748 | ||||||||||||
| Pinnacle Foods, Inc. | 310 | 13,665 | ||||||||||||
| Post Holdings, Inc. (I) | 100 | 6,427 | ||||||||||||
| Seaboard Corp. (I) | 1 | 3,368 | ||||||||||||
| The Hain Celestial Group, Inc. (I) | 270 | 13,460 | ||||||||||||
| The Hershey Company | 370 | 32,815 | ||||||||||||
| The J.M. Smucker Company | 260 | 30,521 | ||||||||||||
| The WhiteWave Foods Company (I) | 410 | 16,802 | ||||||||||||
| Tyson Foods, Inc., Class A | 940 | 41,698 | ||||||||||||
| Household products 0.6% | ||||||||||||||
| Church & Dwight Company, Inc. | 360 | 30,992 | ||||||||||||
| Spectrum Brands Holdings, Inc. | 80 | 7,668 | ||||||||||||
| The Clorox Company | 290 | 35,363 | ||||||||||||
| Personal products 0.3% | ||||||||||||||
| Coty, Inc., Class A | 60 | 1,737 | ||||||||||||
| Edgewell Personal Care Company | 280 | 23,719 | ||||||||||||
| Herbalife, Ltd. (I) | 260 | 14,570 | ||||||||||||
| Energy 3.4% | 450,706 | |||||||||||||
| Energy equipment and services 1.0% | ||||||||||||||
| Cameron International Corp. (I) | 514 | 34,957 | ||||||||||||
| Core Laboratories NV | 140 | 16,286 | ||||||||||||
| FMC Technologies, Inc. (I) | 640 | 21,651 | ||||||||||||
| Shares | Value | |||||||||||||
| Energy (continued) | ||||||||||||||
| Energy equipment and services (continued) | ||||||||||||||
| Helmerich & Payne, Inc. | 370 | $20,820 | ||||||||||||
| Nabors Industries, Ltd. | 1,230 | 12,349 | ||||||||||||
| Oceaneering International, Inc. | 320 | 13,446 | ||||||||||||
| Weatherford International PLC (I) | 820 | 8,397 | ||||||||||||
| Oil, gas and consumable fuels 2.4% | ||||||||||||||
| Antero Resources Corp. (I) | 30 | 707 | ||||||||||||
| Cabot Oil & Gas Corp. | 810 | 17,585 | ||||||||||||
| Cheniere Energy Partners LP Holdings LLC | 70 | 1,378 | ||||||||||||
| Cheniere Energy, Inc. (I) | 220 | 10,894 | ||||||||||||
| Cimarex Energy Company | 190 | 22,431 | ||||||||||||
| Columbia Pipeline Group, Inc. | 558 | 11,590 | ||||||||||||
| Concho Resources, Inc. (I) | 240 | 27,818 | ||||||||||||
| CONSOL Energy, Inc. | 560 | 3,730 | ||||||||||||
| CVR Energy, Inc. | 60 | 2,668 | ||||||||||||
| Diamondback Energy, Inc. (I) | 110 | 8,122 | ||||||||||||
| Energen Corp. | 390 | 22,679 | ||||||||||||
| EnLink Midstream LLC | 100 | 1,970 | ||||||||||||
| EQT Corp. | 360 | 23,785 | ||||||||||||
| Gulfport Energy Corp. (I) | 190 | 5,789 | ||||||||||||
| HollyFrontier Corp. | 570 | 27,913 | ||||||||||||
| Murphy Oil Corp. | 590 | 16,774 | ||||||||||||
| Newfield Exploration Company (I) | 640 | 25,722 | ||||||||||||
| ONEOK, Inc. | 610 | 20,691 | ||||||||||||
| Range Resources Corp. | 280 | 8,523 | ||||||||||||
| Southwestern Energy Company (I) | 300 | 3,312 | ||||||||||||
| Targa Resources Corp. | 90 | 5,144 | ||||||||||||
| Tesoro Corp. | 350 | 37,426 | ||||||||||||
| Western Refining, Inc. | 210 | 8,740 | ||||||||||||
| Whiting Petroleum Corp. (I) | 430 | 7,409 | ||||||||||||
| Financials 19.4% | 2,541,256 | |||||||||||||
| Banks 3.5% | ||||||||||||||
| Bank of the Ozarks, Inc. | 110 | 5,502 | ||||||||||||
| BankUnited, Inc. | 150 | 5,577 | ||||||||||||
| BOK Financial Corp. | 100 | 6,718 | ||||||||||||
| CIT Group, Inc. | 690 | 29,670 | ||||||||||||
| Citizens Financial Group, Inc. | 592 | 14,386 | ||||||||||||
| City National Corp. | 200 | 17,920 | ||||||||||||
| Comerica, Inc. | 590 | 25,606 | ||||||||||||
| Commerce Bancshares, Inc. | 370 | 16,854 | ||||||||||||
| Cullen/Frost Bankers, Inc. | 210 | 14,372 | ||||||||||||
| East West Bancorp, Inc. | 520 | 21,003 | ||||||||||||
| Fifth Third Bancorp | 1,310 | 24,956 | ||||||||||||
| Shares | Value | |||||||||||||
| Financials (continued) | ||||||||||||||
| Banks (continued) | ||||||||||||||
| First Niagara Financial Group, Inc. | 115 | $1,190 | ||||||||||||
| First Republic Bank | 460 | 30,043 | ||||||||||||
| Huntington Bancshares, Inc. | 2,754 | 30,211 | ||||||||||||
| Investors Bancorp, Inc. | 860 | 10,759 | ||||||||||||
| KeyCorp | 2,470 | 30,677 | ||||||||||||
| M&T Bank Corp. | 169 | 20,255 | ||||||||||||
| PacWest Bancorp | 250 | 11,260 | ||||||||||||
| People's United Financial, Inc. | 1,214 | 19,363 | ||||||||||||
| Prosperity Bancshares, Inc. | 140 | 7,193 | ||||||||||||
| Regions Financial Corp. | 3,314 | 30,986 | ||||||||||||
| Signature Bank (I) | 170 | 25,316 | ||||||||||||
| SVB Financial Group (I) | 190 | 23,193 | ||||||||||||
| Synovus Financial Corp. | 294 | 9,299 | ||||||||||||
| Umpqua Holdings Corp. | 410 | 6,847 | ||||||||||||
| Zions Bancorporation | 770 | 22,153 | ||||||||||||
| Capital markets 2.0% | ||||||||||||||
| Affiliated Managers Group, Inc. (I) | 150 | 27,039 | ||||||||||||
| Ameriprise Financial, Inc. | 340 | 39,222 | ||||||||||||
| E*TRADE Financial Corp. (I) | 880 | 25,089 | ||||||||||||
| Eaton Vance Corp. | 580 | 20,944 | ||||||||||||
| Invesco, Ltd. | 637 | 21,129 | ||||||||||||
| Legg Mason, Inc. | 410 | 18,348 | ||||||||||||
| LPL Financial Holdings, Inc. | 270 | 11,502 | ||||||||||||
| Northern Trust Corp. | 310 | 21,821 | ||||||||||||
| Raymond James Financial, Inc. | 460 | 25,351 | ||||||||||||
| SEI Investments Company | 460 | 23,837 | ||||||||||||
| TD Ameritrade Holding Corp. | 690 | 23,784 | ||||||||||||
| Consumer finance 0.6% | ||||||||||||||
| Ally Financial, Inc. (I) | 1,074 | 21,394 | ||||||||||||
| Credit Acceptance Corp. (I) | 20 | 3,782 | ||||||||||||
| LendingClub Corp. (I) | 290 | 4,112 | ||||||||||||
| Navient Corp. | 1,370 | 18,070 | ||||||||||||
| Santander Consumer USA Holdings, Inc. (I) | 380 | 6,844 | ||||||||||||
| SLM Corp. (I) | 2,220 | 15,673 | ||||||||||||
| Springleaf Holdings, Inc. (I) | 130 | 6,098 | ||||||||||||
| Diversified financial services 1.3% | ||||||||||||||
| CBOE Holdings, Inc. | 280 | 18,771 | ||||||||||||
| FactSet Research Systems, Inc. | 170 | 29,770 | ||||||||||||
| Leucadia National Corp. | 830 | 16,608 | ||||||||||||
| MarketAxess Holdings, Inc. | 13 | 1,317 | ||||||||||||
| Moody's Corp. | 360 | 34,618 | ||||||||||||
| MSCI, Inc. | 440 | 29,480 | ||||||||||||
| NASDAQ, Inc. | 340 | 19,683 | ||||||||||||
| Shares | Value | |||||||||||||
| Financials (continued) | ||||||||||||||
| Diversified financial services (continued) | ||||||||||||||
| Voya Financial, Inc. | 410 | $16,634 | ||||||||||||
| Insurance 5.9% | ||||||||||||||
| Alleghany Corp. (I) | 64 | 31,761 | ||||||||||||
| Allied World Assurance Company Holdings AG | 400 | 14,544 | ||||||||||||
| American Financial Group, Inc. | 380 | 27,432 | ||||||||||||
| AmTrust Financial Services, Inc. | 110 | 7,504 | ||||||||||||
| Arch Capital Group, Ltd. (I) | 340 | 25,463 | ||||||||||||
| Arthur J. Gallagher & Company | 510 | 22,302 | ||||||||||||
| Assurant, Inc. | 330 | 26,905 | ||||||||||||
| Assured Guaranty, Ltd. | 860 | 23,598 | ||||||||||||
| Axis Capital Holdings, Ltd. | 500 | 27,000 | ||||||||||||
| Brown & Brown, Inc. | 560 | 18,071 | ||||||||||||
| Cincinnati Financial Corp. | 414 | 24,935 | ||||||||||||
| CNA Financial Corp. | 80 | 2,925 | ||||||||||||
| CNO Financial Group, Inc. | 100 | 1,921 | ||||||||||||
| Endurance Specialty Holdings, Ltd. | 112 | 7,071 | ||||||||||||
| Erie Indemnity Company, Class A, Class A | 60 | 5,248 | ||||||||||||
| Everest Re Group, Ltd. | 150 | 26,696 | ||||||||||||
| First American Financial Corp. | 192 | 7,321 | ||||||||||||
| FNF Group | 510 | 17,993 | ||||||||||||
| Lincoln National Corp. | 600 | 32,106 | ||||||||||||
| Loews Corp. | 314 | 11,448 | ||||||||||||
| Markel Corp. (I) | 30 | 26,040 | ||||||||||||
| Old Republic International Corp. | 1,090 | 19,664 | ||||||||||||
| PartnerRe, Ltd. | 240 | 33,360 | ||||||||||||
| Principal Financial Group, Inc. | 724 | 36,316 | ||||||||||||
| Reinsurance Group of America, Inc. | 300 | 27,072 | ||||||||||||
| RenaissanceRe Holdings, Ltd. | 210 | 23,022 | ||||||||||||
| StanCorp Financial Group, Inc. | 81 | 9,292 | ||||||||||||
| Symetra Financial Corp. | 110 | 3,490 | ||||||||||||
| The Hanover Insurance Group, Inc. | 17 | 1,432 | ||||||||||||
| The Hartford Financial Services Group, Inc. | 780 | 36,083 | ||||||||||||
| The Progressive Corp. | 1,000 | 33,130 | ||||||||||||
| Torchmark Corp. | 500 | 29,005 | ||||||||||||
| Unum Group | 670 | 23,216 | ||||||||||||
| Validus Holdings, Ltd. | 370 | 16,391 | ||||||||||||
| W.R. Berkley Corp. | 520 | 29,032 | ||||||||||||
| White Mountains Insurance Group, Ltd. | 20 | 15,800 | ||||||||||||
| Willis Group Holdings PLC | 480 | 21,413 | ||||||||||||
| XL Group PLC | 694 | 26,428 | ||||||||||||
| Real estate investment trusts 5.0% | ||||||||||||||
| Alexandria Real Estate Equities, Inc. | 170 | 15,256 | ||||||||||||
| American Campus Communities, Inc. | 270 | 10,954 | ||||||||||||
| Shares | Value | |||||||||||||
| Financials (continued) | ||||||||||||||
| Real estate investment trusts (continued) | ||||||||||||||
| Apartment Investment & Management Company, Class A | 380 | $14,892 | ||||||||||||
| AvalonBay Communities, Inc. | 160 | 27,973 | ||||||||||||
| BioMed Realty Trust, Inc. | 484 | 11,330 | ||||||||||||
| Brixmor Property Group, Inc. | 350 | 8,967 | ||||||||||||
| Camden Property Trust | 210 | 15,496 | ||||||||||||
| Corrections Corp. of America | 420 | 11,970 | ||||||||||||
| CubeSmart | 310 | 8,624 | ||||||||||||
| DDR Corp. | 730 | 12,264 | ||||||||||||
| Digital Realty Trust, Inc. | 210 | 15,532 | ||||||||||||
| Douglas Emmett, Inc. | 340 | 10,387 | ||||||||||||
| Duke Realty Corp. | 840 | 17,388 | ||||||||||||
| Equinix, Inc. | 128 | 37,975 | ||||||||||||
| Equity Commonwealth (I) | 39 | 1,120 | ||||||||||||
| Equity LifeStyle Properties, Inc. | 170 | 10,282 | ||||||||||||
| Essex Property Trust, Inc. | 100 | 22,044 | ||||||||||||
| Extra Space Storage, Inc. | 260 | 20,602 | ||||||||||||
| Federal Realty Investment Trust | 150 | 21,524 | ||||||||||||
| Gaming and Leisure Properties, Inc. | 160 | 4,667 | ||||||||||||
| Highwoods Properties, Inc. | 210 | 9,125 | ||||||||||||
| Hospitality Properties Trust | 370 | 9,931 | ||||||||||||
| Host Hotels & Resorts, Inc. | 1,090 | 18,890 | ||||||||||||
| Iron Mountain, Inc. | 630 | 19,303 | ||||||||||||
| Kilroy Realty Corp. | 210 | 13,826 | ||||||||||||
| Kimco Realty Corp. | 614 | 16,437 | ||||||||||||
| Lamar Advertising Company, Class A | 270 | 15,236 | ||||||||||||
| LaSalle Hotel Properties | 200 | 5,882 | ||||||||||||
| Liberty Property Trust | 360 | 12,247 | ||||||||||||
| Mid-America Apartment Communities, Inc. | 170 | 14,482 | ||||||||||||
| National Retail Properties, Inc. | 314 | 11,932 | ||||||||||||
| Omega Healthcare Investors, Inc. | 380 | 13,118 | ||||||||||||
| Paramount Group, Inc. | 210 | 3,732 | ||||||||||||
| Plum Creek Timber Company, Inc. | 420 | 17,111 | ||||||||||||
| Realty Income Corp. | 340 | 16,816 | ||||||||||||
| Regency Centers Corp. | 230 | 15,631 | ||||||||||||
| RLJ Lodging Trust | 230 | 5,771 | ||||||||||||
| Senior Housing Properties Trust | 550 | 8,355 | ||||||||||||
| SL Green Realty Corp. | 150 | 17,793 | ||||||||||||
| Spirit Realty Capital, Inc. | 940 | 9,569 | ||||||||||||
| Strategic Hotels & Resorts, Inc. (I) | 320 | 4,512 | ||||||||||||
| Sun Communities, Inc. | 2 | 134 | ||||||||||||
| Taubman Centers, Inc. | 150 | 11,547 | ||||||||||||
| The Macerich Company | 230 | 19,490 | ||||||||||||
| UDR, Inc. | 570 | 19,642 | ||||||||||||
| Shares | Value | |||||||||||||
| Financials (continued) | ||||||||||||||
| Real estate investment trusts (continued) | ||||||||||||||
| VEREIT, Inc. | 650 | $5,369 | ||||||||||||
| Weingarten Realty Investors | 290 | 10,370 | ||||||||||||
| Weyerhaeuser Company | 700 | 20,531 | ||||||||||||
| WP Carey, Inc. | 220 | 13,941 | ||||||||||||
| Real estate management and development 0.7% | ||||||||||||||
| CBRE Group, Inc., Class A (I) | 790 | 29,451 | ||||||||||||
| Forest City Enterprises, Inc., Class A (I) | 510 | 11,271 | ||||||||||||
| Jones Lang LaSalle, Inc. | 160 | 26,674 | ||||||||||||
| Realogy Holdings Corp. (I) | 480 | 18,768 | ||||||||||||
| The Howard Hughes Corp. (I) | 79 | 9,763 | ||||||||||||
| Thrifts and mortgage finance 0.4% | ||||||||||||||
| Hudson City Bancorp, Inc. | 1,620 | 16,394 | ||||||||||||
| New York Community Bancorp, Inc. | 1,570 | 25,936 | ||||||||||||
| Radian Group, Inc. | 360 | 5,209 | ||||||||||||
| TFS Financial Corp. | 180 | 3,161 | ||||||||||||
| Health care 10.5% | 1,380,362 | |||||||||||||
| Biotechnology 1.3% | ||||||||||||||
| ACADIA Pharmaceuticals, Inc. (I) | 70 | 2,437 | ||||||||||||
| Alkermes PLC (I) | 300 | 21,576 | ||||||||||||
| Alnylam Pharmaceuticals, Inc. (I) | 82 | 7,048 | ||||||||||||
| Anacor Pharmaceuticals, Inc. (I) | 30 | 3,372 | ||||||||||||
| BioMarin Pharmaceutical, Inc. (I) | 220 | 25,749 | ||||||||||||
| Bluebird Bio, Inc. (I) | 60 | 4,628 | ||||||||||||
| Cepheid, Inc. (I) | 110 | 3,674 | ||||||||||||
| Incyte Corp. (I) | 170 | 19,980 | ||||||||||||
| Intercept Pharmaceuticals, Inc. (I) | 20 | 3,144 | ||||||||||||
| Intrexon Corp. (I) | 70 | 2,352 | ||||||||||||
| Isis Pharmaceuticals, Inc. (I) | 210 | 10,112 | ||||||||||||
| Juno Therapeutics, Inc. (I) | 80 | 4,141 | ||||||||||||
| Medivation, Inc. (I) | 400 | 16,824 | ||||||||||||
| Neurocrine Biosciences, Inc. (I) | 80 | 3,927 | ||||||||||||
| OPKO Health, Inc. (I) | 540 | 5,103 | ||||||||||||
| Seattle Genetics, Inc. (I) | 180 | 7,468 | ||||||||||||
| Ultragenyx Pharmaceutical, Inc. (I) | 30 | 2,981 | ||||||||||||
| United Therapeutics Corp. (I) | 190 | 27,860 | ||||||||||||
| Health care equipment and supplies 3.4% | ||||||||||||||
| ABIOMED, Inc. (I) | 40 | 2,946 | ||||||||||||
| Alere, Inc. (I) | 280 | 12,914 | ||||||||||||
| Align Technology, Inc. (I) | 190 | 12,437 | ||||||||||||
| Boston Scientific Corp. (I) | 2,254 | 41,203 | ||||||||||||
| C.R. Bard, Inc. | 230 | 42,861 | ||||||||||||
| DENTSPLY International, Inc. | 640 | 38,944 | ||||||||||||
| Shares | Value | |||||||||||||
| Health care (continued) | ||||||||||||||
| Health care equipment and supplies (continued) | ||||||||||||||
| DexCom, Inc. (I) | 110 | $9,165 | ||||||||||||
| Edwards Lifesciences Corp. (I) | 290 | 45,574 | ||||||||||||
| Hologic, Inc. (I) | 934 | 36,295 | ||||||||||||
| IDEXX Laboratories, Inc. (I) | 380 | 26,076 | ||||||||||||
| ResMed, Inc. | 510 | 29,381 | ||||||||||||
| Sirona Dental Systems, Inc. (I) | 230 | 25,100 | ||||||||||||
| St. Jude Medical, Inc. | 270 | 17,229 | ||||||||||||
| STERIS Corp. | 190 | 14,241 | ||||||||||||
| Teleflex, Inc. | 160 | 21,280 | ||||||||||||
| The Cooper Companies, Inc. | 170 | 25,901 | ||||||||||||
| Varian Medical Systems, Inc. (I) | 390 | 30,627 | ||||||||||||
| West Pharmaceutical Services, Inc. | 210 | 12,602 | ||||||||||||
| Health care providers and services 3.7% | ||||||||||||||
| Acadia Healthcare Company, Inc. (I) | 150 | 9,212 | ||||||||||||
| AmerisourceBergen Corp. | 404 | 38,990 | ||||||||||||
| Amsurg Corp. (I) | 139 | 9,743 | ||||||||||||
| Brookdale Senior Living, Inc. (I) | 650 | 13,592 | ||||||||||||
| Centene Corp. (I) | 392 | 23,316 | ||||||||||||
| Community Health Systems, Inc. (I) | 640 | 17,946 | ||||||||||||
| DaVita HealthCare Partners, Inc. (I) | 660 | 51,157 | ||||||||||||
| Envision Healthcare Holdings, Inc. (I) | 572 | 16,130 | ||||||||||||
| Health Net, Inc. (I) | 260 | 16,708 | ||||||||||||
| HealthSouth Corp. | 172 | 5,991 | ||||||||||||
| Henry Schein, Inc. (I) | 280 | 42,479 | ||||||||||||
| Laboratory Corp. of America Holdings (I) | 339 | 41,609 | ||||||||||||
| MEDNAX, Inc. (I) | 450 | 31,712 | ||||||||||||
| Molina Healthcare, Inc. (I) | 100 | 6,200 | ||||||||||||
| Patterson Companies, Inc. | 470 | 22,278 | ||||||||||||
| Premier, Inc., Class A (I) | 60 | 2,029 | ||||||||||||
| Quest Diagnostics, Inc. | 544 | 36,965 | ||||||||||||
| Team Health Holdings, Inc. (I) | 210 | 12,531 | ||||||||||||
| Tenet Healthcare Corp. (I) | 420 | 13,175 | ||||||||||||
| Universal Health Services, Inc., Class B | 390 | 47,615 | ||||||||||||
| VCA, Inc. (I) | 240 | 13,145 | ||||||||||||
| WellCare Health Plans, Inc. (I) | 160 | 14,176 | ||||||||||||
| Health care technology 0.6% | ||||||||||||||
| athenahealth, Inc. (I) | 100 | 15,245 | ||||||||||||
| Cerner Corp. (I) | 770 | 51,043 | ||||||||||||
| IMS Health Holdings, Inc. (I) | 220 | 5,988 | ||||||||||||
| Life sciences tools and services 1.0% | ||||||||||||||
| Agilent Technologies, Inc. | 500 | 18,880 | ||||||||||||
| Bio-Rad Laboratories, Inc., Class A (I) | 90 | 12,553 | ||||||||||||
| Bio-Techne Corp. | 13 | 1,147 | ||||||||||||
| Shares | Value | |||||||||||||
| Health care (continued) | ||||||||||||||
| Life sciences tools and services (continued) | ||||||||||||||
| Mettler-Toledo International, Inc. (I) | 84 | $26,123 | ||||||||||||
| PAREXEL International Corp. (I) | 110 | 6,943 | ||||||||||||
| PerkinElmer, Inc. | 500 | 25,820 | ||||||||||||
| Quintiles Transnational Holdings, Inc. (I) | 150 | 9,548 | ||||||||||||
| Waters Corp. (I) | 270 | 34,506 | ||||||||||||
| Pharmaceuticals 0.5% | ||||||||||||||
| Akorn, Inc. (I) | 190 | 5,081 | ||||||||||||
| Catalent, Inc. (I) | 190 | 5,050 | ||||||||||||
| Endo International PLC (I) | 250 | 14,998 | ||||||||||||
| Horizon Pharma PLC (I) | 210 | 3,301 | ||||||||||||
| Jazz Pharmaceuticals PLC (I) | 130 | 17,846 | ||||||||||||
| Mallinckrodt PLC (I) | 250 | 16,418 | ||||||||||||
| Zoetis, Inc. | 140 | 6,021 | ||||||||||||
| Industrials 14.6% | 1,908,413 | |||||||||||||
| Aerospace and defense 1.7% | ||||||||||||||
| B/E Aerospace, Inc. | 350 | 16,433 | ||||||||||||
| Hexcel Corp. | 340 | 15,749 | ||||||||||||
| Huntington Ingalls Industries, Inc. | 190 | 22,789 | ||||||||||||
| L-3 Communications Holdings, Inc. | 220 | 27,808 | ||||||||||||
| Orbital ATK, Inc. | 210 | 17,980 | ||||||||||||
| Rockwell Collins, Inc. | 410 | 35,555 | ||||||||||||
| Spirit AeroSystems Holdings, Inc., Class A (I) | 340 | 17,932 | ||||||||||||
| Teledyne Technologies, Inc. (I) | 90 | 8,031 | ||||||||||||
| Textron, Inc. | 790 | 33,314 | ||||||||||||
| TransDigm Group, Inc. (I) | 119 | 26,162 | ||||||||||||
| Air freight and logistics 0.4% | ||||||||||||||
| C.H. Robinson Worldwide, Inc. | 430 | 29,833 | ||||||||||||
| Expeditors International of Washington, Inc. | 530 | 26,389 | ||||||||||||
| Airlines 0.6% | ||||||||||||||
| Alaska Air Group, Inc. | 530 | 40,413 | ||||||||||||
| Allegiant Travel Company | 5 | 987 | ||||||||||||
| JetBlue Airways Corp. (I) | 1,100 | 27,324 | ||||||||||||
| Spirit Airlines, Inc. (I) | 170 | 6,310 | ||||||||||||
| Building products 0.9% | ||||||||||||||
| Allegion PLC | 270 | 17,596 | ||||||||||||
| AO Smith Corp. | 240 | 18,437 | ||||||||||||
| Fortune Brands Home & Security, Inc. | 470 | 24,595 | ||||||||||||
| Lennox International, Inc. | 140 | 18,593 | ||||||||||||
| Masco Corp. | 580 | 16,820 | ||||||||||||
| Owens Corning | 440 | 20,033 | ||||||||||||
| USG Corp. (I) | 240 | 5,657 | ||||||||||||
| Shares | Value | |||||||||||||
| Industrials (continued) | ||||||||||||||
| Commercial services and supplies 1.6% | ||||||||||||||
| Cintas Corp. | 280 | $26,065 | ||||||||||||
| Copart, Inc. (I) | 550 | 19,916 | ||||||||||||
| KAR Auction Services, Inc. | 510 | 19,584 | ||||||||||||
| Pitney Bowes, Inc. | 664 | 13,712 | ||||||||||||
| Republic Services, Inc. | 800 | 34,992 | ||||||||||||
| Rollins, Inc. | 340 | 9,119 | ||||||||||||
| Stericycle, Inc. (I) | 187 | 22,696 | ||||||||||||
| The ADT Corp. | 750 | 24,780 | ||||||||||||
| Tyco International PLC | 108 | 3,936 | ||||||||||||
| Waste Connections, Inc. | 530 | 28,874 | ||||||||||||
| Construction and engineering 0.6% | ||||||||||||||
| AECOM (I) | 390 | 11,493 | ||||||||||||
| Chicago Bridge & Iron Company NV | 292 | 13,102 | ||||||||||||
| Fluor Corp. | 440 | 21,036 | ||||||||||||
| Jacobs Engineering Group, Inc. (I) | 380 | 15,253 | ||||||||||||
| Quanta Services, Inc. (I) | 710 | 14,278 | ||||||||||||
| Electrical equipment 1.1% | ||||||||||||||
| Acuity Brands, Inc. | 90 | 19,674 | ||||||||||||
| AMETEK, Inc. | 680 | 37,278 | ||||||||||||
| Hubbell, Inc., Class B | 280 | 27,118 | ||||||||||||
| Rockwell Automation, Inc. | 360 | 39,298 | ||||||||||||
| Sensata Technologies Holding NV (I) | 420 | 20,198 | ||||||||||||
| SolarCity Corp. (I) | 100 | 2,965 | ||||||||||||
| Industrial conglomerates 0.5% | ||||||||||||||
| Carlisle Companies, Inc. | 230 | 20,010 | ||||||||||||
| Roper Technologies, Inc. | 240 | 44,724 | ||||||||||||
| Machinery 3.7% | ||||||||||||||
| AGCO Corp. | 380 | 18,388 | ||||||||||||
| Allison Transmission Holdings, Inc. | 570 | 16,359 | ||||||||||||
| Colfax Corp. (I) | 210 | 5,662 | ||||||||||||
| Donaldson Company, Inc. | 650 | 19,630 | ||||||||||||
| Dover Corp. | 530 | 34,148 | ||||||||||||
| Flowserve Corp. | 450 | 20,862 | ||||||||||||
| Graco, Inc. | 210 | 15,414 | ||||||||||||
| IDEX Corp. | 320 | 24,563 | ||||||||||||
| Ingersoll-Rand PLC | 384 | 22,756 | ||||||||||||
| ITT Corp. | 210 | 8,312 | ||||||||||||
| Lincoln Electric Holdings, Inc. | 360 | 21,532 | ||||||||||||
| Nordson Corp. | 200 | 14,248 | ||||||||||||
| Parker-Hannifin Corp. | 440 | 46,068 | ||||||||||||
| Pentair PLC | 440 | 24,605 | ||||||||||||
| Snap-on, Inc. | 190 | 31,519 | ||||||||||||
| Shares | Value | |||||||||||||
| Industrials (continued) | ||||||||||||||
| Machinery (continued) | ||||||||||||||
| Stanley Black & Decker, Inc. | 400 | $42,392 | ||||||||||||
| The Middleby Corp. (I) | 160 | 18,710 | ||||||||||||
| The Toro Company | 140 | 10,538 | ||||||||||||
| Trinity Industries, Inc. | 660 | 17,866 | ||||||||||||
| WABCO Holdings, Inc. (I) | 210 | 23,568 | ||||||||||||
| Wabtec Corp. | 260 | 21,546 | ||||||||||||
| Xylem, Inc. | 660 | 24,031 | ||||||||||||
| Marine 0.1% | ||||||||||||||
| Kirby Corp. (I) | 220 | 14,364 | ||||||||||||
| Professional services 1.3% | ||||||||||||||
| Equifax, Inc. | 360 | 38,365 | ||||||||||||
| IHS, Inc., Class A (I) | 160 | 19,126 | ||||||||||||
| ManpowerGroup, Inc. | 300 | 27,534 | ||||||||||||
| Robert Half International, Inc. | 490 | 25,803 | ||||||||||||
| The Dun & Bradstreet Corp. | 130 | 14,803 | ||||||||||||
| Towers Watson & Company, Class A | 219 | 27,060 | ||||||||||||
| TransUnion (I) | 50 | 1,286 | ||||||||||||
| Verisk Analytics, Inc. (I) | 290 | 20,767 | ||||||||||||
| Road and rail 1.2% | ||||||||||||||
| AMERCO | 30 | 12,189 | ||||||||||||
| Avis Budget Group, Inc. (I) | 310 | 15,481 | ||||||||||||
| Genesee & Wyoming, Inc., Class A (I) | 170 | 11,407 | ||||||||||||
| Hertz Global Holdings, Inc. (I) | 1,449 | 28,256 | ||||||||||||
| J.B. Hunt Transport Services, Inc. | 280 | 21,384 | ||||||||||||
| Kansas City Southern | 274 | 22,676 | ||||||||||||
| Old Dominion Freight Line, Inc. (I) | 270 | 16,724 | ||||||||||||
| Ryder Systems, Inc. | 290 | 20,816 | ||||||||||||
| Trading companies and distributors 0.8% | ||||||||||||||
| Fastenal Company | 650 | 25,454 | ||||||||||||
| HD Supply Holdings, Inc. (I) | 420 | 12,512 | ||||||||||||
| MSC Industrial Direct Company, Inc., Class A | 101 | 6,340 | ||||||||||||
| United Rentals, Inc. (I) | 310 | 23,207 | ||||||||||||
| W.W. Grainger, Inc. | 160 | 33,600 | ||||||||||||
| Watsco, Inc. | 60 | 7,382 | ||||||||||||
| Transportation infrastructure 0.1% | ||||||||||||||
| Macquarie Infrastructure Company LLC | 180 | 14,319 | ||||||||||||
| Information technology 17.4% | 2,279,264 | |||||||||||||
| Communications equipment 1.4% | ||||||||||||||
| Arista Networks, Inc. (I) | 90 | 5,806 | ||||||||||||
| ARRIS Group, Inc. (I) | 520 | 14,695 | ||||||||||||
| Brocade Communications Systems, Inc. | 2,000 | 20,840 | ||||||||||||
| Commscope Holding Company, Inc. (I) | 500 | 16,215 | ||||||||||||
| Shares | Value | |||||||||||||
| Information technology (continued) | ||||||||||||||
| Communications equipment (continued) | ||||||||||||||
| EchoStar Corp., Class A (I) | 100 | $4,483 | ||||||||||||
| F5 Networks, Inc. (I) | 240 | 26,448 | ||||||||||||
| Harris Corp. | 400 | 31,652 | ||||||||||||
| Juniper Networks, Inc. | 760 | 23,856 | ||||||||||||
| Motorola Solutions, Inc. | 340 | 23,790 | ||||||||||||
| NetScout Systems, Inc. (I) | 33 | 1,184 | ||||||||||||
| Palo Alto Networks, Inc. (I) | 80 | 12,880 | ||||||||||||
| Electronic equipment, instruments and components 2.2% | ||||||||||||||
| Amphenol Corp., Class A | 820 | 44,460 | ||||||||||||
| Arrow Electronics, Inc. (I) | 570 | 31,344 | ||||||||||||
| Avnet, Inc. | 610 | 27,712 | ||||||||||||
| CDW Corp. | 490 | 21,898 | ||||||||||||
| Fitbit, Inc., Class A (I) | 70 | 2,838 | ||||||||||||
| Flextronics International, Ltd. (I) | 3,680 | 41,915 | ||||||||||||
| FLIR Systems, Inc. | 540 | 14,402 | ||||||||||||
| Ingram Micro, Inc., Class A | 784 | 23,348 | ||||||||||||
| IPG Photonics Corp. (I) | 110 | 9,088 | ||||||||||||
| Jabil Circuit, Inc. | 910 | 20,912 | ||||||||||||
| Keysight Technologies, Inc. (I) | 500 | 16,540 | ||||||||||||
| National Instruments Corp. | 280 | 8,532 | ||||||||||||
| Trimble Navigation, Ltd. (I) | 530 | 12,058 | ||||||||||||
| Zebra Technologies Corp., Class A (I) | 120 | 9,228 | ||||||||||||
| Internet software and services 0.9% | ||||||||||||||
| Akamai Technologies, Inc. (I) | 490 | 29,802 | ||||||||||||
| CoStar Group, Inc. (I) | 60 | 12,184 | ||||||||||||
| GoDaddy, Inc., Class A (I) | 20 | 550 | ||||||||||||
| InterActiveCorp | 380 | 25,464 | ||||||||||||
| j2 Global, Inc. | 18 | 1,396 | ||||||||||||
| MercadoLibre, Inc. | 110 | 10,821 | ||||||||||||
| Pandora Media, Inc. (I) | 8 | 92 | ||||||||||||
| Rackspace Hosting, Inc. (I) | 510 | 13,184 | ||||||||||||
| VeriSign, Inc. (I) | 340 | 27,404 | ||||||||||||
| Zillow Group, Inc., Class A (I) | 60 | 1,849 | ||||||||||||
| IT services 4.5% | ||||||||||||||
| Alliance Data Systems Corp. (I) | 150 | 44,572 | ||||||||||||
| Amdocs, Ltd. | 590 | 35,146 | ||||||||||||
| Black Knight Financial Services Inc (I) | 20 | 721 | ||||||||||||
| Booz Allen Hamilton Holding Corp. | 260 | 7,660 | ||||||||||||
| Broadridge Financial Solutions, Inc. | 530 | 31,577 | ||||||||||||
| Computer Sciences Corp. | 500 | 33,295 | ||||||||||||
| DST Systems, Inc. | 190 | 23,209 | ||||||||||||
| EPAM Systems, Inc. (I) | 15 | 1,160 | ||||||||||||
| Euronet Worldwide, Inc. (I) | 17 | 1,364 | ||||||||||||
| Shares | Value | |||||||||||||
| Information technology (continued) | ||||||||||||||
| IT services (continued) | ||||||||||||||
| Fidelity National Information Services, Inc. | 650 | $47,398 | ||||||||||||
| Fiserv, Inc. (I) | 650 | 62,733 | ||||||||||||
| FleetCor Technologies, Inc. (I) | 150 | 21,729 | ||||||||||||
| Gartner, Inc. (I) | 310 | 28,108 | ||||||||||||
| Genpact, Ltd. (I) | 700 | 17,346 | ||||||||||||
| Global Payments, Inc. | 330 | 45,015 | ||||||||||||
| Jack Henry & Associates, Inc. | 330 | 25,522 | ||||||||||||
| MAXIMUS, Inc. | 160 | 10,912 | ||||||||||||
| Sabre Corp. | 290 | 8,503 | ||||||||||||
| Syntel, Inc. (I) | 130 | 6,115 | ||||||||||||
| Teradata Corp. (I) | 680 | 19,115 | ||||||||||||
| The Western Union Company | 1,020 | 19,635 | ||||||||||||
| Total System Services, Inc. | 470 | 24,652 | ||||||||||||
| Vantiv, Inc., Class A (I) | 440 | 22,066 | ||||||||||||
| VeriFone Systems, Inc. (I) | 260 | 7,836 | ||||||||||||
| WEX, Inc. (I) | 140 | 12,587 | ||||||||||||
| Xerox Corp. | 2,630 | 24,696 | ||||||||||||
| Semiconductors and semiconductor equipment 3.4% | ||||||||||||||
| Altera Corp. | 820 | 43,091 | ||||||||||||
| Analog Devices, Inc. | 714 | 42,926 | ||||||||||||
| Cavium, Inc. (I) | 80 | 5,676 | ||||||||||||
| Cypress Semiconductor Corp. (I) | 320 | 3,373 | ||||||||||||
| First Solar, Inc. (I) | 170 | 9,702 | ||||||||||||
| Freescale Semiconductor, Ltd. (I) | 210 | 7,033 | ||||||||||||
| KLA-Tencor Corp. | 592 | 39,735 | ||||||||||||
| Lam Research Corp. | 440 | 33,700 | ||||||||||||
| Linear Technology Corp. | 570 | 25,319 | ||||||||||||
| Marvell Technology Group, Ltd. | 1,510 | 12,397 | ||||||||||||
| Maxim Integrated Products, Inc. | 830 | 34,013 | ||||||||||||
| Microchip Technology, Inc. | 520 | 25,111 | ||||||||||||
| NVIDIA Corp. | 1,180 | 33,477 | ||||||||||||
| ON Semiconductor Corp. (I) | 2,114 | 23,254 | ||||||||||||
| Qorvo, Inc. (I) | 278 | 12,213 | ||||||||||||
| Skyworks Solutions, Inc. | 500 | 38,620 | ||||||||||||
| Teradyne, Inc. | 900 | 17,568 | ||||||||||||
| Xilinx, Inc. | 700 | 33,334 | ||||||||||||
| Software 3.7% | ||||||||||||||
| Activision Blizzard, Inc. | 820 | 28,503 | ||||||||||||
| ANSYS, Inc. (I) | 290 | 27,640 | ||||||||||||
| Autodesk, Inc. (I) | 550 | 30,355 | ||||||||||||
| CA, Inc. | 930 | 25,770 | ||||||||||||
| Cadence Design Systems, Inc. (I) | 1,020 | 22,664 | ||||||||||||
| CDK Global, Inc. | 509 | 25,343 | ||||||||||||
| Shares | Value | |||||||||||||
| Information technology (continued) | ||||||||||||||
| Software (continued) | ||||||||||||||
| Citrix Systems, Inc. (I) | 430 | $35,303 | ||||||||||||
| Electronic Arts, Inc. (I) | 610 | 43,963 | ||||||||||||
| FireEye, Inc. (I) | 230 | 6,015 | ||||||||||||
| Fortinet, Inc. (I) | 380 | 13,057 | ||||||||||||
| Guidewire Software, Inc. (I) | 80 | 4,658 | ||||||||||||
| Manhattan Associates, Inc. (I) | 122 | 8,888 | ||||||||||||
| NetSuite, Inc. (I) | 70 | 5,955 | ||||||||||||
| Nuance Communications, Inc. (I) | 840 | 14,255 | ||||||||||||
| PTC, Inc. (I) | 420 | 14,885 | ||||||||||||
| Red Hat, Inc. (I) | 350 | 27,689 | ||||||||||||
| ServiceNow, Inc. (I) | 150 | 12,248 | ||||||||||||
| Solera Holdings, Inc. | 25 | 1,367 | ||||||||||||
| Splunk, Inc. (I) | 220 | 12,355 | ||||||||||||
| SS&C Technologies Holdings, Inc. | 240 | 17,796 | ||||||||||||
| Symantec Corp. | 1,510 | 31,106 | ||||||||||||
| Synopsys, Inc. (I) | 670 | 33,487 | ||||||||||||
| Tableau Software, Inc., Class A (I) | 80 | 6,717 | ||||||||||||
| The Ultimate Software Group, Inc. (I) | 80 | 16,348 | ||||||||||||
| Tyler Technologies, Inc. (I) | 87 | 14,821 | ||||||||||||
| Workday, Inc., Class A (I) | 120 | 9,476 | ||||||||||||
| Technology hardware, storage and peripherals 1.3% | ||||||||||||||
| NCR Corp. (I) | 710 | 18,886 | ||||||||||||
| NetApp, Inc. | 680 | 23,120 | ||||||||||||
| SanDisk Corp. | 570 | 43,890 | ||||||||||||
| Seagate Technology PLC | 994 | 37,832 | ||||||||||||
| Western Digital Corp. | 790 | 52,788 | ||||||||||||
| Materials 6.1% | 799,208 | |||||||||||||
| Chemicals 3.0% | ||||||||||||||
| Airgas, Inc. | 234 | 22,501 | ||||||||||||
| Albemarle Corp. | 300 | 16,056 | ||||||||||||
| Ashland, Inc. | 260 | 28,527 | ||||||||||||
| Axalta Coating Systems, Ltd. (I) | 280 | 7,736 | ||||||||||||
| Celanese Corp., Series A | 390 | 27,710 | ||||||||||||
| CF Industries Holdings, Inc. | 794 | 40,311 | ||||||||||||
| Cytec Industries, Inc. | 110 | 8,186 | ||||||||||||
| Eastman Chemical Company | 424 | 30,600 | ||||||||||||
| FMC Corp. | 390 | 15,877 | ||||||||||||
| Huntsman Corp. | 934 | 12,301 | ||||||||||||
| International Flavors & Fragrances, Inc. | 190 | 22,051 | ||||||||||||
| NewMarket Corp. | 40 | 15,750 | ||||||||||||
| Platform Specialty Products Corp. (I) | 260 | 2,714 | ||||||||||||
| RPM International, Inc. | 510 | 23,312 | ||||||||||||
| Shares | Value | |||||||||||||
| Materials (continued) | ||||||||||||||
| Chemicals (continued) | ||||||||||||||
| Sigma-Aldrich Corp. | 280 | $39,122 | ||||||||||||
| The Mosaic Company | 514 | 17,368 | ||||||||||||
| The Scotts Miracle-Gro Company, Class A | 170 | 11,247 | ||||||||||||
| The Valspar Corp. | 300 | 24,285 | ||||||||||||
| W.R. Grace & Company (I) | 240 | 24,072 | ||||||||||||
| Westlake Chemical Corp. | 110 | 6,630 | ||||||||||||
| Construction materials 0.5% | ||||||||||||||
| Eagle Materials, Inc. | 130 | 8,584 | ||||||||||||
| Martin Marietta Materials, Inc. | 150 | 23,273 | ||||||||||||
| Vulcan Materials Company | 360 | 34,769 | ||||||||||||
| Containers and packaging 2.0% | ||||||||||||||
| AptarGroup, Inc. | 280 | 20,597 | ||||||||||||
| Avery Dennison Corp. | 390 | 25,338 | ||||||||||||
| Ball Corp. | 410 | 28,085 | ||||||||||||
| Bemis Company, Inc. | 610 | 27,926 | ||||||||||||
| Berry Plastics Group, Inc. (I) | 170 | 5,695 | ||||||||||||
| Crown Holdings, Inc. (I) | 450 | 23,868 | ||||||||||||
| Graphic Packaging Holding Company | 1,304 | 18,465 | ||||||||||||
| Owens-Illinois, Inc. (I) | 710 | 15,301 | ||||||||||||
| Packaging Corp. of America | 500 | 34,225 | ||||||||||||
| Sealed Air Corp. | 620 | 30,454 | ||||||||||||
| Sonoco Products Company | 590 | 25,187 | ||||||||||||
| WestRock Company | 89 | 4,785 | ||||||||||||
| Metals and mining 0.6% | ||||||||||||||
| Alcoa, Inc. | 1,680 | 15,002 | ||||||||||||
| Newmont Mining Corp. | 183 | 3,561 | ||||||||||||
| Nucor Corp. | 514 | 21,742 | ||||||||||||
| Reliance Steel & Aluminum Company | 320 | 19,187 | ||||||||||||
| Steel Dynamics, Inc. | 910 | 16,808 | ||||||||||||
| Telecommunication services 0.6% | 78,527 | |||||||||||||
| Diversified telecommunication services 0.3% | ||||||||||||||
| Frontier Communications Corp. | 3,794 | 19,501 | ||||||||||||
| Level 3 Communications, Inc. (I) | 390 | 19,871 | ||||||||||||
| Zayo Group Holdings, Inc. (I) | 130 | 3,449 | ||||||||||||
| Wireless telecommunication services 0.3% | ||||||||||||||
| SBA Communications Corp., Class A (I) | 300 | 35,706 | ||||||||||||
| Utilities 5.9% | 769,611 | |||||||||||||
| Electric utilities 2.1% | ||||||||||||||
| Entergy Corp. | 520 | 35,443 | ||||||||||||
| Eversource Energy | 640 | 32,602 | ||||||||||||
| FirstEnergy Corp. | 760 | 23,712 | ||||||||||||
| Shares | Value | |||||||||||||
| Utilities (continued) | ||||||||||||||
| Electric utilities (continued) | ||||||||||||||
| Great Plains Energy, Inc. | 580 | $15,950 | ||||||||||||
| ITC Holdings Corp. | 470 | 15,378 | ||||||||||||
| OGE Energy Corp. | 760 | 21,668 | ||||||||||||
| Pepco Holdings, Inc. | 910 | 24,233 | ||||||||||||
| Pinnacle West Capital Corp. | 530 | 33,660 | ||||||||||||
| Westar Energy, Inc. | 530 | 21,041 | ||||||||||||
| Xcel Energy, Inc. | 1,444 | 51,450 | ||||||||||||
| Gas utilities 0.9% | ||||||||||||||
| AGL Resources, Inc. | 470 | 29,375 | ||||||||||||
| Atmos Energy Corp. | 380 | 23,940 | ||||||||||||
| National Fuel Gas Company | 260 | 13,658 | ||||||||||||
| Questar Corp. | 870 | 17,966 | ||||||||||||
| UGI Corp. | 790 | 28,969 | ||||||||||||
| Independent power and renewable electricity producers 0.4% | ||||||||||||||
| AES Corp. | 2,130 | 23,324 | ||||||||||||
| Calpine Corp. (I) | 1,000 | 15,510 | ||||||||||||
| NRG Energy, Inc. | 800 | 10,312 | ||||||||||||
| Multi-utilities 2.2% | ||||||||||||||
| Alliant Energy Corp. | 430 | 25,379 | ||||||||||||
| Ameren Corp. | 660 | 28,829 | ||||||||||||
| CenterPoint Energy, Inc. | 1,290 | 23,930 | ||||||||||||
| CMS Energy Corp. | 830 | 29,938 | ||||||||||||
| DTE Energy Company | 540 | 44,059 | ||||||||||||
| MDU Resources Group, Inc. | 880 | 16,597 | ||||||||||||
| NiSource, Inc. | 1,870 | 35,829 | ||||||||||||
| SCANA Corp. | 500 | 29,610 | ||||||||||||
| TECO Energy, Inc. | 924 | 24,948 | ||||||||||||
| Vectren Corp. | 30 | 1,364 | ||||||||||||
| WEC Energy Group, Inc. | 570 | 29,389 | ||||||||||||
| Water utilities 0.3% | ||||||||||||||
| American Water Works Company, Inc. | 490 | 28,106 | ||||||||||||
| Aqua America, Inc. | 470 | 13,442 | ||||||||||||
| Yield (%) | Shares | Value | ||||||||||||
| Short-term investments 0.0 % | ||||||||||||||
| (Cost $1,738) | ||||||||||||||
| Money market funds 0.0% | 1,738 | |||||||||||||
| State Street Institutional Liquid Reserves Fund | 0.1451(Y | ) | 1,738 | $1,738 | ||||||||||
| Total investments (Cost $12,500,089)† 99.9% | $13,077,400 | |||||||||||||
| Other assets and liabilities, net 0.1% | $8,121 | |||||||||||||
| Total net assets 100.0% | $13,085,521 | |||||||||||||
| The percentage shown for each investment category is the total value of the category as a percentage of the net assets of the fund. | ||||||||||||||
| Key to Security Abbreviations and Legend | ||||||||||||||
| (I) | Non-income producing security. | |||||||||||||
| (Y) | The rate shown is the annualized seven-day yield as of 10-31-15. | |||||||||||||
| † | At 10-31-15, the aggregate cost of investment securities for federal income tax purposes was $12,500,089. Net unrealized appreciation aggregated $577,311, of which $680,804 related to appreciated investment securities and $103,493 related to depreciated investment securities. | |||||||||||||
Financial statements
STATEMENT OF ASSETS AND LIABILITIES 10-31-15 (unaudited)
| Assets | |||||||||||||
| Investments, at value (Cost $12,500,089) | $13,077,400 | ||||||||||||
| Receivable for fund shares sold | 2,626,441 | ||||||||||||
| Dividends receivable | 6,188 | ||||||||||||
| Receivable due from advisor | 7,236 | ||||||||||||
| Other receivables and prepaid expenses | 4,277 | ||||||||||||
| Total assets | 15,721,542 | ||||||||||||
| Liabilities | |||||||||||||
| Payable for investments purchased | 2,624,658 | ||||||||||||
| Payable to affiliates | |||||||||||||
| Accounting and legal services fees | 8 | ||||||||||||
| Other liabilities and accrued expenses | 11,355 | ||||||||||||
| Total liabilities | 2,636,021 | ||||||||||||
| Net assets | $13,085,521 | ||||||||||||
| Net assets consist of | |||||||||||||
| Paid-in capital | $12,501,279 | ||||||||||||
| Undistributed net investment income | 6,192 | ||||||||||||
| Accumulated net realized gain (loss) on investments | 739 | ||||||||||||
| Net unrealized appreciation (depreciation) on investments | 577,311 | ||||||||||||
| Net assets | $13,085,521 | ||||||||||||
| Net asset value per share | |||||||||||||
| Based on net asset values and shares outstanding-the fund has an unlimited number of shares authorized with no par value | |||||||||||||
| Net assets | $13,085,521 | ||||||||||||
| Shares outstanding | 500,000 | ||||||||||||
| Net asset value per share | $26.17 | ||||||||||||
STATEMENT OF OPERATIONS For the period ended 10-31-15 (unaudited)1
| Investment income | |||||||||||||||||||||||||||||||||
| Dividends | $9,744 | ||||||||||||||||||||||||||||||||
| Total investment income | 9,744 | ||||||||||||||||||||||||||||||||
| Expenses | |||||||||||||||||||||||||||||||||
| Investment management fees | 3,157 | ||||||||||||||||||||||||||||||||
| Accounting and legal services fees | 134 | ||||||||||||||||||||||||||||||||
| Transfer agent fees | 1,062 | ||||||||||||||||||||||||||||||||
| Printing and postage | 1,246 | ||||||||||||||||||||||||||||||||
| Professional fees | 5,288 | ||||||||||||||||||||||||||||||||
| Custodian fees | 1,768 | ||||||||||||||||||||||||||||||||
| Registration and filing fees | 998 | ||||||||||||||||||||||||||||||||
| Other | 825 | ||||||||||||||||||||||||||||||||
| Total expenses | 14,478 | ||||||||||||||||||||||||||||||||
| Less expense reductions | (10,926 | ) | |||||||||||||||||||||||||||||||
| Net expenses | 3,552 | ||||||||||||||||||||||||||||||||
| Net investment income | 6,192 | ||||||||||||||||||||||||||||||||
| Realized and unrealized gain (loss) | |||||||||||||||||||||||||||||||||
| Net realized gain (loss) on investments | 739 | ||||||||||||||||||||||||||||||||
| Change in net unrealized appreciation (depreciation) of investments | 577,311 | ||||||||||||||||||||||||||||||||
| Net realized and unrealized gain | 578,050 | ||||||||||||||||||||||||||||||||
| Increase in net assets from operations | $584,242 | ||||||||||||||||||||||||||||||||
| 1 | Period from 9-28-15 (commencement of operations) to 10-31-15. | ||||||||||||||||||||||
STATEMENT OF CHANGES IN NET ASSETS
| Period ended 10-31-151 | |||||||||||||||||
| (unaudited) | |||||||||||||||||
| Increase (decrease) in net assets | |||||||||||||||||
| From operations | |||||||||||||||||
| Net investment income | $6,192 | ||||||||||||||||
| Net realized gain | 739 | ||||||||||||||||
| Change in net unrealized appreciation (depreciation) | 577,311 | ||||||||||||||||
| Increase in net assets resulting from operations | 584,242 | ||||||||||||||||
| From fund share transactions | |||||||||||||||||
| Shares issued | 12,501,279 | ||||||||||||||||
| Total from fund share transactions | 12,501,279 | ||||||||||||||||
| Total increase | 13,085,521 | ||||||||||||||||
| Net assets | |||||||||||||||||
| Beginning of period | — | ||||||||||||||||
| End of period | $13,085,521 | ||||||||||||||||
| Undistributed net investment income | $6,192 | ||||||||||||||||
| Share activity | |||||||||||||||||
| Shares issued | 500,000 | ||||||||||||||||
| End of period | 500,000 | ||||||||||||||||
| 1 | Period from 9-28-15 (commencement of operations) to 10-31-15. | ||||||||||||||||||||||
Financial highlights
| Period ended | 10-31-15 | 1 | |||||||||||||||||||||||||||||||||||||||
| Per share operating performance | |||||||||||||||||||||||||||||||||||||||||
| Net asset value, beginning of period | $24.29 | ||||||||||||||||||||||||||||||||||||||||
| Net investment income2 | 0.02 | ||||||||||||||||||||||||||||||||||||||||
| Net realized and unrealized gain on investments | 1.86 | ||||||||||||||||||||||||||||||||||||||||
| Total from investment operations | 1.88 | ||||||||||||||||||||||||||||||||||||||||
| Net asset value, end of period | $26.17 | ||||||||||||||||||||||||||||||||||||||||
| Total return (%)3 | 7.75 | 4 | |||||||||||||||||||||||||||||||||||||||
| Ratios and supplemental data | |||||||||||||||||||||||||||||||||||||||||
| Net assets, end of period (in millions) | $13 | ||||||||||||||||||||||||||||||||||||||||
| Ratios (as a percentage of average net assets): | |||||||||||||||||||||||||||||||||||||||||
| Expenses before reductions | 1.83 | 5 | |||||||||||||||||||||||||||||||||||||||
| Expenses including reductions | 0.45 | 5 | |||||||||||||||||||||||||||||||||||||||
| Net investment income | 0.78 | 5 | |||||||||||||||||||||||||||||||||||||||
| Portfolio turnover (%)6 | 1 | ||||||||||||||||||||||||||||||||||||||||
| 1 | Period from 9-28-15 (commencement of operations) to 10-31-15. Unaudited. | |||||||||||||||||||||||||||||||||||||
| 2 | Based on average daily shares outstanding. | |||||||||||||||||||||||||||||||||||||
| 3 | Total returns would have been lower had certain expenses not been reduced during the period. | |||||||||||||||||||||||||||||||||||||
| 4 | Not annualized. | |||||||||||||||||||||||||||||||||||||
| 5 | Annualized. | |||||||||||||||||||||||||||||||||||||
| 6 | Portfolio turnover rate excludes securities received or delivered from in-kind transactions. | |||||||||||||||||||||||||||||||||||||
Note 1 — Organization
John Hancock Multifactor Mid Cap ETF (the fund) is a series of the John Hancock Exchange-Traded Fund Trust (the Trust), an open-end management investment company organized as a Massachusetts business trust and registered under the Investment Company Act of 1940, as amended (the 1940 Act). The investment objective of the fund is to seek to provide investment results that closely correspond, before fees and expenses, to the performance of the John Hancock Dimensional Mid Cap Index. The John Hancock Dimensional Mid Cap Index is designed to comprise a subset of securities in the U.S. Universe issued by companies whose market capitalizations are between the 200th and 951st largest U.S. company at the time of reconstitution.
The fund commenced operations on September 28, 2015.
Note 2 — Significant accounting policies
The financial statements have been prepared in conformity with accounting principles generally accepted in the United States of America (US GAAP), which require management to make certain estimates and assumptions as of the date of the financial statements. Actual results could differ from those estimates and those differences could be significant. The fund qualifies as an investment company under Topic 946 of Accounting Standards Codification of US GAAP.
Events or transactions occurring after the end of the fiscal period through the date that the financial statements were issued have been evaluated in the preparation of the financial statements. The following summarizes the significant accounting policies of the fund:
Security valuation. Investments are stated at value as of the close of regular trading on the New York Stock Exchange (NYSE), normally at 4:00 p.m., Eastern Time. In order to value the securities, the fund uses the following valuation techniques: Equity securities held by the fund are valued at the last sale price or official closing price on the exchange where the security was acquired or most likely will be sold. In the event there were no sales during the day or closing prices are not available, the securities are valued using the last available bid price. Investments by the fund in open-end mutual funds are valued at their respective net asset values each business day. Other portfolio securities and assets, for which reliable market quotations are not readily available, are valued at fair value as determined in good faith by the fund's Pricing Committee following procedures established by the Board of Trustees. The frequency with which these fair valuation procedures are used cannot be predicted and fair value of securities may differ significantly from the value that would have been used had a ready market for such securities existed.
The fund uses a three-tier hierarchy to prioritize the pricing assumptions, referred to as inputs, used in valuation techniques to measure fair value. Level 1 includes securities valued using quoted prices in active markets for identical securities. Level 2 includes securities valued using other significant observable inputs. Observable inputs may include quoted prices for similar securities, interest rates, prepayment speeds and credit risk. Prices for securities valued using these inputs are received from independent pricing vendors and brokers and are based on an evaluation of the inputs described. Level 3 includes securities valued using significant unobservable inputs when market prices are not readily available or reliable, including the fund's own assumptions in determining the fair value of investments. Factors used in determining value may include market or issuer specific events or trends, changes in interest rates and credit quality. The inputs or methodology used for valuing securities are not necessarily an indication of the risks associated with investing in those securities. Changes in valuation techniques and related inputs may result in transfers into or out of an assigned level within the disclosure hierarchy.
As of October 31, 2015, all investments are categorized as Level 1 under the hierarchy described above.
Security transactions and related investment income. Investment security transactions are accounted for on a trade date plus one basis for daily net asset value calculations. However, for financial reporting purposes, investment transactions are reported on trade date. Dividend income is recorded on the ex-date, except for dividends of foreign securities where the dividend may not be known until after the ex-date. In those cases, dividend income, net of withholding taxes, is recorded when the fund becomes aware of the dividends. Gains and losses on securities sold are determined on the basis of identified cost and may include proceeds from litigation.
34
Real estate investment trusts. The fund may invest in real estate investment trusts (REITs). Distributions from REITs may be recorded as income and subsequently characterized by the REIT at the end of the fiscal year as a reduction of cost of investments and/or as a realized gain. As a result, the fund will estimate the components of distributions from these securities. Such estimates are revised when the actual components of the distributions are known.
Overdrafts. Pursuant to the custodian agreement, the fund's custodian may, in its discretion, advance funds to the fund to make properly authorized payments. When such payments result in an overdraft, the fund is obligated to repay the custodian for any overdraft, including any costs or expenses associated with the overdraft. The custodian may have a lien, security interest or security entitlement in any fund property that is not otherwise segregated or pledged, to the maximum extent permitted by law, to the extent of any overdraft.
Expenses. Within the John Hancock group of funds complex, expenses that are directly attributable to an individual fund are allocated to such fund. Expenses that are not readily attributable to a specific fund are allocated among all funds in an equitable manner, taking into consideration, among other things, the nature and type of expense and the fund's relative net assets. Expense estimates are accrued in the period to which they relate and adjustments are made when actual amounts are known.
Federal income taxes. The fund intends to qualify as a regulated investment company by complying with the applicable provisions of the Internal Revenue Code and will not be subject to federal income tax on taxable income that is distributed to shareholders. Therefore, no federal income tax provision is required.
Distribution of income and gains. Distributions to shareholders from net investment income and net realized gains, if any, are recorded on the ex-date. The fund will declare and pay dividends semiannually from net investment income, if any. Capital gain distributions, if any, are typically distributed annually.
Such distributions, on a tax basis, are determined in conformity with income tax regulations, which may differ from US GAAP.
Capital accounts within the financial statements are adjusted for permanent book-tax differences. These adjustments have no impact on net assets or the results of operations. Temporary book-tax differences, if any, will reverse in a subsequent period.
Note 3 — Guarantees and indemnifications
Under the Trust's organizational documents, its Officers and Trustees are indemnified against certain liabilities arising out of the performance of their duties to the Trust, including the fund. Additionally, in the normal course of business, the fund enters into contracts with service providers that contain general indemnification clauses. The fund's maximum exposure under these arrangements is unknown, as this would involve future claims that may be made against the fund that have not yet occurred. The risk of material loss from such claims is considered remote.
Note 4 — Fees and transactions with affiliates
John Hancock Advisers, LLC (the Advisor) serves as investment advisor for the fund. The Advisor is an indirect, wholly owned subsidiary of Manulife Financial Corporation (MFC).
Management fee. The fund has an investment management agreement with the Advisor under which the fund pays a monthly management fee to the Advisor, equivalent on an annual basis, to the sum of: (a) 0.400% of the first $300 million of the fund's average daily net assets; and (b) 0.370% of the fund's average daily net assets in excess of $300 million. The Advisor has a subadvisory agreement with Dimensional Fund Advisors LP. The fund is not responsible for payment of the subadvisory fees.
The Advisor has contractually agreed to waive a portion of its management fee and/or reimburse expenses for certain funds of the John Hancock group of funds complex, including the fund (the participating portfolios). This waiver is based upon aggregate net assets of all the participating portfolios. The amount of the reimbursement is calculated daily and allocated among all the participating portfolios in proportion to the daily net assets of each fund. During the period ended October 31,
35
2015, this waiver amounted to 0.01% of the fund's average net assets (on an annualized basis). This arrangement may be amended or terminated at any time by the Advisor upon notice to the fund and with the approval of the Board of Trustees.
The Advisor has contractually agreed to reduce its management fee or, if necessary, make payment to the fund, in an amount equal to the amount by which expenses of the fund exceed 0.45% of average annual net assets (on an annualized basis). Expenses means all the expenses of the fund, excluding (a) taxes, (b) brokerage commissions, (c) interest expense, (d) litigation and indemnification expenses and other extraordinary expenses not incurred in the ordinary course of the fund's business, (e) borrowing costs, (f) prime brokerage fees, (g) acquired fund fees, and (h) short dividend expenses. The expense limitation expires on August 31, 2017, unless renewed by mutual agreement of the fund and the Advisor based on a determination that this is appropriate under the circumstances at that time.
For the period ended October 31, 2015, the expense reductions described above amounted to $10,926.
The investment management fees, including the impact of the waivers and reimbursements as described above, incurred for the period ended October 31, 2015 were equivalent to a net annual effective rate of 0.00% of the fund's average daily net assets.
Accounting and legal services. Pursuant to a service agreement, the fund reimburses the Advisor for all expenses associated with providing the administrative, financial, legal, accounting and recordkeeping services to the fund, including the preparation of all tax returns, periodic reports to shareholders and regulatory reports, among other services. These accounting and legal services fees incurred for the period ended October 31, 2015 amounted to an annual rate of 0.02% of the fund's average daily net assets.
Trustee expenses. The fund compensates each Trustee who is not an employee of the Advisor or its affiliates. The costs of paying Trustee compensation and expenses are allocated to each fund based on its net assets relative to other funds within the John Hancock group of funds complex.
Note 5 — Capital share transactions
The fund will issue and redeem shares at net asset value (NAV) only in a large specified number of shares, each called a "creation unit," or multiples thereof, that consist of 50,000 shares. Only authorized participants may engage in creation or redemption transactions directly with the fund. Such transactions generally take place when an authorized participant deposits into the fund a designated portfolio of securities (including any portion of such securities for which cash may be substituted) and a specified amount of cash approximating the holdings of the fund in exchange for a specified number of creation units. Authorized participants pay a transaction fee to the custodian when purchasing and redeeming creation units of a fund. The transaction fee is used to defray the costs associated with the issuance and redemption of creation units. Individual shares of the fund may only be purchased and sold in secondary market transactions through brokers. Secondary market transactions may be subject to brokerage commissions. Shares of the fund are listed and traded on the NYSE Arca, Inc., shares trade at market prices rather than NAV, and may trade at a price greater than or less than NAV.
Affiliates of the fund owned 92% of shares outstanding on October 31, 2015.
Note 6 — Purchase and sale of securities
Purchases and sales of securities, other than in-kind transactions and short-term securities, amounted to $71,342 and $63,440, respectively, for the period ended October 31, 2015. Securities received and delivered from in-kind transactions aggregated $12,489,709 and $0, respectively, for the period ended October 31, 2015.
36
EVALUATION OF ADVISORY AND SUBADVISORY AGREEMENTS BY THE BOARD OF TRUSTEES
Approval of Advisory and Subadvisory Agreements
At in-person meetings held on June 23-25, 2015, the Board of Trustees (the Board) of John Hancock Exchange-Traded Fund Trust (the Trust), including all of the Trustees who are not considered to be interested persons of the Trust under the Investment Company Act of 1940, as amended (the 1940 Act) (the Independent Trustees), approved the John Hancock Multifactor Mid Cap ETF (the New Fund).
This section describes the evaluation by the Board of:
| (a) | an advisory agreement between the Trust and John Hancock Advisers, LLC (the Advisor) (the Advisory Agreement); and | |
| (b) | a subadvisory agreement between the Advisor and Dimensional Fund Advisors LP (the Subadvisor) with respect to the New Fund (the Subadvisory Agreement). |
In considering the Advisory Agreement and the Subadvisory Agreement with respect to the New Fund, the Board received in advance of the meetings a variety of materials relating to the New Fund, the Advisor and the Subadvisor, including comparative expense information for a peer group of similar exchange-traded funds and a broader universe of exchange-traded funds, simulated performance information of the New Fund's underlying index (Underlying Index) as compared to an applicable benchmark, and other information provided by the Advisor and the Subadvisor regarding the nature, extent, and quality of services to be provided by the Advisor and the Subadvisor under their respective Agreements, as well as information regarding the Advisor's anticipated profitability in connection with its proposed relationship to the New Fund and any compensation paid to affiliates of the Advisor. The Board also took into account discussions with management and information provided to the Board members at prior meetings with respect to the services provided by the Advisor and the Subadvisor to other John Hancock Funds (the Funds), including quarterly performance reports prepared by management containing reviews of investment results, and periodic presentations from the Subadvisor with respect to the other Funds that it manages. The Board also considered the nature, quality, and extent of the non-advisory services, if any, to be provided to the New Fund by the Advisor and/or its affiliates, including administrative services. The Board members also took into account information with respect to the New Fund presented at their March 10-12, 2015 in-person meeting.
Throughout the process, the Board asked questions of and were afforded the opportunity to request additional information from management. The Board is assisted by legal counsel for the Trust, and the Independent Trustees were also separately assisted by independent legal counsel throughout the process. The Independent Trustees also received a memorandum from their independent legal counsel discussing the legal standards for their consideration of the proposed Advisory Agreement and Subadvisory Agreement and discussed the proposed Advisory Agreement and Subadvisory Agreement in private sessions with their independent legal counsel at which no representatives of management were present.
Approval of Advisory Agreement
In approving the Advisory Agreement with respect to the New Fund, the Board, including the Independent Trustees, considered a variety of factors, including those discussed below. The Board also considered other factors (including conditions and trends prevailing generally in the economy, the securities markets and the industry) and did not treat any single factor as determinative, and each Trustee may have attributed different weights to different factors. The Board members' conclusions may have been based in part on their consideration of the advisory and subadvisory arrangements for other Funds in prior years.
Nature, extent, and quality of services. Among the information received by the Board from the Advisor relating to the nature, extent and quality of services to be provided to the New Fund, the Board considered information provided by the Advisor relating to its operations and personnel, descriptions of its organizational and management structure, and information regarding the Advisor's compliance and regulatory history. The Board members also noted that, on a regular basis, they receive and review information from the Funds' Chief Compliance Officer (CCO) regarding the Funds' compliance policies
37
and procedures established pursuant to Rule 38a-1 under the 1940 Act. The Board considered the investment strategy and Underlying Index of the New Fund. The Board also considered the Advisor's risk management processes. The Board considered that the Advisor would be responsible for the management of the day-to-day operations of the New Fund, including but not limited to, general supervision and coordination of the services to be provided by the Subadvisor, and also would be responsible for monitoring and reviewing the activities of the Subadvisor and other third-party service providers, including the New Fund's distributor.
In considering the nature, extent and quality of the services to be provided by the Advisor, the Trustees also took into account their knowledge of the Advisor's management of other Funds and the quality of the performance of the Advisor's duties with respect to other Funds, through Board meetings, discussions and reports during the preceding year and through each Trustee's experience as a trustee of the other trusts in the complex.
In the course of its deliberations regarding the Advisory Agreement, the Board members considered, among other things:
| (a) | the skills and competency with which the Advisor has in the past managed the Funds' affairs and its subadvisory relationships, including those with the Subadvisor, the Advisor's oversight and monitoring of the Subadvisor's investment performance and compliance programs, such as the Subadvisor's compliance with fund policies and objectives; review of brokerage matters, including with respect to trade allocation and best execution; and the Advisor's timeliness in responding to performance issues; | ||
| (b) | the background, qualifications, and skills of the Advisor's personnel; | ||
| (c) | the Advisor's compliance policies and procedures and its responsiveness to regulatory changes and fund industry developments; | ||
| (d) | the Advisor's administrative capabilities, including its ability to supervise the other service providers for the Funds; | ||
| (e) | the financial condition of the Advisor and whether it has the financial wherewithal to provide a high level and quality of services to the New Fund; and | ||
| (f) | the Advisor's reputation and experience in serving as an investment advisor to the Funds, and the benefit to shareholders of investing in funds that are part of a family of funds offering a variety of investments. |
The Board concluded that the Advisor may reasonably be expected to provide a high quality of services under the Advisory Agreement with respect to the New Fund.
Investment performance. In connection with its consideration of the Advisory Agreement, the Board considered, the New Fund's investment strategy and processes, including the fact that the New Fund will seek performance that closely corresponds to its Underlying Index, which was developed by, and will be maintained, by, the Subadvisor. The Board also considered the simulated performance of the New Fund's Underlying Index as compared to an applicable benchmark.
Fees and Expenses. The Board reviewed comparative information including, among other data, the New Fund's total net expenses as compared to similarly situated exchange-traded funds deemed to be comparable to the New Fund.
The Board took into account management's discussion of the New Fund's anticipated expenses. The Board noted that the Advisor does not currently manage other funds or institutional accounts with the same or similar strategies proposed for the New Fund.
The Board took into account management's discussion with respect to the proposed advisory/subadvisory fee structure, including the amount of the advisory fee to be retained by the Advisor after payment of the subadvisory fees. The Board also noted that the Advisor, and not the New Fund, would be responsible for paying the subadvisory fees and that such fees are negotiated at arm's length with respect to the Subadvisor. The Board also noted that the Advisor has contractually agreed to waive fees and/or reimburse expenses with respect to the New Fund for a specified period. The Board concluded that the advisory fees to be paid by the New Fund are reasonable in relation to the nature, extent and quality of the services expected to be provided.
38
Profitability/Indirect Benefits. In considering the costs of the services to be provided and the profits to be realized by the Advisor and its affiliates from the Advisor's relationship with the New Fund, the Board:
| (a) | noted that because the New Fund was not yet in existence, no actual revenue, cost or profitability data was available for the Board to review; | ||
| (b) | reviewed and considered information presented by the Advisor regarding the advisory fees and advisory spreads prior to distribution, operations and overhead for the New Fund; | ||
| (c) | noted that the Advisor will derive reputational and other indirect benefits from providing advisory services to the New Fund; | ||
| (d) | noted that the subadvisory fee for the New Fund will be paid by Advisor and is negotiated at arm's length; | ||
| (e) | noted that the Advisor will also pay the Subadvisor a license fee in connection with the New Fund's use of the Underlying Index; and | ||
| (f) | considered that the Advisor should be entitled to earn a reasonable level of profits in exchange for the level of services it will provide to the New Fund and the entrepreneurial risk that it assumes as Advisor. |
Based upon its review, the Board concluded that the anticipated level of profitability, if any, of the Advisor and its affiliates from their relationship with the New Fund is reasonable and not excessive.
Economies of Scale. In considering the extent to which economies of scale would be realized if the New Fund grows and whether fee levels reflect these economies of scale for the benefit of fund shareholders, the Board:
| (a) | considered that the Advisor has contractually agreed to waive a portion of its management fee and/or reimburse or pay operating expenses of the New Fund to reduce operating expenses for a specified period of time; | ||
| (b) | reviewed the New Fund's advisory fee structure and concluded that: (i) the New Fund's fee structure contains breakpoints at the subadvisory fee level and that such breakpoints are reflected as breakpoints in the advisory fees for the New Fund; and (ii) although economies of scale cannot be measured with precision, these arrangements permit shareholders of the New Fund to benefit from economies of scale if the New Fund grows. The Board also took into account management's discussion of the New Fund's advisory fee structure; and | ||
| (c) | the Board also considered the potential effect of the New Fund's future growth in size on its performance and fees. The Board also noted that if the New Fund's assets increase over time, the New Fund may realize other economies of scale and the Board would consider whether additional breakpoints would be appropriate at that time. |
Approval of Subadvisory Agreement
In making its determination with respect to approval of the Subadvisory Agreement, the Board reviewed:
| (a) | information relating to the Subadvisor's business, including current subadvisory services (to other funds in the John Hancock family of funds); | ||||||||||
| (b) | the simulated performance of the Underlying Index developed by the Subadvisor as compared to an applicable benchmark; | ||||||||||
| (c) | the proposed advisory fee and total expense ratio for the New Fund, including any breakpoints, and comparable fee information prepared by an independent third party provider of fund data; and |
39
| (d) | information relating to the nature and scope of any material relationships and their significance to the New Fund's Advisor and Subadvisor. |
Nature, Extent, and Quality of Services. With respect to the services to be provided by the Subadvisor, the Board members received and reviewed information provided to the Board by the Subadvisor with respect to the New Fund and took into account information presented throughout the past year with respect to Funds in the complex managed by the Advisor and subadvised by the Subadvisor. In this regard, the Board members considered the Subadvisor's current level of staffing and its overall resources, as well as considered information relating to the Subadvisor's compensation program. The Board members reviewed the Subadvisor's history and investment experience, as well as information regarding the qualifications, background, and responsibilities of the Subadvisor's investment and compliance personnel who will provide services to the New Fund. The Board members also considered the Subadvisor's risk assessment and monitoring processes. The Board members noted that the Advisor conducts regular periodic reviews of the Subadvisor and its operations in regard to the Funds, including regarding investment processes and organizational and staffing matters. The Board members also noted that the Funds' CCO and his staff conduct regular, periodic compliance reviews with the Subadvisor and present reports to the Independent Trustees regarding the same, which include evaluating the regulatory compliance systems of the Subadvisor and procedures reasonably designed by it to assure compliance with the federal securities laws. The Board members also took into account the financial condition of the Subadvisor.
The Board considered the Subadvisor's investment processes and philosophies. The Board took into account that the New Fund will seek performance that closely corresponds to its Underlying Index, which was developed by, and will be maintained, by, the Subadvisor.
Subadvisor compensation. In considering the cost of services to be provided by the Subadvisor, the Board noted that the fees under the Subadvisory Agreement are paid by the Advisor and not the New Fund. The Board members also considered information and took into account any other potential conflicts of interests the Advisor might have in connection with the Subadvisory Agreement.
The Board also relied on the ability of the Advisor to negotiate the Subadvisory Agreement with the Subadvisor, which is not affiliated with the Advisor, and the fees thereunder at arm's length. As a result, the costs of the services to be provided and the profits to be realized by the Subadvisor from its relationship with the Trust were not a factor in the Board's consideration of the Subadvisory Agreement.
The Board also received information regarding the nature and scope (including their significance to the Advisor and its affiliates and to the Subadvisor) of any material relationships with respect to the Subadvisor, which include arrangements in which the Subadvisor will serve as the index provider for the New Fund and for other exchange-traded funds in the complex, as well as arrangements in which the Subadvisor or its affiliates provide advisory, or management services in connection with financial products sponsored by the Advisor or its affiliates, and may include other registered investment companies, including other exchange-traded funds, a 529 education savings plan, managed separate accounts and exempt group annuity contracts sold to qualified plans.
In addition, the Board considered other potential indirect benefits that the Subadvisor and its affiliates may receive from the Subadvisor's relationship with the New Fund, such as the opportunity to provide advisory services to additional John Hancock Funds and reputational benefits.
Subadvisory fees. The Board considered that the New Fund will pay advisory fees to the Advisor and that, in turn, the Advisor will pay subadvisory fees to the Subadvisor. The Board considered the New Fund's advisory fees and total expense ratio. The Board also considered that the Subadvisor receives additional compensation from the Advisor in connection with its role as index provider for the New Fund.
Subadvisor performance. The Board considered the New Fund's investment strategy and processes, including the fact that the New Fund will seek performance that closely corresponds to its Underlying Index and that its Underlying Index has been developed by, and will be maintained by, the Subadvisor. The Board also considered simulated performance of the Underlying
40
Index as compared to an applicable benchmark. The Board noted the Advisor's expertise and resources in monitoring the performance, investment style and risk-adjusted performance of the Subadvisor. The Board was mindful of the Advisor's focus on the Subadvisor's performance.
The Board's decision to approve the Subadvisory Agreement was based on a number of determinations, including the following:
| (1) | The Subadvisor has extensive experience and demonstrated skills as a manager, and currently subadvises other Funds in the complex and the Board is generally satisfied with the Subadvisor's management of these Funds, and may reasonably be expected to provide a high quality of investment management services to the New Fund; | |
| (2) | the proposed subadvisory fees are reasonable in relation to the level and quality of services to be provided; and | |
| (3) | subadvisory fee breakpoints are reflected as breakpoints in the advisory fees for the New Fund in order to permit shareholders to benefit from economies of scale if and as the New Fund grows. | |
| * * * | ||
Based on the Board's evaluation of all factors that it deemed to be material, including those factors described above, and assisted by the advice of independent legal counsel, the Board, including the Independent Trustees, concluded that approval of the Advisory Agreement and the Subadvisory Agreement would be in the best interest of the New Fund and its shareholders. Accordingly, the Board, and the Independent Trustees voting separately, approved the Advisory Agreement and Subadvisory Agreement.
41
Trustees James M. Oates, Chairperson Officers Andrew G. Arnott John J. Danello Francis V. Knox, Jr. Charles A. Rizzo Salvatore Schiavone | Investment advisor John Hancock Advisers, LLC Subadvisor Dimensional Fund Advisors LP Principal distributor Foreside Fund Services, LLC Custodian State Street Bank and Trust Company Transfer agent State Street Bank and Trust Company Legal counsel Dechert LLP Stock symbol NYSE Arca: JHMM |
*Member of the Audit Committee
†Non-Independent Trustee
The fund's proxy voting policies and procedures, as well as the fund proxy voting record for the most recent twelve-month period ended June 30, are available free of charge on the Securities and Exchange Commission (SEC) website at sec.gov or on our website.
The fund's complete list of portfolio holdings, for the first and third fiscal quarters, is filed with the SEC on Form N-Q. The fund's Form N-Q is available on our website and the SEC's website, sec.gov, and can be reviewed and copied (for a fee) at the SEC's Public Reference Room in Washington, DC. Call 800-SEC-0330 to receive information on the operation of the SEC's Public Reference Room.
We make this information on your fund, as well as monthly portfolio holdings, and other fund details available on our website at jhinvestments.com/etf or by calling 800-225-5291.
| You can also contact us: | |||
| 800-225-5291 jhinvestments.com/etf | Regular mail: John Hancock Signature Services, Inc. | Express mail: John Hancock Signature Services, Inc. | |
42
John Hancock family of funds
DOMESTIC EQUITY FUNDS Balanced Blue Chip Growth Classic Value Disciplined Value Disciplined Value Mid Cap Equity Income Fundamental All Cap Core Fundamental Large Cap Core Fundamental Large Cap Value Large Cap Equity New Opportunities Select Growth Small Cap Equity Small Cap Value Small Company Strategic Growth U.S. Equity U.S. Global Leaders Growth Value Equity GLOBAL/INTERNATIONAL FUNDS Disciplined Value International Emerging Markets Emerging Markets Equity Global Equity Global Shareholder Yield Greater China Opportunities International Core International Growth International Small Company International Value Equity | INCOME FUNDS Bond California Tax-Free Income Core High Yield Emerging Markets Debt Floating Rate Income Focused High Yield Global Income Government Income High Yield Municipal Bond Income Investment Grade Bond Money Market Short Duration Credit Opportunities Spectrum Income Strategic Income Opportunities Tax-Free Bond ALTERNATIVE/SPECIALTY FUNDS Absolute Return Currency Alternative Asset Allocation Enduring Assets Financial Industries Global Absolute Return Strategies Global Conservative Absolute Return Global Real Estate Natural Resources Redwood Regional Bank Seaport Technical Opportunities |
The fund's investment objectives, risks, charges, and expenses are included in the prospectus and should be considered carefully before investing. For a prospectus, contact your financial professional, call
John Hancock Investments at 800-225-5291, or visit the fund's website at jhinvestments.com. Please read the prospectus carefully before investing or sending money.
ASSET ALLOCATION PORTFOLIOS Income Allocation Fund Lifestyle Aggressive Portfolio Lifestyle Balanced Portfolio Lifestyle Conservative Portfolio Lifestyle Growth Portfolio Lifestyle Moderate Portfolio Retirement Choices Portfolios (2010-2055) Retirement Living Portfolios (2010-2055) Retirement Living II Portfolios (2010-2055) EXCHANGE-TRADED FUNDS John Hancock Multifactor Consumer Discretionary ETF John Hancock Multifactor Financials ETF John Hancock Multifactor Healthcare ETF John Hancock Multifactor Large Cap ETF John Hancock Multifactor Mid Cap ETF John Hancock Multifactor Technology ETF CLOSED-END FUNDS Financial Opportunities Hedged Equity & Income Income Securities Trust Investors Trust Preferred Income Preferred Income II Preferred Income III Premium Dividend Tax-Advantaged Dividend Income Tax-Advantaged Global Shareholder Yield |
"As an investment firm,
upholding the proud
tradition of John Hancock
comes down to one thing:
putting shareholders
first. We believe that if
our shareholders are
successful, then we will
be successful."
Andrew G. Arnott
President and Chief Executive Officer
John Hancock Investments
John Hancock Multifactor ETF shares are bought and sold at market price (not NAV), and are not individually redeemed from the fund. Brokerage commissions will reduce returns.
John Hancock ETFs are distributed by Foreside Fund Services, LLC, and are subadvised by Dimensional Fund Advisors LP. Foreside is not affiliated with John Hancock Funds, LLC or Dimensional Fund Advisors LP.
Dimensional Fund Advisors LP receives compensation from John Hancock in connection with licensing rights to the John Hancock Dimensional indexes. Dimensional Fund Advisors LP does not sponsor, endorse, or sell, and makes no representation as to the advisability of investing in, John Hancock Multifactor ETFs (Multifactor ETFs). Neither John Hancock Advisers, LLC nor Dimensional Fund Advisors LP guarantees the accuracy and/or the completeness of the John Hancock Dimensional Indexes (the "Indexes") or any data included therein, and neither John Hancock Advisers, LLC nor Dimensional Fund Advisors LP shall have any liability for any errors, omissions, or interruptions therein. Neither John Hancock Advisers, LLC nor Dimensional Fund Advisors LP makes any warranty, express or implied, as to results to be obtained by the Multifactor ETFs, owners of the shares of the Multifactor ETFs or any other person or entity from the use of the Indexes, trading based on the Indexes, or any data included therein, either in connection with the Multifactor ETFs or for any other use. Neither John Hancock Advisers, LLC nor Dimensional Fund Advisors LP makes any express or implied warranties, and expressly disclaim all warranties of merchantability or fitness for a particular purpose or use with respect to the Indexes or any data included therein. Without limiting any of the foregoing, in no event shall either John Hancock Advisers, LLC or Dimensional Fund Advisors LP have any liability for any special, punitive, direct, indirect or consequential damages (including lost profits) arising out of matters relating to the use of the Indexes, even if notified of the possibility of such damages.
John Hancock Investments
A trusted brand
John Hancock Investments is a premier asset manager representing
one of America's most trusted brands, with a heritage of financial
stewardship dating back to 1862. Helping our shareholders pursue
their financial goals is at the core of everything we do. It's why we
support the role of professional financial advice and operate with the
highest standards of conduct and integrity.
A better way to invest
We build funds based on investor needs, then search the world to find
proven portfolio teams with specialized expertise in those strategies.
As a manager of managers, we apply vigorous oversight to ensure that
they continue to meet our uncompromising standards and serve the
best interests of our shareholders.
Results for investors
Our unique approach to asset management enables us to provide
a diverse set of investments backed by some of the world's best
managers, along with strong risk-adjusted returns across asset classes.
| | John Hancock Investments 601 Congress Street n Boston, MA 02210 800-225-5291 n jhinvestments.com/etf | |
| This report is for the information of the shareholders of John Hancock Multifactor Mid Cap ETF. It is not authorized for distribution to prospective investors unless preceded or accompanied by a prospectus. | ||
MF260297 JHAN-2015-12-23-0162 | 840SA 10/15 12/15 | |
John Hancock
A message to shareholders
Dear shareholder,
Welcome to John Hancock Investments, and thank you for investing in a John Hancock Multifactor exchange-traded fund (ETF). At John Hancock Investments, we take a different approach to managing money on behalf of our shareholders. We build funds based on investor needs, then search the world to find proven portfolio teams with specialized expertise in those strategies. We were pleased to team up with Dimensional Fund Advisors LP—a company regarded as one of the pioneers in strategic beta investing*—to create a suite of passively managed ETFs. Each of our John Hancock Multifactor ETFs seeks to track a custom index built upon decades of academic research into the factors that drive higher expected returns: smaller capitalizations, lower valuations, and higher profitability.
This inaugural report to shareholders covers a very brief period of performance due to the fact that your ETF was launched shortly before the midpoint of its fiscal year. In this abbreviated report, your fund's portfolio managers will discuss the construction of the fund's underlying index, provide a review of the current market environment, and give a description of performance achieved so far. The next report you receive will cover the full period from the fund's inception to the end of its fiscal year on April 30, 2016.
We know you have many choices when it comes to your investments, and we appreciate the opportunity to earn the trust you've placed in John Hancock Investments.
Sincerely,
Andrew G. Arnott
President and Chief Executive Officer
John Hancock Investments
This commentary reflects the CEO's views as of October 31, 2015. They are subject to change at any time. For more up-to-date information, you can visit our website at jhinvestments.com.
| * | Strategic beta investing ETFs seek to improve upon cap-weighted strategies by tracking a custom index that combines active management insight with the discipline of a rules-based approach. |
John Hancock
Multifactor Large Cap ETF
Table of contents
| 2 | Your fund at a glance | |
| 4 | Discussion of fund performance | |
| 8 | Premium/discount analysis | |
| 9 | Your expenses | |
| 11 | Fund's investments | |
| 32 | Financial statements | |
| 35 | Financial highlights | |
| 36 | Notes to financial statements | |
| 39 | Evaluation of advisory and subadvisory agreements by the Board of Trustees | |
| 44 | More information |
1
INVESTMENT OBJECTIVE
The fund seeks to provide investment results that closely correspond, before fees and expenses, to the performance of the John Hancock Dimensional Large Cap Index.
TOTAL RETURNS AS OF 10/31/15 (%)
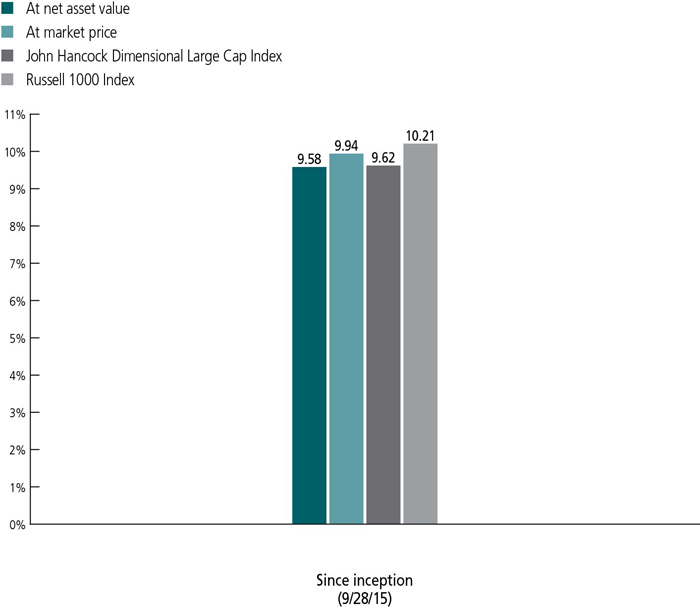
Market performance is determined using the closing price of the fund on its primary exchange, the NYSE Arca, at 4 P.M., Eastern time; your returns may differ if you traded shares at other times during the day. The net asset value is calculated by dividing the total value of all the securities in the fund's portfolio plus cash, interest, and receivables, minus any liabilities, by the number of fund shares outstanding.
The John Hancock Dimensional Large Cap Index is designed to comprise a subset of securities in the U.S. Universe issued by companies whose market capitalizations are larger than that of the 801st largest U.S. company at the time of reconstitution. The Index is reconstituted and rebalanced on a semiannual basis. The U.S. Universe is defined as a free float-adjusted market-capitalization-weighted portfolio of U.S. operating companies listed on the New York Stock Exchange (NYSE), NYSE MKT LLC, NASDAQ Global Market, or such other securities exchanges deemed appropriate in accordance with the rules-based methodology that is maintained by Dimensional Fund Advisors LP.
The Russell 1000 Index comprises 1000 of the largest securities of the large-cap segment of U.S. companies.
It is not possible to invest directly in an index. Index figures do not reflect expenses or sales charges, which would result in lower returns.
The past performance shown here reflects reinvested distributions and the beneficial effect of any expense reductions, and does not guarantee future results. Returns for periods shorter than one year are cumulative. Shares will fluctuate in value and, when sold or redeemed, may be worth more or less than their original cost. Current performance may be lower or higher than the performance cited, and can be found at jhinvestments.com or by calling 800-225-5291. For further information on the fund's objectives, risks, and strategy, see the fund's prospectus.
2
PERFORMANCE HIGHLIGHTS OVER THE PERIOD
Risk assets rebounded
Following a challenging summer, equity markets around the world bounced back; fixed-income asset returns were more subdued, as many bond sectors ended the period roughly where they started.
Smaller-cap stocks trailed larger peers
Relative to the capitalization-weighted Russell 1000 Index, the fund's smaller-cap bias hindered results as large-caps led the way during the period.
Value-oriented shares lagged growth counterparts
The fund emphasizes shares with lower price-to-book ratios; during the period, this value tilt also weighed on results relative to the broad market.
SECTOR COMPOSITION AS OF 10/31/15 (%)
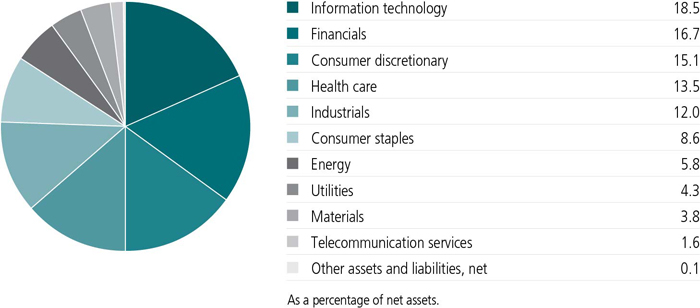
A note about risks
Large company stocks could fall out of favor. Value stocks may underperform other segments of the market. The value of a company's equity securities is subject to changes in the company's financial condition and overall market and economic conditions. Exchange-traded fund shares are bought and sold through exchange trading at market price (not NAV), and are not individually redeemed from the fund. Due to various factors, shares may trade at a premium or discount to their NAV in the secondary market, and the fund's holdings and returns may deviate from those of its index. These variations may be greater when markets are volatile or subject to unusual conditions. Errors in the construction or calculation of the fund's index may occur from time to time. Brokerage commissions will reduce returns. Please see the fund's prospectus for additional risks.
3
Lukas J. Smart, CFA
Portfolio Manager
Dimensional Fund Advisors LP
Would you tell us about your investment philosophy and how it drives the composition of this new exchange-traded fund (ETF)?
Research has shown that there are differences in expected returns among securities. At Dimensional Fund Advisors, we've identified four characteristics, or dimensions, of expected returns—the overall market, company size, relative price, and profitability—that academic research has shown to account for most of the variation in asset returns over time.
The market dimension reflects the excess return over the risk-free rate that market participants demand for investing in a broadly diversified portfolio of equity securities without any style or market capitalization bias. That premium is called the equity premium.
The company size dimension reflects the excess return that investors demand for investing in small-capitalization stocks relative to large-capitalization stocks. The premium associated with this dimension is the small-cap, or size, premium.
The relative price dimension reflects the excess return that investors expect from investing in low relative price, or value, stocks (as measured, for instance, by their price-to-book ratios) in comparison with high relative price, or growth, stocks. The premium associated with this dimension is the value premium.
Finally, the profitability dimension provides a way to discern the expected returns of companies with similar price-driven characteristics. If two companies trade at the same relative price, the one with higher profitability should have a higher expected return. The premium associated with this dimension is called the profitability premium.
4
Relative to a commercial cap-weighted measure of the market, we believe that incorporating these dimensions of expected returns into an investment strategy offers the potential for outperformance over time, and an ETF is a vehicle well suited to our systematic and transparent investment approach. The custom benchmark we developed, the John Hancock Dimensional Large Cap Index, is designed to capture these dimensions over time, and the fund is, in turn, designed to track the custom benchmark.
What was the market environment like during the period?
The abbreviated period from inception on September 28, 2015, through October 31, 2015, followed a difficult and volatile summer for equities. However, stock markets around the world subsequently snapped back for a sharp rebound, posting high single-digit percentage returns in some cases.
Broadly speaking, materials, energy, and information technology equity shares were strong, while utilities—often viewed as a safe-haven sector of the stock market—generated more modest
TOP 10 HOLDINGS AS OF 10/31/15 (%)
| Apple, Inc. | 2.5 |
| Microsoft Corp. | 1.4 |
| Exxon Mobil Corp. | 1.3 |
| Alphabet, Inc., Class A | 1.1 |
| Johnson & Johnson | 1.0 |
| General Electric Company | 1.0 |
| Wells Fargo & Company | 0.9 |
| JPMorgan Chase & Co. | 0.9 |
| Pfizer, Inc. | 0.8 |
| Intel Corp. | 0.8 |
| TOTAL | 11.7 |
| As a percentage of net assets. | |
| Cash and cash equivalents are not included. | |
5
How did the fund perform during this abbreviated period?
The fund generated a 9.58% return on a net asset value (NAV) basis, which was closely in line with the custom benchmark it's intended to track, the John Hancock Dimensional Large Cap Index.
Our approach generally results in the fund broadly maintaining relatively high weightings in securities of smaller-cap issuers and in those trading at lower relative prices in relation to their book values. In the weightings of individual positions, we also place greater emphasis on companies that have demonstrated higher profitability.
The fund lagged the Russell 1000 Index, a commercial cap-weighted benchmark we use as a proxy for the broad U.S. stock market. On balance, the fund's emphasis on smaller and lower relative price shares worked against it during this time period.
The premiums associated with the dimensions we've identified are unpredictable. For this reason, we believe the best way to invest is to structure broadly diversified portfolios with a consistent focus on the desired dimensions, seeking to capture the expected premiums associated with them.
While we would expect small to outperform large and value to outperform growth over an extended time horizon, any given trading day, month, or year can prove otherwise, and that's okay. Patience and persistence are key ingredients to success in our style of investing.
How was the fund positioned at the close of the period?
In keeping with our long-term investment approach, the fund generally held higher weights in low-relative-price stocks and equities with smaller market capitalization while emphasizing companies with higher profitability relative to commercial cap-weighted indexes.
6
The fund's largest absolute exposures were to the information technology, financials, and consumer discretionary sectors.
The fund was broadly diversified across more than 750 names. Top holdings included Apple, Inc., Microsoft Corp., and Exxon Mobil Corp. The fund's weighted average market capitalization was $94 billion, its price-to-book ratio was 2.4, and its price-to-earnings ratio was 17.8.
MANAGED BY
| | Lukas J. Smart, CFA On the fund since inception Investing since 2003 |
| | Joel P. Schneider On the fund since inception Investing since 2011 |
![]()
7
ETF shares are bought and sold through exchange trading at market price—not net asset value (NAV)—and are not individually redeemed from the fund. Due to various factors, shares may trade at a premium or discount to their NAV in the secondary market. If a shareholder purchases shares at a time when the market price is at a premium to the NAV or sells shares at a time when the market price is at a discount to the NAV, the shareholder may sustain losses. Additionally due to various factors, a fund's holdings and returns may deviate from those of its index. These variations may be greater when markets are volatile or subject to unusual conditions.
A premium exists when the closing market price is trading above NAV, while a discount indicates that the closing market price is trading below NAV. The differences are expressed as basis points, with one basis point equaling 1/100 of 1%.
The chart below presents information about the differences between the fund's daily closing market price and the fund's NAV. The closing market price is the daily closing price as reported on the NYSE Arca, Inc., the fund's primary listing exchange. Data presented represents past performance and cannot be used to predict future results.
Period Ended October 31, 2015
| Closing price below NAV | Closing price above or equal to NAV | |||||||
| Basis point differential | Number of days | % of Total days | Number of days | % of Total days | ||||
| 0 - < 25 | 12 | 50.00% | 8 | 33.33% | ||||
| 25 - < 50 | 2 | 8.33% | 1 | 4.17% | ||||
| 50 - < 75 | — | — | — | — | ||||
| 75 - < 100 | 1 | 4.17% | — | — | ||||
| 100 or Above | — | — | — | — | ||||
| Total | 15 | 62.50% | 9 | 37.50% | ||||
8
These examples are intended to help you understand your ongoing operating expenses of investing in the fund so you can compare these costs with the ongoing costs of investing in
other funds.
Understanding fund expenses
As a shareholder of the fund, you incur two types of costs:
| • | Transaction costs, which may include creation and redemption fees or brokerage charges. |
| • | Ongoing operating expenses, including management fees and other fund expenses. |
We are presenting only your ongoing operating expenses here.
Actual expenses/actual returns
This example is intended to provide information about the fund's actual ongoing operating expenses, and is based on the fund's actual return. It assumes an account value of $1,000.00 on September 28, 2015, with the same investment held until October 31, 2015.
| Account value on 9-28-2015 | Ending value on 10-31-2015 | Expenses paid during period ended 10-31-20151 | Annualized expense ratio | |
| $1,000.00 | $1,095.80 | $0.33 | 0.35% |
Together with the value of your account, you may use this information to estimate the operating expenses that you paid over the period. Simply divide your account value at October 31, 2015, by $1,000.00, then multiply it by the "expenses paid" from the table above. For example, for an account value of $8,600.00, the operating expenses should be calculated as follows:
9
Hypothetical example for comparison purposes
This table allows you to compare the fund's ongoing operating expenses with those of any other fund. It provides an example of the fund's hypothetical account values and hypothetical expenses based on the fund's actual expense ratio and an assumed 5% annualized return before expenses (which is not the fund's actual return). It assumes an account value of $1,000.00 on May 1, 2015, with the same investment held until October 31, 2015. Look in any other fund shareholder report to find its hypothetical example and you will be able to compare these expenses. Please remember that these hypothetical account values and expenses may not be used to estimate the actual ending account balance or expenses you paid for the period.
| Account value on 5-1-2015 | Ending value on 10-31-2015 | Expenses paid during period ended 10-31-20152 | Annualized expense ratio | |
| $1,000.00 | $1,023.40 | $1.78 | 0.35% |
Remember, these examples do not include any transaction costs. The fund charges a transaction fee per creation unit to those creating or redeeming creation units, and those buying or selling shares in the secondary market will incur customary brokerage commissions and charges. Therefore, these examples will not help you to determine the relative total costs of owning different funds. If transaction costs were included, your expenses would have been higher. See the prospectus for details regarding transaction costs.
| 1 | The inception date for the fund is 9-28-15. Expenses are equal to the fund's annualized expense ratio, multiplied by the average account value over the period, multiplied by 33/366 (to reflect the period). |
| 2 | Expenses are equal to the fund's annualized expense ratio, multiplied by the average account value over the period, multiplied by 184/366 (to reflect the one-half year period). |
10
Fund's investments
| As of 10-31-15 (unaudited) | |||||||||||
| Shares | Value | ||||||||||
| Common stocks 99.9% | $13,444,899 | ||||||||||
| (Cost $12,717,192) | |||||||||||
| Consumer discretionary 15.1% | 2,034,264 | ||||||||||
| Auto components 0.8% | |||||||||||
| Autoliv, Inc. | 120 | 14,549 | |||||||||
| BorgWarner, Inc. | 286 | 12,247 | |||||||||
| Delphi Automotive PLC | 340 | 28,285 | |||||||||
| Gentex Corp. | 60 | 983 | |||||||||
| Johnson Controls, Inc. | 529 | 23,900 | |||||||||
| Lear Corp. | 120 | 15,007 | |||||||||
| The Goodyear Tire & Rubber Company | 270 | 8,867 | |||||||||
| Automobiles 0.5% | |||||||||||
| Ford Motor Company | 1,822 | 26,984 | |||||||||
| General Motors Company | 440 | 15,360 | |||||||||
| Harley-Davidson, Inc. | 340 | 16,813 | |||||||||
| Tesla Motors, Inc. (I) | 25 | 5,173 | |||||||||
| Distributors 0.2% | |||||||||||
| Genuine Parts Company | 256 | 23,235 | |||||||||
| LKQ Corp. (I) | 270 | 7,995 | |||||||||
| Diversified consumer services 0.2% | |||||||||||
| H&R Block, Inc. | 530 | 19,748 | |||||||||
| Service Corp. International | 126 | 3,561 | |||||||||
| ServiceMaster Global Holdings, Inc. (I) | 50 | 1,783 | |||||||||
| Hotels, restaurants and leisure 2.0% | |||||||||||
| ARAMARK | 140 | 4,249 | |||||||||
| Carnival Corp. | 316 | 17,089 | |||||||||
| Chipotle Mexican Grill, Inc. (I) | 30 | 19,207 | |||||||||
| Darden Restaurants, Inc. | 160 | 9,902 | |||||||||
| Domino's Pizza, Inc. | 20 | 2,133 | |||||||||
| Dunkin' Brands Group, Inc. | 90 | 3,727 | |||||||||
| Hilton Worldwide Holdings, Inc. | 140 | 3,499 | |||||||||
| Las Vegas Sands Corp. | 140 | 6,931 | |||||||||
| Marriott International, Inc., Class A | 250 | 19,195 | |||||||||
| McDonald's Corp. | 550 | 61,738 | |||||||||
| MGM Resorts International (I) | 430 | 9,972 | |||||||||
| Norwegian Cruise Line Holdings, Ltd. (I) | 80 | 5,090 | |||||||||
| Royal Caribbean Cruises, Ltd. | 190 | 18,687 | |||||||||
| Starbucks Corp. | 540 | 33,788 | |||||||||
| Starwood Hotels & Resorts Worldwide, Inc. | 226 | 18,051 | |||||||||
| Wyndham Worldwide Corp. | 180 | 14,643 | |||||||||
| Wynn Resorts, Ltd. | 60 | 4,197 | |||||||||
| Yum! Brands, Inc. | 286 | 20,280 | |||||||||
| Shares | Value | ||||||||||
| Consumer discretionary (continued) | |||||||||||
| Household durables 1.0% | |||||||||||
| D.R. Horton, Inc. | 456 | $13,425 | |||||||||
| Garmin, Ltd. | 150 | 5,321 | |||||||||
| Harman International Industries, Inc. | 50 | 5,498 | |||||||||
| Jarden Corp. (I) | 200 | 8,960 | |||||||||
| Leggett & Platt, Inc. | 170 | 7,655 | |||||||||
| Lennar Corp., Class A | 170 | 8,512 | |||||||||
| Lennar Corp., Class B | 10 | 414 | |||||||||
| Mohawk Industries, Inc. (I) | 90 | 17,595 | |||||||||
| Newell Rubbermaid, Inc. | 408 | 17,311 | |||||||||
| NVR, Inc. (I) | 10 | 16,378 | |||||||||
| PulteGroup, Inc. | 260 | 4,766 | |||||||||
| Toll Brothers, Inc. (I) | 180 | 6,475 | |||||||||
| Whirlpool Corp. | 130 | 20,818 | |||||||||
| Internet and catalog retail 1.4% | |||||||||||
| Amazon.com, Inc. (I) | 125 | 78,238 | |||||||||
| Expedia, Inc. | 160 | 21,808 | |||||||||
| Liberty Interactive Corp., Series A (I) | 766 | 20,965 | |||||||||
| Liberty Ventures, Series A (I) | 60 | 2,614 | |||||||||
| Netflix, Inc. (I) | 140 | 15,173 | |||||||||
| The Priceline Group, Inc. (I) | 30 | 43,627 | |||||||||
| TripAdvisor, Inc. (I) | 90 | 7,540 | |||||||||
| Leisure products 0.3% | |||||||||||
| Hasbro, Inc. | 190 | 14,598 | |||||||||
| Mattel, Inc. | 546 | 13,421 | |||||||||
| Polaris Industries, Inc. | 70 | 7,864 | |||||||||
| Media 3.5% | |||||||||||
| AMC Networks, Inc., Class A (I) | 10 | 739 | |||||||||
| Cablevision Systems Corp., Class A | 50 | 1,630 | |||||||||
| CBS Corp., Class B | 366 | 17,026 | |||||||||
| Charter Communications, Inc., Class A (I) | 90 | 17,185 | |||||||||
| Comcast Corp., Class A | 896 | 56,108 | |||||||||
| Comcast Corp., Special Class A | 576 | 36,121 | |||||||||
| Discovery Communications, Inc., Series A (I) | 370 | 10,893 | |||||||||
| Discovery Communications, Inc., Series C (I) | 90 | 2,477 | |||||||||
| DISH Network Corp., Class A (I) | 249 | 15,680 | |||||||||
| Liberty Broadband Corp., Series A (I) | 10 | 546 | |||||||||
| Liberty Broadband Corp., Series C (I) | 20 | 1,075 | |||||||||
| Liberty Global PLC, Class A (I) | 280 | 12,466 | |||||||||
| Liberty Global PLC, Series C (I) | 296 | 12,621 | |||||||||
| Liberty Media Corp., Series A (I) | 180 | 7,337 | |||||||||
| Liberty Media Corp., Series C (I) | 70 | 2,741 | |||||||||
| Lions Gate Entertainment Corp. | 20 | 779 | |||||||||
| Shares | Value | ||||||||||
| Consumer discretionary (continued) | |||||||||||
| Media (continued) | |||||||||||
| Live Nation Entertainment, Inc. (I) | 80 | $2,182 | |||||||||
| MSG Networks, Inc., Class A (I) | 30 | 616 | |||||||||
| News Corp., Class A | 150 | 2,310 | |||||||||
| News Corp., Class B | 40 | 619 | |||||||||
| Omnicom Group, Inc. | 456 | 34,164 | |||||||||
| Scripps Networks Interactive, Inc., Class A | 120 | 7,210 | |||||||||
| Sirius XM Holdings, Inc. (I) | 2,100 | 8,568 | |||||||||
| TEGNA, Inc. | 330 | 8,923 | |||||||||
| The Interpublic Group of Companies, Inc. | 636 | 14,583 | |||||||||
| The Madison Square Garden Company, Class A (I) | 10 | 1,785 | |||||||||
| The Walt Disney Company | 726 | 82,575 | |||||||||
| Time Warner Cable, Inc. | 196 | 37,122 | |||||||||
| Time Warner, Inc. | 466 | 35,108 | |||||||||
| Twenty-First Century Fox, Inc., Class A | 676 | 20,746 | |||||||||
| Twenty-First Century Fox, Inc., Class B | 326 | 10,067 | |||||||||
| Viacom, Inc., Class A | 10 | 513 | |||||||||
| Viacom, Inc., Class B | 320 | 15,779 | |||||||||
| Multiline retail 1.0% | |||||||||||
| Dollar General Corp. | 320 | 21,686 | |||||||||
| Dollar Tree, Inc. (I) | 296 | 19,385 | |||||||||
| Kohl's Corp. | 338 | 15,589 | |||||||||
| Macy's, Inc. | 590 | 30,078 | |||||||||
| Nordstrom, Inc. | 299 | 19,498 | |||||||||
| Target Corp. | 426 | 32,879 | |||||||||
| Specialty retail 3.3% | |||||||||||
| Advance Auto Parts, Inc. | 140 | 27,780 | |||||||||
| AutoNation, Inc. (I) | 90 | 5,687 | |||||||||
| AutoZone, Inc. (I) | 40 | 31,376 | |||||||||
| Bed Bath & Beyond, Inc. (I) | 270 | 16,100 | |||||||||
| Best Buy Company, Inc. | 396 | 13,872 | |||||||||
| CarMax, Inc. (I) | 250 | 14,753 | |||||||||
| Dick's Sporting Goods, Inc. | 120 | 5,346 | |||||||||
| Foot Locker, Inc. | 158 | 10,705 | |||||||||
| L Brands, Inc. | 180 | 17,276 | |||||||||
| Lowe's Companies, Inc. | 636 | 46,956 | |||||||||
| O'Reilly Automotive, Inc. (I) | 110 | 30,389 | |||||||||
| Office Depot, Inc. (I) | 140 | 1,067 | |||||||||
| Ross Stores, Inc. | 796 | 40,262 | |||||||||
| Signet Jewelers, Ltd. | 20 | 3,019 | |||||||||
| Staples, Inc. | 696 | 9,041 | |||||||||
| The Gap, Inc. | 390 | 10,616 | |||||||||
| The Home Depot, Inc. | 630 | 77,893 | |||||||||
| Shares | Value | ||||||||||
| Consumer discretionary (continued) | |||||||||||
| Specialty retail (continued) | |||||||||||
| The Michaels Companies, Inc. (I) | 30 | $701 | |||||||||
| The TJX Companies, Inc. | 410 | 30,008 | |||||||||
| Tiffany & Company | 160 | 13,190 | |||||||||
| Tractor Supply Company | 150 | 13,859 | |||||||||
| Ulta Salon Cosmetics & Fragrance, Inc. (I) | 60 | 10,438 | |||||||||
| Williams-Sonoma, Inc. | 110 | 8,113 | |||||||||
| Textiles, apparel and luxury goods 0.9% | |||||||||||
| Carter's, Inc. | 20 | 1,818 | |||||||||
| Coach, Inc. | 290 | 9,048 | |||||||||
| Hanesbrands, Inc. | 360 | 11,498 | |||||||||
| lululemon athletica, Inc. (I) | 90 | 4,425 | |||||||||
| Michael Kors Holdings, Ltd. (I) | 116 | 4,482 | |||||||||
| NIKE, Inc., Class B | 350 | 45,861 | |||||||||
| PVH Corp. | 76 | 6,912 | |||||||||
| Ralph Lauren Corp. | 90 | 9,969 | |||||||||
| Skechers U.S.A., Inc., Class A (I) | 30 | 936 | |||||||||
| Under Armour, Inc., Class A (I) | 120 | 11,410 | |||||||||
| VF Corp. | 240 | 16,205 | |||||||||
| Consumer staples 8.6% | 1,165,427 | ||||||||||
| Beverages 1.8% | |||||||||||
| Brown-Forman Corp., Class A | 20 | 2,295 | |||||||||
| Brown-Forman Corp., Class B | 130 | 13,803 | |||||||||
| Coca-Cola Enterprises, Inc. | 380 | 19,509 | |||||||||
| Constellation Brands, Inc., Class A | 140 | 18,872 | |||||||||
| Dr. Pepper Snapple Group, Inc. | 300 | 26,811 | |||||||||
| Molson Coors Brewing Company, Class B | 180 | 15,858 | |||||||||
| Monster Beverage Corp. (I) | 20 | 2,726 | |||||||||
| PepsiCo, Inc. | 766 | 78,278 | |||||||||
| The Coca-Cola Company | 1,694 | 71,741 | |||||||||
| Food and staples retailing 2.0% | |||||||||||
| Costco Wholesale Corp. | 206 | 32,573 | |||||||||
| CVS Health Corp. | 610 | 60,256 | |||||||||
| Rite Aid Corp. (I) | 618 | 4,870 | |||||||||
| Sysco Corp. | 706 | 29,123 | |||||||||
| The Kroger Company | 1,016 | 38,405 | |||||||||
| Wal-Mart Stores, Inc. | 976 | 55,866 | |||||||||
| Walgreens Boots Alliance, Inc. | 406 | 34,380 | |||||||||
| Whole Foods Market, Inc. | 336 | 10,067 | |||||||||
| Food products 2.2% | |||||||||||
| Archer-Daniels-Midland Company | 410 | 18,721 | |||||||||
| Blue Buffalo Pet Products Inc (I) | 10 | 179 | |||||||||
| Bunge, Ltd. | 210 | 15,322 | |||||||||
| Shares | Value | ||||||||||
| Consumer staples (continued) | |||||||||||
| Food products (continued) | |||||||||||
| Campbell Soup Company | 240 | $12,190 | |||||||||
| ConAgra Foods, Inc. | 606 | 24,573 | |||||||||
| Flowers Foods, Inc. | 60 | 1,620 | |||||||||
| General Mills, Inc. | 490 | 28,474 | |||||||||
| Hormel Foods Corp. | 220 | 14,861 | |||||||||
| Ingredion, Inc. | 110 | 10,457 | |||||||||
| Kellogg Company | 236 | 16,643 | |||||||||
| Keurig Green Mountain, Inc. | 110 | 5,583 | |||||||||
| McCormick & Company, Inc. | 176 | 14,780 | |||||||||
| Mead Johnson Nutrition Company | 196 | 16,072 | |||||||||
| Mondelez International, Inc., Class A | 936 | 43,206 | |||||||||
| Pilgrim's Pride Corp. | 50 | 950 | |||||||||
| Pinnacle Foods, Inc. | 50 | 2,204 | |||||||||
| The Hain Celestial Group, Inc. (I) | 50 | 2,493 | |||||||||
| The Hershey Company | 240 | 21,286 | |||||||||
| The J.M. Smucker Company | 120 | 14,087 | |||||||||
| The Kraft Heinz Company | 50 | 3,899 | |||||||||
| The WhiteWave Foods Company (I) | 110 | 4,508 | |||||||||
| Tyson Foods, Inc., Class A | 426 | 18,897 | |||||||||
| Household products 1.4% | |||||||||||
| Church & Dwight Company, Inc. | 156 | 13,430 | |||||||||
| Colgate-Palmolive Company | 480 | 31,848 | |||||||||
| Kimberly-Clark Corp. | 240 | 28,730 | |||||||||
| Spectrum Brands Holdings, Inc. | 10 | 959 | |||||||||
| The Clorox Company | 189 | 23,047 | |||||||||
| The Procter & Gamble Company | 1,232 | 94,100 | |||||||||
| Personal products 0.2% | |||||||||||
| Coty, Inc., Class A | 20 | 579 | |||||||||
| Edgewell Personal Care Company | 110 | 9,318 | |||||||||
| Herbalife, Ltd. (I) | 20 | 1,121 | |||||||||
| The Estee Lauder Companies, Inc., Class A | 200 | 16,092 | |||||||||
| Tobacco 1.0% | |||||||||||
| Altria Group, Inc. | 1,036 | 62,647 | |||||||||
| Philip Morris International, Inc. | 610 | 53,924 | |||||||||
| Reynolds American, Inc. | 480 | 23,194 | |||||||||
| Energy 5.8% | 778,392 | ||||||||||
| Energy equipment and services 0.9% | |||||||||||
| Baker Hughes, Inc. | 210 | 11,063 | |||||||||
| Cameron International Corp. (I) | 246 | 16,730 | |||||||||
| Ensco PLC, Class A | 100 | 1,663 | |||||||||
| FMC Technologies, Inc. (I) | 280 | 9,472 | |||||||||
| Halliburton Company | 386 | 14,815 | |||||||||
| Shares | Value | ||||||||||
| Energy (continued) | |||||||||||
| Energy equipment and services (continued) | |||||||||||
| Helmerich & Payne, Inc. | 130 | $7,315 | |||||||||
| National Oilwell Varco, Inc. | 250 | 9,410 | |||||||||
| Oceaneering International, Inc. | 110 | 4,622 | |||||||||
| Schlumberger, Ltd. | 440 | 34,390 | |||||||||
| Transocean, Ltd. | 166 | 2,628 | |||||||||
| Weatherford International PLC (I) | 616 | 6,308 | |||||||||
| Oil, gas and consumable fuels 4.9% | |||||||||||
| Anadarko Petroleum Corp. | 220 | 14,714 | |||||||||
| Antero Resources Corp. (I) | 10 | 236 | |||||||||
| Apache Corp. | 276 | 13,008 | |||||||||
| Cabot Oil & Gas Corp. | 330 | 7,164 | |||||||||
| Cheniere Energy Partners Lp Holdings Llc | 20 | 394 | |||||||||
| Cheniere Energy, Inc. (I) | 110 | 5,447 | |||||||||
| Chesapeake Energy Corp. | 668 | 4,763 | |||||||||
| Chevron Corp. | 976 | 88,699 | |||||||||
| Cimarex Energy Company | 100 | 11,806 | |||||||||
| Columbia Pipeline Group, Inc. | 80 | 1,662 | |||||||||
| Concho Resources, Inc. (I) | 88 | 10,200 | |||||||||
| ConocoPhillips | 776 | 41,400 | |||||||||
| Continental Resources, Inc. (I) | 80 | 2,713 | |||||||||
| Devon Energy Corp. | 230 | 9,644 | |||||||||
| EOG Resources, Inc. | 220 | 18,887 | |||||||||
| EQT Corp. | 140 | 9,250 | |||||||||
| Exxon Mobil Corp. | 2,120 | 175,409 | |||||||||
| Hess Corp. | 250 | 14,053 | |||||||||
| HollyFrontier Corp. | 250 | 12,243 | |||||||||
| Kinder Morgan, Inc. | 400 | 10,940 | |||||||||
| Marathon Oil Corp. | 616 | 11,322 | |||||||||
| Marathon Petroleum Corp. | 456 | 23,621 | |||||||||
| Murphy Oil Corp. | 310 | 8,813 | |||||||||
| Newfield Exploration Company (I) | 130 | 5,225 | |||||||||
| Noble Energy, Inc. | 216 | 7,741 | |||||||||
| Occidental Petroleum Corp. | 310 | 23,107 | |||||||||
| ONEOK, Inc. | 360 | 12,211 | |||||||||
| Phillips 66 | 220 | 19,591 | |||||||||
| Pioneer Natural Resources Company | 70 | 9,600 | |||||||||
| Range Resources Corp. | 110 | 3,348 | |||||||||
| Southwestern Energy Company (I) | 280 | 3,091 | |||||||||
| Spectra Energy Corp. | 370 | 10,571 | |||||||||
| Tesoro Corp. | 160 | 17,109 | |||||||||
| The Williams Companies, Inc. | 506 | 19,957 | |||||||||
| Valero Energy Corp. | 486 | 32,037 | |||||||||
| Shares | Value | ||||||||||
| Financials 16.7% | $2,253,780 | ||||||||||
| Banks 4.6% | |||||||||||
| Bank of America Corp. | 3,944 | 66,180 | |||||||||
| BB&T Corp. | 466 | 17,312 | |||||||||
| CIT Group, Inc. | 250 | 10,750 | |||||||||
| Citigroup, Inc. | 1,066 | 56,679 | |||||||||
| Citizens Financial Group, Inc. | 190 | 4,617 | |||||||||
| City National Corp. | 20 | 1,792 | |||||||||
| Comerica, Inc. | 230 | 9,982 | |||||||||
| East West Bancorp, Inc. | 136 | 5,493 | |||||||||
| Fifth Third Bancorp | 1,106 | 21,069 | |||||||||
| First Republic Bank | 140 | 9,143 | |||||||||
| Huntington Bancshares, Inc. | 1,086 | 11,913 | |||||||||
| JPMorgan Chase & Co. | 1,852 | 118,991 | |||||||||
| KeyCorp | 1,136 | 14,109 | |||||||||
| M&T Bank Corp. | 150 | 17,978 | |||||||||
| People's United Financial, Inc. | 330 | 5,264 | |||||||||
| Regions Financial Corp. | 1,696 | 15,858 | |||||||||
| Signature Bank (I) | 40 | 5,957 | |||||||||
| SunTrust Banks, Inc. | 630 | 26,158 | |||||||||
| SVB Financial Group (I) | 40 | 4,883 | |||||||||
| The PNC Financial Services Group, Inc. | 270 | 24,370 | |||||||||
| U.S. Bancorp | 916 | 38,637 | |||||||||
| Wells Fargo & Company | 2,222 | 120,299 | |||||||||
| Zions Bancorporation | 200 | 5,754 | |||||||||
| Capital markets 2.3% | |||||||||||
| Affiliated Managers Group, Inc. (I) | 66 | 11,897 | |||||||||
| Ameriprise Financial, Inc. | 286 | 32,993 | |||||||||
| BlackRock, Inc. | 53 | 18,654 | |||||||||
| E*TRADE Financial Corp. (I) | 210 | 5,987 | |||||||||
| Franklin Resources, Inc. | 280 | 11,413 | |||||||||
| Invesco, Ltd. | 456 | 15,126 | |||||||||
| Legg Mason, Inc. | 146 | 6,534 | |||||||||
| Morgan Stanley | 670 | 22,090 | |||||||||
| Northern Trust Corp. | 250 | 17,598 | |||||||||
| Raymond James Financial, Inc. | 146 | 8,046 | |||||||||
| SEI Investments Company | 210 | 10,882 | |||||||||
| State Street Corp. | 296 | 20,424 | |||||||||
| T. Rowe Price Group, Inc. | 280 | 21,174 | |||||||||
| TD Ameritrade Holding Corp. | 400 | 13,788 | |||||||||
| The Bank of New York Mellon Corp. | 686 | 28,572 | |||||||||
| The Charles Schwab Corp. | 620 | 18,922 | |||||||||
| The Goldman Sachs Group, Inc. | 230 | 43,125 | |||||||||
| Shares | Value | ||||||||||
| Financials (continued) | |||||||||||
| Consumer finance 0.8% | |||||||||||
| Ally Financial, Inc. (I) | 360 | $7,171 | |||||||||
| American Express Company | 510 | 37,363 | |||||||||
| Capital One Financial Corp. | 406 | 32,033 | |||||||||
| Discover Financial Services | 466 | 26,199 | |||||||||
| LendingClub Corp. (I) | 60 | 851 | |||||||||
| Navient Corp. | 260 | 3,429 | |||||||||
| Santander Consumer USA Holdings, Inc. (I) | 90 | 1,621 | |||||||||
| Springleaf Holdings, Inc. (I) | 20 | 938 | |||||||||
| Synchrony Financial (I) | 50 | 1,538 | |||||||||
| Diversified financial services 1.7% | |||||||||||
| Berkshire Hathaway, Inc., Class B (I) | 754 | 102,559 | |||||||||
| CBOE Holdings, Inc. | 40 | 2,682 | |||||||||
| CME Group, Inc. | 226 | 21,350 | |||||||||
| FactSet Research Systems, Inc. | 50 | 8,756 | |||||||||
| Intercontinental Exchange, Inc. | 70 | 17,668 | |||||||||
| Leucadia National Corp. | 300 | 6,003 | |||||||||
| McGraw Hill Financial, Inc. | 240 | 22,234 | |||||||||
| Moody's Corp. | 250 | 24,040 | |||||||||
| MSCI, Inc. | 120 | 8,040 | |||||||||
| NASDAQ, Inc. | 160 | 9,262 | |||||||||
| Voya Financial, Inc. | 160 | 6,491 | |||||||||
| Insurance 4.0% | |||||||||||
| ACE, Ltd. | 240 | 27,250 | |||||||||
| Aflac, Inc. | 310 | 19,763 | |||||||||
| Alleghany Corp. (I) | 20 | 9,925 | |||||||||
| American Financial Group, Inc. | 140 | 10,107 | |||||||||
| American International Group, Inc. | 530 | 33,422 | |||||||||
| AmTrust Financial Services, Inc. | 10 | 682 | |||||||||
| Aon PLC | 228 | 21,275 | |||||||||
| Arch Capital Group, Ltd. (I) | 160 | 11,982 | |||||||||
| Arthur J. Gallagher & Company | 150 | 6,560 | |||||||||
| Assurant, Inc. | 20 | 1,631 | |||||||||
| Axis Capital Holdings, Ltd. | 160 | 8,640 | |||||||||
| Brown & Brown, Inc. | 130 | 4,195 | |||||||||
| Cincinnati Financial Corp. | 190 | 11,444 | |||||||||
| CNA Financial Corp. | 46 | 1,682 | |||||||||
| Everest Re Group, Ltd. | 70 | 12,458 | |||||||||
| FNF Group | 160 | 5,645 | |||||||||
| Lincoln National Corp. | 360 | 19,264 | |||||||||
| Loews Corp. | 380 | 13,855 | |||||||||
| Markel Corp. (I) | 12 | 10,416 | |||||||||
| Marsh & McLennan Companies, Inc. | 318 | 17,725 | |||||||||
| Shares | Value | ||||||||||
| Financials (continued) | |||||||||||
| Insurance (continued) | |||||||||||
| MetLife, Inc. | 376 | $18,943 | |||||||||
| PartnerRe, Ltd. | 80 | 11,120 | |||||||||
| Principal Financial Group, Inc. | 430 | 21,569 | |||||||||
| Prudential Financial, Inc. | 300 | 24,750 | |||||||||
| Reinsurance Group of America, Inc. | 110 | 9,926 | |||||||||
| RenaissanceRe Holdings, Ltd. | 19 | 2,083 | |||||||||
| StanCorp Financial Group, Inc. | 10 | 1,147 | |||||||||
| The Allstate Corp. | 420 | 25,990 | |||||||||
| The Chubb Corp. | 190 | 24,577 | |||||||||
| The Hartford Financial Services Group, Inc. | 746 | 34,510 | |||||||||
| The Progressive Corp. | 726 | 24,052 | |||||||||
| The Travelers Companies, Inc. | 390 | 44,027 | |||||||||
| Torchmark Corp. | 170 | 9,862 | |||||||||
| Unum Group | 396 | 13,721 | |||||||||
| W.R. Berkley Corp. | 190 | 10,608 | |||||||||
| Willis Group Holdings PLC | 170 | 7,584 | |||||||||
| XL Group PLC | 346 | 13,176 | |||||||||
| Real estate investment trusts 3.0% | |||||||||||
| Alexandria Real Estate Equities, Inc. | 60 | 5,384 | |||||||||
| American Tower Corp. | 200 | 20,446 | |||||||||
| Apartment Investment & Management Company, Class A | 110 | 4,311 | |||||||||
| AvalonBay Communities, Inc. | 106 | 18,532 | |||||||||
| Boston Properties, Inc. | 120 | 15,102 | |||||||||
| Brixmor Property Group, Inc. | 80 | 2,050 | |||||||||
| Camden Property Trust | 70 | 5,165 | |||||||||
| Crown Castle International Corp. | 200 | 17,092 | |||||||||
| DDR Corp. | 226 | 3,797 | |||||||||
| Digital Realty Trust, Inc. | 100 | 7,396 | |||||||||
| Duke Realty Corp. | 260 | 5,382 | |||||||||
| Equinix, Inc. | 50 | 14,834 | |||||||||
| Equity LifeStyle Properties, Inc. | 20 | 1,210 | |||||||||
| Equity Residential | 230 | 17,784 | |||||||||
| Essex Property Trust, Inc. | 45 | 9,920 | |||||||||
| Extra Space Storage, Inc. | 80 | 6,339 | |||||||||
| Federal Realty Investment Trust | 60 | 8,609 | |||||||||
| General Growth Properties, Inc. | 380 | 11,001 | |||||||||
| HCP, Inc. | 326 | 12,127 | |||||||||
| Host Hotels & Resorts, Inc. | 636 | 11,022 | |||||||||
| Iron Mountain, Inc. | 230 | 7,047 | |||||||||
| Kilroy Realty Corp. | 60 | 3,950 | |||||||||
| Kimco Realty Corp. | 350 | 9,370 | |||||||||
| Lamar Advertising Company, Class A | 20 | 1,129 | |||||||||
| Liberty Property Trust | 110 | 3,742 | |||||||||
| Shares | Value | ||||||||||
| Financials (continued) | |||||||||||
| Real estate investment trusts (continued) | |||||||||||
| Mid-America Apartment Communities, Inc. | 40 | $3,408 | |||||||||
| National Retail Properties, Inc. | 50 | 1,900 | |||||||||
| Omega Healthcare Investors, Inc. | 60 | 2,071 | |||||||||
| Plum Creek Timber Company, Inc. | 190 | 7,741 | |||||||||
| Prologis, Inc. | 330 | 14,101 | |||||||||
| Public Storage | 90 | 20,651 | |||||||||
| Realty Income Corp. | 170 | 8,408 | |||||||||
| Regency Centers Corp. | 80 | 5,437 | |||||||||
| Simon Property Group, Inc. | 140 | 28,204 | |||||||||
| SL Green Realty Corp. | 80 | 9,490 | |||||||||
| Spirit Realty Capital, Inc. | 70 | 713 | |||||||||
| The Macerich Company | 120 | 10,169 | |||||||||
| UDR, Inc. | 196 | 6,754 | |||||||||
| Ventas, Inc. | 220 | 11,818 | |||||||||
| Vornado Realty Trust | 160 | 16,088 | |||||||||
| Welltower, Inc. | 220 | 14,271 | |||||||||
| Weyerhaeuser Company | 686 | 20,120 | |||||||||
| WP Carey, Inc. | 50 | 3,169 | |||||||||
| Real estate management and development 0.2% | |||||||||||
| CBRE Group, Inc., Class A (I) | 320 | 11,930 | |||||||||
| Forest City Enterprises, Inc., Class A (I) | 80 | 1,768 | |||||||||
| Jones Lang LaSalle, Inc. | 40 | 6,668 | |||||||||
| Realogy Holdings Corp. (I) | 90 | 3,519 | |||||||||
| The Howard Hughes Corp. (I) | 20 | 2,472 | |||||||||
| Thrifts and mortgage finance 0.1% | |||||||||||
| Hudson City Bancorp, Inc. | 520 | 5,262 | |||||||||
| New York Community Bancorp, Inc. | 516 | 8,524 | |||||||||
| TFS Financial Corp. | 10 | 176 | |||||||||
| Health care 13.5% | 1,811,953 | ||||||||||
| Biotechnology 2.5% | |||||||||||
| AbbVie, Inc. | 456 | 27,155 | |||||||||
| Alexion Pharmaceuticals, Inc. (I) | 100 | 17,600 | |||||||||
| Alkermes PLC (I) | 80 | 5,754 | |||||||||
| Alnylam Pharmaceuticals, Inc. (I) | 30 | 2,579 | |||||||||
| Amgen, Inc. | 350 | 55,363 | |||||||||
| Anacor Pharmaceuticals, Inc. (I) | 10 | 1,124 | |||||||||
| Baxalta, Inc. | 80 | 2,757 | |||||||||
| Biogen, Inc. (I) | 116 | 33,699 | |||||||||
| BioMarin Pharmaceutical, Inc. (I) | 90 | 10,534 | |||||||||
| Bluebird Bio, Inc. (I) | 10 | 771 | |||||||||
| Celgene Corp. (I) | 316 | 38,776 | |||||||||
| Gilead Sciences, Inc. | 706 | 76,340 | |||||||||
| Shares | Value | ||||||||||
| Health care (continued) | |||||||||||
| Biotechnology (continued) | |||||||||||
| Incyte Corp. (I) | 99 | $11,635 | |||||||||
| Intercept Pharmaceuticals, Inc. (I) | 6 | 943 | |||||||||
| Intrexon Corp. (I) | 10 | 336 | |||||||||
| Isis Pharmaceuticals, Inc. (I) | 50 | 2,408 | |||||||||
| Medivation, Inc. (I) | 100 | 4,206 | |||||||||
| OPKO Health, Inc. (I) | 90 | 851 | |||||||||
| Regeneron Pharmaceuticals, Inc. (I) | 40 | 22,296 | |||||||||
| Seattle Genetics, Inc. (I) | 20 | 830 | |||||||||
| United Therapeutics Corp. (I) | 30 | 4,399 | |||||||||
| Vertex Pharmaceuticals, Inc. (I) | 120 | 14,969 | |||||||||
| Health care equipment and supplies 2.7% | |||||||||||
| Abbott Laboratories | 906 | 40,589 | |||||||||
| Baxter International, Inc. | 816 | 30,510 | |||||||||
| Becton, Dickinson and Company | 180 | 25,654 | |||||||||
| Boston Scientific Corp. (I) | 1,372 | 25,080 | |||||||||
| C.R. Bard, Inc. | 130 | 24,226 | |||||||||
| DENTSPLY International, Inc. | 200 | 12,170 | |||||||||
| DexCom, Inc. (I) | 10 | 833 | |||||||||
| Edwards Lifesciences Corp. (I) | 117 | 18,387 | |||||||||
| Hologic, Inc. (I) | 320 | 12,435 | |||||||||
| IDEXX Laboratories, Inc. (I) | 130 | 8,921 | |||||||||
| Intuitive Surgical, Inc. (I) | 35 | 17,381 | |||||||||
| Medtronic PLC | 586 | 43,317 | |||||||||
| ResMed, Inc. | 150 | 8,642 | |||||||||
| Sirona Dental Systems, Inc. (I) | 30 | 3,274 | |||||||||
| St. Jude Medical, Inc. | 400 | 25,524 | |||||||||
| Stryker Corp. | 210 | 20,080 | |||||||||
| Teleflex, Inc. | 20 | 2,660 | |||||||||
| The Cooper Companies, Inc. | 50 | 7,618 | |||||||||
| Varian Medical Systems, Inc. (I) | 170 | 13,350 | |||||||||
| Zimmer Biomet Holdings, Inc. | 250 | 26,143 | |||||||||
| Health care providers and services 3.5% | |||||||||||
| Acadia Healthcare Company, Inc. (I) | 20 | 1,228 | |||||||||
| Aetna, Inc. | 386 | 44,305 | |||||||||
| AmerisourceBergen Corp. | 210 | 20,267 | |||||||||
| Anthem, Inc. | 250 | 34,788 | |||||||||
| Brookdale Senior Living, Inc. (I) | 80 | 1,673 | |||||||||
| Cardinal Health, Inc. | 256 | 21,043 | |||||||||
| Centene Corp. (I) | 80 | 4,758 | |||||||||
| Cigna Corp. | 240 | 32,170 | |||||||||
| Community Health Systems, Inc. (I) | 140 | 3,926 | |||||||||
| DaVita HealthCare Partners, Inc. (I) | 390 | 30,229 | |||||||||
| Shares | Value | ||||||||||
| Health care (continued) | |||||||||||
| Health care providers and services (continued) | |||||||||||
| Envision Healthcare Holdings, Inc. (I) | 120 | $3,384 | |||||||||
| Express Scripts Holding Company (I) | 350 | 30,233 | |||||||||
| HCA Holdings, Inc. (I) | 160 | 11,006 | |||||||||
| Health Net, Inc. (I) | 20 | 1,285 | |||||||||
| Henry Schein, Inc. (I) | 126 | 19,115 | |||||||||
| Humana, Inc. | 170 | 30,367 | |||||||||
| Laboratory Corp. of America Holdings (I) | 180 | 22,093 | |||||||||
| McKesson Corp. | 150 | 26,820 | |||||||||
| MEDNAX, Inc. (I) | 110 | 7,752 | |||||||||
| Patterson Companies, Inc. | 160 | 7,584 | |||||||||
| Premier, Inc., Class A (I) | 10 | 338 | |||||||||
| Quest Diagnostics, Inc. | 320 | 21,744 | |||||||||
| Tenet Healthcare Corp. (I) | 30 | 941 | |||||||||
| UnitedHealth Group, Inc. | 610 | 71,846 | |||||||||
| Universal Health Services, Inc., Class B | 166 | 20,267 | |||||||||
| Health care technology 0.2% | |||||||||||
| athenahealth, Inc. (I) | 10 | 1,525 | |||||||||
| Cerner Corp. (I) | 350 | 23,202 | |||||||||
| IMS Health Holdings, Inc. (I) | 60 | 1,633 | |||||||||
| Life sciences tools and services 0.7% | |||||||||||
| Agilent Technologies, Inc. | 470 | 17,747 | |||||||||
| Illumina, Inc. (I) | 80 | 11,462 | |||||||||
| Mettler-Toledo International, Inc. (I) | 40 | 12,440 | |||||||||
| PerkinElmer, Inc. | 100 | 5,164 | |||||||||
| Quintiles Transnational Holdings, Inc. (I) | 40 | 2,546 | |||||||||
| Thermo Fisher Scientific, Inc. | 216 | 28,248 | |||||||||
| Waters Corp. (I) | 150 | 19,170 | |||||||||
| Pharmaceuticals 3.9% | |||||||||||
| Akorn, Inc. (I) | 20 | 535 | |||||||||
| Allergan PLC (I) | 120 | 37,016 | |||||||||
| Bristol-Myers Squibb Company | 666 | 43,923 | |||||||||
| Eli Lilly & Company | 470 | 38,338 | |||||||||
| Endo International PLC (I) | 160 | 9,598 | |||||||||
| Horizon Pharma PLC (I) | 30 | 472 | |||||||||
| Jazz Pharmaceuticals PLC (I) | 50 | 6,864 | |||||||||
| Johnson & Johnson | 1,386 | 140,028 | |||||||||
| Mallinckrodt PLC (I) | 70 | 4,597 | |||||||||
| Merck & Company, Inc. | 1,356 | 74,119 | |||||||||
| Mylan NV (I) | 316 | 13,932 | |||||||||
| Perrigo Company PLC | 130 | 20,506 | |||||||||
| Pfizer, Inc. | 3,328 | 112,553 | |||||||||
| Zoetis, Inc. | 350 | 15,054 | |||||||||
| Shares | Value | ||||||||||
| Industrials 12.0% | $1,612,071 | ||||||||||
| Aerospace and defense 2.7% | |||||||||||
| B/E Aerospace, Inc. | 140 | 6,573 | |||||||||
| General Dynamics Corp. | 160 | 23,773 | |||||||||
| Hexcel Corp. | 50 | 2,316 | |||||||||
| Honeywell International, Inc. | 356 | 36,768 | |||||||||
| Huntington Ingalls Industries, Inc. | 40 | 4,798 | |||||||||
| L-3 Communications Holdings, Inc. | 130 | 16,432 | |||||||||
| Lockheed Martin Corp. | 156 | 34,293 | |||||||||
| Northrop Grumman Corp. | 180 | 33,795 | |||||||||
| Precision Castparts Corp. | 110 | 25,389 | |||||||||
| Raytheon Company | 300 | 35,220 | |||||||||
| Rockwell Collins, Inc. | 246 | 21,333 | |||||||||
| Spirit AeroSystems Holdings, Inc., Class A (I) | 70 | 3,692 | |||||||||
| Textron, Inc. | 356 | 15,013 | |||||||||
| The Boeing Company | 328 | 48,567 | |||||||||
| TransDigm Group, Inc. (I) | 50 | 10,993 | |||||||||
| United Technologies Corp. | 486 | 47,827 | |||||||||
| Air freight and logistics 0.7% | |||||||||||
| C.H. Robinson Worldwide, Inc. | 200 | 13,876 | |||||||||
| Expeditors International of Washington, Inc. | 240 | 11,950 | |||||||||
| FedEx Corp. | 216 | 33,707 | |||||||||
| United Parcel Service, Inc., Class B | 300 | 30,906 | |||||||||
| Airlines 0.8% | |||||||||||
| Alaska Air Group, Inc. | 166 | 12,658 | |||||||||
| American Airlines Group, Inc. | 230 | 10,631 | |||||||||
| Delta Air Lines, Inc. | 646 | 32,843 | |||||||||
| JetBlue Airways Corp. (I) | 190 | 4,720 | |||||||||
| Southwest Airlines Company | 578 | 26,756 | |||||||||
| United Continental Holdings, Inc. (I) | 426 | 25,692 | |||||||||
| Building products 0.2% | |||||||||||
| Allegion PLC | 60 | 3,910 | |||||||||
| AO Smith Corp. | 30 | 2,305 | |||||||||
| Fortune Brands Home & Security, Inc. | 140 | 7,326 | |||||||||
| Lennox International, Inc. | 20 | 2,656 | |||||||||
| Masco Corp. | 330 | 9,570 | |||||||||
| Owens Corning | 60 | 2,732 | |||||||||
| Commercial services and supplies 0.9% | |||||||||||
| Cintas Corp. | 150 | 13,964 | |||||||||
| KAR Auction Services, Inc. | 70 | 2,688 | |||||||||
| Republic Services, Inc. | 476 | 20,820 | |||||||||
| Rollins, Inc. | 70 | 1,877 | |||||||||
| Stericycle, Inc. (I) | 90 | 10,923 | |||||||||
| The ADT Corp. | 166 | 5,485 | |||||||||
| Shares | Value | ||||||||||
| Industrials (continued) | |||||||||||
| Commercial services and supplies (continued) | |||||||||||
| Tyco International PLC | 596 | $21,718 | |||||||||
| Waste Connections, Inc. | 150 | 8,172 | |||||||||
| Waste Management, Inc. | 646 | 34,729 | |||||||||
| Construction and engineering 0.2% | |||||||||||
| Chicago Bridge & Iron Company NV | 90 | 4,038 | |||||||||
| Fluor Corp. | 240 | 11,474 | |||||||||
| Jacobs Engineering Group, Inc. (I) | 156 | 6,262 | |||||||||
| Quanta Services, Inc. (I) | 240 | 4,826 | |||||||||
| Electrical equipment 0.7% | |||||||||||
| Acuity Brands, Inc. | 30 | 6,558 | |||||||||
| AMETEK, Inc. | 296 | 16,227 | |||||||||
| Eaton Corp. PLC | 340 | 19,009 | |||||||||
| Emerson Electric Company | 406 | 19,175 | |||||||||
| Hubbell, Inc., Class B | 60 | 5,811 | |||||||||
| Rockwell Automation, Inc. | 180 | 19,649 | |||||||||
| Sensata Technologies Holding NV (I) | 140 | 6,733 | |||||||||
| SolarCity Corp. (I) | 10 | 297 | |||||||||
| Industrial conglomerates 1.8% | |||||||||||
| 3M Company | 356 | 55,967 | |||||||||
| Carlisle Companies, Inc. | 70 | 6,090 | |||||||||
| Danaher Corp. | 300 | 27,993 | |||||||||
| General Electric Company | 4,452 | 128,752 | |||||||||
| Roper Technologies, Inc. | 110 | 20,499 | |||||||||
| Machinery 2.1% | |||||||||||
| Allison Transmission Holdings, Inc. | 140 | 4,018 | |||||||||
| Caterpillar, Inc. | 320 | 23,357 | |||||||||
| Colfax Corp. (I) | 50 | 1,348 | |||||||||
| Cummins, Inc. | 180 | 18,632 | |||||||||
| Deere & Company | 280 | 21,840 | |||||||||
| Donaldson Company, Inc. | 176 | 5,315 | |||||||||
| Dover Corp. | 320 | 20,618 | |||||||||
| Flowserve Corp. | 210 | 9,736 | |||||||||
| IDEX Corp. | 90 | 6,908 | |||||||||
| Illinois Tool Works, Inc. | 276 | 25,375 | |||||||||
| Ingersoll-Rand PLC | 370 | 21,926 | |||||||||
| Lincoln Electric Holdings, Inc. | 70 | 4,187 | |||||||||
| PACCAR, Inc. | 386 | 20,323 | |||||||||
| Parker-Hannifin Corp. | 266 | 27,850 | |||||||||
| Pentair PLC | 150 | 8,388 | |||||||||
| Snap-on, Inc. | 70 | 11,612 | |||||||||
| Stanley Black & Decker, Inc. | 200 | 21,196 | |||||||||
| The Middleby Corp. (I) | 40 | 4,678 | |||||||||
| Shares | Value | ||||||||||
| Industrials (continued) | |||||||||||
| Machinery (continued) | |||||||||||
| WABCO Holdings, Inc. (I) | 60 | $6,734 | |||||||||
| Wabtec Corp. | 80 | 6,630 | |||||||||
| Xylem, Inc. | 170 | 6,190 | |||||||||
| Professional services 0.5% | |||||||||||
| Equifax, Inc. | 190 | 20,248 | |||||||||
| IHS, Inc., Class A (I) | 59 | 7,053 | |||||||||
| ManpowerGroup, Inc. | 130 | 11,931 | |||||||||
| Robert Half International, Inc. | 170 | 8,952 | |||||||||
| Towers Watson & Company, Class A | 70 | 8,649 | |||||||||
| TransUnion (I) | 10 | 257 | |||||||||
| Verisk Analytics, Inc. (I) | 130 | 9,309 | |||||||||
| Road and rail 1.1% | |||||||||||
| AMERCO | 10 | 4,063 | |||||||||
| Avis Budget Group, Inc. (I) | 60 | 2,996 | |||||||||
| CSX Corp. | 1,086 | 29,311 | |||||||||
| Hertz Global Holdings, Inc. (I) | 596 | 11,622 | |||||||||
| J.B. Hunt Transport Services, Inc. | 160 | 12,219 | |||||||||
| Kansas City Southern | 100 | 8,276 | |||||||||
| Norfolk Southern Corp. | 308 | 24,649 | |||||||||
| Old Dominion Freight Line, Inc. (I) | 50 | 3,097 | |||||||||
| Ryder Systems, Inc. | 40 | 2,871 | |||||||||
| Union Pacific Corp. | 506 | 45,211 | |||||||||
| Trading companies and distributors 0.3% | |||||||||||
| Fastenal Company | 310 | 12,140 | |||||||||
| HD Supply Holdings, Inc. (I) | 90 | 2,681 | |||||||||
| United Rentals, Inc. (I) | 90 | 6,737 | |||||||||
| W.W. Grainger, Inc. | 100 | 21,000 | |||||||||
| Transportation infrastructure 0.0% | |||||||||||
| Macquarie Infrastructure Company LLC | 40 | 3,182 | |||||||||
| Information technology 18.5% | 2,485,301 | ||||||||||
| Communications equipment 1.3% | |||||||||||
| Brocade Communications Systems, Inc. | 256 | 2,668 | |||||||||
| Cisco Systems, Inc. | 2,582 | 74,491 | |||||||||
| CommScope Holding Company, Inc. (I) | 86 | 2,789 | |||||||||
| F5 Networks, Inc. (I) | 79 | 8,706 | |||||||||
| Harris Corp. | 190 | 15,035 | |||||||||
| Juniper Networks, Inc. | 486 | 15,256 | |||||||||
| Motorola Solutions, Inc. | 190 | 13,294 | |||||||||
| Palo Alto Networks, Inc. (I) | 30 | 4,830 | |||||||||
| QUALCOMM, Inc. | 718 | 42,664 | |||||||||
| Shares | Value | ||||||||||
| Information technology (continued) | |||||||||||
| Electronic equipment, instruments and components 0.8% | |||||||||||
| Amphenol Corp., Class A | 480 | $26,026 | |||||||||
| Arrow Electronics, Inc. (I) | 160 | 8,798 | |||||||||
| Avnet, Inc. | 200 | 9,086 | |||||||||
| CDW Corp. | 100 | 4,469 | |||||||||
| Corning, Inc. | 986 | 18,340 | |||||||||
| Fitbit, Inc., Class A (I) | 10 | 405 | |||||||||
| Flextronics International, Ltd. (I) | 1,036 | 11,800 | |||||||||
| Keysight Technologies, Inc. (I) | 100 | 3,308 | |||||||||
| TE Connectivity, Ltd. | 376 | 24,229 | |||||||||
| Trimble Navigation, Ltd. (I) | 240 | 5,460 | |||||||||
| Internet software and services 2.3% | |||||||||||
| Akamai Technologies, Inc. (I) | 190 | 11,556 | |||||||||
| Alphabet, Inc., Class A (I) | 206 | 151,902 | |||||||||
| Alphabet, Inc., Class C (I) | 13 | 9,241 | |||||||||
| CoStar Group, Inc. (I) | 20 | 4,061 | |||||||||
| eBay, Inc. (I) | 1,136 | 31,694 | |||||||||
| Facebook, Inc., Class A (I) | 440 | 44,867 | |||||||||
| InterActiveCorp | 90 | 6,031 | |||||||||
| LinkedIn Corp., Class A (I) | 30 | 7,226 | |||||||||
| MercadoLibre, Inc. | 10 | 984 | |||||||||
| Rackspace Hosting, Inc. (I) | 90 | 2,327 | |||||||||
| Twitter, Inc. (I) | 70 | 1,992 | |||||||||
| VeriSign, Inc. (I) | 140 | 11,284 | |||||||||
| Yahoo!, Inc. (I) | 586 | 20,873 | |||||||||
| IT services 3.8% | |||||||||||
| Accenture PLC, Class A | 380 | 40,736 | |||||||||
| Alliance Data Systems Corp. (I) | 90 | 26,758 | |||||||||
| Amdocs, Ltd. | 286 | 17,037 | |||||||||
| Automatic Data Processing, Inc. | 376 | 32,708 | |||||||||
| Broadridge Financial Solutions, Inc. | 86 | 5,124 | |||||||||
| Cognizant Technology Solutions Corp., Class A (I) | 380 | 25,882 | |||||||||
| Computer Sciences Corp. | 270 | 17,979 | |||||||||
| Fidelity National Information Services, Inc. | 366 | 26,689 | |||||||||
| Fiserv, Inc. (I) | 400 | 38,604 | |||||||||
| FleetCor Technologies, Inc. (I) | 67 | 9,706 | |||||||||
| Gartner, Inc. (I) | 100 | 9,067 | |||||||||
| Genpact, Ltd. (I) | 70 | 1,735 | |||||||||
| Global Payments, Inc. | 50 | 6,821 | |||||||||
| IBM Corp. | 450 | 63,036 | |||||||||
| Jack Henry & Associates, Inc. | 70 | 5,414 | |||||||||
| MasterCard, Inc., Class A | 539 | 53,356 | |||||||||
| Paychex, Inc. | 388 | 20,013 | |||||||||
| Shares | Value | ||||||||||
| Information technology (continued) | |||||||||||
| IT services (continued) | |||||||||||
| PayPal Holdings, Inc. (I) | 136 | $4,897 | |||||||||
| Sabre Corp. | 60 | 1,759 | |||||||||
| The Western Union Company | 696 | 13,398 | |||||||||
| Total System Services, Inc. | 260 | 13,637 | |||||||||
| Vantiv, Inc., Class A (I) | 70 | 3,511 | |||||||||
| Visa, Inc., Class A | 756 | 58,650 | |||||||||
| Xerox Corp. | 1,466 | 13,766 | |||||||||
| Semiconductors and semiconductor equipment 3.0% | |||||||||||
| Altera Corp. | 366 | 19,233 | |||||||||
| Analog Devices, Inc. | 420 | 25,250 | |||||||||
| Applied Materials, Inc. | 966 | 16,200 | |||||||||
| Avago Technologies, Ltd. | 180 | 22,163 | |||||||||
| Broadcom Corp., Class A | 450 | 23,130 | |||||||||
| First Solar, Inc. (I) | 30 | 1,712 | |||||||||
| Freescale Semiconductor, Ltd. (I) | 70 | 2,344 | |||||||||
| Intel Corp. | 3,108 | 105,237 | |||||||||
| KLA-Tencor Corp. | 270 | 18,122 | |||||||||
| Lam Research Corp. | 200 | 15,318 | |||||||||
| Linear Technology Corp. | 320 | 14,214 | |||||||||
| Marvell Technology Group, Ltd. | 560 | 4,598 | |||||||||
| Maxim Integrated Products, Inc. | 370 | 15,163 | |||||||||
| Microchip Technology, Inc. | 260 | 12,555 | |||||||||
| Micron Technology, Inc. (I) | 906 | 15,003 | |||||||||
| NVIDIA Corp. | 656 | 18,611 | |||||||||
| Qorvo, Inc. (I) | 80 | 3,514 | |||||||||
| Skyworks Solutions, Inc. | 206 | 15,911 | |||||||||
| Texas Instruments, Inc. | 616 | 34,940 | |||||||||
| Xilinx, Inc. | 386 | 18,381 | |||||||||
| Software 3.7% | |||||||||||
| Activision Blizzard, Inc. | 636 | 22,107 | |||||||||
| Adobe Systems, Inc. (I) | 240 | 21,278 | |||||||||
| ANSYS, Inc. (I) | 90 | 8,578 | |||||||||
| Autodesk, Inc. (I) | 230 | 12,694 | |||||||||
| CA, Inc. | 546 | 15,130 | |||||||||
| Cadence Design Systems, Inc. (I) | 230 | 5,111 | |||||||||
| CDK Global, Inc. | 70 | 3,485 | |||||||||
| Citrix Systems, Inc. (I) | 190 | 15,599 | |||||||||
| Electronic Arts, Inc. (I) | 310 | 22,342 | |||||||||
| FireEye, Inc. (I) | 50 | 1,308 | |||||||||
| Fortinet, Inc. (I) | 40 | 1,374 | |||||||||
| Intuit, Inc. | 210 | 20,460 | |||||||||
| Microsoft Corp. | 3,593 | 189,136 | |||||||||
| Shares | Value | ||||||||||
| Information technology (continued) | |||||||||||
| Software (continued) | |||||||||||
| NetSuite, Inc. (I) | 20 | $1,701 | |||||||||
| Nuance Communications, Inc. (I) | 280 | 4,752 | |||||||||
| Oracle Corp. | 1,764 | 68,514 | |||||||||
| Red Hat, Inc. (I) | 176 | 13,923 | |||||||||
| salesforce.com, Inc. (I) | 210 | 16,319 | |||||||||
| ServiceNow, Inc. (I) | 70 | 5,716 | |||||||||
| Splunk, Inc. (I) | 50 | 2,808 | |||||||||
| SS&C Technologies Holdings, Inc. | 30 | 2,225 | |||||||||
| Symantec Corp. | 1,026 | 21,136 | |||||||||
| Synopsys, Inc. (I) | 180 | 8,996 | |||||||||
| Tableau Software, Inc., Class A (I) | 10 | 840 | |||||||||
| The Ultimate Software Group, Inc. (I) | 10 | 2,044 | |||||||||
| Tyler Technologies, Inc. (I) | 10 | 1,704 | |||||||||
| VMware, Inc., Class A (I) | 50 | 3,008 | |||||||||
| Workday, Inc., Class A (I) | 40 | 3,159 | |||||||||
| Technology hardware, storage and peripherals 3.6% | |||||||||||
| Apple, Inc. | 2,777 | 331,821 | |||||||||
| EMC Corp. | 1,106 | 28,999 | |||||||||
| HP, Inc. (I) | 1,156 | 31,166 | |||||||||
| NCR Corp. (I) | 190 | 5,054 | |||||||||
| NetApp, Inc. | 340 | 11,560 | |||||||||
| SanDisk Corp. | 330 | 25,410 | |||||||||
| Seagate Technology PLC | 566 | 21,542 | |||||||||
| Western Digital Corp. | 400 | 26,728 | |||||||||
| Materials 3.8% | 516,728 | ||||||||||
| Chemicals 2.6% | |||||||||||
| Air Products & Chemicals, Inc. | 150 | 20,847 | |||||||||
| Airgas, Inc. | 110 | 10,578 | |||||||||
| Albemarle Corp. | 110 | 5,887 | |||||||||
| Ashland, Inc. | 90 | 9,875 | |||||||||
| Axalta Coating Systems, Ltd. (I) | 56 | 1,547 | |||||||||
| Celanese Corp., Series A | 206 | 14,636 | |||||||||
| CF Industries Holdings, Inc. | 486 | 24,674 | |||||||||
| Cytec Industries, Inc. | 10 | 744 | |||||||||
| E.I. du Pont de Nemours & Company | 476 | 30,178 | |||||||||
| Eastman Chemical Company | 250 | 18,043 | |||||||||
| Ecolab, Inc. | 186 | 22,385 | |||||||||
| FMC Corp. | 200 | 8,142 | |||||||||
| International Flavors & Fragrances, Inc. | 110 | 12,767 | |||||||||
| LyondellBasell Industries NV, Class A | 200 | 18,582 | |||||||||
| Monsanto Company | 220 | 20,508 | |||||||||
| NewMarket Corp. | 10 | 3,937 | |||||||||
| Shares | Value | ||||||||||
| Materials (continued) | |||||||||||
| Chemicals (continued) | |||||||||||
| PPG Industries, Inc. | 186 | $19,392 | |||||||||
| Praxair, Inc. | 180 | 19,996 | |||||||||
| RPM International, Inc. | 150 | 6,857 | |||||||||
| Sigma-Aldrich Corp. | 130 | 18,164 | |||||||||
| The Dow Chemical Company | 536 | 27,695 | |||||||||
| The Mosaic Company | 200 | 6,758 | |||||||||
| The Sherwin-Williams Company | 75 | 20,012 | |||||||||
| The Valspar Corp. | 100 | 8,095 | |||||||||
| W.R. Grace & Company (I) | 60 | 6,018 | |||||||||
| Westlake Chemical Corp. | 40 | 2,411 | |||||||||
| Construction materials 0.2% | |||||||||||
| Martin Marietta Materials, Inc. | 60 | 9,309 | |||||||||
| Vulcan Materials Company | 160 | 15,453 | |||||||||
| Containers and packaging 0.4% | |||||||||||
| Avery Dennison Corp. | 30 | 1,949 | |||||||||
| Ball Corp. | 246 | 16,851 | |||||||||
| Crown Holdings, Inc. (I) | 170 | 9,017 | |||||||||
| Graphic Packaging Holding Company | 120 | 1,699 | |||||||||
| Packaging Corp. of America | 110 | 7,530 | |||||||||
| Sealed Air Corp. | 236 | 11,592 | |||||||||
| WestRock Company | 90 | 4,838 | |||||||||
| Metals and mining 0.4% | |||||||||||
| Alcoa, Inc. | 1,096 | 9,787 | |||||||||
| Freeport-McMoRan, Inc. | 606 | 7,133 | |||||||||
| Newmont Mining Corp. | 286 | 5,566 | |||||||||
| Nucor Corp. | 410 | 17,343 | |||||||||
| Reliance Steel & Aluminum Company | 100 | 5,996 | |||||||||
| Southern Copper Corp. | 180 | 4,997 | |||||||||
| Steel Dynamics, Inc. | 120 | 2,216 | |||||||||
| Paper and forest products 0.2% | |||||||||||
| International Paper Company | 626 | 26,724 | |||||||||
| Telecommunication services 1.6% | 210,495 | ||||||||||
| Diversified telecommunication services 1.4% | |||||||||||
| AT&T, Inc. | 2,532 | 84,847 | |||||||||
| CenturyLink, Inc. | 410 | 11,566 | |||||||||
| Frontier Communications Corp. | 1,016 | 5,222 | |||||||||
| Level 3 Communications, Inc. (I) | 166 | 8,458 | |||||||||
| Verizon Communications, Inc. | 1,612 | 75,571 | |||||||||
| Zayo Group Holdings, Inc. (I) | 10 | 265 | |||||||||
| Wireless telecommunication services 0.2% | |||||||||||
| SBA Communications Corp., Class A (I) | 130 | 15,473 | |||||||||
| Shares | Value | ||||||||||
| Telecommunication services (continued) | |||||||||||
| Wireless telecommunication services (continued) | |||||||||||
| Sprint Corp. (I) | 160 | $757 | |||||||||
| T-Mobile US, Inc. (I) | 220 | 8,336 | |||||||||
| Utilities 4.3% | 576,488 | ||||||||||
| Electric utilities 2.1% | |||||||||||
| American Electric Power Company, Inc. | 470 | 26,626 | |||||||||
| Duke Energy Corp. | 286 | 20,440 | |||||||||
| Edison International | 546 | 33,044 | |||||||||
| Entergy Corp. | 320 | 21,811 | |||||||||
| Eversource Energy | 326 | 16,606 | |||||||||
| Exelon Corp. | 530 | 14,798 | |||||||||
| FirstEnergy Corp. | 436 | 13,603 | |||||||||
| ITC Holdings Corp. | 160 | 5,235 | |||||||||
| NextEra Energy, Inc. | 260 | 26,692 | |||||||||
| OGE Energy Corp. | 240 | 6,842 | |||||||||
| Pepco Holdings, Inc. | 306 | 8,149 | |||||||||
| Pinnacle West Capital Corp. | 176 | 11,178 | |||||||||
| PPL Corp. | 766 | 26,350 | |||||||||
| The Southern Company | 466 | 21,017 | |||||||||
| Westar Energy, Inc. | 148 | 5,876 | |||||||||
| Xcel Energy, Inc. | 786 | 28,005 | |||||||||
| Gas utilities 0.2% | |||||||||||
| AGL Resources, Inc. | 140 | 8,750 | |||||||||
| Atmos Energy Corp. | 90 | 5,670 | |||||||||
| National Fuel Gas Company | 90 | 4,728 | |||||||||
| UGI Corp. | 240 | 8,801 | |||||||||
| Independent power and renewable electricity producers 0.2% | |||||||||||
| AES Corp. | 1,106 | 12,111 | |||||||||
| Calpine Corp. (I) | 386 | 5,987 | |||||||||
| NRG Energy, Inc. | 370 | 4,769 | |||||||||
| Multi-utilities 1.7% | |||||||||||
| Alliant Energy Corp. | 170 | 10,033 | |||||||||
| Ameren Corp. | 360 | 15,725 | |||||||||
| CenterPoint Energy, Inc. | 610 | 11,316 | |||||||||
| CMS Energy Corp. | 360 | 12,985 | |||||||||
| Consolidated Edison, Inc. | 320 | 21,040 | |||||||||
| Dominion Resources, Inc. | 320 | 22,858 | |||||||||
| DTE Energy Company | 276 | 22,519 | |||||||||
| NiSource, Inc. | 686 | 13,144 | |||||||||
| PG&E Corp. | 446 | 23,816 | |||||||||
| Public Service Enterprise Group, Inc. | 776 | 32,041 | |||||||||
| SCANA Corp. | 170 | 10,067 | |||||||||
| Sempra Energy | 160 | 16,386 | |||||||||
| Shares | Value | ||||||||||
| Utilities (continued) | |||||||||||
| Multi-utilities (continued) | |||||||||||
| TECO Energy, Inc. | 60 | $1,620 | |||||||||
| WEC Energy Group, Inc. | 290 | 14,952 | |||||||||
| Water utilities 0.1% | |||||||||||
| American Water Works Company, Inc. | 190 | 10,898 | |||||||||
| Total investments (Cost $12,717,192)† 99.9% | $13,444,899 | ||||||||||
| Other assets and liabilities, net 0.1% | $8,434 | ||||||||||
| Total net assets 100.0% | $13,453,333 | ||||||||||
| The percentage shown for each investment category is the total value of the category as a percentage of the net assets of the fund. | |||||||||||
| Key to Security Abbreviations and Legend | |||||||||||
| (I) | Non-income producing security. | ||||||||||
| † | At 10-31-15, the aggregate cost of investment securities for federal income tax purposes was $12,717,192. Net unrealized appreciation aggregated $727,707, of which $776,136 related to appreciated investment securities and $48,429 related to depreciated investment securities. | ||||||||||
Financial statements
STATEMENT OF ASSETS AND LIABILITIES 10-31-15 (unaudited)
| Assets | |||||||||||||
| Investments, at value (Cost $12,717,192) | $13,444,899 | ||||||||||||
| Receivable for investments sold | 5,571 | ||||||||||||
| Receivable for fund shares sold | 2,680,570 | ||||||||||||
| Dividends receivable | 8,477 | ||||||||||||
| Receivable due from advisor | 7,957 | ||||||||||||
| Other receivables and prepaid expenses | 6,842 | ||||||||||||
| Total assets | 16,154,316 | ||||||||||||
| Liabilities | |||||||||||||
| Due to custodian | 913 | ||||||||||||
| Payable for investments purchased | 2,687,764 | ||||||||||||
| Payable to affiliates | |||||||||||||
| Accounting and legal services fees | 7 | ||||||||||||
| Other liabilities and accrued expenses | 12,299 | ||||||||||||
| Total liabilities | 2,700,983 | ||||||||||||
| Net assets | $13,453,333 | ||||||||||||
| Net assets consist of | |||||||||||||
| Paid-in capital | $12,716,844 | ||||||||||||
| Undistributed net investment income | 8,780 | ||||||||||||
| Accumulated net realized gain (loss) on investments | 2 | ||||||||||||
| Net unrealized appreciation (depreciation) on investments | 727,707 | ||||||||||||
| Net assets | $13,453,333 | ||||||||||||
| Net asset value per share | |||||||||||||
| Based on net asset values and shares outstanding-the fund has an unlimited number of shares authorized with no par value | |||||||||||||
| Net assets | $13,453,333 | ||||||||||||
| Shares outstanding | 504,107 | ||||||||||||
| Net asset value per share | $26.69 | ||||||||||||
STATEMENT OF OPERATIONS For the period ended 10-31-15 (unaudited)1
| Investment income | |||||||||||||||||||||||||||||||||
| Dividends | $11,574 | ||||||||||||||||||||||||||||||||
| Total investment income | 11,574 | ||||||||||||||||||||||||||||||||
| Expenses | |||||||||||||||||||||||||||||||||
| Investment management fees | 2,395 | ||||||||||||||||||||||||||||||||
| Accounting and legal services fees | 136 | ||||||||||||||||||||||||||||||||
| Transfer agent fees | 1,062 | ||||||||||||||||||||||||||||||||
| Printing and postage | 1,246 | ||||||||||||||||||||||||||||||||
| Professional fees | 5,288 | ||||||||||||||||||||||||||||||||
| Custodian fees | 1,768 | ||||||||||||||||||||||||||||||||
| Registration and filing fees | 998 | ||||||||||||||||||||||||||||||||
| Other | 824 | ||||||||||||||||||||||||||||||||
| Total expenses | 13,717 | ||||||||||||||||||||||||||||||||
| Less expense reductions | (10,923 | ) | |||||||||||||||||||||||||||||||
| Net expenses | 2,794 | ||||||||||||||||||||||||||||||||
| Net investment income | 8,780 | ||||||||||||||||||||||||||||||||
| Realized and unrealized gain (loss) | |||||||||||||||||||||||||||||||||
| Net realized gain (loss) on investments | 2 | ||||||||||||||||||||||||||||||||
| Change in net unrealized appreciation (depreciation) of investments | 727,707 | ||||||||||||||||||||||||||||||||
| Net realized and unrealized gain | 727,709 | ||||||||||||||||||||||||||||||||
| Increase in net assets from operations | $736,489 | ||||||||||||||||||||||||||||||||
| 1 | Period from 9-28-15 (commencement of operations) to 10-31-15. | ||||||||||||||||||||||
STATEMENT OF CHANGES IN NET ASSETS
| Period ended 10-31-151 | |||||||||||||||||
| (unaudited) | |||||||||||||||||
| Increase (decrease) in net assets | |||||||||||||||||
| From operations | |||||||||||||||||
| Net investment income | $8,780 | ||||||||||||||||
| Net realized gain | 2 | ||||||||||||||||
| Change in net unrealized appreciation (depreciation) | 727,707 | ||||||||||||||||
| Increase in net assets resulting from operations | 736,489 | ||||||||||||||||
| From fund share transactions | |||||||||||||||||
| Shares issued | 12,616,844 | ||||||||||||||||
| Total from fund share transactions | 12,616,844 | ||||||||||||||||
| Total increase | 13,353,333 | ||||||||||||||||
| Net assets | |||||||||||||||||
| Beginning of period | 100,000 | ||||||||||||||||
| End of period | $13,453,333 | ||||||||||||||||
| Undistributed net investment income | $8,780 | ||||||||||||||||
| Share activity | |||||||||||||||||
| Beginning of period | 4,000 | ||||||||||||||||
| Shares issued | 500,107 | ||||||||||||||||
| End of period | 504,107 | ||||||||||||||||
| 1 | Period from 9-28-15 (commencement of operations) to 10-31-15. | ||||||||||||||||||||||
Financial highlights
| Period ended | 10-31-15 | 1 | |||||||||||||||||||||||||||||||||||||||
| Per share operating performance | |||||||||||||||||||||||||||||||||||||||||
| Net asset value, beginning of period | $24.35 | ||||||||||||||||||||||||||||||||||||||||
| Net investment income2 | 0.03 | ||||||||||||||||||||||||||||||||||||||||
| Net realized and unrealized gain on investments | 2.31 | ||||||||||||||||||||||||||||||||||||||||
| Total from investment operations | 2.34 | ||||||||||||||||||||||||||||||||||||||||
| Net asset value, end of period | $26.69 | ||||||||||||||||||||||||||||||||||||||||
| Total return (%)3 | 9.58 | 4 | |||||||||||||||||||||||||||||||||||||||
| Ratios and supplemental data | |||||||||||||||||||||||||||||||||||||||||
| Net assets, end of period (in millions) | $13 | ||||||||||||||||||||||||||||||||||||||||
| Ratios (as a percentage of average net assets): | |||||||||||||||||||||||||||||||||||||||||
| Expenses before reductions | 1.72 | 5 | |||||||||||||||||||||||||||||||||||||||
| Expenses including reductions | 0.35 | 5 | |||||||||||||||||||||||||||||||||||||||
| Net investment income | 1.10 | 5 | |||||||||||||||||||||||||||||||||||||||
| Portfolio turnover (%)6 | — | 7 | |||||||||||||||||||||||||||||||||||||||
| 1 | Period from 9-28-15 (commencement of operations) to 10-31-15. Unaudited. | |||||||||||||||||||||||||||||||||||||
| 2 | Based on average daily shares outstanding. | |||||||||||||||||||||||||||||||||||||
| 3 | Total returns would have been lower had certain expenses not been reduced during the period. | |||||||||||||||||||||||||||||||||||||
| 4 | Not annualized. | |||||||||||||||||||||||||||||||||||||
| 5 | Annualized. | |||||||||||||||||||||||||||||||||||||
| 6 | Portfolio turnover rate excludes securities received or delivered from in-kind transactions. | |||||||||||||||||||||||||||||||||||||
| 7 | Less than 1%. | |||||||||||||||||||||||||||||||||||||
Note 1 — Organization
John Hancock Multifactor Large Cap ETF (the fund) is a series of the John Hancock Exchange-Traded Fund Trust (the Trust), an open-end management investment company organized as a Massachusetts business trust and registered under the Investment Company Act of 1940, as amended (the 1940 Act). The investment objective of the fund is to seek to provide investment results that closely correspond, before fees and expenses, to the performance of the John Hancock Dimensional Large Cap Index. The John Hancock Dimensional Large Cap Index is designed to comprise a subset of securities in the U.S. Universe issued by companies whose market capitalizations are larger than that of the 801st largest U.S. company at the time of reconstitution.
The fund commenced operations on September 28, 2015.
Note 2 — Significant accounting policies
The financial statements have been prepared in conformity with accounting principles generally accepted in the United States of America (US GAAP), which require management to make certain estimates and assumptions as of the date of the financial statements. Actual results could differ from those estimates and those differences could be significant. The fund qualifies as an investment company under Topic 946 of Accounting Standards Codification of US GAAP.
Events or transactions occurring after the end of the fiscal period through the date that the financial statements were issued have been evaluated in the preparation of the financial statements. The following summarizes the significant accounting policies of the fund:
Security valuation. Investments are stated at value as of the close of regular trading on the New York Stock Exchange (NYSE), normally at 4:00 p.m., Eastern Time. In order to value the securities, the fund uses the following valuation techniques: Equity securities held by the fund are valued at the last sale price or official closing price on the exchange where the security was acquired or most likely will be sold. In the event there were no sales during the day or closing prices are not available, the securities are valued using the last available bid price. Investments by the fund in open-end mutual funds are valued at their respective net asset values each business day. Other portfolio securities and assets, for which reliable market quotations are not readily available, are valued at fair value as determined in good faith by the fund's Pricing Committee following procedures established by the Board of Trustees. The frequency with which these fair valuation procedures are used cannot be predicted and fair value of securities may differ significantly from the value that would have been used had a ready market for such securities existed.
The fund uses a three-tier hierarchy to prioritize the pricing assumptions, referred to as inputs, used in valuation techniques to measure fair value. Level 1 includes securities valued using quoted prices in active markets for identical securities. Level 2 includes securities valued using other significant observable inputs. Observable inputs may include quoted prices for similar securities, interest rates, prepayment speeds and credit risk. Prices for securities valued using these inputs are received from independent pricing vendors and brokers and are based on an evaluation of the inputs described. Level 3 includes securities valued using significant unobservable inputs when market prices are not readily available or reliable, including the fund's own assumptions in determining the fair value of investments. Factors used in determining value may include market or issuer specific events or trends, changes in interest rates and credit quality. The inputs or methodology used for valuing securities are not necessarily an indication of the risks associated with investing in those securities. Changes in valuation techniques and related inputs may result in transfers into or out of an assigned level within the disclosure hierarchy.
As of October 31, 2015, all investments are categorized as Level 1 under the hierarchy described above.
Security transactions and related investment income. Investment security transactions are accounted for on a trade date plus one basis for daily net asset value calculations. However, for financial reporting purposes, investment transactions are reported on trade date. Dividend income is recorded on the ex-date, except for dividends of foreign securities where the dividend may not be known until after the ex-date. In those cases, dividend income, net of withholding taxes, is recorded when the fund becomes aware of the dividends. Gains and losses on securities sold are determined on the basis of identified cost and may include proceeds from litigation.
36
Real estate investment trusts. The fund may invest in real estate investment trusts (REITs). Distributions from REITs may be recorded as income and subsequently characterized by the REIT at the end of the fiscal year as a reduction of cost of investments and/or as a realized gain. As a result, the fund will estimate the components of distributions from these securities. Such estimates are revised when the actual components of the distributions are known.
Overdrafts. Pursuant to the custodian agreement, the fund's custodian may, in its discretion, advance funds to the fund to make properly authorized payments. When such payments result in an overdraft, the fund is obligated to repay the custodian for any overdraft, including any costs or expenses associated with the overdraft. The custodian may have a lien, security interest or security entitlement in any fund property that is not otherwise segregated or pledged, to the maximum extent permitted by law, to the extent of any overdraft.
Expenses. Within the John Hancock group of funds complex, expenses that are directly attributable to an individual fund are allocated to such fund. Expenses that are not readily attributable to a specific fund are allocated among all funds in an equitable manner, taking into consideration, among other things, the nature and type of expense and the fund's relative net assets. Expense estimates are accrued in the period to which they relate and adjustments are made when actual amounts are known.
Federal income taxes. The fund intends to qualify as a regulated investment company by complying with the applicable provisions of the Internal Revenue Code and will not be subject to federal income tax on taxable income that is distributed to shareholders. Therefore, no federal income tax provision is required.
Distribution of income and gains. Distributions to shareholders from net investment income and net realized gains, if any, are recorded on the ex-date. The fund will declare and pay dividends semiannually from net investment income, if any. Capital gain distributions, if any, are typically distributed annually.
Such distributions, on a tax basis, are determined in conformity with income tax regulations, which may differ from US GAAP.
Capital accounts within the financial statements are adjusted for permanent book-tax differences. These adjustments have no impact on net assets or the results of operations. Temporary book-tax differences, if any, will reverse in a subsequent period.
Note 3 — Guarantees and indemnifications
Under the Trust's organizational documents, its Officers and Trustees are indemnified against certain liabilities arising out of the performance of their duties to the Trust, including the fund. Additionally, in the normal course of business, the fund enters into contracts with service providers that contain general indemnification clauses. The fund's maximum exposure under these arrangements is unknown, as this would involve future claims that may be made against the fund that have not yet occurred. The risk of material loss from such claims is considered remote.
Note 4 — Fees and transactions with affiliates
John Hancock Advisers, LLC (the Advisor) serves as investment advisor for the fund. The Advisor is an indirect, wholly owned subsidiary of Manulife Financial Corporation (MFC).
Management fee. The fund has an investment management agreement with the Advisor under which the fund pays a monthly management fee to the Advisor, equivalent on an annual basis, to the sum of: (a) 0.300% of the first $300 million of the fund's average daily net assets; and (b) 0.280% of the fund's average daily net assets in excess of $300 million. The Advisor has a subadvisory agreement with Dimensional Fund Advisors LP. The fund is not responsible for payment of the subadvisory fees.
The Advisor has contractually agreed to waive a portion of its management fee and/or reimburse expenses for certain funds of the John Hancock group of funds complex, including the fund (the participating portfolios). This waiver is based upon aggregate net assets of all the participating portfolios. The amount of the reimbursement is calculated daily and allocated among all the participating portfolios in proportion to the daily net assets of each fund. During the period ended October 31,
37
2015, this waiver amounted to 0.01% of the fund's average net assets (on an annualized basis). This arrangement may be amended or terminated at any time by the Advisor upon notice to the fund and with the approval of the Board of Trustees.
The Advisor has contractually agreed to reduce its management fee or, if necessary, make payment to the fund, in an amount equal to the amount by which expenses of the fund exceed 0.35% of average annual net assets (on an annualized basis). Expenses means all the expenses of the fund, excluding (a) taxes, (b) brokerage commissions, (c) interest expense, (d) litigation and indemnification expenses and other extraordinary expenses not incurred in the ordinary course of the fund's business, (e) borrowing costs, (f) prime brokerage fees, (g) acquired fund fees, and (h) short dividend expenses. The expense limitation expires on August 31, 2017, unless renewed by mutual agreement of the fund and the Advisor based on a determination that this is appropriate under the circumstances at that time.
For the period ended October 31, 2015, the expense reductions described above amounted to $10,923.
The investment management fees, including the impact of the waivers and reimbursements as described above, incurred for the period ended October 31, 2015 were equivalent to a net annual effective rate of 0.00% of the fund's average daily net assets.
Accounting and legal services. Pursuant to a service agreement, the fund reimburses the Advisor for all expenses associated with providing the administrative, financial, legal, accounting and recordkeeping services to the fund, including the preparation of all tax returns, periodic reports to shareholders and regulatory reports, among other services. These accounting and legal services fees incurred for the period ended October 31, 2015 amounted to an annual rate of 0.02% of the fund's average daily net assets.
Trustee expenses. The fund compensates each Trustee who is not an employee of the Advisor or its affiliates. The costs of paying Trustee compensation and expenses are allocated to each fund based on its net assets relative to other funds within the John Hancock group of funds complex.
Note 5 — Capital share transactions
The fund will issue and redeem shares at net asset value (NAV) only in a large specified number of shares, each called a "creation unit," or multiples thereof, that consist of 50,000 shares. Only authorized participants may engage in creation or redemption transactions directly with the fund. Such transactions generally take place when an authorized participant deposits into the fund a designated portfolio of securities (including any portion of such securities for which cash may be substituted) and a specified amount of cash approximating the holdings of the fund in exchange for a specified number of creation units. Authorized participants pay a transaction fee to the custodian when purchasing and redeeming creation units of a fund. The transaction fee is used to defray the costs associated with the issuance and redemption of creation units. Individual shares of the fund may only be purchased and sold in secondary market transactions through brokers. Secondary market transactions may be subject to brokerage commissions. Shares of the fund are listed and traded on the NYSE Arca, Inc., shares trade at market prices rather than NAV, and may trade at a price greater than or less than NAV.
Affiliates of the fund owned 91% of shares outstanding on October 31, 2015.
Note 6 — Purchase and sale of securities
Purchases and sales of securities, other than in-kind transactions and short-term securities, amounted to $31,426 and $15,554, respectively, for the period ended October 31, 2015. Securities received and delivered from in-kind transactions aggregated $12,701,318 and $0, respectively, for the period ended October 31, 2015.
38
EVALUATION OF ADVISORY AND SUBADVISORY AGREEMENTS BY THE BOARD OF TRUSTEES
Approval of Advisory and Subadvisory Agreements
At in-person meetings held on June 23-25, 2015, the Board of Trustees (the Board) of John Hancock Exchange-Traded Fund Trust (the Trust), including all of the Trustees who are not considered to be interested persons of the Trust under the Investment Company Act of 1940, as amended (the 1940 Act) (the Independent Trustees), approved the John Hancock Multifactor Large Cap ETF (the New Fund).
This section describes the evaluation by the Board of:
| (a) | an advisory agreement between the Trust and John Hancock Advisers, LLC (the Advisor) (the Advisory Agreement); and | |
| (b) | a subadvisory agreement between the Advisor and Dimensional Fund Advisors LP (the Subadvisor) with respect to the New Fund (the Subadvisory Agreement). |
In considering the Advisory Agreement and the Subadvisory Agreement with respect to the New Fund, the Board received in advance of the meetings a variety of materials relating to the New Fund, the Advisor and the Subadvisor, including comparative expense information for a peer group of similar exchange-traded funds and a broader universe of exchange-traded funds, simulated performance information of the New Fund's underlying index (Underlying Index) as compared to applicable benchmarks, and other information provided by the Advisor and the Subadvisor regarding the nature, extent, and quality of services to be provided by the Advisor and the Subadvisor under their respective Agreements, as well as information regarding the Advisor's anticipated profitability in connection with its proposed relationship to the New Fund and any compensation paid to affiliates of the Advisor. The Board also took into account discussions with management and information provided to the Board members at prior meetings with respect to the services provided by the Advisor and the Subadvisor to other John Hancock Funds (the Funds), including quarterly performance reports prepared by management containing reviews of investment results, and periodic presentations from the Subadvisor with respect to the other Funds that it manages. The Board also considered the nature, quality, and extent of the non-advisory services, if any, to be provided to the New Fund by the Advisor and/or its affiliates, including administrative services. The Board members also took into account information with respect to the New Fund presented at their March 10-12, 2015 in-person meeting.
Throughout the process, the Board asked questions of and were afforded the opportunity to request additional information from management. The Board is assisted by legal counsel for the Trust, and the Independent Trustees were also separately assisted by independent legal counsel throughout the process. The Independent Trustees also received a memorandum from their independent legal counsel discussing the legal standards for their consideration of the proposed Advisory Agreement and Subadvisory Agreement and discussed the proposed Advisory Agreement and Subadvisory Agreement in private sessions with their independent legal counsel at which no representatives of management were present.
Approval of Advisory Agreement
In approving the Advisory Agreement with respect to the New Fund, the Board, including the Independent Trustees, considered a variety of factors, including those discussed below. The Board also considered other factors (including conditions and trends prevailing generally in the economy, the securities markets and the industry) and did not treat any single factor as determinative, and each Trustee may have attributed different weights to different factors. The Board members' conclusions may have been based in part on its consideration of the advisory and subadvisory arrangements for other Funds in prior years.
Nature, extent, and quality of services. Among the information received by the Board from the Advisor relating to the nature, extent and quality of services to be provided to the New Fund, the Board considered information provided by the Advisor relating to its operations and personnel, descriptions of its organizational and management structure, and information regarding the Advisor's compliance and regulatory history. The Board members also noted that, on a regular basis, they receive and review information from the Funds' Chief Compliance Officer (CCO) regarding the Funds' compliance policies
39
and procedures established pursuant to Rule 38a-1 under the 1940 Act. The Board considered the investment strategy and Underlying Index of the New Fund. The Board also considered the Advisor's risk management processes. The Board considered that the Advisor would be responsible for the management of the day-to-day operations of the New Fund, including but not limited to, general supervision of and coordination of the services to be provided by the Subadvisor, and also would be responsible for monitoring and reviewing the activities of the Subadvisor and other third-party service providers, including the New Fund's distributor.
In considering the nature, extent and quality of the services to be provided by the Advisor, the Trustees also took into account their knowledge of the Advisor's management of other Funds and the quality of the performance of the Advisor's duties with respect to other Funds, through Board meetings, discussions and reports during the preceding year and through each Trustee's experience as a trustee of the other trusts in the complex.
In the course of its deliberations regarding the Advisory Agreement, the Board members considered, among other things:
| (a) | the skills and competency with which the Advisor has in the past managed the Funds' affairs and its subadvisory relationships, including those with the Subadvisor, the Advisor's oversight and monitoring of the Subadvisor's investment performance and compliance programs, such as the Subadvisor's compliance with fund policies and objectives; review of brokerage matters, including with respect to trade allocation and best execution; and the Advisor's timeliness in responding to performance issues; | ||
| (b) | the background, qualifications, and skills of the Advisor's personnel; | ||
| (c) | the Advisor's compliance policies and procedures and its responsiveness to regulatory changes and fund industry developments; | ||
| (d) | the Advisor's administrative capabilities, including its ability to supervise the other service providers for the Funds; | ||
| (e) | the financial condition of the Advisor and whether it has the financial wherewithal to provide a high level and quality of services to the New Fund; and | ||
| (f) | the Advisor's reputation and experience in serving as an investment advisor to the Funds, and the benefit to shareholders of investing in funds that are part of a family of funds offering a variety of investments. |
The Board concluded that Advisor may reasonably be expected to provide a high quality of services under the Advisory Agreement with respect to the New Fund.
Investment performance. In connection with its consideration of the Advisory Agreement, the Board considered, the New Fund's investment strategy and processes, including the fact that the New Fund will seek performance that closely corresponds to its Underlying Index, which was developed by, and will be maintained, by, the Subadvisor. The Board also considered the simulated performance of the New Fund's Underlying Index as compared to applicable benchmarks.
Fees and Expenses. The Board reviewed comparative information including, among other data, the New Fund's anticipated management fees and total net expenses as compared to similarly situated exchange-traded funds deemed to be comparable to the New Fund.
The Board took into account management's discussion of the New Fund's anticipated expenses. The Board noted that the Advisor does not currently manage other funds or institutional accounts with the same or similar strategies proposed for the New Fund.
The Board took into account management's discussion with respect to the proposed advisory/subadvisory fee structure, including the amount of the advisory fee to be retained by the Advisor after payment of the subadvisory fees. The Board also noted that the Advisor, and not the New Fund, would be responsible for paying the subadvisory fees and that such fees are negotiated at arm's length with respect to the Subadvisor. The Board also noted that the Advisor has contractually agreed to waive fees and/or reimburse expenses with respect to the New Fund for a specified period. The Board concluded that the
40
advisory fees to be paid by the New Fund are reasonable in relation to the nature, extent and quality of the services expected to be provided.
Profitability/Indirect Benefits. In considering the costs of the services to be provided and the profits to be realized by the Advisor and its affiliates from the Advisor's relationship with the New Fund, the Board:
| (a) | noted that because the New Fund was not yet in existence, no actual revenue, cost or profitability data was available for the Board to review; | ||
| (b) | reviewed and considered information presented by the Advisor regarding the advisory fees and advisory spreads prior to distribution, operations and overhead for the New Fund; | ||
| (c) | noted that the Advisor will derive reputational and other indirect benefits from providing advisory services to the New Fund; | ||
| (d) | noted that the subadvisoryfee for the New Fund will be paid by Advisor and is negotiated at arm's length; | ||
| (e) | noted that the Advisor will also pay the Subadvisor a license fee in connection with the New Fund's use of the Underlying Index; and | ||
| (f) | considered that the Advisor should be entitled to earn a reasonable level of profits in exchange for the level of services it will provide to the New Fund and the entrepreneurial risk that it assumes as Advisor. |
Based upon its review, the Board concluded that the anticipated level of profitability, if any, of the Advisor and its affiliates from their relationship with the New Fund is reasonable and not excessive.
Economies of Scale. In considering the extent to which economies of scale would be realized if the New Fund grows and whether fee levels reflect these economies of scale for the benefit of fund shareholders, the Board:
| (a) | considered that the Advisor has contractually agreed to waive a portion of its management fee and/or reimburse or pay operating expenses of the New Fund to reduce operating expenses for a specified period of time; | ||
| (b) | reviewed the New Fund's advisory fee structure and concluded that: (i) the New Fund's fee structure contains breakpoints at the subadvisory fee level and that such breakpoints are reflected as breakpoints in the advisory fees for the New Fund; and (ii) although economies of scale cannot be measured with precision, these arrangements permit shareholders of the New Fund to benefit from economies of scale if the New Fund grows. The Board also took into account management's discussion of the New Fund's advisory fee structure; and | ||
| (c) | the Board also considered the potential effect of the New Fund's future growth in size on its performance and fees. The Board also noted that if the New Fund's assets increase over time, the New Fund may realize other economies of scale and the Board would consider whether additional breakpoints would be appropriate at that time. |
Approval of Subadvisory Agreement
In making its determination with respect to approval of the Subadvisory Agreement, the Board reviewed:
| (a) | information relating to the Subadvisor's business, including current subadvisory services (to other funds in the John Hancock family of funds); | ||||||||||
| (b) | the simulated performance of the Underlying Index developed by the Subadvisor as compared to applicable benchmarks; | ||||||||||
| (c) | the proposed advisory fee and total expense ratio for the New Fund, including any breakpoints, and comparable fee information prepared by an independent third party provider of fund data; and |
41
| (d) | information relating to the nature and scope of any material relationships and their significance to the New Fund's Advisor and Subadvisor. |
Nature, Extent, and Quality of Services. With respect to the services to be provided by the Subadvisor, the Board members received and reviewed information provided to the Board by the Subadvisor with respect to the New Fund and took into account information presented throughout the past year with respect to Funds in the complex managed by the Advisor and subadvised by the Subadvisor. In this regard, the Board members considered the Subadvisor's current level of staffing and its overall resources, as well as considered information relating to the Subadvisor's compensation program. The Board members reviewed the Subadvisor's history and investment experience, as well as information regarding the qualifications, background, and responsibilities of the Subadvisor's investment and compliance personnel who will provide services to the New Fund. The Board members also considered the Subadvisor's risk assessment and monitoring processes. The Board members noted that the Advisor conducts regular periodic reviews of the Subadvisor and its operations in regard to the Funds, including regarding investment processes and organizational and staffing matters. The Board members also noted that the Funds' CCO and his staff conduct regular, periodic compliance reviews with the Subadvisor and present reports to the Independent Trustees regarding the same, which include evaluating the regulatory compliance systems of the Subadvisor and procedures reasonably designed by it to assure compliance with the federal securities laws. The Board members also took into account the financial condition of the Subadvisor.
The Board considered the Subadvisor's investment processes and philosophies. The Board took into account that the New Fund will seek performance that closely corresponds to its Underlying Index, which was developed by, and will be maintained, by, the Subadvisor..
Subadvisor compensation. In considering the cost of services to be provided by the Subadvisor, the Board noted that the fees under the Subadvisory Agreement are paid by the Advisor and not the New Fund. The Board members also considered information and took into account any other potential conflicts of interests the Advisor might have in connection with the Subadvisory Agreement.
The Board also relied on the ability of the Advisor to negotiate the Subadvisory Agreement with the Subadvisor, which is not affiliated with the Advisor, and the fees thereunder at arm's length. As a result, the costs of the services to be provided and the profits to be realized by the Subadvisor from its relationship with the Trust were not a factor in the Board's consideration of the Subadvisory Agreement.
The Board also received information regarding the nature and scope (including their significance to the Advisor and its affiliates and to the Subadvisor) of any material relationships with respect to the Subadvisor, which include arrangements in which the Subadvisor will serve as the index provider for the New Fund and for other exchange-traded funds in the complex, as well as arrangements in which the Subadvisor or its affiliates provide advisory, or management services in connection with financial products sponsored by the Advisor or its affiliates, and may include other registered investment companies, including other exchange-traded funds, a 529 education savings plan, managed separate accounts and exempt group annuity contracts sold to qualified plans.
In addition, the Board considered other potential indirect benefits that the Subadvisor and its affiliates may receive from the Subadvisor's relationship with the New Fund, such as the opportunity to provide advisory services to additional John Hancock Funds and reputational benefits.
Subadvisory fees. The Board considered that the New Fund will pay advisory fees to the Advisor and that, in turn, the Advisor will pay subadvisory fees to the Subadvisor. The Board considered the New Fund's advisory fees and total expense ratio as compared to similarly situated exchange-traded funds deemed to be comparable to the New Fund. The Board also considered that the Subadvisor receives additional compensation from the Advisor in connection with its role as index provider for the New Fund.
Subadvisor performance. The Board considered the New Fund's investment strategy and processes, including the fact that the New Fund will seek performance that closely corresponds to its Underlying Index and that its Underlying Index has been
42
developed by, and will be maintained by, the Subadvisor. The Board also considered simulated performance of the Underlying Index as compared to applicable benchmarks. The Board noted the Advisor's expertise and resources in monitoring the performance, investment style and risk-adjusted performance of the Subadvisor. The Board was mindful of the Advisor's focus on the Subadvisor's performance.
The Board's decision to approve the Subadvisory Agreement was based on a number of determinations, including the following:
| (1) | The Subadvisor has extensive experience and demonstrated skills as a manager, and currently subadvises other Funds in the complex and the Board is generally satisfied with the Subadvisor's management of these Funds, and may reasonably be expected to provide a high quality of investment management services to the New Fund; | |
| (2) | the proposed subadvisory fees are reasonable in relation to the level and quality of services to be provided; and | |
| (3) | subadvisory fee breakpoints are reflected as breakpoints in the advisory fees for the New Fund in order to permit shareholders to benefit from economies of scale if and as the New Fund grows. | |
| * * * | ||
Based on the Board's evaluation of all factors that it deemed to be material, including those factors described above, and assisted by the advice of independent legal counsel, the Board, including the Independent Trustees, concluded that approval of the Advisory Agreement and the Subadvisory Agreement would be in the best interest of the New Fund and its shareholders. Accordingly, the Board, and the Independent Trustees voting separately, approved the Advisory Agreement and Subadvisory Agreement.
43
Trustees James M. Oates, Chairperson Officers Andrew G. Arnott John J. Danello Francis V. Knox, Jr. Charles A. Rizzo Salvatore Schiavone | Investment advisor John Hancock Advisers, LLC Subadvisor Dimensional Fund Advisors LP Principal distributor Foreside Fund Services, LLC Custodian State Street Bank and Trust Company Transfer agent State Street Bank and Trust Company Legal counsel Dechert LLP Stock symbol NYSE Arca: JHML |
*Member of the Audit Committee
†Non-Independent Trustee
The fund's proxy voting policies and procedures, as well as the fund proxy voting record for the most recent twelve-month period ended June 30, are available free of charge on the Securities and Exchange Commission (SEC) website at sec.gov or on our website.
The fund's complete list of portfolio holdings, for the first and third fiscal quarters, is filed with the SEC on Form N-Q. The fund's Form N-Q is available on our website and the SEC's website, sec.gov, and can be reviewed and copied (for a fee) at the SEC's Public Reference Room in Washington, DC. Call 800-SEC-0330 to receive information on the operation of the SEC's Public Reference Room.
We make this information on your fund, as well as monthly portfolio holdings, and other fund details available on our website at jhinvestments.com/etf or by calling 800-225-5291.
| You can also contact us: | |||
| 800-225-5291 jhinvestments.com/etf | Regular mail: John Hancock Signature Services, Inc. | Express mail: John Hancock Signature Services, Inc. | |
44
John Hancock family of funds
DOMESTIC EQUITY FUNDS Balanced Blue Chip Growth Classic Value Disciplined Value Disciplined Value Mid Cap Equity Income Fundamental All Cap Core Fundamental Large Cap Core Fundamental Large Cap Value Large Cap Equity New Opportunities Select Growth Small Cap Equity Small Cap Value Small Company Strategic Growth U.S. Equity U.S. Global Leaders Growth Value Equity GLOBAL/INTERNATIONAL FUNDS Disciplined Value International Emerging Markets Emerging Markets Equity Global Equity Global Shareholder Yield Greater China Opportunities International Core International Growth International Small Company International Value Equity | INCOME FUNDS Bond California Tax-Free Income Core High Yield Emerging Markets Debt Floating Rate Income Focused High Yield Global Income Government Income High Yield Municipal Bond Income Investment Grade Bond Money Market Short Duration Credit Opportunities Spectrum Income Strategic Income Opportunities Tax-Free Bond ALTERNATIVE/SPECIALTY FUNDS Absolute Return Currency Alternative Asset Allocation Enduring Assets Financial Industries Global Absolute Return Strategies Global Conservative Absolute Return Global Real Estate Natural Resources Redwood Regional Bank Seaport Technical Opportunities |
The fund's investment objectives, risks, charges, and expenses are included in the prospectus and should be considered carefully before investing. For a prospectus, contact your financial professional, call
John Hancock Investments at 800-225-5291, or visit the fund's website at jhinvestments.com. Please read the prospectus carefully before investing or sending money.
ASSET ALLOCATION PORTFOLIOS Income Allocation Fund Lifestyle Aggressive Portfolio Lifestyle Balanced Portfolio Lifestyle Conservative Portfolio Lifestyle Growth Portfolio Lifestyle Moderate Portfolio Retirement Choices Portfolios (2010-2055) Retirement Living Portfolios (2010-2055) Retirement Living II Portfolios (2010-2055) EXCHANGE-TRADED FUNDS John Hancock Multifactor Consumer Discretionary ETF John Hancock Multifactor Financials ETF John Hancock Multifactor Healthcare ETF John Hancock Multifactor Large Cap ETF John Hancock Multifactor Mid Cap ETF John Hancock Multifactor Technology ETF CLOSED-END FUNDS Financial Opportunities Hedged Equity & Income Income Securities Trust Investors Trust Preferred Income Preferred Income II Preferred Income III Premium Dividend Tax-Advantaged Dividend Income Tax-Advantaged Global Shareholder Yield |
"As an investment firm,
upholding the proud
tradition of John Hancock
comes down to one thing:
putting shareholders
first. We believe that if
our shareholders are
successful, then we will
be successful."
Andrew G. Arnott
President and Chief Executive Officer
John Hancock Investments
John Hancock Multifactor ETF shares are bought and sold at market price (not NAV), and are not individually redeemed from the fund. Brokerage commissions will reduce returns.
John Hancock ETFs are distributed by Foreside Fund Services, LLC, and are subadvised by Dimensional Fund Advisors LP. Foreside is not affiliated with John Hancock Funds, LLC or Dimensional Fund Advisors LP.
Dimensional Fund Advisors LP receives compensation from John Hancock in connection with licensing rights to the John Hancock Dimensional indexes. Dimensional Fund Advisors LP does not sponsor, endorse, or sell, and makes no representation as to the advisability of investing in, John Hancock Multifactor ETFs (Multifactor ETFs). Neither John Hancock Advisers, LLC nor Dimensional Fund Advisors LP guarantees the accuracy and/or the completeness of the John Hancock Dimensional Indexes (the "Indexes") or any data included therein, and neither John Hancock Advisers, LLC nor Dimensional Fund Advisors LP shall have any liability for any errors, omissions, or interruptions therein. Neither John Hancock Advisers, LLC nor Dimensional Fund Advisors LP makes any warranty, express or implied, as to results to be obtained by the Multifactor ETFs, owners of the shares of the Multifactor ETFs or any other person or entity from the use of the Indexes, trading based on the Indexes, or any data included therein, either in connection with the Multifactor ETFs or for any other use. Neither John Hancock Advisers, LLC nor Dimensional Fund Advisors LP makes any express or implied warranties, and expressly disclaim all warranties of merchantability or fitness for a particular purpose or use with respect to the Indexes or any data included therein. Without limiting any of the foregoing, in no event shall either John Hancock Advisers, LLC or Dimensional Fund Advisors LP have any liability for any special, punitive, direct, indirect or consequential damages (including lost profits) arising out of matters relating to the use of the Indexes, even if notified of the possibility of such damages.
John Hancock Investments
A trusted brand
John Hancock Investments is a premier asset manager representing
one of America's most trusted brands, with a heritage of financial
stewardship dating back to 1862. Helping our shareholders pursue
their financial goals is at the core of everything we do. It's why we
support the role of professional financial advice and operate with the
highest standards of conduct and integrity.
A better way to invest
We build funds based on investor needs, then search the world to find
proven portfolio teams with specialized expertise in those strategies.
As a manager of managers, we apply vigorous oversight to ensure that
they continue to meet our uncompromising standards and serve the
best interests of our shareholders.
Results for investors
Our unique approach to asset management enables us to provide
a diverse set of investments backed by some of the world's best
managers, along with strong risk-adjusted returns across asset classes.
| | John Hancock Investments 601 Congress Street n Boston, MA 02210 800-225-5291 n jhinvestments.com/etf | |
| This report is for the information of the shareholders of John Hancock Multifactor Large Cap ETF. It is not authorized for distribution to prospective investors unless preceded or accompanied by a prospectus. | ||
MF260296 JHAN-2015-12-23-0161 | 850SA 10/15 12/15 | |
ITEM 2. CODE OF ETHICS.
Not applicable at this time.
ITEM 3. AUDIT COMMITTEE FINANCIAL EXPERT.
Not applicable at this time.
ITEM 4. PRINCIPAL ACCOUNTANT FEES AND SERVICES.
Not applicable at this time.
ITEM 5. AUDIT COMMITTEE OF LISTED REGISTRANTS.
Not applicable at this time.
ITEM 6. SCHEDULE OF INVESTMENTS.
| (a) | Not applicable. |
| (b) | Not applicable. |
ITEM 7. DISCLOSURE OF PROXY VOTING POLICIES AND PROCEDURES FOR CLOSED-END MANAGEMENT INVESTMENT COMPANIES.
Not applicable.
ITEM 8. PORTFOLIO MANAGERS OF CLOSED-END MANAGEMENT INVESTMENT COMPANIES.
Not applicable.
ITEM 9. PURCHASES OF EQUITY SECURITIES BY CLOSED-END MANAGEMENT INVESTMENT COMPANY AND AFFILIATED PURCHASERS.
Not applicable.
ITEM 10. SUBMISSION OF MATTERS TO A VOTE OF SECURITY HOLDERS.
The registrant has adopted procedures by which shareholders may recommend nominees to the registrant’s Board of Trustees. A copy of the procedures is filed as an exhibit to this Form N-CSR. See attached “John Hancock Funds – Nominating, Governance and Administration Committee Charter.”
ITEM 11. CONTROLS AND PROCEDURES.
(a) Based upon their evaluation of the registrant's disclosure controls and procedures as conducted within 90 days of the filing date of this Form N-CSR, the registrant's principal executive officer and principal financial officer have concluded that those disclosure controls and procedures provide reasonable assurance that the material information required to be disclosed by the registrant on this report is recorded, processed, summarized and reported within the time periods specified in the Securities and Exchange Commission's rules and forms.
(b) There were no changes in the registrant's internal control over financial reporting that occurred during the registrant's most recent fiscal half-year (the registrant's second fiscal half-year in the case of an annual report) that have materially affected, or are reasonably likely to materially affect, the registrant's internal control over financial reporting.
ITEM 12. EXHIBITS.
(a)(1) Separate certifications for the registrant's principal executive officer and principal financial officer, as required by Section 302 of the Sarbanes-Oxley Act of 2002 and Rule 30a-2(a) under the Investment Company Act of 1940, are attached.
(b)(1) Separate certifications for the registrant's principal executive officer and principal financial officer, as required by 18 U.S.C. Section 1350, as adopted pursuant to Section 906 of the Sarbanes-Oxley Act of 2002, and Rule 30a-2(b) under the Investment Company Act of 1940, are attached. The certifications furnished pursuant to this paragraph are not deemed to be "filed" for purposes of Section 18 of the Securities Exchange Act of 1934, or otherwise subject to the liability of that section. Such certifications are not deemed to be incorporated by reference into any filing under the Securities Act of 1933 or the Securities Exchange Act of 1934, except to the extent that the Registrant specifically incorporates them by reference.
(c)(1) Submission of Matters to a Vote of Security Holders is attached. See attached “John Hancock Funds – Nominating, Governance and Administration Committee Charter.”
(c)(2) Contact person at the registrant.
SIGNATURES
Pursuant to the requirements of the Securities Exchange Act of 1934 and the Investment Company Act of 1940, the registrant has duly caused this report to be signed on its behalf by the undersigned, thereunto duly authorized.
John Hancock Exchange-Traded Fund Trust
| By: | /s/ Andrew Arnott |
| Andrew Arnott | |
| President | |
| Date: | December 17, 2015 |
Pursuant to the requirements of the Securities Exchange Act of 1934 and the Investment Company Act of 1940, this report has been signed below by the following persons on behalf of the registrant and in the capacities and on the dates indicated.
| By: | /s/ Andrew Arnott |
| Andrew Arnott | |
| President | |
| Date: | December 17, 2015 |
| By: | /s/ Charles A. Rizzo |
| Charles A. Rizzo | |
| Chief Financial Officer | |
| Date: | December 17, 2015 |