UNITED STATES
SECURITIES AND EXCHANGE COMMISSION
Washington, D.C. 20549
FORM N-CSR
CERTIFIED SHAREHOLDER REPORT OF REGISTERED
MANAGEMENT INVESTMENT COMPANIES
Investment Company Act file number811- 22733
John Hancock Exchange-Traded Fund Trust
(Exact name of registrant as specified in charter)
200 Berkeley Street, Boston, Massachusetts 02116
(Address of principal executive offices) (Zip code)
Salvatore Schiavone
Treasurer
200 Berkeley Street
Boston, Massachusetts 02116
(Name and address of agent for service)
Registrant's telephone number, including area code:617-663-4497
| Date of fiscal year end: | | April 30 |
| | | |
| | | |
| Date of reporting period: | | April 30, 2020 |
ITEM 1. REPORTS TO STOCKHOLDERS.
John Hancock
Multifactor ETFs

Beginning on January 1, 2021, as permitted by regulations adopted by the Securities and Exchange Commission, paper copies of the fund's shareholder reports like this one will no longer be sent by mail, unless you specifically request paper copies of the reports from the fund or from your financial intermediary. Instead, the reports will be made available on a website, and you will be notified by mail each time a report is posted and provided with a website link to access the report.
If you already elected to receive shareholder reports electronically, you will not be affected by this change, and you do not need to take any action. You may elect to receive shareholder reports and other communications electronically by calling John Hancock Investment Management or by contacting your financial intermediary.
You may elect to receive all reports in paper, free of charge, at any time. You can inform John Hancock Investment Management or your financial intermediary that you wish to continue receiving paper copies of your shareholder reports by following the instructions listed above. Your election to receive reports in paper will apply to all funds held with John Hancock Investment Management or your financial intermediary.
A message to shareholders
Dear shareholder,
Global financial markets were on pace to deliver strong returns during the 12 months ended April 30, 2020, until heightened fears over the coronavirus (COVID-19) sent markets tumbling during the latter half of February and early March.
In response to the sell-off, governments and banks in some of the hardest hit areas throughout the world enacted policies and stimulus efforts designed to reignite their respective economies. The U.S. Federal Reserve acted quickly, lowering interest rates to zero and reinstating quantitative easing, as well as announcing its plans to shore up short-term debt. Congress passed a $2 trillion federal economic stimulus bill. While these measures helped lift equity and fixed-income markets in the United States in the final six weeks of the period, results were mixed in other areas of the world.
The continued spread of COVID-19, trade disputes, rising unemployment, and other geopolitical tensions may continue to create uncertainty among businesses and investors. Your financial professional can helpposition your portfolio so that it's sufficiently diversified to seek to meet your long-term objectives and to withstand the inevitable bouts of market volatility along the way.
On behalf of everyone at John Hancock Investment Management, I'd like to take this opportunity to welcome new shareholders and thank existing shareholders for the continued trust you've placed in us.
Sincerely,
Andrew G. Arnott
President and CEO,
John Hancock Investment Management
Head of Wealth and Asset Management,
United States and Europe
This commentary reflects the CEO's views as of this report's period end and are subject to change at any time. Diversification does not guarantee investment returns and does not eliminate risk of loss. All investments entail risks, including the possible loss of principal. For more up-to-date information, you can visit our website at jhinvestments.com.
John Hancock
Multifactor ETFs
Table of contents
| | | |
| 2 | | Multifactor exchange-traded funds (ETFs) at a glance |
| 3 | | Discussion of fund performance |
| 8 | | John Hancock Multifactor Consumer Discretionary ETF |
| 9 | | John Hancock Multifactor Consumer Staples ETF |
| 10 | | John Hancock Multifactor Developed International ETF |
| 11 | | John Hancock Multifactor Emerging Markets ETF |
| 12 | | John Hancock Multifactor Energy ETF |
| 13 | | John Hancock Multifactor Financials ETF |
| 14 | | John Hancock Multifactor Healthcare ETF |
| 15 | | John Hancock Multifactor Industrials ETF |
| 16 | | John Hancock Multifactor Large Cap ETF |
| 17 | | John Hancock Multifactor Materials ETF |
| 18 | | John Hancock Multifactor Media and Communications ETF |
| 19 | | John Hancock Multifactor Mid Cap ETF |
| 20 | | John Hancock Multifactor Small Cap ETF |
| 21 | | John Hancock Multifactor Technology ETF |
| 22 | | John Hancock Multifactor Utilities ETF |
| 23 | | Premium/discount analysis |
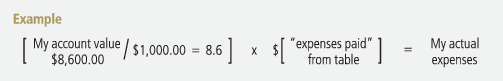
| 26 | | Your expenses |
| 28 | | Funds' investments |
| 79 | | Financial statements |
| 92 | | Financial highlights |
| 100 | | Notes to financial statements |
| 114 | | Report of independent registered public accounting firm |
| 116 | | Tax information |
| 117 | | Statement regarding liquidity risk management |
| 119 | | Trustees and officers |
| 122 | | More information |
ANNUAL REPORT | JOHN HANCOCK MULTIFACTOR ETFS 1
Multifactor exchange-traded funds (ETFs) at a glance
Many traditional indexes and index funds are weighted by market capitalization, a bias that can expose investors to certain risks and potentially reduce returns. Strategic beta strategies such as John Hancock Multifactor ETFs offer a different approach. Each ETF seeks to improve on cap-weighted strategies by tracking an index that combines active management insight with the discipline of a rules-based approach.
STRATEGIC BETA1: STRIKING A BALANCE BETWEEN ACTIVE AND PASSIVE INVESTING
PHILOSOPHY BACKING INDEX DESIGN
According to Dimensional Fund Advisors, subadvisor for all John Hancock Multifactor ETFs, there are four key factors that drive higher expected returns, and these factors guide Dimensional's index construction and semiannual reconstitution.
Market
Equity premium—stocks over bonds
Company size
Small-cap premium—small company stocks over large company stocks
Relative price2
Value premium—value stocks over growth stocks
Profitability3
Profitability premium—stocks of highly profitable companies over stocks of less profitable companies
To be considered a true factor, a premium must be sensible, persistent across time periods, pervasive across markets, robust in data, and cost effective.
WHY MULTIFACTOR?
Individual factors can be volatile: there's no telling which will be the best performing from year to year. Adopting a multifactor approach is one way investors can pursue more consistent—and more attractive—risk-adjusted returns.
| 1 | Strategic beta (also known as smart beta) defines a set of investment strategies that seek to improve on traditional market-capitalization weighted indexes in order to lower risk and achieve better diversification. |
| 2 | Relative price as measured by the price-to-book ratio; value stocks are those with lower price-to-book ratios. |
| 3 | Profitability is a measure of current profitability, based on information from individual companies' income statements. |
ANNUAL REPORT | JOHN HANCOCK MULTIFACTOR ETFS 2
Manager's discussion of fund performance
Can you tell us about your investment philosophy and how it drives the composition of the exchange-traded funds (ETFs)?
We have identified four characteristics, or dimensions, of expected returns that academic research has shown to account for most of the variation in historical asset returns and that we believe will account for most of the variation in future returns. These dimensions are the overall market, company size, relative price, and profitability.*
The overall market dimension reflects the excess return over the risk-free rate, which is typically measured by short-term Treasury bills, that market participants demand for investing in a broadly diversified portfolio of equity securities without any style or market capitalization bias. That premium is called the equity premium.
The company size dimension reflects the excess return that investors demand for investing in small-capitalization stocks relative to large-capitalization stocks. The premium associated with this dimension is the small-cap, or size premium.
The relative price dimension reflects the excess return that investors expect from investing in low relative price, or value, stocks—as measured, for instance, by their price-to-book ratios—in comparison with high relative price, or growth stocks. The premium associated with this dimension is the value premium.
Finally, the profitability dimension provides a way to discern the expected returns of companies with similar price-driven characteristics. Our research shows that if two companies trade at the same relative price, the one with higher profitability should have a higher expected return over time. The premium associated with this dimension is called the profitability premium.
Relative to a cap-weighted measure of the market, we believe that incorporating the four dimensions of expected returns—market, company size, relative price, and profitability—into a single investment strategy offers the potential for outperformance over time, and an ETF is a vehicle well suited to our systematic and transparent investment approach.
The indexes we developed for John Hancock Multifactor ETFs are designed to capture these dimensions over time, and the funds are, in turn, designed to track their respective indexes.
What drives changes to the composition of the funds?
Changes are made to the funds as a result of regularly scheduled reconstitutions, a semiannual process by which the list of stocks and their weights in each index are updated, as well as any unscheduled changes to the index driven by company events. Reconstitution ensures that the indexes that the funds track maintain their intended exposure to the dimensions of expected returns. In addition, we impose a maximum issuer cap in each index at the time of reconstitution to control stock-specific risk.
How did the broad equity market perform during the 12 months ended April 30, 2020?
After moving steadily higher throughout most of the period, most equities plunged once the spread of the coronavirus led to shutdowns across various segments of the global economy beginning in January and continuing through the rest of the period. With no way to assess the outlook for economic growth or corporate earnings in the coming year, investors chose to sell higher-risk assets and move into relative safe havens, such as U.S. Treasuries. Value stocks trailed growth by a wide margin over the full period, due in part to investors' expectation that higher-growth companies would be in a better position to withstand an economic downturn. While the markets rebounded somewhat in April, volatility is still high.
JOHN HANCOCK MULTIFACTOR DEVELOPED INTERNATIONAL ETF (JHMD)
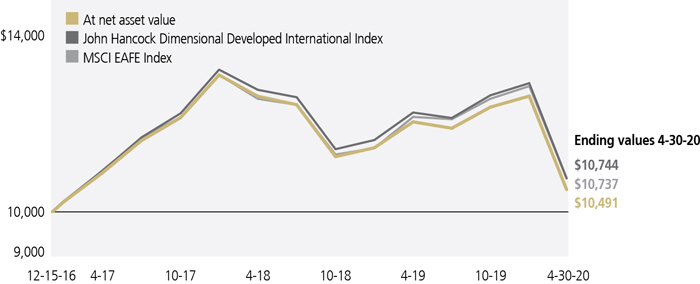
The fund underperformed the MSCI EAFE Index, a cap-weighted benchmark used as a proxy for developed ex-U.S. stock markets.With low relative price (value) stocks underperforming high relative price (growth) stocks, the fund's greater emphasis on value stocks detracted from relative performance. Its greater emphasis on stocks with smaller market capitalizations also detracted from relative performance, as mid caps underperformed large caps for the period. Conversely, the fund's greater emphasis on stocks with higher profitability had a positive impact on relative performance, as these stocks generally outperformed.
Compared with its benchmark, the fund ended the period with an emphasis on stocks with lower relative prices, smaller market capitalizations, and higher profitability. The fund's largest sector exposures were to the industrials, financials, and healthcare sectors. Changes were made to the fund as a result of regularly scheduled reconstitutions during the period. Notable changes in composition for the period included increased weights in Bayer AG and Royal Dutch Shell PLC and decreased weights in ABB, Ltd. and E.ON SE.
ANNUAL REPORT | JOHN HANCOCK MULTIFACTOR ETFS 3
JOHN HANCOCK MULTIFACTOR EMERGING MARKETS ETF (JHEM)
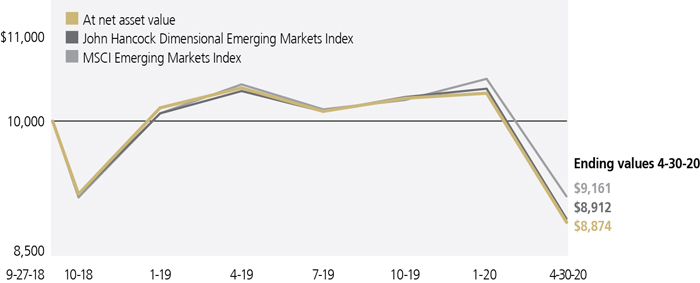
The fund underperformed the MSCI Emerging Markets Index, a cap-weighted benchmark used as a proxy for emerging markets. With low relative price (value) stocks underperforming high relative price (growth) stocks, the fund's greater emphasis on value stocks detracted from relative performance. Its greater emphasis on mid caps had a negative impact on relative performance, as mid caps underperformed large caps. At the country level, the fund's lesser allocation to China also detracted from relative performance, as China outperformed the overall index.
Compared with the benchmark, the fund ended the period with an emphasis on stocks with lower relative prices, smaller market capitalizations, and higher profitability. In absolute terms, the fund's largest sector exposures were to the financials, information technology, and communication services sectors. Changes were made to the fund as a result of regularly scheduled reconstitutions during the period. Notable changes in composition for the period included increased weights in Alibaba Group Holding, Ltd. and Sunac China Holdings, Ltd. and decreased holdings in Tencent Holdings, Ltd. and Samsung Electronics Company, Ltd.
JOHN HANCOCK MULTIFACTOR LARGE CAP ETF (JHML)
The fund underperformed the Russell 1000 Index, a cap-weighted benchmark used as a proxy for the broad large-cap U.S. stock market. Its greater emphasis on stocks with smaller market capitalizations detracted from relative performance, as mid caps underperformed large caps for the period. With low relative price (value) stocks underperforming high relative price (growth) stocks, the fund's greater emphasis on value stocks detracted from relative performance. Conversely, the fund's greater emphasis on stocks with higher profitability had a positive impact on relative performance, as these stocks generally outperformed.
Compared with the benchmark, the fund ended the period with an emphasis on stocks with lower relative prices, smaller market capitalizations, and higher profitability. In absolute terms, the fund's largest sector exposures were to the information technology, healthcare, and financials sectors. Changes were made to the fund as a result of regularly scheduled reconstitutions during the period. Notable changes in composition for the period included increased weights in Truist Financial Corp. and Trane Technologies PLC (both new additions) and decreased holdings in Apple, Inc. and L3Harris Technologies, Inc.
JOHN HANCOCK MULTIFACTOR MID CAP ETF (JHMM)
The fund underperformed the Russell Midcap Index, a cap-weighted benchmark used as a proxy for the broad mid-cap U.S. stock market. With low relative price (value) stocks underperforming high relative price (growth) stocks, the fund's greater emphasis on value stocks detracted from relative performance. Its greater emphasis on stocks with smaller market capitalizations also detracted from relative performance, as smaller mid caps underperformed larger mid caps for the period.
Compared with the benchmark, the fund ended the period with an emphasis on stocks with lower relative prices, smaller market capitalizations, and higher profitability. In absolute terms, the fund's largest sector exposures were to the information technology, industrials, and healthcare sectors. Changes were made to the fund as a result of regularly scheduled reconstitutions during the period. Notable changes in composition for the period included increased weights in The Kroger Company and Hewlett Packard Enterprise Company (both new additions) and decreased weights in L3Harris Technologies, Inc. and Xcel Energy, Inc. (both holdings were sold during the period).
JOHN HANCOCK MULTIFACTOR SMALL CAP ETF (JHSC)
The fund underperformed the Russell 2000 Index, a cap-weighted benchmark we used as proxy for the broad small-cap U.S. stock market. The fund's exclusion of stocks with the lowest profitability and highest relative price (growth stocks) detracted from relative performance, as those stocks outperformed. Conversely, the fund's lesser exposure to micro caps contributed positively to relative performance, as micro caps underperformed small caps for the period.
Compared with the benchmark, the fund ended the period with an emphasis on stocks with higher profitability. In absolute terms, the fund's largest sector exposures were to the financials, industrials, and consumer discretionary sectors. Changes were made to the fund as a result of regularly scheduled reconstitutions during the period. Notable changes in composition for the period included increased weights in ManpowerGroup, Inc. and Leggett & Platt, Inc. (both new additions) and decreased weights in Teladoc Health, Inc. and Chemed Corp. (both holdings were sold during the period).
ANNUAL REPORT | JOHN HANCOCK MULTIFACTOR ETFS 4
JOHN HANCOCK MULTIFACTOR CONSUMER DISCRETIONARY ETF (JHMC)
The fund underperformed the Russell 1000 Consumer Discretionary Index, a cap-weighted benchmark used as a proxy for the consumer discretionary sector of the U.S. stock market. The fund's greater emphasis on stocks with smaller market capitalizations detracted from relative performance, as these stocks underperformed for the period. With low relative price (value) stocks underperforming high relative price (growth) stocks, the fund's greater emphasis on value stocks also detracted from relative performance.
Compared with the benchmark, the fund ended the period withan emphasis on stocks with lower relative prices, smaller market capitalizations, and higher profitability. In absolute terms, the fund's largest industry exposures were to specialty retail and hotels, restaurants, and leisure. Changes were made to the fund as a result of regularly scheduled reconstitutions during the period. Notable changes in composition for the period included increased weights in eBay, Inc. and Stanley Black & Decker, Inc. (both new additions) and decreased weights in The Home Depot, Inc. and Intuit, Inc. (sold during the period).
JOHN HANCOCK MULTIFACTOR CONSUMER STAPLES ETF (JHMS)
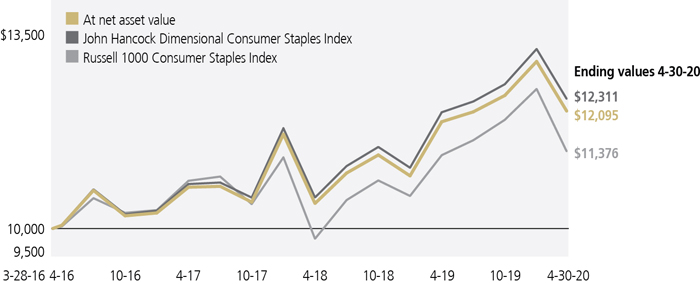
The fund outperformed the Russell 1000 Consumer Staples Index, a cap-weighted benchmark used as a proxy for the consumer staples sector of the U.S. stock market. The fund's greater emphasis on stocks with higher profitability had a positive impact on relative performance, as these stocks generally outperformed within the consumer staples sector. Constituency differences between the fund and the benchmark also contributed positively to relative performance.
Compared with the benchmark, the fund ended the period with an emphasis on stocks with lower relative prices, smaller market capitalizations, and higher profitability. In absolute terms, the fund's largest industry exposures were to food products and food and staples retailing. Changes were made to the fund as a result of regularly scheduled reconstitutions during the period. Notable changes in composition for the period included increased weights in Corteva, Inc. (a new addition) and Keurig Dr. Pepper, Inc. and decreased weights in General Mills, Inc. and The Hershey Company.
JOHN HANCOCK MULTIFACTOR ENERGY ETF (JHME)
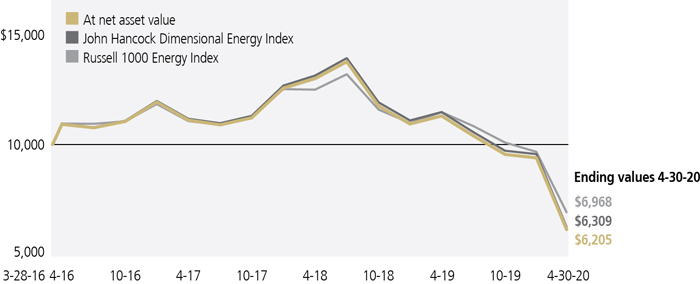
The fund underperformed the Russell 1000 Energy Index, a cap-weighted benchmark used as a proxy for the energy sector of the U.S. stock market. The fund's greater emphasis on stocks with smaller market capitalizations detracted from relative performance, as these stocks underperformed for the period.
Compared with the benchmark, the fund ended the period with an emphasis on stocks with lower relative prices, smaller market capitalizations, and higher profitability. In absolute terms, the fund's largest industry exposures were to oil, gas and consumable fuels, and energy equipment and services. Changes were made to the fund as a result of regularly scheduled reconstitutions during the period. Notable changes in composition for the period included increased weights in Valero Energy Corp. and ConocoPhilips and decreased weights in Kinder Morgan, Inc. and MDU Resources Group, Inc. (sold during the period).
JOHN HANCOCK MULTIFACTOR FINANCIALS ETF (JHMF)
The fund underperformed the Russell 1000 Financial Services Index, a cap-weighted benchmark used as a proxy for the financials sector of the U.S. stock market. The fund's greater emphasis on stocks with smaller market capitalizations detracted from relative performance, as these stocks underperformed for the period. With low relative price (value) stocks underperforming high relative price (growth) stocks, the fund's greater emphasis on value stocks also detracted from relative performance. At the industry level, the fund's general exclusion of real estate investment trusts (REITs) had a negative impact on relative performance, as REITs outperformed the overall index.
Compared with the benchmark, the fund ended the period with an emphasis on stocks with lower relative prices, smaller market capitalizations, and higher profitability. In absolute terms, the fund's largest industry exposures were to banks and capital markets. Changes were made to the fund as a result of regularly scheduled reconstitutions during the period. Notable changes in composition for the period included increased weights in Truist Financial Corp. (a new addition) and PayPal Holdings, Inc. and decreased weights in Accenture PLC and IHS Markit, Ltd. (both holdings were sold during the period).
ANNUAL REPORT | JOHN HANCOCK MULTIFACTOR ETFS 5
JOHN HANCOCK MULTIFACTOR HEALTHCARE ETF (JHMH)
The fund underperformed the Russell 1000 Health Care Index, a cap-weighted benchmark used as a proxy for the healthcare sector of the U.S. stock market. The fund's greater emphasis on stocks with smaller market capitalizations had a negative impact on relative performance, as these stocks underperformed.
Compared with the benchmark, the fund ended the period with an emphasis on stocks with lower relative prices, smaller market capitalizations, and higher profitability. In absolute terms, the fund's largest industry exposures were to health care equipment and supplies and pharmaceuticals. Changes were made to the fund as a result of regularly scheduled reconstitutions during the period. Notable changes in composition for the period included increased weights in Bristol-Myers Squibb Company and McKesson Corp. and decreased weights in Zoetis, Inc. and Cigna Corp.
JOHN HANCOCK MULTIFACTOR INDUSTRIALS ETF (JHMI)
The fund outperformed the Russell 1000 Producer Durables Index, a cap-weighted benchmark used as a proxy for the industrials sector of the U.S. stock market. The fund's greater emphasis on stocks with smaller market capitalizations contributed positively to relative performance, as these stocks outperformed for the period within the industrials sector.
Compared with the benchmark, the fund ended the period with an emphasis on stocks with lower relative price, smaller market capitalization, and higher profitability. In absolute terms, the fund's largest industry exposures were to machinery and aerospace and defense. Changes were made to the fund as a result of regularly scheduled reconstitutions during the period. Notable changes in composition for the period included increased weights in Accenture PLC, Class A and Paychex, Inc. (both new additions) and decreased weights in L3Harris Technologies, Inc. and Ecolab, Inc. (sold during the period).
JOHN HANCOCK MULTIFACTOR MATERIALS ETF (JHMA)
The fund underperformed the Russell 1000 Materials & Processing Index, a cap-weighted benchmark used as a proxy for the materials sector of the U.S. stock market. The fund's greater emphasis on stocks with smaller market capitalizations had a negative impact on relative performance, as these stocks underperformed. With low relative price (value) stocks underperforming high relative price (growth) stocks, the fund's greater emphasis on value stocks also detracted from relative performance.
Compared with the benchmark, the fund ended the period with an emphasis on stocks with lower relative prices, smaller market capitalizations, and higher profitability. In absolute terms, the fund's largest industry exposures were to chemicals and containers and packaging. Changes were made to the fund as a result of regularly scheduled reconstitutions during the period. Notable changes in composition for the period included increased weights in Ecolab, Inc. and Westrock Company (both new additions) and decreased weights in Masco Corp. (sold during the period) and Linde PLC.
JOHN HANCOCK MULTIFACTOR TECHNOLOGY ETF (JHMT)
The fund underperformed the Russell 1000 Technology Index, a cap-weighted benchmark used as a proxy for the information technology sector of the U.S. stock market. The fund's greater emphasis on stocks with smaller market capitalizations detracted from relative performance, as these stocks underperformed. With low relative price (value) stocks underperforming high relative price (growth) stocks, the fund's greater emphasis on value stocks also detracted from relative performance.
Compared with the benchmark, the fund ended the period with an emphasis on stocks with lower relative prices, smaller market capitalizations, and higher profitability. In absolute terms, its largest industry exposures were to software and semiconductors and semiconductor equipment. Changes were made to the fund as a result of regularly scheduled reconstitutions during the period. Notable changes in composition for the period included increased weights in Amphenol Corp. and TE Connectivity, Ltd. (both new additions) and decreased weights in Fiserv, Inc. (sold during the period) and Apple, Inc.
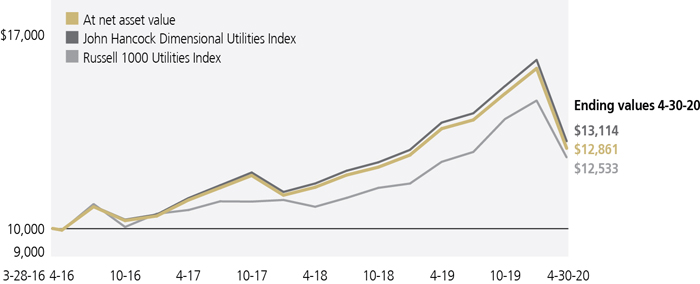
JOHN HANCOCK MULTIFACTOR UTILITIES ETF (JHMU)
The fund underperformed the Russell 1000 Utilities Index, a cap-weighted benchmark used as a proxy for the utilities sector of the U.S. stock market. The fund holds companies involved in the provision of gas, electricity, water and power, as well as energy trading or the provision of related infrastructure or services. It excludes communication services, a sector that is included in the benchmark. The fund's greater emphasis on stocks with smaller market capitalizations detracted from relative performance, as these stocks
ANNUAL REPORT | JOHN HANCOCK MULTIFACTOR ETFS 6
underperformed for the period. The fund's exclusion of communication services securities also detracted from relative performance, as those stocks generally outperformed.
Compared with the benchmark, the fund ended the period with an emphasis on stocks with lower relative prices, smaller market capitalizations, and higher profitability. In absolute terms, the fund's largest industry exposures were to electric utilities and multi-utilities. Changes were made to the fund as a result of regularly scheduled reconstitutions during the period. Notable changes in composition for the period included increased weights in Public Service Enterprise Group, Inc. and Consolidated Edison, Inc. and decreased weights in Xcel Energy, Inc. and Eversource Energy.
JOHN HANCOCK MULTIFACTOR MEDIA AND COMMUNICATIONS ETF (JHCS)
The fund outperformed the Russell 1000 Telecommunications Index, a cap-weighted benchmark used as a proxy for the telecommunication sector of the U.S. stock market. The fund holds companies involved in the media, entertainment, interactive media and services, diversified telecommunication services, and wireless telecommunication services industries. The benchmark contains only companies in the diversified telecommunication services and the wireless telecommunication services industries. The fund's greater exposure to securities outside of the telecommunication services sector detracted from relative performance. Outside of the differences in sector definitions, the fund's greater emphasis on low relative price (value) stocks detracted from relative performance, as value stocks generally underperformed high relative price (growth) stocks for the period.
Compared with the benchmark, the fund ended the period with an emphasis on stocks with lower relative prices, smaller market capitalizations, and higher profitability. In absolute terms, the fund's largest industry exposures were to media and entertainment. Notable changes in composition for the period include increased weights in Spotify Technology SA (added during the period) and ViacomCBS, Inc., Class B and decreased weights in CoStar Group, Inc. (sold during the period) and The Walt Disney Company.
* Profitability is measured as operating income before depreciation and amortization minus interest expense, scaled by book.
A note about risks
Each fund may be subject to various risks as described in the fund's prospectus. Current and future portfolio holdings are subject to change and risk. Investing involves risk, including the potential loss of principal. There is no guarantee that a fund's investment strategy will be successful and there can be no assurance that active trading markets for shares will develop of be maintained by market makers or authorized participants. A widespread health crisis such as a global pandemic could cause substantial market volatility, exchange-trading suspensions and closures, impact the ability to complete redemptions, and affect fund performance. For example, the novel coronavirus disease (COVID-19) has resulted in significant disruptions to global business activity. The impact of a health crisis and other epidemics and pandemics that may arise in the future could affect the global economy in ways that cannot necessarily be foreseen at the present time. A health crisis may exacerbate other pre-existing political, social, and economic risks. Any such impact could adversely affect each fund's performance, resulting in losses to your investment. For more information, please refer to the "Principal risks" section of each fund's prospectus.
A note about the performance shown on the following pages
Net asset value (NAV) performance is based on the NAV calculated each business day. It is calculated in accordance with the standard formula for valuing investment company shares as of the close of regular trading hours on the NYSE (see Note 2 to financial statements). Market price is determined using the bid/ask midpoint at 4 P.M. Eastern time, when the NAV is typically calculated. Your returns may differ if you traded shares at other times during the day.
The past performance shown here reflects reinvested distributions and the beneficial effect of any expense reductions, and does not guarantee future results. Returns for periods shorter than one year are cumulative. Shares will fluctuate in value and, when redeemed, may be worth more or less than their original cost. Current performance may be lower or higher than the performance cited. For the most recent month-end performance, visit jhinvestments.com/etf.
MANAGED BY
| | |
 | Lukas J. Smart, CFA
On the funds since inception
Investing since 2003 |
 | Joel P. Schneider
On the funds since inception
Investing since 2011 |
 | Joseph F. Hohn
On the funds since 2018
Investing since 2012 |

The views expressed in this report are exclusively those of Joseph F. Hohn, Dimensional Fund Advisors and are subject to change. They are not meant as investment advice. Please note that the holdings discussed in this report may not have been held by the fund for the entire period. Portfolio composition is subject to review in accordance with the fund's investment strategy and may vary in the future. Current and future portfolio holdings are subject to risk. A price-to-book ratio is calculated by dividing the market price of a stock by its book value per share. A price-to-earnings ratio is calculated by dividing the market price of a stock by its earnings per share. Actual performance data provided for any MSCI IMI indexes in the market performance commentary are net dividends.
ANNUAL REPORT | JOHN HANCOCK MULTIFACTOR ETFS 7
Multifactor Consumer Discretionary ETF
AVERAGE ANNUAL TOTAL RETURNS (%)
| | | | | | |
| Average annual total returns (%) | | Cumulative total returns (%) |
| | 1-year | Since fund
inception1 | | | Sincefund
inception1 |
| Net asset value | -10.08 | 5.32 | | | 26.89 |
| Market price | -10.18 | 5.31 | | | 26.84 |
John Hancock Dimensional
Consumer Discretionary Index2 | -9.78 | 5.78 | | | 29.43 |
Russell 1000 Consumer
Discretionary Index3 | 1.45 | 12.16 | | | 69.37 |
INDUSTRY COMPOSITION (%)
| | |
| Specialty retail | 25.2 |
| Hotels, restaurants and leisure | 19.7 |
| Internet and direct marketing retail | 16.1 |
| Textiles, apparel and luxury goods | 9.6 |
| Multiline retail | 7.6 |
| Automobiles | 5.1 |
| Household durables | 2.6 |
| Diversified consumer services | 2.2 |
| Commercial services and supplies | 1.9 |
| Leisure products | 1.7 |
| Other | 8.3 |
| TOTAL | 100.0 |
| As a percentage of net assets. | |
GROWTH OF $10,000
This chart shows what happened to a hypothetical $10,000 investment in John Hancock Multifactor Consumer Discretionary ETF for the period indicated, assuming all distributions were reinvested. For comparison, we've shown the same investment in two separate indexes.
TOP TEN HOLDINGS4 (%)
| | |
| Amazon.com, Inc. | 8.5 |
| The Home Depot, Inc. | 5.0 |
| eBay, Inc. | 3.4 |
| NIKE, Inc., Class B | 3.3 |
| Target Corp. | 3.0 |
| McDonald's Corp. | 2.9 |
| Booking Holdings, Inc. | 2.5 |
| O'Reilly Automotive, Inc. | 2.3 |
| Best Buy Company, Inc. | 2.3 |
| Lowe's Companies, Inc. | 2.2 |
| TOTAL | 35.4 |
The value of a $10,000 investment calculated at market value from inception through period end would be $12,684.
The chart and table above do not reflect the deduction of taxes that a shareholder would pay on fund distributions or the redemption or sale of fund shares.
It is not possible to invest directly in an index. Unlike an index, the fund's total returns are reduced by operating expenses and management fees.
| 1 | From 9-28-15. |
| 2 | The John Hancock Dimensional Consumer Discretionary Index is designed to comprise securities in the consumer discretionary sector within the U.S. universe whose market capitalizations are larger than that of the 1001st largest U.S. company at the time of reconstitution. Stocks that compose the index include those that may be considered medium or smaller capitalization company stocks. The index is reconstituted and rebalanced on a semiannual basis. The consumer discretionary sector is composed of companies in areas such as restaurants, media, consumer retail, leisure equipment and products, hotels, apparel, automobiles, and consumer durable goods. The U.S. universe is defined as a free float-adjusted market-capitalization-weighted portfolio of U.S. operating companies listed on the New York Stock Exchange (NYSE), NYSE MKT LLC, NASDAQ Global Market, or such other securities exchanges deemed appropriate in accordance with the rules-based methodology that is maintained by Dimensional Fund Advisors LP. |
| 3 | The Russell 1000 Consumer Discretionary Index comprises securities of the Russell 1000 Index classified in the consumer discretionary sector. |
| 4 | Listed holdings are a portion of the fund's total and may change at any time. They are not recommendations to buy or sell any security. Data is expressed as a percentage of net assets and excludes cash and cash equivalents. |
The expense ratios of the fund, both net (including any fee waivers and/or expense limitations) and gross (excluding any fee waivers and/or expense limitations), are set forth according to the most recent publicly available prospectus for the fund and may differ from those disclosed in the Financial highlights table in this report. Net expenses reflect contractual expense limitations in effect until August 31, 2020 and are subject to change. Had the contractual fee waivers and expense limitations not been in place, gross expenses would apply. The expense ratios are as follows:
Please refer to the most recent prospectus and annual or semiannual report for more information on expenses and any expense limitation arrangements for the fund.
ANNUAL REPORT | JOHN HANCOCK MULTIFACTOR ETFS 8
Multifactor Consumer Staples ETF
AVERAGE ANNUAL TOTAL RETURNS (%)
| | | | | | |
| Average annual total returns (%) | | Cumulative total returns (%) |
| | 1-year | Sincefund
inception1 | | | Sincefund
inception1 |
| Net asset value | 1.62 | 4.76 | | | 20.95 |
| Market price | 1.62 | 4.75 | | | 20.94 |
John Hancock Dimensional
Consumer Staples Index2 | 1.99 | 5.21 | | | 23.11 |
Russell 1000 Consumer
Staples Index3 | 0.62 | 3.20 | | | 13.76 |
INDUSTRY COMPOSITION (%)
| | |
| Food products | 29.6 |
| Food and staples retailing | 22.1 |
| Beverages | 19.7 |
| Household products | 17.3 |
| Tobacco | 7.5 |
| Chemicals | 2.6 |
| Household durables | 0.7 |
| Personal products | 0.4 |
| Short-term investments and other | 0.1 |
| TOTAL | 100.0 |
| As a percentage of net assets. | |
GROWTH OF $10,000
This chart shows what happened to a hypothetical $10,000 investment in John Hancock Multifactor Consumer Staples ETF for the period indicated, assuming all distributions were reinvested. For comparison, we've shown the same investment in two separate indexes.
TOP TEN HOLDINGS4 (%)
| | |
| Walmart, Inc. | 6.7 |
| The Procter & Gamble Company | 6.2 |
| PepsiCo, Inc. | 6.0 |
| The Coca-Cola Company | 5.1 |
| Costco Wholesale Corp. | 5.1 |
| The Kroger Company | 4.9 |
| Philip Morris International, Inc. | 3.9 |
| Altria Group, Inc. | 3.6 |
| Colgate-Palmolive Company | 3.4 |
| Mondelez International, Inc., Class A | 3.1 |
| TOTAL | 48.0 |
The value of a $10,000 investment calculated at market value from inception through period end would be $12,094.
The chart and table above do not reflect the deduction of taxes that a shareholder would pay on fund distributions or the redemption or sale of fund shares.
It is not possible to invest directly in an index. Unlike an index, the fund's total returns are reduced by operating expenses and management fees.
| 1 | From 3-28-16. |
| 2 | The John Hancock Dimensional Consumer Staples Index is designed to comprise securities in the consumer staples sector within the U.S. universe whose market capitalizations are larger than that of the 1001st largest U.S. company at the time of reconstitution. Stocks that compose the index include those that may be considered medium or smaller capitalization company stocks. The index is reconstituted and rebalanced on a semiannual basis. The consumer staples sector is composed of companies involved in areas such as the production, manufacture, distribution or sale of food, beverages, tobacco, household goods, or personal products. The U.S. universe is defined as a free float-adjusted market capitalization-weighted portfolio of U.S. operating companies listed on the New York Stock Exchange (NYSE), NYSE MKT LLC, NASDAQ Global Market, or such other securities exchanges deemed appropriate in accordance with the rules-based methodology that is maintained by Dimensional Fund Advisors LP. |
| 3 | The Russell 1000 Consumer Staples Index comprises securities of the Russell 1000 Index classified in the consumer staples sector. |
| 4 | Listed holdings are a portion of the fund's total and may change at any time. They are not recommendations to buy or sell any security. Data is expressed as a percentage of net assets and excludes cash and cash equivalents. |
The expense ratios of the fund, both net (including any fee waivers and/or expense limitations) and gross (excluding any fee waivers and/or expense limitations), are set forth according to the most recent publicly available prospectus for the fund and may differ from those disclosed in the Financial highlights table in this report. Net expenses reflect contractual expense limitations in effect until August 31, 2020 and are subject to change. Had the contractual fee waivers and expense limitations not been in place, gross expenses would apply. The expense ratios are as follows:
Please refer to the most recent prospectus and annual or semiannual report for more information on expenses and any expense limitation arrangements for the fund.
ANNUAL REPORT | JOHN HANCOCK MULTIFACTOR ETFS 9
Multifactor Developed International ETF
AVERAGE ANNUAL TOTAL RETURNS (%)
| | | | | | |
| Average annual total returns (%) | | Cumulative total returns (%) |
| | 1 year | Sincefund
inception1 | | | Sincefund
inception1 |
| Net asset value | -12.57 | 1.43 | | | 4.91 |
| Market price | -13.69 | 1.08 | | | 3.71 |
John Hancock Dimensional
Developed International Index2 | -11.99 | 2.15 | | | 7.44 |
| MSCI EAFE Index3 | -11.34 | 2.13 | | | 7.37 |
SECTOR COMPOSITION (%)
| | |
| Industrials | 16.2 |
| Financials | 14.5 |
| Health care | 12.2 |
| Consumer discretionary | 11.9 |
| Consumer staples | 9.6 |
| Materials | 9.1 |
| Communication services | 6.4 |
| Information technology | 6.1 |
| Utilities | 4.9 |
| Real estate | 4.3 |
| Other | 4.8 |
| TOTAL | 100.0 |
| As a percentage of net assets. | |
GROWTH OF $10,000
This chart shows what happened to a hypothetical $10,000 investment in John Hancock Multifactor Developed International ETF for the period indicated, assuming all distributions were reinvested. For comparison, we've shown the same investment in two separate indexes.
TOP TEN HOLDINGS4 (%)
| | |
| Nestle SA | 1.7 |
| Toyota Motor Corp. | 1.5 |
| Roche Holding AG | 1.3 |
| Novartis AG | 1.1 |
| Vonovia SE | 1.0 |
| BP PLC | 1.0 |
| Orange SA | 0.9 |
| Bayer AG | 0.7 |
| AstraZeneca PLC | 0.7 |
| Royal Dutch Shell PLC, B Shares | 0.7 |
| TOTAL | 10.6 |
The value of a $10,000 investment calculated at market value from inception through period end would be $10,371.
The chart and table above do not reflect the deduction of taxes that a shareholder would pay on fund distributions or the redemption or sale of fund shares.
It is not possible to invest directly in an index. Unlike an index, the fund's total returns are reduced by operating expenses and management fees.
| 1 | From 12-15-16. |
| 2 | The John Hancock Dimensional Developed International Index is designed to comprise a subset of securities of companies associated with developed markets outside of the United States and Canada. The index is reconstituted and rebalanced on a semiannual basis. |
| 3 | The MSCI Europe, Australasia, and Far East (EAFE) Index comprises securities of publicly traded large- and mid-cap stocks of companies in those regions. |
| 4 | Listed holdings are a portion of the fund's total and may change at any time. They are not recommendations to buy or sell any security. Data is expressed as a percentage of net assets and excludes cash and cash equivalents. |
The expense ratios of the fund, both net (including any fee waivers and/or expense limitations) and gross (excluding any fee waivers and/or expense limitations), are set forth according to the most recent publicly available prospectus for the fund and may differ from those disclosed in the Financial highlights table in this report. Net expenses reflect contractual expense limitations in effect until July 31, 2021 and are subject to change. Had the contractual fee waivers and expense limitations not been in place, gross expenses would apply. The expense ratios are as follows:
Please refer to the most recent prospectus and annual or semiannual report for more information on expenses and any expense limitation arrangements for the fund.
ANNUAL REPORT | JOHN HANCOCK MULTIFACTOR ETFS 10
Multifactor Emerging Markets ETF
AVERAGE ANNUAL TOTAL RETURNS (%)
| | | | | | |
| Average annual total returns (%) | | Cumulative total returns (%) |
| | 1-year | Sincefund
inception1 | | | Sincefund
inception1 |
| Net asset value | -14.44 | -7.23 | | | -11.26 |
| Market price | -16.99 | -8.70 | | | -13.49 |
John Hancock Dimensional
Emerging Markets Index2 | -13.77 | -6.98 | | | -10.88 |
| MSCI Emerging Markets Index3 | -12.00 | -5.36 | | | -8.39 |
SECTOR COMPOSITION (%)
| | |
| Financials | 22.2 |
| Information technology | 15.8 |
| Communication services | 12.5 |
| Consumer discretionary | 12.0 |
| Materials | 7.8 |
| Energy | 7.8 |
| Consumer staples | 7.4 |
| Industrials | 4.6 |
| Real estate | 3.6 |
| Utilities | 3.3 |
| Other | 3.0 |
| TOTAL | 100.0 |
| As a percentage of net assets. | |
GROWTH OF $10,000
This chart shows what happened to a hypothetical $10,000 investment in John Hancock Multifactor Emerging Markets ETF for the period indicated, assuming all distributions were reinvested. For comparison, we've shown the same investment in two separate indexes.
TOP TEN HOLDINGS4 (%)
| | |
| Tencent Holdings, Ltd. | 4.8 |
| Samsung Electronics Company, Ltd. | 4.0 |
| Taiwan Semiconductor Manufacturing Company, Ltd. | 3.8 |
| Alibaba Group Holding, Ltd., ADR | 3.8 |
| China Construction Bank Corp., H Shares | 1.8 |
| China Mobile, Ltd. | 1.6 |
| Ping An Insurance Group Company of China, Ltd., H Shares | 1.5 |
| Reliance Industries, Ltd. | 1.3 |
| Industrial & Commercial Bank of China, Ltd., H Shares | 1.1 |
| NetEase, Inc., ADR | 1.0 |
| TOTAL | 24.7 |
The value of a $10,000 investment calculated at market value from inception through period end would be $8,651.
The chart and table above do not reflect the deduction of taxes that a shareholder would pay on fund distributions or the redemption or sale of fund shares.
It is not possible to invest directly in an index. Unlike an index, the fund's total returns are reduced by operating expenses and management fees.
| 1 | From 9-27-18. |
| 2 | The John Hancock Dimensional Emerging Markets Index is designed to comprise a subset of securities of companies associated with emerging markets, which may include frontier markets (Emerging markets in an earlier stage of development). The index is reconstituted and rebalanced on a semiannual basis. |
| 3 | The MSCI Emerging Markets Index is an unmanaged index designed to measure the performance of developing markets. |
| 4 | Listed holdings are a portion of the fund's total and may change at any time. They are not recommendations to buy or sell any security. Data is expressed as a percentage of net assets and excludes cash and cash equivalents. |
The expense ratios of the fund, both net (including any fee waivers and/or expense limitations) and gross (excluding any fee waivers and/or expense limitations), are set forth according to the most recent publicly available prospectus for the fund and may differ from those disclosed in the Financial highlights table in this report. Net expenses reflect contractual expense limitations in effect until July 31, 2021 and are subject to change. Had the contractual fee waivers and expense limitations not been in place, gross expenses would apply. The expense ratios are as follows:
Please refer to the most recent prospectus and annual or semiannual report for more information on expenses and any expense limitation arrangements for the fund.
ANNUAL REPORT | JOHN HANCOCK MULTIFACTOR ETFS 11
AVERAGE ANNUAL TOTAL RETURNS (%)
| | | | | | |
| Average annual total returns (%) | | Cumulative total returns (%) |
| | 1-year | Sincefund
inception1 | | | Sincefund
inception1 |
| Net asset value | -44.93 | -11.01 | | | -37.95 |
| Market price | -44.93 | -11.01 | | | -37.97 |
John Hancock Dimensional
Energy Index2 | -44.84 | -10.64 | | | -36.91 |
| Russell 1000 Energy Index3 | -39.06 | -8.45 | | | -30.32 |
INDUSTRY COMPOSITION (%)
| | |
| Oil, gas and consumable fuels | 87.8 |
| Energy equipment and services | 12.1 |
| Short-term investments and other | 0.1 |
| TOTAL | 100.0 |
| As a percentage of net assets. | |
GROWTH OF $10,000
This chart shows what happened to a hypothetical $10,000 investment in John Hancock Multifactor Energy ETF for the period indicated, assuming all distributions were reinvested. For comparison, we've shown the same investment in two separate indexes.
TOP TEN HOLDINGS4 (%)
| | |
| Chevron Corp. | 7.6 |
| Valero Energy Corp. | 7.4 |
| Exxon Mobil Corp. | 7.0 |
| ConocoPhillips | 6.7 |
| Marathon Petroleum Corp. | 5.2 |
| EOG Resources, Inc. | 4.1 |
| The Williams Companies, Inc. | 3.9 |
| Pioneer Natural Resources Company | 3.9 |
| Baker Hughes Company | 3.8 |
| Schlumberger, Ltd. | 3.6 |
| TOTAL | 53.2 |
The value of a $10,000 investment calculated at market value from inception through period end would be $6,203.
The chart and table above do not reflect the deduction of taxes that a shareholder would pay on fund distributions or the redemption or sale of fund shares.
It is not possible to invest directly in an index. Unlike an index, the fund's total returns are reduced by operating expenses and management fees.
| 1 | From 3-28-16. |
| 2 | The John Hancock Dimensional Energy Index is designed to comprise securities in the energy sector within the U.S. universe whose market capitalizations are larger than that of the 1001st largest U.S. company at the time of reconstitution. Stocks that compose the index include those that may be considered medium or smaller capitalization company stocks. The index is reconstituted and rebalanced on a semiannual basis. The energy sector is composed of companies involved in areas such as the production, distribution, or sale of alternative fuels, coal, electricity, natural gas, nuclear power, oil, and other forms of energy. The U.S. universe is defined as a free float-adjusted market capitalization-weighted portfolio of U.S. operating companies listed on the New York Stock Exchange (NYSE), NYSE MKT LLC, NASDAQ Global Market, or such other securities exchanges deemed appropriate in accordance with the rules-based methodology that is maintained by Dimensional Fund Advisors LP. |
| 3 | The Russell 1000 Energy Index comprises securities of the Russell 1000 Index s classified in the energy sector. |
| 4 | Listed holdings are a portion of the fund's total and may change at any time. They are not recommendations to buy or sell any security. Data is expressed as a percentage of net assets and excludes cash and cash equivalents. |
The expense ratios of the fund, both net (including any fee waivers and/or expense limitations) and gross (excluding any fee waivers and/or expense limitations), are set forth according to the most recent publicly available prospectus for the fund and may differ from those disclosed in the Financial highlights table in this report. Net expenses reflect contractual expense limitations in effect until August 31, 2020 and are subject to change. Had the contractual fee waivers and expense limitations not been in place, gross expenses would apply. The expense ratios are as follows:
Please refer to the most recent prospectus and annual or semiannual report for more information on expenses and any expense limitation arrangements for the fund.
ANNUAL REPORT | JOHN HANCOCK MULTIFACTOR ETFS 12
Multifactor Financials ETF
AVERAGE ANNUAL TOTAL RETURNS (%)
| | | | | | |
| Average annual total returns (%) | | Cumulative total returns (%) |
| | 1-year | Sincefund
inception1 | | | Sincefund
inception1 |
| Net asset value | -16.06 | 6.52 | | | 33.63 |
| Market price | -16.03 | 6.52 | | | 33.64 |
John Hancock Dimensional
Financials Index2 | -15.78 | 6.99 | | | 36.37 |
Russell 1000 Financial
Services Index3 | -11.28 | 8.50 | | | 45.44 |
INDUSTRY COMPOSITION (%)
| | |
| Banks | 25.0 |
| Capital markets | 23.6 |
| Insurance | 22.0 |
| IT services | 16.8 |
| Consumer finance | 5.3 |
| Diversified financial services | 5.0 |
| Professional services | 1.5 |
| Thrifts and mortgage finance | 0.8 |
| TOTAL | 100.0 |
| As a percentage of net assets. | |
GROWTH OF $10,000
This chart shows what happened to a hypothetical $10,000 investment in John Hancock Multifactor Financials ETF for the period indicated, assuming all distributions were reinvested. For comparison, we've shown the same investment in two separate indexes.
TOP TEN HOLDINGS4 (%)
| | |
| Visa, Inc., Class A | 4.6 |
| Mastercard, Inc., Class A | 4.3 |
| Berkshire Hathaway, Inc., Class B | 4.0 |
| JPMorgan Chase & Co. | 3.8 |
| Bank of America Corp. | 3.1 |
| Wells Fargo & Company | 2.6 |
| Citigroup, Inc. | 2.2 |
| PayPal Holdings, Inc. | 2.1 |
| T. Rowe Price Group, Inc. | 1.5 |
| Marsh & McLennan Companies, Inc. | 1.4 |
| TOTAL | 29.6 |
The value of a $10,000 investment calculated at market value from inception through period end would be $13,364.
The chart and table above do not reflect the deduction of taxes that a shareholder would pay on fund distributions or the redemption or sale of fund shares.
It is not possible to invest directly in an index. Unlike an index, the fund's total returns are reduced by operating expenses and management fees.
| 1 | From 9-28-15. |
| 2 | The John Hancock Dimensional Financials Index is designed to comprise securities in the financials sector within the U.S. universe whose market capitalizations are larger than that of the 1001st largest U.S. company at the time of reconstitution. Stocks that compose the index include those that may be considered medium or smaller capitalization company stocks. The index is reconstituted and rebalanced on a semiannual basis. The financials sector is composed of companies in areas such as banking, savings and loans, insurance, consumer finance, investment brokerage, asset management, or other diverse financial services. The U.S. universe is defined as a free float-adjusted market capitalization-weighted portfolio of U.S. operating companies listed on the New York Stock Exchange (NYSE), NYSE MKT LLC, NASDAQ Global Market, or such other securities exchanges deemed appropriate in accordance with the rules-based methodology that is maintained by Dimensional Fund Advisors LP. |
| 3 | The Russell 1000 Financial Services Index comprises securities of the Russell 1000 Index classified in the financial services sector. |
| 4 | Listed holdings are a portion of the fund's total and may change at any time. They are not recommendations to buy or sell any security. Data is expressed as a percentage of net assets and excludes cash and cash equivalents. |
The expense ratios of the fund, both net (including any fee waivers and/or expense limitations) and gross (excluding any fee waivers and/or expense limitations), are set forth according to the most recent publicly available prospectus for the fund and may differ from those disclosed in the Financial highlights table in this report. Net expenses reflect contractual expense limitations in effect until August 31, 2020 and are subject to change. Had the contractual fee waivers and expense limitations not been in place, gross expenses would apply. The expense ratios are as follows:
Please refer to the most recent prospectus and annual or semiannual report for more information on expenses and any expense limitation arrangements for the fund.
ANNUAL REPORT | JOHN HANCOCK MULTIFACTOR ETFS 13
Multifactor Healthcare ETF
AVERAGE ANNUAL TOTAL RETURNS (%)
| | | | | | |
| Average annual total returns (%) | | Cumulative total returns (%) |
| | 1-year | Sincefund
inception1 | | | Sincefund
inception1 |
| Net asset value | 13.70 | 10.15 | | | 55.86 |
| Market price | 13.71 | 10.14 | | | 55.82 |
John Hancock Dimensional
Healthcare Index2 | 14.16 | 10.64 | | | 59.10 |
| Russell 1000 Health Care Index3 | 15.12 | 11.41 | | | 64.22 |
INDUSTRY COMPOSITION (%)
| | |
| Health care equipment and supplies | 24.9 |
| Pharmaceuticals | 23.5 |
| Health care providers and services | 22.6 |
| Biotechnology | 16.2 |
| Life sciences tools and services | 10.0 |
| Health care technology | 2.4 |
| Diversified consumer services | 0.3 |
| Short-term investments and other | 0.1 |
| TOTAL | 100.0 |
| As a percentage of net assets. | |
GROWTH OF $10,000
This chart shows what happened to a hypothetical $10,000 investment in John Hancock Multifactor Healthcare ETF for the period indicated, assuming all distributions were reinvested. For comparison, we've shown the same investment in two separate indexes.
TOP TEN HOLDINGS4 (%)
| | |
| Johnson & Johnson | 6.3 |
| UnitedHealth Group, Inc. | 5.6 |
| Pfizer, Inc. | 4.3 |
| Merck & Company, Inc. | 3.9 |
| Gilead Sciences, Inc. | 2.5 |
| Abbott Laboratories | 2.5 |
| Thermo Fisher Scientific, Inc. | 2.4 |
| Amgen, Inc. | 2.4 |
| Bristol-Myers Squibb Company | 2.3 |
| Medtronic PLC | 2.2 |
| TOTAL | 34.4 |
The value of a $10,000 investment calculated at market value from inception through period end would be $15,582.
The chart and table above do not reflect the deduction of taxes that a shareholder would pay on fund distributions or the redemption or sale of fund shares.
It is not possible to invest directly in an index. Unlike an index, the fund's total returns are reduced by operating expenses and management fees.
| 1 | From 9-28-15. |
| 2 | The John Hancock Dimensional Healthcare Index is designed to comprise securities in the healthcare sector within the U.S. universe whose market capitalizations are larger than that of the 1001st largest U.S. company at the time of reconstitution. Stocks that compose the index include those that may be considered medium or smaller capitalization company stocks. The index is reconstituted and rebalanced on a semiannual basis. The healthcare sector is composed of companies in areas such as the manufacture of healthcare equipment and supplies, biotechnology, home or long-term healthcare facilities, hospitals, pharmaceuticals, or the provision of basic healthcare services. The U.S. universe is defined as a free float-adjusted market capitalization-weighted portfolio of U.S. operating companies listed on the New York Stock Exchange (NYSE), NYSE MKT LLC, NASDAQ Global Market, or such other securities exchanges deemed appropriate in accordance with the rules-based methodology that is maintained by Dimensional Fund Advisors LP. |
| 3 | The Russell 1000 Health Care Index comprises securities of the Russell 1000 Index classified in the health care sector. |
| 4 | Listed holdings are a portion of the fund's total and may change at any time. They are not recommendations to buy or sell any security. Data is expressed as a percentage of net assets and excludes cash and cash equivalents. |
The expense ratios of the fund, both net (including any fee waivers and/or expense limitations) and gross (excluding any fee waivers and/or expense limitations), are set forth according to the most recent publicly available prospectus for the fund and may differ from those disclosed in the Financial highlights table in this report. Net expenses reflect contractual expense limitations in effect until August 31, 2020 and are subject to change. Had the contractual fee waivers and expense limitations not been in place, gross expenses would apply. The expense ratios are as follows:
Please refer to the most recent prospectus and annual or semiannual report for more information on expenses and any expense limitation arrangements for the fund.
ANNUAL REPORT | JOHN HANCOCK MULTIFACTOR ETFS 14
Multifactor Industrials ETF
AVERAGE ANNUAL TOTAL RETURNS (%)
| | | | | | |
| Average annual total returns (%) | | Cumulative total returns (%) |
| | 1-year | Sincefund
inception1 | | | Sincefund
inception1 |
| Net asset value | -13.92 | 7.41 | | | 33.97 |
| Market price | -13.94 | 7.40 | | | 33.96 |
John Hancock Dimensional
Industrials Index2 | -13.62 | 7.89 | | | 36.48 |
Russell 1000 Producer
Durables Index3 | -15.48 | 6.23 | | | 28.09 |
INDUSTRY COMPOSITION (%)
| | |
| Machinery | 20.6 |
| Aerospace and defense | 13.6 |
| Road and rail | 9.2 |
| IT services | 9.0 |
| Electrical equipment | 6.4 |
| Industrial conglomerates | 6.2 |
| Commercial services and supplies | 5.1 |
| Trading companies and distributors | 4.2 |
| Building products | 4.2 |
| Air freight and logistics | 4.1 |
| Other | 17.4 |
| TOTAL | 100.0 |
| As a percentage of net assets. | |
GROWTH OF $10,000
This chart shows what happened to a hypothetical $10,000 investment in John Hancock Multifactor Industrials ETF for the period indicated, assuming all distributions were reinvested. For comparison, we've shown the same investment in two separate indexes.
TOP TEN HOLDINGS4 (%)
| | |
| Union Pacific Corp. | 2.7 |
| Raytheon Technologies Corp. | 2.6 |
| Accenture PLC, Class A | 2.5 |
| 3M Company | 2.1 |
| Honeywell International, Inc. | 2.0 |
| Lockheed Martin Corp. | 2.0 |
| PACCAR, Inc. | 2.0 |
| Caterpillar, Inc. | 1.9 |
| Deere & Company | 1.8 |
| Cummins, Inc. | 1.8 |
| TOTAL | 21.4 |
The value of a $10,000 investment calculated at market value from inception through period end would be $13,396.
The chart and table above do not reflect the deduction of taxes that a shareholder would pay on fund distributions or the redemption or sale of fund shares.
It is not possible to invest directly in an index. Unlike an index, the fund's total returns are reduced by operating expenses and management fees.
| 1 | From 3-28-16. |
| 2 | The John Hancock Dimensional Industrials Index is designed to comprise securities in the industrials sector within the U.S. universe whose market capitalizations are larger than that of the 1001st largest U.S. company at the time of reconstitution. Stocks that compose the index include those that may be considered medium or smaller capitalization company stocks. The index is reconstituted and rebalanced on a semiannual basis. The industrials sector is composed of companies involved in areas such as aerospace and defense, construction and engineering, machinery, building products and equipment, road/rail/air/marine transportation and infrastructure, industrial trading and distribution, and related services. The U.S. universe is defined as a free float-adjusted market-capitalization-weighted portfolio of U.S. operating companies listed on the New York Stock Exchange (NYSE), NYSE MKT LLC, NASDAQ Global Market, or such other securities exchanges deemed appropriate in accordance with the rules-based methodology that is maintained by Dimensional Fund Advisors LP. |
| 3 | The Russell 1000 Producer Durables Index comprises securities of the Russell 1000 Index classified in the industrials sector. |
| 4 | Listed holdings are a portion of the fund's total and may change at any time. They are not recommendations to buy or sell any security. Data is expressed as a percentage of net assets and excludes cash and cash equivalents. |
The expense ratios of the fund, both net (including any fee waivers and/or expense limitations) and gross (excluding any fee waivers and/or expense limitations), are set forth according to the most recent publicly available prospectus for the fund and may differ from those disclosed in the Financial highlights table in this report. Net expenses reflect contractual expense limitations in effect until August 31, 2020 and are subject to change. Had the contractual fee waivers and expense limitations not been in place, gross expenses would apply. The expense ratios are as follows:
Please refer to the most recent prospectus and annual or semiannual report for more information on expenses and any expense limitation arrangements for the fund.
ANNUAL REPORT | JOHN HANCOCK MULTIFACTOR ETFS 15
Multifactor Large Cap ETF
AVERAGE ANNUAL TOTAL RETURNS (%)
| | | | | | |
| Average annual total returns (%) | | Cumulative total returns (%) |
| | 1-year | Sincefund
inception1 | | | Sincefund
inception1 |
| Net asset value | -3.04 | 9.95 | | | 54.56 |
| Market price | -3.20 | 9.91 | | | 54.34 |
John Hancock Dimensional
Large Cap Index2 | -2.74 | 10.29 | | | 56.78 |
| Russell 1000 Index3 | 0.09 | 11.22 | | | 62.96 |
SECTOR COMPOSITION (%)
| | |
| Information technology | 22.7 |
| Health care | 15.0 |
| Financials | 12.0 |
| Industrials | 10.8 |
| Consumer discretionary | 10.4 |
| Communication services | 8.1 |
| Consumer staples | 6.8 |
| Utilities | 4.6 |
| Materials | 3.4 |
| Real estate | 3.4 |
| Other | 2.8 |
| TOTAL | 100.0 |
| As a percentage of net assets. | |
GROWTH OF $10,000
This chart shows what happened to a hypothetical $10,000 investment in John Hancock Multifactor Large Cap ETF for the period indicated, assuming all distributions were reinvested. For comparison, we've shown the same investment in two separate indexes.
TOP TEN HOLDINGS4 (%)
| | |
| Microsoft Corp. | 3.4 |
| Apple, Inc. | 3.3 |
| Amazon.com, Inc. | 2.3 |
| Alphabet, Inc., Class A | 1.6 |
| Johnson & Johnson | 1.1 |
| Facebook, Inc., Class A | 1.1 |
| Berkshire Hathaway, Inc., Class B | 1.1 |
| Intel Corp. | 0.9 |
| UnitedHealth Group, Inc. | 0.9 |
| JPMorgan Chase & Co. | 0.9 |
| TOTAL | 16.6 |
The value of a $10,000 investment calculated at market value from inception through period end would be $15,434.
The chart and table above do not reflect the deduction of taxes that a shareholder would pay on fund distributions or the redemption or sale of fund shares.
It is not possible to invest directly in an index. Unlike an index, the fund's total returns are reduced by operating expenses and management fees.
| 1 | From 9-28-15. |
| 2 | The John Hancock Dimensional Large Cap Index is designed to comprise a subset of securities in the U.S. universe issued by companies whose market capitalizations are larger than that of the 801st largest U.S. company at the time of reconstitution. The index is reconstituted and rebalanced on a semiannual basis. The U.S. universe is defined as a free float-adjusted market capitalization-weighted portfolio of U.S. operating companies listed on the New York Stock Exchange (NYSE), NYSE MKT LLC, NASDAQ Global Market, or such other securities exchanges deemed appropriate in accordance with the rules-based methodology that is maintained by Dimensional Fund Advisors LP. |
| 3 | The Russell 1000 Index comprises 1000 publicly-traded large-cap companies in the United States. |
| 4 | Listed holdings are a portion of the fund's total and may change at any time. They are not recommendations to buy or sell any security. Data is expressed as a percentage of net assets and excludes cash and cash equivalents. |
The expense ratios of the fund, both net (including any fee waivers and/or expense limitations) and gross (excluding any fee waivers and/or expense limitations), are set forth according to the most recent publicly available prospectus for the fund and may differ from those disclosed in the Financial highlights table in this report. Net expenses reflect contractual expense limitations in effect until July 31, 2021 and are subject to change. Had the contractual fee waivers and expense limitations not been in place, gross expenses would apply. The expense ratios are as follows:
Please refer to the most recent prospectus and annual or semiannual report for more information on expenses and any expense limitation arrangements for the fund.
ANNUAL REPORT | JOHN HANCOCK MULTIFACTOR ETFS 16
Multifactor Materials ETF
AVERAGE ANNUAL TOTAL RETURNS (%)
| | | | | | |
| Average annual total returns (%) | | Cumulative total returns (%) |
| | 1-year | Sincefund
inception1 | | | Sincefund
inception1 |
| Net asset value | -11.77 | 4.45 | | | 19.52 |
| Market price | -11.84 | 4.45 | | | 19.52 |
John Hancock Dimensional
Materials Index2 | -11.47 | 4.90 | | | 21.63 |
Russell 1000 Materials &
Processing Index3 | -9.56 | 5.65 | | | 25.21 |
INDUSTRY COMPOSITION (%)
| | |
| Chemicals | 51.5 |
| Containers and packaging | 23.8 |
| Metals and mining | 16.1 |
| Construction materials | 4.8 |
| Building products | 1.2 |
| Aerospace and defense | 1.1 |
| Multi-utilities | 0.9 |
| Machinery | 0.5 |
| Short-term investments and other | 0.1 |
| TOTAL | 100.0 |
| As a percentage of net assets. | |
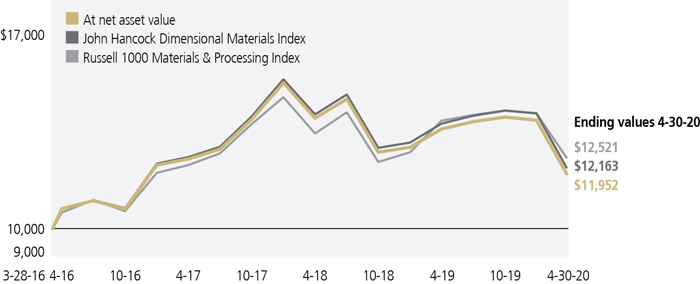
GROWTH OF $10,000
This chart shows what happened to a hypothetical $10,000 investment in John Hancock Multifactor Materials ETF for the period indicated, assuming all distributions were reinvested. For comparison, we've shown the same investment in two separate indexes.
TOP TEN HOLDINGS4 (%)
| | |
| Linde PLC | 5.8 |
| Newmont Corp. | 5.3 |
| PPG Industries, Inc. | 4.7 |
| Air Products & Chemicals, Inc. | 4.4 |
| The Sherwin-Williams Company | 4.2 |
| Ecolab, Inc. | 4.1 |
| Ball Corp. | 3.7 |
| LyondellBasell Industries NV, Class A | 3.6 |
| International Paper Company | 3.5 |
| Nucor Corp. | 3.4 |
| TOTAL | 42.7 |
The value of a $10,000 investment calculated at market value from inception through period end would be $11,952.
The chart and table above do not reflect the deduction of taxes that a shareholder would pay on fund distributions or the redemption or sale of fund shares.
It is not possible to invest directly in an index. Unlike an index, the fund's total returns are reduced by operating expenses and management fees.
| 1 | From 3-28-16. |
| 2 | The John Hancock Dimensional Materials Index is designed to comprise securities in the materials sector within the U.S. universe whose market capitalizations are larger than that of the 1001st largest U.S. company at the time of reconstitution. Stocks that compose the index include those that may be considered medium or smaller capitalization company stocks. The index is reconstituted and rebalanced on a semiannual basis. The materials sector is composed of companies involved in areas such as chemicals, metals, paper products, containers and packaging, and construction materials. The U.S. universe is defined as a free float-adjusted market capitalization-weighted portfolio of U.S. operating companies listed on the New York Stock Exchange (NYSE), NYSE MKT LLC, NASDAQ Global Market, or such other securities exchanges deemed appropriate in accordance with the rules-based methodology that is maintained by Dimensional Fund Advisors LP. |
| 3 | The Russell 1000 Materials & Processing Index comprises securities of the Russell 1000 Index classified in the materials sector. |
| 4 | Listed holdings are a portion of the fund's total and may change at any time. They are not recommendations to buy or sell any security. Data is expressed as a percentage of net assets and excludes cash and cash equivalents. |
The expense ratios of the fund, both net (including any fee waivers and/or expense limitations) and gross (excluding any fee waivers and/or expense limitations), are set forth according to the most recent publicly available prospectus for the fund and may differ from those disclosed in the Financial highlights table in this report. Net expenses reflect contractual expense limitations in effect until August 31, 2020 and are subject to change. Had the contractual fee waivers and expense limitations not been in place, gross expenses would apply. The expense ratios are as follows:
Please refer to the most recent prospectus and annual or semiannual report for more information on expenses and any expense limitation arrangements for the fund.
ANNUAL REPORT | JOHN HANCOCK MULTIFACTOR ETFS 17
Multifactor Media and Communications ETF
AVERAGE ANNUAL TOTAL RETURNS (%)
| | | | | | |
| Average annual total returns (%) | | Cumulative total returns (%) |
| | 1-year | Sincefund
inception1 | | | Sincefund
inception1 |
| Net asset value | -4.60 | 1.03 | | | 1.18 |
| Market price | -4.57 | 1.09 | | | 1.24 |
John Hancock Dimensional
Media & Comm Index2 | -4.26 | 1.34 | | | 1.53 |
| Russell 1000 Telecommunication Index3 | -11.58 | 2.83 | | | 3.23 |
INDUSTRY COMPOSITION (%)
| | |
| Media | 31.6 |
| Entertainment | 25.0 |
| Interactive media and services | 22.0 |
| Diversified telecommunication services | 16.5 |
| Wireless telecommunication services | 3.1 |
| Software | 1.0 |
| Communications equipment | 0.7 |
| Short-term investments and other | 0.1 |
| TOTAL | 100.0 |
| As a percentage of net assets. | |
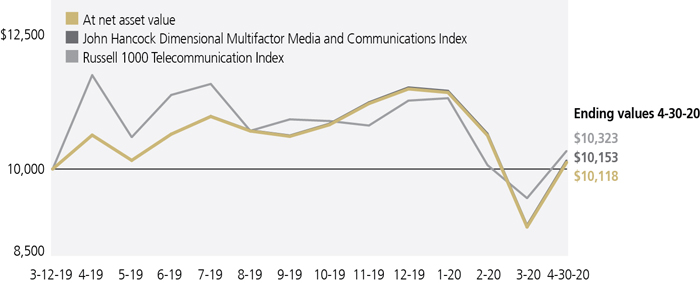
GROWTH OF $10,000
This chart shows what happened to a hypothetical $10,000 investment in John Hancock Multifactor Media and Communications ETF for the period indicated, assuming all distributions were reinvested. For comparison, we've shown the same investment in two separate indexes.
TOP TEN HOLDINGS4 (%)
| | |
| Netflix, Inc. | 7.1 |
| Facebook, Inc., Class A | 6.7 |
| Verizon Communications, Inc. | 6.6 |
| Comcast Corp., Class A | 5.8 |
| AT&T, Inc. | 5.4 |
| The Walt Disney Company | 5.0 |
| Charter Communications, Inc., Class A | 4.8 |
| CenturyLink, Inc. | 3.5 |
| Activision Blizzard, Inc. | 3.4 |
| Twitter, Inc. | 3.4 |
| TOTAL | 51.7 |
The value of a $10,000 investment calculated at market value from inception through period end would be $10,124.
The chart and table above do not reflect the deduction of taxes that a shareholder would pay on fund distributions or the redemption or sale of fund shares.
It is not possible to invest directly in an index. Unlike an index, the fund's total returns are reduced by operating expenses and management fees.
| 1 | From 3-11-19. |
| 2 | The John Hancock Dimensional Media and Communications Index is designed to comprise securities in the media and communications sector within the U.S. Universe whose market capitalizations are larger than that of the 1001st largest U.S. company at the time of reconstitution. |
| 3 | The Russell 1000 Telecommunication Index tracks the performance of 1,000 publicly traded communication companies in the United States. It is not possible to invest directly in an index. |
| 4 | Listed holdings are a portion of the fund's total and may change at any time. They are not recommendations to buy or sell any security. Data is expressed as a percentage of net assets and excludes cash and cash equivalents. |
The expense ratios of the fund, both net (including any fee waivers and/or expense limitations) and gross (excluding any fee waivers and/or expense limitations), are set forth according to the most recent publicly available prospectus for the fund and may differ from those disclosed in the Financial highlights table in this report. Net expenses reflect contractual expense limitations in effect until August 31, 2020 and are subject to change. Had the contractual fee waivers and expense limitations not been in place, gross expenses would apply. The expense ratios are as follows:
Please refer to the most recent prospectus and annual or semiannual report for more information on expenses and any expense limitation arrangements for the fund.
ANNUAL REPORT | JOHN HANCOCK MULTIFACTOR ETFS 18
AVERAGE ANNUAL TOTAL RETURNS (%)
| | | | | | |
| Average annual total returns (%) | | Cumulative total returns (%) |
| | 1-year | Sincefund
inception1 | | | Sincefund
inception1 |
| Net asset value | -10.56 | 6.93 | | | 36.01 |
| Market price | -10.61 | 6.93 | | | 36.01 |
John Hancock Dimensional
Mid Cap Index2 | -10.22 | 7.36 | | | 38.58 |
| Russell Midcap Index3 | -10.00 | 7.05 | | | 36.70 |
SECTOR COMPOSITION (%)
| | |
| Information technology | 20.3 |
| Industrials | 14.9 |
| Health care | 14.3 |
| Financials | 13.1 |
| Consumer discretionary | 10.9 |
| Real estate | 6.3 |
| Materials | 5.7 |
| Utilities | 5.7 |
| Consumer staples | 3.7 |
| Communication services | 3.5 |
| Other | 1.6 |
| TOTAL | 100.0 |
| As a percentage of net assets. | |
GROWTH OF $10,000
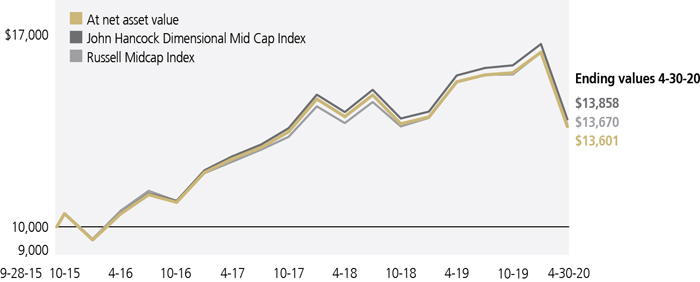
This chart shows what happened to a hypothetical $10,000 investment in John Hancock Multifactor Mid Cap ETF for the period indicated, assuming all distributions were reinvested. For comparison, we've shown the same investment in two separate indexes.
TOP TEN HOLDINGS4 (%)
| | |
| ANSYS, Inc. | 0.4 |
| Synopsys, Inc. | 0.4 |
| Amphenol Corp., Class A | 0.4 |
| MSCI, Inc. | 0.4 |
| Cadence Design Systems, Inc. | 0.4 |
| Rockwell Automation, Inc. | 0.4 |
| Parker-Hannifin Corp. | 0.4 |
| Akamai Technologies, Inc. | 0.4 |
| ResMed, Inc. | 0.4 |
| Best Buy Company, Inc. | 0.4 |
| TOTAL | 4.0 |
The value of a $10,000 investment calculated at market value from inception through period end would be $13,601.
The chart and table above do not reflect the deduction of taxes that a shareholder would pay on fund distributions or the redemption or sale of fund shares.
It is not possible to invest directly in an index. Unlike an index, the fund's total returns are reduced by operating expenses and management fees.
| 1 | From 9-28-15. |
| 2 | The John Hancock Dimensional Mid Cap Index is designed to comprise a subset of securities in the U.S. universe issued by companies whose market capitalizations are between the 200th and 951st largest U.S. companies at the time of reconstitution. The index is reconstituted and rebalanced on a semiannual basis. The U.S. universe is defined as a free float-adjusted market capitalization-weighted portfolio of U.S. operating companies listed on the New York Stock Exchange (NYSE), NYSE MKT LLC, NASDAQ Global Market, or such other securities exchanges deemed appropriate in accordance with the rules-based methodology that is maintained by Dimensional Fund Advisors LP. |
| 3 | The Russell Midcap Index comprises approximately 800 publicly-traded mid-cap companies in the United States. |
| 4 | Listed holdings are a portion of the fund's total and may change at any time. They are not recommendations to buy or sell any security. Data is expressed as a percentage of net assets and excludes cash and cash equivalents. |
The expense ratios of the fund, both net (including any fee waivers and/or expense limitations) and gross (excluding any fee waivers and/or expense limitations), are set forth according to the most recent publicly available prospectus for the fund and may differ from those disclosed in the Financial highlights table in this report. Net expenses reflect contractual expense limitations in effect until July 31, 2021 and are subject to change. Had the contractual fee waivers and expense limitations not been in place, gross expenses would apply. The expense ratios are as follows:
Please refer to the most recent prospectus and annual or semiannual report for more information on expenses and any expense limitation arrangements for the fund.
ANNUAL REPORT | JOHN HANCOCK MULTIFACTOR ETFS 19
Multifactor Small Cap ETF
AVERAGE ANNUAL TOTAL RETURNS (%)
| | | | | | |
| Average annual total returns (%) | | Cumulative total returns (%) |
| | 1-year | Sincefund
inception1 | | | Sincefund
inception1 |
| Net asset value | -18.07 | -4.59 | | | -10.99 |
| Market price | -18.13 | -4.62 | | | -11.05 |
John Hancock Dimensional
Small Cap Index2 | -17.80 | -4.20 | | | -10.09 |
| Russell 2000 Index3 | -16.39 | -3.42 | | | -8.25 |
SECTOR COMPOSITION (%)
| | |
| Financials | 18.1 |
| Industrials | 15.9 |
| Consumer discretionary | 14.3 |
| Information technology | 13.4 |
| Health care | 12.5 |
| Real estate | 10.2 |
| Utilities | 5.3 |
| Materials | 4.0 |
| Consumer staples | 3.5 |
| Communication services | 1.8 |
| Other | 1.0 |
| TOTAL | 100.0 |
| As a percentage of net assets. | |
GROWTH OF $10,000
This chart shows what happened to a hypothetical $10,000 investment in John Hancock Multifactor Small Cap ETF for the period indicated, assuming all distributions were reinvested. For comparison, we've shown the same investment in two separate indexes.
TOP TEN HOLDINGS4 (%)
| | |
| Five9, Inc. | 0.5 |
| Repligen Corp. | 0.5 |
| United Therapeutics Corp. | 0.5 |
| ITT, Inc. | 0.5 |
| Legg Mason, Inc. | 0.5 |
| Leggett & Platt, Inc. | 0.5 |
| ManpowerGroup, Inc. | 0.5 |
| Cree, Inc. | 0.5 |
| Chegg, Inc. | 0.5 |
| Quidel Corp. | 0.5 |
| TOTAL | 5.0 |
The value of a $10,000 investment calculated at market value from inception through period end would be $8,895.
The chart and table above do not reflect the deduction of taxes that a shareholder would pay on fund distributions or the redemption or sale of fund shares.
It is not possible to invest directly in an index. Unlike an index, the fund's total returns are reduced by operating expenses and management fees.
| 1 | From 11-8-17. |
| 2 | The John Hancock Dimensional Small Cap Index is designed to comprise a subset of securities in the U.S. universe issued by companies whose market capitalizations are smaller than the 750th largest U.S. company but excluding the smallest 4% of U.S. companies at the time of reconstitution. The index is reconstituted and rebalanced on a semiannual basis. The U.S. universe is defined as a free float-adjusted market capitalization-weighted portfolio of U.S. operating companies listed on the New York Stock Exchange (NYSE), NYSE American, LLC, NASDAQ Global Market, or such other securities exchanges deemed appropriate in accordance with the rules-based methodology that is maintained by Dimensional Fund Advisors LP. |
| 3 | The Russell 2000 Index comprises 2000 publicly-traded small-cap companies in the United States. |
| 4 | Listed holdings are a portion of the fund's total and may change at any time. They are not recommendations to buy or sell any security. Data is expressed as a percentage of net assets and excludes cash and cash equivalents. |
The expense ratios of the fund, both net (including any fee waivers and/or expense limitations) and gross (excluding any fee waivers and/or expense limitations), are set forth according to the most recent publicly available prospectus for the fund and may differ from those disclosed in the Financial highlights table in this report. Net expenses reflect contractual expense limitations in effect until July 31, 2021 and are subject to change. Had the contractual fee waivers and expense limitations not been in place, gross expenses would apply. The expense ratios are as follows:
Please refer to the most recent prospectus and annual report for more information on expenses and any expense limitation arrangements for the fund.
ANNUAL REPORT | JOHN HANCOCK MULTIFACTOR ETFS 20
Multifactor Technology ETF
AVERAGE ANNUAL TOTAL RETURNS (%)
| | | | | | |
| Average annual total returns (%) | | Cumulative total returns (%) |
| | 1-year | Sincefund
inception1 | | | Sincefund
inception1 |
| Net asset value | 6.65 | 19.15 | | | 123.56 |
| Market price | 6.51 | 19.11 | | | 123.25 |
John Hancock Dimensional
Technology Index2 | 7.02 | 19.55 | | | 126.99 |
| Russell 1000 Technology Index3 | 17.22 | 22.22 | | | 151.29 |
INDUSTRY COMPOSITION (%)
| | |
| Software | 34.8 |
| Semiconductors and semiconductor equipment | 30.9 |
| Technology hardware, storage and peripherals | 10.3 |
| IT services | 8.9 |
| Electronic equipment, instruments and components | 8.1 |
| Communications equipment | 6.6 |
| Electrical equipment | 0.4 |
| TOTAL | 100.0 |
| As a percentage of net assets. | |
GROWTH OF $10,000
This chart shows what happened to a hypothetical $10,000 investment in John Hancock Multifactor Technology ETF for the period indicated, assuming all distributions were reinvested. For comparison, we've shown the same investment in two separate indexes.
TOP TEN HOLDINGS4 (%)
| | |
| Microsoft Corp. | 6.5 |
| Apple, Inc. | 6.3 |
| Intel Corp. | 5.4 |
| Cisco Systems, Inc. | 3.3 |
| Oracle Corp. | 3.0 |
| IBM Corp. | 2.8 |
| Texas Instruments, Inc. | 2.4 |
| salesforce.com, Inc. | 2.4 |
| Broadcom, Inc. | 2.0 |
| Adobe, Inc. | 2.0 |
| TOTAL | 36.1 |
The value of a $10,000 investment calculated at market value from inception through period end would be $22,325.
The chart and table above do not reflect the deduction of taxes that a shareholder would pay on fund distributions or the redemption or sale of fund shares.
It is not possible to invest directly in an index. Unlike an index, the fund's total returns are reduced by operating expenses and management fees.
| 1 | From 9-28-15. |
| 2 | The John Hancock Dimensional Technology Index is designed to comprise securities in the technology sector within the U.S. universe whose market capitalizations are larger than that of the 1001st largest U.S. company at the time of reconstitution. Stocks that compose the index include those that may be considered medium or smaller capitalization company stocks. The index is reconstituted and rebalanced on a semiannual basis. The technology sector is composed of companies in areas such as the creation, development or provision of software, hardware, internet services, database management, information technology consulting and services, data processing, or semi-conductors. The U.S. universe is defined as a free float-adjusted market-capitalization-weighted portfolio of U.S. operating companies listed on the New York Stock Exchange (NYSE), NYSE MKT LLC, NASDAQ Global Market, or such other securities exchanges deemed appropriate in accordance with the rules-based methodology that is maintained by Dimensional Fund Advisors LP. |
| 3 | The Russell 1000 Technology Index comprises securities of the Russell 1000 Index classified in the technology sector. |
| 4 | Listed holdings are a portion of the fund's total and may change at any time. They are not recommendations to buy or sell any security. Data is expressed as a percentage of net assets and excludes cash and cash equivalents. |
The expense ratios of the fund, both net (including any fee waivers and/or expense limitations) and gross (excluding any fee waivers and/or expense limitations), are set forth according to the most recent publicly available prospectus for the fund and may differ from those disclosed in the Financial highlights table in this report. Net expenses reflect contractual expense limitations in effect until August 31, 2020 and are subject to change. Had the contractual fee waivers and expense limitations not been in place, gross expenses would apply. The expense ratios are as follows:
Please refer to the most recent prospectus and annual or semiannual report for more information on expenses and any expense limitation arrangements for the fund.
ANNUAL REPORT | JOHN HANCOCK MULTIFACTOR ETFS 21
Multifactor Utilities ETF
AVERAGE ANNUAL TOTAL RETURNS (%)
| | | | | | |
| Average annual total returns (%) | | Cumulative total returns (%) |
| | 1-year | Sincefund
inception1 | | | Sincefund
inception1 |
| Net asset value | -5.16 | 6.34 | | | 28.61 |
| Market price | -5.10 | 6.35 | | | 28.66 |
John Hancock Dimensional
Utilities Index2 | -4.81 | 6.85 | | | 31.14 |
| Russell 1000 Utilities Index3 | 1.25 | 5.67 | | | 25.33 |
INDUSTRY COMPOSITION (%)
| | |
| Electric utilities | 54.0 |
| Multi-utilities | 32.7 |
| Gas utilities | 5.2 |
| Independent power and renewable electricity producers | 4.0 |
| Water utilities | 4.0 |
| Short-term investments and other | 0.1 |
| TOTAL | 100.0 |
| As a percentage of net assets. | |
GROWTH OF $10,000
This chart shows what happened to a hypothetical $10,000 investment in John Hancock Multifactor Utilities ETF for the period indicated, assuming all distributions were reinvested. For comparison, we've shown the same investment in two separate indexes.
TOP TEN HOLDINGS4 (%)
| | |
| Consolidated Edison, Inc. | 5.5 |
| Public Service Enterprise Group, Inc. | 5.0 |
| PPL Corp. | 4.6 |
| Exelon Corp. | 4.4 |
| The Southern Company | 4.3 |
| Edison International | 4.2 |
| Entergy Corp. | 3.8 |
| NextEra Energy, Inc. | 3.7 |
| DTE Energy Company | 3.7 |
| Duke Energy Corp. | 3.6 |
| TOTAL | 42.8 |
The value of a $10,000 investment calculated at market value from inception through period end would be $12,866.
The chart and table above do not reflect the deduction of taxes that a shareholder would pay on fund distributions or the redemption or sale of fund shares.
It is not possible to invest directly in an index. Unlike an index, the fund's total returns are reduced by operating expenses and management fees.
| 1 | From 3-28-16. |
| 2 | The John Hancock Dimensional Utilities Index is designed to comprise securities in the utilities sector within the U.S. universe whose market capitalizations are larger than that of the 1001st largest U.S. company at the time of reconstitution. Stocks that compose the index include those that may be considered medium or smaller capitalization company stocks. The index is reconstituted and rebalanced on a semiannual basis. The utilities sector is composed of companies involved in areas such as the provision of gas, electric, and water power, energy trading, or the provision of related infrastructure or services. The U.S. universe is defined as a free float-adjusted market capitalization-weighted portfolio of U.S. operating companies listed on the New York Stock Exchange (NYSE), NYSE MKT LLC, NASDAQ Global Market, or such other securities exchanges deemed appropriate in accordance with the rules-based methodology that is maintained by Dimensional Fund Advisors LP. |
| 3 | The Russell 1000 Utilities Index comprises securities of the Russell 1000 Index classified in the utilities sector. |
| 4 | Listed holdings are a portion of the fund's total and may change at any time. They are not recommendations to buy or sell any security. Data is expressed as a percentage of net assets and excludes cash and cash equivalents. |
The expense ratios of the fund, both net (including any fee waivers and/or expense limitations) and gross (excluding any fee waivers and/or expense limitations), are set forth according to the most recent publicly available prospectus for the fund and may differ from those disclosed in the Financial highlights table in this report. Net expenses reflect contractual expense limitations in effect until August 31, 2020 and are subject to change. Had the contractual fee waivers and expense limitations not been in place, gross expenses would apply. The expense ratios are as follows:
Please refer to the most recent prospectus and annual or semiannual report for more information on expenses and any expense limitation arrangements for the fund.
ANNUAL REPORT | JOHN HANCOCK MULTIFACTOR ETFS 22
Premium/discount analysis (unaudited)
ETF shares are bought and sold through exchange trading at market price—not net asset value (NAV)—and are not individually redeemed from the fund. Due to various factors, shares may trade at a premium or discount to their NAV in the secondary market, and as a result you may pay more than NAV when you buy shares and receive less than NAV when you sell shares. Additionally, due to various factors, a fund's holdings and returns may deviate from those of its index. These variations may be greater when markets are volatile or subject to unusual conditions.
A premium exists when the closing market price is trading above NAV, while a discount indicates that the closing market price is trading below NAV. The differences are expressed as basis points, with one basis point equaling 1/100 of 1%.
The chart below presents information about the differences between each fund's daily closing market price and the fund's NAV. The closing market price is determined using the bid/ask midpoint as reported on the NYSE Arca, Inc., at 4 P.M. Eastern time, when the NAV is typically calculated.
Data presented represents past performance and cannot be used to predict future results.
PERIOD ENDED APRIL 30, 2020
| | | | | | | | | | | | |
| | | Closing Price Below NAV | | Closing Price Above or Equal to NAV |
| Basis Point Differential | | Number of Days | | % of Total Days | | Number of Days | | % of Total Days |
| Multifactor Consumer Discretionary ETF | | | | | | | | |
| 0 - < 25 | | 159 | | 62.85% | | 90 | | 35.57% |
| 25 - < 50 | | 2 | | 0.79% | | 1 | | 0.40% |
| 50 - < 75 | | 0 | | 0.00% | | 0 | | 0.00% |
| 75 - < 100 | | 0 | | 0.00% | | 0 | | 0.00% |
| 100 or Above | | 0 | | 0.00% | | 1 | | 0.40% |
| Total | | 161 | | 63.64% | | 92 | | 36.37% |
| Multifactor Consumer Staples ETF |
| 0 - < 25 | | 94 | | 37.15% | | 153 | | 60.47% |
| 25 - < 50 | | 3 | | 1.19% | | 3 | | 1.19% |
| 50 - < 75 | | 0 | | 0.00% | | 0 | | 0.00% |
| 75 - < 100 | | 0 | | 0.00% | | 0 | | 0.00% |
| 100 or Above | | 0 | | 0.00% | | 0 | | 0.00% |
| Total | | 97 | | 38.34% | | 156 | | 61.66% |
| Multifactor Developed International ETF |
| 0 - < 25 | | 73 | | 28.85% | | 62 | | 24.51% |
| 25 - < 50 | | 32 | | 12.65% | | 29 | | 11.46% |
| 50 - < 75 | | 16 | | 6.32% | | 8 | | 3.16% |
| 75 - < 100 | | 9 | | 3.56% | | 3 | | 1.19% |
| 100 or Above | | 14 | | 5.53% | | 7 | | 2.77% |
| Total | | 144 | | 56.91% | | 109 | | 43.09% |
| Multifactor Emerging Markets ETF |
| 0 - < 25 | | 41 | | 16.21% | | 46 | | 18.18% |
| 25 - < 50 | | 25 | | 9.88% | | 34 | | 13.44% |
| 50 - < 75 | | 17 | | 6.72% | | 29 | | 11.46% |
| 75 - < 100 | | 7 | | 2.77% | | 13 | | 5.14% |
| 100 or Above | | 24 | | 9.49% | | 17 | | 6.72% |
| Total | | 114 | | 45.07% | | 139 | | 54.94% |
| Multifactor Energy ETF |
| 0 - < 25 | | 147 | | 58.10% | | 90 | | 35.57% |
| 25 - < 50 | | 1 | | 0.40% | | 4 | | 1.58% |
| 50 - < 75 | | 1 | | 0.40% | | 5 | | 1.98% |
| 75 - < 100 | | 0 | | 0.00% | | 3 | | 1.19% |
| 100 or Above | | 0 | | 0.00% | | 2 | | 0.79% |
| Total | | 149 | | 58.90% | | 104 | | 41.11% |
ANNUAL REPORT | JOHN HANCOCK MULTIFACTOR ETFS 23
PERIOD ENDED APRIL 30, 2020
| | | | | | | | | | | | |
| | | Closing Price Below NAV | | Closing Price Above or Equal to NAV |
| Basis Point Differential | | Number of Days | | % of Total Days | | Number of Days | | % of Total Days |
| Multifactor Financials ETF |
| 0 - < 25 | | 87 | | 34.39% | | 163 | | 64.43% |
| 25 - < 50 | | 2 | | 0.79% | | 1 | | 0.40% |
| 50 - < 75 | | 0 | | 0.00% | | 0 | | 0.00% |
| 75 - < 100 | | 0 | | 0.00% | | 0 | | 0.00% |
| 100 or Above | | 0 | | 0.00% | | 0 | | 0.00% |
| Total | | 89 | | 35.18% | | 164 | | 64.83% |
| Multifactor Healthcare ETF |
| 0 - < 25 | | 187 | | 73.91% | | 63 | | 24.90% |
| 25 - < 50 | | 1 | | 0.40% | | 0 | | 0.00% |
| 50 - < 75 | | 1 | | 0.40% | | 0 | | 0.00% |
| 75 - < 100 | | 0 | | 0.00% | | 1 | | 0.40% |
| 100 or Above | | 0 | | 0.00% | | 0 | | 0.00% |
| Total | | 189 | | 74.71% | | 64 | | 25.30% |
| Multifactor Industrials ETF |
| 0 - < 25 | | 130 | | 51.38% | | 120 | | 47.43% |
| 25 - < 50 | | 3 | | 1.19% | | 0 | | 0.00% |
| 50 - < 75 | | 0 | | 0.00% | | 0 | | 0.00% |
| 75 - < 100 | | 0 | | 0.00% | | 0 | | 0.00% |
| 100 or Above | | 0 | | 0.00% | | 0 | | 0.00% |
| Total | | 133 | | 52.57% | | 120 | | 47.43% |
| Multifactor Large Cap ETF |
| 0 - < 25 | | 81 | | 32.02% | | 167 | | 66.01% |
| 25 - < 50 | | 2 | | 0.79% | | 1 | | 0.40% |
| 50 - < 75 | | 1 | | 0.40% | | 0 | | 0.00% |
| 75 - < 100 | | 0 | | 0.00% | | 1 | | 0.40% |
| 100 or Above | | 0 | | 0.00% | | 0 | | 0.00% |
| Total | | 84 | | 33.21% | | 169 | | 66.81% |
| Multifactor Materials ETF |
| 0 - < 25 | | 88 | | 34.78% | | 164 | | 64.82% |
| 25 - < 50 | | 1 | | 0.40% | | 0 | | 0.00% |
| 50 - < 75 | | 0 | | 0.00% | | 0 | | 0.00% |
| 75 - < 100 | | 0 | | 0.00% | | 0 | | 0.00% |
| 100 or Above | | 0 | | 0.00% | | 0 | | 0.00% |
| Total | | 89 | | 35.18% | | 164 | | 64.82% |
| Multifactor Media and Communications ETF |
| 0 - < 25 | | 121 | | 47.83% | | 128 | | 50.59% |
| 25 - < 50 | | 1 | | 0.40% | | 1 | | 0.40% |
| 50 - < 75 | | 0 | | 0.00% | | 0 | | 0.00% |
| 75 - < 100 | | 0 | | 0.00% | | 0 | | 0.00% |
| 100 or Above | | 1 | | 0.40% | | 1 | | 0.40% |
| Total | | 123 | | 48.63% | | 130 | | 51.39% |
| Multifactor Mid Cap ETF |
| 0 - < 25 | | 39 | | 15.42% | | 212 | | 83.79% |
| 25 - < 50 | | 1 | | 0.40% | | 1 | | 0.40% |
| 50 - < 75 | | 0 | | 0.00% | | 0 | | 0.00% |
| 75 - < 100 | | 0 | | 0.00% | | 0 | | 0.00% |
| 100 or Above | | 0 | | 0.00% | | 0 | | 0.00% |
| Total | | 40 | | 15.82% | | 213 | | 84.19% |
ANNUAL REPORT | JOHN HANCOCK MULTIFACTOR ETFS 24
PERIOD ENDED APRIL 30, 2020
| | | | | | | | | | | | |
| | | Closing Price Below NAV | | Closing Price Above or Equal to NAV |
| Basis Point Differential | | Number of Days | | % of Total Days | | Number of Days | | % of Total Days |
| Multifactor Small Cap ETF |
| 0 - < 25 | | 32 | | 12.65% | | 208 | | 82.21% |
| 25 - < 50 | | 1 | | 0.40% | | 5 | | 1.98% |
| 50 - < 75 | | 0 | | 0.00% | | 1 | | 0.40% |
| 75 - < 100 | | 0 | | 0.00% | | 1 | | 0.40% |
| 100 or Above | | 2 | | 0.79% | | 3 | | 1.19% |
| Total | | 35 | | 13.84% | | 218 | | 86.18% |
| Multifactor Technology ETF |
| 0 - < 25 | | 105 | | 41.50% | | 145 | | 57.31% |
| 25 - < 50 | | 0 | | 0.00% | | 1 | | 0.40% |
| 50 - < 75 | | 0 | | 0.00% | | 2 | | 0.79% |
| 75 - < 100 | | 0 | | 0.00% | | 0 | | 0.00% |
| 100 or Above | | 0 | | 0.00% | | 0 | | 0.00% |
| Total | | 105 | | 41.50% | | 148 | | 58.50% |
| Multifactor Utilities ETF |
| 0 - < 25 | | 66 | | 26.09% | | 185 | | 73.12% |
| 25 - < 50 | | 1 | | 0.40% | | 0 | | 0.00% |
| 50 - < 75 | | 0 | | 0.00% | | 0 | | 0.00% |
| 75 - < 100 | | 0 | | 0.00% | | 0 | | 0.00% |
| 100 or Above | | 0 | | 0.00% | | 1 | | 0.40% |
| Total | | 67 | | 26.49% | | 186 | | 73.52% |
ANNUAL REPORT | JOHN HANCOCK MULTIFACTOR ETFS 25
These examples are intended to help you understand your ongoing operating expenses of investing in the fund so you can compare these costs with the ongoing costs of investing in other funds.
Understanding fund expenses
As a shareholder of a fund, you incur two types of costs:
Transaction costs, which may include creation and redemption fees and brokerage charges.
Ongoing operating expenses, including management fees, and other fund expenses.
We are presenting only your ongoing operating expenses here.
Actual expenses/actual returns
The first line in the table on the following page is intended to provide information about a fund’s actual ongoing operating expenses, and is based on the fund’s actual NAV return. It assumes an account value of $1,000.00 on November 1, 2019, with the same investment held until April 30, 2020.
Together with the value of your account, you may use this information to estimate the operating expenses that you paid over the period. Simply divide your account value at April 30, 2020, by $1,000.00, then multiply it by the “expenses paid” from the table. For example, for an account value of $8,600.00, the operating expenses should be calculated as follows:
Hypothetical example for comparison purposes
The second line in the table on the following page allows you to compare a fund’s ongoing operating expenses with those of any other fund. It provides an example of the fund’s hypothetical account values and hypothetical expenses based on the fund’s actual expense ratio and an assumed 5% annualized return before expenses (which is not the fund’s actual return). It assumes an account value of $1,000.00 on November 1, 2019, with the same investment held until April 30, 2020. Look in any other fund shareholder report to find its hypothetical example and you will be able to compare these expenses. Please remember that these hypothetical account values and expenses may not be used to estimate the actual ending account balance or expenses you paid for the period.
Remember, these examples do not include any transaction costs. A fund charges a transaction fee per creation unit to those creating or redeeming creation units, and those buying or selling shares in the secondary market will incur customary brokerage commissions and charges. Therefore, these examples will not help you to determine the relative total costs of owning different funds. If transaction costs were included, your expenses would have been higher. See the prospectus for details regarding transaction costs.
SHAREHOLDER EXPENSE EXAMPLE CHART
| | Account
value on
11-1-2019 | Ending
value on
4-30-2020 | Expenses
paid during
4-30-20201 | Annualized
expense
ratio |
| Multifactor Consumer Discretionary ETF |
| Actual expenses/actual returns | $1,000.00 | $885.10 | $1.87 | 0.40% |
| Hypothetical example for comparison purposes | 1,000.00 | 1,022.90 | 2.01 | 0.40% |
| Multifactor Consumer Staples ETF |
| Actual expenses/actual returns | $1,000.00 | $977.50 | $1.97 | 0.40% |
| Hypothetical example for comparison purposes | 1,000.00 | 1,022.90 | 2.01 | 0.40% |
| Multifactor Developed International ETF |
| Actual expenses/actual returns | $1,000.00 | $850.90 | $2.02 | 0.44% |
| Hypothetical example for comparison purposes | 1,000.00 | 1,022.70 | 2.21 | 0.44% |
| Multifactor Emerging Markets ETF |
| Actual expenses/actual returns | $1,000.00 | $865.20 | $2.50 | 0.54% |
| Hypothetical example for comparison purposes | 1,000.00 | 1,022.20 | 2.72 | 0.54% |
| 26 | JOHN HANCOCK MULTIFACTOR ETFS | ANNUAL | |
SHAREHOLDER EXPENSE EXAMPLE CHART (continued)
| | Account
value on
11-1-2019 | Ending
value on
4-30-2020 | Expenses
paid during
4-30-20201 | Annualized
expense
ratio |
| Multifactor Energy ETF |
| Actual expenses/actual returns | $1,000.00 | $649.50 | $1.64 | 0.40% |
| Hypothetical example for comparison purposes | 1,000.00 | 1,022.90 | 2.01 | 0.40% |
| Multifactor Financials ETF |
| Actual expenses/actual returns | $1,000.00 | $812.70 | $1.80 | 0.40% |
| Hypothetical example for comparison purposes | 1,000.00 | 1,022.90 | 2.01 | 0.40% |
| Multifactor Healthcare ETF |
| Actual expenses/actual returns | $1,000.00 | $1,078.80 | $2.07 | 0.40% |
| Hypothetical example for comparison purposes | 1,000.00 | 1,022.90 | 2.01 | 0.40% |
| Multifactor Industrials ETF |
| Actual expenses/actual returns | $1,000.00 | $837.20 | $1.83 | 0.40% |
| Hypothetical example for comparison purposes | 1,000.00 | 1,022.90 | 2.01 | 0.40% |
| Multifactor Large Cap ETF |
| Actual expenses/actual returns | $1,000.00 | $933.10 | $1.59 | 0.33% |
| Hypothetical example for comparison purposes | 1,000.00 | 1,023.20 | 1.66 | 0.33% |
| Multifactor Materials ETF |
| Actual expenses/actual returns | $1,000.00 | $855.50 | $1.85 | 0.40% |
| Hypothetical example for comparison purposes | 1,000.00 | 1,022.90 | 2.01 | 0.40% |
| Multifactor Media and Communications ETF |
| Actual expenses/actual returns | $1,000.00 | $937.80 | $1.93 | 0.40% |
| Hypothetical example for comparison purposes | 1,000.00 | 1,022.90 | 2.01 | 0.40% |
| Multifactor Mid Cap ETF |
| Actual expenses/actual returns | $1,000.00 | $875.70 | $1.96 | 0.42% |
| Hypothetical example for comparison purposes | 1,000.00 | 1,022.80 | 2.11 | 0.42% |
| Multifactor Small Cap ETF |
| Actual expenses/actual returns | $1,000.00 | $822.30 | $2.22 | 0.49% |
| Hypothetical example for comparison purposes | 1,000.00 | 1,022.40 | 2.46 | 0.49% |
| Multifactor Technology ETF |
| Actual expenses/actual returns | $1,000.00 | $1,045.80 | $2.03 | 0.40% |
| Hypothetical example for comparison purposes | 1,000.00 | 1,022.90 | 2.01 | 0.40% |
| Multifactor Utilities ETF |
| Actual expenses/actual returns | $1,000.00 | $868.40 | $1.86 | 0.40% |
| Hypothetical example for comparison purposes | 1,000.00 | 1,022.90 | 2.01 | 0.40% |
| | |
| 1 | Expenses are equal to the annualized expense ratio, multiplied by the average account value over the period, multiplied by 182/366 (to reflect the one-half year period). |
| | ANNUAL | JOHN HANCOCK MULTIFACTOR ETFS | 27 |
MULTIFACTOR CONSUMER DISCRETIONARY ETF
As of 4-30-20
| | Shares or
Principal
Amount | Value |
| COMMON STOCKS – 99.9% | | $31,155,726 |
| (Cost $33,719,074) | | |
| Communication services – 0.8% | 258,827 |
| Entertainment – 0.8% | |
| Madison Square Garden Entertainment Corp. (A) | 472 | 39,034 |
| Madison Square Garden Sports Corp. (A) | 472 | 80,863 |
| Roku, Inc. (A) | 1,146 | 138,930 |
| Consumer discretionary – 91.4% | 28,486,899 |
| Automobiles – 5.1% | |
| Ford Motor Company | 84,401 | 429,601 |
| General Motors Company | 19,481 | 434,231 |
| Harley-Davidson, Inc. (B) | 4,348 | 94,917 |
| Tesla, Inc. (A) | 705 | 551,225 |
| Thor Industries, Inc. (B) | 990 | 65,538 |
| Distributors – 1.6% | |
| Genuine Parts Company | 3,831 | 303,722 |
| LKQ Corp. (A) | 7,274 | 190,215 |
| Diversified consumer services – 2.2% | |
| Bright Horizons Family Solutions, Inc. (A) | 1,465 | 170,599 |
| Chegg, Inc. (A) | 2,737 | 117,007 |
| frontdoor, Inc. (A) | 1,623 | 62,826 |
| Grand Canyon Education, Inc. (A) | 1,215 | 104,514 |
| H&R Block, Inc. | 5,319 | 88,561 |
| Laureate Education, Inc., Class A (A) | 2,567 | 24,309 |
| ServiceMaster Global Holdings, Inc. (A) | 3,367 | 114,646 |
| Hotels, restaurants and leisure – 19.7% | |
| Carnival Corp. (B) | 3,800 | 60,420 |
| Chipotle Mexican Grill, Inc. (A) | 682 | 599,171 |
| Choice Hotels International, Inc. (B) | 796 | 59,740 |
| Churchill Downs, Inc. | 916 | 91,802 |
| Cracker Barrel Old Country Store, Inc. | 864 | 84,154 |
| Darden Restaurants, Inc. | 3,494 | 257,822 |
| Domino's Pizza, Inc. | 807 | 292,078 |
| Dunkin' Brands Group, Inc. | 1,668 | 104,817 |
| Eldorado Resorts, Inc. (A)(B) | 1,150 | 24,656 |
| Hilton Worldwide Holdings, Inc. | 5,531 | 418,752 |
| Hyatt Hotels Corp., Class A | 1,080 | 60,761 |
| Las Vegas Sands Corp. | 6,727 | 323,031 |
| Marriott International, Inc., Class A | 3,469 | 315,471 |
| Marriott Vacations Worldwide Corp. | 948 | 78,684 |
| McDonald's Corp. | 4,888 | 916,793 |
| MGM Resorts International | 11,462 | 192,905 |
| Norwegian Cruise Line Holdings, Ltd. (A) | 6,057 | 99,335 |
| Planet Fitness, Inc., Class A (A) | 1,878 | 113,300 |
| Royal Caribbean Cruises, Ltd. | 4,580 | 214,203 |
| Starbucks Corp. | 7,848 | 602,177 |
| Texas Roadhouse, Inc. | 1,646 | 77,510 |
| The Wendy's Company | 5,003 | 99,360 |
| Vail Resorts, Inc. | 1,000 | 171,000 |
MULTIFACTOR CONSUMER DISCRETIONARY ETF (continued)
| | Shares or
Principal
Amount | Value |
| Consumer discretionary (continued) | |
| Hotels, restaurants and leisure (continued) | |
| Wyndham Destinations, Inc. | 2,133 | $54,541 |
| Wyndham Hotels & Resorts, Inc. | 2,544 | 95,934 |
| Wynn Resorts, Ltd. | 3,296 | 281,907 |
| Yum! Brands, Inc. | 5,169 | 446,757 |
| Household durables – 2.6% | |
| Garmin, Ltd. | 3,311 | 268,721 |
| Helen of Troy, Ltd. (A) | 616 | 101,196 |
| Mohawk Industries, Inc. (A) | 1,355 | 118,861 |
| Tempur Sealy International, Inc. (A) | 1,782 | 95,783 |
| Whirlpool Corp. | 1,917 | 214,206 |
| Internet and direct marketing retail – 16.1% | |
| Amazon.com, Inc. (A) | 1,077 | 2,664,498 |
| Booking Holdings, Inc. (A) | 526 | 778,780 |
| Chewy, Inc., Class A (A)(B) | 702 | 30,354 |
| eBay, Inc. | 26,584 | 1,058,841 |
| Etsy, Inc. (A) | 2,163 | 140,314 |
| Expedia Group, Inc. | 3,264 | 231,679 |
| Wayfair, Inc., Class A (A) | 974 | 120,815 |
| Leisure products – 1.7% | |
| Brunswick Corp. | 1,775 | 84,703 |
| Hasbro, Inc. | 3,057 | 220,746 |
| Mattel, Inc. (A) | 5,795 | 50,532 |
| Peloton Interactive, Inc., Class A (A) | 660 | 20,790 |
| Polaris, Inc. | 2,253 | 159,805 |
| Multiline retail – 7.6% | |
| Dollar General Corp. | 3,529 | 618,634 |
| Dollar Tree, Inc. (A) | 7,083 | 564,303 |
| Kohl's Corp. | 5,341 | 98,595 |
| Macy's, Inc. (B) | 7,691 | 45,069 |
| Nordstrom, Inc. (B) | 5,074 | 95,290 |
| Target Corp. | 8,598 | 943,545 |
| Specialty retail – 25.2% | |
| Advance Auto Parts, Inc. | 1,875 | 226,705 |
| AutoNation, Inc. (A) | 1,927 | 71,761 |
| AutoZone, Inc. (A) | 475 | 484,652 |
| Best Buy Company, Inc. | 9,393 | 720,725 |
| Burlington Stores, Inc. (A) | 1,761 | 321,717 |
| CarMax, Inc. (A) | 5,045 | 371,564 |
| Carvana Company (A)(B) | 683 | 54,715 |
| Five Below, Inc. (A) | 1,499 | 135,150 |
| Floor & Decor Holdings, Inc., Class A (A) | 1,671 | 70,850 |
| Foot Locker, Inc. | 2,880 | 73,814 |
| L Brands, Inc. | 4,104 | 48,797 |
| Lowe's Companies, Inc. | 6,541 | 685,170 |
| O'Reilly Automotive, Inc. (A) | 1,896 | 732,501 |
| Penske Automotive Group, Inc. | 598 | 21,516 |
| Ross Stores, Inc. | 7,163 | 654,412 |
| The Gap, Inc. | 5,984 | 48,590 |
| The Home Depot, Inc. | 7,052 | 1,550,241 |
| 28 | JOHN HANCOCK MULTIFACTOR ETFS | ANNUAL REPORT | SEE NOTES TO FINANCIAL STATEMENTS |
MULTIFACTOR CONSUMER DISCRETIONARY ETF (continued)
| | Shares or
Principal
Amount | Value |
| Consumer discretionary (continued) | |
| Specialty retail (continued) | |
| The TJX Companies, Inc. | 13,533 | $663,794 |
| Tractor Supply Company | 3,920 | 397,606 |
| Ulta Beauty, Inc. (A) | 1,637 | 356,735 |
| Williams-Sonoma, Inc. | 2,906 | 179,707 |
| Textiles, apparel and luxury goods – 9.6% | |
| Capri Holdings, Ltd. (A) | 3,483 | 53,116 |
| Carter's, Inc. | 1,200 | 93,840 |
| Columbia Sportswear Company | 882 | 64,289 |
| Deckers Outdoor Corp. (A) | 935 | 139,091 |
| Hanesbrands, Inc. (B) | 17,177 | 170,739 |
| Levi Strauss & Company, Class A (B) | 1,095 | 14,115 |
| Lululemon Athletica, Inc. (A) | 2,560 | 572,109 |
| NIKE, Inc., Class B | 11,948 | 1,041,627 |
| PVH Corp. | 1,412 | 69,513 |
| Ralph Lauren Corp. | 1,409 | 103,956 |
| Skechers U.S.A., Inc., Class A (A) | 3,317 | 93,473 |
| Tapestry, Inc. | 5,059 | 75,278 |
| Under Armour, Inc., Class A (A) | 4,783 | 49,839 |
| Under Armour, Inc., Class C (A) | 4,950 | 45,887 |
| VF Corp. | 7,130 | 414,253 |
| Consumer staples – 1.5% | 480,185 |
| Personal products – 1.5% | |
| Coty, Inc., Class A | 7,028 | 38,303 |
| The Estee Lauder Companies, Inc., Class A | 2,505 | 441,882 |
| Industrials – 6.2% | 1,929,815 |
| Building products – 1.6% | |
| Allegion PLC | 3,223 | 324,040 |
| Fortune Brands Home & Security, Inc. | 3,440 | 165,808 |
| Commercial services and supplies – 1.9% | |
| Copart, Inc. (A) | 5,801 | 464,718 |
| Rollins, Inc. | 3,288 | 131,520 |
| Machinery – 1.3% | |
| Stanley Black & Decker, Inc. | 3,747 | 412,919 |
| Road and rail – 1.2% | |
| Lyft, Inc., Class A (A) | 925 | 30,368 |
| Uber Technologies, Inc. (A) | 10,790 | 326,613 |
| Trading companies and distributors – 0.2% | |
| SiteOne Landscape Supply, Inc. (A) | 833 | 73,829 |
|
| SHORT-TERM INVESTMENTS – 2.2% | | $679,305 |
| (Cost $679,128) | | |
| Short-term funds – 2.2% | 679,305 |
| John Hancock Collateral Trust, 0.6614% (C)(D) | 64,449 | 645,028 |
MULTIFACTOR CONSUMER DISCRETIONARY ETF (continued)
| | Shares or
Principal
Amount | Value |
|
| State Street Institutional U.S. Government Money Market Fund, Premier Class, 0.2162% (C) | 34,277 | $34,277 |
| Total investments (Multifactor Consumer Discretionary ETF) (Cost $34,398,202) 102.1% | $31,835,031 |
| Other assets and liabilities, net (2.1%) | | (663,715) |
| Total net assets 100.0% | | $31,171,316 |
| The percentage shown for each investment category is the total value of the category as a percentage of the net assets of the fund. |
| Security Abbreviations and Legend |
| (A) | Non-income producing security. |
| (B) | All or a portion of this security is on loan as of 4-30-20. |
| (C) | The rate shown is the annualized seven-day yield as of 4-30-20. |
| (D) | Investment is an affiliate of the fund, the advisor and/or subadvisor. This security represents the investment of cash collateral received for securities lending. |
MULTIFACTOR CONSUMER STAPLES ETF
As of 4-30-20
| | Shares or
Principal
Amount | Value |
| COMMON STOCKS – 99.9% | | $19,197,670 |
| (Cost $20,011,093) | | |
| Consumer discretionary – 0.7% | 143,339 |
| Household durables – 0.7% | |
| Newell Brands, Inc. | 10,327 | 143,339 |
| Consumer staples – 96.6% | 18,564,761 |
| Beverages – 19.7% | |
| Brown-Forman Corp., Class A | 1,078 | 61,144 |
| Brown-Forman Corp., Class B | 6,476 | 402,807 |
| Constellation Brands, Inc., Class A | 1,932 | 318,181 |
| Keurig Dr. Pepper, Inc. | 12,262 | 324,453 |
| Molson Coors Beverage Company, Class B | 4,730 | 193,977 |
| Monster Beverage Corp. (A) | 4,026 | 248,847 |
| PepsiCo, Inc. | 8,678 | 1,148,013 |
| The Boston Beer Company, Inc., Class A (A) | 241 | 112,429 |
| The Coca-Cola Company | 21,417 | 982,826 |
| Food and staples retailing – 22.1% | |
| Casey's General Stores, Inc. | 1,072 | 162,312 |
| Costco Wholesale Corp. | 3,237 | 980,811 |
| Performance Food Group Company (A) | 3,076 | 90,281 |
| Sysco Corp. | 6,106 | 343,585 |
| The Kroger Company | 29,808 | 942,231 |
| US Foods Holding Corp. (A) | 6,763 | 145,405 |
| Walgreens Boots Alliance, Inc. | 6,641 | 287,489 |
| Walmart, Inc. | 10,600 | 1,288,430 |
| Food products – 29.6% | |
| Archer-Daniels-Midland Company | 13,886 | 515,726 |
| Beyond Meat, Inc. (A) | 473 | 46,822 |
| Bunge, Ltd. | 3,584 | 142,177 |
| Campbell Soup Company | 5,972 | 298,481 |
| Conagra Brands, Inc. | 12,124 | 405,427 |
| SEE NOTES TO FINANCIAL STATEMENTS | ANNUAL REPORT | JOHN HANCOCK MULTIFACTOR ETFS | 29 |
MULTIFACTOR CONSUMER STAPLES ETF (continued)
| | Shares or
Principal
Amount | Value |
| Consumer staples (continued) | |
| Food products (continued) | |
| Darling Ingredients, Inc. (A) | 3,116 | $64,158 |
| Flowers Foods, Inc. | 4,394 | 97,898 |
| General Mills, Inc. | 8,144 | 487,744 |
| Hormel Foods Corp. | 6,364 | 298,153 |
| Ingredion, Inc. | 1,886 | 153,143 |
| Kellogg Company | 7,494 | 490,857 |
| Lamb Weston Holdings, Inc. | 3,378 | 207,274 |
| Lancaster Colony Corp. | 557 | 74,989 |
| McCormick & Company, Inc. | 2,846 | 446,367 |
| Mondelez International, Inc., Class A | 11,697 | 601,694 |
| Pilgrim's Pride Corp. (A) | 1,872 | 41,184 |
| Post Holdings, Inc. (A) | 2,058 | 189,027 |
| Seaboard Corp. | 9 | 27,100 |
| The Hershey Company | 1,912 | 253,206 |
| The J.M. Smucker Company | 2,812 | 323,127 |
| The Kraft Heinz Company | 4,185 | 126,931 |
| Tyson Foods, Inc., Class A | 6,374 | 396,399 |
| Household products – 17.3% | |
| Church & Dwight Company, Inc. | 5,795 | 405,592 |
| Colgate-Palmolive Company | 9,350 | 657,025 |
| Kimberly-Clark Corp. | 3,343 | 462,939 |
| Reynolds Consumer Products, Inc. | 820 | 26,593 |
| The Clorox Company | 3,144 | 586,167 |
| The Procter & Gamble Company | 10,084 | 1,188,601 |
| Personal products – 0.4% | |
| Herbalife Nutrition, Ltd. (A) | 2,232 | 83,363 |
| Tobacco – 7.5% | |
| Altria Group, Inc. | 17,623 | 691,703 |
| Philip Morris International, Inc. | 9,942 | 741,673 |
| Materials – 2.6% | 489,570 |
| Chemicals – 2.6% | |
| Corteva, Inc. | 18,693 | 489,570 |
|
| SHORT-TERM INVESTMENTS – 0.1% | | $8,249 |
| (Cost $8,249) | | |
| Short-term funds – 0.1% | 8,249 |
| State Street Institutional U.S. Government Money Market Fund, Premier Class, 0.2162% (B) | 8,249 | 8,249 |
| Total investments (Multifactor Consumer Staples ETF) (Cost $20,019,342) 100.0% | $19,205,919 |
| Other assets and liabilities, net 0.0% | | 5,265 |
| Total net assets 100.0% | | $19,211,184 |
| The percentage shown for each investment category is the total value of the category as a percentage of the net assets of the fund. |
| Security Abbreviations and Legend |
| (A) | Non-income producing security. |
| (B) | The rate shown is the annualized seven-day yield as of 4-30-20. |
MULTIFACTOR DEVELOPED INTERNATIONAL ETF
As of 4-30-20
| | Shares or
Principal
Amount | Value |
| COMMON STOCKS - 98.4% | $426,168,986 |
| (Cost $459,076,756) | | |
| Australia - 6.2% | 26,988,576 |
| Afterpay, Ltd. (A)(B) | 2,904 | 59,319 |
| AGL Energy, Ltd. | 73,939 | 820,997 |
| APA Group | 83,509 | 597,033 |
| Aristocrat Leisure, Ltd. | 18,616 | 310,669 |
| ASX, Ltd. | 9,490 | 506,679 |
| Aurizon Holdings, Ltd. | 264,189 | 811,204 |
| Australia & New Zealand Banking Group, Ltd. | 76,962 | 851,541 |
| BHP Group PLC | 67,166 | 1,132,027 |
| BHP Group, Ltd. | 82,360 | 1,744,347 |
| Brambles, Ltd. | 51,900 | 376,487 |
| Caltex Australia, Ltd. | 3,400 | 55,471 |
| CIMIC Group, Ltd. | 7,466 | 120,440 |
| Coca-Cola Amatil, Ltd. | 16,424 | 93,334 |
| Cochlear, Ltd. | 4,552 | 549,846 |
| Coles Group, Ltd. | 34,175 | 347,027 |
| Commonwealth Bank of Australia | 44,202 | 1,814,189 |
| Computershare, Ltd. | 35,860 | 285,956 |
| Crown Resorts, Ltd. | 27,907 | 180,697 |
| CSL, Ltd. | 12,348 | 2,501,586 |
| Dexus | 31,125 | 186,658 |
| Evolution Mining, Ltd. | 69,726 | 233,270 |
| Fortescue Metals Group, Ltd. | 144,906 | 1,134,645 |
| Goodman Group | 27,214 | 234,294 |
| Insurance Australia Group, Ltd. | 52,231 | 197,651 |
| Lendlease Group (A) | 8,263 | 66,130 |
| Lendlease Group, Stapled Security | 47,440 | 383,889 |
| Macquarie Group, Ltd. | 11,591 | 779,049 |
| Magellan Financial Group, Ltd. | 7,058 | 235,757 |
| Medibank Pvt., Ltd. | 230,345 | 407,179 |
| Mirvac Group | 107,872 | 158,197 |
| National Australia Bank, Ltd. | 67,595 | 750,555 |
| National Australia Bank, Ltd., No-Par Value Stock (A) | 4,846 | 53,348 |
| Newcrest Mining, Ltd. | 14,745 | 292,406 |
| Northern Star Resources, Ltd. | 25,296 | 211,819 |
| Oil Search, Ltd. | 148,358 | 296,246 |
| Orica, Ltd. | 16,111 | 189,018 |
| Origin Energy, Ltd. | 126,487 | 460,429 |
| Qantas Airways, Ltd. | 88,371 | 223,326 |
| QBE Insurance Group, Ltd. | 48,950 | 270,802 |
| Ramsay Health Care, Ltd. | 11,334 | 464,589 |
| REA Group, Ltd. (B) | 4,123 | 240,321 |
| Santos, Ltd. | 208,785 | 675,256 |
| Scentre Group | 60,533 | 92,340 |
| Sonic Healthcare, Ltd. | 22,250 | 396,079 |
| South32, Ltd. | 162,017 | 210,554 |
| Stockland | 86,528 | 163,152 |
| Suncorp Group, Ltd. | 66,969 | 402,932 |
| 30 | JOHN HANCOCK MULTIFACTOR ETFS | ANNUAL REPORT | SEE NOTES TO FINANCIAL STATEMENTS |
MULTIFACTOR DEVELOPED INTERNATIONAL ETF (continued)
| | Shares or
Principal
Amount | Value |
| Australia (continued) | |
| Sydney Airport | 22,788 | $93,992 |
| Tabcorp Holdings, Ltd. | 145,228 | 306,160 |
| Telstra Corp., Ltd. | 135,147 | 269,866 |
| The GPT Group | 56,986 | 157,816 |
| TPG Telecom, Ltd. | 13,855 | 66,762 |
| Transurban Group | 29,598 | 267,414 |
| Treasury Wine Estates, Ltd. | 25,262 | 167,871 |
| Vicinity Centres | 91,712 | 89,465 |
| Wesfarmers, Ltd. | 25,258 | 623,257 |
| Westpac Banking Corp. | 95,343 | 1,016,215 |
| Woodside Petroleum, Ltd. | 30,260 | 444,762 |
| Woolworths Group, Ltd. | 39,147 | 916,256 |
| Austria - 0.2% | 689,359 |
| ANDRITZ AG | 2,312 | 75,970 |
| Erste Group Bank AG (A) | 8,709 | 189,110 |
| OMV AG | 4,537 | 148,584 |
| Raiffeisen Bank International AG | 6,850 | 118,019 |
| Telekom Austria AG | 3,106 | 21,841 |
| Verbund AG | 1,135 | 51,417 |
| voestalpine AG | 4,079 | 84,418 |
| Belgium - 0.9% | 4,107,749 |
| Ackermans & van Haaren NV | 2,447 | 324,036 |
| Ageas | 20,156 | 725,225 |
| Anheuser-Busch InBev SA/NV | 19,577 | 898,020 |
| Colruyt SA | 4,546 | 271,966 |
| Elia Group SA/NV | 2,969 | 341,454 |
| Galapagos NV (A) | 705 | 155,676 |
| Galapagos NV (Euronext Amsterdam) (A) | 30 | 6,621 |
| KBC Group NV | 8,398 | 453,294 |
| Proximus SADP | 12,713 | 271,111 |
| Solvay SA (B) | 2,489 | 194,215 |
| Telenet Group Holding NV | 1,420 | 59,227 |
| UCB SA | 1,499 | 137,161 |
| Umicore SA | 6,249 | 269,743 |
| Chile - 0.1% | 250,945 |
| Antofagasta PLC | 24,471 | 250,945 |
| Denmark - 2.1% | 9,253,571 |
| A.P. Moller - Maersk A/S, Series A | 112 | 103,356 |
| A.P. Moller - Maersk A/S, Series B | 131 | 130,218 |
| Carlsberg A/S, Class B | 3,232 | 407,449 |
| Chr. Hansen Holding A/S | 6,650 | 572,959 |
| Coloplast A/S, B Shares | 2,669 | 422,061 |
| Danske Bank A/S (A) | 31,103 | 368,999 |
| DSV Panalpina A/S | 7,215 | 744,314 |
| Genmab A/S (A) | 4,163 | 1,000,920 |
| Novo Nordisk A/S, B Shares | 42,502 | 2,710,258 |
| Novozymes A/S, B Shares | 15,114 | 740,316 |
| Orsted A/S (C) | 5,575 | 563,504 |
| Tryg A/S | 6,308 | 166,993 |
MULTIFACTOR DEVELOPED INTERNATIONAL ETF (continued)
| | Shares or
Principal
Amount | Value |
| Denmark (continued) | |
| Vestas Wind Systems A/S | 15,362 | $1,322,224 |
| Finland - 1.4% | 6,135,836 |
| Elisa OYJ | 10,342 | 628,002 |
| Fortum OYJ | 13,747 | 228,115 |
| Kesko OYJ, A Shares | 6,616 | 107,248 |
| Kesko OYJ, B Shares | 17,628 | 286,723 |
| Kone OYJ, Class B | 11,310 | 685,295 |
| Neste OYJ | 12,126 | 429,394 |
| Nokia OYJ | 90,467 | 329,370 |
| Nordea Bank ABP | 81,331 | 520,861 |
| Orion OYJ, Class A | 713 | 35,221 |
| Orion OYJ, Class B | 3,509 | 178,257 |
| Sampo OYJ, A Shares | 6,800 | 225,229 |
| Stora Enso OYJ, R Shares | 64,586 | 764,003 |
| UPM-Kymmene OYJ | 54,589 | 1,510,329 |
| Wartsila OYJ ABP | 28,298 | 207,789 |
| France - 9.6% | 41,353,498 |
| Aeroports de Paris | 2,371 | 232,168 |
| Air Liquide SA | 13,626 | 1,732,741 |
| Airbus SE (A) | 13,252 | 840,123 |
| AXA SA | 58,597 | 1,039,480 |
| BNP Paribas SA | 28,176 | 884,944 |
| Bouygues SA (A) | 44,883 | 1,381,897 |
| Capgemini SE | 11,978 | 1,124,866 |
| Cie de Saint-Gobain | 38,857 | 1,030,379 |
| Cie Generale des Etablissements Michelin SCA | 27,768 | 2,709,913 |
| Credit Agricole SA | 93,815 | 748,266 |
| Danone SA | 14,952 | 1,036,004 |
| Dassault Systemes SE | 4,653 | 680,628 |
| Electricite de France SA | 30,609 | 243,868 |
| Engie SA | 128,863 | 1,397,886 |
| EssilorLuxottica SA | 5,606 | 691,699 |
| Hermes International | 689 | 503,963 |
| Kering SA | 1,642 | 827,662 |
| Legrand SA | 22,188 | 1,495,091 |
| L'Oreal SA | 3,059 | 888,894 |
| LVMH Moet Hennessy Louis Vuitton SE | 6,954 | 2,684,511 |
| Orange SA | 317,609 | 3,873,611 |
| Pernod Ricard SA | 5,734 | 873,611 |
| Peugeot SA | 97,524 | 1,396,646 |
| Safran SA | 10,940 | 1,009,173 |
| Sanofi | 23,456 | 2,291,412 |
| Sartorius Stedim Biotech | 843 | 202,211 |
| Schneider Electric SE | 16,127 | 1,474,229 |
| Societe Generale SA | 42,743 | 667,602 |
| Sodexo SA (B) | 7,429 | 589,931 |
| Thales SA | 8,467 | 641,198 |
| TOTAL SA | 72,353 | 2,603,304 |
| Unibail-Rodamco-Westfield (B) | 6,331 | 372,513 |
| Veolia Environnement SA | 17,473 | 372,907 |
| SEE NOTES TO FINANCIAL STATEMENTS | ANNUAL REPORT | JOHN HANCOCK MULTIFACTOR ETFS | 31 |
MULTIFACTOR DEVELOPED INTERNATIONAL ETF (continued)
| | Shares or
Principal
Amount | Value |
| France (continued) | |
| Vinci SA | 16,479 | $1,348,294 |
| Vivendi SA | 67,733 | 1,461,873 |
| Germany - 8.3% | 36,015,369 |
| adidas AG | 3,967 | 908,985 |
| Allianz SE | 11,403 | 2,109,261 |
| BASF SE | 27,915 | 1,427,408 |
| Bayer AG | 48,322 | 3,183,035 |
| Bayerische Motoren Werke AG | 22,095 | 1,308,045 |
| Beiersdorf AG | 5,022 | 525,747 |
| Continental AG | 3,959 | 334,762 |
| Daimler AG | 28,865 | 997,005 |
| Delivery Hero SE (A)(C) | 2,006 | 169,182 |
| Deutsche Bank AG | 145,400 | 1,079,441 |
| Deutsche Boerse AG | 5,641 | 875,815 |
| Deutsche Post AG | 24,914 | 740,877 |
| Deutsche Telekom AG | 100,785 | 1,470,944 |
| Deutsche Wohnen SE | 39,253 | 1,590,771 |
| E.ON SE | 28,604 | 286,544 |
| Evonik Industries AG | 21,830 | 537,027 |
| Fresenius Medical Care AG & Company KGaA | 21,610 | 1,696,151 |
| Fresenius SE & Company KGaA | 35,526 | 1,542,068 |
| Hannover Rueck SE | 3,514 | 560,013 |
| Hapag-Lloyd AG (C) | 876 | 125,884 |
| HeidelbergCement AG | 14,156 | 672,610 |
| Henkel AG & Company KGaA | 1,558 | 121,331 |
| Infineon Technologies AG | 93,271 | 1,731,607 |
| Knorr-Bremse AG | 2,902 | 269,733 |
| Merck KGaA | 1,623 | 188,611 |
| MTU Aero Engines AG | 3,489 | 475,013 |
| Muenchener Rueckversicherungs-Gesellschaft AG | 4,709 | 1,035,680 |
| RWE AG | 33,001 | 948,471 |
| SAP SE | 12,868 | 1,535,435 |
| Siemens AG | 12,221 | 1,133,498 |
| Siemens Healthineers AG (C) | 3,057 | 134,603 |
| Symrise AG | 8,175 | 826,640 |
| Traton SE (A) | 2,980 | 44,926 |
| Volkswagen AG | 2,779 | 414,875 |
| Vonovia SE | 86,855 | 4,285,709 |
| Wirecard AG | 7,349 | 727,662 |
| Hong Kong - 3.6% | 15,759,919 |
| AIA Group, Ltd. | 221,724 | 2,057,833 |
| BOC Hong Kong Holdings, Ltd. | 163,795 | 503,913 |
| Budweiser Brewing Company APAC, Ltd. (A)(C) | 11,800 | 32,193 |
| CK Asset Holdings, Ltd. | 156,896 | 991,687 |
| CK Hutchison Holdings, Ltd. | 144,273 | 1,068,227 |
| CK Infrastructure Holdings, Ltd. | 49,929 | 297,551 |
| CLP Holdings, Ltd. | 99,571 | 1,063,481 |
| Galaxy Entertainment Group, Ltd. | 74,641 | 485,742 |
MULTIFACTOR DEVELOPED INTERNATIONAL ETF (continued)
| | Shares or
Principal
Amount | Value |
| Hong Kong (continued) | |
| Hang Seng Bank, Ltd. | 38,889 | $684,741 |
| Henderson Land Development Company, Ltd. | 107,398 | 439,159 |
| HKT Trust & HKT, Ltd. | 417,337 | 670,767 |
| Hong Kong & China Gas Company, Ltd. | 200,484 | 358,434 |
| Hong Kong Exchanges & Clearing, Ltd. | 40,625 | 1,320,567 |
| Hongkong Land Holdings, Ltd. | 80,400 | 338,484 |
| Link REIT | 51,526 | 462,596 |
| MTR Corp., Ltd. | 54,005 | 299,898 |
| New World Development Company, Ltd. | 673,060 | 794,404 |
| Power Assets Holdings, Ltd. | 106,573 | 712,792 |
| Sun Hung Kai Properties, Ltd. | 49,662 | 681,605 |
| Swire Pacific, Ltd., Class A | 38,664 | 253,858 |
| Swire Pacific, Ltd., Class B | 68,128 | 74,523 |
| Swire Properties, Ltd. | 84,801 | 237,918 |
| Techtronic Industries Company, Ltd. | 118,577 | 903,206 |
| Wharf Real Estate Investment Company, Ltd. | 86,992 | 367,500 |
| Wheelock & Company, Ltd. | 90,001 | 658,840 |
| Ireland - 1.1% | 4,604,534 |
| CRH PLC | 30,972 | 934,596 |
| DCC PLC | 4,884 | 348,557 |
| Experian PLC | 27,449 | 822,638 |
| Flutter Entertainment PLC (B) | 2,749 | 336,326 |
| ICON PLC (A) | 2,768 | 444,181 |
| James Hardie Industries PLC | 29,460 | 432,425 |
| Kerry Group PLC, Class A | 2,025 | 232,223 |
| Kingspan Group PLC | 4,914 | 250,277 |
| Smurfit Kappa Group PLC | 25,626 | 803,311 |
| Israel - 0.4% | 1,615,363 |
| Azrieli Group, Ltd. | 736 | 43,915 |
| Bank Hapoalim BM | 32,401 | 209,852 |
| Bank Leumi Le-Israel BM | 56,194 | 305,830 |
| Check Point Software Technologies, Ltd. (A) | 2,713 | 286,873 |
| Elbit Systems, Ltd. | 713 | 97,473 |
| Isracard, Ltd. | 1,600 | 4,218 |
| Israel Chemicals, Ltd. | 12,695 | 44,512 |
| Mizrahi Tefahot Bank, Ltd. | 4,517 | 93,362 |
| Nice, Ltd. (A) | 1,197 | 200,127 |
| Teva Pharmaceutical Industries, Ltd. (A) | 25,565 | 282,763 |
| Wix.com, Ltd. (A) | 355 | 46,438 |
| Italy - 2.1% | 8,903,259 |
| Amplifon SpA | 2,484 | 56,890 |
| Assicurazioni Generali SpA | 26,162 | 372,948 |
| Atlantia SpA | 11,543 | 187,812 |
| Davide Campari-Milano SpA | 29,251 | 226,513 |
| DiaSorin SpA | 1,605 | 273,011 |
| Enel SpA | 162,731 | 1,111,500 |
| Eni SpA | 130,937 | 1,249,721 |
| Ferrari NV | 3,753 | 589,469 |
| FinecoBank Banca Fineco SpA (A) | 35,997 | 399,795 |
| 32 | JOHN HANCOCK MULTIFACTOR ETFS | ANNUAL REPORT | SEE NOTES TO FINANCIAL STATEMENTS |
MULTIFACTOR DEVELOPED INTERNATIONAL ETF (continued)
| | Shares or
Principal
Amount | Value |
| Italy (continued) | |
| Hera SpA | 42,686 | $157,935 |
| Infrastrutture Wireless Italiane SpA (C) | 5,801 | 61,346 |
| Intesa Sanpaolo SpA | 346,891 | 540,668 |
| Leonardo SpA | 44,316 | 305,506 |
| Mediobanca Banca di Credito Finanziario SpA | 63,489 | 367,725 |
| Moncler SpA | 14,148 | 531,523 |
| Nexi SpA (A)(C) | 3,404 | 51,545 |
| Poste Italiane SpA (C) | 7,925 | 67,289 |
| Prysmian SpA | 13,662 | 256,932 |
| Recordati SpA | 7,688 | 334,048 |
| Snam SpA | 39,798 | 178,199 |
| Telecom Italia SpA (A)(B) | 1,161,434 | 459,998 |
| Terna Rete Elettrica Nazionale SpA | 103,298 | 647,174 |
| UniCredit SpA (A) | 48,013 | 369,646 |
| UnipolSai Assicurazioni SpA (B) | 43,154 | 106,066 |
| Japan - 26.8% | 115,963,336 |
| ABC-Mart, Inc. | 1,700 | 87,595 |
| Acom Company, Ltd. | 15,900 | 65,126 |
| Advantest Corp. | 12,400 | 611,100 |
| Aeon Company, Ltd. | 20,500 | 416,288 |
| AGC, Inc. | 14,200 | 358,403 |
| Aisin Seiki Company, Ltd. | 13,400 | 390,340 |
| Ajinomoto Company, Inc. | 16,500 | 295,638 |
| Alfresa Holdings Corp. | 7,700 | 155,390 |
| ANA Holdings, Inc. (A) | 10,100 | 217,329 |
| Asahi Group Holdings, Ltd. | 9,800 | 342,750 |
| Asahi Intecc Company, Ltd. | 12,100 | 323,957 |
| Asahi Kasei Corp. | 64,300 | 459,994 |
| Astellas Pharma, Inc. | 39,700 | 663,244 |
| Bandai Namco Holdings, Inc. | 7,101 | 360,645 |
| Bridgestone Corp. | 38,100 | 1,203,552 |
| Brother Industries, Ltd. | 17,800 | 305,614 |
| Canon, Inc. | 22,700 | 484,950 |
| Central Japan Railway Company | 7,644 | 1,215,563 |
| Chubu Electric Power Company, Inc. | 38,000 | 518,287 |
| Chugai Pharmaceutical Company, Ltd. | 4,300 | 515,107 |
| Coca-Cola Bottlers Japan Holdings, Inc. | 8,400 | 152,784 |
| Concordia Financial Group, Ltd. | 98,200 | 304,881 |
| CyberAgent, Inc. | 7,000 | 297,190 |
| Dai Nippon Printing Company, Ltd. | 27,224 | 582,999 |
| Daifuku Company, Ltd. | 9,100 | 640,791 |
| Dai-ichi Life Holdings, Inc. | 36,900 | 469,640 |
| Daiichi Sankyo Company, Ltd. | 8,300 | 572,971 |
| Daikin Industries, Ltd. | 6,847 | 896,734 |
| Daito Trust Construction Company, Ltd. | 3,986 | 384,491 |
| Daiwa House Industry Company, Ltd. | 31,400 | 809,702 |
| Daiwa House REIT Investment Corp. | 33 | 80,390 |
| Daiwa Securities Group, Inc. | 103,100 | 432,319 |
| Denso Corp. | 11,400 | 406,385 |
| Dentsu Group, Inc. | 4,300 | 91,601 |
MULTIFACTOR DEVELOPED INTERNATIONAL ETF (continued)
| | Shares or
Principal
Amount | Value |
| Japan (continued) | |
| Disco Corp. | 1,298 | $295,566 |
| East Japan Railway Company | 20,200 | 1,487,208 |
| Eisai Company, Ltd. | 3,272 | 230,403 |
| Electric Power Development Company, Ltd. | 16,200 | 327,227 |
| FamilyMart Company, Ltd. | 4,200 | 71,993 |
| FANUC Corp. | 2,670 | 445,187 |
| Fast Retailing Company, Ltd. | 1,719 | 827,872 |
| Fuji Electric Company, Ltd. | 5,993 | 145,377 |
| FUJIFILM Holdings Corp. | 13,100 | 629,550 |
| Fujitsu, Ltd. | 3,200 | 315,257 |
| GMO Payment Gateway, Inc. | 2,000 | 180,483 |
| Hakuhodo DY Holdings, Inc. | 15,400 | 173,103 |
| Hamamatsu Photonics KK | 4,600 | 203,469 |
| Hankyu Hanshin Holdings, Inc. | 27,300 | 944,593 |
| Hikari Tsushin, Inc. | 1,041 | 204,335 |
| Hino Motors, Ltd. | 31,000 | 187,273 |
| Hirose Electric Company, Ltd. | 1,305 | 144,858 |
| Hisamitsu Pharmaceutical Company, Inc. | 1,800 | 85,510 |
| Hitachi Construction Machinery Company, Ltd. | 15,600 | 371,418 |
| Hitachi Metals, Ltd. | 22,700 | 224,166 |
| Hitachi, Ltd. | 32,100 | 972,891 |
| Honda Motor Company, Ltd. | 54,654 | 1,334,215 |
| Hoshizaki Corp. | 2,600 | 200,346 |
| Hoya Corp. | 12,900 | 1,190,175 |
| Hulic Company, Ltd. | 20,800 | 208,515 |
| Idemitsu Kosan Company, Ltd. | 23,659 | 546,479 |
| Iida Group Holdings Company, Ltd. | 12,200 | 164,173 |
| Inpex Corp. | 42,300 | 273,377 |
| Isuzu Motors, Ltd. | 32,400 | 249,935 |
| ITOCHU Corp. | 47,600 | 945,902 |
| Itochu Techno-Solutions Corp. | 5,500 | 169,729 |
| Japan Airlines Company, Ltd. | 10,200 | 185,047 |
| Japan Exchange Group, Inc. | 41,100 | 773,303 |
| Japan Post Bank Company, Ltd. | 10,800 | 100,895 |
| Japan Post Holdings Company, Ltd. | 30,200 | 244,232 |
| Japan Post Insurance Company, Ltd. | 1,300 | 16,801 |
| Japan Real Estate Investment Corp. | 40 | 218,450 |
| Japan Retail Fund Investment Corp. | 74 | 81,934 |
| Japan Tobacco, Inc. | 30,900 | 582,111 |
| JFE Holdings, Inc. | 20,100 | 136,086 |
| JSR Corp. | 8,600 | 164,062 |
| JXTG Holdings, Inc. | 107,600 | 385,080 |
| Kajima Corp. | 52,500 | 554,776 |
| Kansai Paint Company, Ltd. | 8,100 | 156,114 |
| Kao Corp. | 15,800 | 1,228,717 |
| KDDI Corp. | 53,100 | 1,543,815 |
| Keikyu Corp. | 12,500 | 207,135 |
| Keio Corp. | 5,570 | 317,735 |
| Keisei Electric Railway Company, Ltd. | 8,700 | 265,227 |
| Keyence Corp. | 2,170 | 786,748 |
| Kikkoman Corp. | 5,000 | 232,852 |
| SEE NOTES TO FINANCIAL STATEMENTS | ANNUAL REPORT | JOHN HANCOCK MULTIFACTOR ETFS | 33 |
MULTIFACTOR DEVELOPED INTERNATIONAL ETF (continued)
| | Shares or
Principal
Amount | Value |
| Japan (continued) | |
| Kintetsu Group Holdings Company, Ltd. | 16,300 | $786,534 |
| Kirin Holdings Company, Ltd. | 27,900 | 542,293 |
| Kobayashi Pharmaceutical Company, Ltd. | 1,400 | 130,135 |
| Koito Manufacturing Company, Ltd. | 7,500 | 286,857 |
| Komatsu, Ltd. | 37,200 | 717,492 |
| Konami Holdings Corp. | 6,700 | 213,340 |
| Kose Corp. | 1,100 | 138,458 |
| Kubota Corp. | 24,300 | 306,093 |
| Kuraray Company, Ltd. | 38,900 | 394,693 |
| Kyocera Corp. | 11,400 | 616,081 |
| Kyowa Kirin Company, Ltd. | 3,200 | 75,350 |
| Kyushu Railway Company | 4,000 | 108,589 |
| Lawson, Inc. | 5,100 | 265,647 |
| LINE Corp. (A) | 600 | 29,569 |
| Lion Corp. | 12,100 | 254,707 |
| LIXIL Group Corp. | 32,600 | 398,754 |
| M3, Inc. | 13,300 | 483,817 |
| Makita Corp. | 5,300 | 174,461 |
| Marubeni Corp. | 55,900 | 273,920 |
| Mazda Motor Corp. | 67,300 | 385,165 |
| Medipal Holdings Corp. | 4,900 | 95,952 |
| MEIJI Holdings Company, Ltd. | 4,200 | 293,393 |
| MINEBEA MITSUMI, Inc. | 30,500 | 505,980 |
| MISUMI Group, Inc. | 14,100 | 340,979 |
| Mitsubishi Chemical Holdings Corp. | 47,700 | 275,401 |
| Mitsubishi Corp. | 47,000 | 1,010,894 |
| Mitsubishi Electric Corp. | 41,700 | 522,737 |
| Mitsubishi Estate Company, Ltd. | 15,900 | 262,063 |
| Mitsubishi Heavy Industries, Ltd. | 15,000 | 387,642 |
| Mitsubishi Motors Corp. | 12,700 | 36,223 |
| Mitsubishi UFJ Financial Group, Inc. | 353,370 | 1,435,158 |
| Mitsubishi UFJ Lease & Finance Company, Ltd. | 73,900 | 358,667 |
| Mitsui & Company, Ltd. | 58,200 | 824,003 |
| Mitsui Chemicals, Inc. | 20,300 | 403,589 |
| Mitsui Fudosan Company, Ltd. | 20,800 | 388,632 |
| Mizuho Financial Group, Inc. | 611,300 | 719,143 |
| MonotaRO Company, Ltd. | 8,400 | 272,577 |
| MS&AD Insurance Group Holdings, Inc. | 14,900 | 435,010 |
| Murata Manufacturing Company, Ltd. | 13,100 | 737,354 |
| Nagoya Railroad Company, Ltd. | 9,700 | 280,745 |
| NEC Corp. | 23,203 | 903,731 |
| Nexon Company, Ltd. | 4,600 | 75,021 |
| NGK Insulators, Ltd. | 20,000 | 266,330 |
| NH Foods, Ltd. | 4,192 | 151,121 |
| Nidec Corp. | 6,400 | 376,214 |
| Nikon Corp. | 32,300 | 304,167 |
| Nintendo Company, Ltd. | 2,017 | 842,185 |
| Nippon Building Fund, Inc. | 20 | 120,260 |
| Nippon Express Company, Ltd. | 12,200 | 603,526 |
| Nippon Paint Holdings Company, Ltd. | 1,900 | 110,338 |
| Nippon Prologis REIT, Inc. | 49 | 135,451 |
MULTIFACTOR DEVELOPED INTERNATIONAL ETF (continued)
| | Shares or
Principal
Amount | Value |
| Japan (continued) | |
| Nippon Shinyaku Company, Ltd. | 1,200 | $84,949 |
| Nippon Steel Corp. | 29,400 | 250,712 |
| Nippon Telegraph & Telephone Corp. | 95,166 | 2,174,130 |
| Nissan Chemical Corp. | 10,000 | 387,151 |
| Nissan Motor Company, Ltd. | 82,200 | 284,262 |
| Nisshin Seifun Group, Inc. | 11,400 | 179,313 |
| Nissin Foods Holdings Company, Ltd. | 2,716 | 224,524 |
| Nitori Holdings Company, Ltd. | 2,501 | 386,370 |
| Nitto Denko Corp. | 8,194 | 414,547 |
| Nomura Holdings, Inc. | 94,900 | 399,177 |
| Nomura Real Estate Master Fund, Inc. | 140 | 161,818 |
| Nomura Research Institute, Ltd. | 13,500 | 332,529 |
| NSK, Ltd. | 52,300 | 365,833 |
| NTT Data Corp. | 22,800 | 235,601 |
| NTT DOCOMO, Inc. | 37,900 | 1,115,717 |
| Obayashi Corp. | 107,300 | 955,249 |
| Obic Company, Ltd. | 800 | 121,345 |
| Odakyu Electric Railway Company, Ltd. | 24,600 | 545,900 |
| Oji Holdings Corp. | 103,400 | 531,818 |
| Olympus Corp. | 37,800 | 609,940 |
| Omron Corp. | 2,600 | 154,636 |
| Ono Pharmaceutical Company, Ltd. | 5,065 | 122,723 |
| Oracle Corp. Japan | 1,700 | 176,780 |
| Oriental Land Company, Ltd. | 2,500 | 319,820 |
| ORIX Corp. | 43,200 | 520,735 |
| Orix JREIT, Inc. | 46 | 55,793 |
| Osaka Gas Company, Ltd. | 44,900 | 839,343 |
| Otsuka Corp. | 8,600 | 389,648 |
| Otsuka Holdings Company, Ltd. | 9,100 | 362,094 |
| Pan Pacific International Holdings Corp. | 13,600 | 264,789 |
| Panasonic Corp. | 100,704 | 778,623 |
| PeptiDream, Inc. (A) | 5,000 | 189,367 |
| Pigeon Corp. | 4,100 | 147,038 |
| Pola Orbis Holdings, Inc. | 7,100 | 127,347 |
| Rakuten, Inc. | 18,800 | 161,040 |
| Recruit Holdings Company, Ltd. | 27,500 | 818,301 |
| Renesas Electronics Corp. (A) | 14,200 | 77,019 |
| Resona Holdings, Inc. | 121,300 | 382,271 |
| Ricoh Company, Ltd. | 58,600 | 405,517 |
| Rohm Company, Ltd. | 6,900 | 442,643 |
| Ryohin Keikaku Company, Ltd. | 19,000 | 229,560 |
| Santen Pharmaceutical Company, Ltd. | 15,600 | 277,761 |
| SBI Holdings, Inc. | 18,100 | 343,771 |
| SCSK Corp. | 1,600 | 72,717 |
| Secom Company, Ltd. | 2,661 | 224,083 |
| Seibu Holdings, Inc. | 17,500 | 211,928 |
| Seiko Epson Corp. | 36,100 | 414,221 |
| Sekisui Chemical Company, Ltd. | 67,500 | 864,778 |
| Sekisui House, Ltd. | 20,100 | 349,332 |
| Seven & i Holdings Company, Ltd. | 39,200 | 1,302,451 |
| SG Holdings Company, Ltd. | 9,800 | 274,200 |
| 34 | JOHN HANCOCK MULTIFACTOR ETFS | ANNUAL REPORT | SEE NOTES TO FINANCIAL STATEMENTS |
MULTIFACTOR DEVELOPED INTERNATIONAL ETF (continued)
| | Shares or
Principal
Amount | Value |
| Japan (continued) | |
| Sharp Corp. (A) | 7,400 | $82,972 |
| Shimadzu Corp. | 9,900 | 248,576 |
| Shimano, Inc. | 1,086 | 160,866 |
| Shimizu Corp. | 82,400 | 644,189 |
| Shin-Etsu Chemical Company, Ltd. | 8,098 | 909,875 |
| Shionogi & Company, Ltd. | 6,471 | 358,784 |
| Shiseido Company, Ltd. | 8,577 | 511,564 |
| SMC Corp. | 845 | 387,198 |
| Softbank Corp. | 30,700 | 420,300 |
| SoftBank Group Corp. | 54,936 | 2,380,123 |
| Sohgo Security Services Company, Ltd. | 2,100 | 101,529 |
| Sompo Holdings, Inc. | 11,200 | 366,578 |
| Sony Corp. | 28,000 | 1,815,084 |
| Sony Financial Holdings, Inc. | 9,600 | 185,473 |
| Stanley Electric Company, Ltd. | 11,500 | 266,166 |
| Subaru Corp. | 19,300 | 392,552 |
| Sumitomo Chemical Company, Ltd. | 187,600 | 585,948 |
| Sumitomo Corp. | 38,700 | 444,597 |
| Sumitomo Dainippon Pharma Company, Ltd. | 8,000 | 112,068 |
| Sumitomo Electric Industries, Ltd. | 50,000 | 520,643 |
| Sumitomo Metal Mining Company, Ltd. | 17,000 | 432,174 |
| Sumitomo Mitsui Financial Group, Inc. | 40,400 | 1,074,462 |
| Sumitomo Mitsui Trust Holdings, Inc. | 9,075 | 268,257 |
| Sumitomo Realty & Development Company, Ltd. | 6,600 | 179,820 |
| Sundrug Company, Ltd. | 5,200 | 179,679 |
| Suntory Beverage & Food, Ltd. | 2,800 | 106,177 |
| Suzuki Motor Corp. | 17,500 | 567,705 |
| Sysmex Corp. | 4,748 | 330,342 |
| T&D Holdings, Inc. | 42,200 | 370,560 |
| Taisei Corp. | 19,261 | 609,702 |
| Taisho Pharmaceutical Holdings Company, Ltd. | 3,029 | 190,631 |
| Taiyo Nippon Sanso Corp. | 15,900 | 250,094 |
| Takeda Pharmaceutical Company, Ltd. | 32,347 | 1,174,577 |
| TDK Corp. | 4,000 | 350,867 |
| Terumo Corp. | 15,400 | 514,413 |
| The Chiba Bank, Ltd. | 72,000 | 338,000 |
| The Chugoku Electric Power Company, Inc. | 33,700 | 455,699 |
| The Kansai Electric Power Company, Inc. | 41,200 | 425,735 |
| The Shizuoka Bank, Ltd. | 52,200 | 319,248 |
| Tobu Railway Company, Ltd. | 28,900 | 990,494 |
| Toho Company, Ltd. | 3,600 | 119,175 |
| Tohoku Electric Power Company, Inc. | 87,900 | 832,681 |
| Tokio Marine Holdings, Inc. | 22,500 | 1,070,136 |
| Tokyo Century Corp. | 5,400 | 186,085 |
| Tokyo Electric Power Company Holdings, Inc. (A) | 249,500 | 846,949 |
| Tokyo Electron, Ltd. | 3,257 | 698,701 |
| Tokyo Gas Company, Ltd. | 19,100 | 421,170 |
| Tokyu Corp. | 24,400 | 370,558 |
| Toppan Printing Company, Ltd. | 26,000 | 391,939 |
MULTIFACTOR DEVELOPED INTERNATIONAL ETF (continued)
| | Shares or
Principal
Amount | Value |
| Japan (continued) | |
| Toray Industries, Inc. | 95,300 | $444,796 |
| Toshiba Corp. | 11,900 | 299,016 |
| Tosoh Corp. | 35,400 | 439,955 |
| TOTO, Ltd. | 7,600 | 269,360 |
| Toyota Industries Corp. | 5,100 | 258,970 |
| Toyota Motor Corp. | 104,728 | 6,528,422 |
| Toyota Tsusho Corp. | 7,200 | 174,252 |
| Trend Micro, Inc. | 10,900 | 557,563 |
| Tsuruha Holdings, Inc. | 2,200 | 295,843 |
| Unicharm Corp. | 13,400 | 494,974 |
| United Urban Investment Corp. | 78 | 79,360 |
| USS Company, Ltd. | 17,800 | 284,640 |
| Welcia Holdings Company, Ltd. | 1,500 | 108,851 |
| West Japan Railway Company | 8,381 | 522,524 |
| Yakult Honsha Company, Ltd. | 1,200 | 70,361 |
| Yamada Denki Company, Ltd. | 46,800 | 224,076 |
| Yamaha Corp. | 6,566 | 268,940 |
| Yamaha Motor Company, Ltd. | 35,700 | 468,388 |
| Yamato Holdings Company, Ltd. | 5,100 | 90,043 |
| Yamazaki Baking Company, Ltd. | 6,000 | 106,551 |
| Yaskawa Electric Corp. | 14,100 | 470,066 |
| Z Holdings Corp. | 47,700 | 186,901 |
| ZOZO, Inc. | 12,000 | 195,259 |
| Luxembourg - 0.2% | 960,820 |
| ArcelorMittal SA | 23,309 | 255,355 |
| Aroundtown SA | 44,284 | 238,156 |
| Millicom International Cellular SA | 14,838 | 390,426 |
| Tenaris SA | 10,978 | 76,883 |
| Macau - 0.1% | 373,869 |
| Sands China, Ltd. | 64,800 | 266,644 |
| Wynn Macau, Ltd. | 61,121 | 107,225 |
| Mexico - 0.0% | 83,435 |
| Fresnillo PLC | 9,293 | 83,435 |
| Netherlands - 3.9% | 17,080,278 |
| ABN AMRO Bank NV (C) | 28,617 | 219,409 |
| Adyen NV (A)(C) | 456 | 450,110 |
| Akzo Nobel NV (B) | 19,425 | 1,472,313 |
| Argenx SE (A) | 493 | 74,248 |
| ASML Holding NV | 7,326 | 2,171,741 |
| Heineken Holding NV (B) | 10,804 | 841,370 |
| Heineken NV (B) | 9,389 | 798,226 |
| ING Groep NV | 102,841 | 564,110 |
| Just Eat Takeaway.com NV (A)(C) | 2,050 | 208,864 |
| Just Eat Takeaway.com NV (London Stock Exchange) (A)(C) | 24 | 2,448 |
| Koninklijke Ahold Delhaize NV | 93,420 | 2,267,476 |
| Koninklijke DSM NV | 13,224 | 1,618,614 |
| Koninklijke Philips NV | 30,039 | 1,306,692 |
| Prosus NV (A) | 4,190 | 317,488 |
| SEE NOTES TO FINANCIAL STATEMENTS | ANNUAL REPORT | JOHN HANCOCK MULTIFACTOR ETFS | 35 |
MULTIFACTOR DEVELOPED INTERNATIONAL ETF (continued)
| | Shares or
Principal
Amount | Value |
| Netherlands (continued) | |
| Royal Dutch Shell PLC, B Shares | 191,076 | $3,100,402 |
| Wolters Kluwer NV (B) | 22,672 | 1,666,767 |
| New Zealand - 0.2% | 1,078,871 |
| a2 Milk Company, Ltd. (A) | 20,999 | 254,313 |
| Auckland International Airport, Ltd. | 26,826 | 100,791 |
| Fisher & Paykel Healthcare Corp., Ltd. | 13,055 | 220,607 |
| Meridian Energy, Ltd. | 37,632 | 104,245 |
| Ryman Healthcare, Ltd. | 5,375 | 40,158 |
| Spark New Zealand, Ltd. | 56,799 | 155,587 |
| Xero, Ltd. (A) | 3,902 | 203,170 |
| Norway - 0.5% | 2,161,654 |
| Adevinta ASA (A) | 2,312 | 19,173 |
| Aker BP ASA | 3,713 | 61,801 |
| DNB ASA | 26,772 | 325,365 |
| Equinor ASA | 55,944 | 785,276 |
| Gjensidige Forsikring ASA | 2,696 | 47,749 |
| Mowi ASA | 9,546 | 163,933 |
| Norsk Hydro ASA | 29,603 | 75,807 |
| Orkla ASA | 9,355 | 84,894 |
| Salmar ASA | 1,348 | 52,762 |
| Schibsted ASA, A Shares | 1,701 | 36,185 |
| Schibsted ASA, B Shares | 3,149 | 61,350 |
| Telenor ASA (B) | 20,035 | 308,282 |
| Yara International ASA | 4,069 | 139,077 |
| Portugal - 0.2% | 723,566 |
| EDP - Energias de Portugal SA | 65,591 | 276,591 |
| Galp Energia SGPS SA | 12,885 | 148,398 |
| Jeronimo Martins SGPS SA | 17,684 | 298,577 |
| Singapore - 1.1% | 4,691,452 |
| Ascendas Real Estate Investment Trust | 49,792 | 105,052 |
| CapitaLand Commercial Trust | 55,400 | 63,362 |
| CapitaLand Mall Trust | 72,100 | 96,803 |
| CapitaLand, Ltd. (A) | 82,400 | 176,191 |
| City Developments, Ltd. | 44,800 | 253,327 |
| DBS Group Holdings, Ltd. | 36,458 | 516,944 |
| Genting Singapore, Ltd. | 150,200 | 83,759 |
| Jardine Cycle & Carriage, Ltd. | 2,800 | 40,000 |
| Keppel Corp., Ltd. | 49,000 | 208,155 |
| Oversea-Chinese Banking Corp., Ltd. | 107,240 | 688,676 |
| Sea, Ltd., ADR (A) | 2,103 | 116,885 |
| Singapore Airlines, Ltd. (B) | 74,600 | 323,795 |
| Singapore Exchange, Ltd. | 59,400 | 407,196 |
| Singapore Technologies Engineering, Ltd. | 47,900 | 116,713 |
| Singapore Telecommunications, Ltd. | 266,100 | 534,960 |
| United Overseas Bank, Ltd. | 59,324 | 857,178 |
| Wilmar International, Ltd. | 40,400 | 102,456 |
| Spain - 2.6% | 11,095,662 |
| Aena SME SA (A)(C) | 3,675 | 464,914 |
MULTIFACTOR DEVELOPED INTERNATIONAL ETF (continued)
| | Shares or
Principal
Amount | Value |
| Spain (continued) | |
| Amadeus IT Group SA | 14,244 | $685,216 |
| Banco Bilbao Vizcaya Argentaria SA | 155,748 | 509,555 |
| Banco Santander SA | 470,650 | 1,050,337 |
| CaixaBank SA | 235,571 | 423,412 |
| Cellnex Telecom SA (A)(C) | 12,319 | 644,965 |
| EDP Renovaveis SA | 4,903 | 60,147 |
| Endesa SA | 10,402 | 230,715 |
| Ferrovial SA | 21,983 | 548,978 |
| Grifols SA | 31,769 | 1,080,782 |
| Iberdrola SA | 203,795 | 2,040,200 |
| Industria de Diseno Textil SA | 37,359 | 951,374 |
| Naturgy Energy Group SA | 36,500 | 644,053 |
| Red Electrica Corp. SA | 15,288 | 268,840 |
| Repsol SA | 90,292 | 822,228 |
| Telefonica SA | 146,329 | 669,946 |
| Sweden - 2.7% | 11,769,029 |
| Alfa Laval AB (A) | 9,930 | 186,559 |
| Assa Abloy AB, B Shares (B) | 12,107 | 218,224 |
| Atlas Copco AB, A Shares | 17,882 | 621,198 |
| Atlas Copco AB, B Shares | 10,844 | 338,958 |
| Boliden AB (B) | 42,581 | 873,226 |
| Castellum AB | 11,450 | 200,989 |
| Electrolux AB, B Shares | 27,681 | 382,175 |
| Electrolux Professional AB, B Shares (A) | 26,101 | 60,020 |
| Epiroc AB, A Shares | 20,060 | 201,520 |
| Epiroc AB, B Shares | 10,855 | 107,603 |
| Essity AB, B Shares (A) | 12,497 | 406,237 |
| Fabege AB | 14,154 | 169,476 |
| Fastighets AB Balder, B Shares (A) | 6,079 | 240,242 |
| Hennes & Mauritz AB, B Shares (B) | 25,369 | 353,761 |
| Hexagon AB, B Shares (A) | 5,410 | 269,802 |
| Hufvudstaden AB, A Shares | 3,613 | 46,387 |
| Husqvarna AB, B Shares | 30,839 | 186,792 |
| ICA Gruppen AB (B) | 3,368 | 146,966 |
| Lundin Energy AB | 3,252 | 84,470 |
| Nibe Industrier AB, B Shares | 12,262 | 229,555 |
| Sandvik AB (A) | 32,251 | 499,588 |
| Securitas AB, B Shares (B) | 23,080 | 272,810 |
| Skandinaviska Enskilda Banken AB, A Shares | 36,329 | 298,824 |
| Skandinaviska Enskilda Banken AB, C Shares | 371 | 3,320 |
| Skanska AB, B Shares (A) | 18,319 | 351,012 |
| SKF AB, B Shares | 68,671 | 1,093,637 |
| Svenska Cellulosa AB SCA, B Shares (A) | 63,377 | 682,942 |
| Svenska Handelsbanken AB, A Shares (A) | 43,543 | 402,565 |
| Svenska Handelsbanken AB, B Shares (A) | 1,743 | 17,364 |
| Swedbank AB, A Shares | 28,096 | 331,841 |
| Swedish Match AB | 2,608 | 161,705 |
| Swedish Orphan Biovitrum AB (A) | 7,279 | 141,597 |
| Tele2 AB, B Shares | 14,030 | 181,853 |
| Telefonaktiebolaget LM Ericsson, B Shares | 42,028 | 366,183 |
| 36 | JOHN HANCOCK MULTIFACTOR ETFS | ANNUAL REPORT | SEE NOTES TO FINANCIAL STATEMENTS |
MULTIFACTOR DEVELOPED INTERNATIONAL ETF (continued)
| | Shares or
Principal
Amount | Value |
| Sweden (continued) | |
| Telia Company AB | 69,672 | $240,748 |
| Trelleborg AB, B Shares (A) | 16,390 | 211,101 |
| Volvo AB, A Shares (A) | 13,975 | 179,710 |
| Volvo AB, B Shares (A) | 78,050 | 1,008,069 |
| Switzerland - 10.0% | 43,242,867 |
| ABB, Ltd. | 62,243 | 1,181,788 |
| Alcon, Inc. (A) | 30,830 | 1,627,188 |
| Chocoladefabriken Lindt & Spruengli AG | 2 | 167,435 |
| Chocoladefabriken Lindt & Spruengli AG, Participation Certificates | 17 | 132,544 |
| Cie Financiere Richemont SA | 28,336 | 1,609,470 |
| Coca-Cola HBC AG | 20,456 | 519,914 |
| Credit Suisse Group AG (A) | 195,508 | 1,767,604 |
| Givaudan SA | 397 | 1,329,846 |
| Glencore PLC (A) | 368,638 | 683,988 |
| LafargeHolcim, Ltd. (A) | 37,940 | 1,573,970 |
| Lonza Group AG (A) | 5,339 | 2,331,093 |
| Nestle SA | 68,662 | 7,249,293 |
| Novartis AG | 55,056 | 4,692,438 |
| Partners Group Holding AG | 1,263 | 994,278 |
| Roche Holding AG | 15,807 | 5,493,921 |
| Roche Holding AG, Bearer Shares | 1,352 | 470,395 |
| Schindler Holding AG | 1,508 | 323,427 |
| Schindler Holding AG, Participation Certificates | 3,203 | 711,852 |
| SGS SA | 368 | 833,114 |
| Sika AG (B) | 9,590 | 1,586,824 |
| STMicroelectronics NV | 65,337 | 1,696,773 |
| Swiss Re AG (B) | 25,570 | 1,845,523 |
| Swisscom AG | 4,102 | 2,132,708 |
| UBS Group AG (A) | 86,644 | 928,248 |
| Zurich Insurance Group AG | 4,269 | 1,359,233 |
| United Arab Emirates - 0.0% | 1,764 |
| NMC Health PLC | 5,181 | 1,764 |
| United Kingdom - 14.1% | 61,218,999 |
| 3i Group PLC | 106,588 | 1,054,048 |
| Admiral Group PLC | 16,452 | 483,516 |
| Anglo American PLC | 70,572 | 1,259,755 |
| Ashtead Group PLC | 39,857 | 1,093,452 |
| Associated British Foods PLC | 11,685 | 278,933 |
| AstraZeneca PLC | 30,222 | 3,172,391 |
| Auto Trader Group PLC (C) | 32,115 | 185,811 |
| AVEVA Group PLC | 1,582 | 71,238 |
| Aviva PLC | 309,811 | 944,907 |
| BAE Systems PLC | 108,296 | 694,470 |
| Barclays PLC | 474,507 | 633,832 |
| Barratt Developments PLC | 79,350 | 519,458 |
| Berkeley Group Holdings PLC | 4,169 | 219,966 |
| BP PLC | 1,048,193 | 4,139,617 |
| British American Tobacco PLC | 48,780 | 1,895,391 |
MULTIFACTOR DEVELOPED INTERNATIONAL ETF (continued)
| | Shares or
Principal
Amount | Value |
| United Kingdom (continued) | |
| BT Group PLC | 181,177 | $265,206 |
| Bunzl PLC | 24,480 | 533,415 |
| Burberry Group PLC | 36,638 | 642,366 |
| Clarivate Analytics PLC (A) | 1,786 | 41,042 |
| CNH Industrial NV (A) | 71,536 | 447,554 |
| Coca-Cola European Partners PLC (B) | 27,943 | 1,109,466 |
| Compass Group PLC | 52,379 | 882,672 |
| Croda International PLC | 9,325 | 574,225 |
| Diageo PLC | 61,518 | 2,133,884 |
| Ferguson PLC | 16,877 | 1,221,069 |
| Fiat Chrysler Automobiles NV | 59,480 | 522,230 |
| GlaxoSmithKline PLC | 121,090 | 2,536,961 |
| Halma PLC | 23,795 | 627,289 |
| Hargreaves Lansdown PLC | 22,070 | 401,006 |
| HSBC Holdings PLC | 510,869 | 2,641,978 |
| Imperial Brands PLC | 56,438 | 1,195,248 |
| Informa PLC | 79,478 | 440,296 |
| InterContinental Hotels Group PLC | 7,359 | 334,905 |
| Intertek Group PLC | 12,028 | 720,647 |
| ITV PLC | 125,160 | 120,771 |
| JD Sports Fashion PLC | 25,394 | 169,571 |
| Johnson Matthey PLC | 9,791 | 246,071 |
| Land Securities Group PLC | 25,152 | 210,023 |
| Legal & General Group PLC | 422,769 | 1,091,050 |
| Lloyds Banking Group PLC | 1,704,202 | 693,030 |
| London Stock Exchange Group PLC | 4,580 | 430,732 |
| M&G PLC | 112,259 | 187,263 |
| Melrose Industries PLC | 311,917 | 392,571 |
| Mondi PLC | 40,964 | 728,547 |
| National Grid PLC | 109,319 | 1,287,613 |
| Next PLC | 12,880 | 767,795 |
| Ocado Group PLC (A) | 13,423 | 271,660 |
| Persimmon PLC | 23,665 | 658,189 |
| Phoenix Group Holdings PLC | 17,426 | 132,102 |
| Prudential PLC | 35,396 | 503,839 |
| Reckitt Benckiser Group PLC | 8,888 | 743,282 |
| RELX PLC | 61,108 | 1,384,717 |
| Rentokil Initial PLC | 128,318 | 767,673 |
| Rightmove PLC | 30,736 | 192,914 |
| Rio Tinto PLC | 32,143 | 1,493,829 |
| Rio Tinto, Ltd. | 18,452 | 1,057,167 |
| Rolls-Royce Holdings PLC (A) | 80,733 | 336,048 |
| RSA Insurance Group PLC | 76,183 | 347,090 |
| Schroders PLC | 5,499 | 184,086 |
| Schroders PLC, Non-Voting Shares | 3,570 | 95,914 |
| Segro PLC | 30,191 | 315,924 |
| Severn Trent PLC | 13,825 | 416,772 |
| Smith & Nephew PLC | 45,011 | 884,549 |
| Smiths Group PLC | 20,723 | 324,254 |
| Spirax-Sarco Engineering PLC | 4,441 | 488,913 |
| SSE PLC | 34,688 | 546,922 |
| SEE NOTES TO FINANCIAL STATEMENTS | ANNUAL REPORT | JOHN HANCOCK MULTIFACTOR ETFS | 37 |
MULTIFACTOR DEVELOPED INTERNATIONAL ETF (continued)
| | Shares or
Principal
Amount | Value |
| United Kingdom (continued) | |
| St. James's Place PLC | 39,383 | $422,940 |
| Standard Chartered PLC | 113,490 | 583,339 |
| Standard Life Aberdeen PLC | 178,683 | 498,319 |
| Taylor Wimpey PLC | 244,084 | 452,731 |
| Tesco PLC | 350,000 | 1,037,902 |
| The British Land Company PLC | 30,878 | 157,584 |
| The Royal Bank of Scotland Group PLC | 102,111 | 142,386 |
| The Sage Group PLC | 84,335 | 680,806 |
| Unilever NV | 30,595 | 1,527,418 |
| Unilever PLC | 30,253 | 1,565,308 |
| United Utilities Group PLC | 45,680 | 519,834 |
| Vodafone Group PLC | 818,185 | 1,157,305 |
| Whitbread PLC | 10,517 | 395,316 |
| WPP PLC | 87,893 | 688,686 |
| United States - 0.0% | 45,406 |
|
| Carnival PLC | 3,286 | 45,406 |
|
| PREFERRED SECURITIES - 0.7% | $3,091,660 |
| (Cost $3,333,988) | | |
| Germany - 0.7% | 3,091,660 |
| Bayerische Motoren Werke AG | 6,225 | 294,684 |
| Henkel AG & Company KGaA | 2,137 | 189,687 |
| Porsche Automobil Holding SE | 11,280 | 568,700 |
| Sartorius AG | 2,420 | 680,681 |
| Volkswagen AG | 9,669 | 1,357,908 |
|
| SHORT-TERM INVESTMENTS - 2.6% | $11,065,611 |
| (Cost $11,062,439) | | |
| Short-term funds - 2.6% | 11,065,611 |
| John Hancock Collateral Trust, 0.6614% (D)(E) | 1,053,412 | 10,542,966 |
|
| State Street Institutional U.S. Government Money Market Fund, Premier Class, 0.2162% (D) | 522,645 | 522,645 |
| Total investments (Multifactor Developed International ETF) (Cost $473,473,183) - 101.7% | $440,326,257 |
| Other assets and liabilities, net - (1.7%) | (7,288,963) |
| Total net assets - 100.0% | $433,037,294 |
| The percentage shown for each investment category is the total value of the category as a percentage of the net assets of the fund. |
| Security Abbreviations and Legend |
| ADR | American Depositary Receipt |
| (A) | Non-income producing security. |
| (B) | All or a portion of this security is on loan as of 4-30-20. |
| (C) | These securities are exempt from registration under Rule 144A of the Securities Act of 1933. Such securities may be resold, normally to qualified institutional buyers, in transactions exempt from registration. |
| (D) | The rate shown is the annualized seven-day yield as of 4-30-20. |
| (E) | Investment is an affiliate of the fund, the advisor and/or subadvisor. This security represents the investment of cash collateral received for securities lending. |
MULTIFACTOR EMERGING MARKETS ETF
As of 4-30-20
| | Shares or
Principal
Amount | Value |
| COMMON STOCKS - 98.2% | $673,037,862 |
| (Cost $749,601,807) | | |
| Brazil - 4.1% | 28,403,104 |
| Ambev SA | 766,600 | 1,605,905 |
| Atacadao SA | 32,700 | 120,814 |
| B2W Cia Digital (A) | 15,497 | 209,697 |
| B3 SA - Brasil Bolsa Balcao | 216,000 | 1,533,024 |
| Banco Bradesco SA | 200,530 | 650,492 |
| Banco BTG Pactual SA | 20,600 | 160,970 |
| Banco do Brasil SA | 175,600 | 924,501 |
| BB Seguridade Participacoes SA | 140,300 | 688,114 |
| BRF SA (A) | 89,400 | 320,224 |
| CCR SA | 255,100 | 581,990 |
| Centrais Eletricas Brasileiras SA | 68,520 | 306,950 |
| Cia Brasileira de Distribuicao | 43,300 | 529,682 |
| Cia de Saneamento Basico do Estado de Sao Paulo | 118,000 | 873,670 |
| Cia Energetica de Minas Gerais | 7,700 | 13,755 |
| Cielo SA | 232,500 | 174,376 |
| Cogna Educacao | 158,200 | 161,903 |
| Cosan SA | 15,100 | 168,314 |
| Energisa SA | 30,800 | 248,639 |
| Engie Brasil Energia SA | 59,025 | 426,553 |
| Equatorial Energia SA | 120,000 | 406,333 |
| Hapvida Participacoes e Investimentos SA (B) | 27,500 | 266,399 |
| Hypera SA | 45,100 | 242,275 |
| IRB Brasil Resseguros SA | 80,800 | 152,546 |
| JBS SA | 228,600 | 1,006,747 |
| Klabin SA | 63,300 | 208,260 |
| Localiza Rent a Car SA | 81,985 | 517,811 |
| Lojas Americanas SA | 49,586 | 186,223 |
| Lojas Renner SA | 159,160 | 1,128,730 |
| Magazine Luiza SA | 70,393 | 646,285 |
| Natura & Company Holding SA | 88,500 | 580,703 |
| Neoenergia SA | 54,900 | 185,289 |
| Notre Dame Intermedica Participacoes SA | 34,100 | 345,265 |
| Pagseguro Digital, Ltd., Class A (A)(C) | 20,751 | 525,623 |
| Petrobras Distribuidora SA | 66,600 | 240,278 |
| Petroleo Brasileiro SA | 599,800 | 2,066,442 |
| Porto Seguro SA | 14,600 | 122,150 |
| Raia Drogasil SA | 50,600 | 979,415 |
| Rumo SA (A) | 202,400 | 739,936 |
| StoneCo, Ltd., Class A (A)(C) | 7,085 | 186,894 |
| Sul America SA | 14,400 | 119,040 |
| Suzano SA (A) | 85,865 | 625,116 |
| TIM Participacoes SA | 303,900 | 716,340 |
| Ultrapar Participacoes SA | 120,400 | 322,502 |
| Vale SA | 681,500 | 5,647,588 |
| WEG SA | 73,100 | 539,341 |
| Chile - 0.7% | 4,959,875 |
| Banco de Chile | 3,843,931 | 338,425 |
| 38 | JOHN HANCOCK MULTIFACTOR ETFS | ANNUAL REPORT | SEE NOTES TO FINANCIAL STATEMENTS |
MULTIFACTOR EMERGING MARKETS ETF (continued)
| | Shares or
Principal
Amount | Value |
| Chile (continued) | |
| Banco de Credito e Inversiones SA | 6,039 | $223,928 |
| Banco Santander Chile | 8,377,437 | 359,261 |
| Cencosud SA | 242,780 | 293,321 |
| Cencosud Shopping SA (A) | 61,148 | 108,256 |
| Cia Cervecerias Unidas SA | 29,344 | 210,610 |
| Colbun SA | 2,061,366 | 302,065 |
| Empresas CMPC SA | 245,025 | 527,555 |
| Empresas COPEC SA | 56,257 | 351,148 |
| Enel Americas SA | 7,487,103 | 1,226,998 |
| Enel Chile SA | 5,838,696 | 474,865 |
| Falabella SA | 73,613 | 200,770 |
| Latam Airlines Group SA | 90,797 | 342,673 |
| China - 29.1% | 199,030,158 |
| Agricultural Bank of China, Ltd., H Shares | 4,499,000 | 1,891,909 |
| Air China, Ltd., H Shares | 708,000 | 508,692 |
| Alibaba Group Holding, Ltd., ADR (A) | 128,039 | 25,949,666 |
| Anhui Conch Cement Company, Ltd., H Shares | 409,500 | 3,222,184 |
| ANTA Sports Products, Ltd. | 230,000 | 1,941,798 |
| Baidu, Inc., ADR (A) | 26,233 | 2,647,697 |
| Bank of China, Ltd., H Shares | 11,971,000 | 4,586,205 |
| Bank of Communications Company, Ltd., H Shares | 4,145,000 | 2,630,609 |
| BeiGene, Ltd., ADR (A) | 3,445 | 526,499 |
| BYD Company, Ltd., H Shares (C) | 189,000 | 1,189,730 |
| CGN Power Company, Ltd., H Shares (B) | 2,786,000 | 697,187 |
| China CITIC Bank Corp., Ltd., H Shares | 2,506,000 | 1,225,143 |
| China Communications Construction Company, Ltd., H Shares | 1,237,000 | 828,140 |
| China Construction Bank Corp., H Shares | 14,920,000 | 12,163,331 |
| China Eastern Airlines Corp., Ltd., H Shares | 554,000 | 230,823 |
| China Everbright Bank Company, Ltd., H Shares | 611,000 | 259,301 |
| China Evergrande Group (C) | 1,035,000 | 1,837,069 |
| China Galaxy Securities Company, Ltd., H Shares | 684,000 | 349,396 |
| China Life Insurance Company, Ltd., H Shares | 985,000 | 2,101,543 |
| China Merchants Bank Company, Ltd., H Shares | 779,500 | 3,735,438 |
| China Merchants Securities Company, Ltd., H Shares (B) | 138,800 | 153,618 |
| China Minsheng Banking Corp., Ltd., H Shares | 1,574,000 | 1,177,604 |
| China Molybdenum Company, Ltd., H Shares | 642,000 | 193,784 |
| China Pacific Insurance Group Company, Ltd., H Shares | 695,000 | 2,304,011 |
| China Petroleum & Chemical Corp., H Shares | 4,806,000 | 2,430,169 |
| China Railway Construction Corp., Ltd., H Shares | 586,000 | 642,515 |
| China Railway Group, Ltd., H Shares | 809,000 | 486,296 |
| China Shenhua Energy Company, Ltd., H Shares | 976,500 | 1,745,831 |
| China Southern Airlines Company, Ltd., H Shares | 730,000 | 364,419 |
MULTIFACTOR EMERGING MARKETS ETF (continued)
| | Shares or
Principal
Amount | Value |
| China (continued) | |
| China Telecom Corp., Ltd., H Shares | 4,752,000 | $1,636,644 |
| China Vanke Company, Ltd., H Shares | 512,300 | 1,704,946 |
| CITIC Securities Company, Ltd., H Shares | 442,500 | 853,909 |
| CNOOC, Ltd. | 4,404,000 | 4,993,474 |
| Country Garden Holdings Company, Ltd. | 2,397,046 | 3,088,933 |
| Country Garden Services Holdings Company, Ltd. | 109,000 | 506,169 |
| CRRC Corp., Ltd., H Shares | 704,000 | 373,234 |
| CSC Financial Company, Ltd., H Shares (B) | 111,500 | 102,980 |
| CSPC Pharmaceutical Group, Ltd. | 878,000 | 1,744,142 |
| ENN Energy Holdings, Ltd. | 211,700 | 2,392,168 |
| Fosun International, Ltd. | 731,000 | 925,967 |
| GF Securities Company, Ltd., H Shares | 289,800 | 316,627 |
| Great Wall Motor Company, Ltd., H Shares | 906,000 | 605,375 |
| GSX Techedu, Inc., ADR (A) | 955 | 37,780 |
| Guangzhou Automobile Group Company, Ltd., H Shares | 648,000 | 584,277 |
| Guotai Junan Securities Company, Ltd., H Shares (B) | 118,400 | 170,444 |
| Haitong Securities Company, Ltd., H Shares | 571,200 | 520,924 |
| Hengan International Group Company, Ltd. | 213,500 | 1,904,394 |
| Huaneng Power International, Inc., H Shares | 1,348,000 | 507,738 |
| Huatai Securities Company, Ltd., H Shares (B) | 301,800 | 502,977 |
| Huazhu Group, Ltd., ADR (C) | 19,753 | 711,306 |
| Industrial & Commercial Bank of China, Ltd., H Shares | 11,328,000 | 7,700,705 |
| iQIYI, Inc., ADR (A)(C) | 20,030 | 339,909 |
| JD.com, Inc., ADR (A) | 106,736 | 4,600,322 |
| Longfor Group Holdings, Ltd. (B) | 502,000 | 2,541,616 |
| NetEase, Inc., ADR | 20,569 | 7,095,482 |
| New China Life Insurance Company, Ltd., H Shares | 130,800 | 453,865 |
| New Oriental Education & Technology Group, Inc., ADR (A) | 18,531 | 2,365,667 |
| Orient Securities Company, Ltd., H Shares (B) | 160,000 | 82,349 |
| PetroChina Company, Ltd., H Shares | 4,764,000 | 1,714,520 |
| PICC Property & Casualty Company, Ltd., H Shares | 1,396,000 | 1,337,953 |
| Pinduoduo, Inc. (A) | 19,381 | 919,435 |
| Ping An Insurance Group Company of China, Ltd., H Shares | 1,005,000 | 10,332,157 |
| Postal Savings Bank of China Company, Ltd., H Shares (B) | 1,508,000 | 904,526 |
| Semiconductor Manufacturing International Corp. (A)(C) | 290,500 | 555,343 |
| Shandong Gold Mining Company, Ltd., H Shares (B) | 60,550 | 180,033 |
| Shanghai Fosun Pharmaceutical Group Company, Ltd., H Shares | 84,500 | 322,638 |
| Shenwan Hongyuan Group Company, Ltd., H Shares (A)(B) | 173,600 | 41,875 |
| Shenzhou International Group Holdings, Ltd. | 135,100 | 1,574,527 |
| Sinopharm Group Company, Ltd., H Shares | 349,600 | 947,016 |
| Sunac China Holdings, Ltd. | 697,000 | 3,092,843 |
| SEE NOTES TO FINANCIAL STATEMENTS | ANNUAL REPORT | JOHN HANCOCK MULTIFACTOR ETFS | 39 |
MULTIFACTOR EMERGING MARKETS ETF (continued)
| | Shares or
Principal
Amount | Value |
| China (continued) | |
| Sunny Optical Technology Group Company, Ltd. | 121,900 | $1,731,241 |
| TAL Education Group, ADR (A) | 42,428 | 2,299,173 |
| Tencent Holdings, Ltd. | 605,500 | 32,569,930 |
| The People's Insurance Company Group of China, Ltd., H Shares | 1,405,000 | 460,338 |
| Tingyi Cayman Islands Holding Corp. | 326,000 | 576,950 |
| Trip.com Group, Ltd., ADR (A) | 63,802 | 1,643,540 |
| Want Want China Holdings, Ltd. | 1,920,000 | 1,377,028 |
| Weibo Corp., ADR (A) | 7,616 | 285,828 |
| Weichai Power Company, Ltd., H Shares | 713,000 | 1,247,142 |
| Wuxi Biologics Cayman, Inc. (A)(B) | 38,500 | 600,915 |
| Yum China Holdings, Inc. | 75,083 | 3,638,522 |
| Zijin Mining Group Company, Ltd., H Shares | 1,964,000 | 810,696 |
| ZTE Corp., H Shares (A) | 131,400 | 376,283 |
| ZTO Express Cayman, Inc., ADR | 70,725 | 2,104,776 |
| Hong Kong - 5.6% | 38,027,142 |
| Alibaba Health Information Technology, Ltd. (A) | 490,000 | 1,185,757 |
| China Gas Holdings, Ltd. | 655,000 | 2,420,653 |
| China Mengniu Dairy Company, Ltd. (A) | 695,000 | 2,478,829 |
| China Mobile, Ltd. | 1,336,500 | 10,766,339 |
| China Overseas Land & Investment, Ltd. | 1,231,000 | 4,517,591 |
| China Resources Beer Holdings Company, Ltd. | 362,000 | 1,725,399 |
| China Resources Gas Group, Ltd. | 260,000 | 1,468,974 |
| China Resources Land, Ltd. | 944,000 | 3,872,271 |
| China Unicom Hong Kong, Ltd. | 2,060,000 | 1,331,287 |
| Geely Automobile Holdings, Ltd. | 1,620,000 | 2,532,703 |
| Guangdong Investment, Ltd. | 552,000 | 1,147,812 |
| Shimao Property Holdings, Ltd. | 225,000 | 908,434 |
| Sino Biopharmaceutical, Ltd. | 1,617,000 | 2,365,319 |
| Sun Art Retail Group, Ltd. | 783,500 | 1,305,774 |
| India - 12.1% | 83,052,144 |
| ABB India, Ltd. | 6,218 | 74,853 |
| Adani Ports and Special Economic Zone, Ltd. | 195,978 | 758,519 |
| Alkem Laboratories, Ltd. | 1,424 | 49,777 |
| Ambuja Cements, Ltd. | 179,030 | 410,056 |
| Asian Paints, Ltd. | 63,013 | 1,478,513 |
| AU Small Finance Bank, Ltd. (B) | 3,176 | 22,993 |
| Aurobindo Pharma, Ltd. | 86,585 | 721,551 |
| Avenue Supermarts, Ltd. (A)(B) | 19,792 | 622,264 |
| Axis Bank, Ltd. | 300,244 | 1,775,396 |
| Bajaj Auto, Ltd. | 12,853 | 449,081 |
| Bajaj Finance, Ltd. | 23,753 | 733,197 |
| Bajaj Finserv, Ltd. | 7,530 | 510,390 |
| Bajaj Holdings & Investment, Ltd. | 5,618 | 152,691 |
| Bank of Baroda (A) | 160,730 | 105,413 |
| Berger Paints India, Ltd. | 48,943 | 330,436 |
| Bharat Petroleum Corp., Ltd. | 296,042 | 1,465,919 |
| Bharti Airtel, Ltd. (A) | 376,375 | 2,578,917 |
MULTIFACTOR EMERGING MARKETS ETF (continued)
| | Shares or
Principal
Amount | Value |
| India (continued) | |
| Bharti Infratel, Ltd. | 151,251 | $350,962 |
| Biocon, Ltd. | 30,160 | 142,215 |
| Bosch, Ltd. | 1,307 | 184,664 |
| Britannia Industries, Ltd. | 13,061 | 549,694 |
| Cipla, Ltd. | 69,050 | 542,506 |
| Coal India, Ltd. | 170,629 | 338,100 |
| Colgate-Palmolive India, Ltd. | 19,306 | 376,376 |
| Container Corp. of India, Ltd. | 45,733 | 227,767 |
| Dabur India, Ltd. | 142,543 | 930,103 |
| Divi's Laboratories, Ltd. | 14,991 | 465,730 |
| DLF, Ltd. | 104,763 | 204,727 |
| Dr. Reddy's Laboratories, Ltd. | 21,843 | 1,143,416 |
| Eicher Motors, Ltd. | 2,462 | 480,302 |
| GAIL India, Ltd. | 333,375 | 421,075 |
| Godrej Consumer Products, Ltd. | 88,019 | 636,451 |
| Grasim Industries, Ltd. | 50,688 | 342,859 |
| Havells India, Ltd. | 51,032 | 382,596 |
| HCL Technologies, Ltd. | 311,372 | 2,259,774 |
| HDFC Bank, Ltd. | 241,572 | 3,216,885 |
| HDFC Life Insurance Company, Ltd. (A)(B) | 60,552 | 402,565 |
| Hero MotoCorp, Ltd. | 30,888 | 885,570 |
| Hindalco Industries, Ltd. | 198,367 | 343,401 |
| Hindustan Petroleum Corp., Ltd. | 214,721 | 627,193 |
| Hindustan Unilever, Ltd. | 133,601 | 3,922,893 |
| Housing Development Finance Corp., Ltd. | 221,416 | 5,649,727 |
| ICICI Bank, Ltd. | 525,417 | 2,642,653 |
| ICICI Lombard General Insurance Company, Ltd. (B) | 8,520 | 144,430 |
| ICICI Prudential Life Insurance Company, Ltd. (B) | 27,122 | 148,296 |
| Indian Oil Corp., Ltd. | 613,374 | 687,335 |
| Indraprastha Gas, Ltd. | 12,660 | 80,357 |
| Info Edge India, Ltd. | 2,866 | 98,311 |
| Infosys, Ltd. | 568,754 | 5,415,641 |
| InterGlobe Aviation, Ltd. (B) | 9,166 | 121,204 |
| ITC, Ltd. | 607,606 | 1,464,905 |
| JSW Steel, Ltd. | 385,714 | 934,815 |
| Kansai Nerolac Paints, Ltd. | 17,717 | 96,494 |
| Kotak Mahindra Bank, Ltd. | 92,525 | 1,670,120 |
| Larsen & Toubro Infotech, Ltd. (B) | 4,721 | 100,524 |
| Larsen & Toubro, Ltd. | 71,138 | 850,634 |
| Lupin, Ltd. | 45,365 | 503,700 |
| Mahindra & Mahindra, Ltd. | 146,269 | 715,909 |
| Marico, Ltd. | 103,102 | 395,274 |
| Maruti Suzuki India, Ltd. | 20,329 | 1,446,406 |
| Motherson Sumi Systems, Ltd. | 203,555 | 239,891 |
| MRF, Ltd. | 293 | 233,752 |
| Muthoot Finance, Ltd. | 17,140 | 197,933 |
| Nestle India, Ltd. | 5,291 | 1,261,117 |
| NMDC, Ltd. | 70,051 | 75,186 |
| NTPC, Ltd. | 455,477 | 581,970 |
| 40 | JOHN HANCOCK MULTIFACTOR ETFS | ANNUAL REPORT | SEE NOTES TO FINANCIAL STATEMENTS |
MULTIFACTOR EMERGING MARKETS ETF (continued)
| | Shares or
Principal
Amount | Value |
| India (continued) | |
| Oil & Natural Gas Corp., Ltd. | 613,748 | $651,793 |
| Petronet LNG, Ltd. | 177,710 | 573,395 |
| Pidilite Industries, Ltd. | 27,381 | 555,313 |
| Piramal Enterprises, Ltd. | 19,873 | 259,914 |
| Power Finance Corp., Ltd. | 194,453 | 247,290 |
| Power Grid Corp. of India, Ltd. | 588,800 | 1,277,256 |
| Procter & Gamble Hygiene & Health Care, Ltd. | 1,783 | 252,605 |
| Punjab National Bank (A) | 125,995 | 54,361 |
| Reliance Industries, Ltd. | 458,499 | 8,938,578 |
| SBI Life Insurance Company, Ltd. (A)(B) | 12,562 | 121,446 |
| Shree Cement, Ltd. | 1,718 | 448,631 |
| Siemens, Ltd. | 13,906 | 210,548 |
| State Bank of India (A) | 378,082 | 957,603 |
| Sun Pharmaceutical Industries, Ltd. | 117,606 | 729,801 |
| Tata Consultancy Services, Ltd. | 147,114 | 3,956,376 |
| Tata Motors, Ltd. (A) | 364,636 | 455,218 |
| Tata Steel, Ltd. | 81,106 | 321,367 |
| Tech Mahindra, Ltd. | 151,005 | 1,097,825 |
| Titan Company, Ltd. | 69,173 | 891,479 |
| Torrent Pharmaceuticals, Ltd. | 8,092 | 252,905 |
| UltraTech Cement, Ltd. | 16,446 | 773,517 |
| United Breweries, Ltd. | 14,939 | 186,999 |
| United Spirits, Ltd. (A) | 61,940 | 442,022 |
| UPL, Ltd. | 158,510 | 871,758 |
| Vedanta, Ltd. | 359,320 | 424,897 |
| Wipro, Ltd. | 284,773 | 724,873 |
| Indonesia - 2.0% | 13,410,650 |
| Adaro Energy Tbk PT | 5,435,900 | 336,204 |
| Astra International Tbk PT | 4,036,300 | 1,044,689 |
| Bank Central Asia Tbk PT | 1,375,600 | 2,390,538 |
| Bank Mandiri Persero Tbk PT | 3,761,900 | 1,127,938 |
| Bank Negara Indonesia Persero Tbk PT | 1,711,900 | 471,851 |
| Bank Rakyat Indonesia Persero Tbk PT | 10,119,600 | 1,857,244 |
| Barito Pacific Tbk PT (A) | 2,951,300 | 287,690 |
| Charoen Pokphand Indonesia Tbk PT | 1,549,400 | 479,142 |
| Gudang Garam Tbk PT | 125,800 | 383,109 |
| Indocement Tunggal Prakarsa Tbk PT | 293,800 | 230,102 |
| Indofood CBP Sukses Makmur Tbk PT | 446,500 | 296,416 |
| Indofood Sukses Makmur Tbk PT | 1,198,300 | 525,641 |
| Jasa Marga Persero Tbk PT | 563,800 | 119,393 |
| Kalbe Farma Tbk PT | 4,259,700 | 412,368 |
| Mayora Indah Tbk PT | 2,374,900 | 343,263 |
| Pollux Properti Indonesia Tbk PT (A) | 146,625 | 46,723 |
| Semen Indonesia Persero Tbk PT | 774,200 | 413,774 |
| Telekomunikasi Indonesia Persero Tbk PT | 8,973,700 | 2,111,459 |
| United Tractors Tbk PT | 486,500 | 533,106 |
| Malaysia - 2.3% | 16,009,436 |
| AMMB Holdings BHD | 341,700 | 236,806 |
| Axiata Group BHD | 561,595 | 514,578 |
| CIMB Group Holdings BHD | 832,306 | 667,780 |
MULTIFACTOR EMERGING MARKETS ETF (continued)
| | Shares or
Principal
Amount | Value |
| Malaysia (continued) | |
| Dialog Group BHD | 620,700 | $480,682 |
| DiGi.Com BHD | 447,500 | 482,884 |
| Fraser & Neave Holdings BHD | 17,300 | 127,698 |
| Genting BHD | 512,100 | 496,618 |
| Genting Malaysia BHD | 575,300 | 317,084 |
| HAP Seng Consolidated BHD | 104,400 | 178,694 |
| Hartalega Holdings BHD | 270,000 | 477,209 |
| Hong Leong Bank BHD | 108,300 | 334,974 |
| Hong Leong Financial Group BHD | 79,700 | 242,807 |
| IHH Healthcare BHD | 292,900 | 357,610 |
| IOI Corp. BHD | 283,900 | 268,054 |
| KLCCP Stapled Group | 44,100 | 80,406 |
| Kuala Lumpur Kepong BHD | 57,175 | 279,227 |
| Malayan Banking BHD | 820,670 | 1,444,761 |
| Malaysia Airports Holdings BHD | 268,800 | 328,186 |
| Maxis BHD | 282,300 | 359,768 |
| MISC BHD | 225,600 | 413,950 |
| Nestle Malaysia BHD | 8,100 | 263,909 |
| Petronas Chemicals Group BHD | 360,900 | 470,009 |
| Petronas Dagangan BHD | 66,700 | 315,507 |
| Petronas Gas BHD | 88,800 | 318,028 |
| PPB Group BHD | 123,800 | 473,895 |
| Press Metal Aluminium Holdings BHD | 421,400 | 386,120 |
| Public Bank BHD | 294,100 | 1,120,316 |
| RHB Bank BHD | 401,800 | 443,849 |
| Sime Darby BHD | 793,900 | 369,256 |
| Sime Darby Plantation BHD | 290,700 | 334,643 |
| Telekom Malaysia BHD | 341,900 | 320,432 |
| Tenaga Nasional BHD | 795,400 | 2,264,115 |
| Top Glove Corp. BHD | 219,200 | 370,091 |
| Westports Holdings BHD | 237,700 | 204,533 |
| YTL Corp. BHD | 1,489,300 | 264,957 |
| Mexico - 2.0% | 13,981,308 |
| America Movil SAB de CV, Series L | 3,830,188 | 2,342,190 |
| Arca Continental SAB de CV | 76,364 | 297,181 |
| Cemex SAB de CV | 3,110,888 | 666,339 |
| Coca-Cola Femsa SAB de CV | 91,812 | 371,914 |
| El Puerto de Liverpool SAB de CV, Series C1 | 27,256 | 69,645 |
| Fibra Uno Administracion SA de CV | 340,640 | 286,275 |
| Fomento Economico Mexicano SAB de CV | 207,648 | 1,356,209 |
| Grupo Aeroportuario del Pacifico SAB de CV, Series B | 73,228 | 460,158 |
| Grupo Aeroportuario del Sureste SAB de CV, Series B | 27,759 | 280,761 |
| Grupo Bimbo SAB de CV, Series A | 467,600 | 694,035 |
| Grupo Carso SAB de CV, Series A1 | 76,204 | 153,240 |
| Grupo Elektra SAB de CV | 6,281 | 363,248 |
| Grupo Financiero Banorte SAB de CV, Series O | 369,904 | 1,025,043 |
| Grupo Financiero Inbursa SAB de CV, Series O | 580,440 | 350,799 |
| Grupo Mexico SAB de CV, Series B | 697,808 | 1,502,002 |
| Grupo Televisa SAB | 531,452 | 569,843 |
| SEE NOTES TO FINANCIAL STATEMENTS | ANNUAL REPORT | JOHN HANCOCK MULTIFACTOR ETFS | 41 |
MULTIFACTOR EMERGING MARKETS ETF (continued)
| | Shares or
Principal
Amount | Value |
| Mexico (continued) | |
| Industrias Penoles SAB de CV | 29,058 | $225,166 |
| Infraestructura Energetica Nova SAB de CV | 98,536 | 330,992 |
| Kimberly-Clark de Mexico SAB de CV, Class A | 194,300 | 277,863 |
| Orbia Advance Corp. SAB de CV | 153,200 | 184,471 |
| Promotora y Operadora de Infraestructura SAB de CV (A) | 19,500 | 136,787 |
| Wal-Mart de Mexico SAB de CV | 833,840 | 2,037,147 |
| Philippines - 1.3% | 8,982,234 |
| Aboitiz Equity Ventures, Inc. | 387,510 | 319,017 |
| Aboitiz Power Corp. | 598,300 | 325,202 |
| Ayala Corp. | 50,560 | 583,732 |
| Ayala Land, Inc. | 988,900 | 626,768 |
| Bank of the Philippine Islands | 357,000 | 414,293 |
| BDO Unibank, Inc. | 382,780 | 766,927 |
| Globe Telecom, Inc. | 7,585 | 330,424 |
| GT Capital Holdings, Inc. (A) | 25,088 | 225,449 |
| International Container Terminal Services, Inc. | 268,940 | 478,021 |
| JG Summit Holdings, Inc. | 563,770 | 569,250 |
| Jollibee Foods Corp. | 106,350 | 301,898 |
| Manila Electric Company | 59,310 | 299,315 |
| Metropolitan Bank & Trust Company | 556,952 | 431,442 |
| PLDT, Inc. | 29,055 | 748,709 |
| San Miguel Corp. | 140,859 | 271,044 |
| SM Investments Corp. | 53,965 | 904,591 |
| SM Prime Holdings, Inc. | 1,466,700 | 901,958 |
| Universal Robina Corp. | 193,870 | 484,194 |
| Poland - 0.9% | 5,890,449 |
| Bank Polska Kasa Opieki SA | 21,128 | 265,200 |
| CD Projekt SA | 6,378 | 550,758 |
| Cyfrowy Polsat SA | 55,789 | 344,341 |
| Dino Polska SA (A)(B) | 5,788 | 244,035 |
| Grupa Lotos SA | 22,149 | 333,533 |
| ING Bank Slaski SA (A) | 4,026 | 129,691 |
| KGHM Polska Miedz SA (A) | 41,172 | 765,348 |
| LPP SA | 231 | 362,580 |
| mBank SA (A) | 2,775 | 146,753 |
| PGE Polska Grupa Energetyczna SA (A) | 127,839 | 127,248 |
| Polski Koncern Naftowy ORLEN SA | 65,620 | 988,147 |
| Polskie Gornictwo Naftowe i Gazownictwo SA | 323,452 | 290,011 |
| Powszechna Kasa Oszczednosci Bank Polski SA | 110,866 | 589,247 |
| Powszechny Zaklad Ubezpieczen SA | 86,914 | 635,513 |
| Santander Bank Polska SA | 2,999 | 118,044 |
| Romania - 0.0% | 316,259 |
| NEPI Rockcastle PLC | 72,692 | 316,259 |
| Russia - 3.0% | 20,823,591 |
| Gazprom PJSC, ADR | 932,740 | 4,734,588 |
| Gazprom PJSC, ADR (London Stock Exchange) | 3,193 | 16,125 |
| Lukoil PJSC, ADR | 81,461 | 5,335,696 |
MULTIFACTOR EMERGING MARKETS ETF (continued)
| | Shares or
Principal
Amount | Value |
| Russia (continued) | |
| Lukoil PJSC, ADR (London Stock Exchange) | 258 | $16,659 |
| MMC Norilsk Nickel PJSC, ADR | 131,614 | 3,656,237 |
| Novatek PJSC, GDR | 9,832 | 1,380,413 |
| Novatek PJSC, GDR (London Stock Exchange) | 122 | 17,129 |
| Sberbank of Russia PJSC, ADR | 329,102 | 3,506,582 |
| Tatneft PJSC, ADR | 44,621 | 1,990,989 |
| Tatneft PJSC, ADR (London Stock Exchange) | 3,858 | 169,173 |
| South Africa - 4.3% | 29,376,786 |
| Absa Group, Ltd. | 233,963 | 1,163,127 |
| Anglo American Platinum, Ltd. | 9,698 | 515,676 |
| AngloGold Ashanti, Ltd. | 111,000 | 2,808,696 |
| Bid Corp., Ltd. | 66,078 | 869,466 |
| Capitec Bank Holdings, Ltd. | 12,532 | 615,511 |
| Clicks Group, Ltd. | 42,630 | 535,539 |
| Discovery, Ltd. | 151,230 | 798,765 |
| Exxaro Resources, Ltd. | 41,954 | 246,287 |
| FirstRand, Ltd. | 906,121 | 1,996,772 |
| Gold Fields, Ltd. | 227,220 | 1,754,661 |
| Growthpoint Properties, Ltd. (C) | 414,738 | 314,582 |
| Impala Platinum Holdings, Ltd. | 103,721 | 633,678 |
| Investec, Ltd. | 65,630 | 137,192 |
| Kumba Iron Ore, Ltd. | 16,509 | 317,064 |
| Mr. Price Group, Ltd. | 57,166 | 410,885 |
| MTN Group, Ltd. | 493,947 | 1,307,420 |
| MultiChoice Group, Ltd. (A) | 61,453 | 291,889 |
| Naspers, Ltd., N Shares | 34,496 | 5,445,090 |
| Nedbank Group, Ltd. | 122,580 | 715,590 |
| Ninety One, Ltd. (A) | 32,817 | 69,780 |
| Northam Platinum, Ltd. (A) | 31,319 | 157,661 |
| Old Mutual, Ltd. | 778,563 | 558,388 |
| PSG Group, Ltd. | 13,918 | 120,499 |
| Sanlam, Ltd. | 526,067 | 1,698,081 |
| Sasol, Ltd. | 106,595 | 506,479 |
| Shoprite Holdings, Ltd. | 97,472 | 568,591 |
| Sibanye Stillwater, Ltd. (A)(C) | 311,996 | 641,490 |
| Standard Bank Group, Ltd. (C) | 348,659 | 1,938,935 |
| The Bidvest Group, Ltd. | 163,620 | 1,341,301 |
| Vodacom Group, Ltd. (C) | 133,794 | 897,691 |
| South Korea - 12.7% | 86,656,815 |
| Amorepacific Corp. | 3,306 | 480,251 |
| AMOREPACIFIC Group | 5,099 | 243,138 |
| BGF retail Company, Ltd. | 418 | 54,203 |
| Celltrion Healthcare Company, Ltd. (A) | 6,719 | 466,517 |
| Celltrion, Inc. (A) | 10,942 | 1,890,345 |
| CJ CheilJedang Corp. | 2,392 | 534,958 |
| CJ ENM Company, Ltd. | 1,075 | 112,842 |
| CJ Logistics Corp. (A) | 948 | 115,150 |
| Coway Company, Ltd. | 15,271 | 769,535 |
| DB Insurance Company, Ltd. | 15,063 | 545,801 |
| Doosan Bobcat, Inc. | 4,680 | 90,262 |
| 42 | JOHN HANCOCK MULTIFACTOR ETFS | ANNUAL REPORT | SEE NOTES TO FINANCIAL STATEMENTS |
MULTIFACTOR EMERGING MARKETS ETF (continued)
| | Shares or
Principal
Amount | Value |
| South Korea (continued) | |
| E-MART, Inc. | 4,789 | $471,648 |
| GS Holdings Corp. | 19,036 | 602,272 |
| GS Retail Company, Ltd. | 2,432 | 75,747 |
| Hana Financial Group, Inc. | 63,464 | 1,437,569 |
| Hanjin Kal Corp. | 1,882 | 134,379 |
| Hankook Tire & Technology Company, Ltd. | 23,787 | 414,850 |
| Hanmi Pharm Company, Ltd. | 752 | 159,849 |
| Hanon Systems | 31,519 | 236,176 |
| Hanwha Solutions Corp. | 22,390 | 267,368 |
| HLB, Inc. (A) | 2,079 | 163,802 |
| Hotel Shilla Company, Ltd. | 3,487 | 243,828 |
| Hyundai Engineering & Construction Company, Ltd. | 15,141 | 435,547 |
| Hyundai Glovis Company, Ltd. | 6,117 | 509,562 |
| Hyundai Heavy Industries Holdings Company, Ltd. | 1,904 | 379,722 |
| Hyundai Mobis Company, Ltd. | 9,810 | 1,384,809 |
| Hyundai Motor Company | 26,097 | 2,004,743 |
| Hyundai Steel Company | 17,630 | 312,535 |
| Industrial Bank of Korea | 69,037 | 447,612 |
| Kakao Corp. | 5,412 | 817,274 |
| Kangwon Land, Inc. | 16,441 | 338,009 |
| KB Financial Group, Inc. | 72,706 | 2,073,564 |
| Kia Motors Corp. | 56,312 | 1,370,307 |
| Korea Electric Power Corp. (A) | 53,025 | 1,037,914 |
| Korea Gas Corp. | 9,188 | 203,223 |
| Korea Investment Holdings Company, Ltd. | 8,258 | 339,551 |
| Korea Shipbuilding & Offshore Engineering Company, Ltd. (A) | 7,987 | 542,103 |
| Korea Zinc Company, Ltd. | 2,103 | 666,222 |
| KT&G Corp. | 15,307 | 1,018,834 |
| LG Chem, Ltd. | 4,924 | 1,521,512 |
| LG Corp. | 28,145 | 1,432,139 |
| LG Display Company, Ltd. (A) | 64,059 | 580,945 |
| LG Electronics, Inc. | 39,270 | 1,769,398 |
| LG Household & Health Care, Ltd. | 1,674 | 1,904,193 |
| LG Uplus Corp. | 82,722 | 906,347 |
| Lotte Chemical Corp. | 4,742 | 838,689 |
| Lotte Corp. | 9,098 | 299,421 |
| Lotte Shopping Company, Ltd. | 3,519 | 288,232 |
| Mirae Asset Daewoo Company, Ltd. | 75,741 | 348,727 |
| NAVER Corp. | 15,737 | 2,550,829 |
| NCSoft Corp. | 2,512 | 1,325,632 |
| Netmarble Corp. (A)(B) | 5,339 | 418,462 |
| NH Investment & Securities Company, Ltd. | 28,884 | 229,707 |
| Orion Corp. | 3,391 | 345,097 |
| POSCO | 14,204 | 2,150,797 |
| POSCO Chemical Company, Ltd. | 1,423 | 60,496 |
| S-1 Corp. | 3,391 | 240,733 |
| Samsung Biologics Company, Ltd. (A)(B) | 1,080 | 514,982 |
| Samsung C&T Corp. | 10,127 | 881,006 |
MULTIFACTOR EMERGING MARKETS ETF (continued)
| | Shares or
Principal
Amount | Value |
| South Korea (continued) | |
| Samsung Card Company, Ltd. | 6,767 | $166,613 |
| Samsung Electro-Mechanics Company, Ltd. | 10,087 | 939,616 |
| Samsung Electronics Company, Ltd. | 662,406 | 27,182,322 |
| Samsung Fire & Marine Insurance Company, Ltd. | 8,587 | 1,342,545 |
| Samsung Heavy Industries Company, Ltd. (A)(C) | 99,544 | 350,073 |
| Samsung Life Insurance Company, Ltd. | 18,554 | 747,672 |
| Samsung SDI Company, Ltd. | 5,759 | 1,351,778 |
| Samsung SDS Company, Ltd. | 4,417 | 589,078 |
| Samsung Securities Company, Ltd. | 13,798 | 340,859 |
| Shinhan Financial Group Company, Ltd. | 85,874 | 2,153,105 |
| SK Holdings Company, Ltd. | 6,037 | 901,747 |
| SK Hynix, Inc. | 77,020 | 5,290,799 |
| SK Innovation Company, Ltd. | 11,440 | 922,937 |
| SK Telecom Company, Ltd. | 6,686 | 1,160,564 |
| S-Oil Corp. | 6,638 | 381,353 |
| Woori Financial Group, Inc. | 97,674 | 676,572 |
| Yuhan Corp. | 4,130 | 159,817 |
| Taiwan - 15.1% | 103,295,823 |
| Advantech Company, Ltd. | 87,000 | 830,898 |
| ASE Technology Holding Company, Ltd. | 920,000 | 2,075,967 |
| Asia Cement Corp. | 663,000 | 978,787 |
| Asustek Computer, Inc. | 149,000 | 1,014,662 |
| AU Optronics Corp. | 2,728,000 | 724,739 |
| Catcher Technology Company, Ltd. | 157,000 | 1,203,773 |
| Cathay Financial Holding Company, Ltd. | 1,376,359 | 1,846,778 |
| Chailease Holding Company, Ltd. | 338,200 | 1,302,235 |
| Chang Hwa Commercial Bank, Ltd. | 1,811,840 | 1,194,225 |
| Cheng Shin Rubber Industry Company, Ltd. | 597,000 | 693,637 |
| China Development Financial Holding Corp. | 4,132,000 | 1,258,922 |
| China Life Insurance Company, Ltd. | 981,842 | 676,871 |
| China Steel Corp. | 2,495,000 | 1,678,072 |
| Chunghwa Telecom Company, Ltd. | 459,000 | 1,690,196 |
| Compal Electronics, Inc. | 1,246,000 | 800,316 |
| CTBC Financial Holding Company, Ltd. | 3,635,000 | 2,444,807 |
| Delta Electronics, Inc. | 216,000 | 1,016,932 |
| E.Sun Financial Holding Company, Ltd. | 2,437,826 | 2,238,079 |
| Eclat Textile Company, Ltd. | 44,000 | 443,899 |
| Far Eastern New Century Corp. | 1,157,000 | 1,011,619 |
| Far EasTone Telecommunications Company, Ltd. | 353,000 | 788,230 |
| Feng TAY Enterprise Company, Ltd. | 89,900 | 516,971 |
| First Financial Holding Company, Ltd. | 2,271,280 | 1,684,184 |
| Formosa Chemicals & Fibre Corp. | 624,000 | 1,592,709 |
| Formosa Petrochemical Corp. | 190,000 | 573,134 |
| Formosa Plastics Corp. | 597,000 | 1,764,710 |
| Foxconn Technology Company, Ltd. | 271,000 | 524,931 |
| Fubon Financial Holding Company, Ltd. | 1,475,000 | 2,098,179 |
| Globalwafers Company, Ltd. | 39,000 | 504,935 |
| Hiwin Technologies Corp. | 14,420 | 139,659 |
| SEE NOTES TO FINANCIAL STATEMENTS | ANNUAL REPORT | JOHN HANCOCK MULTIFACTOR ETFS | 43 |
MULTIFACTOR EMERGING MARKETS ETF (continued)
| | Shares or
Principal
Amount | Value |
| Taiwan (continued) | |
| Hon Hai Precision Industry Company, Ltd. | 1,844,800 | $4,776,944 |
| Hotai Motor Company, Ltd. | 73,000 | 1,367,377 |
| Hua Nan Financial Holdings Company, Ltd. | 2,388,260 | 1,562,109 |
| Innolux Corp. | 2,709,000 | 595,795 |
| Inventec Corp. | 616,000 | 486,809 |
| Largan Precision Company, Ltd. | 17,000 | 2,349,638 |
| Lite-On Technology Corp. | 631,000 | 986,717 |
| MediaTek, Inc. | 211,000 | 2,944,698 |
| Mega Financial Holding Company, Ltd. | 2,146,000 | 2,172,233 |
| Nan Ya Plastics Corp. | 1,071,000 | 2,384,282 |
| Nanya Technology Corp. | 244,000 | 533,351 |
| Novatek Microelectronics Corp. | 109,000 | 683,621 |
| Pegatron Corp. | 630,000 | 1,400,400 |
| Pou Chen Corp. | 780,000 | 739,697 |
| President Chain Store Corp. | 120,000 | 1,242,917 |
| Quanta Computer, Inc. | 519,000 | 1,132,719 |
| Realtek Semiconductor Corp. | 64,000 | 554,201 |
| Shin Kong Financial Holding Company, Ltd. | 2,993,340 | 859,655 |
| SinoPac Financial Holdings Company, Ltd. | 3,057,000 | 1,254,196 |
| Taishin Financial Holding Company, Ltd. | 3,038,199 | 1,302,676 |
| Taiwan Cement Corp. | 1,017,286 | 1,477,872 |
| Taiwan Cooperative Financial Holding Company, Ltd. | 2,058,450 | 1,391,382 |
| Taiwan High Speed Rail Corp. | 422,000 | 483,924 |
| Taiwan Mobile Company, Ltd. | 321,000 | 1,160,443 |
| Taiwan Semiconductor Manufacturing Company, Ltd. | 2,569,000 | 26,306,408 |
| Uni-President Enterprises Corp. | 1,009,000 | 2,358,230 |
| United Microelectronics Corp. | 2,991,000 | 1,564,073 |
| Vanguard International Semiconductor Corp. | 185,000 | 434,870 |
| Walsin Technology Corp. | 46,000 | 329,494 |
| Win Semiconductors Corp. | 56,000 | 506,583 |
| Yageo Corp. | 45,000 | 591,697 |
| Yuanta Financial Holding Company, Ltd. | 2,721,000 | 1,564,713 |
| Zhen Ding Technology Holding, Ltd. | 133,000 | 483,043 |
| Thailand - 2.5% | 17,170,475 |
| Advanced Info Service PCL, NVDR | 214,700 | 1,313,880 |
| Airports of Thailand PCL | 6,100 | 11,736 |
| Airports of Thailand PCL, Foreign Quota Shares | 1,700 | 3,242 |
| Airports of Thailand PCL, NVDR | 531,600 | 1,022,782 |
| B Grimm Power PCL, NVDR | 94,900 | 131,256 |
| Bangkok Bank PCL, NVDR | 92,600 | 297,648 |
| Bangkok Dusit Medical Services PCL, NVDR | 488,400 | 313,977 |
| Bangkok Expressway & Metro PCL, NVDR | 1,204,400 | 351,772 |
| Bank of Ayudhya PCL, NVDR | 108,600 | 72,501 |
| Berli Jucker PCL, NVDR | 235,800 | 293,338 |
| BTS Group Holdings PCL, NVDR | 1,124,300 | 399,612 |
| Bumrungrad Hospital PCL, NVDR | 73,300 | 266,195 |
| Central Pattana PCL, NVDR | 203,300 | 307,888 |
| Charoen Pokphand Foods PCL, NVDR | 989,500 | 825,730 |
MULTIFACTOR EMERGING MARKETS ETF (continued)
| | Shares or
Principal
Amount | Value |
| Thailand (continued) | |
| CP ALL PCL, NVDR | 828,000 | $1,816,968 |
| Electricity Generating PCL, NVDR | 50,000 | 441,972 |
| Energy Absolute PCL, NVDR | 333,300 | 414,629 |
| Global Power Synergy PCL, NVDR | 110,386 | 240,526 |
| Gulf Energy Development PCL, NVDR | 275,000 | 329,354 |
| Home Product Center PCL, NVDR | 788,800 | 331,562 |
| Indorama Ventures PCL, NVDR | 437,700 | 388,931 |
| Intouch Holdings PCL, NVDR | 167,600 | 277,132 |
| Kasikornbank PCL, NVDR | 114,500 | 305,227 |
| Krung Thai Bank PCL, NVDR | 685,100 | 232,919 |
| Krungthai Card PCL, NVDR | 70,300 | 73,874 |
| Land & Houses PCL, NVDR | 634,600 | 145,141 |
| Minor International PCL, NVDR | 371,800 | 242,466 |
| Muangthai Capital PCL, NVDR | 88,300 | 129,632 |
| Osotspa PCL, NVDR | 129,800 | 166,487 |
| PTT Exploration & Production PCL | 3,800 | 9,924 |
| PTT Exploration & Production PCL, Foreign Quota Shares | 2,600 | 6,711 |
| PTT Exploration & Production PCL, NVDR | 428,500 | 1,119,093 |
| PTT Global Chemical PCL, NVDR | 320,700 | 374,175 |
| PTT PCL, NVDR | 1,642,500 | 1,802,156 |
| Ratch Group PCL, NVDR | 72,800 | 149,628 |
| Thai Beverage PCL | 944,900 | 463,153 |
| Thai Oil PCL, NVDR | 234,100 | 296,650 |
| Thai Union Group PCL, NVDR | 442,700 | 179,242 |
| The Siam Cement PCL, NVDR | 59,000 | 630,938 |
| The Siam Commercial Bank PCL, NVDR | 170,000 | 359,913 |
| TMB Bank PCL, NVDR | 3,505,489 | 104,011 |
| Total Access Communication PCL, NVDR | 174,400 | 227,736 |
| True Corp. PCL, NVDR | 2,894,200 | 298,768 |
| Turkey - 0.5% | 3,651,613 |
| Akbank T.A.S. (A) | 471,960 | 397,717 |
| Aselsan Elektronik Sanayi Ve Ticaret AS | 24,072 | 93,471 |
| BIM Birlesik Magazalar AS | 88,785 | 703,090 |
| Enka Insaat ve Sanayi AS | 213,263 | 184,597 |
| Eregli Demir ve Celik Fabrikalari TAS | 281,127 | 325,391 |
| Ford Otomotiv Sanayi AS | 14,652 | 132,695 |
| KOC Holding AS | 114,778 | 251,906 |
| Tupras Turkiye Petrol Rafinerileri AS (A) | 15,308 | 198,865 |
| Turk Hava Yollari AO (A) | 199,358 | 304,906 |
| Turkcell Iletisim Hizmetleri AS | 156,993 | 313,335 |
| Turkiye Garanti Bankasi AS (A) | 402,728 | 480,542 |
| Turkiye Is Bankasi AS, Class C (A) | 253,514 | 179,540 |
| Yapi ve Kredi Bankasi AS (A) | 284,765 | 85,558 |
|
| PREFERRED SECURITIES - 1.5% | $10,104,694 |
| (Cost $20,463,250) | | |
| Brazil - 1.4% | 9,723,682 |
| Banco Bradesco SA | 606,526 | 2,145,636 |
| Braskem SA, A Shares | 34,700 | 135,510 |
| Centrais Eletricas Brasileiras SA, B Shares | 42,360 | 217,853 |
| 44 | JOHN HANCOCK MULTIFACTOR ETFS | ANNUAL REPORT | SEE NOTES TO FINANCIAL STATEMENTS |
MULTIFACTOR EMERGING MARKETS ETF (continued)
| | Shares or
Principal
Amount | Value |
| Brazil (continued) | |
| Cia Energetica de Minas Gerais | 125,100 | $220,005 |
| Cia Paranaense de Energia, B Shares | 9,700 | 97,478 |
| Gerdau SA | 190,900 | 414,011 |
| Itau Unibanco Holding SA | 536,350 | 2,256,053 |
| Lojas Americanas SA | 121,772 | 559,675 |
| Petroleo Brasileiro SA | 903,600 | 3,012,946 |
| Telefonica Brasil SA | 78,800 | 664,515 |
| Chile - 0.1% | 381,012 |
| Embotelladora Andina SA, B Shares | 31,000 | 73,943 |
| Sociedad Quimica y Minera de Chile SA, B Shares | 12,932 | 307,069 |
|
| INVESTMENT COMPANIES - 0.0% | $130,658 |
| (Cost $134,359) | | |
| South Korea - 0.0% | 130,658 |
|
| Macquarie Korea Infrastructure Fund | 13,904 | 130,658 |
|
| RIGHTS - 0.0% | $2,641 |
| (Cost $0) | | |
| HLB, Inc. (Expiration Date: 5-29-20; Strike Price: KRW 78,700.00) (A) | 186 | 2,641 |
|
| WARRANTS - 0.0% | $3,305 |
| (Cost $0) | | |
| BTS Group Holdings PCL (Expiration Date: 2-16-21; Strike Price: THB 14.00) (A) | 109,110 | 3,305 |
|
| SHORT-TERM INVESTMENTS - 1.1% | $7,175,868 |
| (Cost $7,173,192) | | |
| Short-term funds - 1.1% | 7,175,868 |
| John Hancock Collateral Trust, 0.6614% (D)(E) | 673,310 | 6,738,757 |
|
| State Street Institutional U.S. Government Money Market Fund, Premier Class, 0.2162% (D) | 437,111 | 437,111 |
| Total investments (Multifactor Emerging Markets ETF) (Cost $777,372,608) - 100.8% | $690,455,028 |
| Other assets and liabilities, net - (0.8%) | (5,342,098) |
| Total net assets - 100.0% | $685,112,930 |
| The percentage shown for each investment category is the total value of the category as a percentage of the net assets of the fund. |
| Currency Abbreviations |
| KRW | Korean Won |
| THB | Thai Bhat |
| Security Abbreviations and Legend |
| ADR | American Depositary Receipt |
| GDR | Global Depositary Receipt |
| NVDR | Non-Voting Depositary Receipt |
| (A) | Non-income producing security. |
| (B) | These securities are exempt from registration under Rule 144A of the Securities Act of 1933. Such securities may be resold, normally to qualified institutional buyers, in transactions exempt from registration. |
| (C) | All or a portion of this security is on loan as of 4-30-20. |
| (D) | The rate shown is the annualized seven-day yield as of 4-30-20. |
MULTIFACTOR EMERGING MARKETS ETF (continued)
| (E) | Investment is an affiliate of the fund, the advisor and/or subadvisor. This security represents the investment of cash collateral received for securities lending. |
MULTIFACTOR ENERGY ETF
As of 4-30-20
| | Shares or
Principal
Amount | Value |
| COMMON STOCKS – 99.9% | | $15,010,074 |
| (Cost $24,091,992) | | |
| Energy – 99.9% | 15,010,074 |
| Energy equipment and services – 12.1% | |
| Baker Hughes Company | 40,775 | 568,811 |
| Halliburton Company | 20,521 | 215,471 |
| Helmerich & Payne, Inc. | 4,844 | 95,766 |
| National Oilwell Varco, Inc. | 17,263 | 218,204 |
| Schlumberger, Ltd. | 32,546 | 547,424 |
| TechnipFMC PLC | 19,394 | 172,801 |
| Oil, gas and consumable fuels – 87.8% | |
| Apache Corp. | 19,886 | 260,109 |
| Cabot Oil & Gas Corp. | 18,489 | 399,732 |
| Cheniere Energy, Inc. (A) | 8,099 | 378,142 |
| Chevron Corp. | 12,430 | 1,143,560 |
| Cimarex Energy Company | 5,186 | 131,828 |
| Concho Resources, Inc. | 8,789 | 498,512 |
| ConocoPhillips | 23,970 | 1,009,137 |
| Continental Resources, Inc. (B) | 4,364 | 71,526 |
| Devon Energy Corp. | 27,820 | 346,915 |
| Diamondback Energy, Inc. | 7,224 | 314,533 |
| EOG Resources, Inc. | 13,001 | 617,678 |
| Exxon Mobil Corp. | 22,556 | 1,048,177 |
| Hess Corp. | 11,127 | 541,217 |
| HollyFrontier Corp. | 10,938 | 361,392 |
| Kinder Morgan, Inc. | 29,390 | 447,610 |
| Marathon Oil Corp. | 56,476 | 345,633 |
| Marathon Petroleum Corp. | 24,114 | 773,577 |
| Noble Energy, Inc. | 29,671 | 291,073 |
| Occidental Petroleum Corp. | 20,141 | 334,341 |
| ONEOK, Inc. | 17,394 | 520,602 |
| Parsley Energy, Inc., Class A | 32,759 | 309,573 |
| Phillips 66 | 6,584 | 481,751 |
| Pioneer Natural Resources Company | 6,540 | 584,087 |
| Targa Resources Corp. | 6,167 | 79,924 |
| The Williams Companies, Inc. | 30,468 | 590,165 |
| Valero Energy Corp. | 17,511 | 1,109,322 |
| WPX Energy, Inc. (A) | 32,868 | 201,481 |
|
| SHORT-TERM INVESTMENTS – 0.5% | | $69,108 |
| (Cost $69,094) | | |
| Short-term funds – 0.5% | 69,108 |
| John Hancock Collateral Trust, 0.6614% (C)(D) | 5,957 | 59,622 |
| SEE NOTES TO FINANCIAL STATEMENTS | ANNUAL REPORT | JOHN HANCOCK MULTIFACTOR ETFS | 45 |
MULTIFACTOR ENERGY ETF (continued)
| | Shares or
Principal
Amount | Value |
|
| State Street Institutional U.S. Government Money Market Fund, Premier Class, 0.2162% (C) | 9,486 | $9,486 |
| Total investments (Multifactor Energy ETF) (Cost $24,161,086) 100.4% | $15,079,182 |
| Other assets and liabilities, net (0.4%) | | (62,930) |
| Total net assets 100.0% | | $15,016,252 |
| The percentage shown for each investment category is the total value of the category as a percentage of the net assets of the fund. |
| Security Abbreviations and Legend |
| (A) | Non-income producing security. |
| (B) | All or a portion of this security is on loan as of 4-30-20. |
| (C) | The rate shown is the annualized seven-day yield as of 4-30-20. |
| (D) | Investment is an affiliate of the fund, the advisor and/or subadvisor. This security represents the investment of cash collateral received for securities lending. |
MULTIFACTOR FINANCIALS ETF
As of 4-30-20
| | Shares or
Principal
Amount | Value |
| COMMON STOCKS – 100.0% | | $30,341,528 |
| (Cost $36,157,867) | | |
| Financials – 81.7% | 24,804,668 |
| Banks – 25.0% | |
| Bank of America Corp. | 39,225 | 943,361 |
| BOK Financial Corp. | 373 | 19,318 |
| CIT Group, Inc. | 2,721 | 51,645 |
| Citigroup, Inc. | 14,064 | 682,948 |
| Citizens Financial Group, Inc. | 8,093 | 181,202 |
| Comerica, Inc. | 2,649 | 92,344 |
| Commerce Bancshares, Inc. | 1,895 | 115,955 |
| Cullen/Frost Bankers, Inc. | 977 | 70,207 |
| East West Bancorp, Inc. | 2,481 | 87,009 |
| Fifth Third Bancorp | 13,876 | 259,342 |
| First Citizens BancShares, Inc., Class A | 107 | 40,874 |
| First Financial Bankshares, Inc. | 1,756 | 48,905 |
| First Horizon National Corp. | 5,383 | 48,878 |
| First Republic Bank | 2,272 | 236,947 |
| Huntington Bancshares, Inc. | 17,963 | 165,978 |
| JPMorgan Chase & Co. | 12,176 | 1,165,974 |
| KeyCorp | 18,625 | 216,981 |
| M&T Bank Corp. | 2,044 | 229,092 |
| PacWest Bancorp | 1,971 | 39,893 |
| People's United Financial, Inc. | 5,529 | 70,163 |
| Pinnacle Financial Partners, Inc. | 1,117 | 44,959 |
| Popular, Inc. | 1,849 | 71,353 |
| Prosperity Bancshares, Inc. | 1,326 | 79,467 |
| Regions Financial Corp. | 20,347 | 218,730 |
| Signature Bank | 881 | 94,426 |
| SVB Financial Group (A) | 875 | 169,024 |
| Synovus Financial Corp. | 1,968 | 41,348 |
| TCF Financial Corp. | 692 | 20,545 |
MULTIFACTOR FINANCIALS ETF (continued)
| | Shares or
Principal
Amount | Value |
| Financials (continued) | |
| Banks (continued) | |
| The PNC Financial Services Group, Inc. | 3,303 | $352,331 |
| Truist Financial Corp. | 9,469 | 353,383 |
| U.S. Bancorp | 8,294 | 302,731 |
| Valley National Bancorp | 5,479 | 45,804 |
| Webster Financial Corp. | 1,603 | 45,285 |
| Wells Fargo & Company | 27,633 | 802,739 |
| Western Alliance Bancorp | 1,886 | 67,670 |
| Zions Bancorp NA | 3,475 | 109,845 |
| Capital markets – 23.6% | |
| Affiliated Managers Group, Inc. | 901 | 63,034 |
| Ameriprise Financial, Inc. | 2,601 | 298,959 |
| Ares Management Corp., Class A | 1,106 | 37,106 |
| BlackRock, Inc. | 561 | 281,644 |
| Cboe Global Markets, Inc. | 1,680 | 166,958 |
| CME Group, Inc. | 1,341 | 238,980 |
| E*TRADE Financial Corp. | 4,537 | 184,248 |
| Eaton Vance Corp. | 2,248 | 82,502 |
| FactSet Research Systems, Inc. | 699 | 192,225 |
| Franklin Resources, Inc. | 5,337 | 100,549 |
| Hamilton Lane, Inc., Class A | 293 | 19,001 |
| Interactive Brokers Group, Inc., Class A | 1,024 | 41,984 |
| Intercontinental Exchange, Inc. | 3,827 | 342,325 |
| Invesco, Ltd. | 7,640 | 65,857 |
| Janus Henderson Group PLC | 2,575 | 46,093 |
| KKR & Company, Inc., Class A | 6,033 | 152,092 |
| Lazard, Ltd., Class A | 2,115 | 58,163 |
| Legg Mason, Inc. | 841 | 41,907 |
| LPL Financial Holdings, Inc. | 1,512 | 91,053 |
| MarketAxess Holdings, Inc. | 619 | 281,651 |
| Moody's Corp. | 1,338 | 326,338 |
| Morgan Stanley | 8,437 | 332,671 |
| Morningstar, Inc. | 391 | 60,980 |
| MSCI, Inc. | 1,112 | 363,624 |
| Nasdaq, Inc. | 1,867 | 204,754 |
| Northern Trust Corp. | 3,555 | 281,414 |
| Raymond James Financial, Inc. | 2,221 | 146,408 |
| S&P Global, Inc. | 1,375 | 402,710 |
| SEI Investments Company | 2,560 | 130,458 |
| State Street Corp. | 4,226 | 266,407 |
| Stifel Financial Corp. | 1,174 | 51,985 |
| T. Rowe Price Group, Inc. | 4,001 | 462,636 |
| TD Ameritrade Holding Corp. | 2,649 | 104,026 |
| The Bank of New York Mellon Corp. | 7,964 | 298,969 |
| The Blackstone Group, Inc., Class A | 2,611 | 136,399 |
| The Charles Schwab Corp. | 9,120 | 344,006 |
| The Goldman Sachs Group, Inc. | 2,296 | 421,132 |
| Tradeweb Markets, Inc., Class A | 505 | 26,341 |
| Virtu Financial, Inc., Class A | 370 | 8,647 |
| 46 | JOHN HANCOCK MULTIFACTOR ETFS | ANNUAL REPORT | SEE NOTES TO FINANCIAL STATEMENTS |
MULTIFACTOR FINANCIALS ETF (continued)
| | Shares or
Principal
Amount | Value |
| Financials (continued) | |
| Consumer finance – 5.3% | |
| Ally Financial, Inc. | 10,468 | $171,571 |
| American Express Company | 4,055 | 370,019 |
| Capital One Financial Corp. | 4,858 | 314,604 |
| Credit Acceptance Corp. (A)(B) | 204 | 63,560 |
| Discover Financial Services | 5,637 | 242,222 |
| LendingTree, Inc. (A)(B) | 80 | 19,950 |
| OneMain Holdings, Inc. | 1,898 | 45,951 |
| Santander Consumer USA Holdings, Inc. | 3,556 | 55,438 |
| SLM Corp. | 8,134 | 67,838 |
| Synchrony Financial | 12,458 | 246,544 |
| Diversified financial services – 5.0% | |
| Berkshire Hathaway, Inc., Class B (A) | 6,488 | 1,215,592 |
| Equitable Holdings, Inc. | 6,093 | 111,624 |
| Jefferies Financial Group, Inc. | 4,890 | 67,091 |
| Voya Financial, Inc. | 2,774 | 125,302 |
| Insurance – 22.0% | |
| Aflac, Inc. | 5,851 | 217,891 |
| Alleghany Corp. | 238 | 127,023 |
| American Financial Group, Inc. | 1,333 | 88,298 |
| American International Group, Inc. | 7,916 | 201,304 |
| Aon PLC | 1,936 | 334,289 |
| Arch Capital Group, Ltd. (A) | 5,384 | 129,378 |
| Arthur J. Gallagher & Company | 2,937 | 230,555 |
| Assurant, Inc. | 1,001 | 106,346 |
| Assured Guaranty, Ltd. | 2,157 | 64,128 |
| Athene Holding, Ltd., Class A (A) | 3,118 | 84,186 |
| Axis Capital Holdings, Ltd. | 1,630 | 59,658 |
| Brighthouse Financial, Inc. (A) | 1,621 | 41,676 |
| Brown & Brown, Inc. | 4,106 | 147,446 |
| Chubb, Ltd. | 1,836 | 198,297 |
| Cincinnati Financial Corp. | 2,921 | 192,202 |
| CNA Financial Corp. | 564 | 17,811 |
| Enstar Group, Ltd. (A) | 188 | 27,189 |
| Erie Indemnity Company, Class A | 476 | 84,757 |
| Everest Re Group, Ltd. | 686 | 118,767 |
| Fidelity National Financial, Inc. | 4,672 | 126,378 |
| First American Financial Corp. | 2,150 | 99,158 |
| Globe Life, Inc. | 1,846 | 152,000 |
| Kemper Corp. | 1,010 | 67,892 |
| Lincoln National Corp. | 3,645 | 129,288 |
| Loews Corp. | 4,519 | 156,629 |
| Markel Corp. (A) | 224 | 193,948 |
| Marsh & McLennan Companies, Inc. | 4,371 | 425,429 |
| MetLife, Inc. | 6,549 | 236,288 |
| Old Republic International Corp. | 5,150 | 82,143 |
| Primerica, Inc. | 742 | 77,101 |
| Principal Financial Group, Inc. | 4,910 | 178,773 |
| Prudential Financial, Inc. | 3,293 | 205,384 |
| Reinsurance Group of America, Inc. | 1,179 | 123,418 |
MULTIFACTOR FINANCIALS ETF (continued)
| | Shares or
Principal
Amount | Value |
| Financials (continued) | |
| Insurance (continued) | |
| RenaissanceRe Holdings, Ltd. | 707 | $103,229 |
| RLI Corp. | 390 | 28,404 |
| The Allstate Corp. | 3,014 | 306,584 |
| The Hanover Insurance Group, Inc. | 693 | 69,563 |
| The Hartford Financial Services Group, Inc. | 8,095 | 307,529 |
| The Progressive Corp. | 5,060 | 391,138 |
| The Travelers Companies, Inc. | 2,609 | 264,057 |
| Unum Group | 4,040 | 70,498 |
| W.R. Berkley Corp. | 2,401 | 129,654 |
| Willis Towers Watson PLC | 1,640 | 292,396 |
| Thrifts and mortgage finance – 0.8% | |
| Essent Group, Ltd. | 1,713 | 46,799 |
| MGIC Investment Corp. | 7,621 | 55,710 |
| New York Community Bancorp, Inc. | 7,450 | 80,907 |
| Radian Group, Inc. | 4,228 | 63,335 |
| TFS Financial Corp. | 706 | 9,637 |
| Industrials – 1.5% | 446,465 |
| Professional services – 1.5% | |
| Equifax, Inc. | 1,453 | 201,822 |
| TransUnion | 3,105 | 244,643 |
| Information technology – 16.8% | 5,090,395 |
| IT services – 16.8% | |
| Euronet Worldwide, Inc. (A) | 737 | 67,627 |
| Fidelity National Information Services, Inc. | 2,547 | 335,924 |
| Fiserv, Inc. (A) | 1,951 | 201,070 |
| FleetCor Technologies, Inc. (A) | 1,424 | 343,540 |
| Global Payments, Inc. | 2,043 | 339,179 |
| Jack Henry & Associates, Inc. | 1,056 | 172,709 |
| Mastercard, Inc., Class A | 4,738 | 1,302,808 |
| PayPal Holdings, Inc. (A) | 5,217 | 641,691 |
| Square, Inc., Class A (A) | 1,115 | 72,631 |
| The Western Union Company | 6,845 | 130,534 |
| Visa, Inc., Class A | 7,786 | 1,391,514 |
| WEX, Inc. (A) | 689 | 91,168 |
|
| SHORT-TERM INVESTMENTS – 0.2% | | $69,761 |
| (Cost $69,753) | | |
| Short-term funds – 0.2% | 69,761 |
| John Hancock Collateral Trust, 0.6614% (C)(D) | 3,545 | 35,481 |
|
| State Street Institutional U.S. Government Money Market Fund, Premier Class, 0.2162% (C) | 34,280 | 34,280 |
| Total investments (Multifactor Financials ETF) (Cost $36,227,620) 100.2% | $30,411,289 |
| Other assets and liabilities, net (0.2%) | | (53,393) |
| Total net assets 100.0% | | $30,357,896 |
| The percentage shown for each investment category is the total value of the category as a percentage of the net assets of the fund. |
| SEE NOTES TO FINANCIAL STATEMENTS | ANNUAL REPORT | JOHN HANCOCK MULTIFACTOR ETFS | 47 |
MULTIFACTOR FINANCIALS ETF (continued)
| Security Abbreviations and Legend |
| (A) | Non-income producing security. |
| (B) | All or a portion of this security is on loan as of 4-30-20. |
| (C) | The rate shown is the annualized seven-day yield as of 4-30-20. |
| (D) | Investment is an affiliate of the fund, the advisor and/or subadvisor. This security represents the investment of cash collateral received for securities lending. |
MULTIFACTOR HEALTHCARE ETF
As of 4-30-20
| | Shares or
Principal
Amount | Value |
| COMMON STOCKS – 99.9% | | $43,192,912 |
| (Cost $39,665,683) | | |
| Consumer discretionary – 0.3% | 153,132 |
| Diversified consumer services – 0.3% | |
| Service Corp. International | 4,168 | 153,132 |
| Health care – 99.6% | 43,039,780 |
| Biotechnology – 16.2% | |
| AbbVie, Inc. | 8,439 | 693,686 |
| ACADIA Pharmaceuticals, Inc. (A) | 1,193 | 57,634 |
| Acceleron Pharma, Inc. (A) | 385 | 34,854 |
| Alexion Pharmaceuticals, Inc. (A) | 3,314 | 356,156 |
| Alnylam Pharmaceuticals, Inc. (A) | 1,634 | 215,198 |
| Amgen, Inc. | 4,284 | 1,024,818 |
| Biogen, Inc. (A) | 2,647 | 785,709 |
| BioMarin Pharmaceutical, Inc. (A) | 2,806 | 258,208 |
| Bluebird Bio, Inc. (A) | 786 | 42,350 |
| Bridgebio Pharma, Inc. (A)(B) | 875 | 26,714 |
| Exact Sciences Corp. (A) | 1,512 | 119,418 |
| Exelixis, Inc. (A) | 7,674 | 189,509 |
| FibroGen, Inc. (A) | 1,035 | 38,181 |
| Gilead Sciences, Inc. | 12,992 | 1,091,328 |
| Global Blood Therapeutics, Inc. (A)(B) | 599 | 45,835 |
| Incyte Corp. (A) | 2,848 | 278,136 |
| Ionis Pharmaceuticals, Inc. (A) | 1,723 | 95,678 |
| Iovance Biotherapeutics, Inc. (A) | 950 | 30,543 |
| Mirati Therapeutics, Inc. (A)(B) | 318 | 27,043 |
| Moderna, Inc. (A) | 2,727 | 125,415 |
| Neurocrine Biosciences, Inc. (A) | 1,110 | 108,935 |
| Regeneron Pharmaceuticals, Inc. (A) | 889 | 467,507 |
| Sarepta Therapeutics, Inc. (A) | 848 | 99,962 |
| Seattle Genetics, Inc. (A) | 1,437 | 197,200 |
| United Therapeutics Corp. (A) | 1,277 | 139,908 |
| Vertex Pharmaceuticals, Inc. (A) | 1,770 | 444,624 |
| Health care equipment and supplies – 24.9% | |
| Abbott Laboratories | 11,827 | 1,089,148 |
| ABIOMED, Inc. (A) | 637 | 121,826 |
| Align Technology, Inc. (A) | 1,515 | 325,498 |
| Baxter International, Inc. | 5,613 | 498,322 |
| Becton, Dickinson and Company | 2,006 | 506,575 |
| Boston Scientific Corp. (A) | 14,409 | 540,049 |
| Danaher Corp. | 3,864 | 631,609 |
| Dentsply Sirona, Inc. | 5,231 | 222,004 |
MULTIFACTOR HEALTHCARE ETF (continued)
| | Shares or
Principal
Amount | Value |
| Health care (continued) | |
| Health care equipment and supplies (continued) | |
| DexCom, Inc. (A) | 1,077 | $361,010 |
| Edwards Lifesciences Corp. (A) | 1,736 | 377,580 |
| Envista Holdings Corp. (A) | 2,390 | 46,533 |
| Globus Medical, Inc., Class A (A) | 1,998 | 94,825 |
| Haemonetics Corp. (A) | 911 | 103,654 |
| Hill-Rom Holdings, Inc. | 1,878 | 211,256 |
| Hologic, Inc. (A) | 6,543 | 327,804 |
| IDEXX Laboratories, Inc. (A) | 1,745 | 484,412 |
| Insulet Corp. (A) | 926 | 184,941 |
| Integra LifeSciences Holdings Corp. (A) | 1,387 | 70,806 |
| Intuitive Surgical, Inc. (A) | 667 | 340,757 |
| LivaNova PLC (A) | 1,041 | 55,298 |
| Masimo Corp. (A) | 936 | 200,220 |
| Medtronic PLC | 9,654 | 942,520 |
| Nevro Corp. (A) | 253 | 29,763 |
| Novocure, Ltd. (A) | 895 | 58,891 |
| Penumbra, Inc. (A)(B) | 373 | 66,140 |
| ResMed, Inc. | 2,637 | 409,579 |
| STERIS PLC | 1,857 | 264,623 |
| Stryker Corp. | 2,267 | 422,637 |
| Tandem Diabetes Care, Inc. (A) | 602 | 48,028 |
| Teleflex, Inc. | 856 | 287,102 |
| The Cooper Companies, Inc. | 1,072 | 307,342 |
| Varian Medical Systems, Inc. (A) | 2,085 | 238,482 |
| West Pharmaceutical Services, Inc. | 1,544 | 292,217 |
| Wright Medical Group NV (A)(B) | 1,505 | 43,825 |
| Zimmer Biomet Holdings, Inc. | 4,536 | 542,959 |
| Health care providers and services – 22.6% | |
| Amedisys, Inc. (A) | 583 | 107,365 |
| AmerisourceBergen Corp. | 3,777 | 338,646 |
| Anthem, Inc. | 2,403 | 674,594 |
| Cardinal Health, Inc. | 6,809 | 336,909 |
| Centene Corp. (A) | 6,729 | 448,017 |
| Chemed Corp. | 347 | 144,550 |
| Cigna Corp. | 3,307 | 647,444 |
| CVS Health Corp. | 10,643 | 655,077 |
| DaVita, Inc. (A) | 2,963 | 234,107 |
| Encompass Health Corp. | 2,844 | 188,415 |
| Guardant Health, Inc. (A) | 510 | 39,250 |
| HCA Healthcare, Inc. | 2,464 | 270,744 |
| HealthEquity, Inc. (A) | 959 | 53,963 |
| Henry Schein, Inc. (A) | 3,796 | 207,110 |
| Humana, Inc. | 1,833 | 699,876 |
| Laboratory Corp. of America Holdings (A) | 2,826 | 464,736 |
| LHC Group, Inc. (A) | 442 | 57,456 |
| McKesson Corp. | 5,071 | 716,279 |
| Molina Healthcare, Inc. (A) | 1,948 | 319,414 |
| Premier, Inc., Class A (A) | 1,241 | 41,152 |
| Quest Diagnostics, Inc. | 3,833 | 422,052 |
| 48 | JOHN HANCOCK MULTIFACTOR ETFS | ANNUAL REPORT | SEE NOTES TO FINANCIAL STATEMENTS |
MULTIFACTOR HEALTHCARE ETF (continued)
| | Shares or
Principal
Amount | Value |
| Health care (continued) | |
| Health care providers and services (continued) | |
| UnitedHealth Group, Inc. | 8,291 | $2,424,869 |
| Universal Health Services, Inc., Class B | 2,557 | 270,249 |
| Health care technology – 2.4% | |
| Cerner Corp. | 7,420 | 514,874 |
| Teladoc Health, Inc. (A) | 1,155 | 190,101 |
| Veeva Systems, Inc., Class A (A) | 1,706 | 325,505 |
| Life sciences tools and services – 10.0% | |
| Adaptive Biotechnologies Corp. (A) | 158 | 5,058 |
| Agilent Technologies, Inc. | 6,767 | 518,758 |
| Avantor, Inc. (A) | 4,822 | 81,058 |
| Bio-Rad Laboratories, Inc., Class A (A) | 497 | 218,730 |
| Bio-Techne Corp. | 731 | 164,475 |
| Bruker Corp. | 2,606 | 102,468 |
| Charles River Laboratories International, Inc. (A) | 1,318 | 190,675 |
| Illumina, Inc. (A) | 1,153 | 367,842 |
| IQVIA Holdings, Inc. (A) | 3,892 | 554,960 |
| Mettler-Toledo International, Inc. (A) | 458 | 329,733 |
| PerkinElmer, Inc. | 1,852 | 167,662 |
| PPD, Inc. (A) | 579 | 13,838 |
| PRA Health Sciences, Inc. (A) | 1,184 | 114,256 |
| Repligen Corp. (A) | 711 | 82,583 |
| Syneos Health, Inc. (A) | 1,754 | 97,856 |
| Thermo Fisher Scientific, Inc. | 3,086 | 1,032,822 |
| Waters Corp. (A) | 1,495 | 279,565 |
| Pharmaceuticals – 23.5% | |
| Allergan PLC | 2,426 | 454,487 |
| Bristol-Myers Squibb Company | 16,325 | 992,723 |
| Catalent, Inc. (A) | 3,894 | 269,270 |
| Elanco Animal Health, Inc. (A) | 5,154 | 127,355 |
| Eli Lilly & Company | 5,828 | 901,242 |
| Horizon Therapeutics PLC (A) | 4,161 | 149,962 |
| Jazz Pharmaceuticals PLC (A) | 1,652 | 182,133 |
| Johnson & Johnson | 18,025 | 2,704,471 |
| Merck & Company, Inc. | 21,023 | 1,667,965 |
| Mylan NV (A) | 12,728 | 213,449 |
| Perrigo Company PLC | 2,818 | 150,199 |
| Pfizer, Inc. | 48,817 | 1,872,620 |
| Reata Pharmaceuticals, Inc., Class A (A)(B) | 197 | 31,158 |
| Zoetis, Inc. | 3,595 | 464,869 |
|
| SHORT-TERM INVESTMENTS – 0.5% | | $206,649 |
| (Cost $206,587) | | |
| Short-term funds – 0.5% | 206,649 |
| John Hancock Collateral Trust, 0.6614% (C)(D) | 18,363 | 183,786 |
MULTIFACTOR HEALTHCARE ETF (continued)
| | Shares or
Principal
Amount | Value |
|
| State Street Institutional U.S. Government Money Market Fund, Premier Class, 0.2162% (C) | 22,863 | $22,863 |
| Total investments (Multifactor Healthcare ETF) (Cost $39,872,270) 100.4% | $43,399,561 |
| Other assets and liabilities, net (0.4%) | | (192,645) |
| Total net assets 100.0% | | $43,206,916 |
| The percentage shown for each investment category is the total value of the category as a percentage of the net assets of the fund. |
| Security Abbreviations and Legend |
| (A) | Non-income producing security. |
| (B) | All or a portion of this security is on loan as of 4-30-20. |
| (C) | The rate shown is the annualized seven-day yield as of 4-30-20. |
| (D) | Investment is an affiliate of the fund, the advisor and/or subadvisor. This security represents the investment of cash collateral received for securities lending. |
MULTIFACTOR INDUSTRIALS ETF
As of 4-30-20
| | Shares or
Principal
Amount | Value |
| COMMON STOCKS – 99.9% | | $22,229,705 |
| (Cost $25,327,564) | | |
| Consumer discretionary – 6.6% | 1,459,065 |
| Auto components – 1.7% | |
| Aptiv PLC | 4,087 | 284,251 |
| Gentex Corp. | 3,579 | 86,755 |
| Distributors – 0.5% | |
| Pool Corp. | 523 | 110,698 |
| Hotels, restaurants and leisure – 0.5% | |
| Aramark | 3,823 | 104,406 |
| Household durables – 3.9% | |
| D.R. Horton, Inc. | 5,131 | 242,286 |
| Leggett & Platt, Inc. | 2,845 | 99,945 |
| Lennar Corp., A Shares | 3,640 | 182,255 |
| Lennar Corp., B Shares | 205 | 7,821 |
| NVR, Inc. (A) | 58 | 179,800 |
| PulteGroup, Inc. | 4,258 | 120,374 |
| Toll Brothers, Inc. | 1,685 | 40,474 |
| Industrials – 82.5% | 18,360,255 |
| Aerospace and defense – 13.6% | |
| Aerojet Rocketdyne Holdings, Inc. (A) | 1,106 | 45,501 |
| Axon Enterprise, Inc. (A) | 317 | 23,049 |
| BWX Technologies, Inc. | 1,282 | 68,023 |
| Curtiss-Wright Corp. | 666 | 69,031 |
| General Dynamics Corp. | 1,780 | 232,504 |
| HEICO Corp. | 450 | 39,420 |
| HEICO Corp., Class A | 776 | 56,128 |
| Hexcel Corp. | 1,160 | 40,124 |
| Huntington Ingalls Industries, Inc. | 677 | 129,585 |
| L3Harris Technologies, Inc. | 1,127 | 218,300 |
| SEE NOTES TO FINANCIAL STATEMENTS | ANNUAL REPORT | JOHN HANCOCK MULTIFACTOR ETFS | 49 |
MULTIFACTOR INDUSTRIALS ETF (continued)
| | Shares or
Principal
Amount | Value |
| Industrials (continued) | |
| Aerospace and defense (continued) | |
| Lockheed Martin Corp. | 1,146 | $445,863 |
| Mercury Systems, Inc. (A) | 644 | 57,419 |
| Northrop Grumman Corp. | 980 | 324,057 |
| Parsons Corp. (A) | 331 | 12,379 |
| Raytheon Technologies Corp. | 9,001 | 583,355 |
| Spirit AeroSystems Holdings, Inc., Class A | 1,939 | 42,968 |
| Teledyne Technologies, Inc. (A) | 456 | 148,506 |
| Textron, Inc. | 3,556 | 93,736 |
| The Boeing Company | 1,944 | 274,143 |
| TransDigm Group, Inc. | 315 | 114,370 |
| Virgin Galactic Holdings, Inc. (A)(B) | 338 | 5,956 |
| Air freight and logistics – 4.1% | |
| C.H. Robinson Worldwide, Inc. | 2,199 | 155,909 |
| Expeditors International of Washington, Inc. | 2,513 | 179,943 |
| FedEx Corp. | 1,214 | 153,899 |
| United Parcel Service, Inc., Class B | 3,401 | 321,939 |
| XPO Logistics, Inc. (A) | 1,624 | 108,386 |
| Airlines – 3.4% | |
| Alaska Air Group, Inc. | 2,005 | 65,203 |
| American Airlines Group, Inc. (B) | 4,066 | 48,833 |
| Copa Holdings SA, Class A | 388 | 17,153 |
| Delta Air Lines, Inc. | 6,743 | 174,711 |
| JetBlue Airways Corp. (A) | 4,416 | 43,012 |
| Southwest Airlines Company | 7,975 | 249,219 |
| United Airlines Holdings, Inc. (A) | 5,028 | 148,728 |
| Building products – 4.2% | |
| AO Smith Corp. | 1,710 | 72,470 |
| Armstrong World Industries, Inc. | 628 | 48,406 |
| Carrier Global Corp. (A) | 4,092 | 72,469 |
| Johnson Controls International PLC | 9,117 | 265,396 |
| Lennox International, Inc. | 416 | 77,659 |
| Masco Corp. | 2,916 | 119,673 |
| Trane Technologies PLC | 2,461 | 215,141 |
| Trex Company, Inc. (A) | 599 | 57,037 |
| Commercial services and supplies – 5.1% | |
| ADT, Inc. (B) | 3,374 | 19,333 |
| Cintas Corp. | 1,092 | 242,238 |
| Clean Harbors, Inc. (A) | 738 | 39,431 |
| IAA, Inc. (A) | 1,258 | 48,559 |
| MSA Safety, Inc. | 422 | 47,488 |
| Republic Services, Inc. | 3,330 | 260,872 |
| Stericycle, Inc. (A) | 1,111 | 54,217 |
| Tetra Tech, Inc. | 562 | 42,307 |
| The Brink's Company | 994 | 50,813 |
| Waste Management, Inc. | 3,273 | 327,365 |
| Construction and engineering – 1.9% | |
| AECOM (A) | 2,392 | 86,734 |
| EMCOR Group, Inc. | 1,043 | 66,262 |
| Jacobs Engineering Group, Inc. | 1,910 | 158,053 |
MULTIFACTOR INDUSTRIALS ETF (continued)
| | Shares or
Principal
Amount | Value |
| Industrials (continued) | |
| Construction and engineering (continued) | |
| MasTec, Inc. (A) | 1,111 | $39,885 |
| Quanta Services, Inc. | 2,078 | 75,556 |
| Electrical equipment – 6.4% | |
| Acuity Brands, Inc. | 665 | 57,582 |
| AMETEK, Inc. | 3,609 | 302,687 |
| Eaton Corp. PLC | 3,083 | 257,431 |
| Emerson Electric Company | 4,905 | 279,732 |
| Generac Holdings, Inc. (A) | 852 | 83,019 |
| Hubbell, Inc. | 888 | 110,494 |
| Rockwell Automation, Inc. | 1,711 | 324,200 |
| Industrial conglomerates – 6.2% | |
| 3M Company | 3,116 | 473,383 |
| Carlisle Companies, Inc. | 850 | 102,816 |
| General Electric Company | 32,663 | 222,108 |
| Honeywell International, Inc. | 3,176 | 450,674 |
| Roper Technologies, Inc. | 391 | 133,343 |
| Machinery – 20.6% | |
| AGCO Corp. | 1,001 | 52,893 |
| Allison Transmission Holdings, Inc. | 2,113 | 76,786 |
| Caterpillar, Inc. | 3,698 | 430,373 |
| Colfax Corp. (A) | 869 | 22,412 |
| Crane Company | 809 | 44,050 |
| Cummins, Inc. | 2,487 | 406,625 |
| Deere & Company | 2,815 | 408,344 |
| Donaldson Company, Inc. | 1,996 | 87,485 |
| Dover Corp. | 2,084 | 195,167 |
| Flowserve Corp. | 1,676 | 47,213 |
| Fortive Corp. | 3,932 | 251,648 |
| Graco, Inc. | 2,602 | 116,205 |
| IDEX Corp. | 1,071 | 164,538 |
| Illinois Tool Works, Inc. | 2,110 | 342,875 |
| Ingersoll Rand, Inc. (A) | 2,702 | 78,574 |
| ITT, Inc. | 1,608 | 84,774 |
| Lincoln Electric Holdings, Inc. | 1,033 | 83,167 |
| Nordson Corp. | 705 | 113,442 |
| Oshkosh Corp. | 1,324 | 89,410 |
| Otis Worldwide Corp. (A) | 2,047 | 104,213 |
| PACCAR, Inc. | 6,346 | 439,334 |
| Parker-Hannifin Corp. | 1,994 | 315,291 |
| Pentair PLC | 2,564 | 88,689 |
| Snap-on, Inc. | 916 | 119,346 |
| The Middleby Corp. (A) | 949 | 52,793 |
| The Toro Company | 1,475 | 94,120 |
| Wabtec Corp. | 1,330 | 75,039 |
| Woodward, Inc. | 830 | 50,265 |
| Xylem, Inc. | 2,226 | 160,049 |
| Marine – 0.2% | |
| Kirby Corp. (A) | 918 | 49,040 |
| 50 | JOHN HANCOCK MULTIFACTOR ETFS | ANNUAL REPORT | SEE NOTES TO FINANCIAL STATEMENTS |
MULTIFACTOR INDUSTRIALS ETF (continued)
| | Shares or
Principal
Amount | Value |
| Industrials (continued) | |
| Professional services – 3.4% | |
| CoreLogic, Inc. | 889 | $34,155 |
| Exponent, Inc. | 320 | 22,506 |
| FTI Consulting, Inc. (A) | 438 | 55,784 |
| IHS Markit, Ltd. | 2,737 | 184,200 |
| ManpowerGroup, Inc. | 947 | 70,305 |
| Robert Half International, Inc. | 1,900 | 89,813 |
| TriNet Group, Inc. (A) | 891 | 43,632 |
| Verisk Analytics, Inc. | 1,653 | 252,628 |
| Road and rail – 9.2% | |
| AMERCO | 168 | 47,062 |
| CSX Corp. | 5,547 | 367,378 |
| J.B. Hunt Transport Services, Inc. | 1,676 | 169,477 |
| Kansas City Southern | 1,326 | 173,109 |
| Knight-Swift Transportation Holdings, Inc. (B) | 1,636 | 60,826 |
| Landstar System, Inc. | 681 | 70,354 |
| Norfolk Southern Corp. | 2,006 | 343,227 |
| Old Dominion Freight Line, Inc. | 1,521 | 220,986 |
| Union Pacific Corp. | 3,760 | 600,802 |
| Trading companies and distributors – 4.2% | |
| Air Lease Corp. | 1,733 | 45,318 |
| Fastenal Company | 7,854 | 284,472 |
| HD Supply Holdings, Inc. (A) | 2,857 | 84,796 |
| MSC Industrial Direct Company, Inc., Class A | 698 | 41,629 |
| United Rentals, Inc. (A) | 1,665 | 213,953 |
| W.W. Grainger, Inc. | 733 | 202,000 |
| Watsco, Inc. | 382 | 61,498 |
| Information technology – 10.8% | 2,410,385 |
| Electronic equipment, instruments and components – 1.6% | |
| Arrow Electronics, Inc. (A) | 1,238 | 77,895 |
| CDW Corp. | 1,900 | 210,520 |
| SYNNEX Corp. | 669 | 58,578 |
| IT services – 9.0% | |
| Accenture PLC, Class A | 3,000 | 555,570 |
| Automatic Data Processing, Inc. | 1,811 | 265,656 |
| Black Knight, Inc. (A) | 1,492 | 105,290 |
| Booz Allen Hamilton Holding Corp. | 1,835 | 134,762 |
| Broadridge Financial Solutions, Inc. | 1,525 | 176,900 |
| CACI International, Inc., Class A (A) | 326 | 81,546 |
| Genpact, Ltd. | 2,247 | 77,364 |
| KBR, Inc. | 1,367 | 27,695 |
| Leidos Holdings, Inc. | 2,014 | 199,003 |
| MAXIMUS, Inc. | 852 | 57,357 |
| Paychex, Inc. | 3,797 | 260,170 |
| Sabre Corp. | 4,103 | 29,829 |
| Science Applications International Corp. | 501 | 40,912 |
| Semiconductors and semiconductor equipment – 0.1% | |
| Enphase Energy, Inc. (A) | 748 | 35,029 |
MULTIFACTOR INDUSTRIALS ETF (continued)
| | Shares or
Principal
Amount | Value |
| Information technology (continued) | |
| Software – 0.1% | |
| Globant SA (A)(B) | 141 | $16,309 |
|
| SHORT-TERM INVESTMENTS – 0.6% | | $119,191 |
| (Cost $119,171) | | |
| Short-term funds – 0.6% | 119,191 |
| John Hancock Collateral Trust, 0.6614% (C)(D) | 9,528 | 95,357 |
|
| State Street Institutional U.S. Government Money Market Fund, Premier Class, 0.2162% (C) | 23,834 | 23,834 |
| Total investments (Multifactor Industrials ETF) (Cost $25,446,735) 100.5% | $22,348,896 |
| Other assets and liabilities, net (0.5%) | | (101,056) |
| Total net assets 100.0% | | $22,247,840 |
| The percentage shown for each investment category is the total value of the category as a percentage of the net assets of the fund. |
| Security Abbreviations and Legend |
| (A) | Non-income producing security. |
| (B) | All or a portion of this security is on loan as of 4-30-20. |
| (C) | The rate shown is the annualized seven-day yield as of 4-30-20. |
| (D) | Investment is an affiliate of the fund, the advisor and/or subadvisor. This security represents the investment of cash collateral received for securities lending. |
MULTIFACTOR LARGE CAP ETF
As of 4-30-20
| | Shares or
Principal
Amount | Value |
| COMMON STOCKS – 99.9% | | $788,432,145 |
| (Cost $776,148,143) | | |
| Communication services – 8.1% | 64,150,859 |
| Diversified telecommunication services – 1.5% | |
| AT&T, Inc. | 175,724 | 5,354,310 |
| CenturyLink, Inc. | 70,884 | 752,788 |
| GCI Liberty, Inc., Class A (A) | 3,114 | 189,425 |
| Verizon Communications, Inc. | 102,161 | 5,869,149 |
| Entertainment – 1.4% | |
| Activision Blizzard, Inc. | 23,572 | 1,502,244 |
| Electronic Arts, Inc. (A) | 9,690 | 1,107,179 |
| Liberty Media Corp.-Liberty Formula One, Series A (A) | 751 | 22,718 |
| Liberty Media Corp.-Liberty Formula One, Series C (A) | 9,837 | 316,653 |
| Live Nation Entertainment, Inc. (A) | 7,434 | 333,564 |
| Madison Square Garden Entertainment Corp. (A) | 719 | 59,461 |
| Madison Square Garden Sports Corp. (A) | 719 | 123,179 |
| Netflix, Inc. (A) | 6,409 | 2,690,819 |
| Roku, Inc. (A) | 1,590 | 192,756 |
| Spotify Technology SA (A) | 1,025 | 155,359 |
| Take-Two Interactive Software, Inc. (A) | 4,816 | 582,977 |
| The Walt Disney Company | 37,046 | 4,006,525 |
| SEE NOTES TO FINANCIAL STATEMENTS | ANNUAL REPORT | JOHN HANCOCK MULTIFACTOR ETFS | 51 |
MULTIFACTOR LARGE CAP ETF (continued)
| | Shares or
Principal
Amount | Value |
| Communication services (continued) | |
| Entertainment (continued) | |
| Zynga, Inc., Class A (A) | 11,201 | $84,456 |
| Interactive media and services – 3.2% | |
| Alphabet, Inc., Class A (A) | 9,178 | 12,360,013 |
| Alphabet, Inc., Class C (A) | 1,560 | 2,103,910 |
| Facebook, Inc., Class A (A) | 42,240 | 8,646,950 |
| InterActiveCorp (A) | 3,794 | 847,883 |
| Match Group, Inc. (A)(B) | 2,358 | 181,472 |
| Pinterest, Inc., Class A (A)(B) | 3,741 | 77,289 |
| Snap, Inc., Class A (A) | 16,350 | 287,924 |
| Twitter, Inc. (A) | 27,053 | 775,880 |
| Zillow Group, Inc., Class A (A) | 1,005 | 43,758 |
| Zillow Group, Inc., Class C (A)(B) | 5,318 | 233,779 |
| Media – 1.8% | |
| Altice USA, Inc., Class A (A) | 12,923 | 335,610 |
| Cable One, Inc. | 150 | 286,929 |
| Charter Communications, Inc., Class A (A) | 4,972 | 2,462,284 |
| Comcast Corp., Class A | 137,817 | 5,186,054 |
| Discovery, Inc., Series A (A)(B) | 17,055 | 382,373 |
| Discovery, Inc., Series C (A) | 12,453 | 254,166 |
| DISH Network Corp., Class A (A) | 14,037 | 351,136 |
| Fox Corp., Class A | 15,945 | 412,497 |
| Fox Corp., Class B | 4,681 | 119,646 |
| Liberty Broadband Corp., Series A (A) | 614 | 73,692 |
| Liberty Broadband Corp., Series C (A) | 7,274 | 892,374 |
| Liberty Media Corp.-Liberty SiriusXM, Series A (A) | 7,508 | 253,095 |
| Liberty Media Corp.-Liberty SiriusXM, Series C (A) | 3,764 | 128,239 |
| News Corp., Class A | 21,431 | 212,381 |
| News Corp., Class B | 5,568 | 56,905 |
| Omnicom Group, Inc. | 18,820 | 1,073,305 |
| Sirius XM Holdings, Inc. (B) | 58,231 | 344,145 |
| The Interpublic Group of Companies, Inc. | 33,185 | 563,481 |
| The New York Times Company, Class A | 1,081 | 35,154 |
| ViacomCBS, Inc., Class A | 84 | 1,649 |
| ViacomCBS, Inc., Class B | 36,177 | 624,415 |
| Wireless telecommunication services – 0.2% | |
| T-Mobile US, Inc. (A) | 13,655 | 1,198,909 |
| Consumer discretionary – 10.4% | 82,522,415 |
| Auto components – 0.4% | |
| Aptiv PLC | 18,558 | 1,290,709 |
| Autoliv, Inc. | 5,999 | 360,060 |
| BorgWarner, Inc. | 13,838 | 395,352 |
| Gentex Corp. | 15,460 | 374,750 |
| Lear Corp. | 5,534 | 540,395 |
| Automobiles – 0.4% | |
| Ford Motor Company | 115,594 | 588,373 |
| General Motors Company | 39,559 | 881,770 |
| Tesla, Inc. (A) | 2,326 | 1,818,653 |
MULTIFACTOR LARGE CAP ETF (continued)
| | Shares or
Principal
Amount | Value |
| Consumer discretionary (continued) | |
| Distributors – 0.2% | |
| Genuine Parts Company | 10,029 | $795,099 |
| LKQ Corp. (A) | 16,467 | 430,612 |
| Pool Corp. | 1,803 | 381,623 |
| Diversified consumer services – 0.1% | |
| Bright Horizons Family Solutions, Inc. (A) | 2,132 | 248,271 |
| Service Corp. International | 11,666 | 428,609 |
| ServiceMaster Global Holdings, Inc. (A) | 7,688 | 261,776 |
| Hotels, restaurants and leisure – 1.8% | |
| Aramark | 15,839 | 432,563 |
| Carnival Corp. (B) | 14,695 | 233,651 |
| Chipotle Mexican Grill, Inc. (A) | 1,575 | 1,383,716 |
| Darden Restaurants, Inc. | 7,953 | 586,852 |
| Domino's Pizza, Inc. | 1,895 | 685,857 |
| Dunkin' Brands Group, Inc. | 2,408 | 151,319 |
| Hilton Worldwide Holdings, Inc. | 12,370 | 936,533 |
| Hyatt Hotels Corp., Class A | 2,070 | 116,458 |
| Las Vegas Sands Corp. | 14,427 | 692,785 |
| Marriott International, Inc., Class A | 10,148 | 922,859 |
| McDonald's Corp. | 15,162 | 2,843,785 |
| MGM Resorts International | 30,451 | 512,490 |
| Norwegian Cruise Line Holdings, Ltd. (A) | 9,418 | 154,455 |
| Planet Fitness, Inc., Class A (A) | 2,062 | 124,400 |
| Royal Caribbean Cruises, Ltd. | 9,007 | 421,257 |
| Starbucks Corp. | 25,964 | 1,992,218 |
| Vail Resorts, Inc. | 2,135 | 365,085 |
| Wyndham Hotels & Resorts, Inc. | 7,995 | 301,491 |
| Wynn Resorts, Ltd. | 5,213 | 445,868 |
| Yum! Brands, Inc. | 11,096 | 959,027 |
| Household durables – 0.7% | |
| D.R. Horton, Inc. | 21,198 | 1,000,970 |
| Garmin, Ltd. | 7,619 | 618,358 |
| Lennar Corp., A Shares | 13,524 | 677,147 |
| Lennar Corp., B Shares | 782 | 29,833 |
| Mohawk Industries, Inc. (A) | 4,113 | 360,792 |
| Newell Brands, Inc. | 22,813 | 316,644 |
| NVR, Inc. (A) | 302 | 936,200 |
| PulteGroup, Inc. | 16,824 | 475,614 |
| Toll Brothers, Inc. | 8,587 | 206,260 |
| Whirlpool Corp. | 5,273 | 589,205 |
| Internet and direct marketing retail – 2.9% | |
| Amazon.com, Inc. (A) | 7,476 | 18,495,624 |
| Booking Holdings, Inc. (A) | 1,080 | 1,599,016 |
| Chewy, Inc., Class A (A)(B) | 960 | 41,510 |
| eBay, Inc. | 48,543 | 1,933,468 |
| Etsy, Inc. (A) | 2,367 | 153,547 |
| Expedia Group, Inc. | 7,007 | 497,357 |
| Wayfair, Inc., Class A (A)(B) | 1,292 | 160,260 |
| Leisure products – 0.1% | |
| Hasbro, Inc. | 9,000 | 649,890 |
| 52 | JOHN HANCOCK MULTIFACTOR ETFS | ANNUAL REPORT | SEE NOTES TO FINANCIAL STATEMENTS |
MULTIFACTOR LARGE CAP ETF (continued)
| | Shares or
Principal
Amount | Value |
| Consumer discretionary (continued) | |
| Leisure products (continued) | |
| Peloton Interactive, Inc., Class A (A) | 646 | $20,349 |
| Polaris, Inc. | 3,770 | 267,406 |
| Multiline retail – 0.7% | |
| Dollar General Corp. | 10,437 | 1,829,606 |
| Dollar Tree, Inc. (A) | 15,276 | 1,217,039 |
| Kohl's Corp. | 15,798 | 291,631 |
| Target Corp. | 22,345 | 2,452,140 |
| Specialty retail – 2.4% | |
| Advance Auto Parts, Inc. | 4,241 | 512,779 |
| AutoZone, Inc. (A) | 1,171 | 1,194,795 |
| Best Buy Company, Inc. | 20,919 | 1,605,115 |
| Burlington Stores, Inc. (A) | 3,414 | 623,704 |
| CarMax, Inc. (A) | 11,934 | 878,939 |
| Carvana Company (A)(B) | 1,076 | 86,198 |
| Five Below, Inc. (A) | 1,551 | 139,838 |
| L Brands, Inc. | 2,497 | 29,689 |
| Lowe's Companies, Inc. | 22,314 | 2,337,392 |
| O'Reilly Automotive, Inc. (A) | 3,868 | 1,494,363 |
| Ross Stores, Inc. | 20,564 | 1,878,727 |
| The Gap, Inc. | 18,314 | 148,710 |
| The Home Depot, Inc. | 20,198 | 4,440,126 |
| The TJX Companies, Inc. | 40,590 | 1,990,940 |
| Tractor Supply Company | 8,781 | 890,657 |
| Ulta Beauty, Inc. (A) | 3,580 | 780,154 |
| Textiles, apparel and luxury goods – 0.7% | |
| Columbia Sportswear Company | 876 | 63,852 |
| Levi Strauss & Company, Class A (B) | 746 | 9,616 |
| Lululemon Athletica, Inc. (A) | 5,417 | 1,210,591 |
| NIKE, Inc., Class B | 29,806 | 2,598,487 |
| PVH Corp. | 4,112 | 202,434 |
| Ralph Lauren Corp. | 3,919 | 289,144 |
| Tapestry, Inc. | 14,891 | 221,578 |
| Under Armour, Inc., Class A (A) | 8,394 | 87,465 |
| Under Armour, Inc., Class C (A) | 8,572 | 79,462 |
| VF Corp. | 14,614 | 849,073 |
| Consumer staples – 6.8% | 53,632,536 |
| Beverages – 1.5% | |
| Brown-Forman Corp., Class A | 3,181 | 180,426 |
| Brown-Forman Corp., Class B | 15,961 | 992,774 |
| Constellation Brands, Inc., Class A | 5,804 | 955,861 |
| Keurig Dr. Pepper, Inc. | 11,686 | 309,212 |
| Molson Coors Beverage Company, Class B | 11,203 | 459,435 |
| Monster Beverage Corp. (A) | 13,556 | 837,896 |
| PepsiCo, Inc. | 30,924 | 4,090,936 |
| The Coca-Cola Company | 78,950 | 3,623,016 |
| Food and staples retailing – 1.5% | |
| Casey's General Stores, Inc. | 1,201 | 181,843 |
| Costco Wholesale Corp. | 10,040 | 3,042,120 |
MULTIFACTOR LARGE CAP ETF (continued)
| | Shares or
Principal
Amount | Value |
| Consumer staples (continued) | |
| Food and staples retailing (continued) | |
| Sysco Corp. | 19,994 | $1,125,062 |
| The Kroger Company | 65,355 | 2,065,872 |
| US Foods Holding Corp. (A) | 12,241 | 263,182 |
| Walgreens Boots Alliance, Inc. | 19,710 | 853,246 |
| Walmart, Inc. | 36,660 | 4,456,023 |
| Food products – 1.7% | |
| Archer-Daniels-Midland Company | 28,673 | 1,064,915 |
| Beyond Meat, Inc. (A) | 369 | 36,527 |
| Bunge, Ltd. | 9,772 | 387,655 |
| Campbell Soup Company | 12,845 | 641,993 |
| Conagra Brands, Inc. | 28,951 | 968,121 |
| General Mills, Inc. | 27,265 | 1,632,901 |
| Hormel Foods Corp. | 14,813 | 693,989 |
| Ingredion, Inc. | 4,996 | 405,675 |
| Kellogg Company | 15,078 | 987,609 |
| Lamb Weston Holdings, Inc. | 8,535 | 523,708 |
| McCormick & Company, Inc. | 7,992 | 1,253,465 |
| Mondelez International, Inc., Class A | 36,326 | 1,868,609 |
| Pilgrim's Pride Corp. (A) | 616 | 13,552 |
| Post Holdings, Inc. (A) | 4,312 | 396,057 |
| The Hershey Company | 6,474 | 857,352 |
| The J.M. Smucker Company | 6,442 | 740,250 |
| The Kraft Heinz Company | 9,478 | 287,468 |
| Tyson Foods, Inc., Class A | 13,959 | 868,110 |
| Household products – 1.4% | |
| Church & Dwight Company, Inc. | 12,760 | 893,072 |
| Colgate-Palmolive Company | 19,552 | 1,373,919 |
| Kimberly-Clark Corp. | 9,156 | 1,267,923 |
| Reynolds Consumer Products, Inc. | 493 | 15,988 |
| The Clorox Company | 8,531 | 1,590,520 |
| The Procter & Gamble Company | 51,888 | 6,116,039 |
| Personal products – 0.2% | |
| Coty, Inc., Class A | 12,483 | 68,032 |
| Herbalife Nutrition, Ltd. (A) | 6,467 | 241,542 |
| The Estee Lauder Companies, Inc., Class A | 7,908 | 1,394,971 |
| Tobacco – 0.5% | |
| Altria Group, Inc. | 41,771 | 1,639,512 |
| Philip Morris International, Inc. | 26,356 | 1,966,158 |
| Energy – 2.7% | 21,576,545 |
| Energy equipment and services – 0.1% | |
| Baker Hughes Company | 9,412 | 131,297 |
| Halliburton Company | 19,628 | 206,094 |
| National Oilwell Varco, Inc. | 17,749 | 224,347 |
| Schlumberger, Ltd. | 22,610 | 380,300 |
| TechnipFMC PLC | 23,485 | 209,251 |
| Oil, gas and consumable fuels – 2.6% | |
| Apache Corp. | 18,582 | 243,053 |
| Cabot Oil & Gas Corp. | 19,265 | 416,509 |
| SEE NOTES TO FINANCIAL STATEMENTS | ANNUAL REPORT | JOHN HANCOCK MULTIFACTOR ETFS | 53 |
MULTIFACTOR LARGE CAP ETF (continued)
| | Shares or
Principal
Amount | Value |
| Energy (continued) | |
| Oil, gas and consumable fuels (continued) | |
| Cheniere Energy, Inc. (A) | 8,815 | $411,572 |
| Chevron Corp. | 47,781 | 4,395,852 |
| Concho Resources, Inc. | 8,055 | 456,880 |
| ConocoPhillips | 23,018 | 969,058 |
| Continental Resources, Inc. (B) | 4,906 | 80,409 |
| Devon Energy Corp. | 23,635 | 294,728 |
| Diamondback Energy, Inc. | 7,034 | 306,260 |
| EOG Resources, Inc. | 11,909 | 565,797 |
| Exxon Mobil Corp. | 84,674 | 3,934,801 |
| Hess Corp. | 15,550 | 756,352 |
| HollyFrontier Corp. | 14,073 | 464,972 |
| Kinder Morgan, Inc. | 55,817 | 850,093 |
| Marathon Oil Corp. | 52,830 | 323,320 |
| Marathon Petroleum Corp. | 29,978 | 961,694 |
| Noble Energy, Inc. | 32,326 | 317,118 |
| Occidental Petroleum Corp. | 24,371 | 404,559 |
| ONEOK, Inc. | 20,343 | 608,866 |
| Parsley Energy, Inc., Class A | 8,247 | 77,934 |
| Phillips 66 | 12,004 | 878,333 |
| Pioneer Natural Resources Company | 5,532 | 494,063 |
| Targa Resources Corp. | 9,013 | 116,808 |
| The Williams Companies, Inc. | 36,115 | 699,548 |
| Valero Energy Corp. | 22,047 | 1,396,677 |
| Financials – 12.0% | 94,400,650 |
| Banks – 3.8% | |
| Bank of America Corp. | 165,353 | 3,976,740 |
| BOK Financial Corp. | 1,054 | 54,587 |
| Citigroup, Inc. | 56,115 | 2,724,944 |
| Citizens Financial Group, Inc. | 29,085 | 651,213 |
| Comerica, Inc. | 10,792 | 376,209 |
| Commerce Bancshares, Inc. | 5,576 | 341,195 |
| Cullen/Frost Bankers, Inc. (B) | 2,197 | 157,876 |
| East West Bancorp, Inc. | 8,239 | 288,942 |
| Fifth Third Bancorp | 57,463 | 1,073,983 |
| First Republic Bank | 8,110 | 845,792 |
| Huntington Bancshares, Inc. | 65,009 | 600,683 |
| JPMorgan Chase & Co. | 70,586 | 6,759,315 |
| KeyCorp | 65,087 | 758,264 |
| M&T Bank Corp. | 8,307 | 931,049 |
| People's United Financial, Inc. | 19,954 | 253,216 |
| Prosperity Bancshares, Inc. | 1,154 | 69,159 |
| Regions Financial Corp. | 85,272 | 916,674 |
| Signature Bank | 2,792 | 299,247 |
| SVB Financial Group (A) | 3,063 | 591,680 |
| TCF Financial Corp. | 3,020 | 89,664 |
| The PNC Financial Services Group, Inc. | 12,951 | 1,381,483 |
| Truist Financial Corp. | 46,733 | 1,744,076 |
| U.S. Bancorp | 39,270 | 1,433,355 |
| Wells Fargo & Company | 108,459 | 3,150,734 |
MULTIFACTOR LARGE CAP ETF (continued)
| | Shares or
Principal
Amount | Value |
| Financials (continued) | |
| Banks (continued) | |
| Zions Bancorp NA | 12,258 | $387,475 |
| Capital markets – 3.3% | |
| Ameriprise Financial, Inc. | 11,506 | 1,322,500 |
| Ares Management Corp., Class A | 1,608 | 53,948 |
| BlackRock, Inc. | 2,177 | 1,092,941 |
| Cboe Global Markets, Inc. | 5,443 | 540,925 |
| CME Group, Inc. | 6,856 | 1,221,808 |
| E*TRADE Financial Corp. | 15,151 | 615,282 |
| FactSet Research Systems, Inc. | 2,236 | 614,900 |
| Franklin Resources, Inc. | 19,451 | 366,457 |
| Intercontinental Exchange, Inc. | 15,682 | 1,402,755 |
| Invesco, Ltd. | 22,945 | 197,786 |
| KKR & Company, Inc., Class A | 10,308 | 259,865 |
| LPL Financial Holdings, Inc. | 3,578 | 215,467 |
| MarketAxess Holdings, Inc. | 1,899 | 864,064 |
| Moody's Corp. | 5,684 | 1,386,328 |
| Morgan Stanley | 32,668 | 1,288,099 |
| Morningstar, Inc. | 667 | 104,025 |
| MSCI, Inc. | 5,566 | 1,820,082 |
| Nasdaq, Inc. | 6,889 | 755,517 |
| Northern Trust Corp. | 13,221 | 1,046,574 |
| Raymond James Financial, Inc. | 8,090 | 533,293 |
| S&P Global, Inc. | 7,109 | 2,082,084 |
| SEI Investments Company | 9,963 | 507,714 |
| State Street Corp. | 13,334 | 840,575 |
| T. Rowe Price Group, Inc. | 14,058 | 1,625,527 |
| TD Ameritrade Holding Corp. | 12,393 | 486,673 |
| The Bank of New York Mellon Corp. | 33,313 | 1,250,570 |
| The Blackstone Group, Inc., Class A | 4,558 | 238,110 |
| The Charles Schwab Corp. | 31,509 | 1,188,519 |
| The Goldman Sachs Group, Inc. | 8,538 | 1,566,040 |
| Tradeweb Markets, Inc., Class A | 719 | 37,503 |
| Consumer finance – 0.7% | |
| Ally Financial, Inc. | 36,735 | 602,087 |
| American Express Company | 18,759 | 1,711,759 |
| Capital One Financial Corp. | 21,270 | 1,377,445 |
| Credit Acceptance Corp. (A)(B) | 504 | 157,031 |
| Discover Financial Services | 21,553 | 926,132 |
| Santander Consumer USA Holdings, Inc. | 8,712 | 135,820 |
| Synchrony Financial | 40,075 | 793,084 |
| Diversified financial services – 1.2% | |
| Berkshire Hathaway, Inc., Class B (A) | 45,658 | 8,554,483 |
| Equitable Holdings, Inc. | 12,084 | 221,379 |
| Jefferies Financial Group, Inc. | 15,725 | 215,747 |
| Voya Financial, Inc. | 9,388 | 424,056 |
| Insurance – 3.0% | |
| Aflac, Inc. | 29,869 | 1,112,322 |
| Alleghany Corp. | 848 | 452,586 |
| American Financial Group, Inc. | 5,002 | 331,332 |
| 54 | JOHN HANCOCK MULTIFACTOR ETFS | ANNUAL REPORT | SEE NOTES TO FINANCIAL STATEMENTS |
MULTIFACTOR LARGE CAP ETF (continued)
| | Shares or
Principal
Amount | Value |
| Financials (continued) | |
| Insurance (continued) | |
| American International Group, Inc. | 26,140 | $664,740 |
| Aon PLC | 9,839 | 1,698,900 |
| Arch Capital Group, Ltd. (A) | 19,096 | 458,877 |
| Arthur J. Gallagher & Company | 10,162 | 797,717 |
| Assurant, Inc. | 1,811 | 192,401 |
| Athene Holding, Ltd., Class A (A) | 5,778 | 156,006 |
| Brown & Brown, Inc. | 13,603 | 488,484 |
| Chubb, Ltd. | 8,483 | 916,249 |
| Cincinnati Financial Corp. | 9,538 | 627,600 |
| CNA Financial Corp. | 1,972 | 62,276 |
| Erie Indemnity Company, Class A | 1,298 | 231,122 |
| Everest Re Group, Ltd. | 2,720 | 470,914 |
| Fidelity National Financial, Inc. | 16,270 | 440,104 |
| First American Financial Corp. | 5,274 | 243,237 |
| Globe Life, Inc. | 7,407 | 609,892 |
| Lincoln National Corp. | 16,227 | 575,572 |
| Loews Corp. | 18,165 | 629,599 |
| Markel Corp. (A) | 691 | 598,295 |
| Marsh & McLennan Companies, Inc. | 15,405 | 1,499,369 |
| MetLife, Inc. | 23,098 | 833,376 |
| Old Republic International Corp. | 16,214 | 258,613 |
| Principal Financial Group, Inc. | 20,633 | 751,248 |
| Prudential Financial, Inc. | 14,657 | 914,157 |
| Reinsurance Group of America, Inc. | 4,609 | 482,470 |
| RenaissanceRe Holdings, Ltd. | 1,146 | 167,327 |
| The Allstate Corp. | 12,716 | 1,293,472 |
| The Hartford Financial Services Group, Inc. | 30,130 | 1,144,639 |
| The Progressive Corp. | 21,991 | 1,699,904 |
| The Travelers Companies, Inc. | 13,748 | 1,391,435 |
| W.R. Berkley Corp. | 9,919 | 535,626 |
| Willis Towers Watson PLC | 6,143 | 1,095,235 |
| Thrifts and mortgage finance – 0.0% | |
| New York Community Bancorp, Inc. | 5,767 | 62,630 |
| TFS Financial Corp. | 763 | 10,415 |
| Health care – 15.0% | 118,062,070 |
| Biotechnology – 2.2% | |
| AbbVie, Inc. | 28,739 | 2,362,346 |
| ACADIA Pharmaceuticals, Inc. (A) | 830 | 40,097 |
| Alexion Pharmaceuticals, Inc. (A) | 6,610 | 710,377 |
| Alnylam Pharmaceuticals, Inc. (A) | 2,920 | 384,564 |
| Amgen, Inc. | 15,612 | 3,734,703 |
| Biogen, Inc. (A) | 6,114 | 1,814,819 |
| BioMarin Pharmaceutical, Inc. (A) | 6,298 | 579,542 |
| Exact Sciences Corp. (A) | 3,297 | 260,397 |
| Exelixis, Inc. (A) | 13,349 | 329,654 |
| Gilead Sciences, Inc. | 34,723 | 2,916,732 |
| Incyte Corp. (A) | 6,289 | 614,184 |
| Ionis Pharmaceuticals, Inc. (A) | 3,315 | 184,082 |
| Moderna, Inc. (A) | 2,434 | 111,940 |
MULTIFACTOR LARGE CAP ETF (continued)
| | Shares or
Principal
Amount | Value |
| Health care (continued) | |
| Biotechnology (continued) | |
| Neurocrine Biosciences, Inc. (A) | 2,120 | $208,057 |
| Regeneron Pharmaceuticals, Inc. (A) | 2,029 | 1,067,011 |
| Sarepta Therapeutics, Inc. (A) | 1,189 | 140,159 |
| Seattle Genetics, Inc. (A) | 3,332 | 457,250 |
| Vertex Pharmaceuticals, Inc. (A) | 5,594 | 1,405,213 |
| Health care equipment and supplies – 3.7% | |
| Abbott Laboratories | 41,424 | 3,814,736 |
| ABIOMED, Inc. (A) | 1,379 | 263,734 |
| Align Technology, Inc. (A) | 3,136 | 673,770 |
| Baxter International, Inc. | 16,290 | 1,446,226 |
| Becton, Dickinson and Company | 6,713 | 1,695,234 |
| Boston Scientific Corp. (A) | 35,806 | 1,342,009 |
| Danaher Corp. | 13,934 | 2,277,652 |
| Dentsply Sirona, Inc. | 12,833 | 544,633 |
| DexCom, Inc. (A) | 1,980 | 663,696 |
| Edwards Lifesciences Corp. (A) | 5,974 | 1,299,345 |
| Globus Medical, Inc., Class A (A) | 1,469 | 69,719 |
| Haemonetics Corp. (A) | 1,095 | 124,589 |
| Hill-Rom Holdings, Inc. | 3,286 | 369,642 |
| Hologic, Inc. (A) | 19,395 | 971,690 |
| IDEXX Laboratories, Inc. (A) | 5,124 | 1,422,422 |
| Insulet Corp. (A) | 1,566 | 312,762 |
| Intuitive Surgical, Inc. (A) | 2,273 | 1,161,230 |
| Masimo Corp. (A) | 1,473 | 315,089 |
| Medtronic PLC | 27,089 | 2,644,699 |
| Novocure, Ltd. (A) | 1,127 | 74,157 |
| Penumbra, Inc. (A) | 257 | 45,571 |
| ResMed, Inc. | 7,963 | 1,236,813 |
| STERIS PLC | 4,633 | 660,203 |
| Stryker Corp. | 8,782 | 1,637,228 |
| Teleflex, Inc. | 2,213 | 742,240 |
| The Cooper Companies, Inc. | 2,509 | 719,330 |
| Varian Medical Systems, Inc. (A) | 6,069 | 694,172 |
| West Pharmaceutical Services, Inc. | 3,527 | 667,520 |
| Zimmer Biomet Holdings, Inc. | 11,317 | 1,354,645 |
| Health care providers and services – 3.6% | |
| Amedisys, Inc. (A) | 367 | 67,587 |
| AmerisourceBergen Corp. | 10,321 | 925,381 |
| Anthem, Inc. | 8,536 | 2,396,311 |
| Cardinal Health, Inc. | 18,176 | 899,348 |
| Centene Corp. (A) | 25,087 | 1,670,292 |
| Chemed Corp. | 401 | 167,045 |
| Cigna Corp. | 12,987 | 2,542,595 |
| CVS Health Corp. | 36,246 | 2,230,941 |
| DaVita, Inc. (A) | 10,274 | 811,749 |
| Encompass Health Corp. | 3,852 | 255,195 |
| Guardant Health, Inc. (A) | 749 | 57,643 |
| HCA Healthcare, Inc. | 7,263 | 798,058 |
| Henry Schein, Inc. (A) | 11,687 | 637,643 |
| SEE NOTES TO FINANCIAL STATEMENTS | ANNUAL REPORT | JOHN HANCOCK MULTIFACTOR ETFS | 55 |
MULTIFACTOR LARGE CAP ETF (continued)
| | Shares or
Principal
Amount | Value |
| Health care (continued) | |
| Health care providers and services (continued) | |
| Humana, Inc. | 5,476 | $2,090,846 |
| Laboratory Corp. of America Holdings (A) | 8,474 | 1,393,549 |
| McKesson Corp. | 12,365 | 1,746,556 |
| Molina Healthcare, Inc. (A) | 3,293 | 539,953 |
| Quest Diagnostics, Inc. | 13,934 | 1,534,273 |
| UnitedHealth Group, Inc. | 23,539 | 6,884,451 |
| Universal Health Services, Inc., Class B | 7,945 | 839,707 |
| Health care technology – 0.3% | |
| Cerner Corp. | 19,355 | 1,343,043 |
| Teladoc Health, Inc. (A) | 658 | 108,300 |
| Veeva Systems, Inc., Class A (A) | 4,088 | 779,990 |
| Life sciences tools and services – 1.5% | |
| Agilent Technologies, Inc. | 19,288 | 1,478,618 |
| Avantor, Inc. (A) | 5,883 | 98,893 |
| Bio-Rad Laboratories, Inc., Class A (A) | 1,099 | 483,670 |
| Bio-Techne Corp. | 1,150 | 258,750 |
| Bruker Corp. | 3,110 | 122,285 |
| Charles River Laboratories International, Inc. (A) | 2,176 | 314,802 |
| Illumina, Inc. (A) | 4,074 | 1,299,728 |
| IQVIA Holdings, Inc. (A) | 9,163 | 1,306,552 |
| Mettler-Toledo International, Inc. (A) | 1,633 | 1,175,662 |
| PerkinElmer, Inc. | 5,984 | 541,732 |
| PPD, Inc. (A) | 547 | 13,073 |
| PRA Health Sciences, Inc. (A) | 2,442 | 235,653 |
| Syneos Health, Inc. (A) | 1,225 | 68,343 |
| Thermo Fisher Scientific, Inc. | 8,953 | 2,996,390 |
| Waters Corp. (A) | 4,918 | 919,666 |
| Pharmaceuticals – 3.7% | |
| Allergan PLC | 7,059 | 1,322,433 |
| Bristol-Myers Squibb Company | 43,741 | 2,659,890 |
| Catalent, Inc. (A) | 8,058 | 557,211 |
| Elanco Animal Health, Inc. (A) | 13,924 | 344,062 |
| Eli Lilly & Company | 18,029 | 2,788,005 |
| Horizon Therapeutics PLC (A) | 2,954 | 106,462 |
| Jazz Pharmaceuticals PLC (A) | 3,338 | 368,015 |
| Johnson & Johnson | 58,633 | 8,797,295 |
| Merck & Company, Inc. | 59,560 | 4,725,490 |
| Mylan NV (A) | 27,716 | 464,797 |
| Perrigo Company PLC | 6,824 | 363,719 |
| Pfizer, Inc. | 134,179 | 5,147,106 |
| Reata Pharmaceuticals, Inc., Class A (A)(B) | 174 | 27,520 |
| Zoetis, Inc. | 13,842 | 1,789,909 |
| Industrials – 10.8% | 84,917,674 |
| Aerospace and defense – 1.7% | |
| BWX Technologies, Inc. | 1,612 | 85,533 |
| Curtiss-Wright Corp. | 973 | 100,851 |
| General Dynamics Corp. | 7,083 | 925,181 |
| HEICO Corp. | 1,491 | 130,612 |
MULTIFACTOR LARGE CAP ETF (continued)
| | Shares or
Principal
Amount | Value |
| Industrials (continued) | |
| Aerospace and defense (continued) | |
| HEICO Corp., Class A | 2,832 | $204,839 |
| Hexcel Corp. | 3,283 | 113,559 |
| Howmet Aerospace, Inc. | 23,992 | 313,575 |
| Huntington Ingalls Industries, Inc. | 2,789 | 533,842 |
| L3Harris Technologies, Inc. | 6,428 | 1,245,104 |
| Lockheed Martin Corp. | 5,703 | 2,218,809 |
| Northrop Grumman Corp. | 4,251 | 1,405,678 |
| Raytheon Technologies Corp. | 43,707 | 2,832,651 |
| Spirit AeroSystems Holdings, Inc., Class A | 7,300 | 161,768 |
| Teledyne Technologies, Inc. (A) | 1,411 | 459,520 |
| Textron, Inc. | 17,209 | 453,629 |
| The Boeing Company | 10,221 | 1,441,365 |
| TransDigm Group, Inc. | 1,729 | 627,765 |
| Air freight and logistics – 0.5% | |
| C.H. Robinson Worldwide, Inc. | 9,537 | 676,173 |
| Expeditors International of Washington, Inc. | 11,345 | 812,359 |
| FedEx Corp. | 7,662 | 971,312 |
| United Parcel Service, Inc., Class B | 13,972 | 1,322,590 |
| XPO Logistics, Inc. (A) | 5,770 | 385,090 |
| Airlines – 0.4% | |
| Alaska Air Group, Inc. | 8,912 | 289,818 |
| American Airlines Group, Inc. (B) | 25,753 | 309,294 |
| Delta Air Lines, Inc. | 30,999 | 803,184 |
| Southwest Airlines Company | 31,400 | 981,250 |
| United Airlines Holdings, Inc. (A) | 24,885 | 736,098 |
| Building products – 0.7% | |
| Allegion PLC | 6,838 | 687,493 |
| AO Smith Corp. | 6,819 | 288,989 |
| Carrier Global Corp. (A) | 21,999 | 389,602 |
| Fortune Brands Home & Security, Inc. | 8,755 | 421,991 |
| Johnson Controls International PLC | 33,349 | 970,789 |
| Lennox International, Inc. | 2,038 | 380,454 |
| Masco Corp. | 15,368 | 630,703 |
| Owens Corning | 7,741 | 335,650 |
| Trane Technologies PLC | 14,205 | 1,241,801 |
| Trex Company, Inc. (A) | 634 | 60,369 |
| Commercial services and supplies – 0.8% | |
| Cintas Corp. | 6,139 | 1,361,814 |
| Copart, Inc. (A) | 11,338 | 908,287 |
| IAA, Inc. (A) | 6,597 | 254,644 |
| Republic Services, Inc. | 19,608 | 1,536,091 |
| Rollins, Inc. | 7,770 | 310,800 |
| Waste Management, Inc. | 17,549 | 1,755,251 |
| Construction and engineering – 0.1% | |
| AECOM (A) | 3,987 | 144,569 |
| Jacobs Engineering Group, Inc. | 7,562 | 625,756 |
| Quanta Services, Inc. | 2,019 | 73,411 |
| Electrical equipment – 0.8% | |
| AMETEK, Inc. | 14,112 | 1,183,573 |
| 56 | JOHN HANCOCK MULTIFACTOR ETFS | ANNUAL REPORT | SEE NOTES TO FINANCIAL STATEMENTS |
MULTIFACTOR LARGE CAP ETF (continued)
| | Shares or
Principal
Amount | Value |
| Industrials (continued) | |
| Electrical equipment (continued) | |
| Eaton Corp. PLC | 15,794 | $1,318,799 |
| Emerson Electric Company | 21,100 | 1,203,333 |
| Generac Holdings, Inc. (A) | 833 | 81,168 |
| Hubbell, Inc. | 3,409 | 424,182 |
| Rockwell Automation, Inc. | 8,202 | 1,554,115 |
| Sensata Technologies Holding PLC (A) | 10,331 | 375,842 |
| Industrial conglomerates – 0.9% | |
| 3M Company | 13,336 | 2,026,005 |
| Carlisle Companies, Inc. | 4,135 | 500,170 |
| General Electric Company | 160,980 | 1,094,664 |
| Honeywell International, Inc. | 16,441 | 2,332,978 |
| Roper Technologies, Inc. | 3,545 | 1,208,951 |
| Machinery – 2.5% | |
| Allison Transmission Holdings, Inc. | 8,632 | 313,687 |
| Caterpillar, Inc. | 15,493 | 1,803,075 |
| Cummins, Inc. | 9,378 | 1,533,303 |
| Deere & Company | 13,083 | 1,897,820 |
| Donaldson Company, Inc. | 8,073 | 353,840 |
| Dover Corp. | 11,693 | 1,095,049 |
| Flowserve Corp. | 9,518 | 268,122 |
| Fortive Corp. | 15,102 | 966,528 |
| Graco, Inc. | 7,987 | 356,699 |
| IDEX Corp. | 4,486 | 689,184 |
| Illinois Tool Works, Inc. | 10,721 | 1,742,163 |
| Ingersoll Rand, Inc. (A) | 12,456 | 362,220 |
| Lincoln Electric Holdings, Inc. | 3,632 | 292,412 |
| Nordson Corp. | 2,686 | 432,204 |
| Otis Worldwide Corp. (A) | 10,980 | 558,992 |
| PACCAR, Inc. | 25,919 | 1,794,372 |
| Parker-Hannifin Corp. | 9,232 | 1,459,764 |
| Pentair PLC | 10,050 | 347,630 |
| Snap-on, Inc. | 3,674 | 478,685 |
| Stanley Black & Decker, Inc. | 9,929 | 1,094,176 |
| The Middleby Corp. (A) | 3,133 | 174,289 |
| The Toro Company | 5,421 | 345,914 |
| Wabtec Corp. | 6,684 | 377,111 |
| Woodward, Inc. | 1,656 | 100,287 |
| Xylem, Inc. | 9,412 | 676,723 |
| Professional services – 0.7% | |
| CoStar Group, Inc. (A) | 1,435 | 930,253 |
| Equifax, Inc. | 6,973 | 968,550 |
| IHS Markit, Ltd. | 12,850 | 864,805 |
| Nielsen Holdings PLC | 13,837 | 203,819 |
| Robert Half International, Inc. | 8,024 | 379,294 |
| TransUnion | 9,352 | 736,844 |
| Verisk Analytics, Inc. | 8,856 | 1,353,462 |
| Road and rail – 1.2% | |
| AMERCO | 579 | 162,195 |
| CSX Corp. | 24,218 | 1,603,958 |
MULTIFACTOR LARGE CAP ETF (continued)
| | Shares or
Principal
Amount | Value |
| Industrials (continued) | |
| Road and rail (continued) | |
| J.B. Hunt Transport Services, Inc. | 7,652 | $773,770 |
| Kansas City Southern | 6,816 | 889,829 |
| Knight-Swift Transportation Holdings, Inc. (B) | 3,580 | 133,104 |
| Lyft, Inc., Class A (A) | 431 | 14,150 |
| Norfolk Southern Corp. | 12,017 | 2,056,109 |
| Old Dominion Freight Line, Inc. | 5,746 | 834,836 |
| Uber Technologies, Inc. (A) | 9,246 | 279,876 |
| Union Pacific Corp. | 19,801 | 3,164,002 |
| Trading companies and distributors – 0.5% | |
| Fastenal Company | 34,071 | 1,234,052 |
| HD Supply Holdings, Inc. (A) | 10,909 | 323,779 |
| United Rentals, Inc. (A) | 6,751 | 867,504 |
| W.W. Grainger, Inc. | 4,210 | 1,160,192 |
| Watsco, Inc. | 1,524 | 245,349 |
| Information technology – 22.7% | 179,174,470 |
| Communications equipment – 1.0% | |
| Arista Networks, Inc. (A) | 2,076 | 455,267 |
| Ciena Corp. (A) | 5,361 | 247,946 |
| Cisco Systems, Inc. | 105,695 | 4,479,354 |
| F5 Networks, Inc. (A) | 4,076 | 567,624 |
| Juniper Networks, Inc. | 24,149 | 521,618 |
| Lumentum Holdings, Inc. (A) | 1,053 | 85,198 |
| Motorola Solutions, Inc. | 8,840 | 1,271,280 |
| Ubiquiti, Inc. (B) | 559 | 90,575 |
| Electronic equipment, instruments and components – 1.2% | |
| Amphenol Corp., Class A | 21,417 | 1,890,264 |
| Arrow Electronics, Inc. (A) | 7,011 | 441,132 |
| CDW Corp. | 8,468 | 938,254 |
| Cognex Corp. | 5,690 | 314,316 |
| Corning, Inc. | 54,373 | 1,196,750 |
| Dolby Laboratories, Inc., Class A | 3,029 | 181,831 |
| Flex, Ltd. (A) | 48,403 | 472,417 |
| FLIR Systems, Inc. | 6,184 | 268,386 |
| IPG Photonics Corp. (A) | 1,685 | 217,921 |
| Keysight Technologies, Inc. (A) | 10,295 | 996,247 |
| National Instruments Corp. | 4,421 | 169,855 |
| SYNNEX Corp. | 707 | 61,905 |
| TE Connectivity, Ltd. | 17,677 | 1,298,552 |
| Trimble, Inc. (A) | 13,822 | 478,656 |
| Zebra Technologies Corp., Class A (A) | 2,668 | 612,733 |
| IT services – 5.1% | |
| Accenture PLC, Class A | 15,469 | 2,864,704 |
| Akamai Technologies, Inc. (A) | 10,921 | 1,067,091 |
| Amdocs, Ltd. | 11,274 | 726,497 |
| Automatic Data Processing, Inc. | 10,417 | 1,528,070 |
| Black Knight, Inc. (A) | 6,442 | 454,612 |
| Booz Allen Hamilton Holding Corp. | 7,035 | 516,650 |
| Broadridge Financial Solutions, Inc. | 6,878 | 797,848 |
| SEE NOTES TO FINANCIAL STATEMENTS | ANNUAL REPORT | JOHN HANCOCK MULTIFACTOR ETFS | 57 |
MULTIFACTOR LARGE CAP ETF (continued)
| | Shares or
Principal
Amount | Value |
| Information technology (continued) | |
| IT services (continued) | |
| CACI International, Inc., Class A (A) | 632 | $158,088 |
| Cognizant Technology Solutions Corp., Class A | 19,830 | 1,150,537 |
| DXC Technology Company | 14,179 | 257,065 |
| EPAM Systems, Inc. (A) | 1,956 | 432,061 |
| Euronet Worldwide, Inc. (A) | 1,828 | 167,737 |
| Fidelity National Information Services, Inc. | 13,860 | 1,827,995 |
| Fiserv, Inc. (A) | 10,934 | 1,126,858 |
| FleetCor Technologies, Inc. (A) | 4,950 | 1,194,188 |
| Gartner, Inc. (A) | 4,514 | 536,308 |
| Genpact, Ltd. | 7,998 | 275,371 |
| Global Payments, Inc. | 10,105 | 1,677,632 |
| GoDaddy, Inc., Class A (A) | 4,665 | 323,891 |
| IBM Corp. | 23,749 | 2,981,924 |
| Jack Henry & Associates, Inc. | 4,494 | 734,994 |
| Leidos Holdings, Inc. | 8,312 | 821,309 |
| Mastercard, Inc., Class A | 19,933 | 5,480,977 |
| MongoDB, Inc. (A) | 726 | 117,706 |
| Okta, Inc. (A) | 2,279 | 344,813 |
| Paychex, Inc. | 18,221 | 1,248,503 |
| PayPal Holdings, Inc. (A) | 21,292 | 2,618,916 |
| Square, Inc., Class A (A) | 5,177 | 337,230 |
| The Western Union Company | 27,935 | 532,720 |
| Twilio, Inc., Class A (A) | 4,118 | 462,451 |
| VeriSign, Inc. (A) | 5,362 | 1,123,285 |
| Visa, Inc., Class A | 35,626 | 6,367,079 |
| WEX, Inc. (A) | 1,775 | 234,868 |
| Semiconductors and semiconductor equipment – 4.6% | |
| Advanced Micro Devices, Inc. (A) | 24,300 | 1,273,077 |
| Analog Devices, Inc. | 15,648 | 1,715,021 |
| Applied Materials, Inc. | 35,823 | 1,779,687 |
| Broadcom, Inc. | 8,870 | 2,409,269 |
| Enphase Energy, Inc. (A) | 1,065 | 49,874 |
| Entegris, Inc. | 3,927 | 212,961 |
| First Solar, Inc. (A) | 1,802 | 79,306 |
| Intel Corp. | 114,809 | 6,886,244 |
| KLA Corp. | 9,104 | 1,493,875 |
| Lam Research Corp. | 8,813 | 2,249,783 |
| Marvell Technology Group, Ltd. | 34,355 | 918,653 |
| Maxim Integrated Products, Inc. | 18,245 | 1,003,110 |
| Microchip Technology, Inc. | 13,443 | 1,179,354 |
| Micron Technology, Inc. (A) | 47,941 | 2,295,894 |
| MKS Instruments, Inc. | 774 | 77,578 |
| Monolithic Power Systems, Inc. | 1,269 | 253,686 |
| NVIDIA Corp. | 9,644 | 2,818,748 |
| ON Semiconductor Corp. (A) | 24,811 | 398,093 |
| Qorvo, Inc. (A) | 6,754 | 662,095 |
| QUALCOMM, Inc. | 31,419 | 2,471,733 |
| Skyworks Solutions, Inc. | 11,704 | 1,215,812 |
| SolarEdge Technologies, Inc. (A) | 582 | 64,945 |
MULTIFACTOR LARGE CAP ETF (continued)
| | Shares or
Principal
Amount | Value |
| Information technology (continued) | |
| Semiconductors and semiconductor equipment (continued) | |
| Teradyne, Inc. | 9,966 | $623,274 |
| Texas Instruments, Inc. | 23,720 | 2,753,180 |
| Universal Display Corp. | 993 | 149,069 |
| Xilinx, Inc. | 9,112 | 796,389 |
| Software – 6.9% | |
| Adobe, Inc. (A) | 7,810 | 2,761,928 |
| Alteryx, Inc., Class A (A)(B) | 638 | 72,209 |
| Anaplan, Inc. (A) | 1,286 | 52,546 |
| ANSYS, Inc. (A) | 4,569 | 1,196,301 |
| Aspen Technology, Inc. (A) | 2,452 | 250,717 |
| Atlassian Corp. PLC, Class A (A) | 2,525 | 392,612 |
| Autodesk, Inc. (A) | 5,219 | 976,631 |
| Avalara, Inc. (A) | 873 | 78,020 |
| Cadence Design Systems, Inc. (A) | 15,268 | 1,238,693 |
| CDK Global, Inc. | 7,094 | 278,652 |
| Ceridian HCM Holding, Inc. (A) | 2,265 | 133,567 |
| Citrix Systems, Inc. | 9,050 | 1,312,341 |
| Coupa Software, Inc. (A) | 1,194 | 210,251 |
| Crowdstrike Holdings, Inc., Class A (A) | 1,156 | 78,215 |
| DocuSign, Inc. (A) | 2,538 | 265,856 |
| Dropbox, Inc., Class A (A) | 4,654 | 97,827 |
| Dynatrace, Inc. (A) | 688 | 20,537 |
| Elastic NV (A) | 534 | 34,251 |
| Fair Isaac Corp. (A) | 1,100 | 388,234 |
| Fortinet, Inc. (A) | 5,094 | 548,828 |
| Guidewire Software, Inc. (A) | 3,236 | 293,958 |
| HubSpot, Inc. (A) | 855 | 144,179 |
| Intuit, Inc. | 6,304 | 1,700,882 |
| Microsoft Corp. | 148,504 | 26,613,402 |
| NortonLifeLock, Inc. | 41,806 | 889,214 |
| Nuance Communications, Inc. (A) | 4,016 | 81,123 |
| Oracle Corp. | 75,419 | 3,994,944 |
| Palo Alto Networks, Inc. (A) | 2,744 | 539,223 |
| Paycom Software, Inc. (A) | 1,761 | 459,656 |
| Paylocity Holding Corp. (A) | 545 | 62,419 |
| Pegasystems, Inc. | 719 | 60,123 |
| Proofpoint, Inc. (A) | 1,413 | 172,004 |
| PTC, Inc. (A) | 3,671 | 254,217 |
| RealPage, Inc. (A) | 2,396 | 154,518 |
| RingCentral, Inc., Class A (A) | 1,570 | 358,792 |
| salesforce.com, Inc. (A) | 13,305 | 2,154,745 |
| ServiceNow, Inc. (A) | 4,197 | 1,475,413 |
| Slack Technologies, Inc., Class A (A) | 3,522 | 94,002 |
| Smartsheet, Inc., Class A (A) | 1,885 | 99,377 |
| SolarWinds Corp. (A) | 722 | 12,260 |
| Splunk, Inc. (A) | 4,879 | 684,816 |
| SS&C Technologies Holdings, Inc. | 12,462 | 687,404 |
| Synopsys, Inc. (A) | 8,620 | 1,354,374 |
| The Trade Desk, Inc., Class A (A) | 852 | 249,278 |
| 58 | JOHN HANCOCK MULTIFACTOR ETFS | ANNUAL REPORT | SEE NOTES TO FINANCIAL STATEMENTS |
MULTIFACTOR LARGE CAP ETF (continued)
| | Shares or
Principal
Amount | Value |
| Information technology (continued) | |
| Software (continued) | |
| Tyler Technologies, Inc. (A) | 1,643 | $526,894 |
| VMware, Inc., Class A (A) | 2,049 | 269,484 |
| Workday, Inc., Class A (A) | 3,424 | 526,954 |
| Zendesk, Inc. (A) | 2,275 | 174,902 |
| Zoom Video Communications, Inc., Class A (A) | 1,116 | 150,850 |
| Zscaler, Inc. (A)(B) | 720 | 48,298 |
| Technology hardware, storage and peripherals – 3.9% | |
| Apple, Inc. | 88,334 | 25,952,529 |
| Dell Technologies, Inc., Class C (A) | 5,299 | 226,214 |
| Hewlett Packard Enterprise Company | 71,086 | 715,125 |
| HP, Inc. | 49,350 | 765,419 |
| NetApp, Inc. | 17,977 | 786,853 |
| Seagate Technology PLC | 23,631 | 1,180,368 |
| Western Digital Corp. | 21,754 | 1,002,424 |
| Xerox Holdings Corp. | 15,902 | 290,848 |
| Materials – 3.4% | 27,160,096 |
| Chemicals – 1.9% | |
| Air Products & Chemicals, Inc. | 6,936 | 1,564,623 |
| Albemarle Corp. | 6,111 | 375,399 |
| Axalta Coating Systems, Ltd. (A) | 13,177 | 260,114 |
| Celanese Corp. | 9,501 | 789,248 |
| CF Industries Holdings, Inc. | 17,460 | 480,150 |
| Corteva, Inc. | 26,814 | 702,259 |
| Dow, Inc. | 17,245 | 632,719 |
| DuPont de Nemours, Inc. | 12,837 | 603,596 |
| Eastman Chemical Company | 11,602 | 702,037 |
| Ecolab, Inc. | 8,050 | 1,557,675 |
| FMC Corp. | 8,108 | 745,125 |
| International Flavors & Fragrances, Inc. | 5,296 | 693,935 |
| Linde PLC | 9,485 | 1,745,145 |
| LyondellBasell Industries NV, Class A | 11,147 | 645,969 |
| PPG Industries, Inc. | 13,725 | 1,246,642 |
| RPM International, Inc. | 8,355 | 554,856 |
| The Mosaic Company | 20,494 | 235,886 |
| The Scotts Miracle-Gro Company | 926 | 114,852 |
| The Sherwin-Williams Company | 2,999 | 1,608,574 |
| Westlake Chemical Corp. | 2,272 | 98,718 |
| Construction materials – 0.2% | |
| Martin Marietta Materials, Inc. | 3,589 | 682,735 |
| Vulcan Materials Company | 7,364 | 831,911 |
| Containers and packaging – 0.7% | |
| Amcor PLC | 41,250 | 370,013 |
| AptarGroup, Inc. | 3,226 | 345,440 |
| Avery Dennison Corp. | 4,770 | 526,560 |
| Ball Corp. | 21,038 | 1,379,882 |
| Berry Global Group, Inc. (A) | 6,737 | 268,065 |
| Crown Holdings, Inc. (A) | 8,628 | 555,729 |
| International Paper Company | 30,854 | 1,056,750 |
MULTIFACTOR LARGE CAP ETF (continued)
| | Shares or
Principal
Amount | Value |
| Materials (continued) | |
| Containers and packaging (continued) | |
| Packaging Corp. of America | 7,052 | $681,576 |
| Sonoco Products Company | 2,869 | 140,122 |
| Westrock Company | 13,884 | 446,926 |
| Metals and mining – 0.6% | |
| Arconic Corp. (A) | 5,830 | 50,838 |
| Freeport-McMoRan, Inc. | 86,803 | 766,470 |
| Newmont Corp. | 28,585 | 1,700,236 |
| Nucor Corp. | 21,458 | 883,855 |
| Reliance Steel & Aluminum Company | 4,858 | 435,180 |
| Royal Gold, Inc. | 1,785 | 218,716 |
| Southern Copper Corp. | 3,678 | 119,314 |
| Steel Dynamics, Inc. | 14,102 | 342,256 |
| Real estate – 3.4% | 26,844,653 |
| Equity real estate investment trusts – 3.2% | |
| Alexandria Real Estate Equities, Inc. | 4,418 | 694,024 |
| American Campus Communities, Inc. | 5,127 | 180,932 |
| American Homes 4 Rent, Class A | 9,327 | 225,154 |
| American Tower Corp. | 8,287 | 1,972,306 |
| Americold Realty Trust | 4,075 | 124,654 |
| Apartment Investment & Management Company, Class A | 6,486 | 244,328 |
| AvalonBay Communities, Inc. | 5,755 | 937,777 |
| Boston Properties, Inc. | 6,559 | 637,404 |
| Brixmor Property Group, Inc. | 5,531 | 63,330 |
| Camden Property Trust | 3,885 | 342,152 |
| CoreSite Realty Corp. | 397 | 48,112 |
| Crown Castle International Corp. | 8,866 | 1,413,506 |
| CubeSmart | 4,588 | 115,618 |
| CyrusOne, Inc. | 2,869 | 201,260 |
| Digital Realty Trust, Inc. | 8,161 | 1,219,988 |
| Douglas Emmett, Inc. | 6,373 | 194,313 |
| Duke Realty Corp. | 15,280 | 530,216 |
| Equinix, Inc. | 1,955 | 1,320,016 |
| Equity LifeStyle Properties, Inc. | 6,812 | 410,832 |
| Equity Residential | 12,679 | 824,896 |
| Essex Property Trust, Inc. | 2,755 | 672,496 |
| Extra Space Storage, Inc. | 5,185 | 457,524 |
| Federal Realty Investment Trust | 3,072 | 255,805 |
| Gaming and Leisure Properties, Inc. | 7,896 | 222,983 |
| Healthcare Trust of America, Inc., Class A | 6,327 | 155,834 |
| Healthpeak Properties, Inc. | 20,174 | 527,348 |
| Host Hotels & Resorts, Inc. | 31,008 | 381,708 |
| Invitation Homes, Inc. | 13,442 | 317,903 |
| Iron Mountain, Inc. | 11,465 | 277,224 |
| Kilroy Realty Corp. | 4,111 | 255,951 |
| Kimco Realty Corp. | 17,393 | 189,758 |
| Lamar Advertising Company, Class A | 3,409 | 196,529 |
| Medical Properties Trust, Inc. | 11,195 | 191,882 |
| MGM Growth Properties LLC, Class A | 3,431 | 86,358 |
| SEE NOTES TO FINANCIAL STATEMENTS | ANNUAL REPORT | JOHN HANCOCK MULTIFACTOR ETFS | 59 |
MULTIFACTOR LARGE CAP ETF (continued)
| | Shares or
Principal
Amount | Value |
| Real estate (continued) | |
| Equity real estate investment trusts (continued) | |
| Mid-America Apartment Communities, Inc. | 4,467 | $499,947 |
| National Retail Properties, Inc. | 6,485 | 211,670 |
| Omega Healthcare Investors, Inc. | 8,606 | 250,865 |
| Prologis, Inc. | 15,729 | 1,403,499 |
| Public Storage | 3,223 | 597,705 |
| Realty Income Corp. | 12,517 | 687,434 |
| Regency Centers Corp. | 5,971 | 262,187 |
| SBA Communications Corp. | 3,561 | 1,032,405 |
| Simon Property Group, Inc. | 6,139 | 409,901 |
| SL Green Realty Corp. | 4,023 | 213,420 |
| STORE Capital Corp. | 5,806 | 116,526 |
| Sun Communities, Inc. | 3,244 | 435,994 |
| UDR, Inc. | 11,758 | 440,572 |
| Ventas, Inc. | 14,438 | 467,069 |
| VEREIT, Inc. | 39,910 | 218,707 |
| VICI Properties, Inc. | 12,869 | 224,178 |
| Vornado Realty Trust | 7,359 | 322,471 |
| Welltower, Inc. | 12,886 | 660,150 |
| Weyerhaeuser Company | 40,884 | 894,133 |
| WP Carey, Inc. | 5,864 | 385,734 |
| Real estate management and development – 0.2% | |
| CBRE Group, Inc., Class A (A) | 20,705 | 888,866 |
| Jones Lang LaSalle, Inc. | 3,136 | 331,099 |
| Utilities – 4.6% | 35,990,177 |
| Electric utilities – 2.6% | |
| Alliant Energy Corp. | 14,195 | 689,167 |
| American Electric Power Company, Inc. | 21,784 | 1,810,468 |
| Avangrid, Inc. | 2,690 | 115,670 |
| Duke Energy Corp. | 16,286 | 1,378,773 |
| Edison International | 25,357 | 1,488,709 |
| Entergy Corp. | 14,651 | 1,399,317 |
| Evergy, Inc. | 16,205 | 946,858 |
| Eversource Energy | 19,253 | 1,553,717 |
| Exelon Corp. | 43,319 | 1,606,269 |
| FirstEnergy Corp. | 29,607 | 1,221,881 |
| IDACORP, Inc. | 770 | 70,671 |
| NextEra Energy, Inc. | 9,161 | 2,117,290 |
| NRG Energy, Inc. | 11,526 | 386,467 |
| OGE Energy Corp. | 13,483 | 424,984 |
| Pinnacle West Capital Corp. | 8,522 | 656,109 |
| PPL Corp. | 51,785 | 1,316,375 |
| The Southern Company | 28,167 | 1,597,914 |
MULTIFACTOR LARGE CAP ETF (continued)
| | Shares or
Principal
Amount | Value |
| Utilities (continued) | |
| Electric utilities (continued) | |
| Xcel Energy, Inc. | 23,900 | $1,519,084 |
| Gas utilities – 0.1% | |
| Atmos Energy Corp. | 6,078 | 619,774 |
| UGI Corp. | 12,057 | 363,880 |
| Independent power and renewable electricity producers –0.1% | |
| The AES Corp. | 48,686 | 645,090 |
| Vistra Energy Corp. | 18,866 | 368,642 |
| Multi-utilities – 1.6% | |
| Ameren Corp. | 18,206 | 1,324,487 |
| CenterPoint Energy, Inc. | 35,126 | 598,196 |
| CMS Energy Corp. | 16,597 | 947,523 |
| Consolidated Edison, Inc. | 23,071 | 1,817,995 |
| Dominion Energy, Inc. | 18,122 | 1,397,750 |
| DTE Energy Company | 12,757 | 1,323,411 |
| MDU Resources Group, Inc. | 9,118 | 204,790 |
| NiSource, Inc. | 27,304 | 685,603 |
| Public Service Enterprise Group, Inc. | 32,122 | 1,628,907 |
| Sempra Energy | 7,183 | 889,615 |
| WEC Energy Group, Inc. | 16,139 | 1,461,386 |
| Water utilities – 0.2% | |
| American Water Works Company, Inc. | 9,180 | 1,117,114 |
| Essential Utilities, Inc. | 7,090 | 296,291 |
|
| SHORT-TERM INVESTMENTS – 0.3% | | $2,303,461 |
| (Cost $2,302,487) | | |
| Short-term funds – 0.3% | 2,303,461 |
| John Hancock Collateral Trust, 0.6614% (C)(D) | 188,118 | 1,882,757 |
|
| State Street Institutional U.S. Government Money Market Fund, Premier Class, 0.2162% (C) | 420,704 | 420,704 |
| Total investments (Multifactor Large Cap ETF) (Cost $778,450,630) 100.2% | $790,735,606 |
| Other assets and liabilities, net (0.2%) | | (1,521,484) |
| Total net assets 100.0% | | $789,214,122 |
| The percentage shown for each investment category is the total value of the category as a percentage of the net assets of the fund. |
| Security Abbreviations and Legend |
| (A) | Non-income producing security. |
| (B) | All or a portion of this security is on loan as of 4-30-20. |
| (C) | The rate shown is the annualized seven-day yield as of 4-30-20. |
| (D) | Investment is an affiliate of the fund, the advisor and/or subadvisor. This security represents the investment of cash collateral received for securities lending. |
| 60 | JOHN HANCOCK MULTIFACTOR ETFS | ANNUAL REPORT | SEE NOTES TO FINANCIAL STATEMENTS |
DERIVATIVES
FUTURES
| Open contracts | Number of
contracts | Position | Expiration
date | Notional
basis^ | Notional
value^ | Unrealized
appreciation
(depreciation) |
| S&P 500 Index E-Mini Futures | 2 | Long | Jun 2020 | $235,434 | $290,125 | $54,691 |
| | | | | | | $54,691 |
^ Notional basis refers to the contractual amount agreed upon at inception of open contracts; notional value represents the current value of the open contract.
See Notes to financial statements regarding investment transactions and other derivatives information.
MULTIFACTOR MATERIALS ETF
As of 4-30-20
| | Shares or
Principal
Amount | Value |
| COMMON STOCKS – 99.9% | | $17,154,136 |
| (Cost $19,405,376) | | |
| Industrials – 2.8% | 493,227 |
| Aerospace and defense – 1.1% | |
| Howmet Aerospace, Inc. | 14,993 | 195,959 |
| Building products – 1.2% | |
| Owens Corning | 4,799 | 208,085 |
| Machinery – 0.5% | |
| RBC Bearings, Inc. (A) | 704 | 89,183 |
| Materials – 96.2% | 16,508,787 |
| Chemicals – 51.5% | |
| Air Products & Chemicals, Inc. | 3,380 | 762,460 |
| Albemarle Corp. | 3,419 | 210,029 |
| Ashland Global Holdings, Inc. | 2,203 | 135,903 |
| Axalta Coating Systems, Ltd. (A) | 8,177 | 161,414 |
| Celanese Corp. | 4,294 | 356,703 |
| CF Industries Holdings, Inc. | 8,001 | 220,028 |
| Dow, Inc. | 13,545 | 496,966 |
| DuPont de Nemours, Inc. | 6,004 | 282,308 |
| Eastman Chemical Company | 5,951 | 360,095 |
| Ecolab, Inc. | 3,595 | 695,633 |
| FMC Corp. | 4,624 | 424,946 |
| Huntsman Corp. | 8,832 | 148,466 |
| International Flavors & Fragrances, Inc. | 3,436 | 450,219 |
| Linde PLC | 5,446 | 1,002,010 |
| LyondellBasell Industries NV, Class A | 10,667 | 618,152 |
| NewMarket Corp. | 321 | 132,072 |
| PPG Industries, Inc. | 8,840 | 802,937 |
| RPM International, Inc. | 4,130 | 274,273 |
| The Mosaic Company | 12,334 | 141,964 |
| The Scotts Miracle-Gro Company | 1,247 | 154,665 |
| The Sherwin-Williams Company | 1,349 | 723,563 |
| Valvoline, Inc. | 5,573 | 95,800 |
| W.R. Grace & Company | 2,369 | 111,888 |
| Westlake Chemical Corp. | 1,723 | 74,864 |
| Construction materials – 4.8% | |
| Martin Marietta Materials, Inc. | 1,932 | 367,524 |
| Vulcan Materials Company | 4,084 | 461,369 |
| Containers and packaging – 23.8% | |
| Amcor PLC | 50,418 | 452,249 |
MULTIFACTOR MATERIALS ETF (continued)
| | Shares or
Principal
Amount | Value |
| | |
| Containers and packaging (continued) | |
| AptarGroup, Inc. | 2,158 | $231,079 |
| Ardagh Group SA | 462 | 5,747 |
| Avery Dennison Corp. | 2,854 | 315,053 |
| Ball Corp. | 9,609 | 630,254 |
| Berry Global Group, Inc. (A) | 6,355 | 252,865 |
| Crown Holdings, Inc. (A) | 5,421 | 349,167 |
| Graphic Packaging Holding Company | 12,753 | 170,253 |
| International Paper Company | 17,567 | 601,670 |
| Packaging Corp. of America | 4,379 | 423,230 |
| Sealed Air Corp. | 4,313 | 123,309 |
| Sonoco Products Company | 4,266 | 208,351 |
| Westrock Company | 9,798 | 315,398 |
| Metals and mining – 16.1% | |
| Arconic Corp. (A) | 3,748 | 32,683 |
| Freeport-McMoRan, Inc. | 46,993 | 414,948 |
| Newmont Corp. | 15,404 | 916,230 |
| Nucor Corp. | 14,002 | 576,742 |
| Reliance Steel & Aluminum Company | 2,674 | 239,537 |
| Royal Gold, Inc. | 1,927 | 236,115 |
| Southern Copper Corp. | 2,987 | 96,898 |
| Steel Dynamics, Inc. | 10,332 | 250,758 |
| Utilities – 0.9% | 152,122 |
| Multi-utilities – 0.9% | |
| MDU Resources Group, Inc. | 6,773 | 152,122 |
|
| SHORT-TERM INVESTMENTS – 0.1% | | $18,142 |
| (Cost $18,142) | | |
| Short-term funds – 0.1% | 18,142 |
| State Street Institutional U.S. Government Money Market Fund, Premier Class, 0.2162% (B) | 18,142 | 18,142 |
| Total investments (Multifactor Materials ETF) (Cost $19,423,518) 100.0% | $17,172,278 |
| Other assets and liabilities, net (0.0%) | | (6,840) |
| Total net assets 100.0% | | $17,165,438 |
| The percentage shown for each investment category is the total value of the category as a percentage of the net assets of the fund. |
| Security Abbreviations and Legend |
| (A) | Non-income producing security. |
| (B) | The rate shown is the annualized seven-day yield as of 4-30-20. |
| SEE NOTES TO FINANCIAL STATEMENTS | ANNUAL REPORT | JOHN HANCOCK MULTIFACTOR ETFS | 61 |
MULTIFACTOR MEDIA AND COMMUNICATIONS ETF
As of 4-30-20
| | Shares or
Principal
Amount | Value |
| COMMON STOCKS – 99.9% | | $22,324,297 |
| (Cost $23,041,863) | | |
| Communication services – 98.2% | 21,957,472 |
| Diversified telecommunication services – 16.5% | |
| AT&T, Inc. | 39,721 | 1,210,299 |
| CenturyLink, Inc. | 74,639 | 792,666 |
| GCI Liberty, Inc., Class A (A) | 3,395 | 206,518 |
| Verizon Communications, Inc. | 25,849 | 1,485,025 |
| Entertainment – 25.0% | |
| Activision Blizzard, Inc. | 11,946 | 761,319 |
| Electronic Arts, Inc. (A) | 4,009 | 458,068 |
| Liberty Media Corp.-Liberty Formula One, Series A (A) | 950 | 28,738 |
| Liberty Media Corp.-Liberty Formula One, Series C (A) | 6,840 | 220,180 |
| Live Nation Entertainment, Inc. (A) | 4,676 | 209,812 |
| Netflix, Inc. (A) | 3,798 | 1,594,590 |
| Spotify Technology SA (A) | 2,963 | 449,101 |
| Take-Two Interactive Software, Inc. (A) | 3,749 | 453,816 |
| The Walt Disney Company | 10,307 | 1,114,702 |
| World Wrestling Entertainment, Inc., Class A | 1,403 | 62,391 |
| Zynga, Inc., Class A (A) | 30,117 | 227,082 |
| Interactive media and services – 22.0% | |
| Alphabet, Inc., Class A (A) | 525 | 707,018 |
| Alphabet, Inc., Class C (A) | 520 | 701,303 |
| ANGI Homeservices, Inc., Class A (A)(B) | 1,528 | 10,352 |
| Facebook, Inc., Class A (A) | 7,270 | 1,488,242 |
| InterActiveCorp (A) | 1,547 | 345,724 |
| Match Group, Inc. (A)(B) | 2,047 | 157,537 |
| Pinterest, Inc., Class A (A) | 7,499 | 154,929 |
| Snap, Inc., Class A (A) | 20,783 | 365,989 |
| Twitter, Inc. (A) | 26,124 | 749,236 |
| Zillow Group, Inc., Class A (A) | 1,464 | 63,743 |
| Zillow Group, Inc., Class C (A) | 4,056 | 178,302 |
| Media – 31.6% | |
| Altice USA, Inc., Class A (A) | 11,629 | 302,005 |
| Cable One, Inc. | 189 | 361,531 |
| Charter Communications, Inc., Class A (A) | 2,176 | 1,077,620 |
| Comcast Corp., Class A | 34,625 | 1,302,939 |
| Discovery, Inc., Series A (A) | 5,215 | 116,920 |
| Discovery, Inc., Series C (A) | 9,779 | 199,589 |
| DISH Network Corp., Class A (A) | 9,319 | 233,115 |
| Fox Corp., Class A | 12,273 | 317,503 |
| Fox Corp., Class B | 5,993 | 153,181 |
| Liberty Broadband Corp., Series A (A) | 838 | 100,577 |
MULTIFACTOR MEDIA AND COMMUNICATIONS ETF (continued)
| | Shares or
Principal
Amount | Value |
| Communication services (continued) | |
| Media (continued) | |
| Liberty Broadband Corp., Series C (A) | 5,406 | $663,208 |
| Liberty Media Corp.-Liberty SiriusXM, Series A (A) | 3,029 | 102,108 |
| Liberty Media Corp.-Liberty SiriusXM, Series C (A) | 5,302 | 180,639 |
| News Corp., Class A | 13,263 | 131,436 |
| News Corp., Class B | 4,459 | 45,571 |
| Nexstar Media Group, Inc., Class A | 2,676 | 187,427 |
| Omnicom Group, Inc. | 9,333 | 532,261 |
| Sirius XM Holdings, Inc. | 33,629 | 198,747 |
| The Interpublic Group of Companies, Inc. | 22,623 | 384,139 |
| The New York Times Company, Class A | 3,414 | 111,023 |
| ViacomCBS, Inc., Class A | 287 | 5,634 |
| ViacomCBS, Inc., Class B | 20,491 | 353,675 |
| Wireless telecommunication services – 3.1% | |
| T-Mobile US, Inc. (A) | 7,972 | 699,942 |
| Information technology – 1.7% | 366,825 |
| Communications equipment – 0.7% | |
| EchoStar Corp., Class A (A) | 1,785 | 56,317 |
| ViaSat, Inc. (A) | 2,253 | 95,527 |
| Software – 1.0% | |
| Dynatrace, Inc. (A) | 2,574 | 76,834 |
| Slack Technologies, Inc., Class A (A) | 5,176 | 138,147 |
|
| SHORT-TERM INVESTMENTS – 0.7% | | $156,174 |
| (Cost $156,145) | | |
| Short-term funds – 0.7% | 156,174 |
| John Hancock Collateral Trust, 0.6614% (C)(D) | 15,058 | 150,711 |
|
| State Street Institutional U.S. Government Money Market Fund, Premier Class, 0.2162% (C) | 5,463 | 5,463 |
| Total investments (Multifactor Media and Communications ETF) (Cost $23,198,008) 100.6% | $22,480,471 |
| Other assets and liabilities, net (0.6%) | | (127,968) |
| Total net assets 100.0% | | $22,352,503 |
| The percentage shown for each investment category is the total value of the category as a percentage of the net assets of the fund. |
| Security Abbreviations and Legend |
| (A) | Non-income producing security. |
| (B) | All or a portion of this security is on loan as of 4-30-20. |
| (C) | The rate shown is the annualized seven-day yield as of 4-30-20. |
| (D) | Investment is an affiliate of the fund, the advisor and/or subadvisor. This security represents the investment of cash collateral received for securities lending. |
| 62 | JOHN HANCOCK MULTIFACTOR ETFS | ANNUAL REPORT | SEE NOTES TO FINANCIAL STATEMENTS |
DERIVATIVES
FUTURES
| Open contracts | Number of
contracts | Position | Expiration
date | Notional
basis^ | Notional
value^ | Unrealized
appreciation
(depreciation) |
| S&P 500 Index Micro E-Mini Futures | 1 | Long | Jun 2020 | $14,106 | $14,506 | $400 |
| | | | | | | $400 |
^ Notional basis refers to the contractual amount agreed upon at inception of open contracts; notional value represents the current value of the open contract.
See Notes to financial statements regarding investment transactions and other derivatives information.
MULTIFACTOR MID CAP ETF
As of 4-30-20
| | Shares or
Principal
Amount | Value |
| COMMON STOCKS – 100.0% | | $1,330,514,222 |
| (Cost $1,449,517,181) | | |
| Communication services – 3.5% | 46,852,131 |
| Diversified telecommunication services – 0.3% | |
| CenturyLink, Inc. | 280,509 | 2,979,006 |
| GCI Liberty, Inc., Class A (A) | 27,146 | 1,651,291 |
| Entertainment – 0.8% | |
| Liberty Media Corp.-Liberty Formula One, Series A (A) | 6,280 | 189,970 |
| Liberty Media Corp.-Liberty Formula One, Series C (A) | 63,642 | 2,048,636 |
| Live Nation Entertainment, Inc. (A) | 31,609 | 1,418,296 |
| Madison Square Garden Entertainment Corp. (A) | 6,900 | 570,630 |
| Madison Square Garden Sports Corp. (A) | 6,916 | 1,184,849 |
| Roku, Inc. (A) | 8,618 | 1,044,760 |
| Take-Two Interactive Software, Inc. (A) | 22,495 | 2,723,020 |
| Zynga, Inc., Class A (A) | 195,230 | 1,472,034 |
| Interactive media and services – 0.5% | |
| InterActiveCorp (A) | 14,724 | 3,290,520 |
| Match Group, Inc. (A)(B) | 13,286 | 1,022,491 |
| Pinterest, Inc., Class A (A) | 29,245 | 604,202 |
| Zillow Group, Inc., Class A (A) | 9,005 | 392,078 |
| Zillow Group, Inc., Class C (A) | 26,706 | 1,173,996 |
| Media – 1.9% | |
| Altice USA, Inc., Class A (A) | 64,496 | 1,674,961 |
| Cable One, Inc. | 1,520 | 2,907,547 |
| Discovery, Inc., Series A (A)(B) | 27,892 | 625,339 |
| Discovery, Inc., Series C (A) | 72,588 | 1,481,521 |
| DISH Network Corp., Class A (A) | 52,291 | 1,308,059 |
| Fox Corp., Class A | 43,874 | 1,135,020 |
| Fox Corp., Class B | 20,847 | 532,849 |
| Liberty Broadband Corp., Series A (A) | 4,938 | 592,659 |
| Liberty Broadband Corp., Series C (A) | 21,479 | 2,635,044 |
| Liberty Media Corp.-Liberty SiriusXM, Series A (A) | 24,245 | 817,299 |
| Liberty Media Corp.-Liberty SiriusXM, Series C (A) | 27,621 | 941,047 |
| News Corp., Class A | 146,406 | 1,450,883 |
| News Corp., Class B | 43,001 | 439,470 |
| Nexstar Media Group, Inc., Class A | 17,519 | 1,227,031 |
| Omnicom Group, Inc. | 48,373 | 2,758,712 |
MULTIFACTOR MID CAP ETF (continued)
| | Shares or
Principal
Amount | Value |
| | |
| Media (continued) | |
| The Interpublic Group of Companies, Inc. | 152,307 | $2,586,173 |
| The New York Times Company, Class A | 32,818 | 1,067,241 |
| ViacomCBS, Inc., Class A (B) | 438 | 8,598 |
| ViacomCBS, Inc., Class B | 51,964 | 896,899 |
| Consumer discretionary – 10.9% | 144,372,701 |
| Auto components – 0.9% | |
| Aptiv PLC | 36,594 | 2,545,113 |
| Autoliv, Inc. | 36,535 | 2,192,831 |
| BorgWarner, Inc. | 72,016 | 2,057,497 |
| Gentex Corp. | 97,860 | 2,372,126 |
| Lear Corp. | 26,349 | 2,572,980 |
| Automobiles – 0.2% | |
| Harley-Davidson, Inc. (B) | 70,173 | 1,531,877 |
| Thor Industries, Inc. (B) | 9,831 | 650,812 |
| Distributors – 0.6% | |
| Genuine Parts Company | 37,757 | 2,993,375 |
| LKQ Corp. (A) | 99,180 | 2,593,557 |
| Pool Corp. | 12,372 | 2,618,658 |
| Diversified consumer services – 0.7% | |
| Bright Horizons Family Solutions, Inc. (A) | 14,419 | 1,679,093 |
| Chegg, Inc. (A) | 18,133 | 775,186 |
| Grand Canyon Education, Inc. (A) | 11,563 | 994,649 |
| H&R Block, Inc. | 64,302 | 1,070,628 |
| Service Corp. International | 82,497 | 3,030,940 |
| ServiceMaster Global Holdings, Inc. (A) | 45,431 | 1,546,926 |
| Hotels, restaurants and leisure – 2.0% | |
| Aramark | 93,457 | 2,552,311 |
| Chipotle Mexican Grill, Inc. (A) | 4,580 | 4,023,759 |
| Choice Hotels International, Inc. (B) | 7,976 | 598,599 |
| Churchill Downs, Inc. | 8,165 | 818,296 |
| Darden Restaurants, Inc. | 32,520 | 2,399,651 |
| Domino's Pizza, Inc. | 8,636 | 3,125,627 |
| Dunkin' Brands Group, Inc. | 29,025 | 1,823,931 |
| Hyatt Hotels Corp., Class A | 11,819 | 664,937 |
| Marriott Vacations Worldwide Corp. | 9,306 | 772,398 |
| MGM Resorts International | 102,002 | 1,716,694 |
| Norwegian Cruise Line Holdings, Ltd. (A) | 50,292 | 824,789 |
| Planet Fitness, Inc., Class A (A) | 18,763 | 1,131,972 |
| The Wendy's Company | 48,150 | 956,259 |
| SEE NOTES TO FINANCIAL STATEMENTS | ANNUAL REPORT | JOHN HANCOCK MULTIFACTOR ETFS | 63 |
MULTIFACTOR MID CAP ETF (continued)
| | Shares or
Principal
Amount | Value |
| Consumer discretionary (continued) | |
| Hotels, restaurants and leisure (continued) | |
| Vail Resorts, Inc. | 12,564 | $2,148,444 |
| Wyndham Hotels & Resorts, Inc. | 30,116 | 1,135,674 |
| Wynn Resorts, Ltd. | 20,433 | 1,747,634 |
| Household durables – 1.9% | |
| D.R. Horton, Inc. | 81,204 | 3,834,453 |
| Garmin, Ltd. | 25,033 | 2,031,678 |
| Helen of Troy, Ltd. (A) | 4,043 | 664,184 |
| Leggett & Platt, Inc. | 51,135 | 1,796,373 |
| Lennar Corp., A Shares | 57,933 | 2,900,705 |
| Lennar Corp., B Shares | 3,686 | 140,621 |
| Mohawk Industries, Inc. (A) | 16,712 | 1,465,977 |
| Newell Brands, Inc. | 90,819 | 1,260,568 |
| NVR, Inc. (A) | 1,039 | 3,220,900 |
| PulteGroup, Inc. | 80,445 | 2,274,180 |
| Tempur Sealy International, Inc. (A) | 11,485 | 617,319 |
| Toll Brothers, Inc. | 49,044 | 1,178,037 |
| Whirlpool Corp. | 27,188 | 3,037,987 |
| Internet and direct marketing retail – 0.4% | |
| Chewy, Inc., Class A (A)(B) | 4,383 | 189,521 |
| Etsy, Inc. (A) | 25,588 | 1,659,894 |
| Expedia Group, Inc. | 25,769 | 1,829,084 |
| GrubHub, Inc. (A) | 17,065 | 815,536 |
| Wayfair, Inc., Class A (A)(B) | 6,188 | 767,560 |
| Leisure products – 0.4% | |
| Brunswick Corp. | 33,518 | 1,599,479 |
| Hasbro, Inc. | 27,107 | 1,957,396 |
| Mattel, Inc. (A) | 46,724 | 407,433 |
| Peloton Interactive, Inc., Class A (A) | 4,735 | 149,153 |
| Polaris, Inc. | 21,759 | 1,543,366 |
| Multiline retail – 0.5% | |
| Dollar Tree, Inc. (A) | 49,572 | 3,949,401 |
| Kohl's Corp. | 62,869 | 1,160,562 |
| Macy's, Inc. (B) | 125,648 | 736,297 |
| Nordstrom, Inc. (B) | 40,869 | 767,520 |
| Specialty retail – 2.2% | |
| Advance Auto Parts, Inc. | 19,562 | 2,365,241 |
| AutoNation, Inc. (A) | 15,696 | 584,519 |
| AutoZone, Inc. (A) | 1,707 | 1,741,686 |
| Best Buy Company, Inc. | 68,332 | 5,243,114 |
| Burlington Stores, Inc. (A) | 18,512 | 3,381,957 |
| CarMax, Inc. (A) | 47,752 | 3,516,935 |
| Carvana Company (A)(B) | 4,976 | 398,627 |
| Five Below, Inc. (A) | 12,422 | 1,119,968 |
| Floor & Decor Holdings, Inc., Class A (A) | 16,774 | 711,218 |
| Foot Locker, Inc. | 43,241 | 1,108,267 |
| L Brands, Inc. | 41,323 | 491,330 |
| The Gap, Inc. | 82,135 | 666,936 |
| Tractor Supply Company | 33,375 | 3,385,226 |
| Ulta Beauty, Inc. (A) | 13,337 | 2,906,399 |
MULTIFACTOR MID CAP ETF (continued)
| | Shares or
Principal
Amount | Value |
| Consumer discretionary (continued) | |
| Specialty retail (continued) | |
| Williams-Sonoma, Inc. | 34,034 | $2,104,663 |
| Textiles, apparel and luxury goods – 1.1% | |
| Capri Holdings, Ltd. (A) | 43,874 | 669,079 |
| Carter's, Inc. | 17,972 | 1,405,410 |
| Columbia Sportswear Company | 10,293 | 750,257 |
| Deckers Outdoor Corp. (A) | 8,457 | 1,258,063 |
| Hanesbrands, Inc. | 139,976 | 1,391,361 |
| Levi Strauss & Company, Class A (B) | 14,804 | 190,824 |
| Lululemon Athletica, Inc. (A) | 19,669 | 4,395,628 |
| PVH Corp. | 19,163 | 943,394 |
| Ralph Lauren Corp. | 15,671 | 1,156,206 |
| Skechers U.S.A., Inc., Class A (A) | 44,338 | 1,249,445 |
| Tapestry, Inc. | 50,398 | 749,922 |
| Under Armour, Inc., Class A (A) | 43,591 | 454,218 |
| Under Armour, Inc., Class C (A) | 44,272 | 410,401 |
| Consumer staples – 3.7% | 49,625,289 |
| Beverages – 0.5% | |
| Brown-Forman Corp., Class A | 2,333 | 132,328 |
| Brown-Forman Corp., Class B | 59,891 | 3,725,220 |
| Molson Coors Beverage Company, Class B | 34,192 | 1,402,214 |
| The Boston Beer Company, Inc., Class A (A) | 1,776 | 828,522 |
| Food and staples retailing – 0.6% | |
| Casey's General Stores, Inc. | 12,186 | 1,845,082 |
| Performance Food Group Company (A) | 29,384 | 862,420 |
| The Kroger Company | 107,478 | 3,397,380 |
| US Foods Holding Corp. (A) | 81,603 | 1,754,465 |
| Food products – 1.9% | |
| Beyond Meat, Inc. (A) | 4,123 | 408,136 |
| Bunge, Ltd. | 49,556 | 1,965,887 |
| Campbell Soup Company | 36,167 | 1,807,627 |
| Conagra Brands, Inc. | 103,168 | 3,449,938 |
| Darling Ingredients, Inc. (A) | 29,991 | 617,515 |
| Flowers Foods, Inc. | 53,297 | 1,187,457 |
| Hormel Foods Corp. | 34,435 | 1,613,280 |
| Ingredion, Inc. | 27,539 | 2,236,167 |
| Lamb Weston Holdings, Inc. | 32,040 | 1,965,974 |
| Lancaster Colony Corp. | 5,176 | 696,845 |
| McCormick & Company, Inc. | 23,066 | 3,617,671 |
| Pilgrim's Pride Corp. (A) | 23,525 | 517,550 |
| Post Holdings, Inc. (A) | 26,097 | 2,397,009 |
| Seaboard Corp. | 91 | 274,010 |
| The J.M. Smucker Company | 23,367 | 2,685,102 |
| Household products – 0.6% | |
| Church & Dwight Company, Inc. | 48,195 | 3,373,168 |
| Reynolds Consumer Products, Inc. | 7,399 | 239,950 |
| The Clorox Company | 26,045 | 4,855,830 |
| Personal products – 0.1% | |
| Coty, Inc., Class A | 82,475 | 449,489 |
| 64 | JOHN HANCOCK MULTIFACTOR ETFS | ANNUAL REPORT | SEE NOTES TO FINANCIAL STATEMENTS |
MULTIFACTOR MID CAP ETF (continued)
| | Shares or
Principal
Amount | Value |
| Consumer staples (continued) | |
| Personal products (continued) | |
| Herbalife Nutrition, Ltd. (A) | 35,316 | $1,319,053 |
| Energy – 1.6% | 21,443,818 |
| Energy equipment and services – 0.2% | |
| Helmerich & Payne, Inc. | 45,793 | 905,328 |
| National Oilwell Varco, Inc. | 61,637 | 779,092 |
| TechnipFMC PLC | 86,771 | 773,130 |
| Oil, gas and consumable fuels – 1.4% | |
| Apache Corp. | 73,610 | 962,819 |
| Cabot Oil & Gas Corp. | 82,319 | 1,779,737 |
| Cheniere Energy, Inc. (A) | 33,940 | 1,584,659 |
| Concho Resources, Inc. | 34,457 | 1,954,401 |
| Continental Resources, Inc. (B) | 12,469 | 204,367 |
| Devon Energy Corp. | 70,037 | 873,361 |
| Diamondback Energy, Inc. | 36,240 | 1,577,890 |
| Hess Corp. | 43,219 | 2,102,172 |
| HollyFrontier Corp. | 61,819 | 2,042,500 |
| Marathon Oil Corp. | 195,740 | 1,197,929 |
| Noble Energy, Inc. | 98,332 | 964,637 |
| ONEOK, Inc. | 54,993 | 1,645,940 |
| Parsley Energy, Inc., Class A | 57,464 | 543,035 |
| Targa Resources Corp. | 50,782 | 658,135 |
| WPX Energy, Inc. (A) | 145,952 | 894,686 |
| Financials – 13.1% | 174,429,414 |
| Banks – 3.7% | |
| BOK Financial Corp. | 9,454 | 489,623 |
| CIT Group, Inc. | 56,077 | 1,064,341 |
| Citizens Financial Group, Inc. | 107,003 | 2,395,797 |
| Comerica, Inc. | 43,808 | 1,527,147 |
| Commerce Bancshares, Inc. | 42,192 | 2,581,728 |
| Cullen/Frost Bankers, Inc. | 19,407 | 1,394,587 |
| East West Bancorp, Inc. | 56,539 | 1,982,823 |
| Fifth Third Bancorp | 200,599 | 3,749,195 |
| First Citizens BancShares, Inc., Class A | 2,086 | 796,852 |
| First Financial Bankshares, Inc. | 32,792 | 913,257 |
| First Horizon National Corp. | 106,601 | 967,937 |
| First Republic Bank | 35,775 | 3,730,975 |
| Huntington Bancshares, Inc. | 284,687 | 2,630,508 |
| KeyCorp | 251,693 | 2,932,223 |
| M&T Bank Corp. | 25,317 | 2,837,529 |
| PacWest Bancorp | 43,845 | 887,423 |
| People's United Financial, Inc. | 130,332 | 1,653,913 |
| Pinnacle Financial Partners, Inc. | 20,209 | 813,412 |
| Popular, Inc. | 35,717 | 1,378,319 |
| Prosperity Bancshares, Inc. | 23,780 | 1,425,135 |
| Regions Financial Corp. | 292,579 | 3,145,224 |
| Signature Bank | 18,175 | 1,947,997 |
| SVB Financial Group (A) | 12,953 | 2,502,131 |
| Synovus Financial Corp. | 53,502 | 1,124,077 |
MULTIFACTOR MID CAP ETF (continued)
| | Shares or
Principal
Amount | Value |
| Financials (continued) | |
| Banks (continued) | |
| TCF Financial Corp. | 46,945 | $1,393,797 |
| Western Alliance Bancorp | 34,339 | 1,232,083 |
| Zions Bancorp NA | 67,696 | 2,139,871 |
| Capital markets – 3.3% | |
| Ameriprise Financial, Inc. | 30,385 | 3,492,452 |
| Ares Management Corp., Class A | 20,478 | 687,037 |
| Cboe Global Markets, Inc. | 20,618 | 2,049,017 |
| E*TRADE Financial Corp. | 67,834 | 2,754,739 |
| Eaton Vance Corp. | 51,473 | 1,889,059 |
| FactSet Research Systems, Inc. | 10,760 | 2,959,000 |
| Franklin Resources, Inc. | 50,490 | 951,232 |
| Invesco, Ltd. | 117,751 | 1,015,014 |
| Janus Henderson Group PLC | 27,017 | 483,604 |
| Lazard, Ltd., Class A | 35,235 | 968,963 |
| Legg Mason, Inc. | 12,551 | 625,416 |
| LPL Financial Holdings, Inc. | 24,623 | 1,482,797 |
| MarketAxess Holdings, Inc. | 10,391 | 4,728,009 |
| Morningstar, Inc. | 5,800 | 904,568 |
| MSCI, Inc. | 17,285 | 5,652,195 |
| Nasdaq, Inc. | 30,077 | 3,298,545 |
| Northern Trust Corp. | 38,314 | 3,032,936 |
| Raymond James Financial, Inc. | 38,118 | 2,512,739 |
| SEI Investments Company | 41,769 | 2,128,548 |
| T. Rowe Price Group, Inc. | 15,258 | 1,764,283 |
| Tradeweb Markets, Inc., Class A | 5,707 | 297,677 |
| Consumer finance – 0.6% | |
| Ally Financial, Inc. | 179,998 | 2,950,167 |
| Credit Acceptance Corp. (A) | 3,645 | 1,135,673 |
| OneMain Holdings, Inc. | 34,557 | 836,625 |
| Santander Consumer USA Holdings, Inc. | 66,729 | 1,040,305 |
| SLM Corp. | 88,399 | 737,248 |
| Synchrony Financial | 85,488 | 1,691,808 |
| Diversified financial services – 0.4% | |
| Equitable Holdings, Inc. | 63,631 | 1,165,720 |
| Jefferies Financial Group, Inc. | 95,522 | 1,310,562 |
| Voya Financial, Inc. | 63,074 | 2,849,053 |
| Insurance – 4.7% | |
| Alleghany Corp. | 3,776 | 2,015,289 |
| American Financial Group, Inc. | 32,582 | 2,158,232 |
| Arch Capital Group, Ltd. (A) | 80,346 | 1,930,714 |
| Arthur J. Gallagher & Company | 43,941 | 3,449,369 |
| Assurant, Inc. | 21,879 | 2,324,425 |
| Assured Guaranty, Ltd. | 42,833 | 1,273,425 |
| Athene Holding, Ltd., Class A (A) | 62,512 | 1,687,824 |
| Axis Capital Holdings, Ltd. | 34,404 | 1,259,186 |
| Brighthouse Financial, Inc. (A) | 15,896 | 408,686 |
| Brown & Brown, Inc. | 52,379 | 1,880,930 |
| Cincinnati Financial Corp. | 35,704 | 2,349,323 |
| CNA Financial Corp. | 6,765 | 213,639 |
| SEE NOTES TO FINANCIAL STATEMENTS | ANNUAL REPORT | JOHN HANCOCK MULTIFACTOR ETFS | 65 |
MULTIFACTOR MID CAP ETF (continued)
| | Shares or
Principal
Amount | Value |
| Financials (continued) | |
| Insurance (continued) | |
| Enstar Group, Ltd. (A) | 1,362 | $196,972 |
| Erie Indemnity Company, Class A | 7,580 | 1,349,695 |
| Everest Re Group, Ltd. | 10,300 | 1,783,239 |
| Fidelity National Financial, Inc. | 71,486 | 1,933,696 |
| First American Financial Corp. | 41,819 | 1,928,692 |
| Globe Life, Inc. | 31,039 | 2,555,751 |
| Kemper Corp. | 21,979 | 1,477,428 |
| Lincoln National Corp. | 53,779 | 1,907,541 |
| Loews Corp. | 56,920 | 1,972,847 |
| Markel Corp. (A) | 2,882 | 2,495,351 |
| Old Republic International Corp. | 104,963 | 1,674,160 |
| Primerica, Inc. | 14,768 | 1,534,543 |
| Principal Financial Group, Inc. | 71,301 | 2,596,069 |
| Reinsurance Group of America, Inc. | 27,881 | 2,918,583 |
| RenaissanceRe Holdings, Ltd. | 15,413 | 2,250,452 |
| The Hanover Insurance Group, Inc. | 12,911 | 1,296,006 |
| The Hartford Financial Services Group, Inc. | 101,043 | 3,838,624 |
| Unum Group | 78,659 | 1,372,600 |
| W.R. Berkley Corp. | 32,709 | 1,766,286 |
| Willis Towers Watson PLC | 24,304 | 4,333,160 |
| Thrifts and mortgage finance – 0.4% | |
| Essent Group, Ltd. | 31,805 | 868,913 |
| MGIC Investment Corp. | 143,803 | 1,051,200 |
| New York Community Bancorp, Inc. | 169,376 | 1,839,423 |
| Radian Group, Inc. | 86,705 | 1,298,841 |
| TFS Financial Corp. | 15,048 | 205,405 |
| Health care – 14.3% | 190,052,755 |
| Biotechnology – 1.8% | |
| ACADIA Pharmaceuticals, Inc. (A) | 13,191 | 637,257 |
| Acceleron Pharma, Inc. (A) | 5,310 | 480,714 |
| Alnylam Pharmaceuticals, Inc. (A) | 21,501 | 2,831,682 |
| BioMarin Pharmaceutical, Inc. (A) | 28,029 | 2,579,229 |
| Bluebird Bio, Inc. (A) | 11,114 | 598,822 |
| Exact Sciences Corp. (A) | 19,478 | 1,538,372 |
| Exelixis, Inc. (A) | 127,464 | 3,147,723 |
| FibroGen, Inc. (A) | 11,178 | 412,356 |
| Incyte Corp. (A) | 21,834 | 2,132,308 |
| Ionis Pharmaceuticals, Inc. (A) | 28,079 | 1,559,227 |
| Iovance Biotherapeutics, Inc. (A) | 10,872 | 349,535 |
| Moderna, Inc. (A) | 41,100 | 1,890,189 |
| Neurocrine Biosciences, Inc. (A) | 18,122 | 1,778,493 |
| Sarepta Therapeutics, Inc. (A) | 11,080 | 1,306,110 |
| Seattle Genetics, Inc. (A) | 15,545 | 2,133,240 |
| United Therapeutics Corp. (A) | 7,361 | 806,471 |
| Health care equipment and supplies – 4.7% | |
| ABIOMED, Inc. (A) | 9,024 | 1,725,840 |
| Align Technology, Inc. (A) | 17,724 | 3,808,001 |
| Dentsply Sirona, Inc. | 57,022 | 2,420,014 |
| DexCom, Inc. (A) | 14,108 | 4,729,002 |
MULTIFACTOR MID CAP ETF (continued)
| | Shares or
Principal
Amount | Value |
| Health care (continued) | |
| Health care equipment and supplies (continued) | |
| Envista Holdings Corp. (A) | 31,983 | $622,709 |
| Globus Medical, Inc., Class A (A) | 29,010 | 1,376,815 |
| Haemonetics Corp. (A) | 15,117 | 1,720,012 |
| Hill-Rom Holdings, Inc. | 28,329 | 3,186,729 |
| Hologic, Inc. (A) | 84,007 | 4,208,751 |
| ICU Medical, Inc. (A) | 3,552 | 778,989 |
| IDEXX Laboratories, Inc. (A) | 18,430 | 5,116,168 |
| Insulet Corp. (A) | 10,817 | 2,160,371 |
| Integra LifeSciences Holdings Corp. (A) | 22,981 | 1,173,180 |
| Masimo Corp. (A) | 14,595 | 3,122,016 |
| Nevro Corp. (A) | 2,905 | 341,744 |
| Novocure, Ltd. (A) | 12,425 | 817,565 |
| Penumbra, Inc. (A) | 6,367 | 1,128,996 |
| ResMed, Inc. | 33,771 | 5,245,312 |
| STERIS PLC | 25,413 | 3,621,353 |
| Tandem Diabetes Care, Inc. (A) | 7,849 | 626,193 |
| Teleflex, Inc. | 11,741 | 3,937,931 |
| The Cooper Companies, Inc. | 13,160 | 3,772,972 |
| Varian Medical Systems, Inc. (A) | 30,613 | 3,501,515 |
| West Pharmaceutical Services, Inc. | 20,244 | 3,831,379 |
| Health care providers and services – 3.0% | |
| Amedisys, Inc. (A) | 8,483 | 1,562,229 |
| AmerisourceBergen Corp. | 39,708 | 3,560,219 |
| Cardinal Health, Inc. | 82,634 | 4,088,730 |
| Chemed Corp. | 5,385 | 2,243,229 |
| DaVita, Inc. (A) | 38,755 | 3,062,033 |
| Encompass Health Corp. | 42,189 | 2,795,021 |
| Guardant Health, Inc. (A) | 7,221 | 555,728 |
| HealthEquity, Inc. (A) | 15,518 | 873,198 |
| Henry Schein, Inc. (A) | 58,328 | 3,182,376 |
| Laboratory Corp. of America Holdings (A) | 30,016 | 4,936,131 |
| Molina Healthcare, Inc. (A) | 27,175 | 4,455,885 |
| Quest Diagnostics, Inc. | 46,325 | 5,100,846 |
| Universal Health Services, Inc., Class B | 33,864 | 3,579,086 |
| Health care technology – 1.0% | |
| Cerner Corp. | 73,471 | 5,098,153 |
| Teladoc Health, Inc. (A) | 15,528 | 2,555,754 |
| Veeva Systems, Inc., Class A (A) | 25,427 | 4,851,472 |
| Life sciences tools and services – 2.7% | |
| Agilent Technologies, Inc. | 51,533 | 3,950,520 |
| Avantor, Inc. (A) | 60,979 | 1,025,057 |
| Bio-Rad Laboratories, Inc., Class A (A) | 6,639 | 2,921,824 |
| Bio-Techne Corp. | 11,516 | 2,591,100 |
| Bruker Corp. | 38,908 | 1,529,863 |
| Charles River Laboratories International, Inc. (A) | 20,991 | 3,036,768 |
| IQVIA Holdings, Inc. (A) | 23,549 | 3,357,852 |
| Mettler-Toledo International, Inc. (A) | 6,648 | 4,786,161 |
| PerkinElmer, Inc. | 37,140 | 3,362,284 |
| 66 | JOHN HANCOCK MULTIFACTOR ETFS | ANNUAL REPORT | SEE NOTES TO FINANCIAL STATEMENTS |
MULTIFACTOR MID CAP ETF (continued)
| | Shares or
Principal
Amount | Value |
| Health care (continued) | |
| Life sciences tools and services (continued) | |
| PPD, Inc. (A) | 3,569 | $85,299 |
| PRA Health Sciences, Inc. (A) | 24,946 | 2,407,289 |
| Repligen Corp. (A) | 12,180 | 1,414,707 |
| Syneos Health, Inc. (A) | 29,885 | 1,667,284 |
| Waters Corp. (A) | 17,863 | 3,340,381 |
| Pharmaceuticals – 1.1% | |
| Catalent, Inc. (A) | 63,552 | 4,394,621 |
| Elanco Animal Health, Inc. (A) | 53,179 | 1,314,053 |
| Horizon Therapeutics PLC (A) | 71,703 | 2,584,176 |
| Jazz Pharmaceuticals PLC (A) | 26,480 | 2,919,420 |
| Mylan NV (A) | 86,476 | 1,450,203 |
| Perrigo Company PLC | 35,620 | 1,898,546 |
| Reata Pharmaceuticals, Inc., Class A (A)(B) | 2,276 | 359,972 |
| Industrials – 14.9% | 198,351,284 |
| Aerospace and defense – 1.3% | |
| Axon Enterprise, Inc. (A) | 5,602 | 407,321 |
| BWX Technologies, Inc. | 30,050 | 1,594,453 |
| Curtiss-Wright Corp. | 14,214 | 1,473,281 |
| HEICO Corp. | 8,064 | 706,406 |
| HEICO Corp., Class A | 12,923 | 934,721 |
| Hexcel Corp. | 34,334 | 1,187,613 |
| Howmet Aerospace, Inc. | 103,232 | 1,349,242 |
| Huntington Ingalls Industries, Inc. | 15,004 | 2,871,916 |
| Mercury Systems, Inc. (A) | 11,614 | 1,035,504 |
| Spirit AeroSystems Holdings, Inc., Class A | 34,535 | 765,296 |
| Teledyne Technologies, Inc. (A) | 8,099 | 2,637,601 |
| Textron, Inc. | 79,376 | 2,092,351 |
| Virgin Galactic Holdings, Inc. (A)(B) | 5,194 | 91,518 |
| Air freight and logistics – 0.7% | |
| C.H. Robinson Worldwide, Inc. | 45,218 | 3,205,956 |
| Expeditors International of Washington, Inc. | 47,436 | 3,396,655 |
| XPO Logistics, Inc. (A) | 38,335 | 2,558,478 |
| Airlines – 0.4% | |
| Alaska Air Group, Inc. | 50,833 | 1,653,089 |
| American Airlines Group, Inc. (B) | 30,836 | 370,340 |
| JetBlue Airways Corp. (A) | 135,614 | 1,320,880 |
| United Airlines Holdings, Inc. (A) | 76,595 | 2,265,680 |
| Building products – 1.1% | |
| Allegion PLC | 26,630 | 2,677,380 |
| AO Smith Corp. | 43,518 | 1,844,293 |
| Armstrong World Industries, Inc. | 11,943 | 920,566 |
| Fortune Brands Home & Security, Inc. | 52,561 | 2,533,440 |
| Lennox International, Inc. | 9,062 | 1,691,694 |
| Masco Corp. | 51,769 | 2,124,600 |
| Owens Corning | 46,850 | 2,031,416 |
| Trex Company, Inc. (A) | 15,555 | 1,481,147 |
| Commercial services and supplies – 1.4% | |
| ADT, Inc. | 38,597 | 221,161 |
MULTIFACTOR MID CAP ETF (continued)
| | Shares or
Principal
Amount | Value |
| Industrials (continued) | |
| Commercial services and supplies (continued) | |
| Cintas Corp. | 20,190 | $4,478,748 |
| Copart, Inc. (A) | 50,649 | 4,057,491 |
| IAA, Inc. (A) | 35,185 | 1,358,141 |
| MSA Safety, Inc. | 4,817 | 542,057 |
| Republic Services, Inc. | 60,286 | 4,722,805 |
| Rollins, Inc. | 36,112 | 1,444,480 |
| Stericycle, Inc. (A) | 22,691 | 1,107,321 |
| Tetra Tech, Inc. | 10,516 | 791,644 |
| Construction and engineering – 0.6% | |
| AECOM (A) | 49,056 | 1,778,771 |
| EMCOR Group, Inc. | 18,453 | 1,172,319 |
| Jacobs Engineering Group, Inc. | 33,849 | 2,801,005 |
| MasTec, Inc. (A) | 14,359 | 515,488 |
| Quanta Services, Inc. | 63,480 | 2,308,133 |
| Electrical equipment – 1.5% | |
| Acuity Brands, Inc. | 13,585 | 1,176,325 |
| AMETEK, Inc. | 57,761 | 4,844,415 |
| Generac Holdings, Inc. (A) | 14,500 | 1,412,880 |
| Hubbell, Inc. | 24,831 | 3,089,721 |
| nVent Electric PLC | 25,972 | 484,378 |
| Rockwell Automation, Inc. | 29,390 | 5,568,817 |
| Sensata Technologies Holding PLC (A) | 75,784 | 2,757,022 |
| Industrial conglomerates – 0.2% | |
| Carlisle Companies, Inc. | 22,723 | 2,748,574 |
| Machinery – 3.8% | |
| AGCO Corp. | 29,483 | 1,557,882 |
| Allison Transmission Holdings, Inc. | 53,593 | 1,947,570 |
| Crane Company | 19,147 | 1,042,554 |
| Donaldson Company, Inc. | 51,299 | 2,248,435 |
| Dover Corp. | 43,130 | 4,039,125 |
| Flowserve Corp. | 44,832 | 1,262,917 |
| Graco, Inc. | 52,938 | 2,364,211 |
| IDEX Corp. | 17,523 | 2,692,058 |
| Ingersoll Rand, Inc. (A) | 59,900 | 1,741,892 |
| ITT, Inc. | 28,753 | 1,515,858 |
| Lincoln Electric Holdings, Inc. | 21,772 | 1,752,864 |
| Nordson Corp. | 17,792 | 2,862,911 |
| Oshkosh Corp. | 29,510 | 1,992,810 |
| Parker-Hannifin Corp. | 34,733 | 5,491,982 |
| Pentair PLC | 50,935 | 1,761,842 |
| RBC Bearings, Inc. (A) | 2,706 | 342,796 |
| Snap-on, Inc. | 21,504 | 2,801,756 |
| Stanley Black & Decker, Inc. | 35,539 | 3,916,398 |
| The Middleby Corp. (A) | 19,015 | 1,057,804 |
| The Toro Company | 33,103 | 2,112,302 |
| Wabtec Corp. | 31,809 | 1,794,664 |
| Woodward, Inc. | 17,014 | 1,030,368 |
| Xylem, Inc. | 38,070 | 2,737,233 |
| SEE NOTES TO FINANCIAL STATEMENTS | ANNUAL REPORT | JOHN HANCOCK MULTIFACTOR ETFS | 67 |
MULTIFACTOR MID CAP ETF (continued)
| | Shares or
Principal
Amount | Value |
| Industrials (continued) | |
| Marine – 0.1% | |
| Kirby Corp. (A) | 16,391 | $875,607 |
| Professional services – 1.6% | |
| CoStar Group, Inc. (A) | 5,727 | 3,712,585 |
| Equifax, Inc. | 18,924 | 2,628,544 |
| FTI Consulting, Inc. (A) | 5,652 | 719,839 |
| ManpowerGroup, Inc. | 27,048 | 2,008,044 |
| Nielsen Holdings PLC | 136,967 | 2,017,524 |
| Robert Half International, Inc. | 45,227 | 2,137,880 |
| TransUnion | 35,461 | 2,793,972 |
| TriNet Group, Inc. (A) | 10,659 | 521,971 |
| Verisk Analytics, Inc. | 28,135 | 4,299,872 |
| Road and rail – 0.9% | |
| AMERCO | 3,352 | 938,996 |
| J.B. Hunt Transport Services, Inc. | 23,690 | 2,395,533 |
| Kansas City Southern | 24,851 | 3,244,298 |
| Knight-Swift Transportation Holdings, Inc. (B) | 30,614 | 1,138,229 |
| Landstar System, Inc. | 13,127 | 1,356,150 |
| Lyft, Inc., Class A (A) | 2,840 | 93,237 |
| Old Dominion Freight Line, Inc. | 24,068 | 3,496,840 |
| Trading companies and distributors – 1.3% | |
| Air Lease Corp. | 38,081 | 995,818 |
| Fastenal Company | 118,049 | 4,275,735 |
| HD Supply Holdings, Inc. (A) | 68,929 | 2,045,813 |
| SiteOne Landscape Supply, Inc. (A) | 6,345 | 562,357 |
| United Rentals, Inc. (A) | 33,850 | 4,349,725 |
| W.W. Grainger, Inc. | 12,944 | 3,567,108 |
| Watsco, Inc. | 9,335 | 1,502,842 |
| Information technology – 20.3% | 269,975,696 |
| Communications equipment – 1.3% | |
| Arista Networks, Inc. (A) | 11,269 | 2,471,292 |
| Ciena Corp. (A) | 55,223 | 2,554,064 |
| F5 Networks, Inc. (A) | 23,330 | 3,248,936 |
| Juniper Networks, Inc. | 127,811 | 2,760,718 |
| Lumentum Holdings, Inc. (A) | 19,516 | 1,579,040 |
| Motorola Solutions, Inc. | 30,814 | 4,431,361 |
| Ubiquiti, Inc. | 2,991 | 484,632 |
| Electronic equipment, instruments and components – 3.2% | |
| Amphenol Corp., Class A | 65,206 | 5,755,082 |
| Arrow Electronics, Inc. (A) | 38,561 | 2,426,258 |
| CDW Corp. | 39,943 | 4,425,684 |
| Cognex Corp. | 47,186 | 2,606,555 |
| Corning, Inc. | 110,255 | 2,426,713 |
| Dolby Laboratories, Inc., Class A | 22,516 | 1,351,635 |
| Flex, Ltd. (A) | 233,962 | 2,283,469 |
| FLIR Systems, Inc. | 52,832 | 2,292,909 |
| IPG Photonics Corp. (A) | 12,438 | 1,608,607 |
| Jabil, Inc. | 83,648 | 2,378,949 |
| Keysight Technologies, Inc. (A) | 43,543 | 4,213,656 |
MULTIFACTOR MID CAP ETF (continued)
| | Shares or
Principal
Amount | Value |
| Information technology (continued) | |
| Electronic equipment, instruments andcomponents (continued) | |
| Littelfuse, Inc. | 7,362 | $1,069,257 |
| National Instruments Corp. | 46,589 | 1,789,949 |
| SYNNEX Corp. | 16,289 | 1,426,265 |
| Trimble, Inc. (A) | 72,979 | 2,527,263 |
| Zebra Technologies Corp., Class A (A) | 14,181 | 3,256,808 |
| IT services – 4.6% | |
| Akamai Technologies, Inc. (A) | 54,286 | 5,304,285 |
| Alliance Data Systems Corp. | 17,261 | 864,258 |
| Amdocs, Ltd. | 60,095 | 3,872,522 |
| Black Knight, Inc. (A) | 32,988 | 2,327,963 |
| Booz Allen Hamilton Holding Corp. | 38,890 | 2,856,082 |
| Broadridge Financial Solutions, Inc. | 31,407 | 3,643,212 |
| CACI International, Inc., Class A (A) | 7,547 | 1,887,807 |
| EPAM Systems, Inc. (A) | 15,131 | 3,342,287 |
| Euronet Worldwide, Inc. (A) | 16,858 | 1,546,890 |
| FleetCor Technologies, Inc. (A) | 17,148 | 4,136,955 |
| Gartner, Inc. (A) | 20,154 | 2,394,497 |
| Genpact, Ltd. | 64,472 | 2,219,771 |
| GoDaddy, Inc., Class A (A) | 34,776 | 2,414,498 |
| Jack Henry & Associates, Inc. | 18,806 | 3,075,721 |
| Leidos Holdings, Inc. | 37,832 | 3,738,180 |
| MAXIMUS, Inc. | 25,840 | 1,739,549 |
| MongoDB, Inc. (A)(B) | 6,876 | 1,114,806 |
| Okta, Inc. (A) | 11,502 | 1,740,253 |
| Perspecta, Inc. | 50,401 | 1,087,150 |
| Sabre Corp. | 95,479 | 694,132 |
| Science Applications International Corp. | 16,600 | 1,355,556 |
| Switch, Inc., Class A | 9,265 | 159,080 |
| The Western Union Company | 122,431 | 2,334,759 |
| Twilio, Inc., Class A (A) | 18,232 | 2,047,454 |
| VeriSign, Inc. (A) | 18,946 | 3,968,998 |
| WEX, Inc. (A) | 13,487 | 1,784,600 |
| Semiconductors and semiconductor equipment – 3.7% | |
| Cabot Microelectronics Corp. | 6,219 | 762,076 |
| Cirrus Logic, Inc. (A) | 12,470 | 942,732 |
| Cree, Inc. (A) | 31,483 | 1,357,862 |
| Enphase Energy, Inc. (A) | 15,154 | 709,662 |
| Entegris, Inc. | 53,363 | 2,893,875 |
| First Solar, Inc. (A) | 30,417 | 1,338,652 |
| KLA Corp. | 26,466 | 4,342,806 |
| Marvell Technology Group, Ltd. | 166,995 | 4,465,446 |
| Maxim Integrated Products, Inc. | 74,233 | 4,081,330 |
| Microchip Technology, Inc. | 46,320 | 4,063,654 |
| MKS Instruments, Inc. | 21,608 | 2,165,770 |
| Monolithic Power Systems, Inc. | 10,915 | 2,182,018 |
| ON Semiconductor Corp. (A) | 201,165 | 3,227,692 |
| Qorvo, Inc. (A) | 45,616 | 4,471,736 |
| Silicon Laboratories, Inc. (A) | 7,524 | 731,483 |
| 68 | JOHN HANCOCK MULTIFACTOR ETFS | ANNUAL REPORT | SEE NOTES TO FINANCIAL STATEMENTS |
MULTIFACTOR MID CAP ETF (continued)
| | Shares or
Principal
Amount | Value |
| Information technology (continued) | |
| Semiconductors and semiconductor equipment (continued) | |
| Skyworks Solutions, Inc. | 48,463 | $5,034,336 |
| SolarEdge Technologies, Inc. (A) | 8,804 | 982,438 |
| Teradyne, Inc. | 65,768 | 4,113,131 |
| Universal Display Corp. | 11,806 | 1,772,317 |
| Software – 6.3% | |
| Alteryx, Inc., Class A (A)(B) | 8,074 | 913,815 |
| Anaplan, Inc. (A) | 13,478 | 550,711 |
| ANSYS, Inc. (A) | 22,416 | 5,869,174 |
| Appfolio, Inc., Class A (A) | 2,145 | 235,650 |
| Aspen Technology, Inc. (A) | 21,121 | 2,159,622 |
| Avalara, Inc. (A) | 10,279 | 918,634 |
| Cadence Design Systems, Inc. (A) | 69,486 | 5,637,399 |
| CDK Global, Inc. | 41,858 | 1,644,182 |
| Ceridian HCM Holding, Inc. (A) | 16,530 | 974,774 |
| Citrix Systems, Inc. | 35,291 | 5,117,548 |
| Coupa Software, Inc. (A) | 9,599 | 1,690,288 |
| Crowdstrike Holdings, Inc., Class A (A) | 6,761 | 457,449 |
| DocuSign, Inc. (A) | 17,026 | 1,783,474 |
| Dropbox, Inc., Class A (A) | 34,780 | 731,076 |
| Dynatrace, Inc. (A) | 10,393 | 310,231 |
| Elastic NV (A) | 6,733 | 431,855 |
| Envestnet, Inc. (A) | 9,458 | 591,314 |
| Fair Isaac Corp. (A) | 7,973 | 2,813,991 |
| Five9, Inc. (A) | 6,969 | 645,817 |
| Fortinet, Inc. (A) | 30,617 | 3,298,676 |
| Globant SA (A)(B) | 2,347 | 271,477 |
| Guidewire Software, Inc. (A) | 24,241 | 2,202,052 |
| HubSpot, Inc. (A) | 7,749 | 1,306,714 |
| j2 Global, Inc. | 18,454 | 1,488,131 |
| Manhattan Associates, Inc. (A) | 15,746 | 1,117,021 |
| NortonLifeLock, Inc. | 138,452 | 2,944,874 |
| Nuance Communications, Inc. (A) | 100,444 | 2,028,969 |
| Nutanix, Inc., Class A (A)(B) | 18,787 | 384,946 |
| Palo Alto Networks, Inc. (A) | 12,020 | 2,362,050 |
| Paycom Software, Inc. (A) | 11,204 | 2,924,468 |
| Paylocity Holding Corp. (A) | 8,128 | 930,900 |
| Pegasystems, Inc. | 8,147 | 681,252 |
| Proofpoint, Inc. (A) | 11,279 | 1,372,993 |
| PTC, Inc. (A) | 28,576 | 1,978,888 |
| Q2 Holdings, Inc. (A) | 4,705 | 375,083 |
| RealPage, Inc. (A) | 22,784 | 1,469,340 |
| RingCentral, Inc., Class A (A) | 9,512 | 2,173,777 |
| Slack Technologies, Inc., Class A (A) | 19,124 | 510,420 |
| Smartsheet, Inc., Class A (A) | 16,002 | 843,625 |
| SolarWinds Corp. (A) | 17,331 | 294,280 |
| Splunk, Inc. (A) | 21,372 | 2,999,774 |
| SS&C Technologies Holdings, Inc. | 60,865 | 3,357,313 |
| Synopsys, Inc. (A) | 37,053 | 5,821,767 |
| The Trade Desk, Inc., Class A (A) | 6,318 | 1,848,520 |
MULTIFACTOR MID CAP ETF (continued)
| | Shares or
Principal
Amount | Value |
| Information technology (continued) | |
| Software (continued) | |
| Tyler Technologies, Inc. (A) | 10,420 | $3,341,590 |
| Zendesk, Inc. (A) | 18,775 | 1,443,422 |
| Zscaler, Inc. (A)(B) | 10,005 | 671,135 |
| Technology hardware, storage and peripherals – 1.2% | |
| Hewlett Packard Enterprise Company | 271,307 | 2,729,348 |
| NetApp, Inc. | 63,680 | 2,787,274 |
| Pure Storage, Inc., Class A (A) | 35,238 | 507,427 |
| Seagate Technology PLC | 78,963 | 3,944,202 |
| Western Digital Corp. | 85,311 | 3,931,131 |
| Xerox Holdings Corp. | 81,819 | 1,496,470 |
| Materials – 5.7% | 76,288,257 |
| Chemicals – 2.1% | |
| Albemarle Corp. | 30,463 | 1,871,342 |
| Ashland Global Holdings, Inc. | 23,440 | 1,446,014 |
| Axalta Coating Systems, Ltd. (A) | 78,042 | 1,540,549 |
| Celanese Corp. | 32,238 | 2,678,011 |
| CF Industries Holdings, Inc. | 69,510 | 1,911,525 |
| Eastman Chemical Company | 50,158 | 3,035,061 |
| FMC Corp. | 29,500 | 2,711,050 |
| Huntsman Corp. | 88,395 | 1,485,920 |
| International Flavors & Fragrances, Inc. | 18,102 | 2,371,905 |
| NewMarket Corp. | 3,212 | 1,321,545 |
| RPM International, Inc. | 47,121 | 3,129,306 |
| The Mosaic Company | 69,789 | 803,271 |
| The Scotts Miracle-Gro Company | 10,618 | 1,316,951 |
| Valvoline, Inc. | 24,209 | 416,153 |
| W.R. Grace & Company | 22,473 | 1,061,400 |
| Westlake Chemical Corp. | 11,793 | 512,406 |
| Construction materials – 0.4% | |
| Martin Marietta Materials, Inc. | 13,501 | 2,568,295 |
| Vulcan Materials Company | 29,729 | 3,358,485 |
| Containers and packaging – 2.4% | |
| Amcor PLC | 292,013 | 2,619,357 |
| AptarGroup, Inc. | 24,727 | 2,647,767 |
| Ardagh Group SA | 1,798 | 22,367 |
| Avery Dennison Corp. | 26,425 | 2,917,056 |
| Ball Corp. | 72,023 | 4,723,989 |
| Berry Global Group, Inc. (A) | 52,053 | 2,071,189 |
| Crown Holdings, Inc. (A) | 43,553 | 2,805,249 |
| Graphic Packaging Holding Company | 13,247 | 176,847 |
| International Paper Company | 93,415 | 3,199,464 |
| Packaging Corp. of America | 37,683 | 3,642,062 |
| Sealed Air Corp. | 55,952 | 1,599,668 |
| Sonoco Products Company | 50,920 | 2,486,933 |
| Westrock Company | 86,273 | 2,777,128 |
| Metals and mining – 0.8% | |
| Arconic Corp. (A) | 25,465 | 222,055 |
| Freeport-McMoRan, Inc. | 127,186 | 1,123,052 |
| SEE NOTES TO FINANCIAL STATEMENTS | ANNUAL REPORT | JOHN HANCOCK MULTIFACTOR ETFS | 69 |
MULTIFACTOR MID CAP ETF (continued)
| | Shares or
Principal
Amount | Value |
| Materials (continued) | |
| Metals and mining (continued) | |
| Nucor Corp. | 74,950 | $3,087,191 |
| Reliance Steel & Aluminum Company | 28,362 | 2,540,668 |
| Royal Gold, Inc. | 16,377 | 2,006,674 |
| Steel Dynamics, Inc. | 85,717 | 2,080,352 |
| Real estate – 6.3% | 82,980,439 |
| Equity real estate investment trusts – 5.8% | |
| Alexandria Real Estate Equities, Inc. | 16,846 | 2,646,338 |
| American Campus Communities, Inc. | 31,622 | 1,115,940 |
| American Homes 4 Rent, Class A | 59,605 | 1,438,865 |
| Americold Realty Trust | 37,594 | 1,150,000 |
| Apartment Investment & Management Company, Class A | 36,423 | 1,372,054 |
| Boston Properties, Inc. | 4,448 | 432,257 |
| Brixmor Property Group, Inc. | 68,322 | 782,287 |
| Camden Property Trust | 20,004 | 1,761,752 |
| CoreSite Realty Corp. | 8,541 | 1,035,084 |
| Cousins Properties, Inc. | 26,878 | 810,909 |
| CubeSmart | 44,183 | 1,113,412 |
| CyrusOne, Inc. | 25,692 | 1,802,294 |
| Digital Realty Trust, Inc. | 25,988 | 3,884,946 |
| Douglas Emmett, Inc. | 38,767 | 1,182,006 |
| Duke Realty Corp. | 74,303 | 2,578,314 |
| EastGroup Properties, Inc. | 6,952 | 736,912 |
| EPR Properties | 17,478 | 514,203 |
| Equity LifeStyle Properties, Inc. | 34,324 | 2,070,080 |
| Essex Property Trust, Inc. | 9,258 | 2,259,878 |
| Extra Space Storage, Inc. | 23,643 | 2,086,258 |
| Federal Realty Investment Trust | 16,809 | 1,399,685 |
| First Industrial Realty Trust, Inc. | 23,147 | 874,262 |
| Gaming and Leisure Properties, Inc. | 46,802 | 1,321,688 |
| Healthcare Realty Trust, Inc. | 23,562 | 692,487 |
| Healthcare Trust of America, Inc., Class A | 48,520 | 1,195,048 |
| Healthpeak Properties, Inc. | 67,552 | 1,765,809 |
| Highwoods Properties, Inc. | 23,641 | 917,507 |
| Host Hotels & Resorts, Inc. | 103,684 | 1,276,350 |
| Hudson Pacific Properties, Inc. | 35,249 | 866,420 |
| Invitation Homes, Inc. | 64,481 | 1,524,976 |
| Iron Mountain, Inc. | 64,689 | 1,564,180 |
| JBG SMITH Properties | 26,139 | 887,419 |
| Kilroy Realty Corp. | 24,674 | 1,536,203 |
| Kimco Realty Corp. | 94,909 | 1,035,457 |
| Lamar Advertising Company, Class A | 23,957 | 1,381,121 |
| Life Storage, Inc. | 9,647 | 844,981 |
| Medical Properties Trust, Inc. | 91,268 | 1,564,334 |
| MGM Growth Properties LLC, Class A | 25,778 | 648,832 |
| Mid-America Apartment Communities, Inc. | 17,226 | 1,927,934 |
| National Retail Properties, Inc. | 38,806 | 1,266,628 |
| Omega Healthcare Investors, Inc. | 50,776 | 1,480,120 |
| Park Hotels & Resorts, Inc. | 43,926 | 417,736 |
MULTIFACTOR MID CAP ETF (continued)
| | Shares or
Principal
Amount | Value |
| Real estate (continued) | |
| Equity real estate investment trusts (continued) | |
| PS Business Parks, Inc. | 3,689 | $476,213 |
| Realty Income Corp. | 35,938 | 1,973,715 |
| Regency Centers Corp. | 31,292 | 1,374,032 |
| Rexford Industrial Realty, Inc. | 20,677 | 841,967 |
| Sabra Health Care REIT, Inc. | 24,743 | 317,205 |
| SL Green Realty Corp. | 18,594 | 986,412 |
| Spirit Realty Capital, Inc. | 17,698 | 544,390 |
| STAG Industrial, Inc. | 18,998 | 498,698 |
| STORE Capital Corp. | 48,835 | 980,118 |
| Sun Communities, Inc. | 16,694 | 2,243,674 |
| UDR, Inc. | 53,864 | 2,018,284 |
| VEREIT, Inc. | 234,799 | 1,286,699 |
| VICI Properties, Inc. | 66,838 | 1,164,318 |
| Vornado Realty Trust | 22,925 | 1,004,574 |
| Weyerhaeuser Company | 122,901 | 2,687,845 |
| WP Carey, Inc. | 24,108 | 1,585,824 |
| Real estate management and development – 0.5% | |
| CBRE Group, Inc., Class A (A) | 70,426 | 3,023,388 |
| Cushman & Wakefield PLC (A) | 27,630 | 336,257 |
| Jones Lang LaSalle, Inc. | 17,298 | 1,826,323 |
| The Howard Hughes Corp. (A) | 11,956 | 647,537 |
| Utilities – 5.7% | 76,142,438 |
| Electric utilities – 2.5% | |
| Alliant Energy Corp. | 59,271 | 2,877,607 |
| Avangrid, Inc. | 10,658 | 458,294 |
| Entergy Corp. | 48,009 | 4,585,340 |
| Evergy, Inc. | 74,680 | 4,363,552 |
| Eversource Energy | 59,938 | 4,836,997 |
| FirstEnergy Corp. | 120,089 | 4,956,073 |
| Hawaiian Electric Industries, Inc. | 28,068 | 1,107,844 |
| IDACORP, Inc. | 13,714 | 1,258,671 |
| NRG Energy, Inc. | 61,904 | 2,075,641 |
| OGE Energy Corp. | 77,448 | 2,441,161 |
| Pinnacle West Capital Corp. | 34,520 | 2,657,695 |
| PNM Resources, Inc. | 9,878 | 399,960 |
| Portland General Electric Company | 38,490 | 1,800,947 |
| Gas utilities – 0.5% | |
| Atmos Energy Corp. | 30,586 | 3,118,854 |
| National Fuel Gas Company | 7,882 | 323,162 |
| ONE Gas, Inc. | 14,504 | 1,156,114 |
| Spire, Inc. | 10,020 | 731,059 |
| UGI Corp. | 47,825 | 1,443,359 |
| Independent power and renewable electricity producers –0.4% | |
| Clearway Energy, Inc., Class A | 3,481 | 65,095 |
| Clearway Energy, Inc., Class C | 8,495 | 170,155 |
| TerraForm Power, Inc., Class A | 16,376 | 283,632 |
| The AES Corp. | 186,430 | 2,470,198 |
| Vistra Energy Corp. | 98,767 | 1,929,907 |
| 70 | JOHN HANCOCK MULTIFACTOR ETFS | ANNUAL REPORT | SEE NOTES TO FINANCIAL STATEMENTS |
MULTIFACTOR MID CAP ETF (continued)
| | Shares or
Principal
Amount | Value |
| Utilities (continued) | |
| Multi-utilities – 1.8% | |
| Ameren Corp. | 62,564 | $4,551,531 |
| Black Hills Corp. | 17,630 | 1,092,002 |
| CenterPoint Energy, Inc. | 137,438 | 2,340,569 |
| CMS Energy Corp. | 69,707 | 3,979,573 |
| DTE Energy Company | 39,352 | 4,082,376 |
| MDU Resources Group, Inc. | 69,130 | 1,552,660 |
| NiSource, Inc. | 82,266 | 2,065,699 |
| WEC Energy Group, Inc. | 50,854 | 4,604,830 |
| Water utilities – 0.5% | |
| American Water Works Company, Inc. | 37,185 | 4,525,043 |
| Essential Utilities, Inc. | 43,954 | 1,836,838 |
|
| SHORT-TERM INVESTMENTS – 0.8% | | $11,158,906 |
| (Cost $11,155,270) | | |
| Short-term funds – 0.8% | 11,158,906 |
| John Hancock Collateral Trust, 0.6614% (C)(D) | 971,895 | 9,727,116 |
|
| State Street Institutional U.S. Government Money Market Fund, Premier Class, 0.2162% (C) | 1,431,790 | 1,431,790 |
| Total investments (Multifactor Mid Cap ETF) (Cost $1,460,672,451) 100.8% | $1,341,673,128 |
| Other assets and liabilities, net (0.8%) | | (10,463,729) |
| Total net assets 100.0% | | $1,331,209,399 |
| The percentage shown for each investment category is the total value of the category as a percentage of the net assets of the fund. |
| Security Abbreviations and Legend |
| (A) | Non-income producing security. |
| (B) | All or a portion of this security is on loan as of 4-30-20. |
| (C) | The rate shown is the annualized seven-day yield as of 4-30-20. |
| (D) | Investment is an affiliate of the fund, the advisor and/or subadvisor. This security represents the investment of cash collateral received for securities lending. |
MULTIFACTOR SMALL CAP ETF
As of 4-30-20
| | Shares or
Principal
Amount | Value |
| COMMON STOCKS – 99.9% | | $463,052,268 |
| (Cost $516,803,226) | | |
| Communication services – 1.8% | 8,155,662 |
| Diversified telecommunication services – 0.6% | |
| Cogent Communications Holdings, Inc. | 19,156 | 1,605,847 |
| Iridium Communications, Inc. (A) | 59,180 | 1,331,846 |
| Entertainment – 0.2% | |
| Cinemark Holdings, Inc. | 51,515 | 735,634 |
| Interactive media and services – 0.2% | |
| CarGurus, Inc. (A) | 39,402 | 901,518 |
| Media – 0.7% | |
| Liberty Latin America, Ltd., Class A (A) | 21,999 | 235,389 |
| Liberty Latin America, Ltd., Class C (A) | 56,049 | 579,547 |
MULTIFACTOR SMALL CAP ETF (continued)
| | Shares or
Principal
Amount | Value |
| Communication services (continued) | |
| Media (continued) | |
| Nexstar Media Group, Inc., Class A | 21,595 | $1,512,514 |
| TEGNA, Inc. | 95,362 | 1,022,281 |
| Wireless telecommunication services – 0.1% | |
| United States Cellular Corp. (A) | 7,260 | 231,086 |
| Consumer discretionary – 14.3% | 66,420,232 |
| Auto components – 0.2% | |
| Fox Factory Holding Corp. (A) | 20,286 | 1,034,789 |
| Automobiles – 0.7% | |
| Harley-Davidson, Inc. (B) | 70,155 | 1,531,484 |
| Thor Industries, Inc. (B) | 23,417 | 1,550,205 |
| Diversified consumer services – 2.1% | |
| Chegg, Inc. (A) | 53,394 | 2,282,594 |
| frontdoor, Inc. (A) | 36,829 | 1,425,651 |
| Graham Holdings Company, Class B | 1,976 | 770,660 |
| Grand Canyon Education, Inc. (A) | 21,570 | 1,855,451 |
| H&R Block, Inc. | 87,213 | 1,452,096 |
| Laureate Education, Inc., Class A (A) | 45,618 | 432,002 |
| Strategic Education, Inc. | 9,611 | 1,531,032 |
| Hotels, restaurants and leisure – 3.0% | |
| Boyd Gaming Corp. | 40,022 | 667,967 |
| Choice Hotels International, Inc. (B) | 14,458 | 1,085,073 |
| Churchill Downs, Inc. | 17,632 | 1,767,079 |
| Cracker Barrel Old Country Store, Inc. | 10,350 | 1,008,090 |
| Eldorado Resorts, Inc. (A)(B) | 36,090 | 773,770 |
| Marriott Vacations Worldwide Corp. | 16,700 | 1,386,100 |
| Penn National Gaming, Inc. (A) | 56,095 | 999,613 |
| Texas Roadhouse, Inc. | 28,623 | 1,347,857 |
| The Wendy's Company | 103,671 | 2,058,906 |
| Wingstop, Inc. | 15,280 | 1,791,886 |
| Wyndham Destinations, Inc. | 39,400 | 1,007,458 |
| Household durables – 2.0% | |
| Helen of Troy, Ltd. (A) | 11,168 | 1,834,679 |
| KB Home | 36,938 | 969,253 |
| Leggett & Platt, Inc. | 66,152 | 2,323,920 |
| MDC Holdings, Inc. | 21,691 | 634,462 |
| Taylor Morrison Home Corp. (A) | 57,233 | 832,740 |
| Tempur Sealy International, Inc. (A) | 20,060 | 1,078,225 |
| TopBuild Corp. (A) | 16,095 | 1,499,893 |
| Internet and direct marketing retail – 0.5% | |
| GrubHub, Inc. (A) | 39,765 | 1,900,369 |
| Stitch Fix, Inc., Class A (A)(B) | 25,047 | 402,004 |
| Leisure products – 0.8% | |
| Brunswick Corp. | 37,866 | 1,806,966 |
| Mattel, Inc. (A) | 163,085 | 1,422,101 |
| YETI Holdings, Inc. (A) | 18,123 | 500,376 |
| Multiline retail – 0.4% | |
| Ollie's Bargain Outlet Holdings, Inc. (A) | 26,992 | 1,833,027 |
| SEE NOTES TO FINANCIAL STATEMENTS | ANNUAL REPORT | JOHN HANCOCK MULTIFACTOR ETFS | 71 |
MULTIFACTOR SMALL CAP ETF (continued)
| | Shares or
Principal
Amount | Value |
| Consumer discretionary (continued) | |
| Specialty retail – 3.0% | |
| Aaron's, Inc. | 32,111 | $1,024,662 |
| AutoNation, Inc. (A) | 36,031 | 1,341,794 |
| Dick's Sporting Goods, Inc. | 30,954 | 909,738 |
| Floor & Decor Holdings, Inc., Class A (A) | 32,135 | 1,362,524 |
| Foot Locker, Inc. | 60,467 | 1,549,769 |
| Lithia Motors, Inc., Class A | 11,331 | 1,252,755 |
| Murphy USA, Inc. (A) | 15,243 | 1,627,952 |
| National Vision Holdings, Inc. (A) | 34,604 | 917,006 |
| Penske Automotive Group, Inc. | 22,449 | 807,715 |
| RH (A) | 7,521 | 1,081,369 |
| Williams-Sonoma, Inc. | 33,297 | 2,059,086 |
| Textiles, apparel and luxury goods – 1.6% | |
| Carter's, Inc. | 19,553 | 1,529,045 |
| Deckers Outdoor Corp. (A) | 12,730 | 1,893,715 |
| Hanesbrands, Inc. (B) | 195,739 | 1,945,646 |
| Skechers U.S.A., Inc., Class A (A) | 42,337 | 1,193,057 |
| Steven Madden, Ltd. | 44,939 | 1,126,621 |
| Consumer staples – 3.5% | 16,377,853 |
| Beverages – 0.4% | |
| The Boston Beer Company, Inc., Class A (A) | 3,799 | 1,772,271 |
| Food and staples retailing – 0.7% | |
| BJ's Wholesale Club Holdings, Inc. (A) | 55,100 | 1,449,681 |
| Grocery Outlet Holding Corp. (A) | 21,950 | 730,277 |
| Performance Food Group Company (A) | 44,399 | 1,303,111 |
| Food products – 1.9% | |
| Darling Ingredients, Inc. (A) | 70,835 | 1,458,493 |
| Flowers Foods, Inc. | 77,038 | 1,716,407 |
| Freshpet, Inc. (A) | 14,188 | 1,069,917 |
| J&J Snack Foods Corp. | 6,591 | 837,255 |
| Lancaster Colony Corp. | 10,088 | 1,358,147 |
| Sanderson Farms, Inc. | 9,013 | 1,227,030 |
| Seaboard Corp. | 139 | 418,543 |
| The Hain Celestial Group, Inc. (A) | 35,705 | 922,617 |
| Household products – 0.4% | |
| Energizer Holdings, Inc. | 26,099 | 1,016,817 |
| Spectrum Brands Holdings, Inc. | 18,290 | 787,567 |
| Personal products – 0.1% | |
| BellRing Brands, Inc., Class A (A) | 17,668 | 309,720 |
| Energy – 0.9% | 4,081,210 |
| Energy equipment and services – 0.2% | |
| Helmerich & Payne, Inc. | 48,967 | 968,078 |
| Oil, gas and consumable fuels – 0.7% | |
| CVR Energy, Inc. | 14,297 | 340,983 |
| Murphy Oil Corp. (B) | 64,729 | 767,686 |
| PBF Energy, Inc., Class A | 49,772 | 567,401 |
| WPX Energy, Inc. (A) | 234,431 | 1,437,062 |
MULTIFACTOR SMALL CAP ETF (continued)
| | Shares or
Principal
Amount | Value |
| Financials – 18.1% | $83,864,630 |
| Banks – 8.5% | |
| Associated Banc-Corp | 81,291 | 1,149,455 |
| BancorpSouth Bank | 42,522 | 930,807 |
| Bank of Hawaii Corp. | 21,382 | 1,457,825 |
| Bank OZK | 55,906 | 1,264,594 |
| BankUnited, Inc. | 42,815 | 848,165 |
| Cathay General Bancorp | 34,467 | 962,319 |
| CenterState Bank Corp. | 61,361 | 1,067,068 |
| CIT Group, Inc. | 49,930 | 947,671 |
| Community Bank System, Inc. | 21,377 | 1,335,849 |
| CVB Financial Corp. | 58,398 | 1,213,802 |
| First Citizens BancShares, Inc., Class A | 2,598 | 992,436 |
| First Financial Bankshares, Inc. | 59,007 | 1,643,345 |
| First Hawaiian, Inc. | 59,036 | 1,038,443 |
| First Horizon National Corp. | 149,108 | 1,353,901 |
| FNB Corp. | 144,337 | 1,167,686 |
| Glacier Bancorp, Inc. | 39,982 | 1,522,515 |
| Hancock Whitney Corp. | 41,582 | 869,480 |
| Home BancShares, Inc. | 68,183 | 1,045,245 |
| IBERIABANK Corp. | 22,148 | 918,256 |
| Investors Bancorp, Inc. | 120,869 | 1,125,290 |
| Old National Bancorp | 73,748 | 1,045,009 |
| PacWest Bancorp | 53,005 | 1,072,821 |
| Pinnacle Financial Partners, Inc. | 33,353 | 1,342,458 |
| Popular, Inc. | 41,627 | 1,606,386 |
| Sterling Bancorp | 86,884 | 1,071,280 |
| Synovus Financial Corp. | 64,622 | 1,357,708 |
| UMB Financial Corp. | 20,040 | 1,018,834 |
| Umpqua Holdings Corp. | 98,278 | 1,230,932 |
| United Bankshares, Inc. | 42,882 | 1,284,745 |
| Valley National Bancorp | 174,232 | 1,456,580 |
| Webster Financial Corp. | 47,218 | 1,333,909 |
| Western Alliance Bancorp | 44,724 | 1,604,697 |
| Wintrust Financial Corp. | 26,390 | 1,105,741 |
| Capital markets – 3.6% | |
| Affiliated Managers Group, Inc. | 24,325 | 1,701,777 |
| BGC Partners, Inc., Class A | 127,385 | 394,257 |
| Cohen & Steers, Inc. | 9,787 | 565,101 |
| Eaton Vance Corp. | 47,276 | 1,735,029 |
| Evercore, Inc., Class A | 17,668 | 911,669 |
| Federated Hermes, Inc. | 41,505 | 945,069 |
| Hamilton Lane, Inc., Class A | 10,639 | 689,939 |
| Houlihan Lokey, Inc. | 19,089 | 1,133,505 |
| Interactive Brokers Group, Inc., Class A | 32,137 | 1,317,617 |
| Janus Henderson Group PLC | 76,315 | 1,366,039 |
| Lazard, Ltd., Class A | 54,963 | 1,511,483 |
| Legg Mason, Inc. | 46,949 | 2,339,469 |
| Stifel Financial Corp. | 29,834 | 1,321,050 |
| Virtu Financial, Inc., Class A | 31,990 | 747,606 |
| 72 | JOHN HANCOCK MULTIFACTOR ETFS | ANNUAL REPORT | SEE NOTES TO FINANCIAL STATEMENTS |
MULTIFACTOR SMALL CAP ETF (continued)
| | Shares or
Principal
Amount | Value |
| Financials (continued) | |
| Consumer finance – 1.0% | |
| FirstCash, Inc. | 17,958 | $1,290,103 |
| LendingTree, Inc. (A)(B) | 3,648 | 909,702 |
| OneMain Holdings, Inc. | 34,226 | 828,611 |
| SLM Corp. | 187,827 | 1,566,477 |
| Diversified financial services – 0.4% | |
| Cannae Holdings, Inc. (A) | 32,669 | 1,030,707 |
| FGL Holdings (B) | 69,438 | 720,766 |
| Insurance – 3.8% | |
| American National Insurance Company | 4,309 | 346,875 |
| Assured Guaranty, Ltd. | 42,260 | 1,256,390 |
| Axis Capital Holdings, Ltd. | 36,000 | 1,317,600 |
| Brighthouse Financial, Inc. (A) | 53,296 | 1,370,240 |
| Enstar Group, Ltd. (A) | 4,940 | 714,423 |
| Kemper Corp. | 26,765 | 1,799,143 |
| Kinsale Capital Group, Inc. | 8,618 | 936,087 |
| Primerica, Inc. | 20,914 | 2,173,174 |
| RLI Corp. | 20,022 | 1,458,202 |
| Selective Insurance Group, Inc. | 25,346 | 1,270,595 |
| The Hanover Insurance Group, Inc. | 19,967 | 2,004,287 |
| Unum Group | 83,222 | 1,452,224 |
| White Mountains Insurance Group, Ltd. | 1,665 | 1,620,045 |
| Thrifts and mortgage finance – 0.8% | |
| Essent Group, Ltd. | 39,712 | 1,084,932 |
| MGIC Investment Corp. | 141,924 | 1,037,464 |
| PennyMac Financial Services, Inc. | 12,948 | 390,641 |
| Radian Group, Inc. | 81,514 | 1,221,080 |
| Health care – 12.5% | 57,943,234 |
| Biotechnology – 4.8% | |
| Acceleron Pharma, Inc. (A) | 18,825 | 1,704,227 |
| Agios Pharmaceuticals, Inc. (A) | 27,387 | 1,126,701 |
| Alkermes PLC (A) | 71,987 | 986,942 |
| Allakos, Inc. (A)(B) | 11,987 | 788,265 |
| Arrowhead Pharmaceuticals, Inc. (A) | 46,448 | 1,599,205 |
| Bridgebio Pharma, Inc. (A)(B) | 32,781 | 1,000,804 |
| CRISPR Therapeutics AG (A) | 17,736 | 872,611 |
| Deciphera Pharmaceuticals, Inc. (A) | 15,191 | 880,774 |
| Emergent BioSolutions, Inc. (A) | 20,111 | 1,487,208 |
| FibroGen, Inc. (A) | 38,936 | 1,436,349 |
| Global Blood Therapeutics, Inc. (A)(B) | 27,642 | 2,115,166 |
| Iovance Biotherapeutics, Inc. (A) | 46,066 | 1,481,022 |
| Mirati Therapeutics, Inc. (A)(B) | 16,321 | 1,387,938 |
| PTC Therapeutics, Inc. (A) | 28,068 | 1,429,223 |
| Ultragenyx Pharmaceutical, Inc. (A)(B) | 26,138 | 1,579,519 |
| United Therapeutics Corp. (A) | 21,883 | 2,397,501 |
| Health care equipment and supplies – 4.3% | |
| Cantel Medical Corp. | 17,310 | 640,470 |
| CONMED Corp. | 13,728 | 1,014,636 |
| Envista Holdings Corp. (A) | 71,850 | 1,398,920 |
MULTIFACTOR SMALL CAP ETF (continued)
| | Shares or
Principal
Amount | Value |
| Health care (continued) | |
| Health care equipment and supplies (continued) | |
| ICU Medical, Inc. (A) | 9,993 | $2,191,565 |
| Integer Holdings Corp. (A) | 14,791 | 1,101,338 |
| Integra LifeSciences Holdings Corp. (A) | 32,156 | 1,641,564 |
| LivaNova PLC (A) | 20,917 | 1,111,111 |
| Neogen Corp. (A) | 23,324 | 1,459,849 |
| Nevro Corp. (A) | 13,498 | 1,587,905 |
| NuVasive, Inc. (A) | 24,847 | 1,512,685 |
| Quidel Corp. (A) | 15,897 | 2,209,683 |
| Tandem Diabetes Care, Inc. (A) | 27,092 | 2,161,400 |
| Wright Medical Group NV (A)(B) | 58,062 | 1,690,765 |
| Health care providers and services – 1.8% | |
| Acadia Healthcare Company, Inc. (A) | 38,789 | 931,324 |
| AMN Healthcare Services, Inc. (A) | 20,977 | 985,499 |
| HealthEquity, Inc. (A) | 34,180 | 1,923,309 |
| LHC Group, Inc. (A) | 12,790 | 1,662,572 |
| Premier, Inc., Class A (A) | 30,447 | 1,009,623 |
| Select Medical Holdings Corp. (A) | 49,535 | 845,562 |
| Tenet Healthcare Corp. (A) | 46,518 | 938,733 |
| Health care technology – 0.4% | |
| Inovalon Holdings, Inc., Class A (A) | 32,015 | 560,263 |
| Omnicell, Inc. (A) | 18,761 | 1,367,677 |
| Life sciences tools and services – 1.2% | |
| Adaptive Biotechnologies Corp. (A) | 32,850 | 1,051,529 |
| Medpace Holdings, Inc. (A) | 13,313 | 1,063,176 |
| NeoGenomics, Inc. (A) | 41,713 | 1,140,433 |
| Repligen Corp. (A) | 21,250 | 2,468,188 |
| Industrials – 15.9% | 73,886,274 |
| Aerospace and defense – 1.4% | |
| Aerojet Rocketdyne Holdings, Inc. (A) | 31,500 | 1,295,910 |
| Axon Enterprise, Inc. (A) | 25,494 | 1,853,669 |
| Mercury Systems, Inc. (A) | 23,011 | 2,051,661 |
| Moog, Inc., Class A | 13,997 | 692,572 |
| Parsons Corp. (A) | 10,774 | 402,948 |
| Airlines – 0.4% | |
| Copa Holdings SA, Class A | 13,921 | 615,443 |
| JetBlue Airways Corp. (A) | 130,851 | 1,274,489 |
| Building products – 1.4% | |
| AAON, Inc. | 17,647 | 840,703 |
| Advanced Drainage Systems, Inc. | 18,984 | 769,611 |
| Armstrong World Industries, Inc. | 20,482 | 1,578,753 |
| Builders FirstSource, Inc. (A) | 48,927 | 897,810 |
| Simpson Manufacturing Company, Inc. | 19,173 | 1,382,373 |
| Universal Forest Products Inc | 26,054 | 1,071,340 |
| Commercial services and supplies – 2.5% | |
| ADT, Inc. (B) | 48,789 | 279,561 |
| Brady Corp., Class A | 20,873 | 908,810 |
| Cimpress PLC (A) | 9,874 | 718,728 |
| Clean Harbors, Inc. (A) | 23,147 | 1,236,744 |
| SEE NOTES TO FINANCIAL STATEMENTS | ANNUAL REPORT | JOHN HANCOCK MULTIFACTOR ETFS | 73 |
MULTIFACTOR SMALL CAP ETF (continued)
| | Shares or
Principal
Amount | Value |
| Industrials (continued) | |
| Commercial services and supplies (continued) | |
| KAR Auction Services, Inc. | 64,506 | $966,300 |
| MSA Safety, Inc. | 15,346 | 1,726,885 |
| Stericycle, Inc. (A) | 36,912 | 1,801,306 |
| Tetra Tech, Inc. | 22,943 | 1,727,149 |
| The Brink's Company | 21,913 | 1,120,193 |
| UniFirst Corp. | 6,866 | 1,154,518 |
| Construction and engineering – 0.9% | |
| EMCOR Group, Inc. | 29,732 | 1,888,874 |
| MasTec, Inc. (A) | 27,392 | 983,373 |
| Valmont Industries, Inc. | 9,792 | 1,148,014 |
| Electrical equipment – 1.1% | |
| Acuity Brands, Inc. | 17,857 | 1,546,238 |
| EnerSys | 18,155 | 1,060,070 |
| nVent Electric PLC | 67,673 | 1,262,101 |
| Regal Beloit Corp. | 20,436 | 1,451,160 |
| Machinery – 3.4% | |
| AGCO Corp. | 27,302 | 1,442,638 |
| Barnes Group, Inc. | 20,935 | 803,485 |
| Colfax Corp. (A) | 39,328 | 1,014,269 |
| Crane Company | 24,799 | 1,350,306 |
| Gates Industrial Corp. PLC (A) | 23,488 | 201,762 |
| ITT, Inc. | 44,952 | 2,369,869 |
| John Bean Technologies Corp. | 14,015 | 1,075,511 |
| Navistar International Corp. (A) | 21,862 | 519,660 |
| Oshkosh Corp. | 30,784 | 2,078,844 |
| RBC Bearings, Inc. (A) | 11,166 | 1,414,509 |
| Rexnord Corp. | 52,742 | 1,438,274 |
| The Timken Company | 32,429 | 1,218,682 |
| Watts Water Technologies, Inc., Class A | 11,868 | 977,923 |
| Marine – 0.3% | |
| Kirby Corp. (A) | 25,498 | 1,362,103 |
| Professional services – 2.2% | |
| ASGN, Inc. (A) | 23,909 | 1,110,573 |
| CoreLogic, Inc. | 39,207 | 1,506,333 |
| Exponent, Inc. | 22,859 | 1,607,673 |
| FTI Consulting, Inc. (A) | 16,563 | 2,109,464 |
| Insperity, Inc. | 17,583 | 838,885 |
| ManpowerGroup, Inc. | 31,136 | 2,311,537 |
| TriNet Group, Inc. (A) | 19,374 | 948,745 |
| Road and rail – 0.6% | |
| Landstar System, Inc. | 19,945 | 2,060,518 |
| Schneider National, Inc., Class B | 25,855 | 566,483 |
| Trading companies and distributors – 1.5% | |
| Air Lease Corp. | 47,382 | 1,239,039 |
| GATX Corp. | 15,656 | 928,401 |
| MSC Industrial Direct Company, Inc., Class A | 18,977 | 1,131,788 |
| SiteOne Landscape Supply, Inc. (A) | 20,005 | 1,773,043 |
| Triton International, Ltd. | 23,809 | 737,603 |
MULTIFACTOR SMALL CAP ETF (continued)
| | Shares or
Principal
Amount | Value |
| Industrials (continued) | |
| Trading companies and distributors (continued) | |
| Univar Solutions, Inc. (A) | 80,708 | $1,171,880 |
| Transportation infrastructure – 0.2% | |
| Macquarie Infrastructure Corp. | 31,503 | 869,168 |
| Information technology – 13.4% | 61,938,142 |
| Communications equipment – 0.9% | |
| Acacia Communications, Inc. (A) | 16,316 | 1,104,430 |
| EchoStar Corp., Class A (A) | 21,518 | 678,893 |
| ViaSat, Inc. (A) | 25,196 | 1,068,310 |
| Viavi Solutions, Inc. (A) | 102,714 | 1,240,785 |
| Electronic equipment, instruments and components – 2.3% | |
| Anixter International, Inc. (A) | 13,066 | 1,213,309 |
| Avnet, Inc. | 44,563 | 1,337,781 |
| Coherent, Inc. (A) | 11,058 | 1,413,986 |
| Itron, Inc. (A) | 17,947 | 1,253,060 |
| Jabil, Inc. | 59,878 | 1,702,930 |
| Littelfuse, Inc. | 10,473 | 1,521,099 |
| Novanta, Inc. (A) | 15,133 | 1,314,906 |
| Vishay Intertechnology, Inc. | 58,477 | 970,133 |
| IT services – 2.2% | |
| ExlService Holdings, Inc. (A) | 14,521 | 896,381 |
| KBR, Inc. | 63,312 | 1,282,701 |
| ManTech International Corp., Class A | 12,184 | 908,439 |
| MAXIMUS, Inc. | 30,589 | 2,059,251 |
| Perspecta, Inc. | 63,126 | 1,361,628 |
| Sabre Corp. | 126,283 | 918,077 |
| Science Applications International Corp. | 24,663 | 2,013,981 |
| Switch, Inc., Class A | 32,757 | 562,438 |
| Semiconductors and semiconductor equipment – 2.6% | |
| Amkor Technology, Inc. (A) | 26,939 | 266,157 |
| Brooks Automation, Inc. | 32,504 | 1,251,079 |
| Cabot Microelectronics Corp. | 12,896 | 1,580,276 |
| Cirrus Logic, Inc. (A) | 25,941 | 1,961,140 |
| Cree, Inc. (A) | 53,021 | 2,286,796 |
| Power Integrations, Inc. | 12,245 | 1,253,276 |
| Semtech Corp. (A) | 29,333 | 1,327,025 |
| Silicon Laboratories, Inc. (A) | 21,086 | 2,049,981 |
| Software – 4.8% | |
| ACI Worldwide, Inc. (A) | 49,725 | 1,362,465 |
| Altair Engineering, Inc., Class A (A) | 17,528 | 578,249 |
| Appfolio, Inc., Class A (A) | 7,575 | 832,190 |
| Blackbaud, Inc. | 21,800 | 1,204,668 |
| Cornerstone OnDemand, Inc. (A) | 28,234 | 947,533 |
| Envestnet, Inc. (A) | 23,433 | 1,465,031 |
| FireEye, Inc. (A) | 98,444 | 1,133,090 |
| Five9, Inc. (A) | 26,716 | 2,475,772 |
| Globant SA (A)(B) | 10,455 | 1,209,330 |
| j2 Global, Inc. | 22,268 | 1,795,692 |
| Manhattan Associates, Inc. (A) | 28,765 | 2,040,589 |
| 74 | JOHN HANCOCK MULTIFACTOR ETFS | ANNUAL REPORT | SEE NOTES TO FINANCIAL STATEMENTS |
MULTIFACTOR SMALL CAP ETF (continued)
| | Shares or
Principal
Amount | Value |
| Information technology (continued) | |
| Software (continued) | |
| Mimecast, Ltd. (A) | 25,993 | $1,063,114 |
| Nutanix, Inc., Class A (A) | 85,538 | 1,752,674 |
| Q2 Holdings, Inc. (A) | 21,067 | 1,679,461 |
| Qualys, Inc. (A) | 14,959 | 1,577,277 |
| Verint Systems, Inc. (A) | 30,882 | 1,319,897 |
| Technology hardware, storage and peripherals – 0.6% | |
| NCR Corp. (A) | 57,983 | 1,189,811 |
| Pure Storage, Inc., Class A (A) | 105,073 | 1,513,051 |
| Materials – 4.0% | 18,464,012 |
| Chemicals – 2.4% | |
| Ashland Global Holdings, Inc. | 27,434 | 1,692,403 |
| Balchem Corp. | 14,121 | 1,260,158 |
| Element Solutions, Inc. (A) | 96,380 | 987,895 |
| Huntsman Corp. | 100,678 | 1,692,397 |
| NewMarket Corp. | 3,776 | 1,553,597 |
| Olin Corp. | 74,445 | 993,841 |
| Valvoline, Inc. | 82,842 | 1,424,054 |
| W.R. Grace & Company | 29,312 | 1,384,406 |
| Construction materials – 0.2% | |
| Eagle Materials, Inc. | 19,408 | 1,184,082 |
| Containers and packaging – 1.1% | |
| Ardagh Group SA | 8,460 | 105,242 |
| Graphic Packaging Holding Company | 125,067 | 1,669,644 |
| Sealed Air Corp. | 66,678 | 1,906,324 |
| Silgan Holdings, Inc. | 40,453 | 1,395,629 |
| Paper and forest products – 0.3% | |
| Louisiana-Pacific Corp. | 60,717 | 1,214,340 |
| Real estate – 10.2% | 47,139,951 |
| Equity real estate investment trusts – 9.7% | |
| Agree Realty Corp. | 19,163 | 1,247,703 |
| American Assets Trust, Inc. | 23,602 | 668,409 |
| Apple Hospitality REIT, Inc. | 96,697 | 936,027 |
| Corporate Office Properties Trust | 46,284 | 1,222,823 |
| Cousins Properties, Inc. | 41,274 | 1,245,237 |
| EastGroup Properties, Inc. | 15,428 | 1,635,368 |
| EPR Properties | 34,334 | 1,010,106 |
| Equity Commonwealth | 51,288 | 1,741,228 |
| First Industrial Realty Trust, Inc. | 51,817 | 1,957,128 |
| Healthcare Realty Trust, Inc. | 57,034 | 1,676,229 |
| Highwoods Properties, Inc. | 43,473 | 1,687,187 |
| Hudson Pacific Properties, Inc. | 45,624 | 1,121,438 |
| JBG SMITH Properties | 43,898 | 1,490,337 |
| Lexington Realty Trust | 104,745 | 1,094,585 |
| Life Storage, Inc. | 19,222 | 1,683,655 |
| National Health Investors, Inc. | 18,755 | 1,032,650 |
| National Storage Affiliates Trust | 26,806 | 763,435 |
| Outfront Media, Inc. | 62,661 | 983,151 |
MULTIFACTOR SMALL CAP ETF (continued)
| | Shares or
Principal
Amount | Value |
| Real estate (continued) | |
| Equity real estate investment trusts (continued) | |
| Paramount Group, Inc. | 89,575 | $864,399 |
| Park Hotels & Resorts, Inc. | 108,081 | 1,027,850 |
| Pebblebrook Hotel Trust | 61,403 | 727,012 |
| Physicians Realty Trust | 85,612 | 1,320,137 |
| Piedmont Office Realty Trust, Inc., Class A | 66,583 | 1,155,215 |
| PotlatchDeltic Corp. | 27,907 | 979,815 |
| PS Business Parks, Inc. | 8,705 | 1,123,728 |
| QTS Realty Trust, Inc., Class A | 25,289 | 1,581,321 |
| Rayonier, Inc. | 57,702 | 1,386,579 |
| Rexford Industrial Realty, Inc. | 48,025 | 1,955,578 |
| Ryman Hospitality Properties, Inc. | 23,834 | 842,294 |
| Sabra Health Care REIT, Inc. | 90,396 | 1,158,877 |
| Service Properties Trust | 75,580 | 523,769 |
| Spirit Realty Capital, Inc. | 43,886 | 1,349,933 |
| STAG Industrial, Inc. | 64,277 | 1,687,271 |
| Sunstone Hotel Investors, Inc. | 99,726 | 916,482 |
| Terreno Realty Corp. | 29,794 | 1,633,307 |
| The Macerich Company | 67,459 | 503,919 |
| Weingarten Realty Investors | 52,889 | 962,051 |
| Real estate management and development – 0.5% | |
| Cushman & Wakefield PLC (A) | 47,839 | 582,201 |
| Kennedy-Wilson Holdings, Inc. | 52,778 | 746,809 |
| The Howard Hughes Corp. (A) | 16,889 | 914,708 |
| Utilities – 5.3% | 24,781,068 |
| Electric utilities – 1.7% | |
| ALLETE, Inc. | 21,276 | 1,224,647 |
| Hawaiian Electric Industries, Inc. | 53,140 | 2,097,436 |
| MGE Energy, Inc. | 15,145 | 979,276 |
| PNM Resources, Inc. | 36,451 | 1,475,901 |
| Portland General Electric Company | 41,285 | 1,931,725 |
| Gas utilities – 1.9% | |
| National Fuel Gas Company | 36,414 | 1,492,974 |
| New Jersey Resources Corp. | 39,987 | 1,350,761 |
| ONE Gas, Inc. | 22,261 | 1,774,424 |
| South Jersey Industries, Inc. | 38,773 | 1,108,520 |
| Southwest Gas Holdings, Inc. | 23,679 | 1,794,868 |
| Spire, Inc. | 21,129 | 1,541,572 |
| Independent power and renewable electricity producers –0.6% | |
| Clearway Energy, Inc., Class A | 15,985 | 298,920 |
| Clearway Energy, Inc., Class C | 35,221 | 705,477 |
| Ormat Technologies, Inc. | 17,582 | 1,097,293 |
| TerraForm Power, Inc., Class A | 37,168 | 643,750 |
| Multi-utilities – 0.9% | |
| Avista Corp. | 28,359 | 1,220,571 |
| Black Hills Corp. | 26,242 | 1,625,429 |
| NorthWestern Corp. | 21,007 | 1,211,894 |
| SEE NOTES TO FINANCIAL STATEMENTS | ANNUAL REPORT | JOHN HANCOCK MULTIFACTOR ETFS | 75 |
MULTIFACTOR SMALL CAP ETF (continued)
| | Shares or
Principal
Amount | Value |
| Utilities (continued) | |
| Water utilities – 0.2% | |
| American States Water Company | 15,190 | $1,205,630 |
|
| SHORT-TERM INVESTMENTS – 2.8% | | $12,899,986 |
| (Cost $12,894,499) | | |
| Short-term funds – 2.8% | 12,899,986 |
| John Hancock Collateral Trust, 0.6614% (C)(D) | 1,266,007 | 12,670,705 |
|
| State Street Institutional U.S. Government Money Market Fund, Premier Class, 0.2162% (C) | 229,281 | 229,281 |
| Total investments (Multifactor Small Cap ETF) (Cost $529,697,725) 102.7% | $475,952,254 |
| Other assets and liabilities, net (2.7%) | | (12,706,476) |
| Total net assets 100.0% | | $463,245,778 |
| The percentage shown for each investment category is the total value of the category as a percentage of the net assets of the fund. |
| Security Abbreviations and Legend |
| (A) | Non-income producing security. |
| (B) | All or a portion of this security is on loan as of 4-30-20. |
| (C) | The rate shown is the annualized seven-day yield as of 4-30-20. |
| (D) | Investment is an affiliate of the fund, the advisor and/or subadvisor. This security represents the investment of cash collateral received for securities lending. |
MULTIFACTOR TECHNOLOGY ETF
As of 4-30-20
| | Shares or
Principal
Amount | Value |
| COMMON STOCKS – 100.0% | | $36,258,391 |
| (Cost $33,249,627) | | |
| Industrials – 0.4% | 128,349 |
| Electrical equipment – 0.4% | |
| Sensata Technologies Holding PLC (A) | 3,528 | 128,349 |
| Information technology – 99.6% | 36,130,042 |
| Communications equipment – 6.6% | |
| Arista Networks, Inc. (A) | 1,015 | 222,590 |
| Ciena Corp. (A) | 3,243 | 149,989 |
| Cisco Systems, Inc. | 28,535 | 1,209,313 |
| F5 Networks, Inc. (A) | 1,198 | 166,833 |
| Juniper Networks, Inc. | 6,424 | 138,758 |
| Lumentum Holdings, Inc. (A) | 1,364 | 110,361 |
| Motorola Solutions, Inc. | 2,480 | 356,649 |
| Ubiquiti, Inc. | 173 | 28,031 |
| Electronic equipment, instruments and components – 8.1% | |
| Amphenol Corp., Class A | 6,324 | 558,156 |
| Cognex Corp. | 2,480 | 136,995 |
| Corning, Inc. | 14,498 | 319,101 |
| Dolby Laboratories, Inc., Class A | 1,128 | 67,714 |
| Flex, Ltd. (A) | 10,730 | 104,719 |
| FLIR Systems, Inc. | 3,081 | 133,715 |
| IPG Photonics Corp. (A) | 41 | 5,303 |
MULTIFACTOR TECHNOLOGY ETF (continued)
| | Shares or
Principal
Amount | Value |
| Information technology (continued) | |
| Electronic equipment, instruments andcomponents (continued) | |
| Jabil, Inc. | 5,054 | $143,736 |
| Keysight Technologies, Inc. (A) | 3,736 | 361,533 |
| Littelfuse, Inc. | 577 | 83,803 |
| National Instruments Corp. | 2,618 | 100,584 |
| TE Connectivity, Ltd. | 6,272 | 460,741 |
| Trimble, Inc. (A) | 5,374 | 186,102 |
| Zebra Technologies Corp., Class A (A) | 1,143 | 262,501 |
| IT services – 8.9% | |
| Akamai Technologies, Inc. (A) | 3,571 | 348,922 |
| Amdocs, Ltd. | 2,536 | 163,420 |
| Cognizant Technology Solutions Corp., Class A | 6,131 | 355,721 |
| DXC Technology Company | 4,569 | 82,836 |
| EPAM Systems, Inc. (A) | 886 | 195,709 |
| GoDaddy, Inc., Class A (A) | 2,180 | 151,357 |
| IBM Corp. | 8,181 | 1,027,206 |
| MongoDB, Inc. (A)(B) | 486 | 78,795 |
| Okta, Inc. (A) | 1,154 | 174,600 |
| Perspecta, Inc. | 2,849 | 61,453 |
| Switch, Inc., Class A | 763 | 13,101 |
| Twilio, Inc., Class A (A) | 2,319 | 260,424 |
| VeriSign, Inc. (A) | 1,605 | 336,231 |
| Semiconductors and semiconductor equipment – 30.9% | |
| Advanced Micro Devices, Inc. (A) | 7,248 | 379,723 |
| Analog Devices, Inc. | 3,442 | 377,243 |
| Applied Materials, Inc. | 9,748 | 484,281 |
| Broadcom, Inc. | 2,726 | 740,436 |
| Cabot Microelectronics Corp. | 531 | 65,069 |
| Cirrus Logic, Inc. (A) | 1,052 | 79,531 |
| Cree, Inc. (A) | 2,121 | 91,479 |
| Entegris, Inc. | 2,856 | 154,881 |
| First Solar, Inc. (A) | 1,301 | 57,257 |
| Intel Corp. | 32,775 | 1,965,845 |
| KLA Corp. | 4,171 | 684,419 |
| Lam Research Corp. | 2,064 | 526,898 |
| Marvell Technology Group, Ltd. | 12,479 | 333,688 |
| Maxim Integrated Products, Inc. | 5,988 | 329,220 |
| Microchip Technology, Inc. | 4,551 | 399,259 |
| Micron Technology, Inc. (A) | 11,082 | 530,717 |
| MKS Instruments, Inc. | 1,015 | 101,733 |
| Monolithic Power Systems, Inc. | 699 | 139,737 |
| NVIDIA Corp. | 2,322 | 678,674 |
| ON Semiconductor Corp. (A) | 9,106 | 146,106 |
| Qorvo, Inc. (A) | 2,320 | 227,430 |
| QUALCOMM, Inc. | 7,155 | 562,884 |
| Silicon Laboratories, Inc. (A) | 806 | 78,359 |
| Skyworks Solutions, Inc. | 3,810 | 395,783 |
| SolarEdge Technologies, Inc. (A) | 783 | 87,375 |
| Teradyne, Inc. | 3,856 | 241,154 |
| 76 | JOHN HANCOCK MULTIFACTOR ETFS | ANNUAL REPORT | SEE NOTES TO FINANCIAL STATEMENTS |
MULTIFACTOR TECHNOLOGY ETF (continued)
| | Shares or
Principal
Amount | Value |
| Information technology (continued) | |
| Semiconductors and semiconductor equipment (continued) | |
| Texas Instruments, Inc. | 7,548 | $876,096 |
| Universal Display Corp. | 713 | 107,036 |
| Xilinx, Inc. | 4,154 | 363,060 |
| Software – 34.8% | |
| Adobe, Inc. (A) | 2,040 | 721,426 |
| Alteryx, Inc., Class A (A)(B) | 500 | 56,590 |
| Anaplan, Inc. (A) | 1,028 | 42,004 |
| ANSYS, Inc. (A) | 1,416 | 370,751 |
| Appfolio, Inc., Class A (A) | 159 | 17,468 |
| Aspen Technology, Inc. (A) | 1,137 | 116,258 |
| Atlassian Corp. PLC, Class A (A) | 831 | 129,212 |
| Autodesk, Inc. (A) | 1,143 | 213,890 |
| Avalara, Inc. (A) | 708 | 63,274 |
| Cadence Design Systems, Inc. (A) | 5,476 | 444,268 |
| CDK Global, Inc. | 1,799 | 70,665 |
| Ceridian HCM Holding, Inc. (A) | 1,665 | 98,185 |
| Citrix Systems, Inc. | 2,280 | 330,623 |
| Coupa Software, Inc. (A) | 660 | 116,219 |
| Crowdstrike Holdings, Inc., Class A (A) | 1,036 | 70,096 |
| DocuSign, Inc. (A) | 1,551 | 162,467 |
| Dropbox, Inc., Class A (A) | 3,537 | 74,348 |
| Elastic NV (A) | 457 | 29,312 |
| Envestnet, Inc. (A) | 943 | 58,956 |
| Fair Isaac Corp. (A) | 533 | 188,117 |
| Five9, Inc. (A) | 616 | 57,085 |
| Fortinet, Inc. (A) | 1,844 | 198,673 |
| Guidewire Software, Inc. (A) | 1,456 | 132,263 |
| HubSpot, Inc. (A) | 593 | 99,998 |
| Intuit, Inc. | 1,399 | 377,464 |
| j2 Global, Inc. | 1,222 | 98,542 |
| Manhattan Associates, Inc. (A) | 1,184 | 83,993 |
| Microsoft Corp. | 13,193 | 2,364,318 |
| NortonLifeLock, Inc. | 14,614 | 310,840 |
| Nuance Communications, Inc. (A) | 5,566 | 112,433 |
| Nutanix, Inc., Class A (A) | 1,538 | 31,514 |
| Oracle Corp. | 20,630 | 1,092,771 |
| Palo Alto Networks, Inc. (A) | 1,207 | 237,188 |
| Paycom Software, Inc. (A) | 733 | 191,328 |
| Paylocity Holding Corp. (A) | 430 | 49,248 |
| Pegasystems, Inc. | 603 | 50,423 |
| Proofpoint, Inc. (A) | 932 | 113,452 |
| PTC, Inc. (A) | 1,694 | 117,310 |
| Q2 Holdings, Inc. (A)(B) | 733 | 58,435 |
| RealPage, Inc. (A) | 1,423 | 91,769 |
| RingCentral, Inc., Class A (A) | 781 | 178,482 |
| salesforce.com, Inc. (A) | 5,322 | 861,898 |
| ServiceNow, Inc. (A) | 985 | 346,267 |
| Smartsheet, Inc., Class A (A) | 1,738 | 91,627 |
| SolarWinds Corp. (A) | 1,008 | 17,116 |
MULTIFACTOR TECHNOLOGY ETF (continued)
| | Shares or
Principal
Amount | Value |
| Information technology (continued) | |
| Software (continued) | |
| Splunk, Inc. (A) | 2,059 | $289,001 |
| SS&C Technologies Holdings, Inc. | 5,031 | 277,510 |
| Synopsys, Inc. (A) | 2,750 | 432,080 |
| The Trade Desk, Inc., Class A (A)(B) | 415 | 121,421 |
| Tyler Technologies, Inc. (A) | 646 | 207,166 |
| Verint Systems, Inc. (A) | 1,188 | 50,775 |
| VMware, Inc., Class A (A)(B) | 681 | 89,565 |
| Workday, Inc., Class A (A) | 866 | 133,277 |
| Zendesk, Inc. (A) | 1,204 | 92,564 |
| Zoom Video Communications, Inc., Class A (A) | 1,033 | 139,631 |
| Zscaler, Inc. (A)(B) | 612 | 41,053 |
| Technology hardware, storage and peripherals – 10.3% | |
| Apple, Inc. | 7,826 | 2,299,279 |
| Dell Technologies, Inc., Class C (A) | 1,601 | 68,347 |
| Hewlett Packard Enterprise Company | 25,726 | 258,804 |
| HP, Inc. | 11,107 | 172,270 |
| NetApp, Inc. | 4,636 | 202,918 |
| Pure Storage, Inc., Class A (A) | 3,632 | 52,301 |
| Seagate Technology PLC | 6,760 | 337,662 |
| Western Digital Corp. | 6,105 | 281,318 |
| Xerox Holdings Corp. | 4,492 | 82,159 |
|
| SHORT-TERM INVESTMENTS – 0.5% | | $186,917 |
| (Cost $186,875) | | |
| Short-term funds – 0.5% | 186,917 |
| John Hancock Collateral Trust, 0.6614% (C)(D) | 14,937 | 149,493 |
|
| State Street Institutional U.S. Government Money Market Fund, Premier Class, 0.2162% (C) | 37,424 | 37,424 |
| Total investments (Multifactor Technology ETF) (Cost $33,436,502) 100.5% | $36,445,308 |
| Other assets and liabilities, net (0.5%) | | (178,621) |
| Total net assets 100.0% | | $36,266,687 |
| The percentage shown for each investment category is the total value of the category as a percentage of the net assets of the fund. |
| Security Abbreviations and Legend |
| (A) | Non-income producing security. |
| (B) | All or a portion of this security is on loan as of 4-30-20. |
| (C) | The rate shown is the annualized seven-day yield as of 4-30-20. |
| (D) | Investment is an affiliate of the fund, the advisor and/or subadvisor. This security represents the investment of cash collateral received for securities lending. |
| SEE NOTES TO FINANCIAL STATEMENTS | ANNUAL REPORT | JOHN HANCOCK MULTIFACTOR ETFS | 77 |
MULTIFACTOR UTILITIES ETF
As of 4-30-20
| | Shares or
Principal
Amount | Value |
| COMMON STOCKS – 99.9% | | $25,433,428 |
| (Cost $29,154,314) | | |
| Utilities – 99.9% | 25,433,428 |
| Electric utilities – 54.0% | |
| ALLETE, Inc. | 1,859 | 107,004 |
| Alliant Energy Corp. | 10,044 | 487,636 |
| American Electric Power Company, Inc. | 11,042 | 917,701 |
| Avangrid, Inc. | 2,679 | 115,197 |
| Duke Energy Corp. | 10,905 | 923,217 |
| Edison International | 18,065 | 1,060,596 |
| Entergy Corp. | 10,047 | 959,589 |
| Evergy, Inc. | 13,244 | 773,847 |
| Eversource Energy | 10,129 | 817,410 |
| Exelon Corp. | 30,275 | 1,122,597 |
| FirstEnergy Corp. | 21,256 | 877,235 |
| Hawaiian Electric Industries, Inc. | 6,267 | 247,358 |
| IDACORP, Inc. | 1,681 | 154,282 |
| NextEra Energy, Inc. | 4,123 | 952,908 |
| NRG Energy, Inc. | 7,868 | 263,814 |
| OGE Energy Corp. | 7,072 | 222,909 |
| Pinnacle West Capital Corp. | 5,643 | 434,455 |
| PNM Resources, Inc. | 2,748 | 111,267 |
| Portland General Electric Company | 5,042 | 235,915 |
| PPL Corp. | 46,236 | 1,175,319 |
| The Southern Company | 19,163 | 1,087,117 |
| Xcel Energy, Inc. | 10,906 | 693,188 |
| Gas utilities – 5.2% | |
| Atmos Energy Corp. | 4,335 | 442,040 |
| New Jersey Resources Corp. | 2,370 | 80,059 |
| ONE Gas, Inc. | 2,428 | 193,536 |
| Southwest Gas Holdings, Inc. | 2,993 | 226,869 |
| Spire, Inc. | 1,872 | 136,581 |
| UGI Corp. | 8,298 | 250,434 |
| Independent power and renewable electricity producers –4.0% | |
| Clearway Energy, Inc., Class A | 720 | 13,464 |
| Clearway Energy, Inc., Class C | 1,627 | 32,589 |
| TerraForm Power, Inc., Class A | 2,907 | 50,349 |
| The AES Corp. | 26,813 | 355,272 |
| Vistra Energy Corp. | 28,904 | 564,784 |
| Multi-utilities – 32.7% | |
| Ameren Corp. | 10,341 | 752,308 |
| Black Hills Corp. | 2,961 | 183,404 |
| CenterPoint Energy, Inc. | 31,785 | 541,299 |
| CMS Energy Corp. | 11,261 | 642,890 |
| Consolidated Edison, Inc. | 17,694 | 1,394,287 |
| Dominion Energy, Inc. | 8,234 | 635,088 |
| DTE Energy Company | 9,016 | 935,320 |
| NiSource, Inc. | 18,748 | 470,762 |
| Public Service Enterprise Group, Inc. | 25,316 | 1,283,774 |
| Sempra Energy | 5,224 | 646,992 |
MULTIFACTOR UTILITIES ETF (continued)
| | Shares or
Principal
Amount | Value |
| Utilities (continued) | |
| Multi-utilities (continued) | |
| WEC Energy Group, Inc. | 9,347 | $846,371 |
| Water utilities – 4.0% | |
| American Water Works Company, Inc. | 6,375 | 775,774 |
| Essential Utilities, Inc. | 5,710 | 238,621 |
|
| SHORT-TERM INVESTMENTS – 0.1% | | $31,046 |
| (Cost $31,046) | | |
| Short-term funds – 0.1% | 31,046 |
| State Street Institutional U.S. Government Money Market Fund, Premier Class, 0.2162% (A) | 31,046 | 31,046 |
| Total investments (Multifactor Utilities ETF) (Cost $29,185,360) 100.0% | $25,464,474 |
| Other assets and liabilities, net (0.0%) | | (10,774) |
| Total net assets 100.0% | | $25,453,700 |
| The percentage shown for each investment category is the total value of the category as a percentage of the net assets of the fund. |
| Security Abbreviations and Legend |
| (A) | The rate shown is the annualized seven-day yield as of 4-30-20. |
| 78 | JOHN HANCOCK MULTIFACTOR ETFS | ANNUAL REPORT | SEE NOTES TO FINANCIAL STATEMENTS |
STATEMENTS OF ASSETS AND LIABILITIES 4-30-20
| | Multifactor Consumer Discretionary ETF | Multifactor Consumer Staples ETF | Multifactor Developed International ETF | Multifactor Emerging Markets ETF |
| Assets | | | | |
| Unaffiliated investments, at value | $31,190,003 | $19,205,919 | $429,783,291 | $683,716,271 |
| Affiliated investments, at value | 645,028 | — | 10,542,966 | 6,738,757 |
| Total investments, at value | 31,835,031 | 19,205,919 | 440,326,257 | 690,455,028 |
| Foreign currency, at value | — | — | 900,440 | 996,983 |
| Dividends and interest receivable | 8,680 | 28,550 | 2,467,712 | 760,530 |
| Receivable for investments sold | — | — | 111,405 | 875,953 |
| Receivable for securities lending income | 685 | 208 | 10,327 | 14,456 |
| Receivable from affiliates | — | 1,125 | — | — |
| Other assets | 8,385 | 8,134 | 10,636 | 11,952 |
| Total assets | 31,852,781 | 19,243,936 | 443,826,777 | 693,114,902 |
| Liabilities | | | | |
| Payable for investments purchased | — | — | 53,016 | 875,954 |
| Payable upon return of securities loaned | 646,339 | — | 10,537,500 | 6,740,342 |
| Payable to affiliates | | | | |
| Investment management fees | 736 | — | 95,390 | 167,705 |
| Accounting and legal services fees | 3,488 | 2,659 | 33,254 | 51,768 |
| Trustees' fees | 44 | 37 | 546 | 905 |
| Other liabilities and accrued expenses | 30,858 | 30,056 | 69,777 | 165,298 |
| Total liabilities | 681,465 | 32,752 | 10,789,483 | 8,001,972 |
| Net assets | $31,171,316 | $19,211,184 | $433,037,294 | $685,112,930 |
| Net assets consist of | | | | |
| Paid-in capital | $37,851,751 | $20,861,092 | $478,391,764 | $781,178,446 |
| Total distributable earnings (loss) | (6,680,435) | (1,649,908) | (45,354,470) | (96,065,516) |
| Net assets | $31,171,316 | $19,211,184 | $433,037,294 | $685,112,930 |
| Unaffiliated investments, at cost | $33,753,351 | $20,019,342 | $462,933,389 | $770,636,527 |
| Affiliated investments, at cost | $644,851 | — | $10,539,794 | $6,736,081 |
| Foreign currency, at cost | — | — | $892,836 | $986,870 |
| Securities loaned, at value | $590,699 | — | $9,841,955 | $6,346,286 |
| Net asset value per share | | | | |
| Based on net asset values and shares outstanding-the fund has an unlimited number of shares authorized with no par value. | | | | |
| Net assets | $31,171,316 | $19,211,184 | $433,037,294 | $685,112,930 |
| Shares outstanding | 1,040,000 | 690,000 | 17,800,000 | 31,700,000 |
| Net asset value per share | $29.97 | $27.84 | $24.33 | $21.61 |
| SEE NOTES TO FINANCIAL STATEMENTS | ANNUAL | JOHN HANCOCK MULTIFACTOR ETFS | 79 |
STATEMENTS OF ASSETS AND LIABILITIES 4-30-20
Continued
| | Multifactor Energy ETF | Multifactor Financials ETF | Multifactor Healthcare ETF | Multifactor Industrials ETF |
| Assets | | | | |
| Unaffiliated investments, at value | $15,019,560 | $30,375,808 | $43,215,775 | $22,253,539 |
| Affiliated investments, at value | 59,622 | 35,481 | 183,786 | 95,357 |
| Total investments, at value | 15,079,182 | 30,411,289 | 43,399,561 | 22,348,896 |
| Dividends and interest receivable | 16,256 | 25,471 | 28,563 | 15,699 |
| Receivable for fund shares sold | 973,274 | — | — | — |
| Receivable for investments sold | — | — | 366,015 | 955,067 |
| Receivable for securities lending income | 123 | 40 | 167 | 163 |
| Receivable from affiliates | 4,497 | 631 | — | 1,715 |
| Other assets | 8,040 | 8,545 | 8,442 | 8,167 |
| Total assets | 16,081,372 | 30,445,976 | 43,802,748 | 23,329,707 |
| Liabilities | | | | |
| Payable for investments purchased | 973,064 | 17,153 | — | — |
| Payable for fund shares repurchased | — | — | 372,128 | 953,478 |
| Payable upon return of securities loaned | 59,621 | 35,631 | 183,433 | 95,354 |
| Payable to affiliates | | | | |
| Investment management fees | — | — | 4,386 | — |
| Accounting and legal services fees | 1,892 | 3,357 | 3,597 | 2,637 |
| Trustees' fees | 16 | 41 | 51 | 31 |
| Other liabilities and accrued expenses | 30,527 | 31,898 | 32,237 | 30,367 |
| Total liabilities | 1,065,120 | 88,080 | 595,832 | 1,081,867 |
| Net assets | $15,016,252 | $30,357,896 | $43,206,916 | $22,247,840 |
| Net assets consist of | | | | |
| Paid-in capital | $28,530,325 | $37,865,673 | $42,543,171 | $27,238,857 |
| Total distributable earnings (loss) | (13,514,073) | (7,507,777) | 663,745 | (4,991,017) |
| Net assets | $15,016,252 | $30,357,896 | $43,206,916 | $22,247,840 |
| Unaffiliated investments, at cost | $24,101,478 | $36,192,147 | $39,688,546 | $25,351,398 |
| Affiliated investments, at cost | $59,608 | $35,473 | $183,724 | $95,337 |
| Securities loaned, at value | $60,135 | $33,532 | $175,355 | $89,360 |
| Net asset value per share | | | | |
| Based on net asset values and shares outstanding-the fund has an unlimited number of shares authorized with no par value. | | | | |
| Net assets | $15,016,252 | $30,357,896 | $43,206,916 | $22,247,840 |
| Shares outstanding | 1,080,000 | 970,000 | 1,170,000 | 700,000 |
| Net asset value per share | $13.90 | $31.30 | $36.93 | $31.78 |
| 80 | JOHN HANCOCK MULTIFACTOR ETFS | ANNUAL | SEE NOTES TO FINANCIAL STATEMENTS |
STATEMENTS OF ASSETS AND LIABILITIES 4-30-20
Continued
| | Multifactor Large Cap ETF | Multifactor Materials ETF | Multifactor Media and Communications ETF | Multifactor Mid Cap ETF |
| Assets | | | | |
| Unaffiliated investments, at value | $788,852,849 | $17,172,278 | $22,329,760 | $1,331,946,012 |
| Affiliated investments, at value | 1,882,757 | — | 150,711 | 9,727,116 |
| Total investments, at value | 790,735,606 | 17,172,278 | 22,480,471 | 1,341,673,128 |
| Collateral held at broker for futures contracts | 23,880 | — | 1,180 | — |
| Dividends and interest receivable | 621,970 | 13,609 | 37,239 | 671,103 |
| Receivable for fund shares sold | — | — | 512,601 | — |
| Receivable for investments sold | — | — | — | 5,764,765 |
| Receivable for securities lending income | 3,624 | 31 | — | 18,434 |
| Receivable from affiliates | — | 3,042 | 79 | — |
| Other assets | 16,107 | 8,112 | 6,645 | 19,499 |
| Total assets | 791,401,187 | 17,197,072 | 23,038,215 | 1,348,146,929 |
| Liabilities | | | | |
| Payable for futures variation margin | 3,860 | — | 185 | — |
| Payable for investments purchased | — | — | 511,059 | 823,361 |
| Payable for fund shares repurchased | — | — | — | 5,780,955 |
| Payable upon return of securities loaned | 1,885,827 | — | 150,850 | 9,730,266 |
| Payable to affiliates | | | | |
| Investment management fees | 137,655 | — | — | 348,516 |
| Accounting and legal services fees | 64,773 | 2,072 | 1,519 | 109,758 |
| Trustees' fees | 1,047 | 22 | 26 | 1,758 |
| Other liabilities and accrued expenses | 93,903 | 29,540 | 22,073 | 142,916 |
| Total liabilities | 2,187,065 | 31,634 | 685,712 | 16,937,530 |
| Net assets | $789,214,122 | $17,165,438 | $22,352,503 | $1,331,209,399 |
| Net assets consist of | | | | |
| Paid-in capital | $789,375,596 | $21,229,383 | $23,927,136 | $1,493,589,361 |
| Total distributable earnings (loss) | (161,474) | (4,063,945) | (1,574,633) | (162,379,962) |
| Net assets | $789,214,122 | $17,165,438 | $22,352,503 | $1,331,209,399 |
| Unaffiliated investments, at cost | $776,568,847 | $19,423,518 | $23,047,326 | $1,450,948,971 |
| Affiliated investments, at cost | $1,881,783 | — | $150,682 | $9,723,480 |
| Securities loaned, at value | $1,747,860 | — | $143,079 | $8,966,859 |
| Net asset value per share | | | | |
| Based on net asset values and shares outstanding-the fund has an unlimited number of shares authorized with no par value. | | | | |
| Net assets | $789,214,122 | $17,165,438 | $22,352,503 | $1,331,209,399 |
| Shares outstanding | 21,825,000 | 610,000 | 890,000 | 41,100,000 |
| Net asset value per share | $36.16 | $28.14 | $25.12 | $32.39 |
| SEE NOTES TO FINANCIAL STATEMENTS | ANNUAL | JOHN HANCOCK MULTIFACTOR ETFS | 81 |
STATEMENTS OF ASSETS AND LIABILITIES 4-30-20
Continued
| | Multifactor Small Cap ETF | Multifactor Technology ETF | Multifactor Utilities ETF |
| Assets | | | |
| Unaffiliated investments, at value | $463,281,549 | $36,295,815 | $25,464,474 |
| Affiliated investments, at value | 12,670,705 | 149,493 | — |
| Total investments, at value | 475,952,254 | 36,445,308 | 25,464,474 |
| Dividends and interest receivable | 198,961 | 240 | 15,318 |
| Receivable for investments sold | 6,607,353 | — | 877,243 |
| Receivable for securities lending income | 9,501 | 268 | — |
| Receivable from affiliates | — | — | 111 |
| Other assets | 8,398 | 8,605 | 8,150 |
| Total assets | 482,776,467 | 36,454,421 | 26,365,296 |
| Liabilities | | | |
| Payable for fund shares repurchased | 6,649,923 | — | 877,714 |
| Payable upon return of securities loaned | 12,667,808 | 149,834 | — |
| Payable to affiliates | | | |
| Investment management fees | 123,720 | 1,668 | — |
| Accounting and legal services fees | 35,012 | 3,818 | 3,127 |
| Trustees' fees | 578 | 46 | 41 |
| Other liabilities and accrued expenses | 53,648 | 32,368 | 30,714 |
| Total liabilities | 19,530,689 | 187,734 | 911,596 |
| Net assets | $463,245,778 | $36,266,687 | $25,453,700 |
| Net assets consist of | | | |
| Paid-in capital | $573,340,278 | $35,404,318 | $30,206,022 |
| Total distributable earnings (loss) | (110,094,500) | 862,369 | (4,752,322) |
| Net assets | $463,245,778 | $36,266,687 | $25,453,700 |
| Unaffiliated investments, at cost | $517,032,507 | $33,287,051 | $29,185,360 |
| Affiliated investments, at cost | $12,665,218 | $149,451 | — |
| Securities loaned, at value | $11,929,990 | $144,125 | — |
| Net asset value per share | | | |
| Based on net asset values and shares outstanding-the fund has an unlimited number of shares authorized with no par value. | | | |
| Net assets | $463,245,778 | $36,266,687 | $25,453,700 |
| Shares outstanding | 21,275,000 | 680,000 | 870,000 |
| Net asset value per share | $21.77 | $53.33 | $29.26 |
| 82 | JOHN HANCOCK MULTIFACTOR ETFS | ANNUAL | SEE NOTES TO FINANCIAL STATEMENTS |
STATEMENTS OF OPERATIONSFor the year ended 4-30-20
| | Multifactor Consumer Discretionary ETF | Multifactor Consumer Staples ETF | Multifactor Developed International ETF | Multifactor Emerging Markets ETF |
| Investment income | | | | |
| Dividends | $626,039 | $762,430 | $15,330,925 | $24,579,217 |
| Securities lending | 6,358 | 6,181 | 112,041 | 77,297 |
| Interest | 860 | 593 | 19,048 | 44,673 |
| Non-cash dividends | — | — | 789,133 | 3,457,399 |
| Less foreign taxes withheld | — | — | (1,298,257) | (3,111,413) |
| Total investment income | 633,257 | 769,204 | 14,952,890 | 25,047,173 |
| Expenses | | | | |
| Investment management fees | 147,692 | 109,414 | 2,148,089 | 4,354,839 |
| Accounting and legal services fees | 8,216 | 5,975 | 102,093 | 156,508 |
| Transfer agent fees | 10,000 | 10,000 | 9,996 | 10,837 |
| Trustees' fees | 850 | 660 | 9,115 | 13,351 |
| Custodian fees | 61,293 | 61,326 | 157,157 | 477,057 |
| Printing and postage | 20,821 | 19,910 | 32,385 | 33,071 |
| Professional fees | 16,333 | 15,868 | 41,430 | 82,788 |
| Stock exchange listing fees | 6,899 | 7,175 | 6,856 | 7,247 |
| Other | 11,154 | 9,628 | 34,147 | 29,175 |
| Total expenses | 283,258 | 239,956 | 2,541,268 | 5,164,873 |
| Less expense reductions | (127,792) | (124,783) | (375,543) | (937,665) |
| Net expenses | 155,466 | 115,173 | 2,165,725 | 4,227,208 |
| Net investment income | 477,791 | 654,031 | 12,787,165 | 20,819,965 |
| Realized and unrealized gain (loss) | | | | |
| Net realized gain (loss) on | | | | |
| Unaffiliated investments | (1,246,471) | (386,111) | (10,454,262) | (10,466,843) |
| Affiliated investments | (745) | (252) | 480 | (5,023) |
| Futures contracts | (4,612) | 1,838 | (1,247,787) | (231,104) |
| Redemptions in kind | 2,376,970 | 2,141,212 | 8,894,107 | 8,712,056 |
| | 1,125,142 | 1,756,687 | (2,807,462) | (1,990,914) |
| Change in net unrealized appreciation (depreciation) of | | | | |
| Unaffiliated investments | (6,052,937) | (1,987,455) | (66,314,157) | (128,332,415) |
| Affiliated investments | 168 | (4) | 2,701 | 2,614 |
| | (6,052,769) | (1,987,459) | (66,311,456) | (128,329,801) |
| Net realized and unrealized loss | (4,927,627) | (230,772) | (69,118,918) | (130,320,715) |
| Increase (decrease) in net assets from operations | $(4,449,836) | $423,259 | $(56,331,753) | $(109,500,750) |
| SEE NOTES TO FINANCIAL STATEMENTS | ANNUAL | JOHN HANCOCK MULTIFACTOR ETFS | 83 |
STATEMENTS OF OPERATIONSFor the year ended 4-30-20
Continued
| | Multifactor Energy ETF | Multifactor Financials ETF | Multifactor Healthcare ETF | Multifactor Industrials ETF |
| Investment income | | | | |
| Dividends | $1,162,303 | $933,940 | $1,003,059 | $487,292 |
| Securities lending | 419 | 377 | 1,668 | 1,543 |
| Interest | 685 | 861 | 1,082 | 733 |
| Non-cash dividends | 138,167 | — | — | — |
| Less foreign taxes withheld | — | (275) | — | — |
| Total investment income | 1,301,574 | 934,903 | 1,005,809 | 489,568 |
| Expenses | | | | |
| Investment management fees | 73,002 | 157,476 | 180,182 | 102,438 |
| Accounting and legal services fees | 4,126 | 8,842 | 9,925 | 5,672 |
| Transfer agent fees | 10,000 | 10,000 | 10,000 | 10,000 |
| Trustees' fees | 514 | 927 | 1,056 | 639 |
| Custodian fees | 61,272 | 61,333 | 61,350 | 61,507 |
| Printing and postage | 21,350 | 23,609 | 24,751 | 20,154 |
| Professional fees | 15,463 | 19,113 | 16,840 | 15,748 |
| Stock exchange listing fees | 7,175 | 6,899 | 6,899 | 7,175 |
| Other | 9,435 | 10,461 | 10,181 | 9,621 |
| Total expenses | 202,337 | 298,660 | 321,184 | 232,954 |
| Less expense reductions | (125,493) | (132,896) | (131,519) | (125,124) |
| Net expenses | 76,844 | 165,764 | 189,665 | 107,830 |
| Net investment income | 1,224,730 | 769,139 | 816,144 | 381,738 |
| Realized and unrealized gain (loss) | | | | |
| Net realized gain (loss) on | | | | |
| Unaffiliated investments | (2,253,467) | (895,723) | (1,490,826) | (524,722) |
| Affiliated investments | (58) | (146) | 234 | (45) |
| Futures contracts | (5,957) | (2,839) | — | (3,387) |
| Redemptions in kind | (2,446,792) | 3,163,958 | 4,158,332 | 1,901,504 |
| | (4,706,274) | 2,265,250 | 2,667,740 | 1,373,350 |
| Change in net unrealized appreciation (depreciation) of | | | | |
| Unaffiliated investments | (6,660,737) | (8,624,164) | 2,858,845 | (5,760,080) |
| Affiliated investments | 14 | 8 | 46 | 16 |
| | (6,660,723) | (8,624,156) | 2,858,891 | (5,760,064) |
| Net realized and unrealized gain (loss) | (11,366,997) | (6,358,906) | 5,526,631 | (4,386,714) |
| Increase (decrease) in net assets from operations | $(10,142,267) | $(5,589,767) | $6,342,775 | $(4,004,976) |
| 84 | JOHN HANCOCK MULTIFACTOR ETFS | ANNUAL | SEE NOTES TO FINANCIAL STATEMENTS |
STATEMENTS OF OPERATIONSFor the year ended 4-30-20
Continued
| | Multifactor Large Cap ETF | Multifactor Materials ETF | Multifactor Media and Communications ETF | Multifactor Mid Cap ETF |
| Investment income | | | | |
| Dividends | $20,005,698 | $446,085 | $315,015 | $23,120,053 |
| Securities lending | 27,509 | 943 | 3,163 | 116,333 |
| Interest | 14,088 | 617 | 405 | 24,378 |
| Less foreign taxes withheld | (139) | (18) | — | (4,051) |
| Total investment income | 20,047,156 | 447,627 | 318,583 | 23,256,713 |
| Expenses | | | | |
| Investment management fees | 2,526,608 | 76,684 | 82,195 | 4,973,528 |
| Accounting and legal services fees | 171,273 | 4,238 | 4,436 | 279,494 |
| Transfer agent fees | 10,000 | 10,000 | 7,917 | 10,000 |
| Trustees' fees | 16,181 | 516 | 338 | 22,117 |
| Custodian fees | 161,843 | 61,245 | 28,029 | 229,509 |
| Printing and postage | 62,613 | 18,916 | 19,215 | 108,611 |
| Professional fees | 57,766 | 15,457 | 66,264 | 69,857 |
| Stock exchange listing fees | 6,899 | 7,175 | 7,051 | 6,899 |
| Other | 30,629 | 9,498 | 4,456 | 36,394 |
| Total expenses | 3,043,812 | 203,729 | 219,901 | 5,736,409 |
| Less expense reductions | (88,298) | (123,009) | (133,238) | (125,631) |
| Net expenses | 2,955,514 | 80,720 | 86,663 | 5,610,778 |
| Net investment income | 17,091,642 | 366,907 | 231,920 | 17,645,935 |
| Realized and unrealized gain (loss) | | | | |
| Net realized gain (loss) on | | | | |
| Unaffiliated investments | (11,714,541) | (966,402) | (946,827) | (33,698,833) |
| Affiliated investments | (3,454) | (227) | (169) | (8,177) |
| Futures contracts | (68,713) | (679) | 7,921 | 58,802 |
| Redemptions in kind | 63,608,384 | 937,583 | 465,165 | 44,613,768 |
| | 51,821,676 | (29,725) | (473,910) | 10,965,560 |
| Change in net unrealized appreciation (depreciation) of | | | | |
| Unaffiliated investments | (93,125,875) | (2,701,140) | (773,450) | (203,737,430) |
| Affiliated investments | 894 | — | 29 | 3,405 |
| Futures | 54,691 | — | 400 | — |
| | (93,070,290) | (2,701,140) | (773,021) | (203,734,025) |
| Net realized and unrealized loss | (41,248,614) | (2,730,865) | (1,246,931) | (192,768,465) |
| Decrease in net assets from operations | $(24,156,972) | $(2,363,958) | $(1,015,011) | $(175,122,530) |
| SEE NOTES TO FINANCIAL STATEMENTS | ANNUAL | JOHN HANCOCK MULTIFACTOR ETFS | 85 |
STATEMENTS OF OPERATIONSFor the year ended 4-30-20
Continued
| | Multifactor Small Cap ETF | Multifactor Technology ETF | Multifactor Utilities ETF |
| Investment income | | | |
| Dividends | $8,358,204 | $891,136 | $1,054,783 |
| Securities lending | 92,999 | 4,538 | 9 |
| Interest | 8,479 | 1,154 | 694 |
| Less foreign taxes withheld | (3,224) | — | — |
| Total investment income | 8,456,458 | 896,828 | 1,055,486 |
| Expenses | | | |
| Investment management fees | 2,313,324 | 194,216 | 131,108 |
| Accounting and legal services fees | 98,840 | 10,768 | 7,380 |
| Transfer agent fees | 9,982 | 10,000 | 10,000 |
| Trustees' fees | 8,208 | 1,099 | 779 |
| Custodian fees | 93,815 | 61,453 | 61,146 |
| Printing and postage | 31,767 | 24,799 | 21,370 |
| Professional fees | 34,550 | 16,950 | 16,215 |
| Stock exchange listing fees | 8,379 | 6,899 | 7,175 |
| Other | 17,060 | 10,302 | 9,761 |
| Total expenses | 2,615,925 | 336,486 | 264,934 |
| Less expense reductions | (290,563) | (132,049) | (126,925) |
| Net expenses | 2,325,362 | 204,437 | 138,009 |
| Net investment income | 6,131,096 | 692,391 | 917,477 |
| Realized and unrealized gain (loss) | | | |
| Net realized gain (loss) on | | | |
| Unaffiliated investments | (44,998,414) | (977,868) | (224,651) |
| Affiliated investments | (8,448) | (367) | (23) |
| Futures contracts | 6,618 | 3,658 | (10,044) |
| Redemptions in kind | 21,066,306 | 7,334,267 | 3,641,646 |
| | (23,933,938) | 6,359,690 | 3,406,928 |
| Change in net unrealized appreciation (depreciation) of | | | |
| Unaffiliated investments | (66,712,404) | (4,028,328) | (5,737,233) |
| Affiliated investments | 5,197 | 36 | — |
| | (66,707,207) | (4,028,292) | (5,737,233) |
| Net realized and unrealized gain (loss) | (90,641,145) | 2,331,398 | (2,330,305) |
| Increase (decrease) in net assets from operations | $(84,510,049) | $3,023,789 | $(1,412,828) |
| 86 | JOHN HANCOCK MULTIFACTOR ETFS | ANNUAL | SEE NOTES TO FINANCIAL STATEMENTS |
STATEMENTS OF CHANGES IN NET ASSETS
| | Multifactor Consumer
Discretionary ETF | Multifactor Consumer
Staples ETF | Multifactor Developed
International ETF |
| | Year ended
4-30-20 | Year ended
4-30-19 | Year ended
4-30-20 | Year ended
4-30-19 | Year ended
4-30-20 | Year ended
4-30-19 |
| Increase (decrease) in net assets | | | | | | |
| From operations | | | | | | |
| Net investment income | $477,791 | $506,396 | $654,031 | $752,999 | $12,787,165 | $7,439,007 |
| Net realized gain (loss) | 1,125,142 | 3,463,171 | 1,756,687 | (508,673) | (2,807,462) | 1,214,314 |
| Change in net unrealized appreciation (depreciation) | (6,052,769) | 201,120 | (1,987,459) | 2,552,512 | (66,311,456) | 29,078,060 |
| Increase (decrease) in net assets resulting from operations | (4,449,836) | 4,170,687 | 423,259 | 2,796,838 | (56,331,753) | 37,731,381 |
| Distributions to shareholders | | | | | | |
| From earnings | (485,939) | (530,221) | (655,650) | (726,880) | (16,526,310) | (2,179,880) |
| From fund share transactions | | | | | | |
| Shares issued | 11,360,925 | 29,178,495 | 10,343,541 | 28,284,271 | 81,190,244 | 442,661,741 |
| Shares repurchased | (17,415,480) | (37,248,356) | (19,762,263) | (23,801,043) | (87,062,063) | (33,948,220) |
| Total from fund share transactions | (6,054,555) | (8,069,861) | (9,418,722) | 4,483,228 | (5,871,819) | 408,713,521 |
| Total increase (decrease) | (10,990,330) | (4,429,395) | (9,651,113) | 6,553,186 | (78,729,882) | 444,265,022 |
| Net assets | | | | | | |
| Beginning of year | 42,161,646 | 46,591,041 | 28,862,297 | 22,309,111 | 511,767,176 | 67,502,154 |
| End of year | $31,171,316 | $42,161,646 | $19,211,184 | $28,862,297 | $433,037,294 | $511,767,176 |
| Share activity | | | | | | |
| Shares outstanding | | | | | | |
| Beginning of year | 1,250,000 | 1,520,000 | 1,030,000 | 880,000 | 17,800,000 | 2,200,000 |
| Shares issued | 360,000 | 930,000 | 360,000 | 1,060,000 | 3,200,000 | 16,800,000 |
| Shares repurchased | (570,000) | (1,200,000) | (700,000) | (910,000) | (3,200,000) | (1,200,000) |
| End of year | 1,040,000 | 1,250,000 | 690,000 | 1,030,000 | 17,800,000 | 17,800,000 |
| SEE NOTES TO FINANCIAL STATEMENTS | ANNUAL | JOHN HANCOCK MULTIFACTOR ETFS | 87 |
STATEMENTS OF CHANGES IN NET ASSETS
Continued
| | Multifactor Emerging Markets ETF | Multifactor Energy ETF | Multifactor Financials ETF |
| | Year ended
4-30-20 | Period ended
4-30-191 | Year ended
4-30-20 | Year ended
4-30-19 | Year ended
4-30-20 | Year ended
4-30-19 |
| Increase (decrease) in net assets | | | | | | |
| From operations | | | | | | |
| Net investment income | $20,819,965 | $2,282,377 | $1,224,730 | $523,509 | $769,139 | $947,377 |
| Net realized gain (loss) | (1,990,914) | 33,503 | (4,706,274) | (350,163) | 2,265,250 | 7,325,410 |
| Change in net unrealized appreciation (depreciation) | (128,329,801) | 41,340,904 | (6,660,723) | (5,089,757) | (8,624,156) | (6,337,124) |
| Increase (decrease) in net assets resulting from operations | (109,500,750) | 43,656,784 | (10,142,267) | (4,916,411) | (5,589,767) | 1,935,663 |
| Distributions to shareholders | | | | | | |
| From earnings | (19,729,767) | (587,064) | (1,221,422) | (528,622) | (867,642) | (931,038) |
| From fund share transactions | | | | | | |
| Shares issued | 72,646,860 | 789,649,435 | 6,544,437 | 13,102,633 | 29,464,818 | 12,405,246 |
| Shares repurchased | (75,885,634) | (15,136,934) | (6,406,805) | (18,450,941) | (40,276,738) | (34,334,702) |
| Total from fund share transactions | (3,238,774) | 774,512,501 | 137,632 | (5,348,308) | (10,811,920) | (21,929,456) |
| Total increase (decrease) | (132,469,291) | 817,582,221 | (11,226,057) | (10,793,341) | (17,269,329) | (20,924,831) |
| Net assets | | | | | | |
| Beginning of year | 817,582,221 | — | 26,242,309 | 37,035,650 | 47,627,225 | 68,552,056 |
| End of year | $685,112,930 | $817,582,221 | $15,016,252 | $26,242,309 | $30,357,896 | $47,627,225 |
| Share activity | | | | | | |
| Shares outstanding | | | | | | |
| Beginning of year | 31,600,000 | — | 980,000 | 1,180,000 | 1,250,000 | 1,860,000 |
| Shares issued | 3,100,000 | 32,200,000 | 420,000 | 450,000 | 810,000 | 340,000 |
| Shares repurchased | (3,000,000) | (600,000) | (320,000) | (650,000) | (1,090,000) | (950,000) |
| End of year | 31,700,000 | 31,600,000 | 1,080,000 | 980,000 | 970,000 | 1,250,000 |
| 1 | Period from 9-27-18 (commencement of operations) to 4-30-19. |
| 88 | JOHN HANCOCK MULTIFACTOR ETFS | ANNUAL | SEE NOTES TO FINANCIAL STATEMENTS |
STATEMENTS OF CHANGES IN NET ASSETS
Continued
| | Multifactor Healthcare ETF | Multifactor Industrials ETF | Multifactor Large Cap ETF |
| | Year ended
4-30-20 | Year ended
4-30-19 | Year ended
4-30-20 | Year ended
4-30-19 | Year ended
4-30-20 | Year ended
4-30-19 |
| Increase (decrease) in net assets | | | | | | |
| From operations | | | | | | |
| Net investment income | $816,144 | $1,266,304 | $381,738 | $455,592 | $17,091,642 | $12,674,950 |
| Net realized gain | 2,667,740 | 4,093,261 | 1,373,350 | 3,725,555 | 51,821,676 | 9,435,734 |
| Change in net unrealized appreciation (depreciation) | 2,858,891 | (1,351,861) | (5,760,064) | (1,124,569) | (93,070,290) | 56,144,497 |
| Increase (decrease) in net assets resulting from operations | 6,342,775 | 4,007,704 | (4,004,976) | 3,056,578 | (24,156,972) | 78,255,181 |
| Distributions to shareholders | | | | | | |
| From earnings | (1,306,455) | (415,032) | (372,367) | (439,292) | (16,652,227) | (9,266,101) |
| From fund share transactions | | | | | | |
| Shares issued | 10,898,269 | 35,143,443 | 10,999,231 | 22,199,862 | 131,654,328 | 511,454,207 |
| Shares repurchased | (26,389,183) | (26,182,752) | (16,550,559) | (24,363,027) | (223,416,055) | (59,917,739) |
| Total from fund share transactions | (15,490,914) | 8,960,691 | (5,551,328) | (2,163,165) | (91,761,727) | 451,536,468 |
| Total increase (decrease) | (10,454,594) | 12,553,363 | (9,928,671) | 454,121 | (132,570,926) | 520,525,548 |
| Net assets | | | | | | |
| Beginning of year | 53,661,510 | 41,108,147 | 32,176,511 | 31,722,390 | 921,785,048 | 401,259,500 |
| End of year | $43,206,916 | $53,661,510 | $22,247,840 | $32,176,511 | $789,214,122 | $921,785,048 |
| Share activity | | | | | | |
| Shares outstanding | | | | | | |
| Beginning of year | 1,610,000 | 1,320,000 | 860,000 | 940,000 | 24,275,000 | 11,625,000 |
| Shares issued | 310,000 | 1,060,000 | 310,000 | 620,000 | 3,675,000 | 14,350,000 |
| Shares repurchased | (750,000) | (770,000) | (470,000) | (700,000) | (6,125,000) | (1,700,000) |
| End of year | 1,170,000 | 1,610,000 | 700,000 | 860,000 | 21,825,000 | 24,275,000 |
| SEE NOTES TO FINANCIAL STATEMENTS | ANNUAL | JOHN HANCOCK MULTIFACTOR ETFS | 89 |
STATEMENTS OF CHANGES IN NET ASSETS
Continued
| | Multifactor Materials ETF | Multifactor Media and Communications ETF | Multifactor Mid Cap ETF |
| | Year ended
4-30-20 | Year ended
4-30-19 | Year ended
4-30-20 | Period ended
4-30-192 | Year ended
4-30-20 | Year ended
4-30-19 |
| Increase (decrease) in net assets | | | | | | |
| From operations | | | | | | |
| Net investment income | $366,907 | $363,066 | $231,920 | $6,194 | $17,645,935 | $9,689,897 |
| Net realized gain (loss) | (29,725) | 1,434,017 | (473,910) | (775) | 10,965,560 | 13,674,393 |
| Change in net unrealized appreciation (depreciation) | (2,701,140) | (2,749,386) | (773,021) | 55,884 | (203,734,025) | 54,960,102 |
| Increase (decrease) in net assets resulting from operations | (2,363,958) | (952,303) | (1,015,011) | 61,303 | (175,122,530) | 78,324,392 |
| Distributions to shareholders | | | | | | |
| From earnings | (400,889) | (317,644) | (159,184) | — | (14,393,874) | (7,646,180) |
| From fund share transactions | | | | | | |
| Shares issued | 7,172,493 | 10,356,476 | 6,196,500 | 23,535,317 | 719,955,147 | 739,490,500 |
| Shares repurchased | (9,996,413) | (9,452,363) | (6,266,422) | — | (229,422,956) | (111,863,202) |
| Total from fund share transactions | (2,823,920) | 904,113 | (69,922) | 23,535,317 | 490,532,191 | 627,627,298 |
| Total increase (decrease) | (5,588,767) | (365,834) | (1,244,117) | 23,596,620 | 301,015,787 | 698,305,510 |
| Net assets | | | | | | |
| Beginning of year | 22,754,205 | 23,120,039 | 23,596,620 | — | 1,030,193,612 | 331,888,102 |
| End of year | $17,165,438 | $22,754,205 | $22,352,503 | $23,596,620 | $1,331,209,399 | $1,030,193,612 |
| Share activity | | | | | | |
| Shares outstanding | | | | | | |
| Beginning of year | 700,000 | 680,000 | 890,000 | — | 28,150,000 | 9,750,000 |
| Shares issued | 220,000 | 310,000 | 250,000 | 890,000 | 19,975,000 | 21,625,000 |
| Shares repurchased | (310,000) | (290,000) | (250,000) | — | (7,025,000) | (3,225,000) |
| End of year | 610,000 | 700,000 | 890,000 | 890,000 | 41,100,000 | 28,150,000 |
| 2 | Period from 3-12-19 (commencement of operations) to 4-30-19. |
| 90 | JOHN HANCOCK MULTIFACTOR ETFS | ANNUAL | SEE NOTES TO FINANCIAL STATEMENTS |
STATEMENTS OF CHANGES IN NET ASSETS
Continued
| | Multifactor Small Cap ETF | Multifactor Technology ETF | Multifactor Utilities ETF |
| | Year ended
4-30-20 | Year ended
4-30-19 | Year ended
4-30-20 | Year ended
4-30-19 | Year ended
4-30-20 | Year ended
4-30-19 |
| Increase (decrease) in net assets | | | | | | |
| From operations | | | | | | |
| Net investment income | $6,131,096 | $2,454,656 | $692,391 | $633,578 | $917,477 | $819,391 |
| Net realized gain (loss) | (23,933,938) | (2,478,980) | 6,359,690 | 12,357,497 | 3,406,928 | 1,561,661 |
| Change in net unrealized appreciation (depreciation) | (66,707,207) | 12,757,111 | (4,028,292) | (2,473,617) | (5,737,233) | 2,100,834 |
| Increase (decrease) in net assets resulting from operations | (84,510,049) | 12,732,787 | 3,023,789 | 10,517,458 | (1,412,828) | 4,481,886 |
| Distributions to shareholders | | | | | | |
| From earnings | (5,745,267) | (1,596,006) | (628,863) | (544,744) | (922,136) | (724,139) |
| From fund share transactions | | | | | | |
| Shares issued | 237,133,023 | 464,818,266 | 13,101,142 | 39,668,496 | 34,715,208 | 47,348,977 |
| Shares repurchased | (122,564,999) | (76,202,047) | (41,017,240) | (50,871,145) | (36,393,455) | (39,483,795) |
| Total from fund share transactions | 114,568,024 | 388,616,219 | (27,916,098) | (11,202,649) | (1,678,247) | 7,865,182 |
| Total increase (decrease) | 24,312,708 | 399,753,000 | (25,521,172) | (1,229,935) | (4,013,211) | 11,622,929 |
| Net assets | | | | | | |
| Beginning of year | 438,933,070 | 39,180,070 | 61,787,859 | 63,017,794 | 29,466,911 | 17,843,982 |
| End of year | $463,245,778 | $438,933,070 | $36,266,687 | $61,787,859 | $25,453,700 | $29,466,911 |
| Share activity | | | | | | |
| Shares outstanding | | | | | | |
| Beginning of year | 16,325,000 | 1,525,000 | 1,220,000 | 1,470,000 | 930,000 | 650,000 |
| Shares issued | 9,875,000 | 17,725,000 | 260,000 | 860,000 | 1,060,000 | 1,630,000 |
| Shares repurchased | (4,925,000) | (2,925,000) | (800,000) | (1,110,000) | (1,120,000) | (1,350,000) |
| End of year | 21,275,000 | 16,325,000 | 680,000 | 1,220,000 | 870,000 | 930,000 |
| SEE NOTES TO FINANCIAL STATEMENTS | ANNUAL | JOHN HANCOCK MULTIFACTOR ETFS | 91 |
MULTIFACTOR CONSUMER DISCRETIONARY ETF
| Period ended | 4-30-20 | 4-30-19 | 4-30-18 | 4-30-17 | 4-30-161 |
| Per share operating performance | | | | | |
| Net asset value, beginning of period | $33.73 | $30.65 | $28.04 | $25.56 | $24.21 |
| Net investment income2 | 0.41 | 0.37 | 0.32 | 0.51 | 0.18 |
| Net realized and unrealized gain (loss) on investments | (3.76) | 3.11 | 2.58 | 2.45 | 1.24 |
| Total from investment operations | (3.35) | 3.48 | 2.90 | 2.96 | 1.42 |
| Less distributions | | | | | |
| From net investment income | (0.41) | (0.40) | (0.29) | (0.48) | (0.07) |
| Net asset value, end of period | $29.97 | $33.73 | $30.65 | $28.04 | $25.56 |
| Total return (%)3 | (10.08) | 11.57 | 10.37 | 11.78 | 5.874 |
| Ratios and supplemental data | | | | | |
| Net assets, end of period (in millions) | $31 | $42 | $47 | $31 | $15 |
| Ratios (as a percentage of average net assets): | | | | | |
| Expenses before reductions | 0.73 | 0.73 | 0.85 | 1.07 | 1.275 |
| Expenses including reductions | 0.40 | 0.47 | 0.50 | 0.50 | 0.505 |
| Net investment income | 1.23 | 1.17 | 1.08 | 1.93 | 1.225 |
| Portfolio turnover (%)6 | 20 | 42 | 9 | 16 | 5 |
| 1 | Period from 9-28-15 (commencement of operations) to 4-30-16. |
| 2 | Based on average daily shares outstanding. |
| 3 | Total returns would have been lower had certain expenses not been reduced during the applicable periods. |
| 4 | Not annualized. |
| 5 | Annualized. |
| 6 | Portfolio turnover rate excludes securities received or delivered from in-kind transactions. |
MULTIFACTOR CONSUMER STAPLES ETF
| Period ended | 4-30-20 | 4-30-19 | 4-30-18 | 4-30-17 | 4-30-161 |
| Per share operating performance | | | | | |
| Net asset value, beginning of period | $28.02 | $25.35 | $26.48 | $25.14 | $25.12 |
| Net investment income2 | 0.65 | 0.75 | 0.55 | 0.48 | 0.03 |
| Net realized and unrealized gain (loss) on investments | (0.17) | 2.66 | (1.24) | 1.21 | (0.01) |
| Total from investment operations | 0.48 | 3.41 | (0.69) | 1.69 | 0.02 |
| Less distributions | | | | | |
| From net investment income | (0.66) | (0.74) | (0.44) | (0.35) | — |
| Net asset value, end of period | $27.84 | $28.02 | $25.35 | $26.48 | $25.14 |
| Total return (%)3 | 1.62 | 13.89 | (2.67) | 6.75 | 0.084 |
| Ratios and supplemental data | | | | | |
| Net assets, end of period (in millions) | $19 | $29 | $22 | $17 | $5 |
| Ratios (as a percentage of average net assets): | | | | | |
| Expenses before reductions | 0.83 | 0.91 | 1.07 | 1.18 | 5.965 |
| Expenses including reductions | 0.40 | 0.47 | 0.50 | 0.50 | 0.505 |
| Net investment income | 2.27 | 2.87 | 2.05 | 1.86 | 1.495 |
| Portfolio turnover (%)6 | 12 | 14 | 14 | 11 | 0 |
| 1 | Period from 3-28-16 (commencement of operations) to 4-30-16. |
| 2 | Based on average daily shares outstanding. |
| 3 | Total returns would have been lower had certain expenses not been reduced during the applicable periods. |
| 4 | Not annualized. |
| 5 | Annualized. |
| 6 | Portfolio turnover rate excludes securities received or delivered from in-kind transactions. |
| 92 | JOHN HANCOCK MULTIFACTOR ETFS | ANNUAL | SEE NOTES TO FINANCIAL STATEMENTS |
MULTIFACTOR DEVELOPED INTERNATIONAL ETF
| Period ended | 4-30-20 | 4-30-19 | 4-30-18 | 4-30-171 |
| Per share operating performance | | | | |
| Net asset value, beginning of period | $28.75 | $30.68 | $27.17 | $24.54 |
| Net investment income2 | 0.73 | 0.91 | 0.77 | 0.31 |
| Net realized and unrealized gain (loss) on investments | (4.21) | (2.31) | 3.43 | 2.32 |
| Total from investment operations | (3.48) | (1.40) | 4.20 | 2.63 |
| Less distributions | | | | |
| From net investment income | (0.94) | (0.53) | (0.69) | — |
| Net asset value, end of period | $24.33 | $28.75 | $30.68 | $27.17 |
| Total return (%)3 | (12.57) | (4.54) | 15.64 | 10.734 |
| Ratios and supplemental data | | | | |
| Net assets, end of period (in millions) | $433 | $512 | $68 | $33 |
| Ratios (as a percentage of average net assets): | | | | |
| Expenses before reductions | 0.52 | 0.55 | 0.80 | 0.995 |
| Expenses including reductions | 0.45 | 0.45 | 0.45 | 0.455 |
| Net investment income | 2.46 | 3.28 | 2.60 | 3.025 |
| Portfolio turnover (%)6 | 10 | 17 | 15 | 8 |
| 1 | Period from 12-15-16 (commencement of operations) to 4-30-17. |
| 2 | Based on average daily shares outstanding. |
| 3 | Total returns would have been lower had certain expenses not been reduced during the applicable periods. |
| 4 | Not annualized. |
| 5 | Annualized. |
| 6 | Portfolio turnover rate excludes securities received or delivered from in-kind transactions. |
MULTIFACTOR EMERGING MARKETS ETF
| Period ended | 4-30-20 | 4-30-191 |
| Per share operating performance | | |
| Net asset value, beginning of period | $25.87 | $25.00 |
| Net investment income2 | 0.66 | 0.14 |
| Net realized and unrealized gain (loss) on investments | (4.29) | 0.78 |
| Total from investment operations | (3.63) | 0.92 |
| Less distributions | | |
| From net investment income | (0.63) | (0.05) |
| Net asset value, end of period | $21.61 | $25.87 |
| Total return (%)3 | (14.44) | 3.714 |
| Ratios and supplemental data | | |
| Net assets, end of period (in millions) | $685 | $818 |
| Ratios (as a percentage of average net assets): | | |
| Expenses before reductions | 0.67 | 0.715 |
| Expenses including reductions | 0.55 | 0.555 |
| Net investment income | 2.69 | 0.975 |
| Portfolio turnover (%)6 | 22 | 3 |
| 1 | Period from 9-27-18 (commencement of operations) to 4-30-19. |
| 2 | Based on average daily shares outstanding. |
| 3 | Total returns would have been lower had certain expenses not been reduced during the applicable periods. |
| 4 | Not annualized. |
| 5 | Annualized. |
| 6 | Portfolio turnover rate excludes securities received or delivered from in-kind transactions. |
| SEE NOTES TO FINANCIAL STATEMENTS | ANNUAL | JOHN HANCOCK MULTIFACTOR ETFS | 93 |
MULTIFACTOR ENERGY ETF
| Period ended | 4-30-20 | 4-30-19 | 4-30-18 | 4-30-17 | 4-30-161 |
| Per share operating performance | | | | | |
| Net asset value, beginning of period | $26.78 | $31.39 | $27.42 | $27.23 | $24.84 |
| Net investment income2 | 1.353 | 0.51 | 0.664 | 0.42 | —5 |
| Net realized and unrealized gain (loss) on investments | (12.80) | (4.59) | 3.85 | 0.06 | 2.39 |
| Total from investment operations | (11.45) | (4.08) | 4.51 | 0.48 | 2.39 |
| Less distributions | | | | | |
| From net investment income | (1.43) | (0.53) | (0.54) | (0.29) | — |
| Net asset value, end of period | $13.90 | $26.78 | $31.39 | $27.42 | $27.23 |
| Total return (%)6 | (44.93) | (12.84) | 16.69 | 1.73 | 9.637 |
| Ratios and supplemental data | | | | | |
| Net assets, end of period (in millions) | $15 | $26 | $37 | $16 | $5 |
| Ratios (as a percentage of average net assets): | | | | | |
| Expenses before reductions | 1.05 | 0.86 | 1.07 | 1.15 | 5.868 |
| Expenses including reductions | 0.40 | 0.48 | 0.50 | 0.50 | 0.508 |
| Net investment income | 6.383 | 1.72 | 2.354 | 1.46 | 0.208 |
| Portfolio turnover (%)9 | 22 | 25 | 16 | 30 | 2 |
| 1 | Period from 3-28-16 (commencement of operations) to 4-30-16. |
| 2 | Based on average daily shares outstanding. |
| 3 | Net investment income (loss) per share and ratio of net investment income (loss) to average net assets reflect a special dividend received by the fund, which amounted to $0.82 and 3.84%, respectively. |
| 4 | Net investment income (loss) per share and ratio of net investment income (loss) to average net assets reflect a special dividend received by the fund, which amounted to $0.16 and 0.58%, respectively. |
| 5 | Less than $0.005 per share. |
| 6 | Total returns would have been lower had certain expenses not been reduced during the applicable periods. |
| 7 | Not annualized. |
| 8 | Annualized. |
| 9 | Portfolio turnover rate excludes securities received or delivered from in-kind transactions. |
MULTIFACTOR FINANCIALS ETF
| Period ended | 4-30-20 | 4-30-19 | 4-30-18 | 4-30-17 | 4-30-161 |
| Per share operating performance | | | | | |
| Net asset value, beginning of period | $38.10 | $36.86 | $31.48 | $25.35 | $24.37 |
| Net investment income2 | 0.70 | 0.57 | 0.45 | 0.38 | 0.21 |
| Net realized and unrealized gain (loss) on investments | (6.64) | 1.21 | 5.30 | 6.10 | 0.85 |
| Total from investment operations | (5.94) | 1.78 | 5.75 | 6.48 | 1.06 |
| Less distributions | | | | | |
| From net investment income | (0.86) | (0.54) | (0.37) | (0.35) | (0.08) |
| Net asset value, end of period | $31.30 | $38.10 | $36.86 | $31.48 | $25.35 |
| Total return (%)3 | (16.06) | 5.15 | 18.33 | 25.78 | 4.334 |
| Ratios and supplemental data | | | | | |
| Net assets, end of period (in millions) | $30 | $48 | $69 | $43 | $19 |
| Ratios (as a percentage of average net assets): | | | | | |
| Expenses before reductions | 0.72 | 0.66 | 0.75 | 0.99 | 1.195 |
| Expenses including reductions | 0.40 | 0.47 | 0.50 | 0.50 | 0.505 |
| Net investment income | 1.86 | 1.57 | 1.26 | 1.32 | 1.415 |
| Portfolio turnover (%)6 | 10 | 9 | 8 | 7 | 11 |
| 1 | Period from 9-28-15 (commencement of operations) to 4-30-16. |
| 2 | Based on average daily shares outstanding. |
| 3 | Total returns would have been lower had certain expenses not been reduced during the applicable periods. |
| 4 | Not annualized. |
| 5 | Annualized. |
| 6 | Portfolio turnover rate excludes securities received or delivered from in-kind transactions. |
| 94 | JOHN HANCOCK MULTIFACTOR ETFS | ANNUAL | SEE NOTES TO FINANCIAL STATEMENTS |
MULTIFACTOR HEALTHCARE ETF
| Period ended | 4-30-20 | 4-30-19 | 4-30-18 | 4-30-17 | 4-30-161 |
| Per share operating performance | | | | | |
| Net asset value, beginning of period | $33.33 | $31.14 | $28.59 | $25.77 | $23.93 |
| Net investment income2 | 0.60 | 0.73 | 0.24 | 0.30 | 0.11 |
| Net realized and unrealized gain (loss) on investments | 3.91 | 1.71 | 2.62 | 2.72 | 1.78 |
| Total from investment operations | 4.51 | 2.44 | 2.86 | 3.02 | 1.89 |
| Less distributions | | | | | |
| From net investment income | (0.91) | (0.25) | (0.31) | (0.20) | (0.05) |
| Net asset value, end of period | $36.93 | $33.33 | $31.14 | $28.59 | $25.77 |
| Total return (%)3 | 13.70 | 7.89 | 10.04 | 11.78 | 7.894 |
| Ratios and supplemental data | | | | | |
| Net assets, end of period (in millions) | $43 | $54 | $41 | $33 | $17 |
| Ratios (as a percentage of average net assets): | | | | | |
| Expenses before reductions | 0.68 | 0.66 | 0.86 | 1.06 | 1.235 |
| Expenses including reductions | 0.40 | 0.46 | 0.50 | 0.50 | 0.505 |
| Net investment income | 1.72 | 2.18 | 0.79 | 1.12 | 0.745 |
| Portfolio turnover (%)6 | 10 | 21 | 11 | 14 | 6 |
| 1 | Period from 9-28-15 (commencement of operations) to 4-30-16. |
| 2 | Based on average daily shares outstanding. |
| 3 | Total returns would have been lower had certain expenses not been reduced during the applicable periods. |
| 4 | Not annualized. |
| 5 | Annualized. |
| 6 | Portfolio turnover rate excludes securities received or delivered from in-kind transactions. |
MULTIFACTOR INDUSTRIALS ETF
| Period ended | 4-30-20 | 4-30-19 | 4-30-18 | 4-30-17 | 4-30-161 |
| Per share operating performance | | | | | |
| Net asset value, beginning of period | $37.41 | $33.75 | $30.40 | $25.37 | $25.01 |
| Net investment income2 | 0.52 | 0.59 | 0.33 | 0.35 | 0.01 |
| Net realized and unrealized gain (loss) on investments | (5.64) | 3.69 | 3.33 | 4.94 | 0.35 |
| Total from investment operations | (5.12) | 4.28 | 3.66 | 5.29 | 0.36 |
| Less distributions | | | | | |
| From net investment income | (0.51) | (0.62) | (0.31) | (0.26) | — |
| Net asset value, end of period | $31.78 | $37.41 | $33.75 | $30.40 | $25.37 |
| Total return (%)3 | (13.92) | 13.16 | 12.04 | 20.95 | 1.454 |
| Ratios and supplemental data | | | | | |
| Net assets, end of period (in millions) | $22 | $32 | $32 | $21 | $5 |
| Ratios (as a percentage of average net assets): | | | | | |
| Expenses before reductions | 0.86 | 0.90 | 0.98 | 1.12 | 5.955 |
| Expenses including reductions | 0.40 | 0.47 | 0.50 | 0.50 | 0.505 |
| Net investment income | 1.42 | 1.70 | 0.98 | 1.24 | 0.505 |
| Portfolio turnover (%)6 | 21 | 49 | 3 | 8 | 07 |
| 1 | Period from 3-28-16 (commencement of operations) to 4-30-16. |
| 2 | Based on average daily shares outstanding. |
| 3 | Total returns would have been lower had certain expenses not been reduced during the applicable periods. |
| 4 | Not annualized. |
| 5 | Annualized. |
| 6 | Portfolio turnover rate excludes securities received or delivered from in-kind transactions. |
| 7 | Less than 1%. |
| SEE NOTES TO FINANCIAL STATEMENTS | ANNUAL | JOHN HANCOCK MULTIFACTOR ETFS | 95 |
MULTIFACTOR LARGE CAP ETF
| Period ended | 4-30-20 | 4-30-19 | 4-30-18 | 4-30-17 | 4-30-161 |
| Per share operating performance | | | | | |
| Net asset value, beginning of period | $37.97 | $34.52 | $31.09 | $26.69 | $24.35 |
| Net investment income2 | 0.73 | 0.70 | 0.51 | 0.49 | 0.27 |
| Net realized and unrealized gain (loss) on investments | (1.83) | 3.25 | 3.42 | 4.31 | 2.17 |
| Total from investment operations | (1.10) | 3.95 | 3.93 | 4.80 | 2.44 |
| Less distributions | | | | | |
| From net investment income | (0.71) | (0.50) | (0.50) | (0.40) | (0.10) |
| Net asset value, end of period | $36.16 | $37.97 | $34.52 | $31.09 | $26.69 |
| Total return (%)3 | (3.04) | 11.74 | 12.69 | 18.13 | 10.014 |
| Ratios and supplemental data | | | | | |
| Net assets, end of period (in millions) | $789 | $922 | $401 | $342 | $27 |
| Ratios (as a percentage of average net assets): | | | | | |
| Expenses before reductions | 0.34 | 0.35 | 0.40 | 0.45 | 0.935 |
| Expenses including reductions | 0.33 | 0.34 | 0.35 | 0.35 | 0.355 |
| Net investment income | 1.92 | 1.96 | 1.53 | 1.67 | 1.805 |
| Portfolio turnover (%)6 | 6 | 6 | 5 | 12 | 6 |
| 1 | Period from 9-28-15 (commencement of operations) to 4-30-16. |
| 2 | Based on average daily shares outstanding. |
| 3 | Total returns would have been lower had certain expenses not been reduced during the applicable periods. |
| 4 | Not annualized. |
| 5 | Annualized. |
| 6 | Portfolio turnover rate excludes securities received or delivered from in-kind transactions. |
MULTIFACTOR MATERIALS ETF
| Period ended | 4-30-20 | 4-30-19 | 4-30-18 | 4-30-17 | 4-30-161 |
| Per share operating performance | | | | | |
| Net asset value, beginning of period | $32.51 | $34.00 | $30.85 | $26.76 | $25.10 |
| Net investment income2 | 0.58 | 0.55 | 0.44 | 0.44 | 0.04 |
| Net realized and unrealized gain (loss) on investments | (4.31) | (1.54) | 3.13 | 3.97 | 1.62 |
| Total from investment operations | (3.73) | (0.99) | 3.57 | 4.41 | 1.66 |
| Less distributions | | | | | |
| From net investment income | (0.64) | (0.50) | (0.42) | (0.32) | — |
| Net asset value, end of period | $28.14 | $32.51 | $34.00 | $30.85 | $26.76 |
| Total return (%)3 | (11.77) | (2.76) | 11.62 | 16.58 | 6.634 |
| Ratios and supplemental data | | | | | |
| Net assets, end of period (in millions) | $17 | $23 | $23 | $20 | $5 |
| Ratios (as a percentage of average net assets): | | | | | |
| Expenses before reductions | 1.01 | 1.01 | 1.05 | 1.15 | 5.855 |
| Expenses including reductions | 0.40 | 0.47 | 0.50 | 0.50 | 0.505 |
| Net investment income | 1.82 | 1.68 | 1.32 | 1.51 | 1.575 |
| Portfolio turnover (%)6 | 20 | 46 | 10 | 17 | 0 |
| 1 | Period from 3-28-16 (commencement of operations) to 4-30-16. |
| 2 | Based on average daily shares outstanding. |
| 3 | Total returns would have been lower had certain expenses not been reduced during the applicable periods. |
| 4 | Not annualized. |
| 5 | Annualized. |
| 6 | Portfolio turnover rate excludes securities received or delivered from in-kind transactions. |
| 96 | JOHN HANCOCK MULTIFACTOR ETFS | ANNUAL | SEE NOTES TO FINANCIAL STATEMENTS |
MULTIFACTOR MEDIA AND COMMUNICATIONS ETF
| Period ended | 4-30-20 | 4-30-191 |
| Per share operating performance | | |
| Net asset value, beginning of period | $26.51 | $25.00 |
| Net investment income2 | 0.29 | 0.04 |
| Net realized and unrealized gain (loss) on investments | (1.48) | 1.47 |
| Total from investment operations | (1.19) | 1.51 |
| Less distributions | | |
| From net investment income | (0.20) | — |
| Net asset value, end of period | $25.12 | $26.51 |
| Total return (%)3 | (4.60) | 6.054 |
| Ratios and supplemental data | | |
| Net assets, end of period (in millions) | $22 | $24 |
| Ratios (as a percentage of average net assets): | | |
| Expenses before reductions | 1.02 | 2.985 |
| Expenses including reductions | 0.40 | 0.405 |
| Net investment income | 1.07 | 1.295 |
| Portfolio turnover (%)6 | 19 | 0 |
| 1 | Period from 3-12-19 (commencement of operations) to 4-30-19. |
| 2 | Based on average daily shares outstanding. |
| 3 | Total returns would have been lower had certain expenses not been reduced during the applicable periods. |
| 4 | Not annualized. |
| 5 | Annualized. |
| 6 | Portfolio turnover rate excludes securities received or delivered from in-kind transactions. |
MULTIFACTOR MID CAP ETF
| Period ended | 4-30-20 | 4-30-19 | 4-30-18 | 4-30-17 | 4-30-161 |
| Per share operating performance | | | | | |
| Net asset value, beginning of period | $36.60 | $34.04 | $30.65 | $26.07 | $24.29 |
| Net investment income2 | 0.48 | 0.53 | 0.34 | 0.33 | 0.21 |
| Net realized and unrealized gain (loss) on investments | (4.29) | 2.44 | 3.36 | 4.58 | 1.65 |
| Total from investment operations | (3.81) | 2.97 | 3.70 | 4.91 | 1.86 |
| Less distributions | | | | | |
| From net investment income | (0.40) | (0.41) | (0.31) | (0.33) | (0.08) |
| Net asset value, end of period | $32.39 | $36.60 | $34.04 | $30.65 | $26.07 |
| Total return (%)3 | (10.56) | 8.98 | 12.11 | 18.96 | 7.704 |
| Ratios and supplemental data | | | | | |
| Net assets, end of period (in millions) | $1,331 | $1,030 | $332 | $170 | $20 |
| Ratios (as a percentage of average net assets): | | | | | |
| Expenses before reductions | 0.43 | 0.45 | 0.52 | 0.61 | 1.115 |
| Expenses including reductions | 0.42 | 0.44 | 0.45 | 0.45 | 0.455 |
| Net investment income | 1.33 | 1.53 | 1.03 | 1.16 | 1.445 |
| Portfolio turnover (%)6 | 11 | 13 | 11 | 14 | 12 |
| 1 | Period from 9-28-15 (commencement of operations) to 4-30-16. |
| 2 | Based on average daily shares outstanding. |
| 3 | Total returns would have been lower had certain expenses not been reduced during the applicable periods. |
| 4 | Not annualized. |
| 5 | Annualized. |
| 6 | Portfolio turnover rate excludes securities received or delivered from in-kind transactions. |
| SEE NOTES TO FINANCIAL STATEMENTS | ANNUAL | JOHN HANCOCK MULTIFACTOR ETFS | 97 |
MULTIFACTOR SMALL CAP ETF
| Period ended | 4-30-20 | 4-30-19 | 4-30-181 |
| Per share operating performance | | | |
| Net asset value, beginning of period | $26.89 | $25.69 | $25.00 |
| Net investment income2 | 0.33 | 0.29 | 0.13 |
| Net realized and unrealized gain (loss) on investments | (5.13) | 1.16 | 0.56 |
| Total from investment operations | (4.80) | 1.45 | 0.69 |
| Less distributions | | | |
| From net investment income | (0.32) | (0.25) | — |
| Net asset value, end of period | $21.77 | $26.89 | $25.69 |
| Total return (%)3 | (18.07) | 5.71 | 2.774 |
| Ratios and supplemental data | | | |
| Net assets, end of period (in millions) | $463 | $439 | $39 |
| Ratios (as a percentage of average net assets): | | | |
| Expenses before reductions | 0.55 | 0.60 | 0.905,6 |
| Expenses including reductions | 0.49 | 0.50 | 0.515,6 |
| Net investment income | 1.30 | 1.13 | 1.055 |
| Portfolio turnover (%)7 | 36 | 33 | 17 |
| 1 | Period from 11-8-17 (commencement of operations) to 4-30-18. |
| 2 | Based on average daily shares outstanding. |
| 3 | Total returns would have been lower had certain expenses not been reduced during the applicable periods. |
| 4 | Not annualized. |
| 5 | Annualized. |
| 6 | Certain expenses are presented unannualized due to the short reporting period. |
| 7 | Portfolio turnover rate excludes securities received or delivered from in-kind transactions. |
MULTIFACTOR TECHNOLOGY ETF
| Period ended | 4-30-20 | 4-30-19 | 4-30-18 | 4-30-17 | 4-30-161 |
| Per share operating performance | | | | | |
| Net asset value, beginning of period | $50.65 | $42.87 | $35.10 | $25.86 | $24.42 |
| Net investment income2 | 0.69 | 0.43 | 0.28 | 0.34 | 0.27 |
| Net realized and unrealized gain (loss) on investments | 2.66 | 7.72 | 7.77 | 9.30 | 1.26 |
| Total from investment operations | 3.35 | 8.15 | 8.05 | 9.64 | 1.53 |
| Less distributions | | | | | |
| From net investment income | (0.67) | (0.37) | (0.28) | (0.40) | (0.09) |
| Net asset value, end of period | $53.33 | $50.65 | $42.87 | $35.10 | $25.86 |
| Total return (%)3 | 6.65 | 19.25 | 23.02 | 37.66 | 6.264 |
| Ratios and supplemental data | | | | | |
| Net assets, end of period (in millions) | $36 | $62 | $63 | $42 | $18 |
| Ratios (as a percentage of average net assets): | | | | | |
| Expenses before reductions | 0.66 | 0.64 | 0.74 | 1.00 | 1.185 |
| Expenses including reductions | 0.40 | 0.47 | 0.50 | 0.50 | 0.505 |
| Net investment income | 1.35 | 0.96 | 0.70 | 1.11 | 1.755 |
| Portfolio turnover (%)6 | 21 | 27 | 7 | 18 | 11 |
| 1 | Period from 9-28-15 (commencement of operations) to 4-30-16. |
| 2 | Based on average daily shares outstanding. |
| 3 | Total returns would have been lower had certain expenses not been reduced during the applicable periods. |
| 4 | Not annualized. |
| 5 | Annualized. |
| 6 | Portfolio turnover rate excludes securities received or delivered from in-kind transactions. |
| 98 | JOHN HANCOCK MULTIFACTOR ETFS | ANNUAL | SEE NOTES TO FINANCIAL STATEMENTS |
MULTIFACTOR UTILITIES ETF
| Period ended | 4-30-20 | 4-30-19 | 4-30-18 | 4-30-17 | 4-30-161 |
| Per share operating performance | | | | | |
| Net asset value, beginning of period | $31.68 | $27.45 | $27.02 | $24.86 | $24.92 |
| Net investment income2 | 0.87 | 0.84 | 0.77 | 0.71 | 0.02 |
| Net realized and unrealized gain (loss) on investments | (2.40) | 4.05 | 0.343 | 1.94 | (0.08) |
| Total from investment operations | (1.53) | 4.89 | 1.11 | 2.65 | (0.06) |
| Less distributions | | | | | |
| From net investment income | (0.89) | (0.66) | (0.68) | (0.49) | — |
| Net asset value, end of period | $29.26 | $31.68 | $27.45 | $27.02 | $24.86 |
| Total return (%)4 | (5.16) | 18.21 | 4.14 | 10.79 | (0.27)5 |
| Ratios and supplemental data | | | | | |
| Net assets, end of period (in millions) | $25 | $29 | $18 | $18 | $5 |
| Ratios (as a percentage of average net assets): | | | | | |
| Expenses before reductions | 0.77 | 0.87 | 1.16 | 1.18 | 6.056 |
| Expenses including reductions | 0.40 | 0.46 | 0.50 | 0.50 | 0.506 |
| Net investment income | 2.66 | 2.86 | 2.78 | 2.77 | 0.956 |
| Portfolio turnover (%)7 | 11 | 19 | 12 | 16 | 0 |
| 1 | Period from 3-28-16 (commencement of operations) to 4-30-16. |
| 2 | Based on average daily shares outstanding. |
| 3 | The amount shown for net investment income per share does not correspond with distributions from net investment income due to the timing of sales and repurchase of shares throughout the period as compared to shares outstanding at distribution date. |
| 4 | Total returns would have been lower had certain expenses not been reduced during the applicable periods. |
| 5 | Not annualized. |
| 6 | Annualized. |
| 7 | Portfolio turnover rate excludes securities received or delivered from in-kind transactions. |
| SEE NOTES TO FINANCIAL STATEMENTS | ANNUAL | JOHN HANCOCK MULTIFACTOR ETFS | 99 |
| Notes to financial statements | |
Note 1—Organization
John Hancock Exchange-Traded Fund Trust (the Trust) is an open-end management investment company organized as a Massachusetts business trust. The Trust is registered under the Investment Company Act of 1940, as amended (the 1940 Act). It is a series company with multiple investment series (the funds), fifteen of which are presented in this report.
The investment objective of each fund is to seek to provide investment results that closely correspond, before fees and expenses, to the performance of their respective Index as listed below:
| Fund | Index |
| Multifactor Consumer Discretionary ETF | John Hancock Dimensional Consumer Discretionary Index |
| Multifactor Consumer Staples ETF | John Hancock Dimensional Consumer Staples Index |
| Multifactor Developed International ETF | John Hancock Dimensional Developed International Index |
| Multifactor Emerging Markets ETF | John Hancock Dimensional Emerging Markets Index |
| Multifactor Energy ETF | John Hancock Dimensional Energy Index |
| Multifactor Financials ETF | John Hancock Dimensional Financials Index |
| Multifactor Healthcare ETF | John Hancock Dimensional Healthcare Index |
| Multifactor Industrials ETF | John Hancock Dimensional Industrials Index |
| Multifactor Large Cap ETF | John Hancock Dimensional Large Cap Index |
| Multifactor Materials ETF | John Hancock Dimensional Materials Index |
| Multifactor Media and Communications ETF | John Hancock Dimensional Media and Communications Index |
| Multifactor Mid Cap ETF | John Hancock Dimensional Mid Cap Index |
| Multifactor Small Cap ETF | John Hancock Dimensional Small Cap Index |
| Multifactor Technology ETF | John Hancock Dimensional Technology Index |
| Multifactor Utilities ETF | John Hancock Dimensional Utilities Index |
Note 2—Significant accounting policies
The financial statements have been prepared in conformity with accounting principles generally accepted in the United States of America (US GAAP), which require management to make certain estimates and assumptions as of the date of the financial statements. Actual results could differ from those estimates and those differences could be significant. The funds qualify as investment companies under Topic 946 of Accounting Standards Codification of US GAAP.
Events or transactions occurring after the end of the fiscal period through the date that the financial statements were issued have been evaluated in the preparation of the financial statements. The following summarizes the significant accounting policies of the funds:
Security valuation. Investments are stated at value as of the scheduled close of regular trading on the New York Stock Exchange (NYSE), normally at 4:00 P.M., Eastern Time. In case of emergency or other disruption resulting in the NYSE not opening for trading or the NYSE closing at a time other than the regularly scheduled close, the net asset value (NAV) may be determined as of the regularly scheduled close of the NYSE pursuant to the funds' Valuation Policies and Procedures.
In order to value the securities, the funds use the following valuation techniques: Equity securities, including exchange-traded funds and closed-end funds, held by the funds are typically valued at the last sale price or official closing price on the exchange or principal market where the security trades. In the event there were no sales during the day or closing prices are not available, the securities are valued using the last available bid price. Investments in open-end mutual funds, including John Hancock Collateral Trust (JHCT), are valued at their respective NAVs each business day. Futures contracts are typically valued at the last traded price on the exchange on which they trade. Foreign securities and currencies are valued in U.S. dollars based on foreign currency exchange rates supplied by an independent pricing vendor valued at London close.
In certain instances, the Pricing Committee may determine to value equity securities using prices obtained from another exchange or market if trading on the exchange or market on which prices are typically obtained did not open for trading as scheduled, or if trading closed earlier than scheduled, and trading occurred as normal on another exchange or market.
Other portfolio securities and assets, for which reliable market quotations are not readily available, are valued at fair value as determined in good faith by the funds' Pricing Committee following procedures established by the Board of Trustees. The frequency with which these fair valuation procedures are used cannot be predicted and fair value of securities may differ significantly from the value that would have been used had a ready market for such securities existed. Trading in foreign securities may be completed before the scheduled daily close of trading on the NYSE. Significant events at the issuer or market level may affect the values of securities between the time when the valuation of the securities is generally determined and the close of the NYSE. If a significant event occurs, these securities may be fair valued, as determined in good faith by the funds' Pricing Committee, following procedures established by the Board of Trustees. The funds may use fair value adjustment factors provided by an independent pricing vendor to value certain foreign securities in order to adjust for events that may occur between the close of foreign exchanges or markets and the close of the NYSE.
The funds use a three-tier hierarchy to prioritize the pricing assumptions, referred to as inputs, used in valuation techniques to measure fair value. Level 1 includes securities valued using quoted prices in active markets for identical securities, including registered investment companies. Level 2 includes securities valued using other significant observable inputs. Observable inputs may include quoted prices for similar securities, interest rates, prepayment speeds and credit risk. Prices for securities valued using these inputs are received from independent pricing vendors and brokers and are based on an evaluation of the inputs described. Level 3 includes securities valued using significant unobservable inputs when market prices are not readily available or reliable, including the funds' own assumptions in determining
| 100 | JOHN HANCOCK MULTIFACTOR ETFS | ANNUAL REPORT | |
the fair value of investments. Factors used in determining value may include market or issuer specific events or trends, changes in interest rates and credit quality. The inputs or methodology used for valuing securities are not necessarily an indication of the risks associated with investing in those securities. Changes in valuation techniques and related inputs may result in transfers into or out of an assigned level within the disclosure hierarchy.
The following is a summary of the values by input classification of the funds' investments as of April 30, 2020, by major security category or type:
| | Total
value at
4-30-20 | Level 1
quoted
price | Level 2
significant
observable
inputs | Level 3
significant
unobservable
inputs |
| Multifactor Consumer Discretionary ETF | | | | |
| Investments in securities: | | | | |
| Assets | | | | |
| Common stocks | $31,155,726 | $31,155,726 | — | — |
| Short-term investments | 679,305 | 679,305 | — | — |
| Total investments in securities | $31,835,031 | $31,835,031 | — | — |
| |
| Multifactor Consumer Staples ETF | | | | |
| Investments in securities: | | | | |
| Assets | | | | |
| Common stocks | $19,197,670 | $19,197,670 | — | — |
| Short-term investments | 8,249 | 8,249 | — | — |
| Total investments in securities | $19,205,919 | $19,205,919 | — | — |
| |
| Multifactor Developed International ETF | | | | |
| Investments in securities: | | | | |
| Assets | | | | |
| Common stocks | | | | |
| Australia | $26,988,576 | $26,869,098 | $119,478 | — |
| Austria | 689,359 | 689,359 | — | — |
| Belgium | 4,107,749 | 4,107,749 | — | — |
| Chile | 250,945 | 250,945 | — | — |
| Denmark | 9,253,571 | 9,253,571 | — | — |
| Finland | 6,135,836 | 6,135,836 | — | — |
| France | 41,353,498 | 41,353,498 | — | — |
| Germany | 36,015,369 | 36,015,369 | — | — |
| Hong Kong | 15,759,919 | 15,759,919 | — | — |
| Ireland | 4,604,534 | 4,604,534 | — | — |
| Israel | 1,615,363 | 1,615,363 | — | — |
| Italy | 8,903,259 | 8,903,259 | — | — |
| Japan | 115,963,336 | 115,963,336 | — | — |
| Luxembourg | 960,820 | 960,820 | — | — |
| Macau | 373,869 | 373,869 | — | — |
| Mexico | 83,435 | 83,435 | — | — |
| Netherlands | 17,080,278 | 17,080,278 | — | — |
| New Zealand | 1,078,871 | 1,078,871 | — | — |
| Norway | 2,161,654 | 2,161,654 | — | — |
| Portugal | 723,566 | 723,566 | — | — |
| Singapore | 4,691,452 | 4,691,452 | — | — |
| Spain | 11,095,662 | 11,095,662 | — | — |
| Sweden | 11,769,029 | 11,769,029 | — | — |
| Switzerland | 43,242,867 | 43,242,867 | — | — |
| United Arab Emirates | 1,764 | — | 1,764 | — |
| United Kingdom | 61,218,999 | 61,218,999 | — | — |
| United States | 45,406 | 45,406 | — | — |
| Preferred securities | 3,091,660 | 3,091,660 | — | — |
| Short-term investments | 11,065,611 | 11,065,611 | — | — |
| Total investments in securities | $440,326,257 | $440,205,015 | $121,242 | — |
| |
| | ANNUAL REPORT | JOHN HANCOCK MULTIFACTOR ETFS | 101 |
| | Total
value at
4-30-20 | Level 1
quoted
price | Level 2
significant
observable
inputs | Level 3
significant
unobservable
inputs |
| Multifactor Emerging Markets ETF | | | | |
| Investments in securities: | | | | |
| Assets | | | | |
| Common stocks | $673,037,862 | $673,037,862 | — | — |
| Preferred securities | 10,104,694 | 10,104,694 | — | — |
| Investment companies | 130,658 | 130,658 | — | — |
| Rights | 2,641 | — | $2,641 | — |
| Warrants | 3,305 | 3,305 | — | — |
| Short-term investments | 7,175,868 | 7,175,868 | — | — |
| Total investments in securities | $690,455,028 | $690,452,387 | $2,641 | — |
| |
| Multifactor Energy ETF | | | | |
| Investments in securities: | | | | |
| Assets | | | | |
| Common stocks | $15,010,074 | $15,010,074 | — | — |
| Short-term investments | 69,108 | 69,108 | — | — |
| Total investments in securities | $15,079,182 | $15,079,182 | — | — |
| |
| Multifactor Financials ETF | | | | |
| Investments in securities: | | | | |
| Assets | | | | |
| Common stocks | $30,341,528 | $30,341,528 | — | — |
| Short-term investments | 69,761 | 69,761 | — | — |
| Total investments in securities | $30,411,289 | $30,411,289 | — | — |
| |
| Multifactor Healthcare ETF | | | | |
| Investments in securities: | | | | |
| Assets | | | | |
| Common stocks | $43,192,912 | $43,192,912 | — | — |
| Short-term investments | 206,649 | 206,649 | — | — |
| Total investments in securities | $43,399,561 | $43,399,561 | — | — |
| |
| Multifactor Industrials ETF | | | | |
| Investments in securities: | | | | |
| Assets | | | | |
| Common stocks | $22,229,705 | $22,229,705 | — | — |
| Short-term investments | 119,191 | 119,191 | — | — |
| Total investments in securities | $22,348,896 | $22,348,896 | — | — |
| |
| Multifactor Large Cap ETF | | | | |
| Investments in securities: | | | | |
| Assets | | | | |
| Common stocks | $788,432,145 | $788,432,145 | — | — |
| Short-term investments | 2,303,461 | 2,303,461 | — | — |
| Total investments in securities | $790,735,606 | $790,735,606 | — | — |
| Derivatives: | | | | |
| Assets | | | | |
| Futures | $54,691 | $54,691 | — | — |
| |
| Multifactor Materials ETF | | | | |
| Investments in securities: | | | | |
| Assets | | | | |
| Common stocks | $17,154,136 | $17,154,136 | — | — |
| 102 | JOHN HANCOCK MULTIFACTOR ETFS | ANNUAL REPORT | |
| | Total
value at
4-30-20 | Level 1
quoted
price | Level 2
significant
observable
inputs | Level 3
significant
unobservable
inputs |
| Multifactor Materials ETF (continued) | | | | |
| Short-term investments | $18,142 | $18,142 | — | — |
| Total investments in securities | $17,172,278 | $17,172,278 | — | — |
| |
| Multifactor Media and Communications ETF | | | | |
| Investments in securities: | | | | |
| Assets | | | | |
| Common stocks | $22,324,297 | $22,324,297 | — | — |
| Short-term investments | 156,174 | 156,174 | — | — |
| Total investments in securities | $22,480,471 | $22,480,471 | — | — |
| Derivatives: | | | | |
| Assets | | | | |
| Futures | $400 | $400 | — | — |
| |
| Multifactor Mid Cap ETF | | | | |
| Investments in securities: | | | | |
| Assets | | | | |
| Common stocks | $1,330,514,222 | $1,330,514,222 | — | — |
| Short-term investments | 11,158,906 | 11,158,906 | — | — |
| Total investments in securities | $1,341,673,128 | $1,341,673,128 | — | — |
| |
| Multifactor Small Cap ETF | | | | |
| Investments in securities: | | | | |
| Assets | | | | |
| Common stocks | $463,052,268 | $463,052,268 | — | — |
| Short-term investments | 12,899,986 | 12,899,986 | — | — |
| Total investments in securities | $475,952,254 | $475,952,254 | — | — |
| |
| Multifactor Technology ETF | | | | |
| Investments in securities: | | | | |
| Assets | | | | |
| Common stocks | $36,258,391 | $36,258,391 | — | — |
| Short-term investments | 186,917 | 186,917 | — | — |
| Total investments in securities | $36,445,308 | $36,445,308 | — | — |
| |
| Multifactor Utilities ETF | | | | |
| Investments in securities: | | | | |
| Assets | | | | |
| Common stocks | $25,433,428 | $25,433,428 | — | — |
| Short-term investments | 31,046 | 31,046 | — | — |
| Total investments in securities | $25,464,474 | $25,464,474 | — | — |
Security transactions and related investment income. Investment security transactions are accounted for on a trade date plus one basis for daily NAV calculations. However, for financial reporting purposes, investment transactions are reported on trade date. Interest income is accrued as earned. Dividend income is recorded on the ex-date, except for dividends of certain foreign securities where the dividend may not be known until after the ex-date. In those cases, dividend income, net of withholding taxes, is recorded when the fund becomes aware of the dividends. Non-cash dividends, if any, are recorded at the fair market value of the securities received. Gains and losses on securities sold are determined on the basis of identified cost and may include proceeds from litigation.
Real estate investment trusts. The funds may invest in real estate investment trusts (REITs). Distributions from REITs may be recorded as income and subsequently characterized by the REIT at the end of the fiscal year as a reduction of cost of investments and/or as a realized gain. As a result, the funds will estimate the components of distributions from these securities. Such estimates are revised when the actual components of the distributions are known.
Securities lending. The funds may lend their securities to earn additional income. The funds receive collateral from the borrower in an amount not less than the market value of the loaned securities. The funds will invest their cash collateral in JHCT, an affiliate of the funds, which has a floating NAV and is registered with the Securities and Exchange Commission (SEC) as an investment company. JHCT invests in short-term money market investments. Each fund will receive the benefit of any gains and bear any losses generated by JHCT with respect to the cash collateral.
| | ANNUAL REPORT | JOHN HANCOCK MULTIFACTOR ETFS | 103 |
The funds have the right to recall loaned securities on demand. If a borrower fails to return loaned securities when due, then the lending agent is responsible and indemnifies the funds for the lent securities. The lending agent uses the collateral received from the borrower to purchase replacement securities of the same issue, type, class and series of the loaned securities. If the value of the collateral is less than the purchase cost of replacement securities, the lending agent is responsible for satisfying the shortfall but only to the extent that the shortfall is not due to any decrease in the value of JHCT.
Although the risk of loss on securities lent is mitigated by receiving collateral from the borrower and through lending agent indemnification, the funds could experience a delay in recovering securities or could experience a lower than expected return if the borrower fails to return the securities on a timely basis. The funds receive compensation for lending their securities by retaining a portion of the return on the investment of the collateral and compensation from fees earned from borrowers of the securities. Securities lending income received by the funds is net of fees retained by the securities lending agent. Net income received from JHCT is a component of securities lending income as recorded on the Statements of operations.
Obligations to repay collateral received by the funds are shown on the Statements of assets and liabilities as Payable upon return of securities loaned and are secured by the loaned securities. The following table summarizes the values of securities loaned by the funds and the corresponding cash collateral received at April 30, 2020:
| Fund | Market value of securities on loan | Cash collateral received |
| Multifactor Consumer Discretionary ETF | $590,699 | $646,339 |
| Multifactor Developed International ETF | 9,841,955 | 10,537,500 |
| Multifactor Emerging Markets ETF | 6,346,286 | 6,740,342 |
| Multifactor Energy ETF | 60,135 | 59,621 |
| Multifactor Financials ETF | 33,532 | 35,631 |
| Multifactor Healthcare ETF | 175,355 | 183,433 |
| Multifactor Industrials ETF | 89,360 | 95,354 |
| Multifactor Large Cap ETF | 1,747,860 | 1,885,827 |
| Multifactor Media and Communications ETF | 143,079 | 150,850 |
| Multifactor Mid Cap ETF | 8,966,859 | 9,730,266 |
| Multifactor Small Cap ETF | 11,929,990 | 12,667,808 |
| Multifactor Technology ETF | 144,125 | 149,834 |
Foreign investing. Assets, including investments, and liabilities denominated in foreign currencies are translated into U.S. dollar values each day at the prevailing exchange rate. Purchases and sales of securities, income and expenses are translated into U.S. dollars at the prevailing exchange rate on the date of the transaction. The effect of changes in foreign currency exchange rates on the value of securities is reflected as a component of the realized and unrealized gains (losses) on investments. Foreign investments are subject to a decline in the value of a foreign currency versus the U.S. dollar, which reduces the dollar value of securities denominated in that currency.
Funds that invest internationally generally carry more risk than funds that invest strictly in U.S. securities. These risks are heightened for investments in emerging markets. Risks can result from differences in economic and political conditions, regulations, market practices (including higher transaction costs), accounting standards and other factors.
Foreign taxes. The funds may be subject to withholding tax on income, capital gains or repatriation taxes imposed by certain countries, a portion of which may be recoverable. Foreign taxes are accrued based upon the funds' understanding of the tax rules and rates that exist in the foreign markets in which it invests. Taxes are accrued based on gains realized by the funds as a result of certain foreign security sales. In certain circumstances, estimated taxes are accrued based on unrealized appreciation of such securities. Investment income is recorded net of foreign withholding taxes.
Overdraft. The funds may have the ability to borrow from banks for temporary or emergency purposes, including meeting redemption requests that otherwise might require the untimely sale of securities. Pursuant to the funds' custodian agreement, the custodian may loan money to the funds to make properly authorized payments. The funds are obligated to repay the custodian for any overdraft, including any related costs or expenses. The custodian may have a lien, security interest or security entitlement in any fund property that is not otherwise segregated or pledged, to the extent of any overdraft, and to the maximum extent permitted by law.
Line of credit. The funds and other affiliated funds have entered into a syndicated line of credit agreement with Citibank, N.A. as the administrative agent that enables them to participate in a $750 million unsecured committed line of credit. Effective June 27, 2019, Multifactor Media and Communications ETF entered into the existing $750 million unsecured committed line of credit. Excluding commitments designated for a certain fund and subject to the needs of all other affiliated funds, a fund can borrow up to an aggregate commitment amount of $500 million, subject to asset coverage and other limitations as specified in the agreement.
A commitment fee payable at the end of each calendar quarter, based on the average daily unused portion of each line of credit, is charged to each participating fund based on a combination of fixed and asset based allocations and is reflected in Other expenses on the Statements of operations. For the year ended April 30, 2020, the funds had no borrowings under the line of credit.
Commitment fees for the year ended April 30, 2020 were as follows:
| Fund | Commitment fee |
| Multifactor Consumer Discretionary ETF | $2,243 |
| Multifactor Consumer Staples ETF | 2,213 |
| Multifactor Developed International ETF | 3,397 |
| Multifactor Emerging Markets ETF | 3,938 |
| 104 | JOHN HANCOCK MULTIFACTOR ETFS | ANNUAL REPORT | |
| Fund | Commitment fee |
| Multifactor Energy ETF | $2,199 |
| Multifactor Financials ETF | 2,251 |
| Multifactor Healthcare ETF | 2,268 |
| Multifactor Industrials ETF | 2,215 |
| Multifactor Large Cap ETF | 4,299 |
| Multifactor Materials ETF | 2,197 |
| Multifactor Media and Communications ETF | 1,206 |
| Multifactor Mid Cap ETF | 5,094 |
| Multifactor Small Cap ETF | 3,255 |
| Multifactor Technology ETF | 2,276 |
| Multifactor Utilities ETF | 2,218 |
Expenses. Within the John Hancock group of funds complex, expenses that are directly attributable to an individual fund are allocated to such fund. Expenses that are not readily attributable to a specific fund are allocated among all funds in an equitable manner, taking into consideration, among other things, the nature and type of expense and the fund’s relative net assets. Expense estimates are accrued in the period to which they relate and adjustments are made when actual amounts are known.
Federal income taxes. Each fund intends to continue to qualify as a regulated investment company by complying with the applicable provisions of the Internal Revenue Code and will not be subject to federal income tax on taxable income that is distributed to shareholders. Therefore, no federal income tax provision is required.
For federal income tax purposes, as of April 30, 2020, certain funds have short-term and long-term capital loss carryforwards available to offset future net realized capital gains. These carryforwards do not expire. The following table details the capital loss carryforward available as of April 30, 2020:
| | No Expiration Date |
| Fund | Short Term | Long Term |
| Multifactor Consumer Discretionary ETF | $2,009,939 | $2,185,094 |
| Multifactor Consumer Staples ETF | 873,464 | 141,869 |
| Multifactor Developed International ETF | 8,248,408 | 5,837,151 |
| Multifactor Emerging Markets ETF | 8,583,969 | 1,812,018 |
| Multifactor Energy ETF | 3,499,014 | 1,012,194 |
| Multifactor Financials ETF | 1,354,761 | 504,749 |
| Multifactor Healthcare ETF | 1,633,762 | 1,649,061 |
| Multifactor Industrials ETF | 1,027,142 | 905,998 |
| Multifactor Large Cap ETF | 10,081,955 | 7,357,177 |
| Multifactor Materials ETF | 1,016,878 | 879,524 |
| Multifactor Media and Communications ETF | 936,580 | — |
| Multifactor Mid Cap ETF | 35,946,007 | 12,892,570 |
| Multifactor Small Cap ETF | 47,317,665 | 10,356,537 |
| Multifactor Technology ETF | 1,732,501 | 638,057 |
| Multifactor Utilities ETF | 1,193,729 | 32,049 |
Due to certain Internal Revenue Code rules, utilization of the capital loss carryforwards may be limited in future years.
As of April 30, 2020, the funds had no uncertain tax positions that would require financial statement recognition, derecognition or disclosure. The funds' federal tax returns are subject to examination by the Internal Revenue Service for a period of three years.
For federal income tax purposes, the costs of investments owned on April 30, 2020, including short-term investments, were as follows:
| Fund | Aggregate
cost | Unrealized
appreciation | Unrealized
(depreciation) | Net unrealized
appreciation/
(depreciation) |
| Multifactor Consumer Discretionary ETF | $34,429,073 | $2,711,940 | $(5,305,982) | $(2,594,042) |
| Multifactor Consumer Staples ETF | 20,021,582 | 947,404 | (1,763,067) | (815,663) |
| Multifactor Developed International ETF | 474,063,003 | 30,313,621 | (64,050,367) | (33,736,746) |
| Multifactor Emerging Markets ETF | 778,648,638 | 53,349,843 | (141,543,453) | (88,193,610) |
| Multifactor Energy ETF | 24,216,830 | 20,560 | (9,158,208) | (9,137,648) |
| Multifactor Financials ETF | 36,237,194 | 568,493 | (6,394,398) | (5,825,905) |
| Multifactor Healthcare ETF | 39,898,814 | 4,779,034 | (1,278,287) | 3,500,747 |
| Multifactor Industrials ETF | 25,491,493 | 541,390 | (3,683,987) | (3,142,597) |
| Multifactor Large Cap ETF | 778,919,098 | 104,623,543 | (92,752,344) | 11,871,199 |
| Multifactor Materials ETF | 19,427,460 | 838,208 | (3,093,390) | (2,255,182) |
| | ANNUAL REPORT | JOHN HANCOCK MULTIFACTOR ETFS | 105 |
| Fund | Aggregate
cost | Unrealized
appreciation | Unrealized
(depreciation) | Net unrealized
appreciation/
(depreciation) |
| Multifactor Media and Communications ETF | $23,200,322 | $1,528,476 | $(2,247,927) | $(719,451) |
| Multifactor Mid Cap ETF | 1,461,239,719 | 97,973,617 | (217,540,208) | (119,566,591) |
| Multifactor Small Cap ETF | 529,758,019 | 23,649,932 | (77,455,697) | (53,805,765) |
| Multifactor Technology ETF | 33,439,769 | 4,896,622 | (1,891,083) | 3,005,539 |
| Multifactor Utilities ETF | 29,189,419 | 68,329 | (3,793,274) | (3,724,945) |
Distribution of income and gains. Distributions to shareholders from net investment income and net realized gains, if any, are recorded on the ex-date. The funds generally declare and pay dividends at least semiannually from net investment income, if any. Capital gain distributions, if any, are typically distributed annually.
The tax character of distributions for the year ended April 30, 2020 was as follows:
| Fund | Ordinary
Income |
| Multifactor Consumer Discretionary ETF | $485,939 |
| Multifactor Consumer Staples ETF | 655,650 |
| Multifactor Developed International ETF | 16,526,310 |
| Multifactor Emerging Markets ETF | 19,729,767 |
| Multifactor Energy ETF | 1,221,422 |
| Multifactor Financials ETF | 867,642 |
| Multifactor Healthcare ETF | 1,306,455 |
| Multifactor Industrials ETF | 372,367 |
| Multifactor Large Cap ETF | 16,652,227 |
| Multifactor Materials ETF | 400,889 |
| Multifactor Media and Communications ETF | 159,184 |
| Multifactor Mid Cap ETF | 14,393,874 |
| Multifactor Small Cap ETF | 5,745,267 |
| Multifactor Technology ETF | 628,863 |
| Multifactor Utilities ETF | 922,136 |
The tax character of distributions for the year ended April 30, 2019 was as follows:
| Fund | Ordinary
Income |
| Multifactor Consumer Discretionary ETF | $530,221 |
| Multifactor Consumer Staples ETF | 726,880 |
| Multifactor Developed International ETF | 2,179,880 |
| Multifactor Emerging Markets ETF | 587,064 |
| Multifactor Energy ETF | 528,622 |
| Multifactor Financials ETF | 931,038 |
| Multifactor Healthcare ETF | 415,032 |
| Multifactor Industrials ETF | 439,292 |
| Multifactor Large Cap ETF | 9,266,101 |
| Multifactor Materials ETF | 317,644 |
| Multifactor Mid Cap ETF | 7,646,180 |
| Multifactor Small Cap ETF | 1,596,006 |
| Multifactor Technology ETF | 544,744 |
| Multifactor Utilities ETF | 724,139 |
As of April 30, 2020, the components of distributable earnings on a tax basis were as follows:
| Fund | Undistributed
Ordinary Income |
| Multifactor Consumer Discretionary ETF | $108,639 |
| Multifactor Consumer Staples ETF | 181,088 |
| Multifactor Developed International ETF | 2,428,107 |
| Multifactor Emerging Markets ETF | 2,595,398 |
| Multifactor Energy ETF | 134,783 |
| Multifactor Financials ETF | 177,638 |
| Multifactor Healthcare ETF | 445,821 |
| 106 | JOHN HANCOCK MULTIFACTOR ETFS | ANNUAL REPORT | |
| Fund | Undistributed
Ordinary Income |
| Multifactor Industrials ETF | $84,720 |
| Multifactor Large Cap ETF | 5,406,459 |
| Multifactor Materials ETF | 87,638 |
| Multifactor Media and Communications ETF | 81,397 |
| Multifactor Mid Cap ETF | 6,025,206 |
| Multifactor Small Cap ETF | 1,385,467 |
| Multifactor Technology ETF | 227,388 |
| Multifactor Utilities ETF | 198,401 |
Such distributions and distributable earnings, on a tax basis, are determined in conformity with income tax regulations, which may differ from US GAAP. Distributions in excess of tax basis earnings and profits, if any, are reported in the funds' financial statements as a return of capital.
Capital accounts within the financial statements are adjusted for permanent book-tax differences. These adjustments have no impact on net assets or the results of operations. Temporary book-tax differences, if any, will reverse in a subsequent period. Book-tax differences are primarily attributable to wash sale loss deferrals and redemptions-in-kind.
Note 3—Derivative instruments
The funds may invest in derivatives in order to meet their investment objective. Derivatives include a variety of different instruments that may be traded in the over-the-counter (OTC) market, on a regulated exchange or through a clearing facility. The risks in using derivatives vary depending upon the structure of the instruments, including the use of leverage, optionality, the liquidity or lack of liquidity of the contract, the creditworthiness of the counterparty or clearing organization and the volatility of the position. Some derivatives involve risks that are potentially greater than the risks associated with investing directly in the referenced securities or other referenced underlying instrument. Specifically, the funds are exposed to the risk that the counterparty to an OTC derivatives contract will be unable or unwilling to make timely settlement payments or otherwise honor its obligations. OTC derivatives transactions typically can only be closed out with the other party to the transaction.
Certain derivatives are traded or cleared on an exchange or central clearinghouse. Exchange-traded or centrally-cleared transactions generally present less counterparty risk to a fund than OTC transactions. The exchange or clearinghouse stands between the funds and the broker to the contract and therefore, credit risk is generally limited to the failure of the exchange or clearinghouse and the clearing member.
Futures. A futures contract is a contractual agreement to buy or sell a particular currency or financial instrument at a pre-determined price in the future. Futures are traded on an exchange and cleared through a central clearinghouse. Risks related to the use of futures contracts include possible illiquidity of the futures markets and contract prices that can be highly volatile and imperfectly correlated to movements in the underlying financial instrument and potential losses in excess of the amounts recognized on the Statements of assets and liabilities. Use of long futures contracts subjects the funds to the risk of loss up to the notional value of the futures contracts. Use of short futures contracts subjects the funds to unlimited risk of loss.
Upon entering into a futures contract, the fund is required to deposit initial margin with the broker in the form of cash or securities. The amount of required margin is set by the broker and is generally based on a percentage of the contract value. The margin deposit must then be maintained at the established level over the life of the contract. Cash that has been pledged by a fund is detailed in the Statements of assets and liabilities as Collateral held at broker for futures contracts. Securities pledged by the funds, if any, are identified in the Funds' investments. Subsequent payments, referred to as variation margin, are made or received by a fund periodically and are based on changes in the market value of open futures contracts. Futures contracts are marked-to-market daily and unrealized gain or loss is recorded by the fund. Receivable/Payable for futures variation margin is included in the Statements of assets and liabilities. When the contract is closed, a fund records a realized gain or loss equal to the difference between the value of the contract at the time it was opened and the value at the time it was closed.
The following table details how the funds used futures contracts during the year ended April 30, 2020. In addition, the table summarizes the range of notional contract amounts held by the funds, as measured at each quarter end:
| Fund | Reason | USD Notional range |
| Multifactor Consumer Discretionary ETF | The fund used futures contracts to gain exposure to certain securities markets and as a substitute for securities purchased. As of April 30, 2020, there were no open futures contracts. | Up to $90,000, as measured during the period |
| Multifactor Consumer Staples ETF | The fund used futures contracts to gain exposure to certain securities markets and as a substitute for securities purchased. As of April 30, 2020, there were no open futures contracts. | Up to $86,000, as measured during the period |
| Multifactor Developed International ETF | The fund used futures contracts to gain exposure to certain securities markets and as a substitute for securities purchased. As of April 30, 2020, there were no open futures contracts. | Up to $42.1 million, as measured during the period |
| Multifactor Emerging Markets ETF | The fund used futures contracts to gain exposure to certain securities markets and as a substitute for securities purchased. As of April 30, 2020, there were no open futures contracts. | Up to $115.5 million, as measured during the period |
| Multifactor Energy ETF | The fund used futures contracts to gain exposure to certain securities markets and as a substitute for securities purchased. As of April 30, 2020, there were no open futures contracts. | Up to $125,000, as measured during the period |
| | ANNUAL REPORT | JOHN HANCOCK MULTIFACTOR ETFS | 107 |
| Fund | Reason | USD Notional range |
| Multifactor Financials ETF | The fund used futures contracts to gain exposure to certain securities markets and as a substitute for securities purchased. As of April 30, 2020, there were no open futures contracts. | Up to $90,000, as measured during the period |
| Multifactor Industrials ETF | The fund used futures contracts to gain exposure to certain securities markets and as a substitute for securities purchased. As of April 30, 2020, there were no open futures contracts. | Up to $173,000, as measured during the period |
| Multifactor Large Cap ETF | The fund used futures contracts to gain exposure to certain securities markets and as a substitute for securities purchased. | Up to $290,000 |
| Multifactor Materials ETF | The fund used futures contracts to gain exposure to certain securities markets and as a substitute for securities purchased. As of April 30, 2020, there were no open futures contracts. | Up to $154,000, as measured during the period |
| Multifactor Media and Communications ETF | The fund used futures contracts to gain exposure to certain securities markets and as a substitute for securities purchased. | Up to $76,000 |
| Multifactor Mid Cap ETF | The fund used futures contracts to gain exposure to certain securities markets and as a substitute for securities purchased. As of April 30, 2020, there were no open futures contracts. | Up to $1.7 million |
| Multifactor Small Cap ETF | The fund used futures contracts to gain exposure to certain securities markets and as a substitute for securities purchased. As of April 30, 2020, there were no open futures contracts. | Up to $304,000 |
| Multifactor Technology ETF | The fund used futures contracts to gain exposure to certain securities markets and as a substitute for securities purchased. As of April 30, 2020, there were no open futures contracts. | Up to $147,000, as measured during the period |
| Multifactor Utilities ETF | The fund used futures contracts to gain exposure to certain securities markets and as a substitute for securities purchased. As of April 30, 2020, there were no open futures contracts. | Up to $368,000, as measured during the period |
Fair value of derivative instruments by risk category
The table below summarizes the fair value of derivatives held by the funds at April 30, 2020 by risk category:
| Fund | Risk | Statements of
assets and
liabilities location | Financial
instruments
location | Assets
derivatives
fair value | Liabilities
derivatives
fair value |
| Multifactor Large Cap ETF | Equity | Receivable/payable for futures variation margin | Futures1 | $54,691 | — |
| | | | | $54,691 | — |
| Multifactor Media and Communications ETF | Equity | Receivable/payable for futures variation margin | Futures1 | $400 | — |
| | | | | $400 | — |
| | |
| 1 | Reflects cumulative appreciation/depreciation on futures as disclosed in Funds' investments. Only the year end variation margin is separately disclosed on the Statements of assets and liabilities. |
Effect of derivative instruments on the Statements of operations
The table below summarizes the net realized gain (loss) included in the net increase (decrease) in net assets from operations, classified by derivative instrument and risk category, for the year ended April 30, 2020:
| | | Statements of operations location - Net realized gain (loss) on: |
| Fund | Risk | Futures contracts |
| Multifactor Consumer Discretionary ETF | Equity | $(4,612) |
| | Total | $(4,612) |
| Multifactor Consumer Staples ETF | Equity | $1,838 |
| | Total | $1,838 |
| Multifactor Developed International ETF | Equity | $(1,247,787) |
| | Total | $(1,247,787) |
| Multifactor Emerging Markets ETF | Equity | $(231,104) |
| | Total | $(231,104) |
| Multifactor Energy ETF | Equity | $(5,957) |
| | Total | $(5,957) |
| Multifactor Financials ETF | Equity | $(2,839) |
| | Total | $(2,839) |
| 108 | JOHN HANCOCK MULTIFACTOR ETFS | ANNUAL REPORT | |
| | | Statements of operations location - Net realized gain (loss) on: |
| Fund | Risk | Futures contracts |
| Multifactor Industrials ETF | Equity | $(3,387) |
| | Total | $(3,387) |
| Multifactor Large Cap ETF | Equity | $(68,713) |
| | Total | $(68,713) |
| Multifactor Materials ETF | Equity | $(679) |
| | Total | $(679) |
| Multifactor Media and Communications ETF | Equity | $7,921 |
| | Total | $7,921 |
| Multifactor Mid Cap ETF | Equity | $58,802 |
| | Total | $58,802 |
| Multifactor Small Cap ETF | Equity | $6,618 |
| | Total | $6,618 |
| Multifactor Technology ETF | Equity | $3,658 |
| | Total | $3,658 |
| Multifactor Utilities ETF | Equity | $(10,044) |
| | Total | $(10,044) |
The table below summarizes the net change in unrealized appreciation (depreciation) included in the net increase (decrease) in net assets from operations, classified by derivative instrument and risk category, for the year ended April 30, 2020:
| | | Statements of operations location - Change in net unrealized appreciation (depreciation) of: |
| Fund | Risk | Futures contracts |
| Multifactor Large Cap ETF | Equity | $54,691 |
| | Total | $54,691 |
| Multifactor Media and Communications ETF | Equity | $400 |
| | Total | $400 |
Note 4—Guarantees and indemnifications
Under the Trust's organizational documents, its Officers and Trustees are indemnified against certain liabilities arising out of the performance of their duties to the Trust, including the funds. Additionally, in the normal course of business, the Trust enters into contracts with service providers that contain general indemnification clauses. The Trust's maximum exposure under these arrangements is unknown, as this would involve future claims that may be made against the Trust that have not yet occurred. The risk of material loss from such claims is considered remote.
Note 5—Fees and transactions with affiliates
John Hancock Investment Management LLC (the Advisor) serves as investment advisor for the funds. The Advisor is an indirect, wholly owned subsidiary of Manulife Financial Corporation (MFC). Prior to June 28, 2019, the Advisor was known as John Hancock Advisers, LLC.
Management fee. The funds have an investment management agreement with the Advisor under which each fund pays a monthly management fee to the Advisor equivalent on an annual basis as detailed below. The Advisor has a subadvisory agreement with Dimensional Fund Advisors LP. The funds are not responsible for payment of the subadvisory fees.
The management fee structure is as follows:
• Multifactor Consumer Discretionary ETF, Multifactor Consumer Staples ETF, Multifactor Energy ETF, Multifactor Financials ETF, Multifactor Healthcare ETF, Multifactor Industrials ETF, Multifactor Materials ETF, Multifactor Media and Communications Cap ETF, Multifactor Technology ETF, and Multifactor Utilities ETF —The management fee is 0.380% of the fund’s average daily net assets
• Multifactor Developed International ETF—The management fee is 0.350% of the fund’s average daily net assets
• Multifactor Emerging Markets ETF—The management fee is 0.440% of the fund’s average daily net assets
• Multifactor Large Cap ETF—The management fee is 0.260% of the fund’s average daily net assets
• Multifactor Mid Cap ETF—The management fee is 0.370% of the fund’s average daily net assets
• Multifactor Small Cap ETF—The management fee is 0.390% of the fund’s average daily net assets
| | ANNUAL REPORT | JOHN HANCOCK MULTIFACTOR ETFS | 109 |
Prior to March 30, 2020, the management fee structure was as follows:
• Multifactor Developed International ETF—Aggregate net assets are the aggregate net assets of the fund, Manulife Multifactor Developed International Index ETF (hedged) and Manulife Multifactor Developed International Index ETF (unhedged). The management fee is 0.450% of the fund's aggregate daily net assets
• Multifactor Emerging Markets ETF—Aggregate net assets are the aggregate net assets of the fund and Manulife Multifactor Emerging Markets Index ETF (unhedged). The management fee is as follows: a) 0.600% of the first $500 million of the fund's aggregate daily net assets, b) 0.525% of the next $500 million of the fund's aggregate daily net assets and c) 0.500% of the fund's aggregate daily net assets in excess of $1 billion
• Multifactor Large Cap ETF—Aggregate net assets are the aggregate net assets of the fund, Manulife Multifactor U.S. Large Cap Index ETF (hedged) and Manulife Multifactor U.S. Large Cap Index ETF (unhedged). The management fee is as follows: a) 0.300% of the first $300 million of the fund's aggregate daily net assets and b) 0.280% of the fund's aggregate daily net assets in excess of $300 million
• Multifactor Mid Cap ETF—Aggregate net assets are the aggregate net assets of the fund, Manulife Multifactor U.S. Mid Cap Index ETF (hedged) and Manulife Multifactor U.S. Mid Cap Index ETF (unhedged). The management fee is as follows: a) 0.400% of the first $300 million of the fund's aggregate daily net assets and b) 0.370% of the fund's aggregate daily net assets in excess of $300 million
• Multifactor Small Cap ETF—Aggregate net assets are the aggregate net assets of the fund, Manulife Multifactor U.S. Small Cap Index ETF (hedged) and Manulife Multifactor U.S. Small Cap Index ETF (unhedged). The management fee is 0.500% of the fund's aggregate daily net assets
The Advisor has contractually agreed to waive a portion of its management fee and/or reimburse expenses for certain funds of the John Hancock group of funds complex, including the fund (the participating portfolios). This waiver is based upon aggregate net assets of all the participating portfolios. The amount of the reimbursement is calculated daily and allocated among all the participating portfolios in proportion to the daily net assets of each fund. During the year ended April 30, 2020, this waiver amounted to 0.01% of the fund’s average daily net assets. This arrangement expires on July 31, 2021, unless renewed by mutual agreement of the fund and the Advisor based upon a determination that this is appropriate under the circumstances at that time.
The Advisor has contractually agreed to reduce its management fee or, if necessary, make a payment to a fund, in an amount equal to the amount by which expenses of the fund exceed the following:
| Fund | Expense
limitation as a
percentage of
average net
assets |
| Multifactor Consumer Discretionary ETF | 0.40% |
| Multifactor Consumer Staples ETF | 0.40% |
| Multifactor Developed International ETF | 0.39% |
| Multifactor Emerging Markets ETF | 0.49% |
| Multifactor Energy ETF | 0.40% |
| Multifactor Financials ETF | 0.40% |
| Multifactor Healthcare ETF | 0.40% |
| Multifactor Industrials ETF | 0.40% |
| Fund | Expense
limitation as a
percentage of
average net
assets |
| Multifactor Large Cap ETF | 0.29% |
| Multifactor Materials ETF | 0.40% |
| Multifactor Media and Communications ETF | 0.40% |
| Multifactor Mid Cap ETF | 0.42% |
| Multifactor Small Cap ETF | 0.42% |
| Multifactor Technology ETF | 0.40% |
| Multifactor Utilities ETF | 0.40% |
Prior to March 30, 2020, the Advisor had contractually agreed to reduce its management fee or, if necessary, make a payment to a fund, in an amount equal to the amount by which expenses of the fund exceed the following:
| Fund | Expense
limitation as a
percentage of
average net
assets |
| Multifactor Developed International ETF | 0.45% |
| Multifactor Emerging Markets ETF | 0.55% |
| Multifactor Large Cap ETF | 0.35% |
| Fund | Expense
limitation as a
percentage of
average net
assets |
| Multifactor Mid Cap ETF | 0.45% |
| Multifactor Small Cap ETF | 0.50% |
Expenses means all the expenses of the funds, excluding taxes, brokerage commissions, interest expense, litigation and indemnification expenses and other extraordinary expenses not incurred in the ordinary course of the funds’ business, borrowing costs, prime brokerage fees, acquired fund fees and expenses paid indirectly, and short dividend expense. Each fund’s, excluding Multifactor Developed International ETF, Multifactor Emerging Markets ETF, Multifactor Large Cap ETF, Multifactor Mid Cap ETF, and Multifactor Small Cap ETF, expense limitation agreement expires on August 31, 2020, unless renewed by mutual agreement of the funds and the Advisor based upon a determination that this is appropriate under the circumstances at that time. The expense limitation for Multifactor Developed International ETF, Multifactor Emerging Markets ETF, Multifactor Large Cap ETF, Multifactor Mid Cap ETF, and Multifactor Small Cap ETF expires on August 31, 2021 unless renewed by mutual agreement of the fund and the Advisor based upon a determination that this is appropriate under the circumstances at that time.
The expense reductions described above amount to the following for the year ended April 30, 2020.
| 110 | JOHN HANCOCK MULTIFACTOR ETFS | ANNUAL REPORT | |
| Fund | Expense reimbursement |
| Multifactor Consumer Discretionary ETF | $127,792 |
| Multifactor Consumer Staples ETF | 124,783 |
| Multifactor Developed International ETF | 375,543 |
| Multifactor Emerging Markets ETF | 937,665 |
| Multifactor Energy ETF | 125,493 |
| Multifactor Financials ETF | 132,896 |
| Multifactor Healthcare ETF | 131,519 |
| Multifactor Industrials ETF | 125,124 |
| Fund | Expense reimbursement |
| Multifactor Large Cap ETF | $88,298 |
| Multifactor Materials ETF | 123,009 |
| Multifactor Media and Communications ETF | 133,238 |
| Multifactor Mid Cap ETF | 125,631 |
| Multifactor Small Cap ETF | 290,563 |
| Multifactor Technology ETF | 132,049 |
| Multifactor Utilities ETF | 126,925 |
Expenses waived or reimbursed in the current fiscal period are not subject to recapture in future fiscal periods.
The investment management fees, including the impact of the waivers and reimbursements as described above, incurred for the year ended April 30, 2020, were equivalent to a net annual effective rate of the funds' average daily net assets:
| Fund | Net Annual Effective Rate |
| Multifactor Consumer Discretionary ETF | 0.05% |
| Multifactor Consumer Staples ETF | 0.00% |
| Multifactor Developed International ETF | 0.36% |
| Multifactor Emerging Markets ETF | 0.44% |
| Multifactor Energy ETF | 0.00% |
| Multifactor Financials ETF | 0.06% |
| Multifactor Healthcare ETF | 0.10% |
| Multifactor Industrials ETF | 0.00% |
| Fund | Net Annual Effective Rate |
| Multifactor Large Cap ETF | 0.27% |
| Multifactor Materials ETF | 0.00% |
| Multifactor Media and Communications ETF | 0.00% |
| Multifactor Mid Cap ETF | 0.37% |
| Multifactor Small Cap ETF | 0.43% |
| Multifactor Technology ETF | 0.12% |
| Multifactor Utilities ETF | 0.01% |
Accounting and legal services. Pursuant to a service agreement, the funds reimburse the Advisor for all expenses associated with providing the administrative, financial, legal, compliance, accounting and recordkeeping services to the funds, including the preparation of all tax returns, periodic reports to shareholders and regulatory reports, among other services. These accounting and legal services fees incurred for the year ended April 30, 2020 amounted to an annual rate of 0.02% of the funds' average daily net assets.
Trustee expenses. The funds compensate each Trustee who is not an employee of the Advisor or its affiliates. The costs of paying Trustee compensation and expenses are allocated to each fund based on their net assets relative to other funds within the John Hancock group of funds complex.
Note 6—Capital share transactions
Each fund will issue and redeem shares only in a large number of specified shares, each called a “creation unit,” or multiples thereof. Multifactor Large Cap ETF, Multifactor Mid Cap ETF, and Multifactor Small Cap ETF issue and redeem shares at NAV in creation units of 25,000 shares. Multifactor Consumer Discretionary ETF, Multifactor Consumer Staples ETF, Multifactor Energy ETF, Multifactor Financials ETF, Multifactor Healthcare ETF, Multifactor Industrials ETF, Multifactor Materials ETF, Multifactor Media and Communications ETF, Multifactor Technology ETF, and Multifactor Utilities ETF issue and redeem shares at NAV in creation units of 10,000 shares. Multifactor Developed International ETF and Multifactor Emerging Markets ETF issue and redeem shares at NAV in creation units of 100,000 shares.
Only authorized participants may engage in creation or redemption transactions directly with the funds. Such transactions generally take place when an authorized participant deposits into a fund a designated portfolio of securities (including any portion of such securities for which cash may be substituted) and a specified amount of cash approximating the holdings of the fund in exchange for a specified number of creation units. Similarly, shares can be redeemed only in creation units, generally for a designated portfolio of securities (including any portion of such securities for which cash may be substituted) held by a fund and a specified amount of cash. For purposes of US GAAP, in-kind redemption transactions are treated as a sale of securities and any resulting gains and losses are recognized based on the market value of the securities on the date of the transfer. Authorized participants pay a transaction fee to the custodian when purchasing and redeeming creation units of the funds. The transaction fee is used to defray the costs associated with the issuance and redemption of creation units. Individual shares of the funds may only be purchased and sold in secondary market transactions through brokers. Secondary market transactions may be subject to brokerage commissions. Shares of the funds are listed and traded on the NYSE Arca, Inc., trade at market prices rather than NAV, and may trade at a price greater than or less than NAV.
Affiliates of the funds or the Advisor owned the following percentage of shares outstanding on April 30, 2020:
| Fund | % by Fund |
| Multifactor Consumer Discretionary ETF | 78% |
| Multifactor Consumer Staples ETF | 76% |
| Multifactor Energy ETF | 53% |
| Multifactor Industrials ETF | 77% |
| Multifactor Materials ETF | 89% |
| Multifactor Media and Communications ETF | 84% |
| Multifactor Utilities ETF | 56% |
Such concentration of shareholders’ capital could have a material effect on a fund if such shareholders redeem from the fund.
| | ANNUAL REPORT | JOHN HANCOCK MULTIFACTOR ETFS | 111 |
Note 7—Purchase and sale of securities
Purchases and sales of securities, other than short-term investments and in kind transactions and U.S. Treasury obligations, are aggregated below for the year ended April 30, 2020. In addition, purchases and sales of in-kind transactions are aggregated below for the year ended April 30, 2020:
| | Purchases | Sales and maturities |
| Fund | In-kind transactions | Other issuers | In-kind transactions | Other issuers |
| Multifactor Consumer Discretionary ETF | $11,345,912 | $7,697,117 | $17,288,598 | $7,815,317 |
| Multifactor Consumer Staples ETF | 10,322,280 | 3,404,700 | 19,709,348 | 3,432,419 |
| Multifactor Developed International ETF | 36,585,531 | 82,280,120 | 84,006,484 | 45,835,073 |
| Multifactor Emerging Markets ETF | 12,498,638 | 209,189,660 | 53,145,378 | 169,347,336 |
| Multifactor Energy ETF | 6,540,504 | 4,353,916 | 6,380,576 | 4,216,788 |
| Multifactor Financials ETF | 27,782,035 | 4,238,720 | 38,254,244 | 4,660,854 |
| Multifactor Healthcare ETF | 10,850,935 | 4,847,663 | 26,292,815 | 5,732,550 |
| Multifactor Industrials ETF | 10,374,051 | 5,527,117 | 15,823,597 | 5,603,132 |
| Multifactor Large Cap ETF | 119,083,914 | 49,840,301 | 210,661,933 | 50,510,560 |
| Multifactor Materials ETF | 7,173,874 | 3,911,156 | 9,961,804 | 3,981,374 |
| Multifactor Media and Communications ETF | 6,179,643 | 4,220,685 | 6,181,670 | 4,221,130 |
| Multifactor Mid Cap ETF | 686,184,408 | 156,786,064 | 196,893,734 | 150,317,084 |
| Multifactor Small Cap ETF | 235,531,062 | 168,219,988 | 119,509,153 | 168,302,929 |
| Multifactor Technology ETF | 13,089,738 | 10,916,913 | 40,928,909 | 10,912,511 |
| Multifactor Utilities ETF | 32,230,103 | 3,638,411 | 33,686,923 | 3,815,611 |
Note 8—Industry or sector risk
Certain funds generally invest a large percentage of their assets in one or more particular industries or sectors of the economy. If a large percentage of a fund's assets are economically tied to a single or small number of industries or sectors of the economy, the fund will be less diversified than a more broadly diversified fund, and it may cause the fund to underperform if that industry or sector underperforms. In addition, focusing on a particular industry or sector may make the fund’s NAV more volatile. Further, a fund that invests in particular industries or sectors is particularly susceptible to the impact of market, economic, regulatory and other factors affecting those industries or sectors. Financial services companies can be hurt by economic declines, changes in interest rates regulatory and market impacts.
Note 9—Investment by affiliated funds
Certain investors in the funds are affiliated funds that are managed by the Advisor and its affiliates. The affiliated funds do not invest in the funds for the purpose of exercising management or control; however, this investment may represent a significant portion of the funds' net assets. At April 30, 2020, funds within the John Hancock group of funds complex had the following affiliate ownership as a percentage of the funds’ net assets (funds with an affiliate ownership of 5% or more are disclosed separately):
| Fund | Affiliated fund | Affiliated Concentration |
| Multifactor Developed International ETF | John Hancock Variable Insurance Trust Managed Volatility Growth Portfolio | 46.80% |
| | John Hancock Variable Insurance Trust Managed Volatility Balanced Portfolio | 22.78% |
| | Other affiliated funds | 6.04% |
| | Total | 75.62% |
| Multifactor Emerging Markets ETF | John Hancock Funds II Multimanager Lifestyle Growth Portfolio | 26.29% |
| | John Hancock Variable Insurance Trust Managed Volatility Growth Portfolio | 20.32% |
| | John Hancock Funds II Multimanager Lifestyle Balanced Portfolio | 17.58% |
| | John Hancock Variable Insurance Trust Managed Volatility Balanced Portfolio | 10.56% |
| | John Hancock Funds II Multimanager Lifestyle Aggressive Portfolio | 10.05% |
| | Other affiliated funds | 8.20% |
| | Total | 93.00% |
| Multifactor Large Cap ETF | John Hancock Variable Insurance Trust Managed Volatility Growth Portfolio | 27.02% |
| | John Hancock Variable Insurance Trust Managed Volatility Balanced Portfolio | 17.12% |
| | Other affiliated funds | 7.59% |
| | Total | 51.73% |
| Multifactor Mid Cap ETF | John Hancock Variable Insurance Trust Managed Volatility Growth Portfolio | 11.03% |
| | John Hancock Variable Insurance Trust Managed Volatility Balanced Portfolio | 6.73% |
| | John Hancock Funds II Multimanager Lifestyle Growth Portfolio | 5.22% |
| | Other affiliated funds | 9.18% |
| | Total | 32.16% |
| Multifactor Small Cap ETF | John Hancock Variable Insurance Trust Managed Volatility Growth Portfolio | 29.39% |
| | John Hancock Variable Insurance Trust Managed Volatility Balanced Portfolio | 14.95% |
| | John Hancock Funds II Multimanager Lifestyle Growth Portfolio | 12.79% |
| | John Hancock Funds II Multimanager Lifestyle Balanced Portfolio | 9.64% |
| | Other affiliated funds | 11.02% |
| 112 | JOHN HANCOCK MULTIFACTOR ETFS | ANNUAL REPORT | |
| Fund | Affiliated fund | Affiliated Concentration |
| | Total | 77.79% |
Note 10—Investment in affiliated underlying funds
The funds may invest in affiliated underlying funds that are managed by the Advisor and its affiliates. Information regarding the funds’ purchases and sales of the affiliated underlying funds as well as income and capital gains earned, if any, during the period is as follows:
| | | | | | | | Dividends and distributions |
| Affiliate | Ending
share
amount | Beginning
value | Cost of
purchases | Proceeds
from shares
sold | Realized
gain
(loss) | Change in
unrealized
appreciation
(depreciation) | Income
distributions
received | Capital gain
distributions
received | Ending
value |
| Multifactor Consumer Discretionary ETF |
| John Hancock Collateral Trust* | 64,449 | $1,156,793 | $18,888,406 | $(19,399,594) | $(745) | $168 | $6,358 | — | $645,028 |
| Multifactor Consumer Staples ETF |
| John Hancock Collateral Trust* | — | $216,306 | $6,140,032 | $(6,356,082) | $(252) | $(4) | $6,181 | — | — |
| Multifactor Developed International ETF |
| John Hancock Collateral Trust* | 1,053,412 | $30,501,151 | $87,031,509 | $(106,992,875) | $480 | $2,701 | $112,041 | — | $10,542,966 |
| Multifactor Emerging Markets ETF |
| John Hancock Collateral Trust* | 673,310 | $4,188,357 | $46,277,133 | $(43,724,324) | $(5,023) | $2,614 | $77,297 | — | $6,738,757 |
| Multifactor Energy ETF |
| John Hancock Collateral Trust* | 5,957 | — | $1,463,794 | $(1,404,128) | $(58) | $14 | $419 | — | $59,622 |
| Multifactor Financials ETF |
| John Hancock Collateral Trust* | 3,545 | — | $3,120,749 | $(3,085,130) | $(146) | $8 | $377 | — | $35,481 |
| Multifactor Healthcare ETF |
| John Hancock Collateral Trust* | 18,363 | $637,469 | $7,002,769 | $(7,456,732) | $234 | $46 | $1,668 | — | $183,786 |
| Multifactor Industrials ETF |
| John Hancock Collateral Trust* | 9,528 | $257,948 | $3,832,772 | $(3,995,334) | $(45) | $16 | $1,543 | — | $95,357 |
| Multifactor Large Cap ETF |
| John Hancock Collateral Trust* | 188,118 | $4,260,052 | $77,556,562 | $(79,931,297) | $(3,454) | $894 | $27,509 | — | $1,882,757 |
| Multifactor Materials ETF |
| John Hancock Collateral Trust* | — | — | $3,928,021 | $(3,927,794) | $(227) | — | $943 | — | — |
| Multifactor Media and Communications ETF |
| John Hancock Collateral Trust* | 15,058 | — | $7,053,441 | $(6,902,590) | $(169) | $29 | $3,163 | — | $150,711 |
| Multifactor Mid Cap ETF |
| John Hancock Collateral Trust* | 971,895 | $11,926,516 | $318,193,809 | $(320,388,437) | $(8,177) | $3,405 | $116,333 | — | $9,727,116 |
| Multifactor Small Cap ETF |
| John Hancock Collateral Trust* | 1,266,007 | $17,290,805 | $220,421,657 | $(225,038,506) | $(8,448) | $5,197 | $92,999 | — | $12,670,705 |
| Multifactor Technology ETF |
| John Hancock Collateral Trust* | 14,937 | $595,033 | $19,374,998 | $(19,820,207) | $(367) | $36 | $4,538 | — | $149,493 |
| Multifactor Utilities ETF |
| John Hancock Collateral Trust | — | — | $222,750 | $(222,727) | $(23) | — | $9 | — | — |
| * | Refer to the Securities lending note within Note 2 for details regarding this investment. |
Note 11—Coronavirus (COVID-19) pandemic
The novel COVID-19 disease has resulted in significant disruptions to global business activity. A widespread health crisis such as a global pandemic could cause substantial market volatility, exchange trading suspensions and closures, impact the ability to complete redemptions, and affect fund performance.
| | ANNUAL REPORT | JOHN HANCOCK MULTIFACTOR ETFS | 113 |
| REPORT OF INDEPENDENT REGISTERED PUBLIC ACCOUNTING FIRM |
| To the Board of Trustees of John Hancock Exchange-Traded Fund Trust and Shareholders of John Hancock Multifactor Consumer Discretionary ETF, John Hancock Multifactor Consumer Staples ETF, John Hancock Multifactor Developed International ETF, John Hancock Multifactor Emerging Markets ETF, John Hancock Multifactor Energy ETF, John Hancock Multifactor Financials ETF, John Hancock Multifactor Healthcare ETF, John Hancock Multifactor Industrials ETF, John Hancock Multifactor Large Cap ETF, John Hancock Multifactor Materials ETF, John Hancock Multifactor Media and Communications ETF, John Hancock Multifactor Mid Cap ETF, John Hancock Multifactor Small Cap ETF, John Hancock Multifactor Technology ETF, and John Hancock Multifactor Utilities ETF |
| Opinions on the Financial Statements | | | |
| We have audited the accompanying statements of assets and liabilities, including the Funds’ investments, of each of the funds listed in the table below (constituting John Hancock Exchange-Traded Fund Trust, hereafter collectively referred to as the “Funds”) as of April 30, 2020, the related statements of operations and of changes in net assets for each of the periods indicated in the table below, including the related notes, and the financial highlights for each of the periods indicated in the table below (collectively referred to as the “financial statements”). In our opinion, the financial statements present fairly, in all material respects, the financial position of each of the Funds as of April 30, 2020, the results of each of their operations, the changes in each of their net assets, and each of the financial highlights for each of the periods indicated in the table below, in conformity with accounting principles generally accepted in the United States of America. |
Individual fund comprising the
John Hancock Exchange-Traded Fund Trust | Statement of
operations | Statements of
changes in net assets | Financial Highlights |
John Hancock Multifactor Consumer Discretionary ETF
John Hancock Multifactor Financials ETF
John Hancock Multifactor Healthcare ETF
John Hancock Multifactor Large Cap ETF
John Hancock Multifactor Mid Cap ETF
John Hancock Multifactor Technology ETF | For the year ended April 30, 2020 | For the years ended April 30, 2020 and 2019 | For the years ended April 30, 2020, 2019, 2018, and 2017, and for the period September 28, 2015 (commencement of operations) through April 30, 2016 |
John Hancock Multifactor Consumer Staples ETF
John Hancock Multifactor Energy ETF
John Hancock Multifactor Industrials ETF
John Hancock Multifactor Materials ETF
John Hancock Multifactor Utilities ETF | For the year ended April 30, 2020 | For the years ended April 30, 2020 and 2019 | For the years ended April 30, 2020, 2019, 2018, and 2017, and for the period March 28, 2016 (commencement of operations) through April 30, 2016 |
| John Hancock Multifactor Developed International ETF | For the year ended April 30, 2020 | For the years ended April 30, 2020 and 2019 | For the years ended April 30, 2020, 2019 and 2018, and for the period December 15, 2016 (commencement of operations) through April 30, 2017 |
| John Hancock Multifactor Small Cap ETF | For the year ended April 30, 2020 | For the years ended April 30, 2020 and 2019 | For the years ended April 30, 2020 and 2019, and for the period November 8, 2017 (commencement of operations) through April 30, 2018 |
| John Hancock Multifactor Emerging Markets ETF | For the year ended April 30, 2020 | For the year ended April 30, 2020 and for the period September 27, 2018 (commencement of operations) through April 30, 2019 |
| John Hancock Multifactor Media and Communications ETF | For the year ended April 30, 2020 | For the year ended April 30, 2020 and for the period March 12, 2019 (commencement of operations) through April 30, 2019 |
| Basis for Opinions | | | |
| These financial statements are the responsibility of the Funds’ management. Our responsibility is to express an opinion on the Funds’ financial statements based on our audits. We are a public accounting firm registered with the Public Company Accounting Oversight Board (United States) (PCAOB) and are required to be independent with respect to the Funds in accordance with the U.S. federal securities laws and the applicable rules and regulations of the Securities and Exchange Commission and the PCAOB. |
| We conducted our audits of these financial statements in accordance with the standards of the PCAOB. Those standards require that we plan and perform the audit to obtain reasonable assurance about whether the financial statements are free of material misstatement, whether due to error or fraud. |
| 114 | JOHN HANCOCK MULTIFACTOR ETFS | ANNUAL REPORT | |
| Our audits included performing procedures to assess the risks of material misstatement of the financial statements, whether due to error or fraud, and performing procedures that respond to those risks. Such procedures included examining, on a test basis, evidence regarding the amounts and disclosures in the financial statements. Our audits also included evaluating the accounting principles used and significant estimates made by management, as well as evaluating the overall presentation of the financial statements. Our procedures included confirmation of securities owned as of April 30, 2020 by correspondence with the custodian, transfer agent and brokers; when replies were not received from brokers, we performed other auditing procedures. We believe that our audits provide a reasonable basis for our opinions. |
/s/ PricewaterhouseCoopers LLP
Boston, Massachusetts
June 9, 2020 | | | |
| We have served as the auditor of one or more investment companies in the John Hancock group of funds since 1988. |
| | ANNUAL REPORT | JOHN HANCOCK MULTIFACTOR ETFS | 115 |
| Tax information (Unaudited) | |
For federal income tax purposes, the following information is furnished with respect to the distributions of the funds, if any, paid during its taxable year ended April 30, 2020.
Each fund reports the maximum amount allowable of its net taxable income as eligible for the corporate dividends-received deduction.
Each fund reports the maximum amount allowable of its net taxable income as qualified dividend income as provided in the Jobs and Growth Tax Relief Reconciliation Act of 2003.
Each fund reports the maximum amount allowable of its Section 199A dividends as defined in Proposed Treasury Regulation §1.199A-3(d).
| Fund | Foreign sourced income | Foreign tax credit |
| Multifactor Developed International ETF | $16,120,058 | $1,028,048 |
| Multifactor Emerging Markets ETF | 28,001,857 | 3,025,953 |
Eligible shareholders will be mailed a 2020 Form 1099-DIV in early 2021. This will reflect the tax character of all distributions paid in calendar year 2020.
Please consult a tax advisor regarding the tax consequences of your investment in the fund.
STATEMENT REGARDING LIQUIDITY RISK MANAGEMENT
Operation of the Liquidity Risk Management Program
This section describes operation and effectiveness of the Liquidity Risk Management Program (LRMP) established in accordance with Rule 22e-4 under the Investment Company Act of 1940, as amended (the Liquidity Rule). The Board of Trustees (the Board) of each Fund in the John Hancock Group of Funds (each a Fund and collectively, the Funds) that is subject to the requirements of the Liquidity Rule has appointed John Hancock Investment Management LLC and John Hancock Variable Trust Advisers LLC (together, the Advisor) to serve as Administrator of the LRMP with respect to each of the Funds, including John Hancock Multifactor ETFs, subject to the oversight of the Board. In order to provide a mechanism and process to perform the functions necessary to administer the LRMP, the Advisor established the Liquidity Risk Management Committee (the Committee). The Fund's subadvisor, Dimensional Fund Advisors LP. (the Subadvisor) executes the day-to-day investment management and security-level activities of the Fund in accordance with the requirements of the LRMP, subject to the supervision of the Advisor and the Board.
The Committee holds monthly meetings to: (1) review the day-to-day operations of the LRMP; (2) review and approve month end liquidity classifications; (3) review quarterly testing and determinations, as applicable; and (4) review other LRMP related material. The Committee also conducts daily, monthly, quarterly, and annual quantitative and qualitative assessments of each subadvisor to a Fund that is subject to the requirements of the Liquidity Rule and is a part of the LRMP to monitor investment performance issues, risks and trends. In addition, the Committee may conduct ad-hoc reviews and meetings with subadvisors as issues and trends are identified, including potential liquidity and valuation issues.
The Committee provided the Board at a meeting held on March 15-17, 2020 with a written report which addressed the Committee's assessment of the adequacy and effectiveness of the implementation and operation of the LRMP and any material changes to the LRMP. The report, which covered the period December 1, 2018 through December 31, 2019, included an assessment of important aspects of the LRMP including, but not limited to:
• Operation of the Fund's Redemption-In-Kind Procedures;
• Highly Liquid Investment Minimum (HLIM) determination;
• Compliance with the 15% limit on illiquid investments;
• Reasonably Anticipated Trade Size (RATS) determination;
• Security-level liquidity classifications; and
• Liquidity risk assessment.
The report also covered material liquidity matters which occurred or were reported during this period applicable to the Fund, if any, and the Committee's actions to address such matters.
Redemption-In-Kind Procedures
Rule 22e-4 requires any fund that engages in or reserves the right to engage in in-kind redemptions to adopt and implement written policies and procedures regarding in-kind redemptions as part of the management of its liquidity risk. These procedures address the process for redeeming in kind, as well as the circumstances under which the Fund would consider redeeming in kind. Anticipated large redemption activity will be evaluated to identify situations where redeeming in securities instead of cash may be appropriate.
As part of its annual assessment of the LRMP, the Committee reviewed the implementation and operation of the Redemption-In-Kind Procedures and determined they are operating in a manner that such procedures are adequate and effective to manage in-kind redemptions on behalf of the Fund as part of the LRMP.
Highly Liquid Investment Minimum determination
The Committee uses an HLIM model to determine a Fund's HLIM. This process incorporates the Fund's investment strategy, historical redemptions, liquidity classification rollup percentages and cash balances, redemption policy, access to funding sources, distribution channels and client concentrations. If the Fund falls below its established HLIM for a period greater than 7 consecutive calendar days, the Committee prepares a report to the Board within one business day following the seventh consecutive calendar day with an explanation of how the Fund plans to restore its HLIM within a reasonable period of time.
Based on the HLIM model, the Committee has determined that the Fund qualifies as a Primarily Highly Liquid Fund (PHLF). It is therefore not required to establish a HLIM. The Fund is tested quarterly to confirm its PHLF status.
As part of its annual assessment of the LRMP, the Committee reviewed the policies and procedures in place with respect to HLIM and PHLF determinations, and determined that such policies and procedures are operating in a manner that is adequate and effective as part of the LRMP.
Compliance with the 15% limit on illiquid investments
Rule 22e-4 sets an aggregate illiquid investment limit of 15% for a fund. Funds are prohibited from acquiring an illiquid investment if this results in greater than 15% of its net assets being classified as illiquid. When applying this limit, the Committee defines "illiquid investment" to mean any investment that the Fund reasonably expects cannot be sold or disposed of in current market conditions in seven calendar days or less without the sale or disposition significantly changing the market value of the investment. If a 15% illiquid investment limit breach occurs for longer than 1 business day, the Fund is required to notify the Board and provide a plan on how to bring illiquid investments within the 15% threshold, and after 7 days confidentially notify the Securities and Exchange Commission (the SEC).
ANNUAL REPORT | JOHN HANCOCK MULTIFACTOR ETFS 117
In February 2019, as a result of extended security markets closures in connection with the Chinese New Year in certain countries, the SEC released guidance, and the Committee approved and adopted an Extended Market Holiday Policy to plan for and monitor known Extended Market Holidays (defined as all expected market holiday closures spanning four or more calendar days).
As part of its annual assessment of the LRMP, the Committee reviewed the policies and procedures in place with respect to the 15% illiquid investment limit and determined such policies and procedures are operating in a manner that is adequate and effective as part of the LMRP.
Reasonably Anticipated Trade Size determination
In order to assess the liquidity risk of a Fund, the Committee considers the impact on the Fund that redemptions of a RATS would have under both normal and reasonably foreseeable stressed conditions. Modelling the Fund's RATS requires quantifying cash flow volatility and analyzing distribution channel concentration and redemption risk. The model is designed to estimate the amount of assets that the Fund could reasonably anticipate trading on a given day, during both normal and reasonably foreseeable stressed conditions, to satisfy redemption requests.
As part of its annual assessment of the LRMP, the Committee reviewed the policies and procedures in place with respect to RATS determinations and determined that such policies and procedures are operating in a manner that is adequate and effective at making RATS determinations as part of the LRMP.
Security-level liquidity classifications
When classifying the liquidity of portfolio securities, the Fund adheres to the liquidity classification procedures established by the Advisor. In assigning a liquidity classification to Fund portfolio holdings, the following key inputs, among others, are considered: the Fund's RATS, feedback from the applicable Subadvisor on market-, trading- and investment-specific considerations, an assessment of current market conditions and fund portfolio holdings, and a value impact standard. The Subadvisor also provides position-level data to the Committee for use in monthly classification reconciliation in order to identify any classifications that may need to be changed as a result of the above considerations.
As part of its annual assessment of the LRMP, the Committee reviewed the policies and procedures in place with respect to security-level liquidity classifications and determined that such policies and procedures are operating in a manner that is adequate and effective as part of the LRMP.
Liquidity risk assessment
The Committee periodically reviews and assesses, the Fund's liquidity risk, including its investment strategy and liquidity of portfolio investments during both normal and reasonably foreseeable stressed conditions (including whether the investment strategy is appropriate for an open-end fund, the extent to which the strategy involves a relatively concentrated portfolio or large positions in particular issuers, and the use of borrowings for investment purposes and derivatives), cash flow analysis during both normal and reasonably foreseeable stressed conditions, and holdings of cash and cash equivalents, as well as borrowing arrangements and other funding sources.
The Committee also monitors global events, such as the COVID-19 Coronavirus, that could impact the markets and liquidity of portfolio investments and their classifications.
As part of its annual assessment of the LRMP, the Committee reviewed Fund-Level Liquidity Risk Assessment Reports for each of the Funds and determined that the investment strategy for each Fund continues to be appropriate for an open-ended structure.
Adequacy and Effectiveness
Based on the review and assessment conducted by the Committee, the Committee has determined that the LRMP has been implemented, and is operating in a manner that is adequate and effective at assessing and managing the liquidity risk of each Fund.
ANNUAL REPORT | JOHN HANCOCK MULTIFACTOR ETFS 118
This chart provides information about the Trustees and Officers who oversee your John Hancock fund. Officers elected by the Trustees manage the day-to-day operations of the portfolios and execute policies formulated by the Trustees.
Independent Trustees
| | | |
Name, year of birth
Position(s) held with Trust
Principal occupation(s) and other directorships during past 5 years | Trustee of
the Trust
since1 | Number of
John Hancock
funds overseen
by Trustee |
| Hassell H. McClellan, Born: 1945 | 2015 | 195 |
Trustee and Chairperson of the Board
Director/Trustee, Virtus Funds (since 2008); Director, The Barnes Group (since 2010); Associate Professor, The Wallace E. Carroll School of Management, Boston College (retired 2013). Trustee (since 2005) and Chairperson of the Board (since 2017) of various trusts within the John Hancock Fund Complex. |
| | | |
| Charles L. Bardelis,2 Born: 1941 | 2015 | 195 |
Trustee
Director, Island Commuter Corp. (marine transport). Trustee, John Hancock Collateral Trust (since 2014), Trustee of various trusts within the John Hancock Fund Complex (since 1988). |
| | | |
| James R. Boyle,Born: 1959 | 2015 | 195 |
Trustee
Chief Executive Officer, Foresters Financial (since 2018); Chairman and Chief Executive Officer, Zillion Group, Inc. (formerly HealthFleet, Inc.) (healthcare) (2014-2018); Executive Vice President and Chief Executive Officer, U.S. Life Insurance Division of Genworth Financial, Inc. (insurance) (January 2014-July 2014); Senior Executive Vice President, Manulife Financial, President and Chief Executive Officer, John Hancock (1999-2012); Chairman and Director, John Hancock Investment Management LLC, John Hancock Investment Management Distributors LLC, and John Hancock Variable Trust Advisers LLC (2005-2010). Trustee of various trusts within the John Hancock Fund Complex (2005-2014 and since 2015). |
| | | |
| Peter S. Burgess,2 Born: 1942 | 2015 | 195 |
Trustee
Consultant (financial, accounting, and auditing matters) (since 1999); Certified Public Accountant; Partner, Arthur Andersen (independent public accounting firm) (prior to 1999); Director, Lincoln Educational Services Corporation (since 2004); Director, Symetra Financial Corporation (2010-2016)); Director, PMA Capital Corporation (2004-2010). Trustee of various trusts within the John Hancock Fund Complex (since 2005). |
| | | |
| William H. Cunningham, Born: 1944 | 2015 | 195 |
Trustee
Professor, University of Texas, Austin, Texas (since 1971); former Chancellor, University of Texas System and former President of the University of Texas, Austin, Texas; Chairman (since 2009) and Director (since 2006), Lincoln National Corporation (insurance); Director, Southwest Airlines (since 2000); former Director, LIN Television (2009-2014). Trustee of various trusts within the John Hancock Fund Complex (since 1986). |
| | | |
| Grace K. Fey, Born: 1946 | 2015 | 195 |
Trustee
Chief Executive Officer, Grace Fey Advisors (since 2007); Director and Executive Vice President, Frontier Capital Management Company (1988-2007); Director, Fiduciary Trust (since 2009). Trustee of various trusts within the John Hancock Fund Complex (since 2008). |
| | | |
| Deborah C. Jackson, Born: 1952 | 2015 | 195 |
Trustee
President, Cambridge College, Cambridge, Massachusetts (since 2011); Board of Directors, Massachusetts Women's Forum (since 2018); Board of Directors, National Association of Corporate Directors/New England (since 2015); Board of Directors, Association of Independent Colleges and Universities of Massachusetts (2014-2017); Chief Executive Officer, American Red Cross of Massachusetts Bay (2002-2011); Board of Directors of Eastern Bank Corporation (since 2001); Board of Directors of Eastern Bank Charitable Foundation (since 2001); Board of Directors of American Student Assistance Corporation (1996-2009); Board of Directors of Boston Stock Exchange (2002-2008); Board of Directors of Harvard Pilgrim Healthcare (health benefits company) (2007-2011). Trustee of various trusts within the John Hancock Fund Complex (since 2008). |
ANNUAL REPORT | JOHN HANCOCK MULTIFACTOR ETFS 119
Independent Trustees (continued)
| | | |
Name, year of birth
Position(s) held with Trust
Principal occupation(s) and other directorships during past 5 years | Trustee of
the Trust
since1 | Number of
John Hancock
funds overseen
by Trustee |
| James M. Oates,2 Born: 1946 | 2015 | 195 |
Trustee
Managing Director, Wydown Group (financial consulting firm) (since 1994); Chairman and Director, Emerson Investment Management, Inc. (2000-2015); Independent Chairman, Hudson Castle Group, Inc. (formerly IBEX Capital Markets, Inc.) (financial services company) (1997-2011); Director, Stifel Financial (since 1996); Director, Investor Financial Services Corporation (1995-2007); Director, Connecticut River Bancorp (1998-2014); Director/Trustee, Virtus Funds (since 1988). Trustee (since 2004) and Chairperson of the Board (2005-2016) of various trusts within the John Hancock Fund Complex. |
| | | |
| Steven R. Pruchansky, Born: 1944 | 2015 | 195 |
Trustee and Vice Chairperson of the Board
Managing Director, Pru Realty (since 2017); Chairman and Chief Executive Officer, Greenscapes of Southwest Florida, Inc. (since 2014); Director and President, Greenscapes of Southwest Florida, Inc. (2000-2014); Member, Board of Advisors, First American Bank (until 2010); Managing Director, Jon James, LLC (real estate) (since 2000); Partner, Right Funding, LLC (2014-2017); Director, First Signature Bank & Trust Company (until 1991); Director, Mast Realty Trust (until 1994); President, Maxwell Building Corp. (until 1991). Trustee (since 1992), Chairperson of the Board (2011-2012), and Vice Chairperson of the Board (since 2012) of various trusts within the John Hancock Fund Complex. |
| | | |
| Gregory A. Russo, Born: 1949 | 2015 | 195 |
Trustee
Director and Audit Committee Chairman (since 2012), and Member, Audit Committee and Finance Committee (since 2011), NCH Healthcare System, Inc. (holding company for multi-entity healthcare system); Director and Member (2012-2018) and Finance Committee Chairman (2014-2018), The Moorings, Inc. (nonprofit continuing care community); Vice Chairman, Risk & Regulatory Matters, KPMG LLP (KPMG) (2002-2006); Vice Chairman, Industrial Markets, KPMG (1998-2002); Chairman and Treasurer, Westchester County, New York, Chamber of Commerce (1986-1992); Director, Treasurer, and Chairman of Audit and Finance Committees, Putnam Hospital Center (1989-1995); Director and Chairman of Fundraising Campaign, United Way of Westchester and Putnam Counties, New York (1990-1995). Trustee of various trusts within the John Hancock Fund Complex (since 2008). |
Non-Independent Trustees3
| | | |
Name, year of birth
Position(s) held with Trust
Principal occupation(s) and other directorships during past 5 years | Trustee of
the Trust
since1 | Number of
John Hancock
funds overseen
by Trustee |
| Andrew G. Arnott, Born: 1971 | 2017 | 195 |
President and Non-Independent Trustee
Executive Vice President, John Hancock Financial Services (since 2009, including prior positions); Director and Executive Vice President, John Hancock Investment Management LLC (since 2005, including prior positions); Director and Executive Vice President, John Hancock Variable Trust Advisers LLC (since 2006, including prior positions); President, John Hancock Investment Management Distributors LLC (since 2004, including prior positions); President of various trusts within the John Hancock Fund Complex (since 2007, including prior positions). Trustee of various trusts within the John Hancock Fund Complex (since 2017). |
| | | |
| Marianne Harrison, Born: 1963 | 2018 | 195 |
Non-Independent Trustee
President and CEO, John Hancock (since 2017); President and CEO, Manulife Canadian Division (2013-2017); Member, Board of Directors, CAE Inc. (since 2019); Member, Board of Directors, MA Competitive Partnership Board (since 2018); Member, Board of Directors, American Council of Life Insurers (ACLI) (since 2018); Member, Board of Directors, Communitech, an industry-led innovation center that fosters technology companies in Canada (2017-2019); Member, Board of Directors, Manulife Assurance Canada (2015-2017); Board Member, St. Mary's General Hospital Foundation (2014-2017); Member, Board of Directors, Manulife Bank of Canada (2013-2017); Member, Standing Committee of the Canadian Life & Health Assurance Association (2013-2017); Member, Board of Directors, John Hancock USA, John Hancock Life & Health, John Hancock New York (2012-2013). Trustee of various trusts within the John Hancock Fund Complex (since 2018). |
ANNUAL REPORT | JOHN HANCOCK MULTIFACTOR ETFS 120
Principal officers who are not Trustees
| | |
Name, year of birth
Position(s) held with Trust
Principal occupation(s) during past 5 years | Officer
of the
Trust
since |
| Francis V. Knox, Jr.,Born: 1947 | 2014 |
Chief Compliance Officer
Vice President, John Hancock Financial Services (since 2005); Chief Compliance Officer, various trusts within the John Hancock Fund Complex, John Hancock Investment Management LLC, and John Hancock Variable Trust Advisers LLC (since 2005). |
| | |
| Charles A. Rizzo, Born: 1957 | 2014 |
Chief Financial Officer
Vice President, John Hancock Financial Services (since 2008); Senior Vice President, John Hancock Investment Management LLC and John Hancock Variable Trust Advisers LLC (since 2008); Chief Financial Officer of various trusts within the John Hancock Fund Complex (since 2007). |
| | |
| Salvatore Schiavone, Born: 1965 | 2014 |
Treasurer
Assistant Vice President, John Hancock Financial Services (since 2007); Vice President, John Hancock Investment Management LLC and John Hancock Variable Trust Advisers LLC (since 2007); Treasurer of various trusts within the John Hancock Fund Complex (since 2007, including prior positions). |
| | |
| Christopher (Kit) Sechler,Born: 1973 | 2018 |
Chief Legal Officer and Secretary
Vice President and Deputy Chief Counsel, John Hancock Investments (since 2015); Assistant Vice President and Senior Counsel (2009-2015), John Hancock Investments; Chief Legal Officer and Secretary of various trusts within the John Hancock Fund Complex (since 2018); Assistant Secretary of John Hancock Investment Management LLC and John Hancock Variable Trust Advisers LLC (since 2009). |
The business address for all Trustees and Officers is 200 Berkeley Street, Boston, Massachusetts 02116-5023.
The Statement of Additional Information of the fund includes additional information about members of the Board of Trustees of the Trust and is available without charge, upon request, by calling 800-225-6020.
| 1 | Each Trustee holds office until his or her successor is elected and qualified, or until the Trustee's death, retirement, resignation, or removal. |
| 2 | Member of the Audit Committee. |
| 3 | The Trustee is a Non-Independent Trustee due to current or former positions with the Advisor and certain affiliates. |
ANNUAL REPORT | JOHN HANCOCK MULTIFACTOR ETFS 121
| | |
Trustees
Hassell H. McClellan,Chairperson
Steven R. Pruchansky,Vice Chairperson
Andrew G. Arnott†
Charles L. Bardelis*
James R. Boyle
Peter S. Burgess*
William H. Cunningham
Grace K. Fey
Marianne Harrison†
Deborah C. Jackson
James M. Oates*
Gregory A. Russo
Officers
Andrew G. Arnott
President
Francis V. Knox, Jr.
Chief Compliance Officer
Charles A. Rizzo
Chief Financial Officer
Salvatore Schiavone
Treasurer
Christopher (Kit) Sechler
Secretary and Chief Legal Officer
| Investment advisor
John Hancock Investment Management LLC
Subadvisor
Dimensional Fund Advisors LP
Portfolio Managers
Joseph F. Hohn
Joel P. Schneider
Lukas J. Smart, CFA
Principal distributor
Foreside Fund Services, LLC
Custodian
State Street Bank and Trust Company
Transfer agent
State Street Bank and Trust Company
Legal counsel
Dechert LLP
Independent registered public accounting firm
PricewaterhouseCoopers LLP
|
* Member of the Audit Committee
† Non-Independent Trustee
The funds' proxy voting policies and procedures, as well as the funds' proxy voting record for the most recent twelve-month period ended June 30, are available free of charge on the Securities and Exchange Commission (SEC) website at sec.gov or on our website.
All of the funds' holdings as of the end of the third month of every fiscal quarter are filed with the SEC on Form N-PORT within 60 days of the end of the fiscal quarter. The funds' Form N-PORT filings are available on our website and the SEC's website, sec.gov.
We make this information on your funds', as well asmonthly portfolio holdings, and other funds' details available on our website at jhinvestments.com/etf or by calling 800-225-6020.
| | | |
| | You can also contact us: |
| | 800-225-6020
jhinvestments.com/etf | Regular mail:
John Hancock
200 Berkeley Street
Boston, MA 02116
| |
ANNUAL REPORT | JOHN HANCOCK MULTIFACTOR ETFS 122
John Hancock family of funds
| | | |
DOMESTIC EQUITY FUNDS
Blue Chip Growth
Classic Value
Disciplined Value
Disciplined Value Mid Cap
Equity Income
Financial Industries
Fundamental All Cap Core
Fundamental Large Cap Core
New Opportunities
Regional Bank
Small Cap Core
Small Cap Growth
Small Cap Value
U.S. Global Leaders Growth
U.S. Quality Growth
GLOBAL AND INTERNATIONAL EQUITY FUNDS
Disciplined Value International
Emerging Markets
Emerging Markets Equity
Fundamental Global Franchise
Global Equity
Global Shareholder Yield
Global Thematic Opportunities
International Dynamic Growth
International Growth
International Small Company
| | INCOME FUNDS
Bond
California Tax-Free Income
Emerging Markets Debt
Floating Rate Income
Government Income
High Yield
High Yield Municipal Bond
Income
Investment Grade Bond
Money Market
Short Duration Bond
Short Duration Credit Opportunities
Strategic Income Opportunities
Tax-Free Bond
ALTERNATIVE AND SPECIALTY FUNDS
Absolute Return Currency
Alternative Asset Allocation
Alternative Risk Premia
Diversified Macro
Infrastructure
Multi-Asset Absolute Return
Seaport Long/Short
|
A fund's investment objectives, risks, charges, and expenses should be considered carefully before investing. The prospectus contains this and other important information about the fund. To obtain a prospectus, contact your financial professional, call John Hancock Investment Management at 800-225-5291, or visit our website at jhinvestments.com. Please read the prospectus carefully before investing or sending money.
| | | |
ASSET ALLOCATION
Balanced
Multi-Asset High Income
Multi-Index Lifetime Portfolios
Multi-Index Preservation Portfolios
Multimanager Lifestyle Portfolios
Multimanager Lifetime Portfolios
Retirement Income 2040
EXCHANGE-TRADED FUNDS
John Hancock Multifactor Consumer Discretionary ETF
John Hancock Multifactor Consumer Staples ETF
John Hancock Multifactor Developed International ETF
John Hancock Multifactor Emerging Markets ETF
John Hancock Multifactor Energy ETF
John Hancock Multifactor Financials ETF
John Hancock Multifactor Healthcare ETF
John Hancock Multifactor Industrials ETF
John Hancock Multifactor Large Cap ETF
John Hancock Multifactor Materials ETF
John Hancock Multifactor Media and
Communications ETF
John Hancock Multifactor Mid Cap ETF
John Hancock Multifactor Small Cap ETF
John Hancock Multifactor Technology ETF
John Hancock Multifactor Utilities ETF
| | ENVIRONMENTAL, SOCIAL, AND
GOVERNANCE FUNDS
ESG All Cap Core
ESG Core Bond
ESG International Equity
ESG Large Cap Core
CLOSED-END FUNDS
Financial Opportunities
Hedged Equity & Income
Income Securities Trust
Investors Trust
Preferred Income
Preferred Income II
Preferred Income III
Premium Dividend
Tax-Advantaged Dividend Income
Tax-Advantaged Global Shareholder Yield
|
John Hancock Multifactor ETF shares are bought and sold at market price (not NAV), and are not individually redeemed from the fund. Brokerage commissions will reduce returns.
John Hancock ETFs are distributed by Foreside Fund Services, LLC, and are subadvised by Dimensional Fund Advisors LP. Foreside is not affiliated with John Hancock Investment Management Distributors LLC or Dimensional Fund Advisors LP.
Dimensional Fund Advisors LP receives compensation from John Hancock in connection with licensing rights to the John Hancock Dimensional indexes. Dimensional Fund Advisors LP does not sponsor, endorse, or sell, and makes no representation as to the advisability of investing in, John Hancock Multifactor ETFs.
John Hancock Investment Management
A trusted brand
John Hancock Investment Management is a premier asset manager representing one of America's most
trusted brands, with a heritage of financial stewardship dating back to 1862. Helping our shareholders
pursue their financial goals is at the core of everything we do. It's why we support the role of professional
financial advice and operate with the highest standards of conduct and integrity.
A better way to invest
We serve investors globally through a unique multimanager approach: We search the world to find
proven portfolio teams with specialized expertise for every strategy we offer, then we apply robust
investment oversight to ensure they continue to meet our uncompromising standards and serve the
best interests of our shareholders.
Results for investors
Our unique approach to asset management enables us to provide a diverse set of investments backed
by some of the world's best managers, along with strong risk-adjusted returns across asset classes.
John Hancock Investment Management LLC n 200 Berkeley Street n Boston, MA 02116 n 800-225-6020 n jhinvestments.com/etf
This report is for the information of the shareholders of John Hancock Multifactor ETFs. It is not authorized for distribution to prospective investors unless preceded or accompanied by a prospectus.
| | |
| JHAN-20180615-0136 | ETFA 4/20
6/2020 |
ITEM 2. CODE OF ETHICS.
As of the end of the period, April 30, 2020, the registrant has adopted a code of ethics, as defined in Item 2 of Form N-CSR, that applies to its Chief Executive Officer, Chief Financial Officer and Treasurer (respectively, the principal executive officer, the principal financial officer and the principal accounting officer, the “Senior Financial Officers”). A copy of the code of ethics is filed as an exhibit to this Form N-CSR.
ITEM 3. AUDIT COMMITTEE FINANCIAL EXPERT.
Peter S. Burgess is the audit committee financial expert and is “independent”, pursuant to general instructions on Form N-CSR Item 3.
ITEM 4. PRINCIPAL ACCOUNTANT FEES AND SERVICES.
The aggregate fees billed for professional services rendered by the principal accountant for the audits of the registrant’s annual financial statements or services that are normally provided by the accountant in connection with statutory and regulatory filings or engagements amounted to the following for the fiscal periods ended April 30, 2020 and April 30, 2019. These fees were billed to the registrant and were approved by the registrant’s audit committee.
| Fund | April 30, 2020 | April 30, 2019 |
| John Hancock Multifactor Consumer Discretionary ETF | $ 14,000 | $ 14,000 |
| John Hancock Multifactor Financials ETF | 14,000 | 14,500 |
| John Hancock Multifactor Healthcare ETF | 14,000 | 14,500 |
| John Hancock Multifactor Large Cap ETF | 14,000 | 14,000 |
| John Hancock Multifactor Emerging Markets ETF | 14,000 | 14,000 |
| John Hancock Multifactor Mid Cap ETF | 14,000 | 14,500 |
| John Hancock Multifactor Technology ETF | 14,000 | 14,000 |
| John Hancock Multifactor Materials ETF | 14,000 | 14,000 |
| John Hancock Multifactor Energy ETF | 14,000 | 14,500 |
| John Hancock Multifactor Consumer Staples ETF | 14,000 | 14,000 |
| John Hancock Multifactor Media and Communications ETF | 14,000 | 14,000 |
| John Hancock Multifactor Industrials ETF | 14,000 | 14,000 |
| John Hancock Multifactor Utilities ETF | 14,000 | 14,000 |
| John Hancock Multifactor Developed International ETF | 14,525 | 15,550 |
| John Hancock Multifactor Small Cap ETF | 14,000 | 14,000 |
| Total | $ 210,525 | $ 213,550 |
| (b) | Audit-Related Services |
Audit-related service fees for assurance and related services by the principal accountant are billed to the registrant or to the registrant’s investment adviser (not including any sub-adviser whose role is primarily portfolio management and is subcontracted with or overseen by another investment adviser), and any entity controlling, controlled by, or under common control with the adviser (“control affiliates”) that provides ongoing services to the registrant.
| Fund | April 30, 2020 | April 30, 2019 |
| John Hancock Multifactor Consumer Discretionary ETF | $ 5 | $ 0 |
| John Hancock Multifactor Financials ETF | 5 | 0 |
| John Hancock Multifactor Healthcare ETF | 5 | 0 |
| John Hancock Multifactor Large Cap ETF | 5 | 0 |
| John Hancock Multifactor Emerging Markets ETF | 5 | - |
| John Hancock Multifactor Mid Cap ETF | 5 | 0 |
| John Hancock Multifactor Technology ETF | 5 | 0 |
| John Hancock Multifactor Materials ETF | 5 | 0 |
| John Hancock Multifactor Energy ETF | 5 | 0 |
| John Hancock Multifactor Consumer Staples ETF | 5 | 0 |
| John Hancock Multifactor Media and Communications ETF | 5 | - |
| John Hancock Multifactor Industrials ETF | 5 | 0 |
| John Hancock Multifactor Utilities ETF | 5 | 0 |
| John Hancock Multifactor Developed International ETF | 5 | 0 |
| John Hancock Multifactor Small Cap ETF | 5 | - |
| Total | $ 75 | $ 0 |
(c) Tax Fees
The aggregate fees billed for professional services rendered by the principal accountant for tax compliance, tax advice and tax planning (“tax fees”) amounted to the following for the fiscal period ended April 30, 2020 and for the fiscal period ended April 30, 2019. The nature of the services comprising the tax fees was the review of the registrant’s tax returns and tax distribution requirements. These fees were billed to the registrant and were approved by the registrant’s audit committee.
| Fund | April 30, 2020 | April 30, 2019 |
| John Hancock Multifactor Consumer Discretionary ETF | $ 1,233 | $ 1,000 |
| John Hancock Multifactor Financials ETF | 1,233 | 1,000 |
| John Hancock Multifactor Healthcare ETF | 1,233 | 1,000 |
| John Hancock Multifactor Large Cap ETF | 1,233 | 1,000 |
| John Hancock Multifactor Emerging Markets ETF | 1,233 | 0 |
| John Hancock Multifactor Mid Cap ETF | 1,233 | 1,000 |
| John Hancock Multifactor Technology ETF | 1,233 | 1,000 |
| John Hancock Multifactor Materials ETF | 1,233 | 1,000 |
| John Hancock Multifactor Energy ETF | 1,233 | 1,000 |
| John Hancock Multifactor Consumer Staples ETF | 1,233 | 1,000 |
| John Hancock Multifactor Media and Communications ETF | 1,233 | 0 |
| John Hancock Multifactor Industrials ETF | 1,233 | 1,000 |
| John Hancock Multifactor Utilities ETF | 1,233 | 1,000 |
| John Hancock Multifactor Developed International ETF | 1,233 | 1,000 |
| John Hancock Multifactor Small Cap ETF | 1,233 | 1,000 |
| Total | $ 18,495 | $ 13,000 |
(d) All Other Fees
Other fees billed for professional services rendered by the principal accountant to the registrant or to the control affiliates for the fiscal period ended April 30, 2020 and for the fiscal period ended April 30, 2019 amounted to the following:
| Fund | April 30, 2020 | April 30, 2019 |
| John Hancock Multifactor Consumer Discretionary ETF | $ 91 | $ 102 |
| John Hancock Multifactor Financials ETF | 91 | 102 |
| John Hancock Multifactor Healthcare ETF | 91 | 102 |
| John Hancock Multifactor Large Cap ETF | 91 | 1,213 |
| John Hancock Multifactor Emerging Markets ETF | 91 | 89 |
| John Hancock Multifactor Mid Cap ETF | 91 | 102 |
| John Hancock Multifactor Technology ETF | 91 | 1,213 |
| John Hancock Multifactor Materials ETF | 91 | 1,213 |
| John Hancock Multifactor Energy ETF | 91 | 102 |
| John Hancock Multifactor Consumer Staples ETF | 91 | 102 |
| John Hancock Multifactor Media and Communications ETF | 91 | 84 |
| John Hancock Multifactor Industrials ETF | 91 | 102 |
| John Hancock Multifactor Utilities ETF | 91 | 102 |
| John Hancock Multifactor Developed International ETF | 91 | 102 |
| John Hancock Multifactor Small Cap ETF | 91 | 1,213 |
| Total | $ 1,365 | $ 2,873 |
(e)(1) Audit Committee Pre-Approval Policies and Procedures:
The trust’s Audit Committee must pre-approve all audit and non-audit services provided by the independent registered public accounting firm (the “Auditor”) relating to the operations or financial reporting of the funds. Prior to the commencement of any audit or non-audit services to a fund, the Audit Committee reviews the services to determine whether they are appropriate and permissible under applicable law.
The trust’s Audit Committee has adopted policies and procedures to, among other purposes, provide a framework for the Committee’s consideration of audit-related and non-audit services by the Auditor. The policies and procedures require that any audit-related and non-audit service provided by the Auditor and any non-audit service provided by the Auditor to a fund service provider that relates directly to the operations and financial reporting of a fund are subject to approval by the Audit Committee before such service is provided. Audit-related services provided by the Auditor that are expected to exceed $25,000 per instance/per fund are subject to specific pre-approval by the Audit Committee. Tax services provided by the Auditor that are expected to exceed $30,000 per instance/per fund are subject to specific pre-approval by the Audit Committee.
All audit services, as well as the audit-related and non-audit services that are expected to exceed the amounts stated above, must be approved in advance of provision of the service by formal resolution of the Audit Committee. At the regularly scheduled Audit Committee meetings, the Committee reviews a report summarizing the services, including fees, provided by the Auditor.
(e)(2) Services approved pursuant to paragraph (c)(7)(i)(C) of Rule 2-01 of Regulation S-X:
Audit-Related Fees, Tax Fees and All Other Fees:
There were no amounts that were approved by the Audit Committee pursuant to the de minimis exception under Rule 2-01 of Regulation S-X.
(f) According to the registrant’s principal accountant, for the fiscal period ended April 30, 2020, the percentage of hours spent on the audit of the registrant's financial statements for the most recent fiscal year that were attributed to work performed by persons who were not full-time, permanent employees of principal accountant was less than 50%.
(g) The aggregate non-audit fees billed by the registrant's accountant for non- audit services rendered to the registrant and rendered to the registrant's control affiliates for the fiscal period ended April 30, 2020 and April 30, 2019 amounted to the following:
| Trust | April 30, 2020 | April 30, 2019 |
| John Hancock Exchange-Traded Fund Trust | $ 1,090,477 | $ 1,018,671 |
(h) The audit committee of the registrant has considered the non-audit services provided by the registrant’s principal accountant(s) to the control affiliates and has determined that the services that were not pre-approved are compatible with maintaining the principal accountant(s)' independence.
ITEM 5. AUDIT COMMITTEE OF LISTED REGISTRANTS.
The registrant has a separately-designated standing audit committee comprised of independent trustees. The members of the audit committee are as follows:
Peter S. Burgess - Chairman
Charles L. Bardelis
Theron S. Hoffman
ITEM 6. SCHEDULE OF INVESTMENTS.
ITEM 7. DISCLOSURE OF PROXY VOTING POLICIES AND PROCEDURES FOR CLOSED-END MANAGEMENT INVESTMENT COMPANIES.
Not applicable.
ITEM 8. PORTFOLIO MANAGERS OF CLOSED-END MANAGEMENT INVESTMENT COMPANIES.
Not applicable.
ITEM 9. PURCHASES OF EQUITY SECURITIES BY CLOSED-END MANAGEMENT INVESTMENT COMPANY AND AFFILIATED PURCHASERS.
Not applicable.
ITEM 10. SUBMISSION OF MATTERS TO A VOTE OF SECURITY HOLDERS.
The registrant has adopted procedures by which shareholders may recommend nominees to the registrant's Board of Trustees. A copy of the procedures is filed as an exhibit to this Form N-CSR. See attached “John Hancock Funds – Nominating, Governance and Administration Committee Charter”.
ITEM 11. CONTROLS AND PROCEDURES.
(a) Based upon their evaluation of the registrant's disclosure controls and procedures as conducted within 90 days of the filing date of this Form N-CSR, the registrant's principal executive officer and principal financial officer have concluded that those disclosure controls and procedures provide reasonable assurance that the material information required to be disclosed by the registrant on this report is recorded, processed, summarized and reported within the time periods specified in the Securities and Exchange Commission's rules and forms.
(b) There were no changes in the registrant's internal control over financial reporting that occurred during period covered by this report that have materially affected, or are reasonably likely to materially affect, the registrant's internal control over financial reporting.
ITEM 12. DISCLOSURE OF SECURITIES LENDING ACTIVITIES FOR CLOSED-END MANAGEMENT INVESTMENT COMPANIES.: Not applicable.
ITEM 13. EXHIBITS.
(a)(1)Code of Ethics for Covered Officers is attached.
(a)(2) Separate certifications for the registrant'sprincipal executive officer andprincipal financial officer, as required by Section 302 of the Sarbanes-Oxley Act of 2002 and Rule 30a-2(a) under the Investment Company Act of 1940, are attached.
(b)(1)Separate certifications for the registrant's principal executive officer and principal financial officer, as required by 18 U.S.C. Section 1350, as adopted pursuant to Section 906 of the Sarbanes-Oxley Act of 2002, and Rule 30a-2(b) under the Investment Company Act of 1940, are attached. The certifications furnished pursuant to this paragraph are not deemed to be "filed" for purposes of Section 18 of the Securities Exchange Act of 1934, or otherwise subject to the liability of that section. Such certifications are not deemed to be incorporated by reference into any filing under the Securities Act of 1933 or the Securities Exchange Act of 1934, except to the extent that the Registrant specifically incorporates them by reference.
(c)(1) Submission of Matters to a Vote of Security Holders is attached. See attached “John Hancock Funds – Nominating, Governance and Administration Committee Charter”.
SIGNATURES
Pursuant to the requirements of the Securities Exchange Act of 1934 and the Investment Company Act of 1940, the registrant has duly caused this report to be signed on its behalf by the undersigned, thereunto duly authorized.
John Hancock Exchange-Traded Fund Trust
| | |
| By: | /s/ Andrew Arnott |
| Andrew Arnott |
| President |
| | |
| | |
| Date: | June 11, 2020 |
Pursuant to the requirements of the Securities Exchange Act of 1934 and the Investment Company Act of 1940, this report has been signed below by the following persons on behalf of the registrant and in the capacities and on the dates indicated.
| | |
| By: | /s/ Andrew Arnott |
| Andrew Arnott |
| President |
| |
| |
| Date: | June 11, 2020 |
| |
| |
| By: | /s/ Charles A. Rizzo |
| Charles A. Rizzo |
| Chief Financial Officer |
| |
| |
| Date: | June 11, 2020 |