UNITED STATES
SECURITIES AND EXCHANGE COMMISSION
Washington, D.C. 20549
FORM N-CSR
CERTIFIED SHAREHOLDER REPORT OF REGISTERED
MANAGEMENT INVESTMENT COMPANIES
Investment Company Act file number 811-23013
Goldman Sachs ETF Trust
(Exact name of registrant as specified in charter)
200 West Street, New York, New York 10282
(Address of principal executive offices) (Zip code)
| | |
| Caroline Kraus, Esq. | | Copies to: |
| Goldman, Sachs & Co. | | Geoffrey R.T. Kenyon, Esq. |
| 200 West Street | | Dechert LLP |
| New York, New York 10282 | | 100 Oliver Street |
| | 40th Floor |
| | Boston, MA 02110-2605 |
(Name and address of agents for service)
Registrant’s telephone number, including area code: (312) 655-4400
Date of fiscal year end: August 31
Date of reporting period: August 31, 2016
| ITEM 1. | REPORTS TO STOCKHOLDERS. |
| | The Annual Report to Shareholders is filed herewith. |
Goldman Sachs Funds

| | | | |
| | |
| Annual Report | | | | August 31, 2016 |
| | |
| | | | Goldman Sachs ActiveBeta® ETFs |
| | | | ActiveBeta® Emerging Markets Equity ETF |
| | | | ActiveBeta® Europe Equity ETF |
| | | | ActiveBeta® International Equity ETF |
| | | | ActiveBeta® Japan Equity ETF |
| | | | ActiveBeta® U.S. Large Cap Equity ETF |
ActiveBeta is a registered trademark of GSAM.

Goldman Sachs ActiveBeta® ETFs
| | | | |
TABLE OF CONTENTS | | | | |
| |
Market Review | | | 1 | |
| |
Portfolio Management Discussion and Performance Summaries | | | 4 | |
| |
Schedules of Investments | | | 35 | |
| |
Financial Statements | | | 67 | |
| |
Financial Highlights | | | 70 | |
| |
Notes to Financial Statements | | | 75 | |
| |
Report of Independent Registered Public Accounting Firm | | | 87 | |
| |
Other Information | | | 88 | |
| | | | |
| | | |
| NOT FDIC-INSURED | | May Lose Value | | No Bank Guarantee |
MARKET REVIEW
Goldman Sachs ActiveBeta® ETFs
Market Review
Overall, United States and emerging market equities rallied during the 12 months ended August 31, 2016 (the “Reporting Period”), even amidst persistent volatility. The Standard & Poor’s 500® Index (the “S&P 500 Index”) ended the Reporting Period with a gain of 12.55%. The Russell 3000® Index generated a return of 11.44%. The MSCI Emerging Markets Index gained 11.83% during the Reporting Period. International equities, as represented by the MSCI World ex USA Index, increased a far more modest 0.53% during the Reporting Period.
Following a volatile summer 2015, U.S., international and emerging markets equities tumbled further in September 2015, before rebounding strongly in October 2015. U.S. equities finished November 2015 roughly flat, while international equities declined. In December 2015, the U.S. Federal Reserve (the “Fed”) delivered, as largely expected by markets, and voted unanimously for a 25 basis point hike in the targeted federal funds rate, its first rate hike since 2006. (A basis point is 1/100th of a percentage point.) The fairly dovish language in the Fed’s announcement, which re-emphasized “gradual” adjustments to policy going forward, helped to somewhat assuage the markets. (Dovish language or action tends to be that which is not strong or aggressive (opposite of hawkish).)
Early in 2016, however, U.S., international and emerging markets equities were embroiled in what was a global rout, triggered by investor concerns of an intensifying economic slowdown in China and exacerbated by a plunge in oil prices to less than $30 per barrel, the lowest level since 2003. The Fed’s statement in January 2016 acknowledged the risks from international markets and tightening financial conditions on the U.S. economy, and sentiment improved following a dovish European Central Bank (“ECB”) press conference on January 21, 2016. Global equities stabilized somewhat in February 2016, as other global central banks also sent a more dovish signal. U.S. equities were also supported during the month by strong U.S. economic data, rallying as fourth quarter 2015 Gross Domestic Product (“GDP”) came in above market expectations. However, international equities were still down in February 2016. In March 2016, the Fed kept interest rates on hold and surprised on the dovish side, reducing its forecast to two interest rate increases in 2016, down from four. Along with receding global economic concerns, this helped drive a recovery in U.S. equities. Further dovishness by other global central banks, along with receding global economic concerns, helped to finally drive a recovery in international equities as well. The ECB cut its deposit rate to -40 basis points, raised monthly quantitative easing, including the purchase of corporate bonds, and unveiled a new series of four-year loans to banks.
Following the rebound in March 2016, market sentiment remained sanguine in April 2016, as oil prices rose and China economic growth concerns abated with modestly improving economic data. However, the Bank of Japan (“BoJ”) disappointed markets near month-end, failing to implement additional monetary stimulus, as had been widely anticipated. This, along with a weaker than consensus expected first quarter 2016 U.S. GDP of 0.5%, drove U.S. equities to fall near the end of the month. In May 2016, weaker payroll data drove expectations for a Fed hike in June 2016 temporarily lower, but subsequent hawkish Fed minutes revived market expectations. U.S. and international equities rallied toward month-end on anticipation of better economic data, rising oil prices and optimism that the global economy could withstand U.S. rate hikes.
The Fed ultimately held interest rates steady in June 2016 and signaled a slower pace of hikes, acknowledging the slowdown in the labor market. Equity markets were otherwise dominated
1
MARKET REVIEW
in June 2016 by the U.K. referendum on whether to leave the European Union, popularly known as Brexit. U.S., international and emerging market equities sold off in the global risk-off sentiment that dominated toward the end of June 2016 in the days following the surprise “leave” result. However, global equity markets rather quickly rebounded owing to a combination of improving risk sentiment as markets digested the outcome and on dovish remarks from the Bank of England’s Governor Carney.
International equities rebounded strongly in July 2016, buoyed by expectations of easier monetary policy and a rebound in risk appetite, and U.S. equities were further buoyed by strong economic data and corporate earnings in July 2016, despite increased uncertainty post-Brexit. Internationally, concerns were somewhat assuaged by a dovish Bank of England Governor Carney, who expressed that “some monetary policy easing will likely be required over the summer.” The BoJ eased as had been widely expected, but the lack of further measures disappointed markets. In the U.S., payrolls reached an eight-month high in June 2016, suggesting that the especially weak May 2016 reading had been an outlier in an otherwise strong job market. Such sentiment was substantiated in August 2016, as payrolls data, released for July 2016, surprised to the upside for a second consecutive month.
The Bank of England delivered in August 2016, cutting policy rates by 25 basis points, accompanied by a large extension to its quantitative easing program, which helped offset negative sentiment following Brexit. However, investor concerns about U.S. rate hikes intensified following the strong July 2016 U.S. jobs reports and Fed Chair Janet Yellen’s hawkish speech at Jackson Hole toward the end of August 2016, acknowledging that the case for an interest rate hike had strengthened in recent months. Along with strong labor data and other recent hawkish comments from the Fed, this significantly increased the market-implied probability of an interest rate hike by year-end 2016. These factors combined to cause both U.S. and international equities to sell off and finish the month of August 2016 roughly flat.
Principal Investment Strategies
The investment objective of each of the ActiveBeta® Emerging Markets Equity ETF, ActiveBeta® Europe Equity ETF, ActiveBeta® International Equity ETF, ActiveBeta® Japan Equity ETF, ActiveBeta® U.S. Large Cap Equity ETF (each, a “Fund”), is to seek to provide investment results that closely correspond, before fees and expenses, to the performance of its respective underlying index (each, an “Index”).
Each Fund seeks to achieve its investment objective by investing at least 80% of its assets (exclusive of collateral held from securities lending) in securities included in its underlying index, in depositary receipts representing securities included in its underlying index and in underlying stocks in respect of depositary receipts included in its underlying index.
Each Index is designed to deliver exposure to equity securities within its applicable universe of issuers. Each Index is constructed using the patented ActiveBeta® Portfolio Construction Methodology, which was developed to provide exposure to the
2
MARKET REVIEW
“factors” (or characteristics) that are commonly tied to a stock’s outperformance relative to market returns. These factors include value (i.e., how attractively a stock is priced relative to its “fundamentals,” such as book value and free cash flow), momentum (i.e., whether a company’s share price is trending up or down), quality (i.e., profitability) and low volatility (i.e., a relatively low degree of fluctuation in a company’s share price over time). Given each Fund’s investment objective of attempting to track its Index, each Fund does not follow traditional methods of active investment management, which may involve buying and selling securities based upon analysis of economic and market factors.
Goldman Sachs Asset Management, L.P. (the “Index Provider”) constructs each Index in accordance with a rules-based methodology that involves two steps.
Step 1
In the first step, individual factor subindexes for value, momentum, quality and low volatility (the “ActiveBeta® Factor Subindexes”) are created from the constituents of the applicable Reference Index, a market capitalization-weighted index. To construct each ActiveBeta® Factor Subindex, all constituents in the applicable Reference Index are assigned a “factor score” based on certain specified measurements (for example, in the case of the value factor, the factor score is based on a composite of book value-to-price, sales-to-price and free cash flow-to-price). Securities with a factor score that is above a fixed “Cut-off Score” receive an overweight in the applicable ActiveBeta® Factor Subindex relative to the applicable Reference Index and securities with a factor score that is below the Cut-off Score receive an underweight in the ActiveBeta® Factor Subindex relative to the applicable Reference Index. Accordingly, the magnitude of overweight or underweight that a security receives in constructing the applicable ActiveBeta® Factor Subindex is determined by its attractiveness when evaluated based on the relevant factor. Each Index only includes long positions (i.e., short positions are impermissible), so the smallest weight for any given security is zero.
Step 2
The ActiveBeta® Factor Subindexes are combined in equal weights to form each Index.
Each Index is rebalanced on a quarterly basis in accordance with the published rebalancing schedule of the applicable Reference Index. The rules-based process used to construct each Index incorporates the ActiveBeta® Turnover Minimization Technique, which seeks to reduce turnover within each Index.
3
PORTFOLIO RESULTS
Goldman Sachs ActiveBeta® Emerging Markets Equity ETF
Investment Objective
The Goldman Sachs ActiveBeta® Emerging Markets Equity ETF (the “Fund”) seeks to provide investment results that closely correspond, before fees and expenses, to the performance of the Goldman Sachs ActiveBeta® Emerging Markets Equity Index (the “Index”).
Portfolio Management Discussion and Analysis
Below, the Goldman Sachs Quantitative Investment Strategies Team discusses the Fund’s performance and positioning for the period since its inception on September 25, 2015 through August 31, 2016 (the “Reporting
Period”).
| Q | | How did the Fund perform during the Reporting Period? |
| A | | During the Reporting Period, the Fund returned 13.29% based on net asset value (“NAV”) and 13.20% based on market price.1 The Index returned 13.77%, and the MSCI Emerging Markets Index (net, unhedged, USD) (“MSCI Emerging Markets Index”), a market-cap based index against which the performance of the Fund is measured, and the reference index for the Index, returned 15.75% during the same period. |
| | The Fund had a NAV of $25.00 per share on the date of inception and ended the Reporting Period with a NAV of $28.03 per share. The Fund’s market price on August 31, 2016 was $28.01 per share. |
| Q | | What key factors were responsible for the Fund’s performance during the Reporting Period? |
| A | | The Fund seeks to provide investment results that closely correspond, before fees and expenses, to the performance of the Index. The Fund’s performance reflects Fund expenses, including management fees and brokerage expenses. The Fund’s relative performance also reflects the impact of any cash held in the Fund, as well as any other differences between the Fund’s holdings and the constituents of the Index. The Index is unmanaged, and Index returns do not reflect fees and expenses, which would reduce returns. |
| | The Index is constructed using a rules-based methodology that was developed to provide exposure to the “factors” (or characteristics) that are commonly tied to a stock’s outperformance relative to market returns, and its performance is compared to that of the MSCI Emerging Markets Index. Because the Fund seeks to provide investment results that closely correspond, before fees and expenses, to the performance of the Index, the discussion below compares the performance of the Fund to that of the MSCI Emerging Markets Index. Given the Fund’s investment objective of attempting to track the Index, the Fund does not follow traditional methods of active investment management, which may involve buying and selling securities based upon analysis of economic and market factors. The Fund does not follow a strategy of seeking to outperform the MSCI Emerging Markets Index, and overweights and underweights relative to the MSCI Emerging Markets Index discussed below resulted from the Fund’s replication of the Index, rather than a decision to overweight or underweight a particular sector, country, or stock. |
| | The Fund posted robust absolute gains but underperformed the MSCI Emerging Markets Index during the Reporting Period. Amongst underlying factors, Momentum, Quality and Low Volatility detracted from relative results, while Value contributed positively during the Reporting Period. Momentum is whether a company’s share price is trending up or down. Quality refers to sustainable profitability over time. Low Volatility is a relatively low degree of fluctuations in a company’s share price over time. Value refers to how attractively a stock is priced relative to its fundamentals, such as book value and free cash flow. |
| | 1 | | The first day of secondary market trading is typically several days after the date on which the Fund commenced investment operations; therefore, the NAV of the Fund is used as a proxy for the period from inception of investment operations to the first day of secondary market trading to calculate the market price returns. |
4
PORTFOLIO RESULTS
| Q | | Which sectors and countries contributed most positively to the Fund’s relative performance during the Reporting Period, and which detracted most? |
| A | | Index constituents in the consumer discretionary, financials and materials sectors detracted from the Fund’s results relative to the MSCI Emerging Markets Index during the Reporting Period. Partially offsetting these detractors were Index constituents in the utilities and industrials sectors, which contributed most positively to the Fund’s results relative to the MSCI Emerging Markets Index. |
| | From a country perspective, Index constituents in South Africa, Brazil and Thailand detracted the most from the Fund’s results relative to the MSCI Emerging Markets Index during the Reporting Period. Conversely, holdings in Greece and China contributed most positively to the Fund’s results relative to the MSCI Emerging Markets Index. |
| Q | | Which individual positions detracted from the Fund’s results during the Reporting Period? |
| A | | Relative to the MSCI Emerging Markets Index, an underweight position in Brazilian integrated oil company Petroleo Brasileiro and overweight positions in South Korean home and office furniture manufacturer Hanssem and Hong Kong-based specialty pharmaceutical company Sino Biopharmaceutical detracted most (0.11%, 0.19% and 0.37% of Fund net assets as of August 31, 2016, respectively). Petroleo Brasileiro generated a triple-digit gain during the Reporting Period, while Hanssem and Sino Biopharmaceutical each posted a double-digit decline during the Reporting Period. |
| Q | | Which individual stock positions contributed the most to the Fund’s relative returns during the Reporting Period? |
| A | | Relative to the MSCI Emerging Markets Index, overweight positions in South Korean personal care products manufacturer Amorepacific, Brazilian electric utility Centrais Eletricas Brasileiras and Brazilian retail drugstore chain Raia Drogasil contributed most positively (0.46%, 0.28% and 0.51% of Fund net assets as of August 31, 2016, respectively). Amorepacific and Raia Drogasil each produced a double-digit gain during the Reporting Period, and Centrais Eletricas Brasileiras posted a triple-digit increase during the Reporting Period. |
| Q | | How did the Fund use derivatives and similar instruments during the Reporting Period? |
| A | | The Fund does not employ derivatives as a source of alpha generation, although it may use them to equitize excess cash. |
| Q | | What was the Fund’s sector positioning relative to the Index and the reference index at the end of the Reporting Period?2 |
| | | | | | | | | | | | | | |
| | | Sector Name | | Fund3 | | | GS
ActiveBeta®
Index | | | MSCI EM
Index | |
| | Financials | | | 24.09 | % | | | 24.63 | % | | | 26.52 | % |
| | Information Technology | | | 19.93 | | | | 19.31 | | | | 23.26 | |
| | Consumer Staples | | | 13.96 | | | | 14.40 | | | | 7.93 | |
| | Consumer Discretionary | | | 10.63 | | | | 10.73 | | | | 10.53 | |
| | Telecommunication Services | | | 8.10 | | | | 8.16 | | | | 6.33 | |
| | Energy | | | 7.02 | | | | 6.98 | | | | 7.21 | |
| | Materials | | | 5.43 | | | | 5.29 | | | | 6.47 | |
| | Industrials | | | 3.91 | | | | 4.02 | | | | 6.10 | |
| | Health Care | | | 3.73 | | | | 4.14 | | | | 2.58 | |
| | Utilities | | | 2.91 | | | | 2.34 | | | | 3.07 | |
| | | Cash & Cash Equivalents | | | 0.27 | | | | 0.00 | | | | 0.00 | |
| | 2 | | The Fund seeks to provide investment results that closely correspond, before fees and expenses, to the performance of the Goldman Sachs ActiveBeta® Emerging Markets Equity Index. |
| | 3 | | Country and sector classifications for securities may differ between the above listing and the Statement of Investments due to differing classification methodologies. The classification methodology used for the above listing is as set forth by MSCI. |
5
PORTFOLIO RESULTS
| Q | | What was the Fund’s country positioning relative to the Index and the reference index at the end of the Reporting Period?2 |
| | | | | | | | | | | | | | |
| | | Country Name | | Fund3 | | | GS
ActiveBeta®
Index | | | MSCI EM
Index | |
| | China | | | 25.14 | % | | | 25.11 | % | | | 26.56 | % |
| | Korea | | | 16.25 | | | | 16.68 | | | | 14.94 | |
| | Taiwan | | | 11.34 | | | | 11.33 | | | | 12.04 | |
| | India | | | 8.97 | | | | 8.62 | | | | 8.34 | |
| | Brazil | | | 8.36 | | | | 8.06 | | | | 7.46 | |
| | South Africa | | | 6.55 | | | | 7.41 | | | | 6.88 | |
| | Mexico | | | 3.99 | | | | 4.07 | | | | 3.86 | |
| | Russia | | | 3.84 | | | | 4.08 | | | | 3.59 | |
| | Indonesia | | | 2.86 | | | | 2.66 | | | | 2.72 | |
| | Malaysia | | | 2.72 | | | | 2.50 | | | | 2.79 | |
| | Thailand | | | 2.18 | | | | 2.40 | | | | 2.33 | |
| | Philippines | | | 1.35 | | | | 1.22 | | | | 1.45 | |
| | Turkey | | | 1.23 | | | | 1.31 | | | | 1.20 | |
| | Chile | | | 1.21 | | | | 0.96 | | | | 1.15 | |
| | Poland | | | 0.84 | | | | 0.90 | | | | 1.11 | |
| | United Arab Emirates | | | 0.57 | | | | 0.45 | | | | 0.86 | |
| | Egypt | | | 0.53 | | | | 0.41 | | | | 0.19 | |
| | Hungary | | | 0.46 | | | | 0.46 | | | | 0.28 | |
| | Qatar | | | 0.45 | | | | 0.53 | | | | 0.94 | |
| | Colombia | | | 0.39 | | | | 0.25 | | | | 0.47 | |
| | Peru | | | 0.30 | | | | 0.20 | | | | 0.38 | |
| | Cash & Cash Equivalents | | | 0.27 | | | | 0.00 | | | | 0.00 | |
| | Greece | | | 0.19 | | | | 0.19 | | | | 0.33 | |
| | | Czech | | | 0.00 | | | | 0.18 | | | | 0.15 | |
| | 2 | | The Fund seeks to provide investment results that closely correspond, before fees and expenses, to the performance of the Goldman Sachs ActiveBeta® Emerging Markets Equity Index. |
| | 3 | | Country and sector classifications for securities may differ between the above listing and the Statement of Investments due to differing classification methodologies. The classification methodology used for the above listing is as set forth by MSCI. |
6
FUND BASICS
ActiveBeta® Emerging Markets Equity ETF
as of August 31, 2016
| | | | | | |
| | FUND SNAPSHOT | |
| | | As of August 31, 2016 | | | |
| | Market Price1 | | $ | 28.01 | |
| | | Net Asset Value (NAV)1 | | $ | 28.03 | |
| | 1 | | The Market Price is the price at which the Fund’s shares are trading on the NYSE Arca Inc. The Market Price of the Fund’s shares will fluctuate and, at the time of sale, shares may be worth more or less than the original investment or the Fund’s then current net asset value (“NAV”). The NAV is the market value of one share of the Fund. This amount is derived by dividing the total value of all the securities in the Fund’s portfolio, plus other assets, less any liabilities, by the number of Fund shares outstanding. Fund shares are not individually redeemable and are issued and redeemed by the Fund at their NAV only in large, specified blocks of shares called creation units. Shares otherwise can be bought and sold only through exchange trading at market price (not NAV). Shares may trade at a premium or discount to their NAV in the secondary market. Information regarding how often shares of each Fund traded on NYSE Arca at a price above (i.e., at a premium) or below (i.e., at a discount) the NAV of the Fund can be found at www.GSAMFUNDS.com. |
| | | | | | | | | | | | | | | | | | |
| | PERFORMANCE REVIEW | |
| | | September 25, 2015– August 31, 2016 | | Fund Total Return
(based on NAV)2 | | | Fund Total Return
(based on Market Price)2 | | | GS ActiveBeta®
EME Index3 | | | MSCI EM Index4 | |
| | | Shares | | | 13.29 | % | | | 13.20 | % | | | 13.77 | % | | | 15.75 | % |
| | 2 | | Total returns are calculated assuming purchase of a share at the market price or NAV on the first day and sale of a share at the market price or NAV on the last day of each period reported. The Total Returns Based on NAV and Market Price assume the reinvestment of dividends and do not reflect brokerage commissions in connection with the purchase or sale of Fund shares, which if included would lower the performance shown above. The NAV used in the Total Return calculation assumes all management fees and operating expenses incurred by the Fund. Market Price returns are based upon the midpoint of the bid/ask spread (last trade) at 4:00 pm EST and do not reflect the returns you would receive if you traded shares at other times. The first day of secondary market trading is typically several days after the date on which the Fund commenced investment operations; therefore, the NAV of the Fund is used as a proxy for the period from inception of investment operations to the first day of secondary market trading to calculate the Market Price returns. Total returns for periods less than one full year are not annualized. |
| | 3 | | The Goldman Sachs ActiveBeta® Emerging Markets Equity Index (“the Index”) is designed to deliver exposure to equity securities of emerging market issuers. The Index seeks to capture common sources of active equity returns, including value (i.e., how attractively a stock is priced relative to its “fundamentals”, such as book value or free cash flow), momentum (i.e., whether a company’s share price is trending up or down), quality (i.e., profitability) and low volatility (i.e., a relatively low degree of fluctuation in a company’s share price over time). The Index is reconstituted and rebalanced quarterly. It is not possible to invest directly in an unmanaged index. |
| | 4 | | The MSCI Emerging Markets Index captures large and mid cap representation across 23 Emerging Markets countries. It is not possible to invest directly in an unmanaged index. |
The returns set forth in the tables above represent past performance. Past performance does not guarantee future results. The Fund’s investment returns and principal value will fluctuate so that an investor’s shares, when sold or redeemed, may be worth more or less than their original cost. Current performance may be lower or higher than the performance quoted above. Please visit our web site at www.GSAMFUNDS.com to obtain the most recent month-end returns. Performance reflects applicable fee waivers and/or expense limitations in effect during the periods shown. In their absence, performance would be reduced. Returns do not reflect the deduction of taxes that a shareholder would pay on Fund distributions or the sale or redemption of Fund shares.
7
FUND BASICS
| | | | | | | | | | |
| | EXPENSE RATIOS5 | |
| | | | | Net Expense Ratio (Current) | | | Gross Expense Ratio
(Before expense limitation) | |
| | | Shares | | | 0.45 | % | | | 0.76 | % |
| | 5 | | The expense ratios of the Fund, both current (net of any expense limitation) and before expense limitation (gross of any expense limitation) are as set forth above according to the most recent publicly available Prospectus for the Fund and may differ from the expense ratios disclosed on the Financial Highlights in this report. Pursuant to a contractual arrangement, the Fund’s expense limitation will remain in effect permanently and the Investment Adviser may not terminate the arrangement without the approval of the Fund’s Board of Trustees. |
| | | | | | | | | | |
| | TOP TEN HOLDINGS AS OF 8/31/166 |
| | | Holding | | % of Net Assets | | | Line of Business | | Country |
| | iShares MSCI India ETF | | | 4.6 | % | | Exchange Traded Fund | | United States |
| | Samsung Electronics Co. Ltd. | | | 3.5 | | | Information Technology | | South Korea |
| | Taiwan Semiconductor Manufacturing Co. Ltd. | | | 3.4 | | | Information Technology | | Taiwan |
| | Tencent Holdings Ltd. | | | 3.2 | | | Information Technology | | China |
| | iShares India 50 ETF | | | 2.2 | | | Exchange Traded Fund | | United States |
| | Alibaba Group Holding Ltd. ADR | | | 2.1 | | | Information Technology | | China |
| | China Mobile Ltd. | | | 2.0 | | | Telecommunication Services | | China |
| | China Construction Bank Corp., Class H | | | 1.5 | | | Financials | | China |
| | PowerShares India Portfolio | | | 1.3 | | | Exchange Traded Fund | | United States |
| | | Industrial & Commercial Bank of China Ltd., Class H | | | 1.2 | | | Financials | | China |
| | 6 | | The top 10 holdings may not be representative of the Fund’s future investments. |
8
FUND BASICS
|
| FUND SECTOR ALLOCATIONS7 |
| As of August 31, 2016 |
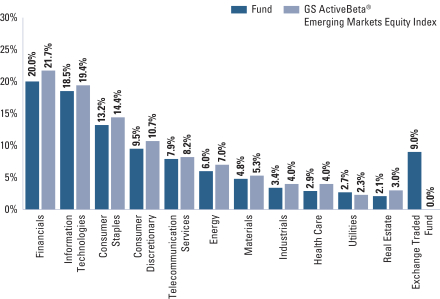
| | 7 | | The Fund’s composition may differ over time. Consequently, the Fund’s overall industry sector allocations may differ from percentages contained in the graph above. The graph categorizes investments using Global Industry Classification Standard (“GICS”), however, the sector classifications used by the portfolio management team may differ from GICS. Underlying sector allocations of exchange-traded funds held by the Fund are not reflected in the graph above. The percentage shown for each investment category reflects the value of investments in that category as a percentage of market value. |
9
ACTIVEBETA® EMERGING MARKETS EQUITY ETF
Performance Summary
August 31, 2016
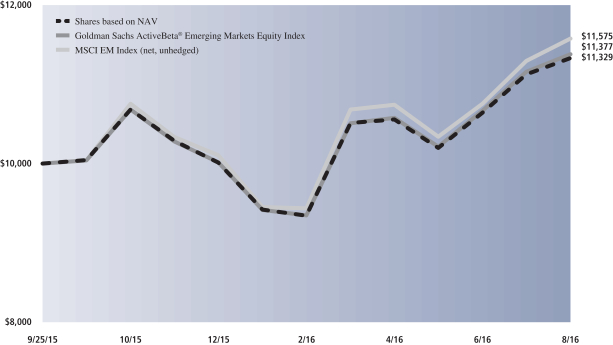
The following graph shows the value, as of August 31, 2016, of a $10,000 investment made on September 25, 2015 (commencement of operations) in ETF Shares at NAV. For comparative purposes, the performance of the Fund’s underlying index and secondary underlying index, the Goldman Sachs ActiveBeta® Emerging Markets Equity Index and the MSCI EM Index (net, unhedged), are shown. This performance data represents past performance and should not be considered indicative of future performance, which will fluctuate with changes in market conditions. These performance fluctuations may cause an investor’s shares to be worth more or less than their original cost. Performance reflects applicable fee waivers and/or expense limitations in effect during the periods shown and in their absence, performance would be reduced. Returns do not reflect the deduction of taxes that a shareholder would pay on Fund distributions or the sale of Fund shares. In addition to the performance of constituents of the underlying index, other factors may affect Fund performance. These factors include, but are not limited to, Fund operating fees and expenses, portfolio turnover and creation and redemption in-kind transactions.
|
| ActiveBeta® Emerging Markets Equity ETF’s Lifetime Performance |
Performance of a $10,000 Investment, with distributions reinvested, from September 25, 2015 through August 31, 2016.
| | |
| Average Annual Total Return through August 31, 2016 | | Since Inception |
|
Shares based on NAV (Commenced September 25, 2015) | | 13.29%* |
|
| * | | Total return for periods of less than one year represents cumulative total return. |
10
PORTFOLIO RESULTS
Goldman Sachs ActiveBeta® Europe Equity ETF
Investment Objective
The Goldman Sachs ActiveBeta® Europe Equity ETF (the “Fund”) seeks to provide investment results that closely correspond, before fees and expenses, to the performance of the Goldman Sachs ActiveBeta® Europe Equity Index (the “Index”).
Portfolio Management Discussion and Analysis
Below, the Goldman Sachs Quantitative Investment Strategies Team discusses the Fund’s performance and positioning for the period since its inception on March 2, 2016 through August 31, 2016 (the “Reporting Period”).
| Q | | How did the Fund perform during the Reporting Period? |
| A | | During the Reporting Period, the Fund returned 6.23% based on net asset value (“NAV”) and 6.55% based on market price.1 The Index returned 6.18%, and the MSCI Europe Index (net, unhedged, USD) (“MSCI Europe Index”), a market-cap based index against which the performance of the Fund is measured, and the reference index for the Index, returned 6.15% during the same period. |
| | The Fund had a NAV of $25.03 per share on the date of inception and ended the Reporting Period with a NAV of $26.12 per share. The Fund’s market price on August 31, 2016 was $26.20 per share. |
| Q | | What key factors were responsible for the Fund’s performance during the Reporting Period? |
| A | | The Fund seeks to provide investment results that closely correspond, before fees and expenses, to the performance of the Index. The Fund’s performance reflects Fund expenses, including management fees and brokerage expenses. The Fund’s relative performance also reflects the impact of any cash held in the Fund, as well as any other differences between the Fund’s holdings and the constituents of the Index. The Index is unmanaged, and Index returns do not reflect fees and expenses, which would reduce returns. |
| | The Index is constructed using a rules-based methodology that was developed to provide exposure to the “factors” (or characteristics) that are commonly tied to a stock’s outperformance relative to market returns, and its performance is compared to that of the MSCI Europe Index. Because the Fund seeks to provide investment results that closely correspond, before fees and expenses, to the performance of the Index, the discussion below compares the performance of the Fund to that of the MSCI Europe Index. Given the Fund’s investment objective of attempting to track the Index, the Fund does not follow traditional methods of active investment management, which may involve buying and selling securities based upon analysis of economic and market factors. The Fund does not follow a strategy of seeking to outperform the MSCI Europe Index, and overweights and underweights relative to the MSCI Europe Index discussed below resulted from the Fund’s replication of the Index, rather than a decision to overweight or underweight a particular sector, country, or stock. |
| | The Fund outperformed the MSCI Europe Index during the Reporting Period. Amongst underlying factors, Momentum contributed positively to relative results during the Reporting Period. Value and Quality detracted from relative results during the Reporting Period, while Low Volatility had a rather neutral effect. Momentum is whether a company’s share price is trending up or down. Value refers to how attractively a stock is priced relative to its fundamentals, such as book value and free cash flow. Quality refers to sustainable profitability over time. Low Volatility is a relatively low degree of fluctuation in a company’s share price over time. |
| Q | | Which sectors and countries contributed most positively to the Fund’s relative performance during the Reporting Period, and which detracted most? |
| A | | Index constituents in the financials, information technology and health care sectors contributed most positively to the Fund’s results relative to the MSCI Europe Index during the Reporting Period. Index constituents in the consumer |
| | 1 | | The first day of secondary market trading is typically several days after the date on which the Fund commenced investment operations; therefore, the NAV of the Fund is used as a proxy for the period from inception of investment operations to the first day of secondary market trading to calculate the market price returns. |
11
PORTFOLIO RESULTS
| | discretionary, materials and industrials sectors detracted most from the Fund’s results relative to the MSCI Europe Index during the Reporting Period. |
| | From a country perspective, Index constituents in Spain, France and Germany contributed most positively to the Fund’s results relative to the MSCI Europe Index. Conversely, holdings in the U.K., Ireland and Belgium detracted the most from the Fund’s results relative to the MSCI Europe Index during the Reporting Period. |
| Q | | Which individual stock positions contributed the most to the Fund’s relative returns during the Reporting Period? |
| A | | Relative to the MSCI Europe Index, overweight positions in French digital services company Atos and German sports shoes, apparel and equipment manufacturer Adidas and an underweight position in U.K. bank Lloyds Banking Group contributed most positively (1.01%, 0.87% and 0.11% of Fund net assets as of August 31, 2016, respectively). Atos and Adidas each posted a double-digit gain during the Reporting Period. Lloyds Banking Group generated a double-digit decline during the Reporting Period. |
| Q | | Which individual positions detracted from the Fund’s results during the Reporting Period? |
| A | | Relative to the MSCI Europe Index, overweight positions in Swiss offshore drilling contractor Transocean, U.K. bookmaking services provider William Hill and Italian bank Banco Popolare detracted most (0.00%, 0.38% and 0.00% of Fund net assets as of August 31, 2016, respectively). Each of these stocks generated a double-digit decline during the Reporting Period. |
| Q | | How did the Fund use derivatives and similar instruments during the Reporting Period? |
| A | | The Fund does not employ derivatives as a source of alpha generation, although it may use them to equitize excess cash. |
| Q | | What was the Fund’s sector positioning relative to the Index and reference index at the end of the Reporting Period?2 |
| | | | | | | | | | | | | | |
| | | Sector Name | | Fund3 | | | GS
ActiveBeta®
Index | | | MSCI EU
Index | |
| | Consumer Staples | | | 18.39 | % | | | 18.45 | % | | | 15.93 | % |
| | Financials | | | 15.14 | | | | 16.58 | | | | 19.79 | |
| | Industrials | | | 14.75 | | | | 14.54 | | | | 12.82 | |
| | Consumer Discretionary | | | 14.42 | | | | 14.04 | | | | 10.52 | |
| | Health Care | | | 14.01 | | | | 13.63 | | | | 13.64 | |
| | Materials | | | 5.96 | | | | 5.68 | | | | 7.50 | |
| | Information Technology | | | 5.53 | | | | 5.42 | | | | 4.68 | |
| | Energy | | | 4.29 | | | | 3.70 | | | | 6.67 | |
| | Utilities | | | 4.04 | | | | 4.23 | | | | 3.95 | |
| | Telecommunication Services | | | 3.46 | | | | 3.73 | | | | 4.50 | |
| | | Cash and Cash Equivalents | | | 0.01 | | | | 0.00 | | | | 0.00 | |
| Q | | What was the Fund’s country positioning relative to the Index and reference index at the end of the Reporting Period?2 |
| | | | | | | | | | | | | | |
| | | Country Name | | Fund3 | | | GS
ActiveBeta®
Index | | | MSCI EU
Index | |
| | UK | | | 28.12 | % | | | 27.50 | % | | | 30.03 | % |
| | France | | | 17.23 | | | | 17.34 | | | | 15.20 | |
| | Switzerland | | | 13.92 | | | | 14.07 | | | | 14.20 | |
| | Germany | | | 13.22 | | | | 13.51 | | | | 14.27 | |
| | Netherlands | | | 5.35 | | | | 5.14 | | | | 5.26 | |
| | Spain | | | 4.88 | | | | 4.75 | | | | 4.77 | |
| | Italy | | | 4.15 | | | | 4.27 | | | | 3.09 | |
| | Sweden | | | 3.61 | | | | 3.60 | | | | 4.38 | |
| | Denmark | | | 3.35 | | | | 3.50 | | | | 2.90 | |
| | Belgium | | | 1.77 | | | | 1.73 | | | | 2.10 | |
| | Norway | | | 1.59 | | | | 1.60 | | | | 0.98 | |
| | Finland | | | 1.41 | | | | 1.34 | | | | 1.52 | |
| | Ireland | | | 0.59 | | | | 0.99 | | | | 0.76 | |
| | Austria | | | 0.48 | | | | 0.39 | | | | 0.27 | |
| | Portugal | | | 0.32 | | | | 0.29 | | | | 0.24 | |
| | | Cash and Cash Equivalents | | | 0.01 | | | | 0.00 | | | | 0.00 | |
| | 2 | | The Fund seeks to provide investment results that closely correspond, before fees and expenses, to the performance of the Goldman Sachs ActiveBeta® Europe Equity Index. |
| | 3 | | Country and sector classifications for securities may differ between the above listing and the Statement of Investments due to differing classification methodologies. The classification methodology used for the above listing is as set forth by MSCI. |
12
FUND BASICS
ActiveBeta® Europe Equity ETF
as of August 31, 2016
| | | | | | |
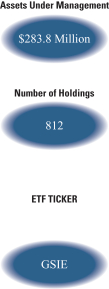
| | FUND SNAPSHOT | |
| | | As of August 31, 2016 | | | |
| | Market Price1 | | $ | 26.20 | |
| | | Net Asset Value (NAV)1 | | | 26.12 | |
| | 1 | | The Market Price is the price at which the Fund’s shares are trading on the NYSE Arca Inc. The Market Price of the Fund’s shares will fluctuate and, at the time of sale, shares may be worth more or less than the original investment or the Fund’s then current net asset value (“NAV”). The NAV is the market value of one share of the Fund. This amount is derived by dividing the total value of all the securities in the Fund’s portfolio, plus other assets, less any liabilities, by the number of Fund shares outstanding. Fund shares are not individually redeemable and are issued and redeemed by the Fund at their NAV only in large, specified blocks of shares called creation units. Shares otherwise can be bought and sold only through exchange trading at market price (not NAV). Shares may trade at a premium or discount to their NAV in the secondary market. Information regarding how often shares of each Fund traded on NYSE Arca at a price above (i.e., at a premium) or below (i.e., at a discount) the NAV of the Fund can be found at www.GSAMFUNDS.com. |
| | | | | | | | | | | | | | | | | | |
| | PERFORMANCE REVIEW | |
| | | March 2, 2016– August 31, 2016 | | Fund Total Return
(based on NAV)2 | | | Fund Total Return
(based on Market Price)2 | | | GS ActiveBeta®
Europe Equity
Index3 | | | MSCI Europe
Index4 | |
| | | Shares | | | 6.23 | % | | | 6.55 | % | | | 6.18 | % | | | 6.15 | % |
| | 2 | | Total returns are calculated assuming purchase of a share at the market price or NAV on the first day and sale of a share at the market price or NAV on the last day of each period reported. The Total Returns Based on NAV and Market Price assume the reinvestment of dividends and do not reflect brokerage commissions in connection with the purchase or sale of Fund shares, which if included would lower the performance shown above. The NAV used in the Total Return calculation assumes all management fees and operating expenses incurred by the Fund. Market Price returns are based upon the midpoint of the bid/ask spread (last trade) at 4:00 pm EST and do not reflect the returns you would receive if you traded shares at other times. The first day of secondary market trading is typically several days after the date on which the Fund commenced investment operations; therefore, the NAV of the Fund is used as a proxy for the period from inception of investment operations to the first day of secondary market trading to calculate the Market Price returns. Total returns for periods less than one full year are not annualized. |
| | 3 | | The Goldman Sachs ActiveBeta® Europe Equity Index (“the Index”) is designed to deliver exposure to equity securities of developed market issuers in Europe. The Index seeks to capture common sources of active equity returns, including value (i.e., how attractively a stock is priced relative to its “fundamentals”, such as book value or free cash flow), momentum (i.e., whether a company’s share price is trending up or down), quality (i.e., profitability) and low volatility (i.e., a relatively low degree of fluctuation in a company’s share price over time). The Index is reconstituted and rebalanced quarterly. It is not possible to invest directly in an unmanaged index. |
| | 4 | | The MSCI Europe Index captures large and mid-cap representation across 15 Developed Markets countries. It is not possible to invest directly in an unmanaged index. |
The returns set forth in the tables above represent past performance. Past performance does not guarantee future results. The Fund’s investment returns and principal value will fluctuate so that an investor’s shares, when sold or redeemed, may be worth more or less than their original cost. Current performance may be lower or higher than the performance quoted above. Please visit our web site at www.GSAMFUNDS.com to obtain the most recent month-end returns. Performance reflects applicable fee waivers and/or expense limitations in effect during the periods shown. In their absence, performance would be reduced. Returns do not reflect the deduction of taxes that a shareholder would pay on Fund distributions or the sale or redemption of Fund shares.
13
FUND BASICS
| | | | | | | | | | |
| | EXPENSE RATIO5 | |
| | | | | | | | Expense Ratio | |
| | | Shares | | | | | | | 0.25 | % |
| | 5 | | The expense ratio of the Fund is as set forth above according to the most recent publicly available Prospectus for the Fund and may differ from the expense ratios disclosed on the Financial Highlights in this report. |
| | | | | | | | | | |
| | TOP TEN HOLDINGS AS OF 8/31/166 |
| | | Holding | | % of Net Assets | | | Line of Business | | Country |
| | Nestle SA | | | 2.9 | % | | Consumer Staples | | Switzerland |
| | Roche Holding AG | | | 2.0 | | | Health Care | | Switzerland |
| | Novartis AG | | | 1.8 | | | Health Care | | Switzerland |
| | HSBC Holdings PLC | | | 1.4 | | | Financials | | United Kingdom |
| | British American Tobacco PLC | | | 1.3 | | | Consumer Staples | | United Kingdom |
| | GlaxoSmithKline PLC | | | 1.1 | | | Health Care | | United Kingdom |
| | Novo Nordisk A/S, Class B | | | 1.1 | | | Health Care | | Denmark |
| | Koninklijke Ahold Delhaize NV | | | 1.1 | | | Consumer Staples | | Netherlands |
| | Sanofi | | | 1.1 | | | Health Care | | France |
| | | SAP SE | | | 1.0 | | | Information Technology | | Germany |
| | 6 | | The top 10 holdings may not be representative of the Fund’s future investments. |
14
FUND BASICS
| | | | |
| | FUND SECTOR ALLOCATIONS7 |
| | | As of August 31, 2016 | | |
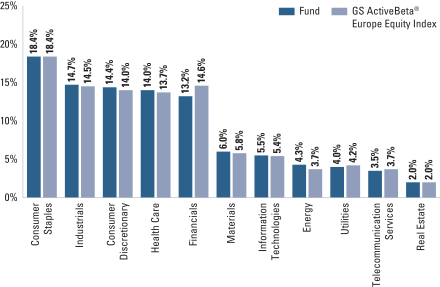
| | 7 | | The Fund’s composition may differ over time. Consequently, the Fund’s overall industry sector allocations may differ from percentages contained in the graph above. The graph categorizes investments using Global Industry Classification Standard (“GICS”), however, the sector classifications used by the portfolio management team may differ from GICS. The percentage shown for each investment category reflects the value of investments in that category as a percentage of market value. |
15
PORTFOLIO RESULTS
Goldman Sachs ActiveBeta® International Equity ETF
Investment Objective
The Goldman Sachs ActiveBeta® International Equity ETF (the “Fund”) seeks to provide investment results that closely correspond, before fees and expenses, to the performance of the Goldman Sachs ActiveBeta® International Equity Index (the “Index”).
Portfolio Management Discussion and Analysis
Below, the Goldman Sachs Quantitative Investment Strategies Team discusses the Fund’s performance and positioning for the period since its inception on November 6, 2015 through August 31, 2016 (the “Reporting Period”).
| Q | | How did the Fund perform during the Reporting Period? |
| A | | During the Reporting Period, the Fund returned 0.90% based on net asset value (“NAV”) and 1.33% based on market price.1 The Index returned 0.95%, and the MSCI World ex USA Index (net, unhedged, USD) (“MSCI World ex USA Index”), a market-cap based index against which the performance of the Fund is measured, and the reference index for the Index, returned -0.01% during the same period. |
| | The Fund had a NAV of $24.78 per share on the date of inception and ended the Reporting Period with a NAV of $24.67 per share. The Fund’s market price on August 31, 2016 was $24.78 per share. |
| Q | | What key factors were responsible for the Fund’s performance during the Reporting Period? |
| A | | The Fund seeks to provide investment results that closely correspond, before fees and expenses, to the performance of the Index. The Fund’s performance reflects Fund expenses, including management fees and brokerage expenses. The Fund’s relative performance also reflects the impact of any cash held in the Fund, as well as any other differences between the Fund’s holdings and the constituents of the Index. The Index is unmanaged, and Index returns do not reflect fees and expenses, which would reduce returns. |
| | The Index is constructed using a rules-based methodology that was developed to provide exposure to the “factors” (or characteristics) that are commonly tied to a stock’s outperformance relative to market returns, and its performance is compared to that of the MSCI World ex USA Index. Because the Fund seeks to provide investment results that closely correspond, before fees and expenses, to the performance of the Index, the discussion below compares the performance of the Fund to that of the MSCI World ex USA Index. Given the Fund’s investment objective of attempting to track the Index, the Fund does not follow traditional methods of active investment management, which may involve buying and selling securities based upon analysis of economic and market factors. The Fund does not follow a strategy of seeking to outperform the MSCI World ex USA Index, and overweights and underweights relative to the MSCI World ex USA Index discussed below resulted from the Fund’s replication of the Index, rather than a decision to overweight or underweight a particular sector, country, or stock. |
| | The Fund outperformed the MSCI World ex USA Index during the Reporting Period. All underlying factors contributed positively, with Value contributing most positively, followed by Low Volatility, Momentum and Quality. Value refers to how attractively a stock is priced relative to its fundamentals, such as book value and free cash flow. Low Volatility is a relatively low degree of fluctuation in a company’s share price over time. Momentum is whether a company’s share price is trending up or down. Quality refers to sustainable profitability over time. |
| | 1 | | The first day of secondary market trading is typically several days after the date on which the Fund commenced investment operations; therefore, the NAV of the Fund is used as a proxy for the period from inception of investment operations to the first day of secondary market trading to calculate the market price returns. |
16
PORTFOLIO RESULTS
| Q | | Which sectors and countries contributed most positively to the Fund’s relative performance during the Reporting Period, and which detracted most? |
| A | | Index constituents in the financials, health care and materials sectors contributed most positively to the Fund’s results relative to the MSCI World ex USA Index during the Reporting Period. Only partially offsetting these positive contributors were Index constituents in the consumer discretionary, energy and telecommunication services sectors, which detracted the most from the Fund’s results relative to the MSCI World ex USA Index. |
| | From a country perspective, Index constituents in Australia, Germany and France contributed most positively to the Fund’s results relative to the MSCI World ex USA Index during the Reporting Period. Conversely, holdings in the U.K., Canada and Ireland detracted the most from the Fund’s results relative to the MSCI World ex USA Index. |
| Q | | Which individual stock positions contributed the most to the Fund’s relative returns during the Reporting Period? |
| A | | Relative to the MSCI World ex USA Index, overweight positions in Australian iron ore producer Fortescue Metals Group and Canadian gold miner Kinross Gold and an underweight position in U.S. specialty pharmaceuticals firm Valeant Pharmaceuticals International contributed most positively (0.28%, 0.18% and 0.07% of Fund net assets as of August 31, 2016, respectively). Fortescue Metals Group and Kinross Gold each generated a robust triple-digit gain during the Reporting Period, while Valeant Pharmaceuticals posted a share price decline. |
| Q | | Which individual positions detracted from the Fund’s results during the Reporting Period? |
| A | | Relative to the MSCI World ex USA Index, overweight positions in Italian telecommunications carrier Telecom Italia and U.K. sports apparel retailer Sports Direct International and an underweight position in Canadian gold miner Barrick Gold detracted most (0.20%, 0.00% and 0.09% of Fund net assets as of August 31, 2016, respectively). Telecom Italia and Sports Direct International each generated a double-digit decline during the Reporting Period, while Barrick Gold posted a single-digit gain during the Reporting Period. |
| Q | | How did the Fund use derivatives and similar instruments during the Reporting Period? |
| A | | The Fund does not employ derivatives as a source of alpha generation, although it may use them to equitize excess cash. |
| Q | | What was the Fund’s sector positioning relative to the Index and the reference index at the end of the Reporting Period?2 |
| | | | | | | | | | | | | | |
| | | Sector Name | | Fund3 | | | GS
ActiveBeta®
Index | | | MSCI World
ex USA
Index | |
| | Financials | | | 20.49 | % | | | 22.50 | % | | | 24.84 | % |
| | Consumer Staples | | | 16.50 | | | | 16.40 | | | | 11.98 | |
| | Consumer Discretionary | | | 14.69 | | | | 14.44 | | | | 11.80 | |
| | Industrials | | | 12.70 | | | | 12.50 | | | | 13.45 | |
| | Health Care | | | 11.83 | | | | 11.40 | | | | 10.52 | |
| | Information Technology | | | 6.32 | | | | 6.46 | | | | 5.41 | |
| | Materials | | | 6.23 | | | | 6.24 | | | | 7.62 | |
| | Telecommunication Services | | | 3.91 | | | | 3.82 | | | | 4.67 | |
| | Energy | | | 3.56 | | | | 3.07 | | | | 6.22 | |
| | Utilities | | | 3.33 | | | | 3.17 | | | | 3.49 | |
| | | Cash & Cash Equivalents | | | 0.43 | | | | 0.00 | | | | 0.00 | |
| | 2 | | The Fund seeks to provide investment results that closely correspond, before fees and expenses, to the performance of the Goldman Sachs ActiveBeta® International Equity Index. |
| | 3 | | Country and sector classifications for securities may differ between the above listing and the Statement of Investments due to differing classification methodologies. The classification methodology used for the above listing is as set forth by MSCI. |
17
PORTFOLIO RESULTS
| Q | | What was the Fund’s country positioning relative to the Index and the reference index at the end of the Reporting Period?2 |
| | | | | | | | | | | | | | |
| | | Country Name | | Fund3 | | | GS
ActiveBeta®
Index | | | MSCI World
ex USA
Index | |
| | Japan | | | 20.79 | % | | | 20.79 | % | | | 21.72 | % |
| | UK | | | 15.84 | | | | 16.18 | | | | 17.38 | |
| | France | | | 9.54 | | | | 9.80 | | | | 8.79 | |
| | Canada | | | 9.33 | | | | 9.05 | | | | 8.70 | |
| | Switzerland | | | 8.13 | | | | 8.24 | | | | 8.22 | |
| | Germany | | | 7.82 | | | | 7.90 | | | | 8.26 | |
| | Australia | | | 6.46 | | | | 6.45 | | | | 6.59 | |
| | Netherlands | | | 3.04 | | | | 3.07 | | | | 3.05 | |
| | Hong Kong | | | 2.84 | | | | 2.78 | | | | 3.11 | |
| | Spain | | | 2.83 | | | | 2.79 | | | | 2.76 | |
| | Sweden | | | 2.47 | | | | 2.28 | | | | 2.54 | |
| | Italy | | | 2.29 | | | | 2.35 | | | | 1.79 | |
| | Denmark | | | 2.11 | | | | 2.15 | | | | 1.68 | |
| | Singapore | | | 1.47 | | | | 1.43 | | | | 1.15 | |
| | Belgium | | | 0.98 | | | | 1.07 | | | | 1.21 | |
| | Israel | | | 0.97 | | | | 1.05 | | | | 0.69 | |
| | Finland | | | 0.90 | | | | 0.84 | | | | 0.88 | |
| | Norway | | | 0.85 | | | | 0.85 | | | | 0.57 | |
| | Cash & Cash Equivalents | | | 0.43 | | | | 0.00 | | | | 0.00 | |
| | Ireland | | | 0.31 | | | | 0.43 | | | | 0.44 | |
| | Austria | | | 0.22 | | | | 0.18 | | | | 0.16 | |
| | New Zealand | | | 0.21 | | | | 0.17 | | | | 0.19 | |
| | | Portugal | | | 0.17 | | | | 0.17 | | | | 0.14 | |
| | 2 | | The Fund seeks to provide investment results that closely correspond, before fees and expenses, to the performance of the Goldman Sachs ActiveBeta® International Equity Index. |
| | 3 | | Country and sector classifications for securities may differ between the above listing and the Statement of Investments due to differing classification methodologies. The classification methodology used for the above listing is as set forth by MSCI. |
18
FUND BASICS
ActiveBeta® International Equity ETF
As of August 31, 2016
| | | | | | |
| | FUND SNAPSHOT | |
| | | As of August 31, 2016 | | | |
| | Market Price1 | | $ | 24.78 | |
| | | Net Asset Value (NAV)1 | | $ | 24.67 | |
| | 1 | | The Market Price is the price at which the Fund’s shares are trading on the NYSE Arca Inc. The Market Price of the Fund’s shares will fluctuate and, at the time of sale, shares may be worth more or less than the original investment or the Fund’s then current net asset value (“NAV”). The NAV is the market value of one share of the Fund. This amount is derived by dividing the total value of all the securities in the Fund’s portfolio, plus other assets, less any liabilities, by the number of Fund shares outstanding. Fund shares are not individually redeemable and are issued and redeemed by the Fund at their NAV only in large, specified blocks of shares called creation units. Shares otherwise can be bought and sold only through exchange trading at market price (not NAV). Shares may trade at a premium or discount to their NAV in the secondary market. Information regarding how often shares of each Fund traded on NYSE Arca at a price above (i.e., at a premium) or below (i.e., at a discount) the NAV of the Fund can be found at www.GSAMFUNDS.com. |
| | | | | | | | | | | | | | | | | | |
| | PERFORMANCE REVIEW | |
| | | November 6, 2015– August 31, 2016 | | Fund Total Return
(based on NAV)2 | | | Fund Total Return
(based on Market Price)2 | | | GS ActiveBeta®
Intl Equity
Index3 | | | MSCI World ex
USA Index4 | |
| | | Shares | | | 0.90 | % | | | 1.33 | % | | | 0.95 | % | | | -0.01 | % |
| | 2 | | Total returns are calculated assuming purchase of a share at the market price or NAV on the first day and sale of a share at the market price or NAV on the last day of each period reported. The Total Returns Based on NAV and Market Price assume the reinvestment of dividends and do not reflect brokerage commissions in connection with the purchase or sale of Fund shares, which if included would lower the performance shown above. The NAV used in the Total Return calculation assumes all management fees and operating expenses incurred by the Fund. Market Price returns are based upon the midpoint of the bid/ask spread (last trade) at 4:00 pm EST and do not reflect the returns you would receive if you traded shares at other times. The first day of secondary market trading is typically several days after the date on which the Fund commenced investment operations; therefore, the NAV of the Fund is used as a proxy for the period from inception of investment operations to the first day of secondary market trading to calculate the Market Price returns. Total returns for periods less than one full year are not annualized. |
| | 3 | | The Goldman Sachs ActiveBeta® International Equity Index (“the Index”) is designed to deliver exposure to equity securities of developed market issuers outside of the United States. The Index seeks to capture common sources of active equity returns, including value (i.e., how attractively a stock is priced relative to its “fundamentals”, such as book value or free cash flow), momentum (i.e., whether a company’s share price is trending up or down), quality (i.e., profitability) and low volatility (i.e., a relatively low degree of fluctuation in a company’s share price over time). The Index is reconstituted and rebalanced quarterly. It is not possible to invest directly in an unmanaged index. |
| | 4 | | The MSCI World ex USA Index captures large and mid cap representation across 22 of 23 Developed Markets countries. It is not possible to invest directly in an unmanaged index. |
The returns set forth in the tables above represent past performance. Past performance does not guarantee future results. The Fund’s investment returns and principal value will fluctuate so that an investor’s shares, when sold or redeemed, may be worth more or less than their original cost. Current performance may be lower or higher than the performance quoted above. Please visit our web site at www.GSAMFUNDS.com to obtain the most recent month-end returns. Performance reflects applicable fee waivers and/or expense limitations in effect during the periods shown. In their absence, performance would be reduced. Returns do not reflect the deduction of taxes that a shareholder would pay on Fund distributions or the sale or redemption of Fund shares.
19
FUND BASICS
| | | | | | | | | | |
| | EXPENSE RATIO5 | |
| | | | | | | | Expense Ratio | |
| | | Shares | | | | | | | 0.25 | % |
| | 5 | | The expense ratio of the Fund is as set forth above according to the most recent publicly available Prospectus for the Fund and may differ from the expense ratios disclosed on the Financial Highlights in this report. |
| | | | | | | | | | |
| | TOP TEN HOLDINGS AS OF 8/31/166 |
| | | Holding | | % of Net Assets | | | Line of Business | | Country |
| | Nestle SA | | | 1.6 | % | | Consumer Staples | | Switzerland |
| | Roche Holding AG | | | 1.1 | | | Health Care | | Switzerland |
| | Novartis AG | | | 1.1 | | | Health Care | | Switzerland |
| | HSBC Holdings PLC | | | 0.8 | | | Financials | | United Kingdom |
| | Koninklijke Ahold Delhaize NV | | | 0.7 | | | Consumer Staples | | Netherlands |
| | Novo Nordisk A/S, Class B | | | 0.7 | | | Health Care | | Denmark |
| | Atos SE | | | 0.6 | | | Information Technology | | France |
| | British American Tobacco PLC | | | 0.6 | | | Consumer Staples | | United Kingdom |
| | Sanofi | | | 0.6 | | | Health Care | | France |
| | | Commonwealth Bank of Australia | | | 0.6 | | | Financials | | Australia |
| | 6 | | The top 10 holdings may not be representative of the Fund’s future investments. |
20
FUND BASICS
| | | | |
| | FUND SECTOR ALLOCATIONS7 |
| | | As of August 31, 2016 | | |
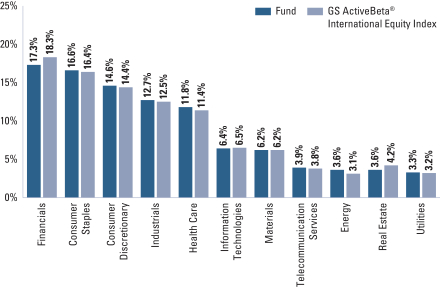
| | 7 | | The Fund’s composition may differ over time. Consequently, the Fund’s overall industry sector allocations may differ from percentages contained in the graph above. The graph categorizes investments using Global Industry Classification Standard (“GICS”), however, the sector classifications used by the portfolio management team may differ from GICS. The percentage shown for each investment category reflects the value of investments in that category as a percentage of market value. |
21
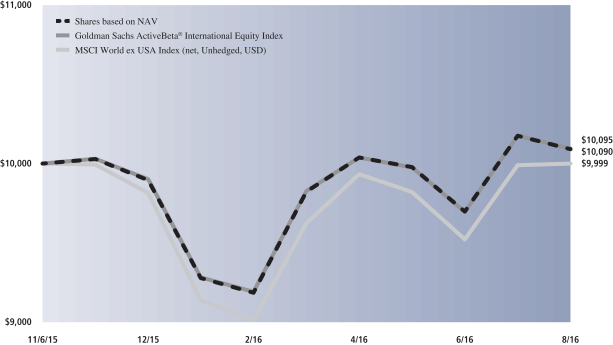
ACTIVEBETA® INTERNATIONAL EQUITY ETF
Performance Summary
August 31, 2016
The following graph shows the value, as of August 31, 2016, of a $10,000 investment made on November 6, 2015 (commencement of operations) in Shares at NAV. For comparative purposes, the performance of the Fund’s underlying index and secondary underlying index, the Goldman Sachs ActiveBeta® International Equity Index and the MSCI World ex USA Index (net, Unhedged, USD), are shown. This performance data represents past performance and should not be considered indicative of future performance, which will fluctuate with changes in market conditions. These performance fluctuations may cause an investor’s shares to be worth more or less than their original cost. Performance reflects applicable fee waivers and/or expense limitations in effect during the periods shown and in their absence, performance would be reduced. Returns do not reflect the deduction of taxes that a shareholder would pay on Fund distributions or the sale of Fund shares. In addition to the performance of constituents of the underlying index, other factors may affect Fund performance. These factors include, but are not limited to, Fund operating fees and expenses, portfolio turnover and creation and redemption in-kind transactions.
|
| ActiveBeta® International Equity ETF’s Lifetime Performance |
Performance of a $10,000 Investment, with distributions reinvested, from November 6, 2015 through August 31, 2016.
| | |
| Average Annual Total Return through August 31, 2016 | | Since Inception |
|
Shares based on NAV (Commenced November 6, 2015) | | 0.90%* |
|
| * | | Total return for periods of less than one year represents cumulative total return. |
22
PORTFOLIO RESULTS
Goldman Sachs ActiveBeta® Japan Equity ETF
Investment Objective
The Goldman Sachs ActiveBeta® Japan Equity ETF (the “Fund”) seeks to provide investment results that closely correspond, before fees and expenses, to the performance of the Goldman Sachs ActiveBeta® Japan Equity Index (the “Index”).
Portfolio Management Discussion and Analysis
Below, the Goldman Sachs Quantitative Investment Strategies Team discusses the Fund’s performance and positioning for the period since its inception on March 2, 2016 through August 31, 2016 (the “Reporting Period”).
| Q | | How did the Fund perform during the Reporting Period? |
| A | | During the Reporting Period, the Fund returned 7.17% based on net asset value (“NAV”) and 7.59% based on market price.1 The Index returned 6.99%, and the MSCI Japan Index (net, unhedged, USD) (“MSCI Japan Index”), a market-cap based index which the performance of the Fund is measured, and the reference index for the Index, returned 9.58% during the same period. |
| | The Fund had a NAV of $25.69 per share on the date of inception and ended the Reporting Period with a NAV of $27.33 per share. The Fund’s market price on August 31, 2016 was $27.44 per share. |
| Q | | What key factors were responsible for the Fund’s performance during the Reporting Period? |
| A | | The Fund seeks to provide investment results that closely correspond, before fees and expenses, to the performance of the Index. The Fund’s performance reflects Fund expenses, including management fees and brokerage expenses. The Fund’s relative performance also reflects the impact of any cash held in the Fund, as well as any other differences between the Fund’s holdings and the constituents of the Index. The Index is unmanaged, and Index returns do not reflect fees and expenses, which would reduce returns. |
| | The Index is constructed using a rules-based methodology that was developed to provide exposure to the “factors” (or characteristics) that are commonly tied to a stock’s outperformance relative to market returns, and its performance is compared to that of the MSCI Japan Index. Because the Fund seeks to provide investment results that closely correspond, before fees and expenses, to the performance of the Index, the discussion below compares the performance of the Fund to that of the MSCI Japan Index. Given the Fund’s investment objective of attempting to track the Index, the Fund does not follow traditional methods of active investment management, which may involve buying and selling securities based upon analysis of economic and market factors. The Fund does not follow a strategy of seeking to outperform the MSCI Japan Index, and overweights and underweights relative to the MSCI Japan Index discussed below resulted from the Fund’s replication of the Index, rather than a decision to overweight or underweight a particular sector or stock. |
| | The Fund posted solid absolute gains but underperformed the MSCI Japan Index during the Reporting Period. All underlying factors detracted from relative results during the Reporting Period, with Momentum detracting most, followed by Low Volatility, Value and Quality. Momentum is whether a company’s share price is trending up or down. Low Volatility is a relatively low degree of fluctuation in a company’s share price over time. Value refers to how attractively a stock is priced relative to its fundamentals, such as book value and free cash flow. Quality refers to sustainable profitability over time. |
| Q | | Which sectors contributed most positively to the Fund’s relative performance during the Reporting Period, and which detracted most? |
| A | | Index constituents in the industrials, materials and consumer discretionary sectors detracted most from the Fund’s results relative to the MSCI Japan Index during the Reporting Period. Index constituents in the health care, consumer staples and utilities sectors detracted the least from the |
| | 1 | | The first day of secondary market trading is typically several days after the date on which the Fund commenced investment operations; therefore, the NAV of the Fund is used as a proxy for the period from inception of investment operations to the first day of secondary market trading to calculate the market price returns. |
23
PORTFOLIO RESULTS
| | Fund’s results relative to the MSCI Japan Index during the Reporting Period. None of the sectors contributed positively. |
| Q | | Which individual positions detracted from the Fund’s results during the Reporting Period? |
| A | | Relative to the MSCI Japan Index, underweight positions in electrical and electronic products manufacturer Toshiba and telecommunication services provider SoftBank Group and an overweight position in electric utility Tokyo Electric Power Company Holdings detracted most (0.03%, 1.14% and 0.63% of Fund net assets as of August 31, 2016, respectively). Toshiba and SoftBank Group each posted a double-digit gain during the Reporting Period, while Tokyo Electric Power Company Holdings generated a double-digit decline during the Reporting Period. |
| Q | | Which individual stock positions contributed the most to the Fund’s relative returns during the Reporting Period? |
| A | | Relative to the MSCI Japan Index, overweight positions in convenience store chain operator FamilyMart UNY Holdings, toy and game equipment and software manufacturer Bandai Namco Holdings and diversified chemicals manufacturer Mitsui Chemicals contributed most positively (0.47%, 0.57% and 0.45% of Fund net assets as of August 31, 2016, respectively). Each of these stocks posted a double-digit gain during the Reporting Period. |
| Q | | How did the Fund use derivatives and similar instruments during the Reporting Period? |
| A | | The Fund does not employ derivatives as a source of alpha generation, although it may use them to equitize excess cash. |
| Q | | What was the Fund’s sector positioning relative to the Index and the reference index at the end of the Reporting Period?2 |
| | | | | | | | | | | | | | |
| | | Sector Name | | Fund3 | | | GS
ActiveBeta®
Index | | | MSCI Japan
Index | |
| | Consumer Discretionary | | | 21.42 | % | | | 21.20 | % | | | 21.22 | % |
| | Industrials | | | 16.96 | | | | 16.86 | | | | 19.79 | |
| | Financials | | | 15.62 | | | | 15.66 | | | | 17.66 | |
| | Consumer Staples | | | 12.03 | | | | 11.93 | | | | 7.95 | |
| | Information Technology | | | 10.46 | | | | 11.30 | | | | 10.45 | |
| | Health Care | | | 10.17 | | | | 10.08 | | | | 7.84 | |
| | Telecommunication Services | | | 4.61 | | | | 4.58 | | | | 6.32 | |
| | Materials | | | 3.92 | | | | 3.90 | | | | 5.96 | |
| | Utilities | | | 2.99 | | | | 2.96 | | | | 2.06 | |
| | Energy | | | 1.54 | | | | 1.53 | | | | 0.76 | |
| | | Cash & Cash Equivalents | | | 0.27 | | | | 0.00 | | | | 0.00 | |
| | 2 | | The Fund seeks to provide investment results that closely correspond, before fees and expenses, to the performance of the Goldman Sachs ActiveBeta® Japan Equity Index. |
| | 3 | | Sector classifications for securities may differ between the above listing and the Statement of Investments due to differing classification methodologies. The classification methodology used for the above listing is as set forth by MSCI. |
24
FUND BASICS
ActiveBeta® Japan Equity ETF
as of August 31, 2016
| | | | | | |
| | FUND SNAPSHOT | |
| | | As of August 31, 2016 | | | |
| | Market Price1 | | $ | 27.44 | |
| | | Net Asset Value (NAV)1 | | $ | 27.33 | |
| | 1 | | The Market Price is the price at which the Fund’s shares are trading on the NYSE Arca Inc. The Market Price of the Fund’s shares will fluctuate and, at the time of sale, shares may be worth more or less than the original investment or the Fund’s then current net asset value (“NAV”). The NAV is the market value of one share of the Fund. This amount is derived by dividing the total value of all the securities in the Fund’s portfolio, plus other assets, less any liabilities, by the number of Fund shares outstanding. Fund shares are not individually redeemable and are issued and redeemed by the Fund at their NAV only in large, specified blocks of shares called creation units. Shares otherwise can be bought and sold only through exchange trading at market price (not NAV). Shares may trade at a premium or discount to their NAV in the secondary market. Information regarding how often shares of each Fund traded on NYSE Arca at a price above (i.e., at a premium) or below (i.e., at a discount) the NAV of the Fund can be found at www.GSAMFUNDS.com. |
| | | | | | | | | | | | | | | | | | |
| | PERFORMANCE REVIEW | |
| | | March 2, 2016–
August 31, 2016 | | Fund Total Return
(based on NAV)2 | | | Fund Total Return
(based on Market Price)2 | | | GS ActiveBeta®
Japan Index3 | | | MSCI World Japan
Index4 | |
| | | Shares | | | 7.17 | % | | | 7.59 | % | | | 6.99 | % | | | 9.58 | % |
| | 2 | | Total returns are calculated assuming purchase of a share at the market price or NAV on the first day and sale of a share at the market price or NAV on the last day of each period reported. The Total Returns Based on NAV and Market Price assume the reinvestment of dividends and do not reflect brokerage commissions in connection with the purchase or sale of Fund shares, which if included would lower the performance shown above. The NAV used in the Total Return calculation assumes all management fees and operating expenses incurred by the Fund. Market Price returns are based upon the midpoint of the bid/ask spread (last trade) at 4:00 pm EST and do not reflect the returns you would receive if you traded shares at other times. The first day of secondary market trading is typically several days after the date on which the Fund commenced investment operations; therefore, the NAV of the Fund is used as a proxy for the period from inception of investment operations to the first day of secondary market trading to calculate the Market Price returns. Total returns for periods less than one full year are not annualized. |
| | 3 | | The Goldman Sachs ActiveBeta® Japan Equity Index (“the Index”) is designed to deliver exposure to equity securities of large capitalization Japan issuers. The Index seeks to capture common sources of active equity returns, including value (i.e., how attractively a stock is priced relative to its “fundamentals”, such as book value or free cash flow), momentum (i.e., whether a company’s share price is trending up or down), quality (i.e., profitability) and low volatility (i.e., a relatively low degree of fluctuation in a company’s share price over time). The Index is reconstituted and rebalanced quarterly. It is not possible to invest directly in an unmanaged index. |
| | 4 | | The MSCI Japan Index is designed to measure the performance of the large and mid cap segments of the Japanese market. It is not possible to invest directly in an unmanaged index. |
The returns set forth in the tables above represent past performance. Past performance does not guarantee future results. The Fund’s investment returns and principal value will fluctuate so that an investor’s shares, when sold or redeemed, may be worth more or less than their original cost. Current performance may be lower or higher than the performance quoted above. Please visit our web site at www.GSAMFUNDS.com to obtain the most recent month-end returns. Performance reflects applicable fee waivers and/or expense limitations in effect during the periods shown. In their absence, performance would be reduced. Returns do not reflect the deduction of taxes that a shareholder would pay on Fund distributions or the sale or redemption of Fund shares.
25
FUND BASICS
| | | | | | | | | | |
| | EXPENSE RATIO5 | |
| | | | | | | | Expense Ratio | |
| | | Shares | | | | | | | 0.25 | % |
| | 5 | | The expense ratio of the Fund is as set forth above according to the most recent publicly available Prospectus for the Fund and may differ from the expense ratios disclosed on the Financial Highlights in this report. |
| | | | | | | | |
| | TOP TEN HOLDINGS AS OF 8/31/166 |
| | | Holding | | % of Net Assets | | | Line of Business |
| | Toyota Motor Corp. | | | 4.6 | % | | Consumer Discretionary |
| | Honda Motor Co. Ltd. | | | 1.9 | | | Consumer Discretionary |
| | Mitsubishi UFJ Financial Group, Inc. | | | 1.9 | | | Financials |
| | Sumitomo Mitsui Financial Group, Inc. | | | 1.5 | | | Financials |
| | KDDI Corp. | | | 1.5 | | | Telecommunication Services |
| | Japan Tobacco, Inc. | | | 1.4 | | | Consumer Staples |
| | Seven & i Holdings Co. Ltd. | | | 1.3 | | | Consumer Staples |
| | Mitsubishi Corp. | | | 1.2 | | | Industrials |
| | Sony Corp. | | | 1.1 | | | Consumer Discretionary |
| | | SoftBank Group Corp. | | | 1.1 | | | Telecommunication Services |
| | 6 | | The top 10 holdings may not be representative of the Fund’s future investments. |
26
FUND BASICS
| | |
| | FUND SECTOR ALLOCATIONS7 |
| | | As of August 31, 2016 |
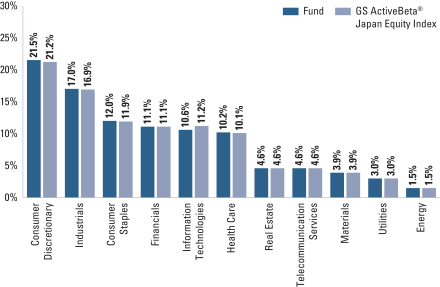
| | 7 | | The Fund’s composition may differ over time. Consequently, the Fund’s overall industry sector allocations may differ from percentages contained in the graph above. The graph categorizes investments using Global Industry Classification Standard (“GICS”), however, the sector classifications used by the portfolio management team may differ from GICS. The percentage shown for each investment category reflects the value of investments in that category as a percentage of market value. |
27
PORTFOLIO RESULTS
Goldman Sachs ActiveBeta® U.S. Large Cap Equity ETF
Investment Objective
The Goldman Sachs ActiveBeta® U.S. Large Cap Equity ETF (the “Fund”) seeks to provide investment results that closely correspond, before fees and expenses, to the performance of the Goldman Sachs ActiveBeta® U.S. Large Cap Equity Index (the “Index”).
Portfolio Management Discussion and Analysis
Below, the Goldman Sachs Quantitative Investment Strategies Team discusses the Fund’s performance and positioning for the period since its inception on September 17, 2015 through August 31, 2016 (the “Reporting Period”).
| Q | | How did the Fund perform during the Reporting Period? |
| A | | During the Reporting Period, the Fund returned 8.97% based on net asset value (“NAV”) and 8.94% based on market price.1 The Index returned 9.07%, and the S&P 500 Index (Total Return, USD) (“S&P 500 Index”), a market-cap based index against which the performance of the Fund is measured, returned 11.40% during the same period. |
| | The Fund had a NAV of $40.70 per share on the date of inception and ended the Reporting Period with a NAV of $43.83 per share. The Fund’s market price on August 31, 2016 was $43.82 per share. |
| Q | | What key factors were responsible for the Fund’s performance during the Reporting Period? |
| A | | The Fund seeks to provide investment results that closely correspond, before fees and expenses, to the performance of the Index. The Fund’s performance reflects Fund expenses, including management fees and brokerage expenses. The Fund’s relative performance also reflects the impact of any cash held in the Fund, as well as any other differences between the Fund’s holdings and the constituents of the Index. The Index is unmanaged, and Index returns do not reflect fees and expenses, which would reduce returns. |
| | The Index is constructed using a rules-based methodology that was developed to provide exposure to the “factors” (or characteristics) that are commonly tied to a stock’s outperformance relative to market returns, and its performance is compared to that of the S&P 500 Index. Because the Fund seeks to provide investment results that closely correspond, before fees and expenses, to the performance of the Index, the discussion below compares the performance of the Fund to that of the S&P 500 Index. Given the Fund’s investment objective of attempting to track the Index, the Fund does not follow traditional methods of active investment management, which may involve buying and selling securities based upon analysis of economic and market factors. The Fund does not follow a strategy of seeking to outperform the S&P 500 Index, and overweights and underweights relative to the S&P 500 Index discussed below resulted from the Fund’s replication of the Index, rather than a decision to overweight or underweight a particular sector or stock. |
| | The Fund posted solid absolute gains but underperformed the S&P 500 Index during the Reporting Period. Amongst underlying factors, Value, Momentum and Quality detracted from relative returns, while Low Volatility contributed positively. Value refers to how attractively a stock is priced relative to its fundamentals, such as book value and free cash flow. Momentum is whether a company’s share price is trending up or down. Quality refers to sustainable profitability over time. Low Volatility is a relatively low degree of fluctuation in a company’s share price over time. |
| Q | | Which sectors contributed most positively to the Fund’s relative performance during the Reporting Period, and which detracted most? |
| A | | Index constituents in the consumer discretionary, information technology and energy sectors detracted the most from the Fund’s results relative to the S&P 500 Index. Partially offsetting these detractors were Index constituents in the financials sector, which contributed positively to the Fund’s results relative to the S&P 500 Index during the Reporting Period. |
| | 1 | | The first day of secondary market trading is typically several days after the date on which the Fund commenced investment operations; therefore, the NAV of the Fund is used as a proxy for the period from inception of investment operations to the first day of secondary market trading to calculate the market price returns. |
28
PORTFOLIO RESULTS
| Q | | Which individual positions detracted from the Fund’s results during the Reporting Period? |
| A | | Relative to the S&P 500 Index, an overweight position in investment and insurance company Voya Financial and underweight positions in telecommunication services giant AT&T and integrated energy company Chevron detracted most (0.00%, 0.96% and 0.40% of Fund net assets as of August 31, 2016, respectively). Voya generated a double-digit negative return during the Reporting Period, while AT&T and Chevron each generated a double-digit gain during the Reporting Period. |
| Q | | Which individual stock positions contributed the most to the Fund’s relative returns during the Reporting Period? |
| A | | Relative to the S&P 500 Index, overweight positions in packaged food producer Tyson Foods, mining company Newmont Mining and aircraft and parts contractor L-3 Communications Holdings contributed most positively (0.62%, 0.11% and 0.49% of Fund net assets as of August 31, 2016, respectively). Tyson Foods and L-3 Communications Holdings each generated a double-digit gain during the Reporting Period, while Newmont Mining posted a triple-digit increase during the Reporting Period. |
| Q | | How did the Fund use derivatives and similar instruments during the Reporting Period? |
| A | | The Fund does not employ derivatives as a source of alpha generation, although it may use them to equitize excess cash. |
| Q | | What was the Fund’s sector positioning relative to the Index and the S&P 500 Index at the end of the Reporting Period?2 |
| | | | | | | | | | | | | | |
| | | Sector Name | | Fund3 | | | GS
ActiveBeta®
Index | | | S&P 500
Index | |
| | Information Technology | | | 20.17 | % | | | 20.27 | % | | | 20.99 | % |
| | Consumer Discretionary | | | 15.55 | | | | 15.60 | | | | 12.22 | |
| | Health Care | | | 14.96 | | | | 15.02 | | | | 14.63 | |
| | Financials | | | 13.83 | | | | 13.87 | | | | 16.33 | |
| | Consumer Staples | | | 13.63 | | | | 13.68 | | | | 10.05 | |
| | Industrials | | | 9.36 | | | | 9.39 | | | | 9.95 | |
| | Utilities | | | 4.11 | | | | 4.13 | | | | 3.24 | |
| | Energy | | | 3.37 | | | | 3.38 | | | | 7.01 | |
| | Telecommunication Services | | | 2.47 | | | | 2.48 | | | | 2.66 | |
| | Materials | | | 2.18 | | | | 2.19 | | | | 2.92 | |
| | | Cash & Cash Equivalents | | | 0.37 | | | | 0.00 | | | | 0.00 | |
| | 2 | | The Fund seeks to provide investment results that closely correspond, before fees and expenses, to the performance of the Goldman Sachs ActiveBeta® U.S. Large Cap Equity Index. |
| | 3 | | Sector classifications for securities may differ between the above listing and the Statement of Investments due to differing classification methodologies. The classification methodology used for the above listing is as set forth by MSCI. |
29
FUND BASICS
ActiveBeta® U.S. Large Cap Equity ETF
as of August 31, 2016
| | | | | | |
| | FUND SNAPSHOT | |
| | | As of August 31, 2016 | | | |
| | Market Price1 | | $ | 43.82 | |
| | | Net Asset Value (NAV)1 | | $ | 43.83 | |
| | 1 | | The Market Price is the price at which the Fund’s shares are trading on the NYSE Arca Inc. The Market Price of the Fund’s shares will fluctuate and, at the time of sale, shares may be worth more or less than the original investment or the Fund’s then current net asset value (“NAV”). The NAV is the market value of one share of the Fund. This amount is derived by dividing the total value of all the securities in the Fund’s portfolio, plus other assets, less any liabilities, by the number of Fund shares outstanding. Fund shares are not individually redeemable and are issued and redeemed by the Fund at their NAV only in large, specified blocks of shares called creation units. Shares otherwise can be bought and sold only through exchange trading at market price (not NAV). Shares may trade at a premium or discount to their NAV in the secondary market. Information regarding how often shares of each Fund traded on NYSE Arca at a price above (i.e., at a premium) or below (i.e., at a discount) the NAV of the Fund can be found at www.GSAMFUNDS.com. |
| | | | | | | | | | | | | | | | | | |
| | PERFORMANCE REVIEW | |
| | | September 17, 2015–
August 31, 2016 | | Fund Total Return
(based on NAV)2 | | | Fund Total Return
(based on Market Price)2 | | | GS ActiveBeta®
LC Index3 | | | S&P 500 Index4 | |
| | | Shares | | | 8.97 | % | | | 8.94 | % | | | 9.07 | % | | | 11.40 | % |
| | 2 | | Total returns are calculated assuming purchase of a share at the market price or NAV on the first day and sale of a share at the market price or NAV on the last day of each period reported. The Total Returns Based on NAV and Market Price assume the reinvestment of dividends and do not reflect brokerage commissions in connection with the purchase or sale of Fund shares, which if included would lower the performance shown above. The NAV used in the Total Return calculation assumes all management fees and operating expenses incurred by the Fund. Market Price returns are based upon the midpoint of the bid/ask spread (last trade) at 4:00 pm EST and do not reflect the returns you would receive if you traded shares at other times. The first day of secondary market trading is typically several days after the date on which the Fund commenced investment operations; therefore, the NAV of the Fund is used as a proxy for the period from inception of investment operations to the first day of secondary market trading to calculate the Market Price returns. Total returns for periods less than one full year are not annualized. |
| | 3 | | The Goldman Sachs ActiveBeta® U.S. Large Cap Equity Index (“the Index”) is designed to deliver exposure to equity securities of large capitalization U.S. issuers. The Index seeks to capture common sources of active equity returns, including value (i.e., how attractively a stock is priced relative to its “fundamentals”, such as book value or free cash flow), momentum (i.e., whether a company’s share price is trending up or down), quality (i.e., profitability) and low volatility (i.e., a relatively low degree of fluctuation in a company’s share price over time). The Index is reconstituted and rebalanced quarterly. It is not possible to invest directly in an unmanaged index. |
| | 4 | | The S&P 500 Index is the Standard & Poor’s 500 Composite Index of 500 stocks, an unmanaged index of common stock prices. The Index figures do not reflect any deduction for fees, expenses or taxes. It is not possible to invest directly in an unmanaged index. |
The returns set forth in the tables above represent past performance. Past performance does not guarantee future results. The Fund’s investment returns and principal value will fluctuate so that an investor’s shares, when sold or redeemed, may be worth more or less than their original cost. Current performance may be lower or higher than the performance quoted above. Please visit our web site at www.GSAMFUNDS.com to obtain the most recent month-end returns. Performance reflects applicable fee waivers and/or expense limitations in effect during the periods shown. In their absence, performance would be reduced. Returns do not reflect the deduction of taxes that a shareholder would pay on Fund distributions or the sale or redemption of Fund shares.
30
FUND BASICS
| | | | | | | | | | |
| | EXPENSE RATIO5 | |
| | | | | | | | Expense Ratio | |
| | | Shares | | | | | | | 0.09 | % |
| | 5 | | The expense ratio of the Fund is as set forth above according to the most recent publicly available Prospectus for the Fund and may differ from the expense ratios disclosed on the Financial Highlights in this report. |
| | | | | | | | |
| | TOP TEN HOLDINGS AS OF 8/31/166 |
| | | Holding | | % of Net Assets | | | Line of Business |
| | Apple, Inc. | | | 2.6 | % | | Information Technology |
| | Microsoft Corp. | | | 2.0 | | | Information Technology |
| | Johnson & Johnson | | | 1.4 | | | Health Care |
| | Exxon Mobil Corp. | | | 1.3 | | | Energy |
| | Amazon.com, Inc. | | | 1.2 | | | Consumer Discretionary |
| | JPMorgan Chase & Co. | | | 1.1 | | | Financials |
| | The Home Depot, Inc. | | | 1.0 | | | Consumer Discretionary |
| | Facebook, Inc., Class A | | | 1.0 | | | Information Technology |
| | Pfizer, Inc. | | | 1.0 | | | Health Care |
| | | AT&T, Inc. | | | 1.0 | | | Telecommunication Services |
| | 6 | | The top 10 holdings may not be representative of the Fund’s future investments. |
31
FUND BASICS
| | |
| | FUND SECTOR ALLOCATIONS7 |
| | | As of August 31, 2016 |
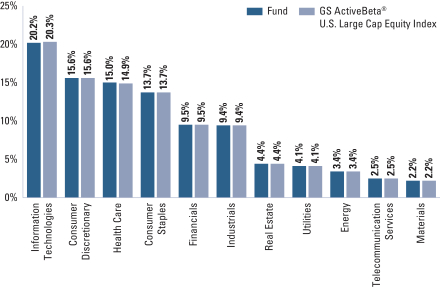
| | 7 | | The Fund’s composition may differ over time. Consequently, the Fund’s overall industry sector allocations may differ from percentages contained in the graph above. The graph categorizes investments using Global Industry Classification Standard (“GICS”), however, the sector classifications used by the portfolio management team may differ from GICS. The percentage shown for each investment category reflects the value of investments in that category as a percentage of market value. |
32
ACTIVEBETA® U.S. LARGE CAP EQUITY ETF
Performance Summary
August 31, 2016
The following graph shows the value, as of August 31, 2016, of a $10,000 investment made on September 17, 2015 (commencement of operations) in Shares at NAV. For comparative purposes, the performance of the Fund’s underlying index and secondary underlying index, the Goldman Sachs ActiveBeta® U.S. Large Cap Equity Index and the S&P 500 Index (Total Return, USD), are shown. This performance data represents past performance and should not be considered indicative of future performance, which will fluctuate with changes in market conditions. These performance fluctuations may cause an investor’s shares to be worth more or less than their original cost. Performance reflects applicable fee waivers and/or expense limitations in effect during the periods shown and in their absence, performance would be reduced. Returns do not reflect the deduction of taxes that a shareholder would pay on Fund distributions or the sale of Fund shares. In addition to the performance of constituents of the underlying index, other factors may affect Fund performance. These factors include, but are not limited to, Fund operating fees and expenses, portfolio turnover and creation and redemption in-kind transactions.
|
| ActiveBeta® U.S. Large Cap Equity ETF’s Lifetime Performance |
Performance of a $10,000 Investment, with distributions reinvested, from September 17, 2015 through August 31, 2016.
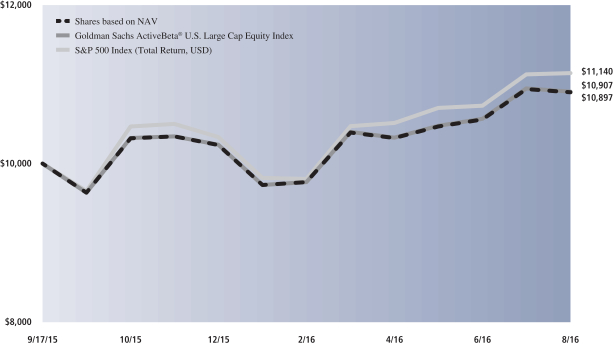
| | |
| Average Annual Total Return through August 31, 2016 | | Since Inception |
|
Shares based on NAV (Commenced September 17, 2015) | | 8.97%* |
|
| * | | Total return for periods of less than one year represents cumulative total return. |
33
FUND BASICS
Index Definitions and Industry Terms
The S&P 500® Index is the Standard & Poor’s 500 Composite Index of 500 stocks, an unmanaged index of common stock prices.
The MSCI World ex USA Index captures large and mid cap representation across 22 of 23 Developed Markets countries. The index as of June 30, 2016, consists of the following 22 developed market country indexes: Australia, Austria, Belgium, Canada, Denmark, Finland, France, Germany, Hong Kong, Ireland, Israel, Italy, Japan, Netherlands, New Zealand, Norway, Portugal, Singapore, Spain, Sweden, Switzerland and the United Kingdom. It is not possible to invest directly in an unmanaged index.
The Russell 3000® Index is an unmanaged index that measures the performance of the 3,000 largest U.S. companies based on total market capitalization, which represents approximately 98% of the investable U.S. equity market. Index figures do not reflect any deduction for fees, expenses or taxes. It is not possible to invest directly in an unmanaged index.
The MSCI Emerging Markets Index is a free float-adjusted market capitalization index that is designed to measure equity market performance of emerging markets. As of June 30, 2016, the MSCI Emerging Markets Index consisted of the following 23 emerging market country indices: Brazil, Chile, China, Colombia, Czech Republic, Egypt, Greece, Hungary, India, Indonesia, Korea, Malaysia, Mexico, Peru, Philippines, Poland, Qatar, Russia, South Africa, Taiwan, Thailand, Turkey and United Arab Emirates. It is not possible to invest directly in an unmanaged index.
Book Value: The total value of the company’s assets that shareholders would theoretically receive if a company were liquidated.
Free Cash Flow: A measure of financial performance calculated as operating cash flow minus capital expenditures.
Alpha: The excess returns of a fund relative to the return of a benchmark index is the fund’s alpha.
34
GOLDMAN SACHS ACTIVEBETA® EMERGING MARKETS EQUITY ETF
Schedule of Investments
August 31, 2016
| | | | | | | | |
| Shares | | | Description | | Value | |
| | Common Stocks – 86.7% | |
| | Brazil – 5.7% | | | | |
| | 1,004,407 | | | Ambev SA (Consumer Staples) | | $ | 5,960,347 | |
| | 213,757 | | | Banco Bradesco SA (Financials) | | | 1,923,535 | |
| | 220,881 | | | Banco do Brasil SA (Financials) | | | 1,585,333 | |
| | 228,442 | | | Banco Santander Brasil SA (Financials) | | | 1,602,160 | |
| | 287,754 | | | BB Seguridade Participacoes SA (Financials) | | | 2,593,861 | |
| | 260,106 | | | BM&FBovespa SA – Bolsa de Valores Mercadorias e Futuros (Financials) | | | 1,440,565 | |
| | 123,950 | | | BRF SA (Consumer Staples) | | | 2,064,045 | |
| | 185,153 | | | CETIP SA – Mercados Organizados (Financials) | | | 2,502,068 | |
| | 139,085 | | | Cia de Saneamento Basico do Estado de Sao Paulo (Utilities) | | | 1,264,057 | |
| | 406,071 | | | Cia Siderurgica Nacional SA (Materials)* | | | 1,079,909 | |
| | 126,180 | | | Cielo SA (Information Technology) | | | 1,310,652 | |
| | 113,532 | | | Cosan SA Industria e Comercio (Energy) | | | 1,320,760 | |
| | 197,212 | | | EDP – Energias Do Brasil SA (Utilities) | | | 872,080 | |
| | 84,216 | | | Engie Brasil Energia SA (Utilities) | | | 1,015,655 | |
| | 153,611 | | | Equatorial Energia SA (Utilities) | | | 2,402,161 | |
| | 140,466 | | | Hypermarcas SA (Consumer Staples) | | | 1,133,701 | |
| | 447,657 | | | Lojas Renner SA (Consumer Discretionary) | | | 3,547,977 | |
| | 37,639 | | | M Dias Branco SA (Consumer Staples) | | | 1,408,349 | |
| | 163,116 | | | Natura Cosmeticos SA (Consumer Staples) | | | 1,571,740 | |
| | 537,069 | | | Odontoprev SA (Health Care) | | | 2,117,518 | |
| | 207,140 | | | Petroleo Brasileiro SA (Energy)* | | | 944,166 | |
| | 155,882 | | | Porto Seguro SA (Financials) | | | 1,328,019 | |
| | 241,074 | | | Raia Drogasil SA (Consumer Staples) | | | 4,449,037 | |
| | 315,106 | | | Sul America SA (Financials) | | | 1,591,218 | |
| | 95,514 | | | Ultrapar Participacoes SA (Energy) | | | 2,198,376 | |
| | | | | | | | |
| | | | | | | 49,227,289 | |
| | |
| | Chile – 1.1% | | | | |
| | 2,121,628 | | | Aguas Andinas SA, Class A (Utilities) | | | 1,274,858 | |
| | 14,906 | | | Banco de Chile ADR (Financials) | | | 984,094 | |
| | 469,428 | | | Cencosud SA (Consumer Staples) | | | 1,381,358 | |
| | 156,745 | | | Cia Cervecerias Unidas SA (Consumer Staples) | | | 1,661,445 | |
| | 117,419 | | | Empresas COPEC SA (Energy) | | | 1,031,429 | |
| | 106,536 | | | Latam Airlines Group SA ADR (Industrials)* | | | 865,072 | |
| | 153,612 | | | SACI Falabella (Consumer Discretionary) | | | 1,097,558 | |
| | 33,844 | | | Sociedad Quimica y Minera de Chile SA ADR (Materials) | | | 863,022 | |
| | | | | | | | |
| | | | | | | 9,158,836 | |
| | |
| | Common Stocks – (continued) | |
| | China – 24.4% | | | | |
| | 214,072 | | | AAC Technologies Holdings, Inc. (Information Technology) | | $ | 2,441,057 | |
| | 8,760,524 | | | Agricultural Bank of China Ltd., Class H (Financials) | | | 3,602,807 | |
| | 188,266 | | | Alibaba Group Holding Ltd. ADR (Information Technology)* | | | 18,297,572 | |
| | 430,303 | | | ANTA Sports Products Ltd. (Consumer Discretionary) | | | 1,164,968 | |
| | 48,129 | | | Baidu, Inc. ADR (Information Technology)* | | | 8,233,428 | |
| | 16,984,660 | | | Bank of China Ltd., Class H (Financials) | | | 7,641,920 | |
| | 3,102,339 | | | Bank of Communications Co. Ltd., Class H (Financials) | | | 2,395,721 | |
| | 185,509 | | | Beijing Enterprises Holdings Ltd. (Industrials) | | | 1,064,254 | |
| | 3,288,717 | | | Belle International Holdings Ltd. (Consumer Discretionary) | | | 2,136,866 | |
| | 142,405 | | | BYD Co. Ltd., Class H (Consumer Discretionary)* | | | 991,378 | |
| | 3,710,254 | | | China Cinda Asset Management Co. Ltd., Class H (Financials) | | | 1,257,997 | |
| | 3,480,556 | | | China CITIC Bank Corp Ltd., Class H (Financials) | | | 2,297,412 | |
| | 3,707,434 | | | China Communications Services Corp. Ltd., Class H (Telecommunication Services) | | | 2,179,508 | |
| | 449,689 | | | China Conch Venture Holdings Ltd. (Industrials) | | | 864,970 | |
| | 17,859,476 | | | China Construction Bank Corp., Class H (Financials) | | | 13,354,170 | |
| | 2,712,173 | | | China Everbright Bank Co. Ltd., Class H (Financials) | | | 1,283,228 | |
| | 3,595,400 | | | China Huishan Dairy Holdings Co. Ltd. (Consumer Staples) | | | 1,381,286 | |
| | 1,033,253 | | | China Life Insurance Co. Ltd., Class H (Financials) | | | 2,469,657 | |
| | 892,997 | | | China Medical System Holdings Ltd. (Health Care) | | | 1,496,627 | |
| | 962,117 | | | China Mengniu Dairy Co. Ltd. (Consumer Staples) | | | 1,825,811 | |
| | 1,102,175 | | | China Merchants Bank Co. Ltd., Class H (Financials) | | | 2,682,704 | |
| | 1,978,763 | | | China Minsheng Banking Corp. Ltd., Class H (Financials) | | | 2,127,551 | |
| | 1,388,854 | | | China Mobile Ltd. (Telecommunication Services) | | | 17,153,088 | |
| | 955,715 | | | China Overseas Land & Investment Ltd. (Real Estate) | | | 3,160,356 | |
| | 283,742 | | | China Pacific Insurance Group Co. Ltd., Class H (Financials) | | | 998,634 | |
| | 4,658,136 | | | China Petroleum & Chemical Corp., Class H (Energy) | | | 3,380,966 | |
| | 1,246,781 | | | China Railway Group Ltd., Class H (Industrials) | | | 924,226 | |
| | 737,851 | | | China Resources Beer Holdings Co. Ltd. (Consumer Staples) | | | 1,702,715 | |
| | |
| | |
| The accompanying notes are an integral part of these financial statements. | | 35 |
GOLDMAN SACHS ACTIVEBETA® EMERGING MARKETS EQUITY ETF
Schedule of Investments (continued)
August 31, 2016
| | | | | | | | |
| Shares | | | Description | | Value | |
| | Common Stocks – (continued) | |
| | China – (continued) | | | | |
| | 425,570 | | | China Resources Land Ltd. (Real Estate) | | $ | 1,198,789 | |
| | 561,995 | | | China Resources Power Holdings Co. Ltd. (Utilities) | | | 970,862 | |
| | 562,830 | | | China Shenhua Energy Co. Ltd., Class H (Energy) | | | 1,011,487 | |
| | 6,034,981 | | | China Telecom Corp. Ltd., Class H (Telecommunication Services) | | | 3,119,899 | |
| | 2,154,861 | | | China Unicom Hong Kong Ltd. (Telecommunication Services) | | | 2,441,902 | |
| | 2,240,259 | | | Chongqing Rural Commercial Bank Co. Ltd., Class H (Financials) | | | 1,299,664 | |
| | 864,747 | | | CITIC Ltd. (Industrials) | | | 1,362,324 | |
| | 1,304,626 | | | CNOOC Ltd. (Energy) | | | 1,602,873 | |
| | 2,488,159 | | | Country Garden Holdings Co. Ltd. (Real Estate) | | | 1,263,847 | |
| | 2,193,978 | | | CSPC Pharmaceutical Group Ltd. (Health Care) | | | 2,129,842 | |
| | 24,363 | | | Ctrip.com International Ltd. ADR (Consumer Discretionary)* | | | 1,153,588 | |
| | 1,553,322 | | | Dongfeng Motor Group Co. Ltd., Class H (Consumer Discretionary) | | | 1,660,108 | |
| | 1,083,079 | | | Far East Horizon Ltd. (Financials) | | | 1,012,321 | |
| | 3,252,886 | | | Geely Automobile Holdings Ltd. (Consumer Discretionary) | | | 2,608,431 | |
| | 725,927 | | | Guangdong Investment Ltd. (Utilities) | | | 1,123,038 | |
| | 956,689 | | | Guangzhou Automobile Group Co. Ltd., Class H (Consumer Discretionary) | | | 1,317,232 | |
| | 826,295 | | | Guangzhou R&F Properties Co. Ltd., Class H (Real Estate) | | | 1,395,489 | |
| | 195,000 | | | Hengan International Group Co. Ltd. (Consumer Staples) | | | 1,650,401 | |
| | 16,036,291 | | | Industrial & Commercial Bank of China Ltd., Class H (Financials) | | | 10,192,273 | |
| | 40,016 | | | JD.com, Inc. ADR (Consumer Discretionary)* | | | 1,016,806 | |
| | 738,258 | | | Jiangsu Expressway Co. Ltd., Class H (Industrials) | | | 1,037,421 | |
| | 1,313,426 | | | Kunlun Energy Co. Ltd. (Energy) | | | 966,856 | |
| | 756,255 | | | Longfor Properties Co. Ltd. (Real Estate) | | | 1,218,705 | |
| | 1,371,204 | | | Luye Pharma Group Ltd. (Health Care)* | | | 871,504 | |
| | 22,164 | | | NetEase, Inc. ADR (Information Technology) | | | 4,698,103 | |
| | 59,294 | | | New Oriental Education & Technology Group, Inc. ADR (Consumer Discretionary) | | | 2,340,927 | |
| | 2,584,085 | | | People’s Insurance Co Group of China Ltd. (The), Class H (Financials) | | | 1,039,397 | |
| | 3,617,547 | | | PetroChina Co. Ltd., Class H (Energy) | | | 2,415,818 | |
| | 1,149,643 | | | PICC Property & Casualty Co. Ltd., Class H (Financials) | | | 1,900,077 | |
| | |
| | Common Stocks – (continued) | |
| | China – (continued) | | | | |
| | 1,095,852 | | | Ping An Insurance Group Co. of China Ltd., Class H (Financials) | | | 5,672,280 | |
| | 202,179 | | | Shenzhou International Group Holdings Ltd. (Consumer Discretionary) | | | 1,328,007 | |
| | 437,342 | | | Sinopharm Group Co. Ltd., Class H (Health Care) | | | 2,241,189 | |
| | 28,218 | | | TAL Education Group ADR (Consumer Discretionary)* | | | 1,686,308 | |
| | 1,067,541 | | | Tencent Holdings Ltd. (Information Technology) | | | 27,773,201 | |
| | 1,134,756 | | | Tingyi Cayman Islands Holding Corp. (Consumer Staples) | | | 1,050,382 | |
| | 462,872 | | | TravelSky Technology Ltd., Class H (Information Technology) | | | 1,007,288 | |
| | 343,796 | | | Tsingtao Brewery Co. Ltd., Class H (Consumer Staples) | | | 1,152,376 | |
| | 108,248 | | | Vipshop Holdings Ltd. ADR (Consumer Discretionary)* | | | 1,532,792 | |
| | 2,438,324 | | | Want Want China Holdings Ltd. (Consumer Staples) | | | 1,606,322 | |
| | 2,489,109 | | | Zijin Mining Group Co. Ltd., Class H (Materials) | | | 827,911 | |
| | | | | | | | |
| | | | | | | 210,408,917 | |
| | |
| | Colombia – 0.4% | | | | |
| | 239,179 | | | Cementos Argos SA (Materials) | | | 955,485 | |
| | 93,558 | | | Grupo de Inversiones Suramericana SA (Financials) | | | 1,223,875 | |
| | 361,840 | | | Interconexion Electrica SA Esp (Utilities) | | | 1,212,748 | |
| | | | | | | | |
| | | | | | | 3,392,108 | |
| | |
| | Egypt – 0.5% | | | | |
| | 875,687 | | | Commercial International Bank Egypt SAE GDR (Financials) | | | 3,679,637 | |
| | 452,906 | | | Global Telecom Holding SAE GDR (Telecommunication Services)* | | | 901,283 | |
| | | | | | | | |
| | | | | | | 4,580,920 | |
| | |
| | Greece – 0.2% | | | | |
| | 175,695 | | | Hellenic Telecommunications Organization SA (Telecommunication Services) | | | 1,663,282 | |
| | |
| | Hong Kong – 0.8% | | | | |
| | 987,179 | | | Haier Electronics Group Co. Ltd. (Consumer Discretionary) | | | 1,651,927 | |
| | 4,954,170 | | | Sino Biopharmaceutical Ltd. (Health Care) | | | 3,180,683 | |
| | 3,304,215 | | | Sun Art Retail Group Ltd. (Consumer Staples) | | | 2,125,637 | |
| | | | | | | | |
| | | | | | | 6,958,247 | |
| | |
| | Hungary – 0.5% | | | | |
| | 23,122 | | | MOL Hungarian Oil & Gas PLC (Energy) | | | 1,441,370 | |
| | 43,423 | | | OTP Bank PLC (Financials) | | | 1,132,738 | |
| | |
| | |
| 36 | | The accompanying notes are an integral part of these financial statements. |
GOLDMAN SACHS ACTIVEBETA® EMERGING MARKETS EQUITY ETF
| | | | | | | | |
| Shares | | | Description | | Value | |
| | Common Stocks – (continued) | |
| | Hungary – (continued) | | | | |
| | 68,950 | | | Richter Gedeon Nyrt (Health Care) | | $ | 1,412,471 | |
| | | | | | | | |
| | | | | | | 3,986,579 | |
| | |
| | Indonesia – 2.9% | | | | |
| | 23,620,514 | | | Adaro Energy Tbk PT (Energy) | | | 2,047,764 | |
| | 2,714,194 | | | Astra International Tbk PT (Consumer Discretionary) | | | 1,667,597 | |
| | 1,996,320 | | | Bank Central Asia Tbk PT (Financials) | | | 2,264,954 | |
| | 1,814,732 | | | Bank Mandiri Persero Tbk PT (Financials) | | | 1,535,648 | |
| | 1,344,341 | | | Bank Rakyat Indonesia Persero Tbk PT (Financials) | | | 1,180,669 | |
| | 3,059,229 | | | Charoen Pokphand Indonesia Tbk PT (Consumer Staples) | | | 860,228 | |
| | 367,916 | | | Gudang Garam Tbk PT (Consumer Staples) | | | 1,786,188 | |
| | 3,725,936 | | | Hanjaya Mandala Sampoerna Tbk PT (Consumer Staples) | | | 1,117,921 | |
| | 1,600,408 | | | Indofood Sukses Makmur TBK PT (Consumer Staples) | | | 956,143 | |
| | 11,357,104 | | | Kalbe Farma Tbk PT (Health Care) | | | 1,536,826 | |
| | 1,033,897 | | | Matahari Department Store Tbk PT (Consumer Discretionary) | | | 1,558,835 | |
| | 4,532,094 | | | Surya Citra Media Tbk PT (Consumer Discretionary) | | | 1,035,224 | |
| | 9,176,202 | | | Telekomunikasi Indonesia Persero Tbk PT (Telecommunication Services) | | | 2,912,311 | |
| | 802,988 | | | Unilever Indonesia Tbk PT (Consumer Staples) | | | 2,763,393 | |
| | 7,237,981 | | | Waskita Karya Persero TBK PT (Industrials) | | | 1,522,350 | |
| | | | | | | | |
| | | | | | | 24,746,051 | |
| | |
| | Malaysia – 2.7% | | | | |
| | 1,198,000 | | | AirAsia Bhd (Industrials) | | | 886,204 | |
| | 1,723,629 | | | Astro Malaysia Holdings Bhd (Consumer Discretionary) | | | 1,253,780 | |
| | 160,002 | | | British American Tobacco Malaysia Bhd (Consumer Staples) | | | 1,941,881 | |
| | 2,135,619 | | | DiGi.Com Bhd (Telecommunication Services) | | | 2,643,523 | |
| | 922,163 | | | Genting Bhd (Consumer Discretionary) | | | 1,773,609 | |
| | 521,234 | | | Hap Seng Consolidated Bhd (Industrials) | | | 999,926 | |
| | 886,738 | | | IHH Healthcare Bhd (Health Care) | | | 1,429,976 | |
| | 1,405,800 | | | IOI Properties Group Bhd (Real Estate) | | | 873,534 | |
| | 207,400 | | | Kuala Lumpur Kepong Bhd (Consumer Staples) | | | 1,205,891 | |
| | 597,738 | | | Malayan Banking Bhd (Financials) | | | 1,152,586 | |
| | 639,813 | | | Maxis Bhd (Telecommunication Services) | | | 990,760 | |
| | 608,332 | | | Petronas Chemicals Group Bhd (Materials) | | | 1,003,511 | |
| | |
| | Common Stocks – (continued) | |
| | Malaysia – (continued) | | | | |
| | 170,612 | | | Petronas Dagangan Bhd (Energy) | | | 984,421 | |
| | 299,788 | | | Public Bank Bhd (Financials) | | | 1,463,642 | |
| | 477,100 | | | Tenaga Nasional Bhd (Utilities) | | | 1,734,054 | |
| | 849,184 | | | Westports Holdings Bhd (Industrials) | | | 931,789 | |
| | 2,781,298 | | | YTL Corp Bhd (Utilities) | | | 1,152,159 | |
| | 2,963,717 | | | YTL Power International Bhd (Utilities) | | | 1,088,876 | |
| | | | | | | | |
| | | | | | | 23,510,122 | |
| | |
| | Mexico – 4.0% | | | | |
| | 708,372 | | | Alfa SAB de CV, Class A (Industrials) | | | 1,148,412 | |
| | 5,317,909 | | | America Movil SAB de CV, Series L (Telecommunication Services) | | | 3,173,483 | |
| | 268,137 | | | Arca Continental SAB de CV (Consumer Staples) | | | 1,665,203 | |
| | 1,761,667 | | | Cemex SAB de CV, Series CPO (Materials)* | | | 1,453,682 | |
| | 130,647 | | | Coca-Cola Femsa SAB de CV, Series L (Consumer Staples) | | | 969,704 | |
| | 83,111 | | | El Puerto de Liverpool SAB de CV, Series C1 (Consumer Discretionary) | | | 901,992 | |
| | 339,228 | | | Fomento Economico Mexicano SAB de CV (Consumer Staples) | | | 3,096,402 | |
| | 679,690 | | | Gentera SAB de CV (Financials) | | | 1,313,362 | |
| | 184,104 | | | Gruma SAB de CV, Class B (Consumer Staples) | | | 2,441,711 | |
| | 162,563 | | | Grupo Aeroportuario del Pacifico SAB de CV, Class B (Industrials) | | | 1,608,938 | |
| | 90,676 | | | Grupo Aeroportuario del Sureste SAB de CV, Class B (Industrials) | | | 1,378,011 | |
| | 1,152,817 | | | Grupo Bimbo SAB de CV, Series A (Consumer Staples) | | | 3,268,059 | |
| | 365,873 | | | Grupo Comercial Chedraui SA de CV (Consumer Staples) | | | 880,325 | |
| | 329,285 | | | Grupo Financiero Banorte SAB de CV, Class O (Financials) | | | 1,766,250 | |
| | 689,332 | | | Grupo Financiero Santander Mexico SAB de CV, Class B (Financials) | | | 1,310,804 | |
| | 487,571 | | | Grupo Lala SAB de CV (Consumer Staples) | | | 1,017,843 | |
| | 509,726 | | | Grupo Mexico SAB de CV, Series B (Materials) | | | 1,271,293 | |
| | 37,028 | | | Industrias Penoles SAB de CV (Materials) | | | 854,879 | |
| | 538,503 | | | Kimberly-Clark de Mexico SAB de CV, Class A (Consumer Staples) | | | 1,287,127 | |
| | 88,629 | | | Promotora y Operadora de Infraestructura SAB de CV (Industrials) | | | 1,060,988 | |
| | 1,152,967 | | | Wal-Mart de Mexico SAB de CV (Consumer Staples) | | | 2,622,608 | |
| | | | | | | | |
| | | | | | | 34,491,076 | |
| | |
| | Netherlands – 0.4% | | | | |
| | 570,163 | | | Steinhoff International Holdings NV (Consumer Discretionary) | | | 3,418,463 | |
| | |
| | |
| The accompanying notes are an integral part of these financial statements. | | 37 |
GOLDMAN SACHS ACTIVEBETA® EMERGING MARKETS EQUITY ETF
Schedule of Investments (continued)
August 31, 2016
| | | | | | | | |
| Shares | | | Description | | Value | |
| | Common Stocks – (continued) | |
| | Peru – 0.3% | | | | |
| | 67,353 | | | Cia de Minas Buenaventura Saa ADR (Materials)* | | $ | 832,483 | |
| | 11,315 | | | Credicorp Ltd. (Financials) | | | 1,772,834 | |
| | | | | | | | |
| | | | | | | 2,605,317 | |
| | |
| | Philippines – 1.3% | | | | |
| | 790,950 | | | Aboitiz Equity Ventures, Inc. (Industrials) | | | 1,273,125 | |
| | 39,854 | | | Globe Telecom, Inc. (Telecommunication Services) | | | 1,684,996 | |
| | 31,615 | | | GT Capital Holdings, Inc. (Financials) | | | 1,041,507 | |
| | 659,918 | | | JG Summit Holdings, Inc. (Industrials) | | | 1,104,702 | |
| | 287,288 | | | Jollibee Foods Corp. (Consumer Discretionary) | | | 1,510,582 | |
| | 8,593,800 | | | Metro Pacific Investments Corp. (Financials) | | | 1,276,298 | |
| | 225,060 | | | Security Bank Corp. (Financials) | | | 1,030,750 | |
| | 2,327,871 | | | SM Prime Holdings, Inc. (Real Estate) | | | 1,491,296 | |
| | 314,795 | | | Universal Robina Corp. (Consumer Staples) | | | 1,263,369 | |
| | | | | | | | |
| | | | | | | 11,676,625 | |
| | |
| | Poland – 0.8% | | | | |
| | 35,753 | | | CCC SA (Consumer Discretionary) | | | 1,663,632 | |
| | 121,932 | | | Grupa Lotos SA (Energy)* | | | 905,601 | |
| | 926 | | | LPP SA (Consumer Discretionary) | | | 1,065,361 | |
| | 113,808 | | | Polski Koncern Naftowy ORLEN SA (Energy) | | | 1,891,296 | |
| | 643,317 | | | Polskie Gornictwo Naftowe i Gazownictwo SA (Energy) | | | 876,649 | |
| | 124,318 | | | Powszechny Zaklad Ubezpieczen SA (Financials) | | | 878,825 | |
| | | | | | | | |
| | | | | | | 7,281,364 | |
| | |
| | Qatar – 0.4% | | | | |
| | 46,505 | | | Commercial Bank QSC (The) (Financials) | | | 536,397 | |
| | 66,441 | | | Ooredoo QSC (Telecommunication Services) | | | 1,873,890 | |
| | 33,647 | | | Qatar National Bank SAQ (Financials) | | | 1,506,162 | |
| | | | | | | | |
| | | | | | | 3,916,449 | |
| | |
| | Russia – 3.7% | | | | |
| | 1,144,935 | | | Gazprom PJSC ADR (Energy) | | | 4,631,262 | |
| | 111,927 | | | Lukoil PJSC (Energy) | | | 4,989,759 | |
| | 12,426 | | | MMC Norilsk Nickel PJSC (Materials) | | | 1,820,090 | |
| | 238,348 | | | Mobile TeleSystems PJSC ADR (Telecommunication Services) | | | 1,937,769 | |
| | 992,758 | | | Moscow Exchange MICEX-RTS PJSC (Financials) | | | 1,930,593 | |
| | 612,655 | | | Rosneft PJSC GDR (Energy) | | | 3,201,123 | |
| | 974,605 | | | Rostelecom PJSC (Telecommunication Services) | | | 1,225,742 | |
| | |
| | Common Stocks – (continued) | |
| | Russia – (continued) | | | | |
| | 430,202 | | | Sberbank of Russia PJSC ADR (Financials) | | | 3,944,952 | |
| | 208,940 | | | Severstal PAO GDR (Materials) | | | 2,459,224 | |
| | 276,684 | | | Surgutneftegas OAO ADR (Energy) | | | 1,397,254 | |
| | 193,902 | | | Surgutneftegas OJSC ADR (Energy) | | | 914,054 | |
| | 99,723 | | | Tatneft PAO ADR (Energy) | | | 2,941,829 | |
| | 439,026 | | | VTB Bank PJSC GDR (Financials) | | | 897,808 | |
| | | | | | | | |
| | | | | | | 32,291,459 | |
| | |
| | South Africa – 6.2% | | | | |
| | 56,291 | | | AngloGold Ashanti Ltd. (Materials)* | | | 917,311 | |
| | 114,467 | | | Barclays Africa Group Ltd. (Financials) | | | 1,158,350 | |
| | 112,125 | | | Bidvest Group Ltd. (The) (Industrials) | | | 1,158,273 | |
| | 247,279 | | | Brait SE (Financials)* | | | 1,957,844 | |
| | 222,798 | | | Coronation Fund Managers Ltd. (Financials) | | | 1,055,986 | |
| | 239,248 | | | Exxaro Resources Ltd. (Energy) | | | 1,223,219 | |
| | 722,994 | | | FirstRand Ltd. (Financials) | | | 2,165,422 | |
| | 95,129 | | | Foschini Group Ltd (The) (Consumer Discretionary) | | | 845,058 | |
| | 270,605 | | | Gold Fields Ltd. (Materials) | | | 1,381,333 | |
| | 773,967 | | | Growthpoint Properties Ltd. REIT (Real Estate) | | | 1,337,623 | |
| | 97,007 | | | Imperial Holdings Ltd. (Consumer Discretionary) | | | 1,039,812 | |
| | 137,662 | | | Liberty Holdings Ltd. (Financials) | | | 1,055,049 | |
| | 385,498 | | | Life Healthcare Group Holdings Ltd. (Health Care) | | | 1,008,667 | |
| | 151,691 | | | Massmart Holdings Ltd. (Consumer Staples) | | | 1,334,113 | |
| | 59,397 | | | Mondi Ltd. (Materials) | | | 1,198,908 | |
| | 135,839 | | | Mr Price Group Ltd. (Consumer Discretionary) | | | 1,703,002 | |
| | 141,420 | | | MTN Group Ltd. (Telecommunication Services) | | | 1,155,261 | |
| | 56,963 | | | Naspers Ltd., Class N (Consumer Discretionary) | | | 9,314,366 | |
| | 595,086 | | | Netcare Ltd. (Health Care) | | | 1,328,556 | |
| | 495,298 | | | Pick n Pay Stores Ltd. (Consumer Staples) | | | 2,480,504 | |
| | 93,787 | | | Pioneer Foods Group Ltd. (Consumer Staples) | | | 1,083,568 | |
| | 1,417,729 | | | Redefine Properties Ltd. REIT (Real Estate) | | | 1,061,792 | |
| | 185,514 | | | Resilient REIT Ltd. REIT (Real Estate) | | | 1,487,728 | |
| | 219,463 | | | Sanlam Ltd. (Financials) | | | 931,895 | |
| | 366,430 | | | Sappi Ltd. (Materials)* | | | 1,803,244 | |
| | 126,000 | | | Shoprite Holdings Ltd. (Consumer Staples) | | | 1,614,160 | |
| | 271,450 | | | Sibanye Gold Ltd. (Materials) | | | 1,052,102 | |
| | 81,884 | | | SPAR Group Ltd (The) (Consumer Staples) | | | 1,068,477 | |
| | 196,818 | | | Standard Bank Group Ltd. (Financials) | | | 1,780,894 | |
| | |
| | |
| 38 | | The accompanying notes are an integral part of these financial statements. |
GOLDMAN SACHS ACTIVEBETA® EMERGING MARKETS EQUITY ETF
| | | | | | | | |
| Shares | | | Description | | Value | |
| | Common Stocks – (continued) | |
| | South Africa – (continued) | | | | |
| | 374,282 | | | Telkom SA SOC Ltd. (Telecommunication Services) | | $ | 1,546,562 | |
| | 40,890 | | | Tiger Brands Ltd. (Consumer Staples) | | | 1,060,228 | |
| | 220,643 | | | Vodacom Group Ltd. (Telecommunication Services) | | | 2,293,230 | |
| | 288,352 | | | Woolworths Holdings Ltd. (Consumer Discretionary) | | | 1,580,295 | |
| | | | | | | | |
| | | | | | | 53,182,832 | |
| | |
| | South Korea – 15.0% | | | | |
| | 10,031 | | | Amorepacific Corp. (Consumer Staples) | | | 3,472,615 | |
| | 19,435 | | | AMOREPACIFIC Group (Consumer Staples) | | | 2,527,422 | |
| | 13,521 | | | BGF Retail Co. Ltd. (Consumer Staples) | | | 2,455,608 | |
| | 118,561 | | | BNK Financial Group, Inc. (Financials) | | | 941,045 | |
| | 14,452 | | | Celltrion, Inc. (Health Care)* | | | 1,384,281 | |
| | 5,405 | | | CJ CheilJedang Corp (Consumer Staples) | | | 1,888,114 | |
| | 29,741 | | | Coway Co. Ltd. (Consumer Discretionary) | | | 2,224,573 | |
| | 151,969 | | | DGB Financial Group, Inc. (Financials) | | | 1,245,737 | |
| | 30,564 | | | Dongbu Insurance Co. Ltd. (Financials) | | | 1,850,287 | |
| | 7,769 | | | E-MART, Inc. (Consumer Staples) | | | 1,097,415 | |
| | 19,119 | | | GS Holdings Corp. (Energy) | | | 847,066 | |
| | 21,503 | | | GS Retail Co. Ltd. (Consumer Staples) | | | 908,333 | |
| | 68,874 | | | Hana Financial Group, Inc. (Financials) | | | 1,809,873 | |
| | 32,667 | | | Hankook Tire Co. Ltd. (Consumer Discretionary) | | | 1,634,815 | |
| | 4,067 | | | Hanmi Pharm Co. Ltd. (Health Care) | | | 2,166,635 | |
| | 12,496 | | | Hanssem Co. Ltd. (Consumer Discretionary) | | | 1,647,455 | |
| | 54,258 | | | Hanwha Chemical Corp. (Materials) | | | 1,245,744 | |
| | 30,989 | | | Hanwha Corp. (Industrials) | | | 1,018,607 | |
| | 173,281 | | | Hanwha Life Insurance Co. Ltd. (Financials) | | | 881,169 | |
| | 20,924 | | | Hotel Shilla Co. Ltd. (Consumer Discretionary) | | | 1,272,329 | |
| | 8,717 | | | Hyosung Corp. (Materials) | | | 1,031,968 | |
| | 37,155 | | | Hyundai Engineering & Construction Co. Ltd. (Industrials) | | | 1,284,597 | |
| | 38,406 | | | Hyundai Marine & Fire Insurance Co. Ltd. (Financials) | | | 1,164,236 | |
| | 11,586 | | | Hyundai Mobis Co. Ltd. (Consumer Discretionary) | | | 2,706,864 | |
| | 10,799 | | | Hyundai Motor Co. (Consumer Discretionary) | | | 1,288,132 | |
| | 22,880 | | | Hyundai Steel Co. (Materials) | | | 1,052,685 | |
| | 83,237 | | | Industrial Bank of Korea (Financials) | | | 877,161 | |
| | |
| | Common Stocks – (continued) | |
| | South Korea – (continued) | | | | |
| | 33,256 | | | Kangwon Land, Inc. (Consumer Discretionary) | | | 1,176,636 | |
| | 77,968 | | | KB Financial Group, Inc. (Financials) | | | 2,720,139 | |
| | 48,319 | | | Kia Motors Corp. (Consumer Discretionary) | | | 1,817,921 | |
| | 59,287 | | | Korea Electric Power Corp. (Utilities) | | | 3,083,987 | |
| | 52,792 | | | Korea Gas Corp. (Utilities) | | | 2,009,884 | |
| | 3,161 | | | Korea Zinc Co. Ltd. (Materials) | | | 1,356,537 | |
| | 77,775 | | | KT Corp. (Telecommunication Services) | | | 2,204,206 | |
| | 19,637 | | | KT&G Corp. (Consumer Staples) | | | 2,060,564 | |
| | 4,857 | | | LG Chem Ltd. (Materials) | | | 1,178,313 | |
| | 23,846 | | | LG Corp. (Industrials) | | | 1,409,373 | |
| | 45,967 | | | LG Display Co. Ltd. (Information Technology) | | | 1,238,842 | |
| | 37,679 | | | LG Electronics, Inc. (Consumer Discretionary) | | | 1,740,331 | |
| | 4,525 | | | LG Household & Health Care Ltd. (Consumer Staples) | | | 3,859,439 | |
| | 298,714 | | | LG Uplus Corp. (Telecommunication Services) | | | 3,121,092 | |
| | 6,437 | | | Lotte Chemical Corp. (Materials) | | | 1,547,189 | |
| | 6,804 | | | NAVER Corp (Information Technology) | | | 5,156,395 | |
| | 5,115 | | | NCSoft Corp. (Information Technology) | | | 1,238,610 | |
| | 1,485 | | | Orion Corp. (Consumer Staples) | | | 989,556 | |
| | 13,381 | | | POSCO (Materials) | | | 2,772,207 | |
| | 24,944 | | | S-1 Corp. (Industrials) | | | 2,304,244 | |
| | 20,589 | | | Samsung Electronics Co. Ltd. (Information Technology) | | | 29,914,063 | |
| | 3,956 | | | Samsung Fire & Marine Insurance Co. Ltd. (Financials) | | | 957,955 | |
| | 14,299 | | | Samsung Life Insurance Co. Ltd. (Financials) | | | 1,320,894 | |
| | 8,049 | | | Samsung SDI Co. Ltd. (Information Technology) | | | 833,775 | |
| | 57,079 | | | Shinhan Financial Group Co. Ltd. (Financials) | | | 2,098,869 | |
| | 5,622 | | | SK Holdings Co. Ltd. (Industrials) | | | 1,068,936 | |
| | 102,359 | | | SK Hynix, Inc. (Information Technology) | | | 3,346,175 | |
| | 10,643 | | | SK Innovation Co. Ltd. (Energy) | | | 1,388,840 | |
| | 11,801 | | | SK Telecom Co. Ltd. (Telecommunication Services) | | | 2,312,573 | |
| | 163,417 | | | Woori Bank (Financials) | | | 1,553,561 | |
| | | | | | | | |
| | | | | | | 129,705,872 | |
| | |
| | Taiwan – 11.4% | | | | |
| | 769,794 | | | Advanced Semiconductor Engineering, Inc. (Information Technology) | | | 946,155 | |
| | 221,563 | | | Advantech Co. Ltd. (Information Technology) | | | 1,811,998 | |
| | 1,268,373 | | | Asia Cement Corp. (Materials) | | | 1,133,243 | |
| | |
| | |
| The accompanying notes are an integral part of these financial statements. | | 39 |
GOLDMAN SACHS ACTIVEBETA® EMERGING MARKETS EQUITY ETF
Schedule of Investments (continued)
August 31, 2016
| | | | | | | | |
| Shares | | | Description | | Value | |
| | Common Stocks – (continued) | |
| | Taiwan – (continued) | | | | |
| | 113,736 | | | Asustek Computer, Inc. (Information Technology) | | $ | 962,421 | |
| | 1,556,580 | | | Cathay Financial Holding Co. Ltd. (Financials) | | | 1,967,156 | |
| | 1,914,978 | | | Chang Hwa Commercial Bank Ltd. (Financials) | | | 962,604 | |
| | 475,002 | | | Cheng Shin Rubber Industry Co. Ltd. (Consumer Discretionary) | | | 1,008,970 | |
| | 3,374,072 | | | China Development Financial Holding Corp. (Financials) | | | 852,809 | |
| | 1,481,184 | | | China Life Insurance Co. Ltd./Taiwan (Financials) | | | 1,311,712 | |
| | 2,392,585 | | | China Steel Corp. (Materials) | | | 1,658,873 | |
| | 856,206 | | | Chunghwa Telecom Co. Ltd. (Telecommunication Services) | | | 3,076,141 | |
| | 3,102,617 | | | CTBC Financial Holding Co. Ltd. (Financials) | | | 1,794,268 | |
| | 1,796,047 | | | E.Sun Financial Holding Co. Ltd. (Financials) | | | 1,010,367 | |
| | 494,563 | | | Far EasTone Telecommunications Co. Ltd. (Telecommunication Services) | | | 1,151,832 | |
| | 460,038 | | | Feng TAY Enterprise Co. Ltd. (Consumer Discretionary) | | | 2,189,242 | |
| | 2,233,881 | | | First Financial Holding Co. Ltd. (Financials) | | | 1,147,548 | |
| | 510,061 | | | Formosa Chemicals & Fibre Corp. (Materials) | | | 1,324,563 | |
| | 474,705 | | | Formosa Petrochemical Corp. (Energy) | | | 1,388,337 | |
| | 590,007 | | | Formosa Plastics Corp. (Materials) | | | 1,455,935 | |
| | 1,000,717 | | | Formosa Taffeta Co. Ltd. (Consumer Discretionary) | | | 966,640 | |
| | 1,698,100 | | | Fubon Financial Holding Co. Ltd. (Financials) | | | 2,402,883 | |
| | 2,491,416 | | | Hon Hai Precision Industry Co. Ltd. (Information Technology) | | | 6,909,586 | |
| | 312,291 | | | HTC Corp. (Information Technology)* | | | 836,568 | |
| | 1,874,345 | | | Hua Nan Financial Holdings Co. Ltd. (Financials) | | | 965,807 | |
| | 1,162,505 | | | Inventec Corp. (Information Technology) | | | 862,797 | |
| | 17,420 | | | Largan Precision Co. Ltd. (Information Technology) | | | 1,954,435 | |
| | 748,523 | | | Lite-On Technology Corp. (Information Technology) | | | 1,132,321 | |
| | 122,068 | | | MediaTek, Inc. (Information Technology) | | | 959,833 | |
| | 1,658,563 | | | Mega Financial Holding Co. Ltd. (Financials) | | | 1,129,039 | |
| | 447,054 | | | Nan Ya Plastics Corp. (Materials) | | | 853,799 | |
| | 127,150 | | | Nien Made Enterprise Co. Ltd. (Consumer Discretionary) | | | 1,442,587 | |
| | 63,742 | | | OBI Pharma, Inc. (Health Care)* | | | 797,516 | |
| | 884,255 | | | Pou Chen Corp. (Consumer Discretionary) | | | 1,281,913 | |
| | |
| | Common Stocks – (continued) | |
| | Taiwan – (continued) | | | | |
| | 438,932 | | | Powertech Technology, Inc. (Information Technology) | | | 1,145,383 | |
| | 550,169 | | | President Chain Store Corp. (Consumer Staples) | | | 4,378,049 | |
| | 213,959 | | | Realtek Semiconductor Corp. (Information Technology) | | | 856,362 | |
| | 3,377,721 | | | SinoPac Financial Holdings Co Ltd. (Financials) | | | 987,859 | |
| | 815,623 | | | Standard Foods Corp. (Consumer Staples) | | | 2,012,678 | |
| | 5,352,812 | | | Taiwan Business Bank (Financials)* | | | 1,430,543 | |
| | 2,094,817 | | | Taiwan Cooperative Financial Holding Co. Ltd. (Financials) | | | 920,965 | |
| | 463,636 | | | Taiwan Mobile Co. Ltd. (Telecommunication Services) | | | 1,629,202 | |
| | 5,192,237 | | | Taiwan Semiconductor Manufacturing Co. Ltd. (Information Technology) | | | 28,799,852 | |
| | 1,726,251 | | | Uni-President Enterprises Corp. (Consumer Staples) | | | 3,264,211 | |
| | 463,595 | | | Vanguard International Semiconductor Corp. (Information Technology) | | | 869,318 | |
| | 1,691,317 | | | Wistron Corp. (Information Technology) | | | 1,241,950 | |
| | 732,145 | | | WPG Holdings Ltd. (Information Technology) | | | 871,038 | |
| | | | | | | | |
| | | | | | | 98,057,308 | |
| | |
| | Thailand – 2.2% | | | | |
| | 231,516 | | | Advanced Info Service PCL NVDR (Telecommunication Services) | | | 1,106,900 | |
| | 115,432 | | | Airports of Thailand PCL NVDR (Industrials) | | | 1,340,546 | |
| | 2,035,100 | | | Bangkok Dusit Medical Services PCL NVDR (Health Care) | | | 1,381,602 | |
| | 1,716,292 | | | BEC World PCL NVDR (Consumer Discretionary) | | | 1,110,628 | |
| | 3,615,666 | | | BTS Group Holdings PCL NVDR (Industrials) | | | 945,292 | |
| | 185,797 | | | Bumrungrad Hospital PCL NVDR (Health Care) | | | 912,467 | |
| | 759,300 | | | Central Pattana PCL NVDR (Real Estate) | | | 1,321,599 | |
| | 882,400 | | | Charoen Pokphand Foods PCL NVDR (Consumer Staples) | | | 828,473 | |
| | 728,977 | | | CP ALL PCL NVDR (Consumer Staples) | | | 1,310,939 | |
| | 245,800 | | | Electricity Generating PCL NVDR (Utilities) | | | 1,402,421 | |
| | 4,050,300 | | | Home Product Center PCL NVDR (Consumer Discretionary) | | | 1,275,390 | |
| | 170,257 | | | PTT PCL NVDR (Energy) | | | 1,716,563 | |
| | 552,500 | | | Robinson Department Store PCL NVDR (Consumer Discretionary) | | | 1,021,508 | |
| | 244,579 | | | Siam Commercial Bank PCL (The) NVDR (Financials) | | | 1,130,495 | |
| | |
| | |
| 40 | | The accompanying notes are an integral part of these financial statements. |
GOLDMAN SACHS ACTIVEBETA® EMERGING MARKETS EQUITY ETF
| | | | | | | | |
| Shares | | | Description | | Value | |
| | Common Stocks – (continued) | |
| | Thailand – (continued) | | | | |
| | 460,700 | | | Thai Oil PCL NVDR (Energy) | | $ | 941,617 | |
| | 1,755,490 | | | Thai Union Group PCL NVDR (Consumer Staples) | | | 1,090,351 | |
| | | | | | | | |
| | | | | | | 18,836,791 | |
| | |
| | Turkey – 1.2% | |
| | 145,330 | | | Arcelik As (Consumer Discretionary) | | | 1,039,229 | |
| | 144,760 | | | BIM Birlesik Magazalar AS (Consumer Staples) | | | 2,480,258 | |
| | 379,306 | | | Haci Omer Sabanci Holding AS (Financials) | | | 1,170,310 | |
| | 211,739 | | | KOC Holding AS (Industrials) | | | 918,769 | |
| | 819,877 | | | Petkim Petrokimya Holding As (Materials) | | | 1,271,750 | |
| | 44,709 | | | Tupras Turkiye Petrol Rafinerileri AS (Energy) | | | 874,810 | |
| | 482,311 | | | Turk Telekomunikasyon AS (Telecommunication Services) | | | 973,065 | |
| | 371,386 | | | Turkiye Garanti Bankasi AS (Financials) | | | 957,614 | |
| | 567,084 | | | Turkiye Is Bankasi, Class C (Financials) | | | 921,792 | |
| | | | | | | | |
| | | | | | | 10,607,597 | |
| | |
| | United Arab Emirates – 0.6% | |
| | 1,320,988 | | | Aldar Properties PJSC (Real Estate) | | | 992,602 | |
| | 664,020 | | | Dubai Islamic Bank PJSC (Financials) | | | 987,054 | |
| | 542,137 | | | Emaar Properties PJSC (Real Estate) | | | 1,047,936 | |
| | 350,783 | | | Emirates Telecommunications Group Co. PJSC (Telecommunication Services) | | | 1,886,136 | |
| | | | | | | | |
| | | | | | | 4,913,728 | |
| | |
| | TOTAL COMMON STOCKS | |
| | (Cost $668,944,048) | | $ | 748,617,232 | |
| | |
| | | | | | | | |
| | Exchange-Traded Funds – 9.0% | |
| | United States – 9.0% | |
| | 626,510 | | | iShares India 50 ETF | | $ | 18,839,156 | |
| | 1,337,948 | | | iShares MSCI India ETF | | | 39,549,743 | |
| | 558,209 | | | PowerShares India Portfolio | | | 11,538,180 | |
| | 361,526 | | | WisdomTree India Earnings Fund | | | 7,837,883 | |
| | |
| | TOTAL EXCHANGE-TRADED FUNDS | | | | |
| | (Cost $67,353,598) | | $ | 77,764,962 | |
| | |
| | | | | | | | |
| | Preferred Stocks – 4.2% | |
| | Brazil – 2.7% | | | | |
| | 501,016 | | | Banco Bradesco SA (Financials) | | $ | 4,502,296 | |
| | 211,363 | | | Braskem SA, Class A (Materials) | | | 1,575,843 | |
| | 271,854 | | | Centrais Eletricas Brasileiras SA, Class B (Utilities)* | | | 2,395,893 | |
| | 113,253 | | | Cia Brasileira de Distribuicao (Consumer Staples) | | | 1,763,690 | |
| | |
| | Preferred Stocks – (continued) | |
| | Brazil – (continued) | | | | |
| | 801,634 | | | Gerdau SA (Materials) | | | 2,250,862 | |
| | 590,631 | | | Itau Unibanco Holding SA (Financials) | | | 6,547,753 | |
| | 526,010 | | | Itausa – Investimentos Itau SA (Financials) | | | 1,398,876 | |
| | 265,505 | | | Petroleo Brasileiro SA (Energy)* | | | 1,055,025 | |
| | 106,654 | | | Telefonica Brasil SA (Telecommunication Services) | | | 1,605,845 | |
| | | | | | | | |
| | | | | | | 23,096,083 | |
| | |
| | Chile – 0.1% | |
| | 367,127 | | | Embotelladora Andina SA, Class B (Consumer Staples) | | | 1,318,268 | |
| | |
| | Russia – 0.1% | |
| | 373 | | | Transneft PJSC (Energy) | | | 884,228 | |
| | |
| | South Korea – 1.3% | |
| | 20,067 | | | Amorepacific Corp. (Consumer Staples) | | | 3,959,408 | |
| | 4,926 | | | LG Household & Health Care Ltd. (Consumer Staples) | | | 2,513,807 | |
| | 3,681 | | | Samsung Electronics Co. Ltd. (Information Technology) | | | 4,370,981 | |
| | | | | | | | |
| | | | | | | 10,844,196 | |
| | |
| | TOTAL PREFERRED STOCKS | |
| | (Cost $26,568,174) | | $ | 36,142,775 | |
| | |
| | TOTAL INVESTMENTS – 99.9% | |
| | (Cost $762,865,820) | | $ | 862,524,969 | |
| | |
| OTHER ASSETS IN EXCESS OF
LIABILITIES – 0.1% | | | 863,092 | |
| | |
| | NET ASSETS – 100.0% | | $ | 863,388,061 | |
| | |
| | |
| The percentage shown for each investment category reflects the value of investments in that category as a percentage of net assets. |
* | | Non-income producing security |
| | |
|
Investment Abbreviations: |
ADR | | —American Depositary Receipt |
GDR | | —Global Depositary Receipt |
NVDR | | —Non-Voting Depository Receipt |
PLC | | —Public Limited Company |
REIT | | —Real Estate Investment Trust |
|
| | |
| The accompanying notes are an integral part of these financial statements. | | 41 |
GOLDMAN SACHS ACTIVEBETA® EUROPE EQUITY ETF
Schedule of Investments
August 31, 2016
| | | | | | | | |
| Shares | | | Description | | Value | |
| | Common Stocks – 99.4% | |
| | Australia – 0.0% | |
| | 624 | | | BHP Billiton PLC (Materials) | | $ | 8,090 | |
| | |
| | Austria – 0.5% | |
| | 707 | | | ANDRITZ AG (Industrials) | | | 36,021 | |
| | 624 | | | Erste Group Bank AG (Financials)* | | | 17,503 | |
| | 1,934 | | | OMV AG (Energy) | | | 54,108 | |
| | 3,859 | | | Raiffeisen Bank International AG (Financials)* | | | 54,756 | |
| | | | | | | | |
| | | | | | | 162,388 | |
| | |
| | Belgium – 1.8% | |
| | 668 | | | Ageas (Financials) | | | 23,041 | |
| | 2,221 | | | Anheuser-Busch InBev SA/NV (Consumer Staples) | | | 274,697 | |
| | 1,836 | | | Colruyt SA (Consumer Staples) | | | 100,617 | |
| | 501 | | | Groupe Bruxelles Lambert SA (Financials) | | | 43,897 | |
| | 598 | | | Proximus SADP (Telecommunication Services) | | | 18,269 | |
| | 78 | | | Solvay SA (Materials) | | | 8,549 | |
| | 1,190 | | | Telenet Group Holding NV (Consumer Discretionary)* | | | 55,725 | |
| | 382 | | | UCB SA (Health Care) | | | 31,317 | |
| | 749 | | | Umicore SA (Materials) | | | 44,163 | |
| | | | | | | | |
| | | | | | | 600,275 | |
| | |
| | Denmark – 3.4% | |
| | 1,220 | | | Carlsberg A/S, Class B (Consumer Staples) | | | 114,194 | |
| | 910 | | | Chr Hansen Holding A/S (Materials) | | | 55,096 | |
| | 962 | | | Coloplast A/S, Class B (Health Care) | | | 73,058 | |
| | 953 | | | Danske Bank A/S (Financials) | | | 27,923 | |
| | 1,174 | | | DSV A/S (Industrials) | | | 58,132 | |
| | 325 | | | Genmab A/S (Health Care)* | | | 51,843 | |
| | 1,924 | | | ISS A/S (Industrials) | | | 77,794 | |
| | 8,231 | | | Novo Nordisk A/S, Class B (Health Care) | | | 385,154 | |
| | 234 | | | Novozymes A/S, Class B (Materials) | | | 10,130 | |
| | 811 | | | Pandora A/S (Consumer Discretionary) | | | 100,729 | |
| | 9,730 | | | TDC A/S (Telecommunication Services)* | | | 53,698 | |
| | 936 | | | Tryg A/S (Financials) | | | 18,643 | |
| | 868 | | | Vestas Wind Systems A/S (Industrials) | | | 71,894 | |
| | 1,769 | | | William Demant Holding A/S (Health Care)* | | | 36,902 | |
| | | | | | | | |
| | | | | | | 1,135,190 | |
| | |
| | Finland – 1.4% | |
| | 806 | | | Elisa OYJ (Telecommunication Services) | | | 28,313 | |
| | 494 | | | Fortum OYJ (Utilities) | | | 7,615 | |
| | 976 | | | Kone OYJ, Class B (Industrials) | | | 48,970 | |
| | 1,615 | | | Neste OYJ (Energy) | | | 67,164 | |
| | 3,659 | | | Nokia OYJ (Information Technology) | | | 20,539 | |
| | 546 | | | Nokian Renkaat OYJ (Consumer Discretionary) | | | 19,684 | |
| | 2,807 | | | Orion OYJ, Class B (Health Care) | | | 106,106 | |
| | 919 | | | Sampo OYJ, Class A (Financials) | | | 39,396 | |
| | 5,910 | | | UPM-Kymmene OYJ (Materials) | | | 118,546 | |
| | 514 | | | Wartsila OYJ Abp (Industrials) | | | 21,113 | |
| | | | | | | | |
| | | | | | | 477,446 | |
| | |
| | Common Stocks – (continued) | |
| | France – 17.0% | |
| | 3,146 | | | Accor SA (Consumer Discretionary) | | $ | 118,588 | |
| | 208 | | | Aeroports de Paris (Industrials) | | | 21,428 | |
| | 661 | | | Air Liquide SA (Materials) | | | 72,390 | |
| | 696 | | | Airbus Group SE (Industrials) | | | 40,534 | |
| | 714 | | | Alstom SA (Industrials)* | | | 18,859 | |
| | 241 | | | Arkema SA (Materials) | | | 21,481 | |
| | 3,500 | | | Atos SE (Information Technology) | | | 343,854 | |
| | 7,113 | | | AXA SA (Financials) | | | 149,094 | |
| | 3,949 | | | BNP Paribas SA (Financials) | | | 200,580 | |
| | 3,224 | | | Bollore SA (Industrials) | | | 11,627 | |
| | 296 | | | Bouygues SA (Industrials) | | | 9,372 | |
| | 1,374 | | | Bureau Veritas SA (Industrials) | | | 29,412 | |
| | 1,271 | | | Capgemini SA (Information Technology) | | | 123,636 | |
| | 3,579 | | | Carrefour SA (Consumer Staples) | | | 89,966 | |
| | 343 | | | Casino Guichard Perrachon SA (Consumer Staples) | | | 16,940 | |
| | 1,150 | | | Christian Dior SE (Consumer Discretionary) | | | 198,526 | |
| | 884 | | | Cie de Saint-Gobain (Industrials) | | | 38,713 | |
| | 676 | | | Cie Generale des Etablissements Michelin (Consumer Discretionary) | | | 71,751 | |
| | 3,900 | | | CNP Assurances (Financials) | | | 62,678 | |
| | 7,665 | | | Credit Agricole SA (Financials) | | | 72,478 | |
| | 3,332 | | | Danone SA (Consumer Staples) | | | 252,757 | |
| | 1,068 | | | Dassault Systemes (Information Technology) | | | 89,830 | |
| | 1,803 | | | Eiffage SA (Industrials) | | | 140,968 | |
| | 1,742 | | | Engie SA (Utilities) | | | 27,725 | |
| | 976 | | | Essilor International SA (Health Care) | | | 123,757 | |
| | 645 | | | Eurazeo SA (Financials) | | | 39,072 | |
| | 1,222 | | | Eutelsat Communications SA (Consumer Discretionary) | | | 23,715 | |
| | 353 | | | Fonciere Des Regions REIT (Real Estate) | | | 32,930 | |
| | 359 | | | Gecina SA REIT (Real Estate) | | | 56,077 | |
| | 562 | | | Hermes International (Consumer Discretionary) | | | 236,976 | |
| | 260 | | | ICADE REIT (Real Estate) | | | 20,033 | |
| | 58 | | | Iliad SA (Telecommunication Services) | | | 11,941 | |
| | 338 | | | Imerys SA (Materials) | | | 23,780 | |
| | 234 | | | Ingenico Group SA (Information Technology) | | | 25,160 | |
| | 520 | | | JCDecaux SA (Consumer Discretionary) | | | 17,838 | |
| | 36 | | | Kering (Consumer Discretionary) | | | 6,814 | |
| | 875 | | | Klepierre REIT (Real Estate) | | | 40,940 | |
| | 1,248 | | | Lagardere SCA (Consumer Discretionary) | | | 30,392 | |
| | 1,222 | | | Legrand SA (Industrials) | | | 73,099 | |
| | 1,351 | | | L’Oreal SA (Consumer Staples) | | | 254,817 | |
| | 1,027 | | | LVMH Moet Hennessy Louis Vuitton SE (Consumer Discretionary) | | | 173,518 | |
| | 5,170 | | | Natixis SA (Financials) | | | 22,837 | |
| | 3,671 | | | Orange SA (Telecommunication Services) | | | 55,972 | |
| | 669 | | | Pernod Ricard SA (Consumer Staples) | | | 76,671 | |
| | 8,108 | | | Peugeot SA (Consumer Discretionary)* | | | 119,425 | |
| | 1,023 | | | Publicis Groupe SA (Consumer Discretionary) | | | 75,825 | |
| | |
| | |
| 42 | | The accompanying notes are an integral part of these financial statements. |
GOLDMAN SACHS ACTIVEBETA® EUROPE EQUITY ETF
| | | | | | | | |
| Shares | | | Description | | Value | |
| | Common Stocks – (continued) | |
| | France – (continued) | |
| | 506 | | | Remy Cointreau SA (Consumer Staples) | | $ | 44,087 | |
| | 1,354 | | | Renault SA (Consumer Discretionary) | | | 110,553 | |
| | 10,051 | | | Rexel SA (Industrials) | | | 161,254 | |
| | 286 | | | Safran SA (Industrials) | | | 19,966 | |
| | 4,734 | | | Sanofi (Health Care) | | | 364,171 | |
| | 1,790 | | | Schneider Electric SE (Industrials) | | | 121,790 | |
| | 2,184 | | | SCOR SE (Financials) | | | 64,155 | |
| | 505 | | | Societe BIC SA (Industrials) | | | 73,596 | |
| | 2,915 | | | Societe Generale SA (Financials) | | | 105,985 | |
| | 512 | | | Sodexo SA (Consumer Discretionary) | | | 59,219 | |
| | 2,118 | | | Suez (Utilities) | | | 31,999 | |
| | 1,164 | | | Technip SA (Energy) | | | 68,671 | |
| | 832 | | | Thales SA (Industrials) | | | 71,935 | |
| | 6,383 | | | TOTAL SA (Energy) | | | 303,912 | |
| | 364 | | | Unibail-Rodamco SE REIT (Real Estate) | | | 99,730 | |
| | 479 | | | Valeo SA (Consumer Discretionary) | | | 24,748 | |
| | 2,245 | | | Veolia Environnement SA (Utilities) | | | 47,669 | |
| | 2,276 | | | Vinci SA (Industrials) | | | 172,347 | |
| | 1,852 | | | Vivendi SA (Consumer Discretionary) | | | 35,849 | |
| | 199 | | | Wendel SA (Financials) | | | 22,596 | |
| | | | | | | | |
| | | | | | | 5,769,008 | |
| | |
| | Germany – 12.4% | |
| | 1,788 | | | adidas AG (Consumer Discretionary) | | | 296,617 | |
| | 1,464 | | | Allianz SE (Financials) | | | 217,757 | |
| | 468 | | | Axel Springer SE (Consumer Discretionary) | | | 23,799 | |
| | 2,404 | | | BASF SE (Materials) | | | 195,186 | |
| | 3,167 | | | Bayer AG (Health Care) | | | 338,510 | |
| | 217 | | | Bayerische Motoren Werke AG (Consumer Discretionary) | | | 18,854 | |
| | 1,586 | | | Beiersdorf AG (Consumer Staples) | | | 147,336 | |
| | 442 | | | Brenntag AG (Industrials) | | | 24,018 | |
| | 996 | | | Commerzbank AG (Financials) | | | 6,995 | |
| | 182 | | | Continental AG (Consumer Discretionary) | | | 38,088 | |
| | 1,801 | | | Covestro AG (Materials)(a) | | | 93,634 | |
| | 1,140 | | | Daimler AG (Consumer Discretionary) | | | 78,821 | |
| | 927 | | | Deutsche Boerse AG (Financials)* | | | 79,085 | |
| | 7,784 | | | Deutsche Lufthansa AG (Industrials) | | | 90,552 | |
| | 7,401 | | | Deutsche Post AG (Industrials) | | | 234,097 | |
| | 11,059 | | | Deutsche Telekom AG (Telecommunication Services) | | | 184,385 | |
| | 1,818 | | | Deutsche Wohnen AG (Real Estate) | | | 68,235 | |
| | 9,704 | | | E.ON SE (Utilities) | | | 89,240 | |
| | 572 | | | Evonik Industries AG (Materials) | | | 19,198 | |
| | 501 | | | Fraport AG Frankfurt Airport Services Worldwide (Industrials) | | | 27,905 | |
| | 869 | | | Fresenius Medical Care AG & Co KGaA (Health Care) | | | 76,789 | |
| | 1,492 | | | Fresenius SE & Co KGaA (Health Care) | | | 108,709 | |
| | 782 | | | GEA Group AG (Industrials) | | | 41,906 | |
| | 308 | | | Hannover Rueck SE (Financials) | | | 31,422 | |
| | 469 | | | HeidelbergCement AG (Materials) | | | 43,496 | |
| | 364 | | | Henkel AG & Co KGaA (Consumer Staples) | | | 40,804 | |
| | 365 | | | HOCHTIEF AG (Industrials) | | | 49,006 | |
| | |
| | Common Stocks – (continued) | |
| | Germany – (continued) | |
| | 2,553 | | | HUGO BOSS AG (Consumer Discretionary) | | | 155,676 | |
| | 3,016 | | | Infineon Technologies AG (Information Technology) | | | 50,705 | |
| | 962 | | | LANXESS AG (Materials) | | | 51,257 | |
| | 189 | | | Linde AG (Materials) | | | 32,322 | |
| | 390 | | | MAN SE (Industrials) | | | 40,509 | |
| | 910 | | | Merck KGaA (Health Care) | | | 95,615 | |
| | 1,026 | | | METRO AG (Consumer Staples) | | | 30,396 | |
| | 628 | | | Muenchener Rueckversicherungs-Gesellschaft AG in Muenchen (Financials) | | | 113,344 | |
| | 754 | | | OSRAM Licht AG (Industrials) | | | 39,419 | |
| | 1,222 | | | ProSiebenSat.1 Media SE (Consumer Discretionary) | | | 52,480 | |
| | 3,931 | | | SAP SE (Information Technology) | | | 344,823 | |
| | 1,942 | | | Siemens AG (Industrials) | | | 231,538 | |
| | 624 | | | Symrise AG (Materials) | | | 45,876 | |
| | 5,122 | | | Telefonica Deutschland Holding AG (Telecommunication Services) | | | 21,016 | |
| | 3,098 | | | TUI AG (Consumer Discretionary) | | | 43,131 | |
| | 1,066 | | | United Internet AG (Information Technology) | | | 43,763 | |
| | 1,214 | | | Vonovia SE (Real Estate) | | | 47,168 | |
| | 3,049 | | | Zalando SE (Consumer Discretionary)*(a) | | | 116,426 | |
| | | | | | | | |
| | | | | | | 4,219,908 | |
| | |
| | Ireland – 0.8% | | | | |
| | 1,408 | | | CRH PLC (Materials) | | | 47,593 | |
| | 3,668 | | | Experian PLC (Industrials) | | | 72,732 | |
| | 1,328 | | | Kerry Group PLC, Class A (Consumer Staples) | | | 112,675 | |
| | 345 | | | Paddy Power Betfair PLC (Consumer Discretionary) | | | 41,172 | |
| | | | | | | | |
| | | | | | | 274,172 | |
| | |
| | Italy – 3.6% | | | | |
| | 4,219 | | | Assicurazioni Generali SpA (Financials) | | | 53,568 | |
| | 1,489 | | | Atlantia SpA (Industrials) | | | 38,242 | |
| | 36,713 | | | Enel SpA (Utilities) | | | 161,839 | |
| | 4,186 | | | Eni SpA (Energy) | | | 63,126 | |
| | 3,247 | | | EXOR SpA (Financials) | | | 133,262 | |
| | 182 | | | Ferrari NV (Consumer Discretionary) | | | 8,757 | |
| | 6,810 | | | Intesa Sanpaolo SpA (Financials) | | | 16,155 | |
| | 2,944 | | | Luxottica Group SpA (Consumer Discretionary) | | | 141,811 | |
| | 5,727 | | | Prysmian SpA (Industrials) | | | 141,091 | |
| | 15,600 | | | Snam SpA (Utilities) | | | 86,351 | |
| | 109,575 | | | Telecom Italia SpA (Telecommunication Services)* | | | 99,279 | |
| | 128,538 | | | Telecom Italia SpA-RSP (Telecommunication Services)* | | | 94,055 | |
| | 16,224 | | | Terna Rete Elettrica Nazionale SpA (Utilities) | | | 83,698 | |
| | 22,616 | | | UniCredit SpA (Financials) | | | 58,085 | |
| | 33,852 | | | UnipolSai SpA (Financials) | | | 56,441 | |
| | | | | | | | |
| | | | | | | 1,235,760 | |
| | |
| | |
| The accompanying notes are an integral part of these financial statements. | | 43 |
GOLDMAN SACHS ACTIVEBETA® EUROPE EQUITY ETF
Schedule of Investments (continued)
August 31, 2016
| | | | | | | | |
| Shares | | | Description | | Value | |
| | Common Stocks – (continued) | |
| | Jersey Island – 0.1% | | | | |
| | 461 | | | Randgold Resources Ltd. (Materials) | | $ | 43,170 | |
| | |
| | Luxembourg – 0.4% | | | | |
| | 896 | | | Millicom International Cellular SA (Telecommunication Services) | | | 45,814 | |
| | 884 | | | RTL Group SA (Consumer Discretionary) | | | 74,285 | |
| | 801 | | | SES SA (Consumer Discretionary) | | | 18,368 | |
| | 676 | | | Tenaris SA (Energy) | | | 9,276 | |
| | | | | | | | |
| | | | | | | 147,743 | |
| | |
| | Mexico – 0.1% | | | | |
| | 1,776 | | | Fresnillo PLC (Materials) | | | 37,356 | |
| | |
| | Netherlands – 5.6% | | | | |
| | 663 | | | ABN AMRO Group NV (Financials)(a) | | | 13,605 | |
| | 364 | | | Akzo Nobel NV (Materials) | | | 24,559 | |
| | 667 | | | ASML Holding NV (Information Technology) | | | 70,847 | |
| | 2,850 | | | Boskalis Westminster (Industrials) | | | 101,733 | |
| | 473 | | | Gemalto NV (Information Technology) | | | 32,899 | |
| | 1,745 | | | Heineken Holding NV (Consumer Staples) | | | 140,048 | |
| | 1,273 | | | Heineken NV (Consumer Staples) | | | 113,566 | |
| | 6,162 | | | ING Groep NV (Financials) | | | 77,002 | |
| | 15,702 | | | Koninklijke Ahold Delhaize NV (Consumer Staples) | | | 375,382 | |
| | 651 | | | Koninklijke DSM NV (Materials) | | | 45,309 | |
| | 10,398 | | | Koninklijke KPN NV (Telecommunication Services) | | | 33,897 | |
| | 2,023 | | | Koninklijke Philips NV (Industrials) | | | 58,671 | |
| | 440 | | | Koninklijke Vopak NV (Energy) | | | 22,278 | |
| | 3,625 | | | NN Group NV (Financials) | | | 107,696 | |
| | 541 | | | NXP Semiconductors NV (Information Technology)* | | | 47,619 | |
| | 2,880 | | | Randstad Holding NV (Industrials) | | | 135,601 | |
| | 9,213 | | | Royal Dutch Shell PLC, Class A (Energy) | | | 224,493 | |
| | 7,975 | | | Royal Dutch Shell PLC, Class B (Energy) | | | 202,839 | |
| | 1,830 | | | Wolters Kluwer NV (Industrials) | | | 76,686 | |
| | | | | | | | |
| | | | | | | 1,904,730 | |
| | |
| | Norway – 1.6% | | | | |
| | 780 | | | DNB ASA (Financials) | | | 9,473 | |
| | 2,337 | | | Gjensidige Forsikring ASA (Financials) | | | 40,093 | |
| | 3,434 | | | Marine Harvest ASA (Consumer Staples)* | | | 53,027 | |
| | 26,844 | | | Norsk Hydro ASA (Materials) | | | 113,992 | |
| | 7,826 | | | Orkla ASA (Consumer Staples) | | | 71,588 | |
| | 3,242 | | | Schibsted ASA, Class A (Consumer Discretionary) | | | 102,844 | |
| | 3,733 | | | Schibsted ASA, Class B (Consumer Discretionary) | | | 107,858 | |
| | 1,700 | | | Telenor ASA (Telecommunication Services) | | | 29,654 | |
| | 338 | | | Yara International ASA (Materials) | | | 11,986 | |
| | | | | | | | |
| | | | | | | 540,515 | |
| | |
| | Common Stocks – (continued) | |
| | Portugal – 0.3% | | | | |
| | 8,776 | | | EDP – Energias de Portugal SA (Utilities) | | | 29,372 | |
| | 2,021 | | | Galp Energia SGPS SA (Energy) | | | 29,329 | |
| | 3,094 | | | Jeronimo Martins SGPS SA (Consumer Staples) | | | 49,845 | |
| | | | | | | | |
| | | | | | | 108,546 | |
| | |
| | South Africa – 0.4% | | | | |
| | 1,134 | | | Investec PLC (Financials) | | | 6,695 | |
| | 8,764 | | | Mediclinic International PLC (Health Care) | | | 117,307 | |
| | 980 | | | Mondi PLC (Materials) | | | 19,882 | |
| | | | | | | | |
| | | | | | | 143,884 | |
| | |
| | Spain – 4.7% | | | | |
| | 1,534 | | | Abertis Infraestructuras SA (Industrials) | | | 23,722 | |
| | 6,449 | | | ACS Actividades de Construccion y Servicios SA (Industrials) | | | 182,473 | |
| | 447 | | | Aena SA (Industrials)(a) | | | 63,102 | |
| | 1,898 | | | Amadeus IT Group SA (Information Technology) | | | 87,082 | |
| | 3,071 | | | Banco Bilbao Vizcaya Argentaria SA (Financials) | | | 19,079 | |
| | 5,055 | | | Banco de Sabadell SA (Financials) | | | 6,840 | |
| | 37,503 | | | Banco Santander SA (Financials) | | | 167,911 | |
| | 1,924 | | | Bankinter SA (Financials) | | | 14,091 | |
| | 20,460 | | | Distribuidora Internacional de Alimentacion SA (Consumer Staples) | | | 124,761 | |
| | 1,690 | | | Enagas SA (Utilities) | | | 49,550 | |
| | 2,412 | | | Endesa SA (Utilities) | | | 49,053 | |
| | 1,365 | | | Ferrovial SA (Industrials) | | | 26,856 | |
| | 2,826 | | | Gas Natural SDG SA (Utilities) | | | 58,244 | |
| | 1,508 | | | Grifols SA (Health Care) | | | 31,894 | |
| | 25,982 | | | Iberdrola SA (Utilities) | | | 170,731 | |
| | 5,674 | | | Industria de Diseno Textil SA (Consumer Discretionary) | | | 200,736 | |
| | 21,711 | | | Mapfre SA (Financials) | | | 58,590 | |
| | 2,288 | | | Red Electrica Corp. SA (Utilities) | | | 49,194 | |
| | 10,480 | | | Repsol SA (Energy) | | | 140,532 | |
| | 4,992 | | | Telefonica SA (Telecommunication Services) | | | 50,205 | |
| | 962 | | | Zardoya Otis SA (Industrials) | | | 9,054 | |
| | | | | | | | |
| | | | | | | 1,583,700 | |
| | |
| | Sweden – 3.5% | | | | |
| | 4,076 | | | Assa Abloy AB, Class B (Industrials) | | | 82,414 | |
| | 1,560 | | | Atlas Copco AB, Class A (Industrials) | | | 44,166 | |
| | 1,144 | | | Atlas Copco AB, Class B (Industrials) | | | 29,361 | |
| | 2,463 | | | Boliden AB (Materials) | | | 52,069 | |
| | 1,482 | | | Electrolux AB, Series B (Consumer Discretionary) | | | 38,536 | |
| | 2,141 | | | Getinge AB, Class B (Health Care) | | | 41,692 | |
| | 7,306 | | | Hennes & Mauritz AB, Class B (Consumer Discretionary) | | | 222,352 | |
| | 1,168 | | | Hexagon AB, Class B (Information Technology) | | | 47,478 | |
| | 3,770 | | | Husqvarna AB, Class B (Consumer Discretionary) | | | 32,553 | |
| | |
| | |
| 44 | | The accompanying notes are an integral part of these financial statements. |
GOLDMAN SACHS ACTIVEBETA® EUROPE EQUITY ETF
| | | | | | | | |
| Shares | | | Description | | Value | |
| | Common Stocks – (continued) | |
| | Sweden – (continued) | | | | |
| | 1,628 | | | ICA Gruppen AB (Consumer Staples) | | $ | 55,603 | |
| | 988 | | | Industrivarden AB, Class C (Financials) | | | 17,972 | |
| | 858 | | | Investor AB, Class B (Financials) | | | 30,214 | |
| | 468 | | | Kinnevik AB, Class B (Financials) | | | 11,504 | |
| | 3,254 | | | Nordea Bank AB (Financials) | | | 31,759 | |
| | 702 | | | Sandvik AB (Industrials) | | | 7,609 | |
| | 3,146 | | | Securitas AB, Class B (Industrials) | | | 54,623 | |
| | 1,638 | | | Skandinaviska Enskilda Banken AB, Class A (Financials) | | | 15,987 | |
| | 1,507 | | | Skanska AB, Class B (Industrials) | | | 32,984 | |
| | 2,008 | | | Svenska Cellulosa AB SCA, Class B (Consumer Staples) | | | 61,603 | |
| | 1,664 | | | Svenska Handelsbanken AB, Class A (Financials) | | | 21,440 | |
| | 1,274 | | | Swedbank AB, Class A (Financials) | | | 29,251 | |
| | 3,467 | | | Swedish Match AB (Consumer Staples) | | | 123,384 | |
| | 1,768 | | | Tele2 AB, Class B (Telecommunication Services) | | | 14,689 | |
| | 6,526 | | | Telefonaktiebolaget LM Ericsson, Class B (Information Technology) | | | 46,457 | |
| | 7,696 | | | Telia Co. AB (Telecommunication Services) | | | 34,702 | |
| | | | | | | | |
| | | | | | | 1,180,402 | |
| | |
| | Switzerland – 15.5% | | | | |
| | 4,826 | | | ABB Ltd. (Industrials)* | | | 104,669 | |
| | 1,370 | | | Actelion Ltd. (Health Care)* | | | 228,252 | |
| | 676 | | | Adecco Group AG (Industrials) | | | 38,941 | |
| | 871 | | | Aryzta AG (Consumer Staples)* | | | 34,732 | |
| | 302 | | | Baloise Holding AG (Financials) | | | 35,961 | |
| | 48 | | | Barry Callebaut AG (Consumer Staples)* | | | 61,750 | |
| | 10 | | | Chocoladefabriken Lindt & Spruengli AG (Consumer Staples) | | | 57,961 | |
| | 668 | | | Cie Financiere Richemont SA (Consumer Discretionary) | | | 38,514 | |
| | 5,694 | | | Coca-Cola HBC AG (Consumer Staples)* | | | 124,837 | |
| | 654 | | | Credit Suisse Group AG (Financials)* | | | 8,527 | |
| | 69 | | | Dufry AG (Consumer Discretionary)* | | | 8,076 | |
| | 125 | | | EMS-Chemie Holding AG (Materials) | | | 66,600 | |
| | 40 | | | Galenica AG (Health Care) | | | 46,450 | |
| | 202 | | | Geberit AG (Industrials) | | | 88,197 | |
| | 34 | | | Givaudan SA (Materials) | | | 70,350 | |
| | 117,067 | | | Glencore PLC (Materials)* | | | 266,858 | |
| | 319 | | | Julius Baer Group Ltd. (Financials)* | | | 13,386 | |
| | 1,283 | | | Kuehne + Nagel International AG (Industrials) | | | 179,284 | |
| | 159 | | | LafargeHolcim Ltd. (Materials)* | | | 8,439 | |
| | 748 | | | Lonza Group AG (Health Care)* | | | 141,903 | |
| | 12,516 | | | Nestle SA (Consumer Staples) | | | 997,408 | |
| | 7,828 | | | Novartis AG (Health Care) | | | 616,648 | |
| | 830 | | | Pargesa Holding SA (Financials) | | | 57,273 | |
| | 398 | | | Partners Group Holding AG (Financials) | | | 182,686 | |
| | 2,789 | | | Roche Holding AG (Health Care) | | | 680,680 | |
| | 294 | | | Schindler Holding AG (Industrials) | | | 55,595 | |
| | 340 | | | Schindler Holding AG Participation Certificates (Industrials) | | | 64,052 | |
| | |
| | Common Stocks – (continued) | |
| | Switzerland – (continued) | | | | |
| | 32 | | | SGS SA (Industrials) | | | 70,380 | |
| | 15 | | | Sika AG (Materials) | | | 71,538 | |
| | 624 | | | Sonova Holding AG (Health Care) | | | 86,435 | |
| | 7,903 | | | STMicroelectronics NV (Information Technology) | | | 59,000 | |
| | 166 | | | Swatch Group AG (The) – Bearer (Consumer Discretionary) | | | 42,761 | |
| | 676 | | | Swatch Group AG (The) – Registered (Consumer Discretionary) | | | 34,366 | |
| | 414 | | | Swiss Life Holding AG (Financials)* | | | 103,653 | |
| | 664 | | | Swiss Prime Site AG (Real Estate)* | | | 58,456 | |
| | 1,277 | | | Swiss Re AG (Financials) | | | 107,873 | |
| | 78 | | | Swisscom AG (Telecommunication Services) | | | 37,303 | |
| | 161 | | | Syngenta AG (Materials) | | | 70,181 | |
| | 7,694 | | | UBS Group AG (Financials) | | | 111,352 | |
| | 1,638 | | | Wolseley PLC (Industrials) | | | 93,964 | |
| | 161 | | | Zurich Insurance Group AG (Financials)* | | | 41,194 | |
| | | | | | | | |
| | | | | | | 5,266,485 | |
| | |
| | United Kingdom – 25.5% | |
| | 5,826 | | | 3i Group PLC (Financials) | | | 46,888 | |
| | 8,164 | | | Admiral Group PLC (Financials) | | | 219,194 | |
| | 6,719 | | | Aggreko PLC (Industrials) | | | 89,671 | |
| | 656 | | | Anglo American PLC (Materials)* | | | 6,700 | |
| | 3,276 | | | ARM Holdings PLC (Information Technology) | | | 72,768 | |
| | 744 | | | Ashtead Group PLC (Industrials) | | | 12,326 | |
| | 1,196 | | | Associated British Foods PLC (Consumer Staples) | | | 47,634 | |
| | 4,487 | | | AstraZeneca PLC (Health Care) | | | 288,483 | |
| | 28,968 | | | Auto Trader Group PLC (Information Technology)(a) | | | 141,552 | |
| | 3,590 | | | Aviva PLC (Financials) | | | 20,143 | |
| | 1,213 | | | Babcock International Group PLC (Industrials) | | | 16,617 | |
| | 9,895 | | | BAE Systems PLC (Industrials) | | | 69,787 | |
| | 9,178 | | | Barclays PLC (Financials) | | | 20,705 | |
| | 5,850 | | | Barratt Developments PLC (Consumer Discretionary) | | | 37,849 | |
| | 43,171 | | | BP PLC (Energy) | | | 241,939 | |
| | 7,186 | | | British American Tobacco PLC (Consumer Staples) | | | 444,693 | |
| | 5,316 | | | British Land Co. PLC (The) REIT (Real Estate) | | | 46,160 | |
| | 25,919 | | | BT Group PLC (Telecommunication Services) | | | 131,151 | |
| | 2,341 | | | Bunzl PLC (Industrials) | | | 72,296 | |
| | 8,981 | | | Burberry Group PLC (Consumer Discretionary) | | | 153,382 | |
| | 1,689 | | | Capita PLC (Industrials) | | | 22,895 | |
| | 23,273 | | | Centrica PLC (Utilities) | | | 70,898 | |
| | 17,403 | | | CNH Industrial NV (Industrials) | | | 126,956 | |
| | 233 | | | Coca-Cola European Partners PLC (Consumer Staples)* | | | 8,927 | |
| | 8,294 | | | Compass Group PLC (Consumer Discretionary) | | | 156,639 | |
| | |
| | |
| The accompanying notes are an integral part of these financial statements. | | 45 |
GOLDMAN SACHS ACTIVEBETA® EUROPE EQUITY ETF
Schedule of Investments (continued)
August 31, 2016
| | | | | | | | |
| Shares | | | Description | | Value | |
| | Common Stocks – (continued) | |
| | United Kingdom – (continued) | |
| | 1,004 | | | Croda International PLC (Materials) | | $ | 43,524 | |
| | 589 | | | DCC PLC (Industrials) | | | 53,459 | |
| | 8,196 | | | Diageo PLC (Consumer Staples) | | | 226,333 | |
| | 12,343 | | | Direct Line Insurance Group PLC (Financials) | | | 59,651 | |
| | 6,484 | | | Dixons Carphone PLC (Consumer Discretionary) | | | 31,480 | |
| | 5,400 | | | Fiat Chrysler Automobiles NV (Consumer Discretionary) | | | 37,258 | |
| | 3,906 | | | G4S PLC (Industrials) | | | 11,797 | |
| | 18,008 | | | GlaxoSmithKline PLC (Health Care) | | | 386,559 | |
| | 5,429 | | | Hammerson PLC REIT (Real Estate) | | | 41,240 | |
| | 10,997 | | | Hargreaves Lansdown PLC (Financials) | | | 190,404 | |
| | 63,325 | | | HSBC Holdings PLC (Financials) | | | 468,012 | |
| | 3,042 | | | ICAP PLC (Financials) | | | 19,056 | |
| | 869 | | | IMI PLC (Industrials) | | | 12,030 | |
| | 3,818 | | | Imperial Brands PLC (Consumer Staples) | | | 199,692 | |
| | 1,972 | | | Inmarsat PLC (Telecommunication Services) | | | 19,913 | |
| | 503 | | | InterContinental Hotels Group PLC (Consumer Discretionary) | | | 21,483 | |
| | 14,097 | | | International Consolidated Airlines Group SA (Industrials) | | | 70,841 | |
| | 1,233 | | | Intertek Group PLC (Industrials) | | | 56,375 | |
| | 5,876 | | | Intu Properties PLC REIT (Real Estate) | | | 24,319 | |
| | 9,352 | | | ITV PLC (Consumer Discretionary) | | | 24,582 | |
| | 7,956 | | | J Sainsbury PLC (Consumer Staples) | | | 25,039 | |
| | 770 | | | Johnson Matthey PLC (Materials) | | | 33,663 | |
| | 13,000 | | | Kingfisher PLC (Consumer Discretionary) | | | 63,184 | |
| | 4,273 | | | Land Securities Group PLC REIT (Real Estate) | | | 61,224 | |
| | 10,946 | | | Legal & General Group PLC (Financials) | | | 30,149 | |
| | 48,389 | | | Lloyds Banking Group PLC (Financials) | | | 37,613 | |
| | 32,112 | | | Marks & Spencer Group PLC (Consumer Discretionary) | | | 144,971 | |
| | 3,250 | | | Meggitt PLC (Industrials) | | | 19,933 | |
| | 5,852 | | | Merlin Entertainments PLC (Consumer Discretionary)(a) | | | 36,797 | |
| | 11,433 | | | National Grid PLC (Utilities) | | | 156,701 | |
| | 1,789 | | | Next PLC (Consumer Discretionary) | | | 129,454 | |
| | 5,260 | | | Old Mutual PLC (Financials) | | | 13,372 | |
| | 1,586 | | | Persimmon PLC (Consumer Discretionary) | | | 37,888 | |
| | 2,467 | | | Petrofac Ltd. (Energy) | | | 26,866 | |
| | 2,730 | | | Provident Financial PLC (Financials) | | | 107,479 | |
| | 5,694 | | | Prudential PLC (Financials) | | | 101,682 | |
| | 2,366 | | | Reckitt Benckiser Group PLC (Consumer Staples) | | | 227,882 | |
| | 4,238 | | | RELX NV (Industrials) | | | 75,049 | |
| | 6,214 | | | RELX PLC (Industrials) | | | 117,601 | |
| | 1,619 | | | Rio Tinto PLC (Materials) | | | 48,790 | |
| | 2,021 | | | Rolls-Royce Holdings PLC (Industrials)* | | | 20,381 | |
| | 26,290 | | | Royal Mail PLC (Industrials) | | | 176,980 | |
| | 2,849 | | | RSA Insurance Group PLC (Financials) | | | 18,504 | |
| | 19,630 | | | Sage Group PLC (The) (Information Technology) | | | 186,393 | |
| | |
| | Common Stocks – (continued) | |
| | United Kingdom – (continued) | |
| | 312 | | | Schroders PLC (Financials) | | | 11,376 | |
| | 11,409 | | | Segro PLC REIT (Real Estate) | | | 67,719 | |
| | 2,392 | | | Severn Trent PLC (Utilities) | | | 74,592 | |
| | 8,515 | | | Sky PLC (Consumer Discretionary) | | | 94,681 | |
| | 6,096 | | | Smith & Nephew PLC (Health Care) | | | 98,123 | |
| | 397 | | | Smiths Group PLC (Industrials) | | | 6,973 | |
| | 3,068 | | | SSE PLC (Utilities) | | | 60,433 | |
| | 1,794 | | | St James’s Place PLC (Financials) | | | 23,073 | |
| | 2,782 | | | Standard Life PLC (Financials) | | | 13,281 | |
| | 7,214 | | | Tate & Lyle PLC (Consumer Staples) | | | 69,302 | |
| | 11,363 | | | Taylor Wimpey PLC (Consumer Discretionary) | | | 24,005 | |
| | 76,054 | | | Tesco PLC (Consumer Staples)* | | | 165,698 | |
| | 5,660 | | | Unilever NV (Consumer Staples) | | | 259,182 | |
| | 6,073 | | | Unilever PLC (Consumer Staples) | | | 280,690 | |
| | 5,232 | | | United Utilities Group PLC (Utilities) | | | 66,570 | |
| | 69,306 | | | Vodafone Group PLC (Telecommunication Services) | | | 208,635 | |
| | 2,112 | | | Whitbread PLC (Consumer Discretionary) | | | 115,401 | |
| | 30,783 | | | William Hill PLC (Consumer Discretionary) | | | 128,287 | |
| | 77,182 | | | Wm Morrison Supermarkets PLC (Consumer Staples) | | | 199,138 | |
| | 10,504 | | | Worldpay Group PLC (Information Technology)*(a) | | | 41,106 | |
| | 7,410 | | | WPP PLC (Consumer Discretionary) | | | 170,417 | |
| | | | | | | | |
| | | | | | | 8,640,538 | |
| | |
| | United States – 0.8% | |
| | 1,454 | | | Carnival PLC (Consumer Discretionary) | | | 69,583 | |
| | 2,210 | | | QIAGEN NV (Health Care)* | | | 58,434 | |
| | 2,236 | | | Shire PLC (Health Care) | | | 139,425 | |
| | | | | | | | |
| | | | | | | 267,442 | |
| | |
| | TOTAL COMMON STOCKS | |
| | (Cost $32,652,261) | | $ | 33,746,748 | |
| | |
| | | | | | | | |
| | Preferred Stocks – 0.5% | |
| | Germany – 0.5% | |
| | 2,143 | | | FUCHS PETROLUB SE (Materials) | | $ | 97,332 | |
| | 611 | | | Henkel AG & Co KGaA (Consumer Staples) | | | 80,061 | |
| | |
| | TOTAL PREFERRED STOCKS | |
| | (Cost $153,447) | | $ | 177,393 | |
| | |
| | TOTAL INVESTMENTS – 99.9% | |
| | (Cost $32,805,708) | | $ | 33,924,141 | |
| | |
| OTHER ASSETS IN EXCESS OF
LIABILITIES – 0.1% | | | 35,345 | |
| | |
| | NET ASSETS – 100.0% | | $ | 33,959,486 | |
| | |
| | |
| 46 | | The accompanying notes are an integral part of these financial statements. |
GOLDMAN SACHS ACTIVEBETA® EUROPE EQUITY ETF
| | |
| The percentage shown for each investment category reflects the value of investments in that category as a percentage of net assets. |
* | | Non-income producing security |
(a) | | Exempt from registration under Rule 144A of the Securities Act of 1933. Under procedures approved by the Board of Trustees, such securities may be deemed liquid by the Investment Adviser and may be resold, normally to qualified institutional buyers in transactions exempt from registration. Total market value of Rule 144A securities amounts to $506,222, which represents approximately 1.5% of net assets as of August 31, 2016. |
| | |
|
Investment Abbreviations: |
PLC | | —Public Limited Company |
REIT | | —Real Estate Investment Trust |
|
| | |
| The accompanying notes are an integral part of these financial statements. | | 47 |
GOLDMAN SACHS ACTIVEBETA® INTERNATIONAL EQUITY ETF
Schedule of Investments
August 31, 2016
| | | | | | | | |
| Shares | | | Description | | Value | |
| | Common Stocks – 99.2% | |
| | Australia – 6.4% | |
| | 11,779 | | | AGL Energy Ltd. (Utilities) | | $ | 164,214 | |
| | 12,674 | | | Amcor Ltd. (Materials) | | | 152,402 | |
| | 37,666 | | | AMP Ltd. (Financials) | | | 148,899 | |
| | 12,060 | | | APA Group (Utilities) | | | 83,748 | |
| | 40,129 | | | Aristocrat Leisure Ltd. (Consumer Discretionary) | | | 455,400 | |
| | 7,885 | | | ASX Ltd. (Financials) | | | 303,114 | |
| | 99,341 | | | AusNet Services (Utilities) | | | 128,415 | |
| | 35,707 | | | Australia & New Zealand Banking Group Ltd. (Financials) | | | 721,878 | |
| | 12,444 | | | Bank of Queensland Ltd. (Financials) | | | 98,667 | |
| | 43,347 | | | Bendigo & Adelaide Bank Ltd. (Financials) | | | 357,700 | |
| | 11,952 | | | Boral Ltd. (Materials) | | | 59,374 | |
| | 20,389 | | | Brambles Ltd. (Industrials) | | | 188,784 | |
| | 8,825 | | | Caltex Australia Ltd. (Energy) | | | 225,171 | |
| | 22,348 | | | Challenger Ltd. (Financials) | | | 154,352 | |
| | 15,519 | | | CIMIC Group Ltd. (Industrials) | | | 345,351 | |
| | 10,075 | | | Cochlear Ltd. (Health Care) | | | 1,066,876 | |
| | 28,931 | | | Commonwealth Bank of Australia (Financials) | | | 1,561,372 | |
| | 9,325 | | | CSL Ltd. (Health Care) | | | 757,587 | |
| | 19,573 | | | Dexus Property Group REIT (Real Estate) | | | 142,982 | |
| | 2,867 | | | Domino’s Pizza Enterprises Ltd. (Consumer Discretionary) | | | 163,089 | |
| | 79,670 | | | DUET Group (Utilities) | | | 157,474 | |
| | 18,366 | | | Flight Centre Travel Group Ltd. (Consumer Discretionary) | | | 508,640 | |
| | 217,160 | | | Fortescue Metals Group Ltd. (Materials) | | | 799,713 | |
| | 27,812 | | | Goodman Group REIT (Real Estate) | | | 158,647 | |
| | 39,455 | | | GPT Group (The) REIT (Real Estate) | | | 158,047 | |
| | 35,752 | | | Harvey Norman Holdings Ltd. (Consumer Discretionary) | | | 144,557 | |
| | 43,689 | | | Insurance Australia Group Ltd. (Financials) | | | 182,560 | |
| | 12,486 | | | LendLease Group (Real Estate) | | | 129,685 | |
| | 5,618 | | | Macquarie Group Ltd. (Financials) | | | 340,732 | |
| | 82,034 | | | Medibank Pvt Ltd. (Financials) | | | 165,846 | |
| | 62,465 | | | Mirvac Group REIT (Real Estate) | | | 108,914 | |
| | 16,762 | | | National Australia Bank Ltd. (Financials) | | | 344,415 | |
| | 14,192 | | | Newcrest Mining Ltd. (Materials)* | | | 236,679 | |
| | 30,376 | | | Origin Energy Ltd. (Energy) | | | 120,081 | |
| | 99,555 | | | Platinum Asset Management Ltd. (Financials) | | | 402,535 | |
| | 73,737 | | | Qantas Airways Ltd. (Industrials)* | | | 179,551 | |
| | 12,666 | | | QBE Insurance Group Ltd. (Financials) | | | 94,430 | |
| | 8,056 | | | Ramsay Health Care Ltd. (Health Care) | | | 502,341 | |
| | 10,950 | | | REA Group Ltd. (Consumer Discretionary) | | | 482,330 | |
| | 96,644 | | | Scentre Group REIT (Real Estate) | | | 360,985 | |
| | 4,959 | | | SEEK Ltd. (Industrials) | | | 59,892 | |
| | 5,379 | | | Sonic Healthcare Ltd. (Health Care) | | | 92,980 | |
| | 333,288 | | | South32 Ltd. (Materials)* | | | 480,927 | |
| | 43,030 | | | Stockland REIT (Real Estate) | | | 156,845 | |
| | 24,647 | | | Suncorp Group Ltd. (Financials) | | | 235,433 | |
| | |
| | Common Stocks – (continued) | |
| | Australia – (continued) | |
| | 56,319 | | | Sydney Airport (Industrials) | | | 308,137 | |
| | 25,619 | | | Tabcorp Holdings Ltd. (Consumer Discretionary) | | | 95,692 | |
| | 58,928 | | | Tatts Group Ltd. (Consumer Discretionary) | | | 168,735 | |
| | 121,772 | | | Telstra Corp. Ltd. (Telecommunication Services) | | | 481,384 | |
| | 7,984 | | | TPG Telecom Ltd. (Telecommunication Services) | | | 73,145 | |
| | 52,485 | | | Transurban Group (Industrials) | | | 452,041 | |
| | 10,623 | | | Treasury Wine Estates Ltd. (Consumer Staples) | | | 89,657 | |
| | 64,510 | | | Vicinity Centres REIT (Real Estate) | | | 160,477 | |
| | 22,729 | | | Vocus Communications Ltd. (Telecommunication Services) | | | 131,360 | |
| | 13,329 | | | Wesfarmers Ltd. (Consumer Staples) | | | 425,139 | |
| | 41,523 | | | Westfield Corp. REIT (Real Estate) | | | 318,932 | |
| | 44,245 | | | Westpac Banking Corp. (Financials) | | | 979,614 | |
| | 33,875 | | | Woolworths Ltd. (Consumer Staples) | | | 603,627 | |
| | | | | | | | |
| | | | | | | 18,171,554 | |
| | |
| | Austria – 0.2% | |
| | 2,366 | | | ANDRITZ AG (Industrials) | | | 120,544 | |
| | 4,112 | | | OMV AG (Energy) | | | 115,043 | |
| | 26,872 | | | Raiffeisen Bank International AG (Financials)* | | | 381,291 | |
| | | | | | | | |
| | | | | | | 616,878 | |
| | |
| | Belgium – 1.0% | |
| | 2,866 | | | Ageas (Financials) | | | 98,856 | |
| | 9,678 | | | Anheuser-Busch InBev SA/NV (Consumer Staples) | | | 1,196,994 | |
| | 7,228 | | | Colruyt SA (Consumer Staples) | | | 396,109 | |
| | 2,665 | | | Groupe Bruxelles Lambert SA (Financials) | | | 233,504 | |
| | 3,239 | | | Proximus SADP (Telecommunication Services) | | | 98,952 | |
| | 2,010 | | | Solvay SA (Materials) | | | 220,304 | |
| | 5,434 | | | Telenet Group Holding NV (Consumer Discretionary)* | | | 254,461 | |
| | 1,642 | | | UCB SA (Health Care) | | | 134,616 | |
| | 2,476 | | | Umicore SA (Materials) | | | 145,990 | |
| | | | | | | | |
| | | | | | | 2,779,786 | |
| | |
| | Canada – 9.1% | |
| | 3,387 | | | Agnico Eagle Mines Ltd. (Materials) | | | 171,589 | |
| | 1,380 | | | Agrium, Inc. (Materials) | | | 132,904 | |
| | 22,283 | | | Alimentation Couche-Tard, Inc., Class B (Consumer Staples) | | | 1,148,584 | |
| | 2,821 | | | Atco Ltd., Class I (Utilities) | | | 103,440 | |
| | 7,823 | | | Bank of Montreal (Financials) | | | 518,612 | |
| | 14,970 | | | Bank of Nova Scotia (The) (Financials) | | | 796,506 | |
| | 15,718 | | | Barrick Gold Corp. (Materials) | | | 267,028 | |
| | 4,694 | | | BCE, Inc. (Telecommunication Services) | | | 219,200 | |
| | 15,260 | | | Brookfield Asset Management, Inc., Class A (Financials) | | | 514,656 | |
| | 7,800 | | | CAE, Inc. (Industrials) | | | 111,170 | |
| | |
| | |
| 48 | | The accompanying notes are an integral part of these financial statements. |
GOLDMAN SACHS ACTIVEBETA® INTERNATIONAL EQUITY ETF
| | | | | | | | |
| Shares | | | Description | | Value | |
| | Common Stocks – (continued) | |
| | Canada – (continued) | |
| | 5,761 | | | Canadian Imperial Bank of Commerce (Financials) | | $ | 457,086 | |
| | 6,369 | | | Canadian National Railway Co. (Industrials) | | | 409,066 | |
| | 5,869 | | | Canadian Natural Resources Ltd. (Energy) | | | 182,192 | |
| | 512 | | | Canadian Pacific Railway Ltd. (Industrials) | | | 78,378 | |
| | 995 | | | Canadian Tire Corp. Ltd., Class A (Consumer Discretionary) | | | 101,870 | |
| | 3,679 | | | Canadian Utilities Ltd., Class A (Utilities) | | | 105,431 | |
| | 881 | | | CCL Industries, Inc., Class B (Materials) | | | 168,035 | |
| | 21,660 | | | Cenovus Energy, Inc. (Energy) | | | 312,836 | |
| | 5,756 | | | CGI Group, Inc., Class A (Information Technology)* | | | 280,024 | |
| | 26,491 | | | CI Financial Corp. (Financials) | | | 518,291 | |
| | 2,558 | | | Constellation Software, Inc. (Information Technology) | | | 1,115,534 | |
| | 12,250 | | | Crescent Point Energy Corp. (Energy) | | | 184,863 | |
| | 14,992 | | | Dollarama, Inc. (Consumer Discretionary) | | | 1,107,218 | |
| | 63,164 | | | Empire Co. Ltd. (Consumer Staples) | | | 1,038,411 | |
| | 4,899 | | | Enbridge, Inc. (Energy) | | | 193,115 | |
| | 19,106 | | | Encana Corp. (Energy) | | | 182,316 | |
| | 359 | | | Fairfax Financial Holdings Ltd. (Financials) | | | 203,085 | |
| | 22,027 | | | Finning International, Inc. (Industrials) | | | 390,494 | |
| | 9,055 | | | First Capital Realty, Inc. (Real Estate) | | | 153,142 | |
| | 4,815 | | | Fortis, Inc. (Utilities) | | | 151,380 | |
| | 2,134 | | | Franco-Nevada Corp. (Materials) | | | 149,033 | |
| | 11,104 | | | George Weston Ltd. (Consumer Staples) | | | 955,483 | |
| | 3,401 | | | Gildan Activewear, Inc. (Consumer Discretionary) | | | 100,082 | |
| | 5,501 | | | Goldcorp, Inc. (Materials) | | | 83,686 | |
| | 17,130 | | | Great-West Lifeco, Inc. (Financials) | | | 408,911 | |
| | 7,481 | | | H&R Real Estate Investment Trust REIT (Real Estate) | | | 132,965 | |
| | 12,042 | | | Husky Energy, Inc. (Energy)* | | | 147,949 | |
| | 5,287 | | | IGM Financial, Inc. (Financials) | | | 149,497 | |
| | 1,845 | | | Imperial Oil Ltd. (Energy) | | | 56,262 | |
| | 14,448 | | | Industrial Alliance Insurance & Financial Services, Inc. (Financials) | | | 514,690 | |
| | 3,642 | | | Intact Financial Corp. (Financials) | | | 264,202 | |
| | 20,112 | | | Jean Coutu Group PJC, Inc. (The), Class A (Consumer Staples) | | | 297,530 | |
| | 126,729 | | | Kinross Gold Corp. (Materials)* | | | 506,124 | |
| | 7,247 | | | Linamar Corp. (Consumer Discretionary) | | | 298,927 | |
| | 12,158 | | | Loblaw Cos. Ltd. (Consumer Staples) | | | 661,159 | |
| | 28,769 | | | Manulife Financial Corp. (Financials) | | | 392,270 | |
| | 23,105 | | | Metro, Inc. (Consumer Staples) | | | 784,342 | |
| | 7,309 | | | National Bank of Canada (Financials) | | | 256,752 | |
| | 11,453 | | | Onex Corp. (Financials) | | | 699,113 | |
| | 2,470 | | | Open Text Corp. (Information Technology) | | | 155,273 | |
| | |
| | Common Stocks – (continued) | |
| | Canada – (continued) | |
| | 29,556 | | | Power Corp. of Canada (Financials) | | | 624,437 | |
| | 18,499 | | | Power Financial Corp. (Financials) | | | 425,940 | |
| | 1,330 | | | Restaurant Brands International, Inc. (Consumer Discretionary) | | | 63,426 | |
| | 6,261 | | | RioCan Real Estate Investment Trust REIT (Real Estate) | | | 131,419 | |
| | 5,872 | | | Rogers Communications, Inc., Class B (Telecommunication Services) | | | 251,341 | |
| | 23,927 | | | Royal Bank of Canada (Financials) | | | 1,486,809 | |
| | 15,541 | | | Saputo, Inc. (Consumer Staples) | | | 516,434 | |
| | 5,591 | | | Seven Generations Energy Ltd., Class A (Energy)* | | | 128,690 | |
| | 5,494 | | | Shaw Communications, Inc., Class B (Consumer Discretionary) | | | 109,834 | |
| | 6,488 | | | Silver Wheaton Corp. (Materials) | | | 164,369 | |
| | 6,160 | | | Smart Real Estate Investment Trust REIT (Real Estate) | | | 166,389 | |
| | 3,487 | | | SNC-Lavalin Group, Inc. (Industrials) | | | 148,564 | |
| | 9,137 | | | Sun Life Financial, Inc. (Financials) | | | 288,167 | |
| | 20,350 | | | Suncor Energy, Inc. (Energy) | | | 551,538 | |
| | 5,479 | | | Teck Resources Ltd., Class B (Materials) | | | 88,738 | |
| | 3,265 | | | TELUS Corp. (Telecommunication Services) | | | 107,054 | |
| | 25,168 | | | Toronto-Dominion Bank (The) (Financials) | | | 1,122,542 | |
| | 8,338 | | | TransCanada Corp. (Energy) | | | 377,928 | |
| | 128,915 | | | Turquoise Hill Resources Ltd. (Materials)* | | | 396,949 | |
| | 30,629 | | | Veresen, Inc. (Energy) | | | 301,610 | |
| | 28,043 | | | Yamana Gold, Inc. (Materials) | | | 113,493 | |
| | | | | | | | |
| | | | | | | 25,896,377 | |
| | |
| | China – 0.1% | |
| | 556,150 | | | Yangzijiang Shipbuilding Holdings Ltd. (Industrials) | | | 312,180 | |
| | |
| | Denmark – 2.1% | |
| | 6,845 | | | Carlsberg A/S, Class B (Consumer Staples) | | | 640,701 | |
| | 2,977 | | | Chr Hansen Holding A/S (Materials) | | | 180,243 | |
| | 6,812 | | | Coloplast A/S, Class B (Health Care) | | | 517,327 | |
| | 4,705 | | | Danske Bank A/S (Financials) | | | 137,856 | |
| | 4,583 | | | DSV A/S (Industrials) | | | 226,935 | |
| | 892 | | | Genmab A/S (Health Care)* | | | 142,291 | |
| | 6,607 | | | ISS A/S (Industrials) | | | 267,143 | |
| | 40,779 | | | Novo Nordisk A/S, Class B (Health Care) | | | 1,908,178 | |
| | 1,353 | | | Novozymes A/S, Class B (Materials) | | | 58,574 | |
| | 5,803 | | | Pandora A/S (Consumer Discretionary) | | | 720,751 | |
| | 44,061 | | | TDC A/S (Telecommunication Services)* | | | 243,164 | |
| | 6,229 | | | Tryg A/S (Financials) | | | 124,066 | |
| | 4,284 | | | Vestas Wind Systems A/S (Industrials) | | | 354,831 | |
| | 22,200 | | | William Demant Holding A/S (Health Care)* | | | 463,095 | |
| | | | | | | | |
| | | | | | | 5,985,155 | |
| | |
| | |
| The accompanying notes are an integral part of these financial statements. | | 49 |
GOLDMAN SACHS ACTIVEBETA® INTERNATIONAL EQUITY ETF
Schedule of Investments (continued)
August 31, 2016
| | | | | | | | |
| Shares | | | Description | | Value | |
| | Common Stocks – (continued) | |
| | Finland – 0.9% | |
| | 5,789 | | | Elisa OYJ (Telecommunication Services) | | $ | 203,354 | |
| | 5,014 | | | Fortum OYJ (Utilities) | | | 77,287 | |
| | 4,212 | | | Kone OYJ, Class B (Industrials) | | | 211,334 | |
| | 6,376 | | | Neste OYJ (Energy) | | | 265,161 | |
| | 10,062 | | | Nokia OYJ (Information Technology) | | | 56,481 | |
| | 1,582 | | | Nokian Renkaat OYJ (Consumer Discretionary) | | | 57,034 | |
| | 12,663 | | | Orion OYJ, Class B (Health Care) | | | 478,670 | |
| | 7,445 | | | Sampo OYJ, Class A (Financials) | | | 319,154 | |
| | 41,098 | | | UPM-Kymmene OYJ (Materials) | | | 824,370 | |
| | 1,421 | | | Wartsila OYJ Abp (Industrials) | | | 58,368 | |
| | | | | | | | |
| | | | | | | 2,551,213 | |
| | |
| | France – 9.4% | |
| | 10,892 | | | Accor SA (Consumer Discretionary) | | | 410,572 | |
| | 953 | | | Aeroports de Paris (Industrials) | | | 98,180 | |
| | 2,064 | | | Air Liquide SA (Materials) | | | 226,039 | |
| | 2,623 | | | Airbus Group SE (Industrials) | | | 152,758 | |
| | 3,311 | | | Alstom SA (Industrials)* | | | 87,452 | |
| | 1,008 | | | Arkema SA (Materials) | | | 89,846 | |
| | 18,421 | | | Atos SE (Information Technology) | | | 1,809,750 | |
| | 27,301 | | | AXA SA (Financials) | | | 572,250 | |
| | 16,590 | | | BNP Paribas SA (Financials) | | | 842,648 | |
| | 6,733 | | | Bureau Veritas SA (Industrials) | | | 144,128 | |
| | 7,009 | | | Capgemini SA (Information Technology) | | | 681,799 | |
| | 18,214 | | | Carrefour SA (Consumer Staples) | | | 457,851 | |
| | 4,266 | | | Casino Guichard Perrachon SA (Consumer Staples) | | | 210,695 | |
| | 5,284 | | | Christian Dior SE (Consumer Discretionary) | | | 912,183 | |
| | 3,653 | | | Cie de Saint-Gobain (Industrials) | | | 159,974 | |
| | 2,712 | | | Cie Generale des Etablissements Michelin (Consumer Discretionary) | | | 287,853 | |
| | 23,193 | | | CNP Assurances (Financials) | | | 372,744 | |
| | 39,296 | | | Credit Agricole SA (Financials) | | | 371,573 | |
| | 14,002 | | | Danone SA (Consumer Staples) | | | 1,062,156 | |
| | 6,621 | | | Dassault Systemes (Information Technology) | | | 556,895 | |
| | 4,668 | | | Eiffage SA (Industrials) | | | 364,969 | |
| | 7,019 | | | Engie SA (Utilities) | | | 111,711 | |
| | 4,972 | | | Essilor International SA (Health Care) | | | 630,452 | |
| | 3,994 | | | Eurazeo SA (Financials) | | | 241,944 | |
| | 8,742 | | | Eutelsat Communications SA (Consumer Discretionary) | | | 169,657 | |
| | 1,282 | | | Fonciere Des Regions REIT (Real Estate) | | | 119,595 | |
| | 1,940 | | | Gecina SA REIT (Real Estate) | | | 303,034 | |
| | 2,598 | | | Hermes International (Consumer Discretionary) | | | 1,095,487 | |
| | 1,380 | | | ICADE REIT (Real Estate) | | | 106,328 | |
| | 1,265 | | | Imerys SA (Materials) | | | 89,000 | |
| | 606 | | | Ingenico Group SA (Information Technology) | | | 65,158 | |
| | 2,761 | | | JCDecaux SA (Consumer Discretionary) | | | 94,712 | |
| | 357 | | | Kering (Consumer Discretionary) | | | 67,574 | |
| | |
| | Common Stocks – (continued) | |
| | France – (continued) | |
| | 4,028 | | | Klepierre REIT (Real Estate) | | | 188,465 | |
| | 5,447 | | | Lagardere SCA (Consumer Discretionary) | | | 132,646 | |
| | 3,378 | | | Legrand SA (Industrials) | | | 202,070 | |
| | 7,970 | | | L’Oreal SA (Consumer Staples) | | | 1,503,249 | |
| | 5,069 | | | LVMH Moet Hennessy Louis Vuitton SE (Consumer Discretionary) | | | 856,437 | |
| | 18,026 | | | Natixis SA (Financials) | | | 79,623 | |
| | 17,086 | | | Orange SA (Telecommunication Services) | | | 260,514 | |
| | 3,135 | | | Pernod Ricard SA (Consumer Staples) | | | 359,286 | |
| | 47,956 | | | Peugeot SA (Consumer Discretionary)* | | | 706,360 | |
| | 5,510 | | | Publicis Groupe SA (Consumer Discretionary) | | | 408,401 | |
| | 1,700 | | | Remy Cointreau SA (Consumer Staples) | | | 148,119 | |
| | 6,269 | | | Renault SA (Consumer Discretionary) | | | 511,858 | |
| | 48,802 | | | Rexel SA (Industrials) | | | 782,958 | |
| | 5,349 | | | Safran SA (Industrials) | | | 373,413 | |
| | 20,759 | | | Sanofi (Health Care) | | | 1,596,921 | |
| | 6,949 | | | Schneider Electric SE (Industrials) | | | 472,803 | |
| | 13,382 | | | SCOR SE (Financials) | | | 393,098 | |
| | 3,124 | | | Societe BIC SA (Industrials) | | | 455,273 | |
| | 14,632 | | | Societe Generale SA (Financials) | | | 531,995 | |
| | 2,630 | | | Sodexo SA (Consumer Discretionary) | | | 304,193 | |
| | 6,308 | | | Suez (Utilities) | | | 95,301 | |
| | 4,945 | | | Technip SA (Energy) | | | 291,732 | |
| | 2,765 | | | Thales SA (Industrials) | | | 239,063 | |
| | 21,213 | | | TOTAL SA (Energy) | | | 1,010,010 | |
| | 1,231 | | | Unibail-Rodamco SE REIT (Real Estate) | | | 337,272 | |
| | 3,589 | | | Valeo SA (Consumer Discretionary) | | | 185,432 | |
| | 13,261 | | | Veolia Environnement SA (Utilities) | | | 281,579 | |
| | 8,981 | | | Vinci SA (Industrials) | | | 680,076 | |
| | 8,203 | | | Vivendi SA (Consumer Discretionary) | | | 158,785 | |
| | 757 | | | Wendel SA (Financials) | | | 85,955 | |
| | | | | | | | |
| | | | | | | 26,599,854 | |
| | |
| | Germany – 7.1% | | | | |
| | 8,851 | | | adidas AG (Consumer Discretionary) | | | 1,468,319 | |
| | 7,894 | | | Allianz SE (Financials) | | | 1,174,163 | |
| | 1,725 | | | Axel Springer SE (Consumer Discretionary) | | | 87,723 | |
| | 7,197 | | | BASF SE (Materials) | | | 584,341 | |
| | 13,059 | | | Bayer AG (Health Care) | | | 1,395,832 | |
| | 1,054 | | | Bayerische Motoren Werke AG (Consumer Discretionary) | | | 91,575 | |
| | 8,834 | | | Beiersdorf AG (Consumer Staples) | | | 820,659 | |
| | 3,066 | | | Brenntag AG (Industrials) | | | 166,606 | |
| | 1,139 | | | Continental AG (Consumer Discretionary) | | | 238,363 | |
| | 1,628 | | | Covestro AG (Materials)(a) | | | 84,639 | |
| | 4,845 | | | Daimler AG (Consumer Discretionary) | | | 334,991 | |
| | 7,760 | | | Deutsche Boerse AG (Financials)* | | | 662,031 | |
| | 34,124 | | | Deutsche Lufthansa AG (Industrials) | | | 396,968 | |
| | 31,291 | | | Deutsche Post AG (Industrials) | | | 989,750 | |
| | 55,701 | | | Deutsche Telekom AG (Telecommunication Services) | | | 928,693 | |
| | |
| | |
| 50 | | The accompanying notes are an integral part of these financial statements. |
GOLDMAN SACHS ACTIVEBETA® INTERNATIONAL EQUITY ETF
| | | | | | | | |
| Shares | | | Description | | Value | |
| | Common Stocks – (continued) | |
| | Germany – (continued) | |
| | 13,596 | | | Deutsche Wohnen AG (Real Estate) | | $ | 510,303 | |
| | 57,349 | | | E.ON SE (Utilities) | | | 527,394 | |
| | 3,192 | | | Evonik Industries AG (Materials) | | | 107,133 | |
| | 3,554 | | | Fraport AG Frankfurt Airport Services Worldwide (Industrials) | | | 197,953 | |
| | 4,610 | | | Fresenius Medical Care AG & Co KGaA (Health Care) | | | 407,362 | |
| | 7,745 | | | Fresenius SE & Co KGaA (Health Care) | | | 564,312 | |
| | 3,146 | | | GEA Group AG (Industrials) | | | 168,588 | |
| | 3,259 | | | Hannover Rueck SE (Financials) | | | 332,482 | |
| | 6,778 | | | HeidelbergCement AG (Materials) | | | 628,605 | |
| | 2,990 | | | Henkel AG & Co KGaA (Consumer Staples) | | | 335,176 | |
| | 1,600 | | | HOCHTIEF AG (Industrials) | | | 214,820 | |
| | 7,976 | | | HUGO BOSS AG (Consumer Discretionary) | | | 486,359 | |
| | 12,748 | | | Infineon Technologies AG (Information Technology) | | | 214,320 | |
| | 2,098 | | | LANXESS AG (Materials) | | | 111,785 | |
| | 1,397 | | | Linde AG (Materials) | | | 238,910 | |
| | 1,737 | | | MAN SE (Industrials) | | | 180,419 | |
| | 5,528 | | | Merck KGaA (Health Care) | | | 580,833 | |
| | 10,774 | | | METRO AG (Consumer Staples) | | | 319,188 | |
| | 3,439 | | | Muenchener Rueckversicherungs-Gesellschaft AG in Muenchen (Financials) | | | 620,681 | |
| | 4,852 | | | OSRAM Licht AG (Industrials) | | | 253,660 | |
| | 7,982 | | | ProSiebenSat.1 Media SE (Consumer Discretionary) | | | 342,796 | |
| | 13,693 | | | SAP SE (Information Technology) | | | 1,201,135 | |
| | 7,414 | | | Siemens AG (Industrials) | | | 883,948 | |
| | 5,076 | | | Symrise AG (Materials) | | | 373,180 | |
| | 36,960 | | | Telefonica Deutschland Holding AG (Telecommunication Services) | | | 151,649 | |
| | 12,266 | | | TUI AG (Consumer Discretionary) | | | 170,768 | |
| | 2,997 | | | United Internet AG (Information Technology) | | | 123,035 | |
| | 5,286 | | | Vonovia SE (Real Estate) | | | 205,378 | |
| | 10,669 | | | Zalando SE (Consumer Discretionary)*(a) | | | 407,395 | |
| | | | | | | | |
| | | | | | | 20,284,220 | |
| | |
| | Hong Kong – 2.8% | | | | |
| | 150,069 | | | AIA Group Ltd. (Financials) | | | 948,965 | |
| | 47,523 | | | Bank of East Asia Ltd. (The) (Financials) | | | 192,071 | |
| | 88,158 | | | BOC Hong Kong Holdings Ltd. (Financials) | | | 308,569 | |
| | 24,734 | | | Cheung Kong Infrastructure Holdings Ltd. (Utilities) | | | 207,744 | |
| | 9,885 | | | CK Hutchison Holdings Ltd. (Industrials) | | | 127,055 | |
| | 26,252 | | | CLP Holdings Ltd. (Utilities) | | | 269,229 | |
| | 77,465 | | | First Pacific Co. Ltd. (Financials) | | | 58,023 | |
| | 16,269 | | | Hang Seng Bank Ltd. (Financials) | | | 285,456 | |
| | 14,274 | | | Henderson Land Development Co. Ltd. (Real Estate) | | | 83,453 | |
| | |
| | Common Stocks – (continued) | |
| | Hong Kong – (continued) | | | | |
| | 283,737 | | | HK Electric Investments & HK Electric Investments Ltd. (Utilities)(a) | | | 266,298 | |
| | 119,352 | | | HKT Trust & HKT Ltd. (Telecommunication Services) | | | 164,639 | |
| | 56,476 | | | Hong Kong & China Gas Co. Ltd. (Utilities) | | | 107,757 | |
| | 26,971 | | | Hong Kong Exchanges and Clearing Ltd. (Financials) | | | 659,606 | |
| | 13,683 | | | Hysan Development Co. Ltd. (Real Estate) | | | 66,062 | |
| | 2,271 | | | Jardine Matheson Holdings Ltd. (Industrials) | | | 135,919 | |
| | 25,848 | | | Kerry Properties Ltd. (Real Estate) | | | 75,144 | |
| | 63,756 | | | Link REIT (Real Estate) | | | 463,575 | |
| | 33,617 | | | MTR Corp. Ltd. (Industrials) | | | 183,758 | |
| | 231,158 | | | New World Development Co. Ltd. (Real Estate) | | | 289,963 | |
| | 184,122 | | | NWS Holdings Ltd. (Industrials) | | | 328,995 | |
| | 356,599 | | | PCCW Ltd. (Telecommunication Services) | | | 226,186 | |
| | 12,920 | | | Power Assets Holdings Ltd. (Utilities) | | | 123,591 | |
| | 32,782 | | | Sino Land Co. Ltd. (Real Estate) | | | 56,125 | |
| | 828,639 | | | SJM Holdings Ltd. (Consumer Discretionary) | | | 521,321 | |
| | 22,091 | | | Sun Hung Kai Properties Ltd. (Real Estate) | | | 310,998 | |
| | 12,863 | | | Swire Pacific Ltd., Class A (Real Estate) | | | 142,116 | |
| | 38,337 | | | Techtronic Industries Co. Ltd. (Consumer Discretionary) | | | 155,439 | |
| | 813,368 | | | WH Group Ltd. (Consumer Staples)(a) | | | 639,642 | |
| | 26,346 | | | Wharf Holdings Ltd. (The) (Real Estate) | | | 186,130 | |
| | 84,614 | | | Wheelock & Co. Ltd. (Real Estate) | | | 484,335 | |
| | | | | | | | |
| | | | | | | 8,068,164 | |
| | |
| | Ireland – 0.5% | | | | |
| | 8,841 | | | CRH PLC (Materials) | | | 298,846 | |
| | 14,542 | | | Experian PLC (Industrials) | | | 288,351 | |
| | 10,166 | | | James Hardie Industries PLC CDI (Materials) | | | 165,717 | |
| | 3,555 | | | Kerry Group PLC, Class A (Consumer Staples) | | | 301,626 | |
| | 2,338 | | | Paddy Power Betfair PLC (Consumer Discretionary) | | | 279,013 | |
| | | | | | | | |
| | | | | | | 1,333,553 | |
| | |
| | Israel – 0.9% | | | | |
| | 2,527 | | | Azrieli Group Ltd. (Real Estate) | | | 110,222 | |
| | 37,207 | | | Bank Hapoalim BM (Financials) | | | 199,272 | |
| | 63,676 | | | Bank Leumi Le-Israel BM (Financials)* | | | 238,016 | |
| | 150,500 | | | Bezeq The Israeli Telecommunication Corp. Ltd. (Telecommunication Services) | | | 301,609 | |
| | 998 | | | Check Point Software Technologies Ltd. (Information Technology)* | | | 76,587 | |
| | 9,673 | | | Mizrahi Tefahot Bank Ltd. (Financials) | | | 116,474 | |
| | 7,111 | | | Nice Ltd. (Information Technology) | | | 484,800 | |
| | |
| | |
| The accompanying notes are an integral part of these financial statements. | | 51 |
GOLDMAN SACHS ACTIVEBETA® INTERNATIONAL EQUITY ETF
Schedule of Investments (continued)
August 31, 2016
| | | | | | | | |
| Shares | | | Description | | Value | |
| | Common Stocks – (continued) | |
| | Israel – (continued) | | | | |
| | 21,388 | | | Teva Pharmaceutical Industries Ltd. (Health Care) | | $ | 1,083,860 | |
| | | | | | | | |
| | | | | | | 2,610,840 | |
| | |
| | Italy – 2.0% | | | | |
| | 9,790 | | | Assicurazioni Generali SpA (Financials) | | | 124,301 | |
| | 8,410 | | | Atlantia SpA (Industrials) | | | 215,994 | |
| | 228,477 | | | Enel SpA (Utilities) | | | 1,007,177 | |
| | 14,520 | | | Eni SpA (Energy) | | | 218,964 | |
| | 13,342 | | | EXOR SpA (Financials) | | | 547,578 | |
| | 26,157 | | | Intesa Sanpaolo SpA (Financials) | | | 62,052 | |
| | 5,177 | | | Leonardo-Finmeccanica SpA (Industrials)* | | | 58,985 | |
| | 15,461 | | | Luxottica Group SpA (Consumer Discretionary) | | | 744,751 | |
| | 27,923 | | | Prysmian SpA (Industrials) | | | 687,915 | |
| | 60,744 | | | Snam SpA (Utilities) | | | 336,238 | |
| | 631,148 | | | Telecom Italia SpA (Telecommunication Services)* | | | 571,842 | |
| | 768,640 | | | Telecom Italia SpA-RSP (Telecommunication Services)* | | | 562,440 | |
| | 53,306 | | | Terna Rete Elettrica Nazionale SpA (Utilities) | | | 275,000 | |
| | 68,265 | | | UniCredit SpA (Financials) | | | 175,325 | |
| | 133,517 | | | UnipolSai SpA (Financials) | | | 222,611 | |
| | | | | | | | |
| | | | | | | 5,811,173 | |
| | |
| | Japan – 20.8% | | | | |
| | 3,581 | | | ABC-Mart, Inc. (Consumer Discretionary) | | | 225,035 | |
| | 9,037 | | | Aeon Co. Ltd. (Consumer Staples) | | | 124,282 | |
| | 14,592 | | | Ajinomoto Co., Inc. (Consumer Staples) | | | 309,376 | |
| | 14,100 | | | Alfresa Holdings Corp. (Health Care) | | | 263,229 | |
| | 41,845 | | | ANA Holdings, Inc. (Industrials) | | | 113,801 | |
| | 43,474 | | | Aozora Bank Ltd. (Financials) | | | 153,831 | |
| | 9,708 | | | Asahi Group Holdings Ltd. (Consumer Staples) | | | 317,797 | |
| | 8,426 | | | Asics Corp. (Consumer Discretionary) | | | 170,825 | |
| | 57,974 | | | Astellas Pharma, Inc. (Health Care) | | | 885,850 | |
| | 15,149 | | | Bandai Namco Holdings, Inc. (Consumer Discretionary) | | | 413,894 | |
| | 14,897 | | | Benesse Holdings, Inc. (Consumer Discretionary) | | | 343,638 | |
| | 9,135 | | | Bridgestone Corp. (Consumer Discretionary) | | | 313,965 | |
| | 28,963 | | | Brother Industries Ltd. (Information Technology) | | | 486,100 | |
| | 18,181 | | | Calbee, Inc. (Consumer Staples) | | | 660,025 | |
| | 22,363 | | | Canon, Inc. (Information Technology) | | | 640,827 | |
| | 6,688 | | | Casio Computer Co. Ltd. (Consumer Discretionary) | | | 94,467 | |
| | 1,433 | | | Central Japan Railway Co. (Industrials) | | | 235,381 | |
| | 27,107 | | | Chubu Electric Power Co., Inc. (Utilities) | | | 366,633 | |
| | 5,081 | | | Chugoku Electric Power Co., Inc. (The) (Utilities) | | | 61,010 | |
| | 13,809 | | | Concordia Financial Group Ltd. (Financials)* | | | 71,238 | |
| | |
| | Common Stocks – (continued) | |
| | Japan – (continued) | | | | |
| | 9,747 | | | CYBERDYNE, Inc. (Health Care)* | | | 153,506 | |
| | 9,541 | | | Dai Nippon Printing Co. Ltd. (Industrials) | | | 97,038 | |
| | 12,339 | | | Daiichi Sankyo Co. Ltd. (Health Care) | | | 283,260 | |
| | 3,216 | | | Daikin Industries Ltd. (Industrials) | | | 298,141 | |
| | 3,268 | | | Daito Trust Construction Co. Ltd. (Real Estate) | | | 481,346 | |
| | 10,850 | | | Daiwa House Industry Co. Ltd. (Real Estate) | | | 280,232 | |
| | 12,878 | | | Daiwa Securities Group, Inc. (Financials) | | | 75,250 | |
| | 2,271 | | | Denso Corp. (Consumer Discretionary) | | | 93,795 | |
| | 2,122 | | | Dentsu, Inc. (Consumer Discretionary) | | | 116,732 | |
| | 2,061 | | | East Japan Railway Co. (Industrials) | | | 176,540 | |
| | 4,830 | | | Eisai Co. Ltd. (Health Care) | | | 281,577 | |
| | 6,251 | | | FamilyMart Co. Ltd. (Consumer Staples) | | | 447,817 | |
| | 493 | | | FANUC Corp. (Industrials) | | | 84,030 | |
| | 2,116 | | | Fast Retailing Co. Ltd. (Consumer Discretionary) | | | 743,418 | |
| | 5,997 | | | Fuji Heavy Industries Ltd. (Consumer Discretionary) | | | 237,596 | |
| | 15,230 | | | FUJIFILM Holdings Corp. (Information Technology) | | | 572,331 | |
| | 77,843 | | | Fujitsu Ltd. (Information Technology) | | | 395,254 | |
| | 159,652 | | | GungHo Online Entertainment, Inc. (Information Technology) | | | 379,701 | |
| | 4,123 | | | Hankyu Hanshin Holdings, Inc. (Industrials) | | | 133,135 | |
| | 8,116 | | | Hikari Tsushin, Inc. (Consumer Discretionary) | | | 729,722 | |
| | 3,979 | | | Hisamitsu Pharmaceutical Co., Inc. (Health Care) | | | 178,110 | |
| | 2,768 | | | Hitachi Chemical Co. Ltd. (Materials) | | | 59,676 | |
| | 20,904 | | | Hitachi Construction Machinery Co. Ltd. (Industrials) | | | 391,666 | |
| | 3,520 | | | Hitachi High-Technologies Corp. (Information Technology) | | | 130,509 | |
| | 23,308 | | | Hitachi Ltd. (Information Technology) | | | 111,768 | |
| | 9,744 | | | Hokuriku Electric Power Co. (Utilities) | | | 116,436 | |
| | 27,216 | | | Honda Motor Co. Ltd. (Consumer Discretionary) | | | 834,096 | |
| | 1,523 | | | Hoshizaki Corp. (Industrials) | | | 121,769 | |
| | 14,914 | | | Hoya Corp. (Health Care) | | | 578,046 | |
| | 16,631 | | | Idemitsu Kosan Co. Ltd. (Energy) | | | 303,405 | |
| | 13,921 | | | Iida Group Holdings Co. Ltd. (Consumer Discretionary) | | | 260,830 | |
| | 19,085 | | | Isetan Mitsukoshi Holdings Ltd. (Consumer Discretionary) | | | 173,810 | |
| | 43,545 | | | ITOCHU Corp. (Industrials) | | | 514,028 | |
| | 2,174 | | | Japan Airlines Co. Ltd. (Industrials) | | | 66,144 | |
| | 2,884 | | | Japan Airport Terminal Co. Ltd. (Industrials) | | | 113,760 | |
| | 8,062 | | | Japan Exchange Group, Inc. (Financials) | | | 125,955 | |
| | 73 | | | Japan Retail Fund Investment Corp. REIT (Real Estate) | | | 163,947 | |
| | 9,600 | | | Japan Tobacco, Inc. (Consumer Staples) | | | 371,990 | |
| | |
| | |
| 52 | | The accompanying notes are an integral part of these financial statements. |
GOLDMAN SACHS ACTIVEBETA® INTERNATIONAL EQUITY ETF
| | | | | | | | |
| Shares | | | Description | | Value | |
| | Common Stocks – (continued) | |
| | Japan – (continued) | | | | |
| | 107,783 | | | JX Holdings, Inc. (Energy) | | $ | 403,164 | |
| | 19,181 | | | Kajima Corp. (Industrials) | | | 128,881 | |
| | 41,921 | | | Kakaku.com, Inc. (Information Technology) | | | 701,149 | |
| | 12,300 | | | Kamigumi Co. Ltd. (Industrials) | | | 106,548 | |
| | 10,146 | | | Kansai Electric Power Co., Inc. (The) (Utilities)* | | | 86,977 | |
| | 2,621 | | | Kansai Paint Co. Ltd. (Materials) | | | 57,749 | |
| | 21,441 | | | Kao Corp. (Consumer Staples) | | | 1,114,596 | |
| | 20,916 | | | KDDI Corp. (Telecommunication Services) | | | 613,922 | |
| | 19,421 | | | Keihan Holdings Co. Ltd. (Industrials) | | | 125,987 | |
| | 11,844 | | | Keikyu Corp. (Industrials) | | | 109,697 | |
| | 11,458 | | | Keio Corp. (Industrials) | | | 95,931 | |
| | 10,787 | | | Keisei Electric Railway Co. Ltd. (Industrials) | | | 129,734 | |
| | 577 | | | Keyence Corp. (Information Technology) | | | 404,600 | |
| | 4,001 | | | Kikkoman Corp. (Consumer Staples) | | | 125,908 | |
| | 33,334 | | | Kintetsu Group Holdings Co. Ltd. (Industrials) | | | 126,974 | |
| | 15,441 | | | Kirin Holdings Co. Ltd. (Consumer Staples) | | | 251,764 | |
| | 1,864 | | | Koito Manufacturing Co. Ltd. (Consumer Discretionary) | | | 88,753 | |
| | 5,511 | | | Komatsu Ltd. (Industrials) | | | 120,492 | |
| | 3,300 | | | Konami Holdings Corp. (Information Technology) | | | 116,610 | |
| | 58,924 | | | Konica Minolta, Inc. (Information Technology) | | | 530,934 | |
| | 6,352 | | | Kose Corp. (Consumer Staples) | | | 569,890 | |
| | 4,152 | | | Kubota Corp. (Industrials) | | | 60,894 | |
| | 7,510 | | | Kuraray Co. Ltd. (Materials) | | | 107,312 | |
| | 4,204 | | | Kurita Water Industries Ltd. (Industrials) | | | 95,879 | |
| | 2,895 | | | Kyocera Corp. (Information Technology) | | | 137,592 | |
| | 6,028 | | | Kyowa Hakko Kirin Co. Ltd. (Health Care) | | | 85,552 | |
| | 7,973 | | | Lawson, Inc. (Consumer Staples) | | | 559,617 | |
| | 16,148 | | | M3, Inc. (Health Care) | | | 483,183 | |
| | 908 | | | Makita Corp. (Industrials) | | | 65,224 | |
| | 15,889 | | | Marubeni Corp. (Industrials) | | | 79,218 | |
| | 5,213 | | | Marui Group Co. Ltd. (Consumer Discretionary) | | | 63,553 | |
| | 5,448 | | | Maruichi Steel Tube Ltd. (Materials) | | | 188,035 | |
| | 17,137 | | | Mazda Motor Corp. (Consumer Discretionary) | | | 282,565 | |
| | 6,633 | | | McDonald’s Holdings Co. Japan Ltd. (Consumer Discretionary) | | | 183,147 | |
| | 6,555 | | | Medipal Holdings Corp. (Health Care) | | | 103,678 | |
| | 9,543 | | | MEIJI Holdings Co. Ltd. (Consumer Staples) | | | 858,948 | |
| | 5,218 | | | Miraca Holdings, Inc. (Health Care) | | | 247,443 | |
| | 73,090 | | | Mitsubishi Chemical Holdings Corp. (Materials) | | | 461,286 | |
| | 24,305 | | | Mitsubishi Corp. (Industrials) | | | 506,496 | |
| | |
| | Common Stocks – (continued) | |
| | Japan – (continued) | | | | |
| | 14,508 | | | Mitsubishi Electric Corp. (Industrials) | | | 189,424 | |
| | 5,802 | | | Mitsubishi Estate Co. Ltd. (Real Estate) | | | 109,774 | |
| | 45,041 | | | Mitsubishi Gas Chemical Co., Inc. (Materials) | | | 304,816 | |
| | 16,000 | | | Mitsubishi Heavy Industries Ltd. (Industrials) | | | 69,671 | |
| | 26,097 | | | Mitsubishi Materials Corp. (Materials) | | | 73,673 | |
| | 70,665 | | | Mitsubishi Motors Corp. (Consumer Discretionary) | | | 323,145 | |
| | 12,891 | | | Mitsubishi Tanabe Pharma Corp. (Health Care) | | | 239,288 | |
| | 144,053 | | | Mitsubishi UFJ Financial Group, Inc. (Financials) | | | 785,617 | |
| | 67,741 | | | Mitsubishi UFJ Lease & Finance Co. Ltd. (Financials) | | | 317,633 | |
| | 31,877 | | | Mitsui & Co. Ltd. (Industrials) | | | 424,369 | |
| | 20,320 | | | Mitsui Chemicals, Inc. (Materials) | | | 97,244 | |
| | 3,093 | | | Mitsui Fudosan Co. Ltd. (Real Estate) | | | 66,623 | |
| | 173,159 | | | Mitsui OSK Lines Ltd. (Industrials) | | | 400,106 | |
| | 14,995 | | | Mixi, Inc. (Information Technology) | | | 532,766 | |
| | 374,441 | | | Mizuho Financial Group, Inc. (Financials) | | | 650,525 | |
| | 1,810 | | | Murata Manufacturing Co. Ltd. (Information Technology) | | | 243,322 | |
| | 87,483 | | | Nagoya Railroad Co. Ltd. (Industrials) | | | 428,809 | |
| | 5,637 | | | Nexon Co. Ltd. (Information Technology) | | | 77,224 | |
| | 2,875 | | | NH Foods Ltd. (Consumer Staples) | | | 62,956 | |
| | 29,091 | | | NHK Spring Co. Ltd. (Consumer Discretionary) | | | 273,937 | |
| | 1,794 | | | Nidec Corp. (Industrials) | | | 161,683 | |
| | 22,626 | | | Nikon Corp. (Consumer Discretionary) | | | 332,275 | |
| | 16,600 | | | Nippon Express Co. Ltd. (Industrials) | | | 78,639 | |
| | 1,696 | | | Nippon Paint Holdings Co. Ltd. (Materials) | | | 60,750 | |
| | 73 | | | Nippon Prologis REIT, Inc. REIT (Real Estate) | | | 175,240 | |
| | 18,395 | | | Nippon Steel & Sumitomo Metal Corp. (Materials) | | | 390,539 | |
| | 14,761 | | | Nippon Telegraph & Telephone Corp. (Telecommunication Services) | | | 648,750 | |
| | 33,181 | | | Nippon Yusen KK (Industrials) | | | 60,309 | |
| | 12,182 | | | Nissan Motor Co. Ltd. (Consumer Discretionary) | | | 119,541 | |
| | 8,767 | | | Nisshin Seifun Group, Inc. (Consumer Staples) | | | 124,002 | |
| | 1,975 | | | Nissin Foods Holdings Co. Ltd. (Consumer Staples) | | | 109,600 | |
| | 8,349 | | | Nitori Holdings Co. Ltd. (Consumer Discretionary) | | | 846,725 | |
| | 950 | | | Nitto Denko Corp. (Materials) | | | 64,879 | |
| | 5,147 | | | Nomura Real Estate Holdings, Inc. (Real Estate) | | | 83,897 | |
| | 2,995 | | | Nomura Research Institute Ltd. (Information Technology) | | | 101,344 | |
| | 5,426 | | | NTT Data Corp. (Information Technology) | | | 282,749 | |
| | |
| | |
| The accompanying notes are an integral part of these financial statements. | | 53 |
GOLDMAN SACHS ACTIVEBETA® INTERNATIONAL EQUITY ETF
Schedule of Investments (continued)
August 31, 2016
| | | | | | | | |
| Shares | | | Description | | Value | |
| | Common Stocks – (continued) | |
| | Japan – (continued) | | | | |
| | 20,499 | | | NTT DOCOMO, Inc. (Telecommunication Services) | | $ | 515,869 | |
| | 11,205 | | | Obayashi Corp. (Industrials) | | | 103,454 | |
| | 2,187 | | | Obic Co. Ltd. (Information Technology) | | | 112,062 | |
| | 11,001 | | | Odakyu Electric Railway Co. Ltd. (Industrials) | | | 112,951 | |
| | 27,306 | | | Oji Holdings Corp. (Materials) | | | 109,821 | |
| | 6,095 | | | Olympus Corp. (Health Care) | | | 199,464 | |
| | 7,652 | | | Omron Corp. (Information Technology) | | | 259,666 | |
| | 4,509 | | | Ono Pharmaceutical Co. Ltd. (Health Care) | | | 117,569 | |
| | 5,718 | | | Oracle Corp. Japan (Information Technology) | | | 332,792 | |
| | 1,462 | | | Oriental Land Co. Ltd. (Consumer Discretionary) | | | 85,641 | |
| | 19,337 | | | ORIX Corp. (Financials) | | | 278,086 | |
| | 50,859 | | | Osaka Gas Co. Ltd. (Utilities) | | | 200,269 | |
| | 13,597 | | | Otsuka Holdings Co. Ltd. (Health Care) | | | 589,311 | |
| | 38,186 | | | Panasonic Corp. (Consumer Discretionary) | | | 391,699 | |
| | 10,404 | | | Park24 Co. Ltd. (Industrials) | | | 304,269 | |
| | 6,049 | | | Pola Orbis Holdings, Inc. (Consumer Staples) | | | 483,054 | |
| | 12,950 | | | Recruit Holdings Co. Ltd. (Industrials) | | | 492,660 | |
| | 50,470 | | | Resona Holdings, Inc. (Financials) | | | 230,893 | |
| | 14,104 | | | Ricoh Co. Ltd. (Information Technology) | | | 127,220 | |
| | 1,018 | | | Rinnai Corp. (Consumer Discretionary) | | | 95,467 | |
| | 2,341 | | | Ryohin Keikaku Co. Ltd. (Consumer Discretionary) | | | 422,324 | |
| | 2,653 | | | Sankyo Co. Ltd. (Consumer Discretionary) | | | 92,080 | |
| | 17,367 | | | SBI Holdings, Inc. (Financials) | | | 206,184 | |
| | 4,047 | | | Secom Co. Ltd. (Industrials) | | | 307,218 | |
| | 5,381 | | | Sega Sammy Holdings, Inc. (Consumer Discretionary) | | | 73,509 | |
| | 10,452 | | | Sekisui Chemical Co. Ltd. (Consumer Discretionary) | | | 146,117 | |
| | 8,890 | | | Sekisui House Ltd. (Consumer Discretionary) | | | 143,189 | |
| | 11,617 | | | Seven & i Holdings Co. Ltd. (Consumer Staples) | | | 489,793 | |
| | 20,145 | | | Seven Bank Ltd. (Financials) | | | 71,282 | |
| | 8,817 | | | Shimadzu Corp. (Information Technology) | | | 138,007 | |
| | 2,235 | | | Shimamura Co. Ltd. (Consumer Discretionary) | | | 258,645 | |
| | 1,905 | | | Shimano, Inc. (Consumer Discretionary) | | | 276,997 | |
| | 10,167 | | | Shimizu Corp. (Industrials) | | | 90,725 | |
| | 2,512 | | | Shin-Etsu Chemical Co. Ltd. (Materials) | | | 184,426 | |
| | 79,620 | | | Shinsei Bank Ltd. (Financials) | | | 127,010 | |
| | 5,495 | | | Shionogi & Co. Ltd. (Health Care) | | | 245,385 | |
| | 24,791 | | | Shiseido Co. Ltd. (Consumer Staples) | | | 623,400 | |
| | 15,230 | | | Showa Shell Sekiyu KK (Energy) | | | 129,868 | |
| | 3,230 | | | SoftBank Group Corp. (Telecommunication Services) | | | 210,972 | |
| | |
| | Common Stocks – (continued) | |
| | Japan – (continued) | | | | |
| | 1,491 | | | Sohgo Security Services Co. Ltd. (Industrials) | | | 74,525 | |
| | 3,133 | | | Sompo Japan Nipponkoa Holdings, Inc. (Financials) | | | 100,440 | |
| | 16,455 | | | Sony Corp. (Consumer Discretionary) | | | 528,959 | |
| | 2,362 | | | Stanley Electric Co. Ltd. (Consumer Discretionary) | | | 60,355 | |
| | 12,915 | | | Start Today Co. Ltd. (Consumer Discretionary) | | | 599,957 | |
| | 36,466 | | | Sumitomo Chemical Co. Ltd. (Materials) | | | 167,109 | |
| | 27,020 | | | Sumitomo Corp. (Industrials) | | | 293,097 | |
| | 13,795 | | | Sumitomo Dainippon Pharma Co. Ltd. (Health Care) | | | 230,995 | |
| | 6,758 | | | Sumitomo Electric Industries Ltd. (Consumer Discretionary) | | | 100,192 | |
| | 19,759 | | | Sumitomo Mitsui Financial Group, Inc. (Financials) | | | 691,713 | |
| | 10,652 | | | Sumitomo Rubber Industries Ltd. (Consumer Discretionary) | | | 157,975 | |
| | 3,647 | | | Sundrug Co. Ltd. (Consumer Staples) | | | 264,441 | |
| | 7,857 | | | Suntory Beverage & Food Ltd. (Consumer Staples) | | | 311,819 | |
| | 13,138 | | | Suzuken Co. Ltd. (Health Care) | | | 380,924 | |
| | 11,256 | | | Sysmex Corp. (Health Care) | | | 725,843 | |
| | 27,840 | | | Taiheiyo Cement Corp. (Materials) | | | 84,514 | |
| | 19,811 | | | Taisei Corp. (Industrials) | | | 149,011 | |
| | 2,411 | | | Taisho Pharmaceutical Holdings Co. Ltd. (Health Care) | | | 220,972 | |
| | 10,035 | | | Takashimaya Co. Ltd. (Consumer Discretionary) | | | 73,442 | |
| | 7,613 | | | Takeda Pharmaceutical Co. Ltd. (Health Care) | | | 335,624 | |
| | 43,418 | | | Teijin Ltd. (Materials) | | | 162,028 | |
| | 6,403 | | | Terumo Corp. (Health Care) | | | 249,162 | |
| | 26,986 | | | Tobu Railway Co. Ltd. (Industrials) | | | 130,971 | |
| | 3,298 | | | Toho Co. Ltd. (Consumer Discretionary) | | | 96,133 | |
| | 20,811 | | | Toho Gas Co. Ltd. (Utilities) | | | 176,854 | |
| | 16,266 | | | Tohoku Electric Power Co., Inc. (Utilities) | | | 203,964 | |
| | 4,155 | | | Tokio Marine Holdings, Inc. (Financials) | | | 163,252 | |
| | 63,486 | | | Tokyo Electric Power Co. Holdings, Inc. (Utilities)* | | | 255,945 | |
| | 3,141 | | | Tokyo Electron Ltd. (Information Technology) | | | 288,728 | |
| | 36,671 | | | Tokyo Gas Co. Ltd. (Utilities) | | | 157,235 | |
| | 5,105 | | | Tokyo Tatemono Co. Ltd. (Real Estate) | | | 59,966 | |
| | 27,299 | | | Tokyu Corp. (Industrials) | | | 203,749 | |
| | 13,790 | | | TonenGeneral Sekiyu KK (Energy) | | | 127,321 | |
| | 14,950 | | | Toppan Printing Co. Ltd. (Industrials) | | | 133,261 | |
| | 17,420 | | | Toray Industries, Inc. (Materials) | | | 167,809 | |
| | 3,000 | | | TOTO Ltd. (Industrials) | | | 113,985 | |
| | 5,411 | | | Toyo Seikan Group Holdings Ltd. (Materials) | | | 100,336 | |
| | 3,528 | | | Toyo Suisan Kaisha Ltd. (Consumer Staples) | | | 144,449 | |
| | |
| | |
| 54 | | The accompanying notes are an integral part of these financial statements. |
GOLDMAN SACHS ACTIVEBETA® INTERNATIONAL EQUITY ETF
| | | | | | | | |
| Shares | | | Description | | Value | |
| | Common Stocks – (continued) | |
| | Japan – (continued) | | | | |
| | 7,870 | | | Toyoda Gosei Co. Ltd. (Consumer Discretionary) | | $ | 181,238 | |
| | 20,703 | | | Toyota Motor Corp. (Consumer Discretionary) | | | 1,248,565 | |
| | 7,874 | | | Toyota Tsusho Corp. (Industrials) | | | 180,112 | |
| | 2,220 | | | Trend Micro, Inc. (Information Technology) | | | 78,768 | |
| | 2,348 | | | Tsuruha Holdings, Inc. (Consumer Staples) | | | 230,181 | |
| | 17,630 | | | Unicharm Corp. (Consumer Staples) | | | 428,329 | |
| | 145 | | | United Urban Investment Corp. REIT (Real Estate) | | | 258,360 | |
| | 1,224 | | | West Japan Railway Co. (Industrials) | | | 70,078 | |
| | 1,901 | | | Yakult Honsha Co. Ltd. (Consumer Staples) | | | 83,899 | |
| | 30,716 | | | Yamada Denki Co. Ltd. (Consumer Discretionary) | | | 143,728 | |
| | 5,950 | | | Yamaguchi Financial Group, Inc. (Financials) | | | 62,816 | |
| | 5,053 | | | Yamaha Corp. (Consumer Discretionary) | | | 163,898 | |
| | 47,378 | | | Yamazaki Baking Co. Ltd. (Consumer Staples) | | | 1,076,866 | |
| | 7,146 | | | Yokohama Rubber Co. Ltd. (The) (Consumer Discretionary) | | | 116,135 | |
| | | | | | | | |
| | | | | | | 59,008,672 | |
| | |
| | Jersey Island – 0.1% | |
| | 1,661 | | | Randgold Resources Ltd. (Materials) | | | 155,542 | |
| | |
| | Luxembourg – 0.4% | |
| | 6,746 | | | Millicom International Cellular SA (Telecommunication Services) | | | 344,934 | |
| | 5,501 | | | RTL Group SA (Consumer Discretionary) | | | 462,262 | |
| | 4,653 | | | SES SA (Consumer Discretionary) | | | 106,703 | |
| | 6,811 | | | Tenaris SA (Energy) | | | 93,457 | |
| | | | | | | | |
| | | | | | | 1,007,356 | |
| | |
| | Mexico – 0.1% | |
| | 9,677 | | | Fresnillo PLC (Materials) | | | 203,544 | |
| | |
| | Netherlands – 3.1% | |
| | 1,976 | | | Akzo Nobel NV (Materials) | | | 133,323 | |
| | 3,384 | | | ASML Holding NV (Information Technology) | | | 359,442 | |
| | 8,721 | | | Boskalis Westminster (Industrials) | | | 311,302 | |
| | 2,091 | | | Gemalto NV (Information Technology) | | | 145,437 | |
| | 12,248 | | | Heineken Holding NV (Consumer Staples) | | | 982,985 | |
| | 6,307 | | | Heineken NV (Consumer Staples) | | | 562,656 | |
| | 38,667 | | | ING Groep NV (Financials) | | | 483,193 | |
| | 81,395 | | | Koninklijke Ahold Delhaize NV (Consumer Staples) | | | 1,945,880 | |
| | 1,869 | | | Koninklijke DSM NV (Materials) | | | 130,079 | |
| | 47,882 | | | Koninklijke KPN NV (Telecommunication Services) | | | 156,093 | |
| | 9,498 | | | Koninklijke Philips NV (Industrials) | | | 275,461 | |
| | 2,447 | | | Koninklijke Vopak NV (Energy) | | | 123,894 | |
| | |
| | Common Stocks – (continued) | |
| | Netherlands – (continued) | | | | |
| | 12,419 | | | NN Group NV (Financials) | | | 368,960 | |
| | 999 | | | NXP Semiconductors NV (Information Technology)* | | | 87,932 | |
| | 8,712 | | | Randstad Holding NV (Industrials) | | | 410,194 | |
| | 40,814 | | | Royal Dutch Shell PLC, Class A (Energy) | | | 994,513 | |
| | 31,436 | | | Royal Dutch Shell PLC, Class B (Energy) | | | 799,555 | |
| | 11,121 | | | Wolters Kluwer NV (Industrials) | | | 466,023 | |
| | | | | | | | |
| | | | | | | 8,736,922 | |
| | |
| | New Zealand – 0.2% | |
| | 40,228 | | | Auckland International Airport Ltd. (Industrials) | | | 218,891 | |
| | 11,235 | | | Fletcher Building Ltd. (Materials) | | | 86,401 | |
| | 45,449 | | | Meridian Energy Ltd. (Utilities) | | | 95,622 | |
| | 8,832 | | | Ryman Healthcare Ltd. (Health Care) | | | 61,513 | |
| | 49,842 | | | Spark New Zealand Ltd. (Telecommunication Services) | | | 137,590 | |
| | | | | | | | |
| | | | | | | 600,017 | |
| | |
| | Norway – 0.8% | |
| | 11,402 | | | DNB ASA (Financials) | | | 138,473 | |
| | 10,485 | | | Gjensidige Forsikring ASA (Financials) | | | 179,881 | |
| | 16,960 | | | Marine Harvest ASA (Consumer Staples)* | | | 261,890 | |
| | 162,629 | | | Norsk Hydro ASA (Materials) | | | 690,595 | |
| | 27,923 | | | Orkla ASA (Consumer Staples) | | | 255,425 | |
| | 9,703 | | | Schibsted ASA, Class A (Consumer Discretionary) | | | 307,802 | |
| | 10,663 | | | Schibsted ASA, Class B (Consumer Discretionary) | | | 308,087 | |
| | 7,443 | | | Telenor ASA (Telecommunication Services) | | | 129,834 | |
| | 4,085 | | | Yara International ASA (Materials) | | | 144,866 | |
| | | | | | | | |
| | | | | | | 2,416,853 | |
| | |
| | Portugal – 0.2% | |
| | 30,702 | | | EDP – Energias de Portugal SA (Utilities) | | | 102,754 | |
| | 9,033 | | | Galp Energia SGPS SA (Energy) | | | 131,088 | |
| | 15,261 | | | Jeronimo Martins SGPS SA (Consumer Staples) | | | 245,861 | |
| | | | | | | | |
| | | | | | | 479,703 | |
| | |
| | Singapore – 1.4% | |
| | 33,566 | | | Ascendas Real Estate Investment Trust REIT (Real Estate) | | | 60,342 | |
| | 50,178 | | | CapitaLand Commercial Trust REIT (Real Estate) | | | 56,884 | |
| | 25,009 | | | CapitaLand Ltd. (Real Estate) | | | 56,336 | |
| | 35,531 | | | CapitaLand Mall Trust REIT (Real Estate) | | | 56,314 | |
| | 42,278 | | | DBS Group Holdings Ltd. (Financials) | | | 465,016 | |
| | 477,941 | | | Golden Agri-Resources Ltd. (Consumer Staples) | | | 126,249 | |
| | 12,057 | | | Jardine Cycle & Carriage Ltd. (Consumer Discretionary) | | | 375,993 | |
| | |
| | |
| The accompanying notes are an integral part of these financial statements. | | 55 |
GOLDMAN SACHS ACTIVEBETA® INTERNATIONAL EQUITY ETF
Schedule of Investments (continued)
August 31, 2016
| | | | | | | | |
| Shares | | | Description | | Value | |
| | Common Stocks – (continued) | |
| | Singapore – (continued) | | | | |
| | 96,775 | | | Oversea-Chinese Banking Corp. Ltd. (Financials) | | $ | 609,970 | |
| | 7,296 | | | Singapore Airlines Ltd. (Industrials) | | | 56,212 | |
| | 102,586 | | | Singapore Exchange Ltd. (Financials) | | | 569,065 | |
| | 50,926 | | | Singapore Telecommunications Ltd. (Telecommunication Services) | | | 150,216 | |
| | 193,532 | | | StarHub Ltd. (Telecommunication Services) | | | 519,740 | |
| | 45,525 | | | Suntec Real Estate Investment Trust REIT (Real Estate) | | | 55,952 | |
| | 19,865 | | | United Overseas Bank Ltd. (Financials) | | | 262,515 | |
| | 198,787 | | | Wilmar International Ltd. (Consumer Staples) | | | 449,253 | |
| | | | | | | | |
| | | | | | | 3,870,057 | |
| | |
| | South Africa – 0.2% | |
| | 13,207 | | | Investec PLC (Financials) | | | 77,976 | |
| | 33,811 | | | Mediclinic International PLC (Health Care) | | | 452,564 | |
| | 5,971 | | | Mondi PLC (Materials) | | | 121,135 | |
| | | | | | | | |
| | | | | | | 651,675 | |
| | |
| | Spain – 2.7% | |
| | 7,746 | | | Abertis Infraestructuras SA (Industrials) | | | 119,788 | |
| | 26,732 | | | ACS Actividades de Construccion y Servicios SA (Industrials) | | | 756,377 | |
| | 1,993 | | | Aena SA (Industrials)(a) | | | 281,347 | |
| | 15,245 | | | Amadeus IT Group SA (Information Technology) | | | 699,455 | |
| | 16,121 | | | Banco Bilbao Vizcaya Argentaria SA (Financials) | | | 100,152 | |
| | 42,270 | | | Banco de Sabadell SA (Financials) | | | 57,200 | |
| | 172,862 | | | Banco Santander SA (Financials) | | | 773,950 | |
| | 95,166 | | | Distribuidora Internacional de Alimentacion SA (Consumer Staples) | | | 580,301 | |
| | 7,192 | | | Enagas SA (Utilities) | | | 210,865 | |
| | 11,181 | | | Endesa SA (Utilities) | | | 227,389 | |
| | 6,734 | | | Ferrovial SA (Industrials) | | | 132,487 | |
| | 5,230 | | | Gas Natural SDG SA (Utilities) | | | 107,790 | |
| | 7,056 | | | Grifols SA (Health Care) | | | 149,235 | |
| | 119,609 | | | Iberdrola SA (Utilities) | | | 785,965 | |
| | 25,262 | | | Industria de Diseno Textil SA (Consumer Discretionary) | | | 893,725 | |
| | 138,508 | | | Mapfre SA (Financials) | | | 373,780 | |
| | 6,232 | | | Red Electrica Corp. SA (Utilities) | | | 133,994 | |
| | 50,771 | | | Repsol SA (Energy) | | | 680,816 | |
| | 37,842 | | | Telefonica SA (Telecommunication Services) | | | 380,583 | |
| | 24,989 | | | Zardoya Otis SA (Industrials) | | | 235,176 | |
| | | | | | | | |
| | | | | | | 7,680,375 | |
| | |
| | Sweden – 2.3% | |
| | 5,064 | | | Alfa Laval AB (Industrials) | | | 78,535 | |
| | 21,801 | | | Assa Abloy AB, Class B (Industrials) | | | 440,804 | |
| | 13,604 | | | Atlas Copco AB, Class A (Industrials) | | | 385,155 | |
| | 5,523 | | | Atlas Copco AB, Class B (Industrials) | | | 141,748 | |
| | 20,649 | | | Boliden AB (Materials) | | | 436,533 | |
| | |
| | Common Stocks – (continued) | |
| | Sweden – (continued) | | | | |
| | 13,082 | | | Electrolux AB, Series B (Consumer Discretionary) | | | 340,173 | |
| | 11,277 | | | Getinge AB, Class B (Health Care) | | | 219,599 | |
| | 34,687 | | | Hennes & Mauritz AB, Class B (Consumer Discretionary) | | | 1,055,668 | |
| | 4,110 | | | Hexagon AB, Class B (Information Technology) | | | 167,067 | |
| | 15,269 | | | Husqvarna AB, Class B (Consumer Discretionary) | | | 131,843 | |
| | 8,748 | | | ICA Gruppen AB (Consumer Staples) | | | 298,778 | |
| | 5,851 | | | Industrivarden AB, Class C (Financials) | | | 106,433 | |
| | 3,801 | | | Investor AB, Class B (Financials) | | | 133,852 | |
| | 3,438 | | | Kinnevik AB, Class B (Financials) | | | 84,508 | |
| | 18,259 | | | Nordea Bank AB (Financials) | | | 178,206 | |
| | 5,281 | | | Sandvik AB (Industrials) | | | 57,238 | |
| | 30,103 | | | Securitas AB, Class B (Industrials) | | | 522,667 | |
| | 10,236 | | | Skandinaviska Enskilda Banken AB, Class A (Financials) | | | 99,902 | |
| | 7,108 | | | Skanska AB, Class B (Industrials) | | | 155,572 | |
| | 8,374 | | | Svenska Cellulosa AB SCA, Class B (Consumer Staples) | | | 256,906 | |
| | 19,536 | | | Svenska Handelsbanken AB, Class A (Financials) | | | 251,720 | |
| | 9,313 | | | Swedbank AB, Class A (Financials) | | | 213,824 | |
| | 10,537 | | | Swedish Match AB (Consumer Staples) | | | 374,992 | |
| | 18,749 | | | Tele2 AB, Class B (Telecommunication Services) | | | 155,770 | |
| | 19,972 | | | Telefonaktiebolaget LM Ericsson, Class B (Information Technology) | | | 142,176 | |
| | 53,117 | | | Telia Co. AB (Telecommunication Services) | | | 239,512 | |
| | | | | | | | |
| | | | | | | 6,669,181 | |
| | |
| | Switzerland – 9.3% | |
| | 21,460 | | | ABB Ltd. (Industrials)* | | | 465,435 | |
| | 5,329 | | | Actelion Ltd. (Health Care)* | | | 887,850 | |
| | 3,720 | | | Adecco Group AG (Industrials) | | | 214,291 | |
| | 7,797 | | | Aryzta AG (Consumer Staples)* | | | 310,912 | |
| | 1,375 | | | Baloise Holding AG (Financials) | | | 163,732 | |
| | 211 | | | Barry Callebaut AG (Consumer Staples)* | | | 271,441 | |
| | 4,824 | | | Cie Financiere Richemont SA (Consumer Discretionary) | | | 278,133 | |
| | 21,808 | | | Coca-Cola HBC AG (Consumer Staples)* | | | 478,126 | |
| | 4,747 | | | Credit Suisse Group AG (Financials)* | | | 61,889 | |
| | 747 | | | EMS-Chemie Holding AG (Materials) | | | 397,999 | |
| | 185 | | | Galenica AG (Health Care) | | | 214,834 | |
| | 776 | | | Geberit AG (Industrials) | | | 338,816 | |
| | 244 | | | Givaudan SA (Materials) | | | 504,862 | |
| | 643,743 | | | Glencore PLC (Materials)* | | | 1,467,433 | |
| | 2,298 | | | Julius Baer Group Ltd. (Financials)* | | | 96,429 | |
| | 6,781 | | | Kuehne + Nagel International AG (Industrials) | | | 947,566 | |
| | 1,570 | | | LafargeHolcim Ltd. (Materials)* | | | 83,330 | |
| | 4,144 | | | Lonza Group AG (Health Care)* | | | 786,160 | |
| | 57,567 | | | Nestle SA (Consumer Staples) | | | 4,587,549 | |
| | |
| | |
| 56 | | The accompanying notes are an integral part of these financial statements. |
GOLDMAN SACHS ACTIVEBETA® INTERNATIONAL EQUITY ETF
| | | | | | | | |
| Shares | | | Description | | Value | |
| | Common Stocks – (continued) | |
| | Switzerland – (continued) | | | | |
| | 38,964 | | | Novartis AG (Health Care) | | $ | 3,069,374 | |
| | 4,990 | | | Pargesa Holding SA (Financials) | | | 344,330 | |
| | 2,117 | | | Partners Group Holding AG (Financials) | | | 971,724 | |
| | 12,722 | | | Roche Holding AG (Health Care) | | | 3,104,917 | |
| | 1,357 | | | Schindler Holding AG (Industrials) | | | 256,608 | |
| | 1,375 | | | Schindler Holding AG Participation Certificates (Industrials) | | | 259,033 | |
| | 158 | | | SGS SA (Industrials) | | | 347,502 | |
| | 64 | | | Sika AG (Materials) | | | 305,230 | |
| | 3,577 | | | Sonova Holding AG (Health Care) | | | 495,476 | |
| | 51,494 | | | STMicroelectronics NV (Information Technology) | | | 384,426 | |
| | 1,396 | | | Swatch Group AG (The) – Bearer (Consumer Discretionary) | | | 359,603 | |
| | 5,505 | | | Swatch Group AG (The) – Registered (Consumer Discretionary) | | | 279,858 | |
| | 1,626 | | | Swiss Life Holding AG (Financials)* | | | 407,100 | |
| | 2,494 | | | Swiss Prime Site AG (Real Estate)* | | | 219,562 | |
| | 8,011 | | | Swiss Re AG (Financials) | | | 676,722 | |
| | 345 | | | Swisscom AG (Telecommunication Services) | | | 164,995 | |
| | 791 | | | Syngenta AG (Materials) | | | 344,802 | |
| | 44,962 | | | UBS Group AG (Financials) | | | 650,715 | |
| | 15,258 | | | Wolseley PLC (Industrials) | | | 875,273 | |
| | 806 | | | Zurich Insurance Group AG (Financials)* | | | 206,227 | |
| | | | | | | | |
| | | | | | | 26,280,264 | |
| | |
| | United Kingdom – 14.3% | |
| | 46,406 | | | 3i Group PLC (Financials) | | | 373,480 | |
| | 20,033 | | | Aberdeen Asset Management PLC (Financials) | | | 84,117 | |
| | 38,400 | | | Admiral Group PLC (Financials) | | | 1,030,995 | |
| | 27,382 | | | Aggreko PLC (Industrials) | | | 365,436 | |
| | 20,309 | | | ARM Holdings PLC (Information Technology) | | | 451,114 | |
| | 3,430 | | | Ashtead Group PLC (Industrials) | | | 56,827 | |
| | 4,101 | | | Associated British Foods PLC (Consumer Staples) | | | 163,334 | |
| | 20,116 | | | AstraZeneca PLC (Health Care) | | | 1,293,321 | |
| | 104,860 | | | Auto Trader Group PLC (Information Technology)(a) | | | 512,397 | |
| | 24,173 | | | Aviva PLC (Financials) | | | 135,629 | |
| | 4,267 | | | Babcock International Group PLC (Industrials) | | | 58,455 | |
| | 42,477 | | | BAE Systems PLC (Industrials) | | | 299,579 | |
| | 36,562 | | | Barclays PLC (Financials) | | | 82,482 | |
| | 47,774 | | | Barratt Developments PLC (Consumer Discretionary) | | | 309,094 | |
| | 235,591 | | | BP PLC (Energy) | | | 1,320,300 | |
| | 26,043 | | | British American Tobacco PLC (Consumer Staples) | | | 1,611,627 | |
| | 28,655 | | | British Land Co. PLC (The) REIT (Real Estate) | | | 248,820 | |
| | 147,292 | | | BT Group PLC (Telecommunication Services) | | | 745,301 | |
| | 8,444 | | | Bunzl PLC (Industrials) | | | 260,774 | |
| | |
| | Common Stocks – (continued) | |
| | United Kingdom – (continued) | | | | |
| | 39,637 | | | Burberry Group PLC (Consumer Discretionary) | | | 676,940 | |
| | 7,650 | | | Capita PLC (Industrials) | | | 103,699 | |
| | 57,480 | | | Centrica PLC (Utilities) | | | 175,105 | |
| | 63,999 | | | CNH Industrial NV (Industrials) | | | 466,876 | |
| | 1,508 | | | Coca-Cola European Partners PLC (Consumer Staples)* | | | 57,776 | |
| | 32,791 | | | Compass Group PLC (Consumer Discretionary) | | | 619,286 | |
| | 4,219 | | | Croda International PLC (Materials) | | | 182,898 | |
| | 2,000 | | | DCC PLC (Industrials) | | | 181,524 | |
| | 27,895 | | | Diageo PLC (Consumer Staples) | | | 770,321 | |
| | 98,037 | | | Direct Line Insurance Group PLC (Financials) | | | 473,792 | |
| | 35,660 | | | Dixons Carphone PLC (Consumer Discretionary) | | | 173,131 | |
| | 19,772 | | | Fiat Chrysler Automobiles NV (Consumer Discretionary) | | | 136,421 | |
| | 30,696 | | | G4S PLC (Industrials) | | | 92,707 | |
| | 65,665 | | | GlaxoSmithKline PLC (Health Care) | | | 1,409,563 | |
| | 21,870 | | | Hammerson PLC REIT (Real Estate) | | | 166,130 | |
| | 44,346 | | | Hargreaves Lansdown PLC (Financials) | | | 767,817 | |
| | 293,944 | | | HSBC Holdings PLC (Financials) | | | 2,172,432 | |
| | 17,489 | | | ICAP PLC (Financials) | | | 109,556 | |
| | 4,940 | | | IMI PLC (Industrials) | | | 68,387 | |
| | 19,733 | | | Imperial Brands PLC (Consumer Staples) | | | 1,032,092 | |
| | 14,430 | | | Inmarsat PLC (Telecommunication Services) | | | 145,711 | |
| | 6,060 | | | InterContinental Hotels Group PLC (Consumer Discretionary) | | | 258,818 | |
| | 57,777 | | | International Consolidated Airlines Group SA (Industrials) | | | 290,343 | |
| | 4,258 | | | Intertek Group PLC (Industrials) | | | 194,683 | |
| | 51,726 | | | Intu Properties PLC REIT (Real Estate) | | | 214,076 | |
| | 44,435 | | | ITV PLC (Consumer Discretionary) | | | 116,800 | |
| | 37,817 | | | J Sainsbury PLC (Consumer Staples) | | | 119,018 | |
| | 3,508 | | | Johnson Matthey PLC (Materials) | | | 153,362 | |
| | 97,940 | | | Kingfisher PLC (Consumer Discretionary) | | | 476,017 | |
| | 24,382 | | | Land Securities Group PLC REIT (Real Estate) | | | 349,348 | |
| | 136,064 | | | Legal & General Group PLC (Financials) | | | 374,761 | |
| | 172,106 | | | Lloyds Banking Group PLC (Financials) | | | 133,779 | |
| | 2,015 | | | London Stock Exchange Group PLC (Financials) | | | 72,706 | |
| | 91,897 | | | Marks & Spencer Group PLC (Consumer Discretionary) | | | 414,872 | |
| | 30,742 | | | Meggitt PLC (Industrials) | | | 188,551 | |
| | 31,866 | | | Merlin Entertainments PLC (Consumer Discretionary)(a) | | | 200,369 | |
| | 48,044 | | | National Grid PLC (Utilities) | | | 658,491 | |
| | 8,730 | | | Next PLC (Consumer Discretionary) | | | 631,711 | |
| | 58,585 | | | Old Mutual PLC (Financials) | | | 148,931 | |
| | 13,143 | | | Persimmon PLC (Consumer Discretionary) | | | 313,972 | |
| | |
| | |
| The accompanying notes are an integral part of these financial statements. | | 57 |
GOLDMAN SACHS ACTIVEBETA® INTERNATIONAL EQUITY ETF
Schedule of Investments (continued)
August 31, 2016
| | | | | | | | |
| Shares | | | Description | | Value | |
| | Common Stocks – (continued) | |
| | United Kingdom – (continued) | | | | |
| | 11,388 | | | Petrofac Ltd. (Energy) | | $ | 124,017 | |
| | 12,014 | | | Provident Financial PLC (Financials) | | | 472,986 | |
| | 38,301 | | | Prudential PLC (Financials) | | | 683,970 | |
| | 10,368 | | | Reckitt Benckiser Group PLC (Consumer Staples) | | | 998,597 | |
| | 26,388 | | | RELX NV (Industrials) | | | 467,295 | |
| | 18,416 | | | RELX PLC (Industrials) | | | 348,526 | |
| | 11,537 | | | Rio Tinto PLC (Materials) | | | 347,681 | |
| | 16,436 | | | Rolls-Royce Holdings PLC (Industrials)* | | | 165,752 | |
| | 145,224 | | | Royal Mail PLC (Industrials) | | | 977,627 | |
| | 16,575 | | | RSA Insurance Group PLC (Financials) | | | 107,651 | |
| | 88,910 | | | Sage Group PLC (The) (Information Technology) | | | 844,229 | |
| | 7,102 | | | Schroders PLC (Financials) | | | 258,953 | |
| | 57,584 | | | Segro PLC REIT (Real Estate) | | | 341,793 | |
| | 7,890 | | | Severn Trent PLC (Utilities) | | | 246,041 | |
| | 36,015 | | | Sky PLC (Consumer Discretionary) | | | 400,463 | |
| | 31,043 | | | Smith & Nephew PLC (Health Care) | | | 499,675 | |
| | 7,620 | | | Smiths Group PLC (Industrials) | | | 133,830 | |
| | 10,818 | | | SSE PLC (Utilities) | | | 213,092 | |
| | 7,969 | | | St James’s Place PLC (Financials) | | | 102,491 | |
| | 19,536 | | | Standard Life PLC (Financials) | | | 93,262 | |
| | 27,861 | | | Tate & Lyle PLC (Consumer Staples) | | | 267,651 | |
| | 67,117 | | | Taylor Wimpey PLC (Consumer Discretionary) | | | 141,788 | |
| | 345,315 | | | Tesco PLC (Consumer Staples)* | | | 752,333 | |
| | 26,694 | | | Unilever NV (Consumer Staples) | | | 1,222,366 | |
| | 26,549 | | | Unilever PLC (Consumer Staples) | | | 1,227,076 | |
| | 21,907 | | | United Utilities Group PLC (Utilities) | | | 278,739 | |
| | 286,273 | | | Vodafone Group PLC (Telecommunication Services) | | | 861,780 | |
| | 7,594 | | | Whitbread PLC (Consumer Discretionary) | | | 414,941 | |
| | 163,736 | | | William Hill PLC (Consumer Discretionary) | | | 682,364 | |
| | 412,081 | | | Wm Morrison Supermarkets PLC (Consumer Staples) | | | 1,063,213 | |
| | 37,591 | | | Worldpay Group PLC (Information Technology)*(a) | | | 147,108 | |
| | 43,422 | | | WPP PLC (Consumer Discretionary) | | | 998,633 | |
| | | | | | | | |
| | | | | | | 40,581,777 | |
| | |
| | United States – 0.8% | | | | |
| | 4,687 | | | Carnival PLC (Consumer Discretionary) | | | 224,303 | |
| | 18,832 | | | QIAGEN NV (Health Care)* | | | 497,926 | |
| | 11,314 | | | Shire PLC (Health Care) | | | 705,482 | |
| | 1,040 | | | Taro Pharmaceutical Industries Ltd. (Health Care)* | | | 131,664 | |
| | 8,837 | | | Thomson Reuters Corp. (Financials) | | | 365,792 | |
| | 7,185 | | | Valeant Pharmaceuticals International, Inc. (Health Care)* | | | 208,587 | |
| | | | | | | | |
| | | | | | | 2,133,754 | |
| | |
| | TOTAL COMMON STOCKS | |
| | (Cost $274,166,406) | | $ | 281,496,639 | |
| | |
| | Preferred Stocks – 0.4% | |
| | Germany – 0.4% | | | | |
| | 823 | | | Bayerische Motoren Werke AG (Consumer Discretionary) | | | 61,587 | |
| | 12,370 | | | FUCHS PETROLUB SE (Materials) | | | 561,829 | |
| | 3,848 | | | Henkel AG & Co KGaA (Consumer Staples) | | | 504,214 | |
| | |
| | TOTAL PREFERRED STOCKS | | | | |
| | (Cost $1,024,050) | | $ | 1,127,630 | |
| | |
| | TOTAL INVESTMENTS – 99.6% | | | | |
| | (Cost $275,190,456) | | $ | 282,624,269 | |
| | |
| OTHER ASSETS IN EXCESS OF
LIABILITIES – 0.4% | | | 1,132,981 | |
| | |
| | NET ASSETS – 100.0% | | $ | 283,757,250 | |
| | |
| | |
| The percentage shown for each investment category reflects the value of investments in that category as a percentage of net assets. |
* | | Non-income producing security |
(a) | | Exempt from registration under Rule 144A of the Securities Act of 1933. Under procedures approved by the Board of Trustees, such securities may be deemed liquid by the Investment Adviser and may be resold, normally to qualified institutional buyers in transactions exempt from registration. Total market value of Rule 144A securities amounts to $2,539,195, which represents approximately 0.9% of net assets as of August 31, 2016. |
| | |
|
Investment Abbreviations: |
PLC | | —Public Limited Company |
REIT | | —Real Estate Investment Trust |
|
| | |
| 58 | | The accompanying notes are an integral part of these financial statements. |
GOLDMAN SACHS ACTIVEBETA® JAPAN EQUITY ETF
Schedule of Investments
August 31, 2016
| | | | | | | | |
| Shares | | | Description | | Value | |
| | Common Stocks – 99.7% | |
| | Consumer Discretionary – 21.4% | | | | |
| | 1,104 | | | ABC-Mart, Inc. | | $ | 69,377 | |
| | 811 | | | Aisin Seiki Co. Ltd. | | | 38,302 | |
| | 3,000 | | | Asics Corp. | | | 60,821 | |
| | 6,882 | | | Bandai Namco Holdings, Inc. | | | 188,027 | |
| | 2,124 | | | Benesse Holdings, Inc. | | | 48,996 | |
| | 7,054 | | | Bridgestone Corp. | | | 242,442 | |
| | 4,017 | | | Casio Computer Co. Ltd. | | | 56,739 | |
| | 2,808 | | | Denso Corp. | | | 115,974 | |
| | 1,924 | | | Dentsu, Inc. | | | 105,840 | |
| | 783 | | | Don Quijote Holdings Co. Ltd. | | | 25,587 | |
| | 521 | | | Fast Retailing Co. Ltd. | | | 183,044 | |
| | 6,441 | | | Fuji Heavy Industries Ltd. | | | 255,187 | |
| | 2,820 | | | Hakuhodo DY Holdings, Inc. | | | 30,644 | |
| | 941 | | | Hikari Tsushin, Inc. | | | 84,607 | |
| | 20,628 | | | Honda Motor Co. Ltd. | | | 632,192 | |
| | 4,897 | | | Iida Group Holdings Co. Ltd. | | | 91,752 | |
| | 8,204 | | | Isetan Mitsukoshi Holdings Ltd. | | | 74,715 | |
| | 1,943 | | | Isuzu Motors Ltd. | | | 22,363 | |
| | 3,600 | | | J Front Retailing Co. Ltd. | | | 40,652 | |
| | 1,038 | | | Koito Manufacturing Co. Ltd. | | | 49,424 | |
| | 5,718 | | | Marui Group Co. Ltd. | | | 69,710 | |
| | 13,307 | | | Mazda Motor Corp. | | | 219,414 | |
| | 2,500 | | | McDonald’s Holdings Co. Japan Ltd. | | | 69,029 | |
| | 40,022 | | | Mitsubishi Motors Corp. | | | 183,017 | |
| | 686 | | | NGK Spark Plug Co. Ltd. | | | 12,833 | |
| | 3,266 | | | NHK Spring Co. Ltd. | | | 30,754 | |
| | 10,013 | | | Nikon Corp. | | | 147,046 | |
| | 14,737 | | | Nissan Motor Co. Ltd. | | | 144,613 | |
| | 1,546 | | | Nitori Holdings Co. Ltd. | | | 156,790 | |
| | 1,200 | | | Oriental Land Co. Ltd. | | | 70,293 | |
| | 20,582 | | | Panasonic Corp. | | | 211,123 | |
| | 4,679 | | | Rakuten, Inc. | | | 58,988 | |
| | 833 | | | Rinnai Corp. | | | 78,118 | |
| | 656 | | | Ryohin Keikaku Co. Ltd. | | | 118,345 | |
| | 854 | | | Sankyo Co. Ltd. | | | 29,640 | |
| | 2,081 | | | Sega Sammy Holdings, Inc. | | | 28,428 | |
| | 7,800 | | | Sekisui Chemical Co. Ltd. | | | 109,042 | |
| | 5,078 | | | Sekisui House Ltd. | | | 81,790 | |
| | 622 | | | Shimamura Co. Ltd. | | | 71,981 | |
| | 732 | | | Shimano, Inc. | | | 106,437 | |
| | 11,716 | | | Sony Corp. | | | 376,620 | |
| | 2,488 | | | Start Today Co. Ltd. | | | 115,578 | |
| | 4,074 | | | Sumitomo Electric Industries Ltd. | | | 60,400 | |
| | 2,675 | | | Sumitomo Rubber Industries Ltd. | | | 39,672 | |
| | 3,103 | | | Suzuki Motor Corp. | | | 102,868 | |
| | 7,730 | | | Takashimaya Co. Ltd. | | | 56,573 | |
| | 1,240 | | | Toho Co. Ltd. | | | 36,144 | |
| | 1,139 | | | Toyoda Gosei Co. Ltd. | | | 26,230 | |
| | 433 | | | Toyota Industries Corp. | | | 20,722 | |
| | 24,997 | | | Toyota Motor Corp. | | | 1,507,529 | |
| | 1,033 | | | USS Co Ltd. | | | 16,518 | |
| | 15,850 | | | Yamada Denki Co. Ltd. | | | 74,166 | |
| | 3,600 | | | Yamaha Corp. | | | 116,769 | |
| | 1,686 | | | Yamaha Motor Co. Ltd. | | | 34,556 | |
| | 1,593 | | | Yokohama Rubber Co. Ltd. (The) | | | 25,889 | |
| | | | | | | | |
| | | | | | | 7,024,310 | |
| | |
| | Common Stocks – (continued) | |
| | Consumer Staples – 12.0% | | | | |
| | 11,614 | | | Aeon Co. Ltd. | | | 159,723 | |
| | 8,116 | | | Ajinomoto Co., Inc. | | | 172,073 | |
| | 6,450 | | | Asahi Group Holdings Ltd. | | | 211,144 | |
| | 1,800 | | | Calbee, Inc. | | | 65,345 | |
| | 2,152 | | | FamilyMart Co. Ltd. | | | 154,168 | |
| | 11,621 | | | Japan Tobacco, Inc. | | | 450,302 | |
| | 6,499 | | | Kao Corp. | | | 337,846 | |
| | 2,484 | | | Kikkoman Corp. | | | 78,169 | |
| | 14,749 | | | Kirin Holdings Co. Ltd. | | | 240,481 | |
| | 1,482 | | | Kose Corp. | | | 132,962 | |
| | 2,227 | | | Lawson, Inc. | | | 156,311 | |
| | 1,981 | | | MEIJI Holdings Co. Ltd. | | | 178,306 | |
| | 2,178 | | | NH Foods Ltd. | | | 47,693 | |
| | 6,199 | | | Nisshin Seifun Group, Inc. | | | 87,680 | |
| | 1,092 | | | Nissin Foods Holdings Co. Ltd. | | | 60,599 | |
| | 1,360 | | | Pola Orbis Holdings, Inc. | | | 108,605 | |
| | 9,917 | | | Seven & i Holdings Co. Ltd. | | | 418,118 | |
| | 5,837 | | | Shiseido Co. Ltd. | | | 146,779 | |
| | 1,266 | | | Sundrug Co. Ltd. | | | 91,797 | |
| | 3,822 | | | Suntory Beverage & Food Ltd. | | | 151,683 | |
| | 2,324 | | | Toyo Suisan Kaisha Ltd. | | | 95,153 | |
| | 927 | | | Tsuruha Holdings, Inc. | | | 90,876 | |
| | 3,881 | | | Unicharm Corp. | | | 94,291 | |
| | 932 | | | Yakult Honsha Co. Ltd. | | | 41,133 | |
| | 7,642 | | | Yamazaki Baking Co. Ltd. | | | 173,697 | |
| | | | | | | | |
| | | | | | | 3,944,934 | |
| | |
| | Energy – 1.5% | | | | |
| | 9,363 | | | Idemitsu Kosan Co. Ltd. | | | 170,812 | |
| | 2,400 | | | Inpex Corp. | | | 20,846 | |
| | 64,367 | | | JX Holdings, Inc. | | | 240,766 | |
| | 3,748 | | | Showa Shell Sekiyu KK | | | 31,959 | |
| | 4,337 | | | TonenGeneral Sekiyu KK | | | 40,043 | |
| | | | | | | | |
| | | | | | | 504,426 | |
| | |
| | Financials – 11.0% | | | | |
| | 11,926 | | | Acom Co. Ltd.* | | | 57,073 | |
| | 1,546 | | | AEON Financial Service Co. Ltd. | | | 28,473 | |
| | 15,896 | | | Aozora Bank Ltd. | | | 56,247 | |
| | 1,062 | | | Bank of Kyoto Ltd. (The) | | | 7,680 | |
| | 3,321 | | | Chiba Bank Ltd. (The) | | | 19,682 | |
| | 1,708 | | | Chugoku Bank Ltd. (The) | | | 21,037 | |
| | 4,652 | | | Concordia Financial Group Ltd.* | | | 23,999 | |
| | 1,088 | | | Credit Saison Co. Ltd. | | | 18,734 | |
| | 11,696 | | | Dai-ichi Life Insurance Co. Ltd. (The) | | | 162,773 | |
| | 13,005 | | | Daiwa Securities Group, Inc. | | | 75,992 | |
| | 3,256 | | | Fukuoka Financial Group, Inc. | | | 13,788 | |
| | 3,827 | | | Hachijuni Bank Ltd. (The) | | | 20,238 | |
| | 2,465 | | | Hiroshima Bank Ltd. (The) | | | 10,271 | |
| | 1,715 | | | Iyo Bank Ltd. (The) | | | 11,059 | |
| | 6,841 | | | Japan Exchange Group, Inc. | | | 106,879 | |
| | 1,800 | | | Japan Post Bank Co. Ltd. | | | 21,161 | |
| | 2,125 | | | Japan Post Holdings Co. Ltd. | | | 27,837 | |
| | 6,354 | | | Joyo Bank Ltd. (The) | | | 25,248 | |
| | 9,321 | | | Kyushu Financial Group, Inc. | | | 55,240 | |
| | 111,685 | | | Mitsubishi UFJ Financial Group, Inc. | | | 609,093 | |
| | 36,000 | | | Mitsubishi UFJ Lease & Finance Co. Ltd. | | | 168,802 | |
| | |
| | |
| The accompanying notes are an integral part of these financial statements. | | 59 |
GOLDMAN SACHS ACTIVEBETA® JAPAN EQUITY ETF
Schedule of Investments (continued)
August 31, 2016
| | | | | | | | |
| Shares | | | Description | | Value | |
| | Common Stocks – (continued) | |
| | Financials – (continued) | | | | |
| | 208,200 | | | Mizuho Financial Group, Inc. | | $ | 361,711 | |
| | 2,869 | | | MS&AD Insurance Group Holdings, Inc. | | | 81,894 | |
| | 16,779 | | | Nomura Holdings, Inc. | | | 79,049 | |
| | 15,616 | | | ORIX Corp. | | | 224,574 | |
| | 28,200 | | | Resona Holdings, Inc. | | | 129,011 | |
| | 2,524 | | | SBI Holdings, Inc. | | | 29,965 | |
| | 12,826 | | | Seven Bank Ltd. | | | 45,384 | |
| | 20,110 | | | Shinsei Bank Ltd. | | | 32,080 | |
| | 2,525 | | | Shizuoka Bank Ltd. (The) | | | 20,799 | |
| | 2,878 | | | Sompo Japan Nipponkoa Holdings, Inc. | | | 92,265 | |
| | 2,262 | | | Sony Financial Holdings, Inc. | | | 31,076 | |
| | 14,396 | | | Sumitomo Mitsui Financial Group, Inc. | | | 503,968 | |
| | 10,579 | | | Sumitomo Mitsui Trust Holdings, Inc. | | | 37,873 | |
| | 3,072 | | | Suruga Bank Ltd. | | | 73,091 | |
| | 6,307 | | | T&D Holdings, Inc. | | | 71,982 | |
| | 6,466 | | | Tokio Marine Holdings, Inc. | | | 254,051 | |
| | | | | | | | |
| | | | | | | 3,610,079 | |
| | |
| | Health Care – 10.2% | | | | |
| | 7,040 | | | Alfresa Holdings Corp. | | | 131,428 | |
| | 22,584 | | | Astellas Pharma, Inc. | | | 345,086 | |
| | 1,717 | | | Chugai Pharmaceutical Co. Ltd. | | | 53,866 | |
| | 2,859 | | | CYBERDYNE, Inc.* | | | 45,026 | |
| | 10,849 | | | Daiichi Sankyo Co. Ltd. | | | 249,054 | |
| | 2,464 | | | Eisai Co. Ltd. | | | 143,645 | |
| | 1,774 | | | Hisamitsu Pharmaceutical Co., Inc. | | | 79,408 | |
| | 5,541 | | | Hoya Corp. | | | 214,762 | |
| | 5,201 | | | Kyowa Hakko Kirin Co. Ltd. | | | 73,815 | |
| | 3,666 | | | M3, Inc. | | | 109,695 | |
| | 4,221 | | | Medipal Holdings Corp. | | | 66,762 | |
| | 2,285 | | | Miraca Holdings, Inc. | | | 108,357 | |
| | 4,011 | | | Mitsubishi Tanabe Pharma Corp. | | | 74,454 | |
| | 3,398 | | | Olympus Corp. | | | 111,202 | |
| | 4,029 | | | Ono Pharmaceutical Co. Ltd. | | | 105,054 | |
| | 7,458 | | | Otsuka Holdings Co. Ltd. | | | 323,239 | |
| | 3,776 | | | Santen Pharmaceutical Co. Ltd. | | | 47,531 | |
| | 3,953 | | | Shionogi & Co. Ltd. | | | 176,525 | |
| | 5,499 | | | Sumitomo Dainippon Pharma Co. Ltd. | | | 92,080 | |
| | 3,246 | | | Suzuken Co. Ltd. | | | 94,115 | |
| | 2,284 | | | Sysmex Corp. | | | 147,284 | |
| | 581 | | | Taisho Pharmaceutical Holdings Co. Ltd. | | | 53,250 | |
| | 7,530 | | | Takeda Pharmaceutical Co. Ltd. | | | 331,965 | |
| | 4,062 | | | Terumo Corp. | | | 158,066 | |
| | | | | | | | |
| | | | | | | 3,335,669 | |
| | |
| | Industrials – 17.0% | | | | |
| | 2,623 | | | Amada Holdings Co. Ltd. | | | 27,438 | |
| | 14,034 | | | ANA Holdings, Inc. | | | 38,167 | |
| | 3,559 | | | Asahi Glass Co. Ltd. | | | 22,641 | |
| | 1,482 | | | Central Japan Railway Co. | | | 243,430 | |
| | 3,381 | | | Dai Nippon Printing Co. Ltd. | | | 34,387 | |
| | 1,896 | | | Daikin Industries Ltd. | | | 175,770 | |
| | 2,937 | | | East Japan Railway Co. | | | 251,577 | |
| | 996 | | | FANUC Corp. | | | 169,763 | |
| | 1,617 | | | Fuji Electric Co. Ltd. | | | 7,379 | |
| | 1,373 | | | Hankyu Hanshin Holdings, Inc. | | | 44,335 | |
| | 1,307 | | | Hino Motors Ltd. | | | 14,481 | |
| | |
| | Common Stocks – (continued) | |
| | Industrials – (continued) | | | | |
| | 8,697 | | | Hitachi Construction Machinery Co. Ltd. | | | 162,951 | |
| | 1,008 | | | Hoshizaki Corp. | | | 80,593 | |
| | 16,181 | | | ITOCHU Corp. | | | 191,009 | |
| | 2,086 | | | Japan Airlines Co. Ltd. | | | 63,466 | |
| | 1,038 | | | Japan Airport Terminal Co. Ltd. | | | 40,944 | |
| | 826 | | | JGC Corp. | | | 13,105 | |
| | 11,768 | | | Kajima Corp. | | | 79,071 | |
| | 3,438 | | | Kamigumi Co. Ltd. | | | 29,781 | |
| | 2,288 | | | Kawasaki Heavy Industries Ltd. | | | 6,702 | |
| | 10,636 | | | Keihan Holdings Co. Ltd. | | | 68,997 | |
| | 4,680 | | | Keikyu Corp. | | | 43,345 | |
| | 6,481 | | | Keio Corp. | | | 54,262 | |
| | 4,266 | | | Keisei Electric Railway Co. Ltd. | | | 51,307 | |
| | 26,194 | | | Kintetsu Group Holdings Co. Ltd. | | | 99,777 | |
| | 4,125 | | | Komatsu Ltd. | | | 90,189 | |
| | 5,734 | | | Kubota Corp. | | | 84,096 | |
| | 1,142 | | | Kurita Water Industries Ltd. | | | 26,045 | |
| | 1,858 | | | LIXIL Group Corp. | | | 37,489 | |
| | 1,500 | | | Makita Corp. | | | 107,749 | |
| | 41,606 | | | Marubeni Corp. | | | 207,437 | |
| | 18,600 | | | Mitsubishi Corp. | | | 387,609 | |
| | 12,289 | | | Mitsubishi Electric Corp. | | | 160,451 | |
| | 7,461 | | | Mitsubishi Heavy Industries Ltd. | | | 32,488 | |
| | 581 | | | Mitsubishi Logistics Corp. | | | 8,959 | |
| | 8,400 | | | Mitsui & Co. Ltd. | | | 111,827 | |
| | 116,238 | | | Mitsui OSK Lines Ltd. | | | 268,583 | |
| | 697 | | | Nabtesco Corp. | | | 17,985 | |
| | 18,459 | | | Nagoya Railroad Co. Ltd. | | | 90,479 | |
| | 1,249 | | | NGK Insulators Ltd. | | | 27,097 | |
| | 1,200 | | | Nidec Corp. | | | 108,149 | |
| | 11,319 | | | Nippon Express Co. Ltd. | | | 53,621 | |
| | 25,949 | | | Nippon Yusen KK | | | 47,164 | |
| | 1,200 | | | NSK Ltd. | | | 12,367 | |
| | 8,540 | | | Obayashi Corp. | | | 78,849 | |
| | 4,322 | | | Odakyu Electric Railway Co. Ltd. | | | 44,375 | |
| | 5,050 | | | Park24 Co. Ltd. | | | 147,689 | |
| | 3,048 | | | Recruit Holdings Co. Ltd. | | | 115,956 | |
| | 1,851 | | | Secom Co. Ltd. | | | 140,514 | |
| | 1,174 | | | Seibu Holdings, Inc. | | | 19,284 | |
| | 4,903 | | | Shimizu Corp. | | | 43,752 | |
| | 141 | | | SMC Corp. | | | 39,723 | |
| | 1,649 | | | Sohgo Security Services Co. Ltd. | | | 82,422 | |
| | 26,318 | | | Sumitomo Corp. | | | 285,482 | |
| | 10,619 | | | Taisei Corp. | | | 79,872 | |
| | 8,451 | | | Tobu Railway Co. Ltd. | | | 41,015 | |
| | 13,320 | | | Tokyu Corp. | | | 99,415 | |
| | 5,402 | | | Toppan Printing Co. Ltd. | | | 48,152 | |
| | 3,360 | | | Toshiba Corp.* | | | 10,629 | |
| | 2,724 | | | TOTO Ltd. | | | 103,498 | |
| | 8,722 | | | Toyota Tsusho Corp. | | | 199,509 | |
| | 1,084 | | | West Japan Railway Co. | | | 62,063 | |
| | 1,026 | | | Yamato Holdings Co. Ltd. | | | 24,218 | |
| | | | | | | | |
| | | | | | | 5,560,879 | |
| | |
| | Information Technology – 10.5% | | | | |
| | 2,313 | | | Alps Electric Co. Ltd. | | | 52,170 | |
| | 7,292 | | | Brother Industries Ltd. | | | 122,385 | |
| | |
| | |
| 60 | | The accompanying notes are an integral part of these financial statements. |
GOLDMAN SACHS ACTIVEBETA® JAPAN EQUITY ETF
| | | | | | | | |
| Shares | | | Description | | Value | |
| | Common Stocks – (continued) | |
| | Information Technology – (continued) | | | | |
| | 10,024 | | | Canon, Inc. | | $ | 287,244 | |
| | 6,000 | | | FUJIFILM Holdings Corp. | | | 225,475 | |
| | 27,268 | | | Fujitsu Ltd. | | | 138,456 | |
| | 20,860 | | | GungHo Online Entertainment, Inc. | | | 49,611 | |
| | 1,117 | | | Hamamatsu Photonics KK | | | 35,151 | |
| | 155 | | | Hirose Electric Co. Ltd. | | | 19,900 | |
| | 257 | | | Hitachi High-Technologies Corp. | | | 9,529 | |
| | 31,098 | | | Hitachi Ltd. | | | 149,124 | |
| | 4,931 | | | Kakaku.com, Inc. | | | 82,473 | |
| | 442 | | | Keyence Corp. | | | 309,936 | |
| | 3,000 | | | Konami Holdings Corp. | | | 106,009 | |
| | 12,636 | | | Konica Minolta, Inc. | | | 113,856 | |
| | 1,996 | | | Kyocera Corp. | | | 94,865 | |
| | 2,400 | | | Mixi, Inc. | | | 85,271 | |
| | 1,392 | | | Murata Manufacturing Co. Ltd. | | | 187,130 | |
| | 5,512 | | | Nexon Co. Ltd. | | | 75,511 | |
| | 608 | | | Nintendo Co. Ltd. | | | 133,286 | |
| | 1,977 | | | Nomura Research Institute Ltd. | | | 66,897 | |
| | 2,747 | | | NTT Data Corp. | | | 143,146 | |
| | 1,254 | | | Obic Co. Ltd. | | | 64,255 | |
| | 3,038 | | | Omron Corp. | | | 103,093 | |
| | 1,647 | | | Oracle Corp. Japan | | | 95,857 | |
| | 1,868 | | | Otsuka Corp. | | | 79,192 | |
| | 7,200 | | | Ricoh Co. Ltd. | | | 64,945 | |
| | 250 | | | Rohm Co. Ltd. | | | 12,496 | |
| | 3,735 | | | Seiko Epson Corp. | | | 71,569 | |
| | 5,667 | | | Shimadzu Corp. | | | 88,702 | |
| | 244 | | | TDK Corp. | | | 17,456 | |
| | 1,262 | | | Tokyo Electron Ltd. | | | 116,006 | |
| | 2,478 | | | Trend Micro, Inc. | | | 87,922 | |
| | 7,200 | | | Yahoo Japan Corp. | | | 29,375 | |
| | 2,737 | | | Yaskawa Electric Corp. | | | 40,327 | |
| | 5,663 | | | Yokogawa Electric Corp. | | | 72,543 | |
| | | | | | | | |
| | | | | | | 3,431,163 | |
| | |
| | Materials – 3.9% | | | | |
| | 1,032 | | | Air Water, Inc. | | | 19,077 | |
| | 3,662 | | | Asahi Kasei Corp. | | | 30,886 | |
| | 2,985 | | | Daicel Corp. | | | 38,065 | |
| | 1,200 | | | JSR Corp. | | | 17,553 | |
| | 9,708 | | | Kaneka Corp. | | | 79,121 | |
| | 2,400 | | | Kuraray Co. Ltd. | | | 34,294 | |
| | 1,925 | | | Maruichi Steel Tube Ltd. | | | 66,440 | |
| | 21,000 | | | Mitsubishi Chemical Holdings Corp. | | | 132,535 | |
| | 2,021 | | | Mitsubishi Gas Chemical Co., Inc. | | | 13,677 | |
| | 20,140 | | | Mitsubishi Materials Corp. | | | 56,856 | |
| | 30,783 | | | Mitsui Chemicals, Inc. | | | 147,316 | |
| | 4,259 | | | Nippon Steel & Sumitomo Metal Corp. | | | 90,422 | |
| | 816 | | | Nitto Denko Corp. | | | 55,728 | |
| | 20,069 | | | Oji Holdings Corp. | | | 80,714 | |
| | 1,652 | | | Shin-Etsu Chemical Co. Ltd. | | | 121,287 | |
| | 14,343 | | | Sumitomo Chemical Co. Ltd. | | | 65,728 | |
| | 10,548 | | | Taiheiyo Cement Corp. | | | 32,021 | |
| | 11,474 | | | Teijin Ltd. | | | 42,819 | |
| | 8,982 | | | Toray Industries, Inc. | | | 86,524 | |
| | 4,000 | | | Toyo Seikan Group Holdings Ltd. | | | 74,172 | |
| | | | | | | | |
| | | | | | | 1,285,235 | |
| | |
| | Common Stocks – (continued) | |
| | Real Estate – 4.6% | | | | |
| | 2,150 | | | Aeon Mall Co. Ltd. | | | 30,264 | |
| | 1,362 | | | Daito Trust Construction Co. Ltd. | | | 200,610 | |
| | 7,490 | | | Daiwa House Industry Co. Ltd. | | | 193,450 | |
| | 2,796 | | | Hulic Co. Ltd. | | | 26,491 | |
| | 18 | | | Japan Prime Realty Investment Corp. REIT | | | 79,615 | |
| | 16 | | | Japan Real Estate Investment Corp. REIT | | | 94,049 | |
| | 28 | | | Japan Retail Fund Investment Corp. REIT | | | 62,884 | |
| | 6,202 | | | Mitsubishi Estate Co. Ltd. | | | 117,342 | |
| | 6,605 | | | Mitsui Fudosan Co. Ltd. | | | 142,272 | |
| | 15 | | | Nippon Building Fund, Inc. REIT | | | 91,797 | |
| | 27 | | | Nippon Prologis REIT, Inc. REIT | | | 64,815 | |
| | 10,275 | | | Nomura Real Estate Holdings, Inc. | | | 167,484 | |
| | 18 | | | Nomura Real Estate Master Fund, Inc. REIT | | | 29,706 | |
| | 2,012 | | | NTT Urban Development Corp. | | | 18,460 | |
| | 2,714 | | | Sumitomo Realty & Development Co. Ltd. | | | 71,645 | |
| | 2,146 | | | Tokyo Tatemono Co. Ltd. | | | 25,208 | |
| | 8,110 | | | Tokyu Fudosan Holdings Corp. | | | 45,162 | |
| | 29 | | | United Urban Investment Corp. REIT | | | 51,672 | |
| | | | | | | | |
| | | | | | | 1,512,926 | |
| | |
| | Telecommunication Services – 4.6% | | | | |
| | 16,313 | | | KDDI Corp. | | | 478,816 | |
| | 7,125 | | | Nippon Telegraph & Telephone Corp. | | | 313,146 | |
| | 13,652 | | | NTT DOCOMO, Inc. | | | 343,560 | |
| | 5,740 | | | SoftBank Group Corp. | | | 374,916 | |
| | | | | | | | |
| | | | | | | 1,510,438 | |
| | |
| | Utilities – 3.0% | |
| | 14,658 | | | Chubu Electric Power Co., Inc. | | | 198,255 | |
| | 3,233 | | | Chugoku Electric Power Co., Inc. (The) | | | 38,820 | |
| | 1,200 | | | Electric Power Development Co. Ltd. | | | 29,305 | |
| | 3,000 | | | Hokuriku Electric Power Co. | | | 35,849 | |
| | 15,743 | | | Kansai Electric Power Co., Inc. (The)* | | | 134,958 | |
| | 2,423 | | | Kyushu Electric Power Co., Inc.* | | | 22,559 | |
| | 15,306 | | | Osaka Gas Co. Ltd. | | | 60,271 | |
| | 1,997 | | | Shikoku Electric Power Co., Inc. | | | 19,037 | |
| | 13,466 | | | Toho Gas Co. Ltd. | | | 114,435 | |
| | 3,399 | | | Tohoku Electric Power Co., Inc. | | | 42,621 | |
| | 50,900 | | | Tokyo Electric Power Co. Holdings, Inc.* | | | 205,204 | |
| | 18,651 | | | Tokyo Gas Co. Ltd. | | | 79,970 | |
| | | | | | | | |
| | | | | | | 981,284 | |
| | |
| | TOTAL INVESTMENTS – 99.7% | |
| | (Cost $30,903,047) | | $ | 32,701,343 | |
| | |
| OTHER ASSETS IN EXCESS OF
LIABILITIES – 0.3% | | | 96,005 | |
| | |
| | NET ASSETS – 100.0% | | $ | 32,797,348 | |
| | |
| | |
| The percentage shown for each investment category reflects the value of investments in that category as a percentage of net assets. |
* | | Non-income producing security |
| | |
|
Investment Abbreviations: |
REIT | | —Real Estate Investment Trust |
|
| | |
| The accompanying notes are an integral part of these financial statements. | | 61 |
GOLDMAN SACHS ACTIVEBETA® U.S. LARGE CAP EQUITY ETF
Schedule of Investments
August 31, 2016
| | | | | | | | |
| Shares | | | Description | | Value | |
| | Common Stocks – 99.6% | |
| | Consumer Discretionary – 15.5% | |
| | 13,566 | | | Advance Auto Parts, Inc. | | $ | 2,135,017 | |
| | 18,015 | | | Amazon.com, Inc.* | | | 13,856,417 | |
| | 9,697 | | | Aramark | | | 367,807 | |
| | 6,503 | | | AutoZone, Inc.* | | | 4,823,925 | |
| | 96,856 | | | Bed Bath & Beyond, Inc. | | | 4,491,213 | |
| | 103,597 | | | Best Buy Co., Inc. | | | 3,986,413 | |
| | 20,908 | | | BorgWarner, Inc. | | | 719,026 | |
| | 42,803 | | | Carnival Corp. | | | 2,045,983 | |
| | 2,601 | | | Charter Communications, Inc., Class A* | | | 669,003 | |
| | 2,096 | | | Chipotle Mexican Grill, Inc.* | | | 867,178 | |
| | 60,065 | | | Coach, Inc. | | | 2,293,282 | |
| | 90,240 | | | Comcast Corp., Class A | | | 5,889,062 | |
| | 29,596 | | | Dollar General Corp. | | | 2,172,642 | |
| | 12,849 | | | Dollar Tree, Inc.* | | | 1,062,612 | |
| | 10,596 | | | DR Horton, Inc. | | | 339,708 | |
| | 10,173 | | | Expedia, Inc. | | | 1,110,078 | |
| | 53,679 | | | Foot Locker, Inc. | | | 3,523,490 | |
| | 435,308 | | | Ford Motor Co. | | | 5,484,881 | |
| | 14,222 | | | General Motors Co. | | | 453,966 | |
| | 27,224 | | | Genuine Parts Co. | | | 2,799,172 | |
| | 12,278 | | | Goodyear Tire & Rubber Co. (The) | | | 360,359 | |
| | 47,512 | | | Hanesbrands, Inc. | | | 1,260,969 | |
| | 22,761 | | | Hasbro, Inc. | | | 1,860,484 | |
| | 26,328 | | | Hilton Worldwide Holdings, Inc. | | | 628,449 | |
| | 87,019 | | | Home Depot, Inc. (The) | | | 11,670,988 | |
| | 39,612 | | | Interpublic Group of Cos., Inc. (The) | | | 916,622 | |
| | 11,753 | | | Johnson Controls, Inc. | | | 515,722 | |
| | 93,787 | | | Kohl’s Corp. | | | 4,162,267 | |
| | 49,606 | | | L Brands, Inc. | | | 3,780,473 | |
| | 30,957 | | | Lear Corp. | | | 3,599,990 | |
| | 6,142 | | | Lennar Corp., Class A | | | 290,517 | |
| | 11,256 | | | LKQ Corp.* | | | 406,229 | |
| | 95,596 | | | Lowe’s Cos., Inc. | | | 7,318,830 | |
| | 65,517 | | | Macy’s, Inc. | | | 2,370,405 | |
| | 9,587 | | | Marriott International, Inc., Class A | | | 683,841 | |
| | 51,048 | | | Mattel, Inc. | | | 1,691,220 | |
| | 36,498 | | | McDonald’s Corp. | | | 4,221,359 | |
| | 46,871 | | | Michael Kors Holdings Ltd.* | | | 2,294,335 | |
| | 3,201 | | | Mohawk Industries, Inc.* | | | 681,109 | |
| | 27,859 | | | Netflix, Inc.* | | | 2,714,860 | |
| | 24,650 | | | Newell Brands, Inc. | | | 1,308,422 | |
| | 101,360 | | | NIKE, Inc., Class B | | | 5,842,390 | |
| | 27,505 | | | Omnicom Group, Inc. | | | 2,369,006 | |
| | 16,934 | | | O’Reilly Automotive, Inc.* | | | 4,740,673 | |
| | 2,477 | | | Priceline Group, Inc. (The)* | | | 3,509,240 | |
| | 39,562 | | | PVH Corp. | | | 4,263,201 | |
| | 72,798 | | | Ross Stores, Inc. | | | 4,530,948 | |
| | 10,912 | | | Royal Caribbean Cruises Ltd. | | | 775,952 | |
| | 4,791 | | | Signet Jewelers Ltd. | | | 392,766 | |
| | 178,286 | | | Sirius XM Holdings, Inc.* | | | 738,104 | |
| | 267,283 | | | Staples, Inc. | | | 2,287,943 | |
| | 89,714 | | | Starbucks Corp. | | | 5,044,618 | |
| | 64,965 | | | Target Corp. | | | 4,559,893 | |
| | 16,933 | | | Tiffany & Co. | | | 1,208,508 | |
| | 12,713 | | | Time Warner, Inc. | | | 996,826 | |
| | 59,602 | | | TJX Cos., Inc. (The) | | | 4,615,579 | |
| | |
| | Common Stocks – (continued) | |
| | Consumer Discretionary – (continued) | |
| | 31,005 | | | Tractor Supply Co. | | | 2,602,870 | |
| | 23,338 | | | TripAdvisor, Inc.* | | | 1,423,618 | |
| | 13,729 | | | Twenty-First Century Fox, Inc., Class A | | | 336,910 | |
| | 17,394 | | | Ulta Salon Cosmetics & Fragrance, Inc.* | | | 4,299,971 | |
| | 38,008 | | | Under Armour, Inc., Class A* | | | 1,506,257 | |
| | 45,783 | | | VF Corp. | | | 2,840,835 | |
| | 6,859 | | | Viacom, Inc., Class B | | | 276,692 | |
| | 56,764 | | | Walt Disney Co. (The) | | | 5,361,927 | |
| | 14,428 | | | Wyndham Worldwide Corp. | | | 1,021,358 | |
| | 27,950 | | | Yum! Brands, Inc. | | | 2,535,345 | |
| | | | | | | | |
| | | | | | | 179,909,755 | |
| | |
| | Consumer Staples – 13.6% | |
| | 104,975 | | | Altria Group, Inc. | | | 6,937,798 | |
| | 67,709 | | | Archer-Daniels-Midland Co. | | | 2,962,946 | |
| | 51,530 | | | Brown-Forman Corp., Class B | | | 2,501,781 | |
| | 24,735 | | | Bunge Ltd. | | | 1,580,566 | |
| | 33,919 | | | Campbell Soup Co. | | | 2,059,562 | |
| | 30,947 | | | Church & Dwight Co., Inc. | | | 3,076,751 | |
| | 34,462 | | | Clorox Co. (The) | | | 4,515,900 | |
| | 161,068 | | | Coca-Cola Co. (The) | | | 6,995,183 | |
| | 19,450 | | | Coca-Cola European Partners PLC | | | 747,853 | |
| | 70,335 | | | Colgate-Palmolive Co. | | | 5,228,704 | |
| | 46,413 | | | ConAgra Foods, Inc. | | | 2,163,310 | |
| | 18,545 | | | Constellation Brands, Inc., Class A | | | 3,042,307 | |
| | 44,842 | | | Costco Wholesale Corp. | | | 7,268,440 | |
| | 78,711 | | | CVS Health Corp. | | | 7,351,607 | |
| | 45,513 | | | Dr Pepper Snapple Group, Inc. | | | 4,264,568 | |
| | 44,357 | | | Estee Lauder Cos., Inc. (The), Class A | | | 3,957,975 | |
| | 37,609 | | | General Mills, Inc. | | | 2,663,469 | |
| | 30,545 | | | Hershey Co. (The) | | | 3,051,140 | |
| | 40,596 | | | Hormel Foods Corp. | | | 1,553,203 | |
| | 21,816 | | | JM Smucker Co. (The) | | | 3,093,291 | |
| | 24,176 | | | Kellogg Co. | | | 1,987,509 | |
| | 30,910 | | | Kimberly-Clark Corp. | | | 3,958,335 | |
| | 27,553 | | | Kraft Heinz Co. (The) | | | 2,465,718 | |
| | 185,555 | | | Kroger Co. (The) | | | 5,935,904 | |
| | 22,125 | | | McCormick & Co., Inc. | | | 2,255,865 | |
| | 30,527 | | | Mead Johnson Nutrition Co. | | | 2,596,932 | |
| | 10,098 | | | Molson Coors Brewing Co., Class B | | | 1,033,227 | |
| | 58,047 | | | Mondelez International, Inc., Class A | | | 2,613,276 | |
| | 4,917 | | | Monster Beverage Corp.* | | | 756,677 | |
| | 85,660 | | | PepsiCo, Inc. | | | 9,144,205 | |
| | 80,240 | | | Philip Morris International, Inc. | | | 8,018,383 | |
| | 123,258 | | | Procter & Gamble Co. (The) | | | 10,761,656 | |
| | 58,347 | | | Reynolds American, Inc. | | | 2,892,261 | |
| | 256,690 | | | Rite Aid Corp.* | | | 1,932,876 | |
| | 75,348 | | | Sysco Corp. | | | 3,907,547 | |
| | 95,111 | | | Tyson Foods, Inc., Class A | | | 7,187,538 | |
| | 58,505 | | | Walgreens Boots Alliance, Inc. | | | 4,721,939 | |
| | 122,518 | | | Wal-Mart Stores, Inc. | | | 8,752,686 | |
| | 58,749 | | | Whole Foods Market, Inc. | | | 1,784,795 | |
| | | | | | | | |
| | | | | | | 157,723,683 | |
| | |
| | Energy – 3.4% | |
| | 4,426 | | | Apache Corp. | | | 219,972 | |
| | |
| | |
| 62 | | The accompanying notes are an integral part of these financial statements. |
GOLDMAN SACHS ACTIVEBETA® U.S. LARGE CAP EQUITY ETF
| | | | | | | | |
| Shares | | | Description | | Value | |
| | Common Stocks – (continued) | |
| | Energy – (continued) | |
| | 63,196 | | | Baker Hughes, Inc. | | $ | 3,104,820 | |
| | 46,592 | | | Chevron Corp. | | | 4,686,223 | |
| | 2,956 | | | EOG Resources, Inc. | | | 261,576 | |
| | 173,990 | | | Exxon Mobil Corp. | | | 15,161,489 | |
| | 5,390 | | | Halliburton Co. | | | 231,824 | |
| | 70,799 | | | National Oilwell Varco, Inc. | | | 2,374,599 | |
| | 13,375 | | | Occidental Petroleum Corp. | | | 1,027,869 | |
| | 5,262 | | | ONEOK, Inc. | | | 246,735 | |
| | 6,880 | | | Phillips 66 | | | 539,736 | |
| | 2,187 | | | Pioneer Natural Resources Co. | | | 391,582 | |
| | 18,433 | | | Schlumberger Ltd. | | | 1,456,207 | |
| | 17,316 | | | Spectra Energy Corp. | | | 616,796 | |
| | 50,604 | | | Tesoro Corp. | | | 3,816,554 | |
| | 86,924 | | | Valero Energy Corp. | | | 4,811,243 | |
| | | | | | | | |
| | | | | | | 38,947,225 | |
| | |
| | Financials – 9.5% | |
| | 23,830 | | | Aflac, Inc. | | | 1,767,709 | |
| | 1,402 | | | Alleghany Corp.* | | | 751,752 | |
| | 33,918 | | | Allstate Corp. (The) | | | 2,338,985 | |
| | 168,253 | | | Ally Financial, Inc. | | | 3,371,790 | |
| | 41,064 | | | American Express Co. | | | 2,692,977 | |
| | 19,363 | | | American International Group, Inc. | | | 1,158,488 | |
| | 4,595 | | | Ameriprise Financial, Inc. | | | 464,463 | |
| | 157,545 | | | Annaly Capital Management, Inc. REIT | | | 1,687,307 | |
| | 17,907 | | | Aon PLC | | | 1,993,944 | |
| | 16,268 | | | Arthur J Gallagher & Co. | | | 803,802 | |
| | 379,800 | | | Bank of America Corp. | | | 6,129,972 | |
| | 15,787 | | | Bank of New York Mellon Corp. (The) | | | 657,844 | |
| | 19,836 | | | BB&T Corp. | | | 763,686 | |
| | 35,757 | | | Berkshire Hathaway, Inc., Class B* | | | 5,381,071 | |
| | 2,647 | | | BlackRock, Inc. | | | 986,828 | |
| | 46,452 | | | Capital One Financial Corp. | | | 3,325,963 | |
| | 19,621 | | | Chubb Ltd. | | | 2,490,494 | |
| | 26,051 | | | Cincinnati Financial Corp. | | | 2,008,793 | |
| | 55,342 | | | CIT Group, Inc. | | | 2,041,013 | |
| | 129,959 | | | Citigroup, Inc. | | | 6,204,243 | |
| | 13,738 | | | CME Group, Inc. | | | 1,488,512 | |
| | 11,008 | | | Discover Financial Services | | | 660,480 | |
| | 5,252 | | | Everest Re Group Ltd. | | | 1,015,632 | |
| | 89,140 | | | Fifth Third Bancorp | | | 1,797,062 | |
| | 12,188 | | | First Republic Bank | | | 937,988 | |
| | 9,897 | | | Franklin Resources, Inc. | | | 361,241 | |
| | 41,071 | | | Hartford Financial Services Group, Inc. (The) | | | 1,686,786 | |
| | 2,688 | | | Huntington Bancshares, Inc. | | | 26,907 | |
| | 4,959 | | | Intercontinental Exchange, Inc. | | | 1,398,537 | |
| | 180,786 | | | JPMorgan Chase & Co. | | | 12,203,055 | |
| | 17,947 | | | Lincoln National Corp. | | | 861,994 | |
| | 22,274 | | | Loews Corp. | | | 932,390 | |
| | 5,238 | | | M&T Bank Corp. | | | 619,813 | |
| | 1,438 | | | Markel Corp.* | | | 1,338,936 | |
| | 44,163 | | | Marsh & McLennan Cos., Inc. | | | 2,986,744 | |
| | 42,683 | | | MetLife, Inc. | | | 1,852,442 | |
| | 4,892 | | | Moody’s Corp. | | | 531,711 | |
| | |
| | Common Stocks – (continued) | |
| | Financials – (continued) | |
| | 81,885 | | | Morgan Stanley | | | 2,625,233 | |
| | 42,358 | | | New York Community Bancorp, Inc. | | | 640,029 | |
| | 6,205 | | | Northern Trust Corp. | | | 438,011 | |
| | 14,907 | | | PNC Financial Services Group, Inc. (The) | | | 1,343,121 | |
| | 8,119 | | | Principal Financial Group, Inc. | | | 398,399 | |
| | 59,234 | | | Progressive Corp. (The) | | | 1,928,659 | |
| | 17,294 | | | Prudential Financial, Inc. | | | 1,372,798 | |
| | 141,241 | | | Regions Financial Corp. | | | 1,408,173 | |
| | 20,443 | | | S&P Global, Inc. | | | 2,525,528 | |
| | 10,582 | | | SunTrust Banks, Inc. | | | 466,349 | |
| | 9,117 | | | Synchrony Financial | | | 253,726 | |
| | 21,676 | | | T Rowe Price Group, Inc. | | | 1,507,349 | |
| | 8,610 | | | TD Ameritrade Holding Corp. | | | 282,968 | |
| | 33,387 | | | Travelers Cos., Inc. (The) | | | 3,963,371 | |
| | 15,270 | | | Unum Group | | | 543,765 | |
| | 37,012 | | | US Bancorp | | | 1,634,080 | |
| | 194,195 | | | Wells Fargo & Co. | | | 9,865,106 | |
| | 5,700 | | | Willis Towers Watson PLC | | | 706,857 | |
| | | | | | | | |
| | | | | | | 109,624,876 | |
| | |
| | Health Care – 15.0% | |
| | 46,543 | | | Abbott Laboratories | | | 1,955,737 | |
| | 64,212 | | | AbbVie, Inc. | | | 4,115,989 | |
| | 48,404 | | | Aetna, Inc. | | | 5,669,077 | |
| | 39,029 | | | Agilent Technologies, Inc. | | | 1,833,582 | |
| | 15,795 | | | Allergan PLC* | | | 3,704,559 | |
| | 16,668 | | | AmerisourceBergen Corp. | | | 1,449,616 | |
| | 42,934 | | | Amgen, Inc. | | | 7,301,356 | |
| | 39,153 | | | Anthem, Inc. | | | 4,897,257 | |
| | 23,067 | | | Baxter International, Inc. | | | 1,077,921 | |
| | 9,560 | | | Becton Dickinson and Co. | | | 1,694,128 | |
| | 14,611 | | | Biogen, Inc.* | | | 4,465,560 | |
| | 53,625 | | | Boston Scientific Corp.* | | | 1,277,348 | |
| | 74,505 | | | Bristol-Myers Squibb Co. | | | 4,275,842 | |
| | 36,288 | | | Cardinal Health, Inc. | | | 2,891,065 | |
| | 27,427 | | | Celgene Corp.* | | | 2,927,558 | |
| | 21,241 | | | Cerner Corp.* | | | 1,370,894 | |
| | 19,706 | | | Cigna Corp. | | | 2,527,492 | |
| | 4,217 | | | Cooper Cos., Inc. (The) | | | 784,025 | |
| | 10,694 | | | CR Bard, Inc. | | | 2,361,663 | |
| | 36,274 | | | Danaher Corp. | | | 2,953,066 | |
| | 16,893 | | | DaVita HealthCare Partners, Inc.* | | | 1,091,795 | |
| | 17,903 | | | DENTSPLY SIRONA, Inc. | | | 1,100,318 | |
| | 33,912 | | | Edwards Lifesciences Corp.* | | | 3,905,306 | |
| | 53,215 | | | Eli Lilly & Co. | | | 4,137,466 | |
| | 54,673 | | | Express Scripts Holding Co.* | | | 3,974,727 | |
| | 111,321 | | | Gilead Sciences, Inc. | | | 8,725,340 | |
| | 10,964 | | | HCA Holdings, Inc.* | | | 828,330 | |
| | 18,277 | | | Henry Schein, Inc.* | | | 2,993,590 | |
| | 10,361 | | | Hologic, Inc.* | | | 398,070 | |
| | 10,347 | | | Humana, Inc. | | | 1,849,112 | |
| | 4,355 | | | Illumina, Inc.* | | | 733,121 | |
| | 2,669 | | | Intuitive Surgical, Inc.* | | | 1,832,055 | |
| | 1,628 | | | Jazz Pharmaceuticals PLC* | | | 201,595 | |
| | 139,702 | | | Johnson & Johnson | | | 16,672,037 | |
| | |
| | |
| The accompanying notes are an integral part of these financial statements. | | 63 |
GOLDMAN SACHS ACTIVEBETA® U.S. LARGE CAP EQUITY ETF
Schedule of Investments (continued)
August 31, 2016
| | | | | | | | |
| Shares | | | Description | | Value | |
| | Common Stocks – (continued) | |
| | Health Care – (continued) | |
| | 12,262 | | | Laboratory Corp. of America Holdings* | | $ | 1,679,036 | |
| | 63,142 | | | Mallinckrodt PLC* | | | 4,706,605 | |
| | 6,661 | | | McKesson Corp. | | | 1,229,754 | |
| | 44,980 | | | Medtronic PLC | | | 3,914,609 | |
| | 115,670 | | | Merck & Co., Inc. | | | 7,262,919 | |
| | 11,163 | | | Mettler-Toledo International, Inc.* | | | 4,499,470 | |
| | 53,304 | | | Mylan NV* | | | 2,257,957 | |
| | 12,521 | | | Perrigo Co. PLC | | | 1,139,286 | |
| | 333,159 | | | Pfizer, Inc. | | | 11,593,933 | |
| | 14,392 | | | Quest Diagnostics, Inc. | | | 1,191,945 | |
| | 38,906 | | | ResMed, Inc. | | | 2,594,641 | |
| | 8,507 | | | St Jude Medical, Inc. | | | 662,865 | |
| | 21,032 | | | Stryker Corp. | | | 2,432,561 | |
| | 27,454 | | | Thermo Fisher Scientific, Inc. | | | 4,178,224 | |
| | 63,223 | | | UnitedHealth Group, Inc. | | | 8,601,489 | |
| | 5,209 | | | Universal Health Services, Inc., Class B | | | 627,841 | |
| | 9,350 | | | Varian Medical Systems, Inc.* | | | 898,816 | |
| | 11,693 | | | Waters Corp.* | | | 1,839,426 | |
| | 10,022 | | | Zimmer Biomet Holdings, Inc. | | | 1,298,951 | |
| | 50,298 | | | Zoetis, Inc. | | | 2,570,228 | |
| | | | | | | | |
| | | | | | | 173,157,153 | |
| | |
| | Industrials – 9.3% | |
| | 36,366 | | | 3M Co. | | | 6,518,242 | |
| | 6,903 | | | Acuity Brands, Inc. | | | 1,899,153 | |
| | 11,562 | | | Alaska Air Group, Inc. | | | 780,782 | |
| | 9,359 | | | AMETEK, Inc. | | | 456,251 | |
| | 19,547 | | | Boeing Co. (The) | | | 2,530,359 | |
| | 24,802 | | | Caterpillar, Inc. | | | 2,032,524 | |
| | 49,027 | | | CH Robinson Worldwide, Inc. | | | 3,403,454 | |
| | 24,413 | | | Cintas Corp. | | | 2,868,772 | |
| | 11,942 | | | CSX Corp. | | | 337,720 | |
| | 5,117 | | | Cummins, Inc. | | | 642,746 | |
| | 7,264 | | | Deere & Co. | | | 614,171 | |
| | 80,016 | | | Delta Air Lines, Inc. | | | 2,940,588 | |
| | 12,045 | | | Dover Corp. | | | 873,263 | |
| | 10,613 | | | Eaton Corp. PLC | | | 706,189 | |
| | 43,737 | | | Emerson Electric Co. | | | 2,304,065 | |
| | 20,231 | | | Equifax, Inc. | | | 2,668,469 | |
| | 10,485 | | | Expeditors International of Washington, Inc. | | | 531,065 | |
| | 67,175 | | | Fastenal Co. | | | 2,895,914 | |
| | 7,465 | | | FedEx Corp. | | | 1,231,202 | |
| | 18,082 | | | Fortive Corp. | | | 952,379 | |
| | 14,882 | | | Fortune Brands Home & Security, Inc. | | | 945,900 | |
| | 9,646 | | | General Dynamics Corp. | | | 1,468,314 | |
| | 330,082 | | | General Electric Co. | | | 10,311,762 | |
| | 22,135 | | | Honeywell International, Inc. | | | 2,583,376 | |
| | 18,851 | | | Illinois Tool Works, Inc. | | | 2,240,441 | |
| | 7,905 | | | Ingersoll-Rand PLC | | | 537,461 | |
| | 7,356 | | | JB Hunt Transport Services, Inc. | | | 583,993 | |
| | 38,464 | | | L-3 Communications Holdings, Inc. | | | 5,724,213 | |
| | 12,805 | | | Lockheed Martin Corp. | | | 3,111,231 | |
| | 30,259 | | | Masco Corp. | | | 1,073,589 | |
| | 21,203 | | | Nielsen Holdings PLC | | | 1,129,696 | |
| | |
| | Common Stocks – (continued) | |
| | Industrials – (continued) | |
| | 15,467 | | | Northrop Grumman Corp. | | | 3,280,087 | |
| | 5,861 | | | PACCAR, Inc. | | | 350,722 | |
| | 9,636 | | | Parker-Hannifin Corp. | | | 1,180,699 | |
| | 19,635 | | | Raytheon Co. | | | 2,751,453 | |
| | 57,963 | | | Republic Services, Inc. | | | 2,928,291 | |
| | 12,541 | | | Rockwell Automation, Inc. | | | 1,453,878 | |
| | 9,037 | | | Rockwell Collins, Inc. | | | 756,307 | |
| | 8,586 | | | Roper Technologies, Inc. | | | 1,524,444 | |
| | 8,581 | | | Sensata Technologies Holding NV* | | | 326,764 | |
| | 12,568 | | | Snap-on, Inc. | | | 1,926,549 | |
| | 39,419 | | | Southwest Airlines Co. | | | 1,453,773 | |
| | 13,507 | | | Stanley Black & Decker, Inc. | | | 1,671,491 | |
| | 3,237 | | | Stericycle, Inc.* | | | 278,317 | |
| | 56,912 | | | Textron, Inc. | | | 2,324,855 | |
| | 4,040 | | | TransDigm Group, Inc.* | | | 1,152,168 | |
| | 15,840 | | | Tyco International PLC | | | 691,891 | |
| | 8,879 | | | Union Pacific Corp. | | | 848,211 | |
| | 90,104 | | | United Continental Holdings, Inc.* | | | 4,542,143 | |
| | 22,256 | | | United Parcel Service, Inc., Class B | | | 2,430,800 | |
| | 22,306 | | | United Technologies Corp. | | | 2,374,028 | |
| | 12,227 | | | Verisk Analytics, Inc.* | | | 1,015,452 | |
| | 3,350 | | | Wabtec Corp. | | | 256,644 | |
| | 43,902 | | | Waste Management, Inc. | | | 2,807,094 | |
| | 13,305 | | | WW Grainger, Inc. | | | 3,068,931 | |
| | | | | | | | |
| | | | | | | 108,292,276 | |
| | |
| | Information Technology – 20.2% | |
| | 50,552 | | | Accenture PLC, Class A | | | 5,813,480 | |
| | 37,920 | | | Activision Blizzard, Inc. | | | 1,568,750 | �� |
| | 23,638 | | | Adobe Systems, Inc.* | | | 2,418,404 | |
| | 11,673 | | | Akamai Technologies, Inc.* | | | 640,848 | |
| | 4,834 | | | Alliance Data Systems Corp.* | | | 988,940 | |
| | 13,522 | | | Alphabet, Inc., Class A* | | | 10,680,352 | |
| | 13,324 | | | Alphabet, Inc., Class C* | | | 10,220,174 | |
| | 47,396 | | | Amdocs Ltd. | | | 2,849,447 | |
| | 15,842 | | | Amphenol Corp., Class A | | | 987,115 | |
| | 4,179 | | | Analog Devices, Inc. | | | 261,438 | |
| | 14,631 | | | ANSYS, Inc.* | | | 1,391,262 | |
| | 279,081 | | | Apple, Inc. | | | 29,610,494 | |
| | 45,844 | | | Applied Materials, Inc. | | | 1,367,985 | |
| | 19,543 | | | Autodesk, Inc.* | | | 1,317,198 | |
| | 23,311 | | | Automatic Data Processing, Inc. | | | 2,093,561 | |
| | 34,194 | | | CA, Inc. | | | 1,159,519 | |
| | 16,931 | | | CDK Global, Inc. | | | 981,659 | |
| | 191,344 | | | Cisco Systems, Inc. | | | 6,015,855 | |
| | 33,943 | | | Citrix Systems, Inc.* | | | 2,959,830 | |
| | 27,338 | | | Cognizant Technology Solutions Corp., Class A* | | | 1,570,295 | |
| | 33,170 | | | Corning, Inc. | | | 752,627 | |
| | 123,405 | | | eBay, Inc.* | | | 3,968,705 | |
| | 47,657 | | | Electronic Arts, Inc.* | | | 3,871,178 | |
| | 112,817 | | | EMC Corp. | | | 3,270,565 | |
| | 92,369 | | | Facebook, Inc., Class A* | | | 11,649,578 | |
| | 29,428 | | | Fidelity National Information Services, Inc. | | | 2,334,523 | |
| | 35,163 | | | Fiserv, Inc.* | | | 3,623,547 | |
| | 1,731 | | | FleetCor Technologies, Inc.* | | | 284,230 | |
| | |
| | |
| 64 | | The accompanying notes are an integral part of these financial statements. |
GOLDMAN SACHS ACTIVEBETA® U.S. LARGE CAP EQUITY ETF
| | | | | | | | |
| Shares | | | Description | | Value | |
| | Common Stocks – (continued) | |
| | Information Technology – (continued) | |
| | 16,033 | | | Global Payments, Inc. | | $ | 1,217,706 | |
| | 11,560 | | | Harris Corp. | | | 1,074,849 | |
| | 44,850 | | | Hewlett Packard Enterprise Co. | | | 963,378 | |
| | 296,552 | | | HP, Inc. | | | 4,261,452 | |
| | 263,847 | | | Intel Corp. | | | 9,469,469 | |
| | 50,045 | | | International Business Machines Corp. | | | 7,951,150 | |
| | 45,742 | | | Intuit, Inc. | | | 5,097,946 | |
| | 28,532 | | | Juniper Networks, Inc. | | | 658,519 | |
| | 14,208 | | | KLA-Tencor Corp. | | | 984,046 | |
| | 13,658 | | | Lam Research Corp. | | | 1,274,565 | |
| | 57,403 | | | Linear Technology Corp. | | | 3,343,151 | |
| | 3,692 | | | LinkedIn Corp., Class A* | | | 711,633 | |
| | 38,677 | | | MasterCard, Inc., Class A | | | 3,737,358 | |
| | 16,282 | | | Maxim Integrated Products, Inc. | | | 663,003 | |
| | 9,293 | | | Microchip Technology, Inc. | | | 575,330 | |
| | 392,869 | | | Microsoft Corp. | | | 22,574,253 | |
| | 18,033 | | | Motorola Solutions, Inc. | | | 1,388,361 | |
| | 62,439 | | | NetApp, Inc. | | | 2,159,765 | |
| | 29,161 | | | NVIDIA Corp. | | | 1,788,736 | |
| | 138,915 | | | Oracle Corp. | | | 5,726,076 | |
| | 9,878 | | | Palo Alto Networks, Inc.* | | | 1,315,453 | |
| | 44,722 | | | Paychex, Inc. | | | 2,713,284 | |
| | 37,395 | | | PayPal Holdings, Inc.* | | | 1,389,224 | |
| | 39,040 | | | QUALCOMM, Inc. | | | 2,462,253 | |
| | 20,027 | | | Red Hat, Inc.* | | | 1,461,570 | |
| | 25,728 | | | salesforce.com, Inc.* | | | 2,043,318 | |
| | 48,373 | | | Seagate Technology PLC | | | 1,632,105 | |
| | 9,940 | | | ServiceNow, Inc.* | | | 722,340 | |
| | 27,033 | | | Skyworks Solutions, Inc. | | | 2,023,690 | |
| | 56,457 | | | Symantec Corp. | | | 1,362,307 | |
| | 79,301 | | | Texas Instruments, Inc. | | | 5,514,592 | |
| | 27,933 | | | Total System Services, Inc. | | | 1,375,700 | |
| | 18,326 | | | Vantiv, Inc., Class A* | | | 984,839 | |
| | 16,515 | | | VeriSign, Inc.* | | | 1,229,542 | |
| | 56,920 | | | Visa, Inc., Class A | | | 4,604,828 | |
| | 71,602 | | | Western Digital Corp. | | | 3,341,665 | |
| | 92,107 | | | Western Union Co. (The) | | | 1,982,143 | |
| | 622,356 | | | Xerox Corp. | | | 6,130,207 | |
| | 8,892 | | | Xilinx, Inc. | | | 482,035 | |
| | 8,592 | | | Yahoo!, Inc.* | | | 367,308 | |
| | | | | | | | |
| | | | | | | 233,410,708 | |
| | |
| | Materials – 2.2% | |
| | 3,623 | | | Air Products & Chemicals, Inc. | | | 563,811 | |
| | 6,260 | | | Ashland, Inc. | | | 732,921 | |
| | 5,596 | | | Ball Corp. | | | 443,147 | |
| | 6,010 | | | Dow Chemical Co. (The) | | | 322,377 | |
| | 38,450 | | | Eastman Chemical Co. | | | 2,610,371 | |
| | 9,619 | | | Ecolab, Inc. | | | 1,183,618 | |
| | 13,101 | | | EI du Pont de Nemours & Co. | | | 911,830 | |
| | 8,985 | | | International Flavors & Fragrances, Inc. | | | 1,245,141 | |
| | 14,592 | | | International Paper Co. | | | 707,566 | |
| | 5,171 | | | LyondellBasell Industries NV, Class A | | | 407,940 | |
| | 2,662 | | | Martin Marietta Materials, Inc. | | | 487,226 | |
| | 16,313 | | | Monsanto Co. | | | 1,737,335 | |
| | 13,728 | | | Mosaic Co. (The) | | | 412,801 | |
| | |
| | Common Stocks – (continued) | |
| | Materials – (continued) | |
| | 31,974 | | | Newmont Mining Corp. | | | 1,222,686 | |
| | 54,867 | | | Nucor Corp. | | | 2,661,598 | |
| | 10,417 | | | PPG Industries, Inc. | | | 1,102,952 | |
| | 8,305 | | | Praxair, Inc. | | | 1,013,542 | |
| | 19,191 | | | Sealed Air Corp. | | | 904,472 | |
| | 15,244 | | | Sherwin-Williams Co. (The) | | | 4,324,875 | |
| | 10,220 | | | Vulcan Materials Co. | | | 1,163,751 | |
| | 22,778 | | | WestRock Co. | | | 1,091,066 | |
| | | | | | | | |
| | | | | | | 25,251,026 | |
| | |
| | Real Estate – 4.3% | |
| | 19,197 | | | American Tower Corp. REIT | | | 2,176,556 | |
| | 10,196 | | | AvalonBay Communities, Inc. REIT | | | 1,784,402 | |
| | 6,504 | | | Boston Properties, Inc. REIT | | | 911,406 | |
| | 55,350 | | | CBRE Group, Inc., Class A* | | | 1,654,411 | |
| | 25,107 | | | Crown Castle International Corp. REIT | | | 2,379,390 | |
| | 18,037 | | | Digital Realty Trust, Inc. REIT | | | 1,787,286 | |
| | 4,728 | | | Equinix, Inc. REIT | | | 1,742,977 | |
| | 54,321 | | | Equity Residential REIT | | | 3,523,803 | |
| | 4,779 | | | Essex Property Trust, Inc. REIT | | | 1,085,311 | |
| | 19,881 | | | Extra Space Storage, Inc. REIT | | | 1,601,415 | |
| | 8,391 | | | Federal Realty Investment Trust REIT | | | 1,334,169 | |
| | 55,827 | | | General Growth Properties, Inc. REIT | | | 1,626,799 | |
| | 90,587 | | | Host Hotels & Resorts, Inc. REIT | | | 1,614,260 | |
| | 67,605 | | | Kimco Realty Corp. REIT | | | 2,031,530 | |
| | 31,279 | | | Macerich Co. (The) REIT | | | 2,561,437 | |
| | 45,917 | | | Prologis, Inc. REIT | | | 2,438,652 | |
| | 15,101 | | | Public Storage REIT | | | 3,381,718 | |
| | 27,594 | | | Realty Income Corp. REIT | | | 1,813,754 | |
| | 27,633 | | | Simon Property Group, Inc. REIT | | | 5,954,083 | |
| | 5,843 | | | SL Green Realty Corp. REIT | | | 687,838 | |
| | 38,163 | | | UDR, Inc. REIT | | | 1,380,737 | |
| | 22,183 | | | Ventas, Inc. REIT | | | 1,612,039 | |
| | 100,010 | | | VEREIT, Inc. REIT | | | 1,045,104 | |
| | 9,448 | | | Vornado Realty Trust REIT | | | 976,073 | |
| | 25,898 | | | Welltower, Inc. REIT | | | 1,987,672 | |
| | 40,600 | | | Weyerhaeuser Co. REIT | | | 1,293,110 | |
| | | | | | | | |
| | | | | | | 50,385,932 | |
| | |
| | Telecommunication Services – 2.5% | |
| | 272,536 | | | AT&T, Inc. | | | 11,141,272 | |
| | 145,680 | | | CenturyLink, Inc. | | | 4,049,904 | |
| | 6,861 | | | Level 3 Communications, Inc.* | | | 340,511 | |
| | 7,884 | | | SBA Communications Corp., Class A* | | | 899,959 | |
| | 32,184 | | | T-Mobile US, Inc.* | | | 1,491,406 | |
| | 203,606 | | | Verizon Communications, Inc. | | | 10,654,702 | |
| | | | | | | | |
| | | | | | | 28,577,754 | |
| | |
| | Utilities – 4.1% | |
| | 34,447 | | | Alliant Energy Corp. | | | 1,307,264 | |
| | 33,792 | | | Ameren Corp. | | | 1,670,001 | |
| | 29,120 | | | American Electric Power Co., Inc. | | | 1,880,278 | |
| | 23,831 | | | American Water Works Co., Inc. | | | 1,763,256 | |
| | 54,402 | | | CenterPoint Energy, Inc. | | | 1,222,413 | |
| | 42,701 | | | CMS Energy Corp. | | | 1,792,161 | |
| | 25,978 | | | Consolidated Edison, Inc. | | | 1,954,844 | |
| | |
| | |
| The accompanying notes are an integral part of these financial statements. | | 65 |
GOLDMAN SACHS ACTIVEBETA® U.S. LARGE CAP EQUITY ETF
Schedule of Investments (continued)
August 31, 2016
| | | | | | | | |
| Shares | | | Description | | Value | |
| | Common Stocks – (continued) | |
| | Utilities – (continued) | |
| | 24,749 | | | Dominion Resources, Inc. | | $ | 1,835,386 | |
| | 19,194 | | | DTE Energy Co. | | | 1,783,122 | |
| | 28,957 | | | Duke Energy Corp. | | | 2,306,715 | |
| | 28,824 | | | Edison International | | | 2,096,081 | |
| | 28,627 | | | Entergy Corp. | | | 2,238,631 | |
| | 27,261 | | | Eversource Energy | | | 1,471,276 | |
| | 40,969 | | | Exelon Corp. | | | 1,392,946 | |
| | 113,500 | | | FirstEnergy Corp. | | | 3,714,855 | |
| | 29,556 | | | NextEra Energy, Inc. | | | 3,574,503 | |
| | 31,044 | | | PG&E Corp. | | | 1,922,865 | |
| | 21,643 | | | Pinnacle West Capital Corp. | | | 1,624,091 | |
| | 46,805 | | | PPL Corp. | | | 1,627,878 | |
| | 24,821 | | | Public Service Enterprise Group, Inc. | | | 1,061,346 | |
| | 23,739 | | | SCANA Corp. | | | 1,677,160 | |
| | 11,622 | | | Sempra Energy | | | 1,216,010 | |
| | 50,103 | | | Southern Co. (The) | | | 2,571,787 | |
| | 31,808 | | | WEC Energy Group, Inc. | | | 1,904,663 | |
| | 48,383 | | | Xcel Energy, Inc. | | | 2,001,121 | |
| | | | | | | | |
| | | | | | | 47,610,653 | |
| | |
| | TOTAL INVESTMENTS – 99.6% | |
| | (Cost $1,113,732,645) | | $ | 1,152,891,041 | |
| | |
| OTHER ASSETS IN EXCESS OF
LIABILITIES – 0.4% | | | 4,315,040 | |
| | |
| | NET ASSETS – 100.0% | | $ | 1,157,206,081 | |
| | |
| | |
| The percentage shown for each investment category reflects the value of investments in that category as a percentage of net assets. |
* | | Non-income producing security |
| | |
|
Investment Abbreviations: |
PLC | | —Public Limited Company |
REIT | | —Real Estate Investment Trust |
|
| | |
| 66 | | The accompanying notes are an integral part of these financial statements. |
GOLDMAN SACHS ACTIVEBETA® ETFS
Statements of Assets and Liabilities
August 31, 2016
| | | | | | | | | | | | | | | | | | | | | | |
| | | | | ActiveBeta®
Emerging Markets
Equity ETF | | | ActiveBeta®
Europe Equity
ETF | | | ActiveBeta®
International
Equity ETF | | | ActiveBeta®
Japan Equity
ETF | | | ActiveBeta®
U.S. Large Cap
Equity ETF | |
| | Assets: | | | | | | | | | | | | | | | | | | | | |
| | Investments at value (cost $762,865,820, $32,805,708, $275,190,456, $30,903,047 and $1,113,732,645, respectively) | | $ | 862,524,969 | | | $ | 33,924,141 | | | $ | 282,624,269 | | | $ | 32,701,343 | | | $ | 1,152,891,041 | |
| | Cash | | | 4,062,074 | | | | 24,187 | | | | 832,799 | | | | 26,813 | | | | 1,995,592 | |
| | Foreign currency, at value (cost $93,238, $1,241, $20,128, $360 and $—, respectively) | | | 93,208 | | | | 1,242 | | | | 20,136 | | | | 360 | | | | — | |
| | Deferred offering costs | | | 11,606 | | | | — | | | | — | | | | — | | | | — | |
| | Receivables: | | | | | | | | | | | | | | | | | | | | |
| | Investments sold | | | 55,475,458 | | | | 1,690,334 | | | | 12,321,116 | | | | — | | | | — | |
| | Dividends | | | 1,084,385 | | | | 61,007 | | | | 540,442 | | | | 50,440 | | | | 2,280,088 | |
| | Foreign tax reclaims | | | 19,032 | | | | 19,323 | | | | 55,012 | | | | 9,993 | | | | — | |
| | Fund shares sold | | | — | | | | — | | | | 148,474 | | | | — | | | | 16,805 | |
| | Reimbursement from advisor | | | 236,045 | | | | 8,299 | | | | 53,336 | | | | 8,399 | | | | 64,964 | |
| | Other assets | | | 20,747 | | | | — | | | | — | | | | — | | | | — | |
| | Total assets | | | 923,527,524 | | | | 35,728,533 | | | | 296,595,584 | | | | 32,797,348 | | | | 1,157,248,490 | |
| | | | | | | | | | | | | | | | | | | | | | |
| | Liabilities: | | | | | | | | | | | | | | | | | | | | |
| | Payables: | | | | | | | | | | | | | | | | | | | | |
| | Investments purchased | | | 59,386,663 | | | | 1,769,047 | | | | 12,796,003 | | | | — | | | | — | |
| | Foreign capital gains tax | | | 289,322 | | | | — | | | | — | | | | — | | | | — | |
| | Management fees | | | 292,988 | | | | — | | | | 39,908 | | | | — | | | | 42,409 | |
| | Trustee fees | | | 25,705 | | | | — | | | | — | | | | — | | | | — | |
| | Accrued expenses and other liabilities | | | 144,785 | | | | — | | | | 2,423 | | | | — | | | | — | |
| | Total liabilities | | | 60,139,463 | | | | 1,769,047 | | | | 12,838,334 | | | | — | | | | 42,409 | |
| | | | | | | | | | | | | | | | | | | | | | |
| | Net Assets: | | | | | | | | | | | | | | | | | | | | |
| | Paid-in capital | | | 773,425,205 | | | | 32,844,724 | | | | 276,873,924 | | | | 30,940,606 | | | | 1,118,301,823 | |
| | Undistributed net investment income | | | 5,548,952 | | | | 126,865 | | | | 863,433 | | | | 69,454 | | | | 3,312,092 | |
| | Accumulated net realized loss | | | (14,954,314 | ) | | | (128,956 | ) | | | (1,409,516 | ) | | | (10,764 | ) | | | (3,566,230 | ) |
| | Net unrealized gain | | | 99,368,218 | | | | 1,116,853 | | | | 7,429,409 | | | | 1,798,052 | | | | 39,158,396 | |
| | NET ASSETS | | $ | 863,388,061 | | | $ | 33,959,486 | | | $ | 283,757,250 | | | $ | 32,797,348 | | | $ | 1,157,206,081 | |
| | SHARES ISSUED AND OUTSTANDING | | | | | | | | | | | | | | | | | | | | |
| | Shares outstanding no par value (unlimited shares authorized): | | | 30,800,000 | | | | 1,300,000 | | | | 11,500,000 | | | | 1,200,000 | | | | 26,402,500 | |
| | Net asset value per share: | | | $28.03 | | | | $26.12 | | | | $24.67 | | | | $27.33 | | | | $43.83 | |
| | |
| The accompanying notes are an integral part of these financial statements. | | 67 |
GOLDMAN SACHS ACTIVEBETA® ETFS
Statements of Operations
| | | | | | | | | | | | | | | | | | | | | | |
| | | | | ActiveBeta®
Emerging Markets
Equity ETF(1) | | | ActiveBeta®
Europe Equity
ETF(2) | | | ActiveBeta®
International
Equity ETF(3) | | | ActiveBeta®
Japan Equity
ETF(2) | | | ActiveBeta®
U.S. Large Cap
Equity ETF(4) | |
| | Investment income: | | | | | | | | | | | | | | | | | | | | |
| | Dividends (net of foreign withholding taxes of $2,046,652, $111,780, $359,967, $42,975 and $1,492, respectively) | | $ | 15,078,999 | | | $ | 799,519 | | | $ | 3,105,895 | | | $ | 325,039 | | | $ | 8,811,883 | |
| | Total investment income | | | 15,078,999 | | | | 799,519 | | | | 3,105,895 | | | | 325,039 | | | | 8,811,883 | |
| | | | | | | | | | | | | | | | | | | | | | |
| | Expenses: | | | | | | | | | | | | | | | | | | | | |
| | Management fees | | | 2,036,659 | | | | 33,150 | | | | 238,023 | | | | 31,572 | | | | 340,656 | |
| | Custody, accounting and administrative services | | | 416,761 | | | | 4,819 | | | | 94,549 | | | | 4,673 | | | | 44,017 | |
| | Professional fees | | | 119,178 | | | | 27,895 | | | | 69,206 | | | | 27,895 | | | | 91,269 | |
| | Amortization of offering costs | | | 93,502 | | | | 11,265 | | | | 55,747 | | | | 11,279 | | | | 79,394 | |
| | Trustee fees | | | 87,537 | | | | 15,160 | | | | 51,548 | | | | 15,161 | | | | 67,954 | |
| | Printing and mailing cost | | | 37,745 | | | | 3,416 | | | | 30,571 | | | | 3,416 | | | | 45,516 | |
| | Registration fees | | | 15,106 | | | | 4,842 | | | | 13,363 | | | | 4,842 | | | | 24,015 | |
| | Other | | | 157,357 | | | | 16,723 | | | | 33,493 | | | | 16,578 | | | | 63,169 | |
| | Total expenses | | | 2,963,845 | | | | 117,270 | | | | 586,500 | | | | 115,416 | | | | 755,990 | |
| | Less — expense reductions | | | (674,705 | ) | | | (75,953 | ) | | | (334,206 | ) | | | (75,847 | ) | | | (393,369 | ) |
| | Net expenses | | | 2,289,140 | | | | 41,317 | | | | 252,294 | | | | 39,569 | | | | 362,621 | |
| | NET INVESTMENT INCOME | | | 12,789,859 | | | | 758,202 | | | | 2,853,601 | | | | 285,470 | | | | 8,449,262 | |
| | | | | | | | | | | | | | | | | | | | | | |
| | Realized and unrealized gain (loss): | | | | | | | | | | | | | | | | | | | | |
| | Net realized gain (loss) from: | | | | | | | | | | | | | | | | | | | | |
| | Investments (including the effects of the foreign capital gains tax liability of $11,436, $—, $—, $— and $—, respectively) | | | (14,936,894 | ) | | | (127,433 | ) | | | (1,403,388 | ) | | | (10,531 | ) | | | (3,710,329 | ) |
| | In-kind redemptions | | | — | | | | — | | | | — | | | | — | | | | 4,173,054 | |
| | Foreign currency transactions | | | (117,403 | ) | | | (10,250 | ) | | | (4,609 | ) | | | 17,484 | | | | — | |
| | Unrealized gain (loss) on: | | | | | | | | | | | | | | | | | | | | |
| | Investments (including the effects of the foreign capital gains tax liability of $278,623, $—, $—, $— and $—, respectively) | | | 99,380,526 | | | | 1,118,433 | | | | 7,433,813 | | | | 1,798,296 | | | | 39,158,396 | |
| | Foreign currency translations | | | (12,308 | ) | | | (1,580 | ) | | | (4,404 | ) | | | (244 | ) | | | — | |
| | Net realized and unrealized gain | | | 84,313,921 | | | | 979,170 | | | | 6,021,412 | | | | 1,805,005 | | | | 39,621,121 | |
| | NET INCREASE IN NET ASSETS RESULTING FROM OPERATIONS | | | 97,103,780 | | | | 1,737,372 | | | | 8,875,013 | | | | 2,090,475 | | | | 48,070,383 | |
| | (1) | | For the period September 25, 2015 (commencement of operations) through August 31, 2016. |
| | (2) | | For the period March 2, 2016 (commencement of operations) through August 31, 2016. |
| | (3) | | For the period November 6, 2015 (commencement of operations) through August 31, 2016. |
| | (4) | | For the period September 17, 2015 (commencement of operations) through August 31, 2016. |
| | |
| 68 | | The accompanying notes are an integral part of these financial statements. |
GOLDMAN SACHS ACTIVEBETA® ETFS
Statements of Changes in Net Assets
| | | | | | | | | | | | | | | | | | | | | | |
| | | | | ActiveBeta®
Emerging Markets
Equity ETF(1) | | | ActiveBeta®
Europe Equity
ETF(2) | | | ActiveBeta®
International
Equity ETF(3) | | | ActiveBeta® Japan Equity
ETF(2) | | | ActiveBeta®
U.S. Large Cap
Equity ETF(4) | |
| | From operations: | | | | | | | | | | | | | | | | | | | | |
| | Net investment income | | $ | 12,789,859 | | | $ | 758,202 | | | $ | 2,853,601 | | | $ | 285,470 | | | $ | 8,449,262 | |
| | Net realized gain (loss) | | | (15,054,297 | ) | | | (137,683 | ) | | | (1,407,997 | ) | | | 6,953 | | | | 462,725 | |
| | Unrealized gain | | | 99,368,218 | | | | 1,116,853 | | | | 7,429,409 | | | | 1,798,052 | | | | 39,158,396 | |
| | Net increase in net assets resulting from operations | | | 97,103,780 | | | | 1,737,372 | | | | 8,875,013 | | | | 2,090,475 | | | | 48,070,383 | |
| | | | | | | | | | | | | | | | | | | | | | |
| | Distributions to shareholders: | | | | | | | | | | | | | | | | | | | | |
| | From net investment income | | | (7,161,211 | ) | | | (624,546 | ) | | | (1,996,958 | ) | | | (235,644 | ) | | | (5,154,092 | ) |
| | Total distributions to shareholders | | | (7,161,211 | ) | | | (624,546 | ) | | | (1,996,958 | ) | | | (235,644 | ) | | | (5,154,092 | ) |
| | | | | | | | | | | | | | | | | | | | | | |
| | From share transactions: | | | | | | | | | | | | | | | | | | | | |
| | Proceeds from sales of shares | | | 773,445,492 | | | | 32,846,660 | | | | 276,879,195 | | | | 30,942,517 | | | | 1,168,663,742 | |
| | Cost of shares redeemed | | | — | | | | — | | | | — | | | | — | | | | (54,473,952 | ) |
| | Net increase in net assets resulting from share transactions | | | 773,445,492 | | | | 32,846,660 | | | | 276,879,195 | | | | 30,942,517 | | | | 1,114,189,790 | |
| | TOTAL INCREASE | | | 863,388,061 | | | | 33,959,486 | | | | 283,757,250 | | | | 32,797,348 | | | | 1,157,106,081 | |
| | | | | | | | | | | | | | | | | | | | | | |
| | Net assets: | | | | | | | | | | | | | | | | | | | | |
| | Beginning of period | | $ | — | | | $ | — | | | $ | — | | | $ | — | | | $ | 100,000 | |
| | End of period | | $ | 863,388,061 | | | $ | 33,959,486 | | | $ | 283,757,250 | | | $ | 32,797,348 | | | $ | 1,157,206,081 | |
| | Undistributed net investment income | | $ | 5,548,952 | | | $ | 126,865 | | | $ | 863,433 | | | $ | 69,454 | | | $ | 3,312,092 | |
| | (1) | | For the period September 25, 2015 (commencement of operations) through August 31, 2016. |
| | (2) | | For the period March 2, 2016 (commencement of operations) through August 31, 2016. |
| | (3) | | For the period November 6, 2015 (commencement of operations) through August 31, 2016. |
| | (4) | | For the period September 17, 2015 (commencement of operations) through August 31, 2016. |
| | |
| The accompanying notes are an integral part of these financial statements. | | 69 |
GOLDMAN SACHS ACTIVEBETA® ETFS
Financial Highlights
Selected Data for a Share Outstanding Throughout The Period
| | | | | | |
| | | | | ActiveBeta®
Emerging Markets Equity ETF* | |
| | Per Share Operating Performance: | | | | |
| | Net asset value, beginning of period | | $ | 25.00 | |
| | Net investment income(a) | | | 0.60 | |
| | Net realized and unrealized gain | | | 2.70 | |
| | Total gain from investment operations | | | 3.30 | |
| | Distributions to shareholders from net investment income | | | (0.27 | ) |
| | Net asset value, end of period | | $ | 28.03 | |
| | Market price, end of period | | $ | 28.01 | |
| | Total Return at Net Asset Value(b) | | | 13.29 | % |
| | Net assets, end of period (in 000’s) | | $ | 863,388 | |
| | Ratio of net expenses to average net assets | | | 0.45 | %(c) |
| | Ratio of total expenses to average net assets | | | 0.58 | %(c) |
| | Ratio of net investment income to average net assets | | | 2.52 | %(c) |
| | Portfolio turnover rate(d) | | | 44 | % |
| | * | | For the period September 25, 2015 to August 31, 2016. |
| | (a) | | Calculated based on the average shares outstanding methodology. |
| | (b) | | Assumes investment at the net asset value at the beginning of the period, reinvestment of all distributions and a complete sale of the investment at the net asset value at the end of the period. Returns do not reflect the impact of taxes to shareholders relating to Fund distributions or the sale of Fund shares. Total returns for periods less than one full year are not annualized. |
| | (d) | | The Fund’s portfolio turnover rate is calculated in accordance with regulatory requirements and excludes portfolio securities received or delivered as a result of in-kind transactions. If such transactions were included, the Fund’s portfolio turnover rate may be higher. |
| | |
| 70 | | The accompanying notes are an integral part of these financial statements. |
GOLDMAN SACHS ACTIVEBETA® ETFS
Financial Highlights
Selected Data for a Share Outstanding Throughout The Period
| | | | | | |
| | | | | ActiveBeta®
Europe Equity ETF* | |
| | Per Share Operating Performance: | | | | |
| | Net asset value, beginning of period | | $ | 25.03 | |
| | Net investment income(a) | | | 0.60 | |
| | Net realized and unrealized gain | | | 0.97 | |
| | Total gain from investment operations | | | 1.57 | |
| | Distributions to shareholders from net investment income | | | (0.48 | ) |
| | Net asset value, end of period | | $ | 26.12 | |
| | Market price, end of period | | $ | 26.20 | |
| | Total Return at Net Asset Value(b) | | | 6.23 | % |
| | Net assets, end of period (in 000’s) | | $ | 33,959 | |
| | Ratio of net expenses to average net assets | | | 0.25 | %(c) |
| | Ratio of total expenses to average net assets | | | 0.71 | %(c) |
| | Ratio of net investment income to average net assets | | | 4.61 | %(c) |
| | Portfolio turnover rate(d) | | | 14 | % |
| | * | | For the period March 2, 2016 to August 31, 2016. |
| | (a) | | Calculated based on the average shares outstanding methodology. |
| | (b) | | Assumes investment at the net asset value at the beginning of the period, reinvestment of all distributions and a complete sale of the investment at the net asset value at the end of the period. Returns do not reflect the impact of taxes to shareholders relating to Fund distributions or the sale of Fund shares. Total returns for periods less than one full year are not annualized. |
| | (d) | | The Fund’s portfolio turnover rate is calculated in accordance with regulatory requirements and excludes portfolio securities received or delivered as a result of in-kind transactions. If such transactions were included, the Fund’s portfolio turnover rate may be higher. |
| | |
| The accompanying notes are an integral part of these financial statements. | | 71 |
GOLDMAN SACHS ACTIVEBETA® ETFS
Financial Highlights
Selected Data for a Share Outstanding Throughout The Period
| | | | | | |
| | | | | ActiveBeta®
International Equity ETF* | |
| | Per Share Operating Performance: | | | | |
| | Net asset value, beginning of period | | $ | 24.78 | |
| | Net investment income(a) | | | 0.59 | |
| | Net realized and unrealized loss | | | (0.37 | ) |
| | Total gain from investment operations | | | 0.22 | |
| | Distributions to shareholders from net investment income | | | (0.33 | ) |
| | Net asset value, end of period | | $ | 24.67 | |
| | Market price, end of period | | $ | 24.78 | |
| | Total Return at Net Asset Value(b) | | | 0.90 | % |
| | Net assets, end of period (in 000’s) | | $ | 283,757 | |
| | Ratio of net expenses to average net assets | | | 0.27 | %(c) |
| | Ratio of total expenses to average net assets | | | 0.62 | %(c) |
| | Ratio of net investment income to average net assets | | | 3.02 | %(c) |
| | Portfolio turnover rate(d) | | | 23 | % |
| | * | | For the period November 6, 2015 to August 31, 2016. |
| | (a) | | Calculated based on the average shares outstanding methodology. |
| | (b) | | Assumes investment at the net asset value at the beginning of the period, reinvestment of all distributions and a complete sale of the investment at the net asset value at the end of the period. Returns do not reflect the impact of taxes to shareholders relating to Fund distributions or the sale of Fund shares. Total returns for periods less than one full year are not annualized. |
| | (d) | | The Fund’s portfolio turnover rate is calculated in accordance with regulatory requirements and excludes portfolio securities received or delivered as a result of in-kind transactions. If such transactions were included, the Fund’s portfolio turnover rate may be higher. |
| | |
| 72 | | The accompanying notes are an integral part of these financial statements. |
GOLDMAN SACHS ACTIVEBETA® ETFS
Financial Highlights
Selected Data for a Share Outstanding Throughout The Period
| | | | | | |
| | | | | ActiveBeta®
Japan Equity ETF* | |
| | Per Share Operating Performance: | | | | |
| | Net asset value, beginning of period | | $ | 25.69 | |
| | Net investment income(a) | | | 0.24 | |
| | Net realized and unrealized gain | | | 1.60 | |
| | Total gain from investment operations | | | 1.84 | |
| | Distributions to shareholders from net investment income | | | (0.20 | ) |
| | Net asset value, end of period | | $ | 27.33 | |
| | Market price, end of period | | $ | 27.44 | |
| | Total Return at Net Asset Value(b) | | | 7.17 | % |
| | Net assets, end of period (in 000’s) | | $ | 32,797 | |
| | Ratio of net expenses to average net assets | | | 0.25 | %(c) |
| | Ratio of total expenses to average net assets | | | 0.73 | %(c) |
| | Ratio of net investment income to average net assets | | | 1.81 | %(c) |
| | Portfolio turnover rate(d) | | | 10 | % |
| | * | | For the period March 2, 2016 to August 31, 2016. |
| | (a) | | Calculated based on the average shares outstanding methodology. |
| | (b) | | Assumes investment at the net asset value at the beginning of the period, reinvestment of all distributions and a complete sale of the investment at the net asset value at the end of the period. Returns do not reflect the impact of taxes to shareholders relating to Fund distributions or the sale of Fund shares. Total returns for periods less than one full year are not annualized. |
| | (d) | | The Fund’s portfolio turnover rate is calculated in accordance with regulatory requirements and excludes portfolio securities received or delivered as a result of in-kind transactions. If such transactions were included, the Fund’s portfolio turnover rate may be higher. |
| | |
| The accompanying notes are an integral part of these financial statements. | | 73 |
GOLDMAN SACHS ACTIVEBETA® ETFS
Financial Highlights
Selected Data for a Share Outstanding Throughout The Period
| | | | | | |
| | | | | ActiveBeta®
U.S. Large Cap Equity ETF* | |
| | Per Share Operating Performance: | | | | |
| | Net asset value, beginning of period | | $ | 40.70 | |
| | Net investment income(a) | | | 0.85 | |
| | Net realized and unrealized gain | | | 2.78 | |
| | Total gain from investment operations | | | 3.63 | |
| | Distributions to shareholders from net investment income | | | (0.50 | ) |
| | Net asset value, end of period | | $ | 43.83 | |
| | Market price, end of period | | $ | 43.82 | |
| | Total Return at Net Asset Value(b) | | | 8.97 | % |
| | Net assets, end of period (in 000’s) | | $ | 1,157,206 | |
| | Ratio of net expenses to average net assets | | | 0.09 | %(c) |
| | Ratio of total expenses to average net assets | | | 0.19 | %(c) |
| | Ratio of net investment income to average net assets | | | 2.11 | %(c) |
| | Portfolio turnover rate(d) | | | 18 | % |
| | * | | For the period September 17, 2015 to August 31, 2016. |
| | (a) | | Calculated based on the average shares outstanding methodology. |
| | (b) | | Assumes investment at the net asset value at the beginning of the period, reinvestment of all distributions and a complete sale of the investment at the net asset value at the end of the period. Returns do not reflect the impact of taxes to shareholders relating to Fund distributions or the sale of Fund shares. Total returns for periods less than one full year are not annualized. |
| | (d) | | The Fund’s portfolio turnover rate is calculated in accordance with regulatory requirements and excludes portfolio securities received or delivered as a result of in-kind transactions. If such transactions were included, the Fund’s portfolio turnover rate may be higher. |
| | |
| 74 | | The accompanying notes are an integral part of these financial statements. |
GOLDMAN SACHS ETF TRUST
Notes to Financial Statements
August 31, 2016
Goldman Sachs ETF Trust (the “Trust”) is an open-end management investment company, registered under the Investment Company Act of 1940, as amended (the “Act”), consisting of multiple series. The Trust was organized as a Delaware statutory trust on December 16, 2009. The following table lists those series of the Trust that are included in this report (collectively, the “Funds” or individually a “Fund”) along with their respective diversification status under the Act:
| | |
| Fund | | Diversification
Classification |
Goldman Sachs ActiveBeta® Emerging Markets Equity ETF (“ActiveBeta® Emerging Markets Equity ETF”) | | Diversified |
Goldman Sachs ActiveBeta® Europe Equity ETF (“ActiveBeta® Europe Equity ETF”) | | Diversified |
Goldman Sachs ActiveBeta® International Equity ETF (“ActiveBeta® International Equity ETF”) | | Diversified |
Goldman Sachs ActiveBeta® Japan Equity ETF (“ActiveBeta® Japan Equity ETF”) | | Diversified |
Goldman Sachs ActiveBeta® U.S. Large Cap Equity ETF (“ActiveBeta® U.S. Large Cap Equity ETF”) | | Diversified |
The investment objective of each Fund is to provide investment results that closely correspond, before fees and expenses, to the performance of its respective Index.
Goldman Sachs Asset Management, L.P. (“GSAM”), an affiliate of Goldman, Sachs & Co., serves as investment adviser to the Funds pursuant to management agreements (each, an “Agreement”) with the Trust.
Each Fund is an exchange-traded fund (“ETF”). Shares of the Funds are listed and traded on the NYSE Arca, Inc. Market prices for the Funds’ shares may be different from their net asset value (“NAV”). The Funds issue and redeem shares at their respective NAV only in blocks of a specified number of shares, or multiples thereof, referred to as “Creation Units”. Creation Units are issued and redeemed principally in-kind for a basket of securities and a cash amount, with respect to the ActiveBeta® Europe Equity ETF, ActiveBeta® International Equity ETF, ActiveBeta® Japan Equity ETF and the ActiveBeta® U.S. Large Cap Equity ETF. The ActiveBeta® Emerging Markets Equity ETF issues and redeems Creation Units partially for cash and partially in-kind. Shares generally trade in the secondary market in quantities less than a Creation Unit at market prices that change throughout the day. Only those that have entered into an authorized participant agreement with ALPS Distributors, Inc. (the “Distributor”) may do business directly with the Funds.
|
| 2. SIGNIFICANT ACCOUNTING POLICIES |
The financial statements have been prepared in accordance with accounting principles generally accepted in the United States of America (“GAAP”) and require management to make estimates and assumptions that may affect the reported amounts and disclosures. Actual results may differ from those estimates and assumptions.
A. Investment Valuation — The Funds’ valuation policy is to value investments at fair value.
B. Investment Income and Investments — Investment income includes interest income, dividend income, net of any foreign withholding taxes less any amounts reclaimable and securities lending income. Interest income is accrued daily and adjusted for amortization of premiums and accretion of discounts. Dividend income is recognized on ex-dividend date or, for certain foreign securities, as soon as such information is obtained subsequent to the ex-dividend date. Investment transactions are reflected on trade date. Realized gains and losses are calculated using identified cost. Investment transactions are recorded on the following business day for daily NAV calculations. Any foreign capital gains tax is accrued daily based upon net unrealized gains, and is payable upon sale of such investments.
C. Expenses — Expenses incurred directly by a Fund are charged to the Fund, and certain expenses incurred by the Trust are allocated across the applicable Funds on a straight-line and/or pro-rata basis, depending upon the nature of the expenses, and are accrued daily.
75
GOLDMAN SACHS ETF TRUST
Notes to Financial Statements (continued)
August 31, 2016
|
| 2. SIGNIFICANT ACCOUNTING POLICIES (continued) |
D. Offering and Organization Costs — Offering costs paid in connection with the initial offering of shares of the ActiveBeta® Emerging Markets Equity ETF are being amortized on a straight-line basis over 12 months from the date of commencement of operations. The offering costs of the ActiveBeta® Europe Equity ETF, the ActiveBeta® International Equity ETF, the ActiveBeta® Japan Equity ETF and the ActiveBeta® U.S. Large Cap Equity ETF were amortized on a straight-line basis prior to the transition of the Funds to a unitary fee structure on May 1, 2016. Organization costs paid in connection with the organization of the Funds were borne by GSAM.
E. Federal Taxes and Distributions to Shareholders — It is each Fund’s policy to comply with the requirements of the Internal Revenue Code of 1986, as amended (the “Code”), applicable to regulated investment companies (mutual funds) and to distribute each year substantially all of its investment company taxable income and capital gains to its shareholders. Accordingly, the Funds are not required to make any provisions for the payment of federal income tax. Distributions to shareholders are recorded on the ex-dividend date. For all Funds, Income Distributions are declared and paid on a quarterly basis whereas Capital Gains Distributions are declared and paid on an annual basis.
Net capital losses are carried forward to future fiscal years and may be used to the extent allowed by the Code to offset any future capital gains. Utilization of capital loss carryforwards will reduce the requirement of future capital gains distributions.
The characterization of distributions to shareholders for financial reporting purposes is determined in accordance with federal income tax rules, which may differ from GAAP. The source of each Fund’s distributions may be shown in the accompanying financial statements as either from net investment income, net realized gain or capital. Certain components of the Funds’ net assets on the Statements of Assets and Liabilities reflect permanent GAAP/tax differences based on the appropriate tax character.
F. Foreign Currency Translation — The accounting records and reporting currency of the Funds are maintained in U.S. dollars. Assets and liabilities denominated in foreign currencies are translated into U.S. dollars using the current exchange rates at the close of each business day. The effect of changes in foreign currency exchange rates on investments is included within net realized and unrealized gain (loss) on investments. Changes in the value of other assets and liabilities as a result of fluctuations in foreign exchange rates are included in the Statements of Operations within net change in unrealized gain (loss) on foreign currency translations. Transactions denominated in foreign currencies are translated into U.S. dollars on the date the transaction occurred, the effects of which are included within net realized gain (loss) on foreign currency transactions.
| | |
| 3. INVESTMENTS AND FAIR VALUE MEASUREMENTS | | |
The fair value of a financial instrument is the amount that would be received to sell an asset or paid to transfer a liability in an orderly transaction between market participants at the measurement date (i.e., the exit price). GAAP establishes a fair value hierarchy that prioritizes the inputs to valuation techniques used to measure fair value. The hierarchy gives the highest priority to unadjusted quoted prices in active markets for identical assets or liabilities (Level 1 measurements) and the lowest priority to unobservable inputs (Level 3 measurements). The levels used for classifying investments are not necessarily an indication of the risk associated with investing in these investments. The three levels of the fair value hierarchy are described below:
Level 1 — Unadjusted quoted prices in active markets that are accessible at the measurement date for identical, unrestricted assets or liabilities;
Level 2 — Quoted prices in markets that are not active or financial instruments for which significant inputs are observable (including, but not limited to, quoted prices for similar investments, interest rates, foreign exchange rates, volatility and credit spreads), either directly or indirectly;
Level 3 — Prices or valuations that require significant unobservable inputs (including GSAM’s assumptions in determining fair value measurement).
Changes in valuation techniques may result in transfers into or out of an assigned level within the hierarchy. In accordance with the Funds’ policy, transfers between different levels of the fair value hierarchy resulting from such changes are deemed to have occurred as of the beginning of the reporting period.
76
GOLDMAN SACHS ETF TRUST
|
| 3. INVESTMENTS AND FAIR VALUE MEASUREMENTS (continued) |
The Board of Trustees (“Trustees”) has approved Valuation Procedures that govern the valuation of the portfolio investments held by the Funds, including investments for which market quotations are not readily available. The Trustees have delegated to GSAM day-to-day responsibility for implementing and maintaining internal controls and procedures related to the valuation of the Funds’ portfolio investments. To assess the continuing appropriateness of pricing sources and methodologies, GSAM regularly performs price verification procedures and issues challenges as necessary to third party pricing vendors or brokers, and any differences are reviewed in accordance with the Valuation Procedures.
A. Level 1 and Level 2 Fair Value Investments — The valuation techniques and significant inputs used in determining the fair values for investments classified as Level 1 and Level 2 are as follows:
Equity Securities — Equity securities traded on a United States (“U.S.”) securities exchange or the NASDAQ system, or those located on certain foreign exchanges, including but not limited to the Americas, are valued daily at their last sale price or official closing price on the principal exchange or system on which they are traded. If there is no sale or official closing price or such price is believed by GSAM to not represent fair value, equity securities are valued at the last bid price for long positions and at the last ask price for short positions. To the extent these investments are actively traded, they are classified as Level 1 of the fair value hierarchy, otherwise they are generally classified as Level 2.
Unlisted equity securities for which market quotations are available are valued at the last sale price on the valuation date, or if no sale occurs, at the last bid price. These investments are generally classified as Level 2 of the fair value hierarchy.
Exchange Traded Funds — Investments in ETFs are valued daily at the last sale price or official closing price on the principal exchange or system on which the investment is traded. To the extent these investments are actively traded, they are classified as Level 1 of the fair value hierarchy, otherwise they are generally classified as Level 2.
B. Level 3 Fair Value Investments — To the extent that significant inputs to valuation models and other alternative pricing sources are unobservable, or if quotations are not readily available, or if GSAM believes that such quotations do not accurately reflect fair value, the fair value of the Funds’ investments may be determined under Valuation Procedures approved by the Trustees. GSAM, consistent with its procedures and applicable regulatory guidance, may make an adjustment to the most recent valuation prices of either domestic or foreign securities in light of significant events to reflect what it believes to be the fair value of the securities at the time of determining a Fund’s NAV. Significant events which could affect a large number of securities in a particular market may include, but are not limited to: significant fluctuations in U.S. or foreign markets; market dislocations; market disruptions; or unscheduled market closings. Significant events which could also affect a single issuer may include, but are not limited to: corporate actions such as reorganizations, mergers and buy-outs; ratings downgrades; and bankruptcies. At August 31, 2016 the Funds did not hold level 3 securities.
77
GOLDMAN SACHS ETF TRUST
Notes to Financial Statements (continued)
August 31, 2016
|
| 3. INVESTMENTS AND FAIR VALUE MEASUREMENTS (continued) |
C. Fair Value Hierarchy — The following is a summary of the Funds’ investments classified in the fair value hierarchy as of August 31, 2016:
| | | | | | | | | | | | |
|
| ACTIVEBETA® EMERGING MARKETS EQUITY ETF | |
| | | |
| Investment Type | | Level 1 | | | Level 2 | | | Level 3 | |
| Assets | | | | | | | | | | | | |
Common Stock and/or Other Equity Investments(a) | | | | | | | | | | | | |
Africa | | $ | 53,182,832 | | | $ | 4,580,920 | | | $ | — | |
Asia | | | 567,673,756 | | | | 19,683,832 | | | | — | |
Europe | | | 16,349,688 | | | | — | | | | — | |
North America | | | 112,256,039 | | | | — | | | | — | |
South America | | | 64,383,551 | | | | 24,414,351 | | | | — | |
| Total | | $ | 813,845,866 | | | $ | 48,679,103 | | | $ | — | |
| | | |
| ACTIVEBETA® EUROPE EQUITY ETF | | | | | | | | | | | | |
| | | |
| Investment Type | | Level 1 | | | Level 2 | | | Level 3 | |
| Assets | | | | | | | | | | | | |
Common Stock and/or Other Equity Investments(a) | | | | | | | | | | | | |
Africa | | $ | 143,884 | | | $ | — | | | $ | — | |
Europe | | | 33,244,162 | | | | 223,207 | | | | — | |
North America | | | 304,798 | | | | — | | | | — | |
Oceania | | | 8,090 | | | | — | | | | — | |
| Total | | $ | 33,700,934 | | | $ | 223,207 | | | $ | — | |
| | | |
| ACTIVEBETA® INTERNATIONAL EQUITY ETF | | | | | | | | | | | | |
| | | |
| Investment Type | | Level 1 | | | Level 2 | | | Level 3 | |
| Assets | | | | | | | | | | | | |
Common Stock and/or Other Equity Investments(a) | | | | | | | | | | | | |
Africa | | $ | 651,675 | | | $ | — | | | $ | — | |
Asia | | | 73,869,913 | | | | — | | | | — | |
Europe | | | 159,624,871 | | | | 1,472,564 | | | | — | |
North America | | | 28,233,675 | | | | — | | | | — | |
Oceania | | | 18,771,571 | | | | — | | | | — | |
| Total | | $ | 281,151,705 | | | $ | 1,472,564 | | | $ | — | |
78
GOLDMAN SACHS ETF TRUST
|
| 3. INVESTMENTS AND FAIR VALUE MEASUREMENTS (continued) |
| | | | | | | | | | | | |
| | | |
| ACTIVEBETA® JAPAN EQUITY ETF | | | | | | | | | | | | |
| | | |
| Investment Type | | Level 1 | | | Level 2 | | | Level 3 | |
| Assets | | | | | | | | | | | | |
Common Stock and/or Other Equity Investments(a) | | | | | | | | | | | | |
Asia | | $ | 32,701,343 | | | $ | — | | | $ | — | |
| Total | | $ | 32,701,343 | | | $ | — | | | $ | — | |
| | | |
| ACTIVEBETA® U.S. LARGE CAP EQUITY ETF | | | | | | | | | | | | |
| | | |
| Investment Type | | Level 1 | | | Level 2 | | | Level 3 | |
| Assets | | | | | | | | | | | | |
Common Stock and/or Other Equity Investments(a) | | | | | | | | | | | | |
North America | | $ | 1,152,891,041 | | | $ | — | | | $ | — | |
| Total | | $ | 1,152,891,041 | | | $ | — | | | $ | — | |
| (a) | | Amounts are disclosed by continent to highlight the impact of time zone differences between local market close and the calculation of NAV. Security valuations are based on the principal exchange or system on which they are traded, which may differ from country of domicile noted in table. |
For further information regarding security characteristics, see the Schedules of Investments.
|
| 4. AGREEMENTS AND AFFILIATED TRANSACTIONS |
A. Management Agreement — Under the Agreement, GSAM manages the Funds, subject to the general supervision of the Trustees.
As compensation for the services rendered pursuant to the Agreement, the assumption of the expenses related thereto and administration of the Funds’ business affairs, including providing facilities, GSAM is entitled to a management fee, accrued daily and paid monthly, equal to an annual percentage rate of each Fund’s average daily net assets.
For each Fund except the Goldman Sachs ActiveBeta® Emerging Markets Equity ETF, the Board of Trustees of Goldman Sachs ETF Trust approved a unitary management fee structure for the Fund and reduction of the Fund’s management fee rate then in effect under a prior management agreement. Under the unitary fee structure, GSAM is responsible for paying substantially all the expenses of each such Fund, excluding payments under the Fund’s 12b-1 plan (if any), interest expenses, taxes, acquired fund fees and expenses, brokerage fees, costs of holding shareholder meetings, litigation, indemnification and extraordinary expenses. Prior to May 1, 2016, each Fund except the Goldman Sachs ActiveBeta® Emerging Markets Equity ETF had a non-unitary management fee structure.
79
GOLDMAN SACHS ETF TRUST
Notes to Financial Statements (continued)
August 31, 2016
|
| 4. AGREEMENTS AND AFFILIATED TRANSACTIONS (continued) |
For the fiscal year ended August 31, 2016, contractual and effective net management fees with GSAM were at the following rates for all Funds except the ActiveBeta® Emerging Markets Equity ETF:
| | | | | | | | | | | | | | |
| Fund | | | | Contractual Management Fee (Inception to April 30, 2016) | | | Contractual Unitary
Management Fee (May 1, 2016 to
Present) | | | Effective Net
Management
Fee | |
ActiveBeta® Europe Equity ETF | | | | | 0.30 | % | | | 0.25 | % | | | 0.17 | %1 |
ActiveBeta® International Equity ETF | | | | | 0.30 | % | | | 0.25 | % | | | 0.23 | %1 |
ActiveBeta® Japan Equity ETF | | | | | 0.30 | % | | | 0.25 | % | | | 0.17 | %1 |
ActiveBeta® U.S. Large Cap Equity ETF | | | | | 0.10 | % | | | 0.09 | % | | | 0.07 | %2 |
| (1) | | Effective March 2, 2016 through April 30, 2016, GSAM agreed to waive a portion of its management fees in order to achieve an effective net management fee rate of 0.20%. |
| (2) | | Effective September 17, 2015 through April 30, 2016, GSAM agreed to waive a portion of its management fee in order to achieve an effective net management fee rate of 0.07%. |
For the fiscal year ended August 31, 2016, contractual and effective net management fees with GSAM were at the following rates for the ActiveBeta® Emerging Markets Equity ETF:
| | | | | | | | | | |
| Fund | | | | Contractual Management
Fee | | | Effective Net
Management
Fee | |
ActiveBeta® Emerging Markets Equity ETF | | | | | 0.40 | % | | | 0.40 | % |
B. Distribution and Service Plans — The Trust, on behalf of the Funds, has adopted a Distribution and Service Plan (the “Plan”), pursuant to Rule 12b-1 under the Act. Under the Plan, the Funds are authorized to pay distribution fees in connection with the sale and distribution of their shares and pay service fees in connection with the provision of ongoing services to shareholders of each Fund and the maintenance of shareholder accounts in an amount up to 0.25% of its average daily net assets each year. No Rule 12b-1 fees are currently paid by any Fund, and there are no current plans to impose these fees.
C. Other Expense Agreements and Affiliated Transactions — GSAM has agreed to limit certain “Other Expenses” of the ActiveBeta® Emerging Markets Equity ETF (excluding acquired fund fees and expenses, taxes, interest, brokerage fees, shareholder meeting, litigation, indemnification and extraordinary expenses) to the extent such expenses exceed, on an annual basis, a percentage rate of the average daily net assets of the Fund. Such Other Expense reimbursements, if any, are accrued daily and paid monthly. In addition, the Funds, including those funds which no longer apply an Other Expense limitation (ActiveBeta® Europe Equity ETF, ActiveBeta® International Equity ETF, ActiveBeta® Japan Equity ETF and ActiveBeta® U.S. Large Cap Equity ETF), are not obligated to reimburse GSAM for prior fiscal year’s expense reimbursements, if any. The Other Expense limitation as an annual percentage rate of average daily net assets for the ActiveBeta® Emerging Markets Equity ETF is 0.05%. This Other Expense limitation will remain in effect permanently and GSAM may not terminate the arrangement without the approval of the Trustees.
From the respective Funds’ inception dates until April 30, 2016 the Other Expense limitations as an annual percentage rate of average daily net assets for ActiveBeta® Europe Equity ETF, ActiveBeta® International Equity ETF, ActiveBeta® Japan Equity ETF and ActiveBeta® U.S. Large Cap Equity ETF were 0.05%, 0.05%, 0.05% and 0.02%, respectively.
80
GOLDMAN SACHS ETF TRUST
|
| 4. AGREEMENTS AND AFFILIATED TRANSACTIONS (continued) |
For the fiscal year ended August 31, 2016, these expense reductions, including any fee waivers and Other Expense reimbursements, were as follows:
| | | | | | | | | | | | | | |
| | | | | Management
Fee Waiver | | | Other
Expense
Reimbursements | | | Total
Expense
Reductions | |
ActiveBeta® Emerging Markets Equity ETF | | $ | — | | | $ | 674,705 | | | $ | 674,705 | |
ActiveBeta® Europe Equity ETF | | | 5,127 | | | | 70,826 | | | | 75,953 | |
ActiveBeta® International Equity ETF | | | 17,143 | | | | 317,063 | | | | 334,206 | |
ActiveBeta® Japan Equity ETF | | | 4,985 | | | | 70,862 | | | | 75,847 | |
ActiveBeta® U.S. Large Cap Equity ETF | | | 46,703 | | | | 346,666 | | | | 393,369 | |
|
| 5. CREATION AND REDEMPTION OF CREATION UNITS |
The Trust issues and redeems shares of the Funds only in Creation Units on a continuous basis through the Distributor, without an initial sales load, at NAV next determined after receipt, on any Business Day (as defined in the Statement of Additional Information), of an order in proper form. Shares of the Funds may only be purchased or redeemed by certain financial institutions (each an “Authorized Participant”).
Authorized Participants transacting in Creation Units for cash may also pay a variable charge to compensate the relevant fund for certain transaction costs (e.g. taxes on currency or other financial transactions, and brokerage costs) and market impact expenses relating to investing in portfolio securities. Such variable charges, if any, are included in “Proceeds from sale of shares” in the Statements of Changes in Net Assets.
Share activity is as follows:
| | | | | | | | | | | | | | | | |
| | | ActiveBeta® Emerging Markets
Equity ETF(1) | | | ActiveBeta® Europe
Equity ETF(2) | |
| | | Shares | | | Dollars | | | Shares | | | Dollars | |
| | | | |
| Fund Share Activity | | | | | | | | | | | | | | | | |
Shares Sold | | | 30,800,000 | | | $ | 773,445,492 | | | | 1,300,000 | | | $ | 32,846,660 | |
Shares Redeemed | | | — | | | | — | | | | — | | | | — | |
NET INCREASE IN SHARES | | | 30,800,000 | | | $ | 773,445,492 | | | | 1,300,000 | | | $ | 32,846,660 | |
| | |
| | | ActiveBeta® International
Equity ETF(3) | | | ActiveBeta® Japan
Equity ETF(2) | |
| | | Shares | | | Dollars | | | Shares | | | Dollars | |
| | | | |
| Fund Share Activity | | | | | | | | | | | | | | | | |
Shares Sold | | | 11,500,000 | | | $ | 276,879,195 | | | | 1,200,000 | | | $ | 30,942,517 | |
Shares Redeemed | | | — | | | | — | | | | — | | | | — | |
NET INCREASE IN SHARES | | | 11,500,000 | | | $ | 276,879,195 | | | | 1,200,000 | | | $ | 30,942,517 | |
81
GOLDMAN SACHS ETF TRUST
Notes to Financial Statements (continued)
August 31, 2016
|
| 5. CREATION AND REDEMPTION OF CREATION UNITS (continued) |
| | | | | | | | | | | | | | | | |
| | | ActiveBeta® U.S. Large Cap
Equity ETF(4) | | | | |
| | | Shares | | | Dollars | | | | | | | |
| | | | | | | | | | | | |
| Fund Share Activity | | | | | | | | | | | | | | | | |
Shares Sold | | | 27,750,000 | | | $ | 1,168,663,742 | | | | | | | | | |
Shares Redeemed | | | (1,350,000 | ) | | | (54,473,952 | ) | | | | | | | | |
NET INCREASE IN SHARES | | | 26,400,000 | | | $ | 1,114,189,790 | | | | | | | | | |
| (1) | | For the period September 25, 2015 (commencement of operations) through August 31, 2016. |
| (2) | | For the period March 2, 2016 (commencement of operations) through August 31, 2016. |
| (3) | | For the period November 6, 2015 (commencement of operations) through August 31, 2016. |
| (4) | | For the period September 17, 2015 (commencement of operations) through August 31, 2016. |
|
| 6. PORTFOLIO SECURITIES TRANSACTIONS |
The cost of purchases and proceeds from sales of long-term securities for the fiscal year ended August 31, 2016, were as follows:
| | | | | | | | | | |
| Fund | | | | Purchases | | | Sales | |
ActiveBeta® Emerging Markets Equity ETF | | | | $ | 688,814,647 | | | $ | 217,319,104 | |
ActiveBeta® Europe Equity ETF | | | | | 4,665,870 | | | | 4,562,403 | |
ActiveBeta® International Equity ETF | | | | | 29,435,229 | | | | 27,233,692 | |
ActiveBeta® Japan Equity ETF | | | | | 2,971,016 | | | | 2,977,139 | |
ActiveBeta® U.S. Large Cap Equity ETF | | | | | 80,841,317 | | | | 75,317,381 | |
The purchases and sales from in-kind creation and redemption transactions for the fiscal year ended August 31, 2016, were as follows:
| | | | | | | | | | |
| Fund | | | | Purchases | | | Sales | |
ActiveBeta® Emerging Markets Equity ETF | | | | $ | 306,298,353 | | | $ | — | |
ActiveBeta® Europe Equity ETF | | | | | 32,831,376 | | | | — | |
ActiveBeta® International Equity ETF | | | | | 274,406,285 | | | | — | |
ActiveBeta® Japan Equity ETF | | | | | 30,919,701 | | | | — | |
ActiveBeta® U.S. Large Cap Equity ETF | | | | | 1,162,145,744 | | | | 54,195,418 | |
82
GOLDMAN SACHS ETF TRUST
The tax character of distributions paid during the fiscal year ended August 31, 2016 was as follows:
| | | | | | | | | | | | | | | | | | | | |
| | | ActiveBeta®
Emerging
Markets Equity
ETF | | | ActiveBeta®
Europe Equity
ETF | | | ActiveBeta®
International
Equity ETF | | | ActiveBeta®
Japan Equity
ETF | | | ActiveBeta®
U.S. Large Cap
Equity ETF | |
Distributions paid from: | | | | | | | | | | | | | | | | | | | | |
Ordinary Income* | | $ | 7,161,211 | | | $ | 624,546 | | | $ | 1,996,958 | | | $ | 235,644 | | | $ | 5,150,101 | |
Net long-term capital gains | | | — | | | | — | | | | — | | | | — | | | | 3,991 | |
Total taxable distributions | | $ | 7,161,211 | | | $ | 624,546 | | | $ | 1,996,958 | | | $ | 235,644 | | | $ | 5,154,092 | |
| * | | For tax purposes short-term capital gain distributions are considered ordinary income distributions. |
As of August 31, 2016, the components of accumulated earnings (losses) on a tax-basis were as follows:
| | | | | | | | | | | | | | | | | | | | |
| | | ActiveBeta®
Emerging
Markets Equity
ETF | | | ActiveBeta®
Europe Equity
ETF | | | ActiveBeta®
International
Equity ETF | | | ActiveBeta®
Japan Equity
ETF | | | ActiveBeta®
U.S. Large Cap
Equity ETF | |
Undistributed ordinary income — net | | $ | 6,046,124 | | | $ | 146,674 | | | $ | 1,138,375 | | | $ | 111,932 | | | $ | 3,305,579 | |
Undistributed long-term capital gains | | | — | | | | — | | | | — | | | | — | | | | — | |
Total undistributed earnings | | $ | 6,046,124 | | | $ | 146,674 | | | $ | 1,138,375 | | | $ | 111,932 | | | $ | 3,305,579 | |
Timing differences (Post-October Loss Deferral) | | $ | (11,689,355 | ) | | $ | (120,230 | ) | | $ | (482,853 | ) | | $ | (10,081 | ) | | $ | (1,088,518 | ) |
Unrealized gains (losses) — net | | $ | 95,606,087 | | | $ | 1,088,318 | | | $ | 6,227,804 | | | $ | 1,754,891 | | | $ | 36,687,197 | |
Total accumulated earnings (losses) net | | $ | 89,962,856 | | | $ | 1,114,762 | | | $ | 6,883,326 | | | $ | 1,856,742 | | | $ | 38,904,258 | |
As of August 31, 2016, the Funds’ aggregate security unrealized gains and losses based on cost for U.S. federal income tax purposes were as follows:
| | | | | | | | | | | | | | | | | | | | |
| | | ActiveBeta®
Emerging
Markets Equity
ETF | | | ActiveBeta®
Europe Equity
ETF | | | ActiveBeta®
International
Equity ETF | | | ActiveBeta®
Japan Equity
ETF | | | ActiveBeta® U.S. Large Cap
Equity ETF | |
Tax Cost | | $ | 766,627,951 | | | $ | 32,834,243 | | | $ | 276,392,061 | | | $ | 30,946,208 | | | $ | 1,116,203,844 | |
Gross unrealized gain | | | 108,200,424 | | | | 2,145,954 | | | | 11,847,117 | | | | 2,723,149 | | | | 59,519,680 | |
Gross unrealized loss | | | (12,303,406 | ) | | | (1,056,056 | ) | | | (5,614,909 | ) | | | (968,014 | ) | | | (22,832,483 | ) |
Net unrealized gains (losses) on securities | | $ | 95,897,018 | | | $ | 1,089,898 | | | $ | 6,232,208 | | | $ | 1,755,135 | | | $ | 36,687,197 | |
Net unrealized gain/(loss) on other investments | | | (290,931 | ) | | | (1,580 | ) | | | (4,404 | ) | | | (244 | ) | | | — | |
Net unrealized gain/(loss) | | $ | 95,606,087 | | | $ | 1,088,318 | | | $ | 6,227,804 | | | $ | 1,754,891 | | | $ | 36,687,197 | |
The difference between GAAP-basis and tax-basis unrealized gains (losses) is attributable primarily to wash sales, and differences in tax treatment of underlying fund investments, partnership investments, and passive foreign investment company investments.
83
GOLDMAN SACHS ETF TRUST
Notes to Financial Statements (continued)
August 31, 2016
|
| 7. TAX INFORMATION (continued) |
In order to present certain components of the Funds' capital accounts on a tax-basis, certain reclassifications have been recorded to the Funds' accounts. These reclassifications have no impact on the net asset value of the Funds and result primarily from certain non-deductible expenses, realized capital gains taxes, redemptions in kind, dividend redesignations, and from differences in the tax treatment of foreign currency transactions, partnership investments, underlying fund investments and passive foreign investment company investments.
| | | | | | | | | | | | | | |
| Fund | | | | Paid-in
Capital | | | Accumulated
Net Realized
Gain (Loss) | | | Accumulated
Undistributed
Net Investment
Income (Loss) | |
ActiveBeta® Emerging Markets Equity ETF | | | | $ | (20,287 | ) | | $ | 99,983 | | | $ | (79,696 | ) |
ActiveBeta® Europe Equity ETF | | | | | (1,936 | ) | | | 8,727 | | | | (6,791 | ) |
ActiveBeta® International Equity ETF | | | | | (5,271 | ) | | | (1,519 | ) | | | 6,790 | |
ActiveBeta® Japan Equity ETF | | | | | (1,911 | ) | | | (17,717 | ) | | | 19,628 | |
ActiveBeta® U.S. Large Cap Equity ETF | | | | | 4,012,033 | | | | (4,028,955 | ) | | | 16,922 | |
GSAM has reviewed the Funds' tax positions for all open tax years (the current and prior three years, as applicable) and has concluded that no provision for income tax is required in the Funds' financial statements. Such open tax years remain subject to examination and adjustment by tax authorities.
The Funds’ risks include, but are not limited to, the following:
Foreign and Emerging Countries Risk — Investing in foreign markets may involve special risks and considerations not typically associated with investing in the United States. Foreign securities may be subject to risk of loss because of more or less foreign government regulation, less public information and less economic, political and social stability in the countries in which the Fund invests. Loss may also result from the imposition of exchange controls, confiscations and other government restrictions by the United States or other governments, or from problems in registration, settlement or custody. Foreign risk also involves the risk of negative foreign currency rate fluctuations, which may cause the value of securities denominated in such foreign currency (or other instruments through which the Fund has exposure to foreign currencies) to decline in value. Currency exchange rates may fluctuate significantly over short periods of time. To the extent that the Fund also invests in securities of issuers located in emerging markets, these risks may be more pronounced.
Foreign Custody Risk — The Funds that invest in foreign securities may hold such securities and cash with foreign banks, agents, and securities depositories appointed by the Fund’s custodian (each a “Foreign Custodian”). Some foreign custodians may be recently organized or new to the foreign custody business. In some countries, Foreign Custodians may be subject to little or no regulatory oversight over, or independent evaluation of, their operations. Further, the laws of certain countries may place limitations on a Fund’s ability to recover its assets if a Foreign Custodian enters bankruptcy.
Investments in emerging markets may be subject to even greater custody risks than investments in more developed markets. Custody services in emerging market countries are very often undeveloped and may be considerably less well regulated than in more developed countries, and thus may not afford the same level of investor protection as would apply in developed countries.
84
GOLDMAN SACHS ETF TRUST
|
| 8. OTHER RISKS (continued) |
Index Risk — GSAM (the “Index Provider”) constructs each Fund’s Index in accordance with a rules-based methodology. A Fund will be negatively affected by general declines in the securities and asset classes represented in its Index. In addition, because the Funds are not “actively” managed, unless a specific security is removed from an Index, a Fund generally would not sell a security because the security’s issuer was in financial trouble. Market disruptions and regulatory restrictions could have an adverse effect on a Fund’s ability to adjust its exposure to the required levels in order to track the Index. A Fund also does not attempt to take defensive positions under any market conditions, including declining markets. Therefore, a Fund’s performance could be lower than funds that may actively shift their portfolio assets to take advantage of market opportunities or to lessen the impact of a market decline or a decline in the value of one or more issuers. The Index Provider relies on third party data it believes to be reliable in constructing each Index, but it does not guarantee the accuracy or availability of such third party data. Each Index is new and has a limited performance history. Errors in index data, index computation or the construction of an Index in accordance with its methodology may occur from time to time and may not be identified and corrected by the Index Provider for a period of time or at all, which may have an adverse impact on the applicable Fund and its shareholders. In addition, neither a Fund, the Investment Adviser nor the Index Provider can guarantee the availability or timeliness of the production of the Index.
Investments in Other Investment Companies Risk — As a shareholder of another investment company, including an ETF, a Fund will indirectly bear its proportionate share of any net management fees and other expenses paid by such other investment companies, in addition to the fees and expenses regularly borne by the Fund. ETFs are subject to risks that do not apply to conventional mutual funds, including but not limited to the following: (i) the market price of the ETF’s shares may trade at a premium or a discount to their NAV; and (ii) an active trading market for an ETF’s shares may not develop or be maintained.
Market and Credit Risks — In the normal course of business, the Fund trades financial instruments and enters into financial transactions where risk of potential loss exists due to changes in the market (market risk). Additionally, the Fund may also be exposed to credit risk in the event that an issuer or guarantor fails to perform or that an institution or entity with which the Fund has unsettled or open transactions defaults.
Market Trading Risk — Each Fund faces numerous market trading risks, including disruptions to creations and redemptions, the existence of extreme market volatility or potential lack of an active trading market for Shares. If a shareholder purchases Shares at a time when the market price is at a premium to the NAV or sells Shares at a time when the market price is at a discount to the NAV, the shareholder may sustain losses. The Investment Adviser cannot predict whether Shares will trade below, at or above their NAV. Price differences may be due, in large part, to the fact that supply and demand forces at work in the secondary trading market for Shares will be closely related to, but not identical to, the same forces influencing the prices of the securities of a Fund’s Index trading individually or in the aggregate at any point in time.
Tracking Error Risk — Tracking error is the divergence of a Fund’s performance from that of its Index. The performance of a Fund may diverge from that of its Index for a number of reasons. Tracking error may occur because of transaction costs, a Fund’s holding of cash, differences in accrual of dividends, changes to its Index or the need to meet new or existing regulatory requirements. Unlike a Fund, the returns of an Index are not reduced by investment and other operating expenses, including the trading costs associated with implementing changes to its portfolio of investments. Tracking error risk may be heightened during times of market volatility or other unusual market conditions.
85
GOLDMAN SACHS ETF TRUST
Notes to Financial Statements (continued)
August 31, 2016
Under the Trust’s organizational documents, its Trustees, officers, employees and agents are indemnified, to the extent permitted by the Act and state law, against certain liabilities that may arise out of performance of their duties to the Funds. Additionally, in the course of business, the Funds enter into contracts that contain a variety of indemnification clauses. The Funds’ maximum exposure under these arrangements is unknown, as this would involve future claims that may be made against the Funds that have not yet occurred. However, GSAM believes the risk of loss under these arrangements to be remote.
Subsequent events after the Statements of Assets and Liabilities date have been evaluated and GSAM has concluded that there is no impact requiring adjustment or disclosure in the financial statements.
86
Report of Independent Registered Public
Accounting Firm
To the Board of Trustees of Goldman Sachs ETF Trust and Shareholders of the Goldman Sachs ActiveBeta® ETFs:
In our opinion, the accompanying statements of assets and liabilities, including the schedules of investments, and the related statements of operations and of changes in net assets and the financial highlights present fairly, in all material respects, the financial position of the Goldman Sachs ActiveBeta® Emerging Markets Equity ETF, Goldman Sachs ActiveBeta® Europe Equity ETF, Goldman Sachs ActiveBeta® International Equity ETF, Goldman Sachs ActiveBeta® Japan Equity ETF, and Goldman Sachs ActiveBeta® U.S. Large Cap Equity ETF (collectively the “Funds”), funds of the Goldman Sachs ETF Trust, at August 31, 2016, and the results of each of their operations, the changes in each of their net assets and the financial highlights for each of the periods indicated, in conformity with accounting principles generally accepted in the United States of America. These financial statements and financial highlights (hereafter referred to as “financial statements”) are the responsibility of the Funds’ management. Our responsibility is to express an opinion on these financial statements based on our audits. We conducted our audits of these financial statements in accordance with the standards of the Public Company Accounting Oversight Board (United States). Those standards require that we plan and perform the audit to obtain reasonable assurance about whether the financial statements are free of material misstatement. An audit includes examining, on a test basis, evidence supporting the amounts and disclosures in the financial statements, assessing the accounting principles used and significant estimates made by management, and evaluating the overall financial statement presentation. We believe that our audits, which included confirmation of securities at August 31, 2016 by correspondence with the custodian, brokers, and the application of alternative auditing procedures where securities purchased confirmations had not been received, provide a reasonable basis for our opinion.
PricewaterhouseCoopers LLP
Boston, Massachusetts
October 21, 2016
87
GOLDMAN SACHS ETF TRUST
Fund Expenses — Six Month Period Ended 8/31/2016 (Unaudited)
As a shareholder you incur ongoing costs, which may include management fees; distribution and service (12b-1) fees; and other Fund expenses. This Example is intended to help you understand your ongoing costs (in dollars) of investing in Shares of the Funds and to compare these costs with the ongoing costs of investing in other exchange-traded funds.
The Example is based on an investment of $1,000 invested at the beginning of the period from March 1, 2016 (or commencement of operations) and held for the six months ended August 31, 2016, which represents a period of 184 days of a 366 day year (or less where indicated).
Actual Expenses — The first line in the table below provides information about actual account values and actual expenses. You may use the information in this line, together with the amount you invested, to estimate the expenses that you paid over the period. Simply divide your account value by $1,000 (for example, an $8,600 account value divided by $1,000=8.6), then multiply the result by the number in the first line under the heading entitled “Expenses Paid” to estimate the expenses you paid on your account during this period.
Hypothetical Example for Comparison Purposes — The second line in the table below provides information about hypothetical account values and hypothetical expenses based on the Funds’ actual net expense ratios and an assumed rate of return of 5% per year before expenses, which is not the Funds’ actual return. The hypothetical account values and expenses may not be used to estimate the actual ending account balance or expenses you paid for the period. You may use this information to compare the ongoing costs of investing in the Funds and other funds. To do so, compare this 5% hypothetical example with the 5% hypothetical examples that appear in the shareholder reports of the other funds.
Please note that the expenses shown in the table are meant to highlight your ongoing costs only and do not reflect any transactional costs, such as redemption fees, or exchange fees. Therefore, the second line of the table is useful in comparing ongoing costs only, and will not help you determine the relative total costs of owning different funds. In addition, if these transactional costs were included, your costs would have been higher.
| | | | | | | | | | | | | | | | | | | | | | | | | | | | | | | | | | | | | | | | | | | | | | | | | | | | | | | | | | | | |
| | | ActiveBeta® Emerging Markets Equity ETF | | | ActiveBeta® Europe Equity ETF(1) | | | ActiveBeta® International Equity ETF | | | ActiveBeta® Japan Equity ETF(1) | | | ActiveBeta® U.S. Large Cap Equity ETF | |
| | | Beginning
Account
Value | | | Ending
Account
Value
8/31/2016 | | | Expenses
Paid* | | | Beginning
Account
Value | | | Ending
Account
Value
8/31/2016 | | | Expenses
Paid* | | | Beginning
Account
Value | | | Ending
Account
Value
8/31/2016 | | | Expenses
Paid* | | | Beginning
Account
Value | | | Ending
Account
Value
8/31/2016 | | | Expenses
Paid* | | | Beginning
Account
Value | | | Ending
Account
Value
8/31/2016 | | | Expenses
Paid* | |
Actual based on NAV | | $ | 1,000 | | | $ | 1,212.59 | | | $ | 2.50 | | | $ | 1,000 | | | $ | 1,062.30 | | | $ | 1.29 | | | $ | 1,000 | | | $ | 1,098.55 | | | $ | 1.32 | | | $ | 1,000 | | | $ | 1,071.70 | | | $ | 1.29 | | | $ | 1,000 | | | $ | 1,115.93 | | | $ | 0.48 | |
Hypothetical 5% return | | $ | 1,000 | | | $ | 1,022.87 | + | | $ | 2.29 | | | $ | 1,000 | | | $ | 1,023.88 | + | | $ | 1.27 | | | $ | 1,000 | | | $ | 1,023.88 | + | | $ | 1.27 | | | $ | 1,000 | | | $ | 1,023.88 | + | | $ | 1.27 | | | $ | 1,000 | | | $ | 1,024.68 | + | | $ | 0.46 | |
| * | | Expenses for each Fund are calculated using each Fund’s annualized net expense ratio, which represents the ongoing expenses as a percentage of net assets for the six months ended August 31, 2016. Expenses are calculated by multiplying the annualized net expense ratio by the average account value for the period; then multiplying the result by the number of days in the most recent fiscal year; and then dividing that result by the number of days in the fiscal year. |
| | | The annualized net expense ratios for the period were as follows: |
| | | | |
| Fund | | | |
ActiveBeta® Emerging Markets Equity ETF | | | 0.45 | % |
ActiveBeta® Europe Equity ETF | | | 0.25 | |
ActiveBeta® International Equity ETF | | | 0.25 | |
ActiveBeta® Japan Equity ETF | | | 0.25 | |
ActiveBeta® U.S. Large Cap Equity ETF | | | 0.09 | |
| + | | Hypothetical expenses are based on each Fund’s actual annualized net expense ratios and an assumed rate of return of 5% per year before expenses. |
| (1) | | Fund commenced operations on March 2, 2016. Expenses are calculated using the Fund’s annualized expense ratio, multiplied by the ending value for the period, multiplied by 183/366 (to reflect commencement of operation). |
88
GOLDMAN SACHS ETF TRUST
Statement Regarding Basis for Initial Approval of Management Agreement for Goldman Sachs ActiveBeta® Europe Equity ETF and Goldman Sachs ActiveBeta® Japan Equity ETF (Unaudited)
Background
The Goldman Sachs ActiveBeta® Europe Equity ETF and Goldman Sachs ActiveBeta® Japan Equity ETF (each, a “Fund” and together, the “Funds”) are newly-organized investment portfolios of Goldman Sachs ETF Trust (the “Trust”) that commenced investment operations on March 2, 2016. At a meeting held on April 16, 2015 (the “Meeting”) in connection with each Fund’s organization, the Trustees, including all of the Trustees present who are not parties to the Fund’s investment management agreement (the “Management Agreement”) or “interested persons” (as defined in the Investment Company Act of 1940, as amended) of any party thereto (the “Independent Trustees”) approved the Management Agreement with Goldman Sachs Asset Management, L.P. (the “Investment Adviser”).
At the Meeting, the Trustees reviewed the Management Agreement with respect to each Fund, including information regarding the terms of the Management Agreement; the nature, extent, and quality of the Investment Adviser’s anticipated services; the fees and expenses to be paid by the Fund; a comparison of the Fund’s proposed management fees and anticipated expenses with those paid by other similar exchange-traded funds (“ETFs”); the Investment Adviser’s proposal to limit certain expenses of the Fund that exceed a specified level; potential benefits to be derived by the Investment Adviser and its affiliates from their relationships with the Fund; and potential benefits to be derived by the Fund from its relationship with the Investment Adviser. Various information was also provided at prior meetings at which the Funds were discussed.
In connection with the Meeting, the Trustees received written materials and oral presentations on the topics covered. The Independent Trustees were advised by their independent legal counsel regarding their responsibilities under applicable law. In evaluating the Management Agreement at the Meeting, the Trustees relied upon information included in a presentation made by the Investment Adviser at the Meeting and information received at prior Board meetings. The Trustees also drew on information they had received in their capacity as Trustees of other registered investment companies sponsored by the Investment Adviser.
Nature, Extent, and Quality of the Services to be Provided Under the Management Agreement
As part of their review, the Trustees considered the nature, extent, and quality of the services to be provided by the Investment Adviser. In this regard, the Trustees considered the investment advisory services that would be provided to the Funds by the Investment Adviser. The Trustees also considered information about each Fund’s structure, investment objective, strategies, and other characteristics. In particular, they noted that the Funds would operate as passively-managed ETFs, which would seek to track proprietary indices created by the Investment Adviser. The Trustees noted the experience and capabilities of the key Investment Adviser personnel who would be providing services to the Funds. The Trustees considered the Investment Adviser’s extensive experience in managing quantitative investment strategies and its expertise in developing “smart beta” products that it had obtained through its acquisition of another investment management firm. The Trustees concluded that the Investment Adviser would be able to commit substantial financial and other resources to the Funds. They also considered that although the Funds were new (and therefore had no performance data to evaluate) and would be among the first ETFs managed by the Investment Adviser, the Investment Adviser had extensive experience managing other types of registered investment companies. The Trustees concluded that the Investment Adviser’s management of the Funds likely would benefit the Funds and their shareholders.
Costs of Services to be Provided and Profitability
The Trustees considered the contractual fee rates payable by the Funds under the Management Agreement, and the net amount expected to be retained by the Investment Adviser. In this regard, the Trustees considered information on the services to be rendered by the Investment Adviser to the Funds, which include advisory and non-advisory services directed to the needs and operations of the Funds as ETFs. The Trustees noted that no license fees would be payable to the Investment Adviser by the Funds for use of the indices created by the Investment Adviser. The Trustees also reviewed the Funds’ projected total operating expense ratios (both gross and net of expense limitations). They compared the Funds’ projected fees and expenses to similar information for comparable ETFs advised by other, unaffiliated investment management firms, as well as the peer group and category medians. The comparisons of the Funds’ fee rates and total operating expense ratios were prepared by a third-party provider of mutual fund data. The Trustees concluded that this information was useful in evaluating the reasonableness of the management fees and total expenses expected to be paid by the Funds.
In addition, the Trustees considered the Investment Adviser’s undertaking to limit certain expenses of the Funds that exceed a specified level. The Trustees recognized that there was not yet profitability data to evaluate for the Funds, but considered the Investment Adviser’s representations that (i) such data would be provided after the Funds commenced operations, and (ii) the Funds were not expected to be profitable to the Investment Adviser and its affiliates initially.
89
GOLDMAN SACHS ETF TRUST
Statement Regarding Basis for Initial Approval of Management Agreement for Goldman Sachs ActiveBeta® Europe Equity ETF and Goldman Sachs ActiveBeta® Japan Equity ETF (Unaudited) (continued)
Economies of Scale
The Trustees noted that the Funds will not have management fee breakpoints. They considered the Funds’ projected asset levels and information comparing the fee rates charged by the Investment Adviser with fee rates charged to other ETFs in the peer groups, as well as the Investment Adviser’s undertaking to limit certain expenses of the Funds that exceed a specified level. The Trustees recognized that if the assets of the Funds increase over time, the Funds and their shareholders could realize economies of scale as certain Fund expenses, such as certain fixed fees, become a smaller percentage of overall assets.
Other Benefits to the Investment Adviser and Its Affiliates
The Trustees also considered the other benefits expected to be derived by the Investment Adviser and its affiliates from their relationships with the Fund, including: (a) the Investment Adviser’s ability to leverage the infrastructure designed to service the Funds on behalf of its other clients; (b) the Investment Adviser’s ability to cross-market other products and services to Fund shareholders; (c) the Investment Adviser’s ability to negotiate better pricing with custodians on behalf of its other clients, as a result of the relationship with the Funds; and (d) the possibility that the working relationship between the Investment Adviser and the Funds’ third-party service providers may cause those service providers to be open to doing business with other areas of Goldman, Sachs & Co. (“Goldman Sachs”).
Other Benefits to the Funds and Their Shareholders
The Trustees also noted that the Funds receive (or are expected to receive) certain potential benefits as a result of their relationships with the Investment Adviser, including: (a) improved servicing and pricing from vendors because of the volume of business generated by the Investment Adviser and its affiliates; (b) the Investment Adviser’s ability to hire and retain qualified personnel to provide services to the Funds because of the reputation of the Goldman Sachs organization; and (c) the Funds’ access to certain affiliated distribution channels.
Conclusion
In connection with their consideration of the Management Agreement for the Funds at the Meeting, the Trustees gave weight to various factors, but did not identify any particular factor as controlling their decision. After deliberation and consideration of the information provided, including the factors described above, the Trustees concluded, in the exercise of their business judgment, that the investment management fees were reasonable. The Trustees concluded that the engagement of the Investment Adviser likely would benefit the Funds and their shareholders and that the Management Agreement should be approved with respect to each Fund for a period of two years.
90
GOLDMAN SACHS ETF TRUST
Statement Regarding Basis for Approval of Management Agreement for All Funds except ActiveBeta® Emerging Markets Equity ETF (Unaudited)
Background
The Goldman Sachs ActiveBeta® Europe Equity ETF, Goldman Sachs ActiveBeta® International Equity ETF, Goldman Sachs ActiveBeta® Japan Equity ETF and Goldman Sachs ActiveBeta® U.S. Large Cap Equity ETF (each, a “Fund” and together, the “Funds”) are investment portfolios of Goldman Sachs ETF Trust (the “Trust”). The Board of Trustees oversees the management of the Trust and determines whether to approve changes to the Trust’s investment management agreement (the “Management Agreement”) with Goldman Sachs Asset Management, L.P. (the “Investment Adviser”) on behalf of the Funds. At a meeting held on April 12, 2016 (the “Meeting”) the Trustees, including all of the Trustees present who are not parties to the Management Agreement or “interested persons” (as defined in the Investment Company Act of 1940, as amended) of any party thereto (the “Independent Trustees”) approved the new Management Agreement with the Investment Adviser.
At the Meeting, the Trustees reviewed the new Management Agreement with respect to each Fund, including information regarding the terms of the Management Agreement; the nature, extent, and quality of the services provided to the Fund by the Investment Adviser; the unitary fee structure of the Fund; a comparison of the Fund’s proposed unitary fee with the fees and expenses paid by other similar exchange-traded funds (“ETFs”); potential benefits derived by the Investment Adviser and its affiliates from their relationships with the Fund; and potential benefits derived by the Fund from its relationship with the Investment Adviser.
In connection with the Meeting, the Trustees received written materials and oral presentations on the topics covered. The Independent Trustees were advised by their independent legal counsel regarding their responsibilities under applicable law. In evaluating the Management Agreement at the Meeting, the Trustees relied upon information included in a presentation made by the Investment Adviser at the Meeting and information received at prior Board meetings. The Trustees also drew on information they had received in their capacity as Trustees of other registered investment companies sponsored by the Investment Adviser.
Nature, Extent, and Quality of the Services Provided Under the Management Agreement
With regard to the nature, extent, and quality of the services provided by the Investment Adviser, the Trustees considered both the investment advisory services, and the other, non-advisory services that are provided to the Funds by the Investment Adviser and its affiliates. The Trustees considered that under the new Management Agreement, the Funds would pay a single fee to the Investment Adviser, and the Investment Adviser would pay all of the Funds’ ordinary operating expenses, including transfer agency, custody, administration, legal, and audit fees. They considered that the unitary fee rate for each Fund would be lower than its respective management fee rate under the previous management agreement. The Trustees also considered information about each Fund’s structure, investment objective, strategies, and other characteristics. In particular, they noted that the Funds are passively-managed ETFs that seek to track proprietary indices created by the Investment Adviser. The Trustees noted the experience and capabilities of the key Investment Adviser personnel who provide services to the Funds. In particular, the Trustees considered the Investment Adviser’s extensive experience in managing quantitative investment strategies and its expertise in developing “smart beta” products. The Trustees concluded that the Investment Adviser commits substantial financial and operational resources to the Funds and expressed confidence that the Investment Adviser would continue to do so in the future. The Trustees concluded that each Fund did not yet have a meaningful performance history.
Unitary Fee Structure and Profitability
The Trustees considered the contractual unitary fee rates which would be payable by the Funds under the Management Agreement. In this regard, the Trustees considered information on the services rendered by the Investment Adviser to the Funds, which include both advisory and administrative services directed to the needs and operations of the Funds as ETFs. The Trustees considered the new unitary fee structure, pursuant to which the Funds would pay a single fee to the Investment Adviser and the Investment Adviser would then pay all of the Funds’ ordinary operating expenses. They considered that the fee change would be favorable to each Fund’s shareholders, in that the unitary fee rate for each Fund would be lower than its respective management fee rate under the previous management agreement. The Trustees also considered information provided at previous Board meetings regarding fees and expenses of comparable ETFs advised by other, unaffiliated investment management firms, as well as the peer group and category medians. The Trustees concluded that this information was useful in evaluating the reasonableness of the unitary fee to be paid by the Funds. The Trustees recognized that they would evaluate profitability data for the Funds at a future meeting of the Board of Trustees.
Economies of Scale
The Trustees noted that the Funds would not have management fee breakpoints. They considered the Funds’ asset levels and information comparing the fee rates charged by the Investment Adviser with fee rates charged to other ETFs in the peer groups.
91
GOLDMAN SACHS ETF TRUST
Statement Regarding Basis for Approval of Management Agreement for All Funds except ActiveBeta® Emerging Markets Equity ETF (Unaudited) (continued)
The Trustees considered information previously provided regarding the amounts of assets in each Fund, the Funds’ recent creation and redemption activity, and the costs of the services provided by the Investment Adviser and its affiliates. The Trustees recognized that if the assets of a Fund increase over time, the Fund and its shareholders could realize economies of scale as certain Fund expenses, such as certain fixed fees, become a smaller percentage of overall assets.
Other Benefits to the Investment Adviser and Its Affiliates
The Trustees also considered the other benefits derived by the Investment Adviser and its affiliates from their relationships with the Funds, including: (a) the Investment Adviser’s ability to leverage the infrastructure designed to service the Funds on behalf of its other clients; (b) the Investment Adviser’s ability to cross-market other products and services to Fund shareholders; (c) the Investment Adviser’s ability to negotiate better pricing with custodians on behalf of its other clients, as a result of the relationship with the Funds; and (d) the possibility that the working relationship between the Investment Adviser and the Funds’ third party service providers may cause those service providers to be open to doing business with other areas of Goldman, Sachs & Co. (“Goldman Sachs”).
Other Benefits to the Funds and Their Shareholders
The Trustees observed that the Funds receive (or are expected to receive) certain potential benefits as a result of their relationship with the Investment Adviser, including: (a) improved servicing and pricing from vendors because of the volume of business generated by the Investment Adviser and its affiliates; (b) the Investment Adviser’s ability to hire and retain qualified personnel to provide services to the Funds because of the reputation of the Goldman Sachs organization; and (c) the Funds’ access to certain affiliated distribution channels.
Conclusion
In connection with their consideration of the Management Agreement, the Trustees gave weight to various factors, but did not identify any particular factor as controlling their decision. After deliberation and consideration of the information provided, including the factors described above, the Trustees concluded, in the exercise of their business judgment, that the unitary fee paid by each Fund was reasonable in light of the services provided to it by the Investment Adviser, its costs, and the Fund’s current and/or reasonably foreseeable asset levels, and that the Management Agreement would likely benefit each Fund and its shareholders and should be approved and continued with respect to the Fund until April 16, 2017.
92
GOLDMAN SACHS ETF TRUST
Trustees and Officers (Unaudited)
Independent Trustees
| | | | | | | | | | |
Name, Address and Age1 | | Position(s) Held with the Trust | | Term of Office and Length of Time Served2 | | Principal Occupation(s) During Past 5 Years | | Number of Portfolios in Fund Complex Overseen by Trustee3 | | Other Directorships Held by Trustee4 |
Ashok N. Bakhru Age: 74 | | Chairman of the Board of Trustees | | Since 2014 | | Mr. Bakhru is retired. He was formerly Director, Apollo Investment Corporation (a business development company) (2008-2013); President, ABN Associates (a management and financial consulting firm) (1994-1996 and 1998-2012); Trustee, Scholarship America (1998-2005); Trustee, Institute for Higher Education Policy (2003-2008); Director, Private Equity Investors — III and IV (1998-2007), and Equity-Linked Investors II (April 2002-2007). Chairman of the Board of Trustees — Goldman Sachs ETF Trust; Goldman Sachs Trust; Goldman Sachs Variable Insurance Trust; Goldman Sachs Trust II; Goldman Sachs BDC, Inc.; Goldman Sachs Private Middle Market Credit LLC; Goldman Sachs MLP Income Opportunities Fund; and Goldman Sachs MLP and Energy Renaissance Fund. | | 141 | | None |
John P. Coblentz, Jr. Age: 75 | | Trustee | | Since 2014 | | Mr. Coblentz is retired. Formerly, he was Partner, Deloitte & Touche LLP (a professional services firm) (1975-2003); Director, Emerging Markets Group, Ltd. (a consulting company) (2004-2006); and Director, Elderhostel, Inc. (a not-for-profit organization) (2006-2012). Previously, Mr. Coblentz served as Trustee of Goldman Sachs Trust and Goldman Sachs Variable Insurance Trust (2003-2015). Trustee — Goldman Sachs ETF Trust; Goldman Sachs Trust II; Goldman Sachs BDC, Inc.; Goldman Sachs Private Middle Market Credit LLC; Goldman Sachs MLP Income Opportunities Fund; and Goldman Sachs MLP and Energy Renaissance Fund. | | 35 | | None |
Linda A. Lang Age: 58 | | Trustee | | Since 2016 | | Ms. Lang is retired. She is Director, WD-40 Company (2004-Present); and was formerly Chairman and Chief Executive Officer (2005-2014); and Director, President and Chief Operating Officer, Jack in the Box, Inc. (a restaurant company) (2003-2005). Trustee — Goldman Sachs ETF Trust; Goldman Sachs MLP Income Opportunities Fund; and Goldman Sachs MLP and Energy Renaissance Fund. | | 17 | | WD-40 Company (a global consumer products company) |
Michael Latham Age: 51 | | Trustee | | Since 2015 | | Mr. Latham is retired. Formerly, he held senior management positions with the iShares exchange-traded fund business, including Chairman (2011-2014); Global Head (2010-2011); U.S. Head (2007-2010); and Chief Operating Officer (2003-2007). Trustee — Goldman Sachs ETF Trust; Goldman Sachs MLP Income Opportunities Fund; and Goldman Sachs MLP and Energy Renaissance Fund. | | 17 | | None |
Lawrence W. Stranghoener Age: 62 | | Trustee | | Since 2015 | | Mr. Stranghoener is retired. He is Chairman of the Board of Directors, Kennametal, Inc. (2003-Present); Director, Aleris Corporation and Aleris International, Inc. (2011-Present); and was formerly Interim Chief Executive Officer (2014); and Executive Vice President and Chief Financial Officer (2004-2014, Mosaic Company (a fertilizer manufacturing company). Trustee — Goldman Sachs ETF Trust; Goldman Sachs MLP Income Opportunities Fund; and Goldman Sachs MLP and Energy Renaissance Fund. | | 17 | | Kennametal Inc. (a global manufacturer and distributor of tooling and industrial materials) |
| | | | | | | | | | |
93
GOLDMAN SACHS ETF TRUST
Trustees and Officers (Unaudited) (continued)
Independent Trustees (continued)
| | | | | | | | | | |
Name, Address and Age1 | | Position(s) Held with the Trust | | Term of Office and Length of Time Served2 | | Principal Occupation(s) During Past 5 Years | | Number of Portfolios in Fund Complex Overseen by Trustee3 | | Other Directorships Held by Trustee4 |
Richard P. Strubel Age: 77 | | Trustee | | Since 2014 | | Mr. Strubel is retired. Formerly, he served as Chairman of the Board of Trustees, Northern Funds (a family of retail and institutional mutual funds managed by Northern Trust Investments, Inc.) (2008-2014) and Trustee (1982-2014); Director, Cardean Learning Group (provider of educational services via the internet) (2003-2008); and Director, Gildan Activewear Inc. (a clothing marketing and manufacturing company) (2000-2014). He serves as Trustee Emeritus, The University of Chicago (1987-Present). Previously, Mr. Strubel served as Trustee of Goldman Sachs Trust (1987-2015) and Goldman Sachs Variable Insurance Trust (1997-2015). Trustee — Goldman Sachs ETF Trust; Goldman Sachs Trust II; Goldman Sachs BDC, Inc.; Goldman Sachs Private Middle Market Credit LLC; Goldman Sachs MLP Income Opportunities Fund; and Goldman Sachs MLP and Energy Renaissance Fund. | | 35 | | None |
| | | | | | | | | | |
Interested Trustee*
| | | | | | | | | | |
Name, Address and Age1 | | Position(s) Held with the Trust | | Term of Office and Length of Time Served2 | | Principal Occupation(s) During Past 5 Years | | Number of Portfolios in Fund Complex Overseen by Trustee3 | | Other Directorships Held by Trustee4 |
James A. McNamara Age: 54 | | Trustee and President | | Since 2014 | | Managing Director, Goldman Sachs (December 1998-Present); Director of Institutional Fund Sales, GSAM (April 1998-December 2000); and Senior Vice President and Manager, Dreyfus Institutional Service Corporation (January 1993-April 1998). President and Trustee — Goldman Sachs ETF Trust; Goldman Sachs Trust; Goldman Sachs Variable Insurance Trust; Goldman Sachs Trust II; Goldman Sachs MLP Income Opportunities Fund; and Goldman Sachs MLP and Energy Renaissance Fund. | | 139 | | None |
| | | | | | | | | | |
| * | | This person is considered to be an “Interested Trustee” because he holds a position with Goldman Sachs and own securities issued by The Goldman Sachs Group, Inc. The Interested Trustee holds comparable positions with certain other companies of which Goldman Sachs, GSAM or an affiliate thereof is the investment adviser, administrator and/or distributor. |
| 1 | | Each Trustee may be contacted by writing to the Trustee, c/o Goldman Sachs, 200 West Street, New York, New York, 10282, Attn: Caroline L. Kraus. Information is provided as of August 31, 2016. |
| 2 | | Each Trustee holds office for an indefinite term until the earliest of: (a) the election of his or her successor; (b) the date the Trustee resigns, retires or is removed by the Board of Trustees or shareholders, in accordance with the Trust’s Declaration of Trust; or (c) the termination of the Trust. |
| 3 | | The Goldman Sachs Fund Complex includes certain other companies listed above for each respective Trustee. As of August 31, 2016, Goldman Sachs ETF Trust consisted of 15 portfolios (seven of which offered shares to the public); Goldman Sachs Trust consisted of 92 portfolios (91 of which offered shares to the public); Goldman Sachs Variable Insurance Trust consisted of 14 portfolios; Goldman Sachs Trust II consisted of 16 portfolios (15 of which offered shares to the public); and Goldman Sachs BDC, Inc., Goldman Sachs Private Middle Market Credit LLC, Goldman Sachs MLP Income Opportunities Fund, and Goldman Sachs MLP and Energy Renaissance Fund each consisted of one portfolio. Goldman Sachs Private Middle Market Credit LLC does not offer shares to the public. |
| 4 | | This column includes only directorships of companies required to report to the Securities and Exchange Commission under the Securities Exchange Act of 1934 (i.e., “public companies”) or other investment companies registered under the Act. |
Additional information about the Trustees is available in the Funds’ Statement of Additional Information, which can be obtained from Goldman Sachs free of charge by calling this toll-free number (in the United States of America): 1-800-526-7384.
94
GOLDMAN SACHS ETF TRUST
Trustees and Officers (Unaudited)(continued)
Officers of the Trust*
| | | | | | |
| Name, Address and Age1 | | Positions Held with the Trust | | Term of Office and
Length of
Time Served2 | | Principal Occupation(s) During Past 5 Years |
James A. McNamara 200 West Street New York, NY 10282 Age: 54 | | Trustee and President | | Since 2014 | | Managing Director, Goldman Sachs (December 1998-Present); Director of Institutional Fund Sales, GSAM (April 1998-December 2000); and Senior Vice President and Manager, Dreyfus Institutional Service Corporation (January 1993-April 1998). President and Trustee — Goldman Sachs ETF Trust; Goldman Sachs Trust; Goldman Sachs Variable Insurance Trust; Goldman Sachs Trust II; Goldman Sachs MLP Income Opportunities Fund; and Goldman Sachs MLP and Energy Renaissance Fund. |
Caroline L. Kraus 200 West Street New York, NY 10282 Age: 39 | | Secretary | | Since 2014 | | Managing Director, Goldman Sachs (January 2016 – Present); Vice President, Goldman Sachs (August 2006-December 2015); Associate General Counsel, Goldman Sachs (2012-Present); Assistant General Counsel, Goldman Sachs (August 2006-December 2011); and Associate, Weil, Gotshal & Manges, LLP (2002-2006). Secretary — Goldman Sachs ETF Trust; Goldman Sachs Trust (previously Assistant Secretary (2012)); Goldman Sachs Variable Insurance Trust (previously Assistant Secretary (2012)); Goldman Sachs Trust II; Goldman Sachs BDC, Inc.; Goldman Sachs Private Middle Market Credit LLC; Goldman Sachs Middle Market Lending LLC; Goldman Sachs MLP Income Opportunities Fund; and Goldman Sachs MLP and Energy Renaissance Fund. |
Scott M. McHugh 200 West Street New York, NY 10282 Age: 45 | | Treasurer, Senior Vice President and Principal Financial Officer | | Since 2014 | | Managing Director, Goldman Sachs (January 2016-Present); Vice President, Goldman Sachs (February 2007-December 2015); Assistant Treasurer of certain mutual funds administered by DWS Scudder (2005-2007); and Director (2005-2007), Vice President (2000-2005), and Assistant Vice President (1998-2000), Deutsche Asset Management or its predecessor (1998-2007). Treasurer, Senior Vice President and Principal Financial Officer — Goldman Sachs ETF Trust; Goldman Sachs Trust; Goldman Sachs Variable Insurance Trust; Goldman Sachs Trust II; Goldman Sachs MLP Income Opportunities Fund; and Goldman Sachs MLP and Energy Renaissance Fund. |
| | | | | | |
| * | | Represents a partial list of officers of the Trust. Additional information about all the officers is available in the Funds’ Statement of Additional Information, which can be obtained from Goldman Sachs free of charge by calling this toll-free number (in the United States): 1-800-621-2550. |
| 1 | | Information is provided as of August 31, 2016. |
| 2 | | Officers hold office at the pleasure of the Board of Trustees or until their successors are duly elected and qualified. Each officer holds comparable positions with certain other companies of which Goldman Sachs, GSAM or an affiliate thereof is the investment adviser, administrator and/or distributor. |
95
GOLDMAN SACHS ETF TRUST
Goldman Sachs ActiveBeta® ETFs — Tax Information (Unaudited)
From distributions paid during the year ended August 31, 2016, the total amount of income received by the ActiveBeta® Emerging Markets Equity ETF and ActiveBeta® International Equity ETF from sources within foreign countries and possessions of the United States was $0.0870 and $0.0152 per share, respectively, all of which is attributable to qualified passive income. The percentage of net investment income dividends paid from foreign sources by the ActiveBeta® Emerging Markets Equity ETF and ActiveBeta® International Equity ETF were 100% and 100%, respectively. The total amount of taxes paid by the ActiveBeta® Emerging Markets Equity ETF and ActiveBeta® International Equity ETF to such countries was $0.0122, and $0.0047 per share, respectively.
For the year ended August 31, 2016, 100% of the dividends paid from net investment company taxable income by the ActiveBeta® Emerging Markets Equity ETF, ActiveBeta® International Equity ETF, and ActiveBeta® U.S. Large Cap Equity ETF qualify for the reduced tax rate under the Jobs and Growth Tax Relief and Reconciliation Act of 2003.
For the year ended August 31, 2016, 87.19% of the dividends paid from net investment company taxable income by the ActiveBeta® U.S. Large Cap Equity ETF qualify for the dividends received deduction available to corporations.
Pursuant to Section 852 of the Internal Revenue Code, the ActiveBeta® U.S. Large Cap Equity ETF designates $3,991, or if different, the maximum amount allowable, as capital gain dividends paid during the fiscal year ended August 31, 2016.
During the year ended August 31, 2016, the ActiveBeta® Emerging Markets Equity ETF designates $1,581 as short-term capital gain dividends pursuant to Section 871(k) of the Internal Revenue Code.
96
FUNDS PROFILE
Goldman Sachs ETFs

Goldman Sachs is a premier financial services firm, known since 1869 for creating thoughtful and customized investment solutions in complex global markets.
Today, the Investment Management Division of Goldman Sachs serves a diverse set of clients worldwide, including private institutions, public entities and individuals. With approximately $1.12 trillion in assets under supervision as of June 30, 2016, Goldman Sachs Asset Management (“GSAM”) has portfolio management teams located around the world and our investment professionals bring firsthand knowledge of local markets to every investment decision. Assets under supervision includes assets under management and other client assets for which Goldman Sachs does not have full discretion. GSAM leverages the resources of Goldman, Sachs & Co. subject to legal, internal and regulatory restrictions.
|
| GOLDMAN SACHS EXCHANGE-TRADED FUNDS |
| Goldman Sachs ActiveBeta® Emerging Markets Equity ETF |
| Goldman Sachs ActiveBeta® Europe Equity ETF |
| Goldman Sachs ActiveBeta® International Equity ETF |
| Goldman Sachs ActiveBeta® Japan Equity ETF |
| Goldman Sachs ActiveBeta® U.S. Large Cap Equity ETF |
INDEX DISCLAIMERS
The MSCI Emerging Markets Index, MSCI Europe Index, MSCI World ex USA Index and MSCI Japan Index (the “MSCI Indices”) were used by GSAM as the reference universe for selection of the companies included in the Goldman Sachs ActiveBeta® Emerging Markets Equity Index, Goldman Sachs ActiveBeta® Europe Equity Index, Goldman Sachs ActiveBeta® International Equity Index and Goldman Sachs ActiveBeta® Japan Equity Index (the “ActiveBeta® Indices”), respectively. MSCI Inc. does not in any way sponsor, support, promote or endorse the ActiveBeta® Indices or the Goldman Sachs ActiveBeta® Emerging Markets Equity ETF, Goldman Sachs ActiveBeta® Europe Equity ETF, Goldman Sachs ActiveBeta® International Equity ETF or Goldman Sachs ActiveBeta® Japan Equity ETF (the “ActiveBeta® ETFs” or the “Funds”). MSCI Inc. was not and is not involved in any way in the creation, calculation, maintenance or review of the ActiveBeta® Indices. The MSCI Indices were provided on an “as is” basis. MSCI Inc., its affiliates and any other person or entity involved in or related to compiling, computing or creating the MSCI Indices (collectively, the “MSCI Parties”) expressly disclaim all warranties (including, without limitation, any warranties of originality, accuracy, completeness, timeliness, non-infringement, merchantability and fitness for a particular purpose). Without limiting any of the foregoing, in no event shall any MSCI Party have any liability for any direct, indirect, special, incidental, punitive, consequential (including without limitation lost profits) or any other damages in connection with the MSCI Indices, the ActiveBeta® ETFs or the ActiveBeta® Indices.
The Goldman Sachs ActiveBeta® U.S. Large Cap Equity ETF is not sponsored, promoted, sold or supported in any other manner by Solactive AG nor does Solactive AG offer any express or implicit guarantee or assurance either with regard to the results of using the Solactive US Large Cap Index (the “Solactive Index”) and/or Solactive Index trade mark or the Solactive Index Price at any time or in any other respect. The Solactive Index is calculated and published by Solactive AG. Solactive AG uses its best efforts to ensure that the Solactive Index is calculated correctly. Irrespective of its obligations towards Goldman Sachs ActiveBeta® U.S. Large Cap Equity ETF, Solactive AG has no obligation to point out errors in the Solactive Index to third parties including but not limited to investors and/or financial intermediaries of Goldman Sachs ActiveBeta® U.S. Large Cap Equity ETF. Neither publication of the Solactive Index by Solactive AG nor the licensing of the Solactive Index or Solactive Index trade mark for the purpose of use in connection with the Goldman Sachs ActiveBeta® U.S. Large Cap Equity ETF constitutes a recommendation by Solactive AG to invest capital in said fund nor does it in any way represent an assurance or opinion of Solactive AG with regard to any investment in this fund.
The ActiveBeta® Indices are trademarks of Goldman Sachs Asset Management, L.P. and have been licensed for use by Goldman Sachs ETF Trust.
GOLDMAN SACHS ASSET MANAGEMENT, L.P., THE GOLDMAN SACHS GROUP, INC., AND GOLDMAN, SACHS & CO. (COLLECTIVELY, “GOLDMAN SACHS”) DOES NOT GUARANTEE NOR MAKE ANY REPRESENTATION OR WARRANTY, EXPRESS OR IMPLIED, TO THE OWNERS OR SHAREHOLDERS OF THE FUNDS OR ANY MEMBER OF THE PUBLIC REGARDING THE ADVISABILITY OF INVESTING IN SECURITIES GENERALLY OR IN A FUND PARTICULARLY OR THE ABILITY OF THE ACTIVEBETA® INDICES TO TRACK GENERAL MARKET PERFORMANCE. GOLDMAN SACHS, IN ITS CAPACITY AS THE INDEX PROVIDER OF THE ACTIVEBETA® INDICES, LICENSES CERTAIN TRADEMARKS AND TRADE NAMES TO THE FUNDS. GOLDMAN SACHS HAS NO OBLIGATION TO TAKE THE NEEDS OF THE FUNDS OR THE SHAREHOLDERS OF THE FUNDS INTO CONSIDERATION IN DETERMINING, COMPOSING OR CALCULATING THE ACTIVEBETA® INDICES. GOLDMAN SACHS OR ANY OF ITS AFFILIATES MAY HOLD LONG OR SHORT POSITIONS IN SECURITIES HELD BY A FUND OR IN RELATED DERIVATIVES.
GOLDMAN SACHS DOES NOT GUARANTEE THE ADEQUACY, TIMELINESS, ACCURACY AND/OR THE COMPLETENESS OF THE ACTIVEBETA® INDICES OR ANY DATA RELATED THERETO. GOLDMAN SACHS HEREBY EXPRESSLY DISCLAIMS ANY AND ALL LIABILITY FOR ANY ERRORS, OMISSIONS, OR INTERRUPTIONS THEREIN OR IN THE CALCULATION THEREOF. GOLDMAN SACHS MAKES NO WARRANTY, EXPRESS OR IMPLIED, AND EXPRESSLY DISCLAIMS ALL WARRANTIES OF MERCHANTABILITY OR FITNESS FOR A PARTICULAR PURPOSE OR USE WITH RESPECT TO THE MARKS, THE ACTIVEBETA® INDICES OR ANY DATA INCLUDED THEREIN AS TO THE RESULTS TO BE OBTAINED BY A FUND, THE SHAREHOLDERS, OR ANY OTHER PERSON OR ENTITY FROM USE OF THE ACTIVEBETA® INDICES OR ANY DATA INCLUDED THEREIN. WITHOUT LIMITING ANY OF THE FOREGOING, GOLDMAN SACHS HEREBY EXPRESSLY DISCLAIMS ANY AND ALL LIABILITY FOR ANY SPECIAL, PUNITIVE, INDIRECT, OR CONSEQUENTIAL DAMAGES (INCLUDING LOST PROFITS), EVEN IF ADVISED OF THE POSSIBILITY OF SUCH DAMAGES.
| | |
TRUSTEES Ashok N. Bakhru, Chairman John P. Coblentz Jr. Caroline Dorsa* Linda A. Lang Michael Latham James A. McNamara Lawrence W. Stranghoener Richard P. Strubel | | OFFICERS James A. McNamara, President Scott M. McHugh, Principal Financial Officer, Senior Vice President and Treasurer Caroline L. Kraus, Secretary |
| |
THE BANK OF NEW YORK MELLON Transfer Agent | | |
| |
ALPS DISTRIBUTORS, INC. Distributor | | GOLDMAN SACHS ASSET MANAGEMENT, L.P. Investment Adviser |
* Effective as of September 15, 2016, Caroline Dorsa was appointed as a Trustee.
Visit our Website at www.GSAMFUNDS.com to obtain the most recent month-end returns.
Goldman Sachs Asset Management, L.P., 200 West Street, New York, New York 10282
The reports concerning the Funds included in this shareholder report may contain certain forward-looking statements about the factors that may affect the performance of the Funds in the future. These statements are based on Fund management’s predictions and expectations concerning certain future events and their expected impact on the Funds, such as performance of the economy as a whole and of specific industry sectors, changes in the levels of interest rates, the impact of developing world events, and other factors that may influence the future performance of the Funds. Management believes these forward-looking statements to be reasonable, although they are inherently uncertain and difficult to predict. Actual events may cause adjustments in portfolio management strategies from those currently expected to be employed.
A description of the policies and procedures that the Funds use to determine how to vote proxies relating to portfolio securities and information regarding how a Fund voted proxies relating to portfolio securities for the most recent 12-month period ended June 30, are available (i) without charge, upon request by calling 1-800-621-2550; and (ii) on the Securities and Exchange Commission (“SEC’’) web site at http://www.sec.gov.
The Funds file their complete schedule of portfolio holdings with the Securities and Exchange Commission (“SEC”) for the first and third quarters of each fiscal year on Form N-Qs. The Fund’s Form N-Qs are available on the SEC’s web site at http://www.sec.gov within 60 days after the Fund’s first and third fiscal quarters. The Fund’s Form N-Qs may be reviewed and copied at the SEC’s Public Reference Room in Washington, D.C., and information on the operation of the Public Reference Room may also be obtained by calling 1-800-SEC-0330. Form N-Qs may be obtained upon request and without charge by calling 1-800-621-2550.
Fund holdings and allocations shown are as of August 31, 2016 and may not be representative of future investments. Fund holdings should not be relied on in making investment decisions and should not be construed as research or investment advice regarding particular securities. Current and future holdings are subject to risk.
The Global Industry Classification Standard (GICS) was developed by and is the exclusive property and a service mark of Morgan Stanley Capital International Inc. (MSCI) and Standard & Poor’s, a division of The McGraw-Hill Companies, Inc. (S&P) and is licensed for use by Goldman Sachs. Neither MSCI, S&P nor any other party involved in making or compiling the GICS or any GICS classifications makes any express or implied warranties or representations with respect to such standard or classification (or the results to be obtained by the use thereof), and all such parties hereby expressly disclaim all warranties of originality, accuracy, completeness, merchantability or fitness for a particular purpose with respect to any of such standard or classification. Without limiting any of the foregoing, in no event shall MSCI, S&P, any of their affiliates or any third party involved in making or compiling the GICS or any GICS classifications have any liability for any direct, indirect, special, punitive, consequential or any other damages (including lost profits) even if notified of the possibility of such damages.
Economic and market forecasts presented herein reflect our judgment as of the date of this presentation and are subject to change without notice. These forecasts do not take into account the specific investment objectives, restrictions, tax and financial situation or other needs of any specific client. Actual data will vary and may not be reflected here. These forecasts are subject to high levels of uncertainty that may affect actual performance. Accordingly, these forecasts should be viewed as merely representative of a broad range of possible outcomes. These forecasts are estimated, based on assumptions, and are subject to significant revision and may change materially as economic and market conditions change. Goldman Sachs has no obligation to provide updates or changes to these forecasts. Case studies and examples are for illustrative purposes only.
ETF Fund shares are not individually redeemable and are issued and redeemed by the Fund at their net asset value (“NAV”) only in large, specified blocks of shares called creation units. Shares otherwise can be bought and sold only through exchange trading at market price (not NAV). Shares may trade at a premium or discount to their NAV in the secondary market. Brokerage commissions will reduce returns. ALPS Distributors, Inc. is the distributor of the Goldman Sachs ETF Funds. ALPS Distributors, Inc. is unaffiliated with Goldman Sachs Asset Management.
This material is not authorized for distribution to prospective investors unless preceded or accompanied by a current Prospectus or summary prospectus, if applicable. Investors should consider a Fund’s objective, risks, and charges and expenses, and read the summary prospectus, if available, and/or the Prospectus carefully before investing or sending money. The summary prospectus, if available, and the Prospectus contain this and other information about a Fund and may be obtained from your authorized dealer or from Goldman, Sachs & Co. by calling 1-800-621-2550.
© 2016 Goldman Sachs. All rights reserved. 67096.MF.TMPL.10/2016 ACTBETAAR-16.GST281.10/21/2017.11841
(a) As of the end of the period covered by this report, the registrant has adopted a code of ethics that applies to the registrant’s principal executive officer, principal financial officer, principal accounting officer or controller, or persons performing similar functions, regardless of whether these individuals are employed by the registrant or a third party (the “Code of Ethics”).
(b) During the period covered by this report, no amendments were made to the provisions of the Code of Ethics.
(c) During the period covered by this report, the registrant did not grant any waivers, including an implicit waiver, from any provision of the Code of Ethics.
(d) A copy of the Code of Ethics is available as provided in Item 12(a)(1) of this report.
| ITEM 3. | AUDIT COMMITTEE FINANCIAL EXPERT. |
The registrant’s board of trustees has determined that the registrant has at least one “audit committee financial expert” (as defined in Item 3 of Form N-CSR) serving on its audit committee. John P. Coblentz, Jr. is the “audit committee financial expert” and is “independent” (as each term is defined in Item 3 of Form N-CSR).
| ITEM 4. | PRINCIPAL ACCOUNTANT FEES AND SERVICES. |
The following disclosure relates to the independence of PricewaterhouseCoopers LLP (“PwC”) with respect to SEC Rule 2-01(c)(1)(ii)(A) of Regulation S-X (the “Loan Rule”). The Loan Rule prohibits accounting firms, such as PwC, from having certain financial relationships with their audit clients and affiliated entities. Specifically, the Loan Rule provides, in relevant part, that an accounting firm generally would not be independent if it receives a loan from a lender that is a “record or beneficial owner of more than ten percent of the audit client’s equity securities.” The Goldman Sachs Asset Management investment company complex (the “Funds”) has been notified by PwC that one of its lenders owns more than ten percent of at least one of the Funds. The Funds are providing this disclosure to explain the facts and circumstances as well as PwC’s conclusions concerning its independence and its objectivity and impartiality with respect to the audits of the Funds.
PwC has advised the Funds that, after evaluating the facts and circumstances related to the matter described above, it has concluded that its financial relationship described above did not and will not impair PwC’s application of objective and impartial judgment on any issues encompassed within its audits of the financial statements of the Funds. PwC has advised the Funds that this conclusion is based in part on the following considerations: (1) the lenders to PwC have no influence over the fund adviser to the Funds; (2) an investment in any such Fund is passive; (3) the PwC lenders are part of various syndicates of unrelated lenders; (4) there have been no changes to the loans in question since the origination of each respective note; (5) the debts are in good standing and no lender has the right to take action against PwC, as borrower, in connection with the financings; (6) the debt balances are immaterial to PwC and to each lender; and (7) the PwC audit engagement team has no involvement in PwC’s treasury function and PwC’s treasury function has no oversight of or ability to influence the PwC audit engagement team.
If it were ultimately determined that PwC was not independent with respect to the Funds for certain periods, any Fund filings with the SEC which contain the Funds’ financial statements for such periods would not comply with applicable securities laws which potentially could have a material adverse effect on the Funds.
Table 1 — Items 4(a) - 4(d). The accountant fees below reflect the aggregate fees billed by the Funds of the Goldman Sachs ETF Trust to which this certified shareholder report relates.
| | | | | | | | | | | | |
| | | 2016 | | 2015 | | Description of Services Rendered |
| | | |
| | | | | | | | | | | | |
| | | |
Audit Fees: | | | | | | | | | | | | |
| | | |
• PricewaterhouseCoopers LLP
(“PwC”) | | | $ | 162,000 | | | | $ | — | | | Financial Statement audits. |
| | | |
Audit-Related Fees: | | | | | | | | | | | | |
| | | |
• PwC | | | $ | 0 | | | | $ | — | | | |
| | | |
Tax Fees: | | | | | | | | | | | | |
| | | |
• PwC | | | $ | 45,352 | | | | $ | — | | | Tax compliance services provided in connection with the preparation and review of registrant’s tax returns. |
Table 2 — Items 4(b)(c) & (d). Non-Audit Services to the Goldman Sachs ETF Trust’s service affiliates * that were pre-approved by the Audit Committee of the Goldman Sachs ETF Trust pursuant to Rule 2-01(c)(7)(ii) of Regulation S-X.
| | | | | | | | | | | | |
| | | 2016 | | 2015 | | Description of Services Rendered |
| | | |
| | | | | | | | | | | | |
| | | |
Audit-Related Fees: | | | | | | | | | | | | |
| | | |
• PwC | | | $ | — | | | | $ | — | | | |
| * | These include the advisor (excluding sub-advisors) and any entity controlling, controlled by or under common control with the advisor that provides ongoing services to the registrant (hereinafter referred to as “service affiliates”). |
Item 4(e)(1) — Audit Committee Pre-Approval Policies and Procedures
Pre-Approval of Audit and Non-Audit Services Provided to the Funds of the Goldman Sachs ETF Trust. The Audit and Non-Audit Services Pre-Approval Policy (the “Policy”) adopted by the Audit Committee of Goldman Sachs ETF Trust (“GS ETF”) sets forth the procedures and the conditions pursuant to which services performed by an independent auditor for GS ETF may be pre-approved. Services may be pre-approved specifically by the Audit Committee as a whole or, in certain circumstances, by the Audit Committee Chairman or the person designated as the Audit Committee Financial Expert. In addition, subject to specified cost limitations, certain services may be pre-approved under the provisions of the Policy. The Policy provides that the Audit Committee will consider whether the services provided by an independent auditor are consistent with the Securities and Exchange Commission’s rules on auditor independence. The Policy provides for periodic review and pre-approval by the Audit Committee of the services that may be provided by the independent auditor.
De Minimis Waiver. The pre-approval requirements of the Policy may be waived with respect to the provision of non-audit services that are permissible for an independent auditor to perform, provided (1) the aggregate amount of all such services provided constitutes no more than five percent of the total amount of revenues subject to pre-approval that was paid to the independent auditors during the fiscal year in which the services are provided; (2) such services were not recognized by GS ETF at the time of the engagement to be non-audit services; and (3) such services are promptly brought to the attention of the Audit Committee and approved prior to the completion of the audit by the Audit Committee or by one or more members of the Audit Committee to whom authority to grant such approvals has been delegated by the Audit Committee, pursuant to the pre-approval provisions of the Policy.
Pre-Approval of Non-Audit Services Provided to the Goldman Sachs ETF Trust’s Investment Advisers. The Policy provides that, in addition to requiring pre-approval of audit and non-audit services provided to GS ETF, the Audit Committee will pre-approve those non-audit services provided to GS ETF’s investment advisers (and entities controlling, controlled by or under common control with the investment advisers that provide ongoing services to GS ETF) where the engagement relates directly to the operations or financial reporting of GS ETF.
Item 4(e)(2) – 0% of the audit-related fees, tax fees and other fees listed in Table 1 were approved by GS ETF’s Audit Committee pursuant to the “de minimis” exception of Rule 2-01(c)(7)(i)(C) of Regulation S-X. In addition, 0% of the non-audit services to the GS ETF’s service affiliates listed in Table 2 were approved by GS ETF’s Audit Committee pursuant to the “de minimis” exception of Rule 2-01(c)(7)(i)(C) of Regulation S-X.
Item 4(f) – Not applicable.
Item 4(g) Aggregate Non-Audit Fees Disclosure
The aggregate non-audit fees billed to GS ETF by PwC for the twelve months ended August 31, 2016 and August 31, 2015 were approximately $0 and $0 respectively. The aggregate non-audit fees billed to GS ETF’s adviser and service affiliates by PwC for non-audit services for the twelve months ended December 31, 2015 and December 31, 2014 were approximately $14.4 million and $10.2 million respectively. With regard to the aggregate non-audit fees billed to GS ETF’s adviser and service affiliates, the 2015 and 2014 amounts include fees for non-audit services required to be pre-approved [see Table 2] and fees for non-audit services that did not require pre-approval since they did not directly relate to GS ETF’s operations or financial reporting.
Item 4(h) — GS ETF’s Audit Committee has considered whether the provision of non-audit services to GS ETF’s investment adviser and service affiliates that did not require pre-approval pursuant to paragraph (c)(7)(ii) of Rule 2-01 of Regulation S-X is compatible with maintaining the auditors’ independence.
| ITEM 5. | AUDIT COMMITTEE OF LISTED REGISTRANTS. |
| | The Registrant has a separately-designated standing Audit Committee established in accordance with Section 3(a)(58)(A) of the Securities Exchange Act of 1934, as amended. The members of the Audit Committee are Ashok N. Bakhru, John P. Coblentz, Jr., Michael Latham, Linda A. Lang, Lawrence W. Stranghoener, Richard P. Strubel, and Caroline Dorsa, each a Trustee of the Registrant. |
| ITEM 6. | SCHEDULE OF INVESTMENTS. |
| | Schedule of Investments is included as part of the Report to Shareholders filed under Item 1. |
| ITEM 7. | DISCLOSURE OF PROXY VOTING POLICIES AND PROCEDURES FOR CLOSED-END MANAGEMENT INVESTMENT COMPANIES. |
| ITEM 8. | PORTFOLIO MANAGERS OF CLOSED-END MANAGEMENT INVESTMENT COMPANIES. |
| ITEM 9. | PURCHASES OF EQUITY SECURITIES BY CLOSED-END MANAGEMENT INVESTMENT COMPANY AND AFFILIATED PURCHASERS. |
| ITEM 10. | SUBMISSION OF MATTERS TO A VOTE OF SECURITY HOLDERS. |
| | There have been no material changes to the procedures by which shareholders may recommend nominees to the registrant’s board of trustees. |
| ITEM 11. | CONTROLS AND PROCEDURES. |
| | (a) | The registrant’s principal executive and principal financial officers, or persons performing similar functions have concluded that the registrant’s disclosure controls and procedures (as defined in Rule 30a-3(c) under the Investment Company Act of 1940, as amended (the “1940 Act”)) are effective as of a date within 90 days of the filing of this report that includes the disclosure required by this paragraph, based on the evaluation of these controls and procedures required by Rule 30a-3(b) under the 1940 Act and 15d-15(b) under the Securities Exchange Act of 1934, as amended. |
| | (b) | There were no changes in the registrant’s internal control over financial reporting (as defined in Rule 30a-3(d) under the 1940 Act) that occurred during the registrant’s second fiscal quarter of the period covered by this report that have materially affected, or are reasonably likely to materially affect, the registrant’s internal control over financial reporting. |
| | | | |
| (a)(1) | | Goldman Sachs ETF Trust’s Code of Ethics for Principal Executive and Senior Financial Officers is filed herewith. |
| | |
| (a)(2) | | Exhibit 99.CERT | | Certifications pursuant to Section 302 of the Sarbanes-Oxley Act of 2002 filed herewith. |
| | |
| (b) | | Exhibit 99.906CERT | | Certifications pursuant to Section 906 of the Sarbanes-Oxley Act of 2002 filed herewith. |
SIGNATURES
Pursuant to the requirements of the Securities Exchange Act of 1934 and the Investment Company Act of 1940, the registrant has duly caused this report to be signed on its behalf by the undersigned, thereunto duly authorized.
| | |
| | | Goldman Sachs ETF Trust |
| |
| By: | | /s/ James A. McNamara |
| |
| | |
| | James A. McNamara |
| | President/Chief Executive Officer |
| | Goldman Sachs ETF Trust |
| |
| Date: | | October 31, 2016 |
Pursuant to the requirements of the Securities Exchange Act of 1934 and the Investment Company Act of 1940, this report has been signed below by the following persons on behalf of the registrant and in the capacities and on the dates indicated.
| | |
| By: | | /s/ James A. McNamara |
| |
| | |
| | James A. McNamara |
| | President/Chief Executive Officer |
| | Goldman Sachs ETF Trust |
| |
| Date: | | October 31, 2016 |
| |
| By: | | /s/ Scott McHugh |
| |
| | |
| | Scott McHugh |
| | Principal Financial Officer |
| | Goldman Sachs ETF Trust |
| |
| Date: | | October 31, 2016 |