UNITED STATES
SECURITIES AND EXCHANGE COMMISSION
Washington, D.C. 20549
FORM N-CSR
CERTIFIED SHAREHOLDER REPORT OF REGISTERED
MANAGEMENT INVESTMENT COMPANIES
Investment Company Act file number 811-23013
Goldman Sachs ETF Trust
(Exact name of registrant as specified in charter)
200 West Street, New York, New York 10282
(Address of principal executive offices) (Zip code)
| | |
| Caroline Kraus, Esq. | | Copies to: |
| Goldman Sachs & Co. LLC | | Geoffrey R.T. Kenyon, Esq. |
| 200 West Street | | Dechert LLP |
| New York, New York 10282 | | 100 Oliver Street |
| | 40th Floor |
| | Boston, MA 02110-2605 |
(Name and address of agents for service)
Registrant’s telephone number, including area code: (312) 655-4400
Date of fiscal year end: August 31
Date of reporting period: August 31, 2017
| ITEM 1. | REPORTS TO STOCKHOLDERS. |
| | The Annual Report to Shareholders is filed herewith. |
Goldman Sachs Funds

| | | | |
| | |
| Annual Report | | | | August 31, 2017 |
| | |
| | | | Goldman Sachs ETFs |
| | | | Access Investment Grade Corporate Bond ETF |

Goldman Sachs Access Investment Grade Corporate Bond ETF
| | | | |
| | | |
| NOT FDIC-INSURED | | May Lose Value | | No Bank Guarantee |
INVESTMENT PROCESS
Goldman Sachs Access Investment Grade Corporate Bond ETF
Principal Investment Strategies
The Goldman Sachs Access Investment Grade Corporate Bond ETF (the “Fund”) seeks to achieve its investment objective by investing at least 80% of its assets (exclusive of collateral held from securities lending) in securities included in its underlying index. The Citi Goldman Sachs Investment Grade Corporate Bond Index (the “Index”) is a rules-based index that is designed to measure the performance of investment grade corporate bonds denominated in U.S. dollars that meet certain liquidity and fundamental screening criteria. As of May 31, 2017, there were 1,941 constituents in the Index and the Index had a weighted average maturity of 10.5 years. The Index is a custom index that is owned and calculated by FTSE Fixed Income LLC (“FTSE” or the “Index Provider”) and is based on the Citi US Broad Investment Grade (USBIG®) Corporate Index (the “Reference Index”) using concepts developed with Goldman Sachs Asset Management, L.P. (“GSAM”).
Given the Fund’s investment objective of attempting to track the Index, the Fund does not follow traditional methods of active investment management, which may involve buying and selling securities based upon analysis of economic and market factors.
The Index Provider constructs the Index in accordance with a rules-based methodology that involves two steps.
Step 1 - In the first step, the Index Provider defines a universe of potential index constituents (the “Universe”) by applying specified criteria to the constituent securities of the Reference Index. The Reference Index includes investment grade corporate bonds that have a minimum of one year to maturity and are rated at least BBB- by Standard & Poor’s Ratings Services (“S&P”) or Baa3 by Moody’s Investors Services, Inc. (“Moody’s”). Only corporate bond constituents of the Reference Index that have a minimum of $750 million outstanding and a minimum issuer size of $2 billion are included in the Universe.
Step 2 - In the second step, the Index Provider applies a fundamental screen to the Universe. Issuers are first grouped into three broad industry groups: financials, industrials and utilities. Within each industry group, issuers are measured by two fundamental factors: operating margin and leverage. The Index Provider ranks each issuer based on the two fundamental factors, equally weighted. The Index is constructed by including the highest ranking eligible securities in each industry group, screening out lowest ranking eligible securities.
The Index is rebalanced (i) monthly on the last business day of each month, to account for changes in maturities, corporate actions or ratings migration, and (ii) quarterly, to account for updates to the constituent securities on the basis of the fundamental factors (as described above).
The Investment Adviser uses a representative sampling strategy to manage the Fund.
“Representative sampling” is an indexing strategy in which the Fund invests in a representative sample of constituent securities that has a collective investment profile similar to that of the Index. The securities selected for investment by the Fund are expected to have, in the aggregate, investment characteristics, fundamental characteristics and liquidity measures similar to those of the Index. The Fund may or may not hold all of the securities in the Index.
The Fund may concentrate its investments (i.e. hold more than 25% of its total assets) in a particular industry or group of industries to the extent that the Index is concentrated. The degree to which components of the Index represent certain sectors or industries may change over time.
1
INVESTMENT PROCESS
The Fund may also invest up to 20% of its assets in securities and other instruments not included in the Index but which the Investment Adviser believes are correlated to the Index, as well as in, among other instruments, futures (including index futures), swaps, other derivatives, investment companies (including exchange-traded funds (“ETFs”), cash and cash equivalents and money market instruments.
At the end of the Reporting Period (i.e., June 6, 2017 through August 31, 2017), we continued to believe the Fund may provide investors with smoother performance and less volatility, as a smart beta approach should provide liquidity while minimizing exposure to factors historically associated with volatility and underperformance.*
| * | | Smart beta refers to quantitative index-based strategies. Liquidity is the ability to invest or redeem during market hours. Volatility refers to the annualized standard deviation of returns. |
2
PORTFOLIO RESULTS
Goldman Sachs Access Investment Grade Corporate Bond ETF
Investment Objective
The Goldman Sachs Access Investment Grade Corporate Bond ETF (the “Fund”) seeks to provide investment results that closely correspond, before fees and expenses, to the performance of the Citi Goldman Sachs Investment Grade Corporate Bond Index (the “Index”).
Portfolio Management Discussion and Analysis
Below, the Goldman Sachs Global Fixed Income and Liquidity Solution Team discusses the Fund’s performance and positioning for the period since its commencement of operations on June 6, 2017 through August 31, 2017 (the “Reporting Period”).
| Q | | How did the Fund perform during the Reporting Period? |
| A | | During the Reporting Period, the Fund returned 1.19% based on net asset value (“NAV”) and 1.11% based on market price.1 The Index returned 1.26% during the same period. |
| | The Fund had a NAV of $49.90 per share on the date of commencement of operations and ended the Reporting Period with a NAV of $50.28 per share. The Fund’s market price on August 31, 2017 was $50.24 per share. |
| Q | | What key factors were responsible for the Fund’s performance during the Reporting Period? |
| A | | The Fund seeks to provide investment results that closely correspond, before fees and expenses, to the performance of the Index. The Fund’s performance reflects Fund expenses, including management fees and brokerage expenses. The Fund’s relative performance also reflects the impact of any cash held in the Fund as well as any other differences between the Fund’s holdings and the constituents of the Index. The Index is unmanaged, and Index returns do not reflect fees and expenses, which would reduce returns. |
| | The Index is designed to measure the performance of investment grade corporate bonds denominated in U.S. dollars that meet certain liquidity and fundamental screening criteria. The Index is a custom index that is owned and calculated by FTSE Fixed Income LLC (“FTSE” or the “Index Provider”) and is based on the Citi US Broad Investment Grade (USBIG®) Corporate Index (the “Reference Index”) using concepts developed with Goldman Sachs Asset Management, L.P. (“GSAM”). The Index is rules-based and the securities in the Index are rebalanced on the last business day of each month. |
| | Given the Fund’s investment objective of attempting to track the Index, the Fund does not follow traditional methods of active investment management, which may involve buying and selling securities based upon analysis of economic and market factors. |
| | During the Reporting Period, the Fund posted positive absolute returns that closely tracked those of the Index, as measured by NAV. The Fund is passively managed to the Index and aims to minimize tracking error to the Index. |
| | Overall, investment grade corporate bond returns are driven by three primary factors — yield, duration (whether interest rates are rising or falling) and spreads (or a widening or tightening of the yield differential to U.S. Treasuries). During the Reporting Period, interest rates declined and spreads tightened, both of which supported the total return of the sector. |
| | Early in the Reporting Period, i.e. in June 2017, the U.S. Federal Reserve (the “Fed”) raised the targeted federal funds rate, while central banks in other key markets kept their monetary policies unchanged. The yield on the 10-year U.S. Treasury moved wider by approximately 25 basis points in the weeks following, before falling back below levels seen at the start of the Reporting Period. (A basis point is 1/100th of a percentage point.) Investment grade credit spreads tightened during the Reporting Period overall, although widened a bit in August 2017. In the month of August, market volatility had begun to heighten as domestic and international geopolitical developments created some |
| | 1 | | The first day of secondary market trading is typically several days after the date on which the Fund commenced investment operations; therefore, the NAV of the Fund is used as a proxy forth period from commencement of investment operations to the first day of secondary market trading to calculate the market price returns. |
3
PORTFOLIO RESULTS
| | uncertainty. Escalating tensions in the Korean Peninsula particularly sent equity markets lower and global government bond prices higher. Overall, however, corporate credit markets were underpinned by strong corporate earnings and firm demand. |
| | At the end of the Reporting Period, we believed it likely the U.S. economy would continue to grow in the months ahead, albeit modestly. We also believed the Fed would hike interest rates again before year-end 2017 and that U.S. Treasury rates may well rise, especially in the intermediate portion of the yield curve, or spectrum of maturities. Should this rising rate scenario materialize against a backdrop of tight valuations and a potential pick-up in volatility due in part to an unwinding of quantitative easing, it was our view at the end of the Reporting Period that investment grade credit spreads may remain range-bound for the near term. |
| Q | | How did the Fund use derivatives and similar instruments during the Reporting Period? |
| A | | The Fund does not employ derivatives. |
| Q | | What was the Fund’s weighted average duration, weighted average maturity, weighted average coupon and 30-day SEC yield at the end of the Reporting Period?2 |
| A | | The Fund had a weighted average duration of 7.18 years, a weighted average maturity of 10.57 years and a weighted average coupon of 3.95% as of August 31, 2017. The 30-day SEC yield of the Fund at the end of the Reporting Period was 0.96%. |
| Q | | What was the Fund’s credit allocation at the end of the Reporting Period? |
| | | | | | |
| AAA | | | 2.4 | % | | |
| AA | | | 13.8 | % | | |
| A | | | 34.9 | % | | |
| BBB | | | 47.6 | % | | |
| BB | | | 1.0 | % | | |
| Cash | | | 0.3 | % | | |
| Q | | What was the Fund’s industry allocation at the end of the Reporting Period? |
| A | | Of the 97% of the Fund’s assets invested in investment grade corporate bonds at the end of the Reporting Period, approximately 33% was in financials, 62% in industrials and 2% in utilities. |
| Q | | What was the Fund’s sector positioning relative to the Index at the end of the Reporting Period?3 |
| A | | While 100% of Index constituents were investment grade corporate bonds, the Fund was 97% invested in investment grade corporate bonds, 1% invested in high yield corporate bonds, 1.7% invested in emerging market debt and 0.3% in cash at the end of the Reporting Period. |
| | 2 | | Duration is a time measure of a bond’s interest-rate sensitivity, based on the weighted average of the time periods over which a bond’s cash flows accrue to the bondholder. Time periods are weighted by multiplying by the present value of its cash flow divided by the bond’s price. (A bond’s cash flows consist of coupon payments and repayment of capital.) |
| | | | A bond’s duration will almost always be shorter than its maturity, with the exception of zero-coupon bonds, for which maturity and duration are equal. Weighted average duration is a measure of the duration for the securities in the portfolio overall. Weighted average maturity (“WAM”) is the weighted average amount of time until the debt securities in a portfolio mature, or the weighted average of the remaining terms to maturity of the debt securities within a portfolio. The higher the WAM, the longer it takes for all of the bonds in the portfolio to mature, and WAM is used to manage debt portfolios and to assess the performance of debt portfolio managers. Coupons are fixed percentages paid out on a fixed income security on an annual basis. Weighted average coupon is calculated by weighting the coupon of each debt security by its relative size in the portfolio. The method of calculation of the 30-Day Standardized Yield is mandated by the Securities and Exchange Commission and is determined by dividing the net investment income per share earned during the last 30 days of the period by the maximum public offering price per share on the last day of the period. This number is then annualized. |
| | 3 | | The Fund seeks to provide investment results that closely correspond, before fees and expenses, to the performance of the Citi Goldman Sachs Investment Grade Corporate Bond Index. |
4
FUND BASICS
Access Investment Grade Corporate Bond ETF
as of August 31, 2017
| | | | | | |
| | FUND SNAPSHOT | |
| | | As of August 31, 2017 | | | |
| | Market Price1 | | $ | 50.24 | |
| | | Net Asset Value (NAV)1 | | $ | 50.28 | |
| | 1 | | The Market Price is the price at which the Fund’s shares are trading on the NYSE Arca, Inc. The Market Price of the Fund’s shares will fluctuate and, at the time of sale, shares may be worth more or less than the original investment or the Fund’s then current net asset value (“NAV”). The NAV is the market value of one share of the Fund. This amount is derived by dividing the total value of all the securities in the Fund’s portfolio, plus other assets, less any liabilities, by the number of Fund shares outstanding. Fund shares are not individually redeemable and are issued and redeemed by the Fund at their NAV only in large, specified blocks of shares called creation units. Shares otherwise can be bought and sold only through exchange trading at market price (not NAV). Shares may trade at a premium or discount to their NAV in the secondary market. Information regarding how often shares of the Fund traded on NYSE Arca at a price above (i.e., at a premium) or below (i.e., at a discount) the NAV of the Fund can be found at www.GSAMFUNDS.com. |
| | | | | | | | | | | | |
| | PERFORMANCE REVIEW | |
| | | June 6, 2017– August 31, 2017 | | Fund Total Return
(based on NAV)2 | | Fund Total Return
(based on Market Price)2 | | | Citi Goldman Sachs
Investment Grade
Corporate Bond Index3 | |
| | | Shares | | 1.19% | | | 1.11 | % | | | 1.26 | % |
| | 2 | | Total returns are calculated assuming purchase of a share at the market price or NAV on the first day and sale of a share at the market price or NAV on the last day of each period reported. The Total Returns Based on NAV and Market Price assume the reinvestment of dividends and do not reflect brokerage commissions in connection with the purchase or sale of Fund shares, which if included would lower the performance shown above. The NAV used in the Total Return calculations assumes all management fees incurred by the Fund. Market Price returns are based upon the last trade as of 4:00 pm EST and do not reflect the returns you would receive if you traded shares at other times. The first day of secondary market trading is typically several days after the date on which the Fund commenced investment operations; therefore, the NAV of the Fund is used as a proxy for the period from inception of investment operations to the first day of secondary market trading to calculate the Market Price returns. Total returns for periods less than one full year are not annualized. |
| | 3 | | The Index was developed and is calculated and maintained by FTSE Fixed Income LLC (“FTSE” or the “Index Provider”). FTSE is not affiliated with the Fund or GSAM. The Fund is not sponsored, endorsed, sold or promoted by FTSE or any of its affiliates and FTSE makes no representation to any owner or prospective owner of the Fund regarding the advisability of investing in securities generally or in the Fund particularly, or the ability of the Fund to track the price and yield performance of the Index or the ability of the Index to track general bond market performance. FTSE’s only relationship to GSAM (“Licensee”) is the licensing of certain information, data, trademarks and trade names of FTSE or its affiliates. The Index is determined, composed and calculated by FTSE without regard to the Fund. FTSE has no obligation to take the needs of the owners or prospective owners of the Fund into consideration in determining, composing or calculating the Index. FTSE is not responsible for and has not participated in the determination of the prices and amount of the shares to be issued by the Fund or the timing of the issuance or sale of the shares to be issued by the Fund or in the determination or calculation of the equation by which the shares to be issued by the Fund are to be converted into cash. FTSE has no obligation or liability in connection with the administration, marketing or trading of the Fund. |
The returns set forth in the tables above represent past performance. Past performance does not guarantee future results. The Fund’s investment returns and principal value will fluctuate so that an investor’s shares, when sold or redeemed, may be worth more or less than their original cost. Current performance may be lower or higher than the performance quoted above. Please visit our web site at www.GSAMFUNDS.com to obtain the most recent month-end returns. Returns do not reflect the deduction of taxes that a shareholder would pay on Fund distributions or the sale or redemption of Fund shares.
5
FUND BASICS
| | | | |
| | 30-DAY STANDARDIZED YIELD4 |
| | | | | 30-Day Standardized Yield4 |
| | | Shares | | 2.84% |
| | 4 | | The method of calculation of the 30-Day Standardized Yield is mandated by the Securities and Exchange Commission and is determined by dividing the net investment income per share earned during the last 30 days of the period by the maximum public offering price per share on the last day of the period. This number is then annualized. |
| | | | |
| | EXPENSE RATIO5 |
| | | | | Expense Ratio |
| | | Shares | | 0.14% |
| | 5 | | The expense ratio of the Fund is as set forth above according to the most recent publicly available Prospectus for the Fund and may differ from the expense ratio disclosed on the Financial Highlights in this report. |
| | | | | | | | | | |
| | TOP TEN HOLDINGS AS OF 8/31/176 |
| | | Holding | | Maturity Date | | % of Net Assets | | | Line of Business |
| | MetLife, Inc., Series D, 4.37% | | 9/15/23 | | | 1.0 | % | | Financials |
| | HSBC Holdings PLC, 6.50% | | 9/15/37 | | | 0.9 | | | Financials |
| | Anheuser-Busch InBev Finance, | | 2/1/19 | | | 0.9 | | | Food & Beverage |
| | Inc., 1.90% | | | | | | | | |
| | Oracle Corp., 2.80% | | 7/8/21 | | | 0.9 | | | Information Technology |
| | ING Groep NV, 3.95% | | 3/29/27 | | | 0.8 | | | Financials |
| | Morgan Stanley, Series GMTN, | | 7/28/21 | | | 0.8 | | | Financials |
| | 5.50% | | | | | | | | |
| | United Technologies Corp., | | 11/1/21 | | | 0.8 | | | Industrials |
| | 1.95% | | | | | | | | |
| | HCP, Inc., 4.25% | | 11/15/23 | | | 0.8 | | | Real Estate |
| | JPMorgan Chase & Co., 2.97% | | 1/15/23 | | | 0.7 | | | Financials |
| | | Intel Corp., 2.45% | | 7/29/20 | | | 0.7 | | | Information Technology |
| | 6 | | The top 10 holdings may not be representative of the Fund’s future investments. |
6
FUND BASICS
| | | | | | |
| | INDUSTRY ALLOCATION AS OF 8/31/177 | |
| | | Industry | | % of Net Assets | |
| | Financials | | | 32.3 | % |
| | Information Technology | | | 12.5 | |
| | Energy | | | 10.0 | |
| | Health Care | | | 7.4 | |
| | Telecommunication Services | | | 7.0 | |
| | Consumer Staples | | | 6.0 | |
| | Consumer Discretionary | | | 5.6 | |
| | Food & Beverage | | | 3.1 | |
| | Industrials | | | 2.7 | |
| | Materials | | | 2.7 | |
| | Consumer, Non-cyclical | | | 2.7 | |
| | Utilities | | | 2.2 | |
| | Consumer Cyclical | | | 1.6 | |
| | Real Estate | | | 1.2 | |
| | Distributors | | | 0.9 | |
| | Transportation | | | 0.4 | |
| | Brokerage | | | 0.2 | |
| | Products | | | 0.2 | |
| | Capital Goods | | | 0.0 | |
| | | Other | | | 1.3 | |
| | 7 | | The percentage shown for each investment category reflects the value of investments in that category as a percentage of net assets. Figures in the graph may not sum to 100% due to the exclusion of other assets and liabilities. |
7
GOLDMAN SACHS ACCESS INVESTMENT GRADE CORPORATE BOND ETF
Schedule of Investments
August 31, 2017
| | | | | | | | | | | | | | |
Principal
Amount | | | Interest
Rate | | | Maturity
Date | | | Value | |
| Corporate Obligations – 78.8% | |
| Aerospace & Defense – 1.8% | |
| | Arconic, Inc. | |
| $ | 120,000 | | | | 5.400 | % | | | 04/15/21 | | | $ | 128,430 | |
| | Lockheed Martin Corp. | |
| | 370,000 | | | | 3.800 | | | | 03/01/45 | | | | 366,984 | |
| | 180,000 | | | | 4.700 | | | | 05/15/46 | | | | 204,443 | |
| | United Technologies Corp. | |
| | 1,410,000 | | | | 1.950 | | | | 11/01/21 | | | | 1,396,518 | |
| | 370,000 | | | | 3.125 | | | | 05/04/27 | | | | 373,002 | |
| | 320,000 | | | | 5.700 | | | | 04/15/40 | | | | 399,430 | |
| | 250,000 | | | | 3.750 | | | | 11/01/46 | | | | 241,452 | |
| | | | | | | | | | | | | | |
| | | | | | | | | | | | | 3,110,259 | |
| | |
| Air Freight & Logistics – 0.6% | |
| | FedEx Corp. | |
| | 360,000 | | | | 4.550 | | | | 04/01/46 | | | | 384,065 | |
| | United Parcel Service, Inc. | |
| | 750,000 | | | | 2.450 | | | | 10/01/22 | | | | 761,402 | |
| | | | | | | | | | | | | | |
| | | | | | | | | | | | | 1,145,467 | |
| | |
| Automobiles – 0.4% | |
| | General Motors Co. | |
| | 288,000 | | | | 3.500 | | | | 10/02/18 | | | | 292,880 | |
| | 180,000 | | | | 6.250 | | | | 10/02/43 | | | | 202,402 | |
| | 120,000 | | | | 6.750 | | | | 04/01/46 | | | | 141,709 | |
| | | | | | | | | | | | | | |
| | | | | | | | | | | | | 636,991 | |
| | |
| Banks – 15.8% | |
| | Bank of America Corp. | |
| | 300,000 | | | | 6.875 | | | | 11/15/18 | | | | 317,915 | |
| | 500,000 | | | | 7.750 | | | | 05/14/38 | | | | 733,134 | |
| | Bank of America Corp., GMTN | |
| | 830,000 | | | | 3.300 | | | | 01/11/23 | | | | 854,621 | |
| | 50,000 | | | | 3.500 | | | | 04/19/26 | | | | 50,942 | |
| | Bank of America Corp., Series L | |
| | 190,000 | | | | 4.183 | | | | 11/25/27 | | | | 196,396 | |
| | Bank of America Corp., MTN | |
| | 620,000 | | | | 5.000 | | | | 05/13/21 | | | | 678,243 | |
| | 30,000 | | | | 3.875 | | | | 08/01/25 | | | | 31,602 | |
| | 520,000 | | | | 3.248 | | | | 10/21/27 | | | | 510,760 | |
| | 730,000 | | | | 5.000 | | | | 01/21/44 | | | | 843,264 | |
| | Bank of America NA | |
| | 430,000 | | | | 2.050 | | | | 12/07/18 | | | | 432,199 | |
| | Branch Banking & Trust Co. | |
| | 250,000 | | | | 2.100 | | | | 01/15/20 | | | | 251,581 | |
| | Capital One Bank USA NA | |
| | 550,000 | | | | 2.250 | | | | 02/13/19 | | | | 552,439 | |
| | 800,000 | | | | 3.375 | | | | 02/15/23 | | | | 816,363 | |
| | Capital One NA/Mclean VA | |
| | 560,000 | | | | 2.350 | | | | 01/31/20 | | | | 561,796 | |
| | Citigroup, Inc. | |
| | 1,020,000 | | | | 8.500 | | | | 05/22/19 | | | | 1,130,381 | |
| | 446,000 | | | | 2.350 | | | | 08/02/21 | | | | 445,168 | |
| | 300,000 | | | | 4.500 | | | | 01/14/22 | | | | 324,156 | |
| | 30,000 | | | | 3.875 | | | | 10/25/23 | | | | 31,659 | |
| | 500,000 | | | | 3.875 | | | | 03/26/25 | | | | 513,948 | |
| | 500,000 | | | | 3.300 | | | | 04/27/25 | | | | 508,205 | |
| | 350,000 | | | | 3.700 | | | | 01/12/26 | | | | 360,981 | |
| Corporate Obligations – (continued) | |
| Banks – (continued) | |
| | Citigroup, Inc. – (continued) | |
| 740,000 | | | | 3.200 | | | | 10/21/26 | | | | 733,777 | |
| | 510,000 | | | | 4.450 | | | | 09/29/27 | | | | 541,353 | |
| | 20,000 | | | | 4.125 | | | | 07/25/28 | | | | 20,634 | |
| | 170,000 | | | | 5.875 | | | | 01/30/42 | | | | 216,466 | |
| | 30,000 | | | | 6.675 | | | | 09/13/43 | | | | 40,900 | |
| | 448,000 | | | | 4.650 | | | | 07/30/45 | | | | 497,237 | |
| | Discover Bank | |
| | 540,000 | | | | 4.200 | | | | 08/08/23 | | | | 575,969 | |
| | 580,000 | | | | 3.450 | | | | 07/27/26 | | | | 575,281 | |
| | JPMorgan Chase & Co. | |
| | 489,000 | | | | 2.350 | | | | 01/28/19 | | | | 493,527 | |
| | 375,000 | | | | 4.400 | | | | 07/22/20 | | | | 400,372 | |
| | 250,000 | | | | 4.250 | | | | 10/15/20 | | | | 266,364 | |
| | 30,000 | | | | 4.625 | | | | 05/10/21 | | | | 32,550 | |
| | 827,000 | | | | 4.500 | | | | 01/24/22 | | | | 899,730 | |
| | 20,000 | | | | 3.250 | | | | 09/23/22 | | | | 20,697 | |
| | 1,325,000 | | | | 2.972 | | | | 01/15/23 | | | | 1,348,449 | |
| | 500,000 | | | | 3.200 | | | | 06/15/26 | | | | 500,472 | |
| | 485,000 | | | | 3.625 | | | | 12/01/27 | | | | 490,277 | |
| | 300,000 | | | | 6.400 | | | | 05/15/38 | | | | 401,775 | |
| | 300,000 | | | | 5.500 | | | | 10/15/40 | | | | 369,084 | |
| | 430,000 | | | | 5.600 | | | | 07/15/41 | | | | 537,554 | |
| | 250,000 | | | | 5.400 | | | | 01/06/42 | | | | 305,964 | |
| | 60,000 | | | | 4.850 | | | | 02/01/44 | | | | 69,470 | |
| | KeyBank NA | |
| | 600,000 | | | | 2.500 | | | | 12/15/19 | | | | 611,266 | |
| | PNC Bank NA | |
| | 765,000 | | | | 1.800 | | | | 11/05/18 | | | | 766,751 | |
| | PNC Bank NA, MTN | |
| | 260,000 | | | | 2.600 | | | | 07/21/20 | | | | 264,862 | |
| | PNC Financial Services Group, Inc. (The) | |
| | 840,000 | | | | 4.375 | | | | 08/11/20 | | | | 897,010 | |
| | Santander Holdings USA, Inc. | |
| | 820,000 | | | | 3.700 | (a) | | | 03/28/22 | | | | 837,893 | |
| | US Bank NA | |
| | 290,000 | | | | 2.125 | | | | 10/28/19 | | | | 292,429 | |
| | 250,000 | | | | 2.000 | | | | 01/24/20 | | | | 251,279 | |
| | Wells Fargo & Co. | |
| | 350,000 | | | | 3.069 | | | | 01/24/23 | | | | 358,067 | |
| | 170,000 | | | | 3.000 | | | | 04/22/26 | | | | 167,992 | |
| | 900,000 | | | | 3.000 | | | | 10/23/26 | | | | 889,538 | |
| | Wells Fargo & Co., GMTN | |
| | 300,000 | | | | 4.300 | | | | 07/22/27 | | | | 320,218 | |
| | 490,000 | | | | 4.900 | | | | 11/17/45 | | | | 543,484 | |
| | Wells Fargo & Co., Series M | |
| | 750,000 | | | | 3.450 | | | | 02/13/23 | | | | 773,841 | |
| | Wells Fargo & Co., MTN | |
| | 1,000,000 | | | | 4.600 | | | | 04/01/21 | | | | 1,081,225 | |
| | Wells Fargo Bank NA, MTN | |
| | 1,000,000 | | | | 2.150 | | | | 12/06/19 | | | | 1,007,783 | |
| | | | | | | | | | | | | | |
| | | | | | | | | | | | | 28,547,293 | |
| | |
| Beverages – 1.5% | |
| | Coca-Cola Co. (The) | |
| | 590,000 | | | | 1.550 | | | | 09/01/21 | | | | 583,859 | |
| | Molson Coors Brewing Co. | |
| | 50,000 | | | | 4.200 | | | | 07/15/46 | | | | 49,929 | |
| | |
| 8 | | The accompanying notes are an integral part of these financial statements. |
GOLDMAN SACHS ACCESS INVESTMENT GRADE CORPORATE BOND ETF
| | | | | | | | | | | | | | |
Principal
Amount | | | Interest
Rate | | | Maturity
Date | | | Value | |
| Corporate Obligations – (continued) | |
| Beverages – (continued) | |
| | PepsiCo, Inc. | |
| $ | 600,000 | | | | 3.000 | % | | | 08/25/21 | | | $ | 624,840 | |
| | 1,100,000 | | | | 2.750 | | | | 03/05/22 | | | | 1,134,745 | |
| | 100,000 | | | | 4.875 | | | | 11/01/40 | | | | 117,503 | |
| | 330,000 | | | | 3.450 | | | | 10/06/46 | | | | 316,608 | |
| | | | | | | | | | | | | | |
| | | | | | | | | | | | | 2,827,484 | |
| | |
| Biotechnology – 3.2% | |
| | AbbVie, Inc. | |
| | 30,000 | | | | 3.200 | | | | 11/06/22 | | | | 30,832 | |
| | 180,000 | | | | 3.600 | | | | 05/14/25 | | | | 186,020 | |
| | 270,000 | | | | 4.500 | | | | 05/14/35 | | | | 289,892 | |
| | 50,000 | | | | 4.300 | | | | 05/14/36 | | | | 52,239 | |
| | 300,000 | | | | 4.700 | | | | 05/14/45 | | | | 326,041 | |
| | Amgen, Inc. | |
| | 100,000 | | | | 2.200 | | | | 05/22/19 | | | | 100,612 | |
| | 780,000 | | | | 3.450 | | | | 10/01/20 | | | | 811,739 | |
| | 790,000 | | | | 4.400 | | | | 05/01/45 | | | | 827,839 | |
| | 200,000 | | | | 4.663 | | | | 06/15/51 | | | | 218,604 | |
| | Celgene Corp. | |
| | 320,000 | | | | 3.550 | | | | 08/15/22 | | | | 336,105 | |
| | 250,000 | | | | 5.000 | | | | 08/15/45 | | | | 286,838 | |
| | Gilead Sciences, Inc. | |
| | 200,000 | | | | 3.250 | | | | 09/01/22 | | | | 208,596 | |
| | 460,000 | | | | 3.650 | | | | 03/01/26 | | | | 483,762 | |
| | 240,000 | | | | 4.800 | | | | 04/01/44 | | | | 266,686 | |
| | 250,000 | | | | 4.750 | | | | 03/01/46 | | | | 279,043 | |
| | 710,000 | | | | 4.150 | | | | 03/01/47 | | | | 732,304 | |
| | | | | | | | | | | | | | |
| | | | | | | | | | | | | 5,437,152 | |
| | |
| Brokerage – 0.2% | |
| | Jefferies Group LLC | |
| | 250,000 | | | | 4.850 | | | | 01/15/27 | | | | 266,096 | |
| | |
| Capital Goods – 0.0% | |
| | Caterpillar Financial Services Corp. | |
| | 60,000 | | | | 1.700 | | | | 08/09/21 | | | | 59,163 | |
| | |
| Capital Markets – 3.5% | |
| | Bank of New York Mellon Corp. (The), Series G | |
| | 800,000 | | | | 3.000 | | | | 02/24/25 | | | | 813,296 | |
| | Bank of New York Mellon Corp. (The), MTN | |
| | 500,000 | | | | 2.600 | | | | 08/17/20 | | | | 509,861 | |
| | 20,000 | | | | 2.800 | | | | 05/04/26 | | | | 19,897 | |
| | 100,000 | | | | 2.450 | | | | 08/17/26 | | | | 96,727 | |
| | 40,000 | | | | 3.250 | | | | 05/16/27 | | | | 41,025 | |
| | BlackRock, Inc. | |
| | 200,000 | | | | 3.500 | | | | 03/18/24 | | | | 212,020 | |
| | Morgan Stanley | |
| | 550,000 | | | | 4.875 | | | | 11/01/22 | | | | 600,386 | |
| | 640,000 | | | | 3.950 | | | | 04/23/27 | | | | 653,508 | |
| | 556,000 | | | | 6.375 | | | | 07/24/42 | | | | 751,230 | |
| | 20,000 | | | | 4.300 | | | | 01/27/45 | | | | 20,930 | |
| | 30,000 | | | | 4.375 | | | | 01/22/47 | | | | 31,943 | |
| | Morgan Stanley, Series F | |
| | 245,000 | | | | 3.875 | | | | 04/29/24 | | | | 257,867 | |
| | Morgan Stanley, GMTN | |
| | 1,290,000 | | | | 5.500 | | | | 07/28/21 | | | | 1,435,767 | |
| Corporate Obligations – (continued) | |
| Capital Markets – (continued) | |
| | Morgan Stanley, GMTN – (continued) | |
| 25,000 | | | | 3.700 | | | | 10/23/24 | | | | 26,038 | |
| | Morgan Stanley, MTN | |
| | 500,000 | | | | 2.625 | | | | 11/17/21 | | | | 503,858 | |
| | 240,000 | | | | 3.125 | | | | 07/27/26 | | | | 237,380 | |
| | State Street Corp. | |
| | 180,000 | | | | 2.650 | | | | 05/19/26 | | | | 177,551 | |
| | | | | | | | | | | | | | |
| | | | | | | | | | | | | 6,389,284 | |
| | |
| Chemicals – 1.6% | |
| | Dow Chemical Co. (The) | |
| | 650,000 | | | | 8.550 | | | | 05/15/19 | | | | 721,426 | |
| | 280,000 | | | | 5.250 | | | | 11/15/41 | | | | 320,738 | |
| | 160,000 | | | | 4.375 | | | | 11/15/42 | | | | 164,867 | |
| | Eastman Chemical Co. | |
| | 520,000 | | | | 3.600 | | | | 08/15/22 | | | | 541,463 | |
| | LyondellBasell Industries NV | |
| | 350,000 | | | | 5.000 | | | | 04/15/19 | | | | 365,791 | |
| | 550,000 | | | | 5.750 | | | | 04/15/24 | | | | 633,016 | |
| | 130,000 | | | | 4.625 | | | | 02/26/55 | | | | 131,051 | |
| | | | | | | | | | | | | | |
| | | | | | | | | | | | | 2,878,352 | |
| | |
| Communications – 1.9% | |
| Charter Communications Operating LLC / Charter
Communications Operating Capital |
|
| | 530,000 | | | | 3.579 | | | | 07/23/20 | | | | 544,234 | |
| | 700,000 | | | | 4.464 | | | | 07/23/22 | | | | 737,985 | |
| | 340,000 | | | | 6.384 | | | | 10/23/35 | | | | 389,983 | |
| | 180,000 | | | | 6.484 | | | | 10/23/45 | | | | 208,166 | |
| | NBCUniversal Media LLC | |
| | 175,000 | | | | 5.950 | | | | 04/01/41 | | | | 223,050 | |
| | Time Warner Cable LLC | |
| | 700,000 | | | | 8.250 | | | | 04/01/19 | | | | 766,510 | |
| | 120,000 | | | | 7.300 | | | | 07/01/38 | | | | 148,488 | |
| | 160,000 | | | | 5.875 | | | | 11/15/40 | | | | 172,306 | |
| | 330,000 | | | | 4.500 | | | | 09/15/42 | | | | 302,533 | |
| | | | | | | | | | | | | | |
| | | | | | | | | | | | | 3,493,255 | |
| | |
| Communications Equipment – 0.5% | |
| | Cisco Systems, Inc. | |
| | 85,000 | | | | 1.600 | | | | 02/28/19 | | | | 85,149 | |
| | 360,000 | | | | 3.625 | | | | 03/04/24 | | | | 386,212 | |
| | 260,000 | | | | 5.900 | | | | 02/15/39 | | | | 342,616 | |
| | | | | | | | | | | | | | |
| | | | | | | | | | | | | 813,977 | |
| | |
| Consumer Cyclical – 1.6% | |
| | General Motors Financial Co., Inc. | |
| | 180,000 | | | | 3.150 | | | | 01/15/20 | | | | 183,596 | |
| | 870,000 | | | | 3.200 | | | | 07/13/20 | | | | 889,681 | |
| | 530,000 | | | | 3.450 | | | | 04/10/22 | | | | 540,383 | |
| | 250,000 | | | | 4.350 | | | | 01/17/27 | | | | 257,217 | |
| | Toyota Motor Credit Corp., MTN | |
| | 1,053,000 | | | | 1.700 | | | | 02/19/19 | | | | 1,055,333 | |
| | | | | | | | | | | | | | |
| | | | | | | | | | | | | 2,926,210 | |
| | |
| Consumer Finance – 0.4% | |
| | Capital One Financial Corp. | |
| | 230,000 | | | | 3.200 | | | | 02/05/25 | | | | 230,719 | |
| | |
| The accompanying notes are an integral part of these financial statements. | | 9 |
GOLDMAN SACHS ACCESS INVESTMENT GRADE CORPORATE BOND ETF
Schedule of Investments (continued)
August 31, 2017
| | | | | | | | | | | | | | |
Principal
Amount | | | Interest
Rate | | | Maturity
Date | | | Value | |
| Corporate Obligations – (continued) | |
| Consumer Finance – (continued) | |
| | Capital One Financial Corp. – (continued) | |
| $ | 500,000 | | | | 4.200 | % | | | 10/29/25 | | | $ | 516,503 | |
| | | | | | | | | | | | | | |
| | | | | | | | | | | | | 747,222 | |
| | |
| Consumer Noncyclical – 1.1% | |
| | Allergan Funding SCS | |
| | 200,000 | | | | 3.450 | | | | 03/15/22 | | | | 207,283 | |
| | 590,000 | | | | 3.800 | | | | 03/15/25 | | | | 616,174 | |
| | 750,000 | | | | 4.550 | | | | 03/15/35 | | | | 808,323 | |
| | 40,000 | | | | 4.750 | | | | 03/15/45 | | | | 43,918 | |
| | Shire Acquisitions Investments Ireland DAC | |
| | 270,000 | | | | 2.875 | | | | 09/23/23 | | | | 269,143 | |
| | Wyeth LLC | |
| | 150,000 | | | | 5.950 | | | | 04/01/37 | | | | 199,118 | |
| | | | | | | | | | | | | | |
| | | | | | | | | | | | | 2,143,959 | |
| | |
| Containers & Packaging – 0.2% | |
| | International Paper Co. | |
| | 130,000 | | | | 3.000 | | | | 02/15/27 | | | | 126,370 | |
| | 190,000 | | | | 4.400 | | | | 08/15/47 | | | | 193,556 | |
| | | | | | | | | | | | | | |
| | | | | | | | | | | | | 319,926 | |
| | |
| Distributors – 0.9% | |
| | American Honda Finance Corp. | |
| | 222,000 | | | | 2.125 | | | | 10/10/18 | | | | 223,391 | |
| | American Honda Finance Corp., GMTN | |
| | 1,030,000 | | | | 1.700 | | | | 09/09/21 | | | | 1,016,585 | |
| | General Motors Financial Co., Inc. | |
| | 340,000 | | | | 4.200 | | | | 03/01/21 | | | | 357,089 | |
| | | | | | | | | | | | | | |
| | | | | | | | | | | | | 1,597,065 | |
| | |
| Diversified Financial Services – 0.1% | |
| | Berkshire Hathaway, Inc. | |
| | 250,000 | | | | 3.125 | | | | 03/15/26 | | | | 255,604 | |
| | |
| Diversified Telecommunication – 6.0% | |
| | AT&T, Inc. | |
| | 510,000 | | | | 2.300 | | | | 03/11/19 | | | | 513,375 | |
| | 1,170,000 | | | | 5.000 | | | | 03/01/21 | | | | 1,269,437 | |
| | 30,000 | | | | 2.625 | | | | 12/01/22 | | | | 29,786 | |
| | 25,000 | | | | 3.800 | | | | 03/01/24 | | | | 25,773 | |
| | 340,000 | | | | 3.400 | | | | 08/14/24 | | | | 343,197 | |
| | 600,000 | | | | 3.400 | | | | 05/15/25 | | | | 598,884 | |
| | 30,000 | | | | 4.125 | | | | 02/17/26 | | | | 31,144 | |
| | 100,000 | | | | 4.250 | | | | 03/01/27 | | | | 103,983 | |
| | 550,000 | | | | 3.900 | | | | 08/14/27 | | | | 556,904 | |
| | 25,000 | | | | 4.500 | | | | 05/15/35 | | | | 24,555 | |
| | 300,000 | | | | 5.250 | | | | 03/01/37 | | | | 318,205 | |
| | 180,000 | | | | 6.550 | | | | 02/15/39 | | | | 216,752 | |
| | 320,000 | | | | 5.150 | | | | 03/15/42 | | | | 326,814 | |
| | 230,000 | | | | 4.800 | | | | 06/15/44 | | | | 224,287 | |
| | 150,000 | | | | 4.350 | | | | 06/15/45 | | | | 136,731 | |
| | 210,000 | | | | 4.750 | | | | 05/15/46 | | | | 202,084 | |
| | 90,000 | | | | 5.450 | | | | 03/01/47 | | | | 94,943 | |
| | 240,000 | | | | 4.500 | | | | 03/09/48 | | | | 223,151 | |
| | 230,000 | | | | 4.550 | | | | 03/09/49 | | | | 213,382 | |
| Corporate Obligations – (continued) | |
| Diversified Telecommunication – (continued) | |
| | AT&T, Inc. – (continued) | |
| 470,000 | | | | 5.150 | | | | 02/14/50 | | | | 476,058 | |
| | 140,000 | | | | 5.700 | | | | 03/01/57 | | | | 150,245 | |
| | Verizon Communications, Inc. | |
| | 1,290,000 | | | | 2.946 | | | | 03/15/22 | | | | 1,314,342 | |
| | 210,000 | | | | 5.150 | | | | 09/15/23 | | | | 234,693 | |
| | 150,000 | | | | 4.400 | | | | 11/01/34 | | | | 150,742 | |
| | 290,000 | | | | 5.250 | | | | 03/16/37 | | | | 313,789 | |
| | 530,000 | | | | 4.812 | | | | 03/15/39 | | | | 539,532 | |
| | 100,000 | | | | 3.850 | | | | 11/01/42 | | | | 87,021 | |
| | 70,000 | | | | 4.125 | | | | 08/15/46 | | | | 62,365 | |
| | 233,000 | | | | 4.862 | | | | 08/21/46 | | | | 232,769 | |
| | 110,000 | | | | 5.500 | | | | 03/16/47 | | | | 119,547 | |
| | 190,000 | | | | 4.522 | | | | 09/15/48 | | | | 178,079 | |
| | 350,000 | | | | 5.012 | | | | 04/15/49 | | | | 352,949 | |
| | 750,000 | | | | 5.012 | | | | 08/21/54 | | | | 738,039 | |
| | 290,000 | | | | 4.672 | | | | 03/15/55 | | | | 271,710 | |
| | | | | | | | | | | | | | |
| | | | | | | | | | | | | 10,675,267 | |
| | |
| Electric – 0.1% | |
| | Exelon Generation Co. LLC | |
| | 200,000 | | | | 5.600 | | | | 06/15/42 | | | | 209,389 | |
| | |
| Electric Utilities – 1.6% | |
| | Duke Energy Corp. | |
| | 250,000 | | | | 3.750 | | | | 04/15/24 | | | | 265,362 | |
| | 250,000 | | | | 2.650 | | | | 09/01/26 | | | | 242,245 | |
| | 90,000 | | | | 3.750 | | | | 09/01/46 | | | | 87,543 | |
| | Exelon Corp. | |
| | 600,000 | | | | 2.850 | | | | 06/15/20 | | | | 613,128 | |
| | 200,000 | | | | 3.497 | | | | 06/01/22 | | | | 207,487 | |
| | 250,000 | | | | 3.950 | | | | 06/15/25 | | | | 264,622 | |
| | FirstEnergy Corp., Series B | |
| | 1,000,000 | | | | 3.900 | | | | 07/15/27 | | | | 1,021,541 | |
| | Pacific Gas & Electric Co. | |
| | 200,000 | | | | 6.050 | | | | 03/01/34 | | | | 260,871 | |
| | | | | | | | | | | | | | |
| | | | | | | | | | | | | 2,962,799 | |
| | |
| Energy – 1.8% | |
| | ConocoPhillips Co. | |
| | 400,000 | | | | 4.950 | | | | 03/15/26 | | | | 449,413 | |
| | ConocoPhillips Holding Co. | |
| | 130,000 | | | | 6.950 | | | | 04/15/29 | | | | 171,055 | |
| | Devon Financing Co. LLC | |
| | 150,000 | | | | 7.875 | | | | 09/30/31 | | | | 196,828 | |
| | Enterprise Products Operating LLC | |
| | 220,000 | | | | 3.750 | | | | 02/15/25 | | | | 229,316 | |
| | 150,000 | | | | 4.850 | | | | 03/15/44 | | | | 160,683 | |
| | 220,000 | | | | 5.100 | | | | 02/15/45 | | | | 244,992 | |
| | Plains All American Pipeline LP / PAA Finance Corp. | |
| | 380,000 | | | | 4.650 | | | | 10/15/25 | | | | 396,120 | |
| | Sabine Pass Liquefaction LLC | |
| | 610,000 | | | | 5.875 | | | | 06/30/26 | | | | 683,581 | |
| | Williams Partners LP / ACMP Finance Corp. | |
| | 680,000 | | | | 4.875 | | | | 03/15/24 | | | | 711,237 | |
| | | | | | | | | | | | | | |
| | | | | | | | | | | | | 3,243,225 | |
| | |
| | |
| 10 | | The accompanying notes are an integral part of these financial statements. |
GOLDMAN SACHS ACCESS INVESTMENT GRADE CORPORATE BOND ETF
| | | | | | | | | | | | | | |
Principal
Amount | | | Interest
Rate | | | Maturity
Date | | | Value | |
| Corporate Obligations – (continued) | |
| Energy Equipment & Services – 0.3% | |
| | Halliburton Co. | |
| $ | 350,000 | | | | 3.800 | % | | | 11/15/25 | | | $ | 362,882 | |
| | 230,000 | | | | 5.000 | | | | 11/15/45 | | | | 250,046 | |
| | National Oilwell Varco, Inc. | |
| | 50,000 | | | | 3.950 | | | | 12/01/42 | | | | 42,491 | |
| | | | | | | | | | | | | | |
| | | | | | | | | | | | | 655,419 | |
| | |
| Equity Real Estate Investment – 1.2% | |
| | Crown Castle International Corp. | |
| | 740,000 | | | | 5.250 | | | | 01/15/23 | | | | 826,407 | |
| | 50,000 | | | | 3.650 | | | | 09/01/27 | | | | 50,384 | |
| | HCP, Inc. | |
| | 1,270,000 | | | | 4.250 | | | | 11/15/23 | | | | 1,362,625 | |
| | | | | | | | | | | | | | |
| | | | | | | | | | | | | 2,239,416 | |
| | |
| Food & Staples Retailing – 3.3% | |
| | Costco Wholesale Corp. | |
| | 864,000 | | | | 2.300 | | | | 05/18/22 | | | | 870,452 | |
| | CVS Health Corp. | |
| | 810,000 | | | | 2.800 | | | | 07/20/20 | | | | 825,612 | |
| | 1,000,000 | | | | 2.125 | | | | 06/01/21 | | | | 996,175 | |
| | 610,000 | | | | 3.500 | | | | 07/20/22 | | | | 638,324 | |
| | 110,000 | | | | 5.125 | | | | 07/20/45 | | | | 127,874 | |
| | Walgreens Boots Alliance, Inc. | |
| | 450,000 | | | | 3.450 | | | | 06/01/26 | | | | 452,106 | |
| | Wal-Mart Stores, Inc. | |
| | 910,000 | | | | 5.250 | | | | 09/01/35 | | | | 1,122,142 | |
| | 150,000 | | | | 5.625 | | | | 04/15/41 | | | | 195,379 | |
| | 500,000 | | | | 4.750 | | | | 10/02/43 | | | | 591,677 | |
| | | | | | | | | | | | | | |
| | | | | | | | | | | | | 5,819,741 | |
| | |
| Food and Beverage – 1.1% | |
| | Kraft Heinz Foods Co. | |
| | 957,000 | | | | 2.800 | | | | 07/02/20 | | | | 975,394 | |
| | 410,000 | | | | 3.500 | | | | 06/06/22 | | | | 425,598 | |
| | 300,000 | | | | 3.000 | | | | 06/01/26 | | | | 289,504 | |
| | 50,000 | | | | 5.000 | | | | 06/04/42 | | | | 53,099 | |
| | 270,000 | | | | 4.375 | | | | 06/01/46 | | | | 264,645 | |
| | | | | | | | | | | | | | |
| | | | | | | | | | | | | 2,008,240 | |
| | |
| Health Care Equipment & Supplies – 0.2% | |
| | Becton Dickinson and Co. | |
| | 200,000 | | | | 3.363 | | | | 06/06/24 | | | | 202,843 | |
| | 100,000 | | | | 3.700 | | | | 06/06/27 | | | | 101,742 | |
| | Zimmer Biomet Holdings, Inc. | |
| | 30,000 | | | | 3.550 | | | | 04/01/25 | | | | 30,564 | |
| | | | | | | | | | | | | | |
| | | | | | | | | | | | | 335,149 | |
| | |
| Health Care Providers & Services – 1.0% | |
| | Anthem, Inc. | |
| | 170,000 | | | | 4.625 | | | | 05/15/42 | | | | 186,048 | |
| | 130,000 | | | | 4.650 | | | | 08/15/44 | | | | 143,072 | |
| | Express Scripts Holding Co. | |
| | 620,000 | | | | 4.750 | | | | 11/15/21 | | | | 676,668 | |
| | 270,000 | | | | 4.500 | | | | 02/25/26 | | | | 291,959 | |
| | 210,000 | | | | 4.800 | | | | 07/15/46 | | | | 221,929 | |
| Corporate Obligations – (continued) | |
| Health Care Providers & Services – (continued) | |
| | UnitedHealth Group, Inc. | |
| 40,000 | | | | 3.750 | | | | 07/15/25 | | | | 42,578 | |
| | 230,000 | | | | 4.750 | | | | 07/15/45 | | | | 268,731 | |
| | 30,000 | | | | 4.200 | | | | 01/15/47 | | | | 32,376 | |
| | | | | | | | | | | | | | |
| | | | | | | | | | | | | 1,863,361 | |
| | |
| Healthcare – 1.2% | |
| | HCA, Inc. | |
| | 730,000 | | | | 3.750 | | | | 03/15/19 | | | | 744,600 | |
| | 550,000 | | | | 5.250 | | | | 06/15/26 | | | | 591,937 | |
| | 80,000 | | | | 5.500 | | | | 06/15/47 | | | | 83,000 | |
| | Medtronic, Inc. | |
| | 400,000 | | | | 2.500 | | | | 03/15/20 | | | | 406,737 | |
| | 220,000 | | | | 4.625 | | | | 03/15/45 | | | | 250,884 | |
| | 200,000 | | | | 4.375 | | | | 03/15/35 | | | | 221,715 | |
| | | | | | | | | | | | | | |
| | | | | | | | | | | | | 2,298,873 | |
| | |
| Hotels, Restaurants & Leisure – 0.4% | |
| | McDonald’s Corp., MTN | |
| | 610,000 | | | | 3.700 | | | | 01/30/26 | | | | 642,079 | |
| | 25,000 | | | | 4.700 | | | | 12/09/35 | | | | 28,089 | |
| | | | | | | | | | | | | | |
| | | | | | | | | | | | | 670,168 | |
| | |
| Household Durables – 0.1% | |
| | Newell Brands, Inc. | |
| | 170,000 | | | | 5.500 | | | | 04/01/46 | | | | 203,104 | |
| | |
| Household Products – 0.3% | |
| | Procter & Gamble Co. (The) | |
| | 340,000 | | | | 5.550 | | | | 03/05/37 | | | | 455,626 | |
| | |
| Industrial Conglomerates – 0.3% | |
| | Honeywell International, Inc. | |
| | 610,000 | | | | 2.500 | | | | 11/01/26 | | | | 593,992 | |
| | |
| Insurance – 1.7% | |
| | Berkshire Hathaway Finance Corp. | |
| | 90,000 | | | | 1.300 | | | | 08/15/19 | | | | 89,469 | |
| | Chubb INA Holdings, Inc. | |
| | 320,000 | | | | 4.350 | | | | 11/03/45 | | | | 355,628 | |
| | MetLife, Inc. | |
| | 260,000 | | | | 5.700 | | | | 06/15/35 | | | | 325,597 | |
| | 259,000 | | | | 4.875 | | | | 11/13/43 | | | | 297,255 | |
| | MetLife, Inc., Series D | |
| | 1,600,000 | | | | 4.368 | | | | 09/15/23 | | | | 1,759,455 | |
| | | | | | | | | | | | | | |
| | | | | | | | | | | | | 2,827,404 | |
| | |
| Internet & Direct Marketing Retail – 0.5% | |
| | Amazon.com, Inc. | |
| | 370,000 | | | | 2.800 | (a) | | | 08/22/24 | | | | 375,693 | |
| | 130,000 | | | | 4.800 | | | | 12/05/34 | | | | 149,303 | |
| | 390,000 | | | | 4.050 | (a) | | | 08/22/47 | | | | 402,850 | |
| | | | | | | | | | | | | | |
| | | | | | | | | | | | | 927,846 | |
| | |
| Internet Software & Services – 0.1% | |
| | eBay, Inc. | | | | | | | | | | | | | |
| | 250,000 | | | | 2.750 | | | | 01/30/23 | | | | 250,836 | |
| | |
| | |
| The accompanying notes are an integral part of these financial statements. | | 11 |
GOLDMAN SACHS ACCESS INVESTMENT GRADE CORPORATE BOND ETF
Schedule of Investments (continued)
August 31, 2017
| | | | | | | | | | | | | | |
Principal
Amount | | | Interest
Rate | | | Maturity
Date | | | Value | |
| Corporate Obligations – (continued) | |
| IT Services – 0.8% | |
| | Fidelity National Information Services, Inc. | |
| $ | 960,000 | | | | 3.000 | % | | | 08/15/26 | | | $ | 946,838 | |
| | International Business Machines Corp. | |
| | 350,000 | | | | 3.375 | | | | 08/01/23 | | | | 366,080 | |
| | 35,000 | | | | 4.000 | | | | 06/20/42 | | | | 35,561 | |
| | Visa, Inc. | |
| | 150,000 | | | | 4.150 | | | | 12/14/35 | | | | 164,174 | |
| | | | | | | | | | | | | | |
| | | | | | | | | | | | | 1,512,653 | |
| | |
| Life Sciences Tools & Services – 0.5% | |
| | Thermo Fisher Scientific, Inc. | |
| | 920,000 | | | | 2.950 | | | | 09/19/26 | | | | 909,391 | |
| | |
| Machinery – 0.0% | |
| | Caterpillar, Inc. | |
| | 30,000 | | | | 3.900 | | | | 05/27/21 | | | | 32,067 | |
| | |
| Media – 3.1% | |
| | Comcast Corp. | |
| | 60,000 | | | | 3.600 | | | | 03/01/24 | | | | 63,350 | |
| | 960,000 | | | | 3.150 | | | | 03/01/26 | | | | 969,480 | |
| | 20,000 | | | | 5.650 | | | | 06/15/35 | | | | 24,345 | |
| | 270,000 | | | | 4.400 | | | | 08/15/35 | | | | 292,091 | |
| | 230,000 | | | | 6.500 | | | | 11/15/35 | | | | 303,147 | |
| | 25,000 | | | | 6.450 | | | | 03/15/37 | | | | 33,130 | |
| | 250,000 | | | | 4.650 | | | | 07/15/42 | | | | 273,012 | |
| | 190,000 | | | | 4.600 | | | | 08/15/45 | | | | 207,104 | |
| | 140,000 | | | | 3.400 | | | | 07/15/46 | | | | 127,521 | |
| | Omnicom Group, Inc. | |
| | 500,000 | | | | 3.625 | | | | 05/01/22 | | | | 524,060 | |
| | Time Warner, Inc. | |
| | 640,000 | | | | 3.600 | | | | 07/15/25 | | | | 647,984 | |
| | 670,000 | | | | 3.800 | | | | 02/15/27 | | | | 673,310 | |
| | 180,000 | | | | 7.700 | | | | 05/01/32 | | | | 252,375 | |
| | 50,000 | | | | 6.100 | | | | 07/15/40 | | | | 58,281 | |
| | 180,000 | | | | 4.850 | | | | 07/15/45 | | | | 182,244 | |
| | Viacom, Inc. | |
| | 500,000 | | | | 4.375 | | | | 03/15/43 | | | | 426,473 | |
| | Walt Disney Co. (The) | |
| | 800,000 | | | | 3.000 | | | | 02/13/26 | | | | 815,128 | |
| | | | | | | | | | | | | | |
| | | | | | | | | | | | | 5,873,035 | |
| | |
| Multi-Utilities – 0.5% | |
| | Dominion Energy, Inc. | |
| | 500,000 | | | | 2.579 | | | | 07/01/20 | | | | 505,221 | |
| | 310,000 | | | | 3.900 | | | | 10/01/25 | | | | 327,417 | |
| | | | | | | | | | | | | | |
| | | | | | | | | | | | | 832,638 | |
| | |
| Oil, Gas & Consumable Fuels – 4.4% | |
| | Anadarko Petroleum Corp. | |
| | 225,000 | | | | 6.450 | | | | 09/15/36 | | | | 263,681 | |
| | Apache Corp. | |
| | 410,000 | | | | 4.750 | | | | 04/15/43 | | | | 411,226 | |
| | Chevron Corp. | |
| | 750,000 | | | | 2.566 | | | | 05/16/23 | | | | 759,300 | |
| | 180,000 | | | | 2.954 | | | | 05/16/26 | | | | 181,813 | |
| | ConocoPhillips | |
| | 150,000 | | | | 6.500 | | | | 02/01/39 | | | | 197,030 | |
| Corporate Obligations – (continued) | |
| Oil, Gas & Consumable Fuels – (continued) | |
| | Devon Energy Corp. | |
| 290,000 | | | | 3.250 | | | | 05/15/22 | | | | 294,759 | |
| | 245,000 | | | | 7.950 | | | | 04/15/32 | | | | 323,754 | |
| | 160,000 | | | | 5.600 | | | | 07/15/41 | | | | 170,765 | |
| | Energy Transfer LP | |
| | 600,000 | | | | 4.150 | | | | 10/01/20 | | | | 629,184 | |
| | 300,000 | | | | 6.125 | | | | 12/15/45 | | | | 329,887 | |
| | 200,000 | | | | 5.300 | | | | 04/15/47 | | | | 200,322 | |
| | EOG Resources, Inc. | |
| | 380,000 | | | | 2.625 | | | | 03/15/23 | | | | 382,251 | |
| | Exxon Mobil Corp. | |
| | 615,000 | | | | 2.222 | | | | 03/01/21 | | | | 623,036 | |
| | 200,000 | | | | 4.114 | | | | 03/01/46 | | | | 213,691 | |
| | Hess Corp. | |
| | 410,000 | | | | 4.300 | | | | 04/01/27 | | | | 401,883 | |
| | Kinder Morgan Energy Partners LP | |
| | 600,000 | | | | 3.500 | | | | 03/01/21 | | | | 615,866 | |
| | Kinder Morgan, Inc. | |
| | 200,000 | | | | 5.550 | | | | 06/01/45 | | | | 212,702 | |
| | Marathon Oil Corp. | |
| | 250,000 | | | | 2.800 | | | | 11/01/22 | | | | 244,707 | |
| | MPLX LP | |
| | 420,000 | | | | 5.200 | | | | 03/01/47 | | | | 434,207 | |
| | Occidental Petroleum Corp. | |
| | 230,000 | | | | 3.400 | | | | 04/15/26 | | | | 235,748 | |
| | 180,000 | | | | 4.625 | | | | 06/15/45 | | | | 196,997 | |
| | 80,000 | | | | 4.100 | | | | 02/15/47 | | | | 81,679 | |
| | Phillips 66 | |
| | 100,000 | | | | 5.875 | | | | 05/01/42 | | | | 122,151 | |
| | Williams Partners LP | |
| | 350,000 | | | | 3.600 | | | | 03/15/22 | | | | 361,040 | |
| | | | | | | | | | | | | | |
| | | | | | | | | | | | | 7,887,679 | |
| | |
| Pharmaceuticals – 1.6% | |
| | Eli Lilly & Co. | |
| | 360,000 | | | | 3.950 | | | | 05/15/47 | | | | 380,587 | |
| | Merck & Co., Inc. | |
| | 200,000 | | | | 3.700 | | | | 02/10/45 | | | | 203,174 | |
| | Mylan NV | |
| | 40,000 | | | | 5.250 | | | | 06/15/46 | | | | 43,186 | |
| | Pfizer, Inc. | |
| | 585,000 | | | | 2.100 | | | | 05/15/19 | | | | 590,938 | |
| | 400,000 | | | | 2.200 | | | | 12/15/21 | | | | 404,540 | |
| | 950,000 | | | | 2.750 | | | | 06/03/26 | | | | 948,349 | |
| | 150,000 | | | | 7.200 | | | | 03/15/39 | | | | 226,167 | |
| | 330,000 | | | | 4.125 | | | | 12/15/46 | | | | 354,109 | |
| | | | | | | | | | | | | | |
| | | | | | | | | | | | | 3,151,050 | |
| | |
| Semiconductors & Semiconductor – 2.2% | |
| | Applied Materials, Inc. | |
| | 520,000 | | | | 3.300 | | | | 04/01/27 | | | | 534,755 | |
| | 460,000 | | | | 4.350 | | | | 04/01/47 | | | | 496,272 | |
| | Intel Corp. | |
| | 1,320,000 | | | | 2.450 | | | | 07/29/20 | | | | 1,343,938 | |
| | 100,000 | | | | 3.300 | | | | 10/01/21 | | | | 105,128 | |
| | 830,000 | | | | 3.700 | | | | 07/29/25 | | | | 885,784 | |
| | 75,000 | | | | 4.250 | | | | 12/15/42 | | | | 80,852 | |
| | |
| 12 | | The accompanying notes are an integral part of these financial statements. |
GOLDMAN SACHS ACCESS INVESTMENT GRADE CORPORATE BOND ETF
| | | | | | | | | | | | | | |
Principal
Amount | | | Interest
Rate | | | Maturity
Date | | | Value | |
| Corporate Obligations – (continued) | |
| Semiconductors & Semiconductor – (continued) | |
| | QUALCOMM, Inc. | |
| $ | 200,000 | | | | 1.850 | % | | | 05/20/19 | | | $ | 200,821 | |
| | 290,000 | | | | 4.650 | | | | 05/20/35 | | | | 321,610 | |
| | | | | | | | | | | | | | |
| | | | | | | | | | | | | 3,969,160 | |
| | |
| Software – 4.3% | |
| | Microsoft Corp. | |
| | 570,000 | | | | 1.850 | | | | 02/12/20 | | | | 573,427 | |
| | 540,000 | | | | 2.000 | | | | 11/03/20 | | | | 544,841 | |
| | 240,000 | | | | 2.400 | | | | 02/06/22 | | | | 244,069 | |
| | 585,000 | | | | 2.650 | | | | 11/03/22 | | | | 599,291 | |
| | 40,000 | | | | 2.875 | | | | 02/06/24 | | | | 41,166 | |
| | 360,000 | | | | 3.300 | | | | 02/06/27 | | | | 374,358 | |
| | 380,000 | | | | 3.450 | | | | 08/08/36 | | | | 382,187 | |
| | 240,000 | | | | 5.200 | | | | 06/01/39 | | | | 296,778 | |
| | 300,000 | | | | 4.450 | | | | 11/03/45 | | | | 339,232 | |
| | 310,000 | | | | 3.700 | | | | 08/08/46 | | | | 310,632 | |
| | 300,000 | | | | 4.000 | | | | 02/12/55 | | | | 307,770 | |
| | Microsoft Corp., Series 30Y | |
| | 260,000 | | | | 4.250 | | | | 02/06/47 | | | | 287,068 | |
| | Oracle Corp. | |
| | 390,000 | | | | 2.375 | | | | 01/15/19 | | | | 394,465 | |
| | 443,000 | | | | 3.875 | | | | 07/15/20 | | | | 470,026 | |
| | 1,550,000 | | | | 2.800 | | | | 07/08/21 | | | | 1,601,571 | |
| | 210,000 | | | | 2.950 | | | | 05/15/25 | | | | 213,514 | |
| | 350,000 | | | | 3.850 | | | | 07/15/36 | | | | 363,680 | |
| | 60,000 | | | | 6.125 | | | | 07/08/39 | | | | 80,320 | |
| | 150,000 | | | | 5.375 | | | | 07/15/40 | | | | 184,731 | |
| | 50,000 | | | | 4.125 | | | | 05/15/45 | | | | 52,298 | |
| | 180,000 | | | | 4.000 | | | | 07/15/46 | | | | 184,884 | |
| | | | | | | | | | | | | | |
| | | | | | | | | | | | | 7,846,308 | |
| | |
| Specialty Retail – 1.0% | |
| | Home Depot, Inc. (The) | |
| | 303,000 | | | | 2.000 | | | | 06/15/19 | | | | 305,404 | |
| | 550,000 | | | | 2.000 | | | | 04/01/21 | | | | 552,799 | |
| | 330,000 | | | | 2.700 | | | | 04/01/23 | | | | 335,442 | |
| | 45,000 | | | | 3.000 | | | | 04/01/26 | | | | 45,794 | |
| | 250,000 | | | | 4.400 | | | | 03/15/45 | | | | 274,638 | |
| | 300,000 | | | | 4.250 | | | | 04/01/46 | | | | 325,144 | |
| | | | | | | | | | | | | | |
| | | | | | | | | | | | | 1,839,221 | |
| | |
| Technology Hardware, Storage & Peripherals – 2.7% | |
| | Apple, Inc. | |
| | 381,000 | | | | 2.250 | | | | 02/23/21 | | | | 385,233 | |
| | 850,000 | | | | 1.550 | | | | 08/04/21 | | | | 838,615 | |
| | 20,000 | | | | 2.150 | | | | 02/09/22 | | | | 20,074 | |
| | 30,000 | | | | 2.700 | | | | 05/13/22 | | | | 30,783 | |
| | 30,000 | | | | 3.000 | | | | 02/09/24 | | | | 30,872 | |
| | 475,000 | | | | 2.850 | | | | 05/11/24 | | | | 483,481 | |
| | 740,000 | | | | 3.000 | | | | 06/20/27 | | | | 744,850 | |
| | 230,000 | | | | 4.500 | | | | 02/23/36 | | | | 262,322 | |
| | 470,000 | | | | 3.850 | | | | 05/04/43 | | | | 479,766 | |
| | 290,000 | | | | 4.375 | | | | 05/13/45 | | | | 316,120 | |
| | 40,000 | | | | 4.650 | | | | 02/23/46 | | | | 45,554 | |
| | Hewlett Packard Enterprise Co. | |
| | 670,000 | | | | 3.600 | | | | 10/15/20 | | | | 695,678 | |
| Corporate Obligations – (continued) | |
| Technology Hardware, Storage & Peripherals – (continued) | |
| | Hewlett Packard Enterprise Co. – (continued) | |
| 250,000 | | | | 4.900 | | | | 10/15/25 | | | | 265,846 | |
| | 20,000 | | | | 6.350 | | | | 10/15/45 | | | | 21,288 | |
| | HP, Inc. | |
| | 70,000 | | | | 6.000 | | | | 09/15/41 | | | | 74,554 | |
| | | | | | | | | | | | | | |
| | | | | | | | | | | | | 4,695,036 | |
| | |
| Tobacco – 0.8% | |
| | Altria Group, Inc. | |
| | 620,000 | | | | 9.250 | | | | 08/06/19 | | | | 705,551 | |
| | 391,000 | | | | 3.875 | | | | 09/16/46 | | | | 380,793 | |
| | Philip Morris International, Inc. | |
| | 200,000 | | | | 1.875 | | | | 02/25/21 | | | | 197,695 | |
| | 20,000 | | | | 2.750 | | | | 02/25/26 | | | | 19,721 | |
| | 200,000 | | | | 4.125 | | | | 03/04/43 | | | | 204,028 | |
| | | | | | | | | | | | | | |
| | | | | | | | | | | | | 1,507,788 | |
| | |
| Transportation – 0.4% | |
| | Burlington Northern Santa Fe LLC | |
| | 470,000 | | | | 4.900 | | | | 04/01/44 | | | | 545,746 | |
| | 200,000 | | | | 4.125 | | | | 06/15/47 | | | | 210,824 | |
| | | | | | | | | | | | | | |
| | | | | | | | | | | | | 756,570 | |
| | |
| | TOTAL CORPORATE OBLIGATIONS | |
| | (Cost $142,212,965) | | | $ | 142,647,210 | |
| | |
| | | | | | | | | | | | | | |
| Foreign Corporate Debt – 19.9% | |
| Banks – 10.8% | |
| | Australia & New Zealand Banking Group Ltd., MTN (Australia) | |
| $ | 640,000 | | | | 2.300 | % | | | 06/01/21 | | | $ | 642,574 | |
| | Banco Santander SA (Spain) | |
| | 400,000 | | | | 4.250 | | | | 04/11/27 | | | | 418,376 | |
| | Bank of Nova Scotia (The) (Canada) | |
| | 600,000 | | | | 2.050 | | | | 10/30/18 | | | | 603,168 | |
| | 500,000 | | | | 1.950 | | | | 01/15/19 | | | | 502,579 | |
| | 700,000 | | | | 1.650 | | | | 06/14/19 | | | | 700,797 | |
| | 500,000 | | | | 2.350 | | | | 10/21/20 | | | | 504,597 | |
| | Barclays PLC (United Kingdom) | |
| | 140,000 | | | | 3.200 | | | | 08/10/21 | | | | 142,948 | |
| | 475,000 | | | | 4.375 | | | | 09/11/24 | | | | 487,635 | |
| | 750,000 | | | | 3.650 | | | | 03/16/25 | | | | 757,027 | |
| | 250,000 | | | | 4.337 | | | | 01/10/28 | | | | 261,227 | |
| | 210,000 | | | | 4.836 | | | | 05/09/28 | | | | 218,681 | |
| | BNP Paribas SA (France) | |
| | 620,000 | | | | 5.000 | | | | 01/15/21 | | | | 677,531 | |
| | Credit Suisse AG (Switzerland) | |
| | 920,000 | | | | 5.300 | | | | 08/13/19 | | | | 979,082 | |
| | Credit Suisse Group Funding Guernsey Ltd. (Switzerland) | |
| | 1,050,000 | | | | 3.800 | | | | 09/15/22 | | | | 1,098,298 | |
| | Deutsche Bank AG (Germany) | |
| | 620,000 | | | | 2.700 | | | | 07/13/20 | | | | 624,501 | |
| | HSBC Holdings PLC (United Kingdom) | |
| | 200,000 | | | | 2.950 | | | | 05/25/21 | | | | 204,304 | |
| | 900,000 | | | | 2.650 | | | | 01/05/22 | | | | 906,160 | |
| | 300,000 | | | | 4.300 | | | | 03/08/26 | | | | 324,004 | |
| | |
| The accompanying notes are an integral part of these financial statements. | | 13 |
GOLDMAN SACHS ACCESS INVESTMENT GRADE CORPORATE BOND ETF
Schedule of Investments (continued)
August 31, 2017
| | | | | | | | | | | | | | |
Principal
Amount | | | Interest
Rate | | | Maturity
Date | | | Value | |
| Foreign Corporate Debt – (continued) | |
| Banks – (continued) | |
| | HSBC Holdings PLC (United Kingdom) – (continued) | |
| $ | 200,000 | | | | 4.375 | % | | | 11/23/26 | | | $ | 210,654 | |
| | 1,280,000 | | | | 6.500 | | | | 09/15/37 | | | | 1,683,363 | |
| | ING Groep NV (Netherlands) | |
| | 1,370,000 | | | | 3.950 | | | | 03/29/27 | | | | 1,437,088 | |
| | Lloyds Banking Group PLC (United Kingdom) | |
| | 1,120,000 | | | | 3.000 | | | | 01/11/22 | | | | 1,134,505 | |
| | 400,000 | | | | 4.500 | | | | 11/04/24 | | | | 422,603 | |
| | 365,000 | | | | 4.650 | | | | 03/24/26 | | | | 387,812 | |
| | Royal Bank of Canada (Canada) | |
| | 150,000 | | | | 2.000 | | | | 12/10/18 | | | | 151,028 | |
| | Royal Bank of Canada, GMTN (Canada) | |
| | 660,000 | | | | 2.150 | | | | 03/15/19 | | | | 666,651 | |
| | 500,000 | | | | 2.150 | | | | 03/06/20 | | | | 503,777 | |
| | Royal Bank of Canada, MTN (Canada) | |
| | 335,000 | | | | 2.350 | | | | 10/30/20 | | | | 338,278 | |
| | Santander UK Group Holdings PLC (United Kingdom) | |
| | 445,000 | | | | 2.875 | | | | 08/05/21 | | | | 449,158 | |
| | Sumitomo Mitsui Financial Group, Inc. (Japan) | |
| | 840,000 | | | | 2.934 | | | | 03/09/21 | | | | 859,224 | |
| | Toronto-Dominion Bank (The) (Canada) | |
| | 60,000 | | | | 1.800 | | | | 07/13/21 | | | | 59,590 | |
| | Toronto-Dominion Bank (The), GMTN (Canada) | |
| | 625,000 | | | | 2.500 | | | | 12/14/20 | | | | 636,489 | |
| | Westpac Banking Corp. (Australia) | |
| | 232,000 | | | | 2.150 | | | | 03/06/20 | | | | 233,639 | |
| | 120,000 | | | | 2.700 | | | | 08/19/26 | | | | 117,633 | |
| | | | | | | | | | | | | | |
| | | | | | | | | | | | | 19,344,981 | |
| | |
| Consumer Noncyclical – 1.3% | |
| | BAT Capital Corp. (United Kingdom) | |
| | 640,000 | | | | 3.222 | (a) | | | 08/15/24 | | | | 646,144 | |
| | GlaxoSmithKline Capital, Inc. (United Kingdom) | |
| | 180,000 | | | | 6.375 | | | | 05/15/38 | | | | 247,725 | |
| | Novartis Capital Corp. (Switzerland) | |
| | 450,000 | | | | 2.400 | | | | 05/17/22 | | | | 454,353 | |
| | 220,000 | | | | 4.400 | | | | 05/06/44 | | | | 248,652 | |
| | Novartis Securities Investment Ltd. (Switzerland) | |
| | 650,000 | | | | 5.125 | | | | 02/10/19 | | | | 682,023 | |
| | | | | | | | | | | | | | |
| | | | | | | | | | | | | 2,278,897 | |
| | |
| Energy – 2.0% | |
| | BP Capital Markets PLC (United Kingdom) | |
| | 200,000 | | | | 2.237 | | | | 05/10/19 | | | | 201,586 | |
| | 580,000 | | | | 3.561 | | | | 11/01/21 | | | | 612,527 | |
| | 20,000 | | | | 2.500 | | | | 11/06/22 | | | | 20,027 | |
| | 20,000 | | | | 3.535 | | | | 11/04/24 | | | | 21,084 | |
| | 230,000 | | | | 3.588 | | | | 04/14/27 | | | | 238,688 | |
| | 1,040,000 | | | | 3.723 | | | | 11/28/28 | | | | 1,088,207 | |
| | Shell International Finance BV (Netherlands) | |
| | 200,000 | | | | 1.375 | | | | 09/12/19 | | | | 199,112 | |
| | 750,000 | | | | 1.750 | | | | 09/12/21 | | | | 742,383 | |
| | 170,000 | | | | 6.375 | | | | 12/15/38 | | | | 231,806 | |
| | 190,000 | | | | 4.375 | | | | 05/11/45 | | | | 203,688 | |
| | 240,000 | | | | 4.000 | | | | 05/10/46 | | | | 243,916 | |
| | | | | | | | | | | | | | |
| | | | | | | | | | | | | 3,803,024 | |
| | |
| Foreign Corporate Debt – (continued) | |
| Financial Co. – 0.2% | |
| AerCap Ireland Capital DAC / AerCap Global Aviation Trust
(Netherlands) |
|
| 350,000 | | | | 5.000 | | | | 10/01/21 | | | | 379,094 | |
| | |
| Food and Beverage – 2.1% | |
| | Anheuser-Busch InBev Finance, Inc. (Belgium) | |
| | 1,600,000 | | | | 1.900 | | | | 02/01/19 | | | | 1,605,858 | |
| | 600,000 | | | | 3.650 | | | | 02/01/26 | | | | 626,169 | |
| | 530,000 | | | | 4.700 | | | | 02/01/36 | | | | 589,861 | |
| | 740,000 | | | | 4.900 | | | | 02/01/46 | | | | 848,522 | |
| | | | | | | | | | | | | | |
| | | | | | | | | | | | | 3,670,410 | |
| | |
| Metals & Mining – 0.2% | |
| | Barrick North America Finance LLC (Canada) | |
| | 200,000 | | | | 5.750 | | | | 05/01/43 | | | | 249,493 | |
| | Southern Copper Corp. (Peru) | |
| | 100,000 | | | | 7.500 | | | | 07/27/35 | | | | 129,483 | |
| | 140,000 | | | | 5.875 | | | | 04/23/45 | | | | 158,956 | |
| | | | | | | | | | | | | | |
| | | | | | | | | | | | | 537,932 | |
| | |
| Mining – 0.6% | |
| | Rio Tinto Finance USA Ltd. (United Kingdom) | |
| | 25,000 | | | | 7.125 | | | | 07/15/28 | | | | 33,810 | |
| | Vale Overseas Ltd. (Brazil) | |
| | 100,000 | | | | 5.625 | | | | 09/15/19 | | | | 108,000 | |
| | 690,000 | | | | 5.875 | | | | 06/10/21 | | | | 764,175 | |
| | 180,000 | | | | 6.250 | | | | 08/10/26 | | | | 204,525 | |
| | | | | | | | | | | | | | |
| | | | | | | | | | | | | 1,110,510 | |
| | |
| Oil Company-Exploration & Production – 0.2% | |
| | Nexen Energy ULC (China) | |
| | 250,000 | | | | 6.400 | | | | 05/15/37 | | | | 327,576 | |
| | |
| Oil, Gas & Consumable Fuels – 1.2% | |
| | Cenovus Energy, Inc. (Canada) | |
| | 200,000 | | | | 4.250 | (a) | | | 04/15/27 | | | | 193,440 | |
| | 150,000 | | | | 6.750 | | | | 11/15/39 | | | | 161,250 | |
| | Ecopetrol SA (Colombia) | |
| | 320,000 | | | | 5.875 | | | | 09/18/23 | | | | 357,200 | |
| | 350,000 | | | | 5.375 | | | | 06/26/26 | | | | 373,844 | |
| | Enbridge, Inc. (Canada) | |
| | 150,000 | | | | 4.250 | | | | 12/01/26 | | | | 158,598 | |
| | 50,000 | | | | 5.500 | | | | 12/01/46 | | | | 58,176 | |
| | Suncor Energy, Inc. (Canada) | |
| | 370,000 | | | | 3.600 | | | | 12/01/24 | | | | 382,554 | |
| | 190,000 | | | | 6.500 | | | | 06/15/38 | | | | 248,598 | |
| | TransCanada PipeLines Ltd. (Canada) | |
| | 180,000 | | | | 7.625 | | | | 01/15/39 | | | | 267,368 | |
| | | | | | | | | | | | | | |
| | | | | | | | | | | | | 2,201,028 | |
| | |
| Pharmaceuticals – 0.0% | |
| | AstraZeneca PLC (United Kingdom) | |
| | 60,000 | | | | 3.125 | | | | 06/12/27 | | | | 60,037 | |
| | |
| Tobacco – 0.1% | |
| | Reynolds American, Inc. (United Kingdom) | |
| | 220,000 | | | | 5.850 | | | | 08/15/45 | | | | 267,428 | |
| | |
| | |
| 14 | | The accompanying notes are an integral part of these financial statements. |
GOLDMAN SACHS ACCESS INVESTMENT GRADE CORPORATE BOND ETF
| | | | | | | | | | | | | | |
Principal
Amount | | | Interest
Rate | | | Maturity
Date | | | Value | |
| Foreign Corporate Debt – (continued) | |
| Wireless Telecommunication Services – 0.2% | |
| | America Movil SAB de CV (Mexico) | |
| $ | 200,000 | | | | 3.125 | % | | | 07/16/22 | | | $ | 207,247 | |
| | 150,000 | | | | 6.125 | | | | 03/30/40 | | | | 187,285 | |
| | | | | | | | | | | | | | |
| | | | | | | | | | | | | 394,532 | |
| | |
| Wirelines – 1.0% | |
| | Deutsche Telekom International Finance BV (Germany) | |
| | 190,000 | | | | 8.750 | | | | 06/15/30 | | | | 281,769 | |
| | Telefonica Emisiones SAU (Spain) | |
| | 1,000,000 | | | | 5.134 | | | | 04/27/20 | | | | 1,079,301 | |
| | 230,000 | | | | 5.213 | | | | 03/08/47 | | | | 256,655 | |
| | | | | | | | | | | | | | |
| | | | | | | | | | | | | 1,617,725 | |
| | |
| | TOTAL FOREIGN CORPORATE DEBT | |
| | (Cost $35,815,966) | | | $ | 35,993,174 | |
| | |
| | | | | | |
Principal
Amount | | Interest
Rate | | Value | |
| Investment Company – 0.1%(b) | |
Goldman Sachs Financial Square Government Fund – Institutional Shares | |
| 183,870 | | 0.93% | | $ | 183,870 | |
| (Cost $183,870) | | | | |
| |
| TOTAL INVESTMENTS – 98.8% | |
| (Cost $178,212,801) | | $ | 178,824,254 | |
| |
OTHER ASSETS IN EXCESS OF LIABILITIES – 1.2% | | | 2,172,503 | |
| |
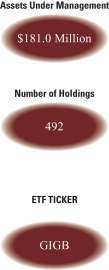
| NET ASSETS – 100.0% | | $ | 180,996,757 | |
| |
| | |
| The percentage shown for each investment category reflects the value of investments in that category as a percentage of net assets. |
(a) | | Exempt from registration under Rule 144A of the Securities Act of 1933. Under procedures approved by the Board of Trustees, such securities may be deemed liquid by the Investment Adviser and may be resold, normally to qualified institutional buyers in transactions exempt from registration. Total market value of Rule 144A securities amounts to $2,456,020, which represents approximately 1.4% of net assets as of August 31, 2017. |
(b) | | Represents an affiliated issuer. |
| | |
|
Investment Abbreviations: |
GMTN | | —Global Medium Term Note |
LP | | —Limited Partnership |
MTN | | —Medium Term Note |
PLC | | —Public Limited Company |
|
| | |
| The accompanying notes are an integral part of these financial statements. | | 15 |
GOLDMAN SACHS ACCESS INVESTMENT GRADE CORPORATE BOND ETF
Statement of Assets and Liabilities
August 31, 2017
| | | | | | |
| | | | | Access
Investment
Grade
Corporate
Bond ETF | |
| | Assets: | |
| | Investments at value (cost $178,028,931) | | $ | 178,640,384 | |
| | Investments in Affiliated Underlying Funds, at value (cost $183,870) | | | 183,870 | |
| | Cash | | | 658,955 | |
| | Receivables: | | | | |
| | Fund shares sold | | | 22,586,508 | |
| | Investments sold | | | 20,105,492 | |
| | Interest | | | 2,012,028 | |
| | Reimbursement from advisor | | | 379 | |
| | Total assets | | | 224,187,616 | |
| | | | | | |
| | Liabilities: | |
| | Payables: | | | | |
| | Investments purchased | | | 23,057,859 | |
| | Fund shares redeemed | | | 20,118,318 | |
| | Management fees | | | 14,682 | |
| | Total liabilities | | | 43,190,859 | |
| | | | | | |
| | Net Assets: | |
| | Paid-in capital | | | 180,121,705 | |
| | Undistributed net investment income | | | 265,719 | |
| | Accumulated net realized loss | | | (2,120 | ) |
| | Net unrealized gain | | | 611,453 | |
| | NET ASSETS | | $ | 180,996,757 | |
| | SHARES ISSUED AND OUTSTANDING | | | | |
| | Shares outstanding no par value (unlimited shares authorized): | | | 3,600,000 | |
| | Net asset value per share: | | $ | 50.28 | |
| | |
| 16 | | The accompanying notes are an integral part of these financial statements. |
GOLDMAN SACHS ACCESS INVESTMENT GRADE CORPORATE BOND ETF
Statement of Operations
For the period ended August 31, 2017(a)
| | | | | | |
| | | | | Access
Investment
Grade
Corporate
Bond ETF | |
| | Investment income: | |
| | Interest | | $ | 519,419 | |
| | Dividends from Affiliated Underlying Funds | | | 6,285 | |
| | Total investment income | | | 525,704 | |
| | | | | | |
| | Expenses: | |
| | Management fees | | | 23,207 | |
| | Trustee fees | | | 3,218 | |
| | Total expenses | | | 26,425 | |
| | Less — expense reductions | | | (1,301 | ) |
| | Net expenses | | | 25,124 | |
| | NET INVESTMENT INCOME | | | 500,580 | |
| | | | | | |
| | Realized and unrealized gain (loss): | |
| | Net realized gain (loss) from: | | | | |
| | Investments unaffiliated | | | (2,120 | ) |
| | In-kind redemptions | | | 47,886 | |
| | Net unrealized gain on: | | | | |
| | Investments unaffiliated | | | 611,453 | |
| | Net realized and unrealized gain | | | 657,219 | |
| | NET INCREASE IN NET ASSETS RESULTING FROM OPERATIONS | | $ | 1,157,799 | |
| | (a) | | For the period June 6, 2017 (commencement of operations) through August 31, 2017. |
| | |
| The accompanying notes are an integral part of these financial statements. | | 17 |
GOLDMAN SACHS ACCESS INVESTMENT GRADE CORPORATE BOND ETF
Statement of Changes in Net Assets
For the period ended August 31, 2017(a)
| | | | | | |
| | | | | Access
Investment
Grade
Corporate
Bond ETF | |
| | From operations: | |
| | Net investment income | | $ | 500,580 | |
| | Net realized gain | | | 45,766 | |
| | Net unrealized gain | | | 611,453 | |
| | Net increase in net assets resulting from operations | | | 1,157,799 | |
| | | | | | |
| | Distributions to shareholders: | |
| | From net investment income | | | (234,861 | ) |
| | Total distributions to shareholders | | | (234,861 | ) |
| | | | | | |
| | From share transactions: | |
| | Proceeds from sales of shares | | | 200,212,160 | |
| | Cost of shares redeemed | | | (20,138,341 | ) |
| | Net increase in net assets resulting from share transactions | | | 180,073,819 | |
| | TOTAL INCREASE | | | 180,996,757 | |
| | | | | | |
| | Net assets: | |
| | Beginning of period | | $ | — | |
| | End of period | | $ | 180,996,757 | |
| | Undistributed net investment income | | $ | 265,719 | |
| | (a) | | For the period June 6, 2017 (commencement of operations) through August 31, 2017. |
| | |
| 18 | | The accompanying notes are an integral part of these financial statements. |
GOLDMAN SACHS ACCESS INVESTMENT GRADE CORPORATE BOND ETF
Financial Highlights
Selected Data for a Share Outstanding Throughout the Period*
| | | | | | |
| | | | | Access
Investment
Grade
Corporate
Bond ETF* | |
| | Per Share Operating Performance: | |
| | Net asset value, beginning of period | | $ | 49.90 | |
| | Net investment income(a) | | | 0.32 | |
| | Net realized and unrealized loss | | | 0.27 | |
| | Total gain from investment operations | | | 0.59 | |
| | Distributions to shareholders from net investment income | | | (0.21 | ) |
| | Net asset value, end of period | | $ | 50.28 | |
| | Market price, end of period | | $ | 50.24 | |
| | Total Return at Net Asset Value(b) | | | 1.19 | % |
| | Net assets, end of period (in 000’s) | | $ | 180,997 | |
| | Ratio of net expenses to average net assets | | | 0.13 | %(c) |
| | Ratio of total expenses to average net assets | | | 0.14 | %(c) |
| | Ratio of net investment income to average net assets | | | 2.65 | %(c) |
| | Portfolio turnover rate(d) | | | 0 | %(e) |
| | * | | For the period June 6, 2017 (commencement of operations) to August 31, 2017. |
| | (a) | | Calculated based on the average shares outstanding methodology. |
| | (b) | | Assumes investment at the net asset value at the beginning of the period, reinvestment of all distributions and a complete sale of the investment at the net asset value at the end of the period. Returns do not reflect the impact of taxes to shareholders relating to Fund distributions or the sale of Fund shares. Total returns for periods less than one full year are not annualized. |
| | (d) | | The Fund’s portfolio turnover rate is calculated in accordance with regulatory requirements and excludes portfolio securities received or delivered as a result of in-kind transactions. If such transactions were included, the Fund’s portfolio turnover rate may be higher. |
| | |
| The accompanying notes are an integral part of these financial statements. | | 19 |
GOLDMAN SACHS ETF TRUST
Notes to Financial Statements
August 31, 2017
Goldman Sachs Access Investment Grade Corporate Bond ETF (the “Fund”) is a series of the Goldman Sachs ETF Trust (the “Trust”) which is an open-end diversified management investment company, registered under the Investment Company Act of 1940, as amended (the “Act”), consisting of multiple series. The Trust was organized as a Delaware statutory trust on December 16, 2009.
The investment objective of the Fund is to provide investment results that closely correspond, before fees and expenses, to the performance of the Citi Goldman Sachs Investment Grade Corporate Bond Index (the “Index”).
Goldman Sachs Asset Management, L.P. (“GSAM”), an affiliate of Goldman Sachs & Co. LLC (formerly, Goldman, Sachs & Co.) (“Goldman Sachs”), serves as investment adviser to the Fund pursuant to a management agreement (the “Agreement”) with the Trust. The Fund is an exchange-traded fund (“ETF”). Shares of the Fund are listed and traded on the NYSE Arca, Inc. (“NYSE Arca”). Market prices for the Fund’s shares may be different from its net asset value (“NAV”). The Fund issues and redeems shares at its respective NAV only in blocks of a specified number of shares, or multiples thereof, referred to as “Creation Units”. Creation Units are generally issued for cash and redeemed principally in-kind for a basket of securities and a cash amount. Shares generally trade in the secondary market in quantities less than a Creation Unit at market prices that change throughout the day. Only those that have entered into an authorized participant agreement with ALPS Distributors, Inc. (the “Distributor”) may do business directly with the Fund.
|
| 2. SIGNIFICANT ACCOUNTING POLICIES |
The financial statements have been prepared in accordance with accounting principles generally accepted in the United States of America (“GAAP”) and require management to make estimates and assumptions that may affect the reported amounts and disclosures. Actual results may differ from those estimates and assumptions.
A. Investment Valuation — The Fund’s valuation policy is to value investments at fair value.
B. Investment Income and Investments — Investment income includes interest income, dividend income, and securities lending income. Interest income is accrued daily and adjusted for amortization of premiums and accretion of discounts. Dividend income is recognized on ex-dividend date or, for certain foreign securities, as soon as such information is obtained subsequent to the ex-dividend date. Investment transactions are reflected on trade date. Realized gains and losses are calculated using identified cost. Investment transactions are recorded on the following business day for daily NAV calculations. Investment income is recorded net of any foreign withholding taxes, less any amounts reclaimable. The Fund may file withholding tax reclaims in certain jurisdictions to recover a portion of amounts previously withheld. Any foreign capital gains tax is accrued daily based upon net unrealized gains, and is payable upon sale of such investments.
C. Expenses — Expenses incurred directly by the Fund are charged to the Fund, and certain expenses incurred by the Trust that may not solely relate to the Fund are allocated to the Fund and the other applicable funds of the Trust on a straight-line and/or pro-rata basis, depending upon the nature of the expenses, and are accrued daily.
20
GOLDMAN SACHS ETF TRUST
|
| 2. SIGNIFICANT ACCOUNTING POLICIES (continued) |
D. Federal Taxes and Distributions to Shareholders — It is the Fund’s policy to comply with the requirements of the Internal Revenue Code of 1986, as amended (the “Code”), applicable to regulated investment companies (mutual funds) and to distribute each year substantially all of its investment company taxable income and capital gains to its shareholders. Accordingly, the Fund is not required to make any provisions for the payment of federal income tax. Distributions to shareholders are recorded on the ex-dividend date. Income and capital gains distributions, if any, are declared and paid according to the following schedule:
| | | | | | |
| Fund | | | | Income Distributions Declared/Paid | | Capital Gains Distributions Declared/Paid |
Access Investment Grade Corporate Bond ETF | | | | Monthly | | Annually |
Net capital losses, if any, are carried forward to future fiscal years and may be used to the extent allowed by the Code to offset any future capital gains. Losses that are carried forward will retain their character as either short-term or long-term capital losses. Utilization of capital loss carryforwards will reduce the requirement of future capital gains distributions.
The characterization of distributions to shareholders for financial reporting purposes is determined in accordance with federal income tax rules, which may differ from GAAP. The source of the Fund’s distributions may be shown in the accompanying financial statements as either from net investment income, net realized gain or capital. Certain components of the Fund’s net assets on the Statement of Assets and Liabilities reflect permanent GAAP/tax differences based on the appropriate tax character.
F. Foreign Currency Translation — The accounting records and reporting currency of the Fund is maintained in U.S.
dollars. Assets and liabilities denominated in foreign currencies are translated into U.S. dollars using the current exchange rates at the close of each business day. The effect of changes in foreign currency exchange rates on investments is included within net realized and unrealized gain (loss) on investments. Changes in the value of other assets and liabilities as a result of fluctuations in foreign exchange rates are included in the Statement of Operations within net change in unrealized gain (loss) on foreign currency translations. Transactions denominated in foreign currencies are translated into U.S. dollars on the date the transaction occurred, the effects of which are included within net realized gain (loss) on foreign currency transactions.
|
| 3. INVESTMENTS AND FAIR VALUE MEASUREMENTS |
U.S. GAAP defines the fair value of a financial instrument as the amount that would be received to sell an asset or paid to transfer a liability in an orderly transaction between market participants at the measurement date (i.e., the exit price); the Fund’s policy is to use the market approach. GAAP establishes a fair value hierarchy that prioritizes the inputs to valuation techniques used to measure fair value. The hierarchy gives the highest priority to unadjusted quoted prices in active markets for identical assets or liabilities (Level 1 measurements) and the lowest priority to unobservable inputs (Level 3 measurements). The levels used for classifying investments are not necessarily an indication of the risk associated with investing in these investments. The three levels of the fair value hierarchy are described below:
Level 1 — Unadjusted quoted prices in active markets that are accessible at the measurement date for identical, unrestricted assets or liabilities;
Level 2 — Quoted prices in markets that are not active or financial instruments for which significant inputs are observable
(including, but not limited to, quoted prices for similar investments, interest rates, foreign exchange rates, volatility and credit spreads), either directly or indirectly;
Level 3 — Prices or valuations that require significant unobservable inputs (including GSAM’s assumptions in determining fair value measurement).
21
GOLDMAN SACHS ETF TRUST
Notes to Financial Statements (continued)
August 31, 2017
|
| 3. INVESTMENTS AND FAIR VALUE MEASUREMENTS (continued) |
Changes in valuation techniques may result in transfers into or out of an assigned level within the hierarchy. In accordance with the Fund’s policy, transfers between different levels of the fair value hierarchy resulting from such changes are deemed to have occurred as of the beginning of the reporting period.
The Board of Trustees (“Trustees”) has approved Valuation Procedures that govern the valuation of the portfolio investments held by the Fund, including investments for which market quotations are not readily available. The Trustees have delegated to GSAM day-to-day responsibility for implementing and maintaining internal controls and procedures related to the valuation of the Fund’s investments. To assess the continuing appropriateness of pricing sources and methodologies, GSAM regularly performs price verification procedures and issues challenges as necessary to third party pricing vendors or brokers, and any differences are reviewed in accordance with the Valuation Procedures.
A. Level 1 and Level 2 Fair Value Investments — The valuation techniques and significant inputs used in determining the fair values for investments classified as Level 1 and Level 2 are as follows:
Debt Securities — Debt securities for which market quotations are readily available are valued daily on the basis of quotations supplied by dealers or an independent pricing service approved by the Trustees. The pricing services may use valuation models or matrix pricing, which consider: (i) yield or price with respect to bonds that are considered comparable in characteristics such as rating, interest rate and maturity date or (ii) quotations from securities dealers to determine current value. With the exception of treasury securities of G8 countries, which are generally classified as Level 1, these investments are generally classified as Level 2 of the fair value hierarchy.
Exchange Traded Funds — Investments in ETFs are valued daily at the last sale price or official closing price on the principal exchange or system on which the investment is traded. To the extent these investments are actively traded, they are classified as Level 1 of the fair value hierarchy, otherwise they are generally classified as Level 2.
Money Market Funds — Investments in the Goldman Sachs Financial Square Government Fund (“Underlying Fund”) are valued at the NAV of the Institutional Share Class on the day of valuation. These investments are generally classified as Level 1 of the fair value hierarchy. For information regarding an Underlying Fund’s accounting policies and investment holdings, please see the Underlying Fund’s shareholder report.
B. Level 3 Fair Value Investments — To the extent that significant inputs to valuation models and other alternative pricing sources are unobservable, or if quotations are not readily available, or if GSAM believes that such quotations do not accurately reflect fair value, the fair value of the Fund’s investments may be determined under Valuation Procedures approved by the Trustees. GSAM, consistent with its procedures and applicable regulatory guidance, may make an adjustment to the most recent valuation prices of either domestic or foreign securities in light of significant events to reflect what it believes to be the fair value of the securities at the time of determining a Fund’s NAV. Significant events which could affect a large number of securities in a particular market may include, but are not limited to: significant fluctuations in U.S. or foreign markets; market dislocations; market disruptions; or unscheduled market closings. Significant events which could also affect a single issuer may include, but are not limited to: corporate actions such as reorganizations, mergers and buy-outs; ratings downgrades; and bankruptcies. At August 31, 2017 the Fund did not hold level 3 securities.
22
GOLDMAN SACHS ETF TRUST
|
| 3. INVESTMENTS AND FAIR VALUE MEASUREMENTS (continued) |
C. Fair Value Hierarchy — The following is a summary of the Fund’s investments classified in the fair value hierarchy as of August 31, 2017:
| | | | | | | | | | | | |
|
| ACCESS INVESTMENT GRADE CORPORATE BOND ETF | |
| | | |
| Investment Type | | Level 1 | | | Level 2 | | | Level 3 | |
| Assets | | | | | | | | | | | | |
Fixed Income | | | | | | | | | | | | |
Corporate Obligations | | $ | — | | | $ | 142,647,210 | | | $ | — | |
Foreign Corporate Debt | | | — | | | | 35,993,174 | | | | — | |
Investment Company | | | 183,870 | | | | — | | | | — | |
| Total | | $ | 183,870 | | | $ | 178,640,384 | | | $ | — | |
For further information regarding security characteristics, see the Schedule of Investments.
|
| 4. AGREEMENTS AND AFFILIATED TRANSACTIONS |
A. Management Agreement — Under the Agreement, GSAM manages the Fund, subject to the general supervision of the Trustees.
As compensation for the services rendered pursuant to the Agreement, the assumption of the expenses related thereto and administration of the Fund’s business affairs, including providing facilities, GSAM is entitled to a management fee, accrued daily and paid monthly, equal to an annual percentage rate of the Fund’s average daily net assets.
The Fund operates under a unitary management fee structure. Under the unitary fee structure, GSAM is responsible for paying substantially all the expenses of the Fund, excluding payments under the Fund’s 12b-1 plan (if any), interest expenses, taxes, acquired fund fees and expenses, brokerage fees, costs of holding shareholder meetings, litigation, indemnification and extraordinary expenses. As the Fund directly pays fees and expenses of the independent Trustees, the management fee collected by GSAM will be reduced by an amount equal to the fees and expenses paid by the Fund to the independent Trustees.
For the fiscal year ended August 31, 2017, contractual and effective net unitary management fees with GSAM were at the following rates:
| | | | | | |
Contractual Unitary
Management Fee | | | Effective Net Unitary
Management Fee* | |
| | 0.14% | | | | 0.13% | |
| * | | Effective Net Unitary Management Fee includes the impact of management fee waivers of affiliated underlying funds. |
The Fund invests in Institutional Shares of the Goldman Sachs Financial Square Government Fund, which is an affiliated Underlying Fund. GSAM has agreed to waive a portion of its management fee payable by the Fund in an amount equal to the management fee it earns as an investment adviser to any of the affiliated Underlying Funds in which the Fund invests. For the fiscal year ended August 31, 2017, GSAM waived $1,301 of the Fund’s management fee.
B. Distribution and Service (12b-1) Plans — The Trust, on behalf of the Fund, has adopted a Distribution and Service Plan (the “Plan”), subject to Rule 12b-1 under the Act. Under the Plan, the Fund is authorized to pay distribution fees in connection with the provision of ongoing services to shareholders of the Fund and the maintenance of shareholder accounts in an amount up to 0.25% of its average daily net assets each year. No Rule 12b-1 fees are currently paid by the Fund, and there are no current plans to impose these fees.
23
GOLDMAN SACHS ETF TRUST
Notes to Financial Statements (continued)
August 31, 2017
|
| 4. AGREEMENTS AND AFFILIATED TRANSACTIONS (continued) |
C. Other Transactions with Affiliates — The Fund may purchase securities from, or sell securities to, an affiliated fund provided the affiliation is solely due to having a common investment adviser, common officers, or common trustees. The following table provides information about the Fund’s investment in the Goldman Sachs Financial Square Government Fund for the fiscal year ended August 31, 2017:
| | | | | | | | | | | | | | | | | | | | | | | | | | |
| Fund | | | | Beginning value as of
August 31, 2016 | | | Purchases
at Cost | | | Proceeds
from Sales | | | Ending value as of
August 31, 2017 | | | Shares as of
August 31, 2017 | | | Dividend
Income | |
Access Investment Grade Corporate Bond ETF* | | | | $ | — | | | $ | 161,754,759 | | | $ | 161,570,889 | | | $ | 183,870 | | | | 183,870 | | | $ | 6,285 | |
| * | | Commencement of operations, June 6, 2017. |
|
| 5. CREATION AND REDEMPTION OF CREATION UNITS |
The Trust issues and redeems shares of the Fund only in Creation Units on a continuous basis through the Distributor, without an initial sales load, at NAV next determined after receipt, on any Business Day (as defined in the Statement of Additional Information), of an order in proper form. Shares of the Fund may only be directly purchased or redeemed by certain financial institutions (each an “Authorized Participant”). An Authorized Participant is either (1) a “Participating Party” or other participant in the clearing process through the Continuous Net Settlement System of the National Securities Clearing Corporation; or (2) a Depository Trust Company participant; which, in either case, must have executed an agreement with the Distributor. Retail investors will typically not qualify as an Authorized Participant or have the resources to buy and sell whole Creation Units. Therefore, they will be unable to purchase or redeem the shares directly from the Fund. Rather, most retail investors will purchase shares in the secondary market at market prices with the assistance of a broker and may be subject to customary brokerage commissions or fees. Fixed creation and redemption transaction fees are imposed in connection with creations and redemptions.
Authorized Participants transacting in Creation Units for cash may also pay a variable charge to compensate the relevant fund for certain transaction costs (e.g. taxes on currency or other financial transactions, and brokerage costs) and market impact expenses relating to investing in portfolio securities. Such variable charges, if any, are included in “Proceeds from sale of shares” in the Statement of Changes in Net Assets.
Share activity for the period ended August 31, 2017 is as follows:
| | | | | | | | |
| | | Access Investment Grade Corporate
Bond ETF | |
| | | | |
| | | Shares | | | Dollars | |
| | | | |
| Fund Share Activity (a) | | | | | | | | |
Shares Sold | | | 4,000,001 | | | $ | 200,195,265 | |
Shares Redeemed | | | (400,001 | ) | | | (20,110,802 | ) |
NET INCREASE IN SHARES | | | 3,600,000 | | | $ | 180,084,463 | |
| (a) | | For the period June 6, 2017 (commencement of operations) through August 31, 2017 |
24
GOLDMAN SACHS ETF TRUST
|
| 6. PORTFOLIO SECURITIES TRANSACTIONS |
The cost of purchases and proceeds from sales of long term securities for the fiscal year ended August 31, 2017, were as follows:
| | | | | | | | | | |
| Fund | | | | Purchases | | | Sales | |
Access Investment Grade Corporate Bond ETF | | | | $ | 198,438,926 | | | $ | 200,700 | |
The proceeds from in-kind creation and redemption transactions for the fiscal year ended August 31, 2017, were as follows:
| | | | | | | | | | |
| Fund | | | | Purchases | | | Sales | |
Access Investment Grade Corporate Bond ETF | | | | $ | — | | | $ | 20,105,493 | |
The tax character of distributions paid during the fiscal year ended August 31, 2017 was as follows:
| | | | |
| | | Access Investment Grade
Corporate Bond ETF | |
Distributions paid from: | | | | |
Ordinary Income* | | $ | 234,861 | |
Total taxable distributions | | $ | 234,861 | |
As of August 31, 2017, the components of accumulated earnings (losses) on a tax-basis were as follows:
| | | | |
| | | Access Investment Grade
Corporate Bond ETF | |
Undistributed ordinary income — net | | $ | 265,719 | |
Total undistributed earnings | | $ | 265,719 | |
Capital loss carryforwards: | | | | |
Perpetual Short Term | | $ | (2,120 | ) |
Unrealized gains (losses) — net | | $ | 611,453 | |
Total accumulated earnings (losses) net | | $ | 875,052 | |
25
GOLDMAN SACHS ETF TRUST
Notes to Financial Statements (continued)
August 31, 2017
|
| 7. TAX INFORMATION (continued) |
As of August 31, 2017, the Fund’s aggregate security unrealized gains and losses based on cost for U.S. federal income tax purposes were as follows:
| | | | |
| | | Access Investment Grade
Corporate Bond ETF | |
Tax Cost | | $ | 178,212,801 | |
Gross unrealized gain | | | 773,672 | |
Gross unrealized loss | | | (162,219 | ) |
Net unrealized gains (losses) on securities | | $ | 611,453 | |
There is no difference between GAAP-basis and tax-basis unrealized gains (losses) for the fiscal year ended August 31, 2017.
In order to present certain components of the Fund’s capital accounts on a tax-basis, certain reclassifications have been recorded to the Fund’s accounts. These reclassifications have no impact on the net asset value of the Fund and result primarily from Redemptions In-Kind.
| | | | | | | | | | | | |
| Fund | | | | | Paid-in Capital | | | Accumulated Net Realized Gain (Loss) | |
Access Investment Grade Corporate Bond ETF | | | | | | $ | 47,886 | | | $ | (47,886 | ) |
GSAM has reviewed the Fund’s tax positions for all open tax years (the current year) and has concluded that no provision for income tax is required in the Fund’s financial statements. Such open tax year remains subject to examination and adjustment by tax authorities.
The Fund’s portfolio’s risks include, but are not limited to, the following:
Interest Rate Risk — When interest rates increase, fixed income securities or instruments held by the Fund will generally decline in value. Long-term fixed income securities or instruments will normally have more price volatility because of this risk than short-term fixed income securities or instruments. The risks associated with increasing rates are heightened given that interest rates are near historic lows, but may be expected to increase in the future with unpredictable effects on the markets and the Fund’s investments. Fluctuations in interest rates may also affect the liquidity of fixed income securities and instruments held by the Fund.
26
GOLDMAN SACHS ETF TRUST
|
| 8. OTHER RISKS (continued) |
Index Risk — FTSE Fixed Income LLC (the “Index Provider”) constructs the Fund’s Index in accordance with a rules-based methodology. The Fund will be negatively affected by general declines in the securities and asset classes represented in its Index. In addition, because the Fund is not “actively” managed, unless a specific security is removed from the Index, the Fund generally would not sell a security because the security’s issuer was in financial trouble. Market disruptions and regulatory restrictions could have an adverse effect on the Fund’s ability to adjust its exposure to the required levels in order to track the Index. The Fund also does not attempt to take defensive positions under any market conditions, including declining markets. Therefore, the Fund’s performance could be lower than funds that may actively shift their portfolio assets to take advantage of market opportunities or to lessen the impact of a market decline or a decline in the value of one or more issuers. The Index Provider relies on third party data it believes to be reliable in constructing the Index, but it does not guarantee the accuracy or availability of such third party data. The Index is new and has a limited performance history. Errors in index data, index computation or the construction of the Index in accordance with its methodology may occur from time to time and may not be identified and corrected by the Index Provider for a period of time or at all, which may have an adverse impact on the Fund and its shareholders. In addition, neither the Fund, the Investment Adviser nor the Index Provider can guarantee the availability or timeliness of the production of the Index.
Investments in Other Investment Companies Risk — As a shareholder of another investment company, including an ETF, the Fund will indirectly bear its proportionate share of any net management fees and other expenses paid by such other investment companies, in addition to the fees and expenses regularly borne by the Fund. ETFs are subject to risks that do not apply to conventional mutual funds, including but not limited to the following: (i) the market price of the ETF’s shares may trade at a premium or a discount to their NAV; and (ii) an active trading market for an ETF’s shares may not develop or be maintained.
Market and Credit Risks — In the normal course of business, the Fund trades financial instruments and enters into financial transactions where risk of potential loss exists due to changes in the market (market risk). Additionally, the Fund may also be exposed to credit risk in the event that an issuer or guarantor fails to perform or that an institution or entity with which the Fund has unsettled or open transactions defaults.
27
GOLDMAN SACHS ETF TRUST
Notes to Financial Statements (continued)
August 31, 2017
|
8. OTHER RISKS (continued) |
Market Trading Risk — The Fund faces numerous market trading risks, including disruptions to creations and redemptions, the existence of extreme market volatility or potential lack of an active trading market for Shares. If a shareholder purchases Shares at a time when the market price is at a premium to the NAV or sells Shares at a time when the market price is at a discount to the NAV, the shareholder may sustain losses. The Investment Adviser cannot predict whether Shares will trade below, at or above their NAV. Price differences may be due, in large part, to the fact that supply and demand forces at work in the secondary trading market for Shares will be closely related to, but not identical to, the same forces influencing the prices of the securities of the Fund’s Index trading individually or in the aggregate at any point in time.
Tracking Error Risk — Tracking error is the divergence of the Fund’s performance from that of its Index. The performance of the Fund may diverge from that of its Index for a number of reasons. Tracking error may occur because of transaction costs, the Fund’s holding of cash, differences in accrual of dividends, changes to its Index or the need to meet new or existing regulatory requirements. Unlike the Fund, the returns of the Index are not reduced by investment and other operating expenses, including the trading costs associated with implementing changes to its portfolio of investments. Tracking error risk may be heightened during times of market volatility or other unusual market conditions.
Foreign Countries Risk — Investing in foreign markets may involve special risks and considerations not typically associated with investing in the United States. Foreign securities may be subject to risk of loss because of more or less foreign government regulation, less public information and less economic, political and social stability in the countries in which the Fund invests. The imposition of exchange controls (including repatriation restrictions), confiscations, trade restrictions (including tariffs) and other government restrictions by the United States or other governments, or from problems in share registration, settlement or custody, may also result in losses. Foreign risk also involves the risk of negative foreign currency rate fluctuations, which may cause the value of securities denominated in such foreign currency (or other instruments through which the Fund has exposure to foreign currencies) to decline in value. Currency exchange rates may fluctuate significantly over short periods of time.
28
GOLDMAN SACHS ETF TRUST
Under the Trust’s organizational documents, its Trustees, officers, employees and agents are indemnified, to the extent permitted by the Act and state law, against certain liabilities that may arise out of performance of their duties to the Fund. Additionally, in the course of business, the Fund enters into contracts that contain a variety of indemnification clauses. The Fund’s maximum exposure under these arrangements is unknown, as this would involve future claims that may be made against the Fund that has not yet occurred. However, GSAM believes the risk of loss under these arrangements to be remote.
Subsequent events after the Statement of Assets and Liabilities date have been evaluated and GSAM has concluded that there is no impact requiring adjustment or disclosure in the financial statements.
29
Report of Independent Registered Public
Accounting Firm
To the Board of Trustees of
Goldman Sachs ETF Trust and Shareholders of the Goldman Sachs Access Investment Grade Corporate Bond ETF:
In our opinion, the accompanying statement of assets and liabilities, including the schedule of investments, and the related statements of operations and of changes in net assets and the financial highlights present fairly, in all material respects, the financial position of the Goldman Sachs Access Investment Grade Corporate Bond ETF (the “Fund”), a fund of the Goldman Sachs ETF Trust, as of August 31, 2017, and the results of its operations, the changes in its net assets and the financial highlights for the period June 6, 2017 (commencement of operations) through August 31, 2017, in conformity with accounting principles generally accepted in the United States of America. These financial statements and financial highlights (hereafter referred to as “financial statements”) are the responsibility of the Fund’s management. Our responsibility is to express an opinion on these financial statements based on our audit. We conducted our audit of these financial statements in accordance with the standards of the Public Company Accounting Oversight Board (United States). Those standards require that we plan and perform the audit to obtain reasonable assurance about whether the financial statements are free of material misstatement. An audit includes examining, on a test basis, evidence supporting the amounts and disclosures in the financial statements, assessing the accounting principles used and significant estimates made by management, and evaluating the overall financial statement presentation. We believe that our audit, which included confirmation of securities as of August 31, 2017 by correspondence with the custodian, brokers, transfer agent of the underlying funds and the application of alternative auditing procedures where securities purchased confirmations had not been received, provides a reasonable basis for our opinion.
PricewaterhouseCoopers LLP
Boston, Massachusetts
October 24, 2017
30
GOLDMAN SACHS ETF TRUST
|
Fund Expenses — For the Period Ended 8/31/2017 (Unaudited) |
As a shareholder you incur ongoing costs, which may include management fees; distribution and service (12b-1) fees; and other Fund expenses. This Example is intended to help you understand your ongoing costs (in dollars) of investing in Shares of the Fund and to compare these costs with the ongoing costs of investing in other exchange-traded funds.
The Example is based on an investment of $1,000 invested at the beginning of the period from June 6, 2017 (commencement of operations) and held for the entire period ended August 31, 2017, which represents a period of 87 days of a 365 day year (or less where indicated).
Actual Expenses — The first line in the table below provides information about actual account values and actual expenses. You may use the information in this line, together with the amount you invested, to estimate the expenses that you paid over the period. Simply divide your account value by $1,000 (for example, an $8,600 account value divided by $1,000=8.6), then multiply the result by the number in the first line under the heading entitled “Expenses Paid” to estimate the expenses you paid on your account during this period.
Hypothetical Example for Comparison Purposes — The second line in the table below provides information about hypothetical account values and hypothetical expenses based on the Fund’s actual net expense ratios and an assumed rate of return of 5% per year before expenses, which is not the Fund’s actual return. The hypothetical account values and expenses may not be used to estimate the actual ending account balance or expenses you paid for the period. You may use this information to compare the ongoing costs of investing in the Fund and other funds. To do so, compare this 5% hypothetical example with the 5% hypothetical examples that appear in the shareholder reports of the other funds.
Please note that the expenses shown in the table are meant to highlight your ongoing costs only and do not reflect any transactional costs, such as redemption fees, or exchange fees. Therefore, the second line of the table is useful in comparing ongoing costs only, and will not help you determine the relative total costs of owning different funds. In addition, if these transactional costs were included, your costs would have been higher.
| | | | | | | | | | | | |
| | | Access Investment Grade Corporate Bond ETF(a) | |
| | | Beginning
Account Value 6/6/17 | | | Ending
Account Value
8/31/2017 | | | Expenses
Paid* | |
Actual based on NAV | | $ | 1,000 | | | $ | 1,011.90 | | | $ | 0.31 | |
Hypothetical 5% return | | $ | 1,000 | | | $ | 1,011.61 | + | | $ | 0.31 | |
| | * | | Expenses for the Fund are calculated using the Fund’s annualized net expense ratio, which represents the ongoing expenses as a percentage of net assets for the period ended August 31, 2017. Expenses are calculated by multiplying the annualized net expense ratio by the average account value for the period; then multiplying the result by the number of days in the most recent fiscal year; and then dividing that result by the number of days in the fiscal year. | |
| | | | The annualized net expense ratio for the period is as follows: |
| | | | |
| Fund | | | |
Access Investment Grade Corporate Bond ETF | | | 0.13 | % |
| | + | | Hypothetical expenses are based on the Fund’s actual annualized net expense ratios and an assumed rate of return of 5% per year before expenses. | |
| | (a) | | The Fund commenced operations on June 6, 2017. | |
31
GOLDMAN SACHS ETF TRUST
Statement Regarding Basis for Initial Approval of Management Agreement (Unaudited)
Background
The Goldman Sachs Access Investment Grade Corporate Bond ETF (the “Fund”) is a newly-organized investment portfolio of Goldman Sachs ETF Trust (the “Trust”) that commenced investment operations on June 6, 2017. At a meeting held on May 15-16, 2017 (the “Meeting”) in connection with the Fund’s organization, the Board of Trustees, including all of the Trustees present who are not parties to the Trust’s investment management agreement (the “Management Agreement”) or “interested persons” (as defined in the Investment Company Act of 1940, as amended) of any party thereto (the “Independent Trustees”) approved the Management Agreement with Goldman Sachs Asset Management, L.P. (the “Investment Adviser”).
At the Meeting, the Trustees reviewed the Management Agreement with respect to the Fund, including information regarding the terms of the Management Agreement; the nature, extent and quality of the Investment Adviser’s anticipated services; the fees and expenses to be paid by the Fund; a comparison of the Fund’s proposed management fees and anticipated expenses with those paid by other similar exchange-traded funds (“ETFs”); the Investment Adviser’s proposal to limit certain expenses of the Fund that exceed a specified level; potential benefits to be derived by the Investment Adviser and its affiliates from their relationships with the Fund; and potential benefits to be derived by the Fund from its relationship with the Investment Adviser. Various information was also provided at prior meetings at which the Fund was discussed.
In connection with the Meeting, the Trustees received written materials and oral presentations on the topics covered. The Independent Trustees were advised by their independent legal counsel regarding their responsibilities under applicable law. In evaluating the Management Agreement at the Meeting, the Trustees relied upon information included in a presentation made by the Investment Adviser at the Meeting and information received at prior Board meetings, as well as on their knowledge of the Investment Adviser resulting from their meetings and other interactions over time.
Nature, Extent, and Quality of the Services Provided Under the Management Agreement
As part of their review, the Trustees considered the nature, extent, and quality of the services to be provided by the Investment Adviser. In this regard, the Trustees considered both the investment advisory services and the other, non-advisory services that would be provided to the Fund by the Investment Adviser. The Trustees also considered information about the Fund’s structure, investment objective, strategies and other characteristics. In particular, they noted that the Fund would operate as a passively-managed ETF that seeks to track an index developed and maintained by a third-party service provider. The Trustees noted the experience and capabilities of the key personnel of the the Investment Adviser who would be providing services to the Fund. In particular, the Trustees considered the Investment Adviser’s extensive experience in managing portfolios that invest in fixed income securities. The Trustees concluded that the Investment Adviser would be able to commit substantial financial and other resources to the Fund. They also considered that although the Fund was new (and therefore had no performance data to evaluate), the Investment Adviser has committed substantial financial and operational resources to ETFs and has extensive experience managing other types of registered investment companies.
Costs of Services to be Provided and Profitability
The Trustees considered the unitary fee rate payable by the Fund under the Management Agreement. In this regard, the Trustees considered information on the services to be rendered by the Investment Adviser to the Fund, which include both advisory and administrative services directed to the needs and operations of the Fund as an ETF. The Trustees considered that the Fund would pay a single fee to the Investment Adviser and the Investment Adviser would then pay all of the Fund’s ordinary operating expenses, including transfer agency, custody, administration, legal, and audit fees. They noted that license fees would be payable by the Investment Adviser to Citigroup Index LLC for the use of the index. They compared the Fund’s management fee and projected expense ratio to similar information for comparable ETFs advised by other, unaffiliated investment management firms, as well as the peer group and category medians. The comparisons of the Fund’s expense ratios were prepared by a third-party provider of mutual fund and ETF data (the “Outside Data Provider”). The Trustees concluded that this information was useful in evaluating the reasonableness of the fees to be paid by the Fund. The Trustees concluded that the Investment Adviser’s management of the Fund likely would benefit the Fund and its shareholders.
The Trustees recognized that there was not yet profitability data to evaluate for the Fund, but considered the Investment Adviser’s representations that (i) such data would be provided after the Fund commenced operations, and (ii) the Fund was not expected to be profitable to the Investment Adviser and its affiliates initially.
Economies of Scale
The Trustees noted that the Fund will not have fee breakpoints. They considered the Fund’s projected asset levels and information comparing the fee rates charged by the Investment Adviser with fee rates charged to other ETFs in the Fund’s peer group.
32
GOLDMAN SACHS ETF TRUST
Statement Regarding Basis for Initial Approval of Management Agreement (Unaudited) (continued)
Other Benefits to the Investment Adviser and Its Affiliates
The Trustees considered the other benefits expected to be derived by the Investment Adviser and its affiliates from their relationships with the Fund, including: (a) the Investment Adviser’s ability to leverage the infrastructure designed to service the Fund on behalf of its other clients; (b) the Investment Adviser’s ability to cross-market other products and services to Fund shareholders; (c) the Investment Adviser’s ability to negotiate better pricing with custodians on behalf of its other clients, as a result of the relationship with the Fund; and (d) the possibility that the working relationship between the Investment Adviser and the Fund’s third party service providers may cause those service providers to be open to doing business with other areas of Goldman Sachs & Co. LLC (“Goldman Sachs”).
Other Benefits to the Fund and Their Shareholders
The Trustees also noted that the Fund receives (or is expected to receive) certain potential benefits as a result of its relationship with the Investment Adviser, including: (a) enhanced servicing from vendors because of the volume of business generated by the Investment Adviser and its affiliates; (b) the Investment Adviser’s ability to hire and retain qualified personnel to provide services to the Fund because of the reputation of the Goldman Sachs organization; and (c) the Fund’s access to certain affiliated distribution channels.
Conclusion
In connection with their consideration of the Management Agreement for the Fund, the Trustees gave weight to each of the factors described above, but did not identify any particular factor as controlling their decision. After deliberation and consideration of all of the information provided, including the factors described above, the Trustees concluded, in the exercise of their business judgment, that the unitary fee paid by the Fund was reasonable. The Trustees concluded that the engagement of the Investment Adviser likely would benefit the Fund and its shareholders and that the Management Agreement should be approved for a two-year period.
33
GOLDMAN SACHS ETF TRUST
Trustees and Officers (Unaudited)
Independent Trustees
| | | | | | | | | | |
Name, Address and Age1 | | Position(s) Held
with the Trust | | Term of
Office and
Length of
Time Served2 | | Principal Occupation(s)
During Past 5 Years | | Number of
Portfolios in
Fund Complex
Overseen by
Trustee3 | | Other
Directorships
Held by Trustee4 |
Caroline Dorsa Age: 58 | | Trustee | | Since 2016 | | Ms. Dorsa is retired. She was formerly Executive Vice President and Chief Financial Officer, Public Service Enterprise Group, Inc. (a generation and energy services company) (2009-2015); Senior Vice President, Merck & Co, Inc. (a pharmaceutical company) (2008-2009 and 1987-2007); Senior Vice President and Chief Financial Officer, Gilead Sciences, Inc. (a pharmaceutical company) (2007-2008); and Senior Vice President and Chief Financial Officer, Avaya, Inc. (a technology company) (2007). Trustee — Goldman Sachs ETF Trust; Goldman Sachs MLP Income Opportunities Fund; and Goldman Sachs MLP and Energy Renaissance Fund. | | 21 | | Biogen Inc. (a biotechnology company); Intellia Therapeutics Inc. (a gene-editing company); Illumina, Inc. (a life sciences company) |
Linda A. Lang Age: 59 | | Trustee | | Since 2016 | | Ms. Lang is retired. She is Chair of the Board of Directors, (2016-Present); and Member of the Board of Directors, WD-40 Company (2004-Present); and was formerly Chairman and Chief Executive Officer (2005-2014); and Director, President and Chief Operating Officer, Jack in the Box, Inc. (a restaurant company) (2003-2005). Previously, Ms. Lang served as an Advisory Board Member of Goldman Sachs MLP Income Opportunities Fund and Goldman Sachs MLP and Energy Renaissance Fund (February 2016-March 2016). Trustee — Goldman Sachs ETF Trust; Goldman Sachs MLP Income Opportunities Fund; and Goldman Sachs MLP and Energy Renaissance Fund. | | 21 | | WD-40 Company (a global consumer products company) |
Michael Latham Age: 51 | | Trustee | | Since 2015 | | Mr. Latham is retired. Formerly, he held senior management positions with the iShares exchange-traded fund business, including Chairman (2011-2014); Global Head (2010-2011); U.S. Head (2007-2010); and Chief Operating Officer (2003-2007). Trustee — Goldman Sachs ETF Trust; Goldman Sachs MLP Income Opportunities Fund; and Goldman Sachs MLP and Energy Renaissance Fund. | | 21 | | None |
Lawrence W. Stranghoener Age: 63 | | Chairman of the Board of Trustees | | Trustee Since 2015; Chairman Since 2017 | | Mr. Stranghoener is retired. He is Chairman of the Board of Directors, Kennametal, Inc. (2003-Present); Director, Aleris Corporation and Aleris International, Inc. (a producer of aluminum rolled products) (2011-Present); and was formerly Interim Chief Executive Officer (2014); and Executive Vice President and Chief Financial Officer (2004-2014), Mosaic Company (a fertilizer manufacturing company). Chairman of the Board of Trustees — Goldman Sachs MLP Income Opportunities Fund; Goldman Sachs MLP and Energy Renaissance Fund; and Goldman Sachs ETF Trust. | | 21 | | Kennametal Inc. (a global manufacturer and distributor of tooling and industrial materials) |
| | | | | | | | | | |
34
GOLDMAN SACHS ETF TRUST
Trustees and Officers (Unaudited) (continued)
Interested Trustee*
| | | | | | | | | | |
Name, Address and Age1 | | Position(s) Held
with the Trust | | Term of
Office and
Length of
Time Served2 | | Principal Occupation(s)
During Past 5 Years | | Number of
Portfolios in
Fund Complex
Overseen by
Trustee3 | | Other
Directorships
Held by Trustee4 |
James A. McNamara Age: 54 | | Trustee and President | | Since 2014 | | Managing Director, Goldman Sachs (December 1998-Present); Director of Institutional Fund Sales, GSAM (April 1998-December 2000); and Senior Vice President and Manager, Dreyfus Institutional Service Corporation (January 1993-April 1998). President and Trustee — Goldman Sachs ETF Trust; Goldman Sachs Trust; Goldman Sachs Variable Insurance Trust; Goldman Sachs Trust II; Goldman Sachs MLP Income Opportunities Fund; and Goldman Sachs MLP and Energy Renaissance Fund. | | 142 | | None |
| | | | | | | | | | |
| * | | This person is considered to be an “Interested Trustee” because he holds a position with Goldman Sachs and own securities issued by The Goldman Sachs Group, Inc. The Interested Trustee holds comparable positions with certain other companies of which Goldman Sachs, GSAM or an affiliate thereof is the investment adviser, administrator and/or distributor. |
| 1 | | Each Trustee may be contacted by writing to the Trustee, c/o Goldman Sachs, 200 West Street, New York, New York, 10282, Attn: Caroline L. Kraus. Information is provided as of August 31, 2017. |
| 2 | | Each Trustee holds office for an indefinite term until the earliest of: (a) the election of his or her successor; (b) the date the Trustee resigns, retires or is removed by the Board of Trustees or shareholders, in accordance with the Trust’s Declaration of Trust; or (c) the termination of the Trust. |
| 3 | | The Goldman Sachs Fund Complex includes certain other companies listed above for each respective Trustee. As of August 31, 2017, Goldman Sachs ETF Trust consisted of 19 portfolios (eight of which offered shares to the public); Goldman Sachs Trust consisted of 90 portfolios (88 of which offered shares to the public); Goldman Sachs Variable Insurance Trust consisted of 14 portfolios; Goldman Sachs Trust II consisted of 17 portfolios (16 of which offered shares to the public); and Goldman Sachs MLP Income Opportunities Fund and Goldman Sachs MLP and Energy Renaissance Fund each consisted of one portfolio. |
| 4 | | This column includes only directorships of companies required to report to the Securities and Exchange Commission under the Securities Exchange Act of 1934 (i.e., “public companies”) or other investment companies registered under the Act. |
Additional information about the Trustees is available in the Fund’s Statement of Additional Information, which can be obtained from Goldman Sachs free of charge by calling this toll-free number (in the United States of America): 1-800-526-7384.
35
GOLDMAN SACHS ETF TRUST
Trustees and Officers (Unaudited) (continued)
Officers of the Trust*
| | | | | | |
| Name, Address and Age1 | | Positions Held
with the Trust | | Term of
Office and
Length of
Time Served2 | | Principal Occupation(s) During Past 5 Years |
James A. McNamara 200 West Street New York, NY 10282 Age: 54 | | Trustee and President | | Since 2014 | | Managing Director, Goldman Sachs (December 1998-Present); Director of Institutional Fund Sales, GSAM (April 1998-December 2000); and Senior Vice President and Manager, Dreyfus Institutional Service Corporation (January 1993-April 1998). President and Trustee — Goldman Sachs ETF Trust; Goldman Sachs Trust; Goldman Sachs Variable Insurance Trust; Goldman Sachs Trust II; Goldman Sachs MLP Income Opportunities Fund; and Goldman Sachs MLP and Energy Renaissance Fund. |
Caroline L. Kraus 200 West Street New York, NY 10282 Age: 40 | | Secretary | | Since 2014 | | Managing Director, Goldman Sachs (January 2016- Present); Vice President, Goldman Sachs (August 2006-December 2015); Associate General Counsel, Goldman Sachs (2012- Present); Assistant General Counsel, Goldman Sachs (August 2006-December 2011); and Associate, Weil, Gotshal & Manges, LLP (2002-2006). Secretary — Goldman Sachs ETF Trust; Goldman Sachs Trust (previously Assistant Secretary (2012)); Goldman Sachs Variable Insurance Trust (previously Assistant Secretary (2012)); Goldman Sachs Trust II; Goldman Sachs BDC, Inc.; Goldman Sachs Private Middle Market Credit LLC; Goldman Sachs Middle Market Lending Corp.; Goldman Sachs MLP Income Opportunities Fund; and Goldman Sachs MLP and Energy Renaissance Fund. |
Scott M. McHugh 200 West Street New York, NY 10282 Age: 45 | | Treasurer, Senior Vice President and Principal Financial Officer | | Since 2014 | | Managing Director, Goldman Sachs (January 2016-Present); Vice President, Goldman Sachs (February 2007-December 2015); Assistant Treasurer of certain mutual funds administered by DWS Scudder (2005-2007); and Director (2005-2007), Vice President (2000-2005), and Assistant Vice President (1998-2000), Deutsche Asset Management or its predecessor (1998-2007). Treasurer, Senior Vice President and Principal Financial Officer — Goldman Sachs ETF Trust; Goldman Sachs Trust; Goldman Sachs Variable Insurance Trust; Goldman Sachs Trust II; Goldman Sachs MLP Income Opportunities Fund; and Goldman Sachs MLP and Energy Renaissance Fund. |
Joseph F. DiMaria 30 Hudson Street Jersey City, NJ 07302 Age: 49 | | Assistant Treasurer and Principal Accounting Officer | | Since 2017 | | Managing Director, Goldman Sachs (November 2015-Present) and Vice President — Mutual Fund Administration, Columbia Management Investment Advisers, LLC (May 2010-October 2015). Assistant Treasurer and Principal Accounting Officer — Goldman Sachs ETF Trust; Goldman Sachs Trust; Goldman Sachs Variable Insurance Trust; Goldman Sachs Trust II; Goldman Sachs MLP Income Opportunities Fund; and Goldman Sachs MLP and Energy Renaissance Fund. |
| | | | | | |
| * | | Represents a partial list of officers of the Trust. Additional information about all the officers is available in the Fund’s Statement of Additional Information, which can be obtained from Goldman Sachs free of charge by calling this toll-free number (in the United States): 1-800-621-2550. |
| 1 | | Information is provided as of August 31, 2017. |
| 2 | | Officers hold office at the pleasure of the Board of Trustees or until their successors are duly elected and qualified. Each officer holds comparable positions with certain other companies of which Goldman Sachs, GSAM or an affiliate thereof is the investment adviser, administrator and/or distributor. |
36
FUNDS PROFILE
Goldman Sachs ETFs

Goldman Sachs is a premier financial services firm, known since 1869 for creating thoughtful and customized investment solutions in complex global markets.
Today, the Investment Management Division of Goldman Sachs serves a diverse set of clients worldwide, including private institutions, public entities and individuals. With approximately $1.21 trillion in assets under supervision as of June 30, 2017, Goldman Sachs Asset Management (“GSAM”) has portfolio management teams located around the world and our investment professionals bring firsthand knowledge of local markets to every investment decision. Assets under supervision includes assets under management and other client assets for which Goldman Sachs does not have full discretion. GSAM leverages the resources of Goldman Sachs & Co. LLC. subject to legal, internal and regulatory restrictions.
|
| GOLDMAN SACHS EXCHANGE-TRADED FUNDS |
| Goldman Sachs ActiveBeta® Emerging Markets Equity ETF |
| Goldman Sachs ActiveBeta® Europe Equity ETF |
| Goldman Sachs ActiveBeta® International Equity ETF |
| Goldman Sachs ActiveBeta® Japan Equity ETF |
| Goldman Sachs ActiveBeta® U.S. Large Cap Equity ETF |
| Goldman Sachs ActiveBeta® U.S. Small Cap Equity ETF |
| Goldman Sachs Equal Weight U.S. Large Cap Equity ETF |
| Goldman Sachs Hedge Industry VIP ETF |
| Goldman Sachs TreasuryAccess 0-1 Year ETF |
| Goldman Sachs Access Investment Grade Corporate Bond ETF |
Goldman Sachs Access High Yield Corporate Bond ETF |
INDEX DISCLAIMERS
The Citi Goldman Sachs Investment Grade Corporate Bond Index was developed and is calculated and maintained by FTSE Fixed Income LLC (“FTSE” or the “Index Provider”). FTSE is not affiliated with the Fund or GSAM. The Fund is not sponsored, endorsed, sold or promoted by FTSE or any of its affiliates and FTSE makes no representation to any owner or prospective owner of the Fund regarding the advisability of investing in securities generally or in the Fund particularly, or the ability of the Fund to track the price and yield performance of the Citi Goldman Sachs Investment Grade Corporate Bond Index or the ability of the Citi Goldman Sachs Investment Grade Corporate Bond Index to track general bond market performance. FTSE’s only relationship to GSAM (“Licensee”) is the licensing of certain information, data, trademarks and trade names of FTSE or its affiliates. The Citi Goldman Sachs Investment Grade Corporate Bond Index is determined, composed and calculated by FTSE without regard to the Fund. FTSE has no obligation to take the needs of the owners or prospective owners of the Fund into consideration in determining, composing or calculating the Citi Goldman Sachs Investment Grade Corporate Bond Index. FTSE is not responsible for and has not participated in the determination of the prices and amount of the shares to be issued by the Fund or the timing of the issuance or sale of the shares to be issued by the Fund or in the determination or calculation of the equation by which the shares to be issued by the Fund are to be converted into cash. FTSE has no obligation or liability in connection with the administration, marketing or trading of the Fund.
FTSE DOES NOT GUARANTEE THE ACCURACY OR COMPLETENESS OF THE CITI GOLDMAN SACHS INVESTMENT GRADE CORPORATE BOND INDEX OR ANY DATA INCLUDED THEREIN, OR OF ANY COMMUNICATIONS, INCLUDING BUT NOT LIMITED TO, ORAL OR WRITTEN COMMUNICATIONS (INCLUDING ELECTRONIC COMMUNICATIONS) WITH RESPECT THERETO, AND FTSE SHALL HAVE NO LIABILITY FOR ANY ERRORS, OMISSIONS OR DELAYS THEREIN. FTSE MAKES NO WARRANTY, EXPRESS OR IMPLIED, AS TO RESULTS TO BE OBTAINED BY LICENSEE, OWNERS OR PROSPECTIVE OWNERS OF SHARES OF THE FUND, OR ANY OTHER PERSON OR ENTITY FROM THE USE OF THE CITI GOLDMAN SACHS INVESTMENT GRADE CORPORATE BOND INDEX OR ANY DATA INCLUDED THEREIN. FTSE MAKES NO EXPRESS OR IMPLIED WARRANTIES, AND EXPRESSLY DISCLAIMS ALL WARRANTIES OF MERCHANTABILITY OR FITNESS FOR A PARTICULAR PURPOSE OR USE WITH RESPECT TO THE CITI GOLDMAN SACHS INVESTMENT GRADE CORPORATE BOND INDEX OR ANY DATA INCLUDED THEREIN. WITHOUT LIMITING ANY OF THE FOREGOING, IN NO EVENT SHALL FTSE HAVE ANY LIABILITY FOR ANY DIRECT, SPECIAL, PUNITIVE, INDIRECT, CONSEQUENTIAL OR ANY OTHER DAMAGES (INCLUDING LOST PROFITS), EVEN IF NOTIFIED OF THE POSSIBILITY OF SUCH DAMAGES, WHETHER IN CONTRACT, TORT, STRICT LIABILITY OR OTHERWISE.
Data and information contained herein regarding the Index is proprietary to FTSE or its licensors, and reproduction of such data and information is prohibited except with the prior written permission of FTSE. CITI is a trademark and service mark of Citigroup Inc. or its affiliates, is used and registered throughout the world, and is used under license for certain purposes by GSAM. The CITI mark is used under license by FTSE. USBIG is a registered service mark of Citigroup Global Markets Inc.
The ActiveBeta® Indices are trademarks of Goldman Sachs Asset Management, L.P. and have been licensed for use by Goldman Sachs ETF Trust.
| | |
TRUSTEES Lawrence W. Stranghoener, Chairman Caroline Dorsa Linda A. Lang Michael Latham James A. McNamara | | OFFICERS James A. McNamara, President Scott M. McHugh, Treasurer, Senior Vice President and
Principal Financial Officer Joseph F. DiMaria, Assistant Treasurer and Principal
Accounting Officer Caroline L. Kraus, Secretary |
| |
THE BANK OF NEW YORK MELLON Transfer Agent | | GOLDMAN SACHS ASSET MANAGEMENT, L.P. Investment Adviser |
ALPS DISTRIBUTORS, INC. Distributor | |
Visit our Website at www.GSAMFUNDS.com to obtain the most recent month-end returns.
Goldman Sachs Asset Management, L.P., 200 West Street, New York, New York 10282
The reports concerning the Fund included in this shareholder report may contain certain forward-looking statements about the factors that may affect the performance of the Fund in the future. These statements are based on Fund management’s predictions and expectations concerning certain future events and their expected impact on the Fund, such as performance of the economy as a whole and of specific industry sectors, changes in the levels of interest rates, the impact of developing world events, and other factors that may influence the future performance of the Fund. Management believes these forward-looking statements to be reasonable, although they are inherently uncertain and difficult to predict. Actual events may cause adjustments in portfolio management strategies from those currently expected to be employed.
A description of the policies and procedures that the Fund uses to determine how to vote proxies relating to portfolio securities and information regarding how the Fund voted proxies relating to portfolio securities for the most recent 12-month period ended June 30, are available (i) without charge, upon request by calling 1-800-621-2550; and (ii) on the Securities and Exchange Commission (“SEC’’) web site at http://www.sec.gov.
The Fund files its complete schedule of portfolio holdings with the SEC for the first and third quarters of each fiscal year on Form N-Qs. The Fund’s Form N-Qs are available on the SEC’s web site at http://www.sec.gov within 60 days after the Fund’s first and third fiscal quarters. The Fund’s Form N-Qs may be reviewed and copied at the SEC’s Public Reference Room in Washington, D.C., and information on the operation of the Public Reference Room may also be obtained by calling 1-800-SEC-0330. Form N-Qs may be obtained upon request and without charge by calling 1-800-621-2550.
Fund holdings and allocations shown are as of August 31, 2017 and may not be representative of future investments. Fund holdings should not be relied on in making investment decisions and should not be construed as research or investment advice regarding particular securities. Current and future holdings are subject to risk.
ETF Fund shares are not individually redeemable and are issued and redeemed by the Fund at their net asset value (“NAV”) only in large, specified blocks of shares called creation units. Shares otherwise can be bought and sold only through exchange trading at market price (not NAV). Shares may trade at a premium or discount to their NAV in the secondary market. Brokerage commissions will reduce returns.
The Fund is recently or newly organized and has limited operating history.
Economic and market forecasts presented herein reflect our judgment as of the date of this presentation and are subject to change without notice. These forecasts do not take into account the specific investment objectives, restrictions, tax and financial situation or other needs of any specific client. Actual data will vary and may not be reflected here. These forecasts are subject to high levels of uncertainty that may affect actual performance. Accordingly, these forecasts should be viewed as merely representative of a broad range of possible outcomes. These forecasts are estimated, based on assumptions, and are subject to significant revision and may change materially as economic and market conditions change. Goldman Sachs has no obligation to provide updates or changes to these forecasts. Case studies and examples are for illustrative purposes only.
THIS MATERIAL IS FOR INFORMATIONAL PURPOSES ONLY AND IS PROVIDED SOLELY ON THE BASIS THAT IT WILL NOT CONSTITUTE INVESTMENT OR OTHER ADVICE OR A RECOMMENDATION RELATING TO ANY PERSON’S OR PLAN’S INVESTMENT OR OTHER DECISIONS, AND GOLDMAN SACHS IS NOT A FIDUCIARY OR ADVISOR WITH RESPECT TO ANY PERSON OR PLAN BY REASON OF PROVIDING THE MATERIAL OR CONTENT HEREIN INCLUDING UNDER THE EMPLOYEE RETIREMENT INCOME SECURITY ACT OF 1974 OR DEPARTMENT OF LABOR REGULATIONS. PLAN SPONSORS AND OTHER FIDUCIARIES SHOULD CONSIDER THEIR OWN CIRCUMSTANCES IN ASSESSING ANY POTENTIAL COURSE OF ACTION.
This material is not authorized for distribution to prospective investors unless preceded or accompanied by a current Prospectus or summary prospectus, if applicable. Investors should consider the Fund’s objective, risks, and charges and expenses, and read the summary prospectus, if available, and/or the Prospectus carefully before investing or sending money. The summary prospectus, if available, and the Prospectus contain this and other information about the Fund and may be obtained from your authorized dealer or from Goldman Sachs & Co. LLC by calling 1-800-621-2550.
ALPS Distributors, Inc. is the distributor of the Goldman Sachs ETF Funds. ALPS Distributors, Inc. is unaffiliated with Goldman Sachs Asset Management.
©2017 Goldman Sachs. All rights reserved. 107200-TMPL-10/2017-629368 AIGCPBNDETFAR-17/GST523/312
Goldman Sachs Funds

| | | | |
| | |
| Annual Report | | | | August 31, 2017 |
| | |
| | | | Goldman Sachs ActiveBeta® ETFs |
| | | | ActiveBeta® Emerging Markets Equity ETF |
| | | | ActiveBeta® Europe Equity ETF |
| | | | ActiveBeta® International Equity ETF |
| | | | ActiveBeta® Japan Equity ETF |
| | | | ActiveBeta® U.S. Large Cap Equity ETF |
| | | | ActiveBeta® U.S. Small Cap Equity ETF |
ActiveBeta is a registered trademark of GSAM.

Goldman Sachs ActiveBeta® ETFs
| | | | |
| | | |
| NOT FDIC-INSURED | | May Lose Value | | No Bank Guarantee |
INVESTMENT PROCESS
Goldman Sachs ActiveBeta® ETFs
Principal Investment Strategies
The investment objective of each of the ActiveBeta® Emerging Markets Equity ETF, ActiveBeta® Europe Equity ETF, ActiveBeta® International Equity ETF, ActiveBeta® Japan Equity ETF, ActiveBeta® U.S. Large Cap Equity ETF and ActiveBeta® U.S. Small Cap Equity ETF (each, a “Fund”), is to seek to provide investment results that closely correspond, before fees and expenses, to the performance of its respective underlying index (each, an “Index”).
Each Fund seeks to achieve its investment objective by investing at least 80% of its assets (exclusive of collateral held from securities lending) in securities included in its underlying index, in depositary receipts representing securities included in its underlying index and in underlying stocks in respect of depositary receipts included in its underlying index.
Each Index is designed to deliver exposure to equity securities within its applicable universe of issuers. Each Index is constructed using the patented ActiveBeta® Portfolio Construction Methodology, which was developed to provide exposure to the “factors” (or characteristics) that are commonly tied to a stock’s outperformance relative to market returns. These factors include value (i.e., how attractively a stock is priced relative to its “fundamentals,” such as book value and free cash flow), momentum (i.e., whether a company’s share price is trending up or down), quality (i.e., profitability) and low volatility (i.e., a relatively low degree of fluctuation in a company’s share price over time). Given each Fund’s investment objective of attempting to track its Index, each Fund does not follow traditional methods of active investment management, which may involve buying and selling securities based upon analysis of economic and market factors.
Goldman Sachs Asset Management, L.P. (the “Index Provider”) constructs each Index in accordance with a rules-based methodology that involves two steps.
Step 1
In the first step, individual factor subindexes for value, momentum, quality and low volatility (the “ActiveBeta® Factor Subindexes”) are created from the constituents of the applicable Reference Index, a market capitalization-weighted index. To construct each ActiveBeta® Factor Subindex, all constituents in the applicable Reference Index are assigned a “factor score” based on certain specified measurements (for example, in the case of the value factor, the factor score is based on a composite of book value-to-price, sales-to-price and free cash flow-to-price). Securities with a factor score that is above a fixed “Cut-off Score” receive an overweight in the applicable ActiveBeta® Factor Subindex relative to the applicable Reference Index and securities with a factor score that is below the Cut-off Score receive an underweight in the ActiveBeta® Factor Subindex relative to the applicable Reference Index. Accordingly, the magnitude of overweight or underweight that a security receives in constructing the applicable ActiveBeta® Factor Subindex is determined by its attractiveness when evaluated based on the relevant factor. Each Index only includes long positions (i.e., short positions are impermissible), so the smallest weight for any given security is zero.
Step 2
The ActiveBeta® Factor Subindexes are combined in equal weights to form each Index.
Each Index is rebalanced on a quarterly basis in accordance with the published rebalancing schedule of the applicable Reference Index. The rules-based process used to construct each
1
INVESTMENT PROCESS
Index incorporates the ActiveBeta® Turnover Minimization Technique, which seeks to reduce turnover within each Index.
* * *
At the end of each Fund’s Reporting Period, we continued to believe in the existence and persistence of certain equity common factors. We further believed that in capturing common factors, investment efficiency (risk-adjusted returns) can be improved by enhancing the informational efficiency and diversification of individual common factor portfolios. Additionally, we advocate the pursuit of factor diversification strategies, which combine individual common factor portfolios, as such strategies tend to dominate individual factors. A passive capture of informationally-efficient and diversified common factor strategies potentially delivers attractive after-cost information ratios.
2
PORTFOLIO RESULTS
Goldman Sachs ActiveBeta® Emerging Markets Equity ETF
Investment Objective
The Goldman Sachs ActiveBeta® Emerging Markets Equity ETF (the “Fund”) seeks to provide investment results that closely correspond, before fees and expenses, to the performance of the Goldman Sachs ActiveBeta® Emerging Markets Equity Index (the “Index”).
Portfolio Management Discussion and Analysis
Below, the Goldman Sachs Quantitative Investment Strategies Team discusses the Fund’s performance and positioning for the 12-month period ended August 31, 2017 (the “Reporting Period”).
| Q | | How did the Fund perform during the Reporting Period? |
| A | | During the Reporting Period, the Fund returned 22.49% based on net asset value (“NAV”) and 22.61% based on market price. The Index returned 22.77%, and the MSCI Emerging Markets Index (net, unhedged, USD) (“MSCI Emerging Markets Index”), a market-cap based index against which the performance of the Fund is measured, and the reference index for the Index, returned 24.53% during the same period. |
| | The Fund had an NAV of $28.03 per share on August 31, 2016 and ended the Reporting Period with an NAV of $33.73 per share. The Fund’s market price on August 31, 2017 was $33.74 per share. |
| Q | | What key factors were responsible for the Fund’s performance during the Reporting Period? |
| A | | The Fund seeks to provide investment results that closely correspond, before fees and expenses, to the performance of the Index. The Fund’s performance reflects Fund expenses, including management fees and brokerage expenses. The Fund’s relative performance also reflects the impact of any cash held in the Fund as well as any other differences between the Fund’s holdings and the constituents of the Index. The Index is unmanaged, and Index returns do not reflect fees and expenses, which would reduce returns. |
| | The Index is constructed using a rules-based methodology that was developed to provide exposure to the “factors” (or characteristics) that are commonly tied to a stock’s outperformance relative to market returns, and its performance is compared to that of the MSCI Emerging Markets Index. Because the Fund seeks to provide investment results that closely correspond, before fees and expenses, to the performance of the Index, the discussion below compared the performance of the Fund to that of the MSCI Emerging Markets Index. Given the Fund’s investment objective of attempting to track the Index, the Fund does not follow traditional methods of active investment management, which may involve buying and selling securities based upon analysis of economic and market factors. The Fund does not follow a strategy of seeking to outperform the MSCI Emerging Markets Index, and overweights and underweights relative to the MSCI Emerging Markets Index discussed below resulted from the Fund’s replication of the Index rather than a decision to overweight or underweight a particular sector, country or stock. |
| | The Fund posted solid double-digit absolute gains but underperformed the MSCI Emerging Markets Index during the Reporting Period, as measured by NAV. Amongst underlying factors, Low Volatility and Quality detracted from relative results, while Momentum and Value contributed positively during the Reporting Period. Low Volatility is a relatively low degree of fluctuation in a company’s share price over time. Quality refers to sustainable profitability over time. Momentum is whether a company’s share price is trending up or down. Value refers to how attractively a stock is priced relative to its fundamentals, such as book value and free cash flow. |
| Q | | Which sectors and countries contributed most positively to the Fund’s relative performance during the Reporting Period, and which detracted most? |
| A | | Index constituents in the consumer staples, information technology and telecommunication services sectors detracted most from the Fund’s results relative to the MSCI Emerging |
3
PORTFOLIO RESULTS
| | Markets Index during the Reporting Period. Partially offsetting these detractors were Index constituents in the consumer discretionary, energy and industrials sectors, which contributed most positively to the Fund’s results relative to the MSCI Emerging Markets Index. |
| | From a country perspective, Index constituents in South Korea, Taiwan and Brazil detracted the most from the Fund’s results relative to the MSCI Emerging Markets Index during the Reporting Period. Conversely, Index constituents in Poland, Qatar and India contributed most positively to the Fund’s results relative to the MSCI Emerging Markets Index. |
| Q | | Which individual positions detracted from the Fund’s results during the Reporting Period? |
| A | | Relative to the MSCI Emerging Markets Index, underweight positions in Brazilian materials company Vale and China-based Internet content and e-commerce services provider Alibaba Group Holding and an overweight position in South Korean consumer staples company Amorepacific detracted most (0.35%, 3.43% and 0.25% of Fund net assets as of August 31, 2017, respectively). Vale and Alibaba Group Holding each generated a robust double-digit gain during the Reporting Period, while Amorepacific posted a double-digit decline during the Reporting Period. |
| Q | | Which individual stock positions contributed the most to the Fund’s relative returns during the Reporting Period? |
| A | | Relative to the MSCI Emerging Markets Index, overweight positions in Chinese consumer discretionary firm Geely Automobile Holdings and Chinese K-12 after-school tutoring services provider TAL Education Group and having no exposure to India-based bank Axis Bank contributed most positively (0.42%, 0.06% and 0.00%1 of Fund net assets as of August 31, 2017, respectively). Geely Automobile Holdings and TAL Education Group each posted a robust triple-digit gain during the Reporting Period, while Axis Bank posted a flat return during the Reporting Period. |
| | 1 | | Some weights are 0.00% at August 31, 2017 because those positions were taken out during the most recent rebalance given the Index construction methodology. |
| Q | | How did the Fund use derivatives and similar instruments during the Reporting Period? |
| A | | The Fund does not employ derivatives as a source of alpha generation, however, during the Reporting Period futures contracts were used to equitize cash. |
| Q | | What was the Fund’s sector positioning relative to the Index and the reference index at the end of the Reporting Period?2 |
| | | | | | | | | | | | | | |
| | | Sector Name | | Fund3 | | | GS
ActiveBeta®
Index | | | MSCI Emerging
Markets Index | |
| | Information | | | 25.42 | % | | | 24.54 | % | | | 26.87 | % |
| | Technology | | | | | | | | | | | | |
| | Financials | | | 22.31 | | | | 22.76 | | | | 23.90 | |
| | Consumer Staples | | | 10.89 | | | | 11.20 | | | | 6.56 | |
| | Consumer | | | 10.48 | | | | 10.50 | | | | 10.22 | |
| | Discretionary | | | | | | | | | | | | |
| | Energy | | | 7.18 | | | | 7.16 | | | | 6.63 | |
| | Telecommunication Services | | | 6.51 | | | | 6.78 | | | | 5.24 | |
| | Materials | | | 6.45 | | | | 6.38 | | | | 7.46 | |
| | Health Care | | | 2.93 | | | | 2.87 | | | | 2.22 | |
| | Utilities | | | 2.90 | | | | 3.18 | | | | 2.59 | |
| | Industrials | | | 2.48 | | | | 2.55 | | | | 5.45 | |
| | | Real Estate | | | 2.46 | | | | 2.09 | | | | 2.82 | |
| | 2 | | The Fund seeks to provide investment results that closely correspond, before fees and expenses, to the performance of the Goldman Sachs ActiveBeta® Emerging Markets Equity Index. |
| | 3 | | Country and sector classifications for securities may differ between the above listing and the Schedule of Investments due to differing classification methodologies. The classification methodology used for the above listing is as set forth by MSCI. |
4
PORTFOLIO RESULTS
| Q | | What was the Fund’s country positioning relative to the Index and the reference index at the end of the Reporting Period?2 |
| | | | | | | | | | | | | | |
| | | Country Name | | Fund3 | | | GS
ActiveBeta®
Index | | | MSCI Emerging
Markets Index | |
| | China | | | 30.64 | % | | | 29.39 | % | | | 29.10 | % |
| | Korea | | | 15.63 | | | | 15.48 | | | | 14.61 | |
| | Taiwan | | | 11.02 | | | | 11.05 | | | | 11.85 | |
| | India | | | 8.74 | | | | 9.67 | | | | 8.70 | |
| | Brazil | | | 8.35 | | | | 8.57 | | | | 7.23 | |
| | South Africa | | | 6.25 | | | | 6.18 | | | | 6.79 | |
| | Mexico | | | 3.30 | | | | 3.09 | | | | 3.57 | |
| | Russia | | | 3.19 | | | | 3.14 | | | | 3.26 | |
| | Indonesia | | | 2.24 | | | | 2.21 | | | | 2.28 | |
| | Poland | | | 1.92 | | | | 1.89 | | | | 1.36 | |
| | Chile | | | 1.80 | | | | 1.82 | | | | 1.23 | |
| | Malaysia | | | 1.57 | | | | 1.98 | | | | 2.24 | |
| | Turkey | | | 1.10 | | | | 1.11 | | | | 1.21 | |
| | Thailand | | | 0.97 | | | | 1.07 | | | | 2.16 | |
| | United Arab Emirates | | | 0.62 | | | | 0.52 | | | | 0.73 | |
| | Qatar | | | 0.55 | | | | 0.45 | | | | 0.61 | |
| | Hungary | | | 0.55 | | | | 0.55 | | | | 0.35 | |
| | Colombia | | | 0.39 | | | | 0.29 | | | | 0.44 | |
| | Egypt | | | 0.36 | | | | 0.42 | | | | 0.13 | |
| | Greece | | | 0.32 | | | | 0.33 | | | | 0.37 | |
| | Philippines | | | 0.27 | | | | 0.36 | | | | 1.09 | |
| | Peru | | | 0.22 | | | | 0.22 | | | | 0.39 | |
| | Czech Republic | | | 0.00 | | | | 0.00 | | | | 0.18 | |
| | | Pakistan | | | 0.00 | | | | 0.22 | | | | 0.10 | |
| | 2 | | The Fund seeks to provide investment results that closely correspond, before fees and expenses, to the performance of the Goldman Sachs ActiveBeta® Emerging Markets Equity Index. |
| | 3 | | Country and sector classifications for securities may differ between the above listing and the Schedule of Investments due to differing classification methodologies. The classification methodology used for the above listing is as set forth by MSCI. |
5
FUND BASICS
ActiveBeta® Emerging Markets Equity ETF
as of August 31, 2017
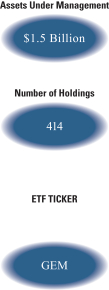
| | | | | | |
| | FUND SNAPSHOT | |
| | | As of August 31, 2017 | | | |
| | Market Price1 | | $ | 33.74 | |
| | | Net Asset Value (NAV)1 | | $ | 33.73 | |
| | 1 | | The Market Price is the price at which the Fund’s shares are trading on the NYSE Arca, Inc. The Market Price of the Fund’s shares will fluctuate and, at the time of sale, shares may be worth more or less than the original investment or the Fund’s then current net asset value (“NAV”). The NAV is the market value of one share of the Fund. This amount is derived by dividing the total value of all the securities in the Fund’s portfolio, plus other assets, less any liabilities, by the number of Fund shares outstanding. Fund shares are not individually redeemable and are issued and redeemed by the Fund at their NAV only in large, specified blocks of shares called creation units. Shares otherwise can be bought and sold only through exchange trading at market price (not NAV). Shares may trade at a premium or discount to their NAV in the secondary market. Information regarding how often shares of each Fund traded on NYSE Arca at a price above (i.e., at a premium) or below (i.e., at a discount) the NAV of the Fund can be found at www.GSAMFUNDS.com. |
| | | | | | | | | | | | | | | | | | |
| | PERFORMANCE REVIEW | |
| | | September 1, 2016– August 31, 2017 | | Fund Total Return
(based on NAV)2 | | | Fund Total Return
(based on Market Price)2 | | | GS ActiveBeta®
EME Index3 | | | MSCI EM Index4 | |
| | | Shares | | | 22.49 | % | | | 22.61 | % | | | 22.77 | % | | | 24.53 | % |
| | 2 | | Total returns are calculated assuming purchase of a share at the market price or NAV on the first day and sale of a share at the market price or NAV on the last day of each period reported. The Total Returns Based on NAV and Market Price assume the reinvestment of dividends and do not reflect brokerage commissions in connection with the purchase or sale of Fund shares, which if included would lower the performance shown above. The NAV used in the Total Return calculation assumes all management fees and operating expenses incurred by the Fund. Market Price returns are based upon the last trade as of 4:00pm EST and do not reflect the returns you would receive if you traded shares at other times. |
| | 3 | | The Goldman Sachs ActiveBeta® Emerging Markets Equity Index (the “Index”) is designed to deliver exposure to equity securities of emerging market issuers. The Index seeks to capture common sources of active equity returns, including value (i.e., how attractively a stock is priced relative to its “fundamentals”, such as book value or free cash flow), momentum (i.e., whether a company’s share price is trending up or down), quality (i.e., profitability) and low volatility (i.e., a relatively low dgree of fluctuation in a company’s share price over time). The Index is reconstituted and rebalanced quarterly. It is not possible to invest directly in an unmanaged index. |
| | 4 | | The MSCI Emerging Markets Index captures large and mid cap representation across 24 Emerging Markets countries. It is not possible to invest directly in an unmanaged index. |
The returns set forth in the tables above represent past performance. Past performance does not guarantee future results. The Fund’s investment returns and principal value will fluctuate so that an investor’s shares, when sold or redeemed, may be worth more or less than their original cost. Current performance may be lower or higher than the performance quoted above. Please visit our web site at www.GSAMFUNDS.com to obtain the most recent month-end returns. Performance reflects applicable fee waivers and/or expense limitations in effect during the periods shown. In their absence, performance would be reduced. Returns do not reflect the deduction of taxes that a shareholder would pay on Fund distributions or the sale or redemption of Fund shares.
6
FUND BASICS
| | | | | | | | | | | | | | |
| | STANDARDIZED TOTAL RETURNS5 | |
| | | For the period ended 6/30/17 | | One Year | | | Since Inception | | | Inception Date | |
| | Shares (based on NAV) | | | 20.58 | % | | | 15.18 | % | | | 9/25/15 | |
| | | Shares (based on Market Price) | | | 19.99 | | | | 15.27 | | | | 9/25/15 | |
| | 5 | | The Standardized Total Returns are average annual total returns as of the most recent calendar quarter-end. They assume reinvestment of all distributions. The first day of secondary market trading is typically several days after the date on which the Fund commenced investment operations; therefore, the NAV of the Fund is used as a proxy for the period from inception of investment operations to the first day of secondary market trading to calculate the Market Price returns. |
The returns set forth in the tables above represent past performance. Past performance does not guarantee future results. The Fund’s investment returns and principal value will fluctuate so that an investor’s shares, when sold or redeemed, may be worth more or less than their original cost. Current performance may be lower or higher than the performance quoted above. Please visit our web site at www.GSAMFUNDS.com to obtain the most recent month-end returns. Returns do not reflect the deduction of taxes that a shareholder would pay on Fund distributions or the sale or redemption of Fund shares.
| | | | | | | | | | |
| | EXPENSE RATIOS6 | |
| | | | | Net Expense Ratio (Current) | | | Gross Expense Ratio
(Before expense limitation) | |
| | | Shares | | | 0.50 | % | | | 0.61 | % |
| | 6 | | The expense ratios of the Fund, both current (net of any expense limitation) and before expense limitation (gross of any expense limitation) are as set forth above according to the most recent publicly available Prospectus for the Fund and may differ from the expense ratios disclosed on the Financial Highlights in this report. Pursuant to a contractual arrangement, the Fund’s expense limitation will remain in effect permanently and the Investment Adviser may not terminate the arrangements without the approval of the Fund’s Board of Trustees. |
| | | | | | | | | | |
| | TOP TEN HOLDINGS AS OF 8/31/177 |
| | | Holding | | % of Net Assets | | | Line of Business | | Country |
| | Tencent Holdings Ltd. | | | 4.4 | % | | Information Technology | | China |
| | Samsung Electronics Co. Ltd. | | | 3.8 | | | Information Technology | | South Korea |
| | Alibaba Group Holding Ltd. | | | 3.3 | | | Information Technology | | China |
| | ADR | | | | | | | | |
| | Taiwan Semiconductor | | | 3.2 | | | Information Technology | | Taiwan |
| | Manufacturing Co. Ltd. | | | | | | | | |
| | China Construction Bank | | | 1.4 | | | Financials | | China |
| | Corp., Class H | | | | | | | | |
| | China Mobile Ltd. | | | 1.2 | | | Telecommunication
Services | | China |
| | Naspers Ltd., Class N | | | 1.2 | | | Consumer Discretionary | | South
Africa |
| | Industrial & Commercial | | | 1.1 | | | Financials | | China |
| | Bank of China Ltd., Class H | | | | | | | | |
| | Baidu, Inc. ADR | | | 1.1 | | | Information Technology | | China |
| | Hon Hai Precision Industry | | | 1.0 | | | Information Technology | | Taiwan |
| | | Co. Ltd. | | | | | | | | |
| | 7 | | The top 10 holdings may not be representative of the Fund’s future investments. |
7
FUND BASICS
|
| FUND SECTOR ALLOCATIONS8 |
| As of August 31, 2017 |
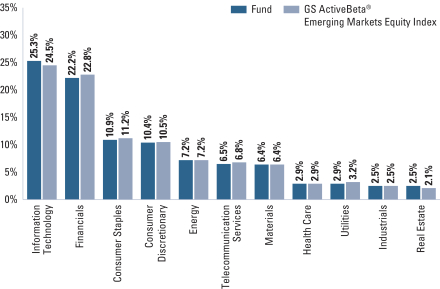
| | 8 | | The Fund’s composition may differ over time. Consequently, the Fund’s overall industry sector allocations may differ from percentages contained in the graph above. The graph categorizes investments using Global Industry Classification Standard (“GICS”), however, the sector classifications used by the portfolio management team may differ from GICS. The percentage shown for each investment category reflects the value of investments in that category as a percentage of market value (excluding investments in the securities lending reinvestment vehicle, if any). Investments in the securities lending reinvestment vehicle represented 1.8% of the Fund’s net assets as of August 31, 2017. |
8
ACTIVEBETA® EMERGING MARKETS EQUITY ETF
Performance Summary
August 31, 2017
The following graph shows the value, as of August 31, 2017, of a $10,000 investment made on September 25, 2015 (commencement of operations) in Shares at NAV. For comparative purposes, the performance of the Fund’s underlying index and secondary underlying index, the Goldman Sachs ActiveBeta® Emerging Markets Equity Index and the MSCI Emerging Markets Index (net, unhedged), are shown. This performance data represents past performance and should not be considered indicative of future performance, which will fluctuate with changes in market conditions. These performance fluctuations may cause an investor’s shares to be worth more or less than their original cost. Performance reflects applicable fee waivers and/or expense limitations in effect during the periods shown and in their absence, performance would be reduced. Returns do not reflect the deduction of taxes that a shareholder would pay on Fund distributions or the sale of Fund shares. In addition to the performance of constituents of the underlying index, other factors may affect Fund performance. These factors include, but are not limited to, Fund operating fees and expenses, portfolio turnover and creation and redemption in-kind transactions.
|
| ActiveBeta® Emerging Markets Equity ETF’s Lifetime Performance |
Performance of a $10,000 Investment, with distributions reinvested, from September 25, 2015 through August 31, 2017.
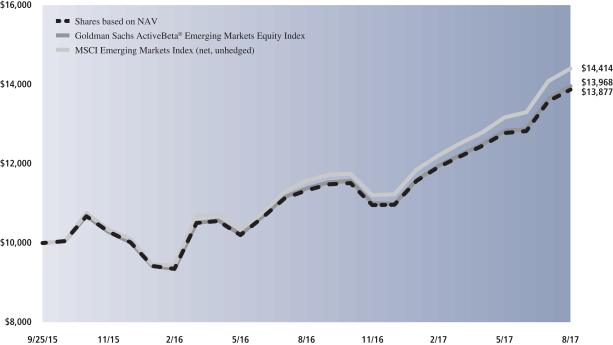
| | | | | | | | |
| Average Annual Total Return through August 31, 2017 | | | 1 Year Return | | | | Since Inception | |
| |
Shares based on NAV (Commenced September 25, 2015) | | | 22.49% | | | | 18.46% | |
| |
9
PORTFOLIO RESULTS
Goldman Sachs ActiveBeta® Europe Equity ETF
Investment Objective
The Goldman Sachs ActiveBeta® Europe Equity ETF (the “Fund”) seeks to provide investment results that closely correspond, before fees and expenses, to the performance of the Goldman Sachs ActiveBeta® Europe Equity Index (the “Index”).
Portfolio Management Discussion and Analysis
Below, the Goldman Sachs Quantitative Investment Strategies Team discusses the Fund’s performance and positioning for the 12-month period ended August 31, 2017 (the “Reporting Period”).
| Q | | How did the Fund perform during the Reporting Period? |
| A | | During the Reporting Period, the Fund returned 19.46% based on net asset value (“NAV”) and 19.68% based on market price. The Index returned 19.70%, and the MSCI Europe Index (net, unhedged, USD) (“MSCI Europe Index”), a market-cap based index against which the performance of the Fund is measured, and the reference index for the Index, returned 19.43% during the same period. |
| | | The Fund had an NAV of $26.12 per share on August 31, 2016 and ended the Reporting Period with an NAV of $30.39 per share. The Fund’s market price on August 31, 2017 was $30.54 per share. |
| Q | | What key factors were responsible for the Fund’s performance during the Reporting Period? |
| A | | The Fund seeks to provide investment results that closely correspond, before fees and expenses, to the performance of the Index. The Fund’s performance reflects Fund expenses, including management fees and brokerage expenses. The Fund’s relative performance also reflects the impact of any cash held in the Fund as well as any other differences between the Fund’s holdings and the constituents of the Index. The Index is unmanaged, and Index returns do not reflect fees and expenses, which would reduce returns. |
| | | The Index is constructed using a rules-based methodology that was developed to provide exposure to the “factors” (or characteristics) that are commonly tied to a stock’s outperformance relative to market returns, and its performance is compared to that of the MSCI Europe Index. Because the Fund seeks to provide investment results that closely correspond, before fees and expenses, to the performance of the Index, the discussion below compared the performance of the Fund to that of the MSCI Europe Index. Given the Fund’s investment objective of attempting to track the Index, the Fund does not follow traditional methods of active investment management, which may involve buying and selling securities based upon analysis of economic and market factors. The Fund does not follow a strategy of seeking to outperform the MSCI Europe Index, and overweights and underweights relative to the MSCI Europe Index discussed below resulted from the Fund’s replication of the Index rather than a decision to overweight or underweight a particular sector, country or stock. |
| | | The Fund posted positive double-digit absolute returns and outperformed the MSCI Europe Index during the Reporting Period, as measured by NAV. Amongst underlying factors, Value contributed positively, while Quality, Low Volatility and Momentum detracted from relative results during the Reporting Period. Value refers to how attractively a stock is priced relative to its fundamentals, such as book value and free cash flow. Quality refers to sustainable profitability over time. Low Volatility is a relatively low degree of fluctuation in a company’s share price over time. Momentum is whether a company’s share price is trending up or down. |
| Q | | Which sectors and countries contributed most positively to the Fund’s relative performance during the Reporting Period, and which detracted most? |
| A | | Index constituents in the health care, materials and telecommunication services sectors contributed most positively to the Fund’s results relative to the MSCI Europe Index during the Reporting Period. Index constituents in the financials, consumer staples and industrials sectors detracted |
10
PORTFOLIO RESULTS
| | most from the Fund’s results relative to the MSCI Europe Index during the Reporting Period. |
| | | From a country perspective, Index constituents in France, Germany and Switzerland contributed most positively to the Fund’s results relative to the MSCI Europe Index. Conversely, Index constituents in the U.K., the Netherlands and Sweden detracted the most from the Fund’s results relative to the MSCI Europe Index during the Reporting Period. |
| Q | | Which individual stock positions contributed the most to the Fund’s relative returns during the Reporting Period? |
| A | | Relative to the MSCI Europe Index, overweight positions in Swiss materials company Glencore, French information technology firm Atos and Swiss health care company Actelion contributed most positively (1.01%, 1.07% and 0.00%1 of Fund net assets as of August 31, 2017, respectively). Glencore posted a triple-digit gain during the Reporting Period, and Atos and Actelion each posted a robust double-digit gain during the Reporting Period. |
| Q | | Which individual positions detracted from the Fund’s results during the Reporting Period? |
| A | | Relative to the MSCI Europe Index, overweight positions in Norwegian consumer discretionary firm Schibsted, U.K. financial services group Provident Financial and U.K. industrials company Royal Mail detracted most (0.27%, 0.08% and 0.35% of Fund net assets as of August 31, 2017, respectively). Each of these companies generated a double-digit decline during the Reporting Period. |
| Q | | How did the Fund use derivatives and similar instruments during the Reporting Period? |
| A | | The Fund did not invest in derivatives or similar instruments during the Reporting Period. The Fund does not employ derivatives as a source of alpha generation, although it may use them to equitize excess cash. |
| Q | | What was the Fund’s sector positioning relative to the Index and reference index at the end of the Reporting Period?2 |
| | | | | | | | | | | | | | |
| | | Sector Name | | Fund3 | | | GS
ActiveBeta®
Index | | | MSCI EU
Index | |
| | Financials | | | 16.93 | % | | | 16.97 | % | | | 21.31 | % |
| | Consumer Staples | | | 15.41 | | | | 15.49 | | | | 14.14 | |
| | Industrials | | | 14.66 | | | | 15.16 | | | | 13.29 | |
| | Consumer Discretionary | | | 14.11 | | | | 14.19 | | | | 10.39 | |
| | Health Care | | | 13.35 | | | | 12.96 | | | | 12.52 | |
| | Materials | | | 8.33 | | | | 8.30 | | | | 7.90 | |
| | Information Technology | | | 5.55 | | | | 5.62 | | | | 4.65 | |
| | Energy | | | 4.43 | | | | 4.49 | | | | 6.64 | |
| | Utilities | | | 2.98 | | | | 2.99 | | | | 3.82 | |
| | Telecommunication Services | | | 2.68 | | | | 2.73 | | | | 3.97 | |
| | | Real Estate | | | 1.06 | | | | 1.09 | | | | 1.36 | |
| | 2 | | The Fund seeks to provide investment results that closely correspond, before fees and expenses, to the performance of the Goldman Sachs ActiveBeta® Europe Equity Index. |
| | 3 | | Country and sector classifications for securities may differ between the above listing and the Schedule of Investments due to differing classification methodologies. The classification methodology used for the above listing is as set forth by MSCI. |
| Q | | What was the Fund’s country positioning relative to the Index and reference index at the end of the Reporting
Period?2 |
| | | | | | | | | | | | | | |
| | | Country Name | | Fund3 | | | GS
ActiveBeta®
Index | | | MSCI EU
Index | |
| | UK | | | 26.40 | % | | | 26.44 | % | | | 27.43 | % |
| | France | | | 18.71 | | | | 18.69 | | | | 16.50 | |
| | Germany | | | 14.00 | | | | 14.02 | | | | 14.73 | |
| | Switzerland | | | 12.82 | | | | 12.80 | | | | 12.93 | |
| | Spain | | | 5.29 | | | | 5.33 | | | | 5.52 | |
| | Netherlands | | | 5.22 | | | | 5.26 | | | | 5.72 | |
| | Italy | | | 4.68 | | | | 4.68 | | | | 3.82 | |
| | Sweden | | | 4.08 | | | | 4.04 | | | | 4.55 | |
| | Denmark | | | 2.89 | | | | 2.88 | | | | 2.95 | |
| | Finland | | | 1.55 | | | | 1.53 | | | | 1.58 | |
| | Norway | | | 1.28 | | | | 1.25 | | | | 1.07 | |
| | Belgium | | | 1.21 | | | | 1.22 | | | | 1.85 | |
| | Portugal | | | 0.72 | | | | 0.72 | | | | 0.25 | |
| | Austria | | | 0.65 | | | | 0.65 | | | | 0.40 | |
| | | Ireland | | | 0.49 | | | | 0.48 | | | | 0.69 | |
| | 2 | | The Fund seeks to provide investment results that closely correspond, before fees and expenses, to the performance of the Goldman Sachs ActiveBeta® Europe Equity Index. |
| | 3 | | Country and sector classifications for securities may differ between the above listing and the Schedule of Investments due to differing classification methodologies. The classification methodology used for the above listing is as set forth by MSCI. |
| | 1 | | Some weights are 0.00% at August 31, 2017 because those positions were taken out during the most recent rebalance given the Index construction methodology. |
11
FUND BASICS
ActiveBeta® Europe Equity ETF
as of August 31, 2017
| | | | | | |
| | FUND SNAPSHOT | | | | |
| | | As of August 31, 2017 | | | |
| | Market Price1 | | $ | 30.54 | |
| | | Net Asset Value (NAV)1 | | $ | 30.39 | |
| | 1 | | The Market Price is the price at which the Fund’s shares are trading on the NYSE Arca, Inc. The Market Price of the Fund’s shares will fluctuate and, at the time of sale, shares may be worth more or less than the original investment or the Fund’s then current net asset value (“NAV”). The NAV is the market value of one share of the Fund. This amount is derived by dividing the total value of all the securities in the Fund’s portfolio, plus other assets, less any liabilities, by the number of Fund shares outstanding. Fund shares are not individually redeemable and are issued and redeemed by the Fund at their NAV only in large, specified blocks of shares called creation units. Shares otherwise can be bought and sold only through exchange trading at market price (not NAV). Shares may trade at a premium or discount to their NAV in the secondary market. Information regarding how often shares of each Fund traded on NYSE Arca at a price above (i.e., at a premium) or below (i.e., at a discount) the NAV of the Fund can be found at www.GSAMFUNDS.com |
| | | | | | | | | | | | | | | | | | |
| | PERFORMANCE REVIEW | |
| | | September 1, 2016–
August 31, 2017 | | Fund Total Return
(based on NAV)2 | | | Fund Total Return
(based on Market Price)2 | | | GS ActiveBeta®
Europe Index3 | | | MSCI Europe
Index4 | |
| | | Shares | | | 19.46 | % | | | 19.68 | % | | | 19.70 | % | | | 19.43 | % |
| | 2 | | Total returns are calculated assuming purchase of a share at the market price or NAV on the first day and sale of a share at the market price or NAV on the last day of each period reported. The Total Returns Based on NAV and Market Price assume the reinvestment of dividends and do not reflect brokerage commissions in connection with the purchase or sale of Fund shares, which if included would lower the performance shown above. The NAV used in the Total Return calculation assumes all management fees incurred by the Fund. Market Price returns are based upon the last trade as of 4:00pm EST and do not reflect the returns you would receive if you traded shares at other times. |
| | 3 | | The Goldman Sachs ActiveBeta® Europe Equity Index (the “Index”) is designed to deliver exposure to equity securities of developed market issuers in Europe. The Index seeks to capture common sources of active equity returns, including value (i.e., how attractively a stock is priced relative to its “fundamentals”, such as book value or free cash flow), momentum (i.e., whether a company’s share price is trending up or down), quality (i.e., profitability) and low volatility (i.e., a relatively low dgree of fluctuation in a company’s share price over time). The Index is reconstituted and rebalanced quarterly. It is not possible to invest directly in an unmanaged index. |
| | 4 | | The MSCI Europe Index captures large and mid-cap representation across 15 Developed Markets countries. It is not possible to invest directly in an unmanaged index. |
The returns set forth in the tables above represent past performance. Past performance does not guarantee future results. The Fund’s investment returns and principal value will fluctuate so that an investor’s shares, when sold or redeemed, may be worth more or less than their original cost. Current performance may be lower or higher than the performance quoted above. Please visit our web site at www.GSAMFUNDS.com to obtain the most recent month-end returns.
Returns do not reflect the deduction of taxes that a shareholder would pay on Fund distributions or the sale or redemption of Fund shares.
12
FUND BASICS
| | | | | | | | | | | | | | |
| | STANDARDIZED TOTAL RETURNS5 | |
| | | For the period ended 6/30/17 | | One Year | | | Since Inception | | | Inception Date | |
| | Shares (based on NAV) | | | 20.62 | % | | | 16.64 | % | | | 3/2/16 | |
| | | Shares (based on Market Price) | | | 20.39 | | | | 17.10 | | | | 3/2/16 | |
| | 5 | | The Standardized Total Returns are average annual total returns as of the most recent calendar quarter-end. They assume reinvestment of all distributions. The first day of secondary market trading is typically several days after the date on which the Fund commenced investment operations; therefore, the NAV of the Fund is used as a proxy for the period from inception of investment operations to the first day of secondary market trading to calculate the Market Price returns. |
The returns set forth in the tables above represent past performance. Past performance does not guarantee future results. The Fund’s investment returns and principal value will fluctuate so that an investor’s shares, when sold or redeemed, may be worth more or less than their original cost. Current performance may be lower or higher than the performance quoted above. Please visit our web site at www.GSAMFUNDS.com to obtain the most recent month-end returns. Returns do not reflect the deduction of taxes that a shareholder would pay on Fund distributions or the sale or redemption of Fund shares.
| | | | | | |
| | EXPENSE RATIO6 | | | | |
| | | | | Expense Ratio | |
| | | Shares | | | 0.25 | % |
| | 6 | | The expense ratio of the Fund is as set forth above according to the most recent publicly available Prospectus for the Fund and may differ from the expense ratio disclosed on the Financial Highlights in this report. |
| | | | | | | | | | |
| | TOP TEN HOLDINGS AS OF 8/31/177 |
| | | Holding | | % of Net Assets | | | Line of Business | | Country |
| | Nestle SA (Consumer Staples) | | | 2.5 | % | | Consumer Staples | | Switzerland |
| | Roche Holding AG | | | 1.8 | | | Health Care | | Switzerland |
| | Novartis AG | | | 1.7 | | | Health Care | | Switzerland |
| | HSBC Holdings PLC | | | 1.6 | | | Financials | | United Kingdom |
| | Sanofi | | | 1.2 | | | Health Care | | France |
| | British American Tobacco PLC | | | 1.1 | | | Consumer Staples | | United Kingdom |
| | SAP SE | | | 1.1 | | | Information Technology | | Germany |
| | Atos SE | | | 1.1 | | | Information Technology | | France |
| | Bayer AG | | | 1.0 | | | Health Care | | Germany |
| | | adidas AG | | | 1.0 | | | Consumer Discretionary | | Germany |
| | 7 | | The top 10 holdings may not be representative of the Fund’s future investments. |
13
FUND BASICS
|
| FUND SECTOR ALLOCATIONS8 |
| As of August 31, 2017 |
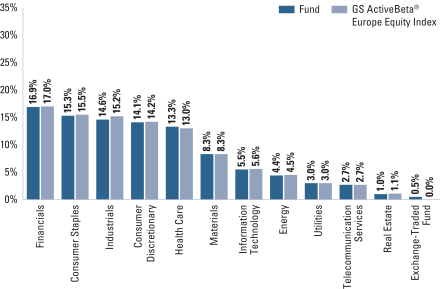
| | 8 | | The Fund’s composition may differ over time. Consequently, the Fund’s overall industry sector allocations may differ from percentages contained in the graph above. The graph categorizes investments using Global Industry Classification Standard (“GICS”), however, the sector classifications used by the portfolio management team may differ from GICS. Underlying sector allocations of exchange-traded funds held by the Fund are not reflected in the graph above. The percentage shown for each investment category reflects the value of investments in that category as a percentage of market value (excluding investments in the securities lending reinvestment vehicle, if any). Investments in the securities lending reinvestment vehicle represented 0.2% of the Fund’s net assets as of August 31, 2017. |
14
ACTIVEBETA® EUROPE EQUITY ETF
Performance Summary
August 31, 2017
The following graph shows the value, as of August 31, 2017, of a $10,000 investment made on March 2, 2016 (commencement of operations) in Shares at NAV. For comparative purposes, the performance of the Fund’s underlying index and secondary underlying index, the Goldman Sachs ActiveBeta® Europe Equity Index and the MSCI Europe Index (Total Return, USD), are shown. This performance data represents past performance and should not be considered indicative of future performance, which will fluctuate with changes in market conditions. These performance fluctuations may cause an investor’s shares to be worth more or less than their original cost. Performance reflects applicable fee waivers and/or expense limitations in effect during the periods shown and in their absence, performance would be reduced. Returns do not reflect the deduction of taxes that a shareholder would pay on Fund distributions or the sale of Fund shares. In addition to the performance of constituents of the underlying index, other factors may affect Fund performance. These factors include, but are not limited to, Fund operating fees and expenses, portfolio turnover and creation and redemption in-kind transactions.
|
| ActiveBeta® Europe Equity ETF’s Lifetime Performance |
Performance of a $10,000 Investment, with distributions reinvested, from March 2, 2016 through August 31, 2017.
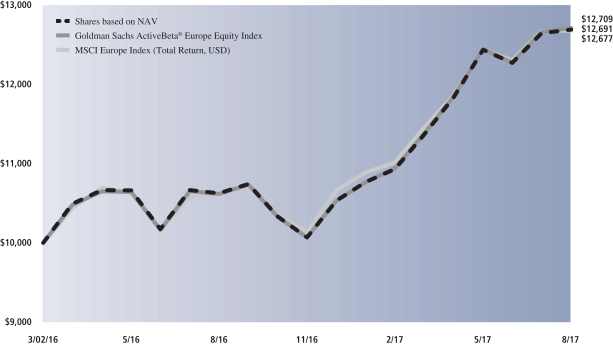
| | | | | | | | |
| Average Annual Total Return through August 31, 2017 | | | 1 Year Return | | | | Since Inception | |
| |
Shares based on NAV (Commenced March 2, 2016) | | | 19.46% | | | | 17.24% | |
| |
15
PORTFOLIO RESULTS
Goldman Sachs ActiveBeta® International Equity ETF
Investment Objective
The Goldman Sachs ActiveBeta® International Equity ETF (the “Fund”) seeks to provide investment results that closely correspond, before fees and expenses, to the performance of the Goldman Sachs ActiveBeta® International Equity Index (the “Index”).
Portfolio Management Discussion and Analysis
Below, the Goldman Sachs Quantitative Investment Strategies Team discusses the Fund’s performance and positioning for the 12-month period ended August 31, 2017 (the “Reporting Period”).
| Q | | How did the Fund perform during the Reporting Period? |
| A | | During the Reporting Period, the Fund returned 17.66% based on net asset value (“NAV”) and 17.75% based on market price. The Index returned 17.87%, and the MSCI World ex USA Index (net, unhedged, USD) (“MSCI World ex USA Index”), a market-cap based index against which the performance of the Fund is measured, and the reference index for the Index, returned 17.14% during the same period. |
| | The Fund had an NAV of $24.67 per share on August 31, 2016 and ended the Reporting Period with an NAV of $28.38 per share. The Fund’s market price on August 31, 2017 was $28.53 per share. |
| Q | | What key factors were responsible for the Fund’s performance during the Reporting Period? |
| A | | The Fund seeks to provide investment results that closely correspond, before fees and expenses, to the performance of the Index. The Fund’s performance reflects Fund expenses, including management fees and brokerage expenses. The Fund’s relative performance also reflects the impact of any cash held in the Fund as well as any other differences between the Fund’s holdings and the constituents of the Index. The Index is unmanaged, and Index returns do not reflect fees and expenses, which would reduce returns. |
| | The Index is constructed using a rules-based methodology that was developed to provide exposure to the “factors” (or characteristics) that are commonly tied to a stock’s outperformance relative to market returns, and its performance is compared to that of the MSCI World ex USA Index. Because the Fund seeks to provide investment results that closely correspond, before fees and expenses, to the performance of the Index, the discussion below compared the performance of the Fund to that of the MSCI World ex USA Index. Given the Fund’s investment objective of |
| | attempting to track the Index, the Fund does not follow traditional methods of active investment management, which may involve buying and selling securities based upon analysis of economic and market factors. The Fund does not follow a strategy of seeking to outperform the MSCI World ex USA Index, and overweights and underweights relative to the MSCI World ex USA Index discussed below resulted from the Fund’s replication of the Index rather than a decision to overweight or underweight a particular sector, country or stock. |
| | The Fund posted positive double-digit absolute returns and outperformed the MSCI World ex USA Index during the Reporting Period, as measured by NAV. Amongst underlying factors, Value and Quality contributed positively to the Fund’s relative results, while Momentum and Low Volatility detracted from the Fund’s relative results during the Reporting Period. Value refers to how attractively a stock is priced relative to its fundamentals, such as book value and free cash flow. Quality refers to sustainable profitability over time. Momentum is whether a company’s share price is trending up or down. Low Volatility is a relatively low degree of fluctuation in a company’s share price over time. |
| Q | | Which sectors and countries contributed most positively to the Fund’s relative performance during the Reporting Period, and which detracted most? |
| A | | Index constituents in the consumer discretionary, industrials and energy sectors contributed most positively to the Fund’s results relative to the MSCI World ex USA Index during the Reporting Period. Index constituents in the financials, |
16
PORTFOLIO RESULTS
| | consumer staples and utilities sectors detracted the most from the Fund’s results relative to the MSCI World ex USA Index during the Reporting Period. |
| | From a country perspective, Index constituents in France, Japan and Switzerland contributed most positively to the Fund’s results relative to the MSCI World ex USA Index during the Reporting Period. Conversely, Index constituents in the Netherlands, the U.K. and Sweden detracted the most from the Fund’s results relative to the MSCI World ex USA Index during the Reporting Period. |
| Q | | Which individual stock positions contributed the most to the Fund’s relative returns during the Reporting Period? |
| A | | Relative to the MSCI World ex USA Index, overweight positions in Swiss materials company Glencore, French information technology firm Atos and Japanese consumer discretionary company Start Today contributed most positively (0.57%, 0.69% and 0.38% of Fund net assets as of August 31, 2017, respectively). Glencore and Start Today each generated a triple-digit gain during the Reporting Period, and Atos posted a robust double-digit gain during the Reporting Period. |
| Q | | Which individual positions detracted from the Fund’s results during the Reporting Period? |
| A | | Relative to the MSCI World ex USA Index, overweight positions in Netherlands-based consumer staples firm Koninklijke Ahold Delhaize, Japanese consumer staples company Yamazaki Baking and U.K. industrials firm Royal Mail detracted most (0.27%, 0.27% and 0.23% of Fund net assets as of August 31, 2017, respectively). Each of these companies generated a double-digit decline during the Reporting Period. |
| Q | | How did the Fund use derivatives and similar instruments during the Reporting Period? |
| A | | The Fund did not invest in derivatives or similar instruments during the Reporting Period. The Fund does not employ derivatives as a source of alpha generation, although it may use them to equitize excess cash. |
| Q | | What was the Fund’s sector positioning relative to the Index and the reference index at the end of the Reporting Period?1 |
| | | | | | | | | | | | | | |
| | | Sector Name | | Fund2 | | | GS
ActiveBeta®
Index | | | MSCI World
ex USA
Index | |
| | Financials | | | 19.99 | % | | | 19.29 | % | | | 23.19 | % |
| | Consumer Discretionary | | | 14.62 | | | | 14.59 | | | | 11.39 | |
| | Consumer Staples | | | 14.52 | | | | 14.50 | | | | 10.90 | |
| | Industrials | | | 13.36 | | | | 13.70 | | | | 13.89 | |
| | Health Care | | | 10.55 | | | | 10.23 | | | | 9.48 | |
| | Information Technology | | | 7.38 | | | | 7.12 | | | | 5.85 | |
| | Materials | | | 7.35 | | | | 7.81 | | | | 8.18 | |
| | Energy | | | 3.51 | | | | 3.78 | | | | 6.27 | |
| | Real Estate | | | 3.00 | | | | 3.12 | | | | 3.41 | |
| | Telecommunication Services | | | 3.00 | | | | 3.03 | | | | 4.07 | |
| | | Utilities | | | 2.72 | | | | 2.81 | | | | 3.38 | |
| | 1 | | The Fund seeks to provide investment results that closely correspond, before fees and expenses, to the performance of the Goldman Sachs ActiveBeta® International Equity Index. |
| | 2 | | Country and sector classifications for securities may differ between the above listing and the Schedule of Investments due to differing classification methodologies. The classification methodology used for the above listing is as set forth by MSCI. |
17
PORTFOLIO RESULTS
| Q | | What was the Fund’s country positioning relative to the Index and the reference index at the end of the Reporting Period?1 |
| | | | | | | | | | | | | | |
| | | Country Name | | Fund2 | | | GS
ActiveBeta®
Index | | | MSCI World
ex USA
Index | |
| | Japan | | | 21.46 | % | | | 21.12 | % | | | 21.26 | % |
| | UK | | | 14.61 | | | | 14.54 | | | | 16.04 | |
| | France | | | 10.66 | | | | 10.74 | | | | 9.65 | |
| | Canada | | | 8.92 | | | | 9.25 | | | | 8.73 | |
| | Germany | | | 8.13 | | | | 7.95 | | | | 8.62 | |
| | Switzerland | | | 7.51 | | | | 7.58 | | | | 7.56 | |
| | Australia | | | 6.23 | | | | 6.35 | | | | 6.49 | |
| | Hong Kong | | | 3.34 | | | | 3.35 | | | | 3.25 | |
| | Spain | | | 3.19 | | | | 3.33 | | | | 3.23 | |
| | Netherlands | | | 3.07 | | | | 3.02 | | | | 3.35 | |
| | Italy | | | 2.89 | | | | 2.84 | | | | 2.23 | |
| | Sweden | | | 2.54 | | | | 2.53 | | | | 2.66 | |
| | Denmark | | | 1.82 | | | | 1.83 | | | | 1.73 | |
| | Singapore | | | 1.60 | | | | 1.50 | | | | 1.20 | |
| | Israel | | | 0.97 | | | | 0.79 | | | | 0.43 | |
| | Finland | | | 0.81 | | | | 0.90 | | | | 0.93 | |
| | Belgium | | | 0.65 | | | | 0.63 | | | | 1.08 | |
| | Norway | | | 0.65 | | | | 0.68 | | | | 0.62 | |
| | Austria | | | 0.37 | | | | 0.34 | | | | 0.23 | |
| | Portugal | | | 0.26 | | | | 0.36 | | | | 0.15 | |
| | Ireland | | | 0.26 | | | | 0.23 | | | | 0.40 | |
| | | New Zealand | | | 0.07 | | | | 0.13 | | | | 0.15 | |
| | 1 | | The Fund seeks to provide investment results that closely correspond, before fees and expenses, to the performance of the Goldman Sachs ActiveBeta® International Equity Index. |
| | 2 | | Country and sector classifications for securities may differ between the above listing and the Schedule of Investments due to differing classification methodologies. The classification methodology used for the above listing is as set forth by MSCI. |
18
FUND BASICS
ActiveBeta® International Equity ETF
as of August 31, 2017
| | | | | | |
| | FUND SNAPSHOT | |
| | | As of August 31, 2017 | |
| | Market Price1 | | $ | 28.53 | |
| | | Net Asset Value (NAV)1 | | $ | 28.38 | |
| | 1 | | The Market Price is the price at which the Fund’s shares are trading on the NYSE Arca, Inc. The Market Price of the Fund’s shares will fluctuate and, at the time of sale, shares may be worth more or less than the original investment or the Fund’s then current net asset value (“NAV”). The NAV is the market value of one share of the Fund. This amount is derived by dividing the total value of all the securities in the Fund’s portfolio, plus other assets, less any liabilities, by the number of Fund shares outstanding. Fund shares are not individually redeemable and are issued and redeemed by the Fund at their NAV only in large, specified blocks of shares called creation units. Shares otherwise can be bought and sold only through exchange trading at market price (not NAV). Shares may trade at a premium or discount to their NAV in the secondary market. Information regarding how often shares of each Fund traded on NYSE Arca at a price above (i.e., at a premium) or below (i.e., at a discount) the NAV of the Fund can be found at www.GSAMFUNDS.com |
| | | | | | | | | | | | | | | | | | |
| | PERFORMANCE REVIEW | |
| | | September 1, 2016–
August 31, 2017 | | Fund Total Return
(based on NAV)2 | | | Fund Total Return
(based on Market Price)2 | | | GS ActiveBeta®
Intl Equity Index3 | | | MSCI World
ex USA Index4 | |
| | | Shares | | | 17.66 | % | | | 17.75 | % | | | 17.87 | % | | | 17.14 | % |
| | 2 | | Total returns are calculated assuming purchase of a share at the market price or NAV on the first day and sale of a share at the market price or NAV on the last day of each period reported. The Total Returns Based on NAV and Market Price assume the reinvestment of dividends and do not reflect brokerage commissions in connection with the purchase or sale of Fund shares, which if included would lower the performance shown above. The NAV used in the Total Return calculation assumes all management fees incurred by the Fund. Market Price returns are based upon the last trade as of 4:00pm EST and do not reflect the returns you would receive if you traded shares at other times. |
| | 3 | | The Goldman Sachs ActiveBeta® International Equity Index (the “Index”) is designed to deliver exposure to equity securities of developed market issuers outside of the United States. The Index seeks to capture common sources of active equity returns, including value (i.e., how attractively a stock is priced relative to its “fundamentals”, such as book value or free cash flow), momentum (i.e., whether a company’s share price is trending up or down), quality (i.e., profitability) and low volatility (i.e., a relatively low degree of fluctuation in a company’s share price over time). The Index is reconstituted and rebalanced quarterly. It is not possible to invest directly in an unmanaged index. |
| | 4 | | The MSCI World ex USA Index captures large and mid cap representation across 22 of 23 Developed Markets countries. It is not possible to invest directly in an unmanaged index. |
The returns set forth in the tables above represent past performance. Past performance does not guarantee future results. The Fund’s investment returns and principal value will fluctuate so that an investor’s shares, when sold or redeemed, may be worth more or less than their original cost. Current performance may be lower or higher than the performance quoted above. Please visit our web site at www.GSAMFUNDS.com to obtain the most recent month-end returns. Returns do not reflect the deduction of taxes that a shareholder would pay on Fund distributions or the sale or redemption of Fund shares.
19
FUND BASICS
| | | | | | | | | | | | |
| | STANDARDIZED TOTAL RETURNS5 |
| | | For the period ended 6/30/17 | | One Year | | | Since Inception | | | Inception Date |
| | Shares (based on NAV) | | | 18.67 | % | | | 8.89 | % | | 11/6/15 |
| | | Shares (based on Market Price) | | | 18.25 | | | | 9.28 | | | 11/6/15 |
| | 5 | | The Standardized Total Returns are average annual total returns as of the most recent calendar quarter-end. They assume reinvestment of all distributions. The first day of secondary market trading is typically several days after the date on which the Fund commenced investment operations; therefore, the NAV of the Fund is used as a proxy for the period from inception of investment operations to the first day of secondary market trading to calculate the Market Price returns. |
The returns set forth in the tables above represent past performance. Past performance does not guarantee future results. The Fund’s investment returns and principal value will fluctuate so that an investor’s shares, when sold or redeemed, may be worth more or less than their original cost. Current performance may be lower or higher than the performance quoted above. Please visit our web site at www.GSAMFUNDS.com to obtain the most recent month-end returns. Returns do not reflect the deduction of taxes that a shareholder would pay on Fund distributions or the sale or redemption of Fund shares.
| | | | | | |
| | EXPENSE RATIO6 | |
| | | | | Expense Ratio | |
| | | Shares | | | 0.25 | % |
| | 6 | | The expense ratio of the Fund is as set forth above according to the most recent publicly available Prospectus for the Fund and may differ from the expense ratio disclosed on the Financial Highlights in this report. |
| | | | | | | | | | |
| | TOP TEN HOLDINGS AS OF 8/31/177 |
| | | Holding | | % of Net Assets | | | Line of Business | | Country |
| | Nestle SA | | | 1.4 | % | | Consumer Staples | | Switzerland |
| | Roche Holding AG | | | 1.0 | | | Health Care | | Switzerland |
| | Novartis AG | | | 0.9 | | | Health Care | | Switzerland |
| | HSBC Holdings PLC | | | 0.8 | | | Financials | | United Kingdom |
| | Atos SE | | | 0.7 | | | Information Technology | | France |
| | Sanofi | | | 0.6 | | | Health Care | | France |
| | Glencore PLC | | | 0.6 | | | Materials | | Switzerland |
| | Royal Bank of Canada | | | 0.6 | | | Financials | | Canada |
| | Bayer AG | | | 0.5 | | | Health Care | | Germany |
| | | Novo Nordisk A/S, Class B | | | 0.5 | | | Health Care | | Denmark |
| | 7 | | The top 10 holdings may not be representative of the Fund’s future investments. |
20
FUND BASICS
|
| FUND SECTOR ALLOCATIONS8 |
| As of August 31, 2017 |
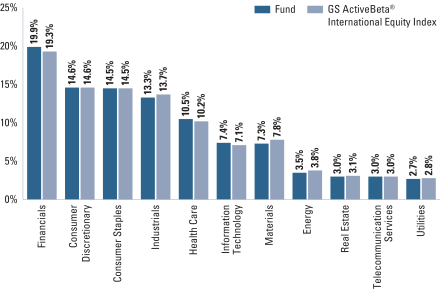
| | 8 | | The Fund’s composition may differ over time. Consequently, the Fund’s overall industry sector allocations may differ from percentages contained in the graph above. The graph categorizes investments using Global Industry Classification Standard (“GICS”), however, the sector classifications used by the portfolio management team may differ from GICS. The percentage shown for each investment category reflects the value of investments in that category as a percentage of market value (excluding investments in the securities lending reinvestment vehicle, if any). Investments in the securities lending reinvestment vehicle represented 1.2% of the Fund’s net assets as of August 31, 2017. |
21
ACTIVEBETA® INTERNATIONAL EQUITY ETF
Performance Summary
August 31, 2017
The following graph shows the value, as of August 31, 2017, of a $10,000 investment made on November 6, 2015 (commencement of operations) in Shares at NAV. For comparative purposes, the performance of the Fund’s underlying index and secondary underlying index, the Goldman Sachs ActiveBeta® International Equity Index and the MSCI World ex USA Index (net, Unhedged, USD), are shown. This performance data represents past performance and should not be considered indicative of future performance, which will fluctuate with changes in market conditions. These performance fluctuations may cause an investor’s shares to be worth more or less than their original cost. Performance reflects applicable fee waivers and/or expense limitations in effect during the periods shown and in their absence, performance would be reduced. Returns do not reflect the deduction of taxes that a shareholder would pay on Fund distributions or the sale of Fund shares. In addition to the performance of constituents of the underlying index, other factors may affect Fund performance. These factors include, but are not limited to, Fund operating fees and expenses, portfolio turnover and creation and redemption in-kind transactions.
|
| ActiveBeta® International Equity ETF’s Lifetime Performance |
Performance of a $10,000 Investment, with distributions reinvested, from November 6, 2015 through August 31, 2017.
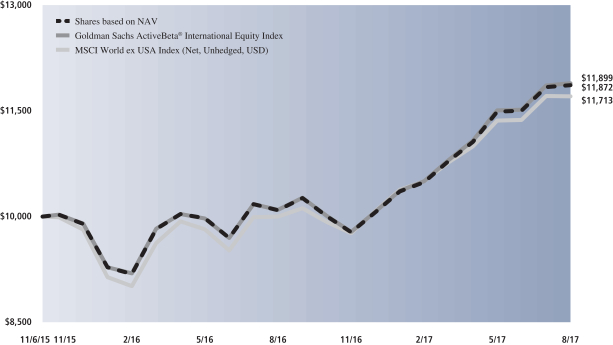
| | | | | | | | |
| Average Annual Total Return through August 31, 2017 | | | 1 Year Return | | | | Since Inception | |
| |
Shares based on NAV (Commenced November 6, 2015) | | | 17.66% | | | | 9.89% | |
| |
22
PORTFOLIO RESULTS
Goldman Sachs ActiveBeta® Japan Equity ETF
Investment Objective
The Goldman Sachs ActiveBeta® Japan Equity ETF (the “Fund”) seeks to provide investment results that closely correspond, before fees and expenses, to the performance of the Goldman Sachs ActiveBeta® Japan Equity Index (the “Index”).
Portfolio Management Discussion and Analysis
Below, the Goldman Sachs Quantitative Investment Strategies Team discusses the Fund’s performance and positioning for the 12-month period ended August 31, 2017 (the “Reporting Period”).
| Q | | How did the Fund perform during the Reporting Period? |
| A | | During the Reporting Period, the Fund returned 14.74% based on net asset value (“NAV”) and 14.58% based on market price. The Index returned 14.73%, while the MSCI Japan Index (net, unhedged, USD) (“MSCI Japan Index”), a market-cap based index against which the performance of the Fund is measured, and the reference index for the Index, returned 13.69% during the same period. |
| | | The Fund had an NAV of $27.33 per share on August 31, 2016 and ended the Reporting Period with an NAV of $30.71 per share. The Fund’s market price on August 31, 2017 was $30.79 per share. |
| Q | | What key factors were responsible for the Fund’s performance during the Reporting Period? |
| A | | The Fund seeks to provide investment results that closely correspond, before fees and expenses, to the performance of the Index. The Fund’s performance reflects Fund expenses, including management fees and brokerage expenses. The Fund’s relative performance also reflects the impact of any cash held in the Fund as well as any other differences between the Fund’s holdings and the constituents of the Index. The Index is unmanaged, and Index returns do not reflect fees and expenses, which would reduce returns. |
| | | The Index is constructed using a rules-based methodology that was developed to provide exposure to the “factors” (or characteristics) that are commonly tied to a stock’s outperformance relative to market returns, and its performance is compared to that of the MSCI Japan Index. Because the Fund seeks to provide investment results that closely correspond, before fees and expenses, to the performance of the Index, the discussion below compared the |
| | performance of the Fund to that of the MSCI Japan Index. Given the Fund’s investment objective of attempting to track the Index, the Fund does not follow traditional methods of active investment management, which may involve buying and selling securities based upon analysis of economic and market factors. The Fund does not follow a strategy of seeking to outperform the MSCI Japan Index, and overweights and underweights relative to the MSCI Japan Index discussed below resulted from the Fund’s replication of the Index, rather than a decision to overweight or underweight a particular sector or stock. |
| | | The Fund posted solid double-digit absolute gains and outperformed the MSCI Japan Index during the Reporting Period, as measured by NAV. Amongst underlying factors, Value and Quality contributed positively to the Fund’s results relative to the MSCI Japan Index, while Momentum and Low Volatility detracted from relative results during the Reporting Period. Value refers to how attractively a stock is priced relative to its fundamentals, such as book value and free cash flow. Quality refers to sustainable profitability over time. Momentum is whether a company’s share price is trending up or down. Low Volatility is a relatively low degree of fluctuation in a company’s share price over time. |
| Q | | Which sectors contributed most positively to the Fund’s relative performance during the Reporting Period, and which detracted most? |
| A | | Index constituents in the consumer discretionary, industrials and energy sectors contributed most positively to the Fund’s results relative to the MSCI Japan Index during the Reporting Period. Conversely, Index constituents in the information technology, health care and materials sectors detracted most from the Fund’s results relative to the MSCI Japan Index during the Reporting Period. |
23
PORTFOLIO RESULTS
| Q | | Which individual stock positions contributed the most to the Fund’s relative returns during the Reporting Period? |
| A | | Relative to the MSCI Japan Index, overweight positions in marine transportation, warehousing and cargo handling services provider Mitsui OSK Lines, Internet apparel shopping sites operator Start Today and integrated petroleum company Idemitsu Kosan contributed most positively (0.21%, 0.48% and 0.25% of Fund net assets as of August 31, 2017, respectively). Mitsui OSK Lines and Idemitsu Kosan each posted a robust double-digit gain during the Reporting Period, and Start Today generated a triple-digit gain during the Reporting Period. |
| Q | | Which individual positions detracted from the Fund’s results during the Reporting Period? |
| A | | Relative to the MSCI Japan Index, underweight positions in video game hardware and software manufacturer Nintendo and technology hardware and equipment manufacturer Hitachi and an overweight position in baked foods producer Yamazaki Baking detracted most (0.63%, 0.67% and 0.39% of Fund net assets as of August 31, 2017, respectively). Nintendo and Hitachi each posted a double-digit gain during the Reporting Period, while Yamazaki Baking generated a double-digit decline during the Reporting Period. |
| Q | | How did the Fund use derivatives and similar instruments during the Reporting Period? |
| A | | The Fund did not invest in derivatives or similar instruments during the Reporting Period. The Fund does not employ derivatives as a source of alpha generation, although it may use them to equitize excess cash. |
| Q | | What was the Fund’s sector positioning relative to the Index and the reference index at the end of the Reporting Period?1 |
| | | | | | | | | | |
| | | Sector Name | | Fund2 | | | GS ActiveBeta®
Index | | MSCI Japan
Index |
| | Consumer Discretionary | | | 20.49 | % | | 20.19% | | 20.03% |
| | Industrials | | | 18.48 | | | 18.18 | | 20.67 |
| | Information Technology | | | 13.96 | | | 13.70 | | 12.52 |
| | Financials | | | 10.67 | | | 10.50 | | 12.31 |
| | Consumer Staples | | | 10.21 | | | 10.87 | | 7.89 |
| | Health Care | | | 7.50 | | | 8.14 | | 7.30 |
| | Materials | | | 6.35 | | | 6.27 | | 6.74 |
| | Telecommunication Services | | | 4.51 | | | 4.44 | | 5.59 |
| | Real Estate | | | 3.64 | | | 3.58 | | 4.14 |
| | Utilities | | | 2.89 | | | 2.84 | | 1.92 |
| | | Energy | | | 1.30 | | | 1.28 | | 0.90 |
| | 1 | | The Fund seeks to provide investment results that closely correspond, before fees and expenses, to the performance of the Goldman Sachs ActiveBeta® Japan Equity Index. |
| | 2 | | Sector classifications for securities may differ between the above listing and the Schedule of Investments due to differing classification methodologies. The classification methodology used for the above listing is as set forth by MSCI. |
24
FUND BASICS
ActiveBeta® Japan Equity ETF
as of August 31, 2017
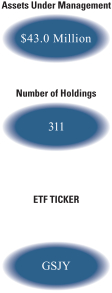
| | | | | | |
| | FUND SNAPSHOT | |
| | | As of August 31, 2017 | |
| | Market Price1 | | $ | 30.79 | |
| | | Net Asset Value (NAV)1 | | $ | 30.71 | |
| | 1 | | The Market Price is the price at which the Fund’s shares are trading on the NYSE Arca, Inc. The Market Price of the Fund’s shares will fluctuate and, at the time of sale, shares may be worth more or less than the original investment or the Fund’s then current net asset value (“NAV”). The NAV is the market value of one share of the Fund. This amount is derived by dividing the total value of all the securities in the Fund’s portfolio, plus other assets, less any liabilities, by the number of Fund shares outstanding. Fund shares are not individually redeemable and are issued and redeemed by the Fund at their NAV only in large, specified blocks of shares called creation units. Shares otherwise can be bought and sold only through exchange trading at market price (not NAV). Shares may trade at a premium or discount to their NAV in the secondary market. Information regarding how often shares of each Fund traded on NYSE Arca at a price above (i.e., at a premium) or below (i.e., at a discount) the NAV of the Fund can be found at www.GSAMFUNDS.com |
| | | | | | | | | | | | | | | | | | |
| | PERFORMANCE REVIEW | |
| | | September 1, 2016–
August 31, 2017 | | Fund Total Return
(based on NAV)2 | | | Fund Total Return
(based on Market Price)2 | | | GS ActiveBeta®
Japan Index3 | | | MSCI World Japan
Index4 | |
| | | Shares | | | 14.74 | % | | | 14.58 | % | | | 14.73 | % | | | 13.69 | % |
| | 2 | | Total returns are calculated assuming purchase of a share at the market price or NAV on the first day and sale of a share at the market price or NAV on the last day of each period reported. The Total Returns Based on NAV and Market Price assume the reinvestment of dividends and do not reflect brokerage commissions in connection with the purchase or sale of Fund shares, which if included would lower the performance shown above. The NAV used in the Total Return calculation assumes all management fees incurred by the Fund. Market Price returns are based upon the last trade as of 4:00pm EST and do not reflect the returns you would receive if you traded shares at other times. |
| | 3 | | The Goldman Sachs ActiveBeta® Japan Equity Index (the “Index”) is designed to deliver exposure to equity securities of large capitalization Japan issuers. The Index seeks to capture common sources of active equity returns, including value (i.e., how attractively a stock is priced relative to its “fundamentals”, such as book value or free cash flow), momentum (i.e., whether a company’s share price is trending up or down), quality (i.e., profitability) and low volatility (i.e., a relatively low degree of fluctuation in a company’s share price over time). The Index is reconstituted and rebalanced quarterly. It is not possible to invest directly in an unmanaged index. |
| | 4 | | The MSCI Japan Index is designed to measure the performance of the large and mid cap segments of the Japanese market. It is not possible to invest directly in an unmanaged index. |
The returns set forth in the tables above represent past performance. Past performance does not guarantee future results. The Fund’s investment returns and principal value will fluctuate so that an investor’s shares, when sold or redeemed, may be worth more or less than their original cost. Current performance may be lower or higher than the performance quoted above. Please visit our web site at www.GSAMFUNDS.com to obtain the most recent month-end returns.
Returns do not reflect the deduction of taxes that a shareholder would pay on Fund distributions or the sale or redemption of Fund shares.
25
FUND BASICS
| | | | | | | | | | | | |
| | STANDARDIZED TOTAL RETURNS5 |
| | | For the period ended 6/30/17 | | One Year | | | Since Inception | | | Inception Date |
| | Shares (based on NAV) | | | 16.30 | % | | | 14.80 | % | | 3/2/16 |
| | | Shares (based on Market Price) | | | 16.08 | | | | 14.98 | | | 3/2/16 |
| | 5 | | The Standardized Total Returns are average annual total returns as of the most recent calendar quarter-end. They assume reinvestment of all distributions. The first day of secondary market trading is typically several days after the date on which the Fund commenced investment operations; therefore, the NAV of the Fund is used as a proxy for the period from inception of investment operations to the first day of secondary market trading to calculate the Market Price returns. |
The returns set forth in the tables above represent past performance. Past performance does not guarantee future results. The Fund’s investment returns and principal value will fluctuate so that an investor’s shares, when sold or redeemed, may be worth more or less than their original cost. Current performance may be lower or higher than the performance quoted above. Please visit our web site at www.GSAMFUNDS.com to obtain the most recent month-end returns.
Returns do not reflect the deduction of taxes that a shareholder would pay on Fund distributions or the sale or redemption of Fund shares.
| | | | | | |
| | EXPENSE RATIO6 | |
| | | | | Expense Ratio | |
| | | Shares | | | 0.25 | % |
| | 6 | | The expense ratio of the Fund is as set forth above according to the most recent publicly available Prospectus for the Fund and may differ from the expense ratio disclosed on the Financial Highlights in this report. |
| | | | | | | | |
| | TOP TEN HOLDINGS AS OF 8/31/177 |
| | | Holding | | % of Net Assets | | | Line of Business |
| | Toyota Motor Corp. | | | 3.7 | % | | Consumer Discretionary |
| | Mitsubishi UFJ Financial Group, Inc. | | | 1.9 | | | Financials |
| | SoftBank Group Corp. | | | 1.7 | | | Telecommunication Services |
| | Sumitomo Mitsui Financial Group, Inc. | | | 1.5 | | | Financials |
| | Keyence Corp. | | | 1.3 | | | Information Technology |
| | Sony Corp. | | | 1.3 | | | Consumer Discretionary |
| | Honda Motor Co. Ltd. | | | 1.2 | | | Consumer Discretionary |
| | Mitsubishi Corp. | | | 1.2 | | | Industrials |
| | KDDI Corp. | | | 1.1 | | | Telecommunication Services |
| | | Mizuho Financial Group, Inc. | | | 1.1 | | | Financials |
| | 7 | | The top 10 holdings may not be representative of the Fund’s future investments. |
26
FUND BASICS
|
| FUND SECTOR ALLOCATIONS8 |
| As of August 31, 2017 |

| | 8 | | The Fund’s composition may differ over time. Consequently, the Fund’s overall industry sector allocations may differ from percentages contained in the graph above. The graph categorizes investments using Global Industry Classification Standard (“GICS”), however, the sector classifications used by the portfolio management team may differ from GICS. The percentage shown for each investment category reflects the value of investments in that category as a percentage of market value (excluding investments in the securities lending reinvestment vehicle, if any). Investments in the securities lending reinvestment vehicle represented 0.7% of the Fund’s net assets as of August 31, 2017. |
27
ACTIVEBETA® JAPAN EQUITY ETF
Performance Summary
August 31, 2017
The following graph shows the value, as of August 31, 2017, of a $10,000 investment made on March 2, 2016 (commencement of operations) in Shares at NAV. For comparative purposes, the performance of the Fund’s underlying index and secondary underlying index, the Goldman Sachs ActiveBeta® Japan Index and the MSCI Japan Index (Total Return, USD), are shown. This performance data represents past performance and should not be considered indicative of future performance, which will fluctuate with changes in market conditions. These performance fluctuations may cause an investor’s shares to be worth more or less than their original cost. Performance reflects applicable fee waivers and/or expense limitations in effect during the periods shown and in their absence, performance would be reduced. Returns do not reflect the deduction of taxes that a shareholder would pay on Fund distributions or the sale of Fund shares. In addition to the performance of constituents of the underlying index, other factors may affect Fund performance. These factors include, but are not limited to, Fund operating fees and expenses, portfolio turnover and creation and redemption in-kind transactions.
|
| ActiveBeta® Japan Equity ETF’s Lifetime Performance |
Performance of a $10,000 Investment, with distributions reinvested, from March 2, 2016 through August 31, 2017.
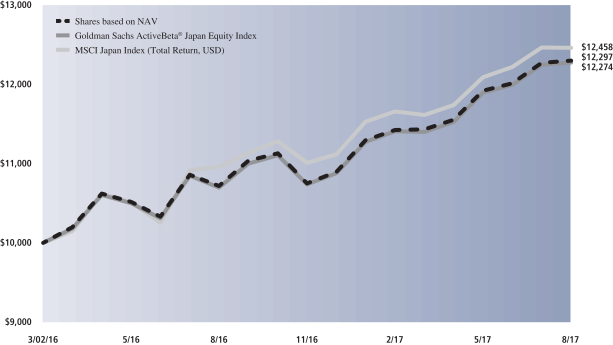
| | | | | | | | |
| Average Annual Total Return through August 31, 2017 | | | 1 Year Return | | | | Since Inception | |
| |
Shares based on NAV (Commenced March 2, 2016) | | | 14.74% | | | | 14.79% | |
| |
28
PORTFOLIO RESULTS
Goldman Sachs ActiveBeta® U.S. Large Cap Equity ETF
Investment Objective
The Goldman Sachs ActiveBeta® U.S. Large Cap Equity ETF (the “Fund”) seeks to provide investment results that closely correspond, before fees and expenses, to the performance of the Goldman Sachs ActiveBeta® U.S. Large Cap Equity Index (the “Index”).
Portfolio Management Discussion and Analysis
Below, the Goldman Sachs Quantitative Investment Strategies Team discusses the Fund’s performance and positioning for the 12-month period ended August 31, 2017 (the “Reporting Period”).
| Q | | How did the Fund perform during the Reporting Period? |
| A | | During the Reporting Period, the Fund returned 14.15% based on net asset value (“NAV”) and 14.16% based on market price. The Index returned 14.30%, and the S&P 500 Index (Total Return, USD) (“S&P 500 Index”), a market-cap based index against which the performance of the Fund is measured, returned 16.23% during the same period. |
| | The Fund had an NAV of $43.83 on August 31, 2016 and ended the Reporting Period with an NAV of $49.16 per share. The Fund’s market price on August 31, 2017 was $49.15 per share. |
| Q | | What key factors were responsible for the Fund’s performance during the Reporting Period? |
| A | | The Fund seeks to provide investment results that closely correspond, before fees and expenses, to the performance of the Index. The Fund’s performance reflects Fund expenses, including management fees and brokerage expenses. The Fund’s relative performance also reflects the impact of any cash held in the Fund as well as any other differences between the Fund’s holdings and the constituents of the Index. The Index is unmanaged, and Index returns do not reflect fees and expenses, which would reduce returns. |
| | The Index is constructed using a rules-based methodology that was developed to provide exposure to the “factors” (or characteristics) that are commonly tied to a stock’s outperformance relative to market returns, and its performance is compared to that of the S&P 500 Index. Because the Fund seeks to provide investment results that closely correspond, before fees and expenses, to the performance of the Index, the discussion below compared the performance of the Fund to that of the S&P 500 Index. Given the Fund’s investment objective of attempting to track the Index, the Fund does not follow traditional methods of active investment management, which may involve buying and selling securities based upon analysis of economic and market factors. The Fund does not follow a strategy of seeking to outperform the S&P 500 Index, and overweights and underweights relative to the S&P 500 Index discussed below resulted from the Fund’s replication of the Index rather than a decision to overweight or underweight a particular sector or stock. |
| | The Fund posted solid double-digit absolute gains but underperformed the S&P 500 Index during the Reporting Period, as measured by NAV. Amongst underlying factors, Quality, Low Volatility and Momentum detracted from relative returns, while Value contributed positively. Quality refers to sustainable profitability over time. Low Volatility is a relatively low degree of fluctuation in a company’s share price over time. Momentum is whether a company’s share price is trending up or down. Value refers to how attractively a stock is priced relative to its fundamentals, such as book value and free cash flow. |
| Q | | Which sectors contributed most positively to the Fund’s relative performance during the Reporting Period, and which detracted most? |
| A | | Index constituents in the consumer discretionary, consumer staples and financials sectors detracted the most from the Fund’s results relative to the S&P 500 Index. Partially offsetting these detractors were Index constituents in the energy, health care and telecommunication services sectors, which contributed positively to the Fund’s results relative to the S&P 500 Index during the Reporting Period. |
29
PORTFOLIO RESULTS
| Q | | Which individual positions detracted from the Fund’s results during the Reporting Period? |
| A | | Relative to the S&P 500 Index, overweight positions in health care company Mallinckrodt and department store retailer Macy’s and an underweight position in information technology giant Apple detracted most (0.00%,1 0.32% and 3.38% of Fund net assets as of August 31, 2017, respectively). Mallinckrodt and Macy’s each generated a double-digit negative return during the Reporting Period, while Apple posted a robust double-digit positive return during the Reporting Period. |
| Q | | Which individual stock positions contributed the most to the Fund’s relative returns during the Reporting Period? |
| A | | Relative to the S&P 500 Index, underweight positions in industrial conglomerate General Electric, oil well services firm Schlumberger and integrated energy company Exxon Mobil contributed most positively (0.51%, 0.09% and 1.04% of Fund net assets as of August 31, 2017, respectively). Each of these companies posted a negative return during the Reporting Period. |
| Q | | How did the Fund use derivatives and similar instruments during the Reporting Period? |
| A | | The Fund did not invest in derivatives or similar instruments during the Reporting Period. The Fund does not employ derivatives as a source of alpha generation, although it may use them to equitize excess cash. |
| | 1 | | Some weights are 0.00% at August 31, 2017 because those positions were taken out during the most recent rebalance given the Index construction methodology |
| Q | | What was the Fund’s sector positioning relative to the Index and the S&P 500 Index at the end of the Reporting Period?2 |
| | | | | | | | | | | | | | |
| | | Sector Name | | Fund3 | | | GS
ActiveBeta®
Index | | | S&P 500
Index | |
| | Information | | | 23.69 | % | | | 23.69 | % | | | 23.51 | % |
| | Technology | | | | | | | | | | | | |
| | Health Care | | | 14.70 | | | | 14.70 | | | | 14.66 | |
| | Consumer Discretionary | | | 13.96 | | | | 13.96 | | | | 12.06 | |
| | Financials | | | 12.62 | | | | 12.62 | | | | 14.23 | |
| | Consumer Staples | | | 11.01 | | | | 11.01 | | | | 8.48 | |
| | Industrials | | | 9.98 | | | | 9.98 | | | | 10.10 | |
| | Utilities | | | 4.29 | | | | 4.29 | | | | 3.26 | |
| | Energy | | | 2.85 | | | | 2.85 | | | | 5.67 | |
| | Materials | | | 2.56 | | | | 2.56 | | | | 2.90 | |
| | Real Estate | | | 2.46 | | | | 2.46 | | | | 2.98 | |
| | | Telecommunication Services | | | 1.87 | | | | 1.87 | | | | 2.14 | |
| | 2 | | The Fund seeks to provide investment results that closely correspond, before fees and expenses, to the performance of the Goldman Sachs ActiveBeta® U.S. Large Cap Equity Index. |
| | 3 | | Sector classifications for securities may differ between the above listing and the Schedule of Investments due to differing classification methodologies. The classification methodology used for the above listing is as set forth by S&P. |
30
FUND BASICS
ActiveBeta® U.S. Large Cap Equity ETF
as of August 31, 2017
| | | | | | |
| | FUND SNAPSHOT | |
| | | As of August 31, 2017 | |
| | Market Price1 | | $ | 49.15 | |
| | | Net Asset Value (NAV)1 | | $ | 49.16 | |
| | 1 | | The Market Price is the price at which the Fund’s shares are trading on the NYSE Arca, Inc. The Market Price of the Fund’s shares will fluctuate and, at the time of sale, shares may be worth more or less than the original investment or the Fund’s then current net asset value (“NAV”). The NAV is the market value of one share of the Fund. This amount is derived by dividing the total value of all the securities in the Fund’s portfolio, plus other assets, less any liabilities, by the number of Fund shares outstanding. Fund shares are not individually redeemable and are issued and redeemed by the Fund at their NAV only in large, specified blocks of shares called creation units. Shares otherwise can be bought and sold only through exchange trading at market price (not NAV). Shares may trade at a premium or discount to their NAV in the secondary market. Information regarding how often shares of each Fund traded on NYSE Arca at a price above (i.e., at a premium) or below (i.e., at a discount) the NAV of the Fund can be found at www.GSAMFUNDS.com |
| | | | | | | | | | | | | | | | | | |
| | PERFORMANCE REVIEW | |
| | | September 1, 2016–
August 31, 2017 | | Fund Total Return
(based on NAV)2 | | | Fund Total Return
(based on Market Price)2 | | | GS ActiveBeta®
LC Index3 | | | S&P 500 Index4 | |
| | | Shares | | | 14.15 | % | | | 14.16 | % | | | 14.30 | % | | | 16.23 | % |
| | 2 | | Total returns are calculated assuming purchase of a share at the market price or NAV on the first day and sale of a share at the market price or NAV on the last day of each period reported. The Total Returns Based on NAV and Market Price assume the reinvestment of dividends and do not reflect brokerage commissions in connection with the purchase or sale of Fund shares, which if included would lower the performance shown above. The NAV used in the Total Return calculation assumes all management fees incurred by the Fund. Market Price returns are based upon the last trade as of 4:00pm EST and do not reflect the returns you would receive if you traded shares at other times. |
| | 3 | | The Goldman Sachs ActiveBeta® U.S. Large Cap Equity Index (the “Index”) is designed to deliver exposure to equity securities of large capitalization U.S. issuers. The Index seeks to capture common sources of active equity returns, including value (i.e., how attractively a stock is priced relative to its “fundamentals”, such as book value or free cash flow), momentum (i.e., whether a company’s share price is trending up or down), quality (i.e., profitability) and low volatility (i.e., a relatively low dgree of fluctuation in a company’s share price over time). The Index is reconstituted and rebalanced quarterly. It is not possible to invest directly in an unmanaged index. |
| | 4 | | The S&P 500 Index is the Standard & Poor’s 500 Composite Index of 500 stocks, an unmanaged index of common stock prices. The Index figures do not reflect any deduction for fees, expenses or taxes. It is not possible to invest directly in an unmanaged index. |
The returns set forth in the tables above represent past performance. Past performance does not guarantee future results. The Fund’s investment returns and principal value will fluctuate so that an investor’s shares, when sold or redeemed, may be worth more or less than their original cost. Current performance may be lower or higher than the performance quoted above. Please visit our web site at www.GSAMFUNDS.com to obtain the most recent month-end returns. Returns do not reflect the deduction of taxes that a shareholder would pay on Fund distributions or the sale or redemption of Fund shares.
31
FUND BASICS
| | | | | | | | | | | | |
| | STANDARDIZED TOTAL RETURNS5 |
| | | For the period ended 6/30/17 | | One Year | | | Since Inception | | | Inception Date |
| | Shares (based on NAV) | | | 15.27 | % | | | 11.61 | % | | 9/17/15 |
| | | Shares (based on Market Price) | | | 15.35 | | | | 11.64 | | | 9/17/15 |
| | 5 | | The Standardized Total Returns are average annual total returns as of the most recent calendar quarter-end. They assume reinvestment of all distributions. The first day of secondary market trading is typically several days after the date on which the Fund commenced investment operations; therefore, the NAV of the Fund is used as a proxy for the period from inception of investment operations to the first day of secondary market trading to calculate the Market Price returns. |
The returns set forth in the tables above represent past performance. Past performance does not guarantee future results. The Fund’s investment returns and principal value will fluctuate so that an investor’s shares, when sold or redeemed, may be worth more or less than their original cost. Current performance may be lower or higher than the performance quoted above. Please visit our web site at www.GSAMFUNDS.com to obtain the most recent month-end returns. Returns do not reflect the deduction of taxes that a shareholder would pay on Fund distributions or the sale or redemption of Fund shares.
| | | | | | |
| | EXPENSE RATIO6 | |
| | | | | Expense Ratio | |
| | | Shares | | | 0.09 | % |
| | 6 | | The expense ratio of the Fund is as set forth above according to the most recent publicly available Prospectus for the Fund and may differ from the expense ratio disclosed on the Financial Highlights in this report. |
| | | | | | | | |
| | TOP TEN HOLDINGS AS OF 8/31/177 |
| | | Holding | | % of Net Assets | | | Line of Business |
| | Apple, Inc. | | | 3.4 | % | | Information Technology |
| | Microsoft Corp. | | | 2.3 | | | Information Technology |
| | Facebook, Inc., Class A | | | 1.5 | | | Information Technology |
| | Johnson & Johnson | | | 1.4 | | | Health Care |
| | Amazon.com, Inc. | | | 1.4 | | | Consumer Discretionary |
| | JPMorgan Chase & Co. | | | 1.3 | | | Financials |
| | Alphabet, Inc., Class A | | | 1.1 | | | Information Technology |
| | Alphabet, Inc., Class C | | | 1.0 | | | Information Technology |
| | Exxon Mobil Corp. | | | 1.0 | | | Energy |
| | | UnitedHealth Group, Inc. | | | 0.9 | | | Health Care |
| | 7 | | The top 10 holdings may not be representative of the Fund’s future investments. |
32
FUND BASICS
|
| FUND SECTOR ALLOCATIONS8 |
| As of August 31, 2017 |
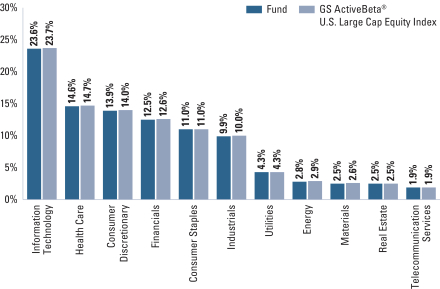
| | 8 | | The Fund’s composition may differ over time. Consequently, the Fund’s overall industry sector allocations may differ from percentages contained in the graph above. The graph categorizes investments using Global Industry Classification Standard (“GICS”), however, the sector classifications used by the portfolio management team may differ from GICS. The percentage shown for each investment category reflects the value of investments in that category as a percentage of market value (excluding investments in the securities lending reinvestment vehicle, if any). Investments in the securities lending reinvestment vehicle represented 0.1% of the Fund’s net assets as of August 31, 2017. |
33
ACTIVEBETA® U.S. LARGE CAP EQUITY ETF
Performance Summary
August 31, 2017
The following graph shows the value, as of August 31, 2017, of a $10,000 investment made on September 17, 2015 (commencement of operations) in Shares at NAV. For comparative purposes, the performance of the Fund’s underlying index and secondary underlying index, the Goldman Sachs ActiveBeta® U.S. Large Cap Equity Index and the S&P 500 Index (Total Return, USD), are shown. This performance data represents past performance and should not be considered indicative of future performance, which will fluctuate with changes in market conditions. These performance fluctuations may cause an investor’s shares to be worth more or less than their original cost. Performance reflects applicable fee waivers and/or expense limitations in effect during the periods shown and in their absence, performance would be reduced. Returns do not reflect the deduction of taxes that a shareholder would pay on Fund distributions or the sale of Fund shares. In addition to the performance of constituents of the underlying index, other factors may affect Fund performance. These factors include, but are not limited to, Fund operating fees and expenses, portfolio turnover and creation and redemption in-kind transactions.
|
| ActiveBeta® U.S. Large Cap Equity ETF’s Lifetime Performance |
Performance of a $10,000 Investment, with distributions reinvested, from September 17, 2015 through August 31, 2017.
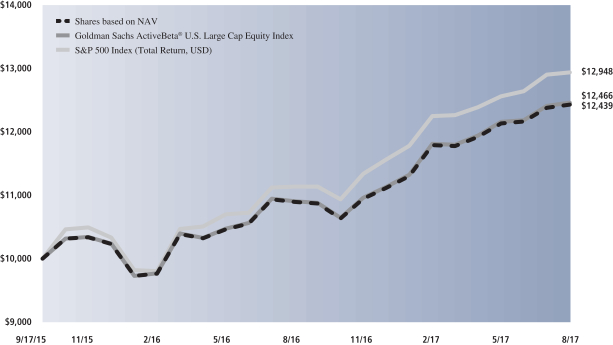
| | | | | | | | |
| Average Annual Total Return through August 31, 2017 | | | 1 year | | | | Since Inception | |
| |
Shares based on NAV (Commenced September 17, 2015) | | | 14.15% | | | | 11.80% | |
| |
34
PORTFOLIO RESULTS
Goldman Sachs ActiveBeta® U.S. Small Cap Equity ETF
Investment Objective
The Goldman Sachs ActiveBeta® U.S. Small Cap Equity ETF (the “Fund”) seeks to provide investment results that closely correspond, before fees and expenses, to the performance of the Goldman Sachs ActiveBeta® U.S. Small Cap Equity Index (the “Index”).
Portfolio Management Discussion and Analysis
Below, the Goldman Sachs Quantitative Investment Strategies Team discusses the Fund’s performance and positioning for the period since its commencement of operations on June 28, 2017 through August 31, 2017 (the “Reporting Period”).
| Q | | How did the Fund perform during the Reporting Period? |
| A | | During the Reporting Period, the Fund returned -1.76% based on net asset value (“NAV”) and -3.49% based on market price.1 The Index returned -1.68%, and the Russell 2000® Index (Total Return, USD) (“Russell 2000® Index”), a market-cap based index against which the performance of the Fund is measured, and the reference index for the Index, returned -1.22% during the same period. |
| | The Fund had an NAV of $40.36 on the date of commencement of operations and ended the Reporting Period with an NAV of $39.65 per share. The Fund’s market price on August 31, 2017 was $38.95 per share. |
| Q | | What key factors were responsible for the Fund’s performance during the Reporting Period? |
| A | | The Fund seeks to provide investment results that closely correspond, before fees and expenses, to the performance of the Index. The Fund’s performance reflects Fund expenses, including management fees and brokerage expenses. The Fund’s relative performance also reflects the impact of any cash held in the Fund as well as any other differences between the Fund’s holdings and the constituents of the Index. The Index is unmanaged, and Index returns do not reflect fees and expenses, which would reduce returns. |
| | The Index is constructed using a rules-based methodology that was developed to provide exposure to the “factors” (or characteristics) that are commonly tied to a stock’s outperformance relative to market returns, and its performance is compared to that of the Russell 2000® Index. Because the Fund seeks to provide investment results that closely correspond, before fees and expenses, to the performance of the Index, the discussion below compared the performance of the Fund to that of the Russell 2000® Index. Given the Fund’s investment objective of attempting to track the Index, the Fund does not follow traditional methods of active investment management, which may involve buying and selling securities based upon analysis of economic and market factors. The Fund does not follow a strategy of seeking to outperform the Russell 2000® Index, and overweights and underweights relative to the Russell 2000® Index discussed below resulted from the Fund’s replication of the Index rather than a decision to overweight or underweight a particular sector or stock. |
| | The Fund posted negative absolute returns and underperformed the Russell 2000® Index during the Reporting Period, as measured by NAV. Amongst underlying factors, Value, Quality and Low Volatility detracted from relative returns, while Momentum contributed positively. Value refers to how attractively a stock is priced relative to its fundamentals, such as book value and free cash flow. Quality refers to sustainable profitability over time. Low Volatility is a relatively low degree of fluctuation in a company’s share price over time. Momentum is whether a company’s share price is trending up or down. |
| Q | | Which sectors contributed most positively to the Fund’s relative performance during the Reporting Period, and which detracted most? |
| A | | Index constituents in the health care, industrials and consumer discretionary sectors detracted the most from the Fund’s results relative to the Russell 2000® Index. Partially offsetting these detractors were Index constituents in the information technology, telecommunication services and |
| | 1 | | The first day of secondary market trading is typically several days after the date on which the Fund commenced investment operations; therefore, the NAV of the Fund is used as a proxy for the period from commencement of investment operations to the first day of secondary market trading to calculate the market price returns. |
35
PORTFOLIO RESULTS
| | energy sectors, which contributed positively to the Fund’s results relative to the Russell 2000® Index during the Reporting Period. |
| Q | | Which individual positions detracted from the Fund’s results during the Reporting Period? |
| A | | Relative to the Russell 2000® Index, underweight positions in pharmaceuticals manufacturer Kite Pharma, online and mobile platform for restaurant pick-up and delivery operator GrubHub and research-based pharmaceutical company FibroGen detracted most (0.17%, 0.09% and 0.04% of Fund net assets as of August 31, 2017, respectively). Each of these companies posted a robust double-digit positive return during the Reporting Period. |
| Q | | Which individual stock positions contributed the most to the Fund’s relative returns during the Reporting Period? |
| A | | Relative to the Russell 2000® Index, overweight positions in pharmaceuticals company Corcept Therapeutics, aesthetic laser systems manufacturer Cutera and independent licensee of the Blue Cross Blue Shield Association Triple-S Management contributed most positively (0.26%, 0.13% and 0.12% of Fund net assets as of August 31, 2017, respectively). Each of these companies generated a robust double-digit gain during the Reporting Period. |
| Q | | How did the Fund use derivatives and similar instruments during the Reporting Period? |
| A | | The Fund did not invest in derivatives or similar instruments during the Reporting Period. The Fund does not employ derivatives as a source of alpha generation, although it may use them to equitize excess cash. |
| Q | | What was the Fund’s sector positioning relative to the Index and the reference index at the end of the Reporting Period?1 |
| | | | | | | | | | | | | | |
| | | Sector Name | | Fund2 | | | GS
ActiveBeta®
Index | | | Russell 2000®
Index | |
| | Financials | | | 20.73 | % | | | 21.57 | % | | | 17.70 | % |
| | Information | | | 17.15 | | | | 17.02 | | | | 17.24 | |
| | Technology | | | | | | | | | | | | |
| | Health Care | | | 14.26 | | | | 14.04 | | | | 15.73 | |
| | Industrials | | | 13.82 | | | | 13.70 | | | | 14.55 | |
| | Consumer Discretionary | | | 12.31 | | | | 12.17 | | | | 12.01 | |
| | Real Estate | | | 7.46 | | | | 7.47 | | | | 7.61 | |
| | Utilities | | | 4.32 | | | | 4.22 | | | | 3.90 | |
| | Materials | | | 4.01 | | | | 3.97 | | | | 4.42 | |
| | Consumer Staples | | | 2.77 | | | | 2.73 | | | | 2.63 | |
| | Energy | | | 2.28 | | | | 2.24 | | | | 3.32 | |
| | | Telecommunication Services | | | 0.88 | | | | 0.87 | | | | 0.89 | |
| | 1 | | The Fund seeks to provide investment results that closely correspond, before fees and expenses, to the performance of the Goldman Sachs ActiveBeta® U.S. Small Cap Equity Index. |
| | 2 | | Sector classifications for securities may differ between the above listing and the Schedule of Investments due to differing classification methodologies. The classification methodology used for the above listing is as set forth by Russell Investments. |
36
FUND BASICS
ActiveBeta® U.S. Small Cap Equity ETF
as of August 31, 2017
| | | | | | |
| | FUND SNAPSHOT | |
| | | As of August 31, 2017 | |
| | Market Price1 | | $ | 38.95 | |
| | | Net Asset Value (NAV)1 | | $ | 39.65 | |
| | 1 | | The Market Price is the price at which the Fund’s shares are trading on the NYSE Arca, Inc. The Market Price of the Fund’s shares will fluctuate and, at the time of sale, shares may be worth more or less than the original investment or the Fund’s then current net asset value (“NAV”). The NAV is the market value of one share of the Fund. This amount is derived by dividing the total value of all the securities in the Fund’s portfolio, plus other assets, less any liabilities, by the number of Fund shares outstanding. Fund shares are not individually redeemable and are issued and redeemed by the Fund at their NAV only in large, specified blocks of shares called creation units. Shares otherwise can be bought and sold only through exchange trading at market price (not NAV). Shares may trade at a premium or discount to their NAV in the secondary market. Information regarding how often shares of each Fund traded on NYSE Arca at a price above (i.e., at a premium) or below (i.e., at a discount) the NAV of the Fund can be found at www.GSAMFUNDS.com. |
| | | | | | | | | | | | | | | | | | |
| | PERFORMANCE REVIEW | |
| | | June 28, 2017–
August 31, 2017 | | Fund Total Return
(based on NAV)2 | | | Fund Total Return
(based on Market Price)2 | | | GS ActiveBeta®
SC Index3 | | | Russell 2000®
Index4 | |
| | | Shares | | | -1.76 | % | | | -3.49 | % | | | -1.68 | % | | | -1.22 | % |
| | 2 | | Total returns are calculated assuming purchase of a share at the market price or NAV on the first day and sale of a share at the market price or NAV on the last day of each period reported. The Total Returns Based on NAV and Market Price assume the reinvestment of dividends and do not reflect brokerage commissions in connection with the purchase or sale of Fund shares, which if included would lower the performance shown above. The NAV used in the Total Return calculation assumes all management fees incurred by the Fund. Market Price returns are based upon the last trade as of 4:00pm EST and do not reflect the returns you would receive if you traded shares at other times. The first day of secondary market trading is typically several days after the date on which the Fund commenced investment operations; therefore, the NAV of the Fund is used as a proxy for the period from inception of investment operations to the first day of secondary market trading to calculate the Market Price returns. Total returns for periods less than one full year are not annualized. |
| | 3 | | The Goldman Sachs ActiveBeta® U.S. Small Cap Equity Index (the “Index”) is designed to deliver exposure to equity securities of small capitalization U.S. issuers. The Index seeks to capture common sources of active equity returns, including value (i.e., how attractively a stock is priced relative to its “fundamentals”, such as book value or free cash flow), momentum (i.e., whether a company’s share price is trending up or down), quality (i.e., profitability) and low volatility (i.e., a relatively low degree of fluctuation in a company’s share price over time). The Index is reconstituted and rebalanced quarterly. It is not possible to invest directly in an unmanaged index. |
| | 4 | | The Russell 2000® Index is an unmanaged index of common stock prices that measures the performance of the 2000 smallest companies in the Russell 3000® Index. The Index is constructed to provide a comprehensive and unbiased small-cap barometer and is completely reconstituted annually to ensure larger stocks do not distort the performance and characteristics of the true small-cap opportunity set. |
The returns set forth in the tables above represent past performance. Past performance does not guarantee future results. The Fund’s investment returns and principal value will fluctuate so that an investor’s shares, when sold or redeemed, may be worth more or less than their original cost. Current performance may be lower or higher than the performance quoted above. Please visit our web site at www.GSAMFUNDS.com to obtain the most recent month-end returns. Returns do not reflect the deduction of taxes that a shareholder would pay on Fund distributions or the sale or redemption of Fund shares.
37
FUND BASICS
| | | | | | |
| | EXPENSE RATIO6 | |
| | | | | Expense Ratio | |
| | | Shares | | | 0.20 | % |
| | 6 | | The expense ratio of the Fund is as set forth above according to the most recent publicly available Prospectus for the Fund and may differ from the expense ratio disclosed on the Financial Highlights in this report. |
| | | | | | | | |
| | TOP TEN HOLDINGS AS OF 8/31/177 |
| | | Holding | | % of Net Assets | | | Line of Business |
| | PAREXEL International Corp. | | | 0.3 | % | | Health Care |
| | Corcept Therapeutics, Inc. | | | 0.3 | | | Health Care |
| | Aspen Technology, Inc. | | | 0.3 | | | Information Technology |
| | Cirrus Logic, Inc. | | | 0.3 | | | Information Technology |
| | Radian Group, Inc. | | | 0.2 | | | Financials |
| | Myriad Genetics, Inc. | | | 0.2 | | | Health Care |
| | Sunstone Hotel Investors, Inc. REIT | | | 0.2 | | | Real Estate |
| | Supernus Pharmaceuticals, Inc. | | | 0.2 | | | Health Care |
| | Masimo Corp. | | | 0.2 | | | Health Care |
| | | Portland General Electric Co. | | | 0.2 | | | Utilities |
| | 7 | | The top 10 holdings may not be representative of the Fund’s future investments. |
38
FUND BASICS
|
| FUND SECTOR ALLOCATIONS8 |
| As of August 31, 2017 |
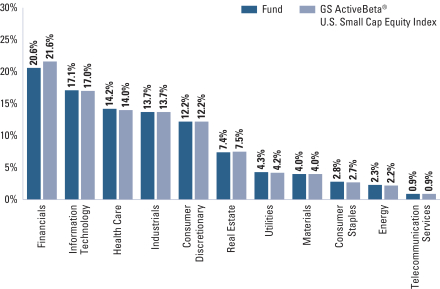
| | 8 | | The Fund’s composition may differ over time. Consequently, the Fund’s overall industry sector allocations may differ from percentages contained in the graph above. The graph categorizes investments using Global Industry Classification Standard (“GICS”), however, the sector classifications used by the portfolio management team may differ from GICS. The percentage shown for each investment category reflects the value of investments in that category as a percentage of market value (excluding investments in the securities lending reinvestment vehicle, if any). Investments in the securities lending reinvestment vehicle represented 5.4% of the Fund’s net assets as of August 31, 2017. |
39
FUND BASICS
Index Definitions and Industry Terms
The MSCI World ex USA Index captures large and mid cap representation across 22 of 23 Developed Markets countries. The index as of June 30, 2017, consists of the following 22 developed market country indexes: Australia, Austria, Belgium, Canada, Denmark, Finland, France, Germany, Hong Kong, Ireland, Israel, Italy, Japan, Netherlands, New Zealand, Norway, Portugal, Singapore, Spain, Sweden, Switzerland and the United Kingdom. It is not possible to invest directly in an unmanaged index.
The Russell 3000® Index is an unmanaged index that measures the performance of the 3,000 largest U.S. companies based on total market capitalization, which represents approximately 98% of the investable U.S. equity market. Index figures do not reflect any deduction for fees, expenses or taxes. It is not possible to invest directly in an unmanaged index.
The MSCI Emerging Markets Index is a free float-adjusted market capitalization index that is designed to measure equity market performance of emerging markets. As of June 30, 2017, the MSCI Emerging Markets Index consisted of the following 24 emerging market country indices: Brazil, Chile, China, Colombia, Czech Republic, Egypt, Greece, Hungary, India, Indonesia, Korea, Malaysia, Mexico, Pakistan, Peru, Philippines, Poland, Qatar, Russia, South Africa, Taiwan, Thailand, Turkey and United Arab Emirates. It is not possible to invest directly in an unmanaged index.
Book Value: The total value of the company’s assets that shareholders would theoretically receive if a company were liquidated.
Free Cash Flow: A measure of financial performance calculated as operating cash flow minus capital expenditures.
Alpha: The excess returns of a fund relative to the return of a benchmark index is the fund’s alpha.
40
GOLDMAN SACHS ACTIVEBETA® EMERGING MARKETS EQUITY ETF
Schedule of Investments
August 31, 2017
| | | | | | | | |
Shares | | | Description | | Value | |
| Common Stocks – 95.3% | | | |
| Brazil – 5.6% | | | |
| | 1,293,063 | | | Ambev SA (Consumer Staples) | | $ | 8,161,653 | |
| | 294,378 | | | B3 SA – Brasil Bolsa Balcao (Financials) | | | 2,069,520 | |
| | 334,655 | | | Banco Bradesco SA (Financials) | | | 3,430,095 | |
| | 316,458 | | | Banco do Brasil SA (Financials) | | | 3,087,689 | |
| | 262,975 | | | Banco Santander Brasil SA (Financials) | | | 2,343,536 | |
| | 415,524 | | | BB Seguridade Participacoes SA (Financials) | | | 3,660,737 | |
| | 195,456 | | | Cia de Saneamento Basico do Estado de Sao Paulo (Utilities) | | | 1,997,143 | |
| | 217,441 | | | Cielo SA (Information Technology) | | | 1,550,065 | |
| | 164,151 | | | Cosan SA Industria e Comercio (Energy) | | | 2,013,249 | |
| | 346,374 | | | CPFL Energia SA (Utilities) | | | 2,982,177 | |
| | 424,857 | | | EDP – Energias do Brasil SA (Utilities) | | | 2,057,818 | |
| | 186,718 | | | Engie Brasil Energia SA (Utilities) | | | 2,142,262 | |
| | 121,396 | | | Equatorial Energia SA (Utilities) | | | 2,358,125 | |
| | 113,588 | | | Fibria Celulose SA (Materials) | | | 1,508,635 | |
| | 202,273 | | | Hypermarcas SA (Health Care) | | | 1,897,083 | |
| | 674,964 | | | JBS SA (Consumer Staples) | | | 1,859,854 | |
| | 600,591 | | | Lojas Renner SA (Consumer Discretionary) | | | 5,840,895 | |
| | 162,528 | | | M Dias Branco SA (Consumer Staples) | | | 2,536,231 | |
| | 74,640 | | | Multiplan Empreendimentos Imobiliarios SA (Real Estate) | | | 1,733,839 | |
| | 230,957 | | | Natura Cosmeticos SA (Consumer Staples) | | | 2,165,371 | |
| | 768,570 | | | Odontoprev SA (Health Care) | | | 3,620,018 | |
| | 719,695 | | | Petroleo Brasileiro SA (Energy)* | | | 3,195,391 | |
| | 226,164 | | | Porto Seguro SA (Financials) | | | 2,497,799 | |
| | 305,334 | | | Raia Drogasil SA (Consumer Staples) | | | 6,729,779 | |
| | 379,301 | | | Sul America SA (Financials) | | | 2,167,469 | |
| | 408,322 | | | TIM Participacoes SA (Telecommunication Services) | | | 1,463,831 | |
| | 136,690 | | | Ultrapar Participacoes SA (Energy) | | | 3,190,860 | |
| | 470,430 | | | Vale SA (Materials) | | | 5,244,858 | |
| | | | | | | | |
| | | | | | | 83,505,982 | |
| | |
| Chile – 1.6% | | | |
| | 21,813 | | | Banco de Chile ADR (Financials)(a) | | | 1,909,074 | |
| | 33,920 | | | Banco de Credito e Inversiones (Financials) | | | 2,199,694 | |
| | 35,717,006 | | | Banco Santander Chile (Financials) | | | 2,611,540 | |
| | 670,308 | | | Cencosud SA (Consumer Staples) | | | 2,015,063 | |
| | 220,461 | | | Cia Cervecerias Unidas SA (Consumer Staples) | | | 3,005,326 | |
| | 173,506 | | | Empresa Nacional de Telecomunicaciones SA (Telecommunication Services) | | | 1,812,862 | |
| | 165,243 | | | Empresas COPEC SA (Energy) | | | 2,109,396 | |
| | 11,285,302 | | | Enel Americas SA (Utilities) | | | 2,434,518 | |
| | |
| Common Stocks – (continued) | | | |
| Chile – (continued) | | | |
| | 151,556 | | | Latam Airlines Group SA ADR (Industrials) | | | 1,909,606 | |
| | 219,148 | | | SACI Falabella (Consumer Discretionary) | | | 2,203,301 | |
| | 49,905 | | | Sociedad Quimica y Minera de Chile SA ADR (Materials) | | | 2,342,042 | |
| | | | | | | | |
| | | | | | | 24,552,422 | |
| | |
| China – 28.6% | | | |
| | 226,688 | | | AAC Technologies Holdings, Inc. (Information Technology) | | | 4,133,212 | |
| | 12,748,646 | | | Agricultural Bank of China Ltd., Class H (Financials) | | | 5,994,419 | |
| | 284,984 | | | Alibaba Group Holding Ltd. ADR (Information Technology)* | | | 48,943,152 | |
| | 674,687 | | | ANTA Sports Products Ltd. (Consumer Discretionary) | | | 2,655,145 | |
| | 33,881 | | | Autohome, Inc. ADR (Information Technology)* | | | 2,177,532 | |
| | 69,841 | | | Baidu, Inc. ADR (Information Technology)* | | | 15,927,240 | |
| | 23,296,030 | | | Bank of China Ltd., Class H (Financials) | | | 12,263,497 | |
| | 4,564,820 | | | Bank of Communications Co. Ltd., Class H (Financials) | | | 3,487,868 | |
| | 776,419 | | | Brilliance China Automotive Holdings Ltd. (Consumer Discretionary) | | | 2,008,891 | |
| | 5,616,789 | | | CGN Power Co. Ltd., Class H (Utilities)(b) | | | 1,550,162 | |
| | 7,097,310 | | | China Cinda Asset Management Co. Ltd., Class H (Financials) | | | 2,638,894 | |
| | 5,050,405 | | | China CITIC Bank Corp Ltd., Class H (Financials) | | | 3,336,199 | |
| | 5,305,197 | | | China Communications Services Corp. Ltd., Class H (Telecommunication Services) | | | 2,874,104 | |
| | 992,909 | | | China Conch Venture Holdings Ltd. (Industrials) | | | 1,806,569 | |
| | 24,022,321 | | | China Construction Bank Corp., Class H (Financials) | | | 21,055,922 | |
| | 5,451,529 | | | China Everbright Bank Co. Ltd., Class H (Financials) | | | 2,619,035 | |
| | 925,434 | | | China Evergrande Group (Real Estate)* | | | 2,796,480 | |
| | 1,672,899 | | | China Galaxy Securities Co. Ltd., Class H (Financials) | | | 1,515,483 | |
| | 4,868,044 | | | China Huarong Asset Management Co. Ltd., Class H (Financials)(b) | | | 2,077,477 | |
| | 3,942,464 | | | China Huishan Dairy Holdings Co. Ltd. (Consumer Staples)(c) | | | 211,569 | |
| | 1,012,916 | | | China Life Insurance Co. Ltd., Class H (Financials) | | | 3,248,496 | |
| | 1,266,362 | | | China Medical System Holdings Ltd. (Health Care) | | | 2,329,998 | |
| | |
| | |
| The accompanying notes are an integral part of these financial statements. | | 41 |
GOLDMAN SACHS ACTIVEBETA® EMERGING MARKETS EQUITY ETF
Schedule of Investments (continued)
August 31, 2017
| | | | | | | | |
Shares | | | Description | | Value | |
| Common Stocks – (continued) | | | |
| China – (continued) | | | |
| | 1,368,246 | | | China Mengniu Dairy Co. Ltd. (Consumer Staples)* | | $ | 3,195,770 | |
| | 1,604,562 | | | China Merchants Bank Co. Ltd., Class H (Financials) | | | 6,048,027 | |
| | 3,544,130 | | | China Minsheng Banking Corp. Ltd., Class H (Financials) | | | 3,536,681 | |
| | 1,738,567 | | | China Mobile Ltd. (Telecommunication Services) | | | 18,437,614 | |
| | 1,020,444 | | | China Overseas Land & Investment Ltd. (Real Estate) | | | 3,566,003 | |
| | 407,708 | | | China Pacific Insurance Group Co. Ltd., Class H (Financials) | | | 1,919,649 | |
| | 8,426,393 | | | China Petroleum & Chemical Corp., Class H (Energy) | | | 6,449,169 | |
| | 4,957,069 | | | China Power International Development Ltd. (Utilities) | | | 1,691,108 | |
| | 759,356 | | | China Resources Beer Holdings Co. Ltd. (Consumer Staples) | | | 1,905,558 | |
| | 621,260 | | | China Resources Land Ltd. (Real Estate) | | | 1,940,830 | |
| | 813,549 | | | China Resources Power Holdings Co. Ltd. (Utilities) | | | 1,492,703 | |
| | 827,793 | | | China Shenhua Energy Co. Ltd., Class H (Energy) | | | 2,131,238 | |
| | 8,758,085 | | | China Telecom Corp. Ltd., Class H (Telecommunication Services) | | | 4,498,528 | |
| | 1,555,897 | | | China Unicom Hong Kong Ltd. (Telecommunication Services)* | | | 2,266,318 | |
| | 3,254,677 | | | Chongqing Rural Commercial Bank Co. Ltd., Class H (Financials) | | | 2,266,416 | |
| | 1,237,554 | | | CITIC Ltd. (Industrials) | | | 1,900,657 | |
| | 941,102 | | | CITIC Securities Co. Ltd., Class H (Financials) | | | 2,087,476 | |
| | 1,870,693 | | | CNOOC Ltd. (Energy) | | | 2,237,245 | |
| | 3,613,660 | | | Country Garden Holdings Co. Ltd. (Real Estate) | | | 4,801,930 | |
| | 2,349,088 | | | CRRC Corp. Ltd., Class H (Industrials) | | | 2,119,040 | |
| | 3,210,533 | | | CSPC Pharmaceutical Group Ltd. (Health Care) | | | 5,012,837 | |
| | 35,262 | | | Ctrip.com International Ltd. ADR (Consumer Discretionary)* | | | 1,814,230 | |
| | 2,248,100 | | | Dongfeng Motor Group Co. Ltd., Class H (Consumer Discretionary) | | | 2,918,398 | |
| | 2,564,999 | | | Geely Automobile Holdings Ltd. (Consumer Discretionary) | | | 6,305,615 | |
| | 835,899 | | | GF Securities Co. Ltd., Class H (Financials) | | | 1,783,633 | |
| | 16,391,735 | | | GOME Retail Holdings Ltd. (Consumer Discretionary) | | | 1,717,410 | |
| | 963,116 | | | Haitong Securities Co. Ltd., Class H (Financials) | | | 1,614,536 | |
| | 278,216 | | | Hengan International Group Co. Ltd. (Consumer Staples) | | | 2,324,851 | |
| | 708,945 | | | Huatai Securities Co. Ltd., Class H (Financials)(b) | | | 1,577,960 | |
| | |
| Common Stocks – (continued) | | | |
| China – (continued) | | | |
| | 21,310,287 | | | Industrial & Commercial Bank of China Ltd., Class H (Financials) | | | 15,955,929 | |
| | 142,382 | | | JD.com, Inc. ADR (Consumer Discretionary)* | | | 5,967,230 | |
| | 1,062,406 | | | Jiangsu Expressway Co. Ltd., Class H (Industrials) | | | 1,628,947 | |
| | 878,910 | | | Kingsoft Corp. Ltd. (Information Technology) | | | 2,084,287 | |
| | 1,904,631 | | | Kunlun Energy Co. Ltd. (Energy) | | | 1,844,655 | |
| | 6,488,476 | | | Lenovo Group Ltd. (Information Technology) | | | 3,548,311 | |
| | 1,111,980 | | | Longfor Properties Co. Ltd. (Real Estate) | | | 2,671,099 | |
| | 71,792 | | | Momo, Inc. ADR (Information Technology)* | | | 2,766,146 | |
| | 31,345 | | | NetEase, Inc. ADR (Information Technology) | | | 8,646,205 | |
| | 485,989 | | | New China Life Insurance Co. Ltd., Class H (Financials) | | | 3,110,995 | |
| | 68,883 | | | New Oriental Education & Technology Group, Inc. ADR (Consumer Discretionary)* | | | 5,631,185 | |
| | 5,180,644 | | | People’s Insurance Co Group of China Ltd. (The), Class H (Financials) | | | 2,442,560 | |
| | 5,220,422 | | | PetroChina Co. Ltd., Class H (Energy) | | | 3,335,115 | |
| | 1,704,560 | | | PICC Property & Casualty Co. Ltd., Class H (Financials) | | | 3,201,583 | |
| | 1,598,669 | | | Ping An Insurance Group Co. of China Ltd., Class H (Financials) | | | 12,695,063 | |
| | 291,789 | | | Shenzhou International Group Holdings Ltd. (Consumer Discretionary) | | | 2,337,608 | |
| | 5,110,241 | | | Sihuan Pharmaceutical Holdings Group Ltd. (Health Care) | | | 1,965,364 | |
| | 29,453 | | | SINA Corp./China (Information Technology)* | | | 2,999,199 | |
| | 2,402,201 | | | Sino-Ocean Group Holding Ltd. (Real Estate) | | | 1,657,442 | |
| | 632,288 | | | Sinopharm Group Co. Ltd., Class H (Health Care) | | | 2,855,877 | |
| | 894,762 | | | Sunac China Holdings Ltd. (Real Estate) | | | 2,686,647 | |
| | 288,073 | | | Sunny Optical Technology Group Co. Ltd. (Information Technology) | | | 4,129,815 | |
| | 142,068 | | | TAL Education Group ADR (Consumer Discretionary) | | | 4,323,129 | |
| | 1,560,008 | | | Tencent Holdings Ltd. (Information Technology) | | | 65,577,961 | |
| | 1,536,065 | | | Tingyi Cayman Islands Holding Corp. (Consumer Staples) | | | 2,045,090 | |
| | 736,267 | | | TravelSky Technology Ltd., Class H (Information Technology) | | | 2,013,188 | |
| | 491,254 | | | Tsingtao Brewery Co. Ltd., Class H (Consumer Staples) | | | 2,036,836 | |
| | |
| | |
| 42 | | The accompanying notes are an integral part of these financial statements. |
GOLDMAN SACHS ACTIVEBETA® EMERGING MARKETS EQUITY ETF
| | | | | | | | |
Shares | | | Description | | Value | |
| Common Stocks – (continued) | | | |
| China – (continued) | | | |
| | 260,610 | | | Vipshop Holdings Ltd. ADR (Consumer Discretionary)* | | $ | 2,426,279 | |
| | 3,497,091 | | | Want Want China Holdings Ltd. (Consumer Staples)(a) | | | 2,314,578 | |
| | 44,813 | | | Weibo Corp. ADR (Information Technology)*(a) | | | 4,530,594 | |
| | 24,674 | | | YY, Inc. ADR (Information Technology)* | | | 1,843,641 | |
| | | | | | | | |
| | | | | | | 426,485,332 | |
| | |
| Colombia – 0.4% | | | |
| | 3,536,124 | | | Ecopetrol SA (Energy) | | | 1,645,103 | |
| | 134,914 | | | Grupo de Inversiones Suramericana SA (Financials) | | | 1,901,297 | |
| | 519,976 | | | Interconexion Electrica SA ESP (Utilities) | | | 2,359,037 | |
| | | | | | | | |
| | | | | | | 5,905,437 | |
| | |
| Egypt – 0.4% | | | |
| | 946,512 | | | Commercial International Bank Egypt SAE GDR (Financials) | | | 4,325,560 | |
| | 2,356,430 | | | Global Telecom Holding SAE (Telecommunication Services)* | | | 939,369 | |
| | | | | | | | |
| | | | | | | 5,264,929 | |
| | |
| Greece – 0.3% | | | |
| | 253,522 | | | Hellenic Telecommunications Organization SA (Telecommunication Services) | | | 3,225,110 | |
| | 147,685 | | | OPAP SA (Consumer Discretionary) | | | 1,648,721 | |
| | | | | | | | |
| | | | | | | 4,873,831 | |
| | |
| Hong Kong – 1.0% | | | |
| | 1,435,764 | | | Haier Electronics Group Co. Ltd. (Consumer Discretionary)* | | | 3,815,764 | |
| | 7,104,644 | | | Sino Biopharmaceutical Ltd. (Health Care) | | | 6,236,404 | |
| | 4,823,900 | | | Sun Art Retail Group Ltd. (Consumer Staples) | | | 4,443,946 | |
| | | | | | | | |
| | | | | | | 14,496,114 | |
| | |
| Hungary – 0.6% | | | |
| | 33,432 | | | MOL Hungarian Oil & Gas PLC (Energy) | | | 3,098,510 | |
| | 62,332 | | | OTP Bank PLC (Financials) | | | 2,533,193 | |
| | 99,334 | | | Richter Gedeon Nyrt (Health Care) | | | 2,582,963 | |
| | | | | | | | |
| | | | | | | 8,214,666 | |
| | |
| India – 8.9% | | | |
| | 263,879 | | | Adani Ports & Special Economic Zone Ltd. (Industrials) | | | 1,622,045 | |
| | 98,274 | | | Asian Paints Ltd. (Materials) | | | 1,796,415 | |
| | 55,289 | | | Bajaj Auto Ltd. (Consumer Discretionary) | | | 2,434,225 | |
| | 127,297 | | | Bajaj Finance Ltd. (Financials) | | | 3,548,316 | |
| | 30,315 | | | Bajaj Finserv Ltd. (Financials) | | | 2,609,552 | |
| | |
| Common Stocks – (continued) | | | |
| India – (continued) | | | |
| | 384,576 | | | Bharat Petroleum Corp. Ltd. (Energy) | | | 3,182,428 | |
| | 384,673 | | | Bharti Airtel Ltd. (Telecommunication Services) | | | 2,573,663 | |
| | 238,455 | | | Cipla Ltd. (Health Care) | | | 2,133,277 | |
| | 316,812 | | | Dabur India Ltd. (Consumer Staples) | | | 1,561,603 | |
| | 73,247 | | | Dr. Reddy’s Laboratories Ltd. (Health Care) | | | 2,315,557 | |
| | 5,014 | | | Eicher Motors Ltd. (Industrials) | | | 2,466,820 | |
| | 339,782 | | | GAIL India Ltd. (Utilities) | | | 2,010,747 | |
| | 126,276 | | | Grasim Industries Ltd. (Materials) | | | 2,360,925 | |
| | 226,389 | | | HCL Technologies Ltd. (Information Technology) | | | 3,064,381 | |
| | 67,255 | | | Hero MotoCorp Ltd. (Consumer Discretionary) | | | 4,203,132 | |
| | 705,397 | | | Hindalco Industries Ltd. (Materials) | | | 2,626,222 | |
| | 379,850 | | | Hindustan Unilever Ltd. (Consumer Staples) | | | 7,247,759 | |
| | 328,016 | | | Housing Development Finance Corp. Ltd. (Financials) | | | 9,117,563 | |
| | 1,244,220 | | | Idea Cellular Ltd. (Telecommunication Services) | | | 1,764,354 | |
| | 161,554 | | | Indiabulls Housing Finance Ltd. (Financials) | | | 3,071,804 | |
| | 229,102 | | | Indian Oil Corp. Ltd. (Energy) | | | 1,629,576 | |
| | 571,617 | | | Infosys Ltd. (Information Technology) | | | 8,181,318 | |
| | 778,847 | | | ITC Ltd. (Consumer Staples) | | | 3,438,800 | |
| | 92,397 | | | Larsen & Toubro Ltd. (Industrials) | | | 1,642,373 | |
| | 186,796 | | | LIC Housing Finance Ltd. (Financials) | | | 1,969,027 | |
| | 72,583 | | | Mahindra & Mahindra Ltd. (Consumer Discretionary) | | | 1,526,910 | |
| | 713,621 | | | Marico Ltd. (Consumer Staples) | | | 3,521,429 | |
| | 34,526 | | | Maruti Suzuki India Ltd. (Consumer Discretionary) | | | 4,158,863 | |
| | 32,710 | | | Nestle India Ltd. (Consumer Staples) | | | 3,643,825 | |
| | 618,731 | | | NTPC Ltd. (Utilities) | | | 1,633,302 | |
| | 721,364 | | | Oil & Natural Gas Corp. Ltd. (Energy) | | | 1,771,074 | |
| | 45,385 | | | Piramal Enterprises Ltd. (Health Care) | | | 1,926,615 | |
| | 876,992 | | | Power Finance Corp. Ltd. (Financials) | | | 1,675,066 | |
| | 230,002 | | | Reliance Industries Ltd. (Energy) | | | 5,736,895 | |
| | 296,396 | | | Sun Pharmaceutical Industries Ltd. (Health Care) | | | 2,230,867 | |
| | 157,061 | | | Tata Consultancy Services Ltd. (Information Technology) | | | 6,133,306 | |
| | 363,509 | | | Tata Motors Ltd. (Consumer Discretionary)* | | | 2,141,207 | |
| | 418,120 | | | Tata Motors Ltd., Class A (Consumer Discretionary)* | | | 1,430,770 | |
| | 1,757,068 | | | Tata Power Co. Ltd. (The) (Utilities) | | | 2,178,254 | |
| | |
| | |
| The accompanying notes are an integral part of these financial statements. | | 43 |
GOLDMAN SACHS ACTIVEBETA® EMERGING MARKETS EQUITY ETF
Schedule of Investments (continued)
August 31, 2017
| | | | | | | | |
Shares | | | Description | | Value | |
| Common Stocks – (continued) | | | |
| India – (continued) | | | |
| | 261,818 | | | Tech Mahindra Ltd. (Information Technology) | | $ | 1,753,542 | |
| | 133,501 | | | UPL Ltd. (Materials) | | | 1,729,266 | |
| | 924,005 | | | Vedanta Ltd. (Materials) | | | 4,464,913 | |
| | 941,724 | | | Wipro Ltd. (Information Technology) | | | 4,406,166 | |
| | 87,129 | | | Yes Bank Ltd. (Financials) | | | 2,389,339 | |
| | | | | | | | |
| | | | | | | 133,023,491 | |
| | |
| Indonesia – 1.9% | | | |
| | 20,551,092 | | | Adaro Energy Tbk PT (Energy) | | | 2,811,104 | |
| | 3,901,815 | | | Astra International Tbk PT (Consumer Discretionary) | | | 2,303,013 | |
| | 2,863,065 | | | Bank Central Asia Tbk PT (Financials) | | | 4,066,488 | |
| | 4,524,825 | | | Bank Negara Indonesia Persero Tbk PT (Financials) | | | 2,492,690 | |
| | 1,936,315 | | | Bank Rakyat Indonesia Persero Tbk PT (Financials) | | | 2,195,080 | |
| | 16,311,385 | | | Kalbe Farma Tbk PT (Health Care) | | | 2,090,576 | |
| | 9,192,957 | | | Perusahaan Gas Negara Persero Tbk (Utilities) | | | 1,460,731 | |
| | 13,279,265 | | | Telekomunikasi Indonesia Persero Tbk PT (Telecommunication Services) | | | 4,667,947 | |
| | 1,144,873 | | | Unilever Indonesia Tbk PT (Consumer Staples) | | | 4,337,680 | |
| | 766,121 | | | United Tractors Tbk PT (Energy) | | | 1,739,879 | |
| | | | | | | | |
| | | | | | | 28,165,188 | |
| | |
| Malaysia – 1.6% | | | |
| | 2,443,629 | | | Astro Malaysia Holdings Bhd (Consumer Discretionary) | | | 1,533,527 | |
| | 227,302 | | | British American Tobacco Malaysia Bhd (Consumer Staples) | | | 2,351,528 | |
| | 1,263,500 | | | CIMB Group Holdings Bhd (Financials) | | | 2,094,738 | |
| | 4,097,300 | | | Dialog Group Bhd (Energy) | | | 1,966,858 | |
| | 3,063,119 | | | DiGi.Com Bhd (Telecommunication Services) | | | 3,471,607 | |
| | 1,321,563 | | | Genting Bhd (Consumer Discretionary) | | | 3,004,888 | |
| | 751,134 | | | HAP Seng Consolidated Bhd (Industrials) | | | 1,597,072 | |
| | 848,938 | | | Malayan Banking Bhd (Financials) | | | 1,880,565 | |
| | 432,988 | | | Public Bank Bhd (Financials) | | | 2,088,644 | |
| | 958,600 | | | Sime Darby Bhd (Industrials) | | | 2,020,232 | |
| | 1,117,800 | | | UMW Holdings Bhd (Consumer Discretionary)* | | | 1,591,435 | |
| | | | | | | | |
| | | | | | | 23,601,094 | |
| | |
| Mexico – 3.3% | | | |
| | 1,548,546 | | | Alfa SAB de CV, Class A (Industrials) | | | 2,174,754 | |
| | |
| Common Stocks – (continued) | | | |
| Mexico – (continued) | | | |
| | 8,390,829 | | | America Movil SAB de CV, Series L (Telecommunication Services) | | | 7,824,582 | |
| | 378,181 | | | Arca Continental SAB de CV (Consumer Staples) | | | 2,775,446 | |
| | 3,516,998 | | | Cemex SAB de CV, Series CPO (Materials)* | | | 3,297,417 | |
| | 332,084 | | | Coca-Cola Femsa SAB de CV, Series L (Consumer Staples) | | | 2,730,234 | |
| | 481,302 | | | Fomento Economico Mexicano SAB de CV (Consumer Staples) | | | 4,831,991 | |
| | 989,906 | | | Gentera SAB de CV (Financials) | | | 1,523,509 | |
| | 260,768 | | | Gruma SAB de CV, Class B (Consumer Staples) | | | 3,836,590 | |
| | 129,470 | | | Grupo Aeroportuario del Sureste SAB de CV, Class B (Industrials) | | | 2,649,367 | |
| | 1,636,784 | | | Grupo Bimbo SAB de CV, Series A (Consumer Staples) | | | 3,980,206 | |
| | 465,494 | | | Grupo Financiero Banorte SAB de CV, Class O (Financials) | | | 3,184,303 | |
| | 722,719 | | | Grupo Mexico SAB de CV, Series B (Materials) | | | 2,390,038 | |
| | 534,013 | | | Infraestructura Energetica Nova SAB de CV (Utilities) | | | 2,910,851 | |
| | 745,837 | | | Kimberly-Clark de Mexico SAB de CV, Class A (Consumer Staples) | | | 1,468,846 | |
| | 1,633,711 | | | Wal-Mart de Mexico SAB de CV (Consumer Staples) | | | 3,986,483 | |
| | | | | | | | |
| | | | | | | 49,564,617 | |
| | |
| Peru – 0.2% | | | |
| | 16,045 | | | Credicorp Ltd. (Financials) | | | 3,254,568 | |
| | |
| Philippines – 0.3% | | | |
| | 55,344 | | | Globe Telecom, Inc. (Telecommunication Services) | | | 2,163,143 | |
| | 405,808 | | | Jollibee Foods Corp. (Consumer Discretionary) | | | 1,889,065 | |
| | | | | | | | |
| | | | | | | 4,052,208 | |
| | |
| Poland – 1.9% | | | |
| | 58,411 | | | Bank Pekao SA (Financials) | | | 2,091,478 | |
| | 51,094 | | | CCC SA (Consumer Discretionary)* | | | 3,749,047 | |
| | 177,425 | | | Grupa Lotos SA (Energy)* | | | 2,922,493 | |
| | 96,704 | | | Jastrzebska Spolka Weglowa SA (Materials)* | | | 2,814,467 | |
| | 68,579 | | | KGHM Polska Miedz SA (Materials) | | | 2,420,052 | |
| | 1,344 | | | LPP SA (Consumer Discretionary) | | | 3,284,364 | |
| | 164,420 | | | Polski Koncern Naftowy ORLEN SA (Energy) | | | 5,424,838 | |
| | 201,016 | | | Powszechna Kasa Oszczednosci Bank Polski SA (Financials)* | | | 2,063,376 | |
| | 178,475 | | | Powszechny Zaklad Ubezpieczen SA (Financials) | | | 2,422,353 | |
| | |
| | |
| 44 | | The accompanying notes are an integral part of these financial statements. |
GOLDMAN SACHS ACTIVEBETA® EMERGING MARKETS EQUITY ETF
| | | | | | | | |
Shares | | | Description | | Value | |
| Common Stocks – (continued) | | | |
| Poland – (continued) | | | |
| | 1,268,768 | | | Synthos SA (Materials) | | $ | 1,697,182 | |
| | | | | | | | |
| | | | | | | 28,889,650 | |
| | |
| Qatar – 0.6% | | | |
| | 176,401 | | | Masraf Al Rayan QSC (Financials) | | | 1,848,183 | |
| | 95,719 | | | Ooredoo QSC (Telecommunication Services) | | | 2,302,514 | |
| | 351,520 | | | Qatar Gas Transport Co. Ltd. (Energy) | | | 1,640,185 | |
| | 69,382 | | | Qatar National Bank QPSC (Financials) | | | 2,488,511 | |
| | | | | | | | |
| | | | | | | 8,279,393 | |
| | |
| Russia – 3.1% | | | |
| | 1,338,775 | | | Alrosa PJSC (Materials) | | | 1,871,865 | |
| | 856,630 | | | Gazprom PJSC ADR (Energy) | | | 3,417,954 | |
| | 44,065,349 | | | Inter RAO UES PJSC (Utilities) | | | 2,981,951 | |
| | 160,204 | | | LUKOIL PJSC (Energy) | | | 8,111,577 | |
| | 12,915 | | | MMC Norilsk Nickel PJSC (Materials) | | | 2,177,148 | |
| | 342,602 | | | Mobile TeleSystems PJSC ADR (Telecommunication Services) | | | 3,422,594 | |
| | 16,014 | | | Novatek PJSC GDR (Energy) | | | 1,692,680 | |
| | 1,396,544 | | | Rostelecom PJSC (Telecommunication Services) | | | 1,611,166 | |
| | 660,492 | | | Sberbank of Russia PJSC ADR (Financials) | | | 9,015,716 | |
| | 189,819 | | | Severstal PJSC GDR (Materials) | | | 3,001,038 | |
| | 423,588 | | | Surgutneftegas OJSC ADR (Energy) | | | 1,937,491 | |
| | 394,426 | | | Surgutneftegas OJSC ADR (Energy) | | | 1,924,799 | |
| | 88,601 | | | Tatneft PJSC ADR (Energy) | | | 3,530,750 | |
| | 988,565 | | | VTB Bank PJSC GDR (Financials) | | | 2,208,454 | |
| | | | | | | | |
| | | | | | | 46,905,183 | |
| | |
| South Africa – 6.3% | | | |
| | 55,861 | | | Anglo American Platinum Ltd. (Materials)* | | | 1,514,984 | |
| | 215,320 | | | AngloGold Ashanti Ltd. (Materials) | | | 2,181,114 | |
| | 162,252 | | | Barclays Africa Group Ltd. (Financials)(a) | | | 1,852,276 | |
| | 160,632 | | | Bidvest Group Ltd. (The) (Industrials)(a) | | | 2,118,896 | |
| | 43,460 | | | Capitec Bank Holdings Ltd. (Financials) | | | 3,011,020 | |
| | 320,005 | | | Coronation Fund Managers Ltd. (Financials) | | | 1,732,052 | |
| | 345,180 | | | Exxaro Resources Ltd. (Energy) | | | 3,475,569 | |
| | 836,188 | | | FirstRand Ltd. (Financials)(a) | | | 3,572,496 | |
| | 499,481 | | | Fortress Income Fund Ltd. REIT (Real Estate) | | | 1,514,487 | |
| | 1,613,446 | | | Fortress Income Fund Ltd., Class A REIT (Real Estate) | | | 2,177,330 | |
| | |
| Common Stocks – (continued) | | | |
| South Africa – (continued) | | | |
| | 135,049 | | | Foschini Group Ltd. (The) (Consumer Discretionary) | | | 1,592,534 | |
| | 621,341 | | | Gold Fields Ltd. (Materials)(a) | | | 2,772,670 | |
| | 1,104,478 | | | Growthpoint Properties Ltd. REIT (Real Estate)(a) | | | 2,137,151 | |
| | 193,502 | | | Liberty Holdings Ltd. (Financials)(a) | | | 1,542,359 | |
| | 740,042 | | | Life Healthcare Group Holdings Ltd. (Health Care) | | | 1,501,436 | |
| | 223,346 | | | Massmart Holdings Ltd. (Consumer Staples)(a) | | | 2,090,577 | |
| | 84,943 | | | Mondi Ltd. (Materials) | | | 2,318,213 | |
| | 194,293 | | | Mr Price Group Ltd. (Consumer Discretionary) | | | 2,709,414 | |
| | 199,685 | | | MTN Group Ltd. (Telecommunication Services)(a) | | | 1,985,404 | |
| | 81,214 | | | Naspers Ltd., Class N (Consumer Discretionary) | | | 18,376,452 | |
| | 851,414 | | | Netcare Ltd. (Health Care) | | | 1,579,349 | |
| | 701,727 | | | Pick n Pay Stores Ltd. (Consumer Staples) | | | 3,454,241 | |
| | 2,539,551 | | | Redefine Properties Ltd. REIT (Real Estate) | | | 2,082,832 | |
| | 159,850 | | | Resilient REIT Ltd. REIT (Real Estate)(a) | | | 1,538,053 | |
| | 523,641 | | | Sappi Ltd. (Materials) | | | 3,521,156 | |
| | 178,840 | | | Shoprite Holdings Ltd. (Consumer Staples) | | | 3,101,269 | |
| | 117,024 | | | SPAR Group Ltd. (The) (Consumer Staples) | | | 1,522,055 | |
| | 276,141 | | | Standard Bank Group Ltd. (Financials) | | | 3,557,168 | |
| | 567,652 | | | Steinhoff International Holdings NV (Consumer Discretionary) | | | 2,745,344 | |
| | 530,750 | | | Telkom SA SOC Ltd. (Telecommunication Services) | | | 2,562,791 | |
| | 57,937 | | | Tiger Brands Ltd. (Consumer Staples) | | | 1,796,392 | |
| | 312,264 | | | Vodacom Group Ltd. (Telecommunication Services) | | | 4,362,687 | |
| | 406,165 | | | Woolworths Holdings Ltd. (Consumer Discretionary)(a) | | | 1,854,343 | |
| | | | | | | | |
| | | | | | | 93,854,114 | |
| | |
| South Korea – 14.5% | | | |
| | 14,515 | | | Amorepacific Corp. (Consumer Staples) | | | 3,707,272 | |
| | 27,606 | | | AMOREPACIFIC Group (Consumer Staples) | | | 3,280,599 | |
| | 25,773 | | | BGF retail Co. Ltd. (Consumer Staples) | | | 2,084,514 | |
| | 175,248 | | | BNK Financial Group, Inc. (Financials) | | | 1,532,410 | |
| | 16,423 | | | Celltrion, Inc. (Health Care)* | | | 1,676,381 | |
| �� | 6,543 | | | CJ CheilJedang Corp (Consumer Staples) | | | 2,103,439 | |
| | |
| | |
| The accompanying notes are an integral part of these financial statements. | | 45 |
GOLDMAN SACHS ACTIVEBETA® EMERGING MARKETS EQUITY ETF
Schedule of Investments (continued)
August 31, 2017
| | | | | | | | |
Shares | | | Description | | Value | |
| Common Stocks – (continued) | | | |
| South Korea – (continued) | | | |
| | 22,681 | | | CJ E&M Corp. (Consumer Discretionary) | | $ | 1,528,695 | |
| | 41,723 | | | Coway Co. Ltd. (Consumer Discretionary) | | | 3,655,758 | |
| | 221,848 | | | DGB Financial Group, Inc. (Financials) | | | 2,164,179 | |
| | 45,223 | | | Dongbu Insurance Co. Ltd. (Financials) | | | 3,015,936 | |
| | 11,324 | | | E-MART, Inc. (Consumer Staples) | | | 2,249,535 | |
| | 41,547 | | | GS Holdings Corp. (Energy) | | | 2,601,293 | |
| | 99,407 | | | Hana Financial Group, Inc. (Financials) | | | 4,319,744 | |
| | 46,456 | | | Hankook Tire Co. Ltd. (Consumer Discretionary) | | | 2,430,741 | |
| | 18,050 | | | Hanssem Co. Ltd. (Consumer Discretionary) | | | 2,721,266 | |
| | 51,646 | | | Hanwha Chemical Corp. (Materials) | | | 1,619,090 | |
| | 45,038 | | | Hanwha Corp. (Industrials) | | | 1,963,123 | |
| | 365,522 | | | Hanwha Life Insurance Co. Ltd. (Financials) | | | 2,372,846 | |
| | 26,476 | | | Hotel Shilla Co. Ltd. (Consumer Discretionary) | | | 1,453,409 | |
| | 12,684 | | | Hyosung Corp. (Materials) | | | 1,782,914 | |
| | 29,368 | | | Hyundai Department Store Co. Ltd. (Consumer Discretionary) | | | 2,515,918 | |
| | 56,634 | | | Hyundai Marine & Fire Insurance Co. Ltd. (Financials) | | | 2,320,407 | |
| | 13,628 | | | Hyundai Mobis Co. Ltd. (Consumer Discretionary) | | | 2,852,260 | |
| | 15,416 | | | Hyundai Motor Co. (Consumer Discretionary) | | | 1,920,848 | |
| | 33,579 | | | Hyundai Steel Co. (Materials) | | | 1,718,259 | |
| | 182,598 | | | Industrial Bank of Korea (Financials) | | | 2,420,929 | |
| | 113,609 | | | KB Financial Group, Inc. (Financials) | | | 5,581,712 | |
| | 116,216 | | | Kia Motors Corp. (Consumer Discretionary) | | | 3,653,651 | |
| | 84,849 | | | Korea Electric Power Corp. (Utilities) | | | 3,228,115 | |
| | 76,676 | | | Korea Gas Corp. (Utilities)* | | | 3,080,368 | |
| | 37,028 | | | Korea Investment Holdings Co. Ltd. (Financials) | | | 2,157,449 | |
| | 100,414 | | | KT Corp. (Telecommunication Services) | | | 3,153,755 | |
| | 28,232 | | | KT&G Corp. (Consumer Staples) | | | 2,866,765 | |
| | 7,023 | | | LG Chem Ltd. (Materials) | | | 2,360,515 | |
| | 34,062 | | | LG Corp. (Industrials) | | | 2,537,432 | |
| | 55,160 | | | LG Electronics, Inc. (Consumer Discretionary) | | | 3,986,822 | |
| | 5,223 | | | LG Household & Health Care Ltd. (Consumer Staples) | | | 4,446,683 | |
| | 5,468 | | | Lotte Chemical Corp. (Materials) | | | 1,937,270 | |
| | 9,956 | | | NAVER Corp (Information Technology) | | | 6,666,176 | |
| | 7,485 | | | NCSoft Corp. (Information Technology) | | | 2,552,308 | |
| | 17,496 | | | OCI Co. Ltd. (Materials) | | | 1,525,237 | |
| | 19,578 | | | POSCO (Materials) | | | 5,964,032 | |
| | |
| Common Stocks – (continued) | | | |
| South Korea – (continued) | | | |
| | 35,500 | | | S-1 Corp. (Industrials) | | | 2,824,007 | |
| | 18,814 | | | Samsung Electro-Mechanics Co. Ltd. (Information Technology) | | | 1,685,185 | |
| | 27,292 | | | Samsung Electronics Co. Ltd. (Information Technology) | | | 56,055,580 | |
| | 8,762 | | | Samsung Fire & Marine Insurance Co. Ltd. (Financials) | | | 2,148,539 | |
| | 20,831 | | | Samsung Life Insurance Co. Ltd. (Financials) | | | 2,133,718 | |
| | 62,992 | | | Samsung Securities Co. Ltd. (Financials) | | | 2,041,821 | |
| | 98,776 | | | Shinhan Financial Group Co. Ltd. (Financials) | | | 4,555,119 | |
| | 8,115 | | | SK Holdings Co. Ltd. (Industrials) | | | 1,925,117 | |
| | 160,239 | | | SK Hynix, Inc. (Information Technology) | | | 9,748,488 | |
| | 15,703 | | | SK Innovation Co. Ltd. (Energy) | | | 2,625,058 | |
| | 20,217 | | | SK Telecom Co. Ltd. (Telecommunication Services) | | | 4,545,060 | |
| | 25,787 | | | S-Oil Corp. (Energy) | | | 2,870,050 | |
| | 236,955 | | | Woori Bank (Financials) | | | 3,908,623 | |
| | 7,642 | | | Yuhan Corp. (Health Care) | | | 1,531,653 | |
| | | | | | | | |
| | | | | | | 216,308,073 | |
| | |
| Taiwan – 11.1% | | | |
| | 2,296,623 | | | Advanced Semiconductor Engineering, Inc. (Information Technology) | | | 2,770,041 | |
| | 350,388 | | | Advantech Co. Ltd. (Information Technology) | | | 2,583,297 | |
| | 1,762,425 | | | Asia Cement Corp. (Materials) | | | 1,597,214 | |
| | 237,171 | | | Asustek Computer, Inc. (Information Technology) | | | 1,964,702 | |
| | 3,687,134 | | | AU Optronics Corp. (Information Technology) | | | 1,514,976 | |
| | 115,610 | | | Catcher Technology Co. Ltd. (Information Technology) | | | 1,471,031 | |
| | 1,868,164 | | | Cathay Financial Holding Co. Ltd. (Financials) | | | 3,048,712 | |
| | 822,666 | | | Chailease Holding Co. Ltd. (Financials) | | | 2,240,735 | |
| | 2,893,653 | | | Chang Hwa Commercial Bank Ltd. (Financials) | | | 1,582,069 | |
| | 3,454,437 | | | China Steel Corp. (Materials) | | | 2,895,963 | |
| | 954,844 | | | Chunghwa Telecom Co. Ltd. (Telecommunication Services) | | | 3,322,132 | |
| | 3,750,615 | | | Compal Electronics, Inc. (Information Technology) | | | 2,696,854 | |
| | 4,781,576 | | | CTBC Financial Holding Co. Ltd. (Financials) | | | 3,097,512 | |
| | 376,478 | | | Delta Electronics, Inc. (Information Technology) | | | 2,064,585 | |
| | 2,923,737 | | | E.Sun Financial Holding Co. Ltd. (Financials) | | | 1,801,965 | |
| | |
| | |
| 46 | | The accompanying notes are an integral part of these financial statements. |
GOLDMAN SACHS ACTIVEBETA® EMERGING MARKETS EQUITY ETF
| | | | | | | | |
Shares | | | Description | | Value | |
| Common Stocks – (continued) | | | |
| Taiwan – (continued) | | | |
| | 707,786 | | | Far EasTone Telecommunications Co. Ltd. (Telecommunication Services) | | $ | 1,716,755 | |
| | 668,851 | | | Feng TAY Enterprise Co. Ltd. (Consumer Discretionary) | | | 3,169,280 | |
| | 3,278,639 | | | First Financial Holding Co. Ltd. (Financials) | | | 2,129,339 | |
| | 730,251 | | | Formosa Chemicals & Fibre Corp. (Materials) | | | 2,296,326 | |
| | 673,431 | | | Formosa Petrochemical Corp. (Energy) | | | 2,376,500 | |
| | 843,244 | | | Formosa Plastics Corp. (Materials) | | | 2,623,699 | |
| | 1,603,333 | | | Fubon Financial Holding Co. Ltd. (Financials) | | | 2,576,681 | |
| | 129,852 | | | General Interface Solution Holding Ltd. (Information Technology) | | | 1,555,436 | |
| | 3,919,903 | | | Hon Hai Precision Industry Co. Ltd. (Information Technology) | | | 15,261,891 | |
| | 2,814,461 | | | Hua Nan Financial Holdings Co. Ltd. (Financials) | | | 1,571,413 | |
| | 3,356,205 | | | Innolux Corp. (Information Technology) | | | 1,634,786 | |
| | 24,796 | | | Largan Precision Co. Ltd. (Information Technology) | | | 4,790,108 | |
| | 1,093,130 | | | Lite-On Technology Corp. (Information Technology) | | | 1,617,292 | |
| | 2,373,702 | | | Mega Financial Holding Co. Ltd. (Financials) | | | 1,907,362 | |
| | 937,624 | | | Nan Ya Plastics Corp. (Materials) | | | 2,367,439 | |
| | 702,181 | | | Nanya Technology Corp. (Information Technology) | | | 1,505,388 | |
| | 245,625 | | | Nien Made Enterprise Co. Ltd. (Consumer Discretionary) | | | 2,641,085 | |
| | 506,623 | | | Pegatron Corp. (Information Technology) | | | 1,594,791 | |
| | 169,753 | | | Phison Electronics Corp. (Information Technology) | | | 2,289,323 | |
| | 1,262,073 | | | Pou Chen Corp. (Consumer Discretionary) | | | 1,637,236 | |
| | 616,696 | | | President Chain Store Corp. (Consumer Staples) | | | 5,159,738 | |
| | 799,977 | | | Quanta Computer, Inc. (Information Technology) | | | 1,821,081 | |
| | 4,854,405 | | | SinoPac Financial Holdings Co Ltd. (Financials)* | | | 1,560,281 | |
| | 1,230,777 | | | Standard Foods Corp. (Consumer Staples) | | | 3,144,336 | |
| | 8,310,359 | | | Taiwan Business Bank (Financials) | | | 2,296,577 | |
| | 3,096,196 | | | Taiwan Cooperative Financial Holding Co. Ltd. (Financials) | | | 1,631,251 | |
| | 665,250 | | | Taiwan Mobile Co. Ltd. (Telecommunication Services) | | | 2,380,695 | |
| | 6,701,099 | | | Taiwan Semiconductor Manufacturing Co. Ltd. (Information Technology) | | | 48,072,764 | |
| | |
| Common Stocks – (continued) | | | |
| Taiwan – (continued) | | | |
| | 2,481,061 | | | Uni-President Enterprises Corp. (Consumer Staples) | | | 5,277,979 | |
| | 2,493,735 | | | Wistron Corp. (Information Technology) | | | 2,354,997 | |
| | | | | | | | |
| | | | | | | 165,613,617 | |
| | |
| Thailand – 1.0% | | | |
| | 332,116 | | | Advanced Info Service PCL NVDR (Telecommunication Services) | | | 1,875,373 | |
| | 1,041,077 | | | CP ALL PCL NVDR (Consumer Staples) | | | 1,943,887 | |
| | 353,000 | | | Electricity Generating PCL NVDR (Utilities) | | | 2,487,637 | |
| | 5,775,400 | | | Home Product Center PCL NVDR (Consumer Discretionary) | | | 1,739,316 | |
| | 246,357 | | | PTT PCL NVDR (Energy) | | | 2,960,291 | |
| | 353,179 | | | Siam Commercial Bank PCL (The) NVDR (Financials) | | | 1,600,766 | |
| | 679,800 | | | Thai Oil PCL NVDR (Energy) | | | 1,929,563 | |
| | | | | | | | |
| | | | | | | 14,536,833 | |
| | |
| Turkey – 1.1% | | | |
| | 255,286 | | | Aselsan Elektronik Sanayi Ve Ticaret AS (Industrials) | | | 1,996,415 | |
| | 208,446 | | | BIM Birlesik Magazalar AS (Consumer Staples) | | | 4,618,650 | |
| | 803,159 | | | Eregli Demir ve Celik Fabrikalari TAS (Materials) | | | 1,912,200 | |
| | 545,889 | | | Haci Omer Sabanci Holding AS (Financials) | | | 1,675,985 | |
| | 1,180,359 | | | Petkim Petrokimya Holding AS (Materials)(a) | | | 2,133,334 | |
| | 64,373 | | | Tupras Turkiye Petrol Rafinerileri AS (Energy) | | | 2,187,065 | |
| | 904,284 | | | Turkiye Is Bankasi, Class C (Financials) | | | 1,961,764 | |
| | | | | | | | |
| | | | | | | 16,485,413 | |
| | |
| United Arab Emirates – 0.6% | | | |
| | 2,932,620 | | | Aldar Properties PJSC (Real Estate) | | | 1,844,315 | |
| | 1,394,897 | | | DAMAC Properties Dubai Co. PJSC (Real Estate) | | | 1,534,231 | |
| | 961,676 | | | Dubai Islamic Bank PJSC (Financials) | | | 1,594,459 | |
| | 783,344 | | | Emaar Properties PJSC (Real Estate) | | | 1,812,753 | |
| | 503,849 | | | Emirates Telecommunications Group Co. PJSC (Telecommunication Services) | | | 2,469,108 | |
| | | | | | | | |
| | | | | | | 9,254,866 | |
| | |
| United States – 0.4% | | | |
| | 162,440 | | | Yum China Holdings, Inc. (Consumer Discretionary)* | | | 5,743,878 | |
| | |
| | TOTAL COMMON STOCKS | |
| | (Cost $1,146,346,032) | | $ | 1,420,830,899 | |
| | |
| | |
| The accompanying notes are an integral part of these financial statements. | | 47 |
GOLDMAN SACHS ACTIVEBETA® EMERGING MARKETS EQUITY ETF
Schedule of Investments (continued)
August 31, 2017
| | | | | | | | |
Shares | | | Description | | Value | |
| Preferred Stocks – 4.4% | | | |
| Brazil – 2.8% | | | |
| | 786,698 | | | Banco Bradesco SA (Financials) | | $ | 8,395,913 | |
| | 240,680 | | | Braskem SA, Class A (Materials) | | | 2,915,131 | |
| | 164,597 | | | Cia Brasileira de Distribuicao (Consumer Staples)* | | | 3,765,939 | |
| | 706,795 | | | Gerdau SA (Materials) | | | 2,661,895 | |
| | 930,049 | | | Itau Unibanco Holding SA (Financials) | | | 11,926,926 | |
| | 764,384 | | | Itausa – Investimentos Itau SA (Financials) | | | 2,477,941 | |
| | 788,195 | | | Petroleo Brasileiro SA (Energy)* | | | 3,419,365 | |
| | 194,819 | | | Telefonica Brasil SA (Telecommunication Services) | | | 3,024,030 | |
| | 328,081 | | | Vale SA (Materials) | | | 3,396,081 | |
| | | | | | | | |
| | | | | | | 41,983,221 | |
| | |
| Chile – 0.2% | | | |
| | 526,450 | | | Embotelladora Andina SA, Class B (Consumer Staples) | | | 2,480,708 | |
| | |
| Russia – 0.1% | | | |
| | 494 | | | Transneft PJSC (Energy) | | | 1,516,238 | |
| | |
| South Korea – 1.3% | | | |
| | 28,133 | | | Amorepacific Corp. (Consumer Staples) | | | 4,278,831 | |
| | 22,766 | | | Hyundai Motor Co. (Consumer Discretionary) | | | 1,946,295 | |
| | 6,933 | | | LG Household & Health Care Ltd. (Consumer Staples) | | | 3,689,074 | |
| | 5,382 | | | Samsung Electronics Co. Ltd. (Information Technology) | | | 8,997,047 | |
| | | | | | | | |
| | | | | | | 18,911,247 | |
| | |
| | TOTAL PREFERRED STOCKS | |
| | (Cost $47,932,768) | | $ | 64,891,414 | |
| | |
| TOTAL INVESTMENTS BEFORE SECURITIES LENDING
REINVESTMENT VEHICLE |
|
| | (Cost $1,194,278,800) | | $ | 1,485,722,313 | |
| | |
| | | | | | | | |
Shares | | | Distribution
rate | | Value | |
| Securities Lending Reinvestment Vehicle – 1.8%(d) | |
| Goldman Sachs Financial Square Government Fund –
Institutional Shares |
|
| | 26,893,134 | | | 0.93% | | $ | 26,893,134 | |
| | (Cost $26,893,134) | | | | |
| | |
| | TOTAL INVESTMENTS – 101.5% | | | | |
| | (Cost $1,221,171,934) | | $ | 1,512,615,447 | |
| | |
| LIABILITIES IN EXCESS OF
OTHER ASSETS – (1.5)% | | | (21,932,665 | ) |
| | |
| | NET ASSETS – 100.0% | | $ | 1,490,682,782 | |
| | |
| | |
| The percentage shown for each investment category reflects the value of investments in that category as a percentage of net assets. |
* | | Security is currently in default and/or non-income producing. |
(a) | | All or a portion of security is on loan. |
(b) | | Exempt from registration under Rule 144A of the Securities Act of 1933. Under procedures approved by the Board of Trustees, such securities may be deemed liquid by the Investment Adviser and may be resold, normally to qualified institutional buyers in transactions exempt from registration. Total market value of Rule 144A securities amounts to $5,205,599, which represents approximately 0.3% of net assets as of August 31, 2017. |
(c) | | Significant unobservable inputs were used in the valuation of this portfolio security; i.e. Level 3. |
(d) | | Represents an affiliated issuer. |
| | |
|
Investment Abbreviations: |
ADR | | —American Depositary Receipt |
GDR | | —Global Depositary Receipt |
NVDR | | —Non-Voting Depository Receipt |
PLC | | —Public Limited Company |
REIT | | —Real Estate Investment Trust |
|
| | |
| 48 | | The accompanying notes are an integral part of these financial statements. |
GOLDMAN SACHS ACTIVEBETA® EUROPE EQUITY ETF
Schedule of Investments
August 31, 2017
| | | | | | | | |
| Shares | | | Description | |
Value | |
| Common Stocks – 98.5% | |
| Australia – 0.3% | | | |
| | 6,364 | | | BHP Billiton PLC (Materials) | | $ | 121,078 | |
| | |
| Austria – 0.6% | | | |
| | 792 | | | ANDRITZ AG (Industrials) | | | 43,041 | |
| | 906 | | | Erste Group Bank AG (Financials)* | | | 38,233 | |
| | 1,603 | | | OMV AG (Energy) | | | 92,031 | |
| | 2,576 | | | Raiffeisen Bank International AG (Financials)* | | | 84,406 | |
| | 562 | | | voestalpine AG (Materials) | | | 29,125 | |
| | | | | | | | |
| | | | | | | 286,836 | |
| | |
| Belgium – 1.2% | | | |
| | 531 | | | Ageas (Financials) | | | 24,627 | |
| | 1,746 | | | Anheuser-Busch InBev SA/NV (Consumer Staples) | | | 206,585 | |
| | 489 | | | Colruyt SA (Consumer Staples) | | | 27,136 | |
| | 555 | | | Groupe Bruxelles Lambert SA (Financials) | | | 56,423 | |
| | 317 | | | KBC Group NV (Financials) | | | 26,016 | |
| | 657 | | | Proximus SADP (Telecommunication Services) | | | 23,132 | |
| | 258 | | | Solvay SA (Materials) | | | 37,376 | |
| | 814 | | | Telenet Group Holding NV (Consumer Discretionary)* | | | 55,037 | |
| | 204 | | | UCB SA (Health Care) | | | 14,040 | |
| | 782 | | | Umicore SA (Materials) | | | 58,340 | |
| | | | | | | | |
| | | | | | | 528,712 | |
| | |
| Chile – 0.1% | | | |
| | 2,369 | | | Antofagasta PLC (Materials) | | | 31,594 | |
| | |
| Denmark – 2.9% | | | |
| | 1,391 | | | Carlsberg A/S, Class B (Consumer Staples) | | | 159,424 | |
| | 455 | | | Chr Hansen Holding A/S (Materials) | | | 39,093 | |
| | 1,091 | | | Coloplast A/S, Class B (Health Care) | | | 89,203 | |
| | 2,333 | | | Danske Bank A/S (Financials) | | | 90,546 | |
| | 779 | | | DSV A/S (Industrials) | | | 55,163 | |
| | 479 | | | H Lundbeck A/S (Health Care) | | | 30,466 | |
| | 1,478 | | | ISS A/S (Industrials) | | | 57,433 | |
| | 9,292 | | | Novo Nordisk A/S, Class B (Health Care) | | | 442,621 | |
| | 259 | | | Novozymes A/S, Class B (Materials) | | | 13,157 | |
| | 903 | | | Pandora A/S (Consumer Discretionary) | | | 95,844 | |
| | 8,428 | | | TDC A/S (Telecommunication Services) | | | 50,143 | |
| | 1,052 | | | Tryg A/S (Financials) | | | 24,282 | |
| | 691 | | | Vestas Wind Systems A/S (Industrials) | | | 62,849 | |
| | 1,978 | | | William Demant Holding A/S (Health Care)* | | | 52,264 | |
| | | | | | | | |
| | | | | | | 1,262,488 | |
| | |
| Finland – 1.5% | | | |
| | 800 | | | Elisa OYJ (Telecommunication Services) | | | 34,906 | |
| | 1,910 | | | Fortum OYJ (Utilities) | | | 34,244 | |
| | 623 | | | Kone OYJ, Class B (Industrials) | | | 33,761 | |
| | 943 | | | Metso OYJ (Industrials) | | | 31,212 | |
| | 1,855 | | | Neste OYJ (Energy) | | | 81,688 | |
| | 3,507 | | | Nokia OYJ (Information Technology) | | | 21,702 | |
| | 3,152 | | | Orion OYJ, Class B (Health Care) | | | 149,072 | |
| | 764 | | | Sampo OYJ, Class A (Financials) | | | 40,275 | |
| | |
| Common Stocks – (continued) | |
| Finland – (continued) | | | |
| | 2,593 | | | Stora Enso OYJ, Class R (Materials) | | | 34,034 | |
| | 6,574 | | | UPM-Kymmene OYJ (Materials) | | | 170,854 | |
| | 686 | | | Wartsila OYJ Abp (Industrials) | | | 47,263 | |
| | | | | | | | |
| | | | | | | 679,011 | |
| | |
| France – 18.0% | | | |
| | 241 | | | Aeroports de Paris (Industrials) | | | 42,936 | |
| | 801 | | | Air Liquide SA (Materials) | | | 97,659 | |
| | 1,049 | | | Airbus SE (Industrials) | | | 88,062 | |
| | 405 | | | Alstom SA (Industrials) | | | 14,385 | |
| | 2,137 | | | Arkema SA (Materials) | | | 231,913 | |
| | 3,049 | | | Atos SE (Information Technology) | | | 469,794 | |
| | 8,025 | | | AXA SA (Financials) | | | 232,560 | |
| | 5,095 | | | BNP Paribas SA (Financials) | | | 387,131 | |
| | 3,582 | | | Bollore SA (Industrials) | | | 16,617 | |
| | 706 | | | Bouygues SA (Industrials) | | | 31,975 | |
| | 1,559 | | | Bureau Veritas SA (Industrials) | | | 37,024 | |
| | 1,427 | | | Capgemini SE (Information Technology) | | | 158,001 | |
| | 3,710 | | | Carrefour SA (Consumer Staples) | | | 74,719 | |
| | 1,479 | | | Cie de Saint-Gobain (Industrials) | | | 81,017 | |
| | 764 | | | Cie Generale des Etablissements Michelin (Consumer Discretionary) | | | 104,003 | |
| | 4,200 | | | CNP Assurances (Financials) | | | 97,371 | |
| | 11,872 | | | Credit Agricole SA (Financials) | | | 209,037 | |
| | 3,035 | | | Danone SA (Consumer Staples) | | | 238,690 | |
| | 19 | | | Dassault Aviation SA (Industrials) | | | 28,989 | |
| | 1,086 | | | Dassault Systemes (Information Technology) | | | 106,842 | |
| | 2,080 | | | Eiffage SA (Industrials) | | | 214,649 | |
| | 1,919 | | | Engie SA (Utilities) | | | 31,987 | |
| | 1,113 | | | Essilor International SA (Health Care) | | | 140,330 | |
| | 1,432 | | | Eurazeo SA (Financials) | | | 118,307 | |
| | 1,364 | | | Eutelsat Communications SA (Consumer Discretionary) | | | 39,593 | |
| | 396 | | | Fonciere Des Regions REIT (Real Estate) | | | 39,109 | |
| | 231 | | | Gecina SA REIT (Real Estate) | | | 35,950 | |
| | 847 | | | Hermes International (Consumer Discretionary) | | | 447,409 | |
| | 291 | | | ICADE REIT (Real Estate) | | | 25,830 | |
| | 64 | | | Iliad SA (Telecommunication Services) | | | 16,508 | |
| | 578 | | | Imerys SA (Materials) | | | 50,783 | |
| | 262 | | | Ingenico Group SA (Information Technology) | | | 25,978 | |
| | 1,562 | | | Ipsen SA (Health Care) | | | 209,570 | |
| | 259 | | | Kering (Consumer Discretionary) | | | 97,089 | |
| | 855 | | | Klepierre SA REIT (Real Estate) | | | 34,409 | |
| | 1,390 | | | Lagardere SCA (Consumer Discretionary) | | | 44,603 | |
| | 1,368 | | | Legrand SA (Industrials) | | | 95,763 | |
| | 1,522 | | | L’Oreal SA (Consumer Staples) | | | 320,916 | |
| | 1,148 | | | LVMH Moet Hennessy Louis Vuitton SE (Consumer Discretionary) | | | 300,610 | |
| | 5,140 | | | Natixis SA (Financials) | | | 38,548 | |
| | 2,607 | | | Orange SA (Telecommunication Services) | | | 44,245 | |
| | 759 | | | Pernod Ricard SA (Consumer Staples) | | | 103,592 | |
| | 9,309 | | | Peugeot SA (Consumer Discretionary) | | | 196,281 | |
| | |
| | |
| The accompanying notes are an integral part of these financial statements. | | 49 |
GOLDMAN SACHS ACTIVEBETA® EUROPE EQUITY ETF
Schedule of Investments (continued)
August 31, 2017
| | | | | | | | |
| Shares | | | Description | |
Value | |
| Common Stocks – (continued) | |
| France – (continued) | | | |
| | 1,121 | | | Publicis Groupe SA (Consumer Discretionary) | | $ | 75,567 | |
| | 570 | | | Remy Cointreau SA (Consumer Staples) | | | 65,009 | |
| | 5,428 | | | Rexel SA (Industrials) | | | 80,989 | |
| | 505 | | | Safran SA (Industrials) | | | 48,986 | |
| | 5,346 | | | Sanofi (Health Care) | | | 519,019 | |
| | 2,039 | | | Schneider Electric SE (Industrials)* | | | 164,189 | |
| | 1,946 | | | SCOR SE (Financials) | | | 81,439 | |
| | 982 | | | SEB SA (Consumer Discretionary) | | | 178,160 | |
| | 570 | | | Societe BIC SA (Industrials) | | | 68,411 | |
| | 4,869 | | | Societe Generale SA (Financials) | | | 272,245 | |
| | 488 | | | Sodexo SA (Consumer Discretionary) | | | 56,875 | |
| | 2,365 | | | Suez (Utilities) | | | 44,805 | |
| | 794 | | | Thales SA (Industrials) | | | 87,791 | |
| | 7,257 | | | TOTAL SA (Energy) | | | 374,837 | |
| | 183 | | | Unibail-Rodamco SE REIT (Real Estate) | | | 46,462 | |
| | 542 | | | Valeo SA (Consumer Discretionary) | | | 36,201 | |
| | 1,780 | | | Veolia Environnement SA (Utilities) | | | 41,711 | |
| | 2,325 | | | Vinci SA (Industrials) | | | 213,810 | |
| | 790 | | | Vivendi SA (Consumer Discretionary) | | | 18,104 | |
| | 351 | | | Wendel SA (Financials) | | | 55,564 | |
| | | | | | | | |
| | | | | | | 7,950,958 | |
| | |
| Germany – 13.0% | |
| | 2,007 | | | adidas AG (Consumer Discretionary) | | | 449,903 | |
| | 1,690 | | | Allianz SE (Financials) | | | 361,161 | |
| | 508 | | | Axel Springer SE (Consumer Discretionary) | | | 31,406 | |
| | 2,764 | | | BASF SE (Materials) | | | 267,391 | |
| | 3,582 | | | Bayer AG (Health Care) | | | 457,803 | |
| | 252 | | | Bayerische Motoren Werke AG (Consumer Discretionary) | | | 23,369 | |
| | 1,788 | | | Beiersdorf AG (Consumer Staples) | | | 190,637 | |
| | 495 | | | Brenntag AG (Industrials) | | | 26,197 | |
| | 1,130 | | | CECONOMY AG (Consumer Discretionary) | | | 12,362 | |
| | 204 | | | Continental AG (Consumer Discretionary) | | | 45,973 | |
| | 2,039 | | | Covestro AG (Materials)(a) | | | 160,019 | |
| | 1,478 | | | Daimler AG (Consumer Discretionary) | | | 107,593 | |
| | 926 | | | Deutsche Boerse AG (Financials) | | | 98,852 | |
| | 8,782 | | | Deutsche Lufthansa AG (Industrials) | | | 219,990 | |
| | 8,331 | | | Deutsche Post AG (Industrials) | | | 345,130 | |
| | 10,552 | | | Deutsche Telekom AG (Telecommunication Services) | | | 190,186 | |
| | 1,126 | | | Deutsche Wohnen SE (Real Estate) | | | 47,765 | |
| | 1,370 | | | E.ON SE (Utilities) | | | 15,465 | |
| | 633 | | | Evonik Industries AG (Materials) | | | 20,493 | |
| | 576 | | | Fraport AG Frankfurt Airport Services Worldwide (Industrials) | | | 56,764 | |
| | 983 | | | Fresenius Medical Care AG & Co KGaA (Health Care) | | | 91,742 | |
| | 1,698 | | | Fresenius SE & Co KGaA (Health Care) | | | 143,513 | |
| | 283 | | | Hannover Rueck SE (Financials) | | | 34,251 | |
| | 741 | | | HeidelbergCement AG (Materials) | | | 71,051 | |
| | 453 | | | Henkel AG & Co KGaA (Consumer Staples) | | | 54,773 | |
| | 411 | | | HOCHTIEF AG (Industrials) | | | 72,343 | |
| | |
| Common Stocks – (continued) | |
| Germany – (continued) | |
| | 2,878 | | | HUGO BOSS AG (Consumer Discretionary) | | | 243,314 | |
| | 3,376 | | | Infineon Technologies AG (Information Technology) | | | 77,746 | |
| | 291 | | | Innogy SE (Utilities)(a) | | | 12,810 | |
| | 1,035 | | | LANXESS AG (Materials) | | | 77,091 | |
| | 212 | | | Linde AG (Materials) | | | 40,592 | |
| | 437 | | | MAN SE (Industrials) | | | 48,999 | |
| | 1,006 | | | Merck KGaA (Health Care) | | | 110,346 | |
| | 1,130 | | | METRO AG (Consumer Staples)* | | | 22,060 | |
| | 714 | | | Muenchener Rueckversicherungs-Gesellschaft AG in Muenchen (Financials) | | | 147,195 | |
| | 389 | | | OSRAM Licht AG (Industrials) | | | 31,902 | |
| | 1,380 | | | ProSiebenSat.1 Media SE (Consumer Discretionary) | | | 46,234 | |
| | 4,355 | | | RWE AG (Utilities)* | | | 108,498 | |
| | 4,515 | | | SAP SE (Information Technology) | | | 472,910 | |
| | 2,440 | | | Siemens AG (Industrials) | | | 318,520 | |
| | 590 | | | Symrise AG (Materials) | | | 43,069 | |
| | 3,680 | | | Telefonica Deutschland Holding AG (Telecommunication Services) | | | 19,890 | |
| | 2,856 | | | TUI AG (Consumer Discretionary) | | | 48,136 | |
| | 883 | | | United Internet AG (Information Technology) | | | 52,333 | |
| | 1,330 | | | Vonovia SE (Real Estate) | | | 56,142 | |
| | 3,517 | | | Zalando SE (Consumer Discretionary)*(a) | | | 166,355 | |
| | | | | | | | |
| | | | | | | 5,740,274 | |
| | |
| Ireland – 0.5% | |
| | 4,982 | | | Bank of Ireland Group PLC (Financials)* | | | 41,461 | |
| | 2,509 | | | CRH PLC (Materials) | | | 87,505 | |
| | 897 | | | Kerry Group PLC, Class A (Consumer Staples) | | | 83,428 | |
| | | | | | | | |
| | | | | | | 212,394 | |
| | |
| Italy – 3.7% | |
| | 4,883 | | | Assicurazioni Generali SpA (Financials) | | | 87,313 | |
| | 1,396 | | | Atlantia SpA (Industrials) | | | 44,812 | |
| | 22,711 | | | Enel SpA (Utilities) | | | 137,301 | |
| | 4,068 | | | Eni SpA (Energy) | | | 63,696 | |
| | 1,477 | | | Ferrari NV (Consumer Discretionary) | | | 168,752 | |
| | 81 | | | GEDI Gruppo Editoriale SpA (Consumer Discretionary)* | | | 69 | |
| | 7,790 | | | Intesa Sanpaolo SpA (Financials) | | | 26,266 | |
| | 7,707 | | | Leonardo SpA (Industrials) | | | 130,204 | |
| | 3,315 | | | Luxottica Group SpA (Consumer Discretionary) | | | 190,557 | |
| | 2,693 | | | Poste Italiane SpA (Financials)(a) | | | 19,546 | |
| | 6,239 | | | Prysmian SpA (Industrials) | | | 195,971 | |
| | 1,949 | | | Recordati SpA (Health Care) | | | 83,372 | |
| | 36,912 | | | Saipem SpA (Energy)* | | | 136,832 | |
| | 7,952 | | | Snam SpA (Energy) | | | 38,668 | |
| | 126,349 | | | Telecom Italia SpA (Telecommunication Services)* | | | 120,849 | |
| | |
| | |
| 50 | | The accompanying notes are an integral part of these financial statements. |
GOLDMAN SACHS ACTIVEBETA® EUROPE EQUITY ETF
| | | | | | | | |
| Shares | | | Description | |
Value | |
| Common Stocks – (continued) | |
| Italy – (continued) | |
| | 148,311 | | | Telecom Italia SpA-RSP (Telecommunication Services) | | $ | 115,053 | |
| | 7,311 | | | Terna Rete Elettrica Nazionale SpA (Utilities) | | | 43,112 | |
| | 838 | | | UniCredit SpA (Financials)* | | | 17,027 | |
| | 9,994 | | | UnipolSai Assicurazioni SpA (Financials) | | | 22,659 | |
| | | | | | | | |
| | | | | | | 1,642,059 | |
| | |
| Jersey Island – 0.0% | |
| | 220 | | | Randgold Resources Ltd. (Materials) | | | 22,423 | |
| | |
| Luxembourg – 0.4% | |
| | 1,853 | | | ArcelorMittal (Materials)* | | | 49,436 | |
| | 22 | | | Eurofins Scientific SE (Health Care) | | | 12,558 | |
| | 287 | | | Millicom International Cellular SA (Telecommunication Services) | | | 17,879 | |
| | 1,077 | | | RTL Group SA (Consumer Discretionary) | | | 81,628 | |
| | 461 | | | SES SA (Consumer Discretionary) | | | 10,526 | |
| | 724 | | | Tenaris SA (Energy) | | | 9,666 | |
| | | | | | | | |
| | | | | | | 181,693 | |
| | |
| Mexico – 0.1% | |
| | 1,537 | | | Fresnillo PLC (Materials) | | | 32,005 | |
| | |
| Netherlands – 5.6% | |
| | 1,003 | | | ABN AMRO Group NV (Financials)(a) | | | 28,071 | |
| | 675 | | | Akzo Nobel NV (Materials) | | | 61,633 | |
| | 531 | | | Altice NV, Class A (Consumer Discretionary)* | | | 12,228 | |
| | 873 | | | ASML Holding NV (Information Technology) | | | 135,447 | |
| | 2,807 | | | Boskalis Westminster (Industrials) | | | 91,607 | |
| | 1,802 | | | EXOR NV (Financials) | | | 115,475 | |
| | 960 | | | Gemalto NV (Information Technology) | | | 51,812 | |
| | 1,493 | | | Heineken Holding NV (Consumer Staples) | | | 147,221 | |
| | 1,144 | | | Heineken NV (Consumer Staples) | | | 119,866 | |
| | 12,565 | | | ING Groep NV (Financials) | | | 222,584 | |
| | 8,853 | | | Koninklijke Ahold Delhaize NV (Consumer Staples) | | | 158,932 | |
| | 1,054 | | | Koninklijke DSM NV (Materials) | | | 79,860 | |
| | 11,935 | | | Koninklijke KPN NV (Telecommunication Services) | | | 42,157 | |
| | 5,166 | | | Koninklijke Philips NV (Health Care) | | | 195,188 | |
| | 488 | | | Koninklijke Vopak NV (Energy) | | | 20,629 | |
| | 2,425 | | | NN Group NV (Financials) | | | 96,107 | |
| | 673 | | | NXP Semiconductors NV (Information Technology)* | | | 76,022 | |
| | 3,152 | | | Randstad Holding NV (Industrials) | | | 184,017 | |
| | 10,806 | | | Royal Dutch Shell PLC, Class A (Energy) | | | 296,165 | |
| | 8,974 | | | Royal Dutch Shell PLC, Class B (Energy) | | | 249,828 | |
| | 2,060 | | | Wolters Kluwer NV (Industrials) | | | 89,871 | |
| | | | | | | | |
| | | | | | | 2,474,720 | |
| | |
| Common Stocks – (continued) | |
| Norway – 1.3% | |
| | 2,685 | | | DNB ASA (Financials) | | | 52,286 | |
| | 2,131 | | | Gjensidige Forsikring ASA (Financials) | | | 37,197 | |
| | 3,863 | | | Marine Harvest ASA (Consumer Staples)* | | | 76,517 | |
| | 8,625 | | | Norsk Hydro ASA (Materials) | | | 62,084 | |
| | 3,975 | | | Orkla ASA (Consumer Staples) | | | 40,696 | |
| | 4,863 | | | Schibsted ASA, Class A (Consumer Discretionary) | | | 117,827 | |
| | 5,287 | | | Schibsted ASA, Class B (Consumer Discretionary) | | | 120,964 | |
| | 1,989 | | | Telenor ASA (Telecommunication Services) | | | 40,164 | |
| | 274 | | | Yara International ASA (Materials) | | | 11,175 | |
| | | | | | | | |
| | | | | | | 558,910 | |
| | |
| Portugal – 0.7% | |
| | 43,890 | | | EDP – Energias de Portugal SA (Utilities) | | | 168,283 | |
| | 1,792 | | | Galp Energia SGPS SA (Energy) | | | 29,635 | |
| | 5,866 | | | Jeronimo Martins SGPS SA (Consumer Staples) | | | 116,886 | |
| | | | | | | | |
| | | | | | | 314,804 | |
| | |
| South Africa – 0.4% | |
| | 1,832 | | | Investec PLC (Financials) | | | 13,928 | |
| | 9,489 | | | Mediclinic International PLC (Health Care) | | | 93,476 | |
| | 2,581 | | | Mondi PLC (Materials) | | | 70,273 | |
| | | | | | | | |
| | | | | | | 177,677 | |
| | |
| Spain – 5.0% | |
| | 1,790 | | | Abertis Infraestructuras SA (Industrials) | | | 36,178 | |
| | 3,639 | | | ACS Actividades de Construccion y Servicios SA (Industrials) | | | 137,407 | |
| | 494 | | | Aena SA (Industrials)(a) | | | 96,349 | |
| | 2,075 | | | Amadeus IT Group SA (Information Technology) | | | 128,455 | |
| | 16,190 | | | Banco Bilbao Vizcaya Argentaria SA (Financials) | | | 142,861 | |
| | 19,504 | | | Banco de Sabadell SA (Financials) | | | 42,829 | |
| | 54,459 | | | Banco Santander SA (Financials) | | | 353,450 | |
| | 4,634 | | | Bankia SA (Financials) | | | 22,528 | |
| | 2,165 | | | Bankinter SA (Financials) | | | 20,617 | |
| | 11,130 | | | CaixaBank SA (Financials) | | | 57,402 | |
| | 21,625 | | | Distribuidora Internacional de Alimentacion SA (Consumer Staples) | | | 136,674 | |
| | 1,317 | | | Enagas SA (Energy) | | | 38,761 | |
| | 2,715 | | | Endesa SA (Utilities) | | | 65,413 | |
| | 1,323 | | | Ferrovial SA (Industrials) | | | 30,113 | |
| | 1,604 | | | Gas Natural SDG SA (Utilities) | | | 38,941 | |
| | 1,709 | | | Grifols SA (Health Care) | | | 48,256 | |
| | 23,227 | | | Iberdrola SA (Utilities) | | | 189,463 | |
| | 5,926 | | | Industria de Diseno Textil SA (Consumer Discretionary) | | | 224,855 | |
| | 17,078 | | | Mapfre SA (Financials) | | | 60,364 | |
| | 1,807 | | | Red Electrica Corp. SA (Utilities) | | | 40,528 | |
| | 10,713 | | | Repsol SA (Energy) | | | 183,790 | |
| | |
| | |
| The accompanying notes are an integral part of these financial statements. | | 51 |
GOLDMAN SACHS ACTIVEBETA® EUROPE EQUITY ETF
Schedule of Investments (continued)
August 31, 2017
| | | | | | | | |
| Shares | | | Description | |
Value | |
| Common Stocks – (continued) | |
| Spain – (continued) | |
| | 8,427 | | | Telefonica SA (Telecommunication Services) | | $ | 90,761 | |
| | | | | | | | |
| | | | | | | 2,185,995 | |
| | |
| Sweden – 4.0% | |
| | 1,290 | | | Alfa Laval AB (Industrials) | | | 29,181 | |
| | 3,260 | | | Assa Abloy AB, Class B (Industrials) | | | 70,384 | |
| | 2,074 | | | Atlas Copco AB, Class A (Industrials) | | | 81,163 | |
| | 1,433 | | | Atlas Copco AB, Class B (Industrials) | | | 51,072 | |
| | 2,009 | | | Boliden AB (Materials) | | | 70,187 | |
| | 1,663 | | | Electrolux AB, Series B (Consumer Discretionary) | | | 60,377 | |
| | 829 | | | Essity AB, Class B (Consumer Staples)* | | | 22,982 | |
| | 2,965 | | | Getinge AB, Class B (Health Care)(b) | | | 54,997 | |
| | 8,662 | | | Hennes & Mauritz AB, Class B (Consumer Discretionary) | | | 218,799 | |
| | 1,326 | | | Hexagon AB, Class B (Information Technology) | | | 64,972 | |
| | 4,259 | | | Husqvarna AB, Class B (Consumer Discretionary) | | | 42,899 | |
| | 735 | | | ICA Gruppen AB (Consumer Staples) | | | 29,262 | |
| | 2,465 | | | Industrivarden AB, Class C (Financials) | | | 58,300 | |
| | 1,733 | | | Investor AB, Class B (Financials) | | | 80,929 | |
| | 537 | | | Kinnevik AB, Class B (Financials) | | | 16,136 | |
| | 821 | | | L E Lundbergforetagen AB, Class B (Financials) | | | 63,504 | |
| | 7,305 | | | Nordea Bank AB (Financials) | | | 98,136 | |
| | 3,913 | | | Sandvik AB (Industrials) | | | 64,566 | |
| | 3,583 | | | Securitas AB, Class B (Industrials) | | | 58,806 | |
| | 4,608 | | | Skandinaviska Enskilda Banken AB, Class A (Financials) | | | 59,878 | |
| | 1,704 | | | Skanska AB, Class B (Industrials) | | | 38,438 | |
| | 1,079 | | | SKF AB, Class B (Industrials) | | | 21,533 | |
| | 829 | | | Svenska Cellulosa AB SCA, Class B (Materials) | | | 6,902 | |
| | 2,409 | | | Svenska Handelsbanken AB, Class A (Financials) | | | 35,965 | |
| | 2,635 | | | Swedbank AB, Class A (Financials) | | | 71,129 | |
| | 3,303 | | | Swedish Match AB (Consumer Staples) | | | 117,595 | |
| | 2,276 | | | Tele2 AB, Class B (Telecommunication Services) | | | 26,457 | |
| | 7,417 | | | Telefonaktiebolaget LM Ericsson, Class B (Information Technology) | | | 43,408 | |
| | 7,209 | | | Telia Co. AB (Telecommunication Services) | | | 34,336 | |
| | 4,016 | | | Volvo AB, Class B (Industrials) | | | 68,487 | |
| | | | | | | | |
| | | | | | | 1,760,780 | |
| | |
| Switzerland – 14.9% | |
| | 6,778 | | | ABB Ltd. (Industrials) | | | 156,578 | |
| | 876 | | | Adecco Group AG (Industrials) | | | 63,353 | |
| | 305 | | | Baloise Holding AG (Financials) | | | 48,464 | |
| | 54 | | | Barry Callebaut AG (Consumer Staples)* | | | 77,544 | |
| | 10 | | | Chocoladefabriken Lindt & Spruengli AG (Consumer Staples) | | | 57,232 | |
| | |
| Common Stocks – (continued) | |
| Switzerland – (continued) | |
| | 952 | | | Cie Financiere Richemont SA (Consumer Discretionary) | | | 84,947 | |
| | 6,250 | | | Coca-Cola HBC AG (Consumer Staples)* | | | 212,933 | |
| | 865 | | | Credit Suisse Group AG (Financials)* | | | 12,691 | |
| | 121 | | | Dufry AG (Consumer Discretionary)* | | | 18,610 | |
| | 221 | | | EMS-Chemie Holding AG (Materials) | | | 150,745 | |
| | 2,389 | | | Ferguson PLC (Industrials) | | | 141,696 | |
| | 181 | | | Geberit AG (Industrials) | | | 82,514 | |
| | 24 | | | Givaudan SA (Materials) | | | 48,949 | |
| | 95,240 | | | Glencore PLC (Materials)* | | | 441,184 | |
| | 359 | | | Julius Baer Group Ltd. (Financials)* | | | 20,023 | |
| | 1,439 | | | Kuehne + Nagel International AG (Industrials) | | | 260,098 | |
| | 482 | | | LafargeHolcim Ltd. (Materials)* | | | 28,263 | |
| | 362 | | | Lonza Group AG (Health Care)* | | | 91,461 | |
| | 13,150 | | | Nestle SA (Consumer Staples) | | | 1,113,166 | |
| | 8,840 | | | Novartis AG (Health Care) | | | 744,179 | |
| | 1,012 | | | Pargesa Holding SA (Financials) | | | 81,824 | |
| | 412 | | | Partners Group Holding AG (Financials) | | | 266,664 | |
| | 3,116 | | | Roche Holding AG (Health Care) | | | 789,538 | |
| | 202 | | | Schindler Holding AG (Industrials) | | | 42,355 | |
| | 269 | | | Schindler Holding AG Participation Certificates (Industrials) | | | 57,495 | |
| | 75 | | | SGS SA (Industrials) | | | 167,248 | |
| | 17 | | | Sika AG (Materials) | | | 120,291 | |
| | 388 | | | Sonova Holding AG (Health Care) | | | 65,447 | |
| | 8,905 | | | STMicroelectronics NV (Information Technology) | | | 154,096 | |
| | 239 | | | Straumann Holding AG (Health Care) | | | 152,826 | |
| | 174 | | | Swatch Group AG (The) – Bearer (Consumer Discretionary) | | | 69,310 | |
| | 714 | | | Swatch Group AG (The) – Registered (Consumer Discretionary) | | | 55,240 | |
| | 445 | | | Swiss Life Holding AG (Financials)* | | | 158,922 | |
| | 476 | | | Swiss Prime Site AG (Real Estate)* | | | 42,994 | |
| | 1,452 | | | Swiss Re AG (Financials) | | | 131,224 | |
| | 85 | | | Swisscom AG (Telecommunication Services) | | | 42,774 | |
| | 8,824 | | | UBS Group AG (Financials)* | | | 145,077 | |
| | 339 | | | Vifor Pharma AG (Health Care) | | | 34,182 | |
| | 393 | | | Zurich Insurance Group AG (Financials) | | | 117,327 | |
| | | | | | | | |
| | | | | | | 6,549,464 | |
| | |
| United Kingdom – 23.6% | |
| | 15,198 | | | 3i Group PLC (Financials) | | | 189,861 | |
| | 9,040 | | | Admiral Group PLC (Financials) | | | 224,932 | |
| | 14,951 | | | Anglo American PLC (Materials) | | | 270,193 | |
| | 1,839 | | | Ashtead Group PLC (Industrials) | | | 39,407 | |
| | 1,390 | | | Associated British Foods PLC (Consumer Staples) | | | 59,500 | |
| | 5,135 | | | AstraZeneca PLC (Health Care) | | | 300,464 | |
| | 31,563 | | | Auto Trader Group PLC (Information Technology)(a) | | | 143,730 | |
| | 4,745 | | | Aviva PLC (Financials) | | | 31,947 | |
| | 1,347 | | | Babcock International Group PLC (Industrials) | | | 14,102 | |
| | |
| | |
| 52 | | The accompanying notes are an integral part of these financial statements. |
GOLDMAN SACHS ACTIVEBETA® EUROPE EQUITY ETF
| | | | | | | | |
| Shares | | | Description | |
Value | |
| Common Stocks – (continued) | |
| United Kingdom – (continued) | |
| | 9,974 | | | BAE Systems PLC (Industrials) | | $ | 78,076 | |
| | 32,972 | | | Barclays PLC (Financials) | | | 81,191 | |
| | 13,003 | | | Barratt Developments PLC (Consumer Discretionary) | | | 104,635 | |
| | 48,372 | | | BP PLC (Energy) | | | 277,461 | |
| | 7,960 | | | British American Tobacco PLC (Consumer Staples) | | | 495,509 | |
| | 1,807 | | | British Land Co. PLC (The) REIT (Real Estate) | | | 14,238 | |
| | 10,731 | | | BT Group PLC (Telecommunication Services) | | | 40,452 | |
| | 1,694 | | | Bunzl PLC (Industrials) | | | 50,423 | |
| | 10,536 | | | Burberry Group PLC (Consumer Discretionary) | | | 243,964 | |
| | 1,861 | | | Capita PLC (Industrials) | | | 15,551 | |
| | 28,622 | | | Centrica PLC (Utilities) | | | 73,725 | |
| | 3,819 | | | CNH Industrial NV (Industrials) | | | 43,270 | |
| | 569 | | | Coca-Cola European Partners PLC (Consumer Staples) | | | 24,333 | |
| | 8,844 | | | Compass Group PLC (Consumer Discretionary) | | | 188,261 | |
| | 2,518 | | | ConvaTec Group PLC (Health Care)*(a) | | | 9,309 | |
| | 1,464 | | | Croda International PLC (Materials) | | | 72,477 | |
| | 659 | | | DCC PLC (Industrials) | | | 59,823 | |
| | 9,162 | | | Diageo PLC (Consumer Staples) | | | 306,004 | |
| | 4,463 | | | Direct Line Insurance Group PLC (Financials) | | | 21,859 | |
| | 7,208 | | | Dixons Carphone PLC (Consumer Discretionary) | | | 16,105 | |
| | 4,089 | | | Experian PLC (Industrials) | | | 81,878 | |
| | 15,704 | | | Fiat Chrysler Automobiles NV (Consumer Discretionary)* | | | 236,182 | |
| | 4,401 | | | G4S PLC (Industrials) | | | 16,077 | |
| | 7,062 | | | GKN PLC (Consumer Discretionary) | | | 29,019 | |
| | 20,032 | | | GlaxoSmithKline PLC (Health Care) | | | 395,831 | |
| | 2,983 | | | Hammerson PLC REIT (Real Estate) | | | 21,563 | |
| | 12,191 | | | Hargreaves Lansdown PLC (Financials) | | | 219,922 | |
| | 71,914 | | | HSBC Holdings PLC (Financials) | | | 695,449 | |
| | 2,619 | | | IMI PLC (Industrials) | | | 38,303 | |
| | 4,285 | | | Imperial Brands PLC (Consumer Staples) | | | 176,714 | |
| | 841 | | | Inmarsat PLC (Telecommunication Services) | | | 7,932 | |
| | 1,269 | | | InterContinental Hotels Group PLC (Consumer Discretionary) | | | 63,052 | |
| | 15,852 | | | International Consolidated Airlines Group SA (Industrials) | | | 125,272 | |
| | 1,040 | | | Intertek Group PLC (Industrials) | | | 68,479 | |
| | 5,218 | | | Intu Properties PLC REIT (Real Estate) | | | 16,729 | |
| | 4,205 | | | ITV PLC (Consumer Discretionary) | | | 8,594 | |
| | 50,537 | | | J Sainsbury PLC (Consumer Staples) | | | 153,421 | |
| | 1,079 | | | Johnson Matthey PLC (Materials) | | | 38,429 | |
| | 29,787 | | | Kingfisher PLC (Consumer Discretionary) | | | 114,724 | |
| | 1,252 | | | Land Securities Group PLC REIT (Real Estate) | | | 16,294 | |
| | 12,257 | | | Legal & General Group PLC (Financials) | | | 41,095 | |
| | 62,480 | | | Lloyds Banking Group PLC (Financials) | | | 51,381 | |
| | |
| Common Stocks – (continued) | |
| United Kingdom – (continued) | |
| | 784 | | | London Stock Exchange Group PLC (Financials) | | | 39,904 | |
| | 26,826 | | | Marks & Spencer Group PLC (Consumer Discretionary)(b) | | | 110,475 | |
| | 3,656 | | | Meggitt PLC (Industrials) | | | 24,403 | |
| | 6,526 | | | Merlin Entertainments PLC (Consumer Discretionary)(a) | | | 38,791 | |
| | 8,349 | | | National Grid PLC (Utilities) | | | 104,859 | |
| | 2,573 | | | Next PLC (Consumer Discretionary) | | | 136,894 | |
| | 5,714 | | | Old Mutual PLC (Financials) | | | 15,278 | |
| | 1,764 | | | Persimmon PLC (Consumer Discretionary) | | | 60,439 | |
| | 9,689 | | | Petrofac Ltd. (Energy) | | | 52,236 | |
| | 3,038 | | | Provident Financial PLC (Financials)(b) | | | 34,566 | |
| | 6,359 | | | Prudential PLC (Financials) | | | 148,760 | |
| | 2,534 | | | Reckitt Benckiser Group PLC (Consumer Staples) | | | 239,403 | |
| | 4,744 | | | RELX NV (Industrials) | | | 99,464 | |
| | 6,906 | | | RELX PLC (Industrials) | | | 150,477 | |
| | 4,107 | | | Rio Tinto PLC (Materials) | | | 198,268 | |
| | 2,231 | | | Rolls-Royce Holdings PLC (Industrials)* | | | 26,275 | |
| | 30,556 | | | Royal Mail PLC (Industrials) | | | 155,208 | |
| | 6,417 | | | RSA Insurance Group PLC (Financials) | | | 55,110 | |
| | 21,860 | | | Sage Group PLC (The) (Information Technology) | | | 195,061 | |
| | 333 | | | Schroders PLC (Financials) | | | 14,452 | |
| | 9,941 | | | Segro PLC REIT (Real Estate) | | | 68,915 | |
| | 1,706 | | | Severn Trent PLC (Utilities) | | | 49,879 | |
| | 3,414 | | | Sky PLC (Consumer Discretionary) | | | 42,055 | |
| | 6,901 | | | Smith & Nephew PLC (Health Care) | | | 124,225 | |
| | 2,953 | | | Smiths Group PLC (Industrials) | | | 58,789 | |
| | 3,253 | | | SSE PLC (Utilities) | | | 59,731 | |
| | 2,024 | | | St James’s Place PLC (Financials) | | | 30,071 | |
| | 6,109 | | | Standard Chartered PLC (Financials)* | | | 60,612 | |
| | 2,319 | | | Standard Life Aberdeen PLC (Financials) | | | 12,837 | |
| | 8,145 | | | Tate & Lyle PLC (Consumer Staples) | | | 71,735 | |
| | 10,553 | | | Taylor Wimpey PLC (Consumer Discretionary) | | | 27,264 | |
| | 74,710 | | | Tesco PLC (Consumer Staples)* | | | 174,148 | |
| | 6,182 | | | Unilever NV (Consumer Staples) | | | 367,562 | |
| | 6,406 | | | Unilever PLC (Consumer Staples) | | | 373,019 | |
| | 3,976 | | | United Utilities Group PLC (Utilities) | | | 46,622 | |
| | 76,923 | | | Vodafone Group PLC (Telecommunication Services) | | | 219,450 | |
| | 1,488 | | | Weir Group PLC (The) (Industrials) | | | 34,417 | |
| | 2,117 | | | Whitbread PLC (Consumer Discretionary) | | | 102,513 | |
| | 81,096 | | | Wm Morrison Supermarkets PLC (Consumer Staples) | | | 257,061 | |
| | 10,518 | | | Worldpay Group PLC (Information Technology)(a) | | | 56,516 | |
| | 8,294 | | | WPP PLC (Consumer Discretionary) | | | 151,759 | |
| | | | | | | | |
| | | | | | | 10,396,645 | |
| | |
| United States – 0.7% | |
| | 1,335 | | | Carnival PLC (Consumer Discretionary) | | | 92,462 | |
| | 2,419 | | | QIAGEN NV (Health Care)* | | | 77,521 | |
| | 2,781 | | | Shire PLC (Health Care) | | | 137,372 | |
| | | | | | | | |
| | | | | | | 307,355 | |
| | |
| | TOTAL COMMON STOCKS | |
| | (Cost $37,781,292) | | $ | 43,417,875 | |
| | |
| | |
| The accompanying notes are an integral part of these financial statements. | | 53 |
GOLDMAN SACHS ACTIVEBETA® EUROPE EQUITY ETF
Schedule of Investments (continued)
August 31, 2017
| | | | | | | | |
| Shares | | | Description | |
Value | |
| Preferred Stocks – 0.6% | |
| Germany – 0.6% | |
| | 153 | | | Bayerische Motoren Werke AG (Consumer Discretionary) | | $ | 12,677 | |
| | 2,487 | | | FUCHS PETROLUB SE (Materials) | | | 138,082 | |
| | 692 | | | Henkel AG & Co KGaA (Consumer Staples) | | | 92,597 | |
| | 122 | | | Volkswagen AG (Consumer Discretionary) | | | 18,181 | |
| | |
| | TOTAL PREFERRED STOCKS | |
| | (Cost $220,383) | | $ | 261,537 | |
| | |
| | | | | | | | |
| Exchange – Traded Fund – 0.5% | |
| United States – 0.5% | |
| | 4,830 | | | iShares Europe ETF | | | | |
| | (Cost $221,927) | | $ | 219,620 | |
| | |
| | | | | | | | | | |
| Units | | Description | | Expiration
Month | | | Value | |
| Right – 0.0% | |
| Sweden – 0.0% | |
| 2,965 | | Getinge AB (Health Care)*(b) | | | | | | | | |
| (Cost $0) | | | 09/17 | | | $ | 1,096 | |
| |
| TOTAL INVESTMENTS BEFORE SECURITIES LENDING REINVESTMENT VEHICLE | |
| (Cost $38,223,602) | | | | | | $ | 43,900,128 | |
| |
| | | | | | |
| Shares | | Distribution
rate | | Value | |
| Securities Lending Reinvestment Vehicle – 0.2%(c) | |
Goldman Sachs Financial Square Government Fund – Institutional Shares | |
| 90,063 | | 0.93% | | $ | 90,063 | |
| (Cost $90,063) | | | | |
| |
| TOTAL INVESTMENTS – 99.8% | |
| (Cost $38,313,665) | | $ | 43,990,191 | |
| |
| OTHER ASSETS IN EXCESS OF LIABILITIES – 0.2% | | | 72,250 | |
| |
| NET ASSETS – 100.0% | | $ | 44,062,441 | |
| |
| | |
| The percentage shown for each investment category reflects the value of investments in that category as a percentage of net assets. |
* | | Security is currently in default and/or non-income producing. |
(a) | | Exempt from registration under Rule 144A of the Securities Act of 1933. Under procedures approved by the Board of Trustees, such securities may be deemed liquid by the Investment Adviser and may be resold, normally to qualified institutional buyers in transactions exempt from registration. Total market value of Rule 144A securities amounts to $731,496, which represents approximately 1.7% of net assets as of August 31, 2017. |
(b) | | All or a portion of security is on loan. |
(c) | | Represents an affiliated issuer. |
| | |
|
Investment Abbreviations: |
PLC | | —Public Limited Company |
REIT | | —Real Estate Investment Trust |
|
| | |
| 54 | | The accompanying notes are an integral part of these financial statements. |
GOLDMAN SACHS ACTIVEBETA® INTERNATIONAL EQUITY ETF
Schedule of Investments
August 31, 2017
| | | | | | | | |
Shares | | | Description | | Value | |
| Common Stocks – 99.3% | |
| Australia – 6.2% | | | |
| | 24,687 | | | AGL Energy Ltd. (Utilities) | | $ | 469,736 | |
| | 22,975 | | | Amcor Ltd. (Materials) | | | 293,566 | |
| | 52,516 | | | AMP Ltd. (Financials) | | | 212,431 | |
| | 22,140 | | | APA Group (Utilities) | | | 155,585 | |
| | 73,263 | | | Aristocrat Leisure Ltd. (Consumer Discretionary) | | | 1,230,157 | |
| | 7,306 | | | ASX Ltd. (Financials) | | | 316,857 | |
| | 81,177 | | | Aurizon Holdings Ltd. (Industrials) | | | 319,352 | |
| | 182,817 | | | AusNet Services (Utilities) | | | 252,302 | |
| | 69,726 | | | Australia & New Zealand Banking Group Ltd. (Financials) | | | 1,625,913 | |
| | 23,023 | | | Bank of Queensland Ltd. (Financials) | | | 229,902 | |
| | 80,770 | | | Bendigo & Adelaide Bank Ltd. (Financials) | | | 765,549 | |
| | 63,614 | | | BHP Billiton Ltd. (Materials) | | | 1,381,470 | |
| | 40,419 | | | BHP Billiton PLC (Materials) | | | 768,989 | |
| | 142,740 | | | BlueScope Steel Ltd. (Materials) | | | 1,230,638 | |
| | 16,122 | | | Caltex Australia Ltd. (Energy) | | | 426,963 | |
| | 41,341 | | | Challenger Ltd. (Financials) | | | 411,182 | |
| | 27,382 | | | CIMIC Group Ltd. (Industrials) | | | 913,243 | |
| | 22,527 | | | Coca-Cola Amatil Ltd. (Consumer Staples) | | | 143,832 | |
| | 16,383 | | | Cochlear Ltd. (Health Care) | | | 2,029,820 | |
| | 52,874 | | | Commonwealth Bank of Australia (Financials) | | | 3,178,825 | |
| | 20,833 | | | Computershare Ltd. (Information Technology) | | | 232,158 | |
| | 17,212 | | | CSL Ltd. (Health Care) | | | 1,754,516 | |
| | 32,129 | | | Dexus REIT (Real Estate) | | | 244,383 | |
| | 38,504 | | | Flight Centre Travel Group Ltd. (Consumer Discretionary)(a) | | | 1,476,582 | |
| | 206,910 | | | Fortescue Metals Group Ltd. (Materials) | | | 986,305 | |
| | 50,884 | | | Goodman Group REIT (Real Estate) | | | 334,573 | |
| | 72,341 | | | GPT Group (The) REIT (Real Estate) | | | 286,886 | |
| | 64,100 | | | Harvey Norman Holdings Ltd. (Consumer Discretionary)(a) | | | 207,431 | |
| | 78,681 | | | Insurance Australia Group Ltd. (Financials) | | | 400,021 | |
| | 22,546 | | | LendLease Group (Real Estate) | | | 296,489 | |
| | 10,395 | | | Macquarie Group Ltd. (Financials) | | | 715,648 | |
| | 148,944 | | | Medibank Pvt Ltd. (Financials) | | | 359,130 | |
| | 148,945 | | | Mirvac Group REIT (Real Estate) | | | 274,075 | |
| | 53,500 | | | National Australia Bank Ltd. (Financials) | | | 1,281,492 | |
| | 13,943 | | | Newcrest Mining Ltd. (Materials) | | | 252,696 | |
| | 7,330 | | | Orica Ltd. (Materials) | | | 118,194 | |
| | 148,203 | | | Qantas Airways Ltd. (Industrials) | | | 672,370 | |
| | 93,968 | | | QBE Insurance Group Ltd. (Financials) | | | 778,100 | |
| | 3,334 | | | Ramsay Health Care Ltd. (Health Care) | | | 180,636 | |
| | 10,115 | | | REA Group Ltd. (Consumer Discretionary) | | | 531,906 | |
| | 85,277 | | | Scentre Group REIT (Real Estate) | | | 261,081 | |
| | 9,168 | | | SEEK Ltd. (Industrials) | | | 121,799 | |
| | 9,790 | | | Sonic Healthcare Ltd. (Health Care) | | | 170,052 | |
| | 611,460 | | | South32 Ltd. (Materials) | | | 1,416,140 | |
| | 94,035 | | | Stockland REIT (Real Estate) | | | 330,406 | |
| | |
| Common Stocks – (continued) | |
| Australia – (continued) | | | |
| | 50,031 | | | Suncorp Group Ltd. (Financials) | | | 517,057 | |
| | 25,603 | | | Sydney Airport (Industrials) | | | 150,272 | |
| | 46,658 | | | Tabcorp Holdings Ltd. (Consumer Discretionary) | | | 152,098 | |
| | 211,301 | | | Telstra Corp. Ltd. (Telecommunication Services) | | | 615,067 | |
| | 33,154 | | | Transurban Group (Industrials) | | | 319,760 | |
| | 117,962 | | | Vicinity Centres REIT (Real Estate) | | | 245,131 | |
| | 38,506 | | | Wesfarmers Ltd. (Consumer Staples) | | | 1,301,658 | |
| | 36,786 | | | Westfield Corp. REIT (Real Estate) | | | 216,784 | |
| | 80,109 | | | Westpac Banking Corp. (Financials) | | | 1,986,847 | |
| | 69,761 | | | Woolworths Ltd. (Consumer Staples) | | | 1,438,604 | |
| | | | | | | | |
| | | | | | | 36,982,659 | |
| | |
| Austria – 0.4% | | | |
| | 4,301 | | | ANDRITZ AG (Industrials) | | | 233,736 | |
| | 3,318 | | | Erste Group Bank AG (Financials)* | | | 140,020 | |
| | 12,551 | | | OMV AG (Energy) | | | 720,577 | |
| | 27,254 | | | Raiffeisen Bank International AG (Financials)* | | | 893,006 | |
| | 3,750 | | | voestalpine AG (Materials) | | | 194,341 | |
| | | | | | | | |
| | | | | | | 2,181,680 | |
| | |
| Belgium – 0.7% | | | |
| | 5,128 | | | Ageas (Financials) | | | 237,831 | |
| | 6,844 | | | Anheuser-Busch InBev SA/NV (Consumer Staples) | | | 809,777 | |
| | 7,002 | | | Colruyt SA (Consumer Staples) | | | 388,554 | |
| | 4,874 | | | Groupe Bruxelles Lambert SA (Financials) | | | 495,504 | |
| | 3,262 | | | KBC Group NV (Financials) | | | 267,712 | |
| | 5,989 | | | Proximus SADP (Telecommunication Services) | | | 210,868 | |
| | 3,716 | | | Solvay SA (Materials) | | | 538,328 | |
| | 7,609 | | | Telenet Group Holding NV (Consumer Discretionary)* | | | 514,465 | |
| | 5,381 | | | Umicore SA (Materials) | | | 401,441 | |
| | | | | | | | |
| | | | | | | 3,864,480 | |
| | |
| Canada – 8.7% | | | |
| | 27,018 | | | Alimentation Couche-Tard, Inc., Class B (Consumer Staples) | | | 1,285,012 | |
| | 5,111 | | | Atco Ltd., Class I (Utilities) | | | 187,563 | |
| | 15,050 | | | Bank of Montreal (Financials) | | | 1,075,677 | |
| | 31,446 | | | Bank of Nova Scotia (The) (Financials) | | | 1,948,586 | |
| | 27,279 | | | Barrick Gold Corp. (Materials) | | | 489,336 | |
| | 8,533 | | | BCE, Inc. (Telecommunication Services) | | | 404,548 | |
| | 15,609 | | | Brookfield Asset Management, Inc., Class A (Financials) | | | 614,898 | |
| | 17,824 | | | CAE, Inc. (Industrials) | | | 293,003 | |
| | 52,740 | | | Cameco Corp. (Energy) | | | 526,664 | |
| | 12,453 | | | Canadian Imperial Bank of Commerce (Financials) | | | 1,042,029 | |
| | 14,307 | | | Canadian National Railway Co. (Industrials) | | | 1,155,058 | |
| | |
| | |
| The accompanying notes are an integral part of these financial statements. | | 55 |
GOLDMAN SACHS ACTIVEBETA® INTERNATIONAL EQUITY ETF
Schedule of Investments (continued)
August 31, 2017
| | | | | | | | |
Shares | | | Description | | Value | |
| Common Stocks – (continued) | |
| Canada – (continued) | | | |
| | 1,671 | | | Canadian Pacific Railway Ltd. (Industrials) | | $ | 258,977 | |
| | 1,818 | | | Canadian Tire Corp. Ltd., Class A (Consumer Discretionary) | | | 214,317 | |
| | 6,642 | | | Canadian Utilities Ltd., Class A (Utilities) | | | 206,187 | |
| | 122,151 | | | Cenovus Energy, Inc. (Energy) | | | 951,876 | |
| | 3,710 | | | CGI Group, Inc., Class A (Information Technology)* | | | 187,993 | |
| | 48,795 | | | CI Financial Corp. (Financials) | | | 1,064,052 | |
| | 4,302 | | | Constellation Software, Inc. (Information Technology) | | | 2,382,562 | |
| | 23,446 | | | Dollarama, Inc. (Consumer Discretionary) | | | 2,301,495 | |
| | 112,515 | | | Empire Co. Ltd., Class A (Consumer Staples) | | | 1,883,701 | |
| | 13,577 | | | Enbridge, Inc. (Energy) | | | 540,589 | |
| | 473 | | | Fairfax Financial Holdings Ltd. (Financials) | | | 244,877 | |
| | 17,849 | | | Finning International, Inc. (Industrials) | | | 406,737 | |
| | 16,360 | | | First Capital Realty, Inc. (Real Estate) | | | 264,761 | |
| | 8,692 | | | Fortis, Inc. (Utilities) | | | 316,759 | |
| | 20,025 | | | George Weston Ltd. (Consumer Staples) | | | 1,733,450 | |
| | 6,185 | | | Gildan Activewear, Inc. (Consumer Discretionary) | | | 192,938 | |
| | 31,359 | | | Great-West Lifeco, Inc. (Financials)(a) | | | 865,171 | |
| | 13,738 | | | H&R Real Estate Investment Trust REIT (Real Estate) | | | 234,053 | |
| | 55,192 | | | Husky Energy, Inc. (Energy)* | | | 643,154 | |
| | 12,090 | | | Hydro One Ltd. (Utilities)(b) | | | 223,430 | |
| | 9,740 | | | IGM Financial, Inc. (Financials) | | | 317,662 | |
| | 19,972 | | | Imperial Oil Ltd. (Energy) | | | 587,173 | |
| | 27,966 | | | Industrial Alliance Insurance & Financial Services, Inc. (Financials) | | | 1,195,372 | |
| | 4,572 | | | Intact Financial Corp. (Financials) | | | 375,387 | |
| | 36,457 | | | Jean Coutu Group PJC, Inc. (The), Class A (Consumer Staples) | | | 647,575 | |
| | 39,811 | | | Kinross Gold Corp. (Materials)* | | | 180,678 | |
| | 16,322 | | | Linamar Corp. (Consumer Discretionary) | | | 906,481 | |
| | 22,001 | | | Loblaw Cos. Ltd. (Consumer Staples) | | | 1,188,537 | |
| | 6,948 | | | Magna International, Inc., Class A (Consumer Discretionary) | | | 333,005 | |
| | 53,677 | | | Manulife Financial Corp. (Financials) | | | 1,050,207 | |
| | 2,618 | | | Methanex Corp. (Materials) | | | 133,244 | |
| | 30,080 | | | Metro, Inc. (Consumer Staples) | | | 988,951 | |
| | 14,859 | | | National Bank of Canada (Financials) | | | 681,233 | |
| | 23,139 | | | Onex Corp. (Financials) | | | 1,842,815 | |
| | 6,028 | | | Open Text Corp. (Information Technology) | | | 193,185 | |
| | 7,770 | | | Pembina Pipeline Corp. (Energy)(a) | | | 249,446 | |
| | 54,924 | | | Power Corp. of Canada (Financials) | | | 1,337,013 | |
| | 34,332 | | | Power Financial Corp. (Financials) | | | 923,096 | |
| | 4,371 | | | Restaurant Brands International, Inc. (Consumer Discretionary) | | | 265,764 | |
| | |
| Common Stocks – (continued) | |
| Canada – (continued) | | | |
| | 11,297 | | | RioCan Real Estate Investment Trust REIT (Real Estate) | | | 214,452 | |
| | 10,739 | | | Rogers Communications, Inc., Class B (Telecommunication Services) | | | 558,385 | |
| | 44,448 | | | Royal Bank of Canada (Financials) | | | 3,285,695 | |
| | 28,281 | | | Saputo, Inc. (Consumer Staples) | | | 951,008 | |
| | 15,068 | | | Shaw Communications, Inc., Class B (Consumer Discretionary) | | | 334,831 | |
| | 7,198 | | | Shopify, Inc., Class A (Information Technology)* | | | 792,282 | |
| | 6,940 | | | Smart Real Estate Investment Trust REIT (Real Estate) | | | 168,442 | |
| | 4,056 | | | SNC-Lavalin Group, Inc. (Industrials) | | | 176,474 | |
| | 19,742 | | | Sun Life Financial, Inc. (Financials)(a) | | | 755,038 | |
| | 29,724 | | | Suncor Energy, Inc. (Energy) | | | 927,697 | |
| | 53,938 | | | Teck Resources Ltd., Class B (Materials) | | | 1,337,103 | |
| | 7,640 | | | TELUS Corp. (Telecommunication Services) | | | 275,497 | |
| | 8,064 | | | Thomson Reuters Corp. (Financials) | | | 367,262 | |
| | 50,594 | | | Toronto-Dominion Bank (The) (Financials) | | | 2,706,149 | |
| | 17,507 | | | TransCanada Corp. (Energy) | | | 885,439 | |
| | 33,789 | | | Veresen, Inc. (Energy) | | | 474,057 | |
| | 2,355 | | | West Fraser Timber Co. Ltd. (Materials) | | | 121,699 | |
| | | | | | | | |
| | | | | | | 51,867,787 | |
| | |
| Chile – 0.1% | | | |
| | 25,428 | | | Antofagasta PLC (Materials) | | | 339,121 | |
| | |
| China – 0.4% | | | |
| | 272,982 | | | BOC Hong Kong Holdings Ltd. (Financials) | | | 1,389,945 | |
| | 839,289 | | | Yangzijiang Shipbuilding Holdings Ltd. (Industrials) | | | 923,959 | |
| | | | | | | | |
| | | | | | | 2,313,904 | |
| | |
| Denmark – 1.8% | | | |
| | 12,619 | | | Carlsberg A/S, Class B (Consumer Staples) | | | 1,446,275 | |
| | 3,372 | | | Chr Hansen Holding A/S (Materials) | | | 289,716 | |
| | 12,388 | | | Coloplast A/S, Class B (Health Care) | | | 1,012,870 | |
| | 18,564 | | | Danske Bank A/S (Financials) | | | 720,489 | |
| | 4,876 | | | DSV A/S (Industrials) | | | 345,282 | |
| | 5,444 | | | H Lundbeck A/S (Health Care) | | | 346,257 | |
| | 6,556 | | | ISS A/S (Industrials) | | | 254,760 | |
| | 67,266 | | | Novo Nordisk A/S, Class B (Health Care) | | | 3,204,192 | |
| | 9,585 | | | Pandora A/S (Consumer Discretionary) | | | 1,017,342 | |
| | 80,291 | | | TDC A/S (Telecommunication Services) | | | 477,694 | |
| | 11,610 | | | Tryg A/S (Financials) | | | 267,982 | |
| | 7,934 | | | Vestas Wind Systems A/S (Industrials) | | | 721,624 | |
| | 24,725 | | | William Demant Holding A/S (Health Care)* | | | 653,305 | |
| | | | | | | | |
| | | | | | | 10,757,788 | |
| | |
| | |
| 56 | | The accompanying notes are an integral part of these financial statements. |
GOLDMAN SACHS ACTIVEBETA® INTERNATIONAL EQUITY ETF
| | | | | | | | |
Shares | | | Description | | Value | |
| Common Stocks – (continued) | |
| Finland – 0.8% | | | |
| | 5,310 | | | Elisa OYJ (Telecommunication Services) | | $ | 231,689 | |
| | 16,061 | | | Fortum OYJ (Utilities) | | | 287,951 | |
| | 4,587 | | | Kone OYJ, Class B (Industrials) | | | 248,570 | |
| | 2,874 | | | Nokian Renkaat OYJ (Consumer Discretionary) | | | 121,334 | |
| | 24,166 | | | Orion OYJ, Class B (Health Care) | | | 1,142,917 | |
| | 9,698 | | | Sampo OYJ, Class A (Financials) | | | 511,238 | |
| | 19,035 | | | Stora Enso OYJ, Class R (Materials) | | | 249,843 | |
| | 61,495 | | | UPM-Kymmene OYJ (Materials) | | | 1,598,215 | |
| | 5,524 | | | Wartsila OYJ Abp (Industrials) | | | 380,585 | |
| | | | | | | | |
| | | | | | | 4,772,342 | |
| | |
| France – 10.2% | | | |
| | 2,492 | | | Aeroports de Paris (Industrials) | | | 443,966 | |
| | 4,257 | | | Air Liquide SA (Materials) | | | 519,020 | |
| | 9,039 | | | Airbus SE (Industrials) | | | 758,808 | |
| | 6,053 | | | Alstom SA (Industrials) | | | 214,993 | |
| | 15,301 | | | Arkema SA (Materials) | | | 1,660,507 | |
| | 26,464 | | | Atos SE (Information Technology) | | | 4,077,610 | |
| | 50,869 | | | AXA SA (Financials) | | | 1,474,154 | |
| | 36,343 | | | BNP Paribas SA (Financials) | | | 2,761,434 | |
| | 6,171 | | | Bouygues SA (Industrials) | | | 279,491 | |
| | 12,359 | | | Bureau Veritas SA (Industrials) | | | 293,505 | |
| | 12,937 | | | Capgemini SE (Information Technology) | | | 1,432,413 | |
| | 33,530 | | | Carrefour SA (Consumer Staples) | | | 675,293 | |
| | 5,403 | | | Casino Guichard Perrachon SA (Consumer Staples) | | | 306,825 | |
| | 12,184 | | | Cie de Saint-Gobain (Industrials) | | | 667,422 | |
| | 5,427 | | | Cie Generale des Etablissements Michelin (Consumer Discretionary) | | | 738,772 | |
| | 43,051 | | | CNP Assurances (Financials) | | | 998,075 | |
| | 87,951 | | | Credit Agricole SA (Financials) | | | 1,548,606 | |
| | 25,740 | | | Danone SA (Consumer Staples) | | | 2,024,340 | |
| | 159 | | | Dassault Aviation SA (Industrials) | | | 242,588 | |
| | 11,336 | | | Dassault Systemes (Information Technology) | | | 1,115,252 | |
| | 11,509 | | | Eiffage SA (Industrials) | | | 1,187,688 | |
| | 12,849 | | | Engie SA (Utilities) | | | 214,172 | |
| | 9,181 | | | Essilor International SA (Health Care) | | | 1,157,566 | |
| | 7,326 | | | Eurazeo SA (Financials) | | | 605,250 | |
| | 13,514 | | | Eutelsat Communications SA (Consumer Discretionary) | | | 392,271 | |
| | 2,366 | | | Fonciere Des Regions REIT (Real Estate) | | | 233,671 | |
| | 1,769 | | | Gecina SA REIT (Real Estate) | | | 275,304 | |
| | 5,506 | | | Hermes International (Consumer Discretionary) | | | 2,908,424 | |
| | 2,497 | | | ICADE REIT (Real Estate) | | | 221,642 | |
| | 485 | | | Iliad SA (Telecommunication Services) | | | 125,097 | |
| | 5,008 | | | Imerys SA (Materials) | | | 440,001 | |
| | 10,144 | | | Ipsen SA (Health Care) | | | 1,360,993 | |
| | 2,001 | | | Kering (Consumer Discretionary) | | | 750,095 | |
| | 7,379 | | | Klepierre SA REIT (Real Estate) | | | 296,962 | |
| | 10,061 | | | Lagardere SCA (Consumer Discretionary) | | | 322,841 | |
| | 7,039 | | | Legrand SA (Industrials) | | | 492,747 | |
| | 11,711 | | | L’Oreal SA (Consumer Staples) | | | 2,469,280 | |
| | |
| Common Stocks – (continued) | |
| France – (continued) | | | |
| | 9,453 | | | LVMH Moet Hennessy Louis Vuitton SE (Consumer Discretionary) | | | 2,475,316 | |
| | 35,931 | | | Natixis SA (Financials) | | | 269,467 | |
| | 22,860 | | | Orange SA (Telecommunication Services) | | | 387,969 | |
| | 5,774 | | | Pernod Ricard SA (Consumer Staples) | | | 788,068 | |
| | 84,055 | | | Peugeot SA (Consumer Discretionary) | | | 1,772,311 | |
| | 10,028 | | | Publicis Groupe SA (Consumer Discretionary) | | | 675,993 | |
| | 3,117 | | | Remy Cointreau SA (Consumer Staples) | | | 355,497 | |
| | 48,784 | | | Rexel SA (Industrials) | | | 727,891 | |
| | 9,857 | | | Safran SA (Industrials) | | | 956,152 | |
| | 38,114 | | | Sanofi (Health Care) | | | 3,700,318 | |
| | 12,858 | | | Schneider Electric SE (Industrials)* | | | 1,035,380 | |
| | 21,628 | | | SCOR SE (Financials) | | | 905,116 | |
| | 7,562 | | | SEB SA (Consumer Discretionary) | | | 1,371,944 | |
| | 5,697 | | | Societe BIC SA (Industrials) | | | 683,750 | |
| | 33,459 | | | Societe Generale SA (Financials) | | | 1,870,825 | |
| | 2,310 | | | Sodexo SA (Consumer Discretionary) | | | 269,225 | |
| | 11,624 | | | Suez (Utilities) | | | 220,218 | |
| | 5,045 | | | Thales SA (Industrials) | | | 557,814 | |
| | 40,306 | | | TOTAL SA (Energy) | | | 2,081,875 | |
| | 1,431 | | | Unibail-Rodamco SE REIT (Real Estate) | | | 363,316 | |
| | 6,556 | | | Valeo SA (Consumer Discretionary) | | | 437,891 | |
| | 24,417 | | | Veolia Environnement SA (Utilities) | | | 572,169 | |
| | 16,614 | | | Vinci SA (Industrials) | | | 1,527,846 | |
| | 7,061 | | | Vivendi SA (Consumer Discretionary) | | | 161,810 | |
| | 2,332 | | | Wendel SA (Financials) | | | 369,160 | |
| | | | | | | | |
| | | | | | | 60,224,399 | |
| | |
| Germany – 7.5% | | | |
| | 14,170 | | | adidas AG (Consumer Discretionary) | | | 3,176,446 | |
| | 13,716 | | | Allianz SE (Financials) | | | 2,931,173 | |
| | 3,177 | | | Axel Springer SE (Consumer Discretionary) | | | 196,411 | |
| | 18,361 | | | BASF SE (Materials) | | | 1,776,257 | |
| | 25,286 | | | Bayer AG (Health Care) | | | 3,231,720 | |
| | 2,826 | | | Bayerische Motoren Werke AG (Consumer Discretionary) | | | 262,067 | |
| | 16,115 | | | Beiersdorf AG (Consumer Staples) | | | 1,718,189 | |
| | 5,643 | | | Brenntag AG (Industrials) | | | 298,649 | |
| | 30,277 | | | Commerzbank AG (Financials)* | | | 375,801 | |
| | 2,082 | | | Continental AG (Consumer Discretionary) | | | 469,191 | |
| | 6,047 | | | Covestro AG (Materials)(b) | | | 474,564 | |
| | 9,194 | | | Daimler AG (Consumer Discretionary) | | | 669,289 | |
| | 7,163 | | | Deutsche Bank AG (Financials) | | | 114,712 | |
| | 14,097 | | | Deutsche Boerse AG (Financials) | | | 1,504,873 | |
| | 62,856 | | | Deutsche Lufthansa AG (Industrials) | | | 1,574,550 | |
| | 60,288 | | | Deutsche Post AG (Industrials) | | | 2,497,563 | |
| | 91,787 | | | Deutsche Telekom AG (Telecommunication Services) | | | 1,654,343 | |
| | 6,882 | | | Deutsche Wohnen SE (Real Estate) | | | 291,934 | |
| | 29,570 | | | E.ON SE (Utilities) | | | 333,804 | |
| | 5,760 | | | Evonik Industries AG (Materials) | | | 186,473 | |
| | 5,412 | | | Fraport AG Frankfurt Airport Services Worldwide (Industrials) | | | 533,341 | |
| | |
| | |
| The accompanying notes are an integral part of these financial statements. | | 57 |
GOLDMAN SACHS ACTIVEBETA® INTERNATIONAL EQUITY ETF
Schedule of Investments (continued)
August 31, 2017
| | | | | | | | |
Shares | | | Description | | Value | |
| Common Stocks – (continued) | |
| Germany – (continued) | | | |
| | 8,454 | | | Fresenius Medical Care AG & Co KGaA (Health Care) | | $ | 789,000 | |
| | 14,237 | | | Fresenius SE & Co KGaA (Health Care) | | | 1,203,295 | |
| | 4,708 | | | Hannover Rueck SE (Financials) | | | 569,809 | |
| | 6,544 | | | HeidelbergCement AG (Materials) | | | 627,470 | |
| | 5,470 | | | Henkel AG & Co KGaA (Consumer Staples) | | | 661,384 | |
| | 3,241 | | | HOCHTIEF AG (Industrials) | | | 570,470 | |
| | 14,706 | | | HUGO BOSS AG (Consumer Discretionary) | | | 1,243,284 | |
| | 23,375 | | | Infineon Technologies AG (Information Technology) | | | 538,302 | |
| | 4,193 | | | KION Group AG (Industrials) | | | 381,955 | |
| | 5,429 | | | LANXESS AG (Materials) | | | 404,377 | |
| | 2,519 | | | Linde AG (Materials) | | | 482,318 | |
| | 3,193 | | | MAN SE (Industrials) | | | 358,015 | |
| | 10,097 | | | Merck KGaA (Health Care) | | | 1,107,519 | |
| | 19,943 | | | METRO AG (Consumer Staples)* | | | 389,322 | |
| | 6,319 | | | Muenchener Rueckversicherungs-Gesellschaft AG in Muenchen (Financials) | | | 1,302,695 | |
| | 4,778 | | | OSRAM Licht AG (Industrials) | | | 391,845 | |
| | 14,589 | | | ProSiebenSat.1 Media SE (Consumer Discretionary) | | | 488,778 | |
| | 47,441 | | | RWE AG (Utilities)* | | | 1,181,916 | |
| | 25,953 | | | SAP SE (Information Technology) | | | 2,718,370 | |
| | 15,579 | | | Siemens AG (Industrials) | | | 2,033,701 | |
| | 4,490 | | | Symrise AG (Materials) | | | 327,763 | |
| | 67,543 | | | Telefonica Deutschland Holding AG (Telecommunication Services) | | | 365,052 | |
| | 22,395 | | | TUI AG (Consumer Discretionary) | | | 377,451 | |
| | 5,575 | | | United Internet AG (Information Technology) | | | 330,412 | |
| | 8,022 | | | Vonovia SE (Real Estate) | | | 338,624 | |
| | 20,118 | | | Zalando SE (Consumer Discretionary)*(b) | | | 951,589 | |
| | | | | | | | |
| | | | | | | 44,406,066 | |
| | |
| Hong Kong – 3.0% | | | |
| | 285,709 | | | AIA Group Ltd. (Financials) | | | 2,192,159 | |
| | 25,337 | | | ASM Pacific Technology Ltd. (Information Technology) | | | 313,376 | |
| | 30,784 | | | Bank of East Asia Ltd. (The) (Financials) | | | 141,010 | |
| | 45,804 | | | Cheung Kong Property Holdings Ltd. (Real Estate) | | | 402,064 | |
| | 18,116 | | | CK Hutchison Holdings Ltd. (Industrials) | | | 237,027 | |
| | 21,347 | | | CK Infrastructure Holdings Ltd. (Utilities) | | | 193,383 | |
| | 48,382 | | | CLP Holdings Ltd. (Utilities) | | | 510,931 | |
| | 215,786 | | | First Pacific Co. Ltd. (Financials) | | | 173,424 | |
| | 61,992 | | | Galaxy Entertainment Group Ltd. (Consumer Discretionary) | | | 388,913 | |
| | 52,253 | | | Hang Lung Group Ltd. (Real Estate) | | | 196,956 | |
| | 65,581 | | | Hang Lung Properties Ltd. (Real Estate) | | | 159,544 | |
| | |
| Common Stocks – (continued) | |
| Hong Kong – (continued) | | | |
| | 30,002 | | | Hang Seng Bank Ltd. (Financials) | | | 690,014 | |
| | 28,860 | | | Henderson Land Development Co. Ltd. (Real Estate) | | | 178,843 | |
| | 290,209 | | | HK Electric Investments & HK Electric Investments Ltd. (Utilities)(b) | | | 266,238 | |
| | 215,635 | | | HKT Trust & HKT Ltd. (Telecommunication Services) | | | 278,276 | |
| | 173,001 | | | Hong Kong & China Gas Co. Ltd. (Utilities) | | | 327,149 | |
| | 49,887 | | | Hong Kong Exchanges & Clearing Ltd. (Financials) | | | 1,361,520 | |
| | 5,088 | | | Jardine Matheson Holdings Ltd. (Industrials) | | | 334,332 | |
| | 8,152 | | | Jardine Strategic Holdings Ltd. (Industrials) | | | 357,465 | |
| | 47,100 | | | Kerry Properties Ltd. (Real Estate) | | | 186,560 | |
| | 61,181 | | | Link REIT (Real Estate) | | | 504,992 | |
| | 7,871 | | | Melco Resorts & Entertainment Ltd. ADR (Consumer Discretionary) | | | 172,768 | |
| | 61,703 | | | MTR Corp. Ltd. (Industrials) | | | 360,689 | |
| | 214,925 | | | New World Development Co. Ltd. (Real Estate) | | | 293,837 | |
| | 288,134 | | | NWS Holdings Ltd. (Industrials) | | | 553,704 | |
| | 649,955 | | | PCCW Ltd. (Telecommunication Services) | | | 362,080 | |
| | 23,650 | | | Power Assets Holdings Ltd. (Utilities) | | | 208,504 | |
| | 30,027 | | | Sands China Ltd. (Consumer Discretionary) | | | 134,473 | |
| | 125,707 | | | Shangri-La Asia Ltd. (Consumer Discretionary) | | | 210,410 | |
| | 1,516,118 | | | SJM Holdings Ltd. (Consumer Discretionary) | | | 1,323,088 | |
| | 40,717 | | | Sun Hung Kai Properties Ltd. (Real Estate) | | | 679,445 | |
| | 51,520 | | | Swire Pacific Ltd., Class A (Real Estate) | | | 524,320 | |
| | 34,568 | | | Swire Properties Ltd. (Real Estate) | | | 119,696 | |
| | 70,169 | | | Techtronic Industries Co. Ltd. (Consumer Discretionary) | | | 363,108 | |
| | 1,481,818 | | | WH Group Ltd. (Consumer Staples)(b) | | | 1,548,757 | |
| | 48,589 | | | Wharf Holdings Ltd. (The) (Real Estate) | | | 462,829 | |
| | 174,773 | | | Wheelock & Co. Ltd. (Real Estate) | | | 1,307,484 | |
| | | | | | | | |
| | | | | | | 18,019,368 | |
| | |
| Ireland – 0.3% | | | |
| | 30,143 | | | Bank of Ireland Group PLC (Financials)* | | | 250,859 | |
| | 19,194 | | | CRH PLC (Materials) | | | 669,417 | |
| | 21,897 | | | James Hardie Industries PLC CDI (Materials) | | | 307,233 | |
| | 6,460 | | | Kerry Group PLC, Class A (Consumer Staples) | | | 600,829 | |
| | | | | | | | |
| | | | | | | 1,828,338 | |
| | |
| | |
| 58 | | The accompanying notes are an integral part of these financial statements. |
GOLDMAN SACHS ACTIVEBETA® INTERNATIONAL EQUITY ETF
| | | | | | | | |
Shares | | | Description | | Value | |
| Common Stocks – (continued) | |
| Israel – 0.9% | | | |
| | 2,234 | | | Azrieli Group Ltd. (Real Estate) | | $ | 128,746 | |
| | 67,178 | | | Bank Hapoalim BM (Financials) | | | 451,955 | |
| | 115,307 | | | Bank Leumi Le-Israel BM (Financials) | | | 603,757 | |
| | 331,775 | | | Bezeq The Israeli Telecommunication Corp. Ltd. (Telecommunication Services) | | | 488,415 | |
| | 4,404 | | | Check Point Software Technologies Ltd. (Information Technology)* | | | 492,675 | |
| | 2,251 | | | Elbit Systems Ltd. (Industrials) | | | 309,723 | |
| | 17,530 | | | Mizrahi Tefahot Bank Ltd. (Financials) | | | 312,218 | |
| | 8,295 | | | Nice Ltd. (Information Technology) | | | 642,018 | |
| | 123,999 | | | Teva Pharmaceutical Industries Ltd. ADR (Health Care) | | | 1,966,624 | |
| | | | | | | | |
| | | | | | | 5,396,131 | |
| | |
| Italy – 2.4% | | | |
| | 21,631 | | | Assicurazioni Generali SpA (Financials) | | | 386,785 | |
| | 11,817 | | | Atlantia SpA (Industrials) | | | 379,329 | |
| | 164,970 | | | Enel SpA (Utilities) | | | 997,335 | |
| | 27,027 | | | Eni SpA (Energy) | | | 423,183 | |
| | 9,880 | | | Ferrari NV (Consumer Discretionary) | | | 1,128,822 | |
| | 248,822 | | | Intesa Sanpaolo SpA (Financials) | | | 838,958 | |
| | 42,468 | | | Intesa Sanpaolo SpA-RSP (Financials) | | | 134,001 | |
| | 68,353 | | | Leonardo SpA (Industrials) | | | 1,154,774 | |
| | 28,474 | | | Luxottica Group SpA (Consumer Discretionary) | | | 1,636,779 | |
| | 23,131 | | | Poste Italiane SpA (Financials)(b) | | | 167,890 | |
| | 49,746 | | | Prysmian SpA (Industrials) | | | 1,562,558 | |
| | 14,393 | | | Recordati SpA (Health Care) | | | 615,684 | |
| | 288,239 | | | Saipem SpA (Energy)* | | | 1,068,499 | |
| | 68,241 | | | Snam SpA (Energy) | | | 331,829 | |
| | 1,176,415 | | | Telecom Italia SpA (Telecommunication Services)* | | | 1,125,205 | |
| | 1,438,416 | | | Telecom Italia SpA-RSP (Telecommunication Services) | | | 1,115,861 | |
| | 59,286 | | | Terna Rete Elettrica Nazionale SpA (Utilities) | | | 349,606 | |
| | 253,333 | | | UnipolSai Assicurazioni SpA (Financials) | | | 574,364 | |
| | | | | | | | |
| | | | | | | 13,991,462 | |
| | |
| Japan – 21.4% | | | |
| | 6,462 | | | ABC-Mart, Inc. (Consumer Discretionary) | | | 331,731 | |
| | 16,278 | | | Aeon Co. Ltd. (Consumer Staples)(a) | | | 239,896 | |
| | 6,559 | | | Aeon Mall Co. Ltd. (Real Estate) | | | 117,759 | |
| | 9,486 | | | Ajinomoto Co., Inc. (Consumer Staples) | | | 187,160 | |
| | 37,662 | | | Alfresa Holdings Corp. (Health Care) | | | 708,002 | |
| | 92,094 | | | ANA Holdings, Inc. (Industrials) | | | 341,231 | |
| | 62,420 | | | Aozora Bank Ltd. (Financials) | | | 235,932 | |
| | 5,093 | | | Asahi Glass Co. Ltd. (Industrials) | | | 198,519 | |
| | 17,366 | | | Asahi Group Holdings Ltd. (Consumer Staples) | | | 755,640 | |
| | |
| Common Stocks – (continued) | |
| Japan – (continued) | | | |
| | 34,301 | | | Asahi Kasei Corp. (Materials) | | | 410,453 | |
| | 15,015 | | | Asics Corp. (Consumer Discretionary) | | | 226,057 | |
| | 105,481 | | | Astellas Pharma, Inc. (Health Care) | | | 1,325,940 | |
| | 27,349 | | | Bandai Namco Holdings, Inc. (Consumer Discretionary) | | | 915,692 | |
| | 20,589 | | | Benesse Holdings, Inc. (Consumer Discretionary) | | | 791,309 | |
| | 16,811 | | | Bridgestone Corp. (Consumer Discretionary) | | | 720,799 | |
| | 52,790 | | | Brother Industries Ltd. (Information Technology) | | | 1,249,961 | |
| | 31,442 | | | Calbee, Inc. (Consumer Staples) | | | 1,074,159 | |
| | 38,225 | | | Canon, Inc. (Information Technology) | | | 1,338,535 | |
| | 12,323 | | | Casio Computer Co. Ltd. (Consumer Discretionary) | | | 173,995 | |
| | 2,568 | | | Central Japan Railway Co. (Industrials) | | | 434,689 | |
| | 18,413 | | | Chubu Electric Power Co., Inc. (Utilities) | | | 240,410 | |
| | 11,610 | | | Chugoku Electric Power Co., Inc. (The) (Utilities) | | | 133,759 | |
| | 17,744 | | | Coca-Cola Bottlers Japan, Inc. (Consumer Staples) | | | 607,804 | |
| | 17,391 | | | Dai Nippon Printing Co. Ltd. (Industrials) | | | 205,102 | |
| | 8,213 | | | Dai-ichi Life Holdings, Inc. (Financials) | | | 132,083 | |
| | 22,171 | | | Daiichi Sankyo Co. Ltd. (Health Care) | | | 523,555 | |
| | 5,868 | | | Daikin Industries Ltd. (Industrials) | | | 586,214 | |
| | 5,919 | | | Daito Trust Construction Co. Ltd. (Real Estate) | | | 1,047,898 | |
| | 10,488 | | | Daiwa House Industry Co. Ltd. (Real Estate) | | | 366,594 | |
| | 121 | | | Daiwa House REIT Investment Corp. REIT (Real Estate) | | | 295,519 | |
| | 23,435 | | | Daiwa Securities Group, Inc. (Financials) | | | 128,141 | |
| | 12,915 | | | DeNA Co. Ltd. (Information Technology) | | | 275,996 | |
| | 4,148 | | | Denso Corp. (Consumer Discretionary) | | | 201,106 | |
| | 1,815 | | | Disco Corp. (Information Technology) | | | 325,038 | |
| | 3,697 | | | East Japan Railway Co. (Industrials) | | | 338,763 | |
| | 7,119 | | | Eisai Co. Ltd. (Health Care) | | | 368,304 | |
| | 4,041 | | | FamilyMart UNY Holdings Co. Ltd. (Consumer Staples)(a) | | | 218,829 | |
| | 3,092 | | | FANUC Corp. (Industrials) | | | 599,521 | |
| | 3,853 | | | Fast Retailing Co. Ltd. (Consumer Discretionary) | | | 1,101,707 | |
| | 29,386 | | | Fuji Electric Co. Ltd. (Industrials) | | | 161,802 | |
| | 27,849 | | | FUJIFILM Holdings Corp. (Information Technology) | | | 1,093,616 | |
| | 153,050 | | | Fujitsu Ltd. (Information Technology) | | | 1,133,482 | |
| | 15,365 | | | Hakuhodo DY Holdings, Inc. (Consumer Discretionary) | | | 208,990 | |
| | 7,456 | | | Hankyu Hanshin Holdings, Inc. (Industrials) | | | 283,851 | |
| | 12,709 | | | Hikari Tsushin, Inc. (Consumer Discretionary) | | | 1,575,057 | |
| | |
| | |
| The accompanying notes are an integral part of these financial statements. | | 59 |
GOLDMAN SACHS ACTIVEBETA® INTERNATIONAL EQUITY ETF
Schedule of Investments (continued)
August 31, 2017
| | | | | | | | |
Shares | | | Description | | Value | |
| Common Stocks – (continued) | |
| Japan – (continued) | | | |
| | 3,631 | | | Hisamitsu Pharmaceutical Co., Inc. (Health Care) | | $ | 174,523 | |
| | 9,461 | | | Hitachi Chemical Co. Ltd. (Materials) | | | 255,823 | |
| | 28,301 | | | Hitachi Construction Machinery Co. Ltd. (Industrials) | | | 798,425 | |
| | 6,366 | | | Hitachi High-Technologies Corp. (Information Technology) | | | 227,027 | |
| | 62,757 | | | Hitachi Ltd. (Information Technology) | | | 431,647 | |
| | 49,916 | | | Honda Motor Co. Ltd. (Consumer Discretionary) | | | 1,397,340 | |
| | 2,798 | | | Hoshizaki Corp. (Industrials) | | | 243,293 | |
| | 27,242 | | | Hoya Corp. (Health Care) | | | 1,558,135 | |
| | 13,600 | | | Idemitsu Kosan Co. Ltd. (Energy) | | | 331,906 | |
| | 79,875 | | | ITOCHU Corp. (Industrials) | | | 1,303,430 | |
| | 3,935 | | | Japan Airlines Co. Ltd. (Industrials) | | | 135,076 | |
| | 5,242 | | | Japan Airport Terminal Co. Ltd. (Industrials) | | | 190,038 | |
| | 10,448 | | | Japan Exchange Group, Inc. (Financials) | | | 177,804 | |
| | 9,831 | | | Japan Post Holdings Co. Ltd. (Financials) | | | 122,017 | |
| | 161 | | | Japan Prime Realty Investment Corp. REIT (Real Estate) | | | 577,821 | |
| | 134 | | | Japan Retail Fund Investment Corp. REIT (Real Estate) | | | 246,304 | |
| | 17,761 | | | Japan Tobacco, Inc. (Consumer Staples) | | | 607,418 | |
| | 83,844 | | | JXTG Holdings, Inc. (Energy) | | | 405,584 | |
| | 34,955 | | | Kajima Corp. (Industrials) | | | 320,458 | |
| | 77,239 | | | Kakaku.com, Inc. (Information Technology) | | | 960,750 | |
| | 27,637 | | | Kamigumi Co. Ltd. (Industrials) | | | 305,599 | |
| | 73,592 | | | Kansai Electric Power Co., Inc. (The) (Utilities) | | | 1,029,726 | |
| | 4,777 | | | Kansai Paint Co. Ltd. (Materials) | | | 121,053 | |
| | 32,320 | | | Kao Corp. (Consumer Staples) | | | 2,015,081 | |
| | 26,683 | | | KDDI Corp. (Telecommunication Services) | | | 719,321 | |
| | 35,107 | | | Keihan Holdings Co. Ltd. (Industrials) | | | 211,484 | |
| | 26,494 | | | Keikyu Corp. (Industrials) | | | 281,165 | |
| | 20,745 | | | Keio Corp. (Industrials) | | | 172,467 | |
| | 5,497 | | | Keisei Electric Railway Co. Ltd. (Industrials) | | | 149,587 | |
| | 2,095 | | | Keyence Corp. (Information Technology) | | | 1,089,948 | |
| | 7,254 | | | Kikkoman Corp. (Consumer Staples) | | | 227,058 | |
| | 60,338 | | | Kintetsu Group Holdings Co. Ltd. (Industrials) | | | 227,515 | |
| | 28,007 | | | Kirin Holdings Co. Ltd. (Consumer Staples) | | | 635,285 | |
| | 3,404 | | | Koito Manufacturing Co. Ltd. (Consumer Discretionary) | | | 211,861 | |
| | 15,833 | | | Komatsu Ltd. (Industrials) | | | 427,977 | |
| | 3,232 | | | Konami Holdings Corp. (Information Technology) | | | 168,266 | |
| | 106,869 | | | Konica Minolta, Inc. (Information Technology) | | | 852,544 | |
| | 11,359 | | | Kose Corp. (Consumer Staples) | | | 1,424,261 | |
| | |
| Common Stocks – (continued) | |
| Japan – (continued) | | | |
| | 7,602 | | | Kubota Corp. (Industrials) | | | 131,512 | |
| | 17,159 | | | Kuraray Co. Ltd. (Materials) | | | 325,531 | |
| | 7,669 | | | Kurita Water Industries Ltd. (Industrials) | | | 220,538 | |
| | 5,309 | | | Kyocera Corp. (Information Technology) | | | 318,366 | |
| | 10,053 | | | Kyushu Electric Power Co., Inc. (Utilities) | | | 118,013 | |
| | 14,445 | | | Lawson, Inc. (Consumer Staples)(a) | | | 969,912 | |
| | 14,653 | | | LINE Corp. (Information Technology)*(a) | | | 516,570 | |
| | 54,109 | | | Lion Corp. (Consumer Staples) | | | 1,074,707 | |
| | 4,850 | | | LIXIL Group Corp. (Industrials) | | | 127,089 | |
| | 29,238 | | | M3, Inc. (Health Care) | | | 758,977 | |
| | 3,271 | | | Makita Corp. (Industrials) | | | 131,214 | |
| | 125,621 | | | Marubeni Corp. (Industrials) | | | 816,548 | |
| | 6,978 | | | Maruichi Steel Tube Ltd. (Materials) | | | 206,373 | |
| | 54,546 | | | Mazda Motor Corp. (Consumer Discretionary) | | | 802,380 | |
| | 12,024 | | | McDonald’s Holdings Co. Japan Ltd. (Consumer Discretionary) | | | 533,684 | |
| | 12,009 | | | Medipal Holdings Corp. (Health Care) | | | 211,571 | |
| | 17,422 | | | MEIJI Holdings Co. Ltd. (Consumer Staples) | | | 1,386,668 | |
| | 7,296 | | | MINEBEA MITSUMI, Inc. (Industrials) | | | 119,788 | |
| | 9,599 | | | Miraca Holdings, Inc. (Health Care) | | | 435,644 | |
| | 16,381 | | | MISUMI Group, Inc. (Industrials) | | | 419,869 | |
| | 122,634 | | | Mitsubishi Chemical Holdings Corp. (Materials) | | | 1,139,874 | |
| | 49,414 | | | Mitsubishi Corp. (Industrials) | | | 1,141,964 | |
| | 33,804 | | | Mitsubishi Electric Corp. (Industrials) | | | 499,719 | |
| | 10,501 | | | Mitsubishi Estate Co. Ltd. (Real Estate) | | | 180,710 | |
| | 24,802 | | | Mitsubishi Gas Chemical Co., Inc. (Materials) | | | 614,980 | |
| | 4,772 | | | Mitsubishi Materials Corp. (Materials) | | | 171,048 | |
| | 16,389 | | | Mitsubishi Motors Corp. (Consumer Discretionary) | | | 120,915 | |
| | 23,762 | | | Mitsubishi Tanabe Pharma Corp. (Health Care) | | | 582,931 | |
| | 242,657 | | | Mitsubishi UFJ Financial Group, Inc. (Financials) | | | 1,486,235 | |
| | 123,440 | | | Mitsubishi UFJ Lease & Finance Co. Ltd. (Financials) | | | 623,593 | |
| | 61,375 | | | Mitsui & Co. Ltd. (Industrials) | | | 917,056 | |
| | 36,711 | | | Mitsui Chemicals, Inc. (Materials) | | | 219,479 | |
| | 5,666 | | | Mitsui Fudosan Co. Ltd. (Real Estate) | | | 122,422 | |
| | 69,267 | | | Mitsui OSK Lines Ltd. (Industrials) | | | 222,163 | |
| | 27,181 | | | Mixi, Inc. (Information Technology) | | | 1,447,217 | |
| | 688,723 | | | Mizuho Financial Group, Inc. (Financials) | | | 1,183,332 | |
| | 2,480 | | | Murata Manufacturing Co. Ltd. (Information Technology) | | | 379,459 | |
| | 5,891 | | | Nabtesco Corp. (Industrials) | | | 205,805 | |
| | 119,150 | | | Nagoya Railroad Co. Ltd. (Industrials) | | | 532,635 | |
| | 395,277 | | | NEC Corp. (Information Technology) | | | 1,045,117 | |
| | 7,161 | | | Nexon Co. Ltd. (Information Technology)* | | | 178,472 | |
| | |
| | |
| 60 | | The accompanying notes are an integral part of these financial statements. |
GOLDMAN SACHS ACTIVEBETA® INTERNATIONAL EQUITY ETF
| | | | | | | | |
Shares | | | Description | | Value | |
| Common Stocks – (continued) | |
| Japan – (continued) | | | |
| | 15,231 | | | NH Foods Ltd. (Consumer Staples) | | $ | 446,994 | |
| | 3,280 | | | Nidec Corp. (Industrials) | | | 371,332 | |
| | 40,913 | | | Nikon Corp. (Consumer Discretionary) | | | 673,953 | |
| | 1,618 | | | Nintendo Co. Ltd. (Information Technology) | | | 538,647 | |
| | 6,726 | | | Nippon Electric Glass Co. Ltd. (Information Technology) | | | 255,449 | |
| | 74,964 | | | Nippon Express Co. Ltd. (Industrials) | | | 516,970 | |
| | 4,728 | | | Nippon Paint Holdings Co. Ltd. (Materials) | | | 161,094 | |
| | 135 | | | Nippon Prologis REIT, Inc. REIT (Real Estate) | | | 292,913 | |
| | 27,133 | | | Nippon Steel & Sumitomo Metal Corp. (Materials) | | | 647,016 | |
| | 26,649 | | | Nippon Telegraph & Telephone Corp. (Telecommunication Services) | | | 1,323,976 | |
| | 6,087 | | | Nissan Chemical Industries Ltd. (Materials) | | | 203,803 | |
| | 22,307 | | | Nissan Motor Co. Ltd. (Consumer Discretionary) | | | 221,530 | |
| | 15,726 | | | Nisshin Seifun Group, Inc. (Consumer Staples) | | | 273,055 | |
| | 3,555 | | | Nissin Foods Holdings Co. Ltd. (Consumer Staples) | | | 218,998 | |
| | 12,469 | | | Nitori Holdings Co. Ltd. (Consumer Discretionary) | | | 1,923,711 | |
| | 1,738 | | | Nitto Denko Corp. (Materials) | | | 153,145 | |
| | 223 | | | Nomura Real Estate Master Fund, Inc. REIT (Real Estate) | | | 294,402 | |
| | 6,088 | | | Nomura Research Institute Ltd. (Information Technology) | | | 236,749 | |
| | 14,058 | | | NSK Ltd. (Industrials) | | | 166,688 | |
| | 49,427 | | | NTT Data Corp. (Information Technology) | | | 533,521 | |
| | 36,632 | | | NTT DOCOMO, Inc. (Telecommunication Services) | | | 849,898 | |
| | 25,406 | | | Obayashi Corp. (Industrials) | | | 299,397 | |
| | 4,016 | | | Obic Co. Ltd. (Information Technology) | | | 251,411 | |
| | 9,831 | | | Odakyu Electric Railway Co. Ltd. (Industrials) | | | 190,260 | |
| | 60,923 | | | Oji Holdings Corp. (Materials) | | | 319,394 | |
| | 11,120 | | | Olympus Corp. (Health Care) | | | 383,431 | |
| | 14,219 | | | Omron Corp. (Information Technology) | | | 713,146 | |
| | 10,467 | | | Oracle Corp. Japan (Information Technology) | | | 773,185 | |
| | 5,690 | | | Oriental Land Co. Ltd. (Consumer Discretionary) | | | 426,983 | |
| | 35,583 | | | ORIX Corp. (Financials) | | | 568,856 | |
| | 97,237 | | | Osaka Gas Co. Ltd. (Utilities) | | | 379,989 | |
| | 3,283 | | | Otsuka Corp. (Information Technology) | | | 217,156 | |
| | 8,140 | | | Otsuka Holdings Co. Ltd. (Health Care) | | | 327,567 | |
| | 48,203 | | | Panasonic Corp. (Consumer Discretionary) | | | 641,845 | |
| | 18,937 | | | Park24 Co. Ltd. (Industrials) | | | 454,756 | |
| | 43,417 | | | Pola Orbis Holdings, Inc. (Consumer Staples) | | | 1,394,504 | |
| | |
| Common Stocks – (continued) | |
| Japan – (continued) | | | |
| | 85,317 | | | Recruit Holdings Co. Ltd. (Industrials) | | | 1,698,433 | |
| | 67,757 | | | Resona Holdings, Inc. (Financials) | | | 337,738 | |
| | 1,841 | | | Rinnai Corp. (Consumer Discretionary) | | | 159,745 | |
| | 3,111 | | | Rohm Co. Ltd. (Information Technology) | | | 241,960 | |
| | 4,235 | | | Ryohin Keikaku Co. Ltd. (Consumer Discretionary) | | | 1,173,610 | |
| | 4,828 | | | Sankyo Co. Ltd. (Consumer Discretionary) | | | 157,482 | |
| | 31,664 | | | SBI Holdings, Inc. (Financials) | | | 439,602 | |
| | 4,273 | | | Secom Co. Ltd. (Industrials) | | | 316,884 | |
| | 9,934 | | | Sega Sammy Holdings, Inc. (Consumer Discretionary) | | | 142,611 | |
| | 7,103 | | | Seiko Epson Corp. (Information Technology) | | | 182,060 | |
| | 22,328 | | | Sekisui Chemical Co. Ltd. (Consumer Discretionary) | | | 415,886 | |
| | 11,443 | | | Sekisui House Ltd. (Consumer Discretionary) | | | 197,960 | |
| | 21,254 | | | Seven & i Holdings Co. Ltd. (Consumer Staples) | | | 842,938 | |
| | 167,224 | | | Sharp Corp. (Consumer Discretionary)*(a) | | | 501,399 | |
| | 15,750 | | | Shimadzu Corp. (Information Technology) | | | 289,213 | |
| | 4,063 | | | Shimamura Co. Ltd. (Consumer Discretionary) | | | 495,416 | |
| | 1,340 | | | Shimano, Inc. (Consumer Discretionary) | | | 180,923 | |
| | 18,390 | | | Shimizu Corp. (Industrials) | | | 189,815 | |
| | 7,135 | | | Shin-Etsu Chemical Co. Ltd. (Materials) | | | 630,390 | |
| | 146,964 | | | Shinsei Bank Ltd. (Financials) | | | 235,014 | |
| | 10,108 | | | Shionogi & Co. Ltd. (Health Care) | | | 532,218 | |
| | 45,480 | | | Shiseido Co. Ltd. (Consumer Staples) | | | 1,883,912 | |
| | 47,145 | | | Showa Shell Sekiyu KK (Energy) | | | 516,170 | |
| | 13,013 | | | SoftBank Group Corp. (Telecommunication Services) | | | 1,054,897 | |
| | 5,669 | | | Sompo Holdings, Inc. (Financials) | | | 212,987 | |
| | 29,802 | | | Sony Corp. (Consumer Discretionary) | | | 1,174,371 | |
| | 4,310 | | | Stanley Electric Co. Ltd. (Consumer Discretionary) | | | 142,936 | |
| | 72,870 | | | Start Today Co. Ltd. (Consumer Discretionary) | | | 2,264,359 | |
| | 11,057 | | | Subaru Corp. (Consumer Discretionary) | | | 387,387 | |
| | 66,607 | | | Sumitomo Chemical Co. Ltd. (Materials) | | | 398,819 | |
| | 62,260 | | | Sumitomo Corp. (Industrials) | | | 880,499 | |
| | 25,001 | | | Sumitomo Dainippon Pharma Co. Ltd. (Health Care) | | | 339,374 | |
| | 12,541 | | | Sumitomo Electric Industries Ltd. (Consumer Discretionary) | | | 196,217 | |
| | 23,755 | | | Sumitomo Heavy Industries Ltd. (Industrials) | | | 176,986 | |
| | 36,247 | | | Sumitomo Mitsui Financial Group, Inc. (Financials) | | | 1,354,899 | |
| | 38,901 | | | Sumitomo Rubber Industries Ltd. (Consumer Discretionary) | | | 644,344 | |
| | |
| | |
| The accompanying notes are an integral part of these financial statements. | | 61 |
GOLDMAN SACHS ACTIVEBETA® INTERNATIONAL EQUITY ETF
Schedule of Investments (continued)
August 31, 2017
| | | | | | | | |
Shares | | | Description | | Value | |
| Common Stocks – (continued) | |
| Japan – (continued) | | | |
| | 13,035 | | | Sundrug Co. Ltd. (Consumer Staples) | | $ | 539,473 | |
| | 15,585 | | | Suntory Beverage & Food Ltd. (Consumer Staples) | | | 719,351 | |
| | 23,911 | | | Suzuken Co. Ltd. (Health Care) | | | 870,103 | |
| | 8,139 | | | Suzuki Motor Corp. (Consumer Discretionary) | | | 408,651 | |
| | 19,173 | | | Sysmex Corp. (Health Care) | | | 1,181,110 | |
| | 10,800 | | | T&D Holdings, Inc. (Financials) | | | 148,026 | |
| | 50,775 | | | Taiheiyo Cement Corp. (Materials) | | | 195,608 | |
| | 41,886 | | | Taisei Corp. (Industrials) | | | 419,773 | |
| | 3,025 | | | Taisho Pharmaceutical Holdings Co. Ltd. (Health Care) | | | 235,821 | |
| | 43,757 | | | Takashimaya Co. Ltd. (Consumer Discretionary) | | | 401,152 | |
| | 13,264 | | | Takeda Pharmaceutical Co. Ltd. (Health Care) | | | 732,376 | |
| | 15,668 | | | Teijin Ltd. (Materials) | | | 317,745 | |
| | 5,928 | | | Terumo Corp. (Health Care) | | | 228,911 | |
| | 5,380 | | | THK Co. Ltd. (Industrials) | | | 179,398 | |
| | 49,175 | | | Tobu Railway Co. Ltd. (Industrials) | | | 271,655 | |
| | 5,971 | | | Toho Co. Ltd. (Consumer Discretionary) | | | 221,620 | |
| | 48,171 | | | Toho Gas Co. Ltd. (Utilities) | | | 317,318 | |
| | 20,161 | | | Tohoku Electric Power Co., Inc. (Utilities) | | | 275,505 | |
| | 7,547 | | | Tokio Marine Holdings, Inc. (Financials) | | | 301,030 | |
| | 237,225 | | | Tokyo Electric Power Co. Holdings, Inc. (Utilities)* | | | 959,160 | |
| | 5,742 | | | Tokyo Electron Ltd. (Information Technology) | | | 806,572 | |
| | 67,237 | | | Tokyo Gas Co. Ltd. (Utilities) | | | 356,284 | |
| | 14,638 | | | Tokyu Corp. (Industrials) | | | 212,800 | |
| | 53,981 | | | Tokyu Fudosan Holdings Corp. (Real Estate) | | | 321,748 | |
| | 27,058 | | | Toppan Printing Co. Ltd. (Industrials) | | | 270,678 | |
| | 31,441 | | | Toray Industries, Inc. (Materials) | | | 299,098 | |
| | 38,032 | | | Tosoh Corp. (Materials) | | | 445,768 | |
| | 5,426 | | | TOTO Ltd. (Industrials) | | | 206,322 | |
| | 9,802 | | | Toyo Seikan Group Holdings Ltd. (Materials) | | | 161,467 | |
| | 6,386 | | | Toyo Suisan Kaisha Ltd. (Consumer Staples) | | | 235,863 | |
| | 5,434 | | | Toyoda Gosei Co. Ltd. (Consumer Discretionary) | | | 126,543 | |
| | 37,951 | | | Toyota Motor Corp. (Consumer Discretionary) | | | 2,132,028 | |
| | 16,106 | | | Toyota Tsusho Corp. (Industrials) | | | 495,355 | |
| | 4,030 | | | Trend Micro, Inc. (Information Technology) | | | 186,377 | |
| | 4,651 | | | Tsuruha Holdings, Inc. (Consumer Staples) | | | 553,167 | |
| | 32,239 | | | Unicharm Corp. (Consumer Staples) | | | 757,789 | |
| | 195 | | | United Urban Investment Corp. REIT (Real Estate) | | | 293,935 | |
| | 10,326 | | | USS Co Ltd. (Consumer Discretionary) | | | 202,748 | |
| | 5,881 | | | West Japan Railway Co. (Industrials) | | | 426,995 | |
| | |
| Common Stocks – (continued) | |
| Japan – (continued) | | | |
| | 3,409 | | | Yakult Honsha Co. Ltd. (Consumer Staples) | | | 236,022 | |
| | 86,798 | | | Yamada Denki Co. Ltd. (Consumer Discretionary) | | | 469,242 | |
| | 16,159 | | | Yamaguchi Financial Group, Inc. (Financials) | | | 182,644 | |
| | 4,550 | | | Yamaha Motor Co. Ltd. (Consumer Discretionary) | | | 128,571 | |
| | 85,730 | | | Yamazaki Baking Co. Ltd. (Consumer Staples) | | | 1,623,309 | |
| | 12,438 | | | Yaskawa Electric Corp. (Information Technology) | | | 376,327 | |
| | 14,506 | | | Yokogawa Electric Corp. (Information Technology) | | | 225,775 | |
| | 19,157 | | | Yokohama Rubber Co. Ltd. (The) (Consumer Discretionary) | | | 354,211 | |
| | | | | | | | |
| | | | | | | 126,952,299 | |
| | |
| Luxembourg – 0.3% | | | |
| | 26,729 | | | ArcelorMittal (Materials)* | | | 713,101 | |
| | 538 | | | Eurofins Scientific SE (Health Care) | | | 307,085 | |
| | 9,997 | | | RTL Group SA (Consumer Discretionary) | | | 757,696 | |
| | 5,861 | | | SES SA (Consumer Discretionary) | | | 133,823 | |
| | | | | | | | |
| | | | | | | 1,911,705 | |
| | |
| Macau – 0.1% | | | |
| | 61,210 | | | MGM China Holdings Ltd. (Consumer Discretionary)(a) | | | 122,632 | |
| | 89,258 | | | Wynn Macau Ltd. (Consumer Discretionary) | | | 195,932 | |
| | | | | | | | |
| | | | | | | 318,564 | |
| | |
| Mexico – 0.0% | | | |
| | 7,410 | | | Fresnillo PLC (Materials) | | | 154,298 | |
| | |
| Netherlands – 3.2% | | | |
| | 9,086 | | | ABN AMRO Group NV (Financials)(b) | | | 254,287 | |
| | 59,738 | | | Aegon NV (Financials) | | | 340,624 | |
| | 4,993 | | | Akzo Nobel NV (Materials) | | | 455,898 | |
| | 7,681 | | | Altice NV, Class A (Consumer Discretionary)* | | | 176,886 | |
| | 6,693 | | | ASML Holding NV (Information Technology) | | | 1,038,428 | |
| | 16,065 | | | Boskalis Westminster (Industrials) | | | 524,286 | |
| | 13,992 | | | EXOR NV (Financials) | | | 896,631 | |
| | 8,637 | | | Gemalto NV (Information Technology) | | | 466,140 | |
| | 15,903 | | | Heineken Holding NV (Consumer Staples) | | | 1,568,152 | |
| | 8,294 | | | Heineken NV (Consumer Staples) | | | 869,026 | |
| | 90,581 | | | ING Groep NV (Financials) | | | 1,604,606 | |
| | 90,478 | | | Koninklijke Ahold Delhaize NV (Consumer Staples) | | | 1,624,296 | |
| | 5,393 | | | Koninklijke DSM NV (Materials) | | | 408,620 | |
| | 87,188 | | | Koninklijke KPN NV (Telecommunication Services) | | | 307,967 | |
| | 31,749 | | | Koninklijke Philips NV (Health Care) | | | 1,199,580 | |
| | |
| | |
| 62 | | The accompanying notes are an integral part of these financial statements. |
GOLDMAN SACHS ACTIVEBETA® INTERNATIONAL EQUITY ETF
| | | | | | | | |
Shares | | | Description | | Value | |
| Common Stocks – (continued) | |
| Netherlands – (continued) | | | |
| | 4,528 | | | Koninklijke Vopak NV (Energy) | | $ | 191,404 | |
| | 23,013 | | | NN Group NV (Financials) | | | 912,051 | |
| | 3,976 | | | NXP Semiconductors NV (Information Technology)* | | | 449,129 | |
| | 16,121 | | | Randstad Holding NV (Industrials) | | | 941,158 | |
| | 81,329 | | | Royal Dutch Shell PLC, Class A (Energy) | | | 2,229,022 | |
| | 63,700 | | | Royal Dutch Shell PLC, Class B (Energy) | | | 1,773,352 | |
| | 20,363 | | | Wolters Kluwer NV (Industrials) | | | 888,370 | |
| | | | | | | | |
| | | | | | | 19,119,913 | |
| | |
| New Zealand – 0.1% | | | |
| | 27,459 | | | Fletcher Building Ltd. (Materials) | | | 160,476 | |
| | 90,653 | | | Spark New Zealand Ltd. (Telecommunication Services) | | | 254,184 | |
| | | | | | | | |
| | | | | | | 414,660 | |
| | |
| Norway – 0.6% | | | |
| | 24,422 | | | DNB ASA (Financials) | | | 475,579 | |
| | 19,358 | | | Gjensidige Forsikring ASA (Financials) | | | 337,900 | |
| | 31,315 | | | Marine Harvest ASA (Consumer Staples)* | | | 620,275 | |
| | 76,084 | | | Norsk Hydro ASA (Materials) | | | 547,659 | |
| | 25,406 | | | Orkla ASA (Consumer Staples) | | | 260,106 | |
| | 27,038 | | | Schibsted ASA, Class A (Consumer Discretionary) | | | 655,111 | |
| | 29,006 | | | Schibsted ASA, Class B (Consumer Discretionary) | | | 663,646 | |
| | 13,577 | | | Telenor ASA (Telecommunication Services) | | | 274,163 | |
| | | | | | | | |
| | | | | | | 3,834,439 | |
| | |
| Portugal – 0.3% | | | |
| | 169,596 | | | EDP – Energias de Portugal SA (Utilities) | | | 650,265 | |
| | 11,831 | | | Galp Energia SGPS SA (Energy) | | | 195,656 | |
| | 34,581 | | | Jeronimo Martins SGPS SA (Consumer Staples) | | | 689,060 | |
| | | | | | | | |
| | | | | | | 1,534,981 | |
| | |
| Singapore – 1.4% | | | |
| | 188,971 | | | CapitaLand Commercial Trust REIT (Real Estate) | | | 242,128 | |
| | 46,211 | | | CapitaLand Ltd. (Real Estate) | | | 128,629 | |
| | 102,891 | | | CapitaLand Mall Trust REIT (Real Estate) | | | 164,413 | |
| | 17,107 | | | City Developments Ltd. (Real Estate) | | | 147,513 | |
| | 77,445 | | | DBS Group Holdings Ltd. (Financials) | | | 1,175,932 | |
| | 205,329 | | | Genting Singapore PLC (Consumer Discretionary) | | | 179,172 | |
| | 3,616,441 | | | Golden Agri-Resources Ltd. (Consumer Staples) | | | 1,051,910 | |
| | 24,095 | | | Jardine Cycle & Carriage Ltd. (Consumer Discretionary) | | | 708,478 | |
| | |
| Common Stocks – (continued) | |
| Singapore – (continued) | | | |
| | 176,859 | | | Oversea-Chinese Banking Corp. Ltd. (Financials) | | | 1,454,724 | |
| | 188,873 | | | Singapore Exchange Ltd. (Financials) | | | 1,043,113 | |
| | 92,930 | | | Singapore Telecommunications Ltd. (Telecommunication Services) | | | 253,196 | |
| | 357,489 | | | StarHub Ltd. (Telecommunication Services) | | | 687,074 | |
| | 127,919 | | | Suntec Real Estate Investment Trust REIT (Real Estate) | | | 178,503 | |
| | 50,023 | | | United Overseas Bank Ltd. (Financials) | | | 885,164 | |
| | 43,298 | | | UOL Group Ltd. (Real Estate) | | | 260,808 | |
| | | | | | | | |
| | | | | | | 8,560,757 | |
| | |
| South Africa – 0.3% | | | |
| | 45,722 | | | Investec PLC (Financials) | | | 347,599 | |
| | 61,586 | | | Mediclinic International PLC (Health Care) | | | 606,682 | |
| | 19,934 | | | Mondi PLC (Materials) | | | 542,744 | |
| | | | | | | | |
| | | | | | | 1,497,025 | |
| | |
| Spain – 3.0% | | | |
| | 14,206 | | | Abertis Infraestructuras SA (Industrials) | | | 287,122 | |
| | 33,825 | | | ACS Actividades de Construccion y Servicios SA (Industrials) | | | 1,277,213 | |
| | 3,642 | | | Aena SA (Industrials)(b) | | | 710,332 | |
| | 27,932 | | | Amadeus IT Group SA (Information Technology) | | | 1,729,158 | |
| | 95,126 | | | Banco Bilbao Vizcaya Argentaria SA (Financials) | | | 839,393 | |
| | 315,901 | | | Banco de Sabadell SA (Financials) | | | 693,686 | |
| | 387,108 | | | Banco Santander SA (Financials) | | | 2,512,409 | |
| | 36,813 | | | Bankia SA (Financials) | | | 178,963 | |
| | 20,248 | | | Bankinter SA (Financials) | | | 192,824 | |
| | 85,833 | | | CaixaBank SA (Financials) | | | 442,679 | |
| | 177,073 | | | Distribuidora Internacional de Alimentacion SA (Consumer Staples) | | | 1,119,135 | |
| | 10,955 | | | Enagas SA (Energy) | | | 322,419 | |
| | 20,427 | | | Endesa SA (Utilities) | | | 492,149 | |
| | 12,425 | | | Ferrovial SA (Industrials) | | | 282,811 | |
| | 9,648 | | | Gas Natural SDG SA (Utilities) | | | 234,227 | |
| | 12,953 | | | Grifols SA (Health Care) | | | 365,746 | |
| | 108,421 | | | Iberdrola SA (Utilities) | | | 884,394 | |
| | 46,458 | | | Industria de Diseno Textil SA (Consumer Discretionary) | | | 1,762,790 | |
| | 230,796 | | | Mapfre SA (Financials) | | | 815,771 | |
| | 13,364 | | | Red Electrica Corp. SA (Utilities) | | | 299,736 | |
| | 101,822 | | | Repsol SA (Energy) | | | 1,746,840 | |
| | 69,899 | | | Telefonica SA (Telecommunication Services) | | | 752,829 | |
| | | | | | | | |
| | | | | | | 17,942,626 | |
| | |
| Sweden – 2.5% | | | |
| | 9,081 | | | Alfa Laval AB (Industrials) | | | 205,418 | |
| | 16,960 | | | Assa Abloy AB, Class B (Industrials) | | | 366,168 | |
| | 24,827 | | | Atlas Copco AB, Class A (Industrials) | | | 971,571 | |
| | 10,072 | | | Atlas Copco AB, Class B (Industrials) | | | 358,966 | |
| | |
| | |
| The accompanying notes are an integral part of these financial statements. | | 63 |
GOLDMAN SACHS ACTIVEBETA® INTERNATIONAL EQUITY ETF
Schedule of Investments (continued)
August 31, 2017
| | | | | | | | |
Shares | | | Description | | Value | |
| Common Stocks – (continued) | |
| Sweden – (continued) | | | |
| | 19,248 | | | Boliden AB (Materials) | | $ | 672,453 | |
| | 23,638 | | | Electrolux AB, Series B (Consumer Discretionary) | | | 858,202 | |
| | 7,734 | | | Essity AB, Class B (Consumer Staples)* | | | 214,408 | |
| | 23,211 | | | Getinge AB, Class B (Health Care) | | | 430,538 | |
| | 63,130 | | | Hennes & Mauritz AB, Class B (Consumer Discretionary) | | | 1,594,643 | |
| | 7,460 | | | Hexagon AB, Class B (Information Technology) | | | 365,530 | |
| | 27,697 | | | Husqvarna AB, Class B (Consumer Discretionary) | | | 278,977 | |
| | 6,145 | | | ICA Gruppen AB (Consumer Staples) | | | 244,647 | |
| | 25,258 | | | Industrivarden AB, Class C (Financials) | | | 597,379 | |
| | 16,831 | | | Investor AB, Class B (Financials) | | | 785,990 | |
| | 8,219 | | | Kinnevik AB, Class B (Financials) | | | 246,962 | |
| | 6,576 | | | L E Lundbergforetagen AB, Class B (Financials) | | | 508,653 | |
| | 55,243 | | | Nordea Bank AB (Financials) | | | 742,141 | |
| | 32,812 | | | Sandvik AB (Industrials) | | | 541,413 | |
| | 54,933 | | | Securitas AB, Class B (Industrials) | | | 901,588 | |
| | 36,095 | | | Skandinaviska Enskilda Banken AB, Class A (Financials) | | | 469,029 | |
| | 8,523 | | | Skanska AB, Class B (Industrials) | | | 192,260 | |
| | 8,359 | | | SKF AB, Class B (Industrials) | | | 166,815 | |
| | 26,317 | | | Svenska Handelsbanken AB, Class A (Financials) | | | 392,902 | |
| | 19,227 | | | Swedbank AB, Class A (Financials) | | | 519,012 | |
| | 19,150 | | | Swedish Match AB (Consumer Staples) | | | 681,784 | |
| | 19,418 | | | Tele2 AB, Class B (Telecommunication Services) | | | 225,724 | |
| | 108,812 | | | Telefonaktiebolaget LM Ericsson, Class B (Information Technology) | | | 636,817 | |
| | 77,198 | | | Telia Co. AB (Telecommunication Services) | | | 367,686 | |
| | 29,953 | | | Volvo AB, Class B (Industrials) | | | 510,801 | |
| | | | | | | | |
| | | | | | | 15,048,477 | |
| | |
| Switzerland – 8.9% | | | |
| | 51,185 | | | ABB Ltd. (Industrials) | | | 1,182,421 | |
| | 8,460 | | | Adecco Group AG (Industrials) | | | 611,831 | |
| | 3,291 | | | Baloise Holding AG (Financials) | | | 522,930 | |
| | 430 | | | Barry Callebaut AG (Consumer Staples)* | | | 617,482 | |
| | 114 | | | Chocoladefabriken Lindt & Spruengli AG (Consumer Staples) | | | 652,445 | |
| | 8,823 | | | Cie Financiere Richemont SA (Consumer Discretionary) | | | 787,276 | |
| | 40,070 | | | Coca-Cola HBC AG (Consumer Staples)* | | | 1,365,156 | |
| | 7,868 | | | Credit Suisse Group AG (Financials)* | | | 115,441 | |
| | 1,752 | | | Dufry AG (Consumer Discretionary)* | | | 269,454 | |
| | 2,078 | | | EMS-Chemie Holding AG (Materials) | | | 1,417,408 | |
| | 28,277 | | | Ferguson PLC (Industrials) | | | 1,677,165 | |
| | 1,219 | | | Geberit AG (Industrials) | | | 555,717 | |
| | 253 | | | Givaudan SA (Materials) | | | 516,004 | |
| | 732,977 | | | Glencore PLC (Materials)* | | | 3,395,397 | |
| | |
| Common Stocks – (continued) | |
| Switzerland – (continued) | | | |
| | 5,270 | | | Julius Baer Group Ltd. (Financials)* | | | 293,935 | |
| | 12,006 | | | Kuehne + Nagel International AG (Industrials) | | | 2,170,075 | |
| | 3,917 | | | LafargeHolcim Ltd. (Materials)* | | | 229,681 | |
| | 1,499 | | | Lonza Group AG (Health Care)* | | | 378,728 | |
| | 100,002 | | | Nestle SA (Consumer Staples) | | | 8,465,310 | |
| | 66,361 | | | Novartis AG (Health Care) | | | 5,586,477 | |
| | 5,855 | | | Pargesa Holding SA (Financials) | | | 473,396 | |
| | 3,671 | | | Partners Group Holding AG (Financials) | | | 2,376,027 | |
| | 23,374 | | | Roche Holding AG (Health Care) | | | 5,922,548 | |
| | 1,467 | | | Schindler Holding AG (Industrials) | | | 307,597 | |
| | 1,991 | | | Schindler Holding AG Participation Certificates (Industrials) | | | 425,548 | |
| | 468 | | | SGS SA (Industrials) | | | 1,043,625 | |
| | 121 | | | Sika AG (Materials) | | | 856,191 | |
| | 5,266 | | | Sonova Holding AG (Health Care) | | | 888,261 | |
| | 95,392 | | | STMicroelectronics NV (Information Technology) | | | 1,650,704 | |
| | 1,582 | | | Straumann Holding AG (Health Care) | | | 1,011,591 | |
| | 2,557 | | | Swatch Group AG (The) – Bearer (Consumer Discretionary) | | | 1,018,543 | |
| | 10,029 | | | Swatch Group AG (The) – Registered (Consumer Discretionary) | | | 775,917 | |
| | 3,015 | | | Swiss Life Holding AG (Financials)* | | | 1,076,741 | |
| | 3,677 | | | Swiss Prime Site AG (Real Estate)* | | | 332,116 | |
| | 13,673 | | | Swiss Re AG (Financials) | | | 1,235,692 | |
| | 636 | | | Swisscom AG (Telecommunication Services) | | | 320,052 | |
| | 63,972 | | | UBS Group AG (Financials)* | | | 1,051,777 | |
| | 3,127 | | | Zurich Insurance Group AG (Financials) | | | 933,545 | |
| | | | | | | | |
| | | | | | | 52,510,204 | |
| | |
| United Kingdom – 13.2% | | | |
| | 138,373 | | | 3i Group PLC (Financials) | | | 1,728,624 | |
| | 70,608 | | | Admiral Group PLC (Financials) | | | 1,756,862 | |
| | 119,115 | | | Anglo American PLC (Materials) | | | 2,152,637 | |
| | 15,112 | | | Ashtead Group PLC (Industrials) | | | 323,829 | |
| | 7,773 | | | Associated British Foods PLC (Consumer Staples) | | | 332,728 | |
| | 32,988 | | | AstraZeneca PLC (Health Care) | | | 1,930,229 | |
| | 267,060 | | | Auto Trader Group PLC (Information Technology)(b) | | | 1,216,121 | |
| | 95,792 | | | Aviva PLC (Financials) | | | 644,936 | |
| | 72,207 | | | BAE Systems PLC (Industrials) | | | 565,232 | |
| | 245,054 | | | Barclays PLC (Financials) | | | 603,426 | |
| | 114,675 | | | Barratt Developments PLC (Consumer Discretionary) | | | 922,789 | |
| | 2,483 | | | Berkeley Group Holdings PLC (Consumer Discretionary) | | | 119,692 | |
| | 387,110 | | | BP PLC (Energy) | | | 2,220,456 | |
| | 47,264 | | | British American Tobacco PLC (Consumer Staples) | | | 2,942,177 | |
| | 27,336 | | | British Land Co. PLC (The) REIT (Real Estate) | | | 215,393 | |
| | 48,107 | | | BT Group PLC (Telecommunication Services) | | | 181,347 | |
| | |
| | |
| 64 | | The accompanying notes are an integral part of these financial statements. |
GOLDMAN SACHS ACTIVEBETA® INTERNATIONAL EQUITY ETF
| | | | | | | | |
Shares | | | Description | | Value | |
| Common Stocks – (continued) | |
| United Kingdom – (continued) | | | |
| | 11,223 | | | Bunzl PLC (Industrials) | | $ | 334,058 | |
| | 77,125 | | | Burberry Group PLC (Consumer Discretionary) | | | 1,785,848 | |
| | 160,506 | | | Centrica PLC (Utilities) | | | 413,433 | |
| | 33,658 | | | CNH Industrial NV (Industrials) | | | 381,352 | |
| | 3,599 | | | Coca-Cola European Partners PLC (Consumer Staples) | | | 153,910 | |
| | 60,351 | | | Compass Group PLC (Consumer Discretionary) | | | 1,284,683 | |
| | 41,319 | | | ConvaTec Group PLC (Health Care)*(b) | | | 152,750 | |
| | 10,124 | | | Croda International PLC (Materials) | | | 501,200 | |
| | 3,649 | | | DCC PLC (Industrials) | | | 331,250 | |
| | 50,635 | | | Diageo PLC (Consumer Staples) | | | 1,691,170 | |
| | 53,647 | | | Direct Line Insurance Group PLC (Financials) | | | 262,751 | |
| | 65,161 | | | Dixons Carphone PLC (Consumer Discretionary) | | | 145,592 | |
| | 29,482 | | | Experian PLC (Industrials) | | | 590,350 | |
| | 120,880 | | | Fiat Chrysler Automobiles NV (Consumer Discretionary)* | | | 1,817,984 | |
| | 56,365 | | | G4S PLC (Industrials) | | | 205,904 | |
| | 68,515 | | | GKN PLC (Consumer Discretionary) | | | 281,541 | |
| | 122,773 | | | GlaxoSmithKline PLC (Health Care) | | | 2,425,985 | |
| | 40,513 | | | Hammerson PLC REIT (Real Estate) | | | 292,859 | |
| | 80,779 | | | Hargreaves Lansdown PLC (Financials) | | | 1,457,229 | |
| | 486,102 | | | HSBC Holdings PLC (Financials) | | | 4,700,883 | |
| | 10,480 | | | IMI PLC (Industrials) | | | 153,271 | |
| | 28,028 | | | Imperial Brands PLC (Consumer Staples) | | | 1,155,876 | |
| | 10,597 | | | InterContinental Hotels Group PLC (Consumer Discretionary) | | | 526,528 | |
| | 116,703 | | | International Consolidated Airlines Group SA (Industrials) | | | 922,259 | |
| | 7,795 | | | Intertek Group PLC (Industrials) | | | 513,261 | |
| | 69,801 | | | Intu Properties PLC REIT (Real Estate) | | | 223,776 | |
| | 400,031 | | | J Sainsbury PLC (Consumer Staples) | | | 1,214,424 | |
| | 9,023 | | | Johnson Matthey PLC (Materials) | | | 321,359 | |
| | 213,256 | | | Kingfisher PLC (Consumer Discretionary) | | | 821,351 | |
| | 18,719 | | | Land Securities Group PLC REIT (Real Estate) | | | 243,616 | |
| | 269,001 | | | Legal & General Group PLC (Financials) | | | 901,909 | |
| | 677,657 | | | Lloyds Banking Group PLC (Financials) | | | 557,273 | |
| | 12,761 | | | London Stock Exchange Group PLC (Financials) | | | 649,506 | |
| | 256,796 | | | Marks & Spencer Group PLC (Consumer Discretionary)(a) | | | 1,057,539 | |
| | 56,441 | | | Meggitt PLC (Industrials) | | | 376,726 | |
| | 58,627 | | | Merlin Entertainments PLC (Consumer Discretionary)(b) | | | 348,484 | |
| | 45,574 | | | National Grid PLC (Utilities) | | | 572,387 | |
| | 17,167 | | | Next PLC (Consumer Discretionary) | | | 913,357 | |
| | 79,549 | | | Old Mutual PLC (Financials) | | | 212,693 | |
| | 20,571 | | | Persimmon PLC (Consumer Discretionary) | | | 704,815 | |
| | |
| Common Stocks – (continued) | |
| United Kingdom – (continued) | | | |
| | 49,725 | | | Provident Financial PLC (Financials)(a) | | | 565,766 | |
| | 67,102 | | | Prudential PLC (Financials) | | | 1,569,759 | |
| | 9,723 | | | Reckitt Benckiser Group PLC (Consumer Staples) | | | 918,595 | |
| | 48,351 | | | RELX NV (Industrials) | | | 1,013,739 | |
| | 41,976 | | | RELX PLC (Industrials) | | | 914,631 | |
| | 5,763 | | | Rio Tinto Ltd. (Materials) | | | 310,091 | |
| | 25,497 | | | Rio Tinto PLC (Materials) | | | 1,230,881 | |
| | 29,378 | | | Rolls-Royce Holdings PLC (Industrials)* | | | 345,995 | |
| | 264,841 | | | Royal Mail PLC (Industrials) | | | 1,345,251 | |
| | 59,635 | | | RSA Insurance Group PLC (Financials) | | | 512,157 | |
| | 163,335 | | | Sage Group PLC (The) (Information Technology) | | | 1,457,472 | |
| | 13,043 | | | Schroders PLC (Financials) | | | 566,045 | |
| | 92,352 | | | Segro PLC REIT (Real Estate) | | | 640,221 | |
| | 14,393 | | | Severn Trent PLC (Utilities) | | | 420,811 | |
| | 39,106 | | | Sky PLC (Consumer Discretionary) | | | 481,729 | |
| | 57,567 | | | Smith & Nephew PLC (Health Care) | | | 1,036,266 | |
| | 22,591 | | | Smiths Group PLC (Industrials) | | | 449,744 | |
| | 25,541 | | | SSE PLC (Utilities) | | | 468,980 | |
| | 14,790 | | | St James’s Place PLC (Financials) | | | 219,735 | |
| | 42,778 | | | Standard Chartered PLC (Financials)* | | | 424,436 | |
| | 51,160 | | | Tate & Lyle PLC (Consumer Staples) | | | 450,578 | |
| | 397,582 | | | Tesco PLC (Consumer Staples)* | | | 926,759 | |
| | 48,937 | | | Unilever NV (Consumer Staples) | | | 2,909,641 | |
| | 50,023 | | | Unilever PLC (Consumer Staples) | | | 2,912,818 | |
| | 32,538 | | | United Utilities Group PLC (Utilities) | | | 381,534 | |
| | 519,786 | | | Vodafone Group PLC (Telecommunication Services) | | | 1,482,871 | |
| | 5,394 | | | Weir Group PLC (The) (Industrials) | | | 124,760 | |
| | 16,246 | | | Whitbread PLC (Consumer Discretionary) | | | 786,692 | |
| | 753,015 | | | Wm Morrison Supermarkets PLC (Consumer Staples) | | | 2,386,932 | |
| | 64,588 | | | Worldpay Group PLC (Information Technology)(b) | | | 347,048 | |
| | 79,433 | | | WPP PLC (Consumer Discretionary) | | | 1,453,418 | |
| | | | | | | | |
| | | | | | | 78,512,975 | |
| | |
| United States – 0.6% | | | |
| | 9,511 | | | Carnival PLC (Consumer Discretionary) | | | 658,728 | |
| | 24,847 | | | QIAGEN NV (Health Care)* | | | 796,267 | |
| | 20,741 | | | Shire PLC (Health Care) | | | 1,024,534 | |
| | 3,306 | | | Taro Pharmaceutical Industries Ltd. (Health Care)*(a) | | | 346,601 | |
| | 68,066 | | | Valeant Pharmaceuticals International, Inc. (Health Care)* | | | 911,528 | |
| | | | | | | | |
| | | | | | | 3,737,658 | |
| | |
| | TOTAL COMMON STOCKS | |
| | (Cost $518,911,387) | | $ | 588,996,106 | |
| | |
| | |
| The accompanying notes are an integral part of these financial statements. | | 65 |
GOLDMAN SACHS ACTIVEBETA® INTERNATIONAL EQUITY ETF
Schedule of Investments (continued)
August 31, 2017
| | | | | | | | |
Shares | | | Description | | Value | |
| Preferred Stocks – 0.4% | |
| Germany – 0.4% | |
| | 1,505 | | | Bayerische Motoren Werke AG (Consumer Discretionary) | | $ | 124,696 | |
| | 23,046 | | | FUCHS PETROLUB SE (Materials) | | | 1,279,551 | |
| | 7,035 | | | Henkel AG & Co KGaA (Consumer Staples) | | | 941,358 | |
| | 969 | | | Volkswagen AG (Consumer Discretionary) | | | 144,408 | |
| | |
| | TOTAL PREFERRED STOCKS | |
| | (Cost $2,167,739) | | $ | 2,490,013 | |
| | |
| TOTAL INVESTMENTS BEFORE SECURITIES LENDING
REINVESTMENT VEHICLE |
|
| | (Cost $521,079,126) | | $ | 591,486,119 | |
| | |
| | | | | | | | |
| Shares | | | Distribution rate | | Value | |
| Securities Lending Reinvestment Vehicle – 1.2%(c) | |
| Goldman Sachs Financial Square Government Fund –
Institutional Shares |
|
| | 6,961,512 | | | 0.93% | | $ | 6,961,512 | |
| | (Cost $6,961,512) | | | | |
| | |
| | TOTAL INVESTMENTS – 100.9% | |
| | (Cost $528,040,638) | | $ | 598,447,631 | |
| | |
| LIABILITIES IN EXCESS OF
OTHER ASSETS – (0.9)% | | | (5,319,100 | ) |
| | |
| | NET ASSETS – 100.0% | | $ | 593,128,531 | |
| | |
| | |
| The percentage shown for each investment category reflects the value of investments in that category as a percentage of net assets. |
* | | Security is currently in default and/or non-income producing. |
(a) | | All or a portion of security is on loan. |
(b) | | Exempt from registration under Rule 144A of the Securities Act of 1933. Under procedures approved by the Board of Trustees, such securities may be deemed liquid by the Investment Adviser and may be resold, normally to qualified institutional buyers in transactions exempt from registration. Total market value of Rule 144A securities amounts to $6,661,490, which represents approximately 1.1% of net assets as of August 31, 2017. |
(c) | | Represents an affiliated issuer. |
| | |
|
Investment Abbreviations: |
ADR | | —American Depositary Receipt |
PLC | | —Public Limited Company |
REIT | | —Real Estate Investment Trust |
|
| | |
| 66 | | The accompanying notes are an integral part of these financial statements. |
GOLDMAN SACHS ACTIVEBETA® JAPAN EQUITY ETF
Schedule of Investments
August 31, 2017
| | | | | | | | |
Shares | | | Description | | Value | |
| Common Stocks – 99.5% | |
| Consumer Discretionary – 20.4% | | | |
| | 1,291 | | | ABC-Mart, Inc. | | $ | 66,274 | |
| | 1,206 | | | Aisin Seiki Co. Ltd. | | | 60,596 | |
| | 3,500 | | | Asics Corp. | | | 52,694 | |
| | 6,873 | | | Bandai Namco Holdings, Inc. | | | 230,120 | |
| | 2,919 | | | Benesse Holdings, Inc. | | | 112,188 | |
| | 8,123 | | | Bridgestone Corp. | | | 348,287 | |
| | 4,717 | | | Casio Computer Co. Ltd. | | | 66,602 | |
| | 3,309 | | | Denso Corp. | | | 160,429 | |
| | 1,359 | | | Dentsu, Inc. | | | 56,800 | |
| | 1,189 | | | Don Quijote Holdings Co. Ltd. | | | 45,103 | |
| | 602 | | | Fast Retailing Co. Ltd. | | | 172,133 | |
| | 3,320 | | | Hakuhodo DY Holdings, Inc. | | | 45,158 | |
| | 1,181 | | | Hikari Tsushin, Inc. | | | 146,364 | |
| | 18,824 | | | Honda Motor Co. Ltd. | | | 526,956 | |
| | 1,842 | | | Iida Group Holdings Co. Ltd. | | | 31,280 | |
| | 2,577 | | | Isetan Mitsukoshi Holdings Ltd. | | | 26,505 | |
| | 2,243 | | | Isuzu Motors Ltd. | | | 29,306 | |
| | 1,786 | | | J Front Retailing Co. Ltd. | | | 24,909 | |
| | 1,406 | | | Koito Manufacturing Co. Ltd. | | | 87,508 | |
| | 863 | | | Marui Group Co. Ltd. | | | 12,068 | |
| | 19,466 | | | Mazda Motor Corp. | | | 286,348 | |
| | 3,375 | | | McDonald’s Holdings Co. Japan Ltd. | | | 149,799 | |
| | 2,076 | | | Mitsubishi Motors Corp. | | | 15,316 | |
| | 637 | | | NGK Spark Plug Co. Ltd. | | | 12,125 | |
| | 9,280 | | | Nikon Corp. | | | 152,868 | |
| | 15,671 | | | Nissan Motor Co. Ltd. | | | 155,628 | |
| | 1,667 | | | Nitori Holdings Co. Ltd. | | | 257,184 | |
| | 1,632 | | | NOK Corp. | | | 36,685 | |
| | 1,377 | | | Oriental Land Co. Ltd. | | | 103,331 | |
| | 24,855 | | | Panasonic Corp. | | | 330,956 | |
| | 2,712 | | | Rakuten, Inc. | | | 32,169 | |
| | 666 | | | Rinnai Corp. | | | 57,789 | |
| | 569 | | | Ryohin Keikaku Co. Ltd. | | | 157,682 | |
| | 964 | | | Sankyo Co. Ltd. | | | 31,444 | |
| | 4,442 | | | Sega Sammy Holdings, Inc. | | | 63,768 | |
| | 9,487 | | | Sekisui Chemical Co. Ltd. | | | 176,707 | |
| | 3,376 | | | Sekisui House Ltd. | | | 58,404 | |
| | 38,221 | | | Sharp Corp.*(a) | | | 114,600 | |
| | 928 | | | Shimamura Co. Ltd. | | | 113,154 | |
| | 629 | | | Shimano, Inc. | | | 84,926 | |
| | 13,770 | | | Sony Corp. | | | 542,618 | |
| | 2,821 | | | Stanley Electric Co. Ltd. | | | 93,555 | |
| | 6,695 | | | Start Today Co. Ltd. | | | 208,040 | |
| | 6,301 | | | Subaru Corp. | | | 220,758 | |
| | 4,873 | | | Sumitomo Electric Industries Ltd. | | | 76,243 | |
| | 13,203 | | | Sumitomo Rubber Industries Ltd. | | | 218,690 | |
| | 4,410 | | | Suzuki Motor Corp. | | | 221,422 | |
| | 24,914 | | | Takashimaya Co. Ltd. | | | 228,405 | |
| | 1,680 | | | Toho Co. Ltd. | | | 62,355 | |
| | 2,535 | | | Toyoda Gosei Co. Ltd. | | | 59,033 | |
| | 533 | | | Toyota Industries Corp. | | | 28,379 | |
| | 28,011 | | | Toyota Motor Corp. | | | 1,573,615 | |
| | 1,526 | | | USS Co Ltd. | | | 29,963 | |
| | 38,402 | | | Yamada Denki Co. Ltd. | | | 207,607 | |
| | 2,142 | | | Yamaha Corp. | | | 74,540 | |
| | 2,146 | | | Yamaha Motor Co. Ltd. | | | 60,640 | |
| | |
| Common Stocks – (continued) | |
| Consumer Discretionary – (continued) | | | |
| | 9,245 | | | Yokohama Rubber Co. Ltd. (The) | | | 170,939 | |
| | | | | | | | |
| | | | | | | 8,768,965 | |
| | |
| Consumer Staples – 10.2% | | | |
| | 7,367 | | | Aeon Co. Ltd.(a) | | | 108,571 | |
| | 6,782 | | | Ajinomoto Co., Inc. | | | 133,810 | |
| | 7,100 | | | Asahi Group Holdings Ltd. | | | 308,940 | |
| | 2,281 | | | Calbee, Inc. | | | 77,926 | |
| | 2,695 | | | Coca-Cola Bottlers Japan, Inc. | | | 92,315 | |
| | 1,836 | | | FamilyMart UNY Holdings Co. Ltd.(a) | | | 99,424 | |
| | 6,132 | | | Kao Corp. | | | 382,317 | |
| | 2,938 | | | Kikkoman Corp. | | | 91,963 | |
| | 16,950 | | | Kirin Holdings Co. Ltd. | | | 384,478 | |
| | 1,045 | | | Kose Corp. | | | 131,028 | |
| | 1,985 | | | Lawson, Inc. | | | 133,283 | |
| | 7,108 | | | Lion Corp. | | | 141,178 | |
| | 2,285 | | | MEIJI Holdings Co. Ltd. | | | 181,870 | |
| | 4,488 | | | NH Foods Ltd. | | | 131,712 | |
| | 7,193 | | | Nisshin Seifun Group, Inc. | | | 124,894 | |
| | 1,290 | | | Nissin Foods Holdings Co. Ltd. | | | 79,468 | |
| | 4,864 | | | Pola Orbis Holdings, Inc. | | | 156,226 | |
| | 9,572 | | | Seven & i Holdings Co. Ltd. | | | 379,627 | |
| | 6,072 | | | Shiseido Co. Ltd. | | | 251,520 | |
| | 2,835 | | | Sundrug Co. Ltd. | | | 117,331 | |
| | 4,405 | | | Suntory Beverage & Food Ltd. | | | 203,320 | |
| | 2,784 | | | Toyo Suisan Kaisha Ltd. | | | 102,825 | |
| | 1,137 | | | Tsuruha Holdings, Inc. | | | 135,229 | |
| | 7,346 | | | Unicharm Corp. | | | 172,670 | |
| | 1,151 | | | Yakult Honsha Co. Ltd. | | | 79,689 | |
| | 8,865 | | | Yamazaki Baking Co. Ltd. | | | 167,860 | |
| | | | | | | | |
| | | | | | | 4,369,474 | |
| | |
| Energy – 1.3% | | | |
| | 4,427 | | | Idemitsu Kosan Co. Ltd. | | | 108,040 | |
| | 2,981 | | | Inpex Corp. | | | 28,466 | |
| | 42,279 | | | JXTG Holdings, Inc. | | | 204,519 | |
| | 19,622 | | | Showa Shell Sekiyu KK | | | 214,833 | |
| | | | | | | | |
| | | | | | | 555,858 | |
| | |
| Financials – 10.6% | | | |
| | 1,867 | | | AEON Financial Service Co. Ltd. | | | 39,542 | |
| | 19,059 | | | Aozora Bank Ltd. | | | 72,038 | |
| | 1,250 | | | Bank of Kyoto Ltd. (The) | | | 11,550 | |
| | 2,849 | | | Chiba Bank Ltd. (The) | | | 19,052 | |
| | 1,226 | | | Chugoku Bank Ltd. (The) | | | 16,509 | |
| | 9,732 | | | Concordia Financial Group Ltd. | | | 46,502 | |
| | 1,502 | | | Credit Saison Co. Ltd. | | | 27,226 | |
| | 10,931 | | | Dai-ichi Life Holdings, Inc. | | | 175,794 | |
| | 12,822 | | | Daiwa Securities Group, Inc. | | | 70,110 | |
| | 2,769 | | | Fukuoka Financial Group, Inc. | | | 12,152 | |
| | 3,004 | | | Hachijuni Bank Ltd. (The) | | | 18,287 | |
| | 2,856 | | | Hiroshima Bank Ltd. (The) | | | 11,470 | |
| | 7,303 | | | Japan Exchange Group, Inc. | | | 124,282 | |
| | 2,304 | | | Japan Post Bank Co. Ltd. | | | 29,308 | |
| | 2,525 | | | Japan Post Holdings Co. Ltd. | | | 31,339 | |
| | 1,576 | | | Kyushu Financial Group, Inc. | | | 9,594 | |
| | |
| | |
| The accompanying notes are an integral part of these financial statements. | | 67 |
GOLDMAN SACHS ACTIVEBETA® JAPAN EQUITY ETF
Schedule of Investments (continued)
August 31, 2017
| | | | | | | | |
Shares | | | Description | | Value | |
| Common Stocks – (continued) | |
| Financials – (continued) | | | |
| | 20,724 | | | Mebuki Financial Group, Inc. | | $ | 73,436 | |
| | 131,987 | | | Mitsubishi UFJ Financial Group, Inc. | | | 808,399 | |
| | 38,947 | | | Mitsubishi UFJ Lease & Finance Co. Ltd. | | | 196,752 | |
| | 275,004 | | | Mizuho Financial Group, Inc. | | | 472,499 | |
| | 4,468 | | | MS&AD Insurance Group Holdings, Inc. | | | 147,323 | |
| | 20,790 | | | Nomura Holdings, Inc. | | | 115,699 | |
| | 19,570 | | | ORIX Corp. | | | 312,860 | |
| | 32,834 | | | Resona Holdings, Inc. | | | 163,663 | |
| | 5,839 | | | SBI Holdings, Inc. | | | 81,065 | |
| | 15,340 | | | Seven Bank Ltd. | | | 58,121 | |
| | 8,923 | | | Shinsei Bank Ltd. | | | 14,269 | |
| | 2,442 | | | Shizuoka Bank Ltd. (The) | | | 21,323 | |
| | 4,596 | | | Sompo Holdings, Inc. | | | 172,674 | |
| | 928 | | | Sony Financial Holdings, Inc. | | | 14,688 | |
| | 17,276 | | | Sumitomo Mitsui Financial Group, Inc. | | | 645,770 | |
| | 1,453 | | | Sumitomo Mitsui Trust Holdings, Inc. | | | 50,246 | |
| | 3,507 | | | Suruga Bank Ltd. | | | 74,945 | |
| | 6,113 | | | T&D Holdings, Inc. | | | 83,786 | |
| | 7,626 | | | Tokio Marine Holdings, Inc. | | | 304,181 | |
| | 3,307 | | | Yamaguchi Financial Group, Inc. | | | 37,379 | |
| | | | | | | | |
| | | | | | | 4,563,833 | |
| | |
| Health Care – 7.4% | | | |
| | 7,555 | | | Alfresa Holdings Corp. | | | 142,025 | |
| | 1,982 | | | Chugai Pharmaceutical Co. Ltd. | | | 80,497 | |
| | 10,868 | | | Daiichi Sankyo Co. Ltd. | | | 256,641 | |
| | 2,532 | | | Eisai Co. Ltd. | | | 130,994 | |
| | 1,652 | | | Hisamitsu Pharmaceutical Co., Inc. | | | 79,403 | |
| | 6,009 | | | Hoya Corp. | | | 343,691 | |
| | 5,747 | | | Kyowa Hakko Kirin Co. Ltd. | | | 100,831 | |
| | 3,397 | | | M3, Inc. | | | 88,181 | |
| | 4,862 | | | Medipal Holdings Corp. | | | 85,657 | |
| | 2,695 | | | Miraca Holdings, Inc. | | | 122,311 | |
| | 4,490 | | | Mitsubishi Tanabe Pharma Corp. | | | 110,149 | |
| | 3,609 | | | Olympus Corp. | | | 124,443 | |
| | 2,399 | | | Ono Pharmaceutical Co. Ltd. | | | 48,848 | |
| | 5,772 | | | Otsuka Holdings Co. Ltd. | | | 232,275 | |
| | 4,397 | | | Santen Pharmaceutical Co. Ltd. | | | 68,156 | |
| | 4,092 | | | Shionogi & Co. Ltd. | | | 215,457 | |
| | 6,791 | | | Sumitomo Dainippon Pharma Co. Ltd. | | | 92,184 | |
| | 3,748 | | | Suzuken Co. Ltd. | | | 136,387 | |
| | 2,237 | | | Sysmex Corp. | | | 137,805 | |
| | 1,028 | | | Taisho Pharmaceutical Holdings Co. Ltd. | | | 80,140 | |
| | 6,971 | | | Takeda Pharmaceutical Co. Ltd. | | | 384,906 | |
| | 3,794 | | | Terumo Corp. | | | 146,507 | |
| | | | | | | | |
| | | | | | | 3,207,488 | |
| | |
| Industrials – 18.4% | | | |
| | 3,969 | | | Amada Holdings Co. Ltd. | | | 43,527 | |
| | 14,932 | | | ANA Holdings, Inc. | | | 55,327 | |
| | 2,497 | | | Asahi Glass Co. Ltd. | | | 97,330 | |
| | 1,421 | | | Central Japan Railway Co. | | | 240,535 | |
| | 4,335 | | | Dai Nippon Printing Co. Ltd. | | | 51,125 | |
| | 2,694 | | | Daikin Industries Ltd. | | | 269,131 | |
| | 2,727 | | | East Japan Railway Co. | | | 249,880 | |
| | 1,618 | | | FANUC Corp. | | | 313,721 | |
| | |
| Common Stocks – (continued) | |
| Industrials – (continued) | | | |
| | 11,573 | | | Fuji Electric Co. Ltd. | | | 63,722 | |
| | 2,008 | | | Hankyu Hanshin Holdings, Inc. | | | 76,445 | |
| | 809 | | | Hino Motors Ltd. | | | 9,284 | |
| | 3,685 | | | Hitachi Construction Machinery Co. Ltd. | | | 103,961 | |
| | 994 | | | Hoshizaki Corp. | | | 86,431 | |
| | 13,908 | | | IHI Corp.* | | | 45,998 | |
| | 24,991 | | | ITOCHU Corp. | | | 407,812 | |
| | 1,500 | | | Japan Airlines Co. Ltd. | | | 51,490 | |
| | 1,237 | | | Japan Airport Terminal Co. Ltd. | | | 44,845 | |
| | 973 | | | JGC Corp. | | | 15,621 | |
| | 12,671 | | | Kajima Corp. | | | 116,164 | |
| | 5,575 | | | Kamigumi Co. Ltd. | | | 61,646 | |
| | 6,131 | | | Keihan Holdings Co. Ltd. | | | 36,933 | |
| | 6,932 | | | Keikyu Corp. | | | 73,565 | |
| | 5,289 | | | Keio Corp. | | | 43,971 | |
| | 1,413 | | | Keisei Electric Railway Co. Ltd. | | | 38,451 | |
| | 13,018 | | | Kintetsu Group Holdings Co. Ltd. | | | 49,087 | |
| | 8,530 | | | Komatsu Ltd. | | | 230,572 | |
| | 6,688 | | | Kubota Corp. | | | 115,700 | |
| | 1,327 | | | Kurita Water Industries Ltd. | | | 38,161 | |
| | 1,032 | | | Kyushu Railway Co. | | | 32,256 | |
| | 3,497 | | | LIXIL Group Corp. | | | 91,635 | |
| | 2,293 | | | Makita Corp. | | | 91,982 | |
| | 58,620 | | | Marubeni Corp. | | | 381,035 | |
| | 3,633 | | | MINEBEA MITSUMI, Inc. | | | 59,648 | |
| | 6,258 | | | MISUMI Group, Inc. | | | 160,402 | |
| | 21,712 | | | Mitsubishi Corp. | | | 501,767 | |
| | 20,044 | | | Mitsubishi Electric Corp. | | | 296,307 | |
| | 10,645 | | | Mitsubishi Heavy Industries Ltd. | | | 40,709 | |
| | 23,437 | | | Mitsui & Co. Ltd. | | | 350,192 | |
| | 27,899 | | | Mitsui OSK Lines Ltd. | | | 89,482 | |
| | 2,239 | | | Nabtesco Corp. | | | 78,221 | |
| | 21,560 | | | Nagoya Railroad Co. Ltd. | | | 96,379 | |
| | 779 | | | NGK Insulators Ltd. | | | 14,531 | |
| | 1,824 | | | Nidec Corp. | | | 206,497 | |
| | 18,191 | | | Nippon Express Co. Ltd. | | | 125,449 | |
| | 5,993 | | | Nippon Yusen KK* | | | 11,871 | |
| | 5,616 | | | NSK Ltd. | | | 66,590 | |
| | 6,234 | | | Obayashi Corp. | | | 73,464 | |
| | 2,039 | | | Odakyu Electric Railway Co. Ltd. | | | 39,461 | |
| | 3,384 | | | Park24 Co. Ltd. | | | 81,264 | |
| | 17,847 | | | Recruit Holdings Co. Ltd. | | | 355,286 | |
| | 1,446 | | | Secom Co. Ltd. | | | 107,235 | |
| | 1,374 | | | Seibu Holdings, Inc. | | | 23,607 | |
| | 6,489 | | | Shimizu Corp. | | | 66,977 | |
| | 250 | | | SMC Corp. | | | 85,658 | |
| | 917 | | | Sohgo Security Services Co. Ltd. | | | 40,034 | |
| | 30,494 | | | Sumitomo Corp. | | | 431,255 | |
| | 7,041 | | | Sumitomo Heavy Industries Ltd. | | | 52,459 | |
| | 7,480 | | | Taisei Corp. | | | 74,963 | |
| | 1,117 | | | THK Co. Ltd. | | | 37,247 | |
| | 9,011 | | | Tobu Railway Co. Ltd. | | | 49,779 | |
| | 2,953 | | | Tokyu Corp. | | | 42,929 | |
| | 5,299 | | | Toppan Printing Co. Ltd. | | | 53,009 | |
| | 13,741 | | | Toshiba Corp.* | | | 38,204 | |
| | 2,750 | | | TOTO Ltd. | | | 104,568 | |
| | |
| | |
| 68 | | The accompanying notes are an integral part of these financial statements. |
GOLDMAN SACHS ACTIVEBETA® JAPAN EQUITY ETF
| | | | | | | | |
Shares | | | Description | | Value | |
| Common Stocks – (continued) | |
| Industrials – (continued) | | | |
| | 10,236 | | | Toyota Tsusho Corp. | | $ | 314,818 | |
| | 762 | | | West Japan Railway Co. | | | 55,326 | |
| | 2,505 | | | Yamato Holdings Co. Ltd. | | | 53,350 | |
| | | | | | | | |
| | | | | | | 7,906,281 | |
| | |
| Information Technology – 13.9% | | | |
| | 1,479 | | | Alps Electric Co. Ltd. | | | 40,583 | |
| | 6,853 | | | Brother Industries Ltd. | | | 162,265 | |
| | 12,748 | | | Canon, Inc. | | | 446,400 | |
| | 2,486 | | | DeNA Co. Ltd. | | | 53,126 | |
| | 697 | | | Disco Corp. | | | 124,822 | |
| | 6,431 | | | FUJIFILM Holdings Corp. | | | 252,542 | |
| | 36,419 | | | Fujitsu Ltd. | | | 269,718 | |
| | 2,366 | | | Hamamatsu Photonics KK | | | 73,198 | |
| | 200 | | | Hirose Electric Co. Ltd. | | | 27,658 | |
| | 2,177 | | | Hitachi High-Technologies Corp. | | | 77,637 | |
| | 41,977 | | | Hitachi Ltd. | | | 288,721 | |
| | 6,438 | | | Kakaku.com, Inc. | | | 80,080 | |
| | 1,092 | | | Keyence Corp. | | | 568,126 | |
| | 2,144 | | | Konami Holdings Corp. | | | 111,622 | |
| | 16,024 | | | Konica Minolta, Inc. | | | 127,831 | |
| | 2,269 | | | Kyocera Corp. | | | 136,066 | |
| | 1,800 | | | LINE Corp.*(a) | | | 63,456 | |
| | 2,783 | | | Mixi, Inc. | | | 148,177 | |
| | 1,668 | | | Murata Manufacturing Co. Ltd. | | | 255,216 | |
| | 129,386 | | | NEC Corp. | | | 342,098 | |
| | 4,603 | | | Nexon Co. Ltd.* | | | 114,719 | |
| | 814 | | | Nintendo Co. Ltd. | | | 270,988 | |
| | 1,689 | | | Nippon Electric Glass Co. Ltd. | | | 64,147 | |
| | 2,373 | | | Nomura Research Institute Ltd. | | | 92,281 | |
| | 16,190 | | | NTT Data Corp. | | | 174,757 | |
| | 686 | | | Obic Co. Ltd. | | | 42,945 | |
| | 3,636 | | | Omron Corp. | | | 182,362 | |
| | 1,687 | | | Oracle Corp. Japan | | | 124,617 | |
| | 1,822 | | | Otsuka Corp. | | | 120,517 | |
| | 8,451 | | | Ricoh Co. Ltd. | | | 84,541 | |
| | 1,296 | | | Rohm Co. Ltd. | | | 100,797 | |
| | 4,394 | | | Seiko Epson Corp. | | | 112,625 | |
| | 4,694 | | | Shimadzu Corp. | | | 86,195 | |
| | 465 | | | TDK Corp. | | | 31,138 | |
| | 2,098 | | | Tokyo Electron Ltd. | | | 294,704 | |
| | 1,923 | | | Trend Micro, Inc. | | | 88,934 | |
| | 11,080 | | | Yahoo Japan Corp. | | | 50,739 | |
| | 6,020 | | | Yaskawa Electric Corp. | | | 182,142 | |
| | 6,667 | | | Yokogawa Electric Corp. | | | 103,767 | |
| | | | | | | | |
| | | | | | | 5,972,257 | |
| | |
| Materials – 6.3% | | | |
| | 3,020 | | | Air Water, Inc. | | | 55,648 | |
| | 15,014 | | | Asahi Kasei Corp. | | | 179,661 | |
| | 835 | | | Daicel Corp. | | | 10,629 | |
| | 3,347 | | | Hitachi Chemical Co. Ltd. | | | 90,502 | |
| | 2,830 | | | Hitachi Metals Ltd. | | | 37,773 | |
| | 1,261 | | | JFE Holdings, Inc. | | | 24,885 | |
| | 2,737 | | | JSR Corp. | | | 53,268 | |
| | 4,276 | | | Kaneka Corp. | | | 33,257 | |
| | |
| Common Stocks – (continued) | |
| Materials – (continued) | | | |
| | 2,351 | | | Kansai Paint Co. Ltd. | | | 59,576 | |
| | 6,304 | | | Kuraray Co. Ltd. | | | 119,596 | |
| | 1,138 | | | Maruichi Steel Tube Ltd. | | | 33,656 | |
| | 30,452 | | | Mitsubishi Chemical Holdings Corp. | | | 283,049 | |
| | 4,685 | | | Mitsubishi Gas Chemical Co., Inc. | | | 116,167 | |
| | 2,917 | | | Mitsubishi Materials Corp. | | | 104,557 | |
| | 25,170 | | | Mitsui Chemicals, Inc. | | | 150,480 | |
| | 1,844 | | | Nippon Paint Holdings Co. Ltd. | | | 62,829 | |
| | 4,966 | | | Nippon Steel & Sumitomo Metal Corp. | | | 118,420 | |
| | 2,519 | | | Nissan Chemical Industries Ltd. | | | 84,341 | |
| | 1,352 | | | Nitto Denko Corp. | | | 119,132 | |
| | 34,127 | | | Oji Holdings Corp. | | | 178,914 | |
| | 3,294 | | | Shin-Etsu Chemical Co. Ltd. | | | 291,031 | |
| | 11,988 | | | Sumitomo Chemical Co. Ltd. | | | 71,780 | |
| | 1,626 | | | Sumitomo Metal Mining Co. Ltd. | | | 27,996 | |
| | 6,066 | | | Taiheiyo Cement Corp. | | | 23,369 | |
| | 2,698 | | | Teijin Ltd. | | | 54,715 | |
| | 10,389 | | | Toray Industries, Inc. | | | 98,831 | |
| | 10,021 | | | Tosoh Corp. | | | 117,455 | |
| | 7,096 | | | Toyo Seikan Group Holdings Ltd. | | | 116,891 | |
| | | | | | | | |
| | | | | | | 2,718,408 | |
| | |
| Real Estate – 3.6% | | | |
| | 1,233 | | | Aeon Mall Co. Ltd. | | | 22,137 | |
| | 1,532 | | | Daito Trust Construction Co. Ltd. | | | 271,225 | |
| | 6,690 | | | Daiwa House Industry Co. Ltd. | | | 233,840 | |
| | 35 | | | Daiwa House REIT Investment Corp. REIT | | | 85,481 | |
| | 2,033 | | | Hulic Co. Ltd. | | | 20,116 | |
| | 12 | | | Japan Prime Realty Investment Corp. REIT | | | 43,067 | |
| | 13 | | | Japan Real Estate Investment Corp. REIT | | | 67,327 | |
| | 25 | | | Japan Retail Fund Investment Corp. REIT | | | 45,952 | |
| | 7,191 | | | Mitsubishi Estate Co. Ltd. | | | 123,749 | |
| | 6,573 | | | Mitsui Fudosan Co. Ltd. | | | 142,019 | |
| | 14 | | | Nippon Building Fund, Inc. REIT | | | 74,414 | |
| | 21 | | | Nippon Prologis REIT, Inc. REIT | | | 45,564 | |
| | 2,449 | | | Nomura Real Estate Holdings, Inc. | | | 50,533 | |
| | 68 | | | Nomura Real Estate Master Fund, Inc. REIT | | | 89,773 | |
| | 2,472 | | | Sumitomo Realty & Development Co. Ltd. | | | 74,726 | |
| | 3,215 | | | Tokyo Tatemono Co. Ltd. | | | 39,552 | |
| | 11,937 | | | Tokyu Fudosan Holdings Corp. | | | 71,149 | |
| | 39 | | | United Urban Investment Corp. REIT | | | 58,787 | |
| | | | | | | | |
| | | | | | | 1,559,411 | |
| | |
| Telecommunication Services – 4.5% | | | |
| | 17,562 | | | KDDI Corp. | | | 473,437 | |
| | 8,482 | | | Nippon Telegraph & Telephone Corp. | | | 421,403 | |
| | 13,479 | | | NTT DOCOMO, Inc. | | | 312,726 | |
| | 8,898 | | | SoftBank Group Corp. | | | 721,315 | |
| | | | | | | | |
| | | | | | | 1,928,881 | |
| | |
| Utilities – 2.9% | | | |
| | 4,748 | | | Chubu Electric Power Co., Inc. | | | 61,992 | |
| | 3,776 | | | Chugoku Electric Power Co., Inc. (The) | | | 43,503 | |
| | |
| | |
| The accompanying notes are an integral part of these financial statements. | | 69 |
GOLDMAN SACHS ACTIVEBETA® JAPAN EQUITY ETF
Schedule of Investments (continued)
August 31, 2017
| | | | | | | | |
Shares | | | Description | | Value | |
| Common Stocks – (continued) | |
| Utilities – (continued) | | | |
| | 1,374 | | | Electric Power Development Co. Ltd. | | $ | 37,577 | |
| | 27,072 | | | Kansai Electric Power Co., Inc. (The) | | | 378,802 | |
| | 2,859 | | | Kyushu Electric Power Co., Inc. | | | 33,562 | |
| | 21,944 | | | Osaka Gas Co. Ltd. | | | 85,754 | |
| | 12,876 | | | Toho Gas Co. Ltd. | | | 84,818 | |
| | 3,908 | | | Tohoku Electric Power Co., Inc. | | | 53,404 | |
| | 85,647 | | | Tokyo Electric Power Co. Holdings, Inc.* | | | 346,292 | |
| | 21,080 | | | Tokyo Gas Co. Ltd. | | | 111,702 | |
| | | | | | | | |
| | | | | | | 1,237,406 | |
| | |
| TOTAL INVESTMENTS BEFORE SECURITIES LENDING
REINVESTMENT VEHICLE |
|
| | (Cost $36,662,241) | | $ | 42,788,262 | |
| | |
| | | | | | | | |
| Shares | | | Distribution
Rate | | Value | |
| Securities Lending Reinvestment Vehicle – 0.7%(b) | |
| Goldman Sachs Financial Square Government Fund –
Institutional Shares |
|
| | 288,307 | | | 0.93% | | $ | 288,307 | |
| | (Cost $288,307) | | | | |
| | |
| | TOTAL INVESTMENTS – 100.2% | |
| | (Cost $36,950,548) | | $ | 43,076,569 | |
| | |
| LIABILITIES IN EXCESS OF
OTHER ASSETS – (0.2)% | | | (84,971 | ) |
| | |
| | NET ASSETS – 100.0% | | $ | 42,991,598 | |
| | |
| | |
| The percentage shown for each investment category reflects the value of investments in that category as a percentage of net assets. |
* | | Security is currently in default and/or on-income producing. |
(a) | | All or a portion of security is on loan. |
(b) | | Represents an affiliated issuer. |
| | |
|
Investment Abbreviations: |
REIT | | —Real Estate Investment Trust |
|
| | |
| 70 | | The accompanying notes are an integral part of these financial statements. |
GOLDMAN SACHS ACTIVEBETA® U.S. LARGE CAP EQUITY ETF
Schedule of Investments
August 31, 2017
| | | | | | | | |
Shares | | | Description | | Value | |
| Common Stocks – 99.5% | |
| Consumer Discretionary – 13.9% | | | |
| | 25,400 | | | Advance Auto Parts, Inc. | | $ | 2,486,660 | |
| | 34,137 | | | Amazon.com, Inc.* | | | 33,474,742 | |
| | 80,557 | | | Aramark | | | 3,277,864 | |
| | 10,666 | | | AutoZone, Inc.* | | | 5,636,341 | |
| | 194,722 | | | Best Buy Co., Inc. | | | 10,565,616 | |
| | 29,420 | | | BorgWarner, Inc. | | | 1,365,382 | |
| | 53,736 | | | Carnival Corp. | | | 3,733,577 | |
| | 53,458 | | | CBS Corp., Class B | | | 3,424,519 | |
| | 9,965 | | | Charter Communications, Inc., Class A* | | | 3,971,451 | |
| | 112,829 | | | Coach, Inc. | | | 4,704,969 | |
| | 339,024 | | | Comcast Corp., Class A | | | 13,767,765 | |
| | 26,739 | | | Darden Restaurants, Inc. | | | 2,195,004 | |
| | 55,600 | | | Dollar General Corp. | | | 4,034,336 | |
| | 46,319 | | | Dollar Tree, Inc.* | | | 3,688,845 | |
| | 32,296 | | | Domino’s Pizza, Inc. | | | 5,886,269 | |
| | 20,017 | | | DR Horton, Inc. | | | 723,615 | |
| | 19,185 | | | Expedia, Inc. | | | 2,846,287 | |
| | 107,161 | | | Foot Locker, Inc. | | | 3,775,282 | |
| | 817,786 | | | Ford Motor Co. | | | 9,020,180 | |
| | 26,652 | | | General Motors Co. | | | 973,864 | |
| | 51,050 | | | Genuine Parts Co. | | | 4,228,471 | |
| | 111,495 | | | Goodyear Tire & Rubber Co. (The) | | | 3,378,298 | |
| | 32,344 | | | Hanesbrands, Inc. | | | 784,665 | |
| | 42,777 | | | Hasbro, Inc. | | | 4,202,840 | |
| | 43,661 | | | Hilton Worldwide Holdings, Inc. | | | 2,808,712 | |
| | 140,780 | | | Home Depot, Inc. (The) | | | 21,098,699 | |
| | 93,207 | | | L Brands, Inc. | | | 3,375,958 | |
| | 36,070 | | | Las Vegas Sands Corp. | | | 2,243,915 | |
| | 49,346 | | | Lear Corp. | | | 7,379,201 | |
| | 15,899 | | | Lennar Corp., Class A | | | 822,932 | |
| | 22,100 | | | Liberty Broadband Corp., Class C* | | | 2,243,813 | |
| | 21,215 | | | LKQ Corp.* | | | 735,100 | |
| | 130,432 | | | Lowe’s Cos., Inc. | | | 9,637,620 | |
| | 373,663 | | | Macy’s, Inc. | | | 7,760,981 | |
| | 32,574 | | | Marriott International, Inc., Class A | | | 3,374,015 | |
| | 95,819 | | | Mattel, Inc. | | | 1,554,184 | |
| | 68,615 | | | McDonald’s Corp. | | | 10,976,342 | |
| | 22,539 | | | MGM Resorts International | | | 742,885 | |
| | 6,031 | | | Mohawk Industries, Inc.* | | | 1,526,567 | |
| | 52,289 | | | Netflix, Inc.* | | | 9,135,411 | |
| | 176,004 | | | NIKE, Inc., Class B | | | 9,294,771 | |
| | 23,537 | | | Omnicom Group, Inc. | | | 1,703,608 | |
| | 26,975 | | | O’Reilly Automotive, Inc.* | | | 5,290,607 | |
| | 5,024 | | | Priceline Group, Inc. (The)* | | | 9,304,850 | |
| | 74,352 | | | PVH Corp. | | | 9,360,173 | |
| | 136,785 | | | Ross Stores, Inc. | | | 7,995,083 | |
| | 14,246 | | | Royal Caribbean Cruises Ltd. | | | 1,773,057 | |
| | 141,539 | | | Starbucks Corp. | | | 7,764,830 | |
| | 161,808 | | | Target Corp. | | | 8,823,390 | |
| | 5,593 | | | Tesla, Inc.*(a) | | | 1,990,549 | |
| | 37,980 | | | Tiffany & Co. | | | 3,471,372 | |
| | 55,772 | | | Time Warner, Inc. | | | 5,638,549 | |
| | 111,962 | | | TJX Cos., Inc. (The) | | | 8,094,853 | |
| | 58,196 | | | Tractor Supply Co. | | | 3,463,244 | |
| | |
| Common Stocks – (continued) | |
| Consumer Discretionary – (continued) | | | |
| | 25,818 | | | Twenty-First Century Fox, Inc., Class A | | | 712,319 | |
| | 22,632 | | | Ulta Beauty, Inc.* | | | 5,001,898 | |
| | 85,932 | | | VF Corp. | | | 5,402,545 | |
| | 106,543 | | | Walt Disney Co. (The) | | | 10,782,152 | |
| | 27,185 | | | Wyndham Worldwide Corp. | | | 2,709,801 | |
| | 3,755 | | | Wynn Resorts Ltd. | | | 521,907 | |
| | 54,982 | | | Yum China Holdings, Inc.* | | | 1,944,164 | |
| | 55,033 | | | Yum! Brands, Inc. | | | 4,227,635 | |
| | | | | | | | |
| | | | | | | 332,834,534 | |
| | |
| Consumer Staples – 11.0% | | | |
| | 192,626 | | | Altria Group, Inc. | | | 12,212,488 | |
| | 91,789 | | | Archer-Daniels-Midland Co. | | | 3,792,721 | |
| | 96,720 | | | Brown-Forman Corp., Class B | | | 5,130,029 | |
| | 139,987 | | | Bunge Ltd. | | | 10,447,230 | |
| | 63,813 | | | Campbell Soup Co. | | | 2,948,161 | |
| | 89,238 | | | Church & Dwight Co., Inc. | | | 4,477,070 | |
| | 62,826 | | | Clorox Co. (The) | | | 8,703,286 | |
| | 302,632 | | | Coca-Cola Co. (The) | | | 13,784,888 | |
| | 132,207 | | | Colgate-Palmolive Co. | | | 9,471,309 | |
| | 87,243 | | | Conagra Brands, Inc. | | | 2,831,908 | |
| | 8,174 | | | Constellation Brands, Inc., Class A | | | 1,635,617 | |
| | 61,214 | | | Costco Wholesale Corp. | | | 9,594,682 | |
| | 147,909 | | | CVS Health Corp. | | | 11,439,282 | |
| | 68,636 | | | Dr Pepper Snapple Group, Inc. | | | 6,249,308 | |
| | 83,365 | | | Estee Lauder Cos., Inc. (The), Class A | | | 8,919,221 | |
| | 65,767 | | | General Mills, Inc. | | | 3,502,750 | |
| | 57,355 | | | Hershey Co. (The) | | | 6,017,687 | |
| | 76,210 | | | Hormel Foods Corp. | | | 2,342,695 | |
| | 32,086 | | | Ingredion, Inc. | | | 3,972,889 | |
| | 41,045 | | | JM Smucker Co. (The) | | | 4,299,874 | |
| | 45,378 | | | Kellogg Co. | | | 2,970,444 | |
| | 57,955 | | | Kimberly-Clark Corp. | | | 7,145,272 | |
| | 21,405 | | | Kraft Heinz Co. (The) | | | 1,728,454 | |
| | 226,392 | | | Kroger Co. (The) | | | 4,951,193 | |
| | 41,551 | | | McCormick & Co., Inc. | | | 3,952,747 | |
| | 16,775 | | | Molson Coors Brewing Co., Class B | | | 1,505,556 | |
| | 54,500 | | | Mondelez International, Inc., Class A | | | 2,215,970 | |
| | 27,957 | | | Monster Beverage Corp.* | | | 1,560,560 | |
| | 161,013 | | | PepsiCo, Inc. | | | 18,634,035 | |
| | 150,747 | | | Philip Morris International, Inc. | | | 17,626,847 | |
| | 222,957 | | | Procter & Gamble Co. (The) | | | 20,572,242 | |
| | 141,496 | | | Sysco Corp. | | | 7,452,594 | |
| | 178,734 | | | Tyson Foods, Inc., Class A | | | 11,313,862 | |
| | 109,865 | | | Walgreens Boots Alliance, Inc. | | | 8,953,998 | |
| | 258,785 | | | Wal-Mart Stores, Inc. | | | 20,203,345 | |
| | | | | | | | |
| | | | | | | 262,560,214 | |
| | |
| Energy – 2.8% | | | |
| | 19,850 | | | Andeavor | | | 1,987,978 | |
| | 112,473 | | | Chevron Corp. | | | 12,104,344 | |
| | 57,046 | | | ConocoPhillips | | | 2,490,628 | |
| | 5,268 | | | EOG Resources, Inc. | | | 447,727 | |
| | 326,790 | | | Exxon Mobil Corp. | | | 24,943,881 | |
| | 96,472 | | | Marathon Petroleum Corp. | | | 5,059,957 | |
| | |
| | |
| The accompanying notes are an integral part of these financial statements. | | 71 |
GOLDMAN SACHS ACTIVEBETA® U.S. LARGE CAP EQUITY ETF
Schedule of Investments (continued)
August 31, 2017
| | | | | | | | |
Shares | | | Description | | Value | |
| Common Stocks – (continued) | |
| Energy – (continued) | | | |
| | 38,432 | | | National Oilwell Varco, Inc. | | $ | 1,178,710 | |
| | 21,344 | | | Occidental Petroleum Corp. | | | 1,274,237 | |
| | 8,489 | | | ONEOK, Inc. | | | 459,764 | |
| | 12,916 | | | Phillips 66 | | | 1,082,490 | |
| | 34,630 | | | Schlumberger Ltd. | | | 2,199,351 | |
| | 19,902 | | | Targa Resources Corp. | | | 887,032 | |
| | 178,893 | | | Valero Energy Corp. | | | 12,182,613 | |
| | 55,662 | | | Williams Cos., Inc. (The) | | | 1,654,831 | |
| | | | | | | | |
| | | | | | | 67,953,543 | |
| | |
| Financials – 12.5% | | | |
| | 44,803 | | | Aflac, Inc. | | | 3,698,488 | |
| | 2,552 | | | Alleghany Corp.* | | | 1,436,189 | |
| | 63,799 | | | Allstate Corp. (The) | | | 5,773,810 | |
| | 316,060 | | | Ally Financial, Inc. | | | 7,142,956 | |
| | 77,110 | | | American Express Co. | | | 6,639,171 | |
| | 38,546 | | | American International Group, Inc. | | | 2,331,262 | |
| | 8,573 | | | Ameriprise Financial, Inc. | | | 1,187,446 | |
| | 296,002 | | | Annaly Capital Management, Inc. REIT | | | 3,700,025 | |
| | 38,251 | | | Aon PLC | | | 5,323,009 | |
| | 36,680 | | | Arch Capital Group Ltd.* | | | 3,570,431 | |
| | 58,149 | | | Arthur J Gallagher & Co. | | | 3,366,827 | |
| | 838,409 | | | Bank of America Corp. | | | 20,029,591 | |
| | 66,136 | | | Bank of New York Mellon Corp. (The) | | | 3,457,590 | |
| | 74,779 | | | BB&T Corp. | | | 3,446,564 | |
| | 76,912 | | | Berkshire Hathaway, Inc., Class B* | | | 13,933,378 | |
| | 4,973 | | | BlackRock, Inc. | | | 2,083,737 | |
| | 4,230 | | | Brighthouse Financial, Inc.* | | | 241,406 | |
| | 87,304 | | | Capital One Financial Corp. | | | 6,950,271 | |
| | 57,652 | | | CBOE Holdings, Inc. | | | 5,816,510 | |
| | 60,790 | | | Charles Schwab Corp. (The) | | | 2,425,521 | |
| | 31,201 | | | Chubb Ltd. | | | 4,412,445 | |
| | 23,616 | | | Cincinnati Financial Corp. | | | 1,814,653 | |
| | 28,697 | | | CIT Group, Inc. | | | 1,287,060 | |
| | 255,716 | | | Citigroup, Inc. | | | 17,396,359 | |
| | 59,397 | | | Citizens Financial Group, Inc. | | | 1,967,823 | |
| | 32,479 | | | CME Group, Inc. | | | 4,085,858 | |
| | 31,094 | | | Comerica, Inc. | | | 2,122,166 | |
| | 42,663 | | | Discover Financial Services | | | 2,514,984 | |
| | 41,726 | | | E*TRADE Financial Corp.* | | | 1,711,183 | |
| | 12,974 | | | Everest Re Group Ltd. | | | 3,275,676 | |
| | 167,468 | | | Fifth Third Bancorp | | | 4,375,939 | |
| | 17,599 | | | First Republic Bank | | | 1,707,983 | |
| | 58,428 | | | Hartford Financial Services Group, Inc. (The) | | | 3,159,202 | |
| | 83,955 | | | Huntington Bancshares, Inc. | | | 1,056,993 | |
| | 41,879 | | | Intercontinental Exchange, Inc. | | | 2,708,315 | |
| | 339,550 | | | JPMorgan Chase & Co. | | | 30,861,700 | |
| | 115,105 | | | KeyCorp | | | 1,980,957 | |
| | 33,729 | | | Lincoln National Corp. | | | 2,288,850 | |
| | 41,861 | | | Loews Corp. | | | 1,949,885 | |
| | 18,880 | | | M&T Bank Corp. | | | 2,791,597 | |
| | 2,108 | | | Markel Corp.* | | | 2,217,595 | |
| | 86,226 | | | Marsh & McLennan Cos., Inc. | | | 6,732,526 | |
| | |
| Common Stocks – (continued) | |
| Financials – (continued) | | | |
| | 46,630 | | | MetLife, Inc. | | | 2,183,683 | |
| | 9,269 | | | Moody’s Corp. | | | 1,242,324 | |
| | 152,296 | | | Morgan Stanley | | | 6,929,468 | |
| | 36,035 | | | MSCI, Inc. | | | 4,129,971 | |
| | 30,256 | | | Northern Trust Corp. | | | 2,677,656 | |
| | 37,774 | | | PNC Financial Services Group, Inc. (The) | | | 4,737,237 | |
| | 43,171 | | | Principal Financial Group, Inc. | | | 2,699,051 | |
| | 95,013 | | | Progressive Corp. (The) | | | 4,416,204 | |
| | 52,874 | | | Prudential Financial, Inc. | | | 5,397,378 | |
| | 25,048 | | | Raymond James Financial, Inc. | | | 1,961,759 | |
| | 139,317 | | | Regions Financial Corp. | | | 1,965,763 | |
| | 56,753 | | | S&P Global, Inc. | | | 8,758,690 | |
| | 26,508 | | | State Street Corp. | | | 2,451,725 | |
| | 32,877 | | | SunTrust Banks, Inc. | | | 1,811,523 | |
| | 11,050 | | | SVB Financial Group* | | | 1,871,207 | |
| | 92,078 | | | Synchrony Financial | | | 2,835,082 | |
| | 40,730 | | | T Rowe Price Group, Inc. | | | 3,435,983 | |
| | 42,536 | | | TD Ameritrade Holding Corp. | | | 1,842,660 | |
| | 50,126 | | | Travelers Cos., Inc. (The) | | | 6,074,269 | |
| | 60,379 | | | Unum Group | | | 2,909,060 | |
| | 102,048 | | | US Bancorp | | | 5,229,960 | |
| | 365,053 | | | Wells Fargo & Co. | | | 18,643,257 | |
| | 10,678 | | | Willis Towers Watson PLC | | | 1,585,363 | |
| | | | | | | | |
| | | | | | | 300,763,204 | |
| | |
| Health Care – 14.6% | | | |
| | 96,652 | | | Abbott Laboratories | | | 4,923,453 | |
| | 120,563 | | | AbbVie, Inc. | | | 9,078,394 | |
| | 49,957 | | | Aetna, Inc. | | | 7,878,219 | |
| | 59,117 | | | Agilent Technologies, Inc. | | | 3,826,052 | |
| | 12,958 | | | Allergan PLC | | | 2,973,602 | |
| | 67,665 | | | Amgen, Inc. | | | 12,028,807 | |
| | 56,559 | | | Anthem, Inc. | | | 11,087,826 | |
| | 74,236 | | | Baxter International, Inc. | | | 4,605,602 | |
| | 19,896 | | | Becton Dickinson and Co. | | | 3,968,058 | |
| | 27,374 | | | Biogen, Inc.* | | | 8,665,513 | |
| | 100,631 | | | Boston Scientific Corp.* | | | 2,772,384 | |
| | 139,967 | | | Bristol-Myers Squibb Co. | | | 8,465,204 | |
| | 6,496 | | | Cardinal Health, Inc. | | | 438,220 | |
| | 51,515 | | | Celgene Corp.* | | | 7,156,979 | |
| | 59,464 | | | Centene Corp.* | | | 5,283,376 | |
| | 39,987 | | | Cerner Corp.* | | | 2,710,319 | |
| | 33,604 | | | Cigna Corp. | | | 6,117,944 | |
| | 11,958 | | | Cooper Cos., Inc. (The) | | | 2,999,425 | |
| | 20,169 | | | CR Bard, Inc. | | | 6,470,417 | |
| | 41,039 | | | Danaher Corp. | | | 3,423,473 | |
| | 53,587 | | | DaVita, Inc.* | | | 3,138,055 | |
| | 28,630 | | | DENTSPLY SIRONA, Inc. | | | 1,619,599 | |
| | 46,719 | | | Edwards Lifesciences Corp.* | | | 5,310,082 | |
| | 99,941 | | | Eli Lilly & Co. | | | 8,124,204 | |
| | 102,641 | | | Express Scripts Holding Co.* | | | 6,447,908 | |
| | 197,297 | | | Gilead Sciences, Inc. | | | 16,515,732 | |
| | 14,321 | | | HCA Healthcare, Inc.* | | | 1,126,490 | |
| | 34,226 | | | Henry Schein, Inc.* | | | 5,944,372 | |
| | 19,360 | | | Hologic, Inc.* | | | 747,296 | |
| | |
| | |
| 72 | | The accompanying notes are an integral part of these financial statements. |
GOLDMAN SACHS ACTIVEBETA® U.S. LARGE CAP EQUITY ETF
| | | | | | | | |
Shares | | | Description | | Value | |
| Common Stocks – (continued) | |
| Health Care – (continued) | | | |
| | 24,528 | | | Humana, Inc. | | $ | 6,318,903 | |
| | 42,919 | | | IDEXX Laboratories, Inc.* | | | 6,670,900 | |
| | 16,250 | | | Illumina, Inc.* | | | 3,322,475 | |
| | 12,446 | | | Incyte Corp.* | | | 1,710,205 | |
| | 4,887 | | | Intuitive Surgical, Inc.* | | | 4,909,822 | |
| | 262,397 | | | Johnson & Johnson | | | 34,733,491 | |
| | 13,321 | | | Laboratory Corp. of America Holdings* | | | 2,089,665 | |
| | 12,414 | | | McKesson Corp. | | | 1,853,534 | |
| | 56,465 | | | Medtronic PLC | | | 4,552,208 | |
| | 217,360 | | | Merck & Co., Inc. | | | 13,880,610 | |
| | 17,775 | | | Mettler-Toledo International, Inc.* | | | 10,755,475 | |
| | 252,320 | | | Mylan NV* | | | 7,943,034 | |
| | 66,993 | | | Perrigo Co. PLC | | | 5,289,767 | |
| | 581,065 | | | Pfizer, Inc. | | | 19,709,725 | |
| | 37,737 | | | Quest Diagnostics, Inc. | | | 4,088,804 | |
| | 29,067 | | | Quintiles IMS Holdings, Inc.* | | | 2,791,304 | |
| | 38,366 | | | ResMed, Inc. | | | 2,976,434 | |
| | 39,474 | | | Stryker Corp. | | | 5,580,439 | |
| | 5,360 | | | Teleflex, Inc. | | | 1,134,980 | |
| | 42,068 | | | Thermo Fisher Scientific, Inc. | | | 7,872,606 | |
| | 107,026 | | | UnitedHealth Group, Inc. | | | 21,287,471 | |
| | 37,085 | | | Varian Medical Systems, Inc.* | | | 3,940,281 | |
| | 22,726 | | | Vertex Pharmaceuticals, Inc.* | | | 3,648,432 | |
| | 15,883 | | | Waters Corp.* | | | 2,914,213 | |
| | 4,969 | | | Zimmer Biomet Holdings, Inc. | | | 567,808 | |
| | 94,561 | | | Zoetis, Inc. | | | 5,928,975 | |
| | | | | | | | |
| | | | | | | 350,318,566 | |
| | |
| Industrials – 9.9% | | | |
| | 68,296 | | | 3M Co. | | | 13,954,239 | |
| | 12,990 | | | Acuity Brands, Inc. | | | 2,296,502 | |
| | 21,668 | | | Alaska Air Group, Inc. | | | 1,617,733 | |
| | 14,343 | | | American Airlines Group, Inc. | | | 641,706 | |
| | 17,495 | | | AMETEK, Inc. | | | 1,106,559 | |
| | 22,898 | | | Arconic, Inc. | | | 583,212 | |
| | 49,838 | | | Boeing Co. (The) | | | 11,944,175 | |
| | 46,615 | | | Caterpillar, Inc. | | | 5,476,796 | |
| | 92,072 | | | CH Robinson Worldwide, Inc. | | | 6,503,045 | |
| | 27,877 | | | Cintas Corp. | | | 3,763,674 | |
| | 56,068 | | | CSX Corp. | | | 2,814,614 | |
| | 13,734 | | | Cummins, Inc. | | | 2,188,925 | |
| | 17,816 | | | Deere & Co. | | | 2,065,409 | |
| | 111,798 | | | Delta Air Lines, Inc. | | | 5,275,748 | |
| | 22,591 | | | Dover Corp. | | | 1,917,524 | |
| | 43,007 | | | Eaton Corp. PLC | | | 3,086,182 | |
| | 82,139 | | | Emerson Electric Co. | | | 4,849,486 | |
| | 13,102 | | | Equifax, Inc. | | | 1,866,642 | |
| | 33,248 | | | Expeditors International of Washington, Inc. | | | 1,865,213 | |
| | 126,249 | | | Fastenal Co. | | | 5,387,045 | |
| | 16,860 | | | FedEx Corp. | | | 3,614,447 | |
| | 34,060 | | | Fortive Corp. | | | 2,212,878 | |
| | 27,994 | | | Fortune Brands Home & Security, Inc. | | | 1,750,465 | |
| | 22,050 | | | General Dynamics Corp. | | | 4,439,767 | |
| | 500,805 | | | General Electric Co. | | | 12,294,763 | |
| | |
| Common Stocks – (continued) | |
| Industrials – (continued) | | | |
| | 47,455 | | | Honeywell International, Inc. | | | 6,561,603 | |
| | 9,351 | | | Huntington Ingalls Industries, Inc. | | | 2,000,740 | |
| | 45,443 | | | IHS Markit Ltd.* | | | 2,128,550 | |
| | 39,274 | | | Illinois Tool Works, Inc. | | | 5,400,568 | |
| | 51,639 | | | Ingersoll-Rand PLC | | | 4,409,454 | |
| | 13,830 | | | JB Hunt Transport Services, Inc. | | | 1,367,649 | |
| | 40,293 | | | Johnson Controls International PLC | | | 1,595,200 | |
| | 58,043 | | | L3 Technologies, Inc. | | | 10,533,644 | |
| | 14,135 | | | Lockheed Martin Corp. | | | 4,316,688 | |
| | 56,927 | | | Masco Corp. | | | 2,093,206 | |
| | 39,894 | | | Nielsen Holdings PLC | | | 1,549,882 | |
| | 20,158 | | | Norfolk Southern Corp. | | | 2,429,442 | |
| | 22,235 | | | Northrop Grumman Corp. | | | 6,052,589 | |
| | 11,001 | | | PACCAR, Inc. | | | 729,696 | |
| | 22,769 | | | Parker-Hannifin Corp. | | | 3,663,304 | |
| | 36,944 | | | Raytheon Co. | | | 6,724,177 | |
| | 101,137 | | | Republic Services, Inc. | | | 6,598,178 | |
| | 23,491 | | | Rockwell Automation, Inc. | | | 3,853,933 | |
| | 17,042 | | | Rockwell Collins, Inc. | | | 2,233,354 | |
| | 16,202 | | | Roper Technologies, Inc. | | | 3,737,153 | |
| | 23,569 | | | Snap-on, Inc. | | | 3,478,077 | |
| | 73,963 | | | Southwest Airlines Co. | | | 3,856,431 | |
| | 27,092 | | | Stanley Black & Decker, Inc. | | | 3,901,248 | |
| | 162,154 | | | Textron, Inc. | | | 7,960,140 | |
| | 48,410 | | | Union Pacific Corp. | | | 5,097,573 | |
| | 118,826 | | | United Continental Holdings, Inc.* | | | 7,362,459 | |
| | 32,794 | | | United Parcel Service, Inc., Class B | | | 3,750,322 | |
| | 11,770 | | | United Rentals, Inc.* | | | 1,389,566 | |
| | 44,696 | | | United Technologies Corp. | | | 5,351,005 | |
| | 23,013 | | | Verisk Analytics, Inc.* | | | 1,865,204 | |
| | 82,507 | | | Waste Management, Inc. | | | 6,362,115 | |
| | 25,061 | | | WW Grainger, Inc. | | | 4,074,167 | |
| | 31,856 | | | Xylem, Inc./NY | | | 1,977,302 | |
| | | | | | | | |
| | | | | | | 237,921,368 | |
| | |
| Information Technology – 23.6% | | | |
| | 94,933 | | | Accenture PLC, Class A | | | 12,413,439 | |
| | 71,210 | | | Activision Blizzard, Inc. | | | 4,668,528 | |
| | 52,292 | | | Adobe Systems, Inc.* | | | 8,113,627 | |
| | 230,850 | | | Advanced Micro Devices, Inc.* | | | 3,001,050 | |
| | 31,465 | | | Akamai Technologies, Inc.* | | | 1,483,575 | |
| | 9,105 | | | Alliance Data Systems Corp. | | | 2,053,177 | |
| | 26,582 | | | Alphabet, Inc., Class A* | | | 25,392,190 | |
| | 26,787 | | | Alphabet, Inc., Class C* | | | 25,161,833 | |
| | 89,019 | | | Amdocs Ltd. | | | 5,767,541 | |
| | 62,014 | | | Amphenol Corp., Class A | | | 5,019,413 | |
| | 56,090 | | | Analog Devices, Inc. | | | 4,693,050 | |
| | 27,416 | | | ANSYS, Inc.* | | | 3,531,729 | |
| | 493,299 | | | Apple, Inc. | | | 80,901,036 | |
| | 115,387 | | | Applied Materials, Inc. | | | 5,206,261 | |
| | 36,732 | | | Autodesk, Inc.* | | | 4,204,345 | |
| | 35,008 | | | Automatic Data Processing, Inc. | | | 3,727,302 | |
| | 82,052 | | | CA, Inc. | | | 2,722,485 | |
| | 119,105 | | | Cadence Design Systems, Inc.* | | | 4,679,635 | |
| | 50,170 | | | CDK Global, Inc. | | | 3,235,965 | |
| | 49,410 | | | CDW Corp. | | | 3,133,582 | |
| | |
| | |
| The accompanying notes are an integral part of these financial statements. | | 73 |
GOLDMAN SACHS ACTIVEBETA® U.S. LARGE CAP EQUITY ETF
Schedule of Investments (continued)
August 31, 2017
| | | | | | | | |
Shares | | | Description | | Value | |
| Common Stocks – (continued) | |
| Information Technology – (continued) | | | |
| | 373,168 | | | Cisco Systems, Inc. | | $ | 12,019,741 | |
| | 62,321 | | | Citrix Systems, Inc.* | | | 4,874,125 | |
| | 51,314 | | | Cognizant Technology Solutions Corp., Class A | | | 3,631,492 | |
| | 132,660 | | | Corning, Inc. | | | 3,815,302 | |
| | 12,963 | | | DXC Technology Co. | | | 1,101,855 | |
| | 231,774 | | | eBay, Inc.* | | | 8,373,995 | |
| | 78,243 | | | Electronic Arts, Inc.* | | | 9,506,525 | |
| | 27,777 | | | F5 Networks, Inc.* | | | 3,316,018 | |
| | 202,675 | | | Facebook, Inc., Class A* | | | 34,854,020 | |
| | 55,224 | | | Fidelity National Information Services, Inc. | | | 5,131,414 | |
| | 44,901 | | | Fiserv, Inc.* | | | 5,554,703 | |
| | 3,297 | | | FleetCor Technologies, Inc.* | | | 474,010 | |
| | 21,175 | | | Gartner, Inc.* | | | 2,553,493 | |
| | 5,957 | | | Global Payments, Inc. | | | 568,834 | |
| | 35,206 | | | Harris Corp. | | | 4,326,817 | |
| | 73,245 | | | Hewlett Packard Enterprise Co. | | | 1,322,805 | |
| | 283,867 | | | HP, Inc. | | | 5,416,182 | |
| | 504,505 | | | Intel Corp. | | | 17,692,990 | |
| | 95,355 | | | International Business Machines Corp. | | | 13,638,626 | |
| | 72,687 | | | Intuit, Inc. | | | 10,281,576 | |
| | 118,914 | | | Juniper Networks, Inc. | | | 3,297,485 | |
| | 34,004 | | | KLA-Tencor Corp. | | | 3,185,835 | |
| | 35,601 | | | Lam Research Corp. | | | 5,909,054 | |
| | 72,732 | | | Mastercard, Inc., Class A | | | 9,695,176 | |
| | 30,555 | | | Maxim Integrated Products, Inc. | | | 1,425,696 | |
| | 33,272 | | | Microchip Technology, Inc. | | | 2,888,010 | |
| | 109,840 | | | Micron Technology, Inc.* | | | 3,511,585 | |
| | 741,357 | | | Microsoft Corp. | | | 55,431,263 | |
| | 33,950 | | | Motorola Solutions, Inc. | | | 2,991,674 | |
| | 106,199 | | | NetApp, Inc. | | | 4,105,653 | |
| | 60,034 | | | NVIDIA Corp. | | | 10,172,161 | |
| | 261,045 | | | Oracle Corp. | | | 13,138,395 | |
| | 12,706 | | | Palo Alto Networks, Inc.* | | | 1,685,959 | |
| | 66,761 | | | Paychex, Inc. | | | 3,807,380 | |
| | 70,194 | | | PayPal Holdings, Inc.* | | | 4,329,566 | |
| | 15,292 | | | Qorvo, Inc.* | | | 1,119,680 | |
| | 77,201 | | | QUALCOMM, Inc. | | | 4,035,296 | |
| | 37,620 | | | Red Hat, Inc.* | | | 4,044,150 | |
| | 48,270 | | | salesforce.com, Inc.* | | | 4,609,302 | |
| | 90,776 | | | Seagate Technology PLC | | | 2,862,167 | |
| | 18,631 | | | ServiceNow, Inc.* | | | 2,164,736 | |
| | 50,823 | | | Skyworks Solutions, Inc. | | | 5,354,711 | |
| | 135,309 | | | Symantec Corp. | | | 4,056,564 | |
| | 66,399 | | | Synopsys, Inc.* | | | 5,339,808 | |
| | 37,360 | | | TE Connectivity Ltd. | | | 2,973,856 | |
| | 149,030 | | | Texas Instruments, Inc. | | | 12,342,665 | |
| | 52,422 | | | Total System Services, Inc. | | | 3,623,409 | |
| | 34,353 | | | Vantiv, Inc., Class A* | | | 2,428,414 | |
| | 31,104 | | | VeriSign, Inc.* | | | 3,227,040 | |
| | 93,778 | | | Visa, Inc., Class A | | | 9,707,899 | |
| | 104,009 | | | Western Digital Corp. | | | 9,180,874 | |
| | 172,857 | | | Western Union Co. (The) | | | 3,270,454 | |
| | 20,291 | | | Xilinx, Inc. | | | 1,340,423 | |
| | | | | | | | |
| | | | | | | 564,820,626 | |
| | |
| Common Stocks – (continued) | |
| Materials – 2.5% | | | |
| | 11,070 | | | Air Products & Chemicals, Inc. | | | 1,609,246 | |
| | 15,208 | | | Ball Corp. | | | 608,168 | |
| | 14,115 | | | Celanese Corp., Series A | | | 1,369,437 | |
| | 81,043 | | | Dow Chemical Co. (The) | | | 5,401,516 | |
| | 68,645 | | | Eastman Chemical Co. | | | 5,917,199 | |
| | 18,154 | | | Ecolab, Inc. | | | 2,419,928 | |
| | 54,602 | | | EI du Pont de Nemours & Co. | | | 4,582,746 | |
| | 9,486 | | | FMC Corp. | | | 817,883 | |
| | 231,218 | | | Freeport-McMoRan, Inc.* | | | 3,417,402 | |
| | 16,879 | | | International Flavors & Fragrances, Inc. | | | 2,309,891 | |
| | 49,588 | | | International Paper Co. | | | 2,671,305 | |
| | 9,694 | | | LyondellBasell Industries NV, Class A | | | 878,179 | |
| | 34,623 | | | Monsanto Co. | | | 4,057,816 | |
| | 104,389 | | | Newmont Mining Corp. | | | 4,002,274 | |
| | 21,399 | | | Packaging Corp. of America | | | 2,405,462 | |
| | 19,494 | | | PPG Industries, Inc. | | | 2,033,614 | |
| | 15,540 | | | Praxair, Inc. | | | 2,044,132 | |
| | 36,090 | | | Sealed Air Corp. | | | 1,601,674 | |
| | 26,512 | | | Sherwin-Williams Co. (The) | | | 8,994,726 | |
| | 68,082 | | | WestRock Co. | | | 3,874,547 | |
| | | | | | | | |
| | | | | | | 61,017,145 | |
| | |
| Real Estate – 2.5% | | | |
| | 16,646 | | | Alexandria Real Estate Equities, Inc. REIT | | | 2,019,326 | |
| | 35,186 | | | American Tower Corp. REIT | | | 5,209,287 | |
| | 10,966 | | | AvalonBay Communities, Inc. REIT | | | 2,058,647 | |
| | 12,310 | | | Boston Properties, Inc. REIT | | | 1,484,586 | |
| | 103,918 | | | CBRE Group, Inc., Class A* | | | 3,749,362 | |
| | 21,743 | | | Crown Castle International Corp. REIT | | | 2,357,811 | |
| | 36,210 | | | Digital Realty Trust, Inc. REIT | | | 4,285,091 | |
| | 102,311 | | | Duke Realty Corp. REIT | | | 3,040,683 | |
| | 5,643 | | | Equinix, Inc. REIT | | | 2,643,238 | |
| | 23,606 | | | Equity Residential REIT | | | 1,585,143 | |
| | 8,981 | | | Essex Property Trust, Inc. REIT | | | 2,388,677 | |
| | 8,587 | | | Federal Realty Investment Trust REIT | | | 1,089,948 | |
| | 211,593 | | | Host Hotels & Resorts, Inc. REIT | | | 3,834,065 | |
| | 55,253 | | | Kimco Realty Corp. REIT | | | 1,084,064 | |
| | 11,859 | | | Macerich Co. (The) REIT | | | 625,800 | |
| | 62,798 | | | Prologis, Inc. REIT | | | 3,978,881 | |
| | 5,774 | | | Public Storage REIT | | | 1,185,633 | |
| | 13,447 | | | Realty Income Corp. REIT | | | 774,009 | |
| | 7,580 | | | Regency Centers Corp. REIT | | | 487,546 | |
| | 10,426 | | | SBA Communications Corp. REIT* | | | 1,600,912 | |
| | 11,040 | | | Simon Property Group, Inc. REIT | | | 1,731,624 | |
| | 10,964 | | | SL Green Realty Corp. REIT | | | 1,056,710 | |
| | 31,377 | | | UDR, Inc. REIT | | | 1,218,055 | |
| | 30,882 | | | Ventas, Inc. REIT | | | 2,113,564 | |
| | 275,732 | | | VEREIT, Inc. REIT | | | 2,327,178 | |
| | 13,850 | | | Vornado Realty Trust REIT | | | 1,031,687 | |
| | 41,567 | | | Welltower, Inc. REIT | | | 3,043,536 | |
| | 22,817 | | | Weyerhaeuser Co. REIT | | | 744,062 | |
| | | | | | | | |
| | | | | | | 58,749,125 | |
| | |
| | |
| 74 | | The accompanying notes are an integral part of these financial statements. |
GOLDMAN SACHS ACTIVEBETA® U.S. LARGE CAP EQUITY ETF
| | | | | | | | |
Shares | | | Description | | Value | |
| Common Stocks – (continued) | |
| Telecommunication Services – 1.9% | | | |
| | 523,531 | | | AT&T, Inc. | | $ | 19,611,471 | |
| | 95,995 | | | CenturyLink, Inc.(a) | | | 1,893,021 | |
| | 29,548 | | | Level 3 Communications, Inc.* | | | 1,608,298 | |
| | 60,453 | | | T-Mobile US, Inc.* | | | 3,911,914 | |
| | 365,221 | | | Verizon Communications, Inc. | | | 17,519,651 | |
| | | | | | | | |
| | | | | | | 44,544,355 | |
| | |
| Utilities – 4.3% | | | |
| | 949,185 | | | AES Corp. | | | 10,479,002 | |
| | 36,022 | | | Alliant Energy Corp. | | | 1,539,580 | |
| | 59,243 | | | Ameren Corp. | | | 3,553,988 | |
| | 54,737 | | | American Electric Power Co., Inc. | | | 4,030,285 | |
| | 19,402 | | | American Water Works Co., Inc. | | | 1,569,622 | |
| | 102,191 | | | CenterPoint Energy, Inc. | | | 3,026,897 | |
| | 60,341 | | | CMS Energy Corp. | | | 2,928,952 | |
| | 48,866 | | | Consolidated Edison, Inc. | | | 4,117,938 | |
| | 46,453 | | | Dominion Energy, Inc. | | | 3,659,103 | |
| | 36,146 | | | DTE Energy Co. | | | 4,059,919 | |
| | 54,396 | | | Duke Energy Corp. | | | 4,748,771 | |
| | 51,049 | | | Edison International | | | 4,093,109 | |
| | 50,707 | | | Entergy Corp. | | | 4,014,473 | |
| | 51,139 | | | Eversource Energy | | | 3,221,757 | |
| | 95,479 | | | Exelon Corp. | | | 3,615,790 | |
| | 136,485 | | | FirstEnergy Corp. | | | 4,446,681 | |
| | 52,404 | | | NextEra Energy, Inc. | | | 7,887,326 | |
| | 58,265 | | | PG&E Corp. | | | 4,100,691 | |
| | 32,310 | | | Pinnacle West Capital Corp. | | | 2,906,931 | |
| | 61,819 | | | PPL Corp. | | | 2,425,778 | |
| | 46,671 | | | Public Service Enterprise Group, Inc. | | | 2,186,070 | |
| | 35,719 | | | SCANA Corp. | | | 2,156,713 | |
| | 19,730 | | | Sempra Energy | | | 2,326,759 | |
| | 84,795 | | | Southern Co. (The) | | | 4,092,207 | |
| | 55,984 | | | WEC Energy Group, Inc. | | | 3,651,276 | |
| | 58,411 | | | Westar Energy, Inc. | | | 2,997,068 | |
| | 90,792 | | | Xcel Energy, Inc. | | | 4,494,204 | |
| | | | | | | | |
| | | | | | | 102,330,890 | |
| | |
| TOTAL INVESTMENTS BEFORE SECURITIES LENDING
REINVESTMENT VEHICLE |
|
| | (Cost $2,148,085,760) | | $ | 2,383,813,570 | |
| | |
| Shares | | | Distribution
rate | | Value | |
| Securities Lending Reinvestment Vehicle – 0.1%(b) | |
| Goldman Sachs Financial Square Government Fund –
Institutional Shares |
|
| | 3,705,216 | | | 0.93% | | $ | 3,705,216 | |
| | (Cost $3,705,216) | | | | |
| | |
| | TOTAL INVESTMENTS – 99.6% | |
| | (Cost $2,151,790,976) | | $ | 2,387,518,786 | |
| | |
| OTHER ASSETS IN EXCESS OF
LIABILITIES – 0.4% | | | 8,971,566 | |
| | |
| | NET ASSETS – 100.0% | | $ | 2,396,490,352 | |
| | |
| | |
| The percentage shown for each investment category reflects the value of investments in that category as a percentage of net assets. |
* | | Security is currently in default and/or non-income producing. |
(a) | | All or a portion of security is on loan. |
(b) | | Represents an affiliated issuer. |
| | |
|
Investment Abbreviations: |
PLC | | —Public Limited Company |
REIT | | —Real Estate Investment Trust |
|
| | |
| The accompanying notes are an integral part of these financial statements. | | 75 |
GOLDMAN SACHS ACTIVEBETA® U.S. SMALL CAP EQUITY ETF
Schedule of Investments
August 31, 2017
| | | | | | | | |
Shares | | | Description | | Value | |
| Common Stocks – 99.5% | |
| Consumer Discretionary – 12.2% | | | |
| | 580 | | | 1-800-Flowers.com, Inc., Class A* | | $ | 5,220 | |
| | 514 | | | Aaron’s, Inc. | | | 22,755 | |
| | 508 | | | Abercrombie & Fitch Co., Class A | | | 6,472 | |
| | 248 | | | Acushnet Holdings Corp. | | | 4,077 | |
| | 460 | | | Adtalem Global Education, Inc. | | | 15,732 | |
| | 102 | | | AMC Entertainment Holdings, Inc., Class A | | | 1,367 | |
| | 400 | | | American Axle & Manufacturing
Holdings, Inc.* | | | 5,844 | |
| | 828 | | | American Eagle Outfitters, Inc. | | | 9,895 | |
| | 356 | | | American Outdoor Brands Corp.* | | | 5,810 | |
| | 418 | | | American Public Education, Inc.* | | | 7,712 | |
| | 134 | | | America’s Car-Mart, Inc.* | | | 5,146 | |
| | 60 | | | Asbury Automotive Group, Inc.* | | | 3,231 | |
| | 3,392 | | | Ascena Retail Group, Inc.* | | | 6,920 | |
| | 344 | | | Ascent Capital Group, Inc., Class A* | | | 3,416 | |
| | 272 | | | AV Homes, Inc.* | | | 4,202 | |
| | 242 | | | Barnes & Noble Education, Inc.* | | | 1,254 | |
| | 362 | | | Barnes & Noble, Inc. | | | 2,805 | |
| | 224 | | | Bassett Furniture Industries, Inc. | | | 8,030 | |
| | 448 | | | Beazer Homes USA, Inc.* | | | 6,680 | |
| | 188 | | | Belmond Ltd., Class A (United Kingdom)* | | | 2,397 | |
| | 406 | | | Big 5 Sporting Goods Corp. | | | 3,106 | |
| | 290 | | | Big Lots, Inc. | | | 13,804 | |
| | 18 | | | Biglari Holdings, Inc.* | | | 5,360 | |
| | 60 | | | BJ’s Restaurants, Inc.* | | | 1,806 | |
| | 212 | | | Bloomin’ Brands, Inc. | | | 3,606 | |
| | 90 | | | Bob Evans Farms, Inc. | | | 6,190 | |
| | 266 | | | Bojangles’, Inc.*(a) | | | 3,551 | |
| | 356 | | | Boot Barn Holdings, Inc.*(a) | | | 2,884 | |
| | 436 | | | Boyd Gaming Corp. | | | 11,528 | |
| | 580 | | | Bridgepoint Education, Inc.* | | | 5,121 | |
| | 284 | | | Brinker International, Inc. | | | 8,866 | |
| | 230 | | | Buckle, Inc. (The)(a) | | | 3,254 | |
| | 84 | | | Buffalo Wild Wings, Inc.* | | | 8,631 | |
| | 230 | | | Build-A-Bear Workshop, Inc.* | | | 2,116 | |
| | 134 | | | Caesars Acquisition Co., Class A* | | | 2,499 | |
| | 454 | | | Caesars Entertainment Corp.* | | | 5,266 | |
| | 296 | | | Caleres, Inc. | | | 7,986 | |
| | 418 | | | Callaway Golf Co. | | | 5,827 | |
| | 176 | | | Capella Education Co. | | | 11,854 | |
| | 1,258 | | | Career Education Corp.* | | | 12,089 | |
| | 230 | | | Carriage Services, Inc. | | | 5,633 | |
| | 188 | | | Carrols Restaurant Group, Inc.* | | | 2,049 | |
| | 254 | | | Carvana Co.*(a) | | | 4,534 | |
| | 30 | | | Cavco Industries, Inc.* | | | 4,037 | |
| | 834 | | | Central European Media Enterprises Ltd., Class A (Bermuda)* | | | 3,461 | |
| | 666 | | | Century Casinos, Inc.* | | | 4,562 | |
| | 236 | | | Century Communities, Inc.* | | | 5,322 | |
| | 254 | | | Cheesecake Factory, Inc. (The) | | | 10,523 | |
| | 834 | | | Chegg, Inc.* | | | 11,834 | |
| | 888 | | | Chico’s FAS, Inc. | | | 6,820 | |
| | 114 | | | Children’s Place, Inc. (The) | | | 12,101 | |
| | 72 | | | Churchill Downs, Inc. | | | 14,069 | |
| | 102 | | | Chuy’s Holdings, Inc.* | | | 1,918 | |
| | 200 | | | Citi Trends, Inc. | | | 3,626 | |
| | |
| Common Stocks – (continued) | |
| Consumer Discretionary – (continued) | | | |
| | 380 | | | Clarus Corp.* | | | 2,755 | |
| | 242 | | | Collectors Universe, Inc. | | | 5,815 | |
| | 152 | | | Columbia Sportswear Co. | | | 8,708 | |
| | 176 | | | Conn’s, Inc.* | | | 3,054 | |
| | 424 | | | Container Store Group, Inc. (The)* | | | 1,721 | |
| | 248 | | | Cooper Tire & Rubber Co. | | | 8,333 | |
| | 120 | | | Cooper-Standard Holdings, Inc.* | | | 12,070 | |
| | 90 | | | Core-Mark Holding Co, Inc. | | | 2,435 | |
| | 36 | | | Cracker Barrel Old Country Store, Inc.(a) | | | 5,352 | |
| | 828 | | | Crocs, Inc.* | | | 7,394 | |
| | 90 | | | CSS Industries, Inc. | | | 2,410 | |
| | 72 | | | Culp, Inc. | | | 2,088 | |
| | 12 | | | Daily Journal Corp.* | | | 2,519 | |
| | 586 | | | Dana, Inc. | | | 14,105 | |
| | 120 | | | Dave & Buster’s Entertainment, Inc.* | | | 7,015 | |
| | 188 | | | Deckers Outdoor Corp.* | | | 12,013 | |
| | 272 | | | Del Frisco’s Restaurant Group, Inc.* | | | 3,808 | |
| | 424 | | | Del Taco Restaurants, Inc.* | | | 5,970 | |
| | 598 | | | Denny’s Corp.* | | | 7,152 | |
| | 54 | | | Dillard’s, Inc., Class A(a) | | | 3,283 | |
| | 60 | | | DineEquity, Inc. | | | 2,385 | |
| | 218 | | | Dorman Products, Inc.* | | | 14,480 | |
| | 834 | | | Drive Shack, Inc. | | | 2,252 | |
| | 224 | | | DSW, Inc., Class A | | | 4,151 | |
| | 218 | | | Duluth Holdings, Inc., Class B*(a) | | | 4,271 | |
| | 344 | | | El Pollo Loco Holdings, Inc.* | | | 3,904 | |
| | 182 | | | Eldorado Resorts, Inc.*(a) | | | 4,186 | |
| | 230 | | | Emerald Expositions Events, Inc.(a) | | | 5,000 | |
| | 188 | | | Entercom Communications Corp., Class A(a) | | | 1,936 | |
| | 386 | | | Entravision Communications Corp., Class A | | | 2,142 | |
| | 230 | | | Eros International PLC (India)*(a) | | | 2,243 | |
| | 242 | | | Ethan Allen Interiors, Inc. | | | 7,079 | |
| | 260 | | | EW Scripps Co. (The), Class A* | | | 4,649 | |
| | 362 | | | Express, Inc.* | | | 2,306 | |
| | 224 | | | Fiesta Restaurant Group, Inc.* | | | 3,898 | |
| | 362 | | | Finish Line, Inc. (The), Class A | | | 3,015 | |
| | 176 | | | Five Below, Inc.* | | | 8,372 | |
| | 66 | | | Flexsteel Industries, Inc. | | | 3,003 | |
| | 302 | | | Fogo De Chao, Inc.* | | | 3,820 | |
| | 950 | | | Fossil Group, Inc.*(a) | | | 7,876 | |
| | 284 | | | Fox Factory Holding Corp.* | | | 11,360 | |
| | 430 | | | Francesca’s Holdings Corp.* | | | 3,122 | |
| | 236 | | | Fred’s, Inc., Class A(a) | | | 1,397 | |
| | 128 | | | FTD Cos, Inc.* | | | 1,714 | |
| | 224 | | | Gaia, Inc.* | | | 2,498 | |
| | 756 | | | Gannett Co, Inc. | | | 6,418 | |
| | 158 | | | Genesco, Inc.* | | | 3,342 | |
| | 158 | | | Gentherm, Inc.* | | | 4,922 | |
| | 140 | | | G-III Apparel Group Ltd.* | | | 3,850 | |
| | 672 | | | GoPro, Inc., Class A*(a) | | | 6,189 | |
| | 266 | | | Grand Canyon Education, Inc.* | | | 21,825 | |
| | 230 | | | Gray Television, Inc.* | | | 3,289 | |
| | 266 | | | Green Brick Partners, Inc.* | | | 2,514 | |
| | 78 | | | Group 1 Automotive, Inc. | | | 4,682 | |
| | 1,482 | | | Groupon, Inc.* | | | 6,580 | |
| | 152 | | | Habit Restaurants, Inc. (The), Class A*(a) | | | 1,976 | |
| | |
| | |
| 76 | | The accompanying notes are an integral part of these financial statements. |
GOLDMAN SACHS ACTIVEBETA® U.S. SMALL CAP EQUITY ETF
| | | | | | | | |
Shares | | | Description | | Value | |
| Common Stocks – (continued) | |
| Consumer Discretionary – (continued) | | | |
| | 266 | | | Haverty Furniture Cos, Inc. | | $ | 6,238 | |
| | 84 | | | Helen of Troy Ltd.* | | | 7,585 | |
| | 230 | | | Hemisphere Media Group, Inc.* | | | 2,979 | |
| | 236 | | | Hibbett Sports, Inc.* | | | 2,903 | |
| | 78 | | | Hooker Furniture Corp. | | | 3,140 | |
| | 170 | | | Horizon Global Corp.*(a) | | | 2,924 | |
| | 338 | | | Houghton Mifflin Harcourt Co.* | | | 3,448 | |
| | 1,052 | | | Hovnanian Enterprises, Inc., Class A* | | | 1,915 | |
| | 212 | | | HSN, Inc. | | | 7,780 | |
| | 248 | | | Iconix Brand Group, Inc.* | | | 1,386 | |
| | 412 | | | ILG, Inc. | | | 10,877 | |
| | 102 | | | Installed Building Products, Inc.* | | | 5,885 | |
| | 200 | | | International Speedway Corp., Class A | | | 7,130 | |
| | 170 | | | iRobot Corp.* | | | 16,221 | |
| | 418 | | | J Alexander’s Holdings, Inc.* | | | 4,138 | |
| | 200 | | | J. Jill, Inc.* | | | 1,942 | |
| | 152 | | | Jack in the Box, Inc. | | | 14,230 | |
| | 108 | | | Johnson Outdoors, Inc., Class A | | | 6,890 | |
| | 672 | | | K12, Inc.* | | | 12,042 | |
| | 352 | | | KB Home | | | 7,533 | |
| | 478 | | | Kirkland’s, Inc.* | | | 5,511 | |
| | 332 | | | La Quinta Holdings, Inc.* | | | 5,246 | |
| | 140 | | | Laureate Education, Inc., Class A* | | | 2,050 | |
| | 386 | | | La-Z-Boy, Inc. | | | 9,206 | |
| | 152 | | | LCI Industries | | | 15,018 | |
| | 302 | | | Libbey, Inc. | | | 2,467 | |
| | 134 | | | Liberty Media Corp. – Liberty Braves, Class A* | | | 3,271 | |
| | 200 | | | Liberty Media Corp. – Liberty Braves, Class C* | | | 4,894 | |
| | 218 | | | Liberty Tax, Inc. | | | 2,932 | |
| | 278 | | | Liberty TripAdvisor Holdings, Inc., Class A* | | | 3,711 | |
| | 290 | | | Lifetime Brands, Inc. | | | 5,046 | |
| | 254 | | | Lindblad Expeditions Holdings, Inc.* | | | 2,824 | |
| | 72 | | | Lithia Motors, Inc., Class A | | | 7,776 | |
| | 60 | | | Loral Space & Communications, Inc.* | | | 2,724 | |
| | 200 | | | Lumber Liquidators Holdings, Inc.* | | | 7,506 | |
| | 182 | | | M/I Homes, Inc.* | | | 4,477 | |
| | 158 | | | Malibu Boats, Inc., Class A* | | | 4,261 | |
| | 158 | | | Marcus Corp. (The) | | | 3,934 | |
| | 200 | | | Marine Products Corp. | | | 3,116 | |
| | 134 | | | MarineMax, Inc.* | | | 2,164 | |
| | 90 | | | Marriott Vacations Worldwide Corp. | | | 10,472 | |
| | 424 | | | MCBC Holdings, Inc.* | | | 7,267 | |
| | 296 | | | MDC Holdings, Inc. | | | 9,250 | |
| | 212 | | | Meredith Corp. | | | 11,522 | |
| | 60 | | | Meritage Homes Corp.* | | | 2,442 | |
| | 108 | | | Monarch Casino & Resort, Inc.* | | | 3,842 | |
| | 72 | | | Monro, Inc. | | | 3,434 | |
| | 102 | | | Movado Group, Inc. | | | 2,831 | |
| | 526 | | | MSG Networks, Inc., Class A* | | | 11,283 | |
| | 66 | | | NACCO Industries, Inc., Class A | | | 4,785 | |
| | 90 | | | Nathan’s Famous, Inc.* | | | 5,270 | |
| | 622 | | | National CineMedia, Inc. | | | 3,365 | |
| | 290 | | | Nautilus, Inc.* | | | 4,742 | |
| | |
| Common Stocks – (continued) | |
| Consumer Discretionary – (continued) | | | |
| | 230 | | | New Home Co., Inc. (The)* | | | 2,374 | |
| | 586 | | | New Media Investment Group, Inc. | | | 8,081 | |
| | 846 | | | New York Times Co. (The), Class A | | | 15,778 | |
| | 134 | | | Nexstar Media Group, Inc., Class A | | | 8,067 | |
| | 230 | | | Nutrisystem, Inc. | | | 12,489 | |
| | 2,340 | | | Office Depot, Inc. | | | 10,039 | |
| | 182 | | | Ollie’s Bargain Outlet Holdings, Inc.* | | | 7,617 | |
| | 146 | | | Overstock.com, Inc.* | | | 3,205 | |
| | 152 | | | Oxford Industries, Inc. | | | 8,787 | |
| | 242 | | | Papa John’s International, Inc. | | | 18,099 | |
| | 158 | | | Party City Holdco, Inc.* | | | 2,204 | |
| | 550 | | | Penn National Gaming, Inc.* | | | 12,205 | |
| | 134 | | | Perry Ellis International, Inc.* | | | 2,925 | |
| | 188 | | | PetMed Express, Inc. | | | 6,819 | |
| | 296 | | | PICO Holdings, Inc.* | | | 4,810 | |
| | 888 | | | Pier 1 Imports, Inc. | | | 3,721 | |
| | 502 | | | Pinnacle Entertainment, Inc.* | | | 9,789 | |
| | 266 | | | Planet Fitness, Inc., Class A | | | 6,748 | |
| | 726 | | | Potbelly Corp.* | | | 8,712 | |
| | 188 | | | RCI Hospitality Holdings, Inc. | | | 4,380 | |
| | 230 | | | Reading International, Inc., Class A* | | | 3,625 | |
| | 36 | | | Red Robin Gourmet Burgers, Inc.* | | | 2,052 | |
| | 272 | | | Red Rock Resorts, Inc., Class A | | | 6,147 | |
| | 604 | | | Regis Corp.* | | | 8,021 | |
| | 646 | | | Rent-A-Center, Inc. | | | 7,817 | |
| | 146 | | | RH*(a) | | | 6,831 | |
| | 374 | | | Ruth’s Hospitality Group, Inc. | | | 7,312 | |
| | 48 | | | Saga Communications, Inc., Class A | | | 1,961 | |
| | 368 | | | Salem Media Group, Inc. | | | 2,226 | |
| | 320 | | | Scholastic Corp. | | | 12,618 | |
| | 296 | | | Scientific Games Corp., Class A* | | | 10,419 | |
| | 272 | | | SeaWorld Entertainment, Inc.(a) | | | 3,531 | |
| | 260 | | | Select Comfort Corp.* | | | 7,678 | |
| | 646 | | | Sequential Brands Group, Inc.*(a) | | | 1,970 | |
| | 60 | | | Shake Shack, Inc., Class A*(a) | | | 1,855 | |
| | 278 | | | Shiloh Industries, Inc.* | | | 2,435 | |
| | 254 | | | Shoe Carnival, Inc. | | | 5,105 | |
| | 212 | | | Shutterfly, Inc.* | | | 9,663 | |
| | 326 | | | Sinclair Broadcast Group, Inc., Class A | | | 9,862 | |
| | 102 | | | Sonic Corp. | | | 2,388 | |
| | 212 | | | Sotheby’s* | | | 9,512 | |
| | 314 | | | Speedway Motorsports, Inc. | | | 6,534 | |
| | 454 | | | Sportsman’s Warehouse Holdings, Inc.*(a) | | | 1,884 | |
| | 236 | | | Standard Motor Products, Inc. | | | 10,408 | |
| | 308 | | | Steven Madden Ltd.* | | | 13,059 | |
| | 654 | | | Stoneridge, Inc.* | | | 10,830 | |
| | 140 | | | Strayer Education, Inc. | | | 11,201 | |
| | 158 | | | Sturm Ruger & Co., Inc. | | | 7,236 | |
| | 128 | | | Superior Industries International, Inc. | | | 1,875 | |
| | 442 | | | Tailored Brands, Inc. | | | 5,224 | |
| | 406 | | | Taylor Morrison Home Corp., Class A* | | | 8,209 | |
| | 188 | | | Tenneco, Inc. | | | 10,190 | |
| | 182 | | | Texas Roadhouse, Inc. | | | 8,636 | |
| | 212 | | | Tile Shop Holdings, Inc. | | | 3,191 | |
| | 472 | | | Tilly’s, Inc., Class A | | | 5,197 | |
| | 690 | | | Time, Inc. | | | 9,074 | |
| | |
| | |
| The accompanying notes are an integral part of these financial statements. | | 77 |
GOLDMAN SACHS ACTIVEBETA® U.S. SMALL CAP EQUITY ETF
Schedule of Investments (continued)
August 31, 2017
| | | | | | | | |
Shares | | | Description | | Value | |
| Common Stocks – (continued) | |
| Consumer Discretionary – (continued) | | | |
| | 176 | | | TopBuild Corp.* | | $ | 10,446 | |
| | 114 | | | Tower International, Inc. | | | 2,559 | |
| | 260 | | | Townsquare Media, Inc., Class A* | | | 2,595 | |
| | 496 | | | TRI Pointe Group, Inc.* | | | 6,319 | |
| | 188 | | | tronc, Inc.* | | | 2,728 | |
| | 84 | | | Unifi, Inc.* | | | 2,611 | |
| | 36 | | | Universal Electronics, Inc.* | | | 2,108 | |
| | 634 | | | Vera Bradley, Inc.* | | | 5,731 | |
| | 152 | | | Vista Outdoor, Inc.* | | | 3,116 | |
| | 224 | | | Vitamin Shoppe, Inc.* | | | 1,198 | |
| | 350 | | | VOXX International Corp.* | | | 2,835 | |
| | 218 | | | Weight Watchers International, Inc.*(a) | | | 10,205 | |
| | 284 | | | West Marine, Inc. | | | 3,683 | |
| | 108 | | | Weyco Group, Inc. | | | 2,975 | |
| | 182 | | | William Lyon Homes, Class A* | | | 4,366 | |
| | 308 | | | Wingstop, Inc. | | | 9,982 | |
| | 66 | | | Winmark Corp. | | | 8,702 | |
| | 108 | | | Winnebago Industries, Inc. | | | 3,904 | |
| | 448 | | | Wolverine World Wide, Inc. | | | 11,782 | |
| | 400 | | | World Wrestling Entertainment, Inc., Class A | | | 8,720 | |
| | 574 | | | ZAGG, Inc.* | | | 7,232 | |
| | 400 | | | Zumiez, Inc.* | | | 4,980 | |
| | | | | | | | |
| | | | | | | 1,456,671 | |
| | |
| Consumer Staples – 2.8% | | | |
| | 78 | | | Alico, Inc. | | | 2,496 | |
| | 66 | | | Andersons, Inc. (The) | | | 2,102 | |
| | 90 | | | B&G Foods, Inc.(a) | | | 2,745 | |
| | 108 | | | Boston Beer Co, Inc. (The), Class A*(a) | | | 16,092 | |
| | 36 | | | Calavo Growers, Inc. | | | 2,417 | |
| | 66 | | | Cal-Maine Foods, Inc.* | | | 2,406 | |
| | 2,744 | | | Castle Brands, Inc.* | | | 3,897 | |
| | 152 | | | Central Garden & Pet Co.* | | | 5,358 | |
| | 164 | | | Central Garden & Pet Co., Class A* | | | 5,591 | |
| | 212 | | | Chefs’ Warehouse, Inc. (The)* | | | 3,657 | |
| | 54 | | | Coca-Cola Bottling Co. Consolidated | | | 11,534 | |
| | 708 | | | Darling Ingredients, Inc.* | | | 12,319 | |
| | 1,064 | | | Dean Foods Co. | | | 11,704 | |
| | 90 | | | elf Beauty, Inc.*(a) | | | 1,862 | |
| | 164 | | | Farmer Brothers Co.* | | | 5,338 | |
| | 206 | | | Fresh Del Monte Produce, Inc. | | | 9,680 | |
| | 254 | | | Freshpet, Inc.* | | | 4,026 | |
| | 708 | | | Hostess Brands, Inc.* | | | 9,445 | |
| | 732 | | | HRG Group, Inc.* | | | 11,558 | |
| | 200 | | | Ingles Markets, Inc., Class A | | | 4,390 | |
| | 66 | | | Inter Parfums, Inc. | | | 2,604 | |
| | 78 | | | J&J Snack Foods Corp. | | | 9,944 | |
| | 42 | | | John B Sanfilippo & Son, Inc. | | | 2,607 | |
| | 72 | | | Lancaster Colony Corp. | | | 8,386 | |
| | 296 | | | Landec Corp.* | | | 3,848 | |
| | 108 | | | Limoneira Co. | | | 2,419 | |
| | 254 | | | Medifast, Inc. | | | 14,382 | |
| | 54 | | | MGP Ingredients, Inc.(a) | | | 3,036 | |
| | 158 | | | National Beverage Corp. | | | 18,361 | |
| | 236 | | | Natural Health Trends Corp. | | | 4,762 | |
| | |
| Common Stocks – (continued) | |
| Consumer Staples – (continued) | | | |
| | 290 | | | Nature’s Sunshine Products, Inc. | | | 3,060 | |
| | 60 | | | Oil-Dri Corp. of America | | | 2,442 | |
| | 368 | | | Omega Protein Corp. | | | 5,814 | |
| | 380 | | | Performance Food Group Co.* | | | 10,564 | |
| | 36 | | | PriceSmart, Inc. | | | 2,925 | |
| | 108 | | | Sanderson Farms, Inc. | | | 15,932 | |
| | 78 | | | Seneca Foods Corp., Class A* | | | 2,324 | |
| | 502 | | | Snyder’s-Lance, Inc. | | | 17,831 | |
| | 188 | | | SpartanNash Co. | | | 4,632 | |
| | 172 | | | SUPERVALU, Inc.* | | | 3,438 | |
| | 78 | | | Tootsie Roll Industries, Inc.(a) | | | 2,913 | |
| | 158 | | | Turning Point Brands, Inc.* | | | 2,718 | |
| | 266 | | | United Natural Foods, Inc.* | | | 9,244 | |
| | 188 | | | Universal Corp. | | | 10,754 | |
| | 120 | | | USANA Health Sciences, Inc.* | | | 7,104 | |
| | 460 | | | Vector Group Ltd. | | | 9,936 | |
| | 248 | | | Village Super Market, Inc., Class A | | | 5,736 | |
| | 66 | | | WD-40 Co.(a) | | | 7,191 | |
| | 102 | | | Weis Markets, Inc. | | | 4,509 | |
| | | | | | | | |
| | | | | | | 328,033 | |
| | |
| Energy – 2.3% | | | |
| | 1,342 | | | Abraxas Petroleum Corp.* | | | 2,281 | |
| | 66 | | | Adams Resources & Energy, Inc. | | | 2,288 | |
| | 72 | | | Arch Coal, Inc., Class A | | | 5,751 | |
| | 726 | | | Archrock, Inc. | | | 7,405 | |
| | 490 | | | Atwood Oceanics, Inc.*(a) | | | 3,219 | |
| | 102 | | | Basic Energy Services, Inc.*(a) | | | 1,453 | |
| | 932 | | | Bill Barrett Corp.* | | | 2,787 | |
| | 78 | | | Bonanza Creek Energy, Inc.* | | | 2,027 | |
| | 260 | | | California Resources Corp.*(a) | | | 2,028 | |
| | 968 | | | Clean Energy Fuels Corp.* | | | 2,304 | |
| | 1,712 | | | Cloud Peak Energy, Inc.* | | | 5,376 | |
| | 362 | | | Contango Oil & Gas Co.* | | | 1,662 | |
| | 152 | | | CVR Energy, Inc.(a) | | | 3,256 | |
| | 686 | | | Delek US Holdings, Inc. | | | 16,958 | |
| | 1,686 | | | Denbury Resources, Inc.* | | | 1,787 | |
| | 628 | | | DHT Holdings, Inc. | | | 2,355 | |
| | 218 | | | Diamond Offshore Drilling, Inc.* | | | 2,476 | |
| | 478 | | | Dorian LPG Ltd.* | | | 3,279 | |
| | 224 | | | Dril-Quip, Inc.* | | | 8,411 | |
| | 912 | | | Eclipse Resources Corp.* | | | 2,125 | |
| | 1,082 | | | Ensco PLC, Class A(a) | | | 4,599 | |
| | 696 | | | EP Energy Corp., Class A* | | | 2,046 | |
| | 356 | | | Era Group, Inc.* | | | 3,136 | |
| | 804 | | | Evolution Petroleum Corp. | | | 5,588 | |
| | 544 | | | Exterran Corp.* | | | 15,091 | |
| | 230 | | | Golar LNG Ltd. (Bermuda) | | | 4,986 | |
| | 302 | | | Green Plains, Inc. | | | 5,602 | |
| | 478 | | | Gulf Island Fabrication, Inc. | | | 5,354 | |
| | 508 | | | Hallador Energy Co. | | | 2,946 | |
| | 484 | | | Lilis Energy, Inc.*(a) | | | 1,771 | |
| | 146 | | | Mammoth Energy Services, Inc.*(a) | | | 2,012 | |
| | 114 | | | Matador Resources Co.* | | | 2,688 | |
| | 478 | | | Matrix Service Co.* | | | 5,664 | |
| | 1,022 | | | McDermott International, Inc.* | | | 6,275 | |
| | |
| | |
| 78 | | The accompanying notes are an integral part of these financial statements. |
GOLDMAN SACHS ACTIVEBETA® U.S. SMALL CAP EQUITY ETF
| | | | | | | | |
Shares | | | Description | | Value | |
| Common Stocks – (continued) | |
| Energy – (continued) | | | |
| | 108 | | | Natural Gas Services Group, Inc.* | | $ | 2,549 | |
| | 2,612 | | | Navios Maritime Acquisition Corp. | | | 3,291 | |
| | 660 | | | Newpark Resources, Inc.* | | | 5,313 | |
| | 1,288 | | | Noble Corp. PLC* | | | 4,199 | |
| | 17 | | | Nordic American Offshore Ltd. (Norway) | | | 21 | |
| | 418 | | | Nordic American Tankers Ltd.(a) | | | 1,981 | |
| | 302 | | | Oasis Petroleum, Inc.* | | | 2,205 | |
| | 248 | | | Oil States International, Inc.* | | | 5,394 | |
| | 1,432 | | | Overseas Shipholding Group, Inc., Class A* | | | 3,236 | |
| | 702 | | | Pacific Ethanol, Inc.* | | | 3,510 | |
| | 102 | | | Panhandle Oil and Gas, Inc., Class A | | | 2,152 | |
| | 140 | | | Par Pacific Holdings, Inc.*(a) | | | 2,493 | |
| | 102 | | | PDC Energy, Inc.* | | | 4,012 | |
| | 170 | | | Peabody Energy Corp.* | | | 4,930 | |
| | 394 | | | Renewable Energy Group, Inc.* | | | 4,767 | |
| | 224 | | | Resolute Energy Corp.*(a) | | | 6,619 | |
| | 134 | | | REX American Resources Corp.* | | | 11,607 | |
| | 418 | | | RigNet, Inc.* | | | 6,688 | |
| | 206 | | | Ring Energy, Inc.* | | | 2,456 | |
| | 502 | | | Rowan Cos PLC, Class A* | | | 4,895 | |
| | 72 | | | SEACOR Holdings, Inc.* | | | 2,763 | |
| | 96 | | | SemGroup Corp., Class A | | | 2,467 | |
| | 188 | | | Ship Finance International Ltd. (Norway) | | | 2,453 | |
| | 592 | | | Smart Sand, Inc.*(a) | | | 3,534 | |
| | 2,176 | | | Teekay Tankers Ltd., Class A (Bermuda) | | | 3,068 | |
| | 308 | | | Tellurian, Inc.* | | | 2,846 | |
| | 786 | | | TETRA Technologies, Inc.* | | | 1,619 | |
| | 230 | | | Ultra Petroleum Corp.* | | | 1,792 | |
| | 266 | | | Unit Corp.* | | | 4,235 | |
| | 1,808 | | | Uranium Energy Corp.* | | | 2,387 | |
| | 218 | | | US Silica Holdings, Inc. | | | 5,932 | |
| | 1,178 | | | W&T Offshore, Inc.* | | | 2,250 | |
| | 586 | | | Westmoreland Coal Co.* | | | 1,365 | |
| | 188 | | | WildHorse Resource Development Corp.* | | | 2,051 | |
| | 1,016 | | | Willbros Group, Inc.* | | | 2,235 | |
| | | | | | | | |
| | | | | | | 270,301 | |
| | |
| Financials – 20.6% | | | |
| | 102 | | | 1st Source Corp. | | | 4,760 | |
| | 356 | | | Access National Corp. | | | 9,142 | |
| | 84 | | | ACNB Corp. | | | 2,197 | |
| | 544 | | | AG Mortgage Investment Trust, Inc. REIT | | | 10,483 | |
| | 96 | | | Allegiance Bancshares, Inc.* | | | 3,269 | |
| | 448 | | | American Equity Investment Life Holding Co. | | | 12,436 | |
| | 120 | | | American National Bankshares, Inc. | | | 4,380 | |
| | 254 | | | Ameris Bancorp | | | 11,189 | |
| | 140 | | | AMERISAFE, Inc. | | | 7,532 | |
| | 84 | | | Ames National Corp. | | | 2,276 | |
| | 424 | | | AmTrust Financial Services, Inc. | | | 5,258 | |
| | 1,318 | | | Anworth Mortgage Asset Corp. REIT | | | 7,987 | |
| | 684 | | | Apollo Commercial Real Estate Finance, Inc. REIT | | | 12,374 | |
| | 436 | | | Ares Commercial Real Estate Corp. REIT | | | 5,751 | |
| | 182 | | | Argo Group International Holdings Ltd. | | | 10,956 | |
| | |
| Common Stocks – (continued) | |
| Financials – (continued) | | | |
| | 290 | | | Arlington Asset Investment Corp., Class A(a) | | | 3,747 | |
| | 598 | | | ARMOUR Residential REIT, Inc. REIT | | | 15,793 | |
| | 206 | | | Arrow Financial Corp. | | | 6,654 | |
| | 356 | | | Artisan Partners Asset Management, Inc.,
Class A | | | 10,929 | |
| | 66 | | | ASB Bancorp, Inc.* | | | 2,927 | |
| | 84 | | | Associated Capital Group, Inc., Class A | | | 2,885 | |
| | 254 | | | Astoria Financial Corp. | | | 4,976 | |
| | 158 | | | Atlas Financial Holdings, Inc.* | | | 2,662 | |
| | 400 | | | B. Riley Financial, Inc. | | | 6,560 | |
| | 158 | | | Baldwin & Lyons, Inc., Class B | | | 3,460 | |
| | 538 | | | Banc of California, Inc. | | | 9,980 | |
| | 156 | | | BancFirst Corp. | | | 7,862 | |
| | 224 | | | Banco Latinoamericano de Comercio Exterior SA, Class E (Panama) | | | 6,039 | |
| | 460 | | | BancorpSouth, Inc. | | | 13,363 | |
| | 356 | | | Bank Mutual Corp. | | | 3,257 | |
| | 350 | | | Bank of Commerce Holdings | | | 3,692 | |
| | 54 | | | Bank of Marin Bancorp | | | 3,534 | |
| | 586 | | | Bank of NT Butterfield & Son Ltd. (The) (Bermuda) | | | 19,268 | |
| | 266 | | | BankFinancial Corp. | | | 4,267 | |
| | 128 | | | Bankwell Financial Group, Inc. | | | 4,339 | |
| | 108 | | | Bar Harbor Bankshares | | | 2,836 | |
| | 302 | | | BCB Bancorp, Inc. | | | 4,288 | |
| | 272 | | | Bear State Financial, Inc.(a) | | | 2,796 | |
| | 206 | | | Beneficial Bancorp, Inc. | | | 3,080 | |
| | 248 | | | Berkshire Hills Bancorp, Inc. | | | 8,382 | |
| | 182 | | | Blue Capital Reinsurance Holdings Ltd. (Bermuda) | | | 3,422 | |
| | 236 | | | Blue Hills Bancorp, Inc. | | | 4,413 | |
| | 690 | | | BofI Holding, Inc.*(a) | | | 18,292 | |
| | 260 | | | Boston Private Financial Holdings, Inc. | | | 3,822 | |
| | 164 | | | Bridge Bancorp, Inc. | | | 5,068 | |
| | 292 | | | Brookline Bancorp, Inc. | | | 4,190 | |
| | 164 | | | Bryn Mawr Bank Corp. | | | 6,716 | |
| | 134 | | | BSB Bancorp, Inc.* | | | 3,819 | |
| | 60 | | | C&F Financial Corp. | | | 2,811 | |
| | 140 | | | Cadence BanCorp* | | | 2,918 | |
| | 248 | | | Camden National Corp. | | | 9,672 | |
| | 140 | | | Capital Bank Financial Corp., Class A | | | 5,264 | |
| | 242 | | | Capital City Bank Group, Inc. | | | 5,007 | |
| | 344 | | | Capitol Federal Financial, Inc. | | | 4,720 | |
| | 170 | | | Capstar Financial Holdings, Inc.* | | | 2,948 | |
| | 762 | | | Capstead Mortgage Corp. REIT | | | 7,369 | |
| | 152 | | | Carolina Financial Corp. | | | 5,173 | |
| | 448 | | | Cathay General Bancorp | | | 15,801 | |
| | 394 | | | CenterState Banks, Inc. | | | 9,641 | |
| | 164 | | | Central Pacific Financial Corp. | | | 4,756 | |
| | 170 | | | Central Valley Community Bancorp | | | 3,344 | |
| | 60 | | | Century Bancorp, Inc., Class A | | | 4,008 | |
| | 326 | | | Charter Financial Corp. | | | 5,301 | |
| | 230 | | | Chemical Financial Corp. | | | 10,444 | |
| | 72 | | | Chemung Financial Corp. | | | 2,908 | |
| | |
| | |
| The accompanying notes are an integral part of these financial statements. | | 79 |
GOLDMAN SACHS ACTIVEBETA® U.S. SMALL CAP EQUITY ETF
Schedule of Investments (continued)
August 31, 2017
| | | | | | | | |
Shares | | | Description | | Value | |
| Common Stocks – (continued) | |
| Financials – (continued) | | | |
| | 374 | | | Cherry Hill Mortgage Investment Corp. REIT | | $ | 6,912 | |
| | 140 | | | Citizens & Northern Corp. | | | 3,142 | |
| | 176 | | | City Holding Co. | | | 11,146 | |
| | 314 | | | Civista Bancshares, Inc. | | | 6,346 | |
| | 266 | | | Clifton Bancorp, Inc. | | | 4,189 | |
| | 146 | | | CNB Financial Corp. | | | 3,527 | |
| | 722 | | | CNO Financial Group, Inc. | | | 16,137 | |
| | 140 | | | Codorus Valley Bancorp, Inc. | | | 3,507 | |
| | 236 | | | Cohen & Steers, Inc. | | | 8,930 | |
| | 290 | | | Columbia Banking System, Inc. | | | 10,779 | |
| | 128 | | | Commerce Union Bancshares, Inc.(a) | | | 3,071 | |
| | 170 | | | Community Bank System, Inc. | | | 8,748 | |
| | 684 | | | Community Bankers Trust Corp.* | | | 5,746 | |
| | 78 | | | Community Financial Corp. (The) | | | 2,730 | |
| | 146 | | | Community Trust Bancorp, Inc. | | | 6,212 | |
| | 200 | | | ConnectOne Bancorp, Inc. | | | 4,560 | |
| | 108 | | | County Bancorp, Inc. | | | 3,238 | |
| | 380 | | | Crawford & Co., Class B(a) | | | 3,770 | |
| | 146 | | | CU Bancorp* | | | 5,205 | |
| | 460 | | | Customers Bancorp, Inc.* | | | 12,963 | |
| | 460 | | | CVB Financial Corp. | | | 9,522 | |
| | 726 | | | CYS Investments, Inc. REIT | | | 6,382 | |
| | 42 | | | Diamond Hill Investment Group, Inc. | | | 8,246 | |
| | 176 | | | Dime Community Bancshares, Inc. | | | 3,335 | |
| | 84 | | | DNB Financial Corp. | | | 2,734 | |
| | 224 | | | Donegal Group, Inc., Class A | | | 3,434 | |
| | 460 | | | Donnelley Financial Solutions, Inc.* | | | 9,849 | |
| | 1,458 | | | Dynex Capital, Inc. REIT | | | 10,425 | |
| | 158 | | | Eagle Bancorp, Inc.* | | | 9,828 | |
| | 128 | | | eHealth, Inc.* | | | 3,108 | |
| | 302 | | | Elevate Credit, Inc.*(a) | | | 1,912 | |
| | 266 | | | Ellington Residential Mortgage REIT | | | 3,892 | |
| | 134 | | | EMC Insurance Group, Inc. | | | 3,736 | |
| | 326 | | | Employers Holdings, Inc. | | | 13,741 | |
| | 140 | | | Encore Capital Group, Inc.* | | | 5,649 | |
| | 362 | | | Enova International, Inc.* | | | 4,308 | |
| | 54 | | | Enstar Group Ltd. (Bermuda)* | | | 11,208 | |
| | 206 | | | Entegra Financial Corp.* | | | 4,779 | |
| | 66 | | | Enterprise Bancorp, Inc. | | | 2,111 | |
| | 158 | | | Enterprise Financial Services Corp. | | | 6,036 | |
| | 108 | | | Equity Bancshares, Inc., Class A* | | | 3,688 | |
| | 206 | | | ESSA Bancorp, Inc. | | | 3,111 | |
| | 114 | | | Evans Bancorp, Inc. | | | 4,708 | |
| | 320 | | | Evercore, Inc., Class A | | | 24,144 | |
| | 66 | | | Farmers & Merchants Bancorp, Inc.(a) | | | 4,419 | |
| | 102 | | | Farmers Capital Bank Corp. | | | 3,820 | |
| | 254 | | | Farmers National Banc Corp. | | | 3,480 | |
| | 140 | | | FB Financial Corp.* | | | 4,865 | |
| | 54 | | | FBL Financial Group, Inc., Class A | | | 3,672 | |
| | 314 | | | FCB Financial Holdings, Inc., Class A* | | | 13,690 | |
| | 230 | | | Federal Agricultural Mortgage Corp., Class C | | | 15,668 | |
| | 200 | | | Fidelity & Guaranty Life | | | 6,250 | |
| | 454 | | | Fidelity Southern Corp. | | | 9,924 | |
| | 158 | | | Financial Engines, Inc. | | | 5,222 | |
| | |
| Common Stocks – (continued) | |
| Financials – (continued) | | | |
| | 248 | | | Financial Institutions, Inc. | | | 6,746 | |
| | 170 | | | First Bancorp, Inc. | | | 4,425 | |
| | 834 | | | First BanCorp/Puerto Rico (Puerto Rico)* | | | 4,737 | |
| | 200 | | | First Bancorp/Southern Pines NC | | | 6,188 | |
| | 120 | | | First Bancshares, Inc. (The) | | | 3,384 | |
| | 341 | | | First Busey Corp. | | | 9,838 | |
| | 182 | | | First Business Financial Services, Inc. | | | 3,878 | |
| | 36 | | | First Citizens BancShares, Inc., Class A | | | 12,258 | |
| | 628 | | | First Commonwealth Financial Corp. | | | 7,919 | |
| | 114 | | | First Community Bancshares, Inc. | | | 2,934 | |
| | 176 | | | First Connecticut Bancorp, Inc. | | | 4,356 | |
| | 96 | | | First Defiance Financial Corp. | | | 4,700 | |
| | 496 | | | First Financial Bancorp | | | 11,879 | |
| | 302 | | | First Financial Bankshares, Inc. | | | 12,095 | |
| | 114 | | | First Financial Corp. | | | 4,948 | |
| | 200 | | | First Financial Northwest, Inc. | | | 3,200 | |
| | 320 | | | First Foundation, Inc.* | | | 5,424 | |
| | 120 | | | First Guaranty Bancshares, Inc. | | | 3,143 | |
| | 140 | | | First Internet Bancorp | | | 4,452 | |
| | 176 | | | First Interstate BancSystem, Inc.,
Class A | | | 6,195 | |
| | 172 | | | First Merchants Corp. | | | 6,754 | |
| | 134 | | | First Mid-Illinois Bancshares, Inc. | | | 4,647 | |
| | 260 | | | First Midwest Bancorp, Inc. | | | 5,481 | |
| | 260 | | | First Northwest Bancorp* | | | 4,124 | |
| | 212 | | | First of Long Island Corp. (The) | | | 5,671 | |
| | 102 | | | FirstCash, Inc. | | | 5,987 | |
| | 332 | | | Flagstar Bancorp, Inc.* | | | 10,896 | |
| | 436 | | | Flushing Financial Corp. | | | 11,920 | |
| | 164 | | | FNB Bancorp(a) | | | 4,912 | |
| | 206 | | | FNFV Group* | | | 3,471 | |
| | 140 | | | Franklin Financial Network, Inc.* | | | 4,578 | |
| | 828 | | | Fulton Financial Corp. | | | 14,449 | |
| | 424 | | | GAIN Capital Holdings, Inc. | | | 2,671 | |
| | 78 | | | GAMCO Investors, Inc., Class A | | | 2,299 | |
| | 290 | | | German American Bancorp, Inc. | | | 9,437 | |
| | 424 | | | Glacier Bancorp, Inc. | | | 14,081 | |
| | 90 | | | Global Indemnity Ltd. (Cayman Islands)* | | | 3,638 | |
| | 374 | | | Great Ajax Corp. REIT | | | 5,303 | |
| | 158 | | | Great Southern Bancorp, Inc. | | | 7,868 | |
| | 180 | | | Great Western Bancorp, Inc. | | | 6,466 | |
| | 176 | | | Green Bancorp, Inc.* | | | 3,529 | |
| | 224 | | | Green Dot Corp., Class A* | | | 10,792 | |
| | 332 | | | Greenhill & Co., Inc. | | | 4,997 | |
| | 128 | | | Greenlight Capital Re Ltd., Class A* | | | 2,848 | |
| | 144 | | | Guaranty Bancorp | | | 3,715 | |
| | 218 | | | Hallmark Financial Services, Inc.* | | | 2,234 | |
| | 92 | | | Hamilton Lane, Inc., Class A | | | 2,156 | |
| | 400 | | | Hancock Holding Co. | | | 17,580 | |
| | 242 | | | Hanmi Financial Corp. | | | 6,461 | |
| | 218 | | | Hannon Armstrong Sustainable Infrastructure Capital, Inc. REIT | | | 5,058 | |
| | 242 | | | HarborOne Bancorp, Inc.* | | | 4,160 | |
| | 176 | | | HCI Group, Inc. | | | 6,862 | |
| | 242 | | | Health Insurance Innovations, Inc., Class A*(a) | | | 8,143 | |
| | |
| | |
| 80 | | The accompanying notes are an integral part of these financial statements. |
GOLDMAN SACHS ACTIVEBETA® U.S. SMALL CAP EQUITY ETF
| | | | | | | | |
Shares | | | Description | | Value | |
| Common Stocks – (continued) | |
| Financials – (continued) | | | |
| | 242 | | | Heartland Financial USA, Inc. | | $ | 11,011 | |
| | 520 | | | Heritage Commerce Corp. | | | 6,968 | |
| | 160 | | | Heritage Financial Corp. | | | 4,184 | |
| | 188 | | | Heritage Insurance Holdings, Inc. | | | 2,139 | |
| | 386 | | | Hilltop Holdings, Inc. | | | 9,137 | |
| | 36 | | | Hingham Institution for Savings | | | 6,624 | |
| | 108 | | | Home Bancorp, Inc. | | | 4,361 | |
| | 640 | | | Home BancShares, Inc. | | | 14,918 | |
| | 266 | | | HomeStreet, Inc.* | | | 6,716 | |
| | 170 | | | HomeTrust Bancshares, Inc.* | | | 3,944 | |
| | 496 | | | Hope Bancorp, Inc. | | | 8,005 | |
| | 176 | | | Horace Mann Educators Corp. | | | 6,186 | |
| | 176 | | | Horizon Bancorp | | | 4,606 | |
| | 182 | | | Houlihan Lokey, Inc. | | | 6,561 | |
| | 170 | | | Howard Bancorp, Inc.* | | | 3,357 | |
| | 236 | | | IBERIABANK Corp. | | | 18,078 | |
| | 338 | | | Impac Mortgage Holdings, Inc.*(a) | | | 4,485 | |
| | 68 | | | Independent Bank Corp. | | | 4,712 | |
| | 308 | | | Independent Bank Corp. | | | 6,283 | |
| | 78 | | | Independent Bank Group, Inc. | | | 4,341 | |
| | 66 | | | Infinity Property & Casualty Corp. | | | 5,838 | |
| | 248 | | | International Bancshares Corp. | | | 8,916 | |
| | 176 | | | INTL. FCStone, Inc.* | | | 6,246 | |
| | 1,198 | | | Invesco Mortgage Capital, Inc. REIT | | | 20,342 | |
| | 176 | | | Investar Holding Corp. | | | 3,872 | |
| | 128 | | | Investment Technology Group, Inc. | | | 2,572 | |
| | 1,130 | | | Investors Bancorp, Inc. | | | 14,792 | |
| | 36 | | | Investors Title Co. | | | 6,331 | |
| | 206 | | | James River Group Holdings Ltd. | | | 8,215 | |
| | 236 | | | Kearny Financial Corp. | | | 3,339 | |
| | 72 | | | Kemper Corp. | | | 3,449 | |
| | 290 | | | Kingstone Cos, Inc. | | | 4,364 | |
| | 236 | | | KKR Real Estate Finance Trust, Inc. | | | 4,902 | |
| | 484 | | | Ladder Capital Corp. REIT | | | 6,640 | |
| | 344 | | | Lakeland Bancorp, Inc. | | | 6,364 | |
| | 260 | | | Lakeland Financial Corp. | | | 11,300 | |
| | 120 | | | LCNB Corp. | | | 2,214 | |
| | 308 | | | LegacyTexas Financial Group, Inc. | | | 11,085 | |
| | 424 | | | LendingClub Corp.* | | | 2,625 | |
| | 60 | | | LendingTree, Inc.* | | | 13,857 | |
| | 188 | | | Live Oak Bancshares, Inc. | | | 4,202 | |
| | 580 | | | Macatawa Bank Corp. | | | 5,551 | |
| | 266 | | | Maiden Holdings Ltd. | | | 1,929 | |
| | 182 | | | MainSource Financial Group, Inc. | | | 5,957 | |
| | 206 | | | Malvern Bancorp, Inc.*(a) | | | 4,903 | |
| | 200 | | | MB Financial, Inc. | | | 7,954 | |
| | 278 | | | MBIA, Inc.* | | | 2,797 | |
| | 472 | | | MBT Financial Corp. | | | 4,791 | |
| | 158 | | | Mercantile Bank Corp. | | | 4,802 | |
| | 272 | | | Meridian Bancorp, Inc. | | | 4,787 | |
| | 128 | | | Meta Financial Group, Inc. | | | 8,998 | |
| | 60 | | | Middlefield Banc Corp. | | | 2,697 | |
| | 254 | | | Midland States Bancorp, Inc. | | | 7,757 | |
| | 284 | | | MidSouth Bancorp, Inc. | | | 3,365 | |
| | 128 | | | MidWestOne Financial Group, Inc. | | | 4,209 | |
| | 200 | | | Moelis & Co., Class A | | | 7,880 | |
| | |
| Common Stocks – (continued) | |
| Financials – (continued) | | | |
| | 460 | | | MTGE Investment Corp. REIT | | | 8,832 | |
| | 72 | | | MutualFirst Financial, Inc. | | | 2,534 | |
| | 182 | | | National Bank Holdings Corp., Class A | | | 5,857 | |
| | 54 | | | National Bankshares, Inc. | | | 2,128 | |
| | 102 | | | National Commerce Corp.* | | | 4,054 | |
| | 278 | | | National General Holdings Corp. | | | 4,773 | |
| | 24 | | | National Western Life Group, Inc., Class A | | | 8,026 | |
| | 102 | | | Navigators Group, Inc. (The) | | | 5,692 | |
| | 224 | | | NBT Bancorp, Inc. | | | 7,354 | |
| | 146 | | | Nelnet, Inc., Class A | | | 6,925 | |
| | 1,094 | | | New York Mortgage Trust, Inc. REIT(a) | | | 6,848 | |
| | 236 | | | NewStar Financial, Inc. | | | 2,530 | |
| | 146 | | | NI Holdings, Inc.*(a) | | | 2,410 | |
| | 102 | | | Nicolet Bankshares, Inc.* | | | 5,574 | |
| | 1,330 | | | NMI Holdings, Inc., Class A* | | | 14,430 | |
| | 230 | | | Northeast Bancorp | | | 4,968 | |
| | 176 | | | Northfield Bancorp, Inc. | | | 2,835 | |
| | 140 | | | Northrim BanCorp, Inc. | | | 4,179 | |
| | 230 | | | Northwest Bancshares, Inc. | | | 3,549 | |
| | 90 | | | Norwood Financial Corp.(a) | | | 3,964 | |
| | 230 | | | OceanFirst Financial Corp. | | | 5,741 | |
| | 882 | | | Ocwen Financial Corp.* | | | 2,584 | |
| | 312 | | | OFG Bancorp (Puerto Rico) | | | 2,714 | |
| | 128 | | | Ohio Valley Banc Corp. | | | 4,211 | |
| | 170 | | | Old Line Bancshares, Inc. | | | 4,675 | |
| | 804 | | | Old National Bancorp | | | 13,145 | |
| | 114 | | | Old Point Financial Corp. | | | 3,504 | |
| | 332 | | | Old Second Bancorp, Inc. | | | 3,801 | |
| | 628 | | | OM Asset Management PLC | | | 8,874 | |
| | 176 | | | OneBeacon Insurance Group Ltd., Class A | | | 3,207 | |
| | 146 | | | Oppenheimer Holdings, Inc., Class A | | | 2,372 | |
| | 478 | | | Orchid Island Capital, Inc. REIT | | | 4,622 | |
| | 442 | | | Oritani Financial Corp. | | | 7,094 | |
| | 212 | | | Owens Realty Mortgage, Inc. REIT | | | 3,678 | |
| | 102 | | | Pacific Continental Corp. | | | 2,422 | |
| | 302 | | | Pacific Mercantile Bancorp* | | | 2,567 | |
| | 152 | | | Pacific Premier Bancorp, Inc.* | | | 5,381 | |
| | 78 | | | Paragon Commercial Corp.* | | | 4,044 | |
| | 96 | | | Park National Corp. | | | 9,273 | |
| | 484 | | | Park Sterling Corp. | | | 5,503 | |
| | 182 | | | Parke Bancorp, Inc. | | | 3,540 | |
| | 194 | | | PCSB Financial Corp.* | | | 3,282 | |
| | 218 | | | Peapack Gladstone Financial Corp. | | | 6,642 | |
| | 90 | | | Penns Woods Bancorp, Inc. | | | 3,862 | |
| | 502 | | | PennyMac Financial Services, Inc., Class A* | | | 8,534 | |
| | 574 | | | PennyMac Mortgage Investment Trust REIT | | | 9,924 | |
| | 134 | | | Peoples Bancorp of North Carolina, Inc. | | | 4,071 | |
| | 236 | | | Peoples Bancorp, Inc. | | | 7,330 | |
| | 108 | | | Peoples Financial Services Corp. | | | 4,487 | |
| | 218 | | | People’s Utah Bancorp | | | 5,962 | |
| | 176 | | | PHH Corp.* | | | 2,499 | |
| | 72 | | | Piper Jaffray Cos | | | 3,992 | |
| | 120 | | | PJT Partners, Inc., Class A | | | 4,639 | |
| | 230 | | | PRA Group, Inc.* | | | 6,647 | |
| | |
| | |
| The accompanying notes are an integral part of these financial statements. | | 81 |
GOLDMAN SACHS ACTIVEBETA® U.S. SMALL CAP EQUITY ETF
Schedule of Investments (continued)
August 31, 2017
| | | | | | | | |
Shares | | | Description | | Value | |
| Common Stocks – (continued) | |
| Financials – (continued) | | | |
| | 212 | | | Preferred Bank | | $ | 11,406 | |
| | 236 | | | Premier Financial Bancorp, Inc. | | | 4,460 | |
| | 326 | | | Primerica, Inc. | | | 24,955 | |
| | 146 | | | Provident Financial Holdings, Inc. | | | 2,765 | |
| | 374 | | | Provident Financial Services, Inc. | | | 9,294 | |
| | 254 | | | Prudential Bancorp, Inc. | | | 4,686 | |
| | 532 | | | Pzena Investment Management, Inc., Class A | | | 5,267 | |
| | 158 | | | QCR Holdings, Inc. | | | 6,905 | |
| | 1,648 | | | Radian Group, Inc. | | | 28,840 | |
| | 634 | | | Redwood Trust, Inc. REIT | | | 10,575 | |
| | 188 | | | Regional Management Corp.* | | | 4,127 | |
| | 144 | | | Renasant Corp. | | | 5,736 | |
| | 170 | | | Republic Bancorp, Inc., Class A | | | 6,049 | |
| | 284 | | | Republic First Bancorp, Inc.*(a) | | | 2,400 | |
| | 604 | | | Riverview Bancorp, Inc. | | | 4,850 | |
| | 152 | | | RLI Corp. | | | 8,135 | |
| | 236 | | | S&T Bancorp, Inc. | | | 8,482 | |
| | 218 | | | Safeguard Scientifics, Inc.* | | | 2,660 | |
| | 102 | | | Safety Insurance Group, Inc. | | | 7,283 | |
| | 224 | | | Sandy Spring Bancorp, Inc. | | | 8,640 | |
| | 248 | | | Seacoast Banking Corp. of Florida* | | | 5,672 | |
| | 380 | | | Selective Insurance Group, Inc. | | | 19,152 | |
| | 430 | | | ServisFirst Bancshares, Inc. | | | 14,667 | |
| | 266 | | | Shore Bancshares, Inc. | | | 4,386 | |
| | 266 | | | SI Financial Group, Inc. | | | 3,884 | |
| | 206 | | | Sierra Bancorp | | | 5,214 | |
| | 128 | | | Simmons First National Corp., Class A | | | 6,682 | |
| | 134 | | | SmartFinancial, Inc.* | | | 3,094 | |
| | 90 | | | South State Corp. | | | 7,403 | |
| | 170 | | | Southern First Bancshares, Inc.* | | | 6,010 | |
| | 182 | | | Southern Missouri Bancorp, Inc. | | | 5,908 | |
| | 266 | | | Southern National Bancorp of Virginia, Inc. | | | 4,456 | |
| | 102 | | | Southside Bancshares, Inc. | | | 3,332 | |
| | 200 | | | Southwest Bancorp, Inc. | | | 5,050 | |
| | 96 | | | State Auto Financial Corp. | | | 2,375 | |
| | 124 | | | State Bank Financial Corp. | | | 3,332 | |
| | 532 | | | State National Cos, Inc. | | | 11,050 | |
| | 580 | | | Sterling Bancorp | | | 13,021 | |
| | 188 | | | Stewart Information Services Corp. | | | 6,783 | |
| | 164 | | | Stifel Financial Corp. | | | 7,831 | |
| | 290 | | | Stock Yards Bancorp, Inc. | | | 10,092 | |
| | 134 | | | Stonegate Bank | | | 6,460 | |
| | 108 | | | Summit Financial Group, Inc. | | | 2,364 | |
| | 338 | | | Sun Bancorp, Inc. | | | 7,892 | |
| | 146 | | | Sunshine Bancorp, Inc.* | | | 3,154 | |
| | 320 | | | Sutherland Asset Management Corp. REIT | | | 4,880 | |
| | 176 | | | Territorial Bancorp, Inc. | | | 5,320 | |
| | 242 | | | Texas Capital Bancshares, Inc.* | | | 17,969 | |
| | 678 | | | Third Point Reinsurance Ltd. (Bermuda)* | | | 9,526 | |
| | 200 | | | Timberland Bancorp, Inc. | | | 5,542 | |
| | 84 | | | Tompkins Financial Corp. | | | 6,377 | |
| | 248 | | | Towne Bank/Portsmouth VA | | | 7,614 | |
| | 164 | | | TriCo Bancshares | | | 5,835 | |
| | 224 | | | TriState Capital Holdings, Inc.* | | | 4,682 | |
| | 236 | | | Triumph Bancorp, Inc.* | | | 6,655 | |
| | |
| Common Stocks – (continued) | |
| Financials – (continued) | | | |
| | 134 | | | Trupanion, Inc.*(a) | | | 2,932 | |
| | 646 | | | TrustCo Bank Corp. | | | 5,103 | |
| | 356 | | | Trustmark Corp. | | | 10,545 | |
| | 230 | | | Two River Bancorp | | | 4,191 | |
| | 212 | | | UMB Financial Corp. | | | 14,229 | |
| | 792 | | | Umpqua Holdings Corp. | | | 13,860 | |
| | 242 | | | Union Bankshares Corp. | | | 7,582 | |
| | 140 | | | United Bankshares, Inc. | | | 4,697 | |
| | 344 | | | United Community Banks, Inc. | | | 8,982 | |
| | 344 | | | United Community Financial Corp. | | | 3,127 | |
| | 430 | | | United Financial Bancorp, Inc. | | | 7,448 | |
| | 90 | | | United Fire Group, Inc. | | | 3,785 | |
| | 260 | | | United Security Bancshares | | | 2,405 | |
| | 248 | | | Unity Bancorp, Inc. | | | 4,303 | |
| | 544 | | | Universal Insurance Holdings, Inc. | | | 11,669 | |
| | 188 | | | Univest Corp. of Pennsylvania | | | 5,480 | |
| | 1,378 | | | Valley National Bancorp | | | 15,420 | |
| | 140 | | | Veritex Holdings, Inc.* | | | 3,697 | |
| | 254 | | | Virtu Financial, Inc., Class A | | | 4,559 | |
| | 30 | | | Virtus Investment Partners, Inc. | | | 3,180 | |
| | 466 | | | Waddell & Reed Financial, Inc., Class A(a) | | | 8,672 | |
| | 424 | | | Walker & Dunlop, Inc.* | | | 20,433 | |
| | 496 | | | Washington Federal, Inc. | | | 15,500 | |
| | 188 | | | Washington Trust Bancorp, Inc. | | | 9,635 | |
| | 128 | | | WashingtonFirst Bankshares, Inc. | | | 4,335 | |
| | 350 | | | Waterstone Financial, Inc. | | | 6,178 | |
| | 248 | | | WesBanco, Inc. | | | 9,419 | |
| | 302 | | | West Bancorporation, Inc. | | | 6,629 | |
| | 102 | | | Westamerica Bancorporation(a) | | | 5,258 | |
| | 490 | | | Western Asset Mortgage Capital Corp. REIT | | | 5,150 | |
| | 436 | | | Western New England Bancorp, Inc. | | | 4,338 | |
| | 66 | | | Westwood Holdings Group, Inc. | | | 4,035 | |
| | 302 | | | Wintrust Financial Corp. | | | 21,989 | |
| | 2,044 | | | WMIH Corp.* | | | 2,555 | |
| | 78 | | | World Acceptance Corp.* | | | 5,836 | |
| | 104 | | | WSFS Financial Corp. | | | 4,649 | |
| | 164 | | | Xenith Bankshares, Inc.* | | | 4,699 | |
| | | | | | | | |
| | | | | | | 2,453,460 | |
| | |
| Health Care – 14.2% | |
| | 102 | | | Abaxis, Inc. | | | 4,714 | |
| | 514 | | | Abeona Therapeutics, Inc.*(a) | | | 6,759 | |
| | 90 | | | Accelerate Diagnostics, Inc.*(a) | | | 2,070 | |
| | 454 | | | Aceto Corp. | | | 4,817 | |
| | 140 | | | Achaogen, Inc.* | | | 2,624 | |
| | 96 | | | Aclaris Therapeutics, Inc.* | | | 2,489 | |
| | 436 | | | Acorda Therapeutics, Inc.* | | | 9,069 | |
| | 152 | | | Addus HomeCare Corp.* | | | 5,176 | |
| | 72 | | | Aerie Pharmaceuticals, Inc.* | | | 4,129 | |
| | 140 | | | Aimmune Therapeutics, Inc.* | | | 3,010 | |
| | 338 | | | Akebia Therapeutics, Inc.* | | | 5,658 | |
| | 114 | | | Albany Molecular Research, Inc.*(a) | | | 2,478 | |
| | 938 | | | Allscripts Healthcare Solutions, Inc.* | | | 12,325 | |
| | 128 | | | Almost Family, Inc.* | | | 6,234 | |
| | 504 | | | AMAG Pharmaceuticals, Inc.* | | | 8,417 | |
| | |
| | |
| 82 | | The accompanying notes are an integral part of these financial statements. |
GOLDMAN SACHS ACTIVEBETA® U.S. SMALL CAP EQUITY ETF
| | | | | | | | |
Shares | | | Description | | Value | |
| Common Stocks – (continued) | |
| Health Care – (continued) | |
| | 290 | | | Amedisys, Inc.* | | $ | 15,150 | |
| | 236 | | | American Renal Associates Holdings, Inc.*(a) | | | 3,382 | |
| | 272 | | | Amicus Therapeutics, Inc.* | | | 3,792 | |
| | 374 | | | AMN Healthcare Services, Inc.* | | | 13,969 | |
| | 344 | | | Amphastar Pharmaceuticals, Inc.* | | | 5,507 | |
| | 114 | | | Analogic Corp. | | | 8,157 | |
| | 454 | | | Anavex Life Sciences Corp.*(a) | | | 2,016 | |
| | 520 | | | AngioDynamics, Inc.* | | | 8,856 | |
| | 78 | | | ANI Pharmaceuticals, Inc.* | | | 3,744 | |
| | 48 | | | Anika Therapeutics, Inc.* | | | 2,578 | |
| | 968 | | | Antares Pharma, Inc.*(a) | | | 2,914 | |
| | 1,808 | | | Array BioPharma, Inc.*(a) | | | 17,501 | |
| | 128 | | | Assembly Biosciences, Inc.* | | | 3,470 | |
| | 176 | | | AtriCure, Inc.* | | | 3,948 | |
| | 12 | | | Atrion Corp. | | | 7,466 | |
| | 48 | | | Avexis, Inc.* | | | 4,481 | |
| | 188 | | | AxoGen, Inc.* | | | 3,309 | |
| | 114 | | | Axovant Sciences Ltd.* | | | 2,280 | |
| | 424 | | | BioCryst Pharmaceuticals, Inc.* | | | 2,162 | |
| | 968 | | | BioScrip, Inc.* | | | 2,933 | |
| | 48 | | | BioSpecifics Technologies Corp.* | | | 2,263 | |
| | 368 | | | BioTelemetry, Inc.* | | | 13,671 | |
| | 96 | | | Bluebird Bio, Inc.* | | | 11,986 | |
| | 108 | | | Blueprint Medicines Corp.* | | | 5,856 | |
| | 176 | | | Calithera Biosciences, Inc.* | | | 2,886 | |
| | 170 | | | Cambrex Corp.* | | | 8,857 | |
| | 128 | | | Cantel Medical Corp. | | | 10,400 | |
| | 152 | | | Capital Senior Living Corp.*(a) | | | 1,889 | |
| | 152 | | | Cara Therapeutics, Inc.* | | | 2,178 | |
| | 436 | | | Cardiovascular Systems, Inc.* | | | 12,805 | |
| | 610 | | | Castlight Health, Inc., Class B*(a) | | | 2,379 | |
| | 592 | | | Catalent, Inc.* | | | 24,444 | |
| | 1,028 | | | Catalyst Pharmaceuticals, Inc.* | | | 2,827 | |
| | 114 | | | Chemed Corp. | | | 22,491 | |
| | 774 | | | ChemoCentryx, Inc.* | | | 5,372 | |
| | 326 | | | Civitas Solutions, Inc.* | | | 6,227 | |
| | 302 | | | Clearside Biomedical, Inc.* | | | 2,111 | |
| | 90 | | | Clovis Oncology, Inc.* | | | 6,846 | |
| | 158 | | | Coherus Biosciences, Inc.*(a) | | | 2,283 | |
| | 1,022 | | | Community Health Systems, Inc.* | | | 7,808 | |
| | 810 | | | Conatus Pharmaceuticals, Inc.* | | | 4,649 | |
| | 140 | | | CONMED Corp. | | | 6,944 | |
| | 412 | | | Corbus Pharmaceuticals Holdings, Inc.*(a) | | | 3,193 | |
| | 1,838 | | | Corcept Therapeutics, Inc.* | | | 30,639 | |
| | 332 | | | Corium International, Inc.*(a) | | | 2,839 | |
| | 90 | | | CorVel Corp.* | | | 4,671 | |
| | 224 | | | Corvus Pharmaceuticals, Inc.* | | | 3,622 | |
| | 120 | | | Cotiviti Holdings, Inc.* | | | 4,288 | |
| | 852 | | | Cross Country Healthcare, Inc.* | | | 10,548 | |
| | 158 | | | CryoLife, Inc.* | | | 3,286 | |
| | 418 | | | Cutera, Inc.* | | | 15,529 | |
| | 302 | | | Cytokinetics, Inc.* | | | 4,485 | |
| | 170 | | | CytomX Therapeutics, Inc.* | | | 2,938 | |
| | 1,142 | | | Depomed, Inc.* | | | 6,943 | |
| | 362 | | | Diplomat Pharmacy, Inc.* | | | 6,063 | |
| | |
| Common Stocks – (continued) | |
| Health Care – (continued) | |
| | 236 | | | Eagle Pharmaceuticals, Inc.*(a) | | | 12,876 | |
| | 146 | | | Editas Medicine, Inc.*(a) | | | 3,082 | |
| | 224 | | | Emergent BioSolutions, Inc.* | | | 8,362 | |
| | 72 | | | Enanta Pharmaceuticals, Inc.* | | | 3,086 | |
| | 218 | | | Ensign Group, Inc. (The) | | | 4,478 | |
| | 230 | | | Entellus Medical, Inc.*(a) | | | 4,071 | |
| | 1,306 | | | Enzo Biochem, Inc.* | | | 14,692 | |
| | 182 | | | Epizyme, Inc.* | | | 3,158 | |
| | 72 | | | Esperion Therapeutics, Inc.*(a) | | | 3,558 | |
| | 90 | | | Evolent Health, Inc., Class A* | | | 1,503 | |
| | 260 | | | Exact Sciences Corp.* | | | 10,891 | |
| | 236 | | | Exactech, Inc.* | | | 7,210 | |
| | 816 | | | Fate Therapeutics, Inc.* | | | 3,084 | |
| | 102 | | | FibroGen, Inc.* | | | 4,916 | |
| | 146 | | | FONAR Corp.* | | | 4,322 | |
| | 188 | | | Foundation Medicine, Inc.* | | | 7,576 | |
| | 344 | | | GenMark Diagnostics, Inc.* | | | 3,351 | |
| | 544 | | | Genomic Health, Inc.* | | | 17,245 | |
| | 308 | | | Glaukos Corp.*(a) | | | 11,627 | |
| | 90 | | | Global Blood Therapeutics, Inc.* | | | 2,736 | |
| | 436 | | | Globus Medical, Inc., Class A* | | | 13,180 | |
| | 308 | | | Haemonetics Corp.* | | | 13,250 | |
| | 170 | | | Halozyme Therapeutics, Inc.* | | | 2,212 | |
| | 302 | | | Halyard Health, Inc.* | | | 13,678 | |
| | 170 | | | HealthEquity, Inc.* | | | 7,271 | |
| | 478 | | | HealthSouth Corp. | | | 21,868 | |
| | 78 | | | HealthStream, Inc.* | | | 1,832 | |
| | 120 | | | Heska Corp.* | | | 12,206 | |
| | 314 | | | HMS Holdings Corp.* | | | 5,564 | |
| | 1,300 | | | Horizon Pharma PLC* | | | 17,784 | |
| | 54 | | | ICU Medical, Inc.* | | | 9,415 | |
| | 502 | | | ImmunoGen, Inc.*(a) | | | 4,197 | |
| | 430 | | | Immunomedics, Inc.*(a) | | | 5,435 | |
| | 290 | | | Impax Laboratories, Inc.* | | | 6,279 | |
| | 374 | | | INC Research Holdings, Inc., Class A* | | | 21,954 | |
| | 326 | | | Innoviva, Inc.*(a) | | | 4,577 | |
| | 114 | | | Inogen, Inc.* | | | 10,921 | |
| | 188 | | | Inovalon Holdings, Inc., Class A*(a) | | | 2,547 | |
| | 182 | | | Insmed, Inc.* | | | 2,260 | |
| | 278 | | | Insulet Corp.* | | | 16,141 | |
| | 762 | | | Insys Therapeutics, Inc.*(a) | | | 6,965 | |
| | 230 | | | Integer Holdings Corp.* | | | 10,569 | |
| | 218 | | | Integra LifeSciences Holdings Corp.* | | | 11,116 | |
| | 308 | | | Intellia Therapeutics, Inc.* | | | 6,477 | |
| | 550 | | | Intersect ENT, Inc.* | | | 16,995 | |
| | 206 | | | Invacare Corp. | | | 2,781 | |
| | 60 | | | iRhythm Technologies, Inc.* | | | 2,864 | |
| | 374 | | | Ironwood Pharmaceuticals, Inc.*(a) | | | 5,965 | |
| | 212 | | | Jounce Therapeutics, Inc.*(a) | | | 3,602 | |
| | 224 | | | K2M Group Holdings, Inc.* | | | 5,237 | |
| | 412 | | | Keryx Biopharmaceuticals, Inc.*(a) | | | 2,971 | |
| | 350 | | | Kindred Biosciences, Inc.* | | | 2,660 | |
| | 696 | | | Kindred Healthcare, Inc. | | | 5,638 | |
| | 114 | | | Kite Pharma, Inc.* | | | 20,291 | |
| | 344 | | | Kura Oncology, Inc.* | | | 2,477 | |
| | 48 | | | Landauer, Inc. | | | 2,978 | |
| | |
| | |
| The accompanying notes are an integral part of these financial statements. | | 83 |
GOLDMAN SACHS ACTIVEBETA® U.S. SMALL CAP EQUITY ETF
Schedule of Investments (continued)
August 31, 2017
| | | | | | | | |
Shares | | | Description | | Value | |
| Common Stocks – (continued) | |
| Health Care – (continued) | |
| | 640 | | | Lannett Co., Inc.*(a) | | $ | 11,232 | |
| | 720 | | | Lantheus Holdings, Inc.* | | | 12,600 | |
| | 302 | | | LeMaitre Vascular, Inc. | | | 10,993 | |
| | 212 | | | LHC Group, Inc.* | | | 13,833 | |
| | 42 | | | Ligand Pharmaceuticals, Inc.*(a) | | | 5,413 | |
| | 260 | | | LivaNova PLC* | | | 16,271 | |
| | 48 | | | Loxo Oncology, Inc.* | | | 4,003 | |
| | 804 | | | Luminex Corp. | | | 15,541 | |
| | 84 | | | Magellan Health, Inc.* | | | 6,796 | |
| | 314 | | | Masimo Corp.* | | | 26,495 | |
| | 912 | | | Matinas BioPharma Holdings, Inc.* | | | 1,167 | |
| | 84 | | | Medicines Co. (The)*(a) | | | 3,082 | |
| | 242 | | | Medidata Solutions, Inc.* | | | 18,140 | |
| | 236 | | | Medpace Holdings, Inc.* | | | 7,703 | |
| | 296 | | | Meridian Bioscience, Inc. | | | 4,114 | |
| | 224 | | | Merit Medical Systems, Inc.* | | | 9,251 | |
| | 1,470 | | | MiMedx Group, Inc.*(a) | | | 23,917 | |
| | 278 | | | Molina Healthcare, Inc.*(a) | | | 17,792 | |
| | 326 | | | Momenta Pharmaceuticals, Inc.* | | | 5,493 | |
| | 170 | | | MyoKardia, Inc.* | | | 7,370 | |
| | 912 | | | Myriad Genetics, Inc.* | | | 27,807 | |
| | 556 | | | NanoString Technologies, Inc.* | | | 8,590 | |
| | 568 | | | Natera, Inc.* | | | 7,015 | |
| | 60 | | | National HealthCare Corp. | | | 3,740 | |
| | 236 | | | National Research Corp., Class A | | | 7,623 | |
| | 146 | | | Natus Medical, Inc.* | | | 4,906 | |
| | 90 | | | Neogen Corp.* | | | 6,201 | |
| | 520 | | | NeoGenomics, Inc.* | | | 5,257 | |
| | 28 | | | Nevro Corp.* | | | 2,413 | |
| | 260 | | | Novelion Therapeutics, Inc. (Canada)* | | | 1,849 | |
| | 278 | | | NuVasive, Inc.* | | | 17,369 | |
| | 406 | | | NxStage Medical, Inc.* | | | 11,368 | |
| | 646 | | | Nymox Pharmaceutical Corp. (Canada)* | | | 2,410 | |
| | 236 | | | Ocular Therapeutix, Inc.* | | | 1,477 | |
| | 96 | | | Omeros Corp.* | | | 1,965 | |
| | 152 | | | Omnicell, Inc.* | | | 7,798 | |
| | 236 | | | OraSure Technologies, Inc.* | | | 4,817 | |
| | 284 | | | Orthofix International NV* | | | 13,976 | |
| | 394 | | | Owens & Minor, Inc. | | | 11,008 | |
| | 200 | | | Oxford Immunotec Global PLC* | | | 3,164 | |
| | 1,118 | | | Pacific Biosciences of California, Inc.* | | | 5,534 | |
| | 96 | | | Pacira Pharmaceuticals, Inc.* | | | 3,658 | |
| | 102 | | | Paratek Pharmaceuticals, Inc.*(a) | | | 2,876 | |
| | 418 | | | PAREXEL International Corp.* | | | 36,738 | |
| | 4,940 | | | PDL BioPharma, Inc.* | | | 15,413 | |
| | 120 | | | Penumbra, Inc.* | | | 10,320 | |
| | 182 | | | PharMerica Corp.* | | | 5,351 | |
| | 532 | | | Phibro Animal Health Corp., Class A | | | 18,886 | |
| | 544 | | | Pieris Pharmaceuticals, Inc.*(a) | | | 2,997 | |
| | 96 | | | Portola Pharmaceuticals, Inc.* | | | 6,091 | |
| | 218 | | | PRA Health Sciences, Inc.* | | | 16,873 | |
| | 302 | | | Prestige Brands Holdings, Inc.* | | | 15,314 | |
| | 356 | | | Progenics Pharmaceuticals, Inc.* | | | 2,396 | |
| | 54 | | | Prothena Corp. PLC (Ireland)*(a) | | | 3,318 | |
| | 72 | | | Providence Service Corp. (The)* | | | 3,732 | |
| | 140 | | | PTC Therapeutics, Inc.* | | | 2,905 | |
| | |
| Common Stocks – (continued) | |
| Health Care – (continued) | |
| | 78 | | | Pulse Biosciences, Inc.* | | | 1,562 | |
| | 54 | | | Puma Biotechnology, Inc.* | | | 4,995 | |
| | 846 | | | Quality Systems, Inc.* | | | 13,325 | |
| | 114 | | | Quidel Corp.* | | | 3,983 | |
| | 666 | | | R1 RCM, Inc.* | | | 2,198 | |
| | 974 | | | RadNet, Inc.* | | | 9,984 | |
| | 84 | | | Reata Pharmaceuticals, Inc., Class A* | | | 2,541 | |
| | 128 | | | REGENXBIO, Inc.* | | | 2,912 | |
| | 140 | | | Repligen Corp.* | | | 6,114 | |
| | 478 | | | RTI Surgical, Inc.* | | | 2,151 | |
| | 78 | | | Sage Therapeutics, Inc.* | | | 6,416 | |
| | 308 | | | Sangamo Therapeutics, Inc.* | | | 4,112 | |
| | 72 | | | Sarepta Therapeutics, Inc.* | | | 2,901 | |
| | 1,644 | | | SciClone Pharmaceuticals, Inc.* | | | 18,084 | |
| | 466 | | | Select Medical Holdings Corp.* | | | 8,668 | |
| | 350 | | | Simulations Plus, Inc. | | | 5,075 | |
| | 980 | | | STAAR Surgical Co.* | | | 11,711 | |
| | 302 | | | Stemline Therapeutics, Inc.* | | | 2,733 | |
| | 556 | | | Strongbridge Biopharma PLC* | | | 3,725 | |
| | 768 | | | Sucampo Pharmaceuticals, Inc., Class A* | | | 9,024 | |
| | 580 | | | Supernus Pharmaceuticals, Inc.* | | | 26,564 | |
| | 248 | | | Surgery Partners, Inc.* | | | 2,418 | |
| | 128 | | | Surmodics, Inc.* | | | 3,328 | |
| | 290 | | | Tactile Systems Technology, Inc.* | | | 9,535 | |
| | 146 | | | Teladoc, Inc.* | | | 4,898 | |
| | 284 | | | Teligent, Inc.*(a) | | | 1,962 | |
| | 332 | | | Tetraphase Pharmaceuticals, Inc.* | | | 2,317 | |
| | 102 | | | Theravance Biopharma, Inc. (Cayman Islands)*(a) | | | 3,332 | |
| | 114 | | | Tivity Health, Inc.* | | | 4,469 | |
| | 592 | | | Triple-S Management Corp., Class B (Puerto Rico)* | | | 14,628 | |
| | 72 | | | US Physical Therapy, Inc. | | | 4,313 | |
| | 36 | | | Utah Medical Products, Inc. | | | 2,597 | |
| | 950 | | | Vanda Pharmaceuticals, Inc.* | | | 16,340 | |
| | 134 | | | Varex Imaging Corp.* | | | 4,091 | |
| | 750 | | | Veracyte, Inc.* | | | 6,143 | |
| | 146 | | | Versartis, Inc.* | | | 2,774 | |
| | 374 | | | ViewRay, Inc.*(a) | | | 1,967 | |
| | 302 | | | Viveve Medical, Inc.* | | | 1,712 | |
| | 284 | | | Vocera Communications, Inc.* | | | 7,909 | |
| | 350 | | | Wright Medical Group NV* | | | 10,360 | |
| | 406 | | | Xencor, Inc.* | | | 8,778 | |
| | 164 | | | Zogenix, Inc.* | | | 1,943 | |
| | 134 | | | Zynerba Pharmaceuticals, Inc.* | | | 851 | |
| | | | | | | | |
| | | | | | | 1,687,585 | |
| | |
| Industrials – 13.7% | | | |
| | 406 | | | AAON, Inc. | | | 13,236 | |
| | 158 | | | AAR Corp. | | | 5,697 | |
| | 136 | | | ABM Industries, Inc. | | | 6,042 | |
| | 720 | | | Acacia Research Corp.* | | | 2,340 | |
| | 484 | | | ACCO Brands Corp.* | | | 5,300 | |
| | 230 | | | Actuant Corp., Class A | | | 5,531 | |
| | 134 | | | Advanced Disposal Services, Inc.* | | | 3,195 | |
| | 242 | | | Advanced Drainage Systems, Inc. | | | 4,707 | |
| | |
| | |
| 84 | | The accompanying notes are an integral part of these financial statements. |
GOLDMAN SACHS ACTIVEBETA® U.S. SMALL CAP EQUITY ETF
| | | | | | | | |
Shares | | | Description | | Value | |
| Common Stocks – (continued) | |
| Industrials – (continued) | | | |
| | 134 | | | Advisory Board Co. (The)* | | $ | 7,135 | |
| | 182 | | | Aegion Corp.* | | | 3,944 | |
| | 350 | | | Aerojet Rocketdyne Holdings, Inc.* | | | 10,370 | |
| | 78 | | | Aerovironment, Inc.* | | | 3,824 | |
| | 206 | | | Air Transport Services Group, Inc.* | | | 4,730 | |
| | 108 | | | Aircastle Ltd. | | | 2,421 | |
| | 96 | | | Alamo Group, Inc. | | | 8,809 | |
| | 60 | | | Albany International Corp., Class A | | | 3,216 | |
| | 48 | | | Allegiant Travel Co. | | | 5,664 | |
| | 212 | | | Allied Motion Technologies, Inc. | | | 5,361 | |
| | 140 | | | Altra Industrial Motion Corp. | | | 6,447 | |
| | 66 | | | American Railcar Industries, Inc. | | | 2,376 | |
| | 134 | | | American Woodmark Corp.* | | | 11,095 | |
| | 206 | | | Apogee Enterprises, Inc. | | | 9,002 | |
| | 380 | | | Applied Industrial Technologies, Inc. | | | 21,660 | |
| | 732 | | | ARC Document Solutions, Inc.* | | | 2,584 | |
| | 308 | | | ArcBest Corp. | | | 9,148 | |
| | 128 | | | Argan, Inc. | | | 8,109 | |
| | 134 | | | Armstrong Flooring, Inc.* | | | 1,999 | |
| | 66 | | | Astec Industries, Inc. | | | 3,279 | |
| | 84 | | | Astronics Corp.* | | | 2,208 | |
| | 394 | | | Atkore International Group, Inc.* | | | 6,564 | |
| | 48 | | | Atlas Air Worldwide Holdings, Inc.* | | | 3,206 | |
| | 296 | | | Avis Budget Group, Inc.* | | | 10,724 | |
| | 568 | | | Axon Enterprise, Inc.*(a) | | | 12,331 | |
| | 54 | | | AZZ, Inc. | | | 2,641 | |
| | 278 | | | Barnes Group, Inc. | | | 17,381 | |
| | 96 | | | Barrett Business Services, Inc. | | | 4,952 | |
| | 350 | | | Beacon Roofing Supply, Inc.* | | | 16,485 | |
| | 224 | | | BG Staffing, Inc. | | | 3,622 | |
| | 230 | | | Blue Bird Corp.* | | | 4,186 | |
| | 762 | | | BMC Stock Holdings, Inc.* | | | 15,469 | |
| | 400 | | | Brady Corp., Class A | | | 13,340 | |
| | 158 | | | Briggs & Stratton Corp. | | | 3,309 | |
| | 176 | | | Brink’s Co. (The) | | | 13,807 | |
| | 768 | | | Builders FirstSource, Inc.* | | | 12,503 | |
| | 200 | | | Caesarstone Ltd. (Israel)* | | | 5,795 | |
| | 102 | | | CAI International, Inc.* | | | 3,161 | |
| | 314 | | | Casella Waste Systems, Inc., Class A* | | | 5,278 | |
| | 610 | | | CBIZ, Inc.* | | | 9,241 | |
| | 356 | | | CECO Environmental Corp. | | | 2,659 | |
| | 224 | | | Chart Industries, Inc.* | | | 7,558 | |
| | 448 | | | Chicago Bridge & Iron Co. NV(a) | | | 5,528 | |
| | 42 | | | CIRCOR International, Inc. | | | 2,017 | |
| | 236 | | | Columbus McKinnon Corp. | | | 7,795 | |
| | 380 | | | Comfort Systems USA, Inc. | | | 12,939 | |
| | 502 | | | Commercial Vehicle Group, Inc.* | | | 2,982 | |
| | 230 | | | Continental Building Products, Inc.* | | | 5,600 | |
| | 732 | | | Costamare, Inc. (Monaco) | | | 4,590 | |
| | 242 | | | Covanta Holding Corp.(a) | | | 3,473 | |
| | 164 | | | CRA International, Inc. | | | 6,155 | |
| | 90 | | | CSW Industrials, Inc.* | | | 3,766 | |
| | 120 | | | Cubic Corp. | | | 5,154 | |
| | 134 | | | Curtiss-Wright Corp. | | | 12,974 | |
| | 296 | | | Deluxe Corp. | | | 20,528 | |
| | 302 | | | DigitalGlobe, Inc.* | | | 10,389 | |
| | |
| Common Stocks – (continued) | |
| Industrials – (continued) | | | |
| | 158 | | | Douglas Dynamics, Inc. | | | 5,514 | |
| | 134 | | | Ducommun, Inc.* | | | 3,685 | |
| | 314 | | | DXP Enterprises, Inc.* | | | 8,506 | |
| | 158 | | | Dycom Industries, Inc.* | | | 12,747 | |
| | 176 | | | Eastern Co. (The) | | | 4,602 | |
| | 634 | | | Echo Global Logistics, Inc.* | | | 9,637 | |
| | 338 | | | EMCOR Group, Inc. | | | 22,322 | |
| | 114 | | | Encore Wire Corp. | | | 4,891 | |
| | 158 | | | Energous Corp.*(a) | | | 1,499 | |
| | 218 | | | EnerSys | | | 13,974 | |
| | 90 | | | Engility Holdings, Inc.* | | | 2,796 | |
| | 146 | | | Ennis, Inc. | | | 2,789 | |
| | 84 | | | EnPro Industries, Inc. | | | 5,919 | |
| | 96 | | | EnviroStar, Inc.(a) | | | 3,173 | |
| | 164 | | | ESCO Technologies, Inc. | | | 8,930 | |
| | 260 | | | Essendant, Inc. | | | 3,084 | |
| | 134 | | | Esterline Technologies Corp.* | | | 11,444 | |
| | 60 | | | Exponent, Inc. | | | 4,086 | |
| | 188 | | | Federal Signal Corp. | | | 3,514 | |
| | 272 | | | Forward Air Corp. | | | 14,136 | |
| | 308 | | | Franklin Covey Co.* | | | 5,790 | |
| | 120 | | | Franklin Electric Co, Inc. | | | 4,626 | |
| | 224 | | | FreightCar America, Inc. | | | 4,068 | |
| | 224 | | | FTI Consulting, Inc.* | | | 7,596 | |
| | 128 | | | GATX Corp. | | | 7,754 | |
| | 158 | | | Gencor Industries, Inc.* | | | 2,433 | |
| | 206 | | | Generac Holdings, Inc.* | | | 8,318 | |
| | 158 | | | Gibraltar Industries, Inc.* | | | 4,621 | |
| | 128 | | | Global Brass & Copper Holdings, Inc. | | | 3,821 | |
| | 472 | | | GMS, Inc.* | | | 15,189 | |
| | 90 | | | Gorman-Rupp Co. (The) | | | 2,740 | |
| | 90 | | | GP Strategies Corp.* | | | 2,574 | |
| | 120 | | | Graham Corp. | | | 2,404 | |
| | 48 | | | Granite Construction, Inc. | | | 2,651 | |
| | 188 | | | Greenbrier Cos, Inc. (The)(a) | | | 8,065 | |
| | 140 | | | H&E Equipment Services, Inc. | | | 3,296 | |
| | 236 | | | Hardinge, Inc. | | | 3,231 | |
| | 374 | | | Harsco Corp.* | | | 6,395 | |
| | 394 | | | Hawaiian Holdings, Inc.* | | | 16,883 | |
| | 520 | | | HC2 Holdings, Inc.* | | | 2,371 | |
| | 338 | | | Healthcare Services Group, Inc. | | | 17,306 | |
| | 146 | | | Heartland Express, Inc. | | | 3,237 | |
| | 120 | | | Heidrick & Struggles International, Inc. | | | 2,190 | |
| | 188 | | | Heritage-Crystal Clean, Inc.* | | | 3,666 | |
| | 484 | | | Herman Miller, Inc. | | | 16,287 | |
| | 326 | | | Hillenbrand, Inc. | | | 11,654 | |
| | 308 | | | HNI Corp. | | | 11,288 | |
| | 254 | | | Hub Group, Inc., Class A* | | | 9,766 | |
| | 134 | | | Hurco Cos, Inc. | | | 4,710 | |
| | 140 | | | Huron Consulting Group, Inc.* | | | 4,235 | |
| | 756 | | | Huttig Building Products, Inc.*(a) | | | 4,309 | |
| | 54 | | | Hyster-Yale Materials Handling, Inc. | | | 3,844 | |
| | 182 | | | ICF International, Inc.* | | | 8,745 | |
| | 296 | | | IES Holdings, Inc.* | | | 4,884 | |
| | 514 | | | InnerWorkings, Inc.* | | | 5,382 | |
| | 108 | | | Insperity, Inc. | | | 8,672 | |
| | |
| | |
| The accompanying notes are an integral part of these financial statements. | | 85 |
GOLDMAN SACHS ACTIVEBETA® U.S. SMALL CAP EQUITY ETF
Schedule of Investments (continued)
August 31, 2017
| | | | | | | | |
Shares | | | Description | | Value | |
| Common Stocks – (continued) | |
| Industrials – (continued) | | | |
| | 496 | | | Interface, Inc. | | $ | 9,424 | |
| | 72 | | | JELD-WEN Holding, Inc.* | | | 2,197 | |
| | 146 | | | John Bean Technologies Corp. | | | 12,950 | |
| | 120 | | | Kadant, Inc. | | | 10,422 | |
| | 136 | | | Kaman Corp. | | | 6,669 | |
| | 164 | | | KBR, Inc. | | | 2,668 | |
| | 326 | | | Kelly Services, Inc., Class A | | | 7,051 | |
| | 302 | | | Kennametal, Inc. | | | 10,570 | |
| | 538 | | | Kforce, Inc. | | | 9,684 | |
| | 906 | | | Kimball International, Inc., Class B | | | 15,366 | |
| | 284 | | | KLX, Inc.* | | | 13,615 | |
| | 218 | | | Knight Transportation, Inc. | | | 8,513 | |
| | 308 | | | Knoll, Inc. | | | 5,559 | |
| | 212 | | | Korn/Ferry International | | | 7,064 | |
| | 290 | | | Kratos Defense & Security Solutions, Inc.* | | | 3,880 | |
| | 206 | | | Lawson Products, Inc.* | | | 4,913 | |
| | 266 | | | LB Foster Co., Class A | | | 5,081 | |
| | 48 | | | Lindsay Corp. | | | 4,155 | |
| | 278 | | | LSC Communications, Inc. | | | 4,479 | |
| | 272 | | | LSI Industries, Inc. | | | 1,548 | |
| | 90 | | | Lydall, Inc.* | | | 4,230 | |
| | 140 | | | Marten Transport Ltd. | | | 2,401 | |
| | 90 | | | Masonite International Corp.* | | | 5,697 | |
| | 320 | | | MasTec, Inc.* | | | 13,056 | |
| | 78 | | | Matson, Inc. | | | 2,012 | |
| | 120 | | | Matthews International Corp., Class A | | | 7,230 | |
| | 72 | | | McGrath RentCorp | | | 2,907 | |
| | 108 | | | Mercury Systems, Inc.* | | | 5,211 | |
| | 454 | | | Meritor, Inc.* | | | 9,016 | |
| | 128 | | | Milacron Holdings Corp.* | | | 2,042 | |
| | 96 | | | Miller Industries, Inc. | | | 2,410 | |
| | 206 | | | Mistras Group, Inc.* | | | 3,895 | |
| | 84 | | | Mobile Mini, Inc. | | | 2,541 | |
| | 128 | | | Moog, Inc., Class A* | | | 9,825 | |
| | 466 | | | MRC Global, Inc.* | | | 7,349 | |
| | 188 | | | MSA Safety, Inc. | | | 13,698 | |
| | 102 | | | Mueller Industries, Inc. | | | 3,043 | |
| | 236 | | | Mueller Water Products, Inc., Class A | | | 2,830 | |
| | 66 | | | Multi-Color Corp. | | | 5,267 | |
| | 108 | | | MYR Group, Inc.* | | | 2,787 | |
| | 48 | | | National Presto Industries, Inc.(a) | | | 4,781 | |
| | 290 | | | Navigant Consulting, Inc.* | | | 4,446 | |
| | 102 | | | Navistar International Corp.* | | | 3,484 | |
| | 460 | | | NCI Building Systems, Inc.* | | | 7,728 | |
| | 260 | | | Neff Corp., Class A* | | | 6,487 | |
| | 592 | | | Nexeo Solutions, Inc.* | | | 4,245 | |
| | 114 | | | NN, Inc. | | | 2,907 | |
| | 152 | | | Northwest Pipe Co.* | | | 2,788 | |
| | 394 | | | NOW, Inc.* | | | 4,594 | |
| | 230 | | | NV5 Global, Inc.* | | | 11,097 | |
| | 90 | | | Omega Flex, Inc. | | | 5,219 | |
| | 344 | | | On Assignment, Inc.* | | | 16,409 | |
| | 622 | | | Orion Group Holdings, Inc.* | | | 3,757 | |
| | 90 | | | Park-Ohio Holdings Corp. | | | 3,587 | |
| | 90 | | | Patrick Industries, Inc.* | | | 6,660 | |
| | 592 | | | PGT Innovations, Inc.* | | | 7,814 | |
| | |
| Common Stocks – (continued) | |
| Industrials – (continued) | | | |
| | 332 | | | Ply Gem Holdings, Inc.* | | | 5,163 | |
| | 152 | | | Powell Industries, Inc. | | | 4,327 | |
| | 102 | | | Preformed Line Products Co. | | | 5,330 | |
| | 218 | | | Primoris Services Corp. | | | 6,237 | |
| | 134 | | | Proto Labs, Inc.* | | | 9,621 | |
| | 170 | | | Quad/Graphics, Inc. | | | 3,240 | |
| | 224 | | | Quanex Building Products Corp. | | | 4,390 | |
| | 1,192 | | | Radiant Logistics, Inc.* | | | 6,020 | |
| | 152 | | | Raven Industries, Inc. | | | 4,256 | |
| | 78 | | | RBC Bearings, Inc.* | | | 8,601 | |
| | 720 | | | Resources Connection, Inc. | | | 9,180 | |
| | 78 | | | REV Group, Inc. | | | 1,965 | |
| | 380 | | | Revolution Lighting Technologies, Inc.* | | | 2,816 | |
| | 368 | | | Rexnord Corp.* | | | 8,788 | |
| | 732 | | | Roadrunner Transportation Systems, Inc.* | | | 5,468 | |
| | 484 | | | RPX Corp.* | | | 6,321 | |
| | 278 | | | Rush Enterprises, Inc., Class A* | | | 11,395 | |
| | 164 | | | Rush Enterprises, Inc., Class B* | | | 6,317 | |
| | 1,094 | | | Safe Bulkers, Inc. (Greece)* | | | 3,545 | |
| | 102 | | | Saia, Inc.* | | | 5,768 | |
| | 394 | | | Scorpio Bulkers, Inc.* | | | 3,172 | |
| | 260 | | | Simpson Manufacturing Co., Inc. | | | 11,383 | |
| | 338 | | | SiteOne Landscape Supply, Inc.* | | | 16,981 | |
| | 152 | | | SkyWest, Inc. | | | 5,274 | |
| | 212 | | | SP Plus Corp.* | | | 7,823 | |
| | 296 | | | Spartan Motors, Inc. | | | 2,723 | |
| | 242 | | | Sparton Corp.* | | | 5,607 | |
| | 152 | | | SPX Corp.* | | | 3,663 | |
| | 152 | | | SPX FLOW, Inc.* | | | 5,087 | |
| | 30 | | | Standex International Corp. | | | 2,864 | |
| | 684 | | | Steelcase, Inc., Class A | | | 9,029 | |
| | 550 | | | Sterling Construction Co., Inc.* | | | 6,479 | |
| | 84 | | | Sun Hydraulics Corp. | | | 4,024 | |
| | 442 | | | Supreme Industries, Inc., Class A | | | 9,255 | |
| | 362 | | | Swift Transportation Co.* | | | 10,154 | |
| | 96 | | | Team, Inc.* | | | 1,186 | |
| | 272 | | | Tennant Co. | | | 16,578 | |
| | 332 | | | Tetra Tech, Inc. | | | 14,143 | |
| | 134 | | | Thermon Group Holdings, Inc.* | | | 2,214 | |
| | 212 | | | Titan International, Inc. | | | 1,819 | |
| | 296 | | | Titan Machinery, Inc.* | | | 3,818 | |
| | 140 | | | TPI Composites, Inc.* | | | 2,848 | |
| | 308 | | | Trex Co., Inc.* | | | 23,408 | |
| | 272 | | | TriMas Corp.* | | | 6,582 | |
| | 212 | | | TriNet Group, Inc.* | | | 7,575 | |
| | 102 | | | Triton International Ltd. (Bermuda)* | | | 3,766 | |
| | 176 | | | Triumph Group, Inc. | | | 4,629 | |
| | 586 | | | TrueBlue, Inc.* | | | 11,984 | |
| | 170 | | | Tutor Perini Corp.* | | | 4,446 | |
| | 296 | | | Twin Disc, Inc.* | | | 5,139 | |
| | 78 | | | UniFirst Corp. | | | 11,201 | |
| | 108 | | | Universal Forest Products, Inc. | | | 9,419 | |
| | 48 | | | US Ecology, Inc. | | | 2,467 | |
| | 200 | | | Vectrus, Inc.* | | | 5,716 | |
| | 278 | | | Veritiv Corp.* | | | 7,784 | |
| | 152 | | | Viad Corp. | | | 8,352 | |
| | |
| | |
| 86 | | The accompanying notes are an integral part of these financial statements. |
GOLDMAN SACHS ACTIVEBETA® U.S. SMALL CAP EQUITY ETF
| | | | | | | | |
Shares | | | Description | | Value | |
| Common Stocks – (continued) | |
| Industrials – (continued) | | | |
| | 502 | | | Vicor Corp.* | | $ | 9,764 | |
| | 72 | | | VSE Corp. | | | 3,755 | |
| | 454 | | | Wabash National Corp. | | | 9,543 | |
| | 66 | | | WageWorks, Inc.* | | | 3,891 | |
| | 146 | | | Watts Water Technologies, Inc., Class A | | | 9,008 | |
| | 176 | | | Werner Enterprises, Inc. | | | 5,826 | |
| | 472 | | | Wesco Aircraft Holdings, Inc.* | | | 3,965 | |
| | 260 | | | West Corp. | | | 6,076 | |
| | 242 | | | Willdan Group, Inc.* | | | 7,504 | |
| | 90 | | | Willis Lease Finance Corp.* | | | 2,142 | |
| | 108 | | | Woodward, Inc. | | | 7,583 | |
| | | | | | | | |
| | | | | | | 1,635,435 | |
| | |
| Information Technology – 17.1% | | | |
| | 314 | | | 2U, Inc.* | | | 15,731 | |
| | 314 | | | 3D Systems Corp.*(a) | | | 3,944 | |
| | 412 | | | 8x8, Inc.* | | | 5,830 | |
| | 968 | | | A10 Networks, Inc.* | | | 6,340 | |
| | 90 | | | Acacia Communications, Inc.*(a) | | | 4,395 | |
| | 332 | | | ACI Worldwide, Inc.* | | | 7,556 | |
| | 344 | | | Actua Corp.* | | | 4,403 | |
| | 254 | | | Acxiom Corp.* | | | 5,916 | |
| | 344 | | | ADTRAN, Inc. | | | 7,602 | |
| | 272 | | | Advanced Energy Industries, Inc.* | | | 20,003 | |
| | 992 | | | Aerohive Networks, Inc.* | | | 3,422 | |
| | 254 | | | Agilysys, Inc.* | | | 2,614 | |
| | 120 | | | Alarm.com Holdings, Inc.* | | | 5,390 | |
| | 140 | | | Alpha & Omega Semiconductor Ltd.* | | | 2,223 | |
| | 212 | | | Ambarella, Inc.*(a) | | | 11,533 | |
| | 344 | | | American Software, Inc., Class A | | | 3,787 | |
| | 974 | | | Amkor Technology, Inc.* | | | 8,552 | |
| | 538 | | | Angie’s List, Inc.*(a) | | | 6,542 | |
| | 218 | | | Anixter International, Inc.* | | | 16,088 | |
| | 254 | | | Appfolio, Inc., Class A* | | | 10,897 | |
| | 66 | | | Applied Optoelectronics, Inc.*(a) | | | 3,902 | |
| | 248 | | | Apptio, Inc., Class A* | | | 4,414 | |
| | 484 | | | Aspen Technology, Inc.* | | | 30,613 | |
| | 1,052 | | | Avid Technology, Inc.* | | | 4,639 | |
| | 338 | | | AVX Corp. | | | 5,898 | |
| | 152 | | | Axcelis Technologies, Inc.* | | | 3,177 | |
| | 768 | | | AXT, Inc.* | | | 5,990 | |
| | 170 | | | Badger Meter, Inc. | | | 7,803 | |
| | 598 | | | Bankrate, Inc.* | | | 8,282 | |
| | 248 | | | Barracuda Networks, Inc.* | | | 6,004 | |
| | 508 | | | Bazaarvoice, Inc.* | | | 2,413 | |
| | 164 | | | Bel Fuse, Inc., Class B | | | 4,182 | |
| | 146 | | | Belden, Inc. | | | 11,252 | |
| | 460 | | | Benchmark Electronics, Inc.* | | | 14,950 | |
| | 134 | | | Blackbaud, Inc. | | | 11,311 | |
| | 454 | | | Blackhawk Network Holdings, Inc.* | | | 20,339 | |
| | 514 | | | Blucora, Inc.* | | | 11,719 | |
| | 102 | | | Bottomline Technologies de, Inc.* | | | 3,092 | |
| | 702 | | | Box, Inc., Class A* | | | 13,773 | |
| | 738 | | | Brightcove, Inc.* | | | 5,203 | |
| | 54 | | | BroadSoft, Inc.*(a) | | | 2,676 | |
| | 344 | | | Brooks Automation, Inc. | | | 8,968 | |
| | |
| Common Stocks – (continued) | |
| Information Technology – (continued) | | | |
| | 140 | | | Cabot Microelectronics Corp. | | | 10,027 | |
| | 164 | | | CACI International, Inc., Class A* | | | 21,287 | |
| | 158 | | | CalAmp Corp.* | | | 2,929 | |
| | 864 | | | Calix, Inc.* | | | 4,234 | |
| | 108 | | | Callidus Software, Inc.* | | | 2,781 | |
| | 356 | | | Carbonite, Inc.* | | | 7,120 | |
| | 266 | | | Cardtronics PLC, Class A* | | | 6,911 | |
| | 332 | | | Care.com, Inc.* | | | 4,970 | |
| | 508 | | | Cars.com, Inc.* | | | 13,137 | |
| | 60 | | | Cass Information Systems, Inc. | | | 3,673 | |
| | 90 | | | CEVA, Inc.* | | | 3,650 | |
| | 350 | | | ChannelAdvisor Corp.* | | | 4,060 | |
| | 702 | | | Ciena Corp.* | | | 15,170 | |
| | 176 | | | Cimpress NV (Netherlands)* | | | 16,269 | |
| | 520 | | | Cirrus Logic, Inc.* | | | 30,150 | |
| | 332 | | | Clearfield, Inc.* | | | 4,050 | |
| | 206 | | | Cohu, Inc. | | | 3,865 | |
| | 454 | | | CommerceHub, Inc., Series C* | | | 9,638 | |
| | 406 | | | CommerceHub, Inc., Series A* | | | 9,001 | |
| | 272 | | | CommVault Systems, Inc.* | | | 16,606 | |
| | 200 | | | Comtech Telecommunications Corp. | | | 3,914 | |
| | 568 | | | Control4 Corp.* | | | 14,064 | |
| | 550 | | | Convergys Corp. | | | 12,925 | |
| | 152 | | | Cornerstone OnDemand, Inc.* | | | 5,317 | |
| | 152 | | | Coupa Software, Inc.*(a) | | | 4,630 | |
| | 586 | | | Cree, Inc.* | | | 14,257 | |
| | 152 | | | CSG Systems International, Inc. | | | 5,884 | |
| | 182 | | | CTS Corp. | | | 4,095 | |
| | 218 | | | CyberOptics Corp.*(a) | | | 3,303 | |
| | 720 | | | Daktronics, Inc. | | | 6,934 | |
| | 1,536 | | | DHI Group, Inc.* | | | 2,995 | |
| | 96 | | | Diebold Nixdorf, Inc. | | | 1,963 | |
| | 418 | | | Digi International, Inc.* | | | 3,846 | |
| | 380 | | | Diodes, Inc.* | | | 10,693 | |
| | 508 | | | DSP Group, Inc.* | | | 6,045 | |
| | 54 | | | Ebix, Inc. | | | 3,116 | |
| | 296 | | | Electro Scientific Industries, Inc.* | | | 3,647 | |
| | 242 | | | Electronics For Imaging, Inc.* | | | 8,606 | |
| | 96 | | | Ellie Mae, Inc.* | | | 7,966 | |
| | 218 | | | EMCORE Corp.* | | | 1,984 | |
| | 828 | | | Entegris, Inc.* | | | 21,073 | |
| | 72 | | | Envestnet, Inc.* | | | 3,200 | |
| | 236 | | | EPAM Systems, Inc.* | | | 19,194 | |
| | 102 | | | ePlus, Inc.* | | | 8,537 | |
| | 188 | | | Etsy, Inc.* | | | 3,078 | |
| | 200 | | | Everbridge, Inc.* | | | 4,634 | |
| | 744 | | | Everi Holdings, Inc.* | | | 5,736 | |
| | 368 | | | EVERTEC, Inc. (Puerto Rico) | | | 6,771 | |
| | 442 | | | Exa Corp.* | | | 6,343 | |
| | 170 | | | ExlService Holdings, Inc.* | | | 9,568 | |
| | 1,458 | | | Extreme Networks, Inc.* | | | 16,665 | |
| | 134 | | | Fair Isaac Corp. | | | 18,862 | |
| | 108 | | | FARO Technologies, Inc.* | | | 3,721 | |
| | 454 | | | Finisar Corp.* | | | 10,964 | |
| | 944 | | | Fitbit, Inc., Class A*(a) | | | 5,692 | |
| | 508 | | | Five9, Inc.* | | | 10,922 | |
| | |
| | |
| The accompanying notes are an integral part of these financial statements. | | 87 |
GOLDMAN SACHS ACTIVEBETA® U.S. SMALL CAP EQUITY ETF
Schedule of Investments (continued)
August 31, 2017
| | | | | | | | |
Shares | | | Description | | Value | |
| Common Stocks – (continued) | |
| Information Technology – (continued) | | | |
| | 218 | | | FormFactor, Inc.* | | $ | 3,292 | |
| | 140 | | | Forrester Research, Inc. | | | 5,705 | |
| | 176 | | | Gigamon, Inc.* | | | 7,559 | |
| | 206 | | | Gogo, Inc.*(a) | | | 2,886 | |
| | 188 | | | GrubHub, Inc.*(a) | | | 10,733 | |
| | 308 | | | GSI Technology, Inc.* | | | 2,045 | |
| | 140 | | | GTT Communications, Inc.* | | | 4,445 | |
| | 708 | | | Guidance Software, Inc.* | | | 5,013 | |
| | 532 | | | Hackett Group, Inc. (The) | | | 7,267 | |
| | 562 | | | Harmonic, Inc.* | | | 1,827 | |
| | 284 | | | Hortonworks, Inc.* | | | 4,825 | |
| | 218 | | | HubSpot, Inc.* | | | 15,990 | |
| | 188 | | | Ichor Holdings Ltd.* | | | 4,301 | |
| | 200 | | | II-VI, Inc.* | | | 7,170 | |
| | 60 | | | Imperva, Inc.* | | | 2,679 | |
| | 120 | | | Impinj, Inc.*(a) | | | 4,589 | |
| | 1,022 | | | Information Services Group, Inc.* | | | 3,833 | |
| | 66 | | | Inphi Corp.* | | | 2,527 | |
| | 108 | | | Insight Enterprises, Inc.* | | | 4,329 | |
| | 380 | | | Instructure, Inc.* | | | 11,248 | |
| | 598 | | | Integrated Device Technology, Inc.* | | | 14,777 | |
| | 206 | | | InterDigital, Inc. | | | 14,698 | |
| | 224 | | | Intevac, Inc.* | | | 2,038 | |
| | 750 | | | Iteris, Inc.* | | | 4,815 | |
| | 230 | | | Itron, Inc.* | | | 16,698 | |
| | 400 | | | IXYS Corp.* | | | 9,200 | |
| | 188 | | | j2 Global, Inc. | | | 14,153 | |
| | 472 | | | KEMET Corp.* | | | 11,286 | |
| | 368 | | | Kimball Electronics, Inc.* | | | 7,010 | |
| | 406 | | | Knowles Corp.* | | | 5,956 | |
| | 660 | | | Kopin Corp.* | | | 2,653 | |
| | 490 | | | KVH Industries, Inc.* | | | 5,782 | |
| | 568 | | | Lattice Semiconductor Corp.* | | | 3,209 | |
| | 368 | | | Leaf Group Ltd.* | | | 2,613 | |
| | 502 | | | Liquidity Services, Inc.* | | | 2,861 | |
| | 72 | | | Littelfuse, Inc. | | | 13,404 | |
| | 586 | | | LivePerson, Inc.* | | | 7,852 | |
| | 164 | | | Lumentum Holdings, Inc.* | | | 9,323 | |
| | 120 | | | MACOM Technology Solutions Holdings, Inc.* | | | 5,465 | |
| | 242 | | | ManTech International Corp., Class A | | | 9,733 | |
| | 412 | | | MAXIMUS, Inc. | | | 25,041 | |
| | 514 | | | MaxLinear, Inc.* | | | 11,102 | |
| | 430 | | | Maxwell Technologies, Inc.* | | | 2,395 | |
| | 1,222 | | | Meet Group, Inc. (The)* | | | 4,790 | |
| | 24 | | | Mesa Laboratories, Inc. | | | 3,278 | |
| | 242 | | | Methode Electronics, Inc. | | | 9,898 | |
| | 42 | | | MicroStrategy, Inc., Class A* | | | 5,418 | |
| | 1,234 | | | MicroVision, Inc.* | | | 2,925 | |
| | 388 | | | MINDBODY, Inc., Class A* | | | 9,176 | |
| | 502 | | | Mitek Systems, Inc.* | | | 5,095 | |
| | 308 | | | MKS Instruments, Inc. | | | 25,364 | |
| | 1,034 | | | MobileIron, Inc.* | | | 3,929 | |
| | 182 | | | Model N, Inc.* | | | 2,466 | |
| | 230 | | | Monolithic Power Systems, Inc. | | | 23,304 | |
| | 128 | | | Monotype Imaging Holdings, Inc. | | | 2,336 | |
| | |
| Common Stocks – (continued) | |
| Information Technology – (continued) | | | |
| | 128 | | | MTS Systems Corp. | | | 6,195 | |
| | 356 | | | Nanometrics, Inc.* | | | 9,181 | |
| | 374 | | | Napco Security Technologies, Inc.* | | | 2,936 | |
| | 176 | | | NETGEAR, Inc.* | | | 8,448 | |
| | 508 | | | NetScout Systems, Inc.* | | | 16,637 | |
| | 236 | | | New Relic, Inc.* | | | 11,304 | |
| | 308 | | | NIC, Inc. | | | 5,036 | |
| | 182 | | | Novanta, Inc.* | | | 7,116 | |
| | 66 | | | NVE Corp. | | | 5,005 | |
| | 508 | | | Oclaro, Inc.*(a) | | | 4,272 | |
| | 96 | | | OSI Systems, Inc.* | | | 7,974 | |
| | 134 | | | Park Electrochemical Corp. | | | 2,433 | |
| | 146 | | | Paycom Software, Inc.* | | | 10,893 | |
| | 48 | | | Paylocity Holding Corp.* | | | 2,359 | |
| | 368 | | | PC Connection, Inc. | | | 9,388 | |
| | 320 | | | PCM, Inc.* | | | 4,208 | |
| | 164 | | | PDF Solutions, Inc.*(a) | | | 2,491 | |
| | 278 | | | Pegasystems, Inc. | | | 15,999 | |
| | 484 | | | Perficient, Inc.* | | | 8,857 | |
| | 986 | | | Photronics, Inc.* | | | 7,789 | |
| | 900 | | | Pixelworks, Inc.* | | | 4,320 | |
| | 1,464 | | | Planet Payment, Inc.* | | | 5,797 | |
| | 260 | | | Plantronics, Inc. | | | 11,084 | |
| | 254 | | | Plexus Corp.* | | | 13,228 | |
| | 146 | | | Power Integrations, Inc. | | | 10,636 | |
| | 320 | | | Progress Software Corp. | | | 10,746 | |
| | 114 | | | Proofpoint, Inc.* | | | 10,461 | |
| | 158 | | | PROS Holdings, Inc.* | | | 4,162 | |
| | 888 | | | Pure Storage, Inc., Class A*(a) | | | 13,222 | |
| | 140 | | | Q2 Holdings, Inc.* | | | 5,684 | |
| | 134 | | | QAD, Inc., Class A | | | 4,516 | |
| | 140 | | | Qualys, Inc.* | | | 6,650 | |
| | 224 | | | Quantenna Communications, Inc.* | | | 4,162 | |
| | 888 | | | Quantum Corp.* | | | 4,893 | |
| | 1,076 | | | QuinStreet, Inc.* | | | 5,757 | |
| | 212 | | | Quotient Technology, Inc.* | | | 3,180 | |
| | 1,016 | | | Radisys Corp.* | | | 1,595 | |
| | 926 | | | Rambus, Inc.* | | | 12,010 | |
| | 284 | | | Rapid7, Inc.* | | | 4,788 | |
| | 254 | | | RealPage, Inc.* | | | 10,947 | |
| | 120 | | | Reis, Inc. | | | 2,052 | |
| | 478 | | | RingCentral, Inc., Class A* | | | 20,243 | |
| | 1,112 | | | Rocket Fuel, Inc.* | | | 2,880 | |
| | 90 | | | Rogers Corp.* | | | 10,670 | |
| | 532 | | | Rosetta Stone, Inc.* | | | 4,894 | |
| | 1,130 | | | Rubicon Project, Inc. (The)* | | | 4,249 | |
| | 400 | | | Rudolph Technologies, Inc.* | | | 8,880 | |
| | 472 | | | Sanmina Corp.* | | | 17,676 | |
| | 200 | | | ScanSource, Inc.* | | | 7,850 | |
| | 278 | | | Science Applications International Corp. | | | 20,539 | |
| | 242 | | | Semtech Corp.* | | | 9,099 | |
| | 1,778 | | | ShoreTel, Inc.* | | | 13,246 | |
| | 114 | | | Shutterstock, Inc.* | | | 3,828 | |
| | 1,192 | | | Sigma Designs, Inc.* | | | 7,450 | |
| | 170 | | | Silicon Laboratories, Inc.* | | | 12,903 | |
| | 1,252 | | | Sonus Networks, Inc.* | | | 8,651 | |
| | |
| | |
| 88 | | The accompanying notes are an integral part of these financial statements. |
GOLDMAN SACHS ACTIVEBETA® U.S. SMALL CAP EQUITY ETF
| | | | | | | | |
Shares | | | Description | | Value | |
| Common Stocks – (continued) | |
| Information Technology – (continued) | | | |
| | 48 | | | SPS Commerce, Inc.* | | $ | 2,924 | |
| | 78 | | | Stamps.com, Inc.*(a) | | | 14,918 | |
| | 320 | | | StarTek, Inc.* | | | 3,808 | |
| | 114 | | | Stratasys Ltd.* | | | 2,551 | |
| | 296 | | | Sykes Enterprises, Inc.* | | | 7,891 | |
| | 290 | | | Synaptics, Inc.* | | | 12,055 | |
| | 666 | | | Synchronoss Technologies, Inc.* | | | 11,182 | |
| | 72 | | | SYNNEX Corp. | | | 8,612 | |
| | 394 | | | Syntel, Inc. | | | 7,116 | |
| | 362 | | | Systemax, Inc. | | | 8,847 | |
| | 134 | | | Tech Data Corp.* | | | 14,779 | |
| | 418 | | | TechTarget, Inc.* | | | 4,155 | |
| | 302 | | | Telenav, Inc.* | | | 1,963 | |
| | 224 | | | TeleTech Holdings, Inc. | | | 8,893 | |
| | 490 | | | TiVo Corp. | | | 8,967 | |
| | 90 | | | Trade Desk, Inc. (The), Class A* | | | 4,767 | |
| | 804 | | | Travelport Worldwide Ltd. | | | 12,173 | |
| | 628 | | | TrueCar, Inc.* | | | 10,645 | |
| | 654 | | | TTM Technologies, Inc.* | | | 9,313 | |
| | 60 | | | Tucows, Inc., Class A*(a) | | | 3,171 | |
| | 84 | | | Twilio, Inc., Class A*(a) | | | 2,460 | |
| | 164 | | | Ubiquiti Networks, Inc.*(a) | | | 9,773 | |
| | 278 | | | Ultra Clean Holdings, Inc.* | | | 6,413 | |
| | 478 | | | Unisys Corp.*(a) | | | 3,705 | |
| | 128 | | | Upland Software, Inc.* | | | 2,944 | |
| | 296 | | | Varonis Systems, Inc.* | | | 11,485 | |
| | 296 | | | VASCO Data Security International, Inc.* | | | 3,715 | |
| | 206 | | | Veeco Instruments, Inc.* | | | 3,893 | |
| | 400 | | | VeriFone Systems, Inc.* | | | 7,908 | |
| | 344 | | | Verint Systems, Inc.* | | | 13,657 | |
| | 66 | | | ViaSat, Inc.*(a) | | | 4,198 | |
| | 870 | | | Viavi Solutions, Inc.* | | | 8,735 | |
| | 78 | | | Virtusa Corp.* | | | 2,833 | |
| | 888 | | | Vishay Intertechnology, Inc. | | | 15,718 | |
| | 230 | | | Vishay Precision Group, Inc.* | | | 5,026 | |
| | 356 | | | Web.com Group, Inc.* | | | 9,007 | |
| | 164 | | | WebMD Health Corp.* | | | 10,896 | |
| | 484 | | | Workiva, Inc.* | | | 9,777 | |
| | 858 | | | Xcerra Corp.* | | | 8,426 | |
| | 544 | | | XO Group, Inc.* | | | 10,129 | |
| | 260 | | | Xperi Corp. | | | 7,085 | |
| | 526 | | | Yelp, Inc.* | | | 22,408 | |
| | 236 | | | Zendesk, Inc.* | | | 6,466 | |
| | 1,076 | | | Zix Corp.* | | | 5,714 | |
| | | | | | | | |
| | | | | | | 2,028,916 | |
| | |
| Materials – 4.0% | | | |
| | 170 | | | A Schulman, Inc. | | | 5,168 | |
| | 146 | | | AdvanSix, Inc.* | | | 4,662 | |
| | 634 | | | AgroFresh Solutions, Inc.* | | | 4,514 | |
| | 514 | | | AK Steel Holding Corp.*(a) | | | 2,878 | |
| | 418 | | | American Vanguard Corp. | | | 8,464 | |
| | 108 | | | Balchem Corp. | | | 8,096 | |
| | 314 | | | Boise Cascade Co.* | | | 9,420 | |
| | 164 | | | Calgon Carbon Corp. | | | 2,001 | |
| | 114 | | | Carpenter Technology Corp. | | | 4,620 | |
| | |
| Common Stocks – (continued) | |
| Materials – (continued) | | | |
| | 170 | | | Century Aluminum Co.* | | | 3,318 | |
| | 146 | | | Chase Corp. | | | 13,651 | |
| | 60 | | | Clearwater Paper Corp.* | | | 2,790 | |
| | 1,240 | | | Cleveland-Cliffs, Inc.* | | | 10,366 | |
| | 732 | | | Coeur Mining, Inc.* | | | 6,405 | |
| | 296 | | | Commercial Metals Co. | | | 5,591 | |
| | 66 | | | Compass Minerals International, Inc. | | | 4,409 | |
| | 236 | | | Core Molding Technologies, Inc. | | | 4,855 | |
| | 30 | | | Deltic Timber Corp. | | | 2,341 | |
| | 350 | | | Ferro Corp.* | | | 6,744 | |
| | 368 | | | Forterra, Inc.*(a) | | | 1,222 | |
| | 224 | | | FutureFuel Corp. | | | 3,020 | |
| | 574 | | | GCP Applied Technologies, Inc.* | | | 16,215 | |
| | 876 | | | Gold Resource Corp. | | | 3,495 | |
| | 108 | | | Greif, Inc., Class A | | | 6,529 | |
| | 36 | | | Greif, Inc., Class B | | | 2,273 | |
| | 66 | | | Hawkins, Inc. | | | 2,353 | |
| | 66 | | | Haynes International, Inc. | | | 2,016 | |
| | 314 | | | HB Fuller Co. | | | 15,760 | |
| | 1,778 | | | Hecla Mining Co. | | | 9,388 | |
| | 314 | | | Ingevity Corp.* | | | 19,773 | |
| | 114 | | | Innophos Holdings, Inc. | | | 5,205 | |
| | 152 | | | Innospec, Inc. | | | 8,436 | |
| | 44 | | | Kaiser Aluminum Corp. | | | 4,238 | |
| | 484 | | | KapStone Paper and Packaging Corp. | | | 10,827 | |
| | 762 | | | Klondex Mines Ltd. (Canada)* | | | 2,568 | |
| | 296 | | | KMG Chemicals, Inc. | | | 14,214 | |
| | 78 | | | Koppers Holdings, Inc.* | | | 3,058 | |
| | 188 | | | Kraton Corp.* | | | 6,172 | |
| | 164 | | | Kronos Worldwide, Inc. | | | 3,433 | |
| | 822 | | | Louisiana-Pacific Corp.* | | | 20,945 | |
| | 188 | | | Materion Corp. | | | 7,182 | |
| | 176 | | | Minerals Technologies, Inc. | | | 11,264 | |
| | 732 | | | Myers Industries, Inc. | | | 13,762 | |
| | 72 | | | Neenah Paper, Inc. | | | 5,562 | |
| | 290 | | | Olympic Steel, Inc. | | | 5,292 | |
| | 362 | | | OMNOVA Solutions, Inc.* | | | 3,149 | |
| | 120 | | | PH Glatfelter Co. | | | 2,078 | |
| | 326 | | | PolyOne Corp. | | | 11,782 | |
| | 134 | | | Quaker Chemical Corp. | | | 18,655 | |
| | 248 | | | Rayonier Advanced Materials, Inc. | | | 3,403 | |
| | 490 | | | Ryerson Holding Corp.* | | | 4,214 | |
| | 120 | | | Schnitzer Steel Industries, Inc., Class A | | | 3,228 | |
| | 152 | | | Schweitzer-Mauduit International, Inc. | | | 5,765 | |
| | 176 | | | Sensient Technologies Corp. | | | 12,698 | |
| | 152 | | | Stepan Co. | | | 11,759 | |
| | 320 | | | Summit Materials, Inc., Class A* | | | 9,453 | |
| | 586 | | | SunCoke Energy, Inc.* | | | 5,462 | |
| | 380 | | | TimkenSteel Corp.* | | | 5,635 | |
| | 218 | | | Trecora Resources* | | | 2,649 | |
| | 272 | | | Trinseo SA | | | 18,197 | |
| | 574 | | | Tronox Ltd., Class A | | | 11,876 | |
| | 206 | | | UFP Technologies, Inc.* | | | 5,480 | |
| | 60 | | | United States Lime & Minerals, Inc. | | | 4,797 | |
| | 48 | | | US Concrete, Inc.*(a) | | | 3,842 | |
| | 1,488 | | | Valhi, Inc. | | | 3,244 | |
| | |
| | |
| The accompanying notes are an integral part of these financial statements. | | 89 |
GOLDMAN SACHS ACTIVEBETA® U.S. SMALL CAP EQUITY ETF
Schedule of Investments (continued)
August 31, 2017
| | | | | | | | |
Shares | | | Description | | Value | |
| Common Stocks – (continued) | |
| Materials – (continued) | | | |
| | 152 | | | Warrior Met Coal, Inc. | | $ | 4,148 | |
| | 170 | | | Worthington Industries, Inc. | | | 8,493 | |
| | | | | | | | |
| | | | | | | 474,502 | |
| | |
| Real Estate – 7.4% | | | |
| | 170 | | | Acadia Realty Trust REIT | | | 4,877 | |
| | 120 | | | Agree Realty Corp. REIT | | | 6,014 | |
| | 326 | | | Alexander & Baldwin, Inc. | | | 14,148 | |
| | 12 | | | Alexander’s, Inc. REIT | | | 5,024 | |
| | 356 | | | Altisource Portfolio Solutions SA*(a) | | | 8,110 | |
| | 424 | | | Altisource Residential Corp. REIT | | | 5,135 | |
| | 128 | | | American Assets Trust, Inc. REIT | | | 5,199 | |
| | 224 | | | Armada Hoffler Properties, Inc. REIT | | | 2,995 | |
| | 792 | | | Ashford Hospitality Prime, Inc. REIT | | | 7,619 | |
| | 1,160 | | | Ashford Hospitality Trust, Inc. REIT | | | 7,204 | |
| | 242 | | | Bluerock Residential Growth REIT, Inc. REIT | | | 2,451 | |
| | 430 | | | CareTrust REIT, Inc. REIT | | | 8,295 | |
| | 272 | | | CatchMark Timber Trust, Inc., Class A REIT | | | 3,136 | |
| | 1,252 | | | CBL & Associates Properties, Inc. REIT(a) | | | 10,016 | |
| | 1,408 | | | Cedar Realty Trust, Inc. REIT | | | 7,096 | |
| | 466 | | | Chatham Lodging Trust REIT | | | 9,450 | |
| | 248 | | | City Office REIT, Inc. REIT | | | 3,172 | |
| | 212 | | | Clipper Realty, Inc. REIT(a) | | | 2,366 | |
| | 170 | | | Community Healthcare Trust, Inc. REIT | | | 4,515 | |
| | 108 | | | Consolidated-Tomoka Land Co. | | | 5,983 | |
| | 188 | | | CorEnergy Infrastructure Trust, Inc. REIT | | | 6,134 | |
| | 2,720 | | | Cousins Properties, Inc. REIT | | | 25,432 | |
| | 1,366 | | | DiamondRock Hospitality Co. REIT | | | 15,012 | |
| | 242 | | | Easterly Government Properties, Inc. REIT | | | 4,855 | |
| | 152 | | | EastGroup Properties, Inc. REIT | | | 13,507 | |
| | 140 | | | Education Realty Trust, Inc. REIT | | | 5,410 | |
| | 296 | | | Farmland Partners, Inc. REIT(a) | | | 2,623 | |
| | 810 | | | FelCor Lodging Trust, Inc. REIT | | | 5,913 | |
| | 490 | | | First Industrial Realty Trust, Inc. REIT | | | 15,180 | |
| | 816 | | | First Potomac Realty Trust REIT | | | 9,082 | |
| | 514 | | | Forestar Group, Inc.*(a) | | | 8,841 | |
| | 394 | | | Four Corners Property Trust, Inc. REIT | | | 10,012 | |
| | 400 | | | Franklin Street Properties Corp. REIT | | | 3,988 | |
| | 108 | | | FRP Holdings, Inc.* | | | 4,741 | |
| | 586 | | | GEO Group, Inc. (The) REIT | | | 16,197 | |
| | 248 | | | Getty Realty Corp. REIT | | | 6,835 | |
| | 278 | | | Gladstone Commercial Corp. REIT | | | 5,949 | |
| | 254 | | | Global Medical REIT, Inc. REIT(a) | | | 2,146 | |
| | 158 | | | Global Net Lease, Inc. REIT | | | 3,422 | |
| | 302 | | | Government Properties Income Trust REIT | | | 5,602 | |
| | 654 | | | Gramercy Property Trust REIT | | | 19,921 | |
| | 454 | | | Healthcare Realty Trust, Inc. REIT | | | 15,109 | |
| | 386 | | | Hersha Hospitality Trust REIT | | | 7,156 | |
| | 132 | | | HFF, Inc., Class A | | | 5,033 | |
| | 520 | | | Independence Realty Trust, Inc. REIT | | | 5,351 | |
| | 550 | | | InfraREIT, Inc. REIT | | | 12,369 | |
| | 400 | | | Investors Real Estate Trust REIT | | | 2,512 | |
| | 406 | | | iStar, Inc. REIT* | | | 4,714 | |
| | 188 | | | Jernigan Capital, Inc. REIT | | | 3,655 | |
| | |
| Common Stocks – (continued) | |
| Real Estate – (continued) | | | |
| | 176 | | | Kennedy-Wilson Holdings, Inc. | | | 3,397 | |
| | 520 | | | Kite Realty Group Trust REIT | | | 10,462 | |
| | 888 | | | LaSalle Hotel Properties REIT | | | 25,201 | |
| | 580 | | | Lexington Realty Trust REIT | | | 5,719 | |
| | 176 | | | LTC Properties, Inc. REIT | | | 8,559 | |
| | 448 | | | Mack-Cali Realty Corp. REIT | | | 10,255 | |
| | 508 | | | Marcus & Millichap, Inc.* | | | 13,376 | |
| | 218 | | | Maui Land & Pineapple Co., Inc.* | | | 2,812 | |
| | 248 | | | MedEquities Realty Trust, Inc. REIT | | | 2,845 | |
| | 412 | | | Monmouth Real Estate Investment Corp. REIT | | | 6,695 | |
| | 738 | | | Monogram Residential Trust, Inc. REIT | | | 8,856 | |
| | 176 | | | National Health Investors, Inc. REIT | | | 14,112 | |
| | 514 | | | National Storage Affiliates Trust REIT | | | 11,472 | |
| | 598 | | | New Senior Investment Group, Inc. REIT | | | 5,520 | |
| | 206 | | | NexPoint Residential Trust, Inc. REIT | | | 4,800 | |
| | 394 | | | NorthStar Realty Europe Corp. REIT | | | 4,897 | |
| | 128 | | | One Liberty Properties, Inc. REIT | | | 3,073 | |
| | 212 | | | Parkway, Inc. REIT | | | 4,868 | |
| | 288 | | | Pebblebrook Hotel Trust REIT(a) | | | 9,674 | |
| | 822 | | | Pennsylvania Real Estate Investment Trust REIT | | | 8,245 | |
| | 574 | | | Physicians Realty Trust REIT | | | 10,751 | |
| | 362 | | | Potlatch Corp. REIT | | | 17,304 | |
| | 400 | | | Preferred Apartment Communities, Inc., Class A REIT | | | 7,276 | |
| | 102 | | | PS Business Parks, Inc. REIT | | | 13,781 | |
| | 164 | | | QTS Realty Trust, Inc., Class A REIT | | | 8,886 | |
| | 816 | | | Quality Care Properties, Inc. REIT* | | | 11,196 | |
| | 2,902 | | | RAIT Financial Trust REIT | | | 2,401 | |
| | 696 | | | Ramco-Gershenson Properties Trust REIT | | | 9,152 | |
| | 308 | | | RE/MAX Holdings, Inc., Class A | | | 18,865 | |
| | 230 | | | Retail Opportunity Investments Corp. REIT | | | 4,563 | |
| | 320 | | | Rexford Industrial Realty, Inc. REIT | | | 9,616 | |
| | 726 | | | RLJ Lodging Trust REIT | | | 14,651 | |
| | 224 | | | RMR Group, Inc. (The), Class A | | | 11,570 | |
| | 272 | | | Ryman Hospitality Properties, Inc. REIT | | | 16,162 | |
| | 1,098 | | | Sabra Health Care REIT, Inc. REIT | | | 23,991 | |
| | 54 | | | Saul Centers, Inc. REIT | | | 3,272 | |
| | 278 | | | Select Income REIT | | | 6,452 | |
| | 176 | | | Seritage Growth Properties, Class A REIT | | | 8,459 | |
| | 170 | | | St Joe Co. (The)* | | | 3,204 | |
| | 356 | | | STAG Industrial, Inc. REIT | | | 9,964 | |
| | 550 | | | Starwood Waypoint Homes REIT | | | 20,477 | |
| | 920 | | | Summit Hotel Properties, Inc. REIT | | | 13,653 | |
| | 1,692 | | | Sunstone Hotel Investors, Inc. REIT | | | 26,734 | |
| | 108 | | | Tejon Ranch Co.* | | | 2,158 | |
| | 266 | | | Terreno Realty Corp. REIT | | | 9,643 | |
| | 332 | | | Tier REIT, Inc. REIT | | | 6,112 | |
| | 320 | | | UMH Properties, Inc. REIT | | | 5,062 | |
| | 84 | | | Universal Health Realty Income Trust REIT | | | 6,360 | |
| | 356 | | | Urban Edge Properties REIT | | | 8,953 | |
| | 164 | | | Urstadt Biddle Properties, Inc., Class A REIT | | | 3,392 | |
| | 1,118 | | | Washington Prime Group, Inc. REIT | | | 9,335 | |
| | |
| | |
| 90 | | The accompanying notes are an integral part of these financial statements. |
GOLDMAN SACHS ACTIVEBETA® U.S. SMALL CAP EQUITY ETF
| | | | | | | | |
Shares | | | Description | | Value | |
| Common Stocks – (continued) | |
| Real Estate – (continued) | | | |
| | 302 | | | Washington Real Estate Investment Trust REIT | | $ | 9,924 | |
| | 212 | | | Whitestone REIT | | | 2,658 | |
| | 646 | | | Xenia Hotels & Resorts, Inc. REIT | | | 12,894 | |
| | | | | | | | |
| | | | | | | 883,215 | |
| | |
| Telecommunication Services – 0.9% | | | |
| | 36 | | | ATN International, Inc. | | | 2,181 | |
| | 266 | | | Boingo Wireless, Inc.* | | | 5,477 | |
| | 266 | | | Cincinnati Bell, Inc.* | | | 5,599 | |
| | 164 | | | Cogent Communications Holdings, Inc. | | | 7,642 | |
| | 532 | | | Consolidated Communications Holdings, Inc. | | | 9,815 | |
| | 282 | | | Frontier Communications Corp. | | | 3,799 | |
| | 84 | | | General Communication, Inc., Class A* | | | 3,623 | |
| | 1,124 | | | Globalstar, Inc.* | | | 2,158 | |
| | 188 | | | Hawaiian Telcom Holdco, Inc.* | | | 5,719 | |
| | 550 | | | IDT Corp., Class B | | | 8,090 | |
| | 224 | | | Iridium Communications, Inc.*(a) | | | 2,486 | |
| | 132 | | | Lumos Networks Corp.* | | | 2,373 | |
| | 296 | | | Ooma, Inc.* | | | 2,901 | |
| | 230 | | | ORBCOMM, Inc.* | | | 2,544 | |
| | 72 | | | Shenandoah Telecommunications Co. | | | 2,596 | |
| | 332 | | | Spok Holdings, Inc. | | | 5,561 | |
| | 24 | | | Straight Path Communications, Inc., Class B* | | | 4,284 | |
| | 3,132 | | | Vonage Holdings Corp.* | | | 25,996 | |
| | 544 | | | Windstream Holdings, Inc.(a) | | | 1,126 | |
| | | | | | | | |
| | | | | | | 103,970 | |
| | |
| Utilities – 4.3% | | | |
| | 332 | | | ALLETE, Inc. | | | 25,673 | |
| | 272 | | | American States Water Co. | | | 13,410 | |
| | 356 | | | AquaVenture Holdings Ltd.* | | | 5,397 | |
| | 78 | | | Artesian Resources Corp., Class A | | | 2,893 | |
| | 3,628 | | | Atlantic Power Corp.* | | | 8,889 | |
| | 394 | | | Avista Corp. | | | 20,252 | |
| | 308 | | | Black Hills Corp. | | | 21,677 | |
| | 248 | | | Cadiz, Inc.*(a) | | | 3,026 | |
| | 200 | | | California Water Service Group | | | 7,490 | |
| | 108 | | | Chesapeake Utilities Corp. | | | 8,581 | |
| | 54 | | | Connecticut Water Service, Inc. | | | 2,929 | |
| | 460 | | | Consolidated Water Co. Ltd. (Cayman Islands) | | | 5,497 | |
| | 96 | | | Delta Natural Gas Co, Inc. | | | 2,941 | |
| | 1,656 | | | Dynegy, Inc.* | | | 15,599 | |
| | 248 | | | El Paso Electric Co. | | | 13,776 | |
| | 430 | | | Genie Energy Ltd., Class B | | | 2,644 | |
| | 290 | | | IDACORP, Inc. | | | 25,804 | |
| | 218 | | | MGE Energy, Inc. | | | 13,865 | |
| | 60 | | | Middlesex Water Co. | | | 2,279 | |
| | 442 | | | New Jersey Resources Corp. | | | 19,293 | |
| | 152 | | | Northwest Natural Gas Co. | | | 10,078 | |
| | 290 | | | NorthWestern Corp. | | | 17,493 | |
| | 840 | | | NRG Yield, Inc., Class A | | | 15,280 | |
| | 980 | | | NRG Yield, Inc., Class C | | | 18,130 | |
| | |
| Common Stocks – (continued) | |
| Utilities – (continued) | | | |
| | 302 | | | ONE Gas, Inc. | | | 22,722 | |
| | 296 | | | Ormat Technologies, Inc. | | | 17,002 | |
| | 260 | | | Otter Tail Corp. | | | 10,868 | |
| | 442 | | | Pattern Energy Group, Inc. | | | 11,103 | |
| | 502 | | | PNM Resources, Inc. | | | 21,285 | |
| | 556 | | | Portland General Electric Co. | | | 26,416 | |
| | 466 | | | Pure Cycle Corp.* | | | 3,378 | |
| | 158 | | | RGC Resources, Inc.(a) | | | 4,353 | |
| | 114 | | | SJW Group | | | 6,327 | |
| | 418 | | | South Jersey Industries, Inc. | | | 14,998 | |
| | 290 | | | Southwest Gas Holdings, Inc. | | | 23,061 | |
| | 368 | | | Spark Energy, Inc., Class A | | | 5,833 | |
| | 266 | | | Spire, Inc. | | | 20,349 | |
| | 490 | | | TerraForm Global, Inc., Class A* | | | 2,474 | |
| | 320 | | | TerraForm Power, Inc., Class A* | | | 4,467 | |
| | 146 | | | Unitil Corp. | | | 7,280 | |
| | 266 | | | WGL Holdings, Inc. | | | 22,413 | |
| | 114 | | | York Water Co. (The) | | | 3,751 | |
| | | | | | | | |
| | | | | | | 510,976 | |
| | |
| TOTAL INVESTMENTS BEFORE SECURITIES LENDING
REINVESTMENT VEHICLE |
|
| | (Cost $12,033,430) | | $ | 11,833,064 | |
| | |
| | | | | | |
| Shares | | Distribution
rate | | Value | |
| Securities Lending Reinvestment Vehicle – 5.4%(b) | |
Goldman Sachs Financial Square Government Fund – Institutional Shares | |
| 649,189 | | 0.93% | | $ | 649,189 | |
| (Cost $649,189) | | | | |
| |
| TOTAL INVESTMENTS – 104.9% | |
| (Cost $12,682,619) | | $ | 12,482,253 | |
| |
| LIABILITIES IN EXCESS OF OTHER ASSETS – (4.9)% | | | (586,323 | ) |
| |
| NET ASSETS – 100.0% | | $ | 11,895,930 | |
| |
| | |
| The percentage shown for each investment category reflects the value of investments in that category as a percentage of net assets. |
* | | Security is currently in default and/or non-income producing.. |
(a) | | All or a portion of security is on loan. |
(b) | | Represents an affiliated issuer. |
| | |
|
Investment Abbreviations: |
PLC | | —Public Limited Company |
REIT | | —Real Estate Investment Trust |
|
| | |
| The accompanying notes are an integral part of these financial statements. | | 91 |
GOLDMAN SACHS ACTIVEBETA® ETFS
Statements of Assets and Liabilities
August 31, 2017
| | | | | | |
| | | | | ActiveBeta®
Emerging Markets
Equity ETF | |
| | Assets: | | | | |
| | Investments at value (cost $1,194,278,800, $38,223,602, $521,079,126, $36,662,241, $2,148,085,760 and $12,033,430, respectively)(a) | | $ | 1,485,722,313 | |
| | Investments in securities lending reinvestment vehicle, at value (cost $26,893,134, $90,063, $6,961,512, $288,307, $3,705,216, $649,189) | | | 26,893,134 | |
| | Cash | | | — | |
| | Foreign currency, at value (cost $350,025, $13, $59,590, $2,507, $— and $—, respectively) | | | 350,839 | |
| | Receivables: | | | | |
| | Fund shares sold | | | 134,286,289 | |
| | Investments sold | | | 208,286,999 | |
| | Dividends and Interest | | | 2,939,898 | |
Due from broker | | | | | 5,518,275 | |
| | Foreign tax reclaims | | | 47,117 | |
| | Securities lending income | | | 11,736 | |
| | Receivable from custodian | | | — | |
| | Reimbursement from advisor | | | 216,981 | |
| | Other assets | | | 24,510 | |
| | Total assets | | | 1,864,298,091 | |
| | | | | | |
| | Liabilities: | | | | |
| | Due to custodian | | | 592,377 | |
| | Payable upon return of securities loaned | | | 26,893,134 | |
| | Payables: | | | | |
| | Investments purchased | | | 210,128,717 | |
| | Fund shares redeemed | | | 134,905,814 | |
| | Management fees | | | 495,990 | |
| | Foreign capital gains tax | | | 387,231 | |
| | Trustee fee | | | 10,665 | |
| | Accrued expenses | | | 201,381 | |
| | Total liabilities | | | 373,615,309 | |
| | | | | | |
| | Net Assets: | | | | |
| | Paid-in capital | | | 1,204,591,018 | |
| | Undistributed (distributions in excess of) net investment income | | | 9,818,288 | |
| | Accumulated net realized gain (loss) | | | (14,796,314 | ) |
| | Net unrealized gain (loss) | | | 291,069,790 | |
| | NET ASSETS | | $ | 1,490,682,782 | |
| | SHARES ISSUED AND OUTSTANDING | | | | |
| | Shares outstanding no par value (unlimited shares authorized): | | | 44,200,000 | |
| | Net asset value per share: | | | $33.73 | |
| | (a) Includes loaned securities having a market value: | | $ | 25,941,618 | |
| | |
| 92 | | The accompanying notes are an integral part of these financial statements. |
GOLDMAN SACHS ACTIVEBETA® ETFS
| | | | | | | | | | | | | | | | | | | | | | | | | | | | |
| | | ActiveBeta®
Europe Equity
ETF | | | | | ActiveBeta®
International
Equity ETF | | | | | ActiveBeta®
Japan
Equity ETF | | | | | ActiveBeta®
U.S. Large Cap
Equity ETF | | | | | ActiveBeta®
U.S. Small Cap
Equity ETF | |
| | | | | | | | | | | | | | | | | | | | | | | | | | | | |
| | | | | | | | | |
| | $ | 43,900,128 | | | | | $ | 591,486,119 | | | | | $ | 42,788,262 | | | | | $ | 2,383,813,570 | | | | | $ | 11,833,064 | |
| | | | | | | | | |
| | | 90,063 | | | | | | 6,961,512 | | | | | | 288,307 | | | | | | 3,705,216 | | | | | | 649,189 | |
| | | 52,356 | | | | | | 530,380 | | | | | | 131,727 | | | | | | 7,791,695 | | | | | | 54,090 | |
| | | 14 | | | | | | 59,669 | | | | | | 2,507 | | | | | | — | | | | | | — | |
| | | | | | | | | | | | | | | | | | | | | | | | | | | | |
| | | — | | | | | | — | | | | | | — | | | | | | 2,457,813 | | | | | | — | |
| | | 611 | | | | | | 22,725,543 | | | | | | — | | | | | | — | | | | | | — | |
| | | 79,011 | | | | | | 1,159,892 | | | | | | 53,478 | | | | | | 5,049,337 | | | | | | 9,134 | |
| | | — | | | | | | — | | | | | | — | | | | | | — | | | | | | — | |
| | | 38,268 | | | | | | 221,041 | | | | | | 4,044 | | | | | | — | | | | | | — | |
| | | 315 | | | | | | 7,648 | | | | | | 716 | | | | | | 1,100 | | | | | | 1,637 | |
| | | — | | | | | | 13,929 | | | | | | 13,581 | | | | | | — | | | | | | — | |
| | | — | | | | | | 5,186 | | | | | | 5,070 | | | | | | — | | | | | | — | |
| | | — | | | | | | — | | | | | | — | | | | | | — | | | | | | — | |
| | | 44,160,766 | | | | | | 623,170,919 | | | | | | 43,287,692 | | | | | | 2,402,818,731 | | | | | | 12,547,114 | |
| | | | | | | | | | | | | | | | | | | | | | | | | | | | |
| | | | | | | | | | | | | | | | | | | | | | | | | | | | |
| | | — | | | | | | — | | | | | | — | | | | | | — | | | | | | — | |
| | | 90,063 | | | | | | 6,961,512 | | | | | | 288,307 | | | | | | 3,705,216 | | | | | | 649,189 | |
| | | | | | | | | | | | | | | | | | | | | | | | | | | | |
| | | — | | | | | | 22,958,039 | | | | | | 34 | | | | | | 2,443,670 | | | | | | — | |
| | | — | | | | | | — | | | | | | — | | | | | | — | | | | | | — | |
| | | 8,262 | | | | | | 122,837 | | | | | | 7,753 | | | | | | 179,493 | | | | | | 1,995 | |
| | | — | | | | | | — | | | | | | — | | | | | | — | | | | | | — | |
| | | — | | | | | | — | | | | | | — | | | | | | — | | | | | | — | |
| | | — | | | | | | — | | | | | | — | | | | | | — | | | | | | — | |
| | | 98,325 | | | | | | 30,042,388 | | | | | | 296,094 | | | | | | 6,328,379 | | | | | | 651,184 | |
| | | | | | | | | | | | | | | | | | | | | | | | | | | | |
| | | | | | | | | | | | | | | | | | | | | | | | | | | | |
| | | 38,352,955 | | | | | | 523,336,071 | | | | | | 36,959,862 | | | | | | 2,168,365,201 | | | | | | 12,076,307 | |
| | | 138,949 | | | | | | 1,931,703 | | | | | | (85,057 | ) | | | | | 9,973,553 | | | | | | 19,762 | |
| | | (108,039 | ) | | | | | (2,566,928 | ) | | | | | (9,638 | ) | | | | | (17,576,212 | ) | | | | | 227 | |
| | | 5,678,576 | | | | | | 70,427,685 | | | | | | 6,126,431 | | | | | | 235,727,810 | | | | | | (200,366 | ) |
| | $ | 44,062,441 | | | | | $ | 593,128,531 | | | | | $ | 42,991,598 | | | | | $ | 2,396,490,352 | | | | | $ | 11,895,930 | |
| | | | | | | | | | | | | | | | | | | | | | | | | | | | |
| | | 1,450,000 | | | | | | 20,900,000 | | | | | | 1,400,000 | | | | | | 48,752,500 | | | | | | 300,000 | |
| | $ | 30.39 | | | | | $ | 28.38 | | | | | $ | 30.71 | | | | | $ | 49.16 | | | | | $ | 39.65 | |
| | $ | 88,340 | | | | | $ | 6,650,091 | | | | | $ | 274,708 | | | | | $ | 3,574,887 | | | | | $ | 625,755 | |
| | |
| The accompanying notes are an integral part of these financial statements. | | 93 |
GOLDMAN SACHS ACTIVEBETA® ETFS
Statements of Operations
For the Fiscal Year Ended August 31, 2017
| | | | | | |
| | | | | ActiveBeta®
Emerging Markets
Equity ETF | |
| | Investment income: | | | | |
| | Dividends (net of foreign withholding taxes of $3,883,699, $129,776, $1,309,032, $88,858, $1,492 and $—, respectively) | | $ | 27,865,231 | |
| | Securities lending income | | | 131,788 | |
| | Total investment income | | | 27,997,019 | |
| | | | | | |
| | Expenses: | | | | |
| | Management fees | | | 4,342,167 | |
| | Custody, accounting and administrative services | | | 825,764 | |
| | Professional fees | | | 160,457 | |
| | Registration fees | | | 136,856 | |
| | Trustee fees | | | 63,196 | |
| | Printing and mailing cost | | | 41,205 | |
| | Amortization of offering costs | | | 11,606 | |
| | Other | | | 100,279 | |
| | Total expenses | | | 5,681,530 | |
| | Less — expense reductions | | | (797,950 | ) |
| | Net expenses | | | 4,883,580 | |
| | NET INVESTMENT INCOME | | | 23,113,439 | |
| | | | | | |
| | Realized and unrealized gain (loss): | | | | |
| | Net realized gain (loss) from: | | | | |
| | Investments | | | (230,519 | ) |
| | In-kind redemptions | | | 28,044,456 | |
| | Futures | | | 262,345 | |
| | Foreign currency transactions | | | (693,569 | ) |
| | Net change in unrealized gain (loss) on: | | | | |
| | Investments (including the effects of the foreign capital gains tax liability of $367,447, $—, $—, $—, $— and $—, respectively) | | | 191,695,541 | |
| | Foreign currency translations | | | 6,031 | |
| | Net realized and unrealized gain (loss) | | | 219,084,285 | |
| | NET INCREASE (LOSS) IN NET ASSETS RESULTING FROM OPERATIONS | | | 242,197,724 | |
| | (1) | | For the period June 28, 2017 (commencement of operations) through August 31, 2017. |
| | |
| 94 | | The accompanying notes are an integral part of these financial statements. |
GOLDMAN SACHS ACTIVEBETA® ETFS
| | | | | | | | | | | | | | | | | | | | | | | | | | | | |
| | | ActiveBeta®
Europe
Equity ETF | | | | | ActiveBeta®
International
Equity ETF | | | | | ActiveBeta®
Japan Equity
ETF | | | | | ActiveBeta®
U.S. Large Cap
Equity ETF | | | | | ActiveBeta®
U.S. Small Cap
Equity ETF(1) | |
| | | | | | | | | | | | | | | | | | | | | | | | | | | | |
| | $ | 1,014,378 | | | | | $ | 11,695,969 | | | | | $ | 678,156 | | | | | $ | 36,030,238 | | | | | $ | 20,989 | |
| | | 7,922 | | | | | | 101,383 | | | | | | 4,174 | | | | | | 44,663 | | | | | | 2,909 | |
| | | 1,022,300 | | | | | | 11,797,352 | | | | | | 682,330 | | | | | | 36,074,901 | | | | | | 23,898 | |
| | | | | | | | | | | | | | | | | | | | | | | | | | | | |
| | | | | | | | | | | | | | | | | | | | | | | | | | | | |
| | | 49,835 | | | | | | 975,355 | | | | | | 52,004 | | | | | | 1,422,205 | | | | | | 3,236 | |
| | | — | | | | | | — | | | | | | — | | | | | | — | | | | | | — | |
| | | — | | | | | | — | | | | | | — | | | | | | — | | | | | | — | |
| | | — | | | | | | — | | | | | | — | | | | | | — | | | | | | — | |
| | | 36,464 | | | | | | 44,266 | | | | | | 36,469 | | | | | | 75,823 | | | | | | 900 | |
| | | — | | | | | | — | | | | | | — | | | | | | — | | | | | | — | |
| | | — | | | | | | — | | | | | | — | | | | | | — | | | | | | — | |
| | | 70 | | | | | | 537 | | | | | | — | | | | | | — | | | | | | — | |
| | | 86,369 | | | | | | 1,020,158 | | | | | | 88,473 | | | | | | 1,498,028 | | | | | | 4,136 | |
| | | — | | | | | | — | | | | | | — | | | | | | — | | | | | | — | |
| | | 86,369 | | | | | | 1,020,158 | | | | | | 88,473 | | | | | | 1,498,028 | | | | | | 4,136 | |
| | | 935,931 | | | | | | 10,777,194 | | | | | | 593,857 | | | | | | 34,576,873 | | | | | | 19,762 | |
| | | | | | | | | | | | | | | | | | | | | | | | | | | | |
| | | | | | | | | | | | | | | | | | | | | | | | | | | | |
| | | | | | | | | | | | | | | | | | | | | | | | | | | | |
| | | 11,402 | | | | | | (1,152,007 | ) | | | | | 1,599 | | | | | | (14,119,857 | ) | | | | | 227 | |
| | | 347,600 | | | | | | — | | | | | | — | | | | | | 7,971,989 | | | | | | — | |
| | | — | | | | | | — | | | | | | — | | | | | | — | | | | | | — | |
| | | 1,988 | | | | | | (64,672 | ) | | | | | (27,569 | ) | | | | | — | | | | | | — | |
| | | | | | | | | | | | | | | | | | | | | | | | | | | | |
| | | | | | | | | |
| | | 4,558,093 | | | | | | 62,973,180 | | | | | | 4,327,725 | | | | | | 196,569,414 | | | | | | (200,366 | ) |
| | | 3,630 | | | | | | 25,096 | | | | | | 654 | | | | | | — | | | | | | — | |
| | | 4,922,713 | | | | | | 61,781,597 | | | | | | 4,302,409 | | | | | | 190,421,546 | | | | | | (200,139 | ) |
| | | 5,858,644 | | | | | | 72,558,791 | | | | | | 4,896,266 | | | | | | 224,998,419 | | | | | | (180,377 | ) |
| | |
| The accompanying notes are an integral part of these financial statements. | | 95 |
GOLDMAN SACHS ACTIVEBETA® ETFS
Statements of Changes in Net Assets
| | | | | | | | | | | | | | | | | | | | | | | | | | | | | | |
| | | | | ActiveBeta® Emerging Markets Equity ETF | | | | | | ActiveBeta® Europe Equity ETF | |
| | | | | Year ended
August 31, 2017 | | | | | | For the period
September 25, 2015(1)
through
August 31, 2016 | | | | | | Year ended
August 31, 2017 | | | | | | For the period
March 2, 2016(1)
through
August 31, 2016 | |
| | From operations: | | | | | | | | | | | | | | | | | | | | | | | | | | | | |
| | Net investment income | | $ | 23,113,439 | | | | | | | $ | 12,789,859 | | | | | | | $ | 935,931 | | | | | | | $ | 758,202 | |
| | Net realized gain (loss) | | | 27,382,713 | | | | | | | | (15,054,297 | ) | | | | | | | 360,990 | | | | | | | | (137,683 | ) |
| | Net change in unrealized gain | | | 191,701,572 | | | | | | | | 99,368,218 | | | | | | | | 4,561,723 | | | | | | | | 1,116,853 | |
| | Net increase (decrease) in net assets resulting from operations | | | 242,197,724 | | | | | | | | 97,103,780 | | | | | | | | 5,858,644 | | | | | | | | 1,737,372 | |
| | | | | | | | | | | | | | | | | | | | | | | | | | | | | | |
| | Distributions to shareholders: | | | | | | | | | | | | | | | | | | | | | | | | | | | | |
| | From net investment income | | | (18,216,894 | ) | | | | | | | (7,161,211 | ) | | | | | | | (931,065 | ) | | | | | | | (624,546 | ) |
| | Total distributions to shareholders | | | (18,216,894 | ) | | | | | | | (7,161,211 | ) | | | | | | | (931,065 | ) | | | | | | | (624,546 | ) |
| | | | | | | | | | | | | | | | | | | | | | | | | | | | | | |
| | From share transactions: | | | | | | | | | | | | | | | | | | | | | | | | | | | | |
| | Proceeds from sales of shares | | | 538,219,705 | | | | | | | | 773,445,492 | | | | | | | | 10,463,180 | | | | | | | | 32,846,660 | |
| | Cost of shares redeemed | | | (134,905,814 | ) | | | | | | | — | | | | | | | | (5,287,804 | ) | | | | | | | — | |
| | Net increase in net assets resulting from share transactions | | | 403,313,891 | | | | | | | | 773,445,492 | | | | | | | | 5,175,376 | | | | | | | | 32,846,660 | |
| | TOTAL INCREASE | | | 627,294,721 | | | | | | | | 863,388,061 | | | | | | | | 10,102,955 | | | | | | | | 33,959,486 | |
| | | | | | | | | | | | | | | | | | | | | | | | | | | | | | |
| | Net assets: | | | | | | | | | | | | | | | | | | | | | | | | | | | | |
| | Beginning of period | | $ | 863,388,061 | | | | | | | $ | — | | | | | | | $ | 33,959,486 | | | | | | | $ | — | |
| | End of period | | $ | 1,490,682,782 | | | | | | | $ | 863,388,061 | | | | | | | $ | 44,062,441 | | | | | | | $ | 33,959,486 | |
| | Undistributed (distributions in excess of) net investment income | | $ | 9,818,288 | | | | | | | $ | 5,548,952 | | | | | | | $ | 138,949 | | | | | | | $ | 126,865 | |
| | (1) | | Commencement of operations |
| | |
| 96 | | The accompanying notes are an integral part of these financial statements. |
GOLDMAN SACHS ACTIVEBETA® ETFS
| | | | | | | | | | | | | | | | | | | | | | | | | | | | | | | | | | | | | | | | |
| | | ActiveBeta® International Equity ETF | | | | | ActiveBeta® Japan Equity ETF | | | | | ActiveBeta® U.S. Large Cap Equity ETF | | | | | ActiveBeta® U.S. Small Cap Equity ETF | |
| | | Year ended
August 31, 2017 | | | | | For the period
November 6, 2015(1)
through
August 31, 2016 | | | | | Year ended
August 31, 2017 | | | | | For the period
March 2, 2016(1) to
August 31, 2016 | | | | | Year ended
August 31, 2017 | | | | | For the period
September 17, 2015(1)
through
August 31, 2016 | | | | | For the period
June 28, 2017(1)
through
August 31, 2017 | |
| | | | | | | | | | | | | | | | | | | | | | | | | | | | | | | | | | | | | | | | |
| | $ | 10,777,194 | | | | | $ | 2,853,601 | | | | | $ | 593,857 | | | | | $ | 285,470 | | | | | $ | 34,576,873 | | | | | $ | 8,449,262 | | | | | $ | 19,762 | |
| | | (1,216,679 | ) | | | | | (1,407,997 | ) | | | | | (25,970 | ) | | | | | 6,953 | | | | | | (6,147,868 | ) | | | | | 462,725 | | | | | | 227 | |
| | | 62,998,276 | | | | | | 7,429,409 | | | | | | 4,328,379 | | | | | | 1,798,052 | | | | | | 196,569,414 | | | | | | 39,158,396 | | | | | | (200,366 | ) |
| | | 72,558,791 | | | | | | 8,875,013 | | | | | | 4,896,266 | | | | | | 2,090,475 | | | | | | 224,998,419 | | | | | | 48,070,383 | | | | | | (180,377 | ) |
| | | | | | | | | | | | | | | | | | | | | | | | | | | | | | | | | | | | | | | | |
| | | | | | | | | | | | | | | | | | | | | | | | | | | | | | | | | | | | | | | | |
| | | (9,649,669 | ) | | | | | (1,996,958 | ) | | | | | (721,272 | ) | | | | | (235,644 | ) | | | | | (28,028,221 | ) | | | | | (5,154,092 | ) | | | | | — | |
| | | (9,649,669 | ) | | | | | (1,996,958 | ) | | | | | (721,272 | ) | | | | | (235,644 | ) | | | | | (28,028,221 | ) | | | | | (5,154,092 | ) | | | | | — | |
| | | | | | | | | | | | | | | | | | | | | | | | | | | | | | | | | | | | | | | | |
| | | | | | | | | | | | | | | | | | | | | | | | | | | | | | | | | | | | | | | | |
| | | 246,462,159 | | | | | | 276,879,195 | | | | | | 6,019,256 | | | | | | 30,942,517 | | | | | | 1,088,221,008 | | | | | | 1,168,663,742 | | | | | | 12,076,307 | |
| | | — | | | | | | — | | | | | | — | | | | | | — | | | | | | (45,906,935 | ) | | | | | (54,473,952 | ) | | | | | — | |
| | | 246,462,159 | | | | | | 276,879,195 | | | | | | 6,019,256 | | | | | | 30,942,517 | | | | | | 1,042,314,073 | | | | | | 1,114,189,790 | | | | | | 12,076,307 | |
| | | 309,371,281 | | | | | | 283,757,250 | | | | | | 10,194,250 | | | | | | 32,797,348 | | | | | | 1,239,284,271 | | | | | | 1,157,106,081 | | | | | | 11,895,930 | |
| | | | | | | | | | | | | | | | | | | | | | | | | | | | | | | | | | | | | | | | |
| | | | | | | | | | | | | | | | | | | | | | | | | | | | | | | | | | | | | | | | |
| | $ | 283,757,250 | | | | | $ | — | | | | | $ | 32,797,348 | | | | | $ | — | | | | | $ | 1,157,206,081 | | | | | $ | 100,000 | | | | | $ | — | |
| | $ | 593,128,531 | | | | | $ | 283,757,250 | | | | | $ | 42,991,598 | | | | | $ | 32,797,348 | | | | | $ | 2,396,490,352 | | | | | $ | 1,157,206,081 | | | | | $ | 11,895,930 | |
| | $ | 1,931,703 | | | | | $ | 863,433 | | | | | $ | (85,057 | ) | | | | $ | 69,454 | | | | | $ | 9,973,553 | | | | | $ | 3,312,092 | | | | | $ | 19,762 | |
| | |
| The accompanying notes are an integral part of these financial statements. | | 97 |
GOLDMAN SACHS ACTIVEBETA® ETFS
Financial Highlights
Selected Data for a Share Outstanding Throughout Each Period
| | | | | | | | | | |
| | | | | ActiveBeta®
Emerging Markets Equity ETF | |
| | | | | Year ended
August 31, 2017 | | | For the period
September 25, 2015*
through
August 31, 2016 | |
| | Per Share Operating Performance: | | | | | | | | |
| | Net asset value, beginning of period | | $ | 28.03 | | | $ | 25.00 | |
| | Net investment income(a) | | | 0.63 | | | | 0.60 | |
| | Net realized and unrealized gain | | | 5.58 | | | | 2.70 | |
| | Total gain from investment operations | | | 6.21 | | | | 3.30 | |
| | Distributions to shareholders from net investment income | | | (0.51 | ) | | | (0.27 | ) |
| | Net asset value, end of period | | $ | 33.73 | | | $ | 28.03 | |
| | Market price, end of period | | $ | 33.74 | | | $ | 28.01 | |
| | Total Return at Net Asset Value(b) | | | 22.49 | % | | | 13.29 | % |
| | Net assets, end of period (in 000’s) | | $ | 1,490,683 | | | $ | 863,388 | |
| | Ratio of net expenses to average net assets | | | 0.45 | % | | | 0.45 | %(c) |
| | Ratio of total expenses to average net assets | | | 0.53 | % | | | 0.58 | %(c) |
| | Ratio of net investment income to average net assets | | | 2.13 | % | | | 2.52 | %(c) |
| | Portfolio turnover rate(d) | | | 27 | % | | | 44 | % |
| | * | | Commencement of operations |
| | (a) | | Calculated based on the average shares outstanding methodology. |
| | (b) | | Assumes investment at the net asset value at the beginning of the period, reinvestment of all distributions and a complete sale of the investment at the net asset value at the end of the period. Returns do not reflect the impact of taxes to shareholders relating to Fund distributions or the sale of Fund shares. Total returns for periods less than one full year are not annualized. |
| | (d) | | The Fund’s portfolio turnover rate is calculated in accordance with regulatory requirements and excludes portfolio securities received or delivered as a result of in-kind transactions. If such transactions were included, the Fund’s portfolio turnover rate may be higher. |
| | |
| 98 | | The accompanying notes are an integral part of these financial statements. |
GOLDMAN SACHS ACTIVEBETA® ETFS
| | | | | | | | | | |
| | | | | ActiveBeta®
Europe Equity ETF | |
| | | | | Year ended
August 31, 2017 | | | For the period
March 2, 2016*
through August 31, 2016 | |
| | Per Share Operating Performance: | | | | | | | | |
| | Net asset value, beginning of period | | $ | 26.12 | | | $ | 25.03 | |
| | Net investment income(a) | | | 0.75 | | | | 0.60 | |
| | Net realized and unrealized gain | | | 4.26 | | | | 0.97 | |
| | Total gain from investment operations | | | 5.01 | | | | 1.57 | |
| | Distributions to shareholders from net investment income | | | (0.74 | ) | | | (0.48 | ) |
| | Net asset value, end of period | | $ | 30.39 | | | $ | 26.12 | |
| | Market price, end of period | | $ | 30.54 | | | $ | 26.20 | |
| | Total Return at Net Asset Value(b) | | | 19.46 | % | | | 6.23 | % |
| | Net assets, end of period (in 000’s) | | $ | 44,062 | | | $ | 33,959 | |
| | Ratio of net expenses to average net assets | | | 0.25 | % | | | 0.25 | %(c) |
| | Ratio of total expenses to average net assets | | | 0.25 | % | | | 0.71 | %(c) |
| | Ratio of net investment income to average net assets | | | 2.71 | % | | | 4.61 | %(c) |
| | Portfolio turnover rate(d) | | | 17 | % | | | 14 | % |
| | * | | Commencement of operations |
| | (a) | | Calculated based on the average shares outstanding methodology. |
| | (b) | | Assumes investment at the net asset value at the beginning of the period, reinvestment of all distributions and a complete sale of the investment at the net asset value at the end of the period. Returns do not reflect the impact of taxes to shareholders relating to Fund distributions or the sale of Fund shares. Total returns for periods less than one full year are not annualized. |
| | (d) | | The Fund’s portfolio turnover rate is calculated in accordance with regulatory requirements and excludes portfolio securities received or delivered as a result of in-kind transactions. If such transactions were included, the Fund’s portfolio turnover rate may be higher. |
| | |
| The accompanying notes are an integral part of these financial statements. | | 99 |
GOLDMAN SACHS ACTIVEBETA® ETFS
Financial Highlights (continued)
Selected Data for a Share Outstanding Throughout Each Period
| | | | | | | | | | |
| | | | | ActiveBeta®
International Equity ETF | |
| | | | | Year ended
August 31, 2017 | | | For the period
November 6, 2015*
to
August 31, 2016 | |
| | Per Share Operating Performance: | | | | | | | | |
| | Net asset value, beginning of period | | $ | 24.67 | | | $ | 24.78 | |
| | Net investment income(a) | | | 0.69 | | | | 0.59 | |
| | Net realized and unrealized gain (loss) | | | 3.61 | | | | (0.37 | ) |
| | Total gain from investment operations | | | 4.30 | | | | 0.22 | |
| | Distributions to shareholders from net investment income | | | (0.59 | ) | | | (0.33 | ) |
| | Net asset value, end of period | | $ | 28.38 | | | $ | 24.67 | |
| | Market price, end of period | | $ | 28.53 | | | $ | 24.78 | |
| | Total Return at Net Asset Value(b) | | | 17.66 | % | | | 0.90 | % |
| | Net assets, end of period (in 000’s) | | $ | 593,129 | | | $ | 283,757 | |
| | Ratio of net expenses to average net assets | | | 0.25 | % | | | 0.27 | %(c) |
| | Ratio of total expenses to average net assets | | | 0.25 | % | | | 0.62 | %(c) |
| | Ratio of net investment income to average net assets | | | 2.64 | % | | | 3.02 | %(c) |
| | Portfolio turnover rate(d) | | | 23 | % | | | 23 | % |
| | * | | Commencement of operations |
| | (a) | | Calculated based on the average shares outstanding methodology. |
| | (b) | | Assumes investment at the net asset value at the beginning of the period, reinvestment of all distributions and a complete sale of the investment at the net asset value at the end of the period. Returns do not reflect the impact of taxes to shareholders relating to Fund distributions or the sale of Fund shares. Total returns for periods less than one full year are not annualized. |
| | (d) | | The Fund’s portfolio turnover rate is calculated in accordance with regulatory requirements and excludes portfolio securities received or delivered as a result of in-kind transactions. If such transactions were included, the Fund’s portfolio turnover rate may be higher. |
| | |
| 100 | | The accompanying notes are an integral part of these financial statements. |
GOLDMAN SACHS ACTIVEBETA® ETFS
| | | | | | | | | | |
| | | | | ActiveBeta®
Japan Equity ETF | |
| | | | | Year ended
August 31, 2017 | | | For the period
March 2, 2016* to
August 31, 2016 | |
| | Per Share Operating Performance: | | | | | | | | |
| | Net asset value, beginning of period | | $ | 27.33 | | | $ | 25.69 | |
| | Net investment income(a) | | | 0.48 | | | | 0.24 | |
| | Net realized and unrealized gain | | | 3.50 | | | | 1.60 | |
| | Total gain from investment operations | | | 3.98 | | | | 1.84 | |
| | Distributions to shareholders from net investment income | | | (0.60 | ) | | | (0.20 | ) |
| | Net asset value, end of period | | $ | 30.71 | | | $ | 27.33 | |
| | Market price, end of period | | $ | 30.79 | | | $ | 27.44 | |
| | Total Return at Net Asset Value(b) | | | 14.74 | % | | | 7.17 | % |
| | Net assets, end of period (in 000’s) | | $ | 42,992 | | | $ | 32,797 | |
| | Ratio of net expenses to average net assets | | | 0.25 | % | | | 0.25 | %(c) |
| | Ratio of total expenses to average net assets | | | 0.25 | % | | | 0.73 | %(c) |
| | Ratio of net investment income to average net assets | | | 1.68 | % | | | 1.81 | %(c) |
| | Portfolio turnover rate(d) | | | 22 | % | | | 10 | % |
| | * | | Commencement of operations |
| | (a) | | Calculated based on the average shares outstanding methodology. |
| | (b) | | Assumes investment at the net asset value at the beginning of the period, reinvestment of all distributions and a complete sale of the investment at the net asset value at the end of the period. Returns do not reflect the impact of taxes to shareholders relating to Fund distributions or the sale of Fund shares. Total returns for periods less than one full year are not annualized. |
| | (d) | | The Fund’s portfolio turnover rate is calculated in accordance with regulatory requirements and excludes portfolio securities received or delivered as a result of in-kind transactions. If such transactions were included, the Fund’s portfolio turnover rate may be higher. |
| | |
| The accompanying notes are an integral part of these financial statements. | | 101 |
GOLDMAN SACHS ACTIVEBETA® ETFS
Financial Highlights (continued)
Selected Data for a Share Outstanding Throughout Each Period
| | | | | | | | | | |
| | | | | ActiveBeta®
U.S. Large Cap Equity ETF | |
| | | | | Year ended
August 31, 2017 | | | For the period
September 17, 2015*
through
August 31, 2016 | |
| | Per Share Operating Performance: | | | | | | | | |
| | Net asset value, beginning of period | | $ | 43.83 | | | $ | 40.70 | |
| | Net investment income(a) | | | 0.97 | | | | 0.85 | |
| | Net realized and unrealized gain | | | 5.17 | | | | 2.78 | |
| | Total gain from investment operations | | | 6.14 | | | | 3.63 | |
| | Distributions to shareholders from net investment income | | | (0.81 | ) | | | (0.50 | ) |
| | Net asset value, end of period | | $ | 49.16 | | | $ | 43.83 | |
| | Market price, end of period | | $ | 49.15 | | | $ | 43.82 | |
| | Total Return at Net Asset Value(b) | | | 14.15 | % | | | 8.97 | % |
| | Net assets, end of period (in 000’s) | | $ | 2,396,490 | | | $ | 1,157,206 | |
| | Ratio of net expenses to average net assets | | | 0.09 | % | | | 0.09 | %(c) |
| | Ratio of total expenses to average net assets | | | 0.09 | % | | | 0.19 | %(c) |
| | Ratio of net investment income to average net assets | | | 2.08 | % | | | 2.11 | %(c) |
| | Portfolio turnover rate(d) | | | 20 | % | | | 18 | % |
| | * | | Commencement of operations |
| | (a) | | Calculated based on the average shares outstanding methodology. |
| | (b) | | Assumes investment at the net asset value at the beginning of the period, reinvestment of all distributions and a complete sale of the investment at the net asset value at the end of the period. Returns do not reflect the impact of taxes to shareholders relating to Fund distributions or the sale of Fund shares. Total returns for periods less than one full year are not annualized. |
| | (d) | | The Fund’s portfolio turnover rate is calculated in accordance with regulatory requirements and excludes portfolio securities received or delivered as a result of in-kind transactions. If such transactions were included, the Fund’s portfolio turnover rate may be higher. |
| | |
| 102 | | The accompanying notes are an integral part of these financial statements. |
GOLDMAN SACHS ACTIVEBETA® ETFS
| | | | | | |
| | | | | ActiveBeta®
U.S. Small Cap Equity ETF | |
| | | | | For the period
June 28, 2017*
through
August 31, 2017 | |
| | Per Share Operating Performance: | | | | |
| | Net asset value, beginning of period | | $ | 40.36 | |
| | Net investment income(a) | | | 0.07 | |
| | Net realized and unrealized loss | | | (0.78 | ) |
| | Total loss from investment operations | | | (0.71 | ) |
| | Net asset value, end of period | | $ | 39.65 | |
| | Market price, end of period | | $ | 38.95 | |
| | Total Return at Net Asset Value(b) | | | (1.76 | )% |
| | Net assets, end of period (in 000’s) | | $ | 11,896 | |
| | Ratio of net expenses to average net assets | | | 0.20 | %(c) |
| | Ratio of total expenses to average net assets | | | 0.20 | %(c) |
| | Ratio of net investment income to average net assets | | | 0.96 | %(c) |
| | Portfolio turnover rate(d) | | | 0 | %(e) |
| | * | | Commencement of operations |
| | (a) | | Calculated based on the average shares outstanding methodology. |
| | (b) | | Assumes investment at the net asset value at the beginning of the year, reinvestment of all distributions and a complete sale of the investment at the net asset value at the end of the year. Returns do not reflect the impact of taxes to shareholders relating to Fund distributions or the sale of Fund shares. Total returns for periods less than one full year are not annualized. |
| | (d) | | The Fund’s portfolio turnover rate is calculated in accordance with regulatory requirements and excludes portfolio securities received or delivered as a result of in-kind transactions. If such transactions were included, the Fund’s portfolio turnover rate may be higher. |
| | |
| The accompanying notes are an integral part of these financial statements. | | 103 |
GOLDMAN SACHS ETF TRUST
Notes to Financial Statements
August 31, 2017
Goldman Sachs ETF Trust (the “Trust”) is an open-end management investment company, registered under the Investment Company Act of 1940, as amended (the “Act”), consisting of multiple series. The Trust was organized as a Delaware statutory trust on December 16, 2009. The following table lists those series of the Trust that are included in this report (collectively, the “Funds” or individually a “Fund”) along with their respective diversification status under the Act:
| | | | |
| Fund | | | | Diversification
Classification |
Goldman Sachs ActiveBeta® Emerging Markets Equity ETF (“ActiveBeta® Emerging Markets Equity ETF”) | | | | Diversified |
Goldman Sachs ActiveBeta® Europe Equity ETF (“ActiveBeta® Europe Equity ETF”) | | | | Diversified |
Goldman Sachs ActiveBeta® International Equity ETF (“ActiveBeta® International Equity ETF”) | | | | Diversified |
Goldman Sachs ActiveBeta® Japan Equity ETF (“ActiveBeta® Japan Equity ETF”) | | | | Diversified |
Goldman Sachs ActiveBeta® U.S. Large Cap Equity ETF (“ActiveBeta® U.S. Large Cap Equity ETF”) | | | | Diversified |
Goldman Sachs ActiveBeta® U.S. Small Cap Equity ETF (“ActiveBeta® U.S. Small Cap Equity ETF”) | | | | Diversified |
The investment objective of each Fund is to provide investment results that closely correspond, before fees and expenses, to the performance of its respective Index.
Goldman Sachs Asset Management, L.P. (“GSAM”), an affiliate of Goldman Sachs & Co. LLC (formerly, Goldman, Sachs & Co.) (“Goldman Sachs”), serves as investment adviser to the Funds pursuant to management agreements (each, an “Agreement”) with the Trust. Each Fund is an exchange-traded fund (“ETF”). Shares of the Funds are listed and traded on the NYSE Arca, Inc. (“NYSE Arca”). Market prices for the Funds’ shares may be different from their net asset value (“NAV”). The Funds issue and redeem shares at their respective NAV only in blocks of a specified number of shares, or multiples thereof, referred to as “Creation Units”. Creation Units are issued and redeemed principally in-kind for a basket of securities and a cash amount, with respect to the ActiveBeta® Europe Equity ETF, ActiveBeta® International Equity ETF, ActiveBeta® Japan Equity ETF, ActiveBeta® U.S. Large Cap Equity ETF and the ActiveBeta® U.S. Small Cap Equity ETF. The ActiveBeta® Emerging Markets Equity ETF issues and redeems Creation Units partially for cash and partially in-kind. Shares generally trade in the secondary market in quantities less than a Creation Unit at market prices that change throughout the day. Only those that have entered into an authorized participant agreement with ALPS Distributors, Inc. (the “Distributor”) may do business directly with the Funds.
|
| 2. SIGNIFICANT ACCOUNTING POLICIES |
The financial statements have been prepared in accordance with accounting principles generally accepted in the United States of America (“GAAP”) and require management to make estimates and assumptions that may affect the reported amounts and disclosures. Actual results may differ from those estimates and assumptions.
A. Investment Valuation — The Funds’ valuation policy is to value investments at fair value.
B. Investment Income and Investments — Investment income includes interest income, dividend income, and securities lending income. Interest income is accrued daily and adjusted for amortization of premiums and accretion of discounts. Dividend income is recognized on ex-dividend date or, for certain foreign securities, as soon as such information is obtained subsequent to the ex-dividend date. Investment transactions are reflected on trade date. Realized gains and losses are calculated using identified cost. Investment transactions are recorded on the following business day for daily NAV calculations. Investment income is recorded net of any foreign withholding taxes, less any amounts reclaimable. The Funds may file withholding tax reclaims in certain jurisdictions to recover a portion of amounts previously withheld. Any foreign capital gains tax is accrued daily based upon net unrealized gains, and is payable upon sale of such investments.
104
GOLDMAN SACHS ETF TRUST
|
| 2. SIGNIFICANT ACCOUNTING POLICIES (continued) |
C. Expenses — Expenses incurred directly by a Fund are charged to the Fund, and certain expenses incurred by the Trust are allocated across the applicable Funds on a straight-line and/or pro-rata basis, depending upon the nature of the expenses, and are accrued daily.
D. Offering Costs — Offering costs paid in connection with the offering of shares of the ActiveBeta® Emerging Markets Equity ETF were amortized on a straight-line basis over 12 months from the date of commencement of operations.
E. Federal Taxes and Distributions to Shareholders — It is each Fund’s policy to comply with the requirements of the Internal Revenue Code of 1986, as amended (the “Code”), applicable to regulated investment companies (mutual funds) and to distribute each year substantially all of its investment company taxable income and capital gains to its shareholders. Accordingly, the Funds are not required to make any provisions for the payment of federal income tax. Distributions to shareholders are recorded on the ex-dividend date. For each fund, income distributions, if any, are declared and paid quarterly. Capital gains distributions, if any, are declared and paid annually.
Net capital losses, if any, are carried forward to future fiscal years and may be used to the extent allowed by the Code to offset any future capital gains. Losses that are carried forward will retain their character as either short-term or long-term capital losses. Utilization of capital loss carryforwards will reduce the requirement of future capital gains distributions.
The characterization of distributions to shareholders for financial reporting purposes is determined in accordance with federal income tax rules, which may differ from GAAP. The source of the Fund’s distributions may be shown in the accompanying financial statements as either from net investment income, net realized gain or capital. Certain components of the Funds’ net assets on the Statements of Assets and Liabilities reflect permanent GAAP/tax differences based on the appropriate tax character.
F. Foreign Currency Translation — The accounting records and reporting currency of the Funds are maintained in U.S. dollars. Assets and liabilities denominated in foreign currencies are translated into U.S. dollars using the current exchange rates at the close of each business day. The effect of changes in foreign currency exchange rates on investments is included within net realized and unrealized gain (loss) on investments. Changes in the value of other assets and liabilities as a result of fluctuations in foreign exchange rates are included in the Statements of Operations within net change in unrealized gain (loss) on foreign currency translations. Transactions denominated in foreign currencies are translated into U.S. dollars on the date the transaction occurred, the effects of which are included within net realized gain (loss) on foreign currency transactions.
|
| 3. INVESTMENTS AND FAIR VALUE MEASUREMENTS |
U.S. GAAP defines the fair value of a financial instrument as the amount that would be received to sell an asset or paid to transfer a liability in an orderly transaction between market participants at the measurement date (i.e., the exit price); the Funds’ policy is to use the market approach. GAAP establishes a fair value hierarchy that prioritizes the inputs to valuation techniques used to measure fair value. The hierarchy gives the highest priority to unadjusted quoted prices in active markets for identical assets or liabilities (Level 1 measurements) and the lowest priority to unobservable inputs (Level 3 measurements). The levels used for classifying investments are not necessarily an indication of the risk associated with investing in these investments. The three levels of the fair value hierarchy are described below:
Level 1 — Unadjusted quoted prices in active markets that are accessible at the measurement date for identical, unrestricted assets or liabilities;
Level 2 — Quoted prices in markets that are not active or financial instruments for which significant inputs are observable (including, but not limited to, quoted prices for similar investments, interest rates, foreign exchange rates, volatility and credit spreads), either directly or indirectly;
Level 3 — Prices or valuations that require significant unobservable inputs (including GSAM’s assumptions in determining fair value measurement).
105
GOLDMAN SACHS ETF TRUST
Notes to Financial Statements (continued)
August 31, 2017
|
| 3. INVESTMENTS AND FAIR VALUE MEASUREMENTS (continued) |
Changes in valuation techniques may result in transfers into or out of an assigned level within the hierarchy. In accordance with the Funds’ policy, transfers between different levels of the fair value hierarchy resulting from such changes are deemed to have occurred as of the beginning of the reporting period.
The Board of Trustees (“Trustees”) has approved Valuation Procedures that govern the valuation of the portfolio investments held by the Funds, including investments for which market quotations are not readily available. The Trustees have delegated to GSAM day-to-day responsibility for implementing and maintaining internal controls and procedures related to the valuation of the Funds’ investments. To assess the continuing appropriateness of pricing sources and methodologies, GSAM regularly performs price verification procedures and issues challenges as necessary to third party pricing vendors or brokers, and any differences are reviewed in accordance with the Valuation Procedures.
A. Level 1 and Level 2 Fair Value Investments — The valuation techniques and significant inputs used in determining the fair values for investments classified as Level 1 and Level 2 are as follows:
Equity Securities — Equity securities traded on a United States (“U.S.”) securities exchange or the NASDAQ system, or those located on certain foreign exchanges, including but not limited to the Americas, are valued daily at their last sale price or official closing price on the principal exchange or system on which they are traded. If there is no sale or official closing price or such price is believed by GSAM to not represent fair value, equity securities are valued at the last bid price for long positions. To the extent these investments are actively traded, they are classified as Level 1 of the fair value hierarchy, otherwise they are generally classified as Level 2.
Unlisted equity securities for which market quotations are available are valued at the last sale price on the valuation date, or if no sale occurs, at the last bid price. These investments are generally classified as Level 2 of the fair value hierarchy.
Exchange Traded Funds — Investments in ETFs are valued daily at the last sale price or official closing price on the principal exchange or system on which the investment is traded. To the extent these investments are actively traded, they are classified as Level 1 of the fair value hierarchy, otherwise they are generally classified as Level 2. For information regarding an ETF’s accounting policies and investment holdings, please see the ETF’s shareholder report.
Money Market Funds — Investments in the Goldman Sachs Financial Square Government Fund (“Underlying Fund”) are valued at the NAV of the Institutional Share class on the day of valuation. These investments are generally classified as Level 1 of the fair value hierarchy. For information regarding an Underlying Fund’s accounting policies and investment holdings, please see the Underlying Fund’s shareholder report.
Derivative Contracts — A derivative is an instrument whose value is derived from underlying assets, indices, reference rates or a combination of these factors. A Fund enters into derivative transactions to hedge against changes in interest rates, securities prices, and/or currency exchange rates, to increase total return, or to gain access to certain markets or attain exposure to other underliers.
Exchange-traded derivatives, including futures and options contracts, are valued at the last sale or settlement price and typically fall within Level 1 of the fair value hierarchy. Over-the-counter (“OTC”) and centrally cleared derivatives are valued using market transactions and other market evidence, including market-based inputs to models, calibration to market-clearing transactions, broker or dealer quotations, or other alternative pricing sources. Where models are used, the selection of a particular model to value OTC and centrally cleared derivatives depends upon the contractual terms of, and specific risks inherent in, the instrument, as well as the availability of pricing information in the market. Valuation models require a variety of inputs, including contractual terms, market prices, yield curves, credit curves, measures of volatility, voluntary and involuntary prepayment rates, loss severity rates and correlations of such inputs. For OTC and centrally cleared derivatives that trade in liquid markets, model inputs can generally be verified and model selection does not involve significant management judgment. OTC and centrally cleared derivatives are classified within Level 2 of the fair value hierarchy when significant inputs are corroborated by market evidence.
i. Futures Contracts — Futures contracts are contracts to buy or sell a standardized quantity of a specified commodity or security and are valued based on exchanged settlement prices or independent market quotes. Futures contracts are valued at the last settlement price, or in the absence of a sale, the last bid price for long positions and at the last ask price for short positions, at the end of each day on the board of trade or exchange upon which they are traded. Upon entering into a futures
106
GOLDMAN SACHS ETF TRUST
|
| 3. INVESTMENTS AND FAIR VALUE MEASUREMENTS (continued) |
contract, a Fund deposits cash or securities in an account on behalf of the broker in an amount sufficient to meet the initial margin requirement. Subsequent payments are made or received by a Fund equal to the daily change in the contract value and are recorded as variation margin receivable or payable with a corresponding offset to unrealized gains or losses. For financial reporting purposes, cash collateral that has been pledged to cover obligations of a Fund and cash collateral received, if, any, is reported separately on the Statement[s] of Assets and Liabilities as receivables/payables for collateral on certain derivative contracts. Non-cash collateral pledged by a Fund, if any, is noted in the Schedules of Investments.
B. Level 3 Fair Value Investments — To the extent that significant inputs to valuation models and other alternative pricing sources are unobservable, or if quotations are not readily available, or if GSAM believes that such quotations do not accurately reflect fair value, the fair value of the Funds’ investments may be determined under Valuation Procedures approved by the Trustees. GSAM, consistent with its procedures and applicable regulatory guidance, may make an adjustment to the most recent valuation prices of either domestic or foreign securities in light of significant events to reflect what it believes to be the fair value of the securities at the time of determining a Fund’s NAV. Significant events which could affect a large number of securities in a particular market may include, but are not limited to: significant fluctuations in U.S. or foreign markets; market dislocations; market disruptions; or unscheduled market closings. Significant events which could also affect a single issuer may include, but are not limited to: corporate actions such as reorganizations, mergers and buy-outs; ratings downgrades; and bankruptcies.
C. Fair Value Hierarchy — The following is a summary of the Funds’ investments classified in the fair value hierarchy as of August 31, 2017:
| | | | | | | | | | | | |
|
| ACTIVEBETA® EMERGING MARKETS EQUITY ETF | |
| | | |
| Investment Type | | Level 1 | | | Level 2 | | | Level 3 | |
| Assets | | | | | | | | | | | | |
Common Stock and/or Other Equity Investments(a) | |
Africa | | $ | 94,793,484 | | | $ | 4,325,560 | | | $ | — | |
Asia | | | 1,095,014,509 | | | | 32,408,210 | | | | 211,569 | |
Europe | | | 41,978,147 | | | | — | | | | — | |
North America | | | 55,308,495 | | | | — | | | | — | |
South America | | | 117,218,409 | | | | 44,463,930 | | | | — | |
Securities Lending Reinvestment Vehicle | | | 26,893,134 | | | | — | | | | — | |
| Total | | $ | 1,431,206,178 | | | $ | 81,197,700 | | | $ | 211,569 | |
|
| ACTIVEBETA® EUROPE EQUITY ETF | |
| | | |
| Investment Type | | Level 1 | | | Level 2 | | | Level 3 | |
| Assets | | | | | | | | | | | | |
Common Stock and/or Other Equity Investments(a) | |
Africa | | $ | 177,676 | | | $ | — | | | $ | — | |
Europe | | | 42,730,289 | | | | 280,511 | | | | — | |
North America | | | 558,980 | | | | — | | | | — | |
Oceania | | | 121,078 | | | | — | | | | — | |
South America | | | 31,594 | | | | — | | | | — | |
Securities Lending Reinvestment Vehicle | | | 90,063 | | | | — | | | | — | |
| Total | | $ | 43,709,680 | | | $ | 280,511 | | | $ | — | |
107
GOLDMAN SACHS ETF TRUST
Notes to Financial Statements (continued)
August 31, 2017
|
| 3. INVESTMENTS AND FAIR VALUE MEASUREMENTS (continued) |
| | | | | | | | | | | | |
|
| ACTIVEBETA® INTERNATIONAL EQUITY ETF | |
| | | |
| Investment Type | | Level 1 | | | Level 2 | | | Level 3 | |
| Assets | | | | | | | | | | | | |
Common Stock and/or Other Equity Investments(a) | |
Africa | | $ | 1,497,025 | | | $ | — | | | $ | — | |
Asia | | | 161,561,023 | | | | — | | | | — | |
Europe | | | 332,441,875 | | | | 2,490,013 | | | | — | |
North America | | | 55,759,743 | | | | — | | | | — | |
Oceania | | | 37,397,319 | | | | — | | | | — | |
South America | | | 339,121 | | | | — | | | | — | |
Securities Lending Reinvestment Vehicle | | | 6,961,512 | | | | — | | | | — | |
| Total | | $ | 595,957,618 | | | $ | 2,490,013 | | | $ | — | |
|
| ACTIVEBETA® JAPAN EQUITY ETF | |
| | | |
| Investment Type | | Level 1 | | | Level 2 | | | Level 3 | |
| Assets | | | | | | | | | | | | |
Common Stock and/or Other Equity Investments(a) | |
Asia | | $ | 42,788,262 | | | $ | — | | | $ | — | |
Securities Lending Reinvestment Vehicle | | | 288,307 | | | | — | | | | — | |
| Total | | $ | 43,076,569 | | | $ | — | | | $ | — | |
|
| ACTIVEBETA® U.S. LARGE CAP EQUITY ETF | |
| | | |
| Investment Type | | Level 1 | | | Level 2 | | | Level 3 | |
| Assets | | | | | | | | | | | | |
Common Stock and/or Other Equity Investments(a) | |
North America | | $ | 2,383,813,570 | | | $ | — | | | $ | — | |
Securities Lending Reinvestment Vehicle | | | 3,705,216 | | | | — | | | | — | |
| Total | | $ | 2,387,518,786 | | | $ | — | | | $ | — | |
|
| ACTIVEBETA® U.S. SMALL CAP EQUITY ETF | |
| | | |
| Investment Type | | Level 1 | | | Level 2 | | | Level 3 | |
| Assets | | | | | | | | | | | | |
Common Stock and/or Other Equity Investments(a) | |
Asia | | $ | 8,038 | | | $ | — | | | $ | — | |
Europe | | | 32,592 | | | | — | | | | — | |
North America | | | 11,792,434 | | | | — | | | | — | |
Securities Lending Reinvestment Vehicle | | | 649,189 | | | | — | | | | — | |
| Total | | $ | 12,482,253 | | | $ | — | | | $ | — | |
| (a) | | Amounts are disclosed by continent to highlight the impact of time zone differences between local market close and the calculation of NAV. Security valuations are based on the principal exchange or system on which they are traded, which may differ from country of domicile noted in the table. |
For further information regarding security characteristics, see the Schedules of Investments.
108
GOLDMAN SACHS ETF TRUST
|
| 4. INVESTMENTS IN DERIVATIVES |
The following tables set forth, by certain risk types, the gross value of derivative contracts as of August 31, 2017. These instruments were used as part of a Fund’s investment strategies and to obtain and/or manage exposure related to the risks below. The values in the tables below exclude the effects of cash collateral received or posted pursuant to these derivative contracts, and therefore are not representative of a Fund’s net exposure.
At August 31, 2017 there were no open futures contracts.
The following tables set forth, by certain risk types, a Fund’s gains related to these derivatives and their indicative volumes for the year ended August 31, 2017. These gains should be considered in the context that these derivative contracts may have been executed to create investment opportunities and/or economically hedge certain investments, and accordingly, certain gains (losses) on such derivative contracts may offset certain (losses) gains attributable to investments. These gains are included in “Net realized gain (loss)” or “Net change in unrealized gain (loss)” on the Statement of Operations:
| | | | | | | | | | | | | | | | |
| Fund | | Risk | | Statement of Operations | | Net Realized
Gain | | | Net Change in
Unrealized
Gain | | | Average
Number of
Contracts(a) | |
ActiveBeta® Emerging Markets Equity ETF | | Equity | | Net realized gain (loss) from futures contracts/Net change in unrealized gain (loss) on futures contracts | | $ | 262,345 | | | $ | — | | | | — | |
| (a) | | Average number of contracts is based on the average of month end balances for the fiscal year ended August 31, 2017. |
Collateral and margin requirements differ between exchange traded derivatives and OTC derivatives. Margin requirements are established by the broker or clearing house for exchange-traded and centrally cleared derivatives (financial futures contracts, options and centrally cleared swaps) pursuant to governing agreements for those instrument types. Brokers can ask for margin in excess of the minimum in certain circumstances. Collateral terms are contract-specific for OTC derivatives. Additionally, a Fund may be required to post initial margin to the counterparty, the terms of which would be outlined in the confirmation of the OTC transaction.
For financial reporting purposes, cash collateral that has been pledged to cover obligations of a Fund and cash collateral received from the counterparty, if any, is reported separately on the Statement of Assets and Liabilities as receivables/payables for collateral on certain derivative contracts. Non-cash collateral pledged by a Fund, if any, is noted in the Schedules of Investments. Generally, the amount of collateral due from or to a counterparty must exceed a minimum transfer amount threshold before a transfer is required to be made. To the extent amounts due to a Fund from its counterparties are not fully collateralized, contractually or otherwise, a Fund bears the risk of loss from counterparty nonperformance. A Fund attempts to mitigate counterparty risk by only entering into agreements with counterparties that the Investment Adviser believes to be of good standing and by monitoring the financial stability of those counterparties.
Additionally, the netting of assets and liabilities and the offsetting of collateral pledged or received are based on contractual netting/set-off provisions in the master netting arrangement or similar agreements. However, in the event of a default or insolvency of a counterparty, a court could determine that such rights are not enforceable due to the restrictions or prohibitions against the right of setoff that may be imposed in accordance with a particular jurisdiction’s bankruptcy or insolvency laws.
As of August 31, 2017 the Funds did not hold any net exposure for derivative instruments.
|
| 5. AGREEMENTS AND AFFILIATED TRANSACTIONS |
A. Management Agreement — Under the Agreement, GSAM manages the Funds, subject to the general supervision of the Trustees.
As compensation for the services rendered pursuant to the Agreement, the assumption of the expenses related thereto and administration of the Funds’ business affairs, including providing facilities, GSAM is entitled to a management fee, accrued daily and paid monthly, equal to an annual percentage rate of each Fund’s average daily net assets.
For each Fund except the ActiveBeta® Emerging Markets Equity ETF, the Funds operate under a unitary management fee structure. Under the unitary fee structure, GSAM is responsible for paying substantially all the expenses of each such Fund, excluding payments under the Fund’s 12b-1 plan (if any), interest expenses, taxes, acquired fund fees and expenses, brokerage fees, costs of holding shareholder meetings, litigation, indemnification and extraordinary expenses. As the Funds directly pay fees and
109
GOLDMAN SACHS ETF TRUST
Notes to Financial Statements (continued)
August 31, 2017
|
| 5. AGREEMENTS AND AFFILIATED TRANSACTIONS (continued) |
expenses of the independent Trustees, the management fee collected by GSAM will be reduced by an amount equal to the fees and expenses paid by the Funds to the independent Trustees.
For the fiscal year ended August 31, 2017, unitary management fees with GSAM were at the following rates for all Funds except the ActiveBeta® Emerging Markets Equity ETF:
| | | | | | | | | | |
| Fund | | | | | | | Unitary Management Fee | |
ActiveBeta® Europe Equity ETF | | | | | | | | | 0.25 | % |
ActiveBeta® International Equity ETF | | | | | | | | | 0.25 | % |
ActiveBeta® Japan Equity ETF | | | | | | | | | 0.25 | % |
ActiveBeta® U.S. Large Cap Equity ETF | | | | | | | | | 0.09 | % |
ActiveBeta® U.S. Small Cap Equity ETF | | | | | | | | | 0.20 | % |
For the fiscal year ended August 31, 2017, contractual and effective net management fees with GSAM were at the following rate for the ActiveBeta® Emerging Markets Equity ETF:
| | | | | | | | | | |
| Fund | | | | | | | Contractual and Effective Net
Management Fee | |
ActiveBeta® Emerging Markets Equity ETF | | | | | | | | | 0.40 | % |
B. Distribution and Service (12b-1) Plans — The Trust, on behalf of the Funds, has adopted a Distribution and Service Plan (the “Plan”), subject to Rule 12b-1 under the Act. Under the Plan, the Funds are authorized to pay distribution fees in connection with the provision of ongoing services to shareholders of each Fund and the maintenance of shareholder accounts in an amount up to 0.25% of its average daily net assets each year. No Rule 12b-1 fees are currently paid by any Fund, and there are no current plans to impose these fees.
C. Other Expense Agreements and Affiliated Transactions — GSAM has agreed to limit certain “Other Expenses” of the ActiveBeta® Emerging Markets Equity ETF (excluding acquired fund fees and expenses, taxes, interest, brokerage fees, shareholder meeting, litigation, indemnification and extraordinary expenses) to the extent such expenses exceed, on an annual basis, a percentage rate of the average daily net assets of the Fund. Such Other Expense reimbursements, if any, are accrued daily and paid monthly. In addition, the Funds are not obligated to reimburse GSAM for prior fiscal year expense reimbursements, if any. The Other Expense limitation as an annual percentage rate of average daily net assets for the ActiveBeta® Emerging Markets Equity ETF is 0.05%. This Other Expense limitation will remain in effect permanently and GSAM may not terminate the arrangement without the approval of the Trustees.
For the year ended August 31, 2017, these expense reductions, including any fee waivers and Other Expense reimbursements amounted to $797,950.
|
| 6. CREATION AND REDEMPTION OF CREATION UNITS |
The Trust issues and redeems shares of the Funds only in Creation Units on a continuous basis through the Distributor, without an initial sales load, at NAV next determined after receipt, on any Business Day (as defined in the Statement of Additional Information), of an order in proper form. Shares of the Funds may only be purchased or redeemed by certain financial institutions (each an “Authorized Participant”). An Authorized Participant is either (1) a “Participating Party” or other participant in the clearing process through the Continuous Net Settlement System of the National Securities Clearing Corporation; or (2) a Depository Trust Company participant; which, in either case, must have executed an agreement with the Distributor. Retail investors will typically not qualify as an Authorized Participant or have the resources to buy and sell whole Creation Units. Therefore, they will be unable to purchase or redeem the shares directly from the Funds. Rather, most retail investors will purchase
110
GOLDMAN SACHS ETF TRUST
|
| 6. CREATION AND REDEMPTION OF CREATION UNITS (continued) |
shares in the secondary market at market prices with the assistance of a broker and may be subject to customary brokerage commissions or fees. Fixed creation and redemption transaction fees are imposed in connection with creations and redemptions.
Authorized Participants transacting in Creation Units for cash may also pay a variable charge to compensate the relevant fund for certain transaction costs (e.g. taxes on currency or other financial transactions, and brokerage costs) and market impact expenses relating to investing in portfolio securities. Such variable charges, if any, are included in “Proceeds from sale of shares” in the Statements of Changes in Net Assets.
Share activity is as follows:
| | | | | | | | | | | | | | | | |
| | | ActiveBeta® Emerging Markets Equity ETF | |
| | | For the Fiscal Year Ended August 31, 2017 | | | For the period September 25, 2015* through
August 31, 2016 | |
Shares Sold | | | 17,400,000 | | | $ | 537,396,840 | | | | 30,800,000 | | | $ | 773,445,492 | |
Shares Redeemed | | | (4,000,000 | ) | | | (134,905,814 | ) | | | — | | | | — | |
NET INCREASE IN SHARES | | | 13,400,000 | | | $ | 402,491,026 | | | | 30,800,000 | | | $ | 773,445,492 | |
| |
| | | ActiveBeta® Europe Equity ETF | |
| | | For the Fiscal Year Ended
August 31, 2017 | | | For the period March 2, 2016* through August 31, 2016 | |
Shares Sold | | | 350,000 | | | $ | 10,463,180 | | | | 1,300,000 | | | $ | 32,846,660 | |
Shares Redeemed | | | (200,000 | ) | | | (5,287,804 | ) | | | — | | | | — | |
NET INCREASE IN SHARES | | | 150,000 | | | $ | 5,175,376 | | | | 1,300,000 | | | $ | 32,846,660 | |
| |
| | | ActiveBeta® International Equity ETF | |
| | | For the Fiscal Year Ended
August 31, 2017 | | | For the period November 6, 2015* to August 31, 2016 | |
Shares Sold | | | 9,400,000 | | | $ | 246,447,741 | | | | 11,500,000 | | | $ | 276,879,195 | |
NET INCREASE IN SHARES | | | 9,400,000 | | | $ | 246,447,741 | | | | 11,500,000 | | | $ | 276,879,195 | |
| |
| | | ActiveBeta® Japan Equity ETF | |
| | | For the Fiscal Year Ended
August 31, 2017 | | | For the period March 2, 2016* to August 31, 2016 | |
Shares Sold | | | 200,000 | | | $ | 6,019,256 | | | | 1,200,000 | | | $ | 30,942,517 | |
NET INCREASE IN SHARES | | | 200,000 | | | $ | 6,019,256 | | | | 1,200,000 | | | $ | 30,942,517 | |
| |
| | | ActiveBeta® U.S. Large Cap Equity ETF | |
| | | For the Fiscal Year Ended
August 31, 2017 | | | For the period September 17, 2015* through August 31, 2016 | |
Shares Sold | | | 23,400,000 | | | $ | 1,088,220,664 | | | | 27,750,000 | | | $ | 1,168,663,742 | |
Shares Redeemed | | | (1,050,000 | ) | | | (45,906,935 | ) | | | (1,350,000 | ) | | | (54,473,952 | ) |
NET INCREASE IN SHARES | | | 22,350,000 | | | $ | 1,042,313,729 | | | | 26,400,000 | | | $ | 1,114,189,790 | |
111
GOLDMAN SACHS ETF TRUST
Notes to Financial Statements (continued)
August 31, 2017
|
| 6. CREATION AND REDEMPTION OF CREATION UNITS (continued) |
| | | | | | | | |
| | | ActiveBeta® U.S. Small Cap Equity ETF | |
| | | For the period June 28, 2017* through August 31, 2017 | |
Shares Sold | | | 300,000 | | | $ | 12,076,307 | |
NET INCREASE IN SHARES | | | 300,000 | | | $ | 12,076,307 | |
| * | | Commencement of operation. |
|
| 7. PORTFOLIO SECURITIES TRANSACTIONS |
The cost of purchases and proceeds from sales of long-term securities for the fiscal year ended August 31, 2017, were as follows:
| | | | | | | | | | |
| Fund | | | | Purchases | | | Sales | |
ActiveBeta® Emerging Markets Equity ETF | | | | $ | 668,961,706 | | | $ | 292,564,192 | |
ActiveBeta® Europe Equity ETF | | | | | 5,936,525 | | | | 5,977,434 | |
ActiveBeta® International Equity ETF | | | | | 97,796,596 | | | | 93,586,424 | |
ActiveBeta® Japan Equity ETF | | | | | 7,738,806 | | | | 7,987,564 | |
ActiveBeta® U.S. Large Cap Equity ETF | | | | | 331,768,062 | | | | 328,537,490 | |
ActiveBeta® U.S. Small Cap Equity ETF | | | | | 45,913 | | | | 62,494 | |
The purchase and sales from in-kind creation and redemption transactions for the fiscal year ended August 31, 2017, were as follows:
| | | | | | | | | | |
| Fund | | | | Purchases | | | Sales | |
ActiveBeta® Emerging Markets Equity ETF | | | | $ | 158,310,351 | | | $ | 131,198,038 | |
ActiveBeta® Europe Equity ETF | | | | | 10,412,272 | | | | 5,264,873 | |
ActiveBeta® International Equity ETF | | | | | 243,113,290 | | | | — | |
ActiveBeta® Japan Equity ETF | | | | | 6,006,401 | | | | — | |
ActiveBeta® U.S. Large Cap Equity ETF | | | | | 1,083,623,241 | | | | 45,506,286 | |
ActiveBeta® U.S. Small Cap Equity ETF | | | | | 12,052,304 | | | | — | |
The ActiveBeta® Emerging Markets Equity ETF, the ActiveBeta® Europe Equity ETF, the ActiveBeta® International Equity ETF, the ActiveBeta® Japan Equity ETF, the ActiveBeta® U.S. Large Cap Equity ETF and the ActiveBeta® U.S. Small Cap Equity ETF, may lend their securities through a securities lending agent, the Bank of New York Mellon (“BNYM”), to certain qualified borrowers. In accordance with the Funds’ securities lending procedures, the Funds receive cash collateral at least equal to the market value of the securities on loan. The market value of the loaned securities is determined at the close of business of the Funds, at their last sale price or official closing price on the principal exchange or system on which they are traded, and any additional required collateral is delivered to the Funds on the next business day. As with other extensions of credit, the Funds may experience
112
GOLDMAN SACHS ETF TRUST
|
| 8. SECURITIES LENDING (continued) |
delay in the recovery of their securities or incur a loss should the borrower of the securities breach its agreement with the Funds or become insolvent at a time when the collateral is insufficient to cover the cost of repurchasing securities on loan. Dividend income received from securities on loan may not be subject to withholding taxes and therefore withholding taxes paid may differ from the amounts listed in the Statements of Operations. Loans of securities are terminable at any time and as such 1) the remaining contractual maturities of the outstanding securities lending transactions are considered to be overnight and continuous and 2) the borrower, after notice, is required to return borrowed securities within the standard time period for settlement of securities transactions.
Effective December 1, 2016 the ActiveBeta® Emerging Markets Equity ETF, the ActiveBeta® Europe Equity ETF, the ActiveBeta® International Equity ETF, the ActiveBeta® Japan Equity ETF and the ActiveBeta® U.S. Large Cap Equity ETF with the exception of the ActiveBeta® U.S. Small Cap Equity ETF, which started on June 28, 2017, began lending their securities and invest the cash collateral received in connection with securities lending transactions in the Goldman Sachs Financial Square Government Fund (“Government Money Market Fund”), an affiliated series of the Trust.
The Government Money Market Fund is registered under the Act as an open end investment company, is subject to Rule 2a-7 under the Act, and is managed by GSAM, for which GSAM may receive a management fee of up to 0.205% on an annualized basis of the average daily net assets of the Government Money Market Fund.
In the event of a default by a borrower with respect to any loan, BNYM may exercise any and all remedies provided under the applicable borrower agreement to make the Funds whole. These remedies include purchasing replacement securities by applying the collateral held from the defaulting broker against the purchase cost of the replacement securities. If BNYM is unable to purchase replacement securities, BNYM will indemnify the Funds by paying the Funds an amount equal to the market value of the securities loaned minus the value of cash collateral received from the borrower for the loan, subject to an exclusion for any shortfalls resulting from a loss of value in such cash collateral due to reinvestment risk. The Funds’ loaned securities were all subject to enforceable Securities Lending Agreements, and the value of the collateral was at least equal to the value of the cash received. The amounts of the Funds’ overnight and continuous agreements which represent the gross amounts of recognized liabilities for securities lending transactions outstanding as of August 31, 2017 are disclosed as “Payable upon return of securities loaned” on the Statements of Assets and Liabilities.
Both the Funds and BNYM received compensation relating to the lending of the Funds’ securities. The amounts earned, if any, by the Funds for the fiscal year ended August 31, 2017, are reported under Investment Income on the Statements of Operations.
The following table provides information about the Funds’ investment in the Goldman Sachs Financial Square Government Fund for the fiscal year ended August 31, 2017:
| | | | | | | | | | | | | | | | | | | | | | | | | | |
| Fund | | | | Beginning value as
of August 31, 2016 | | | Purchases at
Cost | | | Proceeds
from Sales | | | Ending value as
of August 31, 2017 | | | Shares as of
August 31, 2017 | | | Dividend
Income | |
ActiveBeta® Emerging Markets Equity ETF | | | | $ | — | | | $ | 146,417,056 | | | $ | 119,523,922 | | | $ | 26,893,134 | | | | 26,893,134 | | | $ | 131,788 | |
ActiveBeta® Europe Equity ETF | | | | | — | | | | 9,477,998 | | | | 9,387,935 | | | | 90,063 | | | | 90,063 | | | | 7,922 | |
ActiveBeta® International Equity ETF | | | | | — | | | | 77,796,496 | | | | 70,834,984 | | | | 6,961,512 | | | | 6,961,512 | | | | 101,383 | |
ActiveBeta® Japan Equity ETF | | | | | — | | | | 1,589,524 | | | | 1,301,217 | | | | 288,307 | | | | 288,307 | | | | 4,174 | |
ActiveBeta® U.S. Large Cap Equity ETF | | | | | — | | | | 75,477,243 | | | | 71,772,027 | | | | 3,705,216 | | | | 3,705,216 | | | | 44,663 | |
ActiveBeta® U.S. Small Cap Equity ETF* | | | | | — | | | | 1,319,426 | | | | 670,237 | | | | 649,189 | | | | 649,189 | | | | 2,909 | |
| * | | Commencement of operations, June 28, 2017. |
113
GOLDMAN SACHS ETF TRUST
Notes to Financial Statements (continued)
August 31, 2017
The tax character of distributions paid during the fiscal year ended August 31, 2017 was as follows:
| | | | | | | | | | | | | | | | | | | | | | | | |
| | | ActiveBeta®
Emerging
Markets
Equity ETF | | | ActiveBeta®
Europe
Equity ETF | | | ActiveBeta®
International
Equity ETF | | | ActiveBeta®
Japan
Equity ETF | | | ActiveBeta®
U.S. Large Cap
Equity ETF | | | ActiveBeta®
U.S. Small Cap
Equity ETF | |
Distributions paid from: | | | | | | | | | | | | | | | | | | | | | | | | |
Ordinary Income | | $ | 18,216,894 | | | $ | 931,065 | | | $ | 9,649,669 | | | $ | 721,272 | | | $ | 28,028,221 | | | | — | |
Total taxable distributions | | $ | 18,216,894 | | | $ | 931,065 | | | $ | 9,649,669 | | | $ | 721,272 | | | $ | 28,028,221 | | | | — | |
As of August 31, 2017, the components of accumulated earnings (losses) on a tax-basis were as follows:
| | | | | | | | | | | | | | | | | | | | | | | | |
| | | ActiveBeta®
Emerging
Markets
Equity ETF | | | ActiveBeta®
Europe
Equity ETF | | | ActiveBeta®
International
Equity ETF | | | ActiveBeta®
Japan
Equity ETF | | | ActiveBeta®
U.S. Large Cap
Equity ETF | | | ActiveBeta®
U.S. Small Cap
Equity ETF | |
Undistributed ordinary income — net | | $ | 11,332,449 | | | $ | 239,460 | | | $ | 3,480,218 | | | $ | — | | | $ | 9,973,553 | | | $ | 19,765 | |
Undistributed long-term capital gains | | | — | | | | — | | | | — | | | | — | | | | — | | | | 311 | |
Total undistributed earnings | | $ | 11,332,449 | | | $ | 239,460 | | | $ | 3,480,218 | | | $ | — | | | $ | 9,973,553 | | | $ | 20,076 | |
Capital loss carryforwards: | | | | | | | | | | | | | | | | | | | | | | | | |
Perpetual Short-Term | | $ | (7,444,760 | ) | | $ | — | | | $ | (144,209 | ) | | $ | (6,557 | ) | | $ | (691,783 | ) | | $ | — | |
Timing differences (Post-October Capital Loss Deferral/Qualified Late Year Loss Deferral) | | | (2,322,759 | ) | | | (51,393 | ) | | | — | | | | (2,944 | ) | | | (10,476,431 | ) | | | — | |
Unrealized gains (losses) — net | | | 284,526,834 | | | | 5,521,419 | | | | 66,456,451 | | | | 6,041,237 | | | | 229,319,812 | | | | (200,453 | ) |
Total accumulated earnings (losses) net | | $ | 286,091,764 | | | $ | 5,709,486 | | | $ | 69,792,460 | | | $ | 6,031,736 | | | $ | 228,125,151 | | | $ | (180,377 | ) |
As of August 31, 2017, the Funds’ aggregate security unrealized gains and losses based on cost for U.S. federal income tax purposes were as follows:
| | | | | | | | | | | | | | | | | | | | | | | | |
| | | ActiveBeta®
Emerging
Markets
Equity ETF | | | ActiveBeta®
Europe
Equity ETF | | | ActiveBeta®
International
Equity ETF | | | ActiveBeta®
Japan
Equity ETF | | | ActiveBeta®
U.S. Large Cap
Equity ETF | | | ActiveBeta®
U.S. Small Cap
Equity ETF | |
Tax Cost | | $ | 1,227,714,890 | | | $ | 38,470,822 | | | $ | 532,011,872 | | | $ | 37,035,742 | | | $ | 2,158,198,974 | | | $ | 12,682,706 | |
Gross unrealized gain | | | 299,823,615 | | | | 6,501,093 | | | | 76,034,779 | | | | 6,550,758 | | | | 283,699,398 | | | | 472,535 | |
Gross unrealized loss | | | (15,296,781 | ) | | | (979,674 | ) | | | (9,578,328 | ) | | | (509,521 | ) | | | (54,379,586 | ) | | | (672,988 | ) |
Net unrealized gains (losses) | | $ | 284,526,834 | | | $ | 5,521,419 | | | $ | 66,456,451 | | | $ | 6,041,237 | | | $ | 229,319,812 | | | $ | (200,453 | ) |
The difference between GAAP-basis and tax-basis unrealized gains (losses) is attributable primarily to wash sales, net mark to market gains/(losses) on foreign currency contracts and differences in the tax treatment of underlying fund investments, partnership investments, and passive foreign investment company investments.
In order to present certain components of the Funds’ capital accounts on a tax-basis, certain reclassifications have been recorded to the Funds’ accounts. These reclassifications have no impact on the net asset value of the Funds and result primarily from redemptions in-kind, certain non-deductible expenses, and differences in the tax treatment of foreign currency transactions, partnership investments, passive foreign investment company investments and underlying fund investments.
114
GOLDMAN SACHS ETF TRUST
|
| 9. TAX INFORMATION (continued) |
| | | | | | | | | | | | | | | | | | | | | | | | |
| | | ActiveBeta®
Emerging
Markets
Equity ETF | | | ActiveBeta®
Europe
Equity ETF | | | ActiveBeta®
International
Equity ETF | | | ActiveBeta®
Japan
Equity ETF | | | ActiveBeta®
U.S. Large Cap
Equity ETF | | | ActiveBeta®
U.S. Small Cap
Equity ETF | |
Paid-in Capital | | $ | 27,851,922 | | | $ | 332,855 | | | $ | (12 | ) | | $ | — | | | $ | 7,749,305 | | | $ | — | |
Accumulated Net realized Gain (Loss) | | | (27,224,713 | ) | | | (340,073 | ) | | | 59,267 | | | | 27,096 | | | | (7,862,114 | ) | | | — | |
Undistributed Net Investment Income (Loss) | | | (627,209 | ) | | | 7,218 | | | | (59,255 | ) | | | (27,096 | ) | | | 112,809 | | | | — | |
GSAM has reviewed the Funds’ tax positions for all open tax years (the current and prior year, as applicable) and has concluded that no provision for income tax is required in the Funds’ financial statements. Such open tax years remain subject to examination and adjustment by tax authorities.
The Funds’ risks include, but are not limited to, the following:
Derivatives Risk — A Fund’s use of derivatives may result in loss. Derivative instruments, which may pose risks in addition to and greater than those associated with investing directly in securities, currencies or other instruments, may be illiquid or less liquid, volatile, difficult to price and leveraged so that small changes in the value of the underlying instruments may produce disproportionate losses to the Fund. Derivatives are also subject to counterparty risk, which is the risk that the other party in the transaction will not fulfill its contractual obligation. The use of derivatives is a highly specialized activity that involves investment techniques and risks different from those associated with investments in more traditional securities and instruments. Losses from derivatives can also result from a lack of correlation between changes in the value of derivative instruments and the portfolio assets (if any) being hedged.
Foreign and Emerging Countries Risk — Investing in foreign markets may involve special risks and considerations not typically associated with investing in the United States. Foreign securities may be subject to risk of loss because of more or less foreign government regulation, less public information and less economic, political and social stability in the countries in which a Fund invests. The imposition of exchange controls (including repatriation restrictions), confiscations, trade restrictions (including tariffs) and other government restrictions by the United States or other governments, or from problems in share registration, settlement or custody, may also result in losses. Foreign risk also involves the risk of negative foreign currency rate fluctuations, which may cause the value of securities denominated in such foreign currency (or other instruments through which a Fund has exposure to foreign currencies) to decline in value. Currency exchange rates may fluctuate significantly over short periods of time. To the extent that a Fund also invests in securities of issuers located in emerging markets, these risks may be more pronounced.
Foreign Custody Risk — If a Fund invests in foreign securities, the Fund may hold such securities and cash with foreign banks, agents, and securities depositories appointed by the Fund’s custodian (each a “Foreign Custodian”). Some foreign custodians may be recently organized or new to the foreign custody business. In some countries, Foreign Custodians may be subject to little or no regulatory oversight over, or independent evaluation of, their operations. Further, the laws of certain countries may place limitations on a Fund’s ability to recover its assets if a Foreign Custodian enters bankruptcy.
Investments in emerging markets may be subject to even greater custody risks than investments in more developed markets. Custody services in emerging market countries are very often undeveloped and may be considerably less well regulated than in more developed countries, and thus may not afford the same level of investor protection as would apply in developed countries.
Index Risk — GSAM (the “Index Provider”) constructs each Fund’s Index in accordance with a rules-based methodology. A Fund will be negatively affected by general declines in the securities and asset classes represented in its Index. In addition, because the Funds are not “actively” managed, unless a specific security is removed from an Index, a Fund generally would not sell a security
115
GOLDMAN SACHS ETF TRUST
Notes to Financial Statements (continued)
August 31, 2017
|
| 10. OTHER RISKS (continued) |
because the security’s issuer was in financial trouble. Market disruptions and regulatory restrictions could have an adverse effect on a Fund’s ability to adjust its exposure to the required levels in order to track the Index. A Fund also does not attempt to take defensive positions under any market conditions, including declining markets. Therefore, a Fund’s performance could be lower than funds that may actively shift their portfolio assets to take advantage of market opportunities or to lessen the impact of a market decline or a decline in the value of one or more issuers. The Index Provider relies on third party data it believes to be reliable in constructing each Index, but it does not guarantee the accuracy or availability of such third party data. Errors in index data, index computation or the construction of an Index in accordance with its methodology may occur from time to time and may not be identified and corrected by the Index Provider for a period of time or at all, which may have an adverse impact on the applicable Fund and its shareholders. In addition, neither a Fund, the Investment Adviser nor the Index Provider can guarantee the availability or timeliness of the production of the Index.
Investments in Other Investment Companies Risk — As a shareholder of another investment company, including an ETF, a Fund will indirectly bear its proportionate share of any net management fees and other expenses paid by such other investment companies, in addition to the fees and expenses regularly borne by the Fund. ETFs are subject to risks that do not apply to conventional mutual funds, including but not limited to the following: (i) the market price of the ETF’s shares may trade at a premium or a discount to their NAV; and (ii) an active trading market for an ETF’s shares may not develop or be maintained.
Market and Credit Risks — In the normal course of business, a Fund trades financial instruments and enters into financial transactions where risk of potential loss exists due to changes in the market (market risk). Additionally, a Fund may also be exposed to credit risk in the event that an issuer or guarantor fails to perform or that an institution or entity with which the Fund has unsettled or open transactions defaults.
Market Trading Risk — Each Fund faces numerous market trading risks, including disruptions to creations and redemptions, the existence of extreme market volatility or potential lack of an active trading market for Shares. If a shareholder purchases Shares at a time when the market price is at a premium to the NAV or sells Shares at a time when the market price is at a discount to the NAV, the shareholder may sustain losses. The Investment Adviser cannot predict whether Shares will trade below, at or above their NAV. Price differences may be due, in large part, to the fact that supply and demand forces at work in the secondary trading market for Shares will be closely related to, but not identical to, the same forces influencing the prices of the securities of a Fund’s Index trading individually or in the aggregate at any point in time.
Tracking Error Risk — Tracking error is the divergence of a Fund’s performance from that of its Index. The performance of a Fund may diverge from that of its Index for a number of reasons. Tracking error may occur because of transaction costs, a Fund’s holding of cash, differences in accrual of dividends, changes to its Index or the need to meet new or existing regulatory requirements. Unlike a Fund, the returns of an Index are not reduced by investment and other operating expenses, including the trading costs associated with implementing changes to its portfolio of investments. Tracking error risk may be heightened during times of market volatility or other unusual market conditions.
Under the Trust’s organizational documents, its Trustees, officers, employees and agents are indemnified, to the extent permitted by the Act and state law, against certain liabilities that may arise out of performance of their duties to the Funds. Additionally, in the course of business, the Funds enter into contracts that contain a variety of indemnification clauses. The Funds’ maximum exposure under these arrangements is unknown, as this would involve future claims that may be made against the Funds that have not yet occurred. However, GSAM believes the risk of loss under these arrangements to be remote.
Subsequent events after the Statements of Assets and Liabilities date have been evaluated and GSAM has concluded that there is no impact requiring adjustment or disclosure in the financial statements.
116
Report of Independent Registered Public
Accounting Firm
To the Board of Trustees of
Goldman Sachs ETF Trust and Shareholders of the Goldman Sachs ActiveBeta® Emerging Markets Equity ETF, Goldman Sachs ActiveBeta® Europe Equity ETF, Goldman Sachs ActiveBeta® International Equity ETF, Goldman Sachs ActiveBeta® Japan Equity ETF, Goldman Sachs ActiveBeta® U.S. Large Cap Equity ETF, and Goldman Sachs ActiveBeta® U.S. Small Cap Equity ETF
In our opinion, the accompanying statements of assets and liabilities, including the schedules of investments, and the related statements of operations and of changes in net assets and the financial highlights present fairly, in all material respects, the financial positions of each of the six funds listed in the table below
| | |
Goldman Sachs ActiveBeta®
Emerging Markets Equity ETF | | Statement of changes in net assets for the year ended August 31, 2017 and for the period September 25, 2015 (commencement of operations) through August 31, 2016 |
Goldman Sachs ActiveBeta®
Europe Equity ETF | | Statement of changes in net assets for the year ended August 31, 2017 and for the period March 2, 2016 (commencement of operations) through August 31, 2016 |
Goldman Sachs ActiveBeta®
International Equity ETF | | Statement of changes in net assets for the year ended August 31, 2017 and for the period November 6, 2015 (commencement of operations) through August 31, 2016 |
Goldman Sachs ActiveBeta®
Japan Equity ETF | | Statement of changes in net assets for the year ended August 31, 2017 and for the period March 2, 2016 (commencement of operations) through August 31, 2016 |
Goldman Sachs ActiveBeta®
U.S. Large Cap Equity ETF | | Statement of changes in net assets for the year ended August 31, 2017 and for the period September 17, 2015 (commencement of operations) through August 31, 2016 |
Goldman Sachs ActiveBeta®
U.S. Small Cap Equity ETF | | Statement of changes in net assets for the period June 28, 2017 (commencement of operations) through August 31, 2017 |
(each a “Fund” of the Goldman Sachs ETF Trust, hereafter collectively referred to as the “Funds”) as of August 31, 2017, the results of each of their operations for the year then ended (or for Goldman Sachs ActiveBeta® U.S. Small Cap Equity ETF, the period from June 28, 2017 (commencement of operations) through August 31, 2017), the changes in each of their net assets for the respective periods described in the table above, and the financial highlights for each of the periods presented therein, in conformity with accounting principles generally accepted in the United States of America. These financial statements and financial highlights (hereafter referred to as “financial statements”) are the responsibility of the Funds’ management. Our responsibility is to express an opinion on these financial statements based on our audits. We conducted our audits of these financial statements in accordance with the standards of the Public Company Accounting Oversight Board (United States). Those standards require that we plan and perform the audit to obtain reasonable assurance about whether the financial statements are free of material misstatement. An audit includes examining, on a test basis, evidence supporting the amounts and disclosures in the financial statements, assessing the accounting principles used and significant estimates made by management, and evaluating the overall financial statement presentation. We believe that our audits, which included confirmation of securities as of August 31, 2017 by correspondence with the custodian, brokers, transfer agent of the underlying funds and the application of alternative auditing procedures where securities purchased confirmations had not been received, provide a reasonable basis for our opinions.
PricewaterhouseCoopers LLP
Boston, Massachusetts
October 24, 2017
117
GOLDMAN SACHS ETF TRUST
Fund Expenses — Six Months ended 8/31/2017 (Unaudited)
As a shareholder you incur ongoing costs, which may include management fees; distribution and service (12b-1) fees; and other Fund expenses. This Example is intended to help you understand your ongoing costs (in dollars) of investing in Shares of the Fund and to compare these costs with the ongoing costs of investing in other exchange-traded funds.
The Example is based on an investment of $1,000 invested at the beginning of the period from March 1, 2017 (or commencement of operation) and held for the six months ended August 31, 2017, which represents a period of 184 days of a 365 day year (or less where indicated).
Actual Expenses — The first line in the table below provides information about actual account values and actual expenses. You may use the information in this line, together with the amount you invested, to estimate the expenses that you paid over the six months. Simply divide your account value by $1,000 (for example, an $8,600 account value divided by $1,000=8.6), then multiply the result by the number in the first line under the heading entitled “Expenses Paid” to estimate the expenses you paid on your account during this period.
Hypothetical Example for Comparison Purposes — The second line in the table below provides information about hypothetical account values and hypothetical expenses based on the Fund’s actual net expense ratios and an assumed rate of return of 5% per year before expenses, which is not the Fund’s actual return. The hypothetical account values and expenses may not be used to estimate the actual ending account balance or expenses you paid for the period. You may use this information to compare the ongoing costs of investing in the Fund and other funds. To do so, compare this 5% hypothetical example with the 5% hypothetical examples that appear in the shareholder reports of the other funds.
Please note that the expenses shown in the table are meant to highlight your ongoing costs only and do not reflect any transactional costs, such as redemption fees, or exchange fees. Therefore, the second line of the table is useful in comparing ongoing costs only, and will not help you determine the relative total costs of owning different funds. In addition, if these transactional costs were included, your costs would have been higher.
| | | | | | | | | | | | | | | | | | | | | | | | | | | | | | | | | | | | | | | | | | | | | | | | | | | | | | | | | | | | | | | | | | | | | | | | |
| | | ActiveBeta® Emerging Markets Equity ETF | | | ActiveBeta® Europe Equity ETF | | | ActiveBeta® International Equity ETF | | | ActiveBeta® Japan Equity ETF | | | ActiveBeta® U.S. Large Cap Equity ETF | | | ActiveBeta® U.S. Small Cap Equity ETF(1) | |
| | | Beginning
Account
Value
3/1/17 | | | Ending
Account
Value
8/31/2017 | | | Expenses
Paid* | | | Beginning
Account
Value
3/1/17 | | | Ending
Account
Value
8/31/2017 | | | Expenses
Paid* | | | Beginning
Account
Value
3/1/17 | | | Ending
Account
Value
8/31/2017 | | | Expenses
Paid* | | | Beginning
Account
Value
3/1/17 | | | Ending
Account
Value
8/31/2017 | | | Expenses
Paid* | | | Beginning
Account
Value
3/1/17 | | | Ending
Account
Value
8/31/2017 | | | Expenses
Paid* | | | Beginning
Account
Value
6/28/17 | | | Ending
Account
Value
8/31/2017 | | | Expenses
Paid* | |
Actual based on NAV | | $ | 1,000 | | | $ | 1,164.60 | | | $ | 2.46 | | | $ | 1,000 | | | $ | 1,160.90 | | | $ | 1.36 | | | $ | 1,000 | | | $ | 1,131.50 | | | $ | 1.34 | | | $ | 1,000 | | | $ | 1,076.60 | | | $ | 1.31 | | | $ | 1,000 | | | $ | 1,054.50 | | | $ | 0.47 | | | $ | 1,000 | | | $ | 982.40 | | | $ | 0.35 | |
Hypothetical 5% return | | | 1,000 | | | | 1,022.94 | + | | | 2.29 | | | | 1,000 | | | | 1,023.95 | + | | | 1.28 | | | | 1,000 | | | | 1,023.95 | + | | | 1.28 | | | | 1,000 | | | | 1,023.95 | + | | | 1.28 | | | | 1,000 | | | | 1,024.75 | + | | | 0.46 | | | | 1,000 | | | | 1,008.55 | + | | | 0.36 | |
| | * | | Expenses for the Fund are calculated using the Fund’s annualized net expense ratio, which represents the ongoing expenses as a percentage of net assets for the fiscal year ended August 31, 2017. Expenses are calculated by multiplying the annualized net expense ratio by the average account value for the period; then multiplying the result by the number of days in the most recent fiscal year; and then dividing that result by the number of days in the fiscal year. The annualized net expense ratio for the period is as follows: | |
| | | | |
| Fund | | | |
ActiveBeta® Emerging Markets Equity ETF | | | 0.45 | % |
ActiveBeta® Europe Equity ETF | | | 0.25 | |
ActiveBeta® International Equity ETF | | | 0.25 | |
ActiveBeta® Japan Equity ETF | | | 0.25 | |
ActiveBeta® U.S. Large Cap Equity ETF | | | 0.09 | |
ActiveBeta® U.S. Small Cap Equity ETF(1) | | | 0.20 | |
| + | | Hypothetical expenses are based on the Fund’s actual annualized net expense ratios and an assumed rate of return of 5% per year before expenses. |
| (1) | | For the period June 28, 2017 (commencement of operations) through August 31, 2017. |
118
GOLDMAN SACHS ETF TRUST
Statement Regarding Basis for Initial Approval of Management Agreement for Goldman Sachs ActiveBeta® U.S. Small Cap Equity ETF (Unaudited)
Background
The Goldman Sachs ActiveBeta® U.S. Small Cap Equity ETF (the “Fund”) is a newly-organized investment portfolio of Goldman Sachs ETF Trust (the “Trust”) that commenced investment operations on June 28, 2017. At a meeting held on April 16, 2015 (the “Meeting”) in connection with the Fund’s organization, the Trustees, including all of the Trustees present who are not parties to the Trust’s investment management agreement (the “Management Agreement”) or “interested persons” (as defined in the Investment Company Act of 1940, as amended) of any party thereto (the “Independent Trustees”) approved the Management Agreement with Goldman Sachs Asset Management, L.P. (the “Investment Adviser”).
At the Meeting, the Trustees reviewed the Management Agreement with respect to the Fund, including information regarding the terms of the Management Agreement; the nature, extent, and quality of the Investment Adviser’s anticipated services; the fees and expenses to be paid by the Fund; a comparison of the Fund’s proposed management fees and anticipated expenses with those paid by other similar exchange-traded funds (“ETFs”); the Investment Adviser’s proposal to limit certain expenses of the Fund that exceed a specified level; potential benefits to be derived by the Investment Adviser and its affiliates from their relationships with the Fund; and potential benefits to be derived by the Fund from its relationship with the Investment Adviser. Various information was also provided at prior meetings at which the Fund was discussed.
In connection with the Meeting, the Trustees received written materials and oral presentations on the topics covered. The Independent Trustees were advised by their independent legal counsel regarding their responsibilities under applicable law. In evaluating the Management Agreement at the Meeting, the Trustees relied upon information included in a presentation made by the Investment Adviser at the Meeting and information received at prior Board meetings. The Trustees also drew on information they had received in their capacity as Trustees of other registered investment companies sponsored by the Investment Adviser.
Nature, Extent, and Quality of the Services to be Provided Under the Management Agreement
As part of their review, the Trustees considered the nature, extent, and quality of the services to be provided by the Investment Adviser. In this regard, the Trustees considered the investment advisory services that would be provided to the Fund by the Investment Adviser. The Trustees also considered information about the Fund’s structure, investment objective, strategies, and other characteristics. In particular, they noted that the Fund would operate as a passively-managed ETF, which would seek to track a proprietary index created by the Investment Adviser. The Trustees noted the experience and capabilities of the key Investment Adviser personnel who would be providing services to the Fund. In part, the Trustees considered the Investment Adviser’s extensive experience in managing quantitative investment strategies and its expertise in developing “smart beta” products that it had obtained through its acquisition of another investment management firm. The Trustees concluded that the Investment Adviser would be able to commit substantial financial and other resources to the Fund. They also considered that although the Fund was new (and therefore had no performance data to evaluate) and would be among the first ETFs managed by the Investment Adviser, the Investment Adviser had extensive experience managing other types of registered investment companies. The Trustees concluded that the Investment Adviser’s management of the Fund likely would benefit the Fund and its shareholders.
Costs of Services to be Provided and Profitability
The Trustees considered the contractual fee rates payable by the Fund under the Management Agreement, and the net amount expected to be retained by the Investment Adviser. In this regard, the Trustees considered information on the services to be rendered by the Investment Adviser to the Fund, which include advisory and non-advisory services directed to the needs and operations of the Fund as an ETF. The Trustees noted that no license fees would be payable to the Investment Adviser by the Fund for use of the indices created by the Investment Adviser. The Trustees also reviewed the Fund’s projected total operating expense ratios (both gross and net of expense limitations). They compared the Fund’s projected fees and expenses to similar information for comparable ETFs advised by other, unaffiliated investment management firms, as well as the peer group and category medians. The comparisons of the Fund’s fee rates and total operating expense ratios were prepared by a third-party provider of fund data. The Trustees concluded that this information was useful in evaluating the reasonableness of the management fees and total expenses expected to be paid by the Fund.
In addition, the Trustees considered the Investment Adviser’s undertaking to limit certain expenses of the Funs that exceed a specified level. The Trustees recognized that there was not yet profitability data to evaluate for the Fund, but considered the Investment Adviser’s representations that (i) such data would be provided after the Fund commenced operations, and (ii) the Fund was not expected to be profitable to the Investment Adviser and its affiliates initially.
119
GOLDMAN SACHS ETF TRUST
Statement Regarding Basis for Initial Approval of Management Agreement for Goldman Sachs ActiveBeta® U.S. Small Cap Equity ETF (Unaudited) (continued)
Economies of Scale
The Trustees noted that the Fund will not have management fee breakpoints. They considered the Fund’s projected asset levels and information comparing the fee rates charged by the Investment Adviser with fee rates charged to other ETFs in the peer groups, as well as the Investment Adviser’s undertaking to limit certain expenses of the Fund that exceed a specified level. The Trustees recognized that if the assets of the Fund increase over time, the Fund and its shareholders could realize economies of scale as certain Fund expenses, such as certain fixed fees, become a smaller percentage of overall assets.
Other Benefits to the Investment Adviser and Its Affiliates
The Trustees also considered the other benefits expected to be derived by the Investment Adviser and its affiliates from their relationships with the Fund, including: (a) the Investment Adviser’s ability to leverage the infrastructure designed to service the Fund on behalf of its other clients; (b) the Investment Adviser’s ability to cross-market other products and services to Fund shareholders; (c) the Investment Adviser’s ability to negotiate better pricing with custodians on behalf of its other clients, as a result of the relationship with the Fund; and (d) the possibility that the working relationship between the Investment Adviser and the Fund’s third-party service providers may cause those service providers to be open to doing business with other areas of Goldman Sachs & Co. LLC (“Goldman Sachs”).
Other Benefits to the Fund and Its Shareholders
The Trustees also noted that the Fund receives (or is expected to receive) certain potential benefits as a result of their relationships with the Investment Adviser, including: (a) enhanced servicing from vendors because of the volume of business generated by the Investment Adviser and its affiliates; (b) the Investment Adviser’s ability to hire and retain qualified personnel to provide services to the Fund because of the reputation of the Goldman Sachs organization; and (c) the Fund’s access to certain affiliated distribution channels.
Conclusion
In connection with their consideration of the Management Agreement for the Fund at the Meeting, the Trustees gave weight to various factors, but did not identify any particular factor as controlling their decision. After deliberation and consideration of the information provided, including the factors described above, the Trustees concluded, in the exercise of their business judgment, that the investment management fees were reasonable. The Trustees concluded that the engagement of the Investment Adviser likely would benefit the Fund and its shareholders and that the Management Agreement should be approved for a two-year period.
120
GOLDMAN SACHS ETF TRUST
Statement Regarding Basis for Approval of Management Agreement for Goldman Sachs ActiveBeta® ETFs except Goldman Sachs ActiveBeta® Emerging Markets Equity ETF (Unaudited)
Background
The Goldman Sachs ActiveBeta® Europe Equity ETF, Goldman Sachs ActiveBeta® Japan Equity ETF, Goldman Sachs ActiveBeta® International Equity ETF, Goldman Sachs ActiveBeta® U.S. Large Cap Equity ETF and Goldman Sachs ActiveBeta® U.S. Small Cap Equity ETF (each, a “Fund” and together, the “Funds”) are investment portfolios of Goldman Sachs ETF Trust (the “Trust”). The Board of Trustees oversees the management of the Trust and reviews the investment performance and expenses of the Funds at regularly scheduled meetings held throughout the year. In addition, the Board of Trustees determines annually whether to approve the continuance of the Trust’s investment management agreement (the “Management Agreement”) with Goldman Sachs Asset Management, L.P. (the “Investment Adviser”) on behalf of the Funds.
The Management Agreement was most recently approved for continuation until March 31, 2018 by the Board of Trustees, including those Trustees who are not parties to the Management Agreement or “interested persons” (as defined in the Investment Company Act of 1940, as amended) of any party thereto (the “Independent Trustees”), at a meeting held on March 14-15, 2017 (the “Annual Meeting”).
The review process undertaken by the Trustees spans the course of the year and culminates with the Annual Meeting. To assist the Trustees in their deliberations, the Trustees have established a Contract Review Committee (the “Committee”), comprised of the Independent Trustees. At those Committee meetings, regularly scheduled Board or other committee meetings, and/or the Annual Meeting, matters relevant to the renewal of the Management Agreement were considered by the Board, or the Independent Trustees, as applicable. With respect to each Fund, such matters included:
| | (a) | | the nature and quality of the advisory, administrative, and other services provided to the Fund by the Investment Adviser and its affiliates, including information about: |
| | (i) | | the structure, staff, and capabilities of the Investment Adviser and its portfolio management teams; |
| | (ii) | | the groups within the Investment Adviser and its affiliates that support the portfolio management teams or provide other types of necessary services, including fund services groups (e.g., accounting and financial reporting, tax, shareholder services, and operations); controls and risk management groups (e.g., legal, compliance, valuation oversight, credit risk management, internal audit, compliance testing, market risk analysis, finance, and central funding); sales and distribution support groups, and others (e.g., information technology and training); |
| | (iii) | | trends in employee headcount; |
| | (iv) | | the Investment Adviser’s financial resources and ability to hire and retain talented personnel and strengthen its operations; and |
| | (v) | | the parent company’s support of the Investment Adviser and its registered fund business, as expressed by the firm’s senior management; |
| | (b) | | information on the investment performance of the Fund, including comparisons to the performance of similar exchange-traded funds (“ETFs”), as provided by a third-party fund data provider engaged as part of the contract review process (the “Outside Data Provider”), and information on general investment outlooks in the markets in which the Fund invests; |
| | (c) | | the terms of the Management Agreement entered into by the Trust on behalf of the Fund; |
| | (d) | | fee and expense information for the Fund, including: |
| | (i) | | the relative management fee and expense levels of the Fund as compared to those of comparable funds managed by other advisers, as provided by the Outside Data Provider; |
| | (e) | | with respect to the investment performance and expense comparison data provided by the Outside Data Provider, its processes in producing that data for the Fund; |
| | (f) | | information relating to the profitability of the Management Agreement and the transfer agency and distribution and service arrangements of the Fund to the Investment Adviser and its affiliates; |
| | (g) | | whether the Fund’s existing management fee schedule adequately addressed any economies of scale; |
| | (h) | | a summary of the “fall-out” benefits derived by the Investment Adviser and its affiliates from their relationships with the Fund; |
| | (i) | | a summary of potential benefits derived by the Fund as a result of its relationship with the Investment Adviser; |
| | (j) | | portfolio manager ownership of Fund shares; the manner in which portfolio manager compensation is determined; and the number and types of accounts managed by the portfolio managers; |
| | (k) | | the nature and quality of the services provided to the Fund by its unaffiliated service providers, and the Investment Adviser’s general oversight and evaluation (including reports on due diligence) of those service providers as part of the administrative services provided under the Management Agreement; and |
| | (l) | | the Investment Adviser’s processes and policies addressing various types of potential conflicts of interest; its approach to risk management; the annual review of the effectiveness of the Fund’s compliance program; and periodic compliance reports. |
121
GOLDMAN SACHS ETF TRUST
Statement Regarding Basis for Approval of Management Agreement for Goldman Sachs ActiveBeta® ETFs except Goldman Sachs ActiveBeta® Emerging Markets Equity ETF (Unaudited) (continued)
The presentations made at the Board and Committee meetings and at the Annual Meeting encompassed the Funds and other funds for which the Board of Trustees has responsibility. In evaluating the Management Agreement at the Annual Meeting, the Trustees relied upon their knowledge, resulting from their meetings and other interactions throughout the year, of the Investment Adviser and its affiliates, their services, and the Funds. In conjunction with these meetings, the Trustees received written materials and oral presentations on the topics covered, and the Investment Adviser addressed the questions and concerns of the Trustees, including concerns regarding the investment performance of certain of the funds they oversee. The Independent Trustees were advised by their independent legal counsel regarding their responsibilities and other regulatory requirements related to the approval and continuation of registered fund investment management agreements under applicable law. In addition, the Investment Adviser and its affiliates provided the Independent Trustees with a written response to a formal request for information sent on behalf of the Independent Trustees by their independent legal counsel. During the course of their deliberations, the Independent Trustees met in executive sessions with their independent legal counsel, without representatives of the Investment Adviser or its affiliates present.
Nature, Extent, and Quality of the Services Provided Under the Management Agreement
As part of their review, the Trustees considered the nature, extent, and quality of the services provided to the Funds by the Investment Adviser. In this regard, the Trustees considered both the investment advisory services and non-advisory services that are provided by the Investment Adviser and its affiliates. The Trustees considered that under the Management Agreement, the Funds pay a single fee to the Investment Adviser, and the Investment Adviser pays all of the Funds’ ordinary operating expenses, excluding payments under each Fund’s 12b-1 plan (if any), interest expense, taxes, acquired fund fees and expenses, brokerage fees, costs of holding shareholder meetings, litigation, indemnification and extraordinary expenses. The Trustees also considered information about each Fund’s structure, investment objective, strategies and other characteristics. In particular, they noted that the Funds are passively-managed ETFs that seek to track proprietary indices created by the Investment Adviser. The Trustees noted the experience and capabilities of the key personnel of the Investment Adviser who provide services to the Funds. In particular, the Trustees considered the Investment Adviser’s extensive experience in managing quantitative investment strategies and its expertise in developing “smart beta” products. The Trustees concluded that the Investment Adviser continued to commit substantial financial and operational resources to the Funds and expressed confidence that the Investment Adviser would continue to do so in the future.
Investment Performance
The Trustees also considered the investment performance of the Funds. In this regard, they compared the total return of each Fund (with the exception of Goldman Sachs ActiveBeta® U.S. Small Cap Equity ETF) to the performance of its respective proprietary index, a comparable market capitalization-weighted reference index, and a separate account composite with a comparable investment strategy. The information regarding each Fund’s investment performance was provided for the one-year period ended September 30, 2016, or from inception to that date, to the extent that the Fund had not been in existence for that one-year period. The Trustees observed that each Fund’s investment performance was consistent with the investment objective of tracking its respective proprietary index.
Unitary Fee Structure and Profitability
The Trustees considered the contractual fee rates payable by each Fund, noting that the Management Agreement provides for a unitary fee structure, pursuant to which each Fund pays a single fee to the Investment Adviser and the Investment Adviser then pays all of the Fund’s ordinary operating expenses. In addition, the Trustees considered information on the services rendered by the Investment Adviser to the Funds, which included both advisory and administrative services that were directed to the needs and operations of the Funds as ETFs. The Trustees also considered information provided regarding fees and expenses of comparable ETFs advised by other, unaffiliated investment management firms. In particular, the Trustees referred to an analysis comparing each Fund’s management fees and net expense ratios to those of relevant peer funds. The Trustees concluded that the comparisons were useful in evaluating the reasonableness of the management fees and total expenses paid by the Funds.
The Trustees reviewed each Fund’s contribution to the Investment Adviser’s revenues and pre-tax profit margins. In this regard the Trustees noted that they had received, among other things, profitability analyses and summaries, revenue and expense schedules by Fund and by function (i.e., investment management, transfer agency and distribution and service), and information on the Investment Adviser’s expense allocation methodology. They observed that the profitability and expense figures are substantially similar to those used by the Investment Adviser for many internal purposes, including compensation decisions among various business groups, and are thus subject to a vigorous internal debate about how certain revenue and expenses should be allocated. The Trustees also noted that the internal audit group within the Goldman Sachs & Co. LLC (“Goldman Sachs”) organization had audited the expense allocation methodology and that the internal audit group was satisfied with the
122
GOLDMAN SACHS ETF TRUST
Statement Regarding Basis for Approval of Management Agreement for Goldman Sachs ActiveBeta® ETFs except Goldman Sachs ActiveBeta® Emerging Markets Equity ETF (Unaudited) (continued)
reasonableness, consistency, and accuracy of the Investment Adviser’s expense allocation methodology and profitability analysis calculations.
Economies of Scale
The Trustees noted that the Funds do not have fee breakpoints. The Trustees considered information previously provided regarding the amounts of assets in each Fund, the Funds’ recent creation and redemption activity, and the costs of the services provided by the Investment Adviser and its affiliates.
Other Benefits to the Investment Adviser and Its Affiliates
The Trustees also considered the other benefits derived by the Investment Adviser and its affiliates from their relationships with the Funds, including: (a) the Investment Adviser’s ability to leverage the infrastructure designed to service the Funds on behalf of its other clients; (b) the Investment Adviser’s ability to cross-market other products and services to Fund shareholders; (c) the Investment Adviser’s ability to negotiate better pricing with custodians on behalf of its other clients, as a result of the relationship with the Funds; and (d) the possibility that the working relationship between the Investment Adviser and the Funds’ third party service providers may cause those service providers to be more likely to do business with other areas of Goldman Sachs.
Other Benefits to the Funds and Their Shareholders
The Trustees also noted that the Funds receive certain potential benefits as a result of their relationship with the Investment Adviser, including: (a) enhanced servicing from vendors because of the volume of business generated by the Investment Adviser and its affiliates; (b) the Investment Adviser’s ability to hire and retain qualified personnel to provide services to the Funds because of the reputation of the Goldman Sachs organization; and (c) the Funds’ access to certain affiliated distribution channels.
Conclusion
In connection with their consideration of the Management Agreement, the Trustees gave weight to each of the factors described above, but did not identify any particular factor as controlling their decision. After deliberation and consideration of all of the information provided, including the factors described above, the Trustees concluded, in the exercise of their business judgment, that the unitary fee paid by each Fund was reasonable in light of the services provided to it by the Investment Adviser, the Investment Adviser’s costs and each Fund’s current and/or reasonably foreseeable asset levels. The Trustees unanimously concluded that the Investment Adviser’s continued management likely would benefit each Fund and its shareholders and that the Management Agreement should be approved and continued with respect to each Fund until March 31, 2018.
123
GOLDMAN SACHS ETF TRUST
Statement Regarding Basis for Approval of Management Agreement for Goldman Sachs ActiveBeta® Emerging Markets Equity ETF (Unaudited)
Background
The Goldman Sachs ActiveBeta® Emerging Markets Equity ETF (the “Fund”) is an investment portfolio of Goldman Sachs ETF Trust (the “Trust”). The Board of Trustees oversees the management of the Trust and reviews the investment performance and expenses of the Fund at regularly scheduled meetings held throughout the year. In addition, the Board of Trustees determines annually whether to approve the continuance of the Trust’s investment management agreement (the “Management Agreement”) with Goldman Sachs Asset Management, L.P. (the “Investment Adviser”) on behalf of the Fund.
The Management Agreement was most recently approved for continuation until March 31, 2018 by the Board of Trustees, including those Trustees who are not parties to the Management Agreement or “interested persons” (as defined in the Investment Company Act of 1940, as amended) of any party thereto (the “Independent Trustees”), at a meeting held on March 14-15, 2017 (the “Annual Meeting”).
The review process undertaken by the Trustees spans the course of the year and culminates with the Annual Meeting. To assist the Trustees in their deliberations, the Trustees have established a Contract Review Committee (the “Committee”), comprised of the Independent Trustees. At those Committee meetings, regularly scheduled Board or other committee meetings, and/or the Annual Meeting, matters relevant to the renewal of the Management Agreement were considered by the Board, or the Independent Trustees, as applicable. With respect to the Fund, such matters included:
| | (a) | | the nature and quality of the advisory, administrative, and other services provided to the Fund by the Investment Adviser and its affiliates, including information about: |
| | (i) | | the structure, staff, and capabilities of the Investment Adviser and its portfolio management teams; |
| | (ii) | | the groups within the Investment Adviser and its affiliates that support the portfolio management teams or provide other types of necessary services, including fund services groups (e.g., accounting and financial reporting, tax, shareholder services, and operations); controls and risk management groups (e.g., legal, compliance, valuation oversight, credit risk management, internal audit, compliance testing, market risk analysis, finance, and central funding); sales and distribution support groups, and others (e.g., information technology and training); |
| | (iii) | | trends in employee headcount; |
| | (iv) | | the Investment Adviser’s financial resources and ability to hire and retain talented personnel and strengthen its operations; and |
| | (v) | | the parent company’s support of the Investment Adviser and its registered fund business, as expressed by the firm’s senior management; |
| | (b) | | information on the investment performance of the Fund, including comparisons to the performance of similar exchange-traded funds (“ETFs”), as provided by a third-party fund data provider engaged as part of the contract review process (the “Outside Data Provider”), and information on general investment outlooks in the markets in which the Fund invests; |
| | (c) | | the terms of the Management Agreement entered into by the Trust on behalf of the Fund; |
| | (d) | | fee and expense information for the Fund, including: |
| | (i) | | the relative management fee and expense levels of the Fund as compared to those of comparable funds managed by other advisers, as provided by the Outside Data Provider; |
| | (e) | | with respect to the investment performance and expense comparison data provided by the Outside Data Provider, its processes in producing that data for the Fund; |
| | (f) | | the undertakings of the Investment Adviser and its affiliates to implement fee waivers and/or expense limitations; |
| | (g) | | information relating to the profitability of the Management Agreement and the transfer agency and distribution and service arrangements of the Fund to the Investment Adviser and its affiliates; |
| | (h) | | whether the Fund’s existing management fee schedule adequately addressed any economies of scale; |
| | (i) | | a summary of the “fall-out” benefits derived by the Investment Adviser and its affiliates from their relationships with the Fund; |
| | (j) | | a summary of potential benefits derived by the Fund as a result of its relationship with the Investment Adviser; |
| | (k) | | portfolio manager ownership of Fund shares; the manner in which portfolio manager compensation is determined; and the number and types of accounts managed by the portfolio managers; |
| | (l) | | the nature and quality of the services provided to the Fund by its unaffiliated service providers, and the Investment Adviser’s general oversight and evaluation (including reports on due diligence) of those service providers as part of the administrative services provided under the Management Agreement; and |
| | (m) | | the Investment Adviser’s processes and policies addressing various types of potential conflicts of interest; its approach to risk management; the annual review of the effectiveness of the Fund’s compliance program; and periodic compliance reports. |
124
GOLDMAN SACHS ETF TRUST
Statement Regarding Basis for Approval of Management Agreement for Goldman Sachs ActiveBeta® Emerging Markets Equity ETF (Unaudited) (continued)
The presentations made at the Board and Committee meetings and at the Annual Meeting encompassed the Fund and other registered funds for which the Board of Trustees has responsibility. In evaluating the Management Agreement at the Annual Meeting, the Trustees relied upon their knowledge, resulting from their meetings and other interactions throughout the year, of the Investment Adviser and its affiliates, their services, and the Fund. In conjunction with these meetings, the Trustees received written materials and oral presentations on the topics covered, and the Investment Adviser addressed the questions and concerns of the Trustees, including concerns regarding the investment performance of certain of the funds they oversee. The Independent Trustees were advised by their independent legal counsel regarding their responsibilities and other regulatory requirements related to the approval and continuation of mutual fund investment management agreements under applicable law. In addition, the Investment Adviser and its affiliates provided the Independent Trustees with a written response to a formal request for information sent on behalf of the Independent Trustees by their independent legal counsel. During the course of their deliberations, the Independent Trustees met in executive sessions with their independent legal counsel, without representatives of the Investment Adviser or its affiliates present.
Nature, Extent, and Quality of the Services Provided Under the Management Agreement
As part of their review, the Trustees considered the nature, extent, and quality of the services provided to the Fund by the Investment Adviser. In this regard, the Trustees considered both the investment advisory services and non-advisory services that are provided by the Investment Adviser and its affiliates. The Trustees also considered information about the Fund’s structure, investment objective, strategies and other characteristics. In particular, they noted that the Fund is a passively-managed ETF that seeks to track a proprietary index created by the Investment Adviser. The Trustees noted the experience and capabilities of the key personnel of the Investment Adviser who provide services to the Fund. The Trustees considered the Investment Adviser’s extensive experience in managing quantitative investment strategies and its expertise in developing “smart beta” products. The Trustees concluded that the Investment Adviser continued to commit substantial financial and operational resources to the Fund and expressed confidence that the Investment Adviser would continue to do so in the future.
Investment Performance
The Trustees also considered the investment performance of the Fund. In this regard, they compared the total return of the Fund to the performance of its proprietary index, a comparable market capitalization-weighted reference index, and a separate account composite with a comparable investment strategy. The information regarding the Fund’s investment performance was provided from inception through September 30, 2016. The Trustees observed that the Fund’s investment performance was consistent with the investment objective of tracking its proprietary index.
Costs of Services Provided and Profitability
The Trustees considered the contractual terms of the Management Agreement and the fee rates payable by the Fund thereunder. In this regard, the Trustees considered information on the services rendered by the Investment Adviser to the Fund, which included both advisory and administrative services that were directed to the needs and operations of the Fund as an ETF. The Trustees noted that no license fees would be payable to the Investment Adviser by the Fund for use of the index created by the Investment Adviser. The Trustees also reviewed the Fund’s total operating expense ratio (both gross and net of expense limitations). They compared the Fund’s fees and expenses to similar information for comparable ETFs advised by other, unaffiliated investment management firms. In particular, the Trustees referred to a summary comparing the Fund’s management fees and net expense ratios to those of relevant peer funds. The Trustees concluded that the comparisons were useful in evaluating the reasonableness of the management fee and total expenses paid by the Fund.
In addition, the Trustees considered the Investment Adviser’s undertaking to limit certain expenses of the Fund that exceed a specified level and acknowledged the permanent expense limitation agreement in place. The Trustees reviewed the Fund’s contribution to the Investment Adviser’s revenues and pre-tax profit margins. In this regard the Trustees noted that they had received, among other things, profitability analyses and summaries, revenue and expense schedules by Fund and by function (i.e., investment management, transfer agency and distribution and service), and information on the Investment Adviser’s expense allocation methodology. They observed that the profitability and expense figures are substantially similar to those used by the Investment Adviser for many internal purposes, including compensation decisions among various business groups, and are thus subject to a vigorous internal debate about how certain revenue and expenses should be allocated. The Trustees also noted that the internal audit group within the Goldman Sachs & Co. LLC (“Goldman Sachs”) organization had audited the expense allocation methodology and that the internal audit group was satisfied with the reasonableness, consistency, and accuracy of the Investment Adviser’s expense allocation methodology and profitability analysis calculations.
125
GOLDMAN SACHS ETF TRUST
Statement Regarding Basis for Approval of Management Agreement for Goldman Sachs ActiveBeta® Emerging Markets Equity ETF (Unaudited) (continued)
Economies of Scale
The Trustees noted that the Fund does not have management fee breakpoints. The Trustees considered information previously provided regarding the amounts of assets in the Fund, the Fund’s recent creation and redemption activity, and the costs of the services provided by the Investment Adviser and its affiliates. The Trustees recognized that if the assets of the Fund increase over time, the Fund and its shareholders could realize economies of scale as certain Fund expenses, such as certain fixed fees, become a smaller percentage of overall assets.
Other Benefits to the Investment Adviser and Its Affiliates
The Trustees also considered the other benefits derived by the Investment Adviser and its affiliates from their relationships with the Fund, including: (a) the Investment Adviser’s ability to leverage the infrastructure designed to service the Fund on behalf of its other clients; (b) the Investment Adviser’s ability to cross-market other products and services to Fund shareholders; (c) the Investment Adviser’s ability to negotiate better pricing with custodians on behalf of its other clients, as a result of the relationship with the Fund; and (d) the possibility that the working relationship between the Investment Adviser and the Fund’s third party service providers may cause those service providers to be more likely to do business with other areas of Goldman Sachs.
Other Benefits to the Fund and Its Shareholders
The Trustees also noted that the Fund receives certain potential benefits as a result of its relationship with the Investment Adviser, including: (a) enhanced servicing from vendors because of the volume of business generated by the Investment Adviser and its affiliates; (b) the Investment Adviser’s ability to hire and retain qualified personnel to provide services to the Fund because of the reputation of the Goldman Sachs organization; and (c) the Fund’s access to certain affiliated distribution channels.
Conclusion
In connection with their consideration of the Management Agreement, the Trustees gave weight to each of the factors described above, but did not identify any particular factor as controlling their decision. After deliberation and consideration of all of the information provided, including the factors described above, the Trustees concluded, in the exercise of their business judgment, that the management fee paid by the Fund was reasonable in light of the services provided to it by the Investment Adviser, the Investment Adviser’s costs and the Fund’s current and reasonably foreseeable asset levels. The Trustees unanimously concluded that the Investment Adviser’s continued management likely would benefit the Fund and its shareholders and that the Management Agreement should be approved and continued until March 31, 2018.
126
GOLDMAN SACHS ETF TRUST
Trustees and Officers (Unaudited) Independent Trustees
| | | | | | | | | | |
Name,
Address and Age1 | | Position(s) Held
with the Trust | | Term of Office and
Length of Time
Served2 | | Principal Occupation(s)
During Past 5 Years | | Number of
Portfolios in
Fund Complex
Overseen by
Trustee3 | | Other
Directorships
Held by Trustee4 |
Caroline Dorsa Age: 58 | | Trustee | | Since 2016 | | Ms. Dorsa is retired. She was formerly Executive Vice President and Chief Financial Officer, Public Service Enterprise Group, Inc. (a generation and energy services company) (2009-2015); Senior Vice President, Merck & Co, Inc. (a pharmaceutical company) (2008-2009 and 1987-2007); Senior Vice President and Chief Financial Officer, Gilead Sciences, Inc. (a pharmaceutical company) (2007-2008); and Senior Vice President and Chief Financial Officer, Avaya, Inc. (a technology company) (2007). Trustee — Goldman Sachs ETF Trust; Goldman Sachs MLP Income Opportunities Fund; and Goldman Sachs MLP and Energy Renaissance Fund. | | 21 | | Biogen Inc. (a biotechnology company); Intellia Therapeutics Inc. (a gene-editing company); Illumina, Inc. (a life sciences company) |
Linda A. Lang Age: 59 | | Trustee | | Since 2016 | | Ms. Lang is retired. She is Chair of the Board of Directors (2016-present), and Member of the Board of Directors, WD-40 Company (2004-Present); and was formerly Chairman and Chief Executive Officer (2005-2014); and Director, President and Chief Operating Officer, Jack in the Box, Inc. (a restaurant company) (2003-2005). Trustee — Goldman Sachs ETF Trust; Goldman Sachs MLP Income Opportunities Fund; and Goldman Sachs MLP and Energy Renaissance Fund. | | 21 | | WD-40 Company (a global consumer products company) |
Michael Latham Age: 51 | | Trustee | | Since 2015 | | Mr. Latham is retired. Formerly, he held senior management positions with the iShares exchange-traded fund business, including Chairman (2011-2014); Global Head (2010-2011); U.S. Head (2007-2010); and Chief Operating Officer (2003-2007). Trustee — Goldman Sachs ETF Trust; Goldman Sachs MLP Income Opportunities Fund; and Goldman Sachs MLP and Energy Renaissance Fund. | | 21 | | None |
Lawrence W. Stranghoener Age: 63 | | Chairman of the Board of Trustees | | Trustee Since 2015; Chairman Since 2017 | | Mr. Stranghoener is retired. He is Chairman of the Board of Directors, Kennametal, Inc. (2003-Present); Director, Aleris Corporation and Aleris International, Inc. (2011-Present); and was formerly Interim Chief Executive Officer (2014); and Executive Vice President and Chief Financial Officer (2004-2014, Mosaic Company (a fertilizer manufacturing company). Trustee — Goldman Sachs ETF Trust; Goldman Sachs MLP Income Opportunities Fund; and Goldman Sachs MLP and Energy Renaissance Fund. | | 21 | | Kennametal Inc. (a global manufacturer and distributor of tooling and industrial materials) |
| | | | | | | | | | |
Interested Trustee*
| | | | | | | | | | |
Name,
Address and Age1 | | Position(s) Held
with the Trust | | Term of Office and
Length of
Time Served2 | | Principal Occupation(s)
During Past 5 Years | | Number of
Portfolios in
Fund Complex
Overseen by
Trustee3 | | Other
Directorships
Held by Trustee4 |
James A. McNamara Age: 54 | | Trustee and President | | Since 2014 | | Managing Director, Goldman Sachs (December 1998-Present); Director of Institutional Fund Sales, GSAM (April 1998-December 2000); and Senior Vice President and Manager, Dreyfus Institutional Service Corporation (January 1993-April 1998). President and Trustee — Goldman Sachs ETF Trust; Goldman Sachs Trust; Goldman Sachs Variable Insurance Trust; Goldman Sachs Trust II; Goldman Sachs MLP Income Opportunities Fund; and Goldman Sachs MLP and Energy Renaissance Fund. | | 142 | | None |
| | | | | | | | | | |
| * | | This person is considered to be an “Interested Trustee” because he holds a position with Goldman Sachs and own securities issued by The Goldman Sachs Group, Inc. The Interested Trustee holds comparable positions with certain other companies of which Goldman Sachs, GSAM or an affiliate thereof is the investment adviser, administrator and/or distributor. |
| 1 | | Each Trustee may be contacted by writing to the Trustee, c/o Goldman Sachs, 200 West Street, New York, New York, 10282, Attn: Caroline L. Kraus. Information is provided as of August 31, 2017. |
| 2 | | Each Trustee holds office for an indefinite term until the earliest of: (a) the election of his or her successor; (b) the date the Trustee resigns, retires or is removed by the Board of Trustees or shareholders, in accordance with the Trust’s Declaration of Trust; or (c) the termination of the Trust. |
| 3 | | The Goldman Sachs Fund Complex includes certain other companies listed above for each respective Trustee. As of August 31, 2017, Goldman Sachs ETF Trust consisted of 19 portfolios (eight of which offered shares to the public); Goldman Sachs Trust consisted of 90 portfolios (88 of which offered shares to the public); Goldman Sachs Variable Insurance Trust consisted of 14 portfolios; Goldman Sachs Trust II consisted of 17 portfolios (16 of which offered shares to the public); and Goldman Sachs MLP Income Opportunities Fund and Goldman Sachs MLP and Energy Renaissance Fund each consisted of one portfolio. |
| 4 | | This column includes only directorships of companies required to report to the Securities and Exchange Commission under the Securities Exchange Act of 1934 (i.e., “public companies”) or other investment companies registered under the Act. |
Additional information about the Trustees is available in the Funds’ Statement of Additional Information, which can be obtained from Goldman Sachs free of charge by calling this toll-free number (in the United States of America): 1-800-526-7384.
127
GOLDMAN SACHS ETF TRUST
Trustees and Officers (Unaudited) (continued)
Officers of the Trust*
| | | | | | |
Name, Address and Age1 | | Positions Held with the Trust | | Term of Office and
Length of
Time Served2 | | Principal Occupation(s) During Past 5 Years |
James A. McNamara 200 West Street New York, NY 10282 Age: 54 | | Trustee and President | | Since 2014 | | Managing Director, Goldman Sachs (December 1998-Present); Director of Institutional Fund Sales, GSAM (April 1998-December 2000); and Senior Vice President and Manager, Dreyfus Institutional Service Corporation (January 1993-April 1998). President and Trustee — Goldman Sachs ETF Trust; Goldman Sachs Trust; Goldman Sachs Variable Insurance Trust; Goldman Sachs Trust II; Goldman Sachs MLP Income Opportunities Fund; and Goldman Sachs MLP and Energy Renaissance Fund. |
Caroline L. Kraus 200 West Street New York, NY 10282 Age: 40 | | Secretary | | Since 2014 | | Managing Director, Goldman Sachs (January 2016 – Present); Vice President, Goldman Sachs (August 2006-December 2015); Associate General Counsel, Goldman Sachs (2012- Present); Assistant General Counsel, Goldman Sachs (August 2006-December 2011); and Associate, Weil, Gotshal & Manges, LLP (2002-2006). Secretary — Goldman Sachs ETF Trust; Goldman Sachs Trust (previously Assistant Secretary (2012)); Goldman Sachs Variable Insurance Trust (previously Assistant Secretary (2012)); Goldman Sachs Trust II; Goldman Sachs BDC, Inc.; Goldman Sachs Private Middle Market Credit LLC; Goldman Sachs Middle Market Lending Corp.; Goldman Sachs MLP Income Opportunities Fund; and Goldman Sachs MLP and Energy Renaissance Fund. |
Scott M. McHugh 200 West Street New York, NY 10282 Age: 45 | | Treasurer, Senior Vice President and Principal Financial Officer | | Since 2014 | | Managing Director, Goldman Sachs (January 2016-Present); Vice President, Goldman Sachs (February 2007-December 2015); Assistant Treasurer of certain mutual funds administered by DWS Scudder (2005-2007); and Director (2005-2007), Vice President (2000-2005), and Assistant Vice President (1998-2000), Deutsche Asset Management or its predecessor (1998-2007). Treasurer, Senior Vice President and Principal Financial Officer — Goldman Sachs ETF Trust; Goldman Sachs Trust; Goldman Sachs Variable Insurance Trust; Goldman Sachs Trust II; Goldman Sachs MLP Income Opportunities Fund; and Goldman Sachs MLP and Energy Renaissance Fund. |
Joseph F. DiMaria 30 Hudson Street Jersey City, NJ 07302 Age: 49 | | Assistant Treasurer and Principal Accounting Officer | | Since 2017 | | Managing Director, Goldman Sachs (November 2015-Present) and Vice President – Mutual Fund Administration, Columbia Management Investment Advisers, LLC (May 2010-October 2015). Assistant Treasurer and Principal Accounting Officer — Goldman Sachs ETF Trust; Goldman Sachs Trust; Goldman Sachs Variable Insurance Trust; Goldman Sachs Trust II; Goldman Sachs MLP Income Opportunities Fund; and Goldman Sachs MLP and Energy Renaissance Fund. |
| | | | | | |
| * | | Represents a partial list of officers of the Trust. Additional information about all the officers is available in the Funds’ Statement of Additional Information, which can be obtained from Goldman Sachs free of charge by calling this toll-free number (in the United States): 1-800-621-2550. |
| 1 | | Information is provided as of August 31, 2017. |
| 2 | | Officers hold office at the pleasure of the Board of Trustees or until their successors are duly elected and qualified. Each officer holds comparable positions with certain other companies of which Goldman Sachs, GSAM or an affiliate thereof is the investment adviser, administrator and/or distributor. |
Goldman Sachs ActiveBeta® ETFs — Tax Information (Unaudited)
From distributions paid during the year ended August 31, 2017, the total amount of income received by the ActiveBeta® Emerging Markets Equity ETF, ActiveBeta® International Equity ETF, ActiveBeta® Japan Equity ETF and ActiveBeta® Europe Equity ETF from sources within foreign countries and possessions of the United States was $0.3616, $0.2421, $0.2785 and $0.7515 per share, respectively, all of which is attributable to qualified passive income. The percentage of net investment income dividends paid from foreign sources by the ActiveBeta® Emerging Markets Equity ETF, ActiveBeta® International Equity ETF, ActiveBeta® Japan Equity ETF and ActiveBeta® Europe Equity ETF was 94.26%, 92.30%, 85.86%, and 97.93%, respectively. The total amount of taxes paid by the ActiveBeta® Emerging Markets Equity ETF, ActiveBeta® International Equity ETF, ActiveBeta® Japan Equity ETF and ActiveBeta® Europe Equity ETF to foreign countries was $0.0490, $0.0264, $0.0358, and $0.0967 per share, respectively.
For the year ended August 31, 2017, 94.37%, 95.69%, 99.70%, 89.91%, and 86.77% of the dividends paid from net investment company taxable income by the ActiveBeta® Emerging Markets Equity ETF, ActiveBeta® International Equity ETF, ActiveBeta® Europe Equity ETF, ActiveBeta® U.S. Large Cap Equity ETF, and ActiveBeta® Japan Equity ETF, respectively, qualify for the reduced tax rate under the Jobs and Growth Tax Relief and Reconciliation Act of 2003.
For the year ended August 31, 2017, 94.30% of the dividends paid from net investment company taxable income by the ActiveBeta® U.S. Large Cap Equity qualify for the dividends received deduction available to corporations.
128
FUNDS PROFILE
Goldman Sachs ETFs

Goldman Sachs is a premier financial services firm, known since 1869 for creating thoughtful and customized investment solutions in complex global markets.
Today, the Investment Management Division of Goldman Sachs serves a diverse set of clients worldwide, including private institutions, public entities and individuals. With approximately $1.21 trillion in assets under supervision as of June 30, 2017, Goldman Sachs Asset Management (“GSAM”) has portfolio management teams located around the world and our investment professionals bring firsthand knowledge of local markets to every investment decision. Assets under supervision includes assets under management and other client assets for which Goldman Sachs does not have full discretion. GSAM leverages the resources of Goldman Sachs & Co. LLC subject to legal, internal and regulatory restrictions.
|
| GOLDMAN SACHS EXCHANGE-TRADED FUNDS |
| Goldman Sachs ActiveBeta® Emerging Markets Equity ETF |
| Goldman Sachs ActiveBeta® Europe Equity ETF |
| Goldman Sachs ActiveBeta® International Equity ETF |
| Goldman Sachs ActiveBeta® Japan Equity ETF |
| Goldman Sachs ActiveBeta® U.S. Large Cap Equity ETF |
| Goldman Sachs ActiveBeta® U.S. Small Cap Equity ETF |
| Goldman Sachs Equal Weight U.S. Large Cap Equity ETF |
| Goldman Sachs Hedge Industry VIP ETF |
| Goldman Sachs TreasuryAccess 0-1 Year ETF |
| Goldman Sachs Access Investment Grade Corporate Bond ETF |
Goldman Sachs Access High Yield Corporate Bond ETF |
INDEX DISCLAIMERS
The MSCI Emerging Markets Index, MSCI Europe Index, MSCI World ex USA Index and MSCI Japan Index (the “MSCI Indices”) were used by GSAM as the reference universe for selection of the companies included in the Goldman Sachs ActiveBeta® Emerging Markets Equity Index, Goldman Sachs ActiveBeta® Europe Equity Index, Goldman Sachs ActiveBeta® International Equity Index and Goldman Sachs ActiveBeta® Japan Equity Index (the “ActiveBeta® Indices”), respectively. MSCI Inc. does not in any way sponsor, support, promote or endorse the ActiveBeta® Indices or the Goldman Sachs ActiveBeta® Emerging Markets Equity ETF, Goldman Sachs ActiveBeta® Europe Equity ETF, Goldman Sachs ActiveBeta® International Equity ETF or Goldman Sachs ActiveBeta® Japan Equity ETF (the “ActiveBeta® ETFs” or the “Funds”). MSCI Inc. was not and is not involved in any way in the creation, calculation, maintenance or review of the ActiveBeta® Indices. The MSCI Indices were provided on an “as is” basis. MSCI Inc., its affiliates and any other person or entity involved in or related to compiling, computing or creating the MSCI Indices (collectively, the “MSCI Parties”) expressly disclaim all warranties (including, without limitation, any warranties of originality, accuracy, completeness, timeliness, non-infringement, merchantability and fitness for a particular purpose). Without limiting any of the foregoing, in no event shall any MSCI Party have any liability for any direct, indirect, special, incidental, punitive, consequential (including without limitation lost profits) or any other damages in connection with the MSCI Indices, the ActiveBeta® ETFs or the ActiveBeta® Indices.
The Russell 2000® Index was used by Goldman Sachs Asset Management or its affiliate as the starting universe for selection of the companies included in the Goldman Sachs ActiveBeta® U.S. Small Cap Equity Index. Frank Russell Company (“RUSSELL”) does not in any way sponsor, support, promote or endorse the Goldman Sachs ActiveBeta® U.S. Small Cap Equity Index or the Goldman Sachs ActiveBeta® U.S. Small Cap Equity ETF. In no event shall any Russell Party have any liability for any direct, indirect, special, incidental, punitive, consequential (including without limitation lost profits) or any other damages in connection with the Russell 2000® Index or the Goldman Sachs ActiveBeta® U.S. Small Cap Equity Index.
The ActiveBeta® Indices are trademarks of Goldman Sachs Asset Management, L.P. and have been licensed for use by Goldman Sachs ETF Trust.
GOLDMAN SACHS ASSET MANAGEMENT, L.P., THE GOLDMAN SACHS GROUP, INC., AND GOLDMAN SACHS & CO. LLC (COLLECTIVELY, “GOLDMAN SACHS”) DOES NOT GUARANTEE NOR MAKE ANY REPRESENTATION OR WARRANTY, EXPRESS OR IMPLIED, TO THE OWNERS OR SHAREHOLDERS OF THE FUNDS OR ANY MEMBER OF THE PUBLIC REGARDING THE ADVISABILITY OF INVESTING IN SECURITIES GENERALLY OR IN A FUND PARTICULARLY OR THE ABILITY OF THE ACTIVEBETA® INDICES TO TRACK GENERAL MARKET PERFORMANCE. GOLDMAN SACHS, IN ITS CAPACITY AS THE INDEX PROVIDER OF THE ACTIVEBETA® INDICES, LICENSES CERTAIN TRADEMARKS AND TRADE NAMES TO THE FUNDS. GOLDMAN SACHS HAS NO OBLIGATION TO TAKE THE NEEDS OF THE FUNDS OR THE SHAREHOLDERS OF THE FUNDS INTO CONSIDERATION IN DETERMINING, COMPOSING OR CALCULATING THE ACTIVEBETA® INDICES. GOLDMAN SACHS OR ANY OF ITS AFFILIATES MAY HOLD LONG OR SHORT POSITIONS IN SECURITIES HELD BY A FUND OR IN RELATED DERIVATIVES.
GOLDMAN SACHS DOES NOT GUARANTEE THE ADEQUACY, TIMELINESS, ACCURACY AND/OR THE COMPLETENESS OF THE ACTIVEBETA® INDICES OR ANY DATA RELATED THERETO. GOLDMAN SACHS HEREBY EXPRESSLY DISCLAIMS ANY AND ALL LIABILITY FOR ANY ERRORS, OMISSIONS, OR INTERRUPTIONS THEREIN OR IN THE CALCULATION THEREOF. GOLDMAN SACHS MAKES NO WARRANTY, EXPRESS OR IMPLIED, AND EXPRESSLY DISCLAIMS ALL WARRANTIES OF MERCHANTABILITY OR FITNESS FOR A PARTICULAR PURPOSE OR USE WITH RESPECT TO THE MARKS, THE ACTIVEBETA® INDICES OR ANY DATA INCLUDED THEREIN AS TO THE RESULTS TO BE OBTAINED BY A FUND, THE SHAREHOLDERS, OR ANY OTHER PERSON OR ENTITY FROM USE OF THE ACTIVEBETA® INDICES OR ANY DATA INCLUDED THEREIN. WITHOUT LIMITING ANY OF THE FOREGOING, GOLDMAN SACHS HEREBY EXPRESSLY DISCLAIMS ANY AND ALL LIABILITY FOR ANY SPECIAL, PUNITIVE, INDIRECT, OR CONSEQUENTIAL DAMAGES (INCLUDING LOST PROFITS), EVEN IF ADVISED OF THE POSSIBILITY OF SUCH DAMAGES.
| | |
TRUSTEES Lawrence W. Stranghoener, Chairman Caroline Dorsa Linda A. Lang Michael Latham James A. McNamara | | OFFICERS James A. McNamara, President Scott M. McHugh, Treasurer, Senior Vice President and Principal Financial Officer Joseph F. DiMaria, Assistant Treasurer and Principal Accounting Officer Caroline L. Kraus, Secretary |
| |
THE BANK OF NEW YORK MELLON Transfer Agent | | |
| |
ALPS DISTRIBUTORS, INC. Distributor | | GOLDMAN SACHS ASSET MANAGEMENT, L.P. Investment Adviser |
Visit our Website at www.GSAMFUNDS.com to obtain the most recent month-end returns.
Goldman Sachs Asset Management, L.P., 200 West Street, New York, New York 10282
The reports concerning the Funds included in this shareholder report may contain certain forward-looking statements about the factors that may affect the performance of the Funds in the future. These statements are based on Fund management’s predictions and expectations concerning certain future events and their expected impact on the Funds, such as performance of the economy as a whole and of specific industry sectors, changes in the levels of interest rates, the impact of developing world events, and other factors that may influence the future performance of the Funds. Management believes these forward-looking statements to be reasonable, although they are inherently uncertain and difficult to predict. Actual events may cause adjustments in portfolio management strategies from those currently expected to be employed.
A description of the policies and procedures that the Funds use to determine how to vote proxies relating to portfolio securities and information regarding how a Fund voted proxies relating to portfolio securities for the most recent 12-month period ended June 30, are available (i) without charge, upon request by calling 1-800-621-2550; and (ii) on the Securities and Exchange Commission (“SEC’’) web site at http://www.sec.gov.
The Funds file their complete schedule of portfolio holdings with the Securities and Exchange Commission (“SEC”) for the first and third quarters of each fiscal year on Form N-Qs. The Fund’s Form N-Qs are available on the SEC’s web site at http://www.sec.gov within 60 days after the Fund’s first and third fiscal quarters. The Fund’s Form N-Qs may be reviewed and copied at the SEC’s Public Reference Room in Washington, D.C., and information on the operation of the Public Reference Room may also be obtained by calling 1-800-SEC-0330. Form N-Qs may be obtained upon request and without charge by calling 1-800-621-2550.
Fund holdings and allocations shown are as of August 31, 2017 and may not be representative of future investments. Fund holdings should not be relied on in making investment decisions and should not be construed as research or investment advice regarding particular securities. Current and future holdings are subject to risk.
The Global Industry Classification Standard (GICS) was developed by and is the exclusive property and a service mark of Morgan Stanley Capital International Inc. (MSCI) and Standard & Poor’s, a division of The McGraw-Hill Companies, Inc. (S&P) and is licensed for use by Goldman Sachs. Neither MSCI, S&P nor any other party involved in making or compiling the GICS or any GICS classifications makes any express or implied warranties or representations with respect to such standard or classification (or the results to be obtained by the use thereof), and all such parties hereby expressly disclaim all warranties of originality, accuracy, completeness, merchantability or fitness for a particular purpose with respect to any of such standard or classification. Without limiting any of the foregoing, in no event shall MSCI, S&P, any of their affiliates or any third party involved in making or compiling the GICS or any GICS classifications have any liability for any direct, indirect, special, punitive, consequential or any other damages (including lost profits) even if notified of the possibility of such damages.
Economic and market forecasts presented herein reflect our judgment as of the date of this presentation and are subject to change without notice. These forecasts do not take into account the specific investment objectives, restrictions, tax and financial situation or other needs of any specific client. Actual data will vary and may not be reflected here. These forecasts are subject to high levels of uncertainty that may affect actual performance. Accordingly, these forecasts should be viewed as merely representative of a broad range of possible outcomes. These forecasts are estimated, based on assumptions, and are subject to significant revision and may change materially as economic and market conditions change. Goldman Sachs has no obligation to provide updates or changes to these forecasts. Case studies and examples are for illustrative purposes only.
ETF Fund shares are not individually redeemable and are issued and redeemed by the Fund at their net asset value (“NAV”) only in large, specified blocks of shares called creation units. Shares otherwise can be bought and sold only through exchange trading at market price (not NAV). Shares may trade at a premium or discount to their NAV in the secondary market. Brokerage commissions will reduce returns. ALPS Distributors, Inc. is the distributor of the Goldman Sachs ETF Funds. ALPS Distributors, Inc. is unaffiliated with Goldman Sachs Asset Management.
THIS MATERIAL IS FOR INFORMATIONAL PURPOSES ONLY AND IS PROVIDED SOLELY ON THE BASIS THAT IT WILL NOT CONSTITUTE INVESTMENT OR OTHER ADVICE OR A RECOMMENDATION RELATING TO ANY PERSON’S OR PLAN’S INVESTMENT OR OTHER DECISIONS, AND GOLDMAN SACHS IS NOT A FIDUCIARY OR ADVISOR WITH RESPECT TO ANY PERSON OR PLAN BY REASON OF PROVIDING THE MATERIAL OR CONTENT HEREIN INCLUDING UNDER THE EMPLOYEE RETIREMENT INCOME SECURITY ACT OF 1974 OR DEPARTMENT OF LABOR REGULATIONS. PLAN SPONSORS AND OTHER FIDUCIARIES SHOULD CONSIDER THEIR OWN CIRCUMSTANCES IN ASSESSING ANY POTENTIAL COURSE OF ACTION.
This material is not authorized for distribution to prospective investors unless preceded or accompanied by a current Prospectus or summary prospectus, if applicable. Investors should consider a Fund’s objective, risks, and charges and expenses, and read the summary prospectus, if available, and/or the Prospectus carefully before investing or sending money. The summary prospectus, if available, and the Prospectus contain this and other information about a Fund and may be obtained from your authorized dealer or from Goldman Sachs & Co. LLC by calling 1-800-621-2550.
© 2017 Goldman Sachs. All rights reserved. 107364-TMPL-10/2017-630971 ACTBETAAR-17/GST549/22k
Goldman Sachs Funds

| | | | |
| | |
| Annual Report | | | | August 31, 2017 |
| | |
| | | | Goldman Sachs ETFs |
| | | | Hedge Industry VIP ETF |

Goldman Sachs Hedge Industry VIP ETF
| | | | |
| | | |
| NOT FDIC-INSURED | | May Lose Value | | No Bank Guarantee |
INVESTMENT PROCESS
Goldman Sachs Hedge Industry VIP ETF
Principal Investment Strategies
The Goldman Sachs Hedge Industry VIP ETF (the “Fund”) seeks to achieve its investment objective by investing at least 80% of its assets (exclusive of collateral held from securities lending) in securities included in its underlying index, in depositary receipts representing securities included in its underlying index and in underlying stocks in respect of depositary receipts included in its underlying index. The Goldman Sachs Hedge Fund VIP IndexTM (the “Index”) is designed to deliver exposure to equity securities whose performance is expected to influence the long portfolios of hedge funds. Such equity securities are defined as those that appear most frequently among the top ten equity holdings of U.S. hedge fund managers that select their investments based upon fundamental analysis. Goldman Sachs Asset Management, L.P. (the “Index Provider”) is the provider of the Index, which is constructed in accordance with a rules-based methodology.
Hedge fund managers report their U.S. equity holdings, which are made public 45 days after the end of each calendar quarter. The Index is reconstituted and rebalanced on a quarterly basis once the information has been fully disseminated. The construction of the Index involves accessing the identifiers and share counts of U.S. equity holdings disclosed by hedge fund managers in their quarterly 13F filings with the Securities and Exchange Commission (“SEC”). The Index is constructed to then apply share prices at the time of data collection to the numbers of shares listed in each 13F disclosure filing to calculate the dollar market value of each reported position. U.S. hedge fund managers that select their investments based upon fundamental analysis are assumed to be U.S. hedge fund managers with no fewer than 10 and no more than 200 distinct U.S. equity positions, as reported in the hedge fund managers’ most recent Form 13F filings. Managers with less than $10 million of disclosed equity assets are excluded.
The equity positions are then ranked within each individual hedge fund manager’s portfolio by descending market value. The approximately 50 stocks that appear most frequently in the top10 holdings of this universe then become the Index constituents. Constituents are equal dollar-weighted at each rebalance. Given the Fund’s investment objective of attempting to track the Index, the Fund does not follow traditional methods of active investment management, which may involve buying and selling securities based upon analysis of economic and market factors.
The Index does not include hedge funds (i.e., unlisted, privately offered funds) and is not designed to approximate the performance of any hedge fund manager, hedge fund or group of hedge fund managers or hedge funds. The Index should not be considered a hedge fund replication strategy. As of August 31, 2017, the Index consisted of 50 securities with a market capitalization range of between approximately $2.8 billion and $794.3 billion. The components of the Index may change over time. The percentage of the portfolio exposed to any asset class will vary from time to time as the weightings of the securities within the Index change, and the Fund may not be invested in each asset class at all times.
1
INVESTMENT PROCESS
THE FUND IS NOT A HEDGE FUND AND DOES NOT INVEST IN HEDGE FUNDS.
* * *
At the end of the Reporting Period (i.e., November 1, 2016 through August 31, 2017), we continued to believe the most effective way to identify the most important positions of hedge fund managers is to know what equities they are holding. We also maintained conviction in our methodology for extracting these important positions — by obtaining information from quarterly 13F filings of hedge fund managers and identifying stocks that appear among top holdings the most frequently. Through an efficient implementation of our methodology, we believe investors are able to access top hedge fund long equity ideas and gain exposure to evolving U.S. market themes.
2
PORTFOLIO RESULTS
Goldman Sachs Hedge Industry VIP ETF
Investment Objective
The Goldman Sachs Hedge Industry VIP ETF (the “Fund”) seeks to provide investment results that closely correspond, before fees and expenses, to the performance of the Goldman Sachs Hedge Fund VIP IndexTM (the “Index”).
Portfolio Management Discussion and Analysis
Below, the Goldman Sachs Quantitative Investment Strategies Team discusses the Fund’s performance and positioning for the period since its commencement of operations on November 1, 2016 through August 31, 2017 (the “Reporting Period”).
| Q | | How did the Fund perform during the Reporting Period? |
| A | | During the Reporting Period, the Fund returned 26.61% based on net asset value (“NAV”) and 29.18% based on market price.1 The Index returned 27.14%, and the S&P 500 Index (Total Return, USD) (“S&P 500 Index”), a market-cap based index against which the performance of the Fund is measured, returned 19.18% during the same period. |
| | The Fund had a NAV of $40.00 on the date of commencement of operations and ended the Reporting Period with a NAV of $50.46 per share. The Fund’s market price on August 31, 2017 was $50.48 per share. |
| Q | | What key factors were responsible for the Fund’s performance during the Reporting Period?1 |
| A | | The Fund seeks to provide investment results that closely correspond, before fees and expenses, to the performance of the Index. The Fund’s performance reflects Fund expenses, including management fees and brokerage expenses. The Fund’s relative performance also reflects the impact of any cash held in the Fund as well as any other differences between the Fund’s holdings and the constituents of the Index. The Index is unmanaged, and Index returns do not reflect fees and expenses, which would reduce returns. |
| | The Index is designed to deliver exposure to equity securities whose performance is expected to influence the long portfolios of hedge funds. Such equity securities are defined as those that appear most frequently among the top ten equity holdings of U.S. hedge fund managers that select their investments based upon fundamental analysis. Goldman Sachs Asset Management, L.P. (the “Index Provider”) is the provider of the Index, which is constructed in accordance with a rules-based methodology. Hedge fund managers report their U.S. equity holdings, which are made public 45 days after the end of each calendar quarter. The Index is reconstituted and rebalanced on a quarterly basis once the information has been fully disseminated. The construction of the Index involves accessing the identifiers and share counts of U.S. equity holdings disclosed by hedge fund managers in the their quarterly 13F filings with the Securities and Exchange Commission (“SEC”). The Index is constructed to then apply share prices at the time of data collection to the numbers of shares listed in each 13F disclosure filing to calculate the dollar market value of each reported position. U.S. hedge fund managers that select their investments based upon fundamental analysis are assumed to be U.S. hedge fund managers with no fewer than 10 and more than 200 distinct U.S. equity positions, as reported in the hedge fund managers’ most recent Form 13F filings. Managers with less than $10 million of disclosed equity assets are excluded. The equity positions are then ranked within each individual hedge fund manager’s portfolio by descending market value. The approximately 50 stocks that appear most frequently in the top 10 holdings of this universe then become the Index constituents. Constituents are equal dollar-weighted at each rebalance. The Fund seeks to provide investment results that closely correspond, before fees and expenses, to the performance of the Index. |
| | The Index’s performance is compared to that of the S&P 500 Index below. Given the Fund’s investment objective of attempting to track the Index, the Fund does not follow traditional methods of active investment management, which may involve buying and selling securities based |
| | 1 | | The first day of secondary market trading is typically several days after the date on which the Fund commenced investment operations; therefore, the NAV of the Fund is used as a proxy for the period from commencement of investment operations to the first day of secondary market trading to calculate the market price returns. |
3
PORTFOLIO RESULTS
| | upon analysis of economic and market factors. The Fund does not follow a strategy of seeking to outperform the S&P 500 Index. |
| | The Index posted robust absolute gains, and the Index outperformed the S&P 500 Index during the Reporting Period. The Index also outperformed the S&P 500 Index during the Reporting Period, as measured by NAV. |
| Q | | Which sectors contributed most positively to the Index’s relative performance during the Reporting Period, and which detracted most? |
| A | | Index constituents in the information technology, consumer discretionary and consumer staples sectors contributed most positively to the Index’s results relative to the S&P 500 Index during the Reporting Period. Partially offsetting these positive contributors were Index constituents in industrials and real estate, the only two sectors that detracted from the Index’s results relative to the S&P 500 Index during the Reporting Period. |
| Q | | Which individual stock positions contributed the most to the Index’s relative returns during the Reporting Period? |
| A | | Relative to the S&P 500 Index, overweight positions in information technology company Alibaba Group Holding and consumer discretionary companies Liberty Broadband and Charter Communications contributed most positively (2.19%, 1.95% and 1.96% of Fund net assets as of 8/31/17, respectively). Each of these positions generated a robust double-digit gain during the Reporting Period. |
| Q | | Which individual positions detracted from the Index’s results during the Reporting Period? |
| A | | Relative to the S&P 500 Index, overweight positions in information technology company FleetCor Technologies, energy company Pioneer Natural Resources and health care company Valeant Pharmaceuticals International detracted most (2.00%, 0.00% and 0.00%2 of Fund net assets as of 8/31/17, respectively). Each of these positions generated a double-digit negative return during the Reporting Period. |
| Q | | How did the Fund use derivatives and similar instruments during the Reporting Period? |
| A | | The Fund did not invest in derivatives or similar instruments during the Reporting Period. The Fund does not employ derivatives as a source of alpha generation, although it may use them to equitize excess cash. |
| Q | | What was the Fund’s sector positioning relative to the Index and the S&P 500 Index at the end of the Reporting Period?3 |
| | | | | | | | | | | | | | |
| | | Sector Name | | Fund | | | GS Hedge
Fund VIP
IndexTM | | | S&P
500
Index | |
| | Information Technology | | | 36.80 | % | | | 36.88 | % | | | 23.51 | % |
| | Consumer Discretionary | | | 23.50 | | | | 23.60 | | | | 12.06 | |
| | Financials | | | 11.80 | | | | 11.80 | | | | 14.23 | |
| | Health Care | | | 9.95 | | | | 10.03 | | | | 14.66 | |
| | Materials | | | 4.03 | | | | 4.07 | | | | 2.90 | |
| | Energy | | | 3.95 | | | | 3.98 | | | | 5.67 | |
| | Telecommunication Services | | | 3.88 | | | | 3.92 | | | | 2.14 | |
| | Industrials | | | 3.69 | | | | 3.72 | | | | 10.10 | |
| | Consumer Staples | | | 2.00 | | | | 2.01 | | | | 8.48 | |
| | Real Estate | | | 0.00 | | | | 0.00 | | | | 2.98 | |
| | Utilities | | | 0.00 | | | | 0.00 | | | | 3.26 | |
| | | Cash | | | 0.80 | | | | 0.00 | | | | 0.00 | |
| | 3 | | Sector classifications for securities may differ between the above listing and the Schedule of Investments due to differing classification methodologies. The classification methodology used for the above listing is as set forth by S&P 500 Index. |
| | 2 | | Some weights are 0.00% at August 31, 2017 because those positions were eliminated during the most recent rebalance given the Index construction methodology. |
4
FUND BASICS
Hedge Industry VIP ETF
as of August 31, 2017
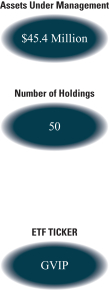
| | | | | | |
| | FUND SNAPSHOT | |
| | | As of August 31, 2017 | | | |
| | Market Price1 | | $ | 50.48 | |
| | | Net Asset Value (NAV)1 | | $ | 50.46 | |
| | 1 | | The Market Price is the price at which the Fund’s shares are trading on the NYSE Arca, Inc. The Market Price of the Fund’s shares will fluctuate and, at the time of sale, shares may be worth more or less than the original investment or the Fund’s then current net asset value (“NAV”). The NAV is the market value of one share of the Fund. This amount is derived by dividing the total value of all the securities in the Fund’s portfolio, plus other assets, less any liabilities, by the number of Fund shares outstanding. Fund shares are not individually redeemable and are issued and redeemed by the Fund at their NAV only in large, specified blocks of shares called creation units. Shares otherwise can be bought and sold only through exchange trading at market price (not NAV). Shares may trade at a premium or discount to their NAV in the secondary market. Information regarding how often shares of the Fund traded on NYSE Arca at a price above (i.e., at a premium) or below (i.e., at a discount) the NAV of the Fund can be found at www.GSAMFUNDS.com. |
| | | | | | | | | | | | | | | | | | |
| | PERFORMANCE REVIEW | |
| | | November 1, 2016–
August 31, 2017 | | Fund Total Return
(based on NAV)2 | | | Fund Total Return
(based on Market Price)2 | | | Goldman Sachs
Hedge Fund
VIP IndexTM3 | | | S&P 500 Index®4 | |
| | | Shares | | | 26.61 | % | | | 29.18 | % | | | 27.14 | % | | | 19.18 | % |
| | 2 | | Total returns are calculated assuming purchase of a share at the market price or NAV on the first day and sale of a share at the market price or NAV on the last day of each period reported. The Total Returns Based on NAV and Market Price assume the reinvestment of dividends and do not reflect brokerage commissions in connection with the purchase or sale of Fund shares, which if included would lower the performance shown above. The NAV used in the Total Return calculations assumes all management fees incurred by the Fund. Market Price returns are based upon the last trade as of 4:00 pm EST and do not reflect the returns you would receive if you traded shares at other times. The first day of secondary market trading is typically several days after the date on which the Fund commenced investment operations; therefore, the NAV of the Fund is used as a proxy for the period from inception of investment operations to the first day of secondary market trading to calculate the Market Price returns. Total returns for periods less than one full year are not annualized. |
| | 3 | | The Index is owned and maintained by the Index Provider. The Index is calculated by Solactive AG. The Index consists of the US-listed stocks whose performance is expected to influence the long portfolios of hedge funds. Those stocks are defined as the positions that appear most frequently among the top 10 long equity holdings within the portfolios of fundamentally-driven hedge fund managers. It is not possible to invest directly in an unmanaged index. |
| | 4 | | The S&P 500® Index is the Standard & Poor’s 500 Composite Index of 500 stocks, an unmanaged index of common stock prices. |
The returns set forth in the tables above represent past performance. Past performance does not guarantee future results. The Fund’s investment returns and principal value will fluctuate so that an investor’s shares, when sold or redeemed, may be worth more or less than their original cost. Current performance may be lower or higher than the performance quoted above. Please visit our web site at www.GSAMFUNDS.com to obtain the most recent month-end returns. Returns do not reflect the deduction of taxes that a shareholder would pay on Fund distributions or the sale or redemption of Fund shares.
5
FUND BASICS
| | | | | | |
| | EXPENSE RATIO5 | |
| | | | | Expense Ratio | |
| | | Shares | | | 0.45 | % |
| | 5 | | The expense ratio of the Fund is as set forth above according to the most recent publicly available Prospectus for the Fund and may differ from the expense ratio disclosed on the Financial Highlights in this report. |
| | | | | | | | |
| | TOP TEN HOLDINGS AS OF 8/31/176 |
| | | Holding | | % of Net Assets | | | Line of Business |
| | Alibaba Group Holding Ltd. ADR | | | 2.2 | % | | Information Technology |
| | Dell Technologies, Inc., Class V | | | 2.2 | | | Information Technology |
| | Micron Technology, Inc. | | | 2.2 | | | Information Technology |
| | Adient PLC | | | 2.1 | | | Consumer Discretionary |
| | salesforce.com, Inc. | | | 2.1 | | | Information Technology |
| | Autodesk, Inc. | | | 2.1 | | | Information Technology |
| | Dow Chemical Co. (The) | | | 2.1 | | | Materials |
| | Celgene Corp. | | | 2.1 | | | Health Care |
| | PayPal Holdings, Inc. | | | 2.1 | | | Information Technology |
| | | eBay, Inc. | | | 2.0 | | | Information Technology |
| | 6 | | The top 10 holdings may not be representative of the Fund’s future investments. |
6
FUND BASICS
| | |
| | FUND SECTOR ALLOCATIONS7 |
| | | As of August 31, 2017 |
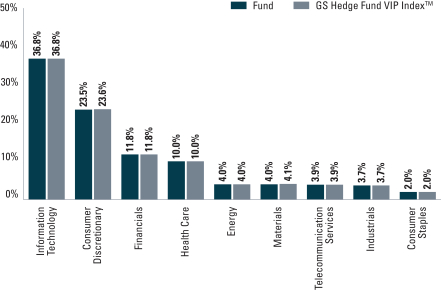
| | 7 | | The Fund’s composition may differ over time. Consequently, the Fund’s overall industry sector allocations may differ from percentages contained in the graph above. The above graph categorizes investments using Global Industry Classification Standard (“GICS”), however, the sector classifications used by the portfolio management team may differ from GICS. The percentage shown for each investment category reflects the value of investments in that category as a percentage of market value. |
7
Performance Summary
August 31, 2017
The following graph shows the value, as of August 31, 2017, of a $10,000 investment made on November 1, 2016 (commencement of operations) in Shares at NAV. For comparative purposes, the performance of the Fund’s underlying index and secondary underlying index, the Goldman Sachs Hedge Fund VIP Index™ and the S&P 500 Index (TR, unhedged, USD) are shown. This performance data represents past performance and should not be considered indicative of future performance, which will fluctuate with changes in market conditions. These performance fluctuations may cause an investor’s shares to be worth more or less than their original cost. Performance reflects applicable fee waivers and/or expense limitations in effect during the periods shown and in their absence, performance would be reduced. Returns do not reflect the deduction of taxes that a shareholder would pay on Fund distributions or the sale of Fund shares. In addition to the performance of constituents of the underlying index, other factors may affect Fund performance. These factors include, but are not limited to, Fund operating fees and expenses, portfolio turnover and creation and redemption in-kind transactions.
|
| Goldman Sachs Hedge Industry VIP ETF’s Lifetime Performance |
Performance of a $10,000 Investment, with distributions reinvested, from November 1, 2016 through August 31, 2017.
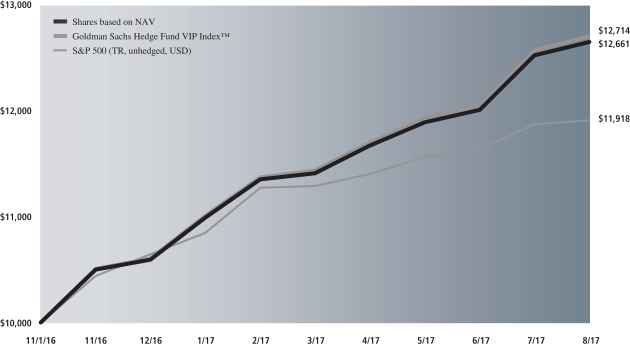
| | |
| Average Annual Total Return through August 31, 2017 | | Since Inception |
Shares based on NAV (Commenced November 1, 2016) | | 26.61%* |
|
| * | | Total return for periods of less than one year represents cumulative total return. |
8
FUND BASICS
Index Definitions and Industry Terms
Alpha: The excess returns of a fund relative to the return of a benchmark index is the fund’s alpha.
The S&P 500® Index is the Standard & Poor’s 500 Composite Index of 500 stocks, an unmanaged index of common stock prices.
9
GOLDMAN SACHS HEDGE INDUSTRY VIP ETF
Schedule of Investments
August 31, 2017
| | | | | | | | |
| Shares | | | Description | | Value | |
| Common Stocks – 99.7% | |
| Consumer Discretionary – 23.5% | | | |
| | 13,518 | | | Adient PLC | | $ | 955,452 | |
| | 913 | | | Amazon.com, Inc.* | | | 895,288 | |
| | 2,236 | | | Charter Communications, Inc., Class A* | | | 891,136 | |
| | 21,412 | | | Comcast Corp., Class A | | | 869,541 | |
| | 6,069 | | | Expedia, Inc. | | | 900,397 | |
| | 20,275 | | | JD.com, Inc. ADR (China)* | | | 849,725 | |
| | 8,702 | | | Liberty Broadband Corp., Class C* | | | 883,514 | |
| | 14,475 | | | Liberty Ventures, Series A* | | | 891,081 | |
| | 5,246 | | | Netflix, Inc.* | | | 916,529 | |
| | 14,195 | | | Nexstar Media Group, Inc., Class A | | | 854,539 | |
| | 478 | | | Priceline Group, Inc. (The)* | | | 885,294 | |
| | 8,771 | | | Time Warner, Inc. | | | 886,748 | |
| | | | | | | | |
| | | | | | | 10,679,244 | |
| | |
| Consumer Staples – 2.0% | | | |
| | 4,551 | | | Constellation Brands, Inc., Class A | | | 910,655 | |
| | |
| Energy – 4.0% | |
| | 35,887 | | | Parsley Energy, Inc., Class A* | | | 898,969 | |
| | 33,021 | | | Rice Energy, Inc.* | | | 903,455 | |
| | | | | | | | |
| | | | | | | 1,802,424 | |
| | |
| Financials – 11.8% | | | |
| | 39,697 | | | Ally Financial, Inc. | | | 897,152 | |
| | 36,739 | | | Bank of America Corp. | | | 877,695 | |
| | 5,060 | | | Berkshire Hathaway, Inc., Class B* | | | 916,670 | |
| | 13,215 | | | Citigroup, Inc. | | | 899,016 | |
| | 9,701 | | | JPMorgan Chase & Co. | | | 881,724 | |
| | 16,979 | | | Wells Fargo & Co. | | | 867,117 | |
| | | | | | | | |
| | | | | | | 5,339,374 | |
| | |
| Health Care – 10.0% | | | |
| | 3,856 | | | Allergan PLC | | | 884,875 | |
| | 4,691 | | | Anthem, Inc. | | | 919,623 | |
| | 6,748 | | | Celgene Corp.* | | | 937,500 | |
| | 2,796 | | | CR Bard, Inc. | | | 896,985 | |
| | 9,682 | | | VCA, Inc.* | | | 900,039 | |
| | | | | | | | |
| | | | | | | 4,539,022 | |
| | |
| Industrials – 3.7% | | | |
| | 17,918 | | | Delta Air Lines, Inc. | | | 845,550 | |
| | 3,219 | | | TransDigm Group, Inc. | | | 839,065 | |
| | | | | | | | |
| | | | | | | 1,684,615 | |
| | |
| Information Technology – 36.8% | | | |
| | 5,802 | | | Alibaba Group Holding Ltd. ADR (China)* | | | 996,435 | |
| | 955 | | | Alphabet, Inc., Class A* | | | 912,254 | |
| | 5,613 | | | Apple, Inc. | | | 920,532 | |
| | 8,239 | | | Autodesk, Inc.* | | | 943,036 | |
| | 4,011 | | | Baidu, Inc. ADR (China)* | | | 914,709 | |
| | 3,576 | | | Broadcom Ltd. | | | 901,402 | |
| | 12,490 | | | Cognizant Technology Solutions Corp., Class A | | | 883,917 | |
| | 13,243 | | | Dell Technologies, Inc., Class V* | | | 992,298 | |
| | 10,653 | | | DXC Technology Co. | | | 905,505 | |
| | 25,487 | | | eBay, Inc.* | | | 920,845 | |
| | |
| | 5,255 | | | Facebook, Inc., Class A* | | | 903,702 | |
| | 6,327 | | | FleetCor Technologies, Inc.* | | | 909,633 | |
| | 30,683 | | | Micron Technology, Inc.* | | | 980,936 | |
| | 12,192 | | | Microsoft Corp. | | | 911,596 | |
| | 7,974 | | | NXP Semiconductors NV (Netherlands)* | | | 900,743 | |
| | 15,192 | | | PayPal Holdings, Inc.* | | | 937,043 | |
| | 9,941 | | | salesforce.com, Inc.* | | | 949,266 | |
| | 8,807 | | | Visa, Inc., Class A | | | 911,701 | |
| | | | | | | | |
| | | | | | | 16,695,553 | |
| | |
| Materials – 4.0% | | | |
| | 14,149 | | | Dow Chemical Co. (The) | | | 943,031 | |
| | 7,658 | | | Monsanto Co. | | | 897,518 | |
| | | | | | | | |
| | | | | | | 1,840,549 | |
| | |
| Telecommunication Services – 3.9% | | | |
| | 15,843 | | | Level 3 Communications, Inc.* | | | 862,334 | |
| | 14,066 | | | T-Mobile US, Inc.* | | | 910,211 | |
| | | | | | | | |
| | | | | | | 1,772,545 | |
| | |
| | TOTAL INVESTMENTS – 99.7% | |
| | (Cost $41,574,024) | | $ | 45,263,981 | |
| | |
| OTHER ASSETS IN EXCESS OF
LIABILITIES – 0.3% | | | 145,529 | |
| | |
| | NET ASSETS – 100.0% | | $ | 45,409,510 | |
| | |
| | |
| The percentage shown for each investment category reflects the value of investments in that category as a percentage of net assets. |
* | | Non-income producing security. |
| | |
|
Investment Abbreviations: |
ADR | | —American Depositary Receipt |
PLC | | —Public Limited Company |
|
| | |
| 10 | | The accompanying notes are an integral part of these financial statements. |
GOLDMAN SACHS HEDGE INDUSTRY VIP ETF
Statement of Assets and Liabilities
August 31, 2017
| | | | | | |
| | | | | Hedge Industry
VIP ETF | |
| | Assets: | | | | |
| | Investments at value (cost $41,574,024) | | $ | 45,263,981 | |
| | Cash | | | 54,523 | |
| | Receivables: | | | | |
| | Dividends | | | 106,164 | |
| | Total assets | | | 45,424,668 | |
| | | | | | |
| | Liabilities: | | | | |
| | Payables: | | | | |
| | Management fees | | | 15,158 | |
| | Total liabilities | | | 15,158 | |
| | | | | | |
| | Net Assets: | | | | |
| | Paid-in capital | | | 41,931,095 | |
| | Undistributed net investment income | | | 104,370 | |
| | Accumulated net realized loss | | | (315,912 | ) |
| | Net unrealized gain | | | 3,689,957 | |
| | NET ASSETS | | $ | 45,409,510 | |
| | SHARES ISSUED AND OUTSTANDING | | | | |
| | Shares outstanding no par value (unlimited shares authorized): | | | 900,000 | |
| | Net asset value per share: | | | $50.46 | |
| | |
| The accompanying notes are an integral part of these financial statements. | | 11 |
GOLDMAN SACHS HEDGE INDUSTRY VIP ETF
Statement of Operations
For the period ended August 31, 2017(1)
| | | | | | |
| | | | | Hedge Industry
VIP ETF | |
| | Investment income: | |
| | Dividends | | $ | 322,051 | |
| | Total investment income | | | 322,051 | |
| | | | | | |
| | Expenses: | | | | |
| | Management fees | | | 83,836 | |
| | Trustee fees | | | 28,189 | |
| | Total expenses | | | 112,025 | |
| | NET INVESTMENT INCOME | | | 210,026 | |
| | | | | | |
| | Realized and unrealized gain (loss): | | | | |
| | Net realized gain (loss) from: | | | | |
| | Investments | | | (377,332 | ) |
| | In-kind redemptions | | | 3,471,016 | |
| | Net unrealized gain on: | | | | |
| | Investments | | | 3,689,957 | |
| | Net realized and unrealized gain | | | 6,783,641 | |
| | NET INCREASE IN NET ASSETS RESULTING FROM OPERATIONS | | | 6,993,667 | |
| | (1) | | For the period November 1, 2016 (commencement of operations) through August 31, 2017. |
| | |
| 12 | | The accompanying notes are an integral part of these financial statements. |
GOLDMAN SACHS HEDGE INDUSTRY VIP ETF
Statement of Changes in Net Assets
For the period ended August 31, 2017(1)
| | | | | | |
| | | | | Hedge Industry
VIP ETF | |
| | From operations: | |
| | Net investment income | | $ | 210,026 | |
| | Net realized gain | | | 3,093,684 | |
| | Net change in unrealized gain | | | 3,689,957 | |
| | Net increase in net assets resulting from operations | | | 6,993,667 | |
| | | | | | |
| | Distributions to shareholders: | | | | |
| | From net investment income | | | (105,656 | ) |
| | Total distributions to shareholders | | | (105,656 | ) |
| | | | | | |
| | From share transactions: | | | | |
| | Proceeds from sales of shares | | | 68,761,793 | |
| | Cost of shares redeemed | | | (30,240,294 | ) |
| | Net increase in net assets resulting from share transactions | | | 38,521,499 | |
| | TOTAL INCREASE | | | 45,409,510 | |
| | | | | | |
| | Net assets: | | | | |
| | Beginning of period | | $ | — | |
| | End of period | | $ | 45,409,510 | |
| | Undistributed net investment income | | $ | 104,370 | |
| | (1) | | For the period November 1, 2016 (commencement of operations) through August 31, 2017. |
| | |
| The accompanying notes are an integral part of these financial statements. | | 13 |
GOLDMAN SACHS HEDGE INDUSTRY VIP ETF
Financial Highlights
Selected Data for a Share Outstanding Throughout The Period
| | | | | | |
| | | | | Hedge Industry
VIP ETF* | |
| | Per Share Operating Performance: | | | | |
| | Net asset value, beginning of period | | $ | 40.00 | |
| | Net investment income(a)(b) | | | 0.32 | |
| | Net realized and unrealized gain | | | 10.31 | |
| | Total gain from investment operations | | | 10.63 | |
| | Distributions to shareholders from net investment income | | | (0.17 | ) |
| | Net asset value, end of period | | $ | 50.46 | |
| | Market price, end of period | | $ | 50.48 | |
| | Total Return at Net Asset Value(c) | | | 26.61 | % |
| | Net assets, end of period (in 000’s) | | $ | 45,410 | |
| | Ratio of total expenses to average net assets(d) | | | 0.45 | % |
| | Ratio of net investment income to average net assets(d) | | | 0.84 | % |
| | Portfolio turnover rate(e) | | | 116 | % |
| | * | | For the period November 1, 2016 (commencement of operations) to August 31, 2017. |
| | (a) | | Calculated based on the average shares outstanding methodology. |
| | (b) | | Reflects income recognized from non-reoccuring special dividends which amounted to $0.11 per share and 0.24% of average net assets. |
| | (c) | | Assumes investment at the net asset value at the beginning of the period, reinvestment of all distributions and a complete sale of the investment at the net asset value at the end of the period. Returns do not reflect the impact of taxes to shareholders relating to Fund distributions or the sale of Fund shares. Total returns for periods less than one full year are not annualized. |
| | (e) | | The Fund’s portfolio turnover rate is calculated in accordance with regulatory requirements and excludes portfolio securities received or delivered as a result of in-kind transactions. If such transactions were included, the Fund’s portfolio turnover rate may be higher. |
| | |
| 14 | | The accompanying notes are an integral part of these financial statements. |
GOLDMAN SACHS ETF TRUST
Notes to Financial Statements
August 31, 2017
Goldman Sachs Hedge Industry VIP ETF (the “Fund”) is a series of the Goldman Sachs ETF Trust (the “Trust”) which is an open-end diversified management investment company, registered under the Investment Company Act of 1940, as amended (the “Act”), consisting of multiple series. The Trust was organized as a Delaware statutory trust on December 16, 2009.
The investment objective of the Fund is to provide investment results that closely correspond to the performance of the Goldman Sachs Hedge Fund VIP Index™ (the “Index”).
Goldman Sachs Asset Management, L.P. (“GSAM”), an affiliate of Goldman Sachs & Co. LLC (formerly, Goldman, Sachs & Co.) (“Goldman Sachs”), serves as investment adviser to the Fund pursuant to a management agreement (the “Agreement”) with the Trust. The Fund is an exchange-traded fund (“ETF”). Shares of the Fund are listed and traded on the NYSE Arca, Inc. (“NYSE Arca”). Market prices for the Fund’s shares may be different from its net asset value (“NAV”). The Fund issues and redeems shares at its respective NAV only in blocks of a specified number of shares, or multiples thereof, referred to as “Creation Units”. Creation Units are issued and redeemed principally in-kind for a basket of securities and a cash amount. Shares generally trade in the secondary market in quantities less than a Creation Unit at market prices that change throughout the day. Only those that have entered into an authorized participant agreement with ALPS Distributors, Inc. (the “Distributor”) may do business directly with the Fund.
|
| 2. SIGNIFICANT ACCOUNTING POLICIES |
The financial statements have been prepared in accordance with accounting principles generally accepted in the United States of America (“GAAP”) and require management to make estimates and assumptions that may affect the reported amounts and disclosures. Actual results may differ from those estimates and assumptions.
A. Investment Valuation — The Fund’s valuation policy is to value investments at fair value.
B. Investment Income and Investments — Investment income includes interest income, dividend income and securities lending income. Interest income is accrued daily and adjusted for amortization of premiums and accretion of discounts. Dividend income is recognized on ex-dividend date or, for certain foreign securities, as soon as such information is obtained subsequent to the ex-dividend date. Investment transactions are reflected on trade date. Realized gains and losses are calculated using identified cost. Investment transactions are recorded on the following business day for daily NAV calculations. Investment income is recorded net of any foreign withholding taxes, less any amounts reclaimable. The Fund may file withholding tax reclaims in certain jurisdictions to recover a portion of amounts previously withheld. Any foreign capital gains tax is accrued daily based upon net unrealized gains, and is payable upon sale of such investments.
C. Expenses — Expenses incurred directly by the Fund are charged to the Fund, and certain expenses incurred by the Trust that may not solely relate to the Fund are allocated to the Fund and the other applicable funds of the Trust on a straight-line and/or pro-rata basis, depending upon the nature of the expenses, and are accrued daily.
D. Federal Taxes and Distributions to Shareholders — It is the Fund’s policy to comply with the requirements of the Internal Revenue Code of 1986, as amended (the “Code”), applicable to regulated investment companies (mutual funds) and to distribute each year substantially all of its investment company taxable income and capital gains to its shareholders. Accordingly, the Fund is not required to make any provisions for the payment of federal income tax. Distributions to shareholders are recorded on the ex-dividend date. Income and capital gains distributions, if any, are declared and paid according to the following schedule:
| | | | | | |
| Fund | | | | Income Distributions Declared/Paid | | Capital Gains Distributions
Declared/Paid |
Hedge Industry VIP ETF | | | | Quarterly | | Annually |
Net capital losses, if any, are carried forward to future fiscal years and may be used to the extent allowed by the Code to offset any future capital gains. Losses that are carried forward will retain their character as either short-term or long-term capital losses. Utilization of capital loss carryforwards will reduce the requirement of future capital gains distributions.
15
GOLDMAN SACHS ETF TRUST
Notes to Financial Statements (continued)
August 31, 2017
|
| 2. SIGNIFICANT ACCOUNTING POLICIES (continued) |
The characterization of distributions to shareholders for financial reporting purposes is determined in accordance with federal income tax rules, which may differ from GAAP. The source of the Fund’s distributions may be shown in the accompanying financial statements as either from net investment income, net realized gain or capital. Certain components of the Fund’s net assets on the Statement of Assets and Liabilities reflect permanent GAAP/tax differences based on the appropriate tax character.
F. Foreign Currency Translation — The accounting records and reporting currency of the Fund is maintained in U.S. dollars. Assets and liabilities denominated in foreign currencies are translated into U.S. dollars using the current exchange rates at the close of each business day. The effect of changes in foreign currency exchange rates on investments is included within net realized and unrealized gain (loss) on investments. Changes in the value of other assets and liabilities as a result of fluctuations in foreign exchange rates are included in the Statement of Operations within net change in unrealized gain (loss) on foreign currency translations. Transactions denominated in foreign currencies are translated into U.S. dollars on the date the transaction occurred, the effects of which are included within net realized gain (loss) on foreign currency transactions.
| | |
| 3. INVESTMENTS AND FAIR VALUE MEASUREMENTS |
U.S. GAAP defines the fair value of a financial instrument as the amount that would be received to sell an asset or paid to transfer a liability in an orderly transaction between market participants at the measurement date (i.e., the exit price); the Fund’s policy is to use the market approach. GAAP establishes a fair value hierarchy that prioritizes the inputs to valuation techniques used to measure fair value. The hierarchy gives the highest priority to unadjusted quoted prices in active markets for identical assets or liabilities (Level 1 measurements) and the lowest priority to unobservable inputs (Level 3 measurements). The levels used for classifying investments are not necessarily an indication of the risk associated with investing in these investments. The three levels of the fair value hierarchy are described below:
Level 1 — Unadjusted quoted prices in active markets that are accessible at the measurement date for identical, unrestricted assets or liabilities;
Level 2 — Quoted prices in markets that are not active or financial instruments for which significant inputs are observable
(including, but not limited to, quoted prices for similar investments, interest rates, foreign exchange rates, volatility and credit spreads), either directly or indirectly;
Level 3 — Prices or valuations that require significant unobservable inputs (including GSAM’s assumptions in determining fair value measurement).
Changes in valuation techniques may result in transfers into or out of an assigned level within the hierarchy. In accordance with the Fund’s policy, transfers between different levels of the fair value hierarchy resulting from such changes are deemed to have occurred as of the beginning of the reporting period.
The Board of Trustees (“Trustees”) has approved Valuation Procedures that govern the valuation of the portfolio investments held by the Fund, including investments for which market quotations are not readily available. The Trustees have delegated to GSAM day-to-day responsibility for implementing and maintaining internal controls and procedures related to the valuation of the Fund’s investments. To assess the continuing appropriateness of pricing sources and methodologies, GSAM regularly performs price verification procedures and issues challenges as necessary to third party pricing vendors or brokers, and any differences are reviewed in accordance with the Valuation Procedures.
A. Level 1 and Level 2 Fair Value Investments — The valuation techniques and significant inputs used in determining the fair values for investments classified as Level 1 and Level 2 are as follows:
Equity Securities — Equity securities traded on a United States (“U.S.”) securities exchange or the NASDAQ system, or those located on certain foreign exchanges, including but not limited to the Americas, are valued daily at their last sale price or official closing price on the principal exchange or system on which they are traded. If there is no sale or official closing price or such price is believed by GSAM to not represent fair value, equity securities are valued at the last bid price for long positions and at the last ask price for short positions. To the extent these investments are actively traded, they are classified as Level 1 of the fair value hierarchy, otherwise they are generally classified as Level 2.
16
GOLDMAN SACHS ETF TRUST
|
| 3. INVESTMENTS AND FAIR VALUE MEASUREMENTS (continued) |
Unlisted equity securities for which market quotations are available are valued at the last sale price on the valuation date, or if no sale occurs, at the last bid price.
B. Level 3 Fair Value Investments — To the extent that significant inputs to valuation models and other alternative pricing sources are unobservable, or if quotations are not readily available, or if GSAM believes that such quotations do not accurately reflect fair value, the fair value of the Fund’s investments may be determined under Valuation Procedures approved by the Trustees. GSAM, consistent with its procedures and applicable regulatory guidance, may make an adjustment to the most recent valuation prices of either domestic or foreign securities in light of significant events to reflect what it believes to be the fair value of the securities at the time of determining the Fund’s NAV. Significant events which could affect a large number of securities in a particular market may include, but are not limited to: significant fluctuations in U.S. or foreign markets; market dislocations; market disruptions; or unscheduled market closings. Significant events which could also affect a single issuer may include, but are not limited to: corporate actions such as reorganizations, mergers and buy-outs; ratings downgrades; and bankruptcies. At August 31, 2017 the Fund did not hold level 3 securities.
C. Fair Value Hierarchy — The following is a summary of the Fund’s investments classified in the fair value hierarchy as of August 31, 2017:
| | | | | | | | | | | | |
| HEDGE INDUSTRY VIP ETF | |
| | | |
| Investment Type | | Level 1 | | | Level 2 | | | Level 3 | |
| Assets | | | | | | | | | | | | |
Common Stock and/or Other Equity Investments(a) | | | | | | | | | | | | |
Asia | | $ | 2,760,869 | | | $ | — | | | $ | — | |
Europe | | | 900,743 | | | | — | | | | — | |
North America | | | 41,602,369 | | | | — | | | | — | |
| Total | | $ | 45,263,981 | | | $ | — | | | $ | — | |
| (a) | | Amounts are disclosed by continent to highlight the impact of time zone differences between local market close and the calculation of NAV. Security valuations are based on the principal exchange or system on which they are traded, which may differ from country of domicile noted in the table. |
For further information regarding security characteristics, see the Schedule of Investments.
|
| 4. AGREEMENTS AND AFFILIATED TRANSACTIONS |
A. Management Agreement — Under the Agreement, GSAM manages the Fund, subject to the general supervision of the Trustees.
As compensation for the services rendered pursuant to the Agreement, the assumption of the expenses related thereto and administration of the Fund’s business affairs, including providing facilities, GSAM is entitled to a management fee, accrued daily and paid monthly, equal to an annual percentage rate of the Fund’s average daily net assets.
The Fund operates under a unitary management fee structure. Under the unitary fee structure, GSAM is responsible for paying substantially all the expenses of the Fund, excluding payments under the Fund’s 12b-1 plan (if any), interest expenses, taxes, acquired fund fees and expenses, brokerage fees, costs of holding shareholder meetings, litigation, indemnification and extraordinary expenses. As the Fund directly pays fees and expenses of the independent Trustees, the management fee collected by GSAM will be reduced by an amount equal to the fees and expenses paid by the Fund to the independent Trustees.
For the fiscal year ended August 31, 2017, the unitary management fee with GSAM was 0.45%.
B. Distribution and Service (12b-1) Plans — The Trust, on behalf of the Fund, has adopted a Distribution and Service Plan (the “Plan”), subject to Rule 12b-1 under the Act. Under the Plan, the Fund is authorized to pay distribution fees in connection with the provision of ongoing services to shareholders of the Fund and the maintenance of shareholder accounts in an amount up to
17
GOLDMAN SACHS ETF TRUST
Notes to Financial Statements (continued)
August 31, 2017
|
| 5. CREATION AND REDEMPTION OF CREATION UNITS |
0.25% of its average daily net assets each year. No Rule 12b-1 fees are currently paid by the Fund, and there are no current plans to impose these fees.
The Trust issues and redeems shares of the Fund only in Creation Units on a continuous basis through the Distributor, without an initial sales load, at NAV next determined after receipt, on any Business Day (as defined in the Statement of Additional Information), of an order in proper form. Shares of the Fund may only be purchased or redeemed by certain financial institutions (each an “Authorized Participant”). An Authorized Participant is either (1) a “Participating Party” or other participant in the clearing process through the Continuous Net Settlement System of the National Securities Clearing Corporation; or (2) a Depository Trust Company participant; which, in either case, must have executed an agreement with the Distributor. Retail investors will typically not qualify as an Authorized Participant or have the resources to buy and sell whole Creation Units. Therefore, they will be unable to purchase or redeem the shares directly from the Fund. Rather, most retail investors will purchase shares in the secondary market at market prices with the assistance of a broker and may be subject to customary brokerage commissions or fees. Fixed creation and redemption transaction fees are imposed in connection with creations and redemptions.
Authorized Participants transacting in Creation Units for cash may also pay a variable charge to compensate the Fund for certain transaction costs (e.g. taxes on currency or other financial transactions, and brokerage costs) and market impact expenses relating to investing in portfolio securities. Such variable charges, if any, are included in “Proceeds from sale of shares” in the Statement of Changes in Net Assets.
Share activity is as follows:
| | | | | | | | | | |
| | | | | Hedge Industry VIP ETF | |
| | | | | Shares | | | Dollars | |
Fund Share Activity (1) | | | | | | | | | | |
Shares Sold | | | | | 1,550,000 | | | $ | 68,761,740 | |
Shares Redeemed | | | | | (650,000 | ) | | | (30,240,294 | ) |
NET INCREASE IN SHARES | | | | | 900,000 | | | $ | 38,521,446 | |
| (1) | | For the period November 1, 2016 (commencement of operations) through August 31, 2017 |
|
| 6. PORTFOLIO SECURITIES TRANSACTIONS |
The cost of purchases and proceeds from sales and maturities of long-term securities for the fiscal year ended August 31, 2017, were as follows:
| | | | | | | | | | |
| Fund | | | | Purchases | | | Sales | |
Hedge Industry VIP ETF | | | | $ | 35,680,832 | | | $ | 34,787,081 | |
The purchases and sales from in-kind creation and redemption transactions for the fiscal year ended August 31, 2017, were as follows:
| | | | | | | | | | |
| Fund | | | | Purchases | | | Sales | |
Hedge Industry VIP ETF | | | | $ | 67,750,993 | | | $ | 30,161,342 | |
18
GOLDMAN SACHS ETF TRUST
The tax character of distributions paid during the fiscal year ended August 31, 2017 was as follows:
| | | | | | |
| | | | | Hedge Industry VIP | |
Distributions paid from: | | | | | | |
Ordinary Income | | | | $ | 105,656 | |
Total taxable distributions | | | | $ | 105,656 | |
As of August 31, 2017, the components of accumulated earnings (losses) on a tax-basis were as follows:
| | | | | | |
| | | | | Hedge Industry VIP | |
Undistributed ordinary income — net | | | | $ | 104,370 | |
Total undistributed earnings | | | | $ | 104,370 | |
Timing differences (Post-October Capital Loss Deferral) | | | | $ | (179,228 | ) |
Unrealized gains (losses) — net | | | | $ | 3,553,273 | |
Total accumulated earnings (losses) net | | | | $ | 3,478,415 | |
As of August 31, 2017, the Fund’s aggregate security unrealized gains and losses based on cost for U.S. federal income tax purposes were as follows:
| | | | | | |
| | | | | Hedge Industry VIP | |
Tax Cost | | | | $ | 41,710,708 | |
Gross unrealized gain | | | | | 3,690,831 | |
Gross unrealized loss | | | | | (137,558 | ) |
Net unrealized gains (losses) on securities | | | | $ | 3,553,273 | |
The difference between GAAP-basis and tax-basis unrealized gains (losses) is attributable primarily to wash sales.
In order to present certain components of the Fund’s capital accounts on a tax-basis, certain reclassifications have been recorded to the Fund’s accounts. These reclassifications have no impact on the NAV of the Fund and result primarily from Redemptions In-Kind.
| | | | | | | | | | |
| Fund | | | | Paid-in Capital | | | Accumulated
Net Realized
Gain (Loss) | |
Hedge Industry VIP | | | | $ | 3,409,596 | | | $ | (3,409,596 | ) |
GSAM has reviewed the Fund’s tax positions for all open tax years (the current year) and has concluded that no provision for income tax is required in the Fund’s financial statements. Such open tax year remains subject to examination and adjustment by tax authorities.
19
GOLDMAN SACHS ETF TRUST
Notes to Financial Statements (continued)
August 31, 2017
The Fund’s portfolio’s risks include, but are not limited to, the following:
Index Risk — GSAM (the “Index Provider”) constructs the Fund’s Index in accordance with a rules-based methodology. The Fund will be negatively affected by general declines in the securities and asset classes represented in the Index. In addition, because the Fund is not “actively” managed, unless a specific security is removed from the Index, the Fund generally would not sell a security because the security’s issuer was in financial trouble. Market disruptions and regulatory restrictions could have an adverse effect on the Fund’s ability to adjust its exposure to the required levels in order to track the Index. The Fund also does not attempt to take defensive positions under any market conditions, including declining markets. Therefore, the Fund’s performance could be lower than funds that may actively shift their portfolio assets to take advantage of market opportunities or to lessen the impact of a market decline or a decline in the value of one or more issuers. The Index Provider relies on third party data it believes to be reliable in constructing the Index, but it does not guarantee the accuracy or availability of such third party data. The Index is new and has a limited performance history. Errors in index data, index computation or the construction of the Index in accordance with its methodology may occur from time to time and may not be identified and corrected by the Index Provider for a period of time or at all, which may have an adverse impact on the Fund and its shareholders. In addition, neither the Fund, the Investment Adviser nor the Index Provider can guarantee the availability or timeliness of the production of the Index.
Market and Credit Risks — In the normal course of business, the Fund trades financial instruments and enters into financial transactions where risk of potential loss exists due to changes in the market (market risk). Additionally, the Fund may also be exposed to credit risk in the event that an issuer or guarantor fails to perform or that an institution or entity with which the Fund has unsettled or open transactions defaults.
Market Trading Risk — The Fund faces numerous market trading risks, including disruptions to creations and redemptions, the existence of extreme market volatility or potential lack of an active trading market for Shares. If a shareholder purchases Shares at a time when the market price is at a premium to the NAV or sells Shares at a time when the market price is at a discount to the NAV, the shareholder may sustain losses. The Investment Adviser cannot predict whether Shares will trade below, at or above their NAV. Price differences may be due, in large part, to the fact that supply and demand forces at work in the secondary trading market for Shares will be closely related to, but not identical to, the same forces influencing the prices of the securities of the Fund’s Index trading individually or in the aggregate at any point in time.
Tracking Error Risk — Tracking error is the divergence of the Fund’s performance from that of the Index. The performance of the Fund may diverge from that of the Index for a number of reasons. Tracking error may occur because of transaction costs, the Fund’s holding of cash, differences in accrual of dividends, changes to the Index or the need to meet new or existing regulatory requirements. Unlike the Fund, the returns of the Index are not reduced by investment and other operating expenses, including the trading costs associated with implementing changes to its portfolio of investments. Tracking error risk may be heightened during times of market volatility or other unusual market conditions.
Under the Trust’s organizational documents, its Trustees, officers, employees and agents are indemnified, to the extent permitted by the Act and state law, against certain liabilities that may arise out of performance of their duties to the Fund. Additionally, in the course of business, the Fund enters into contracts that contain a variety of indemnification clauses. The Fund’s maximum exposure under these arrangements is unknown, as this would involve future claims that may be made against the Fund that have not yet occurred. However, GSAM believes the risk of loss under these arrangements to be remote.
20
GOLDMAN SACHS ETF TRUST
Subsequent events after the Statement of Assets and Liabilities date have been evaluated and GSAM has concluded that there is no impact requiring adjustment or disclosure in the financial statements.
21
Report of Independent Registered Public
Accounting Firm
To the Board of Trustees of Goldman Sachs ETF Trust and Shareholders of the
Goldman Sachs Hedge Industry VIP ETF:
In our opinion, the accompanying statement of assets and liabilities, including the schedule of investments, and the related statements of operations and of changes in net assets and the financial highlights present fairly, in all material respects, the financial position of the Goldman Sachs Hedge Industry VIP ETF (the “Fund”), a fund of the Goldman Sachs ETF Trust, as of August 31, 2017, and the results of its operations, the changes in its net assets and the financial highlights for the period November 1, 2016 (commencement of operations) through August 31, 2017, in conformity with accounting principles generally accepted in the United States of America. These financial statements and financial highlights (hereafter referred to as “financial statements”) are the responsibility of the Fund’s management. Our responsibility is to express an opinion on these financial statements based on our audit. We conducted our audit of these financial statements in accordance with the standards of the Public Company Accounting Oversight Board (United States). Those standards require that we plan and perform the audit to obtain reasonable assurance about whether the financial statements are free of material misstatement. An audit includes examining, on a test basis, evidence supporting the amounts and disclosures in the financial statements, assessing the accounting principles used and significant estimates made by management, and evaluating the overall financial statement presentation. We believe that our audit, which included confirmation of securities as of August 31, 2017 by correspondence with the custodian provides a reasonable basis for our opinion.
PricewaterhouseCoopers LLP
Boston, Massachusetts
October 24, 2017
22
GOLDMAN SACHS ETF TRUST
| | |
Fund Expenses — Six Months Ended 8/31/2017 (Unaudited) | | |
As a shareholder you incur ongoing costs, which may include management fees; distribution and service (12b-1) fees; and other Fund expenses. This Example is intended to help you understand your ongoing costs (in dollars) of investing in Shares of the Fund and to compare these costs with the ongoing costs of investing in other exchange-traded funds.
The Example is based on an investment of $1,000 invested at the beginning of the period from March 1, 2017 and held for the six months ended August 31, 2017, which represents a period of 184 days of a 365 day year (or less where indicated).
Actual Expenses — The first line in the table below provides information about actual account values and actual expenses. You may use the information in this line, together with the amount you invested, to estimate the expenses that you paid over the six months. Simply divide your account value by $1,000 (for example, an $8,600 account value divided by $1,000=8.6), then multiply the result by the number in the first line under the heading entitled “Expenses Paid” to estimate the expenses you paid on your account during this period.
Hypothetical Example for Comparison Purposes — The second line in the table below provides information about hypothetical account values and hypothetical expenses based on the Fund’s actual net expense ratios and an assumed rate of return of 5% per year before expenses, which is not the Fund’s actual return. The hypothetical account values and expenses may not be used to estimate the actual ending account balance or expenses you paid for the period. You may use this information to compare the ongoing costs of investing in the Fund and other funds. To do so, compare this 5% hypothetical example with the 5% hypothetical examples that appear in the shareholder reports of the other funds.
Please note that the expenses shown in the table are meant to highlight your ongoing costs only and do not reflect any transactional costs, such as redemption fees, or exchange fees. Therefore, the second line of the table is useful in comparing ongoing costs only, and will not help you determine the relative total costs of owning different funds. In addition, if these transactional costs were included, your costs would have been higher.
| | | | | | | | | | | | |
| | | Hedge Industry VIP ETF | |
| | | Beginning
Account Value
3/1/17 | | | Ending
Account Value
8/31/2017 | | | Expenses
Paid* | |
Actual based on NAV | | $ | 1,000 | | | $ | 1,114.90 | | | $ | 2.40 | |
Hypothetical 5% return | | $ | 1,000 | | | $ | 1,022.94 | + | | $ | 2.29 | |
| | * | | Expenses for the Fund are calculated using the Fund’s annualized net expense ratio, which represents the ongoing expenses as a percentage of net assets for the six months ended August 31, 2017. Expenses are calculated by multiplying the annualized net expense ratio by the average account value for the period; then multiplying the result by the number of days in the most recent fiscal year; and then dividing that result by the number of days in the fiscal year. | |
| | | | The annualized net expense ratio for the period is as follows: | |
| | | | |
| Fund | | | |
Hedge Industry VIP ETF | | | 0.45% | |
| | + | | Hypothetical expenses are based on the Fund’s actual annualized net expense ratios and an assumed rate of return of 5% per year before expenses. | |
23
GOLDMAN SACHS ETF TRUST
Trustees and Officers (Unaudited) Independent Trustees
| | | | | | | | | | |
Name, Address and Age1 | | Position(s) Held
with the Trust | | Term of
Office and
Length of
Time Served2 | | Principal Occupation(s)
During Past 5 Years | | Number of
Portfolios in
Fund Complex
Overseen by
Trustee3 | | Other
Directorships
Held by Trustee4 |
Caroline Dorsa Age: 58 | | Trustee | | Since 2016 | | Ms. Dorsa is retired. She was formerly Executive Vice President and Chief Financial Officer, Public Service Enterprise Group, Inc. (a generation and energy services company) (2009-2015); Senior Vice President, Merck & Co, Inc. (a pharmaceutical company) (2008-2009 and 1987-2007); Senior Vice President and Chief Financial Officer, Gilead Sciences, Inc. (a pharmaceutical company) (2007-2008); and Senior Vice President and Chief Financial Officer, Avaya, Inc. (a technology company) (2007). Trustee — Goldman Sachs ETF Trust; Goldman Sachs MLP Income Opportunities Fund; and Goldman Sachs MLP and Energy Renaissance Fund. | | 21 | | Biogen Inc. (a biotechnology company); Intellia Therapeutics Inc. (a gene-editing company); Illumina, Inc. (a life sciences company) |
Linda A. Lang Age: 59 | | Trustee | | Since 2016 | | Ms. Lang is retired. She is Chair of the Board of Directors (2016-Present); and Member of the Board of Directors, WD-40 Company (2004-Present); and was formerly Chairman and Chief Executive Officer (2005-2014); and Director, President and Chief Operating Officer, Jack in the Box, Inc. (a restaurant company) (2003-2005). Previously, Ms. Lang served as an Advisory Board Member of Goldman Sachs MLP Income Opportunities Fund and Goldman Sachs MLP and Energy Renaissance Fund (February 2016-March 2016). Trustee — Goldman Sachs ETF Trust; Goldman Sachs MLP Income Opportunities Fund; and Goldman Sachs MLP and Energy Renaissance Fund. | | 21 | | WD-40 Company (a global consumer products company) |
| | | | | | | | | | |
24
GOLDMAN SACHS ETF TRUST
Trustees and Officers (Unaudited) (continued) Independent Trustees
| | | | | | | | | | |
Name, Address and Age1 | | Position(s) Held
with the Trust | | Term of
Office and
Length of
Time Served2 | | Principal Occupation(s)
During Past 5 Years | | Number of
Portfolios in
Fund Complex
Overseen by
Trustee3 | | Other
Directorships
Held by Trustee4 |
Michael Latham Age: 51 | | Trustee | | Since 2015 | | Mr. Latham is retired. Formerly, he held senior management positions with the iShares exchange-traded fund business, including Chairman (2011-2014); Global Head (2010-2011); U.S. Head (2007-2010); and Chief Operating Officer (2003-2007). Trustee — Goldman Sachs ETF Trust; Goldman Sachs MLP Income Opportunities Fund; and Goldman Sachs MLP and Energy Renaissance Fund. | | 21 | | None |
Lawrence W. Stranghoener Age: 63 | | Trustee and Chairman | | Trustee since 2015; Chairman since 2017 | | Mr. Stranghoener is retired. He is Chairman of the Board of Directors, Kennametal, Inc. (2003-Present); Director, Aleris Corporation and Aleris International, Inc. (a producer of aluminum rolled products) (2011-Present); and was formerly Interim Chief Executive Officer (2014); and Executive Vice President and Chief Financial Officer (2004-2014), Mosaic Company (a fertilizer manufacturing company). Chairman of the Board of Trustees — Goldman Sachs ETF Trust; Goldman Sachs MLP Income Opportunities Fund; and Goldman Sachs MLP and Energy Renaissance Fund. | | 21 | | Kennametal Inc. (a global manufacturer and distributor of tooling and industrial materials) |
| | | | | | | | | | |
25
GOLDMAN SACHS ETF TRUST
Trustees and Officers (Unaudited) (continued) Interested Trustee*
| | | | | | | | | | |
Name, Address and Age1 | | Position(s) Held
with the Trust | | Term of
Office and
Length of
Time Served2 | | Principal Occupation(s)
During Past 5 Years | | Number of
Portfolios in
Fund Complex
Overseen by
Trustee3 | | Other
Directorships
Held by Trustee4 |
James A. McNamara Age: 54 | | Trustee and President | | Since 2014 | | Managing Director, Goldman Sachs (December 1998-Present); Director of Institutional Fund Sales, GSAM (April 1998-December 2000); and Senior Vice President and Manager, Dreyfus Institutional Service Corporation (January 1993- April 1998). President and Trustee — Goldman Sachs ETF Trust; Goldman Sachs Trust; Goldman Sachs Variable Insurance Trust; Goldman Sachs Trust II; Goldman Sachs MLP Income Opportunities Fund; and Goldman Sachs MLP and Energy Renaissance Fund. | | 142 | | None |
| | | | | | | | | | |
| * | | This person is considered to be an “Interested Trustee” because he holds a position with Goldman Sachs and own securities issued by The Goldman Sachs Group, Inc. The Interested Trustee holds comparable positions with certain other companies of which Goldman Sachs, GSAM or an affiliate thereof is the investment adviser, administrator and/or distributor. |
| 1 | | Each Trustee may be contacted by writing to the Trustee, c/o Goldman Sachs, 200 West Street, New York, New York, 10282, Attn: Caroline L. Kraus. Information is provided as of August 31, 2017. |
| 2 | | Each Trustee holds office for an indefinite term until the earliest of: (a) the election of his or her successor; (b) the date the Trustee resigns, retires or is removed by the Board of Trustees or shareholders, in accordance with the Trust’s Declaration of Trust; or (c) the termination of the Trust. |
| 3 | | The Goldman Sachs Fund Complex includes certain other companies listed above for each respective Trustee. As of August 31, 2017, Goldman Sachs ETF Trust consisted of 19 portfolios (eight of which offered shares to the public); Goldman Sachs Trust consisted of 90 portfolios (88 of which offered shares to the public); Goldman Sachs Variable Insurance Trust consisted of 14 portfolios; Goldman Sachs Trust II consisted of 17 portfolios (16 of which offered shares to the public); and Goldman Sachs MLP Income Opportunities Fund, and Goldman Sachs MLP and Energy Renaissance Fund each consisted of one portfolio. |
| 4 | | This column includes only directorships of companies required to report to the Securities and Exchange Commission under the Securities Exchange Act of 1934 (i.e., “public companies”) or other investment companies registered under the Act. |
Additional information about the Trustees is available in the Fund’s Statement of Additional Information, which can be obtained from Goldman Sachs free of charge by calling this toll-free number (in the United States of America): 1-800-526-7384.
26
GOLDMAN SACHS ETF TRUST
Trustees and Officers (Unaudited) (continued) Officers of the Trust*
| | | | | | |
| Name, Address and Age1 | | Positions Held
with the Trust | | Term of
Office and
Length of Time Served2 | | Principal Occupation(s)
During Past 5 Years |
James A. McNamara 200 West Street New York, NY 10282 Age: 54 | | Trustee and President | | Since 2014 | | Managing Director, Goldman Sachs (December 1998-Present); Director of Institutional Fund Sales, GSAM (April 1998-December 2000); and Senior Vice President and Manager, Dreyfus Institutional Service Corporation (January 1993-April 1998). President and Trustee — Goldman Sachs ETF Trust; Goldman Sachs Trust; Goldman Sachs Variable Insurance Trust; Goldman Sachs Trust II; Goldman Sachs MLP Income Opportunities Fund; and Goldman Sachs MLP and Energy Renaissance Fund. |
Caroline L. Kraus 200 West Street New York, NY 10282 Age: 40 | | Secretary | | Since 2014 | | Managing Director, Goldman Sachs (January 2016-Present); Vice President, Goldman Sachs (August 2006-December 2015); Associate General Counsel, Goldman Sachs (2012- Present); Assistant General Counsel, Goldman Sachs (August 2006-December 2011); and Associate, Weil, Gotshal & Manges, LLP (2002-2006). Secretary — Goldman Sachs ETF Trust; Goldman Sachs Trust (previously Assistant Secretary (2012)); Goldman Sachs Variable Insurance Trust (previously Assistant Secretary (2012)); Goldman Sachs Trust II; Goldman Sachs BDC, Inc.; Goldman Sachs Private Middle Market Credit LLC; Goldman Sachs Middle Market Lending Corp.; Goldman Sachs MLP Income Opportunities Fund; and Goldman Sachs MLP and Energy Renaissance Fund. |
Scott M. McHugh 200 West Street New York, NY 10282 Age: 45 | | Treasurer, Senior Vice President and Principal Financial Officer | | Since 2014 | | Managing Director, Goldman Sachs (January 2016-Present); Vice President, Goldman Sachs (February 2007-December 2015); Assistant Treasurer of certain mutual funds administered by DWS Scudder (2005-2007); and Director (2005-2007), Vice President (2000-2005), and Assistant Vice President (1998-2000), Deutsche Asset Management or its predecessor (1998-2007). Treasurer, Senior Vice President and Principal Financial Officer — Goldman Sachs ETF Trust; Goldman Sachs Trust; Goldman Sachs Variable Insurance Trust; Goldman Sachs Trust II; Goldman Sachs MLP Income Opportunities Fund; and Goldman Sachs MLP and Energy Renaissance Fund. |
Joseph F. DiMaria 30 Hudson Street Jersey City, NJ 07302 Age: 49 | | Assistant Treasurer and Principal Accounting Officer | | Since 2017 | | Managing Director, Goldman Sachs (November 2015-Present) and Vice President — Mutual Fund Administration, Columbia Management Investment Advisers, LLC (May 2010-October 2015). Assistant Treasurer and Principal Accounting Officer — Goldman Sachs ETF Trust; Goldman Sachs Trust; Goldman Sachs Variable Insurance Trust; Goldman Sachs Trust II; Goldman Sachs MLP Income Opportunities Fund; and Goldman Sachs MLP and Energy Renaissance Fund. |
| | | | | | |
| * | | Represents a partial list of officers of the Trust. Additional information about all the officers is available in the Fund’s Statement of Additional Information, which can be obtained from Goldman Sachs free of charge by calling this toll-free number (in the United States): 1-800-621-2550. |
| 1 | | Information is provided as of August 31, 2017. |
| 2 | | Officers hold office at the pleasure of the Board of Trustees or until their successors are duly elected and qualified. Each officer holds comparable positions with certain other companies of which Goldman Sachs, GSAM or an affiliate thereof is the investment adviser, administrator and/or distributor. |
27
GOLDMAN SACHS ETF TRUST
Goldman Sachs Hedge Industry VIP ETF — Tax Information (Unaudited)
For the year ended August 31, 2017, 100% of the dividends paid from net investment company taxable income by the Goldman Sachs Hedge Industry VIP ETF qualify for the dividends received deduction available to corporations.
For the year ended August 31, 2017, 100% of the dividends paid from net investment company taxable income by the Goldman Sachs Hedge Industry VIP ETF qualify for the reduced tax rate under the Jobs and Growth Tax Relief and Reconciliation Act of 2003.
28
FUNDS PROFILE
Goldman Sachs ETFs

Goldman Sachs is a premier financial services firm, known since 1869 for creating thoughtful and customized investment solutions in complex global markets.
Today, the Investment Management Division of Goldman Sachs serves a diverse set of clients worldwide, including private institutions, public entities and individuals. With approximately $1.21 trillion in assets under supervision as of June 30, 2017, Goldman Sachs Asset Management (“GSAM”) has portfolio management teams located around the world and our investment professionals bring firsthand knowledge of local markets to every investment decision. Assets under supervision includes assets under management and other client assets for which Goldman Sachs does not have full discretion. GSAM leverages the resources of Goldman Sachs & Co. LLC. subject to legal, internal and regulatory restrictions.
|
| GOLDMAN SACHS EXCHANGE-TRADED FUNDS |
| Goldman Sachs ActiveBeta® Emerging Markets Equity ETF |
| Goldman Sachs ActiveBeta® Europe Equity ETF |
| Goldman Sachs ActiveBeta® International Equity ETF |
| Goldman Sachs ActiveBeta® Japan Equity ETF |
| Goldman Sachs ActiveBeta® U.S. Large Cap Equity ETF |
| Goldman Sachs ActiveBeta® U.S. Small Cap Equity ETF |
| Goldman Sachs Equal Weight U.S. Large Cap Equity ETF |
| Goldman Sachs Hedge Industry VIP ETF |
| Goldman Sachs TreasuryAccess 0-1 Year ETF |
| Goldman Sachs Access Investment Grade Corporate Bond ETF |
Goldman Sachs Access High Yield Corporate Bond ETF |
INDEX DISCLAIMER
GOLDMAN SACHS ASSET MANAGEMENT, L.P., THE GOLDMAN SACHS GROUP, INC., AND GOLDMAN SACHS & CO. LLC. (COLLECTIVELY, “GOLDMAN SACHS”) DOES NOT GUARANTEE NOR MAKE ANY REPRESENTATION OR WARRANTY, EXPRESS OR IMPLIED, TO THE OWNERS OR SHAREHOLDERS OF THE FUND OR ANY MEMBER OF THE PUBLIC REGARDING THE ADVISABILITY OF INVESTING IN SECURITIES GENERALLY OR IN THE FUND PARTICULARLY OR THE ABILITY OF THE INDEX TO TRACK GENERAL MARKET PERFORMANCE. GOLDMAN SACHS, IN ITS CAPACITY AS THE INDEX PROVIDER OF THE INDEX, LICENSES CERTAIN TRADEMARKS AND TRADE NAMES TO THE FUND. GOLDMAN SACHS HAS NO OBLIGATION TO TAKE THE NEEDS OF THE FUND OR THE SHAREHOLDERS OF THE FUND INTO CONSIDERATION IN DETERMINING, COMPOSING OR CALCULATING THE INDEX. GOLDMAN SACHS OR ANY OF ITS AFFILIATES MAY HOLD LONG OR SHORT POSITIONS IN SECURITIES HELD BY THE FUND OR IN RELATED DERIVATIVES GOLDMAN SACHS DOES NOT GUARANTEE THE ADEQUACY, TIMELINESS, ACCURACY AND/OR THE COMPLETENESS OF THE INDEX OR ANY DATA RELATED THERETO. GOLDMAN SACHS HEREBY EXPRESSLY DISCLAIMS ANY AND ALL LIABILITY FOR ANY ERRORS, OMISSIONS, OR INTERRUPTIONS THEREIN OR IN THE CALCULATION THEREOF. GOLDMAN SACHS MAKES NO WARRANTY, EXPRESS OR IMPLIED, AND EXPRESSLY DISCLAIMS ALL WARRANTIES OF MERCHANTABILITY OR FITNESS FOR A PARTICULAR PURPOSE OR USE WITH RESPECT TO THE MARKS, THE INDEX OR ANY DATA INCLUDED THEREIN AS TO THE RESULTS TO BE OBTAINED BY THE FUND, THE SHAREHOLDERS, OR ANY OTHER PERSON OR ENTITY FROM USE OF THE INDEX OR ANY DATA INCLUDED THEREIN. WITHOUT LIMITING ANY OF THE FOREGOING, GOLDMAN SACHS HEREBY EXPRESSLY DISCLAIMS ANY AND ALL LIABILITY FOR ANY SPECIAL, PUNITIVE, INDIRECT, OR CONSEQUENTIAL DAMAGES (INCLUDING LOST PROFITS), EVEN IF ADVISED OF THE POSSIBILITY OF SUCH DAMAGES.
| | |
TRUSTEES Lawrence W. Stranghoener, Chairman Caroline Dorsa Linda A. Lang Michael Latham James A. McNamara | | OFFICERS James A. McNamara, President Scott M. McHugh, Treasurer, Senior Vice President and Principal Financial Officer Joseph F. DiMaria, Assistant Treasurer and Principal Accounting Officer Caroline L. Kraus, Secretary |
| |
THE BANK OF NEW YORK MELLON Transfer Agent | | |
| |
ALPS DISTRIBUTORS, INC. Distributor | | GOLDMAN SACHS ASSET MANAGEMENT, L.P. Investment Adviser |
Visit our Website at www.GSAMFUNDS.com to obtain the most recent month-end returns.
Goldman Sachs Asset Management, L.P., 200 West Street, New York, New York 10282
The reports concerning the Fund included in this shareholder report may contain certain forward-looking statements about the factors that may affect the performance of the Fund in the future. These statements are based on Fund management’s predictions and expectations concerning certain future events and their expected impact on the Fund, such as performance of the economy as a whole and of specific industry sectors, changes in the levels of interest rates, the impact of developing world events, and other factors that may influence the future performance of the Fund. Management believes these forward-looking statements to be reasonable, although they are inherently uncertain and difficult to predict. Actual events may cause adjustments in portfolio management strategies from those currently expected to be employed.
A description of the policies and procedures that the Fund uses to determine how to vote proxies relating to portfolio securities and information regarding how the Fund voted proxies relating to portfolio securities for the most recent 12-month period ended June 30, are available (i) without charge, upon request by calling 1-800-621-2550; and (ii) on the Securities and Exchange Commission (“SEC’’) web site at http://www.sec.gov.
The Fund files its complete schedule of portfolio holdings with the SEC for the first and third quarters of each fiscal year on Form N-Qs. The Fund’s Form N-Qs are available on the SEC’s web site at http://www.sec.gov within 60 days after the Fund’s first and third fiscal quarters. The Fund’s Form N-Qs may be reviewed and copied at the SEC’s Public Reference Room in Washington, D.C., and information on the operation of the Public Reference Room may also be obtained by calling 1-800-SEC-0330. Form N-Qs may be obtained upon request and without charge by calling 1-800-621-2550. Fund holdings and allocations shown are as of August 31, 2017 and may not be representative of future investments. Fund holdings should not be relied on in making investment decisions and should not be construed as research or investment advice regarding particular securities. Current and future holdings are subject to risk.
ETF Fund shares are not individually redeemable and are issued and redeemed by the Fund at their net asset value (“NAV”) only in large, specified blocks of shares called creation units. Shares otherwise can be bought and sold only through exchange trading at market price (not NAV). Shares may trade at a premium or discount to their NAV in the secondary market. Brokerage commissions will reduce returns.
The Fund is recently organized and has limited operating history.
The Global Industry Classification Standard (GICS) was developed by and is the exclusive property and a service mark of Morgan Stanley Capital International Inc. (MSCI) and Standard & Poor’s, a division of The McGraw-Hill Companies, Inc. (S&P) and is licensed for use by Goldman Sachs. Neither MSCI, S&P nor any other party involved in making or compiling the GICS or any GICS classifications makes any express or implied warranties or representations with respect to such standard or classification (or the results to be obtained by the use thereof), and all such parties hereby expressly disclaim all warranties of originality, accuracy, completeness, merchantability or fitness for a particular purpose with respect to any of such standard or classification. Without limiting any of the foregoing, in no event shall MSCI, S&P, any of their affiliates or any third party involved in making or compiling the GICS or any GICS classifications have any liability for any direct, indirect, special, punitive, consequential or any other damages (including lost profits) even if notified of the possibility of such damages.
Economic and market forecasts presented herein reflect our judgment as of the date of this presentation and are subject to change without notice. These forecasts do not take into account the specific investment objectives, restrictions, tax and financial situation or other needs of any specific client. Actual data will vary and may not be reflected here. These forecasts are subject to high levels of uncertainty that may affect actual performance. Accordingly, these forecasts should be viewed as merely representative of a broad range of possible outcomes. These forecasts are estimated, based on assumptions, and are subject to significant revision and may change materially as economic and market conditions change. Goldman Sachs has no obligation to provide updates or changes to these forecasts. Case studies and examples are for illustrative purposes only.
THIS MATERIAL IS FOR INFORMATIONAL PURPOSES ONLY AND IS PROVIDED SOLELY ON THE BASIS THAT IT WILL NOT CONSTITUTE INVESTMENT OR OTHER ADVICE OR A RECOMMENDATION RELATING TO ANY PERSON’S OR PLAN’S INVESTMENT OR OTHER DECISIONS, AND GOLDMAN SACHS IS NOT A FIDUCIARY OR ADVISOR WITH RESPECT TO ANY PERSON OR PLAN BY REASON OF PROVIDING THE MATERIAL OR CONTENT HEREIN INCLUDING UNDER THE EMPLOYEE RETIREMENT INCOME SECURITY ACT OF 1974 OR DEPARTMENT OF LABOR REGULATIONS. PLAN SPONSORS AND OTHER FIDUCIARIES SHOULD CONSIDER THEIR OWN CIRCUMSTANCES IN ASSESSING ANY POTENTIAL COURSE OF ACTION.
This material is not authorized for distribution to prospective investors unless preceded or accompanied by a current Prospectus or summary prospectus, if applicable. Investors should consider the Fund’s objective, risks, and charges and expenses, and read the summary prospectus, if available, and/or the Prospectus carefully before investing or sending money. The summary prospectus, if available, and the Prospectus contain this and other information about the Fund and may be obtained from your authorized dealer or from Goldman Sachs & Co. LLC by calling 1-800-621-2550.
ActiveBeta® is a registered trademark of GSAM.
ALPS Distributors, Inc. is the distributor of the Goldman Sachs ETF Funds. ALPS Distributors, Inc. is unaffiliated with Goldman Sachs Asset Management.
©2017 Goldman Sachs. All rights reserved. 107210-TMPL-10/2017-630956 HEDVIPETFAR-17/GST550/851
Goldman Sachs Funds

| | | | |
| | |
| Annual Report | | | | August 31, 2017 |
| | |
| | | | Goldman Sachs ETFs |
| | | | TreasuryAccess 0-1 Year ETF |

Goldman Sachs TreasuryAccess 0-1 Year ETF
| | | | |
| | | |
| NOT FDIC-INSURED | | May Lose Value | | No Bank Guarantee |
INVESTMENT PROCESS & MARKET REVIEW
Goldman Sachs TreasuryAccess 0-1 Year ETF
Principal Investment Strategies
The Goldman Sachs TreasuryAccess 0-1 Year ETF (the “Fund”) seeks to achieve its investment objective by investing at least 80% of its assets (exclusive of collateral held from securities lending) in securities included in its underlying index. The Citi US Treasury 0-1 Year Composite Select Index (the “Index”) is designed to measure the performance of U.S. Treasury Obligations with a maximum remaining maturity of 12 months. “U.S. Treasury Obligations” refer to securities issued or guaranteed by the U.S. Treasury where the payment of principal and interest is backed by the full faith and credit of the U.S. government. U.S. Treasury Obligations include U.S. Treasury notes, U.S. Treasury bills and U.S. Treasury floating rate bonds. As of August 31, 2017, there were 72 issues in the Index and the Index had a weighted average maturity of 0.29 years. The Index includes publicly-issued U.S. Treasury Obligations that have a minimum remaining maturity of 1 month and a maximum remaining maturity of 12 months at the time of rebalance and that have a minimum issue size of $5 billion. In addition, the securities in the Index must be non-convertible and denominated in U.S. dollars. The Index excludes certain special issues, such as targeted investor notes, state and local government series bonds and coupon issues that have been stripped from bonds. 10-year and 30-year U.S. Treasury bonds are not eligible for inclusion in the Index. The Index is rebalanced monthly on the last day of the month.
Goldman Sachs Asset Management, L.P. (“the Investment Adviser”) uses a representative sampling strategy to manage the Fund. “Representative sampling” is an indexing strategy in which the Fund invests in a representative sample of constituent securities that has a collective investment profile similar to that of the Index. The securities selected for investment by the Fund are expected to have, in the aggregate, investment characteristics, fundamental characteristics and liquidity measures similar to those of the Index. The Fund may or may not hold all of the securities in the Index.
The Index is sponsored by FTSE Fixed Income LLC1 (“FTSE” or the “Index Provider”), which is not affiliated with the Fund or the Investment Adviser. The Index is market capitalization-weighted and the securities in the Index are updated on the last business day of each month. Given the Fund’s investment objective of attempting to track the Index, the Fund does not follow traditional methods of active investment management, which may involve buying and selling securities based upon analysis of economic and market factors.
THE FUND IS NOT A MONEY MARKET FUND AND DOES NOT ATTEMPT TO MAINTAIN A STABLE NET ASSET VALUE.
* * *
At the end of the Reporting Period (i.e., September 6, 2016 through August 31, 2017), we expected ongoing improvements in the U.S. economy, particularly in the labor market, to warrant one further interest rate hike by the Federal Reserve (the “Fed”) by year-end 2017, providing financial conditions do not tighten materially and core inflation rises. More specifically, we anticipated one further interest rate hike by the Fed in December 2017 as well as the beginning of its balance sheet normalization during the fourth quarter of 2017. Elsewhere, we believe central banks in Europe and Japan may scale back quantitative easing due to scarcity of assets but to maintain low interest rates amid subdued inflation outlooks. Indeed, we maintain our belief for the European Central Bank (“ECB”) to reduce its asset
| 1 | | Prior to September 14, 2017, the Index was sponsored by Citigroup Index LLC. |
1
INVESTMENT PROCESS & MARKET REVIEW
purchases from January 2018 and for its interest rates to remain on hold for the remainder of 2017 and 2018. We see an increased likelihood of a tapering announcement from the ECB in September 2017 with the implication being potential further increases in London Interbank Offered Rate (“LIBOR”) and European rates at the short-term end of the yield curve, or spectrum of maturities. We believe monetary policy is likely to remain on hold in the U.K., providing inflation expectations do not rise materially, and we see little scope for a near-term interest rate hike in Canada given recent weakness in its inflation data.
While we appreciate that policymakers may use speeches and press conferences to shape expectations of future decisions, we believe policymaker comments made during the Reporting Period were more balanced than headlines suggested.
2
PORTFOLIO RESULTS
Goldman Sachs TreasuryAccess 0-1 Year ETF
Investment Objective
The Goldman Sachs TreasuryAccess 0-1 Year ETF (the “Fund”) seeks to provide investment results that closely correspond, before fees and expenses, to the performance of the Citi US Treasury 0-1 Year Composite Select Index (the “Index”).
Portfolio Management Discussion and Analysis
Below, the Goldman Sachs Quantitative Investment Strategies Team discusses the Fund’s performance and positioning for the period since its commencement of operations on September 6, 2016 through August 31, 2017 (the “Reporting Period”).
| Q | | How did the Fund perform during the Reporting Period? |
| A | | During the Reporting Period, the Fund returned 0.53% based on net asset value (“NAV”) and 0.53% based on market price.1 The Index returned 0.64% during the same period. |
| | The Fund had a NAV of $100.00 on the commencement of operations and ended the Reporting Period with a NAV of $100.10 per share. The Fund’s market price on August 31, 2017 was $100.10 per share. |
| Q | | What key factors were responsible for the Fund’s performance during the Reporting Period? |
| A | | The Fund seeks to provide investment results that closely correspond, before fees and expenses, to the performance of the Index. The Fund’s performance reflects Fund expenses, including management fees and brokerage expenses. The Fund’s relative performance also reflects the impact of any cash held in the Fund as well as any other differences between the Fund’s holdings and the constituents of the Index. The Index is unmanaged, and Index returns do not reflect fees and expenses, which would reduce returns. |
| | The Index is designed to measure the performance of U.S. Treasury Obligations with a maximum remaining maturity of 12 months. “U.S. Treasury Obligations” refer to securities issued or guaranteed by the U.S. Treasury where the payment of principal and interest is backed by the full faith and credit of the U.S. government. U.S. Treasury Obligations include U.S. Treasury notes, U.S. Treasury bills and U.S. Treasury floating rate bonds. The Index is sponsored by FTSE Fixed Income LLC (“FTSE” or the “Index Provider”), which is not affiliated with the Fund or the Investment Adviser. The Index is market capitalization-weighted and the securities in the Index are updated on the last business day of each month. |
| | Given the Fund’s investment objective of attempting to track the Index, the Fund does not follow traditional methods of active investment management, which may involve buying and selling securities based upon analysis of economic and market factors. |
| | During the Reporting Period, the Fund posted positive absolute returns that closely tracked those of the Index, as measured by NAV. The Fund is passively managed to the Index and aims to minimize tracking error to the Index. |
| | During the first half of the Reporting Period, it appeared to us that the Republican presidential election victory marked an important regime change in monetary, fiscal and regulatory policies. Consensus expectations for the U.S. policies mix shifted to one that included a faster pace of tightening monetary policies following several years of accommodation as well as increased fiscal stimulus and a potentially looser regulatory agenda. Since the election in early November 2016 through the end of February 2017, global interest rates rose, equity markets rallied and the U.S. dollar strengthened compared to both major developed and emerging market currencies. The U.S. Treasury money market yield curve, or spectrum of maturities, steepened on the heels of a post-election sell-off, as the market began pricing in higher inflation as a result of greater anticipated fiscal spending. (A steeper yield curve is one wherein the differential in yields between shorter-term and longer-term maturities increases.) |
| | 1 | | The first day of secondary market trading is typically several days after the date on which the Fund commenced investment operations; therefore, the NAV of the Fund is used as a proxy for the period from commencement of operations to the first day of secondary market trading to calculate the market price returns. |
3
PORTFOLIO RESULTS
| | In December 2016, the U.S. Federal Reserve (the “Fed”) raised interest rates for only the second time since the global financial crisis, which drove further increases in the U.S. dollar and U.S. Treasury yields, with particularly notable increases in shorter-dated bonds. Policymakers revised interest rate projections, signaling a steeper trajectory of interest rates, with three interest rate hikes implied in 2017. The Fed noted that it believed the December 2016 interest rate hike was warranted given “realized and expected labor market conditions and inflation.” Strong U.S. economic data year-to-date through February 28, 2017 and hawkish comments from U.S. Fed officials raised expectations for an interest rate hike at the Fed’s next meeting in March 2017. (Hawkish tends to suggest higher interest rates; opposite of dovish.) |
| | During the second half of the Reporting Period, the Fed raised interest rates twice more — in March and June 2017 and began a discussion of balance sheet normalization. (Balance sheet normalization refers to the steps the Fed will take to reverse quantitative easing and remove the substantial monetary accommodation it has provided to the economy since the financial crisis began in 2007.) |
| | U.S. Treasury yields moved higher as the Fed proceeded to raise the target range of the federal funds rate to a range of 1.00% to 1.25% in June 2017, citing ongoing strength in the labor market and a pickup in household spending and business fixed investment. Central banks in the U.K., Europe and Japan kept their respective monetary policies unchanged, but the possibility of tapering by the European Central Bank (“ECB”) and U.K. parliamentary elections were additional factors that influenced the short-term end of the U.S. Treasury market during these months. |
| | On the economic data front, U.S. indicators surprised to the downside toward the end of the Reporting Period but remained at relatively robust levels. Unemployment had declined to 4.3%, which is below the Fed’s estimate of the structural rate, and second quarter 2017 U.S. Gross Domestic Product (“GDP”) growth expectations exceeded 2% on an annualized basis. That said, core personal consumption expenditures remained below the Fed’s 2% target, and U.S. core inflation similarly weakened, casting uncertainty over the pace of monetary tightening going forward. Nonetheless, comments included in the Fed’s minutes from its May and June 2017 meetings suggested to many that a policy announcement concerning a change in its reinvestment policy may occur sooner than the consensus had previously anticipated. |
| | At the Fed’s Jackson Hole Economic Policy Symposium held in late August 2017, Fed Chair Janet Yellen said, “In light of the continued solid performance of the labor market and our outlook for economic activity and inflation, I believe the case for an increase in the federal funds rate has strengthened in recent months.” Further, the Fed released a detailed addendum to its policy statement with specifics around its plan to taper reinvestment of its balance sheet. The plan is to begin, some time in 2017, with a rundown no greater than $10 billion per month between mortgage-backed securities and U.S. Treasuries, with that total rising steadily over the course of one year. |
| | Separately, there were concerns about the U.S. debt ceiling during much of the Reporting Period. We observed accelerated bill pay-downs ahead of the mid-March 2017 debt ceiling deadline. The significant reduction in U.S. Treasury bill supply suppressed short-term U.S. Treasury bill rates. |
| | Additionally, consensus expectations for a tapering announcement in Europe in September 2017 moved from possible to more than probable. ECB President Mario Draghi made a cautious reference to a tapering of its quantitative easing, saying an adjustment in the ECB’s “policy instruments” alongside the ongoing economic recovery would imply a constant rather than tighter policy stance. The market reacted in a hawkish manner, with the euro appreciating and German government bond yields rising. |
| Q | | How did the Fund use derivatives and similar instruments during the Reporting Period? |
| A | | The Fund does not employ derivatives. |
4
PORTFOLIO RESULTS
| Q | | What was the Fund’s weighted average duration, weighted average maturity, weighted average coupon and 30-day standardized yield at the end of the Reporting Period?2 |
| A | | The Fund had a weighted average duration of 0.39 years, a weighted average maturity of 0.39 years and a weighted average coupon of 0.64% as of August 31, 2017. The 30-day standardized yield of the Fund at the end of the Reporting Period was 0.96%. |
| Q | | What was the Fund’s positioning relative to the Index at the end of the Reporting Period?3 |
| A | | The Fund, consistent with the Index, was 100% invested in U.S. Treasury securities at the end of the Reporting Period. |
| | 2 | | Duration is a time measure of a bond’s interest-rate sensitivity, based on the weighted average of the time periods over which a bond’s cash flows accrue to the bondholder. Time periods are weighted by multiplying by the present value of its cash flow divided by the bond’s price. (A bond’s cash flows consist of coupon payments and repayment of capital.) |
| | A | | bond’s duration will almost always be shorter than its maturity, with the exception of zero-coupon bonds, for which maturity and duration are equal. Weighted average duration is a measure of the duration for the securities in the portfolio overall. Weighted average maturity (“WAM”) is the weighted average amount of time until the debt securities in a portfolio mature, or the weighted average of the remaining terms to maturity of the debt securities within a portfolio. The higher the WAM, the longer it takes for all of the bonds in the portfolio to mature, and WAM is used to manage debt portfolios and to assess the performance of debt portfolio managers. Coupons are fixed percentages paid out on a fixed income security on an annual basis. Weighted average coupon is calculated by weighting the coupon of each debt security by its relative size in the portfolio. The method of calculation of the 30-Day Standardized Yield is mandated by the Securities and Exchange Commission and is determined by dividing the net investment income per share earned during the last 30 days of the period by the maximum public offering price per share on the last day of the period. This number is then annualized. |
| | 3 | | The Fund seeks to provide investment results that closely correspond, before fees and expenses, to the performance of the Citi US Treasury 0-1 Year Composite Select Index. |
5
PORTFOLIO RESULTS
| | After the close of the Reporting Period, on October 2, 2017, the Fund will be managed by the Fixed Income ETF Portfolio Management Team of Goldman Sachs Asset Management, L.P. As such, effective that date, Joshua Kruk and Jason Singer will serve as portfolio managers for the Fund. Joshua Kruk is a Managing Director in the Global Fixed Income Team. Jason Singer is a Managing Director and senior portfolio manager in the Global Fixed Income Team. David Fishman will remain as a portfolio manager for the Fund. Effective the same date, Raj Garigipati and Jamie McGregor will no longer serve as portfolio managers of the Fund. | |
6
FUND BASICS
TreasuryAccess 0-1 Year ETF
as of August 31, 2017
| | | | | | |
| | FUND SNAPSHOT | |
| | | As of August 31, 2017 | | | |
| | Market Price1 | | | $100.10 | |
| | | Net Asset Value (NAV)1 | | | $100.10 | |
| | 1 | | The Market Price is the price at which the Fund’s shares are trading on the NYSE Arca, Inc. The Market Price of the Fund’s shares will fluctuate and, at the time of sale, shares may be worth more or less than the original investment or the Fund’s then current net asset value (“NAV”). The NAV is the market value of one share of the Fund. This amount is derived by dividing the total value of all the securities in the Fund’s portfolio, plus other assets, less any liabilities, by the number of Fund shares outstanding. Fund shares are not individually redeemable and are issued and redeemed by the Fund at their NAV only in large, specified blocks of shares called creation units. Shares otherwise can be bought and sold only through exchange trading at market price (not NAV). Shares may trade at a premium or discount to their NAV in the secondary market. Information regarding how often shares of the Fund traded on NYSE Arca at a price above (i.e., at a premium) or below (i.e., at a discount) the NAV of the Fund can be found at www.GSAMFUNDS.com. |
| | | | | | | | | | | | | | |
| | PERFORMANCE REVIEW | |
| | | September 6, 2016–
August 31, 2017 | | Fund Total Return
(based on NAV)2 | | | Fund Total Return
(based on Market Price)2 | | | Citi US Treasury 0-1 Year
Composite Select Index3 | |
| | | Shares | | | 0.53 | % | | | 0.53 | % | | | 0.64 | % |
| | 2 | | Total returns are calculated assuming purchase of a share at the market price or NAV on the first day and sale of a share at the market price or NAV on the last day of each period reported. The Total Returns Based on NAV and Market Price assume the reinvestment of dividends and do not reflect brokerage commissions in connection with the purchase or sale of Fund shares, which if included would lower the performance shown above. The NAV used in the Total Return calculations assumes all management fees incurred by the Fund. Market Price returns are based upon the last trade as of 4:00 pm EST and do not reflect the returns you would receive if you traded shares at other times. The first day of secondary market trading is typically several days after the date on which the Fund commenced investment operations; therefore, the NAV of the Fund is used as a proxy for the period from inception of investment operations to the first day of secondary market trading to calculate the Market Price returns. Total returns for periods less than one full year are not annualized. |
| | 3 | | The Index is designed to measure the performance of U.S. Treasury Obligations with a maximum remaining maturity of 12 months. “U.S. Treasury Obligations” refer to securities issued or guaranteed by the U.S. Treasury where the payment of principal and interest is backed by the full faith and credit of the U.S. government. U.S. Treasury Obligations include U.S. Treasury notes, U.S. Treasury bills and U.S. Treasury floating rate bonds. The Index was developed and is calculated and maintained by FTSE Fixed Income LLC (“FTSE” or the “Index Provider”). FTSE is not affiliated with the Fund or GSAM. The Index is determined, composed and calculated by FTSE without regard to the Fund. It is not possible to invest directly in an unmanaged index. |
The returns set forth in the tables above represent past performance. Past performance does not guarantee future results. The Fund’s investment returns and principal value will fluctuate so that an investor’s shares, when sold or redeemed, may be worth more or less than their original cost. Current performance may be lower or higher than the performance quoted above. Please visit our web site at www.GSAMFUNDS.com to obtain the most recent month-end returns. Returns do not reflect the deduction of taxes that a shareholder would pay on Fund distributions or the sale or redemption of Fund shares.
7
FUND BASICS
| | | | | | |
| | 30-DAY STANDARDIZED SUBSIDIZED YIELD4 | |
| | | | | 30-Day Standardized Yield4 | |
| | | Shares | | | 0.96 | % |
| | 4 | | The method of calculation of the 30-Day Standardized Subsidized Yield is mandated by the Securities and Exchange Commission and is determined by dividing the net investment income per share earned during the last 30 days of the period by the maximum public offering price (“POP”) per share on the last day of the period. This number is then annualized. The 30-Day Standardized Subsidized Yield reflects fee waivers and/or expense reimbursements recorded by the Fund during the period. Without waivers and/or reimbursements, yields would be reduced. This yield does not necessarily reflect income actually earned and distributed by the Fund and, therefore, may not be correlated with the dividends or other distributions paid to shareholders. |
| | | | | | |
| | 30-DAY STANDARDIZED UNSUBSIDIZED YIELD5 | |
| | | | | 30-Day Standardized Yield | |
| | | Shares | | | 0.94 | % |
| | 5 | | The 30-Day Standardized Unsubsidized Yield does not adjust for any fee waivers and/ or expense reimbursements in effect. If the Fund does not incur any fee waivers and/or expense reimbursements during the period, the 30- Day Standardized Subsidized Yield and 30-Day Standardized Unsubsidized Yield will be identical. |
| | | | | | | | | | |
| | EXPENSE RATIO6 | | | | | | | | |
| | | | | Net Expense Ratio (Current)7 | | | Gross Expense Ratio (Before Waivers) | |
| | | Shares | | | 0.12 | % | | | 0.14 | % |
| | 6 | | The expense ratio of the Fund is as set forth above according to the most recent publicly available Prospectus for the Fund and may differ from the expense ratios disclosed on the Financial Highlights in this report. |
| | 7 | | The Investment Adviser has agreed to waive a portion of its management fee in order to achieve an effective net management fee rate of 0.12% as an annual percentage rate of average daily net assets of the Fund. This arrangement will remain in effect through at least July 31, 2018, and prior to such date the Investment Adviser may not terminate the arrangement without the approval of the Board of Trustees. |
| | | | | | | | |
| | TOP TEN HOLDINGS AS OF 8/31/178 |
| | | Holding | | Maturity Date | | | % of Net Assets |
| | U.S. Treasury Bill, Series 1, 1.03% | | | 11/30/17 | | | 24.6% |
| | U.S. Treasury Bill, Series 11, 1.07% | | | 11/24/17 | | | 13.8 |
| | U.S. Treasury Note, 0.88% | | | 1/15/18 | | | 11.0 |
| | U.S. Treasury Note, 1.00% | | | 02/15/18 | | | 10.2 |
| | U.S. Treasury Note, 2.63% | | | 04/30/18 | | | 6.9 |
| | U.S. Treasury Bill, Series 28, 1.13% | | | 12/28/17 | | | 5.7 |
| | U.S. Treasury Note, 0.75% | | | 10/31/17 | | | 5.5 |
| | U.S. Treasury Note, 0.88% | | | 7/15/18 | | | 4.9 |
| | U.S. Treasury Note, 1.00% | | | 12/15/17 | | | 4.7 |
| | U.S. Treasury Note, 1.00% | | | 3/15/18 | | | 4.4 |
| | | Other | | | | | | 8.3 |
| | 8 | | The top 10 holdings may not be representative of the Fund’s future investments. |
8
GOLDMAN SACHS TREASURYACCESS 0-1 YEAR ETF
Performance Summary
August 31, 2017
The following graph shows the value, as of August 31, 2017, of a $10,000 investment made on September 6, 2016 (commencement of operations) in Shares at NAV. For comparative purposes, the performance of the Fund’s underlying index, the Citi US Treasury 0-1 Year Composite Select Index is shown. This performance data represents past performance and should not be considered indicative of future performance, which will fluctuate with changes in market conditions. These performance fluctuations may cause an investor’s shares to be worth more or less than their original cost. Performance reflects applicable fee waivers and/or expense limitations in effect during the periods shown and in their absence, performance would be reduced. Returns do not reflect the deduction of taxes that a shareholder would pay on Fund distributions or the sale of Fund shares. In addition to the performance of constituents of the underlying index, other factors may affect Fund performance. These factors include, but are not limited to, Fund operating fees and expenses, portfolio turnover and creation and redemption in-kind transactions.
|
| Goldman Sachs TreasuryAccess 0-1 Year ETF’s Lifetime Performance |
Performance of a $10,000 investment, with distributions reinvested, from September 6, 2016 through August 31, 2017.
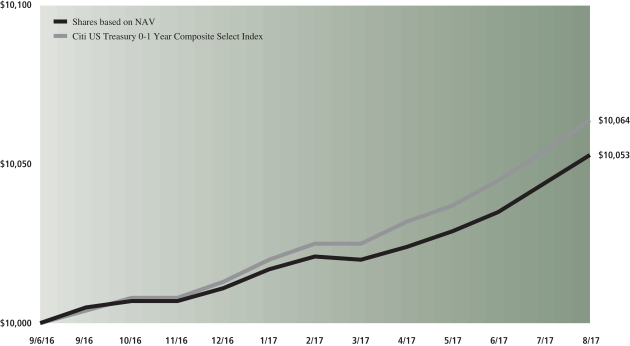
| | |
| Average Annual Total Return through August 31, 2017 | | Since Inception |
Shares based on NAV (Commenced September 6, 2016) | | 0.53%* |
| | |
| * | | Total return for periods of less than one year represents cumulative total return. |
9
GOLDMAN SACHS TREASURYACCESS 0-1 YEAR ETF
Schedule of Investments
August 31, 2017
| | | | | | | | | | | | | | |
Principal
Amount | | | Interest
Rate(a) | | | Maturity
Date | | | Value | |
| U.S. Treasury Notes – 55.7% | |
| | U.S. Treasury Notes | |
| $ | 44,674,600 | | | | 0.750 | % | | | 10/31/17 | | | $ | 44,651,995 | |
| | 38,446,500 | | | | 1.000 | | | | 12/15/17 | | | | 38,437,450 | |
| | 90,004,800 | | | | 0.875 | | | | 01/15/18 | | | | 89,926,532 | |
| | 82,818,900 | | | | 1.000 | | | | 02/15/18 | | | | 82,770,096 | |
| | 36,100,500 | | | | 1.000 | | | | 03/15/18 | | | | 36,071,591 | |
| | 55,611,200 | | | | 2.625 | | | | 04/30/18 | | | | 56,127,124 | |
| | 33,508,000 | | | | 1.000 | | | | 05/15/18 | | | | 33,466,115 | |
| | 32,662,000 | | | | 1.125 | | | | 06/15/18 | | | | 32,633,931 | |
| | 40,114,600 | | | | 0.875 | | | | 07/15/18 | | | | 39,995,510 | |
| | |
| | TOTAL U.S. TREASURY NOTES | |
| | (Cost $454,026,997) | | | $ | 454,080,344 | |
| | |
| | | | | | | | | | | | | | |
| U.S. Treasury Bills – 44.1% | |
| | U.S. Treasury Bills | |
| $ | 3,461,000 | | | | 1.011 | % | | | 11/24/17 | | | $ | 3,453,232 | |
| | 10,383,000 | | | | 1.015 | | | | 11/24/17 | | | | 10,359,697 | |
| | 1,384,600 | | | | 1.039 | | | | 11/24/17 | | | | 1,381,493 | |
| | 2,076,600 | | | | 1.041 | | | | 11/24/17 | | | | 2,071,940 | |
| | 11,075,200 | | | | 1.054 | | | | 11/24/17 | | | | 11,050,344 | |
| | 511,800 | | | | 1.055 | | | | 11/24/17 | | | | 510,651 | |
| | 9,724,200 | | | | 1.057 | | | | 11/24/17 | | | | 9,702,376 | |
| | 22,007,400 | | | | 1.060 | | | | 11/24/17 | | | | 21,958,009 | |
| | 18,932,900 | | | | 1.061 | | | | 11/24/17 | | | | 18,890,409 | |
| | 24,000,000 | | | | 1.067 | | | | 11/24/17 | | | | 23,946,137 | |
| | 1,085,800 | | | | 1.068 | | | | 11/24/17 | | | | 1,083,363 | |
| | 2,558,700 | | | | 1.073 | | | | 11/24/17 | | | | 2,552,958 | |
| | 511,800 | | | | 1.080 | | | | 11/24/17 | | | | 510,651 | |
| | 5,118,000 | | | | 1.084 | | | | 11/24/17 | | | | 5,106,514 | |
| | 201,407,300 | | | | 1.032 | | | | 11/30/17 | | | | 200,909,786 | |
| | 4,273,500 | | | | 1.004 | | | | 12/28/17 | | | | 4,259,613 | |
| | 1,424,500 | | | | 1.025 | | | | 12/28/17 | | | | 1,419,871 | |
| | 854,700 | | | | 1.049 | | | | 12/28/17 | | | | 851,923 | |
| | 4,558,400 | | | | 1.064 | | | | 12/28/17 | | | | 4,543,587 | |
| | 569,800 | | | | 1.073 | | | | 12/28/17 | | | | 567,949 | |
| | 569,800 | | | | 1.083 | | | | 12/28/17 | | | | 567,948 | |
| | 284,900 | | | | 1.091 | | | | 12/28/17 | | | | 283,974 | |
| | 200,000 | | | | 1.102 | | | | 12/28/17 | | | | 199,350 | |
| | 849,900 | | | | 1.112 | | | | 12/28/17 | | | | 847,138 | |
| | 5,382,700 | | | | 1.113 | | | | 12/28/17 | | | | 5,365,208 | |
| | 600,000 | | | | 1.123 | | | | 12/28/17 | | | | 598,050 | |
| | 2,778,000 | | | | 1.126 | | | | 12/28/17 | | | | 2,768,973 | |
| | 22,220,300 | | | | 1.127 | | | | 12/28/17 | | | | 22,148,093 | |
| | 1,866,100 | | | | 1.139 | | | | 12/28/17 | | | | 1,860,036 | |
| | |
| | TOTAL U.S. TREASURY BILLS | |
| | (Cost $359,725,165) | | | $ | 359,769,273 | |
| | |
| | TOTAL INVESTMENTS – 99.8% | |
| | (Cost $813,752,162) | | | $ | 813,849,617 | |
| | |
| OTHER ASSETS IN EXCESS OF
LIABILITIES – 0.2% |
| | | 1,979,649 | |
| | |
| | NET ASSETS – 100.0% | | | $ | 815,829,266 | |
| | |
| | |
| The percentage shown for each investment category reflects the value of investments in that category as a percentage of net assets. |
(a) | | Interest rates represent either the stated coupon rate, annualized yield on date of purchase for discounted securities, or, for floating rate securities, the current reset rate, which is based upon current interest rate indices. |
| | |
| 10 | | The accompanying notes are an integral part of these financial statements. |
GOLDMAN SACHS TREASURYACCESS 0-1 YEAR ETF
Statement of Assets and Liabilities
August 31, 2017
| | | | | | |
| | | | | TreasuryAccess
0-1 Year ETF | |
| | Assets: | | | | |
| | Investments at value (cost $813,752,162 ) | | $ | 813,849,617 | |
| | Cash | | | 889,269 | |
| | Receivables: | | | | |
| | Investments sold | | | 54,925,449 | |
| | Interest | | | 1,300,004 | |
| | Reimbursement from advisor | | | 13,216 | |
| | Total assets | | | 870,977,555 | |
| | | | | | |
| | Liabilities: | | | | |
| | Payables: | | | | |
| | Management fees | | | 92,327 | |
| | Fund shares redeemed | | | 55,055,962 | |
| | Total liabilities | | | 55,148,289 | |
| | | | | | |
| | Net Assets: | | | | |
| | Paid-in capital | | | 815,104,593 | |
| | Undistributed net investment income | | | 630,411 | |
| | Accumulated net realized loss | | | (3,193 | ) |
| | Net unrealized gain | | | 97,455 | |
| | NET ASSETS | | $ | 815,829,266 | |
| | SHARES ISSUED AND OUTSTANDING | | | | |
| | Shares outstanding no par value (unlimited shares authorized): | | | 8,150,000 | |
| | Net asset value per share: | | $ | 100.10 | |
| | |
| The accompanying notes are an integral part of these financial statements. | | 11 |
GOLDMAN SACHS TREASURYACCESS 0-1 YEAR ETF
Statement of Operations
For the period ended August 31, 2017(1)
| | | | | | |
| | | | |
TreasuryAccess
0-1 Year ETF | |
| | Investment income: | |
| | Interest | | $ | 1,399,169 | |
| | Total investment income | | | 1,399,169 | |
| | | | | | |
| | Expenses: | |
| | Management fees | | | 165,984 | |
| | Trustee fees | | | 38,261 | |
| | Total expenses | | | 204,245 | |
| | Less — expense reductions | | | (20,089 | ) |
| | Net expenses | | | 184,156 | |
| | NET INVESTMENT INCOME | | | 1,215,013 | |
| | | | | | |
| | Realized and unrealized gain: | | | | |
| | Net realized gain from: | | | | |
| | Investments | | | 535 | |
| | In-kind redemptions | | | 11,972 | |
| | Net unrealized gain on: | | | | |
| | Investments | | | 97,455 | |
| | Net realized and unrealized gain | | | 109,962 | |
| | NET INCREASE IN NET ASSETS RESULTING FROM OPERATIONS | | $ | 1,324,975 | |
| | (1) | | For the period September 6, 2016 (commencement of operations) through August 31, 2017. |
| | |
| 12 | | The accompanying notes are an integral part of these financial statements. |
GOLDMAN SACHS TREASURYACCESS 0-1 YEAR ETF
Statement of Changes in Net Assets
For the period ended August 31, 2017(1)
| | | | | | |
| | | | | TreasuryAccess
0-1 Year ETF | |
| | From operations: | |
| | Net investment income | | $ | 1,215,013 | |
| | Net realized gain | | | 12,507 | |
| | Net change in unrealized gain | | | 97,455 | |
| | Net increase in net assets resulting from operations | | | 1,324,975 | |
| | | | | | |
| | From net investment income | | | (588,728 | ) |
| | Total distributions to shareholders | | | (588,728 | ) |
| | | | | | |
| | From share transactions: | | | | |
| | Proceeds from sales of shares | | | 870,148,982 | |
| | Cost of shares redeemed | | | (55,055,963 | ) |
| | Net increase in net assets resulting from share transactions | | | 815,093,019 | |
| | TOTAL INCREASE | | | 815,829,266 | |
| | | | | | |
| | Net assets: | | | | |
| | Beginning of period | | $ | — | |
| | End of period | | $ | 815,829,266 | |
| | Undistributed net investment income | | $ | 630,411 | |
| | (1) | | For the period September 6, 2016 (commencement of operations) through August 31, 2017. |
| | |
| The accompanying notes are an integral part of these financial statements. | | 13 |
GOLDMAN SACHS TREASURYACCESS 0-1 YEAR ETF
Financial Highlights
Selected Data for a Share Outstanding Throughout The Period
| | | | | | |
| | | | | TreasuryAccess
0-1 Year ETF* | |
| | Per Share Operating Performance: | | | | |
| | Net asset value, beginning of period | | $ | 100.00 | |
| | Net investment income(a) | | | 0.82 | |
| | Net realized and unrealized loss | | | (0.29 | ) |
| | Total gain from investment operations | | | 0.53 | |
| | Distributions to shareholders from net investment income | | | (0.43 | ) |
| | Net asset value, end of period | | $ | 100.10 | |
| | Market price, end of period | | $ | 100.10 | |
| | Total Return at Net Asset Value(b) | | | 0.53 | % |
| | Net assets, end of period (in 000’s) | | $ | 815,829 | |
| | Ratio of net expenses to average net assets | | | 0.13 | %(c) |
| | Ratio of total expenses to average net assets | | | 0.14 | %(c) |
| | Ratio of net investment income to average net assets | | | 0.83 | %(c) |
| | Portfolio turnover rate(d) | | | — | % |
| | * | | For the period September 6, 2016 (commencement of operations) to August 31, 2017. |
| | (a) | | Calculated based on the average shares outstanding methodology. |
| | (b) | | Assumes investment at the net asset value at the beginning of the period, reinvestment of all distributions and a complete sale of the investment at the net asset value at the end of the period. Returns do not reflect the impact of taxes to shareholders relating to Fund distributions or the sale of Fund shares. Total returns for periods less than one full year are not annualized. |
| | (d) | | The Fund’s portfolio turnover rate is calculated in accordance with regulatory requirements and excludes portfolio securities received or delivered as a result of in-kind transactions. If such transactions were included, the Fund’s portfolio turnover rate may be higher. |
| | |
| 14 | | The accompanying notes are an integral part of these financial statements. |
GOLDMAN SACHS ETF TRUST
Notes to Financial Statements
August 31, 2017
Goldman Sachs TreasuryAccess 0-1 Year ETF (the “Fund”) is a series of the Goldman Sachs ETF Trust (the “Trust”) which is an open-end diversified management investment company, registered under the Investment Company Act of 1940, as amended (the “Act”), consisting of multiple series. The Trust was organized as a Delaware statutory trust on December 16, 2009.
The investment objective of the Fund is to provide investment results that closely correspond, before fee and expenses, to the performance of the Citi US Treasury 0-1 Year Composite Select Index (the “Index”).
Goldman Sachs Asset Management, L.P. (“GSAM”), an affiliate of Goldman Sachs & Co. LLC (formerly, Goldman, Sachs & Co.) (“Goldman Sachs”), serves as investment adviser to the Fund pursuant to a management agreement (the “Agreement”) with the Trust. The Fund is an exchange-traded fund (“ETF”). Shares of the Fund are listed and traded on the NYSE Arca, Inc. (“NYSE Arca”). Market prices for the Fund’s shares may be different from its net asset value (“NAV”). The Fund issues and redeems shares at its respective NAV only in blocks of a specified number of shares, or multiples thereof, referred to as “Creation Units”. Creation Units are issued and redeemed principally in-kind for a basket of securities and a cash amount. Shares generally trade in the secondary market in quantities less than a Creation Unit at market prices that change throughout the day. Only those that have entered into an authorized participant agreement with ALPS Distributors, Inc. (the “Distributor”) may do business directly with the Fund.
|
| 2. SIGNIFICANT ACCOUNTING POLICIES |
The financial statements have been prepared in accordance with accounting principles generally accepted in the United States of America (“GAAP”) and require management to make estimates and assumptions that may affect the reported amounts and disclosures. Actual results may differ from those estimates and assumptions.
A. Investment Valuation — The Fund’s valuation policy is to value investments at fair value.
B. Investment Income and Investments — Interest income is accrued daily and adjusted for amortization of premiums and accretion of discounts. Investment transactions are reflected on trade date. Realized gains and losses are calculated using identified cost.
C. Expenses — Expenses incurred directly by the Fund are charged to the Fund, and certain expenses incurred by the Trust that may not solely relate to the Fund are allocated to the Fund and the other applicable funds of the Trust on a straight-line and/or pro-rata basis, depending upon the nature of the expenses, and are accrued daily.
D. Federal Taxes and Distributions to Shareholders — It is the Fund’s policy to comply with the requirements of the Internal Revenue Code of 1986, as amended (the “Code”), applicable to regulated investment companies (mutual funds) and to distribute each year substantially all of its investment company taxable income and capital gains to its shareholders. Accordingly, the Fund is not required to make any provisions for the payment of federal income tax. Distributions to shareholders are recorded on the ex-dividend date. Income and capital gains distributions, if any, are declared and paid according to the following schedule:
| | | | | | |
| Fund | | | | Income Distributions Declared/Paid | | Capital Gains Distributions Declared/Paid |
TreasuryAccess 0-1 Year ETF | | | | Monthly | | Annually |
Net capital losses, if any, are carried forward to future fiscal years and may be used to the extent allowed by the Code to offset any future capital gains. Losses that are carried forward will retain their character as either short-term or long-term capital losses. Utilization of capital loss carryforwards will reduce the requirement of future capital gains distributions.
The characterization of distributions to shareholders for financial reporting purposes is determined in accordance with federal income tax rules, which may differ from GAAP. The source of the Fund’s distributions may be shown in the accompanying financial statements as either from net investment income, net realized gain or capital. Certain components of the Fund’s net assets on the Statement of Assets and Liabilities reflect permanent GAAP/tax differences based on the appropriate tax character.
15
GOLDMAN SACHS ETF TRUST
Notes to Financial Statements (continued)
August 31, 2017
|
| 3. INVESTMENTS AND FAIR VALUE MEASUREMENTS |
U.S. GAAP defines the fair value of a financial instrument as the amount that would be received to sell an asset or paid to transfer a liability in an orderly transaction between market participants at the measurement date (i.e., the exit price); the Fund’s policy is to use the market approach. GAAP establishes a fair value hierarchy that prioritizes the inputs to valuation techniques used to measure fair value. The hierarchy gives the highest priority to unadjusted quoted prices in active markets for identical assets or liabilities (Level 1 measurements) and the lowest priority to unobservable inputs (Level 3 measurements). The levels used for classifying investments are not necessarily an indication of the risk associated with investing in these investments. The three levels of the fair value hierarchy are described below:
Level 1 — Unadjusted quoted prices in active markets that are accessible at the measurement date for identical, unrestricted assets or liabilities;
Level 2 — Quoted prices in markets that are not active or financial instruments for which significant inputs are observable (including, but not limited to, quoted prices for similar investments, interest rates, foreign exchange rates, volatility and credit spreads), either directly or indirectly;
Level 3 — Prices or valuations that require significant unobservable inputs (including GSAM’s assumptions in determining fair value measurement).
Changes in valuation techniques may result in transfers into or out of an assigned level within the hierarchy. In accordance with the Fund’s policy, transfers between different levels of the fair value hierarchy resulting from such changes are deemed to have occurred as of the beginning of the reporting period.
The Board of Trustees (“Trustees”) has approved Valuation Procedures that govern the valuation of the portfolio investments held by the Fund, including investments for which market quotations are not readily available. The Trustees have delegated to GSAM day-to-day responsibility for implementing and maintaining internal controls and procedures related to the valuation of the Fund’s investments. To assess the continuing appropriateness of pricing sources and methodologies, GSAM regularly performs price verification procedures and issues challenges as necessary to third party pricing vendors or brokers, and any differences are reviewed in accordance with the Valuation Procedures.
A. Level 1 and Level 2 Fair Value Investments — The valuation techniques and significant inputs used in determining the fair values for investments classified as Level 1 and Level 2 are as follows:
i Debt Securities — Debt securities for which market quotations are readily available are valued daily on the basis of quotations supplied by dealers or an independent pricing service approved by the Trustees. The pricing services may use valuation models or matrix pricing, which consider: (i) yield or price with respect to bonds that are considered comparable in characteristics such as rating, interest rate and maturity date or (ii) quotations from securities dealers to determine current value. With the exception of treasury securities of G8 countries, which are generally classified as Level 1, these investments are generally classified as Level 2 of the fair value hierarchy.
B. Level 3 Fair Value Investments — To the extent that significant inputs to valuation models and other alternative pricing sources are unobservable, or if quotations are not readily available, or if GSAM believes that such quotations do not accurately reflect fair value, the fair value of the Fund’s investments may be determined under Valuation Procedures approved by the Trustees. GSAM, consistent with its procedures and applicable regulatory guidance, may make an adjustment to the most recent valuation prices of either domestic or foreign securities in light of significant events to reflect what it believes to be the fair value of the securities at the time of determining the Fund’s NAV. Significant events which could affect a large number of securities in a particular market may include, but are not limited to: significant fluctuations in U.S. or foreign markets; market dislocations; market disruptions; or unscheduled market closings. Significant events which could also affect a single issuer may include, but are not limited to: corporate actions such as reorganizations, mergers and buy-outs; ratings downgrades; and bankruptcies. At August 31, 2017 the Fund did not hold Level 3 securities.
16
GOLDMAN SACHS ETF TRUST
Notes to Financial Statements (continued)
August 31, 2017
|
| 3. INVESTMENTS AND FAIR VALUE MEASUREMENTS (continued) |
C. Fair Value Hierarchy — The following is a summary of the Fund’s investments classified in the fair value hierarchy as of August 31, 2017:
| | | | | | | | | | | | |
| |
| TREASURYACCESS 0-1 YEAR ETF | | | | |
| | | |
| Investment Type | | Level 1 | | | Level 2 | | | Level 3 | |
| Assets(a) | | | | | | | | | | | | |
US Government | | $ | 813,849,617 | | | $ | — | | | $ | — | |
| Total | | $ | 813,849,617 | | | $ | — | | | $ | — | |
| (a) | | Amounts are disclosed by asset type, please refer to the Schedule of Investments for more detail. |
|
| 4. AGREEMENTS AND AFFILIATED TRANSACTIONS |
A. Management Agreement — Under the Agreement, GSAM manages the Fund, subject to the general supervision of the Trustees.
As compensation for the services rendered pursuant to the Agreement, the assumption of the expenses related thereto and administration of the Fund’s business affairs, including providing facilities, GSAM is entitled to a management fee, accrued daily and paid monthly, equal to an annual percentage rate of the Fund’s average daily net assets.
The Fund operates under a unitary management fee structure. Under the unitary fee structure, GSAM is responsible for paying substantially all the expenses of the Fund, excluding payments under the Fund’s 12b-1 plan (if any), interest expenses, taxes, acquired fund fees and expenses, brokerage fees, costs of holding shareholder meetings, litigation, indemnification and extraordinary expenses. As the Fund directly pays fees and expenses of the independent Trustees, the management fee collected by GSAM will be reduced by an amount equal to the fees and expenses paid by the Fund to the independent Trustees.
For the fiscal year ended August 31, 2017, contractual and effective net unitary management fees with GSAM were at the following rates:
| | | | | | |
| Contractual Unitary Management Fee | | | Effective Net Unitary Management Fee * | |
| | 0.14% | | | | 0.13% | |
| * | | Effective Net Unitary Management Fee includes the impact of management fee waivers, if any. |
Effective July 12, 2017, the Investment Adviser agreed to waive a portion of its management fee in order to achieve an effective net management fee rate of 0.12% as an annual percentage rate of average daily net assets of the Fund. This arrangement will remain in effect through at least July 31, 2018, and prior to such date the Investment Adviser may not terminate the arrangement without the approval of the Board of Trustees. For the fiscal year ended August 31, 2017, GSAM waived $20,089 of the Fund’s management fee.
B. Distribution and Service (12b-1) Plans — The Trust, on behalf of the Fund, has adopted a Distribution and Service Plan (the “Plan”), subject to Rule 12b-1 under the Act. Under the Plan, the Fund is authorized to pay distribution fees in connection with the provision of ongoing services to shareholders of the Fund and the maintenance of shareholder accounts in an amount up to 0.25% of its average daily net assets each year. No Rule 12b-1 fees are currently paid by the Fund, and there are no current plans to impose these fees.
C. Other Transactions with Affiliates — As of August 31, 2017, the Goldman Sachs High Yield Fund was the beneficial owner of 6% of total outstanding shares of the Fund.
17
GOLDMAN SACHS ETF TRUST
Notes to Financial Statements (continued)
August 31, 2017
|
| 5. CREATION AND REDEMPTION OF CREATION UNITS |
The Trust issues and redeems shares of the Fund only in Creation Units on a continuous basis through the Distributor, without an initial sales load, at NAV next determined after receipt, on any Business Day (as defined in the Statement of Additional Information), of an order in proper form. Shares of the Fund may only be purchased or redeemed by certain financial institutions (each an “Authorized Participant”). An Authorized Participant is either (1) a “Participating Party” or other participant in the clearing process through the Continuous Net Settlement System of the National Securities Clearing Corporation; or (2) a Depository Trust Company participant; which, in either case, must have executed an agreement with the Distributor. Retail investors will typically not qualify as an Authorized Participant or have the resources to buy and sell whole Creation Units. Therefore, they will be unable to purchase or redeem the shares directly from the Fund. Rather, most retail investors will purchase shares in the secondary market at market prices with the assistance of a broker and may be subject to customary brokerage commissions or fees. Fixed creation and redemption transaction fees are imposed in connection with creations and redemptions.
Authorized Participants transacting in Creation Units for cash may also pay a variable charge to compensate the Fund for certain transaction costs (e.g. taxes on currency or other financial transactions, and brokerage costs) and market impact expenses relating to investing in portfolio securities. Such variable charges, if any, are included in “Proceeds from sale of shares” in the Statement of Changes in Net Assets.
Share activity is as follows:
| | | | | | | | | | |
| | | | | TreasuryAccess 0-1 Year ETF | |
| | | | | Shares | | | Dollars | |
Fund Share Activity(1) | | | | | | | | | | |
Shares Sold | | | | | 8,700,000 | | | $ | 870,148,982 | |
Shares Redeemed | | | | | (550,000 | ) | | | (55,055,963 | ) |
NET INCREASE IN SHARES | | | | | 8,150,000 | | | $ | 815,093,019 | |
| (1) | | For the period September 6, 2016 (commencement of operations) through August 31, 2017 |
|
| 6. PORTFOLIO SECURITIES TRANSACTIONS |
The cost of purchases and proceeds from sales and maturities for the fiscal year ended August 31, 2017, were as follows:
| | | | | | | | | | |
| Fund | | | | Purchases | | | Sales | |
TreasuryAccess 0-1 Year ETF | | | | $ | 755,052,094 | | | $ | 754,211,747 | |
The proceeds from in-kind creation and redemption transactions for the fiscal year ended August 31, 2017, were as follows:
| | | | | | | | | | |
| Fund | | | | Purchases | | | Sales | |
TreasuryAccess 0-1 Year ETF | | | | $ | 867,354,907 | | | $ | 54,925,450 | |
The tax character of distributions paid during the fiscal year ended August 31, 2017 was as follows:
| | | | |
| | | TreasuryAccess 0-1 Year ETF | |
Distributions paid from: | | | | |
Ordinary Income* | | $ | 588,728 | |
Total taxable distributions | | $ | 588,728 | |
| * | | For tax purposes short-term capital gain distributions are considered ordinary income distributions. |
18
GOLDMAN SACHS ETF TRUST
Notes to Financial Statements (continued)
August 31, 2017
|
| 7. TAX INFORMATION (continued) |
As of August 31, 2017, the components of accumulated earnings (losses) on a tax-basis were as follows:
| | | | |
| | | TreasuryAccess 0-1 Year ETF | |
Undistributed ordinary income — net | | $ | 630,411 | |
Total undistributed earnings | | $ | 630,411 | |
Unrealized gains (losses) — net | | $ | 94,262 | |
Total accumulated earnings (losses) net | | $ | 724,673 | |
As of August 31, 2017, the Fund’s aggregate security unrealized gains and losses based on cost for U.S. federal income tax purposes were as follows:
| | | | |
| | | TreasuryAccess 0-1 Year ETF | |
Tax Cost | | $ | 813,755,355 | |
Gross unrealized gain | | | 96,029 | |
Gross unrealized loss | | | (1,767 | ) |
Net unrealized gains (losses) on securities | | $ | 94,262 | |
The difference between GAAP-basis and tax-basis unrealized gains (losses) is attributable primarily to wash sales.
In order to present certain components of the Fund’s capital accounts on a tax-basis, certain reclassifications have been recorded to the Fund’s accounts. These reclassifications have no impact on the NAV of the Fund and result primarily from Redemptions In-Kind.
| | | | | | | | | | | | | | |
| Fund | | | | Paid-in
Capital | | | Accumulated
Net Realized
Gain (Loss) | | | Undistributed
Net Investment
Income (Loss) | |
TreasuryAccess 0-1 Year ETF | | | | $ | 11,574 | | | $ | (15,700 | ) | | $ | 4,126 | |
GSAM has reviewed the Fund’s tax positions for all open tax years (the current year) and has concluded that no provision for income tax is required in the Fund’s financial statements. Such open tax year remains subject to examination and adjustment by tax authorities.
The Fund’s risks include, but are not limited to, the following:
Interest Rate Risk — When interest rates increase, fixed income securities or instruments held by the Fund will generally decline in value. Long-term fixed income securities or instruments will normally have more price volatility because of this risk than short-term fixed income securities or instruments. The risks associated with increasing rates are heightened given that interest rates are near historic lows, but may be expected to increase in the future with unpredictable effects on the markets and the Fund’s investments. Fluctuations in interest rates may also affect the liquidity of fixed income securities and instruments held by the Fund.
Index Risk — FTSE Fixed Income LLC (the “Index Provider”) constructs the Fund’s Index in accordance with a rules-based methodology. The Fund will be negatively affected by general declines in the securities and asset classes represented in its Index. In addition, because the Fund is not “actively” managed, unless a specific security is removed from the Index, the Fund generally would not sell a security because the security’s issuer was in financial trouble. Market disruptions and regulatory restrictions could
19
GOLDMAN SACHS ETF TRUST
Notes to Financial Statements (continued)
August 31, 2017
|
| 8. OTHER RISKS (continued) |
have an adverse effect on the Fund’s ability to adjust its exposure to the required levels in order to track the Index. The Fund also does not attempt to take defensive positions under any market conditions, including declining markets. Therefore, the Fund’s performance could be lower than funds that may actively shift their portfolio assets to take advantage of market opportunities or to lessen the impact of a market decline or a decline in the value of one or more issuers. The Index Provider relies on third party data it believes to be reliable in constructing the Index, but it does not guarantee the accuracy or availability of such third party data. The Index is new and has a limited performance history. Errors in index data, index computation or the construction of the Index in accordance with its methodology may occur from time to time and may not be identified and corrected by the Index Provider for a period of time or at all, which may have an adverse impact on the Fund and its shareholders. In addition, neither the Fund, the Investment Adviser nor the Index Provider can guarantee the availability or timeliness of the production of the Index.
Market and Credit Risks — In the normal course of business, the Fund trades financial instruments and enters into financial transactions where risk of potential loss exists due to changes in the market (market risk). Additionally, the Fund may also be exposed to credit risk in the event that an issuer or guarantor fails to perform or that an institution or entity with which the Fund has unsettled or open transactions defaults.
Market Trading Risk — The Fund faces numerous market trading risks, including disruptions to creations and redemptions, the existence of extreme market volatility or potential lack of an active trading market for Shares. If a shareholder purchases Shares at a time when the market price is at a premium to the NAV or sells Shares at a time when the market price is at a discount to the NAV, the shareholder may sustain losses. The Investment Adviser cannot predict whether Shares will trade below, at or above their NAV. Price differences may be due, in large part, to the fact that supply and demand forces at work in the secondary trading market for Shares will be closely related to, but not identical to, the same forces influencing the prices of the securities of the Fund’s Index trading individually or in the aggregate at any point in time.
Tracking Error Risk — Tracking error is the divergence of the Fund’s performance from that of its Index. The performance of the Fund may diverge from that of its Index for a number of reasons. Tracking error may occur because of transaction costs, the Fund’s holding of cash, differences in accrual of dividends, changes to its Index or the need to meet new or existing regulatory requirements. Unlike the Fund, the returns of the Index are not reduced by investment and other operating expenses, including the trading costs associated with implementing changes to its portfolio of investments. Tracking error risk may be heightened during times of market volatility or other unusual market conditions.
Under the Trust’s organizational documents, its Trustees, officers, employees and agents are indemnified, to the extent permitted by the Act and state law, against certain liabilities that may arise out of performance of their duties to the Fund. Additionally, in the course of business, the Fund enters into contracts that contain a variety of indemnification clauses. The Fund’s maximum exposure under these arrangements is unknown, as this would involve future claims that may be made against the Fund that has not yet occurred. However, GSAM believes the risk of loss under these arrangements to be remote.
Subsequent events after the Statement of Assets and Liabilities date have been evaluated, and GSAM has concluded that there is no impact requiring adjustment or disclosure in the financial statements.
20
Report of Independent Registered Public
Accounting Firm
To the Board of Trustees of
Goldman Sachs ETF Trust and Shareholders of the Goldman Sachs TreasuryAccess 0-1 Year ETF:
In our opinion, the accompanying statement of assets and liabilities, including the schedule of investments, and the related statements of operations and of changes in net assets and the financial highlights present fairly, in all material respects, the financial position of the Goldman Sachs TreasuryAccess 0-1 Year ETF (the “Fund”), a fund of the Goldman Sachs ETF Trust, as of August 31, 2017, and the results of its operations, the changes in its net assets and the financial highlights for the period September 6, 2016 (commencement of operations) through August 31, 2017, in conformity with accounting principles generally accepted in the United States of America. These financial statements and financial highlights (hereafter referred to as “financial statements”) are the responsibility of the Fund’s management. Our responsibility is to express an opinion on these financial statements based on our audit. We conducted our audit of these financial statements in accordance with the standards of the Public Company Accounting Oversight Board (United States). Those standards require that we plan and perform the audit to obtain reasonable assurance about whether the financial statements are free of material misstatement. An audit includes examining, on a test basis, evidence supporting the amounts and disclosures in the financial statements, assessing the accounting principles used and significant estimates made by management, and evaluating the overall financial statement presentation. We believe that our audit, which included confirmation of securities as of August 31, 2017 by correspondence with the custodian provides a reasonable basis for our opinion.
PricewaterhouseCoopers LLP
Boston, Massachusetts
October 24, 2017
21
GOLDMAN SACHS ETF TRUST
| | |
Fund Expenses — Six Months Ended 8/31/2017 (Unaudited) | | |
As a shareholder you incur ongoing costs, which may include management fees; distribution and service (12b-1) fees; and other Fund expenses. This Example is intended to help you understand your ongoing costs (in dollars) of investing in Shares of the Fund and to compare these costs with the ongoing costs of investing in other exchange-traded funds.
The Example is based on an investment of $1,000 invested at the beginning of the period from March 1, 2017 and held for the six months ended August 31, 2017, which represents a period of 184 days of a 365 day year (or less where indicated).
Actual Expenses — The first line in the table below provides information about actual account values and actual expenses. You may use the information in this line, together with the amount you invested, to estimate the expenses that you paid over the period. Simply divide your account value by $1,000 (for example, an $8,600 account value divided by $1,000=8.6), then multiply the result by the number in the first line under the heading entitled “Expenses Paid” to estimate the expenses you paid on your account during this period.
Hypothetical Example for Comparison Purposes — The second line in the table below provides information about hypothetical account values and hypothetical expenses based on the Fund’s actual net expense ratios and an assumed rate of return of 5% per year before expenses, which is not the Fund’s actual return. The hypothetical account values and expenses may not be used to estimate the actual ending account balance or expenses you paid for the period. You may use this information to compare the ongoing costs of investing in the Fund and other funds. To do so, compare this 5% hypothetical example with the 5% hypothetical examples that appear in the shareholder reports of the other funds.
Please note that the expenses shown in the table are meant to highlight your ongoing costs only and do not reflect any transactional costs, such as redemption fees, or exchange fees. Therefore, the second line of the table is useful in comparing ongoing costs only, and will not help you determine the relative total costs of owning different funds. In addition, if these transactional costs were included, your costs would have been higher.
| | | | | | | | | | | | |
| | | TreasuryAccess 0-1 Year ETF | |
| | | Beginning
Account
Value 3/1/2017 | | | Account
Value
8/31/2017 | | | Expenses
Paid* | |
Actual based on NAV | | $ | 1,000 | | | $ | 1,003.20 | | | $ | 0.61 | |
Hypothetical 5% return | | $ | 1,000 | | | $ | 1,024.60 | + | | $ | 0.61 | |
| | * | | Expenses for the Fund are calculated using the Fund’s annualized net expense ratio, which represents the ongoing expenses as a percentage of net assets for the six months ended August 31, 2017. Expenses are calculated by multiplying the annualized net expense ratio by the average account value for the period; then multiplying the result by the number of days in the most recent fiscal year; and then dividing that result by the number of days in the fiscal year. | |
| | | | The annualized net expense ratio for the period is as follows: | |
| | | | |
| Fund | | | |
TreasuryAccess 0-1 Year ETF | | | 0.12 | % |
| | + | | Hypothetical expenses are based on the Fund’s actual annualized net expense ratios and an assumed rate of return of 5% per year before expenses. | |
22
GOLDMAN SACHS ETF TRUST
Trustees and Officers (Unaudited)
Independent Trustees
| | | | | | | | | | |
Name, Address and Age1 | | Position(s) Held
with the Trust | | Term of
Office and
Length of
Time Served2 | | Principal Occupation(s) During Past 5 Years | | Number of
Portfolios in
Fund Complex
Overseen by
Trustee3 | | Other Directorships
Held by Trustee4 |
Caroline Dorsa Age: 58 | | Trustee | | Since 2016 | | Ms. Dorsa is retired. She was formerly Executive Vice President and Chief Financial Officer, Public Service Enterprise Group, Inc. (a generation and energy services company) (2009-2015); Senior Vice President, Merck & Co, Inc. (a pharmaceutical company) (2008-2009 and 1987-2007); Senior Vice President and Chief Financial Officer, Gilead Sciences, Inc. (a pharmaceutical company) (2007-2008); and Senior Vice President and Chief Financial Officer, Avaya, Inc. (a technology company) (2007). Trustee — Goldman Sachs ETF Trust; Goldman Sachs MLP Income Opportunities Fund; and Goldman Sachs MLP and Energy Renaissance Fund. | | 21 | | Biogen Inc. (a biotechnology company); Intellia Therapeutics Inc. (a gene-editing company); Illumina, Inc. (a life sciences company) |
Linda A. Lang Age: 59 | | Trustee | | Since 2016 | | Ms. Lang is retired. She is Chair of the Board of Directors (2016-Present); and Member of the Board of Directors, WD-40 Company (2004-Present); and was formerly Chairman and Chief Executive Officer (2005-2014); and Director, President and Chief Operating Officer, Jack in the Box, Inc. (a restaurant company) (2003-2005). Previously, Ms. Lang served as an Advisory Board Member of Goldman Sachs MLP Income Opportunities Fund and Goldman Sachs MLP and Energy Renaissance Fund (February 2016-March 2016). Trustee — Goldman Sachs ETF Trust; Goldman Sachs MLP Income Opportunities Fund; and Goldman Sachs MLP and Energy Renaissance Fund. | | 21 | | WD-40 Company (a global consumer products company) |
Michael Latham Age: 51 | | Trustee | | Since 2015 | | Mr. Latham is retired. Formerly, he held senior management positions with the iShares exchange-traded fund business, including Chairman (2011-2014); Global Head (2010-2011); U.S. Head (2007-2010); and Chief Operating Officer (2003-2007). Trustee — Goldman Sachs ETF Trust; Goldman Sachs MLP Income Opportunities Fund; and Goldman Sachs MLP and Energy Renaissance Fund. | | 21 | | None |
Lawrence W. Stranghoener Age: 63 | | Trustee | | Trustee
since 2015; Chairman since 2017 | | Mr. Stranghoener is retired. He is Chairman of the Board of Directors, Kennametal, Inc. (2003-Present); Director, Aleris Corporation and Aleris International, Inc. (a producer of aluminum rolled products) (2011-Present); and was formerly Interim Chief Executive Officer (2014); and Executive Vice President and Chief Financial Officer (2004-2014), Mosaic Company (a fertilizer manufacturing company). Chairman of the Board of Trustees — Goldman Sachs ETF Trust; Goldman Sachs MLP Income Opportunities Fund; and Goldman Sachs MLP and Energy Renaissance Fund. | | 21 | | Kennametal Inc. (a global manufacturer and distributor of tooling and industrial materials) |
| | | | | | | | | | |
23
GOLDMAN SACHS ETF TRUST
Trustees and Officers (Unaudited) (continued)
Interested Trustee*
| | | | | | | | | | |
Name, Address and Age1 | | Position(s) Held
with the Trust | | Term of
Office and
Length of
Time Served2 | | Principal Occupation(s) During Past 5 Years | | Number of
Portfolios in
Fund Complex
Overseen by
Trustee3 | | Other Directorships
Held by Trustee4 |
James A. McNamara Age: 54 | | Trustee | | Since 2014 | | Managing Director, Goldman Sachs (December 1998-Present); Director of Institutional Fund Sales, GSAM (April 1998-December 2000); and Senior Vice President and Manager, Dreyfus Institutional Service Corporation (January 1993-April 1998). President and Trustee — Goldman Sachs ETF Trust; Goldman Sachs Trust; Goldman Sachs Variable Insurance Trust; Goldman Sachs Trust II; Goldman Sachs MLP Income Opportunities Fund; and Goldman Sachs MLP and Energy Renaissance Fund. | | 142 | | None |
| | | | | | | | | | |
| * | | This person is considered to be an “Interested Trustee” because he holds a position with Goldman Sachs and own securities issued by The Goldman Sachs Group, Inc. The Interested Trustee holds comparable positions with certain other companies of which Goldman Sachs, GSAM or an affiliate thereof is the investment adviser, administrator and/or distributor. |
| 1 | | Each Trustee may be contacted by writing to the Trustee, c/o Goldman Sachs, 200 West Street, New York, New York, 10282, Attn: Caroline L. Kraus. Information is provided as of August 31, 2017. |
| 2 | | Each Trustee holds office for an indefinite term until the earliest of: (a) the election of his or her successor; (b) the date the Trustee resigns, retires or is removed by the Board of Trustees or shareholders, in accordance with the Trust’s Declaration of Trust; or (c) the termination of the Trust. |
| 3 | | The Goldman Sachs Fund Complex includes certain other companies listed above for each respective Trustee. As of August 31, 2017, Goldman Sachs ETF Trust consisted of 19 portfolios (eight of which offered shares to the public); Goldman Sachs Trust consisted of 90 portfolios (88 of which offered shares to the public); Goldman Sachs Variable Insurance Trust consisted of 14 portfolios; Goldman Sachs Trust II consisted of 17 portfolios (16 of which offered shares to the public); and Goldman Sachs MLP Income Opportunities Fund, and Goldman Sachs MLP and Energy Renaissance Fund each consisted of one portfolio. |
| 4 | | This column includes only directorships of companies required to report to the Securities and Exchange Commission under the Securities Exchange Act of 1934 (i.e., “public companies”) or other investment companies registered under the Act. |
Additional information about the Trustees is available in the Fund’s Statement of Additional Information, which can be obtained from Goldman Sachs free of charge by calling this toll-free number (in the United States of America): 1-800-526-7384.
24
GOLDMAN SACHS ETF TRUST
Trustees and Officers (Unaudited) (continued)
Officers of the Trust*
| | | | | | |
Name,
Address and Age1 | | Positions Held
with the Trust | | Term of
Office and
Length of
Time Served2 | | Principal Occupation(s) During Past 5 Years |
James A. McNamara 200 West Street
New York, NY 10282 Age: 54 | | Trustee and President | | Since 2014 | | Managing Director, Goldman Sachs (December 1998-Present); Director of Institutional Fund Sales, GSAM (April 1998-December 2000); and Senior Vice President and Manager, Dreyfus Institutional Service Corporation (January 1993-April 1998). President and Trustee — Goldman Sachs ETF Trust; Goldman Sachs Trust; Goldman Sachs Variable Insurance Trust; Goldman Sachs Trust II; Goldman Sachs MLP Income Opportunities Fund; and Goldman Sachs MLP and Energy Renaissance Fund. |
Caroline L. Kraus 200 West Street
New York, NY 10282 Age: 40 | | Secretary | | Since 2014 | | Managing Director, Goldman Sachs (January 2016-Present); Vice President, Goldman Sachs (August 2006-December 2015); Associate General Counsel, Goldman Sachs (2012-Present); Assistant General Counsel, Goldman Sachs (August 2006-December 2011); and Associate, Weil, Gotshal & Manges, LLP (2002-2006). Secretary — Goldman Sachs ETF Trust; Goldman Sachs Trust (previously Assistant Secretary (2012)); Goldman Sachs Variable Insurance Trust (previously Assistant Secretary (2012)); Goldman Sachs Trust II; Goldman Sachs BDC, Inc.; Goldman Sachs Private Middle Market Credit LLC; Goldman Sachs Middle Market Lending Corp.; Goldman Sachs MLP Income Opportunities Fund; and Goldman Sachs MLP and Energy Renaissance Fund. |
Scott M. McHugh 200 West Street
New York, NY 10282 Age: 45 | | Treasurer, Senior Vice President and Principal Financial Officer | | Since 2014 | | Managing Director, Goldman Sachs (January 2016-Present); Vice President, Goldman Sachs (February 2007-December 2015); Assistant Treasurer of certain mutual funds administered by DWS Scudder (2005-2007); and Director (2005-2007), Vice President (2000-2005), and Assistant Vice President (1998-2000), Deutsche Asset Management or its predecessor (1998-2007). Treasurer, Senior Vice President and Principal Financial Officer — Goldman Sachs ETF Trust; Goldman Sachs Trust; Goldman Sachs Variable Insurance Trust; Goldman Sachs Trust II; Goldman Sachs MLP Income Opportunities Fund; and Goldman Sachs MLP and Energy Renaissance Fund. |
Joseph F. DiMaria 30 Hudson Street Jersey City, NJ 07302 Age: 49 | | Assistant Treasurer and Principal Accounting Officer | | Since 2017 | | Managing Director, Goldman Sachs (November 2015-Present) and Vice President — Mutual Fund Administration, Columbia Management Investment Advisers, LLC (May 2010-October 2015). Assistant Treasurer and Principal Accounting Officer — Goldman Sachs ETF Trust; Goldman Sachs Trust; Goldman Sachs Variable Insurance Trust; Goldman Sachs Trust II; Goldman Sachs MLP Income Opportunities Fund; and Goldman Sachs MLP and Energy Renaissance Fund. |
| | | | | | |
| * | | Represents a partial list of officers of the Trust. Additional information about all the officers is available in the Fund’s Statement of Additional Information, which can be obtained from Goldman Sachs free of charge by calling this toll-free number (in the United States): 1-800-621-2550. |
| 1 | | Information is provided as of August 31, 2017. |
| 2 | | Officers hold office at the pleasure of the Board of Trustees or until their successors are duly elected and qualified. Each officer holds comparable positions with certain other companies of which Goldman Sachs, GSAM or an affiliate thereof is the investment adviser, administrator and/or distributor. |
Goldman Sachs Treasury Access 0-1 Year ETF — Tax Information (Unaudited)
During the year ended August 31, 2017, 100% of the net investment company taxable income distributions paid by the Fund were designated as either interest-related dividends or short-term capital gain dividends pursuant to Section 871(k) of the Internal Revenue Code.
25
GOLDMAN SACHS ETF TRUST
Goldman Sachs TreasuryAccess 0-1 Year ETFs — Other Information (Unaudited)
Effective from November 1, 2016 and solely for the purpose of marketing the Fund in the United Kingdom (“UK”), Goldman Sachs Asset Management, L.P. (the “Investment Adviser”) identified itself as the alternative investment fund manager (“AIFM”) of the Fund. As AIFM, the Investment Adviser is responsible for complying with the UK marketing rules implementing the Alternative Investment Fund Managers Directive (Directive 2011/61/EU) (the “Directive”).
In accordance with these rules, the AIFM is required to make available an Annual Report for the financial year of the Fund, containing certain disclosures as set out in Article 22 and 23 of the Directive. The disclosures set out below are included to satisfy these requirements as they have not been disclosed elsewhere in this Annual Report.
I. Remuneration
The following disclosures are made in accordance with Article 107 of the EU Commission Delegated Regulation C (2012) 8370 in respect of the AIFM, which is part of The Goldman Sachs Group, Inc. (“GS Group”). GS Group’s global remuneration philosophy, structure and process for setting remuneration generally applies to employees of the AIFM in the same manner as other employees globally. References to the “firm” and “we” throughout this disclosure include GS Group and the AIFM and any subsidiaries and affiliates.
a. Remuneration program Philosophy
The remuneration philosophy and the objectives of the remuneration program for the firm, including the AIFM are reflected in GS Group’s Compensation principles as posted on the Goldman Sachs public website (http://www.goldmansachs.com/investor relations/corporate governance/corporate governance-documents/compensation-principles.pdf) which includes the following:
| | 1. | | We pay for performance – this is an absolute requirement under our compensation program and inherent in our culture. |
| | 2. | | We structure compensation, especially at senior levels, to align with GS Group’s shareholders’ long-term interests. |
| | 3. | | We use compensation as an important tool to attract, retain and motivate talent. |
| | 4. | | We align total compensation with corporate performance over the period. |
The AIFM’s remuneration program is intended to be flexible enough to allow responses to changes in market conditions, but grounded in a framework that maintains effective remuneration practices.
b. Remuneration Governance
The planning, implementation and revision of the compensation policy of the AIFM is subject to the oversight of the Compensation Committee of the Board of Directors of GS Group (the “GS Group Compensation Committee”), the ultimate parent of the AIFM.
The members of the GS Group Compensation Committee at the end of 2016 were James A. Johnson (Chair), M. Michele Burns, William W. George, Ellen J. Kullman, Lakshmi N. Mittal, Debora L. Spar, and Adebayo O. Ogunlesi (ex-officio). None of the members of the GS Group Compensation Committee were an employee of the firm. All members of the GS Group Compensation Committee were “independent” within the meaning of the New York Stock Exchange Rules and the firm’s Director Independence Policy.
The GS Group Compensation Committee has for several years recognised the importance of using an independent remuneration consultant that is appropriately qualified and that provides services solely to the GS Group Compensation Committee and not to the firm. The GS Group Compensation Committee continued to retain Semler Brossy Consulting Group LLC (Semler Brossy) as its independent remuneration consultant in 2016.
GS Group’s global process for setting variable remuneration (including the requirement to consider risk and compliance issues) applies to employees of the AIFM in the same way as to employees of other entities and in other regions and is subject to oversight by the senior management of the firm in the region.
c. Link Between Pay and Performance
Annual remuneration for employees is generally comprised of fixed and variable remuneration. The AIFM’s remuneration practices provide for variable remuneration determinations to be made on a discretionary basis. Variable remuneration is based on multiple factors and is not set as a fixed percentage of revenue or by reference to any other formula. Firmwide performance is a key factor in determining variable remuneration.
26
GOLDMAN SACHS ETF TRUST
Goldman Sachs TreasuryAccess 0-1 Year ETFs — Other Information (Unaudited) (continued)
d. Performance Measurement
Year-end variable remuneration is determined through a discretionary process that relies on certain qualitative and quantitative metrics (amongst other factors) against which we assess performance at year-end. We do not set specific goals, targets or other objectives for purposes of determining year-end variable remuneration nor do we set an initial remuneration pool that is adjusted for any such goals, targets or other objectives. Such metrics are not formulaic nor given any specific weight. In addition, employees are evaluated annually as part of the “360 degree” feedback process.
e. Risk Adjustment
Prudent risk management is a hallmark of both the firm’s and AIFM’s culture and sensitivity to risk and risk management are key elements in assessing employee performance, including as part of the “360 degree” feedback process noted above.
We take risk into account in setting the amount and form of variable remuneration for employees. We provide guidelines to assist compensation managers when applying discretion during the remuneration process to promote consistent consideration of the different metrics/factors considered during the remuneration process. Further, to ensure the independence of control function employees, remuneration for those employees is not determined by individuals in revenue-producing positions but rather by the management of the relevant control function.
f. Structure of Remuneration
| | 2. | | Variable Remuneration: For employees with total and variable remuneration above a specific threshold, variable remuneration is generally paid in a combination of cash and equity-based remuneration. In general, the portion paid in the form of an equity-based award increases as variable remuneration increases and, for AIFM Remuneration Code Staff, is set to ensure compliance with Principle 5 (e) and (f) of the AIFM Remuneration Code. |
g. Total Remuneration
Staff remuneration for the financial period ending December 31, 2016:
| | |
Total remuneration for the financial year ending
December 31, 2016 paid by the AIFM to 12 staff in respect of
the management of the assets of the Fund | | US$56,089, made up of: • US$28,088 fixed remuneration
• US$28,001 variable remuneration |
Which includes: |
(a) Remuneration paid by the AIFM to senior management | | US$30,000 |
(b) Remuneration paid by the AIFM to other staff members whose actions have a material impact on the risk profile of the Fund | | US$0 |
The remuneration figures above:
| | 1. | | relate to the proportion of time spent by those staff on the management of the assets of the Fund; |
| | 2. | | relate to the portion of the year for which the Fund were subject to the Directive; and |
| | 3. | | do not include figures for those staff whose activities may impact the Fund but who provide services through other affiliates of the AIFM. |
II. Risk Management
The current risk profile of the Fund and the risk management framework employed by the AIFM to manage those risks are outlined in the Fund’s Prospectus and Statement of Additional Information. The Investment Adviser’s risk management function will seek to ensure that the risk profile disclosed to investors is consistent with applicable risk limits, monitor compliance with those risk limits, promptly notify the risk management component of the portfolio management team managing the portfolio of any inconsistency, or risk or inconsistency, between the risk profile and risk limits.
27
GOLDMAN SACHS ETF TRUST
Goldman Sachs TreasuryAccess 0-1 Year ETFs — Other Information (Unaudited) (continued)
III. Material Changes
Article 22 of the Directive requires disclosure of any material changes in the information listed in Article 23 of the Directive.
In respect of the period ended December 31, 2016, there have been no material changes to the information listed in Article 23 of the Directive.
28
FUNDS PROFILE
Goldman Sachs ETFs

Goldman Sachs is a premier financial services firm, known since 1869 for creating thoughtful and customized investment solutions in complex global markets.
Today, the Investment Management Division of Goldman Sachs serves a diverse set of clients worldwide, including private institutions, public entities and individuals. With approximately $1.21 trillion in assets under supervision as of June 30, 2017, Goldman Sachs Asset Management (“GSAM”) has portfolio management teams located around the world and our investment professionals bring firsthand knowledge of local markets to every investment decision. Assets under supervision includes assets under management and other client assets for which Goldman Sachs does not have full discretion. GSAM leverages the resources of Goldman Sachs & Co. LLC subject to legal, internal and regulatory restrictions.
|
| GOLDMAN SACHS EXCHANGE-TRADED FUNDS |
| Goldman Sachs Access High Yield Corporate Bond ETF |
| Goldman Sachs Access Investment Grade Corporate Bond ETF |
| Goldman Sachs ActiveBeta® Emerging Markets Equity ETF |
| Goldman Sachs ActiveBeta® Europe Equity ETF |
| Goldman Sachs ActiveBeta® International Equity ETF |
| Goldman Sachs ActiveBeta® Japan Equity ETF |
| Goldman Sachs ActiveBeta® U.S. Large Cap Equity ETF |
| Goldman Sachs ActiveBeta® U.S. Small Cap Equity ETF |
| Goldman Sachs Equal Weight U.S. Large Cap Equity |
| Goldman Sachs Hedge Industry VIP ETF |
Goldman Sachs TreasuryAccess 0-1 Year ETF |
INDEX DISCLAIMERS
The Index was developed and is calculated and maintained by FTSE Fixed Income LLC (“FTSE” or the “Index Provider”). FTSE is not affiliated with the Fund or GSAM. The Fund is not sponsored, endorsed, sold or promoted by FTSE or any of its affiliates and FTSE makes no representation to any owner or prospective owner of the Fund regarding the advisability of investing in securities generally or in the Fund particularly, or the ability of the Fund to track the price and yield performance of the Index or the ability of the Index to track general bond market performance. FTSE’s only relationship to GSAM (“Licensee”) is the licensing of certain information, data, trademarks and trade names of FTSE or its affiliates. The Index is determined, composed and calculated by FTSE without regard to the Fund. FTSE has no obligation to take the needs of the owners or prospective owners of the Fund into consideration in determining, composing or calculating the Index. FTSE is not responsible for and has not participated in the determination of the prices and amount of the shares to be issued by the Fund or the timing of the issuance or sale of the shares to be issued by the Fund or in the determination or calculation of the equation by which the shares to be issued by the Fund are to be converted into cash. FTSE has no obligation or liability in connection with the administration, marketing or trading of the Fund.
FTSE DOES NOT GUARANTEE THE ACCURACY OR COMPLETENESS OF THE INDEX OR ANY DATA INCLUDED THEREIN, OR OF ANY COMMUNICATIONS, INCLUDING BUT NOT LIMITED TO, ORAL OR WRITTEN COMMUNICATIONS (INCLUDING ELECTRONIC COMMUNICATIONS) WITH RESPECT THERETO, AND FTSE SHALL HAVE NO LIABILITY FOR ANY ERRORS, OMISSIONS OR DELAYS THEREIN. FTSE MAKES NO WARRANTY, EXPRESS OR IMPLIED, AS TO RESULTS TO BE OBTAINED BY LICENSEE, OWNERS OR PROSPECTIVE OWNERS OF SHARES OF THE FUND, OR ANY OTHER PERSON OR ENTITY FROM THE USE OF THE INDEX OR ANY DATA INCLUDED THEREIN. FTSE MAKES NO EXPRESS OR IMPLIED WARRANTIES, AND EXPRESSLY DISCLAIMS ALL WARRANTIES OF MERCHANTABILITY OR FITNESS FOR A PARTICULAR PURPOSE OR USE WITH RESPECT TO THE INDEX OR ANY DATA INCLUDED THEREIN. WITHOUT LIMITING ANY OF THE FOREGOING, IN NO EVENT SHALL FTSE HAVE ANY LIABILITY FOR ANY DIRECT, SPECIAL, PUNITIVE, INDIRECT, CONSEQUENTIAL OR ANY OTHER DAMAGES (INCLUDING LOST PROFITS), EVEN IF NOTIFIED OF THE POSSIBILITY OF SUCH DAMAGES, WHETHER IN CONTRACT, TORT, STRICT LIABILITY OR OTHERWISE.
Data and information contained herein regarding the Index is proprietary to FTSE or its licensors, and reproduction of such data and information is prohibited except with the prior written permission of FTSE. CITI is a trademark and service mark of Citigroup Inc. or its affiliates, is used and registered throughout the world, and is used under license for certain purposes by GSAM. The CITI mark is used under license by FTSE.
The ActiveBeta® Indices are trademarks of Goldman Sachs Asset Management, L.P. and have been licensed for use by Goldman Sachs ETF Trust.
| | |
TRUSTEES Lawrence W. Stranghoener, Chairman Caroline Dorsa Linda A. Lang Michael Latham James A. McNamara | | OFFICERS James A. McNamara, President Scott M. McHugh, Treasurer, Senior Vice President and Principal Financial Officer Joseph F. DiMaria, Assistant Treasurer and Principal Accounting Officer Caroline L. Kraus, Secretary |
| |
THE BANK OF NEW YORK MELLON Transfer Agent | | GOLDMAN SACHS ASSET MANAGEMENT, L.P. Investment Adviser |
ALPS DISTRIBUTORS, INC. Distributor | |
Visit our Website at www.GSAMFUNDS.com to obtain the most recent month-end returns.
Goldman Sachs Asset Management, L.P., 200 West Street, New York, New York 10282
The reports concerning the Fund included in this shareholder report may contain certain forward-looking statements about the factors that may affect the performance of the Fund in the future. These statements are based on Fund management’s predictions and expectations concerning certain future events and their expected impact on the Fund, such as performance of the economy as a whole and of specific industry sectors, changes in the levels of interest rates, the impact of developing world events, and other factors that may influence the future performance of the Fund. Management believes these forward-looking statements to be reasonable, although they are inherently uncertain and difficult to predict. Actual events may cause adjustments in portfolio management strategies from those currently expected to be employed.
A description of the policies and procedures that the Fund uses to determine how to vote proxies relating to portfolio securities and information regarding how the Fund voted proxies relating to portfolio securities for the most recent 12-month period ended June 30, are available (i) without charge, upon request by calling 1-800-621-2550; and (ii) on the Securities and Exchange Commission (“SEC’’) web site at http://www.sec.gov.
The Fund files its complete schedule of portfolio holdings with the SEC for the first and third quarters of each fiscal year on Form N-Qs. The Fund’s Form N-Qs are available on the SEC’s web site at http://www.sec.gov within 60 days after the Fund’s first and third fiscal quarters. The Fund’s Form N-Qs may be reviewed and copied at the SEC’s Public Reference Room in Washington, D.C., and information on the operation of the Public Reference Room may also be obtained by calling 1-800-SEC-0330. Form N-Qs may be obtained upon request and without charge by calling 1-800-621-2550.
Fund holdings and allocations shown are as of August 31, 2017 and may not be representative of future investments. Fund holdings should not be relied on in making investment decisions and should not be construed as research or investment advice regarding particular securities. Current and future holdings are subject to risk.
ETF Fund shares are not individually redeemable and are issued and redeemed by the Fund at their net asset value (“NAV”) only in large, specified blocks of shares called creation units. Shares otherwise can be bought and sold only through exchange trading at market price (not NAV). Shares may trade at a premium or discount to their NAV in the secondary market. Brokerage commissions will reduce returns.
The Fund is recently organized and has limited operating history.
Economic and market forecasts presented herein reflect our judgment as of the date of this presentation and are subject to change without notice. These forecasts do not take into account the specific investment objectives, restrictions, tax and financial situation or other needs of any specific client. Actual data will vary and may not be reflected here. These forecasts are subject to high levels of uncertainty that may affect actual performance. Accordingly, these forecasts should be viewed as merely representative of a broad range of possible outcomes. These forecasts are estimated, based on assumptions, and are subject to significant revision and may change materially as economic and market conditions change. Goldman Sachs has no obligation to provide updates or changes to these forecasts. Case studies and examples are for illustrative purposes only.
THIS MATERIAL IS FOR INFORMATIONAL PURPOSES ONLY AND IS PROVIDED SOLELY ON THE BASIS THAT IT WILL NOT CONSTITUTE INVESTMENT OR OTHER ADVICE OR A RECOMMENDATION RELATING TO ANY PERSON’S OR PLAN’S INVESTMENT OR OTHER DECISIONS, AND GOLDMAN SACHS IS NOT A FIDUCIARY OR ADVISOR WITH RESPECT TO ANY PERSON OR PLAN BY REASON OF PROVIDING THE MATERIAL OR CONTENT HEREIN INCLUDING UNDER THE EMPLOYEE RETIREMENT INCOME SECURITY ACT OF 1974 OR DEPARTMENT OF LABOR REGULATIONS. PLAN SPONSORS AND OTHER FIDUCIARIES SHOULD CONSIDER THEIR OWN CIRCUMSTANCES IN ASSESSING ANY POTENTIAL COURSE OF ACTION.
This material is not authorized for distribution to prospective investors unless preceded or accompanied by a current Prospectus or summary prospectus, if applicable. Investors should consider the Fund’s objective, risks, and charges and expenses, and read the summary prospectus, if available, and/or the Prospectus carefully before investing or sending money. The summary prospectus, if available, and the Prospectus contain this and other information about a Fund and may be obtained from your authorized dealer or from Goldman Sachs & Co. LLC by calling 1-800-621-2550.
ALPS Distributors, Inc. is the distributor of the Goldman Sachs ETF Funds. ALPS Distributors, Inc. is unaffiliated with Goldman Sachs Asset Management.
© 2017 Goldman Sachs. All rights reserved. 107126-TMPL-10/2017-630980 TREACCESSAR-17/GST528/1491
(a) As of the end of the period covered by this report, the registrant has adopted a code of ethics that applies to the registrant’s principal executive officer, principal financial officer, principal accounting officer or controller, or persons performing similar functions, regardless of whether these individuals are employed by the registrant or a third party (the “Code of Ethics”).
(b) During the period covered by this report, no amendments were made to the provisions of the Code of Ethics.
(c) During the period covered by this report, the registrant did not grant any waivers, including an implicit waiver, from any provision of the Code of Ethics.
(d) A copy of the Code of Ethics is available as provided in Item 12(a)(1) of this report.
| ITEM 3. | AUDIT COMMITTEE FINANCIAL EXPERT. |
The registrant’s board of trustees has determined that the registrant has at least one “audit committee financial expert” (as defined in Item 3 of Form N-CSR) serving on its audit committee. Caroline Dorsa is the “audit committee financial expert” and is “independent” (as each term is defined in Item 3 of Form N-CSR).
| ITEM 4. | PRINCIPAL ACCOUNTANT FEES AND SERVICES. |
Table 1 — Items 4(a) - 4(d). The accountant fees below reflect the aggregate fees billed by the Funds of the Goldman Sachs ETF Trust to which this certified shareholder report relates.
| | | | | | | | | | | | |
| | | 2017 | | 2016 | | Description of Services Rendered |
| | | |
| | | | | | | | | | | | |
| | | |
Audit Fees: | | | | | | | | | | | | |
| | | |
• PricewaterhouseCoopers LLP
(“PwC”) | | | $ | 212,675 | | | | $ | 162,000 | | | Financial Statement audits. |
| | | |
Audit-Related Fees: | | | | | | | | | | | | |
| | | |
• PwC | | | $ | 12,909 | | | | $ | — | | | |
| | | |
Tax Fees: | | | | | | | | | | | | |
| | | |
• PwC | | | $ | 47,752 | | | | $ | 45,352 | | | Tax compliance services provided in connection with the preparation and review of registrant’s tax returns. |
Table 2 — Items 4(b)(c) & (d). Non-Audit Services to the Goldman Sachs ETF Trust’s service affiliates * that were pre-approved by the Audit Committee of the Goldman Sachs ETF Trust pursuant to Rule 2-01(c)(7)(ii) of Regulation S-X.
| | | | | | | | | | | | |
| | | 2017 | | 2016 | | Description of Services Rendered |
| | | |
| | | | | | | | | | | | |
| | | |
Audit-Related Fees: | | | | | | | | | | | | |
| | | |
• PwC | | | $ | — | | | | $ | — | | | |
| * | These include the advisor (excluding sub-advisors) and any entity controlling, controlled by or under common control with the advisor that provides ongoing services to the registrant (hereinafter referred to as “service affiliates”). |
Item 4(e)(1) — Audit Committee Pre-Approval Policies and Procedures
Pre-Approval of Audit and Non-Audit Services Provided to the Funds of the Goldman Sachs ETF Trust. The Audit and Non-Audit Services Pre-Approval Policy (the “Policy”) adopted by the Audit Committee of Goldman Sachs ETF Trust (“GS ETF”) sets forth the procedures and the conditions pursuant to which services performed by an independent auditor for GS ETF may be pre-approved. Services may be pre-approved specifically by the Audit Committee as a whole or, in certain circumstances, by the Audit Committee Chairman or the person designated as the Audit Committee Financial Expert. In addition, subject to specified cost limitations, certain services may be pre-approved under the provisions of the Policy. The Policy provides that the Audit Committee will consider whether the services provided by an independent auditor are consistent with the Securities and Exchange Commission’s rules on auditor independence. The Policy provides for periodic review and pre-approval by the Audit Committee of the services that may be provided by the independent auditor.
De Minimis Waiver. The pre-approval requirements of the Policy may be waived with respect to the provision of non-audit services that are permissible for an independent auditor to perform, provided (1) the aggregate amount of all such services provided constitutes no more than five percent of the total amount of revenues subject to pre-approval that was paid to the independent auditors during the fiscal year in which the services are provided; (2) such services were not recognized by GS ETF at the time of the engagement to be non-audit services; and (3) such services are promptly brought to the attention of the Audit Committee and approved prior to the completion of the audit by the Audit Committee or by one or more members of the Audit Committee to whom authority to grant such approvals has been delegated by the Audit Committee, pursuant to the pre-approval provisions of the Policy.
Pre-Approval of Non-Audit Services Provided to the Goldman Sachs ETF Trust’s Investment Advisers. The Policy provides that, in addition to requiring pre-approval of audit and non-audit services provided to GS ETF, the Audit Committee will pre-approve those non-audit services provided to GS ETF’s investment advisers (and entities controlling, controlled by or under common control with the investment advisers that provide ongoing services to GS ETF) where the engagement relates directly to the operations or financial reporting of GS ETF.
Item 4(e)(2) – 0% of the audit-related fees, tax fees and other fees listed in Table 1 were approved by GS ETF’s Audit Committee pursuant to the “de minimis” exception of Rule 2-01(c)(7)(i)(C) of Regulation S-X. In addition, 0% of the non-audit services to the GS ETF’s service affiliates listed in Table 2 were approved by GS ETF’s Audit Committee pursuant to the “de minimis” exception of Rule 2-01(c)(7)(i)(C) of Regulation S-X.
Item 4(f) – Not applicable.
Item 4(g) Aggregate Non-Audit Fees Disclosure
The aggregate non-audit fees billed to GS ETF by PwC for the twelve months ended August 31, 2017 and August 31, 2016 were approximately $60,661 and $45,352 respectively. The aggregate non-audit fees billed to GS ETF’s adviser and service affiliates by PwC for non-audit services for the twelve months ended December 31, 2016 and December 31, 2015 were approximately $11.4 million and $14.4 million respectively. With regard to the aggregate non-audit fees billed to GS ETF’s adviser and service affiliates, the 2016 and 2015 amounts include fees for non-audit services required to be pre-approved [see Table 2] and fees for non-audit services that did not require pre-approval since they did not directly relate to GS ETF’s operations or financial reporting.
Item 4(h) — GS ETF’s Audit Committee has considered whether the provision of non-audit services to GS ETF’s investment adviser and service affiliates that did not require pre-approval pursuant to paragraph (c)(7)(ii) of Rule 2-01 of Regulation S-X is compatible with maintaining the auditors’ independence.
| ITEM 5. | AUDIT COMMITTEE OF LISTED REGISTRANTS. |
| | The Registrant has a separately-designated standing Audit Committee established in accordance with Section 3(a)(58)(A) of the Securities Exchange Act of 1934, as amended. The members of the Audit Committee are Michael Latham, Linda A. Lang, Lawrence W. Stranghoener, and Caroline Dorsa, each a Trustee of the Registrant. |
| ITEM 6. | SCHEDULE OF INVESTMENTS. |
| | Schedule of Investments is included as part of the Report to Shareholders filed under Item 1. |
| ITEM 7. | DISCLOSURE OF PROXY VOTING POLICIES AND PROCEDURES FOR CLOSED-END MANAGEMENT INVESTMENT COMPANIES. |
| ITEM 8. | PORTFOLIO MANAGERS OF CLOSED-END MANAGEMENT INVESTMENT COMPANIES. |
| ITEM 9. | PURCHASES OF EQUITY SECURITIES BY CLOSED-END MANAGEMENT INVESTMENT COMPANY AND AFFILIATED PURCHASERS. |
| ITEM 10. | SUBMISSION OF MATTERS TO A VOTE OF SECURITY HOLDERS. |
| | There have been no material changes to the procedures by which shareholders may recommend nominees to the registrant’s board of trustees. |
| ITEM 11. | CONTROLS AND PROCEDURES. |
| | (a) | The registrant’s principal executive and principal financial officers, or persons performing similar functions have concluded that the registrant’s disclosure controls and procedures (as defined in Rule 30a-3(c) under the Investment Company Act of 1940, as amended (the “1940 Act”)) are effective as of a date within 90 days of the filing of this report that includes the disclosure required by this paragraph, based on the evaluation of these controls and procedures required by Rule 30a-3(b) under the 1940 Act and 15d-15(b) under the Securities Exchange Act of 1934, as amended. |
| | (b) | There were no changes in the registrant’s internal control over financial reporting (as defined in Rule 30a-3(d) under the 1940 Act) that occurred during the registrant’s second fiscal quarter of the period covered by this report that have materially affected, or are reasonably likely to materially affect, the registrant’s internal control over financial reporting. |
| | | | |
| (a)(1) | | Goldman Sachs ETF Trust’s Code of Ethics for Principal Executive and Senior Financial Officers is incorporated by reference to Exhibit 12(a)(1) of the registrant’s Form N-CSR filed on October 31, 2016. |
| | |
| (a)(2) | | Exhibit 99.CERT | | Certifications pursuant to Section 302 of the Sarbanes-Oxley Act of 2002 filed herewith. |
| | |
| (b) | | Exhibit 99.906CERT | | Certifications pursuant to Section 906 of the Sarbanes-Oxley Act of 2002 filed herewith. |
SIGNATURES
Pursuant to the requirements of the Securities Exchange Act of 1934 and the Investment Company Act of 1940, the registrant has duly caused this report to be signed on its behalf by the undersigned, thereunto duly authorized.
| | |
| | | Goldman Sachs ETF Trust |
| |
| By: | | /s/ James A. McNamara |
| |
| | |
| | James A. McNamara |
| | President/Chief Executive Officer |
| | Goldman Sachs ETF Trust |
| |
| Date: | | October 31, 2017 |
Pursuant to the requirements of the Securities Exchange Act of 1934 and the Investment Company Act of 1940, this report has been signed below by the following persons on behalf of the registrant and in the capacities and on the dates indicated.
| | |
| By: | | /s/ James A. McNamara |
| |
| | |
| | James A. McNamara |
| | President/Chief Executive Officer |
| | Goldman Sachs ETF Trust |
| |
| Date: | | October 31, 2017 |
| |
| By: | | /s/ Scott McHugh |
| |
| | |
| | Scott McHugh |
| | Principal Financial Officer |
| | Goldman Sachs ETF Trust |
| |
| Date: | | October 31, 2017 |