UNITED STATES
SECURITIES AND EXCHANGE COMMISSION
Washington, D.C. 20549
FORM N-CSR
CERTIFIED SHAREHOLDER REPORT OF REGISTERED
MANAGEMENT INVESTMENT COMPANIES
Investment Company Act file number 811-23013
Goldman Sachs ETF Trust
(Exact name of registrant as specified in charter)
200 West Street, New York, New York 10282
(Address of principal executive offices) (Zip code)
| | |
| Caroline Kraus, Esq. | | Copies to: |
| Goldman Sachs & Co. LLC | | Geoffrey R.T. Kenyon, Esq. |
| 200 West Street | | Dechert LLP |
| New York, New York 10282 | | 100 Oliver Street |
| | 40th Floor |
| | Boston, MA 02110-2605 |
(Name and address of agents for service)
Registrant’s telephone number, including area code: (312) 655-4400
Date of fiscal year end: August 31
Date of reporting period: August 31, 2020
| ITEM 1. | REPORTS TO STOCKHOLDERS. |
| | The Annual Report to Shareholders is filed herewith. |
Goldman Sachs Funds

| | | | |
| | |
| Annual Report | | | | August 31, 2020 |
| | |
| | | | Access Fixed Income ETFs |
| | | | Access High Yield Corporate Bond ETF (GHYB) |
| | | | Access Inflation Protected USD Bond ETF (GTIP) |
| | | | Access Investment Grade Corporate 1-5 Year Bond ETF (GSIG) |
| | | | Access Investment Grade Corporate Bond ETF (GIGB) |
| | | | Access Treasury 0-1 Year ETF (GBIL) |
| | | | Access Ultra Short Bond ETF (GSST) |
It is our intention that beginning on January 1, 2021, paper copies of the Funds’ annual and semi-annual shareholder reports will no longer be sent by mail, unless you specifically request paper copies of the reports from your financial intermediary. Instead, the reports will be made available on a website, and you will be notified by mail each time a report is posted and provided with a website link to access the report.
If you already elected to receive shareholder reports electronically, you will not be affected by this change and you need not take any action. At any time, you may elect to receive reports and certain communications from a Fund electronically by contacting your financial intermediary.
You may elect to receive all future shareholder reports in paper free of charge. You can inform your financial intermediary that you wish to receive paper copies of reports by contacting your financial intermediary. Your election to receive reports in paper will apply to all Goldman Sachs Funds held in your account.

Goldman Sachs Access Fixed Income ETFs
| ∎ | | ACCESS HIGH YIELD CORPORATE BOND ETF |
| ∎ | | ACCESS INFLATION PROTECTED USD BOND ETF |
| ∎ | | ACCESS INVESTMENT GRADE CORPORATE 1-5 YEAR BOND ETF |
| ∎ | | ACCESS INVESTMENT GRADE CORPORATE BOND ETF |
| ∎ | | ACCESS TREASURY 0-1 YEAR ETF |
| ∎ | | ACCESS ULTRA SHORT BOND ETF |
| | | | |
| | | |
| NOT FDIC-INSURED | | May Lose Value | | No Bank Guarantee |
INVESTMENT PROCESS
Goldman Sachs Access Fixed Income ETFs
Principal Investment Strategies
GOLDMAN SACHS ACCESS HIGH YIELD CORPORATE BOND ETF
The Goldman Sachs Access High Yield Corporate Bond ETF (the “Fund”) seeks to achieve its investment objective by investing at least 80% of its assets (exclusive of collateral held from securities lending) in securities included in its underlying index.
The FTSE Goldman Sachs High Yield Corporate Bond Index (the “Index”) is a rules-based index that is designed to measure the performance of high yield corporate bonds denominated in U.S. dollars (“USD”) that meet certain liquidity and fundamental screening criteria. “High yield” bonds are bonds that are rated below investment grade and are commonly referred to as “junk bonds.” As of August 31, 2020, there were 832 constituents in the Index and the Index had a weighted average maturity of 5.94 years. The Index is a custom index that is owned and calculated by FTSE Fixed Income LLC (“FTSE”), a trading name of the London Stock Exchange Group plc and its group undertakings (collectively, the “LSE Group” or the “Index Provider”). The Index is based on the FTSE US High-Yield Market Index (the “Reference Index”) using concepts developed with Goldman Sachs Asset Management, L.P. (“GSAM”).
Given the Fund’s investment objective of attempting to track the Index, the Fund does not follow traditional methods of active investment management, which may involve buying and selling securities based upon analysis of economic and market factors.
The Index Provider constructs the Index in accordance with a rules-based methodology that involves two steps.
Step 1 - In the first step, the Index Provider defines a universe of potential index constituents (the “Universe”) by applying specified criteria to the constituent securities of the Reference Index. The Reference Index includes high yield corporate bonds issued by companies domiciled in the United States or Canada that have a minimum of one year to maturity and are rated a maximum of BB+ by Standard & Poor’s Ratings Services (“S&P”) and Ba1 by Moody’s Investors Service, Inc. (“Moody’s”) and a minimum of C by S&P and Ca by Moody’s. Only constituents of the Reference Index that (i) have a minimum of $400 million outstanding, a minimum issuer size of $1 billion and a maximum final maturity of 15 years and (ii) if neither fundamental factor described below is available, are rated at least CCC+ by S&P or Caa1 by Moody’s, are included in the Universe. A maturity bucketing process is used to approximate the average effective duration of the Reference Index.
Step 2 - In the second step, the Index Provider applies a fundamental screen to the Universe. Issuers are first grouped into three broad industry groups: financials, industrials and utilities. Within each industry group, issuers are measured by two fundamental factors, debt service and leverage. The Index Provider ranks each issuer based on the two fundamental factors, equally weighted. The Index is constructed by including the highest ranking eligible securities in each industry group, screening out lowest ranking eligible securities.
GOLDMAN SACHS ACCESS INFLATION PROTECTED USD BOND ETF
The Goldman Sachs Access Inflation Protected USD Bond ETF (the “Fund”) seeks to achieve its investment objective by investing at least 80% of its assets (exclusive of collateral held from securities lending) in securities included in its underlying index.
The FTSE Goldman Sachs Treasury Inflation Protected USD Bond Index (the “Index”) is designed to track the performance of inflation protected, fixed rate U.S. Treasury Securities denominated in U.S. dollars (“USD”) that meet certain screening criteria. “U.S. Treasury Securities” refer to securities issued or guaranteed by the U.S. Treasury where the payment of principal and interest is backed by the full faith and credit of the U.S. government. U.S. Treasury Securities include U.S. Treasury notes, U.S. Treasury bills and U.S. Treasury floating rate bonds. As of August 31, 2020, there were 38 issues in the Index and the Index had a weighted average maturity of 8.18 years and a weighted average duration of 7.80 years. The Index is a custom index that is owned and calculated by FTSE Fixed Income LLC (“FTSE”), a trading name of the London Stock Exchange Group plc and its group undertakings (collectively, the “LSE Group” or the “Index Provider”). The Index is based on the U.S. sleeve of the FTSE World Inflation-Linked Securities Index (the “Reference Index”) using concepts developed with GSAM.
Given the Fund’s investment objective of attempting to track the Index, the Fund does not follow traditional methods of active investment management, which may involve buying and selling securities based upon analysis of economic and market factors.
1
INVESTMENT PROCESS
The Index Provider constructs the Index in accordance with a rules-based methodology that involves two steps.
Step 1
In the first step, the Index Provider defines a universe of potential index constituents (the “Universe”) by applying specified criteria to the constituents of the Reference Index.
The Reference Index includes fixed-rate, sovereign bonds denominated in USD that are linked to an inflation index. Only constituents of the Reference Index that are U.S. Treasury Inflation-Protected Securities (“TIPS”), have a minimum of 1 year to maturity and a minimum issue size of $5 billion outstanding (before taking into account the Federal Reserve System Open Market Account (“SOMA”) holdings) are included in the Universe.
Step 2
In the second step, the Index Provider screens the Universe to exclude securities that are unseasoned. The Index excludes “on the run” bonds, or the newest issues for each security term. The Index is constructed by weighting each constituent to match the weighted average real yield duration of the Universe.
THE FUND IS NOT A MONEY MARKET FUND AND DOES NOT ATTEMPT TO MAINTAIN A STABLE NET ASSET VALUE.
GOLDMAN SACHS ACCESS INVESTMENT GRADE CORPORATE 1-5 YEAR BOND ETF
The Goldman Sachs Access Investment Grade Corporate 1-5 Year Bond ETF (the “Fund”) seeks to achieve its investment objective by investing at least 80% of its assets (exclusive of collateral held from securities lending) in securities included in its underlying index.
The FTSE Goldman Sachs Investment Grade Corporate Bond 1-5 Years Index (the “Index”) is a rules-based index that is designed to measure the performance of investment grade, corporate bonds denominated in U.S. dollars (“USD”) with remaining maturities between one and five years that meet certain liquidity and fundamental screening criteria.
As of August 31, 2020, there were 2,013 constituents in the Index and the Index had a weighted average maturity of 3.24 years. The Index is a custom index that is owned and calculated by FTSE Fixed Income LLC (“FTSE”), a trading name of the London Stock Exchange Group plc and its group undertakings (collectively, the “LSE Group” or the “Index Provider”). The Index is based on the FTSE US Broad Investment-Grade (USBIG®) Corporate Bond Index (the “Reference Index”) using concepts developed with Goldman Sachs Asset Management, L.P. (the “Investment Adviser” or “GSAM”).
Given the Fund’s investment objective of attempting to track the Index, the Fund does not follow traditional methods of active investment management, which may involve buying and selling securities based upon analysis of economic and market factors.
The Index Provider constructs the Index in accordance with a rules-based methodology that involves two steps.
Step 1 - In the first step, the Index Provider defines a universe of potential Index constituents (the “Universe”) by applying specified criteria to the constituents of the Reference Index. The Reference Index includes investment grade corporate bonds that have a minimum of a minimum of one year to maturity and are rated at least BBB- by Standard & Poor’s Ratings Services (“S&P”) or Baa3 by Moody’s Investors Service, Inc. (“Moody’s”). Only corporate bond constituents of the Reference Index that have a minimum of $250 million outstanding, remaining maturities between one and five years, and from issuers with at least two eligible bonds outstanding are included in the Universe. A maturity bucketing process is used to approximate the average effective duration of constituents of the Reference Index with remaining maturities between one and five years.
Step 2 - In the second step, the Index Provider applies a fundamental screen to the Universe. Issuers are first grouped into three broad industry groups: financials, industrials and utilities. Within each industry group, issuers are measured by two fundamental factors, operating margin and leverage, subject to certain exceptions. The Index Provider ranks each issuer based on the two fundamental factors, equally weighted. The Index is constructed by including the highest ranking eligible securities in each industry group, screening out lowest ranking eligible securities. An issuer weight cap is applied to each Index constituent.
2
INVESTMENT PROCESS
GOLDMAN SACHS ACCESS INVESTMENT GRADE CORPORATE BOND ETF
The Goldman Sachs Access Investment Grade Corporate Bond ETF (the “Fund”) seeks to achieve its investment objective by investing at least 80% of its assets (exclusive of collateral held from securities lending) in securities included in its underlying index.
The FTSE Goldman Sachs Investment Grade Corporate Bond Index (the “Index”) is a rules-based index that is designed to measure the performance of investment grade corporate bonds denominated in U.S. dollars that meet certain liquidity and fundamental screening criteria. As of August 31, 2020, there were 2,529 constituents in the Index and the Index had a weighted average maturity of 12.25 years. The Index is a custom index that is owned and calculated by FTSE Fixed Income LLC (“FTSE”), a trading name of the London Stock Exchange Group plc and its group undertakings (collectively, the “LSE Group” or the “Index Provider”). The Index is based on the FTSE US Broad Investment-Grade (USBIG®) Corporate Index (the “Reference Index”) using concepts developed with Goldman Sachs Asset Management, L.P. (“GSAM”).
Given the Fund’s investment objective of attempting to track the Index, the Fund does not follow traditional methods of active investment management, which may involve buying and selling securities based upon analysis of economic and market factors.
The Index Provider constructs the Index in accordance with a rules-based methodology that involves two steps.
Step 1 - In the first step, the Index Provider defines a universe of potential index constituents (the “Universe”) by applying specified criteria to the constituents of the Reference Index. The Reference Index includes investment grade corporate bonds that have a minimum of one year to maturity and are rated at least BBB- by Standard & Poor’s Ratings Services (“S&P”) or Baa3 by Moody’s Investors’ Service, Inc. (“Moody’s”). Only corporate bond constituents of the Reference Index that have a minimum of $750 million outstanding and a minimum issuer size of $2 billion are included in the Universe. A maturity bucketing process is used to approximate the average effective duration of the Reference Index.
Step 2 - In the second step, the Index Provider applies a fundamental screen to the Universe. Issuers are first grouped into three broad industry groups: financials, industrials and utilities. Within each industry group, issuers are measured by two fundamental factors: operating margin and leverage. The Index Provider ranks each issuer based on the two fundamental factors, equally weighted. The Index is constructed by including the highest ranking eligible securities in each industry group, screening out lowest ranking eligible securities.
GOLDMAN SACHS ACCESS TREASURY 0-1 YEAR ETF
The Goldman Sachs Access Treasury 0-1 Year ETF (the “Fund”) seeks to achieve its investment objective by investing at least 80% of its assets (exclusive of collateral held from securities lending) in securities included in its underlying index.
The FTSE US Treasury 0-1 Year Composite Select Index (the “Index”) is designed to measure the performance of U.S. Treasury Securities with a maximum remaining maturity of 12 months. “U.S. Treasury Securities” refer to securities issued or guaranteed by the U.S. Treasury where the payment of principal and interest is backed by the full faith and credit of the U.S. government. U.S. Treasury Securities include U.S. Treasury notes, U.S. Treasury bills and U.S. Treasury floating rate bonds. The Fund expects to invest 100% of its assets in (i) U.S. Treasury Securities with a maximum remaining maturity of 12 months and (ii) cash. As of August 31, 2020, there were 91 issues in the Index and the Index had a weighted average maturity of 0.26 years. The Index includes publicly-issued U.S. Treasury Securities that have a minimum remaining maturity of 1 month and a maximum remaining maturity of 12 months at the time of rebalance and that have a minimum issue size of $5 billion. In addition, the securities in the Index must be non-convertible and denominated in U.S. dollars. The Index excludes certain special issues, such as targeted investor notes, state and local government series bonds and coupon issues that have been stripped from bonds. 10-year and 30-year U.S. Treasury bonds are not eligible for inclusion in the Index.
The Index is sponsored by FTSE Fixed Income LLC (“FTSE”), a trading name of the London Stock Exchange Group plc and its group undertakings (collectively, the “LSE Group” or the “Index Provider”), which is not affiliated with the Fund or the Investment Adviser. The Index is market capitalization-weighted and the securities in the Index are updated on the last business day of each month.
Given the Fund’s investment objective of attempting to track the Index, the Fund does not follow traditional methods of active investment management, which may involve buying and selling securities based upon analysis of economic and market factors.
3
INVESTMENT PROCESS
THE FUND IS NOT A MONEY MARKET FUND AND DOES NOT ATTEMPT TO MAINTAIN A STABLE NET ASSET VALUE.
ALL ABOVE FUNDS
Each of the FTSE Goldman Sachs High Yield Corporate Bond Index, FTSE Goldman Sachs Investment Grade Corporate Bond 1-5 Years Index and FTSE Goldman Sachs Investment Grade Corporate Bond Index is rebalanced (i) monthly on the last business day of each month, to account for changes in maturities, corporate actions or ratings migration, and (ii) quarterly, to account for updates to the constituent securities on the basis of the fundamental factors (as described above). The FTSE US Treasury 0-1 Year Composite Select Index is rebalanced monthly on the last day of the month. The FTSE Goldman Sachs Treasury Inflation Protected USD Bond Index is rebalanced monthly on the last business day of the month to account for changes in maturities (i.e., removing securities with less than 1 year to maturity), new issues and duration to closely match the weighted average real yield duration of its Universe.
The Investment Adviser uses a representative sampling strategy to manage each Fund. “Representative sampling” is an indexing strategy in which each Fund invests in a representative sample of constituent securities that has a collective investment profile similar to that of its Index. The securities selected for investment by each Fund are expected to have, in the aggregate, investment characteristics, fundamental characteristics and liquidity measures similar to those of its Index. Each Fund may or may not hold all of the securities in its Index.
Each of the Goldman Sachs Access High Yield Corporate Bond ETF, Goldman Sachs Investment Grade Corporate 1-5 Year Bond ETF and Goldman Sachs Access Investment Grade Corporate Bond ETF may concentrate its investments (i.e. hold more than 25% of its total assets) in a particular industry or group of industries to the extent that its Index is concentrated. The degree to which components of its Index represent certain sectors or industries may change over time. Each of the Goldman Sachs Access Treasury 0-1 Year ETF and Goldman Sacs Access Inflation Protected USD Bond ETF may concentrate its investments (i.e., hold more than 25% of its total assets) in a particular industry or group of industries to the extent that its Index is concentrated. The U.S. government, state and municipal governments and their agencies, authorities and instrumentalities are not deemed to be industries for this purpose.
At the end of each Fund’s Reporting Period, i.e. August 31, 2020, we continued to believe the Funds may provide investors with smoother performance and less volatility, as a smart beta approach should provide liquidity while minimizing exposure to factors historically associated with volatility and underperformance.*
GOLDMAN SACHS ACCESS ULTRA SHORT BOND ETF
The Goldman Sachs Access Ultra Short Bond ETF (the “Fund”) seeks to achieve its investment objective by investing, under normal circumstances, at least 80% of its Net Assets in a broad range of U.S. dollar denominated bonds. The Fund primarily invests in U.S. Government Securities, obligations of U.S. banks, corporate notes, commercial paper and other short-term obligations of U.S. companies, states, municipalities and other entities, fixed and floating rate mortgage-backed securities, asset-backed securities, and repurchase agreements. The Fund may also invest in U.S. dollar-denominated obligations issued or guaranteed by foreign banks, companies and governments or their agencies, authorities, instrumentalities or sponsored enterprises. Shareholders will be provided with sixty days’ notice in the manner prescribed by the Securities and Exchange Commission (“SEC”) before any change in the Fund’s policy to invest at least 80% of its Net Assets in the particular type of investment suggested by its name.
The Fund will generally focus its investments in securities of issuers that, at the time of purchase, have a short-term credit rating of at least investment grade by at least one NRSRO (at least A-2, P-2, or F2 by Standard & Poor’s, Moody’s or Fitch, respectively), have a long-term credit rating of at least investment grade by at least one NRSRO (at least BBB-, Baa3, or BBB by Standard & Poor’s, Moody’s or Fitch, respectively) if such securities only maintain long-term ratings, or, if unrated, are determined by the Investment Adviser to be of comparable credit quality at the time of purchase. The Fund may also rely on the credit quality of a guarantee or demand feature in determining the credit quality of a security supported by the guarantee or demand feature.
| * | | Smart beta refers to quantitative index-based strategies. Liquidity is the ability to invest or redeem during market hours. Volatility refers to the annualized standard deviation of returns. |
4
INVESTMENT PROCESS
The Fund will concentrate its investments in the financial services group of industries. Therefore, under normal circumstances, the Fund will invest more than 25% of its total assets in securities issued by companies in the financial services group of industries and repurchase agreements secured by such obligations.
Under normal circumstances, the Fund’s effective duration is expected to be one year or less. “Duration” is a measure of a debt security’s price sensitivity to changes in interest rates. The longer the duration of the Fund (or an individual debt security), the more sensitive its market price to changes in interest rates. In computing duration, the Fund will estimate the duration of obligations that are subject to prepayment or redemption by the issuer, taking into account the influence of interest rates on prepayments and coupon flows. This method of computing duration is known as “option-adjusted” duration.
The Fund is an actively managed ETF, which is a fund that trades like other publicly-traded securities. The Fund is not an index fund and does not seek to replicate the performance of a specified index.
The Fund may, from time to time, take temporary defensive positions that are inconsistent with the Fund’s principal investment strategies in attempting to respond to adverse market, political or other conditions. For temporary defensive purposes, the Fund may invest up to 100% of its total assets in U.S. Government Securities, commercial paper rated at least A-2 by Standard & Poor’s, P-2 by Moody’s, or having a comparable credit rating by another NRSRO (or if unrated, determined by the Investment Adviser to be of comparable credit quality), certificates of deposit, bankers’ acceptances, repurchase agreements, non-convertible preferred stocks and non-convertible corporate bonds with a remaining maturity of less than one year, certain ETFs and other investment companies and cash items. Cash items are not income-generating and, as a result, the Fund’s current yield may be adversely affected during periods when such positions are held. Cash positions may also subject the Fund to additional risks and costs, such as increased exposure to the custodian bank holding the assets and any fees imposed for large cash balances. When the Fund’s assets are invested in such instruments, the Fund may not be achieving its investment objective.
THE FUND IS NOT A MONEY MARKET FUND AND DOES NOT ATTEMPT TO MAINTAIN A STABLE NET ASSET VALUE.
The Fund is managed to seek to generate current income and secondarily maintain an emphasis on preservation of capital and liquidity. The Investment Adviser follows a conservative, risk-managed investment process.
Global fixed income markets are constantly evolving and are highly diverse — with a large number of countries, currencies, sectors, issuers and securities. We believe that inefficiencies in these complex markets cause bond prices to diverge from their fair value. To capitalize on these inefficiencies and generate consistent risk-adjusted performance, we believe it is critical to:
| • | | Thoughtfully combine diversified sources of return by employing multiple strategies |
| • | | Take a global perspective to uncover relative value opportunities |
| • | | Employ focused specialist teams to identify short-term mispricings and incorporate long-term views |
| • | | Emphasize a risk-aware approach as we view risk management as both an offensive and defensive tool |
| • | | Build a strong team of skilled investors who excel on behalf of our clients. |
* * *
5
PORTFOLIO RESULTS
Goldman Sachs Access High Yield Corporate Bond ETF
Investment Objective
The Goldman Sachs Access High Yield Corporate Bond ETF (the “Fund”) seeks to provide investment results that closely correspond, before fees and expenses, to the performance of the FTSE Goldman Sachs High Yield Corporate Bond Index (the “Index”).
Portfolio Management Discussion and Analysis
Below, the Goldman Sachs Global Fixed Income and Liquidity Solutions Team discusses the Fund’s performance and positioning for the 12-month period ended August 31, 2020 (the “Reporting Period”).
| Q | | How did the Fund perform during the Reporting Period? |
| A | | During the Reporting Period, the Fund returned 4.94% based on net asset value (“NAV”) and 5.23% based on market price. The Index returned 4.67% during the same period. |
| | The Fund had a NAV of $49.42 per share on August 31, 2019 and ended the Reporting Period with a NAV of $49.29 per share. The Fund’s market price on August 31, 2020 was $49.23 per share. |
| Q | | What key factors were responsible for the Fund’s performance during the Reporting Period? |
| A | | The Fund seeks to provide investment results that closely correspond, before fees and expenses, to the performance of the Index. The Fund’s performance reflects Fund expenses, including management fees and brokerage expenses. The Fund’s relative performance also reflects the impact of any cash held in the Fund as well as any other differences between the Fund’s holdings and the constituents of the Index. The Index is unmanaged, and Index returns do not reflect fees and expenses, which would reduce returns. |
| | The Index is designed to measure the performance of high yield corporate bonds denominated in U.S. dollars that meet certain liquidity and fundamental screening criteria. “High yield” bonds are bonds that are rated below investment grade and are commonly referred to as “junk bonds.” The Index is a custom index that is owned and calculated by FTSE Fixed Income LLC (“FTSE”), a trading name of the London Stock Exchange Group plc and its group undertakings (collectively, the “LSE Group” or the “Index Provider”), using concepts developed with Goldman Sachs Asset Management, L.P. (“GSAM”). The Index is rules-based and the securities in the Index are updated on the last business day of each month. |
| | Given the Fund’s investment objective of attempting to track the Index, the Fund does not follow traditional methods of active investment management, which may involve buying and selling securities based upon analysis of economic and market factors. |
| | During the Reporting Period, the Fund posted positive absolute returns that outperformed those of the Index, as measured by NAV. The Fund is passively managed to the Index and aims to minimize tracking error to the Index. |
| | Overall, high yield corporate bond returns are driven by two primary factors — duration (whether interest rates are rising or falling) and spreads (a widening or tightening of the yield differential to duration-equivalent U.S. Treasuries). |
| | During the Reporting Period, the U.S. Federal Reserve (the “Fed”) cut the targeted federal funds rate four times. The Fed pre-emptively cut interest rates in September and October 2019 and then twice in March 2020 on the back of concerns surrounding the COVID-19 pandemic, bringing the targeted federal funds rate to a range of 0% to 0.25%. The shift to a more dovish Fed policy created a positive environment for high yield credit by lowering borrowing costs and supporting yield compression. |
| | The U.S. Treasury market saw yields fall across the spectrum of maturities, but overall, the yield curve remained quite flat, as the U.S. entered a turn in the business cycle into a recession. |
| | Amid this backdrop, high yield corporate spreads widened from 393 basis points to 477 basis points during the Reporting Period. (A basis point is 1/100th of a percentage point.) High yield corporate spreads widened especially significantly from August 2019 through March 2020 to 882 basis points over duration-equivalent U.S. Treasuries based on concerns surrounding the COVID-19 pandemic, declining oil prices and stressed liquidity conditions. From March 2020 |
6
PORTFOLIO RESULTS
| | through August 2020, high yield corporate spreads then tightened given investor demand for yield, incremental foreign investment due to low global yields and lower hedging costs, and supportive central bank policy. The sector also benefited from investor demand amidst strong new issuance. Still, volatility in the high yield market remained elevated due to uncertainty on the timing and speed of any economic recovery, the uptick in interest rate volatility and the upcoming U.S. elections. High yield corporate spreads had not reached pre-COVID-19 levels at the end of the Reporting Period. |
| Q | | How did the Fund use derivatives and similar instruments during the Reporting Period? |
| A | | The Fund does not employ derivatives. |
| Q | | What was the Fund’s weighted average duration, weighted average maturity, weighted average coupon, weighted average yield to maturity and 30-day standardized yield at the end of the Reporting Period?1 |
| A | | The Fund had a weighted average duration of 3.38 years, a weighted average maturity of 5.93 years and a weighted average coupon of 5.84% as of August 31, 2020. The Fund’s weighted average yield to maturity was 5.33% on August 31, 2020. The 30-day standardized yield of the Fund at the end of the Reporting Period was 4.27%. |
| Q | | What was the Fund’s credit allocation at the end of the Reporting Period?2 |
| | | | | | |
| BBB | | 0.00% | | | | |
| BB | | 56.90% | | | | |
| B | | 32.50% | | | | |
| CCC | | 8.90% | | | | |
| Not Rated | | 0.00% | | | | |
| Cash | | 1.34% | | | | |
| Q | | What was the Fund’s industry allocation at the end of the Reporting Period? |
| A | | Of the approximately 98.13% of the Fund’s assets invested in high yield corporate bonds at the end of the Reporting Period, approximately 84% was in industrials, 7% in financials and 9% in utilities.3 |
| Q | | What was the Fund’s sector positioning relative to the Index at the end of the Reporting Period?4 |
| A | | While the Index was 98.64% allocated to in high yield corporate bonds, 0.95% invested in emerging market corporate bonds and 0.41% in cash, the Fund was 98.13% invested in high yield corporate bonds, 0.53% in emerging market corporate bonds and 1.34% in cash at the end of the Reporting Period. |
| | 1Duration | | is a time measure of a bond’s interest-rate sensitivity, based on the weighted average of the time periods over which a bond’s cash flows accrue to the bondholder. Time periods are weighted by multiplying by the present value of its cash flow divided by the bond’s price. (A bond’s cash flows consist of coupon payments and repayment of capital.) |
| | | | A bond’s duration will almost always be shorter than its maturity, with the exception of zero-coupon bonds, for which maturity and duration are equal. Weighted average duration is a measure of the duration for the securities in the portfolio overall. Weighted average maturity (“WAM”) is the weighted average amount of time until the debt securities in a portfolio mature, or the weighted average of the remaining terms to maturity of the debt securities within a portfolio. The higher the WAM, the longer it takes for all of the bonds in the portfolio to mature, and WAM is used to manage debt portfolios and to assess the performance of debt portfolio managers. Coupons are fixed percentages paid out on a fixed income security on an annual basis. Weighted average coupon is calculated by weighting the coupon of each debt security by its relative size in the portfolio. Yield to maturity is the annual return that a bond is expected to generate if it is held till its maturity given its coupon rate, payment frequency and current market price. Yield to maturity is essentially the internal rate of return of a bond, i.e. the discount rate at which the present value of a bond’s coupon payments and maturity value is equal to its current market price. The 30-day standardized yield calculation is based on a 30-day period ending on the last day of the Reporting Period. It is computed by dividing the net investment income per share earned during the period by the maximum offering price per share on the last day of the period. |
| | 2The | | Fund and the Index have not been rated by an independent rating agency. The credit allocation provided refers to the Fund’s underlying portfolio securities. For the purpose of determining compliance with any credit rating requirement, the Fund assigns a security, at the time of purchase, the highest rating by a Nationally Recognized Statistical Rating Organization (“NRSRO”) if the security is rated by more than one NRSRO. For this purpose, the Fund relies only on the ratings of the following NRSROs: S&P, Moody’s and Fitch, Inc. This method may differ from the method independently used by the Index Provider. GSAM will use a single rating if that is the only one available. Securities that are not rated by all three agencies are reflected as such in the breakdown. Unrated securities may be purchased by the Fund if they are determined by the Investment Adviser to be of a credit quality consistent with the Fund’s credit rating requirements. Unrated securities do not necessarily indicate low quality, and for such securities the Investment Adviser will evaluate the credit quality. GSAM converts all ratings to the equivalent S&P major rating category when illustrating credit rating breakdowns. Ratings and Fund/Index credit quality may change over time. |
| | 3Industry | | classifications for securities may differ between the above section and the Fund Basics section due to differing classification methodologies. The classification methodology used for the above section is as set forth by GSAM. The Fund’s composition may differ over time. Consequently, the Fund’s overall industry allocations may differ from percentages contained in the above section. |
| | 4The | | Fund seeks to provide investment results that closely correspond, before fees and expenses, to the performance of the FTSE Goldman Sachs High Yield Corporate Bond Index. |
7
FUND BASICS
Access High Yield Corporate Bond ETF
as of August 31, 2020
| | | | | | |
| | FUND SNAPSHOT | |
| | |
| | | As of August 31, 2020 | | | |
| | Market Price1 | | $ | 49.23 | |
| | | Net Asset Value (NAV)1 | | $ | 49.29 | |
| 1 | | The Market Price is the price at which the Fund’s shares are trading on the NYSE Arca, Inc. The Market Price of the Fund’s shares will fluctuate and, at the time of sale, shares may be worth more or less than the original investment or the Fund’s then current net asset value (“NAV”). The NAV is the market value of one share of the Fund. This amount is derived by dividing the total value of all the securities in the Fund’s portfolio, plus other assets, less any liabilities, by the number of Fund shares outstanding. Fund shares are not individually redeemable and are issued and redeemed by the Fund at their NAV only in large, specified blocks of shares called creation units. Shares otherwise can be bought and sold only through exchange trading at market price (not NAV). Shares may trade at a premium or discount to their NAV in the secondary market. Information regarding how often shares of the Fund traded on NYSE Arca at a price above (i.e., at a premium) or below (i.e., at a discount) the NAV of the Fund can be found at www.GSAMFUNDS.com/ETFs. |
| | | | | | | | |
| | TOP TEN HOLDINGS AS OF 8/31/202 |
| | | |
| | | Holding | | % of Net Assets | | | Line of Business |
| | TransDigm, Inc., 6.25%, 03/15/26 | | | 0.7 | % | | Aerospace & Defense |
| | Sirius XM Radio, Inc., 5.00%, 08/01/27 | | | 0.5 | | | Broadcasting |
| | Sprint Corp., 7.88%, 09/15/23 | | | 0.5 | | | Wireless |
| | CHS/Community Health Systems, Inc., 6.25%, 03/31/23 | | | 0.5 | | | Healthcare |
| | United Rentals North America, Inc., 4.88%, 01/15/28 | | | 0.5 | | | Rental Equipment |
| | T-Mobile USA, Inc., 4.75%, 02/01/28 | | | 0.5 | | | Wireless |
| | Bausch Health Cos., Inc., 6.25%, 02/15/29 | | | 0.5 | | | Pharmaceuticals |
| | Targa Resources Partners LP / Targa Resources Partners Finance Corp., 4.88%, 02/01/31 | | | 0.5 | | | Energy |
| | 1011778 BC ULC / New Red Finance, Inc., 5.00%, 10/15/25 | | | 0.5 | | | Consumer Cyclical |
| | | CSC Holdings LLC, 5.75%, 01/15/30 | | | 0.5 | | | Communications |
| 2 | | The top 10 holdings may not be representative of the Fund’s future investments. |
For more information about the Fund, please refer to www.GSAMFUNDS.com/ETFs. There, you can learn more about the Fund’s investment strategies, holdings, and performance
| | | | | | |
| | INDUSTRY ALLOCATION AS OF 8/31/203 | | | | |
| | |
| | | Sector Name | | Fund | |
| | Telecommunication Services | | | 20.54 | % |
| | Consumer, Cyclical | | | 20.03 | |
| | Consumer, Non-cyclical | | | 19.94 | |
| | Energy | | | 9.87 | |
| | Financials | | | 8.74 | |
| | Industrials | | | 7.35 | |
| | Information Technology | | | 4.59 | |
| | Materials | | | 3.57 | |
| | Utilities | | | 2.63 | |
| | | Other | | | 1.17 | |
| 3 | | The percentage shown for each investment category reflects the value of investments in that category as a percentage of net assets. The “Other” category represents the Fund’s investments in other investment companies. Figures in the table may not sum to 100% due to the exclusion of other assets and liabilities. |
8
GOLDMAN SACHS ACCESS HIGH YIELD CORPORATE BOND ETF
Performance Summary
August 31, 2020
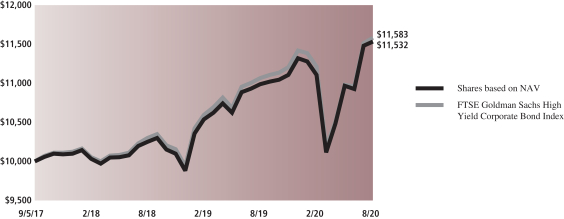
The following graph shows the value, as of August 31, 2020, of a $10,000 investment made on September 5, 2017 (commencement of operations) in Shares at NAV. For comparative purposes, the performance of the Fund’s underlying index, the FTSE Goldman Sachs High Yield Corporate Bond Index is shown. Performance reflects applicable fee waivers and/or expense limitations in effect during the periods shown and in their absence, performance would be reduced. Returns do not reflect the deduction of taxes that a shareholder would pay on Fund distributions or the sale of Fund shares. In addition to the performance of constituents of the underlying index, other factors may affect Fund performance. These factors include, but are not limited to, Fund operating fees and expenses, portfolio turnover and creation and redemption in-kind transactions. The returns set forth below represent past performance. Past performance does not guarantee future results. The Fund’s NAV and investment return may fluctuate. These fluctuations may cause an investor’s shares to be worth more or less than their original cost. Current performance may be lower or higher than the performance quoted below. Please visit our web site at www.GSAMFUNDS.com/ETFs to obtain the most recent month-end returns.
|
| Goldman Sachs Access High Yield Corporate Bond ETF’s Lifetime Performance |
Performance of a $10,000 Investment, with distributions reinvested, from September 5, 2017 through August 31, 2020.
| | | | |
Average Annual Total Return through August 31, 2020* | | 1 Year Return | | Since Inception |
Shares based on NAV (Commenced September 5, 2017) | | 4.94% | | 4.88% |
|
Shares based on Market Price (Commenced September 5, 2017) | | 5.23% | | 4.85% |
|
FTSE Goldman Sachs High Yield Corporate Bond Index | | 4.67% | | 5.03% |
|
| * | | Total returns are calculated assuming purchase of a share at the market price or NAV on the first day and sale of a share at the market price or NAV on the last day of each period reported. The Total Returns based on NAV and Market Price assume the reinvestment of dividends and do not reflect brokerage commissions in connection with the purchase or sale of Fund shares, which if included would lower the performance shown above. The NAV used in the Total Return calculations assumes all management fees incurred by the Fund. Market Price returns are based upon the last trade at 4:00 pm EST and do not reflect the returns you would receive if you traded shares at other times. The first day of secondary market trading is typically several days after the date on which the Fund commenced investment operations; therefore, the NAV of the Fund is used as a proxy for the period from inception of investment operations to the first day of secondary market trading to calculate the Market Price returns. |
9
PORTFOLIO RESULTS
Goldman Sachs Access Inflation Protected USD Bond ETF
Investment Objective
The Goldman Sachs Access Inflation Protected USD Bond ETF (the “Fund”) seeks to provide investment results that closely correspond, before fees and expenses, to the performance of the FTSE Goldman Sachs Treasury Inflation Protected USD Bond Index (the “Index”).
Portfolio Management Discussion and Analysis
Below, the Goldman Sachs Global Fixed Income Team discusses the Fund’s performance and positioning for the 12-month period ended August 31, 2020 (the “Reporting Period”).
| Q | | How did the Fund perform during the Reporting Period? |
| A | | During the Reporting Period, the Fund returned 8.57% based on net asset value (“NAV”) and 8.71% based on market price. The Index returned 8.68% during the same period. |
| | The Fund had a NAV of $53.11 per share on August 31, 2019 and ended the Reporting Period with a NAV of $56.96 per share. The Fund’s market price on August 31, 2020 was $57.00 per share. |
| Q | | What key factors were responsible for the Fund’s performance during the Reporting Period? |
| A | | The Fund seeks to provide investment results that closely correspond, before fees and expenses, to the performance of the Index. The Fund’s performance reflects Fund expenses, including management fees and brokerage expenses. The Fund’s relative performance also reflects the impact of any cash held in the Fund as well as any other differences between the Fund’s holdings and the constituents of the Index. The Index is unmanaged, and Index returns do not reflect fees and expenses, which would reduce returns. |
| | The Index is designed to track the performance of inflation protected, fixed rate U.S. Treasury Securities denominated in U.S. dollars (“USD”) that meet certain screening criteria. “U.S. Treasury Securities” refer to securities issued or guaranteed by the U.S. Treasury where the payment of principal and interest is backed by the full faith and credit of the U.S. government. U.S. Treasury Securities include U.S. Treasury notes, U.S. Treasury bills and U.S. Treasury floating rate bonds. The Index is a custom index that is owned and calculated by FTSE Fixed Income LLC (“FTSE”), a trading name of the London Stock Exchange Group plc and its group undertakings (collectively, the “LSE Group” or the “Index Provider”). The Index is based on the U.S. sleeve of the FTSE World Inflation-Linked Securities Index (the “Reference Index”) using concepts developed with GSAM. |
| | Given the Fund’s investment objective of attempting to track the Index, the Fund does not follow traditional methods of active investment management, which may involve buying and selling securities based upon analysis of economic and market factors. |
| | During the Reporting Period, the Fund posted positive absolute returns that closely tracked those of the Index, as measured by NAV. The Fund is passively managed to the Index and aims to minimize tracking error to the Index. |
| | Two key drivers of return for the Treasury inflation protected securities (“TIPS”) market are interest rates, given the sector’s longer duration profile, and inflation. During the Reporting Period, U.S. Treasuries rallied, with the yield on the 10-year U.S. Treasury declining approximately 78 basis points to 0.72%. (A basis point is 1/100th of a percentage point.) The move in U.S. Treasuries reflected market expectations of lower economic growth amid uncertainty sparked by the COVID-19 pandemic. |
| | The inflation picture during the Reporting Period — and the outlook for inflation — were more mixed. Year-over-year Consumer Price Index readings moved lower — from an annualized rate of 1.8% to an annualized rate of 1.0% during the Reporting Period. At the same time, U.S. employment decreased during the Reporting Period, with unemployment rates increasing from 3.7% to 8.4%, with a spike even higher in-between, due to the COVID-19 pandemic and the simultaneous economic shutdown. Still, we saw improved wage growth, with average hourly earnings increasing from 3.2% year over year in the 12 months ended August 31, 2019 to 4.7% year over year during the Reporting Period. A pick-up in wage growth is typically associated with a pick-up in inflation. |
10
PORTFOLIO RESULTS
| | At the end of the Reporting Period, the U.S. Federal Reserve remained on watch for signs of weakness in the economy. Inflation-linked assets are inherently sensitive to macro data related to inflation estimates, including publication of unemployment, wage growth, inflation in other countries, economic growth and fiscal spending figures. We believed, at the end of the Reporting Period, that U.S. inflation would remain muted for calendar year 2020. |
| Q | | How did the Fund use derivatives and similar instruments during the Reporting Period? |
| A | | The Fund does not employ derivatives. |
| Q | | What was the Fund’s weighted average duration, weighted average maturity, weighted average coupon, weighted average yield to maturity and 30-day standardized yield at the end of the Reporting Period?1 |
| A | The Fund had a weighted average duration of 7.84 years, a weighted average maturity of 8.22 years and a weighted average coupon of 0.56% as of August 31, 2020. The Fund’s weighted average yield to maturity was 0.80% on August 31, 2020. The 30-day standardized yield of the Fund at the end of the Reporting Period was 4.44%. |
| Q | | What was the Fund’s sector positioning relative to the Index at the end of the Reporting Period?2 |
| A | | While the Index was 100% allocated to U.S. TIPS, the Fund was 99.88% invested in U.S. TIPS and 0.12% in cash at the end of the Reporting Period. |
| | 1Duration | | is a time measure of a bond’s interest-rate sensitivity, based on the weighted average of the time periods over which a bond’s cash flows accrue to the bondholder. Time periods are weighted by multiplying by the present value of its cash flow divided by the bond’s price. (A bond’s cash flows consist of coupon payments and repayment of capital.) |
| | | | A bond’s duration will almost always be shorter than its maturity, with the exception of zero-coupon bonds, for which maturity and duration are equal. Weighted average duration is a measure of the duration for the securities in the portfolio overall. Weighted average maturity (“WAM”) is the weighted average amount of time until the debt securities in a portfolio mature, or the weighted average of the remaining terms to maturity of the debt securities within a portfolio. The higher the WAM, the longer it takes for all of the bonds in the portfolio to mature, and WAM is used to manage debt portfolios and to assess the performance of debt portfolio managers. Coupons are fixed percentages paid out on a fixed income security on an annual basis. Weighted average coupon is calculated by weighting the coupon of each debt security by its relative size in the portfolio. Yield to maturity is the annual return that a bond is expected to generate if it is held till its maturity given its coupon rate, payment frequency and current market price. Yield to maturity is essentially the internal rate of return of a bond, i.e. the discount rate at which the present value of a bond’s coupon payments and maturity value is equal to its current market price. The 30-day standardized yield calculation is based on a 30-day period ending on the last day of the Reporting Period. It is computed by dividing the net investment income per share earned during the period by the maximum offering price per share on the last day of the period. |
| | 2The | | Fund seeks to provide investment results that closely correspond, before fees and expenses, to the performance of the FTSE Goldman Sachs Treasury Inflation Protected USD Bond Index. |
11
FUND BASICS
Access Inflation Protected USD Bond ETF
as of August 31, 2020
| | | | | | |
| | FUND SNAPSHOT | |
| | |
| | | As of August 31, 2020 | | | |
| | Market Price1 | | $ | 57.00 | |
| | | Net Asset Value (NAV)1 | | $ | 56.96 | |
| 1 | | The Market Price is the price at which the Fund’s shares are trading on the Cboe BZX Exchange, Inc. The Market Price of the Fund’s shares will fluctuate and, at the time of sale, shares may be worth more or less than the original investment or the Fund’s then current net asset value (“NAV”). The NAV is the market value of one share of the Fund. This amount is derived by dividing the total value of all the securities in the Fund’s portfolio, plus other assets, less any liabilities, by the number of Fund shares outstanding. Fund shares are not individually redeemable and are issued and redeemed by the Fund at their NAV only in large, specified blocks of shares called creation units. Shares otherwise can be bought and sold only through exchange trading at market price (not NAV). Shares may trade at a premium or discount to their NAV in the secondary market. Information regarding how often shares of the Fund traded on Cboe BZX Exchange, Inc. at a price above (i.e., at a premium) or below (i.e., at a discount) the NAV of the Fund can be found at www.GSAMFUNDS.com/ETFs. |
| | | | | | | | |
| | TOP TEN HOLDINGS AS OF 8/31/202 |
| | | |
| | | Holding | | % of Net Assets | | | Line of Business |
| | U.S. Treasury Inflation Indexed Bond, 0.50%, 01/15/28 | | | 15.6 | % | | Government |
| | U.S. Treasury Inflation Indexed Bond, 0.38%, 07/15/23 | | | 13.9 | | | Government |
| | U.S. Treasury Inflation Indexed Bond, 0.25%, 01/15/25 | | | 11.4 | | | Government |
| | U.S. Treasury Inflation Indexed Bond, 0.63%, 01/15/24 | | | 9.7 | | | Government |
| | U.S. Treasury Inflation Indexed Bond, 0.75%, 02/15/42 | | | 8.9 | | | Government |
| | U.S. Treasury Inflation Indexed Bond, 0.38%, 07/15/27 | | | 8.4 | | | Government |
| | U.S. Treasury Inflation Indexed Bond, 0.13%, 04/15/22 | | | 5.5 | | | Government |
| | U.S. Treasury Inflation Indexed Bond, 0.75%, 07/15/28 | | | 5.0 | | | Government |
| | U.S. Treasury Inflation Indexed Bond, 0.88%, 02/15/47 | | | 4.4 | | | Government |
| | | U.S. Treasury Inflation Indexed Bond, 0.13%, 01/15/22 | | | 3.4 | | | Government |
| 2 | | The holdings may not be representative of the Fund’s future investments. |
| 3 | | The percentage shown for each investment category reflects the value of investments in that category as a percentage of net assets. Figures in the table may not sum to 100% due to the exclusion of other assets and liabilities. |
For more information about the Fund, please refer to www.GSAMFUNDS.com/ETFs. There, you can learn more about the Fund’s investment strategies, holdings, and performance.
12
GOLDMAN SACHS ACCESS INFLATION PROTECTED USD BOND ETF
Performance Summary
August 31, 2020
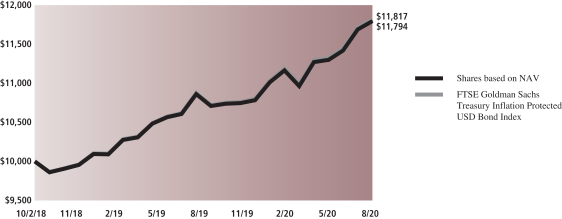
The following graph shows the value, as of August 31, 2020, of a $10,000 investment made on October 2, 2018 (commencement of operations) in Shares at NAV. For comparative purposes, the performance of the Fund’s underlying index, the FTSE Goldman Sachs Treasury Inflation Protected USD Bond Index is shown. Performance reflects applicable fee waivers and/or expense limitations in effect during the periods shown and in their absence, performance would be reduced. Returns do not reflect the deduction of taxes that a shareholder would pay on Fund distributions or the sale of Fund shares. In addition to the performance of constituents of the underlying index, other factors may affect Fund performance. These factors include, but are not limited to, Fund operating fees and expenses, portfolio turnover and creation and redemption in-kind transactions. The returns set forth below represent past performance. Past performance does not guarantee future results. The Fund’s NAV and investment return may fluctuate. These fluctuations may cause an investor’s shares to be worth more or less than their original cost. Current performance may be lower or higher than the performance quoted below. Please visit our web site at www.GSAMFUNDS.com/ETFs to obtain the most recent month-end returns.
|
| Goldman Sachs Access Inflation Protected USD Bond ETF’s Lifetime Performance |
Performance of a $10,000 Investment, with distributions reinvested, from October 2, 2018 through August 31, 2020.
| | | | |
| Average Annual Total Return through August 31, 2020* | | 1 Year Return | | Since Inception |
Shares based on NAV (Commenced October 2, 2018) | | 8.57% | | 8.99% |
|
Shares based on Market Price (Commenced October 2, 2018) | | 8.71% | | 9.03% |
|
FTSE Goldman Sachs Treasury Inflation Protected USD Bond Index | | 8.68% | | 9.10% |
|
| * | | Total return for periods of less than one year represents cumulative total return. Total returns are calculated assuming purchase of a share at the market price or NAV on the first day and sale of a share at the market price or NAV on the last day of each period reported. The Total Returns based on NAV and Market Price assume the reinvestment of dividends and do not reflect brokerage commissions in connection with the purchase or sale of Fund shares, which if included would lower the performance shown above. The NAV used in the Total Return calculations assumes all management fees incurred by the Fund. Market Price returns are based upon the last trade at 4:00 pm EST and do not reflect the returns you would receive if you traded shares at other times. The first day of secondary market trading is typically several days after the date on which the Fund commenced investment operations; therefore, the NAV of the Fund is used as a proxy for the period from inception of investment operations to the first day of secondary market trading to calculate the Market Price returns. Total returns for periods less than one full year are not annualized. |
13
PORTFOLIO RESULTS
Goldman Sachs Access Investment Grade Corporate 1-5 Year Bond ETF
Investment Objective
The Goldman Sachs Access Investment Grade Corporate 1-5 Year Bond ETF (the “Fund”) seeks to provide investment results that closely correspond, before fees and expenses, to the performance of the FTSE Goldman Sachs Investment Grade Corporate Bond 1-5 Years Index (the “Index”).
Portfolio Management Discussion and Analysis
Below, the Goldman Sachs Global Fixed Income and Liquidity Solutions Team discusses the Fund’s performance and positioning for the period since it commenced operations on July 7, 2020 through August 31, 2020 (the “Reporting Period”).
| Q | | How did the Fund perform during the Reporting Period? |
| A | | During the Reporting Period, the Fund returned 0.70% based on net asset value (“NAV”) and 0.84% based on market price. The Index returned 0.77% during the same period. |
| | The Fund had a NAV of $49.89 per share on the date of inception and ended the Reporting Period with a NAV of $50.21 per share. The Fund’s market price on August 31, 2020 was $50.28 per share. |
| Q | | What key factors were responsible for the Fund’s performance during the Reporting Period? |
| A | | The Fund seeks to provide investment results that closely correspond, before fees and expenses, to the performance of the Index. The Fund’s performance reflects Fund expenses, including management fees and brokerage expenses. The Fund’s relative performance also reflects the impact of any cash held in the Fund as well as any other differences between the Fund’s holdings and the constituents of the Index. The Index is unmanaged, and Index returns do not reflect fees and expenses, which would reduce returns. |
| | The Index is a rules-based index that is designed to measure the performance of investment grade, corporate bonds denominated in U.S. dollars (“USD”) with remaining maturities between one and five years that meet certain liquidity and fundamental screening criteria. The Index is a custom index that is owned and calculated by FTSE Fixed Income LLC (“FTSE”), a trading name of the London Stock Exchange Group plc and its group undertakings (collectively, the “LSE Group” or the “Index Provider”). The Index is based on the FTSE US Broad Investment-Grade (USBIG®) Corporate Bond Index (the “Reference Index”) using concepts developed with Goldman Sachs Asset Management, L.P. (the “Investment Adviser” or “GSAM”). The Index is rebalanced (i) monthly on the last business day of each month, to account for changes in maturities, duration, corporate actions or ratings migration, and (ii) quarterly, to account for updates to the constituents on the basis of the fundamental factors. |
| | Given the Fund’s investment objective of attempting to track the Index, the Fund does not follow traditional methods of active investment management, which may involve buying and selling securities based upon analysis of economic and market factors. |
| | During the Reporting Period, the Fund posted positive absolute returns that modestly lagged those of the Index, as measured by NAV. The Fund is passively managed to the Index and aims to minimize tracking error to the Index. |
| | Overall, investment grade corporate bond returns are driven by two primary factors — duration (whether interest rates are rising or falling) and spreads (a widening or tightening of the yield differential to duration-equivalent U.S. Treasuries). |
| | During the Reporting Period, investment grade corporate spreads tightened but had not returned to pre-COVID-19 levels by the end of August 2020. |
| | At the end of the Reporting Period, we remained alert for possible headwinds posed by health outcomes and unemployment rates. However, we believed supportive central bank actions and fiscal policy should keep shorter-dated investment grade corporate credit well supported. Yields on U.S. credit appeared attractive on a relative value basis at the end of the Reporting Period, in our view, given global central bank easing. Gross investment grade corporate credit supply remained strong, a trend, we believed, likely to continue. |
14
PORTFOLIO RESULTS
| Q | | How did the Fund use derivatives and similar instruments during the Reporting Period? |
| A | | The Fund does not employ derivatives. |
| Q | | What was the Fund’s weighted average duration, weighted average maturity, weighted average coupon, weighted average yield to maturity and 30-day standardized yield at the end of the Reporting Period?1 |
| A | | The Fund had a weighted average duration of 2.79 years, a weighted average maturity of 3.19 years and a weighted average coupon of 3.21% as of August 31, 2020. The Fund’s weighted average yield to maturity was 0.86% on August 31, 2020. The 30-day standardized yield of the Fund at the end of the Reporting Period was 0.70%. |
| Q | | What was the Fund’s credit allocation at the end of the Reporting Period?2 |
| | | | | | |
| AAA | | | 0.45 | % | | |
| AA | | | 4.58 | % | | |
| A | | | 38.08 | % | | |
| BBB | | | 53.27 | % | | |
| BB | | | 0.00 | % | | |
| Cash | | | 1.50 | % | | |
| Q | | What was the Fund’s industry allocation at the end of the Reporting Period? |
| A | | Of the approximately 96.37% of the Fund’s assets invested in investment grade corporate bonds at the end of the Reporting Period, approximately 33.88% was in financials, 52.71% in industrials and 4.79% in utilities.3 |
| Q | | What was the Fund’s sector positioning relative to the Index at the end of the Reporting Period?4 |
| A | | While the Index was 97.68% allocated to investment grade corporate bonds, 0.90% allocated to high yield corporate bonds, 0.10% allocated to quasi-government securities and 0.00% in cash, the Fund was 96.37% invested in investment grade corporate bonds, 2.13% in high yield corporate bonds, 0.00% in quasi-government securities and 1.50% in cash at the end of the Reporting Period. |
| | 1Duration | | is a time measure of a bond’s interest-rate sensitivity, based on the weighted average of the time periods over which a bond’s cash flows accrue to the bondholder. Time periods are weighted by multiplying by the present value of its cash flow divided by the bond’s price. (A bond’s cash flows consist of coupon payments and repayment of capital.) |
| | | | A bond’s duration will almost always be shorter than its maturity, with the exception of zero-coupon bonds, for which maturity and duration are equal. Weighted average duration is a measure of the duration for the securities in the portfolio overall. Weighted average maturity (“WAM”) is the weighted average amount of time until the debt securities in a portfolio mature, or the weighted average of the remaining terms to maturity of the debt securities within a portfolio. The higher the WAM, the longer it takes for all of the bonds in the portfolio to mature, and WAM is used to manage debt portfolios and to assess the performance of debt portfolio managers. Coupons are fixed percentages paid out on a fixed income security on an annual basis. Weighted average coupon is calculated by weighting the coupon of each debt security by its relative size in the portfolio. Yield to maturity is the annual return that a bond is expected to generate if it is held till its maturity given its coupon rate, payment frequency and current market price. Yield to maturity is essentially the internal rate of return of a bond, i.e. the discount rate at which the present value of a bond’s coupon payments and maturity value is equal to its current market price. The 30-day standardized yield calculation is based on a 30-day period ending on the last day of the Reporting Period. It is computed by dividing the net investment income per share earned during the period by the maximum offering price per share on the last day of the period. |
| | 2The | | Fund and the Index have not been rated by an independent rating agency. The credit allocation provided refers to the Fund’s underlying portfolio securities. For the purpose of determining compliance with any credit rating requirement, the Fund assigns a security, at the time of purchase, the highest rating by a Nationally Recognized Statistical Rating Organization (“NRSRO”) if the security is rated by more than one NRSRO. For this purpose, the Fund relies only on the ratings of the following NRSROs: S&P, Moody’s and Fitch, Inc. This method may differ from the method independently used by the Index Provider. GSAM will use a single rating if that is the only one available. Securities that are not rated by all three agencies are reflected as such in the breakdown. Unrated securities may be purchased by the Fund if they are determined by the Investment Adviser to be of a credit quality consistent with the Fund’s credit rating requirements. Unrated securities do not necessarily indicate low quality, and for such securities the Investment Adviser will evaluate the credit quality. GSAM converts all ratings to the equivalent S&P major rating category when illustrating credit rating breakdowns. Ratings and Fund/Index credit quality may change over time. |
| | 3Industry | | classifications for securities may differ between the above section and the Fund Basics section due to differing classification methodologies. The classification methodology used for the above section is as set forth by GSAM. The Fund’s composition may differ over time. Consequently, the Fund’s overall industry allocations may differ from percentages contained in the above section. |
| | 4The | | Fund seeks to provide investment results that closely correspond, before fees and expenses, to the performance of the FTSE Goldman Sachs US Investment-Grade Corporate Bond 1-5 Years Index. |
15
FUND BASICS
Access Investment Grade Corporate 1-5 Year Bond ETF
as of August 31, 2020
| | | | | | |
| | FUND SNAPSHOT | |
| | |
| | | As of August 31, 2020 | | | |
| | Market Price1 | | $ | 50.28 | |
| | | Net Asset Value (NAV)1 | | $ | 50.21 | |
| 1 | | The Market Price is the price at which the Fund’s shares are trading on the NYSE Arca, Inc. The Market Price of the Fund’s shares will fluctuate and, at the time of sale, shares may be worth more or less than the original investment or the Fund’s then current net asset value (“NAV”). The NAV is the market value of one share of the Fund. This amount is derived by dividing the total value of all the securities in the Fund’s portfolio, plus other assets, less any liabilities, by the number of Fund shares outstanding. Fund shares are not individually redeemable and are issued and redeemed by the Fund at their NAV only in large, specified blocks of shares called creation units. Shares otherwise can be bought and sold only through exchange trading at market price (not NAV). Shares may trade at a premium or discount to their NAV in the secondary market. Information regarding how often shares of the Fund traded on NYSE Arca at a price above (i.e., at a premium) or below (i.e., at a discount) the NAV of the Fund can be found at www.GSAMFUNDS.com/ETFs. |
| | | | | | | | |
| | TOP TEN HOLDINGS AS OF 8/31/202 |
| | | |
| | | Holding | | % of Net Assets | | | Line of Business |
| | JPMorgan Chase & Co., 1.51%, 06/01/24 | | | 2.0 | % | | Banks |
| | HSBC Holdings PLC, 3.26%, 03/13/23 | | | 1.9 | | | Banks |
| | Bank of America Corp., Series MTN, 4.00%, 01/22/25 | | | 1.4 | | | Banks |
| | Morgan Stanley, 3.74%, 04/24/24 | | | 1.3 | | | Banks |
| | AbbVie, Inc., 2.30%, 11/21/22 | | | 1.3 | | | Consumer Non-cyclical |
| | Shell International Finance BV, 2.38%, 04/06/25 | | | 1.2 | | | Energy |
| | Intel Corp., 3.40%, 03/25/25 | | | 1.2 | | | Technology |
| | Natwest Group PLC, 6.00%, 12/19/23 | | | 1.1 | | | Banks |
| | Citigroup, Inc., 1.68%, 05/15/24 | | | 1.1 | | | Banks |
| | | Air Lease Corp., 3.50%, 01/15/22 | | | 1.1 | | | Financial Company |
| 2 | | The top 10 holdings may not be representative of the Fund’s future investments. |
For more information about the Fund, please refer to www.GSAMFUNDS.com/ETFs. There, you can learn more about the Fund’s investment strategies, holdings, and performance.
| | | | | | |
| | INDUSTRY ALLOCATION AS OF 8/31/203 | |
| | |
| | | Sector Name | | Fund | |
| | Financials | | | 42.32 | % |
| | Consumer, Non-cyclical | | | 14.74 | |
| | Consumer, Cyclical | | | 7.90 | |
| | Information Technology | | | 7.84 | |
| | Energy | | | 7.37 | |
| | Industrials | | | 7.27 | |
| | Utilities | | | 4.74 | |
| | Telecommunication Services | | | 3.72 | |
| | Investment Company | | | 2.48 | |
| | | Materials | | | 1.83 | |
| 3 | | The percentage shown for each investment category reflects the value of investments in that category as a percentage of net assets. The “Other” category represents the Fund’s investments in other investment companies. Figures in the table may not sum to 100% due to the exclusion of other assets and liabilities. |
16
GOLDMAN SACHS ACCESS INVESTMENT GRADE CORPORATE 1-5 YEAR BOND ETF
Performance Summary
August 31, 2020
| | |
| Average Annual Total Return through August 31, 2020* | | Since Inception |
Shares based on NAV (Commenced July 7, 2020) | | 0.70% |
|
Shares based on Market Price (Commenced July 7, 2020) | | 0.84% |
|
| * | | Total return for periods of less than one year represents cumulative total return. Total returns are calculated assuming purchase of a share at the market price or NAV on the first day and sale of a share at the market price or NAV on the last day of each period reported. The Total Returns based on NAV and Market Price assume the reinvestment of dividends and do not reflect brokerage commissions in connection with the purchase or sale of Fund shares, which if included would lower the performance shown above. The NAV used in the Total Return calculations assumes all management fees incurred by the Fund. Market Price returns are based upon the last trade at 4:00 pm EST and do not reflect the returns you would receive if you traded shares at other times. The first day of secondary market trading is typically several days after the date on which the Fund commenced investment operations; therefore, the NAV of the Fund is used as a proxy for the period from inception of investment operations to the first day of secondary market trading to calculate the Market Price returns. Total returns for periods less than one full year are not annualized. |
The returns set forth above represent past performance. Past performance does not guarantee future results. The Fund’s NAV and investment return may fluctuate. These fluctuations may cause an investor’s shares to be worth more or less than their original cost. Current performance may be lower or higher than the performance quoted above. Please visit our web site at www.GSAMFUNDS.com/ETFs to obtain the most recent month-end returns.
17
PORTFOLIO RESULTS
Goldman Sachs Access Investment Grade Corporate Bond ETF
Investment Objective
The Goldman Sachs Access Investment Grade Corporate Bond ETF (the “Fund”) seeks to provide investment results that closely correspond, before fees and expenses, to the performance of the FTSE Goldman Sachs Investment Grade Corporate Bond Index (the “Index”).
Portfolio Management Discussion and Analysis
Below, the Goldman Sachs Global Fixed Income and Liquidity Solutions Team discusses the Fund’s performance and positioning for the 12-month period ended August 31, 2020 (the “Reporting Period”).
| Q | | How did the Fund perform during the Reporting Period? |
| A | | During the Reporting Period, the Fund returned 7.95% based on net asset value (“NAV”) and 8.07% based on market price. The Index returned 8.13% during the same period. |
| | The Fund had a NAV of $52.87 per share on August 31, 2019 and ended the Reporting Period with a NAV of $55.39 per share. The Fund’s market price on August 31, 2020 was $55.47 per share. |
| Q | | What key factors were responsible for the Fund’s performance during the Reporting Period? |
| A | | The Fund seeks to provide investment results that closely correspond, before fees and expenses, to the performance of the Index. The Fund’s performance reflects Fund expenses, including management fees and brokerage expenses. The Fund’s relative performance also reflects the impact of any cash held in the Fund as well as any other differences between the Fund’s holdings and the constituents of the Index. The Index is unmanaged, and Index returns do not reflect fees and expenses, which would reduce returns. |
| | The Index is designed to measure the performance of investment grade corporate bonds denominated in U.S. dollars that meet certain liquidity and fundamental screening criteria. The Index is a custom index that is owned and calculated by FTSE Fixed Income LLC (“FTSE”), a trading name of the London Stock Exchange Group plc and its group undertakings (collectively, the “LSE Group” or the “Index Provider”) and is based on the FTSE US Broad Investment Grade (USBIG®) Corporate Index (the “Reference Index”) using concepts developed with Goldman Sachs Asset Management, L.P. (“GSAM”). The Index is rules-based and the securities in the Index are updated on the last business day of each month. |
| | Given the Fund’s investment objective of attempting to track the Index, the Fund does not follow traditional methods of active investment management, which may involve buying and selling securities based upon analysis of economic and market factors. |
| | During the Reporting Period, the Fund posted positive absolute returns that modestly lagged those of the Index, as measured by NAV. The Fund is passively managed to the Index and aims to minimize tracking error to the Index. |
| | Overall, investment grade corporate bond returns are driven by two primary factors — duration (whether interest rates are rising or falling) and spreads (a widening or tightening of the yield differential to duration-equivalent U.S. Treasuries). |
| | Indices that track the U.S. investment grade corporate credit market typically have durations of between seven to eight years, making them moderately sensitive to changes in underlying rates. During the Reporting Period, the yield on the 10-year U.S. Treasury declined by approximately 78 basis points, from 1.50% at the end of August 2019 to 0.72% at the end of August 2020, which was positive for intermediate duration assets such as investment grade corporate credit. (A basis point is 1/100th of a percentage point.) |
| | The U.S. Federal Reserve (the “Fed”) cut the targeted federal funds rate four times during the Reporting Period. The Fed pre-emptively cut interest rates in September and October 2019 and then twice in March 2020 on the back of concerns surround the COVID-19 pandemic, bringing the targeted federal funds rate to a range of 0% to 0.25%. The U.S. Treasury market saw yields fall across the spectrum of maturities, but overall, the yield curve remained quite flat, as the U.S. entered a turn in the business cycle into a recession. |
| | Investment grade corporate spreads widened from approximately 120 basis points to approximately 129 basis points over duration-equivalent U.S. Treasuries during the Reporting Period. Spreads had initially tightened toward the beginning of 2020, as investor sentiment turned toward risk assets. However, spreads then widened as uncertainty around |
18
PORTFOLIO RESULTS
| | the COVID-19 pandemic heightened in February 2020. From March through August 2020, spreads tightened but had not returned to pre-COVID-19 levels by the end of the Reporting Period. |
| | At the end of the Reporting Period, we remained alert for possible headwinds posed by health outcomes and unemployment rates. However, we believed supportive central bank actions and fiscal policy should keep investment grade corporate credit supported. Yields on U.S. credit appeared attractive on a relative value basis at the end of the Reporting Period, in our view, given global central bank easing. Gross investment grade corporate credit supply remained strong, a trend, we believed, likely to continue. |
| Q | | How did the Fund use derivatives and similar instruments during the Reporting Period? |
| A | | The Fund does not employ derivatives. |
| Q | | What was the Fund’s weighted average duration, weighted average maturity, weighted average coupon, weighted average yield to maturity and 30-day standardized yield at the end of the Reporting Period?1 |
| A | | The Fund had a weighted average duration of 8.40 years, a weighted average maturity of 12.24 years and a weighted average coupon of 3.94% as of August 31, 2020. The Fund’s weighted average yield to maturity was 1.91% on August 31, 2020. The 30-day standardized yield of the Fund at the end of the Reporting Period was 1.65%. |
| Q | | What was the Fund’s credit allocation at the end of the Reporting Period?2 |
| | | | | | |
| AAA | | | 1.99 | % | | |
| AA | | | 10.34 | % | | |
| A | | | 36.31 | % | | |
| BBB | | | 47.72 | % | | |
| BB | | | 0.00 | % | | |
| Cash | | | 1.07 | % | | |
| Q | | What was the Fund’s industry allocation at the end of the Reporting Period? |
| A | | Of the approximately 96.37% of the Fund’s assets invested in investment grade corporate bonds at the end of the Reporting Period, approximately 29.30% was in financials, 64.63% in industrials and 2.44% in utilities.3 |
| Q | | What was the Fund’s sector positioning relative to the Index at the end of the Reporting Period?4 |
| A | | While the Index was 96.88% allocated to investment grade corporate bonds, 1.20% allocated to high yield corporate bonds, 1.52% allocated to emerging market corporate bonds, 0.16% allocated to quasi-government securities and 0.23% in cash, the Fund was 96.37% invested in investment grade corporate bonds, 1.06% in high yield corporate bonds, 1.36% in emerging market corporate bonds, 0.15% in quasi-government securities and 1.07% in cash at the end of the Reporting Period. |
| | 1 | | Duration is a time measure of a bond’s interest-rate sensitivity, based on the weighted average of the time periods over which a bond’s cash flows accrue to the bondholder. Time periods are weighted by multiplying by the present value of its cash flow divided by the bond’s price. (A bond’s cash flows consist of coupon payments and repayment of capital.) |
| | | | A bond’s duration will almost always be shorter than its maturity, with the exception of zero-coupon bonds, for which maturity and duration are equal. Weighted average duration is a measure of the duration for the securities in the portfolio overall. Weighted average maturity (“WAM”) is the weighted average amount of time until the debt securities in a portfolio mature, or the weighted average of the remaining terms to maturity of the debt securities within a portfolio. The higher the WAM, the longer it takes for all of the bonds in the portfolio to mature, and WAM is used to manage debt portfolios and to assess the performance of debt portfolio managers. Coupons are fixed percentages paid out on a fixed income security on an annual basis. Weighted average coupon is calculated by weighting the coupon of each debt security by its relative size in the portfolio. Yield to maturity is the annual return that a bond is expected to generate if it is held till its maturity given its coupon rate, payment frequency and current market price. Yield to maturity is essentially the internal rate of return of a bond, i.e. the discount rate at which the present value of a bond’s coupon payments and maturity value is equal to its current market price. The 30-day standardized yield calculation is based on a 30-day period ending on the last day of the Reporting Period. It is computed by dividing the net investment income per share earned during the period by the maximum offering price per share on the last day of the period. |
| | 2 | | The Fund and the Index have not been rated by an independent rating agency. The credit allocation provided refers to the Fund’s underlying portfolio securities. For the purpose of determining compliance with any credit rating requirement, the Fund assigns a security, at the time of purchase, the highest rating by a Nationally Recognized Statistical Rating Organization (“NRSRO”) if the security is rated by more than one NRSRO. For this purpose, the Fund relies only on the ratings of the following NRSROs: S&P, Moody’s and Fitch, Inc. This method may differ from the method independently used by the Index Provider. GSAM will use a single rating if that is the only one available. Securities that are not rated by all three agencies are reflected as such in the breakdown. Unrated securities may be purchased by the Fund if they are determined by the Investment Adviser to be of a credit quality consistent with the Fund’s credit rating requirements. Unrated securities do not necessarily indicate low quality, and for such securities the Investment Adviser will evaluate the credit quality. GSAM converts all ratings to the equivalent S&P major rating category when illustrating credit rating breakdowns. Ratings and Fund/Index credit quality may change over time. |
| | 3 | | Industry classifications for securities may differ between the above section and the Fund Basics section due to differing classification methodologies. The classification methodology used for the above section is as set forth by GSAM. The Fund’s composition may differ over time. Consequently, the Fund’s overall industry allocations may differ from percentages contained in the above section. |
| | 4 | | The Fund seeks to provide investment results that closely correspond, before fees and expenses, to the performance of the FTSE Goldman Sachs Investment Grade Corporate Bond Index. |
19
FUND BASICS
Access Investment Grade Corporate Bond ETF
as of August 31, 2020
| | | | | | |
| | FUND SNAPSHOT | |
| | |
| | | As of August 31, 2020 | | | |
| | Market Price1 | | $ | 55.47 | |
| | | Net Asset Value (NAV)1 | | $ | 55.39 | |
| 1 | | The Market Price is the price at which the Fund’s shares are trading on the NYSE Arca, Inc. The Market Price of the Fund’s shares will fluctuate and, at the time of sale, shares may be worth more or less than the original investment or the Fund’s then current net asset value (“NAV”). The NAV is the market value of one share of the Fund. This amount is derived by dividing the total value of all the securities in the Fund’s portfolio, plus other assets, less any liabilities, by the number of Fund shares outstanding. Fund shares are not individually redeemable and are issued and redeemed by the Fund at their NAV only in large, specified blocks of shares called creation units. Shares otherwise can be bought and sold only through exchange trading at market price (not NAV). Shares may trade at a premium or discount to their NAV in the secondary market. Information regarding how often shares of the Fund traded on NYSE Arca at a price above (i.e., at a premium) or below (i.e., at a discount) the NAV of the Fund can be found at www.GSAMFUNDS.com/ETFs. |
| | | | | | | | | | |
| | TOP TEN HOLDINGS AS OF 8/31/202 |
| | | | |
| | | Holding | | % of Net Assets | | | Line of Business | | Country |
| | Anheuser-Busch Cos. LLC / Anheuser-Busch InBev Worldwide, Inc., 4.90%, 02/01/46 | | | 0.3 | % | | Food and Beverage | | Belgium |
| | GE Capital International Funding Co. Unlimited Co., 4.42%, 11/15/35 | | | 0.3 | | | Financial Company | | United States |
| | Comcast Corp., 3.70%, 04/15/24 | | | 0.3 | | | Communications | | United States |
| | Apple, Inc., 2.10%, 09/12/22 | | | 0.3 | | | Technology | | United States |
| | Apple, Inc., 2.50%, 02/09/22 | | | 0.3 | | | Technology | | United States |
| | AbbVie, Inc., 3.20%, 11/21/29 | | | 0.3 | | | Consumer Noncyclical | | United States |
| | CVS Health Corp., 4.78%, 03/25/38 | | | 0.3 | | | Healthcare | | United States |
| | AbbVie, Inc., 4.25%, 11/21/49 | | | 0.3 | | | Consumer Noncyclical | | United States |
| | Microsoft Corp., 2.53%, 06/01/50 | | | 0.3 | | | Technology | | United States |
| | | AbbVie, Inc., 2.95%, 11/21/26 | | | 0.3 | | | Consumer Noncyclical | | United States |
| 2 | | The top 10 holdings may not be representative of the Fund’s future investments. |
For more information about the Fund, please refer to www.GSAMFUNDS.com/ETFs. There, you can learn more about the Fund’s investment strategies, holdings, and performance.
| | | | | | |
| | INDUSTRY ALLOCATION AS OF 8/31/203 | |
| | |
| | | Sector Name | | Fund | |
| | Financials | | | 30.40 | % |
| | Consumer, Non-cyclical | | | 19.89 | |
| | Telecommunication Services | | | 13.74 | |
| | Information Technology | | | 9.25 | |
| | Energy | | | 8.48 | |
| | Industrials | | | 6.16 | |
| | Consumer, Cyclical | | | 5.94 | |
| | Utilities | | | 2.42 | |
| | Materials | | | 1.85 | |
| | | Investment Company | | | 1.03 | |
| 3 | | The percentage shown for each investment category reflects the value of investments in that category as a percentage of net assets. The “Other” category represents the Fund’s investments in other investment companies. Figures in the table may not sum to 100% due to the exclusion of other assets and liabilities. |
20
GOLDMAN SACHS ACCESS INVESTMENT GRADE CORPORATE BOND ETF
Performance Summary
August 31, 2020
The following graph shows the value, as of August 31, 2020, of a $10,000 investment made on June 6, 2017 (commencement of operations) in Shares at NAV. For comparative purposes, the performance of the Fund’s underlying index, the FTSE Goldman Sachs Investment Grade Corporate Bond Index is shown. Performance reflects applicable fee waivers and/or expense limitations in effect during the periods shown and in their absence, performance would be reduced. Returns do not reflect the deduction of taxes that a shareholder would pay on Fund distributions or the sale of Fund shares. In addition to the performance of constituents of the underlying index, other factors may affect Fund performance. These factors include, but are not limited to, Fund operating fees and expenses, portfolio turnover and creation and redemption in-kind transactions. The returns set forth below represent past performance. Past performance does not guarantee future results. The Fund’s NAV and investment return may fluctuate. These fluctuations may cause an investor’s shares to be worth more or less than their original cost. Current performance may be lower or higher than the performance quoted below. Please visit our web site at www.GSAMFUNDS.com/ETFs to obtain the most recent month-end returns.
|
| Goldman Sachs Access Investment Grade Corporate Bond ETF’s Lifetime Performance |
Performance of a $10,000 Investment, with distributions reinvested, from June 6, 2017 through August 31, 2020.
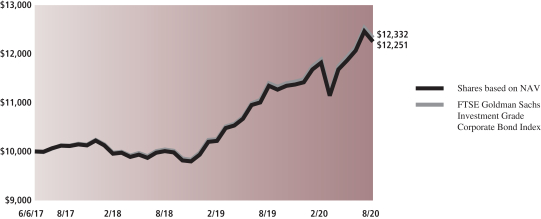
| | | | |
| Average Annual Total Return through August 31, 2020* | | 1 Year Return | | Since Inception |
Shares based on NAV (Commenced June 6, 2017) | | 7.95% | | 6.47% |
|
Shares based on Market Price (Commenced June 6, 2017) | | 8.07% | | 6.51% |
|
FTSE Goldman Sachs Investment Grade Corporate Bond Index | | 8.13% | | 6.68% |
|
| * | | Total returns are calculated assuming purchase of a share at the market price or NAV on the first day and sale of a share at the market price or NAV on the last day of each period reported. The Total Returns based on NAV and Market Price assume the reinvestment of dividends and do not reflect brokerage commissions in connection with the purchase or sale of Fund shares, which if included would lower the performance shown above. The NAV used in the Total Return calculations assumes all management fees incurred by the Fund. Market Price returns are based upon the last trade at 4:00 pm EST and do not reflect the returns you would receive if you traded shares at other times. The first day of secondary market trading is typically several days after the date on which the Fund commenced investment operations; therefore, the NAV of the Fund is used as a proxy for the period from inception of investment operations to the first day of secondary market trading to calculate the Market Price returns. |
21
PORTFOLIO RESULTS
Goldman Sachs Access Treasury 0-1 Year ETF
Investment Objective
The Goldman Sachs Access Treasury 0-1 Year ETF (the “Fund”) seeks to provide investment results that closely correspond, before fees and expenses, to the performance of the FTSE US Treasury 0-1 Year Composite Select Index (the “Index”).
Portfolio Management Discussion and Analysis
Below, the Goldman Sachs Global Fixed Income and Liquidity Solutions Team discusses the Fund’s performance and positioning for the 12-month period ended August 31, 2020 (the “Reporting Period”).
| Q | | How did the Fund perform during the Reporting Period? |
| A | | During the Reporting Period, the Fund returned 1.42% based on net asset value (“NAV”) and 1.41% based on market price. The Index returned 1.49% during the same period. |
| | The Fund had a NAV of $100.38 on August 31, 2019 and ended the Reporting Period with a NAV of $100.44 per share. The Fund’s market price on August 31, 2020 was $100.45 per share. |
| Q | | What key factors were responsible for the Fund’s performance during the Reporting Period? |
| A | | The Fund seeks to provide investment results that closely correspond, before fees and expenses, to the performance of the Index. The Fund’s performance reflects Fund expenses, including management fees and brokerage expenses. The Fund’s relative performance also reflects the impact of any cash held in the Fund as well as any other differences between the Fund’s holdings and the constituents of the Index. The Index is unmanaged, and Index returns do not reflect fees and expenses, which would reduce returns. |
| | The Index is designed to measure the performance of U.S. Treasury Securities with a maximum remaining maturity of 12 months. “U.S. Treasury Securities” refer to securities issued or guaranteed by the U.S. Treasury where the payment of principal and interest is backed by the full faith and credit of the U.S. government. U.S. Treasury Securities include U.S. Treasury notes, U.S. Treasury bills and U.S. Treasury floating rate bonds. The Index is sponsored by FTSE Fixed Income LLC (“FTSE”), a trading name of the London Stock Exchange Group plc and its group undertakings (collectively, the “LSE Group” or the “Index Provider”), which is not affiliated with the Fund or the Investment Adviser. The Index is market capitalization-weighted and the securities in the Index are updated on the last business day of each month. |
| | Given the Fund’s investment objective of attempting to track the Index, the Fund does not follow traditional methods of active investment management, which may involve buying and selling securities based upon analysis of economic and market factors. |
| | During the Reporting Period, the Fund posted positive absolute returns that closely tracked those of the Index, as measured by NAV. The Fund is passively managed to the Index and aims to minimize tracking error to the Index. |
| | The Fund’s and the Index’s performance was largely reflective of the performance of front-end, or short-term, U.S. Treasury rates, which were primarily affected by U.S. Federal Reserve (“Fed”) policy and issuance. Despite higher new issuance at the front-end of the yield curve, or spectrum of maturities, demand for reduced-risk assets and easing Fed monetary policy kept short-term rates at historic lows during the Reporting Period. |
| | Indeed, the Fed cut the targeted federal funds rate four times during the Reporting Period. The Fed pre-emptively cut interest rates in September and October 2019 and then twice in March 2020 on the back of concerns surrounding the COVID-19 pandemic, bringing the targeted federal funds rate to a range of 0% to 0.25%. The U.S. Treasury market saw yields fall across the spectrum of maturities, but lower front-end rates, in turn, decreased the yield of the Fund — the largest component of its return — during the Reporting Period. |
| | At the end of the Reporting Period, we expected Fed policy to remain accommodative until labor markets normalize, which will likely be highly dependent on the development of the COVID-19 pandemic as well as the evolution of economic data. While U.S. economic growth has declined and the U.S. entered into a recession in 2020, demand for U.S. Treasuries remained robust, especially given negative |
22
PORTFOLIO RESULTS
| | rates elsewhere in some developed markets. While U.S. economic growth may well remain fragile for some time and conditional on health outcomes, we did expect some positive economic data at the end of the Reporting Period should lockdown measures loosen going forward as we anticipate. |
| Q | | How did the Fund use derivatives and similar instruments during the Reporting Period? |
| A | | The Fund does not employ derivatives. |
| Q | | What was the Fund’s weighted average duration, weighted average maturity, weighted average coupon, weighted average yield to maturity and 30-day standardized yield at the end of the Reporting Period?1 |
| A | | The Fund had a weighted average duration of 0.34 years, a weighted average maturity of 0.34 years and a weighted average coupon of 0.11% as of August 31, 2020. The Fund’s weighted average yield to maturity was 0.11% on August 31, 2020. The 30-day net standardized yield of the Fund at the end of the Reporting Period was 0.00%. |
| Q | | What was the Fund’s sector positioning relative to the Index at the end of the Reporting Period?2 |
| A | | The Index was 100% allocated to U.S. Treasury Securities as the end of the Reporting Period, and the Fund was also 100% invested in U.S. Treasury Securities at the end of the Reporting Period. |
| | 1Duration | | is a time measure of a bond’s interest-rate sensitivity, based on the weighted average of the time periods over which a bond’s cash flows accrue to the bondholder. Time periods are weighted by multiplying by the present value of its cash flow divided by the bond’s price. (A bond’s cash flows consist of coupon payments and repayment of capital.) A bond’s duration will almost always be shorter than its maturity, with the exception of zero-coupon bonds, for which maturity and duration are equal. Weighted average duration is a measure of the duration for the securities in the portfolio overall. Weighted average maturity (“WAM”) is the weighted average amount of time until the debt securities in a portfolio mature, or the weighted average of the remaining terms to maturity of the debt securities within a portfolio. The higher the WAM, the longer it takes for all of the bonds in the portfolio to mature, and WAM is used to manage debt portfolios and to assess the performance of debt portfolio managers. Coupons are fixed percentages paid out on a fixed income security on an annual basis. Weighted average coupon is calculated by weighting the coupon of each debt security by its relative size in the portfolio. Yield to maturity is the annual return that a bond is expected to generate if it is held till its maturity given its coupon rate, payment frequency and current market price. Yield to maturity is essentially the internal rate of return of a bond, i.e. the discount rate at which the present value of a bond’s coupon payments and maturity value is equal to its current market price. The 30-day standardized yield calculation is based on a 30-day period ending on the last day of the Reporting Period. It is computed by dividing the net investment income per share earned during the period by the maximum offering price per share on the last day of the period. |
| | 2The | | Fund seeks to provide investment results that closely correspond, before fees and expenses, to the performance of the FTSE US Treasury 0-1 Year Composite Select Index. |
23
FUND BASICS
Access Treasury 0-1 Year ETF
as of August 31, 2020
| | | | | | |
| | FUND SNAPSHOT | |
| | |
| | | As of August 31, 2020 | | | |
| | |
| | Market Price1 | | $ | 100.45 | |
| | | Net Asset Value (NAV)1 | | $ | 100.44 | |
| 1 | | The Market Price is the price at which the Fund’s shares are trading on the NYSE Arca, Inc. The Market Price of the Fund’s shares will fluctuate and, at the time of sale, shares may be worth more or less than the original investment or the Fund’s then current net asset value (“NAV”). The NAV is the market value of one share of the Fund. This amount is derived by dividing the total value of all the securities in the Fund’s portfolio, plus other assets, less any liabilities, by the number of Fund shares outstanding. Fund shares are not individually redeemable and are issued and redeemed by the Fund at their NAV only in large, specified blocks of shares called creation units. Shares otherwise can be bought and sold only through exchange trading at market price (not NAV). Shares may trade at a premium or discount to their NAV in the secondary market. Information regarding how often shares of the Fund traded on NYSE Arca at a price above (i.e., at a premium) or below (i.e., at a discount) the NAV of the Fund can be found at www.GSAMFUNDS.com/ETFs. |
| | | | | | | | |
| | TOP TEN HOLDINGS AS OF 8/31/202 | |
| | | |
| | | Holding | | Maturity Date | | % of Net Assets | |
| | | |
| | U.S. Treasury Bill, 0.09% | | 10/08/20 | | | 11.8 | % |
| | U.S. Treasury Bill, 0.16% | | 10/08/20 | | | 6.8 | |
| | U.S. Treasury Bill, 0.09% | | 11/19/20 | | | 6.8 | |
| | U.S. Treasury Bill, 0.16% | | 11/19/20 | | | 6.0 | |
| | U.S. Treasury Bill, 0.16% | | 12/31/20 | | | 4.9 | |
| | U.S. Treasury Bill, 0.14% | | 10/08/20 | | | 4.5 | |
| | U.S. Treasury Bill, 0.10% | | 10/08/20 | | | 4.3 | |
| | U.S. Treasury Bill, 1.31% | | 01/28/21 | | | 4.2 | |
| | U.S. Treasury Bill, 0.14% | | 11/19/20 | | | 3.9 | |
| | U.S. Treasury Bill, 0.11% | | 02/25/21 | | | 3.7 | |
| | | Other | | N/A | | | 43.1 | |
| 2 | | The top 10 holdings may not be representative of the Fund’s future investments. |
For more information about the Fund, please refer to www.GSAMFUNDS.com/ETFs. There, you can learn more about the Fund’s investment strategies, holdings, and performance.
24
GOLDMAN SACHS ACCESS TREASURY 0-1 YEAR ETF
Performance Summary
August 31, 2020
The following graph shows the value, as of August 31, 2020, of a $10,000 investment made on September 6, 2016 (commencement of operations) in Shares at NAV. For comparative purposes, the performance of the Fund’s underlying index, the FTSE US Treasury 0-1 Year Composite Select Index is shown. Performance reflects applicable fee waivers and/or expense limitations in effect during the periods shown and in their absence, performance would be reduced. Returns do not reflect the deduction of taxes that a shareholder would pay on Fund distributions or the sale of Fund shares. In addition to the performance of constituents of the underlying index, other factors may affect Fund performance. These factors include, but are not limited to, Fund operating fees and expenses, portfolio turnover and creation and redemption in-kind transactions. The returns set forth below represent past performance. Past performance does not guarantee future results. The Fund’s NAV and investment return may fluctuate. These fluctuations may cause an investor’s shares to be worth more or less than their original cost. Current performance may be lower or higher than the performance quoted below. Please visit our web site at www.GSAMFUNDS.com/ETFs to obtain the most recent month-end returns.
|
| Goldman Sachs Access Treasury 0-1 Year ETF’s Lifetime Performance |
Performance of a $10,000 Investment, with distributions reinvested, from September 6, 2016 through August 31, 2020.
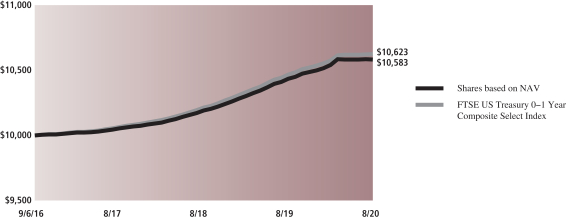
| | | | |
| Average Annual Total Return through August 31, 2020* | | 1 Year Return | | Since Inception |
Shares based on NAV (Commenced September 6, 2016) | | 1.42% | | 1.43% |
|
Shares based on Market Price (Commenced September 6, 2016) | | 1.41% | | 1.43% |
|
FTSE US Treasury 0-1 Year Composite Select Index | | 1.49% | | 1.53% |
|
| * | | Total returns are calculated assuming purchase of a share at the market price or NAV on the first day and sale of a share at the market price or NAV on the last day of each period reported. The Total Returns based on NAV and Market Price assume the reinvestment of dividends and do not reflect brokerage commissions in connection with the purchase or sale of Fund shares, which if included would lower the performance shown above. The NAV used in the Total Return calculations assumes all management fees incurred by the Fund. Market Price returns are based upon the last trade at 4:00 pm EST and do not reflect the returns you would receive if you traded shares at other times. The first day of secondary market trading is typically several days after the date on which the Fund commenced investment operations; therefore, the NAV of the Fund is used as a proxy for the period from inception of investment operations to the first day of secondary market trading to calculate the Market Price returns. |
25
PORTFOLIO RESULTS
Goldman Sachs Access Ultra Short Bond ETF
Investment Objective
The Goldman Sachs Access Ultra Short Bond ETF (the “Fund”) seeks to provide current income with preservation of capital.
Portfolio Management Discussion and Analysis
Below, the Goldman Sachs Global Fixed Income and Liquidity Solutions Team discusses the Fund’s performance and positioning for the 12-month period ended August 31, 2020 (the “Reporting Period”).
| Q | | How did the Fund perform during the Reporting Period? |
| A | | During the Reporting Period, the Fund returned 2.28% based on net asset value (“NAV”) and 2.28% based on market price. The Fund’s benchmark, the FTSE Three-Month U.S. Treasury Bill Index (the “Index”), returned 1.18% for the same period. |
| | | The Fund had a NAV of $50.49 per share on August 31, 2019 and ended the Reporting Period with a NAV of $50.77 per share. The Fund’s market price on August 31, 2020 was $50.78 per share. |
| Q | | What key factors were responsible for the Fund’s performance during the Reporting Period? |
| A | | The Fund seeks to achieve its investment objective by investing, under normal circumstances, at least 80% of its net assets plus any borrowings for investment purposes (measured at the time of purchase) (“Net Assets”) in a broad range of U.S. dollar denominated bonds. The Fund primarily invests in obligations issued or guaranteed by the U.S. Government, its agencies, authorities, instrumentalities or sponsored enterprises (“U.S. Government Securities”), obligations of U.S. banks, corporate notes, commercial paper and other short-term obligations of U.S. companies, states, municipalities and other entities, fixed and floating rate mortgage-backed securities, asset-backed securities, collateralized loan obligations and repurchase agreements. The Fund may also invest in U.S. dollar-denominated obligations issued or guaranteed by foreign banks, companies and governments or their agencies, authorities, instrumentalities or sponsored enterprises. |
| | | The Fund will generally focus its investments in securities of issuers that, at the time of purchase, have a short-term credit rating of at least investment grade by at least one nationally recognized statistical rating organization (“NRSRO”) (at least A-2, P-2, or F2 by Standard & Poor’s Ratings Services (“Standard & Poor’s”), Moody’s Investors Service, Inc. (“Moody’s”) or Fitch Ratings, Inc. (“Fitch”), respectively), have a long-term credit rating of at least investment grade by at least one NRSRO (at least BBB-, Baa3, or BBB by Standard & Poor’s, Moody’s or Fitch, respectively) if such securities only maintain long-term ratings, or, if unrated, are determined by the Investment Adviser to be of comparable credit quality at the time of purchase. The Fund may also rely on the credit quality of a guarantee or demand feature in determining the credit quality of a security supported by the guarantee or demand feature. |
| | | The Fund will concentrate its investments in the financial services group of industries. Therefore, under normal circumstances, the Fund will invest more than 25% of its total assets in securities issued by companies in the financial services group of industries and repurchase agreements secured by such obligations. |
| | | Under normal circumstances, the Fund’s effective duration is expected to be one year or less. “Duration” is a measure of a debt security’s price sensitivity to changes in interest rates. The longer the duration of the Fund (or an individual debt security), the more sensitive its market price to changes in interest rates. In computing duration, the Fund will estimate the duration of obligations that are subject to prepayment or redemption by the issuer, taking into account the influence of interest rates on prepayments and coupon flows. This method of computing duration is known as “option-adjusted” duration. |
| | | The Fund is an actively managed exchange-traded fund (“ETF”), which is a fund that trades like other publicly-traded securities. The Fund is not an index fund and does not seek to replicate the performance of a specified index. |
| | THE FUND IS NOT A MONEY MARKET FUND AND DOES NOT ATTEMPT TO MAINTAIN A STABLE NET ASSET VALUE. |
| | | During the Reporting Period, the Fund posted positive absolute returns that outperformed the Index. The Fund, as |
26
PORTFOLIO RESULTS
| | an actively managed, broadly diversified portfolio of high quality short-term holdings across multiple spread, or non-U.S. Treasury, sectors, outperformed the Index due primarily to credit risk and having a longer duration than that of the Index, both of which boosted the Fund’s results during the Reporting Period. |
| | | Overall, short term bond returns are driven by two primary factors — short-term interest rates and sector yields. |
| | | The U.S. Federal Reserve (the “Fed”) cut the targeted federal funds rate four times during the Reporting Period. The Fed pre-emptively cut interest rates in September and October 2019 and then twice in March 2020 on the back of concerns surrounding the COVID-19 pandemic, bringing the targeted federal funds rate to a range of 0% to 0.25%. The U.S. Treasury market saw yields fall across the spectrum of maturities, but lower front-end rates, in turn, decreased the yield of the Fund during the Reporting Period. |
| | | That said, since the Fund is an ultra-short bond fund, i.e. it maintains an effective duration of less than one year, its NAV has a low sensitivity to interest rate changes. As the fixed income yield curve remained rather flat during the Reporting Period, with little difference in yields between shorter-term and longer-term maturities, this reflected positively on the Fund on a relative value basis. |
| | | During the Reporting Period, short-dated, i.e. maturities of one to three years, investment grade credit yields tightened by approximately 150 basis points, and securitized credit yields fell by approximately 103 basis points. (A basis point is 1/100th of a percentage point.) Yields rose toward the beginning of 2020 as investor sentiment turned negative toward risk assets amid COVID-19 uncertainties and softening macroeconomic data. However, yields then tightened in mid-2020 through the end of the Reporting Period. Yield tightening was beneficial to the performance of the Fund. |
| | | A broad diversified portfolio of high quality short-term holdings, across investment grade corporate credit, U.S. Treasuries, mortgage-backed securities and other securitized credit, helped the Fund achieve a high level of current income for investors while also providing reduced volatility as yields of various individual sectors fluctuated during the Reporting Period. |
| | | While U.S. economic growth has declined and the U.S. entered into a recession in 2020, demand for U.S. Treasuries remained robust, especially given negative rates elsewhere in some developed markets. At the end of the Reporting Period, we remained alert for possible headwinds posed by health outcomes and unemployment rates. However, we believed supportive central bank actions and fiscal policy should keep investment grade corporate credit and securitized credit supported. |
| Q | | How did the Fund use derivatives and similar instruments during the Reporting Period? |
| A | | The Fund does not employ derivatives. |
| Q | | What was the Fund’s weighted average duration, weighted average maturity, weighted average coupon, weighted average yield to maturity and 30-day standardized yield at the end of the Reporting Period?1 |
| A | | The Fund had a weighted average duration of 0.87 years, a weighted average maturity of 9.81 years and a weighted average coupon of 1.39% as of August 31, 2020. The Fund’s weighted average yield to maturity was 0.76% on August 31, 2020. The 30-day standardized yield of the Fund at the end of the Reporting Period was 0.56%. |
| Q | | What was the Fund’s credit allocation at the end of the Reporting Period?2 |
| | | | | | |
| U.S. Treasuries | | | 5.07 | % | | |
Agency Securities | | | 34.58 | % | | |
AAA | | | 21.49 | % | | |
| AA | | | 5.83 | % | | |
| A | | | 18.70 | % | | |
| BBB | | | 11.40 | % | | |
| Not Rated | | | 2.29 | % | | |
| Cash | | | 0.65 | % | | |
| Q | | What was the Fund’s sector positioning relative to the Index at the end of the Reporting Period?2 |
| A | | While the Index was 100% allocated to U.S. Treasury securities, the Fund was 5.07% invested in U.S. Treasury securities, 20.92% in asset-backed securities, 34.58% in residential mortgage-backed securities, 35.92% in investment grade corporate bonds and 0.65% in cash at the end of the Reporting Period. |
| | 1Duration | | is a time measure of a bond’s interest-rate sensitivity, based on the weighted average of the time periods over which a bond’s cash flows accrue to the bondholder. Time periods are weighted by multiplying by the present value of its cash flow divided by the bond’s price. (A bond’s cash flows consist of coupon payments and repayment of capital.) |
| | | | A bond’s duration will almost always be shorter than its maturity, with the exception of zero-coupon bonds, for which maturity and |
27
PORTFOLIO RESULTS
| | duration are equal. Weighted average duration is a measure of the duration for the securities in the portfolio overall. Weighted average maturity (“WAM”) is the weighted average amount of time until the debt securities in a portfolio mature, or the weighted average of the remaining terms to maturity of the debt securities within a portfolio. The higher the WAM, the longer it takes for all of the bonds in the portfolio to mature, and WAM is used to manage debt portfolios and to assess the performance of debt portfolio managers. Coupons are fixed percentages paid out on a fixed income security on an annual basis. Weighted average coupon is calculated by weighting the coupon of each debt security by its relative size in the portfolio. Yield to maturity is the annual return that a bond is expected to generate if it is held till its maturity given its coupon rate, payment frequency and current market price. Yield to maturity is essentially the internal rate of return of a bond, i.e. the discount rate at which the present value of a bond’s coupon payments and maturity value is equal to its current market price. The 30-day standardized yield calculation is based on a 30-day period ending on the last day of the Reporting Period. It is computed by dividing the net investment income per share earned during the period by the maximum offering price per share on the last day of the period. |
| | 2 | | The Fund and the Index have not been rated by an independent rating agency. The credit allocation provided refers to the Fund’s underlying portfolio securities. For the purpose of determining compliance with any credit rating requirement, the Fund assigns a security, at the time of purchase, the highest rating by a Nationally Recognized Statistical Rating Organization (“NRSRO”) if the security is rated by more than one NRSRO. For this purpose, the Fund relies only on the ratings of the following NRSROs: S&P, Moody’s and Fitch, Inc. This method may differ from the method independently used by the Index Provider. GSAM will use a single rating if that is the only one available. Securities that are not rated by all three agencies are reflected as such in the breakdown. Unrated securities may be purchased by the Fund if they are determined by the Investment Adviser to be of a credit quality consistent with the Fund’s credit rating requirements. Unrated securities do not necessarily indicate low quality, and for such securities the Investment Adviser will evaluate the credit quality. GSAM converts all ratings to the equivalent S&P major rating category when illustrating credit rating breakdowns. Ratings and Fund/Index credit quality may change over time. |
28
FUND BASICS
Access Ultra Short Bond ETF
as of August 31, 2020
| | | | | | |
| | FUND SNAPSHOT | |
| | |
| | | As of August 31, 2020 | | | |
| | |
| | Market Price1 | | $ | 50.78 | |
| | | Net Asset Value (NAV)1 | | $ | 50.77 | |
| 1 | | The Market Price is the price at which the Fund’s shares are trading on the Cboe BZX Exchange, Inc. The Market Price of the Fund’s shares will fluctuate and, at the time of sale, shares may be worth more or less than the original investment or the Fund’s then current net asset value (“NAV”). The NAV is the market value of one share of the Fund. This amount is derived by dividing the total value of all the securities in the Fund’s portfolio, plus other assets, less any liabilities, by the number of Fund shares outstanding. Fund shares are not individually redeemable and are issued and redeemed by the Fund at their NAV only in large, specified blocks of shares called creation units. Shares otherwise can be bought and sold only through exchange trading at market price (not NAV). Shares may trade at a premium or discount to their NAV in the secondary market. Information regarding how often shares of the Fund traded on Cboe BZX Exchange, Inc. at a price above (i.e., at a premium) or below (i.e., at a discount) the NAV of the Fund can be found at www.GSAMFUNDS.com/ETFs. |
| | | | | | |
| | TOP TEN HOLDINGS AS OF 8/31/202 | |
| | |
| | | Holding | | % of Net Assets | |
| | |
| | U.S. Treasury Bill, 0.12%, 02/11/21 | | | 4.5 | % |
| | FNMA REMIC, Class GF, Series 2017-91, 0.53%, 11/25/47 | | | 2.8 | |
| | FNMA REMIC, Class WF, Series 2010-46, 0.93%, 05/25/40 | | | 2.3 | |
| | GNMA, Class FH, Series 2004-70, 0.56%, 07/20/34 | | | 1.9 | |
| | State of Texas, 4.00%, 08/26/21 | | | 1.6 | |
| | FHLMC REMIC, Class F, Series 2019-4897, 0.56%, 07/15/49 | | | 1.5 | |
| | FHLMC REMIC, Class CF, Series 2009-3593, 0.76%, 02/15/36 | | | 1.5 | |
| | GNMA, Class KF, Series 2013-64, 0.41%, 04/20/43 | | | 1.5 | |
| | FNMA REMIC, Class DF, Series 2013-19, 0.48%, 09/25/41 | | | 1.4 | |
| | | FNMA REMIC, Class BF, Series 2012-14, 0.78%, 03/25/42 | | | 1.3 | |
| 2 | | The top 10 holdings may not be representative of the Fund’s future investments. |
For more information about the Fund, please refer to www.GSAMFUNDS.com/ETFs. There, you can learn more about the Fund’s investment strategies, holdings, and performance.
| | | | | | |
| | SECTOR ALLOCATION AS OF 8/31/203 | |
| | |
| | | Sector Name | | Fund | |
| | |
| | Mortgage-Backed Securities | | | 35.64 | % |
| | Asset- Backed Securities | | | 20.89 | |
| | Corporate Obligations | | | 19.37 | |
| | Foreign Corporate Debt | | | 16.39 | |
| | U.S. Treasury Bills | | | 5.07 | |
| | Investment Company | | | 2.47 | |
| | Municipal Debt Obligations | | | 1.79 | |
| | | Certificate of Deposit | | | 0.33 | |
| 3 | | The percentage shown for each investment category reflects the value of investments in that category as a percentage of net assets. Figures in the table may not sum to 100% due to the exclusion of other assets and liabilities. |
29
GOLDMAN SACHS ACCESS ULTRA SHORT BOND ETF
Performance Summary
August 31, 2020
The following graph shows the value, as of August 31, 2020, of a $10,000 investment made on April 15, 2019 (commencement of operations) in Shares at NAV. For comparative purposes, the performance of a broad-based securities market index, the FTSE 3 Month T-Bill Index is shown. Performance reflects applicable fee waivers and/or expense limitations in effect during the periods shown and in their absence, performance would be reduced. Returns do not reflect the deduction of taxes that a shareholder would pay on Fund distributions or the sale of Fund shares. Certain factors may affect Fund performance including, but not limited to, Fund operating fees and expenses, portfolio turnover and creation and redemption in-kind transactions. The returns set forth below represent past performance. Past performance does not guarantee future results. The Fund’s NAV and investment return may fluctuate. These fluctuations may cause an investor’s shares to be worth more or less than their original cost. Current performance may be lower or higher than the performance quoted below. Please visit our web site at www.GSAMFUNDS.com/ETFs to obtain the most recent month-end returns.
|
| Goldman Sachs Access Ultra Short Bond ETF’s Lifetime Performance |
Performance of a $10,000 Investment, with distributions reinvested, from April 15, 2019 through August 31, 2020.
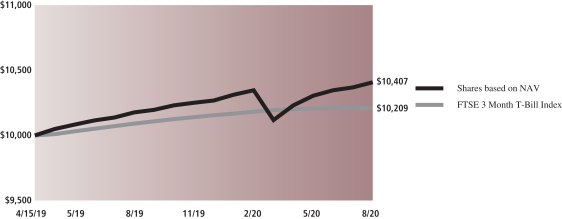
| | | | |
| Average Annual Total Return through August 31, 2020* | | 1 Year Return | | Since Inception |
Shares based on NAV (Commenced April 15, 2019) | | 2.28% | | 2.92% |
|
Shares based on Market Price (Commenced April 15, 2019) | | 2.28% | | 2.93% |
|
FTSE 3 Month T-Bill Index | | 1.18% | | 1.51% |
|
| * | | Total returns are calculated assuming purchase of a share at the market price or NAV on the first day and sale of a share at the market price or NAV on the last day of each period reported. The Total Returns based on NAV and Market Price assume the reinvestment of dividends and do not reflect brokerage commissions in connection with the purchase or sale of Fund shares, which if included would lower the performance shown above. The NAV used in the Total Return calculations assumes all management fees incurred by the Fund. Market Price returns are based upon the last trade at 4:00 pm EST and do not reflect the returns you would receive if you traded shares at other times. The first day of secondary market trading is typically several days after the date on which the Fund commenced investment operations; therefore, the NAV of the Fund is used as a proxy for the period from inception of investment operations to the first day of secondary market trading to calculate the Market Price returns. |
30
FUND BASICS
Index Definitions and Industry Terms
Alpha: The excess returns of a fund relative to the return of a benchmark index is the fund’s alpha.
Access High Yield Corporate Bond ETF
The Index was developed and is calculated and maintained by FTSE Fixed Income LLC (“FTSE”), a trading name of the London Stock Exchange Group plc and its group undertakings (collectively, the “LSE Group” or the “Index Provider”). FTSE is not affiliated with the Fund or GSAM. The Fund is not sponsored, endorsed, sold or promoted by FTSE or any of its affiliates and FTSE makes no representation to any owner or prospective owner of the Fund regarding the advisability of investing in securities generally or in the Fund particularly, or the ability of the Fund to track the price and yield performance of the Index or the ability of the Index to track general bond market performance. FTSE’s only relationship to GSAM (“Licensee”) is the licensing of certain information, data, trademarks and trade names of FTSE or its affiliates. The Index is determined, composed and calculated by FTSE without regard to the Fund. FTSE has no obligation to take the needs of the owners or prospective owners of the Fund into consideration in determining, composing or calculating the Index. FTSE is not responsible for and has not participated in the determination of the prices and amount of the shares to be issued by the Fund or the timing of the issuance or sale of the shares to be issued by the Fund or in the determination or calculation of the equation by which the shares to be issued by the Fund are to be converted into cash. FTSE has no obligation or liability in connection with the administration, marketing or trading of the Fund.
Access Inflation Protected USD Bond ETF
The Index was developed and is calculated and maintained by FTSE Fixed Income LLC (“FTSE”), a trading name of the London Stock Exchange Group plc and its group undertakings (collectively, the “LSE Group” or the “Index Provider”). FTSE is not affiliated with the Fund or GSAM. The Fund is not sponsored, endorsed, sold or promoted by FTSE or any of its affiliates and FTSE makes no representation to any owner or prospective owner of the Fund regarding the advisability of investing in securities generally or in the Fund particularly, or the ability of the Fund to track the price and yield performance of the Index or the ability of the Index to track general bond market performance. FTSE’s only relationship to GSAM (“Licensee”) is the licensing of certain information, data, trademarks and trade names of FTSE or its affiliates. The Index is determined, composed and calculated by FTSE without regard to the Fund. FTSE has no obligation to take the needs of the owners or prospective owners of the Fund into consideration in determining, composing or calculating the Index. FTSE is not responsible for and has not participated in the determination of the prices and amount of the shares to be issued by the Fund or the timing of the issuance or sale of the shares to be issued by the Fund or in the determination or calculation of the equation by which the shares to be issued by the Fund are to be converted into cash. FTSE has no obligation or liability in connection with the administration, marketing or trading of the Fund.
Access Investment Grade Corporate 1-5 Year Bond ETF
The Index was developed and is calculated and maintained by FTSE Fixed Income LLC (“FTSE”), a trading name of the London Stock Exchange Group plc and its group undertakings (collectively, the “LSE Group” or the “Index Provider”). FTSE is not affiliated with the Fund or GSAM. The Fund is not sponsored, endorsed, sold or promoted by FTSE or any of its affiliates and FTSE makes no representation to any owner or prospective owner of the Fund regarding the advisability of investing in securities generally or in the Fund particularly, or the ability of the Fund to track the price and yield performance of the Index or the ability of the Index to track general bond market performance. FTSE’s only relationship to GSAM (“Licensee”) is the licensing of certain information, data, trademarks and trade names of FTSE or its affiliates. The Index is determined, composed and calculated by FTSE without regard to the Fund. FTSE has no obligation to take the needs of the owners or prospective owners of the Fund into consideration in determining, composing or calculating the Index. FTSE is not responsible for and has not participated in the determination of the prices and amount of the shares to be issued by the Fund or the timing of the issuance or sale of the shares to be issued by the Fund or in the determination or calculation of the equation by which the shares to be issued by the Fund are to be converted into cash. FTSE has no obligation or liability in connection with the administration, marketing or trading of the Fund.
Access Investment Grade Corporate Bond ETF
The Index was developed and is calculated and maintained by FTSE Fixed Income LLC (“FTSE”), a trading name of the London Stock Exchange Group plc and its group undertakings (collectively, the “LSE Group” or the “Index Provider”). FTSE is not affiliated with the Fund or GSAM. The Fund is not sponsored, endorsed, sold or promoted by FTSE or any of its affiliates and FTSE makes no representation to any owner or prospective owner of the Fund regarding the advisability of investing in securities generally or in the Fund particularly, or the ability of the Fund to track the price and yield performance of the Index or the ability of the Index to track general bond market performance. FTSE’s only relationship to GSAM (“Licensee”) is the licensing of certain information, data, trademarks and trade names of
31
FUND BASICS
FTSE or its affiliates. The Index is determined, composed and calculated by FTSE without regard to the Fund. FTSE has no obligation to take the needs of the owners or prospective owners of the Fund into consideration in determining, composing or calculating the Index. FTSE is not responsible for and has not participated in the determination of the prices and amount of the shares to be issued by the Fund or the timing of the issuance or sale of the shares to be issued by the Fund or in the determination or calculation of the equation by which the shares to be issued by the Fund are to be converted into cash. FTSE has no obligation or liability in connection with the administration, marketing or trading of the Fund.
Access Treasury 0-1 Year ETF
The Index is designed to measure the performance of U.S. Treasury Securities with a maximum remaining maturity of 12 months. “U.S. Treasury Securities” refer to securities issued or guaranteed by the U.S. Treasury where the payment of principal and interest is backed by the full faith and credit of the U.S. government. U.S. Treasury Securities include U.S. Treasury notes, U.S. Treasury bills and U.S. Treasury floating rate bonds. The Index is sponsored by FTSE Fixed Income LLC (“FTSE”), a trading name of the London Stock Exchange Group plc and its group undertakings (collectively, the “LSE Group” or the “Index Provider”). FTSE is not affiliated with the Fund or GSAM. The Index is determined, composed and calculated by FTSE without regard to the Fund. It is not possible to invest directly in an unmanaged index.
Access Ultra Short Bond ETF
The FTSE 3 Month US T Bill Index is intended to track the daily performance of 3 month US Treasury bills. The index is designed to operate as a reference rate for a series of funds.
Goldman Sachs Access Ultra Short Bond ETF (GSST) does not attempt to track an index and takes a more active approach.
32
GOLDMAN SACHS ACCESS HIGH YIELD CORPORATE BOND ETF
Schedule of Investments
August 31, 2020
| | | | | | | | | | | | | | |
Principal
Amount | | | Interest
Rate | | | Maturity
Date | | | Value | |
|
| Corporate Obligations – 93.0% | |
| Advertising – 1.1% | |
| | Clear Channel Worldwide Holdings, Inc.(a) | |
| $ | 470,000 | | | | 5.125 | % | | | 08/15/27 | | | $ | 473,525 | |
| | Lamar Media Corp. | |
| | 90,000 | | | | 5.000 | | | | 05/01/23 | | | | 91,238 | |
| | 300,000 | | | | 5.750 | | | | 02/01/26 | | | | 313,500 | |
| | Nielsen Finance LLC / Nielsen Finance Co.(a) | |
| | 200,000 | | | | 5.000 | | | | 04/15/22 | | | | 201,250 | |
| | Outfront Media Capital LLC / Outfront Media Capital Corp. | |
| | 120,000 | | | | 5.625 | | | | 02/15/24 | | | | 122,700 | |
| | 400,000 | | | | 6.250 | (a) | | | 06/15/25 | | | | 417,000 | |
| | | | | | | | | | | | | | |
| | | | | | | | | | | | | 1,619,213 | |
| | |
| Aerospace – 0.2% | |
| | Triumph Group, Inc. | |
| | 100,000 | | | | 6.250 | (a) | | | 09/15/24 | | | | 82,000 | |
| | 236,000 | | | | 7.750 | | | | 08/15/25 | | | | 143,370 | |
| | | | | | | | | | | | | | |
| | | | | | | | | | | | | 225,370 | |
| | |
| Aerospace & Defense – 1.9% | |
| | TransDigm, Inc. | |
| | 254,000 | | | | 6.500 | | | | 07/15/24 | | | | 257,810 | |
| | 200,000 | | | | 6.500 | | | | 05/15/25 | | | | 202,000 | |
| | 400,000 | | | | 8.000 | (a) | | | 12/15/25 | | | | 437,500 | |
| | 1,020,000 | | | | 6.250 | (a) | | | 03/15/26 | | | | 1,081,200 | |
| | 551,000 | | | | 6.375 | | | | 06/15/26 | | | | 565,464 | |
| | 70,000 | | | | 7.500 | | | | 03/15/27 | | | | 73,850 | |
| | Wolverine Escrow LLC(a) | |
| | 330,000 | | | | 9.000 | | | | 11/15/26 | | | | 257,400 | |
| | | | | | | | | | | | | | |
| | | | | | | | | | | | | 2,875,224 | |
| | |
| Agriculture – 0.8% | |
| | JBS USA LUX SA / JBS USA Finance, Inc. | |
| | 480,000 | | | | 5.750 | (a) | | | 06/15/25 | | | | 498,000 | |
| | 314,000 | | | | 6.750 | (a) | | | 02/15/28 | | | | 350,110 | |
| JBS USA LUX SA / JBS USA Food Co. / JBS USA Finance,
Inc.(a) |
|
| | 320,000 | | | | 6.500 | | | | 04/15/29 | | | | 364,800 | |
| | | | | | | | | | | | | | |
| | | | | | | | | | | | | 1,212,910 | |
| | |
| Banks – 0.1% | |
| | Freedom Mortgage Corp. | |
| | 74,000 | | | | 8.125 | (a) | | | 11/15/24 | | | | 74,833 | |
| | 147,000 | | | | 8.250 | (a) | | | 04/15/25 | | | | 150,491 | |
| | | | | | | | | | | | | | |
| | | | | | | | | | | | | 225,324 | |
| | |
| Basic Industry – 1.1% | |
| | CF Industries, Inc. | |
| | 170,000 | | | | 3.450 | | | | 06/01/23 | | | | 176,800 | |
| | 100,000 | | | | 5.150 | | | | 03/15/34 | | | | 120,500 | |
| | Chemours Co. (The) | |
| | 420,000 | | | | 6.625 | | | | 05/15/23 | | | | 422,205 | |
| | Olin Corp. | |
| | 512,000 | | | | 5.125 | | | | 09/15/27 | | | | 512,000 | |
| | Tronox, Inc.(a) | |
| | 344,000 | | | | 6.500 | | | | 04/15/26 | | | | 357,760 | |
| | | | | | | | | | | | | | |
| | | | | | | | | | | | | 1,589,265 | |
| | |
|
| Corporate Obligations – (continued) | |
| Broadcasting – 3.5% | |
| | Diamond Sports Group LLC / Diamond Sports Finance Co. | |
| 260,000 | | | | 5.375 | (a) | | | 08/15/26 | | | | 204,100 | |
| | 1,000,000 | | | | 6.625 | (a) | | | 08/15/27 | | | | 565,000 | |
| | iHeartCommunications, Inc.(a) | |
| | 750,000 | | | | 4.750 | | | | 01/15/28 | | | | 721,875 | |
| | Nexstar Broadcasting, Inc.(a) | |
| | 560,000 | | | | 5.625 | | | | 07/15/27 | | | | 594,300 | |
| | Sinclair Television Group, Inc.(a) | |
| | 250,000 | | | | 5.500 | | | | 03/01/30 | | | | 246,875 | |
| | Sirius XM Radio, Inc. | |
| | 210,000 | | | | 4.625 | (a) | | | 07/15/24 | | | | 219,188 | |
| | 128,000 | | | | 5.375 | (a) | | | 07/15/26 | | | | 134,080 | |
| | 755,000 | | | | 5.000 | (a) | | | 08/01/27 | | | | 802,187 | |
| | 240,000 | | | | 5.500 | (a) | | | 07/01/29 | | | | 264,600 | |
| | 411,000 | | | | 4.125 | (a) | | | 07/01/30 | | | | 432,578 | |
| | TEGNA, Inc.(a) | |
| | 300,000 | | | | 5.000 | | | | 09/15/29 | | | | 301,875 | |
| | Terrier Media Buyer, Inc.(a) | |
| | 120,000 | | | | 8.875 | | | | 12/15/27 | | | | 124,500 | |
| | Univision Communications, Inc. | |
| | 257,000 | | | | 5.125 | (a) | | | 02/15/25 | | | | 258,285 | |
| | 405,000 | | | | 6.625 | (a) | | | 06/01/27 | | | | 407,531 | |
| | | | | | | | | | | | | | |
| | | | | | | | | | | | | 5,276,974 | |
| | |
| Brokerage – 0.2% | |
| Ladder Capital Finance Holdings LLLP / Ladder Capital Finance
Corp.(a) |
|
| | 300,000 | | | | 4.250 | | | | 02/01/27 | | | | 276,750 | |
| | |
| Building Materials – 1.1% | |
| | AECOM | |
| | 314,000 | | | | 5.125 | | | | 03/15/27 | | | | 346,970 | |
| | American Builders & Contractors Supply Co., Inc. | |
| | 50,000 | | | | 5.875 | (a) | | | 05/15/26 | | | | 52,625 | |
| | 363,000 | | | | 4.000 | (a) | | | 01/15/28 | | | | 372,982 | |
| | Beacon Roofing Supply, Inc.(a) | |
| | 280,000 | | | | 4.875 | | | | 11/01/25 | | | | 279,300 | |
| | Builders FirstSource, Inc.(a) | |
| | 530,000 | | | | 6.750 | | | | 06/01/27 | | | | 579,688 | |
| | | | | | | | | | | | | | |
| | | | | | | | | | | | | 1,631,565 | |
| | |
| Capital Goods – 3.2% | |
| | Ball Corp. | |
| | 205,000 | | | | 4.000 | | | | 11/15/23 | | | | 219,094 | |
| | 351,000 | | | | 5.250 | | | | 07/01/25 | | | | 400,140 | |
| | 121,000 | | | | 4.875 | | | | 03/15/26 | | | | 136,730 | |
| | Covanta Holding Corp. | |
| | 125,000 | | | | 5.875 | | | | 07/01/25 | | | | 130,567 | |
| | 101,000 | | | | 6.000 | | | | 01/01/27 | | | | 106,216 | |
| | Crown Americas LLC / Crown Americas Capital Corp. IV | |
| | 200,000 | | | | 4.500 | | | | 01/15/23 | | | | 210,500 | |
| | Crown Americas LLC / Crown Americas Capital Corp. V | |
| | 245,000 | | | | 4.250 | | | | 09/30/26 | | | | 261,537 | |
| | Crown Americas LLC / Crown Americas Capital Corp. VI | |
| | 210,000 | | | | 4.750 | | | | 02/01/26 | | | | 219,450 | |
| | Flex Acquisition Co., Inc. | |
| | 130,000 | | | | 6.875 | (a) | | | 01/15/25 | | | | 132,925 | |
| | 157,000 | | | | 7.875 | (a) | | | 07/15/26 | | | | 165,439 | |
| | |
| | |
| The accompanying notes are an integral part of these financial statements. | | 33 |
GOLDMAN SACHS ACCESS HIGH YIELD CORPORATE BOND ETF
Schedule of Investments (continued)
August 31, 2020
| | | | | | | | | | | | | | |
Principal
Amount | | | Interest
Rate | | | Maturity
Date | | | Value | |
|
| Corporate Obligations – (continued) | |
| Capital Goods – (continued) | |
| | Graham Packaging Co., Inc.(a) | |
| $ | 30,000 | | | | 7.125 | % | | | 08/15/28 | | | $ | 31,500 | |
| | Herc Holdings, Inc.(a) | |
| | 490,000 | | | | 5.500 | | | | 07/15/27 | | | | 514,500 | |
| | LABL Escrow Issuer LLC | |
| | 183,000 | | | | 6.750 | (a) | | | 07/15/26 | | | | 196,725 | |
| | 139,000 | | | | 10.500 | (a) | | | 07/15/27 | | | | 152,552 | |
| | Mauser Packaging Solutions Holding Co. | |
| | 304,000 | | | | 5.500 | (a) | | | 04/15/24 | | | | 315,400 | |
| | 275,000 | | | | 7.250 | (a) | | | 04/15/25 | | | | 268,125 | |
| Reynolds Group Issuer, Inc. / Reynolds Group Issuer LLC /
Reynolds Group Issuer Lu |
|
| | 214,000 | | | | 5.125 | (a) | | | 07/15/23 | | | | 218,012 | |
| | 144,000 | | | | 7.000 | (a) | | | 07/15/24 | | | | 147,240 | |
| | Sealed Air Corp. | |
| | 260,000 | | | | 4.875 | (a) | | | 12/01/22 | | | | 275,600 | |
| | 60,000 | | | | 6.875 | (a) | | | 07/15/33 | | | | 77,400 | |
| | Sensata Technologies BV | |
| | 366,000 | | | | 4.875 | (a) | | | 10/15/23 | | | | 387,960 | |
| | 179,000 | | | | 5.000 | (a) | | | 10/01/25 | | | | 194,663 | |
| | | | | | | | | | | | | | |
| | | | | | | | | | | | | 4,762,275 | |
| | |
| Communications – 8.8% | |
| | AMC Networks, Inc. | |
| | 80,000 | | | | 4.750 | | | | 12/15/22 | | | | 80,800 | |
| | 220,000 | | | | 5.000 | | | | 04/01/24 | | | | 226,050 | |
| | 340,000 | | | | 4.750 | | | | 08/01/25 | | | | 351,900 | |
| | CCO Holdings LLC / CCO Holdings Capital Corp. | |
| | 197,000 | | | | 4.000 | (a) | | | 03/01/23 | | | | 199,463 | |
| | 645,000 | | | | 5.750 | (a) | | | 02/15/26 | | | | 675,637 | |
| | 509,000 | | | | 5.500 | (a) | | | 05/01/26 | | | | 534,450 | |
| | 490,000 | | | | 5.125 | (a) | | | 05/01/27 | | | | 520,625 | |
| | 17,000 | | | | 5.875 | (a) | | | 05/01/27 | | | | 17,935 | |
| | 423,000 | | | | 5.000 | (a) | | | 02/01/28 | | | | 448,909 | |
| | 300,000 | | | | 5.375 | (a) | | | 06/01/29 | | | | 330,375 | |
| | 680,000 | | | | 4.750 | (a) | | | 03/01/30 | | | | 730,150 | |
| | 440,000 | | | | 4.500 | (a) | | | 08/15/30 | | | | 467,500 | |
| | 400,000 | | | | 4.250 | (a) | | | 02/01/31 | | | | 418,500 | |
| | CSC Holdings LLC | |
| | 90,000 | | | | 5.875 | | | | 09/15/22 | | | | 96,300 | |
| | 678,000 | | | | 5.250 | | | | 06/01/24 | | | | 737,325 | |
| | 550,000 | | | | 5.500 | (a) | | | 04/15/27 | | | | 588,500 | |
| | 200,000 | | | | 5.375 | (a) | | | 02/01/28 | | | | 214,000 | |
| | 200,000 | | | | 7.500 | (a) | | | 04/01/28 | | | | 225,000 | |
| | 640,000 | | | | 6.500 | (a) | | | 02/01/29 | | | | 722,400 | |
| | 680,000 | | | | 5.750 | (a) | | | 01/15/30 | | | | 743,750 | |
| | DISH DBS Corp. | |
| | 468,000 | | | | 5.000 | | | | 03/15/23 | | | | 488,475 | |
| | 314,000 | | | | 5.875 | | | | 11/15/24 | | | | 333,625 | |
| | 514,000 | | | | 7.750 | | | | 07/01/26 | | | | 591,100 | |
| | 110,000 | | | | 7.375 | (a) | | | 07/01/28 | | | | 116,806 | |
| | Lions Gate Capital Holdings LLC | |
| | 83,000 | | | | 6.375 | (a) | | | 02/01/24 | | | | 85,490 | |
| | 142,000 | | | | 5.875 | (a) | | | 11/01/24 | | | | 143,420 | |
| | Live Nation Entertainment, Inc. | |
| | 490,000 | | | | 6.500 | (a) | | | 05/15/27 | | | | 537,775 | |
| | 224,000 | | | | 4.750 | (a) | | | 10/15/27 | | | | 212,240 | |
| | |
|
| Corporate Obligations – (continued) | |
| Communications – (continued) | |
| | Meredith Corp. | |
| 320,000 | | | | 6.875 | | | | 02/01/26 | | | | 281,200 | |
| | Netflix, Inc. | |
| | 440,000 | | | | 4.375 | | | | 11/15/26 | | | | 491,700 | |
| | 467,000 | | | | 4.875 | | | | 04/15/28 | | | | 540,552 | |
| | 562,000 | | | | 5.875 | | | | 11/15/28 | | | | 694,070 | |
| | 227,000 | | | | 6.375 | | | | 05/15/29 | | | | 288,858 | |
| | 100,000 | | | | 5.375 | (a) | | | 11/15/29 | | | | 120,750 | |
| | | | | | | | | | | | | | |
| | | | | | | | | | | | | 13,255,630 | |
| | |
| Consumer Cyclical – 18.1% | |
| | Adient Global Holdings Ltd.(a) | |
| | 200,000 | | | | 4.875 | | | | 08/15/26 | | | | 188,000 | |
| | Adient US LLC(a) | |
| | 449,000 | | | | 7.000 | | | | 05/15/26 | | | | 484,920 | |
| | ADT Security Corp. (The)(a) | |
| | 230,000 | | | | 4.875 | | | | 07/15/32 | | | | 248,975 | |
| | Allison Transmission, Inc. | |
| | 97,000 | | | | 5.000 | (a) | | | 10/01/24 | | | | 98,455 | |
| | 320,000 | | | | 4.750 | (a) | | | 10/01/27 | | | | 336,800 | |
| | AMC Entertainment Holdings, Inc. | |
| | 100,000 | | | | 5.750 | | | | 06/15/25 | | | | 31,000 | |
| | 250,000 | | | | 6.125 | | | | 05/15/27 | | | | 77,500 | |
| | APX Group, Inc. | |
| | 277,000 | | | | 7.875 | | | | 12/01/22 | | | | 281,155 | |
| | 200,000 | | | | 6.750 | (a) | | | 02/15/27 | | | | 210,750 | |
| | Boyd Gaming Corp. | |
| | 160,000 | | | | 6.375 | | | | 04/01/26 | | | | 167,600 | |
| | 271,000 | | | | 6.000 | | | | 08/15/26 | | | | 285,566 | |
| | 180,000 | | | | 4.750 | | | | 12/01/27 | | | | 179,780 | |
| | Brink’s Co. (The)(a) | |
| | 284,000 | | | | 5.500 | | | | 07/15/25 | | | | 300,330 | |
| | Caesars Entertainment, Inc. | |
| | 450,000 | | | | 6.250 | (a) | | | 07/01/25 | | | | 477,618 | |
| | 450,000 | | | | 8.125 | (a) | | | 07/01/27 | | | | 479,250 | |
| | Caesars Resort Collection LLC / CRC Finco, Inc. | |
| | 150,000 | | | | 5.750 | (a) | | | 07/01/25 | | | | 157,517 | |
| | 511,000 | | | | 5.250 | (a) | | | 10/15/25 | | | | 490,560 | |
| | Cedar Fair LP | |
| | 75,000 | | | | 5.250 | | | | 07/15/29 | | | | 73,312 | |
| Cedar Fair LP / Canada’s Wonderland Co. / Magnum
Management Corp. |
|
| | 270,000 | | | | 5.375 | | | | 06/01/24 | | | | 272,025 | |
| | Cinemark USA, Inc. | |
| | 104,000 | | | | 5.125 | | | | 12/15/22 | | | | 97,760 | |
| | 50,000 | | | | 4.875 | | | | 06/01/23 | | | | 46,250 | |
| | Clarios Global LP / Clarios US Finance Co. | |
| | 418,000 | | | | 6.250 | (a) | | | 05/15/26 | | | | 442,571 | |
| | 415,000 | | | | 8.500 | (a) | | | 05/15/27 | | | | 439,907 | |
| | Dana, Inc. | |
| | 300,000 | | | | 5.625 | | | | 06/15/28 | | | | 318,000 | |
| | Diamond Resorts International, Inc.(a) | |
| | 104,000 | | | | 7.750 | | | | 09/01/23 | | | | 102,180 | |
| | ESH Hospitality, Inc.(a) | |
| | 367,000 | | | | 5.250 | | | | 05/01/25 | | | | 375,257 | |
| | |
| | |
| 34 | | The accompanying notes are an integral part of these financial statements. |
GOLDMAN SACHS ACCESS HIGH YIELD CORPORATE BOND ETF
| | | | | | | | | | | | | | |
Principal
Amount | | | Interest
Rate | | | Maturity
Date | | | Value | |
|
| Corporate Obligations – (continued) | |
| Consumer Cyclical – (continued) | |
| | Ford Motor Co. | |
| $ | 180,000 | | | | 8.500 | % | | | 04/21/23 | | | $ | 199,981 | |
| | 280,000 | | | | 9.000 | | | | 04/22/25 | | | | 328,147 | |
| | 105,000 | | | | 4.346 | | | | 12/08/26 | | | | 105,406 | |
| | 600,000 | | | | 6.625 | | | | 10/01/28 | | | | 662,846 | |
| | 300,000 | | | | 7.450 | | | | 07/16/31 | | | | 351,228 | |
| | Ford Motor Credit Co. LLC | |
| | 700,000 | | | | 3.087 | | | | 01/09/23 | | | | 696,747 | |
| | 380,000 | | | | 5.584 | | | | 03/18/24 | | | | 404,159 | |
| | 300,000 | | | | 5.125 | | | | 06/16/25 | | | | 315,785 | |
| | 200,000 | | | | 4.134 | | | | 08/04/25 | | | | 201,067 | |
| | 200,000 | | | | 4.542 | | | | 08/01/26 | | | | 204,087 | |
| | 400,000 | | | | 4.271 | | | | 01/09/27 | | | | 403,675 | |
| | 200,000 | | | | 3.815 | | | | 11/02/27 | | | | 196,376 | |
| | 200,000 | | | | 5.113 | | | | 05/03/29 | | | | 211,263 | |
| | Gap, Inc. (The)(a) | |
| | 500,000 | | | | 8.625 | | | | 05/15/25 | | | | 558,795 | |
| | Hanesbrands, Inc. | |
| | 397,000 | | | | 4.625 | (a) | | | 05/15/24 | | | | 418,835 | |
| | 250,000 | | | | 5.375 | (a) | | | 05/15/25 | | | | 266,875 | |
| | Hilton Domestic Operating Co., Inc. | |
| | 274,000 | | | | 4.250 | | | | 09/01/24 | | | | 276,740 | |
| | 400,000 | | | | 5.125 | | | | 05/01/26 | | | | 416,000 | |
| | 310,000 | | | | 4.875 | | | | 01/15/30 | | | | 320,850 | |
| Hilton Worldwide Finance LLC / Hilton Worldwide Finance
Corp. |
|
| | 217,000 | | | | 4.625 | | | | 04/01/25 | | | | 220,255 | |
| | 155,000 | | | | 4.875 | | | | 04/01/27 | | | | 160,037 | |
| | Iron Mountain, Inc. | |
| | 331,000 | | | | 4.875 | (a) | | | 09/15/27 | | | | 345,481 | |
| | 272,000 | | | | 5.250 | (a) | | | 03/15/28 | | | | 286,960 | |
| | 570,000 | | | | 5.250 | (a) | | | 07/15/30 | | | | 607,763 | |
| KFC Holding Co./Pizza Hut Holdings LLC/Taco Bell of America
LLC |
|
| | 186,000 | | | | 5.000 | (a) | | | 06/01/24 | | | | 192,742 | |
| | 270,000 | | | | 5.250 | (a) | | | 06/01/26 | | | | 282,488 | |
| | L Brands, Inc. | |
| | 350,000 | | | | 7.500 | | | | 06/15/29 | | | | 374,567 | |
| | Lennar Corp. | |
| | 230,000 | | | | 4.125 | | | | 01/15/22 | | | | 236,038 | |
| | 150,000 | | | | 4.500 | | | | 04/30/24 | | | | 161,259 | |
| | 55,000 | | | | 4.750 | | | | 05/30/25 | | | | 60,548 | |
| | 361,000 | | | | 4.750 | | | | 11/29/27 | | | | 413,796 | |
| | Macy’s Retail Holdings LLC | |
| | 20,000 | | | | 2.875 | | | | 02/15/23 | | | | 16,606 | |
| | Macy’s, Inc.(a) | |
| | 300,000 | | | | 8.375 | | | | 06/15/25 | | | | 314,261 | |
| | Marriott Ownership Resorts, Inc. / ILG LLC | |
| | 340,000 | | | | 6.500 | | | | 09/15/26 | | | | 354,875 | |
| MGM Growth Properties Operating Partnership LP / MGP
Finance Co.-Issuer, Inc. |
|
| | 405,000 | | | | 4.625 | (a) | | | 06/15/25 | | | | 429,300 | |
| | 150,000 | | | | 5.750 | | | | 02/01/27 | | | | 166,125 | |
| | MGM Resorts International | |
| | 298,000 | | | | 6.000 | | | | 03/15/23 | | | | 314,017 | |
| | 77,000 | | | | 5.750 | | | | 06/15/25 | | | | 82,871 | |
| | |
|
| Corporate Obligations – (continued) | |
| Consumer Cyclical – (continued) | |
| | MGM Resorts International – (continued) | |
| 167,000 | | | | 4.625 | | | | 09/01/26 | | | | 170,758 | |
| | 209,000 | | | | 5.500 | | | | 04/15/27 | | | | 222,063 | |
| | Navistar International Corp.(a) | |
| | 326,000 | | | | 6.625 | | | | 11/01/25 | | | | 334,150 | |
| | NCL Corp Ltd.(a) | |
| | 447,000 | | | | 3.625 | | | | 12/15/24 | | | | 307,871 | |
| | Penske Automotive Group, Inc. | |
| | 30,000 | | | | 5.750 | | | | 10/01/22 | | | | 30,112 | |
| | 20,000 | | | | 5.500 | | | | 05/15/26 | | | | 20,900 | |
| | PetSmart, Inc. | |
| | 310,000 | | | | 7.125 | (a) | | | 03/15/23 | | | | 312,862 | |
| | 150,000 | | | | 5.875 | (a) | | | 06/01/25 | | | | 154,687 | |
| | 165,000 | | | | 8.875 | (a) | | | 06/01/25 | | | | 172,013 | |
| | Picasso Finance Sub, Inc.(a) | |
| | 280,000 | | | | 6.125 | | | | 06/15/25 | | | | 299,600 | |
| | Prime Security Services Borrower LLC / Prime Finance, Inc.(a) | |
| | 540,000 | | | | 3.375 | | | | 08/31/27 | | | | 539,325 | |
| | PulteGroup, Inc. | |
| | 201,000 | | | | 5.500 | | | | 03/01/26 | | | | 230,945 | |
| | 172,000 | | | | 5.000 | | | | 01/15/27 | | | | 197,301 | |
| | 100,000 | | | | 6.375 | | | | 05/15/33 | | | | 124,750 | |
| | QVC, Inc. | |
| | 100,000 | | | | 4.450 | | | | 02/15/25 | | | | 103,559 | |
| | 150,000 | | | | 4.750 | | | | 02/15/27 | | | | 159,101 | |
| | RHP Hotel Properties LP / RHP Finance Corp. | |
| | 30,000 | | | | 5.000 | | | | 04/15/23 | | | | 29,550 | |
| | 130,000 | | | | 4.750 | | | | 10/15/27 | | | | 120,575 | |
| | Scientific Games International, Inc. | |
| | 410,000 | | | | 5.000 | (a) | | | 10/15/25 | | | | 407,950 | |
| | 340,000 | | | | 8.250 | (a) | | | 03/15/26 | | | | 351,900 | |
| | 90,000 | | | | 7.000 | (a) | | | 05/15/28 | | | | 89,100 | |
| | Six Flags Entertainment Corp. | |
| | 280,000 | | | | 4.875 | (a) | | | 07/31/24 | | | | 274,050 | |
| | 87,000 | | | | 5.500 | (a) | | | 04/15/27 | | | | 84,716 | |
| | Staples, Inc.(a) | |
| | 547,000 | | | | 7.500 | | | | 04/15/26 | | | | 490,933 | |
| | Station Casinos LLC(a) | |
| | 341,000 | | | | 4.500 | | | | 02/15/28 | | | | 325,655 | |
| | Taylor Morrison Communities, Inc.(a) | |
| | 430,000 | | | | 5.125 | | | | 08/01/30 | | | | 469,775 | |
| | Tesla, Inc.(a) | |
| | 352,000 | | | | 5.300 | | | | 08/15/25 | | | | 367,400 | |
| | Toll Brothers Finance Corp. | |
| | 49,000 | | | | 5.875 | | | | 02/15/22 | | | | 51,265 | |
| | 313,000 | | | | 4.375 | | | | 04/15/23 | | | | 329,208 | |
| | 122,000 | | | | 4.350 | | | | 02/15/28 | | | | 133,603 | |
| | VICI Properties LP / VICI Note Co., Inc. | |
| | 285,000 | | | | 4.250 | (a) | | | 12/01/26 | | | | 293,550 | |
| | 200,000 | | | | 4.625 | (a) | | | 12/01/29 | | | | 209,500 | |
| | 400,000 | | | | 4.125 | (a) | | | 08/15/30 | | | | 402,000 | |
| | William Carter Co. (The)(a) | |
| | 332,000 | | | | 5.625 | | | | 03/15/27 | | | | 354,410 | |
| | Wyndham Destinations, Inc.(a) | |
| | 360,000 | | | | 6.625 | | | | 07/31/26 | | | | 382,956 | |
| | Yum! Brands, Inc.(a) | |
| | 375,000 | | | | 4.750 | | | | 01/15/30 | | | | 413,438 | |
| | | | | | | | | | | | | | |
| | | | | | | | | | | | | 27,183,420 | |
| | |
| | |
| The accompanying notes are an integral part of these financial statements. | | 35 |
GOLDMAN SACHS ACCESS HIGH YIELD CORPORATE BOND ETF
Schedule of Investments (continued)
August 31, 2020
| | | | | | | | | | | | | | |
Principal
Amount | | | Interest
Rate | | | Maturity
Date | | | Value | |
|
| Corporate Obligations – (continued) | |
| Consumer Noncyclical – 3.4% | |
| Albertsons Cos., Inc. / Safeway, Inc. / New Albertsons LP /
Albertsons LLC |
|
| $ | 335,000 | | | | 6.625 | % | | | 06/15/24 | | | $ | 345,469 | |
| | 449,000 | | | | 5.750 | | | | 03/15/25 | | | | 465,276 | |
| | 380,000 | | | | 4.625 | (a) | | | 01/15/27 | | | | 401,375 | |
| | 339,000 | | | | 4.875 | (a) | | | 02/15/30 | | | | 367,391 | |
| | Allied Universal Holdco LLC / Allied Universal Finance Corp.(a) | |
| | 490,000 | | | | 6.625 | | | | 07/15/26 | | | | 526,750 | |
| Change Healthcare Holdings LLC / Change Healthcare Finance,
Inc.(a) |
|
| | 273,000 | | | | 5.750 | | | | 03/01/25 | | | | 279,142 | |
| | Elanco Animal Health, Inc. | |
| | 300,000 | | | | 5.900 | | | | 08/28/28 | | | | 357,205 | |
| | Fresh Market, Inc. (The)(a) | |
| | 80,000 | | | | 9.750 | | | | 05/01/23 | | | | 68,700 | |
| | Hologic, Inc.(a) | |
| | 230,000 | | | | 4.375 | | | | 10/15/25 | | | | 235,750 | |
| | Jaguar Holding Co. II / PPD Development LP(a) | |
| | 312,000 | | | | 5.000 | | | | 06/15/28 | | | | 332,280 | |
| | MEDNAX, Inc.(a) | |
| | 230,000 | | | | 6.250 | | | | 01/15/27 | | | | 244,375 | |
| | MPH Acquisition Holdings LLC(a) | |
| | 307,000 | | | | 7.125 | | | | 06/01/24 | | | | 312,373 | |
| | Polaris Intermediate Corp.(a) (b) (PIK 9.250%, Cash 8.500%) | |
| | 120,000 | | | | 8.500 | | | | 12/01/22 | | | | 121,950 | |
| RegionalCare Hospital Partners Holdings, Inc. / LifePoint Health,
Inc.(a) |
|
| | 170,000 | | | | 9.750 | | | | 12/01/26 | | | | 184,025 | |
| | Rite Aid Corp. | |
| | 262,000 | | | | 7.500 | (a) | | | 07/01/25 | | | | 264,293 | |
| | 68,000 | | | | 8.000 | (a) | | | 11/15/26 | | | | 69,700 | |
| | Teleflex, Inc. | |
| | 546,000 | | | | 4.625 | | | | 11/15/27 | | | | 581,490 | |
| | | | | | | | | | | | | | |
| | | | | | | | | | | | | 5,157,544 | |
| | |
| Consumer Products – 2.1% | |
| | Edgewell Personal Care Co.(a) | |
| | 450,000 | | | | 5.500 | | | | 06/01/28 | | | | 479,813 | |
| | Energizer Holdings, Inc.(a) | |
| | 522,000 | | | | 6.375 | | | | 07/15/26 | | | | 555,930 | |
| | Mattel, Inc. | |
| | 294,000 | | | | 6.750 | (a) | | | 12/31/25 | | | | 313,110 | |
| | 268,000 | | | | 5.875 | (a) | | | 12/15/27 | | | | 292,790 | |
| | Newell Brands, Inc. | |
| | 306,000 | | | | 4.350 | | | | 04/01/23 | | | | 324,089 | |
| | 471,000 | | | | 4.700 | | | | 04/01/26 | | | | 508,452 | |
| | Spectrum Brands, Inc. | |
| | 222,000 | | | | 5.750 | | | | 07/15/25 | | | | 230,325 | |
| | Tempur Sealy International, Inc. | |
| | 369,000 | | | | 5.625 | | | | 10/15/23 | | | | 376,380 | |
| | 100,000 | | | | 5.500 | | | | 06/15/26 | | | | 105,000 | |
| | | | | | | | | | | | | | |
| | | | | | | | | | | | | 3,185,889 | |
| | |
| Distribution & Logistics – 0.7% | |
| | IAA, Inc.(a) | |
| | 345,000 | | | | 5.500 | | | | 06/15/27 | | | | 364,838 | |
| | |
|
| Corporate Obligations – (continued) | |
| Distribution & Logistics – (continued) | |
| | WESCO Distribution, Inc. | |
| 240,000 | | | | 7.125 | (a) | | | 06/15/25 | | | | 266,100 | |
| | 380,000 | | | | 7.250 | (a) | | | 06/15/28 | | | | 424,650 | |
| | | | | | | | | | | | | | |
| | | | | | | | | | | | | 1,055,588 | |
| | |
| Electric – 2.4% | |
| | Clearway Energy Operating LLC | |
| | 130,000 | | | | 5.750 | | | | 10/15/25 | | | | 138,450 | |
| | NextEra Energy Operating Partners LP | |
| | 312,000 | | | | 4.250 | (a) | | | 09/15/24 | | | | 333,840 | |
| | 349,000 | | | | 4.500 | (a) | | | 09/15/27 | | | | 383,900 | |
| | NRG Energy, Inc. | |
| | 120,000 | | | | 7.250 | | | | 05/15/26 | | | | 128,400 | |
| | 271,000 | | | | 6.625 | | | | 01/15/27 | | | | 291,325 | |
| | 521,000 | | | | 5.250 | (a) | | | 06/15/29 | | | | 571,146 | |
| | PG&E Corp. | |
| | 500,000 | | | | 5.000 | | | | 07/01/28 | | | | 499,646 | |
| | 250,000 | | | | 5.250 | | | | 07/01/30 | | | | 249,467 | |
| | Talen Energy Supply LLC | |
| | 368,000 | | | | 10.500 | (a) | | | 01/15/26 | | | | 292,560 | |
| | 330,000 | | | | 7.250 | (a) | | | 05/15/27 | | | | 340,725 | |
| | TerraForm Power Operating LLC | |
| | 8,000 | | | | 4.250 | (a) | | | 01/31/23 | | | | 8,300 | |
| | 330,000 | | | | 4.750 | (a) | | | 01/15/30 | | | | 356,400 | |
| | | | | | | | | | | | | | |
| | | | | | | | | | | | | 3,594,159 | |
| | |
| Energy – 7.7% | |
| | Antero Midstream Partners LP / Antero Midstream Finance Corp. | |
| | 225,000 | | | | 5.750 | (a) | | | 03/01/27 | | | | 201,375 | |
| | 227,000 | | | | 5.750 | (a) | | | 01/15/28 | | | | 200,895 | |
| | Antero Resources Corp. | |
| | 67,000 | | | | 5.125 | | | | 12/01/22 | | | | 58,290 | |
| | 280,000 | | | | 5.625 | | | | 06/01/23 | | | | 224,000 | |
| | 168,000 | | | | 5.000 | | | | 03/01/25 | | | | 117,600 | |
| | Apache Corp. | |
| | 310,000 | | | | 4.875 | | | | 11/15/27 | | | | 317,363 | |
| | 375,000 | | | | 4.375 | | | | 10/15/28 | | | | 374,082 | |
| | Archrock Partners LP / Archrock Partners Finance Corp.(a) | |
| | 250,000 | | | | 6.875 | | | | 04/01/27 | | | | 257,500 | |
| | Ascent Resources Utica Holdings LLC / ARU Finance Corp. | |
| | 211,000 | | | | 10.000 | (a) | | | 04/01/22 | | | | 199,395 | |
| | 188,000 | | | | 7.000 | (a) | | | 11/01/26 | | | | 132,070 | |
| | Buckeye Partners LP | |
| | 200,000 | | | | 3.950 | | | | 12/01/26 | | | | 199,069 | |
| | Callon Petroleum Co. | |
| | 50,000 | | | | 6.375 | | | | 07/01/26 | | | | 15,500 | |
| | Cheniere Energy Partners LP | |
| | 250,000 | | | | 5.250 | | | | 10/01/25 | | | | 256,250 | |
| | 590,000 | | | | 5.625 | | | | 10/01/26 | | | | 621,712 | |
| | 150,000 | | | | 4.500 | | | | 10/01/29 | | | | 157,125 | |
| | Comstock Resources, Inc. | |
| | 85,000 | | | | 7.500 | (a) | | | 05/15/25 | | | | 84,787 | |
| | 160,000 | | | | 9.750 | | | | 08/15/26 | | | | 171,200 | |
| | 209,000 | | | | 9.750 | | | | 08/15/26 | | | | 223,630 | |
| | Continental Resources, Inc. | |
| | 350,000 | | | | 4.500 | | | | 04/15/23 | | | | 353,937 | |
| | 310,000 | | | | 4.375 | | | | 01/15/28 | | | | 299,925 | |
| | |
| | |
| 36 | | The accompanying notes are an integral part of these financial statements. |
GOLDMAN SACHS ACCESS HIGH YIELD CORPORATE BOND ETF
| | | | | | | | | | | | | | |
Principal
Amount | | | Interest
Rate | | | Maturity
Date | | | Value | |
|
| Corporate Obligations – (continued) | |
| Energy – (continued) | |
| | CrownRock LP / CrownRock Finance, Inc.(a) | |
| $ | 423,000 | | | | 5.625 | % | | | 10/15/25 | | | $ | 421,943 | |
| | CVR Energy, Inc.(a) | |
| | 207,000 | | | | 5.750 | | | | 02/15/28 | | | | 189,405 | |
| | DCP Midstream Operating LP | |
| | 250,000 | | | | 5.375 | | | | 07/15/25 | | | | 270,000 | |
| | 250,000 | | | | 5.625 | | | | 07/15/27 | | | | 271,250 | |
| | Endeavor Energy Resources LP / EER Finance, Inc. | |
| | 349,000 | | | | 5.500 | (a) | | | 01/30/26 | | | | 350,745 | |
| | 350,000 | | | | 5.750 | (a) | | | 01/30/28 | | | | 361,375 | |
| | EnLink Midstream Partners LP | |
| | 320,000 | | | | 4.850 | | | | 07/15/26 | | | | 282,648 | |
| | EQM Midstream Partners LP | |
| | 230,000 | | | | 4.750 | | | | 07/15/23 | | | | 235,175 | |
| | 220,000 | | | | 4.000 | | | | 08/01/24 | | | | 222,750 | |
| | 487,000 | | | | 5.500 | | | | 07/15/28 | | | | 507,698 | |
| | Hilcorp Energy I LP / Hilcorp Finance Co. | |
| | 110,000 | | | | 5.750 | (a) | | | 10/01/25 | | | | 104,500 | |
| | 240,000 | | | | 6.250 | (a) | | | 11/01/28 | | | | 227,400 | |
| | Laredo Petroleum, Inc. | |
| | 300,000 | | | | 10.125 | | | | 01/15/28 | | | | 216,750 | |
| | Matador Resources Co. | |
| | 65,000 | | | | 5.875 | | | | 09/15/26 | | | | 56,550 | |
| | Moss Creek Resources Holdings, Inc. | |
| | 59,000 | | | | 7.500 | (a) | | | 01/15/26 | | | | 40,415 | |
| | 75,000 | | | | 10.500 | (a) | | | 05/15/27 | | | | 53,625 | |
| | Murphy Oil Corp. | |
| | 320,000 | | | | 6.875 | | | | 08/15/24 | | | | 325,241 | |
| | 170,000 | | | | 5.750 | | | | 08/15/25 | | | | 163,719 | |
| | QEP Resources, Inc. | |
| | 285,000 | | | | 5.625 | | | | 03/01/26 | | | | 185,963 | |
| | Range Resources Corp. | |
| | 150,000 | | | | 5.000 | | | | 03/15/23 | | | | 149,250 | |
| | 170,000 | | | | 9.250 | (a) | | | 02/01/26 | | | | 179,775 | |
| | SESI LLC | |
| | 190,000 | | | | 7.750 | | | | 09/15/24 | | | | 59,850 | |
| | SM Energy Co. | |
| | 470,000 | | | | 6.625 | | | | 01/15/27 | | | | 233,825 | |
| Targa Resources Partners LP / Targa Resources Partners Finance
Corp.(a) |
|
| | 750,000 | | | | 4.875 | | | | 02/01/31 | | | | 759,375 | |
| | Transocean, Inc. | |
| | 470,000 | | | | 7.500 | (a) | | | 01/15/26 | | | | 144,525 | |
| | 920,000 | | | | 7.500 | | | | 04/15/31 | | | | 193,200 | |
| | Weatherford International Ltd.(a) | |
| | 405,000 | | | | 11.000 | | | | 12/01/24 | | | | 273,375 | |
| | Western Midstream Operating LP | |
| | 630,000 | | | | 4.650 | | | | 07/01/26 | | | | 648,900 | |
| | | | | | | | | | | | | | |
| | | | | | | | | | | | | 11,594,932 | |
| | |
| Financial Company – 4.0% | |
| | Ally Financial, Inc. | |
| | 190,000 | | | | 5.750 | | | | 11/20/25 | | | | 213,519 | |
| | BCD Acquisition, Inc.(a) | |
| | 270,000 | | | | 9.625 | | | | 09/15/23 | | | | 272,025 | |
| | HUB International Ltd.(a) | |
| | 361,000 | | | | 7.000 | | | | 05/01/26 | | | | 376,342 | |
| | |
|
| Corporate Obligations – (continued) | |
| Financial Company – (continued) | |
| | Icahn Enterprises LP / Icahn Enterprises Finance Corp. | |
| 650,000 | | | | 6.750 | | | | 02/01/24 | | | | 675,188 | |
| | 236,000 | | | | 6.375 | | | | 12/15/25 | | | | 247,505 | |
| | 380,000 | | | | 5.250 | | | | 05/15/27 | | | | 408,025 | |
| | Navient Corp. | |
| | 250,000 | | | | 6.500 | | | | 06/15/22 | | | | 261,692 | |
| | 132,000 | | | | 7.250 | | | | 09/25/23 | | | | 139,381 | |
| | 106,000 | | | | 5.875 | | | | 10/25/24 | | | | 109,347 | |
| | 159,000 | | | | 6.750 | | | | 06/25/25 | | | | 167,066 | |
| | 374,000 | | | | 6.750 | | | | 06/15/26 | | | | 391,765 | |
| | Navient Corp., MTN | |
| | 160,000 | | | | 6.125 | | | | 03/25/24 | | | | 167,200 | |
| | 150,000 | | | | 5.625 | | | | 08/01/33 | | | | 132,876 | |
| | OneMain Finance Corp. | |
| | 240,000 | | | | 6.125 | | | | 05/15/22 | | | | 253,011 | |
| | 292,000 | | | | 5.625 | | | | 03/15/23 | | | | 310,071 | |
| | 310,000 | | | | 6.125 | | | | 03/15/24 | | | | 335,575 | |
| | 164,000 | | | | 6.875 | | | | 03/15/25 | | | | 184,635 | |
| | 422,000 | | | | 7.125 | | | | 03/15/26 | | | | 485,408 | |
| | 240,000 | | | | 6.625 | | | | 01/15/28 | | | | 274,800 | |
| | Quicken Loans LLC | |
| | 138,000 | | | | 5.750 | (a) | | | 05/01/25 | | | | 142,199 | |
| | 392,000 | | | | 5.250 | (a) | | | 01/15/28 | | | | 419,168 | |
| | | | | | | | | | | | | | |
| | | | | | | | | | | | | 5,966,798 | |
| | |
| Food and Beverage – 2.5% | |
| | Aramark Services, Inc. | |
| | 90,000 | | | | 5.000 | (a) | | | 04/01/25 | | | | 91,125 | |
| | 374,000 | | | | 6.375 | (a) | | | 05/01/25 | | | | 392,700 | |
| | 370,000 | | | | 5.000 | (a) | | | 02/01/28 | | | | 370,000 | |
| | B&G Foods, Inc. | |
| | 225,000 | | | | 5.250 | | | | 09/15/27 | | | | 241,031 | |
| | Herbalife Nutrition Ltd / HLF Financing, Inc.(a) | |
| | 10,000 | | | | 7.875 | | | | 09/01/25 | | | | 11,075 | |
| | HLF Financing Sarl LLC / Herbalife International, Inc.(a) | |
| | 115,000 | | | | 7.250 | | | | 08/15/26 | | | | 121,038 | |
| | Lamb Weston Holdings, Inc. | |
| | 300,000 | | | | 4.625 | (a) | | | 11/01/24 | | | | 313,875 | |
| | 383,000 | | | | 4.875 | (a) | | | 11/01/26 | | | | 402,150 | |
| | Pilgrim’s Pride Corp.(a) | |
| | 208,000 | | | | 5.875 | | | | 09/30/27 | | | | 221,780 | |
| | Post Holdings, Inc. | |
| | 488,000 | | | | 5.000 | (a) | | | 08/15/26 | | | | 508,130 | |
| | 537,000 | | | | 5.750 | (a) | | | 03/01/27 | | | | 569,891 | |
| | 489,000 | | | | 5.500 | (a) | | | 12/15/29 | | | | 536,678 | |
| | | | | | | | | | | | | | |
| | | | | | | | | | | | | 3,779,473 | |
| | |
| Hardware – 2.2% | |
| | CDW LLC / CDW Finance Corp. | |
| | 413,000 | | | | 5.500 | | | | 12/01/24 | | | | 459,979 | |
| | 100,000 | | | | 5.000 | | | | 09/01/25 | | | | 103,750 | |
| | CommScope Technologies LLC(a) | |
| | 514,000 | | | | 6.000 | | | | 06/15/25 | | | | 530,705 | |
| | CommScope, Inc. | |
| | 250,000 | | | | 5.500 | (a) | | | 03/01/24 | | | | 260,000 | |
| | 400,000 | | | | 6.000 | (a) | | | 03/01/26 | | | | 426,000 | |
| | 300,000 | | | | 8.250 | (a) | | | 03/01/27 | | | | 326,250 | |
| | |
| | |
| The accompanying notes are an integral part of these financial statements. | | 37 |
GOLDMAN SACHS ACCESS HIGH YIELD CORPORATE BOND ETF
Schedule of Investments (continued)
August 31, 2020
| | | | | | | | | | | | | | |
Principal
Amount | | | Interest
Rate | | | Maturity
Date | | | Value | |
|
| Corporate Obligations – (continued) | |
| Hardware – (continued) | |
| | NCR Corp. | |
| $ | 329,000 | | | | 6.125 | %(a) | | | 09/01/29 | | | $ | 355,320 | |
| | 250,000 | | | | 5.250 | (a) | | | 10/01/30 | | | | 253,750 | |
| | Qorvo, Inc. | |
| | 600,000 | | | | 5.500 | | | | 07/15/26 | | | | 639,000 | |
| | | | | | | | | | | | | | |
| | | | | | | | | | | | | 3,354,754 | |
| | |
| Healthcare – 6.5% | |
| | Acadia Healthcare Co., Inc. | |
| | 150,000 | | | | 5.625 | | | | 02/15/23 | | | | 152,062 | |
| | CHS/Community Health Systems, Inc. | |
| | 792,000 | | | | 6.250 | | | | 03/31/23 | | | | 797,940 | |
| | 205,000 | | | | 9.875 | (a) | | | 06/30/23 | | | | 164,000 | |
| | 39,000 | | | | 8.625 | (a) | | | 01/15/24 | | | | 40,950 | |
| | 600,000 | | | | 8.125 | (a) | | | 06/30/24 | | | | 415,500 | |
| | 217,000 | | | | 8.000 | (a) | | | 03/15/26 | | | | 226,222 | |
| | 90,000 | | | | 8.000 | (a) | | | 12/15/27 | | | | 92,025 | |
| | DaVita, Inc. | |
| | 490,000 | | | | 4.625 | (a) | | | 06/01/30 | | | | 516,337 | |
| | 250,000 | | | | 3.750 | (a) | | | 02/15/31 | | | | 250,313 | |
| | Encompass Health Corp. | |
| | 400,000 | | | | 4.750 | | | | 02/01/30 | | | | 417,000 | |
| | HCA, Inc. | |
| | 409,000 | | | | 5.375 | | | | 02/01/25 | | | | 461,147 | |
| | 320,000 | | | | 5.875 | | | | 02/15/26 | | | | 367,200 | |
| | 335,000 | | | | 5.375 | | | | 09/01/26 | | | | 381,063 | |
| | 260,000 | | | | 5.625 | | | | 09/01/28 | | | | 310,050 | |
| | 420,000 | | | | 5.875 | | | | 02/01/29 | | | | 511,350 | |
| | 360,000 | | | | 3.500 | | | | 09/01/30 | | | | 379,350 | |
| | IQVIA, Inc.(a) | |
| | 400,000 | | | | 5.000 | | | | 05/15/27 | | | | 423,000 | |
| | LifePoint Health, Inc.(a) | |
| | 321,000 | | | | 4.375 | | | | 02/15/27 | | | | 321,000 | |
| | Select Medical Corp.(a) | |
| | 340,000 | | | | 6.250 | | | | 08/15/26 | | | | 365,500 | |
| | Service Corp. International | |
| | 70,000 | | | | 5.375 | | | | 05/15/24 | | | | 71,312 | |
| | 125,000 | | | | 4.625 | | | | 12/15/27 | | | | 135,938 | |
| | Tenet Healthcare Corp. | |
| | 290,000 | | | | 8.125 | | | | 04/01/22 | | | | 313,925 | |
| | 304,000 | | | | 6.750 | | | | 06/15/23 | | | | 326,040 | |
| | 275,000 | | | | 4.625 | | | | 07/15/24 | | | | 281,875 | |
| | 200,000 | | | | 4.625 | (a) | | | 09/01/24 | | | | 205,000 | |
| | 110,000 | | | | 5.125 | | | | 05/01/25 | | | | 113,163 | |
| | 122,000 | | | | 7.000 | | | | 08/01/25 | | | | 126,575 | |
| | 637,000 | | | | 4.875 | (a) | | | 01/01/26 | | | | 665,665 | |
| | 200,000 | | | | 6.250 | (a) | | | 02/01/27 | | | | 212,000 | |
| | 663,000 | | | | 5.125 | (a) | | | 11/01/27 | | | | 702,780 | |
| | | | | | | | | | | | | | |
| | | | | | | | | | | | | 9,746,282 | |
| | |
| Household & Leisure – 0.0% | |
| | Prestige Brands, Inc.(a) | |
| | 50,000 | | | | 6.375 | | | | 03/01/24 | | | | 52,000 | |
| | |
| Insurance – 0.5% | |
| | Acrisure LLC / Acrisure Finance, Inc. | |
| | 213,000 | | | | 8.125 | (a) | | | 02/15/24 | | | | 226,312 | |
| | 345,000 | | | | 7.000 | (a) | | | 11/15/25 | | | | 351,900 | |
| | |
|
| Corporate Obligations – (continued) | |
| Insurance – (continued) | |
| | Radian Group, Inc. | |
| 100,000 | | | | 6.625 | % | | | 03/15/25 | | | | 108,250 | |
| | | �� | | | | | | | | | | | |
| | | | | | | | | | | | | 686,462 | |
| | |
| Metals – 0.6% | |
| | Novelis Corp. | |
| | 580,000 | | | | 5.875 | (a) | | | 09/30/26 | | | | 607,550 | |
| | 346,000 | | | | 4.750 | (a) | | | 01/30/30 | | | | 352,055 | |
| | | | | | | | | | | | | | |
| | | | | | | | | | | | | 959,605 | |
| | |
| Mining – 1.0% | |
| | Freeport-McMoRan, Inc. | |
| | 50,000 | | | | 3.875 | | | | 03/15/23 | | | | 52,000 | |
| | 452,000 | | | | 4.550 | | | | 11/14/24 | | | | 487,030 | |
| | 300,000 | | | | 4.375 | | | | 08/01/28 | | | | 317,250 | |
| | 300,000 | | | | 4.625 | | | | 08/01/30 | | | | 321,750 | |
| | 320,000 | | | | 5.400 | | | | 11/14/34 | | | | 362,400 | |
| | | | | | | | | | | | | | |
| | | | | | | | | | | | | 1,540,430 | |
| | |
| Natural Gas – 2.0% | |
| | AmeriGas Partners LP / AmeriGas Finance Corp. | |
| | 502,000 | | | | 5.500 | | | | 05/20/25 | | | | 554,710 | |
| | 145,000 | | | | 5.750 | | | | 05/20/27 | | | | 164,937 | |
| Crestwood Midstream Partners LP / Crestwood Midstream
Finance Corp. |
|
| | 238,000 | | | | 6.250 | | | | 04/01/23 | | | | 236,215 | |
| | 50,000 | | | | 5.750 | | | | 04/01/25 | | | | 47,500 | |
| | 138,000 | | | | 5.625 | (a) | | | 05/01/27 | | | | 126,960 | |
| | Ferrellgas LP / Ferrellgas Finance Corp. | |
| | 323,000 | | | | 6.750 | | | | 06/15/23 | | | | 284,240 | |
| | Genesis Energy LP / Genesis Energy Finance Corp. | |
| | 380,000 | | | | 6.500 | | | | 10/01/25 | | | | 328,700 | |
| | 110,000 | | | | 7.750 | | | | 02/01/28 | | | | 98,725 | |
| | NuStar Logistics LP | |
| | 83,000 | | | | 6.000 | | | | 06/01/26 | | | | 86,735 | |
| | 271,000 | | | | 5.625 | | | | 04/28/27 | | | | 274,387 | |
| | PBF Logistics LP / PBF Logistics Finance Corp. | |
| | 71,000 | | | | 6.875 | | | | 05/15/23 | | | | 71,178 | |
| | Tallgrass Energy Partners LP / Tallgrass Energy Finance Corp. | |
| | 539,000 | | | | 4.750 | (a) | | | 10/01/23 | | | | 530,915 | |
| | 70,000 | | | | 5.500 | (a) | | | 09/15/24 | | | | 68,600 | |
| | 120,000 | | | | 5.500 | (a) | | | 01/15/28 | | | | 111,000 | |
| | | | | | | | | | | | | | |
| | | | | | | | | | | | | 2,984,802 | |
| | |
| Pharmaceuticals – 3.1% | |
| | Bausch Health Americas, Inc. | |
| | 252,000 | | | | 9.250 | (a) | | | 04/01/26 | | | | 280,014 | |
| | 427,000 | | | | 8.500 | (a) | | | 01/31/27 | | | | 471,464 | |
| | Bausch Health Cos., Inc. | |
| | 259,000 | | | | 7.000 | (a) | | | 03/15/24 | | | | 269,341 | |
| | 379,000 | | | | 6.125 | (a) | | | 04/15/25 | | | | 391,069 | |
| | 172,000 | | | | 5.500 | (a) | | | 11/01/25 | | | | 178,188 | |
| | 500,000 | | | | 9.000 | (a) | | | 12/15/25 | | | | 549,243 | |
| | 246,000 | | | | 5.750 | (a) | | | 08/15/27 | | | | 265,287 | |
| | 342,000 | | | | 7.000 | (a) | | | 01/15/28 | | | | 365,814 | |
| | 747,000 | | | | 6.250 | (a) | | | 02/15/29 | | | | 783,323 | |
| | 173,000 | | | | 7.250 | (a) | | | 05/30/29 | | | | 189,500 | |
| | |
| | |
| 38 | | The accompanying notes are an integral part of these financial statements. |
GOLDMAN SACHS ACCESS HIGH YIELD CORPORATE BOND ETF
| | | | | | | | | | | | | | |
Principal
Amount | | | Interest
Rate | | | Maturity
Date | | | Value | |
|
| Corporate Obligations – (continued) | |
| Pharmaceuticals – (continued) | |
| | Endo Dac / Endo Finance LLC / Endo Finco, Inc. | |
| $ | 300,000 | | | | 9.500 | %(a) | | | 07/31/27 | | | $ | 326,250 | |
| | 196,000 | | | | 6.000 | (a) | | | 06/30/28 | | | | 151,900 | |
| | Par Pharmaceutical, Inc.(a) | |
| | 436,000 | | | | 7.500 | | | | 04/01/27 | | | | 468,155 | |
| | | | | | | | | | | | | | |
| | | | | | | | | | | | | 4,689,548 | |
| | |
| REITs and Real Estate – 1.2% | |
| Brookfield Property REIT, Inc. / BPR Cumulus LLC / BPR
Nimbus LLC / GGSI Sellco LL(a) |
|
| | 250,000 | | | | 5.750 | | | | 05/15/26 | | | | 204,543 | |
| | Diversified Healthcare Trust | |
| | 358,000 | | | | 9.750 | | | | 06/15/25 | | | | 402,531 | |
| | Howard Hughes Corp. (The)(a) | |
| | 263,000 | | | | 5.375 | | | | 03/15/25 | | | | 267,602 | |
| | Kennedy-Wilson, Inc. | |
| | 363,000 | | | | 5.875 | | | | 04/01/24 | | | | 369,353 | |
| | Realogy Group LLC / Realogy Co.-Issuer Corp. | |
| | 150,000 | | | | 4.875 | (a) | | | 06/01/23 | | | | 148,125 | |
| | 150,000 | | | | 9.375 | (a) | | | 04/01/27 | | | | 158,250 | |
| | Starwood Property Trust, Inc. | |
| | 200,000 | | | | 4.750 | | | | 03/15/25 | | | | 196,000 | |
| | | | | | | | | | | | | | |
| | | | | | | | | | | | | 1,746,404 | |
| | |
| Rental Equipment – 1.3% | |
| | United Rentals North America, Inc. | |
| | 250,000 | | | | 5.875 | | | | 09/15/26 | | | | 266,250 | |
| | 260,000 | | | | 5.500 | | | | 05/15/27 | | | | 278,541 | |
| | 750,000 | | | | 4.875 | | | | 01/15/28 | | | | 796,875 | |
| | 320,000 | | | | 5.250 | | | | 01/15/30 | | | | 356,800 | |
| | 230,000 | | | | 3.875 | | | | 02/15/31 | | | | 238,987 | |
| | | | | | | | | | | | | | |
| | | | | | | | | | | | | 1,937,453 | |
| | |
| Software – 2.6% | |
| | Banff Merger Sub, Inc.(a) | |
| | 385,000 | | | | 9.750 | | | | 09/01/26 | | | | 411,469 | |
| | Dun & Bradstreet Corp. (The)(a) | |
| | 400,000 | | | | 6.875 | | | | 08/15/26 | | | | 436,500 | |
| | Gartner, Inc.(a) | |
| | 373,000 | | | | 4.500 | | | | 07/01/28 | | | | 390,717 | |
| | MSCI, Inc. | |
| | 445,000 | | | | 4.750 | (a) | | | 08/01/26 | | | | 465,025 | |
| | 530,000 | | | | 4.000 | (a) | | | 11/15/29 | | | | 567,100 | |
| | Refinitiv US Holdings, Inc. | |
| | 240,000 | | | | 6.250 | (a) | | | 05/15/26 | | | | 258,900 | |
| | 471,000 | | | | 8.250 | (a) | | | 11/15/26 | | | | 522,810 | |
| | Solera LLC / Solera Finance, Inc.(a) | |
| | 220,000 | | | | 10.500 | | | | 03/01/24 | | | | 232,100 | |
| | SS&C Technologies, Inc.(a) | |
| | 650,000 | | | | 5.500 | | | | 09/30/27 | | | | 698,750 | |
| | | | | | | | | | | | | | |
| | | | | | | | | | | | | 3,983,371 | |
| | |
| Technology – 1.8% | |
| | CDK Global, Inc. | |
| | 84,000 | | | | 4.875 | | | | 06/01/27 | | | | 89,040 | |
| | 230,000 | | | | 5.250 | (a) | | | 05/15/29 | | | | 251,275 | |
| | |
|
| Corporate Obligations – (continued) | |
| Technology – (continued) | |
| | Dell International LLC / EMC Corp.(a) | |
| 266,000 | | | | 7.125 | % | | | 06/15/24 | | | | 276,640 | |
| | Exela Intermediate LLC / Exela Finance, Inc.(a) | |
| | 250,000 | | | | 10.000 | | | | 07/15/23 | | | | 73,437 | |
| | Microchip Technology, Inc.(a) | |
| | 529,000 | | | | 4.250 | | | | 09/01/25 | | | | 551,092 | |
| | Rackspace Hosting, Inc.(a) | |
| | 125,000 | | | | 8.625 | | | | 11/15/24 | | | | 132,188 | |
| | Uber Technologies, Inc. | |
| | 100,000 | | | | 7.500 | (a) | | | 11/01/23 | | | | 104,625 | |
| | 200,000 | | | | 7.500 | (a) | | | 05/15/25 | | | | 210,500 | |
| | 330,000 | | | | 8.000 | (a) | | | 11/01/26 | | | | 350,625 | |
| | 150,000 | | | | 7.500 | (a) | | | 09/15/27 | | | | 157,688 | |
| | Verscend Escrow Corp.(a) | |
| | 303,000 | | | | 9.750 | | | | 08/15/26 | | | | 328,755 | |
| | Xerox Corp. | |
| | 180,000 | | | | 4.125 | | | | 03/15/23 | | | | 184,791 | |
| | | | | | | | | | | | | | |
| | | | | | | | | | | | | 2,710,656 | |
| | |
| Transportation – 0.5% | |
| | XPO Logistics, Inc. | |
| | 170,000 | | | | 6.750 | (a) | | | 08/15/24 | | | | 181,263 | |
| | 549,000 | | | | 6.250 | (a) | | | 05/01/25 | | | | 590,175 | |
| | | | | | | | | | | | | | |
| | | | | | | | | | | | | 771,438 | |
| | |
| Wireless – 4.6% | |
| | SBA Communications Corp. | |
| | 200,000 | | | | 4.875 | | | | 09/01/24 | | | | 205,750 | |
| | 496,000 | | | | 3.875 | (a) | | | 02/15/27 | | | | 515,840 | |
| | Sprint Capital Corp. | |
| | 495,000 | | | | 6.875 | | | | 11/15/28 | | | | 633,600 | |
| | 470,000 | | | | 8.750 | | | | 03/15/32 | | | | 710,287 | |
| | Sprint Communications, Inc. | |
| | 260,000 | | | | 6.000 | | | | 11/15/22 | | | | 282,425 | |
| | Sprint Corp. | |
| | 130,000 | | | | 7.250 | | | | 09/15/21 | | | | 137,475 | |
| | 687,000 | | | | 7.875 | | | | 09/15/23 | | | | 801,214 | |
| | 345,000 | | | | 7.125 | | | | 06/15/24 | | | | 401,925 | |
| | 388,000 | | | | 7.625 | | | | 02/15/25 | | | | 465,600 | |
| | 412,000 | | | | 7.625 | | | | 03/01/26 | | | | 508,008 | |
| | T-Mobile USA, Inc. | |
| | 290,000 | | | | 4.000 | | | | 04/15/22 | | | | 301,600 | |
| | 123,000 | | | | 6.000 | | | | 03/01/23 | | | | 123,307 | |
| | 80,000 | | | | 6.000 | | | | 04/15/24 | | | | 81,800 | |
| | 295,000 | | | | 5.125 | | | | 04/15/25 | | | | 304,219 | |
| | 15,000 | | | | 6.500 | | | | 01/15/26 | | | | 15,825 | |
| | 115,000 | | | | 5.375 | | | | 04/15/27 | | | | 124,200 | |
| | 740,000 | | | | 4.750 | | | | 02/01/28 | | | | 796,425 | |
| | ViaSat, Inc. | |
| | 225,000 | | | | 5.625 | (a) | | | 04/15/27 | | | | 238,219 | |
| | 220,000 | | | | 6.500 | (a) | | | 07/15/28 | | | | 227,975 | |
| | | | | | | | | | | | | | |
| | | | | | | | | | | | | 6,875,694 | |
| | |
| Wirelines – 2.2% | |
| | CenturyLink, Inc.(a) | |
| | 320,000 | | | | 5.125 | | | | 12/15/26 | | | | 333,600 | |
| | |
| | |
| The accompanying notes are an integral part of these financial statements. | | 39 |
GOLDMAN SACHS ACCESS HIGH YIELD CORPORATE BOND ETF
Schedule of Investments (continued)
August 31, 2020
| | | | | | | | | | | | | | |
Principal
Amount | | | Interest
Rate | | | Maturity
Date | | | Value | |
|
| Corporate Obligations – (continued) | |
| Wirelines – (continued) | |
| | CenturyLink, Inc., Series G | |
| $ | 275,000 | | | | 6.875 | % | | | 01/15/28 | | | $ | 305,250 | |
| | CenturyLink, Inc., Series T | |
| | 175,000 | | | | 5.800 | | | | 03/15/22 | | | | 182,875 | |
| | Level 3 Financing, Inc. | |
| | 210,000 | | | | 5.375 | | | | 01/15/24 | | | | 213,150 | |
| | 200,000 | | | | 5.250 | | | | 03/15/26 | | | | 208,750 | |
| | 500,000 | | | | 4.250 | (a) | | | 07/01/28 | | | | 516,875 | |
| | Uniti Group LP / Uniti Fiber Holdings, Inc. / CSL Capital LLC | |
| | 260,000 | | | | 7.125 | (a) | | | 12/15/24 | | | | 251,550 | |
| | 250,000 | | | | 7.875 | (a) | | | 02/15/25 | | | | 264,687 | |
| | Windstream Escrow LLC / Windstream Escrow Finance Corp.(a) | |
| | 250,000 | | | | 7.750 | | | | 08/15/28 | | | | 251,250 | |
| | Zayo Group Holdings, Inc. | |
| | 496,000 | | | | 4.000 | (a) | | | 03/01/27 | | | | 492,280 | |
| | 293,000 | | | | 6.125 | (a) | | | 03/01/28 | | | | 303,988 | |
| | | | | | | | | | | | | | |
| | | | | | | | | | | | | 3,324,255 | |
| | |
| | TOTAL CORPORATE OBLIGATIONS | |
| | (Cost $136,304,575) | | | $ | 139,831,457 | |
| | |
| | | | | | | | | | | | | | |
|
| Foreign Corporate Debt – 4.3% | |
| Aerospace & Defense – 0.7% | |
| | Bombardier, Inc. (Canada) | |
| | 240,000 | | | | 8.750 | (a) | | | 12/01/21 | | | | 231,000 | |
| | 150,000 | | | | 6.000 | (a) | | | 10/15/22 | | | | 128,250 | |
| | 402,000 | | | | 7.500 | (a) | | | 03/15/25 | | | | 298,485 | |
| | 491,000 | | | | 7.875 | (a) | | | 04/15/27 | | | | 358,430 | |
| | | | | | | | | | | | | | |
| | | | | | | | | | | | | 1,016,165 | |
| | |
| Basic Industry – 0.5% | |
| | NOVA Chemicals Corp. (Canada) | |
| | 210,000 | | | | 5.250 | (a) | | | 08/01/23 | | | | 210,422 | |
| | 217,000 | | | | 5.000 | (a) | | | 05/01/25 | | | | 217,672 | |
| | 300,000 | | | | 5.250 | (a) | | | 06/01/27 | | | | 291,375 | |
| | | | | | | | | | | | | | |
| | | | | | | | | | | | | 719,469 | |
| | |
| Communications – 0.4% | |
| | Videotron Ltd.(a) (Canada) | |
| | 550,000 | | | | 5.125 | | | | 04/15/27 | | | | 585,750 | |
| | |
| Consumer Cyclical – 1.3% | |
| | 1011778 BC ULC / New Red Finance, Inc. (Canada) | |
| | 280,000 | | | | 4.250 | (a) | | | 05/15/24 | | | | 286,300 | |
| | 730,000 | | | | 5.000 | (a) | | | 10/15/25 | | | | 751,900 | |
| | 249,000 | | | | 3.875 | (a) | | | 01/15/28 | | | | 255,225 | |
| | 200,000 | | | | 4.375 | (a) | | | 01/15/28 | | | | 205,500 | |
| Brookfield Residential Properties, Inc. / Brookfield Residential
US Corp.(a) (Canada) |
|
| | 300,000 | | | | 6.250 | | | | 09/15/27 | | | | 304,287 | |
| | Garda World Security Corp.(a) (Canada) | |
| | 150,000 | | | | 4.625 | | | | 02/15/27 | | | | 153,563 | |
| | | | | | | | | | | | | | |
| | | | | | | | | | | | | 1,956,775 | |
| | |
| Energy – 0.5% | |
| | MEG Energy Corp. (Canada) | |
| | 297,000 | | | | 6.500 | (a) | | | 01/15/25 | | | | 303,682 | |
| | 250,000 | | | | 7.125 | (a) | | | 02/01/27 | | | | 239,375 | |
| | |
|
| Foreign Corporate Debt – (continued) | |
| Energy – (continued) | |
| | Seven Generations Energy Ltd. (Canada) | |
| 200,000 | | | | 6.750 | %(a) | | | 05/01/23 | | | | 203,000 | |
| | 50,000 | | | | 5.375 | (a) | | | 09/30/25 | | | | 48,375 | |
| | | | | | | | | | | | | | |
| | | | | | | | | | | | | 794,432 | |
| | |
| Food – 0.1% | |
| | NBM US Holdings, Inc.(a) (Brazil) | |
| | 200,000 | | | | 7.000 | | | | 05/14/26 | | | | 214,000 | |
| | |
| Mining – 0.4% | |
| | First Quantum Minerals Ltd. (Zambia) | |
| | 361,000 | | | | 6.500 | (a) | | | 03/01/24 | | | | 361,000 | |
| | 200,000 | | | | 7.500 | (a) | | | 04/01/25 | | | | 205,500 | |
| | | | | | | | | | | | | | |
| | | | | | | | | | | | | 566,500 | |
| | |
| Natural Gas – 0.1% | |
| | Parkland Corp.(a) (Canada) | |
| | 100,000 | | | | 5.875 | | | | 07/15/27 | | | | 107,583 | |
| | |
| Software – 0.3% | |
| | Open Text Corp.(a) (Canada) | |
| | 420,000 | | | | 5.875 | | | | 06/01/26 | | | | 443,625 | |
| | |
| | TOTAL FOREIGN CORPORATE DEBT | |
| | (Cost $6,224,247) | | | $ | 6,404,299 | |
| | |
| | | | | | | | | | | | | | |
| | | | | | | | |
Principal
Amount | | Dividend
Rate | | | Value | |
|
| Investment Company – 1.2%(c) | |
Goldman Sachs Financial Square Government Fund – Institutional Shares | |
| $1,754,115 | | | 0.027 | % | | $ | 1,754,115 | |
| (Cost $1,754,115) | | | | | |
| |
| TOTAL INVESTMENTS – 98.5% | |
| (Cost $144,282,937) | | | $ | 147,989,871 | |
| |
OTHER ASSETS IN EXCESS OF
LIABILITIES – 1.5% | | | | 2,357,455 | |
| |
| NET ASSETS – 100.0% | | | $ | 150,347,326 | |
| |
| | |
|
| The percentage shown for each investment category reflects the value of investments in that category as a percentage of net assets. |
| |
(a) | | Exempt from registration under Rule 144A of the Securities Act of 1933. |
| |
(b) | | Pay-in-kind securities. |
| |
(c) | | Represents an affiliated issuer. |
| | |
|
Investment Abbreviations: |
LP | | — Limited Partnership |
MTN | | — Medium Term Note |
REIT | | — Real Estate Investment Trust |
|
| | |
| 40 | | The accompanying notes are an integral part of these financial statements. |
GOLDMAN SACHS ACCESS INFLATION PROTECTED USD BOND ETF
Schedule of Investments
August 31, 2020
| | | | | | | | | | | | |
Principal Amount | | | Interest
Rate | | Maturity
Date | | | Value | |
|
| U.S. Treasury Inflation Indexed Bonds – 99.8% | |
| | U.S. Treasury Inflation Indexed Bonds | |
| $ | 1,035,360 | | | 0.125% | | | 01/15/22 | | | $ | 1,056,981 | |
| | 1,681,223 | | | 0.125 | | | 04/15/22 | | | | 1,720,349 | |
| | 513,436 | | | 0.125 | | | 07/15/22 | | | | 530,033 | |
| | 456,663 | | | 0.625 | | | 04/15/23 | | | | 481,183 | |
| | 4,118,689 | | | 0.375 | | | 07/15/23 | | | | 4,355,883 | |
| | 2,842,805 | | | 0.625 | | | 01/15/24 | | | | 3,046,713 | |
| | 3,303,355 | | | 0.250 | | | 01/15/25 | | | | 3,558,924 | |
| | 915,330 | | | 0.375 | | | 07/15/25 | | | | 1,003,490 | |
| | 2,336,430 | | | 0.375 | | | 07/15/27 | | | | 2,624,757 | |
| | 4,314,297 | | | 0.500 | | | 01/15/28 | | | | 4,890,859 | |
| | 1,355,653 | | | 0.750 | | | 07/15/28 | | | | 1,579,815 | |
| | 142,703 | | | 3.875 | | | 04/15/29 | | | | 207,718 | |
| | 245,911 | | | 0.250 | | | 07/15/29 | | | | 278,461 | |
| | 373,262 | | | 3.375 | | | 04/15/32 | | | | 574,271 | |
| | 2,231,581 | | | 0.750 | | | 02/15/42 | | | | 2,791,253 | |
| | 1,038,057 | | | 0.875 | | | 02/15/47 | | | | 1,384,205 | |
| | 685,796 | | | 1.000 | | | 02/15/48 | | | | 957,246 | |
| | 164,943 | | | 1.000 | | | 02/15/49 | | | | 232,533 | |
| | |
| | TOTAL INVESTMENTS – 99.8% | |
| | (Cost $29,459,044) | | | $ | 31,274,674 | |
| | |
| OTHER ASSETS IN EXCESS OF
LIABILITIES – 0.2% |
| | | 55,071 | |
| | |
| | NET ASSETS – 100.0% | | | $ | 31,329,745 | |
| | |
| | |
|
| The percentage shown for each investment category reflects the value of investments in that category as a percentage of net assets. |
| | |
| The accompanying notes are an integral part of these financial statements. | | 41 |
GOLDMAN SACHS ACCESS INVESTMENT GRADE CORPORATE 1-5 YEAR BOND
Schedule of Investments
August 31, 2020
| | | | | | | | | | | | | | |
Principal
Amount | | | Interest
Rate | | | Maturity
Date | | | Value | |
|
| Corporate Obligations – 79.5% | |
| Aerospace & Defense – 1.5% | |
| | L3Harris Technologies, Inc. | |
| $ | 55,000 | | | | 3.850 | % | | | 06/15/23 | | | $ | 59,749 | |
| | Northrop Grumman Corp. | |
| | 65,000 | | | | 2.930 | | | | 01/15/25 | | | | 70,958 | |
| | Precision Castparts Corp. | |
| | 55,000 | | | | 3.250 | | | | 06/15/25 | | | | 61,437 | |
| | Raytheon Technologies Corp.(a) | |
| | 205,000 | | | | 2.800 | | | | 03/15/22 | | | | 211,911 | |
| | | | | | | | | | | | | | |
| | | | | | | | | | | | | 404,055 | |
| | |
| Banks – 19.7% | |
| | American Express Co. | |
| | 200,000 | | | | 3.400 | | | | 02/27/23 | | | | 213,877 | |
| | 55,000 | | | | 3.700 | | | | 08/03/23 | | | | 59,917 | |
| | Bank of America Corp. | |
| | 200,000 | | | | 5.700 | | | | 01/24/22 | | | | 214,486 | |
| | (3M USD LIBOR + 0.780%) | |
| | 210,000 | | | | 3.550 | (b) | | | 03/05/24 | | | | 224,784 | |
| | Bank of America Corp., MTN | |
| | 335,000 | | | | 4.000 | | | | 01/22/25 | | | | 373,571 | |
| | (SOFR + 1.150%) | |
| | 170,000 | | | | 1.319 | (b) | | | 06/19/26 | | | | 172,444 | |
| | Bank of New York Mellon Corp. (The), MTN | |
| | (3M USD LIBOR + 0.634%) | |
| | 260,000 | | | | 2.661 | (b) | | | 05/16/23 | | | | 269,658 | |
| | 120,000 | | | | 1.600 | | | | 04/24/25 | | | | 125,183 | |
| | Capital One Financial Corp. | |
| | 100,000 | | | | 3.200 | | | | 02/05/25 | | | | 109,137 | |
| | Charles Schwab Corp. (The) | |
| | 50,000 | | | | 3.850 | | | | 05/21/25 | | | | 57,317 | |
| | Citigroup, Inc. | |
| | 260,000 | | | | 2.900 | | | | 12/08/21 | | | | 267,807 | |
| | (SOFR + 1.667%) | |
| | 300,000 | | | | 1.678 | (b) | | | 05/15/24 | | | | 307,200 | |
| | (SOFR + 2.750%) | |
| | 150,000 | | | | 3.106 | (b) | | | 04/08/26 | | | | 163,174 | |
| | Huntington Bancshares, Inc. | |
| | 170,000 | | | | 4.000 | | | | 05/15/25 | | | | 193,617 | |
| | JPMorgan Chase & Co. | |
| | (SOFR + 1.455%) | |
| | 550,000 | | | | 1.514 | (b) | | | 06/01/24 | | | | 561,638 | |
| | (SOFR + 1.585%) | |
| | 150,000 | | | | 2.005 | (b) | | | 03/13/26 | | | | 156,732 | |
| | Morgan Stanley | |
| | 70,000 | | | | 2.750 | | | | 05/19/22 | | | | 72,764 | |
| | (3M USD LIBOR + 0.847%) | |
| | 340,000 | | | | 3.737 | (b) | | | 04/24/24 | | | | 366,950 | |
| | (SOFR + 1.990%) | |
| | 150,000 | | | | 2.188 | (b) | | | 04/28/26 | | | | 158,227 | |
| | Morgan Stanley, GMTN | |
| | 70,000 | | | | 3.125 | | | | 01/23/23 | | | | 74,254 | |
| | PNC Financial Services Group, Inc. (The) | |
| | 75,000 | | | | 3.900 | | | | 04/29/24 | | | | 83,290 | |
| | 70,000 | | | | 2.200 | | | | 11/01/24 | | | | 74,659 | |
| | Regions Financial Corp. | |
| | 90,000 | | | | 2.250 | | | | 05/18/25 | | | | 95,711 | |
| | |
|
| Corporate Obligations – (continued) | |
| Banks – (continued) | |
| | Santander Holdings USA, Inc. | |
| 70,000 | | | | 4.450 | | | | 12/03/21 | | | | 72,761 | |
| | 210,000 | | | | 3.400 | | | | 01/18/23 | | | | 220,250 | |
| | State Street Corp. | |
| | (SOFR + 2.690%) | |
| | 80,000 | | | | 2.825 | (a)(b) | | | 03/30/23 | | | | 82,900 | |
| | (SOFR + 2.600%) | |
| | 80,000 | | | | 2.901 | (a)(b) | | | 03/30/26 | | | | 87,450 | |
| | Synchrony Financial | |
| | 25,000 | | | | 4.250 | | | | 08/15/24 | | | | 26,780 | |
| | Truist Bank(b) | |
| | (3M USD LIBOR + 0.735%) | |
| | 120,000 | | | | 3.689 | | | | 08/02/24 | | | | 130,753 | |
| | Truist Financial Corp., MTN | |
| | 150,000 | | | | 2.850 | | | | 10/26/24 | | | | 164,139 | |
| | US Bank NA | |
| | 250,000 | | | | 1.950 | | | | 01/09/23 | | | | 258,928 | |
| | | | | | | | | | | | | | |
| | | | | | | | | | | | | 5,440,358 | |
| | |
| Basic Industry – 1.8% | |
| | Celanese US Holdings LLC | |
| | 45,000 | | | | 4.625 | | | | 11/15/22 | | | | 48,487 | |
| | LYB International Finance BV | |
| | 200,000 | | | | 4.000 | | | | 07/15/23 | | | | 217,843 | |
| | Packaging Corp. of America | |
| | 80,000 | | | | 4.500 | | | | 11/01/23 | | | | 88,162 | |
| | Sherwin-Williams Co. (The) | |
| | 130,000 | | | | 2.750 | | | | 06/01/22 | | | | 134,905 | |
| | | | | | | | | | | | | | |
| | | | | | | | | | | | | 489,397 | |
| | |
| Broadcasting – 0.8% | |
| | Fox Corp. | |
| | 195,000 | | | | 4.030 | | | | 01/25/24 | | | | 215,676 | |
| | |
| Brokerage – 1.1% | |
| | Ameriprise Financial, Inc. | |
| | 50,000 | | | | 3.000 | | | | 03/22/22 | | | | 51,956 | |
| | BlackRock, Inc. | |
| | 50,000 | | | | 3.500 | | | | 03/18/24 | | | | 55,161 | |
| | Intercontinental Exchange, Inc. | |
| | 50,000 | | | | 3.450 | | | | 09/21/23 | | | | 54,301 | |
| | Jefferies Financial Group, Inc. | |
| | 30,000 | | | | 5.500 | | | | 10/18/23 | | | | 33,085 | |
| | TD Ameritrade Holding Corp. | |
| | 100,000 | | | | 2.950 | | | | 04/01/22 | | | | 103,743 | |
| | | | | | | | | | | | | | |
| | | | | | | | | | | | | 298,246 | |
| | |
| Building Materials – 0.5% | |
| | Fortune Brands Home & Security, Inc. | |
| | 80,000 | | | | 4.000 | | | | 09/21/23 | | | | 87,863 | |
| | Stanley Black & Decker, Inc. | |
| | 60,000 | | | | 3.400 | | | | 12/01/21 | | | | 61,765 | |
| | | | | | | | | | | | | | |
| | | | | | | | | | | | | 149,628 | |
| | |
| Capital Goods – 3.3% | |
| | Carrier Global Corp.(a) | |
| | 35,000 | | | | 2.242 | | | | 02/15/25 | | | | 36,704 | |
| | |
| | |
| 42 | | The accompanying notes are an integral part of these financial statements. |
GOLDMAN SACHS ACCESS INVESTMENT GRADE CORPORATE 1-5 YEAR BOND
| | | | | | | | | | | | | | |
Principal
Amount | | | Interest
Rate | | | Maturity
Date | | | Value | |
|
| Corporate Obligations – (continued) | |
| Capital Goods – (continued) | |
| | Caterpillar Financial Services Corp., MTN | |
| $ | 70,000 | | | | 3.150 | % | | | 09/07/21 | | | $ | 72,048 | |
| | 120,000 | | | | 2.150 | | | | 11/08/24 | | | | 127,616 | |
| | Caterpillar, Inc. | |
| | 50,000 | | | | 2.600 | | | | 06/26/22 | | | | 51,771 | |
| | Deere & Co. | |
| | 50,000 | | | | 2.750 | | | | 04/15/25 | | | | 54,740 | |
| | General Electric Co., GMTN | |
| | 55,000 | | | | 3.150 | | | | 09/07/22 | | | | 57,692 | |
| | John Deere Capital Corp., MTN | |
| | 110,000 | | | | 2.800 | | | | 03/06/23 | | | | 116,661 | |
| | Parker-Hannifin Corp. | |
| | 180,000 | | | | 2.700 | | | | 06/14/24 | | | | 193,107 | |
| | Republic Services, Inc. | |
| | 200,000 | | | | 2.500 | | | | 08/15/24 | | | | 213,703 | |
| | | | | | | | | | | | | | |
| | | | | | | | | | | | | 924,042 | |
| | |
| Communications – 1.5% | |
| Charter Communications Operating LLC / Charter
Communications Operating Capital |
|
| | 95,000 | | | | 4.464 | | | | 07/23/22 | | | | 101,330 | |
| | Comcast Corp. | |
| | 130,000 | | | | 3.700 | | | | 04/15/24 | | | | 144,239 | |
| | Time Warner Cable LLC | |
| | 60,000 | | | | 4.000 | | | | 09/01/21 | | | | 61,448 | |
| | Walt Disney Co. (The) | |
| | 110,000 | | | | 1.750 | | | | 08/30/24 | | | | 114,423 | |
| | | | | | | | | | | | | | |
| | | | | | | | | | | | | 421,440 | |
| | |
| Consumer Cyclical – 7.8% | |
| | American Honda Finance Corp., GMTN | |
| | 100,000 | | | | 1.700 | | | | 09/09/21 | | | | 101,312 | |
| | American Honda Finance Corp., MTN | |
| | 100,000 | | | | 1.650 | | | | 07/12/21 | | | | 101,078 | |
| | Booking Holdings, Inc. | |
| | 50,000 | | | | 4.100 | | | | 04/13/25 | | | | 56,709 | |
| | Dollar Tree, Inc. | |
| | 195,000 | | | | 3.700 | | | | 05/15/23 | | | | 210,090 | |
| | DR Horton, Inc. | |
| | 55,000 | | | | 4.750 | | | | 02/15/23 | | | | 59,463 | |
| | eBay, Inc. | |
| | 40,000 | | | | 3.450 | | | | 08/01/24 | | | | 43,989 | |
| | General Motors Financial Co., Inc. | |
| | 250,000 | | | | 5.200 | | | | 03/20/23 | | | | 272,764 | |
| | Global Payments, Inc. | |
| | 50,000 | | | | 4.000 | | | | 06/01/23 | | | | 54,320 | |
| | Las Vegas Sands Corp. | |
| | 50,000 | | | | 3.200 | | | | 08/08/24 | | | | 50,777 | |
| | Marriott International, Inc., Series EE | |
| | 25,000 | | | | 5.750 | | | | 05/01/25 | | | | 28,103 | |
| | NIKE, Inc. | |
| | 110,000 | | | | 2.400 | | | | 03/27/25 | | | | 118,653 | |
| | PACCAR Financial Corp., MTN | |
| | 70,000 | | | | 1.900 | | | | 02/07/23 | | | | 72,427 | |
| | Ross Stores, Inc. | |
| | 40,000 | | | | 4.600 | | | | 04/15/25 | | | | 46,150 | |
| | |
|
| Corporate Obligations – (continued) | |
| Consumer Cyclical – (continued) | |
| | Target Corp. | |
| 110,000 | | | | 3.500 | | | | 07/01/24 | | | | 122,482 | |
| | TJX Cos., Inc. (The) | |
| | 140,000 | | | | 3.500 | | | | 04/15/25 | | | | 156,373 | |
| | Toyota Motor Credit Corp., MTN | |
| | 150,000 | | | | 1.800 | | | | 02/13/25 | | | | 157,077 | |
| | VF Corp. | |
| | 190,000 | | | | 2.400 | | | | 04/23/25 | | | | 201,820 | |
| | Walmart, Inc. | |
| | 105,000 | | | | 2.850 | | | | 07/08/24 | | | | 114,153 | |
| | Western Union Co. (The) | |
| | 180,000 | | | | 3.600 | | | | 03/15/22 | | | | 187,363 | |
| | | | | | | | | | | | | | |
| | | | | | | | | | | | | 2,155,103 | |
| | |
| Consumer Noncyclical – 7.8% | |
| | AbbVie, Inc. | |
| | 340,000 | | | | 2.300 | (a) | | | 11/21/22 | | | | 352,931 | |
| | 100,000 | | | | 2.600 | (a) | | | 11/21/24 | | | | 107,267 | |
| | 125,000 | | | | 3.600 | | | | 05/14/25 | | | | 139,385 | |
| | Agilent Technologies, Inc. | |
| | 40,000 | | | | 3.200 | | | | 10/01/22 | | | | 42,191 | |
| | Altria Group, Inc. | |
| | 70,000 | | | | 4.000 | | | | 01/31/24 | | | | 77,525 | |
| | Amgen, Inc. | |
| | 190,000 | | | | 1.900 | | | | 02/21/25 | | | | 199,832 | |
| | Becton Dickinson and Co. | |
| | 100,000 | | | | 3.363 | | | | 06/06/24 | | | | 108,808 | |
| | Boston Scientific Corp. | |
| | 60,000 | | | | 3.375 | | | | 05/15/22 | | | | 62,796 | |
| | Gilead Sciences, Inc. | |
| | 80,000 | | | | 3.700 | | | | 04/01/24 | | | | 88,257 | |
| | Kroger Co. (The) | |
| | 40,000 | | | | 3.400 | | | | 04/15/22 | | | | 41,613 | |
| | Laboratory Corp of America Holdings | |
| | 100,000 | | | | 3.600 | | | | 02/01/25 | | | | 111,568 | |
| | Philip Morris International, Inc. | |
| | 90,000 | | | | 2.625 | | | | 02/18/22 | | | | 92,799 | |
| | 90,000 | | | | 2.875 | | | | 05/01/24 | | | | 97,179 | |
| | Shire Acquisitions Investments Ireland DAC | |
| | 200,000 | | | | 2.400 | | | | 09/23/21 | | | | 204,109 | |
| | Thermo Fisher Scientific, Inc. | |
| | 60,000 | | | | 4.133 | | | | 03/25/25 | | | | 68,916 | |
| | Upjohn, Inc.(a) | |
| | 60,000 | | | | 1.125 | | | | 06/22/22 | | | | 60,593 | |
| | Walgreens Boots Alliance, Inc. | |
| | 210,000 | | | | 3.800 | | | | 11/18/24 | | | | 232,503 | |
| | Zimmer Biomet Holdings, Inc. | |
| | 50,000 | | | | 3.550 | | | | 04/01/25 | | | | 55,622 | |
| | | | | | | | | | | | | | |
| | | | | | | | | | | | | 2,143,894 | |
| | |
| Electric – 4.7% | |
| | Avangrid, Inc. | |
| | 50,000 | | | | 3.150 | | | | 12/01/24 | | | | 54,689 | |
| | Berkshire Hathaway Energy Co.(a) | |
| | 230,000 | | | | 4.050 | | | | 04/15/25 | | | | 263,633 | |
| | CenterPoint Energy, Inc. | |
| | 60,000 | | | | 3.600 | | | | 11/01/21 | | | | 62,138 | |
| | |
| | |
| The accompanying notes are an integral part of these financial statements. | | 43 |
GOLDMAN SACHS ACCESS INVESTMENT GRADE CORPORATE 1-5 YEAR BOND
Schedule of Investments (continued)
August 31, 2020
| | | | | | | | | | | | | | |
Principal
Amount | | | Interest
Rate | | | Maturity
Date | | | Value | |
|
| Corporate Obligations – (continued) | |
| Electric – (continued) | |
| | Dominion Energy, Inc. | |
| $ | 85,000 | | | | 2.715 | % | | | 08/15/21 | | | $ | 86,818 | |
| | 40,000 | | | | 3.071 | | | | 08/15/24 | | | | 43,379 | |
| | DTE Energy Co., Series D | |
| | 70,000 | | | | 3.700 | | | | 08/01/23 | | | | 75,887 | |
| | Duke Energy Carolinas LLC | |
| | 110,000 | | | | 2.500 | | | | 03/15/23 | | | | 115,294 | |
| | Edison International | |
| | 65,000 | | | | 2.950 | | | | 03/15/23 | | | | 66,454 | |
| | Georgia Power Co., Series A | |
| | 40,000 | | | | 2.100 | | | | 07/30/23 | | | | 41,634 | |
| | ITC Holdings Corp. | |
| | 60,000 | | | | 2.700 | | | | 11/15/22 | | | | 62,695 | |
| | National Rural Utilities Cooperative Finance Corp. | |
| | 65,000 | | | | 2.700 | | | | 02/15/23 | | | | 68,377 | |
| | Public Service Co. of Colorado | |
| | 65,000 | | | | 2.250 | | | | 09/15/22 | | | | 66,835 | |
| | Sempra Energy | |
| | 80,000 | | | | 2.900 | | | | 02/01/23 | | | | 83,991 | |
| | Southern California Edison Co., Series C | |
| | 40,000 | | | | 3.500 | | | | 10/01/23 | | | | 43,100 | |
| | Southern Co. (The) | |
| | 165,000 | | | | 2.950 | | | | 07/01/23 | | | | 175,556 | |
| | | | | | | | | | | | | | |
| | | | | | | | | | | | | 1,310,480 | |
| | |
| Energy – 5.4% | |
| | BP Capital Markets America, Inc. | |
| | 60,000 | | | | 2.520 | | | | 09/19/22 | | | | 62,355 | |
| | 120,000 | | | | 2.750 | | | | 05/10/23 | | | | 127,549 | |
| | Energy Transfer Operating LP | |
| | 50,000 | | | | 2.900 | | | | 05/15/25 | | | | 51,453 | |
| | Enterprise Products Operating LLC | |
| | 190,000 | | | | 3.500 | | | | 02/01/22 | | | | 198,068 | |
| | 50,000 | | | | 3.750 | | | | 02/15/25 | | | | 55,865 | |
| | Exxon Mobil Corp. | |
| | 200,000 | | | | 1.571 | | | | 04/15/23 | | | | 206,249 | |
| | Kinder Morgan Energy Partners LP | |
| | 225,000 | | | | 4.150 | | | | 02/01/24 | | | | 247,053 | |
| | Kinder Morgan, Inc. | |
| | 50,000 | | | | 4.300 | | | | 06/01/25 | | | | 56,716 | |
| | Marathon Oil Corp. | |
| | 60,000 | | | | 2.800 | | | | 11/01/22 | | | | 61,107 | |
| | Sabine Pass Liquefaction LLC | |
| | 140,000 | | | | 5.625 | | | | 04/15/23 | | | | 154,910 | |
| | Spectra Energy Partners LP | |
| | 180,000 | | | | 4.750 | | | | 03/15/24 | | | | 202,282 | |
| | Valero Energy Corp. | |
| | 55,000 | | | | 2.700 | | | | 04/15/23 | | | | 57,490 | |
| | | | | | | | | | | | | | |
| | | | | | | | | | | | | 1,481,097 | |
| | |
| Financial Company – 2.1% | |
| | Air Lease Corp. | |
| | 285,000 | | | | 3.500 | | | | 01/15/22 | | | | 291,277 | |
| | Ally Financial, Inc. | |
| | 230,000 | | | | 3.050 | | | | 06/05/23 | | | | 238,645 | |
| | Franklin Resources, Inc. | |
| | 45,000 | | | | 2.800 | | | | 09/15/22 | | | | 46,993 | |
| | | | | | | | | | | | | | |
| | | | | | | | | | | | | 576,915 | |
| | |
|
| Corporate Obligations – (continued) | |
| Food and Beverage – 2.8% | |
| | Campbell Soup Co. | |
| 55,000 | | | | 2.500 | | | | 08/02/22 | | | | 56,917 | |
| | Conagra Brands, Inc. | |
| | 60,000 | | | | 3.800 | | | | 10/22/21 | | | | 62,254 | |
| | Constellation Brands, Inc. | |
| | 55,000 | | | | 4.250 | | | | 05/01/23 | | | | 60,231 | |
| | General Mills, Inc. | |
| | 100,000 | | | | 4.000 | | | | 04/17/25 | | | | 114,201 | |
| | Keurig Dr Pepper, Inc. | |
| | 65,000 | | | | 3.200 | | | | 11/15/21 | | | | 66,713 | |
| | Kraft Heinz Foods Co. | |
| | 40,000 | | | | 4.000 | | | | 06/15/23 | | | | 43,010 | |
| | Molson Coors Beverage Co. | |
| | 50,000 | | | | 3.500 | | | | 05/01/22 | | | | 52,155 | |
| | PepsiCo, Inc. | |
| | 100,000 | | | | 2.250 | | | | 05/02/22 | | | | 103,228 | |
| | Tyson Foods, Inc. | |
| | 200,000 | | | | 3.950 | | | | 08/15/24 | | | | 222,498 | |
| | | | | | | | | | | | | | |
| | | | | | | | | | | | | 781,207 | |
| | |
| Hardware – 0.7% | |
| | Micron Technology, Inc. | |
| | 195,000 | | | | 2.497 | | | | 04/24/23 | | | | 203,730 | |
| | |
| Healthcare – 1.9% | |
| | Anthem, Inc. | |
| | 100,000 | | | | 2.950 | | | | 12/01/22 | | | | 105,188 | |
| | CVS Health Corp. | |
| | 48,000 | | | | 3.700 | | | | 03/09/23 | | | | 51,645 | |
| | 53,000 | | | | 4.100 | | | | 03/25/25 | | | | 60,381 | |
| | HCA, Inc. | |
| | 100,000 | | | | 5.000 | | | | 03/15/24 | | | | 113,125 | |
| | MPT Operating Partnership LP / MPT Finance Corp. | |
| | 50,000 | | | | 6.375 | | | | 03/01/24 | | | | 51,455 | |
| | UnitedHealth Group, Inc. | |
| | 140,000 | | | | 2.875 | | | | 03/15/22 | | | | 144,594 | |
| | | | | | | | | | | | | | |
| | | | | | | | | | | | | 526,388 | |
| | |
| Insurance – 2.0% | |
| | American International Group, Inc. | |
| | 50,000 | | | | 4.125 | | | | 02/15/24 | | | | 55,715 | |
| | CNA Financial Corp. | |
| | 40,000 | | | | 3.950 | | | | 05/15/24 | | | | 44,134 | |
| | Equitable Holdings, Inc. | |
| | 40,000 | | | | 3.900 | | | | 04/20/23 | | | | 43,157 | |
| | Marsh & McLennan Cos., Inc. | |
| | 190,000 | | | | 4.050 | | | | 10/15/23 | | | | 208,486 | |
| | MetLife, Inc., Series D | |
| | 120,000 | | | | 4.368 | | | | 09/15/23 | | | | 134,185 | |
| | Prudential Financial, Inc.(b) | |
| | (3M USD LIBOR + 3.920%) | |
| | 30,000 | | | | 5.625 | | | | 06/15/43 | | | | 32,215 | |
| | Voya Financial, Inc. | |
| | 40,000 | | | | 3.125 | | | | 07/15/24 | | | | 43,079 | |
| | | | | | | | | | | | | | |
| | | | | | | | | | | | | 560,971 | |
| | |
| | |
| 44 | | The accompanying notes are an integral part of these financial statements. |
GOLDMAN SACHS ACCESS INVESTMENT GRADE CORPORATE 1-5 YEAR BOND
| | | | | | | | | | | | | | |
Principal
Amount | | | Interest
Rate | | | Maturity
Date | | | Value | |
|
| Corporate Obligations – (continued) | |
| Metals – 0.1% | |
| | Nucor Corp. | |
| $ | 20,000 | | | | 4.000 | % | | | 08/01/23 | | | $ | 21,842 | |
| | |
| REITs and Real Estate – 3.4% | |
| | Alexandria Real Estate Equities, Inc. | |
| | 70,000 | | | | 4.000 | | | | 01/15/24 | | | | 77,461 | |
| | AvalonBay Communities, Inc., GMTN | |
| | 60,000 | | | | 2.950 | | | | 09/15/22 | | | | 62,578 | |
| | Boston Properties LP | |
| | 190,000 | | | | 3.125 | | | | 09/01/23 | | | | 201,495 | |
| | Brixmor Operating Partnership LP | |
| | 35,000 | | | | 3.250 | | | | 09/15/23 | | | | 36,114 | |
| | Digital Realty Trust LP | |
| | 50,000 | | | | 2.750 | | | | 02/01/23 | | | | 52,454 | |
| | Essex Portfolio LP | |
| | 40,000 | | | | 3.875 | | | | 05/01/24 | | | | 43,956 | |
| | GLP Capital LP / GLP Financing II, Inc. | |
| | 20,000 | | | | 5.250 | | | | 06/01/25 | | | | 21,578 | |
| | Healthpeak Properties, Inc. | |
| | 60,000 | | | | 4.000 | | | | 06/01/25 | | | | 67,042 | |
| | Omega Healthcare Investors, Inc. | |
| | 50,000 | | | | 4.375 | | | | 08/01/23 | | | | 53,681 | |
| | Realty Income Corp. | |
| | 50,000 | | | | 4.650 | | | | 08/01/23 | | | | 55,242 | |
| | Simon Property Group LP | |
| | 200,000 | | | | 2.000 | | | | 09/13/24 | | | | 206,578 | |
| | Ventas Realty LP / Ventas Capital Corp. | |
| | 50,000 | | | | 3.250 | | | | 08/15/22 | | | | 51,607 | |
| | | | | | | | | | | | | | |
| | | | | | | | | | | | | 929,786 | |
| | |
| Software – 1.0% | |
| | Oracle Corp. | |
| | 80,000 | | | | 1.900 | | | | 09/15/21 | | | | 81,266 | |
| | 180,000 | | | | 2.500 | | | | 05/15/22 | | | | 186,034 | |
| | | | | | | | | | | | | | |
| | | | | | | | | | | | | 267,300 | |
| | |
| Technology – 6.9% | |
| | Analog Devices, Inc. | |
| | 60,000 | | | | 3.125 | | | | 12/05/23 | | | | 64,724 | |
| | Broadcom, Inc. | |
| | 50,000 | | | | 4.700 | | | | 04/15/25 | | | | 57,184 | |
| | Dell International LLC / EMC Corp.(a) | |
| | 70,000 | | | | 5.450 | | | | 06/15/23 | | | | 77,104 | |
| | DXC Technology Co. | |
| | 190,000 | | | | 4.000 | | | | 04/15/23 | | | | 200,422 | |
| | Fiserv, Inc. | |
| | 235,000 | | | | 2.750 | | | | 07/01/24 | | | | 252,280 | |
| | HP, Inc. | |
| | 60,000 | | | | 2.200 | | | | 06/17/25 | | | | 63,272 | |
| | Intel Corp. | |
| | 300,000 | | | | 3.400 | | | | 03/25/25 | | | | 336,540 | |
| | International Business Machines Corp. | |
| | 125,000 | | | | 1.875 | | | | 08/01/22 | | | | 128,708 | |
| | 120,000 | | | | 3.375 | | | | 08/01/23 | | | | 130,329 | |
| | Juniper Networks, Inc. | |
| | 30,000 | | | | 4.500 | | | | 03/15/24 | | | | 33,579 | |
| | |
|
| Corporate Obligations – (continued) | |
| Technology – (continued) | |
| | Microsoft Corp. | |
| 120,000 | | | | 2.125 | | | | 11/15/22 | | | | 124,695 | |
| | Motorola Solutions, Inc. | |
| | 60,000 | | | | 3.750 | | | | 05/15/22 | | | | 63,316 | |
| | PayPal Holdings, Inc. | |
| | 90,000 | | | | 2.400 | | | | 10/01/24 | | | | 96,162 | |
| | QUALCOMM, Inc. | |
| | 80,000 | | | | 2.900 | | | | 05/20/24 | | | | 86,278 | |
| | 80,000 | | | | 3.450 | | | | 05/20/25 | | | | 89,788 | |
| | Seagate HDD Cayman | |
| | 45,000 | | | | 4.750 | | | | 06/01/23 | | | | 48,600 | |
| | Verisk Analytics, Inc. | |
| | 55,000 | | | | 4.125 | | | | 09/12/22 | | | | 58,627 | |
| | | | | | | | | | | | | | |
| | | | | | | | | | | | | 1,911,608 | |
| | |
| Transportation – 1.0% | |
| | FedEx Corp. | |
| | 195,000 | | | | 3.800 | | | | 05/15/25 | | | | 220,608 | |
| | Ryder System, Inc., MTN | |
| | 65,000 | | | | 3.400 | | | | 03/01/23 | | | | 69,079 | |
| | | | | | | | | | | | | | |
| | | | | | | | | | | | | 289,687 | |
| | |
| Wireless – 1.7% | |
| | American Tower Corp. | |
| | 220,000 | | | | 5.000 | | | | 02/15/24 | | | | 251,190 | |
| | Crown Castle International Corp. | |
| | 195,000 | | | | 3.200 | | | | 09/01/24 | | | | 211,443 | |
| | | | | | | | | | | | | | |
| | | | | | | | | | | | | 462,633 | |
| | |
| | TOTAL CORPORATE OBLIGATIONS | |
| | (Cost $21,903,001) | | | $ | 21,965,483 | |
| | |
| | | | | | | | | | | | | | |
|
| Foreign Corporate Debt – 18.2% | |
| Banks – 11.6% | |
| | Bank of Montreal(b) (Canada) | |
| | (5 Year USD Swap + 1.280%) | |
| | 35,000 | | | | 4.338 | | | | 10/05/28 | | | | 37,756 | |
| | Bank of Montreal, Series E (Canada) | |
| | 60,000 | | | | 3.300 | | | | 02/05/24 | | | | 65,402 | |
| | Bank of Nova Scotia (The) (Canada) | |
| | 210,000 | | | | 2.000 | | | | 11/15/22 | | | | 217,344 | |
| | Barclays PLC(b) (United Kingdom) | |
| | (3M USD LIBOR + 1.356%) | |
| | 240,000 | | | | 4.338 | | | | 05/16/24 | | | | 260,100 | |
| | Canadian Imperial Bank of Commerce(b) (Canada) | |
| | (3M USD LIBOR + 0.785%) | |
| | 205,000 | | | | 2.606 | | | | 07/22/23 | | | | 213,159 | |
| | Credit Suisse AG (Switzerland) | |
| | 260,000 | | | | 2.950 | | | | 04/09/25 | | | | 285,241 | |
| | HSBC Holdings PLC(b) (United Kingdom) | |
| | (3M USD LIBOR + 1.055%) | |
| | 500,000 | | | | 3.262 | | | | 03/13/23 | | | | 519,904 | |
| | Lloyds Banking Group PLC(b) (United Kingdom) | |
| | (US 1 Year CMT T-Note + 1.100%) | |
| | 250,000 | | | | 1.326 | | | | 06/15/23 | | | | 251,875 | |
| | |
| | |
| The accompanying notes are an integral part of these financial statements. | | 45 |
GOLDMAN SACHS ACCESS INVESTMENT GRADE CORPORATE 1-5 YEAR BOND
Schedule of Investments (continued)
August 31, 2020
| | | | | | | | | | | | | | |
Principal
Amount | | | Interest
Rate | | | Maturity
Date | | | Value | |
|
| Foreign Corporate Debt – (continued) | |
| Banks – (continued) | |
| | Mitsubishi UFJ Financial Group, Inc. (Japan) | |
| $ | 250,000 | | | | 2.801 | % | | | 07/18/24 | | | $ | 268,430 | |
| | Natwest Group PLC (United Kingdom) | |
| | 105,000 | | | | 6.125 | | | | 12/15/22 | | | | 115,379 | |
| | 280,000 | | | | 6.000 | | | | 12/19/23 | | | | 315,597 | |
| | Royal Bank of Canada, GMTN (Canada) | |
| | 120,000 | | | | 1.950 | | | | 01/17/23 | | | | 124,296 | |
| | Royal Bank of Canada, MTN (Canada) | |
| | 210,000 | | | | 1.150 | | | | 06/10/25 | | | | 213,458 | |
| | Toronto-Dominion Bank (The), GMTN (Canada) | |
| | 90,000 | | | | 3.250 | | | | 03/11/24 | | | | 98,426 | |
| | Toronto-Dominion Bank (The), MTN (Canada) | |
| | 110,000 | | | | 1.900 | | | | 12/01/22 | | | | 113,805 | |
| | Westpac Banking Corp. (Australia) | |
| | 100,000 | | | | 2.800 | | | | 01/11/22 | | | | 103,628 | |
| | | | | | | | | | | | | | |
| | | | | | | | | | | | | 3,203,800 | |
| | |
| Basic Industry – 0.2% | |
| | Airgas, Inc. (France) | |
| | 50,000 | | | | 3.650 | | | | 07/15/24 | | | | 55,225 | |
| | |
| Brokerage – 0.1% | |
| | Brookfield Finance, Inc. (Canada) | |
| | 25,000 | | | | 4.000 | | | | 04/01/24 | | | | 27,601 | |
| | |
| Communications – 0.1% | |
| | WPP Finance 2010 (United Kingdom) | |
| | 20,000 | | | | 3.625 | | | | 09/07/22 | | | | 21,021 | |
| | |
| Consumer Cyclical – 0.5% | |
| | Toyota Motor Corp. (Japan) | |
| | 125,000 | | | | 3.419 | | | | 07/20/23 | | | | 135,390 | |
| | |
| Consumer Noncyclical – 1.6% | |
| | BAT Capital Corp. (United Kingdom) | |
| | 215,000 | | | | 3.222 | | | | 08/15/24 | | | | 232,054 | |
| | GlaxoSmithKline Capital PLC (United Kingdom) | |
| | 100,000 | | | | 3.000 | | | | 06/01/24 | | | | 108,582 | |
| | Reynolds American, Inc. (United Kingdom) | |
| | 90,000 | | | | 4.450 | | | | 06/12/25 | | | | 102,571 | |
| | | | | | | | | | | | | | |
| | | | | | | | | | | | | 443,207 | |
| | |
| Consumer Products – 0.5% | |
| | Unilever Capital Corp. (United Kingdom) | |
| | 140,000 | | | | 2.200 | | | | 05/05/22 | | | | 144,073 | |
| | |
| Energy – 2.0% | |
| | Shell International Finance BV (Netherlands) | |
| | 315,000 | | | | 2.375 | | | | 04/06/25 | | | | 338,405 | |
| | Total Capital International SA (France) | |
| | 90,000 | | | | 2.875 | | | | 02/17/22 | | | | 93,292 | |
| | TransCanada PipeLines Ltd. (Canada) | |
| | 120,000 | | | | 2.500 | | | | 08/01/22 | | | | 124,210 | |
| | | | | | | | | | | | | | |
| | | | | | | | | | | | | 555,907 | |
| | |
| Financial Company – 0.2% | |
| | ORIX Corp. (Japan) | |
| | 50,000 | | | | 2.900 | | | | 07/18/22 | | | | 52,028 | |
| | |
|
| Foreign Corporate Debt – (continued) | |
| Food and Beverage – 0.5% | |
| | Anheuser-Busch InBev Finance, Inc. (Belgium) | |
| 75,000 | | | | 3.300 | | | | 02/01/23 | | | | 79,859 | |
| | Diageo Investment Corp. (United Kingdom) | |
| | 60,000 | | | | 8.000 | | | | 09/15/22 | | | | 68,811 | |
| | | | | | | | | | | | | | |
| | | | | | | | | | | | | 148,670 | |
| | |
| Metals – 0.1% | |
| | ArcelorMittal (Luxembourg) | |
| | 25,000 | | | | 3.600 | | | | 07/16/24 | | | | 26,344 | |
| | |
| Technology – 0.1% | |
| | NXP BV / NXP Funding LLC(a) (Netherlands) | |
| | 30,000 | | | | 4.875 | | | | 03/01/24 | | | | 33,778 | |
| | |
| Transportation – 0.4% | |
| | Canadian Pacific Railway Co. (Canada) | |
| | 100,000 | | | | 2.900 | | | | 02/01/25 | | | | 109,278 | |
| | |
| Wireless – 0.3% | |
| | Vodafone Group PLC (United Kingdom) | |
| | 60,000 | | | | 4.125 | | | | 05/30/25 | | | | 68,816 | |
| | |
| | TOTAL FOREIGN CORPORATE DEBT | |
| | (Cost $5,001,558) | | | $ | 5,025,138 | |
| | |
| | | | | | | | | | | | | | |
Principal
Amount | | | | | | Dividend
Rate | | | Value | |
|
| Investment Company – 2.5%(c) | |
| Goldman Sachs Financial Square Government Fund –
Institutional Shares |
|
| $ | 684,558 | | | | | | | | 0.027% | | | $ | 684,558 | |
| | (Cost $684,558) | |
| | |
| | TOTAL INVESTMENTS – 100.2% | |
| | (Cost $27,589,117) | | | | | | | $ | 27,675,179 | |
| | |
| LIABILITIES IN EXCESS OF
ASSETS – (0.2)% |
| | | (57,813 | ) |
| �� | |
| | NET ASSETS – 100.0% | | | $ | 27,617,366 | |
| | |
| | |
|
| The percentage shown for each investment category reflects the value of investments in that category as a percentage of net assets. |
| |
(a) | | Exempt from registration under Rule 144A of the Securities Act of 1933. |
| |
(b) | | Variable rate security. Interest rate or distribution rate disclosed is that which is in effect on August 31, 2020. |
| |
(c) | | Represents an affiliated issuer. |
| | |
|
Investment Abbreviations: |
CMT | | — Constant Maturity Treasury Index |
GMTN | | — Global Medium Term Note |
LIBOR | | — London Interbank Offered Rate |
LP | | — Limited Partnership |
MTN | | — Medium Term Note |
PLC | | — Public Limited Company |
REIT | | — Real Estate Investment Trust |
SOFR | | — Secured Overnight Financing Rate |
|
| | |
| 46 | | The accompanying notes are an integral part of these financial statements. |
GOLDMAN SACHS ACCESS INVESTMENT GRADE CORPORATE BOND ETF
Schedule of Investments
August 31, 2020
| | | | | | | | | | | | | | |
Principal
Amount | | | Interest
Rate | | | Maturity
Date | | | Value | |
|
| Corporate Obligations – 78.6% | |
| Aerospace & Defense – 2.3% | |
| | Boeing Co. (The) | |
| $ | 1,500,000 | | | | 3.200 | % | | | 03/01/29 | | | $ | 1,489,059 | |
| | 700,000 | | | | 3.600 | | | | 05/01/34 | | | | 686,215 | |
| | 200,000 | | | | 5.705 | | | | 05/01/40 | | | | 232,763 | |
| | 1,000,000 | | | | 5.930 | | | | 05/01/60 | | | | 1,227,614 | |
| | General Dynamics Corp. | |
| | 650,000 | | | | 2.250 | | | | 11/15/22 | | | | 674,672 | |
| | 800,000 | | | | 3.375 | | | | 05/15/23 | | | | 863,605 | |
| | 350,000 | | | | 3.750 | | | | 05/15/28 | | | | 410,210 | |
| | Lockheed Martin Corp. | |
| | 50,000 | | | | 2.900 | | | | 03/01/25 | | | | 54,701 | |
| | 360,000 | | | | 4.070 | | | | 12/15/42 | | | | 455,409 | |
| | 90,000 | | | | 3.800 | | | | 03/01/45 | | | | 110,004 | |
| | 330,000 | | | | 4.700 | | | | 05/15/46 | | | | 453,583 | |
| | 325,000 | | | | 4.090 | | | | 09/15/52 | | | | 422,968 | |
| | Northrop Grumman Corp. | |
| | 95,000 | | | | 2.550 | | | | 10/15/22 | | | | 99,237 | |
| | 650,000 | | | | 2.930 | | | | 01/15/25 | | | | 709,575 | |
| | 290,000 | | | | 3.200 | | | | 02/01/27 | | | | 326,030 | |
| | 560,000 | | | | 3.250 | | | | 01/15/28 | | | | 634,139 | |
| | 900,000 | | | | 4.400 | | | | 05/01/30 | | | | 1,113,462 | |
| | 240,000 | | | | 4.030 | | | | 10/15/47 | | | | 294,515 | |
| | Raytheon Technologies Corp. | |
| | 1,050,000 | | | | 3.950 | | | | 08/16/25 | | | | 1,200,416 | |
| | 100,000 | | | | 3.125 | | | | 05/04/27 | | | | 111,018 | |
| | 300,000 | | | | 4.125 | | | | 11/16/28 | | | | 357,487 | |
| | 350,000 | | | | 6.125 | | | | 07/15/38 | | | | 513,966 | |
| | 173,000 | | | | 4.450 | | | | 11/16/38 | | | | 214,718 | |
| | 140,000 | | | | 5.700 | | | | 04/15/40 | | | | 197,292 | |
| | 400,000 | | | | 4.500 | | | | 06/01/42 | | | | 507,473 | |
| | 370,000 | | | | 3.750 | | | | 11/01/46 | | | | 430,222 | |
| | 380,000 | | | | 4.350 | (a) | | | 04/15/47 | | | | 473,425 | |
| | 450,000 | | | | 4.625 | | | | 11/16/48 | | | | 594,294 | |
| | 100,000 | | | | 3.125 | | | | 07/01/50 | | | | 107,764 | |
| | | | | | | | | | | | | | |
| | | | | | | | | | | | | 14,965,836 | |
| | |
| Banks – 15.4% | |
| | American Express Co. | |
| | 300,000 | | | | 3.400 | | | | 02/22/24 | | | | 328,522 | |
| | 760,000 | | | | 3.000 | | | | 10/30/24 | | | | 828,297 | |
| | 400,000 | | | | 4.200 | | | | 11/06/25 | | | | 468,468 | |
| | 365,000 | | | | 4.050 | | | | 12/03/42 | | | | 453,693 | |
| | American Express Credit Corp., MTN | |
| | 100,000 | | | | 2.700 | | | | 03/03/22 | | | | 103,286 | |
| | 510,000 | | | | 3.300 | | | | 05/03/27 | | | | 581,577 | |
| | Bank of America Corp. | |
| | (3M USD LIBOR + 0.790%) | |
| | 1,042,000 | | | | 3.004 | (b) | | | 12/20/23 | | | | 1,096,556 | |
| | (3M USD LIBOR + 0.780%) | |
| | 135,000 | | | | 3.550 | (b) | | | 03/05/24 | | | | 144,504 | |
| | (3M USD LIBOR + 0.810%) | |
| | 754,000 | | | | 3.366 | (b) | | | 01/23/26 | | | | 828,342 | |
| | (3M USD LIBOR + 1.512%) | |
| | 540,000 | | | | 3.705 | (b) | | | 04/24/28 | | | | 611,988 | |
| | (3M USD LIBOR + 1.040%) | |
| | 1,368,000 | | | | 3.419 | (b) | | | 12/20/28 | | | | 1,529,376 | |
| | 460,000 | | | | 6.110 | | | | 01/29/37 | | | | 658,954 | |
| | |
|
| Corporate Obligations – (continued) | |
| Banks – (continued) | |
| | (3M USD LIBOR + 1.814%) | |
| 390,000 | | | | 4.244 | (b) | | | 04/24/38 | | | | 477,377 | |
| | 370,000 | | | | 7.750 | | | | 05/14/38 | | | | 618,311 | |
| | Bank of America Corp., GMTN | |
| | 1,275,000 | | | | 3.300 | | | | 01/11/23 | | | | 1,357,878 | |
| | 250,000 | | | | 3.500 | | | | 04/19/26 | | | | 283,886 | |
| | (3M USD LIBOR + 1.370%) | |
| | 590,000 | | | | 3.593 | (b) | | | 07/21/28 | | | | 668,749 | |
| | Bank of America Corp., Series L | |
| | 250,000 | | | | 3.950 | | | | 04/21/25 | | | | 281,466 | |
| | 350,000 | | | | 4.183 | | | | 11/25/27 | | | | 403,898 | |
| | Bank of America Corp., MTN | |
| | 150,000 | | | | 2.503 | | | | 10/21/22 | | | | 153,661 | |
| | (3M USD LIBOR + 1.160%) | |
| | 960,000 | | | | 3.124 | (b) | | | 01/20/23 | | | | 994,194 | |
| | 240,000 | | | | 4.000 | | | | 04/01/24 | | | | 267,624 | |
| | 891,000 | | | | 4.200 | | | | 08/26/24 | | | | 1,000,113 | |
| | 600,000 | | | | 4.000 | | | | 01/22/25 | | | | 669,083 | |
| | 530,000 | | | | 3.875 | | | | 08/01/25 | | | | 604,182 | |
| | (3M USD LIBOR + 1.090%) | |
| | 800,000 | | | | 3.093 | (b) | | | 10/01/25 | | | | 868,818 | |
| | 250,000 | | | | 4.450 | | | | 03/03/26 | | | | 289,207 | |
| | 550,000 | | | | 4.250 | | | | 10/22/26 | | | | 635,847 | |
| | 680,000 | | | | 3.248 | | | | 10/21/27 | | | | 755,924 | |
| | (3M USD LIBOR + 1.575%) | |
| | 700,000 | | | | 3.824 | (b) | | | 01/20/28 | | | | 798,049 | |
| | (3M USD LIBOR + 1.070%) | |
| | 150,000 | | | | 3.970 | (b) | | | 03/05/29 | | | | 173,289 | |
| | (3M USD LIBOR + 1.310%) | |
| | 1,030,000 | | | | 4.271 | (b) | | | 07/23/29 | | | | 1,218,654 | |
| | (3M USD LIBOR + 1.210%) | |
| | 500,000 | | | | 3.974 | (b) | | | 02/07/30 | | | | 585,032 | |
| | (3M USD LIBOR + 1.180%) | |
| | 300,000 | | | | 3.194 | (b) | | | 07/23/30 | | | | 333,300 | |
| | (3M USD LIBOR + 1.320%) | |
| | 360,000 | | | | 4.078 | (b) | | | 04/23/40 | | | | 437,673 | |
| | 320,000 | | | | 5.875 | | | | 02/07/42 | | | | 484,034 | |
| | 864,000 | | | | 5.000 | | | | 01/21/44 | | | | 1,197,560 | |
| | (3M USD LIBOR + 1.990%) | |
| | 220,000 | | | | 4.443 | (b) | | | 01/20/48 | | | | 287,804 | |
| | (3M USD LIBOR + 1.520%) | |
| | 700,000 | | | | 4.330 | (b) | | | 03/15/50 | | | | 898,513 | |
| | (3M USD LIBOR + 3.150%) | |
| | 490,000 | | | | 4.083 | (b) | | | 03/20/51 | | | | 618,390 | |
| | Bank of New York Mellon Corp. (The), Series G | |
| | 790,000 | | | | 3.000 | | | | 02/24/25 | | | | 870,446 | |
| | Bank of New York Mellon Corp. (The), MTN | |
| | 445,000 | | | | 2.050 | | | | 05/03/21 | | | | 449,390 | |
| | 263,000 | | | | 2.600 | | | | 02/07/22 | | | | 271,314 | |
| | (3M USD LIBOR + 0.634%) | |
| | 150,000 | | | | 2.661 | (b) | | | 05/16/23 | | | | 155,572 | |
| | 120,000 | | | | 3.450 | | | | 08/11/23 | | | | 130,910 | |
| | 760,000 | | | | 2.200 | | | | 08/16/23 | | | | 797,988 | |
| | 20,000 | | | | 2.800 | | | | 05/04/26 | | | | 22,340 | |
| | 675,000 | | | | 2.450 | | | | 08/17/26 | | | | 739,156 | |
| | 790,000 | | | | 3.250 | | | | 05/16/27 | | | | 898,124 | |
| | 60,000 | | | | 3.300 | | | | 08/23/29 | | | | 69,374 | |
| | |
| | |
| The accompanying notes are an integral part of these financial statements. | | 47 |
GOLDMAN SACHS ACCESS INVESTMENT GRADE CORPORATE BOND ETF
Schedule of Investments (continued)
August 31, 2020
| | | | | | | | | | | | | | |
Principal
Amount | | | Interest
Rate | | | Maturity
Date | | | Value | |
|
| Corporate Obligations – (continued) | |
| Banks – (continued) | |
| | Capital One Financial Corp. | |
| $ | 100,000 | | | | 3.300 | % | | | 10/30/24 | | | $ | 108,937 | |
| | 100,000 | | | | 3.750 | | | | 07/28/26 | | | | 109,544 | |
| | 100,000 | | | | 3.650 | | | | 05/11/27 | | | | 111,290 | |
| | 100,000 | | | | 3.800 | | | | 01/31/28 | | | | 111,781 | |
| | Citibank NA | |
| | 910,000 | | | | 3.650 | | | | 01/23/24 | | | | 1,001,684 | |
| | Citigroup, Inc. | |
| | 320,000 | | | | 2.350 | | | | 08/02/21 | | | | 326,041 | |
| | 781,000 | | | | 2.900 | | | | 12/08/21 | | | | 804,452 | |
| | 700,000 | | | | 4.500 | | | | 01/14/22 | | | | 739,558 | |
| | 200,000 | | | | 2.700 | | | | 10/27/22 | | | | 209,101 | |
| | 600,000 | | | | 3.500 | | | | 05/15/23 | | | | 644,351 | |
| | 130,000 | | | | 3.875 | | | | 10/25/23 | | | | 142,944 | |
| | 90,000 | | | | 4.000 | | | | 08/05/24 | | | | 99,921 | |
| | 635,000 | | | | 3.875 | | | | 03/26/25 | | | | 706,405 | |
| | 190,000 | | | | 3.300 | | | | 04/27/25 | | | | 211,118 | |
| | 150,000 | | | | 4.400 | | | | 06/10/25 | | | | 171,129 | |
| | 655,000 | | | | 5.500 | | | | 09/13/25 | | | | 780,746 | |
| | 225,000 | | | | 3.700 | | | | 01/12/26 | | | | 255,021 | |
| | 40,000 | | | | 4.600 | | | | 03/09/26 | | | | 46,493 | |
| | 800,000 | | | | 3.400 | | | | 05/01/26 | | | | 898,687 | |
| | 1,060,000 | | | | 3.200 | | | | 10/21/26 | | | | 1,181,572 | |
| | 230,000 | | | | 4.300 | | | | 11/20/26 | | | | 264,971 | |
| | 667,000 | | | | 4.450 | | | | 09/29/27 | | | | 775,717 | |
| | 240,000 | | | | 4.125 | | | | 07/25/28 | | | | 275,189 | |
| | (3M USD LIBOR + 1.338%) | |
| | 575,000 | | | | 3.980 | (b) | | | 03/20/30 | | | | 669,252 | |
| | (SOFR + 1.422%) | |
| | 1,160,000 | | | | 2.976 | (b) | | | 11/05/30 | | | | 1,263,576 | |
| | 240,000 | | | | 6.625 | | | | 06/15/32 | | | | 337,323 | |
| | 860,000 | | | | 8.125 | | | | 07/15/39 | | | | 1,517,656 | |
| | 480,000 | | | | 6.675 | | | | 09/13/43 | | | | 751,108 | |
| | 150,000 | | | | 5.300 | | | | 05/06/44 | | | | 203,342 | |
| | 485,000 | | | | 4.650 | | | | 07/30/45 | | | | 627,323 | |
| | 240,000 | | | | 4.750 | | | | 05/18/46 | | | | 308,127 | |
| | (3M USD LIBOR + 1.839%) | |
| | 180,000 | | | | 4.281 | (b) | | | 04/24/48 | | | | 233,491 | |
| | 320,000 | | | | 4.650 | | | | 07/23/48 | | | | 430,792 | |
| | Citizens Financial Group, Inc. | |
| | 380,000 | | | | 4.300 | | | | 12/03/25 | | | | 438,278 | |
| | Fifth Third Bancorp | |
| | 600,000 | | | | 3.650 | | | | 01/25/24 | | | | 657,377 | |
| | 100,000 | | | | 2.550 | | | | 05/05/27 | | | | 108,484 | |
| | Huntington Bancshares, Inc. | |
| | 450,000 | | | | 2.300 | | | | 01/14/22 | | | | 461,540 | |
| | 900,000 | | | | 2.550 | | | | 02/04/30 | | | | 945,452 | |
| | JPMorgan Chase & Co. | |
| | 300,000 | | | | 2.400 | | | | 06/07/21 | | | | 304,541 | |
| | 747,000 | | | | 4.500 | | | | 01/24/22 | | | | 790,283 | |
| | 913,000 | | | | 3.250 | | | | 09/23/22 | | | | 966,000 | |
| | 117,000 | | | | 2.972 | | | | 01/15/23 | | | | 121,204 | |
| | 140,000 | | | | 3.200 | | | | 01/25/23 | | | | 149,192 | |
| | (3M USD LIBOR + 0.935%) | |
| | 200,000 | | | | 2.776 | (b) | | | 04/25/23 | | | | 207,635 | |
| | 60,000 | | | | 3.375 | | | | 05/01/23 | | | | 64,233 | |
| | |
|
| Corporate Obligations – (continued) | |
| Banks – (continued) | |
| | (3M USD LIBOR + 0.935%) – (continued) | |
| 250,000 | | | | 2.700 | | | | 05/18/23 | | | | 264,153 | |
| | 150,000 | | | | 3.875 | | | | 02/01/24 | | | | 165,891 | |
| | 15,000 | | | | 3.875 | | | | 09/10/24 | | | | 16,712 | |
| | 580,000 | | | | 3.125 | | | | 01/23/25 | | | | 632,225 | |
| | (3M USD LIBOR + 1.155%) | |
| | 400,000 | | | | 3.220 | (b) | | | 03/01/25 | | | | 432,548 | |
| | 1,100,000 | | | | 3.300 | | | | 04/01/26 | | | | 1,234,431 | |
| | (SOFR + 1.850%) | |
| | 1,050,000 | | | | 2.083 | (b) | | | 04/22/26 | | | | 1,103,436 | |
| | 750,000 | | | | 3.200 | | | | 06/15/26 | | | | 841,017 | |
| | 400,000 | | | | 4.125 | | | | 12/15/26 | | | | 466,711 | |
| | (3M USD LIBOR + 1.245%) | |
| | 200,000 | | | | 3.960 | (b) | | | 01/29/27 | | | | 229,197 | |
| | 720,000 | | | | 4.250 | | | | 10/01/27 | | | | 841,212 | |
| | 540,000 | | | | 3.625 | | | | 12/01/27 | | | | 608,048 | |
| | (3M USD LIBOR + 1.337%) | |
| | 415,000 | | | | 3.782 | (b) | | | 02/01/28 | | | | 473,728 | |
| | (3M USD LIBOR + 1.380%) | |
| | 700,000 | | | | 3.540 | (b) | | | 05/01/28 | | | | 790,327 | |
| | (SOFR + 1.890%) | |
| | 100,000 | | | | 2.182 | (b) | | | 06/01/28 | | | | 104,730 | |
| | (3M USD LIBOR + 0.945%) | |
| | 200,000 | | | | 3.509 | (b) | | | 01/23/29 | | | | 226,014 | |
| | (3M USD LIBOR + 1.120%) | |
| | 200,000 | | | | 4.005 | (b) | | | 04/23/29 | | | | 233,054 | |
| | (3M USD LIBOR + 1.160%) | |
| | 836,000 | | | | 3.702 | (b) | | | 05/06/30 | | | | 968,491 | |
| | 550,000 | | | | 6.400 | | | | 05/15/38 | | | | 855,016 | |
| | (3M USD LIBOR + 1.360%) | |
| | 750,000 | | | | 3.882 | (b) | | | 07/24/38 | | | | 904,180 | |
| | 675,000 | | | | 5.500 | | | | 10/15/40 | | | | 978,886 | |
| | (SOFR + 2.460%) | |
| | 250,000 | | | | 3.109 | (b) | | | 04/22/41 | | | | 275,849 | |
| | 510,000 | | | | 5.600 | | | | 07/15/41 | | | | 760,167 | |
| | 350,000 | | | | 5.400 | | | | 01/06/42 | | | | 510,923 | |
| | 10,000 | | | | 5.625 | | | | 08/16/43 | | | | 14,576 | |
| | 250,000 | | | | 4.850 | | | | 02/01/44 | | | | 345,479 | |
| | 230,000 | | | | 4.950 | | | | 06/01/45 | | | | 315,830 | |
| | (3M USD LIBOR + 1.580%) | |
| | 460,000 | | | | 4.260 | (b) | | | 02/22/48 | | | | 592,001 | |
| | (3M USD LIBOR + 1.460%) | |
| | 400,000 | | | | 4.032 | (b) | | | 07/24/48 | | | | 496,242 | |
| | (3M USD LIBOR + 1.380%) | |
| | 650,000 | | | | 3.964 | (b) | | | 11/15/48 | | | | 799,396 | |
| | (3M USD LIBOR + 1.220%) | |
| | 20,000 | | | | 3.897 | (b) | | | 01/23/49 | | | | 24,448 | |
| | (SOFR + 2.440%) | |
| | 300,000 | | | | 3.109 | (b) | | | 04/22/51 | | | | 328,210 | |
| | KeyCorp, MTN | |
| | 1,140,000 | | | | 2.550 | | | | 10/01/29 | | | | 1,214,985 | |
| | Morgan Stanley | |
| | 875,000 | | | | 2.750 | | | | 05/19/22 | | | | 909,550 | |
| | (3M USD LIBOR + 0.847%) | |
| | 1,060,000 | | | | 3.737 | (b) | | | 04/24/24 | | | | 1,144,021 | |
| | 200,000 | | | | 5.000 | | | | 11/24/25 | | | | 236,698 | |
| | |
| | |
| 48 | | The accompanying notes are an integral part of these financial statements. |
GOLDMAN SACHS ACCESS INVESTMENT GRADE CORPORATE BOND ETF
| | | | | | | | | | | | | | |
Principal
Amount | | | Interest
Rate | | | Maturity
Date | | | Value | |
|
| Corporate Obligations – (continued) | |
| Banks – (continued) | |
| | (3M USD LIBOR + 0.847%) – (continued) | |
| $ | 220,000 | | | | 3.625 | % | | | 01/20/27 | | | $ | 250,722 | |
| | 586,000 | | | | 3.950 | | | | 04/23/27 | | | | 664,538 | |
| | 558,000 | | | | 6.375 | | | | 07/24/42 | | | | 888,275 | |
| | 370,000 | | | | 4.300 | | | | 01/27/45 | | | | 485,309 | |
| | 520,000 | | | | 4.375 | | | | 01/22/47 | | | | 698,216 | |
| | Morgan Stanley, Series F | |
| | 1,055,000 | | | | 3.875 | | | | 04/29/24 | | | | 1,172,683 | |
| | Morgan Stanley, GMTN | |
| | 790,000 | | | | 5.500 | | | | 07/28/21 | | | | 826,335 | |
| | 40,000 | | | | 3.125 | | | | 01/23/23 | | | | 42,431 | |
| | 300,000 | | | | 3.750 | | | | 02/25/23 | | | | 323,970 | |
| | 25,000 | | | | 3.700 | | | | 10/23/24 | | | | 27,981 | |
| | 160,000 | | | | 4.000 | | | | 07/23/25 | | | | 183,284 | |
| | 730,000 | | | | 3.875 | | | | 01/27/26 | | | | 837,144 | |
| | 790,000 | | | | 4.350 | | | | 09/08/26 | | | | 917,142 | |
| | (SOFR + 1.143%) | |
| | 710,000 | | | | 2.699 | (b) | | | 01/22/31 | | | | 767,674 | |
| | (SOFR + 4.840%) | |
| | 400,000 | | | | 5.597 | (b) | | | 03/24/51 | | | | 613,596 | |
| | Morgan Stanley, MTN | |
| | 600,000 | | | | 2.625 | | | | 11/17/21 | | | | 616,380 | |
| | 800,000 | | | | 4.100 | | | | 05/22/23 | | | | 870,626 | |
| | 865,000 | | | | 3.125 | | | | 07/27/26 | | | | 966,597 | |
| | (SOFR + 3.120%) | |
| | 380,000 | | | | 3.622 | (b) | | | 04/01/31 | | | | 441,090 | |
| | PNC Bank NA | |
| | 600,000 | | | | 2.550 | | | | 12/09/21 | | | | 613,999 | |
| | 610,000 | | | | 3.100 | | | | 10/25/27 | | | | 691,945 | |
| | 760,000 | | | | 2.700 | | | | 10/22/29 | | | | 823,131 | |
| | PNC Financial Services Group, Inc. (The) | |
| | 705,000 | | | | 3.300 | | | | 03/08/22 | | | | 735,360 | |
| | 650,000 | | | | 2.600 | | | | 07/23/26 | | | | 715,611 | |
| | 100,000 | | | | 3.450 | | | | 04/23/29 | | | | 115,780 | |
| | 260,000 | | | | 2.550 | | | | 01/22/30 | | | | 283,516 | |
| | Regions Financial Corp. | |
| | 100,000 | | | | 2.750 | | | | 08/14/22 | | | | 104,217 | |
| | Santander Holdings USA, Inc. | |
| | 400,000 | | | | 3.500 | | | | 06/07/24 | | | | 430,136 | |
| | 400,000 | | | | 3.244 | | | | 10/05/26 | | | | 425,500 | |
| | State Street Corp. | |
| | (3M USD LIBOR + 0.635%) | |
| | 870,000 | | | | 2.653 | (b) | | | 05/15/23 | | | | 904,099 | |
| | 18,000 | | | | 3.100 | | | | 05/15/23 | | | | 19,261 | |
| | 275,000 | | | | 3.700 | | | | 11/20/23 | | | | 303,973 | |
| | 35,000 | | | | 3.300 | | | | 12/16/24 | | | | 39,091 | |
| | 400,000 | | | | 3.550 | | | | 08/18/25 | | | | 455,171 | |
| | 670,000 | | | | 2.650 | | | | 05/19/26 | | | | 743,974 | |
| | Synchrony Financial | |
| | 150,000 | | | | 3.750 | | | | 08/15/21 | | | | 153,209 | |
| | 670,000 | | | | 4.250 | | | | 08/15/24 | | | | 717,702 | |
| | 448,000 | | | | 4.500 | | | | 07/23/25 | | | | 488,157 | |
| | 290,000 | | | | 3.950 | | | | 12/01/27 | | | | 305,751 | |
| | Truist Bank | |
| | 300,000 | | | | 2.250 | | | | 03/11/30 | | | | 313,009 | |
| | |
|
| Corporate Obligations – (continued) | |
| Banks – (continued) | |
| | Truist Financial Corp., MTN | |
| 240,000 | | | | 2.750 | | | | 04/01/22 | | | | 248,516 | |
| | 800,000 | | | | 3.050 | | | | 06/20/22 | | | | 835,817 | |
| | 840,000 | | | | 3.750 | | | | 12/06/23 | | | | 926,246 | |
| | 755,000 | | | | 2.850 | | | | 10/26/24 | | | | 826,166 | |
| | US Bancorp, MTN | |
| | 775,000 | | | | 3.000 | | | | 03/15/22 | | | | 805,790 | |
| | 550,000 | | | | 3.700 | | | | 01/30/24 | | | | 606,947 | |
| | 370,000 | | | | 3.600 | | | | 09/11/24 | | | | 411,388 | |
| | 465,000 | | | | 3.100 | | | | 04/27/26 | | | | 521,800 | |
| | 705,000 | | | | 3.900 | | | | 04/26/28 | | | | 849,586 | |
| | 400,000 | | | | 3.000 | | | | 07/30/29 | | | | 443,011 | |
| | US Bancorp, Series X | |
| | 375,000 | | | | 3.150 | | | | 04/27/27 | | | | 425,344 | |
| | | | | | | | | | | | | | |
| | | | | | | | | | | | | 99,149,132 | |
| | |
| Basic Industry – 1.2% | |
| | Air Products and Chemicals, Inc. | |
| | 467,000 | | | | 2.050 | | | | 05/15/30 | | | | 492,471 | |
| | Dow Chemical Co. (The) | |
| | 970,000 | | | | 3.500 | | | | 10/01/24 | | | | 1,062,712 | |
| | 500,000 | | | | 7.375 | | | | 11/01/29 | | | | 710,913 | |
| | DuPont de Nemours, Inc. | |
| | 500,000 | | | | 2.169 | | | | 05/01/23 | | | | 511,785 | |
| | 240,000 | | | | 4.205 | | | | 11/15/23 | | | | 265,624 | |
| | 530,000 | | | | 4.493 | | | | 11/15/25 | | | | 616,595 | |
| | 100,000 | | | | 5.419 | | | | 11/15/48 | | | | 134,708 | |
| | Ecolab, Inc. | |
| | 200,000 | | | | 4.800 | | | | 03/24/30 | | | | 254,630 | |
| | International Paper Co. | |
| | 220,000 | | | | 3.000 | | | | 02/15/27 | | | | 241,969 | |
| | 150,000 | | | | 4.800 | | | | 06/15/44 | | | | 182,960 | |
| | 190,000 | | | | 4.400 | | | | 08/15/47 | | | | 226,948 | |
| | 150,000 | | | | 4.350 | | | | 08/15/48 | | | | 180,740 | |
| | LYB International Finance BV | |
| | 220,000 | | | | 4.875 | | | | 03/15/44 | | | | 261,668 | |
| | LYB International Finance III LLC | |
| | 750,000 | | | | 4.200 | | | | 10/15/49 | | | | 825,472 | |
| | LyondellBasell Industries NV | |
| | 200,000 | | | | 5.750 | | | | 04/15/24 | | | | 231,499 | |
| | 200,000 | | | | 4.625 | | | | 02/26/55 | | | | 228,333 | |
| | Sherwin-Williams Co. (The) | |
| | 500,000 | | | | 3.450 | | | | 06/01/27 | | | | 567,755 | |
| | 260,000 | | | | 4.500 | | | | 06/01/47 | | | | 330,420 | |
| | Weyerhaeuser Co. | |
| | 187,000 | | | | 7.375 | | | | 03/15/32 | | | | 274,002 | |
| | | | | | | | | | | | | | |
| | | | | | | | | | | | | 7,601,204 | |
| | |
| Broadcasting – 0.7% | |
| | Discovery Communications LLC | |
| | 158,000 | | | | 2.950 | | | | 03/20/23 | | | | 166,773 | |
| | 463,000 | | | | 3.950 | | | | 03/20/28 | | | | 527,771 | |
| | 300,000 | | | | 5.000 | | | | 09/20/37 | | | | 356,654 | |
| | 808,000 | | | | 5.200 | | | | 09/20/47 | | | | 971,172 | |
| | Fox Corp. | |
| | 990,000 | | | | 4.030 | | | | 01/25/24 | | | | 1,094,970 | |
| | 990,000 | | | | 4.709 | | | | 01/25/29 | | | | 1,190,328 | |
| | | | | | | | | | | | | | |
| | | | | | | | | | | | | 4,307,668 | |
| | |
| | |
| The accompanying notes are an integral part of these financial statements. | | 49 |
GOLDMAN SACHS ACCESS INVESTMENT GRADE CORPORATE BOND ETF
Schedule of Investments (continued)
August 31, 2020
| | | | | | | | | | | | | | |
Principal
Amount | | | Interest
Rate | | | Maturity
Date | | | Value | |
|
| Corporate Obligations – (continued) | |
| Brokerage – 0.4% | |
| | BlackRock, Inc. | |
| $ | 150,000 | | | | 3.500 | % | | | 03/18/24 | | | $ | 165,485 | |
| | 550,000 | | | | 2.400 | | | | 04/30/30 | | | | 600,501 | |
| | Intercontinental Exchange, Inc. | |
| | 50,000 | | | | 4.000 | | | | 10/15/23 | | | | 55,097 | |
| | 635,000 | | | | 3.750 | | | | 12/01/25 | | | | 723,503 | |
| | 200,000 | | | | 2.650 | | | | 09/15/40 | | | | 203,732 | |
| | 290,000 | | | | 4.250 | | | | 09/21/48 | | | | 365,827 | |
| | Jefferies Financial Group, Inc. | |
| | 275,000 | | | | 5.500 | | | | 10/18/23 | | | | 303,277 | |
| | | | | | | | | | | | | | |
| | | | | | | | | | | | | 2,417,422 | |
| | |
| Building Materials – 0.0% | |
| Stanley Black & Decker, Inc.(b) (US 5 Year CMT T-Note +
2.657%) |
|
| | 245,000 | | | | 4.000 | | | | 03/15/60 | | | | 260,120 | |
| | |
| Capital Goods – 2.2% | |
| | 3M Co. | |
| | 650,000 | | | | 3.250 | | | | 08/26/49 | | | | 739,795 | |
| | 3M Co., MTN | |
| | 210,000 | | | | 4.000 | | | | 09/14/48 | | | | 268,425 | |
| | Carrier Global Corp. | |
| | 980,000 | | | | 2.722 | (a) | | | 02/15/30 | | | | 1,031,023 | |
| | 500,000 | | | | 3.377 | (a) | | | 04/05/40 | | | | 518,471 | |
| | Caterpillar Financial Services Corp. | |
| | 520,000 | | | | 1.700 | | | | 08/09/21 | | | | 527,278 | |
| | Caterpillar Financial Services Corp., MTN | |
| | 300,000 | | | | 1.950 | | | | 11/18/22 | | | | 310,287 | |
| | Caterpillar, Inc. | |
| | 280,000 | | | | 3.400 | | | | 05/15/24 | | | | 307,220 | |
| | 80,000 | | | | 5.200 | | | | 05/27/41 | | | | 111,231 | |
| | 130,000 | | | | 3.803 | | | | 08/15/42 | | | | 160,216 | |
| | 400,000 | | | | 3.250 | | | | 09/19/49 | | | | 449,234 | |
| | Deere & Co. | |
| | 480,000 | | | | 2.600 | | | | 06/08/22 | | | | 497,374 | |
| | 320,000 | | | | 3.900 | | | | 06/09/42 | | | | 407,648 | |
| | Eaton Corp. | |
| | 650,000 | | | | 2.750 | | | | 11/02/22 | | | | 682,872 | |
| | GE Capital Funding LLC(a) | |
| | 500,000 | | | | 4.050 | | | | 05/15/27 | | | | 531,989 | |
| | General Electric Co. | |
| | 1,400,000 | | | | 2.700 | | | | 10/09/22 | | | | 1,455,638 | |
| | 40,000 | | | | 4.125 | | | | 10/09/42 | | | | 39,736 | |
| | 170,000 | | | | 4.500 | | | | 03/11/44 | | | | 176,109 | |
| | General Electric Co., GMTN | |
| | 450,000 | | | | 6.150 | | | | 08/07/37 | | | | 533,337 | |
| | 224,000 | | | | 6.875 | | | | 01/10/39 | | | | 284,704 | |
| | General Electric Co., MTN | |
| | 800,000 | | | | 6.750 | | | | 03/15/32 | | | | 999,600 | |
| | 354,000 | | | | 5.875 | | | | 01/14/38 | | | | 409,853 | |
| | Honeywell International, Inc. | |
| | 895,000 | | | | 2.500 | | | | 11/01/26 | | | | 985,843 | |
| | Illinois Tool Works, Inc. | |
| | 650,000 | | | | 2.650 | | | | 11/15/26 | | | | 724,091 | |
| | John Deere Capital Corp., MTN | |
| | 250,000 | | | | 2.800 | | | | 03/06/23 | | | | 265,138 | |
| | |
|
| Corporate Obligations – (continued) | |
| Capital Goods – (continued) | |
| | Otis Worldwide Corp.(a) | |
| 290,000 | | | | 3.112 | | | | 02/15/40 | | | | 312,467 | |
| | Republic Services, Inc. | |
| | 470,000 | | | | 3.550 | | | | 06/01/22 | | | | 491,763 | |
| | Waste Management, Inc. | |
| | 250,000 | | | | 4.100 | | | | 03/01/45 | | | | 306,658 | |
| | Westinghouse Air Brake Technologies Corp. | |
| | 100,000 | | | | 3.450 | | | | 11/15/26 | | | | 105,886 | |
| | 260,000 | | | | 4.950 | | | | 09/15/28 | | | | 299,932 | |
| | | | | | | | | | | | | | |
| | | | | | | | | | | | | 13,933,818 | |
| | |
| Communications – 5.1% | |
| Charter Communications Operating LLC / Charter
Communications Operating Capital |
|
| | 170,000 | | | | 4.464 | | | | 07/23/22 | | | | 181,328 | |
| | 250,000 | | | | 4.500 | | | | 02/01/24 | | | | 277,953 | |
| | 1,210,000 | | | | 4.908 | | | | 07/23/25 | | | | 1,409,226 | |
| | 315,000 | | | | 3.750 | | | | 02/15/28 | | | | 351,202 | |
| | 440,000 | | | | 4.200 | | | | 03/15/28 | | | | 504,673 | |
| | 250,000 | | | | 5.050 | | | | 03/30/29 | | | | 302,994 | |
| | 423,000 | | | | 6.384 | | | | 10/23/35 | | | | 580,984 | |
| | 130,000 | | | | 5.375 | | | | 04/01/38 | | | | 158,679 | |
| | 1,000,000 | | | | 6.484 | | | | 10/23/45 | | | | 1,352,699 | |
| | 580,000 | | | | 5.375 | | | | 05/01/47 | | | | 695,809 | |
| | 320,000 | | | | 5.750 | | | | 04/01/48 | | | | 400,581 | |
| | 80,000 | | | | 5.125 | | | | 07/01/49 | | | | 93,570 | |
| | Comcast Corp. | |
| | 700,000 | | | | 3.125 | | | | 07/15/22 | | | | 735,773 | |
| | 1,616,000 | | | | 3.700 | | | | 04/15/24 | | | | 1,793,001 | |
| | 295,000 | | | | 3.375 | | | | 02/15/25 | | | | 327,974 | |
| | 100,000 | | | | 3.375 | | | | 08/15/25 | | | | 112,248 | |
| | 200,000 | | | | 3.150 | | | | 03/01/26 | | | | 224,114 | |
| | 900,000 | | | | 4.150 | | | | 10/15/28 | | | | 1,088,452 | |
| | 550,000 | | | | 4.250 | | | | 10/15/30 | | | | 681,363 | |
| | 645,000 | | | | 4.250 | | | | 01/15/33 | | | | 807,025 | |
| | 260,000 | | | | 7.050 | | | | 03/15/33 | | | | 400,593 | |
| | 390,000 | | | | 4.200 | | | | 08/15/34 | | | | 486,998 | |
| | 420,000 | | | | 3.200 | | | | 07/15/36 | | | | 471,594 | |
| | 140,000 | | | | 3.900 | | | | 03/01/38 | | | | 168,338 | |
| | 600,000 | | | | 4.600 | | | | 10/15/38 | | | | 770,724 | |
| | 855,000 | | | | 3.250 | | | | 11/01/39 | | | | 949,186 | |
| | 80,000 | | | | 4.650 | | | | 07/15/42 | | | | 104,612 | |
| | 400,000 | | | | 4.750 | | | | 03/01/44 | | | | 530,908 | |
| | 230,000 | | | | 3.400 | | | | 07/15/46 | | | | 256,844 | |
| | 550,000 | | | | 3.969 | | | | 11/01/47 | | | | 668,377 | |
| | 742,000 | | | | 4.700 | | | | 10/15/48 | | | | 1,002,327 | |
| | 400,000 | | | | 3.999 | | | | 11/01/49 | | | | 486,644 | |
| | 205,000 | | | | 4.049 | | | | 11/01/52 | | | | 252,237 | |
| | 471,000 | | | | 4.950 | | | | 10/15/58 | | | | 677,945 | |
| | NBCUniversal Media LLC | |
| | 590,000 | | | | 5.950 | | | | 04/01/41 | | | | 885,711 | |
| | Omnicom Group, Inc. / Omnicom Capital, Inc. | |
| | 700,000 | | | | 3.650 | | | | 11/01/24 | | | | 773,261 | |
| | 400,000 | | | | 3.600 | | | | 04/15/26 | | | | 450,450 | |
| | Time Warner Cable LLC | |
| | 70,000 | | | | 6.550 | | | | 05/01/37 | | | | 94,237 | |
| | |
| | |
| 50 | | The accompanying notes are an integral part of these financial statements. |
GOLDMAN SACHS ACCESS INVESTMENT GRADE CORPORATE BOND ETF
| | | | | | | | | | | | | | |
Principal
Amount | | | Interest
Rate | | | Maturity
Date | | | Value | |
|
| Corporate Obligations – (continued) | |
| Communications – (continued) | |
| | Time Warner Cable LLC – (continued) | |
| $ | 470,000 | | | | 7.300 | % | | | 07/01/38 | | | $ | 673,295 | |
| | 360,000 | | | | 6.750 | | | | 06/15/39 | | �� | | 504,044 | |
| | 180,000 | | | | 5.875 | | | | 11/15/40 | | | | 228,249 | |
| | 250,000 | | | | 5.500 | | | | 09/01/41 | | | | 307,099 | |
| | Time Warner Entertainment Co. LP | |
| | 470,000 | | | | 8.375 | | | | 03/15/23 | | | | 556,385 | |
| | 100,000 | | | | 8.375 | | | | 07/15/33 | | | | 155,985 | |
| | TWDC Enterprises 18 Corp., GMTN | |
| | 190,000 | | | | 4.125 | | | | 06/01/44 | | | | 232,081 | |
| | TWDC Enterprises 18 Corp., MTN | |
| | 240,000 | | | | 2.950 | | | | 06/15/27 | | | | 266,685 | |
| | ViacomCBS, Inc. | |
| | 1,180,000 | | | | 4.950 | | | | 01/15/31 | | | | 1,412,612 | |
| | 960,000 | | | | 4.200 | | | | 05/19/32 | | | | 1,094,082 | |
| | 100,000 | | | | 5.850 | | | | 09/01/43 | | | | 124,167 | |
| | 100,000 | | | | 4.950 | | | | 05/19/50 | | | | 117,151 | |
| | Walt Disney Co. (The) | |
| | 510,000 | | | | 3.000 | | | | 09/15/22 | | | | 536,186 | |
| | 950,000 | | | | 1.750 | | | | 08/30/24 | | | | 988,195 | |
| | 500,000 | | | | 2.200 | | | | 01/13/28 | | | | 530,802 | |
| | 1,200,000 | | | | 2.650 | | | | 01/13/31 | | | | 1,301,647 | |
| | 420,000 | | | | 4.625 | | | | 03/23/40 | | | | 535,083 | |
| | 850,000 | | | | 2.750 | | | | 09/01/49 | | | | 842,384 | |
| | 500,000 | | | | 3.800 | | | | 05/13/60 | | | | 590,516 | |
| | | | | | | | | | | | | | |
| | | | | | | | | | | | | 32,507,282 | |
| | |
| Consumer Cyclical – 7.3% | |
| | Amazon.com, Inc. | |
| | 347,000 | | | | 2.400 | | | | 02/22/23 | | | | 364,887 | |
| | 370,000 | | | | 2.800 | | | | 08/22/24 | | | | 403,046 | |
| | 380,000 | | | | 3.800 | | | | 12/05/24 | | | | 430,613 | |
| | 18,000 | | | | 5.200 | | | | 12/03/25 | | | | 22,092 | |
| | 30,000 | | | | 3.150 | | | | 08/22/27 | | | | 34,346 | |
| | 170,000 | | | | 4.800 | | | | 12/05/34 | | | | 233,484 | |
| | 275,000 | | | | 3.875 | | | | 08/22/37 | | | | 345,927 | |
| | 344,000 | | | | 4.950 | | | | 12/05/44 | | | | 490,303 | |
| | 1,045,000 | | | | 4.050 | | | | 08/22/47 | | | | 1,358,997 | |
| | 500,000 | | | | 2.500 | | | | 06/03/50 | | | | 510,341 | |
| | 330,000 | | | | 4.250 | | | | 08/22/57 | | | | 450,811 | |
| | American Honda Finance Corp., GMTN | |
| | 347,000 | | | | 1.700 | | | | 09/09/21 | | | | 351,554 | |
| | Booking Holdings, Inc. | |
| | 100,000 | | | | 3.600 | | | | 06/01/26 | | | | 112,133 | |
| | 550,000 | | | | 4.625 | | | | 04/13/30 | | | | 662,856 | |
| | Costco Wholesale Corp. | |
| | 684,000 | | | | 2.300 | | | | 05/18/22 | | | | 707,880 | |
| | 400,000 | | | | 3.000 | | | | 05/18/27 | | | | 450,625 | |
| | 200,000 | | | | 1.375 | | | | 06/20/27 | | | | 204,765 | |
| | 490,000 | | | | 1.750 | | | | 04/20/32 | | | | 505,624 | |
| | Dollar Tree, Inc. | |
| | 480,000 | | | | 4.000 | | | | 05/15/25 | | | | 544,482 | |
| | 140,000 | | | | 4.200 | | | | 05/15/28 | | | | 165,218 | |
| | eBay, Inc. | |
| | 250,000 | | | | 2.600 | | | | 07/15/22 | | | | 258,576 | |
| | 250,000 | | | | 2.750 | | | | 01/30/23 | | | | 262,892 | |
| | |
|
| Corporate Obligations – (continued) | |
| Consumer Cyclical – (continued) | |
| | eBay, Inc. – (continued) | |
| 50,000 | | | | 3.450 | | | | 08/01/24 | | | | 54,986 | |
| | 100,000 | | | | 3.600 | | | | 06/05/27 | | | | 112,767 | |
| | General Motors Co. | |
| | 500,000 | | | | 4.875 | | | | 10/02/23 | | | | 546,955 | |
| | 340,000 | | | | 5.000 | | | | 10/01/28 | | | | 379,813 | |
| | 674,000 | | | | 6.600 | | | | 04/01/36 | | | | 806,093 | |
| | 500,000 | | | | 6.250 | | | | 10/02/43 | | | | 583,269 | |
| | 628,000 | | | | 5.400 | | | | 04/01/48 | | | | 684,897 | |
| | 200,000 | | | | 5.950 | | | | 04/01/49 | | | | 237,524 | |
| | General Motors Financial Co., Inc. | |
| | 550,000 | | | | 3.200 | | | | 07/06/21 | | | | 558,734 | |
| | 800,000 | | | | 4.200 | | | | 11/06/21 | | | | 826,785 | |
| | 160,000 | | | | 3.450 | | | | 04/10/22 | | | | 164,521 | |
| | 410,000 | | | | 5.100 | | | | 01/17/24 | | | | 451,129 | |
| | 50,000 | | | | 3.950 | | | | 04/13/24 | | | | 53,469 | |
| | 850,000 | | | | 4.000 | | | | 01/15/25 | | | | 914,434 | |
| | 300,000 | | | | 5.250 | | | | 03/01/26 | | | | 341,068 | |
| | Global Payments, Inc. | |
| | 410,000 | | | | 3.200 | | | | 08/15/29 | | | | 450,118 | |
| | Home Depot, Inc. (The) | |
| | 70,000 | | | | 2.625 | | | | 06/01/22 | | | | 72,761 | |
| | 138,000 | | | | 2.700 | | | | 04/01/23 | | | | 145,686 | |
| | 500,000 | | | | 3.750 | | | | 02/15/24 | | | | 553,514 | |
| | 50,000 | | | | 3.350 | | | | 09/15/25 | | | | 56,394 | |
| | 55,000 | | | | 3.000 | | | | 04/01/26 | | | | 62,143 | |
| | 630,000 | | | | 2.125 | | | | 09/15/26 | | | | 680,401 | |
| | 410,000 | | | | 2.800 | | | | 09/14/27 | | | | 456,185 | |
| | 500,000 | | | | 3.900 | | | | 12/06/28 | | | | 597,651 | |
| | 430,000 | | | | 5.875 | | | | 12/16/36 | | | | 646,025 | |
| | 180,000 | | | | 5.950 | | | | 04/01/41 | | | | 273,061 | |
| | 830,000 | | | | 4.400 | | | | 03/15/45 | | | | 1,072,269 | |
| | 200,000 | | | | 4.250 | | | | 04/01/46 | | | | 256,960 | |
| | 290,000 | | | | 3.900 | | | | 06/15/47 | | | | 354,606 | |
| | 220,000 | | | | 4.500 | | | | 12/06/48 | | | | 294,463 | |
| | 200,000 | | | | 3.125 | | | | 12/15/49 | | | | 220,959 | |
| | 130,000 | | | | 3.500 | | | | 09/15/56 | | | | 155,457 | |
| | Las Vegas Sands Corp. | |
| | 150,000 | | | | 3.500 | | | | 08/18/26 | | | | 153,120 | |
| | Lowe’s Cos., Inc. | |
| | 200,000 | | | | 3.120 | | | | 04/15/22 | | | | 207,635 | |
| | 810,000 | | | | 2.500 | | | | 04/15/26 | | | | 880,840 | |
| | 230,000 | | | | 3.100 | | | | 05/03/27 | | | | 255,574 | |
| | 750,000 | | | | 3.650 | | | | 04/05/29 | | | | 866,318 | |
| | 280,000 | | | | 3.700 | | | | 04/15/46 | | | | 317,200 | |
| | 264,000 | | | | 4.050 | | | | 05/03/47 | | | | 315,816 | |
| | 90,000 | | | | 4.550 | | | | 04/05/49 | | | | 114,701 | |
| | 310,000 | | | | 5.125 | | | | 04/15/50 | | | | 431,652 | |
| | Mastercard, Inc. | |
| | 350,000 | | | | 2.000 | | | | 03/03/25 | | | | 373,198 | |
| | 70,000 | | | | 2.950 | | | | 11/21/26 | | | | 79,396 | |
| | 290,000 | | | | 3.650 | | | | 06/01/49 | | | | 348,761 | |
| | 200,000 | | | | 3.850 | | | | 03/26/50 | | | | 253,459 | |
| | McDonald’s Corp., MTN | |
| | 800,000 | | | | 3.350 | | | | 04/01/23 | | | | 858,105 | |
| | 600,000 | | | | 3.500 | | | | 03/01/27 | | | | 681,631 | |
| | |
| | |
| The accompanying notes are an integral part of these financial statements. | | 51 |
GOLDMAN SACHS ACCESS INVESTMENT GRADE CORPORATE BOND ETF
Schedule of Investments (continued)
August 31, 2020
| | | | | | | | | | | | | | |
Principal
Amount | | | Interest
Rate | | | Maturity
Date | | | Value | |
|
| Corporate Obligations – (continued) | |
| Consumer Cyclical – (continued) | |
| | McDonald’s Corp., MTN – (continued) | |
| $ | 350,000 | | | | 3.800 | % | | | 04/01/28 | | | $ | 408,323 | |
| | 150,000 | | | | 3.600 | | | | 07/01/30 | | | | 174,261 | |
| | 443,000 | | | | 4.700 | | | | 12/09/35 | | | | 567,783 | |
| | 320,000 | | | | 4.875 | | | | 12/09/45 | | | | 417,870 | |
| | 320,000 | | | | 4.450 | | | | 09/01/48 | | | | 400,536 | |
| | 100,000 | | | | 4.200 | | | | 04/01/50 | | | | 122,472 | |
| | NIKE, Inc. | |
| | 288,000 | | | | 2.375 | | | | 11/01/26 | | | | 314,037 | |
| | 150,000 | | | | 3.250 | | | | 03/27/40 | | | | 170,190 | |
| | 140,000 | | | | 3.875 | | | | 11/01/45 | | | | 170,290 | |
| | 200,000 | | | | 3.375 | | | | 03/27/50 | | | | 229,719 | |
| | Starbucks Corp. | |
| | 322,000 | | | | 3.800 | | | | 08/15/25 | | | | 366,315 | |
| | 400,000 | | | | 4.000 | | | | 11/15/28 | | | | 472,570 | |
| | 500,000 | | | | 2.550 | | | | 11/15/30 | | | | 530,597 | |
| | 570,000 | | | | 4.500 | | | | 11/15/48 | | | | 699,260 | |
| | Target Corp. | |
| | 590,000 | | | | 3.500 | | | | 07/01/24 | | | | 656,950 | |
| | 350,000 | | | | 4.000 | | | | 07/01/42 | | | | 448,538 | |
| | 140,000 | | | | 3.625 | | | | 04/15/46 | | | | 172,960 | |
| | 80,000 | | | | 3.900 | | | | 11/15/47 | | | | 104,094 | |
| | TJX Cos., Inc. (The) | |
| | 450,000 | | | | 3.875 | | | | 04/15/30 | | | | 534,033 | |
| | 100,000 | | | | 4.500 | | | | 04/15/50 | | | | 127,861 | |
| | Toyota Motor Credit Corp., GMTN | |
| | 570,000 | | | | 3.450 | | | | 09/20/23 | | | | 620,531 | |
| | Toyota Motor Credit Corp., MTN | |
| | 750,000 | | | | 2.150 | | | | 09/08/22 | | | | 776,396 | |
| | 565,000 | | | | 2.150 | | | | 02/13/30 | | | | 599,743 | |
| | VF Corp. | |
| | 1,200,000 | | | | 2.050 | | | | 04/23/22 | | | | 1,228,694 | |
| | Visa, Inc. | |
| | 625,000 | | | | 3.150 | | | | 12/14/25 | | | | 702,666 | |
| | 360,000 | | | | 2.750 | | | | 09/15/27 | | | | 400,097 | |
| | 270,000 | | | | 4.150 | | | | 12/14/35 | | | | 352,878 | |
| | 900,000 | | | | 4.300 | | | | 12/14/45 | | | | 1,189,731 | |
| | 40,000 | | | | 3.650 | | | | 09/15/47 | | | | 49,077 | |
| | Walmart, Inc. | |
| | 100,000 | | | | 2.350 | | | | 12/15/22 | | | | 104,496 | |
| | 437,000 | | | | 2.550 | | | | 04/11/23 | | | | 459,283 | |
| | 500,000 | | | | 3.400 | | | | 06/26/23 | | | | 542,406 | |
| | 470,000 | | | | 2.650 | | | | 12/15/24 | | | | 510,166 | |
| | 200,000 | | | | 3.050 | | | | 07/08/26 | | | | 225,744 | |
| | 905,000 | | | | 3.700 | | | | 06/26/28 | | | | 1,074,771 | |
| | 325,000 | | | | 3.250 | | | | 07/08/29 | | | | 379,484 | |
| | 580,000 | | | | 5.250 | | | | 09/01/35 | | | | 842,617 | |
| | 530,000 | | | | 3.950 | | | | 06/28/38 | | | | 661,162 | |
| | 100,000 | | | | 3.625 | | | | 12/15/47 | | | | 122,713 | |
| | 530,000 | | | | 4.050 | | | | 06/29/48 | | | | 691,336 | |
| | 50,000 | | | | 2.950 | | | | 09/24/49 | | | | 55,755 | |
| | | | | | | | | | | | | | |
| | | | | | | | | | | | | 46,752,360 | |
| | |
| Consumer Noncyclical – 8.2% | |
| | Abbott Laboratories | |
| | 34,000 | | | | 3.400 | | | | 11/30/23 | | | | 37,085 | |
| | 160,000 | | | | 2.950 | | | | 03/15/25 | | | | 175,486 | |
| | |
|
| Corporate Obligations – (continued) | |
| Consumer Noncyclical – (continued) | |
| | Abbott Laboratories – (continued) | |
| 84,000 | | | | 3.750 | | | | 11/30/26 | | | | 98,065 | |
| | 168,000 | | | | 4.750 | | | | 11/30/36 | | | | 227,077 | |
| | 600,000 | | | | 4.900 | | | | 11/30/46 | | | | 866,866 | |
| | AbbVie, Inc. | |
| | 1,000,000 | | | | 2.900 | | | | 11/06/22 | | | | 1,050,455 | |
| | 337,000 | | | | 3.600 | | | | 05/14/25 | | | | 375,782 | |
| | 190,000 | | | | 3.200 | | | | 05/14/26 | | | | 212,016 | |
| | 1,430,000 | | | | 2.950 | (a) | | | 11/21/26 | | | | 1,575,836 | |
| | 525,000 | | | | 4.250 | | | | 11/14/28 | | | | 624,672 | |
| | 1,540,000 | | | | 3.200 | (a) | | | 11/21/29 | | | | 1,711,888 | |
| | 609,000 | | | | 4.500 | | | | 05/14/35 | | | | 753,978 | |
| | 150,000 | | | | 4.300 | | | | 05/14/36 | | | | 179,257 | |
| | 500,000 | | | | 4.050 | (a) | | | 11/21/39 | | | | 590,473 | |
| | 210,000 | | | | 4.400 | | | | 11/06/42 | | | | 252,881 | |
| | 250,000 | | | | 4.450 | | | | 05/14/46 | | | | 301,412 | |
| | 495,000 | | | | 4.875 | | | | 11/14/48 | | | | 636,101 | |
| | 1,325,000 | | | | 4.250 | (a) | | | 11/21/49 | | | | 1,623,186 | |
| | Altria Group, Inc. | |
| | 250,000 | | | | 4.000 | | | | 01/31/24 | | | | 276,874 | |
| | 800,000 | | | | 2.350 | | | | 05/06/25 | | | | 850,851 | |
| | 800,000 | | | | 4.800 | | | | 02/14/29 | | | | 957,216 | |
| | 50,000 | | | | 5.800 | | | | 02/14/39 | | | | 63,938 | |
| | 310,000 | | | | 5.375 | | | | 01/31/44 | | | | 385,863 | |
| | 900,000 | | | | 3.875 | | | | 09/16/46 | | | | 942,201 | |
| | Amgen, Inc. | |
| | 447,429 | | | | 3.875 | | | | 11/15/21 | | | | 462,084 | |
| | 145,000 | | | | 2.650 | | | | 05/11/22 | | | | 150,295 | |
| | 100,000 | | | | 3.625 | | | | 05/22/24 | | | | 110,340 | |
| | 430,000 | | | | 2.600 | | | | 08/19/26 | | | | 472,768 | |
| | 600,000 | | | | 2.200 | | | | 02/21/27 | | | | 633,818 | |
| | 650,000 | | | | 3.200 | | | | 11/02/27 | | | | 728,381 | |
| | 402,000 | | | | 4.400 | | | | 05/01/45 | | | | 501,821 | |
| | 200,000 | | | | 3.375 | | | | 02/21/50 | | | | 221,013 | |
| | 850,000 | | | | 4.663 | | | | 06/15/51 | | | | 1,133,023 | |
| | Becton Dickinson and Co. | |
| | 500,000 | | | | 2.894 | | | | 06/06/22 | | | | 518,535 | |
| | 300,000 | | | | 3.700 | | | | 06/06/27 | | | | 339,780 | |
| | 260,000 | | | | 4.685 | | | | 12/15/44 | | | | 323,337 | |
| | 320,000 | | | | 4.669 | | | | 06/06/47 | | | | 398,422 | |
| | Biogen, Inc. | |
| | 307,000 | | | | 3.625 | | | | 09/15/22 | | | | 326,724 | |
| | 690,000 | | | | 4.050 | | | | 09/15/25 | | | | 795,961 | |
| | 80,000 | | | | 2.250 | | | | 05/01/30 | | | | 82,506 | |
| | 470,000 | | | | 5.200 | | | | 09/15/45 | | | | 645,164 | |
| | Boston Scientific Corp. | |
| | 600,000 | | | | 3.750 | | | | 03/01/26 | | | | 688,622 | |
| | Cardinal Health, Inc. | |
| | 300,000 | | | | 2.616 | | | | 06/15/22 | | | | 310,159 | |
| | 284,000 | | | | 3.079 | | | | 06/15/24 | | | | 306,169 | |
| | Centene Corp. | |
| | 810,000 | | | | 4.750 | | | | 01/15/25 | | | | 834,300 | |
| | 600,000 | | | | 3.375 | | | | 02/15/30 | | | | 630,000 | |
| | Eli Lilly and Co. | |
| | 250,000 | | | | 3.950 | | | | 03/15/49 | | | | 314,203 | |
| | 480,000 | | | | 4.150 | | | | 03/15/59 | | | | 625,139 | |
| | |
| | |
| 52 | | The accompanying notes are an integral part of these financial statements. |
GOLDMAN SACHS ACCESS INVESTMENT GRADE CORPORATE BOND ETF
| | | | | | | | | | | | | | |
Principal
Amount | | | Interest
Rate | | | Maturity
Date | | | Value | |
|
| Corporate Obligations – (continued) | |
| Consumer Noncyclical – (continued) | |
| | Gilead Sciences, Inc. | |
| $ | 100,000 | | | | 4.400 | % | | | 12/01/21 | | | $ | 104,031 | |
| | 1,000,000 | | | | 3.500 | | | | 02/01/25 | | | | 1,115,964 | |
| | 1,000,000 | | | | 3.650 | | | | 03/01/26 | | | | 1,143,922 | |
| | 640,000 | | | | 2.950 | | | | 03/01/27 | | | | 712,904 | |
| | 750,000 | | | | 4.500 | | | | 02/01/45 | | | | 977,900 | |
| | Johnson & Johnson | |
| | 110,000 | | | | 2.250 | | | | 03/03/22 | | | | 113,050 | |
| | 327,000 | | | | 2.625 | | | | 01/15/25 | | | | 356,229 | |
| | 30,000 | | | | 2.450 | | | | 03/01/26 | | | | 32,926 | |
| | 125,000 | | | | 2.950 | | | | 03/03/27 | | | | 140,607 | |
| | 350,000 | | | | 4.375 | | | | 12/05/33 | | | | 458,289 | |
| | 238,000 | | | | 3.550 | | | | 03/01/36 | | | | 282,069 | |
| | 240,000 | | | | 3.625 | | | | 03/03/37 | | | | 292,952 | |
| | 150,000 | | | | 5.950 | | | | 08/15/37 | | | | 229,026 | |
| | 520,000 | | | | 3.400 | | | | 01/15/38 | | | | 613,829 | |
| | 70,000 | | | | 3.700 | | | | 03/01/46 | | | | 86,340 | |
| | 865,000 | | | | 3.750 | | | | 03/03/47 | | | | 1,080,463 | |
| | Medtronic, Inc. | |
| | 492,000 | | | | 4.375 | | | | 03/15/35 | | | | 646,163 | |
| | 274,000 | | | | 4.625 | | | | 03/15/45 | | | | 384,643 | |
| | Merck & Co., Inc. | |
| | 40,000 | | | | 2.350 | | | | 02/10/22 | | | | 41,213 | |
| | 400,000 | | | | 2.900 | | | | 03/07/24 | | | | 431,825 | |
| | 435,000 | | | | 2.750 | | | | 02/10/25 | | | | 474,914 | |
| | 400,000 | | | | 3.400 | | | | 03/07/29 | | | | 467,132 | |
| | 150,000 | | | | 3.900 | | | | 03/07/39 | | | | 183,960 | |
| | 50,000 | | | | 4.150 | | | | 05/18/43 | | | | 63,532 | |
| | 840,000 | | | | 3.700 | | | | 02/10/45 | | | | 1,023,989 | |
| | 255,000 | | | | 4.000 | | | | 03/07/49 | | | | 324,803 | |
| | Mylan NV | |
| | 500,000 | | | | 3.950 | | | | 06/15/26 | | | | 565,046 | |
| | Mylan, Inc. | |
| | 300,000 | | | | 5.200 | | | | 04/15/48 | | | | 374,151 | |
| | Pfizer, Inc. | |
| | 40,000 | | | | 2.200 | | | | 12/15/21 | | | | 40,964 | |
| | 657,000 | | | | 2.950 | | | | 03/15/24 | | | | 711,078 | |
| | 125,000 | | | | 2.750 | | | | 06/03/26 | | | | 138,900 | |
| | 50,000 | | | | 3.000 | | | | 12/15/26 | | | | 56,870 | |
| | 300,000 | | | | 3.450 | | | | 03/15/29 | | | | 350,714 | |
| | 330,000 | | | | 7.200 | | | | 03/15/39 | | | | 551,678 | |
| | 240,000 | | | | 2.550 | | | | 05/28/40 | | | | 251,682 | |
| | 280,000 | | | | 4.400 | | | | 05/15/44 | | | | 362,538 | |
| | 130,000 | | | | 4.125 | | | | 12/15/46 | | | | 164,572 | |
| | 420,000 | | | | 4.200 | | | | 09/15/48 | | | | 541,011 | |
| | 320,000 | | | | 4.000 | | | | 03/15/49 | | | | 411,074 | |
| | Philip Morris International, Inc. | |
| | 100,000 | | | | 2.500 | | | | 11/02/22 | | | | 104,406 | |
| | 50,000 | | | | 3.250 | | | | 11/10/24 | | | | 55,469 | |
| | 435,000 | | | | 3.375 | | | | 08/11/25 | | | | 487,703 | |
| | 20,000 | | | | 2.750 | | | | 02/25/26 | | | | 22,029 | |
| | 390,000 | | | | 6.375 | | | | 05/16/38 | | | | 588,750 | |
| | 100,000 | | | | 4.375 | | | | 11/15/41 | | | | 122,274 | |
| | 30,000 | | | | 3.875 | | | | 08/21/42 | | | | 34,501 | |
| | 315,000 | | | | 4.125 | | | | 03/04/43 | | | | 372,583 | |
| | 145,000 | | | | 4.250 | | | | 11/10/44 | | | | 177,382 | |
| | |
|
| Corporate Obligations – (continued) | |
| Consumer Noncyclical – (continued) | |
| | Shire Acquisitions Investments Ireland DAC | |
| 900,000 | | | | 2.875 | | | | 09/23/23 | | | | 959,574 | |
| | 750,000 | | | | 3.200 | | | | 09/23/26 | | | | 841,194 | |
| | Stryker Corp. | |
| | 420,000 | | | | 3.500 | | | | 03/15/26 | | | | 475,164 | |
| | Thermo Fisher Scientific, Inc. | |
| | 750,000 | | | | 3.000 | | | | 04/15/23 | | | | 795,466 | |
| | 50,000 | | | | 4.150 | | | | 02/01/24 | | | | 55,411 | |
| | 314,000 | | | | 2.950 | | | | 09/19/26 | | | | 351,900 | |
| | 340,000 | | | | 3.200 | | | | 08/15/27 | | | | 384,400 | |
| | Upjohn, Inc.(a) | |
| | 800,000 | | | | 4.000 | | | | 06/22/50 | | | | 880,162 | |
| | Walgreen Co. | |
| | 50,000 | | | | 3.100 | | | | 09/15/22 | | | | 52,444 | |
| | Walgreens Boots Alliance, Inc. | |
| | 550,000 | | | | 3.300 | | | | 11/18/21 | | | | 565,168 | |
| | 174,000 | | | | 3.800 | | | | 11/18/24 | | | | 192,645 | |
| | 350,000 | | | | 3.450 | | | | 06/01/26 | | | | 384,535 | |
| | 250,000 | | | | 4.800 | | | | 11/18/44 | | | | 275,222 | |
| | Wyeth LLC | |
| | 140,000 | | | | 6.500 | | | | 02/01/34 | | | | 215,545 | |
| | 530,000 | | | | 5.950 | | | | 04/01/37 | | | | 780,826 | |
| | Zimmer Biomet Holdings, Inc. | |
| | 320,000 | | | | 3.550 | | | | 04/01/25 | | | | 355,978 | |
| | Zoetis, Inc. | |
| | 280,000 | | | | 3.000 | | | | 09/12/27 | | | | 311,986 | |
| | 200,000 | | | | 4.700 | | | | 02/01/43 | | | | 265,611 | |
| | | | | | | | | | | | | | |
| | | | | | | | | | | | | 52,733,304 | |
| | |
| Consumer Products – 0.4% | |
| | Procter & Gamble Co. (The) | |
| | 638,000 | | | | 3.100 | | | | 08/15/23 | | | | 692,322 | |
| | 655,000 | | | | 2.450 | | | | 11/03/26 | | | | 723,221 | |
| | 980,000 | | | | 3.000 | | | | 03/25/30 | | | | 1,134,958 | |
| | | | | | | | | | | | | | |
| | | | | | | | | | | | | 2,550,501 | |
| | |
| Electric – 2.3% | |
| | Berkshire Hathaway Energy Co. | |
| | 500,000 | | | | 3.700 | (a) | | | 07/15/30 | | | | 595,555 | |
| | 267,000 | | | | 6.125 | | | | 04/01/36 | | | | 384,457 | |
| | 120,000 | | | | 5.150 | | | | 11/15/43 | | | | 164,264 | |
| | 50,000 | | | | 4.500 | | | | 02/01/45 | | | | 63,392 | |
| | 200,000 | | | | 3.800 | | | | 07/15/48 | | | | 235,939 | |
| | 200,000 | | | | 4.250 | (a) | | | 10/15/50 | | | | 255,553 | |
| | Commonwealth Edison Co. | |
| | 500,000 | | | | 4.000 | | | | 03/01/48 | | | | 622,214 | |
| | Consolidated Edison Co. of New York, Inc., Series 20B | |
| | 250,000 | | | | 3.950 | | | | 04/01/50 | | | | 302,637 | |
| | Dominion Energy, Inc. | |
| | 200,000 | | | | 3.900 | | | | 10/01/25 | | | | 228,606 | |
| | Dominion Energy, Inc., Series C | |
| | 400,000 | | | | 3.375 | | | | 04/01/30 | | | | 456,028 | |
| | Duke Energy Corp. | |
| | 680,000 | | | | 1.800 | | | | 09/01/21 | | | | 689,518 | |
| | 500,000 | | | | 2.650 | | | | 09/01/26 | | | | 545,016 | |
| | 375,000 | | | | 3.750 | | | | 09/01/46 | | | | 433,049 | |
| | |
| | |
| The accompanying notes are an integral part of these financial statements. | | 53 |
GOLDMAN SACHS ACCESS INVESTMENT GRADE CORPORATE BOND ETF
Schedule of Investments (continued)
August 31, 2020
| | | | | | | | | | | | | | |
Principal
Amount | | | Interest
Rate | | | Maturity
Date | | | Value | |
|
| Corporate Obligations – (continued) | |
| Electric – (continued) | |
| | Entergy Louisiana LLC | |
| $ | 100,000 | | | | 4.000 | % | | | 03/15/33 | | | $ | 124,892 | |
| | 450,000 | | | | 4.200 | | | | 09/01/48 | | | | 578,598 | |
| | Exelon Corp. | |
| | 290,000 | | | | 4.050 | | | | 04/15/30 | | | | 344,340 | |
| | FirstEnergy Corp., Series C | |
| | 400,000 | | �� | | 4.850 | | | | 07/15/47 | | | | 494,370 | |
| | Florida Power & Light Co. | |
| | 200,000 | | | | 2.850 | | | | 04/01/25 | | | | 219,753 | |
| | 350,000 | | | | 3.950 | | | | 03/01/48 | | | | 443,871 | |
| | MidAmerican Energy Co. | |
| | 250,000 | | | | 4.250 | | | | 07/15/49 | | | | 332,627 | |
| | NextEra Energy Capital Holdings, Inc. | |
| | 550,000 | | | | 2.900 | | | | 04/01/22 | | | | 571,273 | |
| | 200,000 | | | | 2.750 | | | | 05/01/25 | | | | 217,937 | |
| | 80,000 | | | | 3.550 | | | | 05/01/27 | | | | 91,884 | |
| | 600,000 | | | | 2.250 | | | | 06/01/30 | | | | 630,715 | |
| | Pacific Gas and Electric Co. | |
| | 1,000,000 | | | | 4.550 | | | | 07/01/30 | | | | 1,108,756 | |
| | 500,000 | | | | 3.300 | | | | 08/01/40 | | | | 473,339 | |
| | 200,000 | | | | 3.950 | | | | 12/01/47 | | | | 190,171 | |
| | Sempra Energy | |
| | 275,000 | | | | 3.250 | | | | 06/15/27 | | | | 303,263 | |
| | 300,000 | | | | 3.400 | | | | 02/01/28 | | | | 334,571 | |
| | 550,000 | | | | 4.000 | | | | 02/01/48 | | | | 632,102 | |
| | Southern California Edison Co. | |
| | 100,000 | | | | 4.650 | | | | 10/01/43 | | | | 116,835 | |
| | 375,000 | | | | 4.000 | | | | 04/01/47 | | | | 407,869 | |
| | Southern California Edison Co., Series C | |
| | 400,000 | | | | 4.125 | | | | 03/01/48 | | | | 440,787 | |
| | Southern Co. (The) | |
| | 90,000 | | | | 2.350 | | | | 07/01/21 | | | | 90,935 | |
| | 300,000 | | | | 2.950 | | | | 07/01/23 | | | | 319,193 | |
| | 450,000 | | | | 3.250 | | | | 07/01/26 | | | | 503,989 | |
| | 430,000 | | | | 4.400 | | | | 07/01/46 | | | | 510,382 | |
| | Virginia Electric and Power Co., Series A | |
| | 290,000 | | | | 3.150 | | | | 01/15/26 | | | | 324,003 | |
| | | | | | | | | | | | | | |
| | | | | | | | | | | | | 14,782,683 | |
| | |
| Energy – 5.9% | |
| | Baker Hughes a GE Co. LLC / Baker Hughes Co.-Obligor, Inc. | |
| | 100,000 | | | | 4.080 | | | | 12/15/47 | | | | 106,276 | |
| | BP Capital Markets America, Inc. | |
| | 200,000 | | | | 3.245 | | | | 05/06/22 | | | | 209,317 | |
| | 200,000 | | | | 2.750 | | | | 05/10/23 | | | | 212,582 | |
| | 450,000 | | | | 3.790 | | | | 02/06/24 | | | | 494,790 | |
| | 150,000 | | | | 3.224 | | | | 04/14/24 | | | | 162,159 | |
| | 100,000 | | | | 3.194 | | | | 04/06/25 | | | | 110,218 | |
| | 300,000 | | | | 3.410 | | | | 02/11/26 | | | | 335,902 | |
| | 50,000 | | | | 3.119 | | | | 05/04/26 | | | | 55,329 | |
| | 360,000 | | | | 3.017 | | | | 01/16/27 | | | | 393,319 | |
| | 720,000 | | | | 4.234 | | | | 11/06/28 | | | | 858,656 | |
| | 200,000 | | | | 3.633 | | | | 04/06/30 | | | | 230,607 | |
| | 550,000 | | | | 3.000 | | | | 02/24/50 | | | | 538,792 | |
| | Cheniere Corpus Christi Holdings LLC | |
| | 500,000 | | | | 7.000 | | | | 06/30/24 | | | | 582,400 | |
| | 220,000 | | | | 5.875 | | | | 03/31/25 | | | | 255,475 | |
| | |
|
| Corporate Obligations – (continued) | |
| Energy – (continued) | |
| | Cheniere Corpus Christi Holdings LLC – (continued) | |
| 300,000 | | | | 5.125 | | | | 06/30/27 | | | | 339,000 | |
| | Chevron Corp. | |
| | 496,000 | | | | 2.566 | | | | 05/16/23 | | | | 523,809 | |
| | 912,000 | | | | 3.191 | | | | 06/24/23 | | | | 977,785 | |
| | 30,000 | | | | 2.895 | | | | 03/03/24 | | | | 32,286 | |
| | 932,000 | | | | 3.326 | | | | 11/17/25 | | | | 1,056,759 | |
| | 180,000 | | | | 2.954 | | | | 05/16/26 | | | | 200,607 | |
| | 500,000 | | | | 1.995 | | | | 05/11/27 | | | | 529,894 | |
| | 300,000 | | | | 2.236 | | | | 05/11/30 | | | | 320,731 | |
| | Concho Resources, Inc. | |
| | 585,000 | | | | 3.750 | | | | 10/01/27 | | | | 641,891 | |
| | 230,000 | | | | 4.875 | | | | 10/01/47 | | | | 268,238 | |
| | ConocoPhillips | |
| | 100,000 | | | | 6.500 | | | | 02/01/39 | | | | 152,003 | |
| | ConocoPhillips Co. | |
| | 280,000 | | | | 4.950 | | | | 03/15/26 | | | | 337,668 | |
| | Energy Transfer Operating LP | |
| | 190,000 | | | | 3.600 | | | | 02/01/23 | | | | 197,093 | |
| | 100,000 | | | | 4.250 | | | | 03/15/23 | | | | 105,490 | |
| | 100,000 | | | | 5.250 | | | | 04/15/29 | | | | 108,936 | |
| | 1,160,000 | | | | 6.500 | | | | 02/01/42 | | | | 1,247,000 | |
| | 260,000 | | | | 6.000 | | | | 06/15/48 | | | | 269,692 | |
| | 100,000 | | | | 6.250 | | | | 04/15/49 | | | | 105,213 | |
| | 450,000 | | | | 5.000 | | | | 05/15/50 | | | | 433,639 | |
| | Enterprise Products Operating LLC | |
| | 492,000 | | | | 3.350 | | | | 03/15/23 | | | | 522,790 | |
| | 157,000 | | | | 3.900 | | | | 02/15/24 | | | | 172,552 | |
| | 107,000 | | | | 3.750 | | | | 02/15/25 | | | | 119,551 | |
| | 178,000 | | | | 3.125 | | | | 07/31/29 | | | | 194,868 | |
| | 225,000 | | | | 4.850 | | | | 08/15/42 | | | | 262,833 | |
| | 350,000 | | | | 4.450 | | | | 02/15/43 | | | | 387,368 | |
| | 230,000 | | | | 4.850 | | | | 03/15/44 | | | | 266,229 | |
| | 210,000 | | | | 5.100 | | | | 02/15/45 | | | | 251,963 | |
| | 250,000 | | | | 4.900 | | | | 05/15/46 | | | | 292,638 | |
| | 200,000 | | | | 4.800 | | | | 02/01/49 | | | | 236,149 | |
| | 500,000 | | | | 4.200 | | | | 01/31/50 | | | | 550,652 | |
| | 50,000 | | | | 3.950 | | | | 01/31/60 | | | | 51,763 | |
| | Enterprise Products Operating LLC(b), Series E | |
| | (3M USD LIBOR + 3.033%) | |
| | 164,000 | | | | 5.250 | | | | 08/16/77 | | | | 158,875 | |
| | EOG Resources, Inc. | |
| | 200,000 | | | | 4.375 | | | | 04/15/30 | | | | 239,858 | |
| | Exxon Mobil Corp. | |
| | 220,000 | | | | 2.397 | | | | 03/06/22 | | | | 226,245 | |
| | 500,000 | | | | 1.571 | | | | 04/15/23 | | | | 515,623 | |
| | 875,000 | | | | 2.019 | | | | 08/16/24 | | | | 921,067 | |
| | 525,000 | | | | 3.043 | | | | 03/01/26 | | | | 584,606 | |
| | 150,000 | | | | 3.294 | | | | 03/19/27 | | | | 170,355 | |
| | 300,000 | | | | 2.995 | | | | 08/16/39 | | | | 319,997 | |
| | 260,000 | | | | 3.567 | | | | 03/06/45 | | | | 291,582 | |
| | 880,000 | | | | 4.114 | | | | 03/01/46 | | | | 1,064,995 | |
| | 1,000,000 | | | | 3.095 | | | | 08/16/49 | | | | 1,053,275 | |
| | 210,000 | | | | 4.327 | | | | 03/19/50 | | | | 267,354 | |
| | Kinder Morgan Energy Partners LP | |
| | 350,000 | | | | 5.500 | | | | 03/01/44 | | | | 417,420 | |
| | |
| | |
| 54 | | The accompanying notes are an integral part of these financial statements. |
GOLDMAN SACHS ACCESS INVESTMENT GRADE CORPORATE BOND ETF
| | | | | | | | | | | | | | |
Principal
Amount | | | Interest
Rate | | | Maturity
Date | | | Value | |
|
| Corporate Obligations – (continued) | |
| Energy – (continued) | |
| | Kinder Morgan Energy Partners LP, MTN | |
| $ | 200,000 | | | | 6.950 | % | | | 01/15/38 | | | $ | 268,079 | |
| | Kinder Morgan, Inc. | |
| | 180,000 | | | | 3.150 | | | | 01/15/23 | | | | 189,900 | |
| | 600,000 | | | | 4.300 | | | | 06/01/25 | | | | 680,594 | |
| | 408,000 | | | | 4.300 | | | | 03/01/28 | | | | 471,725 | |
| | 320,000 | | | | 5.550 | | | | 06/01/45 | | | | 396,342 | |
| | 325,000 | | | | 5.050 | | | | 02/15/46 | | | | 387,984 | |
| | Kinder Morgan, Inc., GMTN | |
| | 270,000 | | | | 7.750 | | | | 01/15/32 | | | | 383,238 | |
| | Marathon Oil Corp. | |
| | 100,000 | | | | 2.800 | | | | 11/01/22 | | | | 101,845 | |
| | 300,000 | | | | 4.400 | | | | 07/15/27 | | | | 306,613 | |
| | Marathon Petroleum Corp. | |
| | 340,000 | | | | 4.500 | | | | 05/01/23 | | | | 370,600 | |
| | 1,000,000 | | | | 3.625 | | | | 09/15/24 | | | | 1,077,592 | |
| | 340,000 | | | | 6.500 | | | | 03/01/41 | | | | 436,900 | |
| | MPLX LP | |
| | 1,000,000 | | | | 5.200 | | | | 03/01/47 | | | | 1,136,747 | |
| | 200,000 | | | | 5.500 | | | | 02/15/49 | | | | 237,662 | |
| | ONEOK, Inc. | |
| | 680,000 | | | | 3.100 | | | | 03/15/30 | | | | 645,613 | |
| | Phillips 66 | |
| | 1,190,000 | | | | 4.300 | | | | 04/01/22 | | | | 1,265,911 | |
| | 360,000 | | | | 3.900 | | | | 03/15/28 | | | | 408,292 | |
| | 140,000 | | | | 4.650 | | | | 11/15/34 | | | | 170,135 | |
| | 360,000 | | | | 4.875 | | | | 11/15/44 | | | | 440,612 | |
| | Sabine Pass Liquefaction LLC | |
| | 300,000 | | | | 6.250 | | | | 03/15/22 | | | | 321,600 | |
| | 100,000 | | | | 5.625 | | | | 04/15/23 | | | | 110,650 | |
| | 100,000 | | | | 5.750 | | | | 05/15/24 | | | | 115,000 | |
| | 500,000 | | | | 5.625 | | | | 03/01/25 | | | | 585,000 | |
| | 240,000 | | | | 5.000 | | | | 03/15/27 | | | | 273,900 | |
| | 140,000 | | | | 4.200 | | | | 03/15/28 | | | | 154,350 | |
| | 1,100,000 | | | | 4.500 | (a) | | | 05/15/30 | | | | 1,265,000 | |
| | Sunoco Logistics Partners Operations LP | |
| | 150,000 | | | | 5.350 | | | | 05/15/45 | | | | 143,354 | |
| | 200,000 | | | | 5.400 | | | | 10/01/47 | | | | 193,926 | |
| | Valero Energy Corp. | |
| | 1,060,000 | | | | 3.400 | | | | 09/15/26 | | | | 1,169,288 | |
| | 140,000 | | | | 7.500 | | | | 04/15/32 | | | | 202,246 | |
| | Williams Cos., Inc. (The) | |
| | 1,030,000 | | | | 3.600 | | | | 03/15/22 | | | | 1,070,636 | |
| | 500,000 | | | | 3.700 | | | | 01/15/23 | | | | 529,797 | |
| | 100,000 | | | | 4.000 | | | | 09/15/25 | | | | 111,922 | |
| | 100,000 | | | | 3.750 | | | | 06/15/27 | | | | 110,359 | |
| | 100,000 | | | | 6.300 | | | | 04/15/40 | | | | 125,936 | |
| | 100,000 | | | | 4.850 | | | | 03/01/48 | | | | 115,750 | |
| | | | | | | | | | | | | | |
| | | | | | | | | | | | | 37,909,262 | |
| | |
| Financial Company – 0.7% | |
| | Air Lease Corp., MTN | |
| | 300,000 | | | | 2.300 | | | | 02/01/25 | | | | 294,489 | |
| | Ally Financial, Inc. | |
| | 510,000 | | | | 8.000 | | | | 11/01/31 | | | | 694,988 | |
| | GE Capital Funding LLC(a) | |
| | 750,000 | | | | 4.400 | | | | 05/15/30 | | | | 790,038 | |
| | |
|
| Corporate Obligations – (continued) | |
| Financial Company – (continued) | |
| | GE Capital International Funding Co. Unlimited Co. | |
| 300,000 | | | | 3.373 | | | | 11/15/25 | | | | 318,919 | |
| | 1,740,000 | | | | 4.418 | | | | 11/15/35 | | | | 1,802,087 | |
| | International Lease Finance Corp. | |
| | 325,000 | | | | 5.875 | | | | 08/15/22 | | | | 351,497 | |
| | | | | | | | | | | | | | |
| | | | | | | | | | | | | 4,252,018 | |
| | |
| Food and Beverage – 3.0% | |
| | Coca-Cola Co. (The) | |
| | 475,000 | | | | 2.875 | | | | 10/27/25 | | | | 527,217 | |
| | 880,000 | | | | 2.250 | | | | 09/01/26 | | | | 957,976 | |
| | 400,000 | | | | 3.450 | | | | 03/25/30 | | | | 479,194 | |
| | 500,000 | | | | 1.650 | | | | 06/01/30 | | | | 516,388 | |
| | 340,000 | | | | 2.500 | | | | 06/01/40 | | | | 354,056 | |
| | 330,000 | | | | 2.600 | | | | 06/01/50 | | | | 335,762 | |
| | 220,000 | | | | 2.750 | | | | 06/01/60 | | | | 224,574 | |
| | Conagra Brands, Inc. | |
| | 600,000 | | | | 4.600 | | | | 11/01/25 | | | | 696,098 | |
| | 300,000 | | | | 5.300 | | | | 11/01/38 | | | | 388,634 | |
| | General Mills, Inc. | |
| | 470,000 | | | | 4.200 | | | | 04/17/28 | | | | 557,726 | |
| | Keurig Dr Pepper, Inc. | |
| | 578,000 | | | | 4.057 | | | | 05/25/23 | | | | 631,700 | |
| | 210,000 | | | | 4.597 | | | | 05/25/28 | | | | 254,039 | |
| | Kraft Heinz Foods Co. | |
| | 1,157,000 | | | | 3.950 | | | | 07/15/25 | | | | 1,256,847 | |
| | 1,290,000 | | | | 3.000 | | | | 06/01/26 | | | | 1,342,468 | |
| | 174,000 | | | | 5.000 | | | | 07/15/35 | | | | 201,871 | |
| | 250,000 | | | | 6.875 | | | | 01/26/39 | | | | 342,946 | |
| | 250,000 | | | | 6.500 | | | | 02/09/40 | | | | 320,287 | |
| | 300,000 | | | | 4.375 | | | | 06/01/46 | | | | 308,078 | |
| | 490,000 | | | | 4.875 | (a) | | | 10/01/49 | | | | 537,082 | |
| | Molson Coors Beverage Co. | |
| | 120,000 | | | | 2.100 | | | | 07/15/21 | | | | 121,525 | |
| | 1,380,000 | | | | 3.000 | | | | 07/15/26 | | | | 1,476,296 | |
| | 140,000 | | | | 5.000 | | | | 05/01/42 | | | | 156,912 | |
| | 150,000 | | | | 4.200 | | | | 07/15/46 | | | | 155,584 | |
| | PepsiCo, Inc. | |
| | 70,000 | | | | 2.750 | | | | 03/05/22 | | | | 72,661 | |
| | 725,000 | | | | 3.100 | | | | 07/17/22 | | | | 759,233 | |
| | 80,000 | | | | 2.750 | | | | 04/30/25 | | | | 87,549 | |
| | 500,000 | | | | 2.850 | | | | 02/24/26 | | | | 555,088 | |
| | 100,000 | | | | 2.375 | | | | 10/06/26 | | | | 109,621 | |
| | 100,000 | | | | 3.000 | | | | 10/15/27 | | | | 113,140 | |
| | 870,000 | | | | 4.450 | | | | 04/14/46 | | | | 1,162,251 | |
| | 530,000 | | | | 3.450 | | | | 10/06/46 | | | | 625,463 | |
| | 30,000 | | | | 4.000 | | | | 05/02/47 | | | | 37,741 | |
| | 220,000 | | | | 3.875 | | | | 03/19/60 | | | | 283,498 | |
| | Sysco Corp. | |
| | 400,000 | | | | 3.300 | | | | 07/15/26 | | | | 433,671 | |
| | 860,000 | | | | 3.250 | | | | 07/15/27 | | | | 923,529 | |
| | 400,000 | | | | 5.950 | | | | 04/01/30 | | | | 505,358 | |
| | 200,000 | | | | 6.600 | | | | 04/01/50 | | | | 276,012 | |
| | Tyson Foods, Inc. | |
| | 50,000 | | | | 3.950 | | | | 08/15/24 | | | | 55,624 | |
| | 402,000 | | | | 4.000 | | | | 03/01/26 | | | | 462,857 | |
| | |
| | |
| The accompanying notes are an integral part of these financial statements. | | 55 |
GOLDMAN SACHS ACCESS INVESTMENT GRADE CORPORATE BOND ETF
Schedule of Investments (continued)
August 31, 2020
| | | | | | | | | | | | | | |
Principal
Amount | | | Interest
Rate | | | Maturity
Date | | | Value | |
|
| Corporate Obligations – (continued) | |
| Food and Beverage – (continued) | |
| | Tyson Foods, Inc. – (continued) | |
| $ | 350,000 | | | | 3.550 | % | | | 06/02/27 | | | $ | 396,381 | |
| | 110,000 | | | | 4.550 | | | | 06/02/47 | | | | 139,224 | |
| | 300,000 | | | | 5.100 | | | | 09/28/48 | | | | 412,935 | |
| | | | | | | | | | | | | | |
| | | | | | | | | | | | | 19,555,096 | |
| | |
| Hardware – 0.0% | |
| | Micron Technology, Inc. | |
| | 90,000 | | | | 4.185 | | | | 02/15/27 | | | | 103,050 | |
| | |
| Healthcare – 4.1% | |
| | Aetna, Inc. | |
| | 300,000 | | | | 2.800 | | | | 06/15/23 | | | | 317,660 | |
| | 400,000 | | | | 3.500 | | | | 11/15/24 | | | | 440,668 | |
| | 140,000 | | | | 6.625 | | | | 06/15/36 | | | | 199,919 | |
| | Anthem, Inc. | |
| | 350,000 | | | | 3.500 | | | | 08/15/24 | | | | 384,429 | |
| | 50,000 | | | | 3.350 | | | | 12/01/24 | | | | 55,104 | |
| | 720,000 | | | | 3.650 | | | | 12/01/27 | | | | 825,135 | |
| | 90,000 | | | | 4.625 | | | | 05/15/42 | | | | 113,006 | |
| | 250,000 | | | | 4.650 | | | | 01/15/43 | | | | 316,067 | |
| | 75,000 | | | | 4.650 | | | | 08/15/44 | | | | 96,316 | |
| | 595,000 | | | | 4.375 | | | | 12/01/47 | | | | 751,412 | |
| | 300,000 | | | | 3.125 | | | | 05/15/50 | | | | 317,431 | |
| | Cigna Corp. | |
| | 700,000 | | | | 3.000 | | | | 07/15/23 | | | | 743,389 | |
| | 150,000 | | | | 3.400 | | | | 03/01/27 | | | | 168,254 | |
| | 600,000 | | | | 4.375 | | | | 10/15/28 | | | | 713,357 | |
| | 600,000 | | | | 4.800 | | | | 08/15/38 | | | | 755,200 | |
| | 600,000 | | | | 4.800 | | | | 07/15/46 | | | | 797,864 | |
| | 360,000 | | | | 4.900 | | | | 12/15/48 | | | | 472,572 | |
| | CVS Health Corp. | |
| | 415,000 | | | | 2.125 | | | | 06/01/21 | | | | 419,842 | |
| | 548,000 | | | | 2.750 | | | | 12/01/22 | | | | 573,298 | |
| | 294,000 | | | | 3.700 | | | | 03/09/23 | | | | 316,325 | |
| | 500,000 | | | | 2.625 | | | | 08/15/24 | | | | 536,062 | |
| | 154,000 | | | | 4.100 | | | | 03/25/25 | | | | 175,448 | |
| | 100,000 | | | | 3.875 | | | | 07/20/25 | | | | 113,285 | |
| | 100,000 | | | | 3.000 | | | | 08/15/26 | | | | 109,812 | |
| | 500,000 | | | | 3.625 | | | | 04/01/27 | | | | 566,237 | |
| | 1,316,000 | | | | 4.300 | | | | 03/25/28 | | | | 1,543,838 | |
| | 180,000 | | | | 3.250 | | | | 08/15/29 | | | | 199,970 | |
| | 1,370,000 | | | | 4.780 | | | | 03/25/38 | | | | 1,681,585 | |
| | 300,000 | | | | 4.125 | | | | 04/01/40 | | | | 350,629 | |
| | 195,000 | | | | 5.300 | | | | 12/05/43 | | | | 250,280 | |
| | 578,000 | | | | 5.125 | | | | 07/20/45 | | | | 738,448 | |
| | 950,000 | | | | 5.050 | | | | 03/25/48 | | | | 1,242,770 | |
| | DH Europe Finance II Sarl | |
| | 275,000 | | | | 3.250 | | | | 11/15/39 | | | | 308,690 | |
| | 450,000 | | | | 3.400 | | | | 11/15/49 | | | | 529,151 | |
| | HCA, Inc. | |
| | 320,000 | | | | 4.750 | | | | 05/01/23 | | | | 351,600 | |
| | 470,000 | | | | 5.000 | | | | 03/15/24 | | | | 531,687 | |
| | 270,000 | | | | 5.250 | | | | 04/15/25 | | | | 315,225 | |
| | 300,000 | | | | 5.250 | | | | 06/15/26 | | | | 354,375 | |
| | 425,000 | | | | 4.500 | | | | 02/15/27 | | | | 486,094 | |
| | 354,000 | | | | 4.125 | | | | 06/15/29 | | | | 409,224 | |
| | |
|
| Corporate Obligations – (continued) | |
| Healthcare – (continued) | |
| | HCA, Inc. – (continued) | |
| 295,000 | | | | 5.125 | | | | 06/15/39 | | | | 365,063 | |
| | 345,000 | | | | 5.500 | | | | 06/15/47 | | | | 440,392 | |
| | UnitedHealth Group, Inc. | |
| | 400,000 | | | | 2.875 | | | | 03/15/22 | | | | 413,125 | |
| | 359,000 | | | | 2.875 | | | | 03/15/23 | | | | 381,253 | |
| | 420,000 | | | | 3.750 | | | | 07/15/25 | | | | 480,199 | |
| | 480,000 | | | | 3.100 | | | | 03/15/26 | | | | 538,380 | |
| | 580,000 | | | | 3.450 | | | | 01/15/27 | | | | 659,872 | |
| | 200,000 | | | | 3.850 | | | | 06/15/28 | | | | 235,649 | |
| | 700,000 | | | | 2.875 | | | | 08/15/29 | | | | 783,046 | |
| | 120,000 | | | | 4.625 | | | | 07/15/35 | | | | 159,209 | |
| | 225,000 | | | | 5.800 | | | | 03/15/36 | | | | 325,659 | |
| | 140,000 | | | | 6.875 | | | | 02/15/38 | | | | 226,812 | |
| | 200,000 | | | | 4.250 | | | | 03/15/43 | | | | 256,347 | |
| | 300,000 | | | | 4.750 | | | | 07/15/45 | | | | 410,005 | |
| | 180,000 | | | | 4.200 | | | | 01/15/47 | | | | 226,515 | |
| | 130,000 | | | | 3.750 | | | | 10/15/47 | | | | 154,643 | |
| | 270,000 | | | | 4.450 | | | | 12/15/48 | | | | 357,312 | |
| | 500,000 | | | | 3.875 | | | | 08/15/59 | | | | 624,669 | |
| | | | | | | | | | | | | | |
| | | | | | | | | | | | | 26,609,808 | |
| | |
| Insurance – 1.7% | |
| | American International Group, Inc. | |
| | 450,000 | | | | 4.875 | | | | 06/01/22 | | | | 484,530 | |
| | 365,000 | | | | 3.750 | | | | 07/10/25 | | | | 409,794 | |
| | 715,000 | | | | 3.900 | | | | 04/01/26 | | | | 819,810 | |
| | 300,000 | | | | 3.875 | | | | 01/15/35 | | | | 345,831 | |
| | 552,000 | | | | 4.500 | | | | 07/16/44 | | | | 652,661 | |
| | American International Group, Inc.(b), Series A-9 | |
| | (3M USD LIBOR + 2.868%) | |
| | 275,000 | | | | 5.750 | | | | 04/01/48 | | | | 301,813 | |
| | Berkshire Hathaway Finance Corp. | |
| | 10,000 | | | | 5.750 | | | | 01/15/40 | | | | 15,041 | |
| | 460,000 | | | | 4.200 | | | | 08/15/48 | | | | 579,922 | |
| | 610,000 | | | | 4.250 | | | | 01/15/49 | | | | 793,210 | |
| | Berkshire Hathaway, Inc. | |
| | 520,000 | | | | 3.125 | | | | 03/15/26 | | | | 582,450 | |
| | 90,000 | | | | 4.500 | | | | 02/11/43 | | | | 118,962 | |
| | Brighthouse Financial, Inc. | |
| | 450,000 | | | | 4.700 | | | | 06/22/47 | | | | 429,753 | |
| | Chubb INA Holdings, Inc. | |
| | 450,000 | | | | 4.350 | | | | 11/03/45 | | | | 598,815 | |
| | Equitable Holdings, Inc. | |
| | 350,000 | | | | 3.900 | | | | 04/20/23 | | | | 377,626 | |
| | 506,000 | | | | 4.350 | | | | 04/20/28 | | | | 577,761 | |
| | 130,000 | | | | 5.000 | | | | 04/20/48 | | | | 153,199 | |
| | Marsh & McLennan Cos., Inc. | |
| | 200,000 | | | | 4.900 | | | | 03/15/49 | | | | 280,440 | |
| | MetLife, Inc. | |
| | 50,000 | | | | 3.600 | | | | 04/10/24 | | | | 55,649 | |
| | 240,000 | | | | 6.375 | | | | 06/15/34 | | | | 365,842 | |
| | 170,000 | | | | 5.700 | | | | 06/15/35 | | | | 250,260 | |
| | 170,000 | | | | 5.875 | | | | 02/06/41 | | | | 249,440 | |
| | 150,000 | | | | 4.125 | | | | 08/13/42 | | | | 183,890 | |
| | 179,000 | | | | 4.875 | | | | 11/13/43 | | | | 241,631 | |
| | 120,000 | | | | 4.050 | | | | 03/01/45 | | | | 145,398 | |
| | |
| | |
| 56 | | The accompanying notes are an integral part of these financial statements. |
GOLDMAN SACHS ACCESS INVESTMENT GRADE CORPORATE BOND ETF
| | | | | | | | | | | | | | |
Principal
Amount | | | Interest
Rate | | | Maturity
Date | | | Value | |
|
| Corporate Obligations – (continued) | |
| Insurance – (continued) | |
| | MetLife, Inc. – (continued) | |
| $ | 100,000 | | | | 4.600 | % | | | 05/13/46 | | | $ | 132,132 | |
| | Prudential Financial, Inc. | |
| | (3M USD LIBOR + 3.920%) | |
| | 450,000 | | | | 5.625 | (b) | | | 06/15/43 | | | | 483,221 | |
| | (3M USD LIBOR + 2.380%) | |
| | 400,000 | | | | 4.500 | (b) | | | 09/15/47 | | | | 430,439 | |
| | 210,000 | | | | 3.905 | | | | 12/07/47 | | | | 236,109 | |
| | Prudential Financial, Inc., MTN | |
| | 570,000 | | | | 4.350 | | | | 02/25/50 | | | | 681,523 | |
| | | | | | | | | | | | | | |
| | | | | | | | | | | | | 10,977,152 | |
| | |
| Metals and Mining – 0.1% | |
| | Newmont Corp. | |
| | 310,000 | | | | 4.875 | | | | 03/15/42 | | | | 420,898 | |
| | |
| REITs and Real Estate – 1.0% | |
| | Boston Properties LP | |
| | 520,000 | | | | 3.850 | | | | 02/01/23 | | | | 555,788 | |
| | 375,000 | | | | 3.650 | | | | 02/01/26 | | | | 418,092 | |
| | 60,000 | | | | 2.750 | | | | 10/01/26 | | | | 64,793 | |
| | 150,000 | | | | 4.500 | | | | 12/01/28 | | | | 177,923 | |
| | 500,000 | | | | 3.250 | | | | 01/30/31 | | | | 545,698 | |
| | Equinix, Inc. | |
| | 350,000 | | | | 2.625 | | | | 11/18/24 | | | | 375,844 | |
| | 520,000 | | | | 5.375 | | | | 05/15/27 | | | | 571,350 | |
| | 350,000 | | | | 3.200 | | | | 11/18/29 | | | | 387,826 | |
| | GLP Capital LP / GLP Financing II, Inc. | |
| | 475,000 | | | | 5.375 | | | | 04/15/26 | | | | 527,782 | |
| | 300,000 | | | | 5.300 | | | | 01/15/29 | | | | 333,870 | |
| | Healthpeak Properties, Inc. | |
| | 200,000 | | | | 4.000 | | | | 06/01/25 | | | | 223,475 | |
| | Prologis LP | |
| | 450,000 | | | | 4.250 | | | | 08/15/23 | | | | 498,033 | |
| | 50,000 | | | | 3.750 | | | | 11/01/25 | | | | 57,294 | |
| | Simon Property Group LP | |
| | 500,000 | | | | 3.375 | | | | 10/01/24 | | | | 541,406 | |
| | 130,000 | | | | 3.300 | | | | 01/15/26 | | | | 142,295 | |
| | 200,000 | | | | 3.375 | | | | 12/01/27 | | | | 216,780 | |
| | 100,000 | | | | 3.250 | | | | 09/13/49 | | | | 95,360 | |
| | Welltower, Inc. | |
| | 60,000 | | | | 4.000 | | | | 06/01/25 | | | | 67,545 | |
| | 185,000 | | | | 4.250 | | | | 04/15/28 | | | | 209,502 | |
| | 200,000 | | | | 3.100 | | | | 01/15/30 | | | | 210,812 | |
| | | | | | | | | | | | | | |
| | | | | | | | | | | | | 6,221,468 | |
| | |
| Revenue – 0.1% | |
| | CommonSpirit Health | |
| | 100,000 | | | | 2.760 | | | | 10/01/24 | | | | 104,502 | |
| | 120,000 | | | | 3.347 | | | | 10/01/29 | | | | 126,751 | |
| | 250,000 | | | | 4.350 | | | | 11/01/42 | | | | 276,806 | |
| | Kaiser Foundation Hospitals | |
| | 340,000 | | | | 4.150 | | | | 05/01/47 | | | | 438,357 | |
| | | | | | | | | | | | | | |
| | | | | | | | | | | | | 946,416 | |
| | |
| Software – 1.9% | |
| | Fiserv, Inc. | |
| | 300,000 | | | | 2.250 | | | | 06/01/27 | | | | 318,863 | |
| | 500,000 | | | | 2.650 | | | | 06/01/30 | | | | 540,017 | |
| | |
|
| Corporate Obligations – (continued) | |
| Software – (continued) | |
| | Oracle Corp. | |
| 656,000 | | | | 2.800 | | | | 07/08/21 | | | | 669,997 | |
| | 300,000 | | | | 1.900 | | | | 09/15/21 | | | | 304,746 | |
| | 970,000 | | | | 2.500 | | | | 05/15/22 | | | | 1,002,517 | |
| | 600,000 | | | | 2.500 | | | | 10/15/22 | | | | 627,064 | |
| | 30,000 | | | | 2.625 | | | | 02/15/23 | | | | 31,587 | |
| | 150,000 | | | | 2.400 | | | | 09/15/23 | | | | 158,503 | |
| | 625,000 | | | | 3.400 | | | | 07/08/24 | | | | 686,630 | |
| | 40,000 | | | | 2.950 | | | | 11/15/24 | | | | 43,700 | |
| | 130,000 | | | | 2.950 | | | | 05/15/25 | | | | 142,630 | |
| | 1,169,000 | | | | 2.650 | | | | 07/15/26 | | | | 1,283,316 | |
| | 80,000 | | | | 3.250 | | | | 11/15/27 | | | | 90,542 | |
| | 740,000 | | | | 4.300 | | | | 07/08/34 | | | | 926,171 | |
| | 200,000 | | | | 3.900 | | | | 05/15/35 | | | | 242,870 | |
| | 270,000 | | | | 3.850 | | | | 07/15/36 | | | | 319,274 | |
| | 245,000 | | | | 3.800 | | | | 11/15/37 | | | | 283,465 | |
| | 312,000 | | | | 6.500 | | | | 04/15/38 | | | | 479,994 | |
| | 400,000 | | | | 3.600 | | | | 04/01/40 | | | | 453,492 | |
| | 220,000 | | | | 5.375 | | | | 07/15/40 | | | | 302,832 | |
| | 700,000 | | | | 4.125 | | | | 05/15/45 | | | | 835,985 | |
| | 440,000 | | | | 4.000 | | | | 07/15/46 | | | | 520,501 | |
| | 310,000 | | | | 4.000 | | | | 11/15/47 | | | | 368,249 | |
| | 500,000 | | | | 3.600 | | | | 04/01/50 | | | | 566,031 | |
| | 200,000 | | | | 4.375 | | | | 05/15/55 | | | | 248,067 | |
| | 545,000 | | | | 3.850 | | | | 04/01/60 | | | | 633,312 | |
| | | | | | | | | | | | | | |
| | | | | | | | | | | | | 12,080,355 | |
| | |
| Technology – 8.0% | |
| | Adobe, Inc. | |
| | 180,000 | | | | 2.150 | | | | 02/01/27 | | | | 193,355 | |
| | 400,000 | | | | 2.300 | | | | 02/01/30 | | | | 432,208 | |
| | Alphabet, Inc. | |
| | 743,000 | | | | 1.998 | | | | 08/15/26 | | | | 799,555 | |
| | 440,000 | | | | 2.050 | | | | 08/15/50 | | | | 418,975 | |
| | 200,000 | | | | 2.250 | | | | 08/15/60 | | | | 191,832 | |
| | Apple, Inc. | |
| | 165,000 | | | | 1.550 | | | | 08/04/21 | | | | 166,908 | |
| | 1,680,000 | | | | 2.500 | | | | 02/09/22 | | | | 1,731,329 | |
| | 1,688,000 | | | | 2.100 | | | | 09/12/22 | | | | 1,746,199 | |
| | 30,000 | | | | 3.000 | | | | 02/09/24 | | | | 32,398 | |
| | 589,000 | | | | 3.450 | | | | 05/06/24 | | | | 652,299 | |
| | 425,000 | | | | 2.850 | | | | 05/11/24 | | | | 459,560 | |
| | 350,000 | | | | 2.450 | | | | 08/04/26 | | | | 383,600 | |
| | 210,000 | | | | 3.000 | | | | 06/20/27 | | | | 237,241 | |
| | 355,000 | | | | 2.900 | | | | 09/12/27 | | | | 399,914 | |
| | 410,000 | | | | 3.000 | | | | 11/13/27 | | | | 464,563 | |
| | 680,000 | | | | 4.500 | | | | 02/23/36 | | | | 906,191 | |
| | 687,000 | | | | 3.850 | | | | 05/04/43 | | | | 844,114 | |
| | 10,000 | | | | 4.450 | | | | 05/06/44 | | | | 13,397 | |
| | 200,000 | | | | 3.450 | | | | 02/09/45 | | | | 233,817 | |
| | 380,000 | | | | 4.375 | | | | 05/13/45 | | | | 502,255 | |
| | 690,000 | | | | 4.650 | | | | 02/23/46 | | | | 943,922 | |
| | 494,000 | | | | 3.850 | | | | 08/04/46 | | | | 610,499 | |
| | 480,000 | | | | 4.250 | | | | 02/09/47 | | | | 628,768 | |
| | 50,000 | | | | 3.750 | | | | 11/13/47 | | | | 60,742 | |
| | 420,000 | | | | 2.950 | | | | 09/11/49 | | | | 457,379 | |
| | |
| | |
| The accompanying notes are an integral part of these financial statements. | | 57 |
GOLDMAN SACHS ACCESS INVESTMENT GRADE CORPORATE BOND ETF
Schedule of Investments (continued)
August 31, 2020
| | | | | | | | | | | | | | |
Principal
Amount | | | Interest
Rate | | | Maturity
Date | | | Value | |
|
| Corporate Obligations – (continued) | |
| Technology – (continued) | |
| | Applied Materials, Inc. | |
| $ | 940,000 | | | | 3.300 | % | | | 04/01/27 | | | $ | 1,076,644 | |
| | 200,000 | | | | 4.350 | | | | 04/01/47 | | | | 270,443 | |
| | Broadcom Corp. / Broadcom Cayman Finance Ltd. | |
| | 30,000 | | | | 2.650 | | | | 01/15/23 | | | | 31,215 | |
| | 100,000 | | | | 3.625 | | | | 01/15/24 | | | | 108,066 | |
| | 500,000 | | | | 3.125 | | | | 01/15/25 | | | | 536,855 | |
| | 727,000 | | | | 3.875 | | | | 01/15/27 | | | | 806,850 | |
| | 160,000 | | | | 3.500 | | | | 01/15/28 | | | | 173,068 | |
| | Broadcom, Inc. | |
| | 150,000 | | | | 3.625 | | | | 10/15/24 | | | | 164,777 | |
| | 360,000 | | | | 4.250 | | | | 04/15/26 | | | | 407,955 | |
| | 497,000 | | | | 3.459 | | | | 09/15/26 | | | | 541,845 | |
| | 530,000 | | | | 4.750 | | | | 04/15/29 | | | | 619,563 | |
| | 1,000,000 | | | | 5.000 | | | | 04/15/30 | | | | 1,180,713 | |
| | 500,000 | | | | 4.150 | | | | 11/15/30 | | | | 560,393 | |
| | 300,000 | | | | 4.300 | | | | 11/15/32 | | | | 345,210 | |
| | Cisco Systems, Inc. | |
| | 150,000 | | | | 1.850 | | | | 09/20/21 | | | | 152,332 | |
| | 165,000 | | | | 3.625 | | | | 03/04/24 | | | | 183,539 | |
| | 666,000 | | | | 5.900 | | | | 02/15/39 | | | | 1,013,870 | |
| | 270,000 | | | | 5.500 | | | | 01/15/40 | | | | 399,057 | |
| | Dell International LLC / EMC Corp. | |
| | 707,000 | | | | 4.420 | (a) | | | 06/15/21 | | | | 724,982 | |
| | 175,000 | | | | 5.450 | (a) | | | 06/15/23 | | | | 192,760 | |
| | 764,000 | | | | 6.020 | (a) | | | 06/15/26 | | | | 898,384 | |
| | 690,000 | | | | 8.100 | (a) | | | 07/15/36 | | | | 912,897 | |
| | 460,000 | | | | 8.350 | (a) | | | 07/15/46 | | | | 619,551 | |
| | Fidelity National Information Services, Inc. | |
| | 189,000 | | | | 3.000 | | | | 08/15/26 | | | | 210,414 | |
| | Fiserv, Inc. | |
| | 500,000 | | | | 3.800 | | | | 10/01/23 | | | | 547,787 | |
| | 1,100,000 | | | | 3.500 | | | | 07/01/29 | | | | 1,253,649 | |
| | HP, Inc. | |
| | 268,000 | | | | 6.000 | | | | 09/15/41 | | | | 330,144 | |
| | Intel Corp. | |
| | 420,000 | | | | 2.875 | | | | 05/11/24 | | | | 454,713 | |
| | 378,000 | | | | 3.700 | | | | 07/29/25 | | | | 430,770 | |
| | 200,000 | | | | 2.600 | | | | 05/19/26 | | | | 220,317 | |
| | 440,000 | | | | 3.150 | | | | 05/11/27 | | | | 495,724 | |
| | 700,000 | | | | 2.450 | | | | 11/15/29 | | | | 760,877 | |
| | 290,000 | | | | 4.100 | | | | 05/19/46 | | | | 363,309 | |
| | 320,000 | | | | 4.100 | | | | 05/11/47 | | | | 405,398 | |
| | 95,000 | | | | 3.734 | | | | 12/08/47 | | | | 113,528 | |
| | 850,000 | | | | 3.250 | | | | 11/15/49 | | | | 954,160 | |
| | 300,000 | | | | 4.750 | | | | 03/25/50 | | | | 414,699 | |
| | 100,000 | | | | 4.950 | | | | 03/25/60 | | | | 145,298 | |
| | International Business Machines Corp. | |
| | 800,000 | | | | 1.875 | | | | 08/01/22 | | | | 823,732 | |
| | 820,000 | | | | 3.300 | | | | 05/15/26 | | | | 932,013 | |
| | 500,000 | | | | 1.950 | | | | 05/15/30 | | | | 518,434 | |
| | 500,000 | | | | 4.150 | | | | 05/15/39 | | | | 613,779 | |
| | 427,000 | | | | 4.000 | | | | 06/20/42 | | | | 514,929 | |
| | 300,000 | | | | 2.950 | | | | 05/15/50 | | | | 313,165 | |
| | Lam Research Corp. | |
| | 525,000 | | | | 4.000 | | | | 03/15/29 | | | | 630,167 | |
| | 170,000 | | | | 4.875 | | | | 03/15/49 | | | | 244,142 | |
| | |
|
| Corporate Obligations – (continued) | |
| Technology – (continued) | |
| | Microsoft Corp. | |
| 900,000 | | | | 1.550 | | | | 08/08/21 | | | | 910,328 | |
| | 410,000 | | | | 2.400 | | | | 02/06/22 | | | | 422,062 | |
| | 662,000 | | | | 2.375 | | | | 02/12/22 | | | | 681,559 | |
| | 450,000 | | | | 2.000 | | | | 08/08/23 | | | | 471,610 | |
| | 97,000 | | | | 2.875 | | | | 02/06/24 | | | | 104,764 | |
| | 665,000 | | | | 2.700 | | | | 02/12/25 | | | | 728,121 | |
| | 160,000 | | | | 2.400 | | | | 08/08/26 | | | | 175,170 | |
| | 115,000 | | | | 3.300 | | | | 02/06/27 | | | | 131,767 | |
| | 360,000 | | | | 3.500 | | | | 02/12/35 | | | | 443,497 | |
| | 450,000 | | | | 3.450 | | | | 08/08/36 | | | | 541,044 | |
| | 13,000 | | | | 4.100 | | | | 02/06/37 | | | | 16,863 | |
| | 280,000 | | | | 3.500 | | | | 11/15/42 | | | | 334,846 | |
| | 810,000 | | | | 3.700 | | | | 08/08/46 | | | | 1,017,695 | |
| | 1,491,000 | | | | 2.525 | | | | 06/01/50 | | | | 1,580,178 | |
| | 347,000 | | | | 3.950 | | | | 08/08/56 | | | | 451,341 | |
| | 968,000 | | | | 2.675 | | | | 06/01/60 | | | | 1,019,880 | |
| | NVIDIA Corp. | |
| | 680,000 | | | | 3.200 | | | | 09/16/26 | | | | 770,335 | |
| | 440,000 | | | | 3.500 | | | | 04/01/50 | | | | 501,152 | |
| | PayPal Holdings, Inc. | |
| | 500,000 | | | | 2.400 | | | | 10/01/24 | | | | 534,234 | |
| | 460,000 | | | | 3.250 | | | | 06/01/50 | | | | 524,750 | |
| | QUALCOMM, Inc. | |
| | 276,000 | | | | 2.900 | | | | 05/20/24 | | | | 297,661 | |
| | 360,000 | | | | 3.250 | | | | 05/20/27 | | | | 407,087 | |
| | 200,000 | | | | 4.650 | | | | 05/20/35 | | | | 271,423 | |
| | 620,000 | | | | 4.800 | | | | 05/20/45 | | | | 847,876 | |
| | 200,000 | | | | 4.300 | | | | 05/20/47 | | | | 255,980 | |
| | Texas Instruments, Inc. | |
| | 372,000 | | | | 4.150 | | | | 05/15/48 | | | | 491,104 | |
| | VMware, Inc. | |
| | 400,000 | | | | 2.950 | | | | 08/21/22 | | | | 417,480 | |
| | | | | | | | | | | | | | |
| | | | | | | | | | | | | 51,472,944 | |
| | |
| Transportation – 1.6% | |
| | Burlington Northern Santa Fe LLC | |
| | 55,000 | | | | 5.750 | | | | 05/01/40 | | | | 80,427 | |
| | 250,000 | | | | 4.450 | | | | 03/15/43 | | | | 325,607 | |
| | 130,000 | | | | 4.900 | | | | 04/01/44 | | | | 180,065 | |
| | 150,000 | | | | 4.550 | | | | 09/01/44 | | | | 199,023 | |
| | 310,000 | | | | 4.150 | | | | 04/01/45 | | | | 394,478 | |
| | 750,000 | | | | 3.900 | | | | 08/01/46 | | | | 935,873 | |
| | CSX Corp. | |
| | 700,000 | | | | 3.250 | | | | 06/01/27 | | | | 792,134 | |
| | 30,000 | | | | 3.800 | | | | 03/01/28 | | | | 35,171 | |
| | 190,000 | | | | 3.800 | | | | 11/01/46 | | | | 223,595 | |
| | FedEx Corp. | |
| | 1,000,000 | | | | 3.800 | | | | 05/15/25 | | | | 1,131,321 | |
| | 340,000 | | | | 3.100 | | | | 08/05/29 | | | | 374,964 | |
| | 260,000 | | | | 4.400 | | | | 01/15/47 | | | | 298,144 | |
| | 700,000 | | | | 4.950 | | | | 10/17/48 | | | | 877,783 | |
| | Union Pacific Corp. | |
| | 530,000 | | | | 4.163 | | | | 07/15/22 | | | | 562,223 | |
| | 450,000 | | | | 3.950 | | | | 09/10/28 | | | | 534,108 | |
| | 50,000 | | | | 4.375 | | | | 09/10/38 | | | | 62,398 | |
| | 300,000 | | | | 4.300 | | | | 03/01/49 | | | | 391,865 | |
| | |
| | |
| 58 | | The accompanying notes are an integral part of these financial statements. |
GOLDMAN SACHS ACCESS INVESTMENT GRADE CORPORATE BOND ETF
| | | | | | | | | | | | | | |
Principal
Amount | | | Interest
Rate | | | Maturity
Date | | | Value | |
|
| Corporate Obligations – (continued) | |
| Transportation – (continued) | |
| | Union Pacific Corp. – (continued) | |
| $ | 400,000 | | | | 3.250 | % | | | 02/05/50 | | | $ | 443,345 | |
| | 310,000 | | | | 3.799 | | | | 10/01/51 | | | | 376,346 | |
| | United Parcel Service, Inc. | |
| | 1,000,000 | | | | 2.450 | | | | 10/01/22 | | | | 1,044,216 | |
| | 260,000 | | | | 3.400 | | | | 03/15/29 | | | | 301,838 | |
| | 330,000 | | | | 3.750 | | | | 11/15/47 | | | | 393,747 | |
| | 200,000 | | | | 5.300 | | | | 04/01/50 | | | | 296,841 | |
| | | | | | | | | | | | | | |
| | | | | | | | | | | | | 10,255,512 | |
| | |
| Wireless – 5.0% | |
| | American Tower Corp. | |
| | 250,000 | | | | 4.000 | | | | 06/01/25 | | | | 284,246 | |
| | 400,000 | | | | 3.375 | | | | 10/15/26 | | | | 450,517 | |
| | 475,000 | | | | 3.800 | | | | 08/15/29 | | | | 549,876 | |
| | 80,000 | | | | 2.900 | | | | 01/15/30 | | | | 87,148 | |
| | AT&T, Inc. | |
| | 50,000 | | | | 3.000 | | | | 06/30/22 | | | | 52,168 | |
| | 230,000 | | | | 2.625 | | | | 12/01/22 | | | | 240,927 | |
| | 100,000 | | | | 3.950 | | | | 01/15/25 | | | | 112,715 | |
| | 280,000 | | | | 4.125 | | | | 02/17/26 | | | | 323,952 | |
| | 415,000 | | | | 3.800 | | | | 02/15/27 | | | | 474,640 | |
| | 400,000 | | | | 4.250 | | | | 03/01/27 | | | | 469,158 | |
| | 560,000 | | | | 4.100 | | | | 02/15/28 | | | | 649,948 | |
| | 565,000 | | | | 4.350 | | | | 03/01/29 | | | | 672,165 | |
| | 1,020,000 | | | | 4.300 | | | | 02/15/30 | | | | 1,219,251 | |
| | 670,000 | | | | 2.750 | | | | 06/01/31 | | | | 711,140 | |
| | 685,000 | | | | 4.500 | | | | 05/15/35 | | | | 820,681 | |
| | 551,000 | | | | 5.250 | | | | 03/01/37 | | | | 694,496 | |
| | 180,000 | | | | 4.900 | | | | 08/15/37 | | | | 223,481 | |
| | 340,000 | | | | 4.850 | | | | 03/01/39 | | | | 413,333 | |
| | 360,000 | | | | 6.000 | | | | 08/15/40 | | | | 486,413 | |
| | 90,000 | | | | 5.350 | | | | 09/01/40 | | | | 115,716 | |
| | 100,000 | | | | 6.375 | | | | 03/01/41 | | | | 140,770 | |
| | 640,000 | | | | 5.550 | | | | 08/15/41 | | | | 836,281 | |
| | 254,000 | | | | 5.150 | | | | 03/15/42 | | | | 317,166 | |
| | 450,000 | | | | 4.300 | | | | 12/15/42 | | | | 513,297 | |
| | 370,000 | | | | 4.800 | | | | 06/15/44 | | | | 447,425 | |
| | 430,000 | | | | 4.350 | | | | 06/15/45 | | | | 494,035 | |
| | 50,000 | | | | 4.850 | | | | 07/15/45 | | | | 60,665 | |
| | 535,000 | | | | 4.750 | | | | 05/15/46 | | | | 644,502 | |
| | 260,000 | | | | 5.150 | | | | 11/15/46 | | | | 326,816 | |
| | 250,000 | | | | 5.650 | | | | 02/15/47 | | | | 330,356 | |
| | 490,000 | | | | 5.450 | | | | 03/01/47 | | | | 643,046 | |
| | 640,000 | | | | 4.500 | | | | 03/09/48 | | | | 754,718 | |
| | 367,000 | | | | 4.550 | | | | 03/09/49 | | | | 435,757 | |
| | 610,000 | | | | 5.150 | | | | 02/15/50 | | | | 774,865 | |
| | 470,000 | | | | 3.650 | | | | 06/01/51 | | | | 499,097 | |
| | 70,000 | | | | 5.700 | | | | 03/01/57 | | | | 96,374 | |
| | CC Holdings GS V LLC / Crown Castle GS III Corp. | |
| | 450,000 | | | | 3.849 | | | | 04/15/23 | | | | 486,084 | |
| | Crown Castle International Corp. | |
| | 340,000 | | | | 5.250 | | | | 01/15/23 | | | | 376,695 | |
| | 60,000 | | | | 3.150 | | | | 07/15/23 | | | | 64,128 | |
| | 210,000 | | | | 4.450 | | | | 02/15/26 | | | | 243,707 | |
| | 130,000 | | | | 3.650 | | | | 09/01/27 | | | | 147,439 | |
| | 100,000 | | | | 3.250 | | | | 01/15/51 | | | | 104,369 | |
| | |
|
| Corporate Obligations – (continued) | |
| Wireless – (continued) | |
| | T-Mobile USA, Inc. | |
| 700,000 | | | | 3.500 | (a) | | | 04/15/25 | | | | 773,874 | |
| | 1,200,000 | | | | 3.875 | (a) | | | 04/15/30 | | | | 1,376,934 | |
| | 600,000 | | | | 4.375 | (a) | | | 04/15/40 | | | | 725,977 | |
| | 400,000 | | | | 4.500 | (a) | | | 04/15/50 | | | | 492,294 | |
| | Verizon Communications, Inc. | |
| | 521,000 | | | | 2.946 | | | | 03/15/22 | | | | 540,777 | |
| | 480,000 | | | | 5.150 | | | | 09/15/23 | | | | 547,625 | |
| | 150,000 | | | | 3.500 | | | | 11/01/24 | | | | 167,271 | |
| | 184,000 | | | | 3.376 | | | | 02/15/25 | | | | 205,920 | |
| | 1,149,000 | | | | 2.625 | | | | 08/15/26 | | | | 1,265,480 | |
| | 450,000 | | | | 4.125 | | | | 03/16/27 | | | | 532,029 | |
| | 950,000 | | | | 4.329 | | | | 09/21/28 | | | | 1,149,989 | |
| | 270,000 | | | | 4.016 | | | | 12/03/29 | | | | 324,138 | |
| | 485,000 | | | | 4.500 | | | | 08/10/33 | | | | 616,414 | |
| | 350,000 | | | | 4.400 | | | | 11/01/34 | | | | 438,879 | |
| | 220,000 | | | | 4.272 | | | | 01/15/36 | | | | 269,594 | |
| | 385,000 | | | | 5.250 | | | | 03/16/37 | | | | 525,168 | |
| | 225,000 | | | | 4.812 | | | | 03/15/39 | | | | 296,000 | |
| | 400,000 | | | | 3.850 | | | | 11/01/42 | | | | 476,167 | |
| | 60,000 | | | | 6.550 | | | | 09/15/43 | | | | 96,450 | |
| | 430,000 | | | | 4.125 | | | | 08/15/46 | | | | 530,082 | |
| | 640,000 | | | | 4.862 | | | | 08/21/46 | | | | 864,797 | |
| | 110,000 | | | | 5.500 | | | | 03/16/47 | | | | 161,889 | |
| | 300,000 | | | | 4.522 | | | | 09/15/48 | | | | 395,573 | |
| | 330,000 | | | | 5.012 | | | | 04/15/49 | | | | 465,147 | |
| | 562,000 | | | | 5.012 | | | | 08/21/54 | | | | 817,896 | |
| | 405,000 | | | | 4.672 | | | | 03/15/55 | | | | 560,173 | |
| | | | | | | | | | | | | | |
| | | | | | | | | | | | | 32,406,100 | |
| | |
| | TOTAL CORPORATE OBLIGATIONS | |
| | (Cost $469,991,278) | | | | | | | $ | 505,171,409 | |
| | |
| | | | | | | | | | | | | | |
|
| Foreign Corporate Debt – 19.5% | |
| Banks – 9.8% | |
| | Australia & New Zealand Banking Group Ltd., MTN (Australia) | |
| $ | 480,000 | | | | 2.300 | % | | | 06/01/21 | | | $ | 486,678 | |
| | 510,000 | | | | 2.050 | | | | 11/21/22 | | | | 529,370 | |
| | Australia & New Zealand Banking Group Ltd. (Australia) | |
| | 280,000 | | | | 2.550 | | | | 11/23/21 | | | | 287,803 | |
| | Banco Santander SA (Spain) | |
| | 800,000 | | | | 3.848 | | | | 04/12/23 | | | | 859,723 | |
| | 800,000 | | | | 2.706 | | | | 06/27/24 | | | | 851,002 | |
| | 400,000 | | | | 3.800 | | | | 02/23/28 | | | | 439,519 | |
| | 400,000 | | | | 3.306 | | | | 06/27/29 | | | | 437,392 | |
| | Bank of Montreal, MTN (Canada) | |
| | 120,000 | | | | 1.900 | | | | 08/27/21 | | | | 121,989 | |
| | 1,100,000 | | | | 2.900 | | | | 03/26/22 | | | | 1,144,326 | |
| | 200,000 | | | | 2.550 | | | | 11/06/22 | | | | 209,183 | |
| | Bank of Montreal(b) (Canada) (5 Year USD Swap + 1.432%) | |
| | 400,000 | | | | 3.803 | | | | 12/15/32 | | | | 444,500 | |
| | Bank of Nova Scotia (The) (Canada) | |
| | 850,000 | | | | 2.000 | | | | 11/15/22 | | | | 879,724 | |
| | 945,000 | | | | 3.400 | | | | 02/11/24 | | | | 1,032,083 | |
| | |
| | |
| The accompanying notes are an integral part of these financial statements. | | 59 |
GOLDMAN SACHS ACCESS INVESTMENT GRADE CORPORATE BOND ETF
Schedule of Investments (continued)
August 31, 2020
| | | | | | | | | | | | | | |
Principal
Amount | | | Interest
Rate | | | Maturity
Date | | | Value | |
|
| Foreign Corporate Debt – (continued) | |
| Banks – (continued) | |
| | Barclays PLC (United Kingdom) | |
| $ | 200,000 | | | | 3.684 | % | | | 01/10/23 | | | $ | 207,484 | |
| | (3M USD LIBOR + 1.400%) | |
| | 400,000 | | | | 4.610 | (b) | | | 02/15/23 | | | | 421,023 | |
| | (3M USD LIBOR + 1.356%) | |
| | 700,000 | | | | 4.338 | (b) | | | 05/16/24 | | | | 758,625 | |
| | 890,000 | | | | 3.650 | | | | 03/16/25 | | | | 970,734 | |
| | 1,160,000 | | | | 4.375 | | | | 01/12/26 | | | | 1,322,106 | |
| | 400,000 | | | | 4.836 | | | | 05/09/28 | | | | 445,470 | |
| | 330,000 | | | | 5.250 | | | | 08/17/45 | | | | 453,736 | |
| | 400,000 | | | | 4.950 | | | | 01/10/47 | | | | 542,966 | |
| | BNP Paribas SA, MTN (France) | |
| | 50,000 | | | | 3.250 | | | | 03/03/23 | | | | 53,409 | |
| | Canadian Imperial Bank of Commerce (Canada) | |
| | 300,000 | | | | 3.500 | | | | 09/13/23 | | | | 328,028 | |
| | Cooperatieve Rabobank UA (Netherlands) | |
| | 650,000 | | | | 3.875 | | | | 02/08/22 | | | | 683,355 | |
| | 370,000 | | | | 3.950 | | | | 11/09/22 | | | | 394,909 | |
| | 350,000 | | | | 4.625 | | | | 12/01/23 | | | | 390,125 | |
| | 250,000 | | | | 3.750 | | | | 07/21/26 | | | | 278,667 | |
| | 285,000 | | | | 5.250 | | | | 05/24/41 | | | | 418,799 | |
| | 340,000 | | | | 5.750 | | | | 12/01/43 | | | | 498,525 | |
| | 330,000 | | | | 5.250 | | | | 08/04/45 | | | | 457,875 | |
| | Credit Suisse AG (Switzerland) | |
| | 670,000 | | | | 3.000 | | | | 10/29/21 | | | | 690,940 | |
| | Credit Suisse AG, MTN (Switzerland) | |
| | 1,030,000 | | | | 3.625 | | | | 09/09/24 | | | | 1,146,091 | |
| | Credit Suisse Group AG(a) (b) (Switzerland) | |
| | (SOFR + 3.730%) | |
| | 1,200,000 | | | | 4.194 | | | | 04/01/31 | | | | 1,405,500 | |
| | Credit Suisse Group Funding Guernsey Ltd. (Switzerland) | |
| | 300,000 | | | | 3.800 | | | | 09/15/22 | | | | 318,684 | |
| | 710,000 | | | | 4.550 | | | | 04/17/26 | | | | 832,475 | |
| | 300,000 | | | | 4.875 | | | | 05/15/45 | | | | 409,207 | |
| | Deutsche Bank AG (Germany) | |
| | 650,000 | | | | 4.250 | | | | 10/14/21 | | | | 672,142 | |
| | 230,000 | | | | 3.300 | | | | 11/16/22 | | | | 238,337 | |
| | 200,000 | | | | 3.950 | | | | 02/27/23 | | | | 211,512 | |
| | 130,000 | | | | 3.700 | | | | 05/30/24 | | | | 138,938 | |
| | (SOFR + 2.581%) | |
| | 500,000 | | | | 3.961 | (b) | | | 11/26/25 | | | | 536,991 | |
| | Deutsche Bank AG, Series D (Germany) | |
| | 310,000 | | | | 5.000 | | | | 02/14/22 | | | | 325,333 | |
| | Deutsche Bank AG, GMTN (Germany) | |
| | 50,000 | | | | 3.375 | | | | 05/12/21 | | | | 50,831 | |
| | HSBC Holdings PLC (United Kingdom) | |
| | 200,000 | | | | 2.950 | | | | 05/25/21 | | | | 203,840 | |
| | (3M USD LIBOR + 1.055%) | |
| | 400,000 | | | | 3.262 | (b) | | | 03/13/23 | | | | 415,924 | |
| | 340,000 | | | | 4.250 | | | | 03/14/24 | | | | 371,393 | |
| | (3M USD LIBOR + 0.987%) | |
| | 500,000 | | | | 3.950 | (b) | | | 05/18/24 | | | | 540,165 | |
| | 400,000 | | | | 4.250 | | | | 08/18/25 | | | | 443,196 | |
| | (3M USD LIBOR + 1.140%) | |
| | 250,000 | | | | 2.633 | (b) | | | 11/07/25 | | | | 262,469 | |
| | 550,000 | | | | 4.300 | | | | 03/08/26 | | | | 632,143 | |
| | 990,000 | | | | 3.900 | | | | 05/25/26 | | | | 1,118,714 | |
| | |
|
| Foreign Corporate Debt – (continued) | |
| Banks – (continued) | |
| | (3M USD LIBOR + 1.348%) | |
| 500,000 | | | | 4.292 | (b) | | | 09/12/26 | | | | 564,156 | |
| | (3M USD LIBOR + 1.610%) | |
| | 500,000 | | | | 3.973 | (b) | | | 05/22/30 | | | | 566,659 | |
| | 250,000 | | | | 6.500 | | | | 05/02/36 | | | | 339,713 | |
| | 654,000 | | | | 6.500 | | | | 09/15/37 | | | | 922,766 | |
| | 510,000 | | | | 6.800 | | | | 06/01/38 | | | | 724,743 | |
| | 140,000 | | | | 6.100 | | | | 01/14/42 | | | | 203,746 | |
| | 680,000 | | | | 5.250 | | | | 03/14/44 | | | | 884,883 | |
| | ING Groep NV (Netherlands) | |
| | 228,000 | | | | 3.150 | | | | 03/29/22 | | | | 236,941 | |
| | 390,000 | | | | 4.100 | | | | 10/02/23 | | | | 429,890 | |
| | 200,000 | | | | 3.950 | | | | 03/29/27 | | | | 230,428 | |
| | 490,000 | | | | 4.550 | | | | 10/02/28 | | | | 596,929 | |
| | 330,000 | | | | 4.050 | | | | 04/09/29 | | | | 392,205 | |
| | Lloyds Banking Group PLC (United Kingdom) | |
| | 250,000 | | | | 3.000 | | | | 01/11/22 | | | | 258,511 | |
| | 1,120,000 | | | | 4.050 | | | | 08/16/23 | | | | 1,226,511 | |
| | 200,000 | | | | 3.900 | | | | 03/12/24 | | | | 219,961 | |
| | 200,000 | | | | 4.500 | | | | 11/04/24 | | | | 220,671 | |
| | (US 1 Year CMT T-Note + 3.500%) | |
| | 200,000 | | | | 3.870 | (b) | | | 07/09/25 | | | | 220,402 | |
| | 300,000 | | | | 4.582 | | | | 12/10/25 | | | | 338,293 | |
| | 525,000 | | | | 3.750 | | | | 01/11/27 | | | | 591,566 | |
| | 640,000 | | | | 4.375 | | | | 03/22/28 | | | | 754,604 | |
| | 200,000 | | | | 5.300 | | | | 12/01/45 | | | | 274,435 | |
| | 200,000 | | | | 4.344 | | | | 01/09/48 | | | | 246,988 | |
| | Mitsubishi UFJ Financial Group, Inc. (Japan) | |
| | 1,000,000 | | | | 2.623 | | | | 07/18/22 | | | | 1,040,765 | |
| | 730,000 | | | | 2.665 | | | | 07/25/22 | | | | 758,580 | |
| | 950,000 | | | | 3.850 | | | | 03/01/26 | | | | 1,092,699 | |
| | 830,000 | | | | 3.677 | | | | 02/22/27 | | | | 941,649 | |
| | 150,000 | | | | 3.287 | | | | 07/25/27 | | | | 167,228 | |
| | 950,000 | | | | 3.961 | | | | 03/02/28 | | | | 1,104,808 | |
| | 300,000 | | | | 3.195 | | | | 07/18/29 | | | | 333,324 | |
| | 200,000 | | | | 3.751 | | | | 07/18/39 | | | | 234,325 | |
| | Mizuho Financial Group, Inc. (Japan) | |
| | 300,000 | | | | 2.273 | | | | 09/13/21 | | | | 305,343 | |
| | 690,000 | | | | 2.601 | | | | 09/11/22 | | | | 717,915 | |
| | 200,000 | | | | 2.839 | | | | 09/13/26 | | | | 219,004 | |
| | 740,000 | | | | 4.018 | | | | 03/05/28 | | | | 855,150 | |
| | National Australia Bank Ltd. (Australia) | |
| | 1,050,000 | | | | 2.500 | | | | 07/12/26 | | | | 1,143,050 | |
| | National Australia Bank Ltd., GMTN (Australia) | |
| | 550,000 | | | | 2.500 | | | | 05/22/22 | | | | 570,140 | |
| | Natwest Group PLC (United Kingdom) | |
| | (3M USD LIBOR + 1.480%) | |
| | 960,000 | | | | 3.498 | (b) | | | 05/15/23 | | | | 1,002,132 | |
| | 245,000 | | | | 6.100 | | | | 06/10/23 | | | | 271,433 | |
| | (3M USD LIBOR + 1.762%) | |
| | 685,000 | | | | 4.269 | (b) | | | 03/22/25 | | | | 752,347 | |
| | (3M USD LIBOR + 1.754%) | |
| | 345,000 | | | | 4.892 | (b) | | | 05/18/29 | | | | 411,018 | |
| | (US 5 Year CMT T-Note + 2.100%) | |
| | 650,000 | | | | 3.754 | (b) | | | 11/01/29 | | | | 686,291 | |
| | (3M USD LIBOR + 1.905%) | |
| | 500,000 | | | | 5.076 | (b) | | | 01/27/30 | | | | 608,669 | |
| | |
| | |
| 60 | | The accompanying notes are an integral part of these financial statements. |
GOLDMAN SACHS ACCESS INVESTMENT GRADE CORPORATE BOND ETF
| | | | | | | | | | | | | | |
Principal
Amount | | | Interest
Rate | | | Maturity
Date | | | Value | |
|
| Foreign Corporate Debt – (continued) | |
| Banks – (continued) | |
| | Royal Bank of Canada, GMTN (Canada) | |
| $ | 500,000 | | | | 3.700 | % | | | 10/05/23 | | | $ | 549,364 | |
| | 300,000 | | | | 4.650 | | | | 01/27/26 | | | | 355,529 | |
| | Santander UK PLC (United Kingdom) | |
| | 1,000,000 | | | | 2.875 | | | | 06/18/24 | | | | 1,075,371 | |
| | Sumitomo Mitsui Financial Group, Inc. (Japan) | |
| | 637,000 | | | | 2.934 | | | | 03/09/21 | | | | 645,801 | |
| | 520,000 | | | | 2.442 | | | | 10/19/21 | | | | 531,858 | |
| | 340,000 | | | | 2.784 | | | | 07/12/22 | | | | 354,196 | |
| | 150,000 | | | | 2.778 | | | | 10/18/22 | | | | 157,056 | |
| | 650,000 | | | | 3.102 | | | | 01/17/23 | | | | 687,766 | |
| | 400,000 | | | | 3.784 | | | | 03/09/26 | | | | 456,088 | |
| | 50,000 | | | | 2.632 | | | | 07/14/26 | | | | 54,184 | |
| | 610,000 | | | | 3.010 | | | | 10/19/26 | | | | 676,272 | |
| | 100,000 | | | | 3.446 | | | | 01/11/27 | | | | 111,909 | |
| | 150,000 | | | | 3.364 | | | | 07/12/27 | | | | 168,790 | |
| | 500,000 | | | | 3.040 | | | | 07/16/29 | | | | 548,776 | |
| | Toronto-Dominion Bank (The), MTN (Canada) | |
| | 775,000 | | | | 1.900 | | | | 12/01/22 | | | | 801,805 | |
| | 910,000 | | | | 2.650 | | | | 06/12/24 | | | | 979,291 | |
| | Westpac Banking Corp. (Australia) | |
| | 415,000 | | | | 2.000 | | | | 08/19/21 | | | | 422,040 | |
| | 100,000 | | | | 2.500 | | | | 06/28/22 | | | | 104,030 | |
| | 800,000 | | | | 3.650 | | | | 05/15/23 | | | | 868,879 | |
| | 300,000 | | | | 3.300 | | | | 02/26/24 | | | | 327,204 | |
| | 330,000 | | | | 2.850 | | | | 05/13/26 | | | | 366,299 | |
| | 120,000 | | | | 2.700 | | | | 08/19/26 | | | | 132,734 | |
| | 400,000 | | | | 3.400 | | | | 01/25/28 | | | | 465,604 | |
| | 300,000 | | | | 2.650 | | | | 01/16/30 | | | | 332,317 | |
| | (US 5 Year CMT T-Note + 2.000%) | |
| | 100,000 | | | | 4.110 | (b) | | | 07/24/34 | | | | 113,674 | |
| | Westpac Banking Corp.(b), GMTN (Australia) | |
| | (5 Year USD Swap + 2.236%) | |
| | 510,000 | | | | 4.322 | | | | 11/23/31 | | | | 577,623 | |
| | | | | | | | | | | | | | |
| | | | | | | | | | | | | 62,839,284 | |
| | |
| Beverages – 0.1% | |
| | Fomento Economico Mexicano SAB de CV (Mexico) | |
| | 600,000 | | | | 3.500 | | | | 01/16/50 | | | | 646,550 | |
| | |
| Brokerage – 0.1% | |
| | Brookfield Finance, Inc. (Canada) | |
| | 600,000 | | | | 4.700 | | | | 09/20/47 | | | | 704,090 | |
| | |
| Consumer Noncyclical – 1.8% | |
| | AstraZeneca PLC (United Kingdom) | |
| | 200,000 | | | | 2.375 | | | | 06/12/22 | | | | 206,853 | |
| | 460,000 | | | | 3.375 | | | | 11/16/25 | | | | 516,830 | |
| | 20,000 | | | | 3.125 | | | | 06/12/27 | | | | 22,294 | |
| | 280,000 | | | | 4.000 | | | | 01/17/29 | | | | 334,858 | |
| | 330,000 | | | | 6.450 | | | | 09/15/37 | | | | 510,125 | |
| | 80,000 | | | | 4.375 | | | | 11/16/45 | | | | 105,486 | |
| | 160,000 | | | | 4.375 | | | | 08/17/48 | | | | 215,361 | |
| | BAT Capital Corp. (United Kingdom) | |
| | 1,160,000 | | | | 2.764 | | | | 08/15/22 | | | | 1,205,862 | |
| | 300,000 | | | | 3.222 | | | | 08/15/24 | | | | 323,796 | |
| | 560,000 | | | | 3.557 | | | | 08/15/27 | | | | 610,923 | |
| | 723,000 | | | | 4.390 | | | | 08/15/37 | | | | 788,685 | |
| | 350,000 | | | | 4.540 | | | | 08/15/47 | | | | 383,721 | |
| | |
|
| Foreign Corporate Debt – (continued) | |
| Consumer Noncyclical – (continued) | |
| | GlaxoSmithKline Capital PLC (United Kingdom) | |
| 68,000 | | | | 2.850 | | | | 05/08/22 | | | | 70,751 | |
| | 300,000 | | | | 2.875 | | | | 06/01/22 | | | | 312,511 | |
| | 240,000 | | | | 3.375 | | | | 06/01/29 | | | | 276,078 | |
| | GlaxoSmithKline Capital, Inc. (United Kingdom) | |
| | 532,000 | | | | 2.800 | | | | 03/18/23 | | | | 564,310 | |
| | 272,000 | | | | 3.875 | | | | 05/15/28 | | | | 321,268 | |
| | 397,000 | | | | 6.375 | | | | 05/15/38 | | | | 610,550 | |
| | Novartis Capital Corp. (Switzerland) | |
| | 275,000 | | | | 2.400 | | | | 05/17/22 | | | | 285,770 | |
| | 435,000 | | | | 3.000 | | | | 11/20/25 | | | | 484,007 | |
| | 420,000 | | | | 3.100 | | | | 05/17/27 | | | | 470,561 | |
| | 500,000 | | | | 2.200 | | | | 08/14/30 | | | | 538,233 | |
| | 220,000 | | | | 4.400 | | | | 05/06/44 | | | | 288,478 | |
| | 225,000 | | | | 2.750 | | | | 08/14/50 | | | | 235,508 | |
| | Reynolds American, Inc. (United Kingdom) | |
| | 70,000 | | | | 4.450 | | | | 06/12/25 | | | | 79,777 | |
| | 380,000 | | | | 5.700 | | | | 08/15/35 | | | | 474,683 | |
| | 295,000 | | | | 5.850 | | | | 08/15/45 | | | | 367,180 | |
| | Takeda Pharmaceutical Co., Ltd. (Japan) | |
| | 200,000 | | | | 4.400 | | | | 11/26/23 | | | | 223,666 | |
| | 200,000 | | | | 5.000 | | | | 11/26/28 | | | | 248,277 | |
| | 700,000 | | | | 3.175 | | | | 07/09/50 | | | | 718,704 | |
| | | | | | | | | | | | | | |
| | | | | | | | | | | | | 11,795,106 | |
| | |
| Consumer Products – 0.1% | |
| | Unilever Capital Corp. (United Kingdom) | |
| | 500,000 | | | | 3.500 | | | | 03/22/28 | | | | 577,872 | |
| | |
| Electric – 0.2% | |
| | ABB Finance USA, Inc. (Switzerland) | |
| | 600,000 | | | | 3.800 | | | | 04/03/28 | | | | 703,813 | |
| | Emera US Finance LP (Canada) | |
| | 50,000 | | | | 2.700 | | | | 06/15/21 | | | | 50,807 | |
| | 360,000 | | | | 3.550 | | | | 06/15/26 | | | | 403,004 | |
| | 240,000 | | | | 4.750 | | | | 06/15/46 | | | | 300,422 | |
| | | | | | | | | | | | | | |
| | | | | | | | | | | | | 1,458,046 | |
| | |
| Energy – 2.3% | |
| | BP Capital Markets PLC (United Kingdom) | |
| | 1,160,000 | | | | 3.561 | | | | 11/01/21 | | | | 1,202,406 | |
| | 20,000 | | | | 2.500 | | | | 11/06/22 | | | | 20,834 | |
| | 90,000 | | | | 3.994 | | | | 09/26/23 | | | | 99,304 | |
| | 290,000 | | | | 3.814 | | | | 02/10/24 | | | | 319,598 | |
| | 520,000 | | | | 3.535 | | | | 11/04/24 | | | | 575,745 | |
| | 200,000 | | | | 3.279 | | | | 09/19/27 | | | | 222,851 | |
| | Enbridge, Inc. (Canada) | |
| | 120,000 | | | | 4.000 | | | | 10/01/23 | | | | 130,727 | |
| | 850,000 | | | | 3.125 | | | | 11/15/29 | | | | 917,696 | |
| | Equinor ASA (Norway) | |
| | 630,000 | | | | 3.150 | | | | 01/23/22 | | | | 653,825 | |
| | 500,000 | | | | 2.375 | | | | 05/22/30 | | | | 532,047 | |
| | 100,000 | | | | 3.950 | | | | 05/15/43 | | | | 115,480 | |
| | 160,000 | | | | 4.800 | | | | 11/08/43 | | | | 209,920 | |
| | 430,000 | | | | 3.250 | | | | 11/18/49 | | | | 463,926 | |
| | Shell International Finance BV (Netherlands) | |
| | 425,000 | | | | 1.750 | | | | 09/12/21 | | | | 431,506 | |
| | 180,000 | | | | 3.250 | | | | 05/11/25 | | | | 200,793 | |
| | |
| | |
| The accompanying notes are an integral part of these financial statements. | | 61 |
GOLDMAN SACHS ACCESS INVESTMENT GRADE CORPORATE BOND ETF
Schedule of Investments (continued)
August 31, 2020
| | | | | | | | | | | | | | |
Principal
Amount | | | Interest
Rate | | | Maturity
Date | | | Value | |
|
| Foreign Corporate Debt – (continued) | |
| Energy – (continued) | |
| | Shell International Finance BV (Netherlands) – (continued) | |
| $ | 60,000 | | | | 2.875 | % | | | 05/10/26 | | | $ | 66,902 | |
| | 500,000 | | | | 2.500 | | | | 09/12/26 | | | | 547,733 | |
| | 772,000 | | | | 2.375 | | | | 11/07/29 | | | | 821,322 | |
| | 510,000 | | | | 4.125 | | | | 05/11/35 | | | | 633,135 | |
| | 230,000 | | | | 6.375 | | | | 12/15/38 | | | | 344,334 | |
| | 190,000 | | | | 5.500 | | | | 03/25/40 | | | | 268,218 | |
| | 375,000 | | | | 4.550 | | | | 08/12/43 | | | | 468,780 | |
| | 590,000 | | | | 4.375 | | | | 05/11/45 | | | | 736,106 | |
| | 470,000 | | | | 4.000 | | | | 05/10/46 | | | | 562,773 | |
| | Total Capital Canada Ltd. (France) | |
| | 25,000 | | | | 2.750 | | | | 07/15/23 | | | | 26,696 | |
| | Total Capital International SA (France) | |
| | 350,000 | | | | 3.700 | | | | 01/15/24 | | | | 386,532 | |
| | 125,000 | | | | 3.750 | | | | 04/10/24 | | | | 138,647 | |
| | 530,000 | | | | 3.455 | | | | 02/19/29 | | | | 609,014 | |
| | 700,000 | | | | 3.127 | | | | 05/29/50 | | | | 739,166 | |
| | Total Capital SA (France) | |
| | 50,000 | | | | 3.883 | | | | 10/11/28 | | | | 58,969 | |
| | TransCanada PipeLines Ltd. (Canada) | |
| | 390,000 | | | | 4.250 | | | | 05/15/28 | | | | 449,420 | |
| | 50,000 | | | | 4.625 | | | | 03/01/34 | | | | 60,275 | |
| | 260,000 | | | | 6.200 | | | | 10/15/37 | | | | 352,422 | |
| | 200,000 | | | | 7.625 | | | | 01/15/39 | | | | 308,682 | |
| | 160,000 | | | | 6.100 | | | | 06/01/40 | | | | 214,900 | |
| | 190,000 | | | | 4.875 | | | | 05/15/48 | | | | 245,966 | |
| | 500,000 | | | | 5.100 | | | | 03/15/49 | | | | 671,870 | |
| | | | | | | | | | | | | | |
| | | | | | | | | | | | | 14,808,520 | |
| | |
| Financial Company – 0.1% | |
| AerCap Ireland Capital DAC / AerCap Global Aviation Trust
(Ireland) |
|
| | 500,000 | | | | 2.875 | | | | 08/14/24 | | | | 479,545 | |
| | 150,000 | | | | 3.650 | | | | 07/21/27 | | | | 139,608 | |
| | | | | | | | | | | | | | |
| | | | | | | | | | | | | 619,153 | |
| | |
| Food and Beverage – 1.9% | |
| Anheuser-Busch Cos. LLC / Anheuser-Busch InBev Worldwide,
Inc. (Belgium) |
|
| | 785,000 | | | | 3.650 | | | | 02/01/26 | | | | 889,698 | |
| | 750,000 | | | | 4.700 | | | | 02/01/36 | | | | 895,833 | |
| | 1,550,000 | | | | 4.900 | | | | 02/01/46 | | | | 1,923,154 | |
| | Anheuser-Busch InBev Finance, Inc. (Belgium) | |
| | 1,000,000 | | | | 3.300 | | | | 02/01/23 | | | | 1,064,788 | |
| | 300,000 | | | | 4.625 | | | | 02/01/44 | | | | 354,787 | |
| | 100,000 | | | | 4.900 | | | | 02/01/46 | | | | 123,223 | |
| | Anheuser-Busch InBev Worldwide, Inc. (Belgium) | |
| | 1,000,000 | | | | 4.150 | | | | 01/23/25 | | | | 1,138,801 | |
| | 490,000 | | | | 4.000 | | | | 04/13/28 | | | | 567,548 | |
| | 600,000 | | | | 4.750 | | | | 01/23/29 | | | | 731,971 | |
| | 255,000 | | | | 4.900 | | | | 01/23/31 | | | | 322,656 | |
| | 520,000 | | | | 4.375 | | | | 04/15/38 | | | | 599,433 | |
| | 90,000 | | | | 4.950 | | | | 01/15/42 | | | | 109,497 | |
| | 700,000 | | | | 4.600 | | | | 04/15/48 | | | | 835,120 | |
| | 210,000 | | | | 4.439 | | | | 10/06/48 | | | | 246,367 | |
| | 686,000 | | | | 5.550 | | | | 01/23/49 | | | | 922,346 | |
| | 800,000 | | | | 5.800 | | | | 01/23/59 | | | | 1,146,379 | |
| | |
|
| Foreign Corporate Debt – (continued) | |
| Food and Beverage – (continued) | |
| | Diageo Capital PLC (United Kingdom) | |
| 400,000 | | | | 2.125 | | | | 04/29/32 | | | | 415,944 | |
| | Diageo Investment Corp. (United Kingdom) | |
| | 50,000 | | | | 2.875 | | | | 05/11/22 | | | | 52,152 | |
| | | | | | | | | | | | | | |
| | | | | | | | | | | | | 12,339,697 | |
| | |
| Insurance – 0.1% | |
| | AXA SA (France) | |
| | 265,000 | | | | 8.600 | | | | 12/15/30 | | | | 399,583 | |
| | Manulife Financial Corp.(b) (Canada) | |
| | (5 Year USD Swap + 1.647%) | |
| | 410,000 | | | | 4.061 | | | | 02/24/32 | | | | 438,526 | |
| | | | | | | | | | | | | | |
| | | | | | | | | | | | | 838,109 | |
| | |
| Internet – 0.3% | |
| | Alibaba Group Holding Ltd. (China) | |
| | 1,068,000 | | | | 3.125 | | | | 11/28/21 | | | | 1,096,400 | |
| | 300,000 | | | | 3.400 | | | | 12/06/27 | | | | 338,726 | |
| | 236,000 | | | | 4.200 | | | | 12/06/47 | | | | 303,116 | |
| | 270,000 | | | | 4.400 | | | | 12/06/57 | | | | 365,165 | |
| | | | | | | | | | | | | | |
| | | | | | | | | | | | | 2,103,407 | |
| | |
| Lodging – 0.1% | |
| | Sands China Ltd. (Macau) | |
| | 228,000 | | | | 4.600 | | | | 08/08/23 | | | | 243,675 | |
| | |
| Metals & Mining – 0.1% | |
| | BHP Billiton Finance USA Ltd. (Australia) | |
| | 150,000 | | | | 4.125 | | | | 02/24/42 | | | | 189,262 | |
| | Rio Tinto Finance USA Ltd. (Australia) | |
| | 80,000 | | | | 7.125 | | | | 07/15/28 | | | | 113,577 | |
| | | | | | | | | | | | | | |
| | | | | | | | | | | | | 302,839 | |
| | |
| Metals and Mining – 0.2% | |
| | BHP Billiton Finance USA Ltd. (Australia) | |
| | 350,000 | | | | 5.000 | | | | 09/30/43 | | | | 497,077 | |
| | Rio Tinto Finance USA Ltd. (Australia) | |
| | 440,000 | | | | 5.200 | | | | 11/02/40 | | | | 628,357 | |
| | Rio Tinto Finance USA PLC (Australia) | |
| | 80,000 | | | | 4.125 | | | | 08/21/42 | | | | 101,751 | |
| | | | | | | | | | | | | | |
| | | | | | | | | | | | | 1,227,185 | |
| | |
| Mining – 0.4% | |
| | Barrick Gold Corp. (Canada) | |
| | 340,000 | | | | 5.250 | | | | 04/01/42 | | | | 465,559 | |
| | Barrick North America Finance LLC (Canada) | |
| | 50,000 | | | | 5.700 | | | | 05/30/41 | | | | 70,635 | |
| | 170,000 | | | | 5.750 | | | | 05/01/43 | | | | 248,138 | |
| | Southern Copper Corp. (Peru) | |
| | 230,000 | | | | 7.500 | | | | 07/27/35 | | | | 343,586 | |
| | 150,000 | | | | 6.750 | | | | 04/16/40 | | | | 220,004 | |
| | 240,000 | | | | 5.250 | | | | 11/08/42 | | | | 307,328 | |
| | 190,000 | | | | 5.875 | | | | 04/23/45 | | | | 264,177 | |
| | Vale Overseas Ltd. (Brazil) | |
| | 250,000 | | | | 6.875 | | | | 11/21/36 | | | | 332,344 | |
| | 250,000 | | | | 6.875 | | | | 11/10/39 | | | | 337,500 | |
| | | | | | | | | | | | | | |
| | | | | | | | | | | | | 2,589,271 | |
| | |
| | |
| 62 | | The accompanying notes are an integral part of these financial statements. |
GOLDMAN SACHS ACCESS INVESTMENT GRADE CORPORATE BOND ETF
| | | | | | | | | | | | | | |
Principal
Amount | | | Interest
Rate | | | Maturity
Date | | | Value | |
|
| Foreign Corporate Debt – (continued) | |
| Oil Company-Exploration & Production – 0.3% | |
| | CNOOC Finance 2013 Ltd. (China) | |
| $ | 450,000 | | | | 3.000 | % | | | 05/09/23 | | | $ | 474,200 | |
| | CNOOC Finance 2015 USA LLC (China) | |
| | 305,000 | | | | 4.375 | | | | 05/02/28 | | | | 359,932 | |
| | CNOOC Petroleum North America ULC (China) | |
| | 650,000 | | | | 6.400 | | | | 05/15/37 | | | | 957,248 | |
| | | | | | | | | | | | | | |
| | | | | | | | | | | | | 1,791,380 | |
| | |
| Telecommunications – 0.3% | |
| | America Movil SAB de CV (Mexico) | |
| | 214,000 | | | | 3.125 | | | | 07/16/22 | | | | 223,200 | |
| | 935,000 | | | | 3.625 | | | | 04/22/29 | | | | 1,060,182 | |
| | 340,000 | | | | 6.125 | | | | 03/30/40 | | | | 494,462 | |
| | 250,000 | | | | 4.375 | | | | 04/22/49 | | | | 315,892 | |
| | | | | | | | | | | | | | |
| | | | | | | | | | | | | 2,093,736 | |
| | |
| Wireless – 0.6% | |
| | Rogers Communications, Inc. (Canada) | |
| | 105,000 | | | | 4.300 | | | | 02/15/48 | | | | 131,296 | |
| | 150,000 | | | | 4.350 | | | | 05/01/49 | | | | 186,160 | |
| | 250,000 | | | | 3.700 | | | | 11/15/49 | | | | 287,281 | |
| | Vodafone Group PLC (United Kingdom) | |
| | 700,000 | | | | 2.950 | | | | 02/19/23 | | | | 741,068 | |
| | 1,000,000 | | | | 3.750 | | | | 01/16/24 | | | | 1,098,303 | |
| | 500,000 | | | | 5.250 | | | | 05/30/48 | | | | 648,449 | |
| | 500,000 | | | | 4.875 | | | | 06/19/49 | | | | 626,098 | |
| | 200,000 | | | | 4.250 | | | | 09/17/50 | | | | 232,807 | |
| | | | | | | | | | | | | | |
| | | | | | | | | | | | | 3,951,462 | |
| | |
| Wirelines – 0.7% | |
| | British Telecommunications PLC (United Kingdom) | |
| | 310,000 | | | | 9.625 | | | | 12/15/30 | | | | 504,732 | |
| | Deutsche Telekom International Finance BV (Germany) | |
| | 618,000 | | | | 8.750 | | | | 06/15/30 | | | | 972,016 | |
| | Orange SA (France) | |
| | 430,000 | | | | 9.000 | | | | 03/01/31 | | | | 705,800 | |
| | 210,000 | | | | 5.375 | | | | 01/13/42 | | | | 297,475 | |
| | Telefonica Emisiones SA (Spain) | |
| | 100,000 | | | | 7.045 | | | | 06/20/36 | | | | 146,288 | |
| | 500,000 | | | | 4.665 | | | | 03/06/38 | | | | 583,182 | |
| | 650,000 | | | | 5.213 | | | | 03/08/47 | | | | 788,938 | |
| | 350,000 | | | | 4.895 | | | | 03/06/48 | | | | 418,896 | |
| | | | | | | | | | | | | | |
| | | | | | | | | | | | | 4,417,327 | |
| | |
| | TOTAL FOREIGN CORPORATE DEBT | |
| | (Cost $117,255,315) | | | $ | 125,346,709 | |
| | |
| | | | | | | | | | | | | | |
| | | | | | | | |
Principal Amount | | Dividend Rate | | | Value | |
|
| Investment Company – 1.0%(c) | |
Goldman Sachs Financial Square Government Fund – Institutional Shares | |
| $6,635,197 | | | 0.027 | % | | $ | 6,635,197 | |
| (Cost $6,635,197) | | | | | |
| |
| TOTAL INVESTMENTS – 99.1% | |
| (Cost $593,881,790) | | | $ | 637,153,315 | |
| |
| OTHER ASSETS IN EXCESS OF LIABILITIES – 0.9% | | | | 5,424,679 | |
| |
| NET ASSETS – 100.0% | | | $ | 642,577,994 | |
| |
| | |
|
| The percentage shown for each investment category reflects the value of investments in that category as a percentage of net assets. |
| |
(a) | | Exempt from registration under Rule 144A of the Securities Act of 1933. |
| |
(b) | | Variable rate security. Interest rate or distribution rate disclosed is that which is in effect on August 31, 2020. |
| |
(c) | | Represents an affiliated issuer. |
| | |
|
Investment Abbreviations: |
CMT | | — Constant Maturity Treasury Index |
GMTN | | — Global Medium Term Note |
LIBOR | | — London Interbank Offered Rate |
LP | | — Limited Partnership |
MTN | | — Medium Term Note |
PLC | | — Public Limited Company |
REIT | | — Real Estate Investment Trust |
SOFR | | — Secured Overnight Financing Rate |
|
| | |
| The accompanying notes are an integral part of these financial statements. | | 63 |
GOLDMAN SACHS ACCESS TREASURY 0-1 YEAR ETF
Schedule of Investments
August 31, 2020
| | | | | | | | | | | | |
Principal Amount | | | Interest
Rate(a) | | Maturity Date | | | Value | |
|
| U.S. Treasury Bills – 95.3% | |
| | U.S. Treasury Bills | |
| $ | 2,585,000 | | | 0.084% | | | 10/08/20 | | | $ | 2,584,771 | |
| | 360,262,900 | | | 0.092 | | | 10/08/20 | | | | 360,230,964 | |
| | 131,341,600 | | | 0.097 | | | 10/08/20 | | | | 131,329,957 | |
| | 1,710,000 | | | 0.109 | | | 10/08/20 | | | | 1,709,848 | |
| | 560,000 | | | 0.125 | | | 10/08/20 | | | | 559,950 | |
| | 1,400,000 | | | 0.127 | | | 10/08/20 | | | | 1,399,876 | |
| | 800,000 | | | 0.130 | | | 10/08/20 | | | | 799,929 | |
| | 2,284,000 | | | 0.132 | | | 10/08/20 | | | | 2,283,798 | |
| | 1,280,000 | | | 0.135 | | | 10/08/20 | | | | 1,279,887 | |
| | 3,234,000 | | | 0.137 | | | 10/08/20 | | | | 3,233,713 | |
| | 2,052,000 | | | 0.139 | | | 10/08/20 | | | | 2,051,818 | |
| | 135,680,400 | | | 0.142 | | | 10/08/20 | | | | 135,668,373 | |
| | 2,775,000 | | | 0.147 | | | 10/08/20 | | | | 2,774,754 | |
| | 4,323,000 | | | 0.150 | | | 10/08/20 | | | | 4,322,617 | |
| | 896,000 | | | 0.153 | | | 10/08/20 | | | | 895,921 | |
| | 1,572,000 | | | 0.158 | | | 10/08/20 | | | | 1,571,861 | |
| | 208,431,400 | | | 0.159 | | | 10/08/20 | | | | 208,412,924 | |
| | 2,096,000 | | | 0.169 | | | 10/08/20 | | | | 2,095,814 | |
| | 3,930,000 | | | 0.170 | | | 10/08/20 | | | | 3,929,652 | |
| | 88,736,800 | | | 0.092 | | | 11/19/20 | | | | 88,717,814 | |
| | 205,561,500 | | | 0.093 | | | 11/19/20 | | | | 205,517,519 | |
| | 1,463,000 | | | 0.094 | | | 11/19/20 | | | | 1,462,687 | |
| | 1,060,000 | | | 0.120 | | | 11/19/20 | | | | 1,059,773 | |
| | 117,615,100 | | | 0.142 | | | 11/19/20 | | | | 117,589,936 | |
| | 3,312,000 | | | 0.145 | | | 11/19/20 | | | | 3,311,291 | |
| | 840,000 | | | 0.153 | | | 11/19/20 | | | | 839,820 | |
| | 1,500,000 | | | 0.155 | | | 11/19/20 | | | | 1,499,679 | |
| | 3,010,000 | | | 0.158 | | | 11/19/20 | | | | 3,009,356 | |
| | 182,952,100 | | | 0.163 | | | 11/19/20 | | | | 182,912,956 | |
| | 1,120,000 | | | 0.172 | | | 11/19/20 | | | | 1,119,760 | |
| | 2,100,000 | | | 0.181 | | | 11/19/20 | | | | 2,099,551 | |
| | 96,391,700 | | | 0.093 | | | 12/03/20 | | | | 96,364,309 | |
| | 715,000 | | | 0.103 | | | 12/03/20 | | | | 714,797 | |
| | 350,000 | | | 0.117 | | | 12/03/20 | | | | 349,901 | |
| | 945,000 | | | 0.120 | | | 12/03/20 | | | | 944,731 | |
| | 1,505,000 | | | 0.125 | | | 12/03/20 | | | | 1,504,572 | |
| | 2,555,000 | | | 0.128 | | | 12/03/20 | | | | 2,554,274 | |
| | 490,000 | | | 0.130 | | | 12/03/20 | | | | 489,861 | |
| | 840,000 | | | 0.132 | | | 12/03/20 | | | | 839,761 | |
| | 700,000 | | | 0.137 | | | 12/03/20 | | | | 699,801 | |
| | 750,000 | | | 0.148 | | | 12/03/20 | | | | 749,787 | |
| | 1,134,000 | | | 0.150 | | | 12/03/20 | | | | 1,133,678 | |
| | 420,000 | | | 0.153 | | | 12/03/20 | | | | 419,881 | |
| | 504,000 | | | 0.154 | | | 12/03/20 | | | | 503,857 | |
| | 1,620,000 | | | 0.163 | | | 12/03/20 | | | | 1,619,540 | |
| | 350,000 | | | 0.172 | | | 12/03/20 | | | | 349,901 | |
| | 1,656,000 | | | 0.181 | | | 12/03/20 | | | | 1,655,529 | |
| | 87,478,000 | | | 1.462 | | | 12/03/20 | | | | 87,453,142 | |
| | 92,124,200 | | | 0.104 | | | 12/31/20 | | | | 92,090,140 | |
| | 550,000 | | | 0.107 | | | 12/31/20 | | | | 549,797 | |
| | 500,000 | | | 0.127 | | | 12/31/20 | | | | 499,815 | |
| | 500,000 | | | 0.150 | | | 12/31/20 | | | | 499,815 | |
| | 149,471,200 | | | 0.160 | | | 12/31/20 | | | | 149,415,937 | |
| | 600,000 | | | 0.163 | | | 12/31/20 | | | | 599,778 | |
| | 104,048,100 | | | 0.097 | | | 01/28/21 | | | | 104,005,035 | |
| | 913,000 | | | 0.107 | | | 01/28/21 | | | | 912,622 | |
| | |
|
| U.S. Treasury Bills – (continued) | |
| | U.S. Treasury Bills – (continued) | |
| 83,512,500 | | | 0.110 | | | 01/28/21 | | | | 83,477,935 | |
| | 500,000 | | | 0.130 | | | 01/28/21 | | | | 499,793 | |
| | 1,350,000 | | | 0.136 | | | 01/28/21 | | | | 1,349,441 | |
| | 714,000 | | | 0.140 | | | 01/28/21 | | | | 713,704 | |
| | 2,850,000 | | | 0.142 | | | 01/28/21 | | | | 2,848,820 | |
| | 400,000 | | | 0.145 | | | 01/28/21 | | | | 399,834 | |
| | 1,200,000 | | | 0.150 | | | 01/28/21 | | | | 1,199,503 | |
| | 2,620,000 | | | 0.153 | | | 01/28/21 | | | | 2,618,916 | |
| | 600,000 | | | 0.155 | | | 01/28/21 | | | | 599,752 | |
| | 1,765,000 | | | 0.158 | | | 01/28/21 | | | | 1,764,269 | |
| | 2,550,000 | | | 0.163 | | | 01/28/21 | | | | 2,548,945 | |
| | 500,000 | | | 0.165 | | | 01/28/21 | | | | 499,793 | |
| | 1,650,000 | | | 0.168 | | | 01/28/21 | | | | 1,649,317 | |
| | 1,400,000 | | | 0.176 | | | 01/28/21 | | | | 1,399,421 | |
| | 1,500,000 | | | 0.184 | | | 01/28/21 | | | | 1,499,379 | |
| | 127,113,200 | | | 1.312 | | | 01/28/21 | | | | 127,060,589 | |
| | 113,703,800 | | | 0.113 | | | 02/25/21 | | | | 113,639,510 | |
| | 385,000 | | | 0.120 | | | 02/25/21 | | | | 384,782 | |
| | 104,975,800 | | | 0.122 | | | 02/25/21 | | | | 104,916,445 | |
| | 350,000 | | | 0.127 | | | 02/25/21 | | | | 349,802 | |
| | 1,100,000 | | | 0.153 | | | 02/25/21 | | | | 1,099,378 | |
| | 420,000 | | | 0.158 | | | 02/25/21 | | | | 419,762 | |
| | 385,000 | | | 0.126 | | | 03/25/21 | | | | 384,742 | |
| | 104,760,000 | | | 0.127 | | | 03/25/21 | | | | 104,689,906 | |
| | 350,000 | | | 0.128 | | | 03/25/21 | | | | 349,766 | |
| | 490,000 | | | 0.132 | | | 03/25/21 | | | | 489,672 | |
| | 420,000 | | | 0.147 | | | 03/25/21 | | | | 419,719 | |
| | 350,000 | | | 0.152 | | | 03/25/21 | | | | 349,766 | |
| | 490,000 | | | 0.155 | | | 03/25/21 | | | | 489,672 | |
| | 32,002,800 | | | 0.107 | | | 04/22/21 | | | | 31,977,945 | |
| | 440,000 | | | 0.129 | | | 04/22/21 | | | | 439,658 | |
| | 630,000 | | | 0.137 | | | 04/22/21 | | | | 629,511 | |
| | 405,000 | | | 0.138 | | | 04/22/21 | | | | 404,685 | |
| | 885,000 | | | 0.145 | | | 04/22/21 | | | | 884,313 | |
| | 120,000 | | | 0.146 | | | 04/22/21 | | | | 119,907 | |
| | 210,000 | | | 0.150 | | | 04/22/21 | | | | 209,837 | |
| | 49,307,200 | | | 0.152 | | | 04/22/21 | | | | 49,268,905 | |
| | 300,000 | | | 0.155 | | | 04/22/21 | | | | 299,767 | |
| | 1,065,000 | | | 0.157 | | | 04/22/21 | | | | 1,064,173 | |
| | 336,000 | | | 0.162 | | | 04/22/21 | | | | 335,739 | |
| | 35,293,700 | | | 0.166 | | | 04/22/21 | | | | 35,266,289 | |
| | 990,000 | | | 0.168 | | | 04/22/21 | | | | 989,231 | |
| | 110,000 | | | 0.128 | | | 05/20/21 | | | | 109,919 | |
| | 100,000 | | | 0.134 | | | 05/20/21 | | | | 99,927 | |
| | 120,000 | | | 0.148 | | | 05/20/21 | | | | 119,912 | |
| | 240,000 | | | 0.150 | | | 05/20/21 | | | | 239,824 | |
| | 210,000 | | | 0.160 | | | 05/20/21 | | | | 209,846 | |
| | 330,000 | | | 0.165 | | | 05/20/21 | | | | 329,758 | |
| | 380,000 | | | 0.168 | | | 05/20/21 | | | | 379,721 | |
| | 28,708,500 | | | 0.174 | | | 05/20/21 | | | | 28,687,426 | |
| | 300,000 | | | 0.180 | | | 05/20/21 | | | | 299,780 | |
| | 91,382,300 | | | 0.108 | | | 07/15/21 | | | | 91,281,716 | |
| | 38,210,600 | | | 0.109 | | | 07/15/21 | | | | 38,168,542 | |
| | 38,114,500 | | | 0.118 | | | 08/12/21 | | | | 38,064,276 | |
| | |
| | TOTAL U.S. TREASURY BILLS | |
| | (Cost $2,900,175,766) | | | $ | 2,901,189,770 | |
| | |
| | |
| 64 | | The accompanying notes are an integral part of these financial statements. |
GOLDMAN SACHS ACCESS TREASURY 0-1 YEAR ETF
| | | | | | | | | | | | |
Principal Amount | | | Interest
Rate(a) | | Maturity Date | | | Value | |
|
| U.S. Treasury Notes – 4.7% | |
| | U.S. Treasury Notes | |
| $ | 59,427,500 | | | 2.125% | | | 05/31/21 | | | $ | 60,302,507 | |
| | 81,899,400 | | | 2.625 | | | 06/15/21 | | | | 83,499,148 | |
| | |
| | TOTAL U.S. TREASURY NOTES | |
| | (Cost $143,802,705) | | | $ | 143,801,655 | |
| | |
| | TOTAL INVESTMENTS – 100.0% | |
| | (Cost $3,043,978,471) | | | $ | 3,044,991,425 | |
| | |
| OTHER ASSETS IN EXCESS OF
LIABILITIES - 0.0% |
| | | 404,851 | |
| | |
| | NET ASSETS – 100.0% | | | $ | 3,045,396,276 | |
| | |
| | |
|
| The percentage shown for each investment category reflects the value of investments in that category as a percentage of net assets. |
| |
(a) | | Interest rates represent either the stated coupon rate, annualized yield on date of purchase for discounted securities, or, for floating rate securities, the current reset rate, which is based upon current interest rate indices. |
| | |
| The accompanying notes are an integral part of these financial statements. | | 65 |
GOLDMAN SACHS ACCESS ULTRA SHORT BOND ETF
Schedule of Investments
August 31, 2020
| | | | | | | | | | | | | | |
Principal
Amount | | | Interest
Rate | | | Maturity
Date | | | Value | |
|
| Mortgage-Backed Securities – 35.6% | |
| FHLMC REMIC Series 2003-2682, Class FB(a) (1M USD LIBOR
+ 0.900%) |
|
| $ | 306,400 | | | | 1.062 | % | | | 10/15/33 | | | $ | 313,357 | |
| FHLMC REMIC Series 2003-2711, Class FA(a) (1M USD LIBOR
+ 1.000%) |
|
| | 374,204 | | | | 1.162 | | | | 11/15/33 | | | | 383,604 | |
| FHLMC REMIC Series 2005-3033, Class FG(a) (1M USD LIBOR
+ 0.350%) |
|
| | 872,265 | | | | 0.512 | | | | 09/15/35 | | | | 878,710 | |
| FHLMC REMIC Series 2007-3298, Class FC(a) (1M USD LIBOR
+ 0.420%) |
|
| | 462,472 | | | | 0.582 | | | | 04/15/37 | | | | 465,984 | |
| FHLMC REMIC Series 2007-3314, Class FC(a) (1M USD LIBOR
+ 0.400%) |
|
| | 42,963 | | | | 0.562 | | | | 12/15/36 | | | | 43,325 | |
| FHLMC REMIC Series 2007-3314, Class FE(a) (1M USD LIBOR
+ 0.270%) |
|
| | 1,466,833 | | | | 0.432 | | | | 05/15/37 | | | | 1,463,534 | |
| FHLMC REMIC Series 2007-3316, Class FB(a) (1M USD LIBOR
+ 0.300%) |
|
| | 1,085,498 | | | | 0.462 | | | | 08/15/35 | | | | 1,090,332 | |
| FHLMC REMIC Series 2007-3371, Class FA(a) (1M USD LIBOR
+ 0.600%) |
|
| | 185,622 | | | | 0.762 | | | | 09/15/37 | | | | 188,628 | |
| FHLMC REMIC Series 2009-3593, Class CF(a) (1M USD LIBOR
+ 0.600%) |
|
| | 2,253,738 | | | | 0.762 | | | | 02/15/36 | | | | 2,288,640 | |
| FHLMC REMIC Series 2011-3895, Class FM(a) (1M USD
LIBOR + 0.350%) |
|
| | 384,420 | | | | 0.512 | | | | 12/15/40 | | | | 384,883 | |
| FHLMC REMIC Series 2012-4040, Class FW(a) (1M USD
LIBOR + 0.370%) |
|
| | 793,360 | | | | 0.532 | | | | 05/15/32 | | | | 795,553 | |
| FHLMC REMIC Series 2012-4068, Class UF(a) (1M USD LIBOR
+ 0.500%) |
|
| | 431,661 | | | | 0.662 | | | | 06/15/42 | | | | 434,907 | |
| FHLMC REMIC Series 2012-4098, Class MF(a) (1M USD
LIBOR + 0.300%) |
|
| | 655,201 | | | | 0.462 | | | | 11/15/41 | | | | 654,923 | |
| FHLMC REMIC Series 2013-4203, Class QF(a) (1M USD LIBOR
+ 0.250%) |
|
| | 1,981,434 | | | | 0.412 | | | | 05/15/43 | | | | 1,982,764 | |
| FHLMC REMIC Series 2013-4248, Class FL(a) (1M USD LIBOR
+ 0.450%) |
|
| | 147,022 | | | | 0.612 | | | | 05/15/41 | | | | 148,403 | |
| FHLMC REMIC Series 2013-4263, Class FB(a) (1M USD LIBOR
+ 0.400%) |
|
| | 106,606 | | | | 0.562 | | | | 11/15/43 | | | | 107,549 | |
| FHLMC REMIC Series 2013-4272, Class FD(a) (1M USD LIBOR
+ 0.350%) |
|
| | 116,976 | | | | 0.512 | | | | 11/15/43 | | | | 117,581 | |
| FHLMC REMIC Series 2018-4818, Class FC(a) (1M USD LIBOR
+ 0.300%) |
|
| | 762,061 | | | | 0.462 | | | | 04/15/48 | | | | 761,685 | |
| FHLMC REMIC Series 2019-4897, Class F(a) (1M USD LIBOR
+ 0.400%) |
|
| | 2,273,961 | | | | 0.562 | | | | 07/15/49 | | | | 2,291,772 | |
| | |
|
| Mortgage-Backed Securities – (continued) | |
| FHLMC REMIC Series 2019-4903, Class F(a) (1M USD LIBOR
+ 0.450%) |
|
| 661,740 | | | | 0.612 | | | | 09/15/48 | | | | 666,847 | |
| FHLMC STRIPS Series 2006-239, Class F22(a) (1M USD LIBOR
+ 0.350%) |
|
| | 299,042 | | | | 0.512 | | | | 08/15/36 | | | | 300,940 | |
| FHLMC STRIPS Series 2006-239, Class F30(a) (1M USD LIBOR
+ 0.300%) |
|
| | 747,604 | | | | 0.462 | | | | 08/15/36 | | | | 751,850 | |
| FNMA REMIC Series 2004-54, Class FL(a) (1M USD LIBOR +
0.400%) |
|
| | 194,318 | | | | 0.575 | | | | 07/25/34 | | | | 195,772 | |
| FNMA REMIC Series 2004-54, Class FN(a) (1M USD LIBOR +
0.450%) |
|
| | 477,894 | | | | 0.625 | | | | 07/25/34 | | | | 482,503 | |
| FNMA REMIC Series 2005-120, Class FE(a) (1M USD LIBOR +
0.520%) |
|
| | 646,708 | | | | 0.695 | | | | 01/25/36 | | | | 656,102 | |
| FNMA REMIC Series 2005-87, Class FE(a) (1M USD LIBOR +
0.450%) |
|
| | 751,693 | | | | 0.625 | | | | 10/25/35 | | | | 759,231 | |
| FNMA REMIC Series 2006-16, Class FC(a) (1M USD LIBOR +
0.300%) |
|
| | 211,452 | | | | 0.475 | | | | 03/25/36 | | | | 212,306 | |
| FNMA REMIC Series 2006-36, Class FB(a) (1M USD LIBOR +
0.300%) |
|
| | 118,838 | | | | 0.475 | | | | 05/25/36 | | | | 119,361 | |
| FNMA REMIC Series 2006-42, Class PF(a) (1M USD LIBOR +
0.410%) |
|
| | 176,476 | | | | 0.585 | | | | 06/25/36 | | | | 178,114 | |
| FNMA REMIC Series 2006-61, Class FD(a) (1M USD LIBOR +
0.360%) |
|
| | 293,506 | | | | 0.535 | | | | 07/25/36 | | | | 295,531 | |
| FNMA REMIC Series 2006-79, Class DF(a) (1M USD LIBOR +
0.350%) |
|
| | 675,630 | | | | 0.525 | | | | 08/25/36 | | | | 680,298 | |
| FNMA REMIC Series 2006-88, Class AF(a) (1M USD LIBOR +
0.460%) |
|
| | 552,194 | | | | 0.635 | | | | 09/25/36 | | | | 558,708 | |
| FNMA REMIC Series 2007-35, Class PF(a) (1M USD LIBOR +
0.250%) |
|
| | 121,591 | | | | 0.425 | | | | 04/25/37 | | | | 121,983 | |
| FNMA REMIC Series 2007-67, Class FB(a) (1M USD LIBOR +
0.320%) |
|
| | 767,516 | | | | 0.495 | | | | 07/25/37 | | | | 771,301 | |
| FNMA REMIC Series 2008-1, Class CF(a) (1M USD LIBOR +
0.700%) |
|
| | 75,621 | | | | 0.875 | | | | 02/25/38 | | | | 76,589 | |
| FNMA REMIC Series 2009-110, Class FG(a) (1M USD LIBOR +
0.750%) |
|
| | 394,032 | | | | 0.925 | | | | 01/25/40 | | | | 401,394 | |
| FNMA REMIC Series 2010-113, Class FA(a) (1M USD LIBOR +
0.400%) |
|
| | 263,088 | | | | 0.575 | | | | 10/25/40 | | | | 265,229 | |
| FNMA REMIC Series 2010-116, Class FE(a) (1M USD LIBOR +
0.400%) |
|
| | 324,600 | | | | 0.575 | | | | 10/25/40 | | | | 327,212 | |
| | |
| | |
| 66 | | The accompanying notes are an integral part of these financial statements. |
GOLDMAN SACHS ACCESS ULTRA SHORT BOND ETF
| | | | | | | | | | | | | | |
Principal
Amount | | | Interest
Rate | | | Maturity
Date | | | Value | |
|
| Mortgage-Backed Securities – (continued) | |
| FNMA REMIC Series 2010-141, Class FB(a) (1M USD LIBOR +
0.470%) |
|
| $ | 197,017 | | | | 0.645 | % | | | 12/25/40 | | | $ | 199,102 | |
| FNMA REMIC Series 2010-15, Class FJ(a) (1M USD LIBOR +
0.930%) |
|
| | 606,542 | | | | 1.105 | | | | 06/25/36 | | | | 619,132 | |
| FNMA REMIC Series 2010-39, Class FE(a) (1M USD LIBOR +
0.770%) |
|
| | 978,531 | | | | 0.945 | | | | 06/25/37 | | | | 996,695 | |
| FNMA REMIC Series 2010-39, Class FG(a) (1M USD LIBOR +
0.920%) |
|
| | 396,156 | | | | 1.095 | | | | 03/25/36 | | | | 406,926 | |
| FNMA REMIC Series 2010-46, Class WF(a) (1M USD LIBOR +
0.750%) |
|
| | 3,308,811 | | | | 0.925 | | | | 05/25/40 | | | | 3,388,552 | |
| FNMA REMIC Series 2010-49, Class FB(a) (1M USD LIBOR +
0.750%) |
|
| | 305,145 | | | | 0.925 | | | | 05/25/40 | | | | 311,301 | |
| FNMA REMIC Series 2011-5, Class PF(a) (1M USD LIBOR +
0.600%) |
|
| | 669,166 | | | | 0.775 | | | | 11/25/40 | | | | 671,605 | |
| FNMA REMIC Series 2011-53, Class FT(a) (1M USD LIBOR +
0.580%) |
|
| | 270,655 | | | | 0.755 | | | | 06/25/41 | | | | 275,126 | |
| FNMA REMIC Series 2011-87, Class FJ(a) (1M USD LIBOR +
0.550%) |
|
| | 490,135 | | | | 0.725 | | | | 09/25/41 | | | | 495,241 | |
| FNMA REMIC Series 2012-101, Class FC(a) (1M USD LIBOR +
0.500%) |
|
| | 276,145 | | | | 0.675 | | | | 09/25/42 | | | | 278,261 | |
| FNMA REMIC Series 2012-14, Class BF(a) (1M USD LIBOR +
0.600%) |
|
| | 1,949,504 | | | | 0.775 | | | | 03/25/42 | | | | 1,986,358 | |
| FNMA REMIC Series 2012-37, Class BF(a) (1M USD LIBOR +
0.500%) |
|
| | 253,327 | | | | 0.675 | | | | 12/25/35 | | | | 256,360 | |
| FNMA REMIC Series 2013-10, Class KF(a) (1M USD LIBOR +
0.300%) |
|
| | 177,167 | | | | 0.475 | | | | 02/25/43 | | | | 177,616 | |
| FNMA REMIC Series 2013-130, Class FB(a) (1M USD LIBOR +
0.450%) |
|
| | 220,843 | | | | 0.625 | | | | 01/25/44 | | | | 222,784 | |
| FNMA REMIC Series 2013-19, Class DF(a) (1M USD LIBOR +
0.300%) |
|
| | 2,028,714 | | | | 0.475 | | | | 09/25/41 | | | | 2,033,677 | |
| FNMA REMIC Series 2013-2, Class QF(a) (1M USD LIBOR +
0.500%) |
|
| | 135,360 | | | | 0.675 | | | | 02/25/43 | | | | 136,796 | |
| FNMA REMIC Series 2014-17, Class FE(a) (1M USD LIBOR +
0.550%) |
|
| | 1,903,294 | | | | 0.725 | | | | 04/25/44 | | | | 1,926,668 | |
| FNMA REMIC Series 2015-27, Class KF(a) (1M USD LIBOR +
0.300%) |
|
| | 185,923 | | | | 0.475 | | | | 05/25/45 | | | | 186,779 | |
| FNMA REMIC Series 2015-87, Class BF(a) (1M USD LIBOR +
0.300%) |
|
| | 707,833 | | | | 0.475 | | | | 12/25/45 | | | | 710,581 | |
| | |
|
| Mortgage-Backed Securities – (continued) | |
| FNMA REMIC Series 2016-49, Class EF(a) (1M USD LIBOR +
0.400%) |
|
| 1,647,052 | | | | 0.575 | | | | 08/25/46 | | | | 1,661,145 | |
| FNMA REMIC Series 2017-91, Class GF(a) (1M USD LIBOR +
0.350%) |
|
| | 4,137,168 | | | | 0.525 | | | | 11/25/47 | | | | 4,156,730 | |
| | GNMA Series 2004-59, Class FP(a) (1M USD LIBOR + 0.300%) | |
| | 674,567 | | | | 0.462 | | | | 08/16/34 | | | | 678,449 | |
| | GNMA Series 2004-70, Class FH(a) (1M USD LIBOR + 0.400%) | |
| | 2,758,192 | | | | 0.558 | | | | 07/20/34 | | | | 2,783,731 | |
| | GNMA Series 2005-4, Class FA(a) (1M USD LIBOR + 0.370%) | |
| | 638,234 | | | | 0.532 | | | | 01/16/35 | | | | 643,486 | |
| | GNMA Series 2007-59, Class FA(a) (1M USD LIBOR + 0.500%) | |
| | 202,545 | | | | 0.658 | | | | 10/20/37 | | | | 205,502 | |
| | GNMA Series 2011-11, Class FA(a) (1M USD LIBOR + 0.500%) | |
| | 1,490,741 | | | | 0.658 | | | | 01/20/41 | | | | 1,507,192 | |
| | GNMA Series 2013-64, Class KF(a) (1M USD LIBOR + 0.250%) | |
| | 2,238,590 | | | | 0.408 | | | | 04/20/43 | | | | 2,247,838 | |
| JPMBB Commercial Mortgage Securities Trust Series 2015-C31,
Class ASB |
|
| | 728,390 | | | | 3.540 | | | | 08/15/48 | | | | 771,455 | |
| Morgan Stanley Bank of America Merrill Lynch
Trust Series 2013-C7, Class A3 |
|
| | 265,842 | | | | 2.655 | | | | 02/15/46 | | | | 269,715 | |
| | WFRBS Commercial Mortgage Trust Series 2012-C10, Class A3 | |
| | 537,000 | | | | 2.875 | | | | 12/15/45 | | | | 553,395 | |
| | |
| | TOTAL MORTGAGE-BACKED SECURITIES | |
| | (Cost $52,855,566) | | | $ | 53,375,603 | |
| | |
| | | | | | | | | | | | | | |
|
| Asset- Backed Securities – 20.9% | |
| Access to Loans for Learning Student Loan Corp., Series 2012-1,
Class A(a) (1M USD LIBOR + 0.700%) |
|
| $ | 28,839 | | | | 0.875 | % | | | 07/25/36 | | | $ | 28,183 | |
| | Ally Master Owner Trust, Series 2018-1, Class A2 | |
| | 295,000 | | | | 2.700 | | | | 01/17/23 | | | | 297,513 | |
| American Express Credit Account Master Trust, Series 2017-2,
Class A(a) (1M USD LIBOR + 0.450%) |
|
| | 135,000 | | | | 0.612 | | | | 09/16/24 | | | | 135,639 | |
| American Express Credit Account Master Trust, Series 2019-3,
Class A |
|
| | 1,070,000 | | | | 2.000 | | | | 04/15/25 | | | | 1,105,128 | |
| AMMC CLO Ltd., Series 2017-14A, Class A1LR(a)(b) (3M USD
LIBOR + 1.250%) (Cayman Islands) |
|
| | 1,000,000 | | | | 1.495 | | | | 07/25/29 | | | | 994,562 | |
| Atlas Senior Loan Fund III Ltd., Series 2013-1A, Class AR(a)(b)
(3M USD LIBOR + 0.830%) (Cayman Islands) |
|
| | 212,404 | | | | 1.110 | | | | 11/17/27 | | | | 209,791 | |
| Atrium XII, Series 2017-12A, Class AR(a)(b) (3M USD LIBOR +
0.830%) (Cayman Islands) |
|
| | 262,008 | | | | 1.088 | | | | 04/22/27 | | | | 260,578 | |
| | BA Credit Card Trust, Series 2018-A3, Class A3 | |
| | 500,000 | | | | 3.100 | | | | 12/15/23 | | | | 512,194 | |
| Barings CLO Ltd., Series 2018-3A, Class A1(a)(b) (3M USD
LIBOR + 0.950%) (Cayman Islands) |
|
| | 500,000 | | | | 1.222 | | | | 07/20/29 | | | | 497,649 | |
| | |
| | |
| The accompanying notes are an integral part of these financial statements. | | 67 |
GOLDMAN SACHS ACCESS ULTRA SHORT BOND ETF
Schedule of Investments (continued)
August 31, 2020
| | | | | | | | | | | | | | |
Principal
Amount | | | Interest
Rate | | | Maturity
Date | | | Value | |
|
| Asset- Backed Securities – (continued) | |
| BlueMountain CLO Ltd., Series 2016-1A, Class A1R(a)(b) (3M
USD LIBOR + 1.330%) (Cayman Islands) |
|
| $ | 148,530 | | | | 1.596 | % | | | 04/13/27 | | | $ | 148,544 | |
| BlueMountain CLO Ltd., Series 2017-2A, Class A1R(a)(b) (3M
USD LIBOR + 1.180%) (Cayman Islands) |
|
| | 992,368 | | | | 1.438 | | | | 10/22/30 | | | | 987,034 | |
| BlueMountain CLO Ltd., Series 2018-2A, Class A1R(a)(b) (3M
USD LIBOR + 0.930%) (Cayman Islands) |
|
| | 691,803 | | | | 1.202 | | | | 07/18/27 | | | | 687,251 | |
| Brazos Higher Education Authority, Inc., Series 2005-3,
Class A16(a) (3M USD LIBOR + 0.200%) |
|
| | 155,794 | | | | 0.497 | | | | 06/25/26 | | | | 154,792 | |
| Brazos Higher Education Authority, Inc., Series 2006-2,
Class A10(a) (3M USD LIBOR + 0.120%) |
|
| | 957,665 | | | | 0.417 | | | | 06/25/26 | | | | 944,950 | |
| Brazos Higher Education Authority, Inc., Series 2010-1,
Class A1(a) (3M USD LIBOR + 0.900%) |
|
| | 89,454 | | | | 1.150 | | | | 05/25/29 | | | | 89,013 | |
| Brazos Higher Education Authority, Inc., Series 2011-1,
Class A2(a) (3M USD LIBOR + 0.800%) |
|
| | 625,277 | | | | 1.050 | | | | 02/25/30 | | | | 622,604 | |
| Brazos Higher Education Authority, Inc., Series 2011-2,
Class A2(a) (3M USD LIBOR + 0.850%) |
|
| | 97,875 | | | | 1.095 | | | | 07/25/29 | | | | 97,153 | |
| California Street CLO XII Ltd., Series 2013-12A, Class AR(a)(b)
(3M USD LIBOR + 1.030%) (Cayman Islands) |
|
| | 402,303 | | | | 1.305 | | | | 10/15/25 | | | | 401,496 | |
| Capital One Multi-Asset Execution Trust, Series 2016-A7,
Class A7(a) (1M USD LIBOR + 0.510%) |
|
| | 300,000 | | | | 0.672 | | | | 09/16/24 | | | | 301,348 | |
| Carlyle Global Market Strategies CLO Ltd., Series 2018-2A,
Class A1R(a)(b) (3M USD LIBOR + 0.780%) (Cayman Islands) |
|
| | 374,568 | | | | 1.025 | | | | 04/27/27 | | | | 371,963 | |
| Cedar Funding II CLO Ltd., Series 2017-1A, Class A1R(a)(b) (3M
USD LIBOR + 1.230%) (Cayman Islands) |
|
| | 250,000 | | | | 1.543 | | | | 06/09/30 | | | | 249,643 | |
| | Chase Issuance Trust, Series 2020-A1, Class A1 | |
| | 400,000 | | | | 1.530 | | | | 01/15/25 | | | | 411,267 | |
| Crown Point CLO 5 Ltd., Series 2018-5A, Class A(a)(b) (3M USD
LIBOR + 0.940%) (Cayman Islands) |
|
| | 296,127 | | | | 1.213 | | | | 07/17/28 | | | | 294,063 | |
| Crown Point CLO 6 Ltd., Series 2018-6A, Class A1(a)(b) (3M USD
LIBOR + 1.170%) (Cayman Islands) |
|
| | 294,706 | | | | 1.442 | | | | 10/20/28 | | | | 293,409 | |
| Discover Card Execution Note Trust, Series 2017-A7, Class A7(a)
(1M USD LIBOR + 0.360%) |
|
| | 150,000 | | | | 0.522 | | | | 04/15/25 | | | | 150,235 | |
| Dryden XXV Senior Loan Fund, Series 2012-25A, Class ARR(a)(b)
(3M USD LIBOR + 0.900%) (Cayman Islands) |
|
| | 269,551 | | | | 1.175 | | | | 10/15/27 | | | | 268,071 | |
| Dryden XXVI Senior Loan Fund, Series 2013-26A, Class AR(a)(b)
(3M USD LIBOR + 0.900%) (Cayman Islands) |
|
| | 250,000 | | | | 1.175 | | | | 04/15/29 | | | | 248,039 | |
| Edsouth Indenture No 2 LLC, Series 2012-1, Class A1(a)(b) (1M
USD LIBOR + 1.150%) |
|
| | 327,774 | | | | 1.325 | | | | 09/25/40 | | | | 327,083 | |
| | |
|
| Asset- Backed Securities – (continued) | |
| Edsouth Indenture No 3 LLC, Series 2012-2, Class A(a)(b) (1M
USD LIBOR + 0.730%) |
|
| 56,018 | | | | 0.905 | | | | 04/25/39 | | | | 55,183 | |
| Educational Funding of the South, Inc., Series 2011-1, Class A2(a)
(3M USD LIBOR + 0.650%) |
|
| | 795,341 | | | | 0.895 | | | | 04/25/35 | | | | 794,250 | |
| Evergreen Credit Card Trust, Series 2019-1, Class A(a)(b) (1M
USD LIBOR + 0.480%) (Canada) |
|
| | 500,000 | | | | 0.642 | | | | 01/15/23 | | | | 500,341 | |
| | Ford Credit Auto Owner Trust, Series 2017-1, Class A(b) | |
| | 1,450,000 | | | | 2.620 | | | | 08/15/28 | | | | 1,492,370 | |
| Gallatin CLO VIII Ltd., Series 2017-1A, Class A(a)(b) (3M USD
LIBOR + 1.300%) (Cayman Islands) |
|
| | 579,098 | | | | 1.575 | | | | 07/15/27 | | | | 577,905 | |
| GCO Education Loan Funding Trust, Series 2006-1,
Class A10L(a) (3M USD LIBOR + 0.190%) |
|
| | 699,258 | | | | 0.550 | | | | 02/27/28 | | | | 693,379 | |
| Goal Capital Funding Trust, Series 2010-1, Class A(a)(b) (3M USD
LIBOR + 0.700%) |
|
| | 389,589 | | | | 0.950 | | | | 08/25/48 | | | | 382,857 | |
| | Golden Credit Card Trust, Series 2018-1A, Class A(b) (Canada) | |
| | 100,000 | | | | 2.620 | | | | 01/15/23 | | | | 100,873 | |
| Higher Education Funding I, Series 2014-1, Class A(a)(b) (3M USD
LIBOR + 1.050%) |
|
| | 1,053,687 | | | | 1.300 | | | | 05/25/34 | | | | 1,053,686 | |
| | Honda Auto Receivables Owner Trust, Series 2019-4, Class A3 | |
| | 1,000,000 | | | | 1.830 | | | | 01/18/24 | | | | 1,025,113 | |
| Jamestown CLO IX Ltd., Series 2016-9A, Class A1AR(a)(b) (3M
USD LIBOR + 1.170%) (Cayman Islands) |
|
| | 850,000 | | | | 1.442 | | | | 10/20/28 | | | | 845,710 | |
| KnowledgeWorks Foundation, Series 2010-1, Class A(a) (3M
USD LIBOR + 0.950%) |
|
| | 393,584 | | | | 1.200 | | | | 02/25/42 | | | | 386,735 | |
| Madison Park Funding XI Ltd., Series 2017-11A, Class X(a)(b)
(3M USD LIBOR + 0.900%) (Cayman Islands) |
|
| | 56,250 | | | | 1.156 | | | | 07/23/29 | | | | 56,268 | |
| Nelnet Student Loan Trust, Series 2014-2A, Class A2(a)(b) (1M
USD LIBOR + 0.600%) |
|
| | 656,843 | | | | 0.775 | | | | 03/25/30 | | | | 640,364 | |
| Nelnet Student Loan Trust, Series 2014-4A, Class A1(a)(b) (1M
USD LIBOR + 0.540%) |
|
| | 769,105 | | | | 0.715 | | | | 11/27/39 | | | | 758,646 | |
| Nelnet Student Loan Trust, Series 2016-1A, Class A(a)(b) (1M
USD LIBOR + 0.800%) |
|
| | 610,171 | | | | 0.975 | | | | 09/25/65 | | | | 603,703 | |
| Neuberger Berman CLO XX Ltd., Series 2017-20A, Class AR(a)(b)
(3M USD LIBOR + 0.800%) (Cayman Islands) |
|
| | 236,815 | | | | 1.075 | | | | 01/15/28 | | | | 235,224 | |
| | Nissan Auto Lease Trust, Series 2020-A, Class A3 | |
| | 165,000 | | | | 1.840 | | | | 01/17/23 | | | | 168,201 | |
| Northstar Education Finance, Inc., Series 2012-1, Class A(a)(b)
(1M USD LIBOR + 0.700%) |
|
| | 173,593 | | | | 0.875 | | | | 12/26/31 | | | | 170,294 | |
| Octagon Investment Partners 25 Ltd., Series 2015-1A,
Class AR(a)(b) (3M USD LIBOR + 0.800%) (Cayman Islands) |
|
| | 426,739 | | | | 1.072 | | | | 10/20/26 | | | | 424,316 | |
| | |
| | |
| 68 | | The accompanying notes are an integral part of these financial statements. |
GOLDMAN SACHS ACCESS ULTRA SHORT BOND ETF
| | | | | | | | | | | | | | |
Principal
Amount | | | Interest
Rate | | | Maturity
Date | | | Value | |
|
| Asset- Backed Securities – (continued) | |
| Octagon Investment Partners XXIII Ltd., Series 2015-1A,
Class A1R(a)(b) (3M USD LIBOR + 0.850%) (Cayman Islands) |
|
| $ | 433,377 | | | | 1.125 | % | | | 07/15/27 | | | $ | 429,520 | |
| Pennsylvania Higher Education Assistance Agency,
Series 2009-1, Class A1(a) (3M USD LIBOR + 0.900%) |
|
| | 156,378 | | | | 1.168 | | | | 07/25/29 | | | | 155,995 | |
| Recette CLO Ltd., Series 2015-1A, Class AR(a)(b) (3M USD
LIBOR + 0.920%) (Cayman Islands) |
|
| | 159,381 | | | | 1.192 | | | | 10/20/27 | | | | 158,650 | |
| Rhode Island Student Loan Authority, Series 2012-1, Class A1(a)
(1M USD LIBOR + 0.900%) |
|
| | 164,548 | | | | 1.055 | | | | 07/01/31 | | | | 163,734 | |
| Rhode Island Student Loan Authority, Series 2014-1, Class A1(a)
(1M USD LIBOR + 0.700%) |
|
| | 227,199 | | | | 0.856 | | | | 10/02/28 | | | | 224,847 | |
| SLC Student Loan Trust, Series 2005-3, Class A3(a) (3M USD
LIBOR + 0.120%) |
|
| | 204,093 | | | | 0.433 | | | | 06/15/29 | | | | 202,445 | |
| SLC Student Loan Trust, Series 2005-5, Class A4(a) (3M USD
LIBOR + 0.140%) |
|
| | 375,514 | | | | 0.385 | | | | 10/25/28 | | | | 371,935 | |
| SLC Student Loan Trust, Series 2007-1, Class A4(a) (3M USD
LIBOR + 0.060%) |
|
| | 1,062,080 | | | | 0.340 | | | | 05/15/29 | | | | 1,032,291 | |
| SLC Student Loan Trust, Series 2010-1, Class A(a) (3M USD
LIBOR + 0.875%) |
|
| | 494,781 | | | | 1.125 | | | | 11/25/42 | | | | 491,564 | |
| SLM Student Loan Trust, Series 2003-11, Class A6(a)(b) (3M USD
LIBOR + 0.550%) |
|
| | 187,044 | | | | 0.863 | | | | 12/15/25 | | | | 185,860 | |
| SLM Student Loan Trust, Series 2003-14, Class A6(a) (3M USD
LIBOR + 0.300%) |
|
| | 303,643 | | | | 0.545 | | | | 07/25/25 | | | | 296,143 | |
| SLM Student Loan Trust, Series 2004-1, Class A4(a) (3M USD
LIBOR + 0.260%) |
|
| | 382,981 | | | | 0.505 | | | | 10/27/25 | | | | 379,633 | |
| SLM Student Loan Trust, Series 2005-7, Class A4(a) (3M USD
LIBOR + 0.150%) |
|
| | 333,957 | | | | 0.395 | | | | 10/25/29 | | | | 325,383 | |
| Sound Point CLO Ltd., Series 2016-3A, Class AR(a)(b) (3M USD
LIBOR + 1.150%) (Cayman Islands) |
|
| | 400,000 | | | | 1.406 | | | | 01/23/29 | | | | 397,130 | |
| South Carolina Student Loan Corp., Series 2014-1, Class A1(a)
(1M USD LIBOR + 0.750%) |
|
| | 472,809 | | | | 0.905 | | | | 05/01/30 | | | | 469,238 | |
| TICP CLO Ltd., Series 2019-6A, Class AR(a)(b) (3M USD LIBOR
+ 1.200%) (Cayman Islands) |
|
| | 750,000 | | | | 1.475 | | | | 01/15/29 | | | | 748,518 | |
| | Toyota Auto Receivables Owner Trust, Series 2017-C, Class A4 | |
| | 300,000 | | | | 1.980 | | | | 12/15/22 | | | | 303,364 | |
| TRESTLES CLO Ltd., Series 2017-1A, Class A1A(a)(b) (3M USD
LIBOR + 1.290%) (Cayman Islands) |
|
| | 250,000 | | | | 1.535 | | | | 07/25/29 | | | | 249,355 | |
| Utah State Board of Regents, Series 2016-1, Class A(a) (1M USD
LIBOR + 0.750%) |
|
| | 190,031 | | | | 0.925 | | | | 09/25/56 | | | | 188,010 | |
| | |
|
| Asset- Backed Securities – (continued) | |
| Venture XVI CLO Ltd., Series 2014-16A, Class ARR(a)(b) (3M
USD LIBOR + 0.850%) (Cayman Islands) |
|
| 169,257 | | | | 1.125 | | | | 01/15/28 | | | | 167,339 | |
| Voya CLO Ltd., Series 2015-1A, Class A1R(a)(b) (3M USD
LIBOR + 0.900%) (Cayman Islands) |
|
| | 300,000 | | | | 1.172 | | | | 01/18/29 | | | | 296,654 | |
| Wellfleet CLO Ltd., Series 2019-1A, Class AR3(a)(b) (3M USD
LIBOR + 1.280%) (Cayman Islands) |
|
| | 991,458 | | | | 1.552 | | | | 07/20/29 | | | | 986,463 | |
| Zais CLO Ltd., Series 2020-15A, Class A1(a)(b) (3M USD LIBOR
+ 2.555%) (Cayman Islands) |
|
| | 1,000,000 | | | | 2.917 | | | | 07/28/30 | | | | 1,008,666 | |
| | |
| | TOTAL ASSET- BACKED SECURITIES | |
| | (Cost $31,199,337) | | | $ | 31,287,350 | |
| | |
| | | | | | | | | | | | | | |
|
| Corporate Obligations – 19.4% | |
| Banks – 8.5% | |
| | American Express Credit Corp., MTN | |
| $ | 1,000,000 | | | | 2.250 | % | | | 05/05/21 | | | $ | 1,011,595 | |
| | Bank of America Corp.(a) | |
| | (3M USD LIBOR + 0.380%) | |
| | 500,000 | | | | 0.636 | | | | 01/23/22 | | | | 500,421 | |
| | Bank of America Corp.(a), MTN | |
| | (3M USD LIBOR + 0.630%) | |
| | 875,000 | | | | 3.499 | | | | 05/17/22 | | | | 894,080 | |
| | Capital One Financial Corp. | |
| | 200,000 | | | | 3.450 | | | | 04/30/21 | | | | 203,553 | |
| | Capital One NA | |
| | 705,000 | | | | 2.950 | | | | 07/23/21 | | | | 719,373 | |
| | Citigroup, Inc. | |
| | 710,000 | | | | 2.350 | | | | 08/02/21 | | | | 723,350 | |
| | (SOFR + 0.870%) | |
| | 240,000 | | | | 0.958 | (a) | | | 11/04/22 | | | | 240,938 | |
| | Citizens Bank NA/Providence RI | |
| | 550,000 | | | | 2.550 | | | | 05/13/21 | | | | 557,259 | |
| | Citizens Financial Group, Inc. | |
| | 701,000 | | | | 2.375 | | | | 07/28/21 | | | | 711,221 | |
| | Discover Bank | |
| | 250,000 | | | | 3.200 | | | | 08/09/21 | | | | 255,816 | |
| | Fifth Third Bancorp | |
| | 600,000 | | | | 2.600 | | | | 06/15/22 | | | | 621,640 | |
| | Fifth Third Bank NA(a) | |
| | (3M USD LIBOR + 0.640%) | |
| | 500,000 | | | | 0.891 | | | | 02/01/22 | | | | 503,025 | |
| | JPMorgan Chase & Co.(a) | |
| | (3M USD LIBOR + 0.610%) | |
| | 1,545,000 | | | | 3.514 | | | | 06/18/22 | | | | 1,583,715 | |
| | Manufacturers & Traders Trust Co.(a) | |
| | (3M USD LIBOR + 0.640%) | |
| | 675,000 | | | | 0.886 | | | | 12/01/21 | | | | 674,166 | |
| | Morgan Stanley | |
| | (3M USD LIBOR + 1.180%) | |
| | 740,000 | | | | 1.452 | (a) | | | 01/20/22 | | | | 742,751 | |
| | (SOFR + 0.830%) | |
| | 350,000 | | | | 0.922 | (a) | | | 06/10/22 | | | | 351,079 | |
| | |
| | |
| The accompanying notes are an integral part of these financial statements. | | 69 |
GOLDMAN SACHS ACCESS ULTRA SHORT BOND ETF
Schedule of Investments (continued)
August 31, 2020
| | | | | | | | | | | | | | |
Principal
Amount | | | Interest
Rate | | | Maturity
Date | | | Value | |
|
| Corporate Obligations – (continued) | |
| Banks – (continued) | |
| | MUFG Union Bank NA | |
| $ | 300,000 | | | | 3.150 | % | | | 04/01/22 | | | $ | 312,525 | |
| | Truist Bank(a) | |
| | (SOFR + 0.730%) | |
| | 500,000 | | | | 0.821 | | | | 03/09/23 | | | | 502,525 | |
| | Truist Financial Corp.(a), MTN | |
| | (3M USD LIBOR + 0.650%) | |
| | 500,000 | | | | 0.946 | | | | 04/01/22 | | | | 503,032 | |
| | Wells Fargo & Co., MTN | |
| | 325,000 | | | | 2.625 | | | | 07/22/22 | | | | 337,922 | |
| | Wells Fargo Bank NA(a) | |
| | (3M USD LIBOR + 0.510%) | |
| | 750,000 | | | | 0.768 | | | | 10/22/21 | | | | 752,463 | |
| | | | | | | | | | | | | | |
| | | | | | | | | | | | | 12,702,449 | |
| | |
| Basic Industry – 0.4% | |
| | LyondellBasell Industries NV | |
| | 500,000 | | | | 6.000 | | | | 11/15/21 | | | | 525,767 | |
| | |
| Brokerage – 1.3% | |
| | Intercontinental Exchange, Inc.(a) | |
| | (3M USD LIBOR + 0.650%) | |
| | 1,200,000 | | | | 0.903 | | | | 06/15/23 | | | | 1,202,117 | |
| | TD Ameritrade Holding Corp.(a) | |
| | (3M USD LIBOR + 0.430%) | |
| | 758,000 | | | | 0.681 | | | | 11/01/21 | | | | 760,564 | |
| | | | | | | | | | | | | | |
| | | | | | | | | | | | | 1,962,681 | |
| | |
| Capital Goods – 1.0% | |
| | General Electric Co., GMTN | |
| | 675,000 | | | | 3.150 | | | | 09/07/22 | | | | 708,038 | |
| | Honeywell International, Inc. | |
| | 794,000 | | | | 0.483 | | | | 08/19/22 | | | | 795,460 | |
| | | | | | | | | | | | | | |
| | | | | | | | | | | | | 1,503,498 | |
| | |
| Communications – 0.5% | |
| | Moody’s Corp. | |
| | 400,000 | | | | 4.500 | | | | 09/01/22 | | | | 428,552 | |
| | TWDC Enterprises 18 Corp.(a), MTN | |
| | (3M USD LIBOR + 0.390%) | |
| | 375,000 | | | | 0.641 | | | | 03/04/22 | | | | 375,564 | |
| | | | | | | | | | | | | | |
| | | | | | | | | | | | | 804,116 | |
| | |
| Consumer Noncyclical – 0.5% | |
| | AbbVie, Inc. | |
| | (3M USD LIBOR + 0.460%) | |
| | 325,000 | | | | 0.728 | (a)(b) | | | 11/19/21 | | | | 326,003 | |
| | 350,000 | | | | 3.450 | (b) | | | 03/15/22 | | | | 363,830 | |
| | | | | | | | | | | | | | |
| | | | | | | | | | | | | 689,833 | |
| | |
| Consumer Products – 0.3% | |
| | Clorox Co. (The) | |
| | 500,000 | | | | 3.800 | | | | 11/15/21 | | | | 520,109 | |
| | |
| Electric – 1.7% | |
| | Duke Energy Progress LLC(a), Series A | |
| | (3M USD LIBOR + 0.180%) | |
| | 459,000 | | | | 0.433 | | | | 02/18/22 | | | | 459,237 | |
| | |
|
| Corporate Obligations – (continued) | |
| Electric – (continued) | |
| | Florida Power & Light Co.(a) | |
| | (3M USD LIBOR + 0.380%) | |
| 500,000 | | | | 0.641 | | | | 07/28/23 | | | | 500,349 | |
| | NextEra Energy Capital Holdings, Inc.(a) | |
| | (3M USD LIBOR + 0.550%) | |
| | 500,000 | | | | 0.806 | | | | 08/28/21 | | | | 500,147 | |
| | Southern Co. (The) | |
| | 300,000 | | | | 2.350 | | | | 07/01/21 | | | | 304,436 | |
| | Southern Power Co.(a)(b) | |
| | (3M USD LIBOR + 0.550%) | |
| | 804,000 | | | | 0.856 | | | | 12/20/20 | | | | 804,420 | |
| | | | | | | | | | | | | | |
| | | | | | | | | | | | | 2,568,589 | |
| | |
| Energy – 0.9% | |
| | Chevron Corp.(a) | |
| | (3M USD LIBOR + 0.530%) | |
| | 350,000 | | | | 0.781 | | | | 03/03/22 | | | | 352,351 | |
| | Kinder Morgan Energy Partners LP | |
| | 465,000 | | | | 5.000 | | | | 10/01/21 | | | | 481,398 | |
| | MPLX LP(a) | |
| | (3M USD LIBOR + 0.900%) | |
| | 500,000 | | | | 1.213 | | | | 09/09/21 | | | | 499,295 | |
| | | | | | | | | | | | | | |
| | | | | | | | | | | | | 1,333,044 | |
| | |
| Financial Company – 0.5% | |
| | Air Lease Corp. | |
| | 750,000 | | | | 3.500 | | | | 01/15/22 | | | | 765,946 | |
| | |
| Insurance – 2.2% | |
| | Guardian Life Global Funding(b) | |
| | 575,000 | | | | 2.500 | | | | 05/08/22 | | | | 595,128 | |
| | Jackson National Life Global Funding(a)(b) | |
| | (SOFR + 0.600%) | |
| | 900,000 | | | | 0.694 | | | | 01/06/23 | | | | 899,717 | |
| | Marsh & McLennan Cos., Inc. | |
| | 250,000 | | | | 3.500 | | | | 12/29/20 | | | | 252,536 | |
| | Metropolitan Life Global Funding I(a)(b) | |
| | (SOFR + 0.570%) | |
| | 900,000 | | | | 0.662 | | | | 01/13/23 | | | | 904,007 | |
| | Protective Life Global Funding(a)(b) | |
| | (3M USD LIBOR + 0.520%) | |
| | 695,000 | | | | 0.826 | | | | 06/28/21 | | | | 697,082 | |
| | | | | | | | | | | | | | |
| | | | | | | | | | | | | 3,348,470 | |
| | |
| Technology – 1.4% | |
| | Electronic Arts, Inc. | |
| | 300,000 | | | | 3.700 | | | | 03/01/21 | | | | 304,050 | |
| | Fiserv, Inc. | |
| | 800,000 | | | | 4.750 | | | | 06/15/21 | | | | 826,932 | |
| | Hewlett Packard Enterprise Co.(a) | |
| | (3M USD LIBOR + 0.720%) | |
| | 900,000 | | | | 1.024 | | | | 10/05/21 | | | | 899,861 | |
| | | | | | | | | | | | | | |
| | | | | | | | | | | | | 2,030,843 | |
| | |
| Transportation – 0.2% | |
| | Penske Truck Leasing Co. LP / PTL Finance Corp.(b) | |
| | 250,000 | | | | 3.300 | | | | 04/01/21 | | | | 253,511 | |
| | |
| | TOTAL CORPORATE OBLIGATIONS | |
| | (Cost $28,938,887) | | | $ | 29,008,856 | |
| | |
| | |
| 70 | | The accompanying notes are an integral part of these financial statements. |
GOLDMAN SACHS ACCESS ULTRA SHORT BOND ETF
| | | | | | | | | | | | | | |
Principal
Amount | | | Interest
Rate | | | Maturity
Date | | | Value | |
|
| Foreign Corporate Debt – 16.4% | |
| Aerospace & Defense – 0.3% | |
| | BAE Systems PLC(b) (United Kingdom) | |
| $ | 410,000 | | | | 4.750 | % | | | 10/11/21 | | | $ | 428,727 | |
| | |
| Banks – 11.3% | |
| | Australia & New Zealand Banking Group Ltd. (Australia) | |
| | 600,000 | | | | 2.550 | | | | 11/23/21 | | | | 616,466 | |
| | Bank of Montreal(a), MTN (Canada) | |
| | (SOFR + 0.680%) | |
| | 1,750,000 | | | | 0.772 | | | | 03/10/23 | | | | 1,757,998 | |
| | Banque Federative du Credit Mutuel SA(b) (France) | |
| | 550,000 | | | | 2.500 | | | | 04/13/21 | | | | 557,338 | |
| | BNP Paribas SA (France) | |
| | 700,000 | | | | 5.000 | | | | 01/15/21 | | | | 712,263 | |
| | BPCE SA(a), MTN (France) | |
| | (3M USD LIBOR + 0.880%) | |
| | 250,000 | | | | 1.136 | | | | 05/31/22 | | | | 252,672 | |
| | Canadian Imperial Bank of Commerce(a) (Canada) | |
| | (SOFR + 0.800%) | |
| | 128,000 | | | | 0.893 | | | | 03/17/23 | | | | 128,816 | |
| | Commonwealth Bank of Australia(b) (Australia) | |
| | 600,000 | | | | 2.750 | | | | 03/10/22 | | | | 622,029 | |
| | Cooperatieve Rabobank UA (Netherlands) | |
| | 500,000 | | | | 3.875 | | | | 02/08/22 | | | | 525,324 | |
| | Credit Suisse AG(a) (Switzerland) | |
| | (SOFR + 0.450%) | |
| | 1,200,000 | | | | 0.539 | | | | 02/04/22 | | | | 1,201,695 | |
| | DNB Bank ASA(a)(b) (Norway) | |
| | (3M USD LIBOR + 0.620%) | |
| | 850,000 | | | | 0.861 | | | | 12/02/22 | | | | 855,712 | |
| | HSBC Holdings PLC (United Kingdom) | |
| | 850,000 | | | | 2.950 | | | | 05/25/21 | | | | 866,207 | |
| | ING Groep NV (Netherlands) | |
| | (3M USD LIBOR + 1.150%) | |
| | 200,000 | | | | 1.456 | (a) | | | 03/29/22 | | | | 202,267 | |
| | 750,000 | | | | 3.150 | | | | 03/29/22 | | | | 780,567 | |
| | Macquarie Bank Ltd. (Australia) | |
| | 200,000 | | | | 2.850 | (b) | | | 01/15/21 | | | | 201,626 | |
| | 400,000 | | | | 2.100 | (b) | | | 10/17/22 | | | | 413,305 | |
| | Mitsubishi UFJ Financial Group, Inc.(a) (Japan) | |
| | (3M USD LIBOR + 1.060%) | |
| | 400,000 | | | | 1.373 | | | | 09/13/21 | | | | 403,684 | |
| | Mizuho Financial Group, Inc. (Japan) | |
| | (3M USD LIBOR + 1.140%) | |
| | 410,000 | | | | 1.453 | (a) | | | 09/13/21 | | | | 413,535 | |
| | (3M USD LIBOR + 0.940%) | |
| | 600,000 | | | | 1.196 | (a) | | | 02/28/22 | | | | 605,457 | |
| | MUFG Bank Ltd.(b) (Japan) | |
| | 400,000 | | | | 2.850 | | | | 09/08/21 | | | | 409,721 | |
| | National Australia Bank Ltd.(a)(b) (Australia) | |
| | (3M USD LIBOR + 0.890%) | |
| | 250,000 | | | | 1.163 | | | | 01/10/22 | | | | 252,543 | |
| | Nordea Bank Abp(b) (Finland) | |
| | 600,000 | | | | 2.250 | | | | 05/27/21 | | | | 608,478 | |
| | Societe Generale SA(b) (France) | |
| | 500,000 | | | | 5.200 | | | | 04/15/21 | | | | 515,224 | |
| | |
|
| Foreign Corporate Debt – (continued) | |
| Banks – (continued) | |
| | Standard Chartered PLC(a)(b) (United Kingdom) | |
| | (3M USD LIBOR + 1.200%) | |
| 450,000 | | | | 1.510 | | | | 09/10/22 | | | | 451,903 | |
| | Sumitomo Mitsui Financial Group, Inc. (Japan) | |
| | (3M USD LIBOR + 1.110%) | |
| | 246,000 | | | | 1.378 | (a) | | | 07/14/21 | | | | 248,018 | |
| | 427,000 | | | | 2.442 | | | | 10/19/21 | | | | 436,536 | |
| | 530,000 | | | | 2.784 | | | | 07/12/22 | | | | 552,124 | |
| | Toronto-Dominion Bank (The)(a), MTN (Canada) | |
| | (SOFR + 0.480%) | |
| | 1,000,000 | | | | 0.569 | | | | 01/27/23 | | | | 1,002,494 | |
| | UBS Group AG (Switzerland) | |
| | (3M USD LIBOR + 1.780%) | |
| | 450,000 | | | | 2.048 | (a)(b) | | | 04/14/21 | | | | 454,620 | |
| | 450,000 | | | | 3.000 | (b) | | | 04/15/21 | | | | 457,364 | �� |
| | Westpac Banking Corp.(a) (Australia) | |
| | (3M USD LIBOR + 0.850%) | |
| | 350,000 | | | | 1.118 | | | | 08/19/21 | | | | 352,628 | |
| | | | | | | | | | | | | | |
| | | | | | | | | | | | | 16,858,614 | |
| | |
| Consumer Cyclical – 2.4% | |
| | BMW US Capital LLC (Germany) | |
| | 400,000 | | | | 1.850 | (b) | | | 09/15/21 | | | | 404,407 | |
| | 450,000 | | | | 2.950 | (b) | | | 04/14/22 | | | | 467,534 | |
| | Daimler Finance North America LLC (Germany) | |
| | (3M USD LIBOR + 0.550%) | |
| | 450,000 | | | | 0.799 | (a)(b) | | | 05/04/21 | | | | 450,275 | |
| | 500,000 | | | | 2.850 | (b) | | | 01/06/22 | | | | 513,995 | |
| | Volkswagen Group of America Finance LLC (Germany) | |
| | (3M USD LIBOR + 0.860%) | |
| | 1,000,000 | | | | 1.157 | (a)(b) | | | 09/24/21 | | | | 1,002,398 | |
| | (3M USD LIBOR + 0.940%) | |
| | 750,000 | | | | 1.197 | (a)(b) | | | 11/12/21 | | | | 748,550 | |
| | | | | | | | | | | | | | |
| | | | | | | | | | | | | 3,587,159 | |
| | |
| Consumer Noncyclical – 1.0% | |
| | BAT International Finance PLC(b) (United Kingdom) | |
| | 1,000,000 | | | | 3.250 | | | | 06/07/22 | | | | 1,045,384 | |
| | Bayer US Finance II LLC(b) (Germany) | |
| | 450,000 | | | | 3.500 | | | | 06/25/21 | | | | 459,642 | |
| | | | | | | | | | | | | | |
| | | | | | | | | | | | | 1,505,026 | |
| | |
| Energy – 0.9% | |
| | BP Capital Markets PLC (United Kingdom) | |
| | 400,000 | | | | 3.245 | | | | 05/06/22 | | | | 418,492 | |
| | Enbridge, Inc.(a) (Canada) | |
| | (3M USD LIBOR + 0.500%) | |
| | 1,000,000 | | | | 0.770 | | | | 02/18/22 | | | | 1,000,255 | |
| | | | | | | | | | | | | | |
| | | | | | | | | | | | | 1,418,747 | |
| | |
| Food and Beverage – 0.5% | |
| | Danone SA(b) (France) | |
| | 716,000 | | | | 3.000 | | | | 06/15/22 | | | | 746,013 | |
| | |
| | TOTAL FOREIGN CORPORATE DEBT | |
| | (Cost $24,455,320) | | | $ | 24,544,286 | |
| | |
| | | | | | | | | | | | | | |
| | |
| The accompanying notes are an integral part of these financial statements. | | 71 |
GOLDMAN SACHS ACCESS ULTRA SHORT BOND ETF
Schedule of Investments (continued)
August 31, 2020
| | | | | | | | | | | | | | |
Principal
Amount | | | Interest
Rate | | | Maturity
Date | | | Value | |
|
| U.S. Treasury Bills – 5.1% | |
| | U.S. Cash Management Bill | |
| $ | 900,000 | | | | 0.107 | %(c) | | | 12/01/20 | | | $ | 899,782 | |
| | U.S. Treasury Bill | |
| | 6,700,000 | | | | 0.120 | (c) | | | 02/11/21 | | | | 6,696,850 | |
| | |
| | TOTAL U.S. TREASURY BILLS | |
| | (Cost $7,596,329) | | | $ | 7,596,632 | |
| | |
| | | | | | | | | | | | | | |
|
| Municipal Debt Obligations – 1.8% | |
| Pennsylvania – 0.2% | |
| | School District of Philadelphia (The) | |
| $ | 340,000 | | | | 4.000 | % | | | 06/30/21 | | | $ | 350,339 | |
| | |
| Texas – 1.6% | |
| | State of Texas | |
| | 2,240,000 | | | | 4.000 | | | | 08/26/21 | | | | 2,322,343 | |
| | |
| | TOTAL MUNICIPAL DEBT OBLIGATIONS | |
| | (Cost $2,672,170) | | | $ | 2,672,682 | |
| | |
| | | | | | | | | | | | | | |
|
| Certificate of Deposit – 0.3% | |
| | Bayerische Landesbank (3M USD LIBOR + 0.470%) (Germany) | |
| $ | 500,000 | | | | 0.721 | %(c) | | | 02/03/22 | | | $ | 500,142 | |
| | (Cost $500,000) | |
| | |
| | | | | | | | | | | | | | |
| | | | | | | | |
Principal Amount | | Dividend Rate | | | Value | |
|
| Investment Company – 2.5%(d) | |
Goldman Sachs Financial Square Government Fund – Institutional Shares | |
| $3,705,115 | | | 0.027 | % | | $ | 3,705,115 | |
| (Cost $3,705,115) | |
| |
| TOTAL INVESTMENTS – 102.0% | |
| (Cost $151,922,724) | | | $ | 152,690,666 | |
| |
LIABILITIES IN EXCESS OF ASSETS – (2.0)% | | | | (2,925,980 | ) |
| |
| NET ASSETS – 100.0% | | | $ | 149,764,686 | |
| |
| | |
|
| The percentage shown for each investment category reflects the value of investments in that category as a percentage of net assets. |
| |
(a) | | Variable rate security. Interest rate or distribution rate disclosed is that which is in effect on August 31, 2020. |
| |
(b) | | Exempt from registration under Rule 144A of the Securities Act of 1933. |
| |
(c) | | Interest rates represent either the stated coupon rate, annualized yield on date of purchase for discounted securities, or, for floating rate securities, the current reset rate, which is based upon current interest rate indices. |
| |
(d) | | Represents an affiliated issuer. |
| | |
|
Investment Abbreviations: |
GMTN | | —Global Medium Term Note |
LIBOR | | —London Interbank Offered Rate |
LP | | —Limited Partnership |
MTN | | —Medium Term Note |
PLC | | —Public Limited Company |
SOFR | | —Secured Overnight Financing Rate |
|
| | |
| 72 | | The accompanying notes are an integral part of these financial statements. |
GOLDMAN SACHS ACCESS FIXED INCOME ETFS
Statements of Assets and Liabilities
August 31, 2020
| | | | | | | | | | | | | | | | | | |
| | | | | Access
High Yield
Corporate
Bond ETF | | | Access
Inflation
Protected
USD
Bond ETF | | | Access
Investment
Grade
Corporate
1-5 Year
Bond ETF | | | Access
Investment
Grade
Corporate
Bond ETF | |
| | Assets: | | | | | |
| | Investments in unaffiliated issuers, at value (cost $142,528,822, $29,459,044, $26,904,559 and $587,246,593, respectively) | | $ | 146,235,756 | | | $ | 31,274,674 | | | $ | 26,990,621 | | | $ | 630,518,118 | |
| | Investments in affiliated issuers, at value (cost $1,754,115, $0, $684,558 and $6,635,197, respectively) | | | 1,754,115 | | | | — | | | | 684,558 | | | | 6,635,197 | |
| | Cash | | | 177,250 | | | | 36,260 | | | | 50,011 | | | | 52,047 | |
| | | | | |
| | Receivables: | | | | | | | | | | | | | | | | |
| | Fund shares sold | | | 7,390,273 | | | | — | | | | — | | | | 44,228,924 | |
| | Dividends and interest | | | 2,203,993 | | | | 21,824 | | | | 222,260 | | | | 5,705,222 | |
| | | | | |
| | Reimbursement from investment adviser | | | 195 | | | | — | | | | 69 | | | | 495 | |
| | | | | |
| | Total assets | | | 157,761,582 | | | | 31,332,758 | | | | 27,947,519 | | | | 687,140,003 | |
| | | | | | | | | | | | | | | | | | |
| | Liabilities: | | | | | |
| | | | | |
| | Payables: | | | | | | | | | | | | | | | | |
| | Investments purchased | | | 7,353,781 | | | | — | | | | 327,170 | | | | 44,468,645 | |
| | Management fees | | | 41,245 | | | | 3,013 | | | | 2,983 | | | | 70,573 | |
| | | | | |
| | Fund shares redeemed | | | 19,230 | | | | — | | | | — | | | | 22,791 | |
| | | | | |
| | Total liabilities | | | 7,414,256 | | | | 3,013 | | | | 330,153 | | | | 44,562,009 | |
| | | | | | | | | | | | | | | | | | |
| | Net Assets: | | | | | |
| | | | | |
| | Paid-in capital | | | 147,763,703 | | | | 29,536,006 | | | | 27,512,139 | | | | 598,098,385 | |
| | | | | |
| | Total distributable earnings | | | 2,583,623 | | | | 1,793,739 | | | | 105,227 | | | | 44,479,609 | |
| | | | | |
| | NET ASSETS | | $ | 150,347,326 | | | $ | 31,329,745 | | | $ | 27,617,366 | | | $ | 642,577,994 | |
| | SHARES ISSUED AND OUTSTANDING | | | | | | | | | | | | | | | | |
| | | | | |
| | Shares outstanding no par value (unlimited shares authorized): | | | 3,050,000 | | | | 550,000 | | | | 550,000 | | | | 11,600,000 | |
| | | | | |
| | Net asset value per share: | | | $49.29 | | | | $56.96 | | | | $50.21 | | | | $55.39 | |
| | |
| The accompanying notes are an integral part of these financial statements. | | 73 |
GOLDMAN SACHS ACCESS FIXED INCOME ETFS
Statements of Assets and Liabilities (continued)
August 31, 2020
| | | | | | | | | | |
| | | | | Access Treasury
0-1 Year ETF | | | Access Ultra
Short
Bond ETF | |
| | Assets: | | | | | |
| | | |
| | Investments in unaffiliated issuers, at value (cost $3,043,978,471 and $148,217,609, respectively) | | $ | 3,044,991,425 | | | $ | 148,985,551 | |
| | | |
| | Investments in affiliated issuers, at value (cost $0 and $3,705,115, respectively) | | | — | | | | 3,705,115 | |
| | | |
| | Cash | | | 76,775 | | | | 434,526 | |
| | | |
| | Receivables: | | | | | | | | |
| | | |
| | Investments sold | | | 774,816,503 | | | | — | |
| | | |
| | Dividends and interest | | | 779,051 | | | | 321,844 | |
| | | |
| | Reimbursement from investment adviser | | | 52,925 | | | | 5,310 | |
| | | |
| | Total assets | | | 3,820,716,679 | | | | 153,452,346 | |
| | | | | | | | | | |
| | Liabilities: | | | | | |
| | | |
| | Payables: | | | | | | | | |
| | | |
| | Investments purchased | | | 774,949,928 | | | | 3,663,027 | |
| | | |
| | Management fees | | | 370,475 | | | | 24,633 | |
| | | |
| | Total liabilities | | | 775,320,403 | | | | 3,687,660 | |
| | | | | | | | | | |
| | Net Assets: | | | | | |
| | | |
| | Paid-in capital | | | 3,037,042,917 | | | | 148,931,310 | |
| | | |
| | Total distributable earnings | | | 8,353,359 | | | | 833,376 | |
| | | |
| | NET ASSETS | | $ | 3,045,396,276 | | | $ | 149,764,686 | |
| | SHARES ISSUED AND OUTSTANDING | | | | | | | | |
| | | |
| | Shares outstanding no par value (unlimited shares authorized): | | | 30,320,000 | | | | 2,950,000 | |
| | | |
| | Net asset value per share: | | | $100.44 | | | | $50.77 | |
| | |
| 74 | | The accompanying notes are an integral part of these financial statements. |
GOLDMAN SACHS ACCESS FIXED INCOME ETFS
Statements of Operations
For the Fiscal Year Ended August 31, 2020
| | | | | | | | | | | | | | | | | | |
| | | | | Access
High Yield
Corporate
Bond ETF | | | Access
Inflation
Protected
USD
Bond ETF | | | Access
Investment
Grade
Corporate
1-5 Year
Bond ETF* | | | Access
Investment
Grade
Corporate
Bond ETF | |
| | Investment income: | | | | | |
| | | | | |
| | Interest | | $ | 4,366,975 | | | $ | 134,036 | | | $ | 30,478 | | | $ | 16,439,408 | |
| | | | | |
| | Dividends from Affiliated Underlying Funds | | | 7,079 | | | | 16 | | | | 36 | | | | 26,189 | |
| | | | | |
| | Total investment income | | | 4,374,054 | | | | 134,052 | | | | 30,514 | | | | 16,465,597 | |
| | | | | | | | | | | | | | | | | | |
| | Expenses: | | | | | |
| | | | | |
| | Management fees | | | 264,954 | | | | 17,210 | | | | 4,895 | | | | 721,840 | |
| | | | | |
| | Trustee fees | | | 5,908 | | | | 4,953 | | | | — | | | | 13,457 | |
| | | | | |
| | Total expenses | | | 270,862 | | | | 22,163 | | | | 4,895 | | | | 735,297 | |
| | | | | |
| | Less — expense reductions | | | (1,323 | ) | | | (19 | ) | | | (69 | ) | | | (4,916 | ) |
| | | | | |
| | Net expenses | | | 269,539 | | | | 22,144 | | | | 4,826 | | | | 730,381 | |
| | | | | |
| | NET INVESTMENT INCOME | | | 4,104,515 | | | | 111,908 | | | | 25,688 | | | | 15,735,216 | |
| | | | | | | | | | | | | | | | | | |
| | Realized and unrealized gain (loss): | | | | | |
| | | | | |
| | Net realized gain (loss) from: | | | | | | | | | | | | | | | | |
| | | | | |
| | Investments — unaffiliated issuers | | | (1,047,700 | ) | | | 33,786 | | | | 4,949 | | | | 886,824 | |
| | | | | |
| | In-kind redemptions | | | (1,412,345 | ) | | | 441,095 | | | | — | | | | 5,763,505 | |
| | | | | |
| | Net change in unrealized gain (loss) on: | | | | | | | | | | | | | | | | |
| | | | | |
| | Investments | | | 2,696,332 | | | | 1,423,412 | | | | 86,062 | | | | 11,236,182 | |
| | | | | |
| | Net realized and unrealized gain | | | 236,287 | | | | 1,898,293 | | | | 91,011 | | | | 17,886,511 | |
| | | | | |
| | NET INCREASE IN NET ASSETS RESULTING FROM OPERATIONS | | $ | 4,340,802 | | | $ | 2,010,201 | | | $ | 116,699 | | | $ | 33,621,727 | |
| | * | | For the period July 7, 2020 (commencement of operations) through August 31, 2020. |
| | |
| The accompanying notes are an integral part of these financial statements. | | 75 |
GOLDMAN SACHS ACCESS FIXED INCOME ETFS
Statements of Operations (continued)
For the Fiscal Year Ended August 31, 2020
| | | | | | | | | | |
| | | | | Access Treasury
0-1 Year ETF | | | Access Ultra
Short
Bond ETF | |
| | Investment income: | |
| | | |
| | Interest | | $ | 41,994,001 | | | $ | 1,227,953 | |
| | | |
| | Dividends from Affiliated Underlying Funds | | | — | | | | 8,666 | |
| | | |
| | Total investment income | | | 41,994,001 | | | | 1,236,619 | |
| | | | | | | | | | |
| | Expenses: | |
| | | |
| | Management fees | | | 4,652,214 | | | | 148,018 | |
| | | |
| | Trustee fees | | | 62,199 | | | | 5,739 | |
| | | |
| | Total expenses | | | 4,714,413 | | | | 153,757 | |
| | | |
| | Less — expense reductions | | | (673,487 | ) | | | (32,988 | ) |
| | | |
| | Net expenses | | | 4,040,926 | | | | 120,769 | |
| | | |
| | NET INVESTMENT INCOME | | | 37,953,075 | | | | 1,115,850 | |
| | | | | | | | | | |
| | Realized and unrealized gain (loss): | |
| | | |
| | Net realized gain (loss) from: | | | | | | | | |
| | | |
| | Investments — unaffiliated issuers | | | 8,192,160 | | | | (46,343 | ) |
| | | |
| | In-kind redemptions | | | 4,697,070 | | | | — | |
| | | |
| | Net change in unrealized gain (loss) on: | | | | | | | | |
| | | |
| | Investments | | | (2,300,783 | ) | | | 697,031 | |
| | | |
| | Net realized and unrealized gain | | | 10,588,447 | | | | 650,688 | |
| | | |
| | NET INCREASE IN NET ASSETS RESULTING FROM OPERATIONS | | $ | 48,541,522 | | | $ | 1,766,538 | |
| | |
| 76 | | The accompanying notes are an integral part of these financial statements. |
GOLDMAN SACHS ACCESS FIXED INCOME ETFS
Statements of Changes in Net Assets
| | | | | | | | | | | | | | | | | | | | | | |
| | | | | Access High Yield Corporate Bond ETF | | | | | | Access Inflation Protected
USD Bond ETF | |
| | | | | For the Fiscal
Year Ended
August 31, 2020 | | | For the Fiscal
Year Ended
August 31, 2019 | | | | | | For the Fiscal
Year Ended
August 31, 2020 | | | For the Period
October 2, 2018*
to
August 31, 2019 | |
| | From operations: | | | | | |
| | | | | | |
| | Net investment income | | $ | 4,104,515 | | | $ | 3,383,084 | | | | | | | $ | 111,908 | | | $ | 163,069 | |
| | | | | | |
| | Net realized gain (loss) | | | (2,460,045 | ) | | | 305,345 | | | | | | | | 474,881 | | | | (16,827 | ) |
| | | | | | |
| | Net change in unrealized gain | | | 2,696,332 | | | | 979,401 | | | | | | | | 1,423,412 | | | | 392,218 | |
| | | | | | |
| | Net increase in net assets resulting from operations | | | 4,340,802 | | | | 4,667,830 | | | | | | | | 2,010,201 | | | | 538,460 | |
| | | | | | | | | | | | | | | | | | | | | | |
| | Distributions to shareholders: | | | | | | | | | | | | | | | | | | | | |
| | | | | | |
| | From distributable earnings | | | (3,924,025 | ) | | | (3,325,987 | ) | | | | | | | (181,025 | ) | | | (157,830 | ) |
| | | | | | |
| | From return of capital | | | — | | | | — | | | | | | | | (2,030 | ) | | | — | |
| | | | | | |
| | Total distributions to shareholders | | | (3,924,025 | ) | | | (3,325,987 | ) | | | | | | | (183,055 | ) | | | (157,830 | ) |
| | | | | | | | | | | | | | | | | | | | | | |
| | From share transactions: | | | | | |
| | | | | | |
| | Proceeds from sales of shares | | | 106,526,874 | | | | 119,456,665 | | | | | | | | 28,412,564 | | | | 11,281,177 | |
| | | | | | |
| | Cost of shares redeemed | | | (33,198,256 | ) | | | (90,609,448 | ) | | | | | | | (6,876,076 | ) | | | (3,695,696 | ) |
| | | | | | |
| | Net increase in net assets resulting from share transactions | | | 73,328,618 | | | | 28,847,217 | | | | | | | | 21,536,488 | | | | 7,585,481 | |
| | | | | | |
| | TOTAL INCREASE | | | 73,745,395 | | | | 30,189,060 | | | | | | | | 23,363,634 | | | | 7,966,111 | |
| | | | | | | | | | | | | | | | | | | | | | |
| | Net assets: | | | | | |
| | | | | | |
| | Beginning of period | | $ | 76,601,931 | | | $ | 46,412,871 | | | | | | | $ | 7,966,111 | | | $ | — | |
| | | | | | |
| | End of period | | $ | 150,347,326 | | | $ | 76,601,931 | | | | | | | $ | 31,329,745 | | | $ | 7,966,111 | |
| | * | | Commencement of operations. |
| | |
| The accompanying notes are an integral part of these financial statements. | | 77 |
GOLDMAN SACHS ACCESS FIXED INCOME ETFS
Statements of Changes in Net Assets (continued)
| | | | | | | | | | | | | | | | | | |
| | | | | Access Investment
Grade Corporate
1-5 Year Bond ETF | | | | | | Access Investment Grade Corporate
Bond ETF | |
| | | | | For the Period
July 7, 2020*
to
August 31, 2020 | | | | | | For the Fiscal
Year Ended
August 31, 2020 | | | For the Fiscal
Year Ended
August 31, 2019 | |
| | From operations: | | | | | | | | | |
| | | | | |
| | Net investment income | | $ | 25,688 | | | | | | | $ | 15,735,216 | | | $ | 12,782,931 | |
| | | | | |
| | Net realized gain | | | 4,949 | | | | | | | | 6,650,329 | | | | 1,847,736 | |
| | | | | |
| | Net change in unrealized gain | | | 86,062 | | | | | | | | 11,236,182 | | | | 35,258,508 | |
| | | | | |
| | Net increase in net assets resulting from operations | | | 116,699 | | | | | | | | 33,621,727 | | | | 49,889,175 | |
| | | | | | | | | | | | | | | | | | |
| | Distributions to shareholders: | | | | | | | | | | | | | | | | |
| | | | | |
| | From distributable earnings | | | (11,472 | ) | | | | | | | (15,896,442 | ) | | | (12,196,139 | ) |
| | | | | | | | | | | | | | | | | | |
| | From share transactions: | | | | | | | | | |
| | | | | |
| | Proceeds from sales of shares | | | 27,512,139 | | | | | | | | 353,704,682 | | | | 419,766,193 | |
| | | | | |
| | Cost of shares redeemed | | | — | | | | | | | | (254,900,515 | ) | | | (189,872,891 | ) |
| | | | | |
| | Net increase in net assets resulting from share transactions | | | 27,512,139 | | | | | | | | 98,804,167 | | | | 229,893,302 | |
| | | | | |
| | TOTAL INCREASE | | | 27,617,366 | | | | | | | | 116,529,452 | | | | 267,586,338 | |
| | | | | | | | | | | | | | | | | | |
| | Net assets: | | | | | | | | | |
| | | | | |
| | Beginning of period | | $ | — | | | | | | | $ | 526,048,542 | | | $ | 258,462,204 | |
| | | | | |
| | End of period | | $ | 27,617,366 | | | | | | | $ | 642,577,994 | | | $ | 526,048,542 | |
| | * | | Commencement of operations. |
| | |
| 78 | | The accompanying notes are an integral part of these financial statements. |
GOLDMAN SACHS ACCESS FIXED INCOME ETFS
Statements of Changes in Net Assets (continued)
| | | | | | | | | | | | | | | | | | | | | | |
| | | | | Access Treasury 0-1 Year ETF | | | | | | Access Ultra Short Bond ETF | |
| | | | | For the Fiscal
Year Ended
August 31, 2020 | | | For the Fiscal
Year Ended
August 31, 2019 | | | | | | For the Fiscal
Year Ended
August 31, 2020 | | | For the Period
April 15, 2019*
to
August 31, 2019 | |
| | From operations: | | | | | |
| | | | | | |
| | Net investment income | | $ | 37,953,075 | | | $ | 63,305,335 | | | | | | | $ | 1,115,850 | | | $ | 130,040 | |
| | | | | | |
| | Net realized gain (loss) | | | 12,889,230 | | | | 2,235,068 | | | | | | | | (46,343 | ) | | | 6,788 | |
| | | | | | |
| | Net change in unrealized gain (loss) | | | (2,300,783 | ) | | | 3,239,890 | | | | | | | | 697,031 | | | | 70,911 | |
| | | | | | |
| | Net increase in net assets resulting from operations | | | 48,541,522 | | | | 68,780,293 | | | | | | | | 1,766,538 | | | | 207,739 | |
| | | | | | | | | | | | | | | | | | | | | | |
| | Distributions to shareholders: | | | | | | | | | | | | | | | | | | | | |
| | | | | | |
| | From distributable earnings | | | (45,661,342 | ) | | | (60,529,416 | ) | | | | | | | (1,046,869 | ) | | | (94,032 | ) |
| | | | | | | | | | | | | | | | | | | | | | |
| | From share transactions: | | | | | |
| | | | | | |
| | Proceeds from sales of shares | | | 1,673,288,926 | | | | 2,509,825,793 | | | | | | | | 146,532,435 | | | | 15,034,457 | |
| | | | | | |
| | Cost of shares redeemed | | | (1,804,799,190 | ) | | | (986,677,428 | ) | | | | | | | (12,635,582 | ) | | | — | |
| | | | | | |
| | Net increase (decrease) in net assets resulting from share transactions | | | (131,510,264 | ) | | | 1,523,148,365 | | | | | | | | 133,896,853 | | | | 15,034,457 | |
| | | | | | |
| | TOTAL INCREASE (DECREASE) | | | (128,630,084 | ) | | | 1,531,399,242 | | | | | | | | 134,616,522 | | | | 15,148,164 | |
| | | | | | | | | | | | | | | | | | | | | | |
| | Net assets: | | | | | |
| | | | | | |
| | Beginning of period | | $ | 3,174,026,360 | | | $ | 1,642,627,118 | | | | | | | $ | 15,148,164 | | | $ | — | |
| | | | | | |
| | End of period | | $ | 3,045,396,276 | | | $ | 3,174,026,360 | | | | | | | $ | 149,764,686 | | | $ | 15,148,164 | |
| | * | | Commencement of operations. |
| | |
| The accompanying notes are an integral part of these financial statements. | | 79 |
GOLDMAN SACHS ACCESS FIXED INCOME ETFS
Financial Highlights
Selected Data for a Share Outstanding Throughout Each Period
| | | | | | | | | | | | | | |
| | | | | Access High Yield Corporate Bond ETF | |
| | | | | For the Fiscal
Year Ended August 31, | | | For the Period
September 5, 2017*
to
August 31, 2018 | |
| | | | | 2020 | | | 2019 | | | | |
| | Per Share Operating Performance: | | | | | | | | | | | | |
| | | | |
| | Net asset value, beginning of period | | $ | 49.42 | | | $ | 48.86 | | | $ | 49.92 | |
| | | | |
| | Net investment income(a) | | | 2.49 | | | | 2.75 | | | | 2.41 | |
| | | | |
| | Net realized and unrealized gain (loss) | | | (0.15 | ) | | | 0.61 | | | | (1.21 | ) |
| | | | |
| | Total gain from investment operations | | | 2.34 | | | | 3.36 | | | | 1.20 | |
| | | | |
| | Distributions to shareholders from net investment income | | | (2.47 | ) | | | (2.80 | ) | | | (2.26 | ) |
| | | | |
| | Net asset value, end of period | | $ | 49.29 | | | $ | 49.42 | | | $ | 48.86 | |
| | | | |
| | Market price, end of period | | $ | 49.23 | | | $ | 49.24 | | | $ | 48.82 | |
| | | | |
| | Total Return at Net Asset Value(b) | | | 4.94 | % | | | 7.20 | % | | | 2.58 | % |
| | | | |
| | Net assets, end of period (in 000’s) | | $ | 150,347 | | | $ | 76,602 | | | $ | 46,413 | |
| | | | |
| | Ratio of total expenses to average net assets | | | 0.34 | % | | | 0.34 | % | | | 0.34 | %(c) |
| | | | |
| | Ratio of net investment income to average net assets | | | 5.15 | % | | | 5.67 | % | | | 4.93 | %(c) |
| | | | |
| | Portfolio turnover rate(d) | | | 22 | % | | | 23 | % | | | 69 | % |
| | * | | Commencement of operations. |
| | (a) | | Calculated based on the average shares outstanding methodology. |
| | (b) | | Assumes investment at the net asset value at the beginning of the period, reinvestment of all distributions and a complete sale of the investment at the net asset value at the end of the period. Returns do not reflect the impact of taxes to shareholders relating to Fund distributions or the sale of Fund shares. Total returns for periods less than one full year are not annualized. |
| | (d) | | The Fund’s portfolio turnover rate is calculated in accordance with regulatory requirements and excludes portfolio securities received or delivered as a result of in-kind transactions. If such transactions were included, the Fund’s portfolio turnover rate may be higher. |
| | |
| 80 | | The accompanying notes are an integral part of these financial statements. |
GOLDMAN SACHS ACCESS FIXED INCOME ETFS
Financial Highlights (continued)
Selected Data for a Share Outstanding Throughout Each Period
| | | | | | | | | | |
| | | | | Access Inflation Protected
USD Bond ETF | |
| | | | | For the Fiscal
Year Ended
August 31, 2020 | | | For the Period
October 2, 2018*
to
August 31, 2019 | |
| | Per Share Operating Performance: | | | | | | | | |
| | | |
| | Net asset value, beginning of period | | $ | 53.11 | | | $ | 50.00 | |
| | | |
| | Net investment income(a) | | | 0.33 | | | | 1.27 | |
| | | |
| | Net realized and unrealized gain | | | 4.18 | | | | 2.98 | |
| | | |
| | Total gain from investment operations | | | 4.51 | | | | 4.25 | |
| | | |
| | Distributions to shareholders from net investment income | | | (0.61 | ) | | | (1.14 | ) |
| | | |
| | Distributions to shareholders from realized gains | | | (0.04 | ) | | | — | |
| | | |
| | Distributions to shareholders from return of capital | | | (0.01 | ) | | | — | |
| | | |
| | Total distributions to shareholders | | | (0.66 | ) | | | (1.14 | ) |
| | | |
| | Net asset value, end of period | | $ | 56.96 | | | $ | 53.11 | |
| | | |
| | Market price, end of period | | $ | 57.00 | | | $ | 53.08 | |
| | | |
| | Total Return at Net Asset Value(b) | | | 8.57 | % | | | 8.61 | % |
| | | |
| | Net assets, end of period (in 000’s) | | $ | 31,330 | | | $ | 7,966 | |
| | | |
| | Ratio of total expenses to average net assets | | | 0.12 | % | | | 0.12 | %(c) |
| | | |
| | Ratio of net investment income to average net assets | | | 0.61 | % | | | 2.74 | %(c) |
| | | |
| | Portfolio turnover rate(d) | | | 43 | % | | | 36 | % |
| | * | | Commencement of operations. |
| | (a) | | Calculated based on the average shares outstanding methodology. |
| | (b) | | Assumes investment at the net asset value at the beginning of the period, reinvestment of all distributions and a complete sale of the investment at the net asset value at the end of the period. Returns do not reflect the impact of taxes to shareholders relating to Fund distributions or the sale of Fund shares. Total returns for periods less than one full year are not annualized. |
| | (d) | | The Fund’s portfolio turnover rate is calculated in accordance with regulatory requirements and excludes portfolio securities received or delivered as a result of in-kind transactions. If such transactions were included, the Fund’s portfolio turnover rate may be higher. |
| | |
| The accompanying notes are an integral part of these financial statements. | | 81 |
GOLDMAN SACHS ACCESS FIXED INCOME ETFS
Financial Highlights (continued)
Selected Data for a Share Outstanding Throughout the Period
| | | | | | |
| | | | | Access
Investment Grade
Corporate
1-5 Year
Bond ETF | |
| | | | | For the Period
July 7, 2020*
to
August 31, 2020 | |
| | |
| | Per Share Operating Performance: | | | | |
| | |
| | Net asset value, beginning of period | | $ | 49.89 | |
| | |
| | Net investment income(a) | | | 0.06 | |
| | |
| | Net realized and unrealized gain | | | 0.29 | |
| | |
| | Total gain from investment operations | | | 0.35 | |
| | |
| | Distributions to shareholders from net investment income | | | (0.03 | ) |
| | |
| | Net asset value, end of period | | $ | 50.21 | |
| | |
| | Market price, end of period | | $ | 50.28 | |
| | |
| | Total Return at Net Asset Value(b) | | | 0.70 | % |
| | |
| | Net assets, end of period (in 000’s) | | $ | 27,617 | |
| | |
| | Ratio of total expenses to average net assets | | | 0.14 | %(c) |
| | |
| | Ratio of net investment income to average net assets | | | 0.73 | %(c) |
| | |
| | Portfolio turnover rate(d) | | | 3 | % |
| | * | | Commencement of operations. |
| | (a) | | Calculated based on the average shares outstanding methodology. |
| | (b) | | Assumes investment at the net asset value at the beginning of the period, reinvestment of all distributions and a complete sale of the investment at the net asset value at the end of the period. Returns do not reflect the impact of taxes to shareholders relating to Fund distributions or the sale of Fund shares. Total returns for periods less than one full year are not annualized. |
| | (d) | | The Fund’s portfolio turnover rate is calculated in accordance with regulatory requirements and excludes portfolio securities received or delivered as a result of in-kind transactions. If such transactions were included, the Fund’s portfolio turnover rate may be higher. |
| | |
| 82 | | The accompanying notes are an integral part of these financial statements. |
GOLDMAN SACHS ACCESS FIXED INCOME ETFS
Financial Highlights (continued)
Selected Data for a Share Outstanding Throughout Each Period
| | | | | | | | | | | | | | | | | | |
| | | | | Access Investment Grade Corporate Bond ETF | |
| | | | | For the Fiscal
Year Ended August 31, | | | For the Period
June 6, 2017*
to
August 31, 2017 | |
| | 2020 | | | 2019 | | | 2018 | |
| | Per Share Operating Performance: | | | | | | | | | | | | | | | | |
| | | | | |
| | Net asset value, beginning of period | | $ | 52.87 | | | $ | 48.31 | | | $ | 50.28 | | | $ | 49.90 | |
| | | | | |
| | Net investment income(a) | | | 1.59 | | | | 1.74 | | | | 1.55 | | | | 0.32 | |
| | | | | |
| | Net realized and unrealized gain (loss) | | | 2.54 | | | | 4.52 | | | | (2.09 | ) | | | 0.27 | |
| | | | | |
| | Total gain (loss) from investment operations | | | 4.13 | | | | 6.26 | | | | (0.54 | ) | | | 0.59 | |
| | | | | |
| | Distributions to shareholders from net investment income | | | (1.61 | ) | | | (1.70 | ) | | | (1.43 | ) | | | (0.21 | ) |
| | | | | |
| | Net asset value, end of period | | $ | 55.39 | | | $ | 52.87 | | | $ | 48.31 | | | $ | 50.28 | |
| | | | | |
| | Market price, end of period | | $ | 55.47 | | | $ | 52.90 | | | $ | 48.28 | | | $ | 50.24 | |
| | | | | |
| | Total Return at Net Asset Value(b) | | | 7.95 | % | | | 13.35 | % | | | (1.04 | )% | | | 1.19 | % |
| | | | | |
| | Net assets, end of period (in 000’s) | | $ | 642,578 | | | $ | 526,049 | | | $ | 258,462 | | | $ | 180,997 | |
| | | | | |
| | Ratio of net expenses to average net assets | | | 0.14 | % | | | 0.14 | % | | | 0.14 | % | | | 0.13 | %(c) |
| | | | | |
| | Ratio of total expenses to average net assets | | | 0.14 | % | | | 0.14 | % | | | 0.14 | % | | | 0.14 | %(c) |
| | | | | |
| | Ratio of net investment income to average net assets | | | 3.00 | % | | | 3.54 | % | | | 3.18 | % | | | 2.65 | %(c) |
| | | | | |
| | Portfolio turnover rate(d) | | | 9 | % | | | 13 | % | | | 22 | % | | | 0 | %(e) |
| | * | | Commencement of operations. |
| | (a) | | Calculated based on the average shares outstanding methodology. |
| | (b) | | Assumes investment at the net asset value at the beginning of the period, reinvestment of all distributions and a complete sale of the investment at the net asset value at the end of the period. Returns do not reflect the impact of taxes to shareholders relating to Fund distributions or the sale of Fund shares. Total returns for periods less than one full year are not annualized. |
| | (d) | | The Fund’s portfolio turnover rate is calculated in accordance with regulatory requirements and excludes portfolio securities received or delivered as a result of in-kind transactions. If such transactions were included, the Fund’s portfolio turnover rate may be higher. |
| | |
| The accompanying notes are an integral part of these financial statements. | | 83 |
GOLDMAN SACHS ACCESS FIXED INCOME ETFS
Financial Highlights (continued)
Selected Data for a Share Outstanding Throughout Each Period
| | | | | | | | | | | | | | | | | | |
| | | | | Access Treasury 0-1 Year ETF | |
| | | | | For the Fiscal
Year Ended August 31, | | | For the Period
September 6, 2016*
to
August 31, 2017 | |
| | 2020 | | | 2019 | | | 2018 | |
| | Per Share Operating Performance: | | | | | | | | | | | | | | | | |
| | | | | |
| | Net asset value, beginning of period | | $ | 100.38 | | | $ | 100.16 | | | $ | 100.10 | | | $ | 100.00 | |
| | | | | |
| | Net investment income(a) | | | 1.13 | | | | 2.23 | | | | 1.48 | | | | 0.82 | |
| | | | | |
| | Net realized and unrealized gain (loss) | | | 0.29 | | | | 0.15 | | | | (0.13 | ) | | | (0.29 | ) |
| | | | | |
| | Total gain from investment operations | | | 1.42 | | | | 2.38 | | | | 1.35 | | | | 0.53 | |
| | | | | |
| | Distributions to shareholders from net investment income | | | (1.36 | ) | | | (2.16 | ) | | | (1.29 | ) | | | (0.43 | ) |
| | | | | |
| | Net asset value, end of period | | $ | 100.44 | | | $ | 100.38 | | | $ | 100.16 | | | $ | 100.10 | |
| | | | | |
| | Market price, end of period | | $ | 100.45 | | | $ | 100.40 | | | $ | 100.18 | | | $ | 100.10 | |
| | | | | |
| | Total Return at Net Asset Value(b) | | | 1.42 | % | | | 2.40 | % | | | 1.37 | % | | | 0.53 | % |
| | | | | |
| | Net assets, end of period (in 000’s) | | $ | 3,045,396 | | | $ | 3,174,026 | | | $ | 1,642,627 | | | $ | 815,829 | |
| | | | | |
| | Ratio of net expenses to average net assets | | | 0.12 | % | | | 0.12 | % | | | 0.12 | % | | | 0.13 | %(c) |
| | | | | |
| | Ratio of total expenses to average net assets | | | 0.14 | % | | | 0.14 | % | | | 0.14 | % | | | 0.14 | %(c) |
| | | | | |
| | Ratio of net investment income to average net assets | | | 1.13 | % | | | 2.22 | % | | | 1.48 | % | | | 0.83 | %(c) |
| | | | | |
| | Portfolio turnover rate(d) | | | — | % | | | — | % | | | — | % | | | — | % |
| | * | | Commencement of operations. |
| | (a) | | Calculated based on the average shares outstanding methodology. |
| | (b) | | Assumes investment at the net asset value at the beginning of the period, reinvestment of all distributions and a complete sale of the investment at the net asset value at the end of the period. Returns do not reflect the impact of taxes to shareholders relating to Fund distributions or the sale of Fund shares. Total returns for periods less than one full year are not annualized. |
| | (d) | | The Fund’s portfolio turnover rate is calculated in accordance with regulatory requirements and excludes portfolio securities received or delivered as a result of in-kind transactions. If such transactions were included, the Fund’s portfolio turnover rate may be higher. |
| | |
| 84 | | The accompanying notes are an integral part of these financial statements. |
GOLDMAN SACHS ACCESS FIXED INCOME ETFS
Financial Highlights (continued)
Selected Data for a Share Outstanding Throughout Each Period
| | | | | | | | | | |
| | | | | Access Ultra Short Bond ETF | |
| | | | | For the Fiscal
Year Ended
August 31, 2020 | | | For the Period
April 15, 2019*
to
August 31, 2019 | |
| | Per Share Operating Performance: | | | | | | | | |
| | | |
| | Net asset value, beginning of period | | $ | 50.49 | | | $ | 50.00 | |
| | | |
| | Net investment income(a) | | | 0.73 | | | | 0.52 | |
| | | |
| | Net realized and unrealized gain | | | 0.42 | | | | 0.34 | |
| | | |
| | Total gain from investment operations | | | 1.15 | | | | 0.86 | |
| | | |
| | Distributions to shareholders from net investment income | | | (0.87 | ) | | | (0.37 | ) |
| | | |
| | Net asset value, end of period | | $ | 50.77 | | | $ | 50.49 | |
| | | |
| | Market price, end of period | | $ | 50.78 | | | $ | 50.51 | |
| | | |
| | Total Return at Net Asset Value(b) | | | 2.28 | % | | | 1.75 | % |
| | | |
| | Net assets, end of period (in 000’s) | | $ | 149,765 | | | $ | 15,148 | |
| | | |
| | Ratio of net expenses to average net assets | | | 0.16 | % | | | 0.16 | %(c) |
| | | |
| | Ratio of total expenses to average net assets | | | 0.20 | % | | | 0.20 | %(c) |
| | | |
| | Ratio of net investment income to average net assets | | | 1.45 | % | | | 2.72 | %(c) |
| | | |
| | Portfolio turnover rate(d) | | | 63 | % | | | 66 | % |
| | * | | Commencement of operations. |
| | (a) | | Calculated based on the average shares outstanding methodology. |
| | (b) | | Assumes investment at the net asset value at the beginning of the period, reinvestment of all distributions and a complete sale of the investment at the net asset value at the end of the period. Returns do not reflect the impact of taxes to shareholders relating to Fund distributions or the sale of Fund shares. Total returns for periods less than one full year are not annualized. |
| | (d) | | The Fund’s portfolio turnover rate is calculated in accordance with regulatory requirements and excludes portfolio securities received or delivered as a result of in-kind transactions. If such transactions were included, the Fund’s portfolio turnover rate may be higher. |
| | |
| The accompanying notes are an integral part of these financial statements. | | 85 |
GOLDMAN SACHS ACCESS FIXED INCOME ETFS
Notes to Financial Statements
August 31, 2020
Goldman Sachs ETF Trust (the “Trust”) is an open-end management investment company, registered under the Investment Company Act of 1940, as amended (the “Act”), consisting of multiple series. The Trust was organized as a Delaware statutory trust on December 16, 2009. The following table lists those series of the Trust that are included in this report (collectively, the “Funds” or individually a “Fund”) along with their respective diversification status under the Act:
| | | | |
| Fund | | | | Diversification Classification |
Goldman Sachs Access High Yield Corporate Bond ETF (“Access High Yield Corporate Bond ETF”) | | | | Diversified |
Goldman Sachs Access Inflation Protected USD Bond ETF (“Access Inflation Protected USD Bond ETF”) | | | | Diversified |
Goldman Sachs Access Investment Grade Corporate 1-5 Year Bond ETF (“Access Investment Grade Corporate 1-5 Year Bond ETF”)* | | | | Diversified |
Goldman Sachs Access Investment Grade Corporate Bond ETF (“Access Investment Grade Corporate Bond ETF”) | | | | Diversified |
Goldman Sachs Access Treasury 0-1 Year ETF (“Access Treasury 0-1 Year ETF”) | | | | Diversified |
Goldman Sachs Access Ultra Short Bond ETF (“Access Ultra Short Bond ETF”) | | | | Diversified |
| * | | Commencement of operations on July 7, 2020. |
The investment objective of each Fund (except the Access Ultra Short Bond ETF) is to provide investment results that closely correspond, before fees and expenses, to the performance of its respective Index. The Access Ultra Short Bond ETF seeks to provide current income with preservation of capital.
Goldman Sachs Asset Management, L.P. (“GSAM”), an affiliate of Goldman Sachs & Co. LLC (“Goldman Sachs”), serves as investment adviser to the Funds pursuant to a management agreement (the “Agreement”) with the Trust. Each Fund is an exchange-traded fund (“ETF”). Shares of the Access High Yield Corporate Bond ETF, Access Investment Grade Corporate 1-5 Year Bond ETF, Access Investment Grade Corporate Bond ETF and Access Treasury 0-1 Year ETF are listed and traded on the NYSE Arca, Inc. (“NYSE Arca”), and shares of the Access Inflation Protected USD Bond ETF and Access Ultra Short Bond ETF are listed and traded on the Cboe BZX Exchange, Inc. (“Cboe BZX”). Market prices for the Funds’ shares may be different from their net asset value (“NAV”). The Funds issue and redeem shares at their respective NAV only in blocks of a specified number of shares, or multiples thereof, referred to as “Creation Units”. Creation Units are issued and redeemed principally in-kind for a basket of securities and a cash amount, with respect to the Access Inflation Protected USD Bond ETF, Access Treasury 0-1 Year ETF and Access Ultra Short Bond ETF. Creation Units are issued for cash and redeemed principally in-kind for a basket of securities and a cash amount, with respect to the Access High Yield Corporate Bond ETF, Access Investment Grade Corporate 1-5 Year Bond ETF and Access Investment Grade Corporate Bond ETF. Shares generally trade in the secondary market in quantities less than a Creation Unit at market prices that change throughout the day. Only those that have entered into an authorized participant agreement with ALPS Distributors, Inc. (the “Distributor”) may do business directly with the Funds.
|
| 2. SIGNIFICANT ACCOUNTING POLICIES |
The financial statements have been prepared in accordance with accounting principles generally accepted in the United States of America (“GAAP”) and require management to make estimates and assumptions that may affect the reported amounts and disclosures. Actual results may differ from those estimates and assumptions. Each Fund is an investment company under GAAP and follows the accounting and reporting guidance applicable to investment companies.
A. Investment Valuation — The Funds’ valuation policy is to value investments at fair value.
B. Investment Income and Investments — Investment income includes interest income, dividend income, and securities lending income, if any. Interest income is accrued daily and adjusted for amortization of premiums and accretion of discounts. Dividend income is recognized on ex-dividend date or, for certain foreign securities, as soon as such information is obtained
86
GOLDMAN SACHS ACCESS FIXED INCOME ETFS
|
| 2. SIGNIFICANT ACCOUNTING POLICIES (continued) |
subsequent to the ex-dividend date. Non-cash dividends, if any, are recorded at the fair market value of the securities received. Investment transactions are reflected on trade date. Realized gains and losses are calculated using identified cost. Investment transactions are recorded on the following business day for daily NAV calculations. Investment income is recorded net of any foreign withholding taxes, less any amounts reclaimable. The Funds may file withholding tax reclaims in certain jurisdictions to recover a portion of amounts previously withheld. Any foreign capital gains tax is accrued daily based upon net unrealized gains, and is payable upon sale of such investments. Distributions received from the Funds’ investments in U.S. real estate investment trusts (“REITs”) may be characterized as ordinary income, net capital gain and/or a return of capital. A return of capital is recorded by the Funds as a reduction to the cost basis of the REIT.
C. Expenses — Expenses incurred directly by a Fund are charged to the Fund, and certain expenses incurred by the Trust are allocated across the applicable Funds on a straight-line and/or pro-rata basis, depending upon the nature of the expenses, and are accrued daily.
D. Federal Taxes and Distributions to Shareholders — It is each Fund’s policy to comply with the requirements of the Internal Revenue Code of 1986, as amended (the “Code”), applicable to regulated investment companies and to distribute each year substantially all of its investment company taxable income and capital gains to its shareholders. Accordingly, each Fund is not required to make any provisions for the payment of federal income tax. Distributions to shareholders are recorded on the ex- dividend date. For each Fund, income distributions, if any, are declared and paid monthly. Capital gains distributions, if any, are declared and paid annually.
Net capital losses, if any, are carried forward to future fiscal years and may be used to the extent allowed by the Code to offset any future capital gains. Losses that are carried forward will retain their character as either short-term or long-term capital losses. Utilization of capital loss carryforwards will reduce the requirement of future capital gains distributions.
The characterization of distributions to shareholders for financial reporting purposes is determined in accordance with federal income tax rules, which may differ from GAAP. The source of each Fund’s distributions may be shown in the accompanying financial statements as either from distributable earnings or capital. Certain components of the Funds’ net assets on the Statements of Assets and Liabilities reflect permanent GAAP/tax differences based on the appropriate tax character.
|
| 3. INVESTMENTS AND FAIR VALUE MEASUREMENTS |
U.S. GAAP defines the fair value of a financial instrument as the amount that would be received to sell an asset or paid to transfer a liability in an orderly transaction between market participants at the measurement date (i.e., the exit price); the Funds’ policy is to use the market approach. GAAP establishes a fair value hierarchy that prioritizes the inputs to valuation techniques used to measure fair value. The hierarchy gives the highest priority to unadjusted quoted prices in active markets for identical assets or liabilities (Level 1 measurements) and the lowest priority to unobservable inputs (Level 3 measurements). The level in the fair value hierarchy within which the fair value measurement in its entirety falls shall be determined based on the lowest level input that is significant to the fair value measurement in its entirety. The levels used for classifying investments are not necessarily an indication of the risk associated with investing in these investments. The three levels of the fair value hierarchy are described below:
Level 1 — Unadjusted quoted prices in active markets that are accessible at the measurement date for identical, unrestricted assets or liabilities;
Level 2 — Quoted prices in markets that are not active or financial instruments for which significant inputs are observable (including, but not limited to, quoted prices for similar investments, interest rates, foreign exchange rates, volatility and credit spreads), either directly or indirectly;
Level 3 — Prices or valuations that require significant unobservable inputs (including GSAM’s assumptions in determining fair value measurement).
87
GOLDMAN SACHS ACCESS FIXED INCOME ETFS
Notes to Financial Statements (continued)
August 31, 2020
|
| 3. INVESTMENTS AND FAIR VALUE MEASUREMENTS (continued) |
The Board of Trustees (“Trustees”) has approved Valuation Procedures that govern the valuation of the portfolio investments held by the Funds, including investments for which market quotations are not readily available. The Trustees have delegated to GSAM day-to-day responsibility for implementing and maintaining internal controls and procedures related to the valuation of the Funds’ investments. To assess the continuing appropriateness of pricing sources and methodologies, GSAM regularly performs price verification procedures and issues challenges as necessary to third party pricing vendors or brokers, and any differences are reviewed in accordance with the Valuation Procedures.
A. Level 1 and Level 2 Fair Value Investments — The valuation techniques and significant inputs used in determining the fair values for investments classified as Level 1 and Level 2 are as follows:
Debt Securities — Debt securities for which market quotations are readily available are valued daily on the basis of quotations supplied by dealers or an independent pricing service approved by the Trustees. The pricing services may use valuation models or matrix pricing, which consider: (i) yield or price with respect to bonds that are considered comparable in characteristics such as rating, interest rate and maturity date or (ii) quotations from securities dealers to determine current value. With the exception of treasury securities of G7 countries, which are generally classified as Level 1, these investments are generally classified as Level 2 of the fair value hierarchy.
Money Market Funds — Investments in the Goldman Sachs Financial Square Government Fund (“Underlying Fund”) are valued at the NAV per share of the Institutional Share class on the day of valuation. These investments are generally classified as Level 1 of the fair value hierarchy. For information regarding the Underlying Fund’s accounting policies and investment holdings, please see the Underlying Fund’s shareholder report.
B. Level 3 Fair Value Investments — To the extent that significant inputs to valuation models and other alternative pricing sources are unobservable, or if quotations are not readily available, or if GSAM believes that such quotations do not accurately reflect fair value, the fair value of a Fund’s investments may be determined under Valuation Procedures approved by the Trustees. GSAM, consistent with its procedures and applicable regulatory guidance, may make an adjustment to the most recent valuation prices of either domestic or foreign securities in light of significant events to reflect what it believes to be the fair value of the securities at the time of determining a Fund’s NAV. To the extent investments are valued using single source broker quotations obtained directly from the broker or passed through from third party pricing vendors, such investments are classified as Level 3 investments.
C. Fair Value Hierarchy — The following is a summary of the Funds’ investments classified in the fair value hierarchy as of August 31, 2020:
| | | | | | | | | | | | |
| | | |
| ACCESS HIGH YIELD CORPORATE BOND ETF | | | | | | | | | | | | |
| | | |
| Investment Type | | Level 1 | | | Level 2 | | | Level 3 | |
| | | |
| Assets | | | | | | | | | | | | |
|
Fixed Income | |
| | | |
Corporate Obligations | | $ | — | | | $ | 139,831,457 | | | $ | — | |
| | | |
Foreign Corporate Debt | | | — | | | | 6,404,299 | | | | — | |
| | | |
Investment Company | | | 1,754,115 | | | | — | | | | — | |
| | | |
| Total | | $ | 1,754,115 | | | $ | 146,235,756 | | | $ | — | |
88
GOLDMAN SACHS ACCESS FIXED INCOME ETFS
|
| 3. INVESTMENTS AND FAIR VALUE MEASUREMENTS (continued) |
| | | | | | | | | | | | |
| | | |
| ACCESS INFLATION PROTECTED USD BOND ETF | | | | | | | | | | | | |
| | | |
| Investment Type | | Level 1 | | | Level 2 | | | Level 3 | |
| | | |
| Assets | | | | | | | | | | | | |
|
Fixed Income | |
| | | |
U.S. Treasury Inflation Indexed Bonds | | $ | 31,274,674 | | | $ | — | | | $ | — | |
| | | |
| Total | | $ | 31,274,674 | | | $ | — | | | $ | — | |
| | | |
| ACCESS INVESTMENT GRADE CORPORATE 1-5 YEAR BOND ETF | | | | | | | | | | | | |
| | | |
| Investment Type | | Level 1 | | | Level 2 | | | Level 3 | |
| | | |
| Assets | | | | | | | | | | | | |
|
Fixed Income | |
| | | |
Corporate Obligations | | $ | — | | | $ | 21,965,483 | | | $ | — | |
| | | |
Foreign Corporate Debt | | | — | | | | 5,025,138 | | | | — | |
| | | |
Investment Company | | | 684,558 | | | | — | | | | — | |
| | | |
| Total | | $ | 684,558 | | | $ | 26,990,621 | | | $ | — | |
| | | |
| ACCESS INVESTMENT GRADE CORPORATE BOND ETF | | | | | | | | | | | | |
| | | |
| Investment Type | | Level 1 | | | Level 2 | | | Level 3 | |
| | | |
| Assets | | | | | | | | | | | | |
|
Fixed Income | |
| | | |
Corporate Obligations | | $ | — | | | $ | 505,171,409 | | | $ | — | |
| | | |
Foreign Corporate Debt | | | – | | | | 125,346,709 | | | | — | |
| | | |
Investment Company | | | 6,635,197 | | | | — | | | | — | |
| | | |
| Total | | $ | 6,635,197 | | | $ | 630,518,118 | | | $ | — | |
| | |
| ACCESS TREASURY 0-1 YEAR ETF | | | | | | | | | |
| | | |
| Investment Type | | Level 1 | | | Level 2 | | | Level 3 | |
| | | |
| Assets | | | | | | | | | | | | |
|
Fixed Income | |
| | | |
U.S. Treasury Bills | | $ | 2,901,189,770 | | | $ | — | | | $ | — | |
| | | |
U.S. Treasury Notes | | | 143,801,655 | | | | — | | | | — | |
| | | |
| Total | | $ | 3,044,991,425 | | | $ | — | | | $ | — | |
89
GOLDMAN SACHS ACCESS FIXED INCOME ETFS
Notes to Financial Statements (continued)
August 31, 2020
|
| 3. INVESTMENTS AND FAIR VALUE MEASUREMENTS (continued) |
| | | | | | | | | | | | |
| | | |
| ACCESS ULTRA SHORT BOND ETF | | | | | | | | | | | | |
| | | |
| Investment Type | | Level 1 | | | Level 2 | | | Level 3 | |
| | | |
| Assets | | | | | | | | | | | | |
|
Fixed Income | |
| | | |
Mortgage-Backed Securities | | $ | — | | | $ | 53,375,603 | | | $ | — | |
| | | |
Asset- Backed Securities | | | — | | | | 31,287,350 | | | | — | |
| | | |
Corporate Obligations | | | — | | | | 29,008,856 | | | | — | |
| | | |
Foreign Corporate Debt | | | — | | | | 24,544,286 | | | | — | |
| | | |
U.S. Treasury Bills | | | 7,596,632 | | | | — | | | | — | |
| | | |
Municipal Debt Obligations | | | — | | | | 2,672,682 | | | | — | |
| | | |
Investment Company | | | 3,705,115 | | | | — | | | | — | |
| | | |
Certificate of Deposit | | | — | | | | 500,142 | | | | — | |
| | | |
| Total | | $ | 11,301,747 | | | $ | 141,388,919 | | | $ | — | |
For further information regarding security characteristics, see the Schedules of Investments.
|
| 4. AGREEMENTS AND AFFILIATED TRANSACTIONS |
A. Management Agreement — Under the Agreement, GSAM manages the Funds, subject to the general supervision of the Trustees.
As compensation for the services rendered pursuant to the Agreement, the assumption of the expenses related thereto and administration of the Funds’ business affairs, including providing facilities, GSAM is entitled to a management fee, accrued daily and paid monthly, equal to an annual percentage rate of each Fund’s average daily net assets.
The Funds operate under a unitary management fee structure. Under the unitary fee structure, GSAM is responsible for paying substantially all the expenses of each such Fund, excluding payments under the Fund’s 12b-1 plan (if any), interest expenses, taxes, acquired fund fees and expenses, brokerage fees, costs of holding shareholder meetings and litigation, indemnification and extraordinary expenses. As the Funds directly pay fees and expenses of the independent Trustees, the management fee collected by GSAM will be reduced by an amount equal to the fees and expenses paid by the Funds to the independent Trustees.
For the fiscal year ended August 31, 2020, contractual and effective net unitary management fee with GSAM were at the following rates:
| | | | | | | | | | |
| Fund | | | | Contractual Unitary
Management Fee | | | Effective Net Unitary
Management Fee* | |
Access High Yield Corporate Bond ETF | | | | | 0.34 | % | | | 0.34 | % |
Access Inflation Protected USD Bond ETF | | | | | 0.12 | % | | | 0.12 | % |
Access Investment Grade Corporate 1-5 Year Bond ETF | | | | | 0.14 | % | | | 0.14 | % |
Access Investment Grade Corporate Bond ETF | | | | | 0.14 | % | | | 0.14 | % |
Access Treasury 0-1 Year ETF | | | | | 0.14 | % | | | 0.12 | % |
Access Ultra Short Bond ETF | | | | | 0.20 | % | | | 0.16 | % |
| * | | Effective Net Unitary Management Fee includes the impact of management fee waivers, if any. |
GSAM has agreed to waive a portion of its management fee in order to achieve an effective net management fee rate of 0.12% and 0.16% as an annual percentage rate of average daily net assets of the Access Treasury 0-1 Year ETF and the Access Ultra
90
GOLDMAN SACHS ACCESS FIXED INCOME ETFS
|
| 4. AGREEMENTS AND AFFILIATED TRANSACTIONS (continued) |
Short Bond ETF, respectively. These arrangements will remain in effect through at least December 27, 2020 and prior to such dates the Investment Adviser may not terminate the arrangements without the approval of the Board of Trustees. For the fiscal year ended August 31, 2020, GSAM waived $673,487 and 30,752 of the Funds’ management fees for the Access Treasury 0-1 Year ETF and the Access Ultra Short Bond ETF respectively.
The Access High Yield Corporate Bond ETF, Access Inflation Protected USD Bond ETF, Access Investment Grade Corporate 1-5 Year Bond ETF, Access Investment Grade Corporate Bond ETF and Access Ultra Short Bond ETF invest in Institutional Shares of the Goldman Sachs Financial Square Government Fund, which is an affiliated Underlying Fund. GSAM has agreed to waive a portion of its management fee payable by the Funds in an amount equal to the management fee it earns as an investment adviser to the affiliated Underlying Fund in which the Funds invest. For the fiscal year ended August 31, 2020, GSAM waived $1,323, $19, $69, $4,916 and $2,236 of the Funds’ management fees for the Access High Yield Corporate Bond ETF, Access Inflation Protected USD Bond ETF, Access Investment Grade Corporate 1-5 Year Bond ETF, Access Investment Grade Corporate Bond ETF, and Access Ultra Short Bond ETF, respectively.
B. Other Transactions with Affiliates — The following table provides information about the Funds’ investments in the Goldman Sachs Financial Square Government Fund for the fiscal year ended August 31, 2020:
| | | | | | | | | | | | | | | | | | | | | | | | |
| Fund | | Beginning
value as of
August 31, 2019 | | | Purchases
at Cost | | | Proceeds
from Sales | | | Ending
value as of
August 31, 2020 | | | Shares
as of
August 31, 2020 | | | Interest
Income | |
Access High Yield Corporate Bond ETF | | $ | 1,093,653 | | | $ | 14,854,534 | | | $ | (14,194,072 | ) | | $ | 1,754,115 | | | | 1,754,115 | | | $ | 7,079 | |
Access Inflation Protected USD Bond ETF | | $ | — | | | $ | 1,452,002 | | | $ | (1,452,002 | ) | | | | | | | — | | | $ | 16 | |
Access Investment Grade Corporate 1-5 Year Bond ETF* | | $ | — | | | $ | 8,301,859 | | | $ | (7,617,301 | ) | | $ | 684,558 | | | | 684,558 | | | $ | 36 | |
Access Investment Grade Corporate Bond ETF | | $ | 3,519,879 | | | $ | 49,638,838 | | | $ | (46,523,520 | ) | | $ | 6,635,197 | | | | 6,635,197 | | | $ | 26,189 | |
Access Ultra Short Bond ETF | | $ | 392,280 | | | $ | 81,131,404 | | | $ | (77,818,569 | ) | | $ | 3,705,115 | | | | 3,705,115 | | | $ | 8,666 | |
| * | | Commencement of operations on July 7, 2020. |
|
| 5. CREATION AND REDEMPTION OF CREATION UNITS |
The Trust issues and redeems shares of the Funds only in Creation Units on a continuous basis through the Distributor, without an initial sales load, at NAV next determined after receipt, on any Business Day (as defined in the Statement of Additional Information), of an order in proper form. Shares of the Funds may only be purchased or redeemed by certain financial institutions (each an “Authorized Participant”). An Authorized Participant is either (1) a “Participating Party” or other participant in the clearing process through the Continuous Net Settlement System of the National Securities Clearing Corporation; or (2) a Depository Trust Company participant; which, in either case, must have executed an agreement with the Distributor. Retail investors will typically not qualify as an Authorized Participant or have the resources to buy and sell whole Creation Units. Therefore, they will be unable to purchase or redeem the shares directly from the Funds. Rather, most retail investors will purchase shares in the secondary market at market prices with the assistance of a broker and may be subject to customary brokerage commissions or fees. Fixed creation and redemption transaction fees are imposed in connection with creations and redemptions.
Authorized Participants transacting in Creation Units for cash may also pay a variable charge to compensate the relevant fund for certain transaction costs (e.g. taxes on currency or other financial transactions, and brokerage costs) and market impact expenses relating to investing in portfolio securities. Such variable charges, if any, are included in “Proceeds from sale of shares” in the Statements of Changes in Net Assets.
91
GOLDMAN SACHS ACCESS FIXED INCOME ETFS
Notes to Financial Statements (continued)
August 31, 2020
|
| 5. CREATION AND REDEMPTION OF CREATION UNITS (continued) |
Share activity is as follows:
| | | | | | | | | | | | | | | | |
| | | Access High Yield Corporate Bond ETF | |
| | | For the Fiscal Year Ended
August 31, 2020 | | | For the Fiscal Year Ended
August 31, 2019 | |
| | | | |
| | | Shares | | | Dollars | | | Shares | | | Dollars | |
| | | | |
| Fund Share Activity | | | | | | | | | | | | | | | | |
Shares Sold | | | 2,200,000 | | | $ | 106,518,573 | | | | 2,450,000 | | | $ | 119,417,522 | |
Shares Redeemed | | | (700,000 | ) | | | (33,025,220 | ) | | | (1,850,000 | ) | | | (90,435,797 | ) |
| | | | |
NET INCREASE IN SHARES | | | 1,500,000 | | | $ | 73,493,353 | | | | 600,000 | | | $ | 28,981,725 | |
| |
| | | Access Inflation Protected USD Bond ETF | |
| | | For the Fiscal Year Ended
August 31, 2020 | | | For the Period October 2, 2018* through August 31, 2019 | |
| | | | |
| | | Shares | | | Dollars | | | Shares | | | Dollars | |
| | | | |
| Fund Share Activity | | | | | | | | | | | | | | | | |
Shares Sold | | | 525,000 | | | $ | 28,411,888 | | | | 225,000 | | | $ | 11,280,939 | |
Shares Redeemed | | | (125,000 | ) | | | (6,876,076 | ) | | | (75,000 | ) | | | (3,695,696 | ) |
| | | | |
NET INCREASE IN SHARES | | | 400,000 | | | $ | 21,535,812 | | | | 150,000 | | | $ | 7,585,243 | |
| | | | | | | | |
| | | Access Investment Grade
Corporate 1-5 Year Bond
ETF | |
| | | For the Period July 7, 2020* through August 31, 2020 | |
| | | | |
| | | Shares | | | Dollars | |
| | | | |
| Fund Share Activity | | | | | | | | |
Shares Sold | | | 550,000 | | | $ | 27,483,763 | |
Shares Redeemed | | | — | | | | — | |
| | |
NET INCREASE IN SHARES | | | 550,000 | | | $ | 27,483,763 | |
| * | | Commencement of operations. |
| | | | | | | | | | | | | | | | |
| |
| | | Access Investment Grade Corporate Bond ETF | |
| | | For the Fiscal Year Ended August 31, 2020 | | | For the Fiscal Year Ended August 31, 2019 | |
| | | | |
| | | Shares | | | Dollars | | | Shares | | | Dollars | |
| | | | |
| Fund Share Activity | | | | | | | | | | | | | | | | |
Shares Sold | | | 6,550,000 | | | $ | 353,363,901 | | | | 8,450,000 | | | $ | 419,509,892 | |
Shares Redeemed | | | (4,900,000 | ) | | | (254,691,742 | ) | | | (3,850,000 | ) | | | (189,753,355 | ) |
| | | | |
NET INCREASE IN SHARES | | | 1,650,000 | | | $ | 98,672,159 | | | | 4,600,000 | | | $ | 229,756,537 | |
92
GOLDMAN SACHS ACCESS FIXED INCOME ETFS
|
| 5. CREATION AND REDEMPTION OF CREATION UNITS (continued) |
| | | | | | | | | | | | | | | | |
| |
| | | Access Treasury 0-1 Year ETF | |
| | | For the Fiscal Year Ended August 31, 2020 | | | For the Fiscal Year Ended August 31, 2019 | |
| | | | |
| | | Shares | | | Dollars | | | Shares | | | Dollars | |
| | | | |
| Fund Share Activity | | | | | | | | | | | | | | | | |
Shares Sold | | | 16,650,000 | | | $ | 1,673,288,926 | | | | 25,070,000 | | | $ | 2,509,781,663 | |
Shares Redeemed | | | (17,950,000 | ) | | | (1,804,798,807 | ) | | | (9,850,000 | ) | | | (986,671,512 | ) |
| | | | |
NET INCREASE (DECREASE) IN SHARES | | | (1,300,000 | ) | | $ | (131,509,881 | ) | | | 15,220,000 | | | $ | 1,523,110,151 | |
| |
| | | Access Ultra Short Bond ETF | |
| | | For the Fiscal Year Ended August 31, 2020 | | | For the Period April 15, 2019* through August 31, 2019 | |
| | | | |
| | | Shares | | | Dollars | | | Shares | | | Dollars | |
| | | | |
| Fund Share Activity | | | | | | | | | | | | | | | | |
Shares Sold | | | 2,900,000 | | | $ | 146,532,435 | | | | 300,000 | | | $ | 15,034,457 | |
Shares Redeemed | | | (250,000 | ) | | | (12,635,581 | ) | | | — | | | | — | |
| | | | |
NET INCREASE IN SHARES | | | 2,650,000 | | | $ | 133,896,854 | | | | 300,000 | | | $ | 15,034,457 | |
| * | | Commencement of operations. |
|
| 6. PORTFOLIO SECURITIES TRANSACTIONS |
The cost of purchases and proceeds from sales and maturities of long-term securities for the fiscal year ended August 31, 2020, were as follows (with the exception of the Access Treasury 0-1 Year ETF which only owns short term securities):
| | | | | | | | | | |
| Fund | | | | Purchases | | | Sales | |
Access High Yield Corporate Bond ETF | | | | $ | 122,451,212 | | | $ | 17,777,521 | |
Access Inflation Protected USD Bond ETF | | | | | 7,876,334 | | | | 9,369,277 | |
Access Investment Grade Corporate 1-5 Year Bond ETF | | | | | 27,592,230 | | | | 625,134 | |
Access Investment Grade Corporate Bond ETF | | | | | 396,621,255 | | | | 46,961,412 | |
Access Treasury 0-1 Year ETF | | | | | 14,385,547,154 | | | | 14,410,227,259 | |
Access Ultra Short Bond ETF | | | | | 160,984,520 | | | | 41,679,680 | |
The purchases and sales from in-kind creation and redemption transactions for the fiscal year ended August 31, 2020, were as follows:
| | | | | | | | | | |
| Fund | | | | Purchases | | | Sales | |
Access High Yield Corporate Bond ETF | | | | $ | — | | | $ | 32,468,310 | |
Access Inflation Protected USD Bond ETF | | | | | 28,361,801 | | | | 5,474,542 | |
Access Investment Grade Corporate 1-5 Year Bond ETF | | | | | — | | | | — | |
93
GOLDMAN SACHS ACCESS FIXED INCOME ETFS
Notes to Financial Statements (continued)
August 31, 2020
|
| 6. PORTFOLIO SECURITIES TRANSACTIONS (continued) |
| | | | | | | | | | |
| Fund | | | | Purchases | | | Sales | |
Access Investment Grade Corporate Bond ETF | | | | $ | — | | | $ | 251,782,052 | |
Access Treasury 0-1 Year ETF | | | | | 1,661,035,638 | | | | 1,803,006,483 | |
Access Ultra Short Bond ETF | | | | | — | | | | — | |
The tax character of distributions paid during the fiscal year ended August 31, 2020 was as follows:
| | | | | | | | | | | | | | | | | | | | | | | | |
| | | Access High Yield
Corporate Bond ETF | | | Access Inflation
Protected USD
Bond ETF | | | Access Investment Grade
Corporate
1-5 Year Bond ETF | | | Access Investment
Grade Corporate
Bond ETF | | | Access Treasury
0-1 Year ETF | | | Access Ultra Short
Bond ETF | |
Distributions paid from: | | | | | | | | | | | | | | | | | | | | | | | | |
Ordinary Income | | $ | 3,924,025 | | | $ | 170,530 | | | $ | 11,472 | | | $ | 15,896,442 | | | $ | 45,661,342 | | | $ | 1,046,869 | |
Long-term Capital Gain | | | | 10,495 | | | | | | | | | | | | | | | | | |
Return of Capital | | | | | | | 2,030 | | | | | | | | | | | | | | | | | |
Total taxable distributions | | $ | 3,924,025 | | | $ | 183,055 | | | $ | 11,472 | | | $ | 15,896,442 | | | $ | 45,661,342 | | | $ | 1,046,869 | |
The tax character of distributions paid during the fiscal year ended August 31, 2019 was as follows:
| | | | | | | | | | | | | | | | | | | | | | | | |
| | | Access High
Corporate Bond ETF | | | Access
Inflation Protected
USD Bond ETF | | | Access Investment Grade
Corporate 1-5 Year Bond ETF | | | Access Investment Grade
Corporate Bond ETF | | | Access Treasury
0-1 Year ETF | | | Access Ultra Short
Bond ETF | |
Distributions paid from: | | | | | | | | | | | | | | | | | | | | | | | | |
Ordinary Income | | $ | 3,325,987 | | | $ | 157,830 | | | $ | — | | | $ | 12,196,139 | | | $ | 60,529,416 | | | $ | 94,032 | |
Total taxable distributions | | $ | 3,325,987 | | | $ | 157,830 | | | $ | — | | | $ | 12,196,139 | | | $ | 60,529,416 | | | $ | 94,032 | |
As of August 31, 2020, the components of accumulated earnings (losses) on tax-basis were as follows:
| | | | | | | | | | | | | | | | | | | | | | | | |
| | | Access High Yield
Corporate Bond ETF | | | Access Inflation Protected
USD Bond ETF | | | Access Investment Grade
Corporate
1-5 Year Bond ETF | | | Access Investment Grade
Corporate Bond ETF | | | Access Treasury
0-1 Year ETF | | | Access Ultra Short
Bond ETF | |
Undistributed ordinary income — net | | $ | 622,528 | | | $ | — | | | $ | 23,608 | | | $ | 1,300,609 | | | $ | 7,343,148 | | | $ | 141,931 | |
Undistributed long-term capital gains | | | — | | | | — | | | | — | | | | 59,870 | | | | — | | | | — | |
Total undistributed earnings | | $ | 622,528 | | | $ | — | | | $ | 23,608 | | | $ | 1,360,479 | | | $ | 7,343,148 | | | $ | 141,931 | |
Capital loss carryforwards:(1) | | | | | | | | | | | | | | | | | | | | | | | | |
Perpetual Short-Term | | $ | (1,508,264 | ) | | $ | — | | | $ | — | | | $ | — | | | $ | — | | | $ | (64,586 | ) |
Perpetual Long-Term | | | (87,369 | ) | | | — | | | | — | | | | — | | | | — | | | | (339 | ) |
Unrealized gains (losses) — net | | | 3,556,728 | | | | 1,793,739 | | | | 81,619 | | | | 43,119,130 | | | | 1,010,211 | | | | 756,370 | |
Total accumulated earnings (losses) net | | $ | 2,583,623 | | | $ | 1,793,739 | | | $ | 105,227 | | | $ | 44,479,609 | | | $ | 8,353,359 | | | $ | 833,376 | |
| (1) | | Access Investment Grade Corporate Bond ETF utilized 481,075 of capital losses in the current fiscal year. |
94
GOLDMAN SACHS ACCESS FIXED INCOME ETFS
|
| 7. TAX INFORMATION (continued) |
As of August 31, 2020, the Funds’ aggregate security unrealized gains and losses based on cost for U.S. federal income tax purposes were as follows:
| | | | | | | | | | | | | | | | | | | | | | | | |
| | | Access High Yield
Corporate Bond ETF | | | Access Inflation Protected
USD Bond ETF | | | Access Investment Grade
Corporate
1-5 Year Bond ETF | | | Access Investment Grade
Corporate Bond ETF | | | Access Treasury
0-1 Year ETF | | | Access Ultra Short
Bond ETF | |
Tax Cost | | $ | 144,433,143 | | | $ | 29,480,935 | | | $ | 27,593,560 | | | $ | 594,034,185 | | | $ | 3,043,981,214 | | | $ | 151,934,296 | |
Gross unrealized gain | | | 4,538,830 | | | | 1,794,668 | | | | 98,622 | | | | 44,057,119 | | | | 1,069,973 | | | | 853,105 | |
Gross unrealized loss | | | (982,102 | ) | | | (929 | ) | | | (17,003 | ) | | | (937,989 | ) | | | (59,762 | ) | | | (96,735 | ) |
Net unrealized gains (losses) on securities | | $ | 3,556,728 | | | $ | 1,793,739 | | | $ | 81,619 | | | $ | 43,119,130 | | | $ | 1,010,211 | | | $ | 756,370 | |
The difference between GAAP-basis and tax-basis unrealized gains (losses) is due to wash sales, and differences in tax treatment of market discount accretion and premium amortization, and inflation protected securities.
In order to present certain components of the Funds’ capital accounts on a tax-basis, certain reclassifications have been recorded to the Funds’ accounts. These reclassifications have no impact on the NAV of the Funds’ and result primarily from redemptions utilized as distributions, and redemptions in-kind transactions.
| | | | | | | | | | |
| Fund | | | | Paid-in
Capital | | | Total
Distributable
Earnings | |
Access High Yield Corporate Bond ETF | | | | $ | (1,413,580 | ) | | $ | 1,413,580 | |
Access Inflation Protected USD Bond ETF | | | | $ | 444,141 | | | $ | (444,141 | ) |
Access Investment Grade Corporate 1-5 Year Bond ETF | | | | $ | — | | | $ | — | |
Access Investment Grade Corporate Bond ETF | | | | $ | 5,861,611 | | | $ | (5,861,611 | ) |
Access Treasury 0-1 Year ETF | | | | $ | 4,693,562 | | | $ | (4,693,562 | ) |
Access Ultra Short Bond ETF | | | | $ | — | | | $ | — | |
GSAM has reviewed the Funds’ tax positions for all open tax years (the current year, and prior three tax years, as applicable) and has concluded that no provision for income tax is required in the Funds’ financial statements. Such open tax year remains subject to examination and adjustment by tax authorities.
The Funds’ risks include, but are not limited to, the following:
Floating and Variable Rate Obligations Risk — Floating rate and variable rate obligations are debt instruments issued by companies or other entities with interest rates that reset periodically (typically, daily, monthly, quarterly, or semiannually) in response to changes in the market rate of interest on which the interest rate is based. For floating and variable rate obligations, there may be a lag between an actual change in the underlying interest rate benchmark and the reset time for an interest payment of such an obligation, which could harm or benefit a Fund, depending on the interest rate environment or other circumstances. In a rising interest rate environment, for example, a floating or variable rate obligation that does not reset immediately would prevent a Fund from taking full advantage of rising interest rates in a timely manner. However, in a declining interest rate environment, a Fund may benefit from a lag due to an obligation’s interest rate payment not being immediately impacted by a decline in interest rates.
95
GOLDMAN SACHS ACCESS FIXED INCOME ETFS
Notes to Financial Statements (continued)
August 31, 2020
|
| 8. OTHER RISKS (continued) |
In 2017, the United Kingdom’s Financial Conduct Authority (“FCA”) warned that LIBOR may cease to be available or appropriate for use by 2021. The unavailability or replacement of LIBOR may affect the value, liquidity or return on certain Fund investments and may result in costs incurred in connection with closing out positions and entering into new trades. Any pricing adjustments to a Fund’s investments resulting from a substitute reference rate may also adversely affect the Fund’s performance and/or NAV.
Foreign and Emerging Countries Risk — Investing in foreign markets may involve special risks and considerations not typically associated with investing in the United States. Foreign securities may be subject to risk of loss because of more or less foreign government regulation, less public information and less economic, political and social stability in the countries in which a Fund invests. The imposition of exchange controls (including repatriation restrictions), confiscations of assets and property, trade restrictions (including tariffs) and other government restrictions by the United States or other governments, or from problems in share registration, settlement or custody, may also result in losses. Foreign risk also involves the risk of negative foreign currency rate fluctuations, which may cause the value of securities denominated in such foreign currency (or other instruments through which a Fund has exposure to foreign currencies) to decline in value. Currency exchange rates may fluctuate significantly over short periods of time. To the extent that a Fund also invests in securities of issuers located in emerging markets, these risks may be more pronounced.
Interest Rate Risk — When interest rates increase, fixed income securities or instruments held by a Fund will generally decline in value. Long-term fixed income securities or instruments will normally have more price volatility because of this risk than short- term fixed income securities or instruments. The risks associated with changing interest rates may have unpredictable effects on the markets and a Fund’s investments. Fluctuations in interest rates may also affect the liquidity of fixed income securities and instruments held by the Funds.
Index Risk (each Fund except the Access Ultra Short Bond ETF) — FTSE Fixed Income LLC (the “Index Provider”) constructs each Fund’s Index in accordance with a rules-based methodology. A Fund will be negatively affected by general declines in the securities and asset classes represented in its Index. In addition, because the Funds are not “actively” managed, unless a specific security is removed from an Index, a Fund generally would not sell a security because the security’s issuer was in financial trouble. Market disruptions and regulatory restrictions could have an adverse effect on a Fund’s ability to adjust its exposure to the required levels in order to track the Index. A Fund also does not attempt to take defensive positions under any market conditions, including declining markets. Therefore, a Fund’s performance could be lower than funds that may actively shift their portfolio assets to take advantage of market opportunities or to lessen the impact of a market decline or a decline in the value of one or more issuers. When the Index is rebalanced and a Fund in turn rebalances its portfolio to attempt to increase the correlation between the Fund’s portfolio and the Index, any transaction costs and market exposure arising from such portfolio rebalancing may be borne directly by the Fund and its shareholders. The Index Provider may utilize third party data in constructing each Index, but it does not guarantee the accuracy or availability of any such third party data.
The FTSE Goldman Sachs Investment Grade Corporate Bond 1-5 Years Index is new and has a limited performance history. Errors in index data, index computation or the construction of an Index in accordance with its methodology may occur from time to time and may not be identified and corrected by the Index Provider for a period of time or at all, which may have an adverse impact on the applicable Fund and its shareholders. In addition, neither a Fund, the Investment Adviser nor the Index Provider can guarantee the availability or timeliness of the production of the Index.
Investments in Other Investment Companies Risk — As a shareholder of another investment company, including an ETF, a Fund will indirectly bear its proportionate share of any net management fees and other expenses paid by such other investment companies, in addition to the fees and expenses regularly borne by the Fund.
Liquidity Risk — A Fund may make investments that are illiquid or that may become less liquid in response to market developments or adverse investor perceptions. Illiquid investments may be more difficult to value. Liquidity risk may also refer to the risk that a Fund will not be able to pay redemption proceeds within the allowable time period or without significant dilution to remaining investors’ interests because of unusual market conditions, an unusually high volume of redemption requests, or other
96
GOLDMAN SACHS ACCESS FIXED INCOME ETFS
|
| 8. OTHER RISKS (continued) |
reasons. To meet redemption requests, a Fund may be forced to sell investments at an unfavorable time and/or under unfavorable conditions. If a Fund is forced to sell securities at an unfavorable time and/or under unfavorable conditions, such sales may adversely affect the Fund’s NAV and dilute remaining investors’ interests. Liquidity risk may be the result of, among other things, the reduced number and capacity of traditional market participants to make a market in fixed income securities or the lack of an active market. The potential for liquidity risk may be magnified by a rising interest rate environment or other circumstances where investor redemptions from fixed income funds may be higher than normal, potentially causing increased supply in the market due to selling activity. These risks may be more pronounced in connection with a Fund’s investments in securities of issuers located in emerging market countries. Redemptions by large shareholders may have a negative impact on a Fund’s liquidity.
Market and Credit Risks — In the normal course of business, a Fund trades financial instruments and enters into financial transactions where risk of potential loss exists due to changes in the market (market risk). The value of the securities in which a Fund invests may go up or down in response to the prospects of individual companies, particular sectors or governments and/or general economic conditions throughout the world due to increasingly interconnected global economies and financial markets. Events such as war, acts of terrorism, social unrest, natural disasters, the spread of infectious illness or other public health threats could also significantly impact a Fund and its investments. Additionally, a Fund may also be exposed to credit risk in the event that an issuer or guarantor fails to perform or that an institution or entity with which the Fund has unsettled or open transactions defaults.
Market Trading Risk — Each Fund faces numerous market trading risks, including disruptions to creations and redemptions, the existence of extreme market volatility or potential lack of an active trading market for Shares. If a shareholder purchases Shares at a time when the market price is at a premium to the NAV or sells Shares at a time when the market price is at a discount to the NAV, the shareholder may sustain losses. The Investment Adviser cannot predict whether Shares will trade below, at or above their NAV. Price differences may be due, in large part, to the fact that supply and demand forces at work in the secondary trading market for Shares will be closely related to, but not identical to, the same forces influencing the prices of the securities of a Fund’s (except the Access Ultra Short Bond ETF) Index trading individually or in the aggregate at any point in time.
Tracking Error Risk (each Fund except the Access Ultra Short Bond ETF) — Tracking error is the divergence of a Fund’s performance from that of its Index. The performance of a Fund may diverge from that of its Index for a number of reasons. Tracking error may occur because of transaction costs, a Fund’s holding of cash, differences in accrual of dividends, changes to its Index or the need to meet new or existing regulatory requirements. Unlike a Fund, the returns of an Index are not reduced by investment and other operating expenses, including the trading costs associated with implementing changes to its portfolio of investments. Tracking error risk may be heightened during times of market volatility or other unusual market conditions.
Under the Trust’s organizational documents, its Trustees, officers, employees and agents are indemnified, to the extent permitted by the Act and state law, against certain liabilities that may arise out of performance of their duties to the Funds. Additionally, in the course of business, the Funds enter into contracts that contain a variety of indemnification clauses. The Funds’ maximum exposure under these arrangements is unknown, as this would involve future claims that may be made against the Funds that have not yet occurred. However, GSAM believes the risk of loss under these arrangements to be remote.
The Funds have adopted Financial Accounting Standards Board Accounting Standards Update 2017-08 to amend the amortization period for certain purchased callable debt securities held at a premium. Under the new standard, the Funds have changed the amortization period for the premium on certain purchased callable debt securities with non-contingent call features to the earliest call date. In accordance with the transition provisions of the standard, the Funds applied the amendments on a modified
97
GOLDMAN SACHS ACCESS FIXED INCOME ETFS
Notes to Financial Statements (continued)
August 31, 2020
|
| 10. OTHER MATTERS (continued) |
retrospective basis beginning with the fiscal period ended August 31, 2020. This change in accounting policy has been made to comply with the newly issued accounting standard and had no material impact on total distributable earnings (loss) or the net asset value of the Funds.
In March 2020, the FASB issued Accounting Standard Update (“ASU”) No. 2020-04, “Reference Rate Reform (Topic 848): Facilitation of the Effects of Reference Rate Reform on Financial Reporting.” This ASU provides optional exceptions for applying GAAP to contract modifications, hedging relationships and other transactions affected reference rate reform if certain criteria are met. ASU 2020-04 is elective and is effective on March 12, 2020 through December 31, 2022. As of the financial reporting period, GSAM is currently evaluating the impact, if any, of applying ASU 2020-04.
Subsequent events after the Statements of Assets and Liabilities date have been evaluated, and GSAM has concluded that there is no impact requiring adjustment or disclosure in the financial statements.
98
Report of Independent Registered Public
Accounting Firm
To the Board of Trustees of Goldman Sachs ETF Trust and Shareholders of Goldman Sachs Access High Yield Corporate Bond ETF, Goldman Sachs Access Inflation Protected USD Bond ETF, Goldman Sachs Access Investment Grade Corporate 1-5 Year Bond ETF, Goldman Sachs Access Investment Grade Corporate Bond ETF, Goldman Sachs Access Treasury 0-1 Year ETF, and Goldman Sachs Access Ultra Short Bond ETF
Opinions on the Financial Statements
We have audited the accompanying statements of assets and liabilities, including the schedules of investments, of each of the funds indicated in the table below (six of the funds constituting Goldman Sachs ETF Trust, hereafter collectively referred to as the “Funds”) as of August 31, 2020, the related statements of operations and of changes in net assets for each of the periods indicated in the table below, including the related notes, and the financial highlights for each of the periods indicated in the table below (collectively referred to as the “financial statements”). In our opinion, the financial statements present fairly, in all material respects, the financial position of each of the Funds as of August 31, 2020, the results of each of their operations, the changes in each of their net assets for each of the periods listed in the table below and each of the financial highlights for each of the periods listed in the table below in conformity with accounting principles generally accepted in the United States of America.
| | | | | | |
| Fund | | Statements of
operations | | Statements of
changes in net assets | | Financial
highlights |
| Goldman Sachs Access High Yield Corporate Bond ETF, Goldman Sachs Access Investment Grade Corporate Bond ETF, and Goldman Sachs Access Treasury 0-1 Year ETF | | For the year ended August 31, 2020 | | For the two years ended August 31, 2020 | | For each of the periods indicated within |
| Goldman Sachs Access Inflation Protected USD Bond ETF | | For the year ended August 31, 2020 | | For the year ended August 31, 2020, and for the period October 2, 2018 (commencement of operations) through August 31, 2019 |
| Goldman Sachs Access Ultra Short Bond ETF | | For the year ended August 31, 2020 | | For the year ended August 31, 2020, and for the period April 15, 2019 (commencement of operations) through August 31, 2019 |
| Goldman Sachs Access Investment Grade Corporate 1-5 Year Bond ETF | | For the period July 7, 2020 (commencement of operations) through August 31, 2020 |
Basis for Opinions
These financial statements are the responsibility of the Funds’ management. Our responsibility is to express an opinion on the Funds’ financial statements based on our audits. We are a public accounting firm registered with the Public Company Accounting Oversight Board (United States) (PCAOB) and are required to be independent with respect to the Funds in accordance with the U.S. federal securities laws and the applicable rules and regulations of the Securities and Exchange Commission and the PCAOB.
We conducted our audits of these financial statements in accordance with the standards of the PCAOB. Those standards require that we plan and perform the audit to obtain reasonable assurance about whether the financial statements are free of material misstatement, whether due to error or fraud.
Our audits included performing procedures to assess the risks of material misstatement of the financial statements, whether due to error or fraud, and performing procedures that respond to those risks. Such procedures included examining, on a test basis, evidence regarding the amounts and disclosures in the financial statements. Our audits also included evaluating the accounting principles used and significant estimates made by management, as well as evaluating the overall presentation of the financial statements. Our procedures included confirmation of securities owned as of August 31, 2020 by correspondence with the custodian, transfer agent and brokers; when replies were not received from brokers, we performed other auditing procedures. We believe that our audits provide a reasonable basis for our opinions.
/s/ PricewaterhouseCoopers LLP
Boston, Massachusetts
October 26, 2020
We have served as the auditor of one or more investment companies in the Goldman Sachs fund complex since 2000.
99
GOLDMAN SACHS ACCESS FIXED INCOME ETFS
Liquidity Risk Management Program (Unaudited)
Each Fund has adopted and implemented a liquidity risk management program (the “Program”) in accordance with Rule 22e-4 under the 1940 Act. The Program seeks to assess and manage each Fund’s liquidity risk, i.e., the risk that a Fund is unable to satisfy redemption requests without significantly diluting remaining investors’ interests in the Fund. The Board of Trustees of the Trust has designated GSAM, each Fund’s investment adviser, to administer the Program. Certain aspects of the Program rely on third parties to perform certain functions, including the provision of market data and application of models.
The Program is comprised of various components designed to support the assessment and/or management of liquidity risk, including: (1) the periodic assessment (no less frequently than annually) of certain factors that influence a Fund’s liquidity risk; (2) the periodic classification (no less frequently than monthly) of a Fund’s investments into one of four liquidity categories that reflect an estimate of their liquidity under current market conditions; (3) a 15% limit on the acquisition of “illiquid investments” (as defined under Rule 22e-4); (4) for a Fund that does not invest primarily in “highly liquid investments” (as defined under Rule 22e-4), the determination of a minimum percentage of the Fund’s assets that will generally be invested in highly liquid investments (a “Highly Liquid Investment Minimum”); and (5) periodic reporting to the Board of Trustees.
At a meeting of the Board of Trustees on March 18-19, 2020, GSAM provided a written report to the Board (with respect to each Fund except Goldman Sachs Access Investment Grade Corporate 1-5 Year Bond ETF and Goldman Sachs Access U.S. Aggregate Bond ETF) addressing the operation, and the adequacy and effectiveness of the implementation of the Program, including, as applicable, the operation of any Highly Liquid Investment Minimum and any material changes to the Program, for the initial period from December 1, 2018 through December 31, 2019 (the “Reporting Period”). Among other things, the annual report discussed: (1) the results of stress tests designed to assess liquidity under a hypothetical stressed scenario involving elevated redemptions; and (2) an assessment of the methodologies used to classify investments into one of four liquidity categories. The report concluded that the Program was reasonably designed to assess and manage liquidity risk and was adequately and effectively implemented during the Reporting Period.
There can be no assurance that the Program will achieve its objectives under all circumstances in the future. Please refer to your Fund’s prospectus for more information regarding the Fund’s exposure to liquidity risk and other risks to which it may be subject.
100
GOLDMAN SACHS ACCESS FIXED INCOME ETFS
| | |
| | |
Fund Expenses — Six Month Period Ended 8/31/2020 (Unaudited) | | |
As a shareholder you incur ongoing costs, including management fees and other Fund expenses. This example is intended to help you understand your ongoing costs (in dollars) of investing in Shares of a Fund and to compare these costs with the ongoing costs of investing in other exchange-traded funds. This example does not take into account brokerage commissions that you may pay on your purchases and sales of Shares of a Fund.
The example is based on an investment of $1,000 invested at the beginning of the period from March 1, 2020 and held for the entire six months ended August 31, 2020, which represents a period of 184 days of a 366 day year (or less where indicated).
Actual Expenses — The first line in the table below provides information about actual account values and actual expenses. You may use the information in this line, together with the amount you invested, to estimate the expenses that you paid over the six months. Simply divide your account value by $1,000 (for example, an $8,600 account value divided by $1,000=8.6), then multiply the result by the number in the first line under the heading entitled “Expenses Paid” to estimate the expenses you paid on your account during this period.
Hypothetical Example for Comparison Purposes — The second line in the table below provides information about hypothetical account values and hypothetical expenses based on a Fund’s actual net expense ratios and an assumed rate of return of 5% per year before expenses, which is not the Fund’s actual return. The hypothetical account values and expenses may not be used to estimate the actual ending account balance or expenses you paid for the period. You may use this information to compare the ongoing costs of investing in a Fund and other funds. To do so, compare this 5% hypothetical example with the 5% hypothetical examples that appear in the shareholder reports of the other funds.
Please note that the expenses shown in the table are meant to highlight your ongoing costs only and do not reflect any transactional costs, such as redemption fees, or exchange fees. Therefore, the second line of the table is useful in comparing ongoing costs only, and will not help you determine the relative total costs of owning different funds. In addition, if these transactional costs were included, your costs would have been higher.
| | | | | | | | | | | | | | | | | | | | | | | | | | | | | | | | | | | | | | | | | | | | | | | | | | | | | | | | | | | | | | | | | | | | | | | | |
| | | Access High Yield Corporate Bond ETF | | | Access Inflation Protected USD Bond ETF | | | Access Investment Grade Corporate 1-5 Year Bond ETF** | | | Access Investment Grade Corporate Bond ETF | | | Access Treasury 0-1 Year ETF | | | Access Ultra Short Bond ETF | |
| | | Beginning
Account Value
3/1/20 | | | Ending
Account Value
8/31/20 | | | Expenses
Paid* | | | Beginning
Account Value
3/1/20 | | | Ending
Account Value
8/31/20 | | | Expenses
Paid* | | | Beginning
Account Value
3/1/20 | | | Ending
Account Value
8/31/20 | | | Expenses
Paid* | | | Beginning
Account Value
3/1/20 | | | Ending
Account Value
8/31/20 | | | Expenses
Paid* | | | Beginning
Account Value
3/1/20 | | | Ending
Account Value
8/31/20 | | | Expenses
Paid* | | | Beginning
Account Value
3/1/20 | | | Ending
Account Value
8/31/20 | | | Expenses
Paid* | |
Actual based on NAV | | $ | 1,000 | | | $ | 1,038.30 | | | $ | 1.74 | | | $ | 1,000 | | | $ | 1,056.70 | | | $ | 0.62 | | | $ | 1,000 | | | $ | 1,004.80 | | | $ | 0.21 | | | $ | 1,000 | | | $ | 1,036.30 | | | $ | 0.72 | | | $ | 1,000 | | | $ | 1,004.10 | | | $ | 0.60 | | | $ | 1,000 | | | $ | 1,006.00 | | | $ | 0.81 | |
Hypothetical 5% return | | $ | 1,000 | | | $ | 1,023.43 | + | | $ | 1.73 | | | $ | 1,000 | | | $ | 1,024.53 | + | | $ | 0.61 | | | $ | 1,000 | | | $ | 1,007.44 | + | | $ | 0.22 | | | $ | 1,000 | | | $ | 1,024.43 | + | | $ | 0.71 | | | $ | 1,000 | | | $ | 1,024.53 | + | | $ | 0.61 | | | $ | 1,000 | | | $ | 1,024.33 | + | | $ | 0.81 | |
| | + | | Hypothetical expenses are based on each Fund’s actual annualized net expense ratios and an assumed rate of return of 5% per year before expenses. | |
| | * | | Expenses for each Fund are calculated using the Fund’s annualized net expense ratio, which represents the ongoing expenses as a percentage of net assets for the six months ended August 31, 2020. Expenses are calculated by multiplying the annualized net expense ratio by the average account value for the period; then multiplying the result by the number of days in the most recent fiscal year; and then dividing that result by the number of days in the fiscal year. | |
| | ** | | The Fund commenced operations on July 7, 2020. Expenses are calculated using the Fund’s annualized expense ratio, multiplied by the ending value for the period, multiplied by 56/366, which represents a period of 56 days of a 366 day year (to reflect the Fund’s commencement of operation). | |
| | | | The annualized net expense ratio for the period is as follows: | |
| | | | |
| Fund | | | |
Access High Yield Corporate Bond ETF | | | 0.34 | % |
Access Inflation Protected USD Bond ETF | | | 0.12 | |
Access Investment Grade Corporate 1-5 Bond Year ETF | | | 0.14 | |
Access Investment Grade Corporate Bond ETF | | | 0.14 | |
Access Treasury 0-1 Year ETF | | | 0.12 | |
Access Ultra Short Bond ETF | | | 0.16 | |
101
GOLDMAN SACHS ACCESS FIXED INCOME ETFS
Statement Regarding Basis for Initial Approval of Management Agreement (Unaudited)
Background
The Goldman Sachs Access Investment Grade Corporate 1-5 Year Bond ETF (the “Fund”) is a newly-organized investment portfolio of Goldman Sachs ETF Trust (the “Trust”) that commenced investment operations on July 7, 2020. At a meeting held on September 17-18, 2019 (the “Meeting”) in connection with the Fund’s organization, the Board of Trustees, including all of the Trustees present who are not parties to the Fund’s investment management agreement (the “Management Agreement”) or “interested persons” (as defined in the Investment Company Act of 1940, as amended) of any party thereto (the “Independent Trustees”) approved the Management Agreement with Goldman Sachs Asset Management, L.P. (the “Investment Adviser”) on behalf of the Fund.
At the Meeting, the Trustees reviewed the Management Agreement with respect to the Fund, including information regarding the terms of the Management Agreement; the nature, extent and quality of the Investment Adviser’s anticipated services; the fees and expenses to be paid by the Fund; a comparison of the Fund’s proposed management fee and anticipated expenses with those paid by other similar exchange-traded funds (“ETFs”); potential benefits to be derived by the Investment Adviser and its affiliates from their relationships with the Fund; and potential benefits to be derived by the Fund from its relationship with the Investment Adviser. Various information was also provided at prior meetings at which the Fund was discussed.
In connection with the Meeting, the Trustees received written materials and oral presentations on the topics covered, and were advised by their independent legal counsel regarding their responsibilities and other regulatory requirements related to the approval of registered fund investment management agreements under applicable law. In evaluating the Management Agreement at the Meeting, the Trustees relied upon information included in a presentation made by the Investment Adviser at the Meeting and information received at prior Board meetings, as well as on their knowledge of the Investment Adviser resulting from their meetings and other interactions over time.
Nature, Extent, and Quality of the Services Provided Under the Management Agreement
As part of their review, the Trustees considered the nature, extent, and quality of the services to be provided to the Fund by the Investment Adviser. In this regard, the Trustees considered both the investment advisory services and non-advisory services that would be provided by the Investment Adviser and its affiliates. The Trustees noted the ongoing recruitment efforts aimed at bringing high quality investment talent to the Investment Adviser. They also noted the Investment Adviser’s commitment to maintaining high quality systems and expending substantial resources to respond to ongoing changes to the regulatory and control environment in which the Fund and its service providers would operate, as well as the efforts of the Investment Adviser and its affiliates to combat cyber security risks. The Trustees considered that under the Management Agreement, the Fund pays a single management fee to the Investment Adviser, and the Investment Adviser pays all of the Fund’s ordinary operating expenses, excluding payments under the Fund’s 12b-1 plan (if any), interest expenses, taxes, acquired fund fees and expenses, brokerage fees, costs of holding shareholder meetings and litigation, indemnification and extraordinary expenses. The Trustees also considered information about the Fund’s structure, investment objective, strategies and other characteristics. In particular, they noted that the Fund would operate as a passively-managed ETF that seeks to track an index owned and calculated by a third-party service provider using concepts developed with the Investment Adviser. The Trustees noted the experience and capabilities of the key personnel of the Investment Adviser who would provide services to the Fund. In particular, the Trustees considered the Investment Adviser’s extensive experience in managing fixed income investment strategies. The Trustees concluded that the Investment Adviser would be able to commit substantial financial and operational resources to the Fund. They also considered that although the Fund was new (and therefore had no performance data to evaluate), the Investment Adviser has committed substantial financial and operational resources to ETFs and has extensive experience managing other types of registered investment companies. The Trustees also recognized that the Investment Adviser had made significant commitments to address regulatory compliance requirements applicable to the Fund and the Investment Adviser and its affiliates.
Unitary Fee Structure and Profitability
The Trustees considered the contractual management fee rate payable by the Fund, noting that the Management Agreement provides for a unitary fee structure, pursuant to which the Fund pays a single management fee to the Investment Adviser and the Investment Adviser then pays all of the Fund’s ordinary operating expenses. In addition, the Trustees considered information on the services to be rendered by the Investment Adviser to the Fund, which would include both advisory and administrative services directed to the needs and operations of the Fund as an ETF. The Trustees noted that license fees would be payable by the Investment Adviser to FTSE Fixed Income LLC for the use of its index and certain trademarks. The Trustees also considered information provided regarding fees and expenses of comparable ETFs advised by other, unaffiliated investment management firms. The comparisons of the Fund’s unitary management fee rate and projected expense ratio were prepared by the Investment Adviser and a third-party provider of mutual fund and ETF data. In particular, the Trustees referred to an analysis comparing the
102
GOLDMAN SACHS ACCESS FIXED INCOME ETFS
Statement Regarding Basis for Initial Approval of Management Agreement (Unaudited) (continued)
Fund’s unitary management fee rate and projected expense ratio to those of relevant peer funds. The Trustees concluded that the comparisons were useful in evaluating the reasonableness of the management fee and total expenses to be paid by the Fund. The Trustees concluded that the Investment Adviser’s management of the Fund likely would benefit the Fund and its shareholders.
In addition, the Trustees recognized that there was not yet profitability data to evaluate for the Fund, but considered the Investment Adviser’s representations that (i) such data would be provided after the Fund commenced operations, and (ii) the Fund was not expected to be profitable to the Investment Adviser and its affiliates initially.
Economies of Scale
The Trustees noted that the Fund would not have management fee breakpoints. The Trustees considered the Fund’s projected asset levels and information comparing the fee rates charged by the Investment Adviser with fee rates charged to other ETFs in the Fund’s peer group.
Other Benefits to the Investment Adviser and Its Affiliates
The Trustees also considered the other benefits expected to be derived by the Investment Adviser and its affiliates from their relationships with the Fund, including: (a) the Investment Adviser’s ability to leverage the infrastructure designed to service the Fund on behalf of its other clients; (b) the Investment Adviser’s ability to cross-market other products and services to Fund shareholders; (c) the Investment Adviser’s ability to negotiate better pricing with custodians on behalf of its other clients, as a result of the relationship with the Fund; and (d) the possibility that the working relationship between the Investment Adviser and the Fund’s third party service providers may cause those service providers to be more likely to do business with other areas of Goldman Sachs & Co. LLC (“Goldman Sachs”).
Other Benefits to the Fund and Its Shareholders
The Trustees also noted that the Fund is expected to receive certain potential benefits as a result of its relationship with the Investment Adviser, including: (a) enhanced servicing from vendors because of the volume of business generated by the Investment Adviser and its affiliates; (b) the Investment Adviser’s ability to hire and retain qualified personnel to provide services to the Fund because of the reputation of the Goldman Sachs organization; and (c) the Fund’s access to certain affiliated distribution channels.
Conclusion
In connection with their consideration of the Management Agreement, the Trustees gave weight to each of the factors described above, but did not identify any particular factor as controlling their decision. After deliberation and consideration of all of the information provided, including the factors described above, the Trustees concluded, in the exercise of their business judgment, that the unitary management fee to be paid by the Fund was reasonable in light of the services to be provided to it by the Investment Adviser, the Investment Adviser’s costs and the Fund’s reasonably foreseeable asset levels. The Trustees unanimously concluded that the engagement of the Investment Adviser likely would benefit the Fund and its shareholders and that the Management Agreement should be approved until September 18, 2021.
103
GOLDMAN SACHS ACCESS FIXED INCOME ETFS
Trustees and Officers (Unaudited) Independent Trustees
| | | | | | | | | | |
Name, Address and Age1 | | Position(s) Held
with the Trust | | Term of
Office and Length of
Time Served2 | | Principal Occupation(s)
During Past 5 Years | | Number of
Portfolios in
Fund Complex
Overseen by
Trustee3 | | Other
Directorships
Held by Trustee4 |
| | | | | |
Lawrence W. Stranghoener Age: 66 | | Chairman of the Board of Trustees | | Trustee Since 2015; Chairman Since 2017 | | Mr. Stranghoener is retired. He is Director, Kennametal, Inc. (a global manufacturer and distributor of tooling and industrial materials) (2003-Present); and was formerly Director, Aleris Corporation and Aleris International, Inc. (a producer of aluminum rolled products) (2011-2020); Interim Chief Executive Officer (2014); and Executive Vice President and Chief Financial Officer (2004-2014), Mosaic Company (a fertilizer manufacturing company). Chairman of the Board of Trustees — Goldman Sachs ETF Trust; Goldman Sachs MLP Income Opportunities Fund; Goldman Sachs MLP and Energy Renaissance Fund; Goldman Sachs Credit Income Fund; and Goldman Sachs Real Estate Diversified Income Fund. | | 46 | | Kennametal Inc. (a global manufacturer and distributor of tooling and industrial materials) |
| | | | | |
Caroline Dorsa Age: 61 | | Trustee | | Since 2016 | | Ms. Dorsa is retired. She is Director, Biogen Inc. (a biotechnology company) (2010-Present); Director, Intellia Therapeutics Inc. (a gene- editing company) (2015-Present); and Director, Illumina, Inc. (a life sciences company) (2017- Present). She was formerly Executive Vice President and Chief Financial Officer, Public Service Enterprise Group, Inc. (a generation and energy services company) (2009-2015); Senior Vice President, Merck & Co, Inc. (a pharmaceutical company) (2008-2009 and 1987- 2007); Senior Vice President and Chief Financial Officer, Gilead Sciences, Inc. (a pharmaceutical company) (2007-2008); and Senior Vice President and Chief Financial Officer, Avaya, Inc. (a technology company) (2007). Trustee — Goldman Sachs ETF Trust; Goldman Sachs MLP Income Opportunities Fund; Goldman Sachs MLP and Energy Renaissance Fund; Goldman Sachs Credit Income Fund; and Goldman Sachs Real Estate Diversified Income Fund. | | 46 | | Biogen Inc. (a biotechnology company); Intellia Therapeutics Inc. (a gene-editing company); Illumina, Inc. (a life sciences company) |
| | | | | |
Linda A. Lang Age: 62 | | Trustee | | Since 2016 | | Ms. Lang is retired. She was formerly Chair of the Board of Directors (2016-2019), and Member of the Board of Directors, WD-40 Company (a global consumer products company) (2004–2019); Chairman and Chief Executive Officer (2005-2014); and Director, President and Chief Operating Officer, Jack in the Box, Inc. (a restaurant company) (2003-2005). Previously, Ms. Lang served as an Advisory Board Member of Goldman Sachs MLP Income Opportunities Fund and Goldman Sachs MLP and Energy Renaissance Fund (February 2016-March 2016). Trustee — Goldman Sachs ETF Trust; Goldman Sachs MLP Income Opportunities Fund; Goldman Sachs MLP and Energy Renaissance Fund; Goldman Sachs Credit Income Fund; and Goldman Sachs Real Estate Diversified Income Fund. | | 46 | | None |
| | | | | |
Michael Latham Age: 54 | | Trustee | | Since 2015 | | Mr. Latham is retired. Formerly, he held senior management positions with the iShares exchange-traded fund business, including Chairman (2011-2014); Global Head (2010-2011); U.S. Head (2007-2010); and Chief Operating Officer (2003-2007). Trustee — Goldman Sachs ETF Trust; Goldman Sachs MLP Income Opportunities Fund; Goldman Sachs MLP and Energy Renaissance Fund; Goldman Sachs Credit Income Fund; and Goldman Sachs Real Estate Diversified Income Fund. | | 46 | | None |
| | | | | | | | | | |
104
GOLDMAN SACHS ACCESS FIXED INCOME ETFS
Trustees and Officers (Unaudited) (continued)
Interested Trustee*
| | | | | | | | | | |
Name, Address and Age1 | | Position(s) Held
with the Trust | | Term of
Office and Length of
Time Served2 | | Principal Occupation(s)
During Past 5 Years | | Number of
Portfolios in
Fund Complex
Overseen by
Trustee3 | | Other
Directorships
Held by Trustee4 |
| | | | | |
James A. McNamara Age: 57 | | Trustee and President | | Since 2014 | | Advisory Director, Goldman Sachs (January 2018-Present); Managing Director, Goldman Sachs (January 2000-December 2017); Director of Institutional Fund Sales, GSAM (April 1998-December 2000); and Senior Vice President and Manager, Dreyfus Institutional Service Corporation (January 1993-April 1998). President and Trustee — Goldman Sachs ETF Trust; Goldman Sachs Trust; Goldman Sachs Variable Insurance Trust; Goldman Sachs Trust II; Goldman Sachs MLP Income Opportunities Fund; Goldman Sachs MLP and Energy Renaissance Fund; Goldman Sachs Credit Income Fund; and Goldman Sachs Real Estate Diversified Income Fund. | | 168 | | None |
| | | | | | | | | | |
| * | | This person is considered to be an “Interested Trustee” because he holds a position with Goldman Sachs and own securities issued by The Goldman Sachs Group, Inc. The Interested Trustee holds comparable positions with certain other companies of which Goldman Sachs, GSAM or an affiliate thereof is the investment adviser, administrator and/or distributor. |
| 1 | | Each Trustee may be contacted by writing to the Trustee, c/o Goldman Sachs, 200 West Street, New York, New York, 10282, Attn: Caroline L. Kraus. Information is provided as of August 31, 2020. |
| 2 | | Each Trustee holds office for an indefinite term until the earliest of: (a) the election of his or her successor; (b) the date the Trustee resigns, retires or is removed by the Board of Trustees or shareholders, in accordance with the Trust’s Declaration of Trust; or (c) the termination of the Trust. |
| 3 | | The Goldman Sachs Fund Complex includes certain other companies listed above for each respective Trustee. As of August 31, 2020, Goldman Sachs ETF Trust consisted of 42 portfolios (23 of which offered shares to the public); Goldman Sachs Trust consisted of 90 portfolios (89 of which offered shares to the public); Goldman Sachs Variable Insurance Trust consisted of 13 portfolios; Goldman Sachs Trust II consisted of 19 portfolios (17 of which offered shares to the public); and Goldman Sachs MLP Income Opportunities Fund, Goldman Sachs MLP and Energy Renaissance Fund, Goldman Sachs Credit Income Fund and Goldman Sachs Real Estate Diversified Income Fund each consisted of one portfolio. Goldman Sachs Credit Income Fund did not offer shares to the public. |
| 4 | | This column includes only directorships of companies required to report to the Securities and Exchange Commission under the Securities Exchange Act of 1934 (i.e., “public companies”) or other investment companies registered under the Act. |
Additional information about the Trustees is available in the Funds’ Statement of Additional Information, which can be obtained from Goldman Sachs free of charge by calling this toll-free number (in the United States of America): 1-800-621-2550.
105
GOLDMAN SACHS ACCESS FIXED INCOME ETFS
Trustees and Officers (Unaudited) (continued)
Officers of the Trust*
| | | | | | |
| Name, Address and Age1 | | Positions Held
with the Trust | | Term of
Office and
Length of
Time Served2 | | Principal Occupation(s) During Past 5 Years |
| | | |
James A. McNamara 200 West Street New York, NY 10282 Age: 57 | | Trustee and President | | Since 2014 | | Advisory Director, Goldman Sachs (January 2018-Present); Managing Director, Goldman Sachs (January 2000-December 2017); Director of Institutional Fund Sales, GSAM (April 1998-December 2000); and Senior Vice President and Manager, Dreyfus Institutional Service Corporation (January 1993-April 1998). President and Trustee — Goldman Sachs ETF Trust; Goldman Sachs Trust; Goldman Sachs Variable Insurance Trust; Goldman Sachs Trust II; Goldman Sachs MLP Income Opportunities Fund; Goldman Sachs MLP and Energy Renaissance Fund; Goldman Sachs Credit Income Fund; and Goldman Sachs Real Estate Diversified Income Fund. |
| | | |
Caroline L. Kraus 200 West Street New York, NY 10282 Age: 43 | | Secretary | | Since 2014 | | Managing Director, Goldman Sachs (January 2016-Present); Vice President, Goldman Sachs (August 2006-December 2015); Senior Counsel, Goldman Sachs (January 2020-Present); Associate General Counsel, Goldman Sachs (2012-December 2019); Assistant General Counsel, Goldman Sachs (August 2006-December 2011); and Associate, Weil, Gotshal & Manges, LLP (2002-2006). Secretary — Goldman Sachs ETF Trust; Goldman Sachs Trust (previously Assistant Secretary (2012)); Goldman Sachs Variable Insurance Trust (previously Assistant Secretary (2012)); Goldman Sachs Trust II; Goldman Sachs BDC, Inc.; Goldman Sachs Private Middle Market Credit LLC; Goldman Sachs Private Middle Market Credit II LLC; Goldman Sachs Middle Market Lending Corp.; Goldman Sachs MLP Income Opportunities Fund; Goldman Sachs MLP and Energy Renaissance Fund; Goldman Sachs Credit Income Fund; and Goldman Sachs Real Estate Diversified Income Fund. |
| | | |
Joseph F. DiMaria 30 Hudson Street Jersey City, NJ 07302 Age: 52 | | Treasurer, Principal Financial Officer and Principal Accounting Officer | | Since 2017 (Treasurer and Principal Financial Officer since 2019) | | Managing Director, Goldman Sachs (November 2015-Present) and Vice President — Mutual Fund Administration, Columbia Management Investment Advisers, LLC (May 2010- October 2015). Treasurer, Principal Financial Officer and Principal Accounting Officer — Goldman Sachs ETF Trust (previously Assistant Treasurer (2017)); Goldman Sachs Trust (previously Assistant Treasurer (2016)); Goldman Sachs Variable Insurance Trust (previously Assistant Treasurer (2016)); Goldman Sachs Trust II (previously Assistant Treasurer (2017)); Goldman Sachs MLP Income Opportunities Fund (previously Assistant Treasurer (2017)); Goldman Sachs MLP and Energy Renaissance Fund (previously Assistant Treasurer (2017)); Goldman Sachs Credit Income Fund; and Goldman Sachs Real Estate Diversified Income Fund. |
| | | | | | |
| * | | Represents a partial list of officers of the Trust. Additional information about all the officers is available in the Funds’ Statement of Additional Information, which can be obtained from Goldman Sachs free of charge by calling this toll-free number (in the United States): 1-800-621-2550. |
| 1 | | Information is provided as of August 31, 2020. |
| 2 | | Officers hold office at the pleasure of the Board of Trustees or until their successors are duly elected and qualified. Each officer holds comparable positions with certain other companies of which Goldman Sachs, GSAM or an affiliate thereof is the investment adviser, administrator and/or distributor. |
Goldman Sachs Access Fixed Income ETFs — Tax Information (Unaudited)
During the fiscal year ended August 31, 2020, 100% of the net investment company taxable income distributions paid by the Access Inflation Protected USD Bond ETF and Access Treasury 0-1 Year ETF were designated as interest-related dividends pursuant to Section 871(k) of the Internal Revenue Code.
Pursuant to Section 852 of the Internal Revenue Code, the Access Inflation Protected USD Bond ETF and Access Investment Grade Corporate Bond ETF designate $10,495, and $141,378, respectively, or if different, the maximum amount allowable, as capital gain dividends paid during the year ended August 31, 2020.
106
GOLDMAN SACHS ACCESS FIXED INCOME ETFS
Goldman Sachs Access Treasury 0-1 Year ETF
Effective from November 1, 2016 and solely for the purpose of marketing the Fund in the United Kingdom (“UK”), Goldman Sachs Asset Management, L.P. (the “Investment Adviser”) identified itself as the alternative investment fund manager (“AIFM”) of the Fund. As AIFM, the Investment Adviser is responsible for complying with the UK marketing rules implementing the Alternative Investment Fund Managers Directive (Directive 2011/61/EU) (the “Directive”).
In accordance with these rules, the AIFM is required to make available an Annual Report for the financial year of the Fund, containing certain disclosures as set out in Article 22 and 23 of the Directive. The disclosures set out below are included to satisfy these requirements as they have not been disclosed elsewhere in this Annual Report.
I. Remuneration
The following disclosures are made in accordance with Article 107 of the EU Commission Delegated Regulation C (2012) 8370 in respect of the AIFM, which is part of The Goldman Sachs Group, Inc. (“GS Group”). GS Group’s global remuneration philosophy, structure and process for setting remuneration generally applies to employees of the AIFM in the same manner as other employees globally. References to the “firm” and “we” throughout this disclosure include GS Group and the AIFM and any subsidiaries and affiliates.
a. Remuneration Program Philosophy
The remuneration philosophy and the objectives of the remuneration program for the firm, including the AIFM, are reflected in GS Group’s Compensation principles as posted on the Goldman Sachs public website (http://www.goldmansachs.com/investor relations/corporate governance/corporate governance-documents/compensation-principles.pdf) which includes the following:
| | 1. | | We pay for performance – this is an absolute requirement under our compensation program and inherent in our culture. |
| | 2. | | We structure compensation, especially at senior levels, to align with GS Group’s shareholders’ long-term interests. |
| | 3. | | We use compensation as an important tool to attract, retain and motivate talent. |
| | 4. | | We align total compensation with corporate performance over the period. |
The AIFM’s remuneration program is intended to be flexible enough to allow responses to changes in market conditions, but grounded in a framework that maintains effective remuneration practices.
b. Remuneration Governance
The planning, implementation and revision of the compensation policy of the AIFM is subject to the oversight of the Compensation Committee of the Board of Directors of GS Group (the “GS Group Compensation Committee”), the ultimate parent of the AIFM.
The members of the GS Group Compensation Committee at the end of 2019 were M. Michele Burns (Chair), Drew G. Faust, Ellen J. Kullman, Lakshmi N. Mittal, and Adebayo O. Ogunlesi (ex-officio). None of the members of the GS Group Compensation Committee were an employee of the firm. All members of the GS Group Compensation Committee were “independent” within the meaning of the New York Stock Exchange Rules and the firm’s Director Independence Policy.
The GS Group Compensation Committee has for several years recognised the importance of using an independent remuneration consultant that is appropriately qualified and that provides services solely to the GS Group Compensation Committee and not to the firm. The Compensation Committee continued to retain an independent remuneration consultant in 2019.
GS Group’s global process for setting variable remuneration (including the requirement to consider risk and compliance issues) applies to employees of the AIFM in the same way as to employees of other entities and in other regions and is subject to oversight by the senior management of the firm in the region.
c. Link Between Pay and Performance
Annual remuneration for employees is generally comprised of fixed and variable remuneration. The AIFM’s remuneration practices provide for variable remuneration determinations to be made on a discretionary basis. Variable remuneration is based on multiple factors and is not set as a fixed percentage of revenue or by reference to any other formula. Firmwide performance is a key factor in determining variable remuneration.
d. Performance Measurement
Year-end variable remuneration is determined through a discretionary process that relies on certain qualitative and quantitative metrics (amongst other factors) against which we assess performance at year-end. We do not set specific goals, targets or other
107
GOLDMAN SACHS ACCESS FIXED INCOME ETFS
Goldman Sachs TreasuryAccess 0-1 Year ETF (continued)
objectives for purposes of determining year-end variable remuneration nor do we set an initial remuneration pool that is adjusted for any such goals, targets or other objectives. Such metrics are not formulaic nor given any specific weight. In addition, employees are evaluated annually as part of the “360 degree” feedback process.
e. Risk Adjustment
Prudent risk management is a hallmark of both the firm’s and AIFM’s culture and sensitivity to risk and risk management are key elements in assessing employee performance, including as part of the “360 degree” feedback process noted above.
We take risk into account in setting the amount and form of variable remuneration for employees. We provide guidelines to assist compensation managers when applying discretion during the remuneration process to promote consistent consideration of the different metrics/factors considered during the remuneration process. Further, to ensure the independence of control function employees, remuneration for those employees is not determined by individuals in revenue-producing positions but rather by the management of the relevant control function.
f. Structure of Remuneration
| | 2. | | Variable Remuneration: For employees with total and variable remuneration above a specific threshold, variable remuneration is generally paid in a combination of cash and equity-based remuneration. In general, the portion paid in the form of an equity-based award increases as variable remuneration increases. |
g. Total Remuneration
Staff remuneration for the financial period ending December 31, 2019:
| | |
Total remuneration for the financial year ending December 31, 2019 paid by the AIFM to 13 staff in respect of the management of the assets of the Fund | | US$170,802, made up of: • US$76,788 fixed remuneration • US$94,014 variable remuneration |
Which includes: |
(a) Remuneration paid by the AIFM to senior management | | US$127,000 |
(b) Remuneration paid by the AIFM to other staff members whose actions have a material impact on the risk profile of the Fund | | US$43,802 |
The remuneration figures above:
| | 1. | | relate to the proportion of time spent by those staff on the management of the assets of the Fund; and |
| | 2. | | do not include figures for those staff whose activities may impact the Fund but who provide services through other affiliates of the AIFM. |
II. Risk Management
The current risk profile of the Fund and the risk management framework employed by the AIFM to manage those risks are outlined in the Fund’s Prospectus and Statement of Additional Information. The Investment Manager’s risk management function will seek to ensure that the risk profile disclosed to investors is consistent with applicable risk limits, monitor compliance with those risk limits, promptly notify the risk management component of the portfolio management team managing the portfolio of any inconsistency, or risk or inconsistency, between the risk profile and risk limits.
III. Material Changes
Article 22 of the Directive requires disclosure of any material changes in the information listed in Article 23 of the Directive.
In respect of the period ended December 31, 2019, there have been no material changes to the information listed in Article 23 of the Directive.
108
FUNDS PROFILE
Goldman Sachs ETFs

Goldman Sachs is a premier financial services firm, known since 1869 for creating thoughtful and customized investment solutions in complex global markets.
Today, the Consumer and Investment Management Division of Goldman Sachs serves a diverse set of clients worldwide, including private institutions, public entities and individuals. With approximately $1.88 trillion in assets under supervision as of June 30, 2020, Goldman Sachs Asset Management (“GSAM”) has portfolio management teams located around the world and our investment professionals bring firsthand knowledge of local markets to every investment decision. Assets under supervision includes assets under management and other client assets for which Goldman Sachs does not have full discretion. GSAM leverages the resources of Goldman Sachs & Co. LLC subject to legal, internal and regulatory restrictions.
|
|
| GOLDMAN SACHS EXCHANGE-TRADED FUNDS |
| Goldman Sachs ActiveBeta® Emerging Markets Equity ETF |
| Goldman Sachs ActiveBeta® Europe Equity ETF |
| Goldman Sachs ActiveBeta® International Equity ETF |
| Goldman Sachs ActiveBeta® Japan Equity ETF |
| Goldman Sachs ActiveBeta® U.S. Large Cap Equity ETF |
| Goldman Sachs ActiveBeta® U.S. Small Cap Equity ETF |
| Goldman Sachs Equal Weight U.S. Large Cap Equity ETF |
| Goldman Sachs Hedge Industry VIP ETF |
| Goldman Sachs JUST U.S. Large Cap Equity ETF |
| Goldman Sachs Access High Yield Corporate Bond ETF |
| Goldman Sachs Access Inflation Protected USD Bond ETF |
| Goldman Sachs Access Investment Grade Corporate Bond ETF |
| Goldman Sachs Access Investment Grade Corporate 1-5 Year Bond ETF |
| Goldman Sachs Access Treasury 0-1 Year ETF |
| Goldman Sachs Access Ultra Short Bond ETF |
| Goldman Sachs Access U.S. Aggregate Bond ETF |
| Goldman Sachs Data-Driven World ETF |
| Goldman Sachs Finance Reimagined ETF |
| Goldman Sachs Human Evolution ETF |
| Goldman Sachs Manufacturing Revolution ETF |
| Goldman Sachs New Age Consumer ETF |
| Goldman Sachs MarketBeta International Equity ETF |
| Goldman Sachs MarketBeta Emerging Markets Equity ETF |
Goldman Sachs MarketBeta U.S. Equity ETF |
INDEX DISCLAIMERS
Goldman Sachs Access High Yield Corporate Bond ETF
The Goldman Sachs Access High Yield Corporate Bond ETF (the “Fund”) has been developed solely by GSAM. The Fund is not in any way connected to or sponsored, endorsed, sold or promoted by the London Stock Exchange Group plc and its group undertakings (collectively, the “LSE Group”). FTSE Russell is a trading name of certain of the LSE Group companies.
All rights in the FTSE Goldman Sachs High Yield Corporate Bond Index (the “Index”) vest in the relevant LSE Group company which owns the Index. FTSE® is a trademark of the relevant LSE Group company and is used by any other LSE Group company under license.
The Index is calculated by or on behalf of FTSE Fixed Income, LLC or its affiliate, agent or partner. The LSE Group does not accept any liability whatsoever to any person arising out of (a) the use of, reliance on or any error in the Index or (b) investment in or operation of the Fund. The LSE Group makes no claim, prediction, warranty or representation either as to the results to be obtained from the Fund or the suitability of the Index for the purpose to which it is being put by GSAM.
Goldman Sachs Access Inflation Protected USD Bond ETF
The Goldman Sachs Access Inflation Protected USD Bond ETF (the “Fund”) has been developed solely by GSAM. The Fund is not in any way connected to or sponsored, endorsed, sold or promoted by the London Stock Exchange Group plc and its group undertakings (collectively, the “LSE Group”). FTSE Russell is a trading name of certain of the LSE Group companies.
All rights in the FTSE Goldman Sachs Treasury Inflation Protected USD Bond Index (the “Index”) vest in the relevant LSE Group company which owns the Index. FTSE® is a trademark of the relevant LSE Group company and is used by any other LSE Group company under license.
The Index is calculated by or on behalf of FTSE Fixed Income, LLC or its affiliate, agent or partner. The LSE Group does not accept any liability whatsoever to any person arising out of (a) the use of, reliance on or any error in the Index or (b) investment in or operation of the Fund. The LSE Group makes no claim, prediction, warranty or representation either as to the results to be obtained from the Fund or the suitability of the Index for the purpose to which it is being put by GSAM.
Goldman Sachs Access Investment Grade Corporate Bond ETF
The Goldman Sachs Access Investment Grade Corporate Bond ETF (the “Fund”) has been developed solely by GSAM. The Fund is not in any way connected to or sponsored, endorsed, sold or promoted by the London Stock Exchange Group plc and its group undertakings (collectively, the “LSE Group”). FTSE Russell is a trading name of certain of the LSE Group companies.
All rights in the FTSE Goldman Sachs Investment Grade Corporate Bond Index (the “Index”) vest in the relevant LSE Group company which owns the Index. FTSE® is a trademark of the relevant LSE Group company and is used by any other LSE Group company under license.
The Index is calculated by or on behalf of FTSE Fixed Income LLC, or its affiliate, agent or partner. The LSE Group does not accept any liability whatsoever to any person arising out of (a) the use of, reliance on or any error in the Index or (b) investment in or operation of the Fund. The LSE Group makes no claim, prediction, warranty or representation either as to the results to be obtained from the Fund or the suitability of the Index for the purpose to which it is being put by GSAM.
Goldman Sachs Access Investment Grade Corporate 1-5 Year Bond ETF
The Goldman Sachs Access Investment Grade Corporate 1-5 Year Bond ETF (the “Fund”) has been developed solely by GSAM. The Fund is not in any way connected to or sponsored, endorsed, sold or promoted by the London Stock Exchange Group plc and its group undertakings (collectively, the “LSE Group”). FTSE Russell is a trading name of certain of the LSE Group companies.
All rights in the FTSE Goldman Sachs US Investment-Grade Corporate Bond 1-5 Years Index (the “Index”) vest in the relevant LSE Group company which owns the Index. FTSE® is a trademark of the relevant LSE Group company and is used by any other LSE Group company under license.
The Index is calculated by or on behalf of FTSE Fixed Income LLC, or its affiliate, agent or partner. The LSE Group does not accept any liability whatsoever to any person arising out of (a) the use of, reliance on or any error in the Index or (b) investment in or operation of the Fund. The LSE Group makes no claim, prediction, warranty or representation either as to the results to be obtained from the Fund or the suitability of the Index for the purpose to which it is being put by GSAM.
Goldman Sachs Access Treasury 0-1 Year ETF
The Goldman Sachs Access Treasury 0-1 Year ETF (the “Fund”) has been developed solely by GSAM. The Fund is not in any way connected to or sponsored, endorsed, sold or promoted by the London Stock Exchange Group plc and its group undertakings (collectively, the “LSE Group”). FTSE Russell is a trading name of certain of the LSE Group companies.
All rights in the FTSE US Treasury 0-1 Year Composite Select Index (the “Index”) vest in the relevant LSE Group company which owns the Index. FTSE® is a trademark of the relevant LSE Group company and is used by any other LSE Group company under license.
The Index is calculated by or on behalf of FTSE Fixed Income, LLC or its affiliate, agent or partner. The LSE Group does not accept any liability whatsoever to any person arising out of (a) the use of, reliance on or any error in the Index or (b) investment in or operation of the Fund. The LSE Group makes no claim, prediction, warranty or representation either as to the results to be obtained from the Fund or the suitability of the Index for the purpose to which it is being put by GSAM.
| | |
TRUSTEES Lawrence W. Stranghoener, Chairman Caroline Dorsa Linda A. Lang Michael Latham James A. McNamara | | OFFICERS James A. McNamara, President Joseph F. DiMaria, Principal Financial Officer, Principal Accounting Officer and Treasurer Caroline L. Kraus, Secretary |
| |
THE BANK OF NEW YORK MELLON Transfer Agent | | |
| |
ALPS DISTRIBUTORS, INC. Distributor | | GOLDMAN SACHS ASSET MANAGEMENT, L.P. Investment Adviser |
Visit our Website at www.GSAMFUNDS.com/ETFs to obtain the most recent month-end returns.
Goldman Sachs Asset Management, L.P., 200 West Street, New York, New York 10282
The reports concerning the Funds included in this shareholder report may contain certain forward-looking statements about the factors that may affect the performance of the Funds in the future. These statements are based on Fund management’s predictions and expectations concerning certain future events and their expected impact on the Funds, such as performance of the economy as a whole and of specific industry sectors, changes in the levels of interest rates, the impact of developing world events, and other factors that may influence the future performance of the Funds. Management believes these forward-looking statements to be reasonable, although they are inherently uncertain and difficult to predict. Actual events may cause adjustments in portfolio management strategies from those currently expected to be employed.
A description of the policies and procedures that the Funds use to determine how to vote proxies relating to portfolio securities and information regarding how a Fund voted proxies relating to portfolio securities during the most recent 12-month period ended June 30 is available (i) without charge, upon request by calling 1-800-621-2550 and (ii) on the Securities and Exchange Commission (“SEC”) web site at http://www.sec.gov.
The Funds will file portfolio holdings information for each month in a fiscal quarter within 60 days after the end of the relevant fiscal quarter on Form N-PORT. Portfolio holdings information for the third month of each fiscal quarter will be made available on the SEC’s web site at http://www.sec.gov. Portfolio holdings information may be obtained upon request and without charge by calling 1-800-621-2550.
Fund holdings and allocations shown are as of August 31, 2020 and may not be representative of future investments. Fund holdings should not be relied on in making investment decisions and should not be construed as research or investment advice regarding particular securities. Current and future holdings are subject to risk.
ETF Fund shares are not individually redeemable and are issued and redeemed by the Funds at their net asset value (“NAV”) only in large, specified blocks of shares called creation units. Shares otherwise can be bought and sold only through exchange trading at market price (not NAV). Shares may trade at a premium or discount to their NAV in the secondary market. Brokerage commissions will reduce returns.
A Fund may be recently or newly organized and have limited operating history.
Economic and market forecasts presented herein reflect our judgment as of the date of this presentation and are subject to change without notice. These forecasts do not take into account the specific investment objectives, restrictions, tax and financial situation or other needs of any specific client. Actual data will vary and may not be reflected here. These forecasts are subject to high levels of uncertainty that may affect actual performance. Accordingly, these forecasts should be viewed as merely representative of a broad range of possible outcomes. These forecasts are estimated, based on assumptions, and are subject to significant revision and may change materially as economic and market conditions change. Goldman Sachs has no obligation to provide updates or changes to these forecasts. Case studies and examples are for illustrative purposes only.
ETF Fund shares are not individually redeemable and are issued and redeemed by the Fund at their net asset value (“NAV”) only in large, specified blocks of shares called creation units. Shares otherwise can be bought and sold only through exchange trading at market price (not NAV). Shares may trade at a premium or discount to their NAV in the secondary market. Brokerage commissions will reduce returns. Ordinary brokerage commissions apply.
This material is not authorized for distribution to prospective investors unless preceded or accompanied by a current Prospectus or summary prospectus, if applicable. Investors should consider the Funds’ objectives, risks, and charges and expenses, and read the summary prospectuses, if available, and/or the Prospectus carefully before investing or sending money. The summary prospectuses, if available, and the Prospectus contain this and other information about the Funds and may be obtained from your authorized dealer or from Goldman Sachs & Co. LLC by calling 1-800-621-2550.
ActiveBeta® is a registered trademark of GSAM.
ALPS Distributors, Inc. is the distributor of the Goldman Sachs ETF Funds. ALPS Distributors, Inc. is unaffiliated with Goldman Sachs Asset Management.
© 2020 Goldman Sachs. All rights reserved. 218107-OTU-10/2020 AIGAHYCPBNDETFAR-20
Goldman Sachs Funds

| | | | |
| | |
| Annual Report | | | | August 31, 2020 |
| | |
| | | | Goldman Sachs ActiveBeta® ETFs |
| | | | ActiveBeta® Emerging Markets Equity ETF (GEM) |
| | | | ActiveBeta® Europe Equity ETF (GSEU) |
| | | | ActiveBeta® International Equity ETF (GSIE) |
| | | | ActiveBeta® Japan Equity ETF (GSJY) |
| | | | ActiveBeta® U.S. Large Cap Equity ETF (GSLC) |
| | | | ActiveBeta® U.S. Small Cap Equity ETF (GSSC) |
It is our intention that beginning on January 1, 2021, paper copies of the Funds’ annual and semi-annual shareholder reports will no longer be sent by mail, unless you specifically request paper copies of the reports from your financial intermediary. Instead, the reports will be made available on a website, and you will be notified by mail each time a report is posted and provided with a website link to access the report.
If you already elected to receive shareholder reports electronically, you will not be affected by this change and you need not take any action. At any time, you may elect to receive reports and certain communications from a Fund electronically by contacting your financial intermediary.
You may elect to receive all future shareholder reports in paper free of charge. You can inform your financial intermediary that you wish to receive paper copies of reports by contacting your financial intermediary. Your election to receive reports in paper will apply to all Goldman Sachs Funds held in your account.
ActiveBeta® is a registered trademark of GSAM.

Goldman Sachs ActiveBeta® ETFs
| | | | |
| | | |
| NOT FDIC-INSURED | | May Lose Value | | No Bank��Guarantee |
INVESTMENT PROCESS
Goldman Sachs ActiveBeta® ETFs
Principal Investment Strategies
The investment objective of each of the ActiveBeta® Emerging Markets Equity ETF, ActiveBeta® Europe Equity ETF, ActiveBeta® International Equity ETF, ActiveBeta® Japan Equity ETF, ActiveBeta® U.S. Large Cap Equity ETF and ActiveBeta® U.S. Small Cap Equity ETF (each, a “Fund”), is to seek to provide investment results that closely correspond, before fees and expenses, to the performance of its respective underlying index (each, an “Index”).
Each Fund seeks to achieve its investment objective by investing at least 80% of its assets (exclusive of collateral held from securities lending) in securities included in its underlying index, in depositary receipts representing securities included in its underlying index and in underlying stocks in respect of depositary receipts included in its underlying index.
Each Index is designed to deliver exposure to equity securities within its applicable universe of issuers. Each Index is constructed using the patented ActiveBeta® Portfolio Construction Methodology, which was developed to provide exposure to the “factors” (or characteristics) that are commonly tied to a stock’s outperformance relative to market returns. These factors include value (i.e., how attractively a stock is priced relative to its “fundamentals,” such as book value and free cash flow), momentum (i.e., whether a company’s share price is trending up or down), quality (i.e., profitability) and low volatility (i.e., a relatively low degree of fluctuation in a company’s share price over time). Given each Fund’s investment objective of attempting to track its Index, each Fund does not follow traditional methods of active investment management, which may involve buying and selling securities based upon analysis of economic and market factors.
Goldman Sachs Asset Management, L.P. (the “Index Provider”) constructs each Index in accordance with a rules-based methodology that involves two steps.
Step 1
In the first step, individual factor subindexes for value, momentum, quality and low volatility (the “ActiveBeta® Factor Subindexes”) are created from the constituents of the applicable Reference Index, a market capitalization-weighted index. To construct each ActiveBeta® Factor Subindex, all constituents in the applicable Reference Index are assigned a “factor score” based on certain specified measurements (for example, in the case of the value factor, the factor score is based on a composite of book value-to-price, sales-to-price and free cash flow-to-price). Securities with a factor score that is above a fixed “Cut-off Score” receive an overweight in the applicable ActiveBeta® Factor Subindex relative to the applicable Reference Index and securities with a factor score that is below the Cut-off Score receive an underweight in the ActiveBeta® Factor Subindex relative to the applicable Reference Index. Accordingly, the magnitude of overweight or underweight that a security receives in constructing the applicable ActiveBeta® Factor Subindex is determined by its attractiveness when evaluated based on the relevant factor. Each Index only includes long positions (i.e., short positions are impermissible), so the smallest weight for any given security is zero.
Step 2
The ActiveBeta® Factor Subindexes are combined in equal weights to form each Index.
Each Index is rebalanced on a quarterly basis in accordance with the published rebalancing schedule of the applicable Reference Index. The rules-based process used to construct each Index incorporates the ActiveBeta® Turnover Minimization Technique, which seeks to reduce turnover within each Index.
* * *
1
INVESTMENT PROCESS
At the end of the Reporting Period, i.e. the 12 months ended August 31, 2020, we continued to believe in the existence and persistence of certain equity common factors. We further believed that in capturing common factors, investment efficiency (risk-adjusted returns) can be improved by enhancing the informational efficiency and diversification of individual common factor portfolios. Additionally, we advocate the pursuit of factor diversification strategies, which combine individual common factor portfolios, as such strategies tend to dominate individual factors. A passive capture of informationally-efficient and diversified common factor strategies potentially delivers attractive after-cost information ratios.
2
PORTFOLIO RESULTS
Goldman Sachs ActiveBeta® Emerging Markets Equity ETF
Investment Objective
The Goldman Sachs ActiveBeta® Emerging Markets Equity ETF (the “Fund”) seeks to provide investment results that closely correspond, before fees and expenses, to the performance of the Goldman Sachs ActiveBeta® Emerging Markets Equity Index (the “Index”).
Portfolio Management Discussion and Analysis
Below, the Goldman Sachs Quantitative Investment Strategies Team discusses the Fund’s performance and positioning for the 12-month period ended August 31, 2020 (the “Reporting Period”).
| Q | | How did the Fund perform during the Reporting Period? |
| A | | During the Reporting Period, the Fund returned 9.55% based on net asset value (“NAV”) and 9.52% based on market price. The Index returned 9.65%, and the MSCI Emerging Markets Index (net, unhedged, USD) (“MSCI Emerging Markets Index”), a market-cap based index against which the performance of the Fund is measured, and the reference index for the Index, returned 14.44% during the same period. |
| | The Fund had a NAV of $31.12 per share on August 31, 2019 and ended the Reporting Period with a NAV of $33.28 per share. The Fund’s market price on August 31, 2020 was $33.28 per share. |
| Q | | What key factors were responsible for the Fund’s performance during the Reporting Period? |
| A | | The Fund seeks to provide investment results that closely correspond, before fees and expenses, to the performance of the Index. The Fund’s performance reflects Fund expenses, including management fees and brokerage expenses. The Fund’s relative performance also reflects the impact of any cash held in the Fund as well as any other differences between the Fund’s holdings and the constituents of the Index. The Index is unmanaged, and Index returns do not reflect fees and expenses, which would reduce returns. |
| | The Index is constructed using a rules-based methodology that was developed to provide exposure to the “factors” (or characteristics) that are commonly tied to a stock’s outperformance relative to market returns, and its performance is compared to that of the MSCI Emerging Markets Index. Because the Fund seeks to provide investment results that closely correspond, before fees and expenses, to the performance of the Index, the discussion below compared the performance of the Index to that of the MSCI Emerging Markets Index. Given the Fund’s investment objective of attempting to track the Index, the Fund does not follow traditional methods of active investment management, which may involve buying and selling securities based upon analysis of economic and market factors. The Fund does not follow a strategy of seeking to outperform the MSCI Emerging Markets Index. |
| | During the Reporting Period, the Fund posted positive absolute returns but underperformed the MSCI Emerging Markets Index, as measured by NAV. Amongst underlying factors, Low Volatility and Value detracted most from results during the Reporting Period, followed by Quality. Momentum contributed positively to relative results during the Reporting Period. Low Volatility is a relatively low degree of fluctuation in a company’s share price over time. Value refers to how attractively a stock is priced relative to its fundamentals, such as book value and free cash flow. Quality refers to sustainable profitability over time. Momentum is whether a company’s share price is trending up or down. |
| Q | | Which sectors and countries contributed most positively to the Index’s relative performance during the Reporting Period, and which detracted most? |
| A | | Index constituents in the consumer discretionary, communication services, information technology and health care sectors detracted most from the Index’s results relative to the MSCI Emerging Markets Index during the Reporting Period. Index constituents in the real estate, industrials and materials sectors contributed most positively to the Index’s results relative to the MSCI Emerging Markets Index during the Reporting Period. |
| | From a country perspective, Index constituents in China, South Korea and Brazil detracted the most from the Index’s results relative to the MSCI Emerging Markets Index during |
3
PORTFOLIO RESULTS
| | the Reporting Period. Conversely, Index constituents in the Philippines, Greece and Indonesia contributed most positively to the Index’s results relative to the MSCI Emerging Markets Index during the Reporting Period. |
| Q | | Which individual stock positions detracted the most from the Index’s relative returns during the Reporting Period? |
| A | | Relative to the MSCI Emerging Markets Index, underweight positions in Chinese e-commerce retailer Alibaba Group Holdings, Chinese web-based shopping platform Meituan Dianping and Chinese multi-media company Tencent Holdings detracted most (7.29%, 1.26% and 5.39% of Fund net assets as of August 31, 2020, respectively). Alibaba Group Holdings and Tencent Holdings each posted a robust double-digit gain within the Index during the Reporting Period, and Meituan Dianping generated a triple-digit gain within the Index during the Reporting Period. |
| Q | | Which individual stock positions contributed the most to the Index’s relative returns during the Reporting Period? |
| A | | Relative to the MSCI Emerging Markets Index, an overweight position in Chinese condiments producer Yihai International Holding and underweight positions in chemical products producer Sasol and Brazilian oil and natural gas exploration and production company Petroleo Brasileiro contributed most positively (0.33%, 0.00%1 and 0.20% of Fund net assets as of August 31, 2020, respectively). Yihai International Holding posted a triple-digit gain within the Index during the Reporting Period. Sasol generated a double-digit negative return within the Index during the Reporting Period, and Petroleo Brasileiro generated a double-digit negative return within the Index during the Reporting Period. |
| Q | | How did the Fund use derivatives and similar instruments during the Reporting Period? |
| A | | The Fund does not employ derivatives as a source of alpha generation, although it did use index futures to equitize excess cash. The use of futures was not material to the performance of the Fund. |
| Q | | What was the Fund’s sector positioning relative to the Index and the reference index at the end of the Reporting Period?2 |
| | | | | | | | | | | | | | |
| | | | |
| | | Sector Name | | Fund3 | | | GS ActiveBeta®
Emerging Markets
Equity Index | | | MSCI Emerging
Markets Index | |
| | Consumer Discretionary | | | 17.46 | % | | | 17.51 | % | | | 19.77 | % |
| | Consumer Staples | | | 12.34 | | | | 12.02 | | | | 6.25 | |
| | Energy | | | 4.20 | | | | 4.68 | | | | 5.60 | |
| | Financials | | | 16.74 | | | | 17.93 | | | | 17.77 | |
| | Health Care | | | 5.04 | | | | 4.10 | | | | 4.20 | |
| | Industrials | | | 1.84 | | | | 2.38 | | | | 4.47 | |
| | Information Technology | | | 18.82 | | | | 18.69 | | | | 17.54 | |
| | Materials | | | 5.68 | | | | 5.11 | | | | 7.06 | |
| | Real Estate | | | 0.64 | | | | 0.79 | | | | 2.37 | |
| | Communication Services | | | 14.02 | | | | 13.88 | | | | 12.95 | |
| | | Utilities | | | 2.44 | | | | 2.89 | | | | 2.03 | |
| | 1 | | Some weights are 0.00% at August 31, 2020 either because those positions were taken out during the most recent rebalance given the Fund’s index construction methodology or because they were not components of the Index during the Reporting Period. |
| | 2 | | Country and sector classifications for securities may differ between the above listing and the Schedule of Investments due to differing classification methodologies. The classification methodology used for the above listing is as set forth by MSCI. The Fund’s composition may differ over time. Consequently, the Fund’s overall sector allocations may differ from percentages contained in the chart above. The percentage shown for each investment category reflects the value of investments in that category as a percentage of market value (excluding investment in the securities lending reinvestment vehicle, if any). Underlying country and sector allocation of exchange-traded funds held by the Fund are not reflected in the chart above. Investments in the securities lending vehicle represented 0.3% of the Fund’s net assets as of August 31, 2020. Figures above may not sum to 100% due to rounding. |
| | 3 | | The Fund seeks to provide investment results that closely correspond, before fees and expenses, to the performance of the Goldman Sachs ActiveBeta® Emerging Markets Equity Index. |
4
PORTFOLIO RESULTS
| Q | | What was the Fund’s country positioning relative to the Index and the reference index at the end of the Reporting Period?2 |
| | | | | | | | | | | | | | |
| | | | |
| | | Country Name | | Fund3 | | | GS ActiveBeta®
Emerging Markets
Equity Index | | | MSCI Emerging
Markets Index | |
| | Philippines | | | 0.45 | % | | | 0.55 | % | | | 0.74 | % |
| | Greece | | | 0.28 | | | | 0.28 | | | | 0.13 | |
| | Indonesia | | | 1.42 | | | | 1.29 | | | | 1.41 | |
| | Malaysia | | | 0.51 | | | | 1.20 | | | | 1.66 | |
| | Saudi Arabia | | | 2.53 | | | | 2.37 | | | | 2.56 | |
| | Poland | | | 0.84 | | | | 0.94 | | | | 0.71 | |
| | Thailand | | | 1.73 | | | | 1.97 | | | | 1.94 | |
| | Turkey | | | 0.36 | | | | 0.44 | | | | 0.34 | |
| | Czech | | | 0.00 | | | | 0.00 | | | | 0.10 | |
| | United Arab Emirates | | | 0.38 | | | | 0.28 | | | | 0.50 | |
| | Peru | | | 0.12 | | | | 0.13 | | | | 0.25 | |
| | Pakistan | | | 0.00 | | | | 0.00 | | | | 0.02 | |
| | Hong Kong | | | 0.00 | | | | 0.00 | | | | 0.00 | |
| | Hungary | | | 0.00 | | | | 0.00 | | | | 0.21 | |
| | Argentina | | | 0.19 | | | | 0.19 | | | | 0.13 | |
| | Colombia | | | 0.13 | | | | 0.13 | | | | 0.18 | |
| | Chile | | | 0.22 | | | | 0.51 | | | | 0.53 | |
| | Russia | | | 4.23 | | | | 4.20 | | | | 2.93 | |
| | Qatar | | | 1.14 | | | | 1.14 | | | | 0.80 | |
| | Netherlands | | | 0.00 | | | | 0.00 | | | | 0.00 | |
| | Egypt | | | 0.36 | | | | 0.33 | | | | 0.11 | |
| | South Africa | | | 3.42 | | | | 3.37 | | | | 3.54 | |
| | Mexico | | | 1.90 | | | | 1.88 | | | | 1.61 | |
| | Taiwan | | | 14.59 | | | | 15.02 | | | | 12.45 | |
| | India | | | 9.06 | | | | 8.64 | | | | 8.30 | |
| | Brazil | | | 6.40 | | | | 6.10 | | | | 4.84 | |
| | Korea | | | 13.51 | | | | 13.25 | | | | 11.47 | |
| | | China | | | 35.44 | | | | 35.80 | | | | 42.53 | |
| | 2 | | Country and sector classifications for securities may differ between the above listing and the Schedule of Investments due to differing classification methodologies. The classification methodology used for the above listing is as set forth by MSCI. The Fund’s composition may differ over time. Consequently, the Fund’s overall sector allocations may differ from percentages contained in the chart above. The percentage shown for each investment category reflects the value of investments in that category as a percentage of market value (excluding investment in the securities lending reinvestment vehicle, if any). Underlying country and sector allocation of exchange-traded funds held by the Fund are not reflected in the chart above. Investments in the securities lending vehicle represented 0.3% of the Fund’s net assets as of August 31, 2020. Figures above may not sum to 100% due to rounding. |
| | 3 | | The Fund seeks to provide investment results that closely correspond, before fees and expenses, to the performance of the Goldman Sachs ActiveBeta® Emerging Markets Equity Index. |
5
FUND BASICS
ActiveBeta® Emerging Markets Equity ETF
as of August 31, 2020
| | | | | | |
| | FUND SNAPSHOT | |
| | |
| | | As of August 31, 2020 | | | |
| | |
| | Market Price1 | | $ | 33.28 | |
| | | Net Asset Value (NAV)1 | | $ | 33.28 | |
| 1 | | The Market Price is the price at which the Fund’s shares are trading on the NYSE Arca, Inc. The Market Price of the Fund’s shares will fluctuate and, at the time of sale, shares may be worth more or less than the original investment or the Fund’s then current net asset value (“NAV”). The NAV is the market value of one share of the Fund. This amount is derived by dividing the total value of all the securities in the Fund’s portfolio, plus other assets, less any liabilities, by the number of Fund shares outstanding. Fund shares are not individually redeemable and are issued and redeemed by the Fund at their NAV only in large, specified blocks of shares called creation units. Shares otherwise can be bought and sold only through exchange trading at market price (not NAV). Shares may trade at a premium or discount to their NAV in the secondary market. Information regarding how often shares of each Fund traded on NYSE Arca at a price above (i.e., at a premium) or below (i.e., at a discount) the NAV of the Fund can be found at www.GSAMFUNDS.com/ETFs. |
| | | | | | | | | | |
| | TOP 10 HOLDINGS AS OF 8/31/202 |
| | | | |
| | | Holding | | % of Net Assets | | | Line of Business | | Country |
| | | | |
| | Alibaba Group Holding Ltd. ADR | | | 7.4 | % | | Consumer Discretionary | | China |
| | | | |
| | Tencent Holdings Ltd. | | | 5.4 | | | Communication Services | | China |
| | | | |
| | Taiwan Semiconductor Manufacturing Co. Ltd. | | | 5.1 | | | Information Technology | | Taiwan |
| | | | |
| | Samsung Electronics Co. Ltd. | | | 3.2 | | | Information Technology | | South Korea |
| | | | |
| | Meituan Dianping, Class B | | | 1.3 | | | Consumer Discretionary | | China |
| | | | |
| | Reliance Industries Ltd. | | | 0.9 | | | Energy | | India |
| | | | |
| | China Construction Bank Corp., Class H | | | 0.9 | | | Financials | | China |
| | | | |
| | Ping An Insurance Group Co. of China Ltd., Class H | | | 0.8 | | | Financials | | China |
| | | | |
| | Infosys Ltd. | | | 0.8 | | | Information Technology | | India |
| | | | |
| | JD.com, Inc. ADR | | | 0.8 | | | Consumer Discretionary | | China |
| 2 | | The top 10 holdings may not be representative of the Fund’s future investments. |
For more information about the Fund, please refer to www.GSAMFUNDS.com/ETFs. There, you can learn more about the Fund’s investment strategies, holdings, and performance.
6
ACTIVEBETA® EMERGING MARKETS EQUITY ETF
Performance Summary
August 31, 2020
The following graph shows the value, as of August 31, 2020, of a $10,000 investment made on September 25, 2015 (commencement of operations) in Shares at NAV. For comparative purposes, the performance of the Fund’s underlying index and reference index, the Goldman Sachs ActiveBeta® Emerging Markets Equity Index and the MSCI Emerging Markets Index (net, unhedged), respectively, are shown. Performance reflects applicable fee waivers and/or expense limitations in effect during the periods shown and in their absence, performance would be reduced. Returns do not reflect the deduction of taxes that a shareholder would pay on Fund distributions or the sale of Fund shares. In addition to the performance of constituents of the underlying index, other factors may affect Fund performance. These factors include, but are not limited to, Fund operating fees and expenses, portfolio turnover and creation and redemption in-kind transactions. The returns set forth below represent past performance. Past performance does not guarantee future results. The Fund’s NAV and investment return may fluctuate. These fluctuations may cause an investor’s shares to be worth more or less than their original cost. Current performance may be lower or higher than the performance quoted below. Please visit our web site at www.GSAMFUNDS.com/ETFs to obtain the most recent month-end returns.
|
| ActiveBeta® Emerging Markets Equity ETF’s Lifetime Performance |
Performance of a $10,000 Investment, with distributions reinvested, from September 25, 2015 through August 31, 2020.
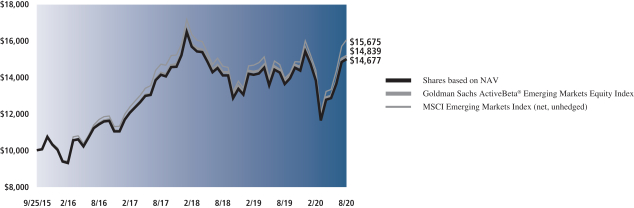
| | | | | | |
| Average Annual Total Return through August 31, 2020* | | | 1 Year Return | | | Since Inception |
Shares based on NAV (Commenced September 25, 2015) | | | 9.55% | | | 8.08% |
|
Shares based on Market Price (Commenced September 25, 2015) | | | 9.52% | | | 8.08% |
|
Goldman Sachs ActiveBeta® Emerging Markets Equity Index | | | 9.65% | | | 8.32% |
|
MSCI Emerging Markets Index (net, unhedged) | | | 14.44% | | | 9.53% |
|
| * | | Total returns are calculated assuming purchase of a share at the market price or NAV on the first day and sale of a share at the market price or NAV on the last day of each period reported. The Total Returns based on NAV and Market Price assume the reinvestment of dividends and do not reflect brokerage commissions in connection with the purchase or sale of Fund shares, which if included would lower the performance shown above. The NAV used in the Total Return calculation assumes all management fees and operating expenses incurred by the Fund. Market Price returns are based upon the last trade as of 4:00pm EST and do not reflect the returns you would receive if you traded shares at other times. The first day of secondary market trading is typically several days after the date on which the Fund commenced investment operations; therefore, the NAV of the Fund is used as a proxy for the period from inception of investment operations to the first day of secondary market trading to calculate the Market Price returns. |
7
PORTFOLIO RESULTS
Goldman Sachs ActiveBeta® Europe Equity ETF
Investment Objective
The Goldman Sachs ActiveBeta® Europe Equity ETF (the “Fund”) seeks to provide investment results that closely correspond, before fees and expenses, to the performance of the Goldman Sachs ActiveBeta® Europe Equity Index (the “Index”).
Portfolio Management Discussion and Analysis
Below, the Goldman Sachs Quantitative Investment Strategies Team discusses the Fund’s performance and positioning for the 12-month period ended August 31, 2020 (the “Reporting Period”).
| Q | | How did the Fund perform during the Reporting Period? |
| A | | During the Reporting Period, the Fund returned 6.69% based on net asset value (“NAV”) and 6.46% based on market price. The Index returned 6.74%, and the MSCI Europe Index (net, unhedged, USD) (“MSCI Europe Index”), a market-cap based index against which the performance of the Fund is measured, and the reference index for the Index, returned 5.41% during the same period. |
| | | The Fund had a NAV of $28.59 per share on August 31, 2019 and ended the Reporting Period with a NAV of $29.85 per share. The Fund’s market price on August 31, 2020 was $29.81 per share. |
| Q | | What key factors were responsible for the Fund’s performance during the Reporting Period? |
| A | | The Fund seeks to provide investment results that closely correspond, before fees and expenses, to the performance of the Index. The Fund’s performance reflects Fund expenses, including management fees and brokerage expenses. The Fund’s relative performance also reflects the impact of any cash held in the Fund as well as any other differences between the Fund’s holdings and the constituents of the Index. The Index is unmanaged, and Index returns do not reflect fees and expenses, which would reduce returns. |
| | | The Index is constructed using a rules-based methodology that was developed to provide exposure to the “factors” (or characteristics) that are commonly tied to a stock’s outperformance relative to market returns, and its performance is compared to that of the MSCI Europe Index. Because the Fund seeks to provide investment results that closely correspond, before fees and expenses, to the performance of the Index, the discussion below compared the performance of the Index to that of the MSCI Europe Index. Given the Fund’s investment objective of attempting to track the Index, the Fund does not follow traditional methods of active investment management, which may involve buying and selling securities based upon analysis of economic and market factors. The Fund does not follow a strategy of seeking to outperform the MSCI Europe Index. |
| | | During the Reporting Period, the Fund posted positive absolute returns that outperformed the MSCI Europe Index, as measured by NAV. Amongst underlying factors, Quality and Momentum contributed positively to relative results during the Reporting Period. Value detracted from relative results during the Reporting Period, while Low Volatility had a rather neutral effect on relative results during the Reporting Period. Quality refers to sustainable profitability over time. Momentum is whether a company’s share price is trending up or down. Value refers to how attractively a stock is priced relative to its fundamentals, such as book value and free cash flow. Low Volatility is a relatively low degree of fluctuation in a company’s share price over time. |
| Q | | Which sectors and countries contributed most positively to the Index’s relative performance during the Reporting Period, and which detracted most? |
| A | | Index constituents in the financials, energy and industrials sectors contributed most positively to the Index’s results relative to the MSCI Europe Index during the Reporting Period. Index constituents in the information technology, materials and consumer discretionary sectors detracted most from the Index’s results relative to the MSCI Europe Index during the Reporting Period. |
| | | From a country perspective, Index constituents in the U.K., France and Norway contributed most positively to the Index’s results relative to the MSCI Europe Index during the Reporting Period. Conversely, Index constituents in the Netherlands, Germany and Switzerland detracted the most from the Index’s results relative to the MSCI Europe Index during the Reporting Period. |
8
PORTFOLIO RESULTS
| Q | | Which individual stock positions contributed the most to the Index’s relative returns during the Reporting Period? |
| A | | Relative to the MSCI Europe Index, underweight positions in U.K. bank HSBC Holdings and Netherlands-based integrated energy company Royal Dutch Shell and an overweight position in Sweden’s tobacco products manufacturer Swedish Match contributed most positively (0.33%, 0.34% and 0.57% of Fund net assets as of August 31, 2020, respectively). HSBC Holdings and Royal Dutch Shell each posted a double-digit decline within the Index during the Reporting Period, while Swedish Match generated a robust double-digit gain within the Index during the Reporting Period. |
| Q | | Which individual stock positions detracted the most from the Index’s relative returns during the Reporting Period? |
| A | | Relative to the MSCI Europe Index, an underweight position in Netherlands-based semiconductor producer ASML Holding and overweight positions in Switzerland-based duty-free shops operator Dufry and U.K. retailer Marks & Spencer Group detracted most (1.31%, 0.00%1 and 0.00% of Fund net assets as of August 31, 2020, respectively). ASML Holding posted a double-digit gain within the Index during the Reporting Period, while Dufry and Marks & Spencer Group each generated a double-digit decline within the Index during the Reporting Period. |
| Q | | How did the Fund use derivatives and similar instruments during the Reporting Period? |
| A | | The Fund does not employ derivatives as a source of alpha generation, although it did use index futures to equitize excess cash. The use of futures was not material to the performance of the Fund. |
| Q | | What was the Fund’s sector positioning relative to the Index and reference index at the end of the Reporting Period?2 |
| | | | | | | | | | | | | | |
| | | | |
| | | Sector Name | | Fund3 | | | GS
ActiveBeta®
Europe Equity
Index | | | MSCI Europe
Index | |
| | Consumer Discretionary | | | 11.82 | % | | | 12.14 | % | | | 10.27 | % |
| | Consumer Staples | | | 15.32 | | | | 15.34 | | | | 14.48 | |
| | Energy | | | 2.51 | | | | 3.47 | | | | 4.31 | |
| | Financials | | | 11.70 | | | | 12.37 | | | | 15.02 | |
| | Health Care | | | 17.27 | | | | 16.92 | | | | 15.71 | |
| | Industrials | | | 14.76 | | | | 14.89 | | | | 14.11 | |
| | Information Technology | | | 7.69 | | | | 7.20 | | | | 7.74 | |
| | Materials | | | 7.10 | | | | 6.54 | | | | 7.93 | |
| | Real Estate | | | 1.15 | | | | 1.09 | | | | 1.42 | |
| | Communication Services | | | 5.14 | | | | 4.85 | | | | 4.05 | |
| | | Utilities | | | 5.27 | | | | 5.19 | | | | 4.96 | |
| | 1 | | Some weights are 0.00% at August 31, 2020 either because those positions were taken out during the most recent rebalance given the Fund’s index construction methodology or because they were not components of the Index during the Reporting Period. |
| | 2 | | Country and sector classifications for securities may differ between the above listing and the Schedule of Investments due to differing classification methodologies. The classification methodology used for the above listing is as set forth by MSCI. The Fund’s composition may differ over time. Consequently, the Fund’s overall sector allocations may differ from percentages contained in the chart above. The percentage shown for each investment category reflects the value of investments in that category as a percentage of market value (excluding investment in the securities lending reinvestment vehicle, if any). Underlying country and sector allocation of exchange-traded funds held by the Fund are not reflected in the chart above. Investments in the securities lending vehicle represented 0.4% of the Fund’s net assets as of August 31, 2020. Figures above may not sum to 100% due to rounding. |
| | 3 | | The Fund seeks to provide investment results that closely correspond, before fees and expenses, to the performance of the Goldman Sachs ActiveBeta® Europe Equity Index. |
9
PORTFOLIO RESULTS
| Q | | What was the Fund’s country positioning relative to the Index and the reference index at the end of the Reporting Period?2 |
| | | | | | | | | | | | | | |
| | | | |
| | | Country Name | | Fund3 | | | GS
ActiveBeta®
Europe Equity
Index | | | MSCI Europe
Index | |
| | UK | | | 20.24 | % | | | 21.06 | % | | | 21.80 | % |
| | France | | | 18.18 | | | | 18.65 | | | | 17.39 | |
| | Norway | | | 1.31 | | | | 1.08 | | | | 0.91 | |
| | Denmark | | | 4.47 | | | | 4.57 | | | | 3.95 | |
| | Belgium | | | 1.53 | | | | 1.47 | | | | 1.47 | |
| | Portugal | | | 0.65 | | | | 0.65 | | | | 0.27 | |
| | Sweden | | | 5.28 | | | | 5.37 | | | | 5.24 | |
| | Finland | | | 1.50 | | | | 1.36 | | | | 1.70 | |
| | Italy | | | 4.20 | | | | 4.38 | | | | 3.68 | |
| | Austria | | | 1.11 | | | | 0.67 | | | | 0.26 | |
| | Spain | | | 3.40 | | | | 3.82 | | | | 3.68 | |
| | Ireland | | | 0.78 | | | | 0.70 | | | | 1.10 | |
| | Switzerland | | | 15.43 | | | | 15.26 | | | | 16.34 | |
| | Germany | | | 15.02 | | | | 14.35 | | | | 15.36 | |
| | | Netherlands | | | 6.63 | | | | 6.62 | | | | 6.85 | |
| | 2 | | Country and sector classifications for securities may differ between the above listing and the Schedule of Investments due to differing classification methodologies. The classification methodology used for the above listing is as set forth by MSCI. The Fund’s composition may differ over time. Consequently, the Fund’s overall sector allocations may differ from percentages contained in the chart above. The percentage shown for each investment category reflects the value of investments in that category as a percentage of market value (excluding investment in the securities lending reinvestment vehicle, if any). Underlying country and sector allocation of exchange-traded funds held by the Fund are not reflected in the chart above. Investments in the securities lending vehicle represented 0.4% of the Fund’s net assets as of August 31, 2020. Figures above may not sum to 100% due to rounding. |
| | 3 | | The Fund seeks to provide investment results that closely correspond, before fees and expenses, to the performance of the Goldman Sachs ActiveBeta® Europe Equity Index. |
10
FUND BASICS
ActiveBeta® Europe Equity ETF
as of August 31, 2020
| | | | | | |
| | FUND SNAPSHOT | | | | |
| | |
| | | As of August 31, 2020 | | | |
| | |
| | Market Price1 | | $ | 29.81 | |
| | | Net Asset Value (NAV)1 | | $ | 29.85 | |
| 1 | | The Market Price is the price at which the Fund’s shares are trading on the NYSE Arca, Inc. The Market Price of the Fund’s shares will fluctuate and, at the time of sale, shares may be worth more or less than the original investment or the Fund’s then current net asset value (“NAV”). The NAV is the market value of one share of the Fund. This amount is derived by dividing the total value of all the securities in the Fund’s portfolio, plus other assets, less any liabilities, by the number of Fund shares outstanding. Fund shares are not individually redeemable and are issued and redeemed by the Fund at their NAV only in large, specified blocks of shares called creation units. Shares otherwise can be bought and sold only through exchange trading at market price (not NAV). Shares may trade at a premium or discount to their NAV in the secondary market. Information regarding how often shares of each Fund traded on NYSE Arca at a price above (i.e., at a premium) or below (i.e., at a discount) the NAV of the Fund can be found at www.GSAMFUNDS.com/ETFs. |
| | | | | | | | | | |
| | TOP 10 HOLDINGS AS OF 8/31/202 |
| | | | |
| | | Holding | | % of Net Assets | | | Line of Business | | Country |
| | | | |
| | Nestle SA | | | 3.5 | % | | Consumer Staples | | Switzerland |
| | Roche Holding AG | | | 2.7 | | | Health Care | | Switzerland |
| | Novartis AG | | | 1.8 | | | Health Care | | Switzerland |
| | | | |
| | SAP SE | | | 1.5 | | | Information Technology | | Germany |
| | AstraZeneca PLC | | | 1.3 | | | Health Care | | United Kingdom |
| | ASML Holding NV | | | 1.3 | | | Information Technology | | Netherlands |
| | Novo Nordisk A/S, Class B | | | 1.3 | | | Health Care | | Denmark |
| | | | |
| | LVMH Moet Hennessy Louis Vuitton SE | | | 1.3 | | | Consumer Discretionary | | France |
| | Sanofi | | | 1.1 | | | Health Care | | France |
| | | L’Oreal SA | | | 1.1 | | | Consumer Staples | | France |
| 2 | | The top 10 holdings may not be representative of the Fund’s future investments. |
For more information about the Fund, please refer to www.GSAMFUNDS.com/ETFs. There, you can learn more about the Fund’s investment strategies, holdings, and performance.
11
ACTIVEBETA® EUROPE EQUITY ETF
Performance Summary
August 31, 2020
The following graph shows the value, as of August 31, 2020, of a $10,000 investment made on March 2, 2016 (commencement of operations) in Shares at NAV. For comparative purposes, the performance of the Fund’s underlying index and reference index, the Goldman Sachs ActiveBeta® Europe Equity Index and the MSCI Europe Index (Total Return, USD), respectively, are shown. Performance reflects applicable fee waivers and/or expense limitations in effect during the periods shown and in their absence, performance would be reduced. Returns do not reflect the deduction of taxes that a shareholder would pay on Fund distributions or the sale of Fund shares. In addition to the performance of constituents of the underlying index, other factors may affect Fund performance. These factors include, but are not limited to, Fund operating fees and expenses, portfolio turnover and creation and redemption in-kind transactions. The returns set forth below represent past performance. Past performance does not guarantee future results. The Fund’s NAV and investment return may fluctuate. These fluctuations may cause an investor’s shares to be worth more or less than their original cost. Current performance may be lower or higher than the performance quoted below. Please visit our web site at www.GSAMFUNDS.com/ETFs to obtain the most recent month-end returns.
|
| ActiveBeta® Europe Equity ETF’s Lifetime Performance |
Performance of a $10,000 Investment, with distributions reinvested, from March 2, 2016 through August 31, 2020.
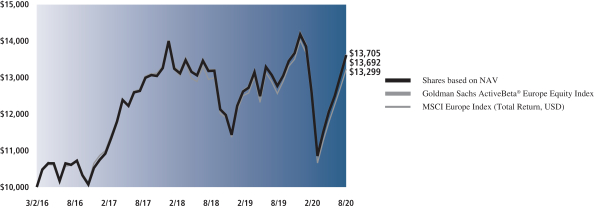
| | | | | | |
| Average Annual Total Return through August 31, 2020* | | | 1 Year Return | | | Since Inception |
Shares based on NAV (Commenced March 2, 2016) | | | 6.69% | | | 7.23% |
|
Shares based on Market Price (Commenced March 2, 2016) | | | 6.46% | | | 7.19% |
|
Goldman Sachs ActiveBeta® Europe Equity Index | | | 6.74% | | | 7.25% |
|
MSCI Europe Index (Total Return, USD) | | | 5.41% | | | 6.53% |
|
| * | | Total returns are calculated assuming purchase of a share at the market price or NAV on the first day and sale of a share at the market price or NAV on the last day of each period reported. The Total Returns based on NAV and Market Price assume the reinvestment of dividends and do not reflect brokerage commissions in connection with the purchase or sale of Fund shares, which if included would lower the performance shown above. The NAV used in the Total Return calculation assumes all management fees incurred by the Fund. Market Price returns are based upon the last trade as of 4:00pm EST and do not reflect the returns you would receive if you traded shares at other times. The first day of secondary market trading is typically several days after the date on which the Fund commenced investment operations; therefore, the NAV of the Fund is used as a proxy for the period from inception of investment operations to the first day of secondary market trading to calculate the Market Price returns. |
12
PORTFOLIO RESULTS
Goldman Sachs ActiveBeta® International Equity ETF
Investment Objective
The Goldman Sachs ActiveBeta® International Equity ETF (the “Fund”) seeks to provide investment results that closely correspond, before fees and expenses, to the performance of the Goldman Sachs ActiveBeta® International Equity Index (the “Index”).
Portfolio Management Discussion and Analysis
Below, the Goldman Sachs Quantitative Investment Strategies Team discusses the Fund’s performance and positioning for the 12-month period ended August 31, 2020 (the “Reporting Period”).
| Q | | How did the Fund perform during the Reporting Period? |
| A | | During the Reporting Period, the Fund returned 5.96% based on net asset value (“NAV”) and 5.52% based on market price. The Index returned 6.08%, and the MSCI World ex U.S. Index (net, unhedged, USD) (“MSCI World ex U.S. Index”), a market-cap based index against which the performance of the Fund is measured, and the reference index for the Index, returned 5.94% during the same period. |
| | The Fund had a NAV of $27.70 per share on August 31, 2019 and ended the Reporting Period with a NAV of $28.72 per share. The Fund’s market price on August 31, 2020 was $28.63 per share. |
| Q | | What key factors were responsible for the Fund’s performance during the Reporting Period? |
| A | | The Fund seeks to provide investment results that closely correspond, before fees and expenses, to the performance of the Index. The Fund’s performance reflects Fund expenses, including management fees and brokerage expenses. The Fund’s relative performance also reflects the impact of any cash held in the Fund as well as any other differences between the Fund’s holdings and the constituents of the Index. The Index is unmanaged, and Index returns do not reflect fees and expenses, which would reduce returns. |
| | The Index is constructed using a rules-based methodology that was developed to provide exposure to the “factors” (or characteristics) that are commonly tied to a stock’s outperformance relative to market returns, and its performance is compared to that of the MSCI World ex USA Index. Because the Fund seeks to provide investment results that closely correspond, before fees and expenses, to the performance of the Index, the discussion below compared the performance of the Index to that of the MSCI World ex USA Index. Given the Fund’s investment objective of attempting to track the Index, the Fund does not follow traditional methods of active investment management, which may involve buying and selling securities based upon analysis of economic and market factors. The Fund does not follow a strategy of seeking to outperform the MSCI World ex USA Index. |
| | During the Reporting Period, the Fund posted positive absolute returns that closely matched the performance of the MSCI World ex USA Index, as measured by NAV. Amongst underlying factors, Quality and Momentum contributed positively to relative results, while Value and Low Volatility detracted from relative results during the Reporting Period. Quality refers to sustainable profitability over time. Momentum is whether a company’s share price is trending up or down. Value refers to how attractively a stock is priced relative to its fundamentals, such as book value and free cash flow. Low Volatility is a relatively low degree of fluctuation in a company’s share price over time. |
| Q | | Which sectors and countries contributed most positively to the Index’s relative performance during the Reporting Period, and which detracted most? |
| A | | Index constituents in the financials, energy and industrials sectors contributed most positively to the Index’s results relative to the MSCI World ex USA Index during the Reporting Period. Index constituents in the information technology, materials and consumer staples sectors detracted the most from the Index’s results relative to the MSCI World ex USA Index during the Reporting Period. |
| | From a country perspective, Index constituents in the U.K., France and Denmark contributed most positively to the Fund’s results relative to the MSCI World ex USA Index during the Reporting Period. Conversely, Index constituents in Japan, Canada and the Netherlands detracted the most from |
13
PORTFOLIO RESULTS
| | the Fund’s results relative to the MSCI World ex USA Index during the Reporting Period. |
| Q | | Which individual stock positions contributed the most to the Index’s relative returns during the Reporting Period? |
| A | | Relative to the MSCI World ex USA Index, underweight positions in Netherlands-based integrated energy company Royal Dutch Shell, U.K. bank HSBC Holdings and U.K.-based integrated energy company BP contributed most positively (0.24%, 0.13% and 0.11% of Fund net assets as of August 31, 2020, respectively). Each of these holdings generated a double-digit decline within the Index during the Reporting Period. |
| Q | | Which individual stock positions detracted the most from the Index’s relative returns during the Reporting Period? |
| A | | Relative to the MSCI World ex USA Index, underweight positions in Netherlands-based semiconductor producer ASML Holding and Japanese telecommunication services provider SoftBank Group and an overweight position in Australia-based retail travel agency Flight Centre Travel Group detracted most (0.53%, 0.25% and 0.00%1 of Fund net assets as of August 31, 2020, respectively). ASML Holding and SoftBank Group each posted a double-digit gain within the Index during the Reporting Period. Flight Centre Travel Group generated a double-digit decline within the Index during the Reporting Period. |
| Q | | How did the Fund use derivatives and similar instruments during the Reporting Period? |
| A | | The Fund does not employ derivatives as a source of alpha generation, although it did use index futures to equitize excess cash. The use of futures was not material to the performance of the Fund. |
| Q | | What was the Fund’s sector positioning relative to the Index and the reference index at the end of the Reporting Period?2 |
| | | | | | | | | | | | | | |
| | | | |
| | | Sector Name | | Fund3 | | | GS ActiveBeta®
International
Equity Index | | | MSCI World ex
USA Index | |
| | Consumer Discretionary | | | 11.65 | % | | | 12.25 | % | | | 10.90 | % |
| | Consumer Staples | | | 15.52 | | | | 15.36 | | | | 11.08 | |
| | Energy | | | 2.79 | | | | 3.40 | | | | 4.12 | |
| | Financials | | | 14.79 | | | | 15.41 | | | | 17.75 | |
| | Health Care | | | 13.49 | | | | 13.33 | | | | 12.64 | |
| | Industrials | | | 14.03 | | | | 14.28 | | | | 14.54 | |
| | Information Technology | | | 8.93 | | | | 8.72 | | | | 8.73 | |
| | Materials | | | 6.41 | | | | 6.06 | | | | 8.22 | |
| | Real Estate | | | 1.81 | | | | 1.88 | | | | 2.90 | |
| | Communication Services | | | 5.85 | | | | 5.19 | | | | 5.18 | |
| | | Utilities | | | 4.33 | | | | 4.13 | | | | 3.95 | |
| | 1 | | Some weights are 0.00% at August 31, 2020 either because those positions were taken out during the most recent rebalance given the Fund’s index construction methodology or because they were not components of the Index during the Reporting Period. |
| | 2 | | Country and sector classifications for securities may differ between the above listing and the Schedule of Investments due to differing classification methodologies. The classification methodology used for the above listing is as set forth by MSCI. The Fund’s composition may differ over time. Consequently, the Fund’s overall sector allocations may differ from percentages contained in the chart above. The percentage shown for each investment category reflects the value of investments in that category as a percentage of market value (excluding investment in the securities lending reinvestment vehicle, if any). Underlying country and sector allocation of exchange-traded funds held by the Fund are not reflected in the chart above. Investments in the securities lending vehicle represented 1.4% of the Fund’s net assets as of August 31, 2020. Figures above may not sum to 100% due to rounding. |
| | 3 | | The Fund seeks to provide investment results that closely correspond, before fees and expenses, to the performance of the Goldman Sachs ActiveBeta® International Equity Index. |
14
PORTFOLIO RESULTS
| Q | | What was the Fund’s country positioning relative to the Index and the reference index at the end of the Reporting Period?2 |
| | | | | | | | | | | | | | |
| | | | |
| | | Country Name | | Fund3 | | | GS ActiveBeta®
International
Equity Index | | | MSCI World ex
USA Index | |
| | UK | | | 12.24 | % | | | 12.50 | % | | | 12.38 | % |
| | France | | | 11.19 | | | | 11.44 | | | | 9.87 | |
| | Denmark | | | 2.78 | | | | 2.85 | | | | 2.25 | |
| | Israel | | | 0.92 | | | | 0.88 | | | | 0.57 | |
| | New Zealand | | | 0.45 | | | | 0.46 | | | | 0.29 | |
| | Norway | | | 0.77 | | | | 0.58 | | | | 0.51 | |
| | Portugal | | | 0.35 | | | | 0.35 | | | | 0.15 | |
| | Belgium | | | 0.88 | | | | 0.84 | | | | 0.83 | |
| | Australia | | | 5.33 | | | | 5.61 | | | | 6.24 | |
| | Finland | | | 0.73 | | | | 0.74 | | | | 0.96 | |
| | Hong Kong | | | 2.57 | | | | 2.51 | | | | 3.08 | |
| | Singapore | | | 1.36 | | | | 1.38 | | | | 0.95 | |
| | Italy | | | 2.44 | | | | 2.65 | | | | 2.09 | |
| | Sweden | | | 2.94 | | | | 2.89 | | | | 2.97 | |
| | Ireland | | | 0.48 | | | | 0.46 | | | | 0.63 | |
| | Austria | | | 0.60 | | | | 0.44 | | | | 0.15 | |
| | Spain | | | 1.82 | | | | 2.22 | | | | 2.09 | |
| | Switzerland | | | 8.62 | | | | 8.71 | | | | 9.28 | |
| | Germany | | | 8.51 | | | | 8.06 | | | | 8.72 | |
| | Netherlands | | | 3.45 | | | | 3.68 | | | | 3.89 | |
| | Canada | | | 9.29 | | | | 9.71 | | | | 9.40 | |
| | | Japan | | | 21.85 | | | | 21.06 | | | | 22.68 | |
| | 2 | | Country and sector classifications for securities may differ between the above listing and the Schedule of Investments due to differing classification methodologies. The classification methodology used for the above listing is as set forth by MSCI. The Fund’s composition may differ over time. Consequently, the Fund’s overall sector allocations may differ from percentages contained in the chart above. The percentage shown for each investment category reflects the value of investments in that category as a percentage of market value (excluding investment in the securities lending reinvestment vehicle, if any). Underlying country and sector allocation of exchange-traded funds held by the Fund are not reflected in the chart above. Investments in the securities lending vehicle represented 1.4% of the Fund’s net assets as of August 31, 2020. Figures above may not sum to 100% due to rounding. |
| | 3 | | The Fund seeks to provide investment results that closely correspond, before fees and expenses, to the performance of the Goldman Sachs ActiveBeta® International Equity Index. |
15
FUND BASICS
ActiveBeta® International Equity ETF
as of August 31, 2020
| | | | | | |
| | FUND SNAPSHOT | |
| |
| | | As of August 31, 2020 | |
| | |
| | Market Price1 | | $ | 28.63 | |
| | | Net Asset Value (NAV)1 | | $ | 28.72 | |
| 1 | | The Market Price is the price at which the Fund’s shares are trading on the NYSE Arca, Inc. The Market Price of the Fund’s shares will fluctuate and, at the time of sale, shares may be worth more or less than the original investment or the Fund’s then current net asset value (“NAV”). The NAV is the market value of one share of the Fund. This amount is derived by dividing the total value of all the securities in the Fund’s portfolio, plus other assets, less any liabilities, by the number of Fund shares outstanding. Fund shares are not individually redeemable and are issued and redeemed by the Fund at their NAV only in large, specified blocks of shares called creation units. Shares otherwise can be bought and sold only through exchange trading at market price (not NAV). Shares may trade at a premium or discount to their NAV in the secondary market. Information regarding how often shares of each Fund traded on NYSE Arca at a price above (i.e., at a premium) or below (i.e., at a discount) the NAV of the Fund can be found at www.GSAMFUNDS.com/ETFs. |
| | | | | | | | | | |
| | TOP 10 HOLDINGS AS OF 8/31/202 |
| | | | |
| | | Holding | | % of Net Assets | | | Line of Business | | Country |
| | | | |
| | Nestle SA | | | 2.0 | % | | Consumer Staples | | Switzerland |
| | Roche Holding AG | | | 1.5 | | | Health Care | | Switzerland |
| | Novartis AG | | | 1.0 | | | Health Care | | Switzerland |
| | | | |
| | SAP SE | | | 0.8 | | | Information Technology | | Germany |
| | LVMH Moet Hennessy Louis Vuitton SE | | | 0.7 | | | Consumer Discretionary | | France |
| | Novo Nordisk A/S, Class B | | | 0.7 | | | Health Care | | Denmark |
| | AstraZeneca PLC | | | 0.7 | | | Health Care | | United Kingdom |
| | | | |
| | L’Oreal SA | | | 0.7 | | | Consumer Staples | | France |
| | Sanofi | | | 0.6 | | | Health Care | | France |
| | | Royal Bank of Canada | | | 0.6 | | | Financials | | Canada |
| 2 | | The top 10 holdings may not be representative of the Fund’s future investments. |
For more information about the Fund, please refer to www.GSAMFUNDS.com/ETFs. There, you can learn more about the Fund’s investment strategies, holdings, and performance.
16
ACTIVEBETA® INTERNATIONAL EQUITY ETF
Performance Summary
August 31, 2020
The following graph shows the value, as of August 31, 2020, of a $10,000 investment made on November 6, 2015 (commencement of operations) in Shares at NAV. For comparative purposes, the performance of the Fund’s underlying index and reference index, the Goldman Sachs ActiveBeta® International Equity Index and the MSCI World ex USA Index (net, Unhedged, USD), respectively, are shown. Performance reflects applicable fee waivers and/or expense limitations in effect during the periods shown and in their absence, performance would be reduced. Returns do not reflect the deduction of taxes that a shareholder would pay on Fund distributions or the sale of Fund shares. In addition to the performance of constituents of the underlying index, other factors may affect Fund performance. These factors include, but are not limited to, Fund operating fees and expenses, portfolio turnover and creation and redemption in-kind transactions. The returns set forth below represent past performance. Past performance does not guarantee future results. The Fund’s NAV and investment return may fluctuate. These fluctuations may cause an investor’s shares to be worth more or less than their original cost. Current performance may be lower or higher than the performance quoted below. Please visit our web site at www.GSAMFUNDS.com/ETFs to obtain the most recent month-end returns.
|
| ActiveBeta® International Equity ETF’s Lifetime Performance |
Performance of a $10,000 Investment, with distributions reinvested, from November 6, 2015 through August 31, 2020.
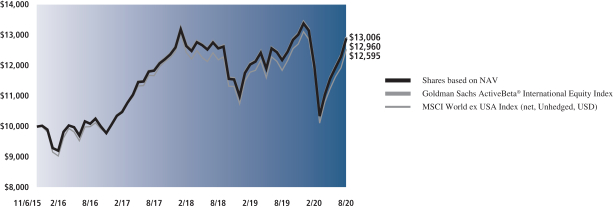
| | | | | | |
| Average Annual Total Return through August 31, 2020* | | | 1 Year Return | | | Since Inception |
Shares based on NAV (Commenced November 6, 2015) | | | 5.96% | | | 5.52% |
|
Shares based on Market Price (Commenced November 6, 2015) | | | 5.52% | | | 5.45% |
|
Goldman Sachs ActiveBeta® International Equity Index | | | 6.08% | | | 5.60% |
|
MSCI World ex USA Index (net, Unhedged, USD) | | | 5.94% | | | 4.90% |
|
| * | | Total returns are calculated assuming purchase of a share at the market price or NAV on the first day and sale of a share at the market price or NAV on the last day of each period reported. The Total Returns based on NAV and Market Price assume the reinvestment of dividends and do not reflect brokerage commissions in connection with the purchase or sale of Fund shares, which if included would lower the performance shown above. The NAV used in the Total Return calculation assumes all management fees incurred by the Fund. Market Price returns are based upon the last trade as of 4:00pm EST and do not reflect the returns you would receive if you traded shares at other times. The first day of secondary market trading is typically several days after the date on which the Fund commenced investment operations; therefore, the NAV of the Fund is used as a proxy for the period from inception of investment operations to the first day of secondary market trading to calculate the Market Price returns. |
17
PORTFOLIO RESULTS
Goldman Sachs ActiveBeta® Japan Equity ETF
Investment Objective
The Goldman Sachs ActiveBeta® Japan Equity ETF (the “Fund”) seeks to provide investment results that closely correspond, before fees and expenses, to the performance of the Goldman Sachs ActiveBeta® Japan Equity Index (the “Index”).
Portfolio Management Discussion and Analysis
Below, the Goldman Sachs Quantitative Investment Strategies Team discusses the Fund’s performance and positioning for the 12-month period ended August 31, 2020 (the “Reporting Period”).
| Q | | How did the Fund perform during the Reporting Period? |
| A | | During the Reporting Period, the Fund returned 9.15% based on net asset value (“NAV”) and 9.12% based on market price. The Index returned 9.14%, while the MSCI Japan Index (net, unhedged, USD) (“MSCI Japan Index”), a market-cap based index against which the performance of the Fund is measured, and the reference index for the Index, returned 10.13% during the same period. |
| | The Fund had a NAV of $30.59 per share on August 31, 2019 and ended the Reporting Period with a NAV of $32.60 per share. The Fund’s market price on August 31, 2020 was $32.51 per share. |
| Q | | What key factors were responsible for the Fund’s performance during the Reporting Period? |
| A | | The Fund seeks to provide investment results that closely correspond, before fees and expenses, to the performance of the Index. The Fund’s performance reflects Fund expenses, including management fees and brokerage expenses. The Fund’s relative performance also reflects the impact of any cash held in the Fund as well as any other differences between the Fund’s holdings and the constituents of the Index. The Index is unmanaged, and Index returns do not reflect fees and expenses, which would reduce returns. |
| | The Index is constructed using a rules-based methodology that was developed to provide exposure to the “factors” (or characteristics) that are commonly tied to a stock’s outperformance relative to market returns, and its performance is compared to that of the MSCI Japan Index. Because the Fund seeks to provide investment results that closely correspond, before fees and expenses, to the performance of the Index, the discussion below compared the performance of the Index to that of the MSCI Japan Index. Given the Fund’s investment objective of attempting to track the Index, the Fund does not follow traditional methods of active investment management, which may involve buying and selling securities based upon analysis of economic and market factors. The Fund does not follow a strategy of seeking to outperform the MSCI Japan Index. |
| | During the Reporting Period, the Fund posted positive absolute returns but underperformed the MSCI Japan Index, as measured by NAV. Amongst underlying factors, Value and Low Volatility detracted from relative results relative to the MSCI Japan Index. Quality and Momentum contributed positively to results relative to the MSCI Japan Index. Value refers to how attractively a stock is priced relative to its fundamentals, such as book value and free cash flow. Low Volatility is a relatively low degree of fluctuation in a company’s share price over time. Quality refers to sustainable profitability over time. Momentum is whether a company’s share price is trending up or down. |
| Q | | Which sectors contributed most positively to the Index’s relative performance during the Reporting Period, and which detracted most? |
| A | | Index constituents in the communication services, industrials and health care sectors detracted most from results relative to the MSCI Japan Index during the Reporting Period. Conversely, Index constituents in the financials, utilities and materials sectors contributed most positively to the Index’s results relative to the MSCI Japan Index during the Reporting Period. |
| Q | | Which individual stock positions detracted the most from the Index’s relative returns during the Reporting Period? |
| A | | Relative to the MSCI Japan Index, underweight positions in telecommunication services provider SoftBank Group, Internet search engine operating as “Yahoo! Japan” Z |
18
PORTFOLIO RESULTS
| | Holdings and sensor and measuring instrument manufacturer Keyence detracted most (2.17%, 0.38% and 1.68% of Fund net assets as of August 31, 2020, respectively). Each of these holdings posted a robust gain within the Index during the Reporting Period. |
| Q | | Which individual stock positions contributed the most to the Index’s relative returns during the Reporting Period? |
| A | | Relative to the MSCI Japan Index, overweight positions in consumer credit company Credit Saison and drugstore chain operator Welcia Holdings and an underweight position in real estate services provider Mitsui Fudosan contributed most positively (0.00%,1 0.45% and 0.20% of Fund net assets as of August 31, 2020, respectively). Credit Saison and Welcia Holdings each generated a double-digit gain within the Index during the Reporting Period. Mitsui Fudosan posted a double-digit decline within the Index during the Reporting Period. |
| Q | | How did the Fund use derivatives and similar instruments during the Reporting Period? |
| A | | The Fund does not employ derivatives as a source of alpha generation, although it did use index futures to equitize excess cash. The use of futures was not material to the performance of the Fund. |
| Q | | What was the Fund’s sector positioning relative to the Index and the reference index at the end of the Reporting Period?2 |
| | | | | | | | | | | | | | |
| | | | |
| | | Sector Name | | Fund3 | | | GS ActiveBeta® Japan Equity
Index | | | MSCI Japan Index | |
| | Consumer Discretionary | | | 17.65 | % | | | 17.76 | % | | | 17.99 | % |
| | Consumer Staples | | | 10.82 | | | | 10.97 | | | | 8.05 | |
| | Energy | | | 1.37 | | | | 1.54 | | | | 0.65 | |
| | Financials | | | 8.12 | | | | 8.31 | | | | 9.09 | |
| | Health Care | | | 11.73 | | | | 11.81 | | | | 11.48 | |
| | Industrials | | | 17.60 | | | | 17.99 | | | | 20.64 | |
| | Information Technology | | | 13.34 | | | | 13.35 | | | | 12.15 | |
| | Materials | | | 3.67 | | | | 3.65 | | | | 4.81 | |
| | Real Estate | | | 2.22 | | | | 2.46 | | | | 3.58 | |
| | Communication Services | | | 10.65 | | | | 10.66 | | | | 10.11 | |
| | | Utilities | | | 1.55 | | | | 1.51 | | | | 1.46 | |
| | 1 | | Some weights are 0.00% at August 31, 2020 either because those positions were taken out during the most recent rebalance given the Fund’s index construction methodology or because they were not components of the Index during the Reporting Period. |
| | 2 | | Sector classifications for securities may differ between the above listing and the Schedule of Investments due to differing classification methodologies. The classification methodology used for the above listing is as set forth by MSCI. The Fund’s composition may differ over time. Consequently, the Fund’s overall sector allocations may differ from percentages contained in the chart above. The percentage shown for each investment category reflects the value of investments in that category as a percentage of market value (excluding investment in the securities lending reinvestment vehicle, if any). Underlying sector allocation of exchange-traded funds held by the Fund are not reflected in the chart above. Investments in the securities lending vehicle represented 5.1% of the Fund’s net assets as of August 31, 2020. Figures above may not sum to 100% due to rounding. |
| | 3 | | The Fund seeks to provide investment results that closely correspond, before fees and expenses, to the performance of the Goldman Sachs ActiveBeta® Japan Equity Index. |
19
FUND BASICS
ActiveBeta® Japan Equity ETF
as of August 31, 2020
| | | | | | |
| | FUND SNAPSHOT | |
| |
| | | As of August 31, 2020 | |
| | |
| | Market Price1 | | $ | 32.51 | |
| | | Net Asset Value (NAV)1 | | $ | 32.60 | |
| 1 | | The Market Price is the price at which the Fund’s shares are trading on the NYSE Arca, Inc. The Market Price of the Fund’s shares will fluctuate and, at the time of sale, shares may be worth more or less than the original investment or the Fund’s then current net asset value (“NAV”). The NAV is the market value of one share of the Fund. This amount is derived by dividing the total value of all the securities in the Fund’s portfolio, plus other assets, less any liabilities, by the number of Fund shares outstanding. Fund shares are not individually redeemable and are issued and redeemed by the Fund at their NAV only in large, specified blocks of shares called creation units. Shares otherwise can be bought and sold only through exchange trading at market price (not NAV). Shares may trade at a premium or discount to their NAV in the secondary market. Information regarding how often shares of each Fund traded on NYSE Arca at a price above (i.e., at a premium) or below (i.e., at a discount) the NAV of the Fund can be found at www.GSAMFUNDS.com/ETFs. |
| | | | | | | | | | |
| | TOP 10 HOLDINGS AS OF 8/31/202 |
| | | | |
| | | Holding | | % of Net Assets | | | Line of Business | | Country |
| | | | |
| | Toyota Motor Corp. | | | 3.2 | % | | Consumer Discretionary | | Japan |
| | Sony Corp. | | | 2.5 | | | Consumer Discretionary | | Japan |
| | SoftBank Group Corp. | | | 2.2 | | | Communication Services | | Japan |
| | Keyence Corp. | | | 1.7 | | | Information Technology | | Japan |
| | Nintendo Co. Ltd. | | | 1.5 | | | Communication Services | | Japan |
| | Takeda Pharmaceutical Co. Ltd. | | | 1.4 | | | Health Care | | Japan |
| | Daiichi Sankyo Co. Ltd. | | | 1.3 | | | Health Care | | Japan |
| | KDDI Corp. | | | 1.3 | | | Communication Services | | Japan |
| | NTT DOCOMO, Inc. | | | 1.2 | | | Communication Services | | Japan |
| | | Nippon Telegraph & Telephone Corp. | | | 1.2 | | | Communication Services | | Japan |
| 2 | | The top 10 holdings may not be representative of the Fund’s future investments. |
For more information about the Fund, please refer to www.GSAMFUNDS.com/ETFs. There, you can learn more about the Fund’s investment strategies, holdings, and performance.
20
ACTIVEBETA® JAPAN EQUITY ETF
Performance Summary
August 31, 2020
The following graph shows the value, as of August 31, 2020, of a $10,000 investment made on March 2, 2016 (commencement of operations) in Shares at NAV. For comparative purposes, the performance of the Fund’s underlying index and reference index, the Goldman Sachs ActiveBeta® Japan Index and the MSCI Japan Index (Total Return, USD), respectively, are shown. Performance reflects applicable fee waivers and/or expense limitations in effect during the periods shown and in their absence, performance would be reduced. Returns do not reflect the deduction of taxes that a shareholder would pay on Fund distributions or the sale of Fund shares. In addition to the performance of constituents of the underlying index, other factors may affect Fund performance. These factors include, but are not limited to, Fund operating fees and expenses, portfolio turnover and creation and redemption in-kind transactions. The returns set forth below represent past performance. Past performance does not guarantee future results. The Fund’s NAV and investment return may fluctuate. These fluctuations may cause an investor’s shares to be worth more or less than their original cost. Current performance may be lower or higher than the performance quoted below. Please visit our web site at www.GSAMFUNDS.com/ETFs to obtain the most recent month-end returns.
|
| ActiveBeta® Japan Equity ETF’s Lifetime Performance |
Performance of a $10,000 Investment, with distributions reinvested, from March 2, 2016 through August 31, 2020.
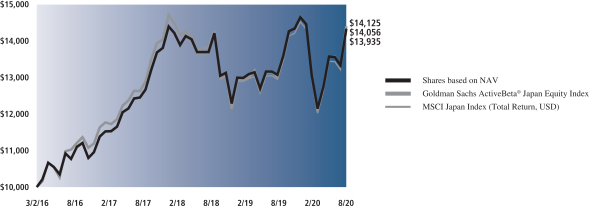
| | | | | | |
| Average Annual Total Return through August 31, 2020* | | | 1 Year Return | | | Since Inception |
Shares based on NAV (Commenced March 2, 2016) | | | 9.15% | | | 7.85% |
|
Shares based on Market Price (Commenced March 2, 2016) | | | 9.12% | | | 7.80% |
|
Goldman Sachs ActiveBeta® Japan Equity Index | | | 9.14% | | | 7.65% |
|
MSCI Japan Index (Total Return, USD) | | | 10.13% | | | 7.97% |
|
| * | | Total returns are calculated assuming purchase of a share at the market price or NAV on the first day and sale of a share at the market price or NAV on the last day of each period reported. The Total Returns based on NAV and Market Price assume the reinvestment of dividends and do not reflect brokerage commissions in connection with the purchase or sale of Fund shares, which if included would lower the performance shown above. The NAV used in the Total Return calculation assumes all management fees incurred by the Fund. Market Price returns are based upon the last trade as of 4:00pm EST and do not reflect the returns you would receive if you traded shares at other times. The first day of secondary market trading is typically several days after the date on which the Fund commenced investment operations; therefore, the NAV of the Fund is used as a proxy for the period from inception of investment operations to the first day of secondary market trading to calculate the Market Price returns. |
21
PORTFOLIO RESULTS
Goldman Sachs ActiveBeta® U.S. Large Cap Equity ETF
Investment Objective
The Goldman Sachs ActiveBeta® U.S. Large Cap Equity ETF (the “Fund”) seeks to provide investment results that closely correspond, before fees and expenses, to the performance of the Goldman Sachs ActiveBeta® U.S. Large Cap Equity Index (the “Index”).
Portfolio Management Discussion and Analysis
Below, the Goldman Sachs Quantitative Investment Strategies Team discusses the Fund’s performance and positioning for the 12-month period ended August 31, 2020 (the “Reporting Period”).
| Q | | How did the Fund perform during the Reporting Period? |
| A | | During the Reporting Period, the Fund returned 21.81% based on net asset value (“NAV”) and 21.69% based on market price. The Index returned 21.96%, and the S&P 500 Index (Total Return, USD) (“S&P 500 Index”), a market-cap based index against which the performance of the Fund is measured, returned 21.87% during the same period. |
| | | The Fund had a NAV of $59.09 on August 31, 2019 and ended the Reporting Period with a NAV of $70.70 per share. The Fund’s market price on August 31, 2020 was $70.61 per share. |
| Q | | What key factors were responsible for the Fund’s performance during the Reporting Period? |
| A | | The Fund seeks to provide investment results that closely correspond, before fees and expenses, to the performance of the Index. The Fund’s performance reflects Fund expenses, including management fees and brokerage expenses. The Fund’s relative performance also reflects the impact of any cash held in the Fund as well as any other differences between the Fund’s holdings and the constituents of the Index. The Index is unmanaged, and Index returns do not reflect fees and expenses, which would reduce returns. |
| | | The Index is constructed using a rules-based methodology that was developed to provide exposure to the “factors” (or characteristics) that are commonly tied to a stock’s outperformance relative to market returns, and its performance is compared to that of the S&P 500 Index. Because the Fund seeks to provide investment results that closely correspond, before fees and expenses, to the performance of the Index, the discussion below compared the performance of the Index to that of the S&P 500 Index. Given the Fund’s investment objective of attempting to track the Index, the Fund does not follow traditional methods of active investment management, which may involve buying and selling securities based upon analysis of economic and market factors. The Fund does not follow a strategy of seeking to outperform the S&P 500 Index. |
| | | During the Reporting Period, the Fund posted positive absolute returns that closely matched the performance of the S&P 500 Index, as measured by NAV. Amongst underlying factors, Quality contributed positively to relative returns, while Low Volatility and Value detracted. Momentum had a rather neutral effect on relative returns during the Reporting Period. Quality refers to sustainable profitability over time. Low Volatility is a relatively low degree of fluctuation in a company’s share price over time. Value refers to how attractively a stock is priced relative to its fundamentals, such as book value and free cash flow. Momentum is whether a company’s share price is trending up or down. |
| Q | | Which sectors contributed most positively to the Index’s relative performance during the Reporting Period, and which detracted most? |
| A | | Index constituents in the energy, financials and industrials sectors contributed most positively to the Index’s results relative to the S&P 500 Index during the Reporting Period. Partially offsetting these positive contributors were Index constituents in information technology, utilities and consumer staples, which detracted from the Index’s results relative to the S&P 500 Index during the Reporting Period. |
| Q | | Which individual stock positions contributed the most to the Index’s relative returns during the Reporting Period? |
| A | | Relative to the S&P 500 Index, underweight positions in aerospace and defense company Boeing and integrated energy company Exxon Mobil and an overweight position in electric vehicle manufacturer Tesla contributed most |
22
PORTFOLIO RESULTS
| | positively (0.00%1, 0.15% and 0.51% of Fund net assets as of August 31, 2020, respectively). Boeing and Exxon Mobil each posted a double-digit decline within the Index during the Reporting Period. Tesla generated a triple-digit gain within the Index during the Reporting Period. |
| Q | | Which individual stock positions detracted the most from the Index’s relative returns during the Reporting Period? |
| A | | Relative to the S&P 500 Index, underweight positions in information technology giant Apple, e-commerce retailing behemoth Amazon.com and software leader Microsoft detracted most (6.25%, 4.33% and 4.97% of Fund net assets as of August 31, 2020, respectively). Each of these holdings generated a robust gain within the Index during the Reporting Period. |
| Q | | How did the Fund use derivatives and similar instruments during the Reporting Period? |
| A | | The Fund does not employ derivatives as a source of alpha generation, although it did use index futures to equitize excess cash. The use of futures was not material to the performance of the Fund. |
| Q | | What was the Fund’s sector positioning relative to the Index and the reference index at the end of the Reporting Period?2 |
| | | | | | | | | | | | | | |
| | | | |
| | | Sector Name | | Fund3 | | | GS ActiveBeta®
U.S. Large Cap
Equity Index | | | S&P 500
Index | |
| | Consumer Discretionary | | | 13.50 | % | | | 13.53 | % | | | 11.44 | % |
| | Consumer Staples | | | 8.82 | | | | 8.83 | | | | 6.89 | |
| | Energy | | | 0.83 | | | | 0.83 | | | | 2.32 | |
| | Financials | | | 6.38 | | | | 6.39 | | | | 9.62 | |
| | Health Care | | | 15.68 | | | | 15.71 | | | | 13.98 | |
| | Industrials | | | 7.59 | | | | 7.61 | | | | 7.99 | |
| | Information Technology | | | 30.03 | | | | 30.08 | | | | 28.71 | |
| | Materials | | | 1.29 | | | | 1.29 | | | | 2.49 | |
| | Real Estate | | | 2.85 | | | | 2.86 | | | | 2.61 | |
| | Communication Services | | | 9.98 | | | | 10.01 | | | | 11.10 | |
| | | Utilities | | | 2.85 | | | | 2.86 | | | | 2.83 | |
| | 1 | | Some weights are 0.00% at August 31, 2020 either because those positions were taken out during the most recent rebalance given the Fund’s index construction methodology or because they were not components of the Index during the Reporting Period. |
| | 3 | | Sector classifications for securities may differ between the above listing and the Schedule of Investments due to differing classification methodologies. The classification methodology used for the above listing is as set forth by Standard & Poor’s. The Fund’s composition may differ over time. Consequently, the Fund’s overall sector allocations may differ from percentages contained in the chart above. The percentage shown for each investment category reflects the value of investments in that category as a percentage of market value (excluding investment in the securities lending reinvestment vehicle, if any). Underlying sector allocation of exchange-traded funds held by the Fund are not reflected in the chart above. Investments in the securities lending vehicle represented 0.1% of the Fund’s net assets as of August 31, 2020. Figures above may not sum to 100% due to rounding. |
| | 3 | | The Fund seeks to provide investment results that closely correspond, before fees and expenses, to the performance of the Goldman Sachs ActiveBeta® U.S. Large Cap Equity Index. |
23
FUND BASICS
ActiveBeta® U.S. Large Cap Equity ETF
as of August 31, 2020
| | | | | | |
| | FUND SNAPSHOT | |
| |
| | | As of August 31, 2020 | |
| | |
| | Market Price1 | | $ | 70.61 | |
| | | Net Asset Value (NAV)1 | | $ | 70.70 | |
| 1 | | The Market Price is the price at which the Fund’s shares are trading on the NYSE Arca, Inc. The Market Price of the Fund’s shares will fluctuate and, at the time of sale, shares may be worth more or less than the original investment or the Fund’s then current net asset value (“NAV”). The NAV is the market value of one share of the Fund. This amount is derived by dividing the total value of all the securities in the Fund’s portfolio, plus other assets, less any liabilities, by the number of Fund shares outstanding. Fund shares are not individually redeemable and are issued and redeemed by the Fund at their NAV only in large, specified blocks of shares called creation units. Shares otherwise can be bought and sold only through exchange trading at market price (not NAV). Shares may trade at a premium or discount to their NAV in the secondary market. Information regarding how often shares of each Fund traded on NYSE Arca at a price above (i.e., at a premium) or below (i.e., at a discount) the NAV of the Fund can be found at www.GSAMFUNDS.com/ETFs. |
| | | | | | | | | | |
| | TOP 10 HOLDINGS AS OF 8/31/202 |
| | | | |
| | | Holding | | % of Net Assets | | | Line of Business | | Country |
| | | | |
| | Apple, Inc. | | | 6.3 | % | | Information Technology | | United States |
| | Microsoft Corp. | | | 5.0 | | | Information Technology | | United States |
| | Amazon.com, Inc. | | | 4.3 | | | Consumer Discretionary | | United States |
| | Facebook, Inc., Class A | | | 2.1 | | | Communication Services | | United States |
| | Alphabet, Inc., Class A | | | 1.4 | | | Communication Services | | United States |
| | Alphabet, Inc., Class C | | | 1.3 | | | Communication Services | | United States |
| | Johnson & Johnson | | | 1.2 | | | Health Care | | United States |
| | Home Depot, Inc. (The) | | | 1.1 | | | Consumer Discretionary | | United States |
| | Walmart, Inc. | | | 0.9 | | | Consumer Staples | | United States |
| | | Visa, Inc., Class A | | | 0.8 | | | Information Technology | | United States |
| 2 | | The top 10 holdings may not be representative of the Fund’s future investments. |
For more information about the Fund, please refer to www.GSAMFUNDS.com/ETFs. There, you can learn more about the Fund’s investment strategies, holdings, and performance.
24
ACTIVEBETA® U.S. LARGE CAP EQUITY ETF
Performance Summary
August 31, 2020
The following graph shows the value, as of August 31, 2020, of a $10,000 investment made on September 17, 2015 (commencement of operations) in Shares at NAV. For comparative purposes, the performance of the Fund’s underlying index and a market-cap based index against which the performance of the Fund is measured, the Goldman Sachs ActiveBeta® U.S. Large Cap Equity Index and the S&P 500 Index (Total Return, USD), respectively, are shown. Performance reflects applicable fee waivers and/or expense limitations in effect during the periods shown and in their absence, performance would be reduced. Returns do not reflect the deduction of taxes that a shareholder would pay on Fund distributions or the sale of Fund shares. In addition to the performance of constituents of the underlying index, other factors may affect Fund performance. These factors include, but are not limited to, Fund operating fees and expenses, portfolio turnover and creation and redemption in-kind transactions. The returns set forth below represent past performance. Past performance does not guarantee future results. The Fund’s NAV and investment return may fluctuate. These fluctuations may cause an investor’s shares to be worth more or less than their original cost. Current performance may be lower or higher than the performance quoted below. Please visit our web site at www.GSAMFUNDS.com/ETFs to obtain the most recent month-end returns.
|
| ActiveBeta® U.S. Large Cap Equity ETF’s Lifetime Performance |
Performance of a $10,000 Investment, with distributions reinvested, from September 17, 2015 through August 31, 2020.
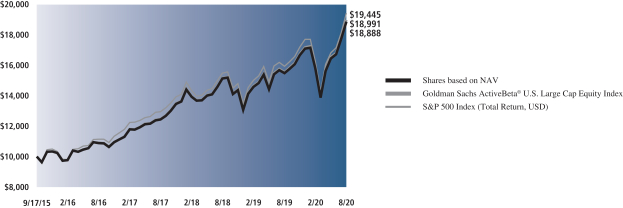
| | | | | | |
| Average Annual Total Return through August 31, 2020* | | | 1 Year Return | | | Since Inception |
Shares based on NAV (Commenced September 17, 2015) | | | 21.81% | | | 13.68% |
|
Shares based on Market Price (Commenced September 17, 2015) | | | 21.69% | | | 13.65% |
|
Goldman Sachs ActiveBeta® U.S. Large Cap Equity Index | | | 21.96% | | | 13.80% |
|
S&P 500 Index (Total Return, USD) | | | 21.87% | | | 14.34% |
|
| * | | Total returns are calculated assuming purchase of a share at the market price or NAV on the first day and sale of a share at the market price or NAV on the last day of each period reported. The Total Returns based on NAV and Market Price assume the reinvestment of dividends and do not reflect brokerage commissions in connection with the purchase or sale of Fund shares, which if included would lower the performance shown above. The NAV used in the Total Return calculation assumes all management fees incurred by the Fund. Market Price returns are based upon the last trade as of 4:00pm EST and do not reflect the returns you would receive if you traded shares at other times. The first day of secondary market trading is typically several days after the date on which the Fund commenced investment operations; therefore, the NAV of the Fund is used as a proxy for the period from inception of investment operations to the first day of secondary market trading to calculate the Market Price returns. |
25
PORTFOLIO RESULTS
Goldman Sachs ActiveBeta® U.S. Small Cap Equity ETF
Investment Objective
The Goldman Sachs ActiveBeta® U.S. Small Cap Equity ETF (the “Fund”) seeks to provide investment results that closely correspond, before fees and expenses, to the performance of the Goldman Sachs ActiveBeta® U.S. Small Cap Equity Index (the “Index”).
Portfolio Management Discussion and Analysis
Below, the Goldman Sachs Quantitative Investment Strategies Team discusses the Fund’s performance and positioning for the for the 12-month period ended August 31, 2020 (the “Reporting Period”).
| Q | | How did the Fund perform during the Reporting Period? |
| A | During the Reporting Period, the Fund returned 3.13% based on net asset value (“NAV”) and 3.28% based on market price. The Index returned 3.20%, and the Russell 2000® Index (Total Return, USD) (“Russell 2000® Index”), a market-cap based index against which the performance of the Fund is measured, and the reference index for the Index, returned 6.00% during the same period. |
| | The Fund had a NAV of $42.84 on August 31, 2019 and ended the Reporting Period with a NAV of $43.57 per share. The Fund’s market price on August 31, 2020 was $43.63 per share. |
| Q | | What key factors were responsible for the Fund’s performance during the Reporting Period? |
| A | The Fund seeks to provide investment results that closely correspond, before fees and expenses, to the performance of the Index. The Fund’s performance reflects Fund expenses, including management fees and brokerage expenses. The Fund’s relative performance also reflects the impact of any cash held in the Fund as well as any other differences between the Fund’s holdings and the constituents of the Index. The Index is unmanaged, and Index returns do not reflect fees and expenses, which would reduce returns. |
| | The Index is constructed using a rules-based methodology that was developed to provide exposure to the “factors” (or characteristics) that are commonly tied to a stock’s outperformance relative to market returns, and its performance is compared to that of the Russell 2000® Index. Because the Fund seeks to provide investment results that closely correspond, before fees and expenses, to the performance of the Index, the discussion below compared the performance of the Index to that of the Russell 2000® Index. Given the Fund’s investment objective of attempting to track the Index, the Fund does not follow traditional methods of active investment management, which may involve buying and selling securities based upon analysis of economic and market factors. The Fund does not follow a strategy of seeking to outperform the Russell 2000® Index. |
| | During the Reporting Period, the Fund posted positive absolute returns but underperformed the Russell 2000® Index, as measured by NAV. Amongst underlying factors, Low Volatility and Value detracted from relative returns, while Quality contributed positively. Momentum had a rather neutral effect on relative returns during the Reporting Period. Low Volatility is a relatively low degree of fluctuation in a company’s share price over time. Value refers to how attractively a stock is priced relative to its fundamentals, such as book value and free cash flow. Quality refers to sustainable profitability over time. Momentum is whether a company’s share price is trending up or down. |
| Q | | Which sectors contributed most positively to the Index’s relative performance during the Reporting Period, and which detracted most? |
| A | Index constituents in the health care sector detracted most from the Index’s results relative to the Russell 2000® Index during the Reporting Period, followed at some distance by consumer discretionary and financials. Partially offsetting these detractors were Index constituents in the energy, consumer staples and real estate, which contributed positively to the Index’s results relative to the Russell 2000® Index during the Reporting Period. |
| Q | | Which individual stock positions detracted the most from the Index’s relative returns during the Reporting Period? |
| A | Relative to the Russell 2000® Index, underweight positions in phone and video health care services provider Teladoc |
26
PORTFOLIO RESULTS
| | Health, clinical stage biotechnology company Novavax and biopharmaceutical company Momenta Pharmaceuticals detracted most (0.00%1, 0.12% and 0.15% of Fund net assets as of August 31, 2020, respectively). Teladoc Health and Momenta Pharmaceuticals each generated a triple-digit gain within the Index during the Reporting Period, and Novavax posted a double-digit positive return within the Index during the Reporting Period. |
| Q | | Which individual stock positions contributed the most to the Index’s relative returns during the Reporting Period? |
| A | Relative to the Russell 2000® Index, overweight positions in cloud-based agent-owned real estate solutions developer eXp World Holdings, web-based real estate services provider Redfin and medical and surgical supplies distributor Owens & Minor contributed most positively (0.27%, 0.37% and 0.22% of Fund net assets as of August 31, 2020, respectively). Each of these holdings posted a triple-digit gain within the Index during the Reporting Period. |
| Q | | How did the Fund use derivatives and similar instruments during the Reporting Period? |
| A | The Fund does not employ derivatives as a source of alpha generation, although it did use index futures to equitize excess cash. The use of futures was not material to the performance of the Fund. |
| Q | | What was the Fund’s sector positioning relative to the Index and the reference index at the end of the Reporting Period?2 |
| | | | | | | | | | | | | | |
| | | | |
| | | Sector Name | | Fund3 | | | GS ActiveBeta®
U.S. Small Cap
Equity Index | | | Russell 2000®
Index | |
| | Consumer Discretionary | | | 13.10 | % | | | 13.62 | % | | | 13.17 | % |
| | Consumer Staples | | | 3.43 | | | | 3.56 | | | | 3.45 | |
| | Energy | | | 1.36 | | | | 1.41 | | | | 2.22 | |
| | Financials | | | 15.63 | | | | 16.21 | | | | 15.37 | |
| | Health Care | | | 17.22 | | | | 17.85 | | | | 20.02 | |
| | Industrials | | | 15.53 | | | | 16.10 | | | | 15.32 | |
| | Information Technology | | | 14.23 | | | | 14.86 | | | | 13.78 | |
| | Materials | | | 3.55 | | | | 3.68 | | | | 4.17 | |
| | Real Estate | | | 6.60 | | | | 6.84 | | | | 6.75 | |
| | Communication Services | | | 2.24 | | | | 2.32 | | | | 2.50 | |
| | | Utilities | | | 3.43 | | | | 3.55 | | | | 3.24 | |
| | 1 | | Some weights are 0.00% at August 31, 2020 either because those positions were taken out during the most recent rebalance given the Fund’s index construction methodology or because they were not components of the Index during the Reporting Period. |
| | 2 | | Sector classifications for securities may differ between the above listing and the Schedule of Investments due to differing classification methodologies. The classification methodology used for the above listing is as set forth by Russell Investments. The Fund’s composition may differ over time. Consequently, the Fund’s overall sector allocations may differ from percentages contained in the chart above. The percentage shown for each investment category reflects the value of investments in that category as a percentage of market value (excluding investment in the securities lending reinvestment vehicle, if any). Underlying sector allocation of exchange-traded funds held by the Fund are not reflected in the chart above. Investments in the securities lending vehicle represented 1.9% of the Fund’s net assets as of August 31, 2020. Figures above may not sum to 100% due to rounding. |
| | 3 | | The Fund seeks to provide investment results that closely correspond, before fees and expenses, to the performance of the Goldman Sachs ActiveBeta® U.S. Small Cap Equity Index. |
27
FUND BASICS
ActiveBeta® U.S. Small Cap Equity ETF
as of August 31, 2020
| | | | | | |
| | FUND SNAPSHOT | |
| |
| | | As of August 31, 2020 | |
| | |
| | Market Price1 | | $ | 43.63 | |
| | | Net Asset Value (NAV)1 | | $ | 43.57 | |
| 1 | | The Market Price is the price at which the Fund’s shares are trading on the NYSE Arca, Inc. The Market Price of the Fund’s shares will fluctuate and, at the time of sale, shares may be worth more or less than the original investment or the Fund’s then current net asset value (“NAV”). The NAV is the market value of one share of the Fund. This amount is derived by dividing the total value of all the securities in the Fund’s portfolio, plus other assets, less any liabilities, by the number of Fund shares outstanding. Fund shares are not individually redeemable and are issued and redeemed by the Fund at their NAV only in large, specified blocks of shares called creation units. Shares otherwise can be bought and sold only through exchange trading at market price (not NAV). Shares may trade at a premium or discount to their NAV in the secondary market. Information regarding how often shares of each Fund traded on NYSE Arca at a price above (i.e., at a premium) or below (i.e., at a discount) the NAV of the Fund can be found at www.GSAMFUNDS.com/ETFs. |
| | | | | | | | | | |
| | TOP 10 HOLDINGS AS OF 8/31/202 |
| | | | |
| | | Holding | | % of Net Assets | | | Line of Business | | Country |
| | | | |
| | Redfin Corp. | | | 0.4 | % | | Real Estate | | United States |
| | iRhythm Technologies, Inc. | | | 0.4 | | | Health Care | | United States |
| | Emergent BioSolutions, Inc. | | | 0.4 | | | Health Care | | United States |
| | SiteOne Landscape Supply, Inc. | | | 0.4 | | | Industrials | | United States |
| | Deckers Outdoor Corp. | | | 0.4 | | | Consumer Discretionary | | United States |
| | Builders FirstSource, Inc. | | | 0.4 | | | Industrials | | United States |
| | Wingstop, Inc. | | | 0.3 | | | Consumer Discretionary | | United States |
| | LHC Group, Inc. | | | 0.3 | | | Health Care | | United States |
| | BMC Stock Holdings, Inc. | | | 0.3 | | | Industrials | | United States |
| | | Varonis Systems, Inc. | | | 0.3 | | | Information Technology | | United States |
| 2 | | The top 10 holdings may not be representative of the Fund’s future investments. |
For more information about the Fund, please refer to www.GSAMFUNDS.com/ETFs. There, you can learn more about the Fund’s investment strategies, holdings, and performance.
28
ACTIVEBETA® U.S. SMALL CAP EQUITY ETF
Performance Summary
August 31, 2020
The following graph shows the value, as of August 31, 2020, of a $10,000 investment made on June 28, 2017 (commencement of operations) in Shares at NAV. For comparative purposes, the performance of the Fund’s underlying index and reference index, the Goldman Sachs ActiveBeta® U.S. Small Cap Equity Index and the Russell 2000® Index, respectively, are shown. Performance reflects applicable fee waivers and/or expense limitations in effect during the periods shown and in their absence, performance would be reduced. Returns do not reflect the deduction of taxes that a shareholder would pay on Fund distributions or the sale of Fund shares. In addition to the performance of constituents of the underlying index, other factors may affect Fund performance. These factors include, but are not limited to, Fund operating fees and expenses, portfolio turnover and creation and redemption in-kind transactions. The returns set forth below represent past performance. Past performance does not guarantee future results. The Fund’s NAV and investment return may fluctuate. These fluctuations may cause an investor’s shares to be worth more or less than their original cost. Current performance may be lower or higher than the performance quoted below. Please visit our web site at www.GSAMFUNDS.com/ETFs to obtain the most recent month-end returns.
|
| ActiveBeta® U.S. Small Cap Equity ETF’s Lifetime Performance |
Performance of a $10,000 Investment, with distributions reinvested, from June 28, 2017 through August 31, 2020.
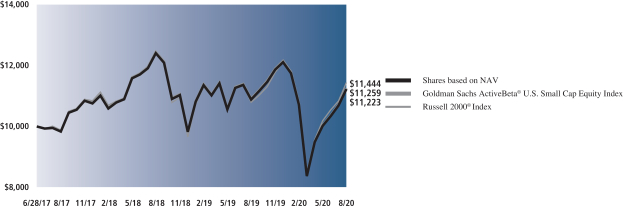
| | | | | | |
| Average Annual Total Return through August 31, 2020* | | | 1 Year Return | | | Since Inception |
Shares based on NAV (Commenced June 28, 2017) | | | 3.13% | | | 3.69% |
|
Shares based on Market Price (Commenced June 28, 2017) | | | 3.28% | | | 3.74% |
|
Goldman Sachs ActiveBeta® U.S. Small Cap Equity Index | | | 3.20% | | | 3.80% |
|
Russell 2000® Index | | | 6.00% | | | 4.33% |
|
| * | | Total returns are calculated assuming purchase of a share at the market price or NAV on the first day and sale of a share at the market price or NAV on the last day of each period reported. The Total Returns based on NAV and Market Price assume the reinvestment of dividends and do not reflect brokerage commissions in connection with the purchase or sale of Fund shares, which if included would lower the performance shown above. The NAV used in the Total Return calculation assumes all management fees incurred by the Fund. Market Price returns are based upon the last trade as of 4:00pm EST and do not reflect the returns you would receive if you traded shares at other times. The first day of secondary market trading is typically several days after the date on which the Fund commenced investment operations; therefore, the NAV of the Fund is used as a proxy for the period from inception of investment operations to the first day of secondary market trading to calculate the Market Price returns. |
29
FUND BASICS
Index Definitions and Industry Terms
Book Value: The total value of the company’s assets that shareholders would theoretically receive if a company were liquidated.
Free Cash Flow: A measure of financial performance calculated as operating cash flow minus capital expenditures.
Alpha: The excess returns of a fund relative to the return of a benchmark index is the fund’s alpha.
The Goldman Sachs ActiveBeta® Emerging Markets Equity Index is designed to deliver exposure to equity securities of emerging market issuers. The Index seeks to capture common sources of active equity returns, including value (i.e., how attractively a stock is priced relative to its “fundamentals,” such as book value and free cash flow), momentum (i.e., whether a company’s share price is trending up or down), quality (i.e., profitability) and low volatility (i.e., a relatively low degree of fluctuation in a company’s share price over time). The Index is reconstituted and rebalanced quarterly. It is not possible to invest directly in an unmanaged index.
The MSCI Emerging Markets Index captures large and mid cap representation across 24 Emerging Markets countries. It is not possible to invest directly in an unmanaged index.
The Goldman Sachs ActiveBeta® Europe Equity Index is designed to deliver exposure to equity securities of developed market issuers in Europe. The Index seeks to capture common sources of active equity returns, including value (i.e., how attractively a stock is priced relative to its “fundamentals,” such as book value and free cash flow), momentum (i.e., whether a company’s share price is trending up or down), quality (i.e., profitability) and low volatility (i.e., a relatively low degree of fluctuation in a company’s share price over time). The Index is reconstituted and rebalanced quarterly. It is not possible to invest directly in an unmanaged index.
The MSCI Europe Index captures large and mid-cap representation across 15 Developed Markets countries. It is not possible to invest directly in an unmanaged index.
The Goldman Sachs ActiveBeta® International Equity Index is designed to deliver exposure to equity securities of developed markets issuers outside of the United States. The Index seeks to capture common sources of active equity returns, including value (i.e., how attractively a stock is priced relative to its “fundamentals,” such as book value and free cash flow), momentum (i.e., whether a company’s share price is trending up or down), quality (i.e., profitability) and low volatility (i.e., a relatively low degree of fluctuation in a company’s share price over time). The Index is reconstituted and rebalanced quarterly. It is not possible to invest directly in an unmanaged index.
The MSCI World ex USA Index captures large and mid cap representation across 22 of 23 Developed Markets countries. It is not possible to invest directly in an unmanaged index.
The Goldman Sachs ActiveBeta® Japan Equity Index is designed to deliver exposure to equity securities of Japanese issuers. The Index seeks to capture common sources of active equity returns, including value (i.e., how attractively a stock is priced relative to its “fundamentals,” such as book value and free cash flow), momentum (i.e., whether a company’s share price is trending up or down), quality (i.e., profitability) and low volatility (i.e., a relatively low degree of fluctuation in a company’s share price over time). The Index is reconstituted and rebalanced quarterly. It is not possible to invest directly in an unmanaged index.
The MSCI Japan Index is designed to measure the performance of the large and mid cap segments of the Japanese market. It is not possible to invest directly in an unmanaged index.
The Goldman Sachs ActiveBeta® U.S. Large Cap Equity Index is designed to deliver exposure to equity securities of large capitalization U.S. issuers. The Index seeks to capture common sources of active equity returns, including value (i.e., how attractively a stock is priced relative to its “fundamentals,” such as book value and free cash flow), momentum (i.e., whether a company’s share price is trending up or down), quality (i.e., profitability) and low volatility (i.e., a relatively low degree of fluctuation in a company’s share price over time). The Index is reconstituted and rebalanced quarterly. It is not possible to invest directly in an unmanaged index.
The S&P 500 Index is the Standard & Poor’s 500 Composite Index of 500 stocks, an unmanaged index of common stock prices. The Index figures do not reflect any deduction for fees, expenses or taxes. It is not possible to invest directly in an unmanaged index.
The Goldman Sachs ActiveBeta® U.S. Small Cap Equity Index is designed to deliver exposure to equity securities of small capitalization U.S. issuers. The Index seeks to capture common sources of active equity returns, including value (i.e., how attractively a stock is priced relative to its “fundamentals,” such as book value and free cash flow), momentum (i.e., whether a company’s share price is trending up or down), quality (i.e., profitability) and low volatility (i.e., a relatively low degree of fluctuation in a company’s share price over time). The Index is reconstituted and rebalanced quarterly. It is not possible to invest directly in an unmanaged index.
30
FUND BASICS
The Russell 2000® Index is an unmanaged index of common stock prices that measures the performance of the 2000 smallest companies in the Russell 3000® Index. The Index is constructed to provide a comprehensive and unbiased small-cap barometer and is completely reconstituted annually to ensure larger stocks do not distort the performance and characteristics of the true small-cap opportunity set.
31
GOLDMAN SACHS ACTIVEBETA® EMERGING MARKETS EQUITY ETF
Schedule of Investments
August 31, 2020
| | | | | | | | |
| Shares | | | Description | | Value | |
|
| Common Stocks – 97.0% | |
| Argentina – 0.2% | |
| | 18,531 | | | Globant SA (Information Technology)* | | $ | 3,290,735 | |
| | |
| Brazil – 5.0% | |
| | 1,503,659 | | | Ambev SA (Consumer Staples) | | | 3,374,112 | |
| | 692,785 | | | Atacadao SA (Consumer Staples) | | | 2,468,865 | |
| | 97,805 | | | B2W Cia Digital (Consumer Discretionary)* | | | 1,998,389 | |
| | 342,238 | | | B3 SA – Brasil Bolsa Balcao (Financials) | | | 3,668,240 | |
| | 565,040 | | | Banco Bradesco SA (Financials) | | | 1,960,063 | |
| | 367,960 | | | Banco do Brasil SA (Financials) | | | 2,189,959 | |
| | 585,048 | | | BB Seguridade Participacoes SA (Financials) | | | 2,813,315 | |
| | 230,553 | | | Cia de Saneamento Basico do Estado de Sao Paulo (Utilities) | | | 2,006,764 | |
| | 152,445 | | | Cosan SA (Energy) | | | 2,313,394 | |
| | 419,200 | | | CPFL Energia SA (Utilities) | | | 2,196,141 | |
| | 224,591 | | | Energisa SA (Utilities) | | | 1,778,829 | |
| | 271,258 | | | Engie Brasil Energia SA (Utilities) | | | 2,107,900 | |
| | 532,300 | | | Equatorial Energia SA (Utilities) | | | 2,251,109 | |
| | 186,747 | | | Hapvida Participacoes e Investimentos SA (Health Care)(a) | | | 2,203,491 | |
| | 1,537,838 | | | IRB Brasil Resseguros SA (Financials) | | | 1,998,721 | |
| | 473,786 | | | Klabin SA (Materials) | | | 2,219,563 | |
| | 552,992 | | | Lojas Renner SA (Consumer Discretionary) | | | 4,381,881 | |
| | 324,067 | | | Magazine Luiza SA (Consumer Discretionary) | | | 5,506,758 | |
| | 290,826 | | | Natura & Co. Holding SA (Consumer Staples) | | | 2,615,679 | |
| | 175,966 | | | Notre Dame Intermedica Participacoes SA (Health Care) | | | 2,376,835 | |
| | 837,062 | | | Petroleo Brasileiro SA (Energy) | | | 3,405,681 | |
| | 262,972 | | | Porto Seguro SA (Financials) | | | 2,533,896 | |
| | 289,494 | | | Raia Drogasil SA (Consumer Staples) | | | 5,688,666 | |
| | 338,042 | | | Sul America SA (Financials) | | | 2,660,758 | |
| | 230,100 | | | Suzano SA (Materials)* | | | 2,105,584 | |
| | 846,410 | | | Vale SA (Materials) | | | 9,207,924 | |
| | 473,300 | | | Via Varejo SA (Consumer Discretionary)* | | | 1,768,652 | |
| | 445,421 | | | WEG SA (Industrials) | | | 5,246,743 | |
| | | | | | | | |
| | | | | | | 85,047,912 | |
| | |
| Chile – 0.2% | |
| | 1,378,617 | | | Cencosud SA (Consumer Staples) | | | 2,044,186 | |
| | 257,012 | | | Cia Cervecerias Unidas SA (Consumer Staples) | | | 1,693,740 | |
| | | | | | | | |
| | | | | | | 3,737,926 | |
| | |
| China – 35.6% | |
| | 1,473,100 | | | 3SBio, Inc. (Health Care)*(a) | | | 1,729,671 | |
| | 4,608,335 | | | Agricultural Bank of China Ltd., Class A (Financials) | | | 2,159,794 | |
| | |
|
| Common Stocks – (continued) | |
| China – (continued) | |
| | 9,530,252 | | | Agricultural Bank of China Ltd., Class H (Financials) | | | 3,184,887 | |
| | 438,325 | | | Alibaba Group Holding Ltd. ADR (Consumer Discretionary)* | | | 125,812,425 | |
| | 305,987 | | | Anhui Conch Cement Co. Ltd., Class H (Materials) | | | 2,218,856 | |
| | 289,444 | | | ANTA Sports Products Ltd. (Consumer Discretionary) | | | 2,858,904 | |
| | 27,135 | | | Autohome, Inc. ADR (Communication Services) | | | 2,177,312 | |
| | 4,291,000 | | | BAIC Motor Corp. Ltd., Class H (Consumer Discretionary)(a) | | | 2,054,103 | |
| | 55,141 | | | Baidu, Inc. ADR (Communication Services)* | | | 6,868,914 | |
| | 3,090,844 | | | Bank of Beijing Co. Ltd., Class A (Financials) | | | 2,197,705 | |
| | 4,957,824 | | | Bank of China Ltd., Class A (Financials) | | | 2,374,260 | |
| | 17,132,362 | | | Bank of China Ltd., Class H (Financials) | | | 5,614,885 | |
| | 2,940,752 | | | Bank of Communications Co. Ltd., Class A (Financials) | | | 2,030,873 | |
| | 5,310,743 | | | Bank of Communications Co. Ltd., Class H (Financials) | | | 2,775,238 | |
| | 2,389,636 | | | Bank of Jiangsu Co. Ltd., Class A (Financials) | | | 2,239,908 | |
| | 2,076,588 | | | Bank of Shanghai Co. Ltd., Class A (Financials) | | | 2,552,853 | |
| | 37,200 | | | Bilibili, Inc. ADR (Communication Services)* | | | 1,757,700 | |
| | 4,578,338 | | | China CITIC Bank Corp. Ltd., Class H (Financials) | | | 1,914,004 | |
| | 599,261 | | | China Conch Venture Holdings Ltd. (Industrials) | | | 2,598,036 | |
| | 2,746,566 | | | China Construction Bank Corp., Class A (Financials) | | | 2,486,251 | |
| | 21,493,548 | | | China Construction Bank Corp., Class H (Financials) | | | 15,225,457 | |
| | 3,165,780 | | | China Everbright Bank Co. Ltd., Class A (Financials) | | | 1,774,906 | |
| | 6,342,589 | | | China Everbright Bank Co. Ltd., Class H (Financials) | | | 2,275,104 | |
| | 1,513,799 | | | China Lesso Group Holdings Ltd. (Industrials) | | | 2,824,401 | |
| | 1,052,850 | | | China Life Insurance Co. Ltd., Class H (Financials) | | | 2,564,829 | |
| | 1,994,054 | | | China Medical System Holdings Ltd. (Health Care) | | | 2,251,308 | |
| | 1,591,694 | | | China Mengniu Dairy Co. Ltd. (Consumer Staples)* | | | 7,824,822 | |
| | 339,549 | | | China Merchants Bank Co. Ltd., Class A (Financials) | | | 1,868,495 | |
| | 1,134,422 | | | China Merchants Bank Co. Ltd., Class H (Financials) | | | 5,415,845 | |
| | 2,913,924 | | | China Minsheng Banking Corp. Ltd., Class A (Financials) | | | 2,361,210 | |
| | |
| | |
| 32 | | The accompanying notes are an integral part of these financial statements. |
GOLDMAN SACHS ACTIVEBETA® EMERGING MARKETS EQUITY ETF
| | | | | | | | |
| Shares | | | Description | | Value | |
|
| Common Stocks – (continued) | |
| China – (continued) | |
| | 4,947,192 | | | China Minsheng Banking Corp. Ltd., Class H (Financials) | | $ | 3,012,941 | |
| | 1,562,332 | | | China Mobile Ltd. (Communication Services) | | | 10,915,954 | |
| | 1,512,162 | | | China National Building Material Co. Ltd., Class H (Materials) | | | 2,126,742 | |
| | 702,165 | | | China Overseas Land & Investment Ltd. (Real Estate) | | | 2,033,974 | |
| | 4,888,571 | | | China Petroleum & Chemical Corp., Class H (Energy) | | | 2,258,161 | |
| | 527,464 | | | China Resources Beer Holdings Co. Ltd. (Consumer Staples) | | | 3,430,151 | |
| | 477,842 | | | China Resources Land Ltd. (Real Estate) | | | 2,210,362 | |
| | 3,850,208 | | | China Resources Pharmaceutical Group Ltd. (Health Care)(a) | | | 2,180,914 | |
| | 1,243,486 | | | China Shenhua Energy Co. Ltd., Class H (Energy) | | | 2,076,180 | |
| | 12,072,451 | | | China Telecom Corp. Ltd., Class H (Communication Services) | | | 3,956,572 | |
| | 146,649 | | | China Tourism Group Duty Free Corp. Ltd., Class A (Consumer Discretionary) | | | 4,453,544 | |
| | 12,565,990 | | | China Tower Corp. Ltd., Class H (Communication Services)(a) | | | 2,399,652 | |
| | 3,352,804 | | | China Unicom Hong Kong Ltd. (Communication Services) | | | 2,375,037 | |
| | 2,830,692 | | | China United Network Communications Ltd., Class A (Communication Services) | | | 2,144,980 | |
| | 651,418 | | | China Yangtze Power Co. Ltd., Class A (Utilities) | | | 1,835,610 | |
| | 2,073,795 | | | CITIC Ltd. (Industrials) | | | 1,891,800 | |
| | 3,311,797 | | | CNOOC Ltd. (Energy) | | | 3,768,966 | |
| | 59,766 | | | Contemporary Amperex Technology Co. Ltd., Class A (Industrials) | | | 1,800,620 | |
| | 2,042,756 | | | Country Garden Holdings Co. Ltd. (Real Estate) | | | 2,532,968 | |
| | 488,205 | | | Country Garden Services Holdings Co. Ltd. (Industrials) | | | 3,404,770 | |
| | 2,306,905 | | | CSPC Pharmaceutical Group Ltd. (Health Care) | | | 5,125,695 | |
| | 244,765 | | | ENN Energy Holdings Ltd. (Utilities) | | | 2,716,049 | |
| | 6,292,295 | | | GD Power Development Co. Ltd., Class A (Utilities) | | | 1,883,329 | |
| | 21,700 | | | GDS Holdings Ltd. ADR (Information Technology)* | | | 1,756,398 | |
| | 223,699 | | | Gree Electric Appliances Inc of Zhuhai, Class A (Consumer Discretionary) | | | 1,780,016 | |
| | 23,900 | | | GSX Techedu, Inc. ADR (Consumer Discretionary)* | | | 2,041,060 | |
| | 447,509 | | | Guangzhou Baiyunshan Pharmaceutical Holdings Co. Ltd., Class A (Health Care) | | | 2,124,135 | |
| | |
|
| Common Stocks – (continued) | |
| China – (continued) | |
| | 413,228 | | | Haidilao International Holding Ltd. (Consumer Discretionary)(a) | | | 2,665,936 | |
| | 1,325,001 | | | Haier Electronics Group Co. Ltd. (Consumer Discretionary) | | | 4,539,109 | |
| | 2,255,254 | | | Huaxia Bank Co. Ltd., Class A (Financials) | | | 2,117,238 | |
| | 3,098,488 | | | Industrial & Commercial Bank of China Ltd., Class A (Financials) | | | 2,243,855 | |
| | 11,889,145 | | | Industrial & Commercial Bank of China Ltd., Class H (Financials) | | | 6,657,792 | |
| | 1,105,510 | | | Industrial Bank Co. Ltd., Class A (Financials) | | | 2,608,359 | |
| | 176,740 | | | JD.com, Inc. ADR (Consumer Discretionary)* | | | 13,898,834 | |
| | 351,287 | | | Jiangsu Hengrui Medicine Co. Ltd., Class A (Health Care) | | | 4,865,801 | |
| | 26,252 | | | JOYY, Inc. ADR (Communication Services)* | | | 2,242,971 | |
| | 719,600 | | | Kingboard Holdings Ltd. (Information Technology) | | | 2,316,603 | |
| | 744,600 | | | Kingdee International Software Group Co. Ltd. (Information Technology)* | | | 1,898,453 | |
| | 2,605,730 | | | Kunlun Energy Co. Ltd. (Utilities) | | | 1,943,333 | |
| | 22,467 | | | Kweichow Moutai Co. Ltd., Class A (Consumer Staples) | | | 5,860,186 | |
| | 3,740,110 | | | Lenovo Group Ltd. (Information Technology) | | | 2,499,793 | |
| | 909,309 | | | Li Ning Co. Ltd. (Consumer Discretionary) | | | 3,848,356 | |
| | 793,573 | | | Longfor Group Holdings Ltd. (Real Estate)(a) | | | 4,203,296 | |
| | 324,542 | | | Luxshare Precision Industry Co. Ltd., Class A (Information Technology) | | | 2,606,135 | |
| | 2,754,600 | | | Luye Pharma Group Ltd. (Health Care)(a) | | | 1,492,787 | |
| | 658,228 | | | Meituan Dianping, Class B (Consumer Discretionary)* | | | 21,708,364 | |
| | 83,500 | | | Momo, Inc. ADR (Communication Services) | | | 1,703,400 | |
| | 20,567 | | | NetEase, Inc. ADR (Communication Services) | | | 10,020,448 | |
| | 46,689 | | | New Oriental Education & Technology Group, Inc. ADR (Consumer Discretionary)* | | | 6,846,008 | |
| | 98,000 | | | NIO, Inc. ADR (Consumer Discretionary)* | | | 1,864,940 | |
| | 7,437,479 | | | PetroChina Co. Ltd., Class H (Energy) | | | 2,571,878 | |
| | 2,976,416 | | | PICC Property & Casualty Co. Ltd., Class H (Financials) | | | 2,300,437 | |
| | 54,369 | | | Pinduoduo, Inc. ADR (Consumer Discretionary)* | | | 4,835,579 | |
| | 200,365 | | | Ping An Insurance Group Co. of China Ltd., Class A (Financials) | | | 2,241,441 | |
| | |
| | |
| The accompanying notes are an integral part of these financial statements. | | 33 |
GOLDMAN SACHS ACTIVEBETA® EMERGING MARKETS EQUITY ETF
Schedule of Investments (continued)
August 31, 2020
| | | | | | | | |
| Shares | | | Description | | Value | |
|
| Common Stocks – (continued) | |
| China – (continued) | |
| | 1,325,127 | | | Ping An Insurance Group Co. of China Ltd., Class H (Financials) | | $ | 14,114,467 | |
| | 4,414,008 | | | Postal Savings Bank of China Co. Ltd., Class H (Financials)(a) | | | 2,090,206 | |
| | 851,709 | | | Semiconductor Manufacturing International Corp. (Information Technology)* | | | 2,736,406 | |
| | 958,820 | | | Shandong Weigao Group Medical Polymer Co. Ltd., Class H (Health Care) | | | 2,239,265 | |
| | 1,645,309 | | | Shanghai Pudong Development Bank Co. Ltd., Class A (Financials) | | | 2,488,689 | |
| | 29,958 | | | Silergy Corp. (Information Technology) | | | 1,904,186 | |
| | 53,522 | | | SINA Corp. (Communication Services)* | | | 2,177,543 | |
| | 789,641 | | | Sinopharm Group Co. Ltd., Class H (Health Care) | | | 1,944,008 | |
| | 3,002,379 | | | Sun Art Retail Group Ltd. (Consumer Staples) | | | 3,912,702 | |
| | 1,243,141 | | | Suning.com Co. Ltd., Class A (Consumer Discretionary) | | | 1,787,804 | |
| | 83,131 | | | TAL Education Group ADR (Consumer Discretionary)* | | | 6,135,899 | |
| | 1,358,631 | | | Tencent Holdings Ltd. (Communication Services) | | | 92,998,683 | |
| | 1,787,484 | | | Tingyi Cayman Islands Holding Corp. (Consumer Staples) | | | 3,358,099 | |
| | 1,942,132 | | | Topsports International Holdings Ltd. (Consumer Discretionary)(a) | | | 2,403,185 | |
| | 62,472 | | | Trip.com Group Ltd. ADR (Consumer Discretionary)* | | | 1,889,153 | |
| | 303,257 | | | Vipshop Holdings Ltd. ADR (Consumer Discretionary)* | | | 5,006,773 | |
| | 2,891,268 | | | Want Want China Holdings Ltd. (Consumer Staples) | | | 1,984,677 | |
| | 1,090,814 | | | Weichai Power Co. Ltd., Class H (Industrials) | | | 2,204,105 | |
| | 443,851 | | | Wuhu Sanqi Interactive Entertainment Network Technology Group Co. Ltd., Class A (Communication Services) | | | 2,954,406 | |
| | 93,657 | | | Wuliangye Yibin Co. Ltd., Class A (Consumer Staples) | | | 3,281,820 | |
| | 114,936 | | | Wuxi Biologics Cayman, Inc. (Health Care)*(a) | | | 2,986,795 | |
| | 1,562,913 | | | Xiaomi Corp., Class B (Information Technology)*(a) | | | 4,739,064 | |
| | 358,008 | | | Yihai International Holding Ltd. (Consumer Staples)* | | | 5,626,391 | |
| | 188,999 | | | Yum China Holdings, Inc. (Consumer Discretionary) | | | 10,907,132 | |
| | 145,091 | | | Zhejiang Supor Co. Ltd., Class A (Consumer Discretionary) | | | 1,795,327 | |
| | 76,531 | | | ZTO Express Cayman, Inc. ADR (Industrials) | | | 2,566,084 | |
| | | | | | | | |
| | | | | | | 609,063,737 | |
| | |
|
| Common Stocks – (continued) | |
| Colombia – 0.1% | |
| | 400,056 | | | Interconexion Electrica SA ESP (Utilities) | | | 2,233,925 | |
| | |
| Egypt – 0.4% | |
| | 1,116,696 | | | Commercial International Bank Egypt SAE GDR (Financials) | | | 4,768,292 | |
| | 346,255 | | | Commercial International Bank Egypt SAE (Financials) | | | 1,476,117 | |
| | | | | | | | |
| | | | | | | 6,244,409 | |
| | |
| Greece – 0.3% | |
| | 294,558 | | | Hellenic Telecommunications Organization SA (Communication Services) | | | 4,826,192 | |
| | |
| Hong Kong – 0.3% | |
| | 3,970,559 | | | Sino Biopharmaceutical Ltd. (Health Care) | | | 4,585,267 | |
| | |
| India – 9.1% | |
| | 114,494 | | | Asian Paints Ltd. (Materials) | | | 2,953,986 | |
| | 268,300 | | | Aurobindo Pharma Ltd. (Health Care) | | | 2,948,448 | |
| | 114,039 | | | Avenue Supermarts Ltd. (Consumer Staples)*(a) | | | 3,487,828 | |
| | 414,951 | | | Berger Paints India Ltd. (Materials) | | | 3,031,201 | |
| | 276,077 | | | Bharti Airtel Ltd. (Communication Services) | | | 1,924,466 | |
| | 536,800 | | | Biocon Ltd. (Health Care)* | | | 2,743,162 | |
| | 55,279 | | | Britannia Industries Ltd. (Consumer Staples) | | | 2,798,252 | |
| | 278,100 | | | Cipla Ltd. (Health Care) | | | 2,695,897 | |
| | 140,796 | | | Colgate-Palmolive India Ltd. (Consumer Staples) | | | 2,607,617 | |
| | 325,914 | | | Dabur India Ltd. (Consumer Staples) | | | 2,101,400 | |
| | 89,545 | | | Divi’s Laboratories Ltd. (Health Care) | | | 3,798,949 | |
| | 85,386 | | | Dr. Reddy’s Laboratories Ltd. (Health Care) | | | 4,947,127 | |
| | 774,024 | | | HCL Technologies Ltd. (Information Technology) | | | 7,302,004 | |
| | 60,328 | | | HDFC Asset Management Co. Ltd. (Financials)(a) | | | 1,975,950 | |
| | 341,062 | | | HDFC Life Insurance Co. Ltd. (Financials)*(a) | | | 2,663,349 | |
| | 294,613 | | | Hindustan Unilever Ltd. (Consumer Staples) | | | 8,474,664 | |
| | 382,129 | | | Housing Development Finance Corp. Ltd. (Financials) | | | 9,513,835 | |
| | 595,494 | | | ICICI Bank Ltd. (Financials)* | | | 3,192,364 | |
| | 127,674 | | | ICICI Lombard General Insurance Co. Ltd. (Financials)(a) | | | 2,179,777 | |
| | 1,476,855 | | | Indian Oil Corp. Ltd. (Energy) | | | 1,721,484 | |
| | 346,484 | | | Indraprastha Gas Ltd. (Utilities) | | | 1,856,749 | |
| | 39,600 | | | Info Edge India Ltd. (Communication Services) | | | 1,755,807 | |
| | 1,110,848 | | | Infosys Ltd. (Information Technology) | | | 14,013,972 | |
| | |
| | |
| 34 | | The accompanying notes are an integral part of these financial statements. |
GOLDMAN SACHS ACTIVEBETA® EMERGING MARKETS EQUITY ETF
| | | | | | | | |
| Shares | | | Description | | Value | |
|
| Common Stocks – (continued) | |
| India – (continued) | |
| | 907,380 | | | ITC Ltd. (Consumer Staples) | | $ | 2,355,743 | |
| | 68,861 | | | Jubilant Foodworks Ltd. (Consumer Discretionary) | | | 1,961,777 | |
| | 625,058 | | | Marico Ltd. (Consumer Staples) | | | 3,132,614 | |
| | 21,400 | | | Nestle India Ltd. (Consumer Staples) | | | 4,637,033 | |
| | 1,852,062 | | | NTPC Ltd. (Utilities) | | | 2,425,551 | |
| | 126,356 | | | Pidilite Industries Ltd. (Materials) | | | 2,408,073 | |
| | 116,947 | | | Piramal Enterprises Ltd. (Health Care) | | | 2,172,355 | |
| | 892,797 | | | Power Grid Corp. of India Ltd. (Utilities) | | | 2,170,513 | |
| | 571,683 | | | Reliance Industries Ltd. (Energy) | | | 16,160,049 | |
| | 208,587 | | | SBI Life Insurance Co. Ltd. (Financials)*(a) | | | 2,345,656 | |
| | 247,500 | | | Sun Pharmaceutical Industries Ltd. (Health Care) | | | 1,749,304 | |
| | 281,257 | | | Tata Consultancy Services Ltd. (Information Technology) | | | 8,625,036 | |
| | 307,644 | | | Tata Consumer Products Ltd. (Consumer Staples) | | | 2,224,967 | |
| | 1,022,500 | | | Tata Motors Ltd. (Consumer Discretionary)* | | | 1,989,227 | |
| | 304,985 | | | Tech Mahindra Ltd. (Information Technology) | | | 3,070,256 | |
| | 68,596 | | | Torrent Pharmaceuticals Ltd. (Health Care) | | | 2,480,387 | |
| | 33,993 | | | UltraTech Cement Ltd. (Materials) | | | 1,802,854 | |
| | 1,086,892 | | | Wipro Ltd. (Information Technology) | | | 4,006,029 | |
| | | | | | | | |
| | | | | | | 156,405,712 | |
| | |
| Indonesia – 1.4% | |
| | 2,100,709 | | | Bank Central Asia Tbk PT (Financials) | | | 4,525,991 | |
| | 11,244,862 | | | Bank Rakyat Indonesia Persero Tbk PT (Financials) | | | 2,710,350 | |
| | 4,198,100 | | | Charoen Pokphand Indonesia Tbk PT (Consumer Staples)* | | | 1,816,174 | |
| | 2,702,800 | | | Indah Kiat Pulp & Paper Corp. Tbk PT (Materials)* | | | 1,726,080 | |
| | 3,122,977 | | | Indofood CBP Sukses Makmur Tbk PT (Consumer Staples) | | | 2,192,786 | |
| | 4,976,367 | | | Indofood Sukses Makmur Tbk PT (Consumer Staples) | | | 2,605,651 | |
| | 19,338,701 | | | Kalbe Farma Tbk PT (Health Care) | | | 2,098,207 | |
| | 15,442,806 | | | Telekomunikasi Indonesia PerseroTbk PT (Communication Services) | | | 3,032,888 | |
| | 6,653,827 | | | Unilever Indonesia Tbk PT (Consumer Staples) | | | 3,758,127 | |
| | | | | | | | |
| | | | | | | 24,466,254 | |
| | |
| Luxembourg – 0.1% | |
| | 122,593 | | | Reinet Investments SCA (Financials) | | | 2,338,213 | |
| | |
|
| Common Stocks – (continued) | |
| Mexico – 1.9% | |
| | 9,762,142 | | | America Movil SAB de CV, Series L (Communication Services) | | | 5,927,939 | |
| | 439,986 | | | Arca Continental SAB de CV (Consumer Staples) | | | 2,006,936 | |
| | 1,235,975 | | | Becle SAB de CV (Consumer Staples) | | | 2,361,149 | |
| | 4,974,700 | | | Cemex SAB de CV, Series CPO (Materials) | | | 1,595,650 | |
| | 559,857 | | | Fomento Economico Mexicano SAB de CV (Consumer Staples) | | | 3,257,945 | |
| | 303,273 | | | Gruma SAB de CV, Class B (Consumer Staples) | | | 3,586,315 | |
| | 1,904,272 | | | Grupo Bimbo SAB de CV, Series A (Consumer Staples) | | | 3,516,891 | |
| | 541,931 | | | Grupo Financiero Banorte SAB de CV, Class O (Financials)* | | | 1,873,706 | |
| | 815,731 | | | Grupo Mexico SAB de CV, Series B (Materials) | | | 2,176,674 | |
| | 1,183,246 | | | Kimberly-Clark de Mexico SAB de CV, Class A (Consumer Staples) | | | 1,900,892 | |
| | 1,900,902 | | | Wal-Mart de Mexico SAB de CV (Consumer Staples) | | | 4,562,477 | |
| | | | | | | | |
| | | | | | | 32,766,574 | |
| | |
| Peru – 0.1% | |
| | 16,512 | | | Credicorp Ltd. (Financials) | | | 2,154,486 | |
| | |
| Philippines – 0.5% | |
| | 96,489 | | | Globe Telecom, Inc. (Communication Services) | | | 4,155,286 | |
| | 237,618 | | | Jollibee Foods Corp. (Consumer Discretionary) | | | 662,105 | |
| | 98,415 | | | PLDT, Inc. (Communication Services) | | | 3,002,079 | |
| | | | | | | | |
| | | | | | | 7,819,470 | |
| | |
| Poland – 0.9% | |
| | 24,774 | | | CD Projekt SA (Communication Services)* | | | 2,961,224 | |
| | 247,743 | | | Cyfrowy Polsat SA (Communication Services)* | | | 1,942,208 | |
| | 71,793 | | | Dino Polska SA (Consumer Staples)*(a) | | | 4,375,820 | |
| | 1,523 | | | LPP SA (Consumer Discretionary)* | | | 2,982,856 | |
| | 312,339 | | | Powszechny Zaklad Ubezpieczen SA (Financials)* | | | 2,313,244 | |
| | | | | | | | |
| | | | | | | 14,575,352 | |
| | |
| Qatar – 1.1% | |
| | 1,588,453 | | | Commercial Bank PSQC (The) (Financials) | | | 1,812,259 | |
| | 2,048,400 | | | Masraf Al Rayan QSC (Financials) | | | 2,346,011 | |
| | 1,112,248 | | | Ooredoo QPSC (Communication Services) | | | 2,016,465 | |
| | 360,772 | | | Qatar Fuel QSC (Energy) | | | 1,823,182 | |
| | 922,189 | | | Qatar International Islamic Bank QSC (Financials) | | | 2,168,069 | |
| | |
| | |
| The accompanying notes are an integral part of these financial statements. | | 35 |
GOLDMAN SACHS ACTIVEBETA® EMERGING MARKETS EQUITY ETF
Schedule of Investments (continued)
August 31, 2020
| | | | | | | | |
| Shares | | | Description | | Value | |
|
| Common Stocks – (continued) | |
| Qatar – (continued) | |
| | 649,942 | | | Qatar Islamic Bank (Financials) | | $ | 2,856,103 | |
| | 1,334,983 | | | Qatar National Bank QPSC (Financials) | | | 6,599,751 | |
| | | | | | | | |
| | | | | | | 19,621,840 | |
| | |
| Russia – 4.1% | |
| | 2,025,666 | | | Gazprom PJSC (Energy) | | | 4,942,286 | |
| | 51,295,831 | | | Inter RAO UES PJSC (Utilities) | | | 3,601,134 | |
| | 152,821 | | | LUKOIL PJSC (Energy) | | | 10,253,999 | |
| | 19,747 | | | MMC Norilsk Nickel PJSC (Materials) | | | 5,131,989 | |
| | 243,557 | | | Mobile TeleSystems PJSC ADR (Communication Services) | | | 2,269,951 | |
| | 1,633,370 | | | Moscow Exchange MICEX-RTS PJSC (Financials) | | | 3,013,339 | |
| | 13,117 | | | Novatek PJSC GDR (Energy) | | | 1,942,628 | |
| | 1,205,916 | | | Novolipetsk Steel PJSC (Materials) | | | 2,511,448 | |
| | 112,622 | | | PhosAgro PJSC GDR (Materials) | | | 1,403,901 | |
| | 191,354 | | | Polymetal International PLC (Materials) | | | 5,109,962 | |
| | 21,835 | | | Polyus PJSC (Materials) | | | 5,303,792 | |
| | 2,386,455 | | | Sberbank of Russia PJSC (Financials)* | | | 7,249,192 | |
| | 101,724 | | | Severstal PAO GDR (Materials) | | | 1,285,791 | |
| | 124,743 | | | Severstal PAO (Materials) | | | 1,564,874 | |
| | 4,830,336 | | | Surgutneftegas PJSC (Energy) | | | 2,381,888 | |
| | 315,098 | | | Tatneft PJSC (Energy) | | | 2,316,314 | |
| | 14,687 | | | Tatneft PJSC ADR (Energy) | | | 656,215 | |
| | 4,019,002,855 | | | VTB Bank PJSC (Financials)* | | | 1,902,051 | |
| | 99,667 | | | X5 Retail Group NV GDR (Consumer Staples) | | | 3,587,954 | |
| | 62,400 | | | Yandex NV, Class A (Communication Services)* | | | 4,351,197 | |
| | | | | | | | |
| | | | | | | 70,779,905 | |
| | |
| Saudi Arabia – 2.6% | |
| | 114,484 | | | Abdullah Al Othaim Markets Co. (Consumer Staples) | | | 3,809,570 | |
| | 269,365 | | | Al Rajhi Bank (Financials) | | | 4,661,251 | |
| | 364,457 | | | Arab National Bank (Financials) | | | 2,017,392 | |
| | 68,294 | | | Bupa Arabia for Cooperative Insurance Co. (Financials)* | | | 2,257,984 | |
| | 317,956 | | | Etihad Etisalat Co. (Communication Services)* | | | 2,272,053 | |
| | 274,724 | | | National Commercial Bank (Financials) | | | 2,724,935 | |
| | 533,833 | | | Sahara International Petrochemical Co. (Materials) | | | 2,266,027 | |
| | 270,906 | | | Samba Financial Group (Financials) | | | 1,990,017 | |
| | 586,789 | | | Saudi Arabian Oil Co. (Energy)(a) | | | 5,562,092 | |
| | 123,004 | | | Saudi Basic Industries Corp. (Materials) | | | 2,886,148 | |
| | |
|
| Common Stocks – (continued) | |
| Saudi Arabia – (continued) | |
| | 611,252 | | | Saudi Electricity Co. (Utilities) | | | 2,594,657 | |
| | 310,240 | | | Saudi Industrial Investment Group (Materials) | | | 1,811,584 | |
| | 988,087 | | | Saudi Kayan Petrochemical Co. (Materials)* | | | 2,392,201 | |
| | 138,330 | | | Saudi Telecom Co. (Communication Services) | | | 3,540,823 | |
| | 226,164 | | | Savola Group (The) (Consumer Staples) | | | 2,930,734 | |
| | | | | | | | |
| | | | | | | 43,717,468 | |
| | |
| South Africa – 3.1% | |
| | 24,540 | | | Anglo American Platinum Ltd. (Materials)(b) | | | 1,831,195 | |
| | 244,042 | | | Aspen Pharmacare Holdings Ltd. (Health Care)* | | | 1,957,234 | |
| | 143,383 | | | Bid Corp. Ltd. (Consumer Staples) | | | 2,369,030 | |
| | 31,816 | | | Capitec Bank Holdings Ltd. (Financials) | | | 1,568,146 | |
| | 149,216 | | | Clicks Group Ltd. (Consumer Staples) | | | 2,025,806 | |
| | 1,155,566 | | | FirstRand Ltd. (Financials) | | | 2,581,756 | |
| | 216,049 | | | Gold Fields Ltd. (Materials) | | | 2,793,764 | |
| | 316,400 | | | Impala Platinum Holdings Ltd. (Materials) | | | 2,920,414 | |
| | 449,400 | | | MTN Group Ltd. (Communication Services) | | | 1,620,002 | |
| | 445,396 | | | MultiChoice Group (Communication Services)* | | | 2,547,298 | |
| | 70,946 | | | Naspers Ltd., Class N (Consumer Discretionary) | | | 12,951,715 | |
| | 332,391 | | | Nedbank Group Ltd. (Financials) | | | 1,883,345 | |
| | 3,301,933 | | | Old Mutual Ltd. (Financials) | | | 2,180,986 | |
| | 355,681 | | | Remgro Ltd. (Financials) | | | 1,845,878 | |
| | 249,300 | | | Shoprite Holdings Ltd. (Consumer Staples) | | | 1,626,070 | |
| | 854,220 | | | Sibanye Stillwater Ltd. (Materials)* | | | 2,586,169 | |
| | 233,408 | | | SPAR Group Ltd. (The) (Consumer Staples) | | | 2,227,270 | |
| | 321,321 | | | Standard Bank Group Ltd. (Financials) | | | 2,002,703 | |
| | 170,096 | | | Tiger Brands Ltd. (Consumer Staples) | | | 1,731,257 | |
| | 254,244 | | | Vodacom Group Ltd. (Communication Services) | | | 1,918,995 | |
| | | | | | | | |
| | | | | | | 53,169,033 | |
| | |
| South Korea – 12.5% | |
| | 11,100 | | | Alteogen, Inc. (Health Care)* | | | 1,952,942 | |
| | 25,081 | | | Amorepacific Corp. (Consumer Staples) | | | 3,547,107 | |
| | 46,872 | | | AMOREPACIFIC Group (Consumer Staples) | | | 2,012,351 | |
| | 11,303 | | | BGF retail Co. Ltd. (Consumer Staples) | | | 1,213,177 | |
| | 20,062 | | | Celltrion Healthcare Co. Ltd. (Health Care)* | | | 1,690,552 | |
| | |
| | |
| 36 | | The accompanying notes are an integral part of these financial statements. |
GOLDMAN SACHS ACTIVEBETA® EMERGING MARKETS EQUITY ETF
| | | | | | | | |
| Shares | | | Description | | Value | |
|
| Common Stocks – (continued) | |
| South Korea – (continued) | |
| | 18,400 | | | Celltrion Pharm, Inc. (Health Care)* | | $ | 1,720,886 | |
| | 16,260 | | | Celltrion, Inc. (Health Care)* | �� | | 4,065,342 | |
| | 155,971 | | | Cheil Worldwide, Inc. (Communication Services) | | | 2,396,221 | |
| | 8,496 | | | CJ CheilJedang Corp. (Consumer Staples) | | | 2,910,912 | |
| | 13,900 | | | CJ Logistics Corp. (Industrials)* | | | 1,772,750 | |
| | 48,580 | | | Coway Co. Ltd. (Consumer Discretionary) | | | 3,263,477 | |
| | 31,200 | | | E-MART, Inc. (Consumer Staples) | | | 3,151,780 | |
| | 73,171 | | | GS Holdings Corp. (Energy) | | | 2,001,900 | |
| | 70,982 | | | GS Retail Co. Ltd. (Consumer Staples) | | | 1,968,900 | |
| | 88,047 | | | Hana Financial Group, Inc. (Financials) | | | 2,090,180 | |
| | 43,362 | | | Hotel Shilla Co. Ltd. (Consumer Discretionary) | | | 2,566,166 | |
| | 15,869 | | | Hyundai Mobis Co. Ltd. (Consumer Discretionary) | | | 2,992,387 | |
| | 20,582 | | | Hyundai Motor Co. (Consumer Discretionary) | | | 3,058,105 | |
| | 19,168 | | | Kakao Corp. (Communication Services) | | | 6,567,368 | |
| | 85,320 | | | KB Financial Group, Inc. (Financials) | | | 2,646,723 | |
| | 102,181 | | | Kia Motors Corp. (Consumer Discretionary) | | | 3,651,472 | |
| | 42,025 | | | KMW Co. Ltd. (Information Technology)* | | | 2,702,845 | |
| | 98,803 | | | Korea Electric Power Corp. (Utilities)* | | | 1,705,077 | |
| | 29,323 | | | Korea Gas Corp. (Utilities) | | | 582,560 | |
| | 6,223 | | | Korea Zinc Co. Ltd. (Materials) | | | 2,087,605 | |
| | 32,837 | | | KT&G Corp. (Consumer Staples) | | | 2,297,125 | |
| | 6,096 | | | LG Chem Ltd. (Materials) | | | 3,797,491 | |
| | 24,560 | | | LG Corp. (Industrials) | | | 1,709,834 | |
| | 64,200 | | | LG Electronics, Inc. (Consumer Discretionary) | | | 4,550,585 | |
| | 6,128 | | | LG Household & Health Care Ltd. (Consumer Staples) | | | 7,598,741 | |
| | 289,881 | | | LG Uplus Corp. (Communication Services) | | | 2,916,136 | |
| | 15,395 | | | Lotte Shopping Co. Ltd. (Consumer Discretionary) | | | 984,948 | |
| | 637,139 | | | Meritz Securities Co. Ltd. (Financials) | | | 1,719,026 | |
| | 19,099 | | | NAVER Corp. (Communication Services) | | | 5,185,140 | |
| | 8,694 | | | NCSoft Corp. (Communication Services) | | | 6,038,008 | |
| | 31,997 | | | Orion Corp. (Consumer Staples) | | | 3,784,476 | |
| | 4,998 | | | Ottogi Corp. (Consumer Staples) | | | 2,532,870 | |
| | 12,136 | | | Pearl Abyss Corp. (Communication Services)* | | | 1,859,375 | |
| | 17,824 | | | POSCO (Materials) | | | 2,768,354 | |
| | 41,306 | | | S-1 Corp. (Industrials) | | | 3,032,143 | |
| | 4,486 | | | Samsung Biologics Co. Ltd. (Health Care)*(a) | | | 2,938,049 | |
| | 23,113 | | | Samsung C&T Corp. (Industrials) | | | 2,101,359 | |
| | |
|
| Common Stocks – (continued) | |
| South Korea – (continued) | |
| | 21,961 | | | Samsung Electro-Mechanics Co. Ltd. (Information Technology) | | | 2,301,662 | |
| | 1,217,632 | | | Samsung Electronics Co. Ltd. (Information Technology) | | | 55,351,568 | |
| | 10,444 | | | Samsung SDI Co. Ltd. (Information Technology) | | | 3,978,374 | |
| | 18,318 | | | Samsung SDS Co. Ltd. (Information Technology) | | | 2,428,727 | |
| | 73,302 | | | Samsung Securities Co. Ltd. (Financials) | | | 1,860,473 | |
| | 10,800 | | | Seegene, Inc. (Health Care) | | | 2,391,110 | |
| | 18,200 | | | Shin Poong Pharmaceutical Co. Ltd. (Health Care)* | | | 2,091,338 | |
| | 115,041 | | | Shinhan Financial Group Co. Ltd. (Financials) | | | 2,871,425 | |
| | 10,000 | | | Shinsegae, Inc. (Consumer Discretionary) | | | 1,708,898 | |
| | 150,161 | | | SK Hynix, Inc. (Information Technology) | | | 9,493,300 | |
| | 23,563 | | | SK Telecom Co. Ltd. (Communication Services) | | | 4,919,289 | |
| | 275,928 | | | Woori Financial Group, Inc. (Financials) | | | 1,965,107 | |
| | 34,759 | | | Yuhan Corp. (Health Care) | | | 1,960,479 | |
| | | | | | | | |
| | | | | | | 213,454,195 | |
| | |
| Taiwan – 14.6% | |
| | 307,702 | | | Accton Technology Corp. (Information Technology) | | | 2,453,940 | |
| | 3,340,500 | | | Acer, Inc. (Information Technology) | | | 2,658,374 | |
| | 449,931 | | | Advantech Co. Ltd. (Information Technology) | | | 4,653,956 | |
| | 1,339,551 | | | ASE Technology Holding Co. Ltd. (Information Technology) | | | 2,794,013 | |
| | 1,688,509 | | | Asia Cement Corp. (Materials) | | | 2,445,738 | |
| | 29,900 | | | ASMedia Technology, Inc. (Information Technology) | | | 1,798,596 | |
| | 214,196 | | | Asustek Computer, Inc. (Information Technology) | | | 1,773,925 | |
| | 270,588 | | | Catcher Technology Co. Ltd. (Information Technology) | | | 1,849,016 | |
| | 2,254,956 | | | Cathay Financial Holding Co. Ltd. (Financials) | | | 3,062,556 | |
| | 1,049,376 | | | Chailease Holding Co. Ltd. (Financials) | | | 4,631,467 | |
| | 1,585,792 | | | Chang Hwa Commercial Bank Ltd. (Financials) | | | 986,340 | |
| | 863,963 | | | Chicony Electronics Co. Ltd. (Information Technology) | | | 2,605,890 | |
| | 8,058,755 | | | China Development Financial Holding Corp. (Financials) | | | 2,345,544 | |
| | 1,114,751 | | | Chunghwa Telecom Co. Ltd. (Communication Services) | | | 4,122,164 | |
| | 4,227,419 | | | Compal Electronics, Inc. (Information Technology) | | | 2,665,414 | |
| | 5,579,835 | | | CTBC Financial Holding Co. Ltd. (Financials) | | | 3,603,697 | |
| | |
| | |
| The accompanying notes are an integral part of these financial statements. | | 37 |
GOLDMAN SACHS ACTIVEBETA® EMERGING MARKETS EQUITY ETF
Schedule of Investments (continued)
August 31, 2020
| | | | | | | | |
| Shares | | | Description | | Value | |
|
| Common Stocks – (continued) | |
| Taiwan – (continued) | |
| | 681,584 | | | Delta Electronics, Inc. (Information Technology) | | $ | 4,390,347 | |
| | 4,185,333 | | | E.Sun Financial Holding Co. Ltd. (Financials) | | | 3,879,865 | |
| | 672,157 | | | Feng TAY Enterprise Co. Ltd. (Consumer Discretionary) | | | 3,905,825 | |
| | 2,828,474 | | | First Financial Holding Co. Ltd. (Financials) | | | 2,048,466 | |
| | 847,443 | | | Formosa Plastics Corp. (Materials) | | | 2,258,577 | |
| | 1,093,554 | | | Foxconn Technology Co. Ltd. (Information Technology) | | | 1,945,487 | |
| | 1,870,844 | | | Fubon Financial Holding Co. Ltd. (Financials) | | | 2,728,972 | |
| | 174,212 | | | Globalwafers Co. Ltd. (Information Technology) | | | 2,339,333 | |
| | 2,634,252 | | | Hon Hai Precision Industry Co. Ltd. (Information Technology) | | | 6,904,009 | |
| | 89,556 | | | Hotai Motor Co. Ltd. (Consumer Discretionary) | | | 1,822,161 | |
| | 199,709 | | | Hua Nan Financial Holdings Co. Ltd. (Financials) | | | 122,855 | |
| | 2,561,554 | | | Inventec Corp. (Information Technology) | | | 1,986,107 | |
| | 21,254 | | | Largan Precision Co. Ltd. (Information Technology) | | | 2,451,981 | |
| | 1,839,807 | | | Lite-On Technology Corp. (Information Technology) | | | 2,909,430 | |
| | 425,645 | | | MediaTek, Inc. (Information Technology) | | | 8,065,662 | |
| | 2,772,725 | | | Mega Financial Holding Co. Ltd. (Financials) | | | 2,764,078 | |
| | 529,200 | | | Micro-Star International Co. Ltd. (Information Technology) | | | 2,443,863 | |
| | 286,817 | | | Nien Made Enterprise Co. Ltd. (Consumer Discretionary) | | | 3,303,994 | |
| | 390,630 | | | Novatek Microelectronics Corp. (Information Technology) | | | 3,195,174 | |
| | 1,119,465 | | | Pegatron Corp. (Information Technology) | | | 2,384,560 | |
| | 2,242,462 | | | Pou Chen Corp. (Consumer Discretionary) | | | 2,117,008 | |
| | 949,099 | | | Powertech Technology, Inc. (Information Technology) | | | 2,794,750 | |
| | 570,117 | | | President Chain Store Corp. (Consumer Staples) | | | 5,246,207 | |
| | 997,295 | | | Quanta Computer, Inc. (Information Technology) | | | 2,617,171 | |
| | 253,484 | | | Realtek Semiconductor Corp. (Information Technology) | | | 3,282,856 | |
| | 5,101,997 | | | SinoPac Financial Holdings Co. Ltd. (Financials) | | | 1,877,940 | |
| | 1,437,612 | | | Standard Foods Corp. (Consumer Staples) | | | 3,121,036 | |
| | 2,226,714 | | | Synnex Technology International Corp. (Information Technology) | | | 3,316,375 | |
| | 5,784,679 | | | Taishin Financial Holding Co. Ltd. (Financials) | | | 2,612,239 | |
| | |
|
| Common Stocks – (continued) | |
| Taiwan – (continued) | |
| | 2,048,491 | | | Taiwan Cement Corp. (Materials) | | | 2,995,084 | |
| | 1,501,686 | | | Taiwan Cooperative Financial Holding Co. Ltd. (Financials) | | | 1,026,151 | |
| | 777,136 | | | Taiwan Mobile Co. Ltd. (Communication Services) | | | 2,688,319 | |
| | 5,986,348 | | | Taiwan Semiconductor Manufacturing Co. Ltd. (Information Technology) | | | 87,015,913 | |
| | 2,896,134 | | | Uni-President Enterprises Corp. (Consumer Staples) | | | 6,573,710 | |
| | 6,365,303 | | | United Microelectronics Corp. (Information Technology) | | | 4,599,098 | |
| | 815,700 | | | Vanguard International Semiconductor Corp. (Information Technology) | | | 2,599,320 | |
| | 2,071,907 | | | Wistron Corp. (Information Technology) | | | 2,252,572 | |
| | 1,236,957 | | | WPG Holdings Ltd. (Information Technology) | | | 1,732,663 | |
| | 3,966,182 | | | Yuanta Financial Holding Co. Ltd. (Financials) | | | 2,487,185 | |
| | 654,997 | | | Zhen Ding Technology Holding Ltd. (Information Technology) | | | 2,745,757 | |
| | | | | | | | |
| | | | | | | 250,002,730 | |
| | |
| Tanzania – 0.2% | |
| | 122,978 | | | AngloGold Ashanti Ltd. (Materials) | | | 3,590,780 | |
| | |
| Thailand – 1.7% | |
| | 555,516 | | | Advanced Info Service PCL NVDR (Communication Services) | | | 3,266,429 | |
| | 1,177,200 | | | B Grimm Power PCL NVDR (Utilities) | | | 1,749,393 | |
| | 3,584,200 | | | Bangkok Dusit Medical Services PCL NVDR (Health Care) | | | 2,395,417 | |
| | 3,767,000 | | | Charoen Pokphand Foods PCL NVDR (Consumer Staples) | | | 3,903,470 | |
| | 1,907,677 | | | CP ALL PCL NVDR (Consumer Staples) | | | 3,892,280 | |
| | 283,102 | | | Electricity Generating PCL NVDR (Utilities) | | | 2,019,396 | |
| | 1,763,700 | | | Gulf Energy Development PCL NVDR (Utilities) | | | 1,785,093 | |
| | 3,717,100 | | | Home Product Center PCL NVDR (Consumer Discretionary) | | | 1,779,574 | |
| | 1,139,800 | | | Intouch Holdings PCL NVDR (Communication Services) | | | 1,995,955 | |
| | 1,737,700 | | | Muangthai Capital PCL NVDR (Financials) | | | 2,777,751 | |
| | 214,200 | | | Siam Cement PCL (The) NVDR (Materials) | | | 2,436,398 | |
| | 4,154,600 | | | Thai Union Group PCL NVDR (Consumer Staples) | | | 1,882,235 | |
| | | | | | | | |
| | | | | | | 29,883,391 | |
| | |
| | |
| 38 | | The accompanying notes are an integral part of these financial statements. |
GOLDMAN SACHS ACTIVEBETA® EMERGING MARKETS EQUITY ETF
| | | | | | | | |
| Shares | | | Description | | Value | |
|
| Common Stocks – (continued) | |
| Turkey – 0.4% | |
| | 484,509 | | | BIM Birlesik Magazalar AS (Consumer Staples) | | $ | 4,467,174 | |
| | 1,699,838 | | | Haci Omer Sabanci Holding AS (Financials) | | | 1,785,535 | |
| | | | | | | | |
| | | | | | | 6,252,709 | |
| | |
| United Arab Emirates – 0.4% | |
| | 573,500 | | | Emirates NBD Bank PJSC (Financials) | | | 1,686,236 | |
| | 585,320 | | | Emirates Telecommunications Group Co. PJSC (Communication Services) | | | 2,638,852 | |
| | 691,647 | | | First Abu Dhabi Bank PJSC (Financials) | | | 2,157,896 | |
| | | | | | | | |
| | | | | | | 6,482,984 | |
| | |
| United States – 0.2% | |
| | 784,826 | | | JBS SA (Consumer Staples) | | | 3,210,320 | |
| | |
| | TOTAL COMMON STOCKS | |
| | (Cost $1,290,327,753) | | $ | 1,659,721,519 | |
| | |
| | | | | | | | | | | | |
| Shares | | | Description | | Rate | | | Value | |
|
| Preferred Stocks – 2.6% | |
| Brazil – 1.3% | | | | |
| | 1,328,463 | | | Banco Bradesco SA (Financials) | | | 8.24 | % | | $ | 5,022,389 | |
| | 1,622,029 | | | Itau Unibanco Holding SA (Financials) | | | 5.25 | | | | 6,963,084 | |
| | 1,503,616 | | | Itausa SA (Financials) | | | 3.12 | | | | 2,584,644 | |
| | 342,286 | | | Lojas Americanas SA (Consumer Discretionary) | | | 0.55 | | | | 2,013,447 | |
| | 916,813 | | | Petroleo Brasileiro SA (Energy) | | | 2.73 | | | | 3,658,294 | |
| | 226,663 | | | Telefonica Brasil SA (Communication Services) | | | 6.10 | | | | 1,976,624 | |
| | | | | | | | | | | | |
| | | | | | | | | | | 22,218,482 | |
| | |
| Russia – 0.1% | | | | |
| | 4,614,819 | | | Surgutneftegas PJSC (Energy) | | | 2.61 | | | | 2,311,750 | |
| | |
| South Korea – 1.2% | | | | |
| | 47,932 | | | Amorepacific Corp. (Consumer Staples) | | | 1.66 | | | | 2,408,907 | |
| | 8,086 | | | LG Household & Health Care Ltd. (Consumer Staples) | | | 1.54 | | | | 4,771,686 | |
| | 313,322 | | | Samsung Electronics Co. Ltd. (Information Technology) | | | 3.01 | | | | 12,528,660 | |
| | | | | | | | | | | | |
| | | | | | | | | | | 19,709,253 | |
| | |
| | TOTAL PREFERRED STOCKS | | | | | |
| | (Cost $46,548,699) | | | | | | $ | 44,239,485 | |
| | |
| | | | | | | | | | | | |
| Units | | | Description | | Expiration
Month | | | Value | |
| |
| Right – 0.0% | | | | |
| Thailand – 0.0% | | | | |
| | 167,930 | | | Gulf Energy Development PCL (Utilities) | | | | | | | | |
| | (Cost $0) | | | 09/20 | | | $ | 0 | |
| | |
| | | | | | | | |
| Shares | | | Description | | Value | |
|
| Exchange-Traded Fund – 0.5% | |
| United States – 0.5% | |
| | 330,810 | | | iShares MSCI Malaysia ETF | | | | |
| | (Cost $9,826,867) | | $ | 8,776,389 | |
| | |
| TOTAL INVESTMENTS BEFORE SECURITIES LENDING
REINVESTMENT VEHICLE |
|
| | (Cost $1,346,703,319) | | $ | 1,712,737,393 | |
| | |
| | |
| Shares | | | Dividend
Rate | | Value | |
|
| Securities Lending Reinvestment Vehicle – 0.3%(c) | |
| Goldman Sachs Financial Square Government Fund –
Institutional Shares |
|
| | 4,333,286 | | | 0.027% | | $ | 4,333,286 | |
| | (Cost $4,333,286) | | | | |
| | |
| | TOTAL INVESTMENTS – 100.4% | |
| | (Cost $1,351,036,605) | | $ | 1,717,070,679 | |
| | |
| LIABILITIES IN EXCESS OF
OTHER ASSETS – (0.4)% | | | (6,594,109 | ) |
| | |
| | NET ASSETS – 100.0% | | $ | 1,710,476,570 | |
| | |
| | |
|
| The percentage shown for each investment category reflects the value of investments in that category as a percentage of net assets. |
| |
* | | Non-income producing security. |
| |
(a) | | Exempt from registration under Rule 144A of the Securities Act of 1933. |
| |
(b) | | All or a portion of security is on loan. |
| |
(c) | | Represents an affiliated issuer. |
| | |
|
Investment Abbreviations: |
ADR | | —American Depositary Receipt |
GDR | | —Global Depositary Receipt |
NVDR | | —Non-Voting Depository Receipt |
PLC | | —Public Limited Company |
|
| | |
| The accompanying notes are an integral part of these financial statements. | | 39 |
GOLDMAN SACHS ACTIVEBETA® EUROPE EQUITY ETF
Schedule of Investments
August 31, 2020
| | | | | | | | |
Shares | | | Description | | Value | |
| |
| Common Stocks – 98.7% | | | |
| Australia – 1.1% | |
| | 1,771 | | | BHP Group PLC (Materials) | | $ | 40,615 | |
| | 29,523 | | | Glencore PLC (Materials)* | | | 66,877 | |
| | 1,292 | | | Rio Tinto PLC (Materials) | | | 80,182 | |
| | | | | | | | |
| | | | | | | 187,674 | |
| | |
| Austria – 1.1% | |
| | 1,049 | | | ANDRITZ AG (Industrials) | | | 35,178 | |
| | 1,170 | | | OMV AG (Energy)* | | | 38,144 | |
| | 1,917 | | | Raiffeisen Bank International AG (Financials)* | | | 34,390 | |
| | 335 | | | Verbund AG (Utilities) | | | 18,029 | |
| | 2,213 | | | voestalpine AG (Materials) | | | 55,076 | |
| | | | | | | | |
| | | | | | | 180,817 | |
| | |
| Belgium – 1.5% | |
| | 603 | | | Ageas SA/NV (Financials) | | | 25,385 | |
| | 619 | | | Anheuser-Busch InBev SA/NV (Consumer Staples) | | | 36,130 | |
| | 621 | | | Colruyt SA (Consumer Staples) | | | 39,362 | |
| | 115 | | | Elia Group SA/NV (Utilities) | | | 12,392 | |
| | 118 | | | Galapagos NV (Health Care)* | | | 16,074 | |
| | 177 | | | Groupe Bruxelles Lambert SA (Financials) | | | 16,422 | |
| | 127 | | | KBC Group NV (Financials) | | | 7,306 | |
| | 159 | | | Proximus SADP (Communication Services) | | | 3,155 | |
| | 71 | | | Sofina SA (Financials) | | | 21,356 | |
| | 104 | | | Solvay SA (Materials) | | | 9,035 | |
| | 103 | | | Telenet Group Holding NV (Communication Services) | | | 4,013 | |
| | 403 | | | UCB SA (Health Care) | | | 47,965 | |
| | 264 | | | Umicore SA (Materials) | | | 12,152 | |
| | | | | | | | |
| | | | | | | 250,747 | |
| | |
| China – 0.2% | |
| | 305 | | | Prosus NV (Consumer Discretionary)* | | | 30,582 | |
| | |
| Denmark – 4.5% | |
| | 278 | | | Ambu A/S, Class B (Health Care) | | | 8,191 | |
| | 43 | | | AP Moller – Maersk A/S, Class A (Industrials) | | | 61,343 | |
| | 44 | | | AP Moller – Maersk A/S, Class B (Industrials) | | | 67,605 | |
| | 261 | | | Carlsberg AS, Class B (Consumer Staples) | | | 36,756 | |
| | 119 | | | Chr Hansen Holding A/S (Materials) | | | 13,692 | |
| | 422 | | | Coloplast A/S, Class B (Health Care) | | | 71,761 | |
| | 1,823 | | | Danske Bank A/S (Financials)* | | | 28,273 | |
| | 191 | | | Demant A/S (Health Care)* | | | 5,713 | |
| | 206 | | | DSV PANALPINA A/S (Industrials) | | | 32,280 | |
| | 92 | | | Genmab A/S (Health Care)* | | | 34,822 | |
| | 124 | | | GN Store Nord A/S (Health Care) | | | 9,002 | |
| | 238 | | | H Lundbeck A/S (Health Care) | | | 7,831 | |
| | 3,179 | | | Novo Nordisk A/S, Class B (Health Care) | | | 211,000 | |
| | 350 | | | Novozymes A/S, Class B (Materials) | | | 20,754 | |
| | 332 | | | Orsted A/S (Utilities)(a) | | | 47,075 | |
| | 474 | | | Pandora A/S (Consumer Discretionary) | | | 34,693 | |
| | |
| |
| Common Stocks – (continued) | | | |
| Denmark – (continued) | |
| | 425 | | | Tryg A/S (Financials) | | | 13,075 | |
| | 181 | | | Vestas Wind Systems A/S (Industrials) | | | 27,578 | |
| | | | | | | | |
| | | | | | | 731,444 | |
| | |
| Finland – 1.6% | |
| | 420 | | | Elisa OYJ (Communication Services) | | | 24,758 | |
| | 673 | | | Fortum OYJ (Utilities) | | | 14,258 | |
| | 508 | | | Kone OYJ, Class B (Industrials) | | | 43,646 | |
| | 403 | | | Neste OYJ (Energy) | | | 21,597 | |
| | 6,775 | | | Nokia OYJ (Information Technology)* | | | 32,998 | |
| | 1,972 | | | Nordea Bank Abp (Financials)* | | | 15,920 | |
| | 1,779 | | | Orion OYJ, Class B (Health Care) | | | 83,657 | |
| | 161 | | | Sampo OYJ, Class A (Financials) | | | 6,495 | |
| | 574 | | | UPM-Kymmene OYJ (Materials) | | | 17,443 | |
| | | | | | | | |
| | | | | | | 260,772 | |
| | |
| France – 17.2% | |
| | 240 | | | Accor SA (Consumer Discretionary)* | | | 7,388 | |
| | 302 | | | Adevinta ASA (Communication Services)* | | | 5,672 | |
| | 542 | | | Air Liquide SA (Materials) | | | 90,133 | |
| | 102 | | | Airbus SE (Industrials)* | | | 8,398 | |
| | 455 | | | Alstom SA (Industrials)* | | | 25,379 | |
| | 96 | | | Amundi SA (Financials)*(a) | | | 7,474 | |
| | 150 | | | Arkema SA (Materials) | | | 16,666 | |
| | 1,098 | | | Atos SE (Information Technology)* | | | 95,204 | |
| | 872 | | | AXA SA (Financials) | | | 17,808 | |
| | 305 | | | BioMerieux (Health Care) | | | 46,325 | |
| | 1,808 | | | BNP Paribas SA (Financials)* | | | 79,064 | |
| | 11,235 | | | Bollore SA (Communication Services) | | | 42,298 | |
| | 366 | | | Bouygues SA (Industrials)* | | | 14,554 | |
| | 529 | | | Bureau Veritas SA (Industrials)* | | | 12,017 | |
| | 415 | | | Capgemini SE (Information Technology) | | | 57,573 | |
| | 3,328 | | | Carrefour SA (Consumer Staples) | | | 53,572 | |
| | 1,469 | | | Cie de Saint-Gobain (Industrials)* | | | 59,698 | |
| | 149 | | | Cie Generale des Etablissements Michelin (Consumer Discretionary) | | | 16,861 | |
| | 2,565 | | | CNP Assurances (Financials)* | | | 34,419 | |
| | 3,927 | | | Credit Agricole SA (Financials)* | | | 40,333 | |
| | 1,147 | | | Danone SA (Consumer Staples) | | | 75,584 | |
| | 5 | | | Dassault Aviation SA (Industrials)* | | | 4,560 | |
| | 184 | | | Dassault Systemes (Information Technology) | | | 34,736 | |
| | 462 | | | Edenred (Information Technology) | | | 23,908 | |
| | 586 | | | Eiffage SA (Industrials)* | | | 54,118 | |
| | 1,087 | | | Electricite de France SA (Utilities) | | | 11,443 | |
| | 2,543 | | | Engie SA (Utilities)* | | | 35,446 | |
| | 374 | | | EssilorLuxottica SA (Consumer Discretionary)* | | | 50,141 | |
| | 95 | | | Eurazeo SE (Financials)* | | | 5,024 | |
| | 49 | | | Gecina SA REIT (Real Estate) | | | 6,751 | |
| | 555 | | | Getlink SE (Industrials)* | | | 8,523 | |
| | 105 | | | Hermes International (Consumer Discretionary) | | | 90,338 | |
| | 176 | | | ICADE REIT (Real Estate) | | | 11,419 | |
| | 70 | | | Iliad SA (Communication Services) | | | 14,985 | |
| | |
| | |
| 40 | | The accompanying notes are an integral part of these financial statements. |
GOLDMAN SACHS ACTIVEBETA® EUROPE EQUITY ETF
| | | | | | | | |
Shares | | | Description | | Value | |
| |
| Common Stocks – (continued) | | | |
| France – (continued) | |
| | 146 | | | Ingenico Group SA (Information Technology)* | | $ | 24,829 | |
| | 974 | | | Ipsen SA (Health Care) | | | 101,109 | |
| | 257 | | | JCDecaux SA (Communication Services)* | | | 4,915 | |
| | 99 | | | Kering (Consumer Discretionary) | | | 60,928 | |
| | 1,862 | | | La Francaise des Jeux SAEM (Consumer Discretionary)(a) | | | 69,233 | |
| | 516 | | | Legrand SA (Industrials) | | | 43,136 | |
| | 531 | | | L’Oreal SA (Consumer Staples) | | | 175,845 | |
| | 439 | | | LVMH Moet Hennessy Louis Vuitton SE (Consumer Discretionary) | | | 206,229 | |
| | 1,495 | | | Orange SA (Communication Services) | | | 16,682 | |
| | 34 | | | Orpea (Health Care)* | | | 4,093 | |
| | 287 | | | Pernod Ricard SA (Consumer Staples) | | | 49,255 | |
| | 524 | | | Peugeot SA (Consumer Discretionary)* | | | 9,005 | |
| | 1,175 | | | Publicis Groupe SA (Communication Services)* | | | 41,272 | |
| | 93 | | | Remy Cointreau SA (Consumer Staples)(b) | | | 15,338 | |
| | 234 | | | Safran SA (Industrials)* | | | 27,151 | |
| | 1,837 | | | Sanofi (Health Care) | | | 186,456 | |
| | 189 | | | Sartorius Stedim Biotech (Health Care) | | | 67,765 | |
| | 789 | | | Schneider Electric SE (Industrials) | | | 97,899 | |
| | 188 | | | SEB SA (Consumer Discretionary) | | | 33,074 | |
| | 125 | | | Sodexo SA (Consumer Discretionary) | | | 8,964 | |
| | 3,090 | | | Suez SA (Utilities) | | | 53,603 | |
| | 122 | | | Teleperformance (Industrials) | | | 37,702 | |
| | 126 | | | Thales SA (Industrials) | | | 9,870 | |
| | 3,551 | | | TOTAL SE (Energy) | | | 140,570 | |
| | 349 | | | Ubisoft Entertainment SA (Communication Services)* | | | 28,783 | |
| | 1,132 | | | Veolia Environnement SA (Utilities) | | | 27,347 | |
| | 612 | | | Vinci SA (Industrials) | | | 57,514 | |
| | 908 | | | Vivendi SA (Communication Services) | | | 25,845 | |
| | 67 | | | Wendel SE (Financials) | | | 6,887 | |
| | 299 | | | Worldline SA (Information Technology)*(a) | | | 27,541 | |
| | | | | | | | |
| | | | | | | 2,816,652 | |
| | |
| Germany – 14.2% | |
| | 491 | | | adidas AG (Consumer Discretionary)* | | | 149,504 | |
| | 437 | | | Allianz SE (Financials) | | | 94,868 | |
| | 698 | | | Aroundtown SA (Real Estate)* | | | 3,825 | |
| | 724 | | | BASF SE (Materials) | | | 44,211 | |
| | 1,473 | | | Bayer AG (Health Care) | | | 97,841 | |
| | 187 | | | Bayerische Motoren Werke AG (Consumer Discretionary) | | | 13,452 | |
| | 510 | | | Beiersdorf AG (Consumer Staples) | | | 59,042 | |
| | 640 | | | Brenntag AG (Industrials) | | | 40,153 | |
| | 197 | | | Carl Zeiss Meditec AG (Health Care) | | | 22,241 | |
| | 58 | | | Continental AG (Consumer Discretionary) | | | 6,326 | |
| | 229 | | | Covestro AG (Materials)(a) | | | 10,917 | |
| | 1,010 | | | Daimler AG (Consumer Discretionary) | | | 51,511 | |
| | 180 | | | Delivery Hero SE (Consumer Discretionary)*(a) | | | 19,379 | |
| | 1,050 | | | Deutsche Bank AG (Financials)* | | | 10,077 | |
| | 322 | | | Deutsche Boerse AG (Financials) | | | 60,999 | |
| | 712 | | | Deutsche Lufthansa AG (Industrials)* | | | 7,434 | |
| | |
| |
| Common Stocks – (continued) | | | |
| Germany – (continued) | |
| | 2,785 | | | Deutsche Post AG (Industrials) | | | 126,967 | |
| | 3,823 | | | Deutsche Telekom AG (Communication Services) | | | 67,439 | |
| | 597 | | | Deutsche Wohnen SE (Real Estate) | | | 31,872 | |
| | 3,134 | | | E.ON SE (Utilities) | | | 37,144 | |
| | 263 | | | Evonik Industries AG (Materials) | | | 7,643 | |
| | 558 | | | Fresenius Medical Care AG & Co. KGaA (Health Care) | | | 47,421 | |
| | 1,417 | | | Fresenius SE & Co. KGaA (Health Care) | | | 65,753 | |
| | 275 | | | GEA Group AG (Industrials) | | | 10,051 | |
| | 108 | | | Hannover Rueck SE (Financials) | | | 18,419 | |
| | 1,061 | | | HeidelbergCement AG (Materials) | | | 67,531 | |
| | 154 | | | Henkel AG & Co. KGaA (Consumer Staples) | | | 13,859 | |
| | 154 | | | HOCHTIEF AG (Industrials) | | | 13,684 | |
| | 940 | | | Infineon Technologies AG (Information Technology) | | | 26,036 | |
| | 179 | | | KION Group AG (Industrials) | | | 15,169 | |
| | 395 | | | Knorr-Bremse AG (Industrials) | | | 50,301 | |
| | 76 | | | LEG Immobilien AG (Real Estate) | | | 11,203 | |
| | 382 | | | Merck KGaA (Health Care) | | | 51,921 | |
| | 5,032 | | | METRO AG (Consumer Staples) | | | 49,902 | |
| | 64 | | | MTU Aero Engines AG (Industrials) | | | 11,883 | |
| | 128 | | | Muenchener Rueckversicherungs-Gesellschaft AG in Muenchen (Financials) | | | 37,000 | |
| | 670 | | | Nemetschek SE (Information Technology) | | | 53,366 | |
| | 949 | | | Puma SE (Consumer Discretionary)* | | | 78,516 | |
| | 1,522 | | | RWE AG (Utilities) | | | 60,614 | |
| | 1,490 | | | SAP SE (Information Technology) | | | 245,983 | |
| | 361 | | | Scout24 AG (Communication Services)(a) | | | 33,654 | |
| | 911 | | | Siemens AG (Industrials) | | | 126,013 | |
| | 320 | | | Siemens Healthineers AG (Health Care)(a) | | | 14,581 | |
| | 245 | | | Symrise AG (Materials) | | | 33,857 | |
| | 2,843 | | | Telefonica Deutschland Holding AG (Communication Services) | | | 7,875 | |
| | 1,205 | | | Uniper SE (Utilities) | | | 39,544 | |
| | 390 | | | United Internet AG (Communication Services) | | | 19,189 | |
| | 32 | | | Volkswagen AG (Consumer Discretionary)* | | | 5,748 | |
| | 597 | | | Vonovia SE (Real Estate) | | | 42,839 | |
| | 1,260 | | | Zalando SE (Consumer Discretionary)*(a) | | | 110,215 | |
| | | | | | | | |
| | | | | | | 2,324,972 | |
| | |
| Ireland – 0.8% | |
| | 942 | | | CRH PLC (Materials) | | | 34,924 | |
| | 148 | | | Flutter Entertainment PLC (Consumer Discretionary) | | | 25,010 | |
| | 237 | | | Kerry Group PLC, Class A (Consumer Staples) | | | 31,179 | |
| | 232 | | | Kingspan Group PLC (Industrials) | | | 19,963 | |
| | 465 | | | Smurfit Kappa Group PLC (Materials) | | | 16,506 | |
| | | | | | | | |
| | | | | | | 127,582 | |
| | |
| | |
| The accompanying notes are an integral part of these financial statements. | | 41 |
GOLDMAN SACHS ACTIVEBETA® EUROPE EQUITY ETF
Schedule of Investments (continued)
August 31, 2020
| | | | | | | | |
Shares | | | Description | | Value | |
| |
| Common Stocks – (continued) | | | |
| Italy – 3.7% | |
| | 1,136 | | | Assicurazioni Generali SpA (Financials) | | $ | 17,669 | |
| | 721 | | | Atlantia SpA (Industrials)* | | | 11,494 | |
| | 1,638 | | | Davide Campari-Milano NV (Consumer Staples) | | | 16,832 | |
| | 254 | | | DiaSorin SpA (Health Care) | | | 46,021 | |
| | 11,265 | | | Enel SpA (Utilities) | | | 102,242 | |
| | 769 | | | Eni SpA (Energy) | | | 7,174 | |
| | 267 | | | Ferrari NV (Consumer Discretionary) | | | 52,113 | |
| | 1,503 | | | FinecoBank Banca Fineco SpA (Financials)* | | | 22,828 | |
| | 1,336 | | | Infrastrutture Wireless Italiane SpA (Communication Services)(a) | | | 13,046 | |
| | 11,698 | | | Intesa Sanpaolo SpA (Financials)* | | | 25,255 | |
| | 1,822 | | | Moncler SpA (Consumer Discretionary)* | | | 70,709 | |
| | 719 | | | Nexi SpA (Information Technology)*(a) | | | 12,825 | |
| | 2,559 | | | Poste Italiane SpA (Financials)(a) | | | 23,535 | |
| | 578 | | | Prysmian SpA (Industrials) | | | 16,203 | |
| | 616 | | | Recordati Industria Chimica e Farmaceutica SpA (Health Care) | | | 33,645 | |
| | 5,540 | | | Snam SpA (Utilities) | | | 28,424 | |
| | 86,688 | | | Telecom Italia SpA (Communication Services) | | | 41,345 | |
| | 86,155 | | | Telecom Italia SpA-RSP (Communication Services) | | | 40,782 | |
| | 3,892 | | | Terna Rete Elettrica Nazionale SpA (Utilities) | | | 28,198 | |
| | 500 | | | UniCredit SpA (Financials)* | | | 4,933 | |
| | | | | | | | |
| | | | | | | 615,273 | |
| | |
| Jordan – 0.1% | |
| | 640 | | | Hikma Pharmaceuticals PLC (Health Care) | | | 20,318 | |
| | |
| Luxembourg – 0.6% | |
| | 6,946 | | | ArcelorMittal (Materials)* | | | 88,072 | |
| | 20 | | | Eurofins Scientific SE (Health Care)* | | | 16,064 | |
| | | | | | | | |
| | | | | | | 104,136 | |
| | |
| Netherlands – 6.3% | |
| | 25 | | | Adyen NV (Information Technology)*(a) | | | 42,247 | |
| | 13,762 | | | Aegon NV (Financials) | | | 38,398 | |
| | 300 | | | Akzo Nobel NV (Materials) | | | 29,758 | |
| | 839 | | | Altice Europe NV (Communication Services)* | | | 3,721 | |
| | 53 | | | Argenx SE (Health Care)* | | | 12,278 | |
| | 568 | | | ASML Holding NV (Information Technology) | | | 213,504 | |
| | 704 | | | EXOR NV (Financials) | | | 41,592 | |
| | 311 | | | Heineken Holding NV (Consumer Staples) | | | 25,534 | |
| | 326 | | | Heineken NV (Consumer Staples) | | | 30,239 | |
| | 3,724 | | | ING Groep NV (Financials)* | | | 30,303 | |
| | 52 | | | Just Eat Takeaway.com NV (Consumer Discretionary)*(a) | | | 5,798 | |
| | 4,674 | | | Koninklijke Ahold Delhaize NV (Consumer Staples) | | | 140,977 | |
| | 232 | | | Koninklijke DSM NV (Materials) | | | 37,304 | |
| | |
| |
| Common Stocks – (continued) | | | |
| Netherlands – (continued) | |
| | 4,450 | | | Koninklijke KPN NV (Communication Services) | | | 11,692 | |
| | 2,003 | | | Koninklijke Philips NV (Health Care)* | | | 94,945 | |
| | 406 | | | Koninklijke Vopak NV (Energy) | | | 22,345 | |
| | 792 | | | NN Group NV (Financials) | | | 29,884 | |
| | 1,156 | | | Randstad NV (Industrials) | | | 60,375 | |
| | 3,710 | | | Royal Dutch Shell PLC, Class A (Energy) | | | 54,980 | |
| | 2,910 | | | Royal Dutch Shell PLC, Class B (Energy) | | | 41,418 | |
| | 777 | | | Wolters Kluwer NV (Industrials) | | | 63,933 | |
| | | | | | | | |
| | | | | | | 1,031,225 | |
| | |
| Norway – 1.3% | |
| | 498 | | | DNB ASA (Financials)* | | | 8,046 | |
| | 434 | | | Equinor ASA (Energy) | | | 7,082 | |
| | 1,261 | | | Gjensidige Forsikring ASA (Financials)* | | | 27,042 | |
| | 524 | | | Mowi ASA (Consumer Staples) | | | 10,316 | |
| | 12,312 | | | Norsk Hydro ASA (Materials)* | | | 39,569 | |
| | 2,275 | | | Orkla ASA (Consumer Staples) | | | 23,311 | |
| | 1,723 | | | Schibsted ASA, Class B (Communication Services)* | | | 68,737 | |
| | 1,109 | | | Telenor ASA (Communication Services) | | | 18,160 | |
| | 166 | | | Yara International ASA (Materials) | | | 7,001 | |
| | | | | | | | |
| | | | | | | 209,264 | |
| | |
| Portugal – 0.6% | |
| | 9,158 | | | EDP – Energias de Portugal SA (Utilities) | | | 46,461 | |
| | 473 | | | Galp Energia SGPS SA (Energy) | | | 5,075 | |
| | 3,295 | | | Jeronimo Martins SGPS SA (Consumer Staples) | | | 54,204 | |
| | | | | | | | |
| | | | | | | 105,740 | |
| | |
| Russia – 0.1% | |
| | 5,082 | | | Evraz PLC (Materials) | | | 22,060 | |
| | |
| South Africa – 0.2% | |
| | 1,073 | | | Anglo American PLC (Materials) | | | 26,329 | |
| | |
| Spain – 3.4% | |
| | 3,052 | | | ACS Actividades de Construccion y Servicios SA (Industrials) | | | 74,899 | |
| | 96 | | | Aena SME SA (Industrials)*(a) | | | 14,363 | |
| | 807 | | | Amadeus IT Group SA (Information Technology) | | | 45,274 | |
| | 1,700 | | | Banco Bilbao Vizcaya Argentaria SA (Financials) | | | 4,987 | |
| | 3,815 | | | Banco Santander SA (Financials) | | | 8,499 | |
| | 834 | | | Bankinter SA (Financials) | | | 4,495 | |
| | 590 | | | Cellnex Telecom SA (Communication Services)*(a) | | | 37,877 | |
| | 813 | | | Enagas SA (Utilities) | | | 19,923 | |
| | 990 | | | Endesa SA (Utilities) | | | 27,504 | |
| | 829 | | | Ferrovial SA (Industrials) | | | 22,189 | |
| | 612 | | | Grifols SA (Health Care) | | | 16,622 | |
| | 8,880 | | | Iberdrola SA (Utilities) | | | 112,041 | |
| | 3,132 | | | Industria de Diseno Textil SA (Consumer Discretionary) | | | 88,212 | |
| | |
| | |
| 42 | | The accompanying notes are an integral part of these financial statements. |
GOLDMAN SACHS ACTIVEBETA® EUROPE EQUITY ETF
| | | | | | | | |
Shares | | | Description | | Value | |
| |
| Common Stocks – (continued) | | | |
| Spain – (continued) | |
| | 10,186 | | | Mapfre SA (Financials) | | $ | 19,345 | |
| | 921 | | | Naturgy Energy Group SA (Utilities) | | | 17,800 | |
| | 729 | | | Red Electrica Corp. SA (Utilities) | | | 13,971 | |
| | 436 | | | Siemens Gamesa Renewable Energy SA (Industrials) | | | 11,701 | |
| | 4,149 | | | Telefonica SA (Communication Services) | | | 16,429 | |
| | | | | | | | |
| | | | | | | 556,131 | |
| | |
| Sweden – 5.2% | |
| | 209 | | | Alfa Laval AB (Industrials)* | | | 5,123 | |
| | 1,266 | | | Assa Abloy AB, Class B (Industrials) | | | 29,357 | |
| | 822 | | | Atlas Copco AB, Class A (Industrials) | | | 38,112 | |
| | 590 | | | Atlas Copco AB, Class B (Industrials) | | | 23,757 | |
| | 450 | | | Electrolux AB, Series B (Consumer Discretionary) | | | 9,777 | |
| | 610 | | | Epiroc AB, Class A (Industrials) | | | 9,106 | |
| | 539 | | | Epiroc AB, Class B (Industrials) | | | 7,771 | |
| | 745 | | | Essity AB, Class B (Consumer Staples)* | | | 25,706 | |
| | 1,116 | | | Evolution Gaming Group AB (Consumer Discretionary)(a) | | | 83,820 | |
| | 4,666 | | | Hennes & Mauritz AB, Class B (Consumer Discretionary) | | | 74,602 | |
| | 395 | | | Hexagon AB, Class B (Information Technology)* | | | 28,688 | |
| | 1,232 | | | Husqvarna AB, Class B (Consumer Discretionary) | | | 13,424 | |
| | 198 | | | ICA Gruppen AB (Consumer Staples) | | | 9,738 | |
| | 527 | | | Industrivarden AB, Class C (Financials)* | | | 13,925 | |
| | 801 | | | Investment AB Latour, Class B (Industrials)(b) | | | 17,915 | |
| | 724 | | | Investor AB, Class B (Financials) | | | 46,286 | |
| | 738 | | | Kinnevik AB, Class B (Financials) | | | 28,583 | |
| | 738 | | | Kinnevik AB, Class B (Financials)* | | | 595 | |
| | 418 | | | L E Lundbergforetagen AB, Class B (Financials)* | | | 19,143 | |
| | 666 | | | Nibe Industrier AB, Class B (Industrials)* | | | 18,764 | |
| | 1,470 | | | Sandvik AB (Industrials)* | | | 28,940 | |
| | 959 | | | Securitas AB, Class B (Industrials)* | | | 13,687 | |
| | 1,549 | | | Skandinaviska Enskilda Banken AB, Class A (Financials)* | | | 15,399 | |
| | 2,447 | | | Skanska AB, Class B (Industrials)* | | | 49,990 | |
| | 404 | | | SKF AB, Class B (Industrials) | | | 8,085 | |
| | 951 | | | Svenska Cellulosa AB SCA, Class B (Materials)* | | | 12,289 | |
| | 1,055 | | | Svenska Handelsbanken AB, Class A (Financials)* | | | 10,644 | |
| | 492 | | | Swedbank AB, Class A (Financials)* | | | 8,364 | |
| | 1,221 | | | Swedish Match AB (Consumer Staples) | | | 92,952 | |
| | 938 | | | Tele2 AB, Class B (Communication Services) | | | 13,328 | |
| | 4,712 | | | Telefonaktiebolaget LM Ericsson, Class B (Information Technology) | | | 54,769 | |
| | 3,383 | | | Telia Co. AB (Communication Services) | | | 13,065 | |
| | 1,101 | | | Volvo AB, Class B (Industrials)* | | | 21,101 | |
| | | | | | | | |
| | | | | | | 846,805 | |
| | |
| |
| Common Stocks – (continued) | | | |
| Switzerland – 15.8% | |
| | 1,862 | | | ABB Ltd. (Industrials) | | | 47,499 | |
| | 490 | | | Adecco Group AG (Industrials) | | | 25,718 | |
| | 520 | | | Alcon, Inc. (Health Care)* | | | 29,660 | |
| | 80 | | | Baloise Holding AG (Financials) | | | 12,483 | |
| | 221 | | | Banque Cantonale Vaudoise (Financials) | | | 23,684 | |
| | 11 | | | Barry Callebaut AG (Consumer Staples) | | | 24,432 | |
| | 5 | | | Chocoladefabriken Lindt & Spruengli AG (Consumer Staples) | | | 42,729 | |
| | 498 | | | Cie Financiere Richemont SA (Consumer Discretionary) | | | 33,051 | |
| | 330 | | | Clariant AG (Materials) | | | 6,890 | |
| | 712 | | | Coca-Cola HBC AG (Consumer Staples)* | | | 19,009 | |
| | 4,078 | | | Credit Suisse Group AG (Financials) | | | 44,990 | |
| | 28 | | | EMS-Chemie Holding AG (Materials) | | | 25,327 | |
| | 53 | | | Geberit AG (Industrials) | | | 30,642 | |
| | 14 | | | Givaudan SA (Materials) | | | 58,926 | |
| | 97 | | | Julius Baer Group Ltd. (Financials) | | | 4,664 | |
| | 547 | | | Kuehne + Nagel International AG (Industrials)* | | | 106,338 | |
| | 793 | | | LafargeHolcim Ltd. (Materials)* | | | 37,781 | |
| | 718 | | | Logitech International SA (Information Technology) | | | 53,281 | |
| | 91 | | | Lonza Group AG (Health Care) | | | 56,634 | |
| | 4,780 | | | Nestle SA (Consumer Staples) | | | 576,286 | |
| | 3,340 | | | Novartis AG (Health Care) | | | 289,470 | |
| | 96 | | | Partners Group Holding AG (Financials) | | | 97,850 | |
| | 1,249 | | | Roche Holding AG (Health Care) | | | 437,902 | |
| | 56 | | | Schindler Holding AG (Industrials) | | | 14,789 | |
| | 75 | | | Schindler Holding AG Participation Certificates (Industrials) | | | 20,082 | |
| | 32 | | | SGS SA (Industrials) | | | 83,087 | |
| | 174 | | | Sika AG (Materials) | | | 41,855 | |
| | 163 | | | Sonova Holding AG (Health Care)* | | | 38,213 | |
| | 1,907 | | | STMicroelectronics NV (Information Technology) | | | 57,496 | |
| | 59 | | | Straumann Holding AG (Health Care) | | | 58,237 | |
| | 85 | | | Swatch Group AG (The) – Bearer (Consumer Discretionary) | | | 18,030 | |
| | 356 | | | Swatch Group AG (The) – Registered (Consumer Discretionary) | | | 14,091 | |
| | 29 | | | Swiss Life Holding AG (Financials) | | | 11,749 | |
| | 185 | | | Swiss Prime Site AG (Real Estate) | | | 16,714 | |
| | 130 | | | Swiss Re AG (Financials) | | | 10,487 | |
| | 50 | | | Swisscom AG (Communication Services) | | | 27,764 | |
| | 32 | | | Temenos AG (Information Technology) | | | 5,181 | |
| | 2,516 | | | UBS Group AG (Financials) | | | 30,694 | |
| | 48 | | | Vifor Pharma AG (Health Care) | | | 7,114 | |
| | 156 | | | Zurich Insurance Group AG (Financials) | | | 57,864 | |
| | | | | | | | |
| | | | | | | 2,598,693 | |
| | |
| United Kingdom – 18.2% | |
| | 422 | | | 3i Group PLC (Financials) | | | 5,300 | |
| | 3,349 | | | Admiral Group PLC (Financials) | | | 118,247 | |
| | 361 | | | Ashtead Group PLC (Industrials) | | | 12,592 | |
| | 816 | | | Associated British Foods PLC (Consumer Staples) | | | 22,354 | |
| | |
| | |
| The accompanying notes are an integral part of these financial statements. | | 43 |
GOLDMAN SACHS ACTIVEBETA® EUROPE EQUITY ETF
Schedule of Investments (continued)
August 31, 2020
| | | | | | | | |
Shares | | | Description | | Value | |
| |
| Common Stocks – (continued) | | | |
| United Kingdom – (continued) | |
| | 1,923 | | | AstraZeneca PLC (Health Care) | | $ | 214,738 | |
| | 11,969 | | | Auto Trader Group PLC (Communication Services)(a) | | | 90,258 | |
| | 295 | | | AVEVA Group PLC (Information Technology) | | | 20,034 | |
| | 15,016 | | | Aviva PLC (Financials) | | | 56,839 | |
| | 4,264 | | | BAE Systems PLC (Industrials) | | | 29,665 | |
| | 4,365 | | | Barclays PLC (Financials)* | | | 6,544 | |
| | 1,470 | | | Barratt Developments PLC (Consumer Discretionary) | | | 10,337 | |
| | 560 | | | Berkeley Group Holdings PLC (Consumer Discretionary) | | | 34,184 | |
| | 11,905 | | | BP PLC (Energy) | | | 42,114 | |
| | 2,969 | | | British American Tobacco PLC (Consumer Staples) | | | 100,676 | |
| | 1,575 | | | British Land Co. PLC (The) REIT (Real Estate) | | | 7,712 | |
| | 7,341 | | | BT Group PLC (Communication Services) | | | 10,286 | |
| | 783 | | | Bunzl PLC (Industrials) | | | 25,392 | |
| | 3,413 | | | Burberry Group PLC (Consumer Discretionary) | | | 66,011 | |
| | 733 | | | Coca-Cola European Partners PLC (Consumer Staples) | | | 30,170 | |
| | 2,674 | | | Compass Group PLC (Consumer Discretionary) | | | 43,698 | |
| | 397 | | | Croda International PLC (Materials) | | | 31,362 | |
| | 231 | | | DCC PLC (Industrials) | | | 20,500 | |
| | 3,108 | | | Diageo PLC (Consumer Staples) | | | 104,432 | |
| | 3,435 | | | Direct Line Insurance Group PLC (Financials) | | | 13,563 | |
| | 1,518 | | | Experian PLC (Industrials) | | | 56,707 | |
| | 8,152 | | | GlaxoSmithKline PLC (Health Care) | | | 160,671 | |
| | 1,091 | | | GVC Holdings PLC (Consumer Discretionary)* | | | 11,748 | |
| | 1,130 | | | Halma PLC (Information Technology) | | | 33,559 | |
| | 3,409 | | | Hargreaves Lansdown PLC (Financials) | | | 73,785 | |
| | 12,340 | | | HSBC Holdings PLC (Financials) | | | 54,550 | |
| | 1,817 | | | Imperial Brands PLC (Consumer Staples) | | | 30,484 | |
| | 893 | | | Informa PLC (Communication Services)* | | | 4,943 | |
| | 197 | | | Intertek Group PLC (Industrials) | | | 15,499 | |
| | 33,871 | | | J Sainsbury PLC (Consumer Staples) | | | 83,356 | |
| | 7,591 | | | JD Sports Fashion PLC (Consumer Discretionary) | | | 73,770 | |
| | 308 | | | Johnson Matthey PLC (Materials) | | | 9,794 | |
| | 5,431 | | | Kingfisher PLC (Consumer Discretionary) | | | 19,656 | |
| | 1,144 | | | Land Securities Group PLC REIT (Real Estate) | | | 8,855 | |
| | 8,513 | | | Legal & General Group PLC (Financials) | | | 24,769 | |
| | 19,374 | | | Lloyds Banking Group PLC (Financials)* | | | 7,354 | |
| | 549 | | | London Stock Exchange Group PLC (Financials) | | | 64,687 | |
| | 21,448 | | | M&G PLC (Financials) | | | 49,682 | |
| | 692 | | | Mondi PLC (Materials) | | | 13,537 | |
| | 3,893 | | | National Grid PLC (Utilities) | | | 43,952 | |
| | 750 | | | Next PLC (Consumer Discretionary) | | | 60,634 | |
| | |
| |
| Common Stocks – (continued) | | | |
| United Kingdom – (continued) | |
| | 1,194 | | | Ocado Group PLC (Consumer Discretionary)* | | | 39,920 | |
| | 1,474 | | | Pearson PLC (Communication Services) | | | 11,040 | |
| | 281 | | | Persimmon PLC (Consumer Discretionary) | | | 9,858 | |
| | 1,337 | | | Prudential PLC (Financials) | | | 21,867 | |
| | 750 | | | Reckitt Benckiser Group PLC (Consumer Staples) | | | 75,416 | |
| | 2,549 | | | RELX PLC (Industrials) | | | 58,106 | |
| | 3,254 | | | Rentokil Initial PLC (Industrials)* | | | 23,223 | |
| | 993 | | | Rolls-Royce Holdings PLC (Industrials)* | | | 3,206 | |
| | 1,605 | | | RSA Insurance Group PLC (Financials) | | | 9,656 | |
| | 6,928 | | | Sage Group PLC (The) (Information Technology) | | | 68,700 | |
| | 322 | | | Schroders PLC (Financials) | | | 12,494 | |
| | 3,653 | | | Segro PLC REIT (Real Estate) | | | 46,603 | |
| | 714 | | | Severn Trent PLC (Utilities) | | | 22,294 | |
| | 1,748 | | | Smith & Nephew PLC (Health Care) | | | 35,610 | |
| | 289 | | | Smiths Group PLC (Industrials) | | | 5,425 | |
| | 160 | | | Spirax-Sarco Engineering PLC (Industrials) | | | 21,948 | |
| | 1,543 | | | SSE PLC (Utilities) | | | 26,011 | |
| | 2,136 | | | St James’s Place PLC (Financials) | | | 28,022 | |
| | 6,640 | | | Standard Chartered PLC (Financials)* | | | 34,887 | |
| | 1,664 | | | Standard Life Aberdeen PLC (Financials) | | | 5,285 | |
| | 15,128 | | | Tesco PLC (Consumer Staples) | | | 44,299 | |
| | 2,225 | | | Unilever NV (Consumer Staples) | | | 129,085 | |
| | 1,846 | | | Unilever PLC (Consumer Staples) | | | 110,238 | |
| | 1,421 | | | United Utilities Group PLC (Utilities) | | | 15,815 | |
| | 35,950 | | | Vodafone Group PLC (Communication Services) | | | 53,642 | |
| | 9,863 | | | Wm Morrison Supermarkets PLC (Consumer Staples)(b) | | | 25,395 | |
| | 2,770 | | | WPP PLC (Communication Services) | | | 23,945 | |
| | | | | | | | |
| | | | | | | 2,980,990 | |
| | |
| United States – 1.0% | |
| | 1,172 | | | Ferguson PLC (Industrials) | | | 115,748 | |
| | 464 | | | QIAGEN NV (Health Care)* | | | 23,623 | |
| | 5,107 | | | Tenaris SA (Energy) | | | 30,050 | |
| | | | | | | | |
| | | | | | | 169,421 | |
| | |
| | TOTAL COMMON STOCKS | |
| | (Cost $16,019,081) | | $ | 16,197,627 | |
| | |
| | | | | | | | | | | | |
| Shares | | | Description | | Rate | | | Value | |
| | | | | | | | | | | | |
|
| Preferred Stocks – 0.6% | |
| Germany – 0.6% | | | | |
| | 73 | | | Bayerische Motoren Werke AG (Consumer Discretionary) | | | 5.36 | % | | $ | 4,112 | |
| | 721 | | | FUCHS PETROLUB SE (Materials) | | | 2.45 | | | | 34,164 | |
| | 193 | | | Henkel AG & Co. KGaA (Consumer Staples) | | | 2.12 | | | | 19,749 | |
| | 72 | | | Sartorius AG (Health Care) | | | 0.10 | | | | 30,568 | |
| | |
| | |
| 44 | | The accompanying notes are an integral part of these financial statements. |
GOLDMAN SACHS ACTIVEBETA® EUROPE EQUITY ETF
| | | | | | | | | | | | |
Shares | | | Description | | Rate | | | Value | |
|
| Preferred Stocks – (continued) | |
| Germany – (continued) | | | | |
| | 108 | | | Volkswagen AG (Consumer Discretionary)* | | | 0.00 | % | | $ | 17,997 | |
| | |
| | TOTAL PREFERRED STOCKS | | | | | |
| | (Cost $105,475) | | | | | | $ | 106,590 | |
| | |
| TOTAL INVESTMENTS BEFORE SECURITIES LENDING
REINVESTMENT VEHICLE |
|
| | (Cost $16,124,556) | | | | | | $ | 16,304,217 | |
| | |
| | | | | | | | |
| Shares | | Dividend
Rate | | | Value | |
|
| Securities Lending Reinvestment Vehicle – 0.4%(c) | |
Goldman Sachs Financial Square Government Fund – Institutional Shares | |
| 62,772 | | | 0.027 | % | | $ | 62,772 | |
| (Cost $62,772) | | | | | |
| |
| TOTAL INVESTMENTS – 99.7% | | | | | |
| (Cost $16,187,328) | | | $ | 16,366,989 | |
| |
| OTHER ASSETS IN EXCESS OF LIABILITIES – 0.3% | | | | 48,802 | |
| |
| NET ASSETS – 100.0% | | | $ | 16,415,791 | |
| |
| | |
|
| The percentage shown for each investment category reflects the value of investments in that category as a percentage of net assets. |
| |
* | | Non-income producing security. |
| |
(a) | | Exempt from registration under Rule 144A of the Securities Act of 1933. |
| |
(b) | | All or a portion of security is on loan. |
| |
(c) | | Represents an affiliated issuer. |
| | |
|
Investment Abbreviations: |
PLC | | —Public Limited Company |
REIT | | —Real Estate Investment Trust |
|
| | |
| The accompanying notes are an integral part of these financial statements. | | 45 |
GOLDMAN SACHS ACTIVEBETA® INTERNATIONAL EQUITY ETF
Schedule of Investments (continued)
August 31, 2020
| | | | | | | | |
Shares | | | Description | | Value | |
|
| Common Stocks – 99.3% | |
| Australia – 5.9% | |
| | 11,933 | | | Afterpay Ltd. (Information Technology)* | | $ | 806,962 | |
| | 179,741 | | | AGL Energy Ltd. (Utilities) | | | 1,967,326 | |
| | 61,707 | | | Ampol Ltd. (Energy) | | | 1,187,433 | |
| | 105,074 | | | APA Group (Utilities) | | | 810,489 | |
| | 48,154 | | | Aristocrat Leisure Ltd. (Consumer Discretionary) | | | 1,010,320 | |
| | 24,890 | | | ASX Ltd. (Financials) | | | 1,607,702 | |
| | 237,240 | | | Aurizon Holdings Ltd. (Industrials) | | | 763,211 | |
| | 533,275 | | | AusNet Services (Utilities) | | | 719,750 | |
| | 203,247 | | | Australia & New Zealand Banking Group Ltd. (Financials) | | | 2,747,690 | |
| | 140,995 | | | BHP Group Ltd. (Materials) | | | 3,952,983 | |
| | 117,827 | | | BHP Group PLC (Materials) | | | 2,702,189 | |
| | 288,709 | | | BlueScope Steel Ltd. (Materials) | | | 2,709,501 | |
| | 135,637 | | | Brambles Ltd. (Industrials) | | | 1,112,441 | |
| | 116,669 | | | CIMIC Group Ltd. (Industrials) | | | 1,826,601 | |
| | 92,057 | | | Coca-Cola Amatil Ltd. (Consumer Staples) | | | 619,535 | |
| | 18,976 | | | Cochlear Ltd. (Health Care) | | | 2,696,575 | |
| | 362,348 | | | Coles Group Ltd. (Consumer Staples) | | | 4,751,186 | |
| | 154,165 | | | Commonwealth Bank of Australia (Financials) | | | 7,784,787 | |
| | 39,268 | | | Computershare Ltd. (Information Technology) | | | 385,950 | |
| | 39,578 | | | CSL Ltd. (Health Care) | | | 8,371,485 | |
| | 131,610 | | | Dexus REIT (Real Estate) | | | 859,443 | |
| | 120,372 | | | Evolution Mining Ltd. (Materials) | | | 494,067 | |
| | 116,070 | | | Fortescue Metals Group Ltd. (Materials) | | | 1,495,325 | |
| | 1,602,305 | | | Glencore PLC (Materials)* | | | 3,629,598 | |
| | 148,494 | | | Goodman Group REIT (Real Estate) | | | 2,010,780 | |
| | 126,928 | | | Insurance Australia Group Ltd. (Financials) | | | 447,758 | |
| | 30,309 | | | Macquarie Group Ltd. (Financials) | | | 2,862,397 | |
| | 66,599 | | | Magellan Financial Group Ltd. (Financials) | | | 2,918,257 | |
| | 506,048 | | | Medibank Pvt Ltd. (Financials) | | | 1,021,696 | |
| | 156,064 | | | National Australia Bank Ltd. (Financials) | | | 2,069,429 | |
| | 40,593 | | | Newcrest Mining Ltd. (Materials) | | | 959,457 | |
| | 49,106 | | | Northern Star Resources Ltd. (Materials) | | | 495,718 | |
| | 46,207 | | | Orica Ltd. (Materials) | | | 593,916 | |
| | 179,649 | | | Origin Energy Ltd. (Energy) | | | 744,012 | |
| | 9,676 | | | Ramsay Health Care Ltd. (Health Care) | | | 465,562 | |
| | 29,513 | | | REA Group Ltd. (Communication Services)(a) | | | 2,491,912 | |
| | 24,471 | | | Rio Tinto Ltd. (Materials) | | | 1,773,557 | |
| | 74,322 | | | Rio Tinto PLC (Materials) | | | 4,612,447 | |
| | 23,548 | | | SEEK Ltd. (Communication Services) | | | 359,966 | |
| | 47,902 | | | Sonic Healthcare Ltd. (Health Care) | | | 1,135,401 | |
| | 1,120,455 | | | South32 Ltd. (Materials) | | | 1,740,128 | |
| | |
|
| Common Stocks – (continued) | |
| Australia – (continued) | |
| | 174,415 | | | Stockland REIT (Real Estate) | | | 510,795 | |
| | 141,663 | | | Suncorp Group Ltd. (Financials) | | | 974,332 | |
| | 530,611 | | | Telstra Corp. Ltd. (Communication Services) | | | 1,134,074 | |
| | 178,514 | | | Transurban Group (Industrials) | | | 1,776,989 | |
| | 152,079 | | | Wesfarmers Ltd. (Consumer Discretionary) | | | 5,344,574 | |
| | 233,467 | | | Westpac Banking Corp. (Financials) | | | 3,028,465 | |
| | 48,701 | | | Woodside Petroleum Ltd. (Energy) | | | 705,209 | |
| | 258,950 | | | Woolworths Group Ltd. (Consumer Staples) | | | 7,635,361 | |
| | | | | | | | |
| | | | | | | 102,824,741 | |
| | |
| Austria – 0.6% | |
| | 63,573 | | | ANDRITZ AG (Industrials) | | | 2,131,886 | |
| | 92,735 | | | OMV AG (Energy)* | | | 3,023,310 | |
| | 66,988 | | | Raiffeisen Bank International AG (Financials)* | | | 1,201,715 | |
| | 17,664 | | | Verbund AG (Utilities) | | | 950,637 | |
| | 130,384 | | | voestalpine AG (Materials) | | | 3,244,962 | |
| | | | | | | | |
| | | | | | | 10,552,510 | |
| | |
| Belgium – 0.8% | |
| | 31,146 | | | Ageas SA/NV (Financials) | | | 1,311,167 | |
| | 37,613 | | | Anheuser-Busch InBev SA/NV (Consumer Staples) | | | 2,195,409 | |
| | 26,908 | | | Colruyt SA (Consumer Staples) | | | 1,705,574 | |
| | 5,739 | | | Elia Group SA/NV (Utilities) | | | 618,407 | |
| | 9,145 | | | Galapagos NV (Health Care)* | | | 1,245,721 | |
| | 12,750 | | | Groupe Bruxelles Lambert SA (Financials) | | | 1,182,969 | |
| | 13,538 | | | KBC Group NV (Financials) | | | 778,776 | |
| | 3,673 | | | Sofina SA (Financials) | | | 1,104,771 | |
| | 8,101 | | | Solvay SA (Materials) | | | 703,765 | |
| | 16,167 | | | Telenet Group Holding NV (Communication Services) | | | 629,932 | |
| | 22,261 | | | UCB SA (Health Care) | | | 2,649,526 | |
| | 14,251 | | | Umicore SA (Materials) | | | 656,004 | |
| | | | | | | | |
| | | | | | | 14,782,021 | |
| | |
| Brazil – 0.1% | |
| | 31,270 | | | Wheaton Precious Metals Corp. (Materials) | | | 1,671,797 | |
| | |
| Canada – 9.2% | |
| | 16,687 | | | Agnico Eagle Mines Ltd. (Materials) | | | 1,377,275 | |
| | 44,737 | | | Air Canada (Industrials)* | | | 604,299 | |
| | 85,619 | | | Algonquin Power & Utilities Corp. (Utilities) | | | 1,188,067 | |
| | 106,465 | | | Alimentation Couche-Tard, Inc., Class B (Consumer Staples) | | | 3,478,426 | |
| | 27,238 | | | AltaGas Ltd. (Utilities) | | | 352,665 | |
| | 14,893 | | | Atco Ltd., Class I (Utilities) | | | 454,237 | |
| | 142,418 | | | B2Gold Corp. (Materials) | | | 957,505 | |
| | 46,090 | | | Bank of Montreal (Financials) | | | 2,928,225 | |
| | 91,659 | | | Bank of Nova Scotia (The) (Financials) | | | 3,965,477 | |
| | |
| | |
| 46 | | The accompanying notes are an integral part of these financial statements. |
GOLDMAN SACHS ACTIVEBETA® INTERNATIONAL EQUITY ETF
| | | | | | | | |
Shares | | | Description | | Value | |
|
| Common Stocks – (continued) | |
| Canada – (continued) | |
| | 87,210 | | | Barrick Gold Corp. (Materials) | | $ | 2,586,281 | |
| | 23,073 | | | BCE, Inc. (Communication Services) | | | 992,726 | |
| | 72,958 | | | Brookfield Asset Management, Inc., Class A (Financials) | | | 2,464,877 | |
| | 41,867 | | | CAE, Inc. (Industrials) | | | 664,499 | |
| | 31,338 | | | Cameco Corp. (Energy) | | | 363,419 | |
| | 18,091 | | | Canadian Apartment Properties REIT (Real Estate) | | | 624,809 | |
| | 38,183 | | | Canadian Imperial Bank of Commerce (Financials) | | | 3,034,830 | |
| | 32,137 | | | Canadian National Railway Co. (Industrials) | | | 3,380,557 | |
| | 83,880 | | | Canadian Natural Resources Ltd. (Energy) | | | 1,655,776 | |
| | 7,448 | | | Canadian Pacific Railway Ltd. (Industrials) | | | 2,205,847 | |
| | 18,900 | | | Canadian Tire Corp. Ltd., Class A (Consumer Discretionary) | | | 1,979,282 | |
| | 31,491 | | | Canadian Utilities Ltd., Class A (Utilities) | | | 791,293 | |
| | 419,778 | | | Cenovus Energy, Inc. (Energy) | | | 1,984,598 | |
| | 45,374 | | | CGI, Inc. (Information Technology)* | | | 3,190,580 | |
| | 222,922 | | | CI Financial Corp. (Financials) | | | 3,168,591 | |
| | 7,751 | | | Constellation Software, Inc. (Information Technology) | | | 8,982,641 | |
| | 92,996 | | | Dollarama, Inc. (Consumer Discretionary) | | | 3,634,335 | |
| | 30,430 | | | Emera, Inc. (Utilities) | | | 1,243,637 | |
| | 291,709 | | | Empire Co. Ltd., Class A (Consumer Staples) | | | 7,600,845 | |
| | 93,778 | | | Enbridge, Inc. (Energy) | | | 3,003,458 | |
| | 2,585 | | | Fairfax Financial Holdings Ltd. (Financials) | | | 797,730 | |
| | 47,756 | | | First Capital Real Estate Investment Trust REIT (Real Estate) | | | 501,402 | |
| | 41,280 | | | Fortis, Inc. (Utilities) | | | 1,652,847 | |
| | 12,576 | | | Franco-Nevada Corp. (Materials) | | | 1,893,422 | |
| | 61,791 | | | George Weston Ltd. (Consumer Staples) | | | 4,468,756 | |
| | 60,439 | | | Great-West Lifeco, Inc. (Financials) | | | 1,234,339 | |
| | 54,350 | | | Hydro One Ltd. (Utilities)(b) | | | 1,126,252 | |
| | 73,896 | | | iA Financial Corp., Inc. (Financials) | | | 2,662,740 | |
| | 28,311 | | | IGM Financial, Inc. (Financials) | | | 691,614 | |
| | 81,090 | | | Imperial Oil Ltd. (Energy)(a) | | | 1,338,690 | |
| | 15,204 | | | Intact Financial Corp. (Financials) | | | 1,630,263 | |
| | 122,011 | | | Kinross Gold Corp. (Materials)* | | | 1,084,376 | |
| | 39,818 | | | Kirkland Lake Gold Ltd. (Materials) | | | 2,123,912 | |
| | 77,086 | | | Loblaw Cos. Ltd. (Consumer Staples) | | | 3,988,156 | |
| | 47,976 | | | Magna International, Inc. (Consumer Discretionary) | | | 2,338,874 | |
| | 264,192 | | | Manulife Financial Corp. (Financials) | | | 3,901,189 | |
| | 39,245 | | | Metro, Inc. (Consumer Staples) | | | 1,774,677 | |
| | 43,284 | | | National Bank of Canada (Financials) | | | 2,381,874 | |
| | 57,268 | | | Nutrien Ltd. (Materials) | | | 2,123,349 | |
| | 9,991 | | | Onex Corp. (Financials) | | | 485,613 | |
| | 21,513 | | | Open Text Corp. (Information Technology) | | | 976,790 | |
| | |
|
| Common Stocks – (continued) | |
| Canada – (continued) | |
| | 23,081 | | | Pan American Silver Corp. (Materials) | | | 834,172 | |
| | 35,637 | | | Parkland Corp. (Energy) | | | 1,011,167 | |
| | 94,316 | | | Power Corp. of Canada (Financials) | | | 1,884,945 | |
| | 29,849 | | | Quebecor, Inc., Class B (Communication Services) | | | 740,870 | |
| | 6,387 | | | Restaurant Brands International, Inc. (Consumer Discretionary) | | | 346,421 | |
| | 29,094 | | | Ritchie Bros Auctioneers, Inc. (Industrials) | | | 1,704,174 | |
| | 16,587 | | | Rogers Communications, Inc., Class B (Communication Services) | | | 690,748 | |
| | 129,592 | | | Royal Bank of Canada (Financials) | | | 9,879,407 | |
| | 73,850 | | | Saputo, Inc. (Consumer Staples) | | | 1,844,337 | |
| | 25,119 | | | Shaw Communications, Inc., Class B (Communication Services) | | | 470,204 | |
| | 8,344 | | | Shopify, Inc., Class A (Information Technology)* | | | 8,922,147 | |
| | 57,535 | | | Sun Life Financial, Inc. (Financials)(a) | | | 2,403,934 | |
| | 68,615 | | | Suncor Energy, Inc. (Energy) | | | 1,102,200 | |
| | 44,701 | | | TC Energy Corp. (Energy) | | | 2,092,416 | |
| | 44,538 | | | TELUS Corp. (Communication Services) | | | 821,062 | |
| | 17,046 | | | Thomson Reuters Corp. (Industrials) | | | 1,304,468 | |
| | 12,633 | | | TMX Group Ltd. (Financials) | | | 1,329,473 | |
| | 150,434 | | | Toronto-Dominion Bank (The) (Financials) | | | 7,512,752 | |
| | 94,275 | | | WSP Global, Inc. (Industrials) | | | 6,402,698 | |
| | 123,423 | | | Yamana Gold, Inc. (Materials) | | | 765,385 | |
| | | | | | | | |
| | | | | | | 160,098,902 | |
| | |
| China – 0.6% | |
| | 1,377 | | | BeiGene Ltd. ADR (Health Care)* | | | 332,642 | |
| | 650,134 | | | BOC Hong Kong Holdings Ltd. (Financials) | | | 1,845,506 | |
| | 206,094 | | | Microport Scientific Corp. (Health Care) | | | 937,377 | |
| | 20,415 | | | Prosus NV (Consumer Discretionary)* | | | 2,046,981 | |
| | 1,268,509 | | | Wilmar International Ltd. (Consumer Staples) | | | 4,067,887 | |
| | 574,743 | | | Yangzijiang Shipbuilding Holdings Ltd. (Industrials) | | | 386,798 | |
| | | | | | | | |
| | | | | | | 9,617,191 | |
| | |
| Denmark – 2.8% | |
| | 14,888 | | | Ambu A/S, Class B (Health Care) | | | 438,653 | |
| | 3,290 | | | AP Moller – Maersk A/S, Class A (Industrials) | | | 4,693,469 | |
| | 3,353 | | | AP Moller – Maersk A/S, Class B (Industrials)(a) | | | 5,151,790 | |
| | 19,167 | | | Carlsberg AS, Class B (Consumer Staples) | | | 2,699,235 | |
| | 6,063 | | | Chr Hansen Holding A/S (Materials) | | | 697,601 | |
| | 33,122 | | | Coloplast A/S, Class B (Health Care) | | | 5,632,387 | |
| | |
| | |
| The accompanying notes are an integral part of these financial statements. | | 47 |
GOLDMAN SACHS ACTIVEBETA® INTERNATIONAL EQUITY ETF
Schedule of Investments (continued)
August 31, 2020
| | | | | | | | |
Shares | | | Description | | Value | |
|
| Common Stocks – (continued) | |
| Denmark – (continued) | |
| | 91,620 | | | Danske Bank A/S (Financials)* | | $ | 1,420,962 | |
| | 38,171 | | | Demant A/S (Health Care)* | | | 1,141,822 | |
| | 18,569 | | | DSV PANALPINA A/S (Industrials) | | | 2,909,754 | |
| | 4,706 | | | Genmab A/S (Health Care)* | | | 1,781,198 | |
| | 4,991 | | | GN Store Nord A/S (Health Care) | | | 362,339 | |
| | 15,648 | | | H Lundbeck A/S (Health Care) | | | 514,842 | |
| | 182,408 | | | Novo Nordisk A/S, Class B (Health Care) | | | 12,107,004 | |
| | 17,630 | | | Novozymes A/S, Class B (Materials) | | | 1,045,397 | |
| | 21,781 | | | Orsted A/S (Utilities)(b) | | | 3,088,352 | |
| | 31,857 | | | Pandora A/S (Consumer Discretionary) | | | 2,331,705 | |
| | 28,919 | | | Tryg A/S (Financials) | | | 889,687 | |
| | 10,994 | | | Vestas Wind Systems A/S (Industrials) | | | 1,675,068 | |
| | | | | | | | |
| | | | | | | 48,581,265 | |
| | |
| Finland – 0.8% | |
| | 18,748 | | | Elisa OYJ (Communication Services) | | | 1,105,165 | |
| | 85,821 | | | Fortum OYJ (Utilities) | | | 1,818,226 | |
| | 26,700 | | | Kone OYJ, Class B (Industrials) | | | 2,293,986 | |
| | 37,391 | | | Neste OYJ (Energy) | | | 2,003,804 | |
| | 147,787 | | | Nokia OYJ (Information Technology)* | | | 719,798 | |
| | 94,373 | | | Nordea Bank Abp (Financials)* | | | 761,882 | |
| | 88,571 | | | Orion OYJ, Class B (Health Care) | | | 4,165,031 | |
| | 20,989 | | | UPM-Kymmene OYJ (Materials) | | | 637,837 | |
| | | | | | | | |
| | | | | | | 13,505,729 | |
| | |
| France – 10.5% | |
| | 18,332 | | | Accor SA (Consumer Discretionary)* | | | 564,328 | |
| | 19,215 | | | Adevinta ASA (Communication Services)* | | | 360,918 | |
| | 28,934 | | | Air Liquide SA (Materials) | | | 4,811,635 | |
| | 6,635 | | | Airbus SE (Industrials)* | | | 546,254 | |
| | 17,127 | | | Alstom SA (Industrials)* | | | 955,329 | |
| | 17,672 | | | Arkema SA (Materials) | | | 1,963,426 | |
| | 79,255 | | | Atos SE (Information Technology)* | | | 6,871,917 | |
| | 105,474 | | | AXA SA (Financials) | | | 2,153,995 | |
| | 22,356 | | | BioMerieux (Health Care) | | | 3,395,557 | |
| | 106,027 | | | BNP Paribas SA (Financials)* | | | 4,636,553 | |
| | 832,293 | | | Bollore SA (Communication Services) | | | 3,133,460 | |
| | 61,323 | | | Bouygues SA (Industrials)* | | | 2,438,531 | |
| | 36,111 | | | Bureau Veritas SA (Industrials)* | | | 820,337 | |
| | 34,039 | | | Capgemini SE (Information Technology) | | | 4,722,239 | |
| | 226,378 | | | Carrefour SA (Consumer Staples) | | | 3,644,119 | |
| | 95,997 | | | Cie de Saint-Gobain (Industrials)* | | | 3,901,164 | |
| | 10,299 | | | Cie Generale des Etablissements Michelin (Consumer Discretionary) | | | 1,165,443 | |
| | 146,669 | | | CNP Assurances (Financials)* | | | 1,968,088 | |
| | 256,597 | | | Credit Agricole SA (Financials)* | | | 2,635,462 | |
| | 75,101 | | | Danone SA (Consumer Staples) | | | 4,948,921 | |
| | 14,841 | | | Dassault Systemes (Information Technology) | | | 2,801,696 | |
| | 23,973 | | | Edenred (Information Technology) | | | 1,240,573 | |
| | |
|
| Common Stocks – (continued) | |
| France – (continued) | |
| | 33,588 | | | Eiffage SA (Industrials)* | | | 3,101,895 | |
| | 73,774 | | | Electricite de France SA (Utilities) | | | 776,601 | |
| | 210,696 | | | Engie SA (Utilities)* | | | 2,936,850 | |
| | 23,690 | | | EssilorLuxottica SA (Consumer Discretionary)* | | | 3,176,025 | |
| | 2,842 | | | Gecina SA REIT (Real Estate) | | | 391,552 | |
| | 34,423 | | | Getlink SE (Industrials)* | | | 528,600 | |
| | 8,235 | | | Hermes International (Consumer Discretionary) | | | 7,085,121 | |
| | 9,789 | | | ICADE REIT (Real Estate) | | | 635,113 | |
| | 3,434 | | | Iliad SA (Communication Services) | | | 735,134 | |
| | 8,965 | | | Ingenico Group SA (Information Technology)* | | | 1,524,625 | |
| | 61,551 | | | Ipsen SA (Health Care) | | | 6,389,517 | |
| | 6,165 | | | Kering (Consumer Discretionary) | | | 3,794,164 | |
| | 97,565 | | | La Francaise des Jeux SAEM (Consumer Discretionary)(b) | | | 3,627,672 | |
| | 25,034 | | | Legrand SA (Industrials) | | | 2,092,766 | |
| | 34,176 | | | L’Oreal SA (Consumer Staples) | | | 11,317,680 | |
| | 27,587 | | | LVMH Moet Hennessy Louis Vuitton SE (Consumer Discretionary) | | | 12,959,527 | |
| | 475,339 | | | Natixis SA (Financials)* | | | 1,310,351 | |
| | 88,522 | | | Orange SA (Communication Services) | | | 987,748 | |
| | 14,697 | | | Pernod Ricard SA (Consumer Staples) | | | 2,522,283 | |
| | 24,233 | | | Peugeot SA (Consumer Discretionary)* | | | 416,464 | |
| | 78,123 | | | Publicis Groupe SA (Communication Services)* | | | 2,744,076 | |
| | 6,715 | | | Remy Cointreau SA (Consumer Staples)(a) | | | 1,107,448 | |
| | 18,597 | | | Safran SA (Industrials)* | | | 2,157,831 | |
| | 103,470 | | | Sanofi (Health Care) | | | 10,502,238 | |
| | 9,370 | | | Sartorius Stedim Biotech (Health Care) | | | 3,359,576 | |
| | 42,610 | | | Schneider Electric SE (Industrials) | | | 5,287,043 | |
| | 22,058 | | | SEB SA (Consumer Discretionary) | | | 3,880,539 | |
| | 11,517 | | | Sodexo SA (Consumer Discretionary) | | | 825,875 | |
| | 201,413 | | | Suez SA (Utilities) | | | 3,493,964 | |
| | 8,446 | | | Teleperformance (Industrials) | | | 2,610,098 | |
| | 7,126 | | | Thales SA (Industrials) | | | 558,214 | |
| | 185,215 | | | TOTAL SE (Energy) | | | 7,331,914 | |
| | 38,959 | | | Ubisoft Entertainment SA (Communication Services)* | | | 3,213,056 | |
| | 99,286 | | | Veolia Environnement SA (Utilities) | | | 2,398,571 | |
| | 39,336 | | | Vinci SA (Industrials) | | | 3,696,710 | |
| | 52,459 | | | Vivendi SA (Communication Services) | | | 1,493,173 | |
| | 4,057 | | | Wendel SE (Financials) | | | 417,027 | |
| | 23,799 | | | Worldline SA (Information Technology)*(b) | | | 2,192,176 | |
| | | | | | | | |
| | | | | | | 183,259,162 | |
| | |
| Germany – 8.0% | |
| | 27,734 | | | adidas AG (Consumer Discretionary)* | | | 8,444,698 | |
| | 32,606 | | | Allianz SE (Financials) | | | 7,078,402 | |
| | 30,066 | | | BASF SE (Materials) | | | 1,835,987 | |
| | |
| | |
| 48 | | The accompanying notes are an integral part of these financial statements. |
GOLDMAN SACHS ACTIVEBETA® INTERNATIONAL EQUITY ETF
| | | | | | | | |
Shares | | | Description | | Value | |
|
| Common Stocks – (continued) | |
| Germany – (continued) | |
| | 80,432 | | | Bayer AG (Health Care) | | $ | 5,342,542 | |
| | 8,242 | | | Bayerische Motoren Werke AG (Consumer Discretionary) | | | 592,900 | |
| | 38,904 | | | Beiersdorf AG (Consumer Staples) | | | 4,503,839 | |
| | 36,910 | | | Brenntag AG (Industrials) | | | 2,315,717 | |
| | 4,947 | | | Carl Zeiss Meditec AG (Health Care) | | | 558,505 | |
| | 6,096 | | | Continental AG (Consumer Discretionary) | | | 664,895 | |
| | 21,880 | | | Covestro AG (Materials)(b) | | | 1,043,032 | |
| | 49,771 | | | Daimler AG (Consumer Discretionary) | | | 2,538,386 | |
| | 9,079 | | | Delivery Hero SE (Consumer Discretionary)*(b) | | | 977,440 | |
| | 40,202 | | | Deutsche Bank AG (Financials)* | | | 385,839 | |
| | 28,085 | | | Deutsche Boerse AG (Financials) | | | 5,320,382 | |
| | 93,426 | | | Deutsche Lufthansa AG (Industrials)*(a) | | | 975,428 | |
| | 178,246 | | | Deutsche Post AG (Industrials) | | | 8,126,170 | |
| | 240,232 | | | Deutsche Telekom AG (Communication Services) | | | 4,237,757 | |
| | 33,801 | | | Deutsche Wohnen SE (Real Estate) | | | 1,804,542 | |
| | 179,120 | | | E.ON SE (Utilities) | | | 2,122,907 | |
| | 21,673 | | | Evonik Industries AG (Materials) | | | 629,852 | |
| | 37,536 | | | Fresenius Medical Care AG & Co. KGaA (Health Care) | | | 3,189,969 | |
| | 91,975 | | | Fresenius SE & Co. KGaA (Health Care) | | | 4,267,905 | |
| | 14,457 | | | GEA Group AG (Industrials) | | | 528,378 | |
| | 10,942 | | | Hannover Rueck SE (Financials) | | | 1,866,077 | |
| | 49,092 | | | HeidelbergCement AG (Materials) | | | 3,124,631 | |
| | 15,946 | | | Henkel AG & Co. KGaA (Consumer Staples) | | | 1,435,065 | |
| | 10,773 | | | HOCHTIEF AG (Industrials) | | | 957,279 | |
| | 41,731 | | | Infineon Technologies AG (Information Technology) | | | 1,155,874 | |
| | 15,798 | | | KION Group AG (Industrials) | | | 1,338,802 | |
| | 21,992 | | | Knorr-Bremse AG (Industrials) | | | 2,800,567 | |
| | 4,808 | | | LEG Immobilien AG (Real Estate) | | | 708,761 | |
| | 29,497 | | | Merck KGaA (Health Care) | | | 4,009,226 | |
| | 257,381 | | | METRO AG (Consumer Staples) | | | 2,552,401 | |
| | 5,196 | | | MTU Aero Engines AG (Industrials) | | | 964,748 | |
| | 7,834 | | | Muenchener Rueckversicherungs-Gesellschaft AG in Muenchen (Financials) | | | 2,264,506 | |
| | 31,514 | | | Nemetschek SE (Information Technology) | | | 2,510,100 | |
| | 52,588 | | | Puma SE (Consumer Discretionary)* | | | 4,350,913 | |
| | 83,205 | | | RWE AG (Utilities) | | | 3,313,652 | |
| | 81,231 | | | SAP SE (Information Technology) | | | 13,410,345 | |
| | 20,651 | | | Scout24 AG (Communication Services)(b) | | | 1,925,176 | |
| | 49,346 | | | Siemens AG (Industrials) | | | 6,825,718 | |
| | 17,052 | | | Siemens Healthineers AG (Health Care)(b) | | | 776,987 | |
| | 14,374 | | | Symrise AG (Materials) | | | 1,986,373 | |
| | |
|
| Common Stocks – (continued) | |
| Germany – (continued) | |
| | 196,771 | | | Telefonica Deutschland Holding AG (Communication Services) | | | 545,021 | |
| | 117,987 | | | Uniper SE (Utilities) | | | 3,871,965 | |
| | 18,124 | | | United Internet AG (Communication Services) | | | 891,726 | |
| | 2,066 | | | Volkswagen AG (Consumer Discretionary)* | | | 371,119 | |
| | 35,955 | | | Vonovia SE (Real Estate) | | | 2,580,024 | |
| | 62,076 | | | Zalando SE (Consumer Discretionary)*(b) | | | 5,429,901 | |
| | | | | | | | |
| | | | | | | 139,452,429 | |
| | |
| Hong Kong – 2.2% | |
| | 760,412 | | | AIA Group Ltd. (Financials) | | | 7,829,639 | |
| | 73,978 | | | ASM Pacific Technology Ltd. (Information Technology) | | | 795,606 | |
| | 371,935 | | | Bank of East Asia Ltd. (The) (Financials) | | | 838,877 | |
| | 449,050 | | | CK Asset Holdings Ltd. (Real Estate) | | | 2,439,308 | |
| | 85,856 | | | CLP Holdings Ltd. (Utilities) | | | 843,588 | |
| | 619,564 | | | Dairy Farm International Holdings Ltd. (Consumer Staples) | | | 2,589,778 | |
| | 191,096 | | | Hang Lung Properties Ltd. (Real Estate) | | | 538,757 | |
| | 87,603 | | | Hang Seng Bank Ltd. (Financials) | | | 1,377,884 | |
| | 94,491 | | | Henderson Land Development Co. Ltd. (Real Estate) | | | 372,470 | |
| | 847,369 | | | HK Electric Investments & HK Electric Investments Ltd. (Utilities) | | | 862,660 | |
| | 740,934 | | | HKT Trust & HKT Ltd. (Communication Services) | | | 1,059,276 | |
| | 547,455 | | | Hong Kong & China Gas Co. Ltd. (Utilities) | | | 796,797 | |
| | 138,399 | | | Hong Kong Exchanges & Clearing Ltd. (Financials) | | | 6,985,889 | |
| | 14,848 | | | Jardine Matheson Holdings Ltd. (Industrials) | | | 623,616 | |
| | 29,058 | | | Jardine Strategic Holdings Ltd. (Industrials) | | | 582,904 | |
| | 81,102 | | | Link REIT (Real Estate) | | | 645,664 | |
| | 126,678 | | | MTR Corp. Ltd. (Industrials) | | | 659,530 | |
| | 1,917,198 | | | PCCW Ltd. (Communication Services) | | | 1,202,245 | |
| | 122,262 | | | Power Assets Holdings Ltd. (Utilities) | | | 700,429 | |
| | 43,955 | | | Sun Hung Kai Properties Ltd. (Real Estate) | | | 590,971 | |
| | 295,754 | | | Swire Pacific Ltd., Class A (Real Estate) | | | 1,610,397 | |
| | 234,344 | | | Techtronic Industries Co. Ltd. (Industrials) | | | 2,975,355 | |
| | 1,809,481 | | | WH Group Ltd. (Consumer Staples)(b) | | | 1,561,960 | |
| | | | | | | | |
| | | | | | | 38,483,600 | |
| | |
| | |
| The accompanying notes are an integral part of these financial statements. | | 49 |
GOLDMAN SACHS ACTIVEBETA® INTERNATIONAL EQUITY ETF
Schedule of Investments (continued)
August 31, 2020
| | | | | | | | |
Shares | | | Description | | Value | |
|
| Common Stocks – (continued) | |
| Ireland – 0.5% | |
| | 55,994 | | | CRH PLC (Materials) | | $ | 2,075,948 | |
| | 7,956 | | | Flutter Entertainment PLC (Consumer Discretionary) | | | 1,344,467 | |
| | 15,548 | | | Kerry Group PLC, Class A (Consumer Staples) | | | 2,045,410 | |
| | 10,524 | | | Kingspan Group PLC (Industrials) | | | 905,576 | |
| | 58,887 | | | Smurfit Kappa Group PLC (Materials) | | | 2,090,242 | |
| | | | | | | | |
| | | | | | | 8,461,643 | |
| | |
| Israel – 0.9% | |
| | 118,986 | | | Bank Hapoalim BM (Financials) | | | 722,063 | |
| | 123,886 | | | Bank Leumi Le-Israel BM (Financials) | | | 635,739 | |
| | 12,870 | | | Check Point Software Technologies Ltd. (Information Technology)* | | | 1,624,966 | |
| | 3,331 | | | Elbit Systems Ltd. (Industrials) | | | 450,197 | |
| | 141,684 | | | Israel Discount Bank Ltd., Class A (Financials) | | | 454,843 | |
| | 17,035 | | | Nice Ltd. (Information Technology)* | | | 3,903,298 | |
| | 580,430 | | | Teva Pharmaceutical Industries Ltd. ADR (Health Care)* | | | 5,728,844 | |
| | 8,777 | | | Wix.com Ltd. (Information Technology)* | | | 2,585,968 | |
| | | | | | | | |
| | | | | | | 16,105,918 | |
| | |
| Italy – 2.1% | |
| | 93,442 | | | Assicurazioni Generali SpA (Financials) | | | 1,453,335 | |
| | 50,485 | | | Atlantia SpA (Industrials)* | | | 804,833 | |
| | 87,516 | | | Davide Campari-Milano NV (Consumer Staples) | | | 899,280 | |
| | 8,577 | | | DiaSorin SpA (Health Care) | | | 1,554,037 | |
| | 561,797 | | | Enel SpA (Utilities) | | | 5,098,908 | |
| | 46,722 | | | Eni SpA (Energy) | | | 435,842 | |
| | 19,295 | | | Ferrari NV (Consumer Discretionary) | | | 3,765,981 | |
| | 116,138 | | | FinecoBank Banca Fineco SpA (Financials)* | | | 1,763,970 | |
| | 73,204 | | | Infrastrutture Wireless Italiane SpA (Communication Services)(b) | | | 714,832 | |
| | 1,081,259 | | | Intesa Sanpaolo SpA (Financials)* | | | 2,334,362 | |
| | 97,221 | | | Moncler SpA (Consumer Discretionary)* | | | 3,773,010 | |
| | 36,761 | | | Nexi SpA (Information Technology)*(b) | | | 655,728 | |
| | 203,327 | | | Poste Italiane SpA (Financials)(b) | | | 1,869,970 | |
| | 47,771 | | | Prysmian SpA (Industrials) | | | 1,339,168 | |
| | 51,046 | | | Recordati Industria Chimica e Farmaceutica SpA (Health Care) | | | 2,788,085 | |
| | 345,047 | | | Snam SpA (Utilities) | | | 1,770,308 | |
| | 5,353,422 | | | Telecom Italia SpA (Communication Services) | | | 2,553,288 | |
| | 4,195,609 | | | Telecom Italia SpA-RSP (Communication Services) | | | 1,986,022 | |
| | |
|
| Common Stocks – (continued) | |
| Italy – (continued) | |
| | 227,665 | | | Terna Rete Elettrica Nazionale SpA (Utilities) | | | 1,649,449 | |
| | | | | | | | |
| | | | | | | 37,210,408 | |
| | |
| Japan – 21.9% | |
| | 18,819 | | | ABC-Mart, Inc. (Consumer Discretionary)(a) | | | 990,240 | |
| | 36,407 | | | Advantest Corp. (Information Technology) | | | 1,740,615 | |
| | 72,189 | | | Aeon Co. Ltd. (Consumer Staples) | | | 1,789,664 | |
| | 43,060 | | | Aeon Mall Co. Ltd. (Real Estate) | | | 569,694 | |
| | 27,596 | | | Ajinomoto Co., Inc. (Consumer Staples) | | | 514,213 | |
| | 50,499 | | | Asahi Group Holdings Ltd. (Consumer Staples) | | | 1,768,144 | |
| | 19,761 | | | Asahi Intecc Co. Ltd. (Health Care) | | | 586,056 | |
| | 306,760 | | | Astellas Pharma, Inc. (Health Care) | | | 4,814,956 | |
| | 41,921 | | | Bandai Namco Holdings, Inc. (Consumer Discretionary) | | | 2,603,929 | |
| | 31,120 | | | Benesse Holdings, Inc. (Consumer Discretionary) | | | 792,636 | |
| | 48,903 | | | Bridgestone Corp. (Consumer Discretionary) | | | 1,549,936 | |
| | 133,556 | | | Brother Industries Ltd. (Information Technology) | | | 2,210,295 | |
| | 91,491 | | | Calbee, Inc. (Consumer Staples) | | | 2,851,410 | |
| | 91,290 | | | Canon, Inc. (Information Technology) | | | 1,577,097 | |
| | 35,841 | | | Casio Computer Co. Ltd. (Consumer Discretionary) | | | 577,606 | |
| | 11,074 | | | Central Japan Railway Co. (Industrials) | | | 1,659,351 | |
| | 42,988 | | | Chubu Electric Power Co., Inc. (Utilities) | | | 530,839 | |
| | 60,220 | | | Chugai Pharmaceutical Co. Ltd. (Health Care) | | | 2,680,924 | |
| | 66,368 | | | Chugoku Electric Power Co., Inc. (The) (Utilities) | | | 808,595 | |
| | 56,150 | | | Coca-Cola Bottlers Japan Holdings, Inc. (Consumer Staples) | | | 936,142 | |
| | 6,648 | | | Cosmos Pharmaceutical Corp. (Consumer Staples) | | | 1,169,175 | |
| | 42,546 | | | CyberAgent, Inc. (Communication Services) | | | 2,266,820 | |
| | 21,529 | | | Dai Nippon Printing Co. Ltd. (Industrials) | | | 457,602 | |
| | 12,047 | | | Daifuku Co. Ltd. (Industrials) | | | 1,059,913 | |
| | 25,057 | | | Dai-ichi Life Holdings, Inc. (Financials) | | | 379,358 | |
| | 49,951 | | | Daiichi Sankyo Co. Ltd. (Health Care) | | | 4,449,876 | |
| | 17,069 | | | Daikin Industries Ltd. (Industrials) | | | 3,213,566 | |
| | 28,293 | | | Daito Trust Construction Co. Ltd. (Real Estate) | | | 2,508,204 | |
| | 18,296 | | | Daiwa House Industry Co. Ltd. (Real Estate) | | | 490,073 | |
| | |
| | |
| 50 | | The accompanying notes are an integral part of these financial statements. |
GOLDMAN SACHS ACTIVEBETA® INTERNATIONAL EQUITY ETF
| | | | | | | | |
Shares | | | Description | | Value | |
|
| Common Stocks – (continued) | |
| Japan – (continued) | |
| | 145 | | | Daiwa House REIT Investment Corp. REIT (Real Estate) | | $ | 378,754 | |
| | 16,972 | | | Denso Corp. (Consumer Discretionary) | | | 713,322 | |
| | 71,859 | | | Dentsu Group, Inc. (Communication Services) | | | 1,886,515 | |
| | 1,697 | | | Disco Corp. (Information Technology) | | | 395,745 | |
| | 10,760 | | | East Japan Railway Co. (Industrials) | | | 699,813 | |
| | 28,307 | | | Eisai Co. Ltd. (Health Care) | | | 2,473,142 | |
| | 789,757 | | | ENEOS Holdings, Inc. (Energy) | | | 3,095,129 | |
| | 25,711 | | | FamilyMart Co. Ltd. (Consumer Staples) | | | 569,766 | |
| | 2,098 | | | FANUC Corp. (Industrials) | | | 368,082 | |
| | 5,386 | | | Fast Retailing Co. Ltd. (Consumer Discretionary)(a) | | | 3,213,976 | |
| | 58,173 | | | FUJIFILM Holdings Corp. (Information Technology) | | | 2,768,079 | |
| | 44,485 | | | Fujitsu Ltd. (Information Technology) | | | 5,797,376 | |
| | 21,098 | | | Fukuoka Financial Group, Inc. (Financials) | | | 349,163 | |
| | 213 | | | GLP J REIT (Real Estate) | | | 328,604 | |
| | 4,202 | | | GMO Payment Gateway, Inc. (Information Technology) | | | 444,193 | |
| | 55,353 | | | Hakuhodo DY Holdings, Inc. (Communication Services) | | | 689,009 | |
| | 12,575 | | | Hamamatsu Photonics KK (Information Technology) | | | 572,750 | |
| | 46,293 | | | Hankyu Hanshin Holdings, Inc. (Industrials) | | | 1,503,884 | |
| | 1,519 | | | Hikari Tsushin, Inc. (Consumer Discretionary) | | | 366,984 | |
| | 110,788 | | | Hitachi Ltd. (Information Technology) | | | 3,687,884 | |
| | 22,696 | | | Hitachi Metals Ltd. (Materials) | | | 340,510 | |
| | 175,571 | | | Honda Motor Co. Ltd. (Consumer Discretionary) | | | 4,518,207 | |
| | 79,267 | | | Hoya Corp. (Health Care) | | | 7,785,052 | |
| | 29,229 | | | Idemitsu Kosan Co. Ltd. (Energy) | | | 643,868 | |
| | 91,970 | | | Iida Group Holdings Co. Ltd. (Consumer Discretionary) | | | 1,795,256 | |
| | 265,567 | | | Inpex Corp. (Energy) | | | 1,687,388 | |
| | 46,199 | | | Ito En Ltd. (Consumer Staples) | | | 2,792,546 | |
| | 203,777 | | | ITOCHU Corp. (Industrials) | | | 5,233,501 | |
| | 25,468 | | | Itochu Techno-Solutions Corp. (Information Technology) | | | 922,223 | |
| | 49,301 | | | Japan Exchange Group, Inc. (Financials) | | | 1,277,563 | |
| | 59,686 | | | Japan Post Bank Co. Ltd. (Financials) | | | 480,100 | |
| | 207,497 | | | Japan Post Holdings Co. Ltd. (Financials) | | | 1,533,457 | |
| | 93,395 | | | Japan Post Insurance Co. Ltd. (Financials) | | | 1,491,924 | |
| | 51,618 | | | Japan Tobacco, Inc. (Consumer Staples) | | | 964,993 | |
| | 51,180 | | | JGC Holdings Corp. (Industrials) | | | 565,154 | |
| | 16,370 | | | JSR Corp. (Materials) | | | 348,873 | |
| | |
|
| Common Stocks – (continued) | |
| Japan – (continued) | |
| | 96,618 | | | Kakaku.com, Inc. (Communication Services) | | | 2,575,690 | |
| | 80,616 | | | Kamigumi Co. Ltd. (Industrials) | | | 1,664,850 | |
| | 62,046 | | | Kao Corp. (Consumer Staples) | | | 4,721,101 | |
| | 148,437 | | | KDDI Corp. (Communication Services) | | | 4,308,445 | |
| | 13,351 | | | Keihan Holdings Co. Ltd. (Industrials) | | | 575,360 | |
| | 7,177 | | | Keio Corp. (Industrials) | | | 433,821 | |
| | 15,956 | | | Keisei Electric Railway Co. Ltd. (Industrials) | | | 469,449 | |
| | 9,023 | | | Keyence Corp. (Information Technology) | | | 3,716,579 | |
| | 40,548 | | | Kikkoman Corp. (Consumer Staples) | | | 2,202,428 | |
| | 10,398 | | | Kintetsu Group Holdings Co. Ltd. (Industrials) | | | 456,926 | |
| | 89,095 | | | Kirin Holdings Co. Ltd. (Consumer Staples) | | | 1,751,738 | |
| | 10,596 | | | Kobayashi Pharmaceutical Co. Ltd. (Consumer Staples) | | | 943,243 | |
| | 13,330 | | | Kobe Bussan Co. Ltd. (Consumer Staples) | | | 785,633 | |
| | 16,204 | | | Komatsu Ltd. (Industrials) | | | 352,058 | |
| | 29,292 | | | Kose Corp. (Consumer Staples) | | | 3,433,444 | |
| | 26,291 | | | Kubota Corp. (Industrials) | | | 475,145 | |
| | 15,338 | | | Kyocera Corp. (Information Technology) | | | 880,404 | |
| | 25,030 | | | Kyowa Kirin Co. Ltd. (Health Care) | | | 647,199 | |
| | 67,441 | | | Kyushu Electric Power Co., Inc. (Utilities) | | | 597,172 | |
| | 21,290 | | | Kyushu Railway Co. (Industrials) | | | 469,386 | |
| | 9,300 | | | Lasertec Corp. (Information Technology) | | | 701,589 | |
| | 42,122 | | | Lawson, Inc. (Consumer Staples)(a) | | | 2,077,402 | |
| | 49,553 | | | LINE Corp. (Communication Services)* | | | 2,523,327 | |
| | 146,832 | | | Lion Corp. (Consumer Staples) | | | 3,109,856 | |
| | 50,707 | | | LIXIL Group Corp. (Industrials) | | | 932,422 | |
| | 34,992 | | | M3, Inc. (Health Care) | | | 2,026,035 | |
| | 7,452 | | | Makita Corp. (Industrials) | | | 344,333 | |
| | 365,482 | | | Marubeni Corp. (Industrials) | | | 2,204,369 | |
| | 19,841 | | | McDonald’s Holdings Co. Japan Ltd. (Consumer Discretionary) | | | 972,919 | |
| | 167,970 | | | Mebuki Financial Group, Inc. (Financials) | | | 407,075 | |
| | 31,829 | | | Medipal Holdings Corp. (Health Care) | | | 608,396 | |
| | 35,579 | | | MEIJI Holdings Co. Ltd. (Consumer Staples) | | | 2,871,953 | |
| | 11,539 | | | Mercari, Inc. (Consumer Discretionary)* | | | 523,387 | |
| | 86,945 | | | MISUMI Group, Inc. (Industrials) | | | 2,280,928 | |
| | 356,989 | | | Mitsubishi Chemical Holdings Corp. (Materials) | | | 2,086,490 | |
| | 143,769 | | | Mitsubishi Corp. (Industrials) | | | 3,406,286 | |
| | 98,411 | | | Mitsubishi Electric Corp. (Industrials) | | | 1,357,681 | |
| | 29,082 | | | Mitsubishi Estate Co. Ltd. (Real Estate) | | | 455,653 | |
| | |
| | |
| The accompanying notes are an integral part of these financial statements. | | 51 |
GOLDMAN SACHS ACTIVEBETA® INTERNATIONAL EQUITY ETF
Schedule of Investments (continued)
August 31, 2020
| | | | | | | | |
Shares | | | Description | | Value | |
|
| Common Stocks – (continued) | |
| Japan – (continued) | |
| | 19,386 | | | Mitsubishi Gas Chemical Co., Inc. (Materials) | | $ | 346,241 | |
| | 66,298 | | | Mitsubishi Heavy Industries Ltd. (Industrials) | | | 1,646,431 | |
| | 472,509 | | | Mitsubishi UFJ Financial Group, Inc. (Financials) | | | 1,971,665 | |
| | 328,123 | | | Mitsubishi UFJ Lease & Finance Co. Ltd. (Financials) | | | 1,550,187 | |
| | 75,193 | | | Mitsui & Co. Ltd. (Industrials) | | | 1,357,154 | |
| | 23,058 | | | Mitsui Chemicals, Inc. (Materials) | | | 542,068 | |
| | 11,217 | | | Miura Co. Ltd. (Industrials) | | | 459,067 | |
| | 983,483 | | | Mizuho Financial Group, Inc. (Financials) | | | 1,333,631 | |
| | 96,314 | | | MonotaRO Co. Ltd. (Industrials) | | | 3,805,513 | |
| | 23,412 | | | MS&AD Insurance Group Holdings, Inc. (Financials) | | | 649,297 | |
| | 35,940 | | | Murata Manufacturing Co. Ltd. (Information Technology) | | | 2,128,372 | |
| | 28,168 | | | Nagoya Railroad Co. Ltd. (Industrials) | | | 785,979 | |
| | 80,696 | | | NEC Corp. (Information Technology) | | | 4,253,766 | |
| | 35,896 | | | Nexon Co. Ltd. (Communication Services) | | | 840,490 | |
| | 17,387 | | | NH Foods Ltd. (Consumer Staples) | | | 787,822 | |
| | 19,604 | | | Nidec Corp. (Industrials) | | | 1,647,331 | |
| | 14,730 | | | Nihon M&A Center, Inc. (Industrials) | | | 733,409 | |
| | 5,993 | | | Nintendo Co. Ltd. (Communication Services) | | | 3,206,590 | |
| | 20,303 | | | Nippon Paint Holdings Co. Ltd. (Materials)(a) | | | 1,742,254 | |
| | 471 | | | Nippon Prologis REIT, Inc. REIT (Real Estate) | | | 1,541,204 | |
| | 239,636 | | | Nippon Telegraph & Telephone Corp. (Communication Services) | | | 5,449,406 | |
| | 13,536 | | | Nissan Chemical Corp. (Materials) | | | 717,359 | |
| | 10,986 | | | Nissin Foods Holdings Co. Ltd. (Consumer Staples) | | | 1,098,134 | |
| | 28,085 | | | Nitori Holdings Co. Ltd. (Consumer Discretionary) | | | 5,874,160 | |
| | 5,620 | | | Nitto Denko Corp. (Materials) | | | 341,297 | |
| | 76,576 | | �� | Nomura Holdings, Inc. (Financials) | | | 393,188 | |
| | 71,610 | | | Nomura Real Estate Holdings, Inc. (Real Estate) | | | 1,370,142 | |
| | 37,684 | | | Nomura Research Institute Ltd. (Information Technology) | | | 1,001,756 | |
| | 118,144 | | | NTT Data Corp. (Information Technology) | | | 1,350,281 | |
| | 199,381 | | | NTT DOCOMO, Inc. (Communication Services) | | | 5,563,378 | |
| | 120,886 | | | Obayashi Corp. (Industrials) | | | 1,182,128 | |
| | 11,920 | | | Obic Co. Ltd. (Information Technology) | | | 2,112,092 | |
| | 21,261 | | | Odakyu Electric Railway Co. Ltd. (Industrials) | | | 525,886 | |
| | 202,088 | | | Olympus Corp. (Health Care) | | | 4,000,026 | |
| | 41,420 | | | Omron Corp. (Information Technology) | | | 3,034,876 | |
| | |
|
| Common Stocks – (continued) | |
| Japan – (continued) | |
| | 43,474 | | | Ono Pharmaceutical Co. Ltd. (Health Care) | | | 1,311,456 | |
| | 7,477 | | | Oracle Corp. Japan (Information Technology) | | | 877,117 | |
| | 6,388 | | | Oriental Land Co. Ltd. (Consumer Discretionary) | | | 866,833 | |
| | 103,515 | | | ORIX Corp. (Financials) | | | 1,290,460 | |
| | 36,669 | | | Osaka Gas Co. Ltd. (Utilities) | | | 716,817 | |
| | 13,705 | | | Otsuka Corp. (Information Technology) | | | 672,035 | |
| | 27,622 | | | Otsuka Holdings Co. Ltd. (Health Care) | | | 1,213,029 | |
| | 30,718 | | | Pan Pacific International Holdings Corp. (Consumer Discretionary) | | | 721,567 | |
| | 140,396 | | | Panasonic Corp. (Consumer Discretionary) | | | 1,294,670 | |
| | 110,829 | | | Persol Holdings Co. Ltd. (Industrials) | | | 1,729,662 | |
| | 39,085 | | | Pigeon Corp. (Consumer Staples) | | | 1,785,721 | |
| | 126,261 | | | Pola Orbis Holdings, Inc. (Consumer Staples) | | | 2,287,212 | |
| | 178,657 | | | Recruit Holdings Co. Ltd. (Industrials) | | | 6,782,716 | |
| | 265,469 | | | Renesas Electronics Corp. (Information Technology)* | | | 1,669,742 | |
| | 197,184 | | | Resona Holdings, Inc. (Financials) | | | 725,180 | |
| | 72,046 | | | Ricoh Co. Ltd. (Information Technology)(a) | | | 538,757 | |
| | 5,578 | | | Rinnai Corp. (Consumer Discretionary) | | | 516,009 | |
| | 128,973 | | | Ryohin Keikaku Co. Ltd. (Consumer Discretionary) | | | 2,018,909 | |
| | 18,127 | | | Santen Pharmaceutical Co. Ltd. (Health Care) | | | 345,463 | |
| | 10,113 | | | Secom Co. Ltd. (Industrials) | | | 956,036 | |
| | 51,069 | | | Sekisui Chemical Co. Ltd. (Consumer Discretionary) | | | 817,239 | |
| | 173,615 | | | Sekisui House Ltd. (Consumer Discretionary)(a) | | | 3,431,534 | |
| | 71,580 | | | Seven & i Holdings Co. Ltd. (Consumer Staples) | | | 2,317,263 | |
| | 13,182 | | | SG Holdings Co. Ltd. (Industrials) | | | 605,990 | |
| | 35,015 | | | Shimadzu Corp. (Information Technology) | | | 1,045,051 | |
| | 11,829 | | | Shimamura Co. Ltd. (Consumer Discretionary) | | | 976,036 | |
| | 4,703 | | | Shimano, Inc. (Consumer Discretionary) | | | 995,637 | |
| | 13,856 | | | Shin-Etsu Chemical Co. Ltd. (Materials) | | | 1,683,574 | |
| | 42,883 | | | Shinsei Bank Ltd. (Financials) | | | 501,033 | |
| | 29,395 | | | Shionogi & Co. Ltd. (Health Care) | | | 1,630,730 | |
| | 90,936 | | | Shiseido Co. Ltd. (Consumer Staples) | | | 5,291,773 | |
| | 55,248 | | | Shizuoka Bank Ltd. (The) (Financials) | | | 383,967 | |
| | 2,974 | | | SMC Corp. (Industrials) | | | 1,633,604 | |
| | 97,110 | | | SoftBank Corp. (Communication Services)(a) | | | 1,275,173 | |
| | 69,382 | | | SoftBank Group Corp. (Communication Services) | | | 4,316,870 | |
| | |
| | |
| 52 | | The accompanying notes are an integral part of these financial statements. |
GOLDMAN SACHS ACTIVEBETA® INTERNATIONAL EQUITY ETF
| | | | | | | | |
Shares | | | Description | | Value | |
|
| Common Stocks – (continued) | |
| Japan – (continued) | |
| | 10,621 | | | Sompo Holdings, Inc. (Financials) | | $ | 398,619 | |
| | 86,697 | | | Sony Corp. (Consumer Discretionary) | | | 6,793,016 | |
| | 16,481 | | | Square Enix Holdings Co. Ltd. (Communication Services) | | | 1,086,352 | |
| | 27,868 | | | SUMCO Corp. (Information Technology) | | | 377,898 | |
| | 150,081 | | | Sumitomo Corp. (Industrials) | | | 1,945,272 | |
| | 95,728 | | | Sumitomo Dainippon Pharma Co. Ltd. (Health Care) | | | 1,211,438 | |
| | 36,437 | | | Sumitomo Electric Industries Ltd. (Consumer Discretionary) | | | 429,156 | |
| | 99,494 | | | Sumitomo Mitsui Financial Group, Inc. (Financials) | | | 2,925,383 | |
| | 28,048 | | | Sumitomo Mitsui Trust Holdings, Inc. (Financials) | | | 812,253 | |
| | 306,650 | | | Sumitomo Rubber Industries Ltd. (Consumer Discretionary) | | | 2,952,423 | |
| | 57,150 | | | Sundrug Co. Ltd. (Consumer Staples) | | | 2,126,048 | |
| | 45,298 | | | Suntory Beverage & Food Ltd. (Consumer Staples) | | | 1,747,077 | |
| | 10,335 | | | Suzuken Co. Ltd. (Health Care) | | | 383,987 | |
| | 41,383 | | | Sysmex Corp. (Health Care) | | | 3,612,452 | |
| | 34,024 | | | T&D Holdings, Inc. (Financials) | | | 356,138 | |
| | 14,795 | | | Taiheiyo Cement Corp. (Materials) | | | 376,136 | |
| | 18,949 | | | Taisho Pharmaceutical Holdings Co. Ltd. (Health Care) | | | 1,165,048 | |
| | 101,621 | | | Takeda Pharmaceutical Co. Ltd. (Health Care) | | | 3,793,838 | |
| | 6,725 | | | TDK Corp. (Information Technology) | | | 698,215 | |
| | 35,009 | | | Teijin Ltd. (Materials) | | | 549,342 | |
| | 39,434 | | | Terumo Corp. (Health Care) | | | 1,602,721 | |
| | 16,037 | | | Tobu Railway Co. Ltd. (Industrials) | | | 500,565 | |
| | 17,360 | | | Toho Co. Ltd. (Communication Services) | | | 659,727 | |
| | 16,151 | | | Toho Gas Co. Ltd. (Utilities) | | | 711,256 | |
| | 137,935 | | | Tohoku Electric Power Co., Inc. (Utilities) | | | 1,398,275 | |
| | 36,165 | | | Tokio Marine Holdings, Inc. (Financials) | | | 1,667,659 | |
| | 6,586 | | | Tokyo Century Corp. (Financials) | | | 337,855 | |
| | 16,704 | | | Tokyo Electron Ltd. (Information Technology) | | | 4,276,615 | |
| | 38,737 | | | Tokyo Gas Co. Ltd. (Utilities) | | | 860,802 | |
| | 39,718 | | | Tokyu Corp. (Industrials) | | | 531,096 | |
| | 26,212 | | | Toppan Printing Co. Ltd. (Industrials) | | | 407,349 | |
| | 267,807 | | | Toray Industries, Inc. (Materials) | | | 1,272,049 | |
| | 21,065 | | | Toshiba Corp. (Industrials) | | | 606,852 | |
| | 15,739 | | | TOTO Ltd. (Industrials) | | | 690,886 | |
| | 18,618 | | | Toyo Suisan Kaisha Ltd. (Consumer Staples) | | | 1,056,913 | |
| | 106,970 | | | Toyota Motor Corp. (Consumer Discretionary) | | | 7,067,111 | |
| | 53,665 | | | Toyota Tsusho Corp. (Industrials) | | | 1,563,722 | |
| | 11,735 | | | Trend Micro, Inc. (Information Technology) | | | 725,933 | |
| | |
|
| Common Stocks – (continued) | |
| Japan – (continued) | |
| | 18,360 | | | Tsuruha Holdings, Inc. (Consumer Staples) | | | 2,451,578 | |
| | 34,544 | | | Unicharm Corp. (Consumer Staples) | | | 1,503,004 | |
| | 29,928 | | | USS Co. Ltd. (Consumer Discretionary) | | | 505,456 | |
| | 199,824 | | | Welcia Holdings Co. Ltd. (Consumer Staples) | | | 8,545,446 | |
| | 9,296 | | | West Japan Railway Co. (Industrials) | | | 488,359 | |
| | 11,539 | | | Yakult Honsha Co. Ltd. (Consumer Staples) | | | 658,314 | |
| | 443,225 | | | Yamada Denki Co. Ltd. (Consumer Discretionary) | | | 2,378,189 | |
| | 9,492 | | | Yamaha Corp. (Consumer Discretionary) | | | 462,762 | |
| | 63,913 | | | Yamato Holdings Co. Ltd. (Industrials) | | | 1,670,676 | |
| | 199,484 | | | Yamazaki Baking Co. Ltd. (Consumer Staples)(a) | | | 3,246,823 | |
| | 42,212 | | | Yokogawa Electric Corp. (Information Technology) | | | 689,833 | |
| | 140,366 | | | Yokohama Rubber Co. Ltd. (The) (Consumer Discretionary) | | | 2,198,575 | |
| | 142,180 | | | Z Holdings Corp. (Communication Services) | | | 945,230 | |
| | 165,394 | | | ZOZO, Inc. (Consumer Discretionary) | | | 4,654,021 | |
| | | | | | | | |
| | | | | | | 381,223,074 | |
| | |
| Jordan – 0.1% | |
| | 40,477 | | | Hikma Pharmaceuticals PLC (Health Care) | | | 1,285,003 | |
| | |
| Luxembourg – 0.4% | |
| | 419,007 | | | ArcelorMittal (Materials)* | | | 5,312,786 | |
| | 1,059 | | | Eurofins Scientific SE (Health Care)* | | | 850,589 | |
| | 151,916 | | | SES SA (Communication Services) | | | 1,081,020 | |
| | | | | | | | |
| | | | | | | 7,244,395 | |
| | |
| Macau – 0.0% | |
| | 651,424 | | | SJM Holdings Ltd. (Consumer Discretionary) | | | 896,006 | |
| | |
| Netherlands – 3.4% | |
| | 1,342 | | | Adyen NV (Information Technology)*(b) | | | 2,267,816 | |
| | 691,796 | | | Aegon NV (Financials) | | | 1,930,216 | |
| | 12,966 | | | Akzo Nobel NV (Materials) | | | 1,286,125 | |
| | 127,915 | | | Altice Europe NV (Communication Services)* | | | 567,250 | |
| | 2,518 | | | Argenx SE (Health Care)* | | | 583,309 | |
| | 24,456 | | | ASML Holding NV (Information Technology) | | | 9,192,699 | |
| | 43,727 | | | EXOR NV (Financials) | | | 2,583,389 | |
| | 16,729 | | | Heineken Holding NV (Consumer Staples) | | | 1,373,484 | |
| | 14,772 | | | Heineken NV (Consumer Staples) | | | 1,370,220 | |
| | 248,888 | | | ING Groep NV (Financials)* | | | 2,025,263 | |
| | |
| | |
| The accompanying notes are an integral part of these financial statements. | | 53 |
GOLDMAN SACHS ACTIVEBETA® INTERNATIONAL EQUITY ETF
Schedule of Investments (continued)
August 31, 2020
| | | | | | | | |
Shares | | | Description | | Value | |
|
| Common Stocks – (continued) | |
| Netherlands – (continued) | |
| | 263,981 | | | Koninklijke Ahold Delhaize NV (Consumer Staples) | | $ | 7,962,161 | |
| | 15,896 | | | Koninklijke DSM NV (Materials) | | | 2,556,006 | |
| | 254,380 | | | Koninklijke KPN NV (Communication Services) | | | 668,384 | |
| | 112,104 | | | Koninklijke Philips NV (Health Care)* | | | 5,313,898 | |
| | 22,970 | | | Koninklijke Vopak NV (Energy) | | | 1,264,215 | |
| | 69,212 | | | NN Group NV (Financials) | | | 2,611,524 | |
| | 53,848 | | | Randstad NV (Industrials) | | | 2,812,328 | |
| | 279,270 | | | Royal Dutch Shell PLC, Class A (Energy) | | | 4,138,641 | |
| | 267,108 | | | Royal Dutch Shell PLC, Class B (Energy) | | | 3,801,758 | |
| | 59,407 | | | Wolters Kluwer NV (Industrials) | | | 4,888,091 | |
| | | | | | | | |
| | | | | | | 59,196,777 | |
| | |
| New Zealand – 0.5% | |
| | 144,346 | | | a2 Milk Co. Ltd. (The) (Consumer Staples)* | | | 1,813,704 | |
| | 137,817 | | | Fisher & Paykel Healthcare Corp. Ltd. (Health Care) | | | 3,432,596 | |
| | 174,357 | | | Mercury NZ Ltd. (Utilities) | | | 611,630 | |
| | 310,776 | | | Meridian Energy Ltd. (Utilities) | | | 1,067,072 | |
| | 309,800 | | | Spark New Zealand Ltd. (Communication Services) | | | 1,011,372 | |
| | | | | | | | |
| | | | | | | 7,936,374 | |
| | |
| Norway – 0.8% | |
| | 31,731 | | | DNB ASA (Financials)* | | | 512,640 | |
| | 28,011 | | | Equinor ASA (Energy) | | | 457,059 | |
| | 134,210 | | | Gjensidige Forsikring ASA (Financials)* | | | 2,878,138 | |
| | 35,678 | | | Mowi ASA (Consumer Staples) | | | 702,418 | |
| | 828,867 | | | Norsk Hydro ASA (Materials)* | | | 2,663,874 | |
| | 80,741 | | | Orkla ASA (Consumer Staples) | | | 827,321 | |
| | 94,661 | | | Schibsted ASA, Class B (Communication Services)* | | | 3,776,405 | |
| | 55,773 | | | Telenor ASA (Communication Services) | | | 913,268 | |
| | 9,942 | | | Yara International ASA (Materials) | | | 419,310 | |
| | | | | | | | |
| | | | | | | 13,150,433 | |
| | |
| Portugal – 0.3% | |
| | 557,591 | | | EDP – Energias de Portugal SA (Utilities) | | | 2,828,783 | |
| | 33,445 | | | Galp Energia SGPS SA (Energy) | | | 358,867 | |
| | 176,004 | | | Jeronimo Martins SGPS SA (Consumer Staples) | | | 2,895,319 | |
| | | | | | | | |
| | | | | | | 6,082,969 | |
| | |
| Russia – 0.1% | |
| | 301,639 | | | Evraz PLC (Materials) | | | 1,309,377 | |
| | |
| Singapore – 1.1% | |
| | 394,959 | | | Ascendas Real Estate Investment Trust REIT (Real Estate) | | | 964,448 | |
| | |
|
| Common Stocks – (continued) | |
| Singapore – (continued) | |
| | 225,927 | | | DBS Group Holdings Ltd. (Financials) | | | 3,468,003 | |
| | 220,445 | | | Jardine Cycle & Carriage Ltd. (Consumer Discretionary) | | | 3,072,545 | |
| | 394,343 | | | Mapletree Logistics Trust REIT (Real Estate) | | | 600,390 | |
| | 516,116 | | | Oversea-Chinese Banking Corp. Ltd. (Financials) | | | 3,291,208 | |
| | 780,138 | | | Singapore Exchange Ltd. (Financials) | | | 4,940,415 | |
| | 271,806 | | | Singapore Telecommunications Ltd. (Communication Services) | | | 459,807 | |
| | 145,896 | | | United Overseas Bank Ltd. (Financials) | | | 2,098,945 | |
| | 23,406 | | | Venture Corp. Ltd. (Information Technology) | | | 341,725 | |
| | | | | | | | |
| | | | | | | 19,237,486 | |
| | |
| South Africa – 0.1% | |
| | 81,923 | | | Anglo American PLC (Materials) | | | 2,010,193 | |
| | |
| Spain – 1.8% | |
| | 197,543 | | | ACS Actividades de Construccion y Servicios SA (Industrials) | | | 4,847,884 | |
| | 2,591 | | | Aena SME SA (Industrials)*(b) | | | 387,648 | |
| | 52,850 | | | Amadeus IT Group SA (Information Technology) | | | 2,964,993 | |
| | 228,013 | | | Banco Santander SA (Financials) | | | 507,971 | |
| | 23,607 | | | Cellnex Telecom SA (Communication Services)*(b) | | | 1,515,537 | |
| | 57,637 | | | Enagas SA (Utilities) | | | 1,412,396 | |
| | 56,992 | | | Endesa SA (Utilities) | | | 1,583,348 | |
| | 47,300 | | | Ferrovial SA (Industrials) | | | 1,266,002 | |
| | 36,015 | | | Grifols SA (Health Care) | | | 978,169 | |
| | 517,070 | | | Iberdrola SA (Utilities) | | | 6,524,016 | |
| | 172,473 | | | Industria de Diseno Textil SA (Consumer Discretionary) | | | 4,857,639 | |
| | 622,953 | | | Mapfre SA (Financials) | | | 1,183,093 | |
| | 55,775 | | | Naturgy Energy Group SA (Utilities) | | | 1,077,939 | |
| | 40,341 | | | Red Electrica Corp. SA (Utilities) | | | 773,140 | |
| | 61,201 | | | Repsol SA (Energy) | | | 484,686 | |
| | 21,396 | | | Siemens Gamesa Renewable Energy SA (Industrials) | | | 574,207 | |
| | 204,039 | | | Telefonica SA (Communication Services) | | | 807,952 | |
| | | | | | | | |
| | | | | | | 31,746,620 | |
| | |
| Sweden – 2.9% | |
| | 64,570 | | | Assa Abloy AB, Class B (Industrials) | | | 1,497,284 | |
| | 72,541 | | | Atlas Copco AB, Class A (Industrials) | | | 3,363,399 | |
| | 34,993 | | | Atlas Copco AB, Class B (Industrials) | | | 1,409,060 | |
| | 37,349 | | | Electrolux AB, Series B (Consumer Discretionary) | | | 811,506 | |
| | 72,555 | | | Epiroc AB, Class A (Industrials) | | | 1,083,074 | |
| | 31,619 | | | Epiroc AB, Class B (Industrials) | | | 455,866 | |
| | 46,902 | | | Essity AB, Class B (Consumer Staples)* | | | 1,618,332 | |
| | 55,513 | | | Evolution Gaming Group AB (Consumer Discretionary)(b) | | | 4,169,453 | |
| | |
| | |
| 54 | | The accompanying notes are an integral part of these financial statements. |
GOLDMAN SACHS ACTIVEBETA® INTERNATIONAL EQUITY ETF
| | | | | | | | |
Shares | | | Description | | Value | |
|
| Common Stocks – (continued) | |
| Sweden – (continued) | |
| | 244,698 | | | Hennes & Mauritz AB, Class B (Consumer Discretionary) | | $ | 3,912,354 | |
| | 12,367 | | | Hexagon AB, Class B (Information Technology)* | | | 898,172 | |
| | 123,498 | | | Husqvarna AB, Class B (Consumer Discretionary) | | | 1,345,671 | |
| | 22,944 | | | ICA Gruppen AB (Consumer Staples) | | | 1,128,452 | |
| | 29,796 | | | Industrivarden AB, Class C (Financials)* | | | 787,310 | |
| | 40,931 | | | Investment AB Latour, Class B (Industrials) | | | 915,436 | |
| | 38,785 | | | Investor AB, Class B (Financials) | | | 2,479,556 | |
| | 28,577 | | | Kinnevik AB, Class B (Financials) | | | 1,106,806 | |
| | 24,034 | | | Kinnevik AB, Class B (Financials)* | | | 19,367 | |
| | 23,835 | | | L E Lundbergforetagen AB, Class B (Financials)* | | | 1,091,580 | |
| | 35,432 | | | Nibe Industrier AB, Class B (Industrials)* | | | 998,264 | |
| | 95,878 | | | Sandvik AB (Industrials)* | | | 1,887,557 | |
| | 126,134 | | | Securitas AB, Class B (Industrials)* | | | 1,800,253 | |
| | 105,593 | | | Skandinaviska Enskilda Banken AB, Class A (Financials)* | | | 1,049,692 | |
| | 153,031 | | | Skanska AB, Class B (Industrials)* | | | 3,126,286 | |
| | 45,017 | | | SKF AB, Class B (Industrials) | | | 900,867 | |
| | 41,360 | | | Svenska Cellulosa AB SCA, Class B (Materials)* | | | 534,446 | |
| | 77,003 | | | Svenska Handelsbanken AB, Class A (Financials)* | | | 776,909 | |
| | 20,882 | | | Swedbank AB, Class A (Financials)* | | | 354,984 | |
| | 63,976 | | | Swedish Match AB (Consumer Staples) | | | 4,870,363 | |
| | 65,857 | | | Tele2 AB, Class B (Communication Services) | | | 935,747 | |
| | 284,422 | | | Telefonaktiebolaget LM Ericsson, Class B (Information Technology) | | | 3,305,910 | |
| | 225,870 | | | Telia Co. AB (Communication Services) | | | 872,322 | |
| | 53,970 | | | Volvo AB, Class B (Industrials)* | | | 1,034,353 | |
| | | | | | | | |
| | | | | | | 50,540,631 | |
| | |
| Switzerland – 9.0% | |
| | 101,707 | | | ABB Ltd. (Industrials) | | | 2,594,491 | |
| | 33,288 | | | Adecco Group AG (Industrials) | | | 1,747,116 | |
| | 18,062 | | | Alcon, Inc. (Health Care)* | | | 1,030,223 | |
| | 5,090 | | | Baloise Holding AG (Financials) | | | 794,209 | |
| | 11,586 | | | Banque Cantonale Vaudoise (Financials) | | | 1,241,656 | |
| | 508 | | | Barry Callebaut AG (Consumer Staples) | | | 1,128,325 | |
| | 258 | | | Chocoladefabriken Lindt & Spruengli AG (Consumer Staples) | | | 2,204,798 | |
| | 25,687 | | | Cie Financiere Richemont SA (Consumer Discretionary) | | | 1,704,764 | |
| | 19,973 | | | Clariant AG (Materials) | | | 417,005 | |
| | 59,606 | | | Coca-Cola HBC AG (Consumer Staples)* | | | 1,591,400 | |
| | |
|
| Common Stocks – (continued) | |
| Switzerland – (continued) | |
| | 200,487 | | | Credit Suisse Group AG (Financials) | | | 2,211,825 | |
| | 1,601 | | | EMS-Chemie Holding AG (Materials)(a) | | | 1,448,181 | |
| | 2,984 | | | Geberit AG (Industrials) | | | 1,725,216 | |
| | 804 | | | Givaudan SA (Materials) | | | 3,384,041 | |
| | 34,936 | | | Kuehne + Nagel International AG (Industrials)* | | | 6,791,656 | |
| | 49,901 | | | LafargeHolcim Ltd. (Materials)* | | | 2,377,426 | |
| | 32,230 | | | Logitech International SA (Information Technology) | | | 2,391,703 | |
| | 4,936 | | | Lonza Group AG (Health Care) | | | 3,071,947 | |
| | 291,018 | | | Nestle SA (Consumer Staples) | | | 35,085,695 | |
| | 193,123 | | | Novartis AG (Health Care) | | | 16,737,541 | |
| | 7,025 | | | Partners Group Holding AG (Financials) | | | 7,160,359 | |
| | 72,154 | | | Roche Holding AG (Health Care) | | | 25,297,371 | |
| | 4,259 | | | Schindler Holding AG (Industrials) | | | 1,124,760 | |
| | 5,796 | | | Schindler Holding AG Participation Certificates (Industrials) | | | 1,551,908 | |
| | 1,643 | | | SGS SA (Industrials) | | | 4,266,016 | |
| | 9,398 | | | Sika AG (Materials) | | | 2,260,655 | |
| | 13,978 | | | Sonova Holding AG (Health Care)* | | | 3,276,979 | |
| | 170,395 | | | STMicroelectronics NV (Information Technology) | | | 5,137,394 | |
| | 4,844 | | | Straumann Holding AG (Health Care) | | | 4,781,328 | |
| | 8,252 | | | Swatch Group AG (The) – Bearer (Consumer Discretionary) | | | 1,750,383 | |
| | 33,369 | | | Swatch Group AG (The) – Registered (Consumer Discretionary) | | | 1,320,752 | |
| | 1,738 | | | Swiss Life Holding AG (Financials) | | | 704,117 | |
| | 11,850 | | | Swiss Prime Site AG (Real Estate) | | | 1,070,573 | |
| | 7,337 | | | Swiss Re AG (Financials) | | | 591,882 | |
| | 2,190 | | | Swisscom AG (Communication Services) | | | 1,216,059 | |
| | 2,836 | | | Temenos AG (Information Technology) | | | 459,202 | |
| | 174,028 | | | UBS Group AG (Financials) | | | 2,123,047 | |
| | 8,952 | | | Zurich Insurance Group AG (Financials) | | | 3,320,526 | |
| | | | | | | | |
| | | | | | | 157,092,529 | |
| | |
| United Kingdom – 11.1% | |
| | 205,880 | | | Admiral Group PLC (Financials) | | | 7,269,233 | |
| | 22,567 | | | Ashtead Group PLC (Industrials) | | | 787,129 | |
| | 85,779 | | | Associated British Foods PLC (Consumer Staples) | | | 2,349,908 | |
| | 104,414 | | | AstraZeneca PLC (Health Care) | | | 11,659,746 | |
| | 841,011 | | | Auto Trader Group PLC (Communication Services)(b) | | | 6,342,035 | |
| | 15,673 | | | AVEVA Group PLC (Information Technology) | | | 1,064,377 | |
| | 780,944 | | | Aviva PLC (Financials) | | | 2,956,038 | |
| | 202,071 | | | BAE Systems PLC (Industrials) | | | 1,405,845 | |
| | 509,708 | | | Barclays PLC (Financials)* | | | 764,097 | |
| | 98,050 | | | Barratt Developments PLC (Consumer Discretionary) | | | 689,504 | |
| | |
| | |
| The accompanying notes are an integral part of these financial statements. | | 55 |
GOLDMAN SACHS ACTIVEBETA® INTERNATIONAL EQUITY ETF
Schedule of Investments (continued)
August 31, 2020
| | | | | | | | |
Shares | | | Description | | Value | |
|
| Common Stocks – (continued) | |
| United Kingdom – (continued) | |
| | 41,539 | | | Berkeley Group Holdings PLC (Consumer Discretionary) | | $ | 2,535,654 | |
| | 546,790 | | | BP PLC (Energy) | | | 1,934,273 | |
| | 203,605 | | | British American Tobacco PLC (Consumer Staples) | | | 6,904,022 | |
| | 102,613 | | | British Land Co. PLC (The) REIT (Real Estate) | | | 502,449 | |
| | 361,816 | | | BT Group PLC (Communication Services) | | | 506,980 | |
| | 42,958 | | | Bunzl PLC (Industrials) | | | 1,393,101 | |
| | 219,872 | | | Burberry Group PLC (Consumer Discretionary) | | | 4,252,573 | |
| | 345,829 | | | CK Hutchison Holdings Ltd. (Industrials) | | | 2,264,578 | |
| | 43,591 | | | Coca-Cola European Partners PLC (Consumer Staples) | | | 1,794,206 | |
| | 164,399 | | | Compass Group PLC (Consumer Discretionary) | | | 2,686,589 | |
| | 28,815 | | | Croda International PLC (Materials) | | | 2,276,328 | |
| | 10,620 | | | DCC PLC (Industrials) | | | 942,478 | |
| | 127,193 | | | Diageo PLC (Consumer Staples) | | | 4,273,805 | |
| | 156,365 | | | Direct Line Insurance Group PLC (Financials) | | | 617,417 | |
| | 107,355 | | | Experian PLC (Industrials) | | | 4,010,428 | |
| | 454,917 | | | GlaxoSmithKline PLC (Health Care) | | | 8,966,114 | |
| | 128,719 | | | GVC Holdings PLC (Consumer Discretionary)* | | | 1,386,025 | |
| | 59,730 | | | Halma PLC (Information Technology) | | | 1,773,856 | |
| | 243,108 | | | Hargreaves Lansdown PLC (Financials) | | | 5,261,859 | |
| | 524,979 | | | HSBC Holdings PLC (Financials) | | | 2,320,692 | |
| | 146,369 | | | Imperial Brands PLC (Consumer Staples) | | | 2,455,639 | |
| | 16,288 | | | Intertek Group PLC (Industrials) | | | 1,281,486 | |
| | 2,069,525 | | | J Sainsbury PLC (Consumer Staples) | | | 5,093,080 | |
| | 449,102 | | | JD Sports Fashion PLC (Consumer Discretionary) | | | 4,364,417 | |
| | 17,502 | | | Johnson Matthey PLC (Materials) | | | 556,565 | |
| | 622,153 | | | Kingfisher PLC (Consumer Discretionary) | | | 2,251,684 | |
| | 66,409 | | | Land Securities Group PLC REIT (Real Estate) | | | 514,037 | |
| | 980,850 | | | Legal & General Group PLC (Financials) | | | 2,853,820 | |
| | 1,145,219 | | | Lloyds Banking Group PLC (Financials)* | | | 434,716 | |
| | 37,173 | | | London Stock Exchange Group PLC (Financials) | | | 4,380,005 | |
| | 1,369,415 | | | M&G PLC (Financials) | | | 3,172,090 | |
| | 265,902 | | | Melrose Industries PLC (Industrials) | | | 362,438 | |
| | 47,492 | | | Mondi PLC (Materials) | | | 929,041 | |
| | 245,055 | | | National Grid PLC (Utilities) | | | 2,766,677 | |
| | 52,627 | | | Next PLC (Consumer Discretionary) | | | 4,254,671 | |
| | 92,671 | | | Ocado Group PLC (Consumer Discretionary)* | | | 3,098,323 | |
| | |
|
| Common Stocks – (continued) | |
| United Kingdom – (continued) | |
| | 129,170 | | | Pearson PLC (Communication Services) | | | 967,494 | |
| | 18,813 | | | Persimmon PLC (Consumer Discretionary) | | | 659,969 | |
| | 98,587 | | | Prudential PLC (Financials) | | | 1,612,417 | |
| | 42,191 | | | Reckitt Benckiser Group PLC (Consumer Staples) | | | 4,242,521 | |
| | 158,071 | | | RELX PLC (Industrials) | | | 3,603,326 | |
| | 187,179 | | | Rentokil Initial PLC (Industrials)* | | | 1,335,822 | |
| | 129,696 | | | Rolls-Royce Holdings PLC (Industrials)* | | | 418,686 | |
| | 95,884 | | | RSA Insurance Group PLC (Financials) | | | 576,829 | |
| | 475,953 | | | Sage Group PLC (The) (Information Technology) | | | 4,719,675 | |
| | 38,028 | | | Schroders PLC (Financials) | | | 1,475,591 | |
| | 269,260 | | | Segro PLC REIT (Real Estate) | | | 3,435,088 | |
| | 45,693 | | | Severn Trent PLC (Utilities) | | | 1,426,732 | |
| | 134,742 | | | Smith & Nephew PLC (Health Care) | | | 2,744,980 | |
| | 10,035 | | | Spirax-Sarco Engineering PLC (Industrials) | | | 1,376,555 | |
| | 84,978 | | | SSE PLC (Utilities) | | | 1,432,506 | |
| | 144,458 | | | St James’s Place PLC (Financials) | | | 1,895,149 | |
| | 368,860 | | | Standard Chartered PLC (Financials)* | | | 1,938,005 | |
| | 248,799 | | | Standard Life Aberdeen PLC (Financials) | | | 790,183 | |
| | 1,158,677 | | | Tesco PLC (Consumer Staples) | | | 3,392,934 | |
| | 142,810 | | | Unilever NV (Consumer Staples) | | | 8,285,202 | |
| | 124,992 | | | Unilever PLC (Consumer Staples) | | | 7,464,167 | |
| | 85,725 | | | United Utilities Group PLC (Utilities) | | | 954,064 | |
| | 2,184,060 | | | Vodafone Group PLC (Communication Services) | | | 3,258,892 | |
| | 800,324 | | | Wm Morrison Supermarkets PLC (Consumer Staples)(a) | | | 2,060,675 | |
| | 277,147 | | | WPP PLC (Communication Services) | | | 2,395,731 | |
| | | | | | | | |
| | | | | | | 193,123,221 | |
| | |
| United States – 0.8% | |
| | 51,736 | | | Bausch Health Cos., Inc. (Health Care)* | | | 859,653 | |
| | 3,468 | | | CyberArk Software Ltd. (Information Technology)* | | | 383,214 | |
| | 78,089 | | | Ferguson PLC (Industrials) | | | 7,712,143 | |
| | 47,689 | | | James Hardie Industries PLC CDI (Materials) | | | 1,087,324 | |
| | 19,508 | | | QIAGEN NV (Health Care)* | | | 993,184 | |
| | 470,997 | | | Tenaris SA (Energy) | | | 2,771,382 | |
| | | | | | | | |
| | | | | | | 13,806,900 | |
| | |
| Zambia – 0.0% | |
| | 37,709 | | | First Quantum Minerals Ltd. (Materials) | | | 373,632 | |
| | |
| | TOTAL COMMON STOCKS | |
| | (Cost $1,590,481,007) | | $ | 1,730,862,936 | |
| | |
| | |
| 56 | | The accompanying notes are an integral part of these financial statements. |
GOLDMAN SACHS ACTIVEBETA® INTERNATIONAL EQUITY ETF
| | | | | | | | | | | | |
Shares | | | Description | | Rate | | | Value | |
|
| Preferred Stocks – 0.4% | |
| Germany – 0.4% | | | | |
| | 67,439 | | | FUCHS PETROLUB SE (Materials) | | | 2.45 | % | | $ | 3,195,500 | |
| | 16,987 | | | Henkel AG & Co. KGaA (Consumer Staples) | | | 2.12 | | | | 1,738,203 | |
| | 5,151 | | | Sartorius AG (Health Care) | | | 0.10 | | | | 2,186,921 | |
| | 5,727 | | | Volkswagen AG (Consumer Discretionary)* | | | 0.00 | | | | 954,369 | |
| | |
| | TOTAL PREFERRED STOCKS | | | | | |
| | (Cost $7,131,474) | | | | | | $ | 8,074,993 | |
| | |
| TOTAL INVESTMENTS BEFORE SECURITIES LENDING
REINVESTMENT VEHICLE |
|
| | (Cost $1,597,612,481) | | | | | | $ | 1,738,937,929 | |
| | |
| | | | | | | | |
| Shares | | Dividend
Rate | | | Value | |
|
| Securities Lending Reinvestment Vehicle – 1.4%(c) | |
Goldman Sachs Financial Square Government Fund – Institutional Shares | |
| 24,830,933 | | | 0.027 | % | | $ | 24,830,933 | |
| (Cost $24,830,933) | | | | | |
| |
| TOTAL INVESTMENTS – 101.1% | |
| (Cost $1,622,443,414) | | | $ | 1,763,768,862 | |
| |
LIABILITIES IN EXCESS OF
OTHER ASSETS – (1.1)% | | | | (20,206,594 | ) |
| |
| NET ASSETS – 100.0% | | | $ | 1,743,562,268 | |
| |
| | |
|
| The percentage shown for each investment category reflects the value of investments in that category as a percentage of net assets. |
| |
* | | Non-income producing security. |
| |
(a) | | All or a portion of security is on loan. |
| |
(b) | | Exempt from registration under Rule 144A of the Securities Act of 1933. |
| |
(c) | | Represents an affiliated issuer. |
| | |
|
Investment Abbreviations: |
ADR | | —American Depositary Receipt |
PLC | | —Public Limited Company |
REIT | | —Real Estate Investment Trust |
|
| | |
| The accompanying notes are an integral part of these financial statements. | | 57 |
GOLDMAN SACHS ACTIVEBETA® JAPAN EQUITY ETF
Schedule of Investments
August 31, 2020
| | | | | | | | |
Shares | | | Description | | Value | |
|
| Common Stocks – 99.5% | |
| Communication Services – 10.7% | |
| | 1,045 | | | CyberAgent, Inc. | | $ | 55,677 | |
| | 1,045 | | | Dentsu Group, Inc. | | | 27,434 | |
| | 3,634 | | | Hakuhodo DY Holdings, Inc. | | | 45,234 | |
| | 1,979 | | | Kakaku.com, Inc. | | | 52,757 | |
| | 8,923 | | | KDDI Corp. | | | 258,994 | |
| | 547 | | | Konami Holdings Corp. | | | 21,071 | |
| | 1,418 | | | LINE Corp.* | | | 72,207 | |
| | 3,284 | | | Nexon Co. Ltd. | | | 76,894 | |
| | 552 | | | Nintendo Co. Ltd. | | | 295,351 | |
| | 10,145 | | | Nippon Telegraph & Telephone Corp. | | | 230,701 | |
| | 8,349 | | | NTT DOCOMO, Inc. | | | 232,964 | |
| | 9,415 | | | SoftBank Corp.(a) | | | 123,631 | |
| | 6,882 | | | SoftBank Group Corp. | | | 428,190 | |
| | 1,104 | | | Square Enix Holdings Co. Ltd. | | | 72,771 | |
| | 810 | | | Toho Co. Ltd. | | | 30,782 | |
| | 11,331 | | | Z Holdings Corp. | | | 75,330 | |
| | | | | | | | |
| | | | | | | 2,099,988 | |
| | |
| Consumer Discretionary – 17.8% | |
| | 757 | | | ABC-Mart, Inc.(a) | | | 39,833 | |
| | 234 | | | Aisin Seiki Co. Ltd. | | | 8,043 | |
| | 1,306 | | | Bandai Namco Holdings, Inc. | | | 81,122 | |
| | 1,482 | | | Benesse Holdings, Inc. | | | 37,747 | |
| | 2,778 | | | Bridgestone Corp. | | | 88,046 | |
| | 2,918 | | | Casio Computer Co. Ltd. | | | 47,026 | |
| | 1,305 | | | Denso Corp. | | | 54,848 | |
| | 282 | | | Fast Retailing Co. Ltd.(a) | | | 168,277 | |
| | 170 | | | Hikari Tsushin, Inc. | | | 41,071 | |
| | 8,540 | | | Honda Motor Co. Ltd. | | | 219,771 | |
| | 4,482 | | | Iida Group Holdings Co. Ltd. | | | 87,489 | |
| | 1,562 | | | Isetan Mitsukoshi Holdings Ltd. | | | 8,602 | |
| | 787 | | | Isuzu Motors Ltd. | | | 7,785 | |
| | 565 | | | JTEKT Corp. | | | 4,364 | |
| | 234 | | | Koito Manufacturing Co. Ltd. | | | 11,342 | |
| | 1,561 | | | Marui Group Co. Ltd. | | | 28,513 | |
| | 1,381 | | | Mazda Motor Corp. | | | 8,855 | |
| | 779 | | | McDonald’s Holdings Co. Japan Ltd. | | | 38,199 | |
| | 574 | | | Mercari, Inc.* | | | 26,036 | |
| | 424 | | | NGK Spark Plug Co. Ltd. | | | 7,297 | |
| | 1,145 | | | Nikon Corp. | | | 8,983 | |
| | 3,069 | | | Nissan Motor Co. Ltd. | | | 12,488 | |
| | 550 | | | Nitori Holdings Co. Ltd. | | | 115,036 | |
| | 595 | | | Oriental Land Co. Ltd. | | | 80,740 | |
| | 2,542 | | | Pan Pacific International Holdings Corp. | | | 59,712 | |
| | 10,769 | | | Panasonic Corp. | | | 99,307 | |
| | 2,673 | | | Rakuten, Inc. | | | 23,517 | |
| | 400 | | | Rinnai Corp. | | | 37,003 | |
| | 2,251 | | | Ryohin Keikaku Co. Ltd. | | | 35,237 | |
| | 1,458 | | | Sega Sammy Holdings, Inc. | | | 16,897 | |
| | 3,381 | | | Sekisui Chemical Co. Ltd. | | | 54,105 | |
| | 6,281 | | | Sekisui House Ltd.(a) | | | 124,145 | |
| | 622 | | | Sharp Corp. | | | 7,725 | |
| | 536 | | | Shimamura Co. Ltd. | | | 44,227 | |
| | 329 | | | Shimano, Inc. | | | 69,650 | |
| | 6,299 | | | Sony Corp. | | | 493,549 | |
| | 488 | | | Stanley Electric Co. Ltd. | | | 13,990 | |
| | |
|
| Common Stocks – (continued) | |
| Consumer Discretionary – (continued) | |
| | 1,482 | | | Subaru Corp. | | | 30,780 | |
| | 2,042 | | | Sumitomo Electric Industries Ltd. | | | 24,051 | |
| | 11,785 | | | Sumitomo Rubber Industries Ltd. | | | 113,466 | |
| | 1,203 | | | Suzuki Motor Corp. | | | 49,336 | |
| | 461 | | | Toyoda Gosei Co. Ltd. | | | 10,064 | |
| | 431 | | | Toyota Industries Corp. | | | 25,117 | |
| | 9,590 | | | Toyota Motor Corp. | | | 633,576 | |
| | 1,123 | | | USS Co. Ltd. | | | 18,966 | |
| | 20,635 | | | Yamada Denki Co. Ltd. | | | 110,720 | |
| | 676 | | | Yamaha Corp. | | | 32,957 | |
| | 744 | | | Yamaha Motor Co. Ltd. | | | 11,724 | |
| | 3,856 | | | Yokohama Rubber Co. Ltd. (The) | | | 60,397 | |
| | 1,678 | | | ZOZO, Inc. | | | 47,217 | |
| | | | | | | | |
| | | | | | | 3,478,948 | |
| | |
| Consumer Staples – 10.9% | |
| | 4,250 | | | Aeon Co. Ltd. | | | 105,363 | |
| | 2,664 | | | Ajinomoto Co., Inc. | | | 49,640 | |
| | 2,290 | | | Asahi Group Holdings Ltd. | | | 80,181 | |
| | 1,347 | | | Calbee, Inc. | | | 41,981 | |
| | 1,610 | | | Coca-Cola Bottlers Japan Holdings, Inc. | | | 26,842 | |
| | 399 | | | Cosmos Pharmaceutical Corp. | | | 70,172 | |
| | 1,671 | | | FamilyMart Co. Ltd. | | | 37,030 | |
| | 934 | | | Ito En Ltd. | | | 56,457 | |
| | 4,542 | | | Japan Tobacco, Inc. | | | 84,912 | |
| | 2,369 | | | Kao Corp. | | | 180,258 | |
| | 943 | | | Kikkoman Corp. | | | 51,221 | |
| | 4,996 | | | Kirin Holdings Co. Ltd. | | | 98,229 | |
| | 568 | | | Kobayashi Pharmaceutical Co. Ltd. | | | 50,563 | |
| | 758 | | | Kobe Bussan Co. Ltd. | | | 44,674 | |
| | 326 | | | Kose Corp. | | | 38,212 | |
| | 830 | | | Lawson, Inc.(a) | | | 40,934 | |
| | 2,492 | | | Lion Corp. | | | 52,780 | |
| | 870 | | | MEIJI Holdings Co. Ltd. | | | 70,227 | |
| | 860 | | | NH Foods Ltd. | | | 38,967 | |
| | 1,476 | | | Nisshin Seifun Group, Inc. | | | 24,371 | |
| | 632 | | | Nissin Foods Holdings Co. Ltd. | | | 63,173 | |
| | 996 | | | Pigeon Corp. | | | 45,505 | |
| | 1,740 | | | Pola Orbis Holdings, Inc. | | | 31,520 | |
| | 4,188 | | | Seven & i Holdings Co. Ltd.(a) | | | 135,578 | |
| | 1,791 | | | Shiseido Co. Ltd. | | | 104,222 | |
| | 1,397 | | | Sundrug Co. Ltd. | | | 51,970 | |
| | 1,664 | | | Suntory Beverage & Food Ltd. | | | 64,178 | |
| | 1,119 | | | Toyo Suisan Kaisha Ltd. | | | 63,524 | |
| | 520 | | | Tsuruha Holdings, Inc. | | | 69,435 | |
| | 2,182 | | | Unicharm Corp. | | | 94,938 | |
| | 2,054 | | | Welcia Holdings Co. Ltd. | | | 87,839 | |
| | 598 | | | Yakult Honsha Co. Ltd. | | | 34,117 | |
| | 2,713 | | | Yamazaki Baking Co. Ltd.(a) | | | 44,157 | |
| | | | | | | | |
| | | | | | | 2,133,170 | |
| | |
| Energy – 1.4% | |
| | 39,774 | | | ENEOS Holdings, Inc. | | | 155,878 | |
| | 774 | | | Idemitsu Kosan Co. Ltd. | | | 17,050 | |
| | 15,251 | | | Inpex Corp. | | | 96,903 | |
| | | | | | | | |
| | | | | | | 269,831 | |
| | |
| | |
| 58 | | The accompanying notes are an integral part of these financial statements. |
GOLDMAN SACHS ACTIVEBETA® JAPAN EQUITY ETF
| | | | | | | | |
Shares | | | Description | | Value | |
|
| Common Stocks – (continued) | |
| Financials – 8.2% | |
| | 7,792 | | | Acom Co. Ltd. | | $ | 30,420 | |
| | 493 | | | Aozora Bank Ltd. | | | 8,856 | |
| | 140 | | | Bank of Kyoto Ltd. (The)(a) | | | 5,967 | |
| | 1,654 | | | Chiba Bank Ltd. (The) | | | 8,578 | |
| | 2,812 | | | Concordia Financial Group Ltd. | | | 9,334 | |
| | 2,480 | | | Dai-ichi Life Holdings, Inc. | | | 37,547 | |
| | 3,701 | | | Daiwa Securities Group, Inc. | | | 16,682 | |
| | 620 | | | Fukuoka Financial Group, Inc. | | | 10,261 | |
| | 4,006 | | | Japan Exchange Group, Inc. | | | 103,810 | |
| | 1,908 | | | Japan Post Bank Co. Ltd. | | | 15,348 | |
| | 12,876 | | | Japan Post Holdings Co. Ltd. | | | 95,157 | |
| | 5,641 | | | Japan Post Insurance Co. Ltd. | | | 90,111 | |
| | 5,496 | | | Mebuki Financial Group, Inc. | | | 13,320 | |
| | 42,463 | | | Mitsubishi UFJ Financial Group, Inc. | | | 177,188 | |
| | 8,653 | | | Mitsubishi UFJ Lease & Finance Co. Ltd. | | | 40,880 | |
| | 77,518 | | | Mizuho Financial Group, Inc. | | | 105,117 | |
| | 2,021 | | | MS&AD Insurance Group Holdings, Inc. | | | 56,049 | |
| | 12,179 | | | Nomura Holdings, Inc. | | | 62,535 | |
| | 7,417 | | | ORIX Corp. | | | 92,463 | |
| | 7,669 | | | Resona Holdings, Inc. | | | 28,204 | |
| | 635 | | | SBI Holdings, Inc. | | | 14,449 | |
| | 7,891 | | | Seven Bank Ltd. | | | 19,794 | |
| | 2,412 | | | Shinsei Bank Ltd. | | | 28,181 | |
| | 2,457 | | | Shizuoka Bank Ltd. (The) | | | 17,076 | |
| | 1,501 | | | Sompo Holdings, Inc. | | | 56,334 | |
| | 7,250 | | | Sumitomo Mitsui Financial Group, Inc. | | | 213,169 | |
| | 1,470 | | | Sumitomo Mitsui Trust Holdings, Inc. | | | 42,570 | |
| | 5,600 | | | T&D Holdings, Inc. | | | 58,617 | |
| | 2,718 | | | Tokio Marine Holdings, Inc. | | | 125,334 | |
| | 329 | | | Tokyo Century Corp. | | | 16,877 | |
| | | | | | | | |
| | | | | | | 1,600,228 | |
| | |
| Health Care – 11.8% | |
| | 404 | | | Alfresa Holdings Corp. | | | 8,115 | |
| | 2,151 | | | Asahi Intecc Co. Ltd. | | | 63,793 | |
| | 12,396 | | | Astellas Pharma, Inc. | | | 194,570 | |
| | 3,895 | | | Chugai Pharmaceutical Co. Ltd. | | | 173,401 | |
| | 2,912 | | | Daiichi Sankyo Co. Ltd. | | | 259,415 | |
| | 1,352 | | | Eisai Co. Ltd. | | | 118,122 | |
| | 406 | | | Hisamitsu Pharmaceutical Co., Inc. | | | 18,722 | |
| | 1,946 | | | Hoya Corp. | | | 191,122 | |
| | 1,883 | | | Kyowa Kirin Co. Ltd. | | | 48,689 | |
| | 2,506 | | | M3, Inc. | | | 145,097 | |
| | 1,321 | | | Medipal Holdings Corp. | | | 25,250 | |
| | 399 | | | Nippon Shinyaku Co. Ltd. | | | 32,922 | |
| | 6,899 | | | Olympus Corp. | | | 136,555 | |
| | 2,749 | | | Ono Pharmaceutical Co. Ltd. | | | 82,927 | |
| | 2,614 | | | Otsuka Holdings Co. Ltd. | | | 114,795 | |
| | 186 | | | PeptiDream, Inc.* | | | 7,551 | |
| | 2,428 | | | Santen Pharmaceutical Co. Ltd. | | | 46,273 | |
| | 1,849 | | | Shionogi & Co. Ltd. | | | 102,576 | |
| | 2,848 | | | Sumitomo Dainippon Pharma Co. Ltd. | | | 36,041 | |
| | 353 | | | Suzuken Co. Ltd. | | | 13,115 | |
| | 947 | | | Sysmex Corp. | | | 82,667 | |
| | 522 | | | Taisho Pharmaceutical Holdings Co. Ltd. | | | 32,094 | |
| | 7,224 | | | Takeda Pharmaceutical Co. Ltd. | | | 269,695 | |
| | |
|
| Common Stocks – (continued) | |
| Health Care – (continued) | |
| | 2,666 | | | Terumo Corp. | | | 108,355 | |
| | | | | | | | |
| | | | | | | 2,311,862 | |
| | |
| Industrials – 17.7% | |
| | 358 | | | AGC, Inc. | | | 10,145 | |
| | 826 | | | Amada Co. Ltd. | | | 7,353 | |
| | 537 | | | ANA Holdings, Inc.* | | | 13,407 | |
| | 673 | | | Central Japan Railway Co. | | | 100,844 | |
| | 1,085 | | | Dai Nippon Printing Co. Ltd. | | | 23,062 | |
| | 661 | | | Daifuku Co. Ltd. | | | 58,156 | |
| | 1,036 | | | Daikin Industries Ltd. | | | 195,047 | |
| | 1,061 | | | East Japan Railway Co. | | | 69,006 | |
| | 517 | | | FANUC Corp. | | | 90,705 | |
| | 233 | | | Fuji Electric Co. Ltd. | | | 7,284 | |
| | 1,318 | | | Hankyu Hanshin Holdings, Inc. | | | 42,817 | |
| | 686 | | | Hino Motors Ltd. | | | 4,619 | |
| | 384 | | | Hitachi Construction Machinery Co. Ltd. | | | 13,470 | |
| | 333 | | | Hoshizaki Corp. | | | 25,467 | |
| | 7,176 | | | ITOCHU Corp.(a) | | | 184,297 | |
| | 982 | | | Japan Airlines Co. Ltd. | | | 19,576 | |
| | 2,605 | | | JGC Holdings Corp. | | | 28,766 | |
| | 919 | | | Kajima Corp. | | | 11,448 | |
| | 2,236 | | | Kamigumi Co. Ltd. | | | 46,177 | |
| | 475 | | | Keihan Holdings Co. Ltd. | | | 20,470 | |
| | 885 | | | Keikyu Corp. | | | 13,203 | |
| | 233 | | | Keio Corp. | | | 14,084 | |
| | 787 | | | Keisei Electric Railway Co. Ltd. | | | 23,155 | |
| | 530 | | | Kintetsu Group Holdings Co. Ltd. | | | 23,290 | |
| | 2,607 | | | Komatsu Ltd. | | | 56,641 | |
| | 2,689 | | | Kubota Corp. | | | 48,597 | |
| | 505 | | | Kurita Water Industries Ltd. | | | 15,810 | |
| | 687 | | | Kyushu Railway Co. | | | 15,146 | |
| | 3,327 | | | LIXIL Group Corp. | | | 61,178 | |
| | 647 | | | Makita Corp. | | | 29,896 | |
| | 23,136 | | | Marubeni Corp. | | | 139,542 | |
| | 817 | | | MINEBEA MITSUMI, Inc. | | | 14,168 | |
| | 1,992 | | | MISUMI Group, Inc. | | | 52,258 | |
| | 7,674 | | | Mitsubishi Corp. | | | 181,818 | |
| | 7,043 | | | Mitsubishi Electric Corp. | | | 97,165 | |
| | 3,568 | | | Mitsubishi Heavy Industries Ltd. | | | 88,607 | |
| | 5,073 | | | Mitsui & Co. Ltd. | | | 91,562 | |
| | 840 | | | Miura Co. Ltd. | | | 34,378 | |
| | 1,702 | | | MonotaRO Co. Ltd. | | | 67,249 | |
| | 409 | | | Nabtesco Corp. | | | 12,940 | |
| | 1,192 | | | Nagoya Railroad Co. Ltd. | | | 33,261 | |
| | 766 | | | NGK Insulators Ltd. | | | 10,886 | |
| | 1,516 | | | Nidec Corp. | | | 127,390 | |
| | 1,312 | | | Nihon M&A Center, Inc. | | | 65,325 | |
| | 396 | | | Nippon Express Co. Ltd. | | | 23,414 | |
| | 634 | | | Nippon Yusen KK | | | 9,912 | |
| | 6,921 | | | Obayashi Corp. | | | 67,679 | |
| | 729 | | | Odakyu Electric Railway Co. Ltd. | | | 18,032 | |
| | 692 | | | Park24 Co. Ltd. | | | 12,503 | |
| | 2,125 | | | Persol Holdings Co. Ltd. | | | 33,164 | |
| | 5,918 | | | Recruit Holdings Co. Ltd. | | | 224,677 | |
| | 737 | | | Secom Co. Ltd. | | | 69,672 | |
| | |
| | |
| The accompanying notes are an integral part of these financial statements. | | 59 |
GOLDMAN SACHS ACTIVEBETA® JAPAN EQUITY ETF
Schedule of Investments (continued)
August 31, 2020
| | | | | | | | |
Shares | | | Description | | Value | |
|
| Common Stocks – (continued) | |
| Industrials – (continued) | |
| | 813 | | | Seibu Holdings, Inc. | | $ | 8,939 | |
| | 807 | | | SG Holdings Co. Ltd. | | | 37,099 | |
| | 1,737 | | | Shimizu Corp. | | | 13,366 | |
| | 206 | | | SMC Corp. | | | 113,155 | |
| | 473 | | | Sohgo Security Services Co. Ltd. | | | 22,101 | |
| | 9,580 | | | Sumitomo Corp. | | | 124,171 | |
| | 205 | | | Sumitomo Heavy Industries Ltd. | | | 4,665 | |
| | 326 | | | Taisei Corp. | | | 11,267 | |
| | 462 | | | THK Co. Ltd. | | | 10,831 | |
| | 998 | | | Tobu Railway Co. Ltd. | | | 31,151 | |
| | 1,871 | | | Tokyu Corp. | | | 25,018 | |
| | 902 | | | Toppan Printing Co. Ltd. | | | 14,018 | |
| | 1,247 | | | Toshiba Corp. | | | 35,924 | |
| | 962 | | | TOTO Ltd. | | | 42,228 | |
| | 3,333 | | | Toyota Tsusho Corp. | | | 97,119 | |
| | 643 | | | West Japan Railway Co. | | | 33,779 | |
| | 2,089 | | | Yamato Holdings Co. Ltd. | | | 54,606 | |
| | 1,126 | | | Yaskawa Electric Corp. | | | 40,508 | |
| | | | | | | | |
| | | | | | | 3,468,663 | |
| | |
| Information Technology – 13.4% | |
| | 1,970 | | | Advantest Corp. | | | 94,186 | |
| | 2,993 | | | Brother Industries Ltd. | | | 49,533 | |
| | 4,051 | | | Canon, Inc. | | | 69,984 | |
| | 189 | | | Disco Corp. | | | 44,075 | |
| | 2,408 | | | FUJIFILM Holdings Corp. | | | 114,581 | |
| | 1,550 | | | Fujitsu Ltd. | | | 201,999 | |
| | 202 | | | GMO Payment Gateway, Inc. | | | 21,353 | |
| | 1,031 | | | Hamamatsu Photonics KK | | | 46,959 | |
| | 163 | | | Hirose Electric Co. Ltd. | | | 18,460 | |
| | 5,814 | | | Hitachi Ltd. | | | 193,535 | |
| | 1,350 | | | Itochu Techno-Solutions Corp. | | | 48,885 | |
| | 805 | | | Keyence Corp. | | | 331,580 | |
| | 1,423 | | | Kyocera Corp. | | | 81,680 | |
| | 517 | | | Lasertec Corp. | | | 39,002 | |
| | 2,576 | | | Murata Manufacturing Co. Ltd. | | | 152,551 | |
| | 2,686 | | | NEC Corp. | | | 141,588 | |
| | 2,731 | | | Nomura Research Institute Ltd. | | | 72,598 | |
| | 5,226 | | | NTT Data Corp. | | | 59,729 | |
| | 398 | | | Obic Co. Ltd. | | | 70,521 | |
| | 1,277 | | | Omron Corp. | | | 93,567 | |
| | 479 | | | Oracle Corp. Japan | | | 56,191 | |
| | 1,022 | | | Otsuka Corp. | | | 50,115 | |
| | 7,498 | | | Renesas Electronics Corp.* | | | 47,161 | |
| | 6,329 | | | Ricoh Co. Ltd.(a) | | | 47,328 | |
| | 150 | | | Rohm Co. Ltd. | | | 9,647 | |
| | 164 | | | SCSK Corp. | | | 8,877 | |
| | 2,370 | | | Seiko Epson Corp. | | | 28,294 | |
| | 1,663 | | | Shimadzu Corp. | | | 49,634 | |
| | 1,386 | | | SUMCO Corp. | | | 18,795 | |
| | 551 | | | TDK Corp. | | | 57,207 | |
| | 807 | | | TIS, Inc. | | | 16,133 | |
| | 818 | | | Tokyo Electron Ltd. | | | 209,427 | |
| | 811 | | | Trend Micro, Inc. | | | 50,169 | |
| | 2,079 | | | Yokogawa Electric Corp. | | | 33,975 | |
| | | | | | | | |
| | | | | | | 2,629,319 | |
| | |
|
| Common Stocks – (continued) | |
| Materials – 3.7% | |
| | 451 | | | Air Water, Inc. | | | 6,337 | |
| | 3,106 | | | Asahi Kasei Corp. | | | 26,068 | |
| | 905 | | | Daicel Corp. | | | 6,571 | |
| | 872 | | | Hitachi Metals Ltd. | | | 13,083 | |
| | 1,531 | | | JSR Corp. | | | 32,628 | |
| | 945 | | | Kansai Paint Co. Ltd. | | | 22,537 | |
| | 643 | | | Kuraray Co. Ltd. | | | 6,579 | |
| | 20,377 | | | Mitsubishi Chemical Holdings Corp. | | | 119,097 | |
| | 1,412 | | | Mitsubishi Gas Chemical Co., Inc. | | | 25,219 | |
| | 330 | | | Mitsubishi Materials Corp. | | | 6,933 | |
| | 646 | | | Mitsui Chemicals, Inc. | | | 15,187 | |
| | 767 | | | Nippon Paint Holdings Co. Ltd.(a) | | | 65,818 | |
| | 466 | | | Nippon Steel Corp. | | | 4,590 | |
| | 704 | | | Nissan Chemical Corp. | | | 37,309 | |
| | 673 | | | Nitto Denko Corp. | | | 40,870 | |
| | 1,230 | | | Shin-Etsu Chemical Co. Ltd. | | | 149,451 | |
| | 3,474 | | | Sumitomo Chemical Co. Ltd. | | | 11,302 | |
| | 228 | | | Sumitomo Metal Mining Co. Ltd. | | | 6,960 | |
| | 802 | | | Taiheiyo Cement Corp. | | | 20,389 | |
| | 1,475 | | | Teijin Ltd. | | | 23,145 | |
| | 15,661 | | | Toray Industries, Inc. | | | 74,388 | |
| | 651 | | | Tosoh Corp. | | | 9,669 | |
| | | | | | | | |
| | | | | | | 724,130 | |
| | |
| Real Estate – 2.3% | |
| | 1,644 | | | Aeon Mall Co. Ltd. | | | 21,751 | |
| | 633 | | | Daito Trust Construction Co. Ltd. | | | 56,116 | |
| | 2,536 | | | Daiwa House Industry Co. Ltd. | | | 67,929 | |
| | 8 | | | Daiwa House REIT Investment Corp. REIT | | | 20,897 | |
| | 10 | | | GLP J REIT | | | 15,427 | |
| | 1,692 | | | Hulic Co. Ltd. | | | 15,413 | |
| | 3 | | | Japan Real Estate Investment Corp. REIT | | | 16,804 | |
| | 3 | | | Japan Retail Fund Investment Corp. REIT | | | 4,524 | |
| | 3,663 | | | Mitsubishi Estate Co. Ltd. | | | 57,391 | |
| | 2,183 | | | Mitsui Fudosan Co. Ltd. | | | 39,524 | |
| | 1 | | | Nippon Building Fund, Inc. REIT | | | 6,026 | |
| | 14 | | | Nippon Prologis REIT, Inc. REIT | | | 45,811 | |
| | 1,604 | | | Nomura Real Estate Holdings, Inc. | | | 30,690 | |
| | 817 | | | Sumitomo Realty & Development Co. Ltd. | | | 24,122 | |
| | 3,737 | | | Tokyu Fudosan Holdings Corp. | | | 16,069 | |
| | | | | | | | |
| | | | | | | 438,494 | |
| | |
| Utilities – 1.6% | |
| | 1,639 | | | Chubu Electric Power Co., Inc. | | | 20,239 | |
| | 1,536 | | | Chugoku Electric Power Co., Inc. (The) | | | 18,714 | |
| | 756 | | | Electric Power Development Co. Ltd. | | | 11,399 | |
| | 1,179 | | | Kansai Electric Power Co., Inc. (The) | | | 11,607 | |
| | 1,787 | | | Kyushu Electric Power Co., Inc. | | | 15,824 | |
| | 1,954 | | | Osaka Gas Co. Ltd. | | | 38,197 | |
| | 658 | | | Toho Gas Co. Ltd. | | | 28,977 | |
| | 10,114 | | | Tohoku Electric Power Co., Inc. | | | 102,528 | |
| | 2,607 | | | Tokyo Electric Power Co. Holdings, Inc.* | | | 7,670 | |
| | 2,267 | | | Tokyo Gas Co. Ltd. | | | 50,377 | |
| | | | | | | | |
| | | | | | | 305,532 | |
| | |
| TOTAL INVESTMENTS BEFORE SECURITIES LENDING
REINVESTMENT VEHICLE |
|
| | (Cost $18,260,875) | | $ | 19,460,165 | |
| | |
| | |
| 60 | | The accompanying notes are an integral part of these financial statements. |
GOLDMAN SACHS ACTIVEBETA® JAPAN EQUITY ETF
| | | | | | | | |
Shares | | | Dividend
Rate | | Value | |
|
| Securities Lending Reinvestment Vehicle – 5.1%(b) | |
| Goldman Sachs Financial Square Government Fund –
Institutional Shares |
|
| | 999,602 | | | 0.027% | | $ | 999,602 | |
| | (Cost $999,602) | |
| | |
| | TOTAL INVESTMENTS – 104.6% | |
| | (Cost $19,260,477) | | $ | 20,459,767 | |
| | |
| LIABILITIES IN EXCESS OF
OTHER ASSETS – (4.6)% | | | (898,796 | ) |
| | |
| | NET ASSETS – 100.0% | | $ | 19,560,971 | |
| | |
| | |
|
| The percentage shown for each investment category reflects the value of investments in that category as a percentage of net assets. |
| |
* | | Non-income producing security. |
| |
(a) | | All or a portion of security is on loan. |
| |
(b) | | Represents an affiliated issuer. |
| | |
|
Investment Abbreviations: |
REIT | | —Real Estate Investment Trust |
|
|
| ADDITIONAL INVESTMENT INFORMATION |
FUTURES CONTRACTS — At August 31, 2020, the Fund had the following futures contracts:
| | | | | | | | | | | | | | | | |
| Description | | Number of
Contracts | | | Expiration
Date | | | Notional
Amount | | | Unrealized
Appreciation/
(Depreciation) | |
Mini Tokyo Price Index | | | 9 | | | | 09/10/20 | | | $ | 133,092 | | | $ | 4,057 | |
| | |
| The accompanying notes are an integral part of these financial statements. | | 61 |
GOLDMAN SACHS ACTIVEBETA® U.S. LARGE CAP EQUITY ETF
Schedule of Investments
August 31, 2020
| | | | | | | | |
Shares | | | Description | | Value | |
|
| Common Stocks – 99.8% | |
| Communication Services – 10.0% | |
| | 270,486 | | | Activision Blizzard, Inc. | | $ | 22,590,991 | |
| | 88,589 | | | Alphabet, Inc., Class A* | | | 144,358,433 | |
| | 85,417 | | | Alphabet, Inc., Class C* | | | 139,586,753 | |
| | 196,913 | | | Altice USA, Inc., Class A* | | | 5,430,861 | |
| | 1,810,681 | | | AT&T, Inc. | | | 53,976,401 | |
| | 7,172 | | | Cable One, Inc. | | | 13,198,847 | |
| | 2,049,104 | | | CenturyLink, Inc. | | | 22,027,868 | |
| | 56,602 | | | Charter Communications, Inc., Class A* | | | 34,844,757 | |
| | 1,227,775 | | | Comcast Corp., Class A | | | 55,016,598 | |
| | 183,594 | | | Electronic Arts, Inc.* | | | 25,605,855 | |
| | 745,892 | | | Facebook, Inc., Class A* | | | 218,695,534 | |
| | 1,454,364 | | | Fox Corp., Class A | | | 40,518,581 | |
| | 80,088 | | | IAC/InterActiveCorp* | | | 10,650,903 | |
| | 107,825 | | | Liberty Broadband Corp., Class C* | | | 15,105,204 | |
| | 173,041 | | | Match Group, Inc.* | | | 19,325,219 | |
| | 85,473 | | | Netflix, Inc.* | | | 45,263,082 | |
| | 170,790 | | | Omnicom Group, Inc. | | | 9,238,031 | |
| | 86,228 | | | Roku, Inc.* | | | 14,958,833 | |
| | 180,451 | | | Snap, Inc., Class A* | | | 4,076,388 | |
| | 82,719 | | | Take-Two Interactive Software, Inc.* | | | 14,160,666 | |
| | 205,712 | | | T-Mobile US, Inc.* | | | 24,002,476 | |
| | 1,071,051 | | | Verizon Communications, Inc. | | | 63,481,193 | |
| | 105,397 | | | ViacomCBS, Inc., Class B | | | 2,935,306 | |
| | 318,181 | | | Walt Disney Co. (The) | | | 41,958,529 | |
| | | | | | | | |
| | | | | | | 1,041,007,309 | |
| | |
| Consumer Discretionary – 13.5% | |
| | 78,899 | | | Advance Auto Parts, Inc. | | | 12,332,703 | |
| | 130,945 | | | Amazon.com, Inc.* | | | 451,885,957 | |
| | 32,857 | | | AutoZone, Inc.* | | | 39,307,158 | |
| | 367,539 | | | Best Buy Co., Inc. | | | 40,763,751 | |
| | 15,978 | | | Booking Holdings, Inc.* | | | 30,525,170 | |
| | 94,019 | | | Burlington Stores, Inc.* | | | 18,515,162 | |
| | 29,603 | | | CarMax, Inc.* | | | 3,165,449 | |
| | 4,597 | | | Chipotle Mexican Grill, Inc.* | | | 6,023,357 | |
| | 171,481 | | | Dollar General Corp. | | | 34,618,584 | |
| | 151,014 | | | Dollar Tree, Inc.* | | | 14,538,118 | |
| | 87,826 | | | Domino’s Pizza, Inc. | | | 35,917,321 | |
| | 63,569 | | | D.R. Horton, Inc. | | | 4,536,920 | |
| | 401,085 | | | eBay, Inc. | | | 21,971,436 | |
| | 62,708 | | | Expedia Group, Inc. | | | 6,154,790 | |
| | 6,114,628 | | | Ford Motor Co. | | | 41,701,763 | |
| | 89,031 | | | Garmin Ltd. | | | 9,224,502 | |
| | 196,787 | | | Genuine Parts Co. | | | 18,584,564 | |
| | 70,117 | | | Hilton Worldwide Holdings, Inc. | | | 6,335,772 | |
| | 395,896 | | | Home Depot, Inc. (The) | | | 112,846,196 | |
| | 518,495 | | | Lennar Corp., Class A | | | 38,793,796 | |
| | 360,477 | | | Lowe’s Cos., Inc. | | | 59,366,957 | |
| | 129,749 | | | McDonald’s Corp. | | | 27,704,006 | |
| | 542,810 | | | NIKE, Inc., Class B | | | 60,735,011 | |
| | 2,151 | | | NVR, Inc.* | | | 8,966,099 | |
| | 76,907 | | | O’Reilly Automotive, Inc.* | | | 35,810,206 | |
| | 177,032 | | | Ross Stores, Inc. | | | 16,124,075 | |
| | 124,981 | | | Starbucks Corp. | | | 10,557,145 | |
| | |
|
| Common Stocks – (continued) | |
| Consumer Discretionary – (continued) | |
| | 407,695 | | | Target Corp. | | | 61,647,561 | |
| | 106,572 | | | Tesla, Inc.* | | | 53,106,959 | |
| | 117,216 | | | Tiffany & Co. | | | 14,358,960 | |
| | 574,604 | | | TJX Cos., Inc. (The) | | | 31,482,553 | |
| | 157,400 | | | Tractor Supply Co. | | | 23,425,842 | |
| | 69,905 | | | Ulta Beauty, Inc.* | | | 16,230,543 | |
| | 239,196 | | | VF Corp. | | | 15,727,137 | |
| | 258,837 | | | Yum! Brands, Inc. | | | 24,809,526 | |
| | | | | | | | |
| | | | | | | 1,407,795,049 | |
| | |
| Consumer Staples – 8.8% | |
| | 212,446 | | | Altria Group, Inc. | | | 9,292,388 | |
| | 187,943 | | | Archer-Daniels-Midland Co. | | | 8,412,329 | |
| | 323,140 | | | Brown-Forman Corp., Class B | | | 23,644,154 | |
| | 126,779 | | | Campbell Soup Co. | | | 6,669,843 | |
| | 176,426 | | | Church & Dwight Co., Inc. | | | 16,906,904 | |
| | 187,430 | | | Clorox Co. (The) | | | 41,890,605 | |
| | 715,967 | | | Coca-Cola Co. (The) | | | 35,461,845 | |
| | 420,996 | | | Colgate-Palmolive Co. | | | 33,368,143 | |
| | 177,616 | | | Conagra Brands, Inc. | | | 6,813,350 | |
| | 22,596 | | | Constellation Brands, Inc., Class A | | | 4,168,510 | |
| | 188,859 | | | Costco Wholesale Corp. | | | 65,658,720 | |
| | 193,550 | | | Estee Lauder Cos., Inc. (The), Class A | | | 42,913,906 | |
| | 201,205 | | | General Mills, Inc. | | | 12,867,060 | |
| | 176,908 | | | Hershey Co. (The) | | | 26,295,605 | |
| | 171,763 | | | Hormel Foods Corp. | | | 8,756,478 | |
| | 126,283 | | | J M Smucker Co. (The) | | | 15,176,691 | |
| | 127,767 | | | Kellogg Co. | | | 9,059,958 | |
| | 178,795 | | | Kimberly-Clark Corp. | | | 28,206,699 | |
| | 726,063 | | | Kraft Heinz Co. (The) | | | 25,441,247 | |
| | 1,399,587 | | | Kroger Co. (The) | | | 49,937,264 | |
| | 99,601 | | | Lamb Weston Holdings, Inc. | | | 6,259,923 | |
| | 78,885 | | | McCormick & Co., Inc. | | | 16,266,087 | |
| | 1,062,801 | | | Molson Coors Beverage Co., Class B | | | 40,003,830 | |
| | 274,472 | | | Mondelez International, Inc., Class A | | | 16,034,654 | |
| | 207,218 | | | Monster Beverage Corp.* | | | 17,377,301 | |
| | 462,896 | | | PepsiCo, Inc. | | | 64,833,214 | |
| | 437,110 | | | Philip Morris International, Inc. | | | 34,877,007 | |
| | 589,604 | | | Procter & Gamble Co. (The) | | | 81,559,921 | |
| | 436,374 | | | Sysco Corp. | | | 26,243,532 | |
| | 253,655 | | | Tyson Foods, Inc., Class A | | | 15,929,534 | |
| | 876,233 | | | Walgreens Boots Alliance, Inc. | | | 33,314,379 | |
| | 689,676 | | | Walmart, Inc. | | | 95,761,513 | |
| | | | | | | | |
| | | | | | | 919,402,594 | |
| | |
| Energy – 0.8% | |
| | 380,664 | | | Baker Hughes Co. | | | 5,435,882 | |
| | 265,800 | | | Chevron Corp. | | | 22,308,594 | |
| | 226,849 | | | ConocoPhillips | | | 8,595,308 | |
| | 411,873 | | | EOG Resources, Inc. | | | 18,674,322 | |
| | 384,253 | | | Exxon Mobil Corp. | | | 15,347,065 | |
| | 71,558 | | | Marathon Petroleum Corp. | | | 2,537,447 | |
| | 261,130 | | | Valero Energy Corp. | | | 13,732,827 | |
| | | | | | | | |
| | | | | | | 86,631,445 | |
| | |
| | |
| 62 | | The accompanying notes are an integral part of these financial statements. |
GOLDMAN SACHS ACTIVEBETA® U.S. LARGE CAP EQUITY ETF
| | | | | | | | |
Shares | | | Description | | Value | |
|
| Common Stocks – (continued) | |
| Financials – 6.4% | |
| | 87,921 | | | Allstate Corp. (The) | | $ | 8,176,653 | |
| | 115,625 | | | American Express Co. | | | 11,746,344 | |
| | 194,420 | | | American International Group, Inc. | | | 5,665,399 | |
| | 31,240 | | | Ameriprise Financial, Inc. | | | 4,898,432 | |
| | 134,958 | | | Arthur J Gallagher & Co. | | | 14,211,077 | |
| | 1,503,401 | | | Bank of America Corp. | | | 38,697,542 | |
| | 486,229 | | | Bank of New York Mellon Corp. (The) | | | 17,980,748 | |
| | 181,742 | | | Berkshire Hathaway, Inc., Class B* | | | 39,627,026 | |
| | 18,489 | | | BlackRock, Inc. | | | 10,985,979 | |
| | 154,105 | | | Blackstone Group, Inc. (The), Class A | | | 8,159,860 | |
| | 139,738 | | | Brown & Brown, Inc. | | | 6,483,843 | |
| | 70,000 | | | Cboe Global Markets, Inc. | | | 6,425,300 | |
| | 154,036 | | | Charles Schwab Corp. (The) | | | 5,472,899 | |
| | 44,091 | | | Chubb Ltd. | | | 5,511,375 | |
| | 482,616 | | | Citigroup, Inc. | | | 24,671,330 | |
| | 425,492 | | | Citizens Financial Group, Inc. | | | 11,007,478 | |
| | 48,085 | | | CME Group, Inc. | | | 8,456,709 | |
| | 15,151 | | | Everest Re Group Ltd. | | | 3,334,432 | |
| | 55,625 | | | FactSet Research Systems, Inc. | | | 19,491,000 | |
| | 83,847 | | | Fidelity National Financial, Inc. | | | 2,752,697 | |
| | 408,849 | | | Fifth Third Bancorp | | | 8,446,820 | |
| | 34,897 | | | First Republic Bank | | | 3,940,220 | |
| | 203,094 | | | Hartford Financial Services Group, Inc. (The) | | | 8,215,152 | |
| | 276,221 | | | Huntington Bancshares, Inc. | | | 2,599,240 | |
| | 140,912 | | | Intercontinental Exchange, Inc. | | | 14,969,082 | |
| | 667,074 | | | JPMorgan Chase & Co. | | | 66,834,144 | |
| | 314,641 | | | KeyCorp | | | 3,876,377 | |
| | 2,352 | | | Markel Corp.* | | | 2,556,224 | |
| | 24,295 | | | MarketAxess Holdings, Inc. | | | 11,805,912 | |
| | 180,831 | | | Marsh & McLennan Cos., Inc. | | | 20,779,290 | |
| | 371,443 | | | MetLife, Inc. | | | 14,285,698 | |
| | 130,232 | | | Moody’s Corp. | | | 38,371,557 | |
| | 453,341 | | | Morgan Stanley | | | 23,691,601 | |
| | 38,383 | | | MSCI, Inc. | | | 14,327,222 | |
| | 83,294 | | | Nasdaq, Inc. | | | 11,196,379 | |
| | 32,625 | | | Northern Trust Corp. | | | 2,671,661 | |
| | 133,184 | | | Principal Financial Group, Inc. | | | 5,608,378 | |
| | 215,218 | | | Progressive Corp. (The) | | | 20,454,319 | |
| | 163,121 | | | Prudential Financial, Inc. | | | 11,054,710 | |
| | 71,453 | | | Raymond James Financial, Inc. | | | 5,410,421 | |
| | 202,236 | | | Regions Financial Corp. | | | 2,337,848 | |
| | 92,666 | | | S&P Global, Inc. | | | 33,954,676 | |
| | 128,943 | | | State Street Corp. | | | 8,779,729 | |
| | 777,775 | | | Synchrony Financial | | | 19,296,598 | |
| | 164,854 | | | T. Rowe Price Group, Inc. | | | 22,949,325 | |
| | 85,467 | | | TD Ameritrade Holding Corp. | | | 3,280,223 | |
| | 35,953 | | | Travelers Cos., Inc. (The) | | | 4,171,986 | |
| | 137,449 | | | US Bancorp | | | 5,003,144 | |
| | 54,012 | | | W R Berkley Corp. | | | 3,351,445 | |
| | 421,819 | | | Wells Fargo & Co. | | | 10,186,929 | |
| | 35,156 | | | Willis Towers Watson PLC | | | 7,225,613 | |
| | | | | | | | |
| | | | | | | 665,388,046 | |
| | |
|
| Common Stocks – (continued) | |
| Health Care – 15.7% | |
| | 369,449 | | | Abbott Laboratories | | | 40,443,582 | |
| | 533,894 | | | AbbVie, Inc. | | | 51,131,028 | |
| | 120,362 | | | Agilent Technologies, Inc. | | | 12,086,752 | |
| | 129,903 | | | Alexion Pharmaceuticals, Inc.* | | | 14,837,521 | |
| | 71,108 | | | Align Technology, Inc.* | | | 21,117,654 | |
| | 68,351 | | | Alnylam Pharmaceuticals, Inc.* | | | 9,066,077 | |
| | 27,027 | | | AmerisourceBergen Corp. | | | 2,622,430 | |
| | 204,263 | | | Amgen, Inc. | | | 51,743,903 | |
| | 99,670 | | | Anthem, Inc. | | | 28,059,098 | |
| | 229,092 | | | Baxter International, Inc. | | | 19,947,040 | |
| | 44,724 | | | Becton Dickinson and Co. | | | 10,857,645 | |
| | 85,789 | | | Biogen, Inc.* | | | 24,676,348 | |
| | 100,087 | | | BioMarin Pharmaceutical, Inc.* | | | 7,809,789 | |
| | 14,837 | | | Bio-Rad Laboratories, Inc., Class A* | | | 7,545,950 | |
| | 310,353 | | | Boston Scientific Corp.* | | | 12,730,680 | |
| | 797,000 | | | Bristol-Myers Squibb Co. | | | 49,573,400 | |
| | 56,785 | | | Cardinal Health, Inc. | | | 2,882,407 | |
| | 60,742 | | | Catalent, Inc.* | | | 5,618,635 | |
| | 181,755 | | | Centene Corp.* | | | 11,145,217 | |
| | 251,712 | | | Cerner Corp. | | | 18,468,109 | |
| | 196,261 | | | Cigna Corp. | | | 34,810,814 | |
| | 29,120 | | | Cooper Cos., Inc. (The) | | | 9,154,746 | |
| | 743,471 | | | CVS Health Corp. | | | 46,184,419 | |
| | 146,590 | | | Danaher Corp. | | | 30,266,437 | |
| | 103,279 | | | DENTSPLY SIRONA, Inc. | | | 4,634,129 | |
| | 57,976 | | | DexCom, Inc.* | | | 24,663,570 | |
| | 415,194 | | | Edwards Lifesciences Corp.* | | | 35,640,253 | |
| | 308,414 | | | Eli Lilly and Co. | | | 45,765,553 | |
| | 445,649 | | | Gilead Sciences, Inc. | | | 29,747,071 | |
| | 17,679 | | | HCA Healthcare, Inc. | | | 2,399,394 | |
| | 195,187 | | | Henry Schein, Inc.* | | | 12,968,224 | |
| | 120,743 | | | Hologic, Inc.* | | | 7,210,772 | |
| | 49,608 | | | Humana, Inc. | | | 20,595,753 | |
| | 115,786 | | | IDEXX Laboratories, Inc.* | | | 45,279,273 | |
| | 37,353 | | | Illumina, Inc.* | | | 13,343,239 | |
| | 204,285 | | | Incyte Corp.* | | | 19,682,860 | |
| | 57,744 | | | Insulet Corp.* | | | 12,602,628 | |
| | 20,439 | | | Intuitive Surgical, Inc.* | | | 14,937,639 | |
| | 65,264 | | | IQVIA Holdings, Inc.* | | | 10,686,980 | |
| | 809,534 | | | Johnson & Johnson | | | 124,190,611 | |
| | 50,562 | | | Laboratory Corp. of America Holdings* | | | 8,886,271 | |
| | 67,595 | | | Masimo Corp.* | | | 15,141,280 | |
| | 146,455 | | | McKesson Corp. | | | 22,472,055 | |
| | 223,324 | | | Medtronic PLC | | | 24,000,630 | |
| | 665,495 | | | Merck & Co., Inc. | | | 56,746,759 | |
| | 36,553 | | | Mettler-Toledo International, Inc.* | | | 35,484,921 | |
| | 119,118 | | | Moderna, Inc.* | | | 7,729,567 | |
| | 17,337 | | | Molina Healthcare, Inc.* | | | 3,206,825 | |
| | 3,090,208 | | | Mylan NV* | | | 50,617,607 | |
| | 57,303 | | | Neurocrine Biosciences, Inc.* | | | 6,671,215 | |
| | 59,115 | | | PerkinElmer, Inc. | | | 6,959,018 | |
| | 1,512,020 | | | Pfizer, Inc. | | | 57,139,236 | |
| | 213,317 | | | QIAGEN NV* | | | 10,870,634 | |
| | 67,220 | | | Quest Diagnostics, Inc. | | | 7,477,553 | |
| | |
| | |
| The accompanying notes are an integral part of these financial statements. | | 63 |
GOLDMAN SACHS ACTIVEBETA® U.S. LARGE CAP EQUITY ETF
Schedule of Investments (continued)
August 31, 2020
| | | | | | | | |
Shares | | | Description | | Value | |
|
| Common Stocks – (continued) | |
| Health Care – (continued) | |
| | 29,687 | | | Regeneron Pharmaceuticals, Inc.* | | $ | 18,403,862 | |
| | 110,460 | | | ResMed, Inc. | | | 19,968,959 | |
| | 79,119 | | | Seattle Genetics, Inc.* | | | 12,527,702 | |
| | 65,627 | | | STERIS PLC | | | 10,476,694 | |
| | 73,939 | | | Stryker Corp. | | | 14,651,752 | |
| | 34,602 | | | Teladoc Health, Inc.* | | | 7,463,305 | |
| | 9,047 | | | Teleflex, Inc. | | | 3,555,019 | |
| | 126,187 | | | Thermo Fisher Scientific, Inc. | | | 54,131,699 | |
| | 256,588 | | | UnitedHealth Group, Inc. | | | 80,196,579 | |
| | 203,125 | | | Universal Health Services, Inc., Class B | | | 22,414,844 | |
| | 63,997 | | | Varian Medical Systems, Inc.* | | | 11,114,359 | |
| | 56,929 | | | Veeva Systems, Inc., Class A* | | | 16,069,349 | |
| | 104,971 | | | Vertex Pharmaceuticals, Inc.* | | | 29,299,506 | |
| | 61,636 | | | Waters Corp.* | | | 13,329,401 | |
| | 53,871 | | | West Pharmaceutical Services, Inc. | | | 15,297,209 | |
| | 37,579 | | | Zimmer Biomet Holdings, Inc. | | | 5,294,130 | |
| | 250,498 | | | Zoetis, Inc. | | | 40,104,730 | |
| | | | | | | | |
| | | | | | | 1,634,830,300 | |
| | |
| Industrials – 7.6% | |
| | 160,334 | | | 3M Co. | | | 26,137,649 | |
| | 67,191 | | | Allegion PLC | | | 6,946,878 | |
| | 118,488 | | | AMETEK, Inc. | | | 11,931,742 | |
| | 711,701 | | | Carrier Global Corp. | | | 21,244,275 | |
| | 70,985 | | | Caterpillar, Inc. | | | 10,101,875 | |
| | 283,945 | | | C.H. Robinson Worldwide, Inc. | | | 27,911,794 | |
| | 85,915 | | | Cintas Corp. | | | 28,630,315 | |
| | 125,935 | | | Copart, Inc.* | | | 13,011,604 | |
| | 14,457 | | | CoStar Group, Inc.* | | | 12,268,210 | |
| | 86,189 | | | CSX Corp. | | | 6,590,011 | |
| | 103,052 | | | Cummins, Inc. | | | 21,357,527 | |
| | 12,262 | | | Deere & Co. | | | 2,575,756 | |
| | 157,307 | | | Delta Air Lines, Inc. | | | 4,852,921 | |
| | 69,860 | | | Dover Corp. | | | 7,673,422 | |
| | 144,541 | | | Eaton Corp. PLC | | | 14,757,636 | |
| | 225,179 | | | Emerson Electric Co. | | | 15,643,185 | |
| | 68,733 | | | Equifax, Inc. | | | 11,565,702 | |
| | 78,770 | | | Expeditors International of Washington, Inc. | | | 6,962,480 | |
| | 749,026 | | | Fastenal Co. | | | 36,597,410 | |
| | 17,817 | | | FedEx Corp. | | | 3,916,889 | |
| | 152,795 | | | Fortive Corp. | | | 11,018,047 | |
| | 48,458 | | | General Dynamics Corp. | | | 7,237,202 | |
| | 4,883,333 | | | General Electric Co. | | | 30,960,331 | |
| | 130,479 | | | Honeywell International, Inc. | | | 21,600,798 | |
| | 22,329 | | | Huntington Ingalls Industries, Inc. | | | 3,383,290 | |
| | 46,309 | | | IDEX Corp. | | | 8,346,271 | |
| | 141,556 | | | IHS Markit Ltd. | | | 11,313,156 | |
| | 121,171 | | | Illinois Tool Works, Inc. | | | 23,937,331 | |
| | 67,869 | | | Jacobs Engineering Group, Inc. | | | 6,126,535 | |
| | 32,828 | | | J.B. Hunt Transport Services, Inc. | | | 4,613,647 | |
| | 180,003 | | | Johnson Controls International PLC | | | 7,331,522 | |
| | 24,319 | | | Kansas City Southern | | | 4,427,031 | |
| | 49,417 | | | L3Harris Technologies, Inc. | | | 8,931,629 | |
| | |
|
| Common Stocks – (continued) | |
| Industrials – (continued) | |
| | 51,982 | | | Lockheed Martin Corp. | | | 20,286,495 | |
| | 246,633 | | | Masco Corp. | | | 14,378,704 | |
| | 29,851 | | | Norfolk Southern Corp. | | | 6,344,233 | |
| | 58,989 | | | Northrop Grumman Corp. | | | 20,210,221 | |
| | 53,780 | | | Old Dominion Freight Line, Inc. | | | 10,873,240 | |
| | 83,035 | | | Otis Worldwide Corp. | | | 5,222,902 | |
| | 67,765 | | | PACCAR, Inc. | | | 5,816,948 | |
| | 70,336 | | | Parker-Hannifin Corp. | | | 14,489,919 | |
| | 264,388 | | | Raytheon Technologies Corp. | | | 16,127,668 | |
| | 153,578 | | | Republic Services, Inc. | | | 14,239,752 | |
| | 72,588 | | | Rockwell Automation, Inc. | | | 16,733,712 | |
| | 31,185 | | | Roper Technologies, Inc. | | | 13,321,920 | |
| | 852,534 | | | Southwest Airlines Co. | | | 32,038,228 | |
| | 31,912 | | | Stanley Black & Decker, Inc. | | | 5,147,406 | |
| | 26,029 | | | Teledyne Technologies, Inc.* | | | 8,162,955 | |
| | 127,373 | | | Trane Technologies PLC | | | 15,079,690 | |
| | 26,504 | | | TransUnion | | | 2,298,427 | |
| | 67,419 | | | Union Pacific Corp. | | | 12,974,112 | |
| | 102,712 | | | United Parcel Service, Inc., Class B | | | 16,805,737 | |
| | 134,575 | | | United Rentals, Inc.* | | | 23,826,504 | |
| | 71,532 | | | Verisk Analytics, Inc. | | | 13,352,878 | |
| | 108,820 | | | Waste Management, Inc. | | | 12,405,480 | |
| | 236,588 | | | Westinghouse Air Brake Technologies Corp. | | | 15,744,931 | |
| | 81,207 | | | W.W. Grainger, Inc. | | | 29,675,474 | |
| | 81,980 | | | Xylem, Inc. | | | 6,573,156 | |
| | | | | | | | |
| | | | | | | 792,034,763 | |
| | |
| Information Technology – 30.0% | |
| | 292,742 | | | Accenture PLC, Class A | | | 70,237,588 | |
| | 161,353 | | | Adobe, Inc.* | | | 82,837,017 | |
| | 689,208 | | | Advanced Micro Devices, Inc.* | | | 62,593,871 | |
| | 125,956 | | | Akamai Technologies, Inc.* | | | 14,665,057 | |
| | 298,796 | | | Amdocs Ltd. | | | 18,295,279 | |
| | 102,851 | | | Amphenol Corp., Class A | | | 11,293,040 | |
| | 48,325 | | | Analog Devices, Inc. | | | 5,648,226 | |
| | 52,377 | | | ANSYS, Inc.* | | | 17,756,327 | |
| | 5,050,599 | | | Apple, Inc. | | | 651,729,295 | |
| | 355,949 | | | Applied Materials, Inc. | | | 21,926,458 | |
| | 28,594 | | | Arista Networks, Inc.* | | | 6,389,329 | |
| | 117,499 | | | Autodesk, Inc.* | | | 28,869,504 | |
| | 99,314 | | | Automatic Data Processing, Inc. | | | 13,813,584 | |
| | 136,815 | | | Black Knight, Inc.* | | | 11,506,141 | |
| | 162,680 | | | Booz Allen Hamilton Holding Corp. | | | 14,325,601 | |
| | 107,154 | | | Broadcom, Inc. | | | 37,198,511 | |
| | 94,340 | | | Broadridge Financial Solutions, Inc. | | | 12,962,316 | |
| | 401,260 | | | Cadence Design Systems, Inc.* | | | 44,503,747 | |
| | 152,485 | | | CDW Corp. | | | 17,329,920 | |
| | 1,151,109 | | | Cisco Systems, Inc. | | | 48,599,822 | |
| | 196,883 | | | Citrix Systems, Inc. | | | 28,587,412 | |
| | 247,771 | | | Cognizant Technology Solutions Corp., Class A | | | 16,565,969 | |
| | 95,005 | | | Corning, Inc. | | | 3,083,862 | |
| | 23,701 | | | Coupa Software, Inc.* | | | 7,767,766 | |
| | |
| | |
| 64 | | The accompanying notes are an integral part of these financial statements. |
GOLDMAN SACHS ACTIVEBETA® U.S. LARGE CAP EQUITY ETF
| | | | | | | | |
Shares | | | Description | | Value | |
|
| Common Stocks – (continued) | |
| Information Technology – (continued) | |
| | 40,564 | | | Dell Technologies, Inc., Class C* | | $ | 2,680,469 | |
| | 73,429 | | | DocuSign, Inc.* | | | 16,374,667 | |
| | 15,699 | | | EPAM Systems, Inc.* | | | 5,135,143 | |
| | 20,747 | | | Fair Isaac Corp.* | | | 8,730,130 | |
| | 191,960 | | | Fidelity National Information Services, Inc. | | | 28,957,166 | |
| | 177,720 | | | Fiserv, Inc.* | | | 17,697,358 | |
| | 26,169 | | | FleetCor Technologies, Inc.* | | | 6,580,195 | |
| | 122,737 | | | Fortinet, Inc.* | | | 16,201,898 | |
| | 66,172 | | | Gartner, Inc.* | | | 8,590,449 | |
| | 81,437 | | | Global Payments, Inc. | | | 14,383,403 | |
| | 52,698 | | | GoDaddy, Inc., Class A* | | | 4,409,769 | |
| | 763,823 | | | HP, Inc. | | | 14,932,740 | |
| | 1,558,070 | | | Intel Corp. | | | 79,383,666 | |
| | 294,215 | | | International Business Machines Corp. | | | 36,279,652 | |
| | 146,338 | | | Intuit, Inc. | | | 50,543,682 | |
| | 76,731 | | | Jack Henry & Associates, Inc. | | | 12,692,842 | |
| | 351,542 | | | Juniper Networks, Inc. | | | 8,788,550 | |
| | 93,870 | | | Keysight Technologies, Inc.* | | | 9,248,072 | |
| | 52,333 | | | KLA Corp. | | | 10,735,592 | |
| | 93,996 | | | Lam Research Corp. | | | 31,614,615 | |
| | 317,198 | | | Leidos Holdings, Inc. | | | 28,703,247 | |
| | 150,898 | | | Marvell Technology Group Ltd. | | | 5,851,824 | |
| | 224,327 | | | Mastercard, Inc., Class A | | | 80,351,688 | |
| | 94,416 | | | Maxim Integrated Products, Inc. | | | 6,461,831 | |
| | 87,231 | | | Microchip Technology, Inc. | | | 9,569,241 | |
| | 443,098 | | | Micron Technology, Inc.* | | | 20,165,390 | |
| | 2,296,531 | | | Microsoft Corp. | | | 517,936,636 | |
| | 104,819 | | | Motorola Solutions, Inc. | | | 16,220,740 | |
| | 209,816 | | | NetApp, Inc. | | | 9,943,180 | |
| | 1,134,334 | | | NortonLifeLock, Inc. | | | 26,679,536 | |
| | 158,992 | | | NVIDIA Corp. | | | 85,057,540 | |
| | 55,935 | | | Okta, Inc.* | | | 12,046,721 | |
| | 787,935 | | | Oracle Corp. | | | 45,085,641 | |
| | 39,117 | | | Palo Alto Networks, Inc.* | | | 10,069,107 | |
| | 141,743 | | | Paychex, Inc. | | | 10,839,087 | |
| | 228,759 | | | PayPal Holdings, Inc.* | | | 46,698,862 | |
| | 137,346 | | | Qorvo, Inc.* | | | 17,617,371 | |
| | 256,040 | | | QUALCOMM, Inc. | | | 30,494,364 | |
| | 94,492 | | | RingCentral, Inc., Class A* | | | 27,475,439 | |
| | 217,108 | | | salesforce.com, Inc.* | | | 59,194,496 | |
| | 245,053 | | | Seagate Technology PLC | | | 11,760,093 | |
| | 81,731 | | | ServiceNow, Inc.* | | | 39,395,977 | |
| | 156,765 | | | Skyworks Solutions, Inc. | | | 22,707,410 | |
| | 49,998 | | | Splunk, Inc.* | | | 10,966,061 | |
| | 82,865 | | | Square, Inc., Class A* | | | 13,221,939 | |
| | 337,717 | | | SS&C Technologies Holdings, Inc. | | | 21,519,327 | |
| | 169,789 | | | Synopsys, Inc.* | | | 37,574,306 | |
| | 105,353 | | | TE Connectivity Ltd. | | | 10,177,100 | |
| | 149,366 | | | Teradyne, Inc. | | | 12,691,629 | |
| | 347,491 | | | Texas Instruments, Inc. | | | 49,395,846 | |
| | 13,684 | | | Trade Desk, Inc. (The), Class A* | | | 6,586,109 | |
| | 50,687 | | | Trimble, Inc.* | | | 2,656,506 | |
| | 20,748 | | | Twilio, Inc., Class A* | | | 5,596,980 | |
| �� | 37,299 | | | Tyler Technologies, Inc.* | | | 12,879,718 | |
| | |
|
| Common Stocks – (continued) | |
| Information Technology – (continued) | |
| | 121,063 | | | VeriSign, Inc.* | | | 26,004,332 | |
| | 404,536 | | | Visa, Inc., Class A | | | 85,757,587 | |
| | 71,732 | | | VMware, Inc., Class A *(a) | | | 10,360,970 | |
| | 639,450 | | | Western Union Co. (The) | | | 15,084,625 | |
| | 34,745 | | | Workday, Inc., Class A* | | | 8,328,724 | |
| | 62,547 | | | Xilinx, Inc. | | | 6,514,896 | |
| | 17,979 | | | Zebra Technologies Corp., Class A* | | | 5,151,523 | |
| | 37,660 | | | Zendesk, Inc.* | | | 3,629,671 | |
| | 44,330 | | | Zoom Video Communications, Inc., Class A* | | | 14,411,683 | |
| | | | | | | | |
| | | | | | | 3,131,280,653 | |
| | |
| Materials – 1.3% | |
| | 50,452 | | | Air Products and Chemicals, Inc. | | | 14,745,101 | |
| | 83,058 | | | Ball Corp. | | | 6,675,371 | |
| | 154,271 | | | Dow, Inc. | | | 6,960,707 | |
| | 85,528 | | | Eastman Chemical Co. | | | 6,252,952 | |
| | 64,921 | | | Ecolab, Inc. | | | 12,794,631 | |
| | 23,390 | | | FMC Corp. | | | 2,499,455 | |
| | 303,476 | | | International Paper Co. | | | 11,007,075 | |
| | 233,392 | | | Newmont Corp. | | | 15,702,614 | |
| | 179,090 | | | Nucor Corp. | | | 8,141,431 | |
| | 29,123 | | | Packaging Corp. of America | | | 2,948,413 | |
| | 60,069 | | | PPG Industries, Inc. | | | 7,232,308 | |
| | 31,382 | | | Sherwin-Williams Co. (The) | | | 21,058,891 | |
| | 20,067 | | | Vulcan Materials Co. | | | 2,408,040 | |
| | 530,332 | | | Westrock Co. | | | 16,084,970 | |
| | | | | | | | |
| | | | | | | 134,511,959 | |
| | |
| Real Estate – 2.8% | |
| | 57,145 | | | Alexandria Real Estate Equities, Inc. REIT | | | 9,622,075 | |
| | 90,798 | | | American Tower Corp. REIT | | | 22,622,322 | |
| | 28,234 | | | AvalonBay Communities, Inc. REIT | | | 4,462,666 | |
| | 37,964 | | | Boston Properties, Inc. REIT | | | 3,297,933 | |
| | 128,103 | | | Camden Property Trust REIT | | | 11,649,687 | |
| | 675,793 | | | CBRE Group, Inc., Class A* | | | 31,782,545 | |
| | 126,144 | | | Crown Castle International Corp. REIT | | | 20,593,008 | |
| | 23,362 | | | CyrusOne, Inc. REIT | | | 1,951,428 | |
| | 118,867 | | | Digital Realty Trust, Inc. REIT | | | 18,501,649 | |
| | 158,057 | | | Duke Realty Corp. REIT | | | 6,093,097 | |
| | 23,729 | | | Equinix, Inc. REIT | | | 18,740,690 | |
| | 180,157 | | | Equity LifeStyle Properties, Inc. REIT | | | 11,942,607 | |
| | 145,299 | | | Equity Residential REIT | | | 8,202,129 | |
| | 24,598 | | | Essex Property Trust, Inc. REIT | | | 5,325,713 | |
| | 63,140 | | | Extra Space Storage, Inc. REIT | | | 6,727,567 | |
| | 1,952,903 | | | Host Hotels & Resorts, Inc. REIT | | | 21,931,101 | |
| | 300,290 | | | Invitation Homes, Inc. REIT | | | 8,597,303 | |
| | 101,118 | | | Medical Properties Trust, Inc. REIT | | | 1,878,772 | |
| | 95,628 | | | Mid-America Apartment Communities, Inc. REIT | | | 11,199,951 | |
| | |
| | |
| The accompanying notes are an integral part of these financial statements. | | 65 |
GOLDMAN SACHS ACTIVEBETA® U.S. LARGE CAP EQUITY ETF
Schedule of Investments (continued)
August 31, 2020
| | | | | | | | |
Shares | | | Description | | Value | |
|
| Common Stocks – (continued) | |
| Real Estate – (continued) | |
| | 155,607 | | | Prologis, Inc. REIT | | $ | 15,850,129 | |
| | 41,114 | | | Public Storage REIT | | | 8,732,614 | |
| | 39,549 | | | SBA Communications Corp. REIT | | | 12,104,762 | |
| | 58,033 | | | Simon Property Group, Inc. REIT | | | 3,937,539 | |
| | 103,294 | | | Sun Communities, Inc. REIT | | | 15,399,069 | |
| | 107,211 | | | UDR, Inc. REIT | | | 3,732,015 | |
| | 158,606 | | | Ventas, Inc. REIT | | | 6,536,153 | |
| | 253,325 | | | VICI Properties, Inc. REIT | | | 5,659,280 | |
| | | | | | | | |
| | | | | | | 297,073,804 | |
| | |
| Utilities – 2.9% | |
| | 132,273 | | | Alliant Energy Corp. | | | 7,162,583 | |
| | 71,673 | | | Ameren Corp. | | | 5,670,051 | |
| | 98,524 | | | American Electric Power Co., Inc. | | | 7,766,647 | |
| | 80,399 | | | American Water Works Co., Inc. | | | 11,363,595 | |
| | 63,690 | | | Atmos Energy Corp. | | | 6,357,536 | |
| | 125,875 | | | CenterPoint Energy, Inc. | | | 2,526,311 | |
| | 120,387 | | | CMS Energy Corp. | | | 7,282,210 | |
| | 132,659 | | | Consolidated Edison, Inc. | | | 9,463,893 | |
| | 171,033 | | | Dominion Energy, Inc. | | | 13,415,829 | |
| | 55,038 | | | DTE Energy Co. | | | 6,531,359 | |
| | 153,703 | | | Duke Energy Corp. | | | 12,348,499 | |
| | 81,313 | | | Edison International | | | 4,267,306 | |
| | 40,635 | | | Entergy Corp. | | | 4,028,554 | |
| | 59,506 | | | Essential Utilities, Inc. | | | 2,529,005 | |
| | 114,017 | | | Evergy, Inc. | | | 6,067,985 | |
| | 100,781 | | | Eversource Energy | | | 8,637,939 | |
| | 330,260 | | | Exelon Corp. | | | 12,189,897 | |
| | 85,309 | | | FirstEnergy Corp. | | | 2,438,984 | |
| | 118,036 | | | NextEra Energy, Inc. | | | 32,952,110 | |
| | 199,181 | | | NiSource, Inc. | | | 4,413,851 | |
| | 564,016 | | | NRG Energy, Inc. | | | 19,407,791 | |
| | 60,942 | | | Pinnacle West Capital Corp. | | | 4,470,096 | |
| | 177,043 | | | PPL Corp. | | | 4,891,698 | |
| | 183,000 | | | Public Service Enterprise Group, Inc. | | | 9,559,920 | |
| | 61,005 | | | Sempra Energy | | | 7,543,268 | |
| | 138,473 | | | Southern Co. (The) | | | 7,225,521 | |
| | 2,611,945 | | | Vistra Corp. | | | 50,227,702 | |
| | 127,779 | | | WEC Energy Group, Inc. | | | 12,021,448 | |
| | 209,496 | | | Xcel Energy, Inc. | | | 14,554,735 | |
| | | | | | | | |
| | | | | | | 297,316,323 | |
| | |
| TOTAL INVESTMENTS BEFORE SECURITIES LENDING
REINVESTMENT VEHICLE |
|
| | (Cost $8,045,630,266) | | $ | 10,407,272,245 | |
| | |
Shares | | | Dividend
Rate | | Value | |
|
| Securities Lending Reinvestment Vehicle – 0.1%(b) | |
| Goldman Sachs Financial Square Government Fund –
Institutional Shares |
|
| | 9,557,821 | | | 0.027% | | $ | 9,557,821 | |
| | (Cost $9,557,821) | |
| | |
| | TOTAL INVESTMENTS – 99.9% | |
| | (Cost $8,055,188,087) | | $ | 10,416,830,066 | |
| | |
| OTHER ASSETS IN EXCESS OF
LIABILITIES – 0.1% | | | 11,064,657 | |
| | |
| | NET ASSETS – 100.0% | | $ | 10,427,894,723 | |
| | |
| | |
|
| The percentage shown for each investment category reflects the value of investments in that category as a percentage of net assets. |
| |
* | | Non-income producing security. |
| |
(a) | | All or a portion of security is on loan. |
| |
(b) | | Represents an affiliated issuer. |
| | |
|
Investment Abbreviations: |
PLC | | —Public Limited Company |
REIT | | —Real Estate Investment Trust |
|
| | |
| 66 | | The accompanying notes are an integral part of these financial statements. |
GOLDMAN SACHS ACTIVEBETA® U.S. SMALL CAP EQUITY ETF
Schedule of Investments
August 31, 2020
| | | | | | | | |
Shares | | | Description | | Value | |
|
| Common Stocks – 98.2% | |
| Communication Services – 2.3% | |
| | 20,296 | | | Alaska Communications Systems Group, Inc. | | $ | 45,463 | |
| | 1,543 | | | AMC Networks, Inc., Class A* | | | 37,480 | |
| | 789 | | | Anterix, Inc.* | | | 34,511 | |
| | 475 | | | ATN International, Inc. | | | 27,550 | |
| | 685 | | | Bandwidth, Inc., Class A* | | | 107,874 | |
| | 1,059 | | | Cardlytics, Inc.* | | | 80,325 | |
| | 5,930 | | | Cargurus, Inc.* | | | 144,573 | |
| | 5,172 | | | Cars.com, Inc.* | | | 44,893 | |
| | 8,530 | | | Central European Media Enterprises Ltd., Class A (Czech Republic)* | | | 35,357 | |
| | 1,867 | | | Cincinnati Bell, Inc.* | | | 28,117 | |
| | 2,889 | | | Cogent Communications Holdings, Inc. | | | 194,314 | |
| | 12,458 | | | Consolidated Communications Holdings, Inc.* | | | 96,923 | |
| | 125 | | | Daily Journal Corp.*(a) | | | 34,400 | |
| | 15,461 | | | DHI Group, Inc.* | | | 37,570 | |
| | 16,605 | | | Entercom Communications Corp., Class A | | | 24,908 | |
| | 18,535 | | | Eros International PLC (India)*(a) | | | 57,644 | |
| | 3,415 | | | EverQuote, Inc., Class A* | | | 121,233 | |
| | 17,139 | | | Glu Mobile, Inc.* | | | 136,084 | |
| | 6,168 | | | Gray Television, Inc.* | | | 95,727 | |
| | 2,097 | | | Hemisphere Media Group, Inc.* | | | 18,663 | |
| | 5,942 | | | IDT Corp., Class B* | | | 38,742 | |
| | 3,021 | | | iHeartMedia, Inc., Class A* | | | 27,854 | |
| | 3,437 | | | Iridium Communications, Inc.* | | | 96,270 | |
| | 4,533 | | | Liberty Latin America Ltd., Class A (Chile)* | | | 44,423 | |
| | 7,048 | | | Liberty Latin America Ltd., Class C (Chile)* | | | 67,238 | |
| | 1,771 | | | Liberty Media Corp.-Liberty Braves, Class A*(a) | | | 34,694 | |
| | 2,573 | | | Liberty Media Corp.-Liberty Braves, Class C* | | | 49,993 | |
| | 19,614 | | | Liberty TripAdvisor Holdings, Inc., Class A* | | | 54,919 | |
| | 2,712 | | | Marcus Corp. (The) | | | 42,497 | |
| | 7,683 | | | Meet Group, Inc. (The)* | | | 48,403 | |
| | 6,909 | | | MSG Networks, Inc., Class A* | | | 67,294 | |
| | 6,600 | | | Ooma, Inc.* | | | 90,024 | |
| | 14,544 | | | ORBCOMM, Inc.* | | | 58,321 | |
| | 4,499 | | | QuinStreet, Inc.* | | | 59,162 | |
| | 17 | | | Saga Communications, Inc., Class A | | | 383 | |
| | 4,556 | | | Scholastic Corp. | | | 102,510 | |
| | 2,227 | | | Shenandoah Telecommunications Co. | | | 123,153 | |
| | 1,376 | | | Sinclair Broadcast Group, Inc., Class A(a) | | | 28,635 | |
| | 4,323 | | | Spok Holdings, Inc. | | | 46,861 | |
| | 5,453 | | | TechTarget, Inc.* | | | 216,375 | |
| | 12,539 | | | TEGNA, Inc. | | | 156,988 | |
| | =-24,765 | | | TrueCar, Inc.* | | | 117,138 | |
| | 30,589 | | | Vonage Holdings Corp.* | | | 350,244 | |
| | 6,864 | | | Yelp, Inc.* | | | 158,696 | |
| | | | | | | | |
| | | | | | | 3,484,426 | |
| | |
|
| Common Stocks – (continued) | |
| Consumer Discretionary – 13.4% | |
| | 7,567 | | | 1-800-Flowers.com, Inc., Class A* | | | 226,480 | |
| | 7,081 | | | Aaron’s, Inc. | | | 395,757 | |
| | 7,440 | | | Abercrombie & Fitch Co., Class A | | | 96,794 | |
| | 3,231 | | | Acushnet Holdings Corp. | | | 114,022 | |
| | 5,469 | | | Adient PLC* | | | 94,832 | |
| | 4,966 | | | Adtalem Global Education, Inc.* | | | 164,871 | |
| | 1,203 | | | America’s Car-Mart, Inc.* | | | 120,901 | |
| | 7,133 | | | American Axle & Manufacturing Holdings, Inc.* | | | 55,495 | |
| | 6,095 | | | American Eagle Outfitters, Inc. | | | 76,858 | |
| | 574 | | | American Outdoor Brands, Inc.* | | | 8,742 | |
| | 5,400 | | | American Public Education, Inc.* | | �� | 169,776 | |
| | 1,659 | | | Asbury Automotive Group, Inc.* | | | 175,506 | |
| | 7,264 | | | Aspen Group, Inc.* | | | 92,834 | |
| | 3,652 | | | At Home Group, Inc.* | | | 69,790 | |
| | 2,453 | | | BBX Capital Corp. | | | 37,776 | |
| | 7,519 | | | Beazer Homes USA, Inc.* | | | 92,033 | |
| | 8,268 | | | Bed Bath & Beyond, Inc. | | | 100,704 | |
| | 3,763 | | | Big Lots, Inc. | | | 177,425 | |
| | 77 | | | Biglari Holdings, Inc., Class B* | | | 7,631 | |
| | 2,111 | | | BJ’s Restaurants, Inc. | | | 66,539 | |
| | 5,101 | | | Bloomin’ Brands, Inc. | | | 73,148 | |
| | 2,613 | | | Boot Barn Holdings, Inc.* | | | 73,765 | |
| | 5,664 | | | Boyd Gaming Corp. | | | 151,682 | |
| | 2,684 | | | Brinker International, Inc. | | | 120,887 | |
| | 3,782 | | | Buckle, Inc. (The) | | | 70,875 | |
| | 3,567 | | | Caesars Entertainment, Inc.* | | | 163,369 | |
| | 4,404 | | | Caleres, Inc. | | | 34,395 | |
| | 5,387 | | | Callaway Golf Co. | | | 112,373 | |
| | 988 | | | Camping World Holdings, Inc., Class A | | | 28,711 | |
| | 7,870 | | | CarParts.com, Inc.* | | | 110,573 | |
| | 2,949 | | | Carriage Services, Inc. | | | 65,291 | |
| | 3,295 | | | Casper Sleep, Inc.* | | | 29,919 | |
| | 414 | | | Cavco Industries, Inc.* | | | 79,037 | |
| | 910 | | | Century Communities, Inc.* | | | 32,469 | |
| | 3,286 | | | Cheesecake Factory, Inc. (The)(a) | | | 97,036 | |
| | 1,665 | | | Children’s Place, Inc. (The) | | | 33,242 | |
| | 1,765 | | | Churchill Downs, Inc. | | | 308,451 | |
| | 2,542 | | | Citi Trends, Inc. | | | 49,137 | |
| | 3,528 | | | Clarus Corp. | | | 44,418 | |
| | 3,217 | | | Collectors Universe, Inc. | | | 143,124 | |
| | 3,063 | | | Conn’s, Inc.* | | | 39,145 | |
| | 3,278 | | | Cooper Tire & Rubber Co. | | | 113,320 | |
| | 3,353 | | | Core-Mark Holding Co., Inc. | | | 112,057 | |
| | 509 | | | Cracker Barrel Old Country Store, Inc. | | | 68,058 | |
| | 8,039 | | | Crocs, Inc.* | | | 320,836 | |
| | 9,308 | | | Dana, Inc. | | | 129,847 | |
| | 2,615 | | | Deckers Outdoor Corp.* | | | 533,120 | |
| | 9,452 | | | Del Taco Restaurants, Inc.* | | | 79,491 | |
| | 8,592 | | | Denny’s Corp.* | | | 98,464 | |
| | 4,340 | | | Designer Brands, Inc., Class A | | | 30,597 | |
| | 2,057 | | | Dillard’s, Inc., Class A(a) | | | 62,142 | |
| | 697 | | | Dine Brands Global, Inc. | | | 41,513 | |
| | 3,079 | | | Dorman Products, Inc.* | | | 260,761 | |
| | 3,846 | | | Duluth Holdings, Inc., Class B*(a) | | | 37,229 | |
| | 4,472 | | | El Pollo Loco Holdings, Inc.* | | | 79,915 | |
| | |
| | |
| The accompanying notes are an integral part of these financial statements. | | 67 |
GOLDMAN SACHS ACTIVEBETA® U.S. SMALL CAP EQUITY ETF
Schedule of Investments (continued)
August 31, 2020
| | | | | | | | |
Shares | | | Description | | Value | |
|
| Common Stocks – (continued) | |
| Consumer Discretionary – (continued) | |
| | 6,284 | | | Ethan Allen Interiors, Inc. | | $ | 89,484 | |
| | 4,701 | | | Everi Holdings, Inc.* | | | 36,480 | |
| | 7,049 | | | Fiesta Restaurant Group, Inc.* | | | 70,631 | |
| | 13,282 | | | Fossil Group, Inc.* | | | 85,470 | |
| | 2,403 | | | Fox Factory Holding Corp.* | | | 242,246 | |
| | 1,066 | | | Franchise Group, Inc. | | | 26,181 | |
| | 7,259 | | | Funko, Inc., Class A*(a) | | | 42,393 | |
| | 9,721 | | | GameStop Corp., Class A*(a) | | | 64,936 | |
| | 2,867 | | | Genesco, Inc.* | | | 55,906 | |
| | 4,074 | | | Gentherm, Inc.* | | | 184,267 | |
| | 2,594 | | | G-III Apparel Group Ltd.* | | | 28,690 | |
| | 8,906 | | | Goodyear Tire & Rubber Co. (The) | | | 85,453 | |
| | 11,560 | | | GoPro, Inc., Class A* | | | 53,060 | |
| | 2,456 | | | Green Brick Partners, Inc.* | | | 34,973 | |
| | 1,473 | | | Group 1 Automotive, Inc. | | | 127,326 | |
| | 2,462 | | | Groupon, Inc.* | | | 78,365 | |
| | 3,228 | | | Guess?, Inc. | | | 37,122 | |
| | 5,225 | | | Haverty Furniture Cos., Inc. | | | 110,352 | |
| | 1,456 | | | Helen of Troy Ltd.* | | | 301,130 | |
| | 4,264 | | | Hibbett Sports, Inc.* | | | 142,290 | |
| | 1,947 | | | Hilton Grand Vacations, Inc.* | | | 42,659 | |
| | 16,745 | | | Houghton Mifflin Harcourt Co.* | | | 37,844 | |
| | 7,687 | | | Hudson Ltd., Class A* | | | 57,960 | |
| | 1,603 | | | Installed Building Products, Inc.* | | | 139,172 | |
| | 5,034 | | | International Game Technology PLC | | | 56,028 | |
| | 2,250 | | | iRobot Corp.* | | | 166,568 | |
| | 1,357 | | | Jack in the Box, Inc. | | | 111,803 | |
| | 1,465 | | | Johnson Outdoors, Inc., Class A | | | 125,565 | |
| | 8,523 | | | K12, Inc.* | | | 317,141 | |
| | 6,952 | | | KB Home | | | 248,604 | |
| | 1,557 | | | Kontoor Brands, Inc. | | | 34,410 | |
| | 1,337 | | | Lakeland Industries, Inc.*(a) | | | 27,315 | |
| | 3,433 | | | Lands’ End, Inc.* | | | 45,934 | |
| | 8,766 | | | Laureate Education, Inc., Class A* | | | 109,750 | |
| | 5,700 | | | La-Z-Boy, Inc. | | | 185,250 | |
| | 2,444 | | | LCI Industries | | | 277,712 | |
| | 576 | | | LGI Homes, Inc.* | | | 64,431 | |
| | 3,092 | | | Lifetime Brands, Inc. | | | 30,363 | |
| | 1,619 | | | Liquidity Services, Inc.* | | | 11,673 | |
| | 1,385 | | | Lithia Motors, Inc., Class A | | | 344,810 | |
| | 3,269 | | | Lumber Liquidators Holdings, Inc.* | | | 78,423 | |
| | 2,798 | | | M/I Homes, Inc.* | | | 119,083 | |
| | 17,106 | | | Macy’s, Inc.(a) | | | 119,229 | |
| | 10,436 | | | Magnite, Inc.* | | | 76,705 | |
| | 2,041 | | | Malibu Boats, Inc., Class A* | | | 105,826 | |
| | 2,305 | | | Marine Products Corp. | | | 33,307 | |
| | 2,034 | | | MarineMax, Inc.* | | | 59,820 | |
| | 2,047 | | | Marriott Vacations Worldwide Corp. | | | 193,789 | |
| | 5,480 | | | MasterCraft Boat Holdings, Inc.* | | | 114,587 | |
| | 2,455 | | | MDC Holdings, Inc. | | | 106,498 | |
| | 2,664 | | | Meritage Homes Corp.* | | | 255,824 | |
| | 5,328 | | | Modine Manufacturing Co.* | | | 36,071 | |
| | 1,410 | | | Monarch Casino & Resort, Inc.* | | | 64,874 | |
| | 1,173 | | | Monro, Inc. | | | 54,064 | |
| | 2,311 | | | Movado Group, Inc. | | | 25,213 | |
| | 2,238 | | | Murphy USA, Inc.* | | | 301,817 | |
| | |
|
| Common Stocks – (continued) | |
| Consumer Discretionary – (continued) | |
| | 1,127 | | | Nathan’s Famous, Inc. | | | 59,111 | |
| | 2,382 | | | National Vision Holdings, Inc.* | | | 89,492 | |
| | 8,282 | | | Nautilus, Inc.* | | | 98,142 | |
| | 3,547 | | | ODP Corp. (The) | | | 82,929 | |
| | 2,528 | | | Overstock.com, Inc.* | | | 221,200 | |
| | 2,445 | | | Oxford Industries, Inc. | | | 121,101 | |
| | 3,093 | | | Papa John’s International, Inc. | | | 304,011 | |
| | 8,606 | | | Penn National Gaming, Inc.* | | | 439,767 | |
| | 17,307 | | | Perdoceo Education Corp.* | | | 248,702 | |
| | 2,451 | | | PetMed Express, Inc. | | | 85,197 | |
| | 7,302 | | | PlayAGS, Inc.* | | | 29,208 | |
| | 3,693 | | | Purple Innovation, Inc.* | | | 69,835 | |
| | 4,136 | | | Quotient Technology, Inc.* | | | 36,025 | |
| | 2,507 | | | RCI Hospitality Holdings, Inc. | | | 47,934 | |
| | 1,907 | | | RealReal, Inc. (The)* | | | 30,626 | |
| | 9,803 | | | Rent-A-Center, Inc. | | | 300,952 | |
| | 1,417 | | | RH* | | | 468,389 | |
| | 4,467 | | | Ruth’s Hospitality Group, Inc. | | | 45,898 | |
| | 9,226 | | | Sally Beauty Holdings, Inc.* | | | 102,962 | |
| | 3,212 | | | Scientific Games Corp.* | | | 66,440 | |
| | 3,521 | | | SeaWorld Entertainment, Inc.* | | | 71,828 | |
| | 677 | | | Shake Shack, Inc., Class A* | | | 46,205 | |
| | 3,638 | | | Shoe Carnival, Inc. | | | 119,617 | |
| | 2,813 | | | Shutterstock, Inc. | | | 141,550 | |
| | 3,060 | | | Signet Jewelers Ltd. | | | 52,846 | |
| | 2,598 | | | Skyline Champion Corp.* | | | 74,147 | |
| | 3,902 | | | Sleep Number Corp.* | | | 187,296 | |
| | 2,299 | | | Smith & Wesson Brands, Inc.* | | | 41,980 | |
| | 1,515 | | | Sonic Automotive, Inc., Class A | | | 64,024 | |
| | 9,052 | | | Sonos, Inc.* | | | 127,362 | |
| | 4,247 | | | Sportsman’s Warehouse Holdings, Inc.* | | | 66,657 | |
| | 1,138 | | | Stamps.com, Inc.* | | | 283,749 | |
| | 3,418 | | | Standard Motor Products, Inc. | | | 155,314 | |
| | 6,578 | | | Steven Madden Ltd. | | | 139,190 | |
| | 4,128 | | | Stitch Fix, Inc., Class A*(a) | | | 99,691 | |
| | 7,845 | | | Stoneridge, Inc.* | | | 158,469 | |
| | 1,194 | | | Strategic Education, Inc. | | | 122,469 | |
| | 2,434 | | | Sturm Ruger & Co., Inc. | | | 172,473 | |
| | 10,134 | | | Taylor Morrison Home Corp.* | | | 238,453 | |
| | 3,375 | | | Texas Roadhouse, Inc. | | | 212,591 | |
| | 2,085 | | | TopBuild Corp.* | | | 320,673 | |
| | 8,591 | | | TRI Pointe Group, Inc.* | | | 145,016 | |
| | 16,540 | | | Tupperware Brands Corp. | | | 269,437 | |
| | 3,790 | | | Turtle Beach Corp.* | | | 74,170 | |
| | 2,503 | | | Unifi, Inc.* | | | 30,612 | |
| | 641 | | | Universal Electronics, Inc.* | | | 26,332 | |
| | 11,283 | | | Universal Technical Institute, Inc.* | | | 79,545 | |
| | 7,999 | | | Vera Bradley, Inc.* | | | 42,155 | |
| | 3,504 | | | Vista Outdoor, Inc.* | | | 68,013 | |
| | 923 | | | Visteon Corp.* | | | 69,622 | |
| | 1,402 | | | Weyco Group, Inc. | | | 25,236 | |
| | 3,214 | | | Wingstop, Inc. | | | 525,168 | |
| | 853 | | | Winmark Corp. | | | 131,746 | |
| | 1,795 | | | Winnebago Industries, Inc. | | | 96,894 | |
| | 5,231 | | | Wolverine World Wide, Inc. | | | 130,670 | |
| | 8,754 | | | WW International, Inc.* | | | 205,544 | |
| | |
| | |
| 68 | | The accompanying notes are an integral part of these financial statements. |
GOLDMAN SACHS ACTIVEBETA® U.S. SMALL CAP EQUITY ETF
| | | | | | | | |
Shares | | | Description | | Value | |
|
| Common Stocks – (continued) | |
| Consumer Discretionary – (continued) | |
| | 4,196 | | | YETI Holdings, Inc.* | | $ | 215,590 | |
| | 5,174 | | | Zumiez, Inc.* | | | 132,868 | |
| | | | | | | | |
| | | | | | | 20,363,163 | |
| | |
| Consumer Staples – 3.5% | |
| | 66 | | | Alico, Inc. | | | 2,133 | |
| | 1,828 | | | B&G Foods, Inc.(a) | | | 56,924 | |
| | 2,936 | | | BellRing Brands, Inc., Class A* | | | 57,076 | |
| | 8,865 | | | BJ’s Wholesale Club Holdings, Inc.* | | | 393,695 | |
| | 686 | | | Calavo Growers, Inc. | | | 43,540 | |
| | 1,469 | | | Cal-Maine Foods, Inc.* | | | 56,689 | |
| | 9,078 | | | Celsius Holdings, Inc. *(a) | | | 176,295 | |
| | 1,967 | | | Central Garden & Pet Co.* | | | 80,037 | |
| | 2,784 | | | Central Garden & Pet Co., Class A* | | | 103,454 | |
| | 3,718 | | | Chefs’ Warehouse, Inc. (The)* | | | 55,064 | |
| | 781 | | | Coca-Cola Consolidated, Inc. | | | 213,447 | |
| | 10,986 | | | Darling Ingredients, Inc.* | | | 351,222 | |
| | 2,817 | | | Edgewell Personal Care Co.* | | | 80,876 | |
| | 1,540 | | | elf Beauty, Inc.* | | | 30,076 | |
| | 1,619 | | | Farmer Bros Co.* | | | 10,184 | |
| | 3,220 | | | Fresh Del Monte Produce, Inc. | | | 74,672 | |
| | 2,922 | | | Freshpet, Inc.* | | | 331,939 | |
| | 11,530 | | | Hostess Brands, Inc.* | | | 148,045 | |
| | 3,286 | | | Ingles Markets, Inc., Class A | | | 132,754 | |
| | 1,469 | | | Inter Parfums, Inc. | | | 65,620 | |
| | 1,025 | | | J & J Snack Foods Corp. | | | 139,349 | |
| | 1,266 | | | John B Sanfilippo & Son, Inc. | | | 100,824 | |
| | 1,205 | | | Lancaster Colony Corp. | | | 214,153 | |
| | 3,895 | | | Landec Corp.* | | | 39,885 | |
| | 5,369 | | | Lifevantage Corp.* | | | 80,642 | |
| | 1,386 | | | Medifast, Inc. | | | 225,530 | |
| | 2,315 | | | National Beverage Corp. *(a) | | | 188,256 | |
| | 2,357 | | | Nature’s Sunshine Products, Inc.* | | | 26,021 | |
| | 7,886 | | | Performance Food Group Co.* | | | 287,918 | |
| | 713 | | | PriceSmart, Inc. | | | 46,880 | |
| | 11,459 | | | Primo Water Corp. | | | 156,759 | |
| | 6,020 | | | Rite Aid Corp.* | | | 78,380 | |
| | 1,181 | | | Sanderson Farms, Inc. | | | 138,130 | |
| | 3,287 | | | Simply Good Foods Co. (The)* | | | 81,682 | |
| | 4,881 | | | SpartanNash Co. | | | 97,522 | |
| | 1,139 | | | Tootsie Roll Industries, Inc. | | | 36,437 | |
| | 2,016 | | | Turning Point Brands, Inc. | | | 58,262 | |
| | 5,245 | | | United Natural Foods, Inc.* | | | 94,672 | |
| | 2,034 | | | Universal Corp. | | | 88,296 | |
| | 2,057 | | | USANA Health Sciences, Inc.* | | | 161,289 | |
| | 10,650 | | | Vector Group Ltd. | | | 107,246 | |
| | 8,074 | | | Veru, Inc.* | | | 22,365 | |
| | 3,156 | | | Village Super Market, Inc., Class A | | | 80,289 | |
| | 1,127 | | | WD-40 Co. | | | 230,336 | |
| | 1,805 | | | Weis Markets, Inc. | | | 88,860 | |
| | | | | | | | |
| | | | | | | 5,333,725 | |
| | |
| Energy – 1.4% | |
| | 7,994 | | | Aspen Aerogels, Inc.* | | | 67,949 | |
| | 574 | | | Bristow Group, Inc.* | | | 10,854 | |
| | 4,415 | | | Cactus, Inc., Class A | | | 97,527 | |
| | |
|
| Common Stocks – (continued) | |
| Energy – (continued) | |
| | 4,459 | | | CNX Resources Corp.* | | | 48,871 | |
| | 5,054 | | | CONSOL Energy, Inc.* | | | 26,129 | |
| | 8,197 | | | Contango Oil & Gas Co.* | | | 13,279 | |
| | 5,715 | | | DHT Holdings, Inc. | | | 30,232 | |
| | 3,664 | | | Diamond S Shipping, Inc.* | | | 30,008 | |
| | 3,153 | | | DMC Global, Inc. | | | 111,711 | |
| | 6,452 | | | Dorian LPG Ltd.* | | | 54,455 | |
| | 10,082 | | | Evolution Petroleum Corp. | | | 27,524 | |
| | 3,763 | | | Frontline Ltd. (Norway)(a) | | | 29,953 | |
| | 12,474 | | | Helix Energy Solutions Group, Inc.* | | | 44,657 | |
| | 1,587 | | | International Seaways, Inc. | | | 26,916 | |
| | 14,751 | | | Kosmos Energy Ltd. (Ghana) | | | 21,684 | |
| | 8,378 | | | Liberty Oilfield Services, Inc., Class A | | | 54,038 | |
| | 2,684 | | | Matador Resources Co.* | | | 26,115 | |
| | 6,255 | | | Matrix Service Co.* | | | 57,796 | |
| | 1,129 | | | Nabors Industries Ltd.(a) | | | 45,137 | |
| | 16,809 | | | Newpark Resources, Inc.* | | | 32,778 | |
| | 26,205 | | | NexTier Oilfield Solutions, Inc.* | | | 66,037 | |
| | 6,433 | | | Nordic American Tankers Ltd.(a) | | | 28,048 | |
| | 9,801 | | | Oil States International, Inc.* | | | 43,026 | |
| | 5,812 | | | Ovintiv, Inc.(a) | | | 64,397 | |
| | 3,944 | | | Par Pacific Holdings, Inc.* | | | 34,234 | |
| | 6,433 | | | Patterson-UTI Energy, Inc. | | | 24,767 | |
| | 2,183 | | | PBF Energy, Inc., Class A | | | 18,686 | |
| | 2,033 | | | PDC Energy, Inc.* | | | 30,780 | |
| | 10,424 | | | Peabody Energy Corp. | | | 27,207 | |
| | 24,086 | | | ProPetro Holding Corp.* | | | 151,260 | |
| | 4,598 | | | Range Resources Corp. | | | 34,301 | |
| | 5,758 | | | Renewable Energy Group, Inc.* | | | 192,490 | |
| | 685 | | | REX American Resources Corp.* | | | 42,319 | |
| | 22,477 | | | RPC, Inc.* | | | 70,353 | |
| | 2,436 | | | Scorpio Tankers, Inc. (Monaco) | | | 28,842 | |
| | 1,460 | | | SEACOR Holdings, Inc.* | | | 46,151 | |
| | 7,479 | | | Select Energy Services, Inc., Class A* | | | 35,675 | |
| | 5,651 | | | SFL Corp. Ltd. (Norway) | | | 49,616 | |
| | 9,025 | | | Solaris Oilfield Infrastructure, Inc., Class A | | | 70,215 | |
| | 10,273 | | | Southwestern Energy Co.* | | | 28,559 | |
| | 32,406 | | | W&T Offshore, Inc. *(a) | | | 72,265 | |
| | 3,557 | | | World Fuel Services Corp. | | | 93,905 | |
| | | | | | | | |
| | | | | | | 2,110,746 | |
| | |
| Financials – 15.9% | |
| | 1,007 | | | 1st Constitution Bancorp | | | 12,255 | |
| | 1,395 | | | 1st Source Corp. | | | 48,058 | |
| | 1,318 | | | Allegiance Bancshares, Inc. | | | 33,504 | |
| | 2,790 | | | Altabancorp | | | 57,530 | |
| | 2,450 | | | Ambac Financial Group, Inc.* | | | 30,943 | |
| | 618 | | | Amerant Bancorp, Inc.* | | | 8,127 | |
| | 9,168 | | | American Equity Investment Life Holding Co. | | | 219,207 | |
| | 1,598 | | | American National Bankshares, Inc. | | | 36,019 | |
| | 2,308 | | | Ameris Bancorp | | | 56,592 | |
| | 2,580 | | | AMERISAFE, Inc. | | | 172,163 | |
| | 198 | | | Ames National Corp. | | | 3,950 | |
| | |
| | |
| The accompanying notes are an integral part of these financial statements. | | 69 |
GOLDMAN SACHS ACTIVEBETA® U.S. SMALL CAP EQUITY ETF
Schedule of Investments (continued)
August 31, 2020
| | | | | | | | |
Shares | | | Description | | Value | |
|
| Common Stocks – (continued) | |
| Financials – (continued) | |
| | 4,852 | | | Apollo Commercial Real Estate Finance, Inc. REIT | | $ | 43,377 | |
| | 5,653 | | | Ares Commercial Real Estate Corp. REIT | | | 56,304 | |
| | 1,823 | | | Argo Group International Holdings Ltd. | | | 67,706 | |
| | 2,887 | | | Arrow Financial Corp. | | | 82,713 | |
| | 6,774 | | | Artisan Partners Asset Management, Inc., Class A | | | 262,222 | |
| | 399 | | | Associated Capital Group, Inc., Class A | | | 15,421 | |
| | 3,165 | | | Atlantic Capital Bancshares, Inc.* | | | 36,508 | |
| | 5,092 | | | Atlantic Union Bankshares Corp. | | | 118,440 | |
| | 8,969 | | | Axos Financial, Inc.* | | | 222,252 | |
| | 2,865 | | | B. Riley Financial, Inc. | | | 76,725 | |
| | 4,550 | | | Banc of California, Inc. | | | 50,004 | |
| | 2,453 | | | BancFirst Corp. | | | 107,932 | |
| | 2,892 | | | Banco Latinoamericano de Comercio Exterior SA, Class E (Panama) | | | 35,225 | |
| | 6,012 | | | BancorpSouth Bank | | | 129,739 | |
| | 913 | | | Bank First Corp. | | | 56,971 | |
| | 4,539 | | | Bank of Commerce Holdings | | | 33,362 | |
| | 1,453 | | | Bank of Marin Bancorp | | | 46,249 | |
| | 7,644 | | | Bank of NT Butterfield & Son Ltd. (The) (Bermuda) | | | 192,629 | |
| | 2,782 | | | BankFinancial Corp. | | | 20,197 | |
| | 2,301 | | | BankUnited, Inc. | | | 53,797 | |
| | 1,251 | | | Bankwell Financial Group, Inc. | | | 19,516 | |
| | 2,150 | | | Banner Corp. | | | 77,658 | |
| | 1,402 | | | Bar Harbor Bankshares | | | 28,405 | |
| | 3,845 | | | BCB Bancorp, Inc. | | | 31,318 | |
| | 4,059 | | | Berkshire Hills Bancorp, Inc. | | | 37,262 | |
| | 6,881 | | | Blackstone Mortgage Trust, Inc., Class A REIT | | | 163,561 | |
| | 7,341 | | | Boston Private Financial Holdings, Inc. | | | 43,606 | |
| | 2,111 | | | Bridge Bancorp, Inc. | | | 42,241 | |
| | 10,633 | | | Brightsphere Investment Group, Inc. | | | 147,373 | |
| | 5,731 | | | Brookline Bancorp, Inc. | | | 55,018 | |
| | 2,173 | | | Bryn Mawr Bank Corp. | | | 58,975 | |
| | 675 | | | C&F Financial Corp. | | | 21,580 | |
| | 618 | | | Cambridge Bancorp | | | 33,891 | |
| | 3,215 | | | Camden National Corp. | | | 104,986 | |
| | 7,003 | | | Cannae Holdings, Inc.* | | | 264,223 | |
| | 3,157 | | | Capital City Bank Group, Inc. | | | 63,992 | |
| | 5,893 | | | Capitol Federal Financial, Inc. | | | 55,041 | |
| | 1,340 | | | Capstar Financial Holdings, Inc. | | | 13,655 | |
| | 6,276 | | | Cathay General Bancorp | | | 154,954 | |
| | 1,132 | | | CB Financial Services, Inc. | | | 21,055 | |
| | 2,731 | | | Central Pacific Financial Corp. | | | 42,303 | |
| | 2,251 | | | Central Valley Community Bancorp | | | 27,080 | |
| | 835 | | | Century Bancorp, Inc., Class A | | | 58,826 | |
| | 785 | | | Chemung Financial Corp. | | | 22,537 | |
| | 1,809 | | | Citizens & Northern Corp. | | | 31,006 | |
| | 2,330 | | | City Holding Co. | | | 149,073 | |
| | 3,935 | | | Civista Bancshares, Inc. | | | 52,532 | |
| | 2,678 | | | CNB Financial Corp. | | | 42,714 | |
| | 9,307 | | | CNO Financial Group, Inc. | | | 151,704 | |
| | 2,093 | | | Codorus Valley Bancorp, Inc. | | | 27,000 | |
| | 3,623 | | | Cohen & Steers, Inc. | | | 219,191 | |
| | |
|
| Common Stocks – (continued) | |
| Financials – (continued) | |
| | 1,497 | | | Colony Bankcorp, Inc. | | | 16,467 | |
| | 4,177 | | | Columbia Banking System, Inc. | | | 116,580 | |
| | 2,024 | | | Columbia Financial, Inc.* | | | 21,596 | |
| | 3,091 | | | Community Bank System, Inc. | | | 185,985 | |
| | 8,523 | | | Community Bankers Trust Corp. | | | 43,723 | |
| | 817 | | | Community Financial Corp. (The) | | | 18,170 | |
| | 1,949 | | | Community Trust Bancorp, Inc. | | | 62,894 | |
| | 2,566 | | | ConnectOne Bancorp, Inc. | | | 38,798 | |
| | 1,822 | | | County Bancorp, Inc. | | | 35,165 | |
| | 4,113 | | | Cowen, Inc., Class A | | | 74,404 | |
| | 2,879 | | | Crawford & Co., Class A | | | 19,750 | |
| | 4,527 | | | Curo Group Holdings Corp. | | | 34,858 | |
| | 5,436 | | | Customers Bancorp, Inc.* | | | 69,418 | |
| | 6,777 | | | CVB Financial Corp. | | | 123,409 | |
| | 680 | | | Diamond Hill Investment Group, Inc. | | | 84,259 | |
| | 3,358 | | | Dime Community Bancshares, Inc. | | | 43,318 | |
| | 2,851 | | | Donegal Group, Inc., Class A | | | 41,140 | |
| | 6,217 | | | Donnelley Financial Solutions, Inc.* | | | 67,765 | |
| | 2,934 | | | Dynex Capital, Inc. REIT | | | 46,475 | |
| | 3,337 | | | Eagle Bancorp, Inc. | | | 96,039 | |
| | 650 | | | eHealth, Inc.* | | | 41,028 | |
| | 4,068 | | | Employers Holdings, Inc. | | | 132,535 | |
| | 4,040 | | | Encore Capital Group, Inc.* | | | 185,598 | |
| | 5,666 | | | Enova International, Inc.* | | | 96,775 | |
| | 761 | | | Enstar Group Ltd. (Bermuda)* | | | 136,211 | |
| | 2,789 | | | Enterprise Financial Services Corp. | | | 83,419 | |
| | 421 | | | Equity Bancshares, Inc., Class A* | | | 6,694 | |
| | 341 | | | Esquire Financial Holdings, Inc.* | | | 5,626 | |
| | 2,606 | | | ESSA Bancorp, Inc. | | | 33,357 | |
| | 9,846 | | | Essent Group Ltd. | | | 351,502 | |
| | 1,494 | | | Evans Bancorp, Inc. | | | 34,063 | |
| | 5,801 | | | EZCORP, Inc., Class A* | | | 31,209 | |
| | 1,682 | | | Farmers & Merchants Bancorp, Inc. | | | 36,247 | |
| | 4,455 | | | Farmers National Banc Corp. | | | 51,945 | |
| | 4,065 | | | FB Financial Corp. | | | 109,755 | |
| | 1,029 | | | FBL Financial Group, Inc., Class A | | | 38,124 | |
| | 3,169 | | | Federal Agricultural Mortgage Corp., Class C | | | 215,967 | |
| | 9,048 | | | Federated Hermes, Inc. | | | 216,338 | |
| | 3,206 | | | Financial Institutions, Inc. | | | 55,239 | |
| | 17,639 | | | First BanCorp. (Puerto Rico) | | | 101,071 | |
| | 2,245 | | | First Bancorp, Inc. (The) | | | 47,774 | |
| | 1,589 | | | First Bancshares, Inc. (The) | | | 34,068 | |
| | 1,051 | | | First Bank | | | 6,853 | |
| | 3,023 | | | First BankCorp | | | 61,820 | |
| | 3,628 | | | First Busey Corp. | | | 64,633 | |
| | 2,384 | | | First Business Financial Services, Inc. | | | 36,952 | |
| | 8,237 | | | First Commonwealth Financial Corp. | | | 67,543 | |
| | 1,535 | | | First Community Bankshares, Inc. | | | 29,533 | |
| | 1,748 | | | First Community Corp/SC | | | 22,165 | |
| | 8,264 | | | First Financial Bancorp | | | 113,382 | |
| | 10,579 | | | First Financial Bankshares, Inc. | | | 320,279 | |
| | 1,545 | | | First Financial Corp. | | | 53,133 | |
| | 4,177 | | | First Foundation, Inc. | | | 63,449 | |
| | 1,419 | | | First Guaranty Bancshares, Inc. | | | 18,206 | |
| | 1,879 | | | First Internet Bancorp | | | 27,452 | |
| | |
| | |
| 70 | | The accompanying notes are an integral part of these financial statements. |
GOLDMAN SACHS ACTIVEBETA® U.S. SMALL CAP EQUITY ETF
| | | | | | | | |
Shares | | | Description | | Value | |
|
| Common Stocks – (continued) | |
| Financials – (continued) | |
| | 2,327 | | | First Interstate BancSystem, Inc., Class A | | $ | 76,326 | |
| | 5,051 | | | First Merchants Corp. | | | 129,205 | |
| | 1,746 | | | First Mid Bancshares, Inc. | | | 45,466 | |
| | 5,095 | | | First Midwest Bancorp, Inc. | | | 63,484 | |
| | 3,382 | | | First Northwest Bancorp | | | 37,540 | |
| | 3,407 | | | First of Long Island Corp. (The) | | | 52,349 | |
| | 638 | | | First Savings Financial Group, Inc. | | | 27,753 | |
| | 2,356 | | | FirstCash, Inc. | | | 140,771 | |
| | 4,714 | | | Flagstar Bancorp, Inc. | | | 148,114 | |
| | 4,827 | | | Flushing Financial Corp. | | | 58,552 | |
| | 1,316 | | | Focus Financial Partners, Inc., Class A* | | | 46,573 | |
| | 1,274 | | | FS Bancorp, Inc. | | | 50,476 | |
| | 11,743 | | | Fulton Financial Corp. | | | 114,847 | |
| | 31,636 | | | Genworth Financial, Inc., Class A* | | | 95,541 | |
| | 3,786 | | | German American Bancorp, Inc. | | | 107,333 | |
| | 5,508 | | | Glacier Bancorp, Inc. | | | 193,248 | |
| | 625 | | | Global Indemnity Group LLC, Class A | | | 14,519 | |
| | 466 | | | Goosehead Insurance, Inc., Class A | | | 47,886 | |
| | 4,125 | | | Granite Point Mortgage Trust, Inc. REIT | | | 27,390 | |
| | 4,838 | | | Great Ajax Corp. REIT | | | 44,123 | |
| | 2,396 | | | Great Southern Bancorp, Inc. | | | 92,342 | |
| | 2,858 | | | Green Dot Corp., Class A* | | | 148,787 | |
| | 5,540 | | | Greenhill & Co., Inc. | | | 62,159 | |
| | 3,130 | | | Hamilton Lane, Inc., Class A | | | 228,834 | |
| | 4,771 | | | Hancock Whitney Corp. | | | 95,468 | |
| | 3,643 | | | Hanmi Financial Corp. | | | 34,718 | |
| | 2,805 | | | Hannon Armstrong Sustainable Infrastructure Capital, Inc. REIT | | | 119,100 | |
| | 5,591 | | | HarborOne Bancorp, Inc. | | | 48,362 | |
| | 915 | | | HCI Group, Inc. | | | 50,069 | |
| | 3,087 | | | Heartland Financial USA, Inc. | | | 106,285 | |
| | 6,814 | | | Heritage Commerce Corp. | | | 47,221 | |
| | 2,362 | | | Heritage Financial Corp. | | | 47,098 | |
| | 2,407 | | | Heritage Insurance Holdings, Inc. | | | 31,411 | |
| | 6,364 | | | Hilltop Holdings, Inc. | | | 131,098 | |
| | 472 | | | Hingham Institution For Savings (The) | | | 86,546 | |
| | 1,408 | | | Home Bancorp, Inc. | | | 34,017 | |
| | 10,828 | | | Home BancShares, Inc. | | | 175,522 | |
| | 3,477 | | | HomeStreet, Inc. | | | 95,165 | |
| | 2,231 | | | HomeTrust Bancshares, Inc. | | | 31,301 | |
| | 8,631 | | | Hope Bancorp, Inc. | | | 73,018 | |
| | 4,203 | | | Horace Mann Educators Corp. | | | 164,169 | |
| | 4,845 | | | Horizon Bancorp, Inc. | | | 54,167 | |
| | 3,805 | | | Houlihan Lokey, Inc. | | | 222,973 | |
| | 778 | | | Howard Bancorp, Inc.* | | | 7,632 | |
| | 4,000 | | | Independent Bank Corp. | | | 59,640 | |
| | 2,110 | | | Independent Bank Corp. | | | 132,613 | |
| | 2,395 | | | Independent Bank Group, Inc. | | | 111,367 | |
| | 3,985 | | | International Bancshares Corp. | | | 125,846 | |
| | 15,057 | | | Invesco Mortgage Capital, Inc. REIT | | | 45,171 | |
| | 2,364 | | | Investar Holding Corp. | | | 32,150 | |
| | 12,804 | | | Investors Bancorp, Inc. | | | 99,231 | |
| | 441 | | | Investors Title Co. | | | 60,002 | |
| | 2,093 | | | James River Group Holdings Ltd. | | | 101,950 | |
| | 4,277 | | | Kearny Financial Corp. | | | 33,190 | |
| | 2,243 | | | Kinsale Capital Group, Inc. | | | 464,817 | |
| | |
|
| Common Stocks – (continued) | |
| Financials – (continued) | |
| | 3,021 | | | KKR Real Estate Finance Trust, Inc. REIT | | | 54,982 | |
| | 8,200 | | | Ladder Capital Corp. REIT | | | 61,090 | |
| | 4,496 | | | Lakeland Bancorp, Inc. | | | 47,792 | |
| | 3,352 | | | Lakeland Financial Corp. | | | 153,153 | |
| | 2,676 | | | Live Oak Bancshares, Inc. | | | 59,354 | |
| | 7,618 | | | Macatawa Bank Corp. | | | 55,764 | |
| | 693 | | | Marlin Business Services Corp. | | | 4,643 | |
| | 2,674 | | | Mercantile Bank Corp. | | | 58,400 | |
| | 3,562 | | | Meridian Bancorp, Inc. | | | 41,462 | |
| | 3,489 | | | Meta Financial Group, Inc. | | | 67,268 | |
| | 2,091 | | | Midland States Bancorp, Inc. | | | 30,550 | |
| | 1,729 | | | MidWestOne Financial Group, Inc. | | | 32,834 | |
| | 1,534 | | | MMA Capital Holdings, Inc.* | | | 36,018 | |
| | 4,135 | | | Moelis & Co., Class A | | | 131,948 | |
| | 8 | | | Morgan Group Holding Co.* | | | 56 | |
| | 16,666 | | | Mr Cooper Group, Inc.* | | | 305,404 | |
| | 1,533 | | | National Bank Holdings Corp., Class A | | | 43,599 | |
| | 9,717 | | | National General Holdings Corp. | | | 330,864 | |
| | 297 | | | National Western Life Group, Inc., Class A | | | 65,337 | |
| | 15,356 | | | Navient Corp. | | | 139,586 | |
| | 3,273 | | | NBT Bancorp, Inc. | | | 99,728 | |
| | 1,947 | | | Nelnet, Inc., Class A | | | 127,509 | |
| | 557 | | | NI Holdings, Inc.* | | | 9,090 | |
| | 1,679 | | | Nicolet Bankshares, Inc.* | | | 100,774 | |
| | 6,486 | | | NMI Holdings, Inc., Class A* | | | 111,235 | |
| | 2,920 | | | Northeast Bank | | | 54,487 | |
| | 1,839 | | | Northrim BanCorp, Inc. | | | 49,487 | |
| | 6,319 | | | Northwest Bancshares, Inc. | | | 63,885 | |
| | 1,765 | | | Norwood Financial Corp. | | | 43,684 | |
| | 3,163 | | | OceanFirst Financial Corp. | | | 49,374 | |
| | 4,962 | | | OFG Bancorp (Puerto Rico) | | | 63,712 | |
| | 1,620 | | | Ohio Valley Banc Corp. | | | 36,936 | |
| | 10,195 | | | Old National Bancorp | | | 142,526 | |
| | 4,344 | | | Old Second Bancorp, Inc. | | | 35,490 | |
| | 1,758 | | | Oppenheimer Holdings, Inc., Class A | | | 42,948 | |
| | 6,291 | | | Orchid Island Capital, Inc. REIT | | | 32,147 | |
| | 5,445 | | | Pacific Premier Bancorp, Inc. | | | 123,003 | |
| | 650 | | | Palomar Holdings, Inc.* | | | 73,028 | |
| | 1,600 | | | Park National Corp. | | | 143,856 | |
| | 2,791 | | | Parke Bancorp, Inc. | | | 34,329 | |
| | 2,572 | | | PCSB Financial Corp. | | | 32,613 | |
| | 2,810 | | | Peapack-Gladstone Financial Corp. | | | 47,770 | |
| | 1,805 | | | Penns Woods Bancorp, Inc. | | | 37,454 | |
| | 6,367 | | | PennyMac Financial Services, Inc. | | | 335,668 | |
| | 1,748 | | | Peoples Bancorp of North Carolina, Inc. | | | 29,716 | |
| | 3,014 | | | Peoples Bancorp, Inc. | | | 63,716 | |
| | 1,471 | | | Peoples Financial Services Corp. | | | 53,603 | |
| | 955 | | | Piper Sandler Cos. | | | 72,055 | |
| | 1,757 | | | PJT Partners, Inc., Class A | | | 103,979 | |
| | 1,247 | | | Plumas Bancorp | | | 24,641 | |
| | 2,986 | | | PRA Group, Inc.* | | | 139,372 | |
| | 2,996 | | | Preferred Bank | | | 112,050 | |
| | 3,787 | | | Premier Financial Bancorp, Inc. | | | 48,549 | |
| | 2,096 | | | Premier Financial Corp. | | | 38,304 | |
| | |
| | |
| The accompanying notes are an integral part of these financial statements. | | 71 |
GOLDMAN SACHS ACTIVEBETA® U.S. SMALL CAP EQUITY ETF
Schedule of Investments (continued)
August 31, 2020
| | | | | | | | |
Shares | | | Description | | Value | |
|
| Common Stocks – (continued) | |
| Financials – (continued) | |
| | 2,057 | | | Protective Insurance Corp., Class B | | $ | 29,539 | |
| | 4,899 | | | Provident Financial Services, Inc. | | | 64,569 | |
| | 3,222 | | | Prudential Bancorp, Inc. | | | 31,866 | |
| | 6,716 | | | Pzena Investment Management, Inc., Class A | | | 33,244 | |
| | 2,046 | | | QCR Holdings, Inc. | | | 61,319 | |
| | 19,233 | | | Radian Group, Inc. | | | 296,958 | |
| | 2,444 | | | Regional Management Corp.* | | | 44,701 | |
| | 887 | | | Reliant Bancorp, Inc. | | | 12,862 | |
| | 3,226 | | | Renasant Corp. | | | 81,844 | |
| | 2,219 | | | Republic Bancorp, Inc., Class A | | | 68,256 | |
| | 7,861 | | | Riverview Bancorp, Inc. | | | 32,466 | |
| | 2,381 | | | RLI Corp. | | | 223,314 | |
| | 3,023 | | | S&T Bancorp, Inc. | | | 61,049 | |
| | 1,822 | | | Safety Insurance Group, Inc. | | | 131,913 | |
| | 3,297 | | | Sandy Spring Bancorp, Inc. | | | 78,864 | |
| | 3,166 | | | Seacoast Banking Corp. of Florida* | | | 64,080 | |
| | 4,989 | | | Selective Insurance Group, Inc. | | | 298,392 | |
| | 6,091 | | | ServisFirst Bancshares, Inc. | | | 223,235 | |
| | 3,425 | | | Shore Bancshares, Inc. | | | 33,394 | |
| | 2,609 | | | Sierra Bancorp | | | 46,623 | |
| | 5,371 | | | Simmons First National Corp., Class A | | | 91,683 | |
| | 1,740 | | | SmartFinancial, Inc. | | | 23,960 | |
| | 3,359 | | | South State Corp. | | | 187,029 | |
| | 2,243 | | | Southern First Bancshares, Inc.* | | | 58,094 | |
| | 2,403 | | | Southern Missouri Bancorp, Inc. | | | 56,903 | |
| | 3,446 | | | Southern National Bancorp of Virginia, Inc. | | | 29,463 | |
| | 2,407 | | | Southside Bancshares, Inc. | | | 66,325 | |
| | 3,790 | | | Stewart Information Services Corp. | | | 161,719 | |
| | 4,678 | | | Stifel Financial Corp. | | | 237,221 | |
| | 3,724 | | | Stock Yards Bancorp, Inc. | | | 159,871 | |
| | 2,031 | | | StoneX Group, Inc.* | | | 115,158 | |
| | 907 | | | Summit Financial Group, Inc. | | | 13,378 | |
| | 2,318 | | | Territorial Bancorp, Inc. | | | 49,049 | |
| | 832 | | | Texas Capital Bancshares, Inc.* | | | 26,948 | |
| | 4,888 | | | Third Point Reinsurance Ltd. (Bermuda)* | | | 41,841 | |
| | 2,466 | | | Timberland Bancorp, Inc. | | | 43,130 | |
| | 1,349 | | | Tompkins Financial Corp. | | | 89,277 | |
| | 5,046 | | | Towne Bank | | | 89,466 | |
| | 3,301 | | | TriCo Bancshares | | | 91,405 | |
| | 4,365 | | | TriState Capital Holdings, Inc.* | | | 60,674 | |
| | 2,507 | | | Triumph Bancorp, Inc.* | | | 71,600 | |
| | 1,033 | | | Trupanion, Inc.* | | | 64,800 | |
| | 10,545 | | | TrustCo Bank Corp. | | | 62,848 | |
| | 4,672 | | | Trustmark Corp. | | | 109,699 | |
| | 2,741 | | | UMB Financial Corp. | | | 147,247 | |
| | 6,866 | | | United Bankshares, Inc. | | | 179,477 | |
| | 6,588 | | | United Community Banks, Inc. | | | 119,375 | |
| | 1,206 | | | United Fire Group, Inc. | | | 30,367 | |
| | 1,829 | | | United Security Bancshares | | | 11,139 | |
| | 3,069 | | | Unity Bancorp, Inc. | | | 40,756 | |
| | 4,691 | | | Universal Insurance Holdings, Inc. | | | 87,018 | |
| | 2,508 | | | Univest Financial Corp. | | | 40,354 | |
| | 25,474 | | | Valley National Bancorp | | | 191,310 | |
| | 3,694 | | | Veritex Holdings, Inc. | | | 66,418 | |
| | |
|
| Common Stocks – (continued) | |
| Financials – (continued) | |
| | 903 | | | Virtus Investment Partners, Inc. | | | 128,136 | |
| | 9,732 | | | Waddell & Reed Financial, Inc., Class A | | | 153,279 | |
| | 5,485 | | | Walker & Dunlop, Inc. | | | 300,468 | |
| | 6,514 | | | Washington Federal, Inc. | | | 152,753 | |
| | 2,468 | | | Washington Trust Bancorp, Inc. | | | 82,382 | |
| | 4,559 | | | Waterstone Financial, Inc. | | | 70,619 | |
| | 4,247 | | | WesBanco, Inc. | | | 94,368 | |
| | 4,736 | | | West BanCorp, Inc. | | | 83,354 | |
| | 1,900 | | | Westamerica BanCorp | | | 115,634 | |
| | 5,689 | | | Western New England Bancorp, Inc. | | | 29,128 | |
| | 1,068 | | | World Acceptance Corp.* | | | 97,177 | |
| | 2,615 | | | WSFS Financial Corp. | | | 76,620 | |
| | | | | | | | |
| | | | | | | 24,307,720 | |
| | |
| Health Care – 17.6% | |
| | 814 | | | 1Life Healthcare, Inc.*(a) | | | 23,744 | |
| | 1,324 | | | Addus HomeCare Corp.* | | | 124,006 | |
| | 1,965 | | | Adverum Biotechnologies, Inc.* | | | 23,973 | |
| | 14,959 | | | Affimed NV (Germany)* | | | 51,609 | |
| | 9,658 | | | Agile Therapeutics, Inc.* | | | 30,906 | |
| | 1,528 | | | Aimmune Therapeutics, Inc.*(a) | | | 52,288 | |
| | 3,900 | | | Akcea Therapeutics, Inc.* | | | 71,292 | |
| | 14,699 | | | Akebia Therapeutics, Inc.* | | | 153,017 | |
| | 1,040 | | | Akero Therapeutics, Inc.* | | | 33,904 | |
| | 1,629 | | | Alector, Inc.* | | | 21,047 | |
| | 347 | | | Allakos, Inc.* | | | 31,084 | |
| | 1,414 | | | Allogene Therapeutics, Inc.* | | | 50,409 | |
| | 13,847 | | | Allscripts Healthcare Solutions, Inc.* | | | 123,654 | |
| | 11,992 | | | Alphatec Holdings, Inc.* | | | 71,832 | |
| | 12,064 | | | AMAG Pharmaceuticals, Inc.*(a) | | | 124,983 | |
| | 5,367 | | | American Renal Associates Holdings, Inc.* | | | 36,174 | |
| | 7,128 | | | Amicus Therapeutics, Inc.* | | | 104,069 | |
| | 4,853 | | | AMN Healthcare Services, Inc.* | | | 261,285 | |
| | 18,502 | | | Amneal Pharmaceuticals, Inc.* | | | 76,043 | |
| | 5,119 | | | Amphastar Pharmaceuticals, Inc.* | | | 104,325 | |
| | 1,239 | | | AnaptysBio, Inc.* | | | 21,472 | |
| | 5,344 | | | Anavex Life Sciences Corp.*(a) | | | 22,659 | |
| | 6,783 | | | AngioDynamics, Inc.* | | | 63,523 | |
| | 3,689 | | | ANI Pharmaceuticals, Inc.* | | | 115,687 | |
| | 2,464 | | | Anika Therapeutics, Inc.* | | | 94,445 | |
| | 25,006 | | | Antares Pharma, Inc.* | | | 70,767 | |
| | 1,354 | | | Apellis Pharmaceuticals, Inc.* | | | 41,744 | |
| | 569 | | | Applied Therapeutics, Inc.* | | | 13,713 | |
| | 3,647 | | | Apyx Medical Corp.* | | | 16,740 | |
| | 7,772 | | | Aquestive Therapeutics, Inc. *(a) | | | 61,088 | |
| | 1,905 | | | Aravive, Inc.*(a) | | | 10,858 | |
| | 686 | | | Arcturus Therapeutics Holdings, Inc.* | | | 33,093 | |
| | 1,066 | | | Arcus Biosciences, Inc.* | | | 25,371 | |
| | 3,900 | | | Ardelyx, Inc.* | | | 22,386 | |
| | 3,733 | | | Arena Pharmaceuticals, Inc.* | | | 260,638 | |
| | 4,849 | | | Arrowhead Pharmaceuticals, Inc.* | | | 204,822 | |
| | 852 | | | Arvinas, Inc.* | | | 22,109 | |
| | 6,169 | | | Aspira Women’s Health, Inc.* | | | 17,674 | |
| | 1,204 | | | Assembly Biosciences, Inc.* | | | 26,331 | |
| | 11,217 | | | Athersys, Inc.*(a) | | | 24,453 | |
| | |
| | |
| 72 | | The accompanying notes are an integral part of these financial statements. |
GOLDMAN SACHS ACTIVEBETA® U.S. SMALL CAP EQUITY ETF
| | | | | | | | |
Shares | | | Description | | Value | |
|
| Common Stocks – (continued) | |
| Health Care – (continued) | |
| | 1,317 | | | Atreca, Inc., Class A* | | $ | 18,728 | |
| | 3,420 | | | AtriCure, Inc.* | | | 152,977 | |
| | 82 | | | Atrion Corp. | | | 51,801 | |
| | 2,602 | | | Avenue Therapeutics, Inc.* | | | 28,960 | |
| | 4,925 | | | Avid Bioservices, Inc.* | | | 41,321 | |
| | 1,257 | | | Avrobio, Inc.* | | | 21,771 | |
| | 756 | | | Axonics Modulation Technologies, Inc.* | | | 31,949 | |
| | 1,335 | | | Axsome Therapeutics, Inc.* | | | 97,869 | |
| | 3,628 | | | Beyond Air, Inc.* | | | 20,135 | |
| | 6,725 | | | BioCryst Pharmaceuticals, Inc.* | | | 27,909 | |
| | 32,777 | | | BioDelivery Sciences International, Inc.* | | | 128,158 | |
| | 1,325 | | | Biohaven Pharmaceutical Holding Co. Ltd.* | | | 83,992 | |
| | 1,098 | | | BioSpecifics Technologies Corp.* | | | 70,821 | |
| | 2,259 | | | BioTelemetry, Inc.* | | | 89,411 | |
| | 488 | | | Bioxcel Therapeutics, Inc.* | | | 19,886 | |
| | 622 | | | Black Diamond Therapeutics, Inc.* | | | 17,895 | |
| | 1,347 | | | Blueprint Medicines Corp.* | | | 104,298 | |
| | 2,882 | | | BrainStorm Cell Therapeutics, Inc.* | | | 36,342 | |
| | 1,692 | | | Bridgebio Pharma, Inc.* | | | 50,523 | |
| | 14,170 | | | Brookdale Senior Living, Inc.* | | | 38,967 | |
| | 5,128 | | | Calithera Biosciences, Inc.* | | | 20,666 | |
| | 624 | | | Cantel Medical Corp. | | | 32,747 | |
| | 1,602 | | | Cara Therapeutics, Inc.* | | | 24,831 | |
| | 5,877 | | | Cardiovascular Systems, Inc.* | | | 192,002 | |
| | 827 | | | CareDx, Inc.* | | | 28,242 | |
| | 2,939 | | | Castle Biosciences, Inc.* | | | 134,400 | |
| | 37,961 | | | Catalyst Pharmaceuticals, Inc.* | | | 124,512 | |
| | 1,836 | | | CEL-SCI Corp.*(a) | | | 23,739 | |
| | 4,224 | | | Cerus Corp.* | | | 26,907 | |
| | 1,445 | | | ChemoCentryx, Inc.* | | | 77,307 | |
| | 7,057 | | | Cidara Therapeutics, Inc.* | | | 22,441 | |
| | 1,681 | | | Co-Diagnostics, Inc.*(a) | | | 18,323 | |
| | 10,973 | | | Coherus Biosciences, Inc.* | | | 208,158 | |
| | 11,471 | | | Collegium Pharmaceutical, Inc.* | | | 218,637 | |
| | 4,278 | | | Computer Programs and Systems, Inc. | | | 117,046 | |
| | 1,819 | | | CONMED Corp. | | | 156,998 | |
| | 867 | | | Constellation Pharmaceuticals, Inc.* | | | 18,250 | |
| | 4,967 | | | Corbus Pharmaceuticals Holdings, Inc.*(a) | | | 46,119 | |
| | 24,094 | | | Corcept Therapeutics, Inc.* | | | 305,994 | |
| | 550 | | | Cortexyme, Inc.* | | | 24,183 | |
| | 1,328 | | | CorVel Corp.* | | | 110,251 | |
| | 3,307 | | | Covetrus, Inc.* | | | 75,763 | |
| | 12,947 | | | Cross Country Healthcare, Inc.* | | | 82,731 | |
| | 2,040 | | | CryoLife, Inc.* | | | 41,249 | |
| | 1,055 | | | CryoPort, Inc.* | | | 58,531 | |
| | 1,064 | | | Cue Biopharma, Inc.* | | | 19,014 | |
| | 6,304 | | | Cutera, Inc.* | | | 103,196 | |
| | 1,544 | | | Cytokinetics, Inc.* | | | 36,994 | |
| | 7,479 | | | CytoSorbents Corp.* | | | 63,123 | |
| | 916 | | | Deciphera Pharmaceuticals, Inc.* | | | 41,229 | |
| | 1,271 | | | Denali Therapeutics, Inc.* | | | 40,545 | |
| | 4,983 | | | Dicerna Pharmaceuticals, Inc.* | | | 92,285 | |
| | 45,809 | | | Durect Corp.* | | | 79,479 | |
| | 4,175 | | | Dynavax Technologies Corp.* | | | 24,966 | |
| | 4,206 | | | Eagle Pharmaceuticals, Inc.* | | | 166,894 | |
| | |
|
| Common Stocks – (continued) | |
| Health Care – (continued) | |
| | 1,537 | | | Editas Medicine, Inc.* | | | 54,148 | |
| | 1,147 | | | Eidos Therapeutics, Inc.* | | | 49,642 | |
| | 2,724 | | | Electromed, Inc.* | | | 33,723 | |
| | 4,834 | | | Emergent BioSolutions, Inc.* | | | 551,318 | |
| | 1,670 | | | Enanta Pharmaceuticals, Inc.* | | | 87,157 | |
| | 42,052 | | | Endo International PLC* | | | 126,577 | |
| | 3,586 | | | Ensign Group, Inc. (The) | | | 209,924 | |
| | 16,368 | | | Enzo Biochem, Inc.* | | | 34,864 | |
| | 1,684 | | | Epizyme, Inc.* | | | 21,892 | |
| | 981 | | | Esperion Therapeutics, Inc.*(a) | | | 35,414 | |
| | 4,319 | | | Evolent Health, Inc., Class A* | | | 61,891 | |
| | 1,725 | | | Fate Therapeutics, Inc.* | | | 62,790 | |
| | 3,028 | | | Fennec Pharmaceuticals, Inc. (Canada)* | | | 16,593 | |
| | 2,851 | | | FibroGen, Inc.* | | | 127,810 | |
| | 7,967 | | | Flexion Therapeutics, Inc.* | | | 92,895 | |
| | 7,399 | | | Fluidigm Corp.* | | | 58,082 | |
| | 2,461 | | | FONAR Corp.* | | | 62,436 | |
| | 9,658 | | | Fortress Biotech, Inc.* | | | 38,197 | |
| | 1,194 | | | Frequency Therapeutics, Inc.* | | | 23,092 | |
| | 1,612 | | | Fulgent Genetics, Inc.* | | | 47,651 | |
| | 1,139 | | | G1 Therapeutics, Inc.* | | | 17,484 | |
| | 5,019 | | | GenMark Diagnostics, Inc.* | | | 65,096 | |
| | 1,066 | | | Glaukos Corp.* | | | 50,987 | |
| | 5,759 | | | Halozyme Therapeutics, Inc.* | | | 166,982 | |
| | 2,605 | | | Hanger, Inc.* | | | 51,475 | |
| | 8,753 | | | Harrow Health, Inc.* | | | 60,308 | |
| | 14,760 | | | Harvard Bioscience, Inc.* | | | 49,446 | |
| | 842 | | | Health Catalyst, Inc.* | | | 26,254 | |
| | 2,990 | | | HealthEquity, Inc.* | | | 171,865 | |
| | 1,958 | | | HealthStream, Inc.* | | | 40,560 | |
| | 2,396 | | | Heron Therapeutics, Inc.* | | | 34,263 | |
| | 643 | | | Heska Corp.* | | | 66,615 | |
| | 4,109 | | | HMS Holdings Corp.* | | | 114,600 | |
| | 1,797 | | | Homology Medicines, Inc.* | | | 19,102 | |
| | 7,859 | | | iCAD, Inc.* | | | 85,113 | |
| | 413 | | | IGM Biosciences, Inc.*(a) | | | 17,759 | |
| | 6,040 | | | ImmunoGen, Inc.* | | | 22,348 | |
| | 987 | | | Immunovant, Inc.* | | | 33,519 | |
| | 5,660 | | | InfuSystem Holdings, Inc.* | | | 82,353 | |
| | 22,033 | | | Innoviva, Inc.* | | | 258,006 | |
| | 1,531 | | | Inogen, Inc.* | | | 46,282 | |
| | 2,919 | | | Inovalon Holdings, Inc., Class A* | | | 72,231 | |
| | 3,793 | | | Inovio Pharmaceuticals, Inc.*(a) | | | 45,478 | |
| | 1,970 | | | Insmed, Inc.* | | | 55,534 | |
| | 1,586 | | | Inspire Medical Systems, Inc.* | | | 189,448 | |
| | 2,477 | | | Integer Holdings Corp.* | | | 171,557 | |
| | 1,206 | | | Intellia Therapeutics, Inc.*(a) | | | 26,025 | |
| | 648 | | | Intercept Pharmaceuticals, Inc.*(a) | | | 32,322 | |
| | 12,726 | | | Intersect ENT, Inc.* | | | 255,538 | |
| | 1,072 | | | Intra-Cellular Therapies, Inc.* | | | 19,532 | |
| | 6,368 | | | Invacare Corp. | | | 43,175 | |
| | 2,537 | | | Invitae Corp.*(a) | | | 88,694 | |
| | 2,504 | | | iRhythm Technologies, Inc.* | | | 551,331 | |
| | 28,164 | | | Ironwood Pharmaceuticals, Inc.* | | | 284,456 | |
| | 4,407 | | | IVERIC bio, Inc.* | | | 19,787 | |
| | 5,187 | | | Joint Corp. (The)* | | | 92,640 | |
| | |
| | |
| The accompanying notes are an integral part of these financial statements. | | 73 |
GOLDMAN SACHS ACTIVEBETA® U.S. SMALL CAP EQUITY ETF
Schedule of Investments (continued)
August 31, 2020
| | | | | | | | |
Shares | | | Description | | Value | |
|
| Common Stocks – (continued) | |
| Health Care – (continued) | |
| | 6,014 | | | Kadmon Holdings, Inc.* | | $ | 30,070 | |
| | 2,220 | | | Kala Pharmaceuticals, Inc.* | | | 19,758 | |
| | 270 | | | Karuna Therapeutics, Inc.* | | | 20,628 | |
| | 1,833 | | | Karyopharm Therapeutics, Inc.* | | | 27,880 | |
| | 1,112 | | | Kiniksa Pharmaceuticals Ltd., Class A* | | | 19,649 | |
| | 828 | | | Kodiak Sciences, Inc.* | | | 43,545 | |
| | 764 | | | Krystal Biotech, Inc.* | | | 36,527 | |
| | 11,817 | | | Lannett Co., Inc.* | | | 62,157 | |
| | 8,418 | | | Lantheus Holdings, Inc.* | | | 112,970 | |
| | 3,950 | | | LeMaitre Vascular, Inc. | | | 127,506 | |
| | 15,463 | | | Lexicon Pharmaceuticals, Inc.*(a) | | | 27,060 | |
| | 2,452 | | | LHC Group, Inc.* | | | 511,095 | |
| | 923 | | | Ligand Pharmaceuticals, Inc.* | | | 94,146 | |
| | 3,060 | | | LivaNova PLC* | | | 143,514 | |
| | 10,482 | | | Luminex Corp. | | | 279,765 | |
| | 298 | | | Madrigal Pharmaceuticals, Inc.* | | | 32,095 | |
| | 2,660 | | | Magellan Health, Inc.* | | | 200,724 | |
| | 33,137 | | | Mallinckrodt PLC *(a) | | | 52,356 | |
| | 12,540 | | | MannKind Corp.* | | | 21,820 | |
| | 10,499 | | | Marinus Pharmaceuticals, Inc.* | | | 20,368 | |
| | 5,550 | | | MEDNAX, Inc.* | | | 103,119 | |
| | 2,708 | | | Medpace Holdings, Inc.* | | | 351,471 | |
| | 6,636 | | | MEI Pharma, Inc.* | | | 18,050 | |
| | 7,210 | | | Meridian Bioscience, Inc.* | | | 101,949 | |
| | 2,898 | | | Merit Medical Systems, Inc.* | | | 142,292 | |
| | 1,281 | | | Mersana Therapeutics, Inc.* | | | 24,544 | |
| | 334 | | | Mesa Laboratories, Inc. | | | 82,137 | |
| | 13,713 | | | Milestone Scientific, Inc.* | | | 20,569 | |
| | 8,004 | | | Minerva Neurosciences, Inc.* | | | 25,453 | |
| | 1,346 | | | Mirati Therapeutics, Inc.* | | | 201,052 | |
| | 1,818 | | | Misonix, Inc.* | | | 23,979 | |
| | 1,871 | | | Molecular Templates, Inc.* | | | 21,722 | |
| | 4,339 | | | Momenta Pharmaceuticals, Inc.* | | | 226,366 | |
| | 1,621 | | | MyoKardia, Inc.* | | | 177,402 | |
| | 21,341 | | | Myriad Genetics, Inc.* | | | 285,329 | |
| | 4,912 | | | NanoString Technologies, Inc.* | | | 198,838 | |
| | 7,699 | | | NantHealth, Inc.* | | | 24,483 | |
| | 2,499 | | | NantKwest, Inc.* | | | 18,243 | |
| | 5,721 | | | Natera, Inc.* | | | 364,485 | |
| | 1,418 | | | National HealthCare Corp. | | | 90,327 | |
| | 3,038 | | | National Research Corp. | | | 170,128 | |
| | 5,132 | | | Natus Medical, Inc.* | | | 93,197 | |
| | 2,505 | | | Neogen Corp.* | | | 190,881 | |
| | 10,167 | | | NeoGenomics, Inc.* | | | 396,005 | |
| | 1,770 | | | Neoleukin Therapeutics, Inc.* | | | 22,497 | |
| | 2,721 | | | Neubase Therapeutics, Inc.*(a) | | | 21,850 | |
| | 2,300 | | | Nevro Corp.* | | | 316,342 | |
| | 1,111 | | | NextCure, Inc.* | | | 9,988 | |
| | 13,559 | | | NextGen Healthcare, Inc.* | | | 179,792 | |
| | 1,206 | | | NGM Biopharmaceuticals, Inc.* | | | 22,492 | |
| | 1,657 | | | Novavax, Inc.* | | | 182,833 | |
| | 4,405 | | | NuVasive, Inc.* | | | 229,633 | |
| | 7,817 | | | Nymox Pharmaceutical Corp.* | | | 19,699 | |
| | 3,092 | | | Ocular Therapeutix, Inc.* | | | 26,900 | |
| | 657 | | | Odonate Therapeutics, Inc.* | | | 10,611 | |
| | 2,846 | | | Omnicell, Inc.* | | | 189,771 | |
| | |
|
| Common Stocks – (continued) | |
| Health Care – (continued) | |
| | 2,848 | | | Ontrak, Inc.*(a) | | | 207,762 | |
| | 29,729 | | | OPKO Health, Inc.*(a) | | | 96,322 | |
| | 3,285 | | | OptimizeRx Corp.* | | | 66,226 | |
| | 3,523 | | | Option Care Health, Inc.* | | | 40,937 | |
| | 4,188 | | | OraSure Technologies, Inc.* | | | 49,083 | |
| | 4,404 | | | Orthofix Medical, Inc.* | | | 133,617 | |
| | 916 | | | OrthoPediatrics Corp.* | | | 46,166 | |
| | 3,807 | | | Ovid therapeutics, Inc.* | | | 21,852 | |
| | 20,462 | | | Owens & Minor, Inc. | | | 339,260 | |
| | 7,781 | | | Pacific Biosciences of California, Inc.* | | | 51,355 | |
| | 5,858 | | | Pacira BioSciences, Inc.* | | | 366,242 | |
| | 772 | | | Passage Bio, Inc.* | | | 12,784 | |
| | 7,217 | | | Patterson Cos., Inc. | | | 209,365 | |
| | 12,319 | | | PAVmed, Inc.*(a) | | | 24,268 | |
| | 24,027 | | | PDL BioPharma, Inc.* | | | 80,490 | |
| | 1,803 | | | Pennant Group, Inc. (The)* | | | 66,783 | |
| | 1,198 | | | PetIQ, Inc.* | | | 42,146 | |
| | 3,147 | | | Pfenex, Inc.* | | | 39,432 | |
| | 615 | | | Phathom Pharmaceuticals, Inc.* | | | 22,607 | |
| | 7,512 | | | Phibro Animal Health Corp., Class A | | | 161,208 | |
| | 960 | | | Phreesia, Inc.* | | | 30,278 | |
| | 11,549 | | | Pieris Pharmaceuticals, Inc.* | | | 33,030 | |
| | 6,644 | | | Prestige Consumer Healthcare, Inc.* | | | 242,041 | |
| | 976 | | | Principia Biopharma, Inc.* | | | 97,610 | |
| | 1,133 | | | Progyny, Inc.* | | | 32,347 | |
| | 1,738 | | | Provention Bio, Inc.* | | | 22,664 | |
| | 1,466 | | | Providence Service Corp. (The)* | | | 135,737 | |
| | 2,782 | | | PTC Therapeutics, Inc.* | | | 137,500 | |
| | 11,953 | | | Puma Biotechnology, Inc.* | | | 122,996 | |
| | 5,250 | | | R1 RCM, Inc.* | | | 76,125 | |
| | 13,783 | | | Radius Health, Inc.* | | | 170,634 | |
| | 8,064 | | | RadNet, Inc.* | | | 116,283 | |
| | 746 | | | REGENXBIO, Inc.* | | | 22,768 | |
| | 571 | | | Relmada Therapeutics, Inc.*(a) | | | 20,373 | |
| | 5,188 | | | Retractable Technologies, Inc.* | | | 32,788 | |
| | 6,955 | | | Retrophin, Inc.* | | | 136,248 | |
| | 1,472 | | | Revance Therapeutics, Inc.* | | | 43,027 | |
| | 703 | | | REVOLUTION Medicines, Inc.* | | | 19,923 | |
| | 1,241 | | | Rocket Pharmaceuticals, Inc.* | | | 31,732 | |
| | 3,021 | | | Sangamo Therapeutics, Inc.* | | | 33,337 | |
| | 1,458 | | | Scholar Rock Holding Corp.* | | | 22,016 | |
| | 362 | | | Schrodinger, Inc.* | | | 21,887 | |
| | 4,705 | | | SeaSpine Holdings Corp.* | | | 62,624 | |
| | 9,963 | | | Select Medical Holdings Corp.* | | | 199,957 | |
| | 8,589 | | | Selecta Biosciences, Inc.* | | | 22,331 | |
| | 5,695 | | | Seres Therapeutics, Inc.* | | | 150,861 | |
| | 3,700 | | | Sharps Compliance Corp.*(a) | | | 28,249 | |
| | 905 | | | Shockwave Medical, Inc.* | | | 57,504 | |
| | 1,625 | | | SI-BONE, Inc.* | | | 35,457 | |
| | 2,007 | | | Silk Road Medical, Inc.* | | | 122,387 | |
| | 3,934 | | | Simulations Plus, Inc. | | | 234,388 | |
| | 609 | | | SpringWorks Therapeutics, Inc.* | | | 27,046 | |
| | 5,319 | | | STAAR Surgical Co.* | | | 255,046 | |
| | 16,088 | | | Stereotaxis, Inc.* | | | 56,630 | |
| | 10,773 | | | Supernus Pharmaceuticals, Inc.* | | | 236,898 | |
| | 8,814 | | | Surgery Partners, Inc.* | | | 168,259 | |
| | |
| | |
| 74 | | The accompanying notes are an integral part of these financial statements. |
GOLDMAN SACHS ACTIVEBETA® U.S. SMALL CAP EQUITY ETF
| | | | | | | | |
Shares | | | Description | | Value | |
|
| Common Stocks – (continued) | |
| Health Care – (continued) | |
| | 2,041 | | | Surmodics, Inc.* | | $ | 92,355 | |
| | 1,813 | | | Syndax Pharmaceuticals, Inc.* | | | 29,570 | |
| | 2,721 | | | Syros Pharmaceuticals, Inc.* | | | 36,053 | |
| | 561 | | | Tabula Rasa HealthCare, Inc.* | | | 28,387 | |
| | 3,697 | | | Tactile Systems Technology, Inc.* | | | 142,076 | |
| | 6,642 | | | Tenet Healthcare Corp.* | | | 187,172 | |
| | 2,596 | | | TG Therapeutics, Inc.* | | | 64,394 | |
| | 1,806 | | | Theravance Biopharma, Inc.* | | | 33,104 | |
| | 16,950 | | | Tivity Health, Inc.* | | | 277,302 | |
| | 1,699 | | | Translate Bio, Inc.* | | | 23,939 | |
| | 4,300 | | | Triple-S Management Corp., Class B (Puerto Rico)* | | | 79,980 | |
| | 775 | | | Turning Point Therapeutics, Inc.* | | | 60,589 | |
| | 684 | | | Twist Bioscience Corp.* | | | 47,832 | |
| | 1,911 | | | Ultragenyx Pharmaceutical, Inc.* | | | 162,550 | |
| | 978 | | | US Physical Therapy, Inc. | | | 86,944 | |
| | 437 | | | Utah Medical Products, Inc. | | | 35,900 | |
| | 20,774 | | | Vanda Pharmaceuticals, Inc.* | | | 213,764 | |
| | 709 | | | Vapotherm, Inc.* | | | 22,057 | |
| | 3,727 | | | Varex Imaging Corp.* | | | 41,332 | |
| | 10,377 | | | Vaxart, Inc.*(a) | | | 61,536 | |
| | 10,576 | | | VBI Vaccines, Inc.* | | | 45,054 | |
| | 8,674 | | | Veracyte, Inc.* | | | 288,931 | |
| | 14,983 | | | Verastem, Inc.* | | | 18,879 | |
| | 14,937 | | | Vericel Corp.* | | | 236,751 | |
| | 606 | | | Viela Bio, Inc.*(a) | | | 20,416 | |
| | 3,524 | | | Viking Therapeutics, Inc.* | | | 23,576 | |
| | 1,064 | | | Vir Biotechnology, Inc.* | | | 43,071 | |
| | 2,517 | | | Vocera Communications, Inc.* | | | 70,451 | |
| | 4,245 | | | Voyager Therapeutics, Inc.* | | | 50,049 | |
| | 5,046 | | | Wright Medical Group NV* | | | 152,541 | |
| | 1,886 | | | XBiotech, Inc.* | | | 35,683 | |
| | 2,919 | | | Xencor, Inc.* | | | 104,354 | |
| | 1,254 | | | XOMA Corp.*(a) | | | 23,851 | |
| | 852 | | | Y-mAbs Therapeutics, Inc.* | | | 36,662 | |
| | 569 | | | Zentalis Pharmaceuticals, Inc.*(a) | | | 19,574 | |
| | 1,169 | | | Zogenix, Inc.* | | | 27,670 | |
| | 6,247 | | | Zynex, Inc.*(a) | | | 92,456 | |
| | | | | | | | |
| | | | | | | 26,776,696 | |
| | |
| Industrials – 15.8% | |
| | 4,402 | | | AAON, Inc. | | | 250,606 | |
| | 2,215 | | | AAR Corp. | | | 44,699 | |
| | 4,571 | | | ABM Industries, Inc. | | | 174,338 | |
| | 916 | | | Acacia Research Corp.* | | | 3,476 | |
| | 10,243 | | | ACCO Brands Corp. | | | 66,375 | |
| | 3,166 | | | Advanced Disposal Services, Inc.* | | | 95,392 | |
| | 3,874 | | | Advanced Drainage Systems, Inc. | | | 214,930 | |
| | 3,856 | | | Aegion Corp.* | | | 62,409 | |
| | 4,604 | | | Aerojet Rocketdyne Holdings, Inc.* | | | 190,467 | |
| | 902 | | | AeroVironment, Inc.* | | | 68,904 | |
| | 1,467 | | | Air Transport Services Group, Inc.* | | | 37,291 | |
| | 1,147 | | | Alamo Group, Inc. | | | 127,202 | |
| | 1,586 | | | Albany International Corp., Class A | | | 82,313 | |
| | 674 | | | Allegiant Travel Co. | | | 86,676 | |
| | 2,641 | | | Allied Motion Technologies, Inc. | | | 112,480 | |
| | |
|
| Common Stocks – (continued) | |
| Industrials – (continued) | |
| | 4,779 | | | Alpha Pro Tech Ltd.* | | | 67,049 | |
| | 4,389 | | | Altra Industrial Motion Corp. | | | 171,390 | |
| | 1,747 | | | Ameresco, Inc., Class A* | | | 59,643 | |
| | 1,239 | | | American Woodmark Corp.* | | | 108,412 | |
| | 5,468 | | | API Group Corp.*(b) | | | 77,318 | |
| | 3,797 | | | Apogee Enterprises, Inc. | | | 79,471 | |
| | 4,972 | | | Applied Industrial Technologies, Inc. | | | 299,364 | |
| | 4,015 | | | ArcBest Corp. | | | 135,787 | |
| | 3,618 | | | Arcosa, Inc. | | | 167,477 | |
| | 657 | | | Argan, Inc. | | | 27,811 | |
| | 4,491 | | | ASGN, Inc.* | | | 322,319 | |
| | 2,366 | | | Astec Industries, Inc. | | | 124,736 | |
| | 3,703 | | | Astronics Corp.* | | | 33,475 | |
| | 5,521 | | | Atkore International Group, Inc.* | | | 147,576 | |
| | 1,196 | | | Atlas Air Worldwide Holdings, Inc.* | | | 67,442 | |
| | 1,878 | | | AZZ, Inc. | | | 65,223 | |
| | 3,153 | | | Barnes Group, Inc. | | | 124,859 | |
| | 1,312 | | | Barrett Business Services, Inc. | | | 75,532 | |
| | 4,483 | | | Beacon Roofing Supply, Inc.* | | | 151,929 | |
| | 3,615 | | | BG Staffing, Inc. | | | 33,909 | |
| | 6,078 | | | Bloom Energy Corp., Class A*(a) | | | 95,181 | |
| | 4,698 | | | Blue Bird Corp.* | | | 53,463 | |
| | 12,586 | | | BMC Stock Holdings, Inc.* | | | 502,433 | |
| | 5,198 | | | Brady Corp., Class A | | | 243,734 | |
| | 3,412 | | | BrightView Holdings, Inc.* | | | 41,899 | |
| | 2,499 | | | Brink’s Co. (The) | | | 120,852 | |
| | 17,277 | | | Builders FirstSource, Inc.* | | | 529,022 | |
| | 4,625 | | | Caesarstone Ltd. | | | 51,037 | |
| | 1,740 | | | CAI International, Inc.* | | | 37,949 | |
| | 3,147 | | | Casella Waste Systems, Inc., Class A* | | | 176,704 | |
| | 6,085 | | | CBIZ, Inc.* | | | 147,987 | |
| | 2,102 | | | Chart Industries, Inc.* | | | 138,143 | |
| | 2,524 | | | Cimpress PLC (Ireland)* | | | 233,975 | |
| | 3,064 | | | Columbus McKinnon Corp. | | | 111,453 | |
| | 4,985 | | | Comfort Systems USA, Inc. | | | 252,590 | |
| | 1,584 | | | Construction Partners, Inc., Class A* | | | 29,605 | |
| | 17,098 | | | Cornerstone Building Brands, Inc.* | | | 136,100 | |
| | 7,005 | | | Costamare, Inc. (Monaco) | | | 35,375 | |
| | 4,194 | | | Covanta Holding Corp. | | | 39,591 | |
| | 1,688 | | | CRA International, Inc. | | | 71,757 | |
| | 2,527 | | | CSW Industrials, Inc. | | | 182,576 | |
| | 761 | | | Cubic Corp. | | | 35,828 | |
| | 5,451 | | | Deluxe Corp. | | | 154,808 | |
| | 1,243 | | | Douglas Dynamics, Inc. | | | 47,719 | |
| | 1,739 | | | Ducommun, Inc.* | | | 64,986 | |
| | 5,732 | | | DXP Enterprises, Inc.* | | | 110,284 | |
| | 1,033 | | | Dycom Industries, Inc.* | | | 63,540 | |
| | 2,106 | | | Eastern Co. (The) | | | 46,121 | |
| | 9,815 | | | Echo Global Logistics, Inc.* | | | 268,146 | |
| | 4,610 | | | EMCOR Group, Inc. | | | 345,796 | |
| | 1,767 | | | Encore Wire Corp. | | | 91,195 | |
| | 3,756 | | | Energy Recovery, Inc.* | | | 31,964 | |
| | 2,988 | | | Enerpac Tool Group Corp. | | | 62,150 | |
| | 2,823 | | | EnerSys | | | 203,200 | |
| | 2,715 | | | Ennis, Inc. | | | 49,766 | |
| | 1,628 | | | EnPro Industries, Inc. | | | 95,271 | |
| | |
| | |
| The accompanying notes are an integral part of these financial statements. | | 75 |
GOLDMAN SACHS ACTIVEBETA® U.S. SMALL CAP EQUITY ETF
Schedule of Investments (continued)
August 31, 2020
| | | | | | | | |
Shares | | | Description | | Value | |
|
| Common Stocks – (continued) | |
| Industrials – (continued) | |
| | 1,681 | | | ESCO Technologies, Inc. | | $ | 151,156 | |
| | 367 | | | EVI Industries, Inc.*(a) | | | 9,014 | |
| | 2,324 | | | Evoqua Water Technologies Corp.* | | | 47,549 | |
| | 2,145 | | | Exponent, Inc. | | | 172,576 | |
| | 3,222 | | | Federal Signal Corp. | | | 103,491 | |
| | 2,249 | | | Forrester Research, Inc.* | | | 79,750 | |
| | 4,085 | | | Forward Air Corp. | | | 240,974 | |
| | 6,815 | | | Foundation Building Materials, Inc.* | | | 110,607 | |
| | 4,479 | | | Franklin Covey Co.* | | | 88,415 | |
| | 4,345 | | | Franklin Electric Co., Inc. | | | 257,919 | |
| | 12,767 | | | FuelCell Energy, Inc.*(a) | | | 36,258 | |
| | 1,309 | | | GATX Corp. | | | 87,546 | |
| | 631 | | | Gencor Industries, Inc.* | | | 7,957 | |
| | 1,135 | | | General Finance Corp.* | | | 7,355 | |
| | 2,512 | | | Gibraltar Industries, Inc.* | | | 156,862 | |
| | 8,693 | | | GMS, Inc.* | | | 230,278 | |
| | 1,454 | | | Gorman-Rupp Co. (The) | | | 46,455 | |
| | 8,096 | | | Great Lakes Dredge & Dock Corp.* | | | 75,860 | |
| | 1,750 | | | Griffon Corp. | | | 38,028 | |
| | 3,525 | | | H&E Equipment Services, Inc. | | | 71,417 | |
| | 3,987 | | | Hawaiian Holdings, Inc. | | | 53,585 | |
| | 7,202 | | | HC2 Holdings, Inc.*(a) | | | 18,005 | |
| | 4,415 | | | Healthcare Services Group, Inc. | | | 91,832 | |
| | 1,908 | | | Heartland Express, Inc. | | | 39,467 | |
| | 1,479 | | | Heidrick & Struggles International, Inc. | | | 31,991 | |
| | 2,517 | | | Heritage-Crystal Clean, Inc.* | | | 36,950 | |
| | 7,255 | | | Herman Miller, Inc. | | | 172,887 | |
| | 5,233 | | | Hillenbrand, Inc. | | | 165,938 | |
| | 5,817 | | | HNI Corp. | | | 185,271 | |
| | 4,457 | | | Hub Group, Inc., Class A* | | | 239,965 | |
| | 1,768 | | | Hurco Cos., Inc. | | | 49,999 | |
| | 2,186 | | | Huron Consulting Group, Inc.* | | | 94,829 | |
| | 961 | | | Hyster-Yale Materials Handling, Inc. | | | 38,767 | |
| | 2,382 | | | ICF International, Inc. | | | 162,714 | |
| | 3,175 | | | IES Holdings, Inc.* | | | 91,535 | |
| | 3,303 | | | Insperity, Inc. | | | 222,523 | |
| | 6,459 | | | Interface, Inc. | | | 48,830 | |
| | 3,516 | | | JELD-WEN Holding, Inc.* | | | 74,012 | |
| | 2,234 | | | John Bean Technologies Corp. | | | 229,007 | |
| | 1,614 | | | Kadant, Inc. | | | 187,934 | |
| | 885 | | | Kaman Corp. | | | 40,931 | |
| | 3,150 | | | KAR Auction Services, Inc. | | | 54,621 | |
| | 6,153 | | | Kelly Services, Inc., Class A | | | 116,845 | |
| | 4,836 | | | Kennametal, Inc. | | | 140,341 | |
| | 7,508 | | | Kforce, Inc. | | | 257,825 | |
| | 11,824 | | | Kimball International, Inc., Class B | | | 132,547 | |
| | 5,525 | | | Knoll, Inc. | | | 71,107 | |
| | 3,855 | | | Korn Ferry | | | 117,578 | |
| | 3,783 | | | Kratos Defense & Security Solutions, Inc.* | | | 73,958 | |
| | 3,300 | | | L B Foster Co., Class A* | | | 49,335 | |
| | 1,670 | | | Lawson Products, Inc.* | | | 59,953 | |
| | 487 | | | Lindsay Corp. | | | 48,666 | |
| | 10,023 | | | LSI Industries, Inc. | | | 68,758 | |
| | 2,011 | | | Luxfer Holdings PLC (United Kingdom) | | | 28,596 | |
| | 3,567 | | | Lydall, Inc.* | | | 66,988 | |
| | |
|
| Common Stocks – (continued) | |
| Industrials – (continued) | |
| | 2,585 | | | Manitowoc Co., Inc. (The)* | | | 24,351 | |
| | 2,847 | | | Marten Transport Ltd. | | | 51,702 | |
| | 1,805 | | | Masonite International Corp.* | | | 164,778 | |
| | 3,795 | | | MasTec, Inc.* | | | 175,367 | |
| | 1,530 | | | Mastech Digital, Inc.* | | | 28,305 | |
| | 1,133 | | | Matson, Inc. | | | 45,399 | |
| | 2,026 | | | Matthews International Corp., Class A | | | 44,369 | |
| | 4,534 | | | Maxar Technologies, Inc. | | | 104,962 | |
| | 954 | | | McGrath RentCorp | | | 63,307 | |
| | 5,944 | | | Meritor, Inc.* | | | 135,285 | |
| | 7,892 | | | Mesa Air Group, Inc.* | | | 28,885 | |
| | 980 | | | Miller Industries, Inc. | | | 30,743 | |
| | 6,777 | | | Mistras Group, Inc.* | | | 32,259 | |
| | 1,675 | | | Moog, Inc., Class A | | | 100,986 | |
| | 10,366 | | | MRC Global, Inc.* | | | 58,983 | |
| | 4,054 | | | Mueller Industries, Inc. | | | 120,404 | |
| | 6,281 | | | Mueller Water Products, Inc., Class A | | | 67,835 | |
| | 1,413 | | | MYR Group, Inc.* | | | 54,839 | |
| | 404 | | | National Presto Industries, Inc. | | | 36,332 | |
| | 2,499 | | | Navistar International Corp.* | | | 79,918 | |
| | 2,030 | | | Northwest Pipe Co.* | | | 57,510 | |
| | 17,081 | | | NOW, Inc.* | | | 124,179 | |
| | 2,569 | | | NV5 Global, Inc.* | | | 132,997 | |
| | 1,132 | | | Omega Flex, Inc. | | | 149,130 | |
| | 10,445 | | | Orion Energy Systems, Inc.* | | | 66,639 | |
| | 574 | | | PAM Transportation Services, Inc.* | | | 20,951 | |
| | 2,507 | | | Park Aerospace Corp. | | | 27,803 | |
| | 1,737 | | | Park-Ohio Holdings Corp. | | | 27,479 | |
| | 3,363 | | | Parsons Corp.* | | | 111,853 | |
| | 2,252 | | | Patrick Industries, Inc. | | | 126,585 | |
| | 7,716 | | | PGT Innovations, Inc.* | | | 139,891 | |
| | 3,824 | | | PICO Holdings, Inc.* | | | 33,995 | |
| | 15,008 | | | Plug Power, Inc.* | | | 194,804 | |
| | 2,008 | | | Powell Industries, Inc. | | | 54,196 | |
| | 1,192 | | | Preformed Line Products Co. | | | 64,857 | |
| | 1,827 | | | Primoris Services Corp. | | | 34,823 | |
| | 2,301 | | | Proto Labs, Inc.* | | | 338,247 | |
| | 12,819 | | | Quad/Graphics, Inc. | | | 44,738 | |
| | 4,748 | | | Quanex Building Products Corp. | | | 79,814 | |
| | 14,861 | | | Radiant Logistics, Inc.* | | | 78,466 | |
| | 4,195 | | | Raven Industries, Inc. | | | 104,246 | |
| | 1,068 | | | RBC Bearings, Inc.* | | | 141,019 | |
| | 2,531 | | | Red Violet, Inc.*(a) | | | 52,619 | |
| | 9,378 | | | Resources Connection, Inc. | | | 115,256 | |
| | 4,285 | | | REV Group, Inc. | | | 33,209 | |
| | 5,964 | | | Rexnord Corp. | | | 172,717 | |
| | 3,132 | | | Rush Enterprises, Inc., Class A | | | 151,338 | |
| | 1,737 | | | Rush Enterprises, Inc., Class B | | | 72,589 | |
| | 1,347 | | | Saia, Inc.* | | | 180,767 | |
| | 4,269 | | | Shyft Group, Inc. (The) | | | 85,252 | |
| | 4,155 | | | Simpson Manufacturing Co., Inc. | | | 408,603 | |
| | 4,272 | | | SiteOne Landscape Supply, Inc.* | | | 534,214 | |
| | 2,591 | | | SkyWest, Inc. | | | 87,187 | |
| | 2,746 | | | SP Plus Corp.* | | | 56,320 | |
| | 3,003 | | | SPX Corp.* | | | 125,615 | |
| | 3,592 | | | SPX FLOW, Inc.* | | | 156,180 | |
| | |
| | |
| 76 | | The accompanying notes are an integral part of these financial statements. |
GOLDMAN SACHS ACTIVEBETA® U.S. SMALL CAP EQUITY ETF
| | | | | | | | |
Shares | | | Description | | Value | |
|
| Common Stocks – (continued) | |
| Industrials – (continued) | |
| | 889 | | | Standex International Corp. | | $ | 51,420 | |
| | 12,183 | | | Steelcase, Inc., Class A | | | 127,312 | |
| | 2,988 | | | Sterling Construction Co., Inc.* | | | 42,250 | |
| | 2,965 | | | Sunrun, Inc.* | | | 167,686 | |
| | 4,560 | | | Systemax, Inc. | | | 101,186 | |
| | 11,110 | | | Team, Inc.* | | | 70,771 | |
| | 2,638 | | | Tennant Co. | | | 175,348 | |
| | 2,584 | | | Terex Corp. | | | 50,569 | |
| | 3,216 | | | Tetra Tech, Inc. | | | 296,869 | |
| | 3,497 | | | Textainer Group Holdings Ltd. (China)* | | | 41,055 | |
| | 3,858 | | | Titan Machinery, Inc.* | | | 52,083 | |
| | 1,236 | | | TPI Composites, Inc.* | | | 37,958 | |
| | 2,722 | | | Transcat, Inc.* | | | 80,054 | |
| | 3,567 | | | TriMas Corp.* | | | 90,174 | |
| | 2,321 | | | TriNet Group, Inc.* | | | 157,457 | |
| | 3,713 | | | Triton International Ltd. (Bermuda) | | | 133,891 | |
| | 8,398 | | | TrueBlue, Inc.* | | | 142,094 | |
| | 6,297 | | | Tutor Perini Corp.* | | | 79,027 | |
| | 5,598 | | | UFP Industries, Inc. | | | 332,241 | |
| | 1,050 | | | UniFirst Corp. | | | 202,251 | |
| | 2,915 | | | Upwork, Inc.* | | | 44,395 | |
| | 2,525 | | | Vectrus, Inc.* | | | 109,610 | |
| | 4,563 | | | Veritiv Corp.* | | | 79,305 | |
| | 1,704 | | | Viad Corp. | | | 36,517 | |
| | 3,846 | | | Vicor Corp.* | | | 334,717 | |
| | 2,780 | | | Vivint Solar, Inc.* | | | 85,846 | |
| | 5,889 | | | Wabash National Corp. | | | 71,905 | |
| | 2,823 | | | Watts Water Technologies, Inc., Class A | | | 270,302 | |
| | 2,635 | | | Werner Enterprises, Inc. | | | 121,236 | |
| | 1,821 | | | WESCO International, Inc.* | | | 85,314 | |
| | 3,033 | | | Willdan Group, Inc.* | | | 85,470 | |
| | 222 | | | Willis Lease Finance Corp.* | | | 4,746 | |
| | 5,940 | | | WillScot Mobile Mini Holdings Corp.* | | | 106,326 | |
| | | | | | | | |
| | | | | | | 24,146,519 | |
| | |
| Information Technology – 14.5% | |
| | 7,887 | | | 3D Systems Corp.* | | | 43,300 | |
| | 9,146 | | | 8x8, Inc.* | | | 154,384 | |
| | 17,268 | | | A10 Networks, Inc.* | | | 147,641 | |
| | 1,819 | | | Acacia Communications, Inc.* | | | 122,746 | |
| | 5,995 | | | ACI Worldwide, Inc.* | | | 176,133 | |
| | 5,232 | | | ADTRAN, Inc. | | | 58,023 | |
| | 2,548 | | | Advanced Energy Industries, Inc.* | | | 188,858 | |
| | 3,984 | | | Agilysys, Inc.* | | | 101,074 | |
| | 3,225 | | | Akoustis Technologies, Inc.*(a) | | | 25,574 | |
| | 3,200 | | | Alarm.com Holdings, Inc.* | | | 191,584 | |
| | 3,313 | | | Altair Engineering, Inc., Class A* | | | 139,212 | |
| | 1,970 | | | Ambarella, Inc.* | | | 103,819 | |
| | 4,432 | | | American Software, Inc., Class A | | | 62,757 | |
| | 14,481 | | | Amkor Technology, Inc.* | | | 176,596 | |
| | 1,903 | | | Appfolio, Inc., Class A* | | | 319,761 | |
| | 3,417 | | | Appian Corp.*(a) | | | 209,257 | |
| | 2,645 | | | Atomera, Inc.*(a) | | | 33,618 | |
| | 10,336 | | | Avaya Holdings Corp.* | | | 160,415 | |
| | 10,912 | | | Avid Technology, Inc.* | | | 88,387 | |
| | 2,954 | | | Axcelis Technologies, Inc.* | | | 69,803 | |
| | |
|
| Common Stocks – (continued) | |
| Information Technology – (continued) | |
| | 5,819 | | | AXT, Inc.* | | | 32,819 | |
| | 2,945 | | | Badger Meter, Inc. | | | 181,677 | |
| | 580 | | | Bel Fuse, Inc., Class B | | | 6,972 | |
| | 2,225 | | | Belden, Inc. | | | 74,938 | |
| | 5,048 | | | Benchmark Electronics, Inc. | | | 98,991 | |
| | 4,478 | | | Benefitfocus, Inc.* | | | 46,303 | |
| | 2,378 | | | Blackbaud, Inc. | | | 151,835 | |
| | 1,757 | | | Blackline, Inc.* | | | 153,509 | |
| | 2,184 | | | Bottomline Technologies DE, Inc.* | | | 104,024 | |
| | 10,860 | | | Box, Inc., Class A* | | | 213,182 | |
| | 11,387 | | | Brightcove, Inc.* | | | 126,623 | |
| | 2,816 | | | Brooks Automation, Inc. | | | 145,390 | |
| | 1,394 | | | Cabot Microelectronics Corp. | | | 212,292 | |
| | 13,594 | | | Calix, Inc.* | | | 264,403 | |
| | 4,036 | | | Cardtronics PLC, Class A* | | | 87,622 | |
| | 1,096 | | | Cass Information Systems, Inc. | | | 42,919 | |
| | 2,153 | | | Cerence, Inc.* | | | 114,540 | |
| | 1,260 | | | CEVA, Inc.* | | | 53,235 | |
| | 8,597 | | | ChannelAdvisor Corp.* | | | 144,602 | |
| | 4,291 | | | Clearfield, Inc.* | | | 75,522 | |
| | 9,876 | | | Cloudera, Inc.* | | | 130,462 | |
| | 4,203 | | | Cohu, Inc. | | | 72,292 | |
| | 4,140 | | | CommVault Systems, Inc.* | | | 178,972 | |
| | 3,165 | | | Comtech Telecommunications Corp. | | | 52,539 | |
| | 15,007 | | | Conduent, Inc.* | | | 50,724 | |
| | 3,661 | | | Cornerstone OnDemand, Inc.* | | | 129,123 | |
| | 3,985 | | | CSG Systems International, Inc. | | | 169,641 | |
| | 2,439 | | | CTS Corp. | | | 50,975 | |
| | 2,665 | | | CyberOptics Corp.* | | | 85,413 | |
| | 12,630 | | | Daktronics, Inc. | | | 55,825 | |
| | 6,661 | | | Diebold Nixdorf, Inc.* | | | 55,553 | |
| | 5,452 | | | Digi International, Inc.* | | | 74,256 | |
| | 8,387 | | | Digital Turbine, Inc.* | | | 202,882 | |
| | 4,930 | | | Diodes, Inc.* | | | 240,880 | |
| | 2,573 | | | Domo, Inc., Class B* | | | 104,773 | |
| | 3,077 | | | DSP Group, Inc.* | | | 44,124 | |
| | 4,922 | | | Ebix, Inc. | | | 113,551 | |
| | 7,012 | | | eGain Corp.* | | | 93,821 | |
| | 2,239 | | | Envestnet, Inc.* | | | 185,815 | |
| | 1,555 | | | ePlus, Inc.* | | | 119,300 | |
| | 5,594 | | | EVERTEC, Inc. (Puerto Rico) | | | 195,902 | |
| | 2,469 | | | ExlService Holdings, Inc.* | | | 157,251 | |
| | 27,374 | | | Extreme Networks, Inc.* | | | 119,624 | |
| | 2,706 | | | Fabrinet (Thailand)* | | | 188,825 | |
| | 2,043 | | | FARO Technologies, Inc.* | | | 115,429 | |
| | 19,523 | | | Fitbit, Inc., Class A* | | | 124,166 | |
| | 7,134 | | | FormFactor, Inc.* | | | 186,411 | |
| | 8,004 | | | Genasys, Inc.* | | | 40,020 | |
| | 5,442 | | | GreenSky, Inc., Class A*(a) | | | 23,673 | |
| | 5,088 | | | GTT Communications, Inc.*(a) | | | 25,338 | |
| | 8,049 | | | Hackett Group, Inc. (The) | | | 101,498 | |
| | 9,260 | | | Harmonic, Inc.* | | | 54,634 | |
| | 927 | | | I3 Verticals, Inc., Class A* | | | 25,854 | |
| | 3,625 | | | Ichor Holdings Ltd.* | | | 91,205 | |
| | 3,418 | | | II-VI, Inc.* | | | 152,101 | |
| | 4,696 | | | Immersion Corp.* | | | 44,659 | |
| | |
| | |
| The accompanying notes are an integral part of these financial statements. | | 77 |
GOLDMAN SACHS ACTIVEBETA® U.S. SMALL CAP EQUITY ETF
Schedule of Investments (continued)
August 31, 2020
| | | | | | | | |
Shares | | | Description | | Value | |
|
| Common Stocks – (continued) | |
| Information Technology – (continued) | |
| | 4,260 | | | Impinj, Inc.*(a) | | $ | 104,157 | |
| | 4,562 | | | Infinera Corp.* | | | 33,257 | |
| | 10,067 | | | Information Services Group, Inc.* | | | 20,688 | |
| | 6,554 | | | Inseego Corp.*(a) | | | 75,240 | |
| | 3,079 | | | Insight Enterprises, Inc.* | | | 184,140 | |
| | 6,224 | | | Intellicheck, Inc.* | | | 39,211 | |
| | 1,767 | | | Intelligent Systems Corp.* | | | 66,422 | |
| | 834 | | | InterDigital, Inc. | | | 50,999 | |
| | 9,449 | | | Iteris, Inc.* | | | 43,182 | |
| | 2,285 | | | Itron, Inc.* | | | 136,117 | |
| | 3,479 | | | J2 Global, Inc.* | | | 243,495 | |
| | 10,859 | | | KBR, Inc. | | | 271,366 | |
| | 4,769 | | | Kimball Electronics, Inc.* | | | 64,310 | |
| | 5,315 | | | Knowles Corp.* | | | 80,044 | |
| | 6,205 | | | KVH Industries, Inc.* | | | 55,783 | |
| | 13,297 | | | Lattice Semiconductor Corp.* | | | 380,294 | |
| | 18,548 | | | Limelight Networks, Inc.* | | | 105,167 | |
| | 6,566 | | | LivePerson, Inc.* | | | 391,728 | |
| | 1,733 | | | LiveRamp Holdings, Inc.* | | | 96,771 | |
| | 11,255 | | | Luna Innovations, Inc.* | | | 72,032 | |
| | 1,687 | | | MACOM Technology Solutions Holdings, Inc.* | | | 60,108 | |
| | 2,935 | | | ManTech International Corp., Class A | | | 219,685 | |
| | 5,590 | | | MAXIMUS, Inc. | | | 433,505 | |
| | 3,967 | | | MaxLinear, Inc.* | | | 96,596 | |
| | 3,108 | | | Methode Electronics, Inc. | | | 87,987 | |
| | 1,054 | | | MicroStrategy, Inc., Class A* | | | 152,240 | |
| | 1,968 | | | Mimecast Ltd.* | | | 96,904 | |
| | 9,584 | | | Mitek Systems, Inc.* | | | 121,621 | |
| | 23,148 | | | MobileIron, Inc.* | | | 151,156 | |
| | 4,127 | | | Model N, Inc.* | | | 162,274 | |
| | 1,685 | | | MTS Systems Corp. | | | 41,114 | |
| | 4,552 | | | Napco Security Technologies, Inc.* | | | 113,390 | |
| | 15,328 | | | NeoPhotonics Corp.* | | | 102,084 | |
| | 2,288 | | | NETGEAR, Inc.* | | | 76,305 | |
| | 6,625 | | | NetScout Systems, Inc.* | | | 153,303 | |
| | 7,620 | | | NIC, Inc. | | | 162,916 | |
| | 1,208 | | | nLight, Inc.* | | | 28,219 | |
| | 2,405 | | | Novanta, Inc.* | | | 257,744 | |
| | 622 | | | NVE Corp. | | | 33,233 | |
| | 3,841 | | | OneSpan, Inc.* | | | 82,774 | |
| | 4,668 | | | Onto Innovation, Inc.* | | | 145,828 | |
| | 1,415 | | | OSI Systems, Inc.* | | | 111,431 | |
| | 1,871 | | | PAR Technology Corp.* | | | 69,863 | |
| | 4,323 | | | PC Connection, Inc. | | | 191,466 | |
| | 6,883 | | | PCTEL, Inc.* | | | 43,638 | |
| | 1,803 | | | PDF Solutions, Inc.* | | | 37,322 | |
| | 5,591 | | | Perficient, Inc.* | | | 239,910 | |
| | 10,373 | | | Perspecta, Inc. | | | 215,447 | |
| | 5,466 | | | PFSweb, Inc.* | | | 46,188 | |
| | 7,630 | | | Photronics, Inc.* | | | 76,529 | |
| | 14,837 | | | Pixelworks, Inc.* | | | 33,828 | |
| | 3,034 | | | Plantronics, Inc. | | | 37,500 | |
| | 2,304 | | | Plexus Corp.* | | | 175,265 | |
| | 4,028 | | | Power Integrations, Inc. | | | 225,447 | |
| | 4,198 | | | Progress Software Corp. | | | 159,062 | |
| | |
|
| Common Stocks – (continued) | |
| Information Technology – (continued) | |
| | 2,044 | | | PROS Holdings, Inc.* | | | 79,716 | |
| | 2,329 | | | Q2 Holdings, Inc.* | | | 226,588 | |
| | 2,080 | | | QAD, Inc., Class A | | | 94,598 | |
| | 2,222 | | | Qualys, Inc.* | | | 235,843 | |
| | 11,440 | | | Quantum Corp.* | | | 62,462 | |
| | 13,283 | | | Rambus, Inc.* | | | 178,391 | |
| | 3,011 | | | Rapid7, Inc.* | | | 194,420 | |
| | 1,615 | | | Repay Holdings Corp.* | | | 40,860 | |
| | 16,362 | | | Ribbon Communications, Inc.* | | | 70,029 | |
| | 633 | | | Rogers Corp.* | | | 71,725 | |
| | 7,833 | | | Rosetta Stone, Inc.* | | | 237,967 | |
| | 2,895 | | | Sailpoint Technologies Holdings, Inc.* | | | 113,571 | |
| | 5,395 | | | Sanmina Corp.* | | | 152,679 | |
| | 1,467 | | | Sapiens International Corp. NV (Israel) | | | 49,203 | |
| | 3,278 | | | ScanSource, Inc.* | | | 80,934 | |
| | 3,264 | | | SecureWorks Corp., Class A* | | | 42,204 | |
| | 4,020 | | | Semtech Corp.* | | | 235,773 | |
| | 24,450 | | | ServiceSource International, Inc.* | | | 36,797 | |
| | 1,944 | | | ShotSpotter, Inc.* | | | 58,242 | |
| | 2,502 | | | Silicon Laboratories, Inc.* | | | 256,230 | |
| | 5,251 | | | SMART Global Holdings, Inc.* | | | 132,325 | |
| | 12,029 | | | Smith Micro Software, Inc.* | | | 46,191 | |
| | 2,789 | | | SPS Commerce, Inc.* | | | 222,785 | |
| | 3,069 | | | Super Micro Computer, Inc.* | | | 84,060 | |
| | 4,973 | | | SVMK, Inc.* | | | 123,778 | |
| | 6,848 | | | Sykes Enterprises, Inc.* | | | 226,703 | |
| | 4,706 | | | Synaptics, Inc.* | | | 401,563 | |
| | 10,375 | | | Telenav, Inc.* | | | 47,621 | |
| | 2,664 | | | Tenable Holdings, Inc.* | | | 100,273 | |
| | 2,892 | | | TTEC Holdings, Inc. | | | 163,947 | |
| | 9,690 | | | TTM Technologies, Inc.* | | | 111,047 | |
| | 702 | | | Tucows, Inc., Class A* | | | 44,380 | |
| | 5,948 | | | Ultra Clean Holdings, Inc.* | | | 145,845 | |
| | 4,195 | | | Unisys Corp.* | | | 48,914 | |
| | 1,098 | | | Upland Software, Inc.* | | | 43,064 | |
| | 3,873 | | | Varonis Systems, Inc.* | | | 478,432 | |
| | 2,101 | | | Veeco Instruments, Inc.* | | | 24,981 | |
| | 4,821 | | | Verint Systems, Inc.* | | | 229,287 | |
| | 5,525 | | | Verra Mobility Corp.* | | | 58,372 | |
| | 14,292 | | | Viavi Solutions, Inc.* | | | 190,584 | |
| | 8,325 | | | VirnetX Holding Corp. | | | 41,375 | |
| | 2,326 | | | Virtusa Corp.* | | | 91,970 | |
| | 9,318 | | | Vishay Intertechnology, Inc. | | | 148,995 | |
| | 2,941 | | | Vishay Precision Group, Inc.* | | | 73,260 | |
| | 2,865 | | | Workiva, Inc.* | | | 169,035 | |
| | 11,437 | | | Xperi Holding Corp. | | | 143,306 | |
| | 8,251 | | | Yext, Inc.* | | | 163,865 | |
| | 5,883 | | | Zix Corp.* | | | 35,651 | |
| | 3,124 | | | Zuora, Inc., Class A* | | | 42,455 | |
| | | | | | | | |
| | | | | | | 22,070,432 | |
| | |
| Materials – 3.6% | |
| | 8,004 | | | AgroFresh Solutions, Inc.* | | | 19,850 | |
| | 3,861 | | | Alcoa Corp.* | | | 56,448 | |
| | 6,593 | | | Allegheny Technologies, Inc.* | | | 54,920 | |
| | 5,470 | | | American Vanguard Corp. | | | 77,401 | |
| | |
| | |
| 78 | | The accompanying notes are an integral part of these financial statements. |
GOLDMAN SACHS ACTIVEBETA® U.S. SMALL CAP EQUITY ETF
| | | | | | | | |
Shares | | | Description | | Value | |
|
| Common Stocks – (continued) | |
| Materials – (continued) | |
| | 23,797 | | | Amyris, Inc.*(a) | | $ | 78,054 | |
| | 3,274 | | | Arconic Corp.* | | | 72,847 | |
| | 6,308 | | | Avient Corp. | | | 160,980 | |
| | 1,612 | | | Balchem Corp. | | | 157,492 | |
| | 6,442 | | | Boise Cascade Co. | | | 295,044 | |
| | 3,363 | | | Caledonia Mining Corp. PLC (South Africa) | | | 61,139 | |
| | 2,531 | | | Carpenter Technology Corp. | | | 53,227 | |
| | 1,903 | | | Chase Corp. | | | 185,676 | |
| | 778 | | | Clearwater Paper Corp.* | | | 26,187 | |
| | 5,483 | | | Cleveland-Cliffs, Inc.(a) | | | 36,078 | |
| | 5,739 | | | Coeur Mining, Inc.* | | | 48,552 | |
| | 9,262 | | | Commercial Metals Co. | | | 193,298 | |
| | 847 | | | Compass Minerals International, Inc. | | | 48,220 | |
| | 2,397 | | | Domtar Corp. | | | 68,362 | |
| | 3,586 | | | Ferro Corp.* | | | 44,717 | |
| | 3,350 | | | Forterra, Inc.* | | | 44,388 | |
| | 4,282 | | | FutureFuel Corp. | | | 51,812 | |
| | 6,144 | | | GCP Applied Technologies, Inc.* | | | 160,113 | |
| | 7,413 | | | Gold Resource Corp. | | | 29,504 | |
| | 1,415 | | | Greif, Inc., Class A | | | 52,143 | |
| | 1,198 | | | Haynes International, Inc. | | | 22,451 | |
| | 3,233 | | | HB Fuller Co. | | | 155,734 | |
| | 14,336 | | | Hecla Mining Co. | | | 86,303 | |
| | 2,679 | | | Ingevity Corp.* | | | 150,479 | |
| | 2,635 | | | Innospec, Inc. | | | 196,808 | |
| | 1,008 | | | Kaiser Aluminum Corp. | | | 64,794 | |
| | 1,871 | | | Koppers Holdings, Inc.* | | | 45,016 | |
| | 3,773 | | | Kraton Corp.* | | | 52,973 | |
| | 2,927 | | | Kronos Worldwide, Inc. | | | 36,558 | |
| | 4,280 | | | Livent Corp.* | | | 36,294 | |
| | 8,144 | | | Louisiana-Pacific Corp. | | | 268,263 | |
| | 10,631 | | | Marrone Bio Innovations, Inc.* | | | 13,501 | |
| | 2,823 | | | Materion Corp. | | | 154,108 | |
| | 2,310 | | | Minerals Technologies, Inc. | | | 117,233 | |
| | 10,071 | | | Myers Industries, Inc. | | | 154,086 | |
| | 928 | | | Neenah, Inc. | | | 41,092 | |
| | 7,765 | | | Novagold Resources, Inc. (Canada)* | | | 82,231 | |
| | 3,201 | | | O-I Glass, Inc. | | | 34,827 | |
| | 3,572 | | | Olympic Steel, Inc. | | | 39,292 | |
| | 8,967 | | | Orion Engineered Carbons SA (Germany) | | | 108,949 | |
| | 4,132 | | | P H Glatfelter Co. | | | 61,939 | |
| | 356 | | | Quaker Chemical Corp. | | | 67,640 | |
| | 6,255 | | | Ryerson Holding Corp.* | | | 34,465 | |
| | 5,341 | | | Schnitzer Steel Industries, Inc., Class A | | | 105,431 | |
| | 2,403 | | | Schweitzer-Mauduit International, Inc. | | | 72,883 | |
| | 2,523 | | | Sensient Technologies Corp. | | | 139,320 | |
| | 1,981 | | | Stepan Co. | | | 228,390 | |
| | 5,654 | | | Summit Materials, Inc., Class A* | | | 84,188 | |
| | 11,999 | | | SunCoke Energy, Inc. | | | 42,956 | |
| | 2,227 | | | Tredegar Corp. | | | 37,703 | |
| | 2,043 | | | Trinseo SA | | | 50,891 | |
| | 7,498 | | | Tronox Holdings PLC, Class A | | | 67,182 | |
| | 2,574 | | | UFP Technologies, Inc.* | | | 106,075 | |
| | 780 | | | United States Lime & Minerals, Inc. | | | 71,861 | |
| | 2,660 | | | US Concrete, Inc.* | | | 70,995 | |
| | |
|
| Common Stocks – (continued) | |
| Materials – (continued) | |
| | 4,851 | | | Verso Corp., Class A | | | 63,597 | |
| | 10,975 | | | Warrior Met Coal, Inc. | | | 169,783 | |
| | 2,577 | | | Worthington Industries, Inc. | | | 107,023 | |
| | | | | | | | |
| | | | | | | 5,519,766 | |
| | |
| Real Estate – 6.7% | |
| | 2,788 | | | Acadia Realty Trust REIT | | | 31,616 | |
| | 2,723 | | | Agree Realty Corp. REIT | | | 182,223 | |
| | 9,165 | | | Alexander & Baldwin, Inc. REIT | | | 110,988 | |
| | 204 | | | Alexander’s, Inc. REIT | | | 52,034 | |
| | 1,662 | | | Alpine, Inc.ome Property Trust, Inc. REIT | | | 24,116 | |
| | 2,508 | | | American Assets Trust, Inc. REIT | | | 64,079 | |
| | 3,843 | | | American Finance Trust, Inc. REIT | | | 26,267 | |
| | 3,353 | | | BRT Apartments Corp. REIT | | | 44,763 | |
| | 6,284 | | | CareTrust REIT, Inc. REIT | | | 121,721 | |
| | 7,745 | | | Chatham Lodging Trust REIT | | | 53,595 | |
| | 3,229 | | | City Office REIT, Inc. REIT | | | 25,961 | |
| | 3,028 | | | Columbia Property Trust, Inc. REIT | | | 35,730 | |
| | 2,257 | | | Community Healthcare Trust, Inc. REIT | | | 105,402 | |
| | 10,967 | | | CoreCivic, Inc. REIT | | | 102,103 | |
| | 4,901 | | | CorEnergy Infrastructure Trust, Inc. REIT | | | 43,815 | |
| | 14,271 | | | CorePoint Lodging, Inc. REIT | | | 81,059 | |
| | 1,398 | | | CTO Realty Growth, Inc. | | | 58,954 | |
| | 4,348 | | | Cushman & Wakefield PLC* | | | 50,480 | |
| | 19,376 | | | DiamondRock Hospitality Co. REIT | | | 102,693 | |
| | 22,752 | | | Diversified Healthcare Trust REIT | | | 86,458 | |
| | 4,404 | | | Easterly Government Properties, Inc. REIT | | | 106,533 | |
| | 2,219 | | | EastGroup Properties, Inc. REIT | | | 295,482 | |
| | 4,336 | | | Essential Properties Realty Trust, Inc. REIT | | | 73,582 | |
| | 9,327 | | | eXp World Holdings, Inc.* | | | 414,865 | |
| | 4,185 | | | Forestar Group, Inc.* | | | 74,367 | |
| | 5,760 | | | Four Corners Property Trust, Inc. REIT | | | 145,440 | |
| | 12,053 | | | Franklin Street Properties Corp. REIT | | | 53,395 | |
| | 5,478 | | | Front Yard Residential Corp. REIT | | | 53,410 | |
| | 1,408 | | | FRP Holdings, Inc.* | | | 57,841 | |
| | 11,389 | | | GEO Group, Inc. (The) REIT | | | 127,101 | |
| | 3,211 | | | Getty Realty Corp. REIT | | | 94,050 | |
| | 4,286 | | | Gladstone Commercial Corp. REIT | | | 84,048 | |
| | 2,194 | | | Gladstone Land Corp. REIT | | | 34,534 | |
| | 3,616 | | | Global Medical REIT, Inc. REIT | | | 46,249 | |
| | 4,542 | | | Global Net Lease, Inc. REIT | | | 79,485 | |
| | 6,854 | | | Healthcare Realty Trust, Inc. REIT | | | 197,738 | |
| | 13,154 | | | Hersha Hospitality Trust REIT | | | 84,580 | |
| | 8,346 | | | Independence Realty Trust, Inc. REIT | | | 97,732 | |
| | 4,963 | | | Industrial Logistics Properties Trust REIT | | | 107,052 | |
| | 1,046 | | | Innovative Industrial Properties, Inc. REIT | | | 128,752 | |
| | 977 | | | Investors Real Estate Trust REIT | | | 69,465 | |
| | 7,333 | | | iStar, Inc. REIT | | | 90,782 | |
| | 2,462 | | | Jernigan Capital, Inc. REIT | | | 42,445 | |
| | 6,724 | | | Kennedy-Wilson Holdings, Inc. | | | 96,086 | |
| | 7,850 | | | Kite Realty Group Trust REIT | | | 88,234 | |
| | |
| | |
| The accompanying notes are an integral part of these financial statements. | | 79 |
GOLDMAN SACHS ACTIVEBETA® U.S. SMALL CAP EQUITY ETF
Schedule of Investments (continued)
August 31, 2020
| | | | | | | | |
Shares | | | Description | | Value | |
|
| Common Stocks – (continued) | |
| Real Estate – (continued) | |
| | 14,361 | | | Lexington Realty Trust REIT | | $ | 163,285 | |
| | 2,706 | | | LTC Properties, Inc. REIT | | | 98,742 | |
| | 9,033 | | | Mack-Cali Realty Corp. REIT | | | 114,087 | |
| | 9,107 | | | Marcus & Millichap, Inc.* | | | 256,908 | |
| | 833 | | | Maui Land & Pineapple Co., Inc.* | | | 9,713 | |
| | 6,489 | | | Monmouth Real Estate Investment Corp. REIT | | | 94,155 | |
| | 2,573 | | | National Health Investors, Inc. REIT | | | 160,169 | |
| | 6,736 | | | National Storage Affiliates Trust REIT | | | 231,112 | |
| | 14,367 | | | New Senior Investment Group, Inc. REIT | | | 62,927 | |
| | 14,547 | | | Newmark Group, Inc., Class A | | | 64,443 | |
| | 2,656 | | | NexPoint Residential Trust, Inc. REIT | | | 109,958 | |
| | 3,559 | | | Office Properties Income Trust REIT | | | 84,847 | |
| | 1,686 | | | One Liberty Properties, Inc. REIT | | | 32,304 | |
| | 11,621 | | | Pebblebrook Hotel Trust REIT | | | 146,657 | |
| | 11,005 | | | Physicians Realty Trust REIT | | | 199,741 | |
| | 10,313 | | | Piedmont Office Realty Trust, Inc., Class A REIT | | | 157,892 | |
| | 5,830 | | | PotlatchDeltic Corp. REIT | | | 268,413 | |
| | 7,440 | | | Preferred Apartment Communities, Inc., Class A REIT | | | 49,104 | |
| | 1,490 | | | PS Business Parks, Inc. REIT | | | 188,038 | |
| | 3,131 | | | QTS Realty Trust, Inc., Class A REIT | | | 212,344 | |
| | 5,589 | | | RE/MAX Holdings, Inc., Class A | | | 196,397 | |
| | 25,605 | | | Realogy Holdings Corp.* | | | 283,703 | |
| | 12,208 | | | Redfin Corp.* | | | 580,735 | |
| | 7,570 | | | Retail Opportunity Investments Corp. REIT | | | 84,254 | |
| | 6,299 | | | Retail Properties of America, Inc., Class A REIT | | | 39,747 | |
| | 4,108 | | | Retail Value, Inc. REIT | | | 52,213 | |
| | 14,161 | | | RLJ Lodging Trust REIT | | | 133,680 | |
| | 4,184 | | | RMR Group, Inc. (The), Class A | | | 118,072 | |
| | 9,051 | | | RPT Realty REIT | | | 53,039 | |
| | 3,493 | | | Ryman Hospitality Properties, Inc. REIT | | | 133,293 | |
| | 13,318 | | | Sabra Health Care REIT, Inc. REIT | | | 197,506 | |
| | 645 | | | Safehold, Inc. REIT | | | 35,778 | |
| | 1,034 | | | Saul Centers, Inc. REIT | | | 28,973 | |
| | 10,774 | | | Service Properties Trust REIT | | | 88,455 | |
| | 5,485 | | | SITE Centers Corp. REIT | | | 41,192 | |
| | 2,222 | | | St Joe Co. (The)* | | | 51,573 | |
| | 7,212 | | | STAG Industrial, Inc. REIT | | | 232,948 | |
| | 13,433 | | | Summit Hotel Properties, Inc. REIT | | | 79,120 | |
| | 22,111 | | | Sunstone Hotel Investors, Inc. REIT | | | 184,185 | |
| | 8,242 | | | Tanger Factory Outlet Centers, Inc. REIT | | | 46,897 | |
| | 3,834 | | | Terreno Realty Corp. REIT | | | 228,660 | |
| | 4,127 | | | UMH Properties, Inc. REIT | | | 60,007 | |
| | 14,842 | | | Uniti Group, Inc. REIT | | | 145,748 | |
| | 1,127 | | | Universal Health Realty Income Trust REIT | | | 75,193 | |
| | 4,626 | | | Urban Edge Properties REIT | | | 48,851 | |
| | 3,921 | | | Washington Real Estate Investment Trust REIT | | | 86,027 | |
| | 10,842 | | | Xenia Hotels & Resorts, Inc. REIT | | | 97,361 | |
| | | | | | | | |
| | | | | | | 10,255,751 | |
| | |
|
| Common Stocks – (continued) | |
| Utilities – 3.5% | |
| | 4,284 | | | ALLETE, Inc. | | | 231,165 | |
| | 4,117 | | | American States Water Co. | | | 313,221 | |
| | 1,001 | | | Artesian Resources Corp., Class A | | | 35,225 | |
| | 35,472 | | | Atlantic Power Corp.* | | | 73,427 | |
| | 5,100 | | | Avista Corp. | | | 187,986 | |
| | 4,607 | | | Black Hills Corp. | | | 258,361 | |
| | 3,160 | | | Brookfield Infrastructure Corp., Class A (Canada) | | | 157,747 | |
| | 3,356 | | | California Water Service Group | | | 152,161 | |
| | 1,725 | | | Chesapeake Utilities Corp. | | | 141,105 | |
| | 10,978 | | | Clearway Energy, Inc., Class A | | | 265,119 | |
| | 12,787 | | | Clearway Energy, Inc., Class C | | | 326,196 | |
| | 5,669 | | | Consolidated Water Co. Ltd. (Cayman Islands) | | | 68,198 | |
| | 5,160 | | | Genie Energy Ltd., Class B | | | 45,615 | |
| | 2,778 | | | MGE Energy, Inc. | | | 180,542 | |
| | 1,168 | | | Middlesex Water Co. | | | 74,904 | |
| | 6,223 | | | New Jersey Resources Corp. | | | 187,561 | |
| | 2,036 | | | Northwest Natural Holding Co. | | | 104,060 | |
| | 4,058 | | | NorthWestern Corp. | | | 209,555 | |
| | 3,932 | | | ONE Gas, Inc. | | | 291,440 | |
| | 3,828 | | | Ormat Technologies, Inc. | | | 233,010 | |
| | 3,639 | | | Otter Tail Corp. | | | 141,375 | |
| | 6,584 | | | PNM Resources, Inc. | | | 287,589 | |
| | 7,295 | | | Portland General Electric Co. | | | 278,304 | |
| | 7,508 | | | Pure Cycle Corp.* | | | 73,278 | |
| | 2,077 | | | RGC Resources, Inc. | | | 48,436 | |
| | 1,984 | | | SJW Group | | | 124,060 | |
| | 5,398 | | | South Jersey Industries, Inc. | | | 119,566 | |
| | 3,967 | | | Southwest Gas Holdings, Inc. | | | 249,405 | |
| | 4,572 | | | Spark Energy, Inc., Class A | | | 42,017 | |
| | 3,478 | | | Spire, Inc. | | | 202,454 | |
| | 2,498 | | | Sunnova Energy International, Inc.* | | | 59,253 | |
| | 1,942 | | | Unitil Corp. | | | 81,952 | |
| | 1,837 | | | York Water Co. (The) | | | 83,786 | |
| | | | | | | | |
| | | | | | | 5,328,073 | |
| | |
| | TOTAL COMMON STOCKS | |
| | (Cost $141,323,600) | | $ | 149,697,017 | |
| | |
| | | | | | | | |
| Units | | | Description | | Value | |
|
| Right – 0.0% | |
| Financials – 0.0% | |
| | 153 | | | NewStar Financial, Inc. CVR*(c) | | $ | 0 | |
| | (Cost $13) | | | | |
| | |
| TOTAL INVESTMENTS BEFORE SECURITIES LENDING
REINVESTMENT VEHICLE |
|
| | (Cost $141,323,613) | | $ | 149,697,017 | |
| | |
| | |
| 80 | | The accompanying notes are an integral part of these financial statements. |
GOLDMAN SACHS ACTIVEBETA® U.S. SMALL CAP EQUITY ETF
| | | | | | | | |
| Shares | | | Dividend
Rate | | Value | |
|
| Securities Lending Reinvestment Vehicle – 1.9%(d) | |
| Goldman Sachs Financial Square Government Fund –
Institutional Shares |
|
| | 2,901,792 | | | 0.027% | | $ | 2,901,792 | |
| | (Cost $2,901,792) | |
| | |
| | TOTAL INVESTMENTS – 100.1% | |
| | (Cost $144,225,405) | | $ | 152,598,809 | |
| | |
| LIABILITIES IN EXCESS OF
OTHER ASSETS – (0.1)% | | | (114,978 | ) |
| | |
| | NET ASSETS – 100.0% | | $ | 152,483,831 | |
| | |
| | |
|
| The percentage shown for each investment category reflects the value of investments in that category as a percentage of net assets. |
| |
* | | Non-income producing security. |
| |
(a) | | All or a portion of security is on loan. |
| |
(b) | | Exempt from registration under Rule 144A of the Securities Act of 1933. |
| |
(c) | | Significant unobservable inputs were used in the valuation of this portfolio security; i.e. Level 3. |
| |
(d) | | Represents an affiliated issuer. |
| | |
|
Investment Abbreviations: |
CVR | | —Contingent Value Right |
PLC | | —Public Limited Company |
REIT | | —Real Estate Investment Trust |
|
|
| ADDITIONAL INVESTMENT INFORMATION |
FUTURES CONTRACTS — At August 31, 2020, the Fund had the following futures contracts:
| | | | | | | | | | | | | | | | |
| Description | | Number of
Contracts | | | Expiration
Date | | | Notional
Amount | | | Unrealized
Appreciation/
(Depreciation) | |
E-mini Russell 2000 Index | | | 32 | | | | 09/18/20 | | | $ | 2,369,834 | | | $ | 128,246 | |
| | |
| The accompanying notes are an integral part of these financial statements. | | 81 |
GOLDMAN SACHS ACTIVEBETA® ETFS
Statements of Assets and Liabilities
August 31, 2020
| | | | | | | | | | | | | | | | | | |
| | | | | ActiveBeta® Emerging Markets Equity ETF | | | ActiveBeta®
Europe Equity
ETF | | | ActiveBeta®
International Equity ETF | | | ActiveBeta®
Japan Equity
ETF | |
| | Assets: | | | | | | | | | | | | | | | | |
| | | | | |
| | Investments in unaffiliated issuers, at value (cost $1,346,703,319, $16,124,556, $1,597,612,481 and $18,260,875, respectively)(a) | | $ | 1,712,737,393 | | | $ | 16,304,217 | | | $ | 1,738,937,929 | | | $ | 19,460,165 | |
| | | | | |
| | Investments in securities lending reinvestment vehicle, at value which equals cost | | | 4,333,286 | | | | 62,772 | | | | 24,830,933 | | | | 999,602 | |
| | | | | |
| | Cash | | | 15,809,357 | | | | 60,177 | | | | 3,346,967 | | | | 108,327 | |
| | | | | |
| | Foreign currency, at value (cost $253,948, $—, $137,448 and $14,969, respectively) | | | 254,353 | | | | — | | | | 141,365 | | | | 15,218 | |
| | | | | |
| | Variation margin on futures contracts | | | — | | | | — | | | | — | | | | 1,061 | |
| | | | | |
| | Receivables: | | | | | | | | | | | | | | | | |
| | | | | |
| | Investments sold | | | 119,908,115 | | | | 775,679 | | | | 88,641,689 | | | | 676,650 | |
| | | | | |
| | Dividends | | | 2,770,034 | | | | 32,663 | | | | 3,659,406 | | | | 23,842 | |
| | | | | |
| | Reimbursement from investment adviser | | | 183,580 | | | | — | | | | — | | | | — | |
| | | | | |
| | Foreign tax reclaims | | | 27,679 | | | | 79,419 | | | | 1,523,202 | | | | 1,294 | |
| | | | | |
| | Securities lending income | | | 2,386 | | | | 338 | | | | 30,761 | | | | 200 | |
| | | | | |
| | Collateral on futures contracts | | | 671,463 | | | | 12,196 | | | | — | | | | 5,738 | |
| | | | | |
| | Total assets | | | 1,856,697,646 | | | | 17,327,461 | | | | 1,861,112,252 | | | | 21,292,097 | |
| | | | | | | | | | | | | | | | | | |
| | Liabilities: | | | | | | | | | | | | | | | | |
| | | | | |
| | Payables: | | | | | | | | | | | | | | | | |
| | | | | |
| | Investments purchased | | | 138,525,819 | | | | 844,803 | | | | 92,355,188 | | | | 727,463 | |
| | | | | |
| | Upon return of securities loaned | | | 4,333,286 | | | | 62,772 | | | | 24,830,933 | | | | 999,602 | |
| | | | | |
| | Foreign capital gains tax | | | 1,525,646 | | | | — | | | | — | | | | — | |
| | | | | |
| | Management fees | | | 599,855 | | | | 3,432 | | | | 363,863 | | | | 4,061 | |
| | | | | |
| | Trustees fees | | | 4,777 | | | | — | | | | — | | | | — | |
| | | | | |
| | Foreign bank overdraft (cost $—, $(650), $— and $—, respectively) | | | — | | | | 663 | | | | — | | | | — | |
| | | | | |
| | Accrued expenses | | | 1,231,693 | | | | — | | | | — | | | | — | |
| | | | | |
| | Total liabilities | | | 146,221,076 | | | | 911,670 | | | | 117,549,984 | | | | 1,731,126 | |
| | | | | | | | | | | | | | | | | | |
| | Net Assets: | | | | | | | | | | | | | | | | |
| | | | | |
| | Paid-in capital | | | 1,508,464,961 | | | | 19,545,722 | | | | 1,719,232,509 | | | | 19,268,694 | |
| | | | | |
| | Total distributable earnings (loss) | | | 202,011,609 | | | | (3,129,931 | ) | | | 24,329,759 | | | | 292,277 | |
| | | | | |
| | NET ASSETS | | $ | 1,710,476,570 | | | $ | 16,415,791 | | | $ | 1,743,562,268 | | | $ | 19,560,971 | |
| | SHARES ISSUED AND OUTSTANDING | | | | | | | | | | | | | | | | |
| | | | | |
| | Shares outstanding no par value (unlimited shares authorized): | | | 51,400,000 | | | | 550,000 | | | | 60,700,000 | | | | 600,000 | |
| | | | | |
| | Net asset value per share: | | | $33.28 | | | | $29.85 | | | | $28.72 | | | | $32.60 | |
| | (a) | | Includes loaned securities having a market value of $4,100,901, $60,056, $23,426,522 and $944,830, respectively. |
| | |
| 82 | | The accompanying notes are an integral part of these financial statements. |
GOLDMAN SACHS ACTIVEBETA® ETFS
Statements of Assets and Liabilities (continued)
August 31, 2020
| | | | | | | | | | |
| | | | | ActiveBeta® U.S. Large Cap Equity ETF | | | ActiveBeta® U.S. Small Cap
Equity ETF | |
| | Assets: | | | | | |
| | | |
| | Investments in unaffiliated issuers, at value (cost $8,045,630,266 and $141,323,613, respectively)(a) | | $ | 10,407,272,245 | | | $ | 149,697,017 | |
| | | |
| | Investments in securities lending reinvestment vehicle, at value which equals cost | | | 9,557,821 | | | | 2,901,792 | |
| | | |
| | Cash | | | 7,346,612 | | | | 2,414,526 | |
| | | |
| | Receivables: | | | | | | | | |
| | | |
| | Fund shares sold | | | 731,745,348 | | | | — | |
| | | |
| | Dividends | | | 12,551,599 | | | | 204,652 | |
| | | |
| | Securities lending income | | | 2,556 | | | | 11,192 | |
| | | |
| | Collateral on futures contracts | | | — | | | | 204,160 | |
| | | |
| | Total assets | | | 11,168,476,181 | | | | 155,433,339 | |
| | | | | | | | | | |
| | Liabilities: | | | | | | | | |
| | | |
| | Variation margin on futures contracts | | | — | | | | 23,040 | |
| | | |
| | Payables: | | | | | | | | |
| | | |
| | Investments purchased | | | 730,315,034 | | | | — | |
| | | |
| | Upon return of securities loaned | | | 9,557,821 | | | | 2,901,792 | |
| | | |
| | Management fees | | | 708,603 | | | | 24,676 | |
| | | |
| | Total liabilities | | | 740,581,458 | | | | 2,949,508 | |
| | | | | | | | | | |
| | Net Assets: | | | | | | | | |
| | | |
| | Paid-in capital | | | 8,493,340,230 | | | | 153,163,441 | |
| | | |
| | Total distributable earnings (loss) | | | 1,934,554,493 | | | | (679,610 | ) |
| | | |
| | `NET ASSETS | | $ | 10,427,894,723 | | | $ | 152,483,831 | |
| | SHARES ISSUED AND OUTSTANDING | | | | | | | | |
| | | |
| | Shares outstanding no par value (unlimited shares authorized): | | | 147,502,500 | | | | 3,500,000 | |
| | | |
| | Net asset value per share: | | | $70.70 | | | | $43.57 | |
| | (a) | | Includes loaned securities having a market value of $9,249,793 and $2,842,554, respectively. |
| | |
| The accompanying notes are an integral part of these financial statements. | | 83 |
GOLDMAN SACHS ACTIVEBETA® ETFS
Statements of Operations
For the Fiscal Year Ended August 31, 2020
| | | | | | | | | | | | | | | | | | |
| | | | | ActiveBeta®
Emerging Markets
Equity ETF | | | ActiveBeta®
Europe Equity
ETF | | | ActiveBeta®
International
Equity ETF | | | ActiveBeta®
Japan Equity
ETF | |
| | Investment income: | |
| | | | | |
| | Dividends — unaffiliated issuers (net of foreign withholding taxes of $5,809,018, $42,400, $4,332,134 and $62,866, respectively) | | $ | 42,777,967 | | | $ | 372,183 | | | $ | 35,889,100 | | | $ | 456,851 | |
| | | | | |
| | Non-cash dividend income | | | 8,809,847 | | | | 15,559 | | | | 1,202,349 | | | | — | |
| | | | | |
| | Securities lending income — unaffiliated issuer | | | 175,574 | | | | 4,171 | | | | 428,104 | | | | 2,178 | |
| | | | | |
| | Total investment income | | | 51,763,388 | | | | 391,913 | | | | 37,519,553 | | | | 459,029 | |
| | | | | | | | | | | | | | | | | | |
| | Expenses: | |
| | | | | |
| | Management fees | | | 6,911,102 | | | | 38,342 | | | | 3,988,468 | | | | 44,041 | |
| | | | | |
| | Custody, accounting and administrative services | | | 1,729,099 | | | | — | | | | — | | | | — | |
| | | | | |
| | Printing and mailing costs | | | 169,464 | | | | — | | | | — | | | | — | |
| | | | | |
| | Professional fees | | | 105,550 | | | | — | | | | — | | | | — | |
| | | | | |
| | Trustee fees | | | 30,256 | | | | 4,976 | | | | 31,186 | | | | 5,023 | |
| | | | | |
| | Registration fees | | | 1,786 | | | | — | | | | — | | | | — | |
| | | | | |
| | Other | | | 99,849 | | | | 49 | | | | 2,771 | | | | — | |
| | | | | |
| | Total expenses | | | 9,047,106 | | | | 43,367 | | | | 4,022,425 | | | | 49,064 | |
| | | | | |
| | Less — expense reductions | | | (1,272,116 | ) | | | — | | | | — | | | | — | |
| | | | | |
| | Net expenses | | | 7,774,990 | | | | 43,367 | | | | 4,022,425 | | | | 49,064 | |
| | | | | |
| | NET INVESTMENT INCOME | | | 43,988,398 | | | | 348,546 | | | | 33,497,128 | | | | 409,965 | |
| | | | | | | | | | | | | | | | | | |
| | Realized and unrealized gain (loss): | |
| | | | | |
| | Net realized gain (loss) from: | | | | | | | | | | | | | | | | |
| | | | | |
| | Investments — unaffiliated issuers (including the effects of the foreign capital gains tax liability of $156,330, $—, $— and $—, respectively) | | | (65,164,901 | ) | | | (1,299,076 | ) | | | (81,002,491 | ) | | | (479,763 | ) |
| | | | | |
| | In-kind redemptions | | | 24,971,066 | | | | (660,668 | ) | | | 10,142,950 | | | | 836,874 | |
| | | | | |
| | Futures | | | 751,736 | | | | (3,058 | ) | | | (626,744 | ) | | | 31,932 | |
| | | | | |
| | Foreign currency transactions | | | (893,394 | ) | | | 335 | | | | (28,384 | ) | | | (865 | ) |
| | | | | |
| | Net change in unrealized gain (loss) on: | | | | | | | | | | | | | | | | |
| | | | | |
| | Investments (including the effects of the foreign capital gains tax liability of $1,525,646, $—, $— and $—, respectively) | | | 146,791,587 | | | | 2,037,642 | | | | 96,226,980 | | | | 1,208,532 | |
| | | | | |
| | Futures | | | — | | | | — | | | | — | | | | 4,057 | |
| | | | | |
| | Foreign currency translations | | | 3,448 | | | | 6,460 | | | | 96,237 | | | | (172 | ) |
| | | | | |
| | Net realized and unrealized gain | | | 106,459,542 | | | | 81,635 | | | | 24,808,548 | | | | 1,600,595 | |
| | | | | |
| | NET INCREASE IN NET ASSETS RESULTING FROM OPERATIONS | | $ | 150,447,940 | | | $ | 430,181 | | | $ | 58,305,676 | | | $ | 2,010,560 | |
| | |
| 84 | | The accompanying notes are an integral part of these financial statements. |
GOLDMAN SACHS ACTIVEBETA® ETFS
Statements of Operations (continued)
For the Fiscal Year Ended August 31, 2020
| | | | | | | | | | |
| | | | | ActiveBeta®
U.S. Large Cap
Equity ETF | | | ActiveBeta®
U.S. Small Cap
Equity ETF | |
| | Investment income: | |
| | | |
| | Dividends — unaffiliated issuers (net of foreign withholding taxes of $— and $905, respectively) | | $ | 138,213,891 | | | $ | 1,267,609 | |
| | | |
| | Securities lending income — unaffiliated issuer | | | 175,041 | | | | 110,656 | |
| | | |
| | Total investment income | | | 138,388,932 | | | | 1,378,265 | |
| | | | | | | | | | |
| | Expenses: | |
| | | |
| | Management fees | | | 6,770,614 | | | | 189,684 | |
| | | |
| | Trustee fees | | | 128,137 | | | | 6,241 | |
| | | |
| | Total expenses | | | 6,898,751 | | | | 195,925 | |
| | | |
| | NET INVESTMENT INCOME | | | 131,490,181 | | | | 1,182,340 | |
| | | | | | | | | | |
| | Realized and unrealized gain (loss): | |
| | | |
| | Net realized gain (loss) from: | | | | | | | | |
| | | |
| | Investments — unaffiliated issuers | | | (343,798,398 | ) | | | (6,986,083 | ) |
| | | |
| | In-kind redemptions | | | 203,631,708 | | | | 5,611,230 | |
| | | |
| | Futures | | | (4,739,566 | ) | | | (42,760 | ) |
| | | |
| | Net change in unrealized gain (loss) on: | | | | | | | | |
| | | |
| | Investments | | | 1,648,452,208 | | | | 8,541,947 | |
| | | |
| | Futures | | | — | | | | 128,246 | |
| | | |
| | Net realized and unrealized gain | | | 1,503,545,952 | | | | 7,252,580 | |
| | | |
| | NET INCREASE IN NET ASSETS RESULTING FROM OPERATIONS | | $ | 1,635,036,133 | | | $ | 8,434,920 | |
| | |
| The accompanying notes are an integral part of these financial statements. | | 85 |
GOLDMAN SACHS ACTIVEBETA® ETFS
Statements of Changes in Net Assets
| | | | | | | | | | | | | | | | | | | | | | |
| | | | | ActiveBeta® Emerging Markets Equity ETF | | | | | | ActiveBeta® Europe Equity ETF | |
| | | | | For the Fiscal
Year Ended
August 31, 2020 | | | For the Fiscal
Year Ended
August 31, 2019 | | | | | | For the Fiscal
Year Ended
August 31, 2020 | | | For the Fiscal
Year Ended
August 31, 2019 | |
| | From operations: | |
| | | | | | |
| | Net investment income | | $ | 43,988,398 | | | $ | 39,862,455 | | | | | | | $ | 348,546 | | | $ | 973,864 | |
| | | | | | |
| | Net realized gain (loss) | | | (40,335,493 | ) | | | (61,811,796 | ) | | | | | | | (1,962,467 | ) | | | 6,372,235 | |
| | | | | | |
| | Net change in unrealized gain (loss) | | | 146,795,035 | | | | (35,128,337 | ) | | | | | | | 2,044,102 | | | | (7,884,289 | ) |
| | | | | | |
| | Net increase (decrease) in net assets resulting from operations | | | 150,447,940 | | | | (57,077,678 | ) | | | | | | | 430,181 | | | | (538,190 | ) |
| | | | | | | | | | | | | | | | | | | | | | |
| | Distributions to shareholders: | |
| | | | | | |
| | From distributable earnings | | | (44,088,214 | ) | | | (42,811,808 | ) | | | | | | | (340,708 | ) | | | (1,153,378 | ) |
| | | | | | | | | | | | | | | | | | | | | | |
| | From share transactions: | |
| | | | | | |
| | Proceeds from sales of shares | | | 148,065,074 | | | | 173,910,887 | | | | | | | | — | | | | 9,731,944 | |
| | | | | | |
| | Cost of shares redeemed | | | (243,149,316 | ) | | | (63,360,446 | ) | | | | | | | (2,258,165 | ) | | | (63,419,366 | ) |
| | | | | | |
| | Net increase (decrease) in net assets resulting from share transactions | | | (95,084,242 | ) | | | 110,550,441 | | | | | | | | (2,258,165 | ) | | | (53,687,422 | ) |
| | | | | | |
| | TOTAL INCREASE (DECREASE) | | | 11,275,484 | | | | 10,660,955 | | | | | | | | (2,168,692 | ) | | | (55,378,990 | ) |
| | | | | | | | | | | | | | | | | | | | | | |
| | Net assets: | |
| | | | | | |
| | Beginning of year | | $ | 1,699,201,086 | | | $ | 1,688,540,131 | | | | | | | $ | 18,584,483 | | | $ | 73,963,473 | |
| | | | | | |
| | End of year | | $ | 1,710,476,570 | | | $ | 1,699,201,086 | | | | | | | $ | 16,415,791 | | | $ | 18,584,483 | |
| | |
| 86 | | The accompanying notes are an integral part of these financial statements. |
GOLDMAN SACHS ACTIVEBETA® ETFS
Statements of Changes in Net Assets (continued)
| | | | | | | | | | | | | | | | | | | | | | |
| | | | | ActiveBeta® International Equity ETF | | | | | | ActiveBeta® Japan Equity ETF | |
| | | | | For the Fiscal
Year Ended
August 31, 2020 | | | For the Fiscal
Year Ended
August 31, 2019 | | | | | | For the Fiscal
Year Ended
August 31, 2020 | | | For the Fiscal
Year Ended
August 31, 2019 | |
| | From operations: | |
| | | | | | |
| | Net investment income | | $ | 33,497,128 | | | $ | 39,751,220 | | | | | | | $ | 409,965 | | | $ | 745,876 | |
| | | | | | |
| | Net realized gain (loss) | | | (71,514,669 | ) | | | (23,424,442 | ) | | | | | | | 388,178 | | | | 8,913,734 | |
| | | | | | |
| | Net change in unrealized gain (loss) | | | 96,323,217 | | | | (41,264,287 | ) | | | | | | | 1,212,417 | | | | (9,018,645 | ) |
| | | | | | |
| | Net increase (decrease) in net assets resulting from operations | | | 58,305,676 | | | | (24,937,509 | ) | | | | | | | 2,010,560 | | | | 640,965 | |
| | | | | | | | | | | | | | | | | | | | | | |
| | Distributions to shareholders: | | | | | | | | | | | | | | | | | | | | |
| | | | | | |
| | From distributable earnings | | | (34,855,286 | ) | | | (37,687,035 | ) | | | | | | | (482,484 | ) | | | (794,800 | ) |
| | | | | | | | | | | | | | | | | | | | | | |
| | From share transactions: | |
| | | | | | |
| | Proceeds from sales of shares | | | 319,433,538 | | | | 533,347,481 | | | | | | | | — | | | | 12,425,460 | |
| | | | | | |
| | Cost of shares redeemed | | | (144,922,933 | ) | | | (19,583,653 | ) | | | | | | | (6,435,562 | ) | | | (40,580,807 | ) |
| | | | | | |
| | Net increase (decrease) in net assets resulting from share transactions | | | 174,510,605 | | | | 513,763,828 | | | | | | | | (6,435,562 | ) | | | (28,155,347 | ) |
| | | | | | |
| | TOTAL INCREASE (DECREASE) | | | 197,960,995 | | | | 451,139,284 | | | | | | | | (4,907,486 | ) | | | (28,309,182 | ) |
| | | | | | | | | | | | | | | | | | | | | | |
| | Net assets: | |
| | | | | | |
| | Beginning of year | | $ | 1,545,601,273 | | | $ | 1,094,461,989 | | | | | | | $ | 24,468,457 | | | $ | 52,777,639 | |
| | | | | | |
| | End of year | | $ | 1,743,562,268 | | | $ | 1,545,601,273 | | | | | | | $ | 19,560,971 | | | $ | 24,468,457 | |
| | |
| The accompanying notes are an integral part of these financial statements. | | 87 |
GOLDMAN SACHS ACTIVEBETA® ETFS
Statements of Changes in Net Assets (continued)
| | | | | | | | | | | | | | | | | | | | | | |
| | | | | ActiveBeta® U.S. Large Cap Equity ETF | | | | | | ActiveBeta® U.S. Small Cap Equity ETF | |
| | | | | For the Fiscal
Year Ended
August 31, 2020 | | | For the Fiscal
Year Ended
August 31, 2019 | | | | | | For the Fiscal
Year Ended
August 31, 2020 | | | For the Fiscal
Year Ended
August 31, 2019 | |
| | From operations: | |
| | | | | | |
| | Net investment income | | $ | 131,490,181 | | | $ | 83,436,579 | | | | | | | $ | 1,182,340 | | | $ | 985,967 | |
| | | | | | |
| | Net realized gain (loss) | | | (144,906,256 | ) | | | 88,486,288 | | | | | | | | (1,417,613 | ) | | | (925,616 | ) |
| | | | | | |
| | Net change in unrealized gain (loss) | | | 1,648,452,208 | | | | (22,078,144 | ) | | | | | | | 8,670,193 | | | | (4,008,744 | ) |
| | | | | | |
| | Net increase (decrease) in net assets resulting from operations | | | 1,635,036,133 | | | | 149,844,723 | | | | | | | | 8,434,920 | | | | (3,948,393 | ) |
| | | | | | | | | | | | | | | | | | | | | | |
| | Distributions to shareholders: | | | | | | | | | | | | | | | | | | | | |
| | | | | | |
| | From distributable earnings | | | (130,496,243 | ) | | | (76,178,483 | ) | | | | | | | (1,215,722 | ) | | | (900,932 | ) |
| | | | | | | | | | | | | | | | | | | | | | |
| | From share transactions: | |
| | | | | | |
| | Proceeds from sales of shares | | | 2,860,908,951 | | | | 3,028,113,603 | | | | | | | | 74,558,334 | | | | 58,670,921 | |
| | | | | | |
| | Cost of shares redeemed | | | (543,604,251 | ) | | | (476,026,399 | ) | | | | | | | (25,692,998 | ) | | | (4,436,399 | ) |
| | | | | | |
| | Net increase in net assets resulting from share transactions | | | 2,317,304,700 | | | | 2,552,087,204 | | | | | | | | 48,865,336 | | | | 54,234,522 | |
| | | | | | |
| | TOTAL INCREASE | | | 3,821,844,590 | | | | 2,625,753,444 | | | | | | | | 56,084,534 | | | | 49,385,197 | |
| | | | | | | | | | | | | | | | | | | | | | |
| | Net assets: | | | | | | | | | | | | | | | | | | | | |
| | | | | | |
| | Beginning of year | | $ | 6,606,050,133 | | | $ | 3,980,296,689 | | | | | | | $ | 96,399,297 | | | $ | 47,014,100 | |
| | | | | | |
| | End of year | | $ | 10,427,894,723 | | | $ | 6,606,050,133 | | | | | | | $ | 152,483,831 | | | $ | 96,399,297 | |
| | |
| 88 | | The accompanying notes are an integral part of these financial statements. |
GOLDMAN SACHS ACTIVEBETA® ETFS
Financial Highlights
Selected Data for a Share Outstanding Throughout Each Period
| | | | | | | | | | | | | | | | | | | | | | |
| | | | | ActiveBeta® Emerging Markets Equity ETF | |
| | | | | For the Fiscal
Year Ended August 31, | | | For the Period
September 25, 2015*
to
August 31, 2016 | |
| | 2020 | | | 2019 | | | 2018 | | | 2017 | |
| | Per Share Operating Performance: | | | | | | | | | | | | | | | | | | | | |
| | | | | | |
| | Net asset value, beginning of period | | $ | 31.12 | | | $ | 32.98 | | | $ | 33.73 | | | $ | 28.03 | | | $ | 25.00 | |
| | | | | | |
| | Net investment income(a) | | | 0.80 | (b) | | | 0.75 | | | | 0.77 | | | | 0.63 | | | | 0.60 | |
| | | | | | |
| | Net realized and unrealized gain (loss) | | | 2.17 | | | | (1.79 | ) | | | (0.84 | ) | | | 5.58 | | | | 2.70 | |
| | | | | | |
| | Total gain (loss) from investment operations | | | 2.97 | | | | (1.04 | ) | | | (0.07 | ) | | | 6.21 | | | | 3.30 | |
| | | | | | |
| | Distributions to shareholders from net investment income | | | (0.81 | ) | | | (0.82 | ) | | | (0.68 | ) | | | (0.51 | ) | | | (0.27 | ) |
| | | | | | |
| | Net asset value, end of period | | $ | 33.28 | | | $ | 31.12 | | | $ | 32.98 | | | $ | 33.73 | | | $ | 28.03 | |
| | | | | | |
| | Market price, end of period | | $ | 33.28 | | | $ | 31.14 | | | $ | 32.87 | | | $ | 33.74 | | | $ | 28.01 | |
| | | | | | |
| | Total Return at Net Asset Value(c) | | | 9.55 | % | | | (3.21 | )% | | | (0.28 | )% | | | 22.49 | % | | | 13.29 | % |
| | | | | | |
| | Net assets, end of period (in 000’s) | | $ | 1,710,477 | | | $ | 1,699,201 | | | $ | 1,688,540 | | | $ | 1,490,683 | | | $ | 863,388 | |
| | | | | | |
| | Ratio of net expenses to average net assets | | | 0.45 | % | | | 0.45 | % | | | 0.45 | % | | | 0.45 | % | | | 0.45 | %(d) |
| | | | | | |
| | Ratio of total expenses to average net assets | | | 0.52 | % | | | 0.51 | % | | | 0.51 | % | | | 0.53 | % | | | 0.58 | %(d) |
| | | | | | |
| | Ratio of net investment income to average net assets | | | 2.55 | %(b) | | | 2.37 | % | | | 2.19 | % | | | 2.13 | % | | | 2.52 | %(d) |
| | | | | | |
| | Portfolio turnover rate(e) | | | 38 | % | | | 28 | % | | | 28 | % | | | 27 | % | | | 44 | % |
| | * | | Commencement of operations. |
| | (a) | | Calculated based on the average shares outstanding methodology. |
| | (b) | | Reflects income recognized from non-recurring special dividends which amounted to $0.03 per share and 0.09% of average net assets. |
| | (c) | | Assumes investment at the net asset value at the beginning of the period, reinvestment of all distributions and a complete sale of the investment at the net asset value at the end of the period. Returns do not reflect the impact of taxes to shareholders relating to Fund distributions or the sale of Fund shares. Total returns for periods less than one full year are not annualized. |
| | (e) | | The Fund’s portfolio turnover rate is calculated in accordance with regulatory requirements and excludes portfolio securities received or delivered as a result of in-kind transactions. If such transactions were included, the Fund’s portfolio turnover rate may be higher. |
| | |
| The accompanying notes are an integral part of these financial statements. | | 89 |
GOLDMAN SACHS ACTIVEBETA® ETFS
Financial Highlights (continued)
Selected Data for a Share Outstanding Throughout Each Period
| | | | | | | | | | | | | | | | | | | | | | |
| | | | | ActiveBeta® Europe Equity ETF | |
| | | | | For the Fiscal
Year Ended August 31, | | | For the Period
March 2, 2016*
to
August 31, 2016 | |
| | 2020 | | | 2019 | | | 2018 | | | 2017 | |
| | Per Share Operating Performance: | | | | | | | | | | | | | | | | | | | | |
| | | | | | |
| | Net asset value, beginning of period | | $ | 28.59 | | | $ | 30.82 | | | $ | 30.39 | | | $ | 26.12 | | | $ | 25.03 | |
| | | | | | |
| | Net investment income(a) | | | 0.58 | | | | 0.89 | | | | 0.95 | | | | 0.75 | | | | 0.60 | |
| | | | | | |
| | Net realized and unrealized gain (loss) | | | 1.27 | | | | (1.84 | ) | | | 0.37 | | | | 4.26 | | | | 0.97 | |
| | | | | | |
| | Total gain (loss) from investment operations | | | 1.85 | | | | (0.95 | ) | | | 1.32 | | | | 5.01 | | | | 1.57 | |
| | | | | | |
| | Distributions to shareholders from net investment income | | | (0.59 | ) | | | (1.28 | ) | | | (0.89 | ) | | | (0.74 | ) | | | (0.48 | ) |
| | | | | | |
| | Net asset value, end of period | | $ | 29.85 | | | $ | 28.59 | | | $ | 30.82 | | | $ | 30.39 | | | $ | 26.12 | |
| | | | | | |
| | Market price, end of period | | $ | 29.81 | | | $ | 28.62 | | | $ | 30.73 | | | $ | 30.54 | | | $ | 26.20 | |
| | | | | | |
| | Total Return at Net Asset Value(b) | | | 6.69 | % | | | (3.15 | )% | | | 4.40 | % | | | 19.46 | % | | | 6.23 | % |
| | | | | | |
| | Net assets, end of period (in 000’s) | | $ | 16,416 | | | $ | 18,584 | | | $ | 73,963 | | | $ | 44,062 | | | $ | 33,959 | |
| | | | | | |
| | Ratio of net expenses to average net assets | | | 0.25 | % | | | 0.25 | % | | | 0.25 | % | | | 0.25 | % | | | 0.25 | %(c) |
| | | | | | |
| | Ratio of total expenses to average net assets | | | 0.25 | % | | | 0.25 | % | | | 0.25 | % | | | 0.25 | % | | | 0.71 | %(c) |
| | | | | | |
| | Ratio of net investment income to average net assets | | | 2.01 | % | | | 3.07 | % | | | 3.02 | % | | | 2.71 | % | | | 4.61 | %(c) |
| | | | | | |
| | Portfolio turnover rate(d) | | | 18 | % | | | 17 | % | | | 23 | % | | | 17 | % | | | 14 | % |
| | * | | Commencement of operations. |
| | (a) | | Calculated based on the average shares outstanding methodology. |
| | (b) | | Assumes investment at the net asset value at the beginning of the period, reinvestment of all distributions and a complete sale of the investment at the net asset value at the end of the period. Returns do not reflect the impact of taxes to shareholders relating to Fund distributions or the sale of Fund shares. Total returns for periods less than one full year are not annualized. |
| | (d) | | The Fund’s portfolio turnover rate is calculated in accordance with regulatory requirements and excludes portfolio securities received or delivered as a result of in-kind transactions. If such transactions were included, the Fund’s portfolio turnover rate may be higher. |
| | |
| 90 | | The accompanying notes are an integral part of these financial statements. |
GOLDMAN SACHS ACTIVEBETA® ETFS
Financial Highlights (continued)
Selected Data for a Share Outstanding Throughout Each Period
| | | | | | | | | | | | | | | | | | | | | | |
| | | | | ActiveBeta® International Equity ETF | |
| | | | | For the Fiscal
Year Ended August 31, | | | For the Period
November 6, 2015*
to
August 31, 2016 | |
| | 2020 | | | 2019 | | | 2018 | | | 2017 | |
| | Per Share Operating Performance: | | | | | | | | | | | | | | | | | | | | |
| | | | | | |
| | Net asset value, beginning of period | | $ | 27.70 | | | $ | 29.42 | | | $ | 28.38 | | | $ | 24.67 | | | $ | 24.78 | |
| | | | | | |
| | Net investment income(a) | | | 0.57 | | | | 0.86 | | | | 0.76 | | | | 0.69 | | | | 0.59 | |
| | | | | | |
| | Net realized and unrealized gain (loss) | | | 1.05 | | | | (1.78 | ) | | | 1.02 | | | | 3.61 | | | | (0.37 | ) |
| | | | | | |
| | Total gain (loss) from investment operations | | | 1.62 | | | | (0.92 | ) | | | 1.78 | | | | 4.30 | | | | 0.22 | |
| | | | | | |
| | Distributions to shareholders from net investment income | | | (0.60 | ) | | | (0.80 | ) | | | (0.74 | ) | | | (0.59 | ) | | | (0.33 | ) |
| | | | | | |
| | Net asset value, end of period | | $ | 28.72 | | | $ | 27.70 | | | $ | 29.42 | | | $ | 28.38 | | | $ | 24.67 | |
| | | | | | |
| | Market price, end of period | | $ | 28.63 | | | $ | 27.73 | | | $ | 29.45 | | | $ | 28.53 | | | $ | 24.78 | |
| | | | | | |
| | Total Return at Net Asset Value(b) | | | 5.96 | % | | | (3.09 | )% | | | 6.30 | % | | | 17.66 | % | | | 0.90 | % |
| | | | | | |
| | Net assets, end of period (in 000’s) | | $ | 1,743,562 | | | $ | 1,545,601 | | | $ | 1,094,462 | | | $ | 593,129 | | | $ | 283,757 | |
| | | | | | |
| | Ratio of net expenses to average net assets | | | 0.25 | % | | | 0.25 | % | | | 0.25 | % | | | 0.25 | % | | | 0.27 | %(c) |
| | | | | | |
| | Ratio of total expenses to average net assets | | | 0.25 | % | | | 0.25 | % | | | 0.25 | % | | | 0.25 | % | | | 0.62 | %(c) |
| | | | | | |
| | Ratio of net investment income to average net assets | | | 2.08 | % | | | 3.10 | % | | | 2.56 | % | | | 2.64 | % | | | 3.02 | %(c) |
| | | | | | |
| | Portfolio turnover rate(d) | | | 20 | % | | | 17 | % | | | 16 | % | | | 23 | % | | | 23 | % |
| | * | | Commencement of operations. |
| | (a) | | Calculated based on the average shares outstanding methodology. |
| | (b) | | Assumes investment at the net asset value at the beginning of the period, reinvestment of all distributions and a complete sale of the investment at the net asset value at the end of the period. Returns do not reflect the impact of taxes to shareholders relating to Fund distributions or the sale of Fund shares. Total returns for periods less than one full year are not annualized. |
| | (d) | | The Fund’s portfolio turnover rate is calculated in accordance with regulatory requirements and excludes portfolio securities received or delivered as a result of in-kind transactions. If such transactions were included, the Fund’s portfolio turnover rate may be higher. |
| | |
| The accompanying notes are an integral part of these financial statements. | | 91 |
GOLDMAN SACHS ACTIVEBETA® ETFS
Financial Highlights (continued)
Selected Data for a Share Outstanding Throughout Each Period
| | | | | | | | | | | | | | | | | | | | | | |
| | | | | ActiveBeta® Japan Equity ETF | |
| | | | | For the Fiscal
Year Ended August 31, | | | For the Period
March 2, 2016*
to
August 31, 2016 | |
| | 2020 | | | 2019 | | | 2018 | | | 2017 | |
| | Per Share Operating Performance: | | | | | | | | | | | | | | | | | | | | |
| | | | | | |
| | Net asset value, beginning of period | | $ | 30.59 | | | $ | 32.99 | | | $ | 30.71 | | | $ | 27.33 | | | $ | 25.69 | |
| | | | | | |
| | Net investment income(a) | | | 0.66 | | | | 0.82 | | | | 0.54 | | | | 0.48 | | | | 0.24 | |
| | | | | | |
| | Net realized and unrealized gain (loss) | | | 2.15 | | | | (2.29 | ) | | | 2.36 | | | | 3.50 | | | | 1.60 | |
| | | | | | |
| | Total gain (loss) from investment operations | | | 2.81 | | | | (1.47 | ) | | | 2.90 | | | | 3.98 | | | | 1.84 | |
| | | | | | |
| | Distributions to shareholders from net investment income | | | (0.80 | ) | | | (0.93 | ) | | | (0.62 | ) | | | (0.60 | ) | | | (0.20 | ) |
| | | | | | |
| | Net asset value, end of period | | $ | 32.60 | | | $ | 30.59 | | | $ | 32.99 | | | $ | 30.71 | | | $ | 27.33 | |
| | | | | | |
| | Market price, end of period | | $ | 32.51 | | | $ | 30.52 | | | $ | 32.90 | | | $ | 30.79 | | | $ | 27.44 | |
| | | | | | |
| | Total Return at Net Asset Value(b) | | | 9.15 | % | | | (4.32 | )% | | | 9.42 | % | | | 14.74 | % | | | 7.17 | % |
| | | | | | |
| | Net assets, end of period (in 000’s) | | $ | 19,561 | | | $ | 24,468 | | | $ | 52,778 | | | $ | 42,992 | | | $ | 32,797 | |
| | | | | | |
| | Ratio of net expenses to average net assets | | | 0.25 | % | | | 0.25 | % | | | 0.25 | % | | | 0.25 | % | | | 0.25 | %(c) |
| | | | | | |
| | Ratio of total expenses to average net assets | | | 0.25 | % | | | 0.25 | % | | | 0.25 | % | | | 0.25 | % | | | 0.73 | %(c) |
| | | | | | |
| | Ratio of net investment income to average net assets | | | 2.09 | % | | | 2.64 | % | | | 1.62 | % | | | 1.68 | % | | | 1.81 | %(c) |
| | | | | | |
| | Portfolio turnover rate(d) | | | 18 | % | | | 33 | % | | | 23 | % | | | 22 | % | | | 10 | % |
| | * | | Commencement of operations. |
| | (a) | | Calculated based on the average shares outstanding methodology. |
| | (b) | | Assumes investment at the net asset value at the beginning of the period, reinvestment of all distributions and a complete sale of the investment at the net asset value at the end of the period. Returns do not reflect the impact of taxes to shareholders relating to Fund distributions or the sale of Fund shares. Total returns for periods less than one full year are not annualized. |
| | (d) | | The Fund’s portfolio turnover rate is calculated in accordance with regulatory requirements and excludes portfolio securities received or delivered as a result of in-kind transactions. If such transactions were included, the Fund’s portfolio turnover rate may be higher. |
| | |
| 92 | | The accompanying notes are an integral part of these financial statements. |
GOLDMAN SACHS ACTIVEBETA® ETFS
Financial Highlights (continued)
Selected Data for a Share Outstanding Throughout Each Period
| | | | | | | | | | | | | | | | | | | | | | |
| | | | | ActiveBeta® U.S. Large Cap Equity ETF | |
| | | | | For the Fiscal
Year Ended August 31, | | | For the Period
September 17, 2015*
to
August 31, 2016 | |
| | 2020 | | | 2019 | | | 2018 | | | 2017 | |
| | Per Share Operating Performance: | | | | | | | | | | | | | | | | | | | | |
| | | | | | |
| | Net asset value, beginning of period | | $ | 59.09 | | | $ | 58.75 | | | $ | 49.16 | | | $ | 43.83 | | | $ | 40.70 | |
| | | | | | |
| | Net investment income(a) | | | 1.06 | | | | 1.03 | | | | 0.96 | | | | 0.97 | | | | 0.85 | |
| | | | | | |
| | Net realized and unrealized gain | | | 11.62 | | | | 0.30 | | | | 9.56 | | | | 5.17 | | | | 2.78 | |
| | | | | | |
| | Total gain from investment operations | | | 12.68 | | | | 1.33 | | | | 10.52 | | | | 6.14 | | | | 3.63 | |
| | | | | | |
| | Distributions to shareholders from net investment income | | | (1.07 | ) | | | (0.99 | ) | | | (0.93 | ) | | | (0.81 | ) | | | (0.50 | ) |
| | | | | | |
| | Net asset value, end of period | | $ | 70.70 | | | $ | 59.09 | | | $ | 58.75 | | | $ | 49.16 | | | $ | 43.83 | |
| | | | | | |
| | Market price, end of period | | $ | 70.61 | | | $ | 59.07 | | | $ | 58.75 | | | $ | 49.15 | | | $ | 43.82 | |
| | | | | | |
| | Total Return at Net Asset Value(b) | | | 21.81 | % | | | 2.42 | % | | | 21.65 | % | | | 14.15 | % | | | 8.97 | % |
| | | | | | |
| | Net assets, end of period (in 000’s) | | $ | 10,427,895 | | | $ | 6,606,050 | | | $ | 3,980,297 | | | $ | 2,396,490 | | | $ | 1,157,206 | |
| | | | | | |
| | Ratio of net expenses to average net assets | | | 0.09 | % | | | 0.09 | % | | | 0.09 | % | | | 0.09 | % | | | 0.09 | %(c) |
| | | | | | |
| | Ratio of total expenses to average net assets | | | 0.09 | % | | | 0.09 | % | | | 0.09 | % | | | 0.09 | % | | | 0.19 | %(c) |
| | | | | | |
| | Ratio of net investment income to average net assets | | | 1.72 | % | | | 1.82 | % | | | 1.78 | % | | | 2.08 | % | | | 2.11 | %(c) |
| | | | | | |
| | Portfolio turnover rate(d) | | | 17 | % | | | 16 | % | | | 16 | % | | | 20 | % | | | 18 | % |
| | * | | Commencement of operations. |
| | (a) | | Calculated based on the average shares outstanding methodology. |
| | (b) | | Assumes investment at the net asset value at the beginning of the period, reinvestment of all distributions and a complete sale of the investment at the net asset value at the end of the period. Returns do not reflect the impact of taxes to shareholders relating to Fund distributions or the sale of Fund shares. Total returns for periods less than one full year are not annualized. |
| | (d) | | The Fund’s portfolio turnover rate is calculated in accordance with regulatory requirements and excludes portfolio securities received or delivered as a result of in-kind transactions. If such transactions were included, the Fund’s portfolio turnover rate may be higher. |
| | |
| The accompanying notes are an integral part of these financial statements. | | 93 |
GOLDMAN SACHS ACTIVEBETA® ETFS
Financial Highlights (continued)
Selected Data for a Share Outstanding Throughout Each Period
| | | | | | | | | | | | | | | | | | |
| | | | | ActiveBeta® U.S. Small Cap Equity ETF | |
| | | | | For the Fiscal
Year Ended August 31, | | | For the Period
June 28, 2017*
to
August 31, 2017 | |
| | 2020 | | | 2019 | | | 2018 | |
| | Per Share Operating Performance: | | | | | | | | | | | | | | | | |
| | | | | |
| | Net asset value, beginning of period | | $ | 42.84 | | | $ | 49.49 | | | $ | 39.65 | | | $ | 40.36 | |
| | | | | |
| | Net investment income(a) | | | 0.51 | | | | 0.57 | | | | 0.56 | | | | 0.07 | |
| | | | | |
| | Net realized and unrealized gain (loss) | | | 0.78 | | | | (6.66 | ) | | | 9.79 | | | | (0.78 | ) |
| | | | | |
| | Total gain (loss) from investment operations | | | 1.29 | | | | (6.09 | ) | | | 10.35 | | | | (0.71 | ) |
| | | | | |
| | Distributions to shareholders from net investment income | | | (0.56 | ) | | | (0.56 | ) | | | (0.51 | ) | | | — | |
| | | | | |
| | Net asset value, end of period | | $ | 43.57 | | | $ | 42.84 | | | $ | 49.49 | | | $ | 39.65 | |
| | | | | |
| | Market price, end of period | | $ | 43.63 | | | $ | 42.84 | | | $ | 49.55 | | | $ | 38.95 | |
| | | | | |
| | Total Return at Net Asset Value(b) | | | 3.13 | % | | | (12.28 | )% | | | 26.28 | % | | | (1.76 | )% |
| | | | | |
| | Net assets, end of period (in 000’s) | | $ | 152,484 | | | $ | 96,399 | | | $ | 47,014 | | | $ | 11,896 | |
| | | | | |
| | Ratio of total expenses to average net assets | | | 0.20 | % | | | 0.20 | % | | | 0.20 | % | | | 0.20 | %(c) |
| | | | | |
| | Ratio of net investment income to average net assets | | | 1.21 | % | | | 1.32 | % | | | 1.24 | % | | | 0.96 | %(c) |
| | | | | |
| | Portfolio turnover rate(d) | | | 20 | % | | | 20 | % | | | 27 | % | | | 0 | %(e) |
| | * | | Commencement of operations. |
| | (a) | | Calculated based on the average shares outstanding methodology. |
| | (b) | | Assumes investment at the net asset value at the beginning of the period, reinvestment of all distributions and a complete sale of the investment at the net asset value at the end of the period. Returns do not reflect the impact of taxes to shareholders relating to Fund distributions or the sale of Fund shares. Total returns for periods less than one full year are not annualized. |
| | (d) | | The Fund’s portfolio turnover rate is calculated in accordance with regulatory requirements and excludes portfolio securities received or delivered as a result of in-kind transactions. If such transactions were included, the Fund’s portfolio turnover rate may be higher. |
| | |
| 94 | | The accompanying notes are an integral part of these financial statements. |
GOLDMAN SACHS ACTIVEBETA® ETFS
Notes to Financial Statements
August 31, 2020
Goldman Sachs ETF Trust (the “Trust”) is an open-end management investment company, registered under the Investment Company Act of 1940, as amended (the “Act”), consisting of multiple series. The Trust was organized as a Delaware statutory trust on December 16, 2009. The following table lists those series of the Trust that are included in this report (collectively, the “Funds” or individually a “Fund”) along with their respective diversification status under the Act:
| | | | |
| Fund | | | | Diversification
Classification |
Goldman Sachs ActiveBeta® Emerging Markets Equity ETF (“ActiveBeta® Emerging Markets Equity ETF”) | | | | Diversified |
Goldman Sachs ActiveBeta® Europe Equity ETF (“ActiveBeta® Europe Equity ETF”) | | | | Diversified |
Goldman Sachs ActiveBeta® International Equity ETF (“ActiveBeta® International Equity ETF”) | | | | Diversified |
Goldman Sachs ActiveBeta® Japan Equity ETF (“ActiveBeta® Japan Equity ETF”) | | | | Diversified |
Goldman Sachs ActiveBeta® U.S. Large Cap Equity ETF (“ActiveBeta® U.S. Large Cap Equity ETF”) | | | | Diversified |
Goldman Sachs ActiveBeta® U.S. Small Cap Equity ETF (“ActiveBeta® U.S. Small Cap Equity ETF”) | | | | Diversified |
The investment objective of each Fund is to provide investment results that closely correspond, before fees and expenses, to the performance of its respective Index.
Goldman Sachs Asset Management, L.P. (“GSAM”), an affiliate of Goldman Sachs & Co. LLC (“Goldman Sachs”), serves as investment adviser to the Funds pursuant to management agreements (each, an “Agreement” and together, the “Agreements”) with the Trust. Each Fund is an exchange-traded fund (“ETF”). Shares of the Funds are listed and traded on the NYSE Arca, Inc. (“NYSE Arca”). Market prices for the Funds’ shares may be different from their net asset value (“NAV”). The Funds issue and redeem shares at their respective NAV only in blocks of a specified number of shares, or multiples thereof, referred to as “Creation Units”. Creation Units are issued and redeemed principally in-kind for a basket of securities and a cash amount, with respect to the ActiveBeta® Europe Equity ETF, ActiveBeta® International Equity ETF, ActiveBeta® Japan Equity ETF, ActiveBeta® U.S. Large Cap Equity ETF and the ActiveBeta® U.S. Small Cap Equity ETF. The ActiveBeta® Emerging Markets Equity ETF issues and redeems Creation Units partially for cash and partially in-kind. Shares generally trade in the secondary market in quantities less than a Creation Unit at market prices that change throughout the day. Only those that have entered into an authorized participant agreement with ALPS Distributors, Inc. (the “Distributor”) may do business directly with the Funds.
|
| 2. SIGNIFICANT ACCOUNTING POLICIES |
The financial statements have been prepared in accordance with accounting principles generally accepted in the United States of America (“GAAP”) and require management to make estimates and assumptions that may affect the reported amounts and disclosures. Actual results may differ from those estimates and assumptions. Each Fund is an investment company under GAAP and follows the accounting and reporting guidance applicable to investment companies.
A. Investment Valuation — The Funds’ valuation policy is to value investments at fair value.
B. Investment Income and Investments — Investment income includes interest income, dividend income, and securities lending income, if any. Interest income is accrued daily and adjusted for amortization of premiums and accretion of discounts. Dividend income is recognized on ex-dividend date or, for certain foreign securities, as soon as such information is obtained subsequent to the ex-dividend date. Non-cash dividends, if any, are recorded at the fair market value of the securities received. Investment transactions are reflected on trade date. Realized gains and losses are calculated using identified cost. Investment transactions are recorded on the following business day for daily NAV calculations. Investment income is recorded net of any foreign withholding taxes, less any amounts reclaimable. The Funds may file withholding tax reclaims in certain jurisdictions to recover a portion of amounts previously withheld. Any foreign capital gains tax is accrued daily based upon net unrealized gains, and is payable upon sale of such investments. Distributions received from the Funds’ investments in U.S. real estate investment
95
GOLDMAN SACHS ACTIVEBETA® ETFS
Notes to Financial Statements (continued)
August 31, 2020
|
| 2. SIGNIFICANT ACCOUNTING POLICIES (continued) |
trusts (“REITs”) may be characterized as ordinary income, net capital gain and/or a return of capital. A return of capital is recorded by the Funds as a reduction to the cost basis of the REIT.
For derivative contracts, realized gains and losses are recorded upon settlement of the contract.
C. Expenses — Expenses incurred directly by a Fund are charged to the Fund, and certain expenses incurred by the Trust are allocated across the applicable Funds on a straight-line and/or pro-rata basis, depending upon the nature of the expenses, and are accrued daily.
D. Federal Taxes and Distributions to Shareholders — It is each Fund’s policy to comply with the requirements of the Internal Revenue Code of 1986, as amended (the “Code”), applicable to regulated investment companies and to distribute each year substantially all of its investment company taxable income and capital gains to its shareholders. Accordingly, each Fund is not required to make any provisions for the payment of federal income tax. Distributions to shareholders are recorded on the ex-dividend date. For each fund, income distributions, if any, are declared and paid quarterly. Capital gains distributions, if any, are declared and paid at least annually.
Net capital losses, if any, are carried forward to future fiscal years and may be used to the extent allowed by the Code to offset any future capital gains. Losses that are carried forward will retain their character as either short-term or long-term capital losses. Utilization of capital loss carryforwards will reduce the requirement of future capital gains distributions.
The characterization of distributions to shareholders for financial reporting purposes is determined in accordance with federal income tax rules, which may differ from GAAP. The source of each Fund’s distributions may be shown in the accompanying financial statements as either from distributable earnings or capital. Certain components of the Funds’ net assets on the Statements of Assets and Liabilities reflect permanent GAAP/tax differences based on the appropriate tax character.
E. Foreign Currency Translation — The accounting records and reporting currency of a Fund are maintained in U.S. dollars. Assets and liabilities denominated in foreign currencies are translated into U.S. dollars using the current exchange rates at the close of each business day. The effect of changes in foreign currency exchange rates on investments is included within net realized and unrealized gain (loss) on investments. Changes in the value of other assets and liabilities as a result of fluctuations in foreign exchange rates are included in the Statements of Operations within net change in unrealized gain (loss) on foreign currency translation. Transactions denominated in foreign currencies are translated into U.S. dollars on the date the transaction occurred, the effects of which are included within net realized gain (loss) on foreign currency transactions.
|
| 3. INVESTMENTS AND FAIR VALUE MEASUREMENTS |
U.S. GAAP defines the fair value of a financial instrument as the amount that would be received to sell an asset or paid to transfer a liability in an orderly transaction between market participants at the measurement date (i.e., the exit price); the Funds’ policy is to use the market approach. GAAP establishes a fair value hierarchy that prioritizes the inputs to valuation techniques used to measure fair value. The hierarchy gives the highest priority to unadjusted quoted prices in active markets for identical assets or liabilities (Level 1 measurements) and the lowest priority to unobservable inputs (Level 3 measurements). The level in the fair value hierarchy within which the fair value measurement in its entirety falls shall be determined based on the lowest level input that is significant to the fair value measurement in its entirety. The levels used for classifying investments are not necessarily an indication of the risk associated with investing in these investments. The three levels of the fair value hierarchy are described below:
Level 1 — Unadjusted quoted prices in active markets that are accessible at the measurement date for identical, unrestricted assets or liabilities;
Level 2 — Quoted prices in markets that are not active or financial instruments for which significant inputs are observable (including, but not limited to, quoted prices for similar investments, interest rates, foreign exchange rates, volatility and credit spreads), either directly or indirectly;
Level 3 — Prices or valuations that require significant unobservable inputs (including GSAM’s assumptions in determining fair value measurement).
96
GOLDMAN SACHS ACTIVEBETA® ETFS
|
| 3. INVESTMENTS AND FAIR VALUE MEASUREMENTS (continued) |
The Board of Trustees (“Trustees”) has approved Valuation Procedures that govern the valuation of the portfolio investments held by the Funds, including investments for which market quotations are not readily available. The Trustees have delegated to GSAM day-to-day responsibility for implementing and maintaining internal controls and procedures related to the valuation of the Funds’ investments. To assess the continuing appropriateness of pricing sources and methodologies, GSAM regularly performs price verification procedures and issues challenges as necessary to third party pricing vendors or brokers, and any differences are reviewed in accordance with the Valuation Procedures.
A. Level 1 and Level 2 Fair Value Investments — The valuation techniques and significant inputs used in determining the fair values for investments classified as Level 1 and Level 2 are as follows:
Equity Securities — Equity securities traded on a United States (“U.S.”) securities exchange or the NASDAQ system, or those located on certain foreign exchanges, including but not limited to the Americas, are valued daily at their last sale price or official closing price on the principal exchange or system on which they are traded. If there is no sale or official closing price or such price is believed by GSAM to not represent fair value, equity securities will be valued at the valid closing bid price for long positions and at the valid closing ask price for short positions (i.e. where there is sufficient volume, during normal exchange trading hours). If no valid bid/ask price is available, the equity security will be valued pursuant to the Valuation Procedures approved by the Trustees and consistent with applicable regulatory guidance. To the extent these investments are actively traded, they are classified as Level 1 of the fair value hierarchy, otherwise they are generally classified as Level 2. Certain equity securities containing unique attributes may be classified as Level 2.
Unlisted equity securities for which market quotations are available are valued at the last sale price on the valuation date, or if no sale occurs, at the last bid price for long positions or the last ask price for short positions, and are generally classified as Level 2.
Underlying Funds (including Money Market Funds) — Underlying funds (“Underlying Funds”) include other investment companies and ETFs. Investments in the Underlying Funds (except ETFs) are valued at the NAV per share on the day of valuation. ETFs are valued daily at the last sale price or official closing price on the principal exchange or system on which the investment is traded. Because the Funds invest in Underlying Funds that fluctuate in value, the Funds’ shares will correspondingly fluctuate in value. To the extent these investments are actively traded, they are classified as Level 1 of the fair value hierarchy, otherwise they are generally classified as Level 2. For information regarding an Underlying Fund’s accounting policies and investment holdings, please see the Underlying Fund’s shareholder report.
Derivative Contracts — A derivative is an instrument whose value is derived from underlying assets, indices, reference rates or a combination of these factors. A Fund enters into derivative transactions to hedge against changes in interest rates, securities prices, and/or currency exchange rates, to increase total return, or to gain access to certain markets or attain exposure to other underliers. For financial reporting purposes, cash collateral that has been pledged to cover obligations of a Fund and cash collateral received, if any, is reported separately on the Statements of Assets and Liabilities as receivables/payables for collateral on certain derivatives contracts. Non-cash collateral pledged by a Fund, if any, is noted in the Schedules of Investments.
Exchange-traded derivatives, including futures and options contracts, are generally valued at the last sale or settlement price on the exchange where they are principally traded. Exchange-traded options without settlement prices are generally valued at the last bid price for long positions and the last ask price for short positions on the exchange where they are principally traded. Exchange-traded derivatives typically fall within Level 1 of the fair value hierarchy. Over-the-counter (“OTC”) and centrally cleared derivatives are valued using market transactions and other market evidence, including market-based inputs to models, calibration to market-clearing transactions, broker or dealer quotations, or other alternative pricing sources. Where models are used, the selection of a particular model to value OTC and centrally cleared derivatives depends upon the contractual terms of, and specific risks inherent in, the instrument, as well as the availability of pricing information in the market. Valuation models require a variety of inputs, including contractual terms, market prices, yield curves, credit curves, measures of volatility, voluntary and involuntary prepayment rates, loss severity rates and correlations of such inputs. For OTC and centrally cleared derivatives that trade in liquid markets, model inputs can generally be verified and model selection does not involve significant management judgment. OTC and centrally cleared derivatives are classified within Level 2 of the fair value hierarchy when significant inputs are corroborated by market evidence.
97
GOLDMAN SACHS ACTIVEBETA® ETFS
Notes to Financial Statements (continued)
August 31, 2020
|
| 3. INVESTMENTS AND FAIR VALUE MEASUREMENTS (continued) |
Futures Contracts — Futures contracts are contracts to buy or sell a standardized quantity of a specified commodity or security. Upon entering into a futures contract, a Fund deposits cash or securities in an account on behalf of the broker in an amount sufficient to meet the initial margin requirement. Subsequent payments are made or received by a Fund equal to the daily change in the contract value and are recorded as variation margin receivable or payable with a corresponding offset to unrealized gains or losses.
B. Level 3 Fair Value Investments — To the extent that significant inputs to valuation models and other alternative pricing sources are unobservable, or if quotations are not readily available, or if GSAM believes that such quotations do not accurately reflect fair value, the fair value of a Fund’s investments may be determined under Valuation Procedures approved by the Trustees. GSAM, consistent with its procedures and applicable regulatory guidance, may make an adjustment to the most recent valuation prices of either domestic or foreign securities in light of significant events to reflect what it believes to be the fair value of the securities at the time of determining a Fund’s NAV. To the extent investments are valued using single source broker quotations obtained directly from the broker or passed through from third party pricing vendors, such investments are classified as Level 3 investments.
C. Fair Value Hierarchy — The following is a summary of the Funds’ investments and derivatives classified in the fair value hierarchy as of August 31, 2020:
| | | | | | | | | | | | |
|
| ACTIVEBETA® EMERGING MARKETS EQUITY ETF | |
| | | |
| Investment Type | | Level 1 | | | Level 2 | | | Level 3 | |
| | | |
| Assets | | | | | | | | | | | | |
| | | |
Common Stock and/or Other Equity Investments(a) | | | | | | | | | | | | |
| | | |
Africa | | $ | 58,235,930 | | | $ | 4,768,292 | | | $ | — | |
| | | |
Asia | | | 1,404,431,997 | | | | 60,124,668 | | | | — | |
| | | |
Europe | | | 21,739,757 | | | | — | | | | — | |
| | | |
North America | | | 44,753,283 | | | | — | | | | — | |
| | | |
South America | | | 96,464,984 | | | | 22,218,482 | | | | — | |
| | | |
Securities Lending Reinvestment Vehicle | | | 4,333,286 | | | | — | | | | — | |
| | | |
| Total | | $ | 1,629,959,237 | | | $ | 87,111,442 | | | $ | — | |
| | | |
| ACTIVEBETA® EUROPE EQUITY ETF | | | | | | | | | | | | |
| | | |
| Investment Type | | Level 1 | | | Level 2 | | | Level 3 | |
| Assets | | | | | | | | | | | | |
| | | |
Common Stock and/or Other Equity Investments(a) | | | | | | | | | | | | |
| | | |
Africa | | $ | 26,329 | | | $ | — | | | $ | — | |
| | | |
Asia | | | 72,960 | | | | — | | | | — | |
| | | |
Europe | | | 15,741,243 | | | | 106,590 | | | | — | |
| | | |
North America | | | 169,421 | | | | — | | | | — | |
| | | |
Oceania | | | 187,674 | | | | — | | | | — | |
| | | |
Securities Lending Reinvestment Vehicle | | | 62,772 | | | | — | | | | — | |
| | | |
| Total | | $ | 16,260,399 | | | $ | 106,590 | | | $ | — | |
| (a) | | Amounts are disclosed by continent to highlight the impact of time zone differences between local market close and the calculation of NAV. Security valuations are based on the principal exchange or system on which they are traded, which may differ from country of domicile noted in table. |
For further information regarding security characteristics, see the Schedules of Investments.
98
GOLDMAN SACHS ACTIVEBETA® ETFS
|
| 3. INVESTMENTS AND FAIR VALUE MEASUREMENTS (continued) |
| | | | | | | | | | | | |
| | | |
| ACTIVEBETA® INTERNATIONAL EQUITY ETF | | | | | | | | | | | | |
| | | |
| Investment Type | | Level 1 | | | Level 2 | | | Level 3 | |
| Assets | | | | | | | | | | | | |
| | | |
Common Stock and/or Other Equity Investments(a) | | | | | | | | | | | | |
| | | |
Africa | | $ | 2,383,825 | | | $ | — | | | $ | — | |
| | | |
Asia | | | 468,157,655 | | | | — | | | | — | |
| | | |
Europe | | | 973,982,742 | | | | 8,074,993 | | | | — | |
| | | |
North America | | | 172,818,478 | | | | 1,087,324 | | | | — | |
| | | |
Oceania | | | 110,761,115 | | | | — | | | | — | |
| | | |
South America | | | 1,671,797 | | | | — | | | | — | |
| | | |
Securities Lending Reinvestment Vehicle | | | 24,830,933 | | | | — | | | | — | |
| | | |
| Total | | $ | 1,754,606,545 | | | $ | 9,162,317 | | | $ | — | |
| | | |
| ACTIVEBETA® JAPAN EQUITY ETF | | | | | | | | | | | | |
| | | |
| Investment Type | | Level 1 | | | Level 2 | | | Level 3 | |
| | | |
| Assets | | | | | | | | | | | | |
| | | |
Common Stock and/or Other Equity Investments(a) | | | | | | | | | | | | |
| | | |
Asia | | $ | 19,460,165 | | | $ | — | | | $ | — | |
| | | |
Securities Lending Reinvestment Vehicle | | | 999,602 | | | | — | | | | — | |
| | | |
| Total | | $ | 20,459,767 | | | $ | — | | | $ | — | |
| | | |
| Derivative Type | | | | | | | | | |
| | | |
| Assets(b) | | | | | | | | | | | | |
| | | |
Futures Contracts | | $ | 4,057 | | | $ | — | | | $ | — | |
| | | |
| ACTIVEBETA® U.S. LARGE CAP EQUITY ETF | | | | | | | | | | | | |
| | | |
| Investment Type | | Level 1 | | | Level 2 | | | Level 3 | |
| | | |
| Assets | | | | | | | | | | | | |
| | | |
Common Stock and/or Other Equity Investments(a) | | | | | | | | | | | | |
| | | |
North America | | $ | 10,407,272,245 | | | $ | — | | | $ | — | |
| | | |
Securities Lending Reinvestment Vehicle | | | 9,557,821 | | | | — | | | | — | |
| | | |
| Total | | $ | 10,416,830,066 | | | $ | — | | | $ | — | |
| (a) | | Amounts are disclosed by continent to highlight the impact of time zone differences between local market close and the calculation of NAV. Security valuations are based on the principal exchange or system on which they are traded, which may differ from country of domicile noted in table. |
| (b) | | Amount shown represents unrealized gain at fiscal year end. |
For further information regarding security characteristics, see the Schedules of Investments.
99
GOLDMAN SACHS ACTIVEBETA® ETFS
Notes to Financial Statements (continued)
August 31, 2020
|
| 3. INVESTMENTS AND FAIR VALUE MEASUREMENTS (continued) |
| | | | | | | | | | | | |
| | | |
| ACTIVEBETA® U.S. SMALL CAP EQUITY ETF | | | | | | | | | | | | |
| | | |
| Investment Type | | Level 1 | | | Level 2 | | | Level 3 | |
| | | |
| Assets | | | | | | | | | | | | |
| | | |
Common Stock and/or Other Equity Investments(a) | | | | | | | | | | | | |
| | | |
Africa | | $ | 82,823 | | | $ | — | | | $ | — | |
| | | |
Asia | | | 336,727 | | | | — | | | | — | |
| | | |
Europe | | | 602,272 | | | | — | | | | — | |
| | | |
North America | | | 148,563,534 | | | | — | | | | — | |
| | | |
South America | | | 111,661 | | | | — | | | | — | |
| | | |
Securities Lending Reinvestment Vehicle | | | 2,901,792 | | | | — | | | | — | |
| | | |
| Total | | $ | 152,598,809 | | | $ | — | | | $ | — | |
| | | |
| Derivative Type | | | | | | | | | |
| | | |
| Assets(b) | | | | | | | | | | | | |
| | | |
Futures Contracts | | $ | 128,246 | | | $ | — | | | $ | — | |
| (a) | | Amounts are disclosed by continent to highlight the impact of time zone differences between local market close and the calculation of NAV. Security valuations are based on the principal exchange or system on which they are traded, which may differ from country of domicile noted in table. |
| (b) | | Amount shown represents unrealized gain at fiscal year end. |
For further information regarding security characteristics, see the Schedules of Investments.
|
| 4. INVESTMENTS IN DERIVATIVES |
The following tables set forth, by certain risk types, the gross value of derivative contracts (not considered to be hedging instruments for accounting disclosure purposes) as of August 31, 2020. These instruments were used as part of the Funds’ investment strategies and to obtain and/or manage exposure related to the risks below. The values in the tables below exclude the effects of cash collateral received or posted pursuant to these derivative contracts, and therefore are not representative of the Funds’ net exposure.
| | | | | | | | | | |
| Risk | | Fund | | Statement of Assets and Liabilities | | | Assets(a) | |
Equity | | Goldman Sachs ActiveBeta® U.S. Japan Equity ETF | | | Variation Margin on Futures Contracts | | | $ | 4,057 | |
| Equity | | Goldman Sachs ActiveBeta® U.S. Small Cap Equity ETF | | | Variation Margin on Futures Contracts | | | | 128,246 | |
| (a) | | Includes unrealized gain (loss) on futures contracts described in the Additional Investment Information sections of the Schedules of Investments. Only the variation margin as of August 31, 2020 is reported within the Statements of Assets and Liabilities. |
The following tables set forth, by certain risk types, the Funds’ gains (losses) related to these derivatives and their indicative volumes for the fiscal year ended August 31, 2020. These gains (losses) should be considered in the context that these derivative contracts may have been executed to create investment opportunities and/or economically hedge certain investments, and
100
GOLDMAN SACHS ACTIVEBETA® ETFS
|
| 4. INVESTMENTS IN DERIVATIVES (continued) |
accordingly, certain gains (losses) on such derivative contracts may offset certain (losses) gains attributable to investments. These gains (losses) are included in “Net realized gain (loss)” or “Net change in unrealized gain (loss)” on the Statements of Operations:
| | | | | | | | | | | | | | |
| Risk | | Fund | | Net Realized
Gain (Loss)
from Futures
Contracts | | | Net Change in
Unrealized
Gain (Loss) on Futures
Contracts | | | Average
Number of
Contracts(a) | |
| Equity | | Goldman Sachs ActiveBeta® Emerging Markets Equity ETF | | $ | 751,736 | | | $ | — | | | | 30 | |
| Equity | | Goldman Sachs ActiveBeta® Europe Equity ETF | | | (3,058 | ) | | | — | | | | 1 | |
| Equity | | Goldman Sachs ActiveBeta® International Equity ETF | | | (626,744 | ) | | | — | | | | 19 | |
| Equity | | Goldman Sachs ActiveBeta® Japan Equity ETF | | | 31,932 | | | | 4,057 | | | | 5 | |
| Equity | | Goldman Sachs ActiveBeta® U.S. Large Cap Equity ETF | | | (4,739,566 | ) | | | — | | | | 23 | |
| Equity | | Goldman Sachs ActiveBeta® U.S. Small Cap Equity ETF | | | (42,760 | ) | | | 128,246 | | | | 10 | |
| (a) | | Average number of contracts is based on the month end balances for the fiscal year ended August 31, 2020. |
|
| 5. AGREEMENTS AND AFFILIATED TRANSACTIONS |
A. Management Agreement — Under the Agreements, GSAM manages the Funds, subject to the general supervision of the Trustees.
As compensation for the services rendered pursuant to the Agreements, the assumption of the expenses related thereto and administration of the Funds’ business affairs, including providing facilities, GSAM is entitled to a management fee, accrued daily and paid monthly, equal to an annual percentage rate of each Fund’s average daily net assets.
For each Fund except the ActiveBeta® Emerging Markets Equity ETF, the Funds operate under a unitary management fee structure. Under the unitary fee structure, GSAM is responsible for paying substantially all the expenses of each such Fund, excluding payments under the Fund’s 12b-1 plan (if any), interest expenses, taxes, acquired fund fees and expenses, brokerage fees, costs of holding shareholder meetings and litigation, indemnification and extraordinary expenses. As the Funds directly pay fees and expenses of the independent Trustees, the management fee collected by GSAM will be reduced by an amount equal to the fees and expenses paid by the Funds to the independent Trustees.
For the fiscal year ended August 31, 2020, unitary management fees with GSAM were at the following rates for each Fund except the ActiveBeta® Emerging Markets Equity ETF:
| | |
| Fund | | Unitary
Management Fee |
ActiveBeta® Europe Equity ETF | | 0.25% |
ActiveBeta® International Equity ETF | | 0.25% |
ActiveBeta® Japan Equity ETF | | 0.25% |
ActiveBeta® U.S. Large Cap Equity ETF | | 0.09% |
ActiveBeta® U.S. Small Cap Equity ETF | | 0.20% |
101
GOLDMAN SACHS ACTIVEBETA® ETFS
Notes to Financial Statements (continued)
August 31, 2020
|
| 5. AGREEMENTS AND AFFILIATED TRANSACTIONS (continued) |
For the fiscal year ended August 31, 2020, contractual and effective net management fees with GSAM were at the following rate for the ActiveBeta® Emerging Markets Equity ETF:
| | |
| Fund | | Contractual and Effective Net
Management Fee |
ActiveBeta® Emerging Markets Equity ETF | | 0.40% |
B. Other Expense Agreements and Affiliated Transactions — GSAM has agreed to reduce or limit certain “Other Expenses” of the ActiveBeta® Emerging Markets Equity ETF (excluding acquired fund fees and expenses, taxes, interest, brokerage fees, expenses of shareholder meetings, litigation and indemnification, and extraordinary expenses) to the extent such expenses exceed, on an annual basis, a percentage rate of the average daily net assets of the Fund. Such Other Expense reimbursements, if any, are accrued daily and paid monthly. In addition, the Fund is not obligated to reimburse GSAM for prior fiscal year expense reimbursements, if any. The Other Expense limitation as an annual percentage rate of average daily net assets for the ActiveBeta® Emerging Markets Equity ETF is 0.05%. This Other Expense limitation will remain in effect permanently and GSAM may not terminate the arrangement without the approval of the Trustees.
For the fiscal year ended August 31, 2020, these expense reimbursements amounted to $1,272,116.
|
| 6. CREATION AND REDEMPTION OF CREATION UNITS |
The Trust issues and redeems shares of the Funds only in Creation Units on a continuous basis through the Distributor, without an initial sales load, at NAV next determined after receipt, on any Business Day (as defined in the Statement of Additional Information), of an order in proper form. Shares of the Funds may only be purchased or redeemed by certain financial institutions (each an “Authorized Participant”). An Authorized Participant is either (1) a “Participating Party” or other participant in the clearing process through the Continuous Net Settlement System of the National Securities Clearing Corporation; or (2) a Depository Trust Company participant; which, in either case, must have executed an agreement with the Distributor. Retail investors will typically not qualify as an Authorized Participant or have the resources to buy and sell whole Creation Units. Therefore, they will be unable to purchase or redeem the shares directly from the Funds. Rather, most retail investors will purchase shares in the secondary market at market prices with the assistance of a broker and may be subject to customary brokerage commissions or fees. Fixed creation and redemption transaction fees are imposed in connection with creations and redemptions.
Authorized Participants transacting in Creation Units for cash may also pay a variable charge to compensate the relevant fund for certain transaction costs (e.g. taxes on currency or other financial transactions, and brokerage costs) and market impact expenses relating to investing in portfolio securities. Such variable charges, if any, are included in “Proceeds from sale of shares” in the Statements of Changes in Net Assets.
Share activity is as follows:
| | | | | | | | | | | | | | | | |
| | | ActiveBeta® Emerging Markets Equity ETF | |
| | | For the Fiscal Year Ended
August 31, 2020 | | | For the Fiscal Year Ended
August 31, 2019 | |
| | | | |
| | | Shares | | | Dollars | | | Shares | | | Dollars | |
| | | | |
| Fund Share Activity | | | | | | | | | | | | | | | | |
Shares Sold | | | 4,400,000 | | | $ | 147,064,435 | | | | 5,400,000 | | | $ | 173,435,103 | |
Shares Redeemed | | | (7,600,000 | ) | | | (242,809,605 | ) | | | (2,000,000 | ) | | | (63,269,200 | ) |
| | | | |
NET INCREASE (DECREASE) IN SHARES | | | (3,200,000 | ) | | $ | (95,745,170 | ) | | | 3,400,000 | | | $ | 110,165,903 | |
102
GOLDMAN SACHS ACTIVEBETA® ETFS
|
| 6. CREATION AND REDEMPTION OF CREATION UNITS (continued) |
| | | | | | | | | | | | | | | | |
| |
| | | ActiveBeta® Europe Equity ETF | |
| | | For the Fiscal Year Ended
August 31, 2020 | | | For the Fiscal Year Ended
August 31, 2019 | |
| | | | |
| | | Shares | | | Dollars | | | Shares | | | Dollars | |
| | | | |
| Fund Share Activity | | | | | | | | | | | | | | | | |
Shares Sold | | | — | | | $ | — | | | | 350,000 | | | $ | 9,731,604 | |
Shares Redeemed | | | (100,000 | ) | | | (2,258,165 | ) | | | (2,100,000 | ) | | | (63,419,366 | ) |
| | | | |
NET DECREASE IN SHARES | | | (100,000 | ) | | $ | (2,258,165 | ) | | | (1,750,000 | ) | | $ | (53,687,762 | ) |
| |
| | | ActiveBeta® International Equity ETF | |
| | | For the Fiscal Year Ended
August 31, 2020 | | | For the Fiscal Year Ended
August 31, 2019 | |
| | | | |
| | | Shares | | | Dollars | | | Shares | | | Dollars | |
| | | | |
| Fund Share Activity | | | | | | | | | | | | | | | | |
Shares Sold | | | 11,200,000 | | | $ | 319,392,338 | | | | 19,300,000 | | | $ | 533,307,092 | |
Shares Redeemed | | | (6,300,000 | ) | | | (144,922,584 | ) | | | (700,000 | ) | | | (19,583,028 | ) |
| | | | |
NET INCREASE IN SHARES | | | 4,900,000 | | | $ | 174,469,754 | | | | 18,600,000 | | | $ | 513,724,064 | |
| |
| | | ActiveBeta® Japan Equity ETF | |
| | | For the Fiscal Year Ended
August 31, 2020 | | | For the Fiscal Year Ended
August 31, 2019 | |
| | | | |
| | | Shares | | | Dollars | | | Shares | | | Dollars | |
| | | | |
| Fund Share Activity | | | | | | | | | | | | | | | | |
Shares Sold | | | — | | | $ | — | | | | 400,000 | | | $ | 12,425,460 | |
Shares Redeemed | | | (200,000 | ) | | | (6,435,562 | ) | | | (1,200,000 | ) | | | (40,580,806 | ) |
| | | | |
NET DECREASE IN SHARES | | | (200,000 | ) | | $ | (6,435,562 | ) | | | (800,000 | ) | | $ | (28,155,346 | ) |
| |
| | | ActiveBeta® U.S. Large Cap Equity ETF | |
| | | For the Fiscal Year Ended
August 31, 2020 | | | For the Fiscal Year Ended
August 31, 2019 | |
| | | | |
| | | Shares | | | Dollars | | | Shares | | | Dollars | |
| | | | |
| Fund Share Activity | | | | | | | | | | | | | | | | |
Shares Sold | | | 44,400,000 | | | $ | 2,860,908,861 | | | | 52,500,000 | | | $ | 3,028,113,210 | |
Shares Redeemed | | | (8,700,000 | ) | | | (543,604,251 | ) | | | (8,450,000 | ) | | | (476,026,399 | ) |
| | | | |
NET INCREASE IN SHARES | | | 35,700,000 | | | $ | 2,317,304,610 | | | | 44,050,000 | | | $ | 2,552,086,811 | |
| |
| | | ActiveBeta® U.S. Small Cap Equity ETF | |
| | | For the Fiscal Year Ended
August 31, 2020 | | | For the Fiscal Year Ended
August 31, 2019 | |
| | | | |
| | | Shares | | | Dollars | | | Shares | | | Dollars | |
| | | | |
| Fund Share Activity | | | | | | | | | | | | | | | | |
Shares Sold | | | 1,900,000 | | | $ | 74,558,334 | | | | 1,400,000 | | | $ | 58,670,905 | |
Shares Redeemed | | | (650,000 | ) | | | (25,692,998 | ) | | | (100,000 | ) | | | (4,436,399 | ) |
| | | | |
NET INCREASE IN SHARES | | | 1,250,000 | | | $ | 48,865,336 | | | | 1,300,000 | | | $ | 54,234,506 | |
103
GOLDMAN SACHS ACTIVEBETA® ETFS
Notes to Financial Statements (continued)
August 31, 2020
|
| 7. PORTFOLIO SECURITIES TRANSACTIONS |
The cost of purchases and proceeds from sales of long-term securities for the fiscal year ended August 31, 2020, were as follows:
| | | | | | | | | | |
| Fund | | | | Purchases | | | Sales | |
ActiveBeta® Emerging Markets Equity ETF | | | | $ | 644,902,698 | | | $ | 684,705,620 | |
ActiveBeta® Europe Equity ETF | | | | | 3,111,768 | | | | 3,083,630 | |
ActiveBeta® International Equity ETF | | | | | 330,927,641 | | | | 313,761,835 | |
ActiveBeta® Japan Equity ETF | | | | | 3,610,451 | | | | 3,745,227 | |
ActiveBeta�� U.S. Large Cap Equity ETF | | | | | 1,360,900,441 | | | | 1,326,640,129 | |
ActiveBeta® U.S. Small Cap Equity ETF | | | | | 19,891,421 | | | | 20,532,959 | |
The purchases and sales from in-kind creation and redemption transactions for the fiscal year ended August 31, 2020, were as follows:
| | | | | | | | | | |
| Fund | | | | Purchases | | | Sales | |
ActiveBeta® Emerging Markets Equity ETF | | | | $ | 30,324,134 | | | $ | 81,867,064 | |
ActiveBeta® Europe Equity ETF | | | | | — | | | | 2,244,293 | |
ActiveBeta® International Equity ETF | | | | | 298,448,682 | | | | 142,515,467 | |
ActiveBeta® Japan Equity ETF | | | | | — | | | | 6,370,895 | |
ActiveBeta® U.S. Large Cap Equity ETF | | | | | 2,824,276,854 | | | | 544,409,424 | |
ActiveBeta® U.S. Small Cap Equity ETF | | | | | 73,653,360 | | | | 25,717,223 | |
The Funds may lend their securities through a securities lending agent, the Bank of New York Mellon (“BNYM”), to certain qualified borrowers. In accordance with the Funds’ securities lending procedures, the Funds receive cash collateral at least equal to the market value of the securities on loan. The market value of the loaned securities is determined at the close of business of the Funds, at their last sale price or official closing price on the principal exchange or system on which they are traded, and any additional required collateral is delivered to the Funds on the next business day. As with other extensions of credit, the Funds may experience delay in the recovery of their securities or incur a loss should the borrower of the securities breach its agreement with the Funds or become insolvent at a time when the collateral is insufficient to cover the cost of repurchasing securities on loan. Dividend income received from securities on loan may not be subject to withholding taxes and therefore withholding taxes paid may differ from the amounts listed in the Statements of Operations. Loans of securities are terminable at any time and as such 1) the remaining contractual maturities of the outstanding securities lending transactions are considered to be overnight and continuous and 2) the borrower, after notice, is required to return borrowed securities within the standard time period for settlement of securities transactions.
The Funds invest the cash collateral received in connection with securities lending transactions in the Goldman Sachs Financial Square Government Fund (“Government Money Market Fund”), an affiliated series of the Goldman Sachs Trust. The Government Money Market Fund is registered under the Act as an open end investment company, is subject to Rule 2a-7 under the Act, and is managed by GSAM, for which GSAM may receive a management fee of up to 0.16% on an annualized basis of the average daily net assets of the Government Money Market Fund.
104
GOLDMAN SACHS ACTIVEBETA® ETFS
|
| 8. SECURITIES LENDING (continued) |
In the event of a default by a borrower with respect to any loan, BNYM may exercise any and all remedies provided under the applicable borrower agreement to make the Funds whole. These remedies include purchasing replacement securities by applying the collateral held from the defaulting broker against the purchase cost of the replacement securities. If BNYM is unable to purchase replacement securities, BNYM will indemnify the Funds by paying the Funds an amount equal to the market value of the securities loaned minus the value of cash collateral received from the borrower for the loan, subject to an exclusion for any shortfalls resulting from a loss of value in such cash collateral due to reinvestment risk. The Funds’ master netting agreements with certain borrowers provide the right, in the event of a default (including bankruptcy or insolvency), for the non-defaulting party to liquidate the collateral and calculate net exposure to the defaulting party or request additional collateral. However, in the event of a default by a borrower, a resolution authority could determine that such rights are not enforceable due to the restrictions or prohibitions against the right of set-off that may be imposed in accordance with a particular jurisdiction’s bankruptcy or insolvency laws. The Funds’ loaned securities were all subject to enforceable Securities Lending Agreements and the value of the collateral was at least equal to the value of the cash received. The amounts of the Funds’ overnight and continuous agreements, which represent the gross amounts of recognized liabilities for securities lending transactions outstanding as of August 31, 2020, are disclosed as “Payable upon return of securities loaned” on the Statements of Assets and Liabilities, where applicable.
Both the Funds and BNYM received compensation relating to the lending of the Funds’ securities. The amounts earned, if any, by the Funds for the fiscal year ended August 31, 2020, are reported under Investment Income on the Statements of Operations.
The following table provides information about the Funds’ investment in the Government Money Market Fund for the fiscal year ended August 31, 2020:
| | | | | | | | | | | | | | | | | | |
| Fund | | | | Beginning value as
of August 31, 2019 | | | Purchases
at Cost | | | Proceeds
from Sales | | | Ending value as
of August 31, 2020 | |
ActiveBeta® Emerging Markets Equity ETF | | | | $ | 16,175,855 | | | $ | 114,462,518 | | | $ | (126,305,087 | ) | | $ | 4,333,286 | |
ActiveBeta® Europe Equity ETF | | | | | 41,424 | | | | 3,147,240 | | | | (3,125,892 | ) | | | 62,772 | |
ActiveBeta® International Equity ETF | | | | | 17,792,823 | | | | 282,231,327 | | | | (275,193,217 | ) | | | 24,830,933 | |
ActiveBeta® Japan Equity ETF | | | | | 670,849 | | | | 4,006,301 | | | | (3,677,548 | ) | | | 999,602 | |
ActiveBeta® U.S. Large Cap Equity ETF | | | | | — | | | | 73,561,714 | | | | (64,003,893 | ) | | | 9,557,821 | |
ActiveBeta® U.S. Small Cap Equity ETF | | | | | 1,802,678 | | | | 17,516,524 | | | | (16,417,410 | ) | | | 2,901,792 | |
The tax character of distributions paid during the fiscal year ended August 31, 2020 and August 31, 2019 were as follows:
| | | | | | | | | | | | | | | | | | | | | | | | |
| | | Fiscal Year Ended August 31, 2020 | |
| | | ActiveBeta®
Emerging
Markets
Equity ETF | | | ActiveBeta®
Europe
Equity ETF | | | ActiveBeta®
International
Equity ETF | | | ActiveBeta®
Japan
Equity ETF | | | ActiveBeta®
U.S. Large Cap
Equity ETF | | | ActiveBeta®
U.S. Small Cap
Equity ETF | |
Distributions paid from: | | | | | | | | | | | | | | | | | | | | | | | | |
Ordinary Income | | $ | 44,088,214 | | | $ | 340,708 | | | $ | 34,855,286 | | | $ | 482,484 | | | $ | 130,496,243 | | | $ | 1,215,722 | |
Total taxable distributions | | $ | 44,088,214 | | | $ | 340,708 | | | $ | 34,855,286 | | | $ | 482,484 | | | $ | 130,496,243 | | | $ | 1,215,722 | |
105
GOLDMAN SACHS ACTIVEBETA® ETFS
Notes to Financial Statements (continued)
August 31, 2020
|
| 9. TAX INFORMATION (continued) |
| | | | | | | | | | | | | | | | | | | | | | | | |
| | | Fiscal Year Ended August 31, 2019 | |
| | | ActiveBeta®
Emerging
Markets
Equity ETF | | | ActiveBeta®
Europe
Equity ETF | | | ActiveBeta®
International
Equity ETF | | | ActiveBeta®
Japan
Equity ETF | | | ActiveBeta®
U.S. Large Cap
Equity ETF | | | ActiveBeta®
U.S. Small Cap
Equity ETF | |
Distributions paid from: | | | | | | | | | | | | | | | | | | | | | | | | |
Ordinary Income | | $ | 42,811,808 | | | $ | 1,153,378 | | | $ | 37,687,035 | | | $ | 794,800 | | | $ | 76,178,483 | | | $ | 900,932 | |
Total taxable distributions | | $ | 42,811,808 | | | $ | 1,153,378 | | | $ | 37,687,035 | | | $ | 794,800 | | | $ | 76,178,483 | | | $ | 900,932 | |
As of August 31, 2020, the components of accumulated earnings (losses) on a tax-basis were as follows:
| | | | | | | | | | | | | | | | | | | | | | | | |
| | | ActiveBeta®
Emerging
Markets
Equity ETF | | | ActiveBeta®
Europe
Equity ETF | | | ActiveBeta®
International
Equity ETF | | | ActiveBeta®
Japan
Equity ETF | | | ActiveBeta®
U.S. Large Cap
Equity ETF | | | ActiveBeta®
U.S. Small Cap
Equity ETF | |
Undistributed ordinary income — net | | $ | 19,893,000 | | | $ | 73,055 | | | $ | 5,411,037 | | | $ | 46,698 | | | $ | 21,141,950 | | | $ | 153,721 | |
Total undistributed earnings | | $ | 19,893,000 | | | $ | 73,055 | | | $ | 5,411,037 | | | $ | 46,698 | | | $ | 21,141,950 | | | $ | 153,721 | |
Capital loss carryforwards: | | | | | | | | | | | | | | | | | | | | | | | | |
Perpetual Short-Term | | $ | (101,846,403 | ) | | $ | (1,057,760 | ) | | $ | (41,653,447 | ) | | $ | (340,063 | ) | | $ | (219,173,013 | ) | | $ | (2,166,488 | ) |
Perpetual Long-Term | | | (60,153,326 | ) | | | (2,253,244 | ) | | | (70,497,387 | ) | | | (404,415 | ) | | | (172,318,274 | ) | | | (3,596,057 | ) |
Timing differences (Qualified Late Year Loss Deferral) | | | (2,662,750 | ) | | | (684 | ) | | | — | | | | (60,525 | ) | | | — | | | | — | |
Unrealized gains (losses) — net | | | 346,781,088 | | | | 108,702 | | | | 131,069,556 | | | | 1,050,582 | | | | 2,304,903,830 | | | | 4,929,214 | |
Total accumulated earnings (losses) net | | $ | 202,011,609 | | | $ | (3,129,931 | ) | | $ | 24,329,759 | | | $ | 292,277 | | | $ | 1,934,554,493 | | | $ | (679,610 | ) |
As of August 31, 2020, the Funds’ aggregate security unrealized gains and losses based on cost for U.S. federal income tax purposes were as follows:
| | | | | | | | | | | | | | | | | | | | | | | | |
| | | ActiveBeta®
Emerging Markets Equity ETF | | | ActiveBeta®
Europe Equity ETF | | | ActiveBeta®
International
Equity ETF | | | ActiveBeta®
Japan Equity ETF | | | ActiveBeta®
U.S. Large Cap
Equity ETF | | | ActiveBeta®
U.S. Small Cap
Equity ETF | |
Tax Cost | | $ | 1,368,713,389 | | | $ | 16,261,212 | | | $ | 1,632,771,140 | | | $ | 19,413,661 | | | $ | 8,111,926,236 | | | $ | 147,797,841 | |
Gross unrealized gain | | | 465,427,637 | | | | 2,333,075 | | | | 270,822,377 | | | | 2,801,262 | | | | 2,598,921,292 | | | | 19,759,017 | |
Gross unrealized loss | | | (118,646,549 | ) | | | (2,224,373 | ) | | | (139,752,821 | ) | | | (1,750,680 | ) | | | (294,017,462 | ) | | | (14,829,803 | ) |
Net unrealized gains (losses) | | $ | 346,781,088 | | | $ | 108,702 | | | $ | 131,069,556 | | | $ | 1,050,582 | | | $ | 2,304,903,830 | | | $ | 4,929,214 | |
The difference between GAAP-basis and tax basis unrealized gains (losses) is attributable primarily to wash sales, net mark to market gains/(losses) on regulated futures, and differences in the tax treatment of partnership investments and passive foreign investment company investments.
106
GOLDMAN SACHS ACTIVEBETA® ETFS
|
| 9. TAX INFORMATION (continued) |
In order to present certain components of the Funds’ capital accounts on a tax-basis, certain reclassifications have been recorded to the Funds’ accounts. These reclassifications have no impact on the net asset value of the Funds’ and result primarily from redemption in-kind transactions.
| | | | | | | | | | | | | | | | | | | | | | | | |
| | | ActiveBeta®
Emerging
Markets
Equity ETF | | | ActiveBeta®
Europe
Equity ETF | | | ActiveBeta®
International
Equity ETF | | | ActiveBeta®
Japan
Equity ETF | | | ActiveBeta®
U.S. Large Cap
Equity ETF | | | ActiveBeta®
U.S. Small Cap
Equity ETF | |
Paid-in Capital | | $ | 23,483,826 | | | $ | (671,256 | ) | | $ | 8,258,295 | | | $ | 715,137 | | | $ | 199,570,733 | | | $ | 5,234,137 | |
Total Distributable Earnings | | $ | (23,483,826 | ) | | $ | 671,256 | | | $ | (8,258,295 | ) | | $ | (715,137 | ) | | $ | (199,570,733 | ) | | $ | (5,234,137 | ) |
GSAM has reviewed the Funds’ tax positions for all open tax years (the current and prior three years, as applicable) and has concluded that no provision for income tax is required in the Funds’ financial statements. Such open tax years remain subject to examination and adjustment by tax authorities.
The Funds’ risks include, but are not limited to, the following:
Derivatives Risk — The Funds’ use of derivatives may result in loss. Derivative instruments, which may pose risks in addition to and greater than those associated with investing directly in securities, currencies or other instruments, may be illiquid or less liquid, volatile, difficult to price and leveraged so that small changes in the value of the underlying instruments may produce disproportionate losses to the Funds. Derivatives are also subject to counterparty risk, which is the risk that the other party in the transaction will not fulfill its contractual obligation. The use of derivatives is a highly specialized activity that involves investment techniques and risks different from those associated with investments in more traditional securities and instruments. Losses from derivatives can also result from a lack of correlation between changes in the value of derivative instruments and the portfolio assets (if any) being hedged.
Foreign and Emerging Countries Risk — Investing in foreign markets may involve special risks and considerations not typically associated with investing in the United States. Foreign securities may be subject to risk of loss because of more or less foreign government regulation, less public information and less economic, political and social stability in the countries in which a Fund invests. The imposition of exchange controls (including repatriation restrictions), confiscations of assets and property, trade restrictions (including tariffs) and other government restrictions by the United States or other governments, or from problems in share registration, settlement or custody, may also result in losses. Foreign risk also involves the risk of negative foreign currency rate fluctuations, which may cause the value of securities denominated in such foreign currency (or other instruments through which a Fund has exposure to foreign currencies) to decline in value. Currency exchange rates may fluctuate significantly over short periods of time. To the extent that a Fund also invests in securities of issuers located in emerging markets, these risks may be more pronounced.
Foreign Custody Risk — If a Fund invests in foreign securities, the Fund may hold such securities and cash with foreign banks, agents, and securities depositories appointed by the Fund’s custodian (each a “Foreign Custodian”). Some foreign custodians may be recently organized or new to the foreign custody business. In some countries, Foreign Custodians may be subject to little or no regulatory oversight over, or independent evaluation of, their operations. Further, the laws of certain countries may place limitations on a Fund’s ability to recover its assets if a Foreign Custodian enters bankruptcy. Investments in emerging markets may be subject to even greater custody risks than investments in more developed markets. Custody services in emerging market countries are very often undeveloped and may be considerably less well regulated than in more developed countries, and thus may not afford the same level of investor protection as would apply in developed countries.
107
GOLDMAN SACHS ACTIVEBETA® ETFS
Notes to Financial Statements (continued)
August 31, 2020
|
| 10. OTHER RISKS (continued) |
Index Risk — GSAM (the “Index Provider”) constructs each Fund’s Index in accordance with a rules-based methodology. A Fund will be negatively affected by general declines in the securities and asset classes represented in its Index. In addition, because the Funds are not “actively” managed, unless a specific security is removed from an Index, a Fund generally would not sell a security because the security’s issuer was in financial trouble. Market disruptions and regulatory restrictions could have an adverse effect on a Fund’s ability to adjust its exposure to the required levels in order to track the Index. A Fund also does not attempt to take defensive positions under any market conditions, including declining markets. Therefore, a Fund’s performance could be lower than funds that may actively shift their portfolio assets to take advantage of market opportunities or to lessen the impact of a market decline or a decline in the value of one or more issuers. The Index Provider relies on third party data it believes to be reliable in constructing each Index, but it does not guarantee the accuracy or availability of such third party data. Errors in index data, index computation or the construction of an Index in accordance with its methodology may occur from time to time and may not be identified and corrected by the Index Provider for a period of time or at all, which may have an adverse impact on the applicable Fund and its shareholders. In addition, neither a Fund, the Investment Adviser, the Calculation Agent nor the Index Provider can guarantee the availability or timeliness of the production of the Index.
Investments in Other Investment Companies Risk — As a shareholder of another investment company, including an ETF, a Fund will indirectly bear its proportionate share of any net management fees and other expenses paid by such other investment companies, in addition to the fees and expenses regularly borne by the Fund. ETFs are subject to risks that do not apply to conventional mutual funds, including but not limited to the following: (i) the market price of the ETF’s shares may trade at a premium or a discount to their NAV; and (ii) an active trading market for an ETF’s shares may not develop or be maintained.
Market and Credit Risks — In the normal course of business, a Fund trades financial instruments and enters into financial transactions where risk of potential loss exists due to changes in the market (market risk). The value of the securities in which a Fund invests may go up or down in response to the prospects of individual companies, particular sectors or governments and/or general economic conditions throughout the world due to increasingly interconnected global economies and financial markets. Events such as war, acts of terrorism, social unrest, natural disasters, the spread of infectious illness or other public health threats could also significantly impact a Fund and its investments.
Additionally, a Fund may also be exposed to credit risk in the event that an issuer or guarantor fails to perform or that an institution or entity with which the Fund has unsettled or open transactions defaults.
Market Trading Risk — Each Fund faces numerous market trading risks, including disruptions to creations and redemptions, the existence of extreme market volatility or potential lack of an active trading market for Shares. If a shareholder purchases Shares at a time when the market price is at a premium to the NAV or sells Shares at a time when the market price is at a discount to the NAV, the shareholder may sustain losses. The Investment Adviser cannot predict whether Shares will trade below, at or above their NAV. Price differences may be due, in large part, to the fact that supply and demand forces at work in the secondary trading market for Shares will be closely related to, but not identical to, the same forces influencing the prices of the securities of a Fund’s Index trading individually or in the aggregate at any point in time.
Tracking Error Risk — Tracking error is the divergence of a Fund’s performance from that of its Index. The performance of a Fund may diverge from that of its Index for a number of reasons. Tracking error may occur because of transaction costs, a Fund’s holding of cash, differences in accrual of dividends, changes to its Index or the need to meet new or existing regulatory requirements. Unlike a Fund, the returns of an Index are not reduced by investment and other operating expenses, including the trading costs associated with implementing changes to its portfolio of investments. Tracking error risk may be heightened during times of market volatility or other unusual market conditions.
108
GOLDMAN SACHS ACTIVEBETA® ETFS
Under the Trust’s organizational documents, its Trustees, officers, employees and agents are indemnified, to the extent permitted by the Act and state law, against certain liabilities that may arise out of performance of their duties to the Funds. Additionally, in the course of business, the Funds enter into contracts that contain a variety of indemnification clauses. The Funds’ maximum exposure under these arrangements is unknown, as this would involve future claims that may be made against the Funds that have not yet occurred. However, GSAM believes the risk of loss under these arrangements to be remote.
Subsequent events after the Statements of Assets and Liabilities date have been evaluated, and GSAM has concluded that there is no impact requiring adjustment or disclosure in the financial statements.
109
Report of Independent Registered Public
Accounting Firm
To the Board of Trustees of Goldman Sachs ETF Trust and Shareholders of Goldman Sachs ActiveBeta® Emerging Markets Equity ETF, Goldman Sachs ActiveBeta® Europe Equity ETF, Goldman Sachs ActiveBeta® International Equity ETF, Goldman Sachs ActiveBeta® Japan Equity ETF, Goldman Sachs ActiveBeta® U.S. Large Cap Equity ETF, and Goldman Sachs ActiveBeta® U.S. Small Cap Equity ETF
Opinions on the Financial Statements
We have audited the accompanying statements of assets and liabilities, including the schedules of investments, of Goldman Sachs ActiveBeta® Emerging Markets Equity ETF, Goldman Sachs ActiveBeta® Europe Equity ETF, Goldman Sachs ActiveBeta® International Equity ETF, Goldman Sachs ActiveBeta® Japan Equity ETF, Goldman Sachs ActiveBeta® U.S. Large Cap Equity ETF, and Goldman Sachs ActiveBeta® U.S. Small Cap Equity ETF (six of the funds constituting Goldman Sachs ETF Trust, hereafter collectively referred to as the “Funds”) as of August 31, 2020, the related statements of operations for the year ended August 31, 2020, the statements of changes in net assets for each of the two years in the period ended August 31, 2020, including the related notes, and the financial highlights for each of the periods indicated therein (collectively referred to as the “financial statements”). In our opinion, the financial statements present fairly, in all material respects, the financial position of each of the Funds as of August 31, 2020, the results of each of their operations for the year then ended, the changes in each of their net assets for each of the two years in the period ended August 31, 2020 and each of the financial highlights for each of the periods indicated therein in conformity with accounting principles generally accepted in the United States of America.
Basis for Opinions
These financial statements are the responsibility of the Funds’ management. Our responsibility is to express an opinion on the Funds’ financial statements based on our audits. We are a public accounting firm registered with the Public Company Accounting Oversight Board (United States) (PCAOB) and are required to be independent with respect to the Funds in accordance with the U.S. federal securities laws and the applicable rules and regulations of the Securities and Exchange Commission and the PCAOB.
We conducted our audits of these financial statements in accordance with the standards of the PCAOB. Those standards require that we plan and perform the audit to obtain reasonable assurance about whether the financial statements are free of material misstatement, whether due to error or fraud.
Our audits included performing procedures to assess the risks of material misstatement of the financial statements, whether due to error or fraud, and performing procedures that respond to those risks. Such procedures included examining, on a test basis, evidence regarding the amounts and disclosures in the financial statements. Our audits also included evaluating the accounting principles used and significant estimates made by management, as well as evaluating the overall presentation of the financial statements. Our procedures included confirmation of securities owned as of August 31, 2020 by correspondence with the custodian, transfer agent and brokers; when replies were not received from brokers, we performed other auditing procedures. We believe that our audits provide a reasonable basis for our opinions.
/s/ PricewaterhouseCoopers LLP
Boston, Massachusetts
October 26, 2020
We have served as the auditor of one or more investment companies in the Goldman Sachs fund complex since 2000.
110
GOLDMAN SACHS ACTIVEBETA® ETFS
Liquidity Risk Management Program (Unaudited)
Each Fund has adopted and implemented a liquidity risk management program (the “Program”) in accordance with Rule 22e-4 under the 1940 Act. The Program seeks to assess and manage each Fund’s liquidity risk, i.e., the risk that a Fund is unable to satisfy redemption requests without significantly diluting remaining investors’ interests in the Fund. The Board of Trustees of the Trust has designated GSAM, each Fund’s investment adviser, to administer the Program. Certain aspects of the Program rely on third parties to perform certain functions, including the provision of market data and application of models.
The Program is comprised of various components designed to support the assessment and/or management of liquidity risk, including: (1) the periodic assessment (no less frequently than annually) of certain factors that influence a Fund’s liquidity risk; (2) the periodic classification (no less frequently than monthly) of a Fund’s investments into one of four liquidity categories that reflect an estimate of their liquidity under current market conditions; (3) a 15% limit on the acquisition of “illiquid investments” (as defined under Rule 22e-4); (4) for a Fund that does not invest primarily in “highly liquid investments” (as defined under Rule 22e-4), the determination of a minimum percentage of the Fund’s assets that will generally be invested in highly liquid investments (a “Highly Liquid Investment Minimum”); and (5) periodic reporting to the Board of Trustees.
At a meeting of the Board of Trustees on March 18-19, 2020, GSAM provided a written report to the Board addressing the operation, and the adequacy and effectiveness of the implementation of the Program, including, as applicable, the operation of any Highly Liquid Investment Minimum and any material changes to the Program, for the initial period from December 1, 2018 through December 31, 2019 (the “Reporting Period”). Among other things, the annual report discussed: (1) the results of stress tests designed to assess liquidity under a hypothetical stressed scenario involving elevated redemptions; and (2) an assessment of the methodologies used to classify investments into one of four liquidity categories. The report concluded that the Program was reasonably designed to assess and manage liquidity risk and was adequately and effectively implemented during the Reporting Period.
There can be no assurance that the Program will achieve its objectives under all circumstances in the future. Please refer to your Fund’s prospectus for more information regarding the Fund’s exposure to liquidity risk and other risks to which it may be subject.
111
GOLDMAN SACHS ACTIVEBETA® ETFS
Fund Expenses — Six Month Period ended 8/31/2020 (Unaudited)
As a shareholder you incur ongoing costs, including management fees and other Fund expenses. This example is intended to help you understand your ongoing costs (in dollars) of investing in Shares of the Funds and to compare these costs with the ongoing costs of investing in other exchange-traded funds. This example does not take into account brokerage commissions that you may pay on your purchases and sales of Shares of a Fund.
The example is based on an investment of $1,000 invested at the beginning of the period from March 1, 2020 and held for the six months ended August 31, 2020, which represents a period of 184 days of a 366 day year (or less where indicated).
Actual Expenses — The first line in the table below provides information about actual account values and actual expenses. You may use the information in this line, together with the amount you invested, to estimate the expenses that you paid over the six months. Simply divide your account value by $1,000 (for example, an $8,600 account value divided by $1,000=8.6), then multiply the result by the number in the first line under the heading entitled “Expenses Paid” to estimate the expenses you paid on your account during this period.
Hypothetical Example for Comparison Purposes — The second line in the table below provides information about hypothetical account values and hypothetical expenses based on a Fund’s actual net expense ratios and an assumed rate of return of 5% per year before expenses, which is not the Fund’s actual return. The hypothetical account values and expenses may not be used to estimate the actual ending account balance or expenses you paid for the period. You may use this information to compare the ongoing costs of investing in a Fund and other funds. To do so, compare this 5% hypothetical example with the 5% hypothetical examples that appear in the shareholder reports of the other funds.
Please note that the expenses shown in the table are meant to highlight your ongoing costs only and do not reflect any transactional costs, such as redemption fees, or exchange fees. Therefore, the second line of the table is useful in comparing ongoing costs only, and will not help you determine the relative total costs of owning different funds. In addition, if these transactional costs were included, your costs would have been higher.
| | | | | | | | | | | | | | | | | | | | | | | | | | | | | | | | | | | | |
| | | ActiveBeta® Emerging Markets Equity ETF | | | ActiveBeta® Europe Equity ETF | | | ActiveBeta® International Equity ETF | |
| | | Beginning
Account
Value
3/1/20 | | | Ending
Account
Value
8/31/20 | | | Expenses
Paid* | | | Beginning
Account
Value
3/1/20 | | | Ending
Account
Value
8/31/20 | | | Expenses
Paid* | | | Beginning
Account
Value
3/1/20 | | | Ending
Account
Value
8/31/20 | | | Expenses
Paid* | |
Actual based on NAV | | $ | 1,000 | | | $ | 1,081.50 | | | $ | 2.35 | | | $ | 1,000 | | | $ | 1,083.40 | | | $ | 1.31 | | | $ | 1,000 | | | $ | 1,077.60 | | | $ | 1.31 | |
Hypothetical 5% return | | | 1,000 | | | | 1,022.87 | + | | | 2.29 | | | | 1,000 | | | | 1,023.88 | + | | | 1.27 | | | | 1,000 | | | | 1,023.88 | + | | | 1.27 | |
| | | ActiveBeta® Japan Equity ETF | | | ActiveBeta® U.S. Large Cap Equity ETF | | | ActiveBeta® U.S. Small Cap Equity ETF | |
| | | Beginning
Account
Value
3/1/20 | | | Ending
Account
Value
8/31/20 | | | Expenses
Paid* | | | Beginning
Account
Value
3/1/20 | | | Ending
Account
Value
8/31/20 | | | Expenses
Paid* | | | Beginning
Account
Value
3/1/20 | | | Ending
Account
Value
8/31/20 | | | Expenses
Paid* | |
Actual based on NAV | | $ | 1,000 | | | $ | 1,093.10 | | | $ | 1.32 | | | $ | 1,000 | | | $ | 1,194.70 | | | $ | 0.50 | | | $ | 1,000 | | | $ | 1,047.80 | | | $ | 1.03 | |
Hypothetical 5% return | | | 1,000 | | | | 1,023.88 | + | | | 1.27 | | | | 1,000 | | | | 1,024.68 | + | | | 0.46 | | | | 1,000 | | | | 1,024.13 | + | | | 1.02 | |
| + | | Hypothetical expenses are based on each Fund’s actual annualized net expense ratios and an assumed rate of return of 5% per year before expenses. |
| * | | Expenses for each Fund are calculated using the Fund’s annualized net expense ratio, which represents the ongoing expenses as a percentage of net assets for the six months ended August 31, 2020. Expenses are calculated by multiplying the annualized net expense ratio by the average account value for the period; then multiplying the result by the number of days in the most recent fiscal year; and then dividing that result by the number of days in the fiscal year. The annualized net expense ratio for the period is as follows: |
| | | | |
| Fund | | | |
ActiveBeta® Emerging Markets Equity ETF | | | 0.45 | % |
ActiveBeta® Europe Equity ETF | | | 0.25 | |
ActiveBeta® International Equity ETF | | | 0.25 | |
ActiveBeta® Japan Equity ETF | | | 0.25 | |
ActiveBeta® U.S. Large Cap Equity ETF | | | 0.09 | |
ActiveBeta® U.S. Small Cap Equity ETF | | | 0.20 | |
112
GOLDMAN SACHS ACTIVEBETA® ETFS
Trustees and Officers (Unaudited) Independent Trustees
| | | | | | | | | | |
Name, Address and Age1 | | Position(s) Held
with the Trust | | Term of Office and Length of
Time Served2 | | Principal Occupation(s)
During Past 5 Years | | Number of
Portfolios in
Fund Complex
Overseen by
Trustee3 | | Other
Directorships
Held by Trustee4 |
| | | | | |
Lawrence W. Stranghoener Age: 66 | | Chairman of the Board of Trustees | | Trustee Since 2015; Chairman Since 2017 | | Mr. Stranghoener is retired. He is Director, Kennametal, Inc. (a global manufacturer and distributor of tooling and industrial materials) (2003-Present); and was formerly Director, Aleris Corporation and Aleris International, Inc. (a producer of aluminum rolled products) (2011-2020); Interim Chief Executive Officer (2014); and Executive Vice President and Chief Financial Officer (2004-2014), Mosaic Company (a fertilizer manufacturing company). Chairman of the Board of Trustees — Goldman Sachs ETF Trust; Goldman Sachs MLP Income Opportunities Fund; Goldman Sachs MLP and Energy Renaissance Fund; Goldman Sachs Credit Income Fund; and Goldman Sachs Real Estate Diversified Income Fund. | | 46 | | Kennametal Inc. (a global manufacturer and distributor of tooling and industrial materials) |
| | | | | |
Caroline Dorsa Age: 61 | | Trustee | | Since 2016 | | Ms. Dorsa is retired. She is Director, Biogen Inc. (a biotechnology company) (2010-Present); Director, Intellia Therapeutics Inc. (a gene-editing company) (2015-Present); and Director, Illumina, Inc. (a life sciences company) (2017- Present). She was formerly Executive Vice President and Chief Financial Officer, Public Service Enterprise Group, Inc. (a generation and energy services company) (2009-2015); Senior Vice President, Merck & Co, Inc. (a pharmaceutical company) (2008-2009 and 1987-2007); Senior Vice President and Chief Financial Officer, Gilead Sciences, Inc. (a pharmaceutical company) (2007-2008); and Senior Vice President and Chief Financial Officer, Avaya, Inc. (a technology company) (2007). Trustee — Goldman Sachs ETF Trust; Goldman Sachs MLP Income Opportunities Fund; Goldman Sachs MLP and Energy Renaissance Fund; Goldman Sachs Credit Income Fund; and Goldman Sachs Real Estate Diversified Income Fund. | | 46 | | Biogen Inc. (a biotechnology company); Intellia Therapeutics Inc. (a gene-editing company); Illumina, Inc. (a life sciences company) |
| | | | | |
Linda A. Lang Age: 62 | | Trustee | | Since 2016 | | Ms. Lang is retired. She was formerly Chair of the Board of Directors (2016-2019), and Member of the Board of Directors, WD-40 Company (a global consumer products company) (2004-2019); Chairman and Chief Executive Officer (2005-2014); and Director, President and Chief Operating Officer, Jack in the Box, Inc. (a restaurant company) (2003-2005). Previously, Ms. Lang served as an Advisory Board Member of Goldman Sachs MLP Income Opportunities Fund and Goldman Sachs MLP and Energy Renaissance Fund (February 2016-March 2016). Trustee — Goldman Sachs ETF Trust; Goldman Sachs MLP Income Opportunities Fund; Goldman Sachs MLP and Energy Renaissance Fund; Goldman Sachs Credit Income Fund; and Goldman Sachs Real Estate Diversified Income Fund. | | 46 | | None |
| | | | | |
Michael Latham Age: 54 | | Trustee | | Since 2015 | | Mr. Latham is retired. Formerly, he held senior management positions with the iShares exchange-traded fund business, including Chairman (2011-2014); Global Head (2010-2011); U.S. Head (2007-2010); and Chief Operating Officer (2003-2007). Trustee — Goldman Sachs ETF Trust; Goldman Sachs MLP Income Opportunities Fund; Goldman Sachs MLP and Energy Renaissance Fund; Goldman Sachs Credit Income Fund; and Goldman Sachs Real Estate Diversified Income Fund. | | 46 | | None |
| | | | | | | | | | |
113
GOLDMAN SACHS ACTIVEBETA® ETFS
Trustees and Officers (Unaudited) (continued) Interested Trustee*
| | | | | | | | | | |
Name, Address and Age1 | | Position(s) Held
with the Trust | | Term of Office and Length of
Time Served2 | | Principal Occupation(s)
During Past 5 Years | | Number of
Portfolios in
Fund Complex
Overseen by
Trustee3 | | Other
Directorships
Held by Trustee4 |
| | | | | |
James A. McNamara Age: 57 | | Trustee and President | | Since 2014 | | Advisory Director, Goldman Sachs (January 2018-Present); Managing Director, Goldman Sachs (January 2000-December 2017); Director of Institutional Fund Sales, GSAM (April 1998-December 2000); and Senior Vice President and Manager, Dreyfus Institutional Service Corporation (January 1993-April 1998). President and Trustee — Goldman Sachs ETF Trust; Goldman Sachs Trust; Goldman Sachs Variable Insurance Trust; Goldman Sachs Trust II; Goldman Sachs MLP Income Opportunities Fund; Goldman Sachs MLP and Energy Renaissance Fund; Goldman Sachs Credit Income Fund; and Goldman Sachs Real Estate Diversified Income Fund. | | 168 | | None |
| | | | | | | | | | |
| * | | This person is considered to be an “Interested Trustee” because he holds a position with Goldman Sachs and own securities issued by The Goldman Sachs Group, Inc. The Interested Trustee holds comparable positions with certain other companies of which Goldman Sachs, GSAM or an affiliate thereof is the investment adviser, administrator and/or distributor. |
| 1 | | Each Trustee may be contacted by writing to the Trustee, c/o Goldman Sachs, 200 West Street, New York, New York, 10282, Attn: Caroline L. Kraus. Information is provided as of August 31, 2020. |
| 2 | | Each Trustee holds office for an indefinite term until the earliest of: (a) the election of his or her successor; (b) the date the Trustee resigns, retires or is removed by the Board of Trustees or shareholders, in accordance with the Trust’s Declaration of Trust; or (c) the termination of the Trust. |
| 3 | | The Goldman Sachs Fund Complex includes certain other companies listed above for each respective Trustee. As of August 31, 2020, Goldman Sachs ETF Trust consisted of 42 portfolios (23 of which offered shares to the public); Goldman Sachs Trust consisted of 90 portfolios (89 of which offered shares to the public); Goldman Sachs Variable Insurance Trust consisted of 13 portfolios; Goldman Sachs Trust II consisted of 19 portfolios (17 of which offered shares to the public); and Goldman Sachs MLP Income Opportunities Fund, Goldman Sachs MLP and Energy Renaissance Fund, Goldman Sachs Credit Income Fund and Goldman Sachs Real Estate Diversified Income Fund each consisted of one portfolio. Goldman Sachs Credit Income Fund did not offer shares to the public. |
| 4 | | This column includes only directorships of companies required to report to the Securities and Exchange Commission under the Securities Exchange Act of 1934 (i.e., “public companies”) or other investment companies registered under the Act. |
Additional information about the Trustees is available in the Funds’ Statement of Additional Information, which can be obtained from Goldman Sachs free of charge by calling this toll-free number (in the United States of America): 1-800-621-2550.
114
GOLDMAN SACHS ACTIVEBETA® ETFS
Trustees and Officers (Unaudited) (continued)
Officers of the Trust*
| | | | | | |
Name, Address and Age1 | | Positions Held
with the Trust | | Term of Office and
Length of
Time Served2 | | Principal Occupation(s) During Past 5 Years |
| | | |
James A. McNamara 200 West Street New York, NY 10282 Age: 57 | | Trustee and President | | Since 2014 | | Advisory Director, Goldman Sachs (January 2018-Present); Managing Director, Goldman Sachs (January 2000-December 2017); Director of Institutional Fund Sales, GSAM (April 1998-December 2000); and Senior Vice President and Manager, Dreyfus Institutional Service Corporation (January 1993-April 1998). President and Trustee — Goldman Sachs ETF Trust; Goldman Sachs Trust; Goldman Sachs Variable Insurance Trust; Goldman Sachs Trust II; Goldman Sachs MLP Income Opportunities Fund; Goldman Sachs MLP and Energy Renaissance Fund; Goldman Sachs Credit Income Fund; and Goldman Sachs Real Estate Diversified Income Fund. |
| | | |
Caroline L. Kraus 200 West Street New York, NY 10282 Age: 43 | | Secretary | | Since 2014 | | Managing Director, Goldman Sachs (January 2016-Present); Vice President, Goldman Sachs (August 2006-December 2015); Senior Counsel, Goldman Sachs (January 2020-Present); Associate General Counsel, Goldman Sachs (2012-December 2019); Assistant General Counsel, Goldman Sachs (August 2006-December 2011); and Associate, Weil, Gotshal & Manges, LLP (2002-2006). Secretary — Goldman Sachs ETF Trust; Goldman Sachs Trust (previously Assistant Secretary (2012)); Goldman Sachs Variable Insurance Trust (previously Assistant Secretary (2012)); Goldman Sachs Trust II; Goldman Sachs BDC, Inc.; Goldman Sachs Private Middle Market Credit LLC; Goldman Sachs Private Middle Market Credit II LLC; Goldman Sachs Middle Market Lending Corp.; Goldman Sachs MLP Income Opportunities Fund; Goldman Sachs MLP and Energy Renaissance Fund; Goldman Sachs Credit Income Fund; and Goldman Sachs Real Estate Diversified Income Fund. |
| | | |
Joseph F. DiMaria 30 Hudson Street Jersey City, NJ 07302 Age: 52 | | Treasurer, Principal Financial Officer and Principal Accounting Officer | | Since 2017 (Treasurer and Principal Financial Officer since 2019) | | Managing Director, Goldman Sachs (November 2015-Present) and Vice President — Mutual Fund Administration, Columbia Management Investment Advisers, LLC (May 2010- October 2015). Treasurer, Principal Financial Officer and Principal Accounting Officer — Goldman Sachs ETF Trust (previously Assistant Treasurer (2017)); Goldman Sachs Trust (previously Assistant Treasurer (2016)); Goldman Sachs Variable Insurance Trust (previously Assistant Treasurer (2016)); Goldman Sachs Trust II (previously Assistant Treasurer (2017)); Goldman Sachs MLP Income Opportunities Fund (previously Assistant Treasurer (2017)); Goldman Sachs MLP and Energy Renaissance Fund (previously Assistant Treasurer (2017)); Goldman Sachs Credit Income Fund; and Goldman Sachs Real Estate Diversified Income Fund. |
| | | | | | |
| * | | Represents a partial list of officers of the Trust. Additional information about all the officers is available in the Funds’ Statement of Additional Information, which can be obtained from Goldman Sachs free of charge by calling this toll-free number (in the United States): 1-800-621-2550. |
| 1 | | Information is provided as of August 31, 2020. |
| 2 | | Officers hold office at the pleasure of the Board of Trustees or until their successors are duly elected and qualified. Each officer holds comparable positions with certain other companies of which Goldman Sachs, GSAM or an affiliate thereof is the investment adviser, administrator and/or distributor. |
Goldman Sachs ActiveBeta ETFs — Tax Information (Unaudited)
From distributions paid during the fiscal year ended August 31, 2020, the total amount of income received by the ActiveBeta Emerging Markets Equity ETF, ActiveBeta Europe Equity ETF, ActiveBeta International Equity ETF and ActiveBeta Japan Equity ETF from sources within foreign countries and possessions of the United States was $0.7861, $1.4162, $0.6486 and $1.3608 per share, respectively, all of which is attributable to qualified passive income. The percentage of net investment income dividends paid from foreign sources by the ActiveBeta Emerging Markets Equity ETF, ActiveBeta Europe Equity ETF, ActiveBeta International Equity ETF and ActiveBeta Japan Equity ETF was 94.81%, 86.24%, 85.23% and 91.90%, respectively. The total amount of taxes paid by the ActiveBeta Emerging Markets Equity ETF, ActiveBeta Europe Equity ETF, ActiveBeta International Equity ETF and ActiveBeta Japan Equity ETF to foreign countries was $0.1126, $0.1437, $0.0583 and $0.1511 per share, respectively.
For the fiscal year ended August 31, 2020, 63.96%, 75.96%, 74.65%, 81.20%, 96.57%, and 85.84% of the dividends paid from net investment company taxable income by the ActiveBeta Emerging Markets Equity ETF, ActiveBeta Europe Equity ETF, ActiveBeta International Equity ETF, ActiveBeta Japan Equity ETF, ActiveBeta U.S. Large Cap Equity ETF, and Active Beta U.S. Small Cap Equity ETF, respectively, qualify for the reduced tax rate under the Jobs and Growth Tax Relief and Reconciliation Act of 2003.
For the fiscal year ended August 31, 2020, 93.42 % and 78.94% of the dividends paid from net investment company taxable income by the ActiveBeta U.S. Large Cap Equity and Active Beta U.S. Small Cap Equity ETF, respectively, qualify for the dividends received deduction available to corporations.
115
FUNDS PROFILE
Goldman Sachs ETFs

Goldman Sachs is a premier financial services firm, known since 1869 for creating thoughtful and customized investment solutions in complex global markets.
Today, the Consumer and Investment Management Division of Goldman Sachs serves a diverse set of clients worldwide, including private institutions, public entities and individuals. With approximately $1.88 trillion in assets under supervision as of June 30, 2020, Goldman Sachs Asset Management (“GSAM”) has portfolio management teams located around the world and our investment professionals bring firsthand knowledge of local markets to every investment decision. Assets under supervision includes assets under management and other client assets for which Goldman Sachs does not have full discretion. GSAM leverages the resources of Goldman Sachs & Co. LLC subject to legal, internal and regulatory restrictions.
|
|
| GOLDMAN SACHS EXCHANGE-TRADED FUNDS |
| Goldman Sachs ActiveBeta® Emerging Markets Equity ETF |
| Goldman Sachs ActiveBeta® Europe Equity ETF |
| Goldman Sachs ActiveBeta® International Equity ETF |
| Goldman Sachs ActiveBeta® Japan Equity ETF |
| Goldman Sachs ActiveBeta® U.S. Large Cap Equity ETF |
| Goldman Sachs ActiveBeta® U.S. Small Cap Equity ETF |
| Goldman Sachs Equal Weight U.S. Large Cap Equity ETF |
| Goldman Sachs Hedge Industry VIP ETF |
| Goldman Sachs JUST U.S. Large Cap Equity ETF |
| Goldman Sachs Access U.S. Aggregate Bond ETF |
| Goldman Sachs Access High Yield Corporate Bond ETF |
| Goldman Sachs Access Inflation Protected USD Bond ETF |
| Goldman Sachs Access Investment Grade Corporate Bond ETF |
| Goldman Sachs Access Investment Grade Corporate 1-5 Year Bond ETF |
| Goldman Sachs Access Treasury 0-1 Year ETF |
| Goldman Sachs Access Ultra Short Bond ETF |
| Goldman Sachs Data-Driven World ETF |
| Goldman Sachs Finance Reimagined ETF |
| Goldman Sachs Human Evolution ETF |
| Goldman Sachs Manufacturing Revolution ETF |
| Goldman Sachs New Age Consumer ETF |
| Goldman Sachs MarketBeta International Equity ETF |
| Goldman Sachs MarketBeta Emerging Markets Equity ETF |
| Goldman Sachs MarketBeta U.S. Equity ETF |
INDEX DISCLAIMERS
The MSCI Emerging Markets Index, MSCI Europe Index, MSCI World ex USA Index and MSCI Japan Index (the “MSCI Indices”) were used by GSAM as the reference universe for selection of the companies included in the Goldman Sachs ActiveBeta® Emerging Markets Equity Index, Goldman Sachs ActiveBeta® Europe Equity Index, Goldman Sachs ActiveBeta® International Equity Index and Goldman Sachs ActiveBeta® Japan Equity Index (the “ActiveBeta® Indices”), respectively. MSCI Inc. does not in any way sponsor, support, promote or endorse the ActiveBeta® Indices or the Goldman Sachs ActiveBeta® Emerging Markets Equity ETF, Goldman Sachs ActiveBeta® Europe Equity ETF, Goldman Sachs ActiveBeta® International Equity ETF or Goldman Sachs ActiveBeta® Japan Equity ETF (the “ActiveBeta® ETFs” or the “Funds”). MSCI Inc. was not and is not involved in any way in the creation, calculation, maintenance or review of the ActiveBeta® Indices. The MSCI Indices were provided on an “as is” basis. MSCI Inc., its affiliates and any other person or entity involved in or related to compiling, computing or creating the MSCI Indices (collectively, the “MSCI Parties”) expressly disclaim all warranties (including, without limitation, any warranties of originality, accuracy, completeness, timeliness, non-infringement, merchantability and fitness for a particular purpose). Without limiting any of the foregoing, in no event shall any MSCI Party have any liability for any direct, indirect, special, incidental, punitive, consequential (including without limitation lost profits) or any other damages in connection with the MSCI Indices, the ActiveBeta® ETFs or the ActiveBeta® Indices.
The Russell 2000® Index was used by Goldman Sachs Asset Management or its affiliate as the starting universe for selection of the companies included in the Goldman Sachs ActiveBeta® U.S. Small Cap Equity Index. Frank Russell Company (“RUSSELL”) does not in any way sponsor, support, promote or endorse the Goldman Sachs ActiveBeta® U.S. Small Cap Equity Index or the Goldman Sachs ActiveBeta® U.S. Small Cap Equity ETF. In no event shall any Russell Party have any liability for any direct, indirect, special, incidental, punitive, consequential (including without limitation lost profits) or any other damages in connection with the Russell 2000® Index or the Goldman Sachs ActiveBeta® U.S. Small Cap Equity Index.
The ActiveBeta® Indices are trademarks of Goldman Sachs Asset Management, L.P. and have been licensed for use by Goldman Sachs ETF Trust.
GOLDMAN SACHS ASSET MANAGEMENT, L.P., THE GOLDMAN SACHS GROUP, INC., AND GOLDMAN SACHS & CO. LLC (COLLECTIVELY, “GOLDMAN SACHS”) DOES NOT GUARANTEE NOR MAKE ANY REPRESENTATION OR WARRANTY, EXPRESS OR IMPLIED, TO THE OWNERS OR SHAREHOLDERS OF THE FUNDS OR ANY MEMBER OF THE PUBLIC REGARDING THE ADVISABILITY OF INVESTING IN SECURITIES GENERALLY OR IN A FUND PARTICULARLY OR THE ABILITY OF THE ACTIVEBETA® INDICES TO TRACK GENERAL MARKET PERFORMANCE. GOLDMAN SACHS, IN ITS CAPACITY AS THE INDEX PROVIDER OF THE ACTIVEBETA® INDICES, LICENSES CERTAIN TRADEMARKS AND TRADE NAMES TO THE FUNDS. GOLDMAN SACHS HAS NO OBLIGATION TO TAKE THE NEEDS OF THE FUNDS OR THE SHAREHOLDERS OF THE FUNDS INTO CONSIDERATION IN DETERMINING, COMPOSING OR CALCULATING THE ACTIVEBETA® INDICES. GOLDMAN SACHS OR ANY OF ITS AFFILIATES MAY HOLD LONG OR SHORT POSITIONS IN SECURITIES HELD BY A FUND OR IN RELATED DERIVATIVES.
GOLDMAN SACHS DOES NOT GUARANTEE THE ADEQUACY, TIMELINESS, ACCURACY AND/OR THE COMPLETENESS OF THE ACTIVEBETA® INDICES OR ANY DATA RELATED THERETO. GOLDMAN SACHS HEREBY EXPRESSLY DISCLAIMS ANY AND ALL LIABILITY FOR ANY ERRORS, OMISSIONS, OR INTERRUPTIONS THEREIN OR IN THE CALCULATION THEREOF. GOLDMAN SACHS MAKES NO WARRANTY, EXPRESS OR IMPLIED, AND EXPRESSLY DISCLAIMS ALL WARRANTIES OF MERCHANTABILITY OR FITNESS FOR A PARTICULAR PURPOSE OR USE WITH RESPECT TO THE MARKS, THE ACTIVEBETA® INDICES OR ANY DATA INCLUDED THEREIN AS TO THE RESULTS TO BE OBTAINED BY A FUND, THE SHAREHOLDERS, OR ANY OTHER PERSON OR ENTITY FROM USE OF THE ACTIVEBETA® INDICES OR ANY DATA INCLUDED THEREIN. WITHOUT LIMITING ANY OF THE FOREGOING, GOLDMAN SACHS HEREBY EXPRESSLY DISCLAIMS ANY AND ALL LIABILITY FOR ANY SPECIAL, PUNITIVE, INDIRECT, OR CONSEQUENTIAL DAMAGES (INCLUDING LOST PROFITS), EVEN IF ADVISED OF THE POSSIBILITY OF SUCH DAMAGES.
| | |
TRUSTEES Lawrence W. Stranghoener, Chairman Caroline Dorsa Linda A. Lang Michael Latham James A. McNamara | | OFFICERS James A. McNamara, President Joseph F. DiMaria, Treasurer, Principal Financial Officer and Principal Accounting Officer Caroline L. Kraus, Secretary |
| |
THE BANK OF NEW YORK MELLON Transfer Agent | | |
| |
ALPS DISTRIBUTORS, INC. Distributor | | GOLDMAN SACHS ASSET MANAGEMENT, L.P. Investment Adviser |
Visit our Website at www.GSAMFUNDS.com/ETFs to obtain the most recent month-end returns.
Goldman Sachs Asset Management, L.P., 200 West Street, New York, New York 10282
The reports concerning the Funds included in this shareholder report may contain certain forward-looking statements about the factors that may affect the performance of the Funds in the future. These statements are based on Fund management’s predictions and expectations concerning certain future events and their expected impact on the Funds, such as performance of the economy as a whole and of specific industry sectors, changes in the levels of interest rates, the impact of developing world events, and other factors that may influence the future performance of the Funds. Management believes these forward-looking statements to be reasonable, although they are inherently uncertain and difficult to predict. Actual events may cause adjustments in portfolio management strategies from those currently expected to be employed.
A description of the policies and procedures that the Funds use to determine how to vote proxies relating to portfolio securities and information regarding how a Fund voted proxies relating to portfolio securities during the most recent 12-month period ended June 30 is available (i) without charge, upon request by calling 1-800-621-2550; and (ii) on the Securities and Exchange Commission (“SEC”) web site at http://www.sec.gov.
The Funds will file their portfolio holdings information for each month in a fiscal quarter within 60 days after the end of the relevant fiscal quarter on the Form N-PORT. Portfolio holdings information for the third month of each fiscal quarter will be made available on the SEC’s web site at http://www.sec.gov. Portfolio holdings information may be obtained upon request and without charge by calling 1-800-621-2550.
Fund holdings and allocations shown are as of August 31, 2020 and may not be representative of future investments. Fund holdings should not be relied on in making investment decisions and should not be construed as research or investment advice regarding particular securities. Current and future holdings are subject to risk.
Economic and market forecasts presented herein reflect our judgment as of the date of this presentation and are subject to change without notice. These forecasts do not take into account the specific investment objectives, restrictions, tax and financial situation or other needs of any specific client. Actual data will vary and may not be reflected here. These forecasts are subject to high levels of uncertainty that may affect actual performance. Accordingly, these forecasts should be viewed as merely representative of a broad range of possible outcomes. These forecasts are estimated, based on assumptions, and are subject to significant revision and may change materially as economic and market conditions change. Goldman Sachs has no obligation to provide updates or changes to these forecasts. Case studies and examples are for illustrative purposes only.
ETF Fund shares are not individually redeemable and are issued and redeemed by the Fund at their net asset value (“NAV”) only in large, specified blocks of shares called creation units. Shares otherwise can be bought and sold only through exchange trading at market price (not NAV). Shares may trade at a premium or discount to their NAV in the secondary market. Brokerage commissions will reduce returns. Ordinary brokerage commissions apply. ALPS Distributors, Inc. is the distributor of the Goldman Sachs ETF Funds. ALPS Distributors, Inc. is unaffiliated with Goldman Sachs Asset Management.
This material is not authorized for distribution to prospective investors unless preceded or accompanied by a current Prospectus or summary prospectus, if applicable. Investors should consider a Fund’s objective, risks, and charges and expenses, and read the summary prospectus, if available, and/or the Prospectus carefully before investing or sending money. The summary prospectus, if available, and the Prospectus contain this and other information about a Fund and may be obtained from your authorized dealer or from Goldman Sachs & Co. LLC by calling 1-800-621-2550.
ActiveBeta® is a registered trademark of GSAM.
© 2020 Goldman Sachs. All rights reserved. 218108-OTU-10/2020 ACTBETAAR-20
Goldman Sachs Funds

| | | | |
| | |
| Annual Report | | | | August 31, 2020 |
| | |
| | | | Equal Weight U.S. Large Cap Equity ETF |
It is our intention that beginning on January 1, 2021, paper copies of the Fund’s annual and semi-annual shareholder reports will no longer be sent by mail, unless you specifically request paper copies of the reports from your financial intermediary. Instead, the reports will be made available on a website, and you will be notified by mail each time a report is posted and provided with a website link to access the report.
If you already elected to receive shareholder reports electronically, you will not be affected by this change and you need not take any action. At any time, you may elect to receive reports and certain communications from the Fund electronically by contacting your financial intermediary.
You may elect to receive all future shareholder reports in paper free of charge. You can inform your financial intermediary that you wish to receive paper copies of reports by contacting your financial intermediary. Your election to receive reports in paper will apply to all Goldman Sachs Funds held in your account.

Goldman Sachs Equal Weight U.S. Large Cap Equity ETF
| | | | |
| | | |
| NOT FDIC-INSURED | | May Lose Value | | No Bank Guarantee |
INVESTMENT PROCESS
Goldman Sachs Equal Weight U.S. Large Cap Equity ETF
Principal Investment Strategies
The Goldman Sachs Equal Weight U.S. Large Cap Equity ETF (the “Fund”) seeks to achieve its investment objective by investing at least 80% of its assets (exclusive of collateral held from securities lending) in securities included in its underlying index.
The Solactive US Large Cap Equal Weight Index (GTR) (the “Index”) consists of equity securities of large capitalization U.S. issuers. The Index is an equal-weight version of the Solactive US Large Cap Index, a market capitalization-weighted index that includes equity securities of approximately 500 of the largest U.S. companies. The Index includes the same constituents as the Solactive US Large Cap Index. However, unlike the Solactive US Large Cap Index, in which each security is weighted based on its market value, each security in the Index is given the same weight, approximately 0.2% of the Index, at each rebalance.
As of August 31, 2020, the Index consisted of 496 securities with a market capitalization range of between approximately $6.1 billion and $2,206.9 billion, and an average market capitalization of approximately $67.3 billion. The Index is reconstituted on a semi-annual basis in May and November to reflect changes in the constituents of the Solactive US Large Cap Index. New securities from initial public offerings are also added on a semi-annual basis in February and August, subject to fulfillment of certain eligibility criteria. The Index is rebalanced on a monthly basis to weight all constituents equally.
Given the Fund’s investment objective of attempting to track the Index, the Fund does not follow traditional methods of active investment management, which may involve buying and selling securities based upon analysis of economic and market factors.
* * *
At the end of the Reporting Period, i.e. the 12 months ended August 31, 2020, we believed that while mega-cap stocks may drive performance in market cap-weighted equity indices, many top performers may be found among non-mega-cap stocks. We maintain conviction in our methodology for providing meaningful access to opportunities among non-mega-cap stocks and avoiding concentration in mega-cap stocks by equally weighting the largest U.S. equities and rebalancing on a monthly basis. We believe this approach allows investors to participate in a broad range of market cycles and potentially reduce exposure to isolated market incidents.
1
PORTFOLIO RESULTS
Goldman Sachs Equal Weight U.S. Large Cap Equity ETF
Investment Objective
The Goldman Sachs Equal Weight U.S. Large Cap Equity ETF (the “Fund”) seeks to provide investment results that closely correspond, before fees and expenses, to the performance of the Solactive US Large Cap Equal Weight Index (GTR) (the “Index”).
Portfolio Management Discussion and Analysis
Below, the Goldman Sachs Quantitative Investment Strategies Team discusses the Fund’s performance and positioning for the 12-month period ended August 31, 2020 (the “Reporting Period”).
| Q | | How did the Fund perform during the Reporting Period? |
| A | | During the Reporting Period, the Fund returned 12.08% based on net asset value (“NAV”) and 12.23% based on market price. The Index returned 12.32%, and the S&P 500® Index (Total Return, USD) (“S&P 500® Index”), a market-cap based index against which the performance of the Fund is measured, returned 21.87% during the same period. |
| | | The Fund had a NAV of $46.30 on August 31, 2019 and ended the Reporting Period with a NAV of $50.86 per share. The Fund’s market price on August 31, 2020 was $50.95 per share. |
| Q | | What key factors were responsible for the Fund’s performance during the Reporting Period? |
| A | | The Fund seeks to provide investment results that closely correspond, before fees and expenses, to the performance of the Index. The Fund’s performance reflects Fund expenses, including management fees and brokerage expenses. The Fund’s relative performance also reflects the impact of any cash held in the Fund as well as any other differences between the Fund’s holdings and the constituents of the Index. The Index is unmanaged, and Index returns do not reflect fees and expenses, which would reduce returns. |
| | | The Index’s performance is compared to that of the S&P 500® Index below. Given the Fund’s investment objective of attempting to track the Index, the Fund does not follow traditional methods of active investment management, which may involve buying and selling securities based upon analysis of economic and market factors. The Fund does not follow a strategy of seeking to outperform the S&P 500® Index. |
| | | During the Reporting Period, the Index posted a double-digit positive absolute return but underperformed the S&P 500® Index. The Fund also underperformed the S&P 500® Index during the Reporting Period, as measured by NAV. |
| Q | | Which sectors contributed most positively to the Index’s relative performance during the Reporting Period, and which detracted most? |
| A | | Index constituents in the information technology, consumer discretionary and real estate sectors detracted most from the Index’s results relative to the S&P 500® Index. Partially offsetting these detractors were Index constituents in the health care, consumer staples and industrials sectors, which contributed positively to the Index’s results relative to the S&P 500® Index during the Reporting Period. |
| Q | | Which individual stock positions detracted the most from the Index’s results during the Reporting Period? |
| A | | Relative to the S&P 500® Index, underweight positions in information technology giant Apple, e-commerce retailing behemoth Amazon.com and software leader Microsoft detracted most (0.23%, 0.21% and 0.21% of Fund net assets as of August 31, 2020, respectively). Apple generated a triple-digit gain within the Index during the Reporting Period, and Amazon.com and Microsoft each posted a robust double-digit positive return within the Index during the Reporting Period. |
| Q | | Which individual stock positions contributed the most to the Index’s relative returns during the Reporting Period? |
| A | | Relative to the S&P 500® Index, an overweight position in electric vehicle manufacturer Tesla and underweight positions in integrated oil company Exxon Mobil and aerospace and defense company Boeing contributed most positively (0.33%, 0.18% and 0.19% of Fund net assets as of August 31, 2020, respectively.) Tesla posted a quadruple- |
2
PORTFOLIO RESULTS
| | digit gain within the Index during the Reporting Period, while Exxon Mobil and Boeing each generated a double-digit negative return within the Index during the Reporting Period. |
| Q | | How did the Fund use derivatives and similar instruments during the Reporting Period? |
| A | | The Fund did not invest in derivatives or similar instruments during the Reporting Period. The Fund does not employ derivatives as a source of alpha generation, although it may use them to equitize cash. |
| Q | | What was the Fund’s sector positioning relative to the Index and the S&P 500® Index at the end of the Reporting Period?1 |
| | | | | | | | | | | | | | |
| | | | |
| | | Sector Name | | Fund2 | | | Solactive
US Large
Cap Equal
Weight Index | | | S&P 500®
Index | |
| | | | |
| | Information Technology | | | 18.64 | % | | | 18.71 | % | | | 28.71 | % |
| | Health Care | | | 14.42 | | | | 14.47 | | | | 13.98 | |
| | Financials | | | 13.21 | | | | 13.25 | | | | 9.62 | |
| | Industrials | | | 12.79 | | | | 12.79 | | | | 7.99 | |
| | Consumer Discretionary | | | 8.78 | | | | 8.78 | | | | 11.44 | |
| | Real Estate | | | 6.56 | | | | 6.59 | | | | 2.61 | |
| | Consumer Staples | | | 6.47 | | | | 6.50 | | | | 6.89 | |
| | Utilities | | | 5.82 | | | | 5.84 | | | | 2.83 | |
| | Communication Services | | | 5.08 | | | | 5.12 | | | | 11.10 | |
| | Materials | | | 4.57 | | | | 4.61 | | | | 2.49 | |
| | | Energy | | | 3.34 | | | | 3.34 | | | | 2.32 | |
| | 1 | | Sector classifications for securities may differ between the above listing and the Schedule of Investments due to differing classification methodologies. The classification methodology used for the above listing is as set forth by Standard & Poor’s. The Fund’s composition may differ over time. Consequently, the Fund’s overall sector allocations may differ from percentages contained in the chart above. The percentage shown for each investment category reflects the value of investments in that category as a percentage of market value (excluding investment in the securities lending reinvestment vehicle, if any). Underlying sector allocation of exchange-traded funds held by the Fund are not reflected in the chart above. Investments in the securities lending vehicle represented 0.22% of the Fund’s net assets as of August 31, 2020. Figures above may not sum to 100% due to rounding. |
| | 2 | | The Fund seeks to provide investment results that closely correspond, before fees and expenses, to the performance of the Solactive US Large Cap Equal Weight Index. |
3
FUND BASICS
Equal Weight U.S. Large Cap Equity ETF
as of August 31, 2020
| | | | | | |
| | FUND SNAPSHOT | |
| | |
| | | As of August 31, 2020 | | | |
| | |
| | Market Price1 | | $ | 50.95 | |
| | | Net Asset Value (NAV)1 | | $ | 50.86 | |
| 1 | | The Market Price is the price at which the Fund’s shares are trading on the Cboe BZX Exchange, Inc. (“Cboe BZX”). The Market Price of the Fund’s shares will fluctuate and, at the time of sale, shares may be worth more or less than the original investment or the Fund’s then current net asset value (“NAV”). The NAV is the market value of one share of the Fund. This amount is derived by dividing the total value of all the securities in the Fund’s portfolio, plus other assets, less any liabilities, by the number of Fund shares outstanding. Fund shares are not individually redeemable and are issued and redeemed by the Fund at their NAV only in large, specified blocks of shares called creation units. Shares otherwise can be bought and sold only through exchange trading at market price (not NAV). Shares may trade at a premium or discount to their NAV in the secondary market. Information regarding how often shares of the Fund traded on Cboe BZX at a price above (i.e., at a premium) or below (i.e., at a discount) the NAV of the Fund can be found at www.GSAMFUNDS.com/ETFs. |
| | | | | | | | |
| | TOP TEN HOLDINGS AS OF 8/31/202 |
| | | |
| | | Holding | | % of Net Assets | | | Line of Business |
| | | |
| | Tesla, Inc. | | | 0.3 | % | | Consumer Discretionary |
| | salesforce.com, inc. | | | 0.3 | | | Information Technology |
| | Workday, Inc., Class A | | | 0.3 | | | Information Technology |
| | FedEx Corp. | | | 0.3 | | | Industrials |
| | Wynn Resorts Ltd. | | | 0.2 | | | Consumer Discretionary |
| | Expedia Group, Inc. | | | 0.2 | | | Consumer Discretionary |
| | Marriott International, Inc., Class A | | | 0.2 | | | Consumer Discretionary |
| | Zoom Video Communications, Inc., Class A | | | 0.2 | | | Information Technology |
| | Delta Air Lines, Inc. | | | 0.2 | | | Industrials |
| | | NVIDIA Corp. | | | 0.2 | | | Information Technology |
| 2 | | The top 10 holdings may not be representative of the Fund’s future investments. |
For more information about the Fund, please refer to www.GSAMFUNDS.com/ETFs. There, you can learn more about the Fund’s investment strategies, holdings, and performance.
4
GOLDMAN SACHS EQUAL WEIGHT U.S. LARGE CAP EQUITY ETF
Performance Summary
August 31, 2020
The following graph shows the value, as of August 31, 2020, of a $10,000 investment made on September 12, 2017 (commencement of operations) in Shares at NAV. For comparative purposes, the performance of the Fund’s underlying index and a market cap-based index against which the performance of the Fund is measured, the Solactive US Large Cap Equal Weight Index (GTR) and the S&P® 500 Index (Total Return, USD), are shown. Performance reflects applicable fee waivers and/or expense limitations in effect during the periods shown and in their absence, performance would be reduced. Returns do not reflect the deduction of taxes that a shareholder would pay on Fund distributions or the sale of Fund shares. In addition to the performance of constituents of the underlying index, other factors may affect Fund performance. These factors include, but are not limited to, Fund operating fees and expenses, portfolio turnover and creation and redemption in-kind transactions. The returns set forth below represent past performance. Past performance does not guarantee future results. The Fund’s NAV and investment return may fluctuate. These fluctuations may cause an investor’s shares to be worth more or less than their original cost. Current performance may be lower or higher than the performance quoted below. Please visit our web site at www.GSAMFUNDS.com/ETFs to obtain the most recent month-end returns.
|
| Goldman Sachs Equal Weight U.S. Large Cap Equity ETF’s Lifetime Performance |
Performance of a $10,000 Investment, with distributions reinvested, from September 12, 2017 through August 31, 2020.
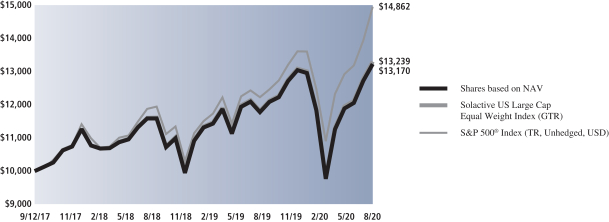
| | | | | | |
| Average Annual Total Return through August 31, 2020* | | | 1 Year | | | Since Inception |
Shares based on NAV (Commenced September 12, 2017) | | | 12.08% | | | 9.70% |
| | | | | | |
Shares based on Market Price (Commenced September 12, 2017) | | | 12.23% | | | 9.77% |
|
Solactive US Large Cap Equal Weight Index (GTR) | | | 12.32% | | | 9.90% |
|
S&P 500® Index (TR, unhedged, USD) | | | 21.87% | | | 14.26% |
|
| * | | Total returns are calculated assuming purchase of a share at the market price or NAV on the first day and sale of a share at the market price or NAV on the last day of each period reported. The Total Returns based on NAV and Market Price assume the reinvestment of dividends and do not reflect brokerage commissions in connection with the purchase or sale of Fund shares, which if included would lower the performance shown above. The NAV used in the Total Return calculation assumes all management fees and operating expenses incurred by the Fund. Market Price returns are based upon the last trade at 4:00 pm EST and do not reflect the returns you would receive if you traded shares at other times. The first day of secondary market trading is typically several days after the date on which the Fund commenced investment operations; therefore, the NAV of the Fund is used as a proxy for the period from inception of investment operations to the first day of secondary market trading to calculate the Market Price returns. |
5
FUND BASICS
Index Definitions and Industry Terms:
Alpha: The excess returns of a fund relative to the return of a benchmark index is the fund’s alpha.
Solactive US Large Cap Equal Weight Index (GTR) is calculated and published by Solactive AG. Solactive AG uses its best efforts to ensure that the Index is calculated correctly. Irrespective of its obligations towards Goldman Sachs Equal Weight U.S. Large Cap Equity ETF, Solactive AG has no obligation to point out errors in the Index to third parties including but not limited to investors and/or financial intermediaries of Goldman Sachs Equal Weight U.S. Large Cap Equity ETF. Neither publication of an Index by Solactive AG nor the licensing of the Index or Index trade mark for the purpose of use in connection with the Goldman Sachs Equal Weight U.S. Large Cap Equity ETF constitutes a recommendation by Solactive AG to invest capital in said fund nor does it in any way represent an assurance or opinion of Solactive AG with regard to any investment in this fund. It is not possible to invest directly in an index.
The S&P 500® Index is the Standard & Poor’s 500 Composite Index of 500 stocks, an unmanaged index of common stock prices. The Index figures do not reflect any deduction for fees, expenses or taxes. It is not possible to invest directly in an index.
6
GOLDMAN SACHS EQUAL WEIGHT U.S. LARGE CAP EQUITY ETF
Schedule of Investments
August 31, 2020
| | | | | | | | |
Shares | | | Description | | Value | |
| |
| Common Stocks – 99.7% | | | |
| Communication Services – 5.1% | |
| | 7,420 | | | Activision Blizzard, Inc. | | $ | 619,718 | |
| | 422 | | | Alphabet, Inc., Class A* | | | 687,662 | |
| | 424 | | | Alphabet, Inc., Class C* | | | 692,892 | |
| | 22,205 | | | Altice USA, Inc., Class A* | | | 612,414 | |
| | 21,094 | | | AT&T, Inc. | | | 628,812 | |
| | 349 | | | Cable One, Inc. | | | 642,275 | |
| | 64,102 | | | CenturyLink, Inc. | | | 689,097 | |
| | 1,048 | | | Charter Communications, Inc., Class A* | | | 645,159 | |
| | 14,786 | | | Comcast Corp., Class A | | | 662,561 | |
| | 4,318 | | | Electronic Arts, Inc.* | | | 602,231 | |
| | 2,508 | | | Facebook, Inc., Class A* | | | 735,346 | |
| | 25,183 | | | Fox Corp., Class A | | | 701,598 | |
| | 4,642 | | | IAC/InterActiveCorp* | | | 617,340 | |
| | 4,441 | | | Liberty Broadband Corp., Class C* | | | 622,140 | |
| | 5,211 | | | Match Group, Inc.* | | | 581,965 | |
| | 1,245 | | | Netflix, Inc.* | | | 659,302 | |
| | 11,874 | | | Omnicom Group, Inc. | | | 642,265 | |
| | 3,811 | | | Roku, Inc.* | | | 661,132 | |
| | 28,533 | | | Snap, Inc., Class A* | | | 644,560 | |
| | 3,559 | | | Take-Two Interactive Software, Inc.* | | | 609,265 | |
| | 5,826 | | | T-Mobile US, Inc.* | | | 679,778 | |
| | 16,854 | | | Twitter, Inc.* | | | 683,935 | |
| | 10,929 | | | Verizon Communications, Inc. | | | 647,762 | |
| | 24,002 | | | ViacomCBS, Inc., Class B | | | 668,456 | |
| | 4,937 | | | Walt Disney Co. (The) | | | 651,042 | |
| | | | | | | | |
| | | | | | | 16,288,707 | |
| | |
| Consumer Discretionary – 8.8% | |
| | 4,136 | | | Advance Auto Parts, Inc. | | | 646,498 | |
| | 199 | | | Amazon.com, Inc.* | | | 686,741 | |
| | 524 | | | AutoZone, Inc.* | | | 626,866 | |
| | 6,236 | | | Best Buy Co., Inc. | | | 691,635 | |
| | 368 | | | Booking Holdings, Inc.* | | | 703,046 | |
| | 3,433 | | | Burlington Stores, Inc.* | | | 676,061 | |
| | 6,260 | | | CarMax, Inc.* | | | 669,382 | |
| | 536 | | | Chipotle Mexican Grill, Inc.* | | | 702,310 | |
| | 8,354 | | | Darden Restaurants, Inc. | | | 724,041 | |
| | 3,237 | | | Dollar General Corp. | | | 653,486 | |
| | 6,573 | | | Dollar Tree, Inc.* | | | 632,783 | |
| | 1,601 | | | Domino’s Pizza, Inc. | | | 654,745 | |
| | 9,240 | | | D.R. Horton, Inc. | | | 659,459 | |
| | 11,073 | | | eBay, Inc. | | | 606,579 | |
| | 7,725 | | | Expedia Group, Inc. | | | 758,209 | |
| | 90,089 | | | Ford Motor Co. | | | 614,407 | |
| | 6,158 | | | Garmin Ltd. | | | 638,030 | |
| | 24,270 | | | General Motors Co. | | | 719,120 | |
| | 6,829 | | | Genuine Parts Co. | | | 644,931 | |
| | 8,202 | | | Hasbro, Inc. | | | 647,466 | |
| | 8,016 | | | Hilton Worldwide Holdings, Inc. | | | 724,326 | |
| | 2,357 | | | Home Depot, Inc. (The) | | | 671,839 | |
| | 14,607 | | | Las Vegas Sands Corp. | | | 740,721 | |
| | 8,531 | | | Lennar Corp., Class A | | | 638,289 | |
| | 4,205 | | | Lowe’s Cos., Inc. | | | 692,521 | |
| | 7,300 | | | Marriott International, Inc., Class A | | | 751,243 | |
| | 3,162 | | | McDonald’s Corp. | | | 675,150 | |
| | 6,248 | | | NIKE, Inc., Class B | | | 699,089 | |
| | 163 | | | NVR, Inc.* | | | 679,439 | |
| | |
| |
| Common Stocks – (continued) | | | |
| Consumer Discretionary – (continued) | |
| | 1,334 | | | O’Reilly Automotive, Inc.* | | | 621,150 | |
| | 7,095 | | | Ross Stores, Inc. | | | 646,213 | |
| | 8,281 | | | Starbucks Corp. | | | 699,496 | |
| | 4,867 | | | Target Corp. | | | 735,939 | |
| | 2,109 | | | Tesla, Inc.* | | | 1,050,957 | |
| | 5,016 | | | Tiffany & Co. | | | 614,460 | |
| | 11,876 | | | TJX Cos., Inc. (The) | | | 650,686 | |
| | 4,297 | | | Tractor Supply Co. | | | 639,522 | |
| | 3,139 | | | Ulta Beauty, Inc.* | | | 728,813 | |
| | 10,217 | | | VF Corp. | | | 671,768 | |
| | 8,883 | | | Wynn Resorts Ltd. | | | 776,818 | |
| | 6,886 | | | Yum! Brands, Inc. | | | 660,023 | |
| | | | | | | | |
| | | | | | | 28,124,257 | |
| | |
| Consumer Staples – 6.5% | |
| | 15,129 | | | Altria Group, Inc. | | | 661,742 | |
| | 14,533 | | | Archer-Daniels-Midland Co. | | | 650,497 | |
| | 9,305 | | | Brown-Forman Corp., Class B | | | 680,847 | |
| | 12,667 | | | Campbell Soup Co. | | | 666,411 | |
| | 6,551 | | | Church & Dwight Co., Inc. | | | 627,782 | |
| | 2,667 | | | Clorox Co. (The) | | | 596,074 | |
| | 13,337 | | | Coca-Cola Co. (The) | | | 660,582 | |
| | 8,220 | | | Colgate-Palmolive Co. | | | 651,517 | |
| | 16,755 | | | Conagra Brands, Inc. | | | 642,722 | |
| | 3,643 | | | Constellation Brands, Inc., Class A | | | 672,061 | |
| | 1,852 | | | Costco Wholesale Corp. | | | 643,866 | |
| | 3,140 | | | Estee Lauder Cos., Inc. (The), Class A | | | 696,201 | |
| | 9,765 | | | General Mills, Inc. | | | 624,472 | |
| | 4,404 | | | Hershey Co. (The) | | | 654,611 | |
| | 12,309 | | | Hormel Foods Corp. | | | 627,513 | |
| | 5,636 | | | J M Smucker Co. (The) | | | 677,334 | |
| | 9,038 | | | Kellogg Co. | | | 640,885 | |
| | 4,045 | | | Kimberly-Clark Corp. | | | 638,139 | |
| | 18,065 | | | Kraft Heinz Co. (The) | | | 632,998 | |
| | 17,909 | | | Kroger Co. (The) | | | 638,993 | |
| | 10,071 | | | Lamb Weston Holdings, Inc. | | | 632,962 | |
| | 3,180 | | | McCormick & Co., Inc. | | | 655,716 | |
| | 17,274 | | | Molson Coors Beverage Co., Class B | | | 650,193 | |
| | 11,369 | | | Mondelez International, Inc., Class A | | | 664,177 | |
| | 7,631 | | | Monster Beverage Corp.* | | | 639,936 | |
| | 4,608 | | | PepsiCo, Inc. | | | 645,396 | |
| | 8,200 | | | Philip Morris International, Inc. | | | 654,278 | |
| | 4,702 | | | Procter & Gamble Co. (The) | | | 650,428 | |
| | 11,486 | | | Sysco Corp. | | | 690,768 | |
| | 9,868 | | | Tyson Foods, Inc., Class A | | | 619,710 | |
| | 15,251 | | | Walgreens Boots Alliance, Inc. | | | 579,843 | |
| | 4,863 | | | Walmart, Inc. | | | 675,228 | |
| | | | | | | | |
| | | | | | | 20,743,882 | |
| | |
| Energy – 3.3% | |
| | 37,253 | | | Baker Hughes Co. | | | 531,973 | |
| | 32,265 | | | Cabot Oil & Gas Corp. | | | 612,067 | |
| | 12,001 | | | Cheniere Energy, Inc.* | | | 624,652 | |
| | 7,231 | | | Chevron Corp. | | | 606,898 | |
| | 11,896 | | | Concho Resources, Inc. | | | 618,354 | |
| | 16,496 | | | ConocoPhillips | | | 625,033 | |
| | |
| | |
| The accompanying notes are an integral part of these financial statements. | | 7 |
GOLDMAN SACHS EQUAL WEIGHT U.S. LARGE CAP EQUITY ETF
Schedule of Investments (continued)
August 31, 2020
| | | | | | | | |
Shares | | | Description | | Value | |
| |
| Common Stocks – (continued) | | | |
| Energy – (continued) | |
| | 12,384 | | | EOG Resources, Inc. | | $ | 561,491 | |
| | 14,356 | | | Exxon Mobil Corp. | | | 573,379 | |
| | 11,942 | | | Hess Corp. | | | 549,810 | |
| | 43,427 | | | Kinder Morgan, Inc. | | | 600,161 | |
| | 17,283 | | | Marathon Petroleum Corp. | | | 612,855 | |
| | 39,303 | | | Occidental Petroleum Corp. | | | 500,720 | |
| | 21,171 | | | ONEOK, Inc. | | | 581,779 | |
| | 10,259 | | | Phillips 66 | | | 599,844 | |
| | 6,140 | | | Pioneer Natural Resources Co. | | | 638,130 | |
| | 32,246 | | | Schlumberger NV | | | 612,996 | |
| | 12,088 | | | Valero Energy Corp. | | | 635,708 | |
| | 29,398 | | | Williams Cos., Inc. (The) | | | 610,303 | |
| | | | | | | | |
| | | | | | | 10,696,153 | |
| | |
| Financials – 13.2% | |
| | 17,638 | | | Aflac, Inc. | | | 640,612 | |
| | 1,185 | | | Alleghany Corp. | | | 657,154 | |
| | 6,631 | | | Allstate Corp. (The) | | | 616,683 | |
| | 6,645 | | | American Express Co. | | | 675,066 | |
| | 20,843 | | | American International Group, Inc. | | | 607,365 | |
| | 4,020 | | | Ameriprise Financial, Inc. | | | 630,336 | |
| | 85,208 | | | Annaly Capital Management, Inc. REIT | | | 626,279 | |
| | 20,352 | | | Arch Capital Group Ltd.* | | | 641,902 | |
| | 5,949 | | | Arthur J Gallagher & Co. | | | 626,430 | |
| | 24,796 | | | Bank of America Corp. | | | 638,249 | |
| | 17,443 | | | Bank of New York Mellon Corp. (The) | | | 645,042 | |
| | 3,084 | | | Berkshire Hathaway, Inc., Class B* | | | 672,435 | |
| | 1,081 | | | BlackRock, Inc. | | | 642,319 | |
| | 11,959 | | | Blackstone Group, Inc. (The), Class A | | | 633,229 | |
| | 13,755 | | | Brown & Brown, Inc. | | | 638,232 | |
| | 9,840 | | | Capital One Financial Corp. | | | 679,255 | |
| | 7,215 | | | Cboe Global Markets, Inc. | | | 662,265 | |
| | 18,464 | | | Charles Schwab Corp. (The) | | | 656,026 | |
| | 4,957 | | | Chubb Ltd. | | | 619,625 | |
| | 7,870 | | | Cincinnati Financial Corp. | | | 624,957 | |
| | 12,316 | | | Citigroup, Inc. | | | 629,594 | |
| | 25,470 | | | Citizens Financial Group, Inc. | | | 658,909 | |
| | 3,855 | | | CME Group, Inc. | | | 677,979 | |
| | 12,677 | | | Discover Financial Services | | | 672,895 | |
| | 11,834 | | | E*TRADE Financial Corp. | | | 640,219 | |
| | 2,837 | | | Everest Re Group Ltd. | | | 624,367 | |
| | 1,786 | | | FactSet Research Systems, Inc. | | | 625,814 | |
| | 18,506 | | | Fidelity National Financial, Inc. | | | 607,552 | |
| | 31,889 | | | Fifth Third Bancorp | | | 658,827 | |
| | 5,507 | | | First Republic Bank | | | 621,795 | |
| | 3,087 | | | Goldman Sachs Group, Inc. (The)(a) | | | 632,434 | |
| | 14,941 | | | Hartford Financial Services Group, Inc. (The) | | | 604,363 | |
| | 67,473 | | | Huntington Bancshares, Inc. | | | 634,921 | |
| | 6,530 | | | Intercontinental Exchange, Inc. | | | 693,682 | |
| | 6,475 | | | JPMorgan Chase & Co. | | | 648,730 | |
| | 51,417 | | | KeyCorp | | | 633,457 | |
| | 17,366 | | | KKR & Co., Inc. | | | 622,050 | |
| | 17,156 | | | Loews Corp. | | | 615,214 | |
| | 6,017 | | | M&T Bank Corp. | | | 621,315 | |
| | 593 | | | Markel Corp.* | | | 644,490 | |
| | |
| |
| Common Stocks – (continued) | | | |
| Financials – (continued) | |
| | 1,235 | | | MarketAxess Holdings, Inc. | | | 600,136 | |
| | 5,316 | | | Marsh & McLennan Cos., Inc. | | | 610,862 | |
| | 16,467 | | | MetLife, Inc. | | | 633,321 | |
| | 2,265 | | | Moody’s Corp. | | | 667,360 | |
| | 12,616 | | | Morgan Stanley | | | 659,312 | |
| | 1,739 | | | MSCI, Inc. | | | 649,117 | |
| | 4,851 | | | Nasdaq, Inc. | | | 652,071 | |
| | 7,835 | | | Northern Trust Corp. | | | 641,608 | |
| | 5,925 | | | PNC Financial Services Group, Inc. (The) | | | 658,860 | |
| | 14,004 | | | Principal Financial Group, Inc. | | | 589,708 | |
| | 6,898 | | | Progressive Corp. (The) | | | 655,586 | |
| | 9,449 | | | Prudential Financial, Inc. | | | 640,359 | |
| | 8,707 | | | Raymond James Financial, Inc. | | | 659,294 | |
| | 57,638 | | | Regions Financial Corp. | | | 666,295 | |
| | 1,800 | | | S&P Global, Inc. | | | 659,556 | |
| | 9,498 | | | State Street Corp. | | | 646,719 | |
| | 2,726 | | | SVB Financial Group* | | | 696,166 | |
| | 27,316 | | | Synchrony Financial | | | 677,710 | |
| | 4,518 | | | T. Rowe Price Group, Inc. | | | 628,951 | |
| | 17,038 | | | TD Ameritrade Holding Corp. | | | 653,918 | |
| | 5,445 | | | Travelers Cos., Inc. (The) | | | 631,838 | |
| | 16,684 | | | Truist Financial Corp. | | | 647,506 | |
| | 17,172 | | | US Bancorp | | | 625,061 | |
| | 10,069 | | | W R Berkley Corp. | | | 624,782 | |
| | 25,750 | | | Wells Fargo & Co. | | | 621,863 | |
| | 3,093 | | | Willis Towers Watson PLC | | | 635,704 | |
| | | | | | | | |
| | | | | | | 42,335,731 | |
| | |
| Health Care – 14.4% | |
| | 6,184 | | | Abbott Laboratories | | | 676,962 | |
| | 6,698 | | | AbbVie, Inc. | | | 641,467 | |
| | 6,389 | | | Agilent Technologies, Inc. | | | 641,583 | |
| | 6,141 | | | Alexion Pharmaceuticals, Inc.* | | | 701,425 | |
| | 2,113 | | | Align Technology, Inc.* | | | 627,519 | |
| | 4,165 | | | Alnylam Pharmaceuticals, Inc.* | | | 552,446 | |
| | 6,034 | | | AmerisourceBergen Corp. | | | 585,479 | |
| | 2,603 | | | Amgen, Inc. | | | 659,392 | |
| | 2,297 | | | Anthem, Inc. | | | 646,651 | |
| | 7,717 | | | Baxter International, Inc. | | | 671,919 | |
| | 2,220 | | | Becton Dickinson and Co. | | | 538,949 | |
| | 2,282 | | | Biogen, Inc.* | | | 656,394 | |
| | 5,248 | | | BioMarin Pharmaceutical, Inc.* | | | 409,501 | |
| | 1,185 | | | Bio-Rad Laboratories, Inc., Class A* | | | 602,679 | |
| | 16,667 | | | Boston Scientific Corp.* | | | 683,680 | |
| | 10,564 | | | Bristol-Myers Squibb Co. | | | 657,081 | |
| | 10,933 | | | Cardinal Health, Inc. | | | 554,959 | |
| | 7,047 | | | Catalent, Inc.* | | | 651,848 | |
| | 9,930 | | | Centene Corp.* | | | 608,908 | |
| | 9,139 | | | Cerner Corp. | | | 670,528 | |
| | 3,584 | | | Cigna Corp. | | | 635,694 | |
| | 2,106 | | | Cooper Cos., Inc. (The) | | | 662,084 | |
| | 9,816 | | | CVS Health Corp. | | | 609,770 | |
| | 3,051 | | | Danaher Corp. | | | 629,940 | |
| | 13,457 | | | DENTSPLY SIRONA, Inc. | | | 603,816 | |
| | 1,388 | | | DexCom, Inc.* | | | 590,469 | |
| | 8,043 | | | Edwards Lifesciences Corp.* | | | 690,411 | |
| | 24,914 | | | Elanco Animal Health, Inc.* | | | 724,001 | |
| | |
| | |
| 8 | | The accompanying notes are an integral part of these financial statements. |
GOLDMAN SACHS EQUAL WEIGHT U.S. LARGE CAP EQUITY ETF
| | | | | | | | |
Shares | | | Description | | Value | |
| |
| Common Stocks – (continued) | | | |
| Health Care – (continued) | |
| | 4,087 | | | Eli Lilly and Co. | | $ | 606,470 | |
| | 6,815 | | | Exact Sciences Corp.* | | | 513,101 | |
| | 9,048 | | | Gilead Sciences, Inc. | | | 603,954 | |
| | 4,794 | | | HCA Healthcare, Inc. | | | 650,642 | |
| | 9,375 | | | Henry Schein, Inc.* | | | 622,875 | |
| | 8,586 | | | Hologic, Inc.* | | | 512,756 | |
| | 1,576 | | | Humana, Inc. | | | 654,308 | |
| | 1,594 | | | IDEXX Laboratories, Inc.* | | | 623,350 | |
| | 1,572 | | | Illumina, Inc.* | | | 561,550 | |
| | 6,441 | | | Incyte Corp.* | | | 620,590 | |
| | 2,930 | | | Insulet Corp.* | | | 639,473 | |
| | 905 | | | Intuitive Surgical, Inc.* | | | 661,410 | |
| | 3,914 | | | IQVIA Holdings, Inc.* | | | 640,918 | |
| | 4,238 | | | Johnson & Johnson | | | 650,152 | |
| | 3,233 | | | Laboratory Corp. of America Holdings* | | | 568,200 | |
| | 2,804 | | | Masimo Corp.* | | | 628,096 | |
| | 4,100 | | | McKesson Corp. | | | 629,104 | |
| | 6,467 | | | Medtronic PLC | | | 695,009 | |
| | 7,697 | | | Merck & Co., Inc. | | | 656,323 | |
| | 662 | | | Mettler-Toledo International, Inc.* | | | 642,656 | |
| | 8,312 | | | Moderna, Inc.* | | | 539,366 | |
| | 3,304 | | | Molina Healthcare, Inc.* | | | 611,141 | |
| | 37,721 | | | Mylan NV* | | | 617,870 | |
| | 5,278 | | | Neurocrine Biosciences, Inc.* | | | 614,465 | |
| | 5,164 | | | PerkinElmer, Inc. | | | 607,906 | |
| | 16,391 | | | Pfizer, Inc. | | | 619,416 | |
| | 13,348 | | | QIAGEN NV* | | | 680,214 | |
| | 4,972 | | | Quest Diagnostics, Inc. | | | 553,085 | |
| | 994 | | | Regeneron Pharmaceuticals, Inc.* | | | 616,210 | |
| | 3,072 | | | ResMed, Inc. | | | 555,356 | |
| | 3,980 | | | Sarepta Therapeutics, Inc.* | | | 582,752 | |
| | 3,859 | | | Seattle Genetics, Inc.* | | | 611,034 | |
| | 3,979 | | | STERIS PLC | | | 635,208 | |
| | 3,318 | | | Stryker Corp. | | | 657,495 | |
| | 2,948 | | | Teladoc Health, Inc.* | | | 635,854 | |
| | 1,696 | | | Teleflex, Inc. | | | 666,443 | |
| | 1,500 | | | Thermo Fisher Scientific, Inc. | | | 643,470 | |
| | 2,028 | | | UnitedHealth Group, Inc. | | | 633,851 | |
| | 5,819 | | | Universal Health Services, Inc., Class B | | | 642,127 | |
| | 3,617 | | | Varian Medical Systems, Inc.* | | | 628,164 | |
| | 2,312 | | | Veeva Systems, Inc., Class A* | | | 652,608 | |
| | 2,313 | | | Vertex Pharmaceuticals, Inc.* | | | 645,605 | |
| | 2,969 | | | Waters Corp.* | | | 642,076 | |
| | 2,287 | | | West Pharmaceutical Services, Inc. | | | 649,417 | |
| | 4,706 | | | Zimmer Biomet Holdings, Inc. | | | 662,981 | |
| | 3,995 | | | Zoetis, Inc. | | | 639,600 | |
| | | | | | | | |
| | | | | | | 46,210,206 | |
| | |
| Industrials – 12.8% | |
| | 4,065 | | | 3M Co. | | | 662,676 | |
| | 6,251 | | | Allegion PLC | | | 646,291 | |
| | 6,506 | | | AMETEK, Inc. | | | 655,154 | |
| | 3,606 | | | Boeing Co. (The) | | | 619,583 | |
| | 22,507 | | | Carrier Global Corp. | | | 671,834 | |
| | 4,671 | | | Caterpillar, Inc. | | | 664,730 | |
| | 6,607 | | | C.H. Robinson Worldwide, Inc. | | | 649,468 | |
| | 2,101 | | | Cintas Corp. | | | 700,137 | |
| | |
| |
| Common Stocks – (continued) | | | |
| Industrials – (continued) | |
| | 6,448 | | | Copart, Inc.* | | | 666,207 | |
| | 748 | | | CoStar Group, Inc.* | | | 634,753 | |
| | 8,819 | | | CSX Corp. | | | 674,301 | |
| | 3,174 | | | Cummins, Inc. | | | 657,811 | |
| | 3,431 | | | Deere & Co. | | | 720,716 | |
| | 24,241 | | | Delta Air Lines, Inc. | | | 747,835 | |
| | 6,003 | | | Dover Corp. | | | 659,369 | |
| | 6,528 | | | Eaton Corp. PLC | | | 666,509 | |
| | 9,744 | | | Emerson Electric Co. | | | 676,916 | |
| | 3,864 | | | Equifax, Inc. | | | 650,195 | |
| | 7,453 | | | Expeditors International of Washington, Inc. | | | 658,771 | |
| | 13,140 | | | Fastenal Co. | | | 642,020 | |
| | 3,677 | | | FedEx Corp. | | | 808,352 | |
| | 8,969 | | | Fortive Corp. | | | 646,755 | |
| | 4,214 | | | General Dynamics Corp. | | | 629,361 | |
| | 101,425 | | | General Electric Co. | | | 643,034 | |
| | 4,200 | | | Honeywell International, Inc. | | | 695,310 | |
| | 3,568 | | | Huntington Ingalls Industries, Inc. | | | 540,623 | |
| | 3,773 | | | IDEX Corp. | | | 680,008 | |
| | 7,654 | | | IHS Markit Ltd. | | | 611,708 | |
| | 3,347 | | | Illinois Tool Works, Inc. | | | 661,200 | |
| | 18,960 | | | Ingersoll Rand, Inc.* | | | 664,738 | |
| | 6,813 | | | Jacobs Engineering Group, Inc. | | | 615,009 | |
| | 4,777 | | | J.B. Hunt Transport Services, Inc. | | | 671,360 | |
| | 16,462 | | | Johnson Controls International PLC | | | 670,497 | |
| | 3,564 | | | Kansas City Southern | | | 648,790 | |
| | 3,655 | | | L3Harris Technologies, Inc. | | | 660,605 | |
| | 1,637 | | | Lockheed Martin Corp. | | | 638,856 | |
| | 10,994 | | | Masco Corp. | | | 640,950 | |
| | 3,242 | | | Norfolk Southern Corp. | | | 689,022 | |
| | 1,902 | | | Northrop Grumman Corp. | | | 651,644 | |
| | 3,426 | | | Old Dominion Freight Line, Inc. | | | 692,669 | |
| | 9,998 | | | Otis Worldwide Corp. | | | 628,874 | |
| | 7,268 | | | PACCAR, Inc. | | | 623,885 | |
| | 3,394 | | | Parker-Hannifin Corp. | | | 699,198 | |
| | 10,640 | | | Raytheon Technologies Corp. | | | 649,040 | |
| | 7,272 | | | Republic Services, Inc. | | | 674,260 | |
| | 2,830 | | | Rockwell Automation, Inc. | | | 652,400 | |
| | 1,446 | | | Roper Technologies, Inc. | | | 617,717 | |
| | 19,621 | | | Southwest Airlines Co. | | | 737,357 | |
| | 4,016 | | | Stanley Black & Decker, Inc. | | | 647,781 | |
| | 1,959 | | | Teledyne Technologies, Inc.* | | | 614,362 | |
| | 5,492 | | | Trane Technologies PLC | | | 650,198 | |
| | 1,355 | | | TransDigm Group, Inc. | | | 677,053 | |
| | 7,168 | | | TransUnion | | | 621,609 | |
| | 19,020 | | | Uber Technologies, Inc.* | | | 639,643 | |
| | 3,552 | | | Union Pacific Corp. | | | 683,547 | |
| | 4,336 | | | United Parcel Service, Inc., Class B | | | 709,456 | |
| | 3,776 | | | United Rentals, Inc.* | | | 668,541 | |
| | 3,365 | | | Verisk Analytics, Inc. | | | 628,144 | |
| | 5,764 | | | Waste Management, Inc. | | | 657,096 | |
| | 9,957 | | | Westinghouse Air Brake Technologies Corp. | | | 662,638 | |
| | 1,849 | | | W.W. Grainger, Inc. | | | 675,680 | |
| | 8,361 | | | Xylem, Inc. | | | 670,385 | |
| | | | | | | | |
| | | | | | | 40,974,631 | |
| | |
| | |
| The accompanying notes are an integral part of these financial statements. | | 9 |
GOLDMAN SACHS EQUAL WEIGHT U.S. LARGE CAP EQUITY ETF
Schedule of Investments (continued)
August 31, 2020
| | | | | | | | |
Shares | | | Description | | Value | |
| |
| Common Stocks – (continued) | | | |
| Information Technology – 18.6% | |
| | 2,757 | | | Accenture PLC, Class A | | $ | 661,487 | |
| | 1,386 | | | Adobe, Inc.* | | | 711,559 | |
| | 7,376 | | | Advanced Micro Devices, Inc.* | | | 669,888 | |
| | 5,669 | | | Akamai Technologies, Inc.* | | | 660,042 | |
| | 10,200 | | | Amdocs Ltd. | | | 624,546 | |
| | 5,792 | | | Amphenol Corp., Class A | | | 635,962 | |
| | 5,421 | | | Analog Devices, Inc. | | | 633,606 | |
| | 2,000 | | | ANSYS, Inc.* | | | 678,020 | |
| | 5,740 | | | Apple, Inc. | | | 740,690 | |
| | 9,731 | | | Applied Materials, Inc. | | | 599,430 | |
| | 2,668 | | | Arista Networks, Inc.* | | | 596,165 | |
| | 2,563 | | | Autodesk, Inc.* | | | 629,729 | |
| | 4,640 | | | Automatic Data Processing, Inc. | | | 645,378 | |
| | 8,290 | | | Black Knight, Inc.* | | | 697,189 | |
| | 7,625 | | | Booz Allen Hamilton Holding Corp. | | | 671,457 | |
| | 1,916 | | | Broadcom, Inc. | | | 665,139 | |
| | 4,616 | | | Broadridge Financial Solutions, Inc. | | | 634,238 | |
| | 5,694 | | | Cadence Design Systems, Inc.* | | | 631,522 | |
| | 5,434 | | | CDW Corp. | | | 617,574 | |
| | 13,294 | | | Cisco Systems, Inc. | | | 561,273 | |
| | 4,418 | | | Citrix Systems, Inc. | | | 641,494 | |
| | 9,171 | | | Cognex Corp. | | | 634,541 | |
| | 9,324 | | | Cognizant Technology Solutions Corp., Class A | | | 623,403 | |
| | 19,851 | | | Corning, Inc. | | | 644,363 | |
| | 1,985 | | | Coupa Software, Inc.* | | | 650,564 | |
| | 10,343 | | | Dell Technologies, Inc., Class C* | | | 683,465 | |
| | 2,757 | | | DocuSign, Inc.* | | | 614,811 | |
| | 2,160 | | | EPAM Systems, Inc.* | | | 706,536 | |
| | 1,426 | | | Fair Isaac Corp.* | | | 600,047 | |
| | 4,300 | | | Fidelity National Information Services, Inc. | | | 648,655 | |
| | 6,325 | | | Fiserv, Inc.* | | | 629,843 | |
| | 2,369 | | | FleetCor Technologies, Inc.* | | | 595,685 | |
| | 4,500 | | | Fortinet, Inc.* | | | 594,022 | |
| | 4,841 | | | Gartner, Inc.* | | | 628,459 | |
| | 3,607 | | | Global Payments, Inc. | | | 637,068 | |
| | 8,548 | | | GoDaddy, Inc., Class A* | | | 715,297 | |
| | 63,262 | | | Hewlett Packard Enterprise Co. | | | 611,744 | |
| | 34,839 | | | HP, Inc. | | | 681,102 | |
| | 12,864 | | | Intel Corp. | | | 655,421 | |
| | 5,026 | | | International Business Machines Corp. | | | 619,756 | |
| | 2,015 | | | Intuit, Inc. | | | 695,961 | |
| | 3,478 | | | Jack Henry & Associates, Inc. | | | 575,331 | |
| | 24,632 | | | Juniper Networks, Inc. | | | 615,800 | |
| | 6,288 | | | Keysight Technologies, Inc.* | | | 619,494 | |
| | 3,096 | | | KLA Corp. | | | 635,113 | |
| | 1,637 | | | Lam Research Corp. | | | 550,589 | |
| | 7,023 | | | Leidos Holdings, Inc. | | | 635,511 | |
| | 16,746 | | | Marvell Technology Group Ltd. | | | 649,410 | |
| | 1,921 | | | Mastercard, Inc., Class A | | | 688,083 | |
| | 9,147 | | | Maxim Integrated Products, Inc. | | | 626,021 | |
| | 6,364 | | | Microchip Technology, Inc. | | | 698,131 | |
| | 12,337 | | | Micron Technology, Inc.* | | | 561,457 | |
| | 2,947 | | | Microsoft Corp. | | | 664,637 | |
| | 4,526 | | | Motorola Solutions, Inc. | | | 700,398 | |
| | 14,616 | | | NetApp, Inc. | | | 692,652 | |
| | |
| |
| Common Stocks – (continued) | | | |
| Information Technology – (continued) | |
| | 28,582 | | | NortonLifeLock, Inc. | | | 672,249 | |
| | 1,392 | | | NVIDIA Corp. | | | 744,692 | |
| | 2,782 | | | Okta, Inc.* | | | 599,159 | |
| | 11,279 | | | Oracle Corp. | | | 645,384 | |
| | 2,373 | | | Palo Alto Networks, Inc.* | | | 610,834 | |
| | 8,599 | | | Paychex, Inc. | | | 657,566 | |
| | 2,090 | | | Paycom Software, Inc.* | | | 625,871 | |
| | 3,084 | | | PayPal Holdings, Inc.* | | | 629,568 | |
| | 4,772 | | | Qorvo, Inc.* | | | 612,104 | |
| | 5,658 | | | QUALCOMM, Inc. | | | 673,868 | |
| | 2,151 | | | RingCentral, Inc., Class A* | | | 625,446 | |
| | 3,094 | | | salesforce.com, Inc.* | | | 843,579 | |
| | 14,022 | | | Seagate Technology PLC | | | 672,916 | |
| | 1,429 | | | ServiceNow, Inc.* | | | 688,807 | |
| | 4,367 | | | Skyworks Solutions, Inc. | | | 632,560 | |
| | 20,858 | | | Slack Technologies, Inc., Class A* | | | 684,977 | |
| | 2,932 | | | Splunk, Inc.* | | | 643,076 | |
| | 4,240 | | | Square, Inc., Class A* | | | 676,534 | |
| | 10,562 | | | SS&C Technologies Holdings, Inc. | | | 673,011 | |
| | 3,094 | | | Synopsys, Inc.* | | | 684,702 | |
| | 6,857 | | | TE Connectivity Ltd. | | | 662,386 | |
| | 6,971 | | | Teradyne, Inc. | | | 592,326 | |
| | 4,763 | | | Texas Instruments, Inc. | | | 677,060 | |
| | 1,265 | | | Trade Desk, Inc. (The), Class A* | | | 608,844 | |
| | 13,851 | | | Trimble, Inc.* | | | 725,931 | |
| | 2,262 | | | Twilio, Inc., Class A* | | | 610,197 | |
| | 1,702 | | | Tyler Technologies, Inc. * | | | 587,718 | |
| | 2,947 | | | VeriSign, Inc.* | | | 633,016 | |
| | 3,204 | | | Visa, Inc., Class A | | | 679,216 | |
| | 4,328 | | | VMware, Inc., Class A*(b) | | | 625,136 | |
| | 14,084 | | | Western Digital Corp. | | | 541,107 | |
| | 27,739 | | | Western Union Co. (The) | | | 654,363 | |
| | 3,411 | | | Workday, Inc., Class A* | | | 817,651 | |
| | 5,802 | | | Xilinx, Inc. | | | 604,336 | |
| | 2,193 | | | Zebra Technologies Corp., Class A* | | | 628,360 | |
| | 6,856 | | | Zendesk, Inc.* | | | 660,781 | |
| | 2,303 | | | Zoom Video Communications, Inc., Class A* | | | 748,705 | |
| | | | | | | | |
| | | | | | | 59,743,794 | |
| | |
| Materials – 4.6% | |
| | 2,195 | | | Air Products and Chemicals, Inc. | | | 641,511 | |
| | 5,419 | | | Avery Dennison Corp. | | | 625,298 | |
| | 8,339 | | | Ball Corp. | | | 670,205 | |
| | 6,301 | | | Celanese Corp. | | | 637,346 | |
| | 21,721 | | | Corteva, Inc. | | | 620,134 | |
| | 14,955 | | | Dow, Inc. | | | 674,770 | |
| | 11,426 | | | DuPont de Nemours, Inc. | | | 637,114 | |
| | 8,690 | | | Eastman Chemical Co. | | | 635,326 | |
| | 3,266 | | | Ecolab, Inc. | | | 643,663 | |
| | 5,759 | | | FMC Corp. | | | 615,407 | |
| | 44,662 | | | Freeport-McMoRan, Inc. | | | 697,174 | |
| | 4,925 | | | International Flavors & Fragrances, Inc.(b) | | | 609,666 | |
| | 17,565 | | | International Paper Co. | | | 637,083 | |
| | 9,491 | | | LyondellBasell Industries NV, Class A | | | 621,471 | |
| | 2,877 | | | Martin Marietta Materials, Inc. | | | 583,657 | |
| | |
| | |
| 10 | | The accompanying notes are an integral part of these financial statements. |
GOLDMAN SACHS EQUAL WEIGHT U.S. LARGE CAP EQUITY ETF
| | | | | | | | |
Shares | | | Description | | Value | |
| |
| Common Stocks – (continued) | | | |
| Materials – (continued) | |
| | 8,941 | | | Newmont Corp. | | $ | 601,550 | |
| | 14,382 | | | Nucor Corp. | | | 653,806 | |
| | 6,521 | | | Packaging Corp. of America | | | 660,186 | |
| | 5,643 | | | PPG Industries, Inc. | | | 679,417 | |
| | 7,460 | | | RPM International, Inc. | | | 632,384 | |
| | 960 | | | Sherwin-Williams Co. (The) | | | 644,208 | |
| | 4,931 | | | Vulcan Materials Co. | | | 591,720 | |
| | 20,878 | | | Westrock Co. | | | 633,230 | |
| | | | | | | | |
| | | | | | | 14,646,326 | |
| | |
| Real Estate – 6.6% | |
| | 3,613 | | | Alexandria Real Estate Equities, Inc. REIT | | | 608,357 | |
| | 2,450 | | | American Tower Corp. REIT | | | 610,417 | |
| | 4,170 | | | AvalonBay Communities, Inc. REIT | | | 659,110 | |
| | 7,272 | | | Boston Properties, Inc. REIT | | | 631,719 | |
| | 7,064 | | | Camden Property Trust REIT | | | 642,400 | |
| | 14,941 | | | CBRE Group, Inc., Class A* | | | 702,675 | |
| | 3,822 | | | Crown Castle International Corp. REIT | | | 623,942 | |
| | 7,336 | | | CyrusOne, Inc. REIT | | | 612,776 | |
| | 3,935 | | | Digital Realty Trust, Inc. REIT | | | 612,483 | |
| | 15,898 | | | Duke Realty Corp. REIT | | | 612,868 | |
| | 791 | | | Equinix, Inc. REIT | | | 624,716 | |
| | 9,438 | | | Equity LifeStyle Properties, Inc. REIT | | | 625,645 | |
| | 11,761 | | | Equity Residential REIT | | | 663,908 | |
| | 2,891 | | | Essex Property Trust, Inc. REIT | | | 625,930 | |
| | 6,018 | | | Extra Space Storage, Inc. REIT | | | 641,218 | |
| | 23,273 | | | Healthpeak Properties, Inc. REIT | | | 643,266 | |
| | 58,010 | | | Host Hotels & Resorts, Inc. REIT | | | 651,452 | |
| | 21,324 | | | Invitation Homes, Inc. REIT | | | 610,506 | |
| | 21,639 | | | Iron Mountain, Inc. REIT | | | 651,118 | |
| | 31,678 | | | Medical Properties Trust, Inc. REIT | | | 588,577 | |
| | 5,405 | | | Mid-America Apartment Communities, Inc. REIT | | | 633,034 | |
| | 5,979 | | | Prologis, Inc. REIT | | | 609,021 | |
| | 3,153 | | | Public Storage REIT | | | 669,697 | |
| | 10,110 | | | Realty Income Corp. REIT | | | 627,123 | |
| | 2,043 | | | SBA Communications Corp. REIT | | | 625,301 | |
| | 10,051 | | | Simon Property Group, Inc. REIT | | | 681,960 | |
| | 4,332 | | | Sun Communities, Inc. REIT | | | 645,815 | |
| | 17,855 | | | UDR, Inc. REIT | | | 621,533 | |
| | 16,504 | | | Ventas, Inc. REIT | | | 680,130 | |
| | 27,898 | | | VICI Properties, Inc. REIT | | | 623,241 | |
| | 11,920 | | | Welltower, Inc. REIT | | | 685,638 | |
| | 22,150 | | | Weyerhaeuser Co. REIT | | | 671,367 | |
| | 8,890 | | | W.P. Carey, Inc. REIT | | | 616,699 | |
| | | | | | | | |
| | | | | | | 21,033,642 | |
| | |
| Utilities – 5.8% | |
| | 40,912 | | | AES Corp. (The) | | | 726,188 | |
| | 11,886 | | | Alliant Energy Corp. | | | 643,627 | |
| | 7,843 | | | Ameren Corp. | | | 620,460 | |
| | 7,412 | | | American Electric Power Co., Inc. | | | 584,288 | |
| | 4,279 | | | American Water Works Co., Inc. | | | 604,794 | |
| | 6,058 | | | Atmos Energy Corp. | | | 604,709 | |
| | 33,027 | | | CenterPoint Energy, Inc. | | | 662,852 | |
| | |
| |
| Common Stocks – (continued) | | | |
| Utilities – (continued) | |
| | 10,040 | | | CMS Energy Corp. | | | 607,320 | |
| | 8,510 | | | Consolidated Edison, Inc. | | | 607,103 | |
| | 7,911 | | | Dominion Energy, Inc. | | | 620,539 | |
| | 5,438 | | | DTE Energy Co. | | | 645,327 | |
| | 7,514 | | | Duke Energy Corp. | | | 603,675 | |
| | 11,745 | | | Edison International | | | 616,378 | |
| | 6,214 | | | Entergy Corp. | | | 616,056 | |
| | 13,986 | | | Essential Utilities, Inc. | | | 594,405 | |
| | 11,668 | | | Evergy, Inc. | | | 620,971 | |
| | 7,117 | | | Eversource Energy | | | 609,998 | |
| | 16,667 | | | Exelon Corp. | | | 615,179 | |
| | 21,774 | | | FirstEnergy Corp. | | | 622,519 | |
| | 2,224 | | | NextEra Energy, Inc. | | | 620,874 | |
| | 26,049 | | | NiSource, Inc. | | | 577,246 | |
| | 18,722 | | | NRG Energy, Inc. | | | 644,224 | |
| | 7,901 | | | Pinnacle West Capital Corp. | | | 579,538 | |
| | 23,704 | | | PPL Corp. | | | 654,941 | |
| | 11,507 | | | Public Service Enterprise Group, Inc. | | | 601,126 | |
| | 4,954 | | | Sempra Energy | | | 612,562 | |
| | 11,722 | | | Southern Co. (The) | | | 611,654 | |
| | 34,270 | | | Vistra Corp. | | | 659,012 | |
| | 6,745 | | | WEC Energy Group, Inc. | | | 634,570 | |
| | 9,030 | | | Xcel Energy, Inc. | | | 627,359 | |
| | | | | | | | |
| | | | | | | 18,649,494 | |
| | |
| TOTAL INVESTMENTS BEFORE SECURITIES LENDING
REINVESTMENT VEHICLE |
|
| | (Cost $277,228,766) | | $ | 319,446,823 | |
| | |
| | | | | | | | |
| Shares | | | Dividend
Rate | | Value | |
|
| Securities Lending Reinvestment Vehicle – 0.2%(a) | |
| Goldman Sachs Financial Square Government Fund –
Institutional Shares |
|
| | 695,187 | | | 0.027% | | $ | 695,187 | |
| | (Cost $695,187) | |
| | |
| | TOTAL INVESTMENTS – 99.9% | |
| | (Cost $277,923,953) | | $ | 320,142,010 | |
| | |
| OTHER ASSETS IN EXCESS OF
LIABILITIES – 0.1% | | | 291,037 | |
| | |
| | NET ASSETS – 100.0% | | $ | 320,433,047 | |
| | |
| | |
|
| The percentage shown for each investment category reflects the value of investments in that category as a percentage of net assets. |
| |
* | | Non-income producing security. |
| |
(a) | | Represents an affiliated issuer. |
| |
(b) | | All or a portion of security is on loan. |
| | | | |
|
Investment Abbreviations: |
PLC | | —Public Limited Company |
REIT | | —Real Estate Investment Trust |
|
| | |
| The accompanying notes are an integral part of these financial statements. | | 11 |
GOLDMAN SACHS EQUAL WEIGHT U.S. LARGE CAP EQUITY ETF
Statement of Assets and Liabilities
August 31, 2020
| | | | | | |
| | | | | |
| | Assets: | |
| | |
| | Investments in unaffiliated issuers, at value (cost $276,620,182)(a) | | $ | 318,814,389 | |
| | |
| | Investments in affiliated issuers, at value (cost $608,584) | | | 632,434 | |
| | |
| | Investments in securities lending reinvestment vehicle, at value which equals cost | | | 695,187 | |
| | |
| | Cash | | | 491,254 | |
| | |
| | Receivables: | | | | |
| | |
| | Fund shares sold | | | 5,086,238 | |
| | |
| | Dividends | | | 502,601 | |
| | |
| | Securities lending income | | | 204 | |
| | |
| | Total assets | | | 326,222,307 | |
| | | | | | |
| | Liabilities: | |
| | |
| | Payables: | | | | |
| | |
| | Investments purchased | | | 5,070,643 | |
| | |
| | Upon return of securities loaned | | | 695,187 | |
| | |
| | Management fees | | | 23,430 | |
| | |
| | Total liabilities | | | 5,789,260 | |
| | | | | | |
| | Net Assets: | |
| | |
| | Paid-in capital | | | 294,824,639 | |
| | |
| | Total distributable earnings | | | 25,608,408 | |
| | |
| | NET ASSETS | | $ | 320,433,047 | |
| | SHARES ISSUED AND OUTSTANDING | |
| | |
| | Shares outstanding no par value (unlimited shares authorized): | | | 6,300,000 | |
| | |
| | Net asset value per share: | | | $50.86 | |
| | (a) | | Includes loaned securities having a market value of $673,328. |
| | |
| 12 | | The accompanying notes are an integral part of these financial statements. |
GOLDMAN SACHS EQUAL WEIGHT U.S. LARGE CAP EQUITY ETF
Statement of Operations
For the Fiscal Year Ended August 31, 2020
| | | | | | |
| | | | | |
| | Investment income: | |
| | |
| | Dividends — unaffiliated issuer | | $ | 4,686,557 | |
| | |
| | Dividends — affiliated issuers | | | 11,990 | |
| | |
| | Securities lending income — unaffiliated issuer | | | 4,074 | |
| | |
| | Total investment income | | | 4,702,621 | |
| | | | | | |
| | Expenses: | |
| | |
| | Management fees | | | 196,360 | |
| | |
| | Trustee fees | | | 8,239 | |
| | |
| | Total expenses | | | 204,599 | |
| | |
| | NET INVESTMENT INCOME | | | 4.498,022 | |
| | | | | | |
| | Realized and unrealized gain (loss): | |
| | |
| | Net realized gain (loss) from: | | | | |
| | |
| | Investments — unaffiliated issuers | | | (16,120,832 | ) |
| | |
| | Investments — affiliated issuers | | | (11,012 | ) |
| | |
| | In-kind redemptions — unaffiliated issuers | | | 7,473,300 | |
| | |
| | In-kind redemptions — affiliated issuers | | | 603 | |
| | |
| | Net change in unrealized gain (loss) on: | | | | |
| | |
| | Investments— unaffiliated issuers | | | 35,053,818 | |
| | |
| | Investments — affiliated issuers | | | 21,354 | |
| | |
| | Net realized and unrealized gain | | | 26,417,231 | |
| | |
| | NET INCREASE IN NET ASSETS RESULTING FROM OPERATIONS | | $ | 30,915,253 | |
| | |
| The accompanying notes are an integral part of these financial statements. | | 13 |
GOLDMAN SACHS EQUAL WEIGHT U.S. LARGE CAP EQUITY ETF
Statements of Changes in Net Assets
| | | | | | | | | | |
| | | | | For the Fiscal
Year Ended
August 31, 2020 | | | For the Fiscal
Year Ended
August 31, 2019 | |
| | From operations: | |
| | | |
| | Net investment income | | $ | 4,498,022 | | | $ | 1,967,256 | |
| | | |
| | Net realized gain (loss) | | | (8,657,941 | ) | | | 3,599,212 | |
| | | |
| | Net change in unrealized gain | | | 35,075,172 | | | | 2,986,124 | |
| | | |
| | Net increase in net assets resulting from operations | | | 30,915,253 | | | | 8,552,592 | |
| | | | | | | | | | |
| | Distributions to shareholders: | | | | | | | | |
| | | |
| | From distributable earnings | | | (4,152,895 | ) | | | (1,705,332 | ) |
| | | |
| | Total distributions to shareholders | | | (4,152,895 | ) | | | (1,705,332 | ) |
| | | | | | | | | | |
| | From share transactions: | |
| | | |
| | Proceeds from sales of shares | | | 156,356,207 | | | | 133,769,866 | |
| | | |
| | Cost of shares redeemed | | | (31,674,529 | ) | | | (48,065,915 | ) |
| | | |
| | Net increase in net assets resulting from share transactions | | | 124,681,678 | | | | 85,703,951 | |
| | | |
| | TOTAL INCREASE | | | 151,444,036 | | | | 92,551,211 | |
| | | | | | | | | | |
| | Net assets: | | | | | | | | |
| | | |
| | Beginning of period | | $ | 168,989,011 | | | $ | 76,437,800 | |
| | | |
| | End of period | | $ | 320,433,047 | | | $ | 168,989,011 | |
| | |
| 14 | | The accompanying notes are an integral part of these financial statements. |
GOLDMAN SACHS EQUAL WEIGHT U.S. LARGE CAP EQUITY ETF
Financial Highlights
Selected Data for a Share Outstanding Throughout Each Period
| | | | | | | | | | | | | | |
| | | | | For the Fiscal
Year Ended August 31, | | | For the Period
September 12, 2017*
to
August 31, 2018 | |
| | | | | 2020 | | | 2019 | |
| | Per Share Operating Performance: | | | | | | | | | | | | |
| | | | |
| | Net asset value, beginning of period | | $ | 46.30 | | | $ | 46.33 | | | $ | 40.58 | |
| | | | |
| | Net investment income(a) | | | 0.93 | | | | 0.81 | | | | 0.77 | |
| | | | |
| | Net realized and unrealized gain (loss) | | | 4.52 | | | | (0.10 | ) | | | 5.52 | |
| | | | |
| | Total gain from investment operations | | | 5.45 | | | | 0.71 | | | | 6.29 | |
| | | | |
| | Distributions to shareholders from net investment income | | | (0.89 | ) | | | (0.74 | ) | | | (0.54 | ) |
| | | | |
| | Net asset value, end of period | | $ | 50.86 | | | $ | 46.30 | | | $ | 46.33 | |
| | | | |
| | Market price, end of period | | $ | 50.95 | | | $ | 46.32 | | | $ | 46.35 | |
| | | | |
| | Total Return at Net Asset Value(b) | | | 12.08 | % | | | 1.62 | % | | | 15.60 | % |
| | | | |
| | Net assets, end of period (in 000’s) | | $ | 320,433 | | | $ | 168,989 | | | $ | 76,438 | |
| | | | |
| | Ratio of total expenses to average net assets | | | 0.09 | % | | | 0.09 | % | | | 0.09 | %(c) |
| | | | |
| | Ratio of net investment income to average net assets | | | 1.98 | % | | | 1.81 | % | | | 1.82 | %(c) |
| | | | |
| | Portfolio turnover rate(d) | | | 48 | % | | | 39 | % | | | 34 | % |
| | * | | Commencement of operations. |
| | (a) | | Calculated based on the average shares outstanding methodology. |
| | (b) | | Assumes investment at the net asset value at the beginning of the year, reinvestment of all distributions and a complete sale of the investment at the net asset value at the end of the year. Returns do not reflect the impact of taxes to shareholders relating to Fund distributions or the sale of Fund shares. Total returns for periods less than one full year are not annualized. |
| | (d) | | The Fund’s portfolio turnover rate is calculated in accordance with regulatory requirements and excludes portfolio securities received or delivered as a result of in-kind transactions. If such transactions were included, the Fund’s portfolio turnover rate may be higher. |
| | |
| The accompanying notes are an integral part of these financial statements. | | 15 |
GOLDMAN SACHS EQUAL WEIGHT U.S. LARGE CAP EQUITY ETF
Notes to Financial Statements
August 31, 2020
Goldman Sachs Equal Weight U.S. Large Cap Equity ETF (the “Fund”) is a diversified series of the Goldman Sachs ETF Trust (the “Trust”) which is an open-end management investment company, registered under the Investment Company Act of 1940, as amended (the “Act”), consisting of multiple series. The Trust was organized as a Delaware statutory trust on December 16, 2009.
The investment objective of the Fund is to provide investment results that closely correspond, before fees and expenses, to the performance of the Solactive US Large Cap Equal Weight Index (GTR) (the “Index”).
Goldman Sachs Asset Management, L.P. (“GSAM”), an affiliate of Goldman Sachs & Co. LLC (“Goldman Sachs”), serves as investment adviser to the Fund pursuant to a management agreement (the “Agreement”) with the Trust. The Fund is an exchange- traded fund (“ETF”). Shares of the Fund are listed and traded on the Cboe BZX Exchange, Inc. (“Cboe BZX”). Market prices for the Fund’s shares may be different from its net asset value (“NAV”). The Fund issues and redeems shares at its NAV only in blocks of a specified number of shares, or multiples thereof, referred to as “Creation Units”. Creation Units are issued and redeemed principally in-kind for a basket of securities and a cash amount, with respect to the Fund. Shares generally trade in the secondary market in quantities less than a Creation Unit at market prices that change throughout the day. Only those that have entered into an authorized participant agreement with ALPS Distributors, Inc. (the “Distributor”) may do business directly with the Fund.
|
| 2. SIGNIFICANT ACCOUNTING POLICIES |
The financial statements have been prepared in accordance with accounting principles generally accepted in the United States of America (“GAAP”) and require management to make estimates and assumptions that may affect the reported amounts and disclosures. Actual results may differ from those estimates and assumptions. The Fund is an investment company under GAAP and follows the accounting and reporting guidance applicable to investment companies.
A. Investment Valuation — The Fund’s valuation policy is to value investments at fair value.
B. Investment Income and Investments — Investment income includes interest income, dividend income, and securities lending income, if any. Interest income is accrued daily and adjusted for amortization of premiums and accretion of discounts. Dividend income is recognized on ex-dividend date or, for certain foreign securities, as soon as such information is obtained subsequent to the ex-dividend date. Non-cash dividends, if any, are recorded at the fair market value of the securities received. Investment transactions are reflected on trade date. Realized gains and losses are calculated using identified cost. Investment transactions are recorded on the following business day for daily NAV calculations. Distributions received from the Fund’s investments in U.S. real estate investment trusts (“REITs”) may be characterized as ordinary income, net capital gain or a return of capital. A return of capital is recorded by the Fund as a reduction to the cost basis of the REIT.
C. Expenses — Expenses incurred directly by the Fund are charged to the Fund, and certain expenses incurred by the Trust that may not solely relate to the Fund are allocated to the Fund and the other applicable funds of the Trust on a straight-line and/or pro- rata basis, depending upon the nature of the expenses, and are accrued daily.
D. Federal Taxes and Distributions to Shareholders — It is the Fund’s policy to comply with the requirements of the Internal Revenue Code of 1986, as amended (the “Code”), applicable to regulated investment companies and to distribute each year substantially all of its investment company taxable income and capital gains to its shareholders. Accordingly, the Fund is not required to make any provisions for the payment of federal income tax. Distributions to shareholders are recorded on the ex- dividend date. Income and capital gains distributions, if any, are declared and paid quarterly and annually, respectively.
Net capital losses, if any, are carried forward to future fiscal years and may be used to the extent allowed by the Code to offset any future capital gains. Losses that are carried forward will retain their character as either short-term or long-term capital losses. Utilization of capital loss carryforwards will reduce the requirement of future capital gains distributions.
The characterization of distributions to shareholders for financial reporting purposes is determined in accordance with federal income tax rules, which may differ from GAAP. The source of the Fund’s distributions may be shown in the accompanying financial statements as either from distributable earnings or capital. Certain components of the Fund’s net assets on the Statement of Assets and Liabilities reflect permanent GAAP/tax differences based on the appropriate tax character.
16
GOLDMAN SACHS EQUAL WEIGHT U.S. LARGE CAP EQUITY ETF
|
| 3. INVESTMENTS AND FAIR VALUE MEASUREMENTS |
U.S. GAAP defines the fair value of a financial instrument as the amount that would be received to sell an asset or paid to transfer a liability in an orderly transaction between market participants at the measurement date (i.e., the exit price); the Fund’s policy is to use the market approach. GAAP establishes a fair value hierarchy that prioritizes the inputs to valuation techniques used to measure fair value. The hierarchy gives the highest priority to unadjusted quoted prices in active markets for identical assets or liabilities (Level 1 measurements) and the lowest priority to unobservable inputs (Level 3 measurements). The level in the fair value hierarchy within which the fair value measurement in its entirety falls shall be determined based on the lowest level input that is significant to the fair value measurement in its entirety. The levels used for classifying investments are not necessarily an indication of the risk associated with investing in these investments. The three levels of the fair value hierarchy are described below:
Level 1 — Unadjusted quoted prices in active markets that are accessible at the measurement date for identical, unrestricted assets or liabilities;
Level 2 — Quoted prices in markets that are not active or financial instruments for which significant inputs are observable (including, but not limited to, quoted prices for similar investments, interest rates, foreign exchange rates, volatility and credit spreads), either directly or indirectly;
Level 3 — Prices or valuations that require significant unobservable inputs (including GSAM’s assumptions in determining fair value measurement).
The Board of Trustees (“Trustees”) has approved Valuation Procedures that govern the valuation of the portfolio investments held by the Fund, including investments for which market quotations are not readily available. The Trustees have delegated to GSAM day-to-day responsibility for implementing and maintaining internal controls and procedures related to the valuation of the Fund’s investments. To assess the continuing appropriateness of pricing sources and methodologies, GSAM regularly performs price verification procedures and issues challenges as necessary to third party pricing vendors or brokers, and any differences are reviewed in accordance with the Valuation Procedures.
A. Level 1 and Level 2 Fair Value Investments — The valuation techniques and significant inputs used in determining the fair values for investments classified as Level 1 and Level 2 are as follows:
Equity Securities — Equity securities traded on a United States (“U.S.”) securities exchange or the NASDAQ system, or those located on certain foreign exchanges, including but not limited to the Americas, are valued daily at their last sale price or official closing price on the principal exchange or system on which they are traded. If there is no sale or official closing price or such price is believed by GSAM to not represent fair value, equity securities will be valued at the valid closing bid price for long positions and at the valid closing ask price for short positions (i.e. where there is sufficient volume, during normal exchange trading hours). If no valid bid/ask price is available, the equity security will be valued pursuant to the Valuation Procedures approved by the Trustees and consistent with applicable regulatory guidance. To the extent these investments are actively traded, they are classified as Level 1 of the fair value hierarchy, otherwise they are generally classified as Level 2. Certain equity securities containing unique attributes may be classified as Level 2
Unlisted equity securities for which market quotations are available are valued at the last sale price on the valuation date, or if no sale occurs, at the last bid price for long positions or the last ask price for short positions, and are generally classified as Level 2.
Underlying Funds (including Money Market Funds) — Underlying funds (“Underlying Funds”) include other investment companies and exchange-traded funds (“ETFs”). Investments in the Underlying Funds (except ETFs) are valued at the NAV per share on the day of valuation. ETFs are valued daily at the last sale price or official closing price on the principal exchange or system on which the investment is traded. Because the Fund invests in Underlying Funds that fluctuate in value, the Fund’s shares will correspondingly fluctuate in value. To the extent these investments are actively traded, they are classified as Level 1 of the fair value hierarchy, otherwise they are generally classified as Level 2. For information regarding an Underlying Fund’s accounting policies and investment holdings, please see the Underlying Fund’s shareholder report.
17
GOLDMAN SACHS EQUAL WEIGHT U.S. LARGE CAP EQUITY ETF
Notes to Financial Statements (continued)
August 31, 2020
|
| 3. INVESTMENTS AND FAIR VALUE MEASUREMENTS (continued) |
B. Level 3 Fair Value Investments — To the extent that significant inputs to valuation models and other alternative pricing sources are unobservable, or if quotations are not readily available, or if GSAM believes that such quotations do not accurately reflect fair value, the fair value of the Fund’s investments may be determined under Valuation Procedures approved by the
Trustees. GSAM, consistent with its procedures and applicable regulatory guidance, may make an adjustment to the most recent valuation prices of either domestic or foreign securities in light of significant events to reflect what it believes to be the fair value of the securities at the time of determining the Fund’s NAV. To the extent investments are valued using single source broker quotations obtained directly from the broker or passed through from third party pricing vendors, such investments are classified as Level 3 investments.
C. Fair Value Hierarchy — The following is a summary of the Fund’s investments classified in the fair value hierarchy as of August 31, 2020:
| | | | | | | | | | | | |
|
| EQUAL WEIGHT U.S. LARGE CAP EQUITY ETF | |
| | | |
| Investment Type | | Level 1 | | | Level 2 | | | Level 3 | |
| | | |
| Assets | | | | | | | | | | | | |
| | | |
Common Stock and/or Other Equity Investments(a) | | | | | | | | | | | | |
| | | |
North America | | $ | 319,446,823 | | | $ | — | | | $ | — | |
| | | |
Securities Lending Reinvestment Vehicle | | | 695,187 | | | | — | | | | — | |
| | | |
| Total | | $ | 320,142,010 | | | $ | — | | | $ | — | |
| (a) | | Amounts are disclosed by continent to highlight the impact of time zone differences between local market close and the calculation of NAV. Security valuations are based on the principal exchange or system on which they are traded, which may differ from country of domicile. |
For further information regarding security characteristics, see the Schedule of Investments.
|
| 4. AGREEMENTS AND AFFILIATED TRANSACTIONS |
A. Management Agreement — Under the Agreement, GSAM manages the Fund, subject to the general supervision of the Trustees.
As compensation for the services rendered pursuant to the Agreement, the assumption of the expenses related thereto and administration of the Fund’s business affairs, including providing facilities, GSAM is entitled to a management fee, accrued daily and paid monthly, equal to an annual percentage rate of the Fund’s average daily net assets.
The Fund operates under a unitary management fee structure. Under the unitary fee structure, GSAM is responsible for paying substantially all the expenses of the Fund, excluding payments under the Fund’s 12b-1 plan (if any), interest expenses, taxes, acquired fund fees and expenses, brokerage fees, costs of holding shareholder meetings, litigation, indemnification and extraordinary expenses. As the Fund directly pays fees and expenses of the independent Trustees, the management fee collected by GSAM will be reduced by an amount equal to the fees and expenses paid by the Fund to the independent Trustees.
For the fiscal year ended August 31, 2020, the unitary management fee rate with GSAM was 0.09%.
B. Other Transactions with Affiliates — The Fund may purchase securities from, or sell securities to, an affiliated fund provided the affiliation is solely due to having a common investment adviser, common officers, or common trustees. The following table provides information about the Fund’s investment in The Goldman Sachs Group, Inc. for the fiscal year ended August 31, 2020:
| | | | | | | | | | | | | | | | | | | | | | | | | | | | |
Beginning
value as of
August 31,
2019 | | Purchases
at Cost | | | Proceeds
from Sales | | | Realized
Loss | | | Change in
Unrealized
Depreciation | | | Ending
value as of
August 31,
2020 | | | Shares as of
August 31,
2020 | | | Dividend
Income | |
| $332,985 | | $ | 420,153 | | | $ | (131,649 | ) | | $ | (10,409 | ) | | $ | 21,354 | | | $ | 632,434 | | | | 3,087 | | | $ | 11,990 | |
18
GOLDMAN SACHS EQUAL WEIGHT U.S. LARGE CAP EQUITY ETF
|
| 5. CREATION AND REDEMPTION OF CREATION UNITS |
The Trust issues and redeems shares of the Fund only in Creation Units on a continuous basis through the Distributor, without an initial sales load, at NAV next determined after receipt, on any Business Day (as defined in the Statement of Additional Information), of an order in proper form. Shares of the Fund may only be purchased or redeemed by certain financial institutions (each an “Authorized Participant”). An Authorized Participant is either (1) a “Participating Party” or other participant in the clearing process through the Continuous Net Settlement System of the National Securities Clearing Corporation; or (2) a Depository Trust Company participant; which, in either case, must have executed an agreement with the Distributor. Retail investors will typically not qualify as an Authorized Participant or have the resources to buy and sell whole Creation Units. Therefore, they will be unable to purchase or redeem the shares directly from the Fund. Rather, most retail investors will purchase shares in the secondary market at market prices with the assistance of a broker and may be subject to customary brokerage commissions or fees. Fixed creation and redemption transaction fees are imposed in connection with creations and redemptions.
Authorized Participants transacting in Creation Units for cash may also pay a variable charge to compensate the Fund for certain transaction costs (e.g. taxes on currency or other financial transactions, and brokerage costs) and market impact expenses relating to investing in portfolio securities. Such variable charges, if any, are included in “Proceeds from sale of shares” in the Statement of Changes in Net Assets.
Share activity is as follows:
| | | | | | | | | | | | | | | | |
| | | Equal Weight U.S. Large Cap Equity ETF | |
| | | | |
| | | For the Fiscal Year Ended
August 31, 2020 | | | For the Fiscal Year Ended
August 31, 2019 | |
| | | | |
| | | Shares | | | Dollars | | | Shares | | | Dollars | |
| | | | |
| Fund Share Activity | | | | |
Shares Sold | | | 3,400,000 | | | $ | 156,356,177 | | | | 3,100,000 | | | $ | 133,769,866 | |
Shares Redeemed | | | (750,000 | ) | | | (31,674,529 | ) | | | (1,100,000 | ) | | | (48,065,915 | ) |
| | | | |
NET INCREASE IN SHARES | | | 2,650,000 | | | $ | 124,681,648 | | | | 2,000,000 | | | $ | 85,703,951 | |
|
| 6. PORTFOLIO SECURITIES TRANSACTIONS |
The cost of purchases and proceeds from sales of long-term securities for the fiscal year ended August 31, 2020, were $109,797,801 and $109,381,201, respectively.
The purchases and sales from in-kind creation and redemption transactions for the fiscal year ended August 31, 2020, were $155,966,201 and $31,591,743, respectively.
The Fund may lend its securities through a securities lending agent, the Bank of New York Mellon (“BNYM”), to certain qualified borrowers. In accordance with the Fund’s securities lending procedures, the Fund receives cash collateral at least equal to the market value of the securities on loan. The market value of the loaned securities is determined at the close of business of the Fund, at their last sale price or official closing price on the principal exchange or system on which they are traded, and any additional required collateral is delivered to the Fund on the next business day. As with other extensions of credit, the Fund may experience delay in the recovery of its securities or incur a loss should the borrower of the securities breach its agreement with the Fund or become insolvent at a time when the collateral is insufficient to cover the cost of repurchasing securities on loan. Dividend income received from securities on loan may not be subject to withholding taxes and therefore withholding taxes paid may differ from the amounts listed in the Statement of Operations. Loans of securities are terminable at any time and as such 1) the remaining contractual maturities of the outstanding securities lending transactions are considered to be overnight and continuous and 2) the borrower, after notice, is required to return borrowed securities within the standard time period for settlement of securities transactions.
19
GOLDMAN SACHS EQUAL WEIGHT U.S. LARGE CAP EQUITY ETF
Notes to Financial Statements (continued)
August 31, 2020
|
| 7. SECURITIES LENDING (continued) |
The Fund invested the cash collateral received in connection with securities lending transactions in the Goldman Sachs Financial Square Government Fund (“Government Money Market Fund”), an affiliated series of the Goldman Sachs Trust. The Government Money Market Fund is registered under the Act as an open end investment company, is subject to Rule 2a-7 under the Act, and is managed by GSAM, for which GSAM may receive a management fee of up to 0.16% on an annualized basis of the average daily net assets of the Government Money Market Fund.
In the event of a default by a borrower with respect to any loan, BNYM may exercise any and all remedies provided under the applicable borrower agreement to make the Fund whole. These remedies include purchasing replacement securities by applying the collateral held from the defaulting broker against the purchase cost of the replacement securities. If BNYM is unable to purchase replacement securities, BNYM will indemnify the Fund by paying the Fund an amount equal to the market value of the securities loaned minus the value of cash collateral received from the borrower for the loan, subject to an exclusion for any shortfalls resulting from a loss of value in such cash collateral due to reinvestment risk. The Fund’s master netting agreements with certain borrowers provide the right, in the event of a default (including bankruptcy or insolvency), for the non-defaulting party to liquidate the collateral and calculate net exposure to the defaulting party or request additional collateral. However, in the event of a default by a borrower, a resolution authority could determine that such rights are not enforceable due to the restrictions or prohibitions against the right of set-off that may be imposed in accordance with a particular jurisdiction’s bankruptcy or insolvency laws. The Fund’s loaned securities were all subject to enforceable Securities Lending Agreements and the value of the collateral was at least equal to the value of the cash received. The amounts of the Fund’s overnight and continuous agreements, which represent the gross amounts of recognized liabilities for securities lending transactions outstanding as of August 31, 2020, are disclosed as “Payable upon return of securities loaned” on the Statement of Assets and Liabilities, where applicable.
Both the Fund and BNYM received compensation relating to the lending of the Fund’s securities. The amounts earned, if any, by the Fund for the fiscal year ended August 31, 2020, are reported under Investment Income on the Statement of Operations.
The following table provides information about the Fund’s investment in the Government Money Market Fund for the fiscal year ended August 31, 2020:
| | | | | | | | | | | | | | |
Beginning
value as of
August 31, 2019 | | | Purchases
at Cost | | | Proceeds
from Sales | | | Ending
value as of
August 31, 2020 | |
| $ | 320,144 | | | $ | 13,876,604 | | | $ | (13,501,561 | ) | | $ | 695,187 | |
The tax character of distributions paid during the fiscal years ended August 31, 2020 and August 31, 2019 were as follows:
| | | | | | | | |
| | | 2020 | | | 2019 | |
Distributions paid from: | | | | | | | | |
Ordinary Income* | | $ | 4,152,895 | | | $ | 1,705,332 | |
Total taxable distributions | | $ | 4,152,895 | | | $ | 1,705,332 | |
| * | | For tax purposes short-term capital gain distributions are considered ordinary income distributions. |
20
GOLDMAN SACHS EQUAL WEIGHT U.S. LARGE CAP EQUITY ETF
|
| 8. TAX INFORMATION (continued) |
As of August 31, 2020, the components of accumulated earnings (losses) on a tax-basis were as follows:
| | | | |
| | | Equal Weight U.S.
Large Cap Equity ETF | |
Undistributed ordinary income — net | | $ | 823,487 | |
Undistributed long-term capital gains | | | — | |
Total undistributed earnings | | $ | 823,487 | |
Capital loss carryforwards: | | | | |
Perpetual Short-Term | | $ | (3,558,901 | ) |
Perpetual Long-Term | | | (3,700,950 | ) |
Timing differences | | | — | |
Unrealized gains (losses) — net | | | 32,044,772 | |
Total accumulated earnings (losses) net | | $ | 25,608,408 | |
As of August 31, 2020, the Fund’s aggregate security unrealized gains and losses based on cost for U.S. federal income tax purposes were as follows:
| | | | |
| | | Equal Weight U.S.
Large Cap Equity ETF | |
Tax Cost | | $ | 288,097,238 | |
Gross unrealized gain | | | 43,858,404 | |
Gross unrealized loss | | | (11,813,632 | ) |
Net unrealized gains (losses) | | $ | 32,044,772 | |
The difference between GAAP-basis and tax-basis unrealized gains (losses) is attributable primarily to wash sales.
The Fund reclassed $6,502,918 from distributable earnings to paid in capital for the year ending August 31, 2020. In order to present certain components of the Fund’s capital accounts on a tax-basis, certain reclassifications have been recorded to the Fund’s accounts. These reclassifications have no impact on the net asset value of the Fund and result primarily from redemptions in-kind.
GSAM has reviewed the Fund’s tax positions for all open tax years (the current and prior three years, as applicable) and has concluded that no provision for income tax is required in the Fund’s financial statements. Such open tax years remain subject to examination and adjustment by tax authorities.
The Fund’s risks include, but are not limited to, the following:
Index Risk — Solactive AG (the “Index Provider”) constructs the Fund’s Index in accordance with a rules-based methodology. The Fund will be negatively affected by general declines in the securities and asset classes represented in its Index. In addition, because the Fund is not “actively” managed, unless a specific security is removed from its Index, the Fund generally would not sell a security because the security’s issuer was in financial trouble. Market disruptions and regulatory restrictions could have an adverse effect on the Fund’s ability to adjust its exposure to the required levels in order to track the Index. The Fund also does not attempt to take defensive positions under any market conditions, including declining markets. Therefore, the Fund’s performance could be lower than funds that may actively shift their portfolio assets to take advantage of market opportunities or to lessen the impact of a market decline or a decline in the value of one or more issuers. The Index Provider relies on third party data it believes to be reliable in constructing the Index, but it does not guarantee the accuracy or availability of such third party data. Errors in index data, index computation or the construction of the Index in accordance with its methodology may occur from time to time
21
GOLDMAN SACHS EQUAL WEIGHT U.S. LARGE CAP EQUITY ETF
Notes to Financial Statements (continued)
August 31, 2020
|
| 9. OTHER RISKS (continued) |
and may not be identified and corrected by the Index Provider for a period of time or at all, which may have an adverse impact on the Fund and its shareholders. In addition, neither the Fund, the Investment Adviser nor the Index Provider can guarantee the availability or timeliness of the production of the Index.
Investments in Other Investment Companies Risk — As a shareholder of another investment company, including an ETF, the Fund will indirectly bear its proportionate share of any net management fees and other expenses paid by such other investment companies, in addition to the fees and expenses regularly borne by the Fund. ETFs are subject to risks that do not apply to conventional mutual funds, including but not limited to the following: (i) the market price of the ETF’s shares may trade at a premium or a discount to their NAV; and (ii) an active trading market for an ETF’s shares may not develop or be maintained.
Market and Credit Risks — In the normal course of business, the Fund trades financial instruments and enters into financial transactions where risk of potential loss exists due to changes in the market (market risk). The value of the securities in which the Fund invests may go up or down in response to the prospects of individual companies, particular sectors or governments and/or general economic conditions throughout the world due to increasingly interconnected global economies and financial markets. Events such as war, acts of terrorism, social unrest, natural disasters, the spread of infectious illness or other public health threats could also significantly impact the Fund and its investments.
Additionally, the Fund may also be exposed to credit risk in the event that an issuer or guarantor fails to perform or that an institution or entity with which the Fund has unsettled or open transactions defaults.
Market Trading Risk — The Fund faces numerous market trading risks, including disruptions to creations and redemptions, the existence of extreme market volatility or potential lack of an active trading market for Shares. If a shareholder purchases Shares at a time when the market price is at a premium to the NAV or sells Shares at a time when the market price is at a discount to the NAV, the shareholder may sustain losses. The Investment Adviser cannot predict whether Shares will trade below, at or above their NAV. Price differences may be due, in large part, to the fact that supply and demand forces at work in the secondary trading market for Shares will be closely related to, but not identical to, the same forces influencing the prices of the securities of the Fund’s Index trading individually or in the aggregate at any point in time.
Tracking Error Risk — Tracking error is the divergence of the Fund’s performance from that of its Index. The performance of the Fund may diverge from that of its Index for a number of reasons. Tracking error may occur because of transaction costs, the Fund’s holding of cash, differences in accrual of dividends, changes to its Index or the need to meet new or existing regulatory requirements. Unlike the Fund, the returns of its Index are not reduced by investment and other operating expenses, including the trading costs associated with implementing changes to the portfolio of investments. Tracking error risk may be heightened during times of market volatility or other unusual market conditions.
Under the Trust’s organizational documents, its Trustees, officers, employees and agents are indemnified, to the extent permitted by the Act and state law, against certain liabilities that may arise out of performance of their duties to the Fund. Additionally, in the course of business, the Fund enters into contracts that contain a variety of indemnification clauses. The Fund’s maximum exposure under these arrangements is unknown, as this would involve future claims that may be made against the Fund that have not yet occurred. However, GSAM believes the risk of loss under these arrangements to be remote.
Subsequent events after the Statement of Assets and Liabilities date have been evaluated and GSAM has concluded that there is no impact requiring adjustment or disclosure in the financial statements.
22
Report of Independent Registered Public
Accounting Firm
To the Board of Trustees of Goldman Sachs ETF Trust and Shareholders of
Goldman Sachs Equal Weight U.S. Large Cap Equity ETF
Opinion on the Financial Statements
We have audited the accompanying statement of assets and liabilities, including the schedule of investments, of Goldman Sachs Equal Weight U.S. Large Cap Equity ETF (one of the funds constituting Goldman Sachs ETF Trust, referred to hereafter as the “Fund”) as of August 31, 2020, the related statement of operations for the year ended August 31, 2020, the statements of changes in net assets for each of the two years in the period ended August 31, 2020, including the related notes, and the financial highlights for each of the periods indicated therein (collectively referred to as the “financial statements”). In our opinion, the financial statements present fairly, in all material respects, the financial position of the Fund as of August 31, 2020, the results of its operations for the year then ended, the changes in its net assets for each of the two years in the period ended August 31, 2020 and the financial highlights for each of the periods indicated therein in conformity with accounting principles generally accepted in the United States of America.
Basis for Opinion
These financial statements are the responsibility of the Fund’s management. Our responsibility is to express an opinion on the Fund’s financial statements based on our audits. We are a public accounting firm registered with the Public Company Accounting Oversight Board (United States) (PCAOB) and are required to be independent with respect to the Fund in accordance with the U.S. federal securities laws and the applicable rules and regulations of the Securities and Exchange Commission and the PCAOB.
We conducted our audits of these financial statements in accordance with the standards of the PCAOB. Those standards require that we plan and perform the audit to obtain reasonable assurance about whether the financial statements are free of material misstatement, whether due to error or fraud.
Our audits included performing procedures to assess the risks of material misstatement of the financial statements, whether due to error or fraud, and performing procedures that respond to those risks. Such procedures included examining, on a test basis, evidence regarding the amounts and disclosures in the financial statements. Our audits also included evaluating the accounting principles used and significant estimates made by management, as well as evaluating the overall presentation of the financial statements. Our procedures included confirmation of securities owned as of August 31, 2020 by correspondence with the custodian and transfer agent. We believe that our audits provide a reasonable basis for our opinion.
/s/ PricewaterhouseCoopers LLP
Boston, Massachusetts
October 26, 2020
We have served as the auditor of one or more investment companies in the Goldman Sachs fund complex since 2000.
23
GOLDMAN SACHS EQUAL WEIGHT U.S. LARGE CAP EQUITY ETF
Liquidity Risk Management Program (Unaudited)
The Fund has adopted and implemented a liquidity risk management program (the “Program”) in accordance with Rule 22e-4 under the 1940 Act. The Program seeks to assess and manage each Fund’s liquidity risk, i.e., the risk that a Fund is unable to satisfy redemption requests without significantly diluting remaining investors’ interests in the Fund. The Board of Trustees of the Trust has designated GSAM, each Fund’s investment adviser, to administer the Program. Certain aspects of the Program rely on third parties to perform certain functions, including the provision of market data and application of models.
The Program is comprised of various components designed to support the assessment and/or management of liquidity risk, including: (1) the periodic assessment (no less frequently than annually) of certain factors that influence a Fund’s liquidity risk; (2) the periodic classification (no less frequently than monthly) of a Fund’s investments into one of four liquidity categories that reflect an estimate of their liquidity under current market conditions; (3) a 15% limit on the acquisition of “illiquid investments” (as defined under Rule 22e-4); (4) for a Fund that does not invest primarily in “highly liquid investments” (as defined under Rule 22e-4), the determination of a minimum percentage of the Fund’s assets that will generally be invested in highly liquid investments (a “Highly Liquid Investment Minimum”); and (5) periodic reporting to the Board of Trustees.
At a meeting of the Board of Trustees on March 18-19, 2020, GSAM provided a written report to the Board addressing the operation, and the adequacy and effectiveness of the implementation, of the Program, including, as applicable, the operation of any Highly Liquid Investment Minimum and any material changes to the Program, for the initial period from December 1, 2018 through December 31, 2019 (the “Reporting Period”). Among other things, the annual report discussed: (1) the results of stress tests designed to assess liquidity under a hypothetical stressed scenario involving elevated redemptions; and (2) an assessment of the methodologies used to classify investments into one of four liquidity categories. The report concluded that the Program was reasonably designed to assess and manage liquidity risk and was adequately and effectively implemented during the Reporting Period.
There can be no assurance that the Program will achieve its objectives under all circumstances in the future. Please refer to your Fund’s prospectus for more information regarding the Fund’s exposure to liquidity risk and other risks to which it may be subject.
24
GOLDMAN SACHS EQUAL WEIGHT U.S. LARGE CAP EQUITY ETF
| | |
| | |
Fund Expenses — Six Month Period Ended 8/31/2020 (Unaudited) | | |
As a shareholder you incur ongoing costs, including management fees and other Fund expenses. This example is intended to help you understand your ongoing costs (in dollars) of investing in Shares of the Fund and to compare these costs with the ongoing costs of investing in other exchange-traded funds. This example does not take into account brokerage commissions that you may pay on your purchases and sales of Shares of the Fund.
The example is based on an investment of $l,000 invested at the beginning of the period from March 1, 2020 and held for the six months ended August 31, 2020, which represents a period of 184 days of a 366 day year (or less where indicated).
Actual Expenses — The first line in the table below provides information about actual account values and actual expenses. You may use the information in this line, together with the amount you invested, to estimate the expenses that you paid over the six months. Simply divide your account value by $1,000 (for example, an $8,600 account value divided by $1,000=8.6), then multiply the result by the number in the first line under the heading entitled “Expenses Paid” to estimate the expenses you paid on your account during this period.
Hypothetical Example for Comparison Purposes — The second line in the table below provides information about hypothetical account values and hypothetical expenses based on the Fund’s actual net expense ratios and an assumed rate of return of 5% per year before expenses, which is not the Fund’s actual return. The hypothetical account values and expenses may not be used to estimate the actual ending account balance or expenses you paid for the period. You may use this information to compare the ongoing costs of investing in the Fund and other funds. To do so, compare this 5% hypothetical example with the 5% hypothetical examples that appear in the shareholder reports of the other funds.
Please note that the expenses shown in the table are meant to highlight your ongoing costs only and do not reflect any transactional costs, such as redemption fees, or exchange fees. Therefore, the second line of the table is useful in comparing ongoing costs only, and will not help you determine the relative total costs of owning different funds. In addition, if these transactional costs were included, your costs would have been higher.
| | | | | | | | | | | | |
| | | Equal Weight U.S. Large Cap Equity ETF | |
| | | Beginning
Account Value
3/1/20 | | | Ending
Account Value
8/31/20 | | | Expenses Paid* | |
Actual based on NAV | | $ | 1,000 | | | $ | 1,116.30 | | | $ | 0.48 | |
Hypothetical 5% return | | $ | 1,000 | | | $ | 1,024.68 | + | | $ | 0.46 | |
| | + | | Hypothetical expenses are based on the Fund’s actual annualized net expense ratios and an assumed rate of return of 5% per year before expenses. | |
| | * | | Expenses for the Fund are calculated using the Fund’s annualized net expense ratio, which represents the ongoing expenses as a percentage of net assets for the six months ended August 31, 2020. Expenses are calculated by multiplying the annualized net expense ratio by the average account value for the period; then multiplying the result by the number of days in the most recent fiscal year; and then dividing that result by the number of days in the fiscal year. | |
| | | | The annualized net expense ratio for the period is as follows: | |
| | | | | | | | |
| Fund | | | | | | |
| | |
Equal Weight U.S. Large Cap Equity ETF | | | | | | | 0.09% | |
25
GOLDMAN SACHS EQUAL WEIGHT U.S. LARGE CAP EQUITY ETF
Trustees and Officers (Unaudited) Independent Trustees
| | | | | | | | | | |
Name, Address and Age1 | | Position(s) Held
with the Trust | | Term of
Office and Length of Time Served2 | | Principal Occupation(s)
During Past 5 Years | | Number of
Portfolios in
Fund Complex
Overseen by
Trustee3 | | Other
Directorships
Held by Trustee4 |
| | | | | |
Lawrence W. Stranghoener Age: 66 | | Chairman of the Board of Trustees | | Trustee Since 2015; Chairman Since 2017 | | Mr. Stranghoener is retired. He is Director, Kennametal, Inc. (a global manufacturer and distributor of tooling and industrial materials) (2003-Present); and was formerly Director, Aleris Corporation and Aleris International, Inc. (a producer of aluminum rolled products) (2011-2020); Interim Chief Executive Officer (2014); and Executive Vice President and Chief Financial Officer (2004-2014), Mosaic Company (a fertilizer manufacturing company). Chairman of the Board of Trustees — Goldman Sachs ETF Trust; Goldman Sachs MLP Income Opportunities Fund; Goldman Sachs MLP and Energy Renaissance Fund; Goldman Sachs Credit Income Fund; and Goldman Sachs Real Estate Diversified Income Fund. | | 46 | | Kennametal Inc. (a global manufacturer and distributor of tooling and industrial materials) |
| | | | | |
Caroline Dorsa Age: 61 | | Trustee | | Since 2016 | | Ms. Dorsa is retired. She is Director, Biogen Inc. (a biotechnology company) (2010-Present); Director, Intellia Therapeutics Inc. (a gene- editing company) (2015-Present); and Director, Illumina, Inc. (a life sciences company) (2017- Present). She was formerly Executive Vice President and Chief Financial Officer, Public Service Enterprise Group, Inc. (a generation and energy services company) (2009-2015); Senior Vice President, Merck & Co, Inc. (a pharmaceutical company) (2008-2009 and 1987- 2007); Senior Vice President and Chief Financial Officer, Gilead Sciences, Inc. (a pharmaceutical company) (2007-2008); and Senior Vice President and Chief Financial Officer, Avaya, Inc. (a technology company) (2007). Trustee — Goldman Sachs ETF Trust; Goldman Sachs MLP Income Opportunities Fund; Goldman Sachs MLP and Energy Renaissance Fund; Goldman Sachs Credit Income Fund; and Goldman Sachs Real Estate Diversified Income Fund. | | 46 | | Biogen Inc. (a biotechnology company); Intellia Therapeutics Inc. (a gene-editing company); Illumina, Inc. (a life sciences company) |
| | | | | |
Linda A. Lang Age: 62 | | Trustee | | Since 2016 | | Ms. Lang is retired. She was formerly Chair of the Board of Directors (2016-2019), and Member of the Board of Directors, WD-40 Company (a global consumer products company) (2004-2019); Chairman and Chief Executive Officer (2005-2014); and Director, President and Chief Operating Officer, Jack in the Box, Inc. (a restaurant company) (2003-2005). Previously, Ms. Lang served as an Advisory Board Member of Goldman Sachs MLP Income Opportunities Fund and Goldman Sachs MLP and Energy Renaissance Fund (February 2016-March 2016). Trustee — Goldman Sachs ETF Trust; Goldman Sachs MLP Income Opportunities Fund; Goldman Sachs MLP and Energy Renaissance Fund; Goldman Sachs Credit Income Fund; and Goldman Sachs Real Estate Diversified Income Fund. | | 46 | | None |
| | | | | |
Michael Latham Age: 54 | | Trustee | | Since 2015 | | Mr. Latham is retired. Formerly, he held senior management positions with the iShares exchange-traded fund business, including Chairman (2011-2014); Global Head (2010-2011); U.S. Head (2007-2010); and Chief Operating Officer (2003-2007). Trustee — Goldman Sachs ETF Trust; Goldman Sachs MLP Income Opportunities Fund; Goldman Sachs MLP and Energy Renaissance Fund; Goldman Sachs Credit Income Fund; and Goldman Sachs Real Estate Diversified Income Fund. | | 46 | | None |
| | | | | | | | | | |
26
GOLDMAN SACHS EQUAL WEIGHT U.S. LARGE CAP EQUITY ETF
Trustees and Officers (Unaudited) (continued) Interested Trustee*
| | | | | | | | | | |
Name,
Address and Age1 | | Position(s) Held
with the Trust | | Term of Office and
Length of
Time Served2 | | Principal Occupation(s)
During Past 5 Years | | Number of
Portfolios in
Fund Complex
Overseen by
Trustee3 | | Other
Directorships
Held by Trustee4 |
| | | | | |
James A. McNamara Age: 57 | | Trustee and President | | Since 2014 | | Advisory Director, Goldman Sachs (January 2018-Present); Managing Director, Goldman Sachs (January 2000-December 2017); Director of Institutional Fund Sales, GSAM (April 1998-December 2000); and Senior Vice President and Manager, Dreyfus Institutional Service Corporation (January 1993-April 1998). President and Trustee — Goldman Sachs ETF Trust; Goldman Sachs Trust; Goldman Sachs Variable Insurance Trust; Goldman Sachs Trust II; Goldman Sachs MLP Income Opportunities Fund; Goldman Sachs MLP and Energy Renaissance Fund; Goldman Sachs Credit Income Fund; and Goldman Sachs Real Estate Diversified Income Fund. | | 168 | | None |
| | | | | | | | | | |
| * | | This person is considered to be an “Interested Trustee” because he holds a position with Goldman Sachs and own securities issued by The Goldman Sachs Group, Inc. The Interested Trustee holds comparable positions with certain other companies of which Goldman Sachs, GSAM or an affiliate thereof is the investment adviser, administrator and/or distributor. |
| 1 | | Each Trustee may be contacted by writing to the Trustee, c/o Goldman Sachs, 200 West Street, New York, New York, 10282, Attn: Caroline L. Kraus. Information is provided as of August 31, 2020. |
| 2 | | Each Trustee holds office for an indefinite term until the earliest of: (a) the election of his or her successor; (b) the date the Trustee resigns, retires or is removed by the Board of Trustees or shareholders, in accordance with the Trust’s Declaration of Trust; or (c) the termination of the Trust. |
| 3 | | The Goldman Sachs Fund Complex includes certain other companies listed above for each respective Trustee. As of August 31, 2020, Goldman Sachs ETF Trust consisted of 42 portfolios (23 of which offered shares to the public); Goldman Sachs Trust consisted of 90 portfolios (89 of which offered shares to the public); Goldman Sachs Variable Insurance Trust consisted of 13 portfolios; Goldman Sachs Trust II consisted of 19 portfolios (17 of which offered shares to the public); and Goldman Sachs MLP Income Opportunities Fund, Goldman Sachs MLP and Energy Renaissance Fund, Goldman Sachs Credit Income Fund and Goldman Sachs Real Estate Diversified Income Fund each consisted of one portfolio. Goldman Sachs Credit Income Fund did not offer shares to the public. |
| 4 | | This column includes only directorships of companies required to report to the Securities and Exchange Commission under the Securities Exchange Act of 1934 (i.e., “public companies”) or other investment companies registered under the Act. |
Additional information about the Trustees is available in the Fund’s Statement of Additional Information, which can be obtained from Goldman Sachs free of charge by calling this toll-free number (in the United States of America): 1-800-621-2550.
27
GOLDMAN SACHS EQUAL WEIGHT U.S. LARGE CAP EQUITY ETF
Trustees and Officers (Unaudited) (continued) Officers of the Trust*
| | | | | | |
Name, Address and Age1 | | Positions Held with the Trust | | Term of Office and
Length of
Time Served2 | | Principal Occupation(s) During Past 5 Years |
| | | |
James A. McNamara 200 West Street New York, NY 10282 Age: 57 | | Trustee and President | | Since 2014 | | Advisory Director, Goldman Sachs (January 2018-Present); Managing Director, Goldman Sachs (January 2000-December 2017); Director of Institutional Fund Sales, GSAM (April 1998-December 2000); and Senior Vice President and Manager, Dreyfus Institutional Service Corporation (January 1993-April 1998). President and Trustee — Goldman Sachs ETF Trust; Goldman Sachs Trust; Goldman Sachs Variable Insurance Trust; Goldman Sachs Trust II; Goldman Sachs MLP Income Opportunities Fund; Goldman Sachs MLP and Energy Renaissance Fund; Goldman Sachs Credit Income Fund; and Goldman Sachs Real Estate Diversified Income Fund. |
| | | |
Caroline L. Kraus 200 West Street New York, NY 10282 Age: 43 | | Secretary | | Since 2014 | | Managing Director, Goldman Sachs (January 2016-Present); Vice President, Goldman Sachs (August 2006-December 2015); Senior Counsel, Goldman Sachs (January 2020-Present); Associate General Counsel, Goldman Sachs (2012-December 2019); Assistant General Counsel, Goldman Sachs (August 2006-December 2011); and Associate, Weil, Gotshal & Manges, LLP (2002-2006). Secretary — Goldman Sachs ETF Trust; Goldman Sachs Trust (previously Assistant Secretary (2012)); Goldman Sachs Variable Insurance Trust (previously Assistant Secretary (2012)); Goldman Sachs Trust II; Goldman Sachs BDC, Inc.; Goldman Sachs Private Middle Market Credit LLC; Goldman Sachs Private Middle Market Credit II LLC; Goldman Sachs Middle Market Lending Corp.; Goldman Sachs MLP Income Opportunities Fund; Goldman Sachs MLP and Energy Renaissance Fund; Goldman Sachs Credit Income Fund; and Goldman Sachs Real Estate Diversified Income Fund. |
| | | |
Joseph F. DiMaria 30 Hudson Street Jersey City, NJ 07302 Age: 52 | | Treasurer, Principal Financial Officer and Principal Accounting Officer | | Since 2017 (Treasurer and Principal Financial Officer since 2019) | | Managing Director, Goldman Sachs (November 2015-Present) and Vice President — Mutual Fund Administration, Columbia Management Investment Advisers, LLC (May 2010- October 2015). Treasurer, Principal Financial Officer and Principal Accounting Officer — Goldman Sachs ETF Trust (previously Assistant Treasurer (2017)); Goldman Sachs Trust (previously Assistant Treasurer (2016)); Goldman Sachs Variable Insurance Trust (previously Assistant Treasurer (2016)); Goldman Sachs Trust II (previously Assistant Treasurer (2017)); Goldman Sachs MLP Income Opportunities Fund (previously Assistant Treasurer (2017)); Goldman Sachs MLP and Energy Renaissance Fund (previously Assistant Treasurer (2017)); Goldman Sachs Credit Income Fund; and Goldman Sachs Real Estate Diversified Income Fund. |
| * | | Represents a partial list of officers of the Trust. Additional information about all the officers is available in the Fund’s Statement of Additional Information, which can be obtained from Goldman Sachs free of charge by calling this toll-free number (in the United States): 1-800-621-2550. |
| 1 | | Information is provided as of August 31, 2020. |
| 2 | | Officers hold office at the pleasure of the Board of Trustees or until their successors are duly elected and qualified. Each officer holds comparable positions with certain other companies of which Goldman Sachs, GSAM or an affiliate thereof is the investment adviser, administrator and/or distributor. |
Goldman Sachs Equal Weight U.S. Large Cap Equity ETF — Tax Information (Unaudited)
For the fiscal year ended August 31, 2020, 87.17% of the dividends paid from net investment company taxable income by the Equal Weight U.S. large Cap Equity ETF, qualify for the reduced tax rate under the Jobs and Growth Tax Relief and Reconciliation Act of 2003.
For the fiscal year ended August 31, 2020, 86.38% of the dividends paid from net investment company taxable income by the Equal Weight U.S. Large Cap Equity ETF qualify for the dividends received deduction available to corporations.
28
FUNDS PROFILE
Goldman Sachs ETFs

Goldman Sachs is a premier financial services firm, known since 1869 for creating thoughtful and customized investment solutions in complex global markets.
Today, the Consumer and Investment Management Division of Goldman Sachs serves a diverse set of clients worldwide, including private institutions, public entities and individuals. With approximately $1.88 trillion in assets under supervision as of June 30, 2020, Goldman Sachs Asset Management (“GSAM”) has portfolio management teams located around the world and our investment professionals bring firsthand knowledge of local markets to every investment decision. Assets under supervision includes assets under management and other client assets for which Goldman Sachs does not have full discretion. GSAM leverages the resources of Goldman Sachs & Co. LLC subject to legal, internal and regulatory restrictions.
|
|
| GOLDMAN SACHS EXCHANGE-TRADED FUNDS |
| Goldman Sachs ActiveBeta® Emerging Markets Equity ETF |
| Goldman Sachs ActiveBeta® Europe Equity ETF |
| Goldman Sachs ActiveBeta® International Equity ETF |
| Goldman Sachs ActiveBeta® Japan Equity ETF |
| Goldman Sachs ActiveBeta® U.S. Large Cap Equity ETF |
| Goldman Sachs ActiveBeta® U.S. Small Cap Equity ETF |
| Goldman Sachs Equal Weight U.S. Large Cap Equity ETF |
| Goldman Sachs Hedge Industry VIP ETF |
| Goldman Sachs JUST U.S. Large Cap Equity ETF |
| Goldman Sachs Access U.S. Aggregate Bond ETF |
| Goldman Sachs Access High Yield Corporate Bond ETF |
| Goldman Sachs Access Inflation Protected USD Bond ETF |
| Goldman Sachs Access Investment Grade Corporate Bond ETF |
| Goldman Sachs Access Investment Grade Corporate 1-5 Year Bond ETF |
| Goldman Sachs Access Treasury 0-1 Year ETF |
| Goldman Sachs Access Ultra Short Bond ETF |
| Goldman Sachs Data-Driven World ETF |
| Goldman Sachs Finance Reimagined ETF |
| Goldman Sachs Human Evolution ETF |
| Goldman Sachs Manufacturing Revolution ETF |
| Goldman Sachs New Age Consumer ETF |
| Goldman Sachs MarketBeta International Equity ETF |
| Goldman Sachs MarketBeta Emerging Markets Equity ETF |
| Goldman Sachs MarketBeta U.S. Equity ETF |
INDEX DISCLAIMERS
The Goldman Sachs Equal Weight U.S. Large Cap Equity ETF is not sponsored, promoted, sold or supported in any other manner by Solactive AG nor does Solactive AG offer any express or implicit guarantee or assurance either with regard to the results of using the Solactive US Large Cap Equal Weight Index (GTR) (“Solactive Index”) and/or Solactive Index trade mark or the Solactive Index Price at any time or in any other respect. The Solactive Index is calculated and published by Solactive AG. Solactive AG uses its best efforts to ensure that the Solactive Index is calculated correctly. Irrespective of its obligations towards Goldman Sachs Equal Weight U.S. Large Cap Equity ETF, Solactive AG has no obligation to point out errors in the Solactive Index to third parties including but not limited to investors and/or financial intermediaries of Goldman Sachs Equal Weight U.S. Large Cap Equity ETF. Neither publication of a Solactive Index by Solactive AG nor the licensing of the Solactive Index or Solactive Index trade mark for the purpose of use in connection with the Goldman Sachs Equal Weight U.S. Large Cap Equity ETF constitutes a recommendation by Solactive AG to invest capital in said fund nor does it in any way represent an assurance or opinion of Solactive AG with regard to any investment in this fund.
| | |
TRUSTEES Lawrence W. Stranghoener, Chairman Caroline Dorsa Linda A. Lang Michael Latham James A. McNamara | | OFFICERS James A. McNamara, President Joseph F. DiMaria, Principal Financial Officer, Principal Accounting Officer and Treasurer Caroline L. Kraus, Secretary |
| |
THE BANK OF NEW YORK MELLON Transfer Agent | | |
| |
ALPS DISTRIBUTORS, INC. Distributor | | GOLDMAN SACHS ASSET MANAGEMENT, L.P. Investment Adviser |
Visit our Website at www.GSAMFUNDS.com/ETFs to obtain the most recent month-end returns.
Goldman Sachs Asset Management, L.P., 200 West Street, New York, New York 10282
The reports concerning the Fund included in this shareholder report may contain certain forward-looking statements about the factors that may affect the performance of the Fund in the future. These statements are based on Fund management’s predictions and expectations concerning certain future events and their expected impact on the Fund, such as performance of the economy as a whole and of specific industry sectors, changes in the levels of interest rates, the impact of developing world events, and other factors that may influence the future performance of the Fund. Management believes these forward-looking statements to be reasonable, although they are inherently uncertain and difficult to predict. Actual events may cause adjustments in portfolio management strategies from those currently expected to be employed.
A description of the policies and procedures that the Fund uses to determine how to vote proxies relating to portfolio securities and information regarding how the Fund voted proxies relating to portfolio securities for the most recent 12-month period ended June 30 is available (i) without charge, upon request by calling 1-800-621-2550; and (ii) on the Securities and Exchange Commission (“SEC”) web site at http://www.sec.gov.
The Fund will file its portfolio holdings information for each month in a fiscal quarter within 60 days after the end of the relevant fiscal quarter on Form N-PORT. Portfolio holdings information for the third month of each fiscal quarter will be made available on the SEC’s web site at http://www.sec.gov. Portfolio holdings information may be obtained upon request and without charge by calling 1-800-621-2550.
Fund holdings and allocations shown are as of August 31, 2020 and may not be representative of future investments. Fund holdings should not be relied on in making investment decisions and should not be construed as research or investment advice regarding particular securities. Current and future holdings are subject to risk.
ETF Fund shares are not individually redeemable and are issued and redeemed by the Fund at their net asset value (“NAV”) only in large, specified blocks of shares called creation units. Shares otherwise can be bought and sold only through exchange trading at market price (not NAV). Shares may trade at a premium or discount to their NAV in the secondary market. Brokerage commissions will reduce returns. Ordinary brokerage commissions apply.
This material is not authorized for distribution to prospective investors unless preceded or accompanied by a current prospectus or summary prospectus, if applicable. Investors should consider the Fund’s objective, risks, and charges and expenses, and read the summary prospectus, if available, and/or the prospectus carefully before investing or sending money. The summary prospectus, if available, and the Prospectus contain this and other information about the Fund and may be obtained from your authorized dealer or from Goldman Sachs & Co. LLC by calling 1-800-621-2550.
ActiveBeta® is a registered trademark of GSAM.
ALPS Distributors, Inc. is the distributor of the Goldman Sachs ETF Funds. ALPS Distributors, Inc. is unaffiliated with Goldman Sachs Asset Management.
©2020 Goldman Sachs. All rights reserved. 218125-OTU-10/2020 EQWUSLCEAR-20
Goldman Sachs Funds

| | | | |
| | |
| Annual Report | | | | August 31, 2020 |
| | |
| | | | Hedge Industry VIP ETF |
It is our intention that beginning on January 1, 2021, paper copies of the Fund’s annual and semi-annual shareholder reports will no longer be sent by mail, unless you specifically request paper copies of the reports from your financial intermediary. Instead, the reports will be made available on a website, and you will be notified by mail each time a report is posted and provided with a website link to access the report.
If you already elected to receive shareholder reports electronically, you will not be affected by this change and you need not take any action. At any time, you may elect to receive reports and certain communications from the Fund electronically by contacting your financial intermediary.
You may elect to receive all future shareholder reports in paper free of charge. You can inform your financial intermediary that you wish to receive paper copies of reports by contacting your financial intermediary. Your election to receive reports in paper will apply to all Goldman Sachs Funds held in your account.

Goldman Sachs Hedge Industry VIP ETF
| | | | |
| | | |
| NOT FDIC-INSURED | | May Lose Value | | No Bank Guarantee |
INVESTMENT PROCESS
Goldman Sachs Hedge Industry VIP ETF
Principal Investment Strategies
The Goldman Sachs Hedge Industry VIP ETF (the “Fund”) seeks to achieve its investment objective by investing at least 80% of its assets (exclusive of collateral held from securities lending) in securities included in its underlying index, in depositary receipts representing securities included in its underlying index and in underlying stocks in respect of depositary receipts included in its underlying index. The Goldman Sachs Hedge Fund VIP IndexTM (the “Index”) is designed to deliver exposure to equity securities whose performance is expected to influence the long portfolios of hedge funds. Such equity securities are defined as those that appear most frequently among the top ten equity holdings of U.S. hedge fund managers that select their investments based upon fundamental analysis. Goldman Sachs Asset Management, L.P. (the “Index Provider”) is the provider of the Index, which is constructed in accordance with a rules-based methodology.
Hedge fund managers report their U.S. equity holdings, which are made public 45 days after the end of each calendar quarter. The Index is reconstituted and rebalanced on a quarterly basis once the information has been fully disseminated. The construction of the Index involves accessing the identifiers and share counts of U.S. equity holdings disclosed by hedge fund managers in their quarterly Form 13F filings with the Securities and Exchange Commission (“SEC”). The Index is constructed to then apply share prices at the time of data collection to the numbers of shares listed in each Form 13F disclosure filing to calculate the dollar market value of each reported position. U.S. hedge fund managers that select their investments based upon fundamental analysis are assumed to be U.S. hedge fund managers with no fewer than 10 and no more than 200 distinct U.S. equity positions, as reported in the hedge fund managers’ most recent Form 13F filings. Managers with less than $10 million of disclosed equity assets are excluded.
The equity positions are then ranked within each individual hedge fund manager’s portfolio by descending market value. The approximately 50 stocks that appear most frequently in the top 10 holdings of this universe then become the Index constituents. Constituents are equal dollar-weighted at each rebalance. Given the Fund’s investment objective of attempting to track the Index, the Fund does not follow traditional methods of active investment management, which may involve buying and selling securities based upon analysis of economic and market factors.
The Index does not include hedge funds (i.e., unlisted, privately offered funds) and is not designed to approximate the performance of any hedge fund manager, hedge fund or group of hedge fund managers or hedge funds. The Index should not be considered a hedge fund replication strategy. As of August 31, 2020, the Index consisted of 50 securities with a market capitalization range of between approximately $7.4 billion and $2,206.9 billion. The components of the Index may change over time. The percentage of the portfolio exposed to any asset class will vary from time to time as the weightings of the securities within the Index change, and the Fund may not be invested in each asset class at all times.
THE FUND IS NOT A HEDGE FUND AND DOES NOT INVEST IN HEDGE FUNDS.
* * *
At the end of the Reporting Period, i.e. the 12 months ended August 31, 2020, we continued to believe the most effective way to identify the most important positions of hedge fund managers is to know what equities they are holding. We also maintained conviction in our methodology for extracting these important positions — by obtaining information from quarterly Form 13F filings of hedge funds and identifying stocks that appear among top holdings the most frequently. Through an efficient implementation, we believe investors are able to access top hedge fund long equity ideas and gain exposure to evolving U.S. market themes.
1
PORTFOLIO RESULTS
Goldman Sachs Hedge Industry VIP ETF
Investment Objective
The Goldman Sachs Hedge Industry VIP ETF (the “Fund”) seeks to provide investment results that closely correspond, before fees and expenses, to the performance of the Goldman Sachs Hedge Fund VIP Index® (the “Index”).
Portfolio Management Discussion and Analysis
Below, the Goldman Sachs Quantitative Investment Strategies Team discusses the Fund’s performance and positioning for the 12-month period ended August 31, 2020 (the “Reporting Period”).
| Q | | How did the Fund perform during the Reporting Period? |
| A | | During the Reporting Period, the Fund returned 40.07% based on net asset value (“NAV”) and 39.88% based on market price. The Index returned 41.26%, and the S&P 500® Index (Total Return, USD) (“S&P 500® Index”), a market-cap based index against which the performance of the Fund is measured, returned 21.87% during the same period. |
| | | The Fund had a NAV of $56.86 on August 31, 2019 and ended the Reporting Period with a NAV of $79.37 per share. The Fund’s market price on August 31, 2020 was $79.50 per share. |
| Q | | What key factors were responsible for the Fund’s performance during the Reporting Period? |
| A | | The Fund seeks to provide investment results that closely correspond, before fees and expenses, to the performance of the Index. The Fund’s performance reflects Fund expenses, including management fees and brokerage expenses. The Fund’s relative performance also reflects the impact of any cash held in the Fund as well as any other differences between the Fund’s holdings and the constituents of the Index. The Index is unmanaged, and Index returns do not reflect fees and expenses, which would reduce returns. |
| | | The Index is designed to deliver exposure to equity securities whose performance is expected to influence the long portfolios of hedge funds. Such equity securities are defined as those that appear most frequently among the top ten equity holdings of U.S. hedge fund managers that select their investments based upon fundamental analysis. Goldman Sachs Asset Management, L.P. (the “Index Provider”) is the provider of the Index, which is constructed in accordance with a rules-based methodology. Hedge fund managers report their U.S. equity holdings, which are made public 45 days after the end of each calendar quarter. The Index is reconstituted and rebalanced on a quarterly basis once the information has been fully disseminated. The construction of the Index involves accessing the identifiers and share counts of U.S. equity holdings disclosed by hedge fund managers in their quarterly Form 13F filings with the Securities and Exchange Commission (“SEC”). The Index is constructed to then apply share prices at the time of data collection to the numbers of shares listed in each Form 13F disclosure filing to calculate the dollar market value of each reported position. U.S. hedge fund managers that select their investments based upon fundamental analysis are assumed to be U.S. hedge fund managers with no fewer than 10 and no more than 200 distinct U.S. equity positions, as reported in the hedge fund managers’ most recent Form 13F filings. Managers with less than $10 million of disclosed equity assets are excluded. The equity positions are then ranked within each individual hedge fund manager’s portfolio by descending market value. The approximately 50 stocks that appear most frequently in the top 10 holdings of this universe then become the Index constituents. Constituents are equal dollar-weighted at each rebalance. |
| | | The Index’s performance is compared to that of the S&P 500® Index below. Given the Fund’s investment objective of attempting to track the Index, the Fund does not follow traditional methods of active investment management, which may involve buying and selling securities based upon analysis of economic and market factors. The Fund does not follow a strategy of seeking to outperform the S&P 500® Index. |
| | | During the Reporting Period, the Index posted a double-digit positive absolute return that outperformed the S&P 500® Index. The Fund also outperformed the S&P 500® Index during the Reporting Period, as measured by NAV. |
2
PORTFOLIO RESULTS
| Q | | Which sectors contributed most positively to the Index’s relative performance during the Reporting Period, and which detracted most? |
| A | | Index constituents in the consumer discretionary, communication services and utilities sectors contributed most positively to the Index’s results relative to the S&P 500® Index during the Reporting Period. Partially offsetting these positive contributors were Index constituents in the industrials and health care sectors, the only two sectors that detracted from the Index’s results relative to the S&P 500® Index during the Reporting Period. |
| Q | | Which individual stock positions contributed the most to the Index’s relative returns during the Reporting Period? |
| A | | Relative to the S&P 500® Index, overweight positions in information technology software and services provider Sea, electric car manufacturer Tesla and online used car retailer and technology company Carvana contributed most positively (2.23%, 2.79% and 2.03% of Fund net assets as of August 31, 2020, respectively). Each of these holdings generated a robust triple-digit positive return within the Index during the Reporting Period. |
| Q | | Which individual stock positions detracted the most from the Index’s results during the Reporting Period? |
| A | | Relative to the S&P 500® Index, underweight positions in information technology giant Apple and software leader Microsoft and an overweight position in airline Delta Air Lines detracted most (2.08%, 2.00% and 0.00%1 of Fund net assets as of August 31, 2020, respectively). Apple posted a triple-digit gain within the Index during the Reporting Period, and Microsoft posted a robust double-digit gain within the Index during the Reporting Period. Delta Air Lines generated a double-digit negative return within the Index during the Reporting Period. |
| Q | | How did the Fund use derivatives and similar instruments during the Reporting Period? |
| A | | The Fund did not invest in derivatives or similar instruments during the Reporting Period. The Fund does not employ derivatives as a source of alpha generation, although it may use them to equitize excess cash. |
| Q | | What was the Fund’s sector positioning relative to the Index and the S&P 500® Index at the end of the Reporting Period?2 |
| | | | | | | | | | | | | | |
| | | | |
| | | Sector Name | | Fund3 | | | GS Hedge
Fund VIP
IndexTM | | | S&P 500®
Index | |
| | | | |
| | Information Technology | | | 34.94 | % | | | 34.94 | % | | | 28.71 | % |
| | | | |
| | Communication Services | | | 23.56 | | | | 23.56 | | | | 11.10 | |
| | | | |
| | Consumer Discretionary | | | 19.10 | | | | 19.10 | | | | 11.44 | |
| | | | |
| | Health Care | | | 11.31 | | | | 11.31 | | | | 13.98 | |
| | | | |
| | Financials | | | 5.51 | | | | 5.51 | | | | 9.62 | |
| | | | |
| | Industrials | | | 3.76 | | | | 3.76 | | | | 7.99 | |
| | | | |
| | Utilities | | | 1.82 | | | | 1.82 | | | | 2.83 | |
| | | | |
| | Consumer Staples | | | 0.00 | | | | 0.00 | | | | 6.89 | |
| | | | |
| | Energy | | | 0.00 | | | | 0.00 | | | | 2.32 | |
| | | | |
| | Materials | | | 0.00 | | | | 0.00 | | | | 2.49 | |
| | | Real Estate | | | 0.00 | | | | 0.00 | | | | 2.61 | |
| | 2 | | Sector classifications for securities may differ between the above listing and the Schedule of Investments due to differing classification methodologies. The classification methodology used for the above listing is as set forth by Standard & Poor’s. The Fund’s composition may differ over time. Consequently, the Fund’s overall sector allocations may differ from percentages contained in the chart above. The percentage shown for each investment category reflects the value of investments in that category as a percentage of market value (excluding investment in the securities lending reinvestment vehicle, if any). Investments in the securities lending vehicle represented 0.00% of the Fund’s net assets as of August 31, 2020. Figures above may not sum to 100% due to rounding. |
| | 3 | | The Fund seeks to provide investment results that closely correspond, before fees and expenses, to the performance of the Goldman Sachs Hedge Fund VIP Index®. |
| | 1 | | Some weights are 0.00% at August 31, 2020 either because those positions were eliminated during the most recent rebalance given the Index construction methodology or were not held at all during the Reporting Period. |
3
FUND BASICS
Hedge Industry VIP ETF
as of August 31, 2020
| | | | | | |
| | FUND SNAPSHOT | |
| | |
| | | As of August 31, 2020 | | | |
| | |
| | Market Price1 | | $ | 79.50 | |
| | | Net Asset Value (NAV)1 | | $ | 79.37 | |
| 1 | | The Market Price is the price at which the Fund’s shares are trading on the NYSE Arca, Inc. The Market Price of the Fund’s shares will fluctuate and, at the time of sale, shares may be worth more or less than the original investment or the Fund’s then current net asset value (“NAV”). The NAV is the market value of one share of the Fund. This amount is derived by dividing the total value of all the securities in the Fund’s portfolio, plus other assets, less any liabilities, by the number of Fund shares outstanding. Fund shares are not individually redeemable and are issued and redeemed by the Fund at their NAV only in large, specified blocks of shares called creation units. Shares otherwise can be bought and sold only through exchange trading at market price (not NAV). Shares may trade at a premium or discount to their NAV in the secondary market. Information regarding how often shares of the Fund traded on NYSE Arca at a price above (i.e., at a premium) or below (i.e., at a discount) the NAV of the Fund can be found at www.GSAMFUNDS.com/ETFs. |
| | | | | | | | | | |
| | TOP 10 HOLDINGS AS OF 8/31/202 |
| | | | |
| | | Holding | | % of Net Assets | | | Line of Business | | Country |
| | | | |
| | Tesla, Inc. | | | 2.8 | % | | Consumer Discretionary | | United States |
| | salesforce.com, Inc. | | | 2.6 | | | Information Technology | | United States |
| | JD.com, Inc. ADR | | | 2.3 | | | Consumer Discretionary | | China |
| | Crowdstrike Holdings, Inc., Class A | | | 2.3 | | | Information Technology | | United States |
| | Sea Ltd. ADR | | | 2.2 | | | Communication Services | | Taiwan |
| | NVIDIA Corp. | | | 2.1 | | | Information Technology | | United States |
| | Adobe, Inc. | | | 2.1 | | | Information Technology | | United States |
| | Coupa Software, Inc. | | | 2.1 | | | Information Technology | | United States |
| | Alibaba Group Holding Ltd. ADR | | | 2.1 | | | Consumer Discretionary | | China |
| | | Apple, Inc. | | | 2.1 | | | Information Technology | | United States |
| 2 | | The top 10 holdings may not be representative of the Fund’s future investments. |
For more information about the Fund, please refer to www.GSAMFUNDS.com/ETFs. There, you can learn more about the Fund’s investment strategies, holdings, and performance.
4
GOLDMAN SACHS HEDGE INDUSTRY VIP ETF
Performance Summary
August 31, 2020
The following graph shows the value, as of August 31, 2020, of a $10,000 investment made on November 1, 2016 (commencement of operations) in Shares at NAV. For comparative purposes, the performance of the Fund’s underlying index and a market cap-based index against which the performance of the Fund is measured, the Goldman Sachs Hedge Fund VIP Index™ and the S&P 500® Index (Total Return, USD) are shown. Performance reflects applicable fee waivers and/or expense limitations in effect during the periods shown and in their absence, performance would be reduced. Returns do not reflect the deduction of taxes that a shareholder would pay on Fund distributions or the sale of Fund shares. In addition to the performance of constituents of the underlying index, other factors may affect Fund performance. These factors include, but are not limited to, Fund operating fees and expenses, portfolio turnover and creation and redemption in-kind transactions. The returns set forth below represent past performance. Past performance does not guarantee future results. The Fund’s NAV and investment return may fluctuate. These fluctuations may cause an investor’s shares to be worth more or less than their original cost. Current performance may be lower or higher than the performance quoted below. Please visit our web site at www.GSAMFUNDS.com/ETFs to obtain the most recent month-end returns.
|
| Goldman Sachs Hedge Industry VIP ETF’s Lifetime Performance |
Performance of a $10,000 Investment, with distributions reinvested, from November 1, 2016 through August 31, 2020.
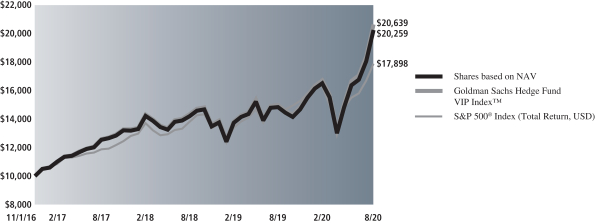
| | | | | | |
| Average Annual Total Return through August 31, 2020* | | | 1 Year Return | | | Since Inception |
Shares based on NAV (Commenced November 1, 2016) | | | 40.07% | | | 20.21% |
|
Shares based on Market Price (Commenced November 1, 2016) | | | 39.88% | | | 20.26% |
|
Goldman Sachs Hedge Fund VIP Index™ | | | 41.26% | | | 20.79% |
|
S&P 500® Index (Total Return, USD) | | | 21.87% | | | 16.39% |
|
| * | | Total returns are calculated assuming purchase of a share at the market price or NAV on the first day and sale of a share at the market price or NAV on the last day of each period reported. The Total Returns based on NAV and Market Price assume the reinvestment of dividends and do not reflect brokerage commissions in connection with the purchase or sale of Fund shares, which if included would lower the performance shown above. The NAV used in the Total Return calculations assumes all management fees incurred by the Fund. Market Price returns are based upon the last trade at 4:00 pm EST and do not reflect the returns you would receive if you traded shares at other times. The first day of secondary market trading is typically several days after the date on which the Fund commenced investment operations; therefore, the NAV of the Fund is used as a proxy for the period from inception of investment operations to the first day of secondary market trading to calculate the Market Price returns. |
5
FUND BASICS
Index Definitions and Industry Terms
The S&P 500® Index is the Standard & Poor’s 500 Composite Index of 500 stocks, an unmanaged index of common stock prices.
Alpha: The excess returns of a fund relative to the return of a benchmark index is the fund’s alpha.
The Goldman Sachs Hedge Fund VIP IndexTM is owned and maintained by the Index Provider. The Index is calculated by Solactive AG. The Index consists of the US-listed stocks whose performance is expected to influence the long portfolios of hedge funds. Those stocks are defined as the positions that appear most frequently among the top 10 long equity holdings within the portfolios of fundamentally-driven hedge fund managers. It is not possible to invest directly in an unmanaged index.
6
GOLDMAN SACHS HEDGE INDUSTRY VIP ETF
Schedule of Investments
August 31, 2020
| | | | | | | | |
| Shares | | | Description | | Value | |
| |
| Common Stocks – 99.9% | | | |
| Communication Services – 23.5% | |
| | 26,444 | | | Activision Blizzard, Inc. | | $ | 2,208,603 | |
| | 1,413 | | | Alphabet, Inc., Class A* | | | 2,302,526 | |
| | 3,514 | | | Charter Communications, Inc., Class A* | | | 2,163,253 | |
| | 48,575 | | | Comcast Corp., Class A | | | 2,176,646 | |
| | 8,139 | | | Facebook, Inc., Class A* | | | 2,386,355 | |
| | 15,123 | | | Liberty Broadband Corp., Class C* | | | 2,118,581 | |
| | 4,405 | | | Netflix, Inc.* | | | 2,332,712 | |
| | 61,307 | | | Pinterest, Inc., Class A* | | | 2,255,484 | |
| | 16,807 | | | Sea Ltd. ADR (Taiwan)* | | | 2,568,278 | |
| | 18,410 | | | T-Mobile US, Inc.* | | | 2,148,079 | |
| | 56,098 | | | Twitter, Inc.* | | | 2,276,457 | |
| | 16,288 | | | Walt Disney Co. (The) | | | 2,147,898 | |
| | | | | | | | |
| | | | | | | 27,084,872 | |
| | |
| Consumer Discretionary – 19.1% | |
| | 8,372 | | | Alibaba Group Holding Ltd. ADR (China)* | | | 2,403,015 | |
| | 675 | | | Amazon.com, Inc.* | | | 2,329,398 | |
| | 1,195 | | | Booking Holdings, Inc.* | | | 2,282,988 | |
| | 51,455 | | | Caesars Entertainment, Inc.* | | | 2,356,639 | |
| | 10,810 | | | Carvana Co.* | | | 2,334,528 | |
| | 34,259 | | | JD.com, Inc. ADR (China)* | | | 2,694,128 | |
| | 13,776 | | | Lowe’s Cos., Inc. | | | 2,268,769 | |
| | 6,440 | | | Tesla, Inc.* | | | 3,209,181 | |
| | 17,009 | | | Tiffany & Co. | | | 2,083,602 | |
| | | | | | | | |
| | | | | | | 21,962,248 | |
| | |
| Financials – 5.5% | |
| | 10,078 | | | Berkshire Hathaway, Inc., Class B* | | | 2,197,407 | |
| | 40,169 | | | Citigroup, Inc. | | | 2,053,439 | |
| | 20,761 | | | JPMorgan Chase & Co. | | | 2,080,045 | |
| | | | | | | | |
| | | | | | | 6,330,891 | |
| | |
| Health Care – 11.3% | |
| | 22,364 | | | AbbVie, Inc. | | | 2,141,800 | |
| | 20,648 | | | Alexion Pharmaceuticals, Inc.* | | | 2,358,415 | |
| | 32,892 | | | Centene Corp.* | | | 2,016,937 | |
| | 10,378 | | | Danaher Corp. | | | 2,142,746 | |
| | 15,816 | | | HCA Healthcare, Inc. | | | 2,146,547 | |
| | 29,197 | | | Horizon Therapeutics PLC* | | | 2,193,279 | |
| | | | | | | | |
| | | | | | | 12,999,724 | |
| | |
| Industrials – 3.8% | |
| | 21,259 | | | Copart, Inc.* | | | 2,196,480 | |
| | 4,263 | | | TransDigm Group, Inc. | | | 2,130,093 | |
| | | | | | | | |
| | | | | | | 4,326,573 | |
| | |
| Information Technology – 34.9% | |
| | 4,750 | | | Adobe, Inc.* | | | 2,438,602 | |
| | 26,152 | | | Advanced Micro Devices, Inc.* | | | 2,375,125 | |
| | 18,504 | | | Apple, Inc. | | | 2,387,756 | |
| | 7,437 | | | Coupa Software, Inc.* | | | 2,437,402 | |
| | 20,999 | | | Crowdstrike Holdings, Inc., Class A* | | | 2,640,204 | |
| | 14,777 | | | Fidelity National Information Services, Inc. | | | 2,229,110 | |
| | 21,310 | | | Fiserv, Inc.* | | | 2,122,050 | |
| | |
| |
| Common Stocks – (continued) | | | |
| Information Technology – (continued) | |
| | 26,339 | | | GoDaddy, Inc., Class A* | | | 2,204,048 | |
| | 6,506 | | | Mastercard, Inc., Class A | | | 2,330,384 | |
| | 46,625 | | | Micron Technology, Inc.* | | | 2,121,904 | |
| | 10,178 | | | Microsoft Corp. | | | 2,295,444 | |
| | 4,596 | | | NVIDIA Corp. | | | 2,458,768 | |
| | 11,105 | | | PayPal Holdings, Inc.* | | | 2,266,975 | |
| | 18,693 | | | QUALCOMM, Inc. | | | 2,226,336 | |
| | 10,990 | | | salesforce.com, Inc.* | | | 2,996,424 | |
| | 4,879 | | | ServiceNow, Inc.* | | | 2,351,776 | |
| | 10,812 | | | Visa, Inc., Class A | | | 2,292,036 | |
| | | | | | | | |
| | | | | | | 40,174,344 | |
| | |
| Utilities – 1.8% | |
| | 225,943 | | | PG&E Corp.* | | | 2,092,232 | |
| | |
| | TOTAL INVESTMENTS – 99.9% | | | | |
| | (Cost $87,801,887) | | $ | 114,970,884 | |
| | |
| OTHER ASSETS IN EXCESS OF
LIABILITIES – 0.1% | | | 114,310 | |
| | |
| | NET ASSETS – 100.0% | | $ | 115,085,194 | |
| | |
| | |
|
| The percentage shown for each investment category reflects the value of investments in that category as a percentage of net assets. |
| |
* | | Non-income producing security. |
| | |
|
Investment Abbreviations: |
ADR | | —American Depositary Receipt |
PLC | | —Public Limited Company |
|
| | |
| The accompanying notes are an integral part of these financial statements. | | 7 |
GOLDMAN SACHS HEDGE INDUSTRY VIP ETF
Statement of Assets and Liabilities
August 31, 2020
| | | | | | |
| | | | | |
| | Assets: | |
| | |
| | Investments at value (cost $87,801,887) | | $ | 114,970,884 | |
| | |
| | Cash | | | 125,079 | |
| | |
| | Receivables: | | | | |
| | |
| | Dividends | | | 31,204 | |
| | |
| | Securities lending income | | | 431 | |
| | |
| | Total assets | | | 115,127,598 | |
| | | | | | |
| | Liabilities: | |
| | |
| | Payables: | | | | |
| | |
| | Management fees | | | 42,404 | |
| | |
| | Total liabilities | | | 42,404 | |
| | | | | | |
| | Net Assets: | | | | |
| | |
| | Paid-in capital | | | 100,551,211 | |
| | |
| | Total distributable earnings | | | 14,533,983 | |
| | |
| | NET ASSETS | | $ | 115,085,194 | |
| | SHARES ISSUED AND OUTSTANDING | | | | |
| | |
| | Shares outstanding no par value (unlimited shares authorized): | | | 1,450,000 | |
| | |
| | Net asset value per share: | | | $79.37 | |
| | |
| 8 | | The accompanying notes are an integral part of these financial statements. |
GOLDMAN SACHS HEDGE INDUSTRY VIP ETF
Statement of Operations
For the Fiscal Year Ended August 31, 2020
| | | | | | |
| | | | | |
| | Investment income: | |
| | |
| | Dividends — unaffiliated issuer (net of foreign withholding taxes of $1,631) | | $ | 624,009 | |
| | |
| | Securities lending income — unaffiliated issuer | | | 7,258 | |
| | |
| | Total investment income | | | 631,267 | |
| | | | | | |
| | Expenses: | |
| | |
| | Management fees | | | 396,235 | |
| | |
| | Trustee fees | | | 6,134 | |
| | |
| | Total expenses | | | 402,369 | |
| | |
| | NET INVESTMENT INCOME | | | 228,898 | |
| | | | | | |
| | Realized and unrealized gain (loss): | |
| | |
| | Net realized gain (loss) from: | | | | |
| | |
| | Investments — unaffiliated issuers | | | (2,282,703 | ) |
| | |
| | In-kind redemptions | | | 11,462,474 | |
| | |
| | Net change in unrealized gain (loss) on: | | | | |
| | |
| | Investments | | | 22,564,797 | |
| | |
| | Net realized and unrealized gain | | | 31,744,568 | |
| | |
| | NET INCREASE IN NET ASSETS RESULTING FROM OPERATIONS | | $ | 31,973,466 | |
| | |
| The accompanying notes are an integral part of these financial statements. | | 9 |
GOLDMAN SACHS HEDGE INDUSTRY VIP ETF
Statements of Changes in Net Assets
| | | | | | | | | | |
| | | | | For the Fiscal Year Ended
August 31, 2020 | | | For the Fiscal Year Ended
August 31, 2019 | |
| | From operations: | |
| | | |
| | Net investment income | | $ | 228,898 | | | $ | 822,518 | |
| | | |
| | Net realized gain (loss) | | | 9,179,771 | | | | (1,362,981 | ) |
| | | |
| | Net change in unrealized gain (loss) | | | 22,564,797 | | | | (6,015,036 | ) |
| | | |
| | Net increase (decrease) in net assets resulting from operations | | | 31,973,466 | | | | (6,555,499 | ) |
| | | | | | | | | | |
| | Distributions to shareholders: | | | | | | | | |
| | | |
| | From distributable earnings | | | (329,128 | ) | | | (814,931 | ) |
| | | |
| | From return of capital | | | (6,291 | ) | | | — | |
| | | |
| | Total distributions to shareholders | | | (335,419 | ) | | | (814,931 | ) |
| | | | | | | | | | |
| | From share transactions: | |
| | | |
| | Proceeds from sales of shares | | | 60,238,984 | | | | 43,224,579 | |
| | | |
| | Cost of shares redeemed | | | (56,399,720 | ) | | | (66,400,806 | ) |
| | | |
| | Net increase (decrease) in net assets resulting from share transactions | | | 3,839,264 | | | | (23,176,227 | ) |
| | | |
| | TOTAL INCREASE (DECREASE) | | | 35,477,311 | | | | (30,546,657 | ) |
| | | | | | | | | | |
| | Net assets: | | | | | | | | |
| | | |
| | Beginning of period | | $ | 79,607,883 | | | $ | 110,154,540 | |
| | | |
| | End of period | | $ | 115,085,194 | | | $ | 79,607,883 | |
| | |
| 10 | | The accompanying notes are an integral part of these financial statements. |
GOLDMAN SACHS HEDGE INDUSTRY VIP ETF
Financial Highlights
Selected Data for a Share Outstanding Throughout Each Period
| | | | | | | | | | | | | | | | | | |
| | | | | For the Fiscal
Year Ended August 31, | | | For the Period
November 1, 2016*
to
August 31, 2017 | |
| | | | | 2020 | | | 2019 | | | 2018 | |
| | Per Share Operating Performance: | | | | | | | | | | | | | | | | |
| | | | | |
| | Net asset value, beginning of period | | $ | 56.86 | | | $ | 57.98 | | | $ | 50.46 | | | $ | 40.00 | |
| | | | | |
| | Net investment income(a) | | | 0.16 | (b) | | | 0.51 | | | | 0.17 | | | | 0.32 | (c) |
| | | | | |
| | Net realized and unrealized gain (loss) | | | 22.59 | | | | (1.11 | ) | | | 7.52 | | | | 10.31 | |
| | | | | |
| | Total gain (loss) from investment operations | | | 22.75 | | | | (0.60 | ) | | | 7.69 | | | | 10.63 | |
| | | | | |
| | Distributions to shareholders from net investment income | | | (0.24 | ) | | | (0.52 | ) | | | (0.17 | ) | | | (0.17 | ) |
| | | | | |
| | Distributions to shareholders from return of capital | | | — | (d) | | | — | | | | — | | | | — | |
| | | | | |
| | Total distributions to shareholders | | | (0.24 | ) | | | (0.52 | ) | | | (0.17 | ) | | | (0.17 | ) |
| | | | | |
| | Net asset value, end of period | | $ | 79.37 | | | $ | 56.86 | | | $ | 57.98 | | | $ | 50.46 | |
| | | | | |
| | Market price, end of period | | $ | 79.50 | | | $ | 57.03 | | | $ | 57.98 | | | $ | 50.48 | |
| | | | | |
| | Total Return at Net Asset Value(e) | | | 40.07 | % | | | (0.99 | )% | | | 15.27 | % | | | 26.61 | % |
| | | | | |
| | Net assets, end of period (in 000’s) | | $ | 115,085 | | | $ | 79,608 | | | $ | 110,155 | | | $ | 45,410 | |
| | | | | |
| | Ratio of total expenses to average net assets | | | 0.45 | % | | | 0.45 | % | | | 0.45 | % | | | 0.45 | %(e) |
| | | | | |
| | Ratio of net investment income to average net assets | | | 0.26 | %(b) | | | 0.91 | % | | | 0.31 | % | | | 0.84 | %(c)(f) |
| | | | | |
| | Portfolio turnover rate(g) | | | 124 | % | | | 103 | % | | | 129 | % | | | 116 | % |
| | * | | Commencement of operations. |
| | (a) | | Calculated based on the average shares outstanding methodology. |
| | (b) | | Reflects income recognized from non-recurring special dividends which amounted to $0.07 per share and 0.11% of average net assets. |
| | (c) | | Reflects income recognized from non-recurring special dividends which amounted to $0.11 per share and 0.24% of average net assets. |
| | (d) | | Amount is less than $0.005 per share. |
| | (e) | | Assumes investment at the net asset value at the beginning of the period, reinvestment of all distributions and a complete sale of the investment at the net asset value at the end of the period. Returns do not reflect the impact of taxes to shareholders relating to Fund distributions or the sale of Fund shares. Total returns for periods less than one full year are not annualized. |
| | (g) | | The Fund’s portfolio turnover rate is calculated in accordance with regulatory requirements and excludes portfolio securities received or delivered as a result of in-kind transactions. If such transactions were included, the Fund’s portfolio turnover rate may be higher. |
| | |
| The accompanying notes are an integral part of these financial statements. | | 11 |
GOLDMAN SACHS HEDGE INDUSTRY VIP ETF
Notes to Financial Statements
August 31, 2020
Goldman Sachs Hedge Industry VIP ETF (the “Fund”) is a diversified series of the Goldman Sachs ETF Trust (the “Trust”) which is an open-end management investment company, registered under the Investment Company Act of 1940, as amended (the “Act”), consisting of multiple series. The Trust was organized as a Delaware statutory trust on December 16, 2009.
The investment objective of the Fund is to provide investment results that closely correspond, before fees and expenses, to the performance of the Goldman Sachs Hedge Fund VIP Index™ (the “Index”).
Goldman Sachs Asset Management, L.P. (“GSAM”), an affiliate of Goldman Sachs & Co. LLC (“Goldman Sachs”), serves as investment adviser to the Fund pursuant to a management agreement (the “Agreement”) with the Trust. The Fund is an exchange-traded fund (“ETF”). Shares of the Fund are listed and traded on the NYSE Arca, Inc. (“NYSE Arca”). Market prices for the Fund’s shares may be different from their net asset value (“NAV”). The Fund issues and redeems shares at its NAV only in blocks of a specified number of shares, or multiples thereof, referred to as “Creation Units”. Creation Units are issued and redeemed principally in-kind for a basket of securities and a cash amount. Shares generally trade in the secondary market in quantities less than a Creation Unit at market prices that change throughout the day. Only those that have entered into an authorized participant agreement with ALPS Distributors, Inc. (the “Distributor”) may do business directly with the Fund.
|
| 2. SIGNIFICANT ACCOUNTING POLICIES |
The financial statements have been prepared in accordance with accounting principles generally accepted in the United States of America (“GAAP”) and require management to make estimates and assumptions that may affect the reported amounts and disclosures. Actual results may differ from those estimates and assumptions. The Fund is an investment company under GAAP and follows the accounting and reporting guidance applicable to investment companies.
A. Investment Valuation — The Fund’s valuation policy is to value investments at fair value.
B. Investment Income and Investments — Investment income includes interest income, dividend income, and securities lending income, if any. Interest income is accrued daily and adjusted for amortization of premiums and accretion of discounts. Dividend income is recognized on ex-dividend date or, for certain foreign securities, as soon as such information is obtained subsequent to the ex-dividend date. Non-cash dividends, if any, are recorded at the fair market value of the securities received. Investment transactions are reflected on trade date. Realized gains and losses are calculated using identified cost. Investment transactions are recorded on the following business day for daily net asset value (“NAV”) calculations. Investment income is recorded net of any foreign withholding taxes, less any amounts reclaimable. The Fund may file withholding tax reclaims in certain jurisdictions to recover a portion of amounts previously withheld. Any foreign capital gains tax is accrued daily based upon net unrealized gains, and is payable upon sale of such investments.
C. Expenses — Expenses incurred directly by the Fund are charged to the Fund, and certain expenses incurred by the Trust that may not solely relate to the Fund are allocated to the Fund and the other applicable funds of the Trust on a straight-line and/or pro-rata basis, depending upon the nature of the expenses, and are accrued daily.
D. Federal Taxes and Distributions to Shareholders — It is the Fund’s policy to comply with the requirements of the Internal Revenue Code of 1986, as amended (the “Code”), applicable to regulated investment companies and to distribute each year substantially all of its investment company taxable income and capital gains to its shareholders. Accordingly, the Fund is not required to make any provisions for the payment of federal income tax. Distributions to shareholders are recorded on the ex-dividend date. Income and capital gains distributions, if any, are declared and paid quarterly and annually, respectively.
Net capital losses, if any, are carried forward to future fiscal years and may be used to the extent allowed by the Code to offset any future capital gains. Losses that are carried forward will retain their character as either short-term or long-term capital losses. Utilization of capital loss carryforwards will reduce the requirement of future capital gains distributions.
The characterization of distributions to shareholders for financial reporting purposes is determined in accordance with federal income tax rules, which may differ from GAAP. The source of the Fund’s distributions may be shown in the accompanying financial statements as either from distributable earnings or capital. Certain components of the Fund’s net assets on the Statement of Assets and Liabilities reflect permanent GAAP/tax differences based on the appropriate tax character.
12
GOLDMAN SACHS HEDGE INDUSTRY VIP ETF
|
| 3. INVESTMENTS AND FAIR VALUE MEASUREMENTS |
U.S. GAAP defines the fair value of a financial instrument as the amount that would be received to sell an asset or paid to transfer a liability in an orderly transaction between market participants at the measurement date (i.e., the exit price); the Fund’s policy is to use the market approach. GAAP establishes a fair value hierarchy that prioritizes the inputs to valuation techniques used to measure fair value. The hierarchy gives the highest priority to unadjusted quoted prices in active markets for identical assets or liabilities (Level 1 measurements) and the lowest priority to unobservable inputs (Level 3 measurements). The level in the fair value hierarchy within which the fair value measurement in its entirety falls shall be determined based on the lowest level input that is significant to the fair value measurement in its entirety. The levels used for classifying investments are not necessarily an indication of the risk associated with investing in these investments. The three levels of the fair value hierarchy are described below:
Level 1 — Unadjusted quoted prices in active markets that are accessible at the measurement date for identical, unrestricted assets or liabilities;
Level 2 — Quoted prices in markets that are not active or financial instruments for which significant inputs are observable (including, but not limited to, quoted prices for similar investments, interest rates, foreign exchange rates, volatility and credit spreads), either directly or indirectly;
Level 3 — Prices or valuations that require significant unobservable inputs (including GSAM’s assumptions in determining fair value measurement).
The Board of Trustees (“Trustees”) has approved Valuation Procedures that govern the valuation of the portfolio investments held by the Fund, including investments for which market quotations are not readily available. The Trustees have delegated to GSAM day-to-day responsibility for implementing and maintaining internal controls and procedures related to the valuation of the Fund’s investments. To assess the continuing appropriateness of pricing sources and methodologies, GSAM regularly performs price verification procedures and issues challenges as necessary to third party pricing vendors or brokers, and any differences are reviewed in accordance with the Valuation Procedures.
A. Level 1 and Level 2 Fair Value Investments — The valuation techniques and significant inputs used in determining the fair values for investments classified as Level 1 and Level 2 are as follows:
Equity Securities — Equity securities traded on a United States (“U.S.”) securities exchange or the NASDAQ system, or those located on certain foreign exchanges, including but not limited to the Americas, are valued daily at their last sale price or official closing price on the principal exchange or system on which they are traded. If there is no sale or official closing price or such price is believed by GSAM to not represent fair value, equity securities will be valued at the valid closing bid price for long positions and at the valid closing ask price for short positions (i.e. where there is sufficient volume, during normal exchange trading hours). If no valid bid/ask price is available, the equity security will be valued pursuant to the Valuation Procedures approved by the Trustees and consistent with applicable regulatory guidance. To the extent these investments are actively traded, they are classified as Level 1 of the fair value hierarchy, otherwise they are generally classified as Level 2. Certain equity securities containing unique attributes may be classified as Level 2.
Unlisted equity securities for which market quotations are available are valued at the last sale price on the valuation date, or if no sale occurs, at the last bid price for long positions or the last ask price for short positions, and are generally classified as Level 2.
Money Market Funds — Investments in the Goldman Sachs Financial Square Government Fund (“Underlying Fund”) are valued at the NAV per share of the Institutional Share class on the day of valuation. These investments are generally classified as Level 1 of the fair value hierarchy. For information regarding the Underlying Fund’s accounting policies and investment holdings, please see the Underlying Fund’s shareholder report.
B. Level 3 Fair Value Investments — To the extent that significant inputs to valuation models and other alternative pricing sources are unobservable, or if quotations are not readily available, or if GSAM believes that such quotations do not accurately reflect fair value, the fair value of the Fund’s investments may be determined under Valuation Procedures approved by the Trustees. GSAM, consistent with its procedures and applicable regulatory guidance, may make an adjustment to the most recent valuation prices of either domestic or foreign securities in light of significant events to reflect what it believes to be the fair value
13
GOLDMAN SACHS HEDGE INDUSTRY VIP ETF
Notes to Financial Statements (continued)
August 31, 2020
|
| 3. INVESTMENTS AND FAIR VALUE MEASUREMENTS (continued) |
of the securities at the time of determining the Fund’s NAV. To the extent investments are valued using single source broker quotations obtained directly from the broker or passed through from third party pricing vendors, such investments are classified as Level 3 investments.
C. Fair Value Hierarchy — The following is a summary of the Fund’s investments classified in the fair value hierarchy as of August 31, 2020:
| | | | | | | | | | | | |
|
| HEDGE INDUSTRY VIP ETF | |
| | | |
| Investment Type | | Level 1 | | | Level 2 | | | Level 3 | |
| | | |
| Assets | | | | | | | | | | | | |
| | | |
Common Stock and/or Other Equity Investments(a) | | | | | | | | | | | | |
| | | |
Asia | | $ | 7,665,421 | | | $ | — | | | $ | — | |
| | | |
North America | | | 107,305,463 | | | | — | | | | — | |
| | | |
| Total | | $ | 114,970,884 | | | $ | — | | | $ | — | |
| (a) | | Amounts are disclosed by continent to highlight the impact of time zone differences between local market close and the calculation of NAV. Security valuations are based on the principal exchange or system on which they are traded, which may differ from country of domicile noted in the table. |
For further information regarding security characteristics, see the Schedule of Investments.
|
| 4. AGREEMENTS AND AFFILIATED TRANSACTIONS |
A. Management Agreement — Under the Agreement, GSAM manages the Fund, subject to the general supervision of the Trustees.
As compensation for the services rendered pursuant to the Agreement, the assumption of the expenses related thereto and administration of the Fund’s business affairs, including providing facilities, GSAM is entitled to a management fee, accrued daily and paid monthly, equal to an annual percentage rate of the Fund’s average daily net assets.
The Fund operates under a unitary management fee structure. Under the unitary fee structure, GSAM is responsible for paying substantially all the expenses of the Fund, excluding payments under the Fund’s 12b-1 plan (if any), interest expenses, taxes, acquired fund fees and expenses, brokerage fees, costs of holding shareholder meetings, litigation, indemnification and extraordinary expenses. As the Fund directly pays fees and expenses of the independent Trustees, the management fee collected by GSAM will be reduced by an amount equal to the fees and expenses paid by the Fund to the independent Trustees.
For the fiscal year ended August 31, 2020, the unitary management fee rate with GSAM was 0.45%.
|
| 5. CREATION AND REDEMPTION OF CREATION UNITS |
The Trust issues and redeems shares of the Fund only in Creation Units on a continuous basis through the Distributor, without an initial sales load, at NAV next determined after receipt, on any Business Day (as defined in the Statement of Additional Information), of an order in proper form. Shares of the Fund may only be purchased or redeemed by certain financial institutions (each an “Authorized Participant”). An Authorized Participant is either (1) a “Participating Party” or other participant in the clearing process through the Continuous Net Settlement System of the National Securities Clearing Corporation; or (2) a Depository Trust Company participant; which, in either case, must have executed an agreement with the Distributor. Retail investors will typically not qualify as an Authorized Participant or have the resources to buy and sell whole Creation Units. Therefore, they will be unable to purchase or redeem the shares directly from the Fund. Rather, most retail investors will purchase shares in the secondary market at market prices with the assistance of a broker and may be subject to customary brokerage commissions or fees. Fixed creation and redemption transaction fees are imposed in connection with creations and redemptions.
14
GOLDMAN SACHS HEDGE INDUSTRY VIP ETF
|
| 5. CREATION AND REDEMPTION OF CREATION UNITS (continued) |
Authorized Participants transacting in Creation Units for cash may also pay a variable charge to compensate the Fund for certain transaction costs (e.g. taxes on currency or other financial transactions, and brokerage costs) and market impact expenses relating to investing in portfolio securities. Such variable charges, if any, are included in “Proceeds from sale of shares” in the Statements of Changes in Net Assets.
Share activity is as follows:
| | | | | | | | | | | | | | | | |
| | | Goldman Sachs Hedge Industry VIP ETF | |
| | | | |
| | | For the Fiscal Year Ended
August 31, 2020 | | | For the Fiscal Year Ended August 31, 2019 | |
| | | | |
| | | Shares | | | Dollars | | | Shares | | | Dollars | |
| | | | |
| Fund Share Activity | | | | | | | | | | | | | | | | |
Shares Sold | | | 900,000 | | | $ | 60,238,946 | | | | 750,000 | | | $ | 43,224,538 | |
Shares Redeemed | | | (850,000 | ) | | | (56,399,720 | ) | | | (1,250,000 | ) | | | (66,400,806 | ) |
| | | | |
NET INCREASE (DECREASE) IN SHARES | | | 50,000 | | | $ | 3,839,226 | | | | (500,000 | ) | | $ | (23,176,268 | ) |
|
| 6. PORTFOLIO SECURITIES TRANSACTIONS |
The cost of purchases and proceeds from sales and maturities of long-term securities for the fiscal year ended August 31, 2020, were $110,414,052 and $111,903,030, respectively.
The purchases and sales from in-kind creation and redemption transactions for the fiscal year ended August 31, 2020, were $59,962,001 and $54,887,920 respectively.
The Fund may lend its securities through a securities lending agent, the Bank of New York Mellon (“BNYM”), to certain qualified borrowers. In accordance with the Fund’s securities lending procedures, the Fund receives cash collateral at least equal to the market value of the securities on loan. The market value of the loaned securities is determined at the close of business of the Fund, at their last sale price or official closing price on the principal exchange or system on which they are traded, and any additional required collateral is delivered to the Fund on the next business day. As with other extensions of credit, the Fund may experience delay in the recovery of its securities or incur a loss should the borrower of the securities breach its agreement with the Fund or become insolvent at a time when the collateral is insufficient to cover the cost of repurchasing securities on loan. Dividend income received from securities on loan may not be subject to withholding taxes and therefore withholding taxes paid may differ from the amounts listed in the Statement of Operations. Loans of securities are terminable at any time and as such 1) the remaining contractual maturities of the outstanding securities lending transactions are considered to be overnight and continuous and 2) the borrower, after notice, is required to return borrowed securities within the standard time period for settlement of securities transactions.
The Fund invests the cash collateral received in connection with securities lending transactions in the Goldman Sachs Financial Square Government Fund (“Government Money Market Fund”), an affiliated series of the Goldman Sachs Trust. The Government Money Market Fund is registered under the Act as an open end investment company, is subject to Rule 2a-7 under the Act, and is managed by GSAM, for which GSAM may receive a management fee of up to 0.16% on an annualized basis of the average daily net assets of the Government Money Market Fund.
15
GOLDMAN SACHS HEDGE INDUSTRY VIP ETF
Notes to Financial Statements (continued)
August 31, 2020
|
| 7. SECURITIES LENDING (continued) |
In the event of a default by a borrower with respect to any loan, BNYM may exercise any and all remedies provided under the applicable borrower agreement to make the Fund whole. These remedies include purchasing replacement securities by applying the collateral held from the defaulting broker against the purchase cost of the replacement securities. If BNYM is unable to purchase replacement securities, BNYM will indemnify the Fund by paying the Fund an amount equal to the market value of the securities loaned minus the value of cash collateral received from the borrower for the loan, subject to an exclusion for any shortfalls resulting from a loss of value in such cash collateral due to reinvestment risk. The Fund’s master netting agreements with certain borrowers provide the right, in the event of a default (including bankruptcy or insolvency), for the non-defaulting party to liquidate the collateral and calculate net exposure to the defaulting party or request additional collateral. However, in the event of a default by a borrower, a resolution authority could determine that such rights are not enforceable due to the restrictions or prohibitions against the right of set-off that may be imposed in accordance with a particular jurisdiction’s bankruptcy or insolvency laws. The Fund’s loaned securities were all subject to enforceable Securities Lending Agreements and the value of the collateral was at least equal to the value of the cash received. The amounts of the Fund’s overnight and continuous agreements, which represent the gross amounts of recognized liabilities for securities lending transactions outstanding as of August 31, 2020, are disclosed as “Payable upon return of securities loaned” on the Statement of Assets and Liabilities, where applicable.
Both the Fund and BNYM received compensation relating to the lending of the Fund’s securities. The amounts earned, if any, by the Fund for the fiscal year ended August 31, 2020, are reported under Investment Income on the Statement of Operations.
The following table provides information about the Fund’s investment in the Government Money Market Fund for the fiscal year ended August 31, 2020:
| | | | | | | | | | | | | | |
Beginning
value as of
August 31, 2019 | | | Purchases
at Cost | | | Proceeds from Sales | | | Ending
value as of
August 31, 2020 | |
| $ | 261,175 | | | $ | 54,947,380 | | | $ | (55,208,555 | ) | | $ | — | |
The tax character of distributions paid during the fiscal years ended August 31, 2020 and August 31, 2019 were as follows:
| | | | | | | | |
| | | 2020 | | | 2019 | |
Distributions paid from: | | | | | | | | |
Ordinary Income | | $ | 329,128 | | | $ | 814,931 | |
Return of capital | | | 6,291 | | | | — | |
Total taxable distributions | | | $335,419 | | | $ | 814,931 | |
As of August 31, 2020, the components of accumulated earnings (losses) on a tax-basis were as follows:
| | | | |
| | | Goldman Sachs
Hedge Industry
VIP ETF | |
Capital loss carryforwards: | | | | |
Perpetual Short-Term | | $ | (10,844,232 | ) |
Perpetual Long-Term | | | (917,719 | ) |
Unrealized gains (losses) — net | | | 26,295,934 | |
Total accumulated earnings (losses) net | | $ | 14,533,983 | |
16
GOLDMAN SACHS HEDGE INDUSTRY VIP ETF
|
| 8. TAX INFORMATION (continued) |
As of August 31, 2020, the Fund’s aggregate security unrealized gains and losses based on cost for U.S. federal income tax purposes were as follows:
| | | | |
| | | Goldman Sachs
Hedge Industry
VIP ETF | |
Tax Cost | | $ | 88,674,950 | |
Gross unrealized gain | | | 27,155,789 | |
Gross unrealized loss | | | (859,855 | ) |
Net unrealized gains (losses) on securities | | $ | 26,295,934 | |
The difference between GAAP-basis and tax-basis unrealized gains (losses) is attributable primarily to wash sales.
The Fund reclassed $11,375,236 from distributable earnings to paid in capital for the year ending August 31, 2020. In order to present certain components of the Fund’s capital accounts on a tax-basis, certain reclassifications have been recorded to the Fund’s accounts. These reclassifications have no impact on the NAV of the Fund and result primarily from redemptions in-kind transactions, redemptions utilized as distributions and partnership investments.
GSAM has reviewed the Fund’s tax positions for all open tax years (the current year and prior two years, as applicable) and has concluded that no provision for income tax is required in the Fund’s financial statements. Such open tax years remain subject to examination and adjustment by tax authorities.
The Fund’s portfolio’s risks include, but are not limited to, the following:
Index Risk — GSAM (the “Index Provider”) constructs the Fund’s Index in accordance with a rules-based methodology. The Fund will be negatively affected by general declines in the securities and asset classes represented in its Index. In addition, because the Fund is not “actively” managed, unless a specific security is removed from its Index, the Fund generally would not sell a security because the security’s issuer was in financial trouble. Market disruptions and regulatory restrictions could have an adverse effect on the Fund’s ability to adjust its exposure to the required levels in order to track the Index. The Fund also does not attempt to take defensive positions under any market conditions, including declining markets. Therefore, the Fund’s performance could be lower than funds that may actively shift their portfolio assets to take advantage of market opportunities or to lessen the impact of a market decline or a decline in the value of one or more issuers. The Index Provider relies on third party data it believes to be reliable in constructing the Index, but it does not guarantee the accuracy or availability of such third party data. Errors in index data, index computation or the construction of the Index in accordance with its methodology may occur from time to time and may not be identified and corrected by the Index Provider for a period of time or at all, which may have an adverse impact on the Fund and its shareholders. In addition, neither the Fund, the Investment Adviser, the Calculation Agent nor the Index Provider can guarantee the availability or timeliness of the production of the Index.
Market and Credit Risks — In the normal course of business, the Fund trades financial instruments and enters into financial transactions where risk of potential loss exists due to changes in the market (market risk). The value of the securities in which the Fund invests may go up or down in response to the prospects of individual companies, particular sectors or governments and/or general economic conditions throughout the world due to increasingly interconnected global economies and financial markets. Events such as war, acts of terrorism, social unrest, natural disasters, the spread of infectious illness or other public health threats could also significantly impact the Fund and its investments. Additionally, the Fund may also be exposed to credit risk in the event that an issuer or guarantor fails to perform or that an institution or entity with which the Fund has unsettled or open transactions defaults.
17
GOLDMAN SACHS HEDGE INDUSTRY VIP ETF
Notes to Financial Statements (continued)
August 31, 2020
|
| 9. OTHER RISKS (continued) |
Market Trading Risk — The Fund faces numerous market trading risks, including disruptions to creations and redemptions, the existence of extreme market volatility or potential lack of an active trading market for Shares. If a shareholder purchases Shares at a time when the market price is at a premium to the NAV or sells Shares at a time when the market price is at a discount to the NAV, the shareholder may sustain losses. The Investment Adviser cannot predict whether Shares will trade below, at or above their NAV. Price differences may be due, in large part, to the fact that supply and demand forces at work in the secondary trading market for Shares will be closely related to, but not identical to, the same forces influencing the prices of the securities of the Fund’s Index trading individually or in the aggregate at any point in time.
Tracking Error Risk — Tracking error is the divergence of the Fund’s performance from that of its Index. The performance of the Fund may diverge from that of its Index for a number of reasons. Tracking error may occur because of transaction costs, the Fund’s holding of cash, differences in accrual of dividends, changes to the Index or the need to meet new or existing regulatory requirements. Unlike the Fund, the returns of the Index are not reduced by investment and other operating expenses, including the trading costs associated with implementing changes to its portfolio of investments. Tracking error risk may be heightened during times of market volatility or other unusual market conditions.
Under the Trust’s organizational documents, its Trustees, officers, employees and agents are indemnified, to the extent permitted
by the Act and state law, against certain liabilities that may arise out of performance of their duties to the Fund. Additionally, in the course of business, the Fund enters into contracts that contain a variety of indemnification clauses. The Fund’s maximum exposure under these arrangements is unknown, as this would involve future claims that may be made against the Fund that have not yet occurred. However, GSAM believes the risk of loss under these arrangements to be remote.
Subsequent events after the Statement of Assets and Liabilities date have been evaluated, and GSAM has concluded that there is no impact requiring adjustment or disclosure in the financial statements.
18
Report of Independent Registered Public Accounting Firm
To the Board of Trustees of Goldman Sachs ETF Trust and Shareholders of
Goldman Sachs Hedge Industry VIP ETF
Opinion on the Financial Statements
We have audited the accompanying statement of assets and liabilities, including the schedule of investments, of Goldman Sachs Hedge Industry VIP ETF (one of the funds constituting Goldman Sachs ETF Trust, referred to hereafter as the “Fund”) as of August 31, 2020, the related statement of operations for the year ended August 31, 2020, the statements of changes in net assets for each of the two years in the period ended August 31, 2020, including the related notes, and the financial highlights for each of the periods indicated therein (collectively referred to as the “financial statements”). In our opinion, the financial statements present fairly, in all material respects, the financial position of the Fund as of August 31, 2020, the results of its operations for the year then ended, the changes in its net assets for each of the two years in the period ended August 31, 2020 and the financial highlights for each of the periods indicated therein in conformity with accounting principles generally accepted in the United States of America.
Basis for Opinion
These financial statements are the responsibility of the Fund’s management. Our responsibility is to express an opinion on the Fund’s financial statements based on our audits. We are a public accounting firm registered with the Public Company Accounting Oversight Board (United States) (PCAOB) and are required to be independent with respect to the Fund in accordance with the U.S. federal securities laws and the applicable rules and regulations of the Securities and Exchange Commission and the PCAOB.
We conducted our audits of these financial statements in accordance with the standards of the PCAOB. Those standards require that we plan and perform the audit to obtain reasonable assurance about whether the financial statements are free of material misstatement, whether due to error or fraud.
Our audits included performing procedures to assess the risks of material misstatement of the financial statements, whether due to error or fraud, and performing procedures that respond to those risks. Such procedures included examining, on a test basis, evidence regarding the amounts and disclosures in the financial statements. Our audits also included evaluating the accounting principles used and significant estimates made by management, as well as evaluating the overall presentation of the financial statements. Our procedures included confirmation of securities owned as of August 31, 2020 by correspondence with the custodian and transfer agent. We believe that our audits provide a reasonable basis for our opinion.
/s/ PricewaterhouseCoopers LLP
Boston, Massachusetts
October 26, 2020
We have served as the auditor of one or more investment companies in the Goldman Sachs fund complex since 2000.
19
GOLDMAN SACHS HEDGE INDUSTRY VIP ETF
Liquidity Risk Management Program (Unaudited)
The Fund has adopted and implemented a liquidity risk management program (the “Program”) in accordance with Rule 22e-4 under the 1940 Act. The Program seeks to assess and manage the Fund’s liquidity risk, i.e., the risk that the Fund is unable to satisfy redemption requests without significantly diluting remaining investors’ interests in the Fund. The Board of Trustees of the Trust has designated GSAM, the Fund’s investment adviser, to administer the Program. Certain aspects of the Program rely on third parties to perform certain functions, including the provision of market data and application of models.
The Program is comprised of various components designed to support the assessment and/or management of liquidity risk, including: (1) the periodic assessment (no less frequently than annually) of certain factors that influence a Fund’s liquidity risk; (2) the periodic classification (no less frequently than monthly) of a Fund’s investments into one of four liquidity categories that reflect an estimate of their liquidity under current market conditions; (3) a 15% limit on the acquisition of “illiquid investments” (as defined under Rule 22e-4); (4) for a Fund that does not invest primarily in “highly liquid investments” (as defined under Rule 22e-4), the determination of a minimum percentage of the Fund’s assets that will generally be invested in highly liquid investments (a “Highly Liquid Investment Minimum”); and (5) periodic reporting to the Board of Trustees.
At a meeting of the Board of Trustees on March 18-19, 2020, GSAM provided a written report to the Board addressing the operation, and the adequacy and effectiveness of the implementation, of the Program, including, as applicable, the operation of any Highly Liquid Investment Minimum and any material changes to the Program, for the initial period from December 1, 2018 through December 31, 2019 (the “Reporting Period”). Among other things, the annual report discussed: (1) the results of stress tests designed to assess liquidity under a hypothetical stressed scenario involving elevated redemptions; and (2) an assessment of the methodologies used to classify investments into one of four liquidity categories. The report concluded that the Program was reasonably designed to assess and manage liquidity risk and was adequately and effectively implemented during the Reporting Period.
There can be no assurance that the Program will achieve its objectives under all circumstances in the future. Please refer to your Fund’s prospectus for more information regarding the Fund’s exposure to liquidity risk and other risks to which it may be subject.
20
GOLDMAN SACHS HEDGE INDUSTRY VIP ETF
| | |
| | |
Fund Expenses —Six Months Ended 8/31/2020 (Unaudited) | | |
As a shareholder you incur ongoing costs, which may include management fees; distribution and service (12b-1) fees; and other Fund expenses. This example is intended to help you understand your ongoing costs (in dollars) of investing in Shares of the Fund and to compare these costs with the ongoing costs of investing in other exchange-traded funds.
The example is based on an investment of $1,000 invested at the beginning of the period from March 1, 2020 and held for the six months ended August 31, 2020, which represents a period of 184 days of a 366 day year (or less where indicated).
Actual Expenses — The first line in the table below provides information about actual account values and actual expenses. You may use the information in this line, together with the amount you invested, to estimate the expenses that you paid over the six months. Simply divide your account value by $1,000 (for example, an $8,600 account value divided by $1,000=8.6), then multiply the result by the number in the first line under the heading entitled “Expenses Paid” to estimate the expenses you paid on your account during this period.
Hypothetical Example for Comparison Purposes — The second line in the table below provides information about hypothetical account values and hypothetical expenses based on the Fund’s actual net expense ratios and an assumed rate of return of 5% per year before expenses, which is not the Fund’s actual return. The hypothetical account values and expenses may not be used to estimate the actual ending account balance or expenses you paid for the period. You may use this information to compare the ongoing costs of investing in the Fund and other funds. To do so, compare this 5% hypothetical example with the 5% hypothetical examples that appear in the shareholder reports of the other funds.
Please note that the expenses shown in the table are meant to highlight your ongoing costs only and do not reflect any transactional costs, such as redemption fees, or exchange fees. Therefore, the second line of the table is useful in comparing ongoing costs only, and will not help you determine the relative total costs of owning different funds. In addition, if these transactional costs were included, your costs would have been higher.
| | | | | | | | | | | | |
| | | Hedge Industry VIP ETF | |
| | | Beginning
Account Value
3/1/20 | | | Ending
Account Value
8/31/20 | | | Expenses
Paid* | |
Actual based on NAV | | $ | 1,000 | | | $ | 1,305.10 | | | $ | 2.61 | |
Hypothetical 5% return | | $ | 1,000 | | | $ | 1,022.87 | + | | $ | 2.29 | |
| | + | | Hypothetical expenses are based on the Fund’s actual annualized net expense ratios and an assumed rate of return of 5% per year before expenses. | |
| | * | | Expenses for the Fund are calculated using the Fund’s annualized net expense ratio, which represents the ongoing expenses as a percentage of net assets for the six months ended August 31, 2020. Expenses are calculated by multiplying the annualized net expense ratio by the average account value for the period; then multiplying the result by the number of days in the most recent fiscal year; and then dividing that result by the number of days in the fiscal year. | |
| | | | The annualized net expense ratio for the period is as follows: | |
| | | | |
| Fund | | | |
| |
Hedge Industry VIP ETF | | | 0.45 | % |
21
GOLDMAN SACHS HEDGE INDUSTRY VIP ETF
Trustees and Officers (Unaudited) Independent Trustees
| | | | | | | | | | |
Name,
Address and Age1 | | Position(s) Held
with the Trust | | Term of
Office and Length of
Time Served2 | | Principal Occupation(s)
During Past 5 Years | | Number of
Portfolios in
Fund Complex
Overseen by
Trustee3 | | Other
Directorships
Held by Trustee4 |
| | | | | |
Lawrence W. Stranghoener Age: 66 | | Chairman of the Board of Trustees | | Trustee Since 2015; Chairman Since 2017 | | Mr. Stranghoener is retired. He is Director, Kennametal, Inc. (a global manufacturer and distributor of tooling and industrial materials) (2003-Present); and was formerly Director, Aleris Corporation and Aleris International, Inc. (a producer of aluminum rolled products) (2011-2020); Interim Chief Executive Officer (2014); and Executive Vice President and Chief Financial Officer (2004-2014), Mosaic Company (a fertilizer manufacturing company). Chairman of the Board of Trustees — Goldman Sachs ETF Trust; Goldman Sachs MLP Income Opportunities Fund; Goldman Sachs MLP and Energy Renaissance Fund; Goldman Sachs Credit Income Fund; and Goldman Sachs Real Estate Diversified Income Fund. | | 46 | | Kennametal Inc. (a global manufacturer and distributor of tooling and industrial materials) |
| | | | | |
Caroline Dorsa Age: 61 | | Trustee | | Since 2016 | | Ms. Dorsa is retired. She is Director, Biogen Inc. (a biotechnology company) (2010-Present); Director, Intellia Therapeutics Inc. (a gene- editing company) (2015-Present); and Director, Illumina, Inc. (a life sciences company) (2017- Present). She was formerly Executive Vice President and Chief Financial Officer, Public Service Enterprise Group, Inc. (a generation and energy services company) (2009-2015); Senior Vice President, Merck & Co, Inc. (a pharmaceutical company) (2008-2009 and 1987- 2007); Senior Vice President and Chief Financial Officer, Gilead Sciences, Inc. (a pharmaceutical company) (2007-2008); and Senior Vice President and Chief Financial Officer, Avaya, Inc. (a technology company) (2007). Trustee — Goldman Sachs ETF Trust; Goldman Sachs MLP Income Opportunities Fund; Goldman Sachs MLP and Energy Renaissance Fund; Goldman Sachs Credit Income Fund; and Goldman Sachs Real Estate Diversified Income Fund. | | 46 | | Biogen Inc. (a biotechnology company); Intellia Therapeutics Inc. (a gene-editing company); Illumina, Inc. (a life sciences company) |
| | | | | |
Linda A. Lang Age: 62 | | Trustee | | Since 2016 | | Ms. Lang is retired. She was formerly Chair of the Board of Directors (2016-2019), and Member of the Board of Directors, WD-40 Company (a global consumer products company) (2004-2019); Chairman and Chief Executive Officer (2005-2014); and Director, President and Chief Operating Officer, Jack in the Box, Inc. (a restaurant company) (2003-2005). Previously, Ms. Lang served as an Advisory Board Member of Goldman Sachs MLP Income Opportunities Fund and Goldman Sachs MLP and Energy Renaissance Fund (February 2016—March 2016). Trustee — Goldman Sachs ETF Trust; Goldman Sachs MLP Income Opportunities Fund; Goldman Sachs MLP and Energy Renaissance Fund; Goldman Sachs Credit Income Fund; and Goldman Sachs Real Estate Diversified Income Fund. | | 46 | | None |
| | | | | |
Michael Latham Age: 54 | | Trustee | | Since 2015 | | Mr. Latham is retired. Formerly, he held senior management positions with the iShares exchange-traded fund business, including Chairman (2011-2014); Global Head (2010-2011); U.S. Head (2007-2010); and Chief Operating Officer (2003-2007). Trustee — Goldman Sachs ETF Trust; Goldman Sachs MLP Income Opportunities Fund; Goldman Sachs MLP and Energy Renaissance Fund; Goldman Sachs Credit Income Fund; and Goldman Sachs Real Estate Diversified Income Fund. | | 46 | | None |
| | | | | | | | | | |
22
GOLDMAN SACHS HEDGE INDUSTRY VIP ETF
Trustees and Officers (Unaudited) (continued) Interested Trustee*
| | | | | | | | | | |
Name,
Address and Age1 | | Position(s) Held
with the Trust | | Term of
Office and
Length of
Time Served2 | | Principal Occupation(s)
During Past 5 Years | | Number of
Portfolios in
Fund Complex
Overseen by
Trustee3 | | Other
Directorships
Held by Trustee4 |
| | | | | |
James A. McNamara Age: 57 | | Trustee and President | | Since 2014 | | Advisory Director, Goldman Sachs (January 2018-Present); Managing Director, Goldman Sachs (January 2000-December 2017); Director of Institutional Fund Sales, GSAM (April 1998-December 2000); and Senior Vice President and Manager, Dreyfus Institutional Service Corporation (January 1993-April 1998). President and Trustee — Goldman Sachs ETF Trust; Goldman Sachs Trust; Goldman Sachs Variable Insurance Trust; Goldman Sachs Trust II; Goldman Sachs MLP Income Opportunities Fund; Goldman Sachs MLP and Energy Renaissance Fund; Goldman Sachs Credit Income Fund; and Goldman Sachs Real Estate Diversified Income Fund. | | 168 | | None |
| | | | | | | | | | |
| * | | This person is considered to be an “Interested Trustee” because he holds a position with Goldman Sachs and own securities issued by The Goldman Sachs Group, Inc. The Interested Trustee holds comparable positions with certain other companies of which Goldman Sachs, GSAM or an affiliate thereof is the investment adviser, administrator and/or distributor. |
| 1 | | Each Trustee may be contacted by writing to the Trustee, c/o Goldman Sachs, 200 West Street, New York, New York, 10282, Attn: Caroline L. Kraus. Information is provided as of August 31, 2020. |
| 2 | | Each Trustee holds office for an indefinite term until the earliest of: (a) the election of his or her successor; (b) the date the Trustee resigns, retires or is removed by the Board of Trustees or shareholders, in accordance with the Trust’s Declaration of Trust; or (c) the termination of the Trust. |
| 3 | | The Goldman Sachs Fund Complex includes certain other companies listed above for each respective Trustee. As of August 31, 2020, Goldman Sachs ETF Trust consisted of 42 portfolios (23 of which offered shares to the public); Goldman Sachs Trust consisted of 90 portfolios (89 of which offered shares to the public); Goldman Sachs Variable Insurance Trust consisted of 13 portfolios; Goldman Sachs Trust II consisted of 19 portfolios (17 of which offered shares to the public); and Goldman Sachs MLP Income Opportunities Fund, Goldman Sachs MLP and Energy Renaissance Fund, Goldman Sachs Credit Income Fund and Goldman Sachs Real Estate Diversified Income Fund each consisted of one portfolio. Goldman Sachs Credit Income Fund did not offer shares to the public. |
| 4 | | This column includes only directorships of companies required to report to the Securities and Exchange Commission under the Securities Exchange Act of 1934 (i.e., “public companies”) or other investment companies registered under the Act. |
Additional information about the Trustees is available in the Fund’s Statement of Additional Information, which can be obtained from Goldman Sachs free of charge by calling this toll-free number (in the United States of America): 1-800-621-2550.
23
GOLDMAN SACHS HEDGE INDUSTRY VIP ETF
Trustees and Officers (Unaudited) (continued) Officers of the Trust*
| | | | | | |
Name,
Address and Age1 | | Positions Held
with the Trust | | Term of
Office and
Length of
Time Served2 | | Principal Occupation(s) During Past 5 Years |
| | | |
James A. McNamara 200 West Street New York, NY 10282 Age: 57 | | Trustee and President | | Since 2014 | | Advisory Director, Goldman Sachs (January 2018-Present); Managing Director, Goldman Sachs (January 2000-December 2017); Director of Institutional Fund Sales, GSAM (April 1998-December 2000); and Senior Vice President and Manager, Dreyfus Institutional Service Corporation (January 1993-April 1998). President and Trustee — Goldman Sachs ETF Trust; Goldman Sachs Trust; Goldman Sachs Variable Insurance Trust; Goldman Sachs Trust II; Goldman Sachs MLP Income Opportunities Fund; Goldman Sachs MLP and Energy Renaissance Fund; Goldman Sachs Credit Income Fund; and Goldman Sachs Real Estate Diversified Income Fund. |
| | | |
Caroline L. Kraus 200 West Street New York, NY 10282 Age: 43 | | Secretary | | Since 2014 | | Managing Director, Goldman Sachs (January 2016-Present); Vice President, Goldman Sachs (August 2006-December 2015); Senior Counsel, Goldman Sachs (January 2020-Present); Associate General Counsel, Goldman Sachs (2012-December 2019); Assistant General Counsel, Goldman Sachs (August 2006-December 2011); and Associate, Weil, Gotshal & Manges, LLP (2002-2006). Secretary — Goldman Sachs ETF Trust; Goldman Sachs Trust (previously Assistant Secretary (2012)); Goldman Sachs Variable Insurance Trust (previously Assistant Secretary (2012)); Goldman Sachs Trust II; Goldman Sachs BDC, Inc.; Goldman Sachs Private Middle Market Credit LLC; Goldman Sachs Private Middle Market Credit II LLC; Goldman Sachs Middle Market Lending Corp.; Goldman Sachs MLP Income Opportunities Fund; Goldman Sachs MLP and Energy Renaissance Fund; Goldman Sachs Credit Income Fund; and Goldman Sachs Real Estate Diversified Income Fund. |
| | | |
Joseph F. DiMaria 30 Hudson Street Jersey City, NJ 07302 Age: 52 | | Treasurer, Principal Financial Officer and Principal Accounting Officer | | Since 2017 (Treasurer and Principal Financial Officer since 2019) | | Managing Director, Goldman Sachs (November 2015-Present) and Vice President — Mutual Fund Administration, Columbia Management Investment Advisers, LLC (May 2010- October 2015). Treasurer, Principal Financial Officer and Principal Accounting Officer — Goldman Sachs ETF Trust (previously Assistant Treasurer (2017)); Goldman Sachs Trust (previously Assistant Treasurer (2016)); Goldman Sachs Variable Insurance Trust (previously Assistant Treasurer (2016)); Goldman Sachs Trust II (previously Assistant Treasurer (2017)); Goldman Sachs MLP Income Opportunities Fund (previously Assistant Treasurer (2017)); Goldman Sachs MLP and Energy Renaissance Fund (previously Assistant Treasurer (2017)); Goldman Sachs Credit Income Fund; and Goldman Sachs Real Estate Diversified Income Fund. |
| | | | | | |
| * | | Represents a partial list of officers of the Trust. Additional information about all the officers is available in the Fund’s Statement of Additional Information, which can be obtained from Goldman Sachs free of charge by calling this toll-free number (in the United States): 1-800-621-2550. |
| 1 | | Information is provided as of August 31, 2020. |
| 2 | | Officers hold office at the pleasure of the Board of Trustees or until their successors are duly elected and qualified. Each officer holds comparable positions with certain other companies of which Goldman Sachs, GSAM or an affiliate thereof is the investment adviser, administrator and/or distributor. |
Goldman Sachs Hedge Industry VIP ETF — Tax Information (Unaudited)
For the fiscal year ended August 31, 2020, 100% of the dividends paid from net investment company taxable income by the Goldman Sachs Hedge Industry VIP ETF qualify for the dividends received deduction available to corporations.
For the fiscal year ended August 31, 2020, 100% of the dividends paid from net investment company taxable income by the Goldman Sachs Hedge Industry VIP ETF qualify for the reduced tax rate under the Jobs and Growth Tax Relief and Reconciliation Act of 2003.
24
FUNDS PROFILE
Goldman Sachs ETFs

Goldman Sachs is a premier financial services firm, known since 1869 for creating thoughtful and customized investment solutions in complex global markets.
Today, the Consumer and Investment Management Division of Goldman Sachs serves a diverse set of clients worldwide, including private institutions, public entities and individuals. With approximately $1.88 trillion in assets under supervision as of June 30, 2020, Goldman Sachs Asset Management (“GSAM”) has portfolio management teams located around the world and our investment professionals bring firsthand knowledge of local markets to every investment decision. Assets under supervision includes assets under management and other client assets for which Goldman Sachs does not have full discretion. GSAM leverages the resources of Goldman Sachs & Co. LLC subject to legal, internal and regulatory restrictions.
|
|
| GOLDMAN SACHS EXCHANGE-TRADED FUNDS |
| Goldman Sachs ActiveBeta® Emerging Markets Equity ETF |
| Goldman Sachs ActiveBeta® Europe Equity ETF |
| Goldman Sachs ActiveBeta® International Equity ETF |
| Goldman Sachs ActiveBeta® Japan Equity ETF |
| Goldman Sachs ActiveBeta® U.S. Large Cap Equity ETF |
| Goldman Sachs ActiveBeta® U.S. Small Cap Equity ETF |
| Goldman Sachs Equal Weight U.S. Large Cap Equity ETF |
| Goldman Sachs Hedge Industry VIP ETF |
| Goldman Sachs JUST U.S. Large Cap Equity ETF |
| Goldman Sachs Access High Yield Corporate Bond ETF |
| Goldman Sachs Access Inflation Protected USD Bond ETF |
| Goldman Sachs Access Investment Grade Corporate Bond ETF |
| Goldman Sachs Access Investment Grade Corporate 1-5 Year Bond ETF |
| Goldman Sachs Access Treasury 0-1 Year ETF |
| Goldman Sachs Access Ultra Short Bond ETF |
| Goldman Sachs Access U.S. Aggregate Bond ETF |
| Goldman Sachs Data-Driven World ETF |
| Goldman Sachs Finance Reimagined ETF |
| Goldman Sachs Human Evolution ETF |
| Goldman Sachs Manufacturing Revolution ETF |
| Goldman Sachs New Age Consumer ETF |
| Goldman Sachs MarketBeta International Equity ETF |
| Goldman Sachs MarketBeta Emerging Markets Equity ETF |
| Goldman Sachs MarketBeta U.S. Equity ETF |
|
INDEX DISCLAIMER
GOLDMAN SACHS ASSET MANAGEMENT, L.P., THE GOLDMAN SACHS GROUP, INC., AND GOLDMAN SACHS & CO. LLC (COLLECTIVELY, “GOLDMAN SACHS”) DOES NOT GUARANTEE NOR MAKE ANY REPRESENTATION OR WARRANTY, EXPRESS OR IMPLIED, TO THE OWNERS OR SHAREHOLDERS OF THE FUND OR ANY MEMBER OF THE PUBLIC REGARDING THE ADVISABILITY OF INVESTING IN SECURITIES GENERALLY OR IN THE FUND PARTICULARLY OR THE ABILITY OF THE INDEX TO TRACK GENERAL MARKET PERFORMANCE. GOLDMAN SACHS, IN ITS CAPACITY AS THE INDEX PROVIDER OF THE INDEX, LICENSES CERTAIN TRADEMARKS AND TRADE NAMES TO THE FUND. GOLDMAN SACHS HAS NO OBLIGATION TO TAKE THE NEEDS OF THE FUND OR THE SHAREHOLDERS OF THE FUND INTO CONSIDERATION IN DETERMINING, COMPOSING OR CALCULATING THE INDEX. GOLDMAN SACHS, ITS AFFILIATES AND ANY OF ITS CLIENTS MAY HOLD LONG OR SHORT POSITIONS IN SECURITIES HELD BY THE FUND OR IN RELATED DERIVATIVES, INCLUDING THOSE LINKED TO THE INDEX. GOLDMAN SACHS DOES NOT GUARANTEE THE ADEQUACY, TIMELINESS, ACCURACY AND/OR THE COMPLETENESS OF THE INDEX OR ANY DATA RELATED THERETO. GOLDMAN SACHS HEREBY EXPRESSLY DISCLAIMS ANY AND ALL LIABILITY FOR ANY ERRORS, OMISSIONS, OR INTERRUPTIONS THEREIN OR IN THE CALCULATION THEREOF. GOLDMAN SACHS MAKES NO WARRANTY, EXPRESS OR IMPLIED, AND EXPRESSLY DISCLAIMS ALL WARRANTIES OF MERCHANTABILITY OR FITNESS FOR A PARTICULAR PURPOSE OR USE WITH RESPECT TO THE MARKS, THE INDEX OR ANY DATA INCLUDED THEREIN AS TO THE RESULTS TO BE OBTAINED BY THE FUND, THE SHAREHOLDERS, OR ANY OTHER PERSON OR ENTITY FROM USE OF THE INDEX OR ANY DATA INCLUDED THEREIN. WITHOUT LIMITING ANY OF THE FOREGOING, GOLDMAN SACHS HEREBY EXPRESSLY DISCLAIMS ANY AND ALL LIABILITY FOR ANY SPECIAL, PUNITIVE, INDIRECT, OR CONSEQUENTIAL DAMAGES (INCLUDING LOST PROFITS), EVEN IF ADVISED OF THE POSSIBILITY OF SUCH DAMAGES.
| | |
TRUSTEES Lawrence W. Stranghoener, Chairman Caroline Dorsa Linda A. Lang Michael Latham James A. McNamara | | OFFICERS James A. McNamara, President Joseph F. DiMaria, Treasurer, Principal Financial Officer and Principal Accounting Officer Caroline L. Kraus, Secretary |
| |
THE BANK OF NEW YORK MELLON Transfer Agent | | |
| |
ALPS DISTRIBUTORS, INC. Distributor | | GOLDMAN SACHS ASSET MANAGEMENT, L.P. Investment Adviser |
Visit our Website at www.GSAMFUNDS.com/ETFs to obtain the most recent month-end returns.
Goldman Sachs Asset Management, L.P., 200 West Street, New York, New York 10282
The reports concerning the Fund included in this shareholder report may contain certain forward-looking statements about the factors that may affect the performance of the Fund in the future. These statements are based on Fund management’s predictions and expectations concerning certain future events and their expected impact on the Fund, such as performance of the economy as a whole and of specific industry sectors, changes in the levels of interest rates, the impact of developing world events, and other factors that may influence the future performance of the Fund. Management believes these forward-looking statements to be reasonable, although they are inherently uncertain and difficult to predict. Actual events may cause adjustments in portfolio management strategies from those currently expected to be employed.
A description of the policies and procedures that the Fund uses to determine how to vote proxies relating to portfolio securities and information regarding how the Fund voted proxies relating to portfolio securities during the most recent 12-month period ended June 30 is available (i) without charge, upon request by calling 1-800-621-2550; and (ii) on the Securities and Exchange Commission (“SEC”) web site at http://www.sec.gov.
The Fund will file portfolio holdings information for each month in a fiscal quarter within 60 days after the end of the relevant fiscal quarter on Form N-PORT. Portfolio holdings information for the third month of each fiscal quarter will be made available on the SEC’s web site at http://www.sec.gov. Portfolio holdings information may be obtained upon request and without charge by calling 1-800-621-2550.
Fund holdings and allocations shown are as of August 31, 2020 and may not be representative of future investments. Fund holdings should not be relied on in making investment decisions and should not be construed as research or investment advice regarding particular securities. Current and future holdings are subject to risk.
ETF Fund shares are not individually redeemable and are issued and redeemed by the Fund at their net asset value (“NAV”) only in large, specified blocks of shares called creation units. Shares otherwise can be bought and sold only through exchange trading at market price (not NAV). Shares may trade at a premium or discount to their NAV in the secondary market. Brokerage commissions will reduce returns. Ordinary brokerage commissions apply.
Economic and market forecasts presented herein reflect our judgment as of the date of this presentation and are subject to change without notice. These forecasts do not take into account the specific investment objectives, restrictions, tax and financial situation or other needs of any specific client. Actual data will vary and may not be reflected here. These forecasts are subject to high levels of uncertainty that may affect actual performance. Accordingly, these forecasts should be viewed as merely representative of a broad range of possible outcomes. These forecasts are estimated, based on assumptions, and are subject to significant revision and may change materially as economic and market conditions change. Goldman Sachs has no obligation to provide updates or changes to these forecasts. Case studies and examples are for illustrative purposes only.
This material is not authorized for distribution to prospective investors unless preceded or accompanied by a current Prospectus or summary prospectus, if applicable. Investors should consider the Fund’s objective, risks, and charges and expenses, and read the summary prospectus, if available, and/or the Prospectus carefully before investing or sending money. The summary prospectus, if available, and the Prospectus contain this and other information about the Fund and may be obtained from your authorized dealer or from Goldman Sachs & Co. LLC by calling 1-800-621-2550.
ActiveBeta® is a registered trademark of GSAM.
ALPS Distributors, Inc. is the distributor of the Goldman Sachs ETF Funds. ALPS Distributors, Inc. is unaffiliated with Goldman Sachs Asset Management.
© 2020 Goldman Sachs. All rights reserved. 218123-OTU-10/2020 HEDVIPETFAR-20
Goldman Sachs Funds

| | | | |
| | |
| Annual Report | | | | August 31, 2020 |
| | |
| | | | JUST U.S. Large Cap Equity ETF (JUST) |
It is our intention that beginning on January 1, 2021, paper copies of the Fund’s annual and semi-annual shareholder reports will no longer be sent by mail, unless you specifically request paper copies of the reports from your financial intermediary. Instead, the reports will be made available on a website, and you will be notified by mail each time a report is posted and provided with a website link to access the report.
If you already elected to receive shareholder reports electronically, you will not be affected by this change and you need not take any action. At any time, you may elect to receive reports and certain communications from the Fund electronically by contacting your financial intermediary.
You may elect to receive all future shareholder reports in paper free of charge. You can inform your financial intermediary that you wish to receive paper copies of reports by contacting your financial intermediary. Your election to receive reports in paper will apply to all Goldman Sachs Funds held in your account.

Goldman Sachs JUST U.S. Large Cap Equity ETF
| | | | |
| | | |
| NOT FDIC-INSURED | | May Lose Value | | No Bank Guarantee |
INVESTMENT PROCESS
Goldman Sachs JUST U.S. Large Cap Equity ETF
Principal Investment Strategies
The Goldman Sachs JUST U.S. Large Cap Equity ETF (the “Fund”) seeks to provide investment results that closely correspond, before fees and expenses, to the performance of the JUST US Large Cap Diversified Index (the “Index”).
The Fund seeks to achieve its investment objective by investing at least 80% of its assets (exclusive of collateral held from securities lending) in securities included in its underlying index, in depositary receipts representing securities included in its underlying index and in underlying stocks in respect of depositary receipts included in its underlying index.
The Index is designed to deliver exposure to equity securities of large capitalization U.S. issuers that engage in “just business behavior” based on rankings produced by JUST Capital Foundation, Inc. (the “Index Provider”). The Index Provider publishes an annual ranking of issuers in the Russell 1000® Index (the “Reference Index”) based on its quantitative performance assessment of seven issue areas: how they treat their workers, their customers, the communities they interact with, the environment, and their shareholders, their commitment to making quality and beneficial products, and job creation.
The Index Provider seeks to encourage greater accountability in the business community and drive positive change among large publicly-traded U.S. corporations by (a) defining business behaviors that the American public cares most about (through extensive qualitative and quantitative survey research), (b) developing metrics that correspond to these issues in accordance with a robust, transparent methodology, (c) ranking the largest publicly-traded U.S. companies on the basis of these metrics, and (d) developing tools and products that allow investors to direct capital towards more “just” companies.
The Index is a market capitalization-weighted index that consists of the top-ranked 50% of companies in the Reference Index by industry, based on the most recent rankings by the Index Provider. On the annual Index reconstitution date, Index constituent weights are adjusted such that the Index is industry neutral and matches the Reference Index’s industry weights, based on the Industry Classification Benchmark (“ICB”) industry classification.
As of August 31, 2020, the Index consisted of 446 securities with a market capitalization range of between approximately $1.7 billion and $2,206.9 billion. The Index is reconstituted annually in December and rebalanced in March, June and September on dates corresponding to the rebalance dates for the Reference Index. The components of the Index may change over time. The Index Provider determines whether an issuer is a U.S. issuer by reference to the index methodology of the Reference Index. FTSE Russell, which constructs the Reference Index, will deem an issuer to be a U.S. issuer if it is incorporated in, has a stated headquarters in, and trades in the U.S.; if any of these do not match, the Reference Index methodology provides for consideration of certain additional factors.
Given the Fund’s investment objective of attempting to track the Index, the Fund does not follow traditional methods of active investment management, which may involve buying and selling securities based upon analysis of economic and market factors.
The Fund seeks to invest in the Index components in approximately the same weighting that such components have within the Index at the applicable time. However, under various circumstances, it may not be possible or practicable to purchase all of the securities in the Index in the approximate Index weight. In these circumstances, the Fund may purchase a sample of securities in the Index. There may also be instances in which the Investment Adviser may choose to underweight or overweight a security in the Fund’s Index, purchase securities not in the Fund’s Index that the Investment Adviser believes are appropriate to substitute for certain securities in such Index or utilize various combinations of other available investment techniques.
The Index is calculated by Frank Russell Company (“Russell” or the “Calculation Agent”) in accordance with the methodology and constituent list developed and provided by the Index Provider.
The Fund may concentrate its investments (i.e., hold more than 25% of its total assets) in a particular industry or group of industries to the extent that the Index is concentrated. The degree to which components of the Index represent certain sectors or industries may change over time.
The Fund may lend securities representing up to one-third of the value of the Fund’s total assets (including the value of any collateral received).
1
INVESTMENT PROCESS
For a complete overview of and more in-depth information about the Index Provider’s processes, please view its Full Ranking Methodology and Survey Research Appendices at https://justcapital.com/methodology/full-ranking-methodology/.
* * *
At the end of the Reporting Period, i.e., the 12 month period ended August 31, 2020, we believed a focus on just business behavior via a data-driven approach may provide a suitable core U.S. equity allocation for investors seeking to encourage greater accountability in the business community through their investments. The Fund’s data-driven approach collects and analyzes data from a diverse range of sources, utilizing more than 120,000 data points across 85 unique metrics to score the performance of Russell 1000® Index companies. These companies are scored across a variety of issues, including worker treatment, customer concerns and environment impacts to provide broad market exposure.
2
PORTFOLIO RESULTS
Goldman Sachs JUST U.S. Large Cap Equity ETF
Investment Objective
The Goldman Sachs JUST U.S. Large Cap Equity ETF (the “Fund”) seeks to provide investment results that closely correspond, before fees and expenses, to the performance of the JUST US Large Cap Diversified Index (the “Index”).
Portfolio Management Discussion and Analysis
Below, the Goldman Sachs Quantitative Investment Strategies Team discusses the Fund’s performance and positioning for the 12-month period ended August 31, 2020 (the “Reporting Period”).
| Q | | How did the Fund perform during the Reporting Period? |
| A | | During the Reporting Period, the Fund returned 23.29% based on net asset value (“NAV”) and 23.13% based on market price. The Index returned 23.73%, and the Russell 1000® Index (Total Return, USD) (“Russell 1000® Index”), a market-cap based index against which the performance of the Fund is measured, returned 22.43% during the same period. |
| | The Fund had an NAV of $42.04 on August 31, 2019 and ended the Reporting Period with an NAV of $50.92 per share. The Fund’s market price on August 31, 2020 was $50.88 per share. |
| Q | | What key factors were responsible for the Fund’s performance during the Reporting Period? |
| A | | The Fund seeks to provide investment results that closely correspond, before fees and expenses, to the performance of the Index. The Fund’s performance reflects Fund expenses, including management fees and brokerage expenses. The Fund’s relative performance also reflects the impact of any cash held in the Fund as well as any other differences between the Fund’s holdings and the constituents of the Index. The Index is unmanaged, and Index returns do not reflect fees and expenses, which would reduce returns. |
| | The Index’s performance is compared to that of the Russell 1000® Index below. Given the Fund’s investment objective of attempting to track the Index, the Fund does not follow traditional methods of active investment management, which may involve buying and selling securities based upon analysis of economic and market factors. The Fund does not follow a strategy of seeking to outperform the Russell 1000® Index. |
| | During the Reporting Period, the Index posted double-digit positive absolute returns that outperformed the Russell 1000® Index. The Fund also outperformed the Russell 1000® Index during the Reporting Period, as measured by NAV. |
| Q | | Which sectors contributed most positively to the Index’s relative performance during the Reporting Period, and which detracted most? |
| A | | Index constituents in the information technology, real estate and communication services sectors contributed most positively to the Index’s results relative to the Russell 1000® Index during the Reporting Period. Index constituents in the consumer discretionary, financials and industrials sectors detracted most from the Index’s results relative to the Russell 1000® Index during the Reporting Period. |
| Q | | Which individual stock positions contributed the most to the Index’s relative returns during the Reporting Period? |
| A | | Relative to the Russell 1000® Index, overweight positions in e-commerce retailing leader Amazon.com and information technology giant Apple and having no exposure to diversified conglomerate Berkshire Hathaway contributed most positively (4.32%, 5.24% and 0.00%1 of Fund net assets as of August 31, 2020, respectively). Amazon.com and Apple each generated a double-digit gain within the Index during the Reporting Period, while Berkshire Hathaway posted a double-digit loss within the Index during the Reporting Period. |
| Q | | Which individual stock positions detracted the most from the Index’s relative returns during the Reporting Period? |
| A | | Relative to the Russell 1000® Index, having no exposure to electric vehicle manufacturer Tesla and overweight positions |
| | 1 | | Some weights are 0.00% at August 31, 2020 either because those positions were eliminated during the most recent rebalance given the Index construction methodology or were not held at all during the Reporting Period. |
3
PORTFOLIO RESULTS
| | in aerospace and defense company Boeing and financial services company Wells Fargo & Company detracted most (0.00%1, 0.69% and 0.77% of Fund net assets as of August 31, 2020, respectively). Tesla generated a double-digit gain within the Index during the Reporting Period, while Boeing and Wells Fargo & Company each posted a double-digit loss within the Index during the Reporting Period. |
| Q | | How did the Fund use derivatives and similar instruments during the Reporting Period? |
| A | | The Fund did not invest in derivatives or similar instruments during the Reporting Period. The Fund does not employ derivatives as a source of alpha generation, although it may use them to equitize excess cash. |
| Q | | What was the Fund’s sector positioning relative to the Index and the Russell 1000® Index at the end of the Reporting Period?2 |
| | | | | | | | | | | | | | |
| | | | |
| | | Sector Name | | Fund3 | | | JUST
US Large Cap
Diversified
Index | | | Russell
1000®
Index | |
| | | | |
| | Information Technology | | | 29.15 | % | | | 29.15 | % | | | 28.40 | % |
| | | | |
| | Health Care | | | 13.41 | | | | 13.40 | | | | 13.83 | |
| | | | |
| | Consumer Discretionary | | | 12.08 | | | | 12.08 | | | | 12.36 | |
| | | | |
| | Communication Services | | | 11.24 | | | | 11.25 | | | | 10.53 | |
| | | | |
| | Financials | | | 9.50 | | | | 9.50 | | | | 9.64 | |
| | | | |
| | Industrials | | | 7.80 | | | | 7.80 | | | | 8.35 | |
| | | | |
| | Consumer Staples | | | 6.95 | | | | 6.95 | | | | 6.35 | |
| | | | |
| | Utilities | | | 2.73 | | | | 2.73 | | | | 2.70 | |
| | | | |
| | Real Estate | | | 2.48 | | | | 2.48 | | | | 3.10 | |
| | | | |
| | Materials | | | 2.43 | | | | 2.42 | | | | 2.57 | |
| | | Energy | | | 2.22 | | | | 2.22 | | | | 2.17 | |
| | 1 | | Some weights are 0.00% at August 31, 2020 either because those positions were eliminated during the most recent rebalance given the Index construction methodology or were not held at all during the Reporting Period. |
| | 2 | | Sector classifications for securities may differ between the above listing and the Schedule of Investments due to differing classification methodologies. The classification methodology used for the above listing is as set forth by GICS. The Fund’s composition may differ over time. Consequently, the Fund’s overall sector allocations may differ from percentages contained in the chart above. The percentage shown for each investment category reflects the value of investments in that category as a percentage of market value (excluding investment in the securities lending reinvestment vehicle, if any). Underlying sector allocation of exchange-traded funds held by the Fund are not reflected in the chart above. Investments in the securities lending vehicle represented 0.05% of the Fund’s net assets as of August 31, 2020. Figures above may not sum to 100% due to rounding. |
| | 3 | | The Fund seeks to provide investment results that closely correspond, before fees and expenses, to the performance of the JUST US Large Cap Diversified Index. |
4
FUND BASICS
Goldman Sachs JUST U.S. Large Cap Equity ETF
as of August 31, 2020
| | | | | | |
| | FUND SNAPSHOT | |
| | |
| | | As of August 31, 2020 | | | |
| | |
| | Market Price1 | | $ | 50.88 | |
| | | Net Asset Value (NAV)1 | | $ | 50.92 | |
| 1 | | The Market Price is the price at which the Fund’s shares are trading on the NYSE Arca, Inc. The Market Price of the Fund’s shares will fluctuate and, at the time of sale, shares may be worth more or less than the original investment or the Fund’s then current net asset value (“NAV”). The NAV is the market value of one share of the Fund. This amount is derived by dividing the total value of all the securities in the Fund’s portfolio, plus other assets, less any liabilities, by the number of Fund shares outstanding. Fund shares are not individually redeemable and are issued and redeemed by the Fund at their NAV only in large, specified blocks of shares called creation units. Shares otherwise can be bought and sold only through exchange trading at market price (not NAV). Shares may trade at a premium or discount to their NAV in the secondary market. Information regarding how often shares of the Fund traded on NYSE Arca at a price above (i.e., at a premium) or below (i.e., at a discount) the NAV of the Fund can be found at www.GSAMFUNDS.com/ETFs. |
| | | | | | | | | | |
| | TOP 10 HOLDINGS AS OF 8/31/202 |
| | | | |
| | | Holding | | % of Net Assets | | | Line of Business | | Country |
| | | | |
| | Apple, Inc. | | | 7.4 | % | | Information Technology | | United States |
| | Amazon.com, Inc. | | | 6.0 | | | Consumer Discretionary | | United States |
| | Microsoft Corp. | | | 5.9 | | | Information Technology | | United States |
| | Facebook, Inc., Class A | | | 2.5 | | | Communication Services | | United States |
| | Alphabet, Inc., Class A | | | 1.7 | | | Communication Services | | United States |
| | Alphabet, Inc., Class C | | | 1.7 | | | Communication Services | | United States |
| | Johnson & Johnson | | | 1.6 | | | Health Care | | United States |
| | Visa, Inc., Class A | | | 1.6 | | | Information Technology | | United States |
| | Procter & Gamble Co. (The) | | | 1.5 | | | Consumer Staples | | United States |
| | | Mastercard, Inc., Class A | | | 1.4 | | | Information Technology | | United States |
| 2 | | The top 10 holdings may not be representative of the Fund’s future investments. |
For more information about the Fund, please refer to www.GSAMFUNDS.com/ETFs. There, you can learn more about the Fund’s investment strategies, holdings, and performance.
5
GOLDMAN SACHS JUST U.S. LARGE CAP EQUITY ETF
Performance Summary
August 31, 2020
The following graph shows the value, as of August 31, 2020, of a $10,000 investment made on June 7, 2018 (commencement of operations) in Shares at NAV. For comparative purposes, the performance of the Fund’s underlying index and a market-cap based index against which the performance of the Fund is measured, the JUST US Large Cap Diversified Index and the Russell 1000® Index (Total Return, USD) are shown. Performance reflects applicable fee waivers and/or expense limitations in effect during the periods shown and in their absence, performance would be reduced. Returns do not reflect the deduction of taxes that a shareholder would pay on Fund distributions or the sale of Fund shares. In addition to the performance of constituents of the underlying index, other factors may affect Fund performance. These factors include, but are not limited to, Fund operating fees and expenses, portfolio turnover and creation and redemption in-kind transactions. The returns set forth below represent past performance. Past performance does not guarantee future results. The Fund’s NAV and investment return may fluctuate. These fluctuations may cause an investor’s shares to be worth more or less than their original cost. Current performance may be lower or higher than the performance quoted below. Please visit our web site at www.GSAMFUNDS.com/ETFs to obtain the most recent month-end returns.
|
| Goldman Sachs JUST U.S. Large Cap Equity ETF’s Lifetime Performance |
Performance of a $10,000 Investment, with distributions reinvested, from June 7, 2018 through August 31, 2020.
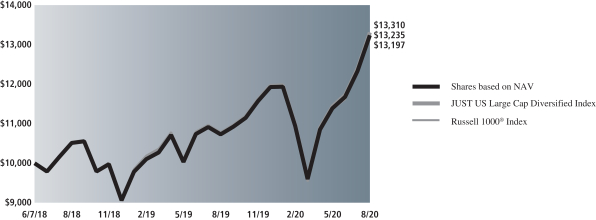
| | | | | | |
| Average Annual Total Return through August 31, 2020* | | | 1 Year Return | | | Since Inception |
Shares based on NAV (Commenced June 7, 2018) | | | 23.29% | | | 13.34% |
| | | | | | |
Shares based on Market Price (Commenced June 7, 2018) | | | 23.13% | | | 13.29% |
|
JUST US Large Cap Diversified Index | | | 23.73% | | | 13.62% |
|
Russell 1000® Index | | | 22.43% | | | 13.19% |
|
| * | | Total returns are calculated assuming purchase of a share at the market price or NAV on the first day and sale of a share at the market price or NAV on the last day of each period reported. The Total Returns based on NAV and Market Price assume the reinvestment of dividends and do not reflect brokerage commissions in connection with the purchase or sale of Fund shares, which if included would lower the performance shown above. The NAV used in the Total Return calculation assumes all management fees and operating expenses incurred by the Fund. Market Price returns are based upon the last trade at 4:00 pm EST and do not reflect the returns you would receive if you traded shares at other times. The first day of secondary market trading is typically several days after the date on which the Fund commenced investment operations; therefore, the NAV of the Fund is used as a proxy for the period from inception of investment operations to the first day of secondary market trading to calculate the Market Price returns. |
6
FUND BASICS
Index Definitions and Industry Terms
Alpha: The excess returns of a fund relative to the return of a benchmark index is the fund’s alpha.
“JUST” and “JUST Capital” are trademarks of JUST Capital Foundation, Inc. or its affiliates and have been licensed for use in connection with the issuance and distribution of the Goldman Sachs JUST U.S. Large Cap Equity ETF. JUST Capital Foundation, Inc. and its affiliates do not in any way recommend the purchase, sale or holding of any security based on the JUST US Large Cap Diversified Index including the Goldman Sachs JUST U.S. Large Cap Equity ETF, or have any involvement in their operations or distribution. JUST Capital Foundation, Inc., its affiliates, calculation agent, and data providers expressly disclaim all representations, warranties, and liabilities relating to or in connection with the Goldman Sachs JUST U.S. Large Cap Equity ETF (including, without limitation, any warranties of originality, accuracy, completeness, timeliness, non-infringement, merchantability, and fitness for a particular purpose). Frank Russell Company (“Russell”) acts solely as calculation agent in respect of the JUST US Large Cap Diversified Index. Russell does not in any way sponsor, support, promote or endorse the JUST US Large Cap Diversified Index or the Goldman Sachs JUST U.S. Large Cap Equity ETF. In no event shall any Russell party have any liability for any direct, indirect, special, incidental, punitive, consequential (including without limitation, lost profits) or any other damages in connection with the JUST US Large Cap Diversified Index.
The Russell 1000® Index is an index of approximately 1,000 of the largest companies in the U.S. equity market. The Russell 1000® is a subset of the Russell 3000® Index. It represents the top companies by market capitalization. The Russell 1000® typically comprises approximately 90% of the total market capitalization of all listed U.S. stocks. It is considered a bellwether index for large cap investing.
7
GOLDMAN SACHS JUST U.S. LARGE CAP EQUITY ETF
Schedule of Investments
August 31, 2020
| | | | | | | | |
| Shares | | | Description | | Value | |
|
| Common Stocks – 99.3% | |
| Communication Services – 11.2% | |
| | 5,237 | | | Activision Blizzard, Inc. | | $ | 437,394 | |
| | 1,602 | | | Alphabet, Inc., Class A* | | | 2,610,507 | |
| | 1,583 | | | Alphabet, Inc., Class C* | | | 2,586,907 | |
| | 35,347 | | | AT&T, Inc. | | | 1,053,694 | |
| | 28,319 | | | Comcast Corp., Class A | | | 1,268,975 | |
| | 973 | | | Discovery, Inc., Class A* | | | 21,469 | |
| | 2,031 | | | Discovery, Inc., Class C* | | | 40,559 | |
| | 1,954 | | | Electronic Arts, Inc.* | | | 272,525 | |
| | 12,836 | | | Facebook, Inc., Class A* | | | 3,763,515 | |
| | 2,422 | | | Interpublic Group of Cos., Inc. (The) | | | 43,015 | |
| | 268 | | | John Wiley & Sons, Inc., Class A | | | 8,482 | |
| | 154 | | | Liberty Media Corp.-Liberty Formula One, Class A* | | | 5,572 | |
| | 1,234 | | | Liberty Media Corp.-Liberty Formula One, Class C* | | | 48,101 | |
| | 2,657 | | | Netflix, Inc.* | | | 1,407,041 | |
| | 1,019 | | | New York Times Co. (The), Class A | | | 44,153 | |
| | 1,326 | | | Omnicom Group, Inc. | | | 71,723 | |
| | 2,628 | | | T-Mobile US, Inc.* | | | 306,635 | |
| | 625 | | | TripAdvisor, Inc. | | | 14,606 | |
| | 4,104 | | | Twitter, Inc.* | | | 166,540 | |
| | 74 | | | United States Cellular Corp.* | | | 2,692 | |
| | 20,537 | | | Verizon Communications, Inc. | | | 1,217,228 | |
| | 11,294 | | | Walt Disney Co. (The) | | | 1,489,340 | |
| | 383 | | | Zillow Group, Inc., Class A* | | | 32,662 | |
| | 909 | | | Zillow Group, Inc., Class C* | | | 77,956 | |
| | 6,076 | | | Zynga, Inc., Class A* | | | 55,049 | |
| | | | | | | | |
| | | | | | | 17,046,340 | |
| | |
| Consumer Discretionary – 12.0% | |
| | 419 | | | Advance Auto Parts, Inc. | | | 65,494 | |
| | 2,649 | | | Amazon.com, Inc.* | | | 9,141,593 | |
| | 1,833 | | | Aptiv PLC | | | 157,858 | |
| | 1,425 | | | Best Buy Co., Inc. | | | 158,047 | |
| | 255 | | | Booking Holdings, Inc.* | | | 487,165 | |
| | 1,418 | | | BorgWarner, Inc. | | | 57,557 | |
| | 1,018 | | | CarMax, Inc.* | | | 108,855 | |
| | 342 | | | Carvana Co.* | | | 73,858 | |
| | 813 | | | Darden Restaurants, Inc. | | | 70,463 | |
| | 4,169 | | | eBay, Inc. | | | 228,378 | |
| | 735 | | | Etsy, Inc.* | | | 87,979 | |
| | 843 | | | Expedia Group, Inc. | | | 82,740 | |
| | 26,716 | | | Ford Motor Co. | | | 182,203 | |
| | 1,141 | | | Gap, Inc. (The) | | | 19,842 | |
| | 8,564 | | | General Motors Co. | | | 253,751 | |
| | 1,679 | | | Gentex Corp. | | | 45,417 | |
| | 24 | | | Graham Holdings Co., Class B | | | 10,271 | |
| | 288 | | | Grand Canyon Education, Inc.* | | | 27,083 | |
| | 869 | | | Hasbro, Inc. | | | 68,599 | |
| | 1,702 | | | Hilton Worldwide Holdings, Inc. | | | 153,793 | |
| | 6,714 | | | Home Depot, Inc. (The) | | | 1,913,759 | |
| | 219 | | | Hyatt Hotels Corp., Class A | | | 12,371 | |
| | 966 | | | Kohl’s Corp. | | | 20,634 | |
| | 1,431 | | | L Brands, Inc. | | | 42,071 | |
| | 2,070 | | | Las Vegas Sands Corp. | | | 104,970 | |
| | 408 | | | Lear Corp. | | | 46,483 | |
| | 4,721 | | | Lowe’s Cos., Inc. | | | 777,501 | |
| | |
|
| Common Stocks – (continued) | |
| Consumer Discretionary – (continued) | |
| | 1,677 | | | Marriott International, Inc., Class A | | | 172,580 | |
| | 2,939 | | | MGM Resorts International | | | 66,127 | |
| | 396 | | | Mohawk Industries, Inc.* | | | 36,563 | |
| | 8,307 | | | NIKE, Inc., Class B | | | 929,470 | |
| | 683 | | | Nordstrom, Inc.(a) | | | 10,928 | |
| | 1,594 | | | Norwegian Cruise Line Holdings Ltd.* | | | 27,273 | |
| | 201 | | | Penske Automotive Group, Inc. | | | 9,481 | |
| | 264 | | | Pool Corp. | | | 86,550 | |
| | 1,829 | | | PulteGroup, Inc. | | | 81,555 | |
| | 481 | | | PVH Corp. | | | 26,821 | |
| | 329 | | | Ralph Lauren Corp. | | | 22,645 | |
| | 1,068 | | | Royal Caribbean Cruises Ltd. | | | 73,521 | |
| | 1,084 | | | Service Corp. International | | | 49,485 | |
| | 7,305 | | | Starbucks Corp. | | | 617,053 | |
| | 1,894 | | | Tapestry, Inc. | | | 27,899 | |
| | 3,122 | | | Target Corp. | | | 472,078 | |
| | 830 | | | Tiffany & Co. | | | 101,675 | |
| | 7,488 | | | TJX Cos., Inc. (The) | | | 410,268 | |
| | 795 | | | Toll Brothers, Inc. | | | 33,565 | |
| | 721 | | | Tractor Supply Co. | | | 107,306 | |
| | 1,290 | | | Under Armour, Inc., Class A* | | | 12,655 | |
| | 1,298 | | | Under Armour, Inc., Class C* | | | 11,487 | |
| | 2,239 | | | VF Corp. | | | 147,214 | |
| | 408 | | | Wayfair, Inc., Class A* | | | 120,996 | |
| | 421 | | | Whirlpool Corp. | | | 74,820 | |
| | 522 | | | Wyndham Destinations, Inc. | | | 15,133 | |
| | 1,883 | | | Yum! Brands, Inc. | | | 180,486 | |
| | | | | | | | |
| | | | | | | 18,324,369 | |
| | |
| Consumer Staples – 6.9% | |
| | 3,797 | | | Archer-Daniels-Midland Co. | | | 169,954 | |
| | 311 | | | Brown-Forman Corp., Class A | | | 20,675 | |
| | 1,235 | | | Brown-Forman Corp., Class B | | | 90,365 | |
| | 946 | | | Bunge Ltd. | | | 43,157 | |
| | 1,202 | | | Campbell Soup Co. | | | 63,237 | |
| | 1,683 | | | Church & Dwight Co., Inc. | | | 161,282 | |
| | 863 | | | Clorox Co. (The) | | | 192,880 | |
| | 26,518 | | | Coca-Cola Co. (The) | | | 1,313,437 | |
| | 5,778 | | | Colgate-Palmolive Co. | | | 457,964 | |
| | 3,339 | | | Conagra Brands, Inc. | | | 128,084 | |
| | 2,758 | | | Costco Wholesale Corp. | | | 958,846 | |
| | 4,162 | | | General Mills, Inc. | | | 266,160 | |
| | 1,008 | | | Hershey Co. (The) | | | 149,829 | |
| | 1,912 | | | Hormel Foods Corp. | | | 97,474 | |
| | 460 | | | Ingredion, Inc. | | | 37,002 | |
| | 754 | | | J M Smucker Co. (The) | | | 90,616 | |
| | 1,717 | | | Kellogg Co. | | | 121,752 | |
| | 2,326 | | | Kimberly-Clark Corp. | | | 366,950 | |
| | 849 | | | McCormick & Co., Inc. | | | 175,064 | |
| | 9,687 | | | Mondelez International, Inc., Class A | | | 565,915 | |
| | 9,519 | | | PepsiCo, Inc. | | | 1,333,231 | |
| | 16,715 | | | Procter & Gamble Co. (The) | | | 2,312,186 | |
| | 3,025 | | | Sysco Corp. | | | 181,924 | |
| | 1,507 | | | US Foods Holding Corp.* | | | 36,695 | |
| | 8,711 | | | Walmart, Inc. | | | 1,209,522 | |
| | | | | | | | |
| | | | | | | 10,544,201 | |
| | |
| | |
| 8 | | The accompanying notes are an integral part of these financial statements. |
GOLDMAN SACHS JUST U.S. LARGE CAP EQUITY ETF
| | | | | | | | |
| Shares | | | Description | | Value | |
|
| Common Stocks – (continued) | |
| Energy – 2.2% | |
| | 2,227 | | | Apache Corp. | | $ | 32,960 | |
| | 3,867 | | | Baker Hughes Co. | | | 55,221 | |
| | 11,037 | | | Chevron Corp. | | | 926,335 | |
| | 592 | | | Cimarex Energy Co. | | | 16,446 | |
| | 1,152 | | | Concho Resources, Inc. | | | 59,881 | |
| | 6,340 | | | ConocoPhillips | | | 240,223 | |
| | 2,251 | | | Devon Energy Corp. | | | 24,468 | |
| | 3,437 | | | EOG Resources, Inc. | | | 155,834 | |
| | 1,505 | | | EQT Corp. | | | 23,884 | |
| | 2,404 | | | Equitrans Midstream Corp. | | | 24,713 | |
| | 24,985 | | | Exxon Mobil Corp. | | | 997,901 | |
| | 5,162 | | | Halliburton Co. | | | 83,521 | |
| | 4,646 | | | Marathon Oil Corp. | | | 24,531 | |
| | 4,788 | | | Occidental Petroleum Corp. | | | 60,999 | |
| | 2,588 | | | ONEOK, Inc. | | | 71,118 | |
| | 1,774 | | | Parsley Energy, Inc., Class A | | | 19,071 | |
| | 2,577 | | | Phillips 66 | | | 150,677 | |
| | 967 | | | Pioneer Natural Resources Co. | | | 100,500 | |
| | 8,188 | | | Schlumberger NV | | | 155,654 | |
| | 7,169 | | | Williams Cos., Inc. (The) | | | 148,828 | |
| | | | | | | | |
| | | | | | | 3,372,765 | |
| | |
| Financials – 9.4% | |
| | 316 | | | Affiliated Managers Group, Inc. | | | 21,693 | |
| | 2,101 | | | Allstate Corp. (The) | | | 195,393 | |
| | 2,499 | | | Ally Financial, Inc. | | | 57,177 | |
| | 4,383 | | | American Express Co. | | | 445,269 | |
| | 5,768 | | | American International Group, Inc. | | | 168,080 | |
| | 823 | | | Ameriprise Financial, Inc. | | | 129,046 | |
| | 1,536 | | | Aon PLC, Class A | | | 307,185 | |
| | 1,016 | | | Associated Banc-Corp. | | | 13,655 | |
| | 397 | | | Assurant, Inc. | | | 48,259 | |
| | 51,815 | | | Bank of America Corp. | | | 1,333,718 | |
| | 262 | | | Bank of Hawaii Corp. | | | 14,421 | |
| | 5,347 | | | Bank of New York Mellon Corp. (The) | | | 197,732 | |
| | 985 | | | BlackRock, Inc. | | | 585,277 | |
| | 211 | | | BOK Financial Corp. | | | 11,846 | |
| | 3,028 | | | Capital One Financial Corp. | | | 209,023 | |
| | 7,738 | | | Charles Schwab Corp. (The) | | | 274,931 | |
| | 13,946 | | | Citigroup, Inc. | | | 712,920 | |
| | 2,851 | | | Citizens Financial Group, Inc. | | | 73,755 | |
| | 190 | | | CNA Financial Corp. | | | 6,112 | |
| | 932 | | | Comerica, Inc. | | | 36,842 | |
| | 2,049 | | | Discover Financial Services | | | 108,761 | |
| | 739 | | | Eaton Vance Corp. | | | 30,314 | |
| | 2,720 | | | Equitable Holdings, Inc. | | | 57,637 | |
| | 166 | | | Erie Indemnity Co., Class A | | | 35,431 | |
| | 232 | | | FactSet Research Systems, Inc. | | | 81,293 | |
| | 4,758 | | | Fifth Third Bancorp | | | 98,300 | |
| | 725 | | | First American Financial Corp. | | | 38,113 | |
| | 2,059 | | | First Horizon National Corp. | | | 19,663 | |
| | 1,142 | | | First Republic Bank | | | 128,943 | |
| | 2,222 | | | Goldman Sachs Group, Inc. (The)(b) | | | 455,221 | |
| | 252 | | | Hanover Insurance Group, Inc. (The) | | | 25,828 | |
| | 2,391 | | | Hartford Financial Services Group, Inc. (The) | | | 96,716 | |
| | 6,751 | | | Huntington Bancshares, Inc. | | | 63,527 | |
| | |
|
| Common Stocks – (continued) | |
| Financials – (continued) | |
| | 3,615 | | | Intercontinental Exchange, Inc. | | | 384,021 | |
| | 2,520 | | | Invesco Ltd. | | | 25,704 | |
| | 20,290 | | | JPMorgan Chase & Co. | | | 2,032,855 | |
| | 6,495 | | | KeyCorp | | | 80,018 | |
| | 1,289 | | | Lincoln National Corp. | | | 46,468 | |
| | 523 | | | LPL Financial Holdings, Inc. | | | 42,970 | |
| | 3,387 | | | Marsh & McLennan Cos., Inc. | | | 389,200 | |
| | 5,149 | | | MetLife, Inc. | | | 198,031 | |
| | 1,087 | | | Moody’s Corp. | | | 320,274 | |
| | 7,387 | | | Morgan Stanley | | | 386,045 | |
| | 134 | | | Morningstar, Inc. | | | 21,460 | |
| | 556 | | | MSCI, Inc. | | | 207,538 | |
| | 763 | | | Nasdaq, Inc. | | | 102,563 | |
| | 1,286 | | | Northern Trust Corp. | | | 105,311 | |
| | 493 | | | Pinnacle Financial Partners, Inc. | | | 19,695 | |
| | 2,842 | | | PNC Financial Services Group, Inc. (The) | | | 316,030 | |
| | 265 | | | Primerica, Inc. | | | 33,085 | |
| | 1,815 | | | Principal Financial Group, Inc. | | | 76,430 | |
| | 3,916 | | | Progressive Corp. (The) | | | 372,177 | |
| | 2,647 | | | Prudential Financial, Inc. | | | 179,387 | |
| | 6,427 | | | Regions Financial Corp. | | | 74,296 | |
| | 454 | | | Reinsurance Group of America, Inc. | | | 41,623 | |
| | 329 | | | RenaissanceRe Holdings Ltd. (Bermuda) | | | 60,450 | |
| | 1,610 | | | S&P Global, Inc. | | | 589,936 | |
| | 345 | | | SVB Financial Group* | | | 88,106 | |
| | 3,901 | | | Synchrony Financial | | | 96,784 | |
| | 1,516 | | | T. Rowe Price Group, Inc. | | | 211,042 | |
| | 1,739 | | | TD Ameritrade Holding Corp. | | | 66,743 | |
| | 328 | | | TFS Financial Corp. | | | 5,068 | |
| | 1,691 | | | Travelers Cos., Inc. (The) | | | 196,224 | |
| | 9,018 | | | Truist Financial Corp. | | | 349,989 | |
| | 1,469 | | | Umpqua Holdings Corp. | | | 16,570 | |
| | 1,357 | | | Unum Group | | | 25,077 | |
| | 9,102 | | | US Bancorp | | | 331,313 | |
| | 840 | | | Voya Financial, Inc. | | | 43,604 | |
| | 25,154 | | | Wells Fargo & Co. | | | 607,469 | |
| | 860 | | | Willis Towers Watson PLC | | | 176,756 | |
| | | | | | | | |
| | | | | | | 14,402,393 | |
| | |
| Health Care – 13.3% | |
| | 10,287 | | | Abbott Laboratories | | | 1,126,118 | |
| | 2,165 | | | Agilent Technologies, Inc. | | | 217,409 | |
| | 364 | | | Agios Pharmaceuticals, Inc.* | | | 14,928 | |
| | 465 | | | Align Technology, Inc.* | | | 138,096 | |
| | 681 | | | Alnylam Pharmaceuticals, Inc.* | | | 90,328 | |
| | 3,502 | | | Amgen, Inc. | | | 887,127 | |
| | 1,504 | | | Anthem, Inc. | | | 423,406 | |
| | 3,027 | | | Baxter International, Inc. | | | 263,561 | |
| | 1,603 | | | Becton Dickinson and Co. | | | 389,160 | |
| | 967 | | | Biogen, Inc.* | | | 278,148 | |
| | 1,073 | | | BioMarin Pharmaceutical, Inc.* | | | 83,726 | |
| | 8,312 | | | Boston Scientific Corp.* | | | 340,958 | |
| | 13,470 | | | Bristol-Myers Squibb Co. | | | 837,834 | |
| | 1,741 | | | Cardinal Health, Inc. | | | 88,373 | |
| | 288 | | | Charles River Laboratories International, Inc.* | | | 63,058 | |
| | 2,154 | | | Cigna Corp. | | | 382,055 | |
| | |
| | |
| The accompanying notes are an integral part of these financial statements. | | 9 |
GOLDMAN SACHS JUST U.S. LARGE CAP EQUITY ETF
Schedule of Investments (continued)
August 31, 2020
| | | | | | | | |
| Shares | | | Description | | Value | |
|
| Common Stocks – (continued) | |
| Health Care – (continued) | |
| | 8,168 | | | CVS Health Corp. | | $ | 507,396 | |
| | 3,725 | | | Danaher Corp. | | | 769,101 | |
| | 3,670 | | | Edwards Lifesciences Corp.* | | | 315,033 | |
| | 2,375 | | | Elanco Animal Health, Inc.* | | | 69,018 | |
| | 5,014 | | | Eli Lilly and Co. | | | 744,027 | |
| | 881 | | | Exact Sciences Corp.* | | | 66,330 | |
| | 7,470 | | | Gilead Sciences, Inc. | | | 498,623 | |
| | 1,584 | | | HCA Healthcare, Inc. | | | 214,980 | |
| | 846 | | | Henry Schein, Inc.* | | | 56,208 | |
| | 1,525 | | | Hologic, Inc.* | | | 91,073 | |
| | 789 | | | Humana, Inc. | | | 327,569 | |
| | 499 | | | IDEXX Laboratories, Inc.* | | | 195,139 | |
| | 871 | | | Illumina, Inc.* | | | 311,139 | |
| | 1,082 | | | Incyte Corp.* | | | 104,251 | |
| | 690 | | | Intuitive Surgical, Inc.* | | | 504,280 | |
| | 15,693 | | | Johnson & Johnson | | | 2,407,463 | |
| | 1,006 | | | McKesson Corp. | | | 154,361 | |
| | 7,985 | | | Medtronic PLC | | | 858,148 | |
| | 15,031 | | | Merck & Co., Inc. | | | 1,281,693 | |
| | 163 | | | Mettler-Toledo International, Inc.* | | | 158,237 | |
| | 374 | | | PRA Health Sciences, Inc.* | | | 39,984 | |
| | 796 | | | Quest Diagnostics, Inc. | | | 88,547 | |
| | 577 | | | Regeneron Pharmaceuticals, Inc.* | | | 357,700 | |
| | 851 | | | ResMed, Inc. | | | 153,844 | |
| | 307 | | | Sage Therapeutics, Inc.* | | | 16,099 | |
| | 2,060 | | | Stryker Corp. | | | 408,210 | |
| | 2,353 | | | Thermo Fisher Scientific, Inc. | | | 1,009,390 | |
| | 5,619 | | | UnitedHealth Group, Inc. | | | 1,756,218 | |
| | 542 | | | Varian Medical Systems, Inc.* | | | 94,129 | |
| | 1,545 | | | Vertex Pharmaceuticals, Inc.* | | | 431,240 | |
| | 431 | | | Waters Corp.* | | | 93,208 | |
| | 1,232 | | | Zimmer Biomet Holdings, Inc. | | | 173,564 | |
| | 2,831 | | | Zoetis, Inc. | | | 453,243 | |
| | | | | | | | |
| | | | | | | 20,333,730 | |
| | |
| Industrials – 7.8% | |
| | 3,941 | | | 3M Co. | | | 642,462 | |
| | 1,070 | | | AECOM* | | | 42,276 | |
| | 3,743 | | | Boeing Co. (The) | | | 643,122 | |
| | 668 | | | BWX Technologies, Inc. | | | 37,147 | |
| | 6,081 | | | Carrier Global Corp. | | | 181,518 | |
| | 3,798 | | | Caterpillar, Inc. | | | 540,493 | |
| | 1,034 | | | Cummins, Inc. | | | 214,296 | |
| | 2,195 | | | Deere & Co. | | | 461,082 | |
| | 3,977 | | | Delta Air Lines, Inc. | | | 122,690 | |
| | 2,800 | | | Eaton Corp. PLC | | | 285,880 | |
| | 4,172 | | | Emerson Electric Co. | | | 289,829 | |
| | 1,164 | | | Expeditors International of Washington, Inc. | | | 102,886 | |
| | 1,700 | | | FedEx Corp. | | | 373,728 | |
| | 944 | | | Fortune Brands Home & Security, Inc. | | | 79,372 | |
| | 61,015 | | | General Electric Co. | | | 386,835 | |
| | 1,158 | | | Graco, Inc. | | | 67,187 | |
| | 561 | | | Hexcel Corp. | | | 22,098 | |
| | 2,762 | | | Howmet Aerospace, Inc. | | | 48,390 | |
| | 275 | | | Huntington Ingalls Industries, Inc. | | | 41,668 | |
| | 2,204 | | | Illinois Tool Works, Inc. | | | 435,400 | |
| | |
|
| Common Stocks – (continued) | |
| Industrials – (continued) | |
| | 874 | | | Jacobs Engineering Group, Inc. | | | 78,896 | |
| | 5,218 | | | Johnson Controls International PLC | | | 212,529 | |
| | 666 | | | Kansas City Southern | | | 121,239 | |
| | 242 | | | Lennox International, Inc. | | | 67,840 | |
| | 1,738 | | | Lockheed Martin Corp. | | | 678,272 | |
| | 512 | | | Macquarie Infrastructure Corp. | | | 14,346 | |
| | 403 | | | ManpowerGroup, Inc. | | | 29,544 | |
| | 315 | | | MSC Industrial Direct Co., Inc., Class A | | | 20,759 | |
| | 2,225 | | | Nielsen Holdings PLC | | | 33,998 | |
| | 400 | | | Nordson Corp. | | | 74,596 | |
| | 1,794 | | | Norfolk Southern Corp. | | | 381,279 | |
| | 1,094 | | | Northrop Grumman Corp. | | | 374,815 | |
| | 685 | | | Old Dominion Freight Line, Inc. | | | 138,493 | |
| | 474 | | | Oshkosh Corp. | | | 36,503 | |
| | 3,038 | | | Otis Worldwide Corp. | | | 191,090 | |
| | 747 | | | Owens Corning | | | 50,527 | |
| | 9,992 | | | Raytheon Technologies Corp. | | | 609,512 | |
| | 1,468 | | | Republic Services, Inc. | | | 136,113 | |
| | 813 | | | Rockwell Automation, Inc. | | | 187,421 | |
| | 376 | | | Snap-on, Inc. | | | 55,750 | |
| | 3,343 | | | Southwest Airlines Co. | | | 125,630 | |
| | 1,079 | | | Stanley Black & Decker, Inc. | | | 174,043 | |
| | 445 | | | Timken Co. (The) | | | 24,115 | |
| | 747 | | | Toro Co. (The) | | | 56,234 | |
| | 1,673 | | | Trane Technologies PLC | | | 198,066 | |
| | 4,762 | | | Union Pacific Corp. | | | 916,399 | |
| | 1,673 | | | United Airlines Holdings, Inc.* | | | 60,228 | |
| | 4,943 | | | United Parcel Service, Inc., Class B | | | 808,774 | |
| | 503 | | | United Rentals, Inc.* | | | 89,056 | |
| | 1,116 | | | Univar Solutions, Inc.* | | | 20,300 | |
| | 1,109 | | | Verisk Analytics, Inc. | | | 207,017 | |
| | 2,961 | | | Waste Management, Inc. | | | 337,554 | |
| | 388 | | | Woodward, Inc. | | | 33,248 | |
| | 314 | | | W.W. Grainger, Inc. | | | 114,745 | |
| | 634 | | | XPO Logistics, Inc.* | | | 55,963 | |
| | 1,255 | | | Xylem, Inc. | | | 100,626 | |
| | | | | | | | |
| | | | | | | 11,833,879 | |
| | |
| Information Technology – 28.9% | |
| | 381 | | | 2U, Inc.* | | | 15,770 | |
| | 4,468 | | | Accenture PLC, Class A | | | 1,072,007 | |
| | 2,569 | | | Adobe, Inc.* | | | 1,318,899 | |
| | 6,233 | | | Advanced Micro Devices, Inc.* | | | 566,081 | |
| | 853 | | | Akamai Technologies, Inc.* | | | 99,315 | |
| | 329 | | | Alliance Data Systems Corp. | | | 14,841 | |
| | 1,963 | | | Analog Devices, Inc. | | | 229,435 | |
| | 87,448 | | | Apple, Inc. | | | 11,284,290 | |
| | 4,898 | | | Applied Materials, Inc. | | | 301,717 | |
| | 1,173 | | | Autodesk, Inc.* | | | 288,206 | |
| | 3,012 | | | Automatic Data Processing, Inc. | | | 418,939 | |
| | 687 | | | Avnet, Inc. | | | 18,899 | |
| | 963 | | | Booz Allen Hamilton Holding Corp. | | | 84,802 | |
| | 763 | | | Broadridge Financial Solutions, Inc. | | | 104,836 | |
| | 1,470 | | | Cadence Design Systems, Inc.* | | | 163,038 | |
| | 755 | | | CDW Corp. | | | 85,806 | |
| | 817 | | | Ciena Corp.* | | | 46,381 | |
| | 22,698 | | | Cisco Systems, Inc. | | | 958,310 | |
| | |
| | |
| 10 | | The accompanying notes are an integral part of these financial statements. |
GOLDMAN SACHS JUST U.S. LARGE CAP EQUITY ETF
| | | | | | | | |
| Shares | | | Description | | Value | |
|
| Common Stocks – (continued) | |
| Information Technology – (continued) | |
| | 661 | | | Citrix Systems, Inc. | | $ | 95,977 | |
| | 166 | | | Coherent, Inc.* | | | 18,702 | |
| | 818 | | | Dell Technologies, Inc., Class C* | | | 54,053 | |
| | 942 | | | DocuSign, Inc.* | | | 210,066 | |
| | 391 | | | Dolby Laboratories, Inc., Class A | | | 27,311 | |
| | 1,310 | | | Dropbox, Inc., Class A* | | | 27,733 | |
| | 290 | | | Elastic NV* | | | 31,488 | |
| | 327 | | | F5 Networks, Inc.* | | | 43,272 | |
| | 463 | | | Gartner, Inc.* | | | 60,107 | |
| | 6,886 | | | Hewlett Packard Enterprise Co. | | | 66,588 | |
| | 7,642 | | | HP, Inc. | | | 149,401 | |
| | 222 | | | HubSpot, Inc.* | | | 66,529 | |
| | 22,660 | | | Intel Corp. | | | 1,154,527 | |
| | 4,751 | | | International Business Machines Corp. | | | 585,846 | |
| | 1,345 | | | Intuit, Inc. | | | 464,550 | |
| | 1,031 | | | Jabil, Inc. | | | 35,209 | |
| | 531 | | | Jack Henry & Associates, Inc. | | | 87,838 | |
| | 1,756 | | | Juniper Networks, Inc. | | | 43,900 | |
| | 1,310 | | | Keysight Technologies, Inc.* | | | 129,061 | |
| | 773 | | | Lam Research Corp. | | | 259,991 | |
| | 162 | | | Littelfuse, Inc. | | | 29,296 | |
| | 5,908 | | | Mastercard, Inc., Class A | | | 2,116,187 | |
| | 1,418 | | | Maxim Integrated Products, Inc. | | | 97,048 | |
| | 5,946 | | | Micron Technology, Inc.* | | | 270,602 | |
| | 40,033 | | | Microsoft Corp. | | | 9,028,642 | |
| | 224 | | | MongoDB, Inc.* | | | 52,371 | |
| | 910 | | | Motorola Solutions, Inc. | | | 140,822 | |
| | 689 | | | National Instruments Corp. | | | 24,728 | |
| | 1,182 | | | NetApp, Inc. | | | 56,015 | |
| | 2,977 | | | NortonLifeLock, Inc. | | | 70,019 | |
| | 951 | | | Nutanix, Inc., Class A* | | | 27,303 | |
| | 3,154 | | | NVIDIA Corp. | | | 1,687,327 | |
| | 613 | | | Okta, Inc.* | | | 132,022 | |
| | 2,164 | | | ON Semiconductor Corp.* | | | 46,245 | |
| | 10,551 | | | Oracle Corp. | | | 603,728 | |
| | 365 | | | PagerDuty, Inc.* | | | 11,925 | |
| | 2,248 | | | Paychex, Inc. | | | 171,905 | |
| | 242 | | | Paylocity Holding Corp.* | | | 35,634 | |
| | 8,236 | | | PayPal Holdings, Inc.* | | | 1,681,297 | |
| | 212 | | | Pegasystems, Inc. | | | 27,236 | |
| | 660 | | | Pluralsight, Inc., Class A* | | | 12,632 | |
| | 559 | | | PTC, Inc.* | | | 51,098 | |
| | 1,290 | | | Pure Storage, Inc., Class A* | | | 19,685 | |
| | 6,015 | | | QUALCOMM, Inc. | | | 716,386 | |
| | 1,720 | | | Sabre Corp. | | | 12,023 | |
| | 4,632 | | | salesforce.com, Inc.* | | | 1,262,915 | |
| | 1,019 | | | ServiceNow, Inc.* | | | 491,178 | |
| | 848 | | | Splunk, Inc.* | | | 185,992 | |
| | 801 | | | Synopsys, Inc.* | | | 177,261 | |
| | 587 | | | Teradata Corp.* | | | 14,293 | |
| | 880 | | | Teradyne, Inc. | | | 74,774 | |
| | 4,907 | | | Texas Instruments, Inc. | | | 697,530 | |
| | 252 | | | Trade Desk, Inc. (The), Class A* | | | 121,288 | |
| | 1,748 | | | Trimble, Inc.* | | | 91,613 | |
| | 687 | | | Twilio, Inc., Class A* | | | 185,325 | |
| | 303 | | | Universal Display Corp. | | | 53,176 | |
| | 548 | | | VeriSign, Inc.* | | | 117,710 | |
| | |
|
| Common Stocks – (continued) | |
| Information Technology – (continued) | |
| | 11,309 | | | Visa, Inc., Class A | | | 2,397,395 | |
| | 425 | | | VMware, Inc., Class A*(a) | | | 61,387 | |
| | 2,742 | | | Western Union Co. (The) | | | 64,684 | |
| | 918 | | | Workday, Inc., Class A* | | | 220,054 | |
| | 965 | | | Xerox Holdings Corp. | | | 18,200 | |
| | 367 | | | Zebra Technologies Corp., Class A* | | | 105,157 | |
| | 603 | | | Zendesk, Inc.* | | | 58,117 | |
| | | | | | | | |
| | | | | | | 44,203,946 | |
| | |
| Materials – 2.4% | |
| | 1,481 | | | Air Products and Chemicals, Inc. | | | 432,837 | |
| | 708 | | | Albemarle Corp. | | | 64,435 | |
| | 370 | | | Ashland Global Holdings, Inc. | | | 27,265 | |
| | 583 | | | Avery Dennison Corp. | | | 67,273 | |
| | 1,414 | | | Axalta Coating Systems Ltd.* | | | 33,724 | |
| | 2,236 | | | Ball Corp. | | | 179,707 | |
| | 793 | | | Celanese Corp. | | | 80,212 | |
| | 1,432 | | | CF Industries Holdings, Inc. | | | 46,726 | |
| | 910 | | | Crown Holdings, Inc.* | | | 69,934 | |
| | 4,986 | | | Dow, Inc. | | | 224,968 | |
| | 912 | | | Eastman Chemical Co. | | | 66,676 | |
| | 1,673 | | | Ecolab, Inc. | | | 329,715 | |
| | 9,729 | | | Freeport-McMoRan, Inc. | | | 151,870 | |
| | 1,943 | | | Graphic Packaging Holding Co. | | | 27,163 | |
| | 718 | | | International Flavors & Fragrances, Inc.(a) | | | 88,881 | |
| | 2,638 | | | International Paper Co. | | | 95,680 | |
| | 3,527 | | | Linde PLC (United Kingdom) | | | 880,833 | |
| | 1,719 | | | LyondellBasell Industries NV, Class A | | | 112,560 | |
| | 437 | | | Martin Marietta Materials, Inc. | | | 88,654 | |
| | 5,393 | | | Newmont Corp. | | | 362,841 | |
| | 1,087 | | | Sealed Air Corp. | | | 42,719 | |
| | 702 | | | Sonoco Products Co. | | | 37,227 | |
| | 927 | | | Vulcan Materials Co. | | | 111,240 | |
| | 1,795 | | | Westrock Co. | | | 54,443 | |
| | | | | | | | |
| | | | | | | 3,677,583 | |
| | |
| Real Estate – 2.5% | |
| | 2,957 | | | American Tower Corp. REIT | | | 736,737 | |
| | 988 | | | Apartment Investment and Management Co., Class A REIT | | | 35,598 | |
| | 942 | | | AvalonBay Communities, Inc. REIT | | | 148,892 | |
| | 1,042 | | | Boston Properties, Inc. REIT | | | 90,519 | |
| | 629 | | | Camden Property Trust REIT | | | 57,201 | |
| | 2,233 | | | CBRE Group, Inc., Class A* | | | 105,018 | |
| | 2,781 | | | Crown Castle International Corp. REIT | | | 453,998 | |
| | 1,789 | | | Digital Realty Trust, Inc. REIT | | | 278,458 | |
| | 589 | | | Equinix, Inc. REIT | | | 465,180 | |
| | 2,461 | | | Equity Residential REIT | | | 138,923 | |
| | 843 | | | Extra Space Storage, Inc. REIT | | | 89,822 | |
| | 260 | | | Howard Hughes Corp. (The)* | | | 15,369 | |
| | 1,912 | | | Iron Mountain, Inc. REIT | | | 57,532 | |
| | 815 | | | JBG SMITH Properties REIT | | | 22,551 | |
| | 345 | | | Jones Lang LaSalle, Inc. | | | 35,549 | |
| | 2,738 | | | Kimco Realty Corp. REIT | | | 32,829 | |
| | 1,598 | | | Park Hotels & Resorts, Inc. REIT | | | 15,165 | |
| | 4,929 | | | Prologis, Inc. REIT | | | 502,068 | |
| | 739 | | | SBA Communications Corp. REIT | | | 226,186 | |
| | |
| | |
| The accompanying notes are an integral part of these financial statements. | | 11 |
GOLDMAN SACHS JUST U.S. LARGE CAP EQUITY ETF
Schedule of Investments (continued)
August 31, 2020
| | | | | | | | |
| Shares | | | Description | | Value | |
|
| Common Stocks – (continued) | |
| Real Estate – (continued) | |
| | 2,497 | | | Ventas, Inc. REIT | | $ | 102,901 | |
| | 4,998 | | | Weyerhaeuser Co. REIT | | | 151,489 | |
| | | | | | | | |
| | | | | | | 3,761,985 | |
| | |
| Utilities – 2.7% | |
| | 1,790 | | | Alliant Energy Corp. | | | 96,928 | |
| | 3,563 | | | American Electric Power Co., Inc. | | | 280,871 | |
| | 404 | | | Avangrid, Inc. | | | 19,408 | |
| | 3,608 | | | CenterPoint Energy, Inc. | | | 72,413 | |
| | 2,046 | | | CMS Energy Corp. | | | 123,762 | |
| | 2,401 | | | Consolidated Edison, Inc. | | | 171,287 | |
| | 6,016 | | | Dominion Energy, Inc. | | | 471,895 | |
| | 1,380 | | | DTE Energy Co. | | | 163,765 | |
| | 5,271 | | | Duke Energy Corp. | | | 423,472 | |
| | 2,561 | | | Edison International | | | 134,401 | |
| | 2,415 | | | Eversource Energy | | | 206,990 | |
| | 6,980 | | | Exelon Corp. | | | 257,632 | |
| | 3,881 | | | FirstEnergy Corp. | | | 110,958 | |
| | 361 | | | IDACORP, Inc. | | | 32,454 | |
| | 1,397 | | | MDU Resources Group, Inc. | | | 32,997 | |
| | 3,511 | | | NextEra Energy, Inc. | | | 980,166 | |
| | 1,432 | | | OGE Energy Corp. | | | 45,623 | |
| | 808 | | | Pinnacle West Capital Corp. | | | 59,267 | |
| | 3,620 | | | Public Service Enterprise Group, Inc. | | | 189,109 | |
| | 2,104 | | | Sempra Energy | | | 260,160 | |
| | | | | | | | |
| | | | | | | 4,133,558 | |
| | |
| TOTAL INVESTMENTS BEFORE SECURITIES
LENDING REINVESTMENT VEHICLE |
|
| | (Cost $122,720,467) | | $ | 151,634,749 | |
| | |
| | |
| Shares | | | Dividend
Rate | | Value | |
|
| Securities Lending Reinvestment Vehicle – 0.0%(b) | |
| Goldman Sachs Financial Square Government
Fund – Institutional Shares | | | | |
| | 76,274 | | | 0.027% | | $ | 76,274 | |
| | (Cost $76,274) | | | | |
| | |
| | TOTAL INVESTMENTS – 99.3% | | | | |
| | (Cost $122,796,741) | | $ | 151,711,023 | |
| | |
| OTHER ASSETS IN EXCESS OF
LIABILITIES – 0.7% | | | 1,042,971 | |
| | |
| | NET ASSETS – 100.0% | | $ | 152,753,994 | |
| | |
| | |
|
| The percentage shown for each investment category reflects the value of investments in that category as a percentage of net assets. |
| |
* | | Non-income producing security. |
| |
(a) | | All or a portion of security is on loan. |
| |
(b) | | Represents an affiliated issuer. |
| | |
|
Investment Abbreviations: |
PLC | | — Public Limited Company |
REIT | | — Real Estate Investment Trust |
|
| | |
| 12 | | The accompanying notes are an integral part of these financial statements. |
GOLDMAN SACHS JUST U.S. LARGE CAP EQUITY ETF
Statement of Assets and Liabilities
August 31, 2020
| | | | | | |
| | Assets: | |
| | |
| | Investments in unaffiliated issuers, at value (cost $122,236,547)(a) | | $ | 151,179,528 | |
| | |
| | Investments in affiliated issuers, at value (cost $483,920) | | | 455,221 | |
| | |
| | Investments in securities lending reinvestment vehicle, at value which equals cost | | | 76,274 | |
| | |
| | Cash | | | 927,392 | |
| | |
| | Receivables: | | | | |
| | |
| | Dividends | | | 216,517 | |
| | |
| | Securities lending income | | | 38 | |
| | |
| | Total assets | | | 152,854,970 | |
| | | | | | |
| | Liabilities: | | | | |
| | |
| | Payables: | | | | |
| | |
| | Upon return of securities loaned | | | 76,274 | |
| | |
| | Management fees | | | 24,702 | |
| | |
| | Total liabilities | | | 100,976 | |
| | | | | | |
| | Net Assets: | | | | |
| | |
| | Paid-in capital | | | 130,028,848 | |
| | |
| | Total distributable earnings | | | 22,725,146 | |
| | |
| | NET ASSETS | | $ | 152,753,994 | |
| | SHARES ISSUED AND OUTSTANDING | | | | |
| | |
| | Shares outstanding no par value (unlimited shares authorized): | | | 3,000,000 | |
| | |
| | Net asset value per share: | | | $50.92 | |
| | (a) | | Includes loaned securities having a market value of $74,186. |
| | |
| The accompanying notes are an integral part of these financial statements. | | 13 |
GOLDMAN SACHS JUST U.S. LARGE CAP EQUITY ETF
Statement of Operations
For the Fiscal Year Ended August 31, 2020
| | | | | | |
| | | | | | |
| | Investment income: | | | | |
| | |
| | Dividends — unaffiliated issuer (net of foreign withholding taxes of $40) | | $ | 2,354,171 | |
| | |
| | Dividends — affiliated issuers | | | 10,589 | |
| | |
| | Securities lending income — unaffiliated issuer | | | 1,104 | |
| | |
| | Total investment income | | | 2,365,864 | |
| | | | | | |
| | Expenses: | | | | |
| | |
| | Management fees | | | 247,063 | |
| | |
| | Trustee fees | | | 6,810 | |
| | |
| | Total expenses | | | 253,873 | |
| | |
| | NET INVESTMENT INCOME | | | 2,111,991 | |
| | | | | | |
| | Realized and unrealized gain (loss): | | | | |
| | |
| | Net realized gain (loss) from: | | | | |
| | |
| | Investments — unaffiliated issuers | | | (3,210,428 | ) |
| | |
| | Investments — affiliated issuers | | | (11,690 | ) |
| | |
| | In-kind redemptions — unaffiliated issuers | | | 8,861,864 | |
| | |
| | In-kind redemptions — affiliated issuers | | | 10,307 | |
| | |
| | Net change in unrealized gain (loss) on: | | | | |
| | |
| | Investments — unaffiliated issuers | | | 23,611,059 | |
| | |
| | Investments — affiliated issuers | | | 32,192 | |
| | |
| | Net realized and unrealized gain | | | 29,293,304 | |
| | |
| | NET INCREASE IN NET ASSETS RESULTING FROM OPERATIONS | | $ | 31,405,295 | |
| | |
| 14 | | The accompanying notes are an integral part of these financial statements. |
GOLDMAN SACHS JUST U.S. LARGE CAP EQUITY ETF
Statements of Changes in Net Assets
| | | | | | | | | | |
| | | | | For the Fiscal
Year Ended
August 31, 2020 | | | For the Fiscal
Year Ended
August 31, 2019 | |
| | From operations: | | | | | | | | |
| | | |
| | Net investment income | | $ | 2,111,991 | | | $ | 3,151,564 | |
| | | |
| | Net realized gain (loss) | | | 5,650,053 | | | | (2,234,063 | ) |
| | | |
| | Net change in unrealized gain (loss) | | | 23,643,251 | | | | (6,457,542 | ) |
| | | |
| | Net increase (decrease) in net assets resulting from operations | | | 31,405,295 | | | | (5,540,041 | ) |
| | | | | | | | | | |
| | Distributions to shareholders: | | | | | | | | |
| | | |
| | From distributable earnings | | | (2,180,884 | ) | | | (3,779,599 | ) |
| | | | | | | | | | |
| | From share transactions: | | | | | | | | |
| | | |
| | Proceeds from sales of shares | | | 46,857,228 | | | | 45,068,001 | |
| | | |
| | Cost of shares redeemed | | | (52,602,473 | ) | | | (179,278,963 | ) |
| | | |
| | Net decrease in net assets resulting from share transactions | | | (5,745,245 | ) | | | (134,210,962 | ) |
| | | |
| | TOTAL INCREASE (DECREASE) | | | 23,479,166 | | | | (143,530,602 | ) |
| | | | | | | | | | |
| | Net assets: | | | | | | | | |
| | | |
| | Beginning of year | | $ | 129,274,828 | | | $ | 272,805,430 | |
| | | |
| | End of year | | $ | 152,753,994 | | | $ | 129,274,828 | |
| | |
| The accompanying notes are an integral part of these financial statements. | | 15 |
GOLDMAN SACHS JUST U.S. LARGE CAP EQUITY ETF
Financial Highlights
Selected Data for a Share Outstanding Throughout Each Period
| | | | | | | | | | | | | | |
| | | | | For the Fiscal
Year Ended August 31, | | | For the Period
June 7, 2018*
to August 31, 2018 | |
| | | | | 2020 | | | 2019 | |
| | Per Share Operating Performance: | | | | | | | | | | | | |
| | | | |
| | Net asset value, beginning of period | | $ | 42.04 | | | $ | 42.13 | | | $ | 40.08 | |
| | | | |
| | Net investment income(a) | | | 0.74 | | | | 0.72 | | | | 0.17 | |
| | | | |
| | Net realized and unrealized gain | | | 8.90 | | | | 0.08 | | | | 1.88 | |
| | | | |
| | Total gain from investment operations | | | 9.64 | | | | 0.80 | | | | 2.05 | |
| | | | |
| | Distributions to shareholders from net investment income | | | (0.76 | ) | | | (0.89 | ) | | | — | |
| | | | |
| | Net asset value, end of period | | $ | 50.92 | | | $ | 42.04 | | | $ | 42.13 | |
| | | | |
| | Market price, end of period | | $ | 50.88 | | | $ | 42.06 | | | $ | 42.13 | |
| | | | |
| | Total Return at Net Asset Value(b) | | | 23.29 | % | | | 2.06 | % | | | 5.11 | % |
| | | | |
| | Net assets, end of period (in 000’s) | | $ | 152,754 | | | $ | 129,275 | | | $ | 272,805 | |
| | | | |
| | Ratio of total expenses to average net assets | | | 0.20 | % | | | 0.20 | % | | | 0.20 | %(c) |
| | | | |
| | Ratio of net investment income to average net assets | | | 1.69 | % | | | 1.79 | % | | | 1.84 | %(c) |
| | | | |
| | Portfolio turnover rate(d) | | | 14 | % | | | 17 | % | | | 2 | % |
| | * | | Commencement of operations. |
| | (a) | | Calculated based on the average shares outstanding methodology. |
| | (b) | | Assumes investment at the net asset value at the beginning of the period, reinvestment of all distributions and a complete sale of the investment at the net asset value at the end of the period. Returns do not reflect the impact of taxes to shareholders relating to Fund distributions or the sale of Fund shares. Total returns for periods less than one full year are not annualized. |
| | (d) | | The Fund’s portfolio turnover rate is calculated in accordance with regulatory requirements and excludes portfolio securities received or delivered as a result of in-kind transactions. If such transactions were included, the Fund’s portfolio turnover rate may be higher. |
| | |
| 16 | | The accompanying notes are an integral part of these financial statements. |
GOLDMAN SACHS JUST U.S. LARGE CAP EQUITY ETF
Notes to Financial Statements
August 31, 2020
Goldman Sachs JUST U.S. Large Cap Equity ETF (the “Fund”) is a diversified series of the Goldman Sachs ETF Trust (the “Trust”) which is an open-end management investment company, registered under the Investment Company Act of 1940, as amended (the “Act”), consisting of multiple series. The Trust was organized as a Delaware statutory trust on December 16, 2009.
The investment objective of the Fund is to provide investment results that closely correspond, before fees and expenses, to the performance of the JUST US Large Cap Diversified Index (the “Index”).
Goldman Sachs Asset Management, L.P. (“GSAM”), an affiliate of Goldman Sachs & Co. LLC (“Goldman Sachs”), serves as investment adviser to the Fund pursuant to a management agreement (the “Agreement”) with the Trust. The Fund is an exchange-traded fund (“ETF”). Shares of the Fund are listed and traded on the NYSE Arca, Inc. (“NYSE Arca”). Market prices for the Fund’s shares may be different from its net asset value (“NAV”). The Fund issues and redeems shares at its NAV only in blocks of a specified number of shares, or multiples thereof, referred to as “Creation Units”. Creation Units are issued and redeemed principally in-kind for a basket of securities and a cash amount. Shares generally trade in the secondary market in quantities less than a Creation Unit at market prices that change throughout the day. Only those that have entered into an authorized participant agreement with ALPS Distributors, Inc. (the “Distributor”) may do business directly with the Fund.
|
| 2. SIGNIFICANT ACCOUNTING POLICIES |
The financial statements have been prepared in accordance with accounting principles generally accepted in the United States of America (“GAAP”) and require management to make estimates and assumptions that may affect the reported amounts and disclosures. Actual results may differ from those estimates and assumptions. The Fund is an investment company under GAAP and follows the accounting and reporting guidance applicable to investment companies.
A. Investment Valuation — The Fund’s valuation policy is to value investments at fair value.
B. Investment Income and Investments — Investment income includes interest income, dividend income, and securities lending income, if any. Interest income is accrued daily and adjusted for amortization of premiums and accretion of discounts. Dividend income is recognized on ex-dividend date or, for certain foreign securities, as soon as such information is obtained subsequent to the ex-dividend date. Non-cash dividends, if any, are recorded at the fair market value of the securities received. Investment transactions are reflected on trade date. Realized gains and losses are calculated using identified cost. Investment transactions are recorded on the following business day for daily NAV calculations. Distributions received from the Fund’s investments in U.S. real estate investment trusts (“REITs”) may be characterized as ordinary income, net capital gain and/or a return of capital. A return of capital is recorded by the Fund as a reduction to the cost basis of the REIT.
C. Expenses — Expenses incurred directly by the Fund are charged to the Fund, and certain expenses incurred by the Trust that may not solely relate to the Fund are allocated to the Fund and the other applicable funds of the Trust on a straight-line and/or pro- rata basis, depending upon the nature of the expenses, and are accrued daily.
D. Federal Taxes and Distributions to Shareholders — It is the Fund’s policy to comply with the requirements of the Internal Revenue Code of 1986, as amended (the “Code”), applicable to regulated investment companies and to distribute each year substantially all of its investment company taxable income and capital gains to its shareholders. Accordingly, the Fund is not required to make any provisions for the payment of federal income tax. Distributions to shareholders are recorded on the ex- dividend date. Income and capital gains distributions, if any, are declared and paid quarterly and annually, respectively.
Net capital losses, if any, are carried forward to future fiscal years and may be used to the extent allowed by the Code to offset any future capital gains. Losses that are carried forward will retain their character as either short-term or long-term capital losses. Utilization of capital loss carryforwards will reduce the requirement of future capital gains distributions.
The characterization of distributions to shareholders for financial reporting purposes is determined in accordance with federal income tax rules, which may differ from GAAP. The source of the Fund’s distributions may be shown in the accompanying financial statements as either from distributable earnings or capital. Certain components of the Fund’s net assets on the Statement of Assets and Liabilities reflect permanent GAAP/tax differences based on the appropriate tax character.
17
GOLDMAN SACHS JUST U.S. LARGE CAP EQUITY ETF
Notes to Financial Statements (continued)
August 31, 2020
|
| 3. INVESTMENTS AND FAIR VALUE MEASUREMENTS |
U.S. GAAP defines the fair value of a financial instrument as the amount that would be received to sell an asset or paid to transfer a liability in an orderly transaction between market participants at the measurement date (i.e., the exit price); the Fund’s policy is to use the market approach. GAAP establishes a fair value hierarchy that prioritizes the inputs to valuation techniques used to measure fair value. The hierarchy gives the highest priority to unadjusted quoted prices in active markets for identical assets or liabilities (Level 1 measurements) and the lowest priority to unobservable inputs (Level 3 measurements). The level in the fair value hierarchy within which the fair value measurement in its entirety falls shall be determined based on the lowest level input that is significant to the fair value measurement in its entirety. The levels used for classifying investments are not necessarily an indication of the risk associated with investing in these investments. The three levels of the fair value hierarchy are described below:
Level 1 — Unadjusted quoted prices in active markets that are accessible at the measurement date for identical, unrestricted assets or liabilities;
Level 2 — Quoted prices in markets that are not active or financial instruments for which significant inputs are observable (including, but not limited to, quoted prices for similar investments, interest rates, foreign exchange rates, volatility and credit spreads), either directly or indirectly;
Level 3 — Prices or valuations that require significant unobservable inputs (including GSAM’s assumptions in determining fair value measurement).
The Board of Trustees (“Trustees”) has approved Valuation Procedures that govern the valuation of the portfolio investments held by the Fund, including investments for which market quotations are not readily available. The Trustees have delegated to GSAM day-to-day responsibility for implementing and maintaining internal controls and procedures related to the valuation of the Fund’s investments. To assess the continuing appropriateness of pricing sources and methodologies, GSAM regularly performs price verification procedures and issues challenges as necessary to third party pricing vendors or brokers, and any differences are reviewed in accordance with the Valuation Procedures.
A. Level 1 and Level 2 Fair Value Investments — The valuation techniques and significant inputs used in determining the fair values for investments classified as Level 1 and Level 2 are as follows:
Equity Securities — Equity securities traded on a United States (“U.S.”) securities exchange or the NASDAQ system, or those located on certain foreign exchanges, including but not limited to the Americas, are valued daily at their last sale price or official closing price on the principal exchange or system on which they are traded. If there is no sale or official closing price or such price is believed by GSAM to not represent fair value, equity securities will be valued at the valid closing bid price for long positions and at the valid closing ask price for short positions (i.e. where there is sufficient volume, during normal exchange trading hours). If no valid bid/ask price is available, the equity security will be valued pursuant to the Valuation Procedures approved by the Trustees and consistent with applicable regulatory guidance. To the extent these investments are actively traded, they are classified as Level 1 of the fair value hierarchy, otherwise they are generally classified as Level 2. Certain equity securities containing unique attributes may be classified as Level 2.
Unlisted equity securities for which market quotations are available are valued at the last sale price on the valuation date, or if no sale occurs, at the last bid price for long positions or the last ask price for short positions, and are generally classified as Level 2.
Money Market Funds — Investments in the Goldman Sachs Financial Square Government Fund (“Underlying Fund”) are valued at the NAV per share of the Institutional Share class on the day of valuation. These investments are generally classified as Level 1 of the fair value hierarchy. For information regarding the Underlying Fund’s accounting policies and investment holdings, please see the Underlying Fund’s shareholder report.
B. Level 3 Fair Value Investments — To the extent that significant inputs to valuation models and other alternative pricing sources are unobservable, or if quotations are not readily available, or if GSAM believes that such quotations do not accurately reflect fair value, the fair value of the Fund’s investments may be determined under Valuation Procedures approved by the Trustees. GSAM, consistent with its procedures and applicable regulatory guidance, may make an adjustment to the most recent valuation prices of either domestic or foreign securities in light of significant events to reflect what it believes to be the fair value
18
GOLDMAN SACHS JUST U.S. LARGE CAP EQUITY ETF
|
| 3. INVESTMENTS AND FAIR VALUE MEASUREMENTS (continued) |
of the securities at the time of determining the Fund’s NAV. To the extent investments are valued using single source broker quotations obtained directly from the broker or passed through from third party pricing vendors, such investments are classified as Level 3 investments.
On August 31, 2020 the Fund did not hold Level 3 securities.
C. Fair Value Hierarchy — The following is a summary of the Fund’s investments classified in the fair value hierarchy as of August 31, 2020:
| | | | | | | | | | | | |
|
| JUST U.S. LARGE CAP EQUITY ETF | |
| | | |
| Investment Type | | Level 1 | | | Level 2 | | | Level 3 | |
| | | |
| Assets | | | | | | | | | | | | |
|
Common Stock and/or Other Equity Investments(a) | |
| | | |
Europe | | $ | 880,833 | | | $ | — | | | $ | — | |
| | | |
North America | | | 150,753,916 | | | | — | | | | — | |
| | | |
Securities Lending Reinvestment Vehicle | | | 76,274 | | | | — | | | | — | |
| | | |
| Total | | $ | 151,711,023 | | | $ | — | | | $ | — | |
| (a) | | Amounts are disclosed by continent to highlight the impact of time zone differences between local market close and the calculation of NAV. Security valuations are based on the principal exchange or system on which they are traded, which may differ from country of domicile noted in the table. |
For further information regarding security characteristics, see the Schedule of Investments.
| | |
| 4. AGREEMENTS AND AFFILIATED TRANSACTIONS | | |
A. Management Agreement — Under the Agreement, GSAM manages the Fund, subject to the general supervision of the Trustees.
As compensation for the services rendered pursuant to the Agreement, the assumption of the expenses related thereto and administration of the Fund’s business affairs, including providing facilities, GSAM is entitled to a management fee, accrued daily and paid monthly, equal to an annual percentage rate of the Fund’s average daily net assets.
The Fund operates under a unitary management fee structure. Under the unitary fee structure, GSAM is responsible for paying substantially all the expenses of the Fund, excluding payments under the Fund’s 12b-1 plan (if any), interest expenses, taxes, acquired fund fees and expenses, brokerage fees, costs of holding shareholder meetings, litigation, indemnification and extraordinary expenses. As the Fund directly pays fees and expenses of the independent Trustees, the management fee collected by GSAM will be reduced by an amount equal to the fees and expenses paid by the Fund to the independent Trustees.
For the fiscal year ended August 31, 2020, the unitary management fee rate with GSAM was 0.20%.
B. Other Transactions with Affiliates — The Fund may purchase securities from, or sell securities to, an affiliated fund provided the affiliation is solely due to having a common investment adviser, common officers, or common trustees. The following table provides information about the Fund’s investment in The Goldman Sachs Group, Inc. for the fiscal year ended August 31, 2020:
| | | | | | | | | | | | | | |
Beginning
value as of
August 31,
2019 | | Purchases
at Cost | | Proceeds
from Sales | | Realized
Loss | | Change in
Unrealized
Appreciation | | Ending
value as of
August 31,
2020 | | Shares as of
August 31,
2020 | | Dividend
Income |
$ 468,789 | | $ 188,001 | | $ (232,378) | | $ (1,383) | | $ 32,192 | | $ 455,221 | | 2,222 | | $ 10,589 |
19
GOLDMAN SACHS JUST U.S. LARGE CAP EQUITY ETF
Notes to Financial Statements (continued)
August 31, 2020
| | |
| 5. CREATION AND REDEMPTION OF CREATION UNITS | | |
The Trust issues and redeems shares of the Fund only in Creation Units on a continuous basis through the Distributor, without an initial sales load, at NAV next determined after receipt, on any Business Day (as defined in the Statement of Additional Information), of an order in proper form. Shares of the Fund may only be purchased or redeemed by certain financial institutions (each an “Authorized Participant”). An Authorized Participant is either (1) a “Participating Party” or other participant in the clearing process through the Continuous Net Settlement System of the National Securities Clearing Corporation; or (2) a Depository Trust Company participant; which, in either case, must have executed an agreement with the Distributor. Retail investors will typically not qualify as an Authorized Participant or have the resources to buy and sell whole Creation Units. Therefore, they will be unable to purchase or redeem the shares directly from the Fund. Rather, most retail investors will purchase shares in the secondary market at market prices with the assistance of a broker and may be subject to customary brokerage commissions or fees. Fixed creation and redemption transaction fees are imposed in connection with creations and redemptions.
Authorized Participants transacting in Creation Units for cash may also pay a variable charge to compensate the Fund for certain transaction costs (e.g. taxes on currency or other financial transactions, and brokerage costs) and market impact expenses relating to investing in portfolio securities. Such variable charges, if any, are included in “Proceeds from sale of shares” in the Statement of Changes in Net Assets.
Share activity is as follows:
| | | | | | | | | | | | | | | | |
| | | JUST U.S. Large Cap Equity ETF | |
| | | | |
| | | For the Fiscal Year Ended August 31, 2020 | | | For the Fiscal Year Ended August 31, 2019 | |
| | | | |
| | | Shares | | | Dollars | | | Shares | | | Dollars | |
| | | | |
| Fund Share Activity | | | | | | | | | | | | | | | | |
Shares Sold | | | 1,075,000 | | | $ | 46,857,228 | | | | 1,125,000 | | | $ | 45,067,999 | |
Shares Redeemed | | | (1,150,000 | ) | | | (52,602,473 | ) | | | (4,525,000 | ) | | | (179,278,963 | ) |
| | | | |
NET DECREASE IN SHARES | | | (75,000 | ) | | $ | (5,745,245 | ) | | | (3,400,000 | ) | | $ | (134,210,964 | ) |
| | |
| 6. PORTFOLIO SECURITIES TRANSACTIONS | | |
The cost of purchases and proceeds from sales of long-term securities for the fiscal year ended August 31, 2020, were $18,079,212 and $18,890,405, respectively.
The purchases and sales from in-kind creation and redemption transactions for the fiscal year ended August 31, 2020 were $46,721,144 and $52,482,608, respectively.
The Fund may lend its securities through a securities lending agent, the Bank of New York Mellon (“BNYM”), to certain qualified borrowers. In accordance with the Fund’s securities lending procedures, the Fund receives cash collateral at least equal to the market value of the securities on loan. The market value of the loaned securities is determined at the close of business of the Fund, at their last sale price or official closing price on the principal exchange or system on which they are traded, and any additional required collateral is delivered to the Fund on the next business day. As with other extensions of credit, the Fund may experience delay in the recovery of its securities or incur a loss should the borrower of the securities breach its agreement with the Fund or become insolvent at a time when the collateral is insufficient to cover the cost of repurchasing securities on loan. Dividend income received from securities on loan may not be subject to withholding taxes and therefore withholding taxes paid may differ from the amounts listed in the Statement of Operations. Loans of securities are terminable at any time and as such 1) the remaining contractual maturities of the outstanding securities lending transactions are considered to be overnight and continuous and 2) the
20
GOLDMAN SACHS JUST U.S. LARGE CAP EQUITY ETF
|
| 7. SECURITIES LENDING (continued) |
borrower, after notice, is required to return borrowed securities within the standard time period for settlement of securities transactions.
The Fund invests the cash collateral received in connection with securities lending transactions in the Goldman Sachs Financial Square Government Fund (“Government Money Market Fund”), an affiliated series of the Goldman Sachs Trust. The Government Money Market Fund is registered under the Act as an open end investment company, is subject to Rule 2a-7 under the Act, and is managed by GSAM, for which GSAM may receive a management fee of up to 0.16% on an annualized basis of the average daily net assets of the Government Money Market Fund.
In the event of a default by a borrower with respect to any loan, BNYM may exercise any and all remedies provided under the applicable borrower agreement to make the Fund whole. These remedies include purchasing replacement securities by applying the collateral held from the defaulting broker against the purchase cost of the replacement securities. If BNYM is unable to purchase replacement securities, BNYM will indemnify the Fund by paying the Fund an amount equal to the market value of the securities loaned minus the value of cash collateral received from the borrower for the loan, subject to an exclusion for any shortfalls resulting from a loss of value in such cash collateral due to reinvestment risk. The Fund’s master netting agreements with certain borrowers provide the right, in the event of a default (including bankruptcy or insolvency), for the non-defaulting party to liquidate the collateral and calculate net exposure to the defaulting party or request additional collateral. However, in the event of a default by a borrower, a resolution authority could determine that such rights are not enforceable due to the restrictions or prohibitions against the right of set-off that may be imposed in accordance with a particular jurisdiction’s bankruptcy or insolvency laws. The Fund’s loaned securities were all subject to enforceable Securities Lending Agreements and the value of the collateral was at least equal to the value of the cash received. The amounts of the Fund’s overnight and continuous agreements, which represent the gross amounts of recognized liabilities for securities lending transactions outstanding as of August 31, 2020, are disclosed as “Payable upon return of securities loaned” on the Statement of Assets and Liabilities, where applicable.
Both the Fund and BNYM received compensation relating to the lending of the Fund’s securities. The amounts earned, if any, by the Fund for the fiscal year ended August 31, 2020, are reported under Investment Income on the Statement of Operations.
The following table provides information about the Fund’s investment in the Government Money Market Fund for the fiscal year ended August 31, 2020:
| | | | | | | | | | | | | | |
Beginning
value as of
August 31,
2019 | | | Purchases
at Cost | | | Proceeds
from Sales | | | Ending
value as of
August 31,
2020 | |
| $ | 44,769 | | | $ | 4,228,209 | | | $ | (4,196,704 | ) | | $ | 76,274 | |
The tax character of distributions paid during the fiscal years ended August 31, 2020 and August 31, 2019 was as follows:
| | | | | | | | |
| | | 2020 | | | 2019 | |
Distributions paid from: | | | | | | | | |
Ordinary Income | | $ | 2,180,884 | | | $ | 3,779,599 | |
Total taxable distributions | | $ | 2,180,884 | | | $ | 3,779,599 | |
21
GOLDMAN SACHS JUST U.S. LARGE CAP EQUITY ETF
Notes to Financial Statements (continued)
August 31, 2020
|
| 8. TAX INFORMATION (continued) |
As of August 31, 2020, the components of accumulated earnings (losses) on a tax-basis were as follows:
| | | | |
| | | JUST U.S. Large
Cap Equity ETF | |
Undistributed ordinary income — net | | $ | 355,416 | |
Capital loss carryforwards: | | | | |
Perpetual Short-Term | | $ | (4,099,633 | ) |
Perpetual Long-Term | | | (1,120,241 | ) |
Unrealized gains (losses) — net | | $ | 27,589,604 | |
Total accumulated earnings (losses) net | | $ | 22,725,146 | |
As of August 31, 2020, the Fund’s aggregate security unrealized gains and losses based on cost for U.S. federal income tax purposes were as follows:
| | | | |
| | | JUST U.S. Large
Cap Equity ETF | |
Tax Cost | | $ | 124,121,419 | |
Gross unrealized gain | | | 36,973,777 | |
Gross unrealized loss | | | (9,384,173 | ) |
Net unrealized gains (losses) | | $ | 27,589,604 | |
The difference between GAAP-basis and tax-basis unrealized gains (losses) is attributable primarily to wash sales.
The Fund reclassified $8,261,311 from distributable earnings to paid in capital for the year ending August 31, 2020. In order to present certain components of the Fund’s capital accounts on a tax-basis, certain reclassifications have been recorded to the Fund’s accounts. These reclassifications have no impact on the NAV of the Fund and result primarily from redemptions in kind.
GSAM has reviewed the Fund’s tax positions for all open tax years (the current and prior two years, as applicable) and has concluded that no provision for income tax is required in the Fund’s financial statements. Such open tax years remain subject to examination and adjustment by tax authorities.
The Fund’s risks include, but are not limited to, the following:
Index Risk — JUST Capital Foundation, Inc. (the “Index Provider”) constructs the Fund’s Index in accordance with a rules-based methodology. The Fund will be negatively affected by general declines in the securities and asset classes represented in its Index. In addition, because the Fund is not “actively” managed, unless a specific security is removed from its Index, the Fund generally would not sell a security because the security’s issuer was in financial trouble. Market disruptions and regulatory restrictions could have an adverse effect on the Fund’s ability to adjust its exposure to the required levels in order to track the Index. The Fund also does not attempt to take defensive positions under any market conditions, including declining markets. Therefore, the Fund’s performance could be lower than funds that may actively shift their portfolio assets to take advantage of market opportunities or to lessen the impact of a market decline or a decline in the value of one or more issuers. The Index Provider relies on third party data it believes to be reliable in constructing the Index, but it does not guarantee the accuracy or availability of such third party data.
Errors in index data, index computation or the construction of the Index in accordance with its methodology may occur from time to time and may not be identified and corrected by the Index Provider for a period of time or at all, which may have an adverse impact on the Fund and its shareholders. In addition, neither the Fund, the Investment Adviser, the Calculation Agent nor the Index Provider can guarantee the availability or timeliness of the production of the Index.
Market and Credit Risks — In the normal course of business, the Fund trades financial instruments and enters into financial transactions where risk of potential loss exists due to changes in the market (market risk). The value of the securities in which the
22
GOLDMAN SACHS JUST U.S. LARGE CAP EQUITY ETF
|
| 9. OTHER RISKS (continued) |
Fund invests may go up or down in response to the prospects of individual companies, particular sectors or governments and/or general economic conditions throughout the world due to increasingly interconnected global economies and financial markets. Events such as war, acts of terrorism, social unrest, natural disasters, the spread of infectious illness or other public health threats could also significantly impact the Fund and its investments.
Additionally, the Fund may also be exposed to credit risk in the event that an issuer or guarantor fails to perform or that an institution or entity with which the Fund has unsettled or open transactions defaults.
Market Trading Risk — The Fund faces numerous market trading risks, including disruptions to creations and redemptions, the existence of extreme market volatility or potential lack of an active trading market for Shares. If a shareholder purchases Shares at a time when the market price is at a premium to the NAV or sells Shares at a time when the market price is at a discount to the NAV, the shareholder may sustain losses. The Investment Adviser cannot predict whether Shares will trade below, at or above their NAV. Price differences may be due, in large part, to the fact that supply and demand forces at work in the secondary trading market for Shares will be closely related to, but not identical to, the same forces influencing the prices of the securities of the Fund’s Index trading individually or in the aggregate at any point in time.
Tracking Error Risk — Tracking error is the divergence of the Fund’s performance from that of its Index. The performance of the Fund may diverge from that of its Index for a number of reasons. Tracking error may occur because of transaction costs, the Fund’s holding of cash, differences in accrual of dividends, changes to the Index or the need to meet new or existing regulatory requirements. Unlike the Fund, the returns of the Index are not reduced by investment and other operating expenses, including the trading costs associated with implementing changes to its portfolio of investments. Tracking error risk may be heightened during times of market volatility or other unusual market conditions.
Under the Trust’s organizational documents, its Trustees, officers, employees and agents are indemnified, to the extent permitted by the Act and state law, against certain liabilities that may arise out of performance of their duties to the Fund. Additionally, in the course of business, the Fund enters into contracts that contain a variety of indemnification clauses. The Fund’s maximum exposure under these arrangements is unknown, as this would involve future claims that may be made against the Fund that have not yet occurred. However, GSAM believes the risk of loss under these arrangements to be remote.
Subsequent events after the Statement of Assets and Liabilities date have been evaluated, and GSAM has concluded that there is no impact requiring adjustment or disclosure in the financial statements.
23
Report of Independent Registered Public
Accounting Firm
To the Board of Trustees of Goldman Sachs ETF Trust and Shareholders of Goldman Sachs JUST U.S. Large Cap Equity ETF
Opinion on the Financial Statements
We have audited the accompanying statement of assets and liabilities, including the schedule of investments, of Goldman Sachs JUST U.S. Large Cap Equity ETF (one of the funds constituting Goldman Sachs ETF Trust, referred to hereafter as the “Fund”) as of August 31, 2020, the related statement of operations for the year ended August 31, 2020, the statements of changes in net assets for each of the two years in the period ended August 31, 2020, including the related notes, and the financial highlights for each of the periods indicated therein (collectively referred to as the “financial statements”). In our opinion, the financial statements present fairly, in all material respects, the financial position of the Fund as of August 31, 2020, the results of its operations for the year then ended, the changes in its net assets for each of the two years in the period ended August 31, 2020 and the financial highlights for each of the periods indicated therein in conformity with accounting principles generally accepted in the United States of America.
Basis for Opinion
These financial statements are the responsibility of the Fund’s management. Our responsibility is to express an opinion on the Fund’s financial statements based on our audits. We are a public accounting firm registered with the Public Company Accounting Oversight Board (United States) (PCAOB) and are required to be independent with respect to the Fund in accordance with the U.S. federal securities laws and the applicable rules and regulations of the Securities and Exchange Commission and the PCAOB.
We conducted our audits of these financial statements in accordance with the standards of the PCAOB. Those standards require that we plan and perform the audit to obtain reasonable assurance about whether the financial statements are free of material misstatement, whether due to error or fraud.
Our audits included performing procedures to assess the risks of material misstatement of the financial statements, whether due to error or fraud, and performing procedures that respond to those risks. Such procedures included examining, on a test basis, evidence regarding the amounts and disclosures in the financial statements. Our audits also included evaluating the accounting principles used and significant estimates made by management, as well as evaluating the overall presentation of the financial statements. Our procedures included confirmation of securities owned as of August 31, 2020 by correspondence with the custodian and transfer agent. We believe that our audits provide a reasonable basis for our opinion.
/s/ PricewaterhouseCoopers LLP
Boston, Massachusetts
October 26, 2020
We have served as the auditor of one or more investment companies in the Goldman Sachs fund complex since 2000.
24
GOLDMAN SACHS JUST U.S. LARGE CAP EQUITY ETF
Liquidity Risk Management Program (Unaudited)
The Fund has adopted and implemented a liquidity risk management program (the “Program”) in accordance with Rule 22e-4 under the 1940 Act. The Program seeks to assess and manage the Fund’s liquidity risk, i.e., the risk that the Fund is unable to satisfy redemption requests without significantly diluting remaining investors’ interests in the Fund. The Board of Trustees of the Trust has designated GSAM, the Fund’s investment adviser, to administer the Program. Certain aspects of the Program rely on third parties to perform certain functions, including the provision of market data and application of models.
The Program is comprised of various components designed to support the assessment and/or management of liquidity risk, including: (1) the periodic assessment (no less frequently than annually) of certain factors that influence a Fund’s liquidity risk; (2) the periodic classification (no less frequently than monthly) of a Fund’s investments into one of four liquidity categories that reflect an estimate of their liquidity under current market conditions; (3) a 15% limit on the acquisition of “illiquid investments” (as defined under Rule 22e-4); (4) for a Fund that does not invest primarily in “highly liquid investments” (as defined under Rule 22e-4), the determination of a minimum percentage of the Fund’s assets that will generally be invested in highly liquid investments (a “Highly Liquid Investment Minimum”); and (5) periodic reporting to the Board of Trustees.
At a meeting of the Board of Trustees on March 18-19, 2020, GSAM provided a written report to the Board addressing the operation, and the adequacy and effectiveness of the implementation, of the Program, including, as applicable, the operation of any Highly Liquid Investment Minimum and any material changes to the Program, for the initial period from December 1, 2018 through December 31, 2019 (the “Reporting Period”). Among other things, the annual report discussed: (1) the results of stress tests designed to assess liquidity under a hypothetical stressed scenario involving elevated redemptions; and (2) an assessment of the methodologies used to classify investments into one of four liquidity categories. The report concluded that the Program was reasonably designed to assess and manage liquidity risk and was adequately and effectively implemented during the Reporting Period.
There can be no assurance that the Program will achieve its objectives under all circumstances in the future. Please refer to your Fund’s prospectus for more information regarding the Fund’s exposure to liquidity risk and other risks to which it may be subject.
25
GOLDMAN SACHS JUST U.S. LARGE CAP EQUITY ETF
| | |
| | |
Fund Expenses — Six Month Period ended 8/31/2020 (Unaudited) | | |
As a shareholder you incur ongoing costs, including management fees and other Fund expenses. This example is intended to help you understand your ongoing costs (in dollars) of investing in Shares of the Fund and to compare these costs with the ongoing costs of investing in other exchange-traded funds. This example does not take into account brokerage commissions that you may pay on your purchases and sales of Shares of the Fund.
The example is based on an investment of $1,000 invested at the beginning of the period from March 1, 2020 and held for the six months ended August 31, 2020, which represents a period of 184 days of a 366 day year (or less where indicated).
Actual Expenses — The first line in the table below provides information about actual account values and actual expenses. You may use the information in this line, together with the amount you invested, to estimate the expenses that you paid over the six months. Simply divide your account value by $1,000 (for example, an $8,600 account value divided by $1,000=8.6), then multiply the result by the number in the first line under the heading entitled “Expenses Paid” to estimate the expenses you paid on your account during this period.
Hypothetical Example for Comparison Purposes — The second line in the table below provides information about hypothetical account values and hypothetical expenses based on the Fund’s actual net expense ratios and an assumed rate of return of 5% per year before expenses, which is not the Fund’s actual return. The hypothetical account values and expenses may not be used to estimate the actual ending account balance or expenses you paid for the period. You may use this information to compare the ongoing costs of investing in the Fund and other funds. To do so, compare this 5% hypothetical example with the 5% hypothetical examples that appear in the shareholder reports of the other funds.
Please note that the expenses shown in the table are meant to highlight your ongoing costs only and do not reflect any transactional costs, such as redemption fees, or exchange fees. Therefore, the second line of the table is useful in comparing ongoing costs only, and will not help you determine the relative total costs of owning different funds. In addition, if these transactional costs were included, your costs would have been higher.
| | | | | | | | | | | | |
| | | JUST U.S. Large Cap Equity ETF | |
| | | Beginning
Account Value
3/1/2020 | | | Ending
Account Value
8/31/2020 | | | Expenses
Paid* | |
Actual based on NAV | | $ | 1,000 | | | $ | 1,209.80 | | | $ | 1.11 | |
Hypothetical 5% return | | $ | 1,000 | | | $ | 1,024.13 | + | | $ | 1.02 | |
| | + | | Hypothetical expenses are based on the Fund’s actual annualized net expense ratios and an assumed rate of return of 5% per year before expenses. | |
| | * | | The Expenses for the Fund are calculated using the Fund’s annualized net expense ratio, which represents the ongoing expenses as a percentage of net assets for the six months ended August 31, 2020. Expenses are calculated by multiplying the annualized net expense ratio by the average account value for the period; then multiplying the result by the number of days in the most recent fiscal year; and then dividing that result by the number of days in the fiscal year. | |
| | | | The annualized net expense ratio for the period is as follows: | |
| | | | |
| Fund | | | |
| |
JUST U.S. Large Cap Equity ETF | | | 0.20 | % |
26
GOLDMAN SACHS JUST U.S. LARGE CAP EQUITY ETF
Trustees and Officers (Unaudited) Independent Trustees
| | | | | | | | | | |
Name,
Address and Age1 | | Position(s) Held
with the Trust | | Term of
Office and Length of
Time Served2 | | Principal Occupation(s)
During Past 5 Years | | Number of
Portfolios in
Fund Complex
Overseen by
Trustee3 | | Other
Directorships
Held by Trustee4 |
| | | | | |
Lawrence W. Stranghoener Age: 66 | | Chairman of the Board of Trustees | | Trustee Since 2015; Chairman Since 2017 | | Mr. Stranghoener is retired. He is Director, Kennametal, Inc. (a global manufacturer and distributor of tooling and industrial materials) (2003-Present); and was formerly Director, Aleris Corporation and Aleris International, Inc. (a producer of aluminum rolled products) (2011-2020); Interim Chief Executive Officer (2014); and Executive Vice President and Chief Financial Officer (2004-2014), Mosaic Company (a fertilizer manufacturing company). Chairman of the Board of Trustees — Goldman Sachs ETF Trust; Goldman Sachs MLP Income Opportunities Fund; Goldman Sachs MLP and Energy Renaissance Fund; Goldman Sachs Credit Income Fund; and Goldman Sachs Real Estate Diversified Income Fund. | | 46 | | Kennametal Inc. (a global manufacturer and distributor of tooling and industrial materials) |
| | | | | |
Caroline Dorsa Age: 61 | | Trustee | | Since 2016 | | Ms. Dorsa is retired. She is Director, Biogen Inc. (a biotechnology company) (2010-Present); Director, Intellia Therapeutics Inc. (a gene- editing company) (2015-Present); and Director, Illumina, Inc. (a life sciences company) (2017- Present). She was formerly Executive Vice President and Chief Financial Officer, Public Service Enterprise Group, Inc. (a generation and energy services company) (2009-2015); Senior Vice President, Merck & Co, Inc. (a pharmaceutical company) (2008-2009 and 1987- 2007); Senior Vice President and Chief Financial Officer, Gilead Sciences, Inc. (a pharmaceutical company) (2007-2008); and Senior Vice President and Chief Financial Officer, Avaya, Inc. (a technology company) (2007). Trustee — Goldman Sachs ETF Trust; Goldman Sachs MLP Income Opportunities Fund; Goldman Sachs MLP and Energy Renaissance Fund; Goldman Sachs Credit Income Fund; and Goldman Sachs Real Estate Diversified Income Fund. | | 46 | | Biogen Inc. (a biotechnology company); Intellia Therapeutics Inc. (a gene-editing company); Illumina, Inc. (a life sciences company) |
| | | | | |
Linda A. Lang Age: 62 | | Trustee | | Since 2016 | | Ms. Lang is retired. She was formerly Chair of the Board of Directors (2016-2019), and Member of the Board of Directors, WD-40 Company (a global consumer products company) (2004-2019); Chairman and Chief Executive Officer (2005-2014); and Director, President and Chief Operating Officer, Jack in the Box, Inc. (a restaurant company) (2003-2005). Previously, Ms. Lang served as an Advisory Board Member of Goldman Sachs MLP Income Opportunities Fund and Goldman Sachs MLP and Energy Renaissance Fund (February 2016-March 2016). Trustee — Goldman Sachs ETF Trust; Goldman Sachs MLP Income Opportunities Fund; Goldman Sachs MLP and Energy Renaissance Fund; Goldman Sachs Credit Income Fund; and Goldman Sachs Real Estate Diversified Income Fund. | | 46 | | None |
| | | | | |
Michael Latham Age: 54 | | Trustee | | Since 2015 | | Mr. Latham is retired. Formerly, he held senior management positions with the iShares exchange-traded fund business, including Chairman (2011-2014); Global Head (2010-2011); U.S. Head (2007-2010); and Chief Operating Officer (2003-2007). Trustee — Goldman Sachs ETF Trust; Goldman Sachs MLP Income Opportunities Fund; Goldman Sachs MLP and Energy Renaissance Fund; Goldman Sachs Credit Income Fund; and Goldman Sachs Real Estate Diversified Income Fund. | | 46 | | None |
| | | | | | | | | | |
27
GOLDMAN SACHS JUST U.S. LARGE CAP EQUITY ETF
Trustees and Officers (Unaudited) (continued) Interested Trustee*
| | | | | | | | | | |
Name,
Address and Age1 | | Position(s) Held
with the Trust | | Term of
Office and
Length of
Time Served2 | | Principal Occupation(s)
During Past 5 Years | | Number of
Portfolios in
Fund Complex
Overseen by
Trustee3 | | Other
Directorships
Held by Trustee4 |
| | | | | |
James A. McNamara Age: 57 | | Trustee and President | | Since 2014 | | Advisory Director, Goldman Sachs (January 2018-Present); Managing Director, Goldman Sachs (January 2000-December 2017); Director of Institutional Fund Sales, GSAM (April 1998-December 2000); and Senior Vice President and Manager, Dreyfus Institutional Service Corporation (January 1993-April 1998). President and Trustee — Goldman Sachs ETF Trust; Goldman Sachs Trust; Goldman Sachs Variable Insurance Trust; Goldman Sachs Trust II; Goldman Sachs MLP Income Opportunities Fund; Goldman Sachs MLP and Energy Renaissance Fund; Goldman Sachs Credit Income Fund; and Goldman Sachs Real Estate Diversified Income Fund. | | 168 | | None |
| | | | | | | | | | |
| * | | This person is considered to be an “Interested Trustee” because he holds a position with Goldman Sachs and own securities issued by The Goldman Sachs Group, Inc. The Interested Trustee holds comparable positions with certain other companies of which Goldman Sachs, GSAM or an affiliate thereof is the investment adviser, administrator and/or distributor. |
| 1 | | Each Trustee may be contacted by writing to the Trustee, c/o Goldman Sachs, 200 West Street, New York, New York, 10282, Attn: Caroline L. Kraus. Information is provided as of August 31, 2020. |
| 2 | | Each Trustee holds office for an indefinite term until the earliest of: (a) the election of his or her successor; (b) the date the Trustee resigns, retires or is removed by the Board of Trustees or shareholders, in accordance with the Trust’s Declaration of Trust; or (c) the termination of the Trust. |
| 3 | | The Goldman Sachs Fund Complex includes certain other companies listed above for each respective Trustee. As of August 31, 2020, Goldman Sachs ETF Trust consisted of 42 portfolios (23 of which offered shares to the public); Goldman Sachs Trust consisted of 90 portfolios (89 of which offered shares to the public); Goldman Sachs Variable Insurance Trust consisted of 13 portfolios; Goldman Sachs Trust II consisted of 19 portfolios (17 of which offered shares to the public); and Goldman Sachs MLP Income Opportunities Fund, Goldman Sachs MLP and Energy Renaissance Fund, Goldman Sachs Credit Income Fund and Goldman Sachs Real Estate Diversified Income Fund each consisted of one portfolio. Goldman Sachs Credit Income Fund did not offer shares to the public. |
| 4 | | This column includes only directorships of companies required to report to the Securities and Exchange Commission under the Securities Exchange Act of 1934 (i.e., “public companies”) or other investment companies registered under the Act. |
Additional information about the Trustees is available in the Fund’s Statement of Additional Information, which can be obtained from Goldman Sachs free of charge by calling this toll-free number (in the United States of America): 1-800-621-2550.
28
GOLDMAN SACHS JUST U.S. LARGE CAP EQUITY ETF
Trustees and Officers (Unaudited) (continued) Officers of the Trust*
| | | | | | |
| Name, Address and Age1 | | Positions Held
with the Trust | | Term of
Office and
Length of
Time Served2 | | Principal Occupation(s) During Past 5 Years |
| | | |
James A. McNamara 200 West Street New York, NY 10282 Age: 57 | | Trustee and President | | Since 2014 | | Advisory Director, Goldman Sachs (January 2018-Present); Managing Director, Goldman Sachs (January 2000-December 2017); Director of Institutional Fund Sales, GSAM (April 1998-December 2000); and Senior Vice President and Manager, Dreyfus Institutional Service Corporation (January 1993-April 1998). President and Trustee — Goldman Sachs ETF Trust; Goldman Sachs Trust; Goldman Sachs Variable Insurance Trust; Goldman Sachs Trust II; Goldman Sachs MLP Income Opportunities Fund; Goldman Sachs MLP and Energy Renaissance Fund; Goldman Sachs Credit Income Fund; and Goldman Sachs Real Estate Diversified Income Fund. |
| | | |
Caroline L. Kraus 200 West Street New York, NY 10282 Age: 43 | | Secretary | | Since 2014 | | Managing Director, Goldman Sachs (January 2016-Present); Vice President, Goldman Sachs (August 2006-December 2015); Senior Counsel, Goldman Sachs (January 2020-Present); Associate General Counsel, Goldman Sachs (2012-December 2019); Assistant General Counsel, Goldman Sachs (August 2006-December 2011); and Associate, Weil, Gotshal & Manges, LLP (2002-2006). Secretary — Goldman Sachs ETF Trust; Goldman Sachs Trust (previously Assistant Secretary (2012)); Goldman Sachs Variable Insurance Trust (previously Assistant Secretary (2012)); Goldman Sachs Trust II; Goldman Sachs BDC, Inc.; Goldman Sachs Private Middle Market Credit LLC; Goldman Sachs Private Middle Market Credit II LLC; Goldman Sachs Middle Market Lending Corp.; Goldman Sachs MLP Income Opportunities Fund; Goldman Sachs MLP and Energy Renaissance Fund; Goldman Sachs Credit Income Fund; and Goldman Sachs Real Estate Diversified Income Fund. |
| | | |
Joseph F. DiMaria 30 Hudson Street Jersey City, NJ 07302 Age: 52 | | Treasurer, Principal Financial Officer and Principal Accounting Officer | | Since 2017 (Treasurer and Principal Financial Officer since 2019) | | Managing Director, Goldman Sachs (November 2015-Present) and Vice President — Mutual Fund Administration, Columbia Management Investment Advisers, LLC (May 2010- October 2015). Treasurer, Principal Financial Officer and Principal Accounting Officer—Goldman Sachs ETF Trust (previously Assistant Treasurer (2017)); Goldman Sachs Trust (previously Assistant Treasurer (2016)); Goldman Sachs Variable Insurance Trust (previously Assistant Treasurer (2016)); Goldman Sachs Trust II (previously Assistant Treasurer (2017)); Goldman Sachs MLP Income Opportunities Fund (previously Assistant Treasurer (2017)); Goldman Sachs MLP and Energy Renaissance Fund (previously Assistant Treasurer (2017)); Goldman Sachs Credit Income Fund; and Goldman Sachs Real Estate Diversified Income Fund. |
| | | | | | |
| * | | Represents a partial list of officers of the Trust. Additional information about all the officers is available in the Fund’s Statement of Additional Information, which can be obtained from Goldman Sachs free of charge by calling this toll-free number (in the United States): 1-800-621-2550. |
| 1 | | Information is provided as of August 31, 2020. |
| 2 | | Officers hold office at the pleasure of the Board of Trustees or until their successors are duly elected and qualified. Each officer holds comparable positions with certain other companies of which Goldman Sachs, GSAM or an affiliate thereof is the investment adviser, administrator and/or distributor. |
Goldman Sachs JUST U.S. Large Cap Equity ETF — Tax Information (Unaudited)
For the fiscal year ended August 31, 2020, 100% of the dividends paid from net investment company taxable income by the JUST U.S. Large Cap Equity ETF qualify for the reduced tax rate under the Jobs and Growth Tax Relief and Reconciliation Act of 2003.
For the fiscal year ended August 31, 2020, 100% of the dividends paid from net investment company taxable income by the JUST U.S. Large Cap Equity ETF qualify for the dividends received deduction available to corporations.
29
FUNDS PROFILE
Goldman Sachs ETFs

Goldman Sachs is a premier financial services firm, known since 1869 for creating thoughtful and customized investment solutions in complex global markets.
Today, the Consumer and Investment Management Division of Goldman Sachs serves a diverse set of clients worldwide, including private institutions, public entities and individuals. With approximately $1.88 trillion in assets under supervision as of June 30, 2020, Goldman Sachs Asset Management (“GSAM”) has portfolio management teams located around the world and our investment professionals bring firsthand knowledge of local markets to every investment decision. Assets under supervision includes assets under management and other client assets for which Goldman Sachs does not have full discretion. GSAM leverages the resources of Goldman Sachs & Co. LLC subject to legal, internal and regulatory restrictions.
|
|
| GOLDMAN SACHS EXCHANGE-TRADED FUNDS |
| Goldman Sachs ActiveBeta® Emerging Markets Equity ETF |
| Goldman Sachs ActiveBeta® Europe Equity ETF |
| Goldman Sachs ActiveBeta® International Equity ETF |
| Goldman Sachs ActiveBeta® Japan Equity ETF |
| Goldman Sachs ActiveBeta® U.S. Large Cap Equity ETF |
| Goldman Sachs ActiveBeta® U.S. Small Cap Equity ETF |
| Goldman Sachs Equal Weight U.S. Large Cap Equity ETF |
| Goldman Sachs Hedge Industry VIP ETF |
| Goldman Sachs JUST U.S. Large Cap Equity ETF |
| Goldman Sachs Access U.S. Aggregate Bond ETF |
| Goldman Sachs Access High Yield Corporate Bond ETF |
| Goldman Sachs Access Inflation Protected USD Bond ETF |
| Goldman Sachs Access Investment Grade Corporate Bond ETF |
| Goldman Sachs Access Investment Grade Corporate 1-5 Year Bond ETF |
| Goldman Sachs Access Treasury 0-1 Year ETF |
| Goldman Sachs Access Ultra Short Bond ETF |
| Goldman Sachs Data-Driven World ETF |
| Goldman Sachs Finance Reimagined ETF |
| Goldman Sachs Human Evolution ETF |
| Goldman Sachs Manufacturing Revolution ETF |
| Goldman Sachs New Age Consumer ETF |
| Goldman Sachs MarketBeta International Equity ETF |
| Goldman Sachs MarketBeta Emerging Markets Equity ETF |
| Goldman Sachs MarketBeta U.S. Equity ETF |
INDEX DISCLAIMERS
Neither JUST Capital Foundation, Inc. (“JUST Capital”) nor any of its affiliates (collectively, the “JUST Parties”) in any way sells, sponsors, supports, promotes, or endorses the Goldman Sachs JUST U.S. Large Cap Equity ETF (the “GS ETF”), or has involvement in its operations or distribution. The JUST US Large Cap Diversified Index (the “JUST Index”) has been licensed by Russell on an “as is” basis to Goldman Sachs Asset Management L.P. (“Goldman Sachs”) in connection with Goldman Sachs’ sponsorship of the GS ETF, and JUST Capital’s only relationship with Goldman Sachs is the licensing of certain trademarks and trade names of JUST Capital or its affiliates. The JUST Parties and any other person or entity involved in or related to compiling, computing, or creating the JUST Index expressly disclaim all representations, warranties, and liabilities relating to or in connection with the GS ETF (including, without limitation, any warranties of originality, accuracy, completeness, timeliness, non-infringement, merchantability, and fitness for a particular purpose).
No JUST Party makes any claim, prediction, warranty, or representation whatsoever, expressly or impliedly, either as to (i) the results to be obtained from the use of the JUST Index, the GS ETF, or any of the data included in either of the foregoing, (ii) the level at which the JUST Index or GS ETF is said to stand at any particular time on any particular day or otherwise, (iii) the suitability of the JUST Index for the purpose to which it is being put in connection with the GS ETF, or (iv) the advisability of investing in securities generally or in any index or ETF, including those provided by Goldman Sachs.
No JUST Party has provided, nor will any provide, any financial or investment advice or recommendation in relation to the JUST Index or the GS ETF to Goldman Sachs Asset Management or to its clients. No JUST Party shall be (i) liable (whether in negligence or otherwise) to any person for any error in the JUST Index or (ii) under any obligation to advise any person of any error therein. Without limiting any of the foregoing, in no event shall any JUST Party have any liability for any direct, indirect, special, incidental, punitive, consequential (including without limitation lost profits), or any other damages in connection with the JUST Index or the GS ETF.
Data and information regarding the JUST Index is proprietary to JUST Capital or its licensors, and reproduction of such data and information is prohibited except with the prior written permission of JUST Capital. JUST Index® and JUST Capital Index® are trademarks of JUST Capital and have been licensed for use by Goldman Sachs Asset Management L.P. by JUST Capital and/or its agent.
Frank Russell Company (“Russell”) acts solely as calculation agent in respect of the JUST US Large Cap Diversified Index and does not in any way sponsor, support, promote or endorse the JUST US Large Cap Diversified Index or the Goldman Sachs JUST U.S. Large Cap Equity ETF. The JUST US Large Cap Diversified Index was provided on an “as is” basis. Russell, its affiliates and any other person or entity involved in or related to compiling, computing or creating the JUST US Large Cap Diversified Index (collectively, the “Russell Parties”) expressly disclaim all warranties (including, without limitation, any warranties of originality, accuracy, completeness, timeliness, non-infringement, merchantability and fitness for a particular purpose).
Russell does not make any claim, prediction, warranty or representation whatsoever, expressly or impliedly, either as to (i) the results to be obtained from the use of the JUST US Large Cap Diversified Index (upon which the Goldman Sachs JUST U.S. Large Cap Equity ETF is based), (ii) the figure at which the JUST US Large Cap Diversified Index is said to stand at any particular time on any particular day or otherwise, or (iii) the suitability of the JUST US Large Cap Diversified Index for the purpose to which it is being put in connection with the Goldman Sachs JUST U.S. Large Cap Equity ETF.
Russell has not provided and will not provide any financial or investment advice or recommendation in relation to the JUST US Large Cap Diversified Index to Goldman Sachs Asset Management or to its clients. The JUST US Large Cap Diversified Index is calculated by Russell or its agent as calculation agent. Russell shall not be (a) liable (whether in negligence or otherwise) to any person for any error in the Index or (b) under any obligation to advise any person of any error therein.
Without limiting any of the foregoing, in no event shall any Russell Party have any liability for any direct, indirect, special, incidental, punitive, consequential (including without limitation lost profits) or any other damages in connection with the JUST US Large Cap Diversified Index or the Goldman Sachs JUST U.S. Large Cap Equity ETF.
| | |
TRUSTEES Lawrence W. Stranghoener, Chairman Caroline Dorsa Linda A. Lang Michael Latham James A. McNamara | | OFFICERS James A. McNamara, President Joseph F. DiMaria, Principal Financial Officer, Principal Accounting Officer and Treasurer Caroline L. Kraus, Secretary |
| |
THE BANK OF NEW YORK MELLON Transfer Agent | | |
| |
ALPS DISTRIBUTORS, INC. Distributor | | GOLDMAN SACHS ASSET MANAGEMENT, L.P. Investment Adviser |
Visit our Website at www.GSAMFUNDS.com/ETFs to obtain the most recent month-end returns.
Goldman Sachs Asset Management, L.P., 200 West Street, New York, New York 10282
The reports concerning the Fund included in this shareholder report may contain certain forward-looking statements about the factors that may affect the performance of the Fund in the future. These statements are based on Fund management’s predictions and expectations concerning certain future events and their expected impact on the Fund, such as performance of the economy as a whole and of specific industry sectors, changes in the levels of interest rates, the impact of developing world events, and other factors that may influence the future performance of the Fund. Management believes these forward-looking statements to be reasonable, although they are inherently uncertain and difficult to predict. Actual events may cause adjustments in portfolio management strategies from those currently expected to be employed.
A description of the policies and procedures that the Fund uses to determine how to vote proxies relating to portfolio securities and information regarding how a Fund voted proxies relating to portfolio securities during the most recent 12-month period ended June 30 is available (i) without charge, upon request by calling 1-800-621-2550; and (ii) on the Securities and Exchange Commission (“SEC”) web site at http://www.sec.gov.
The Fund will file its portfolio holdings information for each month in a fiscal quarter within 60 days after the end of the relevant fiscal quarter on Form N-PORT. Portfolio holdings information for the third month of each fiscal quarter will be made available on the SEC’s web site at http://www.sec.gov. Portfolio holdings information may be obtained upon request and without charge by calling 1-800-621-2550.
Fund holdings and allocations shown are as of August 31, 2020 and may not be representative of future investments. Fund holdings should not be relied on in making investment decisions and should not be construed as research or investment advice regarding particular securities. Current and future holdings are subject to risk.
Economic and market forecasts presented herein reflect our judgment as of the date of this presentation and are subject to change without notice. These forecasts do not take into account the specific investment objectives, restrictions, tax and financial situation or other needs of any specific client. Actual data will vary and may not be reflected here. These forecasts are subject to high levels of uncertainty that may affect actual performance. Accordingly, these forecasts should be viewed as merely representative of a broad range of possible outcomes. These forecasts are estimated, based on assumptions, and are subject to significant revision and may change materially as economic and market conditions change. Goldman Sachs has no obligation to provide updates or changes to these forecasts. Case studies and examples are for illustrative purposes only.
ETF Fund shares are not individually redeemable and are issued and redeemed by the Fund at their net asset value (“NAV”) only in large, specified blocks of shares called creation units. Shares otherwise can be bought and sold only through exchange trading at market price (not NAV). Shares may trade at a premium or discount to their NAV in the secondary market. Brokerage commissions will reduce returns. Ordinary brokerage commissions apply.
This material is not authorized for distribution to prospective investors unless preceded or accompanied by a current Prospectus or summary prospectus, if applicable. Investors should consider the Fund’s objective, risks, and charges and expenses, and read the summary prospectus, if available, and/or the Prospectus carefully before investing or sending money. The summary prospectus, if available, and the Prospectus contain this and other information about the Fund and may be obtained from your authorized dealer or from Goldman Sachs & Co. LLC by calling 1-800-621-2550.
ActiveBeta® is a registered trademark of GSAM.
ALPS Distributors, Inc. is the distributor of the Goldman Sachs ETF Funds. ALPS Distributors, Inc. is unaffiliated with Goldman Sachs Asset Management.
© 2020 Goldman Sachs. All rights reserved. 218126-OTU-10/2020 JUSTUSLCEETFAR-20
Goldman Sachs Funds

| | | | |
| | |
| Annual Report | | | | August 31, 2020 |
| | |
| | | | Goldman Sachs Thematic ETFs |
| | | | Data-Driven World ETF (GDAT) |
| | | | Finance Reimagined ETF (GFIN) |
| | | | Human Evolution ETF (GDNA) |
| | | | Manufacturing Revolution ETF (GMAN) |
| | | | New Age Consumer ETF (GBUY) |
It is our intention that beginning on January 1, 2021, paper copies of the Funds’ annual and semi-annual shareholder reports will no longer be sent by mail, unless you specifically request paper copies of the reports from your financial intermediary. Instead, the reports will be made available on a website, and you will be notified by mail each time a report is posted and provided with a website link to access the report.
If you already elected to receive shareholder reports electronically, you will not be affected by this change and you need not take any action. At any time, you may elect to receive reports and certain communications from a Fund electronically by contacting your financial intermediary.
You may elect to receive all future shareholder reports in paper free of charge. You can inform your financial intermediary that you wish to receive paper copies of reports by contacting your financial intermediary. Your election to receive reports in paper will apply to all Goldman Sachs Funds held in your account.

Goldman Sachs Thematic ETFs
| | | | |
| | | |
| NOT FDIC-INSURED | | May Lose Value | | No Bank Guarantee |
Reorganization of Goldman Sachs Thematic ETFs
On August 7, 2020, Goldman Sachs Asset Management (“GSAM”), investment adviser for the Goldman Sachs Data-Driven World ETF, Goldman Sachs Finance Reimagined ETF, Goldman Sachs Human Evolution ETF, Goldman Sachs Manufacturing Revolution ETF and Goldman Sachs New Age Consumer ETF (each, an “Acquired Fund” and collectively, the “Acquired Funds”), each a series of the Goldman Sachs ETF Trust (the “Trust”) announced that the Board of Trustees of the Trust has approved an Agreement and Plan of Reorganization (the “Plan of Reorganization”) providing for the reorganization of the Acquired Funds with and into the Goldman Sachs Innovate Equity ETF (the “Surviving Fund” and together with the Acquired Funds, the “Funds”), a newly organized series of the Trust (the “Reorganization”).
The Board of Trustees and GSAM believe that the Reorganization is in the best interests of the shareholders of each Fund and that the interests of the shareholders of each Fund will not be diluted as a result of the Reorganization.
The key terms of the Reorganization include:
| ∎ | | Each Acquired Fund will transfer of all of its assets to the Surviving Fund in exchange for shares of the Surviving Fund having an aggregate net asset value (“NAV”) equal to the NAV of such Acquired Fund as of the time of valuation specified in the Plan of Reorganization and the assumption by the Surviving Fund of all of the liabilities of such Acquired Fund. Shares of the Surviving Fund received by the Surviving Fund will be distributed to the shareholders of each Acquired Fund in complete liquidation of each Acquired Fund. |
| ∎ | | Currently, each Acquired Fund seeks to provide investment results that closely correspond, before fees and expenses, to the performance of an underlying index designed to provide exposure to certain potential drivers of changes in the economy, or “Themes.” The Surviving Fund will seek to provide investment results that closely correspond, before fees and expenses, to the performance of the Solactive Innovative Global Equity Index, which will combine the five Themes on an equal-weighted basis to provide exposure to companies that may benefit from technological innovation and the resulting changes in the economy. |
It is currently anticipated that the Reorganization will conclude after the close of business on November 6, 2020, subject to compliance with all regulatory requirements and satisfaction of customary closing conditions. Shares of the Surviving Fund are expected to begin trading on the NYSE Arca, Inc. on November 9, 2020. Shareholders of each Acquired Fund are not required to approve the Plan of Reorganization. The Surviving Fund has not commenced investment operations and does not currently have shareholders.
1
INVESTMENT PROCESS
Goldman Sachs ETF Trust
Principal Investment Strategies
During the Reporting Period, certain changes were made to the names and the respective underlying indices (each, an “Index”) of the Goldman Sachs Motif Data-Driven World ETF, Goldman Sachs Motif Finance Reimagined ETF, Goldman Sachs Motif Human Evolution ETF, Goldman Sachs Motif Manufacturing Revolution ETF and Goldman Sachs Motif New Age Consumer ETF (each, a “Fund”).
Effective May 15, 2020, Goldman Sachs Asset Management, L.P. (“GSAM”) replaced Motif Capital Management, Inc. as the Index Provider for the Funds. At the same time, “Goldman Sachs” replaced “Motif” in the name of each Index and “Motif” was removed from the name of each Fund. No changes were made to the Funds’ respective investment strategies. In connection with the changes discussed above, the quarterly rebalances for each Index scheduled for May and August 2020 did not take place.
The investment objective of each of the Goldman Sachs Data-Driven World ETF, the Goldman Sachs Finance Reimagined ETF, the Goldman Sachs Human Evolution ETF, the Goldman Sachs Manufacturing Revolution ETF and the Goldman Sachs New Age Consumer ETF, is to seek to provide investment results that closely correspond, before fees and expenses, to the performance of its respective Index.
Each Fund seeks to achieve its investment objective by investing at least 80% of its assets (exclusive of collateral held from securities lending) in securities included in its Index, in depositary receipts representing securities included in its Index and in underlying stocks in respect of depositary receipts included in its Index. Given each Fund’s investment objective of attempting to track its underlying index, the Funds do not follow traditional methods of active investment management, which may involve buying and selling securities based upon analysis of economic and market factors.
Each Index is designed to deliver exposure to equity securities of companies located across developed and emerging markets worldwide, listed and traded on major exchanges in certain developed markets, including Australia, Canada, France, Germany, Hong Kong, Japan, South Korea, Switzerland, the Netherlands, the U.K. and the U.S. In addition, company and stock screens are applied to set minimum liquidity and investability requirements for stocks in the eligible universe (“Index Universe”).
The Index Provider determines the components of each Index based on that Index’s exposure to certain Themes (i.e., the Data-Driven World Theme, the Finance Reimagined Theme, the Human Evolution Theme, the Manufacturing Revolution Theme and the New Age Consumer Theme), as well as related Sub-Themes, and in accordance with a rules-based methodology that involves five steps.
Step 1
In the first step, a quantitative measurement is made of the exposure of companies in each Index Universe to each Sub-Theme (“Sub-Theme Thematic Beta”).
For the Digitization of Finance Sub-Theme and the Asset Management Makeover Sub-Theme within the Goldman Sachs Finance Reimagined Index, and all Sub-Themes within the Goldman Sachs New Age Consumer Index:
To calculate a Sub-Theme Thematic Beta, the Index Provider applies automated semantic search algorithms to multiple regulatory filings filed with the applicable regulators or major stock exchanges in certain developed markets to score the relevance of a Sub-Theme to a company. Each regulatory filing is scored for the relevance of the Sub-Theme by applying an automated semantic search algorithm. This algorithm assigns a score to the regulatory filing based on the topic, document length, and number of mentions of the topic, among other factors. Regulatory filings scoring above a fixed theme relevance threshold are then mapped, if possible, to a company. For each company that has a total market capitalization of at least $500,000,000 in U.S. dollars, a stock with an average daily trading volume over the most recent 30-day period (“ADTV”) of at least $1,000,000 in U.S. dollars and at least 50 days of historical returns data over the most recent 90-day period, the company’s reported revenue streams are examined to determine whether each revenue stream is relevant to the Sub-Theme. The company’s Sub-Theme Thematic Beta is equal to the sum of all revenue streams of such company that are theme-relevant divided by the company’s total revenue.
For all other Sub-Themes within each Index:
To calculate a Sub-Theme Thematic Beta, the Index Provider applies automated semantic search algorithms to multiple datasets and documents to score the relevance of a Sub-Theme to a company. The datasets and documents used include one or more of (1) regulatory filings filed with the applicable regulators or major stock exchanges in certain developed markets, (2) academic
2
INVESTMENT PROCESS
journals, and (3) patent filings (the “Search Corpus”). The Search Corpus for the Goldman Sachs Human Evolution Index also includes clinical trial data. Each dataset and document in the Search Corpus is scored for the relevance of the Sub-Theme by applying an automated semantic search algorithm. This algorithm assigns a score to the dataset or document based on the topic, document length, and number of mentions of the topic, among other factors. Datasets and documents with a non-zero score are then mapped, if possible, to a company. Multiple entries within a type of Search Corpus for each company are then combined to make a single score. This results in up to three (or four, in the case of the Goldman Sachs Human Evolution Index) quantitative measurements of the relevance of the Sub-Theme to a company: the “Filing Search Beta,” sourced from the regulatory filings; the “Academic Beta,” sourced from academic journals; and the “Patent Beta,” sourced from patent filings. The three (or four) quantitative measurements are then combined to give a company an overall Sub-Theme Thematic Beta. For the Goldman Sachs Human Evolution Index, the “Clinical Trial Beta,” sourced from clinical trial data, is also combined to calculate a company’s Sub-Theme Thematic Beta.
Step 2
In the second step, a company’s Sub-Theme Thematic Betas for all Sub-Themes are combined to give that company a single Thematic Beta. Each respective Index Universe consists of all companies with a non-zero applicable Thematic Beta.
Step 3
In the third step, each company in the Index Universe is mapped, if possible, to one or more common equity securities listed on major stock exchanges in certain developed markets. If no relevant security is found, the company is removed from the Index Universe.
Step 4
In the fourth step, liquidity, investability and/or theme relevance screens are applied to the Index Universe. Stocks of companies with an applicable Thematic Beta below a fixed threshold are removed from the Index Universe. Additionally, for all Sub-Themes within each Index except the Digitization of Finance Sub-Theme and the Asset Management Makeover Sub-Theme within the Goldman Sachs Finance Reimagined Index, and all Sub-Themes within the Goldman Sachs New Age Consumer Index, stocks of companies with any of the following characteristics are removed from the Index Universe:
| | • | | An ADTV of less than $1,000,000 in U.S. dollars; |
| | • | | A total market capitalization of less than $500,000,000 in U.S. dollars; |
| | • | | Less than 50 days of historical returns data over the most recent 90-day period; or |
| | • | | A Thematic Beta below a fixed threshold. |
All remaining stocks are included in the Index. In addition, if the size of the remaining Index Universe is greater than 120 stocks, the final Index Universe is reduced to 120 stocks based on a function of the applicable Thematic Beta, market variables and the weight of the stock from the previous rebalancing, if any.
Step 5
In the fifth step, stocks are weighted according to a function of a company’s market capitalization and applicable Thematic Beta. A minimum weight of 0.1% and a maximum weight of the lesser of 5% or the ADTV of such stock multiplied by 10-9 (for example, an ADTV of $10 million would correspond to a maximum weight of 1%) are applied to each stock to reduce concentration in individual securities and increase diversification of the Index.
Each Index is reconstituted and rebalanced quarterly on the third Friday of each February, May, August and November.
* * *
At the end of the Reporting Period, i.e., the 12 months ended August 31, 2020, we believed that the Funds presented attractive long-term opportunities, as their respective underlying secular growth Themes and Sub-Themes were still in the early innings of their potential value. Although the growth style of these Themes and Sub-Themes and their exposure to emerging markets may lead to short-term volatility, we remained confident overall in their long-term strength.
3
PORTFOLIO RESULTS
Goldman Sachs Data-Driven World ETF
Investment Objective
The Goldman Sachs Data-Driven World ETF (the “Fund”) seeks to provide investment results that closely correspond, before fees and expenses, to the performance of the Goldman Sachs Data-Driven World Index (the “Index”).
Portfolio Management Discussion and Analysis
Below, the Goldman Sachs Quantitative Investment Strategies Team discusses the Fund’s performance and positioning for the 12-month period ended August 31, 2020 (the “Reporting Period”).
| Q | | How did the Fund perform during the Reporting Period? |
| A | | During the Reporting Period, the Fund returned 41.46% based on net asset value (“NAV”) and 41.57% based on market price. The Index returned 41.54% during the same period. |
| | | The Fund had a NAV of $51.34 per share on August 31, 2019 and ended the Reporting Period with a NAV of $71.88 per share. The Fund’s market price on August 31, 2020 was $72.02 per share. |
| Q | | What key factors were responsible for the Fund’s performance during the Reporting Period? |
| A | | The Fund seeks to provide investment results that closely correspond, before fees and expenses, to the performance of the Index. The Fund’s performance reflects Fund expenses, including management fees and brokerage expenses. The Fund’s relative performance also reflects the impact of any cash held in the Fund as well as any other differences between the Fund’s holdings and the constituents of the Index. The Index is unmanaged, and Index returns do not reflect fees and expenses, which would reduce returns. |
| | | The Index is constructed using a rules-based methodology that was developed to provide exposure to companies with common equity securities listed on exchanges in certain developed markets that may benefit from the ongoing rapid increase in electronically recorded data in the world and its impact on the lifecycle of data delivery and processing (the “Data-Driven World Theme”). This lifecycle includes the recording, transmission, storage and processing, securing and analysis of data. The focus of the Index is to identify and weight companies that originate data solutions as well as companies that deploy data solutions to solve business problems. The Data-Driven World Theme is separated into five sub-themes (each a “Sub-Theme,” and collectively, the “Sub-Themes”), each of which relates to a part of the data lifecycle. Given the Fund’s investment objective of attempting to track the Index, the Fund does not follow traditional methods of active investment management, which may involve buying and selling securities based upon analysis of economic and market factors. The Fund does not follow a strategy of seeking to outperform the Index. |
| | | During the Reporting Period, the Fund generated positive absolute returns that closely tracked the Index, as measured by NAV. All of the underlying Sub-Themes contributed positively to the Index’s performance. Artificial Intelligence added the most to results, followed at a distance by the Internet of Things, Cybersecurity, Data Infrastructure and Big Data Sub-Themes. The Artificial Intelligence Sub-Theme represents companies that may benefit from the development of artificial intelligence, which, for the purposes of the Index, refers to the ability of a machine to perform cognitive tasks typically associated with human brains, such as perception, reasoning, learning, interacting with the environment and problem solving. The Internet of Things Sub-Theme represents companies that may benefit from the development of the Internet of Things, which, for the purposes of the Index, refers to the collection of consumer and industrial network-connected devices beyond traditional appliances. The Cybersecurity Sub-Theme represents companies that may benefit from the need to secure data in an online world. For the purposes of the Index, cybersecurity refers to the practice of ensuring the integrity, confidentiality and availability of information. The Data Infrastructure Sub-Theme represents companies that may benefit from the expansion in physical infrastructure to transmit and store data. For the purposes of the Index, data infrastructure refers to the range of hardware components needed for transmission and storage of large quantities of data, such as routers and switches, wired and wireless transmission networks, and high-density storage. The Big Data Sub-Theme represents companies that may benefit from |
4
PORTFOLIO RESULTS
| | the development of big data technologies. For the purposes of the Index, big data refers to the set of software technologies associated with the storage, processing and analytics of large-scale structured and unstructured data. |
| Q | | Which individual stock positions contributed the most to the Index’s returns during the Reporting Period, and which contributed least? |
| A | | During the Reporting Period, the Index benefited most from positions in U.S.-based NVIDIA, which engages in the design and manufacture of computer graphics processors, chipsets and related multimedia software; U.S.-based Apple, a multinational technology company; and U.S.-based Amazon.com, an e-commerce retailing behemoth (5.16%, 3.68% and 4.24%, respectively, of Fund net assets as of August 31, 2020). Positions in Capital One Financial, a U.S. bank holding company; HEROZ, a Japan-based developer of artificial intelligence technology; and Western Digital, a U.S. hard disk drive manufacturer and data storage company (0.42%, 0.17% and 0.46%, respectively, of Fund net assets as of August 31, 2020) contributed least positively to the Index’s performance during the Reporting Period. |
| Q | | How did the Fund use derivatives and similar instruments during the Reporting Period? |
| A | | During the Reporting Period, the Fund did not invest in derivatives or similar instruments. The Fund does not employ derivatives as a source of alpha generation, although it may use them to equitize excess cash. |
| Q | | What was the Fund’s regional positioning relative to the Index at the end of the Reporting Period?1 |
| | | | | | | | | | |
| | | |
| | | Region Name | | Fund2 | | | Index | |
| | | |
| | North America | | | 75.3 | % | | | 75.3 | % |
| | Emerging Markets | | | 13.1 | | | | 13.1 | |
| | Developed Europe | | | 8.1 | | | | 8.1 | |
| | | Developed Asia Pacific | | | 3.4 | | | | 3.4 | |
| | 1 | | The percentage shown for each investment category reflects the value of investments in that category as a percentage of market value. Figures above may not sum to 100% due to rounding. |
| | 2 | | The Fund seeks to provide investment results that closely correspond, before fees and expenses, to the performance of the Index. |
5
FUND BASICS
Data-Driven World ETF
as of August 31, 2020
| | | | | | |
| | FUND SNAPSHOT | |
| | |
| | | As of August 31, 2020 | | | |
| | |
| | Market Price1 | | $ | 72.02 | |
| | | Net Asset Value (NAV)1 | | $ | 71.88 | |
| 1 | | The Market Price is the price at which the Fund’s shares are trading on the NYSE Arca, Inc. The Market Price of the Fund’s shares will fluctuate and, at the time of sale, shares may be worth more or less than the original investment or the Fund’s then current net asset value (“NAV”). The NAV is the market value of one share of the Fund. This amount is derived by dividing the total value of all the securities in the Fund’s portfolio, plus other assets, less any liabilities, by the number of Fund shares outstanding. Fund shares are not individually redeemable and are issued and redeemed by the Fund at their NAV only in large, specified blocks of shares called creation units. Shares otherwise can be bought and sold only through exchange trading at market price (not NAV). Shares may trade at a premium or discount to their NAV in the secondary market. Information regarding how often shares of each Fund traded on NYSE Arca at a price above (i.e., at a premium) or below (i.e., at a discount) the NAV of the Fund can be found at www.GSAMFUNDS.com/ETFs. |
| | | | | | | | | | |
| | TOP TEN HOLDINGS AS OF 8/31/202 |
| | | | |
| | | Holding | | % of Net Assets | | | Line of Business | | Country |
| | | | |
| | NVIDIA Corp. | | | 5.1 | % | | Information Technology | | United States |
| | Amazon.com, Inc. | | | 4.2 | | | Consumer Discretionary | | United States |
| | Apple, Inc. | | | 3.7 | | | Information Technology | | United States |
| | Microsoft Corp. | | | 3.5 | | | Information Technology | | United States |
| | Facebook, Inc., Class A | | | 3.3 | | | Communication Services | | United States |
| | Alphabet, Inc., Class A | | | 3.0 | | | Communication Services | | United States |
| | Advanced Micro Devices, Inc. | | | 2.3 | | | Information Technology | | United States |
| | Alibaba Group Holding Ltd. ADR | | | 2.2 | | | Consumer Discretionary | | China |
| | Intel Corp. | | | 2.2 | | | Information Technology | | United States |
| | | Adobe, Inc. | | | 2.2 | | | Information Technology | | United States |
| 2 | | The top 10 holdings may not be representative of the Fund’s future investments. |
For more information about the Fund, please refer to www.GSAMFUNDS.com/ETFs. There, you can learn more about the Fund’s investment strategies, holdings, and performance.
6
GOLDMAN SACHS DATA-DRIVEN WORLD ETF
Performance Summary
August 31, 2020
The following graph shows the value, as of August 31, 2020, of a $10,000 investment made on March 1, 2019 (commencement of operations) in Shares at NAV. For comparative purposes, the performance of the Fund’s underlying index, the Goldman Sachs Data-Driven World Index is shown. Performance reflects applicable fee waivers and/or expense limitations in effect during the periods shown and in their absence, performance would be reduced. Returns do not reflect the deduction of taxes that a shareholder would pay on Fund distributions or the sale of Fund shares. In addition to the performance of constituents of the underlying index, other factors may affect Fund performance. These factors include, but are not limited to, Fund operating fees and expenses, portfolio turnover and creation and redemption in-kind transactions. The returns set forth below represent past performance. Past performance does not guarantee future results. The Fund’s NAV and investment return may fluctuate. These fluctuations may cause an investor’s shares to be worth more or less than their original cost. Current performance may be lower or higher than the performance quoted below. Please visit our web site at www.GSAMFUNDS.com/ETFs to obtain the most recent month-end returns.
|
| Goldman Sachs Data-Driven World ETF’s Lifetime Performance |
Performance of a $10,000 Investment, with distributions reinvested, from March 1, 2019 through August 31, 2020.
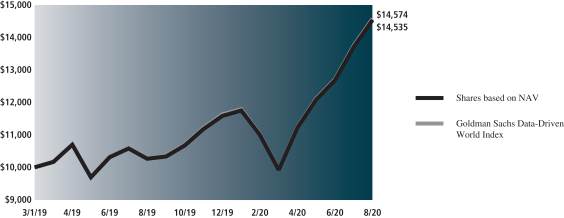
| | | | | | |
| Average Annual Total Return through August 31, 2020* | | | 1 Year Return | | | Since Inception |
Shares based on NAV (Commenced March 1, 2019) | | | 41.46% | | | 28.17% |
|
Shares based on Market Price (Commenced March 1, 2019) | | | 41.57% | | | 28.33% |
|
Goldman Sachs Data-Driven World Index** | | | 41.54% | | | 28.40% |
|
| * | | Total return for periods of less than one year represents cumulative total return. Total returns are calculated assuming purchase of a share at the market price or NAV on the first day and sale of a share at the market price or NAV on the last day of each period reported. The Total Returns based on NAV and Market Price assume the reinvestment of dividends and do not reflect brokerage commissions in connection with the purchase or sale of Fund shares, which if included would lower the performance shown above. The NAV used in the Total Return calculation assumes all management fees incurred by the Fund. Market Price returns are based upon the last trade as of 4:00pm EST and do not reflect the returns you would receive if you traded shares at other times. The first day of secondary market trading is typically several days after the date on which the Fund commenced investment operations; therefore, the NAV of the Fund is used as a proxy for the period from inception of investment operations to the first day of secondary market trading to calculate the Market Price returns. Total returns for periods less than one full year are not annualized. |
| ** | | Effective May 15, 2020, GSAM replaced Motif Capital Management, Inc. as the Index Provider for the Index and “Goldman Sachs” replaced “Motif” in the name of the Index. In addition, the quarterly rebalances for the Index scheduled for May and August 2020 did not take place. No other changes were made to the Index’s methodology. |
7
PORTFOLIO RESULTS
Goldman Sachs Finance Reimagined ETF
Investment Objective
The Goldman Sachs Finance Reimagined ETF (the “Fund”) seeks to provide investment results that closely correspond, before fees and expenses, to the performance of the Goldman Sachs Finance Reimagined Index (the “Index”).
Portfolio Management Discussion and Analysis
Below, the Goldman Sachs Quantitative Investment Strategies Team discusses the Fund’s performance and positioning for the period for the 12-month period ended August 31, 2020 (the “Reporting Period”).
| Q | | How did the Fund perform during the Reporting Period? |
| A | | During the Reporting Period, the Fund returned 21.05% based on net asset value (“NAV”) and 21.10% based on market price. The Index returned 20.91% during the same period. |
| | | The Fund had a NAV of $55.59 per share on August 31, 2019 and ended the Reporting Period with a NAV of $66.76 per share. The Fund’s market price on August 31, 2020 was $66.86 per share. |
| Q | | What key factors were responsible for the Fund’s performance during the Reporting Period? |
| A | | The Fund seeks to provide investment results that closely correspond, before fees and expenses, to the performance of the Index. The Fund’s performance reflects Fund expenses, including management fees and brokerage expenses. The Fund’s relative performance also reflects the impact of any cash held in the Fund as well as any other differences between the Fund’s holdings and the constituents of the Index. The Index is unmanaged, and Index returns do not reflect fees and expenses, which would reduce returns. |
| | | The Index is constructed using a rules-based methodology that was developed to provide exposure to companies with common equity securities listed on exchanges in certain developed markets that may benefit from the ongoing structural changes in the support and delivery of financial services (the “Finance Reimagined Theme”). These structural changes include the impact of rapid technological change on the industry, including the effects of the development of blockchain technology, and the split in the asset management industry toward very low and high cost investment strategies. The Finance Reimagined Theme is separated into three sub-themes (each a “Sub-Theme,” and collectively, the “Sub- Themes”), each of which relates to a part of the data lifecycle. Given the Fund’s investment objective of attempting to track the Index, the Fund does not follow traditional methods of active investment management, which may involve buying and selling securities based upon analysis of economic and market factors. The Fund does not follow a strategy of seeking to outperform the Index. |
| | | During the Reporting Period, the Fund recorded positive absolute returns that modestly outperformed the Index, as measured by NAV. All of the underlying Sub-Themes contributed positively to the Index’s performance. The Digitization of Finance added the most, followed at some distance by the Blockchain and Asset Management Makeover Sub-Themes. The Digitization of Finance Sub-Theme represents companies that may benefit from the digitization of traditional financial services, which, for the purposes of the Index, refers to the impact of technological changes on the support and delivery of traditional financial services, such as payments, lending and insurance. The Blockchain Sub-Theme represents companies that may benefit from the development of blockchain technology, which, for the purposes of the Index, refers to the technology underlying distributed ledgers, applicable to payments, currencies and to other fields and industries that depend on a trusted intermediary. The Asset Management Makeover Sub-Theme represents companies that may benefit from the bifurcation in strategies in the asset management industry. For the purposes of the Index, asset management makeover refers to the movement of assets into low cost, often passive investments such as exchange-traded funds and index funds, and high cost, often complex investments such as private equity and hedge funds. |
8
PORTFOLIO RESULTS
| Q | | Which individual stock positions contributed the most to the Index’s returns during the Reporting Period, and which contributed least? |
| A | | During the Reporting Period, positions in U.S.-based payment processors Square, PayPal Holdings and Mastercard (5.17%, 3.52% and 5.34%, respectively, of Fund net assets as of August 31, 2020) added most to the Index’s returns. Contributing least to the Index’s results during the Reporting Period were Wirecard, a German payment processor; Quidian, a China-based online provider of small consumer credit products; and American Express, a U.S.-based multinational financial services company (0.00%,1 0.11% and 1.74%, respectively, of Fund net assets as of August 31, 2020). |
| Q | | How did the Fund use derivatives and similar instruments during the Reporting Period? |
| A | | During the Reporting Period, the Fund did not invest in derivatives or similar instruments. The Fund does not employ derivatives as a source of alpha generation, although it may use them to equitize excess cash. |
| Q | | What was the Fund’s regional positioning relative to the Index at the end of the Reporting Period?2 |
| | | | | | | | | | |
| | | |
| | | Region Name | | Fund3 | | | Index | |
| | | |
| | North America | | | 79.3 | % | | | 79.3 | % |
| | Developed Europe | | | 11.2 | | | | 11.2 | |
| | Emerging Markets | | | 5.4 | | | | 5.4 | |
| | | Developed Asia Pacific | | | 4.0 | | | | 4.0 | |
| | 1 | | Some weights are 0.00% at August 31, 2020 either because those positions were taken out during the most recent rebalance given the Fund’s index construction methodology or because they were not components of the Index during the Reporting Period. |
| | 2 | | The percentage shown for each investment category reflects the value of investments in that category as a percentage of market value. Figures above may not sum to 100% due to rounding. |
| | 3 | | The Fund seeks to provide investment results that closely correspond, before fees and expenses, to the performance of the Index. |
9
FUND BASICS
Finance Reimagined ETF
as of August 31, 2020
| | | | | | |
| | FUND SNAPSHOT | | | | |
| | |
| | | As of August 31, 2020 | | | |
| | |
| | Market Price1 | | $ | 66.86 | |
| | | Net Asset Value (NAV)1 | | $ | 66.76 | |
| 1 | | The Market Price is the price at which the Fund’s shares are trading on the NYSE Arca, Inc. The Market Price of the Fund’s shares will fluctuate and, at the time of sale, shares may be worth more or less than the original investment or the Fund’s then current net asset value (“NAV”). The NAV is the market value of one share of the Fund. This amount is derived by dividing the total value of all the securities in the Fund’s portfolio, plus other assets, less any liabilities, by the number of Fund shares outstanding. Fund shares are not individually redeemable and are issued and redeemed by the Fund at their NAV only in large, specified blocks of shares called creation units. Shares otherwise can be bought and sold only through exchange trading at market price (not NAV). Shares may trade at a premium or discount to their NAV in the secondary market. Information regarding how often shares of each Fund traded on NYSE Arca at a price above (i.e., at a premium) or below (i.e., at a discount) the NAV of the Fund can be found at www.GSAMFUNDS.com/ETFs. |
| | | | | | | | | | |
| | TOP TEN HOLDINGS AS OF 8/31/202 |
| | | | |
| | | Holding | | % of Net Assets | | | Line of Business | | Country |
| | | | |
| | Mastercard, Inc., Class A | | | 5.3 | % | | Information Technology | | United States |
| | Square, Inc., Class A | | | 5.2 | | | Information Technology | | United States |
| | Visa, Inc., Class A | | | 4.1 | | | Information Technology | | United States |
| | PayPal Holdings, Inc. | | | 3.5 | | | Information Technology | | United States |
| | Fidelity National Information Services, Inc. | | | 2.3 | | | Information Technology | | United States |
| | Intuit, Inc. | | | 2.2 | | | Information Technology | | United States |
| | Worldline SA | | | 1.9 | | | Information Technology | | France |
| | American Express Co. | | | 1.7 | | | Financials | | United States |
| | ZhongAn Online P&C Insurance Co. Ltd., Class H | | | 1.7 | | | Financials | | China |
| | | Zillow Group, Inc., Class C | | | 1.7 | | | Communication Services | | United States |
| 2 | | The top 10 holdings may not be representative of the Fund’s future investments. |
For more information about the Fund, please refer to www.GSAMFUNDS.com/ETFs. There, you can learn more about the Fund’s investment strategies, holdings, and performance.
10
GOLDMAN SACHS FINANCE REIMAGINED ETF
Performance Summary
August 31, 2020
The following graph shows the value, as of August 31, 2020, of a $10,000 investment made on March 1, 2019 (commencement of operations) in Shares at NAV. For comparative purposes, the performance of the Fund’s underlying index, the Goldman Sachs Finance Reimagined Index is shown. Performance reflects applicable fee waivers and/or expense limitations in effect during the periods shown and in their absence, performance would be reduced. Returns do not reflect the deduction of taxes that a shareholder would pay on Fund distributions or the sale of Fund shares. In addition to the performance of constituents of the underlying index, other factors may affect Fund performance. These factors include, but are not limited to, Fund operating fees and expenses, portfolio turnover and creation and redemption in-kind transactions. The returns set forth below represent past performance. Past performance does not guarantee future results. The Fund’s NAV and investment return may fluctuate. These fluctuations may cause an investor’s shares to be worth more or less than their original cost. Current performance may be lower or higher than the performance quoted below. Please visit our web site at www.GSAMFUNDS.com/ETFs to obtain the most recent month-end returns.
|
| Goldman Sachs Finance Reimagined ETF’s Lifetime Performance |
Performance of a $10,000 Investment, with distributions reinvested, from March 1, 2019 through August 31, 2020.
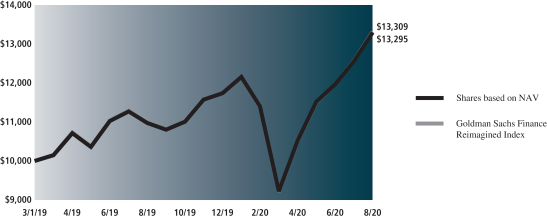
| | | | | | |
| Average Annual Total Return through August 31, 2020* | | | 1 Year Return | | | Since Inception |
Shares based on NAV (Commenced March 1, 2019) | | | 21.05% | | | 20.80% |
|
Shares based on Market Price (Commenced March 1, 2019) | | | 21.10% | | | 20.94% |
|
Goldman Sachs Finance Reimagined Index** | | | 20.91% | | | 20.89% |
|
| * | | Total return for periods of less than one year represents cumulative total return. Total returns are calculated assuming purchase of a share at the market price or NAV on the first day and sale of a share at the market price or NAV on the last day of each period reported. The Total Returns based on NAV and Market Price assume the reinvestment of dividends and do not reflect brokerage commissions in connection with the purchase or sale of Fund shares, which if included would lower the performance shown above. The NAV used in the Total Return calculation assumes all management fees incurred by the Fund. Market Price returns are based upon the last trade as of 4:00pm EST and do not reflect the returns you would receive if you traded shares at other times. The first day of secondary market trading is typically several days after the date on which the Fund commenced investment operations; therefore, the NAV of the Fund is used as a proxy for the period from inception of investment operations to the first day of secondary market trading to calculate the Market Price returns. Total returns for periods less than one full year are not annualized. |
| ** | | Effective May 15, 2020, GSAM replaced Motif Capital Management, Inc. as the Index Provider for the Index and “Goldman Sachs” replaced “Motif” in the name of the Index. In addition, the quarterly rebalances for the Index scheduled for May and August 2020 did not take place. No other changes were made to the Index’s methodology. |
11
PORTFOLIO RESULTS
Goldman Sachs Human Evolution ETF
Investment Objective
The Goldman Sachs Human Evolution ETF (the “Fund”) seeks to provide investment results that closely correspond, before fees and expenses, to the performance of the Goldman Sachs Human Evolution Index (the “Index”).
Portfolio Management Discussion and Analysis
Below, the Goldman Sachs Quantitative Investment Strategies Team discusses the Fund’s performance and positioning for the period for the 12-month period ended August 31, 2020 (the “Reporting Period”).
| Q | | How did the Fund perform during the Reporting Period? |
| A | | During the Reporting Period, the Fund returned 29.91% based on net asset value (“NAV”) and 30.08% based on market price. The Index returned 30.15% during the same period. |
| | | The Fund had a NAV of $50.15 per share on August 31, 2019 and ended the Reporting Period with a NAV of $64.96 per share. The Fund’s market price on August 31, 2020 was $65.19 per share. |
| Q | | What key factors were responsible for the Fund’s performance during the Reporting Period? |
| A | | The Fund seeks to provide investment results that closely correspond, before fees and expenses, to the performance of the Index. The Fund’s performance reflects Fund expenses, including management fees and brokerage expenses. The Fund’s relative performance also reflects the impact of any cash held in the Fund as well as any other differences between the Fund’s holdings and the constituents of the Index. The Index is unmanaged, and Index returns do not reflect fees and expenses, which would reduce returns. |
| | | The Index is constructed using a rules-based methodology that was developed to provide exposure to companies with common equity securities listed on exchanges in certain developed markets that may benefit from the development of new knowledge, medicines and technologies for the medical treatment of the human condition, from birth to end-of-life care (the “Human Evolution Theme”). The Human Evolution Theme is separated into five sub-themes (each a “Sub-Theme,” and collectively, the “Sub-Themes”), each of which relates to a part of the data lifecycle. Given the Fund’s investment objective of attempting to track the Index, the Fund does not follow traditional methods of active investment management, which may involve buying and selling securities based upon analysis of economic and market factors. The Fund does not follow a strategy of seeking to outperform the Index. |
| | | During the Reporting Period, the Fund generated positive absolute returns but modestly underperformed the Index, as measured by NAV. All of the underlying Sub-Themes contributed positively to the Index’s returns. Precision Medicine added the most, followed at some distance by the Life Extension, Genomics, Digital Medicine and Robotic Surgery Sub-Themes. The Precision Medicine Sub-Theme represents companies that may benefit from the development of precise medical treatments. For the purposes of the Index, precision medicine refers to medical treatments or techniques that are either physically precise, targeting a specific group or type of cells, or tailored to a group of patients. The Life Extension Sub-Theme represents companies that may benefit from the long-term demographic shift towards an older population. For the purposes of the Index, life extension refers to medical products and services geared towards managing the health of an aging population. The Genomics Sub-Theme represents companies that may benefit from the development of genomics, which, for the purposes of the Index, refers to the study of genomes, including genome sequencing and bioinformatics, and its application to healthcare as genomic medicine and pharmacogenomics, including gene therapy, gene editing and the use of biomarkers. The Digital Health Sub-Theme represents companies that may benefit from the development of digital health tools. For the purposes of the Index, digital health refers to the use of electronic data and software tools of analysis to assist in health care treatment and the development of drugs. The Robotic Surgery Sub-Theme represents companies that may benefit from the development of robotic surgery, which, for the purposes of the Index, refers to technology that enables minimally invasive surgery as well as the use of miniaturized surgical instruments and robotic systems to assist in surgical procedures. |
12
PORTFOLIO RESULTS
| Q | | Which individual stock positions contributed the most to the Index’s returns during the Reporting Period, and which contributed least? |
| A | | During the Reporting Period, the biggest positive contributors to the Index’s performance were positions in Moderna, a U.S.-based biotechnology company; Intuitive Surgical, a U.S. maker of robotic technologies for surgery; and DexCom, a U.S. company that develops and manufacturers continuous glucose monitoring systems for diabetes management (1.53%, 5.04% and 1.97%, respectively, of Fund net assets as of August 31, 2020). Contributing least to the Index’s returns during the Reporting Period were a position in U.S. biotechnology company bluebird bio and positions in U.K.-based Smith & Nephew and U.S.- based Boston Scientific, each a medical device manufacturer (0.40%, 1.22% and 2.85%, respectively, of Fund net assets as of August 31, 2020). |
| Q | | How did the Fund use derivatives and similar instruments during the Reporting Period? |
| A | | During the Reporting Period, the Fund did not invest in derivatives or similar instruments. The Fund does not employ derivatives as a source of alpha generation, although it may use them to equitize excess cash. |
| Q | | What was the Fund’s regional positioning relative to the Index at the end of the Reporting Period?1 |
| | | | | | | | | | |
| | | |
| | | Region Name | | Fund2 | | | Index | |
| | | |
| | North America | | | 74.3 | % | | | 74.3 | % |
| | Developed Europe | | | 18.4 | | | | 18.4 | |
| | Emerging Markets | | | 5.2 | | | | 5.2 | |
| | | Developed Asia Pacific | | | 2.0 | | | | 2.0 | |
| | 1 | | The percentage shown for each investment category reflects the value of investments in that category as a percentage of market value. Figures above may not sum to 100% due to rounding. |
| | 2 | | The Fund seeks to provide investment results that closely correspond, before fees and expenses, to the performance of the Index. |
13
FUND BASICS
Human Evolution ETF
as of August 31, 2020
| | | | | | |
| | FUND SNAPSHOT | |
| |
| | | As of August 31, 2020 | |
| | |
| | Market Price1 | | $ | 65.19 | |
| | | Net Asset Value (NAV)1 | | $ | 64.96 | |
| 1 | | The Market Price is the price at which the Fund’s shares are trading on the NYSE Arca, Inc. The Market Price of the Fund’s shares will fluctuate and, at the time of sale, shares may be worth more or less than the original investment or the Fund’s then current net asset value (“NAV”). The NAV is the market value of one share of the Fund. This amount is derived by dividing the total value of all the securities in the Fund’s portfolio, plus other assets, less any liabilities, by the number of Fund shares outstanding. Fund shares are not individually redeemable and are issued and redeemed by the Fund at their NAV only in large, specified blocks of shares called creation units. Shares otherwise can be bought and sold only through exchange trading at market price (not NAV). Shares may trade at a premium or discount to their NAV in the secondary market. Information regarding how often shares of each Fund traded on NYSE Arca at a price above (i.e., at a premium) or below (i.e., at a discount) the NAV of the Fund can be found at www.GSAMFUNDS.com/ETFs. |
| | | | | | | | | | |
| | TOP TEN HOLDINGS AS OF 8/31/202 |
| | | | |
| | | Holding | | % of Net Assets | | | Line of Business | | Country |
| | | | |
| | Intuitive Surgical, Inc. | | | 5.0 | % | | Health Care | | United States |
| | Abbott Laboratories | | | 4.0 | | | Health Care | | United States |
| | Medtronic PLC | | | 3.5 | | | Health Care | | United States |
| | Johnson & Johnson | | | 3.0 | | | Health Care | | United States |
| | Boston Scientific Corp. | | | 2.9 | | | Health Care | | United States |
| | Roche Holding AG | | | 2.7 | | | Health Care | | Switzerland |
| | AstraZeneca PLC | | | 2.7 | | | Health Care | | United Kingdom |
| | Fresenius Medical Care AG & Co. KGaA | | | 2.6 | | | Health Care | | Germany |
| | BeiGene Ltd. ADR | | | 2.5 | | | Health Care | | China |
| | | Align Technology, Inc. | | | 2.1 | | | Health Care | | United States |
| 2 | | The top 10 holdings may not be representative of the Fund’s future investments. |
For more information about the Fund, please refer to www.GSAMFUNDS.com/ETFs. There, you can learn more about the Fund’s investment strategies, holdings, and performance.
14
GOLDMAN SACHS HUMAN EVOLUTION ETF
Performance Summary
August 31, 2020
The following graph shows the value, as of August 31, 2020, of a $10,000 investment made on March 1, 2019 (commencement of operations) in Shares at NAV. For comparative purposes, the performance of the Fund’s underlying index, the Goldman Sachs Human Evolution Index is shown. Performance reflects applicable fee waivers and/or expense limitations in effect during the periods shown and in their absence, performance would be reduced. Returns do not reflect the deduction of taxes that a shareholder would pay on Fund distributions or the sale of Fund shares. In addition to the performance of constituents of the underlying index, other factors may affect Fund performance. These factors include, but are not limited to, Fund operating fees and expenses, portfolio turnover and creation and redemption in-kind transactions. The returns set forth below represent past performance. Past performance does not guarantee future results. The Fund’s NAV and investment return may fluctuate. These fluctuations may cause an investor’s shares to be worth more or less than their original cost. Current performance may be lower or higher than the performance quoted below. Please visit our web site at www.GSAMFUNDS.com/ETFs to obtain the most recent month-end returns.
|
| Goldman Sachs Human Evolution ETF’s Lifetime Performance |
Performance of a $10,000 Investment, with distributions reinvested, from March 1, 2019 through August 31, 2020.
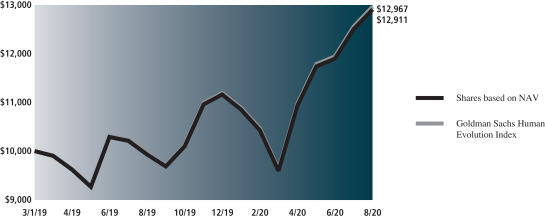
| | | | | | |
| Average Annual Total Return through August 31, 2020* | | | 1 Year Return | | | Since Inception |
Shares based on NAV (Commenced March 1, 2019) | | | 29.91% | | | 18.48% |
| | | | | | |
Shares based on Market Price (Commenced March 1, 2019) | | | 30.08% | | | 18.75% |
| | | | | | |
Goldman Sachs Human Evolution Index** | | | 30.15% | | | 18.82% |
| | | | | | |
| * | | Total return for periods of less than one year represents cumulative total return. Total returns are calculated assuming purchase of a share at the market price or NAV on the first day and sale of a share at the market price or NAV on the last day of each period reported. The Total Returns based on NAV and Market Price assume the reinvestment of dividends and do not reflect brokerage commissions in connection with the purchase or sale of Fund shares, which if included would lower the performance shown above. The NAV used in the Total Return calculation assumes all management fees incurred by the Fund. Market Price returns are based upon the last trade as of 4:00pm EST and do not reflect the returns you would receive if you traded shares at other times. The first day of secondary market trading is typically several days after the date on which the Fund commenced investment operations; therefore, the NAV of the Fund is used as a proxy for the period from inception of investment operations to the first day of secondary market trading to calculate the Market Price returns. Total returns for periods less than one full year are not annualized. |
| ** | | Effective May 15, 2020, GSAM replaced Motif Capital Management, Inc. as the Index Provider for the Index and “Goldman Sachs” replaced “Motif” in the name of the Index. In addition, the quarterly rebalances for the Index scheduled for May and August 2020 did not take place. No other changes were made to the Index’s methodology. |
15
PORTFOLIO RESULTS
Goldman Sachs Manufacturing Revolution ETF
Investment Objective
The Goldman Sachs Manufacturing Revolution ETF (the “Fund”) seeks to provide investment results that closely correspond, before fees and expenses, to the performance of the Goldman Sachs Manufacturing Revolution Index (the “Index”).
Portfolio Management Discussion and Analysis
Below, the Goldman Sachs Quantitative Investment Strategies Team discusses the Fund’s performance and positioning for the period for the 12-month period ended August 31, 2020 (the “Reporting Period”).
| Q | | How did the Fund perform during the Reporting Period? |
| A | | During the Reporting Period, the Fund returned 46.71% based on net asset value (“NAV”) and 46.77% based on market price. The Index returned 46.85% during the same period. |
| | | The Fund had a NAV of $48.11 per share on August 31, 2019 and ended the Reporting Period with a NAV of $70.14 per share. The Fund’s market price on August 31, 2020 was $70.33 per share. |
| Q | | What key factors were responsible for the Fund’s performance during the Reporting Period? |
| A | | The Fund seeks to provide investment results that closely correspond, before fees and expenses, to the performance of the Index. The Fund’s performance reflects Fund expenses, including management fees and brokerage expenses. The Fund’s relative performance also reflects the impact of any cash held in the Fund as well as any other differences between the Fund’s holdings and the constituents of the Index. The Index is unmanaged, and Index returns do not reflect fees and expenses, which would reduce returns. |
| | | The Index is constructed using a rules-based methodology that was developed to provide exposure to companies with common equity securities listed on exchanges in certain developed markets that may benefit from the ongoing technology-driven transformation of the manufacturing industry (the “Manufacturing Revolution Theme”). This transformation includes the use of new materials and energy sources to supply the manufacturing process, the application of new methods and processes, and the manufacture of new products. The focus of the Index is to identify and weight companies that are originating new solutions for manufacturing as well as companies that are deploying new solutions to solve business problems. The Manufacturing Revolution Theme is separated into five sub-themes (each a “Sub-Theme,” and collectively, the “Sub-Themes”), each of which relates to a part of the data lifecycle. Given the Fund’s investment objective of attempting to track the Index, the Fund does not follow traditional methods of active investment management, which may involve buying and selling securities based upon analysis of economic and market factors. The Fund does not follow a strategy of seeking to outperform the Index. |
| | | During the Reporting Period, the Fund generated positive absolute returns but modestly underperformed the Index, as measured by NAV. All of the underlying Sub-Themes contributed positively to the Index’s performance. Future Mobility added the most to results, followed at a distance by Robotics. The Clean Energy, Drones and 3D Printing Sub-Themes also bolstered the Index’s returns. The Future Mobility Sub-Theme represents companies that may benefit from the development of new methods of mobility. For the purposes of the Index, future mobility refers to road vehicles, including automobiles and trucks that apply one or both of electrification and partially or fully autonomous driving capabilities. The Robotics Sub-Theme represents companies that may benefit from the increased sophistication of robotics used in the manufacturing process. For the purposes of the Index, robotics refers to the ability of a machine to perform physical tasks that previously either were not possible or required a human. The Clean Energy Sub-Theme represents companies that may benefit from the development of clean energy sources. For the purposes of the Index, clean energy refers to energy from renewable resources, such as solar, wind and biofuel, as well as battery technology needed for the storage of intermittent power sources. The Drones Sub-Theme represents companies that may benefit from the development of drones, which, for the purposes of the Index, refers to aerial, land or sea-based unmanned vehicles, either remotely operated or autonomous, used in military, consumer or industrial applications. The 3D Printing Sub-Theme represents companies that may benefit from the development |
16
PORTFOLIO RESULTS
| | of 3D printing and its application in manufacturing. For the purposes of the Index, 3D printing refers to the additive process of manufacturing a three-dimensional object from a digital design. |
| Q | | Which individual stock positions contributed the most to the Index’s returns during the Reporting Period, and which contributed least? |
| A | | During the Reporting Period, the Index benefited most from positions in Tesla, a U.S. automotive and energy company; NVIDIA, a U.S.-based company engaged in the design and manufacture of computer graphics processors, chipsets and related multimedia software; and NIO, a Chinese automobile manufacturer (9.78%, 3.44% and 3.30%, respectively, of Fund net assets as of August 31, 2020). Positions in three aerospace and defense companies — U.S.-based Boeing and Raytheon Technologies and France-based Safran (0.00%,1 0.46% and 1.01%, respectively, of Fund net assets as of August 31, 2020) — contributed least to the Index’s results during the Reporting Period. |
| Q | | How did the Fund use derivatives and similar instruments during the Reporting Period? |
| A | | During the Reporting Period, the Fund did not invest in derivatives or similar instruments. The Fund does not employ derivatives as a source of alpha generation, although it may use them to equitize excess cash. |
| Q | | What was the Fund’s regional positioning relative to the Index at the end of the Reporting Period?2 |
| | | | | | | | | | |
| | | |
| | | Region Name | | Fund3 | | | Index | |
| | | |
| | North America | | | 58.0 | % | | | 58.0 | % |
| | Developed Europe | | | 19.3 | | | | 19.3 | |
| | Emerging Markets | | | 13.4 | | | | 13.4 | |
| | | Developed Asia Pacific | | | 9.3 | | | | 9.3 | |
| | 1 | | Some weights are 0.00% at August 31, 2020 either because those positions were taken out during the most recent rebalance given the Fund’s index construction methodology or because they were not components of the Index during the Reporting Period. |
| | 2 | | The percentage shown for each investment category reflects the value of investments in that category as a percentage of market value. Figures above may not sum to 100% due to rounding. |
| | 3 | | The Fund seeks to provide investment results that closely correspond, before fees and expenses, to the performance of the Index. |
17
FUND BASICS
Manufacturing Revolution ETF
as of August 31, 2020
| | | | | | |
| | FUND SNAPSHOT | |
| |
| | | As of August 31, 2020 | |
| | |
| | Market Price1 | | $ | 70.33 | |
| | | Net Asset Value (NAV)1 | | $ | 70.14 | |
| 1 | | The Market Price is the price at which the Fund’s shares are trading on the NYSE Arca, Inc. The Market Price of the Fund’s shares will fluctuate and, at the time of sale, shares may be worth more or less than the original investment or the Fund’s then current net asset value (“NAV”). The NAV is the market value of one share of the Fund. This amount is derived by dividing the total value of all the securities in the Fund’s portfolio, plus other assets, less any liabilities, by the number of Fund shares outstanding. Fund shares are not individually redeemable and are issued and redeemed by the Fund at their NAV only in large, specified blocks of shares called creation units. Shares otherwise can be bought and sold only through exchange trading at market price (not NAV). Shares may trade at a premium or discount to their NAV in the secondary market. Information regarding how often shares of each Fund traded on NYSE Arca at a price above (i.e., at a premium) or below (i.e., at a discount) the NAV of the Fund can be found at www.GSAMFUNDS.com/ETFs. |
| | | | | | | | | | |
| | TOP TEN HOLDINGS AS OF 8/31/202 |
| | | | |
| | | Holding | | % of Net Assets | | | Line of Business | | Country |
| | | | |
| | Tesla, Inc. | | | 9.7 | % | | Consumer Discretionary | | United States |
| | NVIDIA Corp. | | | 3.4 | | | Information Technology | | United States |
| | NIO, Inc. ADR | | | 3.3 | | | Consumer Discretionary | | China |
| | Amazon.com, Inc. | | | 2.9 | | | Consumer Discretionary | | United States |
| | ABB Ltd. | | | 2.7 | | | Industrials | | Switzerland |
| | Rockwell Automation, Inc. | | | 2.3 | | | Industrials | | United States |
| | JD.com, Inc. ADR | | | 2.1 | | | Consumer Discretionary | | China |
| | Dassault Systemes | | | 1.9 | | | Information Technology | | France |
| | Schneider Electric SE | | | 1.9 | | | Industrials | | France |
| | | SolarEdge Technologies, Inc. | | | 1.8 | | | Information Technology | | United States |
| 2 | | The top 10 holdings may not be representative of the Fund’s future investments. |
For more information about the Fund, please refer to www.GSAMFUNDS.com/ETFs. There, you can learn more about the Fund’s investment strategies, holdings, and performance.
18
GOLDMAN SACHS MANUFACTURING REVOLUTION ETF
Performance Summary
August 31, 2020
The following graph shows the value, as of August 31, 2020, of a $10,000 investment made on March 1, 2019 (commencement of operations) in Shares at NAV. For comparative purposes, the performance of the Fund’s underlying index, the Goldman Sachs Manufacturing Revolution Index is shown. Performance reflects applicable fee waivers and/or expense limitations in effect during the periods shown and in their absence, performance would be reduced. Returns do not reflect the deduction of taxes that a shareholder would pay on Fund distributions or the sale of Fund shares. In addition to the performance of constituents of the underlying index, other factors may affect Fund performance. These factors include, but are not limited to, Fund operating fees and expenses, portfolio turnover and creation and redemption in-kind transactions. The returns set forth below represent past performance. Past performance does not guarantee future results. The Fund’s NAV and investment return may fluctuate. These fluctuations may cause an investor’s shares to be worth more or less than their original cost. Current performance may be lower or higher than the performance quoted below. Please visit our web site at www.GSAMFUNDS.com/ETFs to obtain the most recent month-end returns.
|
| Goldman Sachs Manufacturing Revolution ETF’s Lifetime Performance |
Performance of a $10,000 Investment, with distributions reinvested, from March 1, 2019 through August 31, 2020.
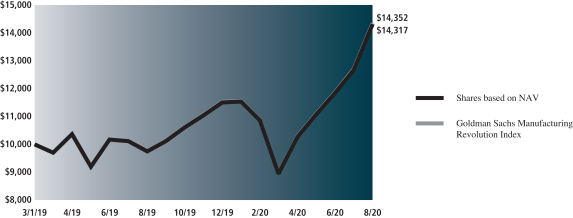
| | | | | | |
| Average Annual Total Return through August 31, 2020* | | | 1 Year Return | | | Since Inception |
Shares based on NAV (Commenced March 1, 2019) | | | 46.71% | | | 26.89% |
| | | | | | |
Shares based on Market Price (Commenced March 1, 2019) | | | 46.77% | | | 27.12% |
| | | | | | |
Goldman Sachs Manufacturing Revolution Index** | | | 46.85% | | | 27.10% |
| | | | | | |
| * | | Total return for periods of less than one year represents cumulative total return. Total returns are calculated assuming purchase of a share at the market price or NAV on the first day and sale of a share at the market price or NAV on the last day of each period reported. The Total Returns based on NAV and Market Price assume the reinvestment of dividends and do not reflect brokerage commissions in connection with the purchase or sale of Fund shares, which if included would lower the performance shown above. The NAV used in the Total Return calculation assumes all management fees incurred by the Fund. Market Price returns are based upon the last trade as of 4:00pm EST and do not reflect the returns you would receive if you traded shares at other times. The first day of secondary market trading is typically several days after the date on which the Fund commenced investment operations; therefore, the NAV of the Fund is used as a proxy for the period from inception of investment operations to the first day of secondary market trading to calculate the Market Price returns. Total returns for periods less than one full year are not annualized. |
| ** | | Effective May 15, 2020, GSAM replaced Motif Capital Management, Inc. as the Index Provider for the Index and “Goldman Sachs” replaced “Motif” in the name of the Index. In addition, the quarterly rebalances for the Index scheduled for May and August 2020 did not take place. No other changes were made to the Index’s methodology. |
19
PORTFOLIO RESULTS
Goldman Sachs New Age Consumer ETF
Investment Objective
The Goldman Sachs New Age Consumer ETF (the “Fund”) seeks to provide investment results that closely correspond, before fees and expenses, to the performance of the Goldman Sachs New Age Consumer Index (the “Index”).
Portfolio Management Discussion and Analysis
Below, the Goldman Sachs Quantitative Investment Strategies Team discusses the Fund’s performance and positioning for the period for the 12-month period ended August 31, 2020 (the “Reporting Period”).
| Q | | How did the Fund perform during the Reporting Period? |
| A | | During the Reporting Period, the Fund returned 57.41% based on net asset value (“NAV”) and 57.52% based on market price. The Index returned 57.74% during the same period. |
| | | The Fund had a NAV of $52.74 per share on August 31, 2019 and ended the Reporting Period with a NAV of $82.85 per share. The Fund’s market price on August 31, 2020 was $83.07 per share. |
| Q | | What key factors were responsible for the Fund’s performance during the Reporting Period? |
| A | | The Fund seeks to provide investment results that closely correspond, before fees and expenses, to the performance of the Index. The Fund’s performance reflects Fund expenses, including management fees and brokerage expenses. The Fund’s relative performance also reflects the impact of any cash held in the Fund as well as any other differences between the Fund’s holdings and the constituents of the Index. The Index is unmanaged, and Index returns do not reflect fees and expenses, which would reduce returns. |
| | | The Index is constructed using a rules-based methodology that was developed to provide exposure to companies with common equity securities listed on exchanges in certain developed markets that may benefit from the ongoing structural shifts in the consumer market due to changes in demographics, technology and preferences (the “New Age Consumer Theme”). The focus of the Index is to identify and weight companies that are originating and monetizing new consumer products as well as those creating and supporting the infrastructure to produce them. The New Age Consumer Theme is separated into seven sub-themes (each a “Sub-Theme,” and collectively, the “Sub-Themes”), each of which relates to a part of the data lifecycle. Given the Fund’s investment objective of attempting to track the Index, the Fund does not follow traditional methods of active investment management, which may involve buying and selling securities based upon analysis of economic and market factors. The Fund does not follow a strategy of seeking to outperform the Index. |
| | | During the Reporting Period, the Fund generated positive absolute returns but modestly underperformed the Index, as measured by NAV. All of the underlying Sub-Themes contributed positively to the Index’s returns. E-commerce added the most, followed at a distance by the Online Gaming Sub-Theme. Evolution of Education, Health and Wellness, Online Music and Video, Social Media and Experiences over Goods also enhanced the Index’s performance. The E-commerce Sub-Theme represents companies that may benefit from the expansion of e-commerce, which, for the purposes of the Index, refers to the purchase and delivery of goods and services over the Internet. The Online Gaming Sub-Theme represents companies that may benefit from the popularity of online gaming, which for the purposes of the Index, refers to a game that is either partially or primarily played through the Internet, including video games and games that may have traditionally been delivered in person, such as betting. The Evolution of Education Sub-Theme represents companies that may benefit from the evolution of education, which, for the purposes of the Index, refers to the delivery of educational materials over the Internet, such as interactive and non-interactive multimedia content, the streaming of lectures and the delivery of teaching and tutoring services online, and for-profit education services in emerging markets. The Health and Wellness Sub-Theme represents companies that may benefit from consumer interest in health and wellness, which, for the purposes of the Index, refers to consumer health-related goods and services outside of traditional health care (e.g., relating to nutrition, exercise and health tracking). The Online Music and Video Sub-Theme represents companies that may benefit from demand for music and video delivered over the Internet. For |
20
PORTFOLIO RESULTS
| | the purposes of the Index, online music and video refers to the digital distribution of music and video. The Social Media Sub-Theme represents companies that may benefit from the development of social media, which, for the purposes of the Index, refers to online platforms that connect people and allow members to interact with one another. The Experiences over Goods Sub-Theme represents companies that may benefit from demand by consumers for experiences relative to goods. For the purposes of the Index, experiences over goods refers to demand for experiences, and the goods that relate to those experiences, relative to the demand for physical goods unrelated to those experiences. |
| Q | | Which individual stock positions contributed the most to the Index’s returns during the Reporting Period, and which contributed least? |
| A | | During the Reporting Period, the Index was helped most by positions in Meituan Dianping, a Chinese web-based shopping platform; Amazon.com, the U.S.-based e-commerce retailing behemoth; and Sea, a Singapore-based provider of forensic engineering services (2.99%, 3.49% and 2.38%, respectively, of Fund net assets as of August 31, 2020). Positions in U.S. online travel company Expedia Group; U.S. manufacturer of footwear, sportswear and casual apparel Under Armour; and U.S. chicken producer Pilgrim’s Pride (0.56%, 0.29% and 0.34%, respectively, of Fund net assets as of August 31, 2020) contributed least to the Index’s results during the Reporting Period. |
| Q | | How did the Fund use derivatives and similar instruments during the Reporting Period? |
| A | | During the Reporting Period, the Fund did not invest in derivatives or similar instruments. The Fund does not employ derivatives as a source of alpha generation, although it may use them to equitize excess cash. |
| Q | | What was the Fund’s regional positioning relative to the Index at the end of the Reporting Period?1 |
| | | | | | | | | | |
| | | |
| | | Region Name | | Fund2 | | | Index | |
| | | |
| | North America | | | 50.1 | % | | | 50.1 | % |
| | Emerging Markets | | | 27.9 | | | | 27.9 | |
| | Developed Europe | | | 11.0 | | | | 11.0 | |
| | | Developed Asia Pacific | | | 10.9 | | | | 10.9 | |
| | 1 | | The percentage shown for each investment category reflects the value of investments in that category as a percentage of market value. Figures above may not sum to 100% due to rounding. |
| | 2 | | The Fund seeks to provide investment results that closely correspond, before fees and expenses, to the performance of the Index. |
21
FUND BASICS
New Age Consumer ETF
as of August 31, 2020
| | | | | | |
| | FUND SNAPSHOT | |
| |
| | | As of August 31, 2020 | |
| | |
| | Market Price1 | | $ | 83.07 | |
| | | Net Asset Value (NAV)1 | | $ | 82.85 | |
| 1 | | The Market Price is the price at which the Fund’s shares are trading on the NYSE Arca, Inc. The Market Price of the Fund’s shares will fluctuate and, at the time of sale, shares may be worth more or less than the original investment or the Fund’s then current net asset value (“NAV”). The NAV is the market value of one share of the Fund. This amount is derived by dividing the total value of all the securities in the Fund’s portfolio, plus other assets, less any liabilities, by the number of Fund shares outstanding. Fund shares are not individually redeemable and are issued and redeemed by the Fund at their NAV only in large, specified blocks of shares called creation units. Shares otherwise can be bought and sold only through exchange trading at market price (not NAV). Shares may trade at a premium or discount to their NAV in the secondary market. Information regarding how often shares of each Fund traded on NYSE Arca at a price above (i.e., at a premium) or below (i.e., at a discount) the NAV of the Fund can be found at www.GSAMFUNDS.com/ETFs. |
| | | | | | | | | | |
| | TOP TEN HOLDINGS AS OF 8/31/202 |
| | | | |
| | | Holding | | % of Net Assets | | | Line of Business | | Country |
| | | | |
| | Amazon.com, Inc. | | | 3.5 | % | | Consumer Discretionary | | United States |
| | Facebook, Inc., Class A | | | 3.3 | | | Communication Services | | United States |
| | Alibaba Group Holding Ltd. ADR | | | 3.1 | | | Consumer Discretionary | | China |
| | Meituan Dianping, Class B | | | 3.0 | | | Consumer Discretionary | | China |
| | Tencent Holdings Ltd. | | | 2.9 | | | Communication Services | | China |
| | JD.com, Inc. ADR | | | 2.6 | | | Consumer Discretionary | | China |
| | Sea Ltd. ADR | | | 2.4 | | | Communication Services | | Taiwan |
| | Netflix, Inc. | | | 2.4 | | | Communication Services | | United States |
| | Pinduoduo, Inc. ADR | | | 2.0 | | | Consumer Discretionary | | China |
| | | Wayfair, Inc., Class A | | | 1.9 | | | Consumer Discretionary | | United States |
| 2 | | The top 10 holdings may not be representative of the Fund’s future investments. |
For more information about the Fund, please refer to www.GSAMFUNDS.com/ETFs. There, you can learn more about the Fund’s investment strategies, holdings, and performance.
22
GOLDMAN SACHS NEW AGE CONSUMER ETF
Performance Summary
August 31, 2020
The following graph shows the value, as of August 31, 2020, of a $10,000 investment made on March 1, 2019 (commencement of operations) in Shares at NAV. For comparative purposes, the performance of the Fund’s underlying index, the Goldman Sachs New Age Consumer Index is shown. Performance reflects applicable fee waivers and/or expense limitations in effect during the periods shown and in their absence, performance would be reduced. Returns do not reflect the deduction of taxes that a shareholder would pay on Fund distributions or the sale of Fund shares. In addition to the performance of constituents of the underlying index, other factors may affect Fund performance. These factors include, but are not limited to, Fund operating fees and expenses, portfolio turnover and creation and redemption in-kind transactions. The returns set forth below represent past performance. Past performance does not guarantee future results. The Fund’s NAV and investment return may fluctuate. These fluctuations may cause an investor’s shares to be worth more or less than their original cost. Current performance may be lower or higher than the performance quoted below. Please visit our web site at www.GSAMFUNDS.com/ETFs to obtain the most recent month-end returns.
|
| Goldman Sachs New Age Consumer ETF’s Lifetime Performance |
Performance of a $10,000 Investment, with distributions reinvested, from March 1, 2019 through August 31, 2020.
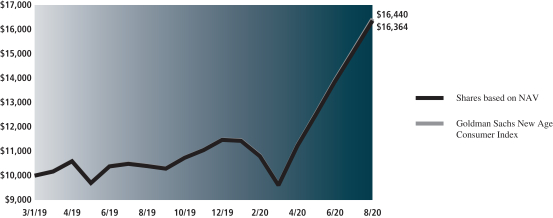
| | | | | | |
| Average Annual Total Return through August 31, 2020* | | | 1 Year Return | | | Since Inception |
Shares based on NAV (Commenced March 1, 2019) | | | 57.41% | | | 38.66% |
| | | | | | |
Shares based on Market Price (Commenced March 1, 2019) | | | 57.52% | | | 38.90% |
| | | | | | |
Goldman Sachs New Age Consumer Index** | | | 57.74% | | | 39.08% |
| | | | | | |
| * | | Total return for periods of less than one year represents cumulative total return. Total returns are calculated assuming purchase of a share at the market price or NAV on the first day and sale of a share at the market price or NAV on the last day of each period reported. The Total Returns based on NAV and Market Price assume the reinvestment of dividends and do not reflect brokerage commissions in connection with the purchase or sale of Fund shares, which if included would lower the performance shown above. The NAV used in the Total Return calculation assumes all management fees incurred by the Fund. Market Price returns are based upon the last trade as of 4:00pm EST and do not reflect the returns you would receive if you traded shares at other times. The first day of secondary market trading is typically several days after the date on which the Fund commenced investment operations; therefore, the NAV of the Fund is used as a proxy for the period from inception of investment operations to the first day of secondary market trading to calculate the Market Price returns. Total returns for periods less than one full year are not annualized. |
| ** | | Effective May 15, 2020, GSAM replaced Motif Capital Management, Inc. as the Index Provider for the Index and “Goldman Sachs” replaced “Motif” in the name of the Index. In addition, the quarterly rebalances for the Index scheduled for May and August 2020 did not take place. No other changes were made to the Index’s methodology. |
23
GOLDMAN SACHS DATA-DRIVEN WORLD ETF
Schedule of Investments
August 31, 2020
| | | | | | | | |
| Shares | | | Description | |
Value | |
| |
| Common Stocks – 99.9% | | | |
| Communication Services – 10.9% | |
| | 770 | | | Alphabet, Inc., Class A* | | $ | 1,254,738 | |
| | 4,310 | | | Baidu, Inc. ADR (China)* | | | 536,897 | |
| | 3,993 | | | Criteo SA ADR (France)* | | | 51,989 | |
| | 4,585 | | | Facebook, Inc., Class A* | | | 1,344,322 | |
| | 1,975 | | | Heroz, Inc. (Japan)* | | | 71,796 | |
| | 12,491 | | | Nippon Telegraph & Telephone Corp. (Japan) | | | 284,050 | |
| | 193,480 | | | PCCW Ltd. (Hong Kong) | | | 121,328 | |
| | 744 | | | SK Telecom Co. Ltd. (South Korea) | | | 155,326 | |
| | 6,804 | | | SoftBank Group Corp. (Japan) | | | 423,337 | |
| | 30,362 | | | Sogou, Inc. ADR (China)* | | | 262,631 | |
| | | | | | | | |
| | | | | | | 4,506,414 | |
| | |
| Consumer Discretionary – 9.2% | |
| | 3,126 | | | Alibaba Group Holding Ltd. ADR (China)* | | | 897,256 | |
| | 506 | | | Amazon.com, Inc.* | | | 1,746,186 | |
| | 5,486 | | | eBay, Inc. | | | 300,523 | |
| | 9,178 | | | JD.com, Inc. ADR (China)* | | | 721,758 | |
| | 2,716 | | | Shutterstock, Inc. | | | 136,669 | |
| | | | | | | | |
| | | | | | | 3,802,392 | |
| | |
| Financials – 2.6% | |
| | 15,095 | | | Bank of America Corp. | | | 388,545 | |
| | 2,511 | | | Capital One Financial Corp. | | | 173,334 | |
| | 46,850 | | | Ping An Insurance Group Co. of China Ltd., Class H (China) | | | 499,019 | |
| | | | | | | | |
| | | | | | | 1,060,898 | |
| | |
| Industrials – 1.1% | |
| | 2,194 | | | Allegion PLC | | | 226,838 | |
| | 1,427 | | | Equifax, Inc. | | | 240,121 | |
| | | | | | | | |
| | | | | | | 466,959 | |
| | |
| Information Technology – 72.8% | |
| | 7,935 | | | 21Vianet Group, Inc. ADR (China)* | | | 184,171 | |
| | 2,321 | | | Accenture PLC, Class A | | | 556,878 | |
| | 1,729 | | | Adobe, Inc.* | | | 887,651 | |
| | 10,423 | | | Advanced Micro Devices, Inc.* | | | 946,617 | |
| | 2,688 | | | Akamai Technologies, Inc.* | | | 312,964 | |
| | 1,568 | | | Alarm.com Holdings, Inc.* | | | 93,876 | |
| | 1,373 | | | Alteryx, Inc., Class A *(a) | | | 165,900 | |
| | 4,304 | | | Ambarella, Inc.* | | | 226,821 | |
| | 2,147 | | | Amdocs Ltd. | | | 131,461 | |
| | 11,748 | | | Apple, Inc. | | | 1,515,962 | |
| | 4,687 | | | Avaya Holdings Corp.* | | | 72,742 | |
| | 33,856 | | | BlackBerry Ltd. (Canada)* | | | 176,728 | |
| | 5,621 | | | Blue Prism Group PLC (United Kingdom)* | | | 119,366 | |
| | 2,118 | | | Booz Allen Hamilton Holding Corp. | | | 186,511 | |
| | 1,483 | | | Broadcom, Inc. | | | 514,823 | |
| | 2,529 | | | Cadence Design Systems, Inc.* | | | 280,491 | |
| | 2,362 | | | CEVA, Inc.* | | | 99,794 | |
| | 2,822 | | | Check Point Software Technologies Ltd. (Israel)* | | | 356,306 | |
| | |
| |
| Common Stocks – (continued) | | | |
| Information Technology – (continued) | |
| | 164,662 | | | Chinasoft International Ltd. (China)* | | | 117,067 | |
| | 3,632 | | | Ciena Corp.* | | | 206,189 | |
| | 10,948 | | | Cisco Systems, Inc. | | | 462,225 | |
| | 13,005 | | | Cloudera, Inc.* | | | 171,796 | |
| | 3,927 | | | Cognex Corp. | | | 271,709 | |
| | 6,169 | | | CommScope Holding Co., Inc.* | | | 63,541 | |
| | 1,997 | | | CommVault Systems, Inc.* | | | 86,330 | |
| | 12,078 | | | Conduent, Inc.* | | | 40,824 | |
| | 1,839 | | | CyberArk Software Ltd.* | | | 203,210 | |
| | 6,350 | | | Dell Technologies, Inc., Class C* | | | 419,608 | |
| | 3,820 | | | Dialog Semiconductor PLC (United Kingdom)* | | | 165,792 | |
| | 1,568 | | | ExlService Holdings, Inc.* | | | 99,866 | |
| | 9,935 | | | Extreme Networks, Inc.* | | | 43,416 | |
| | 431 | | | Fair Isaac Corp.* | | | 181,360 | |
| | 17,622 | | | FireEye, Inc.* | | | 258,691 | |
| | 2,732 | | | FLIR Systems, Inc. | | | 100,811 | |
| | 4,754 | | | Fortinet, Inc.* | | | 627,552 | |
| | 3,180 | | | GDS Holdings Ltd. ADR (China)* | | | 257,389 | |
| | 21,911 | | | Himax Technologies, Inc. ADR (Taiwan)* | | | 82,385 | |
| | 10,493 | | | Infineon Technologies AG (Germany) | | | 290,637 | |
| | 31,918 | | | Infosys Ltd. ADR (India) | | | 402,167 | |
| | 17,594 | | | Intel Corp. | | | 896,414 | |
| | 4,638 | | | International Business Machines Corp. | | | 571,912 | |
| | 1,109 | | | Intuit, Inc. | | | 383,038 | |
| | 2,510 | | | Itron, Inc.* | | | 149,521 | |
| | 7,558 | | | Juniper Networks, Inc. | | | 188,950 | |
| | 7,910 | | | Lattice Semiconductor Corp.* | | | 226,226 | |
| | 4,029 | | | Logitech International SA (Switzerland) | | | 298,981 | |
| | 3,042 | | | MACOM Technology Solutions Holdings, Inc.* | | | 108,386 | |
| | 7,300 | | | Marvell Technology Group Ltd. | | | 283,094 | |
| | 4,229 | | | MaxLinear, Inc.* | | | 102,976 | |
| | 4,415 | | | Medallia, Inc.* | | | 159,779 | |
| | 7,377 | | | Micron Technology, Inc.* | | | 335,727 | |
| | 6,418 | | | Microsoft Corp. | | | 1,447,452 | |
| | 1,886 | | | MongoDB, Inc.* | | | 440,947 | |
| | 5,672 | | | NEC Corp. (Japan) | | | 298,991 | |
| | 3,065 | | | NetScout Systems, Inc.* | | | 70,924 | |
| | 1,805 | | | Nice Ltd. ADR (Israel)* | | | 414,879 | |
| | 56,329 | | | Nokia OYJ ADR (Finland)*(a) | | | 276,012 | |
| | 21,350 | | | NortonLifeLock, Inc. | | | 502,152 | |
| | 13,599 | | | Nuance Communications, Inc.* | | | 407,426 | |
| | 3,970 | | | NVIDIA Corp. | | | 2,123,871 | |
| | 3,346 | | | NXP Semiconductors NV (Netherlands) | | | 420,793 | |
| | 7,981 | | | Opera Ltd. ADR (Norway)*(a) | | | 72,148 | |
| | 11,146 | | | Oracle Corp. | | | 637,774 | |
| | 2,428 | | | Palo Alto Networks, Inc.* | | | 624,991 | |
| | 1,699 | | | PKSHA Technology, Inc. (Japan)* | | | 43,659 | |
| | 1,327 | | | Proofpoint, Inc.* | | | 145,532 | |
| | 1,761 | | | Qorvo, Inc.* | | | 225,883 | |
| | 5,514 | | | QUALCOMM, Inc. | | | 656,717 | |
| | 1,743 | | | Qualys, Inc.* | | | 185,002 | |
| | 3,041 | | | Radware Ltd. (Israel)* | | | 78,823 | |
| | 1,475 | | | Rapid7, Inc.* | | | 95,241 | |
| | |
| | |
| 24 | | The accompanying notes are an integral part of these financial statements. |
GOLDMAN SACHS DATA-DRIVEN WORLD ETF
| | | | | | | | |
| Shares | | | Description | |
Value | |
| |
| Common Stocks – (continued) | | | |
| Information Technology – (continued) | |
| | 14,439 | | | Samsung Electronics Co. Ltd. (South Korea) | | $ | 656,373 | |
| | 5,041 | | | SAP SE (Germany) | | | 832,214 | |
| | 6,111 | | | SecureWorks Corp., Class A* | | | 79,015 | |
| | 74,218 | | | Semiconductor Manufacturing International Corp. (China)* | | | 238,451 | |
| | 2,192 | | | Silicon Laboratories, Inc.* | | | 224,483 | |
| | 2,873 | | | Silicon Motion Technology Corp. ADR (Taiwan) | | | 108,915 | |
| | 2,761 | | | Software AG (Germany) | | | 137,958 | |
| | 2,787 | | | Splunk, Inc.* | | | 611,273 | |
| | 11,784 | | | STMicroelectronics NV (Switzerland) | | | 355,287 | |
| | 1,491 | | | Synaptics, Inc.* | | | 127,227 | |
| | 28,617 | | | Telefonaktiebolaget LM Ericsson ADR (Sweden)(a) | | | 333,388 | |
| | 4,215 | | | Teradata Corp.* | | | 102,635 | |
| | 4,489 | | | Trend Micro, Inc. (Japan) | | | 277,692 | |
| | 2,080 | | | Verint Systems, Inc.* | | | 98,925 | |
| | 1,673 | | | VMware, Inc., Class A*(a) | | | 241,648 | |
| | 4,947 | | | Western Digital Corp. | | | 190,064 | |
| | 35,301 | | | Wipro Ltd. ADR (India) | | | 151,794 | |
| | 988 | | | Zebra Technologies Corp., Class A* | | | 283,092 | |
| | 5,424 | | | Zscaler, Inc.* | | | 777,476 | |
| | | | | | | | |
| | | | | | | 30,083,758 | |
| | |
| Real Estate – 3.3% | |
| | 2,703 | | | CyrusOne, Inc. REIT | | | 225,782 | |
| | 2,205 | | | Digital Realty Trust, Inc. REIT | | | 343,208 | |
| | 658 | | | Equinix, Inc. REIT | | | 519,675 | |
| | 5,916 | | | Iron Mountain, Inc. REIT | | | 178,013 | |
| | 1,555 | | | QTS Realty Trust, Inc., Class A REIT | | | 105,460 | |
| | | | | | | | |
| | | | | | | 1,372,138 | |
| | |
| TOTAL INVESTMENTS BEFORE SECURITIES
LENDING REINVESTMENT VEHICLE | | | | |
| | (Cost $31,651,630) | | $ | 41,292,559 | |
| | |
| | | | | | | | |
| Shares | | | Dividend
Rate | | Value | |
|
| Securities Lending Reinvestment Vehicle – 2.6%(b) | |
| Goldman Sachs Financial Square Government Fund –
Institutional Shares |
|
| | 1,092,435 | | | 0.027% | | $ | 1,092,435 | |
| (Cost $1,092,435) | | | |
| | |
| | TOTAL INVESTMENTS – 102.5% | | | | |
| | (Cost $32,744,065) | | $ | 42,384,994 | |
| | |
| LIABILITIES IN EXCESS OF
OTHER ASSETS – (2.5)% | | | (1,054,058 | ) |
| | |
| | NET ASSETS – 100.0% | | $ | 41,330,936 | |
| | |
| | |
|
| The percentage shown for each investment category reflects the value of investments in that category as a percentage of net assets. |
| |
* | | Non-income producing security. |
| |
(a) | | All or a portion of security is on loan. |
| |
(b) | | Represents an affiliated issuer. |
| | | | |
|
Investment Abbreviations: |
ADR | | —American Depositary Receipt |
PLC | | —Public Limited Company |
REIT | | —Real Estate Investment Trust |
|
| | |
| The accompanying notes are an integral part of these financial statements. | | 25 |
GOLDMAN SACHS FINANCE REIMAGINED ETF
Schedule of Investments
August 31, 2020
| | | | | | | | |
| Shares | | | Description | |
Value | |
| |
| Common Stocks – 99.8% | | | |
| Communication Services – 4.7% | | | |
| | 2,855 | | | Internet Initiative Japan, Inc. (Japan) | | $ | 115,228 | |
| | 1,673 | | | JOYY, Inc. ADR (China)* | | | 142,941 | |
| | 463 | | | NetEase, Inc. ADR (China) | | | 225,578 | |
| | 37,341 | | | Rightmove PLC (United Kingdom) | | | 316,886 | |
| | 1,632 | | | Scout24 AG (Germany)(a) | | | 152,142 | |
| | 6,194 | | | Zillow Group, Inc., Class C* | | | 531,198 | |
| | | | | | | | |
| | | | | | | 1,483,973 | |
| | |
| Consumer Discretionary – 0.5% | | | |
| | 8,254 | | | Everi Holdings, Inc.* | | | 64,051 | |
| | 22,586 | | | Moneysupermarket.com Group PLC (United Kingdom) | | | 92,116 | |
| | | | | | | | |
| | | | | | | 156,167 | |
| | |
| Financials – 33.5% | | | |
| | 19,474 | | | 360 Finance, Inc. ADR (China)* | | | 243,425 | |
| | 934 | | | Affiliated Managers Group, Inc. | | | 64,119 | |
| | 5,403 | | | American Express Co. | | | 548,891 | |
| | 9,587 | | | Apollo Global Management, Inc. | | | 449,343 | |
| | 7,529 | | | Ares Management Corp., Class A | | | 304,548 | |
| | 5,242 | | | Axos Financial, Inc.* | | | 129,897 | |
| | 62,740 | | | Banco Santander SA ADR (Spain)(b) | | | 139,910 | |
| | 3,091 | | | Bank of New York Mellon Corp. (The) | | | 114,305 | |
| | 738 | | | BlackRock, Inc. | | | 438,512 | |
| | 8,604 | | | Blackstone Group, Inc. (The), Class A | | | 455,582 | |
| | 4,411 | | | Blucora, Inc.* | | | 52,623 | |
| | 12,261 | | | Brookfield Asset Management, Inc., Class A (Canada) | | | 413,686 | |
| | 2,730 | | | Canadian Imperial Bank of Commerce (Canada) | | | 216,984 | |
| | 9,113 | | | Carlyle Group, Inc. (The) | | | 235,207 | |
| | 3,470 | | | Curo Group Holdings Corp. | | | 26,719 | |
| | 7,537 | | | Draper Esprit PLC (United Kingdom)* | | | 57,926 | |
| | 4,769 | | | Enova International, Inc.* | | | 81,455 | |
| | 2,420 | | | Eurazeo SE (France)* | | | 127,982 | |
| | 818 | | | FactSet Research Systems, Inc. | | | 286,627 | |
| | 18,287 | | | FinVolution Group ADR (China) | | | 34,745 | |
| | 1,265 | | | Flatex AG (Germany)* | | �� | 61,498 | |
| | 3,623 | | | Green Dot Corp., Class A* | | | 188,613 | |
| | 1,937 | | | Hamilton Lane, Inc., Class A | | | 141,614 | |
| | 5,441 | | | Hong Kong Exchanges & Clearing Ltd. (Hong Kong) | | | 274,642 | |
| | 214 | | | Hypoport SE (Germany)* | | | 128,734 | |
| | 31,418 | | | ING Groep NV (Netherlands)* | | | 255,656 | |
| | 4,925 | | | Intercontinental Exchange, Inc. | | | 523,183 | |
| | 11,188 | | | Intermediate Capital Group PLC (United Kingdom) | | | 204,779 | |
| | 11,970 | | | KKR & Co., Inc. | | | 428,765 | |
| | 9,696 | | | LendingClub Corp.* | | | 51,680 | |
| | 562 | | | LendingTree, Inc.*(b) | | | 173,624 | |
| | 14,897 | | | LexinFintech Holdings Ltd. ADR (China)* | | | 116,346 | |
| | 3,420 | | | London Stock Exchange Group PLC (United Kingdom) | | | 402,970 | |
| | 50,731 | | | Man Group PLC (United Kingdom) | | | 83,244 | |
| | 16,260 | | | Monex Group, Inc. (Japan) | | | 42,319 | |
| | 679 | | | Morningstar, Inc. | | | 108,742 | |
| | |
| |
| Common Stocks – (continued) | | | |
| Financials – (continued) | | | |
| | 1,405 | | | MSCI, Inc. | | | 524,444 | |
| | 2,219 | | | Nasdaq, Inc. | | | 298,278 | |
| | 2,931 | | | Northern Trust Corp. | | | 240,020 | |
| | 22,577 | | | Qudian, Inc. ADR (China)* | | | 35,897 | |
| | 962 | | | S&P Global, Inc. | | | 352,496 | |
| | 8,753 | | | SBI Holdings, Inc. (Japan) | | | 199,170 | |
| | 2,854 | | | Sculptor Capital Management, Inc. | | | 36,446 | |
| | 5,155 | | | SEI Investments Co. | | | 269,916 | |
| | 28,502 | | | Standard Chartered PLC (United Kingdom)* | | | 149,751 | |
| | 3,945 | | | Tradeweb Markets, Inc., Class A | | | 226,009 | |
| | 80,616 | | | Value Partners Group Ltd. (Hong Kong) | | | 36,927 | |
| | 23,007 | | | WisdomTree Investments, Inc. | | | 86,046 | |
| | 82,456 | | | ZhongAn Online P&C Insurance Co. Ltd., Class H (China)*(a) | | | 543,135 | |
| | | | | | | | |
| | | | | | | 10,607,430 | |
| | |
| Health Care – 0.2% | | | |
| | 1,326 | | | HealthEquity, Inc.* | | | 76,218 | |
| | |
| Industrials – 4.4% | |
| | 4,089 | | | CoreLogic, Inc. | | | 271,509 | |
| | 548 | | | CoStar Group, Inc.* | | | 465,033 | |
| | 3,700 | | | PayPoint PLC (United Kingdom) | | | 31,211 | |
| | 2,578 | | | Thomson Reuters Corp. (Canada) | | | 196,882 | |
| | 2,263 | | | Verisk Analytics, Inc. | | | 422,434 | |
| | | | | | | | |
| | | | | | | 1,387,069 | |
| | |
| Information Technology – 54.7% | | | |
| | 1,390 | | | Accenture PLC, Class A | | | 333,503 | |
| | 6,019 | | | ACI Worldwide, Inc.* | | | 176,838 | |
| | 2,072 | | | Appfolio, Inc., Class A* | | | 348,158 | |
| | 3,064 | | | Avalara, Inc.* | | | 405,704 | |
| | 4,951 | | | Black Knight, Inc.* | | | 416,379 | |
| | 2,206 | | | Bottomline Technologies DE, Inc.* | | | 105,072 | |
| | 2,820 | | | Broadridge Financial Solutions, Inc. | | | 387,468 | |
| | 22,282 | | | Canaan, Inc. ADR (China)*(b) | | | 44,787 | |
| | 461 | | | Cass Information Systems, Inc. | | | 18,053 | |
| | 3,236 | | | Ceridian HCM Holding, Inc.* | | | 257,327 | |
| | 2,830 | | | Digital Garage, Inc. (Japan) | | | 86,065 | |
| | 2,880 | | | Ebix, Inc. | | | 66,442 | |
| | 2,694 | | | Envestnet, Inc.* | | | 223,575 | |
| | 20,227 | | | Equiniti Group PLC (United Kingdom)(a) | | | 30,712 | |
| | 1,310 | | | Euronet Worldwide, Inc.* | | | 135,428 | |
| | 1,974 | | | EVERTEC, Inc. (Puerto Rico) | | | 69,129 | |
| | 4,895 | | | Evo Payments, Inc., Class A* | | | 140,633 | |
| | 1,394 | | | ExlService Holdings, Inc.* | | | 88,784 | |
| | 4,752 | | | Fidelity National Information Services, Inc. | | | 716,839 | |
| | 5,091 | | | Fiserv, Inc.* | | | 506,962 | |
| | 1,383 | | | FleetCor Technologies, Inc.* | | | 347,755 | |
| | 2,834 | | | Global Payments, Inc. | | | 500,541 | |
| | 1,314 | | | Globant SA (Argentina)* | | | 233,340 | |
| | 5,262 | | | GMO internet, Inc. (Japan) | | | 141,666 | |
| | 15,080 | | | GreenSky, Inc., Class A*(b) | | | 65,598 | |
| | 3,158 | | | Guidewire Software, Inc.* | | | 354,675 | |
| | 4,436 | | | I3 Verticals, Inc., Class A* | | | 123,720 | |
| | |
| | |
| 26 | | The accompanying notes are an integral part of these financial statements. |
GOLDMAN SACHS FINANCE REIMAGINED ETF
| | | | | | | | |
| Shares | | | Description | |
Value | |
| |
| Common Stocks – (continued) | | | |
| Information Technology – (continued) | | | |
| | 2,230 | | | International Business Machines Corp. | | $ | 274,981 | |
| | 2,018 | | | Intuit, Inc. | | | 696,997 | |
| | 2,085 | | | Jack Henry & Associates, Inc. | | | 344,901 | |
| | 4,711 | | | Mastercard, Inc., Class A | | | 1,687,433 | |
| | 1,458 | | | Money Forward, Inc. (Japan)* | | | 103,942 | |
| | 749 | | | Nice Ltd. ADR (Israel)* | | | 172,158 | |
| | 11,697 | | | Nomura Research Institute Ltd. (Japan) | | | 310,942 | |
| | 5,659 | | | Opera Ltd. ADR (Norway)*(b) | | | 51,157 | |
| | 3,643 | | | Optim Corp. (Japan)* | | | 103,404 | |
| | 5,701 | | | Pagseguro Digital Ltd., Class A (Brazil)* | | | 240,240 | |
| | 2,965 | | | Paychex, Inc. | | | 226,734 | |
| | 5,437 | | | PayPal Holdings, Inc.* | | | 1,109,909 | |
| | 2,779 | | | Q2 Holdings, Inc.* | | | 270,369 | |
| | 6,249 | | | QIWI PLC ADR (Russia) | | | 112,295 | |
| | 3,444 | | | RealPage, Inc.* | | | 215,663 | |
| | 27,798 | | | Sage Group PLC (The) (United Kingdom) | | | 275,652 | |
| | 2,477 | | | Sapiens International Corp. NV (Israel) | | | 83,079 | |
| | 10,238 | | | Square, Inc., Class A* | | | 1,633,575 | |
| | 4,610 | | | SS&C Technologies Holdings, Inc. | | | 293,749 | |
| | 7,568 | | | StoneCo Ltd., Class A (Brazil)* | | | 385,968 | |
| | 7,444 | | | TIS, Inc. (Japan) | | | 148,817 | |
| | 6,078 | | | Visa, Inc., Class A | | | 1,288,475 | |
| | 982 | | | WEX, Inc.* | | | 156,835 | |
| | 971 | | | Workday, Inc., Class A* | | | 232,758 | |
| | 6,645 | | | Worldline SA (France)*(a) | | | 612,085 | |
| | | | | | | | |
| | | | | | | 17,357,271 | |
| | |
| Materials – 0.3% | |
| | 25,169 | | | IAMGOLD Corp. (Burkina Faso)*(b) | | | 107,975 | |
| | |
| Real Estate – 1.5% | |
| | 983 | | | Corestate Capital Holding SA (Germany)*(b) | | | 18,928 | |
| | 1,812 | | | PATRIZIA AG (Germany) | | | 53,526 | |
| | 8,487 | | | Redfin Corp.* | | | 403,727 | |
| | | | | | | | |
| | | | | | | 476,181 | |
| | |
| TOTAL INVESTMENTS BEFORE SECURITIES
LENDING REINVESTMENT VEHICLE | | | | |
| | (Cost $26,359,466) | | $ | 31,652,284 | |
| | |
| | | | | | | | |
| Shares | | | Dividend
Rate | | Value | |
|
| Securities Lending Reinvestment Vehicle – 1.7%(c) | |
| Goldman Sachs Financial Square Government Fund –
Institutional Shares |
|
| | 526,091 | | | 0.027% | | $ | 526,091 | |
| (Cost $526,091) | | | |
| | |
| | TOTAL INVESTMENTS – 101.5% | | | | |
| | (Cost $26,885,557) | | $ | 32,178,375 | |
| | |
| LIABILITIES IN EXCESS OF
OTHER ASSETS – (1.5)% | | | (466,520 | ) |
| | |
| | NET ASSETS – 100.0% | | $ | 31,711,855 | |
| | |
| | |
|
| The percentage shown for each investment category reflects the value of investments in that category as a percentage of net assets. |
| |
* | | Non-income producing security. |
| |
(a) | | Exempt from registration under Rule 144A of the Securities Act of 1933. |
| |
(b) | | All or a portion of security is on loan. |
| |
(c) | | Represents an affiliated issuer. |
| | | | |
|
Investment Abbreviations: |
ADR | | —American Depositary Receipt |
PLC | | —Public Limited Company |
|
| | |
| The accompanying notes are an integral part of these financial statements. | | 27 |
GOLDMAN SACHS HUMAN EVOLUTION ETF
Schedule of Investments
August 31, 2020
| | | | | | | | |
Shares | | | Description | | Value | |
|
| Common Stocks – 99.9% | |
| Health Care – 99.9% | |
| | 138,462 | | | 3SBio, Inc. (China)*(a) | | $ | 162,578 | |
| | 17,597 | | | Abbott Laboratories | | | 1,926,344 | |
| | 15,420 | | | Abcam PLC (United Kingdom) | | | 257,670 | |
| | 1,502 | | | ABIOMED, Inc.* | | | 462,045 | |
| | 2,399 | | | Acceleron Pharma, Inc.* | | | 233,830 | |
| | 6,797 | | | Adaptive Biotechnologies Corp.* | | | 282,823 | |
| | 13,719 | | | Adverum Biotechnologies, Inc.* | | | 167,372 | |
| | 3,259 | | | Agios Pharmaceuticals, Inc.* | | | 133,652 | |
| | 24,477 | | | Akebia Therapeutics, Inc.* | | | 254,806 | |
| | 3,429 | | | Align Technology, Inc.* | | | 1,018,344 | |
| | 6,932 | | | Allogene Therapeutics, Inc.* | | | 247,126 | |
| | 52,469 | | | Allscripts Healthcare Solutions, Inc.* | | | 468,548 | |
| | 11,609 | | | AstraZeneca PLC (United Kingdom) | | | 1,296,359 | |
| | 4,721 | | | Atara Biotherapeutics, Inc.* | | | 63,639 | |
| | 10,080 | | | Athenex, Inc.* | | | 115,819 | |
| | 6,892 | | | Baxter International, Inc. | | | 600,086 | |
| | 4,996 | | | BeiGene Ltd. ADR (China)* | | | 1,206,884 | |
| | 13,525 | | | BioNTech SE ADR (Germany)* | | | 828,406 | |
| | 1,648 | | | BioTelemetry, Inc.* | | | 65,228 | |
| | 3,282 | | | Bluebird Bio, Inc.* | | | 194,623 | |
| | 2,211 | | | Blueprint Medicines Corp.* | | | 171,198 | |
| | 33,840 | | | Boston Scientific Corp.* | | | 1,388,117 | |
| | 5,786 | | | Cara Therapeutics, Inc.* | | | 89,683 | |
| | 3,317 | | | Cardiovascular Systems, Inc.* | | | 108,366 | |
| | 3,272 | | | Cellectis SA ADR (France)* | | | 60,368 | |
| | 7,167 | | | Cerner Corp. | | | 525,843 | |
| | 1,372 | | | Charles River Laboratories International, Inc.* | | | 300,399 | |
| | 21,462 | | | Compugen Ltd. (Israel)*(b) | | | 371,078 | |
| | 1,954 | | | CONMED Corp. | | | 168,650 | |
| | 7,074 | | | CRISPR Therapeutics AG (Switzerland)* | | | 661,136 | |
| | 5,258 | | | DaVita, Inc.* | | | 456,184 | |
| | 2,261 | | | DexCom, Inc.* | | | 961,852 | |
| | 6,351 | | | Editas Medicine, Inc.* | | | 223,746 | |
| | 9,227 | | | Edwards Lifesciences Corp.* | | | 792,046 | |
| | 4,991 | | | EMIS Group PLC (United Kingdom) | | | 68,832 | |
| | 14,289 | | | Exelixis, Inc.* | | | 317,502 | |
| | 12,358 | | | Fate Therapeutics, Inc.* | | | 449,831 | |
| | 5,742 | | | FibroGen, Inc.* | | | 257,414 | |
| | 15,018 | | | Fresenius Medical Care AG & Co. KGaA (Germany) | | | 1,276,293 | |
| | 6,482 | | | Fresenius SE & Co. KGaA (Germany) | | | 300,783 | |
| | 3,050 | | | G1 Therapeutics, Inc.* | | | 46,817 | |
| | 78,281 | | | Genscript Biotech Corp. (China)* | | | 151,307 | |
| | 10,093 | | | Gilead Sciences, Inc. | | | 673,708 | |
| | 6,009 | | | Globus Medical, Inc., Class A* | | | 339,629 | |
| | 3,702 | | | Gossamer Bio, Inc.* | | | 51,458 | |
| | 9,805 | | | Halozyme Therapeutics, Inc.* | | | 284,296 | |
| | 2,650 | | | HCA Healthcare, Inc. | | | 359,658 | |
| | 4,920 | | | Health Catalyst, Inc.* | | | 153,406 | |
| | 5,249 | | | Henry Schein, Inc.* | | | 348,744 | |
| | 5,958 | | | Hutchison China MediTech Ltd. ADR (Hong Kong)* | | | 197,925 | |
| | 2,325 | | | Illumina, Inc.* | | | 830,536 | |
| | 12,944 | | | Innate Pharma SA (France)* | | | 83,671 | |
| | 2,287 | | | Inspire Medical Systems, Inc.* | | | 273,182 | |
| | |
|
| Common Stocks – (continued) | |
| Health Care – (continued) | |
| | 1,291 | | | Insulet Corp.* | | | 281,761 | |
| | 2,739 | | | Integer Holdings Corp.* | | | 189,703 | |
| | 14,317 | | | Intellia Therapeutics, Inc.*(b) | | | 308,961 | |
| | 3,359 | | | Intuitive Surgical, Inc.* | | | 2,454,892 | |
| | 18,675 | | | Iovance Biotherapeutics, Inc.* | | | 622,438 | |
| | 1,474 | | | iRhythm Technologies, Inc.* | | | 324,545 | |
| | 9,434 | | | Johnson & Johnson | | | 1,447,270 | |
| | 10,070 | | | Karyopharm Therapeutics, Inc.* | | | 153,165 | |
| | 2,882 | | | Krystal Biotech, Inc.* | | | 137,788 | |
| | 1,387 | | | Laboratory Corp. of America Holdings* | | | 243,765 | |
| | 1,663 | | | LivaNova PLC* | | | 77,995 | |
| | 16,060 | | | Medtronic PLC | | | 1,725,968 | |
| | 4,685 | | | MeiraGTx Holdings PLC* | | | 60,952 | |
| | 5,506 | | | Merck KGaA (Germany) | | | 748,374 | |
| | 4,540 | | | Merit Medical Systems, Inc.* | | | 222,914 | |
| | 64,928 | | | Mesoblast Ltd. (Australia)*(b) | | | 254,973 | |
| | 61,303 | | | Microport Scientific Corp. (China) | | | 278,824 | |
| | 4,241 | | | Mirati Therapeutics, Inc.* | | | 633,478 | |
| | 11,455 | | | Moderna, Inc.* | | | 743,315 | |
| | 11,211 | | | Molecular Templates, Inc.* | | | 130,160 | |
| | 1,887 | | | MorphoSys AG (Germany)* | | | 237,975 | |
| | 11,160 | | | Myriad Genetics, Inc.* | | | 149,209 | |
| | 7,640 | | | Natera, Inc.* | | | 486,744 | |
| | 13,050 | | | Nektar Therapeutics* | | | 252,387 | |
| | 7,961 | | | NeoGenomics, Inc.* | | | 310,081 | |
| | 8,834 | | | NextGen Healthcare, Inc.* | | | 117,139 | |
| | 6,642 | | | Nichi-iko Pharmaceutical Co. Ltd. (Japan) | | | 74,534 | |
| | 8,267 | | | Novartis AG (Switzerland) | | | 716,482 | |
| | 2,559 | | | Novocure Ltd.* | | | 211,757 | |
| | 55,084 | | | OPKO Health, Inc.*(b) | | | 178,472 | |
| | 27,660 | | | Precigen, Inc.*(b) | | | 167,343 | |
| | 8,799 | | | QIAGEN NV* | | | 448,397 | |
| | 5,272 | | | Quanterix Corp.* | | | 187,683 | |
| | 2,572 | | | Quest Diagnostics, Inc. | | | 286,109 | |
| | 1,486 | | | Reata Pharmaceuticals, Inc., Class A* | | | 155,956 | |
| | 1,057 | | | Regeneron Pharmaceuticals, Inc.* | | | 655,266 | |
| | 6,135 | | | REGENXBIO, Inc.* | | | 187,240 | |
| | 5,743 | | | Replimune Group, Inc.* | | | 155,061 | |
| | 2,276 | | | ResMed, Inc. | | | 411,455 | |
| | 8,448 | | | Rhythm Pharmaceuticals, Inc.* | | | 249,300 | |
| | 3,704 | | | Roche Holding AG (Switzerland) | | | 1,298,632 | |
| | 5,822 | | | Rocket Pharmaceuticals, Inc.* | | | 148,869 | |
| | 33,651 | | | Sangamo Therapeutics, Inc.* | | | 371,339 | |
| | 9,541 | | | Sanofi (France) | | | 968,415 | |
| | 3,594 | | | Seattle Genetics, Inc.* | | | 569,074 | |
| | 7,642 | | | Shockwave Medical, Inc.* | | | 485,573 | |
| | 29,185 | | | Smith & Nephew PLC (United Kingdom) | | | 594,560 | |
| | 4,136 | | | Stoke Therapeutics, Inc.*(b) | | | 121,474 | |
| | 3,423 | | | Stryker Corp. | | | 678,302 | |
| | 3,007 | | | Surmodics, Inc.* | | | 136,067 | |
| | 7,371 | | | Takara Bio, Inc. (Japan) | | | 198,863 | |
| | 12,484 | | | Takeda Pharmaceutical Co. Ltd. (Japan) | | | 466,068 | |
| | 1,831 | | | Teleflex, Inc. | | | 719,491 | |
| | 18,124 | | | TG Therapeutics, Inc.* | | | 449,566 | |
| | 8,652 | | | Theravance Biopharma, Inc.* | | | 158,591 | |
| | 2,028 | | | Thermo Fisher Scientific, Inc. | | | 869,971 | |
| | |
| | |
| 28 | | The accompanying notes are an integral part of these financial statements. |
GOLDMAN SACHS HUMAN EVOLUTION ETF
| | | | | | | | |
Shares | | | Description | | Value | |
|
| Common Stocks – (continued) | |
| Health Care – (continued) | |
| | 4,778 | | | Vocera Communications, Inc.* | | $ | 133,736 | |
| | 50,716 | | | WuXi AppTec Co. Ltd., Class H (China)(a) | | | 751,237 | |
| | 49,825 | | | ZIOPHARM Oncology, Inc.*(b) | | | 140,008 | |
| | | | | | | | |
| | | | | | | 48,669,507 | |
| | |
| TOTAL INVESTMENTS BEFORE SECURITIES
LENDING REINVESTMENT VEHICLE | | | | |
| | (Cost $42,808,309) | | $ | 48,669,507 | |
| | |
| | | | | | | | |
| Shares | | | Dividend
Rate | | Value | |
| |
| Securities Lending Reinvestment Vehicle – 2.3%(c) | | | |
| Goldman Sachs Financial Square Government Fund –
Institutional Shares |
|
| | 1,129,919 | | | 0.027% | | $ | 1,129,919 | |
| | (Cost $1,129,919) | | | | |
| | |
| | TOTAL INVESTMENTS – 102.2% | | | | |
| | (Cost $43,938,228) | | $ | 49,799,426 | |
| | |
| LIABILITIES IN EXCESS OF
OTHER ASSETS – (2.2)% | | | (1,077,148 | ) |
| | |
| | NET ASSETS – 100.0% | | $ | 48,722,278 | |
| | |
| | |
|
| The percentage shown for each investment category reflects the value of investments in that category as a percentage of net assets. |
| |
* | | Non-income producing security. |
| |
(a) | | Exempt from registration under Rule 144A of the Securities Act of 1933. |
| |
(b) | | All or a portion of security is on loan. |
| |
(c) | | Represents an affiliated issuer. |
| | |
|
Investment Abbreviations: |
ADR | | —American Depositary Receipt |
PLC | | —Public Limited Company |
|
| | |
| The accompanying notes are an integral part of these financial statements. | | 29 |
GOLDMAN SACHS MANUFACTURING REVOLUTION ETF
Schedule of Investments
August 31, 2020
| | | | | | | | |
Shares | | | Description | | Value | |
|
| Common Stocks – 99.9% | |
| Communication Services – 0.3% | |
| | 3,816 | | | Iridium Communications, Inc.* | | $ | 106,886 | |
| | |
| Consumer Discretionary – 32.1% | |
| | 264 | | | Amazon.com, Inc.* | | | 911,053 | |
| | 4,433 | | | Aptiv PLC | | | 381,770 | |
| | 48,218 | | | BYD Co. Ltd., Class H (China)(a) | | | 479,060 | |
| | 1,420 | | | Ferrari NV (Italy) | | | 276,545 | |
| | 29,055 | | | Fiat Chrysler Automobiles NV (United Kingdom)* | | | 320,477 | |
| | 25,684 | | | Ford Motor Co. | | | 175,165 | |
| | 1,984 | | | Garmin Ltd. | | | 205,562 | |
| | 7,967 | | | General Motors Co. | | | 236,062 | |
| | 1,920 | | | Gentherm, Inc.* | | | 86,842 | |
| | 13,185 | | | GoPro, Inc., Class A* | | | 60,519 | |
| | 2,914 | | | Hella GmbH & Co. KGaA (Germany) | | | 142,885 | |
| | 8,576 | | | JD.com, Inc. ADR (China)* | | | 674,417 | |
| | 6,292 | | | Magna International, Inc. (Canada) | | | 305,854 | |
| | 54,263 | | | NIO, Inc. ADR (China)*(a) | | | 1,032,625 | |
| | 6,379 | | | Niu Technologies ADR (China)*(a) | | | 131,854 | |
| | 11,526 | | | Ocado Group PLC (United Kingdom)* | | | 385,355 | |
| | 15,218 | | | Panasonic Corp. (Japan) | | | 140,334 | |
| | 11,633 | | | Tata Motors Ltd. ADR (India)* | | | 113,305 | |
| | 6,135 | | | Tesla, Inc.* | | | 3,057,193 | |
| | 29,852 | | | Tianneng Power International Ltd. (China) | | | 64,094 | |
| | 6,843 | | | Toyota Motor Corp. (Japan) | | | 452,092 | |
| | 7,017 | | | Valeo SA (France) | | | 214,835 | |
| | 6,557 | | | Veoneer, Inc. (Sweden)*(a) | | | 91,011 | |
| | 1,626 | | | Visteon Corp.* | | | 122,649 | |
| | 77,797 | | | Yadea Group Holdings Ltd. (China)*(b) | | | 78,799 | |
| | | | | | | | |
| | | | | | | 10,140,357 | |
| | |
| Energy – 1.2% | |
| | 7,163 | | | Eni SpA ADR (Italy) | | | 133,232 | |
| | 6,166 | | | TOTAL SE (France) | | | 244,087 | |
| | | | | | | | |
| | | | | | | 377,319 | |
| | |
| Health Care – 2.2% | |
| | 1,637 | | | Align Technology, Inc.* | | | 486,156 | |
| | 1,856 | | | Hogy Medical Co. Ltd. (Japan) | | | 58,807 | |
| | 2,122 | | | Omnicell, Inc.* | | | 141,495 | |
| | | | | | | | |
| | | | | | | 686,458 | |
| | |
| Industrials – 29.1% | |
| | 33,401 | | | ABB Ltd. (Switzerland) | | | 852,042 | |
| | 1,481 | | | AeroVironment, Inc.* | | | 113,134 | |
| | 3,011 | | | Altra Industrial Motion Corp. | | | 117,580 | |
| | 141,980 | | | AviChina Industry & Technology Co. Ltd., Class H (China) | | | 88,667 | |
| | 15,211 | | | Ballard Power Systems, Inc. (Canada)*(a) | | | 252,503 | |
| | 2,377 | | | Carrier Global Corp. | | | 70,953 | |
| | 18,569 | | | CNH Industrial NV (United Kingdom)* | | | 146,695 | |
| | 1,208 | | | Curtiss-Wright Corp. | | | 123,603 | |
| | 5,058 | | | Daifuku Co. Ltd. (Japan) | | | 445,010 | |
| | 6,557 | | | DMG Mori Co. Ltd. (Japan) | | | 83,350 | |
| | 296 | | | Elbit Systems Ltd. (Israel) | | | 39,762 | |
| | |
|
| Common Stocks – (continued) | |
| Industrials – (continued) | |
| | 7,172 | | | Emerson Electric Co. | | | 498,239 | |
| | 1,356 | | | FANUC Corp. (Japan) | | | 237,903 | |
| | 4,016 | | | GS Yuasa Corp. (Japan) | | | 66,539 | |
| | 1,457 | | | HEICO Corp. | | | 160,153 | |
| | 2,756 | | | Honeywell International, Inc. | | | 456,256 | |
| | 3,515 | | | KION Group AG (Germany) | | | 297,879 | |
| | 1,758 | | | L3Harris Technologies, Inc. | | | 317,741 | |
| | 793 | | | Lockheed Martin Corp. | | | 309,476 | |
| | 2,574 | | | Matthews International Corp., Class A | | | 56,371 | |
| | 1,145 | | | Mercury Systems, Inc.* | | | 86,722 | |
| | 616 | | | MTU Aero Engines AG (Germany) | | | 114,373 | |
| | 2,486 | | | Nachi-Fujikoshi Corp. (Japan) | | | 77,244 | |
| | 3,593 | | | Nidec Corp. (Japan) | | | 301,921 | |
| | 849 | | | Northrop Grumman Corp. | | | 290,876 | |
| | 900 | | | NV5 Global, Inc.* | | | 46,593 | |
| | 5,589 | | | Okamura Corp. (Japan) | | | 39,264 | |
| | 1,188 | | | Otis Worldwide Corp. | | | 74,725 | |
| | 1,865 | | | Proto Labs, Inc.* | | | 274,155 | |
| | 2,377 | | | Raytheon Technologies Corp. | | | 144,997 | |
| | 2,844 | | | Rexnord Corp. | | | 82,362 | |
| | 3,148 | | | Rockwell Automation, Inc. | | | 725,708 | |
| | 2,725 | | | Safran SA (France)* | | | 316,185 | |
| | 4,795 | | | Schneider Electric SE (France) | | | 594,963 | |
| | 4,083 | | | Sensata Technologies Holding PLC* | | | 170,016 | |
| | 2,400 | | | Siemens AG (Germany) | | | 331,977 | |
| | 35,758 | | | Techtronic Industries Co. Ltd. (Hong Kong) | | | 454,002 | |
| | 2,156 | | | Thales SA (France) | | | 168,890 | |
| | 1,389 | | | TPI Composites, Inc.* | | | 42,656 | |
| | 725 | | | Varta AG (Germany)*(a) | | | 113,152 | |
| | | | | | | | |
| | | | | | | 9,184,637 | |
| | |
| Information Technology – 30.0% | |
| | 2,860 | | | Ambarella, Inc.* | | | 150,722 | |
| | 2,166 | | | Analog Devices, Inc. | | | 253,162 | |
| | 1,624 | | | ANSYS, Inc.* | | | 550,552 | |
| | 1,865 | | | Autodesk, Inc.* | | | 458,231 | |
| | 1,236 | | | Belden, Inc. | | | 41,628 | |
| | 2,635 | | | Brooks Automation, Inc. | | | 136,045 | |
| | 2,221 | | | Cognex Corp. | | | 153,671 | |
| | 610 | | | Coherent, Inc.* | | | 68,723 | |
| | 3,170 | | | Dassault Systemes (France) | | | 598,435 | |
| | 3,086 | | | Enphase Energy, Inc.* | | | 238,332 | |
| | 2,019 | | | FARO Technologies, Inc.* | | | 114,074 | |
| | 3,022 | | | First Solar, Inc.* | | | 231,455 | |
| | 10,223 | | | Flex Ltd.* | | | 111,022 | |
| | 3,254 | | | FLIR Systems, Inc. | | | 120,073 | |
| | 8,343 | | | Infineon Technologies AG (Germany) | | | 231,086 | |
| | 7,508 | | | Intel Corp. | | | 382,533 | |
| | 1,305 | | | IPG Photonics Corp.* | | | 211,058 | |
| | 6,043 | | | JinkoSolar Holding Co. Ltd. ADR (China)* | | | 138,022 | |
| | 1,386 | | | Keyence Corp. (Japan) | | | 570,894 | |
| | 646 | | | Maxeon Solar Technologies Ltd. (Singapore)* | | | 13,424 | |
| | |
| | |
| 30 | | The accompanying notes are an integral part of these financial statements. |
GOLDMAN SACHS MANUFACTURING REVOLUTION ETF
| | | | | | | | |
Shares | | | Description | | Value | |
|
| Common Stocks – (continued) | |
| Information Technology – (continued) | |
| | 2,013 | | | NVIDIA Corp. | | $ | 1,076,915 | |
| | 2,849 | | | Omron Corp. (Japan) | | | 208,748 | |
| | 5,886 | | | ON Semiconductor Corp.* | | | 125,784 | |
| | 2,122 | | | PTC, Inc.* | | | 193,972 | |
| | 2,496 | | | Renishaw PLC (United Kingdom) | | | 159,882 | |
| | 1,743 | | | Rorze Corp. (Japan) | | | 81,607 | |
| | 1,071 | | | Silicon Laboratories, Inc.* | | | 109,681 | |
| | 2,601 | | | SolarEdge Technologies, Inc.* | | | 575,211 | |
| | 3,055 | | | Spectris PLC (United Kingdom) | | | 103,735 | |
| | 9,119 | | | STMicroelectronics NV (Switzerland) | | | 274,937 | |
| | 21,101 | | | Sunny Optical Technology Group Co. Ltd. (China) | | | 312,833 | |
| | 5,170 | | | SunPower Corp.*(a) | | | 57,852 | |
| | 4,325 | | | Teradyne, Inc. | | | 367,495 | |
| | 3,401 | | | Texas Instruments, Inc. | | | 483,452 | |
| | 10,329 | | | Topcon Corp. (Japan) | | | 83,181 | |
| | 6,098 | | | Trimble, Inc.* | | | 319,596 | |
| | 1,714 | | | ViaSat, Inc.* | | | 68,149 | |
| | 4,423 | | | Xerox Holdings Corp. | | | 83,418 | |
| | | | | | | | |
| | | | | | | 9,459,590 | |
| | |
| Materials – 4.8% | |
| | 3,200 | | | Albemarle Corp. | | | 291,232 | |
| | 1,181 | | | Arkema SA (France) | | | 131,214 | |
| | 3,318 | | | FMC Corp. | | | 354,561 | |
| | 79,739 | | | Ganfeng Lithium Co. Ltd., Class H (China)(b) | | | 403,832 | |
| | 15,946 | | | Livent Corp.* | | | 135,222 | |
| | 25,712 | | | Nippon Light Metal Holdings Co. Ltd. (Japan) | | | 45,098 | |
| | 4,591 | | | Sociedad Quimica y Minera de Chile SA ADR (Chile) | | | 143,974 | |
| | | | | | | | |
| | | | | | | 1,505,133 | |
| | |
| Utilities – 0.2% | |
| | 70,885 | | | HK Electric Investments & HK Electric Investments Ltd. (Hong Kong) | | | 72,164 | |
| | |
| TOTAL INVESTMENTS BEFORE SECURITIES
LENDING REINVESTMENT VEHICLE | | | | |
| | (Cost $24,951,770) | | $ | 31,532,544 | |
| | |
| | | | | | | | |
| Shares | | | Dividend
Rate | | Value | |
|
| Securities Lending Reinvestment Vehicle – 5.1%(c) | |
| Goldman Sachs Financial Square Government Fund –
Institutional Shares |
|
| | 1,606,015 | | | 0.027% | | $ | 1,606,015 | |
| | (Cost $1,606,015) | | | | |
| | |
| | TOTAL INVESTMENTS – 105.0% | | | | |
| | (Cost $26,557,785) | | $ | 33,138,559 | |
| | |
| LIABILITIES IN EXCESS OF
OTHER ASSETS – (5.0)% | | | (1,576,216 | ) |
| | |
| | NET ASSETS – 100.0% | | $ | 31,562,343 | |
| | |
| | |
|
| The percentage shown for each investment category reflects the value of investments in that category as a percentage of net assets. |
| |
* | | Non-income producing security. |
| |
(a) | | All or a portion of security is on loan. |
| |
(b) | | Exempt from registration under Rule 144A of the Securities Act of 1933. |
| |
(c) | | Represents an affiliated issuer. |
| | |
|
Investment Abbreviations: |
ADR | | —American Depositary Receipt |
PLC | | —Public Limited Company |
|
| | |
| The accompanying notes are an integral part of these financial statements. | | 31 |
GOLDMAN SACHS NEW AGE CONSUMER ETF
Schedule of Investments
August 31, 2020
| | | | | | | | |
Shares | | | Description | | Value | |
|
| Common Stocks – 99.9% | |
| Communication Services – 35.9% | |
| | 9,943 | | | Activision Blizzard, Inc. | | $ | 830,439 | |
| | 11,926 | | | Bilibili, Inc. ADR (China)* | | | 563,504 | |
| | 4,577 | | | Cargurus, Inc.* | | | 111,587 | |
| | 43,472 | | | China Literature Ltd. (China)*(a) | | | 270,082 | |
| | 9,584 | | | Dip Corp. (Japan) | | | 212,205 | |
| | 4,457 | | | Electronic Arts, Inc.* | | | 621,618 | |
| | 5,057 | | | Eventbrite, Inc., Class A*(b) | | | 54,363 | |
| | 7,066 | | | Facebook, Inc., Class A* | | | 2,071,751 | |
| | 10,066 | | | GungHo Online Entertainment, Inc. (Japan) | | | 207,879 | |
| | 12,015 | | | HUYA, Inc. ADR (China)*(b) | | | 345,071 | |
| | 176,276 | | | IGG, Inc. (Singapore) | | | 203,566 | |
| | 16,022 | | | iQIYI, Inc. ADR (China)* | | | 346,876 | |
| | 3,571 | | | JOYY, Inc. ADR (China)* | | | 305,106 | |
| | 13,975 | | | Kakaku.com, Inc. (Japan) | | | 372,552 | |
| | 10,936 | | | Koei Tecmo Holdings Co. Ltd. (Japan) | | | 433,645 | |
| | 5,595 | | | Live Nation Entertainment, Inc.* | | | 317,796 | |
| | 4,967 | | | Mail.Ru Group Ltd. GDR (Russia)* | | | 153,232 | |
| | 6,466 | | | Match Group, Inc.* | | | 722,123 | |
| | 8,597 | | | Momo, Inc. ADR (China) | | | 175,379 | |
| | 1,979 | | | NetEase, Inc. ADR (China) | | | 964,189 | |
| | 2,762 | | | Netflix, Inc.* | | | 1,462,645 | |
| | 24,031 | | | Nexon Co. Ltd. (Japan) | | | 562,676 | |
| | 1,587 | | | Nintendo Co. Ltd. (Japan) | | | 849,134 | |
| | 19,293 | | | Pinterest, Inc., Class A* | | | 709,789 | |
| | 3,987 | | | Roku, Inc.* | | | 691,665 | |
| | 9,675 | | | Sea Ltd. ADR (Taiwan)* | | | 1,478,437 | |
| | 67,326 | | | Sirius XM Holdings, Inc. | | | 395,204 | |
| | 25,649 | | | Snap, Inc., Class A* | | | 579,411 | |
| | 3,780 | | | Spotify Technology SA* | | | 1,066,565 | |
| | 5,507 | | | Square Enix Holdings Co. Ltd. (Japan) | | | 362,996 | |
| | 3,421 | | | Take-Two Interactive Software, Inc.* | | | 585,641 | |
| | 26,310 | | | Tencent Holdings Ltd. (China) | | | 1,800,927 | |
| | 28,307 | | | Tencent Music Entertainment Group ADR (China)* | | | 442,438 | |
| | 3,239 | | | TripAdvisor, Inc. | | | 75,695 | |
| | 14,295 | | | Twitter, Inc.* | | | 580,091 | |
| | 5,566 | | | Ubisoft Entertainment SA (France)* | | | 459,043 | |
| | 8,174 | | | Weibo Corp. ADR (China)* | | | 304,890 | |
| | 7,605 | | | Yelp, Inc.* | | | 175,828 | |
| | 49,970 | | | Zynga, Inc., Class A* | | | 452,728 | |
| | | | | | | | |
| | | | | | | 22,318,766 | |
| | |
| Consumer Discretionary – 56.6% | |
| | 6,376 | | | Acushnet Holdings Corp. | | | 225,009 | |
| | 2,431 | | | adidas AG (Germany)* | | | 740,213 | |
| | 6,793 | | | Alibaba Group Holding Ltd. ADR (China)* | | | 1,949,795 | |
| | 629 | | | Amazon.com, Inc.* | | | 2,170,654 | |
| | 49,299 | | | ANTA Sports Products Ltd. (China) | | | 486,937 | |
| | 5,368 | | | Arco Platform Ltd., Class A (Brazil)* | | | 242,848 | |
| | 19,953 | | | Asics Corp. (Japan) | | | 275,460 | |
| | 7,006 | | | ASOS PLC (United Kingdom)* | | | 460,498 | |
| | 4,559 | | | Baozun, Inc. ADR (China)*(b) | | | 188,925 | |
| | 77,855 | | | boohoo Group PLC (United Kingdom)* | | | 301,786 | |
| | 331 | | | Booking Holdings, Inc.* | | | 632,359 | |
| | |
|
| Common Stocks – (continued) | |
| Consumer Discretionary – (continued) | |
| | 4,697 | | | Brunswick Corp. | | | 290,697 | |
| | 7,168 | | | Callaway Golf Co. | | | 149,525 | |
| | 4,757 | | | Carvana Co.* | | | 1,027,322 | |
| | 6,494 | | | Chegg, Inc.* | | | 478,868 | |
| | 14,973 | | | Chewy, Inc., Class A* | | | 914,401 | |
| | 147,765 | | | China Education Group Holdings Ltd. (China) | | | 290,567 | |
| | 303,951 | | | China Maple Leaf Educational Systems Ltd. (China) | | | 118,441 | |
| | 317,613 | | | China Yuhua Education Corp. Ltd. (China)(a) | | | 304,493 | |
| | 3,421 | | | Columbia Sportswear Co. | | | 292,735 | |
| | 6,978 | | | Delivery Hero SE (Germany)*(a) | | | 751,248 | |
| | 6,977 | | | Descente Ltd. (Japan)* | | | 119,480 | |
| | 5,836 | | | Dick’s Sporting Goods, Inc. | | | 315,844 | |
| | 15,093 | | | eBay, Inc. | | | 826,795 | |
| | 4,456 | | | Etsy, Inc.* | | | 533,383 | |
| | 3,540 | | | Expedia Group, Inc. | | | 347,451 | |
| | 13,399 | | | Farfetch Ltd., Class A (United Kingdom)* | | | 371,018 | |
| | 3,081 | | | Flutter Entertainment PLC (Ireland) | | | 510,713 | |
| | 5,804 | | | Foot Locker, Inc. | | | 176,035 | |
| | 22,956 | | | Frasers Group PLC (United Kingdom)* | | | 107,579 | |
| | 3,840 | | | Goldwin, Inc. (Japan) | | | 277,014 | |
| | 2,791 | | | Groupon, Inc.* | | | 88,838 | |
| | 4,288 | | | GrubHub, Inc.* | | | 310,237 | |
| | 10,276 | | | GSX Techedu, Inc. ADR (China)*(b) | | | 877,570 | |
| | 23,072 | | | GVC Holdings PLC (United Kingdom)* | | | 248,435 | |
| | 13,097 | | | HelloFresh SE (Germany)* | | | 675,091 | |
| | 33,830 | | | JD Sports Fashion PLC (United Kingdom) | | | 328,763 | |
| | 20,193 | | | JD.com, Inc. ADR (China)* | | | 1,587,978 | |
| | 111,556 | | | Li Ning Co. Ltd. (China) | | | 472,125 | |
| | 2,190 | | | Lululemon Athletica, Inc.* | | | 822,717 | |
| | 8,867 | | | MakeMyTrip Ltd. (India)* | | | 149,675 | |
| | 56,119 | | | Meituan Dianping, Class B (China)* | | | 1,850,805 | |
| | 631 | | | MercadoLibre, Inc. (Argentina)* | | | 737,380 | |
| | 10,007 | | | Mercari, Inc. (Japan)* | | | 453,899 | |
| | 4,488 | | | New Oriental Education & Technology Group, Inc. ADR (China)* | | | 658,075 | |
| | 9,226 | | | NIKE, Inc., Class B | | | 1,032,297 | |
| | 18,633 | | | Ocado Group PLC (United Kingdom)* | | | 622,968 | |
| | 12,557 | | | Peloton Interactive, Inc., Class A* | | | 962,745 | |
| | 14,027 | | | Pinduoduo, Inc. ADR (China)* | | | 1,247,561 | |
| | 4,048 | | | Planet Fitness, Inc., Class A* | | | 246,078 | |
| | 4,048 | | | Puma SE (Germany)* | | | 334,915 | |
| | 34,188 | | | Rakuten, Inc. (Japan) | | | 300,791 | |
| | 6,407 | | | Stitch Fix, Inc., Class A*(b) | | | 154,729 | |
| | 10,064 | | | TAL Education Group ADR (China)* | | | 742,824 | |
| | 4,019 | | | Thor Industries, Inc. | | | 379,514 | |
| | 12,165 | | | Trip.com Group Ltd. ADR (China)* | | | 367,870 | |
| | 18,363 | | | Under Armour, Inc., Class A* | | | 180,141 | |
| | 27,618 | | | Vipshop Holdings Ltd. ADR (China)* | | | 455,973 | |
| | 3,887 | | | Wayfair, Inc., Class A* | | | 1,152,729 | |
| | 6,557 | | | WW International, Inc.* | | | 153,958 | |
| | 6,916 | | | YETI Holdings, Inc.* | | | 355,344 | |
| | |
| | |
| 32 | | The accompanying notes are an integral part of these financial statements. |
GOLDMAN SACHS NEW AGE CONSUMER ETF
| | | | | | | | |
Shares | | | Description | | Value | |
|
| Common Stocks – (continued) | |
| Consumer Discretionary – (continued) | |
| | 9,555 | | | Zalando SE (Germany)*(a) | | $ | 835,793 | |
| | 18,840 | | | ZOZO, Inc. (Japan) | | | 530,139 | |
| | | | | | | | |
| | | | | | | 35,196,050 | |
| | |
| Consumer Staples – 2.8% | |
| | 3,479 | | | Beyond Meat, Inc.*(b) | | | 472,622 | |
| | 1,679 | | | Calavo Growers, Inc. | | | 106,566 | |
| | 4,019 | | | Cal-Maine Foods, Inc.* | | | 155,093 | |
| | 7,307 | | | Fresh Del Monte Produce, Inc. | | | 169,450 | |
| | 4,936 | | | Herbalife Nutrition Ltd.* | | | 242,605 | |
| | 5,145 | | | Maruha Nichiro Corp. (Japan) | | | 116,344 | |
| | 19,353 | | | Nippon Suisan Kaisha Ltd. (Japan) | | | 86,869 | |
| | 13,187 | | | Pilgrim’s Pride Corp.* | | | 210,992 | |
| | 1,498 | | | Sanderson Farms, Inc. | | | 175,206 | |
| | | | | | | | |
| | | | | | | 1,735,747 | |
| | |
| Health Care – 1.6% | |
| | 7,816 | | | Dechra Pharmaceuticals PLC (United Kingdom) | | | 329,655 | |
| | 1,710 | | | IDEXX Laboratories, Inc.* | | | 668,712 | |
| | | | | | | | |
| | | | | | | 998,367 | |
| | |
| Industrials – 0.5% | |
| | 4,727 | | | en-japan, Inc. (Japan) | | | 136,847 | |
| | 9,554 | | | Upwork, Inc.* | | | 145,507 | |
| | | | | | | | |
| | | | | | | 282,354 | |
| | |
| Information Technology – 2.5% | |
| | 4,148 | | | 2U, Inc.* | | | 171,686 | |
| | 4,230 | | | GoDaddy, Inc., Class A* | | | 353,966 | |
| | 5,400 | | | LivePerson, Inc.* | | | 322,164 | |
| | 2,400 | | | Wix.com Ltd. (Israel)* | | | 707,112 | |
| | | | | | | | |
| | | | | | | 1,554,928 | |
| | |
| TOTAL INVESTMENTS BEFORE SECURITIES
LENDING REINVESTMENT VEHICLE | | | | |
| | (Cost $47,898,985) | | $ | 62,086,212 | |
| | |
| | | | | | | | |
| Shares | | | Dividend
Rate | | Value | |
|
| Securities Lending Reinvestment Vehicle – 3.0%(c) | |
| Goldman Sachs Financial Square Government Fund –
Institutional Shares |
|
| | 1,858,500 | | | 0.027% | | $ | 1,858,500 | |
| | (Cost $1,858,500) | | | | |
| | |
| | TOTAL INVESTMENTS – 102.9% | | | | |
| | (Cost $49,757,485) | | $ | 63,944,712 | |
| | |
| LIABILITIES IN EXCESS OF
OTHER ASSETS – (2.9)% | | | (1,806,230 | ) |
| | |
| | NET ASSETS – 100.0% | | $ | 62,138,482 | |
| | |
| | |
|
| The percentage shown for each investment category reflects the value of investments in that category as a percentage of net assets. |
| |
* | | Non-income producing security. |
| |
(a) | | Exempt from registration under Rule 144A of the Securities Act of 1933. |
| |
(b) | | All or a portion of security is on loan. |
| |
(c) | | Represents an affiliated issuer. |
| | | | |
|
| | Investment Abbreviations: |
| | ADR | | —American Depositary Receipt |
| | GDR | | —Global Depositary Receipt |
| | PLC | | —Public Limited Company |
| | |
| | |
| The accompanying notes are an integral part of these financial statements. | | 33 |
GOLDMAN SACHS ETF TRUST
Statements of Assets and Liabilities
August 31, 2020
| | | | | | | | | | | | | | | | | | |
| | | | | Data-Driven
World ETF | | | Finance
Reimagined ETF | | | Human
Evolution ETF | | | Manufacturing
Revolution ETF | |
| | Assets: | | | | | | | | | | | | | | | | |
| | | | | |
| | Investments in unaffiliated issuers, at value (cost $31,651,630, $26,359,466, $42,808,309 and $24,951,770, respectively)(a) | | $ | 41,292,559 | | | $ | 31,652,284 | | | $ | 48,669,507 | | | $ | 31,532,544 | |
| | | | | |
| | Investments in securities lending reinvestment vehicle, at value which equals cost | | | 1,092,435 | | | | 526,091 | | | | 1,129,919 | | | | 1,606,015 | |
| | | | | |
| | Cash | | | 28,699 | | | | 53,260 | | | | 23,309 | | | | 18,541 | |
| | | | | |
| | Foreign currency, at value (cost $—, $—, $— and $189, respectively) | | | — | | | | — | | | | — | | | | 189 | |
| | | | | |
| | Receivables: | | | | | | | | | | | | | | | | |
| | | | | |
| | Dividends | | | 24,324 | | | | 17,993 | | | | 42,894 | | | | 19,802 | |
| | | | | |
| | Foreign tax reclaims | | | 1,199 | | | | — | | | | 3,803 | | | | 707 | |
| | | | | |
| | Securities lending income | | | 1,026 | | | | 773 | | | | 2,507 | | | | 2,720 | |
| | | | | |
| | Total assets | | | 42,440,242 | | | | 32,250,401 | | | | 49,871,939 | | | | 33,180,518 | |
| | | | | | | | | | | | | | | | | | |
| | Liabilities: | | | | | | | | | | | | | | | | |
| | | | | |
| | Payables: | | | | | | | | | | | | | | | | |
| | | | | |
| | Upon return of securities loaned | | | 1,092,435 | | | | 526,091 | | | | 1,129,919 | | | | 1,606,015 | |
| | | | | |
| | Management fees | | | 16,871 | | | | 12,455 | | | | 19,742 | | | | 12,160 | |
| | | | | |
| | Total liabilities | | | 1,109,306 | | | | 538,546 | | | | 1,149,661 | | | | 1,618,175 | |
| | | | | | | | | | | | | | | | | | |
| | Net Assets: | | | | | | | | | | | | | | | | |
| | | | | |
| | Paid-in capital | | | 31,743,876 | | | | 26,686,512 | | | | 42,892,264 | | | | 24,992,583 | |
| | | | | |
| | Total distributable earnings | | | 9,587,060 | | | | 5,025,343 | | | | 5,830,014 | | | | 6,569,760 | |
| | | | | |
| | NET ASSETS | | $ | 41,330,936 | | | $ | 31,711,855 | | | $ | 48,722,278 | | | $ | 31,562,343 | |
| | SHARES ISSUED AND OUTSTANDING | | | | | | | | | | | | | | | | |
| | | | | |
| | Shares outstanding no par value (unlimited shares authorized): | | | 575,000 | | | | 475,000 | | | | 750,000 | | | | 450,000 | |
| | | | | |
| | Net asset value per share: | | | $71.88 | | | | $66.76 | | | | $64.96 | | | | $70.14 | |
| | (a) | | Includes loaned securities having a market value of $1,050,853, $492,952, $1,095,841 and $1,542,380, respectively. |
| | |
| 34 | | The accompanying notes are an integral part of these financial statements. |
GOLDMAN SACHS ETF TRUST
Statements of Assets and Liabilities (continued)
August 31, 2020
| | | | | | |
| | | | | New Age
Consumer ETF | |
| | Assets: | | | | |
| | |
| | Investments in unaffiliated issuers, at value (cost $47,898,985)(a) | | $ | 62,086,212 | |
| | |
| | Investments in securities lending reinvestment vehicle, at value which equals cost | | | 1,858,500 | |
| | |
| | Cash | | | 54,204 | |
| | |
| | Receivables: | | | | |
| | |
| | Dividends | | | 22,783 | |
| | |
| | Securities lending income | | | 758 | |
| | |
| | Total assets | | | 64,022,457 | |
| | | | | | |
| | Liabilities: | | | | |
| | |
| | Payables: | | | | |
| | |
| | Upon return of securities loaned | | | 1,858,500 | |
| | |
| | Management fees | | | 25,475 | |
| | |
| | Total liabilities | | | 1,883,975 | |
| | | | | | |
| | Net Assets: | | | | |
| | |
| | Paid-in capital | | | 47,947,049 | |
| | |
| | Total distributable earnings | | | 14,191,433 | |
| | |
| | NET ASSETS | | $ | 62,138,482 | |
| | SHARES ISSUED AND OUTSTANDING | | | | |
| | |
| | Shares outstanding no par value (unlimited shares authorized): | | | 750,000 | |
| | |
| | Net asset value per share: | | | $82.85 | |
| | (a) | | Includes loaned securities having a market value of $1,820,458. |
| | |
| The accompanying notes are an integral part of these financial statements. | | 35 |
GOLDMAN SACHS ETF TRUST
Statements of Operations
For the Fiscal Year Ended August 31, 2020
| | | | | | | | | | | | | | | | | | |
| | | | | Data-Driven World ETF | | | Finance
Reimagined ETF | | | Human Evolution ETF | | | Manufacturing
Revolution ETF | |
| | Investment income: | | | | | | | | | | | | | | | | |
| | | | | |
| | Dividends — unaffiliated issuers (net of foreign withholding taxes of $8,774, $4,180, $17,314 and $15,432, respectively) | | $ | 313,145 | | | $ | 175,587 | | | $ | 157,775 | | | $ | 130,304 | |
| | | | | |
| | Securities lending income — unaffiliated issuer | | | 6,043 | | | | 19,994 | | | | 33,583 | | | | 23,817 | |
| | | | | |
| | Total investment income | | | 319,188 | | | | 195,581 | | | | 191,358 | | | | 154,121 | |
| | | | | | | | | | | | | | | | | | |
| | Expenses: | | | | | | | | | | | | | | | | |
| | | | | |
| | Management fees | | | 97,869 | | | | 79,223 | | | | 90,489 | | | | 54,279 | |
| | | | | |
| | Trustee fees | | | 4,987 | | | | 4,949 | | | | 4,939 | | | | 4,854 | |
| | | | | |
| | Total expenses | | | 102,856 | | | | 84,172 | | | | 95,428 | | | | 59,133 | |
| | | | | |
| | NET INVESTMENT INCOME | | | 216,332 | | | | 111,409 | | | | 95,930 | | | | 94,988 | |
| | | | | | | | | | | | | | | | | | |
| | Realized and unrealized gain (loss): | | | | | | | | | | | | | | | | |
| | | | | |
| | Net realized gain (loss) from: | | | | | | | | | | | | | | | | |
| | | | | |
| | Investments — unaffiliated issuers | | | (48,206 | ) | | | (250,149 | ) | | | (49,327 | ) | | | (14,520 | ) |
| | | | | |
| | Foreign currency transactions | | | (327 | ) | | | (2 | ) | | | (1,149 | ) | | | (821 | ) |
| | | | | |
| | Net change in unrealized gain (loss) on: | | | | | | | | | | | | | | | | |
| | | | | |
| | Investments | | | 9,614,108 | | | | 4,720,687 | | | | 5,948,274 | | | | 6,743,931 | |
| | | | | |
| | Foreign currency translations | | | 87 | | | | 82 | | | | 171 | | | | 89 | |
| | | | | |
| | Net realized and unrealized gain | | | 9,565,662 | | | | 4,470,618 | | | | 5,897,969 | | | | 6,728,679 | |
| | | | | |
| | NET INCREASE IN NET ASSETS RESULTING FROM OPERATIONS | | $ | 9,781,994 | | | $ | 4,582,027 | | | $ | 5,993,899 | | | $ | 6,823,667 | |
| | |
| 36 | | The accompanying notes are an integral part of these financial statements. |
GOLDMAN SACHS ETF TRUST
Statements of Operations (continued)
For the Fiscal Year Ended August 31, 2020
| | | | | | |
| | | | | New Age
Consumer ETF | |
| | Investment income: | | | | |
| | |
| | Dividends — unaffiliated issuers (net of foreign withholding taxes of $2,203) | | $ | 71,990 | |
| | |
| | Securities lending income — unaffiliated issuer | | | 21,245 | |
| | |
| | Total investment income | | | 93,235 | |
| | | | | | |
| | Expenses: | | | | |
| | |
| | Management fees | | | 84,527 | |
| | |
| | Trustee fees | | | 4,890 | |
| | |
| | Total expenses | | | 89,417 | |
| | |
| | NET INVESTMENT INCOME | | | 3,818 | |
| | | | | | |
| | Realized and unrealized gain (loss): | | | | |
| | |
| | Net realized gain (loss) from: | | | | |
| | |
| | Investments — unaffiliated issuers | | | 36,002 | |
| | |
| | Foreign currency transactions | | | (1,911 | ) |
| | |
| | Net change in unrealized gain (loss) on: | | | | |
| | |
| | Investments | | | 13,993,032 | |
| | |
| | Foreign currency translations | | | 2 | |
| | |
| | Net realized and unrealized gain | | | 14,027,125 | |
| | |
| | NET INCREASE IN NET ASSETS RESULTING FROM OPERATIONS | | $ | 14,030,943 | |
| | |
| The accompanying notes are an integral part of these financial statements. | | 37 |
GOLDMAN SACHS ETF TRUST
Statements of Changes in Net Assets
| | | | | | | | | | | | | | | | | | | | | | |
| | | | | Data-Driven World ETF | | | | | | Finance Reimagined ETF | |
| | | | | For the Fiscal
Year Ended
August 31, 2020 | | | For the Period
March 1, 2019*
to
August 31, 2019 | | | | | | For the Fiscal
Year Ended
August 31, 2020 | | | For the Period
March 1, 2019*
to
August 31, 2019 | |
| | From operations: | | | | | | | | | | | | | | | | | | | | |
| | | | | | |
| | Net investment income | | $ | 216,332 | | | $ | 29,851 | | | | | | | $ | 111,409 | | | $ | 26,946 | |
| | | | | | |
| | Net realized loss | | | (48,533 | ) | | | (14,756 | ) | | | | | | | (250,151 | ) | | | (13,040 | ) |
| | | | | | |
| | Net change in unrealized gain | | | 9,614,195 | | | | 26,827 | | | | | | | | 4,720,769 | | | | 572,137 | |
| | | | | | |
| | Net increase in net assets resulting from operations | | | 9,781,994 | | | | 41,922 | | | | | | | | 4,582,027 | | | | 586,043 | |
| | | | | | | | | | | | | | | | | | | | | | |
| | Distributions to shareholders: | | | | | | | | | | | | | | | | | | | | |
| | | | | | |
| | From distributable earnings | | | (219,222 | ) | | | (17,634 | ) | | | | | | | (125,194 | ) | | | (17,533 | ) |
| | | | | | | | | | | | | | | | | | | | | | |
| | From share transactions: | | | | | | | | | | | | | | | | | | | | |
| | | | | | |
| | Proceeds from sales of shares | | | 21,500,619 | | | | 10,243,257 | | | | | | | | 16,137,782 | | | | 10,548,730 | |
| | | | | | |
| | Net increase in net assets resulting from share transactions | | | 21,500,619 | | | | 10,243,257 | | | | | | | | 16,137,782 | | | | 10,548,730 | |
| | | | | | |
| | TOTAL INCREASE | | | 31,063,391 | | | | 10,267,545 | | | | | | | | 20,594,615 | | | | 11,117,240 | |
| | | | | | | | | | | | | | | | | | | | | | |
| | Net assets: | | | | | | | | | | | | | | | | | | | | |
| | | | | | |
| | Beginning of period | | $ | 10,267,545 | | | $ | — | | | | | | | $ | 11,117,240 | | | $ | — | |
| | | | | | |
| | End of period | | $ | 41,330,936 | | | $ | 10,267,545 | | | | | | | $ | 31,711,855 | | | $ | 11,117,240 | |
| | * | | Commencement of operations. |
| | |
| 38 | | The accompanying notes are an integral part of these financial statements. |
GOLDMAN SACHS ETF TRUST
Statements of Changes in Net Assets (continued)
| | | | | | | | | | | | | | | | | | | | | | |
| | | | | Human Evolution ETF | | | | | | Manufacturing Revolution ETF | |
| | | | | For the Fiscal
Year Ended
August 31, 2020 | | | For the Period
March 1, 2019*
to
August 31, 2019 | | | | | | For the Fiscal
Year Ended
August 31, 2020 | | | For the Period
March 1, 2019* to
August 31, 2019 | |
| | From operations: | | | | | | | | | | | | | | | | | | | | |
| | | | | | |
| | Net investment income | | $ | 95,930 | | | $ | 14,837 | | | | | | | $ | 94,988 | | | $ | 39,390 | |
| | | | | | |
| | Net realized loss | | | (50,476 | ) | | | (6,103 | ) | | | | | | | (15,341 | ) | | | (12,337 | ) |
| | | | | | |
| | Net change in unrealized gain (loss) | | | 5,948,445 | | | | (87,125 | ) | | | | | | | 6,744,020 | | | | (163,179 | ) |
| | | | | | |
| | Net increase (decrease) in net assets resulting from operations | | | 5,993,899 | | | | (78,391 | ) | | | | | | | 6,823,667 | | | | (136,126 | ) |
| | | | | | | | | | | | | | | | | | | | | | |
| | Distributions to shareholders: | | | | | | | | | | | | | | | | | | | | |
| | | | | | |
| | From distributable earnings | | | (72,044 | ) | | | (13,450 | ) | | | | | | | (83,010 | ) | | | (34,771 | ) |
| | | | | | | | | | | | | | | | | | | | | | |
| | From share transactions: | | | | | | | | | | | | | | | | | | | | |
| | | | | | |
| | Proceeds from sales of shares | | | 34,024,022 | | | | 8,868,242 | | | | | | | | 18,807,793 | | | | 6,184,790 | |
| | | | | | |
| | Net increase in net assets resulting from share transactions | | | 34,024,022 | | | | 8,868,242 | | | | | | | | 18,807,793 | | | | 6,184,790 | |
| | | | | | |
| | TOTAL INCREASE | | | 39,945,877 | | | | 8,776,401 | | | | | | | | 25,548,450 | | | | 6,013,893 | |
| | | | | | | | | | | | | | | | | | | | | | |
| | Net assets: | | | | | | | | | | | | | | | | | | | | |
| | | | | | |
| | Beginning of period | | $ | 8,776,401 | | | $ | — | | | | | | | $ | 6,013,893 | | | $ | — | |
| | | | | | |
| | End of period | | $ | 48,722,278 | | | $ | 8,776,401 | | | | | | | $ | 31,562,343 | | | $ | 6,013,893 | |
| | * | | Commencement of operations. |
| | |
| The accompanying notes are an integral part of these financial statements. | | 39 |
GOLDMAN SACHS ETF TRUST
Statements of Changes in Net Assets (continued)
| | | | | | | | | | |
| | | | | New Age Consumer ETF | |
| | | | | For the Fiscal
Year Ended
August 31, 2020 | | | For the Period
March 1, 2019* to
August 31, 2019 | |
| | From operations: | | | | | | | | |
| | | |
| | Net investment income | | $ | 3,818 | | | $ | 4,414 | |
| | | |
| | Net realized gain (loss) | | | 34,091 | | | | (4,863 | ) |
| | | |
| | Net change in unrealized gain | | | 13,993,034 | | | | 194,187 | |
| | | |
| | Net increase in net assets resulting from operations | | | 14,030,943 | | | | 193,738 | |
| | | | | | | | | | |
| | Distributions to shareholders: | | | | | | | | |
| | | |
| | From distributable earnings | | | (28,466 | ) | | | (4,782 | ) |
| | | | | | | | | | |
| | From share transactions: | | | | | | | | |
| | | |
| | Proceeds from sales of shares | | | 42,862,235 | | | | 5,084,814 | |
| | | |
| | Net increase in net assets resulting from share transactions | | | 42,862,235 | | | | 5,084,814 | |
| | | |
| | TOTAL INCREASE | | | 56,864,712 | | | | 5,273,770 | |
| | | | | | | | | | |
| | Net assets: | | | | | | | | |
| | | |
| | Beginning of period | | $ | 5,273,770 | | | $ | — | |
| | | |
| | End of period | | $ | 62,138,482 | | | $ | 5,273,770 | |
| | * | | Commencement of operations. |
| | |
| 40 | | The accompanying notes are an integral part of these financial statements. |
GOLDMAN SACHS ETF TRUST
Financial Highlights
Selected Data for a Share Outstanding Throughout Each Period
| | | | | | | | | | |
| | | | | Data-Driven World ETF | |
| | | | | For the Fiscal
Year Ended
August 31, 2020 | | | For the Period
March 1, 2019* to
August 31, 2019 | |
| | Per Share Operating Performance: | | | | | | | | |
| | | |
| | Net asset value, beginning of period | | $ | 51.34 | | | $ | 50.10 | |
| | | |
| | Net investment income(a) | | | 0.62 | (b) | | | 0.17 | |
| | | |
| | Net realized and unrealized gain | | | 20.50 | | | | 1.16 | |
| | | |
| | Total gain from investment operations | | | 21.12 | | | | 1.33 | |
| | | |
| | Distributions to shareholders from net investment income | | | (0.58 | ) | | | (0.09 | ) |
| | | |
| | Net asset value, end of period | | $ | 71.88 | | | $ | 51.34 | |
| | | |
| | Market price, end of period | | $ | 72.02 | | | $ | 51.40 | |
| | | |
| | Total Return at Net Asset Value(c) | | | 41.46 | % | | | 2.65 | % |
| | | |
| | Net assets, end of period (in 000’s) | | $ | 41,331 | | | $ | 10,268 | |
| | | |
| | Ratio of total expenses to average net assets | | | 0.50 | % | | | 0.50 | %(d) |
| | | |
| | Ratio of net investment income to average net assets | | | 1.05 | %(b) | | | 0.65 | %(d) |
| | | |
| | Portfolio turnover rate(e) | | | 9 | % | | | 17 | % |
| | * | | Commencement of operations. |
| | (a) | | Calculated based on the average shares outstanding methodology. |
| | (b) | | Reflects income recognized from non-recurring special dividends which amounted to $0.32 per share and 0.54% of average net assets. |
| | (c) | | Assumes investment at the net asset value at the beginning of the period, reinvestment of all distributions and a complete sale of the investment at the net asset value at the end of the period. Returns do not reflect the impact of taxes to shareholders relating to Fund distributions or the sale of Fund shares. Total returns for periods less than one full year are not annualized. |
| | (e) | | The Fund’s portfolio turnover rate is calculated in accordance with regulatory requirements and excludes portfolio securities received or delivered as a result of in-kind transactions. If such transactions were included, the Fund’s portfolio turnover rate may be higher. |
| | |
| The accompanying notes are an integral part of these financial statements. | | 41 |
GOLDMAN SACHS ETF TRUST
Financial Highlights (continued)
Selected Data for a Share Outstanding Throughout Each Period
| | | | | | | | | | |
| | | | | Finance Reimagined ETF | |
| | | | | For the Fiscal
Year Ended
August 31, 2020 | | | For the Period
March 1, 2019* to
August 31, 2019 | |
| | Per Share Operating Performance: | | | | | | | | |
| | | |
| | Net asset value, beginning of period | | $ | 55.59 | | | $ | 50.74 | |
| | | |
| | Net investment income(a) | | | 0.38 | | | | 0.20 | |
| | | |
| | Net realized and unrealized gain | | | 11.26 | | | | 4.77 | |
| | | |
| | Total gain from investment operations | | | 11.64 | | | | 4.97 | |
| | | |
| | Distributions to shareholders from net investment income | | | (0.47 | ) | | | (0.12 | ) |
| | | |
| | Net asset value, end of period | | $ | 66.76 | | | $ | 55.59 | |
| | | |
| | Market price, end of period | | $ | 66.86 | | | $ | 55.64 | |
| | | |
| | Total Return at Net Asset Value(b) | | | 21.05 | % | | | 9.77 | % |
| | | |
| | Net assets, end of period (in 000’s) | | $ | 31,712 | | | $ | 11,117 | |
| | | |
| | Ratio of total expenses to average net assets | | | 0.50 | % | | | 0.50 | %(c) |
| | | |
| | Ratio of net investment income to average net assets | | | 0.66 | % | | | 0.73 | %(c) |
| | | |
| | Portfolio turnover rate(d) | | | 5 | % | | | 18 | % |
| | * | | Commencement of operations. |
| | (a) | | Calculated based on the average shares outstanding methodology. |
| | (b) | | Assumes investment at the net asset value at the beginning of the period, reinvestment of all distributions and a complete sale of the investment at the net asset value at the end of the period. Returns do not reflect the impact of taxes to shareholders relating to Fund distributions or the sale of Fund shares. Total returns for periods less than one full year are not annualized. |
| | (d) | | The Fund’s portfolio turnover rate is calculated in accordance with regulatory requirements and excludes portfolio securities received or delivered as a result of in-kind transactions. If such transactions were included, the Fund’s portfolio turnover rate may be higher. |
| | |
| 42 | | The accompanying notes are an integral part of these financial statements. |
GOLDMAN SACHS ETF TRUST
Financial Highlights (continued)
Selected Data for a Share Outstanding Throughout Each Period
| | | | | | | | | | |
| | | | | Human Evolution ETF | |
| | | | | For the Fiscal
Year Ended
August 31, 2020 | | | For the Period
March 1, 2019* to
August 31, 2019 | |
| | Per Share Operating Performance: | | | | | | | | |
| | | |
| | Net asset value, beginning of period | | $ | 50.15 | | | $ | 50.63 | |
| | | |
| | Net investment income(a) | | | 0.29 | | | | 0.12 | |
| | | |
| | Net realized and unrealized gain (loss) | | | 14.71 | | | | (0.47 | ) |
| | | |
| | Total gain (loss) from investment operations | | | 15.00 | | | | (0.35 | ) |
| | | |
| | Distributions to shareholders from net investment income | | | (0.19 | ) | | | (0.13 | ) |
| | | |
| | Net asset value, end of period | | $ | 64.96 | | | $ | 50.15 | |
| | | |
| | Market price, end of period | | $ | 65.19 | | | $ | 50.26 | |
| | | |
| | Total Return at Net Asset Value(b) | | | 29.91 | % | | | (0.69 | )% |
| | | |
| | Net assets, end of period (in 000’s) | | $ | 48,722 | | | $ | 8,776 | |
| | | |
| | Ratio of total expenses to average net assets | | | 0.50 | % | | | 0.50 | %(c) |
| | | |
| | Ratio of net investment income to average net assets | | | 0.50 | % | | | 0.49 | %(c) |
| | | |
| | Portfolio turnover rate(d) | | | 11 | % | | | 24 | % |
| | * | | Commencement of operations. |
| | (a) | | Calculated based on the average shares outstanding methodology. |
| | (b) | | Assumes investment at the net asset value at the beginning of the period, reinvestment of all distributions and a complete sale of the investment at the net asset value at the end of the period. Returns do not reflect the impact of taxes to shareholders relating to Fund distributions or the sale of Fund shares. Total returns for periods less than one full year are not annualized. |
| | (d) | | The Fund’s portfolio turnover rate is calculated in accordance with regulatory requirements and excludes portfolio securities received or delivered as a result of in-kind transactions. If such transactions were included, the Fund’s portfolio turnover rate may be higher. |
| | |
| The accompanying notes are an integral part of these financial statements. | | 43 |
GOLDMAN SACHS ETF TRUST
Financial Highlights (continued)
Selected Data for a Share Outstanding Throughout Each Period
| | | | | | | | | | |
| | | | | Manufacturing Revolution ETF | |
| | | | | For the Fiscal
Year Ended
August 31, 2020 | | | For the Period
March 1, 2019* to
August 31, 2019 | |
| | Per Share Operating Performance: | | | | | | | | |
| | | |
| | Net asset value, beginning of period | | $ | 48.11 | | | $ | 49.70 | |
| | | |
| | Net investment income(a) | | | 0.45 | | | | 0.38 | |
| | | |
| | Net realized and unrealized gain (loss) | | | 21.97 | | | | (1.62 | ) |
| | | |
| | Total gain (loss) from investment operations | | | 22.42 | | | | (1.24 | ) |
| | | |
| | Distributions to shareholders from net investment income | | | (0.39 | ) | | | (0.35 | ) |
| | | |
| | Net asset value, end of period | | $ | 70.14 | | | $ | 48.11 | |
| | | |
| | Market price, end of period | | $ | 70.33 | | | $ | 48.22 | |
| | | |
| | Total Return at Net Asset Value(b) | | | 46.71 | % | | | (2.52 | )% |
| | | |
| | Net assets, end of period (in 000’s) | | $ | 31,562 | | | $ | 6,014 | |
| | | |
| | Ratio of total expenses to average net assets | | | 0.50 | % | | | 0.50 | %(c) |
| | | |
| | Ratio of net investment income to average net assets | | | 0.80 | % | | | 1.55 | %(c) |
| | | |
| | Portfolio turnover rate(d) | | | 12 | % | | | 21 | % |
| | * | | Commencement of operations. |
| | (a) | | Calculated based on the average shares outstanding methodology. |
| | (b) | | Assumes investment at the net asset value at the beginning of the period, reinvestment of all distributions and a complete sale of the investment at the net asset value at the end of the period. Returns do not reflect the impact of taxes to shareholders relating to Fund distributions or the sale of Fund shares. Total returns for periods less than one full year are not annualized. |
| | (d) | | The Fund’s portfolio turnover rate is calculated in accordance with regulatory requirements and excludes portfolio securities received or delivered as a result of in-kind transactions. If such transactions were included, the Fund’s portfolio turnover rate may be higher. |
| | |
| 44 | | The accompanying notes are an integral part of these financial statements. |
GOLDMAN SACHS ETF TRUST
Financial Highlights (continued)
Selected Data for a Share Outstanding Throughout Each Period
| | | | | | | | | | |
| | | | | New Age Consumer ETF | |
| | | | | For the Fiscal
Year Ended
August 31, 2020 | | | For the Period
March 1, 2019* to
August 31, 2019 | |
| | Per Share Operating Performance: | | | | | | | | |
| | | |
| | Net asset value, beginning of period | | $ | 52.74 | | | $ | 50.83 | |
| | | |
| | Net investment income(a) | | | 0.01 | | | | 0.04 | |
| | | |
| | Net realized and unrealized gain | | | 30.28 | | | | 1.92 | |
| | | |
| | Total gain from investment operations | | | 30.29 | | | | 1.96 | |
| | | |
| | Distributions to shareholders from net investment income | | | (0.18 | ) | | | (0.05 | ) |
| | | |
| | Net asset value, end of period | | $ | 82.85 | | | $ | 52.74 | |
| | | |
| | Market price, end of period | | $ | 83.07 | | | $ | 52.83 | |
| | | |
| | Total Return at Net Asset Value(b) | | | 57.41 | % | | | 3.83 | % |
| | | |
| | Net assets, end of period (in 000’s) | | $ | 62,138 | | | $ | 5,274 | |
| | | |
| | Ratio of total expenses to average net assets | | | 0.50 | % | | | 0.50 | %(c) |
| | | |
| | Ratio of net investment income to average net assets | | | 0.02 | % | | | 0.17 | %(c) |
| | | |
| | Portfolio turnover rate(d) | | | 3 | % | | | 7 | % |
| | * | | Commencement of operations. |
| | (a) | | Calculated based on the average shares outstanding methodology. |
| | (b) | | Assumes investment at the net asset value at the beginning of the period, reinvestment of all distributions and a complete sale of the investment at the net asset value at the end of the period. Returns do not reflect the impact of taxes to shareholders relating to Fund distributions or the sale of Fund shares. Total returns for periods less than one full year are not annualized. |
| | (d) | | The Fund’s portfolio turnover rate is calculated in accordance with regulatory requirements and excludes portfolio securities received or delivered as a result of in-kind transactions. If such transactions were included, the Fund’s portfolio turnover rate may be higher. |
| | |
| The accompanying notes are an integral part of these financial statements. | | 45 |
GOLDMAN SACHS ETF TRUST
Notes to Financial Statements
August 31, 2020
Goldman Sachs ETF Trust (the “Trust”) is an open-end management investment company, registered under the Investment Company Act of 1940, as amended (the “Act”), consisting of multiple series. The Trust was organized as a Delaware statutory trust on December 16, 2009. The following table lists those series of the Trust that are included in this report (collectively, the “Funds” or individually a “Fund”) along with their respective diversification status under the Act:
| | |
| Fund | | Diversification
Classification |
Goldman Sachs Data-Driven World ETF (formerly Goldman Sachs Motif Data-Driven World ETF)
(“Data-Driven World ETF”) | | Diversified |
Goldman Sachs Finance Reimagined ETF (formerly Goldman Sachs Motif Finance Reimagined ETF)
(“Finance Reimagined ETF”) | | Diversified |
Goldman Sachs Human Evolution ETF (formerly Goldman Sachs Motif Human Evolution ETF)
(“Human Evolution ETF”) | | Diversified |
Goldman Sachs Manufacturing Revolution ETF (formerly Goldman Sachs Motif Manufacturing Revolution ETF) (“Manufacturing Revolution ETF”) | | Diversified |
Goldman Sachs New Age Consumer ETF (formerly Goldman Sachs Motif New Age Consumer ETF)
(“New Age Consumer ETF”) | | Diversified |
The investment objective of each Fund is to provide investment results that closely correspond, before fees and expenses, to the performance of its respective Index.
Goldman Sachs Asset Management, L.P. (“GSAM”), an affiliate of Goldman Sachs & Co. LLC (“Goldman Sachs”), serves as investment adviser to the Funds pursuant to a management agreement (the “Agreement”) with the Trust. Each Fund is an exchange-traded fund (“ETF”). Shares of the Funds are listed and traded on the NYSE Arca, Inc. (“NYSE Arca”). Market prices for the Funds’ shares may be different from their net asset value (“NAV”). The Funds issue and redeem shares at their respective NAV only in blocks of a specified number of shares, or multiples thereof, referred to as “Creation Units”. Creation Units are issued and redeemed principally in-kind for a basket of securities and a cash amount. Shares generally trade in the secondary market in quantities less than a Creation Unit at market prices that change throughout the day. Only those that have entered into an authorized participant agreement with ALPS Distributors, Inc. (the “Distributor”) may do business directly with the Funds.
|
| 2. SIGNIFICANT ACCOUNTING POLICIES |
The financial statements have been prepared in accordance with accounting principles generally accepted in the United States of America (“GAAP”) and require management to make estimates and assumptions that may affect the reported amounts and disclosures. Actual results may differ from those estimates and assumptions. Each Fund is an investment company under GAAP and follows the accounting and reporting guidance applicable to investment companies.
A. Investment Valuation — The Funds’ valuation policy is to value investments at fair value.
B. Investment Income and Investments — Investment income includes interest income, dividend income, and securities lending income, if any. Interest income is accrued daily and adjusted for amortization of premiums and accretion of discounts. Dividend income is recognized on ex-dividend date or, for certain foreign securities, as soon as such information is obtained subsequent to the ex-dividend date. Non-cash dividends, if any, are recorded at the fair market value of the securities received. Investment transactions are reflected on trade date. Realized gains and losses are calculated using identified cost. Investment transactions are recorded on the following business day for daily NAV calculations. Investment income is recorded net of any foreign withholding taxes, less any amounts reclaimable. The Funds may file withholding tax reclaims in certain jurisdictions to recover a portion of amounts previously withheld. Any foreign capital gains tax is accrued daily based upon net unrealized gains, and is payable upon sale of such investments. Distributions received from the Funds’ investments in U.S. real estate investment trusts (“REITs”) may be characterized as ordinary income, net capital gain and/or a return of capital. A return of capital is recorded by the Funds as a reduction to the cost basis of the REIT.
46
GOLDMAN SACHS ETF TRUST
|
| 2. SIGNIFICANT ACCOUNTING POLICIES (continued) |
C. Expenses — Expenses incurred directly by a Fund are charged to the Fund, and certain expenses incurred by the Trust are allocated across the applicable Funds on a straight-line and/or pro-rata basis, depending upon the nature of the expenses, and are accrued daily.
D. Federal Taxes and Distributions to Shareholders — It is each Fund’s policy to comply with the requirements of the Internal Revenue Code of 1986, as amended (the “Code”), applicable to regulated investment companies and to distribute each year substantially all of its investment company taxable income and capital gains to its shareholders. Accordingly, each Fund is not required to make any provisions for the payment of federal income tax. Distributions to shareholders are recorded on the ex-dividend date. For each fund, income distributions, if any, are declared and paid quarterly. Capital gains distributions, if any, are declared and paid annually.
Net capital losses, if any, are carried forward to future fiscal years and may be used to the extent allowed by the Code to offset any future capital gains. Losses that are carried forward will retain their character as either short-term or long-term capital losses. Utilization of capital loss carryforwards will reduce the requirement of future capital gains distributions.
The characterization of distributions to shareholders for financial reporting purposes is determined in accordance with federal income tax rules, which may differ from GAAP. The source of each Fund’s distributions may be shown in the accompanying financial statements as either from distributable earnings or capital. Certain components of the Funds’ net assets on the Statements of Assets and Liabilities reflect permanent GAAP/tax differences based on the appropriate tax character.
E. Foreign Currency Translation — The accounting records and reporting currency of a Fund are maintained in U.S. dollars. Assets and liabilities denominated in foreign currencies are translated into U.S. dollars using the current exchange rates at the close of each business day. The effect of changes in foreign currency exchange rates on investments is included within net realized and unrealized gain (loss) on investments. Changes in the value of other assets and liabilities as a result of fluctuations in foreign exchange rates are included in the Statements of Operations within net change in unrealized gain (loss) on foreign currency translation. Transactions denominated in foreign currencies are translated into U.S. dollars on the date the transaction occurred, the effects of which are included within net realized gain (loss) on foreign currency transactions.
| | |
| 3. INVESTMENTS AND FAIR VALUE MEASUREMENTS | | |
U.S. GAAP defines the fair value of a financial instrument as the amount that would be received to sell an asset or paid to transfer a liability in an orderly transaction between market participants at the measurement date (i.e., the exit price); the Funds’ policy is to use the market approach. GAAP establishes a fair value hierarchy that prioritizes the inputs to valuation techniques used to measure fair value. The hierarchy gives the highest priority to unadjusted quoted prices in active markets for identical assets or liabilities (Level 1 measurements) and the lowest priority to unobservable inputs (Level 3 measurements). The level in the fair value hierarchy within which the fair value measurement in its entirety falls shall be determined based on the lowest level input that is significant to the fair value measurement in its entirety. The levels used for classifying investments are not necessarily an indication of the risk associated with investing in these investments. The three levels of the fair value hierarchy are described below:
Level 1 — Unadjusted quoted prices in active markets that are accessible at the measurement date for identical, unrestricted assets or liabilities;
Level 2 — Quoted prices in markets that are not active or financial instruments for which significant inputs are observable (including, but not limited to, quoted prices for similar investments, interest rates, foreign exchange rates, volatility and credit spreads), either directly or indirectly;
Level 3 — Prices or valuations that require significant unobservable inputs (including GSAM’s assumptions in determining fair value measurement).
The Board of Trustees (“Trustees”) has approved Valuation Procedures that govern the valuation of the portfolio investments held by the Funds, including investments for which market quotations are not readily available. The Trustees have delegated to GSAM day-to-day responsibility for implementing and maintaining internal controls and procedures related to the valuation of the Funds’
47
GOLDMAN SACHS ETF TRUST
Notes to Financial Statements (continued)
August 31, 2020
|
| 3. INVESTMENTS AND FAIR VALUE MEASUREMENTS (continued) |
investments. To assess the continuing appropriateness of pricing sources and methodologies, GSAM regularly performs price verification procedures and issues challenges as necessary to third party pricing vendors or brokers, and any differences are reviewed in accordance with the Valuation Procedures.
A. Level 1 and Level 2 Fair Value Investments — The valuation techniques and significant inputs used in determining the fair values for investments classified as Level 1 and Level 2 are as follows:
Equity Securities — Equity securities traded on a United States (“U.S.”) securities exchange or the NASDAQ system, or those located on certain foreign exchanges, including but not limited to the Americas, are valued daily at their last sale price or official closing price on the principal exchange or system on which they are traded. If there is no sale or official closing price or such price is believed by GSAM to not represent fair value, equity securities will be valued at the valid closing bid price for long positions and at the valid closing ask price for short positions (i.e. where there is sufficient volume, during normal exchange trading hours). If no valid bid/ask price is available, the equity security will be valued pursuant to the Valuation Procedures approved by the Trustees and consistent with applicable regulatory guidance. To the extent these investments are actively traded, they are classified as Level 1 of the fair value hierarchy, otherwise they are generally classified as Level 2. Certain equity securities containing unique attributes may be classified as Level 2.
Unlisted equity securities for which market quotations are available are valued at the last sale price on the valuation date, or if no sale occurs, at the last bid price for long positions or the last ask price for short positions, and are generally classified as Level 2.
Money Market Funds — Investments in the Goldman Sachs Financial Square Government Fund (“Underlying Fund”) are valued at the NAV per share of the Institutional Share class on the day of valuation. These investments are generally classified as Level 1 of the fair value hierarchy. For information regarding an Underlying Fund’s accounting policies and investment holdings, please see the Underlying Fund’s shareholder report.
B. Level 3 Fair Value Investments — To the extent that significant inputs to valuation models and other alternative pricing sources are unobservable, or if quotations are not readily available, or if GSAM believes that such quotations do not accurately reflect fair value, the fair value of a Fund’s investments may be determined under Valuation Procedures approved by the Trustees. GSAM, consistent with its procedures and applicable regulatory guidance, may make an adjustment to the most recent valuation prices of either domestic or foreign securities in light of significant events to reflect what it believes to be the fair value of the securities at the time of determining a Fund’s NAV. To the extent investments are valued using single source broker quotations obtained directly from the broker or passed through from third party pricing vendors, such investments are classified as Level 3 investments.
C. Fair Value Hierarchy — The following is a summary of the Funds’ investments classified in the fair value hierarchy as of August 31, 2020:
| | | | | | | | | | | | |
| DATA-DRIVEN WORLD ETF | |
| | | |
| Investment Type | | Level 1 | | | Level 2 | | | Level 3 | |
| | | |
| Assets | | | | | | | | | | | | |
|
Common Stock and/or Other Equity Investments(a) | |
| | | |
Asia | | $ | 7,642,460 | | | $ | — | | | $ | — | |
| | | |
Europe | | | 3,354,565 | | | | — | | | | — | |
| | | |
North America | | | 30,295,534 | | | | — | | | | — | |
| | | |
Securities Lending Reinvestment Vehicle | | | 1,092,435 | | | | — | | | | — | |
| | | |
| Total | | $ | 42,384,994 | | | $ | — | | | $ | — | |
| (a) | | Amounts are disclosed by continent to highlight the impact of time zone differences between local market close and the calculation of NAV. Security valuations are based on the principal exchange or system on which they are traded, which may differ from country of domicile noted in table. |
48
GOLDMAN SACHS ETF TRUST
|
| 3. INVESTMENTS AND FAIR VALUE MEASUREMENTS (continued) |
| | | | | | | | | | | | |
|
| FINANCE REIMAGINED ETF | |
| | | |
| Investment Type | | Level 1 | | | Level 2 | | | Level 3 | |
| | | |
| Assets | | | | | | | | | | | | |
|
Common Stock and/or Other Equity Investments(a) | |
| | | |
Africa | | $ | 107,975 | | | $ | — | | | $ | — | |
| | | |
Asia | | | 3,317,508 | | | | — | | | | — | |
| | | |
Europe | | | 3,246,865 | | | | — | | | | — | |
| | | |
North America | | | 24,120,388 | | | | — | | | | — | |
| | | |
South America | | | 859,548 | | | | — | | | | — | |
| | | |
Securities Lending Reinvestment Vehicle | | | 526,091 | | | | — | | | | — | |
| | | |
| Total | | $ | 32,178,375 | | | $ | — | | | $ | — | |
|
| HUMAN EVOLUTION ETF | |
| | | |
| Investment Type | | Level 1 | | | Level 2 | | | Level 3 | |
| | | |
| Assets | | | | | | | | | | | | |
|
Common Stock and/or Other Equity Investments(a) | |
| | | |
Asia | | $ | 3,859,298 | | | $ | — | | | $ | — | |
| | | |
Europe | | | 9,397,956 | | | | — | | | | — | |
| | | |
North America | | | 35,157,280 | | | | — | | | | — | |
| | | |
Oceania | | | 254,973 | | | | — | | | | — | |
| | | |
Securities Lending Reinvestment Vehicle | | | 1,129,919 | | | | — | | | | — | |
| | | |
| Total | | $ | 49,799,426 | | | $ | — | | | $ | — | |
|
| MANUFACTURING REVOLUTION ETF | |
| | | |
| Investment Type | | Level 1 | | | Level 2 | | | Level 3 | |
| | | |
| Assets | | | | | | | | | | | | |
|
Common Stock and/or Other Equity Investments(a) | |
| | | |
Asia | | $ | 6,988,852 | | | $ | — | | | $ | — | |
| | | |
Europe | | | 6,243,872 | | | | — | | | | — | |
| | | |
North America | | | 18,155,846 | | | | — | | | | — | |
| | | |
South America | | | 143,974 | | | | — | | | | — | |
| | | |
Securities Lending Reinvestment Vehicle | | | 1,606,015 | | | | — | | | | — | |
| | | |
| Total | | $ | 33,138,559 | | | $ | — | | | $ | — | |
| (a) | | Amounts are disclosed by continent to highlight the impact of time zone differences between local market close and the calculation of NAV. Security valuations are based on the principal exchange or system on which they are traded, which may differ from country of domicile noted in table. |
49
GOLDMAN SACHS ETF TRUST
Notes to Financial Statements (continued)
August 31, 2020
|
| 3. INVESTMENTS AND FAIR VALUE MEASUREMENTS (continued) |
| | | | | | | | | | | | |
|
| NEW AGE CONSUMER ETF | |
| | | |
| Investment Type | | Level 1 | | | Level 2 | | | Level 3 | |
| | | |
| Assets | | | | | | | | | | | | |
|
Common Stock and/or Other Equity Investments(a) | |
| | | |
Asia | | $ | 24,955,121 | | | $ | 153,232 | | | $ | — | |
| | | |
Europe | | | 7,077,718 | | | | — | | | | — | |
| | | |
North America | | | 28,919,913 | | | | — | | | | — | |
| | | |
South America | | | 980,228 | | | | — | | | | — | |
| | | |
Securities Lending Reinvestment Vehicle | | | 1,858,500 | | | | — | | | | — | |
| | | |
| Total | | $ | 63,791,480 | | | $ | 153,232 | | | $ | — | |
| (a) | | Amounts are disclosed by continent to highlight the impact of time zone differences between local market close and the calculation of NAV. Security valuations are based on the principal exchange or system on which they are traded, which may differ from country of domicile noted in table. |
For further information regarding security characteristics, see the Schedules of Investments.
| | |
| 4. AGREEMENTS AND AFFILIATED TRANSACTIONS | | |
A. Management Agreement — Under the Agreement, GSAM manages the Funds, subject to the general supervision of the Trustees.
As compensation for the services rendered pursuant to the Agreement, the assumption of the expenses related thereto and administration of the Funds’ business affairs, including providing facilities, GSAM is entitled to a management fee, accrued daily and paid monthly, equal to an annual percentage rate of each Fund’s average daily net assets.
The Funds operate under a unitary management fee structure. Under the unitary fee structure, GSAM is responsible for paying substantially all the expenses of each Fund, excluding payments under a Fund’s 12b-1 plan (if any), interest expenses, taxes, acquired fund fees and expenses, brokerage fees, costs of holding shareholder meetings, litigation, indemnification and extraordinary expenses. As the Funds directly pay fees and expenses of the independent Trustees, the management fee collected by GSAM will be reduced by an amount equal to the fees and expenses paid by the Funds to the independent Trustees.
For the fiscal year ended August 31, 2020, contractual and effective net unitary management fee rates with GSAM were 0.50% for each Fund.
| | |
| 5. CREATION AND REDEMPTION OF CREATION UNITS | | |
The Trust issues and redeems shares of the Funds only in Creation Units on a continuous basis through the Distributor, without an initial sales load, at NAV next determined after receipt, on any Business Day (as defined in the Statement of Additional Information), of an order in proper form. Shares of the Funds may only be purchased or redeemed by certain financial institutions (each an “Authorized Participant”). An Authorized Participant is either (1) a “Participating Party” or other participant in the clearing process through the Continuous Net Settlement System of the National Securities Clearing Corporation; or (2) a Depository Trust Company participant; which, in either case, must have executed an agreement with the Distributor. Retail investors will typically not qualify as an Authorized Participant or have the resources to buy and sell whole Creation Units. Therefore, they will be unable to purchase or redeem the shares directly from the Funds. Rather, most retail investors will purchase shares in the secondary market at market prices with the assistance of a broker and may be subject to customary brokerage commissions or fees. Fixed creation and redemption transaction fees are imposed in connection with creations and redemptions.
Authorized Participants transacting in Creation Units for cash may also pay a variable charge to compensate the relevant fund for certain transaction costs (e.g. taxes on currency or other financial transactions, and brokerage costs) and market impact expenses relating to investing in portfolio securities. Such variable charges, if any, are included in “Proceeds from sale of shares” in the Statements of Changes in Net Assets.
50
GOLDMAN SACHS ETF TRUST
|
| 5. CREATION AND REDEMPTION OF CREATION UNITS (continued) |
Share activity is as follows:
| | | | | | | | | | | | | | | | |
| | | Data-Driven World ETF | |
| | | | |
| | | For the Fiscal Year Ended
August 31, 2020 | | | For the period March 1, 2019*
through August 31, 2019 | |
| | | | |
| | | Shares | | | Dollars | | | Shares | | | Dollars | |
| | | | |
| Fund Share Activity | | | | | | | | | | | | | | | | |
Shares Sold | | | 375,000 | | | $ | 21,499,021 | | | | 200,000 | | | $ | 10,242,706 | |
| | | | |
NET INCREASE IN SHARES | | | 375,000 | | | $ | 21,499,021 | | | | 200,000 | | | $ | 10,242,706 | |
| |
| | | Finance Reimagined ETF | |
| | | | |
| | | For the Fiscal Year Ended
August 31, 2020 | | | For the period March 1, 2019*
through August 31, 2019 | |
| | | | |
| | | Shares | | | Dollars | | | Shares | | | Dollars | |
| | | | |
| Fund Share Activity | | | | | | | | | | | | | | | | |
Shares Sold | | | 275,000 | | | $ | 16,137,246 | | | | 200,000 | | | $ | 10,548,731 | |
| | | | |
NET INCREASE IN SHARES | | | 275,000 | | | $ | 16,137,246 | | | | 200,000 | | | $ | 10,548,731 | |
| |
| | | Human Evolution ETF | |
| | | | |
| | | For the Fiscal Year Ended
August 31, 2020 | | | For the period March 1, 2019*
through August 31, 2019 | |
| | | | |
| | | Shares | | | Dollars | | | Shares | | | Dollars | |
| | | | |
| Fund Share Activity | | | | | | | | | | | | | | | | |
Shares Sold | | | 575,000 | | | $ | 34,022,468 | | | | 175,000 | | | $ | 8,869,648 | |
| | | | |
NET INCREASE IN SHARES | | | 575,000 | | | $ | 34,022,468 | | | | 175,000 | | | $ | 8,869,648 | |
| |
| | | Manufacturing Revolution ETF | |
| | | | |
| | | For the Fiscal Year Ended
August 31, 2020 | | | For the period March 1, 2019*
through August 31, 2019 | |
| | | | |
| | | Shares | | | Dollars | | | Shares | | | Dollars | |
| | | | |
| Fund Share Activity | | | | | | | | | | | | | | | | |
Shares Sold | | | 325,000 | | | $ | 18,805,303 | | | | 125,000 | | | $ | 6,183,762 | |
| | | | |
NET INCREASE IN SHARES | | | 325,000 | | | $ | 18,805,303 | | | | 125,000 | | | $ | 6,183,762 | |
| |
| | | New Age Consumer ETF | |
| | | | |
| | | For the Fiscal Year Ended
August 31, 2020 | | | For the period March 1, 2019*
through August 31, 2019 | |
| | | | |
| | | Shares | | | Dollars | | | Shares | | | Dollars | |
| | | | |
| Fund Share Activity | | | | | | | | | | | | | | | | |
Shares Sold | | | 650,000 | | | $ | 42,854,695 | | | | 100,000 | | | $ | 5,083,282 | |
| | | | |
NET INCREASE IN SHARES | | | 650,000 | | | $ | 42,854,695 | | | | 100,000 | | | $ | 5,083,282 | |
| * | | Commencement of operation |
51
GOLDMAN SACHS ETF TRUST
Notes to Financial Statements (continued)
August 31, 2020
|
| 6. PORTFOLIO SECURITIES TRANSACTIONS |
The cost of purchases and proceeds from sales of long-term securities for the fiscal year ended August 31, 2020, were as follows:
| | | | | | | | | | |
| Fund | | | | Purchases | | | Sales | |
Data-Driven World ETF | | | | $ | 2,844,881 | | | $ | 1,915,320 | |
Finance Reimagined ETF | | | | | 1,092,668 | | | | 901,335 | |
Human Evolution ETF | | | | | 2,954,841 | | | | 2,148,665 | |
Manufacturing Revolution ETF | | | | | 2,618,336 | | | | 1,509,238 | |
New Age Consumer ETF | | | | | 3,812,221 | | | | 508,080 | |
The purchases and sales from in-kind creation and redemption transactions for the fiscal year ended August 31, 2020, were as follows:
| | | | | | | | | | |
| Fund | | | | Purchases | | | Sales | |
Data-Driven World ETF | | | | $ | 20,543,924 | | | $ | — | |
Finance Reimagined ETF | | | | | 15,932,749 | | | | — | |
Human Evolution ETF | | | | | 33,245,989 | | | | — | |
Manufacturing Revolution ETF | | | | | 17,708,206 | | | | — | |
New Age Consumer ETF | | | | | 39,512,996 | | | | — | |
The Funds may lend their securities through a securities lending agent, the Bank of New York Mellon (“BNYM”), to certain qualified borrowers. In accordance with the Funds’ securities lending procedures, the Funds receive cash collateral at least equal to the market value of the securities on loan. The market value of the loaned securities is determined at the close of business of the Funds, at their last sale price or official closing price on the principal exchange or system on which they are traded, and any additional required collateral is delivered to the Funds on the next business day. As with other extensions of credit, the Funds may experience delay in the recovery of their securities or incur a loss should the borrower of the securities breach its agreement with the Funds or become insolvent at a time when the collateral is insufficient to cover the cost of repurchasing securities on loan. Dividend income received from securities on loan may not be subject to withholding taxes and therefore withholding taxes paid may differ from the amounts listed in the Statements of Operations. Loans of securities are terminable at any time and as such 1) the remaining contractual maturities of the outstanding securities lending transactions are considered to be overnight and continuous and 2) the borrower, after notice, is required to return borrowed securities within the standard time period for settlement of securities transactions.
The Funds invested the cash collateral received in connection with securities lending transactions in the Goldman Sachs Financial Square Government Fund (“Government Money Market Fund”), an affiliated series of the Goldman Sachs Trust. The Government Money Market Fund is registered under the Act as an open end investment company, is subject to Rule 2a-7 under the Act, and is managed by GSAM, for which GSAM may receive a management fee of up to 0.16% on an annualized basis of the average daily net assets of the Government Money Market Fund.
In the event of a default by a borrower with respect to any loan, BNYM may exercise any and all remedies provided under the applicable borrower agreement to make the Funds whole. These remedies include purchasing replacement securities by applying the collateral held from the defaulting broker against the purchase cost of the replacement securities. If BNYM is unable to purchase replacement securities, BNYM will indemnify the Funds by paying the Funds an amount equal to the market value of the
52
GOLDMAN SACHS ETF TRUST
|
| 7. SECURITIES LENDING (continued) |
securities loaned minus the value of cash collateral received from the borrower for the loan, subject to an exclusion for any shortfalls resulting from a loss of value in such cash collateral due to reinvestment risk. The Funds’ master netting agreements with certain borrowers provide the right, in the event of a default (including bankruptcy or insolvency), for the non-defaulting party to liquidate the collateral and calculate net exposure to the defaulting party or request additional collateral. However, in the event of a default by a borrower, a resolution authority could determine that such rights are not enforceable due to the restrictions or prohibitions against the right of set-off that may be imposed in accordance with a particular jurisdiction’s bankruptcy or insolvency laws. The Funds’ loaned securities were all subject to enforceable Securities Lending Agreements, and the value of the collateral was at least equal to the value of the cash received. The amounts of the Funds’ overnight and continuous agreements, which represent the gross amounts of recognized liabilities for securities lending transactions outstanding as of August 31, 2020, are disclosed as “Payable upon return of securities loaned” on the Statements of Assets and Liabilities, where applicable.
Both the Funds and BNYM received compensation relating to the lending of the Funds’ securities. The amounts earned, if any, by the Funds for the fiscal year ended August 31, 2020, are reported under Investment Income on the Statements of Operations.
The following table provides information about the Funds’ investment in the Government Money Market Fund for the fiscal year ended August 31, 2020:
| | | | | | | | | | | | | | | | | | |
| Fund | | | | Beginning value
as of
August 31, 2019 | | | Purchases
at Cost | | | Proceeds
from Sales | | | Ending value
as of
August 31, 2019 | |
Data-Driven World ETF* | | | | $ | 95,421 | | | $ | 6,255,168 | | | $ | (5,258,154 | ) | | $ | 1,092,435 | |
Finance Reimagined ETF* | | | | | 334,439 | | | | 7,943,890 | | | | (7,752,238 | ) | | | 526,091 | |
Human Evolution ETF* | | | | | 387,038 | | | | 9,329,914 | | | | (8,587,033 | ) | | | 1,129,919 | |
Manufacturing Revolution ETF* | | | | | 295,431 | | | | 7,144,886 | | | | (5,834,302 | ) | | | 1,606,015 | |
New Age Consumer ETF* | | | | | 300,049 | | | | 14,425,945 | | | | (12,867,494 | ) | | | 1,858,500 | |
| * | | Commencement of operations on March 1, 2019. |
The tax character of distributions paid during the fiscal year ended August 31, 2020 and August 31, 2019 were as follows:
| | | | | | | | | | | | | | | | | | | | |
| | | Year Ended August 31, 2020 | |
| | | Data-Driven
World ETF | | | Finance
Reimagined
ETF | | | Human
Evolution
ETF | | | Manufacturing
Revolution
ETF | | | New Age
Consumer
ETF | |
Distributions paid from: | | | | | | | | | | | | | | | | | | | | |
Ordinary Income* | | $ | 219,222 | | | $ | 125,194 | | | $ | 72,044 | | | $ | 83,010 | | | $ | 28,466 | |
Total taxable distributions | | $ | 219,222 | | | $ | 125,194 | | | $ | 72,044 | | | $ | 83,010 | | | $ | 28,466 | |
| * | | For tax purposes short-term capital gain distributions are considered ordinary income distributions. |
53
GOLDMAN SACHS ETF TRUST
Notes to Financial Statements (continued)
August 31, 2020
|
| 8. TAX INFORMATION (continued) |
| | | | | | | | | | | | | | | | | | | | |
| | | Year Ended August 31, 2019 | |
| | | Data-Driven
World ETF | | | Finance
Reimagined
ETF | | | Human
Evolution
ETF | | | Manufacturing
Revolution
ETF | | | New Age
Consumer
ETF | |
Distributions paid from: | | | | | | | | | | | | | | | | | | | | |
Ordinary Income* | | $ | 17,634 | | | $
| 17,533
|
| | $ | 13,450 | | | $ | 34,771 | | | $ | 4,782 | |
Total taxable distributions | | $ | 17,634 | | | $ | 17,533 | | | $ | 13,450 | | | $ | 34,771 | | | $ | 4,782 | |
| * | | For tax purposes short-term capital gain distributions are considered ordinary income distributions. |
As of August 31, 2020, the components of accumulated earnings (loss) on a tax-basis were as follows:
| | | | | | | | | | | | | | | | | | | | |
| | | Data-Driven
World ETF | | | Finance
Reimagined
ETF | | | Human
Evolution
ETF | | | Manufacturing
Revolution
ETF | | | New Age
Consumer ETF | |
Undistributed ordinary income — net | | $ | 9,292 | | | $ | 71,936 | | | $ | 331,852 | | | $ | 17,225 | | | $ | 59,928 | |
Total undistributed earnings | | $ | 9,292 | | | $ | 71,936 | | | $ | 331,852 | | | $ | 17,225 | | | $ | 59,928 | |
Capital loss carryforwards: | | | | | | | | | | | | | | | | | | | | |
Perpetual Short-Term | | $ | — | | | $ | (87,899 | ) | | $ | — | | | $ | — | | | $ | — | |
Perpetual Long-Term | | | (14,402 | ) | | | (172,440 | ) | | | (52,386 | ) | | | (25,223 | ) | | | — | |
Unrealized gains (losses) — net | | | 9,592,170 | | | | 5,213,746 | | | | 5,550,548 | | | | 6,577,758 | | | | 14,131,505 | |
Total accumulated earnings (losses) net | | $ | 9,587,060 | | | $ | 5,025,343 | | | $ | 5,830,014 | | | $ | 6,569,760 | | | $ | 14,191,433 | |
As of August 31, 2020, the Funds’ aggregate security unrealized gains and losses based on cost for U.S. federal income tax purposes were as follows:
| | | | | | | | | | | | | | | | | | | | |
| | | Data-Driven
World ETF | | | Finance
Reimagined
ETF | | | Human
Evolution ETF | | | Manufacturing
Revolution
ETF | | | New Age
Consumer ETF | |
Tax Cost | | $ | 32,792,917 | | | $ | 26,964,717 | | | $ | 44,249,000 | | | $ | 26,560,868 | | | $ | 49,813,201 | |
Gross unrealized gain | | | 10,484,559 | | | | 6,363,093 | | | | 7,005,048 | | | | 7,255,938 | | | | 15,024,098 | |
Gross unrealized loss | | | (892,389 | ) | | | (1,149,347 | ) | | | (1,454,500 | ) | | | (678,180 | ) | | | (892,593 | ) |
Net unrealized gains (losses) | | $ | 9,592,170 | | | $ | 5,213,746 | | | $ | 5,550,548 | | | $ | 6,577,758 | | | $ | 14,131,505 | |
The difference between GAAP-basis and tax-basis unrealized gains (losses) is attributable primarily to wash sales, partnership investments and passive foreign investment company investments.
GSAM has reviewed the Funds’ tax positions for all open tax years (the current year, and prior, as applicable) and has concluded that no provision for income tax is required in the Funds’ financial statements. Such open tax years remain subject to examination and adjustment by tax authorities.
54
GOLDMAN SACHS ETF TRUST
The Funds’ risks include, but are not limited to, the following:
Foreign and Emerging Countries Risk — Investing in foreign markets may involve special risks and considerations not typically associated with investing in the United States. Foreign securities may be subject to risk of loss because of more or less foreign government regulation, less public information and less economic, political and social stability in the countries in which a Fund invests. The imposition of exchange controls (including repatriation restrictions), confiscation of assets and property, trade restrictions (including tariffs) and other government restrictions by the United States or other governments, or from problems in share registration, settlement or custody, may also result in losses. Foreign risk also involves the risk of negative foreign currency rate fluctuations, which may cause the value of securities denominated in such foreign currency (or other instruments through which a Fund has exposure to foreign currencies) to decline in value. Currency exchange rates may fluctuate significantly over short periods of time. To the extent that a Fund also invests in securities of issuers located in emerging markets, these risks may be more pronounced.
Foreign Custody Risk — If a Fund invests in foreign securities, the Fund may hold such securities and cash with foreign banks, agents, and securities depositories appointed by the Fund’s custodian (each a “Foreign Custodian”). Some foreign custodians may be recently organized or new to the foreign custody business. In some countries, Foreign Custodians may be subject to little or no regulatory oversight over, or independent evaluation of, their operations. Further, the laws of certain countries may place limitations on a Fund’s ability to recover its assets if a Foreign Custodian enters bankruptcy. Investments in emerging markets may be subject to even greater custody risks than investments in more developed markets. Custody services in emerging market countries are very often undeveloped and may be considerably less well regulated than in more developed countries, and thus may not afford the same level of investor protection as would apply in developed countries.
Index Risk — GSAM (the “Index Provider”) constructs each Fund’s Index in accordance with a rules-based methodology. A Fund will be negatively affected by general declines in the securities and asset classes represented in its Index. In addition, because the Funds are not “actively” managed, unless a specific security is removed from an Index, a Fund generally would not sell a security because the security’s issuer was in financial trouble. Market disruptions and regulatory restrictions could have an adverse effect on a Fund’s ability to adjust its exposure to the required levels in order to track the Index. A Fund also does not attempt to take defensive positions under any market conditions, including declining markets. Therefore, a Fund’s performance could be lower than funds that may actively shift their portfolio assets to take advantage of market opportunities or to lessen the impact of a market decline or a decline in the value of one or more issuers. The Index Provider relies on third party data it believes to be reliable in constructing each Index, but it does not guarantee the accuracy or availability of such third party data. Errors in index data, index computation or the construction of an Index in accordance with its methodology may occur from time to time and may not be identified and corrected by the Index Provider for a period of time or at all, which may have an adverse impact on the applicable Fund and its shareholders. In addition, neither a Fund, the Investment Adviser, the Calculation Agent nor the Index Provider can guarantee the availability or timeliness of the production of the Index. Furthermore, the Index Provider may delay or change a scheduled rebalancing or reconstitution of an Index or the implementation of certain rules at its sole discretion. In such circumstances, a Fund, in replicating the composition of its Index, may have more or less exposure to a particular sector or individual company than had the Index been constructed in accordance with its stated methodology.
Liquidity Risk — A Fund may make investments that are illiquid or that may become less liquid in response to market developments or adverse investor perceptions. Illiquid investments may be more difficult to value. To the extent a Fund engages in cash redemptions, then liquidity risk may also refer to the risk that a Fund will not be able to pay redemption proceeds within the allowable time period or without significant dilution to remaining investors’ interests because of unusual market conditions, an unusually high volume of redemption requests, or other reasons. To meet redemption requests, a Fund may be forced to sell investments at an unfavorable time and/or under unfavorable conditions. If a Fund is forced to sell securities at an unfavorable time and/or under unfavorable conditions, such sales may adversely affect the Fund’s NAV and dilute remaining investors’ interests. These risks may be more pronounced in connection with a Fund’s investments in securities of issuers located in emerging market countries. Redemptions by large shareholders may have a negative impact on a Fund’s liquidity.
55
GOLDMAN SACHS ETF TRUST
Notes to Financial Statements (continued)
August 31, 2020
|
| 9. OTHER RISKS (continued) |
Market and Credit Risks — In the normal course of business, a Fund trades financial instruments and enters into financial transactions where risk of potential loss exists due to changes in the market (market risk). The value of the securities in which a Fund invests may go up or down in response to the prospects of individual companies, particular sectors or governments and/or general economic conditions throughout the world due to increasingly interconnected global economies and financial markets. Events such as war, acts of terrorism, social unrest, natural disasters, the spread of infectious illness or other public health threats could also significantly impact a Fund and its investments. Additionally, a Fund may also be exposed to credit risk in the event that an issuer or guarantor fails to perform or that an institution or entity with which the Fund has unsettled or open transactions defaults.
Market Trading Risk — Each Fund faces numerous market trading risks, including disruptions to creations and redemptions, the existence of extreme market volatility or potential lack of an active trading market for Shares. If a shareholder purchases Shares at a time when the market price is at a premium to the NAV or sells Shares at a time when the market price is at a discount to the NAV, the shareholder may sustain losses. The Investment Adviser cannot predict whether Shares will trade below, at or above their NAV. Price differences may be due, in large part, to the fact that supply and demand forces at work in the secondary trading market for Shares will be closely related to, but not identical to, the same forces influencing the prices of the securities of a Fund’s Index trading individually or in the aggregate at any point in time.
Sector Risk — To the extent a Fund focuses its investments in securities of issuers in one or more sectors (such as the financial services or telecommunications sectors), the Fund may be subjected, to a greater extent than if its investments were diversified across different sectors, to the risks of volatile economic cycles and/or conditions and developments that may be particular to that sector, such as: adverse economic, business, political, environmental or other developments.
Tracking Error Risk — Tracking error is the divergence of a Fund’s performance from that of its Index. The performance of a Fund may diverge from that of its Index for a number of reasons. Tracking error may occur because of transaction costs, a Fund’s holding of cash, differences in accrual of dividends, changes to its Index or the need to meet new or existing regulatory requirements. Unlike a Fund, the returns of an Index are not reduced by investment and other operating expenses, including the trading costs associated with implementing changes to its portfolio of investments. Tracking error risk may be heightened during times of market volatility or other unusual market conditions. The Funds are expected to deviate from their respective investment objectives in anticipation of the closing of the Reorganization. The Funds therefore may be subject to higher tracking error risk during the period leading up to the closing of the Reorganization.
Under the Trust’s organizational documents, its Trustees, officers, employees and agents are indemnified, to the extent permitted by the Act and state law, against certain liabilities that may arise out of performance of their duties to the Funds. Additionally, in the course of business, the Funds enter into contracts that contain a variety of indemnification clauses. The Funds’ maximum exposure under these arrangements is unknown, as this would involve future claims that may be made against the Funds that have not yet occurred. However, GSAM believes the risk of loss under these arrangements to be remote.
On July 27, 2020, the Trustees of the Trust, on behalf of each Fund and the Goldman Sachs Innovate Equity ETF, a newly created series of the Trust, approved an agreement and plan of reorganization pursuant to which each Fund will be reorganized into the Goldman Sachs Innovate Equity ETF (the “Reorganization”). It is currently anticipated that the Reorganization will conclude on November 6, 2020, subject to certain conditions.
Subsequent events after the Statements of Assets and Liabilities date other than noted above have been evaluated, and GSAM has concluded that there is no impact requiring adjustment or disclosure in the financial statements.
56
Report of Independent Registered Public Accounting Firm
To the Board of Trustees of Goldman Sachs ETF Trust and Shareholders of
Goldman Sachs Data-Driven World ETF (formerly known as Goldman Sachs Motif Data-Driven World ETF), Goldman Sachs Finance Reimagined ETF (formerly known as Goldman Sachs Motif Finance Reimagined ETF), Goldman Sachs Human Evolution ETF (formerly known as Goldman Sachs Motif Human Evolution ETF), Goldman Sachs Manufacturing Revolution ETF (formerly known as Goldman Sachs Motif Manufacturing Revolution ETF), and Goldman Sachs New Age Consumer ETF (formerly known as Goldman Sachs Motif New Age Consumer ETF)
Opinions on the Financial Statements
We have audited the accompanying statements of assets and liabilities, including the schedules of investments, of Goldman Sachs Data-Driven World ETF, Goldman Sachs Finance Reimagined ETF, Goldman Sachs Human Evolution ETF, Goldman Sachs Manufacturing Revolution ETF, and Goldman Sachs New Age Consumer ETF (five of the funds constituting Goldman Sachs ETF Trust, hereafter collectively referred to as the “Funds”) as of August 31, 2020, the related statements of operations for the year ended August 31, 2020, and the statements of changes in net assets and the financial highlights for the year ended August 31, 2020, and for the period March 1, 2019 (commencement of operations) through August 31, 2019, including the related notes (collectively referred to as the “financial statements”). In our opinion, the financial statements present fairly, in all material respects, the financial position of each of the Funds as of August 31, 2020, the results of each of their operations for the year ended August 31, 2020, and the changes in each of their net assets and each of the financial highlights for the year ended August 31, 2020, and for the period March 1, 2019 (commencement of operations) through August 31, 2019 in conformity with accounting principles generally accepted in the United States of America.
Basis for Opinions
These financial statements are the responsibility of the Funds’ management. Our responsibility is to express an opinion on the Funds’ financial statements based on our audits. We are a public accounting firm registered with the Public Company Accounting Oversight Board (United States) (PCAOB) and are required to be independent with respect to the Funds in accordance with the U.S. federal securities laws and the applicable rules and regulations of the Securities and Exchange Commission and the PCAOB.
We conducted our audits of these financial statements in accordance with the standards of the PCAOB. Those standards require that we plan and perform the audit to obtain reasonable assurance about whether the financial statements are free of material misstatement, whether due to error or fraud.
Our audits included performing procedures to assess the risks of material misstatement of the financial statements, whether due to error or fraud, and performing procedures that respond to those risks. Such procedures included examining, on a test basis, evidence regarding the amounts and disclosures in the financial statements. Our audits also included evaluating the accounting principles used and significant estimates made by management, as well as evaluating the overall presentation of the financial statements. Our procedures included confirmation of securities owned as of August 31, 2020 by correspondence with the custodian and transfer agent. We believe that our audits provide a reasonable basis for our opinions.
/s/ PricewaterhouseCoopers LLP
Boston, Massachusetts
October 26, 2020
We have served as the auditor of one or more investment companies in the Goldman Sachs fund complex since 2000.
57
GOLDMAN SACHS THEMATIC ETFS
Liquidity Risk Management Program (Unaudited)
Each Fund has adopted and implemented a liquidity risk management program (the “Program”) in accordance with Rule 22e-4 under the 1940 Act. The Program seeks to assess and manage each Fund’s liquidity risk, i.e., the risk that a Fund is unable to satisfy redemption requests without significantly diluting remaining investors’ interests in the Fund. The Board of Trustees of the Trust has designated GSAM, each Fund’s investment adviser, to administer the Program. Certain aspects of the Program rely on third parties to perform certain functions, including the provision of market data and application of models.
The Program is comprised of various components designed to support the assessment and/or management of liquidity risk, including: (1) the periodic assessment (no less frequently than annually) of certain factors that influence a Fund’s liquidity risk; (2) the periodic classification (no less frequently than monthly) of a Fund’s investments into one of four liquidity categories that reflect an estimate of their liquidity under current market conditions; (3) a 15% limit on the acquisition of “illiquid investments” (as defined under Rule 22e-4); (4) for a Fund that does not invest primarily in “highly liquid investments” (as defined under Rule 22e-4), the determination of a minimum percentage of the Fund’s assets that will generally be invested in highly liquid investments (a “Highly Liquid Investment Minimum”); and (5) periodic reporting to the Board of Trustees.
At a meeting of the Board of Trustees on March 18-19, 2020, GSAM provided a written report to the Board addressing the operation, and the adequacy and effectiveness of the implementation of the Program, including, as applicable, the operation of any Highly Liquid Investment Minimum and any material changes to the Program, for the initial period from December 1, 2018 through December 31, 2019 (the “Reporting Period”). Among other things, the annual report discussed: (1) the results of stress tests designed to assess liquidity under a hypothetical stressed scenario involving elevated redemptions; and (2) an assessment of the methodologies used to classify investments into one of four liquidity categories. The report concluded that the Program was reasonably designed to assess and manage liquidity risk and was adequately and effectively implemented during the Reporting Period.
There can be no assurance that the Program will achieve its objectives under all circumstances in the future. Please refer to your Fund’s prospectus for more information regarding the Fund’s exposure to liquidity risk and other risks to which it may be subject.
58
GOLDMAN SACHS ETF TRUST
Fund Expenses — Six Months ended 8/31/2020 (Unaudited)
As a shareholder you incur ongoing costs, including management fees and other Fund expenses. This example is intended to help you understand your ongoing costs (in dollars) of investing in Shares of the Funds and to compare these costs with the ongoing costs of investing in other exchange-traded funds. This example does not take into account brokerage commissions that you may pay on your purchases and sales of Shares of a Fund.
The example is based on an investment of $1,000 invested at the beginning of the period from March 1, 2020 and held for the six months ended August 31, 2020, which represents a period of 184 days of a 366 day year (or less where indicated).
Actual Expenses — The first line in the table below provides information about actual account values and actual expenses. You may use the information in this line, together with the amount you invested, to estimate the expenses that you paid over the six months. Simply divide your account value by $1,000 (for example, an $8,600 account value divided by $1,000=8.6), then multiply the result by the number in the first line under the heading entitled “Expenses Paid” to estimate the expenses you paid on your account during this period.
Hypothetical Example for Comparison Purposes — The second line in the table below provides information about hypothetical account values and hypothetical expenses based on a Fund’s actual net expense ratios and an assumed rate of return of 5% per year before expenses, which is not the Fund’s actual return. The hypothetical account values and expenses may not be used to estimate the actual ending account balance or expenses you paid for the period. You may use this information to compare the ongoing costs of investing in a Fund and other funds. To do so, compare this 5% hypothetical example with the 5% hypothetical examples that appear in the shareholder reports of the other funds.
Please note that the expenses shown in the table are meant to highlight your ongoing costs only and do not reflect any transactional costs, such as redemption fees, or exchange fees. Therefore, the second line of the table is useful in comparing ongoing costs only, and will not help you determine the relative total costs of owning different funds. In addition, if these transactional costs were included, your costs would have been higher.
| | | | | | | | | | | | | | | | | | | | | | | | | | | | | | | | | | | | |
| | | Data-Driven World ETF | | | Finance Reimagined ETF | | | Human Evolution ETF | |
| | | Beginning
Account
Value
3/1/20 | | | Ending
Account
Value
8/31/20 | | | Expenses
Paid* | | | Beginning
Account
Value
3/1/20 | | | Ending
Account
Value
8/31/20 | | | Expenses
Paid* | | | Beginning
Account
Value
3/1/20 | | | Ending
Account
Value
8/31/20 | | | Expenses
Paid* | |
Actual based on NAV | | $ | 1,000 | | | $ | 1,320.30 | | | $ | 2.92 | | | $ | 1,000 | | | $ | 1,166.40 | | | $ | 2.72 | | | $ | 1,000 | | | $ | 1,237.90 | | | $ | 2.81 | |
Hypothetical 5% return | | | 1,000 | | | | 1,022.62 | + | | | 2.54 | | | | 1,000 | | | | 1,022.62 | + | | | 2.54 | | | | 1,000 | | | | 1,022.62 | + | | | 2.54 | |
| | | | | | | | | | | | | | | | | | | | | | | | |
| | | Manufacturing Revolution ETF | | | New Age Consumer ETF | |
| | | Beginning
Account
Value
3/1/20 | | | Ending
Account
Value
8/31/20 | | | Expenses
Paid* | | | Beginning
Account
Value
3/1/20 | | | Ending
Account
Value
8/31/20 | | | Expenses
Paid* | |
Actual based on NAV | | $ | 1,000 | | | $ | 1,391.10 | | | $ | 2.91 | | | $ | 1,000 | | | $ | 1516.30 | | | $ | 3.16 | |
Hypothetical 5% return | | | 1,000 | | | | 1,022.62 | + | | | 2.54 | | | | 1,000 | | | | 1,022.62 | + | | | 2.54 | |
| + | | Hypothetical expenses are based on each Fund’s actual annualized net expense ratios and an assumed rate of return of 5% per year before expenses. |
| * | | Expenses for each Fund are calculated using the Fund’s annualized net expense ratio, which represents the ongoing expenses as a percentage of net assets for the six months ended August 31, 2020. Expenses are calculated by multiplying the annualized net expense ratio by the average account value for the period; then multiplying the result by the number of days in the most recent fiscal year; and then dividing that result by the number of days in the fiscal year. The annualized net expense ratio for the period is as follows: |
| | | | |
| Fund | | | |
Data-Driven World ETF | | | 0.50 | % |
Finance Reimagined ETF | | | 0.50 | |
Human Evolution ETF | | | 0.50 | |
Manufacturing Revolution ETF | | | 0.50 | |
New Age Consumer ETF | | | 0.50 | |
59
GOLDMAN SACHS ETF TRUST
Trustees and Officers (Unaudited) Independent Trustees
| | | | | | | | | | |
Name, Address and Age1 | | Position(s) Held with the Trust | | Term of
Office and Length of
Time Served2 | | Principal Occupation(s) During Past 5 Years | | Number of Portfolios in Fund Complex Overseen by
Trustee3 | | Other Directorships Held by Trustee4 |
| | | | | |
Lawrence W. Stranghoener Age: 66 | | Chairman of the Board of Trustees | | Trustee Since 2015; Chairman Since 2017 | | Mr. Stranghoener is retired. He is Director, Kennametal, Inc. (a global manufacturer and distributor of tooling and industrial materials) (2003-Present); and was formerly Director, Aleris Corporation and Aleris International, Inc. (a producer of aluminum rolled products) (2011-2020); Interim Chief Executive Officer (2014); and Executive Vice President and Chief Financial Officer (2004-2014), Mosaic Company (a fertilizer manufacturing company). Chairman of the Board of Trustees — Goldman Sachs ETF Trust; Goldman Sachs MLP Income Opportunities Fund; Goldman Sachs MLP and Energy Renaissance Fund; Goldman Sachs Credit Income Fund; and Goldman Sachs Real Estate Diversified Income Fund. | | 46 | | Kennametal Inc. (a global manufacturer and distributor of tooling and industrial materials) |
| | | | | |
Caroline Dorsa Age: 61 | | Trustee | | Since 2016 | | Ms. Dorsaisretired. She is Director, Biogen Inc. (a biotechnology company) (2010-Present); Director, Intellia Therapeutics Inc. (a gene-editing company) (2015-Present); and Director, Illumina, Inc. (a life sciences company) (2017- Present). She was formerly Executive Vice President and Chief Financial Officer, Public Service Enterprise Group, Inc. (a generation and energy services company) (2009-2015); Senior Vice President, Merck & Co, Inc. (a pharmaceutical company) (2008-2009 and 1987- 2007); Senior Vice President and Chief Financial Officer, Gilead Sciences, Inc. (a pharmaceutical company) (2007-2008); and Senior Vice President and Chief Financial Officer, Avaya, Inc. (a technology company) (2007). Trustee — Goldman Sachs ETF Trust; Goldman Sachs MLP Income Opportunities Fund; Goldman Sachs MLP and Energy Renaissance Fund; Goldman Sachs Credit Income Fund; and Goldman Sachs Real Estate Diversified Income Fund. | | 46 | | Biogen Inc. (a biotechnology company); Intellia Therapeutics Inc. (a gene-editing company); Illumina, Inc. (a life sciences company) |
| | | | | |
Linda A. Lang Age: 62 | | Trustee | | Since 2016 | | Ms. Lang is retired. She was formerly Chair of the Board of Directors (2016-2019), and Member of the Board of Directors, WD-40 Company (a global consumer products company) (2004–2019); Chairman and Chief Executive Officer (2005-2014); and Director, President and Chief Operating Officer, Jack in the Box, Inc. (a restaurant company) (2003-2005). Previously, Ms. Lang served as an Advisory Board Member of Goldman Sachs MLP Income Opportunities Fund and Goldman Sachs MLP and Energy Renaissance Fund (February 2016-March 2016). Trustee — Goldman Sachs ETF Trust; Goldman Sachs MLP Income Opportunities Fund; Goldman Sachs MLP and Energy Renaissance Fund; Goldman Sachs Credit Income Fund; and Goldman Sachs Real Estate Diversified Income Fund. | | 46 | | None |
| | | | | |
Michael Latham Age: 54 | | Trustee | | Since 2015 | | Mr. Latham is retired. Formerly, he held senior management positions with the iShares exchange-traded fund business, including Chairman (2011-2014); Global Head (2010-2011); U.S. Head (2007-2010); and Chief Operating Officer (2003-2007). Trustee — Goldman Sachs ETF Trust; Goldman Sachs MLP Income Opportunities Fund; Goldman Sachs MLP and Energy Renaissance Fund; Goldman Sachs Credit Income Fund; and Goldman Sachs Real Estate Diversified Income Fund. | | 46 | | None |
| | | | | | | | | | |
60
GOLDMAN SACHS ETF TRUST
Trustees and Officers (Unaudited) (continued) Interested Trustee*
| | | | | | | | | | |
Name, Address and Age1 | | Position(s) Held with the Trust | | Term of Office and
Length of
Time Served2 | | Principal Occupation(s) During Past 5 Years | | Number of
Portfolios in
Fund Complex
Overseen by
Trustee3 | | Other Directorships
Held by Trustee4 |
| | | | | |
James A. McNamara Age: 57 | | Trustee and President | | Since 2014 | | Advisory Director, Goldman Sachs (January 2018-Present); Managing Director, Goldman Sachs (January 2000-December 2017); Director of Institutional Fund Sales, GSAM (April 1998-December 2000); and Senior Vice President and Manager, Dreyfus Institutional Service Corporation (January 1993-April 1998). President and Trustee — Goldman Sachs ETF Trust; Goldman Sachs Trust; Goldman Sachs Variable Insurance Trust; Goldman Sachs Trust II; Goldman Sachs MLP Income Opportunities Fund; Goldman Sachs MLP and Energy Renaissance Fund; Goldman Sachs Credit Income Fund; and Goldman Sachs Real Estate Diversified Income Fund. | | 168 | | None |
| | | | | | | | | | |
| * | | This person is considered to be an “Interested Trustee” because he holds a position with Goldman Sachs and own securities issued by The Goldman Sachs Group, Inc. The Interested Trustee holds comparable positions with certain other companies of which Goldman Sachs, GSAM or an affiliate thereof is the investment adviser, administrator and/or distributor. |
| 1 | | Each Trustee may be contacted by writing to the Trustee, c/o Goldman Sachs, 200 West Street, New York, New York, 10282, Attn: Caroline L. Kraus. Information is provided as of August 31, 2020. |
| 2 | | Each Trustee holds office for an indefinite term until the earliest of: (a) the election of his or her successor; (b) the date the Trustee resigns, retires or is removed by the Board of Trustees or shareholders, in accordance with the Trust’s Declaration of Trust; or (c) the termination of the Trust. |
| 3 | | The Goldman Sachs Fund Complex includes certain other companies listed above for each respective Trustee. As of August 31, 2020, Goldman Sachs ETF Trust consisted of 42 portfolios (23 of which offered shares to the public); Goldman Sachs Trust consisted of 90 portfolios (89 of which offered shares to the public); Goldman Sachs Variable Insurance Trust consisted of 13 portfolios; Goldman Sachs Trust II consisted of 19 portfolios (17 of which offered shares to the public); and Goldman Sachs MLP Income Opportunities Fund, Goldman Sachs MLP and Energy Renaissance Fund, Goldman Sachs Credit Income Fund and Goldman Sachs Real Estate Diversified Income Fund each consisted of one portfolio. Goldman Sachs Credit Income Fund did not offer shares to the public. |
| 4 | | This column includes only directorships of companies required to report to the Securities and Exchange Commission under the Securities Exchange Act of 1934 (i.e., “public companies”) or other investment companies registered under the Act. |
Additional information about the Trustees is available in the Funds’ Statement of Additional Information, which can be obtained from Goldman Sachs free of charge by calling this toll-free number (in the United States of America): 1-800-621-2550.
61
GOLDMAN SACHS ETF TRUST
Trustees and Officers (Unaudited) (continued) Officers of the Trust*
| | | | | | |
| Name, Address and Age1 | | Positions Held with the Trust | | Term of Office and
Length of
Time Served2 | | Principal Occupation(s) During Past 5 Years |
| | | |
James A. McNamara 200 West Street New York, NY 10282 Age: 57 | | Trustee and President | | Since 2014 | | Advisory Director, Goldman Sachs (January 2018-Present); Managing Director, Goldman Sachs (January 2000-December 2017); Director of Institutional Fund Sales, GSAM (April 1998-December 2000); and Senior Vice President and Manager, Dreyfus Institutional Service Corporation (January 1993-April 1998). President and Trustee — Goldman Sachs ETF Trust; Goldman Sachs Trust; Goldman Sachs Variable Insurance Trust; Goldman Sachs Trust II; Goldman Sachs MLP Income Opportunities Fund; Goldman Sachs MLP and Energy Renaissance Fund; Goldman Sachs Credit Income Fund; and Goldman Sachs Real Estate Diversified Income Fund. |
| | | |
Caroline L. Kraus 200 West Street New York, NY 10282 Age: 43 | | Secretary | | Since 2014 | | Managing Director, Goldman Sachs (January 2016-Present); Vice President, Goldman Sachs (August 2006-December 2015); Senior Counsel, Goldman Sachs (January 2020–Present); Associate General Counsel, Goldman Sachs (2012-December 2019); Assistant General Counsel, Goldman Sachs (August 2006-December 2011); and Associate, Weil, Gotshal & Manges, LLP (2002-2006). Secretary — Goldman Sachs ETF Trust; Goldman Sachs Trust (previously Assistant Secretary (2012)); Goldman Sachs Variable Insurance Trust (previously Assistant Secretary (2012)); Goldman Sachs Trust II; Goldman Sachs BDC, Inc.; Goldman Sachs Private Middle Market Credit LLC; Goldman Sachs Private Middle Market Credit II LLC; Goldman Sachs Middle Market Lending Corp.; Goldman Sachs MLP Income Opportunities Fund; Goldman Sachs MLP and Energy Renaissance Fund; Goldman Sachs Credit Income Fund; and Goldman Sachs Real Estate Diversified Income Fund. |
| | | |
Joseph F. DiMaria 30 Hudson Street Jersey City, NJ 07302 Age: 52 | | Treasurer, Principal Financial Officer and Principal Accounting Officer | | Since 2017 (Treasurer and Principal Financial Officer since 2019) | | Managing Director, Goldman Sachs (November 2015-Present) and Vice President — Mutual Fund Administration, Columbia Management Investment Advisers, LLC (May 2010- October 2015). Treasurer, Principal Financial Officer and Principal Accounting Officer — Goldman Sachs ETF Trust (previously Assistant Treasurer (2017)); Goldman Sachs Trust (previously Assistant Treasurer (2016)); Goldman Sachs Variable Insurance Trust (previously Assistant Treasurer (2016)); Goldman Sachs Trust II (previously Assistant Treasurer (2017)); Goldman Sachs MLP Income Opportunities Fund (previously Assistant Treasurer (2017)); Goldman Sachs MLP and Energy Renaissance Fund (previously Assistant Treasurer (2017)); Goldman Sachs Credit Income Fund; and Goldman Sachs Real Estate Diversified Income Fund. |
| | | | | | |
| * | | Represents a partial list of officers of the Trust. Additional information about all the officers is available in the Funds’ Statement of Additional Information, which can be obtained from Goldman Sachs free of charge by calling this toll-free number (in the United States): 1-800-621-2550. |
| 1 | | Information is provided as of August 31, 2020. |
| 2 | | Officers hold office at the pleasure of the Board of Trustees or until their successors are duly elected and qualified. Each officer holds comparable positions with certain other companies of which Goldman Sachs, GSAM or an affiliate thereof is the investment adviser, administrator and/or distributor. |
Goldman Sachs ETF Trust — Goldman Sachs Thematics ETFs — Tax Information (Unaudited)
For the fiscal year ended August 31, 2020, 99.68%, 59.69 %, 13.52%, 47.95%, and 31.00% of the dividends paid from net investment company taxable income by the Goldman Sachs Data-Driven World ETF, Goldman Sachs Finance Reimagined ETF, Goldman Sachs Human Evolution ETF, Goldman Sachs Manufacturing Revolution ETF and Goldman Sachs New Age Consumer ETF, respectively, qualify for the dividends received deduction available to corporations.
For the fiscal year ended August 31, 2020, the Goldman Sachs Data-Driven World ETF, Goldman Sachs Finance Reimagined ETF, Goldman Sachs Human Evolution ETF, Goldman Sachs Manufacturing Revolution ETF and Goldman Sachs New Age Consumer ETF designate 100%, 95.41%, 100%, 100% and 100%, respectively, of the dividends paid from net investment company taxable income as qualifying for the reduced tax rate under the Jobs and Growth Tax Relief and Reconciliation Act of 2003.
62
FUNDS PROFILE
Goldman Sachs ETFs

Goldman Sachs is a premier financial services firm, known since 1869 for creating thoughtful and customized investment solutions in complex global markets.
Today, the Consumer and Investment Management Division of Goldman Sachs serves a diverse set of clients worldwide, including private institutions, public entities and individuals. With approximately $1.88 trillion in assets under supervision as of June 30, 2020, Goldman Sachs Asset Management (“GSAM”) has portfolio management teams located around the world and our investment professionals bring firsthand knowledge of local markets to every investment decision. Assets under supervision includes assets under management and other client assets for which Goldman Sachs does not have full discretion. GSAM leverages the resources of Goldman Sachs & Co. LLC subject to legal, internal and regulatory restrictions.
|
|
| GOLDMAN SACHS EXCHANGE-TRADED FUNDS |
| Goldman Sachs ActiveBeta® Emerging Markets Equity ETF |
| Goldman Sachs ActiveBeta® Europe Equity ETF |
| Goldman Sachs ActiveBeta® International Equity ETF |
| Goldman Sachs ActiveBeta® Japan Equity ETF |
| Goldman Sachs ActiveBeta® U.S. Large Cap Equity ETF |
| Goldman Sachs ActiveBeta® U.S. Small Cap Equity ETF |
| Goldman Sachs Equal Weight U.S. Large Cap Equity ETF |
| Goldman Sachs Hedge Industry VIP ETF |
| Goldman Sachs JUST U.S. Large Cap Equity ETF |
| Goldman Sachs Access U.S. Aggregate Bond ETF |
| Goldman Sachs Access High Yield Corporate Bond ETF |
| Goldman Sachs Access Inflation Protected USD Bond ETF |
Goldman Sachs Access Investment Grade Corporate Bond ETF Goldman Sachs Access Investment Grade Corporate 1-5 Year Bond ETF |
| Goldman Sachs Access Treasury 0-1 Year ETF |
| Goldman Sachs Access Ultra Short Bond ETF |
| Goldman Sachs Data-Driven World ETF |
| Goldman Sachs Finance Reimagined ETF |
| Goldman Sachs Human Evolution ETF |
| Goldman Sachs Manufacturing Revolution ETF |
Goldman Sachs New Age Consumer ETF Goldman Sachs MarketBeta International Equity ETF Goldman Sachs MarketBeta Emerging Markets Equity ETF Goldman Sachs MarketBeta U.S. Equity ETF |
INDEX DISCLAIMERS
GOLDMAN SACHS ASSET MANAGEMENT, L.P., THE GOLDMAN SACHS GROUP, INC., AND GOLDMAN SACHS & CO. LLC (COLLECTIVELY, “GOLDMAN SACHS”) DOES NOT GUARANTEE NOR MAKE ANY REPRESENTATION OR WARRANTY, EXPRESS OR IMPLIED, TO THE OWNERS OR SHAREHOLDERS OF THE FUNDS OR ANY MEMBER OF THE PUBLIC REGARDING THE ADVISABILITY OF INVESTING IN SECURITIES GENERALLY OR IN THE FUNDS PARTICULARLY OR THE ABILITY OF THE INDEXES TO TRACK GENERAL MARKET PERFORMANCE. GOLDMAN SACHS, IN ITS CAPACITY AS THE INDEX PROVIDER OF THE INDEXES, LICENSES CERTAIN TRADEMARKS AND TRADE NAMES TO THE FUNDS. GOLDMAN SACHS HAS NO OBLIGATION TO TAKE THE NEEDS OF THE FUNDS OR THE SHAREHOLDERS OF THE FUNDS INTO CONSIDERATION IN DETERMINING, COMPOSING OR CALCULATING THE INDEXES. GOLDMAN SACHS, ITS AFFILIATES AND ANY OF ITS CLIENTS MAY HOLD LONG OR SHORT POSITIONS IN SECURITIES HELD BY THE FUNDS OR IN RELATED DERIVATIVES, INCLUDING THOSE LINKED TO THE INDEXES. GOLDMAN SACHS DOES NOT GUARANTEE THE ADEQUACY, TIMELINESS, ACCURACY AND/OR THE COMPLETENESS OF THE INDEXES OR ANY DATA RELATED THERETO. GOLDMAN SACHS HEREBY EXPRESSLY DISCLAIMS ANY AND ALL LIABILITY FOR ANY ERRORS, OMISSIONS, OR INTERRUPTIONS THEREIN OR IN THE CALCULATION THEREOF. GOLDMAN SACHS MAKES NO WARRANTY, EXPRESS OR IMPLIED, AND EXPRESSLY DISCLAIMS ALL WARRANTIES OF MERCHANTABILITY OR FITNESS FOR A PARTICULAR PURPOSE OR USE WITH RESPECT TO THE MARKS, THE INDEXES OR ANY DATA INCLUDED THEREIN AS TO THE RESULTS TO BE OBTAINED BY THE FUNDS, THE SHAREHOLDERS, OR ANY OTHER PERSON OR ENTITY FROM USE OF THE INDEXES OR ANY DATA INCLUDED THEREIN. WITHOUT LIMITING ANY OF THE FOREGOING, GOLDMAN SACHS HEREBY EXPRESSLY DISCLAIMS ANY AND ALL LIABILITY FOR ANY SPECIAL, PUNITIVE, INDIRECT, OR CONSEQUENTIAL DAMAGES (INCLUDING LOST PROFITS), EVEN IF ADVISED OF THE POSSIBILITY OF SUCH DAMAGES.
| | |
TRUSTEES Lawrence W. Stranghoener, Chairman Caroline Dorsa Linda A. Lang Michael Latham James A. McNamara | | OFFICERS James A. McNamara, President Joseph F. DiMaria, Principal Financial Officer, Principal Accounting Officer and Treasurer Caroline L. Kraus, Secretary |
| |
THE BANK OF NEW YORK MELLON Transfer Agent | | |
| |
ALPS DISTRIBUTORS, INC. Distributor | | GOLDMAN SACHS ASSET MANAGEMENT, L.P. Investment Adviser |
Visit our Website at www.GSAMFUNDS.com/ETFs to obtain the most recent month-end returns.
Goldman Sachs Asset Management, L.P., 200 West Street, New York, New York 10282
The Funds are recently or newly organized and have limited operating history.
The reports concerning the Funds included in this shareholder report may contain certain forward-looking statements about the factors that may affect the performance of the Funds in the future. These statements are based on Fund management’s predictions and expectations concerning certain future events and their expected impact on the Funds, such as performance of the economy as a whole and of specific industry sectors, changes in the levels of interest rates, the impact of developing world events, and other factors that may influence the future performance of the Funds. Management believes these forward-looking statements to be reasonable, although they are inherently uncertain and difficult to predict. Actual events may cause adjustments in portfolio management strategies from those currently expected to be employed.
A description of the policies and procedures that the Funds use to determine how to vote proxies relating to portfolio securities and information regarding how a Fund voted proxies relating to portfolio securities during the most recent 12-month period ended June 30 is available (i) without charge, upon request by calling 1-800-621-2550; and (ii) on the Securities and Exchange Commission (“SEC”) web site at http://www.sec.gov.
The Funds will file portfolio holdings information for each month in a fiscal quarter within 60 days after the end of the relevant fiscal quarter on the Form N-PORT. Portfolio holdings information for the third month of each fiscal quarter will be made available on the SEC’s web site at http://www.sec.gov. Portfolio holdings information may be obtained upon request and without charge by calling 1-800-621-2550.
Fund holdings and allocations shown are as of August 31, 2020 and may not be representative of future investments. Fund holdings should not be relied on in making investment decisions and should not be construed as research or investment advice regarding particular securities. Current and future holdings are subject to risk.
Economic and market forecasts presented herein reflect our judgment as of the date of this presentation and are subject to change without notice. These forecasts do not take into account the specific investment objectives, restrictions, tax and financial situation or other needs of any specific client. Actual data will vary and may not be reflected here. These forecasts are subject to high levels of uncertainty that may affect actual performance. Accordingly, these forecasts should be viewed as merely representative of a broad range of possible outcomes. These forecasts are estimated, based on assumptions, and are subject to significant revision and may change materially as economic and market conditions change. Goldman Sachs has no obligation to provide updates or changes to these forecasts. Case studies and examples are for illustrative purposes only.
ETF Fund shares are not individually redeemable and are issued and redeemed by the Fund at their net asset value (“NAV”) only in large, specified blocks of shares called creation units. Shares otherwise can be bought and sold only through exchange trading at market price (not NAV). Shares may trade at a premium or discount to their NAV in the secondary market. Brokerage commissions will reduce returns. Ordinary brokerage commissions apply.
The Funds are recently or newly organized and have limited operating history. Economic and market forecasts presented herein reflect our judgment as of the date of this presentation and are subject to change without notice. These forecasts do not take into account the specific investment objectives, restrictions, tax and financial situation or other needs of any specific client. Actual data will vary and may not be reflected here. These forecasts are subject to high levels of uncertainty that may affect actual performance. Accordingly, these forecasts should be viewed as merely representative of a broad range of possible outcomes. These forecasts are estimated, based on assumptions, and are subject to significant revision and may change materially as economic and market conditions change. Goldman Sachs has no obligation to provide updates or changes to these forecasts. Case studies and examples are for illustrative purposes only.
This material is not authorized for distribution to prospective investors unless preceded or accompanied by a current Prospectus or summary prospectus, if applicable. Investors should consider a Fund’s objective, risks, and charges and expenses, and read the summary prospectus, if available, and/or the Prospectus carefully before investing or sending money. The summary prospectus, if available, and the Prospectus contain this and other information about a Fund and may be obtained from your authorized dealer or from Goldman Sachs & Co. LLC by calling 1-800-621-2550.
ALPS Distributors, Inc. is the distributor of the Goldman Sachs ETF Funds. ALPS Distributors, Inc. is unaffiliated with Goldman Sachs Asset Management.
© 2020 Goldman Sachs. All rights reserved. 218109-OTU-10/2020 TECHETFAR-20
Goldman Sachs Funds

| | | | |
| | |
| Annual Report | | | | August 31, 2020 |
| | |
| | | | Goldman Sachs MarketBeta ETFs |
| | | | MarketBeta® Emerging Markets Equity ETF (GSEE) |
| | | | MarketBeta® International Equity ETF (GSID) |
| | | | MarketBeta® U.S. Equity ETF (GSUS) |
It is our intention that beginning on January 1, 2021, paper copies of the Funds’ annual and semi-annual shareholder reports will no longer be sent by mail, unless you specifically request paper copies of the reports from your financial intermediary. Instead, the reports will be made available on a website, and you will be notified by mail each time a report is posted and provided with a website link to access the report.
If you already elected to receive shareholder reports electronically, you will not be affected by this change and you need not take any action. At any time, you may elect to receive reports and certain communications from a Fund electronically by contacting your financial intermediary.
You may elect to receive all future shareholder reports in paper free of charge. You can inform your financial intermediary that you wish to receive paper copies of reports by contacting your financial intermediary. Your election to receive reports in paper will apply to all Goldman Sachs Funds held in your account.
MarketBeta® is a registered trademark of GSAM.

Goldman Sachs MarketBeta® ETFs
| | | | |
| | | |
| NOT FDIC-INSURED | | May Lose Value | | No Bank Guarantee |
INVESTMENT PROCESS
Goldman Sachs MarketBeta® Equity ETFs
Principal Investment Strategies
The investment objective of each of the MarketBeta Emerging Markets Equity ETF, MarketBeta International Equity ETF and MarketBeta U.S. Equity ETF (each, a “Fund”), is to seek to provide investment results that closely correspond, before fees and expenses, to the performance of its respective underlying index (each, an “Index”).
Each Fund seeks to achieve its investment objective by investing at least 80% of its assets (exclusive of collateral held from securities lending) in securities included in its underlying index, in depositary receipts representing securities included in its underlying index and in underlying stocks in respect of depositary receipts included in its underlying index.
MarketBeta Emerging Markets Equity ETF
The Solactive GBS Emerging Markets Large & Mid Cap Index (the “Index”). consists of equity securities of large and mid-capitalization issuers covering approximately the largest 85% of the free-float market capitalization in emerging markets. It is calculated as a net total return index in U.S. dollars and weighted by free-float market capitalization.
As of March 31, 2020, the Index consisted of 1,328 securities with a market capitalization range of between approximately $0.1 billion and $1,601.6 billion, and an average market capitalization of approximately $13.1 billion from issuers in the following emerging market countries: Argentina, Brazil, Chile, China, Colombia, the Czech Republic, Egypt, Greece, Hungary, India, Indonesia, Malaysia, Mexico, Pakistan, Peru, the Philippines, Poland, Qatar, Russia, South Africa, South Korea, Taiwan, Thailand, Turkey and the United Arab Emirates. The components of the Index may change over time. The percentage of the portfolio exposed to any asset class, country or geographic region will vary from time to time as the weightings of the securities within the Index change, and the Fund may not be invested in each asset class, country or geographic region at all times. Solactive AG (“Solactive” or the “Index Provider”) will generally deem an issuer to be located in an emerging market country if it is organized under the laws of the emerging market country and it is primarily listed in the emerging market country; in the event that these factors point to more than one country, the Index methodology provides for consideration of certain additional factors. The Index is reconstituted on a semi-annual basis in May and November. New securities from initial public offerings are also added on a semi-annual basis in February and August, subject to fulfillment of certain eligibility criteria.
Given the Fund’s investment objective of attempting to track the Index, the Fund does not follow traditional methods of active investment management, which may involve buying and selling securities based upon analysis of economic and market factors.
MarketBeta International Equity ETF
The Solactive GBS Developed Markets ex North America Large & Mid Cap Index (the “Index”) consists of equity securities of large and mid-capitalization issuers covering approximately the largest 85% of the free-float market capitalization in developed markets excluding North America. It is calculated as a net total return index in U.S. dollars and weighted by free-float market capitalization.
As of March 31, 2020, the Index consisted of 962 securities with a market capitalization range of between approximately $0.3 billion and $306.4 billion, and an average market capitalization of approximately $16.7 billion from issuers in the following developed market countries: Australia, Austria, Belgium, Denmark, Finland, France, Germany, Hong Kong, Ireland, Israel, Italy, Japan, the Netherlands, New Zealand, Norway, Portugal, Singapore, Spain, Sweden, Switzerland and the United Kingdom. The components of the Index may change over time. The percentage of the portfolio exposed to any asset class, country or geographic region will vary from time to time as the weightings of the securities within the Index change, and the Fund may not be invested in each asset class, country or geographic region at all times. Solactive AG (“Solactive” or the “Index Provider”) will generally deem an issuer to be located in a developed market country if it is organized under the laws of the developed market country and it is primarily listed in the developed market country; in the event that these factors point to more than one country, the Index methodology provides for consideration of certain additional factors. The Index is reconstituted on a semi-annual basis in May and November. New securities from initial public offerings are also added on a semi-annual basis in February and August, subject to fulfillment of certain eligibility criteria.
1
INVESTMENT PROCESS
Given the Fund’s investment objective of attempting to track the Index, the Fund does not follow traditional methods of active investment management, which may involve buying and selling securities based upon analysis of economic and market factors.
MarketBeta U.S. Equity ETF
The Solactive GBS United States Large & Mid Cap Index (the “Index”) consists of equity securities of large and mid-capitalization equity issuers covering approximately the largest 85% of the free-float market capitalization in the United States. It is calculated as a total return index in U.S. dollars and weighted by free-float market capitalization.
As of March 31, 2020, the Index consisted of 541 securities with a market capitalization range of between approximately $1.6 billion and $1,199.5 billion, and an average market capitalization of approximately $45.6 billion. The components of the Index may change over time. The percentage of the portfolio exposed to any asset class will vary from time to time as the weightings of the securities within the Index change, and the Fund may not be invested in each asset class at all times. Solactive AG (“Solactive” or the “Index Provider”) will deem an issuer to be a U.S. issuer if it is organized under the laws of the U.S. and it is primarily listed in the U.S.; in the event that these factors point to more than one country, the Index methodology provides for consideration of certain additional factors. The Index is reconstituted on a semi-annual basis in May and November. New securities from initial public offerings are also added on a semi-annual basis in February and August, subject to fulfillment of certain eligibility criteria.
Given the Fund’s investment objective of attempting to track the Index, the Fund does not follow traditional methods of active investment management, which may involve buying and selling securities based upon analysis of economic and market factors.
All Above Funds
Each Fund seeks to invest in the respective Index components in approximately the same weighting that such components have within the respective Index at the applicable time. However, under various circumstances, it may not be possible or practicable to purchase all of the securities in the respective Index in the approximate respective Index weight. In these circumstances, the Fund may purchase a sample of securities in the respective Index. There may also be instances in which the Investment Adviser may choose to underweight or overweight a security in each Fund’s Index, purchase securities not in each Fund’s Index that the Investment Adviser believes are appropriate to substitute for certain securities in such Index or utilize various combinations of other available investment techniques.
Each Index is owned and calculated by Solactive.
Each Fund is classified as “diversified” under the Investment Company Act of 1940, as amended (the “Investment Company Act”). However, each Fund may become “non-diversified” solely as a result of a change in the relative market capitalization or index weighting of one or more constituents of the respective Index. A non-diversified fund may invest a larger percentage of its assets in fewer issuers than diversified funds.
Each Fund may concentrate its investments (i.e., hold more than 25% of its total assets) in a particular industry or group of industries to the extent that the respective Index is concentrated. The degree to which components of the respective Index represent certain sectors or industries may change over time.
* * *
At the end of the Reporting Period, i.e. August 31, 2020, we maintained conviction in our principal investment strategies, as each Fund continues to seek to provide efficient and diversified access to approximately 85% of the broad equity market represented by each respective Index in one portfolio.
2
PORTFOLIO RESULTS
Goldman Sachs MarketBeta® Emerging Markets Equity ETF
Investment Objective
The Goldman Sachs MarketBeta Emerging Markets Equity ETF (the “Fund”) seeks to provide investment results that closely correspond, before fees and expenses, to the performance of the Solactive GBS Emerging Markets Large & Mid Cap Index (the “Index”).
Portfolio Management Discussion and Analysis
Below, the Goldman Sachs Quantitative Investment Strategies Team discusses the Fund’s performance and positioning for the period since it commenced operations on May 12, 2020 through August 31, 2020 (the “Reporting Period”).
| Q | | How did the Fund perform during the Reporting Period? |
| A | | During the Reporting Period, the Fund returned 21.54% based on net asset value (“NAV”) and 22.13% based on market price. The Index returned 22.06% during the same period. |
| | The Fund had a NAV of $39.60 per share on the date of inception and ended the Reporting Period with a NAV of $48.15 per share. The Fund’s market price on August 31, 2020 was $48.36 per share. |
| Q | | What key factors were responsible for the Fund’s performance during the Reporting Period? |
| A | | The Fund seeks to provide investment results that closely correspond, before fees and expenses, to the performance of the Index. The Fund’s performance reflects Fund expenses, including management fees and brokerage expenses. The Fund’s relative performance also reflects the impact of any cash held in the Fund as well as any other differences between the Fund’s holdings and the constituents of the Index. The Index is unmanaged, and Index returns do not reflect fees and expenses, which would reduce returns. |
| | | Given the Fund’s investment objective of attempting to track the Index, the Fund does not follow traditional methods of active investment management, which may involve buying and selling securities based upon analysis of economic and market factors. The Fund does not follow a strategy of seeking to outperform the Index. |
| Q | | Which sectors and countries contributed most to the Index’s performance during the Reporting Period, and which contributed least? |
| A | | Index constituents in the consumer discretionary, information technology and communication services sectors contributed most positively to the Index’s results during the Reporting Period. Index constituents in the utilities, real estate and industrials sectors contributed least to the Index’s results during the Reporting Period. |
| | From a country perspective, Index constituents in China, Taiwan and South Korea contributed most to the Index’s results during the Reporting Period. Conversely, Index constituents in Peru, Panama and Turkey contributed least to the Index’s results during the Reporting Period. |
| Q | | Which individual stock positions contributed the most to the Index’s returns during the Reporting Period? |
| A | | Positions in China-based consumer discretionary company Alibaba Group Holding, Taiwan-based information technology company Taiwan Semiconductor Manufacturing and China-based communication services company Tencent Holdings contributed most positively (8.99%, 6.12% and 6.86% of Fund net assets as of August 31, 2020, respectively). Each of these holdings posted a robust double-digit positive return within the Index during the Reporting Period. |
| Q | | Which individual stock positions contributed the least to the Index’s results during the Reporting Period? |
| A | | Positions in Chinese financials companies Industrial & Commercial Bank of China and China Construction Bank and in South Korean information technology company SK Hynix contributed least (0.04%, 0.01% and 0.00%1 of Fund net assets as of August 31, 2020, respectively). Each of these holdings posted a single-digit negative return within the Index during the Reporting Period. |
| | 1 | | Some weights are 0.00% at August 31, 2020 either because those positions were eliminated during the most recent rebalance given the Index construction methodology or were not held at all during the Reporting Period. |
3
PORTFOLIO RESULTS
| Q | | How did the Fund use derivatives and similar instruments during the Reporting Period? |
| A | | The Fund does not employ derivatives as a source of alpha generation, although it did use index futures to equitize excess cash. The use of futures was not material to the performance of the fund. |
| Q | | What was the Fund’s sector positioning relative to the Index at the end of the Reporting Period?2 |
| | | | | | | | | | |
| | | |
| | | Sector Name | | Fund2 | | | Solactive
Index | |
| | Financials | | | 17.33 | % | | | 18.98 | % |
| | Information Technology | | | 17.66 | | | | 17.44 | |
| | Consumer Discretionary | | | 19.34 | | | | 18.36 | |
| | Communication Services | | | 14.11 | | | | 13.74 | |
| | Materials | | | 6.82 | | | | 6.75 | |
| | Energy | | | 6.14 | | | | 6.29 | |
| | Consumer Staples | | | 5.96 | | | | 6.05 | |
| | Industrials | | | 4.81 | | | | 4.56 | |
| | Health Care | | | 3.92 | | | | 3.73 | |
| | Real Estate | | | 2.07 | | | | 2.22 | |
| | | Utilities | | | 1.84 | | | | 1.89 | |
| Q | | What was the Fund’s country positioning relative to the Index at the end of the Reporting Period?2 |
| | | | | | | | | | |
| | | |
| | | Country Name | | Fund3 | | | Solactive
Index | |
| | China | | | 39.86 | % | | | 40.96 | % |
| | Taiwan | | | 13.58 | | | | 13.03 | |
| | South Korea | | | 11.03 | | | | 10.92 | |
| | India | | | 8.50 | | | | 8.28 | |
| | Brazil | | | 5.77 | | | | 5.46 | |
| | South Africa | | | 3.39 | | | | 3.22 | |
| | Saudi Arabia | | | 3.13 | | | | 2.96 | |
| | Russia | | | 2.62 | | | | 3.25 | |
| | Indonesia | | | 1.53 | | | | 1.44 | |
| | Malaysia | | | 1.29 | | | | 1.22 | |
| | Mexico | | | 1.61 | | | | 1.73 | |
| | Kuwait | | | 0.76 | | | | 0.71 | |
| | United Arab Emirates | | | 0.72 | | | | 0.68 | |
| | Qatar | | | 0.89 | | | | 0.85 | |
| | Philippines | | | 0.74 | | | | 0.70 | |
| | Argentina | | | 0.18 | | | | 0.17 | |
| | Greece | | | 0.22 | | | | 0.21 | |
| | Colombia | | | 0.20 | | | | 0.19 | |
| | Chile | | | 0.61 | | | | 0.58 | |
| | Hungary | | | 0.23 | | | | 0.22 | |
| | Czech Republic | | | 0.11 | | | | 0.10 | |
| | Thailand | | | 1.99 | | | | 2.16 | |
| | Luxembourg | | | 0.05 | | | | 0.05 | |
| | Pakistan | | | 0.06 | | | | 0.06 | |
| | Egypt | | | 0.16 | | | | 0.15 | |
| | Singapore | | | 0.03 | | | | 0.03 | |
| | Turkey | | | 0.56 | | | | 0.53 | |
| | Panama | | | 0.03 | | | | 0.03 | |
| | | Peru | | | 0.14 | | | | 0.13 | |
| | 2 | | Country and sector classifications for securities may differ between the above listing and the Schedule of Investments due to differing classification methodologies. The classification methodology used for the above listing is as set forth by Solactive. The Fund’s composition may differ over time. Consequently, the Fund’s overall sector allocations may differ from percentages contained in the chart above. The percentage shown for each investment category reflects the value of investments in that category as a percentage of market value (excluding investment in the securities lending reinvestment vehicle, if any). Underlying sector allocation of exchange-traded funds held by the Fund are not reflected in the chart above. Investments in the securities lending vehicle represented 0.6% of the Fund’s net assets as of August 31, 2020. Figures above may not sum to 100% due to rounding. |
| | 3 | | The Fund seeks to provide investment results that closely correspond, before fees and expenses, to the performance of the Solactive GBS Emerging Markets Large & Mid Cap Index. |
4
FUND BASICS
MarketBeta® Emerging Markets Equity ETF
as of August 31, 2020
| | | | | | |
| | FUND SNAPSHOT | |
| | |
| | | As of August 31, 2020 | | | |
| | |
| | Market Price1 | | $ | 48.36 | |
| | | Net Asset Value (NAV)1 | | $ | 48.15 | |
| 1 | | The Market Price is the price at which the Fund’s shares are trading on the NYSE Arca, Inc. The Market Price of the Fund’s shares will fluctuate and, at the time of sale, shares may be worth more or less than the original investment or the Fund’s then current net asset value (“NAV”). The NAV is the market value of one share of the Fund. This amount is derived by dividing the total value of all the securities in the Fund’s portfolio, plus other assets, less any liabilities, by the number of Fund shares outstanding. Fund shares are not individually redeemable and are issued and redeemed by the Fund at their NAV only in large, specified blocks of shares called creation units. Shares otherwise can be bought and sold only through exchange trading at market price (not NAV). Shares may trade at a premium or discount to their NAV in the secondary market. Information regarding how often shares of each Fund traded on NYSE Arca at a price above (i.e., at a premium) or below (i.e., at a discount) the NAV of the Fund can be found at www.GSAMFUNDS.com/ETFs. |
| | | | | | | | | | |
| | TOP 10 HOLDINGS AS OF 8/31/202 |
| | | | |
| | | Holding | | % of Net Assets | | | Line of Business | | Country |
| | | | |
| | Alibaba Group Holding Ltd. ADR | | | 8.5 | % | | Consumer Discretionary | | China |
| | | | |
| | Tencent Holdings Ltd. | | | 6.5 | | | Communication Services | | China |
| | | | |
| | Taiwan Semiconductor Manufacturing Co. Ltd. | | | 5.8 | | | Information Technology | | Taiwan |
| | | | |
| | Samsung Electronics Co. Ltd. | | | 3.5 | | | Information Technology | | South Korea |
| | | | |
| | Reliance Industries Ltd. | | | 1.4 | | | Energy | | India |
| | | | |
| | Meituan Dianping, Class B | | | 1.2 | | | Consumer Discretionary | | China |
| | | | |
| | iShares MSCI Malaysia ETF | | | 1.2 | | | Exchange-Traded Fund | | United States |
| | | | |
| | Naspers Ltd., Class N | | | 1.2 | | | Consumer Discretionary | | South Africa |
| | | | |
| | JD.com, Inc. ADR | | | 1.2 | | | Consumer Discretionary | | China |
| | | Ping An Insurance Group Co. of China Ltd., Class H | | | 1.0 | | | Financials | | China |
| 2 | | The top 10 holdings may not be representative of the Fund’s future investments. |
For more information about the Fund, please refer to www.GSAMFUNDS.com/ETFs. There, you can learn more about the Fund’s investment strategies, holdings, and performance.
5
MARKETBETA® EMERGING MARKETS EQUITY ETF
Performance Summary
August 31, 2020
| | |
| Average Annual Total Return through August 31, 2020* | | Since Inception |
Shares based on NAV (Commenced May 12, 2020) | | 21.54% |
|
Shares based on Market Price (Commenced May 12, 2020) | | 22.13% |
|
| * | | Total return for periods of less than one year represents cumulative total return. Total returns are calculated assuming purchase of a share at the market price or NAV on the first day and sale of a share at the market price or NAV on the last day of each period reported. The Total Returns based on NAV and Market Price assume the reinvestment of dividends and do not reflect brokerage commissions in connection with the purchase or sale of Fund shares, which if included would lower the performance shown above. The NAV used in the Total Return calculations assumes all management fees incurred by the Fund. Market Price returns are based upon the last trade as of 4:00 pm EST and do not reflect the returns you would receive if you traded shares at other times. The first day of secondary market trading is typically several days after the date on which the Fund commenced investment operations; therefore, the NAV of the Fund is used as a proxy for the period from inception of investment operations to the first day of secondary market trading to calculate the Market Price returns. Total returns for periods less than one full year are not annualized. |
The returns set forth above represent past performance. Past performance does not guarantee future results. The Fund’s NAV and investment return may fluctuate. These fluctuations may cause an investor’s shares to be worth more or less than their original cost. Current performance may be lower or higher than the performance quoted above. Please visit our web site at www.GSAMFUNDS.com/ETFs to obtain the most recent month-end returns.
6
PORTFOLIO RESULTS
Goldman Sachs MarketBeta® International Equity ETF
Investment Objective
The Goldman Sachs MarketBeta International Equity ETF (the “Fund”) seeks to provide investment results that closely correspond, before fees and expenses, to the performance of the Solactive GBS Developed Markets ex North America Large & Mid Cap Index (the “Index”).
Portfolio Management Discussion and Analysis
Below, the Goldman Sachs Quantitative Investment Strategies Team discusses the Fund’s performance and positioning for the period since it commenced operations on May 12, 2020 through August 31, 2020 (the “Reporting Period”).
| Q | | How did the Fund perform during the Reporting Period? |
| A | | During the Reporting Period, the Fund returned 16.57% based on net asset value (“NAV”) and 16.65% based on market price. The Index returned 16.50% during the same period. |
| | The Fund had a NAV of $40.14 per share on the date of inception and ended the Reporting Period with a NAV of $46.79 per share. The Fund’s market price on August 31, 2020 was $46.82 per share. |
| Q | | What key factors were responsible for the Fund’s performance during the Reporting Period? |
| A | | The Fund seeks to provide investment results that closely correspond, before fees and expenses, to the performance of the Index. The Fund’s performance reflects Fund expenses, including management fees and brokerage expenses. The Fund’s relative performance also reflects the impact of any cash held in the Fund as well as any other differences between the Fund’s holdings and the constituents of the Index. The Index is unmanaged, and Index returns do not reflect fees and expenses, which would reduce returns. |
| | | Given the Fund’s investment objective of attempting to track the Index, the Fund does not follow traditional methods of active investment management, which may involve buying and selling securities based upon analysis of economic and market factors. The Fund does not follow a strategy of seeking to outperform the Index. |
| Q | | Which sectors and countries contributed most positively to the Index’s performance during the Reporting Period, and which contributed least? |
| A | | Index constituents in the industrials, financials and consumer discretionary sectors contributed most to the Index’s results during the Reporting Period. Index constituents in the energy, real estate and utilities sectors contributed least to the Index’s results during the Reporting Period. |
| | From a country perspective, Index constituents in Japan, Germany and France contributed most to the Fund’s results during the Reporting Period. Index constituents in Faroe Islands, Colombia and Macao contributed least to the Fund’s results during the Reporting Period. |
| Q | | Which individual stock positions contributed the most to the Index’s returns during the Reporting Period? |
| A | | Positions in German information technology company SAP, German industrials company Siemens and Switzerland-based consumer staples company Nestle contributed most (1.20%, 0.80% and 2.48% of Fund net assets as of August 31, 2020, respectively). SAP and Siemens each generated a double-digit positive return within the Index during the Reporting Period; Nestle posted a single-digit positive return within the Index during the Reporting Period. |
| Q | | Which individual stock positions contributed the least to the Index’s results during the Reporting Period? |
| A | | Positions in U.K. financials firm HSBC Holdings, German information technology company Wirecard and U.K. consumer staples company British American Tobacco contributed least (0.64%, 0.00%1 and 0.78% of Fund net assets as of August 31, 2020, respectively). Each of these holdings posted a double-digit negative return within the Index during the Reporting Period. |
| | 1 | | Some weights are 0.00% at August 31, 2020 either because those positions were taken out during the most recent rebalance given the Fund’s index construction methodology or because they were not components of the Index during the Reporting Period. |
7
PORTFOLIO RESULTS
| Q | | How did the Fund use derivatives and similar instruments during the Reporting Period? |
| | The Fund did not invest in derivatives or similar instruments during the Reporting Period. The Fund does not employ derivatives as a source of alpha generation, although it may use them to equitize excess cash. |
| Q | | What was the Fund’s sector positioning relative to the Index at the end of the Reporting Period?2 |
| | | | | | | | | | |
| | | |
| | | Sector Name | | Fund3 | | | Solactive
Index | |
| | Financials | | | 16.08 | % | | | 16.09 | % |
| | Industrials | | | 15.43 | | | | 15.49 | |
| | Health Care | | | 13.83 | | | | 13.82 | |
| | Consumer Staples | | | 11.39 | | | | 11.38 | |
| | Consumer Discretionary | | | 11.38 | | | | 11.49 | |
| | Information Technology | | | 8.27 | | | | 8.26 | |
| | Materials | | | 7.59 | | | | 7.58 | |
| | Communication Services | | | 5.56 | | | | 5.56 | |
| | Utilities | | | 3.89 | | | | 3.89 | |
| | Energy | | | 3.23 | | | | 3.23 | |
| | | Real Estate | | | 3.22 | | | | 3.20 | |
| Q | | What was the Fund’s country positioning relative to the Index at the end of the Reporting Period?2 |
| | | | | | | | | | |
| | | |
| | | Country Name | | Fund3 | | | Solactive
Index | |
| | | |
| | Japan | | | 25.96 | % | | | 25.96 | % |
| | Germany | | | 8.72 | | | | 8.72 | |
| | France | | | 8.85 | | | | 8.85 | |
| | Australia | | | 6.98 | | | | 7.00 | |
| | Netherlands | | | 4.87 | | | | 5.11 | |
| | UK | | | 13.40 | | | | 13.28 | |
| | Switzerland | | | 9.44 | | | | 9.29 | |
| | Sweden | | | 3.48 | | | | 3.47 | |
| | Denmark | | | 2.24 | | | | 2.23 | |
| | Italy | | | 2.01 | | | | 2.01 | |
| | Hong Kong | | | 3.22 | | | | 3.22 | |
| | Finland | | | 1.39 | | | | 1.39 | |
| | Spain | | | 2.24 | | | | 2.27 | |
| | Ireland | | | 0.99 | | | | 1.00 | |
| | Norway | | | 0.77 | | | | 0.77 | |
| | Belgium | | | 0.99 | | | | 0.99 | |
| | Jersey | | | 0.73 | | | | 0.73 | |
| | Israel | | | 0.79 | | | | 0.79 | |
| | New Zealand | | | 0.48 | | | | 0.48 | |
| | Singapore | | | 1.18 | | | | 1.18 | |
| | Poland | | | 0.28 | | | | 0.28 | |
| | Austria | | | 0.29 | | | | 0.29 | |
| | China | | | 0.32 | | | | 0.32 | |
| | Portugal | | | 0.16 | | | | 0.16 | |
| | Luxembourg | | | 0.09 | | | | 0.09 | |
| | Macao | | | 0.10 | | | | 0.10 | |
| | Colombia | | | 0.02 | | | | 0.02 | |
| | | Faroe Islands | | | 0.02 | | | | 0.02 | |
| | 2 | | Country and sector classifications for securities may differ between the above listing and the Schedule of Investments due to differing classification methodologies. The classification methodology used for the above listing is as set forth by Solactive. The Fund’s composition may differ over time. Consequently, the Fund’s overall sector allocations may differ from percentages contained in the chart above. The percentage shown for each investment category reflects the value of investments in that category as a percentage of market value (excluding investment in the securities lending reinvestment vehicle, if any). Underlying sector allocation of exchange-traded funds held by the Fund are not reflected in the chart above. Investments in the securities lending vehicle represented 0.1% of the Fund’s net assets as of August 31, 2020. Figures above may not sum to 100% due to rounding. |
| | 3 | | The Fund seeks to provide investment results that closely correspond, before fees and expenses, to the performance of the Solactive GBS Developed Markets ex North America Large & Mid Cap Index. |
8
FUND BASICS
MarketBeta® International Equity ETF
as of August 31, 2020
| | | | | | |
| | FUND SNAPSHOT | | | | |
| | |
| | | As of August 31, 2020 | | | |
| | |
| | Market Price1 | | $ | 46.82 | |
| | | Net Asset Value (NAV)1 | | $ | 46.79 | |
| 1 | | The Market Price is the price at which the Fund’s shares are trading on the NYSE Arca, Inc. The Market Price of the Fund’s shares will fluctuate and, at the time of sale, shares may be worth more or less than the original investment or the Fund’s then current net asset value (“NAV”). The NAV is the market value of one share of the Fund. This amount is derived by dividing the total value of all the securities in the Fund’s portfolio, plus other assets, less any liabilities, by the number of Fund shares outstanding. Fund shares are not individually redeemable and are issued and redeemed by the Fund at their NAV only in large, specified blocks of shares called creation units. Shares otherwise can be bought and sold only through exchange trading at market price (not NAV). Shares may trade at a premium or discount to their NAV in the secondary market. Information regarding how often shares of each Fund traded on NYSE Arca at a price above (i.e., at a premium) or below (i.e., at a discount) the NAV of the Fund can be found at www.GSAMFUNDS.com/ETFs. |
| | | | | | | | | | |
| | TOP 10 HOLDINGS AS OF 8/31/202 |
| | | | |
| | | Holding | | % of Net Assets | | | Line of Business | | Country |
| | | | |
| | Nestle SA | | | 2.5 | % | | Consumer Staples | | Switzerland |
| | Roche Holding AG | | | 1.8 | | | Health Care | | Switzerland |
| | Novartis AG | | | 1.4 | | | Health Care | | Switzerland |
| | | | |
| | SAP SE | | | 1.2 | | | Information Technology | | Germany |
| | ASML Holding NV | | | 1.1 | | | Information Technology | | Netherlands |
| | Toyota Motor Corp. | | | 1.1 | | | Consumer Discretionary | | Japan |
| | AstraZeneca PLC | | | 1.0 | | | Health Care | | United Kingdom |
| | | | |
| | AIA Group Ltd. | | | 0.9 | | | Financials | | Hong Kong |
| | LVMH Moet Hennessy Louis Vuitton SE | | | 0.9 | | | Consumer Discretionary | | France |
| | | Siemens AG | | | 0.8 | | | Industrials | | Germany |
| 2 | | The top 10 holdings may not be representative of the Fund’s future investments. |
For more information about the Fund, please refer to www.GSAMFUNDS.com/ETFs. There, you can learn more about the Fund’s investment strategies, holdings, and performance.
9
MARKETBETA® INTERNATIONAL EQUITY ETF
Performance Summary
August 31, 2020
| | |
| Average Annual Total Return through August 31, 2020* | | Since Inception |
Shares based on NAV (Commenced May 12, 2020) | | 16.57% |
|
Shares based on Market Price (Commenced May 12, 2020) | | 16.65% |
|
| * | | Total return for periods of less than one year represents cumulative total return. Total returns are calculated assuming purchase of a share at the market price or NAV on the first day and sale of a share at the market price or NAV on the last day of each period reported. The Total Returns based on NAV and Market Price assume the reinvestment of dividends and do not reflect brokerage commissions in connection with the purchase or sale of Fund shares, which if included would lower the performance shown above. The NAV used in the Total Return calculations assumes all management fees incurred by the Fund. Market Price returns are based upon the last trade as of 4:00 pm EST and do not reflect the returns you would receive if you traded shares at other times. The first day of secondary market trading is typically several days after the date on which the Fund commenced investment operations; therefore, the NAV of the Fund is used as a proxy for the period from inception of investment operations to the first day of secondary market trading to calculate the Market Price returns. Total returns for periods less than one full year are not annualized. |
The returns set forth above represent past performance. Past performance does not guarantee future results. The Fund’s NAV and investment return may fluctuate. These fluctuations may cause an investor’s shares to be worth more or less than their original cost. Current performance may be lower or higher than the performance quoted above. Please visit our web site at www.GSAMFUNDS.com/ETFs to obtain the most recent month-end returns.
10
PORTFOLIO RESULTS
Goldman Sachs MarketBeta® U.S. Equity ETF
Investment Objective
The Goldman Sachs MarketBeta U.S. Equity ETF (the “Fund”) seeks to provide investment results that closely correspond, before fees and expenses, to the performance of the Solactive GBS United States Large & Mid Cap Index (the “Index”).
Portfolio Management Discussion and Analysis
Below, the Goldman Sachs Quantitative Investment Strategies Team discusses the Fund’s performance and positioning for the period since it commenced operations on May 12, 2020 through August 31, 2020 (the “Reporting Period”).
| Q | | How did the Fund perform during the Reporting Period? |
| A | | During the Reporting Period, the Fund returned 24.03% based on net asset value (“NAV”) and 24.21% based on market price. The Index returned 24.10% during the same period. |
| | The Fund had a NAV of $39.20 per share on the date of inception and ended the Reporting Period with a NAV of $48.62 per share. The Fund’s market price on August 31, 2020 was $48.69 per share. |
| Q | | What key factors were responsible for the Fund’s performance during the Reporting Period? |
| A | | The Fund seeks to provide investment results that closely correspond, before fees and expenses, to the performance of the Index. The Fund’s performance reflects Fund expenses, including management fees and brokerage expenses. The Fund’s relative performance also reflects the impact of any cash held in the Fund as well as any other differences between the Fund’s holdings and the constituents of the Index. The Index is unmanaged, and Index returns do not reflect fees and expenses, which would reduce returns. |
| | | Given the Fund’s investment objective of attempting to track the Index, the Fund does not follow traditional methods of active investment management, which may involve buying and selling securities based upon analysis of economic and market factors. The Fund does not follow a strategy of seeking to outperform the Index. |
| Q | | Which sectors contributed most positively to the Index’s relative performance during the Reporting Period, and which contributed least? |
| A | | Index constituents in the information technology, consumer discretionary and communication services sectors contributed most to the Index’s results during the Reporting Period. Index constituents in the energy, utilities and real estate sectors contributed least to the Index’s results during the Reporting Period. |
| Q | | Which individual stock positions contributed the most to the Index’s returns during the Reporting Period? |
| A | | Positions in information technology giant Apple, e-commerce retailing leader Amazon.com and software leader Microsoft contributed most (7.50%, 4.89% and 5.66% of Fund net assets as of August 31, 2020, respectively). Each of these holdings posted a double-digit positive return within the Index during the Reporting Period. |
| Q | | Which individual stock positions contributed the least to the Index’s results during the Reporting Period? |
| A | | Positions in semiconductor bellwether Intel, integrated oil company Exxon Mobil and biopharmaceutical company Gilead Sciences contributed least (0.72%, 0.57% and 0.28% of Fund net assets as of August 31, 2020, respectively). Each of these holdings generated a negative return within the Index during the Reporting Period. |
| Q | | How did the Fund use derivatives and similar instruments during the Reporting Period? |
| A | | The Fund did not invest in derivatives or similar instruments during the Reporting Period. The Fund does not employ derivatives as a source of alpha generation, although it may use them to equitize excess cash. |
11
PORTFOLIO RESULTS
| Q | | What was the Fund’s sector positioning relative to the Index at the end of the Reporting Period?1 |
| | | | | | | | | | |
| | | |
| | | Sector Name | | Fund2 | | | Solactive
Index | |
| | Information Technology | | | 29.28 | % | | | 29.26 | % |
| | Health Care | | | 13.64 | | | | 13.64 | |
| | Consumer Discretionary | | | 12.61 | | | | 12.61 | |
| | Communication Services | | | 11.10 | | | | 11.10 | |
| | Financials | | | 9.17 | | | | 9.16 | |
| | Industrials | | | 7.78 | | | | 7.78 | |
| | Consumer Staples | | | 6.66 | | | | 6.66 | |
| | Utilities | | | 2.71 | | | | 2.71 | |
| | Real Estate | | | 2.58 | | | | 2.58 | |
| | Energy | | | 2.13 | | | | 2.16 | |
| | | Materials | | | 2.34 | | | | 2.33 | |
| | 1 | | Sector classifications for securities may differ between the above listing and the Schedule of Investments due to differing classification methodologies. The classification methodology used for the above listing is as set forth by Solactive. The Fund’s composition may differ over time. Consequently, the Fund’s overall sector allocations may differ from percentages contained in the chart above. The percentage shown for each investment category reflects the value of investments in that category as a percentage of market value (excluding investment in the securities lending reinvestment vehicle, if any). Underlying sector allocation of exchange-traded funds held by the Fund are not reflected in the chart above. Investments in the securities lending vehicle represented 0.1% of the Fund’s net assets as of August 31, 2020. Figures above may not sum to 100% due to rounding. |
| | 2 | | The Fund seeks to provide investment results that closely correspond, before fees and expenses, to the performance of the Solactive GBS United States Large & Mid Cap Index. |
12
FUND BASICS
MarketBeta® U.S. Equity ETF
as of August 31, 2020
| | | | | | |
| | FUND SNAPSHOT | |
| |
| | | As of August 31, 2020 | |
| | |
| | Market Price1 | | $ | 48.69 | |
| | | Net Asset Value (NAV)1 | | $ | 48.62 | |
| 1 | | The Market Price is the price at which the Fund’s shares are trading on the NYSE Arca, Inc. The Market Price of the Fund’s shares will fluctuate and, at the time of sale, shares may be worth more or less than the original investment or the Fund’s then current net asset value (“NAV”). The NAV is the market value of one share of the Fund. This amount is derived by dividing the total value of all the securities in the Fund’s portfolio, plus other assets, less any liabilities, by the number of Fund shares outstanding. Fund shares are not individually redeemable and are issued and redeemed by the Fund at their NAV only in large, specified blocks of shares called creation units. Shares otherwise can be bought and sold only through exchange trading at market price (not NAV). Shares may trade at a premium or discount to their NAV in the secondary market. Information regarding how often shares of each Fund traded on NYSE Arca at a price above (i.e., at a premium) or below (i.e., at a discount) the NAV of the Fund can be found at www.GSAMFUNDS.com/ETFs. |
| | | | | | | | | | |
| | TOP 10 HOLDINGS AS OF 8/31/202 |
| | | | |
| | | Holding | | % of Net Assets | | | Line of Business | | Country |
| | | | |
| | Apple, Inc. | | | 7.5 | % | | Information Technology | | United States |
| | Microsoft Corp. | | | 5.6 | | | Information Technology | | United States |
| | Amazon.com, Inc. | | | 4.9 | | | Consumer Discretionary | | United States |
| | | | |
| | Facebook, Inc., Class A | | | 2.4 | | | Communication Services | | United States |
| | Alphabet, Inc., Class A | | | 1.6 | | | Communication Services | | United States |
| | Alphabet, Inc., Class C | | | 1.6 | | | Communication Services | | United States |
| | Johnson & Johnson | | | 1.4 | | | Health Care | | United States |
| | | | |
| | Tesla, Inc. | | | 1.2 | | | Consumer Discretionary | | United States |
| | Visa, Inc., Class A | | | 1.2 | | | Information Technology | | United States |
| | | Procter & Gamble Co. (The) | | | 1.1 | | | Consumer Staples | | United States |
| 2 | | The top 10 holdings may not be representative of the Fund’s future investments. |
For more information about the Fund, please refer to www.GSAMFUNDS.com/ETFs. There, you can learn more about the Fund’s investment strategies, holdings, and performance.
13
MARKETBETA® U.S. EQUITY ETF
Performance Summary
August 31, 2020
| | |
| Average Annual Total Return through August 31, 2020* | | Since Inception |
Shares based on NAV (Commenced May 12, 2020) | | 24.03% |
|
Shares based on Market Price (Commenced May 12, 2020) | | 24.21% |
|
| * | | Total return for periods of less than one year represents cumulative total return. Total returns are calculated assuming purchase of a share at the market price or NAV on the first day and sale of a share at the market price or NAV on the last day of each period reported. The Total Returns based on NAV and Market Price assume the reinvestment of dividends and do not reflect brokerage commissions in connection with the purchase or sale of Fund shares, which if included would lower the performance shown above. The NAV used in the Total Return calculations assumes all management fees incurred by the Fund. Market Price returns are based upon the last trade as of 4:00 pm EST and do not reflect the returns you would receive if you traded shares at other times. The first day of secondary market trading is typically several days after the date on which the Fund commenced investment operations; therefore, the NAV of the Fund is used as a proxy for the period from inception of investment operations to the first day of secondary market trading to calculate the Market Price returns. Total returns for periods less than one full year are not annualized. |
The returns set forth above represent past performance. Past performance does not guarantee future results. The Fund’s NAV and investment return may fluctuate. These fluctuations may cause an investor’s shares to be worth more or less than their original cost. Current performance may be lower or higher than the performance quoted above. Please visit our web site at www.GSAMFUNDS.com/ETFs to obtain the most recent month-end returns.
14
FUND BASICS
Index Definitions and Industry Terms
Book Value: The total value of the company’s assets that shareholders would theoretically receive if a company were liquidated.
Free Cash Flow: A measure of financial performance calculated as operating cash flow minus capital expenditures.
Alpha: The excess returns of a fund relative to the return of a benchmark index is the fund’s alpha.
The Solactive GBS Emerging Markets Large & Mid Cap Index, Solactive GBS Developed Markets ex North America Small Cap Index, and Solactive GBS United States Large & Mid Cap Index (the, “Solactive Indexes”) are calculated and published by Solactive AG. Solactive AG uses its best efforts to ensure that the Solactive Indexes are calculated correctly. Irrespective of its obligations towards the Funds, Solactive AG has no obligation to point out errors in the Solactive Indexes to third parties including but not limited to investors and/or financial intermediaries of the Funds. Neither publication of the Solactive Indexes by Solactive AG nor the licensing of the Solactive Indexes or Index trade mark for the purpose of use in connection with a Fund constitutes a recommendation by Solactive AG to invest capital in said fund nor does it in any way represent an assurance or opinion of Solactive AG with regard to any investment in this fund. Solactive AG is registered as a benchmark administrator under the Regulation (EU) 2016/2011 (BMR). Solactive appears on the ESMA register of administrators.
15
GOLDMAN SACHS MARKETBETA EMERGING MARKETS EQUITY ETF
Schedule of Investments
August 31, 2020
| | | | | | | | |
| Shares | | | Description | |
Value | |
| |
| Common Stocks – 91.6% | | | |
| Argentina – 0.2% | | | |
| | 148 | | | Banco Macro SA ADR (Financials)* | | $ | 2,805 | |
| | 243 | | | Globant SA (Information Technology)* | | | 43,152 | |
| | 404 | | | Grupo Financiero Galicia SA ADR (Financials)* | | | 4,173 | |
| | 348 | | | Pampa Energia SA ADR (Utilities)* | | | 3,999 | |
| | 426 | | | Telecom Argentina SA ADR (Communication Services) | | | 2,880 | |
| | 192 | | | Transportadora de Gas del Sur SA ADR (Energy)* | | | 902 | |
| | 1,221 | | | YPF SA ADR (Energy)* | | | 6,813 | |
| | | | | | | | |
| | | | | | | 64,724 | |
| | |
| Brazil – 4.1% | | | |
| | 27,975 | | | Ambev SA (Consumer Staples) | | | 62,774 | |
| | 2,458 | | | Atacadao SA (Consumer Staples) | | | 8,760 | |
| | 1,364 | | | B2W Cia Digital (Consumer Discretionary)* | | | 27,870 | |
| | 13,028 | | | B3 SA – Brasil Bolsa Balcao (Financials) | | | 139,639 | |
| | 8,139 | | | Banco Bradesco SA (Financials) | | | 28,233 | |
| | 1,767 | | | Banco BTG Pactual SA (Financials) | | | 25,874 | |
| | 5,477 | | | Banco do Brasil SA (Financials) | | | 32,597 | |
| | 2,418 | | | Banco Santander Brasil SA (Financials) | | | 12,465 | |
| | 4,297 | | | BB Seguridade Participacoes SA (Financials) | | | 20,663 | |
| | 4,409 | | | BRF SA (Consumer Staples)* | | | 15,744 | |
| | 7,299 | | | CCR SA (Industrials) | | | 17,736 | |
| | 2,578 | | | Centrais Eletricas Brasileiras SA (Utilities) | | | 16,687 | |
| | 1,003 | | | Cia Brasileira de Distribuicao (Consumer Staples) | | | 11,612 | |
| | 2,163 | | | Cia de Saneamento Basico do Estado de Sao Paulo (Utilities) | | | 18,827 | |
| | 1,227 | | | Cia Energetica de Minas Gerais (Utilities) | | | 2,360 | |
| | 4,089 | | | Cia Siderurgica Nacional SA (Materials) | | | 11,337 | |
| | 7,120 | | | Cielo SA (Information Technology) | | | 5,918 | |
| | 11,901 | | | Cogna Educacao (Consumer Discretionary) | | | 12,365 | |
| | 979 | | | Cosan SA (Energy) | | | 14,857 | |
| | 1,195 | | | CPFL Energia SA (Utilities) | | | 6,260 | |
| | 1,607 | | | Energisa SA (Utilities) | | | 12,728 | |
| | 1,619 | | | Engie Brasil Energia SA (Utilities) | | | 12,581 | |
| | 6,432 | | | Equatorial Energia SA (Utilities) | | | 27,201 | |
| | 1,379 | | | Hapvida Participacoes e Investimentos SA (Health Care)(a) | | | 16,271 | |
| | 2,518 | | | Hypera SA (Health Care) | | | 14,527 | |
| | 5,749 | | | IRB Brasil Resseguros SA (Financials) | | | 7,472 | |
| | 2,870 | | | Itau Unibanco Holding SA (Financials) | | | 11,802 | |
| | 4,537 | | | Klabin SA (Materials) | | | 21,255 | |
| | 3,770 | | | Localiza Rent a Car SA (Industrials) | | | 33,144 | |
| | 1,179 | | | Lojas Americanas SA (Consumer Discretionary) | | | 5,884 | |
| | 5,045 | | | Lojas Renner SA (Consumer Discretionary) | | | 39,976 | |
| | 783 | | | M Dias Branco SA (Consumer Staples) | | | 5,068 | |
| | 4,221 | | | Magazine Luiza SA (Consumer Discretionary) | | | 71,726 | |
| | 1,719 | | | Multiplan Empreendimentos Imobiliarios SA (Real Estate) | | | 6,524 | |
| | |
| |
| Common Stocks – (continued) | | | |
| Brazil – (continued) | | | |
| | 5,076 | | | Natura & Co. Holding SA (Consumer Staples) | | | 45,653 | |
| | 1,523 | | | Neoenergia SA (Utilities) | | | 5,175 | |
| | 3,058 | | | Notre Dame Intermedica Participacoes SA (Health Care) | | | 41,306 | |
| | 1,143 | | | Pagseguro Digital Ltd., Class A (Information Technology)* | | | 48,166 | |
| | 4,615 | | | Petrobras Distribuidora SA (Consumer Discretionary) | | | 17,952 | |
| | 23,498 | | | Petroleo Brasileiro SA (Energy) | | | 95,604 | |
| | 599 | | | Porto Seguro SA (Financials) | | | 5,772 | |
| | 1,463 | | | Raia Drogasil SA (Consumer Staples) | | | 28,749 | |
| | 6,708 | | | Rumo SA (Industrials)* | | | 27,635 | |
| | 891 | | | StoneCo Ltd., Class A (Information Technology)* | | | 45,441 | |
| | 4,057 | | | Suzano SA (Materials)* | | | 37,125 | |
| | 5,149 | | | TIM Participacoes SA (Communication Services) | | | 13,441 | |
| | 5,393 | | | Ultrapar Participacoes SA (Energy) | | | 19,111 | |
| | 24,641 | | | Vale SA (Materials) | | | 268,064 | |
| | 4,729 | | | WEG SA (Industrials) | | | 55,704 | |
| | 717 | | | XP, Inc., Class A (Financials)* | | | 35,413 | |
| | | | | | | | |
| | | | | | | 1,569,048 | |
| | |
| Chile – 0.5% | | | |
| | 284,472 | | | Banco de Chile (Financials) | | | 23,838 | |
| | 353 | | | Banco de Credito e Inversiones SA (Financials) | | | 11,151 | |
| | 358,175 | | | Banco Santander Chile (Financials) | | | 13,808 | |
| | 8,795 | | | Cencosud SA (Consumer Staples) | | | 13,041 | |
| | 10,861 | | | Cencosud Shopping SA (Real Estate) | | | 16,260 | |
| | 943 | | | Cia Cervecerias Unidas SA (Consumer Staples) | | | 6,214 | |
| | 46,069 | | | Colbun SA (Utilities) | | | 7,128 | |
| | 867 | | | Empresa Nacional de Telecomunicaciones SA (Communication Services) | | | 5,261 | |
| | 7,355 | | | Empresas CMPC SA (Materials) | | | 15,316 | |
| | 2,506 | | | Empresas COPEC SA (Energy) | | | 18,421 | |
| | 168,784 | | | Enel Americas SA (Utilities) | | | 24,346 | |
| | 147,624 | | | Enel Chile SA (Utilities) | | | 11,383 | |
| | 6,692 | | | Falabella SA (Consumer Discretionary) | | | 21,140 | |
| | 1,459 | | | Latam Airlines Group SA (Industrials)* | | | 2,467 | |
| | 4,777 | | | Plaza SA (Real Estate) | | | 7,638 | |
| | | | | | | | |
| | | | | | | 197,412 | |
| | |
| China – 37.7% | | | |
| | 1,519 | | | 360 Security Technology, Inc., Class A (Information Technology) | | | 4,143 | |
| | 6,628 | | | 3SBio, Inc. (Health Care)*(a) | | | 7,782 | |
| | 184 | | | 51job, Inc. ADR (Industrials)* | | | 12,059 | |
| | 723 | | | 58.com, Inc. ADR (Communication Services)* | | | 40,025 | |
| | 4,073 | | | AAC Technologies Holdings, Inc. (Information Technology) | | | 25,699 | |
| | 240 | | | ADAMA Ltd., Class A (Materials) | | | 325 | |
| | |
| | |
| 16 | | The accompanying notes are an integral part of these financial statements. |
GOLDMAN SACHS MARKETBETA EMERGING MARKETS EQUITY ETF
| | | | | | | | |
| Shares | | | Description | |
Value | |
| |
| Common Stocks – (continued) | | | |
| China – (continued) | | | |
| | 799 | | | AECC Aviation Power Co. Ltd., Class A (Industrials) | | $ | 5,208 | |
| | 6,240 | | | Agile Group Holdings Ltd. (Real Estate) | | | 8,615 | |
| | 18,389 | | | Agricultural Bank of China Ltd., Class A (Financials) | | | 8,618 | |
| | 1,451 | | | Aier Eye Hospital Group Co. Ltd., Class A (Health Care) | | | 11,010 | |
| | 2,159 | | | Air China Ltd., Class A (Industrials) | | | 2,285 | |
| | 10,857 | | | Air China Ltd., Class H (Industrials) | | | 7,481 | |
| | 715 | | | Airtac International Group (Industrials) | | | 15,864 | |
| | 639 | | | Aisino Corp., Class A (Information Technology) | | | 1,680 | |
| | 11,402 | | | Alibaba Group Holding Ltd. ADR (Consumer Discretionary)* | | | 3,272,716 | |
| | 2,626 | | | A-Living Services Co. Ltd., Class H (Industrials)(a) | | | 13,553 | |
| | 4,957 | | | Aluminum Corp. of China Ltd., Class A (Materials)* | | | 2,287 | |
| | 24,082 | | | Aluminum Corp. of China Ltd., Class H (Materials)* | | | 5,904 | |
| | 1,839 | | | Angang Steel Co. Ltd., Class A (Materials) | | | 722 | |
| | 8,986 | | | Angang Steel Co. Ltd., Class H (Materials) | | | 2,597 | |
| | 1,439 | | | Anhui Conch Cement Co. Ltd., Class A (Materials) | | | 12,797 | |
| | 7,531 | | | Anhui Conch Cement Co. Ltd., Class H (Materials) | | | 54,611 | |
| | 372 | | | Anhui Gujing Distillery Co. Ltd., Class A (Consumer Staples) | | | 14,032 | |
| | 160 | | | Anhui Kouzi Distillery Co. Ltd., Class A (Consumer Staples) | | | 1,404 | |
| | 6,624 | | | ANTA Sports Products Ltd. (Consumer Discretionary) | | | 65,427 | |
| | 80 | | | Asymchem Laboratories Tianjin Co. Ltd., Class A (Health Care) | | | 3,200 | |
| | 80 | | | Autobio Diagnostics Co. Ltd., Class A (Health Care) | | | 1,883 | |
| | 360 | | | Autohome, Inc. ADR (Communication Services) | | | 28,886 | |
| | 320 | | | Avary Holding Shenzhen Co. Ltd., Class A (Information Technology) | | | 2,285 | |
| | 1,039 | | | AVIC Aircraft Co. Ltd., Class A (Industrials) | | | 3,671 | |
| | 3,358 | | | Avic Capital Co. Ltd., Class A (Financials) | | | 2,466 | |
| | 400 | | | AVIC Jonhon Optronic Technology Co. Ltd., Class A (Information Technology) | | | 2,821 | |
| | 320 | | | AVIC Shenyang Aircraft Co. Ltd., Class A (Industrials) | | | 2,759 | |
| | 10,542 | | | BAIC Motor Corp. Ltd., Class H (Consumer Discretionary)(a) | | | 5,046 | |
| | 1,723 | | | Baidu, Inc. ADR (Communication Services)* | | | 214,634 | |
| | 8,075 | | | Bank of Beijing Co. Ltd., Class A (Financials) | | | 5,742 | |
| | 1,359 | | | Bank of Chengdu Co. Ltd., Class A (Financials) | | | 2,016 | |
| | 14,311 | | | Bank of China Ltd., Class A (Financials) | | | 6,853 | |
| | |
| |
| Common Stocks – (continued) | | | |
| China – (continued) | | | |
| | 14,951 | | | Bank of Communications Co. Ltd., Class A (Financials) | | | 10,325 | |
| | 46,260 | | | Bank of Communications Co. Ltd., Class H (Financials) | | | 24,174 | |
| | 1,919 | | | Bank of Hangzhou Co. Ltd., Class A (Financials) | | | 3,628 | |
| | 4,397 | | | Bank of Jiangsu Co. Ltd., Class A (Financials) | | | 4,121 | |
| | 3,198 | | | Bank of Nanjing Co. Ltd., Class A (Financials) | | | 4,011 | |
| | 2,279 | | | Bank of Ningbo Co. Ltd., Class A (Financials) | | | 11,812 | |
| | 5,357 | | | Bank of Shanghai Co. Ltd., Class A (Financials) | | | 6,586 | |
| | 1,846 | | | Bank of Zhengzhou Co. Ltd., Class A (Financials) | | | 1,030 | |
| | 6,457 | | | Baoshan Iron & Steel Co. Ltd., Class A (Materials) | | | 4,657 | |
| | 3,118 | | | BBMG Corp., Class A (Materials) | | | 1,502 | |
| | 13,560 | | | BBMG Corp., Class H (Materials) | | | 2,852 | |
| | 336 | | | BeiGene Ltd. ADR (Health Care)* | | | 81,168 | |
| | 1,599 | | | Beijing Dabeinong Technology Group Co. Ltd., Class A (Consumer Staples) | | | 2,654 | |
| | 3,054 | | | Beijing Enterprises Holdings Ltd. (Utilities) | | | 9,713 | |
| | 29,790 | | | Beijing Enterprises Water Group Ltd. (Utilities)* | | | 11,724 | |
| | 639 | | | Beijing New Building Materials PLC, Class A (Industrials) | | | 3,060 | |
| | 559 | | | Beijing Oriental Yuhong Waterproof Technology Co. Ltd., Class A (Materials) | | | 4,892 | |
| | 1,199 | | | Beijing Originwater Technology Co. Ltd., Class A (Industrials) | | | 1,703 | |
| | 240 | | | Beijing Shiji Information Technology Co. Ltd., Class A (Information Technology) | | | 1,153 | |
| | 240 | | | Beijing Shunxin Agriculture Co. Ltd., Class A (Consumer Staples) | | | 2,637 | |
| | 559 | | | Beijing Sinnet Technology Co. Ltd., Class A (Information Technology) | | | 2,151 | |
| | 480 | | | Beijing Tiantan Biological Products Corp. Ltd., Class A (Health Care) | | | 2,967 | |
| | 480 | | | Beijing Tongrentang Co. Ltd., Class A (Health Care) | | | 2,081 | |
| | 80 | | | BGI Genomics Co. Ltd., Class A (Health Care) | | | 1,711 | |
| | 1,265 | | | Bilibili, Inc. ADR (Communication Services)* | | | 59,771 | |
| | 16,790 | | | BOE Technology Group Co. Ltd., Class A (Information Technology) | | | 13,483 | |
| | 19,670 | | | Brilliance China Automotive Holdings Ltd. (Consumer Discretionary) | | | 17,614 | |
| | 639 | | | BYD Co. Ltd., Class A (Consumer Discretionary) | | | 7,930 | |
| | 4,393 | | | BYD Co. Ltd., Class H (Consumer Discretionary)(b) | | | 43,646 | |
| | 559 | | | By-health Co. Ltd., Class A (Consumer Staples) | | | 2,002 | |
| | |
| | |
| The accompanying notes are an integral part of these financial statements. | | 17 |
GOLDMAN SACHS MARKETBETA EMERGING MARKETS EQUITY ETF
Schedule of Investments (continued)
August 31, 2020
| | | | | | | | |
| Shares | | | Description | |
Value | |
| |
| Common Stocks – (continued) | | | |
| China – (continued) | | | |
| | 1,359 | | | Caitong Securities Co. Ltd., Class A (Financials) | | $ | 2,889 | |
| | 5,037 | | | CGN Power Co. Ltd., Class A (Utilities) | | | 2,214 | |
| | 64,570 | | | CGN Power Co. Ltd., Class H (Utilities)(a) | | | 13,997 | |
| | 100 | | | Changchun High & New Technology Industry Group, Inc., Class A (Health Care) | | | 6,827 | |
| | 2,079 | | | Changjiang Securities Co. Ltd., Class A (Financials) | | | 2,589 | |
| | 639 | | | Chaozhou Three-Circle Group Co. Ltd., Class A (Information Technology) | | | 2,610 | |
| | 240 | | | Chengdu Kanghong Pharmaceutical Group Co. Ltd., Class A (Health Care) | | | 1,693 | |
| | 76 | | | China Biologic Products Holdings, Inc. (Health Care)* | | | 8,022 | |
| | 74,248 | | | China Cinda Asset Management Co. Ltd., Class H (Financials) | | | 14,179 | |
| | 1,759 | | | China CITIC Bank Corp. Ltd., Class A (Financials) | | | 1,341 | |
| | 58,869 | | | China CITIC Bank Corp. Ltd., Class H (Financials) | | | 24,611 | |
| | 1,279 | | | China Coal Energy Co. Ltd., Class A (Energy) | | | 764 | |
| | 13,332 | | | China Coal Energy Co. Ltd., Class H (Energy) | | | 3,354 | |
| | 1,679 | | | China Communications Construction Co. Ltd., Class A (Industrials) | | | 1,949 | |
| | 28,195 | | | China Communications Construction Co. Ltd., Class H (Industrials) | | | 15,825 | |
| | 15,227 | | | China Communications Services Corp. Ltd., Class H (Industrials) | | | 10,000 | |
| | 9,586 | | | China Conch Venture Holdings Ltd. (Industrials) | | | 41,559 | |
| | 3,598 | | | China Construction Bank Corp., Class A (Financials) | | | 3,257 | |
| | 639 | | | China CSSC Holdings Ltd., Class A (Industrials)* | | | 1,949 | |
| | 3,118 | | | China Eastern Airlines Corp. Ltd., Class A (Industrials) | | | 2,299 | |
| | 8,423 | | | China Eastern Airlines Corp. Ltd., Class H (Industrials) | | | 3,478 | |
| | 14,311 | | | China Everbright Bank Co. Ltd., Class A (Financials) | | | 8,023 | |
| | 46,488 | | | China Everbright Bank Co. Ltd., Class H (Financials) | | | 16,675 | |
| | 23,498 | | | China Everbright International Ltd. (Industrials) | | | 14,189 | |
| | 11,125 | | | China Evergrande Group (Real Estate)(b) | | | 25,982 | |
| | 8,331 | | | China Feihe Ltd. (Consumer Staples)(a) | | | 16,877 | |
| | 559 | | | China Film Co. Ltd., Class A (Communication Services) | | | 1,226 | |
| | 1,454 | | | China Fortune Land Development Co. Ltd., Class A (Real Estate) | | | 3,566 | |
| | 1,279 | | | China Galaxy Securities Co. Ltd., Class A (Financials) | | | 2,530 | |
| | 23,506 | | | China Galaxy Securities Co. Ltd., Class H (Financials) | | | 14,164 | |
| | |
| |
| Common Stocks – (continued) | | | |
| China – (continued) | | | |
| | 1,759 | | | China Gezhouba Group Co. Ltd., Class A (Industrials) | | | 1,633 | |
| | 639 | | | China Great Wall Securities Co. Ltd., Class A (Financials) | | | 1,300 | |
| | 1,119 | | | China Greatwall Technology Group Co. Ltd., Class A (Information Technology) | | | 2,893 | |
| | 15,830 | | | China Hongqiao Group Ltd. (Materials) | | | 10,213 | |
| | 42,686 | | | China Huarong Asset Management Co. Ltd., Class H (Financials)(a) | | | 4,902 | |
| | 9,882 | | | China International Capital Corp. Ltd., Class H (Financials)*(a) | | | 23,487 | |
| | 559 | | | China International Marine Containers Group Co. Ltd., Class A (Industrials) | | | 715 | |
| | 2,894 | | | China International Marine Containers Group Co. Ltd., Class H (Industrials) | | | 2,950 | |
| | 37,306 | | | China Jinmao Holdings Group Ltd. (Real Estate) | | | 23,346 | |
| | 1,279 | | | China Jushi Co. Ltd., Class A (Materials) | | | 2,773 | |
| | 719 | | | China Life Insurance Co. Ltd., Class A (Financials) | | | 4,585 | |
| | 47,388 | | | China Life Insurance Co. Ltd., Class H (Financials) | | | 115,441 | |
| | 1,439 | | | China Literature Ltd. (Communication Services)*(a) | | | 8,940 | |
| | 20,004 | | | China Longyuan Power Group Corp. Ltd., Class H (Utilities) | | | 12,622 | |
| | 17,066 | | | China Mengniu Dairy Co. Ltd. (Consumer Staples)* | | | 83,897 | |
| | 7,835 | | | China Merchants Bank Co. Ltd., Class A (Financials) | | | 43,115 | |
| | 26,192 | | | China Merchants Bank Co. Ltd., Class H (Financials) | | | 125,043 | |
| | 2,238 | | | China Merchants Energy Shipping Co. Ltd., Class A (Energy) | | | 2,111 | |
| | 8,023 | | | China Merchants Port Holdings Co. Ltd. (Industrials) | | | 9,182 | |
| | 2,179 | | | China Merchants Securities Co. Ltd., Class A (Financials)* | | | 6,856 | |
| | 1,019 | | | China Merchants Securities Co. Ltd., Class H (Financials)*(a) | | | 1,315 | |
| | 2,318 | | | China Merchants Shekou Industrial Zone Holdings Co. Ltd., Class A (Real Estate) | | | 5,652 | |
| | 13,512 | | | China Minsheng Banking Corp. Ltd., Class A (Financials) | | | 10,949 | |
| | 44,745 | | | China Minsheng Banking Corp. Ltd., Class H (Financials) | | | 27,251 | |
| | 35,398 | | | China Mobile Ltd. (Communication Services) | | | 247,324 | |
| | 6,716 | | | China Molybdenum Co. Ltd., Class A (Materials) | | | 4,197 | |
| | 23,118 | | | China Molybdenum Co. Ltd., Class H (Materials) | | | 9,396 | |
| | 24,637 | | | China National Building Material Co. Ltd., Class H (Materials) | | | 34,650 | |
| | 1,839 | | | China National Chemical Engineering Co. Ltd., Class A (Industrials) | | | 1,573 | |
| | |
| | |
| 18 | | The accompanying notes are an integral part of these financial statements. |
GOLDMAN SACHS MARKETBETA EMERGING MARKETS EQUITY ETF
| | | | | | | | |
| Shares | | | Description | |
Value | |
| |
| Common Stocks – (continued) | | | |
| China – (continued) | | | |
| | 4,477 | | | China National Nuclear Power Co. Ltd., Class A (Utilities) | | $ | 3,046 | |
| | 160 | | | China National Software & Service Co. Ltd., Class A (Information Technology) | | | 2,309 | |
| | 1,359 | | | China Northern Rare Earth Group High-Tech Co. Ltd., Class A (Materials)* | | | 2,450 | |
| | 400 | | | China Oilfield Services Ltd., Class A (Energy) | | | 771 | |
| | 11,537 | | | China Oilfield Services Ltd., Class H (Energy) | | | 9,066 | |
| | 2,518 | | | China Pacific Insurance Group Co. Ltd., Class A (Financials) | | | 11,331 | |
| | 17,673 | | | China Pacific Insurance Group Co. Ltd., Class H (Financials) | | | 49,141 | |
| | 8,555 | | | China Petroleum & Chemical Corp., Class A (Energy) | | | 5,034 | |
| | 158,199 | | | China Petroleum & Chemical Corp., Class H (Energy) | | | 73,076 | |
| | 4,397 | | | China Railway Construction Corp. Ltd., Class A (Industrials) | | | 5,733 | |
| | 12,021 | | | China Railway Construction Corp. Ltd., Class H (Industrials) | | | 9,244 | |
| | 7,196 | | | China Railway Group Ltd., Class A (Industrials) | | | 5,884 | |
| | 24,673 | | | China Railway Group Ltd., Class H (Industrials) | | | 12,671 | |
| | 9,674 | | | China Railway Signal & Communication Corp. Ltd., Class H (Information Technology)(a) | | | 3,919 | |
| | 39,576 | | | China Reinsurance Group Corp., Class H (Financials) | | | 4,238 | |
| | 9,029 | | | China Resources Beer Holdings Co. Ltd. (Consumer Staples) | | | 58,716 | |
| | 13,904 | | | China Resources Cement Holdings Ltd. (Materials) | | | 20,273 | |
| | 5,652 | | | China Resources Gas Group Ltd. (Utilities) | | | 26,546 | |
| | 18,345 | | | China Resources Land Ltd. (Real Estate) | | | 84,859 | |
| | 10,538 | | | China Resources Pharmaceutical Group Ltd. (Health Care)(a) | | | 5,969 | |
| | 11,321 | | | China Resources Power Holdings Co. Ltd. (Utilities) | | | 13,439 | |
| | 2,039 | | | China Shenhua Energy Co. Ltd., Class A (Energy) | | | 4,811 | |
| | 21,643 | | | China Shenhua Energy Co. Ltd., Class H (Energy) | | | 36,136 | |
| | 8,715 | | | China Shipbuilding Industry Co. Ltd., Class A (Industrials)* | | | 6,171 | |
| | 2,718 | | | China Southern Airlines Co. Ltd., Class A (Industrials)* | | | 2,325 | |
| | 9,818 | | | China Southern Airlines Co. Ltd., Class H (Industrials)* | | | 5,181 | |
| | 400 | | | China Spacesat Co. Ltd., Class A (Industrials) | | | 2,305 | |
| | 15,990 | | | China State Construction Engineering Corp. Ltd., Class A (Industrials) | | | 12,000 | |
| | |
| |
| Common Stocks – (continued) | | | |
| China – (continued) | | | |
| | 11,293 | | | China State Construction International Holdings Ltd. (Industrials) | | | 8,757 | |
| | 9,238 | | | China Taiping Insurance Holdings Co. Ltd. (Financials) | | | 14,685 | |
| | 88,376 | | | China Telecom Corp. Ltd., Class H (Communication Services) | | | 28,964 | |
| | 639 | | | China Tourism Group Duty Free Corp. Ltd., Class A (Consumer Discretionary) | | | 19,406 | |
| | 559 | | | China TransInfo Technology Co. Ltd., Class A (Information Technology) | | | 1,996 | |
| | 39,097 | | | China Unicom Hong Kong Ltd. (Communication Services) | | | 27,695 | |
| | 11,113 | | | China United Network Communications Ltd., Class A (Communication Services) | | | 8,421 | |
| | 3,678 | | | China Vanke Co. Ltd., Class A (Real Estate) | | | 14,644 | |
| | 12,001 | | | China Vanke Co. Ltd., Class H (Real Estate) | | | 37,319 | |
| | 5,596 | | | China Yangtze Power Co. Ltd., Class A (Utilities) | | | 15,769 | |
| | 3,198 | | | China Zheshang Bank Co. Ltd., Class A (Financials) | | | 1,947 | |
| | 3,438 | | | Chongqing Changan Automobile Co. Ltd., Class A (Consumer Discretionary)* | | | 5,878 | |
| | 3,358 | | | Chongqing Rural Commercial Bank Co. Ltd., Class A (Financials) | | | 2,559 | |
| | 16,002 | | | Chongqing Rural Commercial Bank Co. Ltd., Class H (Financials) | | | 6,525 | |
| | 559 | | | Chongqing Zhifei Biological Products Co. Ltd., Class A (Health Care) | | | 11,030 | |
| | 23,341 | | | CIFI Holdings Group Co. Ltd. (Real Estate) | | | 19,877 | |
| | 40,323 | | | CITIC Ltd. (Industrials) | | | 36,784 | |
| | 3,997 | | | CITIC Securities Co. Ltd., Class A (Financials) | | | 18,558 | |
| | 14,507 | | | CITIC Securities Co. Ltd., Class H (Financials) | | | 34,854 | |
| | 101,084 | | | CNOOC Ltd. (Energy) | | | 115,038 | |
| | 894 | | | CNPC Capital Co. Ltd., Class A (Industrials) | | | 957 | |
| | 799 | | | Contemporary Amperex Technology Co. Ltd., Class A (Industrials) | | | 24,072 | |
| | 1,199 | | | COSCO SHIPPING Energy Transportation Co. Ltd., Class A (Energy) | | | 1,332 | |
| | 8,251 | | | COSCO SHIPPING Energy Transportation Co. Ltd., Class H (Energy) | | | 3,801 | |
| | 2,478 | | | COSCO SHIPPING Holdings Co. Ltd., Class A (Industrials)* | | | 1,968 | |
| | 16,434 | | | COSCO SHIPPING Holdings Co. Ltd., Class H (Industrials)* | | | 8,249 | |
| | 58,445 | | | Country Garden Holdings Co. Ltd. (Real Estate) | | | 72,470 | |
| | 8,085 | | | Country Garden Services Holdings Co. Ltd. (Industrials) | | | 56,385 | |
| | 9,274 | | | CRRC Corp. Ltd., Class A (Industrials) | | | 7,935 | |
| | 27,835 | | | CRRC Corp. Ltd., Class H (Industrials) | | | 12,570 | |
| | |
| | |
| The accompanying notes are an integral part of these financial statements. | | 19 |
GOLDMAN SACHS MARKETBETA EMERGING MARKETS EQUITY ETF
Schedule of Investments (continued)
August 31, 2020
| | | | | | | | |
| Shares | | | Description | |
Value | |
| |
| Common Stocks – (continued) | | | |
| China – (continued) | | | |
| | 559 | | | CSC Financial Co. Ltd., Class A (Financials) | | $ | 4,266 | |
| | 4,929 | | | CSC Financial Co. Ltd., Class H (Financials)(a) | | | 7,327 | |
| | 1,395 | | | Dada Nexus Ltd. ADR (Consumer Discretionary)* | | | 31,750 | |
| | 13,080 | | | Dali Foods Group Co. Ltd. (Consumer Staples)(a) | | | 8,017 | |
| | 4,797 | | | Daqin Railway Co. Ltd., Class A (Industrials) | | | 4,636 | |
| | 192 | | | DaShenLin Pharmaceutical Group Co. Ltd., Class A (Consumer Staples) | | | 2,388 | |
| | 1,839 | | | Datang International Power Generation Co. Ltd., Class A (Utilities) | | | 660 | |
| | 479 | | | Dawning Information Industry Co. Ltd., Class A (Information Technology) | | | 3,160 | |
| | 1,119 | | | DHC Software Co. Ltd., Class A (Information Technology) | | | 1,905 | |
| | 240 | | | Dong-E-E-Jiao Co. Ltd., Class A (Health Care) | | | 1,620 | |
| | 1,039 | | | Dongfang Electric Corp. Ltd., Class A (Industrials) | | | 1,518 | |
| | 18,185 | | | Dongfeng Motor Group Co. Ltd., Class H (Consumer Discretionary) | | | 12,624 | |
| | 1,039 | | | Dongxing Securities Co. Ltd., Class A (Financials) | | | 2,025 | |
| | 3,070 | | | East Money Information Co. Ltd., Class A (Financials) | | | 11,726 | |
| | 4,809 | | | ENN Energy Holdings Ltd. (Utilities) | | | 53,363 | |
| | 607 | | | Eve Energy Co. Ltd., Class A (Industrials) | | | 4,343 | |
| | 1,439 | | | Everbright Securities Co. Ltd., Class A (Financials) | | | 4,605 | |
| | 1,455 | | | Fangda Carbon New Material Co. Ltd., Class A (Industrials)* | | | 1,430 | |
| | 639 | | | FAW Jiefang Group Co. Ltd., Class A (Consumer Discretionary)* | | | 1,316 | |
| | 400 | | | Fiberhome Telecommunication Technologies Co. Ltd., Class A (Information Technology) | | | 1,536 | |
| | 5,596 | | | Focus Media Information Technology Co. Ltd., Class A (Communication Services) | | | 6,160 | |
| | 559 | | | Foshan Haitian Flavouring & Food Co. Ltd., Class A (Consumer Staples) | | | 14,952 | |
| | 2,398 | | | Founder Securities Co. Ltd., Class A (Financials)* | | | 3,071 | |
| | 3,438 | | | Foxconn Industrial Internet Co. Ltd., Class A (Information Technology) | | | 7,399 | |
| | 400 | | | Fujian Sunner Development Co. Ltd., Class A (Consumer Staples) | | | 1,570 | |
| | 719 | | | Fuyao Glass Industry Group Co. Ltd., Class A (Consumer Discretionary) | | | 3,042 | |
| | 3,218 | | | Fuyao Glass Industry Group Co. Ltd., Class H (Consumer Discretionary)(a) | | | 10,360 | |
| | 400 | | | Ganfeng Lithium Co. Ltd., Class A (Materials) | | | 2,950 | |
| | 979 | | | Ganfeng Lithium Co. Ltd., Class H (Materials)(a) | | | 4,958 | |
| | |
| |
| Common Stocks – (continued) | | | |
| China – (continued) | | | |
| | 7,435 | | | GD Power Development Co. Ltd., Class A (Utilities) | | | 2,225 | |
| | 295 | | | GDS Holdings Ltd. ADR (Information Technology)* | | | 23,877 | |
| | 1,679 | | | Gemdale Corp., Class A (Real Estate) | | | 3,510 | |
| | 2,238 | | | GF Securities Co. Ltd., Class A (Financials) | | | 5,284 | |
| | 8,683 | | | GF Securities Co. Ltd., Class H (Financials) | | | 10,274 | |
| | 559 | | | Giant Network Group Co. Ltd., Class A (Communication Services) | | | 1,689 | |
| | 160 | | | Gigadevice Semiconductor Beijing, Inc., Class A (Information Technology) | | | 4,661 | |
| | 225 | | | Glodon Co. Ltd., Class A (Information Technology) | | | 2,289 | |
| | 1,199 | | | GoerTek, Inc., Class A (Information Technology) | | | 7,193 | |
| | 719 | | | Great Wall Motor Co. Ltd., Class A (Consumer Discretionary) | | | 1,464 | |
| | 19,548 | | | Great Wall Motor Co. Ltd., Class H (Consumer Discretionary) | | | 21,212 | |
| | 2,238 | | | Gree Electric Appliances Inc of Zhuhai, Class A (Consumer Discretionary) | | | 17,808 | |
| | 2,638 | | | Greenland Holdings Corp. Ltd., Class A (Real Estate) | | | 2,946 | |
| | 819 | | | GSX Techedu, Inc. ADR (Consumer Discretionary)*(b) | | | 69,943 | |
| | 559 | | | Guangdong Haid Group Co. Ltd., Class A (Consumer Staples) | | | 5,776 | |
| | 719 | | | Guangxi Guiguan Electric Power Co. Ltd., Class A (Utilities) | | | 501 | |
| | 959 | | | Guangzhou Automobile Group Co. Ltd., Class A (Consumer Discretionary) | | | 1,453 | |
| | 17,857 | | | Guangzhou Automobile Group Co. Ltd., Class H (Consumer Discretionary) | | | 15,345 | |
| | 719 | | | Guangzhou Baiyun International Airport Co. Ltd., Class A (Industrials) | | | 1,598 | |
| | 480 | | | Guangzhou Baiyunshan Pharmaceutical Holdings Co. Ltd., Class A (Health Care) | | | 2,278 | |
| | 883 | | | Guangzhou Baiyunshan Pharmaceutical Holdings Co. Ltd., Class H (Health Care) | | | 2,313 | |
| | 7,915 | | | Guangzhou R&F Properties Co. Ltd., Class H (Real Estate) | | | 10,070 | |
| | 240 | | | Guangzhou Shiyuan Electronic Technology Co. Ltd., Class A (Information Technology) | | | 3,507 | |
| | 480 | | | Guangzhou Yuexiu Financial Holdings Group Co. Ltd., Class A (Financials) | | | 1,471 | |
| | 1,519 | | | Guosen Securities Co. Ltd., Class A (Financials) | | | 3,107 | |
| | 2,798 | | | Guotai Junan Securities Co. Ltd., Class A (Financials) | | | 7,901 | |
| | 5,437 | | | Guotai Junan Securities Co. Ltd., Class H (Financials)(a) | | | 8,489 | |
| | 1,279 | | | Guoyuan Securities Co. Ltd., Class A (Financials) | | | 2,058 | |
| | |
| | |
| 20 | | The accompanying notes are an integral part of these financial statements. |
GOLDMAN SACHS MARKETBETA EMERGING MARKETS EQUITY ETF
| | | | | | | | |
| Shares | | | Description | |
Value | |
| |
| Common Stocks – (continued) | | | |
| China – (continued) | | | |
| | 2,988 | | | Haidilao International Holding Ltd. (Consumer Discretionary)(a) | | $ | 19,277 | |
| | 2,398 | | | Haier Smart Home Co. Ltd., Class A (Consumer Discretionary) | | | 7,808 | |
| | 3,038 | | | Haitong Securities Co. Ltd., Class A (Financials)* | | | 6,729 | |
| | 18,717 | | | Haitong Securities Co. Ltd., Class H (Financials)* | | | 17,002 | |
| | 160 | | | Han’s Laser Technology Industry Group Co. Ltd., Class A (Industrials) | | | 868 | |
| | 3,278 | | | Hangzhou Hikvision Digital Technology Co. Ltd., Class A (Information Technology) | | | 17,909 | |
| | 320 | | | Hangzhou Robam Appliances Co. Ltd., Class A (Consumer Discretionary) | | | 1,822 | |
| | 142 | | | Hangzhou Tigermed Consulting Co. Ltd., Class A (Health Care) | | | 2,322 | |
| | 5,723 | | | Hansoh Pharmaceutical Group Co. Ltd. (Health Care)*(a) | | | 27,138 | |
| | 799 | | | Henan Shuanghui Investment & Development Co. Ltd., Class A (Consumer Staples) | | | 7,408 | |
| | 4,069 | | | Hengan International Group Co. Ltd. (Consumer Staples) | | | 32,079 | |
| | 1,839 | | | Hengli Petrochemical Co. Ltd., Class A (Materials) | | | 5,647 | |
| | 719 | | | Hengtong Optic-electric Co. Ltd., Class A (Information Technology) | | | 1,716 | |
| | 1,351 | | | Hengyi Petrochemical Co. Ltd., Class A (Materials) | | | 2,456 | |
| | 3,997 | | | Hesteel Co. Ltd., Class A (Materials)* | | | 1,296 | |
| | 160 | | | Hithink RoyalFlush Information Network Co. Ltd., Class A (Financials) | | | 3,923 | |
| | 400 | | | Hongta Securities Co. Ltd., Class A (Financials) | | | 1,215 | |
| | 3,038 | | | Huadian Power International Corp. Ltd., Class A (Utilities) | | | 1,779 | |
| | 10,390 | | | Huadian Power International Corp. Ltd., Class H (Utilities) | | | 2,909 | |
| | 639 | | | Huadong Medicine Co. Ltd., Class A (Health Care) | | | 2,609 | |
| | 639 | | | Hualan Biological Engineering, Inc., Class A (Health Care) | | | 5,374 | |
| | 1,839 | | | Huaneng Lancang River Hydropower, Inc., Class A (Utilities) | | | 1,093 | |
| | 2,558 | | | Huaneng Power International, Inc., Class A (Utilities) | | | 2,058 | |
| | 26,824 | | | Huaneng Power International, Inc., Class H (Utilities) | | | 11,179 | |
| | 2,798 | | | Huatai Securities Co. Ltd., Class A (Financials) | | | 8,746 | |
| | 10,038 | | | Huatai Securities Co. Ltd., Class H (Financials)(a) | | | 17,615 | |
| | 959 | | | Huaxi Securities Co. Ltd., Class A (Financials) | | | 1,792 | |
| | 4,477 | | | Huaxia Bank Co. Ltd., Class A (Financials) | | | 4,203 | |
| | |
| |
| Common Stocks – (continued) | | | |
| China – (continued) | | | |
| | 1,359 | | | Huaxin Cement Co. Ltd., Class A (Materials) | | | 5,548 | |
| | 1,199 | | | Huayu Automotive Systems Co. Ltd., Class A (Consumer Discretionary) | | | 4,355 | |
| | 927 | | | Huazhu Group Ltd. ADR (Consumer Discretionary) | | | 41,465 | |
| | 1,599 | | | Hubei Biocause Pharmaceutical Co. Ltd., Class A (Financials) | | | 1,314 | |
| | 312 | | | Hundsun Technologies, Inc., Class A (Information Technology) | | | 5,076 | |
| | 412 | | | HUYA, Inc. ADR (Communication Services)*(b) | | | 11,833 | |
| | 799 | | | Iflytek Co. Ltd., Class A (Information Technology) | | | 4,397 | |
| | 20,769 | | | Industrial & Commercial Bank of China Ltd., Class A (Financials) | | | 15,040 | |
| | 7,915 | | | Industrial Bank Co. Ltd., Class A (Financials) | | | 18,675 | |
| | 2,558 | | | Industrial Securities Co. Ltd., Class A (Financials) | | | 3,070 | |
| | 17,350 | | | Inner Mongolia BaoTou Steel Union Co. Ltd., Class A (Materials)* | | | 2,938 | |
| | 3,038 | | | Inner Mongolia Junzheng Energy & Chemical Industry Group Co. Ltd., Class A (Materials) | | | 4,152 | |
| | 2,238 | | | Inner Mongolia Yili Industrial Group Co. Ltd., Class A (Consumer Staples) | | | 13,704 | |
| | 4,262 | | | Innovent Biologics, Inc. (Health Care)*(a) | | | 28,404 | |
| | 480 | | | Inspur Electronic Information Industry Co. Ltd., Class A (Information Technology) | | | 2,530 | |
| | 855 | | | iQIYI, Inc. ADR (Communication Services)* | | | 18,511 | |
| | 304 | | | Jafron Biomedical Co. Ltd., Class A (Health Care) | | | 3,383 | |
| | 5,754 | | | JD.com, Inc. ADR (Consumer Discretionary)* | | | 452,495 | |
| | 559 | | | Jiangsu Expressway Co. Ltd., Class A (Industrials) | | | 784 | |
| | 7,783 | | | Jiangsu Expressway Co. Ltd., Class H (Industrials) | | | 7,793 | |
| | 236 | | | Jiangsu Hengli Hydraulic Co. Ltd., Class A (Industrials) | | | 2,257 | |
| | 2,015 | | | Jiangsu Hengrui Medicine Co. Ltd., Class A (Health Care) | | | 27,910 | |
| | 400 | | | Jiangsu King’s Luck Brewery JSC Ltd., Class A (Consumer Staples) | | | 3,182 | |
| | 320 | | | Jiangsu Yanghe Brewery Joint-Stock Co. Ltd., Class A (Consumer Staples) | | | 6,592 | |
| | 320 | | | Jiangsu Yuyue Medical Equipment & Supply Co. Ltd., Class A (Health Care) | | | 1,720 | |
| | 1,359 | | | Jiangsu Zhongnan Construction Group Co. Ltd., Class A (Real Estate) | | | 1,933 | |
| | 1,119 | | | Jiangsu Zhongtian Technology Co. Ltd., Class A (Industrials) | | | 1,846 | |
| | 719 | | | Jiangxi Copper Co. Ltd., Class A (Materials) | | | 1,640 | |
| | |
| | |
| The accompanying notes are an integral part of these financial statements. | | 21 |
GOLDMAN SACHS MARKETBETA EMERGING MARKETS EQUITY ETF
Schedule of Investments (continued)
August 31, 2020
| | | | | | | | |
| Shares | | | Description | |
Value | |
| |
| Common Stocks – (continued) | | | |
| China – (continued) | | | |
| | 7,244 | | | Jiangxi Copper Co. Ltd., Class H (Materials) | | $ | 8,543 | |
| | 959 | | | Jiangxi Zhengbang Technology Co. Ltd., Class A (Consumer Staples) | | | 3,479 | |
| | 1,999 | | | Jinke Properties Group Co. Ltd., Class A (Real Estate) | | | 2,983 | |
| | 639 | | | Jointown Pharmaceutical Group Co. Ltd., Class A (Health Care)* | | | 1,653 | |
| | 240 | | | Jonjee Hi-Tech Industrial And Commercial Holding Co. Ltd., Class A (Consumer Staples) | | | 2,859 | |
| | 305 | | | JOYY, Inc. ADR (Communication Services)* | | | 26,059 | |
| | 1,279 | | | Kingsoft Cloud Holdings Ltd. ADR (Information Technology)* | | | 44,100 | |
| | 23,386 | | | Kunlun Energy Co. Ltd. (Utilities) | | | 17,441 | |
| | 400 | | | Kweichow Moutai Co. Ltd., Class A (Consumer Staples) | | | 104,334 | |
| | 7,531 | | | KWG Group Holdings Ltd. (Real Estate)* | | | 14,323 | |
| | 6,860 | | | Legend Holdings Corp., Class H (Information Technology)(a) | | | 10,108 | |
| | 43,222 | | | Lenovo Group Ltd. (Information Technology) | | | 28,888 | |
| | 1,479 | | | Lens Technology Co. Ltd., Class A (Information Technology) | | | 7,454 | |
| | 639 | | | Lepu Medical Technology Beijing Co. Ltd., Class A (Health Care) | | | 3,616 | |
| | 13,756 | | | Li Ning Co. Ltd. (Consumer Discretionary) | | | 58,218 | |
| | 2,479 | | | Lingyi iTech Guangdong Co., Class A (Information Technology)* | | | 4,329 | |
| | 160 | | | Livzon Pharmaceutical Group, Inc., Class A (Health Care) | | | 1,250 | |
| | 995 | | | Livzon Pharmaceutical Group, Inc., Class H (Health Care) | | | 4,769 | |
| | 7,895 | | | Logan Group Co. Ltd. (Real Estate) | | | 14,710 | |
| | 639 | | | Lomon Billions Group Co. Ltd., Class A (Materials) | | | 2,190 | |
| | 9,931 | | | Longfor Group Holdings Ltd. (Real Estate)(a) | | | 52,601 | |
| | 1,439 | | | LONGi Green Energy Technology Co. Ltd., Class A (Information Technology) | | | 13,295 | |
| | 2,597 | | | Luxshare Precision Industry Co. Ltd., Class A (Information Technology) | | | 20,854 | |
| | 559 | | | Luzhou Laojiao Co. Ltd., Class A (Consumer Staples) | | | 12,202 | |
| | 2,238 | | | Maanshan Iron & Steel Co. Ltd., Class A (Materials) | | | 918 | |
| | 5,329 | | | Maanshan Iron & Steel Co. Ltd., Class H (Materials) | | | 1,437 | |
| | 559 | | | Mango Excellent Media Co. Ltd., Class A (Communication Services) | | | 5,795 | |
| | 1,439 | | | Meinian Onehealth Healthcare Holdings Co. Ltd., Class A (Health Care)* | | | 3,689 | |
| | 14,240 | | | Meituan Dianping, Class B (Consumer Discretionary)* | | | 469,635 | |
| | |
| |
| Common Stocks – (continued) | | | |
| China – (continued) | | | |
| | 6,796 | | | Metallurgical Corp. of China Ltd., Class A (Industrials) | | | 2,798 | |
| | 18,285 | | | Metallurgical Corp. of China Ltd., Class H (Industrials) | | | 3,138 | |
| | 1,027 | | | Momo, Inc. ADR (Communication Services) | | | 20,951 | |
| | 1,359 | | | Muyuan Foodstuff Co. Ltd., Class A (Consumer Staples) | | | 17,421 | |
| | 208 | | | Nanjing King-Friend Biochemical Pharmaceutical Co. Ltd., Class A (Health Care) | | | 1,494 | |
| | 1,199 | | | Nanjing Securities Co. Ltd., Class A (Financials) | | | 2,587 | |
| | 1,519 | | | NARI Technology Co. Ltd., Class A (Industrials) | | | 4,968 | |
| | 160 | | | NAURA Technology Group Co. Ltd., Class A (Information Technology) | | | 4,305 | |
| | 719 | | | NavInfo Co. Ltd., Class A (Consumer Discretionary) | | | 1,726 | |
| | 507 | | | NetEase, Inc. ADR (Communication Services) | | | 247,015 | |
| | 639 | | | New China Life Insurance Co. Ltd., Class A (Financials) | | | 5,584 | |
| | 6,168 | | | New China Life Insurance Co. Ltd., Class H (Financials) | | | 24,632 | |
| | 1,599 | | | New Hope Liuhe Co. Ltd., Class A (Consumer Staples) | | | 8,871 | |
| | 1,004 | | | New Oriental Education & Technology Group, Inc. ADR (Consumer Discretionary)* | | | 147,217 | |
| | 400 | | | Ninestar Corp., Class A (Information Technology) | | | 2,133 | |
| | 2,638 | | | Ningbo Zhoushan Port Co. Ltd., Class A (Industrials) | | | 1,429 | |
| | 1,119 | | | Oceanwide Holdings Co. Ltd., Class A (Real Estate) | | | 673 | |
| | 719 | | | Offcn Education Technology Co. Ltd., Class A (Consumer Discretionary) | | | 3,749 | |
| | 1,039 | | | OFILM Group Co. Ltd., Class A (Information Technology) | | | 2,869 | |
| | 112 | | | Oppein Home Group, Inc., Class A (Consumer Discretionary) | | | 1,652 | |
| | 2,238 | | | Orient Securities Co. Ltd., Class A (Financials) | | | 3,859 | |
| | 5,213 | | | Orient Securities Co. Ltd., Class H (Financials)(a) | | | 3,296 | |
| | 1,279 | | | Oriental Pearl Group Co. Ltd., Class A (Communication Services) | | | 1,991 | |
| | 1,519 | | | People’s Insurance Co. Group of China Ltd. (The), Class A (Financials) | | | 1,601 | |
| | 52,229 | | | People’s Insurance Co. Group of China Ltd. (The), Class H (Financials) | | | 17,050 | |
| | 720 | | | Perfect World Co. Ltd., Class A (Communication Services) | | | 3,849 | |
| | 6,236 | | | PetroChina Co. Ltd., Class A (Energy) | | | 4,033 | |
| | 132,501 | | | PetroChina Co. Ltd., Class H (Energy) | | | 45,819 | |
| | |
| | |
| 22 | | The accompanying notes are an integral part of these financial statements. |
GOLDMAN SACHS MARKETBETA EMERGING MARKETS EQUITY ETF
| | | | | | | | |
| Shares | | | Description | |
Value | |
| |
| Common Stocks – (continued) | | | |
| China – (continued) | | | |
| | 80 | | | Pharmaron Beijing Co. Ltd., Class A (Health Care) | | $ | 1,286 | |
| | 780 | | | Pharmaron Beijing Co. Ltd., Class H (Health Care)(a) | | | 10,366 | |
| | 43,938 | | | PICC Property & Casualty Co. Ltd., Class H (Financials) | | | 33,959 | |
| | 543 | | | Pinduoduo, Inc. ADR (Consumer Discretionary)* | | | 48,294 | |
| | 7,355 | | | Ping An Bank Co. Ltd., Class A (Financials) | | | 16,194 | |
| | 2,518 | | | Ping An Healthcare and Technology Co. Ltd. (Health Care)*(a)(b) | | | 36,713 | |
| | 4,077 | | | Ping An Insurance Group Co. of China Ltd., Class A (Financials) | | | 45,609 | |
| | 36,348 | | | Ping An Insurance Group Co. of China Ltd., Class H (Financials) | | | 387,157 | |
| | 4,557 | | | Poly Developments and Holdings Group Co. Ltd., Class A (Real Estate) | | | 10,712 | |
| | 874 | | | Poly Property Services Co. Ltd. (Real Estate) | | | 7,652 | |
| | 4,557 | | | Postal Savings Bank of China Co. Ltd., Class A (Financials) | | | 3,074 | |
| | 81,210 | | | Postal Savings Bank of China Co. Ltd., Class H (Financials)(a) | | | 38,456 | |
| | 5,197 | | | Power Construction Corp. of China Ltd., Class A (Industrials) | | | 3,088 | |
| | 352 | | | Red Star Macalline Group Corp. Ltd., Class A (Real Estate) | | | 503 | |
| | 1,599 | | | RiseSun Real Estate Development Co. Ltd., Class A (Real Estate) | | | 1,924 | |
| | 1,519 | | | Rongsheng Petro Chemical Co. Ltd., Class A (Materials) | | | 4,391 | |
| | 2,238 | | | SAIC Motor Corp. Ltd., Class A (Consumer Discretionary) | | | 6,097 | |
| | 1,519 | | | Sanan Optoelectronics Co. Ltd., Class A (Information Technology) | | | 6,019 | |
| | 80 | | | Sangfor Technologies, Inc., Class A (Information Technology) | | | 2,569 | |
| | 879 | | | Sansteel Minguang Co. Ltd. Fujian, Class A (Materials) | | | 892 | |
| | 3,198 | | | Sany Heavy Industry Co. Ltd., Class A (Industrials) | | | 10,338 | |
| | 1,119 | | | SDIC Capital Co. Ltd., Class A (Financials) | | | 2,480 | |
| | 2,558 | | | SDIC Power Holdings Co. Ltd., Class A (Utilities) | | | 3,384 | |
| | 12,508 | | | Seazen Group Ltd. (Real Estate)* | | | 11,346 | |
| | 799 | | | Seazen Holdings Co. Ltd., Class A (Real Estate) | | | 4,188 | |
| | 28,326 | | | Semiconductor Manufacturing International Corp. (Information Technology)* | | | 91,007 | |
| | 939 | | | SF Holding Co. Ltd., Class A (Industrials) | | | 11,667 | |
| | 2,558 | | | Shaanxi Coal Industry Co. Ltd., Class A (Energy) | | | 3,036 | |
| | 1,342 | | | Shandong Gold Mining Co. Ltd., Class A (Materials) | | | 5,680 | |
| | |
| |
| Common Stocks – (continued) | | | |
| China – (continued) | | | |
| | 3,133 | | | Shandong Gold Mining Co. Ltd., Class H (Materials)(a) | | | 8,813 | |
| | 14,904 | | | Shandong Weigao Group Medical Polymer Co. Ltd., Class H (Health Care) | | | 34,807 | |
| | 879 | | | Shanghai Baosight Software Co. Ltd., Class A (Information Technology) | | | 8,922 | |
| | 3,038 | | | Shanghai Electric Group Co. Ltd., Class A (Industrials)* | | | 2,466 | |
| | 16,998 | | | Shanghai Electric Group Co. Ltd., Class H (Industrials)* | | | 5,001 | |
| | 719 | | | Shanghai Fosun Pharmaceutical Group Co. Ltd., Class A (Health Care) | | | 5,755 | |
| | 3,258 | | | Shanghai Fosun Pharmaceutical Group Co. Ltd., Class H (Health Care) | | | 13,767 | |
| | 320 | | | Shanghai International Airport Co. Ltd., Class A (Industrials) | | | 3,569 | |
| | 3,118 | | | Shanghai International Port Group Co. Ltd., Class A (Industrials) | | | 2,021 | |
| | 320 | | | Shanghai Lingang Holdings Corp. Ltd., Class A (Real Estate) | | | 1,078 | |
| | 4,157 | | | Shanghai Lujiazui Finance & Trade Zone Development Co. Ltd., Class A (Real Estate) | | | 7,556 | |
| | 320 | | | Shanghai M&G Stationery, Inc., Class A (Industrials) | | | 3,247 | |
| | 719 | | | Shanghai Pharmaceuticals Holding Co. Ltd., Class A (Health Care) | | | 2,330 | |
| | 5,305 | | | Shanghai Pharmaceuticals Holding Co. Ltd., Class H (Health Care) | | | 9,460 | |
| | 11,193 | | | Shanghai Pudong Development Bank Co. Ltd., Class A (Financials) | | | 16,930 | |
| | 1,679 | | | Shanghai RAAS Blood Products Co. Ltd., Class A (Health Care) | | | 2,204 | |
| | 1,439 | | | Shanghai Yuyuan Tourist Mart Group Co. Ltd., Class A (Consumer Discretionary) | | | 2,082 | |
| | 1,359 | | | Shanxi Meijin Energy Co. Ltd., Class A (Energy)* | | | 1,310 | |
| | 2,159 | | | Shanxi Taigang Stainless Steel Co. Ltd., Class A (Materials) | | | 1,154 | |
| | 240 | | | Shanxi Xinghuacun Fen Wine Factory Co. Ltd., Class A (Consumer Staples) | | | 6,911 | |
| | 799 | | | Shengyi Technology Co. Ltd., Class A (Information Technology) | | | 2,894 | |
| | 112 | | | Shennan Circuits Co. Ltd., Class A (Information Technology) | | | 2,267 | |
| | 7,675 | | | Shenwan Hongyuan Group Co. Ltd., Class A (Financials) | | | 6,320 | |
| | 80 | | | Shenzhen Goodix Technology Co. Ltd., Class A (Information Technology) | | | 2,090 | |
| | 240 | | | Shenzhen Hepalink Pharmaceutical Group Co. Ltd., Class A (Health Care) | | | 857 | |
| | 639 | | | Shenzhen Inovance Technology Co. Ltd., Class A (Industrials) | | | 5,206 | |
| | 6,752 | | | Shenzhen International Holdings Ltd. (Industrials) | | | 10,838 | |
| | 240 | | | Shenzhen Kangtai Biological Products Co. Ltd., Class A (Health Care) | | | 6,938 | |
| | |
| | |
| The accompanying notes are an integral part of these financial statements. | | 23 |
GOLDMAN SACHS MARKETBETA EMERGING MARKETS EQUITY ETF
Schedule of Investments (continued)
August 31, 2020
| | | | | | | | |
| Shares | | | Description | |
Value | |
| |
| Common Stocks – (continued) | | | |
| China – (continued) | | | |
| | 320 | | | Shenzhen Mindray Bio-Medical Electronics Co. Ltd., Class A (Health Care) | | $ | 16,000 | |
| | 3,118 | | | Shenzhen Overseas Chinese Town Co. Ltd., Class A (Consumer Discretionary) | | | 3,255 | |
| | 320 | | | Shenzhen Sunway Communication Co. Ltd., Class A (Information Technology) | | | 2,898 | |
| | 4,805 | | | Shenzhou International Group Holdings Ltd. (Consumer Discretionary) | | | 77,498 | |
| | 1,199 | | | Sichuan Chuantou Energy Co. Ltd., Class A (Utilities) | | | 1,754 | |
| | 480 | | | Sichuan Kelun Pharmaceutical Co. Ltd., Class A (Health Care) | | | 1,734 | |
| | 1,119 | | | Sinolink Securities Co. Ltd., Class A (Financials) | | | 2,542 | |
| | 1,999 | | | Sinopec Oilfield Service Corp., Class A (Energy)* | | | 555 | |
| | 1,679 | | | Sinopec Shanghai Petrochemical Co. Ltd., Class A (Materials) | | | 856 | |
| | 20,915 | | | Sinopec Shanghai Petrochemical Co. Ltd., Class H (Materials) | | | 4,318 | |
| | 8,543 | | | Sinopharm Group Co. Ltd., Class H (Health Care) | | | 21,032 | |
| | 1,999 | | | Sinotrans Ltd., Class A (Industrials) | | | 1,068 | |
| | 12,976 | | | Sinotrans Ltd., Class H (Industrials) | | | 3,081 | |
| | 4,217 | | | Sinotruk Hong Kong Ltd. (Industrials) | | | 10,964 | |
| | 863 | | | Songcheng Performance Development Co. Ltd., Class A (Consumer Discretionary) | | | 2,253 | |
| | 1,439 | | | SooChow Securities Co. Ltd., Class A (Financials) | | | 2,261 | |
| | 320 | | | Spring Airlines Co. Ltd., Class A (Industrials) | | | 2,061 | |
| | 400 | | | STO Express Co. Ltd., Class A (Industrials) | | | 964 | |
| | 16,058 | | | Sunac China Holdings Ltd. (Real Estate) | | | 67,546 | |
| | 3,198 | | | Suning.com Co. Ltd., Class A (Consumer Discretionary) | | | 4,599 | |
| | 4,265 | | | Sunny Optical Technology Group Co. Ltd. (Information Technology) | | | 63,231 | |
| | 559 | | | Suzhou Dongshan Precision Manufacturing Co. Ltd., Class A (Information Technology) | | | 2,268 | |
| | 959 | | | Suzhou Gold Mantis Construction Decoration Co. Ltd., Class A (Industrials) | | | 1,472 | |
| | 2,480 | | | TAL Education Group ADR (Consumer Discretionary)* | | | 183,049 | |
| | 1,359 | | | TBEA Co. Ltd., Class A (Industrials) | | | 1,621 | |
| | 5,117 | | | TCL Technology Group Corp., Class A (Consumer Discretionary) | | | 5,289 | |
| | 36,496 | | | Tencent Holdings Ltd. (Communication Services) | | | 2,498,162 | |
| | 4,049 | | | Tencent Music Entertainment Group ADR (Communication Services)* | | | 63,286 | |
| | 2,478 | | | Tianfeng Securities Co. Ltd., Class A (Financials) | | | 2,500 | |
| | 1,039 | | | Tianjin Zhonghuan Semiconductor Co. Ltd., Class A (Information Technology) | | | 3,287 | |
| | |
| |
| Common Stocks – (continued) | | | |
| China – (continued) | | | |
| | 719 | | | Tianma Microelectronics Co. Ltd., Class A (Information Technology) | | | 1,725 | |
| | 559 | | | Tianqi Lithium Corp., Class A (Materials)* | | | 1,853 | |
| | 11,681 | | | Tingyi Cayman Islands Holding Corp. (Consumer Staples) | | | 21,945 | |
| | 160 | | | Toly Bread Co. Ltd., Class A (Consumer Staples) | | | 1,475 | |
| | 3,642 | | | Tongcheng-Elong Holdings Ltd. (Consumer Discretionary)* | | | 7,143 | |
| | 719 | | | Tonghua Dongbao Pharmaceutical Co. Ltd., Class A (Health Care) | | | 1,494 | |
| | 639 | | | Tongkun Group Co. Ltd., Class A (Materials) | | | 1,505 | |
| | 1,599 | | | Tongwei Co. Ltd., Class A (Consumer Staples) | | | 5,696 | |
| | 80 | | | Topchoice Medical Corp., Class A (Health Care)* | | | 2,643 | |
| | 8,471 | | | Topsports International Holdings Ltd. (Consumer Discretionary)(a) | | | 10,482 | |
| | 959 | | | Transfar Zhilian Co. Ltd., Class A (Materials) | | | 846 | |
| | 5,936 | | | TravelSky Technology Ltd., Class H (Information Technology) | | | 12,347 | |
| | 3,591 | | | Trip.com Group Ltd. ADR (Consumer Discretionary)* | | | 108,592 | |
| | 240 | | | Tsingtao Brewery Co. Ltd., Class A (Consumer Staples) | | | 3,061 | |
| | 2,410 | | | Tsingtao Brewery Co. Ltd., Class H (Consumer Staples) | | | 21,954 | |
| | 2,079 | | | Tunghsu Optoelectronic Technology Co. Ltd., Class A (Information Technology)* | | | 953 | |
| | 200 | | | Unigroup Guoxin Microelectronics Co. Ltd., Class A (Information Technology) | | | 3,659 | |
| | 8,051 | | | Uni-President China Holdings Ltd. (Consumer Staples) | | | 7,334 | |
| | 1,006 | | | Unisplendour Corp. Ltd., Class A (Information Technology) | | | 4,818 | |
| | 400 | | | Universal Scientific Industrial Shanghai Co. Ltd., Class A (Information Technology) | | | 1,366 | |
| | 178 | | | Venustech Group, Inc., Class A (Information Technology) | | | 991 | |
| | 3,418 | | | Vipshop Holdings Ltd. ADR (Consumer Discretionary)* | | | 56,431 | |
| | 559 | | | Walvax Biotechnology Co. Ltd., Class A (Health Care)* | | | 5,183 | |
| | 719 | | | Wanda Film Holding Co. Ltd., Class A (Communication Services)* | | | 1,945 | |
| | 879 | | | Wangsu Science & Technology Co. Ltd., Class A (Information Technology) | | | 1,176 | |
| | 1,199 | | | Wanhua Chemical Group Co. Ltd., Class A (Materials) | | | 12,830 | |
| | 30,838 | | | Want Want China Holdings Ltd. (Consumer Staples) | | | 21,168 | |
| | 408 | | | Weibo Corp. ADR (Communication Services)* | | | 15,218 | |
| | |
| | |
| 24 | | The accompanying notes are an integral part of these financial statements. |
GOLDMAN SACHS MARKETBETA EMERGING MARKETS EQUITY ETF
| | | | | | | | |
| Shares | | | Description | |
Value | |
| |
| Common Stocks – (continued) | | | |
| China – (continued) | | | |
| | 2,238 | | | Weichai Power Co. Ltd., Class A (Industrials) | | $ | 4,843 | |
| | 12,376 | | | Weichai Power Co. Ltd., Class H (Industrials) | | | 25,007 | |
| | 2,398 | | | Wens Foodstuffs Group Co. Ltd., Class A (Consumer Staples) | | | 8,641 | |
| | 1,279 | | | Western Securities Co. Ltd., Class A (Financials) | | | 1,823 | |
| | 240 | | | Will Semiconductor Ltd., Class A (Information Technology) | | | 5,881 | |
| | 726 | | | Winning Health Technology Group Co. Ltd., Class A (Health Care) | | | 2,247 | |
| | 408 | | | Wuhan Guide Infrared Co. Ltd., Class A (Information Technology) | | | 2,286 | |
| | 799 | | | Wuhu Sanqi Interactive Entertainment Network Technology Group Co. Ltd., Class A (Communication Services) | | | 5,318 | |
| | 1,439 | | | Wuliangye Yibin Co. Ltd., Class A (Consumer Staples) | | | 50,424 | |
| | 639 | | | WUS Printed Circuit Kunshan Co. Ltd., Class A (Information Technology) | | | 1,963 | |
| | 771 | | | WuXi AppTec Co. Ltd., Class A (Health Care) | | | 12,372 | |
| | 1,343 | | | WuXi AppTec Co. Ltd., Class H (Health Care)(a) | | | 19,893 | |
| | 5,655 | | | Wuxi Biologics Cayman, Inc. (Health Care)*(a) | | | 146,954 | |
| | 320 | | | Wuxi Lead Intelligent Equipment Co. Ltd., Class A (Information Technology) | | | 2,100 | |
| | 2,958 | | | XCMG Construction Machinery Co. Ltd., Class A (Industrials) | | | 2,682 | |
| | 46,239 | | | Xiaomi Corp., Class B (Information Technology)*(a) | | | 140,206 | |
| | 3,278 | | | Xinhu Zhongbao Co. Ltd., Class A (Real Estate) | | | 1,685 | |
| | 1,279 | | | Xinjiang Goldwind Science & Technology Co. Ltd., Class A (Industrials) | | | 2,039 | |
| | 4,925 | | | Xinjiang Goldwind Science & Technology Co. Ltd., Class H (Industrials) | | | 4,239 | |
| | 22,754 | | | Xinyi Solar Holdings Ltd. (Information Technology) | | | 28,743 | |
| | 1,519 | | | Yango Group Co. Ltd., Class A (Real Estate) | | | 1,564 | |
| | 799 | | | Yanzhou Coal Mining Co. Ltd., Class A (Energy) | | | 1,083 | |
| | 9,434 | | | Yanzhou Coal Mining Co. Ltd., Class H (Energy) | | | 7,267 | |
| | 240 | | | Yealink Network Technology Corp. Ltd., Class A (Information Technology) | | | 1,975 | |
| | 112 | | | Yifeng Pharmacy Chain Co. Ltd., Class A (Consumer Staples) | | | 1,648 | |
| | 2,678 | | | Yihai International Holding Ltd. (Consumer Staples)* | | | 42,087 | |
| | 3,598 | | | Yonghui Superstores Co. Ltd., Class A (Consumer Staples) | | | 4,665 | |
| | 1,143 | | | Yonyou Network Technology Co. Ltd., Class A (Information Technology) | | | 6,994 | |
| | |
| |
| Common Stocks – (continued) | | | |
| China – (continued) | | | |
| | 719 | | | YTO Express Group Co. Ltd., Class A (Industrials) | | | 1,681 | |
| | 727 | | | Yunda Holding Co. Ltd., Class A (Industrials) | | | 2,206 | |
| | 400 | | | Yunnan Baiyao Group Co. Ltd., Class A (Health Care) | | | 6,758 | |
| | 240 | | | Yunnan Energy New Material Co. Ltd., Class A (Materials) | | | 2,741 | |
| | 160 | | | Zhangzhou Pientzehuang Pharmaceutical Co. Ltd., Class A (Health Care) | | | 5,884 | |
| | 2,130 | | | Zhejiang Century Huatong Group Co. Ltd., Class A (Communication Services)* | | | 3,443 | |
| | 799 | | | Zhejiang Chint Electrics Co. Ltd., Class A (Industrials) | | | 4,021 | |
| | 1,119 | | | Zhejiang Dahua Technology Co. Ltd., Class A (Information Technology) | | | 3,735 | |
| | 9,130 | | | Zhejiang Expressway Co. Ltd., Class H (Industrials) | | | 6,161 | |
| | 527 | | | Zhejiang Huahai Pharmaceutical Co. Ltd., Class A (Health Care) | | | 3,376 | |
| | 400 | | | Zhejiang Huayou Cobalt Co. Ltd., Class A (Materials)* | | | 2,345 | |
| | 1,199 | | | Zhejiang Longsheng Group Co. Ltd., Class A (Materials) | | | 2,512 | |
| | 799 | | | Zhejiang NHU Co. Ltd., Class A (Health Care) | | | 3,823 | |
| | 1,351 | | | Zhejiang Sanhua Intelligent Controls Co. Ltd., Class A (Industrials) | | | 4,458 | |
| | 559 | | | Zhejiang Semir Garment Co. Ltd., Class A (Consumer Discretionary) | | | 628 | |
| | 80 | | | Zhejiang Supor Co. Ltd., Class A (Consumer Discretionary) | | | 990 | |
| | 799 | | | Zhengzhou Yutong Bus Co. Ltd., Class A (Industrials) | | | 1,658 | |
| | 959 | | | Zheshang Securities Co. Ltd., Class A (Financials) | | | 2,083 | |
| | 2,534 | | | ZhongAn Online P&C Insurance Co. Ltd., Class H (Financials)*(a) | | | 16,691 | |
| | 240 | | | Zhongji Innolight Co. Ltd., Class A (Information Technology) | | | 2,075 | |
| | 3,222 | | | Zhongsheng Group Holdings Ltd. (Consumer Discretionary) | | | 20,122 | |
| | 2,638 | | | Zhongtian Financial Group Co. Ltd., Class A (Real Estate)* | | | 1,371 | |
| | 3,486 | | | Zhuzhou CRRC Times Electric Co. Ltd., Class H (Industrials) | | | 11,200 | |
| | 7,435 | | | Zijin Mining Group Co. Ltd., Class A (Materials) | | | 7,805 | |
| | 36,434 | | | Zijin Mining Group Co. Ltd., Class H (Materials) | | | 24,869 | |
| | 2,478 | | | Zoomlion Heavy Industry Science and Technology Co. Ltd., Class A (Industrials)* | | | 3,082 | |
| | 8,807 | | | Zoomlion Heavy Industry Science and Technology Co. Ltd., Class H (Industrials)* | | | 8,818 | |
| | |
| | |
| The accompanying notes are an integral part of these financial statements. | | 25 |
GOLDMAN SACHS MARKETBETA EMERGING MARKETS EQUITY ETF
Schedule of Investments (continued)
August 31, 2020
| | | | | | | | |
| Shares | | | Description | |
Value | |
| |
| Common Stocks – (continued) | | | |
| China – (continued) | | | |
| | 1,439 | | | ZTE Corp., Class A (Information Technology) | | $ | 8,194 | |
| | 4,809 | | | ZTE Corp., Class H (Information Technology) | | | 13,992 | |
| | 3,518 | | | ZTO Express Cayman, Inc. ADR (Industrials) | | | 117,959 | |
| | | | | | | | |
| | | | | | | 14,515,203 | |
| | |
| Colombia – 0.1% | | | |
| | 1,747 | | | Bancolombia SA (Financials) | | | 12,113 | |
| | 22,754 | | | Ecopetrol SA (Energy) | | | 13,288 | |
| | 1,527 | | | Grupo de Inversiones Suramericana SA (Financials) | | | 8,551 | |
| | 8,231 | | | Grupo Energia Bogota SA ESP (Utilities) | | | 5,400 | |
| | 2,618 | | | Interconexion Electrica SA ESP (Utilities) | | | 14,619 | |
| | | | | | | | |
| | | | | | | 53,971 | |
| | |
| Czech Republic – 0.1% | | | |
| | 1,015 | | | CEZ AS (Utilities) | | | 20,951 | |
| | 440 | | | Komercni banka AS (Financials)* | | | 10,614 | |
| | 3,158 | | | Moneta Money Bank AS (Financials)(a) | | | 7,977 | |
| | | | | | | | |
| | | | | | | 39,542 | |
| | |
| Egypt – 0.2% | | | |
| | 9,354 | | | Commercial International Bank Egypt SAE (Financials) | | | 39,877 | |
| | 6,220 | | | Eastern Co. SAE (Consumer Staples) | | | 4,992 | |
| | 2,482 | | | Egypt Kuwait Holding Co. SAE (Materials) | | | 2,802 | |
| | 4,417 | | | Egyptian Financial Group-Hermes Holding Co. (Financials)* | | | 3,915 | |
| | 4,497 | | | ElSewedy Electric Co. (Industrials) | | | 2,131 | |
| | 6,412 | | | Talaat Moustafa Group (Real Estate) | | | 2,796 | |
| | 2,171 | | | Telecom Egypt Co. (Communication Services) | | | 1,846 | |
| | | | | | | | |
| | | | | | | 58,359 | |
| | |
| Greece – 0.2% | | | |
| | 8,027 | | | Alpha Bank AE (Financials)* | | | 5,324 | |
| | 15,774 | | | Eurobank Ergasias Services and Holdings SA (Financials)* | | | 7,587 | |
| | 1,495 | | | Hellenic Telecommunications Organization SA (Communication Services) | | | 24,495 | |
| | 663 | | | JUMBO SA (Consumer Discretionary) | | | 11,537 | |
| | 440 | | | LAMDA Development SA (Real Estate)* | | | 2,973 | |
| | 412 | | | Motor Oil Hellas Corinth Refineries SA (Energy) | | | 5,790 | |
| | 667 | | | Mytilineos SA (Industrials) | | | 6,294 | |
| | 3,474 | | | National Bank of Greece SA (Financials)* | | | 4,739 | |
| | 1,311 | | | OPAP SA (Consumer Discretionary) | | | 12,041 | |
| | | | | | | | |
| | | | | | | 80,780 | |
| | |
| Hungary – 0.2% | | | |
| | 3,006 | | | MOL Hungarian Oil & Gas PLC (Energy)* | | | 16,977 | |
| | |
| |
| Common Stocks – (continued) | | | |
| Hungary – (continued) | | | |
| | 1,375 | | | OTP Bank Nyrt (Financials)* | | | 46,519 | |
| | 887 | | | Richter Gedeon Nyrt (Health Care) | | | 21,730 | |
| | | | | | | | |
| | | | | | | 85,226 | |
| | |
| India – 8.0% | | | |
| | 272 | | | ABB India Ltd. (Industrials) | | | 3,513 | |
| | 288 | | | ACC Ltd. (Materials) | | | 5,172 | |
| | 4,245 | | | Adani Ports & Special Economic Zone Ltd. (Industrials) | | | 20,516 | |
| | 160 | | | Alkem Laboratories Ltd. (Health Care) | | | 5,918 | |
| | 3,758 | | | Ambuja Cements Ltd. (Materials) | | | 10,749 | |
| | 1,835 | | | Asian Paints Ltd. (Materials) | | | 47,344 | |
| | 1,627 | | | Aurobindo Pharma Ltd. (Health Care) | | | 17,880 | |
| | 991 | | | Avenue Supermarts Ltd. (Consumer Staples)*(a) | | | 30,309 | |
| | 13,292 | | | Axis Bank Ltd. (Financials)* | | | 89,703 | |
| | 440 | | | Bajaj Auto Ltd. (Consumer Discretionary) | | | 17,736 | |
| | 1,151 | | | Bajaj Finance Ltd. (Financials) | | | 54,539 | |
| | 244 | | | Bajaj Finserv Ltd. (Financials) | | | 20,520 | |
| | 80 | | | Bajaj Holdings & Investment Ltd. (Financials) | | | 2,911 | |
| | 2,458 | | | Bandhan Bank Ltd. (Financials)*(a) | | | 10,212 | |
| | 5,884 | | | Bank of Baroda (Financials)* | | | 3,913 | |
| | 1,483 | | | Berger Paints India Ltd. (Materials) | | | 10,833 | |
| | 3,726 | | | Bharat Electronics Ltd. (Industrials) | | | 5,371 | |
| | 4,297 | | | Bharat Petroleum Corp. Ltd. (Energy) | | | 23,806 | |
| | 2,123 | | | Bharti Infratel Ltd. (Communication Services) | | | 5,727 | |
| | 1,835 | | | Biocon Ltd. (Health Care)* | | | 9,377 | |
| | 44 | | | Bosch Ltd. (Consumer Discretionary) | | | 7,660 | |
| | 228 | | | Britannia Industries Ltd. (Consumer Staples) | | | 11,541 | |
| | 1,370 | | | Cadila Healthcare Ltd. (Health Care) | | | 6,910 | |
| | 2,055 | | | Cipla Ltd. (Health Care) | | | 19,921 | |
| | 9,418 | | | Coal India Ltd. (Energy) | | | 17,190 | |
| | 412 | | | Colgate-Palmolive India Ltd. (Consumer Staples) | | | 7,630 | |
| | 1,319 | | | Container Corp. Of India Ltd. (Industrials) | | | 7,042 | |
| | 3,374 | | | Dabur India Ltd. (Consumer Staples) | | | 21,755 | |
| | 504 | | | Divi’s Laboratories Ltd. (Health Care) | | | 21,382 | |
| | 3,786 | | | DLF Ltd. (Real Estate) | | | 8,145 | |
| | 516 | | | Dr. Reddy’s Laboratories Ltd. (Health Care) | | | 29,896 | |
| | 790 | | | Eicher Motors Ltd. (Consumer Discretionary) | | | 22,453 | |
| | 4,800 | | | Embassy Office Parks REIT (Real Estate) | | | 23,615 | |
| | 6,892 | | | GAIL India Ltd. (Utilities) | | | 8,956 | |
| | 2,194 | | | Godrej Consumer Products Ltd. (Consumer Staples) | | | 19,413 | |
| | 2,055 | | | Grasim Industries Ltd. (Materials) | | | 18,841 | |
| | 1,317 | | | Havells India Ltd. (Industrials) | | | 11,014 | |
| | 6,640 | | | HCL Technologies Ltd. (Information Technology) | | | 62,641 | |
| | 308 | | | HDFC Asset Management Co. Ltd. (Financials)(a) | | | 10,088 | |
| | 3,082 | | | HDFC Life Insurance Co. Ltd. (Financials)*(a) | | | 24,067 | |
| | |
| | |
| 26 | | The accompanying notes are an integral part of these financial statements. |
GOLDMAN SACHS MARKETBETA EMERGING MARKETS EQUITY ETF
| | | | | | | | |
| Shares | | | Description | |
Value | |
| |
| Common Stocks – (continued) | | | |
| India – (continued) | | | |
| | 312 | | | Hero MotoCorp Ltd. (Consumer Discretionary) | | $ | 12,742 | |
| | 5,720 | | | Hindalco Industries Ltd. (Materials)* | | | 14,396 | |
| | 3,881 | | | Hindustan Petroleum Corp. Ltd. (Energy) | | | 10,627 | |
| | 5,654 | | | Hindustan Unilever Ltd. (Consumer Staples) | | | 162,640 | |
| | 9,237 | | | Housing Development Finance Corp. Ltd. (Financials) | | | 229,973 | |
| | 10,098 | | | ICICI Bank Ltd. (Financials)* | | | 54,134 | |
| | 1,083 | | | ICICI Lombard General Insurance Co. Ltd. (Financials)(a) | | | 18,490 | |
| | 2,194 | | | ICICI Prudential Life Insurance Co. Ltd. (Financials)(a) | | | 12,598 | |
| | 12,081 | | | Indian Oil Corp. Ltd. (Energy) | | | 14,082 | |
| | 1,335 | | | Indraprastha Gas Ltd. (Utilities) | | | 7,154 | |
| | 376 | | | Info Edge India Ltd. (Communication Services) | | | 16,671 | |
| | 20,352 | | | Infosys Ltd. (Information Technology) | | | 256,752 | |
| | 571 | | | InterGlobe Aviation Ltd. (Industrials)*(a) | | | 9,302 | |
| | 18,789 | | | ITC Ltd. (Consumer Staples) | | | 48,780 | |
| | 5,349 | | | JSW Steel Ltd. (Materials) | | | 19,606 | |
| | 823 | | | Kansai Nerolac Paints Ltd. (Materials) | | | 5,342 | |
| | 228 | | | Larsen & Toubro Infotech Ltd. (Information Technology)(a) | | | 7,615 | |
| | 2,143 | | | Larsen & Toubro Ltd. (Industrials) | | | 27,511 | |
| | 1,355 | | | Lupin Ltd. (Health Care) | | | 17,075 | |
| | 3,878 | | | Mahindra & Mahindra Ltd. (Consumer Discretionary) | | | 31,974 | |
| | 2,878 | | | Marico Ltd. (Consumer Staples) | | | 14,424 | |
| | 767 | | | Maruti Suzuki India Ltd. (Consumer Discretionary) | | | 71,273 | |
| | 4,825 | | | Motherson Sumi Systems Ltd. (Consumer Discretionary) | | | 7,191 | |
| | 6 | | | MRF Ltd. (Consumer Discretionary) | | | 4,727 | |
| | 611 | | | Muthoot Finance Ltd. (Financials) | | | 9,519 | |
| | 148 | | | Nestle India Ltd. (Consumer Staples) | | | 32,069 | |
| | 15,351 | | | NHPC Ltd. (Utilities) | | | 4,515 | |
| | 3,406 | | | NMDC Ltd. (Materials) | | | 4,495 | |
| | 15,119 | | | NTPC Ltd. (Utilities) | | | 19,801 | |
| | 15,866 | | | Oil & Natural Gas Corp. Ltd. (Energy) | | | 17,664 | |
| | 116 | | | Oracle Financial Services Software Ltd. (Information Technology) | | | 4,779 | |
| | 32 | | | Page Industries Ltd. (Consumer Discretionary) | | | 8,255 | |
| | 3,822 | | | Petronet LNG Ltd. (Energy) | | | 12,480 | |
| | 775 | | | Pidilite Industries Ltd. (Materials) | | | 14,770 | |
| | 594 | | | Piramal Enterprises Ltd. (Health Care) | | | 11,034 | |
| | 4,033 | | | Power Finance Corp. Ltd. (Financials) | | | 5,153 | |
| | 9,994 | | | Power Grid Corp. of India Ltd. (Utilities) | | | 24,297 | |
| | 5,061 | | | Punjab National Bank (Financials)* | | | 2,410 | |
| | 519 | | | Rajesh Exports Ltd. (Consumer Discretionary) | | | 3,148 | |
| | 4,401 | | | REC Ltd. (Financials) | | | 6,347 | |
| | 19,688 | | | Reliance Industries Ltd. (Energy) | | | 556,530 | |
| | 1,813 | | | SBI Cards & Payment Services Ltd. (Financials) | | | 19,897 | |
| | |
| |
| Common Stocks – (continued) | | | |
| India – (continued) | | | |
| | 1,527 | | | SBI Life Insurance Co. Ltd. (Financials)*(a) | | | 17,172 | |
| | 56 | | | Shree Cement Ltd. (Materials) | | | 15,431 | |
| | 460 | | | Siemens Ltd. (Industrials) | | | 7,248 | |
| | 11,369 | | | State Bank of India (Financials)* | | | 32,744 | |
| | 5,603 | | | Sun Pharmaceutical Industries Ltd. (Health Care) | | | 39,601 | |
| | 5,636 | | | Tata Consultancy Services Ltd. (Information Technology) | | | 172,834 | |
| | 2,043 | | | Tata Consumer Products Ltd. (Consumer Staples) | | | 14,776 | |
| | 6,884 | | | Tata Motors Ltd. (Consumer Discretionary)* | | | 13,392 | |
| | 2,426 | | | Tata Motors Ltd., Class A (Consumer Discretionary)* | | | 1,679 | |
| | 1,723 | | | Tata Steel Ltd. (Materials) | | | 9,667 | |
| | 2,954 | | | Tech Mahindra Ltd. (Information Technology) | | | 29,738 | |
| | 803 | | | Titan Co. Ltd. (Consumer Discretionary) | | | 12,006 | |
| | 260 | | | Torrent Pharmaceuticals Ltd. (Health Care) | | | 9,401 | |
| | 697 | | | UltraTech Cement Ltd. (Materials) | | | 36,966 | |
| | 416 | | | United Breweries Ltd. (Consumer Staples) | | | 5,712 | |
| | 1,903 | | | United Spirits Ltd. (Consumer Staples)* | | | 14,133 | |
| | 3,060 | | | UPL Ltd. (Materials) | | | 21,033 | |
| | 9,971 | | | Vedanta Ltd. (Materials) | | | 17,427 | |
| | 8,692 | | | Wipro Ltd. (Information Technology) | | | 32,037 | |
| | 16,292 | | | Yes Bank Ltd. (Financials)* | | | 3,176 | |
| | | | | | | | |
| | | | | | | 3,094,624 | |
| | |
| Indonesia – 1.4% | | | |
| | 92,149 | | | Adaro Energy Tbk PT (Energy) | | | 6,866 | |
| | 115,631 | | | Astra International Tbk PT (Consumer Discretionary) | | | 40,495 | |
| | 67,680 | | | Bank Central Asia Tbk PT (Financials) | | | 145,817 | |
| | 118,810 | | | Bank Mandiri Persero Tbk PT (Financials) | | | 48,544 | |
| | 47,452 | | | Bank Negara Indonesia Persero Tbk PT (Financials) | | | 16,618 | |
| | 339,647 | | | Bank Rakyat Indonesia Persero Tbk PT (Financials) | | | 81,865 | |
| | 179,120 | | | Barito Pacific Tbk PT (Materials)* | | | 10,332 | |
| | 9,346 | | | Chandra Asri Petrochemical Tbk PT (Materials) | | | 4,573 | |
| | 46,436 | | | Charoen Pokphand Indonesia Tbk PT (Consumer Staples)* | | | 20,089 | |
| | 2,914 | | | Gudang Garam Tbk PT (Consumer Staples)* | | | 9,505 | |
| | 16,286 | | | Indah Kiat Pulp & Paper Corp. Tbk PT (Materials)* | | | 10,401 | |
| | 11,489 | | | Indocement Tunggal Prakarsa Tbk PT (Materials) | | | 9,369 | |
| | 14,455 | | | Indofood CBP Sukses Makmur Tbk PT (Consumer Staples) | | | 10,149 | |
| | 27,911 | | | Indofood Sukses Makmur Tbk PT (Consumer Staples) | | | 14,614 | |
| | |
| | |
| The accompanying notes are an integral part of these financial statements. | | 27 |
GOLDMAN SACHS MARKETBETA EMERGING MARKETS EQUITY ETF
Schedule of Investments (continued)
August 31, 2020
| | | | | | | | |
| Shares | | | Description | |
Value | |
| |
| Common Stocks – (continued) | | | |
| Indonesia – (continued) | | | |
| | 127,624 | | | Kalbe Farma Tbk PT (Health Care) | | $ | 13,847 | |
| | 18,505 | | | Semen Indonesia Persero Tbk PT (Materials) | | | 13,406 | |
| | 302,217 | | | Telekomunikasi Indonesia Persero Tbk PT (Communication Services) | | | 59,354 | |
| | 36,458 | | | Unilever Indonesia Tbk PT (Consumer Staples) | | | 20,592 | |
| | 9,594 | | | United Tractors Tbk PT (Energy) | | | 15,153 | |
| | 23,010 | | | XL Axiata Tbk PT (Communication Services) | | | 3,855 | |
| | | | | | | | |
| | | | | | | 555,444 | |
| | |
| Kuwait – 0.7% | | | |
| | 5,594 | | | Agility Public Warehousing Co. KSC (Industrials) | | | 11,439 | |
| | 5,856 | | | Boubyan Bank KSCP (Financials) | | | 11,092 | |
| | 39,744 | | | Kuwait Finance House KSCP (Financials) | | | 81,533 | |
| | 26,160 | | | Mobile Telecommunications Co. KSC (Communication Services) | | | 50,580 | |
| | 42,870 | | | National Bank of Kuwait SAKP (Financials) | | | 120,820 | |
| | | | | | | | |
| | | | | | | 275,464 | |
| | |
| Luxembourg – 0.0% | | | |
| | 963 | | | Reinet Investments SCA (Financials) | | | 18,367 | |
| | |
| Mexico – 1.5% | | | |
| | 32,041 | | | Alfa SAB de CV, Class A (Industrials) | | | 20,598 | |
| | 189,716 | | | America Movil SAB de CV, Series L (Communication Services) | | | 115,203 | |
| | 2,470 | | | Arca Continental SAB de CV (Consumer Staples) | | | 11,267 | |
| | 3,490 | | | Becle SAB de CV (Consumer Staples) | | | 6,667 | |
| | 94,572 | | | Cemex SAB de CV, Series CPO (Materials) | | | 30,334 | |
| | 3,346 | | | Coca-Cola Femsa SAB de CV (Consumer Staples) | | | 14,035 | |
| | 1,259 | | | El Puerto de Liverpool SAB de CV (Consumer Discretionary) | | | 3,308 | |
| | 22,291 | | | Fibra Uno Administracion SA de CV REIT (Real Estate) | | | 17,396 | |
| | 3,682 | | | GMexico Transportes SAB de CV (Industrials)(a) | | | 4,781 | |
| | 1,110 | | | Gruma SAB de CV, Class B (Consumer Staples) | | | 13,126 | |
| | 2,290 | | | Grupo Aeroportuario del Pacifico SAB de CV, Class B (Industrials) | | | 17,806 | |
| | 835 | | | Grupo Aeroportuario del Sureste SAB de CV, Class B (Industrials)* | | | 9,461 | |
| | 9,502 | | | Grupo Bimbo SAB de CV, Series A (Consumer Staples) | | | 17,549 | |
| | 3,118 | | | Grupo Carso SAB de CV, Series A1 (Industrials) | | | 6,156 | |
| | 404 | | | Grupo Elektra SAB DE CV (Financials) | | | 22,114 | |
| | 18,365 | | | Grupo Financiero Banorte SAB de CV, Class O (Financials)* | | | 63,496 | |
| | |
| |
| Common Stocks – (continued) | | | |
| Mexico – (continued) | | | |
| | 14,031 | | | Grupo Financiero Inbursa SAB de CV, Class O (Financials)* | | | 10,264 | |
| | 19,453 | | | Grupo Mexico SAB de CV, Series B (Materials) | | | 51,908 | |
| | 18,337 | | | Grupo Televisa SAB, Series CPO (Communication Services)* | | | 22,639 | |
| | 787 | | | Industrias Penoles SAB de CV (Materials) | | | 13,127 | |
| | 3,282 | | | Infraestructura Energetica Nova SAB de CV (Utilities) | | | 9,611 | |
| | 10,218 | | | Kimberly-Clark de Mexico SAB de CV, Class A (Consumer Staples) | | | 16,415 | |
| | 6,632 | | | Orbia Advance Corp. SAB de CV (Materials) | | | 10,654 | |
| | 32,792 | | | Wal-Mart de Mexico SAB de CV (Consumer Staples) | | | 78,706 | |
| | | | | | | | |
| | | | | | | 586,621 | |
| | |
| Pakistan – 0.1% | | | |
| | 1,995 | | | Engro Corp. Ltd. (Materials) | | | 3,590 | |
| | 4,461 | | | Habib Bank Ltd. (Financials) | | | 3,621 | |
| | 5,748 | | | Hub Power Co. Ltd. (The) (Utilities)* | | | 2,967 | |
| | 1,291 | | | Lucky Cement Ltd. (Materials) | | | 4,788 | |
| | 4,101 | | | Oil & Gas Development Co. Ltd. (Energy) | | | 2,841 | |
| | 4,357 | | | Pakistan Petroleum Ltd. (Energy) | | | 2,670 | |
| | 3,062 | | | United Bank Ltd. (Financials) | | | 2,308 | |
| | | | | | | | |
| | | | | | | 22,785 | |
| | |
| Peru – 0.2% | | | |
| | 386 | | | Credicorp Ltd. (Financials) | | | 50,365 | |
| | 196 | | | InRetail Peru Corp. (Consumer Staples)(a) | | | 6,115 | |
| | 212 | | | Intercorp Financial Services, Inc. (Financials) | | | 5,239 | |
| | | | | | | | |
| | | | | | | 61,719 | |
| | |
| Philippines – 0.7% | | | |
| | 14,400 | | | Aboitiz Equity Ventures, Inc. (Industrials) | | | 14,256 | |
| | 8,800 | | | Aboitiz Power Corp. (Utilities) | | | 4,837 | |
| | 1,600 | | | Ayala Corp. (Industrials) | | | 24,205 | |
| | 37,600 | | | Ayala Land, Inc. (Real Estate) | | | 22,334 | |
| | 11,510 | | | Bank of the Philippine Islands (Financials) | | | 15,905 | |
| | 11,150 | | | BDO Unibank, Inc. (Financials) | | | 19,777 | |
| | 180 | | | Globe Telecom, Inc. (Communication Services) | | | 7,752 | |
| | 5,110 | | | International Container Terminal Services, Inc. (Industrials) | | | 11,066 | |
| | 18,390 | | | JG Summit Holdings, Inc. (Industrials) | | | 24,389 | |
| | 2,800 | | | Jollibee Foods Corp. (Consumer Discretionary) | | | 7,802 | |
| | 1,520 | | | Manila Electric Co. (Utilities) | | | 8,433 | |
| | 11,600 | | | Metropolitan Bank & Trust Co. (Financials) | | | 8,015 | |
| | 540 | | | PLDT, Inc. (Communication Services) | | | 16,472 | |
| | 1,520 | | | SM Investments Corp. (Industrials) | | | 26,648 | |
| | 66,300 | | | SM Prime Holdings, Inc. (Real Estate) | | | 39,929 | |
| | 5,590 | | | Universal Robina Corp. (Consumer Staples) | | | 15,888 | |
| | | | | | | | |
| | | | | | | 267,708 | |
| | |
| | |
| 28 | | The accompanying notes are an integral part of these financial statements. |
GOLDMAN SACHS MARKETBETA EMERGING MARKETS EQUITY ETF
| | | | | | | | |
| Shares | | | Description | |
Value | |
| |
| Common Stocks – (continued) | | | |
| Qatar – 0.8% | | | |
| | 12,628 | | | Commercial Bank PSQC (The) (Financials) | | $ | 14,407 | |
| | 18,877 | | | Industries Qatar QSC (Industrials) | | | 51,120 | |
| | 23,406 | | | Masraf Al Rayan QSC (Financials) | | | 26,807 | |
| | 27,635 | | | Mesaieed Petrochemical Holding Co. (Materials) | | | 16,091 | |
| | 7,056 | | | Ooredoo QPSC (Communication Services) | | | 12,792 | |
| | 3,434 | | | Qatar Electricity & Water Co. QSC (Utilities) | | | 16,222 | |
| | 3,102 | | | Qatar Fuel QSC (Energy) | | | 15,676 | |
| | 7,371 | | | Qatar Islamic Bank (Financials) | | | 32,391 | |
| | 28,275 | | | Qatar National Bank QPSC (Financials) | | | 139,783 | |
| | | | | | | | |
| | | | | | | 325,289 | |
| | |
| Russia – 2.4% | | | |
| | 19,668 | | | Alrosa PJSC (Materials) | | | 17,432 | |
| | 2,210 | | | Gazprom Neft PJSC (Energy) | | | 9,487 | |
| | 2,651 | | | LUKOIL PJSC (Energy) | | | 177,877 | |
| | 7,030 | | | Mobile TeleSystems PJSC (Communication Services) | | | 32,117 | |
| | 2,322 | | | Novatek PJSC (Energy) | | | 34,703 | |
| | 6,108 | | | Novolipetsk Steel PJSC (Materials) | | | 12,721 | |
| | 152 | | | Polyus PJSC (Materials) | | | 36,921 | |
| | 7,156 | | | Rosneft Oil Co. PJSC (Energy) | | | 35,925 | |
| | 68,396 | | | Sberbank of Russia PJSC (Financials)* | | | 207,762 | |
| | 1,227 | | | Severstal PAO (Materials) | | | 15,392 | |
| | 226,594 | | | Surgutneftegas PJSC (Energy) | | | 111,736 | |
| | 8,923 | | | Tatneft PJSC (Energy) | | | 65,594 | |
| | 27,276,568 | | | VTB Bank PJSC (Financials)* | | | 12,909 | |
| | 1,922 | | | Yandex NV, Class A (Communication Services)* | | | 134,022 | |
| | | | | | | | |
| | | | | | | 904,598 | |
| | |
| Saudi Arabia – 3.0% | | | |
| | 675 | | | Advanced Petrochemical Co. (Materials) | | | 9,917 | |
| | 7,803 | | | Al Rajhi Bank (Financials) | | | 135,028 | |
| | 6,240 | | | Alinma Bank (Financials)* | | | 25,789 | |
| | 2,662 | | | Almarai Co. JSC (Consumer Staples) | | | 38,115 | |
| | 1,043 | | | Arabian Centres Co. Ltd. (Real Estate) | | | 7,105 | |
| | 2,258 | | | Bank AlBilad (Financials) | | | 14,462 | |
| | 3,762 | | | Banque Saudi Fransi (Financials) | | | 32,048 | |
| | 197 | | | Bupa Arabia for Cooperative Insurance Co. (Financials)* | | | 6,513 | |
| | 3,370 | | | Dar Al Arkan Real Estate Development Co. (Real Estate)* | | | 7,287 | |
| | 537 | | | Dr Sulaiman Al Habib Medical Services Group Co. (Health Care) | | | 12,858 | |
| | 2,402 | | | Etihad Etisalat Co. (Communication Services)* | | | 17,164 | |
| | 376 | | | Jarir Marketing Co. (Consumer Discretionary) | | | 16,382 | |
| | |
| |
| Common Stocks – (continued) | | | |
| Saudi Arabia – (continued) | | | |
| | 8,627 | | | National Commercial Bank (Financials) | | | 85,570 | |
| | 2,091 | | | National Industrialization Co. (Materials)* | | | 6,590 | |
| | 761 | | | National Petrochemical Co. (Materials) | | | 5,448 | |
| | 694 | | | Rabigh Refining & Petrochemical Co. (Energy)* | | | 2,642 | |
| | 9,362 | | | Riyad Bank (Financials) | | | 47,878 | |
| | 6,240 | | | Samba Financial Group (Financials) | | | 45,838 | |
| | 1,275 | | | Saudi Arabian Fertilizer Co. (Materials) | | | 28,183 | |
| | 2,570 | | | Saudi Arabian Mining Co. (Materials)* | | | 26,999 | |
| | 21,948 | | | Saudi Arabian Oil Co. (Energy)(a) | | | 208,042 | |
| | 5,696 | | | Saudi Basic Industries Corp. (Materials) | | | 133,650 | |
| | 6,184 | | | Saudi British Bank (The) (Financials) | | | 44,272 | |
| | 4,981 | | | Saudi Electricity Co. (Utilities) | | | 21,143 | |
| | 1,403 | | | Saudi Industrial Investment Group (Materials) | | | 8,193 | |
| | 4,681 | | | Saudi Kayan Petrochemical Co. (Materials)* | | | 11,333 | |
| | 3,822 | | | Saudi Telecom Co. (Communication Services) | | | 97,831 | |
| | 1,667 | | | Savola Group (The) (Consumer Staples) | | | 21,602 | |
| | 1,479 | | | Yanbu National Petrochemical Co. (Materials) | | | 21,098 | |
| | | | | | | | |
| | | | | | | 1,138,980 | |
| | |
| Singapore – 0.0% | | | |
| | 1,323 | | | BOC Aviation Ltd. (Industrials)(a) | | | 9,841 | |
| | |
| South Africa – 3.0% | | | |
| | 3,274 | | | Absa Group Ltd. (Financials) | | | 14,929 | |
| | 319 | | | Anglo American Platinum Ltd. (Materials)(b) | | | 23,804 | |
| | 2,103 | | | Aspen Pharmacare Holdings Ltd. (Health Care)* | | | 16,866 | |
| | 1,879 | | | Bid Corp. Ltd. (Consumer Staples) | | | 31,046 | |
| | 2,015 | | | Bidvest Group Ltd. (The) (Industrials) | | | 16,189 | |
| | 463 | | | Capitec Bank Holdings Ltd. (Financials) | | | 22,820 | |
| | 1,487 | | | Clicks Group Ltd. (Consumer Staples) | | | 20,188 | |
| | 2,432 | | | Discovery Ltd. (Financials) | | | 17,375 | |
| | 2,155 | | | Exxaro Resources Ltd. (Energy) | | | 17,450 | |
| | 19,640 | | | FirstRand Ltd. (Financials) | | | 43,880 | |
| | 4,901 | | | Gold Fields Ltd. (Materials) | | | 63,376 | |
| | 14,960 | | | Growthpoint Properties Ltd. REIT (Real Estate) | | | 10,782 | |
| | 4,745 | | | Impala Platinum Holdings Ltd. (Materials) | | | 43,797 | |
| | 1,547 | | | Investec Ltd. (Financials) | | | 2,871 | |
| | 308 | | | Kumba Iron Ore Ltd. (Materials) | | | 9,654 | |
| | 1,407 | | | Mr Price Group Ltd. (Consumer Discretionary) | | | 9,624 | |
| | 10,730 | | | MTN Group Ltd. (Communication Services) | | | 38,680 | |
| | 2,462 | | | MultiChoice Group (Communication Services)* | | | 14,081 | |
| | 2,552 | | | Naspers Ltd., Class N (Consumer Discretionary) | | | 465,886 | |
| | 2,910 | | | Nedbank Group Ltd. (Financials) | | | 16,488 | |
| | 29,986 | | | Old Mutual Ltd. (Financials) | | | 19,806 | |
| | |
| | |
| The accompanying notes are an integral part of these financial statements. | | 29 |
GOLDMAN SACHS MARKETBETA EMERGING MARKETS EQUITY ETF
Schedule of Investments (continued)
August 31, 2020
| | | | | | | | |
| Shares | | | Description | |
Value | |
| |
| Common Stocks – (continued) | | | |
| South Africa – (continued) | | | |
| | 3,989 | | | Pepkor Holdings Ltd. (Consumer Discretionary)(a) | | $ | 2,284 | |
| | 875 | | | PSG Group Ltd. (Financials) | | | 2,324 | |
| | 4,125 | | | Rand Merchant Investment Holdings Ltd. (Financials) | | | 7,322 | |
| | 2,826 | | | Remgro Ltd. (Financials) | | | 14,666 | |
| | 5,810 | | | RMB Holdings Ltd. (Financials) | | | 422 | |
| | 12,445 | | | Sanlam Ltd. (Financials) | | | 40,388 | |
| | 2,398 | | | Sasol Ltd. (Materials)* | | | 19,614 | |
| | 2,434 | | | Shoprite Holdings Ltd. (Consumer Staples) | | | 15,876 | |
| | 14,113 | | | Sibanye Stillwater Ltd. (Materials)* | | | 42,727 | |
| | 7,627 | | | Standard Bank Group Ltd. (Financials) | | | 47,537 | |
| | 1,063 | | | Tiger Brands Ltd. (Consumer Staples) | | | 10,819 | |
| | 3,720 | | | Vodacom Group Ltd. (Communication Services) | | | 28,078 | |
| | 5,389 | | | Woolworths Holdings Ltd. (Consumer Discretionary) | | | 10,112 | |
| | | | | | | | |
| | | | | | | 1,161,761 | |
| | |
| South Korea – 10.3% | | | |
| | 168 | | | Amorepacific Corp. (Consumer Staples) | | | 23,760 | |
| | 172 | | | AMOREPACIFIC Group (Consumer Staples) | | | 7,384 | |
| | 48 | | | BGF retail Co. Ltd. (Consumer Staples) | | | 5,152 | |
| | 1,343 | | | BNK Financial Group, Inc. (Financials) | | | 5,743 | |
| | 457 | | | Celltrion Healthcare Co. Ltd. (Health Care)* | | | 38,510 | |
| | 100 | | | Celltrion Pharm, Inc. (Health Care)* | | | 9,353 | |
| | 505 | | | Celltrion, Inc. (Health Care)* | | | 126,261 | |
| | 344 | | | Cheil Worldwide, Inc. (Communication Services) | | | 5,285 | |
| | 36 | | | CJ CheilJedang Corp. (Consumer Staples) | | | 12,334 | |
| | 72 | | | CJ Corp. (Industrials) | | | 4,909 | |
| | 60 | | | CJ ENM Co. Ltd. (Consumer Discretionary) | | | 5,995 | |
| | 48 | | | CJ Logistics Corp. (Industrials)* | | | 6,122 | |
| | 304 | | | Coway Co. Ltd. (Consumer Discretionary) | | | 20,422 | |
| | 144 | | | Daelim Industrial Co. Ltd. (Industrials) | | | 10,534 | |
| | 1,067 | | | Daewoo Engineering & Construction Co. Ltd. (Industrials)* | | | 2,645 | |
| | 300 | | | Daewoo Shipbuilding & Marine Engineering Co. Ltd. (Industrials)* | | | 5,594 | |
| | 252 | | | DB Insurance Co. Ltd. (Financials) | | | 9,260 | |
| | 304 | | | Dongsuh Cos., Inc. (Consumer Staples) | | | 6,539 | |
| | 264 | | | Doosan Bobcat, Inc. (Industrials) | | | 5,845 | |
| | 40 | | | Doosan Co. Ltd. (Industrials) | | | 1,564 | |
| | 751 | | | Doosan Heavy Industries & Construction Co. Ltd. (Industrials)* | | | 10,179 | |
| | 787 | | | Doosan Infracore Co. Ltd. (Industrials)* | | | 5,327 | |
| | 104 | | | Doosan Solus Co. Ltd. (Information Technology)* | | | 3,502 | |
| | 108 | | | Douzone Bizon Co. Ltd. (Information Technology) | | | 9,183 | |
| | 96 | | | E-MART, Inc. (Consumer Staples) | | | 9,698 | |
| | 260 | | | Fila Holdings Corp. (Consumer Discretionary) | | | 7,595 | |
| | |
| |
| Common Stocks – (continued) | | | |
| South Korea – (continued) | | | |
| | 324 | | | GS Engineering & Construction Corp. (Industrials) | | | 6,737 | |
| | 428 | | | GS Holdings Corp. (Energy) | | | 11,710 | |
| | 144 | | | GS Retail Co. Ltd. (Consumer Staples) | | | 3,994 | |
| | 1,641 | | | Hana Financial Group, Inc. (Financials) | | | 38,956 | |
| | 80 | | | Hanjin Kal Corp. (Industrials) | | | 5,112 | |
| | 416 | | | Hankook Tire & Technology Co. Ltd. (Consumer Discretionary) | | | 10,331 | |
| | 31 | | | Hanmi Pharm Co. Ltd. (Health Care) | | | 7,999 | |
| | 136 | | | Hanmi Science Co. Ltd. (Health Care) | | | 6,709 | |
| | 815 | | | Hanon Systems (Consumer Discretionary) | | | 8,850 | |
| | 64 | | | Hanssem Co. Ltd. (Consumer Discretionary) | | | 5,242 | |
| | 156 | | | Hanwha Aerospace Co. Ltd. (Industrials)* | | | 3,388 | |
| | 224 | | | Hanwha Corp. (Industrials) | | | 5,186 | |
| | 2,234 | | | Hanwha Life Insurance Co. Ltd. (Financials) | | | 2,877 | |
| | 531 | | | Hanwha Solutions Corp. (Materials) | | | 17,858 | |
| | 204 | | | HDC Hyundai Development Co.-Engineering & Construction, Class E (Industrials) | | | 3,950 | |
| | 152 | | | Helixmith Co. Ltd. (Health Care)* | | | 6,302 | |
| | 164 | | | Hite Jinro Co. Ltd. (Consumer Staples) | | | 5,094 | |
| | 290 | | | HLB, Inc. (Consumer Discretionary)* | | | 21,190 | |
| | 188 | | | Hotel Shilla Co. Ltd. (Consumer Discretionary) | | | 11,126 | |
| | 48 | | | Hugel, Inc. (Health Care)* | | | 6,619 | |
| | 80 | | | Hyundai Department Store Co. Ltd. (Consumer Discretionary) | | | 3,616 | |
| | 126 | | | Hyundai Elevator Co. Ltd. (Industrials) | | | 4,354 | |
| | 380 | | | Hyundai Engineering & Construction Co. Ltd. (Industrials) | | | 10,316 | |
| | 92 | | | Hyundai Glovis Co. Ltd. (Industrials) | | | 11,269 | |
| | 48 | | | Hyundai Heavy Industries Holdings Co. Ltd. (Industrials) | | | 9,132 | |
| | 328 | | | Hyundai Marine & Fire Insurance Co. Ltd. (Financials) | | | 6,102 | |
| | 116 | | | Hyundai Mipo Dockyard Co. Ltd. (Industrials) | | | 3,003 | |
| | 332 | | | Hyundai Mobis Co. Ltd. (Consumer Discretionary) | | | 62,605 | |
| | 730 | | | Hyundai Motor Co. (Consumer Discretionary) | | | 108,465 | |
| | 452 | | | Hyundai Steel Co. (Materials) | | | 9,551 | |
| | 1,375 | | | Industrial Bank of Korea (Financials) | | | 9,364 | |
| | 276 | | | Kakao Corp. (Communication Services) | | | 94,563 | |
| | 587 | | | Kangwon Land, Inc. (Consumer Discretionary) | | | 10,204 | |
| | 2,067 | | | KB Financial Group, Inc. (Financials) | | | 64,121 | |
| | 24 | | | KCC Corp. (Materials) | | | 2,818 | |
| | 112 | | | KEPCO Plant Service & Engineering Co. Ltd. (Industrials) | | | 2,621 | |
| | 1,407 | | | Kia Motors Corp. (Consumer Discretionary) | | | 50,280 | |
| | 148 | | | KMW Co. Ltd. (Information Technology)* | | | 9,519 | |
| | 256 | | | Komipharm International Co. Ltd. (Health Care)* | | | 3,330 | |
| | |
| | |
| 30 | | The accompanying notes are an integral part of these financial statements. |
GOLDMAN SACHS MARKETBETA EMERGING MARKETS EQUITY ETF
| | | | | | | | |
| Shares | | | Description | |
Value | |
| |
| Common Stocks – (continued) | | | |
| South Korea – (continued) | | | |
| | 420 | | | Korea Aerospace Industries Ltd. (Industrials) | | $ | 7,938 | |
| | 1,635 | | | Korea Electric Power Corp. (Utilities)* | | | 28,216 | |
| | 176 | | | Korea Gas Corp. (Utilities) | | | 3,497 | |
| | 224 | | | Korea Investment Holdings Co. Ltd. (Financials) | | | 11,484 | |
| | 216 | | | Korea Shipbuilding & Offshore Engineering Co. Ltd. (Industrials)* | | | 15,674 | |
| | 56 | | | Korea Zinc Co. Ltd. (Materials) | | | 18,786 | |
| | 304 | | | Korean Air Lines Co. Ltd. (Industrials)* | | | 4,517 | |
| | 408 | | | KT Corp. (Communication Services) | | | 8,209 | |
| | 607 | | | KT&G Corp. (Consumer Staples) | | | 42,463 | |
| | 92 | | | Kumho Petrochemical Co. Ltd. (Materials) | | | 7,783 | |
| | 238 | | | LG Chem Ltd. (Materials) | | | 148,262 | |
| | 551 | | | LG Corp. (Industrials) | | | 38,360 | |
| | 1,259 | | | LG Display Co. Ltd. (Information Technology)* | | | 15,474 | |
| | 575 | | | LG Electronics, Inc. (Consumer Discretionary) | | | 40,757 | |
| | 51 | | | LG Household & Health Care Ltd. (Consumer Staples) | | | 63,240 | |
| | 76 | | | LG Innotek Co. Ltd. (Information Technology) | | | 9,277 | |
| | 1,359 | | | LG Uplus Corp. (Communication Services) | | | 13,671 | |
| | 80 | | | Lotte Chemical Corp. (Materials) | | | 12,762 | |
| | 160 | | | Lotte Corp. (Industrials) | | | 4,041 | |
| | 60 | | | Lotte Shopping Co. Ltd. (Consumer Discretionary) | | | 3,839 | |
| | 104 | | | LS Corp. (Industrials) | | | 3,962 | |
| | 164 | | | Mando Corp. (Consumer Discretionary) | | | 4,335 | |
| | 28 | | | Medytox, Inc. (Health Care) | | | 5,886 | |
| | 252 | | | Meritz Fire & Marine Insurance Co. Ltd. (Financials) | | | 2,705 | |
| | 1,575 | | | Meritz Securities Co. Ltd. (Financials) | | | 4,249 | |
| | 1,693 | | | Mirae Asset Daewoo Co. Ltd. (Financials) | | | 13,254 | |
| | 749 | | | NAVER Corp. (Communication Services) | | | 203,344 | |
| | 86 | | | NCSoft Corp. (Communication Services) | | | 59,727 | |
| | 132 | | | Netmarble Corp. (Communication Services)*(a) | | | 18,502 | |
| | 703 | | | NH Investment & Securities Co. Ltd. (Financials) | | | 5,303 | |
| | 16 | | | NongShim Co. Ltd. (Consumer Staples) | | | 4,842 | |
| | 108 | | | OCI Co. Ltd. (Materials)* | | | 5,882 | |
| | 120 | | | Orion Corp. (Consumer Staples) | | | 14,193 | |
| | 12 | | | Ottogi Corp. (Consumer Staples) | | | 6,081 | |
| | 1,203 | | | Pan Ocean Co. Ltd. (Industrials)* | | | 3,438 | |
| | 32 | | | Pearl Abyss Corp. (Communication Services)* | | | 4,903 | |
| | 432 | | | POSCO (Materials) | | | 67,097 | |
| | 136 | | | POSCO Chemical Co. Ltd. (Materials) | | | 10,189 | |
| | 248 | | | Posco International Corp. (Industrials) | | | 2,839 | |
| | 108 | | | S-1 Corp. (Industrials) | | | 7,928 | |
| | 104 | | | Samsung Biologics Co. Ltd. (Health Care)*(a) | | | 68,113 | |
| | 472 | | | Samsung C&T Corp. (Industrials) | | | 42,913 | |
| | 148 | | | Samsung Card Co. Ltd. (Financials) | | | 3,582 | |
| | |
| |
| Common Stocks – (continued) | | | |
| South Korea – (continued) | | | |
| | 288 | | | Samsung Electro-Mechanics Co. Ltd. (Information Technology) | | | 30,184 | |
| | 29,886 | | | Samsung Electronics Co. Ltd. (Information Technology) | | | 1,358,569 | |
| | 839 | | | Samsung Engineering Co. Ltd. (Industrials)* | | | 7,981 | |
| | 222 | | | Samsung Fire & Marine Insurance Co. Ltd. (Financials) | | | 34,947 | |
| | 2,630 | | | Samsung Heavy Industries Co. Ltd. (Industrials)* | | | 11,424 | |
| | 539 | | | Samsung Life Insurance Co. Ltd. (Financials) | | | 27,769 | |
| | 284 | | | Samsung SDI Co. Ltd. (Information Technology) | | | 108,182 | |
| | 180 | | | Samsung SDS Co. Ltd. (Information Technology) | | | 23,866 | |
| | 320 | | | Samsung Securities Co. Ltd. (Financials) | | | 8,122 | |
| | 124 | | | Seegene, Inc. (Health Care) | | | 27,453 | |
| | 2,536 | | | Shinhan Financial Group Co. Ltd. (Financials) | | | 63,299 | |
| | 36 | | | Shinsegae, Inc. (Consumer Discretionary) | | | 6,152 | |
| | 176 | | | SK Holdings Co. Ltd. (Industrials) | | | 31,706 | |
| | 283 | | | SK Innovation Co. Ltd. (Energy) | | | 34,544 | |
| | 767 | | | SK Networks Co. Ltd. (Industrials) | | | 3,351 | |
| | 252 | | | SK Telecom Co. Ltd. (Communication Services) | | | 52,610 | |
| | 212 | | | S-Oil Corp. (Energy) | | | 10,083 | |
| | 583 | | | Ssangyong Cement Industrial Co. Ltd. (Materials) | | | 2,768 | |
| | 68 | | | Studio Dragon Corp. (Communication Services)* | | | 4,579 | |
| | 2,652 | | | Woori Financial Group, Inc. (Financials) | | | 18,887 | |
| | 240 | | | Yuhan Corp. (Health Care) | | | 13,536 | |
| | | | | | | | |
| | | | | | | 3,964,687 | |
| | |
| Taiwan – 12.8% | | | |
| | 2,674 | | | Accton Technology Corp. (Information Technology) | | | 21,325 | |
| | 18,345 | | | Acer, Inc. (Information Technology) | | | 14,599 | |
| | 2,593 | | | Advantech Co. Ltd. (Information Technology) | | | 26,821 | |
| | 18,297 | | | ASE Technology Holding Co. Ltd. (Information Technology) | | | 38,164 | |
| | 13,168 | | | Asia Cement Corp. (Materials) | | | 19,073 | |
| | 4,053 | | | Asustek Computer, Inc. (Information Technology) | | | 33,566 | |
| | 48,383 | | | AU Optronics Corp. (Information Technology)* | | | 17,232 | |
| | 3,993 | | | Catcher Technology Co. Ltd. (Information Technology) | | | 27,285 | |
| | 48,915 | | | Cathay Financial Holding Co. Ltd. (Financials) | | | 66,434 | |
| | 8,031 | | | Chailease Holding Co. Ltd. (Financials) | | | 35,445 | |
| | 30,598 | | | Chang Hwa Commercial Bank Ltd. (Financials) | | | 19,031 | |
| | |
| | |
| The accompanying notes are an integral part of these financial statements. | | 31 |
GOLDMAN SACHS MARKETBETA EMERGING MARKETS EQUITY ETF
Schedule of Investments (continued)
August 31, 2020
| | | | | | | | |
| Shares | | | Description | |
Value | |
| |
| Common Stocks – (continued) | | | |
| Taiwan – (continued) | | | |
| | 11,177 | | | Cheng Shin Rubber Industry Co. Ltd. (Consumer Discretionary) | | $ | 13,713 | |
| | 3,602 | | | Chicony Electronics Co. Ltd. (Information Technology) | | | 10,864 | |
| | 16,398 | | | China Airlines Ltd. (Industrials)* | | | 4,773 | |
| | 87,320 | | | China Development Financial Holding Corp. (Financials) | | | 25,415 | |
| | 18,813 | | | China Life Insurance Co. Ltd. (Financials) | | | 13,176 | |
| | 72,003 | | | China Steel Corp. (Materials) | | | 48,834 | |
| | 2,266 | | | Chroma ATE, Inc. (Information Technology) | | | 12,434 | |
| | 24,205 | | | Chunghwa Telecom Co. Ltd. (Communication Services) | | | 89,506 | |
| | 26,276 | | | Compal Electronics, Inc. (Information Technology) | | | 16,567 | |
| | 113,341 | | | CTBC Financial Holding Co. Ltd. (Financials) | | | 73,200 | |
| | 11,033 | | | Delta Electronics, Inc. (Information Technology) | | | 71,068 | |
| | 1,155 | | | Eclat Textile Co. Ltd. (Consumer Discretionary) | | | 15,254 | |
| | 72,995 | | | E.Sun Financial Holding Co. Ltd. (Financials) | | | 67,667 | |
| | 14,683 | | | Eva Airways Corp. (Industrials) | | | 5,755 | |
| | 15,323 | | | Evergreen Marine Corp. Taiwan Ltd. (Industrials)* | | | 9,087 | |
| | 19,244 | | | Far Eastern New Century Corp. (Industrials) | | | 17,348 | |
| | 10,166 | | | Far EasTone Telecommunications Co. Ltd. (Communication Services) | | | 21,239 | |
| | 2,542 | | | Feng TAY Enterprise Co. Ltd. (Consumer Discretionary) | | | 14,771 | |
| | 60,511 | | | First Financial Holding Co. Ltd. (Financials) | | | 43,824 | |
| | 9,146 | | | FIT Hon Teng Ltd. (Information Technology)*(a) | | | 3,611 | |
| | 21,291 | | | Formosa Chemicals & Fibre Corp. (Materials) | | | 49,197 | |
| | 7,543 | | | Formosa Petrochemical Corp. (Energy) | | | 21,080 | |
| | 27,256 | | | Formosa Plastics Corp. (Materials) | | | 72,642 | |
| | 400 | | | Formosa Sumco Technology Corp. (Information Technology) | | | 1,404 | |
| | 4,609 | | | Formosa Taffeta Co. Ltd. (Consumer Discretionary) | | | 4,972 | |
| | 5,644 | | | Foxconn Technology Co. Ltd. (Information Technology) | | | 10,041 | |
| | 36,906 | | | Fubon Financial Holding Co. Ltd. (Financials) | | | 53,834 | |
| | 1,439 | | | General Interface Solution Holding Ltd. (Information Technology) | | | 6,376 | |
| | 1,867 | | | Giant Manufacturing Co. Ltd. (Consumer Discretionary) | | | 19,407 | |
| | 1,347 | | | Globalwafers Co. Ltd. (Information Technology) | | | 18,088 | |
| | |
| |
| Common Stocks – (continued) | | | |
| Taiwan – (continued) | | | |
| | 5,065 | | | Highwealth Construction Corp. (Real Estate) | | | 8,010 | |
| | 1,506 | | | Hiwin Technologies Corp. (Industrials) | | | 16,527 | |
| | 76,064 | | | Hon Hai Precision Industry Co. Ltd. (Information Technology) | | | 199,353 | |
| | 1,755 | | | Hotai Motor Co. Ltd. (Consumer Discretionary) | | | 35,708 | |
| | 57,784 | | | Hua Nan Financial Holdings Co. Ltd. (Financials) | | | 35,547 | |
| | 52,277 | | | Innolux Corp. (Information Technology)* | | | 16,249 | |
| | 15,583 | | | Inventec Corp. (Information Technology) | | | 12,082 | |
| | 356 | | | King Slide Works Co. Ltd. (Information Technology) | | | 3,694 | |
| | 11,785 | | | Lite-On Technology Corp. (Information Technology) | | | 18,636 | |
| | 11,257 | | | Macronix International (Information Technology) | | | 11,586 | |
| | 8,631 | | | MediaTek, Inc. (Information Technology) | | | 163,551 | |
| | 64,214 | | | Mega Financial Holding Co. Ltd. (Financials) | | | 64,014 | |
| | 1,299 | | | Merida Industry Co. Ltd. (Consumer Discretionary) | | | 10,847 | |
| | 4,409 | | | Micro-Star International Co. Ltd. (Information Technology) | | | 20,361 | |
| | 30,094 | | | Nan Ya Plastics Corp. (Materials) | | | 63,077 | |
| | 7,164 | | | Nanya Technology Corp. (Information Technology) | | | 12,672 | |
| | 911 | | | Nien Made Enterprise Co. Ltd. (Consumer Discretionary) | | | 10,494 | |
| | 3,406 | | | Novatek Microelectronics Corp. (Information Technology) | | | 27,859 | |
| | 12,005 | | | Pegatron Corp. (Information Technology) | | | 25,572 | |
| | 939 | | | Phison Electronics Corp. (Information Technology) | | | 8,865 | |
| | 14,067 | | | Pou Chen Corp. (Consumer Discretionary) | | | 13,280 | |
| | 3,901 | | | Powertech Technology, Inc. (Information Technology) | | | 11,487 | |
| | 3,366 | | | President Chain Store Corp. (Consumer Staples) | | | 30,974 | |
| | 16,666 | | | Quanta Computer, Inc. (Information Technology) | | | 43,736 | |
| | 2,698 | | | Realtek Semiconductor Corp. (Information Technology) | | | 34,942 | |
| | 5,193 | | | Ruentex Development Co. Ltd. (Real Estate) | | | 7,646 | |
| | 2,039 | | | Ruentex Industries Ltd. (Consumer Discretionary) | | | 4,837 | |
| | 25,265 | | | Shanghai Commercial & Savings Bank Ltd. (The) (Financials) | | | 35,993 | |
| | 67,116 | | | Shin Kong Financial Holding Co. Ltd. (Financials) | | | 18,985 | |
| | 232 | | | Silicon Motion Technology Corp. ADR (Information Technology) | | | 8,795 | |
| | 3,198 | | | Sino-American Silicon Products, Inc. (Information Technology) | | | 10,507 | |
| | |
| | |
| 32 | | The accompanying notes are an integral part of these financial statements. |
GOLDMAN SACHS MARKETBETA EMERGING MARKETS EQUITY ETF
| | | | | | | | |
| Shares | | | Description | |
Value | |
| |
| Common Stocks – (continued) | | | |
| Taiwan – (continued) | | | |
| | 59,824 | | | SinoPac Financial Holdings Co. Ltd. (Financials) | | $ | 22,020 | |
| | 3,370 | | | Standard Foods Corp. (Consumer Staples) | | | 7,316 | |
| | 8,167 | | | Synnex Technology International Corp. (Information Technology) | | | 12,164 | |
| | 62,374 | | | Taishin Financial Holding Co. Ltd. (Financials) | | | 28,167 | |
| | 33,852 | | | Taiwan Business Bank (Financials) | | | 11,537 | |
| | 31,519 | | | Taiwan Cement Corp. (Materials) | | | 46,084 | |
| | 56,238 | | | Taiwan Cooperative Financial Holding Co. Ltd. (Financials) | | | 38,429 | |
| | 4,613 | | | Taiwan Fertilizer Co. Ltd. (Materials) | | | 8,537 | |
| | 12,572 | | | Taiwan High Speed Rail Corp. (Industrials) | | | 13,925 | |
| | 10,402 | | | Taiwan Mobile Co. Ltd. (Communication Services) | | | 35,983 | |
| | 153,319 | | | Taiwan Semiconductor Manufacturing Co. Ltd. (Information Technology) | | | 2,228,603 | |
| | 12,788 | | | Tatung Co. Ltd. (Consumer Discretionary)* | | | 7,496 | |
| | 9,982 | | | Teco Electric and Machinery Co. Ltd. (Industrials) | | | 9,968 | |
| | 3,006 | | | Tripod Technology Corp. (Information Technology) | | | 11,884 | |
| | 28,999 | | | Uni-President Enterprises Corp. (Consumer Staples) | | | 65,823 | |
| | 68,036 | | | United Microelectronics Corp. (Information Technology) | | | 49,158 | |
| | 5,572 | | | Vanguard International Semiconductor Corp. (Information Technology) | | | 17,756 | |
| | 15,990 | | | Walsin Lihwa Corp. (Industrials) | | | 9,183 | |
| | 1,827 | | | Walsin Technology Corp. (Information Technology) | | | 9,963 | |
| | 1,935 | | | Win Semiconductors Corp. (Information Technology) | | | 18,861 | |
| | 17,134 | | | Winbond Electronics Corp. (Information Technology) | | | 7,095 | |
| | 16,746 | | | Wistron Corp. (Information Technology) | | | 18,206 | |
| | 983 | | | Wiwynn Corp. (Information Technology) | | | 26,199 | |
| | 9,642 | | | WPG Holdings Ltd. (Information Technology) | | | 13,506 | |
| | 2,042 | | | Yageo Corp. (Information Technology) | | | 23,175 | |
| | 69,875 | | | Yuanta Financial Holding Co. Ltd. (Financials) | | | 43,818 | |
| | 5,165 | | | Yulon Motor Co. Ltd. (Consumer Discretionary)* | | | 4,454 | |
| | 3,510 | | | Zhen Ding Technology Holding Ltd. (Information Technology) | | | 14,714 | |
| | | | | | | | |
| | | | | | | 4,944,032 | |
| | |
| Tanzania – 0.2% | | | |
| | 2,543 | | | AngloGold Ashanti Ltd. (Materials) | | | 74,252 | |
| | |
| Thailand – 1.9% | | | |
| | 6,400 | | | Advanced Info Service PCL NVDR (Communication Services) | | | 37,632 | |
| | |
| |
| Common Stocks – (continued) | | | |
| Thailand – (continued) | | | |
| | 26,400 | | | Airports of Thailand PCL NVDR (Industrials) | | | 47,503 | |
| | 5,200 | | | B Grimm Power PCL NVDR (Utilities) | | | 7,727 | |
| | 6,400 | | | Bangkok Bank PCL NVDR (Financials) | | | 21,900 | |
| | 34,000 | | | Bangkok Dusit Medical Services PCL NVDR (Health Care) | | | 22,723 | |
| | 56,700 | | | Bangkok Expressway & Metro PCL NVDR (Industrials) | | | 16,487 | |
| | 4,000 | | | Banpu Power PCL NVDR (Utilities) | | | 1,838 | |
| | 8,000 | | | Berli Jucker PCL NVDR (Consumer Staples) | | | 9,511 | |
| | 49,600 | | | BTS Group Holdings PCL NVDR (Industrials) | | | 16,574 | |
| | 2,800 | | | Bumrungrad Hospital PCL NVDR (Health Care) | | | 9,941 | |
| | 2,400 | | | Carabao Group PCL NVDR (Consumer Staples) | | | 9,331 | |
| | 10,400 | | | Central Pattana PCL NVDR (Real Estate) | | | 15,706 | |
| | 19,600 | | | Central Retail Corp. PCL NVDR (Consumer Discretionary)* | | | 18,736 | |
| | 25,973 | | | Charoen Pokphand Foods PCL NVDR (Consumer Staples) | | | 26,914 | |
| | 1,600 | | | Electricity Generating PCL NVDR (Utilities) | | | 11,413 | |
| | 10,000 | | | Energy Absolute PCL NVDR (Utilities) | | | 13,495 | |
| | 232 | | | Fabrinet (Information Technology)* | | | 16,189 | |
| | 4,125 | | | Global Power Synergy PCL NVDR (Utilities) | | | 8,483 | |
| | 30,800 | | | Home Product Center PCL NVDR (Consumer Discretionary) | | | 14,746 | |
| | 12,400 | | | Indorama Ventures PCL NVDR (Materials) | | | 9,443 | |
| | 13,200 | | | Intouch Holdings PCL NVDR (Communication Services) | | | 23,115 | |
| | 65,233 | | | IRPC PCL NVDR (Energy) | | | 4,905 | |
| | 9,800 | | | Kasikornbank PCL NVDR (Financials) | | | 26,529 | |
| | 2,800 | | | Kiatnakin Phatra Bank PCL NVDR (Financials) | | | 3,576 | |
| | 28,000 | | | Krung Thai Bank PCL NVDR (Financials) | | | 8,592 | |
| | 3,819 | | | Krungthai Card PCL NVDR (Financials) | | | 3,773 | |
| | 35,600 | | | Land & Houses PCL NVDR (Real Estate) | | | 8,465 | |
| | 17,600 | | | Minor International PCL NVDR (Consumer Discretionary)* | | | 12,667 | |
| | 4,400 | | | Muangthai Capital PCL NVDR (Financials) | | | 7,033 | |
| | 9,200 | | | Osotspa PCL NVDR (Consumer Staples) | | | 11,455 | |
| | 8,400 | | | PTT Exploration & Production PCL NVDR (Energy) | | | 24,021 | |
| | 12,400 | | | PTT Global Chemical PCL NVDR (Materials) | | | 18,427 | |
| | 63,578 | | | PTT PCL NVDR (Energy) | | | 73,542 | |
| | 3,200 | | | Ratch Group PCL NVDR (Utilities) | | | 5,758 | |
| | 2,636 | | | Siam Cement PCL (The) NVDR (Materials) | | | 29,983 | |
| | 12,000 | | | Siam Commercial Bank PCL (The) NVDR (Financials) | | | 27,954 | |
| | |
| | |
| The accompanying notes are an integral part of these financial statements. | | 33 |
GOLDMAN SACHS MARKETBETA EMERGING MARKETS EQUITY ETF
Schedule of Investments (continued)
August 31, 2020
| | | | | | | | |
| Shares | | | Description | |
Value | |
| |
| Common Stocks – (continued) | | | |
| Thailand – (continued) | | | |
| | 12,400 | | | Siam Global House PCL NVDR (Consumer Discretionary) | | $ | 8,168 | |
| | 4,650 | | | Srisawad Corp. PCL NVDR (Financials) | | | 6,835 | |
| | 51,600 | | | Thai Beverage PCL (Consumer Staples) | | | 23,341 | |
| | 6,400 | | | Thai Oil PCL NVDR (Energy) | | | 8,534 | |
| | 16,800 | | | Thai Union Group PCL NVDR (Consumer Staples) | | | 7,611 | |
| | 4,000 | | | Thanachart Capital PCL NVDR (Financials) | | | 4,145 | |
| | 3,200 | | | Tisco Financial Group PCL NVDR (Financials) | | | 6,915 | |
| | 327,800 | | | TMB Bank PCL NVDR (Financials) | | | 9,901 | |
| | 4,400 | | | TOA Paint Thailand PCL NVDR (Materials) | | | 5,584 | |
| | 4,000 | | | Total Access Communication PCL NVDR (Communication Services) | | | 4,595 | |
| | 117,100 | | | True Corp. PCL NVDR (Communication Services) | | | 12,492 | |
| | 18,400 | | | VGI PCL NVDR (Communication Services) | | | 4,138 | |
| | | | | | | | |
| | | | | | | 728,346 | |
| | |
| Turkey – 0.5% | | | |
| | 19,620 | | | Akbank T.A.S. (Financials)* | | | 13,037 | |
| | 1,243 | | | Anadolu Efes Biracilik Ve Malt Sanayii AS (Consumer Staples) | | | 3,282 | |
| | 1,579 | | | Arcelik AS (Consumer Discretionary)* | | | 4,519 | |
| | 3,750 | | | Aselsan Elektronik Sanayi Ve Ticaret AS (Industrials) | | | 8,276 | |
| | 2,882 | | | BIM Birlesik Magazalar AS (Consumer Staples) | | | 26,572 | |
| | 436 | | | Coca-Cola Icecek AS (Consumer Staples) | | | 2,561 | |
| | 12,261 | | | Emlak Konut Gayrimenkul Yatirim Ortakligi AS REIT (Real Estate) | | | 2,932 | |
| | 1,503 | | | Enerjisa Enerji AS (Utilities)(a) | | | 1,667 | |
| | 10,701 | | | Enka Insaat ve Sanayi AS (Industrials) | | | 9,292 | |
| | 7,927 | | | Eregli Demir ve Celik Fabrikalari TAS (Materials) | | | 9,393 | |
| | 456 | | | Ford Otomotiv Sanayi AS (Consumer Discretionary) | | | 5,236 | |
| | 320 | | | Gubre Fabrikalari TAS (Materials)* | | | 1,291 | |
| | 10,254 | | | Haci Omer Sabanci Holding AS (Financials) | | | 10,771 | |
| | 6,932 | | | KOC Holding AS (Industrials) | | | 14,035 | |
| | 292 | | | Koza Altin Isletmeleri AS (Materials)* | | | 3,083 | |
| | 228 | | | Pegasus Hava Tasimaciligi AS (Industrials)* | | | 1,419 | |
| | 6,588 | | | Petkim Petrokimya Holding AS (Materials)* | | | 3,500 | |
| | 803 | | | Sasa Polyester Sanayi AS (Materials)* | | | 1,645 | |
| | 695 | | | Selcuk Ecza Deposu Ticaret ve Sanayi A.S. (Health Care) | | | 755 | |
| | 2,406 | | | Soda Sanayii AS (Materials) | | | 2,226 | |
| | 1,671 | | | Sok Marketler Ticaret AS (Consumer Staples)* | | | 2,918 | |
| | 1,099 | | | TAV Havalimanlari Holding AS (Industrials) | | | 2,240 | |
| | |
| |
| Common Stocks – (continued) | | | |
| Turkey – (continued) | | | |
| | 1,267 | | | Tekfen Holding AS (Industrials) | | | 2,553 | |
| | 779 | | | Tofas Turk Otomobil Fabrikasi AS (Consumer Discretionary) | | | 2,378 | |
| | 779 | | | Tupras Turkiye Petrol Rafinerileri AS (Energy)* | | | 8,469 | |
| | 4,473 | | | Turk Hava Yollari AO (Industrials)* | | | 6,419 | |
| | 2,970 | | | Turk Telekomunikasyon AS (Communication Services) | | | 2,756 | |
| | 6,860 | | | Turkcell Iletisim Hizmetleri AS (Communication Services) | | | 13,349 | |
| | 13,412 | | | Turkiye Garanti Bankasi AS (Financials)* | | | 12,320 | |
| | 3,889 | | | Turkiye Halk Bankasi AS (Financials)* | | | 2,595 | |
| | 9,666 | | | Turkiye Is Bankasi AS, Class C (Financials)* | | | 6,449 | |
| | 3,466 | | | Turkiye Sise ve Cam Fabrikalari AS (Industrials) | | | 2,845 | |
| | 10,271 | | | Turkiye Vakiflar Bankasi TAO, Class D (Financials)* | | | 5,681 | |
| | 1,067 | | | Ulker Biskuvi Sanayi AS (Consumer Staples)* | | | 3,320 | |
| | 16,150 | | | Yapi ve Kredi Bankasi AS (Financials)* | | | 4,455 | |
| | | | | | | | |
| | | | | | | 204,239 | |
| | |
| United Arab Emirates – 0.7% | | | |
| | 17,629 | | | Abu Dhabi Commercial Bank PJSC (Financials) | | | 26,589 | |
| | 9,208 | | | Abu Dhabi Islamic Bank PJSC (Financials) | | | 10,027 | |
| | 7,963 | | | Abu Dhabi National Oil Co. for Distribution PJSC (Consumer Discretionary) | | | 6,937 | |
| | 11,529 | | | Dubai Islamic Bank PJSC (Financials) | | | 12,869 | |
| | 12,736 | | | Emaar Malls PJSC (Real Estate)* | | | 4,820 | |
| | 22,343 | | | Emaar Properties PJSC (Real Estate)* | | | 17,518 | |
| | 8,047 | | | Emirates NBD Bank PJSC (Financials) | | | 23,660 | |
| | 11,077 | | | Emirates Telecommunications Group Co. PJSC (Communication Services) | | | 49,940 | |
| | 27,815 | | | First Abu Dhabi Bank PJSC (Financials) | | | 86,781 | |
| | 2,123 | | | International Holdings Co. PJSC (Consumer Staples)* | | | 21,905 | |
| | | | | | | | |
| | | | | | | 261,046 | |
| | |
| United States – 0.1% | | | |
| | 7,229 | | | JBS SA (Consumer Staples) | | $ | 29,570 | |
| | |
| | TOTAL COMMON STOCKS | |
| | (Cost $28,807,378) | | $ | 35,293,638 | |
| | |
| | | | | | | | | | |
Shares | | Description | | Rate | | | Value | |
|
| Preferred Stocks – 1.7% | |
| Brazil – 1.3% | |
| 27,432 | | Banco Bradesco SA
(Financials) | | | 8.24 | % | | $ | 103,709 | |
| 1,187 | | Braskem SA,
Class A (Materials) | | | 3.90 | | | | 4,607 | |
| |
| | |
| 34 | | The accompanying notes are an integral part of these financial statements. |
GOLDMAN SACHS MARKETBETA EMERGING MARKETS EQUITY ETF
| | | | | | | | | | |
Shares | | Description | | Rate | | | Value | |
|
| Preferred Stocks – (continued) | |
| Brazil – (continued) | |
| 1,547 | | Centrais Eletricas Brasileiras
SA, Class B (Utilities) | | | 4.85 | % | | $ | 10,121 | |
| 6,259 | | Cia Energetica de Minas
Gerais (Utilities) | | | 4.64 | | | | 12,014 | |
| 6,716 | | Gerdau SA (Materials) | | | 0.70 | | | | 23,370 | |
| 30,858 | | Itau Unibanco Holding SA
(Financials) | | | 5.25 | | | | 132,468 | |
| 28,371 | | Itausa SA (Financials) | | | 3.12 | | | | 48,768 | |
| 4,817 | | Lojas Americanas SA
(Consumer Discretionary) | | | 0.55 | | | | 28,335 | |
| 29,083 | | Petroleo Brasileiro SA
(Energy) | | | 2.73 | | | | 116,048 | |
| 2,642 | | Telefonica Brasil SA
(Communication Services) | | | 6.10 | | | | 23,040 | |
| | | | | | | | | | |
| | | | | | | | | 502,480 | |
| |
| Chile – 0.1% | | | | |
| 2,143 | | Embotelladora Andina SA,
Class B (Consumer Staples) | | | 6.52 | | | | 4,576 | |
| 635 | | Sociedad Quimica y Minera
de Chile SA, Class B
(Materials) | | | 2.79 | | | | 19,898 | |
| | | | | | | | | | |
| | | | | | | | | 24,474 | |
| |
| Colombia – 0.1% | | | | |
| 555 | | Banco Davivienda SA
(Financials) | | | 3.04 | | | | 4,289 | |
| 1,439 | | Bancolombia SA
(Financials) | | | 5.71 | | | | 10,253 | |
| 22,642 | | Grupo Aval Acciones y
Valores SA (Financials) | | | 6.32 | | | | 5,646 | |
| | | | | | | | | | |
| | | | | | | | | 20,188 | |
| |
| Russia – 0.1% | | | | |
| 6,368 | | Sberbank of Russia PJSC
(Financials)* | | | 0.00 | | | | 18,526 | |
| 49,047 | | Surgutneftegas PJSC
(Energy) | | | 2.61 | | | | 24,570 | |
| 939 | | Tatneft PJSC (Energy) | | | 9.57 | | | | 6,788 | |
| | | | | | | | | | |
| | | | | | | | | 49,884 | |
| |
| South Korea – 0.1% | | | | |
| 68 | | Amorepacific Corp.
(Consumer Staples) | | | 1.66 | | | | 3,418 | |
| 48 | | Doosan Solus Co. Ltd.
(Information Technology)* | | | 0.00 | | | | 640 | |
| 12 | | Doosan Solus Co. Ltd.
(Information Technology)* | | | 0.00 | | | | 326 | |
| 4 | | Hanjin Kal Corp.
(Industrials) | | | 0.55 | | | | 169 | |
| 228 | | Hyundai Motor Co.
(Consumer Discretionary) | | | 3.51 | | | | 16,967 | |
| 144 | | Hyundai Motor Co.
(Consumer Discretionary) | | | 3.55 | | | | 10,546 | |
| 4 | | Korean Air Lines Co. Ltd.
(Industrials)* | | | 0.00 | | | | 75 | |
| 48 | | LG Chem Ltd. (Materials) | | | 0.55 | | | | 15,153 | |
| |
|
| Preferred Stocks – (continued) | |
| South Korea – (continued) | | | | |
| 20 | |
| Samsung Electro-Mechanics
Co. Ltd. (Information
Technology) |
| | | 1.93 | | | | 982 | |
| 16 | |
| Samsung Fire & Marine
Insurance Co. Ltd.
(Financials) |
| | | 6.28 | | | | 1,765 | |
| 8 | |
| Samsung SDI Co. Ltd.
(Information Technology) |
| | | 0.40 | | | | 1,751 | |
| 4 | |
| SK Holdings Co. Ltd.
(Industrials) |
| | | 2.40 | | | | 712 | |
| | | | | | | | | | | | |
| | | | | | | | | | | 52,504 | |
| |
| TOTAL PREFERRED STOCKS | |
| (Cost $519,264) | | | $ | 649,530 | |
| |
| | | | | | | | | | | | |
| Units | | Description | | | Expiration
Month | | | Value | |
|
| Right – 0.0% | |
| Thailand – 0.0% | |
| 2,642 | |
| Gulf Energy Development
PCL (Utilities)* |
| | | | | | | | |
| (Cost $0) | | | | 09/20 | | | $ | 0 | |
| |
| | | | | | | | | | | | |
|
| Warrant – 0.0% | |
| Thailand – 0.0% | |
| 186 | |
| Srisawad Corp. PCL
(Financials)* |
| | | | | | | | |
| (Cost $0) | | | | 06/26 | | | $ | 0 | |
| |
| | | | | | | | |
| Shares | | | Description | | Value | |
|
| Exchange-Traded Fund – 1.2% | |
| United States – 1.2% | |
| | 17,685 | | | iShares MSCI Malaysia ETF | | | | |
| | (Cost $417,196) | | $ | 469,183 | |
| | |
| TOTAL INVESTMENTS BEFORE SECURITIES LENDING
REINVESTMENT VEHICLE |
|
| | (Cost $29,743,838) | | $ | 36,412,351 | |
| | |
| | |
| Shares | | | Dividend
Rate | | Value | |
|
| Securities Lending Reinvestment Vehicle – 0.6%(c) | |
| Goldman Sachs Financial Square Government Fund –
Institutional Shares |
|
| | 212,078 | | | 0.027% | | $ | 212,078 | |
| | (Cost $212,078) | | | | |
| | |
| | TOTAL INVESTMENTS – 95.1% | |
| | (Cost $29,955,916) | | $ | 36,624,429 | |
| | |
| OTHER ASSETS IN EXCESS OF
LIABILITIES – 4.9% | | | 1,892,832 | |
| | |
| | NET ASSETS – 100.0% | | $ | 38,517,261 | |
| | |
| | |
| The accompanying notes are an integral part of these financial statements. | | 35 |
GOLDMAN SACHS MARKETBETA EMERGING MARKETS EQUITY ETF
Schedule of Investments (continued)
August 31, 2020
| | |
The percentage shown for each investment category reflects the value of investments in that category as a percentage of net assets. |
| |
* | | Non-income producing security. |
| |
(a) | | Exempt from registration under Rule 144A of the Securities Act of 1933. |
| |
(b) | | All or a portion of security is on loan. |
| |
(c) | | Represents an affiliated issuer. |
| | |
|
Investment Abbreviations: |
ADR | | —American Depositary Receipt |
NVDR | | —Non-Voting Depository Receipt |
PLC | | —Public Limited Company |
REIT | | —Real Estate Investment Trust |
|
FUTURES CONTRACTS — At August 31, 2020, the Fund had the following futures contracts:
| | | | | | | | | | | | |
| Description | | Number of
Contracts | | Expiration
Date | | Notional
Amount | | | Unrealized
Appreciation/
(Depreciation) | |
MSCI Emerging Markets Index Futures | | 36 | | 09/18/20 | | $ | 2,002,864 | | | $ | (22,144 | ) |
| | |
| 36 | | The accompanying notes are an integral part of these financial statements. |
GOLDMAN SACHS MARKETBETA INTERNATIONAL EQUITY ETF
Schedule of Investments
August 31, 2020
| | | | | | | | |
Shares | | | Description | | Value | |
|
| Common Stocks – 99.1% | |
| Australia – 7.9% | |
| | 3,871 | | | Afterpay Ltd. (Information Technology)* | | $ | 261,774 | |
| | 12,373 | | | AGL Energy Ltd. (Utilities) | | | 135,427 | |
| | 50,892 | | | Alumina Ltd. (Materials) | | | 59,090 | |
| | 67,395 | | | AMP Ltd. (Financials)* | | | 76,258 | |
| | 4,920 | | | Ampol Ltd. (Energy) | | | 94,676 | |
| | 23,474 | | | APA Group (Utilities) | | | 181,067 | |
| | 12,736 | | | Aristocrat Leisure Ltd. (Consumer Discretionary) | | | 267,214 | |
| | 3,825 | | | ASX Ltd. (Financials) | | | 247,065 | |
| | 37,157 | | | Aurizon Holdings Ltd. (Industrials) | | | 119,536 | |
| | 36,804 | | | AusNet Services (Utilities) | | | 49,674 | |
| | 53,066 | | | Australia & New Zealand Banking Group Ltd. (Financials) | | | 717,398 | |
| | 58,665 | | | BHP Group Ltd. (Materials) | | | 1,644,751 | |
| | 40,997 | | | BHP Group PLC (Materials) | | | 940,206 | |
| | 10,009 | | | BlueScope Steel Ltd. (Materials) | | | 93,933 | |
| | 24,414 | | | Boral Ltd. (Materials) | | | 72,402 | |
| | 30,114 | | | Brambles Ltd. (Industrials) | | | 246,983 | |
| | 12,085 | | | Challenger Ltd. (Financials) | | | 36,465 | |
| | 1,440 | | | CIMIC Group Ltd. (Industrials) | | | 22,545 | |
| | 9,949 | | | Coca-Cola Amatil Ltd. (Consumer Staples) | | | 66,956 | |
| | 1,307 | | | Cochlear Ltd. (Health Care) | | | 185,731 | |
| | 25,258 | | | Coles Group Ltd. (Consumer Staples) | | | 331,188 | |
| | 34,937 | | | Commonwealth Bank of Australia (Financials) | | | 1,764,195 | |
| | 9,289 | | | Computershare Ltd. (Information Technology) | | | 91,298 | |
| | 8,514 | | | Crown Resorts Ltd. (Consumer Discretionary) | | | 56,732 | |
| | 9,031 | | | CSL Ltd. (Health Care) | | | 1,910,225 | |
| | 21,663 | | | Dexus REIT (Real Estate) | | | 141,464 | |
| | 31,678 | | | Evolution Mining Ltd. (Materials) | | | 130,022 | |
| | 33,792 | | | Fortescue Metals Group Ltd. (Materials) | | | 435,341 | |
| | 241,481 | | | Glencore PLC (Materials)* | | | 547,011 | |
| | 36,077 | | | Goodman Group REIT (Real Estate) | | | 488,524 | |
| | 38,777 | | | GPT Group (The) REIT (Real Estate) | | | 109,835 | |
| | 46,021 | | | Insurance Australia Group Ltd. (Financials) | | | 162,346 | |
| | 13,703 | | | Lendlease Corp. Ltd. (Real Estate) | | | 117,758 | |
| | 7,128 | | | Macquarie Group Ltd. (Financials) | | | 673,172 | |
| | 2,523 | | | Magellan Financial Group Ltd. (Financials) | | | 110,554 | |
| | 54,746 | | | Medibank Pvt Ltd. (Financials) | | | 110,531 | |
| | 78,264 | | | Mirvac Group REIT (Real Estate) | | | 122,127 | |
| | 65,645 | | | National Australia Bank Ltd. (Financials) | | | 870,461 | |
| | 16,268 | | | Newcrest Mining Ltd. (Materials) | | | 384,511 | |
| | 14,523 | | | Northern Star Resources Ltd. (Materials) | | | 146,608 | |
| | 37,359 | | | Oil Search Ltd. (Energy) | | | 90,346 | |
| | 8,095 | | | Orica Ltd. (Materials) | | | 104,048 | |
| | 34,937 | | | Origin Energy Ltd. (Energy) | | | 144,691 | |
| | 36,969 | | | Qantas Airways Ltd. (Industrials) | | | 107,721 | |
| | 27,627 | | | QBE Insurance Group Ltd. (Financials) | | | 216,779 | |
| | |
|
| Common Stocks – (continued) | |
| Australia – (continued) | |
| | 3,696 | | | Ramsay Health Care Ltd. (Health Care) | | | 177,833 | |
| | 1,140 | | | REA Group Ltd. (Communication Services) | | | 96,255 | |
| | 7,347 | | | Rio Tinto Ltd. (Materials) | | | 532,480 | |
| | 21,239 | | | Rio Tinto PLC (Materials) | | | 1,318,099 | |
| | 41,521 | | | Santos Ltd. (Energy) | | | 174,108 | |
| | 101,847 | | | Scentre Group REIT (Real Estate) | | | 170,225 | |
| | 9,349 | | | Sonic Healthcare Ltd. (Health Care) | | | 221,595 | |
| | 91,878 | | | South32 Ltd. (Materials) | | | 142,692 | |
| | 47,352 | | | Stockland REIT (Real Estate) | | | 138,676 | |
| | 25,489 | | | Suncorp Group Ltd. (Financials) | | | 175,309 | |
| | 45,001 | | | Sydney Airport (Industrials) | | | 190,364 | |
| | 30,809 | | | Tabcorp Holdings Ltd. (Consumer Discretionary) | | | 82,481 | |
| | 235,966 | | | Telstra Corp. Ltd. (Communication Services) | | | 504,330 | |
| | 54,532 | | | Transurban Group (Industrials) | | | 542,830 | |
| | 14,343 | | | Treasury Wine Estates Ltd. (Consumer Staples) | | | 98,118 | |
| | 9,264 | | | Tuas Ltd. (Communication Services)* | | | 3,426 | |
| | 73,060 | | | Vicinity Centres REIT (Real Estate) | | | 78,075 | |
| | 22,489 | | | Wesfarmers Ltd. (Consumer Discretionary) | | | 790,340 | |
| | 72,070 | | | Westpac Banking Corp. (Financials) | | | 934,871 | |
| | 2,769 | | | WiseTech Global Ltd. (Information Technology)(a) | | | 57,707 | |
| | 18,963 | | | Woodside Petroleum Ltd. (Energy) | | | 274,592 | |
| | 25,138 | | | Woolworths Group Ltd. (Consumer Staples) | | | 741,215 | |
| | | | | | | | |
| | | | | | | 22,332,260 | |
| | |
| Austria – 0.3% | | | |
| | 5,014 | | | ams AG (Information Technology)* | | | 89,065 | |
| | 1,440 | | | ANDRITZ AG (Industrials) | | | 48,290 | |
| | 1,740 | | | BAWAG Group AG (Financials)*(b) | | | 65,675 | |
| | 1,320 | | | CA Immobilien Anlagen AG (Real Estate) | | | 41,282 | |
| | 6,874 | | | Erste Group Bank AG (Financials)* | | | 167,543 | |
| | 720 | | | EVN AG (Utilities) | | | 12,158 | |
| | 284 | | | Mayr Melnhof Karton AG (Materials) | | | 48,774 | |
| | 660 | | | Oesterreichische Post AG (Industrials)(a) | | | 22,101 | |
| | 2,820 | | | OMV AG (Energy)* | | | 91,937 | |
| | 2,700 | | | Raiffeisen Bank International AG (Financials)* | | | 48,436 | |
| | 2,700 | | | Telekom Austria AG (Communication Services)* | | | 19,956 | |
| | 1,320 | | | Verbund AG (Utilities) | | | 71,039 | |
| | 780 | | | Vienna Insurance Group AG Wiener Versicherung Gruppe (Financials)* | | | 19,123 | |
| | 2,220 | | | voestalpine AG (Materials) | | | 55,251 | |
| | | | | | | | |
| | | | | | | 800,630 | |
| | |
| Belgium – 1.0% | | | |
| | 436 | | | Ackermans & van Haaren NV (Financials)* | | | 62,103 | |
| | 3,778 | | | Ageas SA/NV (Financials) | | | 159,044 | |
| | |
| | |
| The accompanying notes are an integral part of these financial statements. | | 37 |
GOLDMAN SACHS MARKETBETA INTERNATIONAL EQUITY ETF
Schedule of Investments (continued)
August 31, 2020
| | | | | | | | |
Shares | | | Description | | Value | |
|
| Common Stocks – (continued) | |
| Belgium – (continued) | | | |
| | 16,942 | | | Anheuser-Busch InBev SA/NV (Consumer Staples) | | $ | 988,877 | |
| | 1,056 | | | Colruyt SA (Consumer Staples) | | | 66,935 | |
| | 579 | | | Elia Group SA/NV (Utilities) | | | 62,390 | |
| | 840 | | | Galapagos NV (Health Care)* | | | 114,424 | |
| | 1,500 | | | Groupe Bruxelles Lambert SA (Financials) | | | 139,173 | |
| | 5,581 | | | KBC Group NV (Financials) | | | 321,048 | |
| | 2,820 | | | Proximus SADP (Communication Services) | | | 55,951 | |
| | 300 | | | Sofina SA (Financials) | | | 90,235 | |
| | 1,420 | | | Solvay SA (Materials) | | | 123,361 | |
| | 840 | | | Telenet Group Holding NV (Communication Services) | | | 32,730 | |
| | 2,400 | | | UCB SA (Health Care) | | | 285,650 | |
| | 3,840 | | | Umicore SA (Materials) | | | 176,763 | |
| | 2,640 | | | Warehouses De Pauw CVA REIT (Real Estate) | | | 93,456 | |
| | | | | | | | |
| | | | | | | 2,772,140 | |
| | |
| Chile – 0.0% | | | |
| | 6,895 | | | Antofagasta PLC (Materials) | | | 99,152 | |
| | |
| China – 0.8% | |
| | 80,722 | | | Alibaba Health Information Technology Ltd. (Health Care)* | | | 194,979 | |
| | 33,792 | | | Budweiser Brewing Co. APAC Ltd. (Consumer Staples)(b) | | | 114,018 | |
| | 37,337 | | | China Gas Holdings Ltd. (Utilities) | | | 102,374 | |
| | 114,722 | | | CSPC Pharmaceutical Group Ltd. (Health Care) | | | 254,900 | |
| | 48,732 | | | Fosun International Ltd. (Industrials) | | | 54,264 | |
| | 114,493 | | | Geely Automobile Holdings Ltd. (Consumer Discretionary) | | | 241,982 | |
| | 24,058 | | | Haier Electronics Group Co. Ltd. (Consumer Discretionary) | | | 82,416 | |
| | 7,764 | | | Prosus NV (Consumer Discretionary)* | | | 778,485 | |
| | 24,613 | | | Shimao Group Holdings Ltd. (Real Estate) | | | 110,836 | |
| | 34,152 | | | Sun Art Retail Group Ltd. (Consumer Staples) | | | 44,507 | |
| | 41,902 | | | Wilmar International Ltd. (Consumer Staples) | | | 134,372 | |
| | 54,822 | | | Yangzijiang Shipbuilding Holdings Ltd. (Industrials) | | | 36,895 | |
| | | | | | | | |
| | | | | | | 2,150,028 | |
| | |
| Colombia – 0.0% | | | |
| | 2,040 | | | Millicom International Cellular SA SDR (Communication Services) | | | 60,668 | |
| | |
| Denmark – 2.2% | | | |
| | 59 | | | AP Moller – Maersk A/S, Class A (Industrials) | | | 84,169 | |
| | 115 | | | AP Moller – Maersk A/S, Class B (Industrials) | | | 176,694 | |
| | |
|
| Common Stocks – (continued) | |
| Denmark – (continued) | | | |
| | 1,971 | | | Carlsberg AS, Class B (Consumer Staples) | | | 277,570 | |
| | 1,954 | | | Chr Hansen Holding A/S (Materials) | | | 224,825 | |
| | 2,460 | | | Coloplast A/S, Class B (Health Care) | | | 418,322 | |
| | 12,829 | | | Danske Bank A/S (Financials)* | | | 198,969 | |
| | 1,932 | | | Demant A/S (Health Care)* | | | 57,793 | |
| | 4,355 | | | DSV PANALPINA A/S (Industrials) | | | 682,427 | |
| | 1,296 | | | Genmab A/S (Health Care)* | | | 490,530 | |
| | 1,200 | | | H Lundbeck A/S (Health Care) | | | 39,482 | |
| | 33,108 | | | Novo Nordisk A/S, Class B (Health Care) | | | 2,197,484 | |
| | 4,010 | | | Novozymes A/S, Class B (Materials) | | | 237,779 | |
| | 3,571 | | | Orsted A/S (Utilities)(b) | | | 506,336 | |
| | 2,400 | | | Tryg A/S (Financials) | | | 73,835 | |
| | 3,932 | | | Vestas Wind Systems A/S (Industrials) | | | 599,087 | |
| | | | | | | | |
| | | | | | | 6,265,302 | |
| | |
| Faroe Islands – 0.0% | | | |
| | 1,000 | | | Bakkafrost P/F (Consumer Staples)* | | | 63,033 | |
| | |
| Finland – 1.4% | |
| | 2,820 | | | Elisa OYJ (Communication Services) | | | 166,234 | |
| | 8,383 | | | Fortum OYJ (Utilities) | | | 177,604 | |
| | 1,740 | | | Huhtamaki OYJ (Materials)* | | | 84,362 | |
| | 5,220 | | | Kesko OYJ, Class B (Consumer Staples) | | | 116,055 | |
| | 7,117 | | | Kone OYJ, Class B (Industrials) | | | 611,472 | |
| | 2,460 | | | Neles OYJ (Industrials) | | | 33,657 | |
| | 9,223 | | | Neste OYJ (Energy) | | | 494,265 | |
| | 111,747 | | | Nokia OYJ (Information Technology)* | | | 544,265 | |
| | 79,538 | | | Nordea Bank Abp (Financials)* | | | 642,179 | |
| | 1,920 | | | Orion OYJ, Class B (Health Care) | | | 90,287 | |
| | 9,165 | | | Sampo OYJ, Class A (Financials) | | | 369,711 | |
| | 11,209 | | | Stora Enso OYJ, Class R (Materials) | | | 165,289 | |
| | 10,130 | | | UPM-Kymmene OYJ (Materials) | | | 307,842 | |
| | 10,789 | | | Wartsila OYJ Abp (Industrials) | | | 92,438 | |
| | | | | | | | |
| | | | | | | 3,895,660 | |
| | |
| France – 9.2% | | | |
| | 3,697 | | | Accor SA (Consumer Discretionary)* | | | 113,808 | |
| | 5,015 | | | Adevinta ASA (Communication Services)* | | | 94,197 | |
| | 660 | | | Aeroports de Paris (Industrials) | | | 69,303 | |
| | 9,443 | | | Air Liquide SA (Materials) | | | 1,570,342 | |
| | 11,569 | | | Airbus SE (Industrials)* | | | 952,467 | |
| | 1,194 | | | Amundi SA (Financials)*(b) | | | 92,960 | |
| | 45,003 | | | AXA SA (Financials) | | | 919,054 | |
| | 794 | | | BioMerieux (Health Care) | | | 120,597 | |
| | 22,744 | | | BNP Paribas SA (Financials)* | | | 994,594 | |
| | 17,823 | | | Bollore SA (Communication Services) | | | 67,101 | |
| | 5,995 | | | Bouygues SA (Industrials)* | | | 238,393 | |
| | 3,209 | | | Capgemini SE (Information Technology) | | | 445,185 | |
| | 10,653 | | | Carrefour SA (Consumer Staples) | | | 171,487 | |
| | 10,825 | | | Cie de Saint-Gobain (Industrials)* | | | 439,911 | |
| | 3,230 | | | Cie Generale des Etablissements Michelin (Consumer Discretionary) | | | 365,509 | |
| | 25,318 | | | Credit Agricole SA (Financials)* | | | 260,037 | |
| | |
| | |
| 38 | | The accompanying notes are an integral part of these financial statements. |
GOLDMAN SACHS MARKETBETA INTERNATIONAL EQUITY ETF
| | | | | | | | |
Shares | | | Description | | Value | |
|
| Common Stocks – (continued) | |
| France – (continued) | | | |
| | 12,028 | | | Danone SA (Consumer Staples) | | $ | 792,608 | |
| | 2,651 | | | Dassault Systemes (Information Technology) | | | 500,458 | |
| | 10,070 | | | Electricite de France SA (Utilities) | | | 106,004 | |
| | 36,257 | | | Engie SA (Utilities)* | | | 505,379 | |
| | 5,877 | | | EssilorLuxottica SA (Consumer Discretionary)* | | | 787,906 | |
| | 660 | | | Hermes International (Consumer Discretionary) | | | 567,842 | |
| | 1,491 | | | Kering (Consumer Discretionary) | | | 917,615 | |
| | 5,253 | | | Legrand SA (Industrials) | | | 439,135 | |
| | 4,180 | | | L’Oreal SA (Consumer Staples) | | | 1,384,243 | |
| | 5,217 | | | LVMH Moet Hennessy Louis Vuitton SE (Consumer Discretionary) | | | 2,450,787 | |
| | 18,543 | | | Natixis SA (Financials)* | | | 51,117 | |
| | 39,797 | | | Orange SA (Communication Services) | | | 444,064 | |
| | 3,413 | | | Pernod Ricard SA (Consumer Staples) | | | 585,735 | |
| | 11,269 | | | Peugeot SA (Consumer Discretionary)* | | | 193,667 | |
| | 4,329 | | | Publicis Groupe SA (Communication Services)* | | | 152,056 | |
| | 7,025 | | | Safran SA (Industrials)* | | | 815,119 | |
| | 21,601 | | | Sanofi (Health Care) | | | 2,192,508 | |
| | 475 | | | Sartorius Stedim Biotech (Health Care) | | | 170,309 | |
| | 10,698 | | | Schneider Electric SE (Industrials) | | | 1,327,406 | |
| | 16,619 | | | Societe Generale SA (Financials)* | | | 269,949 | |
| | 1,680 | | | Sodexo SA (Consumer Discretionary) | | | 120,471 | |
| | 1,146 | | | Teleperformance (Industrials) | | | 354,152 | |
| | 2,102 | | | Thales SA (Industrials) | | | 164,660 | |
| | 51,931 | | | TOTAL SE (Energy) | | | 2,055,739 | |
| | 2,516 | | | Unibail-Rodamco-Westfield REIT (Real Estate) | | | 117,833 | |
| | 11,089 | | | Vinci SA (Industrials) | | | 1,042,120 | |
| | 13,892 | | | Vivendi SA (Communication Services) | | | 395,417 | |
| | | | | | | | |
| | | | | | | 25,819,244 | |
| | |
| Germany – 8.2% | | | |
| | 3,639 | | | adidas AG (Consumer Discretionary)* | | | 1,108,036 | |
| | 8,315 | | | Allianz SE (Financials) | | | 1,805,095 | |
| | 18,327 | | | BASF SE (Materials) | | | 1,119,143 | |
| | 19,623 | | | Bayer AG (Health Care) | | | 1,303,420 | |
| | 6,355 | | | Bayerische Motoren Werke AG (Consumer Discretionary) | | | 457,156 | |
| | 1,965 | | | Beiersdorf AG (Consumer Staples) | | | 227,484 | |
| | 2,160 | | | Continental AG (Consumer Discretionary) | | | 235,593 | |
| | 3,360 | | | Covestro AG (Materials)(b) | | | 160,173 | |
| | 15,936 | | | Daimler AG (Consumer Discretionary) | | | 812,757 | |
| | 2,507 | | | Delivery Hero SE (Consumer Discretionary)*(b) | | | 269,902 | |
| | 34,966 | | | Deutsche Bank AG (Financials)* | | | 335,586 | |
| | 3,657 | | | Deutsche Boerse AG (Financials) | | | 692,777 | |
| | 19,623 | | | Deutsche Post AG (Industrials) | | | 894,605 | |
| | 64,695 | | | Deutsche Telekom AG (Communication Services) | | | 1,141,237 | |
| | 6,904 | | | Deutsche Wohnen SE (Real Estate) | | | 368,585 | |
| | 44,101 | | | E.ON SE (Utilities) | | | 522,679 | |
| | |
|
| Common Stocks – (continued) | |
| Germany – (continued) | | | |
| | 3,780 | | | Evonik Industries AG (Materials) | | | 109,853 | |
| | 3,960 | | | Fresenius Medical Care AG & Co. KGaA (Health Care) | | | 336,538 | |
| | 8,127 | | | Fresenius SE & Co. KGaA (Health Care) | | | 377,116 | |
| | 1,200 | | | Hannover Rueck SE (Financials) | | | 204,651 | |
| | 483 | | | Hapag-Lloyd AG (Industrials)(b) | | | 28,131 | |
| | 2,940 | | | HeidelbergCement AG (Materials) | | | 187,127 | |
| | 2,017 | | | Henkel AG & Co. KGaA (Consumer Staples) | | | 181,520 | |
| | 439 | | | HOCHTIEF AG (Industrials) | | | 39,009 | |
| | 26,023 | | | Infineon Technologies AG (Information Technology) | | | 720,791 | |
| | 960 | | | Knorr-Bremse AG (Industrials) | | | 122,251 | |
| | 2,580 | | | Merck KGaA (Health Care) | | | 350,673 | |
| | 1,064 | | | MTU Aero Engines AG (Industrials) | | | 197,554 | |
| | 2,800 | | | Muenchener Rueckversicherungs-Gesellschaft AG in Muenchen (Financials) | | | 809,371 | |
| | 11,313 | | | RWE AG (Utilities) | | | 450,542 | |
| | 20,386 | | | SAP SE (Information Technology) | | | 3,365,505 | |
| | 16,221 | | | Siemens AG (Industrials) | | | 2,243,748 | |
| | 3,000 | | | Siemens Healthineers AG (Health Care)(b) | | | 136,697 | |
| | 2,474 | | | Symrise AG (Materials) | | | 341,887 | |
| | 1,080 | | | Talanx AG (Financials) | | | 40,221 | |
| | 15,665 | | | Telefonica Deutschland Holding AG (Communication Services) | | | 43,389 | |
| | 587 | | | Volkswagen AG (Consumer Discretionary)* | | | 105,444 | |
| | 10,825 | | | Vonovia SE (Real Estate) | | | 776,770 | |
| | 3,244 | | | Zalando SE (Consumer Discretionary)*(b) | | | 283,759 | |
| | | | | | | | |
| | | | | | | 22,906,775 | |
| | |
| Hong Kong – 3.0% | | | |
| | 241,147 | | | AIA Group Ltd. (Financials) | | | 2,482,988 | |
| | 6,055 | | | ASM Pacific Technology Ltd. (Information Technology) | | | 65,119 | |
| | 27,358 | | | Bank of East Asia Ltd. (The) (Financials) | | | 61,704 | |
| | 19,290 | | | Cathay Pacific Airways Ltd. (Industrials) | | | 15,681 | |
| | 35,388 | | | Chow Tai Fook Jewellery Group Ltd. (Consumer Discretionary) | | | 39,725 | |
| | 47,643 | | | CK Asset Holdings Ltd. (Real Estate) | | | 258,804 | |
| | 12,169 | | | CK Infrastructure Holdings Ltd. (Utilities) | | | 64,377 | |
| | 36,317 | | | CLP Holdings Ltd. (Utilities) | | | 356,837 | |
| | 5,995 | | | Dairy Farm International Holdings Ltd. (Consumer Staples) | | | 25,059 | |
| | 36,617 | | | Hang Lung Properties Ltd. (Real Estate) | | | 103,234 | |
| | 14,463 | | | Hang Seng Bank Ltd. (Financials) | | | 227,485 | |
| | 26,218 | | | Henderson Land Development Co. Ltd. (Real Estate) | | | 103,348 | |
| | |
| | |
| The accompanying notes are an integral part of these financial statements. | | 39 |
GOLDMAN SACHS MARKETBETA INTERNATIONAL EQUITY ETF
Schedule of Investments (continued)
August 31, 2020
| | | | | | | | |
Shares | | | Description | | Value | |
|
| Common Stocks – (continued) | |
| Hong Kong – (continued) | | | |
| | 45,181 | | | HK Electric Investments & HK Electric Investments Ltd. (Utilities) | | $ | 45,996 | |
| | 67,935 | | | HKT Trust & HKT Ltd. (Communication Services) | | | 97,123 | |
| | 206,135 | | | Hong Kong & China Gas Co. Ltd. (Utilities) | | | 300,020 | |
| | 25,297 | | | Hong Kong Exchanges & Clearing Ltd. (Financials) | | | 1,276,903 | |
| | 23,054 | | | Hongkong Land Holdings Ltd. (Real Estate) | | | 88,297 | |
| | 5,076 | | | Jardine Matheson Holdings Ltd. (Industrials) | | | 213,192 | |
| | 3,342 | | | Jardine Strategic Holdings Ltd. (Industrials) | | | 67,040 | |
| | 11,749 | | | Kerry Properties Ltd. (Real Estate) | | | 30,547 | |
| | 40,997 | | | Link REIT (Real Estate) | | | 326,383 | |
| | 9,109 | | | Melco Resorts & Entertainment Ltd. ADR (Consumer Discretionary) | | | 177,808 | |
| | 30,298 | | | MTR Corp. Ltd. (Industrials) | | | 157,742 | |
| | 28,150 | | | New World Development Co. Ltd. (Real Estate) | | | 146,196 | |
| | 27,898 | | | NWS Holdings Ltd. (Industrials) | | | 23,722 | |
| | 27,238 | | | Power Assets Holdings Ltd. (Utilities) | | | 156,044 | |
| | 194,499 | | | Sino Biopharmaceutical Ltd. (Health Care) | | | 224,611 | |
| | 60,081 | | | Sino Land Co. Ltd. (Real Estate) | | | 70,003 | |
| | 28,858 | | | Sun Hung Kai Properties Ltd. (Real Estate) | | | 387,993 | |
| | 9,889 | | | Swire Pacific Ltd., Class A (Real Estate) | | | 53,846 | |
| | 17,403 | | | Swire Pacific Ltd., Class B (Real Estate) | | | 15,808 | |
| | 21,003 | | | Swire Properties Ltd. (Real Estate) | | | 56,910 | |
| | 27,118 | | | Techtronic Industries Co. Ltd. (Industrials) | | | 344,304 | |
| | 188,440 | | | WH Group Ltd. (Consumer Staples)(b) | | | 162,663 | |
| | 16,346 | | | Wharf Holdings Ltd. (The) (Real Estate) | | | 31,890 | |
| | 18,372 | | | Wharf Real Estate Investment Co. Ltd. (Real Estate) | | | 76,450 | |
| | | | | | | | |
| | | | | | | 8,335,852 | |
| | |
| Ireland – 0.9% | | | |
| | 2,520 | | | AerCap Holdings NV (Industrials)* | | | 74,517 | |
| | 15,663 | | | AIB Group PLC (Financials)* | | | 19,350 | |
| | 7,613 | | | Amarin Corp. PLC ADR (Health Care)* | | | 59,077 | |
| | 15,663 | | | CRH PLC (Materials) | | | 580,697 | |
| | 3,047 | | | Flutter Entertainment PLC (Consumer Discretionary) | | | 514,906 | |
| | 1,029 | | | ICON PLC (Health Care)* | | | 191,816 | |
| | 3,071 | | | Kerry Group PLC, Class A (Consumer Staples) | | | 404,004 | |
| | 3,042 | | | Kingspan Group PLC (Industrials) | | | 261,760 | |
| | 3,539 | | | Ryanair Holdings PLC ADR (Industrials)* | | | 286,305 | |
| | 4,723 | | | Smurfit Kappa Group PLC (Materials) | | | 167,647 | |
| | | | | | | | |
| | | | | | | 2,560,079 | |
| | |
|
| Common Stocks – (continued) | |
| Israel – 0.7% | | | |
| | 1,440 | | | Airport City Ltd. (Real Estate)* | | | 16,794 | |
| | 2,880 | | | Alony Hetz Properties & Investments Ltd. (Real Estate) | | | 33,855 | |
| | 3,300 | | | Amot Investments Ltd. (Real Estate) | | | 16,954 | |
| | 720 | | | Azrieli Group Ltd. (Real Estate) | | | 38,881 | |
| | 22,323 | | | Bank Hapoalim BM (Financials) | | | 135,467 | |
| | 28,978 | | | Bank Leumi Le-Israel BM (Financials) | | | 148,705 | |
| | 40,637 | | | Bezeq The Israeli Telecommunication Corp. Ltd. (Communication Services)* | | | 46,472 | |
| | 120 | | | Big Shopping Centers Ltd. (Real Estate) | | | 9,896 | |
| | 2,171 | | | Check Point Software Technologies Ltd. (Information Technology)* | | | 274,110 | |
| | 420 | | | Elbit Systems Ltd. (Industrials) | | | 56,764 | |
| | 43 | | | Electra Ltd. (Industrials) | | | 19,552 | |
| | 4,178 | | | Energix-Renewable Energies Ltd. (Utilities)* | | | 19,720 | |
| | 1,020 | | | First International Bank Of Israel Ltd. (Financials) | | | 23,935 | |
| | 1,620 | | | Gazit-Globe Ltd. (Real Estate) | | | 8,429 | |
| | 2,280 | | | Harel Insurance Investments & Financial Services Ltd. (Financials)* | | | 16,373 | |
| | 13,803 | | | ICL Group Ltd. (Materials) | | | 51,436 | |
| | 60 | | | Israel Corp. Ltd. (The) (Materials)* | | | 7,153 | |
| | 23,174 | | | Israel Discount Bank Ltd., Class A (Financials) | | | 74,395 | |
| | 822 | | | Kornit Digital Ltd. (Industrials)* | | | 50,906 | |
| | 600 | | | Matrix IT Ltd. (Information Technology) | | | 15,463 | |
| | 420 | | | Melisron Ltd. (Real Estate) | | | 16,866 | |
| | 13,249 | | | Mivne Real Estate KD Ltd. (Real Estate)* | | | 27,472 | |
| | 2,640 | | | Mizrahi Tefahot Bank Ltd. (Financials) | | | 53,883 | |
| | 1,145 | | | Nice Ltd. (Information Technology)* | | | 262,359 | |
| | 2,925 | | | Phoenix Holdings Ltd. (The) (Financials)* | | | 14,652 | |
| | 1,860 | | | Plus500 Ltd. (Financials) | | | 36,323 | |
| | 2,820 | | | Shapir Engineering and Industry Ltd. (Industrials)* | | | 19,730 | |
| | 4,200 | | | Shikun & Binui Ltd. (Industrials)* | | | 18,796 | |
| | 3,480 | | | Shufersal Ltd. (Consumer Staples) | | | 27,410 | |
| | 960 | | | Strauss Group Ltd. (Consumer Staples) | | | 28,069 | |
| | 21,723 | | | Teva Pharmaceutical Industries Ltd. (Health Care)* | | | 207,784 | |
| | 2,100 | | | Tower Semiconductor Ltd. (Information Technology)* | | | 41,345 | |
| | 1,000 | | | Wix.com Ltd. (Information Technology)* | | | 294,630 | |
| | | | | | | | |
| | | | | | | 2,114,579 | |
| | |
| Italy – 2.2% | | | |
| | 30,778 | | | A2A SpA (Utilities) | | | 45,017 | |
| | 2,431 | | | Amplifon SpA (Health Care)* | | | 81,173 | |
| | 23,101 | | | Assicurazioni Generali SpA (Financials) | | | 359,298 | |
| | 9,229 | | | Atlantia SpA (Industrials)* | | | 147,129 | |
| | 4,230 | | | Banca Mediolanum SpA (Financials) | | | 31,441 | |
| | 1,320 | | | Buzzi Unicem SpA (Materials) | | | 32,394 | |
| | 780 | | | Buzzi Unicem SpA-RSP (Materials) | | | 10,896 | |
| | |
| | |
| 40 | | The accompanying notes are an integral part of these financial statements. |
GOLDMAN SACHS MARKETBETA INTERNATIONAL EQUITY ETF
| | | | | | | | |
Shares | | | Description | | Value | |
|
| Common Stocks – (continued) | |
| Italy – (continued) | | | |
| | 11,389 | | | Davide Campari-Milano NV (Consumer Staples) | | $ | 117,029 | |
| | 495 | | | DiaSorin SpA (Health Care) | | | 89,687 | |
| | 155,058 | | | Enel SpA (Utilities) | | | 1,407,317 | |
| | 49,306 | | | Eni SpA (Energy) | | | 459,947 | |
| | 2,233 | | | Ferrari NV (Consumer Discretionary) | | | 435,835 | |
| | 12,169 | | | FinecoBank Banca Fineco SpA (Financials)* | | | 184,830 | |
| | 14,593 | | | Hera SpA (Utilities) | | | 55,883 | |
| | 6,518 | | | Infrastrutture Wireless Italiane SpA (Communication Services)(b) | | | 63,648 | |
| | 303,656 | | | Intesa Sanpaolo SpA (Financials)* | | | 655,572 | |
| | 7,555 | | | Leonardo SpA (Industrials) | | | 51,213 | |
| | 14,643 | | | Mediobanca Banca di Credito Finanziario SpA (Financials) | | | 127,525 | |
| | 4,001 | | | Moncler SpA (Consumer Discretionary)* | | | 155,273 | |
| | 7,103 | | | Nexi SpA (Information Technology)*(b) | | | 126,700 | |
| | 7,114 | | | Pirelli & C SpA (Consumer Discretionary)*(b) | | | 30,807 | |
| | 9,205 | | | Poste Italiane SpA (Financials)(b) | | | 84,657 | |
| | 10,249 | | | PRADA SpA (Consumer Discretionary)* | | | 40,202 | |
| | 4,740 | | | Prysmian SpA (Industrials) | | | 132,877 | |
| | 1,894 | | | Recordati Industria Chimica e Farmaceutica SpA (Health Care) | | | 103,448 | |
| | 11,089 | | | Saipem SpA (Energy) | | | 23,805 | |
| | 38,672 | | | Snam SpA (Utilities) | | | 198,412 | |
| | 199,894 | | | Telecom Italia SpA (Communication Services) | | | 95,338 | |
| | 120,196 | | | Telecom Italia SpA-RSP (Communication Services) | | | 56,896 | |
| | 28,138 | | | Terna Rete Elettrica Nazionale SpA (Utilities) | | | 203,862 | |
| | 42,509 | | | UniCredit SpA (Financials)* | | | 419,419 | |
| | 8,849 | | | UnipolSai Assicurazioni SpA (Financials) | | | 25,441 | |
| | | | | | | | |
| | | | | | | 6,052,971 | |
| | |
| Japan – 25.9% | | | |
| | 600 | | | ABC-Mart, Inc. (Consumer Discretionary) | | | 31,571 | |
| | 6,295 | | | Acom Co. Ltd. (Financials) | | | 24,576 | |
| | 3,941 | | | Advantest Corp. (Information Technology) | | | 188,419 | |
| | 14,043 | | | Aeon Co. Ltd. (Consumer Staples) | | | 348,145 | |
| | 2,040 | | | AEON Financial Service Co. Ltd. (Financials) | | | 18,141 | |
| | 1,980 | | | Aeon Mall Co. Ltd. (Real Estate) | | | 26,196 | |
| | 3,900 | | | AGC, Inc. (Industrials) | | | 110,514 | |
| | 3,720 | | | Air Water, Inc. (Materials) | | | 52,268 | |
| | 3,120 | | | Aisin Seiki Co. Ltd. (Consumer Discretionary) | | | 107,241 | |
| | 10,789 | | | Ajinomoto Co., Inc. (Consumer Staples) | | | 201,038 | |
| | 3,540 | | | Alfresa Holdings Corp. (Health Care) | | | 71,104 | |
| | |
|
| Common Stocks – (continued) | |
| Japan – (continued) | | | |
| | 3,960 | | | Alps Alpine Co. Ltd. (Information Technology) | | | 62,960 | |
| | 6,715 | | | Amada Co. Ltd. (Industrials) | | | 59,776 | |
| | 6,115 | | | ANA Holdings, Inc. (Industrials)*(a) | | | 152,666 | |
| | 2,340 | | | Aozora Bank Ltd. (Financials) | | | 42,036 | |
| | 8,155 | | | Asahi Group Holdings Ltd. (Consumer Staples) | | | 285,535 | |
| | 3,833 | | | Asahi Intecc Co. Ltd. (Health Care) | | | 113,676 | |
| | 26,398 | | | Asahi Kasei Corp. (Materials) | | | 221,550 | |
| | 36,797 | | | Astellas Pharma, Inc. (Health Care) | | | 577,572 | |
| | 3,828 | | | Bandai Namco Holdings, Inc. (Consumer Discretionary) | | | 237,777 | |
| | 1,500 | | | Benesse Holdings, Inc. (Consumer Discretionary) | | | 38,205 | |
| | 11,329 | | | Bridgestone Corp. (Consumer Discretionary) | | | 359,062 | |
| | 4,860 | | | Brother Industries Ltd. (Information Technology) | | | 80,431 | |
| | 1,620 | | | Calbee, Inc. (Consumer Staples) | | | 50,489 | |
| | 20,364 | | | Canon, Inc. (Information Technology) | | | 351,802 | |
| | 1,689 | | | Capcom Co. Ltd. (Communication Services) | | | 81,866 | |
| | 4,200 | | | Casio Computer Co. Ltd. (Consumer Discretionary) | | | 67,686 | |
| | 3,401 | | | Central Japan Railway Co. (Industrials) | | | 509,613 | |
| | 13,623 | | | Chiba Bank Ltd. (The) (Financials) | | | 70,655 | |
| | 14,523 | | | Chubu Electric Power Co., Inc. (Utilities) | | | 179,338 | |
| | 12,549 | | | Chugai Pharmaceutical Co. Ltd. (Health Care) | | | 558,667 | |
| | 6,235 | | | Chugoku Electric Power Co., Inc. (The) (Utilities) | | | 75,964 | |
| | 2,340 | | | Coca-Cola Bottlers Japan Holdings, Inc. (Consumer Staples) | | | 39,013 | |
| | 21,543 | | | Concordia Financial Group Ltd. (Financials) | | | 71,509 | |
| | 377 | | | Cosmos Pharmaceutical Corp. (Consumer Staples) | | | 66,303 | |
| | 2,940 | | | Credit Saison Co. Ltd. (Financials) | | | 33,518 | |
| | 1,980 | | | CyberAgent, Inc. (Communication Services) | | | 105,493 | |
| | 4,560 | | | Dai Nippon Printing Co. Ltd. (Industrials) | | | 96,923 | |
| | 5,340 | | | Daicel Corp. (Materials) | | | 38,774 | |
| | 2,233 | | | Daifuku Co. Ltd. (Industrials) | | | 196,463 | |
| | 21,303 | | | Dai-ichi Life Holdings, Inc. (Financials) | | | 322,523 | |
| | 12,382 | | | Daiichi Sankyo Co. Ltd. (Health Care) | | | 1,103,048 | |
| | 5,160 | | | Daikin Industries Ltd. (Industrials) | | | 971,469 | |
| | 1,273 | | | Daito Trust Construction Co. Ltd. (Real Estate) | | | 112,853 | |
| | 12,012 | | | Daiwa House Industry Co. Ltd. (Real Estate) | | | 321,751 | |
| | 45 | | | Daiwa House REIT Investment Corp. REIT (Real Estate) | | | 117,544 | |
| | 28,918 | | | Daiwa Securities Group, Inc. (Financials) | | | 130,348 | |
| | 8,800 | | | Denso Corp. (Consumer Discretionary) | | | 369,858 | |
| | 4,200 | | | Dentsu Group, Inc. (Communication Services) | | | 110,263 | |
| | |
| | |
| The accompanying notes are an integral part of these financial statements. | | 41 |
GOLDMAN SACHS MARKETBETA INTERNATIONAL EQUITY ETF
Schedule of Investments (continued)
August 31, 2020
| | | | | | | | |
Shares | | | Description | | Value | |
|
| Common Stocks – (continued) | |
| Japan – (continued) | | | |
| | 1,620 | | | DIC Corp. (Materials) | | $ | 38,543 | |
| | 552 | | | Disco Corp. (Information Technology) | | | 128,728 | |
| | 6,864 | | | East Japan Railway Co. (Industrials) | | | 446,424 | |
| | 1,860 | | | Ebara Corp. (Industrials) | | | 47,919 | |
| | 5,400 | | | Eisai Co. Ltd. (Health Care) | | | 471,790 | |
| | 3,240 | | | Electric Power Development Co. Ltd. (Utilities) | | | 48,854 | |
| | 60,081 | | | ENEOS Holdings, Inc. (Energy) | | | 235,463 | |
| | 960 | | | Ezaki Glico Co. Ltd. (Consumer Staples) | | | 40,737 | |
| | 4,839 | | | FamilyMart Co. Ltd. (Consumer Staples) | | | 107,234 | |
| | 3,793 | | | FANUC Corp. (Industrials) | | | 665,461 | |
| | 1,085 | | | Fast Retailing Co. Ltd. (Consumer Discretionary) | | | 647,450 | |
| | 2,520 | | | Fuji Electric Co. Ltd. (Industrials) | | | 78,776 | |
| | 3,300 | | | Fuji Media Holdings, Inc. (Communication Services) | | | 32,768 | |
| | 7,495 | | | FUJIFILM Holdings Corp. (Information Technology) | | | 356,639 | |
| | 3,748 | | | Fujitsu Ltd. (Information Technology) | | | 488,447 | |
| | 3,480 | | | Fukuoka Financial Group, Inc. (Financials) | | | 57,593 | |
| | 69 | | | GLP J REIT (Real Estate) | | | 106,449 | |
| | 825 | | | GMO Payment Gateway, Inc. (Information Technology) | | | 87,211 | |
| | 4,320 | | | Hakuhodo DY Holdings, Inc. (Communication Services) | | | 53,773 | |
| | 2,760 | | | Hamamatsu Photonics KK (Information Technology) | | | 125,709 | |
| | 4,560 | | | Hankyu Hanshin Holdings, Inc. (Industrials) | | | 148,137 | |
| | 681 | | | Harmonic Drive Systems, Inc. (Industrials) | | | 35,898 | |
| | 5,400 | | | Haseko Corp. (Consumer Discretionary) | | | 73,684 | |
| | 403 | | | Hikari Tsushin, Inc. (Consumer Discretionary) | | | 97,363 | |
| | 5,220 | | | Hino Motors Ltd. (Industrials) | | | 35,146 | |
| | 639 | | | Hirose Electric Co. Ltd. (Information Technology) | | | 72,369 | |
| | 1,260 | | | Hisamitsu Pharmaceutical Co., Inc. (Health Care) | | | 58,102 | |
| | 2,040 | | | Hitachi Construction Machinery Co. Ltd. (Industrials) | | | 71,562 | |
| | 18,783 | | | Hitachi Ltd. (Information Technology) | | | 625,244 | |
| | 3,960 | | | Hitachi Metals Ltd. (Materials) | | | 59,412 | |
| | 32,095 | | | Honda Motor Co. Ltd. (Consumer Discretionary) | | | 825,944 | |
| | 1,091 | | | Hoshizaki Corp. (Industrials) | | | 83,436 | |
| | 7,458 | | | Hoya Corp. (Health Care) | | | 732,473 | |
| | 7,555 | | | Hulic Co. Ltd. (Real Estate) | | | 68,821 | |
| | 4,020 | | | Idemitsu Kosan Co. Ltd. (Energy) | | | 88,554 | |
| | 2,520 | | | IHI Corp. (Industrials) | | | 37,428 | |
| | 2,940 | | | Iida Group Holdings Co. Ltd. (Consumer Discretionary) | | | 57,389 | |
| | 19,383 | | | Inpex Corp. (Energy) | | | 123,158 | |
| | 6,595 | | | Isetan Mitsukoshi Holdings Ltd. (Consumer Discretionary) | | | 36,319 | |
| | |
|
| Common Stocks – (continued) | |
| Japan – (continued) | | | |
| | 11,149 | | | Isuzu Motors Ltd. (Consumer Discretionary) | | | 110,286 | |
| | 1,080 | | | Ito En Ltd. (Consumer Staples) | | | 65,282 | |
| | 29,426 | | | ITOCHU Corp. (Industrials) | | | 755,733 | |
| | 1,800 | | | Itochu Techno-Solutions Corp. (Information Technology) | | | 65,180 | |
| | 780 | | | Izumi Co. Ltd. (Consumer Discretionary) | | | 30,414 | |
| | 4,800 | | | J Front Retailing Co. Ltd. (Consumer Discretionary) | | | 33,405 | |
| | 6,295 | | | Japan Airlines Co. Ltd. (Industrials) | | | 125,490 | |
| | 10,609 | | | Japan Exchange Group, Inc. (Financials) | | | 274,917 | |
| | 8,095 | | | Japan Post Bank Co. Ltd. (Financials) | | | 65,114 | |
| | 28,318 | | | Japan Post Holdings Co. Ltd. (Financials) | | | 209,277 | |
| | 3,900 | | | Japan Post Insurance Co. Ltd. (Financials) | | | 62,300 | |
| | 54 | | | Japan Retail Fund Investment Corp. REIT (Real Estate) | | | 81,424 | |
| | 21,903 | | | Japan Tobacco, Inc. (Consumer Staples) | | | 409,474 | |
| | 10,249 | | | JFE Holdings, Inc. (Materials) | | | 77,608 | |
| | 4,380 | | | JGC Holdings Corp. (Industrials) | | | 48,366 | |
| | 3,960 | | | JSR Corp. (Materials) | | | 84,394 | |
| | 4,500 | | | JTEKT Corp. (Consumer Discretionary) | | | 34,754 | |
| | 8,989 | | | Kajima Corp. (Industrials) | | | 111,976 | |
| | 2,520 | | | Kakaku.com, Inc. (Communication Services) | | | 67,179 | |
| | 14,643 | | | Kansai Electric Power Co., Inc. (The) (Utilities) | | | 144,159 | |
| | 4,260 | | | Kansai Paint Co. Ltd. (Materials) | | | 101,594 | |
| | 9,391 | | | Kao Corp. (Consumer Staples) | | | 714,564 | |
| | 2,940 | | | Kawasaki Heavy Industries Ltd. (Industrials) | | | 41,642 | |
| | 32,008 | | | KDDI Corp. (Communication Services) | | | 929,045 | |
| | 2,023 | | | Keihan Holdings Co. Ltd. (Industrials) | | | 87,181 | |
| | 4,740 | | | Keikyu Corp. (Industrials) | | | 70,712 | |
| | 2,280 | | | Keio Corp. (Industrials) | | | 137,817 | |
| | 2,940 | | | Keisei Electric Railway Co. Ltd. (Industrials) | | | 86,499 | |
| | 2,040 | | | Kewpie Corp. (Consumer Staples) | | | 38,628 | |
| | 3,603 | | | Keyence Corp. (Information Technology) | | | 1,484,078 | |
| | 2,880 | | | Kikkoman Corp. (Consumer Staples) | | | 156,432 | |
| | 3,600 | | | Kintetsu Group Holdings Co. Ltd. (Industrials) | | | 158,197 | |
| | 15,876 | | | Kirin Holdings Co. Ltd. (Consumer Staples) | | | 312,145 | |
| | 953 | | | Kobayashi Pharmaceutical Co. Ltd. (Consumer Staples) | | | 84,835 | |
| | 1,080 | | | Kobe Bussan Co. Ltd. (Consumer Staples) | | | 63,652 | |
| | 2,382 | | | Koito Manufacturing Co. Ltd. (Consumer Discretionary) | | | 115,456 | |
| | 18,663 | | | Komatsu Ltd. (Industrials) | | | 405,484 | |
| | 1,860 | | | Konami Holdings Corp. (Communication Services) | | | 71,650 | |
| | 9,709 | | | Konica Minolta, Inc. (Information Technology) | | | 31,404 | |
| | 600 | | | Kose Corp. (Consumer Staples) | | | 70,329 | |
| | |
| | |
| 42 | | The accompanying notes are an integral part of these financial statements. |
GOLDMAN SACHS MARKETBETA INTERNATIONAL EQUITY ETF
| | | | | | | | |
Shares | | | Description | | Value | |
|
| Common Stocks – (continued) | |
| Japan – (continued) | | | |
| | 23,174 | | | Kubota Corp. (Industrials) | | $ | 418,812 | |
| | 6,715 | | | Kuraray Co. Ltd. (Materials) | | | 68,705 | |
| | 6,512 | | | Kyocera Corp. (Information Technology) | | | 373,790 | |
| | 4,860 | | | Kyowa Kirin Co. Ltd. (Health Care) | | | 125,665 | |
| | 8,929 | | | Kyushu Electric Power Co., Inc. (Utilities) | | | 79,064 | |
| | 3,000 | | | Kyushu Railway Co. (Industrials) | | | 66,142 | |
| | 1,500 | | | Lasertec Corp. (Information Technology) | | | 113,160 | |
| | 940 | | | Lawson, Inc. (Consumer Staples) | | | 46,360 | |
| | 1,090 | | | LINE Corp. (Communication Services)* | | | 55,505 | |
| | 4,860 | | | Lion Corp. (Consumer Staples) | | | 102,933 | |
| | 5,400 | | | LIXIL Group Corp. (Industrials) | | | 99,297 | |
| | 8,131 | | | M3, Inc. (Health Care) | | | 470,784 | |
| | 900 | | | Mabuchi Motor Co. Ltd. (Industrials) | | | 31,699 | |
| | 4,800 | | | Makita Corp. (Industrials) | | | 221,793 | |
| | 33,058 | | | Marubeni Corp. (Industrials) | | | 199,386 | |
| | 3,900 | | | Marui Group Co. Ltd. (Consumer Discretionary) | | | 71,237 | |
| | 1,620 | | | Matsumotokiyoshi Holdings Co. Ltd. (Consumer Staples) | | | 56,676 | |
| | 11,449 | | | Mazda Motor Corp. (Consumer Discretionary) | | | 73,415 | |
| | 1,320 | | | McDonald’s Holdings Co. Japan Ltd. (Consumer Discretionary) | | | 64,727 | |
| | 21,423 | | | Mebuki Financial Group, Inc. (Financials) | | | 51,919 | |
| | 3,120 | | | Medipal Holdings Corp. (Health Care) | | | 59,637 | |
| | 2,564 | | | MEIJI Holdings Co. Ltd. (Consumer Staples) | | | 206,967 | |
| | 1,739 | | | Mercari, Inc. (Consumer Discretionary)* | | | 78,878 | |
| | 7,615 | | | MINEBEA MITSUMI, Inc. (Industrials) | | | 132,057 | |
| | 5,695 | | | MISUMI Group, Inc. (Industrials) | | | 149,403 | |
| | 27,538 | | | Mitsubishi Chemical Holdings Corp. (Materials) | | | 160,951 | |
| | 26,578 | | | Mitsubishi Corp. (Industrials) | | | 629,706 | |
| | 38,897 | | | Mitsubishi Electric Corp. (Industrials) | | | 536,624 | |
| | 23,638 | | | Mitsubishi Estate Co. Ltd. (Real Estate) | | | 370,357 | |
| | 3,720 | | | Mitsubishi Gas Chemical Co., Inc. (Materials) | | | 66,440 | |
| | 6,055 | | | Mitsubishi Heavy Industries Ltd. (Industrials) | | | 150,369 | |
| | 2,280 | | | Mitsubishi Materials Corp. (Materials) | | | 47,903 | |
| | 12,349 | | | Mitsubishi Motors Corp. (Consumer Discretionary) | | | 29,695 | |
| | 228,503 | | | Mitsubishi UFJ Financial Group, Inc. (Financials) | | | 953,487 | |
| | 10,249 | | | Mitsubishi UFJ Lease & Finance Co. Ltd. (Financials) | | | 48,420 | |
| | 32,203 | | | Mitsui & Co. Ltd. (Industrials) | | | 581,230 | |
| | 3,360 | | | Mitsui Chemicals, Inc. (Materials) | | | 78,990 | |
| | 17,883 | | | Mitsui Fudosan Co. Ltd. (Real Estate) | | | 323,781 | |
| | 2,280 | | | Mitsui OSK Lines Ltd. (Industrials) | | | 42,205 | |
| | 1,912 | | | Miura Co. Ltd. (Industrials) | | | 78,251 | |
| | |
|
| Common Stocks – (continued) | |
| Japan – (continued) | | | |
| | 465,264 | | | Mizuho Financial Group, Inc. (Financials) | | | 630,911 | |
| | 2,400 | | | MonotaRO Co. Ltd. (Industrials) | | | 94,828 | |
| | 9,408 | | | MS&AD Insurance Group Holdings, Inc. (Financials) | | | 260,917 | |
| | 12,349 | | | Murata Manufacturing Co. Ltd. (Information Technology) | | | 731,310 | |
| | 2,220 | | | Nabtesco Corp. (Industrials) | | | 70,235 | |
| | 3,840 | | | Nagoya Railroad Co. Ltd. (Industrials) | | | 107,148 | |
| | 4,965 | | | NEC Corp. (Information Technology) | | | 261,722 | |
| | 8,929 | | | Nexon Co. Ltd. (Communication Services) | | | 209,069 | |
| | 6,115 | | | NGK Insulators Ltd. (Industrials) | | | 86,900 | |
| | 3,720 | | | NGK Spark Plug Co. Ltd. (Consumer Discretionary) | | | 64,020 | |
| | 1,980 | | | NH Foods Ltd. (Consumer Staples) | | | 89,716 | |
| | 2,400 | | | Nichirei Corp. (Consumer Staples) | | | 62,622 | |
| | 10,003 | | | Nidec Corp. (Industrials) | | | 840,556 | |
| | 2,860 | | | Nihon M&A Center, Inc. (Industrials) | | | 142,400 | |
| | 5,755 | | | Nikon Corp. (Consumer Discretionary) | | | 45,152 | |
| | 2,333 | | | Nintendo Co. Ltd. (Communication Services) | | | 1,248,285 | |
| | 62 | | | Nippon Building Fund, Inc. REIT (Real Estate) | | | 373,596 | |
| | 1,680 | | | Nippon Express Co. Ltd. (Industrials) | | | 99,331 | |
| | 3,480 | | | Nippon Paint Holdings Co. Ltd. (Materials) | | | 298,628 | |
| | 44 | | | Nippon Prologis REIT, Inc. REIT (Real Estate) | | | 143,977 | |
| | 1,125 | | | Nippon Shinyaku Co. Ltd. (Health Care) | | | 92,826 | |
| | 16,923 | | | Nippon Steel Corp. (Materials) | | | 166,685 | |
| | 47,261 | | | Nippon Telegraph & Telephone Corp. (Communication Services) | | | 1,074,731 | |
| | 2,820 | | | Nippon Television Holdings, Inc. (Communication Services) | | | 33,294 | |
| | 3,000 | | | Nippon Yusen KK (Industrials) | | | 46,905 | |
| | 2,553 | | | Nissan Chemical Corp. (Materials) | | | 135,300 | |
| | 46,681 | | | Nissan Motor Co. Ltd. (Consumer Discretionary) | | | 189,946 | |
| | 4,560 | | | Nisshin Seifun Group, Inc. (Consumer Staples) | | | 75,294 | |
| | 1,361 | | | Nissin Foods Holdings Co. Ltd. (Consumer Staples) | | | 136,042 | |
| | 1,614 | | | Nitori Holdings Co. Ltd. (Consumer Discretionary) | | | 337,579 | |
| | 2,946 | | | Nitto Denko Corp. (Materials) | | | 178,907 | |
| | 1,740 | | | NOK Corp. (Consumer Discretionary) | | | 18,951 | |
| | 59,541 | | | Nomura Holdings, Inc. (Financials) | | | 305,720 | |
| | 2,220 | | | Nomura Real Estate Holdings, Inc. (Real Estate) | | | 42,476 | |
| | 77 | | | Nomura Real Estate Master Fund, Inc. REIT (Real Estate) | | | 98,678 | |
| | 7,195 | | | Nomura Research Institute Ltd. (Information Technology) | | | 191,265 | |
| | 9,109 | | | NSK Ltd. (Industrials) | | | 69,835 | |
| | |
| | |
| The accompanying notes are an integral part of these financial statements. | | 43 |
GOLDMAN SACHS MARKETBETA INTERNATIONAL EQUITY ETF
Schedule of Investments (continued)
August 31, 2020
| | | | | | | | |
Shares | | | Description | | Value | |
|
| Common Stocks – (continued) | |
| Japan – (continued) | | | |
| | 12,529 | | | NTT Data Corp. (Information Technology) | | $ | 143,195 | |
| | 21,363 | | | NTT DOCOMO, Inc. (Communication Services) | | | 596,097 | |
| | 12,949 | | | Obayashi Corp. (Industrials) | | | 126,627 | |
| | 1,266 | | | Obic Co. Ltd. (Information Technology) | | | 224,321 | |
| | 6,715 | | | Odakyu Electric Railway Co. Ltd. (Industrials) | | | 166,094 | |
| | 17,943 | | | Oji Holdings Corp. (Materials) | | | 81,048 | |
| | 24,898 | | | Olympus Corp. (Health Care) | | | 492,818 | |
| | 3,780 | | | Omron Corp. (Information Technology) | | | 276,964 | |
| | 7,844 | | | Ono Pharmaceutical Co. Ltd. (Health Care) | | | 236,626 | |
| | 660 | | | Oracle Corp. Japan (Information Technology) | | | 77,424 | |
| | 3,939 | | | Oriental Land Co. Ltd. (Consumer Discretionary) | | | 534,511 | |
| | 24,828 | | | ORIX Corp. (Financials) | | | 309,516 | |
| | 56 | | | Orix JREIT, Inc. REIT (Real Estate) | | | 83,278 | |
| | 7,961 | | | Osaka Gas Co. Ltd. (Utilities) | | | 155,624 | |
| | 2,040 | | | Otsuka Corp. (Information Technology) | | | 100,033 | |
| | 7,955 | | | Otsuka Holdings Co. Ltd. (Health Care) | | | 349,346 | |
| | 7,762 | | | Pan Pacific International Holdings Corp. (Consumer Discretionary) | | | 182,330 | |
| | 43,370 | | | Panasonic Corp. (Consumer Discretionary) | | | 399,939 | |
| | 2,160 | | | Park24 Co. Ltd. (Industrials) | | | 39,026 | |
| | 1,860 | | | PeptiDream, Inc. (Health Care)* | | | 75,509 | |
| | 3,480 | | | Persol Holdings Co. Ltd. (Industrials) | | | 54,311 | |
| | 2,280 | | | Pigeon Corp. (Consumer Staples) | | | 104,169 | |
| | 1,680 | | | Pola Orbis Holdings, Inc. (Consumer Staples) | | | 30,433 | |
| | 16,023 | | | Rakuten, Inc. (Consumer Discretionary) | | | 140,973 | |
| | 24,256 | | | Recruit Holdings Co. Ltd. (Industrials) | | | 920,879 | |
| | 14,708 | | | Renesas Electronics Corp. (Information Technology)* | | | 92,510 | |
| | 44,881 | | | Resona Holdings, Inc. (Financials) | | | 165,058 | |
| | 13,863 | | | Ricoh Co. Ltd. (Information Technology) | | | 103,667 | |
| | 696 | | | Rinnai Corp. (Consumer Discretionary) | | | 64,386 | |
| | 1,680 | | | Rohm Co. Ltd. (Information Technology) | | | 108,045 | |
| | 4,740 | | | Ryohin Keikaku Co. Ltd. (Consumer Discretionary) | | | 74,199 | |
| | 7,435 | | | Santen Pharmaceutical Co. Ltd. (Health Care) | | | 141,696 | |
| | 4,440 | | | SBI Holdings, Inc. (Financials) | | | 101,030 | |
| | 840 | | | SCREEN Holdings Co. Ltd. (Information Technology) | | | 40,952 | |
| | 960 | | | SCSK Corp. (Information Technology) | | | 51,963 | |
| | 4,185 | | | Secom Co. Ltd. (Industrials) | | | 395,630 | |
| | 3,420 | | | Sega Sammy Holdings, Inc. (Consumer Discretionary) | | | 39,636 | |
| | 4,140 | | | Seibu Holdings, Inc. (Industrials) | | | 45,521 | |
| | 5,695 | | | Seiko Epson Corp. (Information Technology) | | | 67,989 | |
| | 7,943 | | | Sekisui Chemical Co. Ltd. (Consumer Discretionary) | | | 127,109 | |
| | |
|
| Common Stocks – (continued) | |
| Japan – (continued) | | | |
| | 11,809 | | | Sekisui House Ltd. (Consumer Discretionary) | | | 233,407 | |
| | 14,943 | | | Seven & i Holdings Co. Ltd. (Consumer Staples) | | | 483,750 | |
| | 11,929 | | | Seven Bank Ltd. (Financials) | | | 29,922 | |
| | 4,260 | | | SG Holdings Co. Ltd. (Industrials) | | | 195,837 | |
| | 4,020 | | | Sharp Corp. (Consumer Discretionary) | | | 49,925 | |
| | 5,574 | | | Shimadzu Corp. (Information Technology) | | | 166,361 | |
| | 480 | | | Shimamura Co. Ltd. (Consumer Discretionary) | | | 39,606 | |
| | 1,519 | | | Shimano, Inc. (Consumer Discretionary) | | | 321,576 | |
| | 11,569 | | | Shimizu Corp. (Industrials) | | | 89,022 | |
| | 8,075 | | | Shin-Etsu Chemical Co. Ltd. (Materials) | | | 981,153 | |
| | 4,440 | | | Shinsei Bank Ltd. (Financials) | | | 51,876 | |
| | 5,935 | | | Shionogi & Co. Ltd. (Health Care) | | | 329,253 | |
| | 7,837 | | | Shiseido Co. Ltd. (Consumer Staples) | | | 456,053 | |
| | 10,129 | | | Shizuoka Bank Ltd. (The) (Financials) | | | 70,395 | |
| | 2,820 | | | Showa Denko KK (Materials) | | | 54,967 | |
| | 1,247 | | | SMC Corp. (Industrials) | | | 684,971 | |
| | 35,871 | | | SoftBank Corp. (Communication Services) | | | 471,030 | |
| | 27,836 | | | SoftBank Group Corp. (Communication Services) | | | 1,731,924 | |
| | 1,380 | | | Sohgo Security Services Co. Ltd. (Industrials) | | | 64,481 | |
| | 21,483 | | | Sojitz Corp. (Industrials) | | | 49,228 | |
| | 6,602 | | | Sompo Holdings, Inc. (Financials) | | | 247,781 | |
| | 25,126 | | | Sony Corp. (Consumer Discretionary) | | | 1,968,711 | |
| | 1,740 | | | Square Enix Holdings Co. Ltd. (Communication Services) | | | 114,693 | |
| | 2,940 | | | Stanley Electric Co. Ltd. (Consumer Discretionary) | | | 84,281 | |
| | 11,989 | | | Subaru Corp. (Consumer Discretionary) | | | 249,005 | |
| | 4,980 | | | SUMCO Corp. (Information Technology) | | | 67,530 | |
| | 31,618 | | | Sumitomo Chemical Co. Ltd. (Materials) | | | 102,864 | |
| | 22,983 | | | Sumitomo Corp. (Industrials) | | | 297,894 | |
| | 3,300 | | | Sumitomo Dainippon Pharma Co. Ltd. (Health Care) | | | 41,762 | |
| | 14,763 | | | Sumitomo Electric Industries Ltd. (Consumer Discretionary) | | | 173,879 | |
| | 2,280 | | | Sumitomo Heavy Industries Ltd. (Industrials) | | | 51,880 | |
| | 4,730 | | | Sumitomo Metal Mining Co. Ltd. (Materials) | | | 144,382 | |
| | 25,558 | | | Sumitomo Mitsui Financial Group, Inc. (Financials) | | | 751,472 | |
| | 6,235 | | | Sumitomo Mitsui Trust Holdings, Inc. (Financials) | | | 180,562 | |
| | 6,535 | | | Sumitomo Realty & Development Co. Ltd. (Real Estate) | | | 192,947 | |
| | 3,540 | | | Sumitomo Rubber Industries Ltd. (Consumer Discretionary) | | | 34,083 | |
| | 1,320 | | | Sundrug Co. Ltd. (Consumer Staples) | | | 49,106 | |
| | 2,460 | | | Suntory Beverage & Food Ltd. (Consumer Staples) | | | 94,879 | |
| | |
| | |
| 44 | | The accompanying notes are an integral part of these financial statements. |
GOLDMAN SACHS MARKETBETA INTERNATIONAL EQUITY ETF
| | | | | | | | |
Shares | | | Description | | Value | |
|
| Common Stocks – (continued) | |
| Japan – (continued) | | | |
| | 1,260 | | | Suzuken Co. Ltd. (Health Care) | | $ | 46,814 | |
| | 8,095 | | | Suzuki Motor Corp. (Consumer Discretionary) | | | 331,983 | |
| | 3,034 | | | Sysmex Corp. (Health Care) | | | 264,847 | |
| | 10,909 | | | T&D Holdings, Inc. (Financials) | | | 114,187 | |
| | 2,400 | | | Taiheiyo Cement Corp. (Materials) | | | 61,016 | |
| | 3,780 | | | Taisei Corp. (Industrials) | | | 130,640 | |
| | 720 | | | Taisho Pharmaceutical Holdings Co. Ltd. (Health Care) | | | 44,268 | |
| | 3,240 | | | Taiyo Nippon Sanso Corp. (Materials) | | | 57,012 | |
| | 30,658 | | | Takeda Pharmaceutical Co. Ltd. (Health Care) | | | 1,144,561 | |
| | 2,511 | | | TDK Corp. (Information Technology) | | | 260,702 | |
| | 3,600 | | | Teijin Ltd. (Materials) | | | 56,489 | |
| | 14,053 | | | Terumo Corp. (Health Care) | | | 571,158 | |
| | 2,340 | | | THK Co. Ltd. (Industrials) | | | 54,856 | |
| | 4,560 | | | TIS, Inc. (Information Technology) | | | 91,161 | |
| | 3,960 | | | Tobu Railway Co. Ltd. (Industrials) | | | 123,604 | |
| | 2,160 | | | Toho Co. Ltd. (Communication Services) | | | 82,086 | |
| | 1,800 | | | Toho Gas Co. Ltd. (Utilities) | | | 79,268 | |
| | 9,229 | | | Tohoku Electric Power Co., Inc. (Utilities) | | | 93,556 | |
| | 12,709 | | | Tokio Marine Holdings, Inc. (Financials) | | | 586,044 | |
| | 1,860 | | | Tokyo Broadcasting System Holdings, Inc. (Communication Services) | | | 32,133 | |
| | 795 | | | Tokyo Century Corp. (Financials) | | | 40,783 | |
| | 29,578 | | | Tokyo Electric Power Co. Holdings, Inc. (Utilities)* | | | 87,023 | |
| | 2,790 | | | Tokyo Electron Ltd. (Information Technology) | | | 714,305 | |
| | 8,313 | | | Tokyo Gas Co. Ltd. (Utilities) | | | 184,729 | |
| | 11,869 | | | Tokyu Corp. (Industrials) | | | 158,708 | |
| | 11,989 | | | Tokyu Fudosan Holdings Corp. (Real Estate) | | | 51,553 | |
| | 5,611 | | | Toppan Printing Co. Ltd. (Industrials) | | | 87,198 | |
| | 29,698 | | | Toray Industries, Inc. (Materials) | | | 141,062 | |
| | 8,569 | | | Toshiba Corp. (Industrials) | | | 246,860 | |
| | 5,755 | | | Tosoh Corp. (Materials) | | | 85,474 | |
| | 3,060 | | | TOTO Ltd. (Industrials) | | | 134,323 | |
| | 2,880 | | | Toyo Seikan Group Holdings Ltd. (Materials) | | | 32,210 | |
| | 1,740 | | | Toyo Suisan Kaisha Ltd. (Consumer Staples) | | | 98,777 | |
| | 1,380 | | | Toyoda Gosei Co. Ltd. (Consumer Discretionary) | | | 30,126 | |
| | 1,080 | | | Toyota Boshoku Corp. (Consumer Discretionary) | | | 15,317 | |
| | 3,060 | | | Toyota Industries Corp. (Consumer Discretionary) | | | 178,328 | |
| | 45,053 | | | Toyota Motor Corp. (Consumer Discretionary) | | | 2,976,485 | |
| | 4,440 | | | Toyota Tsusho Corp. (Industrials) | | | 129,375 | |
| | 2,640 | | | Trend Micro, Inc. (Information Technology) | | | 163,312 | |
| | 737 | | | Tsuruha Holdings, Inc. (Consumer Staples) | | | 98,410 | |
| | |
|
| Common Stocks – (continued) | |
| Japan – (continued) | | | |
| | 7,642 | | | Unicharm Corp. (Consumer Staples) | | | 332,502 | |
| | 58 | | | United Urban Investment Corp. REIT (Real Estate) | | | 64,539 | |
| | 4,020 | | | USS Co. Ltd. (Consumer Discretionary) | | | 67,894 | |
| | 1,880 | | | Welcia Holdings Co. Ltd. (Consumer Staples) | | | 80,398 | |
| | 3,540 | | | West Japan Railway Co. (Industrials) | | | 185,971 | |
| | 360 | | | Workman Co. Ltd. (Consumer Discretionary) | | | 31,028 | |
| | 2,319 | | | Yakult Honsha Co. Ltd. (Consumer Staples) | | | 132,302 | |
| | 13,121 | | | Yamada Denki Co. Ltd. (Consumer Discretionary) | | | 70,403 | |
| | 3,300 | | | Yamaha Corp. (Consumer Discretionary) | | | 160,885 | |
| | 5,755 | | | Yamaha Motor Co. Ltd. (Consumer Discretionary) | | | 90,684 | |
| | 6,588 | | | Yamato Holdings Co. Ltd. (Industrials) | | | 172,209 | |
| | 2,580 | | | Yamazaki Baking Co. Ltd. (Consumer Staples) | | | 41,992 | |
| | 4,966 | | | Yaskawa Electric Corp. (Industrials) | | | 178,653 | |
| | 5,040 | | | Yokogawa Electric Corp. (Information Technology) | | | 82,364 | |
| | 2,640 | | | Yokohama Rubber Co. Ltd. (The) (Consumer Discretionary) | | | 41,351 | |
| | 51,746 | | | Z Holdings Corp. (Communication Services) | | | 344,014 | |
| | 1,920 | | | ZOZO, Inc. (Consumer Discretionary) | | | 54,027 | |
| | | | | | | | |
| | | | | | | 72,685,741 | |
| | |
| Jordan – 0.0% | | | |
| | 2,827 | | | Hikma Pharmaceuticals PLC (Health Care) | | | 89,747 | |
| | |
| Luxembourg – 0.1% | |
| | 13,780 | | | ArcelorMittal (Materials)* | | | 174,723 | |
| | 731 | | | RTL Group SA (Communication Services)* | | | 24,321 | |
| | | | | | | | |
| | | | | | | 199,044 | |
| | |
| Macau – 0.2% | | | |
| | 39,238 | | | Galaxy Entertainment Group Ltd. (Consumer Discretionary) | | | 309,088 | |
| | 16,383 | | | MGM China Holdings Ltd. (Consumer Discretionary) | | | 23,845 | |
| | 48,492 | | | Sands China Ltd. (Consumer Discretionary) | | | 213,987 | |
| | 37,157 | | | SJM Holdings Ltd. (Consumer Discretionary) | | | 51,108 | |
| | 28,798 | | | Wynn Macau Ltd. (Consumer Discretionary)* | | | 54,176 | |
| | | | | | | | |
| | | | | | | 652,204 | |
| | |
| Mexico – 0.0% | | | |
| | 3,660 | | | Fresnillo PLC (Materials) | | | 61,870 | |
| | |
| Netherlands – 4.2% | |
| | 8,869 | | | ABN AMRO Bank NV (Financials)*(b) | | | 84,685 | |
| | |
| | |
| The accompanying notes are an integral part of these financial statements. | | 45 |
GOLDMAN SACHS MARKETBETA INTERNATIONAL EQUITY ETF
Schedule of Investments (continued)
August 31, 2020
| | | | | | | | |
Shares | | | Description | | Value | |
|
| Common Stocks – (continued) | |
| Netherlands – (continued) | |
| | 369 | | | Adyen NV (Information Technology)*(b) | | $ | 623,565 | |
| | 3,456 | | | Akzo Nobel NV (Materials) | | | 342,808 | |
| | 8,496 | | | ASML Holding NV (Information Technology) | | | 3,193,538 | |
| | 2,078 | | | EXOR NV (Financials) | | | 122,768 | |
| | 1,696 | | | HAL Trust (Financials) | | | 227,173 | |
| | 2,022 | | | Heineken Holding NV (Consumer Staples) | | | 166,010 | |
| | 3,762 | | | Heineken NV (Consumer Staples) | | | 348,955 | |
| | 77,784 | | | ING Groep NV (Financials)* | | | 632,948 | |
| | 1,446 | | | JDE Peet’s BV (Consumer Staples)* | | | 63,830 | |
| | 2,648 | | | Just Eat Takeaway.com NV (Consumer Discretionary)*(b) | | | 295,280 | |
| | 17,722 | | | Koninklijke Ahold Delhaize NV (Consumer Staples) | | | 534,529 | |
| | 3,395 | | | Koninklijke DSM NV (Materials) | | | 545,901 | |
| | 68,715 | | | Koninklijke KPN NV (Communication Services) | | | 180,549 | |
| | 17,994 | | | Koninklijke Philips NV (Health Care)* | | | 852,943 | |
| | 4,075 | | | NN Group NV (Financials) | | | 153,759 | |
| | 5,551 | | | NXP Semiconductors NV (Information Technology) | | | 698,094 | |
| | 2,378 | | | Randstad NV (Industrials) | | | 124,196 | |
| | 81,430 | | | Royal Dutch Shell PLC, Class A (Energy) | | | 1,206,752 | |
| | 68,775 | | | Royal Dutch Shell PLC, Class B (Energy) | | | 978,877 | |
| | 5,439 | | | Wolters Kluwer NV (Industrials) | | | 447,528 | |
| | | | | | | | |
| | | | | | | 11,824,688 | |
| | |
| New Zealand – 0.5% | | | |
| | 14,643 | | | a2 Milk Co. Ltd. (The) (Consumer Staples)* | | | 183,989 | |
| | 24,065 | | | Auckland International Airport Ltd. (Industrials) | | | 107,840 | |
| | 14,343 | | | Contact Energy Ltd. (Utilities) | | | 60,590 | |
| | 2,575 | | | EBOS Group Ltd. (Health Care) | | | 40,239 | |
| | 11,449 | | | Fisher & Paykel Healthcare Corp. Ltd. (Health Care) | | | 285,159 | |
| | 16,443 | | | Fletcher Building Ltd. (Materials)* | | | 39,899 | |
| | 10,129 | | | Genesis Energy Ltd. (Utilities) | | | 20,676 | |
| | 26,578 | | | Goodman Property Trust REIT (Real Estate) | | | 41,856 | |
| | 13,108 | | | Infratil Ltd. (Utilities) | | | 43,944 | |
| | 1,423 | | | Mainfreight Ltd. (Industrials) | | | 46,157 | |
| | 12,169 | | | Mercury NZ Ltd. (Utilities) | | | 42,688 | |
| | 25,018 | | | Meridian Energy Ltd. (Utilities) | | | 85,901 | |
| | 8,275 | | | Ryman Healthcare Ltd. (Health Care) | | | 75,171 | |
| | 36,617 | | | Spark New Zealand Ltd. (Communication Services) | | | 119,540 | |
| | 1,980 | | | Xero Ltd. (Information Technology)* | | | 147,851 | |
| | | | | | | | |
| | | | | | | 1,341,500 | |
| | |
| Norway – 0.7% | | | |
| | 420 | | | Aker ASA, Class A (Financials) | | | 19,659 | |
| | 2,100 | | | Aker BP ASA (Energy) | | | 42,058 | |
| | |
|
| Common Stocks – (continued) | |
| Norway – (continued) | | | |
| | 1,680 | | | Austevoll Seafood ASA (Consumer Staples) | | | 15,613 | |
| | 17,463 | | | DNB ASA (Financials)* | | | 282,129 | |
| | 3,240 | | | Entra ASA (Real Estate)(b) | | | 44,579 | |
| | 21,123 | | | Equinor ASA (Energy) | | | 344,666 | |
| | 3,660 | | | Gjensidige Forsikring ASA (Financials)* | | | 78,489 | |
| | 1,753 | | | Kongsberg Gruppen ASA (Industrials) | | | 26,220 | |
| | 5,635 | | | Leroy Seafood Group ASA (Consumer Staples) | | | 35,857 | |
| | 8,929 | | | Mowi ASA (Consumer Staples) | | | 175,792 | |
| | 26,458 | | | Norsk Hydro ASA (Materials)* | | | 85,033 | |
| | 14,943 | | | Orkla ASA (Consumer Staples) | | | 153,115 | |
| | 1,020 | | | Salmar ASA (Consumer Staples)* | | | 55,654 | |
| | 1,425 | | | Schibsted ASA, Class A (Communication Services)* | | | 62,465 | |
| | 1,860 | | | Schibsted ASA, Class B (Communication Services)* | | | 74,203 | |
| | 3,568 | | | SpareBank 1 SR-Bank ASA (Financials)* | | | 32,317 | |
| | 9,078 | | | Storebrand ASA (Financials)* | | | 56,133 | |
| | 11,829 | | | Telenor ASA (Communication Services) | | | 193,697 | |
| | 2,280 | | | TGS NOPEC Geophysical Co. ASA (Energy) | | | 29,860 | |
| | 2,318 | | | TOMRA Systems ASA (Industrials)* | | | 113,122 | |
| | 3,360 | | | Yara International ASA (Materials) | | | 141,710 | |
| | | | | | | | |
| | | | | | | 2,062,371 | |
| | |
| Poland – 0.3% | | | |
| | 3,180 | | | Bank Pekao SA (Financials)* | | | 45,335 | |
| | 1,273 | | | CD Projekt SA (Communication Services)* | | | 152,161 | |
| | 3,958 | | | Cyfrowy Polsat SA (Communication Services)* | | | 31,029 | |
| | 959 | | | Dino Polska SA (Consumer Staples)*(b) | | | 58,452 | |
| | 1,738 | | | Grupa Lotos SA (Energy) | | | 19,168 | |
| | 2,756 | | | KGHM Polska Miedz SA (Materials)* | | | 102,809 | |
| | 241 | | | mBank SA (Financials)* | | | 12,357 | |
| | 15,903 | | | PGE Polska Grupa Energetyczna SA (Utilities)* | | | 26,174 | |
| | 5,763 | | | Polski Koncern Naftowy ORLEN SA (Energy) | | | 79,551 | |
| | 32,419 | | | Polskie Gornictwo Naftowe i Gazownictwo SA (Energy) | | | 45,334 | |
| | 17,640 | | | Powszechna Kasa Oszczednosci Bank Polski SA (Financials)* | | | 103,718 | |
| | 11,331 | | | Powszechny Zaklad Ubezpieczen SA (Financials)* | | | 83,920 | |
| | 660 | | | Santander Bank Polska SA (Financials)* | | | 27,256 | |
| | | | | | | | |
| | | | | | | 787,264 | |
| | |
| Portugal – 0.2% | | | |
| | 48,964 | | | EDP – Energias de Portugal SA (Utilities) | | | 248,405 | |
| | 9,829 | | | Galp Energia SGPS SA (Energy) | | | 105,466 | |
| | 4,860 | | | Jeronimo Martins SGPS SA (Consumer Staples) | | | 79,948 | |
| | |
| | |
| 46 | | The accompanying notes are an integral part of these financial statements. |
GOLDMAN SACHS MARKETBETA INTERNATIONAL EQUITY ETF
| | | | | | | | |
Shares | | | Description | | Value | |
|
| Common Stocks – (continued) | |
| Portugal – (continued) | | | |
| | 4,620 | | | NOS SGPS SA (Communication Services) | | $ | 18,720 | |
| | | | | | | | |
| | | | | | | 452,539 | |
| | |
| Russia – 0.0% | | | |
| | 11,449 | | | Evraz PLC (Materials) | | | 49,699 | |
| | |
| Singapore – 1.1% | |
| | 57,860 | | | Ascendas Real Estate Investment Trust REIT (Real Estate) | | | 141,288 | |
| | 57,449 | | | CapitaLand Commercial Trust REIT (Real Estate) | | | 70,987 | |
| | 49,272 | | | CapitaLand Ltd. (Real Estate) | | | 100,385 | |
| | 48,072 | | | CapitaLand Mall Trust REIT (Real Estate) | | | 69,301 | |
| | 11,689 | | | City Developments Ltd. (Real Estate) | | | 69,037 | |
| | 43,081 | | | ComfortDelGro Corp. Ltd. (Industrials) | | | 46,896 | |
| | 35,357 | | | DBS Group Holdings Ltd. (Financials) | | | 542,734 | |
| | 113,302 | | | Genting Singapore Ltd. (Consumer Discretionary) | | | 58,334 | |
| | 1,980 | | | Jardine Cycle & Carriage Ltd. (Consumer Discretionary) | | | 27,597 | |
| | 28,618 | | | Keppel Corp. Ltd. (Industrials) | | | 96,404 | |
| | 25,617 | | | Keppel DC REIT (Real Estate) | | | 54,829 | |
| | 41,990 | | | Mapletree Commercial Trust REIT (Real Estate) | | | 59,298 | |
| | 34,697 | | | Mapletree Industrial Trust REIT (Real Estate) | | | 77,836 | |
| | 52,526 | | | Mapletree Logistics Trust REIT (Real Estate) | | | 79,971 | |
| | 73,315 | | | Oversea-Chinese Banking Corp. Ltd. (Financials) | | | 467,521 | |
| | 12,949 | | | SATS Ltd. (Industrials) | | | 28,572 | |
| | 17,943 | | | Sembcorp Industries Ltd. (Industrials) | | | 24,679 | |
| | 26,278 | | | Singapore Airlines Ltd. (Industrials) | | | 70,546 | |
| | 15,663 | | | Singapore Exchange Ltd. (Financials) | | | 99,190 | |
| | 31,738 | | | Singapore Press Holdings Ltd. (Communication Services) | | | 25,445 | |
| | 30,577 | | | Singapore Technologies Engineering Ltd. (Industrials) | | | 76,465 | |
| | 157,888 | | | Singapore Telecommunications Ltd. (Communication Services) | | | 267,095 | |
| | 35,417 | | | Suntec Real Estate Investment Trust REIT (Real Estate) | | | 36,469 | |
| | 28,318 | | | United Overseas Bank Ltd. (Financials) | | | 407,399 | |
| | 10,669 | | | UOL Group Ltd. (Real Estate) | | | 51,556 | |
| | 5,340 | | | Venture Corp. Ltd. (Information Technology) | | | 77,963 | |
| | | | | | | | |
| | | | | | | 3,127,797 | |
| | |
| South Africa – 0.2% | | | |
| | 23,114 | | | Anglo American PLC (Materials) | | | 567,162 | |
| | |
| Spain – 2.2% | |
| | 4,690 | | | ACS Actividades de Construccion y Servicios SA (Industrials) | | | 115,097 | |
| | 1,357 | | | Aena SME SA (Industrials)*(b) | | | 203,025 | |
| | |
|
| Common Stocks – (continued) | |
| Spain – (continued) | |
| | 8,973 | | | Amadeus IT Group SA (Information Technology) | | | 503,404 | |
| | 132,685 | | | Banco Bilbao Vizcaya Argentaria SA (Financials) | | | 389,254 | |
| | 327,430 | | | Banco Santander SA (Financials) | | | 729,454 | |
| | 22,978 | | | Bankia SA (Financials) | | | 29,006 | |
| | 70,695 | | | CaixaBank SA (Financials) | | | 155,737 | |
| | 6,889 | | | Cellnex Telecom SA (Communication Services)*(b) | | | 442,264 | |
| | 6,355 | | | Endesa SA (Utilities) | | | 176,554 | |
| | 9,349 | | | Ferrovial SA (Industrials) | | | 250,229 | |
| | 5,852 | | | Grifols SA (Health Care) | | | 158,941 | |
| | 120,969 | | | Iberdrola SA (Utilities) | | | 1,526,299 | |
| | 16,351 | | | Industria de Diseno Textil SA (Consumer Discretionary) | | | 460,520 | |
| | 19,143 | | | Mapfre SA (Financials) | | | 36,356 | |
| | 9,709 | | | Naturgy Energy Group SA (Utilities) | | | 187,642 | |
| | 8,629 | | | Red Electrica Corp. SA (Utilities) | | | 165,376 | |
| | 27,418 | | | Repsol SA (Energy) | | | 217,139 | |
| | 3,300 | | | Siemens Gamesa Renewable Energy SA (Industrials) | | | 88,562 | |
| | 90,318 | | | Telefonica SA (Communication Services) | | | 357,640 | |
| | | | | | | | |
| | | | | | | 6,192,499 | |
| | |
| Sweden – 3.5% | | | |
| | 3,374 | | | AAK AB (Consumer Staples)* | | | 67,030 | |
| | 5,935 | | | Alfa Laval AB (Industrials)* | | | 145,469 | |
| | 18,723 | | | Assa Abloy AB, Class B (Industrials) | | | 434,159 | |
| | 12,917 | | | Atlas Copco AB, Class A (Industrials) | | | 598,903 | |
| | 7,795 | | | Atlas Copco AB, Class B (Industrials) | | | 313,880 | |
| | 2,100 | | | Axfood AB (Consumer Staples) | | | 46,553 | |
| | 5,340 | | | Boliden AB (Materials) | | | 159,675 | |
| | 4,550 | | | Castellum AB (Real Estate) | | | 93,374 | |
| | 4,980 | | | Electrolux AB, Series B (Consumer Discretionary) | | | 108,204 | |
| | 6,475 | | | Elekta AB, Class B (Health Care)(a) | | | 81,417 | |
| | 12,433 | | | Epiroc AB, Class A (Industrials) | | | 185,595 | |
| | 7,279 | | | Epiroc AB, Class B (Industrials) | | | 104,945 | |
| | 7,111 | | | EQT AB (Financials) | | | 131,503 | |
| | 12,133 | | | Essity AB, Class B (Consumer Staples)* | | | 418,644 | |
| | 2,400 | | | Evolution Gaming Group AB (Consumer Discretionary)(b) | | | 180,258 | |
| | 5,280 | | | Fabege AB (Real Estate) | | | 64,493 | |
| | 1,842 | | | Fastighets AB Balder, Class B (Real Estate)* | | | 73,595 | |
| | 3,713 | | | Getinge AB, Class B (Health Care) | | | 82,698 | |
| | 14,823 | | | Hennes & Mauritz AB, Class B (Consumer Discretionary) | | | 236,997 | |
| | 5,574 | | | Hexagon AB, Class B (Information Technology)* | | | 404,820 | |
| | 1,751 | | | Holmen AB, Class B (Materials)* | | | 62,488 | |
| | 7,945 | | | Husqvarna AB, Class B (Consumer Discretionary) | | | 86,571 | |
| | 1,723 | | | ICA Gruppen AB (Consumer Staples) | | | 84,742 | |
| | |
| | |
| The accompanying notes are an integral part of these financial statements. | | 47 |
GOLDMAN SACHS MARKETBETA INTERNATIONAL EQUITY ETF
Schedule of Investments (continued)
August 31, 2020
| | | | | | | | |
Shares | | | Description | | Value | |
|
| Common Stocks – (continued) | |
| Sweden – (continued) | | | |
| | 2,111 | | | Industrivarden AB, Class A (Financials)* | | $ | 56,196 | |
| | 2,980 | | | Industrivarden AB, Class C (Financials)* | | | 78,742 | |
| | 2,220 | | | Investment AB Latour, Class B (Industrials) | | | 49,651 | |
| | 2,640 | | | Investor AB, Class A (Financials) | | | 167,124 | |
| | 9,085 | | | Investor AB, Class B (Financials) | | | 580,811 | |
| | 4,800 | | | Kinnevik AB, Class B (Financials)* | | | 3,868 | |
| | 4,800 | | | Kinnevik AB, Class B (Financials) | | | 185,907 | |
| | 1,452 | | | L E Lundbergforetagen AB, Class B (Financials)* | | | 66,498 | |
| | 3,480 | | | Lundin Energy AB (Energy) | | | 85,296 | |
| | 8,449 | | | Nibe Industrier AB, Class B (Industrials)* | | | 238,043 | |
| | 1,620 | | | Saab AB, Class B (Industrials)* | | | 48,835 | |
| | 21,303 | | | Sandvik AB (Industrials)* | | | 419,394 | |
| | 6,175 | | | Securitas AB, Class B (Industrials)* | | | 88,133 | |
| | 30,418 | | | Skandinaviska Enskilda Banken AB, Class A (Financials)* | | | 302,383 | |
| | 360 | | | Skandinaviska Enskilda Banken AB, Class C (Financials)* | | | 3,723 | |
| | 7,675 | | | Skanska AB, Class B (Industrials)* | | | 156,793 | |
| | 8,441 | | | SKF AB, Class B (Industrials) | | | 168,919 | |
| | 3,960 | | | SSAB AB, Class A (Materials)* | | | 12,975 | |
| | 10,909 | | | SSAB AB, Class B (Materials)* | | | 33,809 | |
| | 11,329 | | | Svenska Cellulosa AB SCA, Class B (Materials)* | | | 146,391 | |
| | 29,098 | | | Svenska Handelsbanken AB, Class A (Financials)* | | | 293,579 | |
| | 21,423 | | | Swedbank AB, Class A (Financials)* | | | 364,181 | |
| | 3,154 | | | Swedish Match AB (Consumer Staples) | | | 240,108 | |
| | 3,277 | | | Swedish Orphan Biovitrum AB (Health Care)* | | | 73,614 | |
| | 8,989 | | | Tele2 AB, Class B (Communication Services) | | | 127,723 | |
| | 58,700 | | | Telefonaktiebolaget LM Ericsson,
Class B (Information Technology) | | | 682,285 | |
| | 41,158 | | | Telia Co. AB (Communication Services) | | | 158,954 | |
| | 4,800 | | | Trelleborg AB, Class B (Industrials)* | | | 83,980 | |
| | 3,940 | | | Volvo AB, Class A (Industrials)* | | | 76,471 | |
| | 29,904 | | | Volvo AB, Class B (Industrials)* | | | 573,120 | |
| | | | | | | | |
| | | | | | | 9,733,519 | |
| | |
| Switzerland – 9.4% | | | |
| | 37,337 | | | ABB Ltd. (Industrials) | | | 952,447 | |
| | 9,769 | | | Alcon, Inc. (Health Care)* | | | 557,206 | |
| | 10,174 | | | Cie Financiere Richemont SA (Consumer Discretionary) | | | 675,216 | |
| | 45,849 | | | Credit Suisse Group AG (Financials) | | | 505,818 | |
| | 715 | | | Geberit AG (Industrials) | | | 413,381 | |
| | 163 | | | Givaudan SA (Materials) | | | 686,068 | |
| | 1,099 | | | Kuehne + Nagel International AG (Industrials)* | | | 213,649 | |
| | 10,287 | | | LafargeHolcim Ltd. (Materials)* | | | 490,102 | |
| | 1,485 | | | Lonza Group AG (Health Care) | | | 924,198 | |
| | 57,471 | | | Nestle SA (Consumer Staples) | | | 6,928,815 | |
| | 46,660 | | | Novartis AG (Health Care) | | | 4,043,918 | |
| | |
|
| Common Stocks – (continued) | |
| Switzerland – (continued) | | | |
| | 360 | | | Partners Group Holding AG (Financials) | | | 366,937 | |
| | 532 | | | Roche Holding AG (Health Care) | | | 186,934 | |
| | 14,014 | | | Roche Holding AG (Health Care) | | | 4,913,343 | |
| | 378 | | | Schindler Holding AG (Industrials) | | | 99,826 | |
| | 797 | | | Schindler Holding AG Participation Certificates (Industrials) | | | 213,401 | |
| | 110 | | | SGS SA (Industrials) | | | 285,613 | |
| | 2,677 | | | Sika AG (Materials) | | | 643,943 | |
| | 12,809 | | | STMicroelectronics NV (Information Technology) | | | 385,118 | |
| | 582 | | | Swatch Group AG (The) – Bearer (Consumer Discretionary) | | | 123,452 | |
| | 1,015 | | | Swatch Group AG (The) – Registered (Consumer Discretionary) | | | 40,174 | |
| | 5,503 | | | Swiss Re AG (Financials) | | | 443,931 | |
| | 500 | | | Swisscom AG (Communication Services) | | | 277,639 | |
| | 76,981 | | | UBS Group AG (Financials) | | | 939,126 | |
| | 2,996 | | | Zurich Insurance Group AG (Financials) | | | 1,111,293 | |
| | | | | | | | |
| | | | | | | 26,421,548 | |
| | |
| United Kingdom – 12.5% | | | |
| | 19,383 | | | 3i Group PLC (Financials) | | | 243,438 | |
| | 5,100 | | | Admiral Group PLC (Financials) | | | 180,071 | |
| | 8,936 | | | Ashtead Group PLC (Industrials) | | | 311,685 | |
| | 7,178 | | | Associated British Foods PLC (Consumer Staples) | | | 196,641 | |
| | 25,151 | | | AstraZeneca PLC (Health Care) | | | 2,808,572 | |
| | 18,843 | | | Auto Trader Group PLC (Communication Services)(b) | | | 142,094 | |
| | 1,275 | | | AVEVA Group PLC (Information Technology) | | | 86,587 | |
| | 78,264 | | | Aviva PLC (Financials) | | | 296,246 | |
| | 64,035 | | | BAE Systems PLC (Industrials) | | | 445,503 | |
| | 345,853 | | | Barclays PLC (Financials)* | | | 518,464 | |
| | 20,283 | | | Barratt Developments PLC (Consumer Discretionary) | | | 142,633 | |
| | 2,371 | | | Berkeley Group Holdings PLC (Consumer Discretionary) | | | 144,732 | |
| | 403,949 | | | BP PLC (Energy) | | | 1,428,972 | |
| | 45,766 | | | British American Tobacco PLC (Consumer Staples) | | | 1,551,875 | |
| | 17,108 | | | British Land Co. PLC (The) REIT (Real Estate) | | | 83,770 | |
| | 173,077 | | | BT Group PLC (Communication Services) | | | 242,517 | |
| | 6,715 | | | Bunzl PLC (Industrials) | | | 217,763 | |
| | 8,095 | | | Burberry Group PLC (Consumer Discretionary) | | | 156,566 | |
| | 53,246 | | | CK Hutchison Holdings Ltd. (Industrials) | | | 348,669 | |
| | 5,345 | | | Clarivate PLC (Industrials)* | | | 157,357 | |
| | 19,563 | | | CNH Industrial NV (Industrials)* | | | 155,212 | |
| | 2,852 | | | Coca-Cola European Partners PLC (Consumer Staples) | | | 117,388 | |
| | |
| | |
| 48 | | The accompanying notes are an integral part of these financial statements. |
GOLDMAN SACHS MARKETBETA INTERNATIONAL EQUITY ETF
| | | | | | | | |
Shares | | | Description | | Value | |
|
| Common Stocks – (continued) | |
| United Kingdom – (continued) | | | |
| | 35,572 | | | Compass Group PLC (Consumer Discretionary) | | $ | 581,313 | |
| | 31,760 | | | ConvaTec Group PLC (Health Care)(b) | | | 81,478 | |
| | 2,568 | | | Croda International PLC (Materials) | | | 202,867 | |
| | 1,904 | | | DCC PLC (Industrials) | | | 168,972 | |
| | 46,621 | | | Diageo PLC (Consumer Staples) | | | 1,566,510 | |
| | 27,178 | | | Direct Line Insurance Group PLC (Financials) | | | 107,314 | |
| | 27,344 | | | DS Smith PLC (Materials) | | | 94,716 | |
| | 6,101 | | | easyJet PLC (Industrials) | | | 51,726 | |
| | 18,256 | | | Experian PLC (Industrials) | | | 681,984 | |
| | 22,263 | | | Fiat Chrysler Automobiles NV (Consumer Discretionary)* | | | 245,780 | |
| | 100,114 | | | GlaxoSmithKline PLC (Health Care) | | | 1,973,181 | |
| | 7,555 | | | Halma PLC (Information Technology) | | | 224,368 | |
| | 6,424 | | | Hargreaves Lansdown PLC (Financials) | | | 139,042 | |
| | 406,305 | | | HSBC Holdings PLC (Financials) | | | 1,796,089 | |
| | 18,843 | | | Imperial Brands PLC (Consumer Staples) | | | 316,130 | |
| | 29,925 | | | Informa PLC (Communication Services)* | | | 165,641 | |
| | 3,480 | | | InterContinental Hotels Group PLC (Consumer Discretionary)* | | | 205,300 | |
| | 28,798 | | | International Consolidated Airlines Group SA (Industrials)(a) | | | 83,403 | |
| | 3,216 | | | Intertek Group PLC (Industrials) | | | 253,024 | |
| | 72,255 | | | ITV PLC (Communication Services) | | | 58,744 | |
| | 44,221 | | | J Sainsbury PLC (Consumer Staples) | | | 108,827 | |
| | 8,629 | | | JD Sports Fashion PLC (Consumer Discretionary) | | | 83,857 | |
| | 3,840 | | | Johnson Matthey PLC (Materials) | | | 122,112 | |
| | 42,121 | | | Kingfisher PLC (Consumer Discretionary) | | | 152,444 | |
| | 14,823 | | | Land Securities Group PLC REIT (Real Estate) | | | 114,737 | |
| | 118,896 | | | Legal & General Group PLC (Financials) | | | 345,932 | |
| | 2,820 | | | Liberty Global PLC, Class A (Communication Services)* | | | 65,903 | |
| | 7,650 | | | Liberty Global PLC, Class C (Communication Services)* | | | 176,027 | |
| | 1,410,656 | | | Lloyds Banking Group PLC (Financials)* | | | 535,474 | |
| | 7,015 | | | London Stock Exchange Group PLC (Financials) | | | 826,560 | |
| | 51,866 | | | M&G PLC (Financials) | | | 120,142 | |
| | 38,897 | | | Marks & Spencer Group PLC (Consumer Discretionary) | | | 57,862 | |
| | 95,653 | | | Melrose Industries PLC (Industrials) | | | 130,380 | |
| | 9,709 | | | Mondi PLC (Materials) | | | 189,928 | |
| | 70,028 | | | National Grid PLC (Utilities) | | | 790,618 | |
| | 91,398 | | | Natwest Group PLC (Financials)* | | | 138,042 | |
| | 2,463 | | | Next PLC (Consumer Discretionary) | | | 199,123 | |
| | 10,063 | | | Ocado Group PLC (Consumer Discretionary)* | | | 336,442 | |
| | |
|
| Common Stocks – (continued) | |
| United Kingdom – (continued) | | | |
| | 15,003 | | | Pearson PLC (Communication Services) | | | 112,374 | |
| | 6,295 | | | Persimmon PLC (Consumer Discretionary) | | | 220,832 | |
| | 51,926 | | | Prudential PLC (Financials) | | | 849,264 | |
| | 14,163 | | | Reckitt Benckiser Group PLC (Consumer Staples) | | | 1,424,162 | |
| | 38,537 | | | RELX PLC (Industrials) | | | 878,475 | |
| | 36,977 | | | Rentokil Initial PLC (Industrials)* | | | 263,890 | |
| | 38,537 | | | Rolls-Royce Holdings PLC (Industrials)* | | | 124,405 | |
| | 20,643 | | | RSA Insurance Group PLC (Financials) | | | 124,186 | |
| | 21,663 | | | Sage Group PLC (The) (Information Technology) | | | 214,816 | |
| | 2,340 | | | Schroders PLC (Financials) | | | 90,798 | |
| | 23,715 | | | Segro PLC REIT (Real Estate) | | | 302,544 | |
| | 4,800 | | | Severn Trent PLC (Utilities) | | | 149,877 | |
| | 17,463 | | | Smith & Nephew PLC (Health Care) | | | 355,758 | |
| | 7,902 | | | Smiths Group PLC (Industrials) | | | 148,337 | |
| | 1,474 | | | Spirax-Sarco Engineering PLC (Industrials) | | | 202,197 | |
| | 20,703 | | | SSE PLC (Utilities) | | | 348,998 | |
| | 10,669 | | | St James’s Place PLC (Financials) | | | 139,967 | |
| | 63,015 | | | Standard Chartered PLC (Financials)* | | | 331,083 | |
| | 45,077 | | | Standard Life Aberdeen PLC (Financials) | | | 143,164 | |
| | 70,743 | | | Taylor Wimpey PLC (Consumer Discretionary) | | | 116,034 | |
| | 8,395 | | | TechnipFMC PLC (Energy) | | | 64,642 | |
| | 195,280 | | | Tesco PLC (Consumer Staples) | | | 571,835 | |
| | 27,358 | | | Unilever NV (Consumer Staples) | | | 1,587,190 | |
| | 22,002 | | | Unilever PLC (Consumer Staples) | | | 1,313,897 | |
| | 13,623 | | | United Utilities Group PLC (Utilities) | | | 151,615 | |
| | 534,987 | | | Vodafone Group PLC (Communication Services) | | | 798,268 | |
| | 5,160 | | | Weir Group PLC (The) (Industrials) | | | 87,640 | |
| | 4,023 | | | Whitbread PLC (Consumer Discretionary) | | | 136,227 | |
| | 47,892 | | | Wm Morrison Supermarkets PLC (Consumer Staples) | | | 123,312 | |
| | 24,418 | | | WPP PLC (Communication Services) | | | 211,076 | |
| | | | | | | | |
| | | | | | | 35,055,610 | |
| | |
| United States – 0.3% | | | |
| | 3,060 | | | Carnival PLC (Consumer Discretionary) | | | 43,205 | |
| | 768 | | | CyberArk Software Ltd. (Information Technology)* | | | 84,864 | |
| | 4,485 | | | Ferguson PLC (Industrials) | | | 442,943 | |
| | 8,435 | | | James Hardie Industries PLC CDI (Materials) | | | 192,321 | |
| | 9,349 | | | Tenaris SA (Energy) | | | 55,010 | |
| | | | | | | | |
| | | | | | | 818,343 | |
| | |
| | TOTAL COMMON STOCKS | |
| | (Cost $270,314,905) | | $ | 278,351,518 | |
| | |
| | |
| The accompanying notes are an integral part of these financial statements. | | 49 |
GOLDMAN SACHS MARKETBETA INTERNATIONAL EQUITY ETF
Schedule of Investments (continued)
August 31, 2020
| | | | | | | | | | | | |
Shares | | Description | | | Rate | | | Value | |
|
| Preferred Stocks – 0.6% | |
| Germany – 0.6% | |
| 1,140 | |
| Bayerische Motoren Werke AG
(Consumer Discretionary) |
| | | 5.36 | % | | $ | 64,215 | |
| 3,480 | |
| Henkel AG & Co. KGaA
(Consumer Staples) |
| | | 2.12 | | | | 356,093 | |
| 3,060 | |
| Porsche Automobil Holding SE
(Consumer Discretionary)* |
| | | 0.00 | | | | 187,738 | |
| 675 | | | Sartorius AG (Health Care) | | | | 0.10 | | | | 286,580 | |
| 3,653 | |
| Volkswagen AG (Consumer
Discretionary)* |
| | | 0.00 | | | | 608,749 | |
| | | | | | | | | | | | |
| | | | | | | | | | | 1,503,375 | |
| |
| Spain – 0.0% | |
| 5,160 | |
| Grifols SA, Class B (Health
Care) |
| | | 1.49 | | | | 83,557 | |
| |
| TOTAL PREFERRED STOCKS | |
| (Cost $1,503,777) | | | $ | 1,586,932 | |
| |
| TOTAL INVESTMENTS BEFORE SECURITIES LENDING REINVESTMENT VEHICLE | |
| (Cost $271,818,682) | | | $ | 279,938,450 | |
| |
| | | | | | | | | | | | |
| Shares | | Dividend
Rate | | | Value | |
|
| Securities Lending Reinvestment Vehicle – 0.1%(c) | |
Goldman Sachs Financial Square Government Fund – Institutional Shares | |
| 292,150 | | | 0.027% | | | | | | | $ | 292,150 | |
| (Cost $292,150) | | | | | | | | | |
| |
| TOTAL INVESTMENTS – 99.8% | |
| (Cost $272,110,832) | | | $ | 280,230,600 | |
| |
OTHER ASSETS IN EXCESS OF LIABILITIES – 0.2% | | | | 492,696 | |
| |
| NET ASSETS – 100.0% | | | $ | 280,723,296 | |
| |
| | |
|
| The percentage shown for each investment category reflects the value of investments in that category as a percentage of net assets. |
| |
* | | Non-income producing security. |
| |
(a) | | All or a portion of security is on loan. |
| |
(b) | | Exempt from registration under Rule 144A of the Securities Act of 1933. |
| |
(c) | | Represents an affiliated issuer. |
| | |
|
Investment Abbreviations: |
ADR | | —American Depositary Receipt |
PLC | | —Public Limited Company |
REIT | | —Real Estate Investment Trust |
SDR | | —Swedish Depositary Receipt |
|
| | |
| 50 | | The accompanying notes are an integral part of these financial statements. |
GOLDMAN SACHS MARKETBETA U.S. EQUITY ETF
Schedule of Investments
August 31, 2020
| | | | | | | | |
Shares | | | Description | | Value | |
|
| Common Stocks – 99.7% | |
| Communication Services – 11.1% | | | |
| | 6,572 | | | Activision Blizzard, Inc. | | $ | 548,893 | |
| | 2,560 | | | Alphabet, Inc., Class A* | | | 4,171,597 | |
| | 2,517 | | | Alphabet, Inc., Class C* | | | 4,113,231 | |
| | 2,768 | | | Altice USA, Inc., Class A* | | | 76,341 | |
| | 61,395 | | | AT&T, Inc. | | | 1,830,185 | |
| | 9,436 | | | CenturyLink, Inc. | | | 101,437 | |
| | 1,237 | | | Charter Communications, Inc., Class A* | | | 761,510 | |
| | 39,030 | | | Comcast Corp., Class A | | | 1,748,934 | |
| | 1,272 | | | Discovery, Inc., Class A* | | | 28,067 | |
| | 2,799 | | | Discovery, Inc., Class C* | | | 55,896 | |
| | 2,120 | | | DISH Network Corp., Class A* | | | 75,302 | |
| | 2,474 | | | Electronic Arts, Inc.* | | | 345,049 | |
| | 20,630 | | | Facebook, Inc., Class A* | | | 6,048,716 | |
| | 2,915 | | | Fox Corp., Class A | | | 81,212 | |
| | 1,378 | | | Fox Corp., Class B | | | 38,308 | |
| | 673 | | | IAC/InterActiveCorp* | | | 89,502 | |
| | 3,286 | | | Interpublic Group of Cos., Inc. (The) | | | 58,359 | |
| | 212 | | | Liberty Broadband Corp., Class A* | | | 29,296 | |
| | 1,272 | | | Liberty Broadband Corp., Class C* | | | 178,195 | |
| | 742 | | | Liberty Media Corp.-Liberty SiriusXM, Class A* | | | 26,942 | |
| | 1,429 | | | Liberty Media Corp.-Liberty SiriusXM, Class C* | | | 51,437 | |
| | 2,097 | | | Match Group, Inc.* | | | 234,193 | |
| | 3,721 | | | Netflix, Inc.* | | | 1,970,493 | |
| | 1,829 | | | Omnicom Group, Inc. | | | 98,931 | |
| | 566 | | | Sea Ltd. ADR (Taiwan)* | | | 86,491 | |
| | 9,249 | | | Sirius XM Holdings, Inc. | | | 54,292 | |
| | 8,858 | | | Snap, Inc., Class A* | | | 200,102 | |
| | 1,084 | | | Spotify Technology SA* | | | 305,861 | |
| | 966 | | | Take-Two Interactive Software, Inc.* | | | 165,370 | |
| | 3,310 | | | T-Mobile US, Inc.* | | | 386,211 | |
| | 6,509 | | | Twitter, Inc.* | | | 264,135 | |
| | 35,681 | | | Verizon Communications, Inc. | | | 2,114,813 | |
| | 106 | | | ViacomCBS, Inc., Class A | | | 3,237 | |
| | 4,664 | | | ViacomCBS, Inc., Class B | | | 129,892 | |
| | 15,562 | | | Walt Disney Co. (The) | | | 2,052,161 | |
| | | | | | | | |
| | | | | | | 28,524,591 | |
| | |
| Consumer Discretionary – 12.6% | |
| | 569 | | | Advance Auto Parts, Inc. | | | 88,940 | |
| | 3,643 | | | Amazon.com, Inc.* | | | 12,571,847 | |
| | 2,313 | | | Aptiv PLC | | | 199,196 | |
| | 201 | | | AutoZone, Inc.* | | | 240,458 | |
| | 1,982 | | | Best Buy Co., Inc. | | | 219,824 | |
| | 350 | | | Booking Holdings, Inc.* | | | 668,657 | |
| | 1,398 | | | CarMax, Inc.* | | | 149,488 | |
| | 4,028 | | | Carnival Corp.(a) | | | 66,381 | |
| | 549 | | | Chewy, Inc., Class A* | | | 33,527 | |
| | 236 | | | Chipotle Mexican Grill, Inc.* | | | 309,226 | |
| | 1,120 | | | Darden Restaurants, Inc. | | | 97,070 | |
| | 2,171 | | | Dollar General Corp. | | | 438,281 | |
| | 2,014 | | | Dollar Tree, Inc.* | | | 193,888 | |
| | 334 | | | Domino’s Pizza, Inc. | | | 136,593 | |
| | 2,926 | | | D.R. Horton, Inc. | | | 208,829 | |
| | |
| | 5,752 | | | eBay, Inc. | | | 315,095 | |
| | 1,166 | | | Expedia Group, Inc. | | | 114,443 | |
| | 33,430 | | | Ford Motor Co. | | | 227,993 | |
| | 1,202 | | | Garmin Ltd. | | | 124,539 | |
| | 10,814 | | | General Motors Co. | | | 320,419 | |
| | 1,205 | | | Genuine Parts Co. | | | 113,800 | |
| | 1,098 | | | Hasbro, Inc. | | | 86,676 | |
| | 2,350 | | | Hilton Worldwide Holdings, Inc. | | | 212,346 | |
| | 9,268 | | | Home Depot, Inc. (The) | | | 2,641,751 | |
| | 3,180 | | | Las Vegas Sands Corp. | | | 161,258 | |
| | 2,332 | | | Lennar Corp., Class A | | | 174,480 | |
| | 133 | | | Lennar Corp., Class B | | | 7,887 | |
| | 2,438 | | | LKQ Corp.* | | | 77,382 | |
| | 6,512 | | | Lowe’s Cos., Inc. | | | 1,072,461 | |
| | 1,034 | | | Lululemon Athletica, Inc.* | | | 388,443 | |
| | 2,061 | | | Marriott International, Inc., Class A | | | 212,097 | |
| | 6,413 | | | McDonald’s Corp. | | | 1,369,304 | |
| | 410 | | | MercadoLibre, Inc. (Argentina)* | | | 479,122 | |
| | 3,816 | | | MGM Resorts International | | | 85,860 | |
| | 509 | | | Mohawk Industries, Inc.* | | | 46,996 | |
| | 3,254 | | | Newell Brands, Inc. | | | 51,999 | |
| | 10,568 | | | NIKE, Inc., Class B | | | 1,182,453 | |
| | 28 | | | NVR, Inc.* | | | 116,713 | |
| | 630 | | | O’Reilly Automotive, Inc.* | | | 293,347 | |
| | 2,226 | | | PulteGroup, Inc. | | | 99,257 | |
| | 3,000 | | | Ross Stores, Inc. | | | 273,240 | |
| | 1,484 | | | Royal Caribbean Cruises Ltd. | | | 102,159 | |
| | 10,055 | | | Starbucks Corp. | | | 849,346 | |
| | 4,303 | | | Target Corp. | | | 650,657 | |
| | 6,360 | | | Tesla, Inc.* | | | 3,169,315 | |
| | 1,040 | | | Tiffany & Co. | | | 127,400 | |
| | 9,540 | | | TJX Cos., Inc. (The) | | | 522,697 | |
| | 988 | | | Tractor Supply Co. | | | 147,044 | |
| | 460 | | | Ulta Beauty, Inc.* | | | 106,803 | |
| | 340 | | | Vail Resorts, Inc. | | | 74,008 | |
| | 2,766 | | | VF Corp. | | | 181,864 | |
| | 530 | | | Whirlpool Corp. | | | 94,192 | |
| | 848 | | | Wynn Resorts Ltd. | | | 74,158 | |
| | 3,097 | | | Yum China Holdings, Inc. (China) | | | 178,728 | |
| | 2,595 | | | Yum! Brands, Inc. | | | 248,731 | |
| | | | | | | | |
| | | | | | | 32,398,668 | |
| | |
| Consumer Staples – 6.6% | |
| | 16,002 | | | Altria Group, Inc. | | | 699,927 | |
| | 4,770 | | | Archer-Daniels-Midland Co. | | | 213,505 | |
| | 318 | | | Brown-Forman Corp., Class A | | | 21,141 | |
| | 2,606 | | | Brown-Forman Corp., Class B | | | 190,681 | |
| | 1,667 | | | Campbell Soup Co. | | | 87,701 | |
| | 2,120 | | | Church & Dwight Co., Inc. | | | 203,160 | |
| | 1,082 | | | Clorox Co. (The) | | | 241,827 | |
| | 33,224 | | | Coca-Cola Co. (The) | | | 1,645,585 | |
| | 7,362 | | | Colgate-Palmolive Co. | | | 583,512 | |
| | 4,093 | | | Conagra Brands, Inc. | | | 157,007 | |
| | 1,349 | | | Constellation Brands, Inc., Class A | | | 248,864 | |
| | 3,754 | | | Costco Wholesale Corp. | | | 1,305,116 | |
| | 1,705 | | | Estee Lauder Cos., Inc. (The), Class A | | | 378,033 | |
| | |
| | |
| The accompanying notes are an integral part of these financial statements. | | 51 |
GOLDMAN SACHS MARKETBETA U.S. EQUITY ETF
Schedule of Investments (continued)
August 31, 2020
| | | | | | | | |
Shares | | | Description | | Value | |
|
| Common Stocks – (continued) | |
| Consumer Staples – (continued) | |
| | 5,246 | | | General Mills, Inc. | | $ | 335,482 | |
| | 1,272 | | | Hershey Co. (The) | | | 189,070 | |
| | 2,438 | | | Hormel Foods Corp. | | | 124,289 | |
| | 940 | | | J M Smucker Co. (The) | | | 112,969 | |
| | 2,198 | | | Kellogg Co. | | | 155,860 | |
| | 3,362 | | | Keurig Dr Pepper, Inc. | | | 100,288 | |
| | 2,929 | | | Kimberly-Clark Corp. | | | 462,079 | |
| | 5,512 | | | Kraft Heinz Co. (The) | | | 193,140 | |
| | 6,466 | | | Kroger Co. (The) | | | 230,707 | |
| | 1,060 | | | McCormick & Co., Inc. | | | 218,572 | |
| | 1,590 | | | Molson Coors Beverage Co., Class B | | | 59,848 | |
| | 12,152 | | | Mondelez International, Inc., Class A | | | 709,920 | |
| | 3,177 | | | Monster Beverage Corp.* | | | 266,423 | |
| | 11,944 | | | PepsiCo, Inc. | | | 1,672,877 | |
| | 13,403 | | | Philip Morris International, Inc. | | | 1,069,425 | |
| | 21,245 | | | Procter & Gamble Co. (The) | | | 2,938,821 | |
| | 4,156 | | | Sysco Corp. | | | 249,942 | |
| | 2,506 | | | Tyson Foods, Inc., Class A | | | 157,377 | |
| | 6,254 | | | Walgreens Boots Alliance, Inc. | | | 237,777 | |
| | 11,984 | | | Walmart, Inc. | | | 1,663,978 | |
| | | | | | | | |
| | | | | | | 17,124,903 | |
| | |
| Energy – 2.1% | |
| | 5,618 | | | Baker Hughes Co. | | | 80,225 | |
| | 3,392 | | | Cabot Oil & Gas Corp. | | | 64,346 | |
| | 1,979 | | | Cheniere Energy, Inc.* | | | 103,007 | |
| | 16,091 | | | Chevron Corp. | | | 1,350,517 | |
| | 1,696 | | | Concho Resources, Inc. | | | 88,158 | |
| | 9,239 | | | ConocoPhillips | | | 350,066 | |
| | 4,982 | | | EOG Resources, Inc. | | | 225,884 | |
| | 36,404 | | | Exxon Mobil Corp. | | | 1,453,976 | |
| | 6,996 | | | Halliburton Co. | | | 113,195 | |
| | 2,417 | | | Hess Corp. | | | 111,279 | |
| | 16,734 | | | Kinder Morgan, Inc. | | | 231,264 | |
| | 5,580 | | | Marathon Petroleum Corp. | | | 197,867 | |
| | 3,805 | | | ONEOK, Inc. | | | 104,561 | |
| | 3,759 | | | Phillips 66 | | | 219,789 | |
| | 1,405 | | | Pioneer Natural Resources Co. | | | 146,022 | |
| | 11,946 | | | Schlumberger NV | | | 227,093 | |
| | 3,498 | | | Valero Energy Corp. | | | 183,960 | |
| | 10,445 | | | Williams Cos., Inc. (The) | | | 216,838 | |
| | | | | | | | |
| | | | | | | 5,468,047 | |
| | |
| Financials – 9.1% | |
| | 5,739 | | | Aflac, Inc. | | | 208,440 | |
| | 119 | | | Alleghany Corp. | | | 65,993 | |
| | 2,650 | | | Allstate Corp. (The) | | | 246,450 | |
| | 3,180 | | | Ally Financial, Inc. | | | 72,758 | |
| | 5,194 | | | American Express Co. | | | 527,658 | |
| | 636 | | | American Financial Group, Inc. | | | 42,517 | |
| | 7,420 | | | American International Group, Inc. | | | 216,219 | |
| | 1,051 | | | Ameriprise Financial, Inc. | | | 164,797 | |
| | 12,287 | | | Annaly Capital Management, Inc. REIT | | | 90,309 | |
| | 1,978 | | | Aon PLC, Class A | | | 395,580 | |
| | 1,759 | | | Apollo Global Management, Inc. | | | 82,444 | |
| | 3,392 | | | Arch Capital Group Ltd.* | | | 106,984 | |
| | |
| | 1,617 | | | Arthur J Gallagher & Co. | | | 170,270 | |
| | 1,572 | | | Athene Holding Ltd., Class A* | | | 57,472 | |
| | 66,759 | | | Bank of America Corp. | | | 1,718,377 | |
| | 6,859 | | | Bank of New York Mellon Corp. (The) | | | 253,646 | |
| | 11,573 | | | Berkshire Hathaway, Inc., Class B* | | | 2,523,377 | |
| | 1,229 | | | BlackRock, Inc. | | | 730,259 | |
| | 5,725 | | | Blackstone Group, Inc. (The), Class A | | | 303,139 | |
| | 3,888 | | | Capital One Financial Corp. | | | 268,389 | |
| | 942 | | | Cboe Global Markets, Inc. | | | 86,466 | |
| | 10,018 | | | Charles Schwab Corp. (The) | | | 355,940 | |
| | 3,382 | | | Chubb Ltd. | | | 422,750 | |
| | 1,353 | | | Cincinnati Financial Corp. | | | 107,442 | |
| | 17,907 | | | Citigroup, Inc. | | | 915,406 | |
| | 3,664 | | | Citizens Financial Group, Inc. | | | 94,788 | |
| | 3,054 | | | CME Group, Inc. | | | 537,107 | |
| | 2,624 | | | Discover Financial Services | | | 139,282 | |
| | 1,908 | | | E*TRADE Financial Corp. | | | 103,223 | |
| | 338 | | | Everest Re Group Ltd. | | | 74,387 | |
| | 2,450 | | | Fidelity National Financial, Inc. | | | 80,433 | |
| | 6,148 | | | Fifth Third Bancorp | | | 127,018 | |
| | 1,465 | | | First Republic Bank | | | 165,413 | |
| | 2,438 | | | Franklin Resources, Inc. | | | 51,344 | |
| | 848 | | | Globe Life, Inc. | | | 69,943 | |
| | 2,927 | | | Goldman Sachs Group, Inc. (The) | | | 599,654 | |
| | 3,074 | | | Hartford Financial Services Group, Inc. (The) | | | 124,343 | |
| | 8,692 | | | Huntington Bancshares, Inc. | | | 81,792 | |
| | 636 | | | Interactive Brokers Group, Inc., Class A | | | 33,721 | |
| | 4,664 | | | Intercontinental Exchange, Inc. | | | 495,457 | |
| | 25,579 | | | JPMorgan Chase & Co. | | | 2,562,760 | |
| | 8,367 | | | KeyCorp | | | 103,081 | |
| | 4,558 | | | KKR & Co., Inc. | | | 163,268 | |
| | 1,567 | | | Lincoln National Corp. | | | 56,490 | |
| | 2,082 | | | Loews Corp. | | | 74,660 | |
| | 1,060 | | | M&T Bank Corp. | | | 109,456 | |
| | 115 | | | Markel Corp.* | | | 124,985 | |
| | 4,396 | | | Marsh & McLennan Cos., Inc. | | | 505,144 | |
| | 6,042 | | | MetLife, Inc. | | | 232,375 | |
| | 1,395 | | | Moody’s Corp. | | | 411,023 | |
| | 10,284 | | | Morgan Stanley | | | 537,442 | |
| | 701 | | | MSCI, Inc. | | | 261,662 | |
| | 981 | | | Nasdaq, Inc. | | | 131,866 | |
| | 1,696 | | | Northern Trust Corp. | | | 138,885 | |
| | 3,560 | | | PNC Financial Services Group, Inc. (The) | | | 395,872 | |
| | 2,332 | | | Principal Financial Group, Inc. | | | 98,200 | |
| | 5,036 | | | Progressive Corp. (The) | | | 478,621 | |
| | 3,392 | | | Prudential Financial, Inc. | | | 229,876 | |
| | 1,060 | | | Raymond James Financial, Inc. | | | 80,263 | |
| | 8,268 | | | Regions Financial Corp. | | | 95,578 | |
| | 585 | | | Reinsurance Group of America, Inc. | | | 53,633 | |
| | 2,077 | | | S&P Global, Inc. | | | 761,054 | |
| | 1,166 | | | SEI Investments Co. | | | 61,052 | |
| | 2,862 | | | State Street Corp. | | | 194,874 | |
| | 441 | | | SVB Financial Group* | | | 112,623 | |
| | 4,876 | | | Synchrony Financial | | | 120,974 | |
| | 1,908 | | | T. Rowe Price Group, Inc. | | | 265,613 | |
| | |
| | |
| 52 | | The accompanying notes are an integral part of these financial statements. |
GOLDMAN SACHS MARKETBETA U.S. EQUITY ETF
| | | | | | | | |
Shares | | | Description | | Value | |
|
| Common Stocks – (continued) | |
| Financials – (continued) | |
| | 2,226 | | | TD Ameritrade Holding Corp. | | $ | 85,434 | |
| | 2,175 | | | Travelers Cos., Inc. (The) | | | 252,387 | |
| | 11,559 | | | Truist Financial Corp. | | | 448,605 | |
| | 11,674 | | | US Bancorp | | | 424,934 | |
| | 1,180 | | | W R Berkley Corp. | | | 73,219 | |
| | 32,477 | | | Wells Fargo & Co. | | | 784,320 | |
| | 1,095 | | | Willis Towers Watson PLC | | | 225,055 | |
| | | | | | | | |
| | | | | | | 23,566,271 | |
| | |
| Health Care – 13.6% | |
| | 15,142 | | | Abbott Laboratories | | | 1,657,595 | |
| | 15,187 | | | AbbVie, Inc. | | | 1,454,459 | |
| | 382 | | | ABIOMED, Inc.* | | | 117,511 | |
| | 2,650 | | | Agilent Technologies, Inc. | | | 266,113 | |
| | 1,819 | | | Alexion Pharmaceuticals, Inc.* | | | 207,766 | |
| | 621 | | | Align Technology, Inc.* | | | 184,425 | |
| | 1,262 | | | AmerisourceBergen Corp. | | | 122,452 | |
| | 5,063 | | | Amgen, Inc. | | | 1,282,559 | |
| | 2,175 | | | Anthem, Inc. | | | 612,306 | |
| | 4,364 | | | Baxter International, Inc. | | | 379,973 | |
| | 2,496 | | | Becton Dickinson and Co. | | | 605,954 | |
| | 1,393 | | | Biogen, Inc.* | | | 400,682 | |
| | 1,551 | | | BioMarin Pharmaceutical, Inc.* | | | 121,025 | |
| | 12,285 | | | Boston Scientific Corp.* | | | 503,931 | |
| | 19,496 | | | Bristol-Myers Squibb Co. | | | 1,212,651 | |
| | 2,506 | | | Cardinal Health, Inc. | | | 127,205 | |
| | 4,880 | | | Centene Corp.* | | | 299,242 | |
| | 2,622 | | | Cerner Corp. | | | 192,376 | |
| | 3,173 | | | Cigna Corp. | | | 562,795 | |
| | 455 | | | Cooper Cos., Inc. (The) | | | 143,043 | |
| | 11,238 | | | CVS Health Corp. | | | 698,105 | |
| | 5,414 | | | Danaher Corp. | | | 1,117,829 | |
| | 693 | | | DaVita, Inc.* | | | 60,125 | |
| | 1,881 | | | DENTSPLY SIRONA, Inc. | | | 84,400 | |
| | 781 | | | DexCom, Inc.* | | | 332,245 | |
| | 5,302 | | | Edwards Lifesciences Corp.* | | | 455,124 | |
| | 3,392 | | | Elanco Animal Health, Inc.* | | | 98,571 | |
| | 7,279 | | | Eli Lilly and Co. | | | 1,080,131 | |
| | 10,776 | | | Gilead Sciences, Inc. | | | 719,298 | |
| | 2,279 | | | HCA Healthcare, Inc. | | | 309,306 | |
| | 1,216 | | | Henry Schein, Inc.* | | | 80,791 | |
| | 2,209 | | | Hologic, Inc.* | | | 131,921 | |
| | 1,139 | | | Humana, Inc. | | | 472,879 | |
| | 725 | | | IDEXX Laboratories, Inc.* | | | 283,518 | |
| | 1,263 | | | Illumina, Inc.* | | | 451,169 | |
| | 1,579 | | | Incyte Corp.* | | | 152,137 | |
| | 994 | | | Intuitive Surgical, Inc.* | | | 726,455 | |
| | 1,581 | | | IQVIA Holdings, Inc.* | | | 258,889 | |
| | 459 | | | Jazz Pharmaceuticals PLC* | | | 61,685 | |
| | 22,710 | | | Johnson & Johnson | | | 3,483,941 | |
| | 835 | | | Laboratory Corp. of America Holdings* | | | 146,751 | |
| | 1,396 | | | McKesson Corp. | | | 214,202 | |
| | 11,553 | | | Medtronic PLC | | | 1,241,601 | |
| | 21,759 | | | Merck & Co., Inc. | | | 1,855,390 | |
| | 203 | | | Mettler-Toledo International, Inc.* | | | 197,068 | |
| | |
| | 4,452 | | | Mylan NV* | | | 72,924 | |
| | 1,166 | | | Perrigo Co. PLC | | | 60,982 | |
| | 47,889 | | | Pfizer, Inc. | | | 1,809,725 | |
| | 1,148 | | | Quest Diagnostics, Inc. | | | 127,704 | |
| | 843 | | | Regeneron Pharmaceuticals, Inc.* | | | 522,601 | |
| | 1,239 | | | ResMed, Inc. | | | 223,986 | |
| | 1,060 | | | Seattle Genetics, Inc.* | | | 167,840 | |
| | 2,862 | | | Stryker Corp. | | | 567,134 | |
| | 400 | | | Teleflex, Inc. | | | 157,180 | |
| | 3,398 | | | Thermo Fisher Scientific, Inc. | | | 1,457,674 | |
| | 8,130 | | | UnitedHealth Group, Inc. | | | 2,541,031 | |
| | 646 | | | Universal Health Services, Inc., Class B | | | 71,286 | |
| | 778 | | | Varian Medical Systems, Inc.* | | | 135,115 | |
| | 1,158 | | | Veeva Systems, Inc., Class A* | | | 326,869 | |
| | 2,233 | | | Vertex Pharmaceuticals, Inc.* | | | 623,275 | |
| | 530 | | | Waters Corp.* | | | 114,618 | |
| | 1,783 | | | Zimmer Biomet Holdings, Inc. | | | 251,189 | |
| | 4,095 | | | Zoetis, Inc. | | | 655,609 | |
| | | | | | | | |
| | | | | | | 35,054,336 | |
| | |
| Industrials – 7.8% | |
| | 4,945 | | | 3M Co. | | | 806,134 | |
| | 1,140 | | | A O Smith Corp. | | | 55,826 | |
| | 1,972 | | | AMETEK, Inc. | | | 198,580 | |
| | 4,592 | | | Boeing Co. (The) | | | 788,997 | |
| | 7,472 | | | Carrier Global Corp. | | | 223,039 | |
| | 4,660 | | | Caterpillar, Inc. | | | 663,165 | |
| | 1,151 | | | C.H. Robinson Worldwide, Inc. | | | 113,143 | |
| | 755 | | | Cintas Corp. | | | 251,596 | |
| | 1,814 | | | Copart, Inc.* | | | 187,423 | |
| | 334 | | | CoStar Group, Inc.* | | | 283,432 | |
| | 6,572 | | | CSX Corp. | | | 502,495 | |
| | 1,256 | | | Cummins, Inc. | | | 260,306 | |
| | 2,687 | | | Deere & Co. | | | 564,431 | |
| | 5,483 | | | Delta Air Lines, Inc. | | | 169,151 | |
| | 1,237 | | | Dover Corp. | | | 135,872 | |
| | 3,445 | | | Eaton Corp. PLC | | | 351,735 | |
| | 5,116 | | | Emerson Electric Co. | | | 355,409 | |
| | 1,043 | | | Equifax, Inc. | | | 175,506 | |
| | 1,429 | | | Expeditors International of Washington, Inc. | | | 126,309 | |
| | 4,939 | | | Fastenal Co. | | | 241,320 | |
| | 2,079 | | | FedEx Corp. | | | 457,047 | |
| | 2,658 | | | Fortive Corp. | | | 191,668 | |
| | 1,180 | | | Fortune Brands Home & Security, Inc. | | | 99,214 | |
| | 2,155 | | | General Dynamics Corp. | | | 321,849 | |
| | 74,423 | | | General Electric Co. | | | 471,842 | |
| | 6,042 | | | Honeywell International, Inc. | | | 1,000,253 | |
| | 339 | | | Huntington Ingalls Industries, Inc. | | | 51,365 | |
| | 3,136 | | | IHS Markit Ltd. | | | 250,629 | |
| | 2,456 | | | Illinois Tool Works, Inc. | | | 485,183 | |
| | 3,296 | | | Ingersoll Rand, Inc.* | | | 115,558 | |
| | 721 | | | J.B. Hunt Transport Services, Inc. | | | 101,329 | |
| | 6,399 | | | Johnson Controls International PLC | | | 260,631 | |
| | 817 | | | Kansas City Southern | | | 148,727 | |
| | 1,855 | | | L3Harris Technologies, Inc. | | | 335,273 | |
| | |
| | |
| The accompanying notes are an integral part of these financial statements. | | 53 |
GOLDMAN SACHS MARKETBETA U.S. EQUITY ETF
Schedule of Investments (continued)
August 31, 2020
| | | | | | | | |
Shares | | | Description | | Value | |
|
| Common Stocks – (continued) | |
| Industrials – (continued) | |
| | 2,050 | | | Lockheed Martin Corp. | | $ | 800,033 | |
| | 1,855 | | | Lyft, Inc., Class A* | | | 55,038 | |
| | 2,259 | | | Masco Corp. | | | 131,700 | |
| | 2,208 | | | Norfolk Southern Corp. | | | 469,266 | |
| | 1,288 | | | Northrop Grumman Corp. | | | 441,282 | |
| | 911 | | | Old Dominion Freight Line, Inc. | | | 184,186 | |
| | 3,733 | | | Otis Worldwide Corp. | | | 234,806 | |
| | 2,929 | | | PACCAR, Inc. | | | 251,425 | |
| | 1,096 | | | Parker-Hannifin Corp. | | | 225,787 | |
| | 13,068 | | | Raytheon Technologies Corp. | | | 797,148 | |
| | 1,802 | | | Republic Services, Inc. | | | 167,081 | |
| | 989 | | | Rockwell Automation, Inc. | | | 227,994 | |
| | 1,272 | | | Rollins, Inc. | | | 70,138 | |
| | 881 | | | Roper Technologies, Inc. | | | 376,354 | |
| | 460 | | | Snap-on, Inc. | | | 68,204 | |
| | 5,066 | | | Southwest Airlines Co. | | | 190,380 | |
| | 1,328 | | | Stanley Black & Decker, Inc. | | | 214,206 | |
| | 1,957 | | | Textron, Inc. | | | 77,165 | |
| | 2,050 | | | Trane Technologies PLC | | | 242,700 | |
| | 440 | | | TransDigm Group, Inc. | | | 219,855 | |
| | 1,623 | | | TransUnion | | | 140,747 | |
| | 9,434 | | | Uber Technologies, Inc.* | | | 317,265 | |
| | 5,839 | | | Union Pacific Corp. | | | 1,123,657 | |
| | 2,428 | | | United Airlines Holdings, Inc.* | | | 87,408 | |
| | 6,069 | | | United Parcel Service, Inc., Class B | | | 993,010 | |
| | 619 | | | United Rentals, Inc.* | | | 109,594 | |
| | 1,385 | | | Verisk Analytics, Inc. | | | 258,538 | |
| | 3,648 | | | Waste Management, Inc. | | | 415,872 | |
| | 1,536 | | | Westinghouse Air Brake Technologies Corp. | | | 102,221 | |
| | 388 | | | W.W. Grainger, Inc. | | | 141,787 | |
| | 1,546 | | | Xylem, Inc. | | | 123,958 | |
| | | | | | | | |
| | | | | | | 20,003,242 | |
| | |
| Information Technology – 29.2% | |
| | 5,478 | | | Accenture PLC, Class A | | | 1,314,337 | |
| | 4,124 | | | Adobe, Inc.* | | | 2,117,220 | |
| | 10,039 | | | Advanced Micro Devices, Inc.* | | | 911,742 | |
| | 1,378 | | | Akamai Technologies, Inc.* | | | 160,441 | |
| | 1,166 | | | Amdocs Ltd. | | | 71,394 | |
| | 2,544 | | | Amphenol Corp., Class A | | | 279,331 | |
| | 3,167 | | | Analog Devices, Inc. | | | 370,159 | |
| | 730 | | | ANSYS, Inc.* | | | 247,477 | |
| | 149,372 | | | Apple, Inc. | | | 19,274,963 | |
| | 7,844 | | | Applied Materials, Inc. | | | 483,190 | |
| | 473 | | | Arista Networks, Inc.* | | | 105,692 | |
| | 1,074 | | | Atlassian Corp. PLC, Class A* | | | 205,950 | |
| | 1,888 | | | Autodesk, Inc.* | | | 463,882 | |
| | 3,435 | | | Automatic Data Processing, Inc. | | | 477,774 | |
| | 3,385 | | | Broadcom, Inc. | | | 1,175,103 | |
| | 981 | | | Broadridge Financial Solutions, Inc. | | | 134,789 | |
| | 2,377 | | | Cadence Design Systems, Inc.* | | | 263,633 | |
| | 1,218 | | | CDW Corp. | | | 138,426 | |
| | 33,661 | | | Cisco Systems, Inc. | | | 1,421,167 | |
| | 1,054 | | | Citrix Systems, Inc. | | | 153,041 | |
| | |
| | 4,649 | | | Cognizant Technology Solutions Corp., Class A | | | 310,832 | |
| | 6,572 | | | Corning, Inc. | | | 213,327 | |
| | 2,034 | | | Dell Technologies, Inc., Class C* | | | 134,407 | |
| | 1,496 | | | DocuSign, Inc.* | | | 333,608 | |
| | 2,120 | | | Dropbox, Inc., Class A* | | | 44,880 | |
| | 530 | | | F5 Networks, Inc.* | | | 70,135 | |
| | 5,313 | | | Fidelity National Information Services, Inc. | | | 801,466 | |
| | 4,773 | | | Fiserv, Inc.* | | | 475,295 | |
| | 711 | | | FleetCor Technologies, Inc.* | | | 178,781 | |
| | 1,181 | | | Fortinet, Inc.* | | | 155,898 | |
| | 742 | | | Gartner, Inc.* | | | 96,327 | |
| | 2,558 | | | Global Payments, Inc. | | | 451,794 | |
| | 11,132 | | | Hewlett Packard Enterprise Co. | | | 107,646 | |
| | 12,304 | | | HP, Inc. | | | 240,543 | |
| | 36,507 | | | Intel Corp. | | | 1,860,032 | |
| | 7,648 | | | International Business Machines Corp. | | | 943,075 | |
| | 2,176 | | | Intuit, Inc. | | | 751,569 | |
| | 2,862 | | | Juniper Networks, Inc. | | | 71,550 | |
| | 1,601 | | | Keysight Technologies, Inc.* | | | 157,731 | |
| | 1,334 | | | KLA Corp. | | | 273,657 | |
| | 1,239 | | | Lam Research Corp. | | | 416,725 | |
| | 1,218 | | | Leidos Holdings, Inc. | | | 110,217 | |
| | 5,685 | | | Marvell Technology Group Ltd. | | | 220,464 | |
| | 7,554 | | | Mastercard, Inc., Class A | | | 2,705,767 | |
| | 2,285 | | | Maxim Integrated Products, Inc. | | | 156,385 | |
| | 2,073 | | | Microchip Technology, Inc. | | | 227,408 | |
| | 9,562 | | | Micron Technology, Inc.* | | | 435,167 | |
| | 64,476 | | | Microsoft Corp. | | | 14,541,272 | |
| | 1,462 | | | Motorola Solutions, Inc. | | | 226,245 | |
| | 1,908 | | | NetApp, Inc. | | | 90,420 | |
| | 4,770 | | | NortonLifeLock, Inc. | | | 112,190 | |
| | 5,082 | | | NVIDIA Corp. | | | 2,718,768 | |
| | 988 | | | Okta, Inc.* | | | 212,786 | |
| | 16,587 | | | Oracle Corp. | | | 949,108 | |
| | 809 | | | Palo Alto Networks, Inc.* | | | 208,245 | |
| | 2,756 | | | Paychex, Inc. | | | 210,751 | |
| | 10,118 | | | PayPal Holdings, Inc.* | | | 2,065,489 | |
| | 979 | | | Qorvo, Inc.* | | | 125,576 | |
| | 9,694 | | | QUALCOMM, Inc. | | | 1,154,555 | |
| | 651 | | | RingCentral, Inc., Class A* | | | 189,291 | |
| | 7,480 | | | salesforce.com, Inc.* | | | 2,039,422 | |
| | 1,928 | | | Seagate Technology PLC | | | 92,525 | |
| | 1,641 | | | ServiceNow, Inc.* | | | 790,995 | |
| | 1,437 | | | Skyworks Solutions, Inc. | | | 208,150 | |
| | 1,359 | | | Splunk, Inc.* | | | 298,070 | |
| | 3,100 | | | Square, Inc., Class A* | | | 494,636 | |
| | 1,933 | | | SS&C Technologies Holdings, Inc. | | | 123,171 | |
| | 1,291 | | | Synopsys, Inc.* | | | 285,698 | |
| | 2,839 | | | TE Connectivity Ltd. | | | 274,247 | |
| | 7,905 | | | Texas Instruments, Inc. | | | 1,123,696 | |
| | 2,120 | | | Trimble, Inc.* | | | 111,109 | |
| | 1,082 | | | Twilio, Inc., Class A* | | | 291,880 | |
| | 870 | | | VeriSign, Inc.* | | | 186,876 | |
| | 14,454 | | | Visa, Inc., Class A | | | 3,064,104 | |
| | |
| | |
| 54 | | The accompanying notes are an integral part of these financial statements. |
GOLDMAN SACHS MARKETBETA U.S. EQUITY ETF
| | | | | | | | |
Shares | | | Description | | Value | |
|
| Common Stocks – (continued) | |
| Information Technology – (continued) | |
| | 690 | | | VMware, Inc., Class A*(a) | | $ | 99,664 | |
| | 2,519 | | | Western Digital Corp. | | | 96,780 | |
| | 3,498 | | | Western Union Co. (The) | | | 82,518 | |
| | 1,484 | | | Workday, Inc., Class A* | | | 355,730 | |
| | 2,096 | | | Xilinx, Inc. | | | 218,319 | |
| | 1,484 | | | Zoom Video Communications, Inc., Class A* | | | 482,448 | |
| | | | | | | | |
| | | | | | | 75,239,131 | |
| | |
| Materials – 2.3% | |
| | 1,900 | | | Air Products and Chemicals, Inc. | | | 555,294 | |
| | 915 | | | Albemarle Corp. | | | 83,274 | |
| | 13,558 | | | Amcor PLC | | | 149,952 | |
| | 2,789 | | | Ball Corp. | | | 224,152 | |
| | 1,013 | | | Celanese Corp. | | | 102,465 | |
| | 6,466 | | | Corteva, Inc. | | | 184,604 | |
| | 6,401 | | | Dow, Inc. | | | 288,813 | |
| | 6,319 | | | DuPont de Nemours, Inc. | | | 352,347 | |
| | 1,165 | | | Eastman Chemical Co. | | | 85,173 | |
| | 2,216 | | | Ecolab, Inc. | | | 436,729 | |
| | 1,111 | | | FMC Corp. | | | 118,721 | |
| | 12,456 | | | Freeport-McMoRan, Inc. | | | 194,438 | |
| | 921 | | | International Flavors & Fragrances, Inc.(a) | | | 114,011 | |
| | 3,392 | | | International Paper Co. | | | 123,028 | |
| | 4,458 | | | Linde PLC (United Kingdom) | | | 1,113,341 | |
| | 2,203 | | | LyondellBasell Industries NV, Class A | | | 144,252 | |
| | 530 | | | Martin Marietta Materials, Inc. | | | 107,521 | |
| | 6,896 | | | Newmont Corp. | | | 463,963 | |
| | 2,575 | | | Nucor Corp. | | | 117,060 | |
| | 808 | | | Packaging Corp. of America | | | 81,802 | |
| | 2,031 | | | PPG Industries, Inc. | | | 244,532 | |
| | 710 | | | Sherwin-Williams Co. (The) | | | 476,446 | |
| | 711 | | | Southern Copper Corp. (Peru) | | | 34,199 | |
| | 1,142 | | | Vulcan Materials Co. | | | 137,040 | |
| | 2,226 | | | Westrock Co. | | | 67,515 | |
| | | | | | | | |
| | | | | | | 6,000,672 | |
| | |
| Real Estate – 2.6% | |
| | 1,135 | | | Alexandria Real Estate Equities, Inc. REIT | | | 191,111 | |
| | 3,811 | | | American Tower Corp. REIT | | | 949,511 | |
| | 1,214 | | | AvalonBay Communities, Inc. REIT | | | 191,885 | |
| | 1,228 | | | Boston Properties, Inc. REIT | | | 106,676 | |
| | 2,756 | | | CBRE Group, Inc., Class A* | | | 129,615 | |
| | 3,579 | | | Crown Castle International Corp. REIT | | | 584,272 | |
| | 2,308 | | | Digital Realty Trust, Inc. REIT | | | 359,240 | |
| | 3,180 | | | Duke Realty Corp. REIT | | | 122,589 | |
| | 758 | | | Equinix, Inc. REIT | | | 598,653 | |
| | 3,160 | | | Equity Residential REIT | | | 178,382 | |
| | 561 | | | Essex Property Trust, Inc. REIT | | | 121,462 | |
| | 1,084 | | | Extra Space Storage, Inc. REIT | | | 115,500 | |
| | 636 | | | Federal Realty Investment Trust REIT | | | 50,397 | |
| | 4,633 | | | Healthpeak Properties, Inc. REIT | | | 128,056 | |
| | 6,042 | | | Host Hotels & Resorts, Inc. REIT | | | 67,852 | |
| | 4,819 | | | Invitation Homes, Inc. REIT | | | 137,968 | |
| | 2,438 | | | Iron Mountain, Inc. REIT | | | 73,359 | |
| | |
| | 978 | | | Mid-America Apartment Communities, Inc. REIT | | | 114,543 | |
| | 6,338 | | | Prologis, Inc. REIT | | | 645,589 | |
| | 1,289 | | | Public Storage REIT | | | 273,784 | |
| | 2,968 | | | Realty Income Corp. REIT | | | 184,105 | |
| | 1,447 | | | Regency Centers Corp. REIT | | | 57,460 | |
| | 954 | | | SBA Communications Corp. REIT | | | 291,991 | |
| | 2,623 | | | Simon Property Group, Inc. REIT | | | 177,970 | |
| | 2,544 | | | UDR, Inc. REIT | | | 88,557 | |
| | 3,180 | | | Ventas, Inc. REIT | | | 131,048 | |
| | 1,484 | | | Vornado Realty Trust REIT | | | 53,172 | |
| | 3,594 | | | Welltower, Inc. REIT | | | 206,727 | |
| | 6,421 | | | Weyerhaeuser Co. REIT | | | 194,620 | |
| | 1,514 | | | W.P. Carey, Inc. REIT | | | 105,026 | |
| | | | | | | | |
| | | | | | | 6,631,120 | |
| | |
| Utilities – 2.7% | |
| | 2,147 | | | Alliant Energy Corp. | | | 116,260 | |
| | 2,120 | | | Ameren Corp. | | | 167,713 | |
| | 4,269 | | | American Electric Power Co., Inc. | | | 336,525 | |
| | 1,559 | | | American Water Works Co., Inc. | | | 220,349 | |
| | 1,044 | | | Atmos Energy Corp. | | | 104,212 | |
| | 489 | | | Avangrid, Inc. | | | 23,492 | |
| | 4,346 | | | CenterPoint Energy, Inc. | | | 87,224 | |
| | 2,455 | | | CMS Energy Corp. | | | 148,503 | |
| | 2,862 | | | Consolidated Edison, Inc. | | | 204,175 | |
| | 7,208 | | | Dominion Energy, Inc. | | | 565,396 | |
| | 1,649 | | | DTE Energy Co. | | | 195,687 | |
| | 6,333 | | | Duke Energy Corp. | | | 508,793 | |
| | 3,259 | | | Edison International | | | 171,032 | |
| | 1,719 | | | Entergy Corp. | | | 170,422 | |
| | 1,946 | | | Evergy, Inc. | | | 103,566 | |
| | 2,947 | | | Eversource Energy | | | 252,588 | |
| | 8,374 | | | Exelon Corp. | | | 309,084 | |
| | 4,664 | | | FirstEnergy Corp. | | | 133,344 | |
| | 4,213 | | | NextEra Energy, Inc. | | | 1,176,143 | |
| | 3,286 | | | NiSource, Inc. | | | 72,818 | |
| | 954 | | | Pinnacle West Capital Corp. | | | 69,976 | |
| | 6,625 | | | PPL Corp. | | | 183,049 | |
| | 4,346 | | | Public Service Enterprise Group, Inc. | | | 227,035 | |
| | 2,520 | | | Sempra Energy | | | 311,598 | |
| | 9,102 | | | Southern Co. (The) | | | 474,942 | |
| | 1,802 | | | UGI Corp. | | | 62,223 | |
| | 2,717 | | | WEC Energy Group, Inc. | | | 255,615 | |
| | 4,517 | | | Xcel Energy, Inc. | | | 313,819 | |
| | | | | | | | |
| | | | | | | 6,965,583 | |
| | |
| TOTAL INVESTMENTS BEFORE SECURITIES LENDING
REINVESTMENT VEHICLE |
|
| | (Cost $232,251,163) | | $ | 256,976,564 | |
| | |
| | |
| The accompanying notes are an integral part of these financial statements. | | 55 |
GOLDMAN SACHS MARKETBETA U.S. EQUITY ETF
Schedule of Investments (continued)
August 31, 2020
| | | | | | | | |
Shares | | | Dividend Rate | | Value | |
|
| Securities Lending Reinvestment Vehicle – 0.1%(b) | |
| Goldman Sachs Financial Square Government Fund –
Institutional Shares |
|
| | 278,029 | | | 0.027% | | $ | 278,029 | |
| | (Cost $278,029) | | | | |
| | |
| | TOTAL INVESTMENTS – 99.8% | |
| | (Cost $232,529,192) | | $ | 257,254,593 | |
| | |
| OTHER ASSETS IN EXCESS OF
LIABILITIES – 0.2% | | | 408,483 | |
| | |
| | NET ASSETS – 100.0% | | $ | 257,663,076 | |
| | |
| | |
|
| The percentage shown for each investment category reflects the value of investments in that category as a percentage of net assets. |
| |
* | | Non-income producing security. |
| |
(a) | | All or a portion of security is on loan. |
| |
(b) | | Represents an affiliated issuer. |
| | |
|
Investment Abbreviations: |
ADR | | —American Depositary Receipt |
PLC | | —Public Limited Company |
REIT | | —Real Estate Investment Trust |
|
| | |
| 56 | | The accompanying notes are an integral part of these financial statements. |
GOLDMAN SACHS MARKETBETA ETFS
Statements of Assets and Liabilities
August 31, 2020
| | | | | | | | | | | | | | |
| | | | | MarketBeta
Emerging
Markets
Equity ETF | | | MarketBeta
International
Equity ETF | | | MarketBeta
U.S. Equity ETF | |
| | Assets: | | | | | | | | | | | | |
| | | | |
| | Investments in unaffiliated issuers, at value (cost $29,743,838, $271,818,682 and $232,251,163, respectively)(a) | | $ | 36,412,351 | | | $ | 279,938,450 | | | $ | 256,976,564 | |
| | | | |
| | Investments in securities lending reinvestment vehicle, at value which equals cost | | | 212,078 | | | | 292,150 | | | | 278,029 | |
| | | | |
| | Cash | | | 1,998,505 | | | | 170,174 | | | | 332,670 | |
| | | | |
| | Foreign currency, at value (cost $3,457, $11,748 and $–, respectively) | | | 3,459 | | | | 11,841 | | | | — | |
| | | | |
| | Receivables: | | | | | | | | | | | | |
| | | | |
| | Due from broker | | | 209,880 | | | | — | | | | — | |
| | | | |
| | Dividends | | | 42,027 | | | | 590,202 | | | | 367,901 | |
| | | | |
| | Investments sold | | | 3,709 | | | | 978 | | | | — | |
| | | | |
| | Reimbursement from investment adviser | | | 2,924 | | | | 10,048 | | | | 4,042 | |
| | | | |
| | Securities lending income | | | 165 | | | | 353 | | | | 86 | |
| | | | |
| | Foreign tax reclaims | | | — | | | | 38,357 | | | | — | |
| | | | |
| | Fund shares sold | | | — | | | | 24,989 | | | | — | |
| | | | |
| | Total assets | | | 38,885,098 | | | | 281,077,542 | | | | 257,959,292 | |
| | | | | | | | | | | | | | |
| | Liabilities: | | | | | | | | | | | | |
| | | | |
| | Variation margin on futures contracts | | | 35,100 | | | | — | | | | — | |
| | | | |
| | Payables: | | | | | | | | | | | | |
| | | | |
| | Upon return of securities loaned | | | 212,078 | | | | 292,150 | | | | 278,029 | |
| | | | |
| | Foreign capital gains tax | | | 102,146 | | | | — | | | | — | |
| | | | |
| | Management fees | | | 14,622 | | | | 50,238 | | | | 18,187 | |
| | | | |
| | Investments purchased | | | 3,456 | | | | 81 | | | | — | |
| | | | |
| | Accrued expenses | | | 435 | | | | 11,777 | | | | — | |
| | | | |
| | Total liabilities | | | 367,837 | | | | 354,246 | | | | 296,216 | |
| | | | | | | | | | | | | | |
| | Net Assets: | | | | | | | | | | | | |
| | | | |
| | Paid-in capital | | | 31,195,581 | | | | 271,484,976 | | | | 232,137,199 | |
| | | | |
| | Total distributable earnings | | | 7,321,680 | | | | 9,238,320 | | | | 25,525,877 | |
| | | | |
| | NET ASSETS | | $ | 38,517,261 | | | $ | 280,723,296 | | | $ | 257,663,076 | |
| | SHARES ISSUED AND OUTSTANDING | | | | | | | | | | | | |
| | | | |
| | Shares outstanding no par value (unlimited shares authorized): | | | 800,000 | | | | 6,000,000 | | | | 5,300,000 | |
| | | | |
| | Net asset value per share: | | $ | 48.15 | | | $ | 46.79 | | | $ | 48.62 | |
| | (a) | | Includes loaned securities having a market value of $206,212, $281,260 and $267,310, respectively. |
| | |
| The accompanying notes are an integral part of these financial statements. | | 57 |
GOLDMAN SACHS MARKETBETA ETFS
Statements of Operations
For the Period Ended August 31, 2020
| | | | | | | | | | | | | | |
| | | | | MarketBeta
Emerging
Markets
Equity ETF(a) | | | MarketBeta
International
Equity ETF(a) | | | MarketBeta
U.S. Equity ETF(a) | |
| | Investment income: | | | | | | | | | | | | |
| | | | |
| | Dividends — unaffiliated issuers (net of foreign withholding taxes of $63,325, $99,310 and $–, respectively) | | $ | 471,712 | | | $ | 1,107,415 | | | $ | 863,361 | |
| | | | |
| | Non cash dividend income — unaffiliated issuer | | | — | | | | 120,861 | | | | — | |
| | | | |
| | Securities lending income — unaffiliated issuer | | | 267 | | | | 945 | | | | 584 | |
| | | | |
| | Total investment income | | | 471,979 | | | | 1,229,221 | | | | 863,945 | |
| | | | | | | | | | | | | | |
| | Expenses: | | | | | | | | | | | | |
| | | | |
| | Management fees | | | 52,904 | | | | 129,363 | | | | 44,698 | |
| | | | |
| | Trustee fees | | | 678 | | | | 1,406 | | | | 1,326 | |
| | | | |
| | Total expenses | | | 53,582 | | | | 130,769 | | | | 46,024 | |
| | | | |
| | Less — expense reductions | | | (10,717 | ) | | | (26,154 | ) | | | (10,228 | ) |
| | | | |
| | Net expenses | | | 42,865 | | | | 104,615 | | | | 35,796 | |
| | | | |
| | NET INVESTMENT INCOME | | | 429,114 | | | | 1,124,606 | | | | 828,149 | |
| | | | | | | | | | | | | | |
| | Realized and unrealized gain (loss): | | | | | | | | | | | | |
| | | | |
| | Net realized gain (loss) from: | | | | | | | | | | | | |
| | | | |
| | Investments — unaffiliated issuers (including the effects of the foreign capital gains tax liability of $11,356, $– and $– , respectively) | | | 331,944 | | | | (65,377 | ) | | | (27,673 | ) |
| | | | |
| | In-kind redemptions | | | 284,635 | | | | 2,974,015 | | | | — | |
| | | | |
| | Foreign currency transactions | | | 59,326 | | | | 46,818 | | | | — | |
| | | | |
| | Net change in unrealized gain (loss) on: | | | | | | | | | | | | |
| | | | |
| | Investments — unaffiliated issuers (including the effects of the foreign capital gains tax liability of $102,138, $– and $–, respectively) | | | 6,566,375 | | | | 8,119,768 | | | | 24,725,401 | |
| | | | |
| | Futures | | | (22,144 | ) | | | — | | | | — | |
| | | | |
| | Foreign currency translations | | | (136 | ) | | | 11,366 | | | | — | |
| | | | |
| | Net realized and unrealized gain | | | 7,220,000 | | | | 11,086,590 | | | | 24,697,728 | |
| | | | |
| | NET INCREASE IN NET ASSETS RESULTING FROM OPERATIONS | | $ | 7,649,114 | | | $ | 12,211,196 | | | $ | 25,525,877 | |
| | (a) | | For the period May 12, 2020 (commencement of operations) through August 31, 2020. |
| | |
| 58 | | The accompanying notes are an integral part of these financial statements. |
GOLDMAN SACHS MARKETBETA ETFS
Statements of Changes in Net Assets
| | | | | | | | | | | | | | | | | | | | | | |
| | | | | MarketBeta
Emerging
Markets
Equity ETF | | | | | | MarketBeta
International
Equity ETF | | | | | | MarketBeta U.S.
Equity ETF | |
| | | | | For the Period
May 12, 2020*
to
August 31, 2020 | | | | | | For the Period
May 12, 2020*
to
August 31, 2020 | | | | | | For the Period
May 12, 2020*
to
August 31, 2020 | |
| | From operations: | | | | | | | | | | | | | | | | | | | | |
| | | | | | |
| | Net investment income | | $ | 429,114 | | | | | | | $ | 1,124,606 | | | | | | | $ | 828,149 | |
| | | | | | |
| | Net realized gain (loss) | | | 675,905 | | | | | | | | 2,955,456 | | | | | | | | (27,673 | ) |
| | | | | | |
| | Net change in unrealized gain | | | 6,544,095 | | | | | | | | 8,131,134 | | | | | | | | 24,725,401 | |
| | | | | | |
| | Net increase in net assets resulting from operations | | | 7,649,114 | | | | | | | | 12,211,196 | | | | | | | | 25,525,877 | |
| | | | | | | | | | | | | | | | | | | | | | |
| | From share transactions: | | | | | | | | | | | | | | | | | | | | |
| | | | | | |
| | Proceeds from sales of shares | | | 39,611,628 | | | | | | | | 295,853,235 | | | | | | | | 232,137,239 | |
| | | | | | |
| | Cost of shares redeemed | | | (8,743,481 | ) | | | | | | | (27,341,135 | ) | | | | | | | (40 | ) |
| | | | | | |
| | Net increase in net assets resulting from share transactions | | | 30,868,147 | | | | | | | | 268,512,100 | | | | | | | | 232,137,199 | |
| | | | | | |
| | TOTAL INCREASE | | | 38,517,261 | | | | | | | | 280,723,296 | | | �� | | | | | 257,663,076 | |
| | | | | | | | | | | | | | | | | | | | | | |
| | Net assets: | | | | | | | | | | | | | | | | | | | | |
| | | | | | |
| | Beginning of period | | $ | — | | | | | | | $ | — | | | | | | | $ | — | |
| | | | | | |
| | End of period | | $ | 38,517,261 | | | | | | | $ | 280,723,296 | | | | | | | $ | 257,663,076 | |
| | * | | Commencement of operations. |
| | |
| The accompanying notes are an integral part of these financial statements. | | 59 |
GOLDMAN SACHS MARKETBETA EMERGING MARKETS EQUITY ETF
Financial Highlights
Selected Data for a Share Outstanding Throughout the Period
| | | | | | |
| | | | | MarketBeta
Emerging Markets
Equity ETF | |
| | | | | For the Period
May 12, 2020*
to
August 31, 2020 | |
| | Per Share Operating Performance: | | | | |
| | |
| | Net asset value, beginning of period | | $ | 39.60 | |
| | |
| | Net investment income(a) | | | 0.49 | |
| | |
| | Net realized and unrealized gain | | | 8.06 | |
| | |
| | Total gain from investment operations | | | 8.55 | |
| | |
| | Net asset value, end of period | | $ | 48.15 | |
| | |
| | Market price, end of period | | $ | 48.36 | |
| | |
| | Total Return at Net Asset Value(b) | | | 21.54 | % |
| | |
| | Net assets, end of period (in 000’s) | | $ | 38,517 | |
| | |
| | Ratio of net expenses to average net assets | | | 0.36 | %(c) |
| | |
| | Ratio of total expenses to average net assets | | | 0.45 | %(c) |
| | |
| | Ratio of net investment income to average net assets | | | 3.60 | %(c) |
| | |
| | Portfolio turnover rate(d) | | | 23 | % |
| | * | | Commencement of operations. |
| | (a) | | Calculated based on the average shares outstanding methodology. |
| | (b) | | Assumes investment at the net asset value at the beginning of the period, reinvestment of all distributions and a complete sale of the investment at the net asset value at the end of the period. Returns do not reflect the impact of taxes to shareholders relating to Fund distributions or the sale of Fund shares. Total returns for periods less than one full year are not annualized. |
| | (d) | | The Fund’s portfolio turnover rate is calculated in accordance with regulatory requirements and excludes portfolio securities received or delivered as a result of in-kind transactions. If such transactions were included, the Fund’s portfolio turnover rate may be higher. |
| | |
| 60 | | The accompanying notes are an integral part of these financial statements. |
GOLDMAN SACHS MARKETBETA INTERNATIONAL EQUITY ETF
Financial Highlights (continued)
Selected Data for a Share Outstanding Throughout the Period
| | | | | | |
| | | | | MarketBeta
International
Equity ETF | |
| | | | | For the Period
May 12, 2020*
to
August 31, 2020 | |
| | Per Share Operating Performance: | | | | |
| | |
| | Net asset value, beginning of period | | $ | 40.14 | |
| | |
| | Net investment income(a) | | | 0.30 | |
| | |
| | Net realized and unrealized gain | | | 6.35 | |
| | |
| | Total gain from investment operations | | | 6.65 | |
| | |
| | Net asset value, end of period | | $ | 46.79 | |
| | |
| | Market price, end of period | | $ | 46.82 | |
| | |
| | Total Return at Net Asset Value(b) | | | 16.57 | % |
| | |
| | Net assets, end of period (in 000’s) | | $ | 280,723 | |
| | |
| | Ratio of net expenses to average net assets | | | 0.20 | %(c) |
| | |
| | Ratio of total expenses to average net assets | | | 0.25 | %(c) |
| | |
| | Ratio of net investment income to average net assets | | | 2.15 | %(c) |
| | |
| | Portfolio turnover rate(d) | | | 1 | % |
| | * | | Commencement of operations. |
| | (a) | | Calculated based on the average shares outstanding methodology. |
| | (b) | | Assumes investment at the net asset value at the beginning of the period, reinvestment of all distributions and a complete sale of the investment at the net asset value at the end of the period. Returns do not reflect the impact of taxes to shareholders relating to Fund distributions or the sale of Fund shares. Total returns for periods less than one full year are not annualized. |
| | (d) | | The Fund’s portfolio turnover rate is calculated in accordance with regulatory requirements and excludes portfolio securities received or delivered as a result of in-kind transactions. If such transactions were included, the Fund’s portfolio turnover rate may be higher. |
| | |
| The accompanying notes are an integral part of these financial statements. | | 61 |
GOLDMAN SACHS MARKETBETA U.S. EQUITY ETF
Financial Highlights (continued)
Selected Data for a Share Outstanding Throughout the Period
| | | | | | |
| | | | | MarketBeta U.S.
Equity ETF | |
| | | | | For the Period
May 12, 2020*
to
August 31, 2020 | |
| | Per Share Operating Performance: | | | | |
| | |
| | Net asset value, beginning of period | | $ | 39.20 | |
| | |
| | Net investment income(a) | | | 0.22 | |
| | |
| | Net realized and unrealized gain | | | 9.20 | |
| | |
| | Total gain from investment operations | | | 9.42 | |
| | |
| | Net asset value, end of period | | $ | 48.62 | |
| | |
| | Market price, end of period | | $ | 48.69 | |
| | |
| | Total Return at Net Asset Value(b) | | | 24.03 | % |
| | |
| | Net assets, end of period (in 000’s) | | $ | 257,663 | |
| | |
| | Ratio of net expenses to average net assets | | | 0.07 | %(c) |
| | |
| | Ratio of total expenses to average net assets | | | 0.09 | %(c) |
| | |
| | Ratio of net investment income to average net assets | | | 1.62 | %(c) |
| | |
| | Portfolio turnover rate(d) | | | 1 | % |
| | * | | Commencement of operations. |
| | (a) | | Calculated based on the average shares outstanding methodology. |
| | (b) | | Assumes investment at the net asset value at the beginning of the period, reinvestment of all distributions and a complete sale of the investment at the net asset value at the end of the period. Returns do not reflect the impact of taxes to shareholders relating to Fund distributions or the sale of Fund shares. Total returns for periods less than one full year are not annualized. |
| | (d) | | The Fund’s portfolio turnover rate is calculated in accordance with regulatory requirements and excludes portfolio securities received or delivered as a result of in-kind transactions. If such transactions were included, the Fund’s portfolio turnover rate may be higher. |
| | |
| 62 | | The accompanying notes are an integral part of these financial statements. |
GOLDMAN SACHS MARKETBETA ETFS
Notes to Financial Statements
August 31, 2020
Goldman Sachs ETF Trust (the “Trust”) is an open-end management investment company, registered under the Investment Company Act of 1940, as amended (the “Act”), consisting of multiple series. The Trust was organized as a Delaware statutory trust on December 16, 2009. The following table lists those series of the Trust that are included in this report (collectively, the “Funds” or individually a “Fund”) along with their respective diversification status under the Act:
| | | | |
| Fund | | | | Diversification Classification |
Goldman Sachs MarketBeta Emerging Markets Equity ETF (“MarketBeta Emerging Markets Equity ETF”)* | | | | Diversified |
Goldman Sachs MarketBeta International Equity ETF (“MarketBeta International Equity ETF”)* | | | | Diversified |
Goldman Sachs MarketBeta U.S. Equity ETF (“MarketBeta U.S. Equity ETF”)* | | | | Diversified |
| * | | Commencement of operations on May 12, 2020. |
The investment objective of each Fund is to provide investment results that closely correspond, before fees and expenses, to the performance of its respective Index.
Goldman Sachs Asset Management, L.P. (“GSAM”), an affiliate of Goldman Sachs & Co. LLC (“Goldman Sachs”), serves as investment adviser to the Funds pursuant to a management agreement (the “Agreement”) with the Trust. Each Fund is an exchange-traded fund (“ETF”). Shares of the Funds are listed and traded on the NYSE Arca, Inc. (“NYSE Arca”). Market prices for the Funds’ shares may be different from their net asset value (“NAV”). The Funds issue and redeem shares at their respective NAV only in blocks of a specified number of shares, or multiples thereof, referred to as “Creation Units”. Creation Units are issued and redeemed principally in-kind for a basket of securities and a cash amount, with respect to the MarketBeta International Equity ETF and MarketBeta U.S. Equity ETF. The Goldman Sachs MarketBeta Emerging Markets Equity ETF issues and redeems Creation Units partially for cash and partially in-kind. Shares generally trade in the secondary market in quantities less than a Creation Unit at market prices that change throughout the day. Only those that have entered into an authorized participant agreement with ALPS Distributors, Inc. (the “Distributor”) may do business directly with the Funds.
|
| 2. SIGNIFICANT ACCOUNTING POLICIES |
The financial statements have been prepared in accordance with accounting principles generally accepted in the United States of America (“GAAP”) and require management to make estimates and assumptions that may affect the reported amounts and disclosures. Actual results may differ from those estimates and assumptions. Each Fund is an investment company under GAAP and follows the accounting and reporting guidance applicable to investment companies.
A. Investment Valuation — The Funds’ valuation policy is to value investments at fair value.
B. Investment Income and Investments — Investment income includes interest income, dividend income, and securities lending income, if any. Interest income is accrued daily and adjusted for amortization of premiums and accretion of discounts. Dividend income is recognized on ex-dividend date or, for certain foreign securities, as soon as such information is obtained subsequent to the ex-dividend date. Non-cash dividends, if any, are recorded at the fair market value of the securities received. Investment transactions are reflected on trade date. Realized gains and losses are calculated using identified cost. Investment transactions are recorded on the following business day for daily NAV calculations. Investment income is recorded net of any foreign withholding taxes, less any amounts reclaimable. The Funds may file withholding tax reclaims in certain jurisdictions to recover a portion of amounts previously withheld. Any foreign capital gains tax is accrued daily based upon net unrealized gains, and is payable upon sale of such investments. Distributions received from the Funds’ investments in U.S. real estate investment trusts (“REITs”) may be characterized as ordinary income, net capital gain or a return of capital. A return of capital is recorded by the Funds as a reduction to the cost basis of the REIT. For derivative contracts, realized gains and losses are recorded upon settlement of the contract.
63
GOLDMAN SACHS MARKETBETA ETFS
Notes to Financial Statements (continued)
August 31, 2020
|
| 2. SIGNIFICANT ACCOUNTING POLICIES (continued) |
C. Expenses — Expenses incurred directly by a Fund are charged to the Fund, and certain expenses incurred by the Trust are allocated across the applicable Funds on a straight-line and/or pro-rata basis, depending upon the nature of the expenses, and are accrued daily.
D. Federal Taxes and Distributions to Shareholders — It is each Fund’s policy to comply with the requirements of the Internal Revenue Code of 1986, as amended (the “Code”), applicable to regulated investment companies and to distribute each year substantially all of its investment company taxable income and capital gains to its shareholders. Accordingly, each Fund is not required to make any provisions for the payment of federal income tax. Distributions to shareholders are recorded on the ex-dividend date. For each Fund, income distributions, if any, are declared and paid quarterly. Capital gains distributions, if any, are declared and paid annually.
Net capital losses, if any, are carried forward to future fiscal years and may be used to the extent allowed by the Code to offset any future capital gains. Losses that are carried forward will retain their character as either short-term or long-term capital losses. Utilization of capital loss carryforwards will reduce the requirement of future capital gains distributions.
The characterization of distributions to shareholders for financial reporting purposes is determined in accordance with federal income tax rules, which may differ from GAAP. The source of each Fund’s distributions may be shown in the accompanying financial statements as either from distributable earnings or capital. Certain components of the Funds’ net assets on the Statements of Assets and Liabilities reflect permanent GAAP/tax differences based on the appropriate tax character.
E. Foreign Currency Translation — The accounting records and reporting currency of a Fund are maintained in U.S. dollars. Assets and liabilities denominated in foreign currencies are translated into U.S. dollars using the current exchange rates at the close of each business day. The effect of changes in foreign currency exchange rates on investments is included within net realized and unrealized gain (loss) on investments. Changes in the value of other assets and liabilities as a result of fluctuations in foreign exchange rates are included in the Statements of Operations within net change in unrealized gain (loss) on foreign currency translation. Transactions denominated in foreign currencies are translated into U.S. dollars on the date the transaction occurred, the effects of which are included within net realized gain (loss) on foreign currency transactions.
| | |
| 3. INVESTMENTS AND FAIR VALUE MEASUREMENTS | | |
U.S. GAAP defines the fair value of a financial instrument as the amount that would be received to sell an asset or paid to transfer a liability in an orderly transaction between market participants at the measurement date (i.e., the exit price); the Funds’ policy is to use the market approach. GAAP establishes a fair value hierarchy that prioritizes the inputs to valuation techniques used to measure fair value. The hierarchy gives the highest priority to unadjusted quoted prices in active markets for identical assets or liabilities (Level 1 measurements) and the lowest priority to unobservable inputs (Level 3 measurements). The level in the fair value hierarchy within which the fair value measurement in its entirety falls shall be determined based on the lowest level input that is significant to the fair value measurement in its entirety. The levels used for classifying investments are not necessarily an indication of the risk associated with investing in these investments. The three levels of the fair value hierarchy are described below:
Level 1 — Unadjusted quoted prices in active markets that are accessible at the measurement date for identical, unrestricted assets or liabilities;
Level 2 — Quoted prices in markets that are not active or financial instruments for which significant inputs are observable (including, but not limited to, quoted prices for similar investments, interest rates, foreign exchange rates, volatility and credit spreads), either directly or indirectly;
Level 3 — Prices or valuations that require significant unobservable inputs (including GSAM’s assumptions in determining fair value measurement).
The Board of Trustees (“Trustees”) has approved Valuation Procedures that govern the valuation of the portfolio investments held by the Funds, including investments for which market quotations are not readily available. The Trustees have delegated to GSAM day-to-day responsibility for implementing and maintaining internal controls and procedures related to the valuation of the
64
GOLDMAN SACHS MARKETBETA ETFS
|
| 3. INVESTMENTS AND FAIR VALUE MEASUREMENTS (continued) |
Funds’ investments. To assess the continuing appropriateness of pricing sources and methodologies, GSAM regularly performs price verification procedures and issues challenges as necessary to third party pricing vendors or brokers, and any differences are reviewed in accordance with the Valuation Procedures.
A. Level 1 and Level 2 Fair Value Investments — The valuation techniques and significant inputs used in determining the fair values for investments classified as Level 1 and Level 2 are as follows:
Equity Securities — Equity securities traded on a United States (“U.S.”) securities exchange or the NASDAQ system, or those located on certain foreign exchanges, including but not limited to the Americas, are valued daily at their last sale price or official closing price on the principal exchange or system on which they are traded. If there is no sale or official closing price or such price is believed by GSAM to not represent fair value, equity securities will be valued at the valid closing bid price for long positions and at the valid closing ask price for short positions (i.e. where there is sufficient volume, during normal exchange trading hours). If no valid bid/ask price is available, the equity security will be valued pursuant to the Valuation Procedures approved by the Trustees and consistent with applicable regulatory guidance. To the extent these investments are actively traded, they are classified as Level 1 of the fair value hierarchy, otherwise they are generally classified as Level 2. Certain equity securities containing unique attributes may be classified as Level 2.
Unlisted equity securities for which market quotations are available are valued at the last sale price on the valuation date, or if no sale occurs, at the last bid price for long positions or the last ask price for short positions, and are generally classified as Level 2.
Derivative Contracts — A derivative is an instrument whose value is derived from underlying assets, indices, reference rates or a combination of these factors. A Fund enters into derivative transactions to hedge against changes in interest rates, securities prices, and/or currency exchange rates, to increase total return, or to gain access to certain markets or attain exposure to other underliers. For financial reporting purposes, cash collateral that has been pledged to cover obligations of a Fund and cash collateral received, if any, is reported separately on the Statements of Assets and Liabilities as receivables/payables for collateral on certain derivatives contracts. Non-cash collateral pledged by a Fund, if any, is noted in the Schedules of Investments.
Exchange-traded derivatives, including futures and options contracts, are generally valued at the last sale or settlement price on the exchange where they are principally traded. Exchange-traded options without settlement prices are generally valued at the last bid price for long positions and the last ask price for short positions on the exchange where they are principally traded.
Exchange-traded derivatives typically fall within Level 1 of the fair value hierarchy. Over-the-counter (“OTC”) and centrally cleared derivatives are valued using market transactions and other market evidence, including market-based inputs to models, calibration to market-clearing transactions, broker or dealer quotations, or other alternative pricing sources. Where models are used, the selection of a particular model to value OTC and centrally cleared derivatives depends upon the contractual terms of, and specific risks inherent in, the instrument, as well as the availability of pricing information in the market. Valuation models require a variety of inputs, including contractual terms, market prices, yield curves, credit curves, measures of volatility, voluntary and involuntary prepayment rates, loss severity rates and correlations of such inputs. For OTC and centrally cleared derivatives that trade in liquid markets, model inputs can generally be verified and model selection does not involve significant management judgment. OTC and centrally cleared derivatives are classified within Level 2 of the fair value hierarchy when significant inputs are corroborated by market evidence.
Futures Contracts — Futures contracts are contracts to buy or sell a standardized quantity of a specified commodity or security. Upon entering into a futures contract, a Fund deposits cash or securities in an account on behalf of the broker in an amount sufficient to meet the initial margin requirement. Subsequent payments are made or received by a Fund equal to the daily change in the contract value and are recorded as variation margin receivable or payable with a corresponding offset to unrealized gains or losses.
Underlying Funds (including Money Market Funds) — Underlying funds (“Underlying Funds”) include other investment companies and ETFs. Investments in the Underlying Funds (except ETFs) are valued at the NAV per share on the day of valuation. ETFs are valued daily at the last sale price or official closing price on the principal exchange or system on which the investment is traded. Because the Funds invest in Underlying Funds that fluctuate in value, the Funds’ shares will correspondingly fluctuate in
65
GOLDMAN SACHS MARKETBETA ETFS
Notes to Financial Statements (continued)
August 31, 2020
|
| 3. INVESTMENTS AND FAIR VALUE MEASUREMENTS (continued) |
value. To the extent these investments are actively traded, they are classified as Level 1 of the fair value hierarchy, otherwise they are generally classified as Level 2. For information regarding an Underlying Fund’s accounting policies and investment holdings, please see the Underlying Fund’s shareholder report.
B. Level 3 Fair Value Investments — To the extent that significant inputs to valuation models and other alternative pricing sources are unobservable, or if quotations are not readily available, or if GSAM believes that such quotations do not accurately reflect fair value, the fair value of a Fund’s investments may be determined under Valuation Procedures approved by the Trustees. GSAM, consistent with its procedures and applicable regulatory guidance, may make an adjustment to the most recent valuation prices of either domestic or foreign securities in light of significant events to reflect what it believes to be the fair value of the securities at the time of determining a Fund’s NAV. To the extent investments are valued using single source broker quotations obtained directly from the broker or passed through from third party pricing vendors, such investments are classified as Level 3 investments.
C. Fair Value Hierarchy — The following is a summary of the Funds’ investments and derivatives classified in the fair value hierarchy as of August 31, 2020:
| | | | | | | | | | | | |
|
| MARKETBETA EMERGING MARKETS EQUITY ETF | |
| | | |
| Investment Type | | Level 1 | | | Level 2 | | | Level 3 | |
| | | |
| Assets | | | | | | | | | | | | |
| | | |
Common Stock and/or Other Equity Investments(a) | | | | | | | | | | | | |
| | | |
Africa | | $ | 1,294,372 | | | $ | — | | | $ | — | |
| | | |
Asia | | | 30,527,352 | | | | 787,322 | | | | — | |
| | | |
Europe | | | 223,915 | | | | — | | | | — | |
| | | |
North America | | | 1,085,374 | | | | — | | | | — | |
| | | |
South America | | | 1,976,707 | | | | 517,309 | | | | — | |
| | | |
Securities Lending Reinvestment Vehicle | | | 212,078 | | | | — | | | | — | |
| | | |
| Total | | $ | 35,319,798 | | | $ | 1,304,631 | | | $ | — | |
| | | |
| Derivative Type | | | | | | | | | |
| | | |
| Liabilities(b) | | | | | | | | | | | | |
| | | |
Futures Contracts | | $ | (22,144 | ) | | $ | — | | | $ | — | |
| | | | | | | | | | | | |
|
| MARKETBETA INTERNATIONAL EQUITY ETF | |
| | | |
| Investment Type | | Level 1 | | | Level 2 | | | Level 3 | |
| | | |
| Assets | | | | | | | | | | | | |
| | | |
Common Stock and/or Other Equity Investments(a) | | | | | | | | | | | | |
| | | |
Africa | | $ | 567,162 | | | $ | — | | | $ | — | |
| | | |
Asia | | | 89,205,647 | | | | — | | | | — | |
| | | |
Europe | | | 163,863,788 | | | | 1,588,060 | | | | — | |
| | | |
North America | | | 687,892 | | | | 192,321 | | | | — | |
| | | |
Oceania | | | 23,673,760 | | | | — | | | | — | |
| | | |
South America | | | 99,152 | | | | 60,668 | | | | — | |
| | | |
Securities Lending Reinvestment Vehicle | | | 292,150 | | | | — | | | | — | |
| | | |
| Total | | $ | 278,389,551 | | | $ | 1,841,049 | | | $ | — | |
| (a) | | Amounts are disclosed by continent to highlight the impact of time zone differences between local market close and the calculation of NAV. Security valuations are based on the principal exchange or system on which they are traded, which may differ from country of domicile noted in table. |
| (b) | | Amount shown represents unrealized loss at period end. |
66
GOLDMAN SACHS MARKETBETA ETFS
|
| 3. INVESTMENTS AND FAIR VALUE MEASUREMENTS (continued) |
| | | | | | | | | | | | |
|
| MARKETBETA U.S. EQUITY ETF | |
| | | |
| Investment Type | | Level 1 | | | Level 2 | | | Level 3 | |
| | | |
| Assets | | | | | | | | | | | | |
| | | |
Common Stock and/or Other Equity Investments(a) | | | | | | | | | | | | |
| | | |
Asia | | $ | 265,219 | | | $ | — | | | $ | — | |
| | | |
Europe | | | 1,113,341 | | | | — | | | | — | |
| | | |
North America | | | 255,084,683 | | | | — | | | | — | |
| | | |
South America | | | 513,321 | | | | — | | | | — | |
| | | |
Securities Lending Reinvestment Vehicle | | | 278,029 | | | | — | | | | — | |
| | | |
| Total | | $ | 257,254,593 | | | $ | — | | | $ | — | |
| (a) | | Amounts are disclosed by continent to highlight the impact of time zone differences between local market close and the calculation of NAV. Security valuations are based on the principal exchange or system on which they are traded, which may differ from country of domicile noted in table. |
For further information regarding security characteristics, see the Schedules of Investments.
|
| 4. INVESTMENTS IN DERIVATIVES |
The following table sets forth, by certain risk types, the gross value of derivative contracts (not considered to be hedging instruments for accounting disclosure purposes) as of August 31, 2020. These instruments were used as part of the MarketBeta Emerging Markets Equity ETF’s investment strategies and to obtain and/or manage exposure related to the risks below. The values in the table below exclude the effects of cash collateral received or posted pursuant to these derivative contracts, and therefore are not representative of the MarketBeta Emerging Markets Equity ETF’s net exposure.
| | | | | | | | | | |
| Risk | | Fund | | Statement of Assets and Liabilities | | | Liability(a) | |
Equity | | MarketBeta Emerging Markets Equity ETF | | | Variation Margin on Futures Contracts | | | $ | (22,144 | ) |
| (a) | | Includes unrealized gain (loss) on futures contracts described in the Additional Investment Information sections of the Schedules of Investments. Only the variation margin as of August 31, 2020 is reported within the Statements of Assets and Liabilities. |
The following table sets forth, by certain risk types, the gains (losses) related to these derivatives and their indicative volumes for the period ended August 31, 2020. These gains (losses) should be considered in the context that these derivative contracts may have been executed to create investment opportunities and/or economically hedge certain investments, and accordingly, certain gains (losses) on such derivative contracts may offset certain (losses) gains attributable to investments. These gains (losses) are included in “Net realized gain (loss)” or “Net change in unrealized gain (loss)” on the Statements of Operations:
| | | | | | | | | | | | | | | | | | |
| Risk | | | | Fund | | | | Net Realized
Gain (Loss)
from Futures
Contracts | | | | | Net Change in
Unrealized
Gain (Loss) on Futures Contracts | | Average
Number of
Contracts(a) | |
Equity | | | | MarketBeta Emerging Markets Equity ETF | | | | $ | — | | | | | $(22,144) | | | 9 | |
| (a) | | Average number of contracts is based on the month end balances for the period ended August 31, 2020. |
|
| 5. AGREEMENTS AND AFFILIATED TRANSACTIONS |
A. Management Agreement — Under the Agreement, GSAM manages the Funds, subject to the general supervision of the Trustees.
As compensation for the services rendered pursuant to the Agreement, the assumption of the expenses related thereto and administration of the Funds’ business affairs, including providing facilities, GSAM is entitled to a management fee, accrued daily and paid monthly, equal to an annual percentage rate of each Fund’s average daily net assets.
67
GOLDMAN SACHS MARKETBETA ETFS
Notes to Financial Statements (continued)
August 31, 2020
|
| 5. AGREEMENTS AND AFFILIATED TRANSACTIONS (continued) |
The Funds operate under a unitary management fee structure. Under the unitary fee structure, GSAM is responsible for paying substantially all the expenses of each such Fund, excluding payments under the Fund’s 12b-1 plan (if any), interest expenses, taxes, acquired fund fees and expenses, brokerage fees, costs of holding shareholder meetings, litigation, indemnification and extraordinary expenses. As the Funds directly pay fees and expenses of the independent Trustees, the management fee collected by GSAM will be reduced by an amount equal to the fees and expenses paid by the Funds to the independent Trustees.
For the period ended August 31, 2020, contractual and effective net unitary management fees with GSAM were at the following rates for each Fund:
| | | | | | | | | | |
| Fund | | | | Contractual Unitary Management Fee | | | Effective Net Unitary Management Fee* | |
MarketBeta Emerging Markets Equity ETF | | | | | 0.45 | % | | | 0.36 | % |
MarketBeta International Equity ETF | | | | | 0.25 | % | | | 0.20 | % |
MarketBeta U.S. Equity ETF | | | | | 0.09 | % | | | 0.07 | % |
| * | | Effective Net Unitary Management Fee includes the impact of management fee waivers, if any. |
GSAM has agreed to waive a portion of its management fee in order to achieve an effective net management fee rate of 0.36%, 0.20% and 0.07% as an annual percentage rate of average daily net assets of the MarketBeta Emerging Markets Equity ETF, MarketBeta International Equity ETF and MarketBeta U.S. Equity ETF, respectively. These arrangements will remain in effect through at least May 11, 2021 and prior to such date, the Investment Adviser may not terminate the arrangement without the approval of the Board of Trustees. For the fiscal year ended August 31, 2020, GSAM waived $10,717, $26,154 and $10,228 of the Funds’ management fees for the MarketBeta Emerging Markets Equity ETF, MarketBeta International Equity ETF and MarketBeta U.S. Equity ETF, respectively
|
| 6. CREATION AND REDEMPTION OF CREATION UNITS |
The Trust issues and redeems shares of the Funds only in Creation Units on a continuous basis through the Distributor, without an initial sales load, at NAV next determined after receipt, on any Business Day (as defined in the Statement of Additional Information), of an order in proper form. Shares of the Funds may only be purchased or redeemed by certain financial institutions (each an “Authorized Participant”). An Authorized Participant is either (1) a “Participating Party” or other participant in the clearing process through the Continuous Net Settlement System of the National Securities Clearing Corporation; or (2) a Depository Trust Company participant; which, in either case, must have executed an agreement with the Distributor. Retail investors will typically not qualify as an Authorized Participant or have the resources to buy and sell whole Creation Units.
Therefore, they will be unable to purchase or redeem the shares directly from the Funds. Rather, most retail investors will purchase shares in the secondary market at market prices with the assistance of a broker and may be subject to customary brokerage commissions or fees. Fixed creation and redemption transaction fees are imposed in connection with creations and redemptions.
Authorized Participants transacting in Creation Units for cash may also pay a variable charge to compensate the relevant fund for certain transaction costs (e.g. taxes on currency or other financial transactions, and brokerage costs) and market impact expenses relating to investing in portfolio securities. Such variable charges, if any, are included in “Proceeds from sale of shares” in the Statements of Changes in Net Assets.
68
GOLDMAN SACHS MARKETBETA ETFS
|
| 6. CREATION AND REDEMPTION OF CREATION UNITS (continued) |
Share activity is as follows:
| | | | | | | | |
| | | MarketBeta Emerging Markets
Equity ETF | |
| | | | |
| | | For the period* May 12, 2020
through August 31, 2020 | |
| | | | |
| | | Shares | | | Dollars | |
| | | | |
| Fund Share Activity | | | | | | | | |
Shares Sold | | | 1,000,001 | | | $ | 39,597,471 | |
Shares Redeemed | | | (200,001 | ) | | | (8,743,481 | ) |
| | |
NET INCREASE IN SHARES | | | 800,000 | | | $ | 30,853,990 | |
| |
| | | MarketBeta International Equity ETF | |
| | | | |
| | | For the period* May 12, 2020
through August 31, 2020 | |
| | | | |
| | | Shares | | | Dollars | |
| | | | |
| Fund Share Activity | | | | | | | | |
Shares Sold | | | 6,600,001 | | | $ | 295,827,537 | |
Shares Redeemed | | | (600,001 | ) | | | (27,341,135 | ) |
| | |
NET INCREASE IN SHARES | | | 6,000,000 | | | $ | 268,486,402 | |
| |
| | | MarketBeta U.S. Equity ETF | |
| | | | |
| | | For the period* May 12, 2020
through August 31, 2020 | |
| | | | |
| | | Shares | | | Dollars | |
| | | | |
| Fund Share Activity | | | | | | | | |
Shares Sold | | | 5,300,001 | | | $ | 232,137,239 | |
Shares Redeemed | | | (1 | ) | | | (40 | ) |
| | |
NET INCREASE IN SHARES | | | 5,300,000 | | | $ | 232,137,199 | |
| * | | Commencement of operations |
|
| 7. PORTFOLIO SECURITIES TRANSACTIONS |
The cost of purchases and proceeds from sales of long-term securities for the period ended August 31, 2020, were as follows:
| | | | | | | | | | |
| Fund | | | | Purchases | | | Sales | |
MarketBeta Emerging Markets Equity ETF | | | | $ | 40,250,137 | | | $ | 8,585,907 | |
MarketBeta International Equity ETF | | | | | 32,985,930 | | | | 1,909,893 | |
MarketBeta U.S. Equity ETF | | | | | 4,108,674 | | | | 2,001,426 | |
The purchases and sales from in-kind creation and redemption transactions for the period ended August 31, 2020, were as follows:
| | | | | | | | | | |
| Fund | | | | Purchases | | | Sales | |
MarketBeta Emerging Markets Equity ETF | | | | $ | — | | | $ | 2,542,872 | |
MarketBeta International Equity ETF | | | | | 265,192,773 | | | | 27,331,421 | |
MarketBeta U.S. Equity ETF | | | | | 230,174,933 | | | | — | |
69
GOLDMAN SACHS MARKETBETA ETFS
Notes to Financial Statements (continued)
August 31, 2020
The Funds may lend their securities through a securities lending agent, the Bank of New York Mellon (“BNYM”), to certain qualified borrowers. In accordance with the Funds’ securities lending procedures, the Funds receive cash collateral at least equal to the market value of the securities on loan. The market value of the loaned securities is determined at the close of business of the Funds, at their last sale price or official closing price on the principal exchange or system on which they are traded, and any additional required collateral is delivered to the Funds on the next business day. As with other extensions of credit, the Funds may experience delay in the recovery of their securities or incur a loss should the borrower of the securities breach its agreement with the Funds or become insolvent at a time when the collateral is insufficient to cover the cost of repurchasing securities on loan. Dividend income received from securities on loan may not be subject to withholding taxes and therefore withholding taxes paid may differ from the amounts listed in the Statements of Operations. Loans of securities are terminable at any time and as such 1) the remaining contractual maturities of the outstanding securities lending transactions are considered to be overnight and continuous and 2) the borrower, after notice, is required to return borrowed securities within the standard time period for settlement of securities transactions.
The Funds invest the cash collateral received in connection with securities lending transactions in the Goldman Sachs Financial Square Government Fund (“Government Money Market Fund”), an affiliated series of the Goldman Sachs Trust. The Government Money Market Fund is registered under the Act as an open end investment company, is subject to Rule 2a-7 under the Act, and is managed by GSAM, for which GSAM may receive a management fee of up to 0.16% on an annualized basis of the average daily net assets of the Government Money Market Fund.
In the event of a default by a borrower with respect to any loan, BNYM may exercise any and all remedies provided under the applicable borrower agreement to make the Funds whole. These remedies include purchasing replacement securities by applying the collateral held from the defaulting broker against the purchase cost of the replacement securities. If BNYM is unable to purchase replacement securities, BNYM will indemnify the Funds by paying the Funds an amount equal to the market value of the securities loaned minus the value of cash collateral received from the borrower for the loan, subject to an exclusion for any shortfalls resulting from a loss of value in such cash collateral due to reinvestment risk. The Funds’ master netting agreements with certain borrowers provide the right, in the event of a default (including bankruptcy or insolvency), for the non-defaulting party to liquidate the collateral and calculate net exposure to the defaulting party or request additional collateral. However, in the event of a default by a borrower, a resolution authority could determine that such rights are not enforceable due to the restrictions or prohibitions against the right of set-off that may be imposed in accordance with a particular jurisdiction’s bankruptcy or insolvency laws. The Funds’ loaned securities were all subject to enforceable Securities Lending Agreements, and the value of the collateral was at least equal to the value of the cash received. The amounts of the Funds’ overnight and continuous agreements, which represent the gross amounts of recognized liabilities for securities lending transactions outstanding as of August 31, 2020, are disclosed as “Payable upon return of securities loaned” on the Statements of Assets and Liabilities, where applicable.
Both the Funds and BNYM received compensation relating to the lending of the Funds’ securities. The amounts earned, if any, by the Funds for the period ended August 31, 2020, are reported under Investment Income on the Statements of Operations.
The following table provides information about the Funds’ investment in the Government Money Market Fund for the period ended August 31, 2020:
| | | | | | | | | | | | | | | | | | |
| Fund | | | | Beginning value
as of May 12,
2020* | | | Purchases at
Cost | | | Proceeds
from Sales | | | Ending
value as of
August 31,
2020 | |
MarketBeta Emerging Markets Equity ETF | | | | $ | — | | | $ | 729,991 | | | $ | (517,913 | ) | | $ | 212,078 | |
MarketBeta International Equity ETF | | | | | — | | | | 2,341,510 | | | | (2,049,360 | ) | | | 292,150 | |
MarketBeta U.S. Equity ETF | | | | | — | | | | 981,383 | | | | (703,354 | ) | | | 278,029 | |
| * | | Commencement of operations |
70
GOLDMAN SACHS MARKETBETA ETFS
There were no distributions from the Funds for the period ended August 31, 2020.
As of August 31, 2020, the components of accumulated earnings (losses) on a tax-basis were as follows:
| | | | | | | | | | | | |
| | | MarketBeta
Emerging Markets
Equity ETF | | | MarketBeta
International
Equity ETF | | | MarketBeta U.S.
Equity ETF | |
Undistributed ordinary income — net | | $ | 905,632 | | | $ | 1,428,403 | | | $ | 861,285 | |
Undistributed long-term capital gains | | | | | | | | | | | 3,352 | |
Total undistributed earnings | | $ | 905,632 | | | $ | 1,428,403 | | | $ | 864,637 | |
Capital loss carryforwards: | | | | | | | | | | | | |
Perpetual Short-Term | | $ | — | | | $ | (46,560 | ) | | $ | — | |
Perpetual Long-Term | | | — | | | | — | | | | — | |
Timing differences (Post-October Capital Loss Deferral) | | | — | | | | — | | | | — | |
Unrealized gains (losses) — net | | | 6,416,048 | | | | 7,856,477 | | | | 24,661,240 | |
Total accumulated earnings (losses) net | | $ | 7,321,680 | | | $ | 9,238,320 | | | $ | 25,525,877 | |
As of August 31, 2020, the Funds’ aggregate security unrealized gains and losses based on cost for U.S. federal income tax purposes were as follows:
| | | | | | | | | | | | |
| | | MarketBeta
Emerging Markets
Equity ETF | | | MarketBeta
International
Equity ETF | | | MarketBeta U.S.
Equity ETF | |
Tax Cost | | $ | 30,083,963 | | | $ | 272,385,489 | | | $ | 232,593,353 | |
Gross unrealized gain | | | 6,764,050 | | | | 14,819,243 | | | | 30,803,162 | |
Gross unrealized loss | | | (348,002 | ) | | | (6,962,766 | ) | | | (6,141,922 | ) |
Net unrealized gains (losses) | | $ | 6,416,048 | | | $ | 7,856,477 | | | $ | 24,661,240 | |
The difference between GAAP-basis and tax-basis unrealized gains (losses) is attributable primarily to wash sales, net mark to market gains/(losses) on regulated futures and differences in the tax treatment of partnership investments and passive foreign investment company investments.
In order to present certain components of the Funds’ capital accounts on a tax-basis, certain reclassifications have been recorded to the Funds’ accounts. These reclassifications have no impact on the net asset value of the Funds and result primarily from redemptions utilized as distributions and redemptions in-kind.
| | | | | | | | | | |
| Fund | | | | Paid-in Capital | | | Total Distributable Earnings | |
MarketBeta Emerging Markets Equity ETF | | | | $ | 327,434 | | | $ | (327,434 | ) |
MarketBeta International Equity ETF | | | | $ | 2,972,876 | | | $ | (2,972,876 | ) |
MarketBeta U.S. Equity ETF | | | | $ | — | | | $ | — | |
GSAM has reviewed the Funds’ tax positions for all open tax years (the current year) and has concluded that no provision for income tax is required in the Funds’ financial statements. Such open tax year remains subject to examination and adjustment by tax authorities.
71
GOLDMAN SACHS MARKETBETA ETFS
Notes to Financial Statements (continued)
August 31, 2020
The Funds’ risks include, but are not limited to, the following:
Derivatives Risk — The Funds’ use of derivatives may result in loss. Derivative instruments, which may pose risks in addition to and greater than those associated with investing directly in securities, currencies or other instruments, may be illiquid or less liquid, volatile, difficult to price and leveraged so that small changes in the value of the underlying instruments may produce disproportionate losses to the Funds. Derivatives are also subject to counterparty risk, which is the risk that the other party in the transaction will not fulfill its contractual obligation. The use of derivatives is a highly specialized activity that involves investment techniques and risks different from those associated with investments in more traditional securities and instruments. Losses from derivatives can also result from a lack of correlation between changes in the value of derivative instruments and the portfolio assets (if any) being hedged.
Foreign and Emerging Countries Risk — Investing in foreign markets may involve special risks and considerations not typically associated with investing in the United States. Foreign securities may be subject to risk of loss because of more or less foreign government regulation, less public information and less economic, political and social stability in the countries in which a Fund invests. The imposition of exchange controls (including repatriation restrictions), confiscation of assets and property, trade restrictions (including tariffs) and other government restrictions by the United States or other governments, or from problems in share registration, settlement or custody, may also result in losses. Foreign risk also involves the risk of negative foreign currency rate fluctuations, which may cause the value of securities denominated in such foreign currency (or other instruments through which a Fund has exposure to foreign currencies) to decline in value. Currency exchange rates may fluctuate significantly over short periods of time. To the extent that a Fund also invests in securities of issuers located in emerging markets, these risks may be more pronounced.
Investments in Other Investment Companies Risk — As a shareholder of another investment company, including an ETF, a Fund will indirectly bear its proportionate share of any net management fees and other expenses paid by such other investment companies, in addition to the fees and expenses regularly borne by the Fund. ETFs are subject to risks that do not apply to conventional mutual funds, including but not limited to the following: (i) the market price of the ETF’s shares may trade at a premium or a discount to their NAV; and (ii) an active trading market for an ETF’s shares may not develop or be maintained.
Foreign Custody Risk — If a Fund invests in foreign securities, the Fund may hold such securities and cash with foreign banks, agents, and securities depositories appointed by the Fund’s custodian (each a “Foreign Custodian”). Some foreign custodians may be recently organized or new to the foreign custody business. In some countries, Foreign Custodians may be subject to little or no regulatory oversight over, or independent evaluation of, their operations. Further, the laws of certain countries may place limitations on a Fund’s ability to recover its assets if a Foreign Custodian enters bankruptcy. Investments in emerging markets may be subject to even greater custody risks than investments in more developed markets. Custody services in emerging market countries are very often undeveloped and may be considerably less well regulated than in more developed countries, and thus may not afford the same level of investor protection as would apply in developed countries.
Index Risk — Solactive AG (the “Index Provider”) constructs each Fund’s Index in accordance with a rules-based methodology. A Fund will be negatively affected by general declines in the securities and asset classes represented in its Index. In addition, because the Funds are not “actively” managed, unless a specific security is removed from an Index, a Fund generally would not sell a security because the security’s issuer was in financial trouble. Market disruptions and regulatory restrictions could have an adverse effect on a Fund’s ability to adjust its exposure to the required levels in order to track the Index. A Fund also does not attempt to take defensive positions under any market conditions, including declining markets. Therefore, a Fund’s performance could be lower than funds that may actively shift their portfolio assets to take advantage of market opportunities or to lessen the impact of a market decline or a decline in the value of one or more issuers. The Index Provider relies on third party data it believes to be reliable in constructing each Index, but it does not guarantee the accuracy or availability of such third party data. Errors in index data, index computation or the construction of an Index in accordance with its methodology may occur from time to time and may not be identified and corrected by the Index Provider for a period of time or at all, which may have an adverse impact on the applicable Fund and its shareholders. In addition, neither a Fund, the Investment Adviser, the Calculation Agent nor the Index Provider can guarantee the availability or timeliness of the production of the Index.
72
GOLDMAN SACHS MARKETBETA ETFS
|
| 10. OTHER RISKS (continued) |
Market and Credit Risks — In the normal course of business, a Fund trades financial instruments and enters into financial transactions where risk of potential loss exists due to changes in the market (market risk). The value of the securities in which a Fund invests may go up or down in response to the prospects of individual companies, particular sectors or governments and/or general economic conditions throughout the world due to increasingly interconnected global economies and financial markets. Events such as war, acts of terrorism, social unrest, natural disasters, the spread of infectious illness or other public health threats could also significantly impact a Fund and its investments. Additionally, a Fund may also be exposed to credit risk in the event that an issuer or guarantor fails to perform or that an institution or entity with which the Fund has unsettled or open transactions defaults.
Market Trading Risk — Each Fund faces numerous market trading risks, including disruptions to creations and redemptions, the existence of extreme market volatility or potential lack of an active trading market for Shares. If a shareholder purchases Shares at a time when the market price is at a premium to the NAV or sells Shares at a time when the market price is at a discount to the NAV, the shareholder may sustain losses. The Investment Adviser cannot predict whether Shares will trade below, at or above their NAV. Price differences may be due, in large part, to the fact that supply and demand forces at work in the secondary trading market for Shares will be closely related to, but not identical to, the same forces influencing the prices of the securities of a Fund’s Index trading individually or in the aggregate at any point in time.
Tracking Error Risk — Tracking error is the divergence of a Fund’s performance from that of its Index. The performance of a Fund may diverge from that of its Index for a number of reasons. Tracking error may occur because of transaction costs, a Fund’s holding of cash, differences in accrual of dividends, changes to the Index or the need to meet new or existing regulatory requirements. Unlike a Fund, the returns of an Index are not reduced by investment and other operating expenses, including the trading costs associated with implementing changes to its portfolio of investments. Tracking error risk may be heightened during times of market volatility or other unusual market conditions.
Under the Trust’s organizational documents, its Trustees, officers, employees and agents are indemnified, to the extent permitted by the Act and state law, against certain liabilities that may arise out of performance of their duties to the Funds. Additionally, in the course of business, the Funds enter into contracts that contain a variety of indemnification clauses. The Funds’ maximum exposure under these arrangements is unknown, as this would involve future claims that may be made against the Funds that have not yet occurred. However, GSAM believes the risk of loss under these arrangements to be remote.
Subsequent events after the Statements of Assets and Liabilities date have been evaluated and GSAM has concluded that there is no impact requiring adjustment or disclosure in the financial statements.
73
Report of Independent Registered Public
Accounting Firm
To the Board of Trustees of Goldman Sachs ETF Trust and Shareholders of
Goldman Sachs MarketBeta Emerging Markets Equity ETF, Goldman Sachs MarketBeta International Equity ETF, and Goldman Sachs MarketBeta U.S. Equity ETF
Opinions on the Financial Statements
We have audited the accompanying statements of assets and liabilities, including the schedules of investments, of Goldman Sachs MarketBeta Emerging Markets Equity ETF, Goldman Sachs MarketBeta International Equity ETF, and Goldman Sachs MarketBeta U.S. Equity ETF (three of the funds constituting Goldman Sachs ETF Trust, hereafter collectively referred to as the “Funds”) as of August 31, 2020, the related statements of operations and changes in net assets, including the related notes, and the financial highlights for the period May 12, 2020 (commencement of operations) through August 31, 2020 (collectively referred to as the “financial statements”). In our opinion, the financial statements present fairly, in all material respects, the financial position of each of the Funds as of August 31, 2020, and the results of each of their operations, changes in each of their net assets, and each of the financial highlights for the period May 12, 2020 (commencement of operations) through August 31, 2020 in conformity with accounting principles generally accepted in the United States of America.
Basis for Opinions
These financial statements are the responsibility of the Funds’ management. Our responsibility is to express an opinion on the Funds’ financial statements based on our audits. We are a public accounting firm registered with the Public Company Accounting Oversight Board (United States) (PCAOB) and are required to be independent with respect to the Funds in accordance with the U.S. federal securities laws and the applicable rules and regulations of the Securities and Exchange Commission and the PCAOB.
We conducted our audits of these financial statements in accordance with the standards of the PCAOB. Those standards require that we plan and perform the audit to obtain reasonable assurance about whether the financial statements are free of material misstatement, whether due to error or fraud.
Our audits included performing procedures to assess the risks of material misstatement of the financial statements, whether due to error or fraud, and performing procedures that respond to those risks. Such procedures included examining, on a test basis, evidence regarding the amounts and disclosures in the financial statements. Our audits also included evaluating the accounting principles used and significant estimates made by management, as well as evaluating the overall presentation of the financial statements. Our procedures included confirmation of securities owned as of August 31, 2020 by correspondence with the custodian, transfer agent and brokers; when replies were not received from brokers, we performed other auditing procedures. We believe that our audits provide a reasonable basis for our opinions.
/s/ PricewaterhouseCoopers LLP
Boston, Massachusetts
October 26, 2020
We have served as the auditor of one or more investment companies in the Goldman Sachs fund complex since 2000.
74
GOLDMAN SACHS MARKETBETA ETFS
| | |
| | |
Fund Expenses — For the Period ended 8/31/2020 (Unaudited) | | |
As a shareholder you incur ongoing costs, including management fees and other Fund expenses. This example is intended to help you understand your ongoing costs (in dollars) of investing in Shares of the Funds and to compare these costs with the ongoing costs of investing in other exchange-traded funds. This example does not take into account brokerage commissions that you may pay on your purchases and sales of Shares of a Fund.
The example is based on an investment of $1,000 invested at the beginning of the period from May 12, 2020 (commencement of operations) and held for the entire period ended August 31, 2020, which represents a period of 112 days of a 366 day year (or less where indicated).
Actual Expenses — The first line in the table below provides information about actual account values and actual expenses. You may use the information in this line, together with the amount you invested, to estimate the expenses that you paid over the six months. Simply divide your account value by $1,000 (for example, an $8,600 account value divided by $1,000=8.6), then multiply the result by the number in the first line under the heading entitled “Expenses Paid” to estimate the expenses you paid on your account during this period.
Hypothetical Example for Comparison Purposes — The second line in the table below provides information about hypothetical account values and hypothetical expenses based on a Fund’s actual net expense ratios and an assumed rate of return of 5% per year before expenses, which is not the Fund’s actual return. The hypothetical account values and expenses may not be used to estimate the actual ending account balance or expenses you paid for the period. You may use this information to compare the ongoing costs of investing in a Fund and other funds. To do so, compare this 5% hypothetical example with the 5% hypothetical examples that appear in the shareholder reports of the other funds.
Please note that the expenses shown in the table are meant to highlight your ongoing costs only and do not reflect any transactional costs, such as redemption fees, or exchange fees. Therefore, the second line of the table is useful in comparing ongoing costs only, and will not help you determine the relative total costs of owning different funds. In addition, if these transactional costs were included, your costs would have been higher.
| | | | | | | | | | | | | | | | | | | | | | | | | | | | | | | | | | | | |
| | | MarketBeta Emerging Markets Equity ETF* | | | MarketBeta International Equity ETF* | | | MarketBeta U.S. Equity ETF* | |
| | | Beginning
Account Value
5/12/2020 | | | Ending
Account
Value
8/31/20 | | | Expenses
Paid** | | | Beginning
Account Value
5/12/20 | | | Ending
Account
Value
8/31/20 | | | Expenses
Paid** | | | Beginning
Account Value
5/12/20 | | | Ending
Account
Value
8/31/20 | | | Expenses
Paid** | |
Actual based on NAV | | $ | 1,000 | | | $ | 1,215.40 | | | $ | 1.22 | | | $ | 1,000 | | | $ | 1,165.70 | | | $ | 0.66 | | | $ | 1,000 | | | $ | 1,240.30 | | | $ | 0.24 | |
Hypothetical 5% return | | $ | 1,000 | | | $ | 1,014.20 | + | | $ | 1.11 | | | $ | 1,000 | | | $ | 1,014.69 | + | | $ | 0.62 | | | $ | 1,000 | | | $ | 1,015.09 | + | | $ | 0.22 | |
| | + | | Hypothetical expenses are based on each Fund’s actual annualized net expense ratios and an assumed rate of return of 5% per year before expenses. | |
| | * | | Each Fund commenced operations on May 12, 2020. | |
| | ** | | Expenses for each Fund are calculated using the Fund’s annualized net expense ratio, which represents the ongoing expenses as a percentage of net assets for the period ended August 31, 2020. Expenses are calculated by multiplying the annualized net expense ratio by the average account value for the period; then multiplying the result by the number of days in the most recent fiscal year; and then dividing that result by the number of days in the fiscal year. | |
| | | | The annualized net expense ratio for the period is as follows: | |
| | | | |
| Fund | | | |
MarketBeta Emerging Markets Equity ETF | | | 0.36 | % |
MarketBeta International Equity ETF | | | 0.20 | |
MarketBeta U.S. Equity ETF | | | 0.07 | |
75
GOLDMAN SACHS MARKETBETA ETFS
Statement Regarding Basis for Initial Approval of Management Agreement (Unaudited)
Background
The Goldman Sachs MarketBeta Emerging Markets Equity ETF, Goldman Sachs MarketBeta International Equity ETF and Goldman Sachs MarketBeta U.S. Equity ETF (each, a “Fund” and together, the “Funds”) are newly-organized investment portfolios of Goldman Sachs ETF Trust (the “Trust”) that commenced investment operations on May 12th, 2020. At a meeting held on September 17-18, 2019 (the “Meeting”) in connection with the Funds’ organization, the Board of Trustees, including all of the Trustees present who are not parties to the Funds’ investment management agreement (the “Management Agreement”) or “interested persons” (as defined in the Investment Company Act of 1940, as amended) of any party thereto (the “Independent Trustees”) approved the Management Agreement with Goldman Sachs Asset Management, L.P. (the “Investment Adviser”) on behalf of the Funds.
At the Meeting, the Trustees reviewed the Management Agreement with respect to the Funds, including information regarding the terms of the Management Agreement; the nature, extent and quality of the Investment Adviser’s anticipated services; the fees and expenses to be paid by each Fund; a comparison of each Fund’s proposed management fee and anticipated expenses with those paid by other similar exchange-traded funds (“ETFs”); potential benefits to be derived by the Investment Adviser and its affiliates from their relationships with the Funds; and potential benefits to be derived by the Funds from their relationship with the Investment Adviser. Various information was also provided at prior meetings at which each Fund was discussed.
In connection with the Meeting, the Trustees received written materials and oral presentations on the topics covered, and were advised by their independent legal counsel regarding their responsibilities and other regulatory requirements related to the approval of registered fund investment management agreements under applicable law. In evaluating the Management Agreement at the Meeting, the Trustees relied upon information included in a presentation made by the Investment Adviser at the Meeting and information received at prior Board meetings, as well as on their knowledge of the Investment Adviser resulting from their meetings and other interactions over time.
Nature, Extent, and Quality of the Services Provided Under the Management Agreement
As part of their review, the Trustees considered the nature, extent, and quality of the services to be provided to the Funds by the Investment Adviser. In this regard, the Trustees considered both the investment advisory services and non-advisory services that would be provided by the Investment Adviser and its affiliates. The Trustees noted the ongoing recruitment efforts aimed at bringing high quality investment talent to the Investment Adviser. They also noted the Investment Adviser’s commitment to maintaining high quality systems and expending substantial resources to respond to ongoing changes to the regulatory and control environment in which the Funds and their service providers would operate, as well as the efforts of the Investment Adviser and its affiliates to combat cyber security risks. The Trustees considered that under the Management Agreement, each Fund pays a single management fee to the Investment Adviser, and the Investment Adviser pays all of such Fund’s ordinary operating expenses, excluding payments under such Fund’s 12b-1 plan (if any), interest expenses, taxes, acquired fund fees and expenses, brokerage fees, costs of holding shareholder meetings and litigation, indemnification and extraordinary expenses. The Trustees also considered information about each Fund’s structure, investment objective, strategies and other characteristics. In particular, they noted that each Fund would operate as a passively-managed ETF that seeks to track an index owned and calculated by a third-party service provider. The Trustees noted the experience and capabilities of the key personnel of the Investment Adviser who would provide services to the Funds. In particular, the Trustees considered the Investment Adviser’s extensive experience in managing quantitative investment strategies. The Trustees concluded that the Investment Adviser would be able to commit substantial financial and operational resources to the Funds. They also considered that although the Funds were new (and therefore had no performance data to evaluate), the Investment Adviser has committed substantial financial and operational resources to ETFs and has extensive experience managing other types of registered investment companies. The Trustees also recognized that the Investment Adviser had made significant commitments to address regulatory compliance requirements applicable to the Funds and the Investment Adviser and its affiliates.
Unitary Fee Structure and Profitability
The Trustees considered the contractual management fee rate payable by each Fund, noting that the Management Agreement provides for a unitary fee structure, pursuant to which each Fund pays a single management fee to the Investment Adviser and the Investment Adviser then pays all of the Fund’s ordinary operating expenses. In addition, the Trustees considered information on the services to be rendered by the Investment Adviser to the Funds, which would include both advisory and administrative services directed to the needs and operations of the Funds as ETFs. In addition, the Trustees considered the Investment Adviser’s undertakings to implement a fee waiver for each Fund. The Trustees noted that license fees would be payable by the Investment Adviser to Solactive AG for the use of its indices. The Trustees also considered information provided regarding fees and expenses of comparable ETFs advised by other, unaffiliated investment management firms. The comparisons of the Funds’ unitary
76
GOLDMAN SACHS MARKETBETA ETFS
Statement Regarding Basis for Initial Approval of Management Agreement (Unaudited) (continued)
management fee rates and projected expense ratios were prepared by the Investment Adviser and a third-party provider of mutual fund and ETF data. In particular, the Trustees referred to an analysis comparing each Fund’s unitary management fee rate and projected expense ratio to those of relevant peer funds. The Trustees concluded that the comparisons were useful in evaluating the reasonableness of the management fees and total expenses to be paid by the Funds. The Trustees concluded that the Investment Adviser’s management of the Funds likely would benefit the Funds and their shareholders.
In addition, the Trustees recognized that there was not yet profitability data to evaluate for the Funds, but considered the Investment Adviser’s representations that (i) such data would be provided after the Funds commenced operations, and (ii) the Funds were not expected to be profitable to the Investment Adviser and its affiliates initially.
Economies of Scale
The Trustees noted that the Funds would not have management fee breakpoints. The Trustees considered the Funds’ projected asset levels and information comparing the fee rates charged by the Investment Adviser with fee rates charged to other ETFs in the Funds’ peer groups.
Other Benefits to the Investment Adviser and Its Affiliates
The Trustees also considered the other benefits expected to be derived by the Investment Adviser and its affiliates from their relationships with the Funds, including: (a) the Investment Adviser’s ability to leverage the infrastructure designed to service the Funds on behalf of its other clients; (b) the Investment Adviser’s ability to cross-market other products and services to Fund shareholders; (c) the Investment Adviser’s ability to negotiate better pricing with custodians on behalf of its other clients, as a result of the relationship with the Funds; and (d) the possibility that the working relationship between the Investment Adviser and the Funds’ third party service providers may cause those service providers to be more likely to do business with other areas of Goldman Sachs & Co. LLC (“Goldman Sachs”).
Other Benefits to the Funds and Their Shareholders
The Trustees also noted that the Funds are expected to receive certain potential benefits as a result of their relationships with the Investment Adviser, including: (a) enhanced servicing from vendors because of the volume of business generated by the Investment Adviser and its affiliates; (b) the Investment Adviser’s ability to hire and retain qualified personnel to provide services to the Funds because of the reputation of the Goldman Sachs organization; and (c) the Funds’ access to certain affiliated distribution channels.
Conclusion
In connection with their consideration of the Management Agreement, the Trustees gave weight to each of the factors described above, but did not identify any particular factor as controlling their decision. After deliberation and consideration of all of the information provided, including the factors described above, the Trustees concluded, in the exercise of their business judgment, that the unitary management fee to be paid by each Fund was reasonable in light of the services to be provided to it by the Investment Adviser, the Investment Adviser’s costs and each Fund’s reasonably foreseeable asset levels. The Trustees unanimously concluded that the engagement of the Investment Adviser likely would benefit each Fund and its shareholders and that the Management Agreement should be approved until September 18, 2021.
77
GOLDMAN SACHS MARKETBETA ETFS
Trustees and Officers (Unaudited) Independent Trustees
| | | | | | | | | | |
Name,
Address and Age1 | | Position(s) Held
with the Trust | | Term of
Office and Length of
Time Served2 | | Principal Occupation(s)
During Past 5 Years | | Number of
Portfolios in
Fund Complex
Overseen by
Trustee3 | | Other
Directorships
Held by Trustee4 |
| | | | | |
Lawrence W. Stranghoener Age: 66 | | Chairman of the Board of Trustees | | Trustee Since 2015; Chairman Since 2017 | | Mr. Stranghoener is retired. He is Director, Kennametal, Inc. (a global manufacturer and distributor of tooling and industrial materials) (2003-Present); and was formerly Director, Aleris Corporation and Aleris International, Inc. (a producer of aluminum rolled products) (2011-2020); Interim Chief Executive Officer (2014); and Executive Vice President and Chief Financial Officer (2004-2014), Mosaic Company (a fertilizer manufacturing company). Chairman of the Board of Trustees — Goldman Sachs ETF Trust; Goldman Sachs MLP Income Opportunities Fund; Goldman Sachs MLP and Energy Renaissance Fund; Goldman Sachs Credit Income Fund; and Goldman Sachs Real Estate Diversified Income Fund. | | 46 | | Kennametal Inc. (a global manufacturer and distributor of tooling and industrial materials) |
| | | | | |
Caroline Dorsa Age: 61 | | Trustee | | Since 2016 | | Ms. Dorsa is retired. She is Director, Biogen Inc. (a biotechnology company) (2010-Present); Director, Intellia Therapeutics Inc. (a gene- editing company) (2015-Present); and Director, Illumina, Inc. (a life sciences company) (2017- Present). She was formerly Executive Vice President and Chief Financial Officer, Public Service Enterprise Group, Inc. (a generation and energy services company) (2009-2015); Senior Vice President, Merck & Co, Inc. (a pharmaceutical company) (2008-2009 and 1987- 2007); Senior Vice President and Chief Financial Officer, Gilead Sciences, Inc. (a pharmaceutical company) (2007-2008); and Senior Vice President and Chief Financial Officer, Avaya, Inc. (a technology company) (2007). Trustee — Goldman Sachs ETF Trust; Goldman Sachs MLP Income Opportunities Fund; Goldman Sachs MLP and Energy Renaissance Fund; Goldman Sachs Credit Income Fund; and Goldman Sachs Real Estate Diversified Income Fund. | | 46 | | Biogen Inc. (a biotechnology company); Intellia Therapeutics Inc. (a gene-editing company); Illumina, Inc. (a life sciences company) |
| | | | | |
Linda A. Lang Age: 62 | | Trustee | | Since 2016 | | Ms. Lang is retired. She was formerly Chair of the Board of Directors (2016-2019), and Member of the Board of Directors, WD-40 Company (a global consumer products company) (2004-2019); Chairman and Chief Executive Officer (2005-2014); and Director, President and Chief Operating Officer, Jack in the Box, Inc. (a restaurant company) (2003-2005). Previously, Ms. Lang served as an Advisory Board Member of Goldman Sachs MLP Income Opportunities Fund and Goldman Sachs MLP and Energy Renaissance Fund (February 2016—March 2016). Trustee — Goldman Sachs ETF Trust; Goldman Sachs MLP Income Opportunities Fund; Goldman Sachs MLP and Energy Renaissance Fund; Goldman Sachs Credit Income Fund; and Goldman Sachs Real Estate Diversified Income Fund. | | 46 | | None |
| | | | | |
Michael Latham Age: 54 | | Trustee | | Since 2015 | | Mr. Latham is retired. Formerly, he held senior management positions with the iShares exchange-traded fund business, including Chairman (2011-2014); Global Head (2010-2011); U.S. Head (2007-2010); and Chief Operating Officer (2003-2007). Trustee — Goldman Sachs ETF Trust; Goldman Sachs MLP Income Opportunities Fund; Goldman Sachs MLP and Energy Renaissance Fund; Goldman Sachs Credit Income Fund; and Goldman Sachs Real Estate Diversified Income Fund. | | 46 | | None |
| | | | | | | | | | |
78
GOLDMAN SACHS MARKETBETA ETFS
Trustees and Officers (Unaudited) (continued) Interested Trustee*
| | | | | | | | | | |
Name,
Address and Age1 | | Position(s) Held
with the Trust | | Term of
Office and
Length of
Time Served2 | | Principal Occupation(s)
During Past 5 Years | | Number of
Portfolios in
Fund Complex
Overseen by
Trustee3 | | Other
Directorships Held by Trustee4 |
| | | | | |
James A. McNamara Age: 57 | | Trustee and President | | Since 2014 | | Advisory Director, Goldman Sachs (January 2018-Present); Managing Director, Goldman Sachs (January 2000-December 2017); Director of Institutional Fund Sales, GSAM (April 1998-December 2000); and Senior Vice President and Manager, Dreyfus Institutional Service Corporation (January 1993-April 1998). President and Trustee — Goldman Sachs ETF Trust; Goldman Sachs Trust; Goldman Sachs Variable Insurance Trust; Goldman Sachs Trust II; Goldman Sachs MLP Income Opportunities Fund; Goldman Sachs MLP and Energy Renaissance Fund; Goldman Sachs Credit Income Fund; and Goldman Sachs Real Estate Diversified Income Fund. | | 168 | | None |
| | | | | | | | | | |
| * | | This person is considered to be an “Interested Trustee” because he holds a position with Goldman Sachs and own securities issued by The Goldman Sachs Group, Inc. The Interested Trustee holds comparable positions with certain other companies of which Goldman Sachs, GSAM or an affiliate thereof is the investment adviser, administrator and/or distributor. |
| 1 | | Each Trustee may be contacted by writing to the Trustee, c/o Goldman Sachs, 200 West Street, New York, New York, 10282, Attn: Caroline L. Kraus. Information is provided as of August 31, 2020. |
| 2 | | Each Trustee holds office for an indefinite term until the earliest of: (a) the election of his or her successor; (b) the date the Trustee resigns, retires or is removed by the Board of Trustees or shareholders, in accordance with the Trust’s Declaration of Trust; or (c) the termination of the Trust. |
| 3 | | The Goldman Sachs Fund Complex includes certain other companies listed above for each respective Trustee. As of August 31, 2020, Goldman Sachs ETF Trust consisted of 42 portfolios (23 of which offered shares to the public); Goldman Sachs Trust consisted of 90 portfolios (89 of which offered shares to the public); Goldman Sachs Variable Insurance Trust consisted of 13 portfolios; Goldman Sachs Trust II consisted of 19 portfolios (17 of which offered shares to the public); and Goldman Sachs MLP Income Opportunities Fund, Goldman Sachs MLP and Energy Renaissance Fund, Goldman Sachs Credit Income Fund and Goldman Sachs Real Estate Diversified Income Fund each consisted of one portfolio. Goldman Sachs Credit Income Fund did not offer shares to the public. |
| 4 | | This column includes only directorships of companies required to report to the Securities and Exchange Commission under the Securities Exchange Act of 1934 (i.e., “public companies”) or other investment companies registered under the Act. |
Additional information about the Trustees is available in the Funds’ Statement of Additional Information, which can be obtained from Goldman Sachs free of charge by calling this toll-free number (in the United States of America): 1-800-621-2550.
79
GOLDMAN SACHS MARKETBETA ETFS
Trustees and Officers (Unaudited) (continued) Officers of the Trust*
| | | | | | |
Name,
Address and Age1 | | Positions Held
with the Trust | | Term of
Office and
Length of
Time Served2 | | Principal Occupation(s) During Past 5 Years |
| | | |
James A. McNamara 200 West Street New York, NY 10282 Age: 57 | | Trustee and President | | Since 2014 | | Advisory Director, Goldman Sachs (January 2018-Present); Managing Director, Goldman Sachs (January 2000-December 2017); Director of Institutional Fund Sales, GSAM (April 1998-December 2000); and Senior Vice President and Manager, Dreyfus Institutional Service Corporation (January 1993-April 1998). President and Trustee — Goldman Sachs ETF Trust; Goldman Sachs Trust; Goldman Sachs Variable Insurance Trust; Goldman Sachs Trust II; Goldman Sachs MLP Income Opportunities Fund; Goldman Sachs MLP and Energy Renaissance Fund; Goldman Sachs Credit Income Fund; and Goldman Sachs Real Estate Diversified Income Fund. |
| | | |
Caroline L. Kraus 200 West Street New York, NY 10282 Age: 43 | | Secretary | | Since 2014 | | Managing Director, Goldman Sachs (January 2016-Present); Vice President, Goldman Sachs (August 2006-December 2015); Senior Counsel, Goldman Sachs (January 2020–Present); Associate General Counsel, Goldman Sachs (2012-December 2019); Assistant General Counsel, Goldman Sachs (August 2006-December 2011); and Associate, Weil, Gotshal & Manges, LLP (2002-2006). Secretary — Goldman Sachs ETF Trust; Goldman Sachs Trust (previously Assistant Secretary (2012)); Goldman Sachs Variable Insurance Trust (previously Assistant Secretary (2012)); Goldman Sachs Trust II; Goldman Sachs BDC, Inc.; Goldman Sachs Private Middle Market Credit LLC; Goldman Sachs Private Middle Market Credit II LLC; Goldman Sachs Middle Market Lending Corp.; Goldman Sachs MLP Income Opportunities Fund; Goldman Sachs MLP and Energy Renaissance Fund; Goldman Sachs Credit Income Fund; and Goldman Sachs Real Estate Diversified Income Fund. |
| | | |
Joseph F. DiMaria 30 Hudson Street Jersey City, NJ 07302 Age: 52 | | Treasurer, Principal Financial Officer and Principal Accounting Officer | | Since 2017 (Treasurer and Principal Financial Officer since 2019) | | Managing Director, Goldman Sachs (November 2015-Present) and Vice President — Mutual Fund Administration, Columbia Management Investment Advisers, LLC (May 2010- October 2015). Treasurer, Principal Financial Officer and Principal Accounting Officer—Goldman Sachs ETF Trust (previously Assistant Treasurer (2017)); Goldman Sachs Trust (previously Assistant Treasurer (2016)); Goldman Sachs Variable Insurance Trust (previously Assistant Treasurer (2016)); Goldman Sachs Trust II (previously Assistant Treasurer (2017)); Goldman Sachs MLP Income Opportunities Fund (previously Assistant Treasurer (2017)); Goldman Sachs MLP and Energy Renaissance Fund (previously Assistant Treasurer (2017)); Goldman Sachs Credit Income Fund; and Goldman Sachs Real Estate Diversified Income Fund. |
| | | | | | |
| * | | Represents a partial list of officers of the Trust. Additional information about all the officers is available in the Funds’ Statement of Additional Information, which can be obtained from Goldman Sachs free of charge by calling this toll-free number (in the United States): 1-800-621-2550. |
| 1 | | Information is provided as of August 31, 2020. |
| 2 | | Officers hold office at the pleasure of the Board of Trustees or until their successors are duly elected and qualified. Each officer holds comparable positions with certain other companies of which Goldman Sachs, GSAM or an affiliate thereof is the investment adviser, administrator and/or distributor. |
80
FUNDS PROFILE
Goldman Sachs ETFs

Goldman Sachs is a premier financial services firm, known since 1869 for creating thoughtful and customized investment solutions in complex global markets.
Today, the Consumer and Investment Management Division of Goldman Sachs serves a diverse set of clients worldwide, including private institutions, public entities and individuals. With approximately $1.88 trillion in assets under supervision as of June 30, 2020, Goldman Sachs Asset Management (“GSAM”) has portfolio management teams located around the world and our investment professionals bring firsthand knowledge of local markets to every investment decision. Assets under supervision includes assets under management and other client assets for which Goldman Sachs does not have full discretion. GSAM leverages the resources of Goldman Sachs & Co. LLC subject to legal, internal and regulatory restrictions.
|
|
| GOLDMAN SACHS EXCHANGE-TRADED FUNDS |
| Goldman Sachs ActiveBeta® Emerging Markets Equity ETF |
| Goldman Sachs ActiveBeta® Europe Equity ETF |
|
| Goldman Sachs ActiveBeta® International Equity ETF |
| Goldman Sachs ActiveBeta® Japan Equity ETF |
| Goldman Sachs ActiveBeta® U.S. Large Cap Equity ETF |
| Goldman Sachs ActiveBeta® U.S. Small Cap Equity ETF |
| Goldman Sachs Equal Weight U.S. Large Cap Equity ETF |
| Goldman Sachs Hedge Industry VIP ETF |
| Goldman Sachs JUST U.S. Large Cap Equity ETF |
| Goldman Sachs Access U.S. Aggregate Bond ETF |
|
| Goldman Sachs Access High Yield Corporate Bond ETF |
| Goldman Sachs Access Inflation Protected USD Bond ETF |
| Goldman Sachs Access Investment Grade Corporate Bond ETF |
| Goldman Sachs Access Investment Grade Corporate 1-5 Year Bond ETF |
| Goldman Sachs Access Treasury 0-1 Year ETF |
| Goldman Sachs Access Ultra Short Bond ETF |
| Goldman Sachs Data-Driven World ETF |
| Goldman Sachs Finance Reimagined ETF |
| Goldman Sachs Human Evolution ETF |
| Goldman Sachs Manufacturing Revolution ETF |
| Goldman Sachs New Age Consumer ETF |
| Goldman Sachs MarketBeta International Equity ETF |
| Goldman Sachs MarketBeta Emerging Markets Equity ETF |
| Goldman Sachs MarketBeta U.S. Equity ETF |
INDEX DISCLAIMERS
The Goldman Sachs MarketBeta International Equity ETF, Goldman Sachs MarketBeta Emerging Markets Equity ETF, Goldman Sachs MarketBeta International Small Cap Equity ETF, and Goldman Sachs MarketBeta U.S. Equity ETF are not sponsored, promoted, sold or supported in any other manner by Solactive AG nor does Solactive AG offer any express or implicit guarantee or assurance either with regard to the results of using the Solactive GBS Developed Markets ex North America Large & Mid Cap Index, the Solactive GBS Emerging Markets Large & Mid Cap Index, Solactive GBS Developed Markets ex North America Small Cap Index, Solactive GBS United States Large & Mid Cap Index (“Solactive Indexes”) and/ or Solactive Index trade mark or the Solactive Index Price at any time or in any other respect. The Solactive Indexes are calculated and published by Solactive AG. Solactive AG uses its best efforts to ensure that the Solactive Indexes are calculated correctly. Irrespective of its obligations towards the Funds, Solactive AG has no obligation to point out errors in the Solactive Indexes to third parties including but not limited to investors and/or financial intermediaries of the Funds. Neither publication of a Solactive Index by Solactive AG nor the licensing of the Solactive Index or Solactive Index trade mark for the purpose of use in connection with a Fund constitutes a recommendation by Solactive AG to invest capital in said fund nor does it in any way represent an assurance or opinion of Solactive AG with regard to any investment in this fund. Solactive AG is registered as a benchmark administrator under the Regulation (EU) 2016/2011 (BMR). Solactive appears on the ESMA register of administrators.
| | |
TRUSTEES Lawrence W. Stranghoener, Chairman Caroline Dorsa Linda A. Lang Michael Latham James A. McNamara | | OFFICERS James A. McNamara, President Joseph F. DiMaria, Principal Financial Officer,
Principal Accounting Officer and Treasurer Caroline L. Kraus, Secretary |
| |
THE BANK OF NEW YORK MELLON Transfer Agent | | |
| |
ALPS DISTRIBUTORS, INC. Distributor | | GOLDMAN SACHS ASSET MANAGEMENT, L.P. Investment Adviser |
Visit our Website at www.GSAMFUNDS.com/ETFs to obtain the most recent month-end returns.
Goldman Sachs Asset Management, L.P., 200 West Street, New York, New York 10282
The reports concerning the Funds included in this shareholder report may contain certain forward-looking statements about the factors that may affect the performance of the Funds in the future. These statements are based on Fund management’s predictions and expectations concerning certain future events and their expected impact on the Funds, such as performance of the economy as a whole and of specific industry sectors, changes in the levels of interest rates, the impact of developing world events, and other factors that may influence the future performance of the Funds. Management believes these forward-looking statements to be reasonable, although they are inherently uncertain and difficult to predict. Actual events may cause adjustments in portfolio management strategies from those currently expected to be employed.
A description of the policies and procedures that the Funds use to determine how to vote proxies relating to portfolio securities and information regarding how a Fund voted proxies relating to portfolio securities during the most recent 12-month period ended June 30 is available (i) without charge, upon request by calling 1-800-621-2550; and (ii) on the Securities and Exchange Commission (“SEC”) web site at http://www.sec.gov.
The Funds will file portfolio holdings information for each month in a fiscal quarter within 60 days after the end of the relevant fiscal quarter on the Form N-PORT. Portfolio holdings information for the third month of each fiscal quarter will be made available on the SEC’s web site at http://www.sec.gov. Portfolio holdings information may be obtained upon request and without charge by calling 1-800-621-2550.
Fund holdings and allocations shown are as of August 31, 2020 and may not be representative of future investments. Fund holdings should not be relied on in making investment decisions and should not be construed as research or investment advice regarding particular securities. Current and future holdings are subject to risk.
Economic and market forecasts presented herein reflect our judgment as of the date of this presentation and are subject to change without notice. These forecasts do not take into account the specific investment objectives, restrictions, tax and financial situation or other needs of any specific client. Actual data will vary and may not be reflected here. These forecasts are subject to high levels of uncertainty that may affect actual performance. Accordingly, these forecasts should be viewed as merely representative of a broad range of possible outcomes. These forecasts are estimated, based on assumptions, and are subject to significant revision and may change materially as economic and market conditions change. Goldman Sachs has no obligation to provide updates or changes to these forecasts. Case studies and examples are for illustrative purposes only.
ETF Fund shares are not individually redeemable and are issued and redeemed by the Fund at their net asset value (“NAV”) only in large, specified blocks of shares called creation units. Shares otherwise can be bought and sold only through exchange trading at market price (not NAV). Shares may trade at a premium or discount to their NAV in the secondary market. Brokerage commissions will reduce returns. Ordinary brokerage commissions apply. ALPS Distributors, Inc. is the distributor of the Goldman Sachs ETF Funds. ALPS Distributors, Inc. is unaffiliated with Goldman Sachs Asset Management.
This material is not authorized for distribution to prospective investors unless preceded or accompanied by a current Prospectus or summary prospectus, if applicable. Investors should consider a Fund’s objective, risks, and charges and expenses, and read the summary prospectus, if available, and/or the Prospectus carefully before investing or sending money. The summary prospectus, if available, and the Prospectus contain this and other information about a Fund and may be obtained from your authorized dealer or from Goldman Sachs & Co. LLC by calling 1-800-621-2550.
MarketBeta® and ActiveBeta® are registered trademarks of GSAM.
© 2020 Goldman Sachs. All rights reserved. 218110-OTU-10/2020 MCEQWGETFAR-20
(a) As of the end of the period covered by this report, the registrant has adopted a code of ethics that applies to the registrant’s principal executive officer, principal financial officer, principal accounting officer or controller, or persons performing similar functions, regardless of whether these individuals are employed by the registrant or a third party (the “Code of Ethics”).
(b) During the period covered by this report, no amendments were made to the provisions of the Code of Ethics.
(c) During the period covered by this report, the registrant did not grant any waivers, including an implicit waiver, from any provision of the Code of Ethics.
(d) A copy of the Code of Ethics is available as provided in Item 13(a)(1) of this report.
| ITEM 3. | AUDIT COMMITTEE FINANCIAL EXPERT. |
The registrant’s board of trustees has determined that the registrant has at least one “audit committee financial expert” (as defined in Item 3 of Form N-CSR) serving on its audit committee. Caroline Dorsa is the “audit committee financial expert” and is “independent” (as each term is defined in Item 3 of Form N-CSR).
| ITEM 4. | PRINCIPAL ACCOUNTANT FEES AND SERVICES. |
Table 1 — Items 4(a) - 4(d). The accountant fees below reflect the aggregate fees billed by the Funds of the Goldman Sachs ETF Trust to which this certified shareholder report relates.
| | | | | | | | | | | | |
| | | 2020 | | 2019 | | Description of Services Rendered |
| | | |
| | | | | | | | | | | | |
| | | |
Audit Fees: | | | | | | | | | | | | |
| | | |
• PricewaterhouseCoopers LLP
(“PwC”) | | | $ | 611,900 | | | | $ | 436,500 | | | Financial Statement audits. |
| | | |
Audit-Related Fees: | | | | | | | | | | | | |
| | | |
• PwC | | | $ | 36,324 | | | | $ | 12,753 | | | |
| | | |
Tax Fees: | | | | | | | | | | | | |
| | | |
• PwC | | | $ | 2,325 | | | | $ | 100,736 | | | Tax compliance services provided in connection with the preparation and review of registrant’s tax returns. |
Table 2 — Items 4(b)(c) & (d). Non-Audit Services to the Goldman Sachs ETF Trust’s service affiliates * that were pre-approved by the Audit Committee of the Goldman Sachs ETF Trust pursuant to Rule 2-01(c)(7)(ii) of Regulation S-X.
| | | | | | | | | | | | |
| | | 2020 | | 2019 | | Description of Services Rendered |
| | | |
| | | | | | | | | | | | |
| | | |
Audit-Related Fees: | | | | | | | | | | | | |
| | | |
• PwC | | | $ | 1,441,351 | | | | $ | 1,406,035 | | | Internal control review performanced in accordance with Statement on Standards for Attestation Engagements No. 16 and Semi-annual Updates related to withholding tax accrual for non-US Jurisdictions. These fees are borne by the Funds’ Adviser. |
| * | These include the advisor (excluding sub-advisors) and any entity controlling, controlled by or under common control with the advisor that provides ongoing services to the registrant (hereinafter referred to as “service affiliates”). |
Item 4(e)(1) — Audit Committee Pre-Approval Policies and Procedures
Pre-Approval of Audit and Non-Audit Services Provided to the Funds of the Goldman Sachs ETF Trust. The Audit and Non-Audit Services Pre-Approval Policy (the “Policy”) adopted by the Audit Committee of Goldman Sachs ETF Trust (“GS ETF”) sets forth the procedures and the conditions pursuant to which services performed by an independent auditor for GS ETF may be pre-approved. Services may be pre-approved specifically by the Audit Committee as a whole or, in certain circumstances, by the Audit Committee Chairman or the person designated as the Audit Committee Financial Expert. In addition, subject to specified cost limitations, certain services may be pre-approved under the provisions of the Policy. The Policy provides that the Audit Committee will consider whether the services provided by an independent auditor are consistent with the Securities and Exchange Commission’s rules on auditor independence. The Policy provides for periodic review and pre-approval by the Audit Committee of the services that may be provided by the independent auditor.
De Minimis Waiver. The pre-approval requirements of the Policy may be waived with respect to the provision of non-audit services that are permissible for an independent auditor to perform, provided (1) the aggregate amount of all such services provided constitutes no more than five percent of the total amount of revenues subject to pre-approval that was paid to the independent auditors during the fiscal year in which the services are provided; (2) such services were not recognized by GS ETF at the time of the engagement to be non-audit services; and (3) such services are promptly brought to the attention of the Audit Committee and approved prior to the completion of the audit by the Audit Committee or by one or more members of the Audit Committee to whom authority to grant such approvals has been delegated by the Audit Committee, pursuant to the pre-approval provisions of the Policy.
Pre-Approval of Non-Audit Services Provided to the Goldman Sachs ETF Trust’s Investment Advisers. The Policy provides that, in addition to requiring pre-approval of audit and non-audit services provided to GS ETF, the Audit Committee will pre-approve those non-audit services provided to GS ETF’s investment advisers (and entities controlling, controlled by or under common control with the investment advisers that provide ongoing services to GS ETF) where the engagement relates directly to the operations or financial reporting of GS ETF.
Item 4(e)(2) – 0% of the audit-related fees, tax fees and other fees listed in Table 1 were approved by GS ETF’s Audit Committee pursuant to the “de minimis” exception of Rule 2-01(c)(7)(i)(C) of Regulation S-X. In addition, 0% of the non-audit services to the GS ETF’s service affiliates listed in Table 2 were approved by GS ETF’s Audit Committee pursuant to the “de minimis” exception of Rule 2-01(c)(7)(i)(C) of Regulation S-X.
Item 4(f) – Not applicable.
Item 4(g) Aggregate Non-Audit Fees Disclosure
The aggregate non-audit fees billed to GS ETF by PwC for the twelve months ended August 31, 2020 and August 31, 2019 were approximately $38,649 and $113,489 respectively. The aggregate non-audit fees billed to GS ETF’s adviser and service affiliates by PwC for non-audit services for the twelve months ended December 31, 2019 and December 31, 2018 were approximately $14.7 million and $12.3 million respectively. With regard to the aggregate non-audit fees billed to GS ETF’s adviser and service affiliates, the 2019 and 2018 amounts include fees for non-audit services required to be pre-approved [see Table 2] and fees for non-audit services that did not require pre-approval since they did not directly relate to GS ETF’s operations or financial reporting.
Item 4(h) — GS ETF’s Audit Committee has considered whether the provision of non-audit services to GS ETF’s investment adviser and service affiliates that did not require pre-approval pursuant to paragraph (c)(7)(ii) of Rule 2-01 of Regulation S-X is compatible with maintaining the auditors’ independence.
| ITEM 5. | AUDIT COMMITTEE OF LISTED REGISTRANTS. |
| | The Registrant has a separately-designated standing Audit Committee established in accordance with Section 3(a)(58)(A) of the Securities Exchange Act of 1934, as amended. The members of the Audit Committee are Michael Latham, Linda A. Lang, Lawrence W. Stranghoener, and Caroline Dorsa, each a Trustee of the Registrant. |
| ITEM 6. | SCHEDULE OF INVESTMENTS. |
| | Schedule of Investments is included as part of the Report to Shareholders filed under Item 1. |
| ITEM 7. | DISCLOSURE OF PROXY VOTING POLICIES AND PROCEDURES FOR CLOSED-END MANAGEMENT INVESTMENT COMPANIES. |
| ITEM 8. | PORTFOLIO MANAGERS OF CLOSED-END MANAGEMENT INVESTMENT COMPANIES. |
| ITEM 9. | PURCHASES OF EQUITY SECURITIES BY CLOSED-END MANAGEMENT INVESTMENT COMPANY AND AFFILIATED PURCHASERS. |
| ITEM 10. | SUBMISSION OF MATTERS TO A VOTE OF SECURITY HOLDERS. |
| | There have been no material changes to the procedures by which shareholders may recommend nominees to the registrant’s board of trustees. |
| ITEM 11. | CONTROLS AND PROCEDURES. |
| | (a) | The registrant’s principal executive and principal financial officers, or persons performing similar functions have concluded that the registrant’s disclosure controls and procedures (as defined in Rule 30a-3(c) under the Investment Company Act of 1940, as amended (the “1940 Act”)) are effective as of a date within 90 days of the filing of this report that includes the disclosure required by this paragraph, based on the evaluation of these controls and procedures required by Rule 30a-3(b) under the 1940 Act and 15d-15(b) under the Securities Exchange Act of 1934, as amended. |
| | (b) | There were no changes in the registrant’s internal control over financial reporting (as defined in Rule 30a-3(d) under the 1940 Act) that occurred during the period covered by this report that have materially affected, or are reasonably likely to materially affect, the registrant’s internal control over financial reporting. |
| ITEM 12. | DISCLOSURE OF SECURITIES LENDING ACTIVITIES FOR CLOSED-END MANAGEMENT INVESTMENT COMPANIES |
SIGNATURES
Pursuant to the requirements of the Securities Exchange Act of 1934 and the Investment Company Act of 1940, the registrant has duly caused this report to be signed on its behalf by the undersigned, thereunto duly authorized.
| | |
| | | Goldman Sachs ETF Trust |
| |
| By: | | /s/ James A. McNamara |
| |
| | |
| | James A. McNamara |
| | President/Chief Executive Officer |
| | Goldman Sachs ETF Trust |
| |
| Date: | | November 2, 2020 |
Pursuant to the requirements of the Securities Exchange Act of 1934 and the Investment Company Act of 1940, this report has been signed below by the following persons on behalf of the registrant and in the capacities and on the dates indicated.
| | |
| By: | | /s/ James A. McNamara |
| |
| | |
| | James A. McNamara |
| | President/Chief Executive Officer |
| | Goldman Sachs ETF Trust |
| |
| Date: | | November 2, 2020 |
| |
| By: | | /s/ Joseph F. DiMaria |
| |
| | |
| | Joseph F. DiMaria |
| | Principal Financial Officer |
| | Goldman Sachs ETF Trust |
| |
| Date: | | November 2, 2020 |