UNITED STATES
SECURITIES AND EXCHANGE COMMISSION
Washington, D.C. 20549
FORM N-CSR
CERTIFIED SHAREHOLDER REPORT OF REGISTERED
MANAGEMENT INVESTMENT COMPANIES
Investment Company Act file number 811-23013
Goldman Sachs ETF Trust
(Exact name of registrant as specified in charter)
200 West Street, New York, New York 10282
(Address of principal executive offices) (Zip code)
Copies to:
| | |
Robert Griffith, Esq. | | Stephen H. Bier, Esq. |
Goldman Sachs & Co. LLC | | Dechert LLP |
200 West Street | | 1095 Avenue of the Americas |
New York, New York 10282 | | New York, NY 10036 |
(Name and address of agents for service)
Registrant’s telephone number, including area code: (312) 655-4400
Date of fiscal year end: August 31
Date of reporting period: August 31, 2023
| ITEM 1. | REPORTS TO STOCKHOLDERS. |
| | The Annual Report to Shareholders is filed herewith. |
Goldman Sachs Funds
| | | | |
| | |
| Annual Report | | | | August 31, 2023 |
| | |
| | | | Access Fixed Income ETFs |
| | | | Access Emerging Markets USD Bond ETF (GEMD) |
| | | | Access High Yield Corporate Bond ETF (GHYB) |
| | | | Access Inflation Protected USD Bond ETF (GTIP) |
| | | | Access Investment Grade Corporate 1-5 Year Bond ETF (GSIG) |
| | | | Access Investment Grade Corporate Bond ETF (GIGB) |
| | | | Access Treasury 0-1 Year ETF (GBIL) |
| | | | Access U.S. Aggregate Bond ETF (GCOR) |
| | | | Access Ultra Short Bond ETF (GSST) |

Goldman Sachs Access Fixed Income ETFs
| ∎ | | ACCESS EMERGING MARKETS USD BOND ETF |
| ��� | | ACCESS HIGH YIELD CORPORATE BOND ETF |
| ∎ | | ACCESS INFLATION PROTECTED USD BOND ETF |
| ∎ | | ACCESS INVESTMENT GRADE CORPORATE 1-5 YEAR BOND ETF |
| ∎ | | ACCESS INVESTMENT GRADE CORPORATE BOND ETF |
| ∎ | | ACCESS TREASURY 0-1 YEAR ETF |
| ∎ | | ACCESS U.S. AGGREGATE BOND ETF |
| ∎ | | ACCESS ULTRA SHORT BOND ETF |
| | | | |
| | | |
| NOT FDIC-INSURED | | May Lose Value | | No Bank Guarantee |
INVESTMENT PROCESS
Goldman Sachs Access Fixed Income ETFs
Principal Investment Strategies
GOLDMAN SACHS ACCESS EMERGING MARKETS USD BOND ETF
The Goldman Sachs Access Emerging Markets USD Bond ETF (the “Fund”) seeks to achieve its investment objective by investing at least 80% of its assets (exclusive of collateral held from securities lending) in securities included in its underlying index.
The FTSE Goldman Sachs Emerging Markets USD Bond Index (the “Index”) is a rules-based index that is designed to measure the performance of investment grade and high yield bonds issued by emerging market governments or quasi-government entities denominated in U.S. dollars (“USD”) that meet certain liquidity, governance and fundamental screening criteria. As of August 31, 2023, there were 538 constituents in the Index and the Index had a weighted average maturity of 12.20 years.
The Index is a custom index that is owned and calculated by FTSE Fixed Income LLC (“FTSE”), a trading name of the London Stock Exchange Group plc and its group undertakings (collectively, the “LSE Group” or the “Index Provider”). The Index is based on the government and quasi-government bonds of the FTSE Emerging Markets Broad Bond Index (the “Reference Index”) using concepts developed with Goldman Sachs Asset Management, L.P. (“GSAM”).
Given the Fund’s investment objective of attempting to track the Index, the Fund does not follow traditional methods of active investment management, which may involve buying and selling securities based upon analysis of economic and market factors.
The Index Provider constructs the Index in accordance with a rules-based methodology that involves two steps.
Step 1 - In the first step, the Index Provider defines a universe of potential index constituents (the “Universe”) by applying specified criteria to the constituents of the Reference Index. The Reference Index includes sovereign and quasi-sovereign debt issued in USD with a minimum of $500 million and $250 million outstanding, respectively, that is rated at least C by S&P Global Ratings (“S&P”) or Ca by Moody’s Investors Service, Inc. (“Moody’s”). Only constituents of the Reference Index that have a minimum issue equivalent of $500 million outstanding, a minimum issuer size of $1 billion, and are rated at least B- by S&P or B3 by Moody’s are included in the Universe. The weight of each country within the Universe is capped at 5%. A maturity bucketing process is used to approximate the average effective duration of the Reference Index.
Step 2 - In the second step, the Index Provider applies both governance and fundamental screens to the Universe. First, issuers are ranked by improvement or deterioration in governance based on the Worldwide Governance Indicators. Based on this ranking, the bottom 10% of issuing countries are excluded from the Universe. Second, issuers are ranked by improvement or deterioration in two fundamental factors, import coverage and inflation. Based on this second ranking, the bottom 5% of issuing countries are excluded from the Universe. Inclusion or exclusion of quasi-government bonds is based on the country of domicile.
As of August 31, 2023, issuers from 40 emerging market countries were included in the Index. The majority of these countries are likely to be located in Africa, Asia, the Middle East, Eastern and Central Europe and Central and South America. The countries included in the Index may change over time. The percentage of the portfolio exposed to any country or geographic region will vary from time to time as the weightings of the securities within the Index change, and the Fund may not be invested in each country or geographic region at all times.
The securities included in the Index include non-investment grade fixed income securities (commonly known as “junk bonds”).
Non-investment grade fixed income securities in the Index are securities rated below BBB- by S&P or Baa3 by Moody’s. The Investment Adviser uses a representative sampling strategy to manage the Fund. “Representative sampling” is an indexing strategy in which the Fund invests in a representative sample of constituent securities that has a collective investment profile similar to that of the Index.
The securities selected for investment by the Fund are expected to have, in the aggregate, investment characteristics, governance characteristics, fundamental characteristics and liquidity measures similar to those of the Index. The Fund may or may not hold all of the securities in the Index.
1
INVESTMENT PROCESS
The Fund may concentrate its investments (i.e., hold more than 25% of its total assets) in a particular industry or group of industries to the extent that the Index is concentrated. The degree to which components of the Index represent certain sectors or industries may change over time.
GOLDMAN SACHS ACCESS HIGH YIELD CORPORATE BOND ETF
The Goldman Sachs Access High Yield Corporate Bond ETF (the “Fund”) seeks to achieve its investment objective by investing at least 80% of its assets (exclusive of collateral held from securities lending) in securities included in its underlying index.
The FTSE Goldman Sachs High Yield Corporate Bond Index (the “Index”) is a rules-based index that is designed to measure the performance of high yield corporate bonds denominated in U.S. dollars (“USD”) that meet certain liquidity and fundamental screening criteria. “High yield” bonds are bonds that are rated below investment grade and are commonly referred to as “junk bonds.” As of August 31, 2023, there were 875 constituents in the Index and the Index had a weighted average maturity of 4.90 years. The Index is a custom index that is owned and calculated by FTSE Fixed Income LLC (“FTSE”), a trading name of the London Stock Exchange Group plc and its group undertakings (collectively, the “LSE Group” or the “Index Provider”). The Index is based on the FTSE US High-Yield Market Index (the “Reference Index”) using concepts developed with Goldman Sachs Asset Management, L.P. (“GSAM”).
Given the Fund’s investment objective of attempting to track the Index, the Fund does not follow traditional methods of active investment management, which may involve buying and selling securities based upon analysis of economic and market factors.
The Index Provider constructs the Index in accordance with a rules-based methodology that involves two steps.
Step 1 - In the first step, the Index Provider defines a universe of potential index constituents (the “Universe”) by applying specified criteria to the constituents of the Reference Index. The Reference Index includes high yield corporate bonds issued by companies domiciled in the United States or Canada that have a minimum of one year to maturity and are rated a maximum of BB+ by S&P Global Ratings (“S&P”) and Ba1 by Moody’s Investors Service, Inc. (“Moody’s”) and a minimum of C by S&P and Ca by Moody’s. Only constituents of the Reference Index that (i) have a minimum of $400 million outstanding, a minimum issuer size of $1 billion and a maximum final maturity of 15 years and (ii) if neither fundamental factor described below is available, are rated at least CCC+ by S&P or Caa1 by Moody’s, are included in the Universe. A maturity bucketing process is used to approximate the average effective duration of the Reference Index.
Step 2 - In the second step, the Index Provider applies a fundamental screen to the Universe. Issuers are first grouped into three broad industry groups: financials, industrials and utilities. Within each industry group, issuers are measured by two fundamental factors, debt service and leverage. The Index Provider ranks each issuer based on the two fundamental factors, equally weighted. The Index is constructed by including the highest ranking eligible securities in each industry group, screening out lowest ranking eligible securities.
GOLDMAN SACHS ACCESS INFLATION PROTECTED USD BOND ETF
The Goldman Sachs Access Inflation Protected USD Bond ETF (the “Fund”) seeks to achieve its investment objective by investing at least 80% of its assets (exclusive of collateral held from securities lending) in securities included in its underlying index.
The FTSE Goldman Sachs Treasury Inflation Protected USD Bond Index (the “Index”) is designed to track the performance of inflation-protected, fixed rate U.S. Treasury Securities denominated in U.S. dollars (“USD”) that meet certain screening criteria. “U.S. Treasury Securities” refer to securities issued or guaranteed by the U.S. Treasury where the payment of principal and interest is backed by the full faith and credit of the U.S. government. U.S. Treasury Securities include U.S. Treasury notes, U.S. Treasury bills and U.S. Treasury floating rate bonds. As of August 31, 2023, there were 43 issues in the Index and the Index had a weighted average maturity of 7.22 years and a weighted average duration of 6.77 years. The Index is a custom index that is owned and calculated by FTSE Fixed Income LLC (“FTSE”), a trading name of the London Stock Exchange Group plc and its group undertakings (collectively, the “LSE Group” or the “Index Provider”). The Index is based on the U.S. sleeve of the FTSE World Inflation-Linked Securities Index (the “Reference Index”) using concepts developed with GSAM.
2
INVESTMENT PROCESS
Given the Fund’s investment objective of attempting to track the Index, the Fund does not follow traditional methods of active investment management, which may involve buying and selling securities based upon analysis of economic and market factors.
The Index Provider constructs the Index in accordance with a rules-based methodology that involves two steps.
Step 1 - In the first step, the Index Provider defines a universe of potential index constituents (the “Universe”) by applying specified criteria to the constituents of the Reference Index. The Reference Index includes fixed-rate, sovereign bonds denominated in USD that are linked to an inflation index. Only constituents of the Reference Index that are U.S. Treasury Inflation-Protected Securities (“TIPS”), have a minimum of 1 year to maturity and a minimum issue size of $5 billion outstanding (before taking into account the Federal Reserve System Open Market Account (“SOMA”) holdings) are included in the Universe.
Step 2 - In the second step, the Index Provider screens the Universe to exclude securities that are unseasoned. The Index excludes “on-the-run” bonds, or the newest issues for each security term. The Index is constructed by weighting each constituent to match the weighted average real yield duration of the Universe.
THE FUND IS NOT A MONEY MARKET FUND AND DOES NOT ATTEMPT TO MAINTAIN A STABLE NET ASSET VALUE.
GOLDMAN SACHS ACCESS INVESTMENT GRADE CORPORATE BOND ETF
The Goldman Sachs Access Investment Grade Corporate Bond ETF (the “Fund”) seeks to achieve its investment objective by investing at least 80% of its assets (exclusive of collateral held from securities lending) in securities included in its underlying index.
The FTSE Goldman Sachs Investment Grade Corporate Bond Index (the “Index”) is a rules-based index that is designed to measure the performance of investment grade corporate bonds denominated in U.S. dollars that meet certain liquidity and fundamental screening criteria. As of August 31, 2023, there were 3,033 constituents in the Index and the Index had a weighted average maturity of 11.45 years. The Index is a custom index that is owned and calculated by FTSE Fixed Income LLC (“FTSE”), a trading name of the London Stock Exchange Group plc and its group undertakings (collectively, the “LSE Group” or the “Index Provider”). The Index is based on the FTSE US Broad Investment-Grade (USBIG®) Corporate Index (the “Reference Index”) using concepts developed with Goldman Sachs Asset Management, L.P. (“GSAM”).
Given the Fund’s investment objective of attempting to track the Index, the Fund does not follow traditional methods of active investment management, which may involve buying and selling securities based upon analysis of economic and market factors.
The Index Provider constructs the Index in accordance with a rules-based methodology that involves two steps.
Step 1 - In the first step, the Index Provider defines a universe of potential index constituents (the “Universe”) by applying specified criteria to the constituents of the Reference Index. The Reference Index includes investment grade corporate bonds that have a minimum of one year to maturity and are rated at least BBB- by S&P Global Ratings (“S&P”) or Baa3 by Moody’s Investors Service, Inc. (“Moody’s”). Only corporate bond constituents of the Reference Index that have a minimum of $750 million outstanding and a minimum issuer size of $2 billion are included in the Universe.
Step 2 - In the second step, the Index Provider applies a fundamental screen to the Universe. Issuers are first grouped into three broad industry groups: financials, industrials and utilities. Within each industry group, issuers are measured by two fundamental factors, operating margin and leverage. The Index Provider ranks each issuer based on the two fundamental factors, equally weighted. The Index is constructed by including the highest ranking eligible securities in each industry group, screening out lowest ranking eligible securities.
GOLDMAN SACHS ACCESS INVESTMENT GRADE CORPORATE 1-5 YEAR BOND ETF
The Fund seeks to achieve its investment objective by investing at least 80% of its assets (exclusive of collateral held from securities lending) in securities included in its underlying index.
3
INVESTMENT PROCESS
The FTSE Goldman Sachs US Investment Grade Corporate Bond 1-5 Years Index (the “Index”) is a rules-based index that is designed to measure the performance of investment grade, corporate bonds denominated in U.S. dollars (“USD”) with remaining maturities between one and five years that meet certain liquidity and fundamental screening criteria. As of August 31, 2023, there were 2,352 constituents in the Index and the Index had a weighted average maturity of 2.90 years. The Index is a custom index that is owned and calculated by FTSE Fixed Income LLC (“FTSE”), a trading name of the London Stock Exchange Group plc and its group undertakings (collectively, the “LSE Group” or the “Index Provider”). The Index is based on the FTSE US Broad Investment-Grade (USBIG®) Corporate Bond Index (the “Reference Index”) using concepts developed with Goldman Sachs Asset Management, L.P. (the “Investment Adviser” or “GSAM”).
Given the Fund’s investment objective of attempting to track the Index, the Fund does not follow traditional methods of active investment management, which may involve buying and selling securities based upon analysis of economic and market factors.
The Index Provider constructs the Index in accordance with a rules-based methodology that involves two steps.
Step 1 - In the first step, the Index Provider defines a universe of potential Index constituents (the “Universe”) by applying specified criteria to the constituents of the Reference Index. The Reference Index includes investment grade corporate bonds that have a minimum of a minimum of one year to maturity and are rated at least BBB- by S&P Global Ratings (“S&P”) or Baa3 by Moody’s Investors Service, Inc. (“Moody’s”). Only corporate bond constituents of the Reference Index that have a minimum of $250 million outstanding, remaining maturities between one and five years, and from issuers with at least two eligible bonds outstanding are included in the Universe. A maturity bucketing process is used to approximate the average effective duration of constituents of the Reference Index with remaining maturities between one and five years.
Step 2 - In the second step, the Index Provider applies a fundamental screen to the Universe. Issuers are first grouped into three broad industry groups: financials, industrials and utilities. Within each industry group, issuers are measured by two fundamental factors, operating margin and leverage, subject to certain exceptions. The Index Provider ranks each issuer based on the two fundamental factors, equally weighted. The Index is constructed by including the highest ranking eligible securities in each industry group, screening out lowest ranking eligible securities. An issuer weight cap is applied to each Index constituent.
GOLDMAN SACHS ACCESS TREASURY 0-1 YEAR ETF
The Goldman Sachs Access Treasury 0-1 Year ETF (the “Fund”) seeks to achieve its investment objective by investing at least 80% of its assets (exclusive of collateral held from securities lending) in securities included in its underlying index.
The FTSE US Treasury 0-1 Year Composite Select Index (the “Index”) is designed to measure the performance of U.S. Treasury Securities with a maximum remaining maturity of 12 months. “U.S. Treasury Securities” refer to securities issued or guaranteed by the U.S. Treasury where the payment of principal and interest is backed by the full faith and credit of the U.S. government. U.S. Treasury Securities include U.S. Treasury notes, U.S. Treasury bills and U.S. Treasury floating rate bonds. The Fund expects to invest 100% of its assets in (i) U.S. Treasury Securities with a maximum remaining maturity of 12 months and (ii) cash.
As of August 31, 2023, there were 90 issues in the Index and the Index had a weighted average maturity of 0.26 years. The Index includes publicly-issued U.S. Treasury Securities that have a minimum remaining maturity of 1 month and a maximum remaining maturity of 12 months at the time of rebalance and that have a minimum issue size of $5 billion. In addition, the securities in the Index must be non-convertible and denominated in U.S. dollars. The Index excludes certain special issues, such as targeted investor notes, state and local government series bonds and coupon issues that have been stripped from bonds. 10-year and 30-year U.S. Treasury bonds are not eligible for inclusion in the Index.
The Index is sponsored by FTSE Fixed Income LLC (“FTSE”), a trading name of the London Stock Exchange Group plc and its group undertakings (collectively, the “LSE Group” or the “Index Provider”), which is not affiliated with the Fund or the Investment Adviser. The Index is market capitalization-weighted and the securities in the Index are updated on the last business day of each month.
4
INVESTMENT PROCESS
Given the Fund’s investment objective of attempting to track the Index, the Fund does not follow traditional methods of active investment management, which may involve buying and selling securities based upon analysis of economic and market factors.
THE FUND IS NOT A MONEY MARKET FUND AND DOES NOT ATTEMPT TO MAINTAIN A STABLE NET ASSET VALUE.
GOLDMAN SACHS ACCESS U.S. AGGREGATE BOND ETF
The Goldman Sachs Access U.S. Aggregate Bond ETF (the “Fund”) seeks to achieve its investment objective by investing at least 80% of its assets (exclusive of collateral held from securities lending) in securities included in its underlying index. To-Be-Announced (“TBA”) transactions representing securities included in the Fund’s underlying index are counted towards the Fund’s 80% investment policy.
The FTSE Goldman Sachs US Broad Bond Market Index (the “Index”) is a rules-based index that is designed to measure the performance of investment grade, U.S. dollar (“USD”)-denominated bonds issued in the United States that meet certain liquidity and fundamental screening criteria. The Index consists of the following fixed income asset class sectors: U.S. Treasury Securities, corporate bonds, mortgage-backed securities, government-sponsored securities, non-U.S. sovereign and provincial securities and asset-backed securities. As of August 31, 2023, there were 8,450 constituents in the Index and the Index had a weighted average maturity of 9.08 years. In addition, as of August 31, 2023, the percentage breakdown of bonds included in the Index was as follows: U.S. Treasury securities (41.6%), corporate bonds (25.3%), mortgage-backed securities (26.5%), asset-backed securities (0.2%), government-sponsored securities (3.5%), emerging markets debt (2.7%) and non-U.S. sovereign and provincial securities (0.1%). The Index is a custom index that is owned and calculated by FTSE Fixed Income LLC (“FTSE”), a trading name of the London Stock Exchange Group plc and its group undertakings (collectively, the “LSE Group” or the “Index Provider”). The Index is based on the FTSE US Broad Investment-Grade (USBIG®) Index (the “Reference Index”), using concepts developed with Goldman Sachs Asset Management, L.P. (the “Investment Adviser” or “GSAM”).
Given the Fund’s investment objective of attempting to track the Index, the Fund does not follow traditional methods of active investment management, which may involve buying and selling securities based upon analysis of economic and market factors.
The Index Provider constructs the Index in accordance with a rules-based methodology that involves two steps.
Step 1 - In the first step, the Index Provider defines a universe of potential index constituents (the “Universe”) by applying specified criteria to constituents of the Reference Index as described below. All constituents of the Reference Index must have a minimum of one year to maturity and are rated at least BBB- by S&P Global Ratings (“S&P”) or Baa3 by Moody’s Investors Service, Inc. (“Moody’s”).
U.S. Treasury Securities: “U.S. Treasury Securities” refer to securities issued or guaranteed by the U.S. Treasury where the payment of principal and interest is backed by the full faith and credit of the U.S. government. U.S. Treasury Securities include U.S. Treasury notes, U.S. Treasury bills and U.S. Treasury floating rate bonds. U.S. Treasury Securities that are included in the Reference Index must have a minimum of $5 billion outstanding (before taking into account the Federal Reserve System Open Market Account (“SOMA”) holdings). Only fixed-rate U.S. Treasury Securities within the Reference Index are included in the Universe.
Corporate Bonds: Corporate bonds that are included in the Reference Index must have a minimum of $250 million outstanding. Only corporate bonds within the Reference Index from issuers with at least two eligible bonds outstanding are included in the Universe. A maturity bucketing process is used to approximate the average effective duration of the Reference Index.
Mortgage-Backed Securities: Mortgage-backed securities that are included in the Reference Index must have a minimum issuer size of $250 million. Only mortgage-backed securities within the Reference Index that have a minimum of $1 billion outstanding per origination year generic when the coupon has a minimum amount outstanding of $5 billion are included in the Universe.
5
INVESTMENT PROCESS
Government-Sponsored Securities, Non-U.S. Sovereign and Provincial Securities and Asset-Backed Securities: Government-sponsored securities, non-U.S. sovereign and provincial securities and asset-backed securities that are included in the Reference Index must have a minimum of $1 billion, $500 million and $250 million outstanding, respectively. All government-sponsored securities, non-U.S. sovereign and provincial securities and asset-backed securities within the Reference Index are included in the Universe, except for callable zero coupon bonds, bonds callable less than one year from the issue date, and bonds issued by supranational entities.
Step 2 - In the second step, the Index Provider applies specified fundamental screens to each type of constituents in the Universe as described below.
U.S. Treasury Securities: U.S. Treasury Securities within the Universe are screened to exclude securities that are “on-the-run” bonds, or the newest issues for each security term. The remaining U.S. Treasury Securities are divided into “maturity sectors” according to their weighted average maturities. The weight of each U.S. Treasury Security within its maturity sector is determined through an optimization process with the goal of maximizing projected one-month return net of transaction costs subject to a cap on volatility.
Corporate Bonds: Corporate bond issuers within the Universe are grouped into three broad industry groups: financials, industrials and utilities. Within each industry group, issuers are measured by two fundamental factors, operating margin and leverage, subject to certain exceptions. The Index Provider ranks each issuer based on the two fundamental factors, equally weighted. The Index is constructed by including the highest ranking eligible securities in each industry group and screening out lowest ranking eligible securities. An issuer weight cap is applied to each Index constituent.
Mortgage-Backed Securities: Mortgage-backed securities within the Universe are grouped by issuer agency and are ranked within each issuer agency group based on “seasoning” (i.e., the length of time the security has been publicly traded). “Unseasoned” mortgage-backed securities (i.e., securities with less than six months of loan age) within each issuer agency group are removed from the Index. In addition, the most “negatively convex” mortgage-backed securities within each issuer agency group are removed from the Index (“negative convexity” refers to the tendency for a security’s price to fall when interest rates fall). The weights of the remaining mortgage-backed securities in the Index are determined according to their market capitalizations within the Reference Index, and the weight of each issuer agency group is adjusted to match the weighted average effective duration of such group within the Reference Index.
Government-Sponsored Securities, Non-U.S. Sovereign and Provincial Securities and Asset-Backed Securities: Government-sponsored securities, non-U.S. sovereign and provincial securities and asset-backed securities within the Universe are included in the Index in accordance with their market capitalizations.
ALL ABOVE FUNDS
Each of the FTSE Goldman Sachs Emerging Markets USD Bond Index, FTSE Goldman Sachs High Yield Corporate Bond Index, FTSE Goldman Sachs Investment Grade Corporate Bond 1-5 Years Index, FTSE Goldman Sachs Investment Grade Corporate Bond Index and FTSE Goldman Sachs US Broad Bond Market Index is rebalanced (i) monthly on the last business day of each month, to account for changes in maturities, corporate actions or ratings migration, and (ii) quarterly, to account for updates to the constituent securities on the basis of the fundamental factors (as described above). The FTSE US Treasury 0-1 Year Composite Select Index is rebalanced monthly on the last day of the month. The FTSE Goldman Sachs Treasury Inflation Protected USD Bond Index is rebalanced monthly on the last business day of the month to account for changes in maturities (i.e., removing securities with less than 1 year to maturity), new issues and duration to closely match the weighted average real yield duration of its Universe.
The Investment Adviser uses a representative sampling strategy to manage each Fund. “Representative sampling” is an indexing strategy in which each Fund invests in a representative sample of constituent securities that has a collective investment profile similar to that of its Index. The securities selected for investment by each Fund are expected to have, in the aggregate, investment characteristics, fundamental characteristics and liquidity measures similar to those of its Index.
6
INVESTMENT PROCESS
Each Fund may or may not hold all of the securities in its Index. Each of the Goldman Sachs Access High Yield Corporate Bond ETF, Goldman Sachs Investment Grade Corporate 1-5 Year Bond ETF, Goldman Sachs Access Investment Grade Corporate Bond ETF and Goldman Sachs Access U.S. Aggregate Bond ETF may concentrate its investments (i.e., hold more than 25% of its total assets) in a particular industry or group of industries to the extent that its Index is concentrated. The degree to which components of its Index represent certain sectors or industries may change over time. Each of the Goldman Sachs Access Treasury 0-1 Year ETF and Goldman Sachs Access Inflation Protected USD Bond ETF may concentrate its investments (i.e., hold more than 25% of its total assets) in a particular industry or group of industries to the extent that its Index is concentrated. The U.S. government, state and municipal governments and their agencies, authorities and instrumentalities are not deemed to be industries for this purpose.
At the end of each Fund’s Reporting Period, i.e., August 31, 2023, we continued to believe the Funds may provide investors with smoother performance and less volatility, as a smart beta approach should provide liquidity while minimizing exposure to factors historically associated with volatility and underperformance.*
GOLDMAN SACHS ACCESS ULTRA SHORT BOND ETF
The Goldman Sachs Access Ultra Short Bond ETF (the “Fund”) seeks to achieve its investment objective by investing, under normal circumstances, at least 80% of its Net Assets in a broad range of U.S. dollar denominated bonds. The Fund primarily invests in U.S. Government Securities, obligations of U.S. banks, corporate notes, commercial paper and other short-term obligations of U.S. companies, states, municipalities and other entities, fixed and floating rate mortgage-backed securities, asset-backed securities, collateralized loan obligations and repurchase agreements. The Fund may also invest in U.S. dollar-denominated obligations issued or guaranteed by foreign banks, companies and governments or their agencies, authorities, instrumentalities or sponsored enterprises. Shareholders will be provided with sixty days’ notice in the manner prescribed by the Securities and Exchange Commission (“SEC”) before any change in the Fund’s policy to invest at least 80% of its Net Assets in the particular type of investment suggested by its name.
The Fund will generally focus its investments in securities of issuers that, at the time of purchase, have a short-term credit rating of at least investment grade by at least one NRSRO (at least A-2, P-2, or F2 by S&P Global Ratings (“S&P”), Moody’s Investor Services (“Moody’s”) or Fitch Ratings Inc. (“Fitch”), respectively), have a long-term credit rating of at least investment grade by at least one NRSRO (at least BBB-, Baa3, or BBB by S&P, Moody’s or Fitch, respectively) if such securities only maintain long-term ratings, or, if unrated, are determined by the Investment Adviser to be of comparable credit quality at the time of purchase. The Fund may also rely on the credit quality of a guarantee or demand feature in determining the credit quality of a security supported by the guarantee or demand feature.
The Fund will concentrate its investments in the financial services group of industries. Therefore, under normal circumstances, the Fund will invest more than 25% of its total assets in securities issued by companies in the financial services group of industries and repurchase agreements secured by such obligations.
Under normal circumstances, the Fund’s effective duration is expected to be one year or less. “Duration” is a measure of a debt security’s price sensitivity to changes in interest rates. The longer the duration of the Fund (or an individual debt security), the more sensitive its market price to changes in interest rates. In computing duration, the Fund will estimate the duration of obligations that are subject to prepayment or redemption by the issuer, taking into account the influence of interest rates on prepayments and coupon flows. This method of computing duration is known as “option-adjusted” duration.
The Fund is an actively managed ETF, which is a fund that trades like other publicly-traded securities. The Fund is not an index fund and does not seek to replicate the performance of a specified index.
The Fund may, from time to time, take temporary defensive positions that are inconsistent with the Fund’s principal investment strategies in attempting to respond to adverse market, political or other conditions. For temporary defensive purposes, the Fund may invest up to 100% of its total assets in U.S. Government Securities, commercial paper rated at least A-2 by S&P, P-2 by Moody’s, or having a comparable credit rating by another NRSRO (or if unrated, determined by the Investment Adviser to be of comparable credit quality), certificates of deposit, bankers’ acceptances, repurchase agreements, non-convertible preferred stocks
| * | | Smart beta refers to quantitative index-based strategies. Liquidity is the ability to invest or redeem during market hours. Volatility refers to the annualized standard deviation of returns. |
7
INVESTMENT PROCESS
and non-convertible corporate bonds with a remaining maturity of less than one year, certain ETFs and other investment companies and cash items. Cash items are not income-generating and, as a result, the Fund’s current yield may be adversely affected during periods when such positions are held. Cash positions may also subject the Fund to additional risks and costs, such as increased exposure to the custodian bank holding the assets and any fees imposed for large cash balances. When the Fund’s assets are invested in such instruments, the Fund may not be achieving its investment objective.
THE FUND IS NOT A MONEY MARKET FUND AND DOES NOT ATTEMPT TO MAINTAIN A STABLE NET ASSET VALUE.
The Fund is managed to seek to generate current income and secondarily maintain an emphasis on preservation of capital and liquidity. The Investment Adviser follows a conservative, risk-managed investment process.
Global fixed income markets are constantly evolving and are highly diverse — with a large number of countries, currencies, sectors, issuers and securities. We believe that inefficiencies in these complex markets cause bond prices to diverge from their fair value. To capitalize on these inefficiencies and generate consistent risk-adjusted performance, we believe it is critical to:
| • | | Thoughtfully combine diversified sources of return by employing multiple strategies |
| • | | Take a global perspective to uncover relative value opportunities |
| • | | Employ focused specialist teams to identify short-term mispricings and incorporate long-term views |
| • | | Emphasize a risk-aware approach as we view risk management as both an offensive and defensive tool |
| • | | Build a strong team of skilled investors who excel on behalf of our clients. |
* * *
At the end of the Reporting Period, i.e. the 12-month period ended August 31, 2023, we believed the major factors that would influence the fixed income markets included global economic conditions (with modest growth reflecting resilient consumer demand, although softer China growth was likely to weigh on global activity); inflation (moderating further, reflecting supply-chain improvements and slower wage growth); central bank policy decisions (with developed markets’ central banks remaining on hold in the near term and emerging markets’ central banks taking the lead on interest rate cuts); geopolitical risk (especially related to Russia and China); and the relative strength of the U.S. dollar (potential impact on commodity prices and global markets).
8
PORTFOLIO RESULTS
Goldman Sachs Access Emerging Markets USD Bond ETF
Investment Objective
The Goldman Sachs Access Emerging Markets USD Bond ETF (the “Fund”) seeks to provide investment results that closely correspond, before fees and expenses, to the performance of the FTSE Goldman Sachs Emerging Markets USD Bond Index (the “Index”).
Portfolio Management Discussion and Analysis
Below, the Goldman Sachs Global Fixed Income and Liquidity Solutions Team discusses the Fund’s performance and positioning for the 12-month period ended August 31, 2023 (the “Reporting Period”).
| Q | | How did the Fund perform during the Reporting Period? |
| A | | During the Reporting Period, the Fund returned 3.54% based on net asset value (“NAV”) and 4.80% based on market price. The Index returned 4.06% during the same period. |
| | The Fund had an NAV of $40.58 per share on August 31, 2022 and ended the Reporting Period with an NAV of $39.59 per share. The Fund’s market price on August 31, 2023 was $39.64 per share. |
| | Effective February 17, 2023, Goldman Sachs Asset Management, L.P. (“GSAM”), the Fund’s investment adviser, implemented a management fee waiver for the Fund such that total annual fund operating expenses after the fee waiver are 0.39% until February 17, 2025 or until terminated with the approval of the Board of Trustees. |
| Q | | What key factors were responsible for the Fund’s performance during the Reporting Period? |
| A | | The Fund seeks to provide investment results that closely correspond, before fees and expenses, to the performance of the Index. The Fund’s performance reflects Fund expenses, including management fees and brokerage expenses. The Fund’s relative performance also reflects the impact of any cash held in the Fund as well as any other differences between the Fund’s holdings and the constituents of the Index. The Index is unmanaged, and Index returns do not reflect fees and expenses, which would reduce returns. |
| | The Index is designed to measure the performance of investment grade and high yield bonds issued by emerging market governments or quasi-government entities denominated in U.S. dollars that meet certain liquidity, governance and fundamental screening criteria. “High yield” bonds are bonds that are rated below investment grade and are commonly referred to as “junk bonds.” The Index is a custom index that is owned and calculated by FTSE Fixed Income LLC (“FTSE”), a trading name of the London Stock Exchange Group plc and its group undertakings (collectively, the “LSE Group” or the “Index Provider”). The Index is based on the government and quasigovernment bonds of the FTSE Emerging Markets Broad Bond Index (the “Reference Index”) using concepts developed with GSAM. The Index is rules-based and the securities in the Index are updated on the last business day of each month. |
| | Given the Fund’s investment objective of attempting to track the Index, the Fund does not follow traditional methods of active investment management, which may involve buying and selling securities based upon analysis of economic and market factors. |
| | During the Reporting Period, the Fund generated positive absolute returns but modestly underperformed the Index, as measured by NAV. The Fund is passively managed to the Index and aims to minimize tracking error to the Index. The Fund invests in U.S. dollar-denominated sovereign and quasi-sovereign debt of emerging market countries, both investment grade and below investment grade bonds included. |
| | Overall, the performance of the emerging debt markets are driven by five key factors — duration (whether interest rates are rising or falling), spreads (a widening or tightening of the yield differential to duration-equivalent U.S. Treasuries), value of the U.S. dollar, macroeconomic conditions and geopolitical concerns. |
| | U.S. dollar-denominated emerging markets debt produced modest gains during the Reporting Period. The asset class benefited from narrowing spreads, which helped offset the impact of higher interest rates as central banks tightened monetary policy. Spreads on global sovereign emerging markets debt tightened approximately 79 basis points during the Reporting Period, from 501 basis points to 422 basis points. (A basis point is 1/100th of a percentage point.) Geopolitical concerns, such as the Russia/Ukraine war and overall tensions |
9
PORTFOLIO RESULTS
| | between Western nations and China, dampened returns. The value of the U.S. dollar, which fluctuated during the Reporting Period, had a rather neutral impact on the performance of U.S. dollar-denominated emerging markets debt. |
| Q | | How did the Fund use derivatives and similar instruments during the Reporting Period? |
| A | | The Fund does not employ derivatives. During the Reporting Period, the Fund did not invest in derivatives or similar instruments. The Fund does not employ derivatives as a source of alpha generation, although it may use them to equitize excess cash. |
| Q | | Were there any changes to the Fund’s portfolio management team during the Reporting Period? |
| A | | There were no changes to the Fund’s portfolio management team during the Reporting Period. |
| Q | | What was the Fund’s weighted average duration, weighted average maturity, weighted average coupon, weighted average yield to maturity and 30-day standardized yield at the end of the Reporting Period?1 |
| A | | The Fund had a weighted average duration of 7.11 years, a weighted average maturity of 12.30 years and a weighted average coupon of 5.18% as of August 31, 2023. The Fund’s weighted average yield to maturity was 6.94% on August 31, 2023. The 30-day standardized yield of the Fund at the end of the Reporting Period was 6.67%. |
| Q | | What was the Fund’s credit allocation at the end of the Reporting Period?2 |
| | | | |
| AA | | 5.44% | | |
| A | | 16.85% | | |
| BBB | | 37.15% | | |
| BB | | 15.70% | | |
| B | | 22.42% | | |
| Not Rated | | 1.82% | | |
| Cash | | 0.63% | | |
| Q | | What was the Fund’s regional allocation at the end of the Reporting Period?3 |
| A | | Of the approximately 99.02% of the Fund’s assets invested in emerging markets debt at the end of the Reporting Period, approximately 40.06% was in Latin America, 15.06% in Europe, 23.87% in the Middle East and Africa, 19.78% in Asia and 0.25% elsewhere. |
| | 1 | | Duration is a time measure of a bond’s interest-rate sensitivity, based on the weighted average of the time periods over which a bond’s cash flows accrue to the bondholder. Time periods are weighted by multiplying by the present value of its cash flow divided by the bond’s price. (A bond’s cash flows consist of coupon payments and repayment of capital.) |
| | | | A bond’s duration will almost always be shorter than its maturity, with the exception of zero-coupon bonds, for which maturity and duration are equal. Weighted average duration is a measure of the duration for the securities in the portfolio overall. Weighted average maturity (“WAM”) is the weighted average amount of time until the debt securities in a portfolio mature, or the weighted average of the remaining terms to maturity of the debt securities within a portfolio. The higher the WAM, the longer it takes for all of the bonds in the portfolio to mature, and WAM is used to manage debt portfolios and to assess the performance of debt portfolio managers. Coupons are fixed percentages paid out on a fixed income security on an annual basis. Weighted average coupon is calculated by weighting the coupon of each debt security by its relative size in the portfolio. Yield to maturity is the annual return that a bond is expected to generate if it is held till its maturity given its coupon rate, payment frequency and current market price. Yield to maturity is essentially the internal rate of return of a bond, i.e. the discount rate at which the present value of a bond’s coupon payments and maturity value is equal to its current market price. The 30-day standardized yield calculation is based on a 30-day period ending on the last day of the Reporting Period. It is computed by dividing the net investment income per share earned during the period by the maximum offering price per share on the last day of the period. |
| | 2 | | The Fund and the Index have not been rated by an independent rating agency. The credit allocation provided refers to the Fund’s underlying portfolio securities. For the purpose of determining compliance with any credit rating requirement, the Fund assigns a security, at the time of purchase, the highest rating by a Nationally Recognized Statistical Rating Organization (“NRSRO”) if the security is rated by more than one NRSRO. For this purpose, the Fund relies only on the ratings of the following NRSROs: S&P Global Ratings, Moody’s Investor Services and Fitch Ratings Inc. This method may differ from the method independently used by the Index Provider. GSAM will use a single rating if that is the only one available. Securities that are not rated by all three agencies are reflected as such in the breakdown. Unrated securities may be purchased by the Fund if they are determined by the Investment Adviser to be of a credit quality consistent with the Fund’s credit rate requirements. Unrated securities do not necessarily indicate low quality, and for such securities the Investment Adviser will evaluate the credit quality. GSAM converts all ratings to the equivalent S&P major rating category when illustrating credit rating breakdowns. Ratings and Fund/Index credit quality may change over time. |
| | 3 | | The Fund seeks to provide investment results that closely correspond, before fees and expenses, to the performance of the FTSE Goldman Sachs Emerging Markets USD Bond Index. |
10
FUND BASICS
Access Emerging Markets USD Bond ETF
as of August 31, 2023
| | | | | | |
| | FUND SNAPSHOT | |
| | |
| | | As of August 31, 2023 | | | |
| | Market Price1 | | $ | 39.64 | |
| | | Net Asset Value (NAV)1 | | $ | 39.59 | |
| 1 | | The Market Price is the price at which the Fund’s shares are trading on the Cboe BZX Exchange, Inc. The Market Price of the Fund’s shares will fluctuate and, at the time of sale, shares may be worth more or less than the original investment or the Fund’s then current net asset value (“NAV”). The NAV is the market value of one share of the Fund. This amount is derived by dividing the total value of all the securities in the Fund’s portfolio, plus other assets, less any liabilities, by the number of Fund shares outstanding. Fund shares are not individually redeemable and are issued and redeemed by the Fund at their NAV only in large, specified blocks of shares called creation units. Shares otherwise can be bought and sold only through exchange trading at market price (not NAV). Shares may trade at a premium or discount to their NAV in the secondary market. Information regarding how often shares of the Fund traded on Cboe BZX Exchange, Inc. at a price above (i.e., at a premium) or below (i.e., at a discount) the NAV of the Fund can be found at www.GSAMFUNDS.com/ETFs. |
| | | | | | | | |
| | TOP TEN HOLDINGS AS OF 8/31/232 |
| | | |
| | | Holding | | % of Net Assets | | | Line of Business |
| | Brazilian Government International Bond, 6.00%, 10/20/33 | | | 1.5 | % | | Brazil |
| | Philippine Government International Bond, 10.63%, 03/16/25 | | | 1.4 | | | Philippines |
| | Pertamina Persero PT, 3.10%, 08/27/30 | | | 1.3 | | | Indonesia |
| | Hungary Government International Bond, 7.63%, 03/29/41 | | | 1.2 | | | Hungary |
| | Republic of Kenya Government International Bond, 6.88%, 06/24/24 | | | 1.1 | | | Kenya |
| | Mexico Government International Bond, 4.88%, 05/19/33 | | | 1.1 | | | Mexico |
| | Bahrain Government International Bond, 7.00%, 01/26/26 | | | 1.1 | | | Bahrain |
| | Chile Government International Bond, 3.50%, 01/31/34 | | | 1.0 | | | Chile |
| | Turkey Government International Bond, 5.75%, 05/11/47 | | | 1.0 | | | Turkey |
| | | Turkey Government International Bond, 5.60%, 11/14/24 | | | 1.0 | | | Turkey |
| 2 | | The top 10 holdings may not be representative of the Fund’s future investments. |
For more information about the Fund, please refer to www.GSAMFUNDS.com/ETFs. There, you can learn more about the Fund’s investment strategies, holdings, and performance.
| | | | | | |
| | INDUSTRY ALLOCATION AS OF 8/31/233 | | | | |
| | |
| | | Sector Name | | Fund | |
| | Government | | | 87.0 | % |
| | Energy | | | 7.1 | |
| | Financials | | | 2.5 | |
| | Materials | | | 2.0 | |
| | Industrials | | | 0.9 | |
| | | Investment Company | | | 0.5 | |
| 3 | | The percentage shown for each investment category reflects the value of investments in that category as a percentage of net assets. Figures in the table may not sum to 100% due to the exclusion of other assets and liabilities. |
11
GOLDMAN SACHS ACCESS EMERGING MARKETS USD BOND ETF
Performance Summary
August 31, 2023
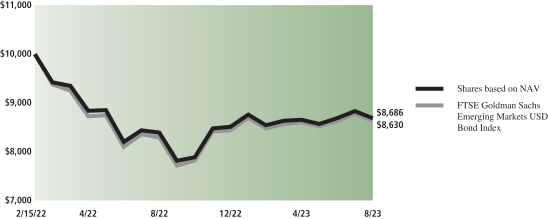
The following graph shows the value, as of August 31, 2023, of a $10,000 investment made on February 15, 2022 (commencement of operations) in Shares at NAV. For comparative purposes, the performance of the Fund’s underlying index, the FTSE Goldman Sachs Emerging Markets USD Bond Index, is shown. Performance reflects applicable fee waivers and/or expense limitations in effect during the periods shown and in their absence, performance would be reduced. Returns do not reflect the deduction of taxes that a shareholder would pay on Fund distributions or the sale of Fund shares. In addition to the performance of constituents of the underlying index, other factors may affect Fund performance. These factors include, but are not limited to, Fund operating fees and expenses, portfolio turnover and creation and redemption in-kind transactions. The returns set forth below represent past performance. Past performance does not guarantee future results. The Fund’s NAV and investment return may fluctuate. These fluctuations may cause an investor’s shares to be worth more or less than their original cost. Current performance may be lower or higher than the performance quoted below. Please visit our web site at www.GSAMFUNDS.com/ETFs to obtain the most recent month-end returns.
| | |
| Goldman Sachs Access Emerging Markets USD Bond ETF’s Lifetime Performance | | |
Performance of a $10,000 Investment, with distributions reinvested, from February 15, 2022 through August 31, 2023.
| | | | |
| Average Annual Total Return through August 31, 2023* | | 1 Year Return | | Since Inception |
Shares based on NAV (Commenced February 15, 2022) | | 3.54% | | -8.75% |
|
Shares based on Market Price (Commenced February 15, 2022) | | 4.80% | | -8.69% |
|
FTSE Goldman Sachs Emerging Markets USD Bond Index | | 4.06% | | -9.13% |
|
| * | | Total returns are calculated assuming purchase of a share at the market price or NAV on the first day and sale of a share at the market price or NAV on the last day of each period reported. The Total Returns based on NAV and Market Price assume the reinvestment of dividends and do not reflect brokerage commissions in connection with the purchase or sale of Fund shares, which if included would lower the performance shown above. The NAV used in the Total Return calculations assumes all management fees incurred by the Fund. Market Price returns are based upon the last trade at 4:00 pm EST and do not reflect the returns you would receive if you traded shares at other times. The first day of secondary market trading is typically several days after the date on which the Fund commenced investment operations; therefore, the NAV of the Fund is used as a proxy for the period from inception of investment operations to the first day of secondary market trading to calculate the Market Price returns. |
12
PORTFOLIO RESULTS
Goldman Sachs Access High Yield Corporate Bond ETF
Investment Objective
The Goldman Sachs Access High Yield Corporate Bond ETF (the “Fund”) seeks to provide investment results that closely correspond, before fees and expenses, to the performance of the FTSE Goldman Sachs High Yield Corporate Bond Index (the “Index”).
Portfolio Management Discussion and Analysis
Below, the Goldman Sachs Global Fixed Income and Liquidity Solutions Team discusses the Fund’s performance and positioning for the 12-month period ended August 31, 2023 (the “Reporting Period”).
| Q | | How did the Fund perform during the Reporting Period? |
| A | | During the Reporting Period, the Fund returned 7.13% based on net asset value (“NAV”) and 8.09% based on market price. The Index returned 7.47% during the same period. |
| | The Fund had an NAV of $42.70 per share on August 31, 2022 and ended the Reporting Period with an NAV of $43.08 per share. The Fund’s market price on August 31, 2023 was $43.04 per share. |
| Q | | What key factors were responsible for the Fund’s performance during the Reporting Period? |
| A | | The Fund seeks to provide investment results that closely correspond, before fees and expenses, to the performance of the Index. The Fund’s performance reflects Fund expenses, including management fees and brokerage expenses. The Fund’s relative performance also reflects the impact of any cash held in the Fund as well as any other differences between the Fund’s holdings and the constituents of the Index. The Index is unmanaged, and Index returns do not reflect fees and expenses, which would reduce returns. |
| | The Index is designed to measure the performance of high yield corporate bonds denominated in U.S. dollars that meet certain liquidity and fundamental screening criteria. “High yield” bonds are bonds that are rated below investment grade and are commonly referred to as “junk bonds.” The Index is a custom index that is owned and calculated by FTSE Fixed Income LLC (“FTSE”), a trading name of the London Stock Exchange Group plc and its group undertakings (collectively, the “LSE Group” or the “Index Provider”), using concepts developed with Goldman Sachs Asset Management, L.P. (“GSAM”). The Index is rules-based and the securities in the Index are updated on the last business day of each month. |
| | Given the Fund’s investment objective of attempting to track the Index, the Fund does not follow traditional methods of active investment management, which may involve buying and selling securities based upon analysis of economic and market factors. |
| | During the Reporting Period, the Fund posted positive absolute returns but modestly underperformed the Index, as measured by NAV. The Fund is passively managed to the Index and aims to minimize tracking error to the Index. |
| | Overall, high yield corporate bond returns are driven by two primary factors — duration (whether interest rates are rising or falling) and spreads (a widening or tightening of the yield differential to duration-equivalent U.S. Treasuries). |
| | During the Reporting Period, the performance of the broad U.S. fixed income market was driven, in our view, by a combination of higher interest rates and a generally healthy U.S. economic backdrop. U.S. economic data was relatively robust, despite above-average inflation, with strong consumer spending, a tight labor market and rising wages. The U.S. Federal Reserve (the “Fed”) continued to raise interest rates in an effort to stem inflation, lifting the targeted federal funds rate by a total of 300 basis points during the Reporting Period. (A basis point is 1/100th of a percentage point.) |
| | Although bonds were pressured by higher interest rates, a number of fixed income sectors, including high yield corporate bonds, recorded positive returns. High yield corporate bonds benefited from the strong U.S. economic backdrop and the comparatively higher yields they offered. The sector was also less hurt by rising interest rates than some other fixed income sectors, as many high yield issuers had previously borrowed or refinanced their debt at lower levels. In addition, high yield corporate bonds were helped by spread tightening; high yield spreads narrowed from 486 basis points to 373 basis points during the Reporting |
13
PORTFOLIO RESULTS
| | Period. Lastly, the high yield corporate bond sector benefited from its historical correlation with equities, as stocks rose overall during the Reporting Period.1 |
| Q | | How did the Fund use derivatives and similar instruments during the Reporting Period? |
| A | | The Fund does not employ derivatives. During the Reporting Period, the Fund did not invest in derivatives or similar instruments. The Fund does not employ derivatives as a source of alpha generation, although it may use them to equitize excess cash. |
| Q | | Were there any changes to the Fund’s portfolio management team during the Reporting Period? |
| A | | There were no changes to the Fund’s portfolio management team during the Reporting Period. |
| Q | | What was the Fund’s weighted average duration, weighted average maturity, weighted average coupon, weighted average yield to maturity and 30-day standardized yield at the end of the Reporting Period?2 |
| A | | The Fund had a weighted average duration of 3.55 years, a weighted average maturity of 4.76 years and a weighted average coupon of 5.65% as of August 31, 2023. The Fund’s weighted average yield to maturity was 7.81% on August 31, 2023. The 30-day standardized yield of the Fund at the end of the Reporting Period was 7.69%. |
| Q | | What was the Fund’s credit allocation at the end of the Reporting Period?3 |
| | | | |
| BB | | 51.90% | | |
| B | | 39.04% | | |
| CCC | | 7.23% | | |
| C | | 0.58% | | |
| Cash | | 1.25% | | |
| Q | | What was the Fund’s industry allocation at the end of the Reporting Period? |
| A | | Of the approximately 98.13% of the Fund’s assets invested in high yield corporate bonds at the end of the Reporting Period, approximately 85.29% was in industrials, 10.30% in financials and 2.63% in utilities.4 |
| Q | | What was the Fund’s sector positioning relative to the Index at the end of the Reporting Period?5 |
| A | | While the Index was 99.23% invested in high yield corporate bonds, 0.77% invested in emerging market corporate bonds and 0.00% in cash, the Fund was 98.13% invested in high yield corporate bonds, 0.62% in emerging markets corporate bonds and 1.25% in cash at the end of the Reporting Period. |
| | 1 | | Past performance does not guarantee future results, which may vary. The value of investments and the income derived from investments will fluctuate and can go down as well as up. A loss of principal may occur. |
| | 2 | | Duration is a time measure of a bond’s interest-rate sensitivity, based on the weighted average of the time periods over which a bond’s cash flows accrue to the bondholder. Time periods are weighted by multiplying by the present value of its cash flow divided by the bond’s price. (A bond’s cash flows consist of coupon payments and repayment of capital.) |
| | | | A bond’s duration will almost always be shorter than its maturity, with the exception of zero-coupon bonds, for which maturity and duration are equal. Weighted average duration is a measure of the duration for the securities in the portfolio overall. Weighted average maturity (“WAM”) is the weighted average amount of time until the debt securities in a portfolio mature, or the weighted average of the remaining terms to maturity of the debt securities within a portfolio. The higher the WAM, the longer it takes for all of the bonds in the portfolio to mature, and WAM is used to manage debt portfolios and to assess the performance of debt portfolio managers. Coupons are fixed percentages paid out on a fixed income security on an annual basis. Weighted average coupon is calculated by weighting the coupon of each debt security by its relative size in the portfolio. Yield to maturity is the annual return that a bond is expected to generate if it is held till its maturity given its coupon rate, payment frequency and current market price. Yield to maturity is essentially the internal rate of return of a bond, i.e. the discount rate at which the present value of a bond’s coupon payments and maturity value is equal to its current market price. The 30-day standardized yield calculation is based on a 30-day period ending on the last day of the Reporting Period. It is computed by dividing the net investment |
| | income per share earned during the period by the maximum offering price per share on the last day of the period. |
| | 3 | | The Fund and the Index have not been rated by an independent rating agency. The credit allocation provided refers to the Fund’s underlying portfolio securities. For the purpose of determining compliance with any credit rating requirement, the Fund assigns a security, at the time of purchase, the highest rating by a Nationally Recognized Statistical Rating Organization (“NRSRO”) if the security is rated by more than one NRSRO. For this purpose, the Fund relies only on the ratings of the following NRSROs: S&P Global Ratings, Moody’s Investor Services and Fitch Ratings Inc. This method may differ from the method independently used by the Index Provider. GSAM will use a single rating if that is the only one available. Securities that are not rated by all three agencies are reflected as such in the breakdown. Unrated securities may be purchased by the Fund if they are determined by the Investment Adviser to be of a credit quality consistent with the Fund’s credit rate requirements. Unrated securities do not necessarily indicate low quality, and for such securities the Investment Adviser will evaluate the credit quality. GSAM converts all ratings to the equivalent S&P major rating category when illustrating credit rating breakdowns. Ratings and Fund/Index credit quality may change over time. |
| | 4 | | Industry classifications for securities may differ between the above section and the Fund Basics section due to differing classification methodologies. The classification methodology used for the above section is as set forth by GSAM. The Fund’s composition may differ over time. Consequently, the Fund’s overall industry allocations may differ from percentages contained in the above section. |
| | 5 | | The Fund seeks to provide investment results that closely correspond, before fees and expenses, to the performance of the FTSE Goldman Sachs High Yield Corporate Bond Index. |
14
FUND BASICS
Access High Yield Corporate Bond ETF
as of August 31, 2023
| | | | | | |
| | FUND SNAPSHOT | |
| | |
| | | As of August 31, 2023 | | | |
| | Market Price1 | | $ | 43.04 | |
| | | Net Asset Value (NAV)1 | | $ | 43.08 | |
| 1 | | The Market Price is the price at which the Fund’s shares are trading on the NYSE Arca, Inc. The Market Price of the Fund’s shares will fluctuate and, at the time of sale, shares may be worth more or less than the original investment or the Fund’s then current net asset value (“NAV”). The NAV is the market value of one share of the Fund. This amount is derived by dividing the total value of all the securities in the Fund’s portfolio, plus other assets, less any liabilities, by the number of Fund shares outstanding. Fund shares are not individually redeemable and are issued and redeemed by the Fund at their NAV only in large, specified blocks of shares called creation units. Shares otherwise can be bought and sold only through exchange trading at market price (not NAV). Shares may trade at a premium or discount to their NAV in the secondary market. Information regarding how often shares of the Fund traded on NYSE Arca at a price above (i.e., at a premium) or below (i.e., at a discount) the NAV of the Fund can be found at www.GSAMFUNDS.com/ETFs. |
| | | | | | | | |
| | TOP TEN HOLDINGS AS OF 8/31/232 |
| | | |
| | | Holding | | % of Net Assets | | | Line of Business |
| | Medline Borrower LP, 3.88%, 04/01/29 | | | 0.9 | % | | Consumer Noncyclical |
| | Carnival Corp., 7.63%, 03/01/26 | | | 0.8 | | | Consumer Cyclical |
| | Carnival Corp., 6.00%, 05/01/29 | | | 0.8 | | | Consumer Cyclical |
| | CommScope, Inc., 6.00%, 03/01/26 | | | 0.8 | | | Hardware |
| | TransDigm, Inc., 6.25%, 03/15/26 | | | 0.7 | | | Aerospace & Defense |
| | Alliant Holdings Intermediate LLC / Alliant Holdings Co.-Issuer, 4.25%, 10/15/27 | | | 0.7 | | | Insurance |
| | American Airlines, Inc./AAdvantage Loyalty IP Ltd., 5.75%, 04/20/29 | | | 0.7 | | | Transportation |
| | Bombardier, Inc., 7.13%, 06/15/26 | | | 0.7 | | | Aerospace & Defense |
| | Caesars Entertainment, Inc., 6.25%, 07/01/25 | | | 0.7 | | | Consumer Cyclical |
| | | Organon & Co. / Organon Foreign Debt Co.-Issuer BV, 4.13%, 04/30/28 | | | 0.7 | | | Consumer Noncyclical |
| 2 | | The top 10 holdings may not be representative of the Fund’s future investments. |
For more information about the Fund, please refer to www.GSAMFUNDS.com/ETFs. There, you can learn more about the Fund’s investment strategies, holdings, and performance.
| | | | | | |
| | INDUSTRY ALLOCATION AS OF 8/31/233 | | | | |
| | |
| | | Sector Name | | Fund | |
| | Consumer, Cyclical | | | 23.5 | % |
| | Consumer, Non-cyclical | | | 15.4 | |
| | Energy | | | 14.0 | |
| | Telecommunication Services | | | 13.2 | |
| | Financials | | | 11.6 | |
| | Industrials | | | 9.5 | |
| | Materials | | | 5.0 | |
| | Information Technology | | | 3.8 | |
| | Utilities | | | 3.0 | |
| | | Investment Company | | | 1.0 | |
| 3 | | The percentage shown for each investment category reflects the value of investments in that category as a percentage of net assets. Figures in the table may not sum to 100% due to the exclusion of other assets and liabilities. |
15
GOLDMAN SACHS ACCESS HIGH YIELD CORPORATE BOND ETF
Performance Summary
August 31, 2023
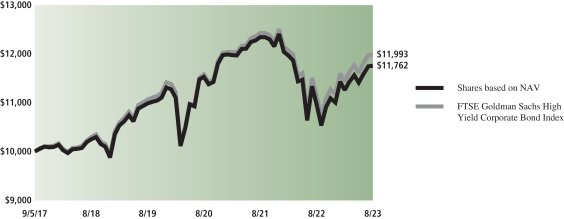
The following graph shows the value, as of August 31, 2023, of a $10,000 investment made on September 5, 2017 (commencement of operations) in Shares at NAV. For comparative purposes, the performance of the Fund’s underlying index, the FTSE Goldman Sachs High Yield Corporate Bond Index, is shown. Performance reflects applicable fee waivers and/or expense limitations in effect during the periods shown and in their absence, performance would be reduced. Returns do not reflect the deduction of taxes that a shareholder would pay on Fund distributions or the sale of Fund shares. In addition to the performance of constituents of the underlying index, other factors may affect Fund performance. These factors include, but are not limited to, Fund operating fees and expenses, portfolio turnover and creation and redemption in-kind transactions. The returns set forth below represent past performance. Past performance does not guarantee future results. The Fund’s NAV and investment return may fluctuate. These fluctuations may cause an investor’s shares to be worth more or less than their original cost. Current performance may be lower or higher than the performance quoted below. Please visit our web site at www.GSAMFUNDS.com/ETFs to obtain the most recent month-end returns.
| | |
| Goldman Sachs Access High Yield Corporate Bond ETF’s Lifetime Performance | | |
Performance of a $10,000 Investment, with distributions reinvested, from September 5, 2017 through August 31, 2023.
| | | | | | |
| Average Annual Total Return through August 31, 2023* | | 1 Year Return | | 5 Year Return | | Since Inception |
Shares based on NAV (Commenced September 5, 2017) | | 7.13% | | 2.79% | | 2.75% |
|
Shares based on Market Price (Commenced September 5, 2017) | | 8.09% | | 2.79% | | 2.73% |
|
FTSE Goldman Sachs High Yield Corporate Bond Index | | 7.47% | | 3.09% | | 3.08% |
|
| * | | Total returns are calculated assuming purchase of a share at the market price or NAV on the first day and sale of a share at the market price or NAV on the last day of each period reported. The Total Returns based on NAV and Market Price assume the reinvestment of dividends and do not reflect brokerage commissions in connection with the purchase or sale of Fund shares, which if included would lower the performance shown above. The NAV used in the Total Return calculations assumes all management fees incurred by the Fund. Market Price returns are based upon the last trade at 4:00 pm EST and do not reflect the returns you would receive if you traded shares at other times. The first day of secondary market trading is typically several days after the date on which the Fund commenced investment operations; therefore, the NAV of the Fund is used as a proxy for the period from inception of investment operations to the first day of secondary market trading to calculate the Market Price returns. |
16
PORTFOLIO RESULTS
Goldman Sachs Access Inflation Protected USD Bond ETF
Investment Objective
The Goldman Sachs Access Inflation Protected USD Bond ETF (the “Fund”) seeks to provide investment results that closely correspond, before fees and expenses, to the performance of the FTSE Goldman Sachs Treasury Inflation Protected USD Bond Index (the “Index”).
Portfolio Management Discussion and Analysis
Below, the Goldman Sachs Global Fixed Income Team discusses the Fund’s performance and positioning for the 12-month period ended August 31, 2023 (the “Reporting Period”).
| Q | | How did the Fund perform during the Reporting Period? |
| A | | During the Reporting Period, the Fund returned -3.64% based on net asset value (“NAV”) and -3.48% based on market price. The Index returned -3.53% during the same period. |
| | The Fund had an NAV of $51.68 per share on August 31, 2022 and ended the Reporting Period with an NAV of $48.32 per share. The Fund’s market price on August 31, 2023 was $48.36 per share. |
| Q | | What key factors were responsible for the Fund’s performance during the Reporting Period? |
| A | | The Fund seeks to provide investment results that closely correspond, before fees and expenses, to the performance of the Index. The Fund’s performance reflects Fund expenses, including management fees and brokerage expenses. The Fund’s relative performance also reflects the impact of any cash held in the Fund as well as any other differences between the Fund’s holdings and the constituents of the Index. The Index is unmanaged, and Index returns do not reflect fees and expenses, which would reduce returns. |
| | The Index is designed to track the performance of inflation protected, fixed rate U.S. Treasury Securities denominated in U.S. dollars that meet certain screening criteria. “U.S. Treasury Securities” refer to securities issued or guaranteed by the U.S. Treasury where the payment of principal and interest is backed by the full faith and credit of the U.S. government. U.S. Treasury Securities include U.S. Treasury notes, U.S. Treasury bills and U.S. Treasury floating rate bonds. The Index is a custom index that is owned and calculated by FTSE Fixed Income LLC (“FTSE”), a trading name of the London Stock Exchange Group plc and its group undertakings (collectively, the “LSE Group” or the “Index Provider”). The Index is based on the U.S. sleeve of the FTSE World Inflation-Linked Securities Index (the “Reference Index”) using concepts developed with Goldman Sachs Asset Management, L.P. |
| | Given the Fund’s investment objective of attempting to track the Index, the Fund does not follow traditional methods of active investment management, which may involve buying and selling securities based upon analysis of economic and market factors. |
| | During the Reporting Period, the Fund posted negative absolute returns that closely tracked the Index, as measured by NAV. The Fund is passively managed to the Index and aims to minimize tracking error to the Index. |
| | Two key drivers of return for the Treasury inflation protected securities (“TIPS”) market are interest rates, given the sector’s longer duration profile, and inflation. During the Reporting Period, the yield on the 10-year U.S. Treasury rose by approximately 94 basis points to 4.09%. (A basis point is 1/100th of a percentage point.) The increase in Treasury yields was driven by the U.S. Federal Reserve’s (“Fed”) hawkish monetary policy. (Hawkish tends to suggest higher interest rates; opposite of dovish.) The Fed raised the targeted federal funds rate by a total of 300 basis points during the Reporting Period in an effort to stem inflation. As for inflation, annualized Consumer Price Index readings fell from 8.2% at the start of the Reporting Period to 3.7% in August 2023. While declining dramatically, inflation remained persistent and well above the Fed’s target of approximately 2%. Still, inflation was not at high enough levels during the Reporting Period to offset the impact of rising interest rates, which drove negative returns for the sector during the Reporting Period. |
17
PORTFOLIO RESULTS
| Q | | How did the Fund use derivatives and similar instruments during the Reporting Period? |
| A | | The Fund does not employ derivatives. During the Reporting Period, the Fund did not invest in derivatives or similar instruments. The Fund does not employ derivatives as a source of alpha generation, although it may use them to equitize excess cash. |
| Q | | Were there any changes to the Fund’s portfolio management team during the Reporting Period? |
| A | | There were no changes to the Fund’s portfolio management team during the Reporting Period. |
| Q | | What was the Fund’s weighted average duration, weighted average maturity, weighted average coupon, weighted average yield to maturity and 30-day standardized yield at the end of the Reporting Period?1 |
| A | | The Fund had a weighted average duration of 6.72 years, a weighted average maturity of 7.20 years and a weighted average coupon of 0.56% as of August 31, 2023. The Fund’s weighted average yield to maturity was 4.76% on August 31, 2023. The 30-day standardized yield of the Fund at the end of the Reporting Period was 6.31%. |
| Q | | What was the Fund’s sector positioning relative to the Index at the end of the Reporting Period?2 |
| A | | While the Index was 100% allocated to U.S. TIPS, the Fund was 99.47% invested in U.S. TIPS and 0.53% in cash at the end of the Reporting Period. |
| | 1 | | Duration is a time measure of a bond’s interest-rate sensitivity, based on the weighted average of the time periods over which a bond’s cash flows accrue to the bondholder. Time periods are weighted by multiplying by the present value of its cash flow divided by the bond’s price. (A bond’s cash flows consist of coupon payments and repayment of capital.) |
| | | | A bond’s duration will almost always be shorter than its maturity, with the exception of zero-coupon bonds, for which maturity and duration are equal. Weighted average duration is a measure of the duration for the securities in the portfolio overall. Weighted average maturity (“WAM”) is the weighted average amount of time until the debt securities in a portfolio mature, or the weighted average of the remaining terms to maturity of the debt securities within a portfolio. The higher the WAM, the longer it takes for all of the bonds in the portfolio to mature, and WAM is used to manage debt portfolios and to assess the performance of debt portfolio managers. Coupons are fixed percentages paid out on a fixed income security on an annual basis. Weighted average coupon is calculated by weighting the coupon of each debt security by its relative size in the portfolio. Yield to maturity is the annual return that a bond is expected to generate if it is held till its maturity given its coupon rate, payment frequency and current market price. Yield to maturity is essentially the internal rate of return of a bond, i.e. the discount rate at which the present value of a bond’s coupon payments and maturity value is equal to its current market price. The 30-day standardized yield calculation is based on a 30-day period ending on the last day of the Reporting Period. It is computed by dividing the net investment income per share earned during the period by the maximum offering price per share on the last day of the period. |
| | 2 | | The Fund seeks to provide investment results that closely correspond, before fees and expenses, to the performance of the FTSE Goldman Sachs Treasury Inflation Protected USD Bond Index. |
18
FUND BASICS
Access Inflation Protected USD Bond ETF
as of August 31, 2023
| | | | | | |
| | FUND SNAPSHOT | |
| | |
| | | As of August 31, 2023 | | | |
| | Market Price1 | | $ | 48.36 | |
| | | Net Asset Value (NAV)1 | | $ | 48.32 | |
| 1 | | The Market Price is the price at which the Fund’s shares are trading on the Cboe BZX Exchange, Inc. The Market Price of the Fund’s shares will fluctuate and, at the time of sale, shares may be worth more or less than the original investment or the Fund’s then current net asset value (“NAV”). The NAV is the market value of one share of the Fund. This amount is derived by dividing the total value of all the securities in the Fund’s portfolio, plus other assets, less any liabilities, by the number of Fund shares outstanding. Fund shares are not individually redeemable and are issued and redeemed by the Fund at their NAV only in large, specified blocks of shares called creation units. Shares otherwise can be bought and sold only through exchange trading at market price (not NAV). Shares may trade at a premium or discount to their NAV in the secondary market. Information regarding how often shares of the Fund traded on Cboe BZX Exchange, Inc. at a price above (i.e., at a premium) or below (i.e., at a discount) the NAV of the Fund can be found at www.GSAMFUNDS.com/ETFs. |
| | | | | | |
| | TOP TEN HOLDINGS AS OF 8/31/232 | |
| | |
| | | Holding | | % of Net Assets | |
| | U.S. Treasury Inflation Indexed Bond, 0.63%, 01/15/26 | | | 8.7 | % |
| | U.S. Treasury Inflation Indexed Bond, 0.50%, 01/15/28 | | | 8.1 | |
| | U.S. Treasury Inflation Indexed Bond, 0.13%, 07/15/26 | | | 7.5 | |
| | U.S. Treasury Inflation Indexed Bond, 0.13%, 01/15/30 | | | 7.3 | |
| | U.S. Treasury Inflation Indexed Bond, 0.13%, 04/15/26 | | | 7.3 | |
| | U.S. Treasury Inflation Indexed Bond, 0.13%, 10/15/24 | | | 5.6 | |
| | U.S. Treasury Inflation Indexed Bond, 0.13%, 07/15/30 | | | 5.1 | |
| | U.S. Treasury Inflation Indexed Bond, 0.38%, 07/15/27 | | | 5.1 | |
| | U.S. Treasury Inflation Indexed Bond, 2.13%, 02/15/40 | | | 4.8 | |
| | | U.S. Treasury Inflation Indexed Bond, 0.75%, 02/15/42 | | | 4.6 | |
| 2 | | The holdings may not be representative of the Fund’s future investments. |
For more information about the Fund, please refer to www.GSAMFUNDS.com/ETFs. There, you can learn more about the Fund’s investment strategies, holdings, and performance.
| | | | | | |
| | INDUSTRY ALLOCATION AS OF 8/31/233 | |
| | |
| | | Sector Name | | Fund | |
| | Government | | | 99.5 | % |
| | | Investment Company | | | 0.5 | |
| 3 | | The percentage shown for each investment category reflects the value of investments in that category as a percentage of net assets. Figures in the table may not sum to 100% due to the exclusion of other assets and liabilities. |
19
GOLDMAN SACHS ACCESS INFLATION PROTECTED USD BOND ETF
Performance Summary
August 31, 2023
The following graph shows the value, as of August 31, 2023, of a $10,000 investment made on October 2, 2018 (commencement of operations) in Shares at NAV. For comparative purposes, the performance of the Fund’s underlying index, the FTSE Goldman Sachs Treasury Inflation Protected USD Bond Index, is shown. Performance reflects applicable fee waivers and/or expense limitations in effect during the periods shown and in their absence, performance would be reduced. Returns do not reflect the deduction of taxes that a shareholder would pay on Fund distributions or the sale of Fund shares. In addition to the performance of constituents of the underlying index, other factors may affect Fund performance. These factors include, but are not limited to, Fund operating fees and expenses, portfolio turnover and creation and redemption in-kind transactions. The returns set forth below represent past performance. Past performance does not guarantee future results. The Fund’s NAV and investment return may fluctuate. These fluctuations may cause an investor’s shares to be worth more or less than their original cost. Current performance may be lower or higher than the performance quoted below. Please visit our web site at www.GSAMFUNDS.com/ETFs to obtain the most recent month-end returns.
| | |
| Goldman Sachs Access Inflation Protected USD Bond ETF’s Lifetime Performance | | |
Performance of a $10,000 Investment, with distributions reinvested, from October 2, 2018 through August 31, 2023.

| | | | |
| Average Annual Total Return through August 31, 2023* | | 1 Year Return | | Since Inception |
Shares based on NAV (Commenced October 2, 2018) | | -3.64% | | 2.47% |
|
Shares based on Market Price (Commenced October 2, 2018) | | -3.48% | | 2.48% |
|
FTSE Goldman Sachs Treasury Inflation Protected USD Bond Index | | 3.53% | | 2.57% |
|
| * | | Total returns are calculated assuming purchase of a share at the market price or NAV on the first day and sale of a share at the market price or NAV on the last day of each period reported. The Total Returns based on NAV and Market Price assume the reinvestment of dividends and do not reflect brokerage commissions in connection with the purchase or sale of Fund shares, which if included would lower the performance shown above. The NAV used in the Total Return calculations assumes all management fees incurred by the Fund. Market Price returns are based upon the last trade at 4:00 pm EST and do not reflect the returns you would receive if you traded shares at other times. The first day of secondary market trading is typically several days after the date on which the Fund commenced investment operations; therefore, the NAV of the Fund is used as a proxy for the period from inception of investment operations to the first day of secondary market trading to calculate the Market Price returns. |
20
PORTFOLIO RESULTS
Goldman Sachs Access Investment Grade Corporate 1-5 Year Bond ETF
Investment Objective
The Goldman Sachs Access Investment Grade Corporate 1-5 Year Bond ETF (the “Fund”) seeks to provide investment results that closely correspond, before fees and expenses, to the performance of the FTSE Goldman Sachs US Investment Grade Corporate Bond 1-5 Years Index (the “Index”).
Portfolio Management Discussion and Analysis
Below, the Goldman Sachs Global Fixed Income and Liquidity Solutions Team discusses the Fund’s performance and positioning for the 12-month period ended August 31, 2023 (the “Reporting Period”).
| Q | | How did the Fund perform during the Reporting Period? |
| A | | During the Reporting Period, the Fund returned 2.11% based on net asset value (“NAV”) and 2.34% based on market price. The Index returned 2.31% during the same period. |
| | The Fund had an NAV of $46.46 per share on August 31, 2022 and ended the Reporting Period with an NAV of $46.01 per share. The Fund’s market price on August 31, 2023 was $46.03 per share. |
| Q | | What key factors were responsible for the Fund’s performance during the Reporting Period? |
| A | | The Fund seeks to provide investment results that closely correspond, before fees and expenses, to the performance of the Index. The Fund’s performance reflects Fund expenses, including management fees and brokerage expenses. The Fund’s relative performance also reflects the impact of any cash held in the Fund as well as any other differences between the Fund’s holdings and the constituents of the Index. The Index is unmanaged, and Index returns do not reflect fees and expenses, which would reduce returns. |
| | The Index is a rules-based index that is designed to measure the performance of investment grade, corporate bonds denominated in U.S. dollars with remaining maturities between one and five years that meet certain liquidity and fundamental screening criteria. The Index is a custom index that is owned and calculated by FTSE Fixed Income LLC (“FTSE”), a trading name of the London Stock Exchange Group plc and its group undertakings (collectively, the “LSE Group” or the “Index Provider”). The Index is based on the FTSE US Broad Investment-Grade (USBIG®) Corporate Bond Index (the “Reference Index”) using concepts developed with Goldman Sachs Asset Management, L.P. (“GSAM”). The Index is rebalanced (i) monthly on the last business day of each month, to account for changes in maturities, duration, corporate actions or ratings migration, and (ii) quarterly, to account for updates to the constituents on the basis of the fundamental factors. |
| | Given the Fund’s investment objective of attempting to track the Index, the Fund does not follow traditional methods of active investment management, which may involve buying and selling securities based upon analysis of economic and market factors. |
| | During the Reporting Period, the Fund generated positive absolute returns that closely tracked the Index, as measured by NAV. The Fund is passively managed to the Index and aims to minimize tracking error to the Index. |
| | Overall, investment grade corporate bond returns are driven by two primary factors — duration (whether interest rates are rising or falling) and spreads (a widening or tightening of the yield differential to duration-equivalent U.S. Treasuries). |
| | The performance of the fixed income markets was influenced during the Reporting Period by a combination of higher interest rates and a generally healthy economic backdrop. U.S. economic data was relatively robust, despite above-average inflation, with strong consumer spending, a tight labor market and rising wages. The U.S. Federal Reserve (the “Fed”) continued to raise interest rates in an effort to stem inflation, lifting the targeted federal funds rate by a total of 300 basis points to a range between 5.25% and 5.50%. (A basis point is 1/100th of a percentage point.) Yields rose across the U.S. Treasury yield curve, or spectrum of maturities, with shorter-term yields rising more than longer-term yields. The bellwether 10-year U.S. Treasury yield was up 94 basis points during the Reporting Period, from 3.15% to 4.09%. Shorter-term U.S. Treasury yields rose even more, with the three-year U.S. Treasury yield increasing 103 basis points, from 3.46% to 4.54% during the Reporting Period. |
21
PORTFOLIO RESULTS
| | The two-year to 10-year portion of the U.S. Treasury yield curve remained inverted, meaning 10-year U.S. Treasury yields were lower than those of two-year U.S. Treasury yields. Although an inverted yield curve has historically foreshadowed a recession, disinflationary trends combined with relatively strong economic data fueled market optimism about the possibility of a soft economic landing. (A soft landing, in economics, is a cyclical slowdown in economic growth that avoids recession.) |
| | Although bonds were pressured by higher interest rates, a number of fixed income sectors, including investment grade corporate bonds, produced positive returns. Investment grade corporate bonds benefited from tightening credit spreads, which helped boost returns and offset the impact of higher interest rates. Short-term investment grade corporate bond spreads narrowed by approximately 11 basis points, from 98 basis points to 87 basis points, during the Reporting Period. Corporate fundamentals generally remained healthy despite pockets of stress, such as the regional banking industry following the failure of Silicon Valley Bank. |
| Q | | How did the Fund use derivatives and similar instruments during the Reporting Period? |
| A | | The Fund does not employ derivatives. During the Reporting Period, the Fund did not invest in derivatives or similar instruments. The Fund does not employ derivatives as a source of alpha generation, although it may use them to equitize excess cash. |
| Q | | Were there any changes to the Fund’s portfolio management team during the Reporting Period? |
| A | | There were no changes to the Fund’s portfolio management team during the Reporting Period. |
| Q | | What was the Fund’s weighted average duration, weighted average maturity, weighted average coupon, weighted average yield to maturity and 30-day standardized yield at the end of the Reporting Period?1 |
| A | | The Fund had a weighted average duration of 2.60 years, a weighted average maturity of 2.88 years and a weighted average coupon of 3.62% as of August 31, 2023. The Fund’s weighted average yield to maturity was 5.61% on August 31, 2023. The 30-day standardized yield of the Fund at the end of the Reporting Period was 5.44%. |
| | 1 | | Duration is a time measure of a bond’s interest-rate sensitivity, based on the weighted average of the time periods over which a bond’s cash flows accrue to the bondholder. Time periods are weighted by multiplying by the present value of its cash flow divided by the bond’s price. (A bond’s cash flows consist of coupon payments and repayment of capital.) |
| | | | A bond’s duration will almost always be shorter than its maturity, with the exception of zero-coupon bonds, for which maturity and duration are equal. Weighted average duration is a measure of the duration for the securities in the portfolio overall. Weighted average maturity (“WAM”) is the weighted average amount of time until the debt securities in a portfolio mature, or the weighted average of the remaining terms to maturity of the debt securities within a portfolio. The higher the WAM, the longer it takes for all of the bonds in the portfolio to mature, and WAM is used to manage debt portfolios and to assess the performance of debt portfolio managers. Coupons are fixed percentages paid out on a fixed income security on an annual basis. Weighted average coupon is calculated by weighting the coupon of each debt security by its relative size in the portfolio. Yield to maturity is the annual return that a bond is expected to generate if it is held till its maturity given its coupon rate, payment frequency and current market price. Yield to maturity is essentially the internal rate of return of a bond, i.e. the discount rate at which the present value of a bond’s coupon payments and maturity value is equal to its current market price. The 30-day standardized yield calculation is based on a 30-day period ending on the last day of the Reporting Period. It is computed by dividing the net investment income per share earned during the period by the maximum offering price per share on the last day of the period. |
22
PORTFOLIO RESULTS
| Q | | What was the Fund’s credit allocation at the end of the Reporting Period?2 |
| | | | | | |
| AAA | | | 0.33 | % | | |
| AA | | | 8.34 | % | | |
| A | | | 38.04 | % | | |
| BBB | | | 51.90 | % | | |
| BB | | | 0.87 | % | | |
| Cash | | | 0.53 | % | | |
| Q | | What was the Fund’s industry allocation at the end of the Reporting Period? |
| A | | Of the approximately 98.60% of the Fund’s assets invested in investment grade corporate bonds at the end of the Reporting Period, approximately 39.96% was in financials, 52.66% in industrials and 5.98% in utilities.3 |
| Q | | What was the Fund’s sector positioning relative to the Index at the end of the Reporting Period?4 |
| A | | While the Index was 98.21% allocated to investment grade corporate bonds, 0.71% allocated to high yield corporate bonds, 0.17% allocated to quasi-government securities, 0.89% to emerging markets debt, 0.02% allocated to asset backed securities and 0.00% in cash, the Fund was 98.60% invested in investment grade corporate bonds, 0.87% in high yield corporate bonds and 0.53% in cash at the end of the Reporting Period. |
| | 2 | | The Fund and the Index have not been rated by an independent rating agency. The credit allocation provided refers to the Fund’s underlying portfolio securities. For the purpose of determining compliance with any credit rating requirement, the Fund assigns a security, at the time of purchase, the highest rating by a Nationally Recognized Statistical Rating Organization (“NRSRO”) if the security is rated by more than one NRSRO. For this purpose, the Fund relies only on the ratings of the following NRSROs: S&P Global Ratings, Moody’s Investor Services and Fitch Ratings Inc. This method may differ from the method independently used by the Index Provider. GSAM will use a single rating if that is the only one available. Securities that are not rated by all three agencies are reflected as such in the breakdown. Unrated securities may be purchased by the Fund if they are determined by the Investment Adviser to be of a credit quality consistent with the Fund’s credit rate requirements. Unrated securities do not necessarily indicate low quality, and for such securities the Investment Adviser will evaluate the credit quality. GSAM converts all ratings to the equivalent S&P major rating category when illustrating credit rating breakdowns. Ratings and Fund/Index credit quality may change over time. |
| | 3 | | Industry classifications for securities may differ between the above section and the Fund Basics section due to differing classification methodologies. The classification methodology used for the above section is as set forth by GSAM. The Fund’s composition may differ over time. Consequently, the Fund’s overall industry allocations may differ from percentages contained in the above section. |
| | 4 | | The Fund seeks to provide investment results that closely correspond, before fees and expenses, to the performance of the FTSE Goldman Sachs Investment Grade Corporate Bond 1-5 Years Index. |
23
FUND BASICS
Access Investment Grade Corporate 1-5 Year Bond ETF
as of August 31, 2023
| | | | | | |
| | FUND SNAPSHOT | |
| | |
| | | As of August 31, 2023 | | | |
| | Market Price1 | | $ | 46.03 | |
| | | Net Asset Value (NAV)1 | | $ | 46.01 | |
| 1 | | The Market Price is the price at which the Fund’s shares are trading on the NYSE Arca, Inc. The Market Price of the Fund’s shares will fluctuate and, at the time of sale, shares may be worth more or less than the original investment or the Fund’s then current net asset value (“NAV”). The NAV is the market value of one share of the Fund. This amount is derived by dividing the total value of all the securities in the Fund’s portfolio, plus other assets, less any liabilities, by the number of Fund shares outstanding. Fund shares are not individually redeemable and are issued and redeemed by the Fund at their NAV only in large, specified blocks of shares called creation units. Shares otherwise can be bought and sold only through exchange trading at market price (not NAV). Shares may trade at a premium or discount to their NAV in the secondary market. Information regarding how often shares of the Fund traded on NYSE Arca at a price above (i.e., at a premium) or below (i.e., at a discount) the NAV of the Fund can be found at www.GSAMFUNDS.com/ETFs. |
| | | | | | | | |
| | TOP TEN HOLDINGS AS OF 8/31/232 |
| | | |
| | | Holding | | % of Net Assets | | | Line of Business |
| | JPMorgan Chase & Co., 5.30%, 07/24/29 | | | 1.1 | % | | Banks |
| | Morgan Stanley, Series MTN, 5.16%, 04/20/29 | | | 1.1 | | | Banks |
| | Mitsubishi UFJ Financial Group, Inc., 3.78%, 03/02/25 | | | 1.1 | | | Banks |
| | Royal Bank of Canada, 3.63%, 05/04/27 | | | 1.0 | | | Banks |
| | International Business Machines Corp., 6.22%, 08/01/27 | | | 1.0 | | | Technology |
| | Apple, Inc., 4.00%, 05/10/28 | | | 1.0 | | | Technology |
| | Westpac Banking Corp., 5.46%, 11/18/27 | | | 0.8 | | | Banks |
| | Amazon.com, Inc., 3.80%, 12/05/24 | | | 0.8 | | | Consumer Cyclical |
| | Canadian Imperial Bank of Commerce, 1.25%, 06/22/26 | | | 0.8 | | | Banks |
| | | Bank of America Corp., Series MTN, 2.55%, 02/04/28 | | | 0.7 | | | Banks |
| 2 | | The top 10 holdings may not be representative of the Fund’s future investments. |
For more information about the Fund, please refer to www.GSAMFUNDS.com/ETFs. There, you can learn more about the Fund’s investment strategies, holdings, and performance.
| | | | | | |
| | INDUSTRY ALLOCATION AS OF 8/31/233 | |
| | |
| | | Sector Name | | Fund | |
| | Financials | | | 41.9 | % |
| | Industrials | | | 10.5 | |
| | Energy | | | 10.2 | |
| | Consumer, Non-cyclical | | | 9.3 | |
| | Consumer, Cyclical | | | 8.3 | |
| | Information Technology | | | 7.1 | |
| | Utilities | | | 6.2 | |
| | Telecommunication Services | | | 5.6 | |
| | | Materials | | | 0.9 | |
| 3 | | The percentage shown for each investment category reflects the value of investments in that category as a percentage of net assets. Figures in the table may not sum to 100% due to the exclusion of other assets and liabilities. |
24
GOLDMAN SACHS ACCESS INVESTMENT GRADE CORPORATE 1-5 YEAR BOND ETF
Performance Summary
August 31, 2023
The following graph shows the value, as of August 31, 2023, of a $10,000 investment made on July 7, 2020 (commencement of operations) in Shares at NAV. For comparative purposes, the performance of the Fund’s underlying index, FTSE Goldman Sachs US Investment-Grade Corporate Bond 1-5 Years Index, is shown. Performance reflects applicable fee waivers and/or expense limitations in effect during the periods shown and in their absence, performance would be reduced. Returns do not reflect the deduction of taxes that a shareholder would pay on Fund distributions or the sale of Fund shares. In addition to the performance of constituents of the underlying index, other factors may affect Fund performance. These factors include, but are not limited to, Fund operating fees and expenses, portfolio turnover and creation and redemption in-kind transactions. The returns set forth below represent past performance. Past performance does not guarantee future results. The Fund’s NAV and investment return may fluctuate. These fluctuations may cause an investor’s shares to be worth more or less than their original cost. Current performance may be lower or higher than the performance quoted below. Please visit our web site at www.GSAMFUNDS.com/ETFs to obtain the most recent month-end returns.
| | |
| Goldman Sachs Access Investment Grade Corporate 1-5 Year Bond ETF’s Lifetime Performance |
Performance of a $10,000 Investment, with distributions reinvested, from July 7, 2020 through August 31, 2023.
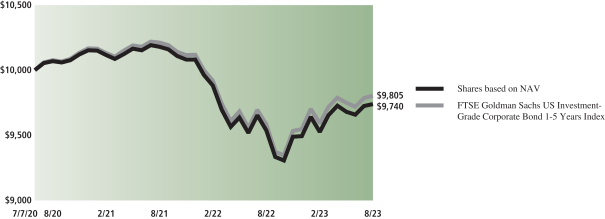
| | | | |
| Average Annual Total Return through August 31, 2023* | | 1 Year Return | | Since Inception |
Shares based on NAV (Commenced July 7, 2020) | | 2.11% | | -0.83% |
|
Shares based on Market Price (Commenced July 7, 2020) | | 2.34% | | -0.82% |
|
FTSE Goldman Sachs US Investment-Grade Corporate Bond 1-5 Years Index | | 2.31% | | -0.62% |
|
| * | | Total returns are calculated assuming purchase of a share at the market price or NAV on the first day and sale of a share at the market price or NAV on the last day of each period reported. The Total Returns based on NAV and Market Price assume the reinvestment of dividends and do not reflect brokerage commissions in connection with the purchase or sale of Fund shares, which if included would lower the performance shown above. The NAV used in the Total Return calculations assumes all management fees incurred by the Fund. Market Price returns are based upon the last trade at 4:00 pm EST and do not reflect the returns you would receive if you traded shares at other times. The first day of secondary market trading is typically several days after the date on which the Fund commenced investment operations; therefore, the NAV of the Fund is used as a proxy for the period from inception of investment operations to the first day of secondary market trading to calculate the Market Price returns. |
25
PORTFOLIO RESULTS
Goldman Sachs Access Investment Grade Corporate Bond ETF
Investment Objective
The Goldman Sachs Access Investment Grade Corporate Bond ETF (the “Fund”) seeks to provide investment results that closely correspond, before fees and expenses, to the performance of the FTSE Goldman Sachs Investment Grade Corporate Bond Index (the “Index”).
Portfolio Management Discussion and Analysis
Below, the Goldman Sachs Global Fixed Income and Liquidity Solutions Team discusses the Fund’s performance and positioning for the 12-month period ended August 31, 2023 (the “Reporting Period”).
| Q | | How did the Fund perform during the Reporting Period? |
| A | | During the Reporting Period, the Fund returned 0.84% based on net asset value (“NAV”) and 1.29% based on market price. The Index returned 0.84% during the same period. |
| | The Fund had an NAV of $45.81 per share on August 31, 2022 and ended the Reporting Period with an NAV of $44.63 per share. The Fund’s market price on August 31, 2023 was $44.63 per share. |
| Q | | What key factors were responsible for the Fund’s performance during the Reporting Period? |
| A | | The Fund seeks to provide investment results that closely correspond, before fees and expenses, to the performance of the Index. The Fund’s performance reflects Fund expenses, including management fees and brokerage expenses. The Fund’s relative performance also reflects the impact of any cash held in the Fund as well as any other differences between the Fund’s holdings and the constituents of the Index. The Index is unmanaged, and Index returns do not reflect fees and expenses, which would reduce returns. |
| | The Index is a rules-based index that is designed to measure the performance of investment grade, corporate bonds denominated in U.S. dollars that meet certain liquidity and fundamental screening criteria. The Index is a custom index that is owned and calculated by FTSE Fixed Income LLC (“FTSE”), a trading name of the London Stock Exchange Group plc and its group undertakings (collectively, the “LSE Group” or the “Index Provider”) and is based on the FTSE US Broad Investment-Grade (USBIG®) Corporate Index (the “Reference Index”) using concepts developed with Goldman Sachs Asset Management, L.P. (“GSAM”). The Index is rules-based and the securities in the Index are updated on the last business day of each month. |
| | Given the Fund’s investment objective of attempting to track the Index, the Fund does not follow traditional methods of active investment management, which may involve buying and selling securities based upon analysis of economic and market factors. |
| | During the Reporting Period, the Fund posted positive absolute returns that closely tracked the Index, as measured by NAV. The Fund is passively managed to the Index and aims to minimize tracking error to the Index. |
| | Overall, investment grade corporate bond returns are driven by two primary factors — duration (whether interest rates are rising or falling) and spreads (a widening or tightening of the yield differential to duration-equivalent U.S. Treasuries). |
| | The performance of the fixed income markets was influenced during the Reporting Period by a combination of higher interest rates and a generally healthy economic backdrop. U.S. economic data was relatively robust, despite above-average inflation, with strong consumer spending, a tight labor market and rising wages. The U.S. Federal Reserve (the “Fed”) continued to raise interest rates in an effort to stem inflation, lifting the targeted federal funds rate by a total of 300 basis points to a range between 5.25% and 5.50%. (A basis point is 1/100th of a percentage point.) Yields rose across the U.S. Treasury yield curve, or spectrum of maturities, with shorter-term yields rising more than longer-term yields. The bellwether 10-year U.S. Treasury yield was up 94 basis points during the Reporting Period, from 3.15% to 4.09%. Shorter-term U.S. Treasury security yields rose even more, with the three-year U.S. Treasury yield increasing 103 basis points, from 3.46% to 4.54% during the Reporting Period. |
| | The two-year to 10-year portion of the U.S. Treasury yield curve remained inverted, meaning 10-year U.S. Treasury yields were lower than those of two-year U.S. Treasury yields. Although an inverted yield curve has historically |
26
PORTFOLIO RESULTS
| | foreshadowed a recession, disinflationary trends combined with relatively strong economic data fueled market optimism about the possibility of a soft economic landing. (A soft landing, in economics, is a cyclical slowdown in economic growth that avoids recession.) |
| | Although bonds were pressured by higher interest rates, a number of fixed income sectors, including investment grade corporate bonds, produced positive returns. Investment grade corporate bonds benefited from tightening credit spreads, which helped boost returns and offset the impact of higher interest rates. Investment grade corporate spreads narrowed by approximately 23 basis points, from 140 basis points to 117 basis points, during the Reporting Period. Corporate fundamentals generally remained healthy despite pockets of stress, such as the regional banking industry following the failure of Silicon Valley Bank. |
| Q | | How did the Fund use derivatives and similar instruments during the Reporting Period? |
| A | | The Fund does not employ derivatives. During the Reporting Period, the Fund did not invest in derivatives or similar instruments. The Fund does not employ derivatives as a source of alpha generation, although it may use them to equitize excess cash. |
| Q | | Were there any changes to the Fund’s portfolio management team during the Reporting Period? |
| A | | There were no changes to the Fund’s portfolio management team during the Reporting Period. |
| Q | | What was the Fund’s weighted average duration, weighted average maturity, weighted average coupon, weighted average yield to maturity and 30-day standardized yield at the end of the Reporting Period?1 |
| A | | The Fund had a weighted average duration of 6.93 years, a weighted average maturity of 10.68 years and a weighted average coupon of 3.87% as of August 31, 2023. The Fund’s weighted average yield to maturity was 5.61% on August 31, 2023. The 30-day standardized yield of the Fund at the end of the Reporting Period was 5.43%. |
| | 1 | | Duration is a time measure of a bond’s interest-rate sensitivity, based on the weighted average of the time periods over which a bond’s cash flows accrue to the bondholder. Time periods are weighted by multiplying by the present value of its cash flow divided by the bond’s price. (A bond’s cash flows consist of coupon payments and repayment of capital.) |
| | | | A bond’s duration will almost always be shorter than its maturity, with the exception of zero-coupon bonds, for which maturity and duration are equal. Weighted average duration is a measure of the duration for the securities in the portfolio overall. Weighted average maturity (“WAM”) is the weighted average amount of time until the debt securities in a portfolio mature, or the weighted average of the remaining terms to maturity of the debt securities within a portfolio. The higher the WAM, the longer it takes for all of the bonds in the portfolio to mature, and WAM is used to manage debt portfolios and to assess the performance of debt portfolio managers. Coupons are fixed percentages paid out on a fixed income security on an annual basis. Weighted average coupon is calculated by weighting the coupon of each debt security by its relative size in the portfolio. Yield to maturity is the annual return that a bond is expected to generate if it is held till its maturity given its coupon rate, payment frequency and current market price. Yield to maturity is essentially the internal rate of return of a bond, i.e., the discount rate at which the present value of a bond’s coupon payments and maturity value is equal to its current market price. The 30-day standardized yield calculation is based on a 30-day period ending on the last day of the Reporting Period. It is computed by dividing the net investment income per share earned during the period by the maximum offering price per share on the last day of the period. |
27
PORTFOLIO RESULTS
| Q | | What was the Fund’s credit allocation at the end of the Reporting Period?2 |
| | | | | | |
| AAA | | | 1.17 | % | | |
| AA | | | 7.70 | % | | |
| A | | | 40.48 | % | | |
| BBB | | | 49.84 | % | | |
| BB | | | 0.39 | % | | |
| Cash | | | 0.42 | % | | |
| Q | | What was the Fund’s industry allocation at the end of the Reporting Period? |
| A | | Of the approximately 98.07% of the Fund’s assets invested in investment grade corporate bonds at the end of the Reporting Period, approximately 36.19% was in financials, 59.44% in industrials and 2.43% in utilities.3 |
| Q | | What was the Fund’s sector positioning relative to the Index at the end of the Reporting Period?4 |
| A | | While the Index was 98.42% allocated to investment grade corporate bonds, 0.43% allocated to high yield corporate bonds, 0.92% allocated to emerging markets corporate bonds, 0.22% allocated to quasi-government securities and 0.00% in cash, the Fund was 98.07% invested in investment grade corporate bonds, 0.39% in high yield corporate bonds, 0.69% in emerging markets corporate bonds, 0.43% in quasi-government securities and 0.49% in cash at the end of the Reporting Period. |
| | 2 | | The Fund and the Index have not been rated by an independent rating agency. The credit allocation provided refers to the Fund’s underlying portfolio securities. For the purpose of determining compliance with any credit rating requirement, the Fund assigns a security, at the time of purchase, the highest rating by a Nationally Recognized Statistical Rating Organization (“NRSRO”) if the security is rated by more than one NRSRO. For this purpose, the Fund relies only on the ratings of the following NRSROs: S&P Global Ratings, Moody’s Investor Services and Fitch Ratings Inc. This method may differ from the method independently used by the Index Provider. GSAM will use a single rating if that is the only one available. Securities that are not rated by all three agencies are reflected as such in the breakdown. Unrated securities may be purchased by the Fund if they are determined by the Investment Adviser to be of a credit quality consistent with the Fund’s credit rate requirements. Unrated securities do not necessarily indicate low quality, and for such securities the Investment Adviser will evaluate the credit quality. GSAM converts all ratings to the equivalent S&P major rating category when illustrating credit rating breakdowns. Ratings and Fund/Index credit quality may change over time. |
| | 3 | | Industry classifications for securities may differ between the above section and the Fund Basics section due to differing classification methodologies. The classification methodology used for the above section is as set forth by GSAM. The Fund’s composition may differ over time. Consequently, the Fund’s overall industry allocations may differ from percentages contained in the above section. |
| | 4 | | The Fund seeks to provide investment results that closely correspond, before fees and expenses, to the performance of the FTSE Goldman Sachs Investment Grade Corporate Bond Index. |
28
FUND BASICS
Access Investment Grade Corporate Bond ETF
as of August 31, 2023
| | | | | | |
| | FUND SNAPSHOT | |
| | |
| | | As of August 31, 2023 | | | |
| | Market Price1 | | $ | 44.63 | |
| | | Net Asset Value (NAV)1 | | $ | 44.63 | |
| 1 | | The Market Price is the price at which the Fund’s shares are trading on the NYSE Arca, Inc. The Market Price of the Fund’s shares will fluctuate and, at the time of sale, shares may be worth more or less than the original investment or the Fund’s then current net asset value (“NAV”). The NAV is the market value of one share of the Fund. This amount is derived by dividing the total value of all the securities in the Fund’s portfolio, plus other assets, less any liabilities, by the number of Fund shares outstanding. Fund shares are not individually redeemable and are issued and redeemed by the Fund at their NAV only in large, specified blocks of shares called creation units. Shares otherwise can be bought and sold only through exchange trading at market price (not NAV). Shares may trade at a premium or discount to their NAV in the secondary market. Information regarding how often shares of the Fund traded on NYSE Arca at a price above (i.e., at a premium) or below (i.e., at a discount) the NAV of the Fund can be found at www.GSAMFUNDS.com/ETFs. |
| | | | | | | | |
| | TOP TEN HOLDINGS AS OF 8/31/232 |
| | | |
| | | Holding | | % of Net Assets | | | Line of Business |
| | | |
| | American Express Co., 3.00%, 10/30/24 | | | 0.4 | % | | Banks |
| | Morgan Stanley, 2.19%, 04/28/26 | | | 0.4 | | | Banks |
| | Oracle Corp., 6.90%, 11/09/52 | | | 0.4 | | | Software |
| | Morgan Stanley, 2.94%, 01/21/33 | | | 0.4 | | | Banks |
| | Cigna Group (The), 4.13%, 11/15/25 | | | 0.4 | | | Healthcare |
| | AbbVie, Inc., 3.60%, 05/14/25 | | | 0.4 | | | Consumer Noncyclical |
| | Morgan Stanley, Series MTN, 1.79%, 02/13/32 | | | 0.3 | | | Banks |
| | Anheuser-Busch Cos. LLC / Anheuser-Busch InBev Worldwide, Inc., 4.90%, 02/01/46 | | | 0.3 | | | Food and Beverage |
| | NVIDIA Corp., 0.58%, 06/14/24 | | | 0.3 | | | Technology |
| | | Oracle Corp., 6.25%, 11/09/32 | | | 0.3 | | | Software |
| 2 | | The top 10 holdings may not be representative of the Fund’s future investments. |
For more information about the Fund, please refer to www.GSAMFUNDS.com/ETFs. There, you can learn more about the Fund’s investment strategies, holdings, and performance.
| | | | | | |
| | INDUSTRY ALLOCATION AS OF 8/31/233 | |
| | |
| | | Sector Name | | Fund | |
| | Financials | | | 37.5 | % |
| | Consumer, Non-cyclical | | | 19.1 | |
| | Telecommunication Services | | | 11.7 | |
| | Information Technology | | | 8.8 | |
| | Energy | | | 8.2 | |
| | Consumer, Cyclical | | | 5.7 | |
| | Industrials | | | 5.2 | |
| | Utilities | | | 2.4 | |
| | Materials | | | 1.2 | |
| | | Investment Company | | | 0.2 | |
| 3 | | The percentage shown for each investment category reflects the value of investments in that category as a percentage of net assets. Figures in the table may not sum to 100% due to the exclusion of other assets and liabilities. |
29
GOLDMAN SACHS ACCESS INVESTMENT GRADE CORPORATE BOND ETF
Performance Summary
August 31, 2023
The following graph shows the value, as of August 31, 2023, of a $10,000 investment made on June 6, 2017 (commencement of operations) in Shares at NAV. For comparative purposes, the performance of the Fund’s underlying index, the FTSE Goldman Sachs Investment Grade Corporate Bond Index, is shown. Performance reflects applicable fee waivers and/or expense limitations in effect during the periods shown and in their absence, performance would be reduced. Returns do not reflect the deduction of taxes that a shareholder would pay on Fund distributions or the sale of Fund shares. In addition to the performance of constituents of the underlying index, other factors may affect Fund performance. These factors include, but are not limited to, Fund operating fees and expenses, portfolio turnover and creation and redemption in-kind transactions. The returns set forth below represent past performance. Past performance does not guarantee future results. The Fund’s NAV and investment return may fluctuate. These fluctuations may cause an investor’s shares to be worth more or less than their original cost. Current performance may be lower or higher than the performance quoted below. Please visit our web site at www.GSAMFUNDS.com/ETFs to obtain the most recent month-end returns.
|
| Goldman Sachs Access Investment Grade Corporate Bond ETF’s Lifetime Performance |
Performance of a $10,000 Investment, with distributions reinvested, from June 6, 2017 through August 31, 2023.
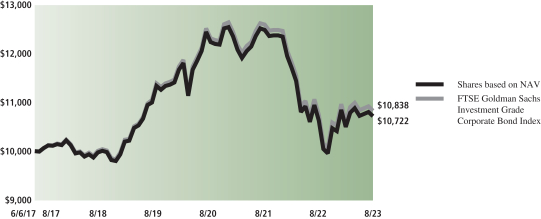
| | | | | | |
| Average Annual Total Return through August 31, 2023* | | 1 Year Return | | 5 Year Return | | Since Inception |
Shares based on NAV (Commenced June 6, 2017) | | 0.84% | | 1.38% | | 1.12% |
|
Shares based on Market Price (Commenced June 6, 2017) | | 1.29% | | 1.40% | | 1.12% |
|
FTSE Goldman Sachs Investment Grade Corporate Bond Index | | 0.84% | | 1.54% | | 1.30% |
|
| * | | Total returns are calculated assuming purchase of a share at the market price or NAV on the first day and sale of a share at the market price or NAV on the last day of each period reported. The Total Returns based on NAV and Market Price assume the reinvestment of dividends and do not reflect brokerage commissions in connection with the purchase or sale of Fund shares, which if included would lower the performance shown above. The NAV used in the Total Return calculations assumes all management fees incurred by the Fund. Market Price returns are based upon the last trade at 4:00 pm EST and do not reflect the returns you would receive if you traded shares at other times. The first day of secondary market trading is typically several days after the date on which the Fund commenced investment operations; therefore, the NAV of the Fund is used as a proxy for the period from inception of investment operations to the first day of secondary market trading to calculate the Market Price returns. |
30
PORTFOLIO RESULTS
Goldman Sachs Access Treasury 0-1 Year ETF
Investment Objective
The Goldman Sachs Access Treasury 0-1 Year ETF (the “Fund”) seeks to provide investment results that closely correspond, before fees and expenses, to the performance of the FTSE US Treasury 0-1 Year Composite Select Index (the “Index”).
Portfolio Management Discussion and Analysis
Below, the Goldman Sachs Global Fixed Income and Liquidity Solutions Team discusses the Fund’s performance and positioning for the 12-month period ended August 31, 2023 (the “Reporting Period”).
| Q | | How did the Fund perform during the Reporting Period? |
| A | | During the Reporting Period, the Fund returned 3.99% based on net asset value (“NAV”) and 4.00% based on market price. The Index returned 4.23% during the same period. |
| | The Fund had an NAV of $99.84 on August 31, 2022 and ended the Reporting Period with an NAV of $100.07 per share. The Fund’s market price on August 31, 2023 was $100.12 per share. |
| Q | | What key factors were responsible for the Fund’s performance during the Reporting Period? |
| A | | The Fund seeks to provide investment results that closely correspond, before fees and expenses, to the performance of the Index. The Fund’s performance reflects Fund expenses, including management fees and brokerage expenses. The Fund’s relative performance also reflects the impact of any cash held in the Fund as well as any other differences between the Fund’s holdings and the constituents of the Index. The Index is unmanaged, and Index returns do not reflect fees and expenses, which would reduce returns. |
| | The Index is designed to measure the performance of U.S. Treasury Securities with a maximum remaining maturity of 12 months. “U.S. Treasury Securities” refer to securities issued or guaranteed by the U.S. Treasury where the payment of principal and interest is backed by the full faith and credit of the U.S. government. U.S. Treasury Securities include U.S. Treasury notes, U.S. Treasury bills and U.S. Treasury floating rate bonds. The Index is sponsored by FTSE Fixed Income LLC (“FTSE”), a trading name of the London Stock Exchange Group plc and its group undertakings (collectively, the “LSE Group” or the “Index Provider”), which is not affiliated with the Fund or Goldman Sachs Asset Management, L.P. The Index is market capitalization-weighted and the securities in the Index are updated on the last business day of each month. |
| | Given the Fund’s investment objective of attempting to track the Index, the Fund does not follow traditional methods of active investment management, which may involve buying and selling securities based upon analysis of economic and market factors. |
| | During the Reporting Period, the Fund posted positive absolute returns but modestly underperformed the Index, as measured by NAV. The Fund is passively managed to the Index and aims to minimize tracking error to the Index. |
| | The Fund’s and the Index’s performance was largely reflective of the performance of front-end, or short-term, U.S. Treasury rates, which were primarily affected, in turn, by U.S. Federal Reserve (“Fed”) policy. During the Reporting Period, the Fed continued to raise interest rates, increasing the targeted federal funds rate by a total of 300 basis points — to a range between 5.25% and 5.50% — in an effort to stem inflation. (A basis point is 1/100th of a percentage point.) This put upward pressure on short-term U.S. interest rates and downward pressure on short-term bond prices. In fact, short-term U.S. interest rates increased significantly during the Reporting Period, with six-month U.S. Treasury yields up from 3.32% to 5.48%. |
| | The Fund is an ultra-short bond fund, i.e., it invests in U.S. Treasury securities with maturities of one-month to one-year, and thus its NAV has a low sensitivity to interest rate changes, which helped insulate the Fund from the increase in interest rates during the Reporting Period. In addition, rising yields provided additional income as maturing bonds were reinvested, bolstering the Fund’s return during the Reporting Period. |
| Q | | How did the Fund use derivatives and similar instruments during the Reporting Period? |
| A | | The Fund does not employ derivatives. During the Reporting Period, the Fund did not invest in derivatives or similar |
31
PORTFOLIO RESULTS
| | instruments. The Fund does not employ derivatives as a source of alpha generation, although it may use them to equitize excess cash. |
| Q | | Were there any changes to the Fund’s portfolio management team during the Reporting Period? |
| A | | Effective October 1, 2022, David Fishman no longer served as a portfolio manager for the Fund. Todd Henry and David Westbrook continue to serve as portfolio managers for the Fund. By design, all investment decisions for the Fund are performed within a co-lead or team structure, with multiple subject matter experts. This strategic decision making has been a cornerstone of our approach and helps to ensure continuity in the Fund. |
| Q | | What was the Fund’s weighted average duration, weighted average maturity, weighted average coupon, weighted average yield to maturity and 30-day standardized yield at the end of the Reporting Period?1 |
| A | | The Fund had a weighted average duration of 0.32 years, a weighted average maturity of 0.32 years and a weighted average coupon of 0.01% as of August 31, 2023. The Fund’s weighted average yield to maturity was 5.37% on August 31, 2023. The 30-day net standardized yield of the Fund at the end of the Reporting Period was 5.18%. |
| Q | | What was the Fund’s sector positioning relative to the Index at the end of the Reporting Period?2 |
| A | | While the Index was 100% allocated to U.S. Treasury securities at the end of the Reporting Period, the Fund was 99.99% invested in U.S. Treasury securities, with the remainder in cash. |
| | 1 | | Duration is a time measure of a bond’s interest-rate sensitivity, based on the weighted average of the time periods over which a bond’s cash flows accrue to the bondholder. Time periods are weighted by multiplying by the present value of its cash flow divided by the bond’s price. (A bond’s cash flows consist of coupon payments and repayment of capital.) |
| | | | A bond’s duration will almost always be shorter than its maturity, with the exception of zero-coupon bonds, for which maturity and duration are equal. Weighted average duration is a measure of the duration for the securities in the portfolio overall. Weighted average maturity (“WAM”) is the weighted average amount of time until the debt securities in a portfolio mature, or the weighted average of the remaining terms to maturity of the debt securities within a portfolio. The higher the WAM, the longer it takes for all of the bonds in the portfolio to mature, and WAM is used to manage debt portfolios and to assess the performance of debt portfolio managers. Coupons are fixed percentages paid out on a fixed income security on an annual basis. Weighted average coupon is calculated by weighting the coupon of each debt security by its relative size in the portfolio. Yield to maturity is the annual return that a bond is expected to generate if it is held till its maturity given its coupon rate, payment frequency and current market price. Yield to maturity is essentially the internal rate of return of a bond, i.e., the discount rate at which the present value of a bond’s coupon payments and maturity value is equal to its current market price. The 30-day standardized yield calculation is based on a 30-day period ending on the last day of the Reporting Period. It is computed by dividing the net investment income per share earned during the period by the maximum offering price per share on the last day of the period. |
| | 2 | | The Fund seeks to provide investment results that closely correspond, before fees and expenses, to the performance of the FTSE US Treasury 0-1 Year Composite Select Index. |
32
FUND BASICS
Access Treasury 0-1 Year ETF
as of August 31, 2023
| | | | | | |
| | FUND SNAPSHOT | |
| | |
| | | As of August 31, 2023 | | | |
| | |
| | Market Price1 | | $ | 100.12 | |
| | | Net Asset Value (NAV)1 | | $ | 100.07 | |
| 1 | | The Market Price is the price at which the Fund’s shares are trading on the NYSE Arca, Inc. The Market Price of the Fund’s shares will fluctuate and, at the time of sale, shares may be worth more or less than the original investment or the Fund’s then current net asset value (“NAV”). The NAV is the market value of one share of the Fund. This amount is derived by dividing the total value of all the securities in the Fund’s portfolio, plus other assets, less any liabilities, by the number of Fund shares outstanding. Fund shares are not individually redeemable and are issued and redeemed by the Fund at their NAV only in large, specified blocks of shares called creation units. Shares otherwise can be bought and sold only through exchange trading at market price (not NAV). Shares may trade at a premium or discount to their NAV in the secondary market. Information regarding how often shares of the Fund traded on NYSE Arca at a price above (i.e., at a premium) or below (i.e., at a discount) the NAV of the Fund can be found at www.GSAMFUNDS.com/ETFs. |
| | | | | | | | |
| | TOP TEN HOLDINGS AS OF 8/31/232 | |
| | | |
| | | Holding | | Maturity Date | | % of Net Assets | |
| | | |
| | U.S. Treasury Bill, 5.40% | | 10/12/23 | | | 7.5 | % |
| | U.S. Treasury Bill, 5.47% | | 11/30/23 | | | 7.4 | |
| | U.S. Treasury Bill, 4.98% | | 10/05/23 | | | 6.8 | |
| | U.S. Treasury Bill, 5.40% | | 10/12/23 | | | 6.6 | |
| | U.S. Treasury Bill, 5.28% | | 10/05/23 | | | 4.0 | |
| | U.S. Treasury Bill, 5.45% | | 01/04/24 | | | 3.5 | |
| | U.S. Treasury Bill, 5.47% | | 02/01/24 | | | 3.0 | |
| | U.S. Treasury Bill, 5.40% | | 12/07/23 | | | 3.0 | |
| | U.S. Treasury Bill, 5.38% | | 11/09/23 | | | 2.7 | |
| | | U.S. Treasury Bill, 5.48% | | 02/08/24 | | | 2.7 | |
| 2 | | The top 10 holdings may not be representative of the Fund’s future investments. |
For more information about the Fund, please refer to www.GSAMFUNDS.com/ETFs. There, you can learn more about the Fund’s investment strategies, holdings, and performance.
33
GOLDMAN SACHS ACCESS TREASURY 0-1 YEAR ETF
Performance Summary
August 31, 2023
The following graph shows the value, as of August 31, 2023, of a $10,000 investment made on September 6, 2016 (commencement of operations) in Shares at NAV. For comparative purposes, the performance of the Fund’s underlying index, the FTSE US Treasury 0-1 Year Composite Select Index, is shown. Performance reflects applicable fee waivers and/or expense limitations in effect during the periods shown and in their absence, performance would be reduced. Returns do not reflect the deduction of taxes that a shareholder would pay on Fund distributions or the sale of Fund shares. In addition to the performance of constituents of the underlying index, other factors may affect Fund performance. These factors include, but are not limited to, Fund operating fees and expenses, portfolio turnover and creation and redemption in-kind transactions. The returns set forth below represent past performance. Past performance does not guarantee future results. The Fund’s NAV and investment return may fluctuate. These fluctuations may cause an investor’s shares to be worth more or less than their original cost. Current performance may be lower or higher than the performance quoted below. Please visit our web site at www.GSAMFUNDS.com/ETFs to obtain the most recent month-end returns.
|
| Goldman Sachs Access Treasury 0-1 Year ETF’s Lifetime Performance |
Performance of a $10,000 Investment, with distributions reinvested, from September 6, 2016 through August 31, 2023.
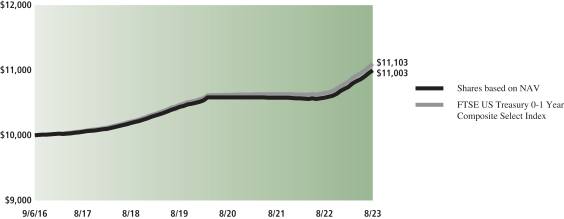
| | | | | | |
| Average Annual Total Return through August 31, 2023* | | 1 Year Return | | 5 Year Return | | Since Inception |
Shares based on NAV (Commenced September 6, 2016) | | 3.99% | | 1.55% | | 1.38% |
|
Shares based on Market Price (Commenced September 6, 2016) | | 4.00% | | 1.55% | | 1.38% |
|
FTSE US Treasury 0-1 Year Composite Select Index | | 4.23% | | 1.69% | | 1.51% |
|
| * | | Total returns are calculated assuming purchase of a share at the market price or NAV on the first day and sale of a share at the market price or NAV on the last day of each period reported. The Total Returns based on NAV and Market Price assume the reinvestment of dividends and do not reflect brokerage commissions in connection with the purchase or sale of Fund shares, which if included would lower the performance shown above. The NAV used in the Total Return calculations assumes all management fees incurred by the Fund. Market Price returns are based upon the last trade at 4:00 pm EST and do not reflect the returns you would receive if you traded shares at other times. The first day of secondary market trading is typically several days after the date on which the Fund commenced investment operations; therefore, the NAV of the Fund is used as a proxy for the period from inception of investment operations to the first day of secondary market trading to calculate the Market Price returns. |
34
PORTFOLIO RESULTS
Goldman Sachs Access U.S. Aggregate Bond ETF
Investment Objective
The Goldman Sachs Access U.S. Aggregate Bond ETF (the “Fund”) seeks to provide investment results that closely correspond, before fees and expenses, to the performance of the FTSE Goldman Sachs US Broad Bond Market Index (the “Index”).
Portfolio Management Discussion and Analysis
Below, the Goldman Sachs Global Fixed Income and Liquidity Solutions Team discusses the Fund’s performance and positioning for the 12-month period ended August 31, 2023 (the “Reporting Period”).
| Q | | How did the Fund perform during the Reporting Period? |
| A | | During the Reporting Period, the Fund returned -1.58% based on net asset value (“NAV”) and -1.44% based on market price. The Index returned -1.26% during the same period. |
| | The Fund had an NAV of $42.88 per share on August 31, 2022 and ended the Reporting Period with an NAV of $40.88 per share. The Fund’s market price on August 31, 2023 was $40.99 per share. |
| Q | | What key factors were responsible for the Fund’s performance during the Reporting Period? |
| A | | The Fund seeks to provide investment results that closely correspond, before fees and expenses, to the performance of the Index. The Fund’s performance reflects Fund expenses, including management fees and brokerage expenses. The Fund’s relative performance also reflects the impact of any cash held in the Fund as well as any other differences between the Fund’s holdings and the constituents of the Index. The Index is unmanaged, and Index returns do not reflect fees and expenses, which would reduce returns. |
| | The Index is a rules-based index that is designed to measure the performance of investment grade, U.S. dollar denominated bonds issued in the United States that meet certain liquidity and fundamental screening criteria. The Index is a custom index that is owned and calculated by FTSE Fixed Income LLC (“FTSE”), a trading name of the London Stock Exchange Group plc and its group undertakings (collectively, the “LSE Group” or the “Index Provider”). The Index is based on the FTSE US Broad Investment-Grade (USBIG®) Index (the “Reference Index”) using concepts developed with Goldman Sachs Asset Management, L.P. (“GSAM”). The Index is normally rebalanced (i) monthly on the last business day of each month, to account for changes in maturities, duration, corporate actions or ratings migration, and (ii) quarterly, to account for updates to the corporate bond constituents of the Index on the basis of the fundamental factors. |
| | Given the Fund’s investment objective of attempting to track the Index, the Fund does not follow traditional methods of active investment management, which may involve buying and selling securities based upon analysis of economic and market factors. |
| | During the Reporting Period, the Fund posted negative absolute returns that modestly underperformed the Index, as measured by NAV. The Fund is passively managed to the Index and aims to minimize tracking error to the Index. |
| | Overall, U.S. bond returns are driven by two primary factors — duration (whether interest rates are rising or falling) and spreads (a widening or tightening of the yield differential to duration-equivalent U.S. Treasuries). |
| | The performance of the fixed income markets was driven during the Reporting Period by a combination of higher interest rates and a generally healthy economic backdrop. U.S. economic data was relatively robust, despite above-average inflation, with strong consumer spending, a tight labor market and rising wages. The U.S. Federal Reserve (the “Fed”) continued to raise interest rates in an effort to stem inflation, lifting the targeted federal funds rate by a total of 300 basis points to a range between 5.25% and 5.50%. (A basis point is 1/100th of a percentage point.) Higher interest rates put downward pressure on bond prices, resulting in a negative return for the broad U.S. fixed income market. |
| | The Fund had a duration of six to seven years during the Reporting Period, which means moves in the U.S. Treasury yield curve, particularly in the five-year to 10-year segment |
35
PORTFOLIO RESULTS
| | of the maturity spectrum, made the Fund sensitive to moves in this intermediate segment of the curve. During the Reporting Period, five-year U.S. Treasury yields increased approximately 93 basis points, while the bellwether 10-year U.S. Treasury yield was up 94 basis points, from 3.15% to 4.09%. |
| | Investment grade corporate spreads narrowed by approximately 23 basis points during the Reporting Period, from 140 basis points to 117 basis points. U.S. mortgage-backed securities spreads widened by 13 basis points, from 40 basis points to 53 basis points, during the Reporting Period. |
| Q | | How did the Fund use derivatives and similar instruments during the Reporting Period? |
| A | | The Fund does not employ derivatives. During the Reporting Period, the Fund did not invest in derivatives or similar instruments. The Fund does not employ derivatives as a source of alpha generation, although it may use them to equitize excess cash. |
| Q | | Were there any changes to the Fund’s portfolio management team during the Reporting Period? |
| A | | There were no changes to the Fund’s portfolio management team during the Reporting Period. |
| Q | | What was the Fund’s weighted average duration, weighted average maturity, weighted average coupon, weighted average yield to maturity and 30-day standardized yield at the end of the Reporting Period?1 |
| A | | The Fund had a weighted average duration of 6.30 years, a weighted average maturity of 8.95 years and a weighted average coupon of 2.70% as of August 31, 2023. The Fund’s weighted average yield to maturity was 5.04% on August 31, 2023. The 30-day standardized yield of the Fund at the end of the Reporting Period was 4.77%. |
| | 1 | | Duration is a time measure of a bond’s interest-rate sensitivity, based on the weighted average of the time periods over which a bond’s cash flows accrue to the bondholder. Time periods are weighted by multiplying by the present value of its cash flow divided by the bond’s price. (A bond’s cash flows consist of coupon payments and repayment of capital.) |
| | | | A bond’s duration will almost always be shorter than its maturity, with the exception of zero-coupon bonds, for which maturity and duration are equal. Weighted average duration is a measure of the duration for the securities in the portfolio overall. Weighted average maturity (“WAM”) is the weighted average amount of time until the debt securities in a portfolio mature, or the weighted average of the remaining terms to maturity of the debt securities within a portfolio. The higher the WAM, the longer it takes for all of the bonds in the portfolio to mature, and WAM is used to manage debt portfolios and to assess the performance of debt portfolio managers. Coupons are fixed percentages paid out on a fixed income security on an annual basis. Weighted average coupon is calculated by weighting the coupon of each debt security by its relative size in the portfolio. Yield to maturity is the annual return that a bond is expected to generate if it is held till its maturity given its coupon rate, payment frequency and current market price. Yield to maturity is essentially the internal rate of return of a bond, i.e. the discount rate at which the present value of a bond’s coupon payments and maturity value is equal to its current market price. The 30-day standardized yield calculation is based on a 30-day period ending on the last day of the Reporting Period. It is computed by dividing the net investment income per share earned during the period by the maximum offering price per share on the last day of the period. |
36
PORTFOLIO RESULTS
| Q | | What was the Fund’s credit allocation at the end of the Reporting Period?2 |
| | | | | | |
U.S. Treasuries | | | 45.34 | % | | |
Agency Securities | | | 26.13 | % | | |
AAA | | | 0.25 | % | | |
AA | | | 2.79 | % | | |
A | | | 10.95 | % | | |
BBB | | | 14.18 | % | | |
BB | | | 0.31 | % | | |
Cash | | | 0.04 | % | | |
| Q | | What was the Fund’s sector positioning relative to the Index at the end of the Reporting Period?3 |
| | | | | | | | | | |
| | | |
| | | Sector | | Fund | | | Index | |
| | | |
| | U.S. Treasuries | | | 45.34 | % | | | 41.62 | % |
| | Foreign Government Securities | | | 0.00 | % | | | 0.13 | % |
| | Quasi-Government Securities | | | 0.46 | % | | | 3.50 | % |
| | Asset-Backed Securities | | | 0.00 | % | | | 0.20 | % |
| | Commercial Mortgage-Backed Securities | | | 0.00 | % | | | 0.00 | % |
| | Residential Mortgage-Backed Securities | | | 26.13 | % | | | 26.53 | % |
| | Investment Grade Corporate Bonds | | | 24.71 | % | | | 25.11 | % |
| | High Yield Corporate Bonds | | | 0.19 | % | | | 0.18 | % |
| | Emerging Markets Debt | | | 3.13 | % | | | 2.74 | % |
| | | Cash | | | 0.04 | % | | | 0.00 | % |
| | 2 | | The Fund and the Index have not been rated by an independent rating agency. The credit allocation provided refers to the Fund’s underlying portfolio securities. For the purpose of determining compliance with any credit rating requirement, the Fund assigns a security, at the time of purchase, the highest rating by a Nationally Recognized Statistical Rating Organization (“NRSRO”) if the security is rated by more than one NRSRO. For this purpose, the Fund relies only on the ratings of the following NRSROs: S&P Global Ratings, Moody’s Investor Services and Fitch Ratings Inc. This method may differ from the method independently used by the Index Provider. GSAM will use a single rating if that is the only one available. Securities that are not rated by all three agencies are reflected as such in the breakdown. Unrated securities may be purchased by the Fund if they are determined by the Investment Adviser to be of a credit quality consistent with the Fund’s credit rate requirements. Unrated securities do not necessarily indicate low quality, and for such securities the Investment Adviser will evaluate the credit quality. GSAM converts all ratings to the equivalent S&P major rating category when illustrating credit rating breakdowns. Ratings and Fund/Index credit quality may change over time. |
| | 3 | | The Fund seeks to provide investment results that closely correspond, before fees and expenses, to the performance of the FTSE Goldman Sachs US Broad Bond Market Index. |
37
FUND BASICS
Access U.S. Aggregate Bond ETF
as of August 31, 2023
| | | | | | |
| | FUND SNAPSHOT | |
| | |
| | | As of August 31, 2023 | | | |
| | Market Price1 | | $ | 40.99 | |
| | | Net Asset Value (NAV)1 | | $ | 40.88 | |
| 1 | | The Market Price is the price at which the Fund’s shares are trading on the NYSE Arca, Inc. The Market Price of the Fund’s shares will fluctuate and, at the time of sale, shares may be worth more or less than the original investment or the Fund’s then current net asset value (“NAV”). The NAV is the market value of one share of the Fund. This amount is derived by dividing the total value of all the securities in the Fund’s portfolio, plus other assets, less any liabilities, by the number of Fund shares outstanding. Fund shares are not individually redeemable and are issued and redeemed by the Fund at their NAV only in large, specified blocks of shares called creation units. Shares otherwise can be bought and sold only through exchange trading at market price (not NAV). Shares may trade at a premium or discount to their NAV in the secondary market. Information regarding how often shares of the Fund traded on NYSE Arca at a price above (i.e., at a premium) or below (i.e., at a discount) the NAV of the Fund can be found at www.GSAMFUNDS.com/ETFs. |
| | | | | | |
| | TOP TEN HOLDINGS AS OF 8/31/232 | |
| | |
| | | Holding | | % of Net Assets | |
| | |
| | U.S. Treasury Note, 0.25%, 10/31/25 | | | 9.9 | % |
| | U.S. Treasury Note, 1.50%, 10/31/24 | | | 6.9 | |
| | U.S. Treasury Note, 1.63%, 05/15/26 | | | 4.9 | |
| | U.S. Treasury Note, 2.00%, 02/15/25 | | | 4.2 | |
| | U.S. Treasury Note, 2.50%, 01/31/25 | | | 3.8 | |
| | U.S. Treasury Bond, 2.50%, 02/15/45 | | | 2.5 | |
| | U.S. Treasury Bond, 2.75%, 08/15/42 | | | 2.4 | |
| | U.S. Treasury Bond, 2.25%, 02/15/52 | | | 1.9 | |
| | Federal National Mortgage Association, 5.00%, 04/01/53 | | | 1.8 | |
| | | Federal National Mortgage Association, 3.00%, 09/15/53 | | | 1.8 | |
| 2 | | The top 10 holdings may not be representative of the Fund’s future investments. |
For more information about the Fund, please refer to www.GSAMFUNDS.com/ETFs. There, you can learn more about the Fund’s investment strategies, holdings, and performance.
| | | | | | |
| | INDUSTRY ALLOCATION AS OF 8/31/233 | |
| | |
| | | Sector Name | | Fund | |
| | U.S. Treasury Notes | | | 28.1 | % |
| | Mortgage-Backed Securities | | | 27.5 | |
| | Corporate Obligations | | | 17.4 | |
| | Investment Company | | | 8.1 | |
| | U.S. Treasury Bonds | | | 7.7 | |
| | Foreign Corporate Debt | | | 5.2 | |
| | U.S. Treasury Obligations | | | 3.9 | |
| | | Foreign Debt Obligations | | | 2.1 | |
| 3 | | The percentage shown for each investment category reflects the value of investments in that category as a percentage of net assets. Figures in the table may not sum to 100% due to the exclusion of other assets and liabilities. |
38
GOLDMAN SACHS ACCESS U.S. AGGREGATE BOND ETF
Performance Summary
August 31, 2023
The following graph shows the value, as of August 31, 2023, of a $10,000 investment made on September 8, 2020 (commencement of operations) in Shares at NAV. For comparative purposes, the performance of a broad-based securities market index, the FTSE Goldman Sachs US Broad Bond Market Index, is shown. Performance reflects applicable fee waivers and/or expense limitations in effect during the periods shown and in their absence, performance would be reduced. Returns do not reflect the deduction of taxes that a shareholder would pay on Fund distributions or the sale of Fund shares. Certain factors may affect Fund performance including, but not limited to, Fund operating fees and expenses, portfolio turnover and creation and redemption in-kind transactions. The returns set forth below represent past performance. Past performance does not guarantee future results. The Fund’s NAV and investment return may fluctuate. These fluctuations may cause an investor’s shares to be worth more or less than their original cost. Current performance may be lower or higher than the performance quoted below. Please visit our web site at www.GSAMFUNDS.com/ETFs to obtain the most recent month-end returns.
|
| Goldman Sachs Access U.S. Aggregate Bond ETF’s Lifetime Performance |
Performance of a $10,000 Investment, with distributions reinvested, from September 8, 2020 through August 31, 2023.
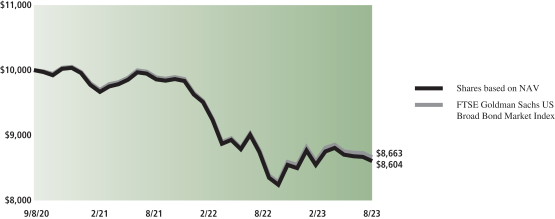
| | | | |
| Average Annual Total Return through August 31, 2023* | | 1 Year Return | | Since Inception |
Shares based on NAV (Commenced September 8, 2020) | | -1.58% | | -4.92% |
|
Shares based on Market Price (Commenced September 8, 2020) | | -1.44% | | -4.84% |
|
FTSE Goldman Sachs US Broad Bond Market Index | | -1.26% | | -4.70% |
|
| * | | Total returns are calculated assuming purchase of a share at the market price or NAV on the first day and sale of a share at the market price or NAV on the last day of each period reported. The Total Returns based on NAV and Market Price assume the reinvestment of dividends and do not reflect brokerage commissions in connection with the purchase or sale of Fund shares, which if included would lower the performance shown above. The NAV used in the Total Return calculations assumes all management fees incurred by the Fund. Market Price returns are based upon the last trade at 4:00 pm EST and do not reflect the returns you would receive if you traded shares at other times. The first day of secondary market trading is typically several days after the date on which the Fund commenced investment operations; therefore, the NAV of the Fund is used as a proxy for the period from inception of investment operations to the first day of secondary market trading to calculate the Market Price returns. |
39
PORTFOLIO RESULTS
Goldman Sachs Access Ultra Short Bond ETF
Investment Objective
The Goldman Sachs Access Ultra Short Bond ETF (the “Fund”) seeks to provide current income with preservation of capital.
Portfolio Management Discussion and Analysis
Below, the Goldman Sachs Global Fixed Income and Liquidity Solutions Team discusses the Fund’s performance and positioning for the 12-month period ended August 31, 2023 (the “Reporting Period”).
| Q | | How did the Fund perform during the Reporting Period? |
| A | | During the Reporting Period, the Fund returned 4.25% based on net asset value (“NAV”) and 4.28% based on market price. The Fund’s benchmark, the FTSE Three-Month U.S. Treasury Bill Index (the “Index”), returned 4.44% for the same period. |
| | The Fund had an NAV of $49.95 per share on August 31, 2022 and ended the Reporting Period with an NAV of $49.98 per share. The Fund’s market price on August 31, 2023 was $49.99 per share. |
| Q | | What key factors were responsible for the Fund’s performance during the Reporting Period? |
| A | | The Fund seeks to achieve its investment objective by investing, under normal circumstances, at least 80% of its net assets plus any borrowings for investment purposes (measured at the time of purchase) (“Net Assets”) in a broad range of U.S. dollar denominated bonds. The Fund primarily invests in obligations issued or guaranteed by the U.S. Government, its agencies, authorities, instrumentalities or sponsored enterprises (“U.S. Government Securities”), obligations of U.S. banks, corporate notes, commercial paper and other short-term obligations of U.S. companies, states, municipalities and other entities, fixed and floating rate mortgage-backed securities, asset-backed securities, collateralized loan obligations and repurchase agreements. The Fund may also invest in U.S. dollar-denominated obligations issued or guaranteed by foreign banks, companies and governments or their agencies, authorities, instrumentalities or sponsored enterprises. |
| | The Fund will generally focus its investments in securities of issuers that, at the time of purchase, have a short-term credit rating of at least investment grade by at least one nationally recognized statistical rating organization (“NRSRO”) (at least A-2, P-2, or F2 by S&P Global Ratings (“S&P”), Moody’s Investors Service, Inc. (“Moody’s”) or Fitch Ratings, Inc. (“Fitch”), respectively), have a long-term credit rating of at least investment grade by at least one NRSRO (at least BBB-, Baa3, or BBB by S&P, Moody’s or Fitch, respectively) if such securities only maintain long-term ratings, or, if unrated, are determined by Goldman Sachs Asset Management, L.P. (“GSAM”) to be of comparable credit quality at the time of purchase. The Fund may also rely on the credit quality of a guarantee or demand feature in determining the credit quality of a security supported by the guarantee or demand feature. |
| | The Fund will concentrate its investments in the financial services group of industries. Therefore, under normal circumstances, the Fund will invest more than 25% of its total assets in securities issued by companies in the financial services group of industries and repurchase agreements secured by such obligations. |
| | Under normal circumstances, the Fund’s effective duration is expected to be one year or less. “Duration” is a measure of a debt security’s price sensitivity to changes in interest rates. The longer the duration of the Fund (or an individual debt security), the more sensitive its market price to changes in interest rates. In computing duration, the Fund will estimate the duration of obligations that are subject to prepayment or redemption by the issuer, taking into account the influence of interest rates on prepayments and coupon flows. This method of computing duration is known as “option-adjusted” duration. |
| | The Fund is an actively managed exchange-traded fund (“ETF”), which is a fund that trades like other publicly traded securities. The Fund is not an index fund and does not seek to replicate the performance of a specified index. |
| | THE FUND IS NOT A MONEY MARKET FUND AND DOES NOT ATTEMPT TO MAINTAIN A STABLE NET ASSET VALUE. |
| | During the Reporting Period, the Fund generated positive absolute returns but modestly lagged the Index. The Fund, as |
40
PORTFOLIO RESULTS
| | an actively managed, broadly diversified portfolio of high quality short-term holdings across multiple spread, or non-U.S. Treasury, sectors, slightly underperformed the Index during the Reporting Period due primarily to differences in sector positioning and duration and yield curve positioning relative to that of the Index. |
| | Overall, short term bond returns are driven by two primary factors — short-term interest rates and sector yields. |
| | During the Reporting Period, in a continuing effort to stem inflation, the U.S. Federal Reserve (the “Fed”) raised the targeted federal funds rate by a total of 300 basis points — to a range between 5.25% and 5.50%. (A basis point is 1/100th of a percentage point.) As the Fed tightened monetary policy, yields rose across the U.S. Treasury yield curve, or spectrum of maturities, with shorter-term yields rising more than longer-term yields. The bellwether 10-year U.S. Treasury yield was up 94 basis points during the Reporting Period, from 3.15% to 4.09%. Shorter-term interest rates rose even more significantly, with six-month U.S. Treasury yields up 212 basis points, from 3.32% to 5.48% during the Reporting Period. |
| | The increase in short-term interest rates put downward pressure on short-term bond prices during the Reporting Period, but since the Fund is an ultra-short bond fund, i.e., it maintains an effective duration of less than one year, its NAV has a low sensitivity to interest rate changes, thus mitigating the impact of higher rates. The Fund’s allocation to floating rate assets also helped reduce the effect of rising rates, enabling the yield of the strategy to increase along with the market. Lastly, the Fund benefited from credit spread tightening. (Credit spreads are yield differentials versus duration-equivalent U.S. Treasuries.) During the Reporting Period, short-dated, i.e. maturities of one to three years, investment grade credit yields tightened by approximately 3 basis points, from 76 basis points to 73 basis points. |
| | A broad diversified portfolio of high quality short-term holdings, across investment grade corporate credit, U.S. Treasuries, mortgage-backed securities and other securitized credit, helped the Fund achieve a high level of current income for investors while also providing reduced volatility as yields of various individual sectors fluctuated during the Reporting Period. |
| Q | | How did the Fund use derivatives and similar instruments during the Reporting Period? |
| A | | The Fund does not employ derivatives. During the Reporting Period, the Fund did not invest in derivatives or similar instruments. The Fund does not employ derivatives as a source of alpha generation, although it may use them to equitize excess cash. |
| Q | | Were there any changes to the Fund’s portfolio management team during the Reporting Period? |
| A | | Effective October 1, 2022, David Fishman no longer served as a portfolio manager for the Fund. Todd Henry and David Westbrook continue to serve as portfolio managers for the Fund. By design, all investment decisions for the Fund are performed within a co-lead or team structure, with multiple subject matter experts. This strategic decision making has been a cornerstone of our approach and helps to ensure continuity in the Fund. |
| Q | | What was the Fund’s weighted average duration, weighted average maturity, weighted average coupon, weighted average yield to maturity and 30-day standardized yield at the end of the Reporting Period?1 |
| A | | The Fund had a weighted average duration of 0.65 years, a weighted average maturity of 2.03 years and a weighted average coupon of 4.93% as of August 31, 2023. The Fund’s weighted average yield to maturity was 5.78% on August 31, 2023. The 30-day standardized yield of the Fund at the end of the Reporting Period was 5.11%. |
| | 1 | | Duration is a time measure of a bond’s interest-rate sensitivity, based on the weighted average of the time periods over which a bond’s cash flows accrue to the bondholder. Time periods are weighted by multiplying by the present value of its cash flow divided by the bond’s price. (A bond’s cash flows consist of coupon payments and repayment of capital.) A bond’s duration will almost always be shorter than its maturity, with the exception of zero-coupon bonds, for which maturity and duration are equal. Weighted average duration is a measure of the duration for the securities in the portfolio overall. Weighted average maturity (“WAM”) is the weighted average amount of time until the debt securities in a portfolio mature, or the weighted average of the remaining terms to maturity of the debt securities within a portfolio. The higher the WAM, the longer it takes for all of the bonds in the portfolio to mature, and WAM is used to manage debt portfolios and to assess the performance of debt portfolio managers. Coupons are fixed percentages paid out on a fixed income security on an annual basis. Weighted average coupon is calculated by weighting the coupon of each debt security by its relative size in the portfolio. Yield to maturity is the annual return that a bond is expected to generate if it is held till its maturity given its coupon rate, payment frequency and current market price. Yield to maturity is essentially the internal rate of return of a bond, i.e. the discount rate at which the present value of a bond’s coupon payments and maturity value is equal to its current market price. The 30-day standardized yield calculation is based on a 30-day period ending on the last day of the Reporting Period. It is computed by dividing the net investment income per share earned during the period by the maximum offering price per share on the last day of the period. |
41
PORTFOLIO RESULTS
| Q | | What was the Fund’s credit allocation at the end of the Reporting Period?2 |
| | | | | | |
U.S. Treasuries | | | 5.61 | % | | |
Agency Securities | | | 22.22 | % | | |
AAA | | | 28.64 | % | | |
AA | | | 7.07 | % | | |
A | | | 20.37 | % | | |
BBB | | | 4.86 | % | | |
Cash | | | 11.24 | % | | |
| Q | | What was the Fund’s sector positioning relative to the Index at the end of the Reporting Period? |
| A | | While the Index was 100% allocated to U.S. Treasury securities, the Fund was 5.61% invested in U.S. Treasury securities, 1.69% in quasi-government securities, 18.34% in asset-backed securities, 8.71% in commercial mortgage-backed securities, 22.22% in residential mortgage-backed securities, 32.20% in investment grade corporate bonds and 11.24% in cash at the end of the Reporting Period. |
| | 2 | | The Fund and the Index have not been rated by an independent rating agency. The credit allocation provided refers to the Fund’s underlying portfolio securities. For the purpose of determining compliance with any credit rating requirement, the Fund assigns a security, at the time of purchase, the highest rating by a Nationally Recognized Statistical Rating Organization (“NRSRO”) if the security is rated by more than one NRSRO. For this purpose, the Fund relies only on the ratings of the following NRSROs: S&P, Moody’s and Fitch, Inc. This method may differ from the method independently used by the Index Provider. GSAM will use a single rating if that is the only one available. Securities that are not rated by all three agencies are reflected as such in the breakdown. Unrated securities may be purchased by the Fund if they are determined by the Investment Adviser to be of a credit quality consistent with the Fund’s credit rating requirements. Unrated securities do not necessarily indicate low quality, and for such securities the Investment Adviser will evaluate the credit quality. GSAM converts all ratings to the equivalent S&P major rating category when illustrating credit rating breakdowns. Ratings and Fund/Index credit quality may change over time. |
42
FUND BASICS
Access Ultra Short Bond ETF
as of August 31, 2023
| | | | | | |
| | FUND SNAPSHOT | |
| | |
| | | As of August 31, 2023 | | | |
| | |
| | Market Price1 | | $ | 49.99 | |
| | | Net Asset Value (NAV)1 | | $ | 49.98 | |
| 1 | | The Market Price is the price at which the Fund’s shares are trading on the Cboe BZX Exchange, Inc. The Market Price of the Fund’s shares will fluctuate and, at the time of sale, shares may be worth more or less than the original investment or the Fund’s then current net asset value (“NAV”). The NAV is the market value of one share of the Fund. This amount is derived by dividing the total value of all the securities in the Fund’s portfolio, plus other assets, less any liabilities, by the number of Fund shares outstanding. Fund shares are not individually redeemable and are issued and redeemed by the Fund at their NAV only in large, specified blocks of shares called creation units. Shares otherwise can be bought and sold only through exchange trading at market price (not NAV). Shares may trade at a premium or discount to their NAV in the secondary market. Information regarding how often shares of the Fund traded on Cboe BZX Exchange, Inc. at a price above (i.e., at a premium) or below (i.e., at a discount) the NAV of the Fund can be found at www.GSAMFUNDS.com/ETFs. |
| | | | | | |
| | TOP TEN HOLDINGS AS OF 8/31/232 | |
| | |
| | | Holding | | % of Net Assets | |
| | FNMA REMIC, Class BM, Series 2023-7266, 4.42%, 05/01/44 | | | 3.1 | % |
| | FNMA REMIC, Class BM, Series 2023-7262, 4.66%, 02/01/45 | | | 2.0 | |
| | U.S. Treasury Floating Rate Note, 5.55%, 10/31/24 | | | 1.9 | |
| | FNMA REMIC, Class BM, Series 2020-6347, 4.34%, 02/01/41 | | | 1.7 | |
| | FNMA REMIC, Class AL, Series 2016-9335, 4.59%, 12/01/40 | | | 1.6 | |
| | U.S. Treasury Note, 3.88%, 03/31/25 | | | 1.4 | |
| | FNMA REMIC, Class FC, Series 2005-103, 5.90%, 07/25/35 | | | 1.3 | |
| | FHLMC REMIC, 4.80%, 01/01/46 | | | 1.1 | |
| | Morgan Stanley Bank NA, 6.10%, 07/16/25 | | | 1.0 | |
| | | American Express Credit Account Master Trust, Class A, Series 2022-2, 3.39%, 05/15/27 | | | 1.0 | |
| 2 | | The top 10 holdings may not be representative of the Fund’s future investments. |
For more information about the Fund, please refer to www.GSAMFUNDS.com/ETFs. There, you can learn more about the Fund’s investment strategies, holdings, and performance.
| | | | | | |
| | SECTOR ALLOCATION AS OF 8/31/233 | |
| | |
| | | Sector Name | | Fund | |
| | Asset-Backed Securities | | | 26.0 | % |
| | Mortgage-Backed Securities | | | 23.6 | |
| | Foreign Corporate Debt | | | 17.2 | |
| | Corporate Obligations | | | 14.8 | |
| | Commercial Papers | | | 6.2 | |
| | U.S. Treasury Notes | | | 5.6 | |
| | Certificate of Deposits | | | 4.6 | |
| | U.S. Government Agency Obligations | | | 1.2 | |
| | | Investment Company | | | 0.3 | |
| | |
| | | TOTAL INVESTMENTS | | | 99.5 | |
| 3 | | The percentage shown for each investment category reflects the value of investments in that category as a percentage of net assets. Figures in the table may not sum to 100% due to the exclusion of other assets and liabilities. |
43
GOLDMAN SACHS ACCESS ULTRA SHORT BOND ETF
Performance Summary
August 31, 2023
The following graph shows the value, as of August 31, 2023, of a $10,000 investment made on April 15, 2019 (commencement of operations) in Shares at NAV. For comparative purposes, the performance of a broad-based securities market index, the FTSE Three-Month U.S. Treasury Bill Index, is shown. Performance reflects applicable fee waivers and/or expense limitations in effect during the periods shown and in their absence, performance would be reduced. Returns do not reflect the deduction of taxes that a shareholder would pay on Fund distributions or the sale of Fund shares. Certain factors may affect Fund performance including, but not limited to, Fund operating fees and expenses, portfolio turnover and creation and redemption in-kind transactions. The returns set forth below represent past performance. Past performance does not guarantee future results. The Fund’s NAV and investment return may fluctuate. These fluctuations may cause an investor’s shares to be worth more or less than their original cost. Current performance may be lower or higher than the performance quoted below. Please visit our web site at www.GSAMFUNDS.com/ETFs to obtain the most recent month-end returns.
|
| Goldman Sachs Access Ultra Short Bond ETF’s Lifetime Performance |
Performance of a $10,000 Investment, with distributions reinvested, from April 15, 2019 through August 31, 2023.
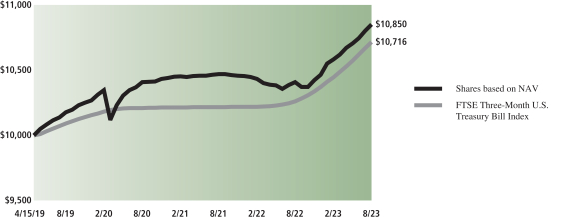
| | | | |
| Average Annual Total Return through August 31, 2023* | | 1 Year Return | | Since Inception |
Shares based on NAV (Commenced April 15, 2019) | | 4.25% | | 1.88% |
|
Shares based on Market Price (Commenced April 15, 2019) | | 4.28% | | 1.88% |
|
FTSE Three-Month U.S. Treasury Bill Index | | 4.44% | | 1.59% |
|
| * | | Total returns are calculated assuming purchase of a share at the market price or NAV on the first day and sale of a share at the market price or NAV on the last day of each period reported. The Total Returns based on NAV and Market Price assume the reinvestment of dividends and do not reflect brokerage commissions in connection with the purchase or sale of Fund shares, which if included would lower the performance shown above. The NAV used in the Total Return calculations assumes all management fees incurred by the Fund. Market Price returns are based upon the last trade at 4:00 pm EST and do not reflect the returns you would receive if you traded shares at other times. The first day of secondary market trading is typically several days after the date on which the Fund commenced investment operations; therefore, the NAV of the Fund is used as a proxy for the period from inception of investment operations to the first day of secondary market trading to calculate the Market Price returns. |
44
FUND BASICS
Index Definitions and Industry Terms
Alpha: The excess returns of a fund relative to the return of a benchmark index is the fund’s alpha.
Access Emerging Markets USD Bond ETF
The Index was developed and is calculated and maintained by FTSE Fixed Income LLC (“FTSE”), a trading name of the London Stock Exchange Group plc and its group undertakings (collectively, the “LSE Group” or the “Index Provider”). FTSE is not affiliated with the Fund or GSAM. The Fund is not sponsored, endorsed, sold or promoted by FTSE or any of its affiliates and FTSE makes no representation to any owner or prospective owner of the Fund regarding the advisability of investing in securities generally or in the Fund particularly, or the ability of the Fund to track the price and yield performance of the Index or the ability of the Index to track general bond market performance. FTSE’s only relationship to GSAM (“Licensee”) is the licensing of certain information, data, trademarks and trade names of FTSE or its affiliates. The Index is determined, composed and calculated by FTSE without regard to the Fund. FTSE has no obligation to take the needs of the owners or prospective owners of the Fund into consideration in determining, composing or calculating the Index. FTSE is not responsible for and has not participated in the determination of the prices and amount of the shares to be issued by the Fund or the timing of the issuance or sale of the shares to be issued by the Fund or in the determination or calculation of the equation by which the shares to be issued by the Fund are to be converted into cash. FTSE has no obligation or liability in connection with the administration, marketing or trading of the Fund.
Access High Yield Corporate Bond ETF
The Index was developed and is calculated and maintained by FTSE Fixed Income LLC (“FTSE”), a trading name of the London Stock Exchange Group plc and its group undertakings (collectively, the “LSE Group” or the “Index Provider”). FTSE is not affiliated with the Fund or GSAM. The Fund is not sponsored, endorsed, sold or promoted by FTSE or any of its affiliates and FTSE makes no representation to any owner or prospective owner of the Fund regarding the advisability of investing in securities generally or in the Fund particularly, or the ability of the Fund to track the price and yield performance of the Index or the ability of the Index to track general bond market performance. FTSE’s only relationship to GSAM (“Licensee”) is the licensing of certain information, data, trademarks and trade names of FTSE or its affiliates. The Index is determined, composed and calculated by FTSE without regard to the Fund. FTSE has no obligation to take the needs of the owners or prospective owners of the Fund into consideration in determining, composing or calculating the Index. FTSE is not responsible for and has not participated in the determination of the prices and amount of the shares to be issued by the Fund or the timing of the issuance or sale of the shares to be issued by the Fund or in the determination or calculation of the equation by which the shares to be issued by the Fund are to be converted into cash. FTSE has no obligation or liability in connection with the administration, marketing or trading of the Fund.
Access Inflation Protected USD Bond ETF
The Index was developed and is calculated and maintained by FTSE Fixed Income LLC (“FTSE”), a trading name of the London Stock Exchange Group plc and its group undertakings (collectively, the “LSE Group” or the “Index Provider”). FTSE is not affiliated with the Fund or GSAM. The Fund is not sponsored, endorsed, sold or promoted by FTSE or any of its affiliates and FTSE makes no representation to any owner or prospective owner of the Fund regarding the advisability of investing in securities generally or in the Fund particularly, or the ability of the Fund to track the price and yield performance of the Index or the ability of the Index to track general bond market performance. FTSE’s only relationship to GSAM (“Licensee”) is the licensing of certain information, data, trademarks and trade names of FTSE or its affiliates. The Index is determined, composed and calculated by FTSE without regard to the Fund. FTSE has no obligation to take the needs of the owners or prospective owners of the Fund into consideration in determining, composing or calculating the Index. FTSE is not responsible for and has not participated in the determination of the prices and amount of the shares to be issued by the Fund or the timing of the issuance or sale of the shares to be issued by the Fund or in the determination or calculation of the equation by which the shares to be issued by the Fund are to be converted into cash. FTSE has no obligation or liability in connection with the administration, marketing or trading of the Fund.
Access Investment Grade Corporate 1-5 Year Bond ETF
The Index was developed and is calculated and maintained by FTSE Fixed Income LLC (“FTSE”), a trading name of the London Stock Exchange Group plc and its group undertakings (collectively, the “LSE Group” or the “Index Provider”). FTSE is not affiliated with the Fund or GSAM. The Fund is not sponsored, endorsed, sold or promoted by FTSE or any of its affiliates and FTSE makes no representation to any owner or prospective owner of the Fund regarding the advisability of investing in securities generally or in the Fund particularly, or the ability of the Fund to track the price and yield performance of the Index or the ability of the Index to track general bond market performance. FTSE’s only relationship to GSAM (“Licensee”) is the licensing of certain information, data, trademarks and trade names of
45
FUND BASICS
FTSE or its affiliates. The Index is determined, composed and calculated by FTSE without regard to the Fund. FTSE has no obligation to take the needs of the owners or prospective owners of the Fund into consideration in determining, composing or calculating the Index. FTSE is not responsible for and has not participated in the determination of the prices and amount of the shares to be issued by the Fund or the timing of the issuance or sale of the shares to be issued by the Fund or in the determination or calculation of the equation by which the shares to be issued by the Fund are to be converted into cash. FTSE has no obligation or liability in connection with the administration, marketing or trading of the Fund.
Access Investment Grade Corporate Bond ETF
The Index was developed and is calculated and maintained by FTSE Fixed Income LLC (“FTSE”), a trading name of the London Stock Exchange Group plc and its group undertakings (collectively, the “LSE Group” or the “Index Provider”). FTSE is not affiliated with the Fund or GSAM. The Fund is not sponsored, endorsed, sold or promoted by FTSE or any of its affiliates and FTSE makes no representation to any owner or prospective owner of the Fund regarding the advisability of investing in securities generally or in the Fund particularly, or the ability of the Fund to track the price and yield performance of the Index or the ability of the Index to track general bond market performance. FTSE’s only relationship to GSAM (“Licensee”) is the licensing of certain information, data, trademarks and trade names of FTSE or its affiliates. The Index is determined, composed and calculated by FTSE without regard to the Fund. FTSE has no obligation to take the needs of the owners or prospective owners of the Fund into consideration in determining, composing or calculating the Index. FTSE is not responsible for and has not participated in the determination of the prices and amount of the shares to be issued by the Fund or the timing of the issuance or sale of the shares to be issued by the Fund or in the determination or calculation of the equation by which the shares to be issued by the Fund are to be converted into cash. FTSE has no obligation or liability in connection with the administration, marketing or trading of the Fund.
Access Treasury 0-1 Year ETF
The Index is designed to measure the performance of U.S. Treasury Securities with a maximum remaining maturity of 12 months. “U.S. Treasury Securities” refer to securities issued or guaranteed by the U.S. Treasury where the payment of principal and interest is backed by the full faith and credit of the U.S. government. U.S. Treasury Securities include U.S. Treasury notes, U.S. Treasury bills and U.S. Treasury floating rate bonds. The Index is sponsored by FTSE Fixed Income LLC (“FTSE”), a trading name of the London Stock Exchange Group plc and its group undertakings (collectively, the “LSE Group” or the “Index Provider”). FTSE is not affiliated with the Fund or GSAM. The Index is determined, composed and calculated by FTSE without regard to the Fund. It is not possible to invest directly in an unmanaged index.
Access U.S. Aggregate Bond ETF
The Index was developed and is calculated and maintained by FTSE Fixed Income LLC (“FTSE”), a trading name of the London Stock Exchange Group plc and its group undertakings (collectively, the “LSE Group” or the “Index Provider”). FTSE is not affiliated with the Fund or GSAM. The Fund is not sponsored, endorsed, sold or promoted by FTSE or any of its affiliates and FTSE makes no representation to any owner or prospective owner of the Fund regarding the advisability of investing in securities generally or in the Fund particularly, or the ability of the Fund to track the price and yield performance of the Index or the ability of the Index to track general bond market performance. FTSE’s only relationship to GSAM (“Licensee”) is the licensing of certain information, data, trademarks and trade names of FTSE or its affiliates. The Index is determined, composed and calculated by FTSE without regard to the Fund. FTSE has no obligation to take the needs of the owners or prospective owners of the Fund into consideration in determining, composing or calculating the Index. FTSE is not responsible for and has not participated in the determination of the prices and amount of the shares to be issued by the Fund or the timing of the issuance or sale of the shares to be issued by the Fund or in the determination or calculation of the equation by which the shares to be issued by the Fund are to be converted into cash. FTSE has no obligation or liability in connection with the administration, marketing or trading of the Fund.
Access Ultra Short Bond ETF
The FTSE Three-Month U.S. Treasury Bill Index is intended to track the daily performance of three-month U.S. Treasury bills. The index is designed to operate as a reference rate for a series of funds.
Goldman Sachs Access Ultra Short Bond ETF (GSST) does not attempt to track an index and takes a more active approach.
46
GOLDMAN SACHS ACCESS EMERGING MARKETS USD BOND ETF
Schedule of Investments
August 31, 2023
| | | | | | | | | | | | | | |
Principal
Amount | | | Interest
Rate | | | Maturity
Date | | | Value | |
|
| Sovereign Debt Obligations – 83.4% | |
| Bahamas – 0.3% | |
| | Bahamas Government International Bond (B+/B1) | |
| $ | 200,000 | | | | 8.950 | % | | | 10/15/32 | | | $ | 173,000 | |
| | |
| Bahrain – 3.3% | |
| | Bahrain Government International Bond (B+/NR) | |
| | 550,000 | | | | 7.000 | | | | 01/26/26 | | | | 559,163 | |
| | 225,000 | | | | 7.375 | | | | 05/14/30 | | | | 230,971 | |
| | 200,000 | | | | 5.625 | | | | 09/30/31 | | | | 184,623 | |
| | 225,000 | | | | 5.625 | | | | 05/18/34 | | | | 198,586 | |
| | 200,000 | | | | 6.000 | | | | 09/19/44 | | | | 160,750 | |
| | 200,000 | | | | 7.500 | | | | 09/20/47 | | | | 184,781 | |
| | 200,000 | | | | 6.250 | | | | 01/25/51 | | | | 160,250 | |
| | | | | | | | | | | | | | |
| | | | | | | | | | | | | 1,679,124 | |
| | |
| Bolivia – 0.2% | |
| | Bolivian Government International Bond (B-/Caa1) | |
| | 200,000 | | | | 4.500 | | | | 03/20/28 | | | | 125,750 | |
| | |
| Brazil – 3.3% | |
| | Brazilian Government International Bond (BB-/Ba2) | |
| | 200,000 | | | | 4.250 | | | | 01/07/25 | | | | 195,898 | |
| | 779,000 | | | | 6.000 | | | | 10/20/33 | | | | 760,698 | |
| | 200,000 | | | | 7.125 | | | | 01/20/37 | | | | 210,000 | |
| | 585,000 | | | | 5.625 | | | | 01/07/41 | | | | 516,263 | |
| | | | | | | | | | | | | | |
| | | | | | | | | | | | | 1,682,859 | |
| | |
| Chile – 3.1% | |
| | Chile Government International Bond (A/A2) | |
| | 410,000 | | | | 3.125 | | | | 01/21/26 | | | | 391,153 | |
| | 400,000 | | | | 3.240 | | | | 02/06/28 | | | | 372,856 | |
| | 600,000 | | | | 3.500 | | | | 01/31/34 | | | | 517,370 | |
| | 200,000 | | | | 4.000 | | | | 01/31/52 | | | | 158,089 | |
| | 225,000 | | | | 3.250 | | | | 09/21/71 | | | | 139,764 | |
| | | | | | | | | | | | | | |
| | | | | | | | | | | | | 1,579,232 | |
| | |
| China – 3.1% | |
| | China Government International Bond (A+/A1) | |
| | 200,000 | | | | 0.750 | | | | 10/26/24 | | | | 190,317 | |
| | 400,000 | | | | 1.250 | | | | 10/26/26 | | | | 358,464 | |
| | 200,000 | | | | 3.500 | | | | 10/19/28 | | | | 192,628 | |
| | 390,000 | | | | 1.200 | | | | 10/21/30 | | | | 319,966 | |
| | 200,000 | | | | 2.750 | | | | 12/03/39 | | | | 156,315 | |
| | 250,000 | | | | 4.000 | | | | 10/19/48 | | | | 224,812 | |
| | 200,000 | | | | 2.250 | | | | 10/21/50 | | | | 125,428 | |
| | | | | | | | | | | | | | |
| | | | | | | | | | | | | 1,567,930 | |
| | |
| Colombia – 5.2% | |
| | Colombia Government International Bond (BB+/Baa2) | |
| | 300,000 | | | | 3.875 | | | | 04/25/27 | | | | 276,385 | |
| | 460,000 | | | | 3.000 | | | | 01/30/30 | | | | 365,089 | |
| | 500,000 | | | | 3.125 | | | | 04/15/31 | | | | 385,845 | |
| | 250,000 | | | | 3.250 | | | | 04/22/32 | | | | 187,495 | |
| | 200,000 | | | | 7.375 | | | | 09/18/37 | | | | 194,340 | |
| | 300,000 | | | | 6.125 | | | | 01/18/41 | | | | 248,238 | |
| | 275,000 | | | | 5.625 | | | | 02/26/44 | | | | 208,072 | |
| | 550,000 | | | | 5.000 | | | | 06/15/45 | | | | 385,599 | |
| | 400,000 | | | | 5.200 | | | | 05/15/49 | | | | 280,574 | |
| | 200,000 | | | | 4.125 | | | | 05/15/51 | | | | 120,087 | |
| | | | | | | | | | | | | | |
| | | | | | | | | | | | | 2,651,724 | |
| | |
|
| Sovereign Debt Obligations – (continued) | |
| Costa Rica – 1.7% | |
| | Costa Rica Government International Bond (B+/B2) | |
| 450,000 | | | | 6.125 | | | | 02/19/31 | | | | 451,125 | |
| | 400,000 | | | | 7.158 | | | | 03/12/45 | | | | 404,000 | |
| | | | | | | | | | | | | | |
| | | | | | | | | | | | | 855,125 | |
| | |
| Dominican Republic – 5.3% | |
| | Dominican Republic International Bond (BB/Ba3) | |
| | 200,000 | | | | 5.500 | | | | 01/27/25 | | | | 198,500 | |
| | 150,000 | | | | 6.875 | | | | 01/29/26 | | | | 151,500 | |
| | 450,000 | | | | 5.950 | | | | 01/25/27 | | | | 441,000 | |
| | 425,000 | | | | 6.000 | | | | 07/19/28 | | | | 412,250 | |
| | 200,000 | | | | 5.500 | | | | 02/22/29 | | | | 188,000 | |
| | 225,000 | | | | 4.500 | | | | 01/30/30 | | | | 196,875 | |
| | 450,000 | | | | 4.875 | | | | 09/23/32 | | | | 384,750 | |
| | 175,000 | | | | 7.450 | | | | 04/30/44 | | | | 169,750 | |
| | 225,000 | | | | 6.850 | | | | 01/27/45 | | | | 202,500 | |
| | 200,000 | | | | 6.400 | | | | 06/05/49 | | | | 168,500 | |
| | 300,000 | | | | 5.875 | | | | 01/30/60 | | | | 231,750 | |
| | | | | | | | | | | | | | |
| | | | | | | | | | | | | 2,745,375 | |
| | |
| Ecuador – 1.3% | |
| | Ecuador Government International Bond (B-/NR) | |
| | 450,000 | | | | 6.000 | (a) | | | 07/31/30 | | | | 223,875 | |
| | 850,000 | | | | 3.500 | (a) | | | 07/31/35 | | | | 318,750 | |
| | 450,000 | | | | 2.500 | (a) | | | 07/31/40 | | | | 150,188 | |
| | | | | | | | | | | | | | |
| | | | | | | | | | | | | 692,813 | |
| | |
| Egypt – 3.5% | |
| | Egypt Government International Bond (B/B3) | |
| | 200,000 | | | | 5.875 | | | | 06/11/25 | | | | 162,752 | |
| | 200,000 | | | | 3.875 | | | | 02/16/26 | | | | 143,731 | |
| | 200,000 | | | | 7.500 | | | | 01/31/27 | | | | 144,250 | |
| | 300,000 | | | | 5.800 | | | | 09/30/27 | | | | 198,489 | |
| | 200,000 | | | | 6.588 | | | | 02/21/28 | | | | 130,589 | |
| | 350,000 | | | | 7.625 | | | | 05/29/32 | | | | 201,609 | |
| | 200,000 | | | | 7.300 | | | | 09/30/33 | | | | 110,475 | |
| | 125,000 | | | | 6.875 | | | | 04/30/40 | | | | 64,687 | |
| | 450,000 | | | | 8.500 | | | | 01/31/47 | | | | 240,187 | |
| | 200,000 | | | | 7.903 | | | | 02/21/48 | | | | 102,500 | |
| | 200,000 | | | | 8.700 | | | | 03/01/49 | | | | 106,750 | |
| | 200,000 | | | | 8.875 | | | | 05/29/50 | | | | 107,750 | |
| | 200,000 | | | | 7.500 | | | | 02/16/61 | | | | 101,500 | |
| | | | | | | | | | | | | | |
| | | | | | | | | | | | | 1,815,269 | |
| | |
| Guatemala – 1.3% | |
| | Guatemala Government Bond (NR/NR) | |
| | 300,000 | | | | 5.375 | | | | 04/24/32 | | | | 286,500 | |
| | 225,000 | | | | 3.700 | | | | 10/07/33 | | | | 182,250 | |
| | 200,000 | | | | 6.125 | | | | 06/01/50 | | | | 183,750 | |
| | | | | | | | | | | | | | |
| | | | | | | | | | | | | 652,500 | |
| | |
| Hungary – 2.7% | |
| | Hungary Government International Bond (BBB-/Baa2) | |
| | 200,000 | | | | 6.125 | | | | 05/22/28 | | | | 203,039 | |
| | 200,000 | | | | 5.250 | | | | 06/16/29 | | | | 195,534 | |
| | 200,000 | | | | 5.500 | | | | 06/16/34 | | | | 189,852 | |
| | 550,000 | | | | 7.625 | | | | 03/29/41 | | | | 607,315 | |
| | 200,000 | | | | 6.750 | | | | 09/25/52 | | | | 203,109 | |
| | | | | | | | | | | | | | |
| | | | | | | | | | | | | 1,398,849 | |
| | |
| | |
| The accompanying notes are an integral part of these financial statements. | | 47 |
GOLDMAN SACHS ACCESS EMERGING MARKETS USD BOND ETF
Schedule of Investments (continued)
August 31, 2023
| | | | | | | | | | | | | | |
Principal
Amount | | | Interest
Rate | | | Maturity
Date | | | Value | |
|
| Sovereign Debt Obligations – (continued) | |
| Indonesia – 4.5% | |
| | Indonesia Government International Bond (BBB/Baa2) | |
| $ | 330,000 | | | | 4.125 | % | | | 01/15/25 | | | $ | 324,408 | |
| | 200,000 | | | | 3.850 | | | | 07/18/27 | | | | 191,198 | |
| | 350,000 | | | | 2.850 | | | | 02/14/30 | | | | 307,389 | |
| | 400,000 | | | | 4.650 | | | | 09/20/32 | | | | 386,218 | |
| | 125,000 | | | | 8.500 | | | | 10/12/35 | | | | 158,935 | |
| | 325,000 | | | | 7.750 | | | | 01/17/38 | | | | 400,007 | |
| | 225,000 | | | | 4.200 | | | | 10/15/50 | | | | 187,170 | |
| | 275,000 | | | | 3.050 | | | | 03/12/51 | | | | 195,614 | |
| | 200,000 | | | | 4.300 | | | | 03/31/52 | | | | 167,017 | |
| | | | | | | | | | | | | | |
| | | | | | | | | | | | | 2,317,956 | |
| | |
| Jordan – 1.0% | |
| | Jordan Government International Bond (B+/B1) | |
| | 200,000 | | | | 6.125 | | | | 01/29/26 | | | | 199,328 | |
| | 350,000 | | | | 5.850 | | | | 07/07/30 | | | | 324,209 | |
| | | | | | | | | | | | | | |
| | | | | | | | | | | | | 523,537 | |
| | |
| Kazakhstan – 1.2% | |
| | Kazakhstan Government International Bond (BBB-/Baa2) | |
| | 400,000 | | | | 4.875 | | | | 10/14/44 | | | | 357,220 | |
| | 225,000 | | | | 6.500 | | | | 07/21/45 | | | | 236,450 | |
| | | | | | | | | | | | | | |
| | | | | | | | | | | | | 593,670 | |
| | |
| Kenya – 2.0% | |
| | Republic of Kenya Government International Bond (B/NR) | |
| | 606,000 | | | | 6.875 | | | | 06/24/24 | | | | 574,612 | |
| | 350,000 | | | | 7.000 | | | | 05/22/27 | | | | 310,729 | |
| | 200,000 | | | | 8.250 | | | | 02/28/48 | | | | 149,750 | |
| | | | | | | | | | | | | | |
| | | | | | | | | | | | | 1,035,091 | |
| | |
| Kuwait – 0.7% | |
| | Kuwait International Government Bond (A+/NR) | |
| | 400,000 | | | | 3.500 | | | | 03/20/27 | | | | 382,424 | |
| | |
| Mexico – 3.5% | |
| | Mexico Government International Bond (BBB/Baa2) | |
| | 200,000 | | | | 3.750 | | | | 01/11/28 | | | | 189,657 | |
| | 325,000 | | | | 4.500 | | | | 04/22/29 | | | | 313,838 | |
| | 600,000 | | | | 4.875 | | | | 05/19/33 | | | | 568,897 | |
| | 50,000 | | | | 6.050 | | | | 01/11/40 | | | | 50,043 | |
| | 150,000 | | | | 5.550 | | | | 01/21/45 | | | | 139,822 | |
| | 200,000 | | | | 6.338 | | | | 05/04/53 | | | | 199,946 | |
| | Mexico Government International Bond, MTN (BBB/Baa2) | |
| | 50,000 | | | | 8.300 | | | | 08/15/31 | | | | 59,090 | |
| | 175,000 | | | | 7.500 | | | | 04/08/33 | | | | 196,299 | |
| | 150,000 | | | | 4.750 | | | | 03/08/44 | | | | 125,865 | |
| | | | | | | | | | | | | | |
| | | | | | | | | | | | | 1,843,457 | |
| | |
| Morocco – 0.5% | |
| | Morocco Government International Bond (BB+/NR) | |
| | 350,000 | | | | 4.000 | | | | 12/15/50 | | | | 230,125 | |
| | |
| Nigeria – 2.6% | |
| | Nigeria Government International Bond (B-/Caa1) | |
| | 200,000 | | | | 6.500 | | | | 11/28/27 | | | | 172,500 | |
| | 249,000 | | | | 6.125 | | | | 09/28/28 | | | | 206,064 | |
| | 200,000 | | | | 8.747 | | | | 01/21/31 | | | | 174,926 | |
| | 275,000 | | | | 7.875 | | | | 02/16/32 | | | | 224,749 | |
| | |
|
| Sovereign Debt Obligations – (continued) | |
| Nigeria – (continued) | |
| | Nigeria Government International Bond (B-/Caa1) – (continued) | |
| 200,000 | | | | 7.375 | | | | 09/28/33 | | | | 153,494 | |
| | 200,000 | | | | 7.696 | | | | 02/23/38 | | | | 145,548 | |
| | 200,000 | | | | 7.625 | | | | 11/28/47 | | | | 138,000 | |
| | 200,000 | | | | 8.250 | | | | 09/28/51 | | | | 142,985 | |
| | | | | | | | | | | | | | |
| | | | | | | | | | | | | 1,358,266 | |
| | |
| Panama – 5.1% | |
| | Panama Government International Bond (BBB/Baa2) | |
| | 225,000 | | | | 3.750 | | | | 03/16/25 | | | | 218,531 | |
| | 260,000 | | | | 8.875 | | | | 09/30/27 | | | | 293,475 | |
| | 200,000 | | | | 3.875 | | | | 03/17/28 | | | | 188,750 | |
| | 50,000 | | | | 9.375 | | | | 04/01/29 | | | | 59,437 | |
| | 410,000 | | | | 3.160 | | | | 01/23/30 | | | | 358,238 | |
| | 400,000 | | | | 2.252 | | | | 09/29/32 | | | | 306,500 | |
| | 150,000 | | | | 6.700 | | | | 01/26/36 | | | | 158,250 | |
| | 250,000 | | | | 4.500 | | | | 04/16/50 | | | | 189,688 | |
| | 200,000 | | | | 4.300 | | | | 04/29/53 | | | | 145,000 | |
| | 200,000 | | | | 6.853 | | | | 03/28/54 | | | | 206,000 | |
| | 275,000 | | | | 4.500 | | | | 04/01/56 | | | | 201,781 | |
| | 245,000 | | | | 3.870 | | | | 07/23/60 | | | | 158,331 | |
| | 200,000 | | | | 4.500 | | | | 01/19/63 | | | | 144,500 | |
| | | | | | | | | | | | | | |
| | | | | | | | | | | | | 2,628,481 | |
| | |
| Philippines – 4.7% | |
| | Philippine Government International Bond (BBB+/Baa2) | |
| | 650,000 | | | | 10.625 | | | | 03/16/25 | | | | 702,013 | |
| | 400,000 | | | | 3.000 | | | | 02/01/28 | | | | 368,169 | |
| | 200,000 | | | | 6.375 | | | | 10/23/34 | | | | 219,026 | |
| | 200,000 | | | | 3.700 | | | | 03/01/41 | | | | 160,114 | |
| | 200,000 | | | | 3.700 | | | | 02/02/42 | | | | 159,366 | |
| | 480,000 | | | | 2.950 | | | | 05/05/45 | | | | 329,690 | |
| | 450,000 | | | | 2.650 | | | | 12/10/45 | | | | 291,275 | |
| | 283,000 | | | | 3.200 | | | | 07/06/46 | | | | 200,987 | |
| | | | | | | | | | | | | | |
| | | | | | | | | | | | | 2,430,640 | |
| | |
| Poland – 1.9% | |
| | Republic of Poland Government International Bond (A-/A2) | |
| | 400,000 | | | | 5.500 | | | | 11/16/27 | | | | 407,006 | |
| | 300,000 | | | | 4.875 | | | | 10/04/33 | | | | 291,035 | |
| | 300,000 | | | | 5.500 | | | | 04/04/53 | | | | 291,576 | |
| | | | | | | | | | | | | | |
| | | | | | | | | | | | | 989,617 | |
| | |
| Qatar – 3.1% | |
| | Qatar Government International Bond (AA/Aa3) | |
| | 200,000 | | | | 3.400 | | | | 04/16/25 | | | | 194,152 | |
| | 350,000 | | | | 3.750 | | | | 04/16/30 | | | | 331,533 | |
| | 200,000 | | | | 4.625 | | | | 06/02/46 | | | | 183,452 | |
| | 220,000 | | | | 5.103 | | | | 04/23/48 | | | | 211,235 | |
| | 350,000 | | | | 4.817 | | | | 03/14/49 | | | | 326,146 | |
| | 400,000 | | | | 4.400 | | | | 04/16/50 | | | | 352,026 | |
| | | | | | | | | | | | | | |
| | | | | | | | | | | | | 1,598,544 | |
| | |
| Romania – 3.0% | |
| | Romanian Government International Bond (BBB-/Baa3) | |
| | 460,000 | | | | 5.250 | | | | 11/25/27 | | | | 453,141 | |
| | 170,000 | | | | 3.000 | | | | 02/14/31 | | | | 140,532 | |
| | 250,000 | | | | 3.625 | | | | 03/27/32 | | | | 209,548 | |
| | |
| | |
| 48 | | The accompanying notes are an integral part of these financial statements. |
GOLDMAN SACHS ACCESS EMERGING MARKETS USD BOND ETF
| | | | | | | | | | | | | | |
Principal
Amount | | | Interest
Rate | | | Maturity
Date | | | Value | |
|
| Sovereign Debt Obligations – (continued) | |
| Romania – (continued) | |
| Romanian Government International Bond (BBB-/
Baa3) – (continued) |
|
| $ | 300,000 | | | | 7.125 | % | | | 01/17/33 | | | $ | 315,370 | |
| | 180,000 | | | | 6.125 | | | | 01/22/44 | | | | 170,460 | |
| | 280,000 | | | | 5.125 | | | | 06/15/48 | | | | 232,823 | |
| | | | | | | | | | | | | | |
| | | | | | | | | | | | | 1,521,874 | |
| | |
| Saudi Arabia – 3.5% | |
| | Saudi Government International Bond (NR/A1) | |
| | 400,000 | | | | 2.500 | | | | 02/03/27 | | | | 367,546 | |
| | 225,000 | | | | 4.375 | | | | 04/16/29 | | | | 218,611 | |
| | 225,000 | | | | 4.500 | | | | 04/17/30 | | | | 219,146 | |
| | 400,000 | | | | 3.250 | | | | 10/22/30 | | | | 359,936 | |
| | 350,000 | | | | 4.500 | | | | 10/26/46 | | | | 296,060 | |
| | 200,000 | | | | 4.625 | | | | 10/04/47 | | | | 169,967 | |
| | 200,000 | | | | 4.500 | | | | 04/22/60 | | | | 165,045 | |
| | | | | | | | | | | | | | |
| | | | | | | | | | | | | 1,796,311 | |
| | |
| Serbia – 0.4% | |
| | Serbia International Bond (BB+/Ba2) | |
| | 200,000 | | | | 6.500 | | | | 09/26/33 | | | | 197,754 | |
| | |
| Trinidad and Tobago – 0.4% | |
| | Trinidad & Tobago Government International Bond (NR/NR) | |
| | 200,000 | | | | 4.500 | | | | 08/04/26 | | | | 193,500 | |
| | |
| Turkey – 6.0% | |
| | Turkey Government International Bond (NR/B3) | |
| | 325,000 | | | | 6.350 | | | | 08/10/24 | | | | 324,069 | |
| | 525,000 | | | | 5.600 | | | | 11/14/24 | | | | 516,397 | |
| | 350,000 | | | | 7.375 | | | | 02/05/25 | | | | 351,778 | |
| | 330,000 | | | | 4.250 | | | | 03/13/25 | | | | 316,017 | |
| | 525,000 | | | | 4.875 | | | | 10/09/26 | | | | 484,014 | |
| | 100,000 | | | | 11.875 | | | | 01/15/30 | | | | 118,000 | |
| | 362,000 | | | | 6.875 | | | | 03/17/36 | | | | 318,654 | |
| | 200,000 | | | | 6.000 | | | | 01/14/41 | | | | 154,497 | |
| | 725,000 | | | | 5.750 | | | | 05/11/47 | | | | 516,562 | |
| | | | | | | | | | | | | | |
| | | | | | | | | | | | | 3,099,988 | |
| | |
| United Arab Emirates – 1.3% | |
| | UAE Government International Bond (NR/Aa2) | |
| | 350,000 | | | | 2.000 | | | | 10/19/31 | | | | 288,591 | |
| | 200,000 | | | | 2.875 | | | | 10/19/41 | | | | 146,213 | |
| | 375,000 | | | | 3.250 | | | | 10/19/61 | | | | 256,316 | |
| | | | | | | | | | | | | | |
| | | | | | | | | | | | | 691,120 | |
| | |
| Uruguay – 3.7% | |
| | Uruguay Government International Bond (BBB+/Baa2) | |
| | 150,000 | | | | 4.375 | | | | 10/27/27 | | | | 148,875 | |
| | 408,000 | | | | 4.375 | | | | 01/23/31 | | | | 399,330 | |
| | 50,000 | | | | 7.875 | (b) | | | 01/15/33 | | | | 60,750 | |
| | 200,000 | | | | 5.750 | | | | 10/28/34 | | | | 214,500 | |
| | 200,000 | | | | 7.625 | | | | 03/21/36 | | | | 241,250 | |
| | 200,000 | | | | 4.125 | | | | 11/20/45 | | | | 174,250 | |
| | 450,000 | | | | 5.100 | | | | 06/18/50 | | | | 432,844 | |
| | 240,000 | | | | 4.975 | | | | 04/20/55 | | | | 225,300 | |
| | | | | | | | | | | | | | |
| | | | | | | | | | | | | 1,897,099 | |
| | |
| | TOTAL SOVEREIGN DEBT OBLIGATIONS | |
| | (Cost $45,876,770) | | | $ | 42,949,004 | |
| | |
|
| Corporate Obligations – 14.5% | |
| Brazil – 1.2% | |
| | Petrobras Global Finance BV (BB-/Ba1) | |
| $ | 200,000 | | | | 7.375 | % | | | 01/17/27 | | | $ | 206,750 | |
| | 200,000 | | | | 5.999 | | | | 01/27/28 | | | | 199,500 | |
| | 209,000 | | | | 6.850 | | | | 06/05/15 | | | | 182,722 | |
| | | | | | | | | | | | | | |
| | | | | | | | | | | | | 588,972 | |
| | |
| Chile – 2.2% | |
| | Corp. Nacional del Cobre de Chile (A/Baa1) | |
| | 200,000 | | | | 3.625 | | | | 08/01/27 | | | | 185,271 | |
| | 200,000 | | | | 3.000 | | | | 09/30/29 | | | | 172,937 | |
| | 200,000 | | | | 3.150 | | | | 01/14/30 | | | | 172,938 | |
| | 400,000 | | | | 4.500 | | | | 08/01/47 | | | | 322,192 | |
| | 200,000 | | | | 3.700 | | | | 01/30/50 | | | | 139,500 | |
| | Empresa de Transporte de Pasajeros Metro SA (NR/NR) | |
| | 200,000 | | | | 4.700 | | | | 05/07/50 | | | | 162,003 | |
| | | | | | | | | | | | | | |
| | | | | | | | | | | | | 1,154,841 | |
| | |
| China – 1.4% | |
| | China Development Bank, Series EMTN (A+/A1) | |
| | 200,000 | | | | 3.000 | | | | 06/01/26 | | | | 189,408 | |
| China Development Bank Financial Leasing Co. Ltd.(c)
(BBB+/NR) |
|
| | (US 5 Year CMT T-Note + 2.750%) | |
| | 200,000 | | | | 2.875 | | | | 09/28/30 | | | | 186,161 | |
| | Export-Import Bank of China (The) (A+/A1) | |
| | 350,000 | | | | 3.625 | | | | 07/31/24 | | | | 343,967 | |
| | | | | | | | | | | | | | |
| | | | | | | | | | | | | 719,536 | |
| | |
| Hungary – 0.4% | |
| | Magyar Export-Import Bank Zrt (BBB-/NR) | |
| | 200,000 | | | | 6.125 | % | | | 12/04/27 | | | | 199,343 | |
| | |
| India – 2.6% | |
| | Export-Import Bank of India (BBB-/Baa3) | |
| | 200,000 | | | | 3.375 | | | | 08/05/26 | | | | 189,079 | |
| | 200,000 | | | | 3.875 | | | | 02/01/28 | | | | 187,340 | |
| | 250,000 | | | | 3.250 | | | | 01/15/30 | | | | 217,507 | |
| | Indian Railway Finance Corp. Ltd. (BBB-/Baa3) | |
| | 350,000 | | | | 2.800 | | | | 02/10/31 | | | | 288,621 | |
| | 200,000 | | | | 3.570 | | | | 01/21/32 | | | | 171,372 | |
| | REC Ltd. (NR/Baa3) | |
| | 303,000 | | | | 5.625 | | | | 04/11/28 | | | | 299,415 | |
| | | | | | | | | | | | | | |
| | | | | | | | | | | | | 1,353,334 | |
| | |
| Indonesia – 1.7% | |
| | Pertamina Persero PT (NR/Baa2) | |
| | 757,000 | | | | 3.100 | | | | 08/27/30 | | | | 655,751 | |
| | 200,000 | | | | 6.450 | | | | 05/30/44 | | | | 202,500 | |
| | | | | | | | | | | | | | |
| | | | | | | | | | | | | 858,251 | |
| | |
| Mexico – 2.3% | |
| | Petroleos Mexicanos (BBB/B1) | |
| | 100,000 | | | | 6.875 | | | | 10/16/25 | | | | 94,590 | |
| | 200,000 | | | | 4.500 | | | | 01/23/26 | | | | 175,440 | |
| | 180,000 | | | | 6.500 | | | | 03/13/27 | | | | 157,738 | |
| | 25,000 | | | | 5.350 | | | | 02/12/28 | | | | 20,058 | |
| | 50,000 | | | | 6.500 | | | | 01/23/29 | | | | 40,624 | |
| | 100,000 | | | | 6.840 | | | | 01/23/30 | | | | 79,385 | |
| | |
| | |
| The accompanying notes are an integral part of these financial statements. | | 49 |
GOLDMAN SACHS ACCESS EMERGING MARKETS USD BOND ETF
Schedule of Investments (continued)
August 31, 2023
| | | | | | | | | | | | | | |
Principal
Amount | | | Interest
Rate | | | Maturity
Date | | | Value | |
|
| Corporate Obligations – (continued) | |
| Mexico – (continued) | |
| | Petroleos Mexicanos (BBB/B1) – (continued) | |
| $ | 250,000 | | | | 5.950 | % | | | 01/28/31 | | | $ | 181,286 | |
| | 25,000 | | | | 6.625 | | | | 06/15/35 | | | | 17,093 | |
| | 25,000 | | | | 6.500 | | | | 06/02/41 | | | | 15,531 | |
| | 50,000 | | | | 5.625 | | | | 01/23/46 | | | | 28,693 | |
| | 428,000 | | | | 6.750 | | | | 09/21/47 | | | | 264,874 | |
| | 75,000 | | | | 7.690 | | | | 01/23/50 | | | | 50,263 | |
| | 100,000 | | | | 6.950 | | | | 01/28/60 | | | | 61,637 | |
| | | | | | | | | | | | | | |
| | | | | | | | | | | | | 1,187,212 | |
| | |
| Philippines – 0.4% | |
| Power Sector Assets & Liabilities Management Corp.
(BBB+/Baa2) |
|
| | 200,000 | | | | 7.390 | | | | 12/02/24 | | | | 205,250 | |
| | |
| Poland – 0.4% | |
| | Bank Gospodarstwa Krajowego (NR/A2) | |
| | 200,000 | | | | 5.375 | | | | 05/22/33 | | | | 198,326 | |
| | |
| Qatar – 0.9% | |
| | QatarEnergy (NR/NR) | |
| | 309,000 | | | | 2.250 | | | | 07/12/31 | | | | 254,153 | |
| | 300,000 | | | | 3.300 | | | | 07/12/51 | | | | 210,253 | |
| | | | | | | | | | | | | | |
| | | | | | | | | | | | | 464,406 | |
| | |
| Saudi Arabia – 1.0% | |
| | Saudi Arabian Oil Co. (NR/A1) | |
| | 375,000 | | | | 3.500 | | | | 04/16/29 | | | | 343,519 | |
| | 200,000 | | | | 4.250 | | | | 04/16/39 | | | | 171,613 | |
| | | | | | | | | | | | | | |
| | | | | | | | | | | | | 515,132 | |
| | |
| | TOTAL CORPORATE OBLIGATIONS | |
| | (Cost $7,915,355) | | | | | | | $ | 7,444,603 | |
| | |
| | | | | | | | |
| Shares | | Dividend
Rate | | | Value | |
|
| Investment Company – 0.5%(d) | |
Goldman Sachs Financial Square Government Fund – Institutional Shares | |
| 255,051 | | | 5.234 | % | | $ | 255,051 | |
| (Cost $255,051) | |
| |
| TOTAL INVESTMENTS – 98.4% | |
| (Cost $54,047,176) | | | $ | 50,648,658 | |
| |
| OTHER ASSETS IN EXCESS OF LIABILITIES – 1.6% | | | | 811,974 | |
| |
| NET ASSETS – 100.0% | | | $ | 51,460,632 | |
| |
| | |
|
| The percentage shown for each investment category reflects the value of investments in that category as a percentage of net assets. |
| |
(a) | | Step coupon. |
| |
(b) | | Pay-in-kind securities. |
| |
(c) | | Variable rate security. Interest rate or distribution rate disclosed is that which is in effect on August 31, 2023. |
| |
(d) | | Represents an affiliated issuer. |
| | |
|
Investment Abbreviations: |
CMT | | —Constant Maturity Treasury Index |
MTN | | —Medium Term Note |
|
| | |
| 50 | | The accompanying notes are an integral part of these financial statements. |
GOLDMAN SACHS ACCESS HIGH YIELD CORPORATE BOND ETF
Schedule of Investments
August 31, 2023
| | | | | | | | | | | | | | |
Principal
Amount | | | Interest
Rate | | | Maturity
Date | | | Value | |
|
| Corporate Obligations – 91.2% | |
| Advertising – 0.7% | |
| | Clear Channel Outdoor Holdings, Inc. (B/B1) | |
| $ | 316,000 | | | | 5.125 | %(a) | | | 08/15/27 | | | $ | 282,820 | |
| | 136,000 | | | | 7.500 | (a) | | | 06/01/29 | | | | 101,320 | |
| | Lamar Media Corp. (BB/Ba3) | |
| | 179,000 | | | | 3.750 | | | | 02/15/28 | | | | 163,785 | |
| | 234,000 | | | | 4.000 | | | | 02/15/30 | | | | 205,920 | |
| | | | | | | | | | | | | | |
| | | | | | | | | | | | | 753,845 | |
| | |
| Aerospace & Defense – 2.8% | |
| | Howmet Aerospace, Inc. (BB+/Ba1) | |
| | 50,000 | | | | 5.125 | | | | 10/01/24 | | | | 49,687 | |
| | 590,000 | | | | 6.875 | | | | 05/01/25 | | | | 594,425 | |
| | TransDigm UK Holdings PLC (B-/B3) | |
| | 200,000 | | | | 6.875 | | | | 05/15/26 | | | | 204,190 | |
| | TransDigm, Inc. (B+/Ba3) | |
| | 758,000 | | | | 6.250 | (a) | | | 03/15/26 | | | | 752,315 | |
| | 62,000 | | | | 6.375 | | | | 06/15/26 | | | | 61,969 | |
| | 46,000 | | | | 7.500 | | | | 03/15/27 | | | | 46,172 | |
| | 523,000 | | | | 5.500 | | | | 11/15/27 | | | | 497,504 | |
| | 730,000 | | | | 4.625 | | | | 01/15/29 | | | | 654,263 | |
| | | | | | | | | | | | | | |
| | | | | | | | | | | | | 2,860,525 | |
| | |
| Banks – 0.3% | |
| | Freedom Mortgage Corp. (B/B2) | |
| | 179,000 | | | | 8.250 | (a) | | | 04/15/25 | | | | 176,315 | |
| | 197,000 | | | | 7.625 | (a) | | | 05/01/26 | | | | 181,733 | |
| | | | | | | | | | | | | | |
| | | | | | | | | | | | | 358,048 | |
| | |
| Basic Industry – 2.3% | |
| | Axalta Coating Systems LLC(a) (BB-/B1) | |
| | 280,000 | | | | 3.375 | | | | 02/15/29 | | | | 238,350 | |
| | Chemours Co. (The)(a) (BB/B1) | |
| | 213,000 | | | | 5.750 | | | | 11/15/28 | | | | 191,700 | |
| | Olin Corp. (BB+/Ba1) | |
| | 289,000 | | | | 5.625 | | | | 08/01/29 | | | | 277,801 | |
| | 220,000 | | | | 5.000 | | | | 02/01/30 | | | | 202,950 | |
| | Olympus Water US Holding Corp.(a) (B-/B3) | |
| | 280,000 | | | | 4.250 | | | | 10/01/28 | | | | 221,550 | |
| | SCIH Salt Holdings, Inc.(a) (CCC+/Caa2) | |
| | 317,000 | | | | 6.625 | | | | 05/01/29 | | | | 280,941 | |
| | Tronox, Inc.(a) (BB-/B1) | |
| | 438,000 | | | | 4.625 | | | | 03/15/29 | | | | 360,255 | |
| | Valvoline, Inc.(a) (B+/Ba3) | |
| | 247,000 | | | | 3.625 | | | | 06/15/31 | | | | 198,218 | |
| | WR Grace Holdings LLC (B/B1) | |
| | 200,000 | | | | 4.875 | (a) | | | 06/15/27 | | | | 187,000 | |
| | 160,000 | | | | 5.625 | (a) | | | 08/15/29 | | | | 135,800 | |
| | | | | | | | | | | | | | |
| | | | | | | | | | | | | 2,294,565 | |
| | |
| Broadcasting – 2.6% | |
| | CMG Media Corp.(a) (CCC+/Caa1) | |
| | 315,000 | | | | 8.875 | | | | 12/15/27 | | | | 248,063 | |
| | Nexstar Media, Inc.(a) (BB+/B2) | |
| | 407,000 | | | | 5.625 | | | | 07/15/27 | | | | 383,597 | |
| | Sirius XM Radio, Inc. (BB/Ba3) | |
| | 476,000 | | | | 5.000 | (a) | | | 08/01/27 | | | | 440,300 | |
| | 494,000 | | | | 4.000 | (a) | | | 07/15/28 | | | | 428,545 | |
| | 326,000 | | | | 3.875 | (a) | | | 09/01/31 | | | | 253,261 | |
| | |
|
| Corporate Obligations – (continued) | |
| Broadcasting – (continued) | |
| | TEGNA, Inc. (BB+/Ba3) | |
| 126,000 | | | | 4.625 | | | | 03/15/28 | | | | 113,400 | |
| | 361,000 | | | | 5.000 | | | | 09/15/29 | | | | 319,485 | |
| | Univision Communications, Inc. (B+/B1) | |
| | 102,000 | | | | 5.125 | (a) | | | 02/15/25 | | | | 100,598 | |
| | 94,000 | | | | 6.625 | (a) | | | 06/01/27 | | | | 91,180 | |
| | 280,000 | | | | 4.500 | (a) | | | 05/01/29 | | | | 240,800 | |
| | | | | | | | | | | | | | |
| | | | | | | | | | | | | 2,619,229 | |
| | |
| Brokerage – 0.7% | |
| | Coinbase Global, Inc.(a) (BB-/B1) | |
| | 148,000 | | | | 3.375 | | | | 10/01/28 | | | | 108,595 | |
| | Jefferies Finance LLC / JFIN Co.-Issuer Corp.(a) (BB-/B1) | |
| | 470,000 | | | | 5.000 | | | | 08/15/28 | | | | 403,468 | |
| Ladder Capital Finance Holdings LLLP / Ladder Capital Finance
Corp.(a) (BB-/Ba2) |
|
| | 297,000 | | | | 4.750 | | | | 06/15/29 | | | | 250,594 | |
| | | | | | | | | | | | | | |
| | | | | | | | | | | | | 762,657 | |
| | |
| Building Materials – 1.0% | |
| | American Builders & Contractors Supply Co., Inc. (BB+/Ba2) | |
| | 177,000 | | | | 4.000 | (a) | | | 01/15/28 | | | | 160,849 | |
| | 50,000 | | | | 3.875 | (a) | | | 11/15/29 | | | | 43,187 | |
| | Builders FirstSource, Inc. (BB-/Ba2) | |
| | 88,000 | | | | 5.000 | (a) | | | 03/01/30 | | | | 80,960 | |
| | 301,000 | | | | 4.250 | (a) | | | 02/01/32 | | | | 256,603 | |
| | Standard Industries, Inc. (BB/B1) | |
| | 329,000 | | | | 4.375 | (a) | | | 07/15/30 | | | | 283,333 | |
| | 179,000 | | | | 3.375 | (a) | | | 01/15/31 | | | | 142,750 | |
| | | | | | | | | | | | | | |
| | | | | | | | | | | | | 967,682 | |
| | |
| Capital Goods – 3.7% | |
| Ardagh Metal Packaging Finance USA LLC / Ardagh Metal
Packaging Finance PLC(a) (B+/Caa1) |
|
| | 300,000 | | | | 4.000 | | | | 09/01/29 | | | | 243,187 | |
| Ardagh Packaging Finance PLC / Ardagh Holdings USA, Inc.
(B-/Caa1) |
|
| | 400,000 | | | | 5.250 | (a) | | | 08/15/27 | | | | 346,000 | |
| | 200,000 | | | | 5.250 | (a) | | | 08/15/27 | | | | 171,000 | |
| | ASP Unifrax Holdings, Inc.(a) (CCC/Caa2) | |
| | 204,000 | | | | 7.500 | | | | 09/30/29 | | | | 107,100 | |
| | Ball Corp. (BB+/Ba1) | |
| | 500,000 | | | | 2.875 | | | | 08/15/30 | | | | 411,875 | |
| | Clydesdale Acquisition Holdings, Inc. (CCC+/Caa2) | |
| | 51,000 | | | | 6.625 | (a) | | | 04/15/29 | | | | 48,641 | |
| | 215,000 | | | | 8.750 | (a) | | | 04/15/30 | | | | 193,500 | |
| | Covanta Holding Corp.(a) (B/B3) | |
| | 337,000 | | | | 4.875 | | | | 12/01/29 | | | | 289,682 | |
| Crown Americas LLC / Crown Americas Capital Corp V
(BB+/Ba2) |
|
| | 213,000 | | | | 4.250 | | | | 09/30/26 | | | | 201,019 | |
| Crown Americas LLC / Crown Americas Capital Corp. VI
(BB+/Ba2) |
|
| | 148,000 | | | | 4.750 | | | | 02/01/26 | | | | 142,820 | |
| | Herc Holdings, Inc.(a) (B+/Ba3) | |
| | 226,000 | | | | 5.500 | | | | 07/15/27 | | | | 217,807 | |
| | |
| | |
| The accompanying notes are an integral part of these financial statements. | | 51 |
GOLDMAN SACHS ACCESS HIGH YIELD CORPORATE BOND ETF
Schedule of Investments (continued)
August 31, 2023
| | | | | | | | | | | | | | |
Principal
Amount | | | Interest
Rate | | | Maturity
Date | | | Value | |
|
| Corporate Obligations – (continued) | |
| Capital Goods – (continued) | |
| | LABL, Inc. (B-/B2) | |
| $ | 233,000 | | | | 6.750 | %(a) | | | 07/15/26 | | | $ | 228,923 | |
| | 152,000 | | | | 10.500 | (a) | | | 07/15/27 | | | | 145,160 | |
| | Mauser Packaging Solutions Holding Co.(a) (B/B2) | |
| | 645,000 | | | | 7.875 | | | | 08/15/26 | | | | 635,325 | |
| | Sensata Technologies, Inc.(a) (BB+/Ba2) | |
| | 428,000 | | | | 3.750 | | | | 02/15/31 | | | | 357,380 | |
| | | | | | | | | | | | | | |
| | | | | | | | | | | | | 3,739,419 | |
| | |
| Communications – 5.6% | |
| | AMC Networks, Inc. (BB-/Ba3) | |
| | 175,000 | | | | 4.250 | | | | 02/15/29 | | | | 112,000 | |
| | CCO Holdings LLC / CCO Holdings Capital Corp. (BB-/B1) | |
| | 300,000 | | | | 5.125 | (a) | | | 05/01/27 | | | | 283,875 | |
| | 400,000 | | | | 5.000 | (a) | | | 02/01/28 | | | | 369,000 | |
| | 300,000 | | | | 5.375 | (a) | | | 06/01/29 | | | | 274,125 | |
| | 450,000 | | | | 4.750 | (a) | | | 03/01/30 | | | | 389,812 | |
| | 300,000 | | | | 4.500 | (a) | | | 08/15/30 | | | | 253,500 | |
| | 350,000 | | | | 4.250 | (a) | | | 02/01/31 | | | | 288,313 | |
| | 440,000 | | | | 7.375 | (a) | | | 03/01/31 | | | | 438,350 | |
| | 550,000 | | | | 4.500 | | | | 05/01/32 | | | | 446,875 | |
| | 400,000 | | | | 4.250 | (a) | | | 01/15/34 | | | | 307,500 | |
| | CSC Holdings LLC (B/B2) | |
| | 200,000 | | | | 5.500 | (a) | | | 04/15/27 | | | | 173,000 | |
| | 250,000 | | | | 7.500 | (a) | | | 04/01/28 | | | | 158,750 | |
| | 400,000 | | | | 6.500 | (a) | | | 02/01/29 | | | | 331,000 | |
| | 240,000 | | | | 5.750 | (a) | | | 01/15/30 | | | | 132,900 | |
| | 250,000 | | | | 4.125 | (a) | | | 12/01/30 | | | | 178,750 | |
| | 400,000 | | | | 4.625 | (a) | | | 12/01/30 | | | | 210,000 | |
| | 250,000 | | | | 3.375 | (a) | | | 02/15/31 | | | | 171,875 | |
| Directv Financing LLC / Directv Financing Co.-Obligor, Inc.(a)
(BB/Ba3) |
|
| | 558,000 | | | | 5.875 | | | | 08/15/27 | | | | 498,015 | |
| | Live Nation Entertainment, Inc.(a) (B+/B2) | |
| | 442,000 | | | | 4.750 | | | | 10/15/27 | | | | 413,822 | |
| | WMG Acquisition Corp. (BB+/Ba2) | |
| | 232,000 | | | | 3.875 | (a) | | | 07/15/30 | | | | 202,420 | |
| | 93,000 | | | | 3.000 | (a) | | | 02/15/31 | | | | 76,260 | |
| | | | | | | | | | | | | | |
| | | | | | | | | | | | | 5,710,142 | |
| | |
| Consumer Cyclical – 19.2% | |
| | ADT Security Corp. (The) (BB/Ba3) | |
| | 86,000 | | | | 4.125 | (a) | | | 08/01/29 | | | | 75,357 | |
| | 46,000 | | | | 4.875 | (a) | | | 07/15/32 | | | | 39,963 | |
| | Allison Transmission, Inc.(a) (NR/Ba2) | |
| | 289,000 | | | | 3.750 | | | | 01/30/31 | | | | 242,037 | |
| | American Axle & Manufacturing, Inc. (B+/B2) | |
| | 263,000 | | | | 6.875 | | | | 07/01/28 | | | | 241,960 | |
| | 126,000 | | | | 5.000 | | | | 10/01/29 | | | | 103,635 | |
| | Asbury Automotive Group, Inc.(a) (BB/B1) | |
| | 300,000 | | | | 4.625 | | | | 11/15/29 | | | | 265,125 | |
| | Bath & Body Works, Inc. (BB/Ba2) | |
| | 200,000 | | | | 6.875 | | | | 11/01/35 | | | | 187,250 | |
| | 100,000 | | | | 6.750 | | | | 07/01/36 | | | | 92,000 | |
| | Boyd Gaming Corp. (BB/B1) | |
| | 108,000 | | | | 4.750 | | | | 12/01/27 | | | | 101,655 | |
| | 146,000 | | | | 4.750 | (a) | | | 06/15/31 | | | | 129,392 | |
| | |
|
| Corporate Obligations – (continued) | |
| Consumer Cyclical – (continued) | |
| | Caesars Entertainment, Inc. (B/Ba3) | |
| 680,000 | | | | 6.250 | %(a) | | | 07/01/25 | | | | 675,750 | |
| | 305,000 | | | | 8.125 | (a) | | | 07/01/27 | | | | 309,582 | |
| | 375,000 | | | | 4.625 | (a) | | | 10/15/29 | | | | 329,063 | |
| | Carnival Corp. (B/B3) | |
| | 841,000 | | | | 7.625 | (a) | | | 03/01/26 | | | | 841,000 | |
| | 50,000 | | | | 5.750 | (a) | | | 03/01/27 | | | | 47,125 | |
| | 908,000 | | | | 6.000 | (a) | | | 05/01/29 | | | | 822,875 | |
| | Carnival Holdings Bermuda Ltd.(a) (B+/B2) | |
| | 273,000 | | | | 10.375 | | | | 05/01/28 | | | | 297,570 | |
| | Carvana Co. (D/Ca) | |
| | 400,000 | | | | 5.875 | (a) | | | 10/01/28 | | | | 246,000 | |
| | 400,000 | | | | 10.250 | (a) | | | 05/01/30 | | | | 317,000 | |
| Cedar Fair LP / Canada’s Wonderland Co. / Magnum
Management Corp. / Millennium Op(a) (BB+/Ba2) |
|
| | 235,000 | | | | 5.500 | | | | 05/01/25 | | | | 233,531 | |
| | Churchill Downs, Inc. (B+/B1) | |
| | 277,000 | | | | 5.500 | (a) | | | 04/01/27 | | | | 266,959 | |
| | 215,000 | | | | 4.750 | (a) | | | 01/15/28 | | | | 199,950 | |
| | Clarios Global LP / Clarios US Finance Co.(a) (B-/Caa1) | |
| | 296,000 | | | | 8.500 | | | | 05/15/27 | | | | 297,480 | |
| Fertitta Entertainment LLC / Fertitta Entertainment Finance Co.,
Inc. (B/B2) |
|
| | 147,000 | | | | 4.625 | (a) | | | 01/15/29 | | | | 127,339 | |
| | 44,000 | | | | 6.750 | (a) | | | 01/15/30 | | | | 36,465 | |
| | Ford Motor Co. (BB+/Ba1) | |
| | 240,000 | | | | 4.346 | | | | 12/08/26 | | | | 231,251 | |
| | 390,000 | | | | 9.625 | | | | 04/22/30 | | | | 451,113 | |
| | Ford Motor Credit Co. LLC (BB+/Ba1) | |
| | 200,000 | | | | 3.664 | | | | 09/08/24 | | | | 193,998 | |
| | 200,000 | | | | 4.063 | | | | 11/01/24 | | | | 193,740 | |
| | 200,000 | | | | 4.687 | | | | 06/09/25 | | | | 192,450 | |
| | 200,000 | | | | 4.271 | | | | 01/09/27 | | | | 185,637 | |
| | 210,000 | | | | 4.125 | | | | 08/17/27 | | | | 190,687 | |
| | 300,000 | | | | 3.815 | | | | 11/02/27 | | | | 268,167 | |
| | 400,000 | | | | 5.113 | | | | 05/03/29 | | | | 367,423 | |
| | 280,000 | | | | 7.350 | | | | 03/06/30 | | | | 285,301 | |
| | Ford Motor Credit Co. LLC, GMTN (BB+/Ba1) | |
| | 200,000 | | | | 4.389 | | | | 01/08/26 | | | | 189,470 | |
| | Gap, Inc. (The)(a) (BB/B1) | |
| | 212,000 | | | | 3.875 | | | | 10/01/31 | | | | 153,700 | |
| | Goodyear Tire & Rubber Co. (The) (BB-/B2) | |
| | 50,000 | | | | 9.500 | | | | 05/31/25 | | | | 51,062 | |
| | 50,000 | | | | 5.000 | | | | 05/31/26 | | | | 48,375 | |
| | 50,000 | | | | 4.875 | | | | 03/15/27 | | | | 47,250 | |
| | 170,000 | | | | 5.000 | | | | 07/15/29 | | | | 151,725 | |
| | 180,000 | | | | 5.250 | | | | 04/30/31 | | | | 157,500 | |
| | 110,000 | | | | 5.250 | | | | 07/15/31 | | | | 95,150 | |
| | Hilton Domestic Operating Co., Inc. (BB+/Ba2) | |
| | 50,000 | | | | 5.375 | (a) | | | 05/01/25 | | | | 49,562 | |
| | 220,000 | | | | 5.750 | (a) | | | 05/01/28 | | | | 216,150 | |
| | 145,000 | | | | 3.750 | (a) | | | 05/01/29 | | | | 128,144 | |
| | 45,000 | | | | 4.875 | | | | 01/15/30 | | | | 41,906 | |
| | 303,000 | | | | 4.000 | (a) | | | 05/01/31 | | | | 264,118 | |
| | 259,000 | | | | 3.625 | (a) | | | 02/15/32 | | | | 215,780 | |
| | |
| | |
| 52 | | The accompanying notes are an integral part of these financial statements. |
GOLDMAN SACHS ACCESS HIGH YIELD CORPORATE BOND ETF
| | | | | | | | | | | | | | |
Principal
Amount | | | Interest
Rate | | | Maturity
Date | | | Value | |
|
| Corporate Obligations – (continued) | |
| Consumer Cyclical – (continued) | |
| Hilton Grand Vacations Borrower Escrow LLC / Hilton Grand
Vacations Borrower Esc(a) (B+/B2) |
|
| $ | 438,000 | | | | 5.000 | % | | | 06/01/29 | | | $ | 389,272 | |
| | Iron Mountain, Inc. (BB-/Ba3) | |
| | 200,000 | | | | 4.875 | (a) | | | 09/15/27 | | | | 189,000 | |
| | 256,000 | | | | 5.250 | (a) | | | 03/15/28 | | | | 241,280 | |
| | 341,000 | | | | 5.250 | (a) | | | 07/15/30 | | | | 308,605 | |
| | 400,000 | | | | 4.500 | (a) | | | 02/15/31 | | | | 343,750 | |
| KFC Holding Co./Pizza Hut Holdings LLC/Taco Bell of America
LLC(a) (BB+/Ba2) |
|
| | 50,000 | | | | 4.750 | | | | 06/01/27 | | | | 48,437 | |
| | LCM Investments Holdings II LLC(a) (B+/B2) | |
| | 300,000 | | | | 4.875 | | | | 05/01/29 | | | | 260,250 | |
| | Light & Wonder International, Inc. (B+/B3) | |
| | 145,000 | | | | 7.000 | (a) | | | 05/15/28 | | | | 145,181 | |
| | 46,000 | | | | 7.250 | (a) | | | 11/15/29 | | | | 46,345 | |
| | Macy’s Retail Holdings LLC (BB+/Ba2) | |
| | 200,000 | | | | 5.875 | (a) | | | 04/01/29 | | | | 181,750 | |
| | 101,000 | | | | 6.125 | (a) | | | 03/15/32 | | | | 86,860 | |
| | MGM Resorts International (BB-/B1) | |
| | 79,000 | | | | 5.750 | | | | 06/15/25 | | | | 78,012 | |
| | 173,000 | | | | 4.625 | | | | 09/01/26 | | | | 163,269 | |
| | 190,000 | | | | 5.500 | | | | 04/15/27 | | | | 182,400 | |
| | 160,000 | | | | 4.750 | | | | 10/15/28 | | | | 145,800 | |
| | Mohegan Tribal Gaming Authority(a) (B-/B3) | |
| | 209,000 | | | | 8.000 | | | | 02/01/26 | | | | 193,847 | |
| | NCL Corp Ltd.(a) (B-/Caa1) | |
| | 207,000 | | | | 3.625 | | | | 12/15/24 | | | | 198,461 | |
| | NCL Corp. Ltd. (B-/Caa1) | |
| | 340,000 | | | | 5.875 | (a) | | | 03/15/26 | | | | 321,300 | |
| | 119,000 | | | | 7.750 | (a) | | | 02/15/29 | | | | 113,348 | |
| NMG Holding Co., Inc. / Neiman Marcus Group LLC(a)
(B-/Caa1) |
|
| | 240,000 | | | | 7.125 | | | | 04/01/26 | | | | 229,200 | |
| | Nordstrom, Inc. (BB+/Ba1) | |
| | 251,000 | | | | 4.375 | | | | 04/01/30 | | | | 200,173 | |
| | PetSmart, Inc. / PetSmart Finance Corp. (B-/B3) | |
| | 250,000 | | | | 4.750 | (a) | | | 02/15/28 | | | | 225,000 | |
| | 250,000 | | | | 7.750 | (a) | | | 02/15/29 | | | | 239,375 | |
| Premier Entertainment Sub LLC / Premier Entertainment Finance
Corp. (CCC+/B3) |
|
| | 120,000 | | | | 5.625 | (a) | | | 09/01/29 | | | | 96,000 | |
| | 120,000 | | | | 5.875 | (a) | | | 09/01/31 | | | | 93,300 | |
| Prime Security Services Borrower LLC / Prime Finance, Inc.
(B/B3) |
|
| | 88,000 | | | | 3.375 | (a) | | | 08/31/27 | | | | 78,430 | |
| | 358,000 | | | | 6.250 | (a) | | | 01/15/28 | | | | 342,785 | |
| | RHP Hotel Properties LP / RHP Finance Corp.(a) (B+/B1) | |
| | 205,000 | | | | 4.500 | | | | 02/15/29 | | | | 180,144 | |
| | Royal Caribbean Cruises Ltd. (BB+/Ba1) | |
| | 78,000 | | | | 11.500 | (a) | | | 06/01/25 | | | | 82,388 | |
| | 437,000 | | | | 4.250 | (a) | | | 07/01/26 | | | | 408,595 | |
| | 150,000 | | | | 3.700 | | | | 03/15/28 | | | | 130,687 | |
| | 351,000 | | | | 5.500 | (a) | | | 04/01/28 | | | | 329,940 | |
| | Six Flags Entertainment Corp.(a) (B/B3) | |
| | 150,000 | | | | 5.500 | | | | 04/15/27 | | | | 141,563 | |
| | |
|
| Corporate Obligations – (continued) | |
| Consumer Cyclical – (continued) | |
| | Staples, Inc. (B-/B3) | |
| 238,000 | | | | 7.500 | %(a) | | | 04/15/26 | | | | 197,540 | |
| | 376,000 | | | | 10.750 | (a) | | | 04/15/27 | | | | 206,800 | |
| | Taylor Morrison Communities, Inc.(a) (BB/Ba2) | |
| | 143,000 | | | | 5.125 | | | | 08/01/30 | | | | 131,203 | |
| | Travel + Leisure Co.(a) (BB-/Ba3) | |
| | 260,000 | | | | 6.625 | | | | 07/31/26 | | | | 258,700 | |
| | Williams Scotsman International, Inc.(a) (BB-/B2) | |
| | 273,000 | | | | 6.125 | | | | 06/15/25 | | | | 271,635 | |
| | Wynn Las Vegas LLC / Wynn Las Vegas Capital Corp. (B+/B2) | |
| | 179,000 | | | | 5.500 | (a) | | | 03/01/25 | | | | 176,986 | |
| | 100,000 | | | | 5.250 | (a) | | | 05/15/27 | | | | 95,625 | |
| Wynn Resorts Finance LLC / Wynn Resorts Capital Corp.(a)
(B+/B2) |
|
| | 200,000 | | | | 5.125 | | | | 10/01/29 | | | | 179,500 | |
| | Yum! Brands, Inc. (BB/Ba3) | |
| | 161,000 | | | | 4.750 | (a) | | | 01/15/30 | | | | 148,724 | |
| | 164,000 | | | | 3.625 | | | | 03/15/31 | | | | 139,400 | |
| | 375,000 | | | | 5.375 | | | | 04/01/32 | | | | 352,969 | |
| | | | | | | | | | | | | | |
| | | | | | | | | | | | | 19,469,551 | |
| | |
| Consumer Noncyclical – 4.3% | |
| Allied Universal Holdco LLC / Allied Universal Finance Corp.
(CCC+/Caa2) |
|
| | 62,000 | | | | 6.625 | (a) | | | 07/15/26 | | | | 58,900 | |
| | 220,000 | | | | 9.750 | (a) | | | 07/15/27 | | | | 202,262 | |
| | 280,000 | | | | 6.000 | (a) | | | 06/01/29 | | | | 215,600 | |
| Allied Universal Holdco LLC/Allied Universal Finance Corp./
Atlas Luxco 4 Sarl(a) (B/B3) |
|
| | 200,000 | | | | 4.625 | | | | 06/01/28 | | | | 171,000 | |
| | Avantor Funding, Inc.(a) (BB/B2) | |
| | 396,000 | | | | 4.625 | | | | 07/15/28 | | | | 368,775 | |
| | Hologic, Inc. (BB+/Ba2) | |
| | 104,000 | | | | 4.625 | (a) | | | 02/01/28 | | | | 98,280 | |
| | 399,000 | | | | 3.250 | (a) | | | 02/15/29 | | | | 348,127 | |
| | Medline Borrower LP (B+/B1) | |
| | 998,000 | | | | 3.875 | (a) | | | 04/01/29 | | | | 874,498 | |
| | 121,000 | | | | 5.250 | (a) | | | 10/01/29 | | | | 107,690 | |
| | Molina Healthcare, Inc.(a) (BB-/Ba3) | |
| | 470,000 | | | | 4.375 | | | | 06/15/28 | | | | 431,813 | |
| | Organon & Co. / Organon Foreign Debt Co.-Issuer BV (BB/Ba2) | |
| | 730,000 | | | | 4.125 | (a) | | | 04/30/28 | | | | 661,562 | |
| | 290,000 | | | | 5.125 | (a) | | | 04/30/31 | | | | 248,313 | |
| RegionalCare Hospital Partners Holdings, Inc. / LifePoint Health,
Inc.(a) (CCC+/Caa2) |
|
| | 393,000 | | | | 9.750 | | | | 12/01/26 | | | | 367,455 | |
| | Vector Group Ltd.(a) (B-/Caa1) | |
| | 160,000 | | | | 10.500 | | | | 11/01/26 | | | | 160,800 | |
| | | | | | | | | | | | | | |
| | | | | | | | | | | | | 4,315,075 | |
| | |
| Consumer Products – 0.5% | |
| | Coty, Inc.(a) (BB/Ba2) | |
| | 382,000 | | | | 5.000 | | | | 04/15/26 | | | | 367,675 | |
| | Tempur Sealy International, Inc.(a) (BB/Ba2) | |
| | 200,000 | | | | 4.000 | | | | 04/15/29 | | | | 172,250 | |
| | | | | | | | | | | | | | |
| | | | | | | | | | | | | 539,925 | |
| | |
| | |
| The accompanying notes are an integral part of these financial statements. | | 53 |
GOLDMAN SACHS ACCESS HIGH YIELD CORPORATE BOND ETF
Schedule of Investments (continued)
August 31, 2023
| | | | | | | | | | | | | | |
Principal
Amount | | | Interest
Rate | | | Maturity
Date | | | Value | |
|
| Corporate Obligations – (continued) | |
| Distribution & Logistics – 0.2% | |
| | WESCO Distribution, Inc.(a) (BB/Ba3) | |
| $ | 171,000 | | | | 7.250 | % | | | 06/15/28 | | | $ | 173,993 | |
| | |
| Electric – 2.6% | |
| | Calpine Corp. (BB+/Ba2) | |
| | 191,000 | | | | 5.250 | (a) | | | 06/01/26 | | | | 187,180 | |
| | 150,000 | | | | 4.625 | (a) | | | 02/01/29 | | | | 130,125 | |
| | 68,000 | | | | 5.000 | (a) | | | 02/01/31 | | | | 57,800 | |
| | 277,000 | | | | 3.750 | (a) | | | 03/01/31 | | | | 231,295 | |
| | Clearway Energy Operating LLC(a) (BB/Ba2) | |
| | 497,000 | | | | 3.750 | | | | 02/15/31 | | | | 407,540 | |
| | FirstEnergy Corp. (BB+/Ba1) | |
| | 520,000 | | | | 2.650 | | | | 03/01/30 | | | | 436,909 | |
| | FirstEnergy Corp., Series B (BB+/Ba1) | |
| | 126,000 | | | | 4.150 | | | | 07/15/27 | | | | 119,303 | |
| | PG&E Corp. (BB-/B1) | |
| | 514,000 | | | | 5.250 | | | | 07/01/30 | | | | 457,460 | |
| | Vistra Operations Co. LLC (BB/Ba2) | |
| | 187,000 | | | | 5.625 | (a) | | | 02/15/27 | | | | 180,455 | |
| | 385,000 | | | | 5.000 | (a) | | | 07/31/27 | | | | 361,900 | |
| | 84,000 | | | | 4.375 | (a) | | | 05/01/29 | | | | 73,920 | |
| | | | | | | | | | | | | | |
| | | | | | | | | | | | | 2,643,887 | |
| | |
| Energy – 11.4% | |
| Antero Midstream Partners LP / Antero Midstream Finance Corp.
(BB/Ba3) |
|
| | 167,000 | | | | 5.750 | (a) | | | 03/01/27 | | | | 161,990 | |
| | 71,000 | | | | 5.750 | (a) | | | 01/15/28 | | | | 68,160 | |
| | Antero Resources Corp. (BB+/Ba2) | |
| | 126,000 | | | | 7.625 | (a) | | | 02/01/29 | | | | 128,835 | |
| | 50,000 | | | | 5.375 | (a) | | | 03/01/30 | | | | 46,750 | |
| Archrock Partners LP / Archrock Partners Finance Corp.(a)
(B+/B2) |
|
| | 297,000 | | | | 6.875 | | | | 04/01/27 | | | | 292,545 | |
| Ascent Resources Utica Holdings LLC / ARU Finance Corp.(a)
(B+/B3) |
|
| | 159,000 | | | | 5.875 | | | | 06/30/29 | | | | 145,286 | |
| | Buckeye Partners LP (BB-/B1) | |
| | 68,000 | | | | 3.950 | | | | 12/01/26 | | | | 62,985 | |
| | 144,000 | | | | 4.125 | | | | 12/01/27 | | | | 130,330 | |
| | 152,000 | | | | 4.500 | (a) | | | 03/01/28 | | | | 138,700 | |
| | Callon Petroleum Co.(a) (BB-/B3) | |
| | 351,000 | | | | 8.000 | | | | 08/01/28 | | | | 357,142 | |
| | CITGO Petroleum Corp.(a) (B+/B3) | |
| | 75,000 | | | | 6.375 | | | | 06/15/26 | | | | 73,688 | |
| | Civitas Resources, Inc.(a) (BB-/B1) | |
| | 200,000 | | | | 8.750 | | | | 07/01/31 | | | | 207,125 | |
| | Comstock Resources, Inc. (B+/B2) | |
| | 108,000 | | | | 6.750 | (a) | | | 03/01/29 | | | | 101,250 | |
| | 132,000 | | | | 5.875 | (a) | | | 01/15/30 | | | | 116,820 | |
| | CQP Holdco LP / BIP-V Chinook Holdco LLC(a) (BB/B1) | |
| | 500,000 | | | | 5.500 | | | | 06/15/31 | | | | 457,500 | |
| | CrownRock LP / CrownRock Finance, Inc.(a) (BB-/B1) | |
| | 391,000 | | | | 5.625 | | | | 10/15/25 | | | | 385,135 | |
| | DT Midstream, Inc.(a) (BB+/Ba2) | |
| | 197,000 | | | | 4.375 | | | | 06/15/31 | | | | 170,651 | |
| | |
|
| Corporate Obligations – (continued) | |
| Energy – (continued) | |
| | Endeavor Energy Resources LP / EER Finance, Inc.(a) (BB+/Ba2) | |
| $ | 243,000 | | | | 5.750 | % | | | 01/30/28 | | | $ | 236,925 | |
| | EnLink Midstream LLC (BB+/Ba1) | |
| | 363,000 | | | | 5.375 | | | | 06/01/29 | | | | 346,562 | |
| | EnLink Midstream Partners LP (BB+/Ba1) | |
| | 335,000 | | | | 4.850 | | | | 07/15/26 | | | | 322,233 | |
| | EQM Midstream Partners LP (BB-/Ba3) | |
| | 315,000 | | | | 6.000 | (a) | | | 07/01/25 | | | | 313,425 | |
| | 50,000 | | | | 7.500 | (a) | | | 06/01/27 | | | | 50,563 | |
| | 170,000 | | | | 6.500 | (a) | | | 07/01/27 | | | | 169,362 | |
| | 67,000 | | | | 5.500 | | | | 07/15/28 | | | | 64,152 | |
| | 210,000 | | | | 4.500 | (a) | | | 01/15/29 | | | | 191,100 | |
| | 246,000 | | | | 4.750 | (a) | | | 01/15/31 | | | | 218,018 | |
| | Hess Midstream Operations LP (BB+/Ba2) | |
| | 82,000 | | | | 5.125 | (a) | | | 06/15/28 | | | | 77,490 | |
| | 248,000 | | | | 4.250 | (a) | | | 02/15/30 | | | | 217,620 | |
| | 100,000 | | | | 5.500 | (a) | | | 10/15/30 | | | | 93,500 | |
| | Hilcorp Energy I LP / Hilcorp Finance Co. (BB+/Ba3) | |
| | 75,000 | | | | 6.250 | (a) | | | 11/01/28 | | | | 72,375 | |
| | 277,000 | | | | 5.750 | (a) | | | 02/01/29 | | | | 258,995 | |
| | 50,000 | | | | 6.000 | (a) | | | 02/01/31 | | | | 46,000 | |
| | ITT Holdings LLC(a) (B/B2) | |
| | 260,000 | | | | 6.500 | | | | 08/01/29 | | | | 235,950 | |
| | Moss Creek Resources Holdings, Inc. (B+/B3) | |
| | 139,000 | | | | 7.500 | (a) | | | 01/15/26 | | | | 133,614 | |
| | 265,000 | | | | 10.500 | (a) | | | 05/15/27 | | | | 264,337 | |
| | Nabors Industries Ltd.(a) (CCC/B3) | |
| | 199,000 | | | | 7.250 | | | | 01/15/26 | | | | 192,284 | |
| | Nabors Industries, Inc. (CCC/Caa1) | |
| | 81,000 | | | | 5.750 | | | | 02/01/25 | | | | 79,785 | |
| | New Fortress Energy, Inc.(a) (BB/B1) | |
| | 578,000 | | | | 6.500 | | | | 09/30/26 | | | | 539,708 | |
| | PBF Holding Co. LLC / PBF Finance Corp. (BB/Ba3) | |
| | 81,000 | | | | 7.250 | | | | 06/15/25 | | | | 81,008 | |
| | 340,000 | | | | 6.000 | | | | 02/15/28 | | | | 323,850 | |
| | Range Resources Corp. (BB/Ba3) | |
| | 199,000 | | | | 4.875 | | | | 05/15/25 | | | | 195,020 | |
| | 164,000 | | | | 8.250 | | | | 01/15/29 | | | | 169,740 | |
| | 100,000 | | | | 4.750 | (a) | | | 02/15/30 | | | | 90,250 | |
| | SM Energy Co. (BB-/B1) | |
| | 90,000 | | | | 6.750 | | | | 09/15/26 | | | | 89,775 | |
| | 199,000 | | | | 6.625 | | | | 01/15/27 | | | | 197,508 | |
| | Southwestern Energy Co. (BB+/Ba2) | |
| | 293,000 | | | | 5.375 | | | | 03/15/30 | | | | 273,955 | |
| | 200,000 | | | | 4.750 | | | | 02/01/32 | | | | 177,500 | |
| | Sunoco LP / Sunoco Finance Corp. (BB/Ba3) | |
| | 130,000 | | | | 6.000 | | | | 04/15/27 | | | | 129,188 | |
| | 200,000 | | | | 4.500 | | | | 05/15/29 | | | | 181,250 | |
| | Transocean Titan Financing Ltd.(a) (B-/B2) | |
| | 100,000 | | | | 8.375 | | | | 02/01/28 | | | | 103,125 | |
| | Transocean, Inc. (B-/B2) | |
| | 87,000 | | | | 11.500 | (a) | | | 01/30/27 | | | | 91,894 | |
| | 627,000 | | | | 8.750 | (a) | | | 02/15/30 | | | | 646,594 | |
| USA Compression Partners LP / USA Compression Finance
Corp. (B+/B3) |
|
| | 340,000 | | | | 6.875 | | | | 04/01/26 | | | | 336,600 | |
| | |
| | |
| 54 | | The accompanying notes are an integral part of these financial statements. |
GOLDMAN SACHS ACCESS HIGH YIELD CORPORATE BOND ETF
| | | | | | | | | | | | | | |
Principal
Amount | | | Interest
Rate | | | Maturity
Date | | | Value | |
|
| Corporate Obligations – (continued) | |
| Energy – (continued) | |
| | Venture Global Calcasieu Pass LLC (BB+/Ba2) | |
| $ | 548,000 | | | | 3.875 | %(a) | | | 08/15/29 | | | $ | 476,075 | |
| | 247,000 | | | | 3.875 | (a) | | | 11/01/33 | | | | 200,996 | |
| | Venture Global LNG, Inc.(a) (BB/B1) | |
| | 260,000 | | | | 8.125 | | | | 06/01/28 | | | | 262,600 | |
| | Weatherford International Ltd.(a) (BB-/Ba3) | |
| | 300,000 | | | | 6.500 | | | | 09/15/28 | | | | 302,250 | |
| | | | | | | | | | | | | | |
| | | | | | | | | | | | | 11,498,068 | |
| | |
| Financial Company – 5.0% | |
| | Coinbase Global, Inc.(a) (BB-/B1) | |
| | 250,000 | | | | 3.625 | | | | 10/01/31 | | | | 167,812 | |
| | HUB International Ltd. (B-/Caa2) | |
| | 290,000 | | | | 7.000 | (a) | | | 05/01/26 | | | | 290,362 | |
| | 70,000 | | | | 5.625 | (a) | | | 12/01/29 | | | | 61,950 | |
| | Icahn Enterprises LP / Icahn Enterprises Finance Corp. (BB/Ba3) | |
| | 591,000 | | | | 6.375 | | | | 12/15/25 | | | | 563,936 | |
| | 317,000 | | | | 5.250 | | | | 05/15/27 | | | | 279,753 | |
| | LD Holdings Group LLC(a) (CCC+/Caa1) | |
| | 239,000 | | | | 6.125 | | | | 04/01/28 | | | | 155,947 | |
| | Midcap Financial Issuer Trust(a) (B+/B1) | |
| | 500,000 | | | | 6.500 | | | | 05/01/28 | | | | 446,875 | |
| | Nationstar Mortgage Holdings, Inc. (B/B1) | |
| | 130,000 | | | | 6.000 | (a) | | | 01/15/27 | | | | 124,800 | |
| | 253,000 | | | | 5.500 | (a) | | | 08/15/28 | | | | 229,597 | |
| | Navient Corp. (B+/Ba3) | |
| | 108,000 | | | | 5.875 | | | | 10/25/24 | | | | 107,122 | |
| | 164,000 | | | | 6.750 | | | | 06/25/25 | | | | 163,795 | |
| | 171,000 | | | | 6.750 | | | | 06/15/26 | | | | 168,322 | |
| | Navient Corp., MTN (B+/Ba3) | |
| | 197,000 | | | | 5.625 | | | | 08/01/33 | | | | 149,474 | |
| | NFP Corp.(a) (CCC+/Caa2) | |
| | 342,000 | | | | 6.875 | | | | 08/15/28 | | | | 302,243 | |
| | OneMain Finance Corp. (BB/Ba2) | |
| | 120,000 | | | | 3.500 | | | | 01/15/27 | | | | 104,850 | |
| | 390,000 | | | | 3.875 | | | | 09/15/28 | | | | 321,263 | |
| | 240,000 | | | | 4.000 | | | | 09/15/30 | | | | 186,360 | |
| | PennyMac Financial Services, Inc. (B+/Ba3) | |
| | 302,000 | | | | 5.375 | (a) | | | 10/15/25 | | | | 293,317 | |
| | 50,000 | | | | 5.750 | (a) | | | 09/15/31 | | | | 42,063 | |
| | Rocket Mortgage LLC(a) (BB/Ba1) | |
| | 244,000 | | | | 5.250 | | | | 01/15/28 | | | | 230,911 | |
| Rocket Mortgage LLC / Rocket Mortgage Co.-Issuer, Inc.
(BB/Ba1) |
|
| | 386,000 | | | | 3.875 | (a) | | | 03/01/31 | | | | 316,473 | |
| | 120,000 | | | | 4.000 | (a) | | | 10/15/33 | | | | 95,387 | |
| | United Wholesale Mortgage LLC(a) (NR/Ba3) | |
| | 281,000 | | | | 5.500 | | | | 04/15/29 | | | | 245,173 | |
| | | | | | | | | | | | | | |
| | | | | | | | | | | | | 5,047,785 | |
| | |
| Food and Beverage – 2.6% | |
| | Aramark Services, Inc.(a) (BB-/B1) | |
| | 413,000 | | | | 5.000 | | | | 02/01/28 | | | | 386,155 | |
| | Lamb Weston Holdings, Inc.(a) (BB+/Ba3) | |
| | 655,000 | | | | 4.125 | | | | 01/31/30 | | | | 578,038 | |
| | Performance Food Group, Inc.(a) (BB/B2) | |
| | 488,000 | | | | 5.500 | | | | 10/15/27 | | | | 470,920 | |
| | |
|
| Corporate Obligations – (continued) | |
| Food and Beverage – (continued) | |
| | Post Holdings, Inc. (B+/B2) | |
| 279,000 | | | | 5.750 | %(a) | | | 03/01/27 | | | | 272,722 | |
| | 180,000 | | | | 5.625 | (a) | | | 01/15/28 | | | | 173,025 | |
| | 273,000 | | | | 5.500 | (a) | | | 12/15/29 | | | | 253,890 | |
| | 370,000 | | | | 4.500 | (a) | | | 09/15/31 | | | | 319,588 | |
| | US Foods, Inc.(a) (BB-/B2) | |
| | 200,000 | | | | 4.750 | | | | 02/15/29 | | | | 182,250 | |
| | | | | | | | | | | | | | |
| | | | | | | | | | | | | 2,636,588 | |
| | |
| Hardware – 1.6% | |
| | CommScope Technologies LLC(a) (CCC+/Caa1) | |
| | 300,000 | | | | 5.000 | | | | 03/15/27 | | | | 166,500 | |
| | CommScope, Inc. (B/B1) | |
| | 879,000 | | | | 6.000 | (a) | | | 03/01/26 | | | | 799,890 | |
| | 80,000 | | | | 7.125 | (a) | | | 07/01/28 | | | | 44,900 | |
| | NCR Corp. (B+/B2) | |
| | 341,000 | | | | 5.750 | (a) | | | 09/01/27 | | | | 345,262 | |
| | 54,000 | | | | 5.000 | (a) | | | 10/01/28 | | | | 49,545 | |
| | 62,000 | | | | 6.125 | (a) | | | 09/01/29 | | | | 63,550 | |
| | 190,000 | | | | 5.250 | (a) | | | 10/01/30 | | | | 171,238 | |
| | | | | | | | | | | | | | |
| | | | | | | | | | | | | 1,640,885 | |
| | |
| Healthcare – 5.0% | |
| | AdaptHealth LLC(a) (B/B1) | |
| | 200,000 | | | | 5.125 | | | | 03/01/30 | | | | 165,500 | |
| | CHS/Community Health Systems, Inc. (B-/B3) | |
| | 226,000 | | | | 6.000 | (a) | | | 01/15/29 | | | | 190,405 | |
| | 238,000 | | | | 6.875 | (a) | | | 04/15/29 | | | | 145,775 | |
| | 497,000 | | | | 5.250 | (a) | | | 05/15/30 | | | | 392,630 | |
| | 419,000 | | | | 4.750 | (a) | | | 02/15/31 | | | | 314,250 | |
| | DaVita, Inc. (B+/B1) | |
| | 376,000 | | | | 4.625 | (a) | | | 06/01/30 | | | | 323,360 | |
| | 163,000 | | | | 3.750 | (a) | | | 02/15/31 | | | | 130,604 | |
| | Encompass Health Corp. (B+/B1) | |
| | 421,000 | | | | 4.750 | | | | 02/01/30 | | | | 385,215 | |
| | IQVIA, Inc.(a) (BB/Ba2) | |
| | 280,000 | | | | 5.000 | | | | 05/15/27 | | | | 270,200 | |
| | Legacy LifePoint Health LLC(a) (B/B2) | |
| | 342,000 | | | | 4.375 | | | | 02/15/27 | | | | 297,540 | |
| | Owens & Minor, Inc.(a) (B/B2) | |
| | 130,000 | | | | 4.500 | | | | 03/31/29 | | | | 110,825 | |
| | Service Corp. International (BB/Ba3) | |
| | 115,000 | | | | 4.625 | | | | 12/15/27 | | | | 108,675 | |
| | 468,000 | | | | 5.125 | | | | 06/01/29 | | | | 442,260 | |
| | Tenet Healthcare Corp. (B-/B3) | |
| | 397,000 | | | | 4.875 | | | | 01/01/26 | | | | 386,082 | |
| | 290,000 | | | | 6.250 | | | | 02/01/27 | | | | 285,650 | |
| | 205,000 | | | | 5.125 | | | | 11/01/27 | | | | 195,775 | |
| | 93,000 | | | | 4.625 | | | | 06/15/28 | | | | 86,025 | |
| | 468,000 | | | | 6.125 | | | | 10/01/28 | | | | 451,620 | |
| | 420,000 | | | | 4.250 | | | | 06/01/29 | | | | 375,900 | |
| | | | | | | | | | | | | | |
| | | | | | | | | | | | | 5,058,291 | |
| | |
| Insurance – 1.3% | |
| | Acrisure LLC / Acrisure Finance, Inc. (CCC+/Caa2) | |
| | 80,000 | | | | 7.000 | (a) | | | 11/15/25 | | | | 77,508 | |
| | 163,000 | | | | 10.125 | (a) | | | 08/01/26 | | | | 167,890 | |
| | |
| | |
| The accompanying notes are an integral part of these financial statements. | | 55 |
GOLDMAN SACHS ACCESS HIGH YIELD CORPORATE BOND ETF
Schedule of Investments (continued)
August 31, 2023
| | | | | | | | | | | | | | |
Principal
Amount | | | Interest
Rate | | | Maturity
Date | | | Value | |
|
| Corporate Obligations – (continued) | |
| Insurance – (continued) | |
| Alliant Holdings Intermediate LLC / Alliant Holdings Co.-Issuer
(B/B2) |
|
| $ | 783,000 | | | | 4.250 | %(a) | | | 10/15/27 | | | $ | 714,488 | |
| | 210,000 | | | | 6.750 | (a) | | | 10/15/27 | | | | 198,712 | |
| | AssuredPartners, Inc.(a) (CCC+/Caa2) | |
| | 150,000 | | | | 5.625 | | | | 01/15/29 | | | | 131,063 | |
| | | | | | | | | | | | | | |
| | | | | | | | | | | | | 1,289,661 | |
| | |
| Metals – 0.5% | |
| | Novelis Corp. (BB/Ba3) | |
| | 471,000 | | | | 4.750 | (a) | | | 01/30/30 | | | | 423,900 | |
| | 60,000 | | | | 3.875 | (a) | | | 08/15/31 | | | | 49,800 | |
| | | | | | | | | | | | | | |
| | | | | | | | | | | | | 473,700 | |
| | |
| Metals and Mining – 0.4% | |
| | Cleveland-Cliffs, Inc.(a) (BB+/Ba2) | |
| | 386,000 | | | | 6.750 | | | | 03/15/26 | | | | 385,518 | |
| | |
| Natural Gas – 2.7% | |
| | AmeriGas Partners LP / AmeriGas Finance Corp. (NR/B1) | |
| | 295,000 | | | | 5.500 | | | | 05/20/25 | | | | 290,944 | |
| | 75,000 | | | | 5.750 | | | | 05/20/27 | | | | 69,750 | |
| Crestwood Midstream Partners LP / Crestwood Midstream
Finance Corp. (BB/Ba3) |
|
| | 50,000 | | | | 5.750 | | | | 04/01/25 | | | | 49,562 | |
| | 69,000 | | | | 5.625 | (a) | | | 05/01/27 | | | | 67,103 | |
| | 382,000 | | | | 6.000 | (a) | | | 02/01/29 | | | | 373,405 | |
| | Ferrellgas LP / Ferrellgas Finance Corp.(a) (B/B2) | |
| | 376,000 | | | | 5.375 | | | | 04/01/26 | | | | 354,380 | |
| | Genesis Energy LP / Genesis Energy Finance Corp. (B/B3) | |
| | 601,000 | | | | 8.000 | | | | 01/15/27 | | | | 591,985 | |
| NGL Energy Operating LLC / NGL Energy Finance Corp.(a)
(B+/B2) |
|
| | 128,000 | | | | 7.500 | | | | 02/01/26 | | | | 127,680 | |
| | NuStar Logistics LP (BB-/Ba3) | |
| | 100,000 | | | | 6.000 | | | | 06/01/26 | | | | 98,750 | |
| | 100,000 | | | | 5.625 | | | | 04/28/27 | | | | 97,250 | |
| | Rockies Express Pipeline LLC(a) (BB+/Ba2) | |
| | 268,000 | | | | 4.950 | | | | 07/15/29 | | | | 245,890 | |
| Tallgrass Energy Partners LP / Tallgrass Energy Finance Corp.
(BB-/B1) |
|
| | 153,000 | | | | 6.000 | (a) | | | 03/01/27 | | | | 146,689 | |
| | 111,000 | | | | 5.500 | (a) | | | 01/15/28 | | | | 102,536 | |
| | 150,000 | | | | 6.000 | (a) | | | 09/01/31 | | | | 132,937 | |
| | | | | | | | | | | | | | |
| | | | | | | | | | | | | 2,748,861 | |
| | |
| Pharmaceuticals – 0.7% | |
| | Bausch Health Cos., Inc. (CCC+/Caa1) | |
| | 450,000 | | | | 5.500 | (a) | | | 11/01/25 | | | | 406,125 | |
| | 500,000 | | | | 4.875 | (a) | | | 06/01/28 | | | | 298,750 | |
| | | | | | | | | | | | | | |
| | | | | | | | | | | | | 704,875 | |
| | |
| REITs and Real Estate – 2.1% | |
| Brookfield Property REIT, Inc. / BPR Cumulus LLC / BPR
Nimbus LLC / GGSI Sellco LL(a) (BB+/B1) |
|
| | 500,000 | | | | 5.750 | | | | 05/15/26 | | | | 459,583 | |
| | Howard Hughes Corp. (The)(a) (B+/Ba3) | |
| | 236,000 | | | | 4.375 | | | | 02/01/31 | | | | 189,390 | |
| | |
|
| Corporate Obligations – (continued) | |
| REITs and Real Estate – (continued) | |
| | Kennedy-Wilson, Inc. (BB-/B2) | |
| 249,000 | | | | 5.000 | | | | 03/01/31 | | | | 189,862 | |
| Park Intermediate Holdings LLC / PK Domestic Property LLC /
PK Finance Co.-Issuer(a) (B+/B1) |
|
| | 316,000 | | | | 4.875 | | | | 05/15/29 | | | | 275,710 | |
| | Service Properties Trust (BB/B1) | |
| | 239,000 | | | | 7.500 | | | | 09/15/25 | | | | 236,639 | |
| | 60,000 | | | | 4.950 | | | | 10/01/29 | | | | 47,400 | |
| | 278,000 | | | | 4.375 | | | | 02/15/30 | | | | 212,670 | |
| | Starwood Property Trust, Inc. (BB-/Ba3) | |
| | 434,000 | | | | 3.750 | (a) | | | 12/31/24 | | | | 417,709 | |
| | 60,000 | | | | 4.750 | | | | 03/15/25 | | | | 58,350 | |
| | | | | | | | | | | | | | |
| | | | | | | | | | | | | 2,087,313 | |
| | |
| Rental Equipment – 1.5% | |
| | H&E Equipment Services, Inc.(a) (BB-/B1) | |
| | 460,000 | | | | 3.875 | | | | 12/15/28 | | | | 401,350 | |
| | Hertz Corp. (The)(a) (B+/Caa1) | |
| | 300,000 | | | | 5.000 | | | | 12/01/29 | | | | 247,500 | |
| | United Rentals North America, Inc. (BB+/Ba2) | |
| | 228,000 | | | | 5.500 | | | | 05/15/27 | | | | 223,421 | |
| | 180,000 | | | | 4.875 | | | | 01/15/28 | | | | 172,125 | |
| | 240,000 | | | | 5.250 | | | | 01/15/30 | | | | 228,600 | |
| | 281,000 | | | | 3.875 | | | | 02/15/31 | | | | 241,660 | |
| | | | | | | | | | | | | | |
| | | | | | | | | | | | | 1,514,656 | |
| | |
| Software – 1.7% | |
| | Clarivate Science Holdings Corp.(a) (B+/B1) | |
| | 400,000 | | | | 3.875 | | | | 07/01/28 | | | | 352,000 | |
| | Cloud Software Group, Inc. (B/B2) | |
| | 587,000 | | | | 6.500 | (a) | | | 03/31/29 | | | | 526,832 | |
| | 500,000 | | | | 9.000 | (a) | | | 09/30/29 | | | | 448,125 | |
| | SS&C Technologies, Inc.(a) (B+/B2) | |
| | 412,000 | | | | 5.500 | | | | 09/30/27 | | | | 396,905 | |
| | | | | | | | | | | | | | |
| | | | | | | | | | | | | 1,723,862 | |
| | |
| Technology – 2.8% | |
| | Arches Buyer, Inc. (CCC+/Caa1) | |
| | 152,000 | | | | 4.250 | (a) | | | 06/01/28 | | | | 132,620 | |
| | 247,000 | | | | 6.125 | (a) | | | 12/01/28 | | | | 211,185 | |
| | Imola Merger Corp.(a) (BB-/B1) | |
| | 328,000 | | | | 4.750 | | | | 05/15/29 | | | | 292,740 | |
| | McAfee Corp.(a) (CCC+/Caa2) | |
| | 302,000 | | | | 7.375 | | | | 02/15/30 | | | | 265,005 | |
| | Presidio Holdings, Inc.(a) (CCC+/Caa1) | |
| | 130,000 | | | | 8.250 | | | | 02/01/28 | | | | 125,937 | |
| | Seagate HDD Cayman (BB/Ba3) | |
| | 150,000 | | | | 8.250 | (a) | | | 12/15/29 | | | | 157,500 | |
| | 400,000 | | | | 9.625 | (a) | | | 12/01/32 | | | | 443,000 | |
| | Uber Technologies, Inc.(a) (B/B1) | |
| | 650,000 | | | | 4.500 | | | | 08/15/29 | | | | 598,813 | |
| | Veritas US, Inc. / Veritas Bermuda Ltd.(a) (B-/B3) | |
| | 310,000 | | | | 7.500 | | | | 09/01/25 | | | | 252,758 | |
| | Verscend Escrow Corp.(a) (CCC+/Caa2) | |
| | 215,000 | | | | 9.750 | | | | 08/15/26 | | | | 213,790 | |
| | Xerox Holdings Corp.(a) (BB/Ba2) | |
| | 200,000 | | | | 5.500 | | | | 08/15/28 | | | | 174,500 | |
| | | | | | | | | | | | | | |
| | | | | | | | | | | | | 2,867,848 | |
| | |
| | |
| 56 | | The accompanying notes are an integral part of these financial statements. |
GOLDMAN SACHS ACCESS HIGH YIELD CORPORATE BOND ETF
| | | | | | | | | | | | | | |
Principal
Amount | | | Interest
Rate | | | Maturity
Date | | | Value | |
|
| Corporate Obligations – (continued) | |
| Transportation – 2.3% | |
| | American Airlines, Inc.(a) (BB/Ba2) | |
| $ | 371,000 | | | | 11.750 | % | | | 07/15/25 | | | $ | 407,173 | |
| | American Airlines, Inc./AAdvantage Loyalty IP Ltd. (NR/Ba1) | |
| | 554,583 | | | | 5.500 | (a) | | | 04/20/26 | | | | 546,958 | |
| | 726,000 | | | | 5.750 | (a) | | | 04/20/29 | | | | 694,316 | |
| Fortress Transportation and Infrastructure Investors LLC(a)
(B/Ba2) |
|
| | 95,000 | | | | 6.500 | | | | 10/01/25 | | | | 94,288 | |
| | United Airlines, Inc. (BB/Ba1) | |
| | 88,000 | | | | 4.375 | (a) | | | 04/15/26 | | | | 83,090 | |
| | 535,000 | | | | 4.625 | (a) | | | 04/15/29 | | | | 477,198 | |
| | | | | | | | | | | | | | |
| | | | | | | | | | | | | 2,303,023 | |
| | |
| Wireless – 0.3% | |
| | SBA Communications Corp. (BB/Ba3) | |
| | 300,000 | | | | 3.875 | | | | 02/15/27 | | | | 277,405 | |
| | |
| Wirelines – 2.8% | |
| | Cablevision Lightpath LLC(a) (B-/Caa1) | |
| | 200,000 | | | | 5.625 | | | | 09/15/28 | | | | 154,500 | |
| | Consolidated Communications, Inc.(a) (B-/B3) | |
| | 208,000 | | | | 6.500 | | | | 10/01/28 | | | | 160,680 | |
| | Embarq Corp. (CCC/Caa2) | |
| | 200,000 | | | | 7.995 | | | | 06/01/36 | | | | 122,500 | |
| | Frontier Communications Holdings LLC (B/B3) | |
| | 300,000 | | | | 5.000 | (a) | | | 05/01/28 | | | | 257,250 | |
| | 200,000 | | | | 6.750 | (a) | | | 05/01/29 | | | | 155,500 | |
| | 290,000 | | | | 5.875 | | | | 11/01/29 | | | | 215,687 | |
| | 150,000 | | | | 6.000 | (a) | | | 01/15/30 | | | | 111,188 | |
| | Level 3 Financing, Inc. (B/B1) | |
| | 150,000 | | | | 4.250 | (a) | | | 07/01/28 | | | | 99,000 | |
| | 100,000 | | | | 3.625 | (a) | | | 01/15/29 | | | | 60,000 | |
| | 125,000 | | | | 3.750 | (a) | | | 07/15/29 | | | | 75,000 | |
| | 390,000 | | | | 3.875 | (a) | | | 11/15/29 | | | | 347,587 | |
| | Lumen Technologies, Inc.(a) (B/Caa2) | |
| | 200,000 | | | | 4.000 | | | | 02/15/27 | | | | 127,000 | |
| Uniti Group LP / Uniti Group Finance, Inc. / CSL Capital LLC(a)
(B/B2) |
|
| | 500,000 | | | | 4.750 | | | | 04/15/28 | | | | 423,750 | |
| Windstream Escrow LLC / Windstream Escrow Finance Corp.(a)
(B-/B3) |
|
| | 452,000 | | | | 7.750 | | | | 08/15/28 | | | | 368,945 | |
| | Zayo Group Holdings, Inc.(a) (B-/B3) | |
| | 225,000 | | | | 4.000 | | | | 03/01/27 | | | | 169,313 | |
| | | | | | | | | | | | | | |
| | | | | | | | | | | | | 2,847,900 | |
| | |
| | TOTAL CORPORATE OBLIGATIONS | |
| | (Cost $97,079,107) | | | $ | 92,314,782 | |
| | |
| | | | | | | | | | | | | | |
|
| Foreign Corporate Debt – 6.1% | |
| Aerospace & Defense – 1.0% | |
| | Bombardier, Inc. (Canada) (B/B2) | |
| $ | 704,000 | | | | 7.125 | %(a) | | | 06/15/26 | | | $ | 693,440 | |
| | 359,000 | | | | 7.875 | (a) | | | 04/15/27 | | | | 359,000 | |
| | | | | | | | | | | | | | |
| | | | | | | | | | | | | 1,052,440 | |
| | |
|
| Foreign Corporate Debt – (continued) | |
| Basic Industry – 0.7% | |
| | Methanex Corp. (Canada) (BB/Ba1) | |
| 200,000 | | | | 5.125 | | | | 10/15/27 | | | | 188,500 | |
| | 102,000 | | | | 5.250 | | | | 12/15/29 | | | | 92,928 | |
| | NOVA Chemicals Corp. (Canada) (BB/Ba3) | |
| | 201,000 | | | | 5.000 | (a) | | | 05/01/25 | | | | 190,447 | |
| | 283,000 | | | | 5.250 | (a) | | | 06/01/27 | | | | 252,224 | |
| | | | | | | | | | | | | | |
| | | | | | | | | | | | | 724,099 | |
| | |
| Capital Goods – 0.8% | |
| | ARD Finance SA(a)(b) (Luxembourg) (0) (B-/Caa3) | |
| | 200,000 | | | | 6.500 | | | | 06/30/27 | | | | 160,750 | |
| | GFL Environmental, Inc. (Canada) (B-/B3) | |
| | 271,000 | | | | 4.250 | (a) | | | 06/01/25 | | | | 263,547 | |
| | 50,000 | | | | 3.750 | (a) | | | 08/01/25 | | | | 47,688 | |
| | 342,000 | | | | 4.750 | (a) | | | 06/15/29 | | | | 312,075 | |
| | | | | | | | | | | | | | |
| | | | | | | | | | | | | 784,060 | |
| | |
| Consumer Cyclical – 1.7% | |
| | 1011778 BC ULC / New Red Finance, Inc. (Canada) (B+/B2) | |
| | 316,000 | | | | 3.875 | (a) | | | 01/15/28 | | | | 289,140 | |
| | 54,000 | | | | 4.375 | (a) | | | 01/15/28 | | | | 49,680 | |
| | 117,000 | | | | 3.500 | (a) | | | 02/15/29 | | | | 102,814 | |
| | 469,000 | | | | 4.000 | (a) | | | 10/15/30 | | | | 397,477 | |
| Brookfield Residential Properties, Inc. / Brookfield Residential
US LLC(a) (Canada) (B+/B1) |
|
| | 80,000 | | | | 4.875 | | | | 02/15/30 | | | | 66,300 | |
| | Garda World Security Corp. (Canada) (B/B2) | |
| | 167,000 | | | | 4.625 | (a) | | | 02/15/27 | | | | 154,684 | |
| | 135,000 | | | | 9.500 | (a) | | | 11/01/27 | | | | 130,613 | |
| | Mattamy Group Corp. (Canada) (BB/Ba3) | |
| | 197,000 | | | | 5.250 | (a) | | | 12/15/27 | | | | 184,714 | |
| | 117,000 | | | | 4.625 | (a) | | | 03/01/30 | | | | 103,252 | |
| | Odeon Finco PLC(a) (United Kingdom) (B/B3) | |
| | 260,000 | | | | 12.750 | | | | 11/01/27 | | | | 258,050 | |
| | | | | | | | | | | | | | |
| | | | | | | | | | | | | 1,736,724 | |
| | |
| Energy – 0.1% | |
| | MEG Energy Corp.(a) (Canada) (BB-/B1) | |
| | 70,000 | | | | 7.125 | | | | 02/01/27 | | | | 71,050 | |
| | |
| Mining – 1.0% | |
| | First Quantum Minerals Ltd. (Zambia) (B+/NR) | |
| | 207,000 | | | | 7.500 | (a) | | | 04/01/25 | | | | 206,557 | |
| | 410,000 | | | | 6.875 | (a) | | | 03/01/26 | | | | 403,564 | |
| | Hudbay Minerals, Inc.(a) (Canada) (B/B2) | |
| | 435,000 | | | | 4.500 | | | | 04/01/26 | | | | 411,619 | |
| | | | | | | | | | | | | | |
| | | | | | | | | | | | | 1,021,740 | |
| | |
| Natural Gas – 0.3% | |
| | Parkland Corp.(a) (Canada) (BB/Ba3) | |
| | 363,000 | | | | 4.625 | | | | 05/01/30 | | | | 320,347 | |
| | |
| Transportation – 0.1% | |
| VistaJet Malta Finance PLC / Vista Management Holding, Inc.(a)
(Switzerland) (B-/B3) |
|
| | 100,000 | | | | 9.500 | | | | 06/01/28 | | | | 92,750 | |
| | |
| | |
| The accompanying notes are an integral part of these financial statements. | | 57 |
GOLDMAN SACHS ACCESS HIGH YIELD CORPORATE BOND ETF
Schedule of Investments (continued)
August 31, 2023
| | | | | | | | | | | | | | |
Principal
Amount | | | Interest
Rate | | | Maturity
Date | | | Value | |
|
| Foreign Corporate Debt – (continued) | |
| Wireless – 0.4% | |
| | Intelsat Jackson Holdings SA(a) (Luxembourg) (B+/B3) | |
| $ | 392,000 | | | | 6.500 | % | | | 03/15/30 | | | $ | 361,130 | |
| | |
| | TOTAL FOREIGN CORPORATE DEBT | |
| | (Cost $6,392,124) | | | $ | 6,164,340 | |
| | |
| | | | | | | | |
| Shares | | Dividend
Rate | | | Value | |
|
| Investment Company – 1.0%(c) | |
Goldman Sachs Financial Square Government Fund – Institutional Shares | |
| 1,043,475 | | | 5.234 | % | | $ | 1,043,475 | |
| (Cost $1,043,475) | |
| |
| TOTAL INVESTMENTS – 98.3% | |
| (Cost $104,514,706) | | | $ | 99,522,597 | |
| |
| OTHER ASSETS IN EXCESS OF LIABILITIES – 1.7% | | | | 1,724,779 | |
| |
| NET ASSETS – 100.0% | | | $ | 101,247,376 | |
| |
| | |
|
| The percentage shown for each investment category reflects the value of investments in that category as a percentage of net assets. |
| |
(a) | | Exempt from registration under Rule 144A of the Securities Act of 1933. |
| |
(b) | | Pay-in-kind securities. |
| |
(c) | | Represents an affiliated issuer. |
| | |
|
Investment Abbreviations: |
GMTN | | —Global Medium Term Note |
LP | | —Limited Partnership |
MTN | | —Medium Term Note |
PLC | | —Public Limited Company |
REIT | | —Real Estate Investment Trust |
|
| | |
| 58 | | The accompanying notes are an integral part of these financial statements. |
GOLDMAN SACHS ACCESS INFLATION PROTECTED USD BOND ETF
Schedule of Investments
August 31, 2023
| | | | | | | | | | | | | | |
Principal
Amount | | | Interest
Rate | | | Maturity
Date | | | Value | |
|
| U.S. Treasury Inflation Indexed Bonds – 99.4% | |
| | U.S. Treasury Inflation Indexed Bonds | |
| $ | 6,388,436 | | | | 0.125 | % | | | 10/15/24 | | | $ | 6,176,525 | |
| | 3,253,917 | | | | 0.250 | | | | 01/15/25 | | | | 3,127,865 | |
| | 1,814,106 | | | | 0.375 | | | | 07/15/25 | | | | 1,738,940 | |
| | 3,899,251 | | | | 0.125 | | | | 10/15/25 | | | | 3,702,181 | |
| | 10,109,483 | | | | 0.625 | | | | 01/15/26 | | | | 9,643,244 | |
| | 8,600,075 | | | | 0.125 | | | | 04/15/26 | | | | 8,069,427 | |
| | 8,889,724 | | | | 0.125 | | | | 07/15/26 | | | | 8,351,348 | |
| | 5,993,228 | | | | 0.375 | | | | 07/15/27 | | | | 5,607,935 | |
| | 9,682,688 | | | | 0.500 | | | | 01/15/28 | | | | 9,027,338 | |
| | 4,965,277 | | | | 0.750 | | | | 07/15/28 | | | | 4,684,657 | |
| | 2,809,939 | | | | 3.875 | | | | 04/15/29 | | | | 3,074,835 | |
| | 4,863,005 | | | | 0.250 | | | | 07/15/29 | | | | 4,417,002 | |
| | 9,114,751 | | | | 0.125 | | | | 01/15/30 | | | | 8,112,652 | |
| | 6,430,814 | | | | 0.125 | | | | 07/15/30 | | | | 5,703,096 | |
| | 3,721,364 | | | | 0.125 | | | | 07/15/31 | | | | 3,247,180 | |
| | 4,268,398 | | | | 0.125 | | | | 01/15/32 | | | | 3,681,378 | |
| | 2,853,149 | | | | 0.625 | | | | 07/15/32 | | | | 2,563,988 | |
| | 5,156,684 | | | | 2.125 | | | | 02/15/40 | | | | 5,286,128 | |
| | 6,313,909 | | | | 0.750 | | | | 02/15/42 | | | | 5,120,363 | |
| | 3,697,054 | | | | 0.875 | | | | 02/15/47 | | | | 2,910,113 | |
| | 2,335,985 | | | | 1.000 | | | | 02/15/48 | | | | 1,880,561 | |
| | 1,511,988 | | | | 1.000 | | | | 02/15/49 | | | | 1,208,585 | |
| | 3,207,812 | | | | 0.250 | | | | 02/15/50 | | | | 2,064,451 | |
| | 1,774,489 | | | | 0.125 | | | | 02/15/52 | | | | 1,073,060 | |
| | |
| | TOTAL U.S. TREASURY INFLATION INDEXED BONDS | |
| | (Cost $128,080,755) | | | $ | 110,472,852 | |
| | |
| | | | | | |
| Shares | | Dividend
Rate | | Value | |
|
| Investment Company – 0.5%(a) | |
Goldman Sachs Financial Square Government Fund – Institutional Shares | |
| 536,220 | | 5.234% | | $ | 536,220 | |
| (Cost $536,220) | |
| |
| TOTAL INVESTMENTS – 99.9% | |
| (Cost $128,616,975) | | $ | 111,009,072 | |
| |
| OTHER ASSETS IN EXCESS OF LIABILITIES – 0.1% | | | 133,602 | |
| |
| NET ASSETS – 100.0% | | $ | 111,142,674 | |
| |
| | |
|
| The percentage shown for each investment category reflects the value of investments in that category as a percentage of net assets. |
| |
(a) | | Represents an affiliated issuer. |
| | |
| The accompanying notes are an integral part of these financial statements. | | 59 |
GOLDMAN SACHS ACCESS INVESTMENT GRADE CORPORATE 1-5 YEAR BOND
Schedule of Investments
August 31, 2023
| | | | | | | | | | | | | | |
Principal
Amount | | | Interest
Rate | | | Maturity
Date | | | Value | |
|
| Corporate Obligations – 81.5% | |
| Aerospace & Defense – 2.4% | |
| | Boeing Co. (The) | |
| $ | 10,000 | | | | 4.875 | % | | | 05/01/25 | | | $ | 9,878 | |
| | 20,000 | | | | 2.196 | | | | 02/04/26 | | | | 18,494 | |
| | 70,000 | | | | 3.250 | | | | 03/01/28 | | | | 63,904 | |
| | General Dynamics Corp. | |
| | 16,000 | | | | 1.150 | | | | 06/01/26 | | | | 14,458 | |
| | Huntington Ingalls Industries, Inc. | |
| | 20,000 | | | | 3.483 | | | | 12/01/27 | | | | 18,475 | |
| | L3Harris Technologies, Inc. | |
| | 16,000 | | | | 3.850 | | | | 12/15/26 | | | | 15,302 | |
| | Lockheed Martin Corp. | |
| | 50,000 | | | | 3.550 | | | | 01/15/26 | | | | 48,382 | |
| | Northrop Grumman Corp. | |
| | 8,000 | | | | 3.200 | | | | 02/01/27 | | | | 7,557 | |
| | RTX Corp. | |
| | 16,000 | | | | 3.500 | | | | 03/15/27 | | | | 15,111 | |
| | Textron, Inc. | |
| | 13,000 | | | | 3.650 | | | | 03/15/27 | | | | 12,233 | |
| | | | | | | | | | | | | | |
| | | | | | | | | | | | | 223,794 | |
| | |
| Banks – 22.7% | |
| | American Express Co. | |
| | 29,000 | | | | 3.125 | | | | 05/20/26 | | | | 27,408 | |
| | 20,000 | | | | 5.850 | | | | 11/05/27 | | | | 20,446 | |
| | Bank of America Corp. | |
| | (SOFR + 1.290%) | |
| | 30,000 | | | | 5.080 | (a) | | | 01/20/27 | | | | 29,660 | |
| | (SOFR + 0.960%) | |
| | 32,000 | | | | 1.734 | (a) | | | 07/22/27 | | | | 28,645 | |
| | (SOFR + 1.580%) | |
| | 32,000 | | | | 4.376 | (a) | | | 04/27/28 | | | | 30,727 | |
| | (SOFR + 1.630%) | |
| | 30,000 | | | | 5.202 | (a) | | | 04/25/29 | | | | 29,593 | |
| | Bank of America Corp., MTN | |
| | 21,000 | | | | 4.000 | | | | 01/22/25 | | | | 20,484 | |
| | (SOFR + 1.010%) | |
| | 21,000 | | | | 1.197 | (a) | | | 10/24/26 | | | | 19,039 | |
| | (3M U.S. T-Bill MMY + 1.322%) | |
| | 25,000 | | | | 3.559 | (a) | | | 04/23/27 | | | | 23,697 | |
| | (SOFR + 1.050%) | |
| | 76,000 | | | | 2.551 | (a) | | | 02/04/28 | | | | 68,477 | |
| | (SOFR + 2.040%) | |
| | 50,000 | | | | 4.948 | (a) | | | 07/22/28 | | | | 48,752 | |
| | (3M U.S. T-Bill MMY + 1.572%) | |
| | 60,000 | | | | 4.271 | (a) | | | 07/23/29 | | | | 56,458 | |
| | Bank of America Corp.(a), Series N | |
| | (SOFR + 0.910%) | |
| | 17,000 | | | | 1.658 | | | | 03/11/27 | | | | 15,361 | |
| | Bank of New York Mellon Corp. (The), MTN | |
| | 20,000 | | | | 1.600 | | | | 04/24/25 | | | | 18,795 | |
| | 50,000 | | | | 3.350 | | | | 04/25/25 | | | | 48,353 | |
| | (3M U.S. T-Bill MMY + 1.331%) | |
| | 34,000 | | | | 3.442 | (a) | | | 02/07/28 | | | | 32,073 | |
| | Capital One Financial Corp. | |
| | (SOFR + 2.080%) | |
| | 20,000 | | | | 5.468 | (a) | | | 02/01/29 | | | | 19,332 | |
| | |
|
| Corporate Obligations – (continued) | |
| Banks – (continued) | |
| | Capital One Financial Corp. – (continued) | |
| | (SOFR + 2.640%) | |
| 60,000 | | | | 6.312 | (a) | | | 06/08/29 | | | | 59,892 | |
| | Charles Schwab Corp. (The) | |
| | 33,000 | | | | 3.000 | | | | 03/10/25 | | | | 31,627 | |
| | 40,000 | | | | 3.300 | | | | 04/01/27 | | | | 37,028 | |
| | Citigroup, Inc. | |
| | (SOFR + 0.694%) | |
| | 50,000 | | | | 2.014 | (a) | | | 01/25/26 | | | | 47,273 | |
| | (SOFR + 0.765%) | |
| | 60,000 | | | | 1.122 | (a) | | | 01/28/27 | | | | 53,621 | |
| | 34,000 | | | | 4.450 | | | | 09/29/27 | | | | 32,517 | |
| | (3M U.S. T-Bill MMY + 1.825%) | |
| | 24,000 | | | | 3.887 | (a) | | | 01/10/28 | | | | 22,683 | |
| | Citizens Financial Group, Inc. | |
| | 50,000 | | | | 2.850 | | | | 07/27/26 | | | | 45,405 | |
| | Comerica, Inc. | |
| | 13,000 | | | | 3.800 | | | | 07/22/26 | | | | 11,845 | |
| | Discover Financial Services | |
| | 40,000 | | | | 3.750 | | | | 03/04/25 | | | | 38,289 | |
| | 20,000 | | | | 4.100 | | | | 02/09/27 | | | | 18,565 | |
| | Fifth Third Bancorp(a) | |
| | (SOFRINDX + 2.192%) | |
| | 65,000 | | | | 6.361 | | | | 10/27/28 | | | | 65,638 | |
| | Huntington Bancshares, Inc. | |
| | 18,000 | | | | 4.000 | | | | 05/15/25 | | | | 17,365 | |
| | JPMorgan Chase & Co. | |
| | 34,000 | | | | 3.875 | | | | 09/10/24 | | | | 33,329 | |
| | (3M U.S. T-Bill MMY + 1.585%) | |
| | 28,000 | | | | 2.005 | (a) | | | 03/13/26 | | | | 26,482 | |
| | (SOFR + 1.850%) | |
| | 21,000 | | | | 2.083 | (a) | | | 04/22/26 | | | | 19,785 | |
| | 27,000 | | | | 3.200 | | | | 06/15/26 | | | | 25,569 | |
| | 30,000 | | | | 2.950 | | | | 10/01/26 | | | | 28,014 | |
| | (SOFR + 0.800%) | |
| | 17,000 | | | | 1.045 | (a) | | | 11/19/26 | | | | 15,343 | |
| | (SOFR + 0.885%) | |
| | 25,000 | | | | 1.578 | (a) | | | 04/22/27 | | | | 22,455 | |
| | (SOFR + 1.170%) | |
| | 25,000 | | | | 2.947 | (a) | | | 02/24/28 | | | | 22,954 | |
| | (SOFR + 1.560%) | |
| | 47,000 | | | | 4.323 | (a) | | | 04/26/28 | | | | 45,234 | |
| | (SOFR + 1.450%) | |
| | 100,000 | | | | 5.299 | (a) | | | 07/24/29 | | | | 99,523 | |
| | KeyCorp, MTN | |
| | 35,000 | | | | 2.250 | | | | 04/06/27 | | | | 30,093 | |
| | M&T Bank Corp.(a) | |
| | (SOFRINDX + 1.780%) | |
| | 20,000 | | | | 4.553 | | | | 08/16/28 | | | | 18,736 | |
| | Morgan Stanley | |
| | (SOFR + 1.990%) | |
| | 60,000 | | | | 2.188 | (a) | | | 04/28/26 | | | | 56,532 | |
| | (SOFR + 1.295%) | |
| | 20,000 | | | | 5.050 | (a) | | | 01/28/27 | | | | 19,795 | |
| | Morgan Stanley, GMTN | |
| | 20,000 | | | | 3.875 | | | | 01/27/26 | | | | 19,250 | |
| | |
| | |
| 60 | | The accompanying notes are an integral part of these financial statements. |
GOLDMAN SACHS ACCESS INVESTMENT GRADE CORPORATE 1-5 YEAR BOND
| | | | | | | | | | | | | | |
Principal
Amount | | | Interest
Rate | | | Maturity
Date | | | Value | |
|
| Corporate Obligations – (continued) | |
| Banks – (continued) | |
| | Morgan Stanley(a), MTN | |
| | (SOFR + 1.590%) | |
| $ | 100,000 | | | | 5.164 | % | | | 04/20/29 | | | $ | 98,124 | |
| | Northern Trust Corp.(a) | |
| | (3M USD LIBOR + 1.131%) | |
| | 50,000 | | | | 3.375 | | | | 05/08/32 | | | | 44,651 | |
| | PNC Financial Services Group, Inc. (The)(a) | |
| | (SOFR + 1.620%) | |
| | 20,000 | | | | 5.354 | | | | 12/02/28 | | | | 19,673 | |
| | Santander Holdings USA, Inc. | |
| | 13,000 | | | | 3.450 | | | | 06/02/25 | | | | 12,458 | |
| | 20,000 | | | | 4.500 | | | | 07/17/25 | | | | 19,548 | |
| | (SOFR + 1.249%) | |
| | 20,000 | | | | 2.490 | (a) | | | 01/06/28 | | | | 17,586 | |
| | (SOFR + 2.356%) | |
| | 20,000 | | | | 6.499 | (a) | | | 03/09/29 | | | | 19,888 | |
| | State Street Corp. | |
| | 20,000 | | | | 3.300 | | | | 12/16/24 | | | | 19,412 | |
| | (SOFR + 2.600%) | |
| | 13,000 | | | | 2.901 | (a) | | | 03/30/26 | | | | 12,473 | |
| | Synovus Financial Corp. | |
| | 30,000 | | | | 5.200 | | | | 08/11/25 | | | | 28,806 | |
| | Truist Financial Corp., MTN | |
| | (SOFR + 1.626%) | |
| | 50,000 | | | | 5.900 | (a) | | | 10/28/26 | | | | 50,073 | |
| | (SOFR + 1.435%) | |
| | 20,000 | | | | 4.873 | (a) | | | 01/26/29 | | | | 19,206 | |
| | US Bancorp, MTN | |
| | (SOFR + 0.730%) | |
| | 10,000 | | | | 2.215 | (a) | | | 01/27/28 | | | | 8,930 | |
| | (SOFR + 1.660%) | |
| | 30,000 | | | | 4.548 | (a) | | | 07/22/28 | | | | 28,736 | |
| | US Bancorp, Series X | |
| | 21,000 | | | | 3.150 | | | | 04/27/27 | | | | 19,461 | |
| | Wells Fargo & Co. | |
| | 6,000 | | | | 3.000 | | | | 04/22/26 | | | | 5,624 | |
| | (SOFR + 2.000%) | |
| | 26,000 | | | | 2.188 | (a) | | | 04/30/26 | | | | 24,464 | |
| | 23,000 | | | | 3.000 | | | | 10/23/26 | | | | 21,313 | |
| | Wells Fargo & Co., MTN | |
| | (3M U.S. T-Bill MMY + 1.012%) | |
| | 51,000 | | | | 2.164 | (a) | | | 02/11/26 | | | | 48,241 | |
| | (3M U.S. T-Bill MMY + 1.432%) | |
| | 11,000 | | | | 3.196 | (a) | | | 06/17/27 | | | | 10,240 | |
| | (SOFR + 1.510%) | |
| | 16,000 | | | | 3.526 | (a) | | | 03/24/28 | | | | 14,888 | |
| | (3M U.S. T-Bill MMY + 1.572%) | |
| | 15,000 | | | | 3.584 | (a) | | | 05/22/28 | | | | 13,933 | |
| | (SOFR + 2.100%) | |
| | 15,000 | | | | 2.393 | (a) | | | 06/02/28 | | | | 13,352 | |
| | (SOFR + 1.980%) | |
| | 16,000 | | | | 4.808 | (a) | | | 07/25/28 | | | | 15,456 | |
| | | | | | | | | | | | | | |
| | | | | | | | | | | | | 2,088,678 | |
| | |
| Basic Industry – 0.3% | |
| | Linde, Inc. | |
| | 24,000 | | | | 3.200 | | | | 01/30/26 | | | | 23,077 | |
| | |
|
| Corporate Obligations – (continued) | |
| Building Materials – 0.2% | |
| | Owens Corning | |
| 16,000 | | | | 4.200 | | | | 12/01/24 | | | | 15,698 | |
| | |
| Capital Goods – 5.6% | |
| | 3M Co., MTN | |
| | 20,000 | | | | 3.000 | | | | 08/07/25 | | | | 19,218 | |
| | Berry Global, Inc. | |
| | 20,000 | | | | 1.650 | | | | 01/15/27 | | | | 17,327 | |
| | Carrier Global Corp. | |
| | 12,000 | | | | 2.242 | | | | 02/15/25 | | | | 11,427 | |
| | Caterpillar Financial Services Corp. | |
| | 17,000 | | | | 0.900 | | | | 03/02/26 | | | | 15,398 | |
| | Caterpillar Financial Services Corp., MTN | |
| | 60,000 | | | | 4.900 | | | | 01/17/25 | | | | 59,811 | |
| | 20,000 | | | | 3.600 | | | | 08/12/27 | | | | 19,143 | |
| | Honeywell International, Inc. | |
| | 60,000 | | | | 4.850 | | | | 11/01/24 | | | | 59,687 | |
| | Hubbell, Inc. | |
| | 40,000 | | | | 3.500 | | | | 02/15/28 | | | | 37,312 | |
| | John Deere Capital Corp., MTN | |
| | 50,000 | | | | 5.150 | | | | 03/03/25 | | | | 49,947 | |
| | 17,000 | | | | 2.350 | | | | 03/08/27 | | | | 15,608 | |
| | 20,000 | | | | 4.750 | | | | 01/20/28 | | | | 19,925 | |
| | 20,000 | | | | 1.500 | | | | 03/06/28 | | | | 17,301 | |
| | Lennox International, Inc. | |
| | 40,000 | | | | 1.350 | | | | 08/01/25 | | | | 36,747 | |
| | Otis Worldwide Corp. | |
| | 30,000 | | | | 2.293 | | | | 04/05/27 | | | | 27,242 | |
| | Republic Services, Inc. | |
| | 9,000 | | | | 2.900 | | | | 07/01/26 | | | | 8,483 | |
| | Roper Technologies, Inc. | |
| | 16,000 | | | | 1.000 | | | | 09/15/25 | | | | 14,648 | |
| | 16,000 | | | | 3.850 | | | | 12/15/25 | | | | 15,453 | |
| | Sonoco Products Co. | |
| | 16,000 | | | | 2.250 | | | | 02/01/27 | | | | 14,328 | |
| | Trane Technologies Luxembourg Finance SA | |
| | 40,000 | | | | 3.500 | | | | 03/21/26 | | | | 38,319 | |
| | Westinghouse Air Brake Technologies Corp. | |
| | 16,000 | | | | 3.200 | | | | 06/15/25 | | | | 15,267 | |
| | | | | | | | | | | | | | |
| | | | | | | | | | | | | 512,591 | |
| | |
| Communications – 1.0% | |
| Charter Communications Operating LLC / Charter
Communications Operating Capital |
|
| | 17,000 | | | | 4.908 | | | | 07/23/25 | | | | 16,702 | |
| | Moody’s Corp. | |
| | 50,000 | | | | 3.750 | | | | 03/24/25 | | | | 48,706 | |
| | TWDC Enterprises 18 Corp., MTN | |
| | 8,000 | | | | 1.850 | | | | 07/30/26 | | | | 7,327 | |
| | Walt Disney Co. (The) | |
| | 24,000 | | | | 3.350 | | | | 03/24/25 | | | | 23,290 | |
| | | | | | | | | | | | | | |
| | | | | | | | | | | | | 96,025 | |
| | |
| Consumer Cyclical – 9.4% | |
| | Amazon.com, Inc. | |
| | 70,000 | | | | 3.800 | | | | 12/05/24 | | | | 68,811 | |
| | 20,000 | | | | 0.800 | | | | 06/03/25 | | | | 18,579 | |
| | |
| | |
| The accompanying notes are an integral part of these financial statements. | | 61 |
GOLDMAN SACHS ACCESS INVESTMENT GRADE CORPORATE 1-5 YEAR BOND
Schedule of Investments (continued)
August 31, 2023
| | | | | | | | | | | | | | |
Principal
Amount | | | Interest
Rate | | | Maturity
Date | | | Value | |
|
| Corporate Obligations – (continued) | |
| Consumer Cyclical – (continued) | |
| | Amazon.com, Inc. – (continued) | |
| $ | 33,000 | | | | 1.000 | % | | | 05/12/26 | | | $ | 29,838 | |
| | 15,000 | | | | 4.550 | | | | 12/01/27 | | | | 14,963 | |
| | American Honda Finance Corp., GMTN | |
| | 20,000 | | | | 3.500 | | | | 02/15/28 | | | | 18,760 | |
| | American Honda Finance Corp., MTN | |
| | 13,000 | | | | 1.200 | | | | 07/08/25 | | | | 12,053 | |
| | 13,000 | | | | 1.300 | | | | 09/09/26 | | | | 11,608 | |
| | AutoNation, Inc. | |
| | 18,000 | | | | 3.500 | | | | 11/15/24 | | | | 17,438 | |
| | Booking Holdings, Inc. | |
| | 43,000 | | | | 3.600 | | | | 06/01/26 | | | | 41,319 | |
| | DR Horton, Inc. | |
| | 13,000 | | | | 2.500 | | | | 10/15/24 | | | | 12,528 | |
| | 10,000 | | | | 1.300 | | | | 10/15/26 | | | | 8,830 | |
| | General Motors Co. | |
| | 34,000 | | | | 6.800 | | | | 10/01/27 | | | | 35,104 | |
| | General Motors Financial Co., Inc. | |
| | 70,000 | | | | 4.000 | | | | 01/15/25 | | | | 67,982 | |
| | 21,000 | | | | 1.250 | | | | 01/08/26 | | | | 18,859 | |
| | 20,000 | | | | 2.700 | | | | 08/20/27 | | | | 17,822 | |
| | Home Depot, Inc. (The) | |
| | 40,000 | | | | 4.000 | | | | 09/15/25 | | | | 39,189 | |
| | 21,000 | | | | 2.800 | | | | 09/14/27 | | | | 19,510 | |
| | Las Vegas Sands Corp. | |
| | 10,000 | | | | 3.500 | | | | 08/18/26 | | | | 9,276 | |
| | Lennar Corp. | |
| | 32,000 | | | | 4.750 | | | | 05/30/25 | | | | 31,486 | |
| | 20,000 | | | | 4.750 | | | | 11/29/27 | | | | 19,478 | |
| | Marriott International, Inc., Series EE | |
| | 8,000 | | | | 5.750 | | | | 05/01/25 | | | | 8,012 | |
| | McDonald’s Corp., MTN | |
| | 70,000 | | | | 3.300 | | | | 07/01/25 | | | | 67,682 | |
| | NIKE, Inc. | |
| | 50,000 | | | | 2.750 | | | | 03/27/27 | | | | 46,719 | |
| | Ross Stores, Inc. | |
| | 13,000 | | | | 4.600 | | | | 04/15/25 | | | | 12,779 | |
| | Starbucks Corp. | |
| | 16,000 | | | | 2.000 | | | | 03/12/27 | | | | 14,443 | |
| | 20,000 | | | | 3.500 | | | | 03/01/28 | | | | 18,788 | |
| | Toll Brothers Finance Corp. | |
| | 16,000 | | | | 4.875 | | | | 11/15/25 | | | | 15,700 | |
| | Toyota Motor Credit Corp., MTN | |
| | 16,000 | | | | 0.800 | | | | 01/09/26 | | | | 14,493 | |
| | 40,000 | | | | 3.050 | | | | 03/22/27 | | | | 37,600 | |
| | Visa, Inc. | |
| | 16,000 | | | | 1.900 | | | | 04/15/27 | | | | 14,498 | |
| | 50,000 | | | | 2.750 | | | | 09/15/27 | | | | 46,413 | |
| | Walmart, Inc. | |
| | 24,000 | | | | 1.050 | | | | 09/17/26 | | | | 21,522 | |
| | Western Union Co. (The) | |
| | 40,000 | | | | 1.350 | | | | 03/15/26 | | | | 35,762 | |
| | | | | | | | | | | | | | |
| | | | | | | | | | | | | 867,844 | |
| | |
| Consumer Noncyclical – 3.8% | |
| | Abbott Laboratories | |
| | 20,000 | | | | 1.150 | | | | 01/30/28 | | | | 17,268 | |
| | |
|
| Corporate Obligations – (continued) | |
| Consumer Noncyclical – (continued) | |
| | AbbVie, Inc. | |
| 25,000 | | | | 2.600 | | | | 11/21/24 | | | | 24,142 | |
| | 31,000 | | | | 3.600 | | | | 05/14/25 | | | | 30,074 | |
| | Amgen, Inc. | |
| | 15,000 | | | | 5.150 | | | | 03/02/28 | | | | 15,013 | |
| | Becton Dickinson & Co. | |
| | 18,000 | | | | 3.734 | | | | 12/15/24 | | | | 17,561 | |
| | Equifax, Inc. | |
| | 19,000 | | | | 2.600 | | | | 12/01/24 | | | | 18,268 | |
| | Gilead Sciences, Inc. | |
| | 60,000 | | | | 3.500 | | | | 02/01/25 | | | | 58,411 | |
| | 20,000 | | | | 1.200 | | | | 10/01/27 | | | | 17,207 | |
| | Merck & Co., Inc. | |
| | 16,000 | | | | 0.750 | | | | 02/24/26 | | | | 14,488 | |
| | Royalty Pharma PLC | |
| | 50,000 | | | | 1.200 | | | | 09/02/25 | | | | 45,621 | |
| | Shire Acquisitions Investments Ireland DAC | |
| | 50,000 | | | | 3.200 | | | | 09/23/26 | | | | 46,957 | |
| | Utah Acquisition Sub, Inc. | |
| | 13,000 | | | | 3.950 | | | | 06/15/26 | | | | 12,308 | |
| | Walgreens Boots Alliance, Inc. | |
| | 37,000 | | | | 3.800 | | | | 11/18/24 | | | | 36,151 | |
| | | | | | | | | | | | | | |
| | | | | | | | | | | | | 353,469 | |
| | |
| Consumer Products – 0.6% | |
| | Procter & Gamble Co. (The) | |
| | 50,000 | | | | 4.100 | | | | 01/26/26 | | | | 49,284 | |
| | 8,000 | | | | 1.900 | | | | 02/01/27 | | | | 7,319 | |
| | | | | | | | | | | | | | |
| | | | | | | | | | | | | 56,603 | |
| | |
| Electric – 5.9% | |
| | AES Corp. (The) | |
| | 17,000 | | | | 1.375 | | | | 01/15/26 | | | | 15,301 | |
| | Black Hills Corp. | |
| | 20,000 | | | | 5.950 | | | | 03/15/28 | | | | 20,264 | |
| | Dominion Energy, Inc., Series A | |
| | 17,000 | | | | 1.450 | | | | 04/15/26 | | | | 15,345 | |
| | DTE Energy Co., Series F | |
| | 24,000 | | | | 1.050 | | | | 06/01/25 | | | | 22,149 | |
| | Duke Energy Corp. | |
| | 20,000 | | | | 0.900 | | | | 09/15/25 | | | | 18,271 | |
| | 16,000 | | | | 2.650 | | | | 09/01/26 | | | | 14,807 | |
| | 40,000 | | | | 4.300 | | | | 03/15/28 | | | | 38,465 | |
| | Eastern Energy Gas Holdings LLC | |
| | 40,000 | | | | 3.600 | | | | 12/15/24 | | | | 38,822 | |
| | Edison International | |
| | 40,000 | | | | 4.125 | | | | 03/15/28 | | | | 37,360 | |
| | Entergy Louisiana LLC | |
| | 50,000 | | | | 5.590 | | | | 10/01/24 | | | | 49,872 | |
| | Exelon Corp. | |
| | 11,000 | | | | 3.400 | | | | 04/15/26 | | | | 10,467 | |
| | NextEra Energy Capital Holdings, Inc. | |
| | 13,000 | | | | 1.875 | | | | 01/15/27 | | | | 11,590 | |
| | 27,000 | | | | 3.550 | | | | 05/01/27 | | | | 25,459 | |
| | 30,000 | | | | 4.900 | | | | 02/28/28 | | | | 29,527 | |
| | (US 5 Year CMT T-Note + 2.547%) | |
| | 20,000 | | | | 3.800 | (a) | | | 03/15/82 | | | | 16,862 | |
| | |
| | |
| 62 | | The accompanying notes are an integral part of these financial statements. |
GOLDMAN SACHS ACCESS INVESTMENT GRADE CORPORATE 1-5 YEAR BOND
| | | | | | | | | | | | | | |
Principal
Amount | | | Interest
Rate | | | Maturity
Date | | | Value | |
|
| Corporate Obligations – (continued) | |
| Electric – (continued) | |
| | Pacific Gas and Electric Co. | |
| $ | 7,000 | | | | 3.450 | % | | | 07/01/25 | | | $ | 6,650 | |
| | 28,000 | | | | 3.300 | | | | 03/15/27 | | | | 25,542 | |
| | 20,000 | | | | 5.450 | | | | 06/15/27 | | | | 19,461 | |
| | Public Service Electric and Gas Co., MTN | |
| | 50,000 | | | | 3.050 | | | | 11/15/24 | | | | 48,541 | |
| | Sempra | |
| | 34,000 | | | | 3.250 | | | | 06/15/27 | | | | 31,466 | |
| | Southern California Edison Co. | |
| | 15,000 | | | | 5.850 | | | | 11/01/27 | | | | 15,338 | |
| | Southern Co. (The) | |
| | 16,000 | | | | 3.250 | | | | 07/01/26 | | | | 15,162 | |
| | Southern Co. Gas Capital Corp. | |
| | 16,000 | | | | 3.875 | | | | 11/15/25 | | | | 15,408 | |
| | | | | | | | | | | | | | |
| | | | | | | | | | | | | 542,129 | |
| | |
| Energy – 7.9% | |
| | Baker Hughes Holdings LLC / Baker Hughes Co.-Obligor, Inc. | |
| | 15,000 | | | | 3.337 | | | | 12/15/27 | | | | 13,929 | |
| | Boardwalk Pipelines LP | |
| | 40,000 | | | | 4.450 | | | | 07/15/27 | | | | 37,970 | |
| | BP Capital Markets America, Inc. | |
| | 20,000 | | | | 3.796 | | | | 09/21/25 | | | | 19,453 | |
| | 40,000 | | | | 3.017 | | | | 01/16/27 | | | | 37,532 | |
| | Chevron Corp. | |
| | 25,000 | | | | 3.326 | | | | 11/17/25 | | | | 24,274 | |
| | 50,000 | | | | 1.995 | | | | 05/11/27 | | | | 45,271 | |
| | DCP Midstream Operating LP | |
| | 40,000 | | | | 5.375 | | | | 07/15/25 | | | | 39,700 | |
| | Energy Transfer LP | |
| | 40,000 | | | | 4.750 | | | | 01/15/26 | | | | 39,147 | |
| | 40,000 | | | | 5.550 | | | | 02/15/28 | | | | 39,859 | |
| | Enterprise Products Operating LLC | |
| | 16,000 | | | | 3.750 | | | | 02/15/25 | | | | 15,569 | |
| | Exxon Mobil Corp. | |
| | 24,000 | | | | 3.043 | | | | 03/01/26 | | | | 22,926 | |
| | 13,000 | | | | 2.275 | | | | 08/16/26 | | | | 12,125 | |
| | Hercules Capital, Inc. | |
| | 20,000 | | | | 3.375 | | | | 01/20/27 | | | | 17,727 | |
| | Kinder Morgan, Inc. | |
| | 16,000 | | | | 4.300 | | | | 06/01/25 | | | | 15,660 | |
| | Magellan Midstream Partners LP | |
| | 24,000 | | | | 5.000 | | | | 03/01/26 | | | | 23,783 | |
| | Marathon Petroleum Corp. | |
| | 11,000 | | | | 4.700 | | | | 05/01/25 | | | | 10,811 | |
| | MPLX LP | |
| | 24,000 | | | | 4.875 | | | | 12/01/24 | | | | 23,722 | |
| | 12,000 | | | | 1.750 | | | | 03/01/26 | | | | 10,937 | |
| | National Fuel Gas Co. | |
| | 16,000 | | | | 5.500 | | | | 01/15/26 | | | | 15,846 | |
| | Occidental Petroleum Corp. | |
| | 50,000 | | | | 5.875 | | | | 09/01/25 | | | | 49,859 | |
| | ONEOK Partners LP | |
| | 50,000 | | | | 4.900 | | | | 03/15/25 | | | | 49,235 | |
| | Plains All American Pipeline LP / PAA Finance Corp. | |
| | 16,000 | | | | 4.650 | | | | 10/15/25 | | | | 15,621 | |
| | |
|
| Corporate Obligations – (continued) | |
| Energy – (continued) | |
| | Sabine Pass Liquefaction LLC | |
| 10,000 | | | | 5.625 | | | | 03/01/25 | | | | 9,969 | |
| | 31,000 | | | | 5.000 | | | | 03/15/27 | | | | 30,535 | |
| Targa Resources Partners LP / Targa Resources Partners Finance
Corp. |
|
| | 40,000 | | | | 6.500 | | | | 07/15/27 | | | | 40,175 | |
| | Western Midstream Operating LP | |
| | 16,000 | | | | 3.100 | | | | 02/01/25 | | | | 15,380 | |
| | 16,000 | | | | 3.950 | | | | 06/01/25 | | | | 15,460 | |
| | Williams Cos., Inc. (The) | |
| | 34,000 | | | | 4.000 | | | | 09/15/25 | | | | 32,980 | |
| | | | | | | | | | | | | | |
| | | | | | | | | | | | | 725,455 | |
| | |
| Financial Company – 2.1% | |
| | Air Lease Corp. | |
| | 37,000 | | | | 3.625 | | | | 04/01/27 | | | | 34,439 | |
| | Ally Financial, Inc. | |
| | 50,000 | | | | 5.125 | | | | 09/30/24 | | | | 49,260 | |
| | 15,000 | | | | 7.100 | | | | 11/15/27 | | | | 15,202 | |
| | Ares Capital Corp. | |
| | 17,000 | | | | 2.875 | | | | 06/15/27 | | | | 14,928 | |
| | Bain Capital Specialty Finance, Inc. | |
| | 20,000 | | | | 2.550 | | | | 10/13/26 | | | | 17,262 | |
| | BGC Partners, Inc. | |
| | 40,000 | | | | 4.375 | | | | 12/15/25 | | | | 37,320 | |
| | FS KKR Capital Corp. | |
| | 16,000 | | | | 3.250 | | | | 07/15/27 | | | | 13,830 | |
| | Sixth Street Specialty Lending, Inc. | |
| | 16,000 | | | | 3.875 | | | | 11/01/24 | | | | 15,480 | |
| | | | | | | | | | | | | | |
| | | | | | | | | | | | | 197,721 | |
| | |
| Food and Beverage – 2.1% | |
| | Coca-Cola Co. (The) | |
| | 50,000 | | | | 1.500 | | | | 03/05/28 | | | | 43,808 | |
| | General Mills, Inc. | |
| | 20,000 | | | | 4.000 | | | | 04/17/25 | | | | 19,502 | |
| | 30,000 | | | | 5.241 | | | | 11/18/25 | | | | 29,912 | |
| | Kellogg Co. | |
| | 50,000 | | | | 3.250 | | | | 04/01/26 | | | | 47,583 | |
| | McCormick & Co., Inc. | |
| | 16,000 | | | | 0.900 | | | | 02/15/26 | | | | 14,422 | |
| | PepsiCo, Inc. | |
| | 26,000 | | | | 2.250 | | | | 03/19/25 | | | | 24,886 | |
| | 11,000 | | | | 2.850 | | | | 02/24/26 | | | | 10,478 | |
| | | | | | | | | | | | | | |
| | | | | | | | | | | | | 190,591 | |
| | |
| Hardware – 0.5% | |
| | CDW LLC / CDW Finance Corp. | |
| | 50,000 | | | | 4.125 | | | | 05/01/25 | | | | 48,375 | |
| | |
| Healthcare – 0.9% | |
| | CVS Health Corp. | |
| | 13,000 | | | | 3.000 | | | | 08/15/26 | | | | 12,178 | |
| | HCA, Inc. | |
| | 10,000 | | | | 5.375 | | | | 02/01/25 | | | | 9,950 | |
| | 16,000 | | | | 4.500 | | | | 02/15/27 | | | | 15,450 | |
| | Quest Diagnostics, Inc. | |
| | 16,000 | | | | 3.450 | | | | 06/01/26 | | | | 15,295 | |
| | |
| | |
| The accompanying notes are an integral part of these financial statements. | | 63 |
GOLDMAN SACHS ACCESS INVESTMENT GRADE CORPORATE 1-5 YEAR BOND
Schedule of Investments (continued)
August 31, 2023
| | | | | | | | | | | | | | |
Principal
Amount | | | Interest
Rate | | | Maturity
Date | | | Value | |
|
| Corporate Obligations – (continued) | |
| Healthcare – (continued) | |
| | UnitedHealth Group, Inc. | |
| $ | 16,000 | | | | 3.375 | % | | | 04/15/27 | | | $ | 15,200 | |
| | 15,000 | | | | 5.250 | | | | 02/15/28 | | | | 15,266 | |
| | | | | | | | | | | | | | |
| | | | | | | | | | | | | 83,339 | |
| | |
| Insurance – 0.3% | |
| | Lincoln National Corp. | |
| | 30,000 | | | | 3.800 | | | | 03/01/28 | | | | 27,444 | |
| | |
| Media Non Cable – 0.3% | |
| | Netflix, Inc. | |
| | 16,000 | | | | 5.875 | | | | 02/15/25 | | | | 16,137 | |
| | 16,000 | | | | 4.375 | | | | 11/15/26 | | | | 15,620 | |
| | | | | | | | | | | | | | |
| | | | | | | | | | | | | 31,757 | |
| | |
| Pharmaceuticals – 0.2% | |
| | Viatris, Inc. | |
| | 16,000 | | | | 2.300 | | | | 06/22/27 | | | | 14,017 | |
| | |
| REITs and Real Estate – 3.6% | |
| | Boston Properties LP | |
| | 20,000 | | | | 3.200 | | | | 01/15/25 | | | | 19,204 | |
| | Brandywine Operating Partnership LP | |
| | 20,000 | | | | 3.950 | | | | 11/15/27 | | | | 16,501 | |
| | Brixmor Operating Partnership LP | |
| | 20,000 | | | | 3.900 | | | | 03/15/27 | | | | 18,557 | |
| | Equinix, Inc. | |
| | 23,000 | | | | 1.800 | | | | 07/15/27 | | | | 20,059 | |
| | ERP Operating LP | |
| | 16,000 | | | | 3.375 | | | | 06/01/25 | | | | 15,403 | |
| | GLP Capital LP / GLP Financing II, Inc. | |
| | 40,000 | | | | 3.350 | | | | 09/01/24 | | | | 38,825 | |
| | 9,000 | | | | 5.375 | | | | 04/15/26 | | | | 8,818 | |
| | Healthpeak OP LLC | |
| | 16,000 | | | | 3.250 | | | | 07/15/26 | | | | 15,142 | |
| | Highwoods Realty LP | |
| | 20,000 | | | | 4.125 | | | | 03/15/28 | | | | 17,978 | |
| | Public Storage Operating Co. | |
| | 13,000 | | | | 1.500 | | | | 11/09/26 | | | | 11,713 | |
| | Simon Property Group LP | |
| | 16,000 | | | | 3.500 | | | | 09/01/25 | | | | 15,434 | |
| | 16,000 | | | | 3.300 | | | | 01/15/26 | | | | 15,250 | |
| | Spirit Realty LP | |
| | 7,000 | | | | 3.200 | | | | 01/15/27 | | | | 6,373 | |
| | Tanger Properties LP | |
| | 30,000 | | | | 3.875 | | | | 07/15/27 | | | | 26,867 | |
| | VICI Properties LP | |
| | 50,000 | | | | 4.375 | | | | 05/15/25 | | | | 48,539 | |
| | Vornado Realty LP | |
| | 20,000 | | | | 2.150 | | | | 06/01/26 | | | | 17,127 | |
| | Welltower OP LLC | |
| | 16,000 | | | | 4.000 | | | | 06/01/25 | | | | 15,515 | |
| | | | | | | | | | | | | | |
| | | | | | | | | | | | | 327,305 | |
| | |
| Technology – 7.8% | |
| | Activision Blizzard, Inc. | |
| | 40,000 | | | | 3.400 | | | | 09/15/26 | | | | 38,207 | |
| | |
|
| Corporate Obligations – (continued) | |
| Technology – (continued) | |
| | Alphabet, Inc. | |
| 16,000 | | | | 1.998 | | | | 08/15/26 | | | | 14,817 | |
| | Apple, Inc. | |
| | 25,000 | | | | 2.450 | | | | 08/04/26 | | | | 23,386 | |
| | 17,000 | | | | 2.050 | | | | 09/11/26 | | | | 15,688 | |
| | 32,000 | | | | 3.350 | | | | 02/09/27 | | | | 30,551 | |
| | 90,000 | | | | 4.000 | | | | 05/10/28 | | | | 87,965 | |
| | Arrow Electronics, Inc. | |
| | 50,000 | | | | 4.000 | | | | 04/01/25 | | | | 48,552 | |
| | Autodesk, Inc. | |
| | 40,000 | | | | 3.500 | | | | 06/15/27 | | | | 37,779 | |
| | Broadcom Corp. / Broadcom Cayman Finance Ltd. | |
| | 17,000 | | | | 3.875 | | | | 01/15/27 | | | | 16,160 | |
| | Fiserv, Inc. | |
| | 12,000 | | | | 3.850 | | | | 06/01/25 | | | | 11,649 | |
| | 24,000 | | | | 3.200 | | | | 07/01/26 | | | | 22,651 | |
| | Genpact Luxembourg Sarl | |
| | 16,000 | | | | 3.375 | | | | 12/01/24 | | | | 15,480 | |
| | Hewlett Packard Enterprise Co. | |
| | 15,000 | | | | 4.900 | | | | 10/15/25 | | | | 14,831 | |
| | International Business Machines Corp. | |
| | 90,000 | | | | 6.220 | | | | 08/01/27 | | | | 94,352 | |
| | Intuit, Inc. | |
| | 16,000 | | | | 1.350 | | | | 07/15/27 | | | | 14,033 | |
| | Jabil, Inc. | |
| | 40,000 | | | | 4.250 | | | | 05/15/27 | | | | 38,181 | |
| | Keysight Technologies, Inc. | |
| | 40,000 | | | | 4.600 | | | | 04/06/27 | | | | 39,149 | |
| | Microchip Technology, Inc. | |
| | 16,000 | | | | 4.250 | | | | 09/01/25 | | | | 15,537 | |
| | Microsoft Corp. | |
| | 31,000 | | | | 3.300 | | | | 02/06/27 | | | | 29,815 | |
| | Motorola Solutions, Inc. | |
| | 13,000 | | | | 7.500 | | | | 05/15/25 | | | | 13,341 | |
| | NetApp, Inc. | |
| | 13,000 | | | | 3.300 | | | | 09/29/24 | | | | 12,580 | |
| | 40,000 | | | | 2.375 | | | | 06/22/27 | | | | 36,279 | |
| | QUALCOMM, Inc. | |
| | 7,000 | | | | 3.450 | | | | 05/20/25 | | | | 6,794 | |
| | VeriSign, Inc. | |
| | 40,000 | | | | 5.250 | | | | 04/01/25 | | | | 39,750 | |
| | | | | | | | | | | | | | |
| | | | | | | | | | | | | 717,527 | |
| | |
| Transportation – 1.7% | |
| | CSX Corp. | |
| | 17,000 | | | | 3.250 | | | | 06/01/27 | | | | 16,015 | |
| | Delta Air Lines, Inc. | |
| | 20,000 | | | | 2.900 | | | | 10/28/24 | | | | 19,361 | |
| | Ryder System, Inc., MTN | |
| | 5,000 | | | | 1.750 | | | | 09/01/26 | | | | 4,504 | |
| | 8,000 | | | | 2.900 | | | | 12/01/26 | | | | 7,364 | |
| | 20,000 | | | | 5.650 | | | | 03/01/28 | | | | 20,079 | |
| | Southwest Airlines Co. | |
| | 40,000 | | | | 5.125 | | | | 06/15/27 | | | | 39,455 | |
| | Union Pacific Corp. | |
| | 17,000 | | | | 3.250 | | | | 08/15/25 | | | | 16,383 | |
| | |
| | |
| 64 | | The accompanying notes are an integral part of these financial statements. |
GOLDMAN SACHS ACCESS INVESTMENT GRADE CORPORATE 1-5 YEAR BOND
| | | | | | | | | | | | | | |
Principal
Amount | | | Interest
Rate | | | Maturity
Date | | | Value | |
|
| Corporate Obligations – (continued) | |
| Transportation – (continued) | |
| | United Airlines Pass Through Trust, Series 20-1 | |
| $ | 14,339 | | | | 5.875 | % | | | 10/15/27 | | | $ | 14,268 | |
| | United Airlines Pass Through Trust, Series A | |
| | 15,491 | | | | 4.300 | | | | 08/15/25 | | | | 14,961 | |
| | | | | | | | | | | | | | |
| | | | | | | | | | | | | 152,390 | |
| | |
| Wireless – 2.2% | |
| | American Tower Corp. | |
| | 13,000 | | | | 3.375 | | | | 10/15/26 | | | | 12,197 | |
| | AT&T, Inc. | |
| | 21,000 | | | | 1.700 | | | | 03/25/26 | | | | 19,135 | |
| | 10,000 | | | | 1.650 | | | | 02/01/28 | | | | 8,549 | |
| | Crown Castle, Inc. | |
| | 33,000 | | | | 3.200 | | | | 09/01/24 | | | | 32,066 | |
| | Sprint LLC | |
| | 30,000 | | | | 7.625 | | | | 03/01/26 | | | | 31,144 | |
| | T-Mobile USA, Inc. | |
| | 16,000 | | | | 3.750 | | | | 04/15/27 | | | | 15,147 | |
| | 70,000 | | | | 2.050 | | | | 02/15/28 | | | | 61,206 | |
| | Verizon Communications, Inc. | |
| | 25,000 | | | | 2.100 | | | | 03/22/28 | | | | 21,841 | |
| | | | | | | | | | | | | | |
| | | | | | | | | | | | | 201,285 | |
| | |
| | TOTAL CORPORATE OBLIGATIONS | |
| | (Cost $7,724,397) | | | $ | 7,497,114 | |
| | |
| | | | | | | | | | | | | | |
|
| Foreign Corporate Debt – 16.8% | |
| Banks – 9.9% | |
| | Bank of Montreal, MTN (Canada) | |
| $ | 50,000 | | | | 1.250 | % | | | 09/15/26 | | | $ | 44,256 | |
| | 30,000 | | | | 2.650 | | | | 03/08/27 | | | | 27,266 | |
| | Bank of Montreal(a) (Canada) | |
| | (5 Year USD Swap + 1.432%) | |
| | 40,000 | | | | 3.803 | | | | 12/15/32 | | | | 35,350 | |
| | Bank of Nova Scotia (The) (Canada) | |
| | 17,000 | | | | 1.050 | | | | 03/02/26 | | | | 15,244 | |
| | 17,000 | | | | 2.700 | | | | 08/03/26 | | | | 15,794 | |
| | 21,000 | | | | 1.300 | | | | 09/15/26 | | | | 18,611 | |
| | 50,000 | | | | 2.951 | | | | 03/11/27 | | | | 46,001 | |
| | Canadian Imperial Bank of Commerce (Canada) | |
| | 77,000 | | | | 1.250 | | | | 06/22/26 | | | | 68,625 | |
| | Deutsche Bank AG (Germany) | |
| | 50,000 | | | | 4.100 | | | | 01/13/26 | | | | 47,628 | |
| | Mitsubishi UFJ Financial Group, Inc. (Japan) | |
| | 100,000 | | | | 3.777 | | | | 03/02/25 | | | | 97,125 | |
| | 20,000 | | | | 3.287 | | | | 07/25/27 | | | | 18,614 | |
| | Royal Bank of Canada (Canada) | |
| | 101,000 | | | | 3.625 | | | | 05/04/27 | | | | 95,294 | |
| | Royal Bank of Canada, GMTN (Canada) | |
| | 20,000 | | | | 4.240 | | | | 08/03/27 | | | | 19,229 | |
| | Royal Bank of Canada, MTN (Canada) | |
| | 23,000 | | | | 1.150 | | | | 06/10/25 | | | | 21,304 | |
| | Sumitomo Mitsui Financial Group, Inc. (Japan) | |
| | 20,000 | | | | 3.446 | | | | 01/11/27 | | | | 18,719 | |
| | 51,000 | | | | 3.364 | | | | 07/12/27 | | | | 47,367 | |
| | |
|
| Foreign Corporate Debt – (continued) | |
| Banks – (continued) | |
| | Sumitomo Mitsui Financial Group, Inc. (Japan) – (continued) | |
| 30,000 | | | | 3.352 | | | | 10/18/27 | | | | 27,617 | |
| | 50,000 | | | | 3.544 | | | | 01/17/28 | | | | 46,233 | |
| | Toronto-Dominion Bank (The) (Canada) | |
| | 50,000 | | | | 5.103 | | | | 01/09/26 | | | | 49,614 | |
| | 15,000 | | | | 5.156 | | | | 01/10/28 | | | | 14,859 | |
| | Toronto-Dominion Bank (The), MTN (Canada) | |
| | 34,000 | | | | 0.750 | | | | 01/06/26 | | | | 30,539 | |
| | 16,000 | | | | 1.250 | | | | 09/10/26 | | | | 14,184 | |
| | Westpac Banking Corp. (Australia) | |
| | 23,000 | | | | 1.150 | | | | 06/03/26 | | | | 20,672 | |
| | 70,000 | | | | 5.457 | | | | 11/18/27 | | | | 71,244 | |
| | | | | | | | | | | | | | |
| | | | | | | | | | | | | 911,389 | |
| | |
| Consumer Cyclical – 0.3% | |
| | Toyota Motor Corp. (Japan) | |
| | 28,000 | | | | 1.339 | | | | 03/25/26 | | | | 25,530 | |
| | |
| Consumer Noncyclical – 1.4% | |
| | AstraZeneca PLC (United Kingdom) | |
| | 50,000 | | | | 3.375 | | | | 11/16/25 | | | | 48,044 | |
| | BAT Capital Corp. (United Kingdom) | |
| | 20,000 | | | | 2.789 | | | | 09/06/24 | | | | 19,362 | |
| | BAT International Finance PLC (United Kingdom) | |
| | 67,000 | | | | 1.668 | | | | 03/25/26 | | | | 60,723 | |
| | | | | | | | | | | | | | |
| | | | | | | | | | | | | 128,129 | |
| | |
| Energy – 2.5% | |
| | BP Capital Markets PLC (United Kingdom) | |
| | 21,000 | | | | 3.279 | | | | 09/19/27 | | | | 19,774 | |
| | Canadian Natural Resources Ltd. (Canada) | |
| | 50,000 | | | | 2.050 | | | | 07/15/25 | | | | 46,892 | |
| | Enbridge, Inc.(a) (Canada) | |
| | (3M U.S. T-Bill MMY + 3.903%) | |
| | 50,000 | | | | 6.250 | | | | 03/01/78 | | | | 46,312 | |
| | Equinor ASA (Norway) | |
| | 60,000 | | | | 1.750 | | | | 01/22/26 | | | | 55,628 | |
| | Shell International Finance BV (Netherlands) | |
| | 50,000 | | | | 2.000 | | | | 11/07/24 | | | | 48,088 | |
| | 16,000 | | | | 3.250 | | | | 05/11/25 | | | | 15,495 | |
| | | | | | | | | | | | | | |
| | | | | | | | | | | | | 232,189 | |
| | |
| Financial Company – 0.3% | |
| | ORIX Corp. (Japan) | |
| | 30,000 | | | | 5.000 | | | | 09/13/27 | | | | 29,674 | |
| | |
| Insurance – 0.6% | |
| | Manulife Financial Corp. (Canada) | |
| | 60,000 | | | | 2.484 | | | | 05/19/27 | | | | 54,921 | |
| | |
| Metals and Mining – 0.7% | |
| | BHP Billiton Finance USA Ltd. (Australia) | |
| | 60,000 | | | | 4.750 | | | | 02/28/28 | | | | 59,419 | |
| | |
| Technology – 0.4% | |
| | NXP BV / NXP Funding LLC / NXP USA, Inc. (China) | |
| | 40,000 | | | | 4.400 | | | | 06/01/27 | | | | 38,478 | |
| | |
| | |
| The accompanying notes are an integral part of these financial statements. | | 65 |
GOLDMAN SACHS ACCESS INVESTMENT GRADE CORPORATE 1-5 YEAR BOND
Schedule of Investments (continued)
August 31, 2023
| | | | | | | | | | | | | | |
Principal
Amount | | | Interest
Rate | | | Maturity
Date | | | Value | |
|
| Foreign Corporate Debt – (continued) | |
| Transportation – 0.4% | |
| | Canadian Pacific Railway Co. (Canada) | |
| $ | 40,000 | | | | 3.700 | % | | | 02/01/26 | | | $ | 38,268 | |
| | |
| Wireless – 0.3% | |
| | Rogers Communications, Inc. (Canada) | |
| | 34,000 | | | | 3.200 | | | | 03/15/27 | | | | 31,524 | |
| | |
| | TOTAL FOREIGN CORPORATE DEBT | |
| | (Cost $1,588,978) | | | $ | 1,549,521 | |
| | |
| | TOTAL INVESTMENTS – 98.3% | |
| | (Cost $9,313,342) | | | $ | 9,046,635 | |
| | |
| OTHER ASSETS IN EXCESS OF
LIABILITIES – 1.7% |
| | | 155,345 | |
| | |
| | NET ASSETS – 100.0% | | | $ | 9,201,980 | |
| | |
| | |
|
| The percentage shown for each investment category reflects the value of investments in that category as a percentage of net assets. |
| |
(a) | | Variable rate security. Interest rate or distribution rate disclosed is that which is in effect on August 31, 2023. |
| | |
|
Investment Abbreviations: |
CMT | | —Constant Maturity Treasury Index |
GMTN | | —Global Medium Term Note |
LIBOR | | —London Interbank Offered Rate |
LP | | —Limited Partnership |
MTN | | —Medium Term Note |
PLC | | —Public Limited Company |
REIT | | —Real Estate Investment Trust |
SOFR | | —Secured Overnight Financing Rate |
SOFRINDX | | —Secured Overnight Financing Rate Index |
|
| | |
| 66 | | The accompanying notes are an integral part of these financial statements. |
GOLDMAN SACHS ACCESS INVESTMENT GRADE CORPORATE BOND ETF
Schedule of Investments
August 31, 2023
| | | | | | | | | | | | | | |
Principal
Amount | | | Interest
Rate | | | Maturity
Date | | | Value | |
|
| Corporate Obligations – 79.2% | |
| Aerospace & Defense – 2.5% | |
| | Boeing Co. (The) | |
| $ | 300,000 | | | | 2.196 | % | | | 02/04/26 | | | $ | 277,410 | |
| | 290,000 | | | | 2.700 | | | | 02/01/27 | | | | 265,834 | |
| | 400,000 | | | | 3.250 | | | | 02/01/28 | | | | 365,929 | |
| | 400,000 | | | | 3.200 | | | | 03/01/29 | | | | 359,693 | |
| | 290,000 | | | | 2.950 | | | | 02/01/30 | | | | 252,348 | |
| | 1,500,000 | | | | 5.150 | | | | 05/01/30 | | | | 1,480,231 | |
| | 500,000 | | | | 3.600 | | | | 05/01/34 | | | | 423,932 | |
| | 300,000 | | | | 3.250 | | | | 02/01/35 | | | | 241,710 | |
| | 300,000 | | | | 5.705 | | | | 05/01/40 | | | | 292,772 | |
| | 275,000 | | | | 3.900 | | | | 05/01/49 | | | | 206,863 | |
| | 300,000 | | | | 3.750 | | | | 02/01/50 | | | | 220,126 | |
| | 400,000 | | | | 5.805 | | | | 05/01/50 | | | | 392,143 | |
| | 500,000 | | | | 5.930 | | | | 05/01/60 | | | | 487,234 | |
| | General Dynamics Corp. | |
| | 50,000 | | | | 3.250 | | | | 04/01/25 | | | | 48,472 | |
| | 600,000 | | | | 3.500 | | | | 04/01/27 | | | | 571,548 | |
| | 250,000 | | | | 4.250 | | | | 04/01/40 | | | | 223,339 | |
| | 384,000 | | | | 4.250 | | | | 04/01/50 | | | | 337,602 | |
| | Lockheed Martin Corp. | |
| | 250,000 | | | | 5.100 | | | | 11/15/27 | | | | 252,847 | |
| | 620,000 | | | | 5.250 | | | | 01/15/33 | | | | 638,135 | |
| | 533,000 | | | | 4.070 | | | | 12/15/42 | | | | 462,800 | |
| | 260,000 | | | | 3.800 | | | | 03/01/45 | | | | 212,620 | |
| | 100,000 | | | | 4.700 | | | | 05/15/46 | | | | 93,279 | |
| | 168,000 | | | | 4.090 | | | | 09/15/52 | | | | 141,616 | |
| | 640,000 | | | | 4.150 | | | | 06/15/53 | | | | 541,611 | |
| | 428,000 | | | | 5.900 | | | | 11/15/63 | | | | 470,563 | |
| | Northrop Grumman Corp. | |
| | 476,000 | | | | 2.930 | | | | 01/15/25 | | | | 460,076 | |
| | 290,000 | | | | 3.200 | | | | 02/01/27 | | | | 273,926 | |
| | 738,000 | | | | 3.250 | | | | 01/15/28 | | | | 686,817 | |
| | 400,000 | | | | 4.400 | | | | 05/01/30 | | | | 385,131 | |
| | 1,016,000 | | | | 4.030 | | | | 10/15/47 | | | | 835,381 | |
| | 267,000 | | | | 5.250 | | | | 05/01/50 | | | | 261,722 | |
| | RTX Corp. | |
| | 1,080,000 | | | | 3.950 | | | | 08/16/25 | | | | 1,050,426 | |
| | 100,000 | | | | 3.125 | | | | 05/04/27 | | | | 93,374 | |
| | 300,000 | | | | 4.125 | | | | 11/16/28 | | | | 286,347 | |
| | 620,000 | | | | 1.900 | | | | 09/01/31 | | | | 486,305 | |
| | 250,000 | | | | 2.375 | | | | 03/15/32 | | | | 201,404 | |
| | 243,000 | | | | 4.450 | | | | 11/16/38 | | | | 214,983 | |
| | 500,000 | | | | 4.500 | | | | 06/01/42 | | | | 436,498 | |
| | 870,000 | | | | 4.150 | | | | 05/15/45 | | | | 707,851 | |
| | 208,000 | | | | 3.750 | | | | 11/01/46 | | | | 157,692 | |
| | 554,000 | | | | 4.350 | | | | 04/15/47 | | | | 467,192 | |
| | 292,000 | | | | 4.625 | | | | 11/16/48 | | | | 256,281 | |
| | 406,000 | | | | 3.125 | | | | 07/01/50 | | | | 276,034 | |
| | 260,000 | | | | 2.820 | | | | 09/01/51 | | | | 162,693 | |
| | | | | | | | | | | | | | |
| | | | | | | | | | | | | 16,960,790 | |
| | |
| Agriculture – 0.1% | |
| | Archer-Daniels-Midland Co. | |
| | 462,000 | | | | 3.250 | | | | 03/27/30 | | | | 420,099 | |
| | 500,000 | | | | 2.900 | | | | 03/01/32 | | | | 431,140 | |
| | | | | | | | | | | | | | |
| | | | | | | | | | | | | 851,239 | |
| | |
|
| Corporate Obligations – (continued) | |
| Banks – 19.4% | |
| | American Express Co. | |
| 2,912,000 | | | | 3.000 | | | | 10/30/24 | | | | 2,828,041 | |
| | 649,000 | | | | 4.200 | | | | 11/06/25 | | | | 631,135 | |
| | 470,000 | | | | 3.125 | | | | 05/20/26 | | | | 444,200 | |
| | 250,000 | | | | 1.650 | | | | 11/04/26 | | | | 223,163 | |
| | (SOFR + 2.255%) | |
| | 192,000 | | | | 4.989 | (a) | | | 05/26/33 | | | | 182,404 | |
| | Bank of America Corp. | |
| | (3M U.S. T-Bill MMY + 1.072%) | |
| | 584,000 | | | | 3.366 | (a) | | | 01/23/26 | | | | 562,603 | |
| | (SOFR + 0.960%) | |
| | 696,000 | | | | 1.734 | (a) | | | 07/22/27 | | | | 623,033 | |
| | (3M U.S. T-Bill MMY + 1.774%) | |
| | 485,000 | | | | 3.705 | (a) | | | 04/24/28 | | | | 452,243 | |
| | (SOFR + 1.990%) | |
| | 800,000 | | | | 6.204 | (a) | | | 11/10/28 | | | | 820,466 | |
| | (3M U.S. T-Bill MMY + 1.302%) | |
| | 1,148,000 | | | | 3.419 | (a) | | | 12/20/28 | | | | 1,052,958 | |
| | (SOFR + 2.150%) | |
| | 519,000 | | | | 2.592 | (a) | | | 04/29/31 | | | | 430,200 | |
| | (SOFR + 1.320%) | |
| | 1,130,000 | | | | 2.687 | (a) | | | 04/22/32 | | | | 925,333 | |
| | (SOFR + 1.220%) | |
| | 1,140,000 | | | | 2.299 | (a) | | | 07/21/32 | | | | 899,578 | |
| | (SOFR + 1.210%) | |
| | 700,000 | | | | 2.572 | (a) | | | 10/20/32 | | | | 561,589 | |
| | (SOFR + 1.910%) | |
| | 630,000 | | | | 5.288 | (a) | | | 04/25/34 | | | | 616,301 | |
| | (US 5 Year CMT T-Note + 1.200%) | |
| | 278,000 | | | | 2.482 | (a) | | | 09/21/36 | | | | 211,876 | |
| | 860,000 | | | | 6.110 | | | | 01/29/37 | | | | 888,249 | |
| | (3M U.S. T-Bill MMY + 2.076%) | |
| | 418,000 | | | | 4.244 | (a) | | | 04/24/38 | | | | 364,254 | |
| | 370,000 | | | | 7.750 | | | | 05/14/38 | | | | 434,072 | |
| | (SOFR + 1.580%) | |
| | 519,000 | | | | 3.311 | (a) | | | 04/22/42 | | | | 391,948 | |
| | (3M U.S. T-Bill MMY + 1.452%) | |
| | 750,000 | | | | 3.946 | (a) | | | 01/23/49 | | | | 586,668 | |
| | (SOFR + 1.560%) | |
| | 457,000 | | | | 2.972 | (a) | | | 07/21/52 | | | | 301,556 | |
| | Bank of America Corp., GMTN | |
| | 220,000 | | | | 3.500 | | | | 04/19/26 | | | | 209,376 | |
| | (3M U.S. T-Bill MMY + 1.632%) | |
| | 588,000 | | | | 3.593 | (a) | | | 07/21/28 | | | | 547,427 | |
| | Bank of America Corp., Series L | |
| | 110,000 | | | | 3.950 | | | | 04/21/25 | | | | 106,620 | |
| | 580,000 | | | | 4.183 | | | | 11/25/27 | | | | 550,843 | |
| | Bank of America Corp., MTN | |
| | 596,000 | | | | 4.200 | | | | 08/26/24 | | | | 585,612 | |
| | 340,000 | | | | 4.000 | | | | 01/22/25 | | | | 331,637 | |
| | 215,000 | | | | 3.875 | | | | 08/01/25 | | | | 209,324 | |
| | (3M U.S. T-Bill MMY + 1.352%) | |
| | 820,000 | | | | 3.093 | (a) | | | 10/01/25 | | | | 794,793 | |
| | (3M U.S. T-Bill MMY + 1.132%) | |
| | 1,000,000 | | | | 2.456 | (a) | | | 10/22/25 | | | | 961,432 | |
| | |
| | |
| The accompanying notes are an integral part of these financial statements. | | 67 |
GOLDMAN SACHS ACCESS INVESTMENT GRADE CORPORATE BOND ETF
Schedule of Investments (continued)
August 31, 2023
| | | | | | | | | | | | | | |
Principal
Amount | | | Interest
Rate | | | Maturity
Date | | | Value | |
|
| Corporate Obligations – (continued) | |
| Banks – (continued) | |
| | Bank of America Corp., MTN – (continued) | |
| | (3M U.S. T-Bill MMY + 0.902%) | |
| $ | 700,000 | | | | 2.015 | %(a) | | | 02/13/26 | | | $ | 660,548 | |
| | 180,000 | | | | 4.450 | | | | 03/03/26 | | | | 175,061 | |
| | (SOFR + 1.150%) | |
| | 1,718,000 | | | | 1.319 | (a) | | | 06/19/26 | | | | 1,581,106 | |
| | 629,000 | | | | 4.250 | | | | 10/22/26 | | | | 604,081 | |
| | (3M U.S. T-Bill MMY + 1.322%) | |
| | 760,000 | | | | 3.559 | (a) | | | 04/23/27 | | | | 720,399 | |
| | 670,000 | | | | 3.248 | | | | 10/21/27 | | | | 624,497 | |
| | (3M U.S. T-Bill MMY + 1.837%) | |
| | 628,000 | | | | 3.824 | (a) | | | 01/20/28 | | | | 592,112 | |
| | (SOFR + 1.050%) | |
| | 490,000 | | | | 2.551 | (a) | | | 02/04/28 | | | | 441,497 | |
| | (SOFR + 2.040%) | |
| | 1,000,000 | | | | 4.948 | (a) | | | 07/22/28 | | | | 975,039 | |
| | (3M U.S. T-Bill MMY + 1.332%) | |
| | 150,000 | | | | 3.970 | (a) | | | 03/05/29 | | | | 140,122 | |
| | (3M U.S. T-Bill MMY + 1.572%) | |
| | 710,000 | | | | 4.271 | (a) | | | 07/23/29 | | | | 668,087 | |
| | (3M U.S. T-Bill MMY + 1.472%) | |
| | 504,000 | | | | 3.974 | (a) | | | 02/07/30 | | | | 464,257 | |
| | (3M U.S. T-Bill MMY + 1.442%) | |
| | 200,000 | | | | 3.194 | (a) | | | 07/23/30 | | | | 175,026 | |
| | (3M U.S. T-Bill MMY + 1.452%) | |
| | 281,000 | | | | 2.884 | (a) | | | 10/22/30 | | | | 241,105 | |
| | (3M U.S. T-Bill MMY + 1.252%) | |
| | 1,345,000 | | | | 2.496 | (a) | | | 02/13/31 | | | | 1,118,985 | |
| | (SOFR + 1.530%) | |
| | 830,000 | | | | 1.898 | (a) | | | 07/23/31 | | | | 654,729 | |
| | (SOFR + 1.370%) | |
| | 500,000 | | | | 1.922 | (a) | | | 10/24/31 | | | | 392,116 | |
| | (3M U.S. T-Bill MMY + 1.582%) | |
| | 208,000 | | | | 4.078 | (a) | | | 04/23/40 | | | | 175,074 | |
| | (SOFR + 1.930%) | |
| | 704,000 | | | | 2.676 | (a) | | | 06/19/41 | | | | 486,598 | |
| | 248,000 | | | | 5.875 | | | | 02/07/42 | | | | 256,078 | |
| | 334,000 | | | | 5.000 | | | | 01/21/44 | | | | 317,910 | |
| | (3M U.S. T-Bill MMY + 2.252%) | |
| | 354,000 | | | | 4.443 | (a) | | | 01/20/48 | | | | 302,407 | |
| | (3M U.S. T-Bill MMY + 1.782%) | |
| | 477,000 | | | | 4.330 | (a) | | | 03/15/50 | | | | 404,414 | |
| | (3M U.S. T-Bill MMY + 3.412%) | |
| | 826,000 | | | | 4.083 | (a) | | | 03/20/51 | | | | 668,389 | |
| | Bank of America Corp.(a), Series N | |
| | (SOFR + 1.220%) | |
| | 500,000 | | | | 2.651 | | | | 03/11/32 | | | | 410,549 | |
| | Bank of America NA | |
| | 250,000 | | | | 5.526 | | | | 08/18/26 | | | | 251,471 | |
| | Bank of New York Mellon Corp. (The), MTN | |
| | 100,000 | | | | 2.100 | | | | 10/24/24 | | | | 96,412 | |
| | 50,000 | | | | 2.800 | | | | 05/04/26 | | | | 47,000 | |
| | 290,000 | | | | 3.250 | | | | 05/16/27 | | | | 272,158 | |
| | 636,000 | | | | 3.400 | | | | 01/29/28 | | | | 592,988 | |
| | (3M U.S. T-Bill MMY + 1.331%) | |
| | 887,000 | | | | 3.442 | (a) | | | 02/07/28 | | | | 836,728 | |
| | 400,000 | | | | 3.850 | | | | 04/28/28 | | | | 379,758 | |
| | 144,000 | | | | 3.300 | | | | 08/23/29 | | | | 128,680 | |
| | |
|
| Corporate Obligations – (continued) | |
| Banks – (continued) | |
| | Capital One Financial Corp. | |
| 50,000 | | | | 4.200 | | | | 10/29/25 | | | | 47,910 | |
| | (SOFR + 1.290%) | |
| | 550,000 | | | | 2.636 | (a) | | | 03/03/26 | | | | 519,164 | |
| | (SOFR + 2.160%) | |
| | 150,000 | | | | 4.985 | (a) | | | 07/24/26 | | | | 147,000 | |
| | 250,000 | | | | 3.750 | | | | 03/09/27 | | | | 232,588 | |
| | 300,000 | | | | 3.650 | | | | 05/11/27 | | | | 279,404 | |
| | 690,000 | | | | 3.800 | | | | 01/31/28 | | | | 634,122 | |
| | (SOFR + 2.057%) | |
| | 250,000 | | | | 4.927 | (a) | | | 05/10/28 | | | | 240,873 | |
| | (SOFR + 2.640%) | |
| | 1,000,000 | | | | 6.312 | (a) | | | 06/08/29 | | | | 998,197 | |
| | (SOFR + 1.337%) | |
| | 500,000 | | | | 2.359 | (a) | | | 07/29/32 | | | | 356,934 | |
| | (SOFR + 2.860%) | |
| | 500,000 | | | | 6.377 | (a) | | | 06/08/34 | | | | 494,390 | |
| | Charles Schwab Corp. (The) | |
| | 450,000 | | | | 2.000 | | | | 03/20/28 | | | | 386,457 | |
| | 700,000 | | | | 2.300 | | | | 05/13/31 | | | | 562,270 | |
| | 300,000 | | | | 1.950 | | | | 12/01/31 | | | | 229,341 | |
| | Citigroup, Inc. | |
| | 250,000 | | | | 4.000 | | | | 08/05/24 | | | | 245,542 | |
| | 500,000 | | | | 3.875 | | | | 03/26/25 | | | | 484,775 | |
| | 100,000 | | | | 3.700 | | | | 01/12/26 | | | | 95,925 | |
| | (SOFR + 0.694%) | |
| | 1,018,000 | | | | 2.014 | (a) | | | 01/25/26 | | | | 962,465 | |
| | (SOFR + 2.842%) | |
| | 640,000 | | | | 3.106 | (a) | | | 04/08/26 | | | | 613,986 | |
| | (SOFR + 0.765%) | |
| | 1,857,000 | | | | 1.122 | (a) | | | 01/28/27 | | | | 1,659,567 | |
| | (SOFR + 0.770%) | |
| | 275,000 | | | | 1.462 | (a) | | | 06/09/27 | | | | 244,429 | |
| | 700,000 | | | | 4.450 | | | | 09/29/27 | | | | 669,475 | |
| | (3M U.S. T-Bill MMY + 1.825%) | |
| | 100,000 | | | | 3.887 | (a) | | | 01/10/28 | | | | 94,512 | |
| | (SOFR + 1.280%) | |
| | 1,530,000 | | | | 3.070 | (a) | | | 02/24/28 | | | | 1,401,611 | |
| | (SOFR + 1.887%) | |
| | 300,000 | | | | 4.658 | (a) | | | 05/24/28 | | | | 292,612 | |
| | (3M U.S. T-Bill MMY + 1.652%) | |
| | 1,180,000 | | | | 3.668 | (a) | | | 07/24/28 | | | | 1,098,108 | |
| | 600,000 | | | | 4.125 | | | | 07/25/28 | | | | 560,013 | |
| | (3M U.S. T-Bill MMY + 1.413%) | |
| | 1,150,000 | | | | 3.520 | (a) | | | 10/27/28 | | | | 1,060,829 | |
| | (3M U.S. T-Bill MMY + 1.600%) | |
| | 200,000 | | | | 3.980 | (a) | | | 03/20/30 | | | | 184,056 | |
| | (SOFR + 1.422%) | |
| | 800,000 | | | | 2.976 | (a) | | | 11/05/30 | | | | 687,452 | |
| | (SOFR + 2.107%) | |
| | 1,000,000 | | | | 2.572 | (a) | | | 06/03/31 | | | | 828,927 | |
| | (SOFR + 1.167%) | |
| | 800,000 | | | | 2.561 | (a) | | | 05/01/32 | | | | 646,692 | |
| | 544,000 | | | | 6.625 | | | | 06/15/32 | | | | 564,289 | |
| | (SOFR + 1.939%) | |
| | 600,000 | | | | 3.785 | (a) | | | 03/17/33 | | | | 521,651 | |
| | |
| | |
| 68 | | The accompanying notes are an integral part of these financial statements. |
GOLDMAN SACHS ACCESS INVESTMENT GRADE CORPORATE BOND ETF
| | | | | | | | | | | | | | |
Principal
Amount | | | Interest
Rate | | | Maturity
Date | | | Value | |
|
| Corporate Obligations – (continued) | |
| Banks – (continued) | |
| | Citigroup, Inc. – (continued) | |
| | (SOFR + 2.086%) | |
| $ | 500,000 | | | | 4.910 | %(a) | | | 05/24/33 | | | $ | 476,419 | |
| | (SOFR + 2.338%) | |
| | 1,000,000 | | | | 6.270 | (a) | | | 11/17/33 | | | | 1,045,753 | |
| | (3M U.S. T-Bill MMY + 1.430%) | |
| | 300,000 | | | | 3.878 | (a) | | | 01/24/39 | | | | 245,736 | |
| | 650,000 | | | | 6.675 | | | | 09/13/43 | | | | 683,839 | |
| | 540,000 | | | | 5.300 | | | | 05/06/44 | | | | 492,100 | |
| | 500,000 | | | | 4.750 | | | | 05/18/46 | | | | 416,640 | |
| | (3M U.S. T-Bill MMY + 2.101%) | |
| | 300,000 | | | | 4.281 | (a) | | | 04/24/48 | | | | 250,331 | |
| | Citizens Bank NA(a) | |
| | (SOFR + 2.000%) | |
| | 300,000 | | | | 4.575 | | | | 08/09/28 | | | | 279,339 | |
| | Discover Financial Services | |
| | 100,000 | | | | 6.700 | | | | 11/29/32 | | | | 99,605 | |
| | Fifth Third Bancorp | |
| | 506,000 | | | | 2.550 | | | | 05/05/27 | | | | 455,284 | |
| | (SOFRINDX + 2.192%) | |
| | 100,000 | | | | 6.361 | (a) | | | 10/27/28 | | | | 100,982 | |
| | 190,000 | | | | 8.250 | | | | 03/01/38 | | | | 214,820 | |
| | Fifth Third Bank NA | |
| | 560,000 | | | | 3.850 | | | | 03/15/26 | | | | 521,791 | |
| | Huntington Bancshares, Inc. | |
| | 870,000 | | | | 2.625 | | | | 08/06/24 | | | | 839,998 | |
| | 328,000 | | | | 2.550 | | | | 02/04/30 | | | | 267,711 | |
| | JPMorgan Chase & Co. | |
| | 325,000 | | | | 3.875 | | | | 09/10/24 | | | | 318,585 | |
| | 240,000 | | | | 3.125 | | | | 01/23/25 | | | | 231,786 | |
| | 378,000 | | | | 3.900 | | | | 07/15/25 | | | | 367,214 | |
| | (SOFR + 0.490%) | |
| | 800,000 | | | | 0.768 | (a) | | | 08/09/25 | | | | 760,562 | |
| | (SOFR + 1.160%) | |
| | 630,000 | | | | 2.301 | (a) | | | 10/15/25 | | | | 604,370 | |
| | (SOFR + 0.915%) | |
| | 250,000 | | | | 2.595 | (a) | | | 02/24/26 | | | | 238,944 | |
| | (3M U.S. T-Bill MMY + 1.585%) | |
| | 170,000 | | | | 2.005 | (a) | | | 03/13/26 | | | | 160,782 | |
| | 730,000 | | | | 3.300 | | | | 04/01/26 | | | | 693,107 | |
| | (SOFR + 1.850%) | |
| | 840,000 | | | | 2.083 | (a) | | | 04/22/26 | | | | 791,415 | |
| | 690,000 | | | | 3.200 | | | | 06/15/26 | | | | 653,436 | |
| | 290,000 | | | | 4.125 | | | | 12/15/26 | | | | 279,363 | |
| | (3M U.S. T-Bill MMY + 1.507%) | |
| | 300,000 | | | | 3.960 | (a) | | | 01/29/27 | | | | 288,527 | |
| | (SOFR + 0.885%) | |
| | 600,000 | | | | 1.578 | (a) | | | 04/22/27 | | | | 538,910 | |
| | 293,000 | | | | 4.250 | | | | 10/01/27 | | | | 283,683 | |
| | 184,000 | | | | 3.625 | | | | 12/01/27 | | | | 172,454 | |
| | (3M U.S. T-Bill MMY + 1.599%) | |
| | 213,000 | | | | 3.782 | (a) | | | 02/01/28 | | | | 201,197 | |
| | (3M U.S. T-Bill MMY + 1.642%) | |
| | 1,064,000 | | | | 3.540 | (a) | | | 05/01/28 | | | | 993,541 | |
| | (SOFR + 1.890%) | |
| | 1,002,000 | | | | 2.182 | (a) | | | 06/01/28 | | | | 890,449 | |
| | |
|
| Corporate Obligations – (continued) | |
| Banks – (continued) | |
| | JPMorgan Chase & Co. – (continued) | |
| | (3M U.S. T-Bill MMY + 1.207%) | |
| 2,142,000 | | | | 3.509 | %(a) | | | 01/23/29 | | | | 1,974,649 | |
| | (3M U.S. T-Bill MMY + 1.382%) | |
| | 518,000 | | | | 4.005 | (a) | | | 04/23/29 | | | | 486,758 | |
| | (3M U.S. T-Bill MMY + 1.592%) | |
| | 450,000 | | | | 4.452 | (a) | | | 12/05/29 | | | | 429,323 | |
| | (3M U.S. T-Bill MMY + 1.422%) | |
| | 114,000 | | | | 3.702 | (a) | | | 05/06/30 | | | | 103,993 | |
| | (3M U.S. T-Bill MMY + 1.510%) | |
| | 692,000 | | | | 2.739 | (a) | | | 10/15/30 | | | | 593,337 | |
| | (3M U.S. T-Bill MMY + 3.790%) | |
| | 400,000 | | | | 4.493 | (a) | | | 03/24/31 | | | | 379,194 | |
| | (SOFR + 2.040%) | |
| | 1,130,000 | | | | 2.522 | (a) | | | 04/22/31 | | | | 948,534 | |
| | (3M U.S. T-Bill MMY + 2.515%) | |
| | 422,000 | | | | 2.956 | (a) | | | 05/13/31 | | | | 359,825 | |
| | (3M U.S. T-Bill MMY + 1.105%) | |
| | 80,000 | | | | 1.764 | (a) | | | 11/19/31 | | | | 62,638 | |
| | (SOFR + 1.065%) | |
| | 1,052,000 | | | | 1.953 | (a) | | | 02/04/32 | | | | 827,496 | |
| | (3M U.S. T-Bill MMY + 1.250%) | |
| | 1,104,000 | | | | 2.580 | (a) | | | 04/22/32 | | | | 905,022 | |
| | (SOFR + 1.180%) | |
| | 1,067,000 | | | | 2.545 | (a) | | | 11/08/32 | | | | 861,859 | |
| | (SOFR + 1.260%) | |
| | 600,000 | | | | 2.963 | (a) | | | 01/25/33 | | | | 499,611 | |
| | 513,000 | | | | 6.400 | | | | 05/15/38 | | | | 561,734 | |
| | (3M U.S. T-Bill MMY + 1.622%) | |
| | 485,000 | | | | 3.882 | (a) | | | 07/24/38 | | | | 408,130 | |
| | 147,000 | | | | 5.500 | | | | 10/15/40 | | | | 148,374 | |
| | (3M U.S. T-Bill MMY + 2.460%) | |
| | 230,000 | | | | 3.109 | (a) | | | 04/22/41 | | | | 169,967 | |
| | 126,000 | | | | 5.600 | | | | 07/15/41 | | | | 128,025 | |
| | 328,000 | | | | 5.400 | | | | 01/06/42 | | | | 327,235 | |
| | (SOFR + 1.460%) | |
| | 200,000 | | | | 3.157 | (a) | | | 04/22/42 | | | | 146,636 | |
| | 60,000 | | | | 5.625 | | | | 08/16/43 | | | | 59,545 | |
| | 423,000 | | | | 4.850 | | | | 02/01/44 | | | | 395,440 | |
| | 614,000 | | | | 4.950 | | | | 06/01/45 | | | | 558,604 | |
| | (3M U.S. T-Bill MMY + 1.842%) | |
| | 471,000 | | | | 4.260 | (a) | | | 02/22/48 | | | | 395,125 | |
| | (3M U.S. T-Bill MMY + 1.722%) | |
| | 268,000 | | | | 4.032 | (a) | | | 07/24/48 | | | | 216,080 | |
| | (3M U.S. T-Bill MMY + 1.642%) | |
| | 622,000 | | | | 3.964 | (a) | | | 11/15/48 | | | | 492,710 | |
| | (3M U.S. T-Bill MMY + 1.482%) | |
| | 190,000 | | | | 3.897 | (a) | | | 01/23/49 | | | | 148,668 | |
| | (SOFR + 2.440%) | |
| | 368,000 | | | | 3.109 | (a) | | | 04/22/51 | | | | 250,864 | |
| | (SOFR + 1.580%) | |
| | 820,000 | | | | 3.328 | (a) | | | 04/22/52 | | | | 579,099 | |
| | KeyBank NA | |
| | 300,000 | | | | 4.900 | | | | 08/08/32 | | | | 250,292 | |
| | KeyCorp, MTN | |
| | 467,000 | | | | 2.250 | | | | 04/06/27 | | | | 401,526 | |
| | 516,000 | | | | 4.100 | | | | 04/30/28 | | | | 461,487 | |
| | 274,000 | | | | 2.550 | | | | 10/01/29 | | | | 219,330 | |
| | |
| | |
| The accompanying notes are an integral part of these financial statements. | | 69 |
GOLDMAN SACHS ACCESS INVESTMENT GRADE CORPORATE BOND ETF
Schedule of Investments (continued)
August 31, 2023
| | | | | | | | | | | | | | |
Principal
Amount | | | Interest
Rate | | | Maturity
Date | | | Value | |
|
| Corporate Obligations – (continued) | |
| Banks – (continued) | |
| | M&T Bank Corp.(a) | |
| | (SOFR + 1.850%) | |
| $ | 260,000 | | | | 5.053 | % | | | 01/27/34 | | | $ | 236,748 | |
| | Manufacturers & Traders Trust Co. | |
| | 840,000 | | | | 2.900 | | | | 02/06/25 | | | | 798,269 | |
| | Morgan Stanley | |
| | (SOFR + 1.990%) | |
| | 3,000,000 | | | | 2.188 | (a) | | | 04/28/26 | | | | 2,826,614 | |
| | 600,000 | | | | 3.591 | (a) | | | 07/22/28 | | | | 555,267 | |
| | (SOFR + 1.290%) | |
| | 3,000,000 | | | | 2.943 | (a) | | | 01/21/33 | | | | 2,454,066 | |
| | (SOFR + 2.620%) | |
| | 1,720,000 | | | | 5.297 | (a) | | | 04/20/37 | | | | 1,604,906 | |
| | (3M U.S. T-Bill MMY + 1.693%) | |
| | 2,000,000 | | | | 4.457 | (a) | | | 04/22/39 | | | | 1,763,782 | |
| | Morgan Stanley, GMTN | |
| | 1,000,000 | | | | 3.875 | | | | 01/27/26 | | | | 962,483 | |
| | (SOFR + 1.143%) | |
| | 500,000 | | | | 2.699 | (a) | | | 01/22/31 | | | | 421,426 | |
| | Morgan Stanley, MTN | |
| | (SOFR + 1.034%) | |
| | 3,000,000 | | | | 1.794 | (a) | | | 02/13/32 | | | | 2,315,073 | |
| | (SOFR + 1.430%) | |
| | 2,110,000 | | | | 2.802 | (a) | | | 01/25/52 | | | | 1,336,315 | |
| | Morgan Stanley Bank NA | |
| | 1,000,000 | | | | 5.479 | | | | 07/16/25 | | | | 1,000,693 | |
| | Northern Trust Corp. | |
| | 100,000 | | | | 4.000 | | | | 05/10/27 | | | | 96,095 | |
| | 300,000 | | | | 6.125 | | | | 11/02/32 | | | | 306,637 | |
| | PNC Bank NA | |
| | 1,150,000 | | | | 3.100 | | | | 10/25/27 | | | | 1,044,630 | |
| | 260,000 | | | | 2.700 | | | | 10/22/29 | | | | 217,223 | |
| | PNC Financial Services Group, Inc. (The) | |
| | 502,000 | | | | 2.600 | | | | 07/23/26 | | | | 466,580 | |
| | 290,000 | | | | 3.150 | | | | 05/19/27 | | | | 268,837 | |
| | (SOFR + 1.620%) | |
| | 300,000 | | | | 5.354 | (a) | | | 12/02/28 | | | | 295,092 | |
| | 100,000 | | | | 3.450 | | | | 04/23/29 | | | | 90,353 | |
| | 410,000 | | | | 2.550 | | | | 01/22/30 | | | | 343,874 | |
| | (SOFR + 0.979%) | |
| | 500,000 | | | | 2.307 | (a) | | | 04/23/32 | | | | 403,452 | |
| | Santander Holdings USA, Inc. | |
| | 1,310,000 | | | | 3.500 | | | | 06/07/24 | | | | 1,283,013 | |
| | 440,000 | | | | 3.450 | | | | 06/02/25 | | | | 421,654 | |
| | (SOFR + 1.249%) | |
| | 444,000 | | | | 2.490 | (a) | | | 01/06/28 | | | | 390,409 | |
| | State Street Corp. | |
| | 40,000 | | | | 3.550 | | | | 08/18/25 | | | | 38,544 | |
| | 160,000 | | | | 2.650 | | | | 05/19/26 | | | | 150,425 | |
| | 100,000 | | | | 2.200 | | | | 03/03/31 | | | | 79,634 | |
| | Synchrony Bank | |
| | 400,000 | | | | 5.400 | | | | 08/22/25 | | | | 387,157 | |
| | Synchrony Financial | |
| | 770,000 | | | | 4.250 | | | | 08/15/24 | | | | 752,104 | |
| | 392,000 | | | | 4.500 | | | | 07/23/25 | | | | 374,322 | |
| | 724,000 | | | | 3.950 | | | | 12/01/27 | | | | 648,440 | |
| | |
|
| Corporate Obligations – (continued) | |
| Banks – (continued) | |
| | Truist Bank | |
| 500,000 | | | | 1.500 | | | | 03/10/25 | | | | 466,777 | |
| | (US 5 Year CMT T-Note + 1.150%) | |
| | 750,000 | | | | 2.636 | (a) | | | 09/17/29 | | | | 695,901 | |
| | 550,000 | | | | 2.250 | | | | 03/11/30 | | | | 435,973 | |
| | Truist Financial Corp., MTN | |
| | 250,000 | | | | 2.500 | | | | 08/01/24 | | | | 241,933 | |
| | 605,000 | | | | 2.850 | | | | 10/26/24 | | | | 583,598 | |
| | 280,000 | | | | 3.700 | | | | 06/05/25 | | | | 269,929 | |
| | 150,000 | | | | 1.200 | | | | 08/05/25 | | | | 137,594 | |
| | (SOFR + 0.609%) | |
| | 550,000 | | | | 1.267 | (a) | | | 03/02/27 | | | | 492,414 | |
| | 750,000 | | | | 1.950 | | | | 06/05/30 | | | | 595,585 | |
| | US Bancorp | |
| | 250,000 | | | | 1.450 | | | | 05/12/25 | | | | 234,020 | |
| | (US 5 Year CMT T-Note + 0.950%) | |
| | 300,000 | | | | 2.491 | (a) | | | 11/03/36 | | | | 221,790 | |
| | US Bancorp, MTN | |
| | 290,000 | | | | 3.600 | | | | 09/11/24 | | | | 283,184 | |
| | 286,000 | | | | 3.100 | | | | 04/27/26 | | | | 268,410 | |
| | (SOFR + 0.730%) | |
| | 300,000 | | | | 2.215 | (a) | | | 01/27/28 | | | | 267,900 | |
| | 755,000 | | | | 3.900 | | | | 04/26/28 | | | | 708,978 | |
| | 387,000 | | | | 3.000 | | | | 07/30/29 | | | | 332,176 | |
| | 300,000 | | | | 1.375 | | | | 07/22/30 | | | | 227,536 | |
| | (SOFR + 1.020%) | |
| | 950,000 | | | | 2.677 | (a) | | | 01/27/33 | | | | 756,799 | |
| | US Bancorp, Series V | |
| | 100,000 | | | | 2.375 | | | | 07/22/26 | | | | 92,153 | |
| | US Bancorp, Series X | |
| | 535,000 | | | | 3.150 | | | | 04/27/27 | | | | 495,791 | |
| | US Bank NA | |
| | 550,000 | | | | 2.050 | | | | 01/21/25 | | | | 524,066 | |
| | 800,000 | | | | 2.800 | | | | 01/27/25 | | | | 768,337 | |
| | Wells Fargo & Co. | |
| | 815,000 | | | | 3.000 | | | | 04/22/26 | | | | 763,886 | |
| | (SOFR + 2.000%) | |
| | 600,000 | | | | 2.188 | (a) | | | 04/30/26 | | | | 564,559 | |
| | 1,234,000 | | | | 3.000 | | | | 10/23/26 | | | | 1,143,467 | |
| | (SOFR + 2.530%) | |
| | 1,119,000 | | | | 3.068 | (a) | | | 04/30/41 | | | | 800,672 | |
| | 550,000 | | | | 5.375 | | | | 11/02/43 | | | | 505,176 | |
| | 492,000 | | | | 3.900 | | | | 05/01/45 | | | | 384,736 | |
| | Wells Fargo & Co., GMTN | |
| | 250,000 | | | | 4.300 | | | | 07/22/27 | | | | 239,506 | |
| | 404,000 | | | | 4.900 | | | | 11/17/45 | | | | 346,864 | |
| | Wells Fargo & Co., MTN | |
| | 50,000 | | | | 3.300 | | | | 09/09/24 | | | | 48,815 | |
| | 460,000 | | | | 3.000 | | | | 02/19/25 | | | | 442,837 | |
| | 272,000 | | | | 3.550 | | | | 09/29/25 | | | | 261,103 | |
| | (3M U.S. T-Bill MMY + 1.087%) | |
| | 500,000 | | | | 2.406 | (a) | | | 10/30/25 | | | | 479,768 | |
| | (3M U.S. T-Bill MMY + 1.012%) | |
| | 530,000 | | | | 2.164 | (a) | | | 02/11/26 | | | | 501,325 | |
| | (SOFR + 1.320%) | |
| | 150,000 | | | | 3.908 | (a) | | | 04/25/26 | | | | 145,116 | |
| | 250,000 | | | | 4.100 | | | | 06/03/26 | | | | 239,931 | |
| | |
| | |
| 70 | | The accompanying notes are an integral part of these financial statements. |
GOLDMAN SACHS ACCESS INVESTMENT GRADE CORPORATE BOND ETF
| | | | | | | | | | | | | | |
Principal
Amount | | | Interest
Rate | | | Maturity
Date | | | Value | |
|
| Corporate Obligations – (continued) | |
| Banks – (continued) | |
| | Wells Fargo & Co., MTN – (continued) | |
| | (SOFR + 1.560%) | |
| $ | 200,000 | | | | 4.540 | %(a) | | | 08/15/26 | | | $ | 195,151 | |
| | (3M U.S. T-Bill MMY + 1.432%) | |
| | 320,000 | | | | 3.196 | (a) | | | 06/17/27 | | | | 297,899 | |
| | (SOFR + 1.510%) | |
| | 50,000 | | | | 3.526 | (a) | | | 03/24/28 | | | | 46,526 | |
| | (3M U.S. T-Bill MMY + 1.572%) | |
| | 168,000 | | | | 3.584 | (a) | | | 05/22/28 | | | | 156,050 | |
| | (SOFR + 2.100%) | |
| | 955,000 | | | | 2.393 | (a) | | | 06/02/28 | | | | 850,055 | |
| | (SOFR + 1.740%) | |
| | 1,470,000 | | | | 5.574 | (a) | | | 07/25/29 | | | | 1,467,107 | |
| | (3M U.S. T-Bill MMY + 1.432%) | |
| | 976,000 | | | | 2.879 | (a) | | | 10/30/30 | | | | 835,750 | |
| | (3M U.S. T-Bill MMY + 1.262%) | |
| | 900,000 | | | | 2.572 | (a) | | | 02/11/31 | | | | 752,340 | |
| | (3M U.S. T-Bill MMY + 4.032%) | |
| | 200,000 | | | | 4.478 | (a) | | | 04/04/31 | | | | 187,511 | |
| | (SOFR + 1.500%) | |
| | 750,000 | | | | 3.350 | (a) | | | 03/02/33 | | | | 629,457 | |
| | (SOFR + 2.100%) | |
| | 900,000 | | | | 4.897 | (a) | | | 07/25/33 | | | | 845,296 | |
| | 293,000 | | | | 4.400 | | | | 06/14/46 | | | | 233,132 | |
| | 400,000 | | | | 4.750 | | | | 12/07/46 | | | | 331,941 | |
| | (3M U.S. T-Bill MMY + 4.502%) | |
| | 1,192,000 | | | | 5.013 | (a) | | | 04/04/51 | | | | 1,077,327 | |
| | Wells Fargo Bank NA | |
| | 1,470,000 | | | | 5.550 | | | | 08/01/25 | | | | 1,474,560 | |
| | 400,000 | | | | 6.600 | | | | 01/15/38 | | | | 423,365 | |
| | | | | | | | | | | | | | |
| | | | | | | | | | | | | 132,345,853 | |
| | |
| Basic Industry – 0.8% | |
| | Air Products and Chemicals, Inc. | |
| | 300,000 | | | | 2.700 | | | | 05/15/40 | | | | 218,132 | |
| | CF Industries, Inc. | |
| | 500,000 | | | | 5.150 | | | | 03/15/34 | | | | 472,188 | |
| | 220,000 | | | | 4.950 | | | | 06/01/43 | | | | 186,450 | |
| | 375,000 | | | | 5.375 | | | | 03/15/44 | | | | 331,914 | |
| | Dow Chemical Co. (The) | |
| | 690,000 | | | | 7.375 | | | | 11/01/29 | | | | 758,075 | |
| | 200,000 | | | | 4.375 | | | | 11/15/42 | | | | 164,976 | |
| | 450,000 | | | | 5.550 | | | | 11/30/48 | | | | 426,579 | |
| | 200,000 | | | | 3.600 | | | | 11/15/50 | | | | 142,850 | |
| | DuPont de Nemours, Inc. | |
| | 500,000 | | | | 4.493 | | | | 11/15/25 | | | | 489,322 | |
| | 400,000 | | | | 5.319 | | | | 11/15/38 | | | | 390,252 | |
| | LYB International Finance BV | |
| | 753,000 | | | | 4.875 | | | | 03/15/44 | | | | 639,848 | |
| | LYB International Finance III LLC | |
| | 240,000 | | | | 4.200 | | | | 10/15/49 | | | | 178,060 | |
| | 308,000 | | | | 4.200 | | | | 05/01/50 | | | | 227,846 | |
| | 200,000 | | | | 3.625 | | | | 04/01/51 | | | | 135,116 | |
| | LyondellBasell Industries NV | |
| | 200,000 | | | | 4.625 | | | | 02/26/55 | | | | 156,874 | |
| | Sherwin-Williams Co. (The) | |
| | 288,000 | | | | 3.450 | | | | 06/01/27 | | | | 270,800 | |
| | |
|
| Corporate Obligations – (continued) | |
| Basic Industry – (continued) | |
| | Sherwin-Williams Co. (The) – (continued) | |
| 300,000 | | | | 4.500 | | | | 06/01/47 | | | | 256,310 | |
| | | | | | | | | | | | | | |
| | | | | | | | | | | | | 5,445,592 | |
| | |
| Broadcasting – 0.0% | |
| | Discovery Communications LLC | |
| | 310,000 | | | | 5.200 | | | | 09/20/47 | | | | 251,349 | |
| | |
| Brokerage – 0.5% | |
| | BlackRock, Inc. | |
| | 200,000 | | | | 2.400 | | | | 04/30/30 | | | | 171,796 | |
| | 200,000 | | | | 1.900 | | | | 01/28/31 | | | | 162,492 | |
| | 150,000 | | | | 2.100 | | | | 02/25/32 | | | | 119,512 | |
| | CME Group, Inc. | |
| | 50,000 | | | | 2.650 | | | | 03/15/32 | | | | 41,971 | |
| | 100,000 | | | | 5.300 | | | | 09/15/43 | | | | 101,125 | |
| | Intercontinental Exchange, Inc. | |
| | 340,000 | | | | 2.100 | | | | 06/15/30 | | | | 280,490 | |
| | 830,000 | | | | 1.850 | | | | 09/15/32 | | | | 632,527 | |
| | 360,000 | | | | 4.600 | | | | 03/15/33 | | | | 344,290 | |
| | 566,000 | | | | 3.000 | | | | 06/15/50 | | | | 377,840 | |
| | 392,000 | | | | 4.950 | | | | 06/15/52 | | | | 366,271 | |
| | 416,000 | | | | 3.000 | | | | 09/15/60 | | | | 258,245 | |
| | Jefferies Financial Group, Inc. | |
| | 125,000 | | | | 4.150 | | | | 01/23/30 | | | | 112,384 | |
| | 600,000 | | | | 2.625 | | | | 10/15/31 | | | | 467,310 | |
| | | | | | | | | | | | | | |
| | | | | | | | | | | | | 3,436,253 | |
| | |
| Capital Goods – 1.0% | |
| | 3M Co. | |
| | 500,000 | | | | 2.375 | | | | 08/26/29 | | | | 432,382 | |
| | 3M Co., MTN | |
| | 550,000 | | | | 4.000 | | | | 09/14/48 | | | | 445,618 | |
| | Carrier Global Corp. | |
| | 40,000 | | | | 2.493 | | | | 02/15/27 | | | | 36,452 | |
| | 565,000 | | | | 2.722 | | | | 02/15/30 | | | | 485,419 | |
| | 307,000 | | | | 2.700 | | | | 02/15/31 | | | | 257,786 | |
| | 438,000 | | | | 3.377 | | | | 04/05/40 | | | | 330,579 | |
| | 250,000 | | | | 3.577 | | | | 04/05/50 | | | | 179,570 | |
| | Caterpillar, Inc. | |
| | 40,000 | | | | 2.600 | | | | 04/09/30 | | | | 35,177 | |
| | 80,000 | | | | 5.200 | | | | 05/27/41 | | | | 81,309 | |
| | 88,000 | | | | 3.803 | | | | 08/15/42 | | | | 74,849 | |
| | 246,000 | | | | 3.250 | | | | 09/19/49 | | | | 185,404 | |
| | Deere & Co. | |
| | 266,000 | | | | 3.900 | | | | 06/09/42 | | | | 233,374 | |
| | 190,000 | | | | 3.750 | | | | 04/15/50 | | | | 162,693 | |
| | Emerson Electric Co. | |
| | 180,000 | | | | 2.800 | | | | 12/21/51 | | | | 116,731 | |
| | General Electric Co., MTN | |
| | 135,000 | | | | 6.750 | | | | 03/15/32 | | | | 150,430 | |
| | Honeywell International, Inc. | |
| | 112,000 | | | | 2.300 | | | | 08/15/24 | | | | 108,757 | |
| | 763,000 | | | | 2.500 | | | | 11/01/26 | | | | 712,248 | |
| | 80,000 | | | | 2.700 | | | | 08/15/29 | | | | 71,192 | |
| | 290,000 | | | | 1.750 | | | | 09/01/31 | | | | 230,391 | |
| | 300,000 | | | | 5.000 | | | | 02/15/33 | | | | 303,167 | |
| | |
| | |
| The accompanying notes are an integral part of these financial statements. | | 71 |
GOLDMAN SACHS ACCESS INVESTMENT GRADE CORPORATE BOND ETF
Schedule of Investments (continued)
August 31, 2023
| | | | | | | | | | | | | | |
Principal
Amount | | | Interest
Rate | | | Maturity
Date | | | Value | |
|
| Corporate Obligations – (continued) | |
| Capital Goods – (continued) | |
| | Illinois Tool Works, Inc. | |
| $ | 321,000 | | | | 2.650 | % | | | 11/15/26 | | | $ | 300,621 | |
| | 290,000 | | | | 3.900 | | | | 09/01/42 | | | | 248,904 | |
| | Otis Worldwide Corp. | |
| | 624,000 | | | | 2.565 | | | | 02/15/30 | | | | 534,427 | |
| | Parker-Hannifin Corp. | |
| | 300,000 | | | | 3.650 | | | | 06/15/24 | | | | 294,959 | |
| | Republic Services, Inc. | |
| | 390,000 | | | | 3.950 | | | | 05/15/28 | | | | 370,443 | |
| | Westinghouse Air Brake Technologies Corp. | |
| | 326,000 | | | | 3.450 | | | | 11/15/26 | | | | 306,921 | |
| | 340,000 | | | | 4.950 | | | | 09/15/28 | | | | 328,286 | |
| | | | | | | | | | | | | | |
| | | | | | | | | | | | | 7,018,089 | |
| | |
| Communications – 4.0% | |
| Charter Communications Operating LLC / Charter
Communications Operating Capital |
|
| | 798,000 | | | | 4.908 | | | | 07/23/25 | | | | 784,043 | |
| | 261,000 | | | | 3.750 | | | | 02/15/28 | | | | 239,035 | |
| | 414,000 | | | | 4.200 | | | | 03/15/28 | | | | 386,042 | |
| | 250,000 | | | | 2.250 | | | | 01/15/29 | | | | 207,897 | |
| | 128,000 | | | | 5.050 | | | | 03/30/29 | | | | 121,834 | |
| | 370,000 | | | | 2.800 | | | | 04/01/31 | | | | 297,733 | |
| | 200,000 | | | | 2.300 | | | | 02/01/32 | | | | 151,126 | |
| | 425,000 | | | | 6.384 | | | | 10/23/35 | | | | 412,161 | |
| | 338,000 | | | | 5.375 | | | | 04/01/38 | | | | 285,673 | |
| | 300,000 | | | | 3.500 | | | | 06/01/41 | | | | 198,946 | |
| | 590,000 | | | | 6.484 | | | | 10/23/45 | | | | 541,851 | |
| | 466,000 | | | | 5.375 | | | | 05/01/47 | | | | 373,101 | |
| | 432,000 | | | | 5.750 | | | | 04/01/48 | | | | 364,848 | |
| | 430,000 | | | | 5.125 | | | | 07/01/49 | | | | 330,331 | |
| | 350,000 | | | | 4.800 | | | | 03/01/50 | | | | 258,833 | |
| | 748,000 | | | | 3.700 | | | | 04/01/51 | | | | 465,196 | |
| | 250,000 | | | | 3.900 | | | | 06/01/52 | | | | 160,128 | |
| | 354,000 | | | | 3.850 | | | | 04/01/61 | | | | 211,850 | |
| | 254,000 | | | | 4.400 | | | | 12/01/61 | | | | 167,136 | |
| | 282,000 | | | | 3.950 | | | | 06/30/62 | | | | 170,321 | |
| | Comcast Corp. | |
| | 400,000 | | | | 3.150 | | | | 02/15/28 | | | | 371,171 | |
| | 400,000 | | | | 3.550 | | | | 05/01/28 | | | | 377,682 | |
| | 400,000 | | | | 4.150 | | | | 10/15/28 | | | | 385,984 | |
| | 700,000 | | | | 4.550 | | | | 01/15/29 | | | | 685,334 | |
| | 150,000 | | | | 2.650 | | | | 02/01/30 | | | | 130,585 | |
| | 400,000 | | | | 3.400 | | | | 04/01/30 | | | | 364,313 | |
| | 300,000 | | | | 4.250 | | | | 10/15/30 | | | | 285,466 | |
| | 500,000 | | | | 4.650 | | | | 02/15/33 | | | | 487,016 | |
| | 300,000 | | | | 7.050 | | | | 03/15/33 | | | | 340,892 | |
| | 250,000 | | | | 4.800 | | | | 05/15/33 | | | | 244,931 | |
| | 150,000 | | | | 4.200 | | | | 08/15/34 | | | | 137,139 | |
| | 880,000 | | | | 3.900 | | | | 03/01/38 | | | | 747,178 | |
| | 400,000 | | | | 3.969 | | | | 11/01/47 | | | | 319,983 | |
| | 300,000 | | | | 4.000 | | | | 03/01/48 | | | | 242,009 | |
| | 400,000 | | | | 4.700 | | | | 10/15/48 | | | | 362,260 | |
| | 400,000 | | | | 3.999 | | | | 11/01/49 | | | | 319,307 | |
| | 400,000 | | | | 3.450 | | | | 02/01/50 | | | | 291,951 | |
| | 400,000 | | | | 2.800 | | | | 01/15/51 | | | | 253,437 | |
| | |
|
| Corporate Obligations – (continued) | |
| Communications – (continued) | |
| | Comcast Corp. – (continued) | |
| 600,000 | | | | 2.887 | | | | 11/01/51 | | | | 385,614 | |
| | 400,000 | | | | 2.450 | | | | 08/15/52 | | | | 234,740 | |
| | 750,000 | | | | 5.350 | | | | 05/15/53 | | | | 736,889 | |
| | 750,000 | | | | 2.937 | | | | 11/01/56 | | | | 468,052 | |
| | 400,000 | | | | 4.950 | | | | 10/15/58 | | | | 368,825 | |
| | 560,000 | | | | 2.650 | | | | 08/15/62 | | | | 320,724 | |
| | 400,000 | | | | 2.987 | | | | 11/01/63 | | | | 242,272 | |
| | Meta Platforms, Inc. | |
| | 50,000 | | | | 4.800 | | | | 05/15/30 | | | | 49,809 | |
| | Netflix, Inc. | |
| | 400,000 | | | | 5.875 | | | | 02/15/25 | | | | 403,420 | |
| | 325,000 | | | | 4.375 | | | | 11/15/26 | | | | 317,281 | |
| | 690,000 | | | | 5.875 | | | | 11/15/28 | | | | 710,700 | |
| | 227,000 | | | | 6.375 | | | | 05/15/29 | | | | 238,645 | |
| | Omnicom Group, Inc. | |
| | 125,000 | | | | 2.600 | | | | 08/01/31 | | | | 102,397 | |
| | Omnicom Group, Inc. / Omnicom Capital, Inc. | |
| | 362,000 | | | | 3.650 | | | | 11/01/24 | | | | 353,650 | |
| | 850,000 | | | | 3.600 | | | | 04/15/26 | | | | 813,882 | |
| | Time Warner Cable Enterprises LLC | |
| | 216,000 | | | | 8.375 | | | | 07/15/33 | | | | 240,577 | |
| | Time Warner Cable LLC | |
| | 70,000 | | | | 6.550 | | | | 05/01/37 | | | | 66,357 | |
| | 304,000 | | | | 7.300 | | | | 07/01/38 | | | | 306,383 | |
| | 322,000 | | | | 6.750 | | | | 06/15/39 | | | | 311,916 | |
| | 180,000 | | | | 5.875 | | | | 11/15/40 | | | | 156,710 | |
| | 431,000 | | | | 5.500 | | | | 09/01/41 | | | | 353,447 | |
| | TWDC Enterprises 18 Corp., GMTN | |
| | 290,000 | | | | 4.125 | | | | 06/01/44 | | | | 243,002 | |
| | TWDC Enterprises 18 Corp., MTN | |
| | 705,000 | | | | 1.850 | | | | 07/30/26 | | | | 645,683 | |
| | 102,000 | | | | 2.950 | | | | 06/15/27 | | | | 95,534 | |
| | Walt Disney Co. (The) | |
| | 632,000 | | | | 1.750 | | | | 08/30/24 | | | | 609,477 | |
| | 400,000 | | | | 3.350 | | | | 03/24/25 | | | | 388,162 | |
| | 202,000 | | | | 2.200 | | | | 01/13/28 | | | | 182,065 | |
| | 330,000 | | | | 2.000 | | | | 09/01/29 | | | | 279,840 | |
| | 498,000 | | | | 3.800 | | | | 03/22/30 | | | | 464,943 | |
| | 1,180,000 | | | | 2.650 | | | | 01/13/31 | | | | 1,010,130 | |
| | 75,000 | | | | 6.400 | | | | 12/15/35 | | | | 82,362 | |
| | 100,000 | | | | 6.650 | | | | 11/15/37 | | | | 112,622 | |
| | 250,000 | | | | 4.625 | | | | 03/23/40 | | | | 231,051 | |
| | 1,100,000 | | | | 2.750 | | | | 09/01/49 | | | | 708,969 | |
| | 270,000 | | | | 4.700 | | | | 03/23/50 | | | | 245,863 | |
| | 383,000 | | | | 3.800 | | | | 05/13/60 | | | | 288,740 | |
| | Warnermedia Holdings, Inc. | |
| | 1,000,000 | | | | 3.755 | | | | 03/15/27 | | | | 938,744 | |
| | 1,000,000 | | | | 5.391 | | | | 03/15/62 | | | | 796,295 | |
| | | | | | | | | | | | | | |
| | | | | | | | | | | | | 26,980,495 | |
| | |
| Consumer Cyclical – 6.9% | |
| | Amazon.com, Inc. | |
| | 212,000 | | | | 2.800 | | | | 08/22/24 | | | | 206,745 | |
| | 379,000 | | | | 3.800 | | | | 12/05/24 | | | | 372,562 | |
| | 670,000 | | | | 0.800 | | | | 06/03/25 | | | | 622,392 | |
| | |
| | |
| 72 | | The accompanying notes are an integral part of these financial statements. |
GOLDMAN SACHS ACCESS INVESTMENT GRADE CORPORATE BOND ETF
| | | | | | | | | | | | | | |
Principal
Amount | | | Interest
Rate | | | Maturity
Date | | | Value | |
|
| Corporate Obligations – (continued) | |
| Consumer Cyclical – (continued) | |
| | Amazon.com, Inc. – (continued) | |
| $ | 118,000 | | | | 5.200 | % | | | 12/03/25 | | | $ | 118,410 | |
| | 200,000 | | | | 1.200 | | | | 06/03/27 | | | | 176,300 | |
| | 780,000 | | | | 3.150 | | | | 08/22/27 | | | | 734,097 | |
| | 575,000 | | | | 1.500 | | | | 06/03/30 | | | | 468,725 | |
| | 600,000 | | | | 3.600 | | | | 04/13/32 | | | | 553,452 | |
| | 420,000 | | | | 4.800 | | | | 12/05/34 | | | | 421,250 | |
| | 715,000 | | | | 3.875 | | | | 08/22/37 | | | | 643,036 | |
| | 400,000 | | | | 2.875 | | | | 05/12/41 | | | | 300,948 | |
| | 284,000 | | | | 4.950 | | | | 12/05/44 | | | | 280,626 | |
| | 731,000 | | | | 4.050 | | | | 08/22/47 | | | | 632,933 | |
| | 444,000 | | | | 2.500 | | | | 06/03/50 | | | | 284,368 | |
| | 1,086,000 | | | | 3.100 | | | | 05/12/51 | | | | 777,473 | |
| | 482,000 | | | | 4.250 | | | | 08/22/57 | | | | 417,775 | |
| | 400,000 | | | | 2.700 | | | | 06/03/60 | | | | 247,651 | |
| | 400,000 | | | | 3.250 | | | | 05/12/61 | | | | 278,454 | |
| | 500,000 | | | | 4.100 | | | | 04/13/62 | | | | 413,067 | |
| | American Honda Finance Corp., MTN | |
| | 430,000 | | | | 2.150 | | | | 09/10/24 | | | | 415,374 | |
| | 40,000 | | | | 1.200 | | | | 07/08/25 | | | | 37,086 | |
| | Aptiv PLC | |
| | 300,000 | | | | 3.100 | | | | 12/01/51 | | | | 183,108 | |
| | Aptiv PLC / Aptiv Corp. | |
| | 216,000 | | | | 4.150 | | | | 05/01/52 | | | | 159,531 | |
| | Booking Holdings, Inc. | |
| | 150,000 | | | | 4.625 | | | | 04/13/30 | | | | 146,781 | |
| | Costco Wholesale Corp. | |
| | 232,000 | | | | 3.000 | | | | 05/18/27 | | | | 219,167 | |
| | 200,000 | | | | 1.375 | | | | 06/20/27 | | | | 176,817 | |
| | 100,000 | | | | 1.600 | | | | 04/20/30 | | | | 82,528 | |
| | 876,000 | | | | 1.750 | | | | 04/20/32 | | | | 695,159 | |
| | Dollar Tree, Inc. | |
| | 236,000 | | | | 4.200 | | | | 05/15/28 | | | | 224,048 | |
| | eBay, Inc. | |
| | 250,000 | | | | 1.900 | | | | 03/11/25 | | | | 236,879 | |
| | 550,000 | | | | 4.000 | | | | 07/15/42 | | | | 429,776 | |
| | Expedia Group, Inc. | |
| | 300,000 | | | | 3.250 | | | | 02/15/30 | | | | 261,682 | |
| | General Motors Co. | |
| | 500,000 | | | | 6.125 | | | | 10/01/25 | | | | 502,544 | |
| | 250,000 | | | | 5.000 | | | | 10/01/28 | | | | 241,609 | |
| | 500,000 | | | | 5.600 | | | | 10/15/32 | | | | 482,030 | |
| | 300,000 | | | | 6.600 | | | | 04/01/36 | | | | 302,722 | |
| | 300,000 | | | | 5.150 | | | | 04/01/38 | | | | 261,589 | |
| | 404,000 | | | | 6.750 | | | | 04/01/46 | | | | 397,496 | |
| | 200,000 | | | | 5.400 | | | | 04/01/48 | | | | 166,943 | |
| | 550,000 | | | | 5.950 | | | | 04/01/49 | | | | 495,256 | |
| | General Motors Financial Co., Inc. | |
| | 200,000 | | | | 5.250 | | | | 03/01/26 | | | | 196,796 | |
| | 400,000 | | | | 2.350 | | | | 02/26/27 | | | | 356,398 | |
| | 100,000 | | | | 5.000 | | | | 04/09/27 | | | | 97,439 | |
| | 600,000 | | | | 2.700 | | | | 08/20/27 | | | | 534,667 | |
| | 200,000 | | | | 6.000 | | | | 01/09/28 | | | | 200,681 | |
| | 1,100,000 | | | | 2.350 | | | | 01/08/31 | | | | 856,563 | |
| | 250,000 | | | | 2.700 | | | | 06/10/31 | | | | 197,096 | |
| | |
|
| Corporate Obligations – (continued) | |
| Consumer Cyclical – (continued) | |
| | Global Payments, Inc. | |
| 400,000 | | | | 2.900 | | | | 11/15/31 | | | | 327,539 | |
| | Home Depot, Inc. (The) | |
| | 220,000 | | | | 3.350 | | | | 09/15/25 | | | | 212,475 | |
| | 800,000 | | | | 4.000 | | | | 09/15/25 | | | | 783,766 | |
| | 556,000 | | | | 3.000 | | | | 04/01/26 | | | | 531,774 | |
| | 244,000 | | | | 3.900 | | | | 12/06/28 | | | | 234,793 | |
| | 390,000 | | | | 2.950 | | | | 06/15/29 | | | | 354,180 | |
| | 400,000 | | | | 1.375 | | | | 03/15/31 | | | | 313,061 | |
| | 400,000 | | | | 1.875 | | | | 09/15/31 | | | | 321,931 | |
| | 680,000 | | | | 5.875 | | | | 12/16/36 | | | | 728,926 | |
| | 460,000 | | | | 3.300 | | | | 04/15/40 | | | | 362,667 | |
| | 500,000 | | | | 4.200 | | | | 04/01/43 | | | | 436,448 | |
| | 150,000 | | | | 4.875 | | | | 02/15/44 | | | | 141,530 | |
| | 130,000 | | | | 4.400 | | | | 03/15/45 | | | | 113,719 | |
| | 300,000 | | | | 4.250 | | | | 04/01/46 | | | | 257,355 | |
| | 300,000 | | | | 4.500 | | | | 12/06/48 | | | | 268,397 | |
| | 300,000 | | | | 3.125 | | | | 12/15/49 | | | | 210,523 | |
| | 300,000 | | | | 3.350 | | | | 04/15/50 | | | | 219,723 | |
| | 406,000 | | | | 2.375 | | | | 03/15/51 | | | | 241,632 | |
| | 300,000 | | | | 3.500 | | | | 09/15/56 | | | | 220,062 | |
| | Las Vegas Sands Corp. | |
| | 116,000 | | | | 3.200 | | | | 08/08/24 | | | | 112,302 | |
| | 190,000 | | | | 3.500 | | | | 08/18/26 | | | | 176,244 | |
| | 320,000 | | | | 3.900 | | | | 08/08/29 | | | | 282,110 | |
| | Lowe’s Cos., Inc. | |
| | 500,000 | | | | 4.800 | | | | 04/01/26 | | | | 495,039 | |
| | 280,000 | | | | 1.700 | | | | 10/15/30 | | | | 222,426 | |
| | 250,000 | | | | 3.750 | | | | 04/01/32 | | | | 224,630 | |
| | 1,750,000 | | | | 5.150 | | | | 07/01/33 | | | | 1,730,502 | |
| | 700,000 | | | | 5.625 | | | | 04/15/53 | | | | 681,783 | |
| | Marriott International, Inc., Series FF | |
| | 236,000 | | | | 4.625 | | | | 06/15/30 | | | | 224,093 | |
| | Marriott International, Inc., Series GG | |
| | 300,000 | | | | 3.500 | | | | 10/15/32 | | | | 255,111 | |
| | Marriott International, Inc., Series R | |
| | 200,000 | | | | 3.125 | | | | 06/15/26 | | | | 188,099 | |
| | Mastercard, Inc. | |
| | 90,000 | | | | 2.000 | | | | 03/03/25 | | | | 86,029 | |
| | 143,000 | | | | 2.950 | | | | 11/21/26 | | | | 134,936 | |
| | 144,000 | | | | 3.300 | | | | 03/26/27 | | | | 137,076 | |
| | 132,000 | | | | 2.950 | | | | 06/01/29 | | | | 119,676 | |
| | 508,000 | | | | 3.350 | | | | 03/26/30 | | | | 467,184 | |
| | 250,000 | | | | 2.000 | | | | 11/18/31 | | | | 203,232 | |
| | 162,000 | | | | 3.650 | | | | 06/01/49 | | | | 130,267 | |
| | 400,000 | | | | 3.850 | | | | 03/26/50 | | | | 332,318 | |
| | McDonald’s Corp., MTN | |
| | 370,000 | | | | 3.700 | | | | 01/30/26 | | | | 358,025 | |
| | 304,000 | | | | 3.500 | | | | 03/01/27 | | | | 289,531 | |
| | 350,000 | | | | 3.800 | | | | 04/01/28 | | | | 334,729 | |
| | 100,000 | | | | 2.625 | | | | 09/01/29 | | | | 88,438 | |
| | 282,000 | | | | 2.125 | | | | 03/01/30 | | | | 237,748 | |
| | 150,000 | | | | 3.600 | | | | 07/01/30 | | | | 138,172 | |
| | 941,000 | | | | 4.700 | | | | 12/09/35 | | | | 896,995 | |
| | 150,000 | | | | 4.875 | | | | 12/09/45 | | | | 138,763 | |
| | 500,000 | | | | 4.450 | | | | 03/01/47 | | | | 432,795 | |
| | |
| | |
| The accompanying notes are an integral part of these financial statements. | | 73 |
GOLDMAN SACHS ACCESS INVESTMENT GRADE CORPORATE BOND ETF
Schedule of Investments (continued)
August 31, 2023
| | | | | | | | | | | | | | |
Principal
Amount | | | Interest
Rate | | | Maturity
Date | | | Value | |
|
| Corporate Obligations – (continued) | |
| Consumer Cyclical – (continued) | |
| | McDonald’s Corp., MTN – (continued) | |
| $ | 296,000 | | | | 4.450 | % | | | 09/01/48 | | | $ | 257,203 | |
| | 372,000 | | | | 4.200 | | | | 04/01/50 | | | | 308,803 | |
| | NIKE, Inc. | |
| | 80,000 | | | | 2.400 | | | | 03/27/25 | | | | 76,583 | |
| | 115,000 | | | | 2.375 | | | | 11/01/26 | | | | 106,552 | |
| | 550,000 | | | | 2.750 | | | | 03/27/27 | | | | 513,911 | |
| | 204,000 | | | | 2.850 | | | | 03/27/30 | | | | 182,133 | |
| | 250,000 | | | | 3.250 | | | | 03/27/40 | | | | 201,638 | |
| | 140,000 | | | | 3.875 | | | | 11/01/45 | | | | 119,694 | |
| | 340,000 | | | | 3.375 | | | | 03/27/50 | | | | 263,263 | |
| | Starbucks Corp. | |
| | 2,012,000 | | | | 3.800 | | | | 08/15/25 | | | | 1,956,948 | |
| | 100,000 | | | | 4.000 | | | | 11/15/28 | | | | 95,710 | |
| | 300,000 | | | | 3.000 | | | | 02/14/32 | | | | 257,641 | |
| | 250,000 | | | | 4.500 | | | | 11/15/48 | | | | 214,080 | |
| | 358,000 | | | | 4.450 | | | | 08/15/49 | | | | 303,673 | |
| | 290,000 | | | | 3.500 | | | | 11/15/50 | | | | 209,879 | |
| | Target Corp. | |
| | 600,000 | | | | 2.250 | | | | 04/15/25 | | | | 573,013 | |
| | Toyota Motor Credit Corp., MTN | |
| | 20,000 | | | | 1.800 | | | | 02/13/25 | | | | 19,012 | |
| | 500,000 | | | | 3.000 | | | | 04/01/25 | | | | 483,013 | |
| | 1,428,000 | | | | 1.900 | | | | 01/13/27 | | | | 1,292,092 | |
| | 200,000 | | | | 3.050 | | | | 03/22/27 | | | | 188,000 | |
| | 535,000 | | | | 2.150 | | | | 02/13/30 | | | | 454,738 | |
| | 487,000 | | | | 3.375 | | | | 04/01/30 | | | | 443,515 | |
| | Visa, Inc. | |
| | 473,000 | | | | 3.150 | | | | 12/14/25 | | | | 453,623 | |
| | 100,000 | | | | 1.900 | | | | 04/15/27 | | | | 90,616 | |
| | 315,000 | | | | 2.750 | | | | 09/15/27 | | | | 292,401 | |
| | 201,000 | | | | 2.050 | | | | 04/15/30 | | | | 170,607 | |
| | 980,000 | | | | 4.150 | | | | 12/14/35 | | | | 923,918 | |
| | 300,000 | | | | 2.700 | | | | 04/15/40 | | | | 223,307 | |
| | 729,000 | | | | 4.300 | | | | 12/14/45 | | | | 658,433 | |
| | 300,000 | | | | 3.650 | | | | 09/15/47 | | | | 244,731 | |
| | 200,000 | | | | 2.000 | | | | 08/15/50 | | | | 118,536 | |
| | Walmart, Inc. | |
| | 150,000 | | | | 2.850 | | | | 07/08/24 | | | | 146,631 | |
| | 300,000 | | | | 3.050 | | | | 07/08/26 | | | | 286,863 | |
| | 466,000 | | | | 3.700 | | | | 06/26/28 | | | | 449,348 | |
| | 300,000 | | | | 1.500 | | | | 09/22/28 | | | | 259,315 | |
| | 220,000 | | | | 1.800 | | | | 09/22/31 | | | | 180,003 | |
| | 455,000 | | | | 5.250 | | | | 09/01/35 | | | | 476,230 | |
| | 330,000 | | | | 6.500 | | | | 08/15/37 | | | | 380,356 | |
| | 465,000 | | | | 4.050 | | | | 06/29/48 | | | | 409,349 | |
| | 400,000 | | | | 2.650 | | | | 09/22/51 | | | | 270,099 | |
| | 1,000,000 | | | | 4.500 | | | | 09/09/52 | | | | 932,377 | |
| | | | | | | | | | | | | | |
| | | | | | | | | | | | | 47,394,620 | |
| | |
| Consumer Noncyclical – 7.6% | |
| | Abbott Laboratories | |
| | 763,000 | | | | 2.950 | | | | 03/15/25 | | | | 740,266 | |
| | 68,000 | | | | 3.750 | | | | 11/30/26 | | | | 65,874 | |
| | 538,000 | | | | 4.750 | | | | 11/30/36 | | | | 534,962 | |
| | 540,000 | | | | 4.900 | | | | 11/30/46 | | | | 527,409 | |
| | |
|
| Corporate Obligations – (continued) | |
| Consumer Noncyclical – (continued) | |
| | AbbVie, Inc. | |
| 100,000 | | | | 2.600 | | | | 11/21/24 | | | | 96,565 | |
| | 1,452,000 | | | | 3.800 | | | | 03/15/25 | | | | 1,414,745 | |
| | 2,482,000 | | | | 3.600 | | | | 05/14/25 | | | | 2,407,878 | |
| | 291,000 | | | | 3.200 | | | | 05/14/26 | | | | 276,711 | |
| | 250,000 | | | | 4.250 | | | | 11/14/28 | | | | 241,820 | |
| | 625,000 | | | | 3.200 | | | | 11/21/29 | | | | 564,015 | |
| | 425,000 | | | | 4.550 | | | | 03/15/35 | | | | 401,710 | |
| | 1,006,000 | | | | 4.050 | | | | 11/21/39 | | | | 866,524 | |
| | 300,000 | | | | 4.850 | | | | 06/15/44 | | | | 274,848 | |
| | 379,000 | | | | 4.750 | | | | 03/15/45 | | | | 341,618 | |
| | 500,000 | | | | 4.700 | | | | 05/14/45 | | | | 448,786 | |
| | 304,000 | | | | 4.450 | | | | 05/14/46 | | | | 262,221 | |
| | 320,000 | | | | 4.875 | | | | 11/14/48 | | | | 295,463 | |
| | 950,000 | | | | 4.250 | | | | 11/21/49 | | | | 804,680 | |
| | Altria Group, Inc. | |
| | 800,000 | | | | 2.350 | | | | 05/06/25 | | | | 758,152 | |
| | 780,000 | | | | 4.800 | | | | 02/14/29 | | | | 755,434 | |
| | 370,000 | | | | 2.450 | | | | 02/04/32 | | | | 288,986 | |
| | 100,000 | | | | 5.800 | | | | 02/14/39 | | | | 97,020 | |
| | 270,000 | | | | 3.400 | | | | 02/04/41 | | | | 184,167 | |
| | 220,000 | | | | 4.250 | | | | 08/09/42 | | | | 166,779 | |
| | 310,000 | | | | 5.375 | | | | 01/31/44 | | | | 288,084 | |
| | 348,000 | | | | 3.875 | | | | 09/16/46 | | | | 239,785 | |
| | 690,000 | | | | 5.950 | | | | 02/14/49 | | | | 642,711 | |
| | 70,000 | | | | 3.700 | | | | 02/04/51 | | | | 45,556 | |
| | 150,000 | | | | 4.000 | | | | 02/04/61 | | | | 100,810 | |
| | Amgen, Inc. | |
| | 300,000 | | | | 3.125 | | | | 05/01/25 | | | | 288,742 | |
| | 500,000 | | | | 2.200 | | | | 02/21/27 | | | | 455,063 | |
| | 800,000 | | | | 3.200 | | | | 11/02/27 | | | | 744,168 | |
| | 800,000 | | | | 5.150 | | | | 03/02/28 | | | | 800,689 | |
| | 400,000 | | | | 1.650 | | | | 08/15/28 | | | | 341,914 | |
| | 150,000 | | | | 3.000 | | | | 02/22/29 | | | | 135,769 | |
| | 500,000 | | | | 2.000 | | | | 01/15/32 | | | | 392,223 | |
| | 460,000 | | | | 4.200 | | | | 03/01/33 | | | | 423,274 | |
| | 300,000 | | | | 3.150 | | | | 02/21/40 | | | | 224,945 | |
| | 610,000 | | | | 4.563 | | | | 06/15/48 | | | | 519,726 | |
| | 712,000 | | | | 3.375 | | | | 02/21/50 | | | | 500,444 | |
| | 900,000 | | | | 4.663 | | | | 06/15/51 | | | | 772,823 | |
| | 334,000 | | | | 2.770 | | | | 09/01/53 | | | | 200,241 | |
| | 1,280,000 | | | | 4.400 | | | | 02/22/62 | | | | 1,016,838 | |
| | 360,000 | | | | 5.750 | | | | 03/02/63 | | | | 355,288 | |
| | Baxter International, Inc. | |
| | 450,000 | | | | 2.539 | | | | 02/01/32 | | | | 362,504 | |
| | Biogen, Inc. | |
| | 372,000 | | | | 5.200 | | | | 09/15/45 | | | | 350,314 | |
| | Bristol-Myers Squibb Co. | |
| | 1,922,000 | | | | 0.750 | | | | 11/13/25 | | | | 1,753,407 | |
| | 430,000 | | | | 4.550 | | | | 02/20/48 | | | | 383,417 | |
| | 714,000 | | | | 4.250 | | | | 10/26/49 | | | | 605,170 | |
| | 600,000 | | | | 2.550 | | | | 11/13/50 | | | | 365,324 | |
| | 750,000 | | | | 3.700 | | | | 03/15/52 | | | | 574,878 | |
| | 400,000 | | | | 3.900 | | | | 03/15/62 | | | | 305,195 | |
| | Centene Corp. | |
| | 860,000 | | | | 4.250 | | | | 12/15/27 | | | | 808,400 | |
| | 400,000 | | | | 2.450 | | | | 07/15/28 | | | | 343,500 | |
| | |
| | |
| 74 | | The accompanying notes are an integral part of these financial statements. |
GOLDMAN SACHS ACCESS INVESTMENT GRADE CORPORATE BOND ETF
| | | | | | | | | | | | | | |
Principal
Amount | | | Interest
Rate | | | Maturity
Date | | | Value | |
|
| Corporate Obligations – (continued) | |
| Consumer Noncyclical – (continued) | |
| | Centene Corp. – (continued) | |
| $ | 904,000 | | | | 4.625 | % | | | 12/15/29 | | | $ | 833,940 | |
| | 550,000 | | | | 3.000 | | | | 10/15/30 | | | | 462,688 | |
| | 1,046,000 | | | | 2.500 | | | | 03/01/31 | | | | 836,171 | |
| | Elevance Health, Inc. | |
| | 400,000 | | | | 6.100 | | | | 10/15/52 | | | | 423,419 | |
| | Eli Lilly & Co. | |
| | 190,000 | | | | 3.950 | | | | 03/15/49 | | | | 163,801 | |
| | 300,000 | | | | 2.250 | | | | 05/15/50 | | | | 184,913 | |
| | 292,000 | | | | 2.500 | | | | 09/15/60 | | | | 173,474 | |
| | Gilead Sciences, Inc. | |
| | 500,000 | | | | 2.950 | | | | 03/01/27 | | | | 466,617 | |
| | 476,000 | | | | 4.000 | | | | 09/01/36 | | | | 420,392 | |
| | 300,000 | | | | 4.800 | | | | 04/01/44 | | | | 275,897 | |
| | 300,000 | | | | 4.750 | | | | 03/01/46 | | | | 272,255 | |
| | 528,000 | | | | 4.150 | | | | 03/01/47 | | | | 443,488 | |
| | 500,000 | | | | 2.800 | | | | 10/01/50 | | | | 323,330 | |
| | Johnson & Johnson | |
| | 1,500,000 | | | | 0.550 | | | | 09/01/25 | | | | 1,375,078 | |
| | Kenvue, Inc.(b) | |
| | 150,000 | | | | 5.200 | | | | 03/22/63 | | | | 147,058 | |
| | Kroger Co. (The) | |
| | 500,000 | | | | 3.950 | | | | 01/15/50 | | | | 387,657 | |
| | Medtronic, Inc. | |
| | 580,000 | | | | 4.375 | | | | 03/15/35 | | | | 547,773 | |
| | 385,000 | | | | 4.625 | | | | 03/15/45 | | | | 361,263 | |
| | Merck & Co., Inc. | |
| | 528,000 | | | | 2.750 | | | | 02/10/25 | | | | 511,278 | |
| | 102,000 | | | | 0.750 | | | | 02/24/26 | | | | 92,361 | |
| | 240,000 | | | | 3.400 | | | | 03/07/29 | | | | 223,635 | |
| | 800,000 | | | | 1.450 | | | | 06/24/30 | | | | 645,313 | |
| | 500,000 | | | | 2.150 | | | | 12/10/31 | | | | 409,880 | |
| | 800,000 | | | | 4.500 | | | | 05/17/33 | | | | 781,563 | |
| | 100,000 | | | | 3.900 | | | | 03/07/39 | | | | 87,452 | |
| | 250,000 | | | | 4.150 | | | | 05/18/43 | | | | 220,644 | |
| | 540,000 | | | | 3.700 | | | | 02/10/45 | | | | 440,975 | |
| | 300,000 | | | | 4.000 | | | | 03/07/49 | | | | 252,863 | |
| | 846,000 | | | | 2.450 | | | | 06/24/50 | | | | 528,323 | |
| | 300,000 | | | | 2.750 | | | | 12/10/51 | | | | 196,344 | |
| | Mylan, Inc. | |
| | 195,000 | | | | 4.550 | | | | 04/15/28 | | | | 184,422 | |
| | 254,000 | | | | 5.200 | | | | 04/15/48 | | | | 197,604 | |
| | Pfizer Investment Enterprises Pte Ltd. | |
| | 1,000,000 | | | | 4.650 | | | | 05/19/25 | | | | 988,571 | |
| | 1,000,000 | | | | 4.450 | | | | 05/19/28 | | | | 978,214 | |
| | 1,000,000 | | | | 4.750 | | | | 05/19/33 | | | | 986,071 | |
| | 1,000,000 | | | | 5.110 | | | | 05/19/43 | | | | 975,674 | |
| | 1,000,000 | | | | 5.300 | | | | 05/19/53 | | | | 1,000,047 | |
| | 380,000 | | | | 5.340 | | | | 05/19/63 | | | | 375,695 | |
| | Pfizer, Inc. | |
| | 92,000 | | | | 0.800 | | | | 05/28/25 | | | | 85,390 | |
| | 276,000 | | | | 3.450 | | | | 03/15/29 | | | | 258,507 | |
| | 618,000 | | | | 2.625 | | | | 04/01/30 | | | | 543,644 | |
| | 400,000 | | | | 3.900 | | | | 03/15/39 | | | | 347,505 | |
| | 425,000 | | | | 7.200 | | | | 03/15/39 | | | | 510,090 | |
| | 260,000 | | | | 2.550 | | | | 05/28/40 | | | | 185,410 | |
| | |
|
| Corporate Obligations – (continued) | |
| Consumer Noncyclical – (continued) | |
| | Pfizer, Inc. – (continued) | |
| 100,000 | | | | 4.300 | | | | 06/15/43 | | | | 90,014 | |
| | 110,000 | | | | 4.400 | | | | 05/15/44 | | | | 100,485 | |
| | 300,000 | | | | 4.125 | | | | 12/15/46 | | | | 260,518 | |
| | 352,000 | | | | 4.200 | | | | 09/15/48 | | | | 311,206 | |
| | 100,000 | | | | 4.000 | | | | 03/15/49 | | | | 86,034 | |
| | 525,000 | | | | 2.700 | | | | 05/28/50 | | | | 355,174 | |
| | Regeneron Pharmaceuticals, Inc. | |
| | 346,000 | | | | 2.800 | | | | 09/15/50 | | | | 215,510 | |
| | Stryker Corp. | |
| | 220,000 | | | | 4.625 | | | | 03/15/46 | | | | 195,437 | |
| | Utah Acquisition Sub, Inc. | |
| | 565,000 | | | | 3.950 | | | | 06/15/26 | | | | 534,920 | |
| | 200,000 | | | | 5.250 | | | | 06/15/46 | | | | 159,218 | |
| | Viatris, Inc. | |
| | 423,000 | | | | 4.000 | | | | 06/22/50 | | | | 279,288 | |
| | Walgreens Boots Alliance, Inc. | |
| | 574,000 | | | | 3.800 | | | | 11/18/24 | | | | 560,831 | |
| | 450,000 | | | | 3.450 | | | | 06/01/26 | | | | 425,409 | |
| | 106,000 | | | | 4.800 | | | | 11/18/44 | | | | 82,960 | |
| | 50,000 | | | | 4.100 | | | | 04/15/50 | | | | 34,130 | |
| | Wyeth LLC | |
| | 388,000 | | | | 6.500 | | | | 02/01/34 | | | | 432,866 | |
| | 300,000 | | | | 5.950 | | | | 04/01/37 | | | | 321,807 | |
| | Zoetis, Inc. | |
| | 158,000 | | | | 3.000 | | | | 09/12/27 | | | | 146,933 | |
| | 410,000 | | | | 4.700 | | | | 02/01/43 | | | | 370,585 | |
| | | | | | | | | | | | | | |
| | | | | | | | | | | | | 52,227,849 | |
| | |
| Consumer Products – 0.4% | |
| | Haleon US Capital LLC | |
| | 300,000 | | | | 3.625 | | | | 03/24/32 | | | | 265,612 | |
| | 400,000 | | | | 4.000 | | | | 03/24/52 | | | | 319,832 | |
| | Procter & Gamble Co. (The) | |
| | 80,000 | | | | 0.550 | | | | 10/29/25 | | | | 72,876 | |
| | 50,000 | | | | 2.450 | | | | 11/03/26 | | | | 46,811 | |
| | 214,000 | | | | 1.900 | | | | 02/01/27 | | | | 195,791 | |
| | 250,000 | | | | 2.850 | | | | 08/11/27 | | | | 234,324 | |
| | 680,000 | | | | 3.000 | | | | 03/25/30 | | | | 620,645 | |
| | 500,000 | | | | 1.200 | | | | 10/29/30 | | | | 399,429 | |
| | 300,000 | | | | 1.950 | | | | 04/23/31 | | | | 251,881 | |
| | 110,000 | | | | 2.300 | | | | 02/01/32 | | | | 93,881 | |
| | | | | | | | | | | | | | |
| | | | | | | | | | | | | 2,501,082 | |
| | |
| Electric – 2.4% | |
| | Consolidated Edison Co. of New York, Inc. | |
| | 250,000 | | | | 4.625 | | | | 12/01/54 | | | | 211,325 | |
| | 134,000 | | | | 3.600 | | | | 06/15/61 | | | | 92,560 | |
| | Consolidated Edison Co. of New York, Inc., Series 20B | |
| | 400,000 | | | | 3.950 | | | | 04/01/50 | | | | 316,572 | |
| | Duke Energy Carolinas LLC | |
| | 345,000 | | | | 3.200 | | | | 08/15/49 | | | | 237,651 | |
| | Duke Energy Corp. | |
| | 390,000 | | | | 2.650 | | | | 09/01/26 | | | | 360,905 | |
| | 480,000 | | | | 2.450 | | | | 06/01/30 | | | | 399,152 | |
| | 504,000 | | | | 3.750 | | | | 09/01/46 | | | | 367,980 | |
| | 350,000 | | | | 3.500 | | | | 06/15/51 | | | | 240,250 | |
| | 370,000 | | | | 5.000 | | | | 08/15/52 | | | | 325,034 | |
| | |
| | |
| The accompanying notes are an integral part of these financial statements. | | 75 |
GOLDMAN SACHS ACCESS INVESTMENT GRADE CORPORATE BOND ETF
Schedule of Investments (continued)
August 31, 2023
| | | | | | | | | | | | | | |
Principal
Amount | | | Interest
Rate | | | Maturity
Date | | | Value | |
|
| Corporate Obligations – (continued) | |
| Electric – (continued) | |
| | Duke Energy Florida LLC | |
| $ | 300,000 | | | | 6.400 | % | | | 06/15/38 | | | $ | 322,768 | |
| | Entergy Louisiana LLC | |
| | 250,000 | | | | 0.950 | | | | 10/01/24 | | | | 237,110 | |
| | 1,770,000 | | | | 4.000 | | | | 03/15/33 | | | | 1,590,219 | |
| | 242,000 | | | | 4.200 | | | | 09/01/48 | | | | 194,116 | |
| | Exelon Corp. | |
| | 92,000 | | | | 4.050 | | | | 04/15/30 | | | | 85,112 | |
| | 288,000 | | | | 4.700 | | | | 04/15/50 | | | | 244,501 | |
| | Florida Power & Light Co. | |
| | 200,000 | | | | 5.050 | | | | 04/01/28 | | | | 200,593 | |
| | 250,000 | | | | 3.950 | | | | 03/01/48 | | | | 203,145 | |
| | 342,000 | | | | 3.150 | | | | 10/01/49 | | | | 237,110 | |
| | Georgia Power Co. | |
| | 1,000,000 | | | | 4.950 | | | | 05/17/33 | | | | 966,991 | |
| | 100,000 | | | | 5.125 | | | | 05/15/52 | | | | 92,991 | |
| | Georgia Power Co., Series A | |
| | 436,000 | | | | 3.250 | | | | 03/15/51 | | | | 296,493 | |
| | NextEra Energy Capital Holdings, Inc. | |
| | 1,050,000 | | | | 6.051 | | | | 03/01/25 | | | | 1,053,565 | |
| | 1,060,000 | | | | 2.250 | | | | 06/01/30 | | | | 872,290 | |
| | 800,000 | | | | 2.440 | | | | 01/15/32 | | | | 640,162 | |
| | Pacific Gas and Electric Co. | |
| | 1,000,000 | | | | 6.100 | | | | 01/15/29 | | | | 989,616 | |
| | PacifiCorp | |
| | 1,000,000 | | | | 5.500 | | | | 05/15/54 | | | | 884,943 | |
| | Sempra | |
| | 548,000 | | | | 3.250 | | | | 06/15/27 | | | | 507,151 | |
| | 250,000 | | | | 3.400 | | | | 02/01/28 | | | | 230,703 | |
| | 300,000 | | | | 6.000 | | | | 10/15/39 | | | | 299,365 | |
| | 240,000 | | | | 4.000 | | | | 02/01/48 | | | | 182,802 | |
| | (US 5 Year CMT T-Note + 2.868%) | |
| | 640,000 | | | | 4.125 | (a) | | | 04/01/52 | | | | 518,400 | |
| | Southern California Edison Co. | |
| | 250,000 | | | | 4.650 | | | | 10/01/43 | | | | 214,094 | |
| | 687,000 | | | | 4.000 | | | | 04/01/47 | | | | 532,771 | |
| | 318,000 | | | | 3.650 | | | | 02/01/50 | | | | 229,999 | |
| | Southern California Edison Co., Series 20A | |
| | 220,000 | | | | 2.950 | | | | 02/01/51 | | | | 139,521 | |
| | Southern California Edison Co., Series C | |
| | 200,000 | | | | 4.125 | | | | 03/01/48 | | | | 157,947 | |
| | Southern Co. (The) | |
| | 856,000 | | | | 3.250 | | | | 07/01/26 | | | | 811,173 | |
| | 430,000 | | | | 4.400 | | | | 07/01/46 | | | | 352,668 | |
| | Southern Co. (The)(a), Series B | |
| | (US 5 Year CMT T-Note + 3.733%) | |
| | 300,000 | | | | 4.000 | | | | 01/15/51 | | | | 281,250 | |
| | Virginia Electric and Power Co. | |
| | 492,000 | | | | 2.450 | | | | 12/15/50 | | | | 283,618 | |
| | | | | | | | | | | | | | |
| | | | | | | | | | | | | 16,404,616 | |
| | |
| Energy – 6.3% | |
| | Baker Hughes Holdings LLC | |
| | 50,000 | | | | 5.125 | | | | 09/15/40 | | | | 47,393 | |
| | Baker Hughes Holdings LLC / Baker Hughes Co.-Obligor, Inc. | |
| | 240,000 | | | | 3.337 | | | | 12/15/27 | | | | 222,862 | |
| | 300,000 | | | | 4.080 | | | | 12/15/47 | | | | 238,256 | |
| | |
|
| Corporate Obligations – (continued) | |
| Energy – (continued) | |
| | BP Capital Markets America, Inc. | |
| $ | 150,000 | | | | 3.119 | % | | | 05/04/26 | | | $ | 142,568 | |
| | 1,842,000 | | | | 3.017 | | | | 01/16/27 | | | | 1,728,335 | |
| | 250,000 | | | | 4.234 | | | | 11/06/28 | | | | 241,534 | |
| | 230,000 | | | | 1.749 | | | | 08/10/30 | | | | 185,823 | |
| | 700,000 | | | | 2.721 | | | | 01/12/32 | | | | 587,151 | |
| | 548,000 | | | | 2.772 | | | | 11/10/50 | | | | 345,645 | |
| | 578,000 | | | | 2.939 | | | | 06/04/51 | | | | 376,933 | |
| | Cheniere Corpus Christi Holdings LLC | |
| | 617,000 | | | | 5.875 | | | | 03/31/25 | | | | 615,457 | |
| | 1,196,000 | | | | 5.125 | | | | 06/30/27 | | | | 1,182,545 | |
| | Cheniere Energy Partners LP | |
| | 400,000 | | | | 4.500 | | | | 10/01/29 | | | | 370,000 | |
| | 400,000 | | | | 4.000 | | | | 03/01/31 | | | | 353,500 | |
| | 400,000 | | | | 3.250 | | | | 01/31/32 | | | | 330,500 | |
| | Cheniere Energy, Inc. | |
| | 248,000 | | | | 4.625 | | | | 10/15/28 | | | | 233,740 | |
| | Chevron Corp. | |
| | 200,000 | | | | 1.554 | | | | 05/11/25 | | | | 188,210 | |
| | 110,000 | | | | 3.326 | | | | 11/17/25 | | | | 106,805 | |
| | 255,000 | | | | 1.995 | | | | 05/11/27 | | | | 230,882 | |
| | 590,000 | | | | 2.236 | | | | 05/11/30 | | | | 506,223 | |
| | 352,000 | | | | 3.078 | | | | 05/11/50 | | | | 249,170 | |
| | Chevron USA, Inc. | |
| | 174,000 | | | | 0.687 | | | | 08/12/25 | | | | 160,074 | |
| | ConocoPhillips | |
| | 410,000 | | | | 6.500 | | | | 02/01/39 | | | | 456,143 | |
| | ConocoPhillips Co. | |
| | 100,000 | | | | 6.950 | | | | 04/15/29 | | | | 110,434 | |
| | 100,000 | | | | 3.758 | | | | 03/15/42 | | | | 81,253 | |
| | 300,000 | | | | 4.300 | | | | 11/15/44 | | | | 259,260 | |
| | 100,000 | | | | 5.300 | | | | 05/15/53 | | | | 97,596 | |
| | 250,000 | | | | 4.025 | | | | 03/15/62 | | | | 190,947 | |
| | Devon Energy Corp. | |
| | 170,000 | | | | 5.600 | | | | 07/15/41 | | | | 157,750 | |
| | 355,000 | | | | 4.750 | | | | 05/15/42 | | | | 297,573 | |
| | 100,000 | | | | 5.000 | | | | 06/15/45 | | | | 85,892 | |
| | Diamondback Energy, Inc. | |
| | 515,000 | | | | 3.250 | | | | 12/01/26 | | | | 484,100 | |
| | 92,000 | | | | 3.500 | | | | 12/01/29 | | | | 83,157 | |
| | 896,000 | | | | 6.250 | | | | 03/15/33 | | | | 925,439 | |
| | Energy Transfer LP | |
| | 608,000 | | | | 4.050 | | | | 03/15/25 | | | | 591,749 | |
| | 668,000 | | | | 2.900 | | | | 05/15/25 | | | | 635,559 | |
| | 200,000 | | | | 4.750 | | | | 01/15/26 | | | | 195,736 | |
| | 200,000 | | | | 5.500 | | | | 06/01/27 | | | | 199,019 | |
| | 100,000 | | | | 4.000 | | | | 10/01/27 | | | | 93,722 | |
| | 230,000 | | | | 4.950 | | | | 06/15/28 | | | | 222,855 | |
| | 151,000 | | | | 5.250 | | | | 04/15/29 | | | | 147,618 | |
| | 100,000 | | | | 3.750 | | | | 05/15/30 | | | | 89,535 | |
| | 100,000 | | | | 6.500 | | | | 02/01/42 | | | | 99,180 | |
| | 201,000 | | | | 5.300 | | | | 04/15/47 | | | | 170,975 | |
| | 283,000 | | | | 5.400 | | | | 10/01/47 | | | | 243,176 | |
| | 277,000 | | | | 6.000 | | | | 06/15/48 | | | | 256,256 | |
| | 431,000 | | | | 6.250 | | | | 04/15/49 | | | | 411,313 | |
| | 480,000 | | | | 5.000 | | | | 05/15/50 | | | | 395,480 | |
| | |
| | |
| 76 | | The accompanying notes are an integral part of these financial statements. |
GOLDMAN SACHS ACCESS INVESTMENT GRADE CORPORATE BOND ETF
| | | | | | | | | | | | | | |
Principal
Amount | | | Interest
Rate | | | Maturity
Date | | | Value | |
|
| Corporate Obligations – (continued) | |
| Energy – (continued) | |
| | Enterprise Products Operating LLC | |
| $ | 207,000 | | | | 3.750 | % | | | 02/15/25 | | | $ | 201,428 | |
| | 326,000 | | | | 3.125 | | | | 07/31/29 | | | | 292,480 | |
| | 150,000 | | | | 2.800 | | | | 01/31/30 | | | | 130,249 | |
| | 150,000 | | | | 5.950 | | | | 02/01/41 | | | | 153,371 | |
| | 207,000 | | | | 4.850 | | | | 08/15/42 | | | | 185,935 | |
| | 220,000 | | | | 4.450 | | | | 02/15/43 | | | | 187,603 | |
| | 268,000 | | | | 4.850 | | | | 03/15/44 | | | | 239,775 | |
| | 176,000 | | | | 5.100 | | | | 02/15/45 | | | | 161,357 | |
| | 220,000 | | | | 4.900 | | | | 05/15/46 | | | | 195,694 | |
| | 414,000 | | | | 4.800 | | | | 02/01/49 | | | | 363,134 | |
| | 368,000 | | | | 4.200 | | | | 01/31/50 | | | | 294,465 | |
| | 775,000 | | | | 3.950 | | | | 01/31/60 | | | | 568,801 | |
| | Enterprise Products Operating LLC(a), Series E | |
| | (3M U.S. T-Bill MMY + 3.295%) | |
| | 164,000 | | | | 5.250 | | | | 08/16/77 | | | | 144,459 | |
| | EOG Resources, Inc. | |
| | 916,000 | | | | 4.150 | | | | 01/15/26 | | | | 895,649 | |
| | 216,000 | | | | 4.375 | | | | 04/15/30 | | | | 209,643 | |
| | 236,000 | | | | 4.950 | | | | 04/15/50 | | | | 222,897 | |
| | Exxon Mobil Corp. | |
| | 302,000 | | | | 2.019 | | | | 08/16/24 | | | | 292,307 | |
| | 742,000 | | | | 2.992 | | | | 03/19/25 | | | | 718,371 | |
| | 310,000 | | | | 3.043 | | | | 03/01/26 | | | | 296,128 | |
| | 130,000 | | | | 2.275 | | | | 08/16/26 | | | | 121,253 | |
| | 100,000 | | | | 3.294 | | | | 03/19/27 | | | | 95,309 | |
| | 476,000 | | | | 3.482 | | | | 03/19/30 | | | | 441,159 | |
| | 100,000 | | | | 4.227 | | | | 03/19/40 | | | | 89,099 | |
| | 430,000 | | | | 3.567 | | | | 03/06/45 | | | | 336,021 | |
| | 100,000 | | | | 4.114 | | | | 03/01/46 | | | | 84,271 | |
| | 408,000 | | | | 3.095 | | | | 08/16/49 | | | | 286,168 | |
| | 628,000 | | | | 4.327 | | | | 03/19/50 | | | | 544,093 | |
| | 260,000 | | | | 3.452 | | | | 04/15/51 | | | | 193,346 | |
| | Halliburton Co. | |
| | 368,000 | | | | 2.920 | | | | 03/01/30 | | | | 321,410 | |
| | 493,000 | | | | 4.850 | | | | 11/15/35 | | | | 461,503 | |
| | 500,000 | | | | 7.450 | | | | 09/15/39 | | | | 578,899 | |
| | 200,000 | | | | 5.000 | | | | 11/15/45 | | | | 180,631 | |
| | Hess Corp. | |
| | 290,000 | | | | 4.300 | | | | 04/01/27 | | | | 279,485 | |
| | 148,000 | | | | 6.000 | | | | 01/15/40 | | | | 144,930 | |
| | 373,000 | | | | 5.600 | | | | 02/15/41 | | | | 350,543 | |
| | Kinder Morgan Energy Partners LP | |
| | 388,000 | | | | 5.500 | | | | 03/01/44 | | | | 346,017 | |
| | Kinder Morgan, Inc. | |
| | 396,000 | | | | 5.550 | | | | 06/01/45 | | | | 358,628 | |
| | 402,000 | | | | 5.050 | | | | 02/15/46 | | | | 338,967 | |
| | 100,000 | | | | 3.600 | | | | 02/15/51 | | | | 67,021 | |
| | Kinder Morgan, Inc., GMTN | |
| | 1,000,000 | | | | 7.750 | | | | 01/15/32 | | | | 1,120,640 | |
| | Marathon Petroleum Corp. | |
| | 250,000 | | | | 3.625 | | | | 09/15/24 | | | | 244,569 | |
| | 200,000 | | | | 4.750 | | | | 09/15/44 | | | | 166,285 | |
| | MPLX LP | |
| | 136,000 | | | | 4.125 | | | | 03/01/27 | | | | 130,212 | |
| | 100,000 | | | | 4.800 | | | | 02/15/29 | | | | 96,226 | |
| | |
|
| Corporate Obligations – (continued) | |
| Energy – (continued) | |
| | MPLX LP – (continued) | |
| 914,000 | | | | 2.650 | | | | 08/15/30 | | | | 759,670 | |
| | 350,000 | | | | 4.500 | | | | 04/15/38 | | | | 295,419 | |
| | 310,000 | | | | 5.200 | | | | 03/01/47 | | | | 268,290 | |
| | 520,000 | | | | 5.500 | | | | 02/15/49 | | | | 463,053 | |
| | Occidental Petroleum Corp. | |
| | 250,000 | | | | 6.625 | | | | 09/01/30 | | | | 258,750 | |
| | 165,000 | | | | 6.125 | | | | 01/01/31 | | | | 167,063 | |
| | 130,000 | | | | 7.500 | | | | 05/01/31 | | | | 141,340 | |
| | 224,000 | | | | 6.450 | | | | 09/15/36 | | | | 229,600 | |
| | 1,600,000 | | | | 0.000 | (c) | | | 10/10/36 | | | | 838,679 | |
| | 350,000 | | | | 6.600 | | | | 03/15/46 | | | | 359,361 | |
| | ONEOK, Inc. | |
| | 200,000 | | | | 4.550 | | | | 07/15/28 | | | | 190,727 | |
| | 378,000 | | | | 3.100 | | | | 03/15/30 | | | | 324,254 | |
| | 680,000 | | | | 6.100 | | | | 11/15/32 | | | | 691,524 | |
| | 100,000 | | | | 5.200 | | | | 07/15/48 | | | | 85,861 | |
| | Phillips 66 | |
| | 100,000 | | | | 3.900 | | | | 03/15/28 | | | | 94,687 | |
| | 390,000 | | | | 4.650 | | | | 11/15/34 | | | | 365,924 | |
| | 150,000 | | | | 5.875 | | | | 05/01/42 | | | | 152,932 | |
| | 450,000 | | | | 4.875 | | | | 11/15/44 | | | | 406,291 | |
| | Plains All American Pipeline LP / PAA Finance Corp. | |
| | 750,000 | | | | 3.600 | | | | 11/01/24 | | | | 730,622 | |
| | 766,000 | | | | 4.650 | | | | 10/15/25 | | | | 747,840 | |
| | 240,000 | | | | 4.500 | | | | 12/15/26 | | | | 232,288 | |
| | 339,000 | | | | 3.550 | | | | 12/15/29 | | | | 298,119 | |
| | Sabine Pass Liquefaction LLC | |
| | 500,000 | | | | 5.625 | | | | 03/01/25 | | | | 498,437 | |
| | 1,252,000 | | | | 5.875 | | | | 06/30/26 | | | | 1,256,539 | |
| | 430,000 | | | | 5.000 | | | | 03/15/27 | | | | 423,550 | |
| | 108,000 | | | | 4.200 | | | | 03/15/28 | | | | 102,465 | |
| | Targa Resources Corp. | |
| | 400,000 | | | | 4.950 | | | | 04/15/52 | | | | 325,419 | |
| | Transcontinental Gas Pipe Line Co. LLC | |
| | 144,000 | | | | 7.850 | | | | 02/01/26 | | | | 150,139 | |
| | Valero Energy Corp. | |
| | 820,000 | | | | 6.625 | | | | 06/15/37 | | | | 870,628 | |
| | Western Midstream Operating LP | |
| | 470,000 | | | | 5.250 | | | | 02/01/50 | | | | 381,288 | |
| | Williams Cos., Inc. (The) | |
| | 280,000 | | | | 4.000 | | | | 09/15/25 | | | | 271,600 | |
| | 318,000 | | | | 3.750 | | | | 06/15/27 | | | | 299,448 | |
| | 384,000 | | | | 3.500 | | | | 11/15/30 | | | | 339,451 | |
| | 250,000 | | | | 2.600 | | | | 03/15/31 | | | | 205,463 | |
| | 432,000 | | | | 6.300 | | | | 04/15/40 | | | | 441,811 | |
| | 200,000 | | | | 5.100 | | | | 09/15/45 | | | | 174,832 | |
| | 240,000 | | | | 4.850 | | | | 03/01/48 | | | | 203,633 | |
| | | | | | | | | | | | | | |
| | | | | | | | | | | | | 42,802,751 | |
| | |
| Financial Co. – 0.0% | |
| | Ally Financial, Inc. | |
| | 139,000 | | | | 7.100 | | | | 11/15/27 | | | | 140,873 | |
| | |
| Financial Company – 0.7% | |
| | Air Lease Corp. | |
| | 80,000 | | | | 1.875 | | | | 08/15/26 | | | | 71,567 | |
| | 550,000 | | | | 3.125 | | | | 12/01/30 | | | | 458,858 | |
| | |
| | |
| The accompanying notes are an integral part of these financial statements. | | 77 |
GOLDMAN SACHS ACCESS INVESTMENT GRADE CORPORATE BOND ETF
Schedule of Investments (continued)
August 31, 2023
| | | | | | | | | | | | | | |
Principal
Amount | | | Interest
Rate | | | Maturity
Date | | | Value | |
|
| Corporate Obligations – (continued) | |
| Financial Company – (continued) | |
| | Air Lease Corp., MTN | |
| $ | 1,170,000 | | | | 2.875 | % | | | 01/15/26 | | | $ | 1,094,142 | |
| | Ally Financial, Inc. | |
| | 100,000 | | | | 5.750 | | | | 11/20/25 | | | | 96,950 | |
| | 469,000 | | | | 8.000 | | | | 11/01/31 | | | | 485,870 | |
| | Ares Capital Corp. | |
| | 475,000 | | | | 2.150 | | | | 07/15/26 | | | | 417,244 | |
| | 300,000 | | | | 2.875 | | | | 06/15/28 | | | | 253,284 | |
| | Blackstone Private Credit Fund | |
| | 49,000 | | | | 2.625 | | | | 12/15/26 | | | | 42,136 | |
| | 500,000 | | | | 3.250 | | | | 03/15/27 | | | | 435,661 | |
| | GE Capital International Funding Co. Unlimited | |
| | 1,772,000 | | | | 4.418 | | | | 11/15/35 | | | | 1,641,646 | |
| | | | | | | | | | | | | | |
| | | | | | | | | | | | | 4,997,358 | |
| | |
| Food and Beverage – 2.0% | |
| | Coca-Cola Co. (The) | |
| | 300,000 | | | | 3.375 | | | | 03/25/27 | | | | 287,386 | |
| | 250,000 | | | | 1.450 | | | | 06/01/27 | | | | 222,990 | |
| | 240,000 | | | | 1.000 | | | | 03/15/28 | | | | 206,088 | |
| | 102,000 | | | | 2.125 | | | | 09/06/29 | | | | 89,085 | |
| | 852,000 | | | | 3.450 | | | | 03/25/30 | | | | 792,407 | |
| | 226,000 | | | | 1.650 | | | | 06/01/30 | | | | 186,491 | |
| | 300,000 | | | | 2.000 | | | | 03/05/31 | | | | 249,200 | |
| | 500,000 | | | | 1.375 | | | | 03/15/31 | | | | 394,933 | |
| | 610,000 | | | | 2.500 | | | | 06/01/40 | | | | 438,874 | |
| | 110,000 | | | | 2.875 | | | | 05/05/41 | | | | 83,088 | |
| | 430,000 | | | | 2.600 | | | | 06/01/50 | | | | 285,228 | |
| | 100,000 | | | | 3.000 | | | | 03/05/51 | | | | 72,347 | |
| | 250,000 | | | | 2.500 | | | | 03/15/51 | | | | 161,378 | |
| | 220,000 | | | | 2.750 | | | | 06/01/60 | | | | 142,476 | |
| | Keurig Dr Pepper, Inc. | |
| | 1,019,000 | | | | 3.200 | | | | 05/01/30 | | | | 902,626 | |
| | 100,000 | | | | 3.800 | | | | 05/01/50 | | | | 76,030 | |
| | 560,000 | | | | 4.500 | | | | 04/15/52 | | | | 475,174 | |
| | Kraft Heinz Foods Co. | |
| | 565,000 | | | | 3.000 | | | | 06/01/26 | | | | 532,459 | |
| | 250,000 | | | | 6.875 | | | | 01/26/39 | | | | 274,047 | |
| | 507,000 | | | | 5.000 | | | | 06/04/42 | | | | 463,903 | |
| | 552,000 | | | | 4.375 | | | | 06/01/46 | | | | 455,423 | |
| | 410,000 | | | | 4.875 | | | | 10/01/49 | | | | 364,845 | |
| | Molson Coors Beverage Co. | |
| | 880,000 | | | | 3.000 | | | | 07/15/26 | | | | 824,933 | |
| | 190,000 | | | | 5.000 | | | | 05/01/42 | | | | 172,073 | |
| | 370,000 | | | | 4.200 | | | | 07/15/46 | | | | 293,212 | |
| | Mondelez International, Inc. | |
| | 435,000 | | | | 2.750 | | | | 04/13/30 | | | | 377,159 | |
| | 490,000 | | | | 2.625 | | | | 09/04/50 | | | | 304,174 | |
| | PepsiCo, Inc. | |
| | 456,000 | | | | 2.250 | | | | 03/19/25 | | | | 436,465 | |
| | 112,000 | | | | 2.750 | | | | 04/30/25 | | | | 107,761 | |
| | 160,000 | | | | 2.850 | | | | 02/24/26 | | | | 152,406 | |
| | 166,000 | | | | 2.375 | | | | 10/06/26 | | | | 155,409 | |
| | 68,000 | | | | 3.000 | | | | 10/15/27 | | | | 63,856 | |
| | 96,000 | | | | 2.625 | | | | 07/29/29 | | | | 85,947 | |
| | 210,000 | | | | 2.750 | | | | 03/19/30 | | | | 186,984 | |
| | |
|
| Corporate Obligations – (continued) | |
| Food and Beverage – (continued) | |
| | PepsiCo, Inc. – (continued) | |
| 210,000 | | | | 1.625 | | | | 05/01/30 | | | | 173,105 | |
| | 100,000 | | | | 1.400 | | | | 02/25/31 | | | | 79,645 | |
| | 400,000 | | | | 1.950 | | | | 10/21/31 | | | | 326,503 | |
| | 290,000 | | | | 2.625 | | | | 10/21/41 | | | | 211,040 | |
| | 300,000 | | | | 4.450 | | | | 04/14/46 | | | | 279,356 | |
| | 280,000 | | | | 3.450 | | | | 10/06/46 | | | | 221,891 | |
| | 200,000 | | | | 2.875 | | | | 10/15/49 | | | | 141,399 | |
| | 130,000 | | | | 3.625 | | | | 03/19/50 | | | | 104,966 | |
| | Sysco Corp. | |
| | 604,000 | | | | 3.300 | | | | 07/15/26 | | | | 573,355 | |
| | 547,000 | | | | 3.250 | | | | 07/15/27 | | | | 510,232 | |
| | 329,000 | | | | 5.950 | | | | 04/01/30 | | | | 340,971 | |
| | 270,000 | | | | 6.600 | | | | 04/01/50 | | | | 296,549 | |
| | | | | | | | | | | | | | |
| | | | | | | | | | | | | 13,575,869 | |
| | |
| Healthcare – 5.2% | |
| | Aetna, Inc. | |
| | 450,000 | | | | 3.500 | | | | 11/15/24 | | | | 437,883 | |
| | 140,000 | | | | 6.625 | | | | 06/15/36 | | | | 150,035 | |
| | 348,000 | | | | 3.875 | | | | 08/15/47 | | | | 262,463 | |
| | Cigna Group (The) | |
| | 2,482,000 | | | | 4.125 | | | | 11/15/25 | | | | 2,416,168 | |
| | 1,270,000 | | | | 4.375 | | | | 10/15/28 | | | | 1,225,860 | |
| | 500,000 | | | | 2.400 | | | | 03/15/30 | | | | 422,108 | |
| | 300,000 | | | | 4.800 | | | | 08/15/38 | | | | 277,291 | |
| | 130,000 | | | | 4.800 | | | | 07/15/46 | | | | 115,209 | |
| | 674,000 | | | | 4.900 | | | | 12/15/48 | | | | 599,753 | |
| | 290,000 | | | | 3.400 | | | | 03/15/50 | | | | 203,860 | |
| | 472,000 | | | | 3.400 | | | | 03/15/51 | | | | 329,245 | |
| | CVS Health Corp. | |
| | 850,000 | | | | 2.625 | | | | 08/15/24 | | | | 825,082 | |
| | 1,154,000 | | | | 4.100 | | | | 03/25/25 | | | | 1,129,894 | |
| | 556,000 | | | | 3.875 | | | | 07/20/25 | | | | 539,468 | |
| | 100,000 | | | | 2.875 | | | | 06/01/26 | | | | 93,773 | |
| | 368,000 | | | | 3.000 | | | | 08/15/26 | | | | 344,721 | |
| | 488,000 | | | | 3.625 | | | | 04/01/27 | | | | 462,212 | |
| | 750,000 | | | | 1.300 | | | | 08/21/27 | | | | 647,692 | |
| | 825,000 | | | | 4.300 | | | | 03/25/28 | | | | 794,462 | |
| | 523,000 | | | | 3.250 | | | | 08/15/29 | | | | 468,031 | |
| | 150,000 | | | | 5.125 | | | | 02/21/30 | | | | 147,509 | |
| | 260,000 | | | | 1.750 | | | | 08/21/30 | | | | 206,799 | |
| | 410,000 | | | | 5.250 | | | | 02/21/33 | | | | 401,672 | |
| | 1,116,000 | | | | 4.780 | | | | 03/25/38 | | | | 1,004,207 | |
| | 246,000 | | | | 4.125 | | | | 04/01/40 | | | | 200,331 | |
| | 520,000 | | | | 2.700 | | | | 08/21/40 | | | | 349,599 | |
| | 176,000 | | | | 5.300 | | | | 12/05/43 | | | | 162,344 | |
| | 616,000 | | | | 5.125 | | | | 07/20/45 | | | | 549,167 | |
| | 1,468,000 | | | | 5.050 | | | | 03/25/48 | | | | 1,292,984 | |
| | 50,000 | | | | 4.250 | | | | 04/01/50 | | | | 39,596 | |
| | 1,300,000 | | | | 5.875 | | | | 06/01/53 | | | | 1,274,237 | |
| | Danaher Corp. | |
| | 340,000 | | | | 2.800 | | | | 12/10/51 | | | | 224,682 | |
| | Elevance Health, Inc. | |
| | 506,000 | | | | 3.500 | | | | 08/15/24 | | | | 495,722 | |
| | 50,000 | | | | 3.350 | | | | 12/01/24 | | | | 48,649 | |
| | |
| | |
| 78 | | The accompanying notes are an integral part of these financial statements. |
GOLDMAN SACHS ACCESS INVESTMENT GRADE CORPORATE BOND ETF
| | | | | | | | | | | | | | |
Principal
Amount | | | Interest
Rate | | | Maturity
Date | | | Value | |
|
| Corporate Obligations – (continued) | |
| Healthcare – (continued) | |
| | Elevance Health, Inc. – (continued) | |
| $ | 552,000 | | | | 3.650 | % | | | 12/01/27 | | | $ | 520,884 | |
| | 300,000 | | | | 2.550 | | | | 03/15/31 | | | | 251,000 | |
| | 84,000 | | | | 4.625 | | | | 05/15/42 | | | | 74,584 | |
| | 309,000 | | | | 4.650 | | | | 01/15/43 | | | | 275,154 | |
| | 174,000 | | | | 4.650 | | | | 08/15/44 | | | | 152,009 | |
| | 340,000 | | | | 4.375 | | | | 12/01/47 | | | | 287,562 | |
| | 318,000 | | | | 4.550 | | | | 03/01/48 | | | | 274,687 | |
| | 300,000 | | | | 3.125 | | | | 05/15/50 | | | | 202,744 | |
| | HCA, Inc. | |
| | 1,820,000 | | | | 5.250 | | | | 04/15/25 | | | | 1,804,075 | |
| | 528,000 | | | | 5.250 | | | | 06/15/26 | | | | 521,400 | |
| | 308,000 | | | | 5.375 | | | | 09/01/26 | | | | 306,460 | |
| | 555,000 | | | | 4.500 | | | | 02/15/27 | | | | 535,922 | |
| | 500,000 | | | | 5.200 | | | | 06/01/28 | | | | 493,716 | |
| | 300,000 | | | | 5.625 | | | | 09/01/28 | | | | 299,625 | |
| | 50,000 | | | | 5.875 | | | | 02/01/29 | | | | 50,187 | |
| | 404,000 | | | | 4.125 | | | | 06/15/29 | | | | 373,347 | |
| | 500,000 | | | | 3.500 | | | | 09/01/30 | | | | 436,546 | |
| | 100,000 | | | | 5.125 | | | | 06/15/39 | | | | 91,125 | |
| | 315,000 | | | | 5.500 | | | | 06/15/47 | | | | 285,272 | |
| | 410,000 | | | | 5.250 | | | | 06/15/49 | | | | 358,910 | |
| | 220,000 | | | | 3.500 | | | | 07/15/51 | | | | 147,109 | |
| | 415,000 | | | | 4.625 | | | | 03/15/52 | | | | 337,531 | |
| | Humana, Inc. | |
| | 300,000 | | | | 3.700 | | | | 03/23/29 | | | | 278,235 | |
| | 1,000,000 | | | | 5.875 | | | | 03/01/33 | | | | 1,034,860 | |
| | UnitedHealth Group, Inc. | |
| | 548,000 | | | | 3.750 | | | | 07/15/25 | | | | 534,168 | |
| | 100,000 | | | | 3.100 | | | | 03/15/26 | | | | 95,599 | |
| | 100,000 | | | | 3.450 | | | | 01/15/27 | | | | 95,835 | |
| | 400,000 | | | | 2.950 | | | | 10/15/27 | | | | 371,339 | |
| | 600,000 | | | | 2.300 | | | | 05/15/31 | | | | 501,694 | |
| | 688,000 | | | | 4.200 | | | | 05/15/32 | | | | 651,325 | |
| | 500,000 | | | | 5.350 | | | | 02/15/33 | | | | 512,428 | |
| | 758,000 | | | | 4.625 | | | | 07/15/35 | | | | 733,980 | |
| | 838,000 | | | | 4.250 | | | | 03/15/43 | | | | 732,844 | |
| | 631,000 | | | | 4.450 | | | | 12/15/48 | | | | 552,799 | |
| | 300,000 | | | | 3.700 | | | | 08/15/49 | | | | 233,105 | |
| | 700,000 | | | | 3.250 | | | | 05/15/51 | | | | 497,805 | |
| | 511,000 | | | | 4.750 | | | | 05/15/52 | | | | 467,009 | |
| | 500,000 | | | | 3.875 | | | | 08/15/59 | | | | 386,580 | |
| | 1,500,000 | | | | 6.050 | | | | 02/15/63 | | | | 1,637,696 | |
| | | | | | | | | | | | | | |
| | | | | | | | | | | | | 35,539,858 | |
| | |
| Insurance – 1.5% | |
| | American International Group, Inc. | |
| | 386,000 | | | | 2.500 | | | | 06/30/25 | | | | 365,907 | |
| | 50,000 | | | | 3.900 | | | | 04/01/26 | | | | 48,278 | |
| | 204,000 | | | | 4.800 | | | | 07/10/45 | | | | 180,248 | |
| | 301,000 | | | | 4.750 | | | | 04/01/48 | | | | 265,765 | |
| | 100,000 | | | | 4.375 | | | | 06/30/50 | | | | 83,169 | |
| | American International Group, Inc.(a), Series A-9 | |
| | (3M USD LIBOR + 2.868%) | |
| | 338,000 | | | | 5.750 | | | | 04/01/48 | | | | 327,644 | |
| | Aon Corp. | |
| | 200,000 | | | | 2.800 | | | | 05/15/30 | | | | 172,170 | |
| | |
|
| Corporate Obligations – (continued) | |
| Insurance – (continued) | |
| | Aon Corp. / Aon Global Holdings PLC | |
| 352,000 | | | | 3.900 | | | | 02/28/52 | | | | 270,715 | |
| | Berkshire Hathaway Finance Corp. | |
| | 130,000 | | | | 1.450 | | | | 10/15/30 | | | | 104,576 | |
| | 530,000 | | | | 2.875 | | | | 03/15/32 | | | | 462,935 | |
| | 430,000 | | | | 2.850 | | | | 10/15/50 | | | | 287,598 | |
| | 50,000 | | | | 2.500 | | | | 01/15/51 | | | | 31,102 | |
| | 850,000 | | | | 3.850 | | | | 03/15/52 | | | | 677,621 | |
| | Berkshire Hathaway, Inc. | |
| | 100,000 | | | | 4.500 | | | | 02/11/43 | | | | 93,776 | |
| | Chubb INA Holdings, Inc. | |
| | 472,000 | | | | 4.350 | | | | 11/03/45 | | | | 414,587 | |
| | Equitable Holdings, Inc. | |
| | 426,000 | | | | 5.000 | | | | 04/20/48 | | | | 357,108 | |
| | Everest Reinsurance Holdings, Inc. | |
| | 470,000 | | | | 3.500 | | | | 10/15/50 | | | | 323,387 | |
| | Marsh & McLennan Cos., Inc. | |
| | 175,000 | | | | 4.375 | | | | 03/15/29 | | | | 168,931 | |
| | 100,000 | | | | 2.250 | | | | 11/15/30 | | | | 82,657 | |
| | 206,000 | | | | 4.900 | | | | 03/15/49 | | | | 188,816 | |
| | MetLife, Inc. | |
| | 150,000 | | | | 4.550 | | | | 03/23/30 | | | | 146,005 | |
| | 400,000 | | | | 5.700 | | | | 06/15/35 | | | | 409,066 | |
| | 556,000 | | | | 6.400 | | | | 12/15/36 | | | | 552,958 | |
| | 304,000 | | | | 4.125 | | | | 08/13/42 | | | | 250,982 | |
| | 250,000 | | | | 4.875 | | | | 11/13/43 | | | | 227,789 | |
| | 460,000 | | | | 4.600 | | | | 05/13/46 | | | | 401,938 | |
| | 270,000 | | | | 5.000 | | | | 07/15/52 | | | | 246,965 | |
| | Prudential Financial, Inc. | |
| | 250,000 | | | | 4.600 | | | | 05/15/44 | | | | 220,220 | |
| | (3M USD LIBOR + 3.031%) | |
| | 1,162,000 | | | | 5.375 | (a) | | | 05/15/45 | | | | 1,135,871 | |
| | (3M USD LIBOR + 2.380%) | |
| | 228,000 | | | | 4.500 | (a) | | | 09/15/47 | | | | 204,788 | |
| | 210,000 | | | | 3.905 | | | | 12/07/47 | | | | 162,336 | |
| | 246,000 | | | | 3.935 | | | | 12/07/49 | | | | 190,005 | |
| | (US 5 Year CMT T-Note + 3.035%) | |
| | 192,000 | | | | 3.700 | (a) | | | 10/01/50 | | | | 162,712 | |
| | Prudential Financial, Inc., MTN | |
| | 300,000 | | | | 5.700 | | | | 12/14/36 | | | | 306,123 | |
| | 307,000 | | | | 4.350 | | | | 02/25/50 | | | | 255,621 | |
| | 308,000 | | | | 3.700 | | | | 03/13/51 | | | | 229,292 | |
| | Travelers Cos., Inc. (The) | |
| | 440,000 | | | | 3.050 | | | | 06/08/51 | | | | 303,399 | |
| | | | | | | | | | | | | | |
| | | | | | | | | | | | | 10,313,060 | |
| | |
| Metals and Mining – 0.0% | |
| | Newmont Corp. | |
| | 300,000 | | | | 2.250 | | | | 10/01/30 | | | | 244,174 | |
| | |
| Pharmaceuticals – 0.1% | |
| | Viatris, Inc. | |
| | 610,000 | | | | 3.850 | | | | 06/22/40 | | | | 426,853 | |
| | |
| REITs and Real Estate – 1.0% | |
| | Alexandria Real Estate Equities, Inc. | |
| | 50,000 | | | | 3.375 | | | | 08/15/31 | | | | 43,145 | |
| | 250,000 | | | | 2.950 | | | | 03/15/34 | | | | 197,518 | |
| | 210,000 | | | | 3.550 | | | | 03/15/52 | | | | 143,055 | |
| | |
| | |
| The accompanying notes are an integral part of these financial statements. | | 79 |
GOLDMAN SACHS ACCESS INVESTMENT GRADE CORPORATE BOND ETF
Schedule of Investments (continued)
August 31, 2023
| | | | | | | | | | | | | | |
Principal
Amount | | | Interest
Rate | | | Maturity
Date | | | Value | |
|
| Corporate Obligations – (continued) | |
| REITs and Real Estate – (continued) | |
| | Boston Properties LP | |
| $ | 726,000 | | | | 2.550 | % | | | 04/01/32 | | | $ | 544,712 | |
| | 390,000 | | | | 2.450 | | | | 10/01/33 | | | | 276,132 | |
| | Digital Realty Trust LP | |
| | 900,000 | | | | 3.600 | | | | 07/01/29 | | | | 812,535 | |
| | Equinix, Inc. | |
| | 80,000 | | | | 2.625 | | | | 11/18/24 | | | | 77,104 | |
| | 270,000 | | | | 3.200 | | | | 11/18/29 | | | | 236,396 | |
| | 204,000 | | | | 2.150 | | | | 07/15/30 | | | | 164,824 | |
| | 200,000 | | | | 2.500 | | | | 05/15/31 | | | | 162,209 | |
| | GLP Capital LP / GLP Financing II, Inc. | |
| | 594,000 | | | | 5.375 | | | | 04/15/26 | | | | 581,990 | |
| | 236,000 | | | | 5.300 | | | | 01/15/29 | | | | 222,793 | |
| | 150,000 | | | | 3.250 | | | | 01/15/32 | | | | 121,379 | |
| | Simon Property Group LP | |
| | 440,000 | | | | 3.300 | | | | 01/15/26 | | | | 419,387 | |
| | 68,000 | | | | 3.250 | | | | 11/30/26 | | | | 63,720 | |
| | 440,000 | | | | 2.450 | | | | 09/13/29 | | | | 371,123 | |
| | 204,000 | | | | 2.650 | | | | 07/15/30 | | | | 171,922 | |
| | 284,000 | | | | 3.250 | | | | 09/13/49 | | | | 185,053 | |
| | 220,000 | | | | 3.800 | | | | 07/15/50 | | | | 158,616 | |
| | VICI Properties LP | |
| | 300,000 | | | | 4.750 | | | | 02/15/28 | | | | 285,393 | |
| | 400,000 | | | | 4.950 | | | | 02/15/30 | | | | 376,712 | |
| | 400,000 | | | | 5.125 | | | | 05/15/32 | | | | 371,135 | |
| | Welltower OP LLC | |
| | 300,000 | | | | 4.250 | | | | 04/15/28 | | | | 284,476 | |
| | 276,000 | | | | 3.100 | | | | 01/15/30 | | | | 240,487 | |
| | | | | | | | | | | | | | |
| | | | | | | | | | | | | 6,511,816 | |
| | |
| Revenue – 0.4% | |
| | Ascension Health | |
| | 200,000 | | | | 3.945 | | | | 11/15/46 | | | | 164,095 | |
| | Ascension Health, Series B | |
| | 440,000 | | | | 2.532 | | | | 11/15/29 | | | | 380,883 | |
| | CommonSpirit Health | |
| | 1,100,000 | | | | 2.760 | | | | 10/01/24 | | | | 1,065,107 | |
| | 220,000 | | | | 3.347 | | | | 10/01/29 | | | | 196,540 | |
| | 239,000 | | | | 4.350 | | | | 11/01/42 | | | | 203,619 | |
| | 200,000 | | | | 4.187 | | | | 10/01/49 | | | | 158,866 | |
| | Kaiser Foundation Hospitals | |
| | 295,000 | | | | 4.150 | | | | 05/01/47 | | | | 252,227 | |
| | Kaiser Foundation Hospitals, Series 2019 | |
| | 286,000 | | | | 3.266 | | | | 11/01/49 | | | | 205,719 | |
| | Kaiser Foundation Hospitals, Series 2021 | |
| | 125,000 | | | | 2.810 | | | | 06/01/41 | | | | 89,326 | |
| | 300,000 | | | | 3.002 | | | | 06/01/51 | | | | 203,324 | |
| | | | | | | | | | | | | | |
| | | | | | | | | | | | | 2,919,706 | |
| | |
| Software – 1.7% | |
| | Oracle Corp. | |
| | 1,500,000 | | | | 6.150 | | | | 11/09/29 | | | | 1,558,334 | |
| | 300,000 | | | | 2.950 | | | | 04/01/30 | | | | 260,073 | |
| | 2,000,000 | | | | 6.250 | | | | 11/09/32 | | | | 2,098,537 | |
| | 600,000 | | | | 3.900 | | | | 05/15/35 | | | | 513,653 | |
| | 550,000 | | | | 3.600 | | | | 04/01/40 | | | | 417,279 | |
| | 150,000 | | | | 3.650 | | | | 03/25/41 | | | | 113,279 | |
| | |
|
| Corporate Obligations – (continued) | |
| Software – (continued) | |
| | Oracle Corp. – (continued) | |
| 250,000 | | | | 4.125 | | | | 05/15/45 | | | | 193,934 | |
| | 490,000 | | | | 4.000 | | | | 11/15/47 | | | | 365,097 | |
| | 2,530,000 | | | | 6.900 | | | | 11/09/52 | | | | 2,765,867 | |
| | 1,000,000 | | | | 4.375 | | | | 05/15/55 | | | | 770,317 | |
| | 500,000 | | | | 3.850 | | | | 04/01/60 | | | | 339,688 | |
| | 500,000 | | | | 4.100 | | | | 03/25/61 | | | | 356,512 | |
| | Salesforce, Inc. | |
| | 800,000 | | | | 3.700 | | | | 04/11/28 | | | | 765,876 | |
| | 500,000 | | | | 1.950 | | | | 07/15/31 | | | | 407,230 | |
| | 700,000 | | | | 2.900 | | | | 07/15/51 | | | | 468,551 | |
| | | | | | | | | | | | | | |
| | | | | | | | | | | | | 11,394,227 | |
| | |
| Technology – 7.7% | |
| | Activision Blizzard, Inc. | |
| | 620,000 | | | | 2.500 | | | | 09/15/50 | | | | 394,630 | |
| | Adobe, Inc. | |
| | 192,000 | | | | 3.250 | | | | 02/01/25 | | | | 186,912 | |
| | 82,000 | | | | 2.150 | | | | 02/01/27 | | | | 75,290 | |
| | 500,000 | | | | 2.300 | | | | 02/01/30 | | | | 433,898 | |
| | Alphabet, Inc. | |
| | 182,000 | | | | 1.998 | | | | 08/15/26 | | | | 168,537 | |
| | 50,000 | | | | 0.800 | | | | 08/15/27 | | | | 43,350 | |
| | 132,000 | | | | 1.100 | | | | 08/15/30 | | | | 105,837 | |
| | 1,500,000 | | | | 1.900 | | | | 08/15/40 | | | | 1,007,588 | |
| | 823,000 | | | | 2.050 | | | | 08/15/50 | | | | 491,531 | |
| | 747,000 | | | | 2.250 | | | | 08/15/60 | | | | 437,009 | |
| | Analog Devices, Inc. | |
| | 75,000 | | | | 3.500 | | | | 12/05/26 | | | | 71,868 | |
| | 250,000 | | | | 1.700 | | | | 10/01/28 | | | | 214,554 | |
| | Apple, Inc. | |
| | 184,000 | | | | 2.750 | | | | 01/13/25 | | | | 177,949 | |
| | 112,000 | | | | 2.500 | | | | 02/09/25 | | | | 108,078 | |
| | 91,000 | | | | 1.125 | | | | 05/11/25 | | | | 85,111 | |
| | 50,000 | | | | 0.550 | | | | 08/20/25 | | | | 45,979 | |
| | 179,000 | | | | 0.700 | | | | 02/08/26 | | | | 162,037 | |
| | 1,111,000 | | | | 3.250 | | | | 02/23/26 | | | | 1,069,669 | |
| | 944,000 | | | | 2.450 | | | | 08/04/26 | | | | 883,078 | |
| | 150,000 | | | | 2.050 | | | | 09/11/26 | | | | 138,424 | |
| | 360,000 | | | | 3.000 | | | | 06/20/27 | | | | 339,893 | |
| | 692,000 | | | | 2.900 | | | | 09/12/27 | | | | 648,575 | |
| | 218,000 | | | | 3.000 | | | | 11/13/27 | | | | 205,037 | |
| | 488,000 | | | | 1.200 | | | | 02/08/28 | | | | 421,497 | |
| | 330,000 | | | | 1.400 | | | | 08/05/28 | | | | 283,551 | |
| | 400,000 | | | | 1.650 | | | | 05/11/30 | | | | 333,908 | |
| | 400,000 | | | | 1.250 | | | | 08/20/30 | | | | 322,269 | |
| | 850,000 | | | | 1.650 | | | | 02/08/31 | | | | 698,842 | |
| | 300,000 | | | | 1.700 | | | | 08/05/31 | | | | 244,348 | |
| | 625,000 | | | | 4.500 | | | | 02/23/36 | | | | 625,300 | |
| | 102,000 | | | | 2.375 | | | | 02/08/41 | | | | 72,586 | |
| | 545,000 | | | | 3.850 | | | | 05/04/43 | | | | 473,078 | |
| | 310,000 | | | | 4.450 | | | | 05/06/44 | | | | 295,982 | |
| | 305,000 | | | | 3.450 | | | | 02/09/45 | | | | 246,868 | |
| | 350,000 | | | | 4.375 | | | | 05/13/45 | | | | 320,754 | |
| | 642,000 | | | | 4.650 | | | | 02/23/46 | | | | 614,183 | |
| | 306,000 | | | | 3.850 | | | | 08/04/46 | | | | 259,421 | |
| | |
| | |
| 80 | | The accompanying notes are an integral part of these financial statements. |
GOLDMAN SACHS ACCESS INVESTMENT GRADE CORPORATE BOND ETF
| | | | | | | | | | | | | | |
Principal
Amount | | | Interest
Rate | | | Maturity
Date | | | Value | |
|
| Corporate Obligations – (continued) | |
| Technology – (continued) | |
| | Apple, Inc. – (continued) | |
| $ | 208,000 | | | | 4.250 | % | | | 02/09/47 | | | $ | 190,704 | |
| | 270,000 | | | | 3.750 | | | | 09/12/47 | | | | 226,384 | |
| | 446,000 | | | | 3.750 | | | | 11/13/47 | | | | 370,980 | |
| | 793,000 | | | | 2.950 | | | | 09/11/49 | | | | 563,373 | |
| | 594,000 | | | | 2.650 | | | | 05/11/50 | | | | 397,080 | |
| | 239,000 | | | | 2.400 | | | | 08/20/50 | | | | 153,190 | |
| | 940,000 | | | | 2.650 | | | | 02/08/51 | | | | 625,095 | |
| | 325,000 | | | | 2.800 | | | | 02/08/61 | | | | 210,231 | |
| | Applied Materials, Inc. | |
| | 130,000 | | | | 3.300 | | | | 04/01/27 | | | | 123,545 | |
| | 650,000 | | | | 1.750 | | | | 06/01/30 | | | | 534,726 | |
| | 236,000 | | | | 4.350 | | | | 04/01/47 | | | | 212,144 | |
| | Broadcom Corp. / Broadcom Cayman Finance Ltd. | |
| | 659,000 | | | | 3.875 | | | | 01/15/27 | | | | 626,441 | |
| | 598,000 | | | | 3.500 | | | | 01/15/28 | | | | 552,671 | |
| | Broadcom, Inc. | |
| | 440,000 | | | | 3.150 | | | | 11/15/25 | | | | 418,688 | |
| | 380,000 | | | | 3.459 | | | | 09/15/26 | | | | 360,638 | |
| | 500,000 | | | | 1.950 | (b) | | | 02/15/28 | | | | 433,602 | |
| | 605,000 | | | | 4.750 | | | | 04/15/29 | | | | 582,920 | |
| | 274,000 | | | | 4.150 | | | | 11/15/30 | | | | 250,455 | |
| | 570,000 | | | | 2.450 | (b) | | | 02/15/31 | | | | 460,341 | |
| | 470,000 | | | | 4.300 | | | | 11/15/32 | | | | 424,327 | |
| | 805,000 | | | | 3.419 | (b) | | | 04/15/33 | | | | 669,269 | |
| | 290,000 | | | | 3.469 | (b) | | | 04/15/34 | | | | 236,830 | |
| | 600,000 | | | | 3.137 | (b) | | | 11/15/35 | | | | 458,595 | |
| | 500,000 | | | | 3.187 | (b) | | | 11/15/36 | | | | 377,440 | |
| | 600,000 | | | | 3.500 | (b) | | | 02/15/41 | | | | 440,234 | |
| | 360,000 | | | | 3.750 | (b) | | | 02/15/51 | | | | 258,689 | |
| | Dell International LLC / EMC Corp. | |
| | 50,000 | | | | 5.750 | | | | 02/01/33 | | | | 50,035 | |
| | 250,000 | | | | 8.100 | | | | 07/15/36 | | | | 287,837 | |
| | Fiserv, Inc. | |
| | 150,000 | | | | 3.850 | | | | 06/01/25 | | | | 145,606 | |
| | 440,000 | | | | 3.200 | | | | 07/01/26 | | | | 415,276 | |
| | 300,000 | | | | 4.200 | | | | 10/01/28 | | | | 286,162 | |
| | 500,000 | | | | 3.500 | | | | 07/01/29 | | | | 456,432 | |
| | 400,000 | | | | 4.400 | | | | 07/01/49 | | | | 326,028 | |
| | Hewlett Packard Enterprise Co. | |
| | 300,000 | | | | 4.900 | | | | 10/15/25 | | | | 296,615 | |
| | 300,000 | | | | 6.350 | | | | 10/15/45 | | | | 307,732 | |
| | Intel Corp. | |
| | 1,000,000 | | | | 3.700 | | | | 07/29/25 | | | | 972,141 | |
| | 1,000,000 | | | | 4.875 | | | | 02/10/26 | | | | 994,508 | |
| | 600,000 | | | | 4.000 | | | | 08/05/29 | | | | 570,912 | |
| | 700,000 | | | | 5.125 | | | | 02/10/30 | | | | 701,404 | |
| | International Business Machines Corp. | |
| | 500,000 | | | | 4.000 | | | | 07/27/25 | | | | 488,687 | |
| | 250,000 | | | | 3.450 | | | | 02/19/26 | | | | 239,762 | |
| | 1,510,000 | | | | 3.300 | | | | 05/15/26 | | | | 1,438,619 | |
| | 300,000 | | | | 1.700 | | | | 05/15/27 | | | | 265,756 | |
| | 1,086,000 | | | | 1.950 | | | | 05/15/30 | | | | 896,842 | |
| | 540,000 | | | | 4.150 | | | | 05/15/39 | | | | 463,330 | |
| | 200,000 | | | | 4.000 | | | | 06/20/42 | | | | 164,380 | |
| | 300,000 | | | | 4.250 | | | | 05/15/49 | | | | 247,516 | |
| | |
|
| Corporate Obligations – (continued) | |
| Technology – (continued) | |
| | International Business Machines Corp. – (continued) | |
| 300,000 | | | | 2.950 | | | | 05/15/50 | | | | 194,401 | |
| | 500,000 | | | | 4.900 | | | | 07/27/52 | | | | 453,637 | |
| | KLA Corp. | |
| | 87,000 | | | | 4.650 | | | | 11/01/24 | | | | 86,263 | |
| | 130,000 | | | | 4.100 | | | | 03/15/29 | | | | 124,999 | |
| | 100,000 | | | | 3.300 | | | | 03/01/50 | | | | 71,982 | |
| | Lam Research Corp. | |
| | 238,000 | | | | 4.000 | | | | 03/15/29 | | | | 228,149 | |
| | 228,000 | | | | 1.900 | | | | 06/15/30 | | | | 188,512 | |
| | 220,000 | | | | 4.875 | | | | 03/15/49 | | | | 206,013 | |
| | 352,000 | | | | 2.875 | | | | 06/15/50 | | | | 235,762 | |
| | Leidos, Inc. | |
| | 300,000 | | | | 4.375 | | | | 05/15/30 | | | | 276,750 | |
| | 50,000 | | | | 2.300 | | | | 02/15/31 | | | | 39,649 | |
| | 500,000 | | | | 5.750 | | | | 03/15/33 | | | | 496,684 | |
| | Meta Platforms, Inc. | |
| | 1,000,000 | | | | 4.600 | | | | 05/15/28 | | | | 990,273 | |
| | 100,000 | | | | 3.850 | | | | 08/15/32 | | | | 91,921 | |
| | 750,000 | | | | 4.950 | | | | 05/15/33 | | | | 746,383 | |
| | 800,000 | | | | 4.450 | | | | 08/15/52 | | | | 679,987 | |
| | Microchip Technology, Inc. | |
| | 120,000 | | | | 4.250 | | | | 09/01/25 | | | | 116,528 | |
| | Microsoft Corp. | |
| | 1,348,000 | | | | 2.700 | | | | 02/12/25 | | | | 1,304,028 | |
| | 154,000 | | | | 3.125 | | | | 11/03/25 | | | | 148,684 | |
| | 680,000 | | | | 2.400 | | | | 08/08/26 | | | | 637,863 | |
| | 87,000 | | | | 3.300 | | | | 02/06/27 | | | | 83,675 | |
| | 960,000 | | | | 3.500 | | | | 02/12/35 | | | | 874,998 | |
| | 470,000 | | | | 3.450 | | | | 08/08/36 | | | | 418,481 | |
| | 81,000 | | | | 4.100 | | | | 02/06/37 | | | | 76,806 | |
| | 264,000 | | | | 4.450 | | | | 11/03/45 | | | | 251,189 | |
| | 300,000 | | | | 3.700 | | | | 08/08/46 | | | | 255,036 | |
| | 470,000 | | | | 4.250 | | | | 02/06/47 | | | | 437,372 | |
| | 1,047,000 | | | | 2.525 | | | | 06/01/50 | | | | 695,035 | |
| | 1,040,000 | | | | 2.921 | | | | 03/17/52 | | | | 735,488 | |
| | 632,000 | | | | 2.675 | | | | 06/01/60 | | | | 405,560 | |
| | 400,000 | | | | 3.041 | | | | 03/17/62 | | | | 276,546 | |
| | Motorola Solutions, Inc. | |
| | 692,000 | | | | 4.600 | | | | 05/23/29 | | | | 671,948 | |
| | NVIDIA Corp. | |
| | 2,198,000 | | | | 0.584 | | | | 06/14/24 | | | | 2,117,043 | |
| | 80,000 | | | | 1.550 | | | | 06/15/28 | | | | 69,508 | |
| | 400,000 | | | | 2.000 | | | | 06/15/31 | | | | 330,859 | |
| | 400,000 | | | | 3.500 | | | | 04/01/50 | | | | 315,886 | |
| | PayPal Holdings, Inc. | |
| | 400,000 | | | | 2.400 | | | | 10/01/24 | | | | 386,946 | |
| | 250,000 | | | | 1.650 | | | | 06/01/25 | | | | 234,205 | |
| | 1,060,000 | | | | 4.400 | | | | 06/01/32 | | | | 1,012,510 | |
| | 50,000 | | | | 3.250 | | | | 06/01/50 | | | | 35,542 | |
| | QUALCOMM, Inc. | |
| | 135,000 | | | | 3.450 | | | | 05/20/25 | | | | 131,017 | |
| | 304,000 | | | | 3.250 | | | | 05/20/27 | | | | 287,222 | |
| | 126,000 | | | | 2.150 | | | | 05/20/30 | | | | 107,287 | |
| | 320,000 | | | | 4.650 | | | | 05/20/35 | | | | 313,365 | |
| | 396,000 | | | | 4.800 | | | | 05/20/45 | | | | 372,245 | |
| | |
| | |
| The accompanying notes are an integral part of these financial statements. | | 81 |
GOLDMAN SACHS ACCESS INVESTMENT GRADE CORPORATE BOND ETF
Schedule of Investments (continued)
August 31, 2023
| | | | | | | | | | | | | | |
Principal
Amount | | | Interest
Rate | | | Maturity
Date | | | Value | |
|
| Corporate Obligations – (continued) | |
| Technology – (continued) | |
| | QUALCOMM, Inc. – (continued) | |
| $ | 250,000 | | | | 4.300 | % | | | 05/20/47 | | | $ | 217,730 | |
| | 470,000 | | | | 4.500 | | | | 05/20/52 | | | | 409,655 | |
| | Texas Instruments, Inc. | |
| | 232,000 | | | | 2.250 | | | | 09/04/29 | | | | 201,671 | |
| | 300,000 | | | | 4.900 | | | | 03/14/33 | | | | 301,671 | |
| | 669,000 | | | | 4.150 | | | | 05/15/48 | | | | 581,157 | |
| | VMware, Inc. | |
| | 50,000 | | | | 1.400 | | | | 08/15/26 | | | | 44,317 | |
| | | | | | | | | | | | | | |
| | | | | | | | | | | | | 52,852,031 | |
| | |
| Transportation – 1.4% | |
| | Burlington Northern Santa Fe LLC | |
| | 120,000 | | | | 4.450 | | | | 01/15/53 | | | | 106,511 | |
| | CSX Corp. | |
| | 400,000 | | | | 4.100 | | | | 03/15/44 | | | | 331,298 | |
| | 600,000 | | | | 3.800 | | | | 11/01/46 | | | | 470,686 | |
| | 500,000 | | | | 4.500 | | | | 11/15/52 | | | | 436,892 | |
| | FedEx Corp. | |
| | 500,000 | | | | 2.400 | | | | 05/15/31 | | | | 413,334 | |
| | 408,000 | | | | 5.100 | | | | 01/15/44 | | | | 372,316 | |
| | 510,000 | | | | 4.750 | | | | 11/15/45 | | | | 439,183 | |
| | 1,334,000 | | | | 4.550 | | | | 04/01/46 | | | | 1,121,105 | |
| | FedEx Corp. Pass Through Trust, Series 2020-1 | |
| | 41,979 | | | | 1.875 | | | | 02/20/34 | | | | 33,983 | |
| | Southwest Airlines Co. | |
| | 270,000 | | | | 5.250 | | | | 05/04/25 | | | | 268,145 | |
| | 125,000 | | | | 5.125 | | | | 06/15/27 | | | | 123,298 | |
| | Union Pacific Corp. | |
| | 500,000 | | | | 2.400 | | | | 02/05/30 | | | | 430,932 | |
| | 1,950,000 | | | | 2.800 | | | | 02/14/32 | | | | 1,666,679 | |
| | 278,000 | | | | 3.799 | | | | 10/01/51 | | | | 220,887 | |
| | 95,000 | | | | 2.950 | | | | 03/10/52 | | | | 63,845 | |
| | 408,000 | | | | 3.839 | | | | 03/20/60 | | | | 312,571 | |
| | 646,000 | | | | 3.799 | | | | 04/06/71 | | | | 470,630 | |
| | United Parcel Service, Inc. | |
| | 292,000 | | | | 3.050 | | | | 11/15/27 | | | | 273,603 | |
| | 792,000 | | | | 3.400 | | | | 03/15/29 | | | | 740,740 | |
| | 570,000 | | | | 3.750 | | | | 11/15/47 | | | | 462,395 | |
| | 500,000 | | | | 4.250 | | | | 03/15/49 | | | | 432,416 | |
| | 448,000 | | | | 5.300 | | | | 04/01/50 | | | | 455,129 | |
| | | | | | | | | | | | | | |
| | | | | | | | | | | | | 9,646,578 | |
| | |
| Wireless – 5.6% | |
| | American Tower Corp. | |
| | 250,000 | | | | 4.000 | | | | 06/01/25 | | | | 242,823 | |
| | 556,000 | | | | 3.375 | | | | 10/15/26 | | | | 521,638 | |
| | 200,000 | | | | 2.750 | | | | 01/15/27 | | | | 182,756 | |
| | 361,000 | | | | 3.800 | | | | 08/15/29 | | | | 328,461 | |
| | 80,000 | | | | 2.900 | | | | 01/15/30 | | | | 68,285 | |
| | 300,000 | | | | 1.875 | | | | 10/15/30 | | | | 233,772 | |
| | 251,000 | | | | 3.100 | | | | 06/15/50 | | | | 157,317 | |
| | AT&T, Inc. | |
| | 611,000 | | | | 3.800 | | | | 02/15/27 | | | | 581,409 | |
| | 346,000 | | | | 4.250 | | | | 03/01/27 | | | | 333,588 | |
| | 339,000 | | | | 2.300 | | | | 06/01/27 | | | | 303,361 | |
| | 75,000 | | | | 1.650 | | | | 02/01/28 | | | | 64,119 | |
| | |
|
| Corporate Obligations – (continued) | |
| Wireless – (continued) | |
| | AT&T, Inc. – (continued) | |
| 300,000 | | | | 4.100 | | | | 02/15/28 | | | | 283,931 | |
| | 912,000 | | | | 4.350 | | | | 03/01/29 | | | | 862,740 | |
| | 1,789,000 | | | | 4.300 | | | | 02/15/30 | | | | 1,666,953 | |
| | 389,000 | | | | 2.750 | | | | 06/01/31 | | | | 321,435 | |
| | 428,000 | | | | 2.250 | | | | 02/01/32 | | | | 334,761 | |
| | 630,000 | | | | 2.550 | | | | 12/01/33 | | | | 481,773 | |
| | 685,000 | | | | 4.500 | | | | 05/15/35 | | | | 607,767 | |
| | 140,000 | | | | 4.850 | | | | 03/01/39 | | | | 124,729 | |
| | 330,000 | | | | 4.350 | | | | 06/15/45 | | | | 261,581 | |
| | 435,000 | | | | 4.750 | | | | 05/15/46 | | | | 363,884 | |
| | 293,000 | | | | 4.500 | | | | 03/09/48 | | | | 233,858 | |
| | 225,000 | | | | 4.550 | | | | 03/09/49 | | | | 180,320 | |
| | 538,000 | | | | 3.650 | | | | 06/01/51 | | | | 369,428 | |
| | 130,000 | | | | 3.300 | | | | 02/01/52 | | | | 84,757 | |
| | 1,560,000 | | | | 3.500 | | | | 09/15/53 | | | | 1,026,618 | |
| | 1,358,000 | | | | 3.550 | | | | 09/15/55 | | | | 882,897 | |
| | 530,000 | | | | 3.800 | | | | 12/01/57 | | | | 359,080 | |
| | 1,319,000 | | | | 3.650 | | | | 09/15/59 | | | | 856,973 | |
| | 92,000 | | | | 3.850 | | | | 06/01/60 | | | | 62,893 | |
| | Crown Castle, Inc. | |
| | 467,000 | | | | 4.450 | | | | 02/15/26 | | | | 454,717 | |
| | 506,000 | | | | 3.700 | | | | 06/15/26 | | | | 481,441 | |
| | 649,000 | | | | 1.050 | | | | 07/15/26 | | | | 573,618 | |
| | 98,000 | | | | 3.650 | | | | 09/01/27 | | | | 91,277 | |
| | 200,000 | | | | 3.800 | | | | 02/15/28 | | | | 186,039 | |
| | 220,000 | | | | 3.300 | | | | 07/01/30 | | | | 191,913 | |
| | 180,000 | | | | 2.250 | | | | 01/15/31 | | | | 144,558 | |
| | 301,000 | | | | 2.100 | | | | 04/01/31 | | | | 237,704 | |
| | 300,000 | | | | 2.900 | | | | 04/01/41 | | | | 202,875 | |
| | 100,000 | | | | 3.250 | | | | 01/15/51 | | | | 64,821 | |
| | Sprint Capital Corp. | |
| | 700,000 | | | | 6.875 | | | | 11/15/28 | | | | 739,628 | |
| | 1,400,000 | | | | 8.750 | | | | 03/15/32 | | | | 1,669,500 | |
| | T-Mobile USA, Inc. | |
| | 500,000 | | | | 2.250 | | | | 02/15/26 | | | | 462,485 | |
| | 800,000 | | | | 3.750 | | | | 04/15/27 | | | | 757,344 | |
| | 300,000 | | | | 4.950 | | | | 03/15/28 | | | | 295,193 | |
| | 50,000 | | | | 4.800 | | | | 07/15/28 | | | | 48,953 | |
| | 100,000 | | | | 2.625 | | | | 02/15/29 | | | | 86,396 | |
| | 700,000 | | | | 3.375 | | | | 04/15/29 | | | | 627,705 | |
| | 900,000 | | | | 3.875 | | | | 04/15/30 | | | | 821,647 | |
| | 1,280,000 | | | | 2.550 | | | | 02/15/31 | | | | 1,057,218 | |
| | 300,000 | | | | 2.875 | | | | 02/15/31 | | | | 252,130 | |
| | 408,000 | | | | 2.250 | | | | 11/15/31 | | | | 323,556 | |
| | 408,000 | | | | 2.700 | | | | 03/15/32 | | | | 332,218 | |
| | 500,000 | | | | 5.050 | | | | 07/15/33 | | | | 482,109 | |
| | 700,000 | | | | 4.375 | | | | 04/15/40 | | | | 602,560 | |
| | 500,000 | | | | 3.000 | | | | 02/15/41 | | | | 352,001 | |
| | 600,000 | | | | 4.500 | | | | 04/15/50 | | | | 497,328 | |
| | 400,000 | | | | 3.300 | | | | 02/15/51 | | | | 268,837 | |
| | 500,000 | | | | 5.750 | | | | 01/15/54 | | | | 495,061 | |
| | 300,000 | | | | 3.600 | | | | 11/15/60 | | | | 201,122 | |
| | Verizon Communications, Inc. | |
| | 394,000 | | | | 3.500 | | | | 11/01/24 | | | | 384,924 | |
| | 434,000 | | | | 3.376 | | | | 02/15/25 | | | | 421,297 | |
| | |
| | |
| 82 | | The accompanying notes are an integral part of these financial statements. |
GOLDMAN SACHS ACCESS INVESTMENT GRADE CORPORATE BOND ETF
| | | | | | | | | | | | | | |
Principal
Amount | | | Interest
Rate | | | Maturity
Date | | | Value | |
|
| Corporate Obligations – (continued) | |
| Wireless – (continued) | |
| | Verizon Communications, Inc. – (continued) | |
| $ | 1,988,000 | | | | 0.850 | % | | | 11/20/25 | | | $ | 1,806,595 | |
| | 559,000 | | | | 4.125 | | | | 03/16/27 | | | | 538,348 | |
| | 250,000 | | | | 3.000 | | | | 03/22/27 | | | | 232,849 | |
| | 710,000 | | | | 2.100 | | | | 03/22/28 | | | | 620,295 | |
| | 722,000 | | | | 4.329 | | | | 09/21/28 | | | | 691,231 | |
| | 786,000 | | | | 4.016 | | | | 12/03/29 | | | | 729,122 | |
| | 471,000 | | | | 3.150 | | | | 03/22/30 | | | | 414,100 | |
| | 280,000 | | | | 1.500 | | | | 09/18/30 | | | | 218,869 | |
| | 100,000 | | | | 1.680 | | | | 10/30/30 | | | | 78,006 | |
| | 1,330,000 | | | | 2.550 | | | | 03/21/31 | | | | 1,097,319 | |
| | 50,000 | | | | 2.355 | | | | 03/15/32 | | | | 39,525 | |
| | 1,000,000 | | | | 5.050 | | | | 05/09/33 | | | | 967,891 | |
| | 220,000 | | | | 4.272 | | | | 01/15/36 | | | | 194,871 | |
| | 478,000 | | | | 5.250 | | | | 03/16/37 | | | | 466,774 | |
| | 550,000 | | | | 2.650 | | | | 11/20/40 | | | | 368,404 | |
| | 510,000 | | | | 3.400 | | | | 03/22/41 | | | | 379,659 | |
| | 60,000 | | | | 6.550 | | | | 09/15/43 | | | | 65,826 | |
| | 704,000 | | | | 4.862 | | | | 08/21/46 | | | | 618,927 | |
| | 455,000 | | | | 4.522 | | | | 09/15/48 | | | | 382,225 | |
| | 400,000 | | | | 2.875 | | | | 11/20/50 | | | | 247,093 | |
| | 800,000 | | | | 3.550 | | | | 03/22/51 | | | | 561,095 | |
| | 364,000 | | | | 5.012 | | | | 08/21/54 | | | | 323,524 | |
| | 150,000 | | | | 2.987 | | | | 10/30/56 | | | | 89,690 | |
| | 500,000 | | | | 3.000 | | | | 11/20/60 | | | | 295,008 | |
| | 555,000 | | | | 3.700 | | | | 03/22/61 | | | | 376,829 | |
| | | | | | | | | | | | | | |
| | | | | | | | | | | | | 37,996,157 | |
| | |
| | TOTAL CORPORATE OBLIGATIONS | |
| | (Cost $607,343,930) | | | $ | 541,179,138 | |
| | |
| | | | | | | | | | | | | | |
|
| Foreign Corporate Debt – 19.4% | |
| Banks – 11.9% | |
| | Australia & New Zealand Banking Group Ltd. (Australia) | |
| $ | 300,000 | | | | 5.088 | % | | | 12/08/25 | | | $ | 298,679 | |
| | Banco Bilbao Vizcaya Argentaria SA (Spain) | |
| | 200,000 | | | | 1.125 | | | | 09/18/25 | | | | 182,732 | |
| | Banco Santander SA (Spain) | |
| | 200,000 | | | | 2.706 | | | | 06/27/24 | | | | 194,541 | |
| | 1,432,000 | | | | 2.746 | | | | 05/28/25 | | | | 1,352,513 | |
| | 800,000 | | | | 5.179 | | | | 11/19/25 | | | | 782,128 | |
| | 600,000 | | | | 1.849 | | | | 03/25/26 | | | | 541,182 | |
| | 600,000 | | | | 4.250 | | | | 04/11/27 | | | | 567,188 | |
| | (US 1 Year CMT T-Note + 0.900%) | |
| | 600,000 | | | | 1.722 | (a) | | | 09/14/27 | | | | 527,575 | |
| | 325,000 | | | | 3.490 | | | | 05/28/30 | | | | 280,376 | |
| | (US 1 Year CMT T-Note + 1.600%) | |
| | 336,000 | | | | 3.225 | (a) | | | 11/22/32 | | | | 262,201 | |
| | Bank of Montreal (Canada) | |
| | (5 Year USD Swap + 1.432%) | |
| | 341,000 | | | | 3.803 | (a) | | | 12/15/32 | | | | 301,360 | |
| | (US 5 Year CMT T-Note + 1.400%) | |
| | 204,000 | | | | 3.088 | (a) | | | 01/10/37 | | | | 157,056 | |
| | Bank of Montreal, MTN (Canada) | |
| | 150,000 | | | | 1.500 | | | | 01/10/25 | | | | 141,828 | |
| | 425,000 | | | | 1.250 | | | | 09/15/26 | | | | 376,174 | |
| | |
|
| Foreign Corporate Debt – (continued) | |
| Banks – (continued) | |
| | Bank of Montreal, MTN (Canada) – (continued) | |
| | (SOFR + 0.603%) | |
| 40,000 | | | | 0.949 | %(a) | | | 01/22/27 | | | | 35,904 | |
| | 264,000 | | | | 2.650 | | | | 03/08/27 | | | | 239,944 | |
| | Bank of Nova Scotia (The) (Canada) | |
| | 75,000 | | | | 0.650 | | | | 07/31/24 | | | | 71,540 | |
| | 448,000 | | | | 1.300 | | | | 06/11/25 | | | | 414,895 | |
| | 626,000 | | | | 4.500 | | | | 12/16/25 | | | | 606,724 | |
| | 220,000 | | | | 2.700 | | | | 08/03/26 | | | | 204,393 | |
| | 80,000 | | | | 1.950 | | | | 02/02/27 | | | | 71,747 | |
| | 750,000 | | | | 4.850 | | | | 02/01/30 | | | | 724,925 | |
| | 530,000 | | | | 2.450 | | | | 02/02/32 | | | | 426,854 | |
| | Barclays PLC (United Kingdom) | |
| | 1,140,000 | | | | 3.650 | | | | 03/16/25 | | | | 1,099,393 | |
| | 1,035,000 | | | | 4.375 | | | | 01/12/26 | | | | 996,738 | |
| | (SOFR + 2.714%) | |
| | 200,000 | | | | 2.852 | (a) | | | 05/07/26 | | | | 189,372 | |
| | 210,000 | | | | 5.200 | | | | 05/12/26 | | | | 204,276 | |
| | 850,000 | | | | 4.836 | | | | 05/09/28 | | | | 785,899 | |
| | (US 1 Year CMT T-Note + 1.200%) | |
| | 424,000 | | | | 2.667 | (a) | | | 03/10/32 | | | | 332,751 | |
| | (SOFR + 2.980%) | |
| | 1,000,000 | | | | 6.224 | (a) | | | 05/09/34 | | | | 986,218 | |
| | (US 5 Year CMT T-Note + 2.900%) | |
| | 960,000 | | | | 3.564 | (a) | | | 09/23/35 | | | | 762,066 | |
| | (US 1 Year CMT T-Note + 1.700%) | |
| | 500,000 | | | | 3.811 | (a) | | | 03/10/42 | | | | 352,274 | |
| | 330,000 | | | | 5.250 | | | | 08/17/45 | | | | 296,229 | |
| | 436,000 | | | | 4.950 | | | | 01/10/47 | | | | 376,694 | |
| | Canadian Imperial Bank of Commerce (Canada) | |
| | 110,000 | | | | 2.250 | | | | 01/28/25 | | | | 104,708 | |
| | 300,000 | | | | 1.250 | | | | 06/22/26 | | | | 267,369 | |
| | 150,000 | | | | 3.450 | | | | 04/07/27 | | | | 140,094 | |
| | 150,000 | | | | 3.600 | | | | 04/07/32 | | | | 133,747 | |
| | Cooperatieve Rabobank UA (Netherlands) | |
| | 1,105,000 | | | | 3.750 | | | | 07/21/26 | | | | 1,039,054 | |
| | 186,000 | | | | 5.250 | | | | 05/24/41 | | | | 189,801 | |
| | 250,000 | | | | 5.750 | | | | 12/01/43 | | | | 243,459 | |
| | 485,000 | | | | 5.250 | | | | 08/04/45 | | | | 442,673 | |
| | Credit Suisse AG (Switzerland) | |
| | 750,000 | | | | 7.950 | | | | 01/09/25 | | | | 766,957 | |
| | 1,210,000 | | | | 2.950 | | | | 04/09/25 | | | | 1,152,444 | |
| | 1,350,000 | | | | 1.250 | | | | 08/07/26 | | | | 1,186,370 | |
| | Deutsche Bank AG (Germany) | |
| | (SOFR + 2.581%) | |
| | 800,000 | | | | 3.961 | (a) | | | 11/26/25 | | | | 773,632 | |
| | (SOFR + 1.870%) | |
| | 1,000,000 | | | | 2.129 | (a) | | | 11/24/26 | | | | 907,922 | |
| | (SOFR + 1.219%) | |
| | 1,694,000 | | | | 2.311 | (a) | | | 11/16/27 | | | | 1,487,313 | |
| | (SOFR + 3.180%) | |
| | 800,000 | | | | 6.720 | (a) | | | 01/18/29 | | | | 807,630 | |
| | (SOFR + 3.043%) | |
| | 260,000 | | | | 3.547 | (a) | | | 09/18/31 | | | | 217,452 | |
| | (SOFR + 1.718%) | |
| | 370,000 | | | | 3.035 | (a) | | | 05/28/32 | | | | 294,625 | |
| | |
| | |
| The accompanying notes are an integral part of these financial statements. | | 83 |
GOLDMAN SACHS ACCESS INVESTMENT GRADE CORPORATE BOND ETF
Schedule of Investments (continued)
August 31, 2023
| | | | | | | | | | | | | | |
Principal
Amount | | | Interest
Rate | | | Maturity
Date | | | Value | |
|
| Foreign Corporate Debt – (continued) | |
| Banks – (continued) | |
| | HSBC Holdings PLC (United Kingdom) | |
| $ | 260,000 | | | | 4.375 | % | | | 11/23/26 | | | $ | 248,210 | |
| | (SOFR + 1.290%) | |
| | 580,000 | | | | 1.589 | (a) | | | 05/24/27 | | | | 516,194 | |
| | (3M U.S. T-Bill MMY + 1.808%) | |
| | 1,100,000 | | | | 4.041 | (a) | | | 03/13/28 | | | | 1,032,815 | |
| | (SOFR + 2.610%) | |
| | 710,000 | | | | 5.210 | (a) | | | 08/11/28 | | | | 693,349 | |
| | (SOFR + 3.350%) | |
| | 290,000 | | | | 7.390 | (a) | | | 11/03/28 | | | | 304,670 | |
| | (3M U.S. T-Bill MMY + 1.796%) | |
| | 900,000 | | | | 4.583 | (a) | | | 06/19/29 | | | | 850,658 | |
| | (3M U.S. T-Bill MMY + 1.872%) | |
| | 416,000 | | | | 3.973 | (a) | | | 05/22/30 | | | | 374,060 | |
| | (SOFR + 2.870%) | |
| | 550,000 | | | | 5.402 | (a) | | | 08/11/33 | | | | 524,934 | |
| | (SOFR + 4.250%) | |
| | 1,100,000 | | | | 8.113 | (a) | | | 11/03/33 | | | | 1,196,207 | |
| | (SOFR + 2.390%) | |
| | 1,700,000 | | | | 6.254 | (a) | | | 03/09/34 | | | | 1,723,473 | |
| | (SOFR + 2.980%) | |
| | 1,000,000 | | | | 6.547 | (a) | | | 06/20/34 | | | | 980,085 | |
| | 1,470,000 | | | | 6.500 | | | | 09/15/37 | | | | 1,435,545 | |
| | (SOFR + 2.650%) | |
| | 400,000 | | | | 6.332 | (a) | | | 03/09/44 | | | | 403,399 | |
| | ING Groep NV (Netherlands) | |
| | (SOFR + 1.640%) | |
| | 260,000 | | | | 3.869 | (a) | | | 03/28/26 | | | | 252,291 | |
| | 200,000 | | | | 3.950 | | | | 03/29/27 | | | | 189,556 | |
| | (SOFR + 1.005%) | |
| | 800,000 | | | | 1.726 | (a) | | | 04/01/27 | | | | 720,200 | |
| | (SOFR + 1.830%) | |
| | 500,000 | | | | 4.017 | (a) | | | 03/28/28 | | | | 471,245 | |
| | 490,000 | | | | 4.550 | | | | 10/02/28 | | | | 470,115 | |
| | 330,000 | | | | 4.050 | | | | 04/09/29 | | | | 305,688 | |
| | (SOFR + 1.316%) | |
| | 690,000 | | | | 2.727 | (a) | | | 04/01/32 | | | | 562,580 | |
| | Lloyds Banking Group PLC (United Kingdom) | |
| | 940,000 | | | | 4.450 | | | | 05/08/25 | | | | 915,842 | |
| | 400,000 | | | | 4.582 | | | | 12/10/25 | | | | 386,011 | |
| | 1,500,000 | | | | 3.750 | | | | 01/11/27 | | | | 1,411,542 | |
| | 940,000 | | | | 4.375 | | | | 03/22/28 | | | | 888,037 | |
| | (3M USD LIBOR + 1.205%) | |
| | 1,220,000 | | | | 3.574 | (a) | | | 11/07/28 | | | | 1,106,116 | |
| | 200,000 | | | | 5.300 | | | | 12/01/45 | | | | 174,770 | |
| | 490,000 | | | | 4.344 | | | | 01/09/48 | | | | 365,238 | |
| | Mitsubishi UFJ Financial Group, Inc. (Japan) | |
| | 290,000 | | | | 2.193 | | | | 02/25/25 | | | | 274,523 | |
| | (US 1 Year CMT T-Note + 1.080%) | |
| | 260,000 | | | | 5.719 | (a) | | | 02/20/26 | | | | 258,901 | |
| | (US 1 Year CMT T-Note + 0.830%) | |
| | 1,300,000 | | | | 2.341 | (a) | | | 01/19/28 | | | | 1,168,228 | |
| | 290,000 | | | | 3.961 | | | | 03/02/28 | | | | 274,966 | |
| | (US 1 Year CMT T-Note + 1.950%) | |
| | 800,000 | | | | 5.017 | (a) | | | 07/20/28 | | | | 780,886 | |
| | |
|
| Foreign Corporate Debt – (continued) | |
| Banks – (continued) | |
| | Mitsubishi UFJ Financial Group, Inc. (Japan) – (continued) | |
| | (US 1 Year CMT T-Note + 1.900%) | |
| 300,000 | | | | 5.354 | %(a) | | | 09/13/28 | | | | 297,341 | |
| | (US 1 Year CMT T-Note + 1.380%) | |
| | 1,800,000 | | | | 5.422 | (a) | | | 02/22/29 | | | | 1,792,841 | |
| | 250,000 | | | | 3.741 | | | | 03/07/29 | | | | 230,876 | |
| | (US 1 Year CMT T-Note + 1.100%) | |
| | 300,000 | | | | 2.852 | (a) | | | 01/19/33 | | | | 245,123 | |
| | (US 1 Year CMT T-Note + 1.630%) | |
| | 1,000,000 | | | | 5.441 | (a) | | | 02/22/34 | | | | 988,930 | |
| | Mizuho Financial Group, Inc. (Japan) | |
| | 490,000 | | | | 2.839 | | | | 09/13/26 | | | | 451,445 | |
| | (US 1 Year CMT T-Note + 0.670%) | |
| | 500,000 | | | | 1.234 | (a) | | | 05/22/27 | | | | 442,647 | |
| | (3M U.S. T-Bill MMY + 1.532%) | |
| | 800,000 | | | | 4.254 | (a) | | | 09/11/29 | | | | 747,815 | |
| | (3M U.S. T-Bill MMY + 1.392%) | |
| | 430,000 | | | | 3.153 | (a) | | | 07/16/30 | | | | 371,556 | |
| | 300,000 | | | | 2.564 | | | | 09/13/31 | | | | 233,848 | |
| | National Australia Bank Ltd. (Australia) | |
| | 940,000 | | | | 2.500 | | | | 07/12/26 | | | | 874,598 | |
| | NatWest Group PLC (United Kingdom) | |
| | 846,000 | | | | 4.800 | | | | 04/05/26 | | | | 822,465 | |
| | (US 1 Year CMT T-Note + 2.550%) | |
| | 355,000 | | | | 3.073 | (a) | | | 05/22/28 | | | | 320,694 | |
| | (3M USD LIBOR + 1.754%) | |
| | 345,000 | | | | 4.892 | (a) | | | 05/18/29 | | | | 329,514 | |
| | (US 5 Year CMT T-Note + 2.100%) | |
| | 748,000 | | | | 3.754 | (a) | | | 11/01/29 | | | | 711,324 | |
| | (3M USD LIBOR + 1.905%) | |
| | 470,000 | | | | 5.076 | (a) | | | 01/27/30 | | | | 447,354 | |
| | (3M USD LIBOR + 1.871%) | |
| | 370,000 | | | | 4.445 | (a) | | | 05/08/30 | | | | 339,559 | |
| | (US 5 Year CMT T-Note + 2.350%) | |
| | 420,000 | | | | 3.032 | (a) | | | 11/28/35 | | | | 325,439 | |
| | Royal Bank of Canada (Canada) | |
| | 130,000 | | | | 1.200 | | | | 04/27/26 | | | | 116,658 | |
| | 800,000 | | | | 3.625 | | | | 05/04/27 | | | | 754,806 | |
| | Royal Bank of Canada, GMTN (Canada) | |
| | 500,000 | | | | 2.250 | | | | 11/01/24 | | | | 480,929 | |
| | 980,000 | | | | 0.875 | | | | 01/20/26 | | | | 881,876 | |
| | 308,000 | | | | 4.650 | | | | 01/27/26 | | | | 302,602 | |
| | 264,000 | | | | 1.400 | | | | 11/02/26 | | | | 233,949 | |
| | 500,000 | | | | 4.240 | | | | 08/03/27 | | | | 480,726 | |
| | 250,000 | | | | 2.300 | | | | 11/03/31 | | | | 200,488 | |
| | 300,000 | | | | 5.000 | | | | 02/01/33 | | | | 290,597 | |
| | Royal Bank of Canada, MTN (Canada) | |
| | 257,000 | | | | 1.150 | | | | 06/10/25 | | | | 238,045 | |
| | Santander UK Group Holdings PLC (United Kingdom) | |
| | (SOFR + 2.749%) | |
| | 870,000 | | | | 6.833 | (a) | | | 11/21/26 | | | | 879,742 | |
| | (SOFR + 0.989%) | |
| | 1,790,000 | | | | 1.673 | (a) | | | 06/14/27 | | | | 1,578,292 | |
| | (3M USD LIBOR + 1.400%) | |
| | 1,260,000 | | | | 3.823 | (a) | | | 11/03/28 | | | | 1,138,279 | |
| | |
| | |
| 84 | | The accompanying notes are an integral part of these financial statements. |
GOLDMAN SACHS ACCESS INVESTMENT GRADE CORPORATE BOND ETF
| | | | | | | | | | | | | | |
Principal
Amount | | | Interest
Rate | | | Maturity
Date | | | Value | |
|
| Foreign Corporate Debt – (continued) | |
| Banks – (continued) | |
| | Sumitomo Mitsui Financial Group, Inc. (Japan) | |
| $ | 1,030,000 | | | | 1.474 | % | | | 07/08/25 | | | $ | 953,747 | |
| | 400,000 | | | | 3.784 | | | | 03/09/26 | | | | 382,710 | |
| | 664,000 | | | | 3.364 | | | | 07/12/27 | | | | 616,705 | |
| | 200,000 | | | | 5.520 | | | | 01/13/28 | | | | 199,921 | |
| | 550,000 | | | | 3.544 | | | | 01/17/28 | | | | 508,567 | |
| | 1,390,000 | | | | 3.944 | | | | 07/19/28 | | | | 1,297,044 | |
| | 1,000,000 | | | | 3.040 | | | | 07/16/29 | | | | 873,222 | |
| | 490,000 | | | | 2.750 | | | | 01/15/30 | | | | 417,623 | |
| | 500,000 | | | | 2.130 | | | | 07/08/30 | | | | 403,582 | |
| | 500,000 | | | | 2.222 | | | | 09/17/31 | | | | 394,869 | |
| | 500,000 | | | | 5.766 | | | | 01/13/33 | | | | 507,343 | |
| | Toronto-Dominion Bank (The) (Canada) | |
| | 290,000 | | | | 4.108 | | | | 06/08/27 | | | | 277,040 | |
| | (5 Year USD Swap + 2.205%) | |
| | 338,000 | | | | 3.625 | (a) | | | 09/15/31 | | | | 316,181 | |
| | Toronto-Dominion Bank (The), MTN (Canada) | |
| | 830,000 | | | | 2.650 | | | | 06/12/24 | | | | 810,383 | |
| | 270,000 | | | | 1.150 | | | | 06/12/25 | | | | 250,481 | |
| | 643,000 | | | | 0.750 | | | | 01/06/26 | | | | 577,547 | |
| | 330,000 | | | | 1.250 | | | | 09/10/26 | | | | 292,549 | |
| | 440,000 | | | | 2.800 | | | | 03/10/27 | | | | 403,787 | |
| | 340,000 | | | | 2.000 | | | | 09/10/31 | | | | 269,274 | |
| | 481,000 | | | | 3.200 | | | | 03/10/32 | | | | 409,784 | |
| | Toronto-Dominion Bank (The), Series FXD (Canada) | |
| | 50,000 | | | | 1.950 | | | | 01/12/27 | | | | 44,948 | |
| | UBS Group AG (Switzerland) | |
| | 660,000 | | | | 3.750 | | | | 03/26/25 | | | | 637,333 | |
| | 250,000 | | | | 4.550 | | | | 04/17/26 | | | | 242,169 | |
| | (SOFR + 3.730%) | |
| | 621,000 | | | | 4.194 | (a)(b) | | | 04/01/31 | | | | 560,598 | |
| | 300,000 | | | | 4.875 | | | | 05/15/45 | | | | 267,097 | |
| | Westpac Banking Corp. (Australia) | |
| | 1,000,000 | | | | 5.350 | | | | 10/18/24 | | | | 998,468 | |
| | 112,000 | | | | 1.019 | | | | 11/18/24 | | | | 105,958 | |
| | 40,000 | | | | 2.350 | | | | 02/19/25 | | | | 38,365 | |
| | 200,000 | | | | 2.850 | | | | 05/13/26 | | | | 188,550 | |
| | 550,000 | | | | 1.150 | | | | 06/03/26 | | | | 494,315 | |
| | 290,000 | | | | 3.350 | | | | 03/08/27 | | | | 273,699 | |
| | 350,000 | | | | 5.457 | | | | 11/18/27 | | | | 356,221 | |
| | 40,000 | | | | 3.400 | | | | 01/25/28 | | | | 37,493 | |
| | 247,000 | | | | 2.650 | | | | 01/16/30 | | | | 215,922 | |
| | (US 5 Year CMT T-Note + 1.350%) | |
| | 1,126,000 | | | | 2.894 | (a) | | | 02/04/30 | | | | 1,062,793 | |
| | 400,000 | | | | 2.150 | | | | 06/03/31 | | | | 328,016 | |
| | (US 5 Year CMT T-Note + 2.000%) | |
| | 400,000 | | | | 4.110 | (a) | | | 07/24/34 | | | | 350,464 | |
| | (US 5 Year CMT T-Note + 1.750%) | |
| | 300,000 | | | | 2.668 | (a) | | | 11/15/35 | | | | 230,292 | |
| | 186,000 | | | | 4.421 | | | | 07/24/39 | | | | 150,280 | |
| | 100,000 | | | | 2.963 | | | | 11/16/40 | | | | 64,871 | |
| | Westpac Banking Corp.(a), GMTN (Australia) | |
| | (5 Year USD Swap + 2.236%) | |
| | 146,000 | | | | 4.322 | | | | 11/23/31 | | | | 136,493 | |
| | | | | | | | | | | | | | |
| | | | | | | | | | | | | 81,057,015 | |
| | |
|
| Foreign Corporate Debt – (continued) | |
| Beverages – 0.0% | |
| | Coca-Cola Femsa SAB de CV (Mexico) | |
| 280,000 | | | | 2.750 | | | | 01/22/30 | | | | 244,019 | |
| | |
| Brokerage – 0.4% | |
| | Brookfield Finance, Inc. (Canada) | |
| | 814,000 | | | | 3.900 | | | | 01/25/28 | | | | 758,268 | |
| | 120,000 | | | | 4.850 | | | | 03/29/29 | | | | 114,792 | |
| | 425,000 | | | | 4.350 | | | | 04/15/30 | | | | 392,177 | |
| | 237,000 | | | | 4.700 | | | | 09/20/47 | | | | 195,895 | |
| | Nomura Holdings, Inc. (Japan) | |
| | 300,000 | | | | 2.679 | | | | 07/16/30 | | | | 243,106 | |
| | 550,000 | | | | 2.608 | | | | 07/14/31 | | | | 430,848 | |
| | 780,000 | | | | 2.999 | | | | 01/22/32 | | | | 622,142 | |
| | | | | | | | | | | | | | |
| | | | | | | | | | | | | 2,757,228 | |
| | |
| Consumer Cyclical – 0.1% | |
| | Honda Motor Co., Ltd. (Japan) | |
| | 300,000 | | | | 2.967 | | | | 03/10/32 | | | | 262,292 | |
| | Toyota Motor Corp. (Japan) | |
| | 80,000 | | | | 1.339 | | | | 03/25/26 | | | | 72,943 | |
| | | | | | | | | | | | | | |
| | | | | | | | | | | | | 335,235 | |
| | |
| Consumer Noncyclical – 1.2% | |
| | Astrazeneca Finance LLC (United Kingdom) | |
| | 300,000 | | | | 2.250 | | | | 05/28/31 | | | | 250,239 | |
| | AstraZeneca PLC (United Kingdom) | |
| | 400,000 | | | | 6.450 | | | | 09/15/37 | | | | 449,179 | |
| | BAT Capital Corp. (United Kingdom) | |
| | 150,000 | | | | 3.222 | | | | 08/15/24 | | | | 146,320 | |
| | 634,000 | | | | 3.215 | | | | 09/06/26 | | | | 592,044 | |
| | 352,000 | | | | 4.700 | | | | 04/02/27 | | | | 341,387 | |
| | 792,000 | | | | 3.557 | | | | 08/15/27 | | | | 733,206 | |
| | 330,000 | | | | 2.259 | | | | 03/25/28 | | | | 283,917 | |
| | 410,000 | | | | 2.726 | | | | 03/25/31 | | | | 324,435 | |
| | 524,000 | | | | 4.390 | | | | 08/15/37 | | | | 416,583 | |
| | 353,000 | | | | 4.540 | | | | 08/15/47 | | | | 256,242 | |
| | 204,000 | | | | 4.758 | | | | 09/06/49 | | | | 150,712 | |
| | 318,000 | | | | 3.984 | | | | 09/25/50 | | | | 208,401 | |
| | BAT International Finance PLC (United Kingdom) | |
| | 259,000 | | | | 1.668 | | | | 03/25/26 | | | | 234,735 | |
| | 1,346,000 | | | | 4.448 | | | | 03/16/28 | | | | 1,275,743 | |
| | GlaxoSmithKline Capital, Inc. (United Kingdom) | |
| | 910,000 | | | | 3.875 | | | | 05/15/28 | | | | 877,309 | |
| | 511,000 | | | | 6.375 | | | | 05/15/38 | | | | 581,570 | |
| | Reynolds American, Inc. (United Kingdom) | |
| | 500,000 | | | | 5.700 | | | | 08/15/35 | | | | 462,650 | |
| | 324,000 | | | | 5.850 | | | | 08/15/45 | | | | 280,308 | |
| | Takeda Pharmaceutical Co., Ltd. (Japan) | |
| | 250,000 | | | | 3.175 | | | | 07/09/50 | | | | 167,795 | |
| | | | | | | | | | | | | | |
| | | | | | | | | | | | | 8,032,775 | |
| | |
| Consumer Products – 0.2% | |
| | Unilever Capital Corp. (United Kingdom) | |
| | 100,000 | | | | 2.900 | | | | 05/05/27 | | | | 93,440 | |
| | 500,000 | | | | 3.500 | | | | 03/22/28 | | | | 475,682 | |
| | 500,000 | | | | 2.125 | | | | 09/06/29 | | | | 435,416 | |
| | 132,000 | | | | 5.900 | | | | 11/15/32 | | | | 142,401 | |
| | | | | | | | | | | | | | |
| | | | | | | | | | | | | 1,146,939 | |
| | |
| | |
| The accompanying notes are an integral part of these financial statements. | | 85 |
GOLDMAN SACHS ACCESS INVESTMENT GRADE CORPORATE BOND ETF
Schedule of Investments (continued)
August 31, 2023
| | | | | | | | | | | | | | |
Principal
Amount | | | Interest
Rate | | | Maturity
Date | | | Value | |
|
| Foreign Corporate Debt – (continued) | |
| Energy – 1.8% | |
| | BP Capital Markets PLC (United Kingdom) | |
| $ | 764,000 | | | | 3.279 | % | | | 09/19/27 | | | $ | 719,405 | |
| | 168,000 | | | | 3.723 | | | | 11/28/28 | | | | 157,974 | |
| | (US 5 Year CMT T-Note + 4.036%) | |
| | 400,000 | | | | 4.375 | (a) | | | 09/22/71 | | | | 383,500 | |
| | (US 5 Year CMT T-Note + 4.398%) | |
| | 400,000 | | | | 4.875 | (a) | | | 12/22/71 | | | | 363,772 | |
| | Canadian Natural Resources Ltd. (Canada) | |
| | 513,000 | | | | 3.850 | | | | 06/01/27 | | | | 485,663 | |
| | Canadian Natural Resources Ltd., GMTN (Canada) | |
| | 214,000 | | | | 4.950 | | | | 06/01/47 | | | | 186,035 | |
| | Cenovus Energy, Inc. (Canada) | |
| | 172,000 | | | | 6.750 | | | | 11/15/39 | | | | 178,741 | |
| | 322,000 | | | | 5.400 | | | | 06/15/47 | | | | 289,524 | |
| | Enbridge, Inc. (Canada) | |
| | 484,000 | | | | 3.125 | | | | 11/15/29 | | | | 427,142 | |
| | 400,000 | | | | 2.500 | | | | 08/01/33 | | | | 310,807 | |
| | (3M U.S. T-Bill MMY + 3.903%) | |
| | 570,000 | | | | 6.250 | (a) | | | 03/01/78 | | | | 527,963 | |
| | Equinor ASA (Norway) | |
| | 460,000 | | | | 2.875 | | | | 04/06/25 | | | | 443,601 | |
| | 200,000 | | | | 1.750 | | | | 01/22/26 | | | | 185,425 | |
| | 204,000 | | | | 3.125 | | | | 04/06/30 | | | | 184,914 | |
| | 100,000 | | | | 2.375 | | | | 05/22/30 | | | | 85,642 | |
| | 430,000 | | | | 3.950 | | | | 05/15/43 | | | | 360,001 | |
| | 114,000 | | | | 3.250 | | | | 11/18/49 | | | | 80,746 | |
| | 250,000 | | | | 3.700 | | | | 04/06/50 | | | | 193,113 | |
| | Shell International Finance BV (Netherlands) | |
| | 662,000 | | | | 2.000 | | | | 11/07/24 | | | | 636,684 | |
| | 682,000 | | | | 3.250 | | | | 05/11/25 | | | | 660,459 | |
| | 330,000 | | | | 2.875 | | | | 05/10/26 | | | | 312,942 | |
| | 130,000 | | | | 2.500 | | | | 09/12/26 | | | | 121,105 | |
| | 352,000 | | | | 3.875 | | | | 11/13/28 | | | | 337,814 | |
| | 240,000 | | | | 2.375 | | | | 11/07/29 | | | | 208,637 | |
| | 300,000 | | | | 2.750 | | | | 04/06/30 | | | | 264,662 | |
| | 328,000 | | | | 4.125 | | | | 05/11/35 | | | | 299,197 | |
| | 521,000 | | | | 6.375 | | | | 12/15/38 | | | | 570,354 | |
| | 352,000 | | | | 4.375 | | | | 05/11/45 | | | | 305,351 | |
| | 306,000 | | | | 4.000 | | | | 05/10/46 | | | | 251,973 | |
| | 230,000 | | | | 3.750 | | | | 09/12/46 | | | | 180,523 | |
| | 282,000 | | | | 3.125 | | | | 11/07/49 | | | | 196,336 | |
| | 300,000 | | | | 3.000 | | | | 11/26/51 | | | | 200,128 | |
| | Suncor Energy, Inc. (Canada) | |
| | 230,000 | | | | 6.800 | | | | 05/15/38 | | | | 239,720 | |
| | 264,000 | | | | 4.000 | | | | 11/15/47 | | | | 197,169 | |
| | 100,000 | | | | 3.750 | | | | 03/04/51 | | | | 71,074 | |
| | TotalEnergies Capital International SA (France) | |
| | 192,000 | | | | 2.829 | | | | 01/10/30 | | | | 170,415 | |
| | 231,000 | | | | 2.986 | | | | 06/29/41 | | | | 169,415 | |
| | 370,000 | | | | 3.461 | | | | 07/12/49 | | | | 274,840 | |
| | 220,000 | | | | 3.386 | | | | 06/29/60 | | | | 152,450 | |
| | TotalEnergies Capital SA (France) | |
| | 344,000 | | | | 3.883 | | | | 10/11/28 | | | | 327,869 | |
| | TransCanada PipeLines Ltd. (Canada) | |
| | 800,000 | | | | 6.200 | | | | 10/15/37 | | | | 810,458 | |
| | |
|
| Foreign Corporate Debt – (continued) | |
| Energy – (continued) | |
| | Transcanada Trust(a) (Canada) | |
| | (3M USD LIBOR + 3.208%) | |
| 100,000 | | | | 5.300 | | | | 03/15/77 | | | | 87,108 | |
| | | | | | | | | | | | | | |
| | | | | | | | | | | | | 12,610,651 | |
| | |
| Financial Company – 0.4% | |
| AerCap Ireland Capital DAC / AerCap Global Aviation Trust
(Ireland) |
|
| | 500,000 | | | | 3.500 | | | | 01/15/25 | | | | 483,509 | |
| | 450,000 | | | | 6.500 | | | | 07/15/25 | | | | 452,761 | |
| | 952,000 | | | | 2.450 | | | | 10/29/26 | | | | 857,784 | |
| | 300,000 | | | | 3.000 | | | | 10/29/28 | | | | 260,091 | |
| | 432,000 | | | | 3.300 | | | | 01/30/32 | | | | 350,604 | |
| | 300,000 | | | | 3.400 | | | | 10/29/33 | | | | 237,763 | |
| | 480,000 | | | | 3.850 | | | | 10/29/41 | | | | 356,712 | |
| | | | | | | | | | | | | | |
| | | | | | | | | | | | | 2,999,224 | |
| | |
| Food and Beverage – 1.6% | |
| Anheuser-Busch Cos. LLC / Anheuser-Busch InBev Worldwide,
Inc. (Belgium) |
|
| | 458,000 | | | | 3.650 | | | | 02/01/26 | | | | 442,578 | |
| | 1,630,000 | | | | 4.700 | | | | 02/01/36 | | | | 1,561,191 | |
| | 2,466,000 | | | | 4.900 | | | | 02/01/46 | | | | 2,296,663 | |
| | Anheuser-Busch InBev Finance, Inc. (Belgium) | |
| | 1,026,000 | | | | 4.625 | | | | 02/01/44 | | | | 930,769 | |
| | 600,000 | | | | 4.900 | | | | 02/01/46 | | | | 558,799 | |
| | Anheuser-Busch InBev Worldwide, Inc. (Belgium) | |
| | 536,000 | | | | 4.000 | | | | 04/13/28 | | | | 515,399 | |
| | 628,000 | | | | 4.750 | | | | 01/23/29 | | | | 622,166 | |
| | 281,000 | | | | 4.900 | | | | 01/23/31 | | | | 281,627 | |
| | 293,000 | | | | 4.375 | | | | 04/15/38 | | | | 267,856 | |
| | 340,000 | | | | 5.450 | | | | 01/23/39 | | | | 344,850 | |
| | 100,000 | | | | 4.350 | | | | 06/01/40 | | | | 89,630 | |
| | 244,000 | | | | 4.950 | | | | 01/15/42 | | | | 232,763 | |
| | 299,000 | | | | 4.600 | | | | 04/15/48 | | | | 269,021 | |
| | 146,000 | | | | 4.439 | | | | 10/06/48 | | | | 128,054 | |
| | 632,000 | | | | 5.550 | | | | 01/23/49 | | | | 646,535 | |
| | 280,000 | | | | 4.500 | | | | 06/01/50 | | | | 249,487 | |
| | 214,000 | | | | 4.750 | | | | 04/15/58 | | | | 191,899 | |
| | 262,000 | | | | 5.800 | | | | 01/23/59 | | | | 275,015 | |
| | Diageo Capital PLC (United Kingdom) | |
| | 200,000 | | | | 1.375 | | | | 09/29/25 | | | | 184,654 | |
| | 700,000 | | | | 2.375 | | | | 10/24/29 | | | | 603,895 | |
| | | | | | | | | | | | | | |
| | | | | | | | | | | | | 10,692,851 | |
| | |
| Insurance – 0.1% | |
| | Manulife Financial Corp. (Canada) | |
| | 600,000 | | | | 3.703 | | | | 03/16/32 | | | | 538,341 | |
| | 186,000 | | | | 5.375 | | | | 03/04/46 | | | | 179,041 | |
| | | | | | | | | | | | | | |
| | | | | | | | | | | | | 717,382 | |
| | |
| Lodging – 0.2% | |
| | Sands China Ltd. (Macau) | |
| | 290,000 | | | | 5.375 | | | | 08/08/25 | | | | 280,213 | |
| | 500,000 | | | | 4.300 | | | | 01/08/26 | | | | 469,375 | |
| | 740,000 | | | | 5.650 | | | | 08/08/28 | | | | 697,450 | |
| | | | | | | | | | | | | | |
| | | | | | | | | | | | | 1,447,038 | |
| | |
| | |
| 86 | | The accompanying notes are an integral part of these financial statements. |
GOLDMAN SACHS ACCESS INVESTMENT GRADE CORPORATE BOND ETF
| | | | | | | | | | | | | | |
Principal
Amount | | | Interest
Rate | | | Maturity
Date | | | Value | |
|
| Foreign Corporate Debt – (continued) | |
| Metals and Mining – 0.1% | |
| | BHP Billiton Finance USA Ltd. (Australia) | |
| $ | 351,000 | | | | 4.125 | % | | | 02/24/42 | | | $ | 307,478 | |
| | 274,000 | | | | 5.000 | | | | 09/30/43 | | | | 265,096 | |
| | | | | | | | | | | | | | |
| | | | | | | | | | | | | 572,574 | |
| | |
| Mining – 0.3% | |
| | Southern Copper Corp. (Mexico) | |
| | 941,000 | | | | 7.500 | | | | 07/27/35 | | | | 1,067,768 | |
| | 242,000 | | | | 6.750 | | | | 04/16/40 | | | | 262,444 | |
| | 166,000 | | | | 5.250 | | | | 11/08/42 | | | | 152,415 | |
| | 306,000 | | | | 5.875 | | | | 04/23/45 | | | | 298,232 | |
| | | | | | | | | | | | | | |
| | | | | | | | | | | | | 1,780,859 | |
| | |
| Oil Company-Exploration & Production – 0.0% | |
| | CNOOC Finance 2015 USA LLC (China) | |
| | 200,000 | | | | 4.375 | | | | 05/02/28 | | | | 195,634 | |
| | |
| Semiconductors – 0.1% | |
| | TSMC Arizona Corp. (Taiwan) | |
| | 260,000 | | | | 1.750 | | | | 10/25/26 | | | | 233,847 | |
| | 300,000 | | | | 2.500 | | | | 10/25/31 | | | | 249,030 | |
| | 720,000 | | | | 3.250 | | | | 10/25/51 | | | | 520,077 | |
| | | | | | | | | | | | | | |
| | | | | | | | | | | | | 1,002,954 | |
| | |
| Technology – 0.2% | |
| | NXP BV / NXP Funding LLC / NXP USA, Inc. (China) | |
| | 226,000 | | | | 3.400 | | | | 05/01/30 | | | | 198,432 | |
| | 263,000 | | | | 2.500 | | | | 05/11/31 | | | | 212,624 | |
| | 579,000 | | | | 2.650 | | | | 02/15/32 | | | | 464,236 | |
| | 300,000 | | | | 5.000 | | | | 01/15/33 | | | | 284,460 | |
| | | | | | | | | | | | | | |
| | | | | | | | | | | | | 1,159,752 | |
| | |
| Transportation – 0.0% | |
| | Canadian Pacific Railway Co. (Canada) | |
| | 400,000 | | | | 3.100 | | | | 12/02/51 | | | | 272,656 | |
| | |
| Wireless – 0.4% | |
| | Rogers Communications Inc/Ontario (Canada) | |
| | 594,000 | | | | 4.300 | | | | 02/15/48 | | | | 444,407 | |
| | 500,000 | | | | 4.350 | | | | 05/01/49 | | | | 378,731 | |
| | 500,000 | | | | 3.700 | | | | 11/15/49 | | | | 338,601 | |
| | Rogers Communications, Inc. (Canada) | |
| | 200,000 | | | | 5.000 | | | | 03/15/44 | | | | 170,460 | |
| | Vodafone Group PLC (United Kingdom) | |
| | 150,000 | | | | 4.125 | | | | 05/30/25 | | | | 146,580 | |
| | 419,000 | | | | 6.150 | | | | 02/27/37 | | | | 428,773 | |
| | 50,000 | | | | 4.375 | | | | 02/19/43 | | | | 40,720 | |
| | 450,000 | | | | 4.875 | | | | 06/19/49 | | | | 380,758 | |
| | 330,000 | | | | 4.250 | | | | 09/17/50 | | | | 253,982 | |
| | | | | | | | | | | | | | |
| | | | | | | | | | | | | 2,583,012 | |
| | |
| Wirelines – 0.4% | |
| | Deutsche Telekom International Finance BV (Germany) | |
| | 650,000 | | | | 8.750 | | | | 06/15/30 | | | | 764,417 | |
| | Orange SA (France) | |
| | 800,000 | | | | 9.000 | | | | 03/01/31 | | | | 970,894 | |
| | 100,000 | | | | 5.375 | | | | 01/13/42 | | | | 95,994 | |
| | |
|
| Foreign Corporate Debt – (continued) | |
| Wirelines – (continued) | |
| | Telefonica Emisiones SA (Spain) | |
| 200,000 | | | | 4.103 | | | | 03/08/27 | | | | 190,714 | |
| | 500,000 | | | | 4.665 | | | | 03/06/38 | | | | 412,648 | |
| | 500,000 | | | | 4.895 | | | | 03/06/48 | | | | 400,172 | |
| | | | | | | | | | | | | | |
| | | | | | | | | | | | | 2,834,839 | |
| | |
| | TOTAL FOREIGN CORPORATE DEBT | |
| | (Cost $143,593,935) | | | $ | 132,442,637 | |
| | |
| | | | | | | | | | | | | | |
| | | | | | | | |
| Shares | | Dividend
Rate | | | Value | |
|
| Investment Company – 0.2%(d) | |
Goldman Sachs Financial Square Government Fund – Institutional Shares | |
| 1,389,970 | | | 5.234 | % | | $ | 1,389,970 | |
| (Cost $1,389,970) | |
| |
| TOTAL INVESTMENTS – 98.8% | |
| (Cost $752,327,835) | | | $ | 675,011,745 | |
| |
OTHER ASSETS IN EXCESS OF LIABILITIES – 1.2% | | | | 7,828,775 | |
| |
| NET ASSETS – 100.0% | | | $ | 682,840,520 | |
| |
| | |
|
| The percentage shown for each investment category reflects the value of investments in that category as a percentage of net assets. |
| |
(a) | | Variable rate security. Interest rate or distribution rate disclosed is that which is in effect on August 31, 2023. |
| |
(b) | | Exempt from registration under Rule 144A of the Securities Act of 1933. |
| |
(c) | | Issued with a zero coupon. Income is recognized through the accretion of discount. |
| |
(d) | | Represents an affiliated issuer. |
| | |
|
Investment Abbreviations: |
CMT | | —Constant Maturity Treasury Index |
GMTN | | —Global Medium Term Note |
LIBOR | | —London Interbank Offered Rate |
LP | | —Limited Partnership |
MTN | | —Medium Term Note |
PLC | | —Public Limited Company |
REIT | | —Real Estate Investment Trust |
SOFR | | —Secured Overnight Financing Rate |
SOFRINDX | | —Secured Overnight Financing Rate Index |
|
| | |
| The accompanying notes are an integral part of these financial statements. | | 87 |
GOLDMAN SACHS ACCESS TREASURY 0-1 YEAR ETF
Schedule of Investments
August 31, 2023
| | | | | | | | | | | | |
Principal
Amount | | | Interest
Rate(a) | | Maturity
Date | | | Value | |
|
| U.S. Treasury Bills – 95.7% | |
| | U.S. Treasury Bills | |
| $ | 396,000 | | | 4.456% | | | 10/05/23 | | | $ | 394,032 | |
| | 126,000 | | | 4.458 | | | 10/05/23 | | | | 125,374 | |
| | 774,000 | | | 4.476 | | | 10/05/23 | | | | 770,154 | |
| | 450,000 | | | 4.483 | | | 10/05/23 | | | | 447,764 | |
| | 126,000 | | | 4.531 | | | 10/05/23 | | | | 125,374 | |
| | 558,000 | | | 4.544 | | | 10/05/23 | | | | 555,227 | |
| | 720,000 | | | 4.568 | | | 10/05/23 | | | | 716,423 | |
| | 162,000 | | | 4.584 | | | 10/05/23 | | | | 161,195 | |
| | 1,044,000 | | | 4.588 | | | 10/05/23 | | | | 1,038,813 | |
| | 180,000 | | | 4.589 | | | 10/05/23 | | | | 179,106 | |
| | 90,000 | | | 4.595 | | | 10/05/23 | | | | 89,553 | |
| | 691,800 | | | 4.597 | | | 10/05/23 | | | | 688,363 | |
| | 702,000 | | | 4.601 | | | 10/05/23 | | | | 698,512 | |
| | 72,000 | | | 4.618 | | | 10/05/23 | | | | 71,642 | |
| | 10,692,000 | | | 4.620 | | | 10/05/23 | | | | 10,638,875 | |
| | 54,000 | | | 4.628 | | | 10/05/23 | | | | 53,732 | |
| | 108,000 | | | 4.631 | | | 10/05/23 | | | | 107,463 | |
| | 18,000 | | | 4.635 | | | 10/05/23 | | | | 17,911 | |
| | 324,000 | | | 4.645 | | | 10/05/23 | | | | 322,390 | |
| | 378,000 | | | 4.653 | | | 10/05/23 | | | | 376,122 | |
| | 36,000 | | | 4.662 | | | 10/05/23 | | | | 35,821 | |
| | 92,000 | | | 4.663 | | | 10/05/23 | | | | 91,543 | |
| | 1,944,000 | | | 4.684 | | | 10/05/23 | | | | 1,934,341 | |
| | 144,000 | | | 4.756 | | | 10/05/23 | | | | 143,285 | |
| | 72,000 | | | 4.767 | | | 10/05/23 | | | | 71,642 | |
| | 198,000 | | | 4.795 | | | 10/05/23 | | | | 197,016 | |
| | 2,160,000 | | | 4.801 | | | 10/05/23 | | | | 2,149,268 | |
| | 2,772,000 | | | 4.802 | | | 10/05/23 | | | | 2,758,227 | |
| | 666,000 | | | 4.811 | | | 10/05/23 | | | | 662,691 | |
| | 460,000 | | | 4.837 | | | 10/05/23 | | | | 457,714 | |
| | 630,000 | | | 4.838 | | | 10/05/23 | | | | 626,870 | |
| | 126,000 | | | 4.850 | | | 10/05/23 | | | | 125,374 | |
| | 270,000 | | | 4.872 | | | 10/05/23 | | | | 268,658 | |
| | 207,000 | | | 4.880 | | | 10/05/23 | | | | 205,971 | |
| | 72,000 | | | 4.887 | | | 10/05/23 | | | | 71,642 | |
| | 126,000 | | | 4.900 | | | 10/05/23 | | | | 125,374 | |
| | 198,000 | | | 4.905 | | | 10/05/23 | | | | 197,016 | |
| | 558,000 | | | 4.910 | | | 10/05/23 | | | | 555,227 | |
| | 378,000 | | | 4.924 | | | 10/05/23 | | | | 376,122 | |
| | 900,000 | | | 4.927 | | | 10/05/23 | | | | 895,528 | |
| | 1,296,000 | | | 4.938 | | | 10/05/23 | | | | 1,289,561 | |
| | 270,000 | | | 4.942 | | | 10/05/23 | | | | 268,658 | |
| | 306,000 | | | 4.943 | | | 10/05/23 | | | | 304,480 | |
| | 9,396,000 | | | 4.961 | | | 10/05/23 | | | | 9,349,314 | |
| | 162,000 | | | 4.967 | | | 10/05/23 | | | | 161,195 | |
| | 500,000 | | | 4.970 | | | 10/05/23 | | | | 497,516 | |
| | 407,813,900 | | | 4.983 | | | 10/05/23 | | | | 405,787,595 | |
| | 342,000 | | | 4.988 | | | 10/05/23 | | | | 340,301 | |
| | 564,000 | | | 4.989 | | | 10/05/23 | | | | 561,198 | |
| | 72,000 | | | 4.994 | | | 10/05/23 | | | | 71,642 | |
| | 288,000 | | | 5.000 | | | 10/05/23 | | | | 286,569 | |
| | 2,632,000 | | | 5.005 | | | 10/05/23 | | | | 2,618,922 | |
| | 144,000 | | | 5.025 | | | 10/05/23 | | | | 143,285 | |
| | 752,000 | | | 5.027 | | | 10/05/23 | | | | 748,264 | |
| | 1,128,000 | | | 5.032 | | | 10/05/23 | | | | 1,122,395 | |
| | 360,000 | | | 5.044 | | | 10/05/23 | | | | 358,211 | |
| | |
| | | | | | | | | | | | |
Principal
Amount | | | Interest
Rate(a) | | Maturity
Date | | | Value | |
|
| U.S. Treasury Bills – (continued) | |
| | U.S. Treasury Bills – (continued) | |
| $ | 752,000 | | | 5.088 % | | | 10/05/23 | | | $ | 748,264 | |
| | 940,000 | | | 5.093 | | | 10/05/23 | | | | 935,329 | |
| | 234,000 | | | 5.095 | | | 10/05/23 | | | | 232,837 | |
| | 288,000 | | | 5.121 | | | 10/05/23 | | | | 286,569 | |
| | 1,786,000 | | | 5.131 | | | 10/05/23 | | | | 1,777,126 | |
| | 1,120,000 | | | 5.256 | | | 10/05/23 | | | | 1,114,435 | |
| | 238,931,600 | | | 5.279 | | | 10/05/23 | | | | 237,744,421 | |
| | 9,632,000 | | | 5.284 | | | 10/05/23 | | | | 9,584,141 | |
| | 6,608,000 | | | 5.310 | | | 10/05/23 | | | | 6,575,167 | |
| | 2,128,000 | | | 5.312 | | | 10/05/23 | | | | 2,117,427 | |
| | 3,360,000 | | | 5.316 | | | 10/05/23 | | | | 3,343,305 | |
| | 1,386,000 | | | 5.344 | | | 10/05/23 | | | | 1,379,113 | |
| | 4,158,000 | | | 5.346 | | | 10/05/23 | | | | 4,137,340 | |
| | 770,000 | | | 5.349 | | | 10/05/23 | | | | 766,174 | |
| | 1,550,000 | | | 5.350 | | | 10/05/23 | | | | 1,542,299 | |
| | 924,000 | | | 5.351 | | | 10/05/23 | | | | 919,409 | |
| | 7,677,000 | | | 5.354 | | | 10/05/23 | | | | 7,638,855 | |
| | 2,002,000 | | | 5.356 | | | 10/05/23 | | | | 1,992,053 | |
| | 1,248,000 | | | 5.357 | | | 10/05/23 | | | | 1,241,799 | |
| | 560,000 | | | 5.358 | | | 10/05/23 | | | | 557,218 | |
| | 1,248,000 | | | 5.359 | | | 10/05/23 | | | | 1,241,799 | |
| | 94,787,900 | | | 5.360 | | | 10/05/23 | | | | 94,316,927 | |
| | 9,360,000 | | | 5.361 | | | 10/05/23 | | | | 9,313,493 | |
| | 61,749,000 | | | 5.362 | | | 10/05/23 | | | | 61,442,188 | |
| | 1,768,000 | | | 5.364 | | | 10/05/23 | | | | 1,759,215 | |
| | 8,321,000 | | | 5.368 | | | 10/05/23 | | | | 8,279,655 | |
| | 770,000 | | | 5.372 | | | 10/05/23 | | | | 766,174 | |
| | 1,792,000 | | | 5.374 | | | 10/05/23 | | | | 1,783,096 | |
| | 640,000 | | | 5.376 | | | 10/05/23 | | | | 636,820 | |
| | 1,872,000 | | | 5.396 | | | 10/05/23 | | | | 1,862,699 | |
| | 11,550,000 | | | 5.523 | | | 10/05/23 | | | | 11,492,612 | |
| | 600,000 | | | 5.348 | | | 10/12/23 | | | | 596,402 | |
| | 3,975,000 | | | 5.353 | | | 10/12/23 | | | | 3,951,160 | |
| | 600,000 | | | 5.356 | | | 10/12/23 | | | | 596,402 | |
| | 2,714,000 | | | 5.359 | | | 10/12/23 | | | | 2,697,723 | |
| | 29,333,000 | | | 5.367 | | | 10/12/23 | | | | 29,157,078 | |
| | 675,000 | | | 5.369 | | | 10/12/23 | | | | 670,952 | |
| | 9,060,000 | | | 5.371 | | | 10/12/23 | | | | 9,005,663 | |
| | 693,000 | | | 5.373 | | | 10/12/23 | | | | 688,844 | |
| | 3,075,000 | | | 5.374 | | | 10/12/23 | | | | 3,056,558 | |
| | 455,105,800 | | | 5.395 | | | 10/12/23 | | | | 452,376,337 | |
| | 401,563,800 | | | 5.398 | | | 10/12/23 | | | | 399,155,451 | |
| | 118,523,900 | | | 4.668 | | | 11/02/23 | | | | 117,450,985 | |
| | 20,476,000 | | | 4.711 | | | 11/02/23 | | | | 20,290,645 | |
| | 432,000 | | | 4.766 | | | 11/02/23 | | | | 428,089 | |
| | 1,998,000 | | | 4.837 | | | 11/02/23 | | | | 1,979,913 | |
| | 6,480,000 | | | 4.842 | | | 11/02/23 | | | | 6,421,341 | |
| | 702,000 | | | 4.849 | | | 11/02/23 | | | | 695,645 | |
| | 2,120,000 | | | 4.860 | | | 11/02/23 | | | | 2,100,809 | |
| | 378,000 | | | 4.880 | | | 11/02/23 | | | | 374,578 | |
| | 56,856,800 | | | 4.891 | | | 11/02/23 | | | | 56,342,115 | |
| | 378,000 | | | 4.914 | | | 11/02/23 | | | | 374,578 | |
| | 630,000 | | | 4.932 | | | 11/02/23 | | | | 624,297 | |
| | 1,140,000 | | | 4.940 | | | 11/02/23 | | | | 1,129,680 | |
| | 1,672,000 | | | 4.941 | | | 11/02/23 | | | | 1,656,865 | |
| | 2,700,000 | | | 4.942 | | | 11/02/23 | | | | 2,675,559 | |
| | |
| | |
| 88 | | The accompanying notes are an integral part of these financial statements. |
GOLDMAN SACHS ACCESS TREASURY 0-1 YEAR ETF
| | | | | | | | | | | | |
Principal
Amount | | | Interest
Rate(a) | | Maturity
Date | | | Value | |
|
| U.S. Treasury Bills – (continued) | |
| | U.S. Treasury Bills – (continued) | |
| $ | 1,400,000 | | | 4.948 % | | | 11/02/23 | | | $ | 1,387,327 | |
| | 594,000 | | | 4.952 | | | 11/02/23 | | | | 588,623 | |
| | 810,000 | | | 4.954 | | | 11/02/23 | | | | 802,668 | |
| | 918,000 | | | 4.966 | | | 11/02/23 | | | | 909,690 | |
| | 318,000 | | | 4.970 | | | 11/02/23 | | | | 315,121 | |
| | 486,000 | | | 4.980 | | | 11/02/23 | | | | 481,601 | |
| | 1,026,000 | | | 5.007 | | | 11/02/23 | | | | 1,016,712 | |
| | 4,312,000 | | | 5.022 | | | 11/02/23 | | | | 4,272,966 | |
| | 1,484,000 | | | 5.035 | | | 11/02/23 | | | | 1,470,566 | |
| | 27,054,000 | | | 5.042 | | | 11/02/23 | | | | 26,809,099 | |
| | 636,000 | | | 5.043 | | | 11/02/23 | | | | 630,243 | |
| | 424,000 | | | 5.097 | | | 11/02/23 | | | | 420,162 | |
| | 530,000 | | | 5.115 | | | 11/02/23 | | | | 525,202 | |
| | 1,216,000 | | | 5.146 | | | 11/02/23 | | | | 1,204,992 | |
| | 1,007,000 | | | 5.153 | | | 11/02/23 | | | | 997,884 | |
| | 6,622,000 | | | 5.291 | | | 11/02/23 | | | | 6,562,056 | |
| | 770,000 | | | 5.306 | | | 11/02/23 | | | | 763,030 | |
| | 1,463,000 | | | 5.315 | | | 11/02/23 | | | | 1,449,756 | |
| | 4,543,000 | | | 5.354 | | | 11/02/23 | | | | 4,501,875 | |
| | 2,310,000 | | | 5.360 | | | 11/02/23 | | | | 2,289,089 | |
| | 1,092,000 | | | 5.370 | | | 11/02/23 | | | | 1,082,115 | |
| | 35,217,000 | | | 5.373 | | | 11/02/23 | | | | 34,898,205 | |
| | 693,000 | | | 5.377 | | | 11/02/23 | | | | 686,727 | |
| | 5,460,000 | | | 5.378 | | | 11/02/23 | | | | 5,410,574 | |
| | 1,204,000 | | | 5.380 | | | 11/02/23 | | | | 1,193,101 | |
| | 5,481,000 | | | 5.381 | | | 11/02/23 | | | | 5,431,384 | |
| | 1,001,000 | | | 5.383 | | | 11/02/23 | | | | 991,939 | |
| | 2,079,000 | | | 5.384 | | | 11/02/23 | | | | 2,060,180 | |
| | 846,000 | | | 5.387 | | | 11/02/23 | | | | 838,342 | |
| | 847,000 | | | 5.389 | | | 11/02/23 | | | | 839,333 | |
| | 728,000 | | | 5.390 | | | 11/02/23 | | | | 721,410 | |
| | 819,000 | | | 5.391 | | | 11/02/23 | | | | 811,586 | |
| | 385,000 | | | 5.392 | | | 11/02/23 | | | | 381,515 | |
| | 728,000 | | | 5.393 | | | 11/02/23 | | | | 721,410 | |
| | 376,000 | | | 5.394 | | | 11/02/23 | | | | 372,596 | |
| | 84,080,000 | | | 5.397 | | | 11/02/23 | | | | 83,318,882 | |
| | 126,871,600 | | | 5.404 | | | 11/02/23 | | | | 125,723,119 | |
| | 1,232,000 | | | 5.408 | | | 11/02/23 | | | | 1,220,848 | |
| | 770,000 | | | 5.431 | | | 11/02/23 | | | | 763,030 | |
| | 5,775,000 | | | 5.531 | | | 11/02/23 | | | | 5,722,723 | |
| | 192,000 | | | 5.367 | | | 11/09/23 | | | | 190,065 | |
| | 864,000 | | | 5.373 | | | 11/09/23 | | | | 855,293 | |
| | 180,000 | | | 5.374 | | | 11/09/23 | | | | 178,186 | |
| | 165,519,200 | | | 5.376 | | | 11/09/23 | | | | 163,851,227 | |
| | 528,000 | | | 5.377 | | | 11/09/23 | | | | 522,679 | |
| | 2,748,000 | | | 5.379 | | | 11/09/23 | | | | 2,720,308 | |
| | 603,000 | | | 5.381 | | | 11/09/23 | | | | 596,923 | |
| | 17,593,000 | | | 5.383 | | | 11/09/23 | | | | 17,415,711 | |
| | 2,992,000 | | | 5.385 | | | 11/09/23 | | | | 2,961,849 | |
| | 352,000 | | | 5.391 | | | 11/09/23 | | | | 348,453 | |
| | 160,000 | | | 5.400 | | | 11/09/23 | | | | 158,388 | |
| | 716,000 | | | 5.405 | | | 11/09/23 | | | | 708,785 | |
| | 1,804,000 | | | 5.407 | | | 11/09/23 | | | | 1,785,821 | |
| | 352,000 | | | 5.409 | | | 11/09/23 | | | | 348,453 | |
| | 68,204,100 | | | 5.413 | | | 11/09/23 | | | | 67,516,792 | |
| | 2,400,000 | | | 5.502 | | | 11/09/23 | | | | 2,375,815 | |
| | |
| | | | | | | | | | | | |
Principal
Amount | | | Interest
Rate(a) | | Maturity
Date | | | Value | |
|
| U.S. Treasury Bills – (continued) | |
| | U.S. Treasury Bills – (continued) | |
| $ | 1,368,000 | | | 5.436 % | | | 11/30/23 | | | $ | 1,349,904 | |
| | 3,192,000 | | | 5.437 | | | 11/30/23 | | | | 3,149,777 | |
| | 452,483,800 | | | 5.471 | | | 11/30/23 | | | | 446,498,457 | |
| | 181,181,100 | | | 5.402 | | | 12/07/23 | | | | 178,611,918 | |
| | 1,800,000 | | | 5.413 | | | 12/07/23 | | | | 1,774,476 | |
| | 27,000 | | | 5.431 | | | 12/19/23 | | | | 26,569 | |
| | 1,200,000 | | | 5.433 | | | 12/19/23 | | | | 1,180,841 | |
| | 1,007,000 | | | 5.434 | | | 12/19/23 | | | | 990,923 | |
| | 80,000 | | | 5.457 | | | 12/19/23 | | | | 78,723 | |
| | 180,000 | | | 5.465 | | | 12/19/23 | | | | 177,126 | |
| | 113,731,100 | | | 5.469 | | | 12/19/23 | | | | 111,915,332 | |
| | 140,000 | | | 5.475 | | | 12/19/23 | | | | 137,765 | |
| | 1,500,000 | | | 5.454 | | | 12/26/23 | | | | 1,474,443 | |
| | 151,205,200 | | | 5.485 | | | 12/26/23 | | | | 148,628,937 | |
| | 2,160,000 | | | 5.435 | | | 01/04/24 | | | | 2,120,527 | |
| | 212,244,500 | | | 5.453 | | | 01/04/24 | | | | 208,365,859 | |
| | 96,000 | | | 5.435 | | | 01/11/24 | | | | 94,147 | |
| | 1,380,000 | | | 5.441 | | | 01/11/24 | | | | 1,353,369 | |
| | 216,000 | | | 5.444 | | | 01/11/24 | | | | 211,832 | |
| | 168,000 | | | 5.452 | | | 01/11/24 | | | | 164,758 | |
| | 137,262,100 | | | 5.475 | | | 01/11/24 | | | | 134,613,280 | |
| | 102,116,300 | | | 4.755 | | | 01/25/24 | | | | 99,934,728 | |
| | 296,000 | | | 4.819 | | | 01/25/24 | | | | 289,676 | |
| | 481,000 | | | 4.916 | | | 01/25/24 | | | | 470,724 | |
| | 555,000 | | | 5.000 | | | 01/25/24 | | | | 543,143 | |
| | 89,948,800 | | | 5.003 | | | 01/25/24 | | | | 88,027,170 | |
| | 407,000 | | | 5.014 | | | 01/25/24 | | | | 398,305 | |
| | 333,000 | | | 5.032 | | | 01/25/24 | | | | 325,886 | |
| | 2,664,000 | | | 5.052 | | | 01/25/24 | | | | 2,607,087 | |
| | 703,000 | | | 5.064 | | | 01/25/24 | | | | 687,981 | |
| | 18,537,000 | | | 5.067 | | | 01/25/24 | | | | 18,140,983 | |
| | 1,056,000 | | | 5.171 | | | 01/25/24 | | | | 1,033,440 | |
| | 486,000 | | | 5.433 | | | 01/25/24 | | | | 475,617 | |
| | 266,000 | | | 5.455 | | | 01/25/24 | | | | 260,317 | |
| | 2,372,000 | | | 5.457 | | | 01/25/24 | | | | 2,321,326 | |
| | 342,000 | | | 5.476 | | | 01/25/24 | | | | 334,694 | |
| | 1,961,000 | | | 5.485 | | | 01/25/24 | | | | 1,919,106 | |
| | 1,860,000 | | | 5.440 | | | 02/01/24 | | | | 1,818,529 | |
| | 182,692,100 | | | 5.474 | | | 02/01/24 | | | | 178,618,736 | |
| | 1,680,000 | | | 5.447 | | | 02/08/24 | | | | 1,640,820 | |
| | 167,220,400 | | | 5.478 | | | 02/08/24 | | | | 163,320,563 | |
| | 435,000 | | | 5.481 | | | 02/08/24 | | | | 424,855 | |
| | 3,000,000 | | | 5.474 | | | 02/29/24 | | | | 2,920,925 | |
| | 144,286,400 | | | 5.542 | | | 02/29/24 | | | | 140,483,265 | |
| | 152,642,200 | | | 5.590 | | | 02/29/24 | | | | 148,618,821 | |
| | 75,284,800 | | | 4.828 | | | 04/18/24 | | | | 72,792,011 | |
| | 110,307,800 | | | 5.260 | | | 04/18/24 | | | | 106,655,348 | |
| | 1,860,000 | | | 5.449 | | | 04/18/24 | | | | 1,798,413 | |
| | 413,000 | | | 5.463 | | | 04/18/24 | | | | 399,325 | |
| | 304,000 | | | 5.173 | | | 05/16/24 | | | | 292,708 | |
| | 480,000 | | | 5.221 | | | 05/16/24 | | | | 462,170 | |
| | 80,000 | | | 5.231 | | | 05/16/24 | | | | 77,028 | |
| | 944,000 | | | 5.242 | | | 05/16/24 | | | | 908,935 | |
| | 75,094,500 | | | 5.259 | | | 05/16/24 | | | | 72,305,096 | |
| | 1,376,000 | | | 5.271 | | | 05/16/24 | | | | 1,324,888 | |
| | 256,000 | | | 5.277 | | | 05/16/24 | | | | 246,491 | |
| | |
| | |
| The accompanying notes are an integral part of these financial statements. | | 89 |
GOLDMAN SACHS ACCESS TREASURY 0-1 YEAR ETF
Schedule of Investments (continued)
August 31, 2023
| | | | | | | | | | | | |
Principal
Amount | | | Interest
Rate(a) | | Maturity
Date | | | Value | |
|
| U.S. Treasury Bills – (continued) | |
| | U.S. Treasury Bills – (continued) | |
| $ | 160,000 | | | 5.303 % | | | 05/16/24 | | | $ | 154,057 | |
| | 342,000 | | | 5.347 | | | 05/16/24 | | | | 329,296 | |
| | 328,000 | | | 5.382 | | | 05/16/24 | | | | 315,816 | |
| | 494,000 | | | 5.383 | | | 05/16/24 | | | | 475,650 | |
| | 228,000 | | | 5.388 | | | 05/16/24 | | | | 219,531 | |
| | 328,000 | | | 5.392 | | | 05/16/24 | | | | 315,816 | |
| | 492,000 | | | 5.394 | | | 05/16/24 | | | | 473,725 | |
| | 15,867,000 | | | 5.402 | | | 05/16/24 | | | | 15,277,616 | |
| | 13,179,100 | | | 5.404 | | | 05/16/24 | | | | 12,689,559 | |
| | 697,000 | | | 5.409 | | | 05/16/24 | | | | 671,110 | |
| | 1,681,000 | | | 5.410 | | | 05/16/24 | | | | 1,618,559 | |
| | 190,000 | | | 5.416 | | | 05/16/24 | | | | 182,942 | |
| �� | 380,000 | | | 5.437 | | | 05/16/24 | | | | 365,885 | |
| | 369,000 | | | 5.440 | | | 05/16/24 | | | | 355,293 | |
| | 2,173,000 | | | 5.447 | | | 05/16/24 | | | | 2,092,283 | |
| | 168,000 | | | 5.461 | | | 05/16/24 | | | | 161,760 | |
| | 2,460,000 | | | 5.473 | | | 05/16/24 | | | | 2,368,623 | |
| | 190,000 | | | 5.476 | | | 05/16/24 | | | | 182,942 | |
| | 1,026,000 | | | 5.484 | | | 05/16/24 | | | | 987,889 | |
| | 378,000 | | | 5.488 | | | 05/16/24 | | | | 363,959 | |
| | 294,000 | | | 5.496 | | | 05/16/24 | | | | 283,079 | |
| | 121,706,100 | | | 5.505 | | | 05/16/24 | | | | 117,185,297 | |
| | 2,850,000 | | | 5.545 | | | 05/16/24 | | | | 2,744,136 | |
| | 189,000 | | | 5.314 | | | 06/13/24 | | | | 181,287 | |
| | 352,000 | | | 5.363 | | | 06/13/24 | | | | 337,634 | |
| | 352,000 | | | 5.367 | | | 06/13/24 | | | | 337,634 | |
| | 396,000 | | | 5.376 | | | 06/13/24 | | | | 379,839 | |
| | 1,930,000 | | | 5.377 | | | 06/13/24 | | | | 1,851,234 | |
| | 378,000 | | | 5.378 | | | 06/13/24 | | | | 362,573 | |
| | 17,028,000 | | | 5.385 | | | 06/13/24 | | | | 16,333,063 | |
| | 352,000 | | | 5.388 | | | 06/13/24 | | | | 337,634 | |
| | 528,000 | | | 5.395 | | | 06/13/24 | | | | 506,452 | |
| | 210,000 | | | 5.415 | | | 06/13/24 | | | | 201,430 | |
| | 126,825,400 | | | 5.422 | | | 06/13/24 | | | | 121,649,472 | |
| | 396,000 | | | 5.423 | | | 06/13/24 | | | | 379,839 | |
| | 180,000 | | | 5.424 | | | 06/13/24 | | | | 172,654 | |
| | 2,332,000 | | | 5.438 | | | 06/13/24 | | | | 2,236,828 | |
| | 105,000 | | | 5.439 | | | 06/13/24 | | | | 100,715 | |
| | 2,640,000 | | | 5.445 | | | 06/13/24 | | | | 2,532,258 | |
| | 567,000 | | | 5.456 | | | 06/13/24 | | | | 543,860 | |
| | 405,000 | | | 5.473 | | | 06/13/24 | | | | 388,471 | |
| | 315,000 | | | 5.482 | | | 06/13/24 | | | | 302,144 | |
| | 109,029,200 | | | 5.494 | | | 06/13/24 | | | | 104,579,561 | |
| | 1,575,000 | | | 5.530 | | | 06/13/24 | | | | 1,510,722 | |
| | 176,000 | | | 5.347 | | | 07/11/24 | | | | 168,172 | |
| | 176,000 | | | 5.348 | | | 07/11/24 | | | | 168,172 | |
| | 902,000 | | | 5.355 | | | 07/11/24 | | | | 861,880 | |
| | 176,000 | | | 5.365 | | | 07/11/24 | | | | 168,172 | |
| | 264,000 | | | 5.373 | | | 07/11/24 | | | | 252,258 | |
| | 8,514,000 | | | 5.381 | | | 07/11/24 | | | | 8,135,308 | |
| | 198,000 | | | 5.395 | | | 07/11/24 | | | | 189,193 | |
| | 1,166,000 | | | 5.409 | | | 07/11/24 | | | | 1,114,138 | |
| | 198,000 | | | 5.419 | | | 07/11/24 | | | | 189,193 | |
| | 2,520,000 | | | 5.426 | | | 07/11/24 | | | | 2,407,914 | |
| | 118,092,300 | | | 5.444 | | | 07/11/24 | | | | 112,839,707 | |
| | 92,000 | | | 5.446 | | | 07/11/24 | | | | 87,908 | |
| | |
| | | | | | | | | | | | |
Principal
Amount | | | Interest
Rate(a) | | Maturity
Date | | | Value | |
|
| U.S. Treasury Bills – (continued) | |
| | U.S. Treasury Bills – (continued) | |
| $ | 118,892,900 | | | 5.448 % | | | 07/11/24 | | | $ | 113,604,698 | |
| | 207,000 | | | 5.472 | | | 07/11/24 | | | | 197,793 | |
| | 161,000 | | | 5.483 | | | 07/11/24 | | | | 153,839 | |
| | 1,080,000 | | | 5.419 | | | 08/08/24 | | | | 1,027,944 | |
| | 106,352,500 | | | 5.468 | | | 08/08/24 | | | | 101,226,357 | |
| | |
| | TOTAL U.S. TREASURY BILLS | |
| | (Cost $5,753,238,447) | | | $ | 5,752,215,364 | |
| | |
| | | | | | | | | | | | |
|
| U.S. Treasury Notes – 4.3% | |
| | U.S. Treasury Notes | |
| $ | 132,038,600 | | | 4.761% | | | 12/15/23 | | | $ | 130,091,546 | |
| | 264,000 | | | 4.799 | | | 12/15/23 | | | | 260,107 | |
| | 1,880,000 | | | 4.861 | | | 12/15/23 | | | | 1,852,277 | |
| | 440,000 | | | 4.862 | | | 12/15/23 | | | | 433,512 | |
| | 528,000 | | | 4.864 | | | 12/15/23 | | | | 520,214 | |
| | 352,000 | | | 4.876 | | | 12/15/23 | | | | 346,809 | |
| | 1,232,000 | | | 4.886 | | | 12/15/23 | | | | 1,213,833 | |
| | 352,000 | | | 4.922 | | | 12/15/23 | | | | 346,809 | |
| | 836,000 | | | 5.020 | | | 12/15/23 | | | | 823,672 | |
| | 378,000 | | | 5.079 | | | 12/15/23 | | | | 372,426 | |
| | 462,000 | | | 5.089 | | | 12/15/23 | | | | 455,187 | |
| | 798,000 | | | 5.101 | | | 12/15/23 | | | | 786,233 | |
| | 3,024,000 | | | 5.113 | | | 12/15/23 | | | | 2,979,408 | |
| | 1,080,000 | | | 5.117 | | | 12/15/23 | | | | 1,064,074 | |
| | 51,709,300 | | | 5.118 | | | 12/15/23 | | | | 50,946,790 | |
| | 21,042,000 | | | 5.131 | | | 12/15/23 | | | | 20,731,713 | |
| | 1,005,000 | | | 5.154 | | | 12/15/23 | | | | 990,180 | |
| | 1,474,000 | | | 5.176 | | | 12/15/23 | | | | 1,452,264 | |
| | 1,320,000 | | | 5.229 | | | 12/15/23 | | | | 1,300,535 | |
| | 6,380,000 | | | 5.257 | | | 12/15/23 | | | | 6,285,920 | |
| | 264,000 | | | 5.259 | | | 12/15/23 | | | | 260,107 | |
| | 132,000 | | | 5.260 | | | 12/15/23 | | | | 130,054 | |
| | 1,188,000 | | | 5.280 | | | 12/15/23 | | | | 1,170,482 | |
| | 264,000 | | | 5.283 | | | 12/15/23 | | | | 260,107 | |
| | 440,000 | | | 5.285 | | | 12/15/23 | | | | 433,512 | |
| | 1,232,000 | | | 5.288 | | | 12/15/23 | | | | 1,213,833 | |
| | 871,000 | | | 5.306 | | | 12/15/23 | | | | 858,156 | |
| | 220,000 | | | 5.308 | | | 12/15/23 | | | | 216,756 | |
| | 836,000 | | | 5.310 | | | 12/15/23 | | | | 823,672 | |
| | 352,000 | | | 5.328 | | | 12/15/23 | | | | 346,809 | |
| | 352,000 | | | 5.334 | | | 12/15/23 | | | | 346,809 | |
| | 1,804,000 | | | 5.339 | | | 12/15/23 | | | | 1,777,398 | |
| | 17,028,000 | | | 5.343 | | | 12/15/23 | | | | 16,776,904 | |
| | 1,276,000 | | | 5.345 | | | 12/15/23 | | | | 1,257,184 | |
| | 1,072,000 | | | 5.350 | | | 12/15/23 | | | | 1,056,192 | |
| | 3,300,000 | | | 5.351 | | | 12/15/23 | | | | 3,251,338 | |
| | 396,000 | | | 5.366 | | | 12/15/23 | | | | 390,161 | |
| | 2,640,000 | | | 5.374 | | | 12/15/23 | | | | 2,601,070 | |
| | 405,000 | | | 5.384 | | | 12/15/23 | | | | 399,028 | |
| | 180,000 | | | 5.407 | | | 12/15/23 | | | | 177,346 | |
| | 2,332,000 | | | 5.418 | | | 12/15/23 | | | | 2,297,612 | |
| | 396,000 | | | 5.423 | | | 12/15/23 | | | | 390,161 | |
| | 528,000 | | | 5.429 | | | 12/15/23 | | | | 520,214 | |
| | |
| | |
| 90 | | The accompanying notes are an integral part of these financial statements. |
GOLDMAN SACHS ACCESS TREASURY 0-1 YEAR ETF
| | | | | | | | | | | | |
Principal
Amount | | | Interest
Rate(a) | | Maturity
Date | | | Value | |
|
| U.S. Treasury Notes – (continued) | |
| | U.S. Treasury Notes – (continued) | |
| $ | 315,000 | | | 5.440 % | | | 12/15/23 | | | $ | 310,355 | |
| | |
| | TOTAL U.S. TREASURY NOTES | |
| | (Cost $260,705,017) | | | $ | 260,518,769 | |
| | |
| | TOTAL INVESTMENTS – 100.0% | |
| | (Cost $6,013,943,464) | | | $ | 6,012,734,133 | |
| | |
| OTHER ASSETS IN EXCESS OF
LIABILITIES – 0.0% |
| | | 482,096 | |
| | |
| | NET ASSETS – 100.0% | | | | | | $ | 6,013,216,229 | |
| | |
| | |
|
| The percentage shown for each investment category reflects the value of investments in that category as a percentage of net assets. |
| |
(a) | | Interest rates represent either the stated coupon rate, annualized yield on date of purchase for discounted securities, or, for floating rate securities, the current reset rate, which is based upon current interest rate indices. |
| | |
| The accompanying notes are an integral part of these financial statements. | | 91 |
GOLDMAN SACHS ACCESS U.S. AGGREGATE BOND ETF
Schedule of Investments
August 31, 2023
| | | | | | | | | | | | | | |
Principal
Amount | | | Interest
Rate | | | Maturity
Date | | | Value | |
|
| U.S. Treasury Notes – 32.0% | |
| | U.S. Treasury Notes | |
| $ | 35,416,000 | | | | 1.500 | % | | | 10/31/24 | | | $ | 33,918,471 | |
| | 19,564,000 | | | | 2.500 | | | | 01/31/25 | | | | 18,859,943 | |
| | 21,549,000 | | | | 2.000 | | | | 02/15/25 | | | | 20,612,019 | |
| | 53,773,000 | | | | 0.250 | | | | 10/31/25 | | | | 48,825,064 | |
| | 26,275,000 | | | | 1.625 | | | | 05/15/26 | | | | 24,301,839 | |
| | 3,803,000 | | | | 2.875 | | | | 08/15/28 | | | | 3,566,204 | |
| | 3,130,000 | | | | 2.875 | | | | 04/30/29 | | | | 2,913,415 | |
| | 4,928,000 | | | | 2.750 | | | | 05/31/29 | | | | 4,552,365 | |
| | |
| | TOTAL U.S. TREASURY NOTES | |
| | (Cost $160,282,518) | | | | | | | $ | 157,549,320 | |
| | |
| | | | | | | | | | | | | | |
|
| Mortgage-Backed Securities – 31.5% | |
| | Federal Home Loan Mortgage Corporation | |
| $ | 263,402 | | | | 4.500 | % | | | 07/01/48 | | | $ | 252,864 | |
| | 235,564 | | | | 2.500 | | | | 11/01/50 | | | | 198,540 | |
| | 1,925,570 | | | | 2.000 | | | | 05/01/51 | | | | 1,531,127 | |
| | 2,717,542 | | | | 2.500 | | | | 05/01/51 | | | | 2,265,361 | |
| | 924,437 | | | | 2.500 | | | | 11/01/51 | | | | 767,735 | |
| | 10,803,360 | | | | 2.000 | | | | 03/01/52 | | | | 8,612,322 | |
| | 7,717,222 | | | | 2.000 | | | | 03/01/52 | | | | 6,145,255 | |
| | 1,245,994 | | | | 2.000 | | | | 03/01/52 | | | | 993,649 | |
| | 9,715,497 | | | | 2.000 | | | | 05/01/52 | | | | 7,735,570 | |
| | 202,846 | | | | 4.500 | | | | 05/01/52 | | | | 192,968 | |
| | 505,611 | | | | 2.000 | | | | 07/01/52 | | | | 402,644 | |
| | 3,779,657 | | | | 3.000 | | | | 08/01/52 | | | | 3,298,522 | |
| | 27,373 | | | | 2.500 | | | | 01/01/53 | | | | 22,722 | |
| | 248,749 | | | | 5.000 | | | | 01/01/53 | | | | 241,301 | |
| | 883,916 | | | | 5.000 | | | | 02/01/53 | | | | 857,447 | |
| | 799,748 | | | | 5.000 | | | | 04/01/53 | | | | 775,533 | |
| | Federal National Mortgage Association | |
| | 1,000,000 | | | | 1.750 | | | | 07/02/24 | | | | 970,715 | |
| | 5,000,000 | | | | 1.500 | | | | TBA-15yr | (a) | | | 4,259,766 | |
| | 8,000,000 | | | | 2.000 | | | | TBA-15yr | (a) | | | 7,004,375 | |
| | 4,000,000 | | | | 2.500 | | | | TBA-15yr | (a) | | | 3,597,812 | |
| | 2,000,000 | | | | 3.000 | | | | TBA-15yr | (a) | | | 1,846,094 | |
| | 2,567,002 | | | | 3.500 | | | | 07/01/45 | | | | 2,345,196 | |
| | 65,372 | | | | 4.500 | | | | 06/01/48 | | | | 63,963 | |
| | 351,542 | | | | 4.500 | | | | 07/01/48 | | | | 343,968 | |
| | 25,904 | | | | 5.000 | | | | 12/01/48 | | | | 25,779 | |
| | 46,144 | | | | 4.500 | | | | 01/01/49 | | | | 44,377 | |
| | 38,811 | | | | 4.500 | | | | 08/01/49 | | | | 37,297 | |
| | 641,959 | | | | 4.500 | | | | 08/01/49 | | | | 617,005 | |
| | 194,907 | | | | 5.000 | | | | 12/01/49 | | | | 191,469 | |
| | 27,664 | | | | 4.500 | | | | 01/01/50 | | | | 26,938 | |
| | 114,869 | | | | 4.500 | | | | 03/01/50 | | | | 110,591 | |
| | 108,562 | | | | 5.000 | | | | 04/01/50 | | | | 107,346 | |
| | 1,549,099 | | | | 2.500 | | | | 06/01/50 | | | | 1,303,428 | |
| | 80,993 | | | | 4.500 | | | | 10/01/50 | | | | 77,922 | |
| | 51,621 | | | | 4.500 | | | | 10/01/50 | | | | 50,281 | |
| | 99,288 | | | | 2.500 | | | | 02/01/51 | | | | 82,468 | |
| | 534,465 | | | | 2.500 | | | | 03/01/51 | | | | 449,358 | |
| | 668,719 | | | | 2.500 | | | | 09/01/51 | | | | 559,745 | |
| | 2,671,013 | | | | 2.500 | | | | 10/01/51 | | | | 2,246,487 | |
| | 1,575,192 | | | | 2.500 | | | | 11/01/51 | | | | 1,324,549 | |
| | |
|
| Mortgage-Backed Securities – (continued) | |
| | Federal National Mortgage Association – (continued) | |
| 1,218,819 | | | | 2.500 | | | | 11/01/51 | | | | 1,024,500 | |
| | 7,740,214 | | | | 2.000 | | | | 02/01/52 | | | | 6,165,773 | |
| | 6,863,280 | | | | 2.500 | | | | 04/01/52 | | | | 5,690,432 | |
| | 85,420 | | | | 2.000 | | | | 10/01/52 | | | | 67,947 | |
| | 793,592 | | | | 5.000 | | | | 10/01/52 | | | | 770,083 | |
| | 978,852 | | | | 5.000 | | | | 11/01/52 | | | | 949,863 | |
| | 40,228 | | | | 2.500 | | | | 12/01/52 | | | | 33,388 | |
| | 1,303,486 | | | | 5.000 | | | | 02/01/53 | | | | 1,264,265 | |
| | 447,394 | | | | 5.000 | | | | 03/01/53 | | | | 433,881 | |
| | 389,655 | | | | 5.000 | | | | 03/01/53 | | | | 377,930 | |
| | 9,014,684 | | | | 5.000 | | | | 04/01/53 | | | | 8,741,838 | |
| | 192,207 | | | | 5.000 | | | | 04/01/53 | | | | 186,411 | |
| | 588,055 | | | | 5.000 | | | | 05/01/53 | | | | 570,345 | |
| | 3,900,000 | | | | 1.500 | | | | TBA-30yr | (a) | | | 2,939,625 | |
| | 1,000,000 | | | | 2.500 | | | | TBA-30yr | (a) | | | 828,437 | |
| | 10,000,000 | | | | 3.000 | | | | TBA-30yr | (a) | | | 8,613,281 | |
| | 9,000,000 | | | | 3.500 | | | | TBA-30yr | (a) | | | 8,041,641 | |
| | 8,000,000 | | | | 4.000 | | | | TBA-30yr | (a) | | | 7,386,250 | |
| | 1,000,000 | | | | 4.500 | | | | TBA-30yr | (a) | | | 948,438 | |
| | 7,000,000 | | | | 5.500 | | | | TBA-30yr | (a) | | | 6,915,234 | |
| | Government National Mortgage Association | |
| | 53,482 | | | | 5.000 | | | | 12/20/48 | | | | 53,044 | |
| | 28,909 | | | | 5.000 | | | | 05/20/49 | | | | 28,535 | |
| | 287,958 | | | | 3.000 | | | | 09/20/49 | | | | 256,301 | |
| | 106,116 | | | | 4.500 | | | | 03/20/50 | | | | 102,658 | |
| | 58,150 | | | | 5.000 | | | | 05/20/50 | | | | 57,581 | |
| | 225,286 | | | | 4.000 | | | | 09/20/50 | | | | 212,855 | |
| | 763,424 | | | | 3.000 | | | | 07/20/51 | | | | 674,964 | |
| | 3,472,559 | | | | 2.000 | | | | 09/20/51 | | | | 2,863,637 | |
| | 2,320,694 | | | | 4.500 | | | | 10/20/52 | | | | 2,213,912 | |
| | 4,000,000 | | | | 2.000 | | | | TBA-30yr | (a) | | | 3,290,000 | |
| | 6,000,000 | | | | 2.500 | | | | TBA-30yr | (a) | | | 5,103,281 | |
| | 7,000,000 | | | | 3.000 | | | | TBA-30yr | (a) | | | 6,153,437 | |
| | 6,000,000 | | | | 3.500 | | | | TBA-30yr | (a) | | | 5,448,281 | |
| | 3,000,000 | | | | 4.000 | | | | TBA-30yr | (a) | | | 2,794,453 | |
| | 1,000,000 | | | | 5.000 | | | | TBA-30yr | (a) | | | 972,891 | |
| | 1,000,000 | | | | 5.500 | | | | TBA-30yr | (a) | | | 990,078 | |
| | |
| | TOTAL MORTGAGE-BACKED SECURITIES | |
| | (Cost $157,553,550) | | | | | | | $ | 155,145,959 | |
| | |
| | | | | | | | | | | | | | |
|
| Corporate Obligations – 20.6% | |
| Aerospace & Defense – 0.6% | |
| | Boeing Co. (The) | |
| $ | 500,000 | | | | 4.875 | % | | | 05/01/25 | | | $ | 493,888 | |
| | 500,000 | | | | 3.625 | | | | 02/01/31 | | | | 446,388 | |
| | 300,000 | | | | 5.805 | | | | 05/01/50 | | | | 294,107 | |
| | General Dynamics Corp. | |
| | 215,000 | | | | 3.625 | | | | 04/01/30 | �� | | | 200,294 | |
| | Hexcel Corp. | |
| | 40,000 | | | | 4.200 | | | | 02/15/27 | | | | 37,561 | |
| | Lockheed Martin Corp. | |
| | 335,000 | | | | 5.250 | | | | 01/15/33 | | | | 344,799 | |
| | Northrop Grumman Corp. | |
| | 200,000 | | | | 4.700 | | | | 03/15/33 | | | | 194,075 | |
| | 40,000 | | | | 4.030 | | | | 10/15/47 | | | | 32,889 | |
| | |
| | |
| 92 | | The accompanying notes are an integral part of these financial statements. |
GOLDMAN SACHS ACCESS U.S. AGGREGATE BOND ETF
| | | | | | | | | | | | | | |
Principal
Amount | | | Interest
Rate | | | Maturity
Date | | | Value | |
|
| Corporate Obligations – (continued) | |
| Aerospace & Defense – (continued) | |
| | RTX Corp. | |
| $ | 200,000 | | | | 3.950 | % | | | 08/16/25 | | | $ | 194,523 | |
| | 100,000 | | | | 2.375 | | | | 03/15/32 | | | | 80,562 | |
| | 30,000 | | | | 4.450 | | | | 11/16/38 | | | | 26,541 | |
| | 60,000 | | | | 4.875 | | | | 10/15/40 | | | | 55,032 | |
| | 400,000 | | | | 2.820 | | | | 09/01/51 | | | | 250,296 | |
| | Textron, Inc. | |
| | 80,000 | | | | 3.000 | | | | 06/01/30 | | | | 69,278 | |
| | | | | | | | | | | | | | |
| | | | | | | | | | | | | 2,720,233 | |
| | |
| Banks – 3.9% | |
| | American Express Co. | |
| | 80,000 | | | | 3.625 | | | | 12/05/24 | | | | 77,843 | |
| | 400,000 | | | | 3.950 | | | | 08/01/25 | | | | 388,106 | |
| | Bank of America Corp. | |
| | (SOFR + 0.690%) | |
| | 425,000 | | | | 0.976 | (b) | | | 04/22/25 | | | | 410,952 | |
| | (SOFR + 0.960%) | |
| | 300,000 | | | | 1.734 | (b) | | | 07/22/27 | | | | 268,549 | |
| | (3M U.S. T-Bill MMY + 1.302%) | |
| | 200,000 | | | | 3.419 | (b) | | | 12/20/28 | | | | 183,442 | |
| | (SOFR + 2.150%) | |
| | 180,000 | | | | 2.592 | (b) | | | 04/29/31 | | | | 149,202 | |
| | (US 5 Year CMT T-Note + 1.200%) | |
| | 200,000 | | | | 2.482 | (b) | | | 09/21/36 | | | | 152,429 | |
| | (3M U.S. T-Bill MMY + 2.076%) | |
| | 264,000 | | | | 4.244 | (b) | | | 04/24/38 | | | | 230,055 | |
| | 100,000 | | | | 7.750 | | | | 05/14/38 | | | | 117,317 | |
| | Bank of America Corp., Series L | |
| | 125,000 | | | | 4.183 | | | | 11/25/27 | | | | 118,716 | |
| | 73,000 | | | | 4.750 | | | | 04/21/45 | | | | 65,304 | |
| | Bank of America Corp., MTN | |
| | 100,000 | | | | 3.875 | | | | 08/01/25 | | | | 97,360 | |
| | (SOFR + 1.010%) | |
| | 100,000 | | | | 1.197 | (b) | | | 10/24/26 | | | | 90,661 | |
| | (3M U.S. T-Bill MMY + 1.322%) | |
| | 80,000 | | | | 3.559 | (b) | | | 04/23/27 | | | | 75,831 | |
| | 75,000 | | | | 3.248 | | | | 10/21/27 | | | | 69,906 | |
| | (SOFR + 2.040%) | |
| | 900,000 | | | | 4.948 | (b) | | | 07/22/28 | | | | 877,535 | |
| | (3M U.S. T-Bill MMY + 1.472%) | |
| | 300,000 | | | | 3.974 | (b) | | | 02/07/30 | | | | 276,344 | |
| | (3M U.S. T-Bill MMY + 1.252%) | |
| | 200,000 | | | | 2.496 | (b) | | | 02/13/31 | | | | 166,392 | |
| | (SOFR + 1.530%) | |
| | 40,000 | | | | 1.898 | (b) | | | 07/23/31 | | | | 31,553 | |
| | (SOFR + 1.930%) | |
| | 700,000 | | | | 2.676 | (b) | | | 06/19/41 | | | | 483,834 | |
| | (3M U.S. T-Bill MMY + 3.412%) | |
| | 300,000 | | | | 4.083 | (b) | | | 03/20/51 | | | | 242,756 | |
| | (SOFR + 1.880%) | |
| | 60,000 | | | | 2.831 | (b) | | | 10/24/51 | | | | 38,446 | |
| | Bank of America Corp.(b), Series N | |
| | (SOFR + 1.650%) | |
| | 100,000 | | | | 3.483 | | | | 03/13/52 | | | | 73,063 | |
| | |
|
| Corporate Obligations – (continued) | |
| Banks – (continued) | |
| | Bank of New York Mellon Corp. (The), MTN | |
| 300,000 | | | | 2.800 | | | | 05/04/26 | | | | 282,001 | |
| | 646,000 | | | | 1.800 | | | | 07/28/31 | | | | 507,661 | |
| | Capital One Financial Corp.(b) | |
| | (SOFR + 2.600%) | |
| | 400,000 | | | | 5.817 | | | | 02/01/34 | | | | 378,646 | |
| | Charles Schwab Corp. (The) | |
| | 610,000 | | | | 3.200 | | | | 03/02/27 | | | | 565,642 | |
| | 150,000 | | | | 2.900 | | | | 03/03/32 | | | | 124,161 | |
| | Citigroup, Inc. | |
| | (SOFR + 1.372%) | |
| | 800,000 | | | | 4.140 | (b) | | | 05/24/25 | | | | 790,747 | |
| | (SOFR + 0.765%) | |
| | 100,000 | | | | 1.122 | (b) | | | 01/28/27 | | | | 89,368 | |
| | (3M U.S. T-Bill MMY + 1.825%) | |
| | 100,000 | | | | 3.887 | (b) | | | 01/10/28 | | | | 94,512 | |
| | (SOFR + 1.887%) | |
| | 300,000 | | | | 4.658 | (b) | | | 05/24/28 | | | | 292,612 | |
| | (SOFR + 1.351%) | |
| | 600,000 | | | | 3.057 | (b) | | | 01/25/33 | | | | 494,918 | |
| | (SOFR + 2.086%) | |
| | 700,000 | | | | 4.910 | (b) | | | 05/24/33 | | | | 666,987 | |
| | Citizens Bank NA | |
| | 400,000 | | | | 3.750 | | | | 02/18/26 | | | | 372,174 | |
| | Comerica, Inc. | |
| | 25,000 | | | | 4.000 | | | | 02/01/29 | | | | 21,392 | |
| | Fifth Third Bancorp | |
| | 300,000 | | | | 3.950 | | | | 03/14/28 | | | | 276,909 | |
| | 40,000 | | | | 8.250 | | | | 03/01/38 | | | | 45,225 | |
| | JPMorgan Chase & Co. | |
| | (3M U.S. T-Bill MMY + 0.540%) | |
| | 300,000 | | | | 0.824 | (b) | | | 06/01/25 | | | | 288,184 | |
| | (3M U.S. T-Bill MMY + 0.580%) | |
| | 500,000 | | | | 0.969 | (b) | | | 06/23/25 | | | | 478,613 | |
| | (SOFR + 0.490%) | |
| | 300,000 | | | | 0.768 | (b) | | | 08/09/25 | | | | 285,211 | |
| | (3M U.S. T-Bill MMY + 1.585%) | |
| | 165,000 | | | | 2.005 | (b) | | | 03/13/26 | | | | 156,053 | |
| | 40,000 | | | | 7.625 | | | | 10/15/26 | | | | 42,539 | |
| | (SOFR + 0.800%) | |
| | 100,000 | | | | 1.045 | (b) | | | 11/19/26 | | | | 90,254 | |
| | 300,000 | | | | 8.000 | | | | 04/29/27 | | | | 327,645 | |
| | 80,000 | | | | 4.250 | | | | 10/01/27 | | | | 77,456 | |
| | (3M U.S. T-Bill MMY + 1.599%) | |
| | 400,000 | | | | 3.782 | (b) | | | 02/01/28 | | | | 377,835 | |
| | (3M U.S. T-Bill MMY + 1.642%) | |
| | 50,000 | | | | 3.540 | (b) | | | 05/01/28 | | | | 46,689 | |
| | (3M U.S. T-Bill MMY + 1.592%) | |
| | 40,000 | | | | 4.452 | (b) | | | 12/05/29 | | | | 38,162 | |
| | (3M U.S. T-Bill MMY + 1.510%) | |
| | 90,000 | | | | 2.739 | (b) | | | 10/15/30 | | | | 77,168 | |
| | (3M U.S. T-Bill MMY + 3.790%) | |
| | 342,000 | | | | 4.493 | (b) | | | 03/24/31 | | | | 324,211 | |
| | (3M U.S. T-Bill MMY + 1.105%) | |
| | 25,000 | | | | 1.764 | (b) | | | 11/19/31 | | | | 19,574 | |
| | |
| | |
| The accompanying notes are an integral part of these financial statements. | | 93 |
GOLDMAN SACHS ACCESS U.S. AGGREGATE BOND ETF
Schedule of Investments (continued)
August 31, 2023
| | | | | | | | | | | | | | |
Principal
Amount | | | Interest
Rate | | | Maturity
Date | | | Value | |
|
| Corporate Obligations – (continued) | |
| Banks – (continued) | |
| | JPMorgan Chase & Co. – (continued) | |
| | (SOFR + 1.180%) | |
| $ | 300,000 | | | | 2.545 | %(b) | | | 11/08/32 | | | $ | 242,322 | |
| | (3M U.S. T-Bill MMY + 1.622%) | |
| | 152,000 | | | | 3.882 | (b) | | | 07/24/38 | | | | 127,909 | |
| | 15,000 | | | | 5.400 | | | | 01/06/42 | | | | 14,965 | |
| | 40,000 | | | | 4.850 | | | | 02/01/44 | | | | 37,394 | |
| | (3M U.S. T-Bill MMY + 1.642%) | |
| | 40,000 | | | | 3.964 | (b) | | | 11/15/48 | | | | 31,685 | |
| | (SOFR + 2.440%) | |
| | 660,000 | | | | 3.109 | (b) | | | 04/22/51 | | | | 449,920 | |
| | KeyCorp, MTN | |
| | 120,000 | | | | 4.100 | | | | 04/30/28 | | | | 107,323 | |
| | 80,000 | | | | 2.550 | | | | 10/01/29 | | | | 64,038 | |
| | (SOFRINDX + 2.060%) | |
| | 250,000 | | | | 4.789 | (b) | | | 06/01/33 | | | | 215,184 | |
| | M&T Bank Corp.(b) | |
| | (SOFR + 1.850%) | |
| | 400,000 | | | | 5.053 | | | | 01/27/34 | | | | 364,227 | |
| | Manufacturers & Traders Trust Co. | |
| | 280,000 | | | | 3.400 | | | | 08/17/27 | | | | 251,095 | |
| | Northern Trust Corp. | |
| | 315,000 | | | | 3.950 | | | | 10/30/25 | | | | 305,061 | |
| | 56,000 | | | | 3.650 | | | | 08/03/28 | | | | 52,612 | |
| | 135,000 | | | | 3.150 | | | | 05/03/29 | | | | 122,687 | |
| | PNC Bank NA | |
| | 300,000 | | | | 2.700 | | | | 10/22/29 | | | | 250,642 | |
| | PNC Financial Services Group, Inc. (The) | |
| | 290,000 | | | | 3.450 | | | | 04/23/29 | | | | 262,024 | |
| | State Street Corp. | |
| | (SOFR + 0.560%) | |
| | 40,000 | | | | 1.684 | (b) | | | 11/18/27 | | | | 36,022 | |
| | (3M U.S. T-Bill MMY + 1.292%) | |
| | 50,000 | | | | 4.141 | (b) | | | 12/03/29 | | | | 47,994 | |
| | 100,000 | | | | 2.200 | | | | 03/03/31 | | | | 79,634 | |
| | (SOFR + 1.490%) | |
| | 40,000 | | | | 3.031 | (b) | | | 11/01/34 | | | | 34,475 | |
| | Synchrony Financial | |
| | 150,000 | | | | 3.950 | | | | 12/01/27 | | | | 134,345 | |
| | 100,000 | | | | 2.875 | | | | 10/28/31 | | | | 73,920 | |
| | Truist Financial Corp., MTN | |
| | (SOFR + 1.626%) | |
| | 400,000 | | | | 5.900 | (b) | | | 10/28/26 | | | | 400,585 | |
| | 80,000 | | | | 3.875 | | | | 03/19/29 | | | | 71,105 | |
| | US Bancorp, MTN | |
| | 80,000 | | | | 3.900 | | | | 04/26/28 | | | | 75,124 | |
| | 80,000 | | | | 3.000 | | | | 07/30/29 | | | | 68,667 | |
| | 40,000 | | | | 1.375 | | | | 07/22/30 | | | | 30,338 | |
| | US Bancorp, Series V | |
| | 300,000 | | | | 2.375 | | | | 07/22/26 | | | | 276,459 | |
| | US Bancorp, Series X | |
| | 150,000 | | | | 3.150 | | | | 04/27/27 | | | | 139,007 | |
| | US Bank NA | |
| | 300,000 | | | | 2.050 | | | | 01/21/25 | | | | 285,855 | |
| | Wells Fargo & Co. | |
| | (SOFR + 2.000%) | |
| | 300,000 | | | | 2.188 | (b) | | | 04/30/26 | | | | 282,279 | |
| | |
|
| Corporate Obligations – (continued) | |
| Banks – (continued) | |
| | Wells Fargo & Co. – (continued) | |
| 400,000 | | | | 3.000 | | | | 10/23/26 | | | | 370,654 | |
| | 128,000 | | | | 5.606 | | | | 01/15/44 | | | | 120,357 | |
| | 60,000 | | | | 3.900 | | | | 05/01/45 | | | | 46,919 | |
| | Wells Fargo & Co., MTN | |
| | (3M U.S. T-Bill MMY + 1.572%) | |
| | 50,000 | | | | 3.584 | (b) | | | 05/22/28 | | | | 46,444 | |
| | 25,000 | | | | 4.150 | | | | 01/24/29 | | | | 23,560 | |
| | (3M U.S. T-Bill MMY + 1.262%) | |
| | 400,000 | | | | 2.572 | (b) | | | 02/11/31 | | | | 334,373 | |
| | (3M U.S. T-Bill MMY + 4.032%) | |
| | 340,000 | | | | 4.478 | (b) | | | 04/04/31 | | | | 318,769 | |
| | 290,000 | | | | 4.750 | | | | 12/07/46 | | | | 240,657 | |
| | Wells Fargo Bank NA | |
| | 300,000 | | | | 6.600 | | | | 01/15/38 | | | | 317,524 | |
| | | | | | | | | | | | | | |
| | | | | | | | | | | | | 19,072,299 | |
| | |
| Basic Industry – 0.2% | |
| | CF Industries, Inc. | |
| | 100,000 | | | | 5.150 | | | | 03/15/34 | | | | 94,438 | |
| | 100,000 | | | | 5.375 | | | | 03/15/44 | | | | 88,510 | |
| | Dow Chemical Co. (The) | |
| | 60,000 | | | | 3.600 | | | | 11/15/50 | | | | 42,855 | |
| | DuPont de Nemours, Inc. | |
| | 400,000 | | | | 5.419 | | | | 11/15/48 | | | | 387,630 | |
| | FMC Corp. | |
| | 102,000 | | | | 4.500 | | | | 10/01/49 | | | | 76,098 | |
| | Linde, Inc. | |
| | 85,000 | | | | 1.100 | | | | 08/10/30 | | | | 66,841 | |
| | LYB International Finance III LLC | |
| | 40,000 | | | | 2.250 | | | | 10/01/30 | | | | 32,386 | |
| | 180,000 | | | | 3.625 | | | | 04/01/51 | | | | 121,604 | |
| | Sherwin-Williams Co. (The) | |
| | 200,000 | | | | 3.450 | | | | 06/01/27 | | | | 188,056 | |
| | | | | | | | | | | | | | |
| | | | | | | | | | | | | 1,098,418 | |
| | |
| Brokerage – 0.3% | |
| | Affiliated Managers Group, Inc. | |
| | 130,000 | | | | 3.300 | | | | 06/15/30 | | | | 109,596 | |
| | CME Group, Inc. | |
| | 375,000 | | | | 3.000 | | | | 03/15/25 | | | | 362,049 | |
| | Intercontinental Exchange, Inc. | |
| | 185,000 | | | | 2.100 | | | | 06/15/30 | | | | 152,620 | |
| | 482,000 | | | | 4.600 | | | | 03/15/33 | | | | 460,966 | |
| | Jefferies Financial Group, Inc. | |
| | 40,000 | | | | 4.850 | | | | 01/15/27 | | | | 38,956 | |
| | 40,000 | | | | 4.150 | | | | 01/23/30 | | | | 35,963 | |
| | 200,000 | | | | 6.250 | | | | 01/15/36 | | | | 203,023 | |
| | 20,000 | | | | 6.500 | | | | 01/20/43 | | | | 20,017 | |
| | | | | | | | | | | | | | |
| | | | | | | | | | | | | 1,383,190 | |
| | |
| Capital Goods – 0.6% | |
| | 3M Co. | |
| | 250,000 | | | | 3.050 | | | | 04/15/30 | | | | 224,134 | |
| | Carrier Global Corp. | |
| | 100,000 | | | | 3.577 | | | | 04/05/50 | | | | 71,828 | |
| | |
| | |
| 94 | | The accompanying notes are an integral part of these financial statements. |
GOLDMAN SACHS ACCESS U.S. AGGREGATE BOND ETF
| | | | | | | | | | | | | | |
Principal
Amount | | | Interest
Rate | | | Maturity
Date | | | Value | |
|
| Corporate Obligations – (continued) | |
| Capital Goods – (continued) | |
| | Caterpillar Financial Services Corp., MTN | |
| $ | 400,000 | | | | 3.400 | % | | | 05/13/25 | | | $ | 387,741 | |
| | Caterpillar, Inc. | |
| | 50,000 | | | | 3.803 | | | | 08/15/42 | | | | 42,528 | |
| | 230,000 | | | | 3.250 | | | | 04/09/50 | | | | 175,100 | |
| | CNH Industrial Capital LLC | |
| | 50,000 | | | | 1.450 | | | | 07/15/26 | | | | 44,780 | |
| | Cummins, Inc. | |
| | 111,000 | | | | 2.600 | | | | 09/01/50 | | | | 68,350 | |
| | Deere & Co. | |
| | 25,000 | | | | 3.900 | | | | 06/09/42 | | | | 21,934 | |
| | 40,000 | | | | 2.875 | | | | 09/07/49 | | | | 28,799 | |
| | 25,000 | | | | 3.750 | | | | 04/15/50 | | | | 21,407 | |
| | Emerson Electric Co. | |
| | 45,000 | | | | 1.950 | | | | 10/15/30 | | | | 37,029 | |
| | 15,000 | | | | 6.000 | | | | 08/15/32 | | | | 15,838 | |
| | Fortive Corp. | |
| | 15,000 | | | | 4.300 | | | | 06/15/46 | | | | 11,665 | |
| | Honeywell International, Inc. | |
| | 100,000 | | | | 2.700 | | | | 08/15/29 | | | | 88,990 | |
| | 188,000 | | | | 1.950 | | | | 06/01/30 | | | | 156,411 | |
| | Illinois Tool Works, Inc. | |
| | 115,000 | | | | 3.900 | | | | 09/01/42 | | | | 98,703 | |
| | John Deere Capital Corp., MTN | |
| | 300,000 | | | | 4.750 | | | | 01/20/28 | | | | 298,868 | |
| | 35,000 | | | | 2.800 | | | | 07/18/29 | | | | 31,529 | |
| | 80,000 | | | | 2.450 | | | | 01/09/30 | | | | 69,686 | |
| | Leggett & Platt, Inc. | |
| | 80,000 | | | | 4.400 | | | | 03/15/29 | | | | 75,548 | |
| | 100,000 | | | | 3.500 | | | | 11/15/51 | | | | 69,025 | |
| | Otis Worldwide Corp. | |
| | 60,000 | | | | 2.293 | | | | 04/05/27 | | | | 54,485 | |
| | Republic Services, Inc. | |
| | 150,000 | | | | 2.375 | | | | 03/15/33 | | | | 119,444 | |
| | Trane Technologies Luxembourg Finance SA | |
| | 50,000 | | | | 3.800 | | | | 03/21/29 | | | | 46,499 | |
| | Waste Management, Inc. | |
| | 50,000 | | | | 0.750 | | | | 11/15/25 | | | | 45,473 | |
| | 50,000 | | | | 2.500 | | | | 11/15/50 | | | | 30,705 | |
| | Westinghouse Air Brake Technologies Corp. | |
| | 133,000 | | | | 3.450 | | | | 11/15/26 | | | | 125,216 | |
| | 415,000 | | | | 4.950 | | | | 09/15/28 | | | | 400,702 | |
| | WW Grainger, Inc. | |
| | 100,000 | | | | 1.850 | | | | 02/15/25 | | | | 94,923 | |
| | 60,000 | | | | 4.600 | | | | 06/15/45 | | | | 55,078 | |
| | 100,000 | | | | 3.750 | | | | 05/15/46 | | | | 79,922 | |
| | Xylem, Inc. | |
| | 15,000 | | | | 3.250 | | | | 11/01/26 | | | | 14,120 | |
| | | | | | | | | | | | | | |
| | | | | | | | | | | | | 3,106,460 | |
| | |
| Communications – 1.0% | |
| Charter Communications Operating LLC / Charter
Communications Operating Capital |
|
| | 190,000 | | | | 4.908 | | | | 07/23/25 | | | | 186,677 | |
| | 140,000 | | | | 3.750 | | | | 02/15/28 | | | | 128,218 | |
| | 82,000 | | | | 4.200 | | | | 03/15/28 | | | | 76,462 | |
| | |
|
| Corporate Obligations – (continued) | |
| Communications – (continued) | |
| Charter Communications Operating LLC / Charter
Communications Operating Capital – (continued) |
|
| 90,000 | | | | 5.050 | | | | 03/30/29 | | | | 85,664 | |
| | 40,000 | | | | 2.800 | | | | 04/01/31 | | | | 32,187 | |
| | 130,000 | | | | 6.384 | | | | 10/23/35 | | | | 126,073 | |
| | 300,000 | | | | 5.375 | | | | 04/01/38 | | | | 253,556 | |
| | 240,000 | | | | 6.484 | | | | 10/23/45 | | | | 220,414 | |
| | 60,000 | | | | 5.750 | | | | 04/01/48 | | | | 50,673 | |
| | 40,000 | | | | 5.125 | | | | 07/01/49 | | | | 30,729 | |
| | 40,000 | | | | 6.834 | | | | 10/23/55 | | | | 37,204 | |
| | 100,000 | | | | 3.850 | | | | 04/01/61 | | | | 59,845 | |
| | 60,000 | | | | 4.400 | | | | 12/01/61 | | | | 39,481 | |
| | Comcast Corp. | |
| | 500,000 | | | | 3.950 | | | | 10/15/25 | | | | 487,252 | |
| | 500,000 | | | | 4.250 | | | | 01/15/33 | | | | 469,127 | |
| | 300,000 | | | | 2.887 | | | | 11/01/51 | | | | 192,807 | |
| | 400,000 | | | | 5.350 | | | | 05/15/53 | | | | 393,008 | |
| | Meta Platforms, Inc. | |
| | 200,000 | | | | 5.600 | | | | 05/15/53 | | | | 201,305 | |
| | Omnicom Group, Inc. | |
| | 511,000 | | | | 2.450 | | | | 04/30/30 | | | | 423,734 | |
| | 80,000 | | | | 4.200 | | | | 06/01/30 | | | | 73,927 | |
| | Time Warner Cable Enterprises LLC | |
| | 115,000 | | | | 8.375 | | | | 07/15/33 | | | | 128,085 | |
| | Time Warner Cable LLC | |
| | 115,000 | | | | 6.750 | | | | 06/15/39 | | | | 111,399 | |
| | 15,000 | | | | 5.875 | | | | 11/15/40 | | | | 13,059 | |
| | 15,000 | | | | 5.500 | | | | 09/01/41 | | | | 12,301 | |
| | TWDC Enterprises 18 Corp. | |
| | 15,000 | | | | 4.375 | | | | 08/16/41 | | | | 13,137 | |
| | TWDC Enterprises 18 Corp., GMTN | |
| | 15,000 | | | | 4.125 | | | | 06/01/44 | | | | 12,569 | |
| | TWDC Enterprises 18 Corp., MTN | |
| | 250,000 | | | | 2.950 | | | | 06/15/27 | | | | 234,150 | |
| | Walt Disney Co. (The) | |
| | 400,000 | | | | 1.750 | | | | 08/30/24 | | | | 385,745 | |
| | 80,000 | | | | 2.000 | | | | 09/01/29 | | | | 67,840 | |
| | 80,000 | | | | 3.800 | | | | 03/22/30 | | | | 74,690 | |
| | 90,000 | | | | 3.500 | | | | 05/13/40 | | | | 71,866 | |
| | 15,000 | | | | 4.750 | | | | 09/15/44 | | | | 13,586 | |
| | 50,000 | | | | 3.600 | | | | 01/13/51 | | | | 37,684 | |
| | | | | | | | | | | | | | |
| | | | | | | | | | | | | 4,744,454 | |
| | |
| Consumer Cyclical – 1.8% | |
| | Amazon.com, Inc. | |
| | 500,000 | | | | 3.300 | | | | 04/13/27 | | | | 476,064 | |
| | 250,000 | | | | 3.150 | | | | 08/22/27 | | | | 235,288 | |
| | 100,000 | | | | 2.100 | | | | 05/12/31 | | | | 82,943 | |
| | 80,000 | | | | 4.050 | | | | 08/22/47 | | | | 69,268 | |
| | 15,000 | | | | 2.500 | | | | 06/03/50 | | | | 9,607 | |
| | 200,000 | | | | 3.950 | | | | 04/13/52 | | | | 167,505 | |
| | 75,000 | | | | 4.250 | | | | 08/22/57 | | | | 65,006 | |
| | 50,000 | | | | 2.700 | | | | 06/03/60 | | | | 30,956 | |
| | Booking Holdings, Inc. | |
| | 200,000 | | | | 4.625 | | | | 04/13/30 | | | | 195,708 | |
| | Costco Wholesale Corp. | |
| | 40,000 | | | | 3.000 | | | | 05/18/27 | | | | 37,787 | |
| | |
| | |
| The accompanying notes are an integral part of these financial statements. | | 95 |
GOLDMAN SACHS ACCESS U.S. AGGREGATE BOND ETF
Schedule of Investments (continued)
August 31, 2023
| | | | | | | | | | | | | | |
Principal
Amount | | | Interest
Rate | | | Maturity
Date | | | Value | |
|
| Corporate Obligations – (continued) | |
| Consumer Cyclical – (continued) | |
| | DR Horton, Inc. | |
| $ | 80,000 | | | | 2.500 | % | | | 10/15/24 | | | $ | 77,092 | |
| | 90,000 | | | | 2.600 | | | | 10/15/25 | | | | 84,747 | |
| | 100,000 | | | | 1.400 | | | | 10/15/27 | | | | 85,735 | |
| | eBay, Inc. | |
| | 200,000 | | | | 6.300 | | | | 11/22/32 | | | | 210,555 | |
| | General Motors Co. | |
| | 400,000 | | | | 5.600 | | | | 10/15/32 | | | | 385,624 | |
| | General Motors Financial Co., Inc. | |
| | 500,000 | | | | 6.050 | | | | 10/10/25 | | | | 501,233 | |
| | Home Depot, Inc. (The) | |
| | 250,000 | | | | 2.800 | | | | 09/14/27 | | | | 232,265 | |
| | 300,000 | | | | 4.500 | | | | 09/15/32 | | | | 292,987 | |
| | 237,000 | | | | 3.125 | | | | 12/15/49 | | | | 166,313 | |
| | 300,000 | | | | 3.625 | | | | 04/15/52 | | | | 227,964 | |
| | Las Vegas Sands Corp. | |
| | 473,000 | | | | 3.900 | | | | 08/08/29 | | | | 416,994 | |
| | Lowe’s Cos., Inc. | |
| | 400,000 | | | | 5.150 | | | | 07/01/33 | | | | 395,543 | |
| | 200,000 | | | | 5.625 | | | | 04/15/53 | | | | 194,795 | |
| | Marriott International, Inc., Series EE | |
| | 200,000 | | | | 5.750 | | | | 05/01/25 | | | | 200,307 | |
| | Marriott International, Inc., Series FF | |
| | 200,000 | | | | 4.625 | | | | 06/15/30 | | | | 189,909 | |
| | Mastercard, Inc. | |
| | 60,000 | | | | 2.000 | | | | 03/03/25 | | | | 57,352 | |
| | 15,000 | | | | 3.300 | | | | 03/26/27 | | | | 14,279 | |
| | 100,000 | | | | 3.950 | | | | 02/26/48 | | | | 85,159 | |
| | 50,000 | | | | 3.850 | | | | 03/26/50 | | | | 41,540 | |
| | McDonald’s Corp., MTN | |
| | 200,000 | | | | 3.500 | | | | 07/01/27 | | | | 190,283 | |
| | 45,000 | | | | 4.700 | | | | 12/09/35 | | | | 42,895 | |
| | 60,000 | | | | 4.450 | | | | 09/01/48 | | | | 52,136 | |
| | 200,000 | | | | 5.150 | | | | 09/09/52 | | | | 192,200 | |
| | MDC Holdings, Inc. | |
| | 434,000 | | | | 2.500 | | | | 01/15/31 | | | | 337,978 | |
| | 40,000 | | | | 6.000 | | | | 01/15/43 | | | | 34,800 | |
| | NIKE, Inc. | |
| | 20,000 | | | | 3.375 | | | | 03/27/50 | | | | 15,486 | |
| | O’Reilly Automotive, Inc. | |
| | 80,000 | | | | 4.200 | | | | 04/01/30 | | | | 74,962 | |
| | PulteGroup, Inc. | |
| | 264,000 | | | | 6.375 | | | | 05/15/33 | | | | 273,734 | |
| | Starbucks Corp. | |
| | 250,000 | | | | 3.800 | | | | 08/15/25 | | | | 243,160 | |
| | 30,000 | | | | 3.750 | | | | 12/01/47 | | | | 22,875 | |
| | Tapestry, Inc. | |
| | 33,000 | | | | 4.125 | | | | 07/15/27 | | | | 30,645 | |
| | Target Corp. | |
| | 550,000 | | | | 2.250 | | | | 04/15/25 | | | | 525,262 | |
| | Toyota Motor Credit Corp. | |
| | 100,000 | | | | 0.625 | | | | 09/13/24 | | | | 95,138 | |
| | 40,000 | | | | 3.650 | | | | 01/08/29 | | | | 37,697 | |
| | Toyota Motor Credit Corp., MTN | |
| | 300,000 | | | | 0.800 | | | | 01/09/26 | | | | 271,738 | |
| | 100,000 | | | | 1.150 | | | | 08/13/27 | | | | 86,518 | |
| | 80,000 | | | | 3.375 | | | | 04/01/30 | | | | 72,857 | |
| | |
|
| Corporate Obligations – (continued) | |
| Consumer Cyclical – (continued) | |
| | Visa, Inc. | |
| 40,000 | | | | 1.900 | | | | 04/15/27 | | | | 36,247 | |
| | 135,000 | | | | 0.750 | | | | 08/15/27 | | | | 116,716 | |
| | 405,000 | | | | 2.750 | | | | 09/15/27 | | | | 375,944 | |
| | 40,000 | | | | 4.300 | | | | 12/14/45 | | | | 36,128 | |
| | Walmart, Inc. | |
| | 340,000 | | | | 2.850 | | | | 07/08/24 | | | | 332,364 | |
| | 100,000 | | | | 7.550 | | | | 02/15/30 | | | | 115,840 | |
| | 200,000 | | | | 2.650 | | | | 09/22/51 | | | | 135,049 | |
| | Western Union Co. (The) | |
| | 50,000 | | | | 1.350 | | | | 03/15/26 | | | | 44,703 | |
| | | | | | | | | | | | | | |
| | | | | | | | | | | | | 9,023,880 | |
| | |
| Consumer Noncyclical – 1.7% | |
| | Abbott Laboratories | |
| | 60,000 | | | | 3.875 | | | | 09/15/25 | | | | 58,639 | |
| | 150,000 | | | | 4.750 | | | | 11/30/36 | | | | 149,153 | |
| | 100,000 | | | | 6.000 | | | | 04/01/39 | | | | 109,192 | |
| | 40,000 | | | | 4.750 | | | | 04/15/43 | | | | 38,111 | |
| | AbbVie, Inc. | |
| | 600,000 | | | | 2.950 | | | | 11/21/26 | | | | 561,786 | |
| | 100,000 | | | | 4.625 | | | | 10/01/42 | | | | 88,981 | |
| | 200,000 | | | | 4.400 | | | | 11/06/42 | | | | 174,351 | |
| | 200,000 | | | | 4.700 | | | | 05/14/45 | | | | 179,514 | |
| | 150,000 | | | | 4.250 | | | | 11/21/49 | | | | 127,055 | |
| | Agilent Technologies, Inc. | |
| | 100,000 | | | | 2.750 | | | | 09/15/29 | | | | 87,609 | |
| | Altria Group, Inc. | |
| | 115,000 | | | | 3.400 | | | | 05/06/30 | | | | 100,841 | |
| | 40,000 | | | | 4.500 | | | | 05/02/43 | | | | 31,237 | |
| | 40,000 | | | | 5.375 | | | | 01/31/44 | | | | 37,172 | |
| | 75,000 | | | | 3.875 | | | | 09/16/46 | | | | 51,678 | |
| | 150,000 | | | | 5.950 | | | | 02/14/49 | | | | 139,720 | |
| | 55,000 | | | | 4.450 | | | | 05/06/50 | | | | 40,872 | |
| | Amgen, Inc. | |
| | 200,000 | | | | 2.600 | | | | 08/19/26 | | | | 186,122 | |
| | 200,000 | | | | 2.200 | | | | 02/21/27 | | | | 182,025 | |
| | 500,000 | | | | 5.250 | | | | 03/02/33 | | | | 496,706 | |
| | 400,000 | | | | 5.600 | | | | 03/02/43 | | | | 394,867 | |
| | 200,000 | | | | 4.663 | | | | 06/15/51 | | | | 171,738 | |
| | Baxter International, Inc. | |
| | 50,000 | | | | 4.500 | | | | 06/15/43 | | | | 39,020 | |
| | Bristol-Myers Squibb Co. | |
| | 300,000 | | | | 0.750 | | | | 11/13/25 | | | | 273,684 | |
| | 300,000 | | | | 3.200 | | | | 06/15/26 | | | | 286,765 | |
| | 50,000 | | | | 3.250 | | | | 02/27/27 | | | | 47,922 | |
| | 500,000 | | | | 3.550 | | | | 03/15/42 | | | | 399,412 | |
| | Centene Corp. | |
| | 400,000 | | | | 4.250 | | | | 12/15/27 | | | | 376,000 | |
| | Elevance Health, Inc. | |
| | 300,000 | | | | 5.500 | | | | 10/15/32 | | | | 306,302 | |
| | Eli Lilly & Co. | |
| | 15,000 | | | | 3.100 | | | | 05/15/27 | | | | 14,227 | |
| | 102,000 | | | | 3.375 | | | | 03/15/29 | | | | 95,309 | |
| | 160,000 | | | | 3.950 | | | | 03/15/49 | | | | 137,937 | |
| | Equifax, Inc. | |
| | 40,000 | | | | 3.250 | | | | 06/01/26 | | | | 37,447 | |
| | 100,000 | | | | 2.350 | | | | 09/15/31 | | | | 78,383 | |
| | |
| | |
| 96 | | The accompanying notes are an integral part of these financial statements. |
GOLDMAN SACHS ACCESS U.S. AGGREGATE BOND ETF
| | | | | | | | | | | | | | |
Principal
Amount | | | Interest
Rate | | | Maturity
Date | | | Value | |
|
| Corporate Obligations – (continued) | |
| Consumer Noncyclical – (continued) | |
| | Gilead Sciences, Inc. | |
| $ | 479,000 | | | | 2.800 | % | | | 10/01/50 | | | $ | 309,750 | |
| | Kroger Co. (The) | |
| | 25,000 | | | | 3.875 | | | | 10/15/46 | | | | 18,752 | |
| | Medtronic, Inc. | |
| | 50,000 | | | | 4.375 | | | | 03/15/35 | | | | 47,222 | |
| | Merck & Co., Inc. | |
| | 150,000 | | | | 1.700 | | | | 06/10/27 | | | | 134,445 | |
| | 100,000 | | | | 3.600 | | | | 09/15/42 | | | | 81,708 | |
| | 250,000 | | | | 3.700 | | | | 02/10/45 | | | | 204,155 | |
| | Mylan, Inc. | |
| | 210,000 | | | | 5.400 | | | | 11/29/43 | | | | 174,209 | |
| | 135,000 | | | | 5.200 | | | | 04/15/48 | | | | 105,026 | |
| | Pfizer Investment Enterprises Pte Ltd. | |
| | 400,000 | | | | 4.450 | | | | 05/19/28 | | | | 391,286 | |
| | 300,000 | | | | 5.300 | | | | 05/19/53 | | | | 300,014 | |
| | Pfizer, Inc. | |
| | 290,000 | | | | 0.800 | | | | 05/28/25 | | | | 269,165 | |
| | 245,000 | | | | 4.000 | | | | 12/15/36 | | | | 221,894 | |
| | 10,000 | | | | 4.100 | | | | 09/15/38 | | | | 8,937 | |
| | 40,000 | | | | 2.700 | | | | 05/28/50 | | | | 27,061 | |
| | Royalty Pharma PLC | |
| | 200,000 | | | | 1.750 | | | | 09/02/27 | | | | 173,423 | |
| | Utah Acquisition Sub, Inc. | |
| | 75,000 | | | | 5.250 | | | | 06/15/46 | | | | 59,707 | |
| | Viatris, Inc. | |
| | 150,000 | | | | 2.700 | | | | 06/22/30 | | | | 122,201 | |
| | 15,000 | | | | 4.000 | | | | 06/22/50 | | | | 9,904 | |
| | Walgreens Boots Alliance, Inc. | |
| | 40,000 | | | | 4.800 | | | | 11/18/44 | | | | 31,306 | |
| | 15,000 | | | | 4.650 | | | | 06/01/46 | | | | 11,572 | |
| | Wyeth LLC | |
| | 10,000 | | | | 6.500 | | | | 02/01/34 | | | | 11,156 | |
| | | | | | | | | | | | | | |
| | | | | | | | | | | | | 8,212,670 | |
| | |
| Consumer Products – 0.3% | |
| | Clorox Co. (The) | |
| | 347,000 | | | | 4.600 | | | | 05/01/32 | | | | 336,473 | |
| | Colgate-Palmolive Co., MTN | |
| | 40,000 | | | | 4.000 | | | | 08/15/45 | | | | 35,418 | |
| | 15,000 | | | | 3.700 | | | | 08/01/47 | | | | 12,622 | |
| | Haleon US Capital LLC | |
| | 250,000 | | | | 4.000 | | | | 03/24/52 | | | | 199,895 | |
| | Kimberly-Clark Corp. | |
| | 475,000 | | | | 6.625 | | | | 08/01/37 | | | | 546,570 | |
| | Procter & Gamble Co. (The) | |
| | 40,000 | | | | 0.550 | | | | 10/29/25 | | | | 36,438 | |
| | 40,000 | | | | 1.000 | | | | 04/23/26 | | | | 36,382 | |
| | 300,000 | | | | 2.450 | | | | 11/03/26 | | | | 280,862 | |
| | 15,000 | | | | 2.850 | | | | 08/11/27 | | | | 14,060 | |
| | | | | | | | | | | | | | |
| | | | | | | | | | | | | 1,498,720 | |
| | |
| Electric – 2.0% | |
| | Alabama Power Co., Series 20-A | |
| | 15,000 | | | | 1.450 | | | | 09/15/30 | | | | 11,791 | |
| | Alabama Power Co., Series A | |
| | 100,000 | | | | 4.300 | | | | 07/15/48 | | | | 81,892 | |
| | |
|
| Corporate Obligations – (continued) | |
| Electric – (continued) | |
| | Atmos Energy Corp. | |
| 100,000 | | | | 2.850 | | | | 02/15/52 | | | | 64,666 | |
| | 100,000 | | | | 5.750 | | | | 10/15/52 | | | | 103,970 | |
| | Berkshire Hathaway Energy Co. | |
| | 400,000 | | | | 4.050 | | | | 04/15/25 | | | | 391,722 | |
| | 300,000 | | | | 4.600 | | | | 05/01/53 | | | | 248,024 | |
| | Black Hills Corp. | |
| | 20,000 | | | | 2.500 | | | | 06/15/30 | | | | 16,431 | |
| | Cleco Corporate Holdings LLC | |
| | 80,000 | | | | 3.375 | | | | 09/15/29 | | | | 67,860 | |
| | Cleco Power LLC | |
| | 15,000 | | | | 6.000 | | | | 12/01/40 | | | | 14,259 | |
| | Commonwealth Edison Co. | |
| | 300,000 | | | | 3.650 | | | | 06/15/46 | | | | 225,526 | |
| | Commonwealth Edison Co., Series 123 | |
| | 40,000 | | | | 3.750 | | | | 08/15/47 | | | | 30,463 | |
| | Consolidated Edison Co. of New York, Inc. | |
| | 170,000 | | | | 3.850 | | | | 06/15/46 | | | | 129,616 | |
| | 40,000 | | | | 4.625 | | | | 12/01/54 | | | | 33,812 | |
| | 100,000 | | | | 4.500 | | | | 05/15/58 | | | | 81,433 | |
| | Consolidated Edison Co. of New York, Inc., Series 08-B | |
| | 10,000 | | | | 6.750 | | | | 04/01/38 | | | | 11,009 | |
| | Consolidated Edison Co. of New York, Inc., Series 12-A | |
| | 40,000 | | | | 4.200 | | | | 03/15/42 | | | | 33,280 | |
| | Consolidated Edison Co. of New York, Inc., Series A | |
| | 15,000 | | | | 4.125 | | | | 05/15/49 | | | | 11,883 | |
| | Dominion Energy, Inc. | |
| | 80,000 | | | | 4.250 | | | | 06/01/28 | | | | 76,316 | |
| | Dominion Energy, Inc., Series C | |
| | 300,000 | | | | 3.375 | | | | 04/01/30 | | | | 265,203 | |
| | DTE Electric Co. | |
| | 150,000 | | | | 3.950 | | | | 06/15/42 | | | | 117,627 | |
| | 15,000 | | | | 3.700 | | | | 03/15/45 | | | | 11,476 | |
| | DTE Electric Co., Series A | |
| | 40,000 | | | | 4.000 | | | | 04/01/43 | | | | 32,331 | |
| | DTE Energy Co.(c), Series C | |
| | 60,000 | | | | 2.529 | | | | 10/01/24 | | | | 57,936 | |
| | Duke Energy Carolinas LLC | |
| | 350,000 | | | | 3.700 | | | | 12/01/47 | | | | 263,568 | |
| | 50,000 | | | | 3.950 | | | | 03/15/48 | | | | 39,221 | |
| | Duke Energy Corp. | |
| | 300,000 | | | | 3.750 | | | | 09/01/46 | | | | 219,036 | |
| | Duke Energy Florida LLC | |
| | 25,000 | | | | 3.400 | | | | 10/01/46 | | | | 17,924 | |
| | Duke Energy Indiana LLC | |
| | 50,000 | | | | 6.350 | | | | 08/15/38 | | | | 53,231 | |
| | 40,000 | | | | 6.450 | | | | 04/01/39 | | | | 42,139 | |
| | Duke Energy Progress LLC | |
| | 100,000 | | | | 3.450 | | | | 03/15/29 | | | | 91,863 | |
| | 200,000 | | | | 6.300 | | | | 04/01/38 | | | | 210,110 | |
| | 15,000 | | | | 4.100 | | | | 05/15/42 | | | | 12,246 | |
| | Edison International | |
| | 485,000 | | | | 5.750 | | | | 06/15/27 | | | | 485,949 | |
| | Entergy Corp. | |
| | 50,000 | | | | 2.800 | | | | 06/15/30 | | | | 42,062 | |
| | |
| | |
| The accompanying notes are an integral part of these financial statements. | | 97 |
GOLDMAN SACHS ACCESS U.S. AGGREGATE BOND ETF
Schedule of Investments (continued)
August 31, 2023
| | | | | | | | | | | | | | |
Principal
Amount | | | Interest
Rate | | | Maturity
Date | | | Value | |
|
| Corporate Obligations – (continued) | |
| Electric – (continued) | |
| | Entergy Louisiana LLC | |
| $ | 250,000 | | | | 0.950 | % | | | 10/01/24 | | | $ | 237,110 | |
| | 230,000 | | | | 4.200 | | | | 04/01/50 | | | | 183,227 | |
| | Evergy Kansas Central, Inc. | |
| | 40,000 | | | | 4.250 | | | | 12/01/45 | | | | 32,192 | |
| | 50,000 | | | | 5.700 | | | | 03/15/53 | | | | 49,736 | |
| | Evergy Metro, Inc. | |
| | 200,000 | | | | 4.200 | | | | 03/15/48 | | | | 162,838 | |
| | Evergy Metro, Inc., Series 2019 | |
| | 15,000 | | | | 4.125 | | | | 04/01/49 | | | | 11,841 | |
| | Eversource Energy | |
| | 60,000 | | | | 3.450 | | | | 01/15/50 | | | | 42,092 | |
| | Exelon Corp. | |
| | 100,000 | | | | 4.450 | | | | 04/15/46 | | | | 82,460 | |
| | Florida Power & Light Co. | |
| | 80,000 | | | | 4.950 | | | | 06/01/35 | | | | 78,220 | |
| | 275,000 | | | | 5.950 | | | | 02/01/38 | | | | 289,027 | |
| | 50,000 | | | | 5.960 | | | | 04/01/39 | | | | 52,388 | |
| | 100,000 | | | | 5.690 | | | | 03/01/40 | | | | 102,299 | |
| | 15,000 | | | | 4.125 | | | | 02/01/42 | | | | 12,718 | |
| | 140,000 | | | | 4.050 | | | | 10/01/44 | | | | 116,405 | |
| | 100,000 | | | | 2.875 | | | | 12/04/51 | | | | 64,878 | |
| | Georgia Power Co., Series B | |
| | 400,000 | | | | 2.650 | | | | 09/15/29 | | | | 344,722 | |
| | 15,000 | | | | 3.700 | | | | 01/30/50 | | | | 11,083 | |
| | Gulf Power Co., Series A | |
| | 300,000 | | | | 3.300 | | | | 05/30/27 | | | | 281,926 | |
| | Interstate Power and Light Co. | |
| | 200,000 | | | | 2.300 | | | | 06/01/30 | | | | 164,144 | |
| | 40,000 | | | | 3.500 | | | | 09/30/49 | | | | 28,029 | |
| | National Rural Utilities Cooperative Finance Corp. | |
| | 40,000 | | | | 2.400 | | | | 03/15/30 | | | | 33,803 | |
| | 100,000 | | | | 2.750 | | | | 04/15/32 | | | | 82,160 | |
| | 300,000 | | | | 4.023 | | | | 11/01/32 | | | | 272,499 | |
| | Northern States Power Co. | |
| | 200,000 | | | | 4.500 | | | | 06/01/52 | | | | 172,498 | |
| | NSTAR Electric Co. | |
| | 15,000 | | | | 3.200 | | | | 05/15/27 | | | | 14,001 | |
| | 100,000 | | | | 3.950 | | | | 04/01/30 | | | | 93,106 | |
| | Oncor Electric Delivery Co. LLC | |
| | 250,000 | | | | 3.100 | | | | 09/15/49 | | | | 170,815 | |
| | Pacific Gas and Electric Co. | |
| | 100,000 | | | | 3.450 | | | | 07/01/25 | | | | 95,007 | |
| | 200,000 | | | | 2.100 | | | | 08/01/27 | | | | 172,982 | |
| | 210,000 | | | | 4.300 | | | | 03/15/45 | | | | 146,424 | |
| | 150,000 | | | | 4.000 | | | | 12/01/46 | | | | 99,240 | |
| | PECO Energy Co. | |
| | 100,000 | | | | 4.800 | | | | 10/15/43 | | | | 87,889 | |
| | PPL Capital Funding, Inc. | |
| | 25,000 | | | | 5.000 | | | | 03/15/44 | | | | 20,710 | |
| | Public Service Electric and Gas Co., MTN | |
| | 100,000 | | | | 1.900 | | | | 08/15/31 | | | | 79,875 | |
| | 300,000 | | | | 3.800 | | | | 03/01/46 | | | | 236,280 | |
| | 100,000 | | | | 3.000 | | | | 03/01/51 | | | | 66,916 | |
| | Public Service Enterprise Group, Inc. | |
| | 40,000 | | | | 2.450 | | | | 11/15/31 | | | | 32,218 | |
| | |
|
| Corporate Obligations – (continued) | |
| Electric – (continued) | |
| | Puget Sound Energy, Inc. | |
| 205,000 | | | | 4.223 | | | | 06/15/48 | | | | 166,511 | |
| | Sempra | |
| | 400,000 | | | | 3.800 | | | | 02/01/38 | | | | 325,499 | |
| | 100,000 | | | | 4.000 | | | | 02/01/48 | | | | 76,168 | |
| | Southern California Edison Co. | |
| | 40,000 | | | | 2.850 | | | | 08/01/29 | | | | 35,094 | |
| | 200,000 | | | | 5.700 | | | | 03/01/53 | | | | 193,953 | |
| | Southern Co. (The) | |
| | 110,000 | | | | 5.113 | | | | 08/01/27 | | | | 108,784 | |
| | 250,000 | | | | 4.400 | | | | 07/01/46 | | | | 205,039 | |
| | Southern Co. (The)(b), Series 21-A | |
| | (US 5 Year CMT T-Note + 2.915%) | |
| | 100,000 | | | | 3.750 | | | | 09/15/51 | | | | 86,400 | |
| | Southern Co. Gas Capital Corp. | |
| | 15,000 | | | | 3.950 | | | | 10/01/46 | | | | 11,169 | |
| | 100,000 | | | | 4.400 | | | | 05/30/47 | | | | 80,645 | |
| | Tucson Electric Power Co. | |
| | 300,000 | | | | 4.850 | | | | 12/01/48 | | | | 257,169 | |
| | Virginia Electric and Power Co., Series A | |
| | 100,000 | | | | 3.500 | | | | 03/15/27 | | | | 94,458 | |
| | Virginia Electric and Power Co., Series B | |
| | 100,000 | | | | 6.000 | | | | 01/15/36 | | | | 103,316 | |
| | Virginia Electric and Power Co., Series C | |
| | 150,000 | | | | 4.000 | | | | 11/15/46 | | | | 114,879 | |
| | Xcel Energy, Inc. | |
| | 400,000 | | | | 1.750 | | | | 03/15/27 | | | | 353,126 | |
| | | | | | | | | | | | | | |
| | | | | | | | | | | | | 10,031,843 | |
| | |
| Energy – 1.5% | |
| | Baker Hughes Holdings LLC / Baker Hughes Co.-Obligor, Inc. | |
| | 185,000 | | | | 4.080 | | | | 12/15/47 | | | | 146,924 | |
| | Boardwalk Pipelines LP | |
| | 100,000 | | | | 4.800 | | | | 05/03/29 | | | | 95,209 | |
| | BP Capital Markets America, Inc. | |
| | 300,000 | | | | 4.234 | | | | 11/06/28 | | | | 289,841 | |
| | Cheniere Corpus Christi Holdings LLC | |
| | 80,000 | | | | 5.875 | | | | 03/31/25 | | | | 79,800 | |
| | 40,000 | | | | 5.125 | | | | 06/30/27 | | | | 39,550 | |
| | 300,000 | | | | 2.742 | | | | 12/31/39 | | | | 232,416 | |
| | Chevron Corp. | |
| | 300,000 | | | | 3.326 | | | | 11/17/25 | | | | 291,287 | |
| | Chevron USA, Inc. | |
| | 200,000 | | | | 2.343 | | | | 08/12/50 | | | | 121,253 | |
| | ConocoPhillips Co. | |
| | 250,000 | | | | 3.758 | | | | 03/15/42 | | | | 203,131 | |
| | Devon Energy Corp. | |
| | 9,000 | | | | 4.500 | | | | 01/15/30 | | | | 8,414 | |
| | Energy Transfer LP | |
| | 140,000 | | | | 3.750 | | | | 05/15/30 | | | | 125,348 | |
| | 75,000 | | | | 6.125 | | | | 12/15/45 | | | | 69,966 | |
| | 225,000 | | | | 5.300 | | | | 04/15/47 | | | | 191,390 | |
| | 55,000 | | | | 6.250 | | | | 04/15/49 | | | | 52,488 | |
| | Enterprise Products Operating LLC | |
| | 100,000 | | | | 2.800 | | | | 01/31/30 | | | | 86,833 | |
| | 160,000 | | | | 4.850 | | | | 08/15/42 | | | | 143,718 | |
| | |
| | |
| 98 | | The accompanying notes are an integral part of these financial statements. |
GOLDMAN SACHS ACCESS U.S. AGGREGATE BOND ETF
| | | | | | | | | | | | | | |
Principal
Amount | | | Interest
Rate | | | Maturity
Date | | | Value | |
|
| Corporate Obligations – (continued) | |
| Energy – (continued) | |
| | Enterprise Products Operating LLC – (continued) | |
| $ | 100,000 | | | | 4.800 | % | | | 02/01/49 | | | $ | 87,713 | |
| | 60,000 | | | | 4.200 | | | | 01/31/50 | | | | 48,011 | |
| | 15,000 | | | | 3.950 | | | | 01/31/60 | | | | 11,009 | |
| | Enterprise Products Operating LLC, Series D | |
| | 80,000 | | | | 6.875 | | | | 03/01/33 | | | | 88,563 | |
| | EOG Resources, Inc. | |
| | 60,000 | | | | 3.900 | | | | 04/01/35 | | | | 52,727 | |
| | Exxon Mobil Corp. | |
| | 75,000 | | | | 2.709 | | | | 03/06/25 | | | | 72,349 | |
| | 200,000 | | | | 2.275 | | | | 08/16/26 | | | | 186,543 | |
| | 200,000 | | | | 4.227 | | | | 03/19/40 | | | | 178,197 | |
| | Halliburton Co. | |
| | 50,000 | | | | 5.000 | | | | 11/15/45 | | | | 45,158 | |
| | Hess Corp. | |
| | 120,000 | | | | 4.300 | | | | 04/01/27 | | | | 115,649 | |
| | 55,000 | | | | 6.000 | | | | 01/15/40 | | | | 53,859 | |
| | 75,000 | | | | 5.600 | | | | 02/15/41 | | | | 70,485 | |
| | 100,000 | | | | 5.800 | | | | 04/01/47 | | | | 95,561 | |
| | Kinder Morgan Energy Partners LP | |
| | 300,000 | | | | 7.300 | | | | 08/15/33 | | | | 326,032 | |
| | Kinder Morgan, Inc. | |
| | 40,000 | | | | 4.300 | | | | 06/01/25 | | | | 39,151 | |
| | 56,000 | | | | 2.000 | | | | 02/15/31 | | | | 44,106 | |
| | 200,000 | | | | 5.200 | | | | 03/01/48 | | | | 172,425 | |
| | Magellan Midstream Partners LP | |
| | 300,000 | | | | 4.200 | | | | 10/03/47 | | | | 220,921 | |
| | MPLX LP | |
| | 100,000 | | | | 4.875 | | | | 12/01/24 | | | | 98,839 | |
| | 200,000 | | | | 1.750 | | | | 03/01/26 | | | | 182,289 | |
| | 476,000 | | | | 2.650 | | | | 08/15/30 | | | | 395,627 | |
| | 140,000 | | | | 4.700 | | | | 04/15/48 | | | | 112,441 | |
| | 100,000 | | | | 5.500 | | | | 02/15/49 | | | | 89,049 | |
| | NOV, Inc. | |
| | 15,000 | | | | 3.950 | | | | 12/01/42 | | | | 10,943 | |
| | Occidental Petroleum Corp. | |
| | 50,000 | | | | 5.550 | | | | 03/15/26 | | | | 49,620 | |
| | 350,000 | | | | 0.000 | (d) | | | 10/10/36 | | | | 183,461 | |
| | ONEOK Partners LP | |
| | 15,000 | | | | 6.650 | | | | 10/01/36 | | | | 15,442 | |
| | ONEOK, Inc. | |
| | 80,000 | | | | 2.200 | | | | 09/15/25 | | | | 74,592 | |
| | 100,000 | | | | 3.400 | | | | 09/01/29 | | | | 88,033 | |
| | 25,000 | | | | 6.350 | | | | 01/15/31 | | | | 25,570 | |
| | 140,000 | | | | 5.200 | | | | 07/15/48 | | | | 120,206 | |
| | Ovintiv, Inc. | |
| | 40,000 | | | | 7.375 | | | | 11/01/31 | | | | 42,540 | |
| | 65,000 | | | | 6.500 | | | | 08/15/34 | | | | 65,804 | |
| | Phillips 66 Co. | |
| | 250,000 | | | | 3.550 | | | | 10/01/26 | | | | 236,666 | |
| | Plains All American Pipeline LP / PAA Finance Corp. | |
| | 90,000 | | | | 3.600 | | | | 11/01/24 | | | | 87,675 | |
| | 50,000 | | | | 4.650 | | | | 10/15/25 | | | | 48,814 | |
| | 40,000 | | | | 4.500 | | | | 12/15/26 | | | | 38,715 | |
| | 92,000 | | | | 3.550 | | | | 12/15/29 | | | | 80,905 | |
| | 35,000 | | | | 6.700 | | | | 05/15/36 | | | | 34,170 | |
| | 40,000 | | | | 6.650 | | | | 01/15/37 | | | | 40,519 | |
| | 15,000 | | | | 4.700 | | | | 06/15/44 | | | | 11,676 | |
| | |
|
| Corporate Obligations – (continued) | |
| Energy – (continued) | |
| | Sabine Pass Liquefaction LLC | |
| 110,000 | | | | 5.625 | | | | 03/01/25 | | | | 109,656 | |
| | 120,000 | | | | 4.200 | | | | 03/15/28 | | | | 113,850 | |
| | 15,000 | | | | 4.500 | | | | 05/15/30 | | | | 14,138 | |
| | Spectra Energy Partners LP | |
| | 125,000 | | | | 3.375 | | | | 10/15/26 | | | | 117,707 | |
| | Transcontinental Gas Pipe Line Co. LLC | |
| | 50,000 | | | | 5.400 | | | | 08/15/41 | | | | 46,833 | |
| | 40,000 | | | | 3.950 | | | | 05/15/50 | | | | 29,875 | |
| | Valero Energy Corp. | |
| | 200,000 | | | | 3.400 | | | | 09/15/26 | | | | 188,697 | |
| | 15,000 | | | | 4.900 | | | | 03/15/45 | | | | 12,957 | |
| | 60,000 | | | | 3.650 | | | | 12/01/51 | | | | 41,152 | |
| | Williams Cos., Inc. (The) | |
| | 200,000 | | | | 3.750 | | | | 06/15/27 | | | | 188,332 | |
| | 15,000 | | | | 6.300 | | | | 04/15/40 | | | | 15,341 | |
| | 140,000 | | | | 4.900 | | | | 01/15/45 | | | | 118,163 | |
| | XTO Energy, Inc. | |
| | 50,000 | | | | 6.750 | | | | 08/01/37 | | | | 56,036 | |
| | | | | | | | | | | | | | |
| | | | | | | | | | | | | 7,272,360 | |
| | |
| Financial Company – 0.2% | |
| | Air Lease Corp. | |
| | 300,000 | | | | 2.200 | | | | 01/15/27 | | | | 267,897 | |
| | Blackstone Private Credit Fund | |
| | 150,000 | | | | 3.250 | | | | 03/15/27 | | | | 130,698 | |
| | GE Capital Funding LLC | |
| | 300,000 | | | | 4.550 | | | | 05/15/32 | | | | 286,488 | |
| | GE Capital International Funding Co. Unlimited | |
| | 200,000 | | | | 4.418 | | | | 11/15/35 | | | | 185,288 | |
| | | | | | | | | | | | | | |
| | | | | | | | | | | | | 870,371 | |
| | |
| Food and Beverage – 0.6% | |
| | Coca-Cola Co. (The) | |
| | 155,000 | | | | 1.750 | | | | 09/06/24 | | | | 149,441 | |
| | 50,000 | | | | 2.250 | | | | 01/05/32 | | | | 41,919 | |
| | 593,000 | | | | 3.000 | | | | 03/05/51 | | | | 429,015 | |
| | Conagra Brands, Inc. | |
| | 100,000 | | | | 1.375 | | | | 11/01/27 | | | | 84,976 | |
| | Constellation Brands, Inc. | |
| | 40,000 | | | | 3.150 | | | | 08/01/29 | | | | 35,741 | |
| | 291,000 | | | | 4.750 | | | | 05/09/32 | | | | 279,351 | |
| | Hershey Co. (The) | |
| | 40,000 | | | | 3.375 | | | | 08/15/46 | | | | 29,583 | |
| | 100,000 | | | | 3.125 | | | | 11/15/49 | | | | 71,396 | |
| | J M Smucker Co. (The) | |
| | 40,000 | | | | 2.125 | | | | 03/15/32 | | | | 31,720 | |
| | 15,000 | | | | 4.375 | | | | 03/15/45 | | | | 12,515 | |
| | 100,000 | | | | 3.550 | | | | 03/15/50 | | | | 70,153 | |
| | Kellogg Co. | |
| | 100,000 | | | | 4.500 | | | | 04/01/46 | | | | 85,919 | |
| | Keurig Dr Pepper, Inc. | |
| | 100,000 | | | | 4.420 | | | | 12/15/46 | | | | 83,341 | |
| | 100,000 | | | | 4.500 | | | | 04/15/52 | | | | 84,852 | |
| | Kraft Heinz Foods Co. | |
| | 159,000 | | | | 3.000 | | | | 06/01/26 | | | | 149,842 | |
| | 40,000 | | | | 3.875 | | | | 05/15/27 | | | | 38,145 | |
| | |
| | |
| The accompanying notes are an integral part of these financial statements. | | 99 |
GOLDMAN SACHS ACCESS U.S. AGGREGATE BOND ETF
Schedule of Investments (continued)
August 31, 2023
| | | | | | | | | | | | | | |
Principal
Amount | | | Interest
Rate | | | Maturity
Date | | | Value | |
|
| Corporate Obligations – (continued) | |
| Food and Beverage – (continued) | |
| | Kraft Heinz Foods Co. – (continued) | |
| $ | 80,000 | | | | 3.750 | % | | | 04/01/30 | | | $ | 73,289 | |
| | 22,000 | | | | 5.000 | | | | 07/15/35 | | | | 21,379 | |
| | 285,000 | | | | 5.200 | | | | 07/15/45 | | | | 261,287 | |
| | 110,000 | | | | 4.375 | | | | 06/01/46 | | | | 90,755 | |
| | 40,000 | | | | 4.875 | | | | 10/01/49 | | | | 35,595 | |
| | Molson Coors Beverage Co. | |
| | 120,000 | | | | 4.200 | | | | 07/15/46 | | | | 95,096 | |
| | PepsiCo, Inc. | |
| | 300,000 | | | | 3.500 | | | | 07/17/25 | | | | 291,778 | |
| | 146,000 | | | | 2.750 | | | | 03/19/30 | | | | 129,998 | |
| | 160,000 | | | | 4.600 | | | | 07/17/45 | | | | 146,822 | |
| | 200,000 | | | | 4.650 | | | | 02/15/53 | | | | 191,682 | |
| | Sysco Corp. | |
| | 80,000 | | | | 2.400 | | | | 02/15/30 | | | | 67,668 | |
| | | | | | | | | | | | | | |
| | | | | | | | | | | | | 3,083,258 | |
| | |
| Healthcare – 0.9% | |
| | Aetna, Inc. | |
| | 40,000 | | | | 4.750 | | | | 03/15/44 | | | | 34,332 | |
| | Bio-Rad Laboratories, Inc. | |
| | 100,000 | | | | 3.700 | | | | 03/15/32 | | | | 87,525 | |
| | Cigna Group (The) | |
| | 400,000 | | | | 4.375 | | | | 10/15/28 | | | | 386,098 | |
| | CVS Health Corp. | |
| | 200,000 | | | | 3.250 | | | | 08/15/29 | | | | 178,979 | |
| | 250,000 | | | | 3.750 | | | | 04/01/30 | | | | 227,403 | |
| | 76,000 | | | | 1.750 | | | | 08/21/30 | | | | 60,449 | |
| | 280,000 | | | | 4.780 | | | | 03/25/38 | | | | 251,952 | |
| | 370,000 | | | | 5.050 | | | | 03/25/48 | | | | 325,888 | |
| | 100,000 | | | | 4.250 | | | | 04/01/50 | | | | 79,193 | |
| | Elevance Health, Inc. | |
| | 150,000 | | | | 2.550 | | | | 03/15/31 | | | | 125,500 | |
| | 15,000 | | | | 4.650 | | | | 08/15/44 | | | | 13,104 | |
| | 40,000 | | | | 4.850 | | | | 08/15/54 | | | | 33,848 | |
| | Evernorth Health, Inc. | |
| | 120,000 | | | | 4.500 | | | | 02/25/26 | | | | 117,698 | |
| | HCA, Inc. | |
| | 70,000 | | | | 5.875 | | | | 02/15/26 | | | | 70,175 | |
| | 46,000 | | | | 5.250 | | | | 06/15/26 | | | | 45,425 | |
| | 90,000 | | | | 5.375 | | | | 09/01/26 | | | | 89,550 | |
| | 40,000 | | | | 4.500 | | | | 02/15/27 | | | | 38,625 | |
| | 25,000 | | | | 5.625 | | | | 09/01/28 | | | | 24,969 | |
| | 785,000 | | | | 5.875 | | | | 02/01/29 | | | | 787,944 | |
| | 75,000 | | | | 4.125 | | | | 06/15/29 | | | | 69,309 | |
| | 50,000 | | | | 3.500 | | | | 09/01/30 | | | | 43,654 | |
| | 40,000 | | | | 5.500 | | | | 06/15/47 | | | | 36,225 | |
| | Humana, Inc. | |
| | 100,000 | | | | 2.150 | | | | 02/03/32 | | | | 78,576 | |
| | McKesson Corp. | |
| | 200,000 | | | | 3.950 | | | | 02/16/28 | | | | 190,887 | |
| | Quest Diagnostics, Inc. | |
| | 100,000 | | | | 2.800 | | | | 06/30/31 | | | | 84,952 | |
| | UnitedHealth Group, Inc. | |
| | 250,000 | | | | 4.625 | | | | 07/15/35 | | | | 242,078 | |
| | 250,000 | | | | 4.750 | | | | 07/15/45 | | | | 233,428 | |
| | |
|
| Corporate Obligations – (continued) | |
| Healthcare – (continued) | |
| | UnitedHealth Group, Inc. – (continued) | |
| 450,000 | | | | 3.750 | | | | 10/15/47 | | | | 355,834 | |
| | 25,000 | | | | 2.900 | | | | 05/15/50 | | | | 16,648 | |
| | 300,000 | | | | 5.200 | | | | 04/15/63 | | | | 286,957 | |
| | | | | | | | | | | | | | |
| | | | | | | | | | | | | 4,617,205 | |
| | |
| Insurance – 0.8% | |
| | Allstate Corp. (The) | |
| | 120,000 | | | | 3.850 | | | | 08/10/49 | | | | 89,881 | |
| | American International Group, Inc. | |
| | 50,000 | | | | 3.900 | | | | 04/01/26 | | | | 48,278 | |
| | 100,000 | | | | 4.750 | | | | 04/01/48 | | | | 88,294 | |
| | American International Group, Inc.(b), Series A-9 | |
| | (3M USD LIBOR + 2.868%) | |
| | 140,000 | | | | 5.750 | | | | 04/01/48 | | | | 135,711 | |
| | Aon Global Ltd. | |
| | 100,000 | | | | 4.600 | | | | 06/14/44 | | | | 85,991 | |
| | Arch Capital Group Ltd. | |
| | 90,000 | | | | 3.635 | | | | 06/30/50 | | | | 64,729 | |
| | Arch Capital Group US, Inc. | |
| | 40,000 | | | | 5.144 | | | | 11/01/43 | | | | 35,442 | |
| | Assurant, Inc. | |
| | 100,000 | | | | 2.650 | | | | 01/15/32 | | | | 75,109 | |
| | AXIS Specialty Finance LLC | |
| | 40,000 | | | | 3.900 | | | | 07/15/29 | | | | 36,291 | |
| | Berkshire Hathaway Finance Corp. | |
| | 150,000 | | | | 4.250 | | | | 01/15/49 | | | | 131,733 | |
| | Berkshire Hathaway, Inc. | |
| | 350,000 | | | | 3.125 | | | | 03/15/26 | | | | 335,602 | |
| | Brighthouse Financial, Inc. | |
| | 40,000 | | | | 5.625 | | | | 05/15/30 | | | | 38,588 | |
| | 75,000 | | | | 4.700 | | | | 06/22/47 | | | | 56,054 | |
| | Chubb INA Holdings, Inc. | |
| | 150,000 | | | | 3.350 | | | | 05/03/26 | | | | 143,873 | |
| | 100,000 | | | | 1.375 | | | | 09/15/30 | | | | 78,673 | |
| | CNO Financial Group, Inc. | |
| | 200,000 | | | | 5.250 | | | | 05/30/29 | | | | 190,500 | |
| | Fidelity National Financial, Inc. | |
| | 230,000 | | | | 3.400 | | | | 06/15/30 | | | | 199,678 | |
| | Hartford Financial Services Group, Inc. (The) | |
| | 30,000 | | | | 3.600 | | | | 08/19/49 | | | | 21,921 | |
| | Jackson Financial, Inc. | |
| | 100,000 | | | | 3.125 | | | | 11/23/31 | | | | 78,604 | |
| | Marsh & McLennan Cos., Inc. | |
| | 80,000 | | | | 3.500 | | | | 06/03/24 | | | | 78,536 | |
| | 100,000 | | | | 2.375 | | | | 12/15/31 | | | | 81,532 | |
| | 100,000 | | | | 4.350 | | | | 01/30/47 | | | | 84,446 | |
| | MetLife, Inc. | |
| | 15,000 | | | | 4.125 | | | | 08/13/42 | | | | 12,384 | |
| | 80,000 | | | | 4.600 | | | | 05/13/46 | | | | 69,902 | |
| | PartnerRe Finance B LLC | |
| | 150,000 | | | | 3.700 | | | | 07/02/29 | | | | 135,875 | |
| | (US 5 Year CMT T-Note + 3.815%) | |
| | 300,000 | | | | 4.500 | (b) | | | 10/01/50 | | | | 252,345 | |
| | Progressive Corp. (The) | |
| | 100,000 | | | | 4.125 | | | | 04/15/47 | | | | 83,092 | |
| | |
| | |
| 100 | | The accompanying notes are an integral part of these financial statements. |
GOLDMAN SACHS ACCESS U.S. AGGREGATE BOND ETF
| | | | | | | | | | | | | | |
Principal
Amount | | | Interest
Rate | | | Maturity
Date | | | Value | |
|
| Corporate Obligations – (continued) | |
| Insurance – (continued) | |
| | Prudential Financial, Inc. | |
| $ | 40,000 | | | | 3.935 | % | | | 12/07/49 | | | $ | 30,895 | |
| | Prudential Financial, Inc., MTN | |
| | 15,000 | | | | 6.625 | | | | 06/21/40 | | | | 16,205 | |
| | 50,000 | | | | 4.600 | | | | 05/15/44 | | | | 44,044 | |
| | 120,000 | | | | 4.418 | | | | 03/27/48 | | | | 101,444 | |
| | 15,000 | | | | 4.350 | | | | 02/25/50 | | | | 12,490 | |
| | 60,000 | | | | 3.700 | | | | 03/13/51 | | | | 44,667 | |
| | Radian Group, Inc. | |
| | 250,000 | | | | 4.500 | | | | 10/01/24 | | | | 243,125 | |
| | Reinsurance Group of America, Inc. | |
| | 430,000 | | | | 3.900 | | | | 05/15/29 | | | | 392,208 | |
| | Travelers Cos., Inc. (The) | |
| | 150,000 | | | | 3.750 | | | | 05/15/46 | | | | 116,070 | |
| | Voya Financial, Inc.(b) | |
| | (3M USD LIBOR + 2.084%) | |
| | 40,000 | | | | 4.700 | | | | 01/23/48 | | | | 32,364 | |
| | W R Berkley Corp. | |
| | 40,000 | | | | 4.750 | | | | 08/01/44 | | | | 34,223 | |
| | Willis North America, Inc. | |
| | 200,000 | | | | 5.050 | | | | 09/15/48 | | | | 167,372 | |
| | | | | | | | | | | | | | |
| | | | | | | | | | | | | 3,968,171 | |
| | |
| Metals – 0.1% | |
| | Nucor Corp. | |
| | 500,000 | | | | 3.950 | | | | 05/23/25 | | | | 486,792 | |
| | Steel Dynamics, Inc. | |
| | 80,000 | | | | 3.450 | | | | 04/15/30 | | | | 71,400 | |
| | 145,000 | | | | 3.250 | | | | 01/15/31 | | | | 126,875 | |
| | | | | | | | | | | | | | |
| | | | | | | | | | | | | 685,067 | |
| | |
| REITs and Real Estate – 0.7% | |
| | Alexandria Real Estate Equities, Inc. | |
| | 100,000 | | | | 3.375 | | | | 08/15/31 | | | | 86,290 | |
| | Brandywine Operating Partnership LP | |
| | 100,000 | | | | 3.950 | | | | 11/15/27 | | | | 82,506 | |
| | CBRE Services, Inc. | |
| | 129,000 | | | | 2.500 | | | | 04/01/31 | | | | 103,540 | |
| | Corporate Office Properties LP | |
| | 490,000 | | | | 2.750 | | | | 04/15/31 | | | | 378,720 | |
| | Digital Realty Trust LP | |
| | 40,000 | | | | 3.700 | | | | 08/15/27 | | | | 37,324 | |
| | Equinix, Inc. | |
| | 95,000 | | | | 3.000 | | | | 07/15/50 | | | | 59,713 | |
| | Extra Space Storage LP | |
| | 140,000 | | | | 2.400 | | | | 10/15/31 | | | | 109,894 | |
| | GLP Capital LP / GLP Financing II, Inc. | |
| | 50,000 | | | | 3.350 | | | | 09/01/24 | | | | 48,532 | |
| | 90,000 | | | | 5.250 | | | | 06/01/25 | | | | 88,642 | |
| | 40,000 | | | | 5.750 | | | | 06/01/28 | | | | 38,878 | |
| | 255,000 | | | | 4.000 | | | | 01/15/30 | | | | 222,128 | |
| | 72,000 | | | | 4.000 | | | | 01/15/31 | | | | 61,738 | |
| | Healthcare Realty Holdings LP | |
| | 410,000 | | | | 2.000 | | | | 03/15/31 | | | | 316,588 | |
| | Mid-America Apartments LP | |
| | 100,000 | | | | 2.875 | | | | 09/15/51 | | | | 63,055 | |
| | |
|
| Corporate Obligations – (continued) | |
| REITs and Real Estate – (continued) | |
| | Prologis LP | |
| 80,000 | | | | 4.000 | | | | 09/15/28 | | | | 76,096 | |
| | 200,000 | | | | 2.250 | | | | 04/15/30 | | | | 167,935 | |
| | 40,000 | | | | 1.250 | | | | 10/15/30 | | | | 30,729 | |
| | 120,000 | | | | 2.125 | | | | 10/15/50 | | | | 64,910 | |
| | Public Storage Operating Co. | |
| | 60,000 | | | | 3.094 | | | | 09/15/27 | | | | 55,943 | |
| | Realty Income Corp. | |
| | 200,000 | | | | 5.625 | | | | 10/13/32 | | | | 200,473 | |
| | Sabra Health Care LP | |
| | 85,000 | | | | 5.125 | | | | 08/15/26 | | | | 82,256 | |
| | 100,000 | | | | 3.200 | | | | 12/01/31 | | | | 76,528 | |
| | Simon Property Group LP | |
| | 200,000 | | | | 2.450 | | | | 09/13/29 | | | | 168,692 | |
| | 100,000 | | | | 2.200 | | | | 02/01/31 | | | | 79,807 | |
| | 10,000 | | | | 6.750 | | | | 02/01/40 | | | | 10,728 | |
| | 250,000 | | | | 5.850 | | | | 03/08/53 | | | | 244,958 | |
| | UDR, Inc., MTN | |
| | 100,000 | | | | 1.900 | | | | 03/15/33 | | | | 73,111 | |
| | Vornado Realty LP | |
| | 220,000 | | | | 3.500 | | | | 01/15/25 | | | | 208,321 | |
| | Welltower OP LLC | |
| | 200,000 | | | | 4.000 | | | | 06/01/25 | | | | 193,941 | |
| | 200,000 | | | | 4.250 | | | | 04/15/28 | | | | 189,651 | |
| | | | | | | | | | | | | | |
| | | | | | | | | | | | | 3,621,627 | |
| | |
| Revenue – 0.1% | |
| | California Institute of Technology | |
| | 15,000 | | | | 3.650 | | | | 09/01/19 | | | | 9,804 | |
| | Hackensack Meridian Health, Inc., Series 2020 | |
| | 15,000 | | | | 2.675 | | | | 09/01/41 | | | | 10,413 | |
| | Stanford Health Care | |
| | 100,000 | | | | 3.027 | | | | 08/15/51 | | | | 67,857 | |
| | University of Chicago (The), Series 20B | |
| | 40,000 | | | | 2.761 | | | | 04/01/45 | | | | 29,836 | |
| | Yale University, Series 2020 | |
| | 190,000 | | | | 1.482 | | | | 04/15/30 | | | | 155,876 | |
| | 80,000 | | | | 2.402 | | | | 04/15/50 | | | | 50,207 | |
| | | | | | | | | | | | | | |
| | | | | | | | | | | | | 323,993 | |
| | |
| Software – 0.4% | |
| | Oracle Corp. | |
| | 800,000 | | | | 2.300 | | | | 03/25/28 | | | | 705,524 | |
| | 500,000 | | | | 4.900 | | | | 02/06/33 | | | | 478,517 | |
| | 300,000 | | | | 3.600 | | | | 04/01/40 | | | | 227,607 | |
| | 500,000 | | | | 4.000 | | | | 07/15/46 | | | | 375,459 | |
| | Salesforce, Inc. | |
| | 20,000 | | | | 2.900 | | | | 07/15/51 | | | | 13,387 | |
| | | | | | | | | | | | | | |
| | | | | | | | | | | | | 1,800,494 | |
| | |
| Technology – 1.5% | |
| | Adobe, Inc. | |
| | 40,000 | | | | 2.300 | | | | 02/01/30 | | | | 34,712 | |
| | Alphabet, Inc. | |
| | 150,000 | | | | 2.250 | | | | 08/15/60 | | | | 87,753 | |
| | Apple, Inc. | |
| | 90,000 | | | | 3.450 | | | | 05/06/24 | | | | 88,855 | |
| | |
| | |
| The accompanying notes are an integral part of these financial statements. | | 101 |
GOLDMAN SACHS ACCESS U.S. AGGREGATE BOND ETF
Schedule of Investments (continued)
August 31, 2023
| | | | | | | | | | | | | | |
Principal
Amount | | | Interest
Rate | | | Maturity
Date | | | Value | |
|
| Corporate Obligations – (continued) | |
| Technology – (continued) | |
| | Apple, Inc. – (continued) | |
| $ | 400,000 | | | | 1.800 | % | | | 09/11/24 | | | $ | 385,876 | |
| | 50,000 | | | | 3.200 | | | | 05/13/25 | | | | 48,542 | |
| | 200,000 | | | | 4.421 | | | | 05/08/26 | | | | 198,250 | |
| | 230,000 | | | | 2.450 | | | | 08/04/26 | | | | 215,157 | |
| | 15,000 | | | | 3.350 | | | | 02/09/27 | | | | 14,321 | |
| | 15,000 | | | | 3.200 | | | | 05/11/27 | | | | 14,248 | |
| | 60,000 | | | | 2.900 | | | | 09/12/27 | | | | 56,235 | |
| | 40,000 | | | | 1.650 | | | | 02/08/31 | | | | 32,887 | |
| | 45,000 | | | | 4.500 | | | | 02/23/36 | | | | 45,022 | |
| | 80,000 | | | | 3.850 | | | | 05/04/43 | | | | 69,443 | |
| | 80,000 | | | | 4.450 | | | | 05/06/44 | | | | 76,382 | |
| | 100,000 | | | | 3.450 | | | | 02/09/45 | | | | 80,940 | |
| | 300,000 | | | | 4.650 | | | | 02/23/46 | | | | 287,001 | |
| | 50,000 | | | | 4.250 | | | | 02/09/47 | | | | 45,842 | |
| | 50,000 | | | | 3.750 | | | | 11/13/47 | | | | 41,590 | |
| | 300,000 | | | | 2.650 | | | | 02/08/51 | | | | 199,498 | |
| | 160,000 | | | | 2.550 | | | | 08/20/60 | | | | 100,571 | |
| | Applied Materials, Inc. | |
| | 125,000 | | | | 3.900 | | | | 10/01/25 | | | | 121,924 | |
| | 256,000 | | | | 3.300 | | | | 04/01/27 | | | | 243,289 | |
| | Broadcom, Inc. | |
| | 300,000 | | | | 4.110 | | | | 09/15/28 | | | | 282,992 | |
| | 90,000 | | | | 3.469 | (e) | | | 04/15/34 | | | | 73,499 | |
| | 60,000 | | | | 3.187 | (e) | | | 11/15/36 | | | | 45,293 | |
| | 160,000 | | | | 3.500 | (e) | | | 02/15/41 | | | | 117,395 | |
| | Corning, Inc. | |
| | 125,000 | | | | 5.350 | | | | 11/15/48 | | | | 117,698 | |
| | 45,000 | | | | 4.375 | | | | 11/15/57 | | | | 36,513 | |
| | Dell International LLC / EMC Corp. | |
| | 500,000 | | | | 5.250 | | | | 02/01/28 | | | | 499,568 | |
| | 300,000 | | | | 5.750 | | | | 02/01/33 | | | | 300,213 | |
| | Fiserv, Inc. | |
| | 235,000 | | | | 4.400 | | | | 07/01/49 | | | | 191,541 | |
| | Hewlett Packard Enterprise Co. | |
| | 100,000 | | | | 6.350 | | | | 10/15/45 | | | | 102,577 | |
| | International Business Machines Corp. | |
| | 15,000 | | | | 5.875 | | | | 11/29/32 | | | | 15,930 | |
| | 150,000 | | | | 4.150 | | | | 05/15/39 | | | | 128,703 | |
| | 250,000 | | | | 4.000 | | | | 06/20/42 | | | | 205,475 | |
| | Jabil, Inc. | |
| | 80,000 | | | | 3.600 | | | | 01/15/30 | | | | 71,723 | |
| | KLA Corp. | |
| | 60,000 | | | | 3.300 | | | | 03/01/50 | | | | 43,189 | |
| | Kyndryl Holdings, Inc. | |
| | 323,000 | | | | 2.700 | | | | 10/15/28 | | | | 270,266 | |
| | 100,000 | | | | 3.150 | | | | 10/15/31 | | | | 77,233 | |
| | 100,000 | | | | 4.100 | | | | 10/15/41 | | | | 68,386 | |
| | Lam Research Corp. | |
| | 40,000 | | | | 3.125 | | | | 06/15/60 | | | | 25,799 | |
| | Leidos, Inc. | |
| | 100,000 | | | | 4.375 | | | | 05/15/30 | | | | 92,250 | |
| | Meta Platforms, Inc. | |
| | 300,000 | | | | 4.950 | | | | 05/15/33 | | | | 298,553 | |
| | Microsoft Corp. | |
| | 65,000 | | | | 3.300 | | | | 02/06/27 | | | | 62,516 | |
| | |
|
| Corporate Obligations – (continued) | |
| Technology – (continued) | |
| | Microsoft Corp. – (continued) | |
| 15,000 | | | | 3.500 | | | | 02/12/35 | | | | 13,672 | |
| | 203,000 | | | | 4.200 | | | | 11/03/35 | | | | 196,198 | |
| | 220,000 | | | | 4.250 | | | | 02/06/47 | | | | 204,727 | |
| | 200,000 | | | | 4.000 | | | | 02/12/55 | | | | 174,278 | |
| | 20,000 | | | | 2.675 | | | | 06/01/60 | | | | 12,834 | |
| | Motorola Solutions, Inc. | |
| | 624,000 | | | | 2.750 | | | | 05/24/31 | | | | 506,847 | |
| | NVIDIA Corp. | |
| | 250,000 | | | | 3.500 | | | | 04/01/50 | | | | 197,429 | |
| | QUALCOMM, Inc. | |
| | 250,000 | | | | 4.300 | | | | 05/20/47 | | | | 217,730 | |
| | VeriSign, Inc. | |
| | 350,000 | | | | 2.700 | | | | 06/15/31 | | | | 286,563 | |
| | | | | | | | | | | | | | |
| | | | | | | | | | | | | 7,425,928 | |
| | |
| Transportation – 0.4% | |
| | Burlington Northern Santa Fe LLC | |
| | 200,000 | | | | 5.200 | | | | 04/15/54 | | | | 197,248 | |
| | CSX Corp. | |
| | 250,000 | | | | 4.100 | | | | 11/15/32 | | | | 235,119 | |
| | 100,000 | | | | 4.500 | | | | 11/15/52 | | | | 87,379 | |
| | FedEx Corp. | |
| | 40,000 | | | | 3.900 | | | | 02/01/35 | | | | 34,889 | |
| | 300,000 | | | | 4.750 | | | | 11/15/45 | | | | 258,343 | |
| | 40,000 | | | | 4.400 | | | | 01/15/47 | | | | 32,975 | |
| | 40,000 | | | | 4.950 | | | | 10/17/48 | | | | 35,853 | |
| | Southwest Airlines Co. | |
| | 40,000 | | | | 5.250 | | | | 05/04/25 | | | | 39,725 | |
| | Union Pacific Corp. | |
| | 40,000 | | | | 3.700 | | | | 03/01/29 | | | | 37,939 | |
| | 70,000 | | | | 4.050 | | | | 03/01/46 | | | | 56,894 | |
| | 10,000 | | | | 4.500 | | | | 09/10/48 | | | | 8,687 | |
| | 80,000 | | | | 3.799 | | | | 10/01/51 | | | | 63,564 | |
| | 60,000 | | | | 3.839 | | | | 03/20/60 | | | | 45,966 | |
| | 15,000 | | | | 3.750 | | | | 02/05/70 | | | | 10,936 | |
| | Union Pacific Railroad Co. Pass-Through Trust, Series 2015-1 | |
| | 181,330 | | | | 2.695 | | | | 05/12/27 | | | | 163,954 | |
| | United Parcel Service, Inc. | |
| | 500,000 | | | | 4.875 | | | | 03/03/33 | | | | 500,217 | |
| | 40,000 | | | | 3.625 | | | | 10/01/42 | | | | 32,378 | |
| | 15,000 | | | | 4.250 | | | | 03/15/49 | | | | 12,972 | |
| | 15,000 | | | | 5.300 | | | | 04/01/50 | | | | 15,239 | |
| | | | | | | | | | | | | | |
| | | | | | | | | | | | | 1,870,277 | |
| | |
| Water – 0.0% | |
| | Essential Utilities, Inc. | |
| | 100,000 | | | | 3.351 | | | | 04/15/50 | | | | 66,558 | |
| | |
| Wireless – 1.0% | |
| | American Tower Corp. | |
| | 200,000 | | | | 3.375 | | | | 10/15/26 | | | | 187,640 | |
| | 40,000 | | | | 3.950 | | | | 03/15/29 | | | | 36,824 | |
| | 100,000 | | | | 3.700 | | | | 10/15/49 | | | | 69,794 | |
| | 20,000 | | | | 3.100 | | | | 06/15/50 | | | | 12,535 | |
| | AT&T, Inc. | |
| | 320,000 | | | | 2.750 | | | | 06/01/31 | | | | 264,419 | |
| | |
| | |
| 102 | | The accompanying notes are an integral part of these financial statements. |
GOLDMAN SACHS ACCESS U.S. AGGREGATE BOND ETF
| | | | | | | | | | | | | | |
Principal
Amount | | | Interest
Rate | | | Maturity
Date | | | Value | |
|
| Corporate Obligations – (continued) | |
| Wireless – (continued) | |
| | AT&T, Inc. – (continued) | |
| $ | 395,000 | | | | 2.250 | % | | | 02/01/32 | | | $ | 308,950 | |
| | 250,000 | | | | 4.500 | | | | 05/15/35 | | | | 221,813 | |
| | 400,000 | | | | 3.500 | | | | 06/01/41 | | | | 292,988 | |
| | 140,000 | | | | 3.650 | | | | 06/01/51 | | | | 96,134 | |
| | 100,000 | | | | 3.300 | | | | 02/01/52 | | | | 65,198 | |
| | 300,000 | | | | 3.500 | | | | 09/15/53 | | | | 197,426 | |
| | 310,000 | | | | 3.550 | | | | 09/15/55 | | | | 201,545 | |
| | Crown Castle, Inc. | |
| | 40,000 | | | | 3.300 | | | | 07/01/30 | | | | 34,893 | |
| | 140,000 | | | | 4.150 | | | | 07/01/50 | | | | 106,091 | |
| | T-Mobile USA, Inc. | |
| | 400,000 | | | | 3.750 | | | | 04/15/27 | | | | 378,672 | |
| | 300,000 | | | | 4.950 | | | | 03/15/28 | | | | 295,193 | |
| | 400,000 | | | | 4.500 | | | | 04/15/50 | | | | 331,552 | |
| | 100,000 | | | | 5.650 | | | | 01/15/53 | | | | 97,744 | |
| | Verizon Communications, Inc. | |
| | 500,000 | | | | 0.850 | | | | 11/20/25 | | | | 454,375 | |
| | 500,000 | | | | 2.355 | | | | 03/15/32 | | | | 395,254 | |
| | 350,000 | | | | 3.400 | | | | 03/22/41 | | | | 260,550 | |
| | 300,000 | | | | 3.550 | | | | 03/22/51 | | | | 210,411 | |
| | 300,000 | | | | 2.987 | | | | 10/30/56 | | | | 179,380 | |
| | 40,000 | | | | 3.700 | | | | 03/22/61 | | | | 27,159 | |
| | | | | | | | | | | | | | |
| | | | | | | | | | | | | 4,726,540 | |
| | |
| | TOTAL CORPORATE OBLIGATIONS | |
| | (Cost $112,194,709) | | | | | | | $ | 101,224,016 | |
| | |
| | | | | | | | | | | | | | |
|
| U.S. Treasury Bonds – 8.7%(f) | |
| | U.S. Treasury Bonds | |
| $ | 950,000 | | | | 4.500 | % | | | 02/15/36 | | | $ | 993,348 | |
| | 5,480,000 | | | | 4.375 | | | | 02/15/38 | | | | 5,615,041 | |
| | 7,889,000 | | | | 3.875 | | | | 08/15/40 | | | | 7,492,588 | |
| | 16,791,000 | | | | 2.500 | | | | 02/15/45 | | | | 12,332,046 | |
| | 9,823,000 | | | | 2.500 | | | | 05/15/46 | | | | 7,137,919 | |
| | 13,946,000 | | | | 2.250 | | | | 02/15/52 | | | | 9,416,300 | |
| | |
| | TOTAL U.S. TREASURY BONDS | |
| | (Cost $51,763,454) | | | | | | | $ | 42,987,242 | |
| | |
| | | | | | | | | | | | | | |
|
| Foreign Corporate Debt – 5.1% | |
| Banks – 2.5% | |
| | Banco Bilbao Vizcaya Argentaria SA (Spain) | |
| $ | 200,000 | | | | 1.125 | % | | | 09/18/25 | | | $ | 182,732 | |
| | Banco Santander SA (Spain) | |
| | 200,000 | | | | 1.849 | | | | 03/25/26 | | | | 180,394 | |
| | 200,000 | | | | 3.800 | | | | 02/23/28 | | | | 182,451 | |
| | Bank of Montreal(b) (Canada) | |
| | (5 Year USD Swap + 1.432%) | |
| | 110,000 | | | | 3.803 | | | | 12/15/32 | | | | 97,213 | |
| | Bank of Montreal, MTN (Canada) | |
| | 200,000 | | | | 2.500 | | | | 06/28/24 | | | | 194,554 | |
| | Bank of Nova Scotia (The) (Canada) | |
| | 500,000 | | | | 5.250 | | | | 06/12/28 | | | | 495,639 | |
| | |
|
| Foreign Corporate Debt – (continued) | |
| Banks – (continued) | |
| | Barclays PLC (United Kingdom) | |
| $ | 200,000 | | | | 4.375 | % | | | 09/11/24 | | | $ | 196,197 | |
| | 200,000 | | | | 5.200 | | | | 05/12/26 | | | | 194,549 | |
| | (US 1 Year CMT T-Note + 3.050%) | |
| | 300,000 | | | | 7.325 | (b) | | | 11/02/26 | | | | 305,836 | |
| | (US 1 Year CMT T-Note + 3.000%) | |
| | 300,000 | | | | 5.746 | (b) | | | 08/09/33 | | | | 286,980 | |
| | Deutsche Bank AG(b) (Germany) | |
| | (SOFR + 1.318%) | |
| | 500,000 | | | | 2.552 | | | | 01/07/28 | | | | 443,278 | |
| | Export-Import Bank of China/The(e) (China) | |
| | 400,000 | | | | 3.625 | | | | 07/31/24 | | | | 393,136 | |
| | Export-Import Bank of Korea (South Korea) | |
| | 340,000 | | | | 2.625 | | | | 05/26/26 | | | | 316,576 | |
| | 300,000 | | | | 1.250 | | | | 09/21/30 | | | | 235,096 | |
| | 300,000 | | | | 2.500 | | | | 06/29/41 | | | | 212,784 | |
| | HSBC Holdings PLC (United Kingdom) | |
| | (SOFR + 3.030%) | |
| | 500,000 | | | | 7.336 | (b) | | | 11/03/26 | | | | 512,463 | |
| | 400,000 | | | | 4.950 | | | | 03/31/30 | | | | 384,655 | |
| | (SOFR + 2.390%) | |
| | 400,000 | | | | 6.254 | (b) | | | 03/09/34 | | | | 405,523 | |
| | (SOFR + 2.650%) | |
| | 200,000 | | | | 6.332 | (b) | | | 03/09/44 | | | | 201,699 | |
| | ING Groep NV (Netherlands) | |
| | 354,000 | | | | 4.550 | | | | 10/02/28 | | | | 339,635 | |
| | Korea Development Bank (The) (South Korea) | |
| | 300,000 | | | | 0.800 | | | | 07/19/26 | | | | 264,135 | |
| | 400,000 | | | | 4.375 | | | | 02/15/33 | | | | 381,310 | |
| | Landwirtschaftliche Rentenbank (Germany) | |
| | 15,000 | | | | 3.125 | | | | 11/14/23 | | | | 14,921 | |
| | 70,000 | | | | 0.875 | | | | 03/30/26 | | | | 63,578 | |
| | Lloyds Banking Group PLC (United Kingdom) | |
| | 300,000 | | | | 4.375 | | | | 03/22/28 | | | | 283,416 | |
| | Mitsubishi UFJ Financial Group, Inc. (Japan) | |
| | 500,000 | | | | 2.193 | | | | 02/25/25 | | | | 473,315 | |
| | (US 1 Year CMT T-Note + 1.950%) | |
| | 500,000 | | | | 5.017 | (b) | | | 07/20/28 | | | | 488,054 | |
| | (US 1 Year CMT T-Note + 1.970%) | |
| | 400,000 | | | | 5.406 | (b) | | | 04/19/34 | | | | 395,334 | |
| | Mizuho Financial Group, Inc. (Japan) | |
| | (US 1 Year CMT T-Note + 0.750%) | |
| | 200,000 | | | | 1.554 | (b) | | | 07/09/27 | | | | 177,708 | |
| | 400,000 | | | | 3.170 | | | | 09/11/27 | | | | 366,441 | |
| | NatWest Group PLC(b) (United Kingdom) | |
| | (US 5 Year CMT T-Note + 2.350%) | |
| | 300,000 | | | | 3.032 | | | | 11/28/35 | | | | 232,456 | |
| | Royal Bank of Canada (Canada) | |
| | 285,000 | | | | 3.875 | | | | 05/04/32 | | | | 258,100 | |
| | Royal Bank of Canada, GMTN (Canada) | |
| | 300,000 | | | | 5.200 | | | | 07/20/26 | | | | 298,857 | |
| | Santander UK Group Holdings PLC(b) (United Kingdom) | |
| | (SOFR + 1.475%) | |
| | 340,000 | | | | 2.896 | | | | 03/15/32 | | | | 272,181 | |
| | Sumitomo Mitsui Financial Group, Inc. (Japan) | |
| | 400,000 | | | | 3.364 | | | | 07/12/27 | | | | 371,509 | |
| | 400,000 | | | | 2.930 | | | | 09/17/41 | | | | 277,632 | |
| | |
| | |
| The accompanying notes are an integral part of these financial statements. | | 103 |
GOLDMAN SACHS ACCESS U.S. AGGREGATE BOND ETF
Schedule of Investments (continued)
August 31, 2023
| | | | | | | | | | | | | | |
Principal
Amount | | | Interest
Rate | | | Maturity
Date | | | Value | |
|
| Foreign Corporate Debt – (continued) | |
| Banks – (continued) | |
| | Svensk Exportkredit AB, GMTN (Sweden) | |
| $ | 200,000 | | | | 0.375 | % | | | 07/30/24 | | | $ | 190,918 | |
| | 200,000 | | | | 0.625 | | | | 05/14/25 | | | | 185,317 | |
| | Toronto-Dominion Bank (The)(b) (Canada) | |
| | (5 Year USD Swap + 2.205%) | |
| | 375,000 | | | | 3.625 | | | | 09/15/31 | | | | 350,793 | |
| | UBS Group AG (Switzerland) | |
| | 400,000 | | | | 3.750 | | | | 03/26/25 | | | | 386,262 | |
| | Westpac Banking Corp. (Australia) | |
| | 200,000 | | | | 2.850 | | | | 05/13/26 | | | | 188,550 | |
| | 75,000 | | | | 3.350 | | | | 03/08/27 | | | | 70,784 | |
| | 40,000 | | | | 2.150 | | | | 06/03/31 | | | | 32,802 | |
| | (US 5 Year CMT T-Note + 2.000%) | |
| | 10,000 | | | | 4.110 | (b) | | | 07/24/34 | | | | 8,762 | |
| | (US 5 Year CMT T-Note + 1.530%) | |
| | 100,000 | | | | 3.020 | (b) | | | 11/18/36 | | | | 76,809 | |
| | 100,000 | | | | 2.963 | | | | 11/16/40 | | | | 64,871 | |
| | 340,000 | | | | 3.133 | | | | 11/18/41 | | | | 222,174 | |
| | | | | | | | | | | | | | |
| | | | | | | | | | | | | 12,158,379 | |
| | |
| Brokerage – 0.1% | |
| | Brookfield Finance, Inc. (Canada) | |
| | 150,000 | | | | 4.350 | | | | 04/15/30 | | | | 138,415 | |
| | 15,000 | | | | 3.500 | | | | 03/30/51 | | | | 9,761 | |
| | Nomura Holdings, Inc. (Japan) | |
| | 300,000 | | | | 5.709 | | | | 01/09/26 | | | | 298,126 | |
| | | | | | | | | | | | | | |
| | | | | | | | | | | | | 446,302 | |
| | |
| Capital Goods – 0.0% | |
| | Johnson Controls International PLC | |
| | 100,000 | | | | 4.500 | | | | 02/15/47 | | | | 84,519 | |
| | |
| Communications – 0.0% | |
| | RELX Capital, Inc. (United Kingdom) | |
| | 100,000 | | | | 3.000 | | | | 05/22/30 | | | | 87,918 | |
| | |
| Consumer Cyclical – 0.1% | |
| | Honda Motor Co. Ltd. (Japan) | |
| | 400,000 | | | | 2.534 | | | | 03/10/27 | | | | 367,558 | |
| | |
| Consumer Noncyclical – 0.4% | |
| | Ahold Finance USA LLC (Netherlands) | |
| | 360,000 | | | | 6.875 | | | | 05/01/29 | | | | 384,645 | |
| | BAT Capital Corp. (United Kingdom) | |
| | 400,000 | | | | 2.789 | | | | 09/06/24 | | | | 387,232 | |
| | 100,000 | | | | 3.462 | | | | 09/06/29 | | | | 87,294 | |
| | 80,000 | | | | 3.984 | | | | 09/25/50 | | | | 52,428 | |
| | 140,000 | | | | 5.650 | | | | 03/16/52 | | | | 117,099 | |
| | BAT International Finance PLC (United Kingdom) | |
| | 50,000 | | | | 1.668 | | | | 03/25/26 | | | | 45,316 | |
| | Bayer US Finance II LLC (Germany) | |
| | 100,000 | | | | 3.375 | (e) | | | 07/15/24 | | | | 97,788 | |
| | 15,000 | | | | 4.200 | (e) | | | 07/15/34 | | | | 13,131 | |
| | 50,000 | | | | 4.400 | (e) | | | 07/15/44 | | | | 39,312 | |
| | 170,000 | | | | 4.700 | (e) | | | 07/15/64 | | | | 129,857 | |
| | GlaxoSmithKline Capital, Inc. (United Kingdom) | |
| | 200,000 | | | | 6.375 | | | | 05/15/38 | | | | 227,620 | |
| | Reynolds American, Inc. (United Kingdom) | |
| | 250,000 | | | | 5.850 | | | | 08/15/45 | | | | 216,287 | |
| | |
|
| Foreign Corporate Debt – (continued) | |
| Consumer Noncyclical – (continued) | |
| | Takeda Pharmaceutical Co., Ltd. (Japan) | |
| 250,000 | | | | 2.050 | | | | 03/31/30 | | | | 205,840 | |
| | | | | | | | | | | | | | |
| | | | | | | | | | | | | 2,003,849 | |
| | |
| Consumer Products – 0.0% | |
| | Unilever Capital Corp. (United Kingdom) | |
| | 100,000 | | | | 0.626 | | | | 08/12/24 | | | | 95,688 | |
| | |
| Electric – 0.0% | |
| | Emera US Finance LP (Canada) | |
| | 50,000 | | | | 4.750 | | | | 06/15/46 | | | | 38,972 | |
| | |
| Energy – 0.6% | |
| | BP Capital Markets PLC (United Kingdom) | |
| | 300,000 | | | | 3.279 | | | | 09/19/27 | | | | 282,489 | |
| | Canadian Natural Resources Ltd. (Canada) | |
| | 85,000 | | | | 6.250 | | | | 03/15/38 | | | | 85,661 | |
| | Canadian Natural Resources Ltd., GMTN (Canada) | |
| | 100,000 | | | | 4.950 | | | | 06/01/47 | | | | 86,932 | |
| | Cenovus Energy, Inc. (Canada) | |
| | 100,000 | | | | 2.650 | | | | 01/15/32 | | | | 80,571 | |
| | 50,000 | | | | 5.250 | | | | 06/15/37 | | | | 45,830 | |
| | Enbridge, Inc. (Canada) | |
| | 110,000 | | | | 3.125 | | | | 11/15/29 | | | | 97,078 | |
| | 15,000 | | | | 5.500 | | | | 12/01/46 | | | | 13,806 | |
| | 100,000 | | | | 3.400 | | | | 08/01/51 | | | | 67,007 | |
| | (3M U.S. T-Bill MMY + 3.903%) | |
| | 15,000 | | | | 6.250 | (b) | | | 03/01/78 | | | | 13,893 | |
| | Equinor ASA (Norway) | |
| | 140,000 | | | | 1.750 | | | | 01/22/26 | | | | 129,798 | |
| | 40,000 | | | | 3.625 | | | | 09/10/28 | | | | 37,967 | |
| | 210,000 | | | | 3.125 | | | | 04/06/30 | | | | 190,353 | |
| | 210,000 | | | | 3.700 | | | | 04/06/50 | | | | 162,215 | |
| | Shell International Finance BV (Netherlands) | |
| | 40,000 | | | | 2.000 | | | | 11/07/24 | | | | 38,470 | |
| | 55,000 | | | | 3.250 | | | | 05/11/25 | | | | 53,263 | |
| | 75,000 | | | | 4.375 | | | | 05/11/45 | | | | 65,061 | |
| | 462,000 | | | | 4.000 | | | | 05/10/46 | | | | 380,430 | |
| | Suncor Energy, Inc. (Canada) | |
| | 100,000 | | | | 4.000 | | | | 11/15/47 | | | | 74,685 | |
| | TotalEnergies Capital International SA (France) | |
| | 250,000 | | | | 2.434 | | | | 01/10/25 | | | | 240,374 | |
| | 185,000 | | | | 3.455 | | | | 02/19/29 | | | | 172,138 | |
| | 200,000 | | | | 2.829 | | | | 01/10/30 | | | | 177,515 | |
| | 100,000 | | | | 3.127 | | | | 05/29/50 | | | | 69,797 | |
| | TransCanada PipeLines Ltd. (Canada) | |
| | 400,000 | | | | 6.203 | | | | 03/09/26 | | | | 399,699 | |
| | Transcanada Trust(b) (Canada) | |
| | (SOFR + 4.416%) | |
| | 50,000 | | | | 5.500 | | | | 09/15/79 | | | | 42,063 | |
| | | | | | | | | | | | | | |
| | | | | | | | | | | | | 3,007,095 | |
| | |
| Financial Company – 0.1% | |
| AerCap Ireland Capital DAC / AerCap Global Aviation Trust
(Ireland) |
|
| | 455,000 | | | | 3.300 | | | | 01/30/32 | | | | 369,271 | |
| | |
| | |
| 104 | | The accompanying notes are an integral part of these financial statements. |
GOLDMAN SACHS ACCESS U.S. AGGREGATE BOND ETF
| | | | | | | | | | | | | | |
Principal
Amount | | | Interest
Rate | | | Maturity
Date | | | Value | |
|
| Foreign Corporate Debt – (continued) | |
| Food and Beverage – 0.2% | |
| Anheuser-Busch Cos. LLC / Anheuser-Busch InBev Worldwide,
Inc. (Belgium) |
|
| $ | 180,000 | | | | 4.900 | % | | | 02/01/46 | | | $ | 167,640 | |
| | Anheuser-Busch InBev Finance, Inc. (Belgium) | |
| | 55,000 | | | | 4.700 | | | | 02/01/36 | | | | 52,678 | |
| | 100,000 | | | | 4.900 | | | | 02/01/46 | | | | 93,133 | |
| | Anheuser-Busch InBev Worldwide, Inc. (Belgium) | |
| | 300,000 | | | | 3.500 | | | | 06/01/30 | | | | 276,368 | |
| | 46,000 | | | | 4.375 | | | | 04/15/38 | | | | 42,052 | |
| | 40,000 | | | | 4.600 | | | | 04/15/48 | | | | 35,990 | |
| | 40,000 | | | | 5.550 | | | | 01/23/49 | | | | 40,920 | |
| | 300,000 | | | | 4.500 | | | | 06/01/50 | | | | 267,308 | |
| | 90,000 | | | | 4.750 | | | | 04/15/58 | | | | 80,705 | |
| | | | | | | | | | | | | | |
| | | | | | | | | | | | | 1,056,794 | |
| | |
| Insurance – 0.1% | |
| | Fairfax Financial Holdings Ltd. (Canada) | |
| | 400,000 | | | | 3.375 | | | | 03/03/31 | | | | 335,297 | |
| | |
| Internet – 0.0% | |
| | JD.com, Inc. (China) | |
| | 200,000 | | | | 3.875 | | | | 04/29/26 | | | | 191,481 | |
| | |
| Lodging – 0.1% | |
| | Sands China Ltd. (Macau) | |
| | 400,000 | | | | 3.500 | | | | 08/08/31 | | | | 322,500 | |
| | |
| Media – 0.0% | |
| | Grupo Televisa SAB (Mexico) | |
| | 100,000 | | | | 6.625 | | | | 03/18/25 | | | | 100,570 | |
| | |
| Mining – 0.0% | |
| | Southern Copper Corp. (Mexico) | |
| | 55,000 | | | | 3.875 | | | | 04/23/25 | | | | 53,080 | |
| | 100,000 | | | | 5.875 | | | | 04/23/45 | | | | 97,462 | |
| | Teck Resources Ltd. (Canada) | |
| | 40,000 | | | | 6.250 | | | | 07/15/41 | | | | 38,591 | |
| | | | | | | | | | | | | | |
| | | | | | | | | | | | | 189,133 | |
| | |
| Multi-National – 0.0% | |
| | Inter-American Development Bank, GMTN (Supranational) | |
| | 300,000 | | | | 1.750 | | | | 03/14/25 | | | | 285,481 | |
| | |
| Oil Company-Integrated – 0.3% | |
| | Petroleos Mexicanos (Mexico) | |
| | 225,000 | | | | 6.875 | | | | 08/04/26 | | | | 205,011 | |
| | 100,000 | | | | 5.350 | | | | 02/12/28 | | | | 80,230 | |
| | 250,000 | | | | 5.950 | | | | 01/28/31 | | | | 181,286 | |
| | 250,000 | | | | 10.000 | (e) | | | 02/07/33 | | | | 226,266 | |
| | 140,000 | | | | 6.950 | | | | 01/28/60 | | | | 86,292 | |
| | QatarEnergy(e) (Qatar) | |
| | 400,000 | | | | 3.300 | | | | 07/12/51 | | | | 279,724 | |
| | Saudi Arabian Oil Co.(e) (Saudi Arabia) | |
| | 300,000 | | | | 2.250 | | | | 11/24/30 | | | | 246,686 | |
| | | | | | | | | | | | | | |
| | | | | | | | | | | | | 1,305,495 | |
| | |
| Pharmaceuticals – 0.1% | |
| | Astrazeneca Finance LLC (United Kingdom) | |
| | 350,000 | | | | 2.250 | | | | 05/28/31 | | | | 291,945 | |
| | |
|
| Foreign Corporate Debt – (continued) | |
| Technology – 0.1% | |
| | NXP BV / NXP Funding LLC (China) | |
| 40,000 | | | | 5.350 | | | | 03/01/26 | | | | 39,707 | |
| | NXP BV / NXP Funding LLC / NXP USA, Inc. (China) | |
| | 120,000 | | | | 3.400 | | | | 05/01/30 | | | | 105,362 | |
| | 244,000 | | | | 2.500 | | | | 05/11/31 | | | | 197,263 | |
| | 375,000 | | | | 5.000 | | | | 01/15/33 | | | | 355,575 | |
| | | | | | | | | | | | | | |
| | | | | | | | | | | | | 697,907 | |
| | |
| Telecommunications – 0.1% | |
| | America Movil SAB de CV (Mexico) | |
| | 280,000 | | | | 3.625 | | | | 04/22/29 | | | | 255,998 | |
| | 200,000 | | | | 2.875 | | | | 05/07/30 | | | | 171,794 | |
| | | | | | | | | | | | | | |
| | | | | | | | | | | | | 427,792 | |
| | |
| Transportation – 0.1% | |
| | Canadian National Railway Co. (Canada) | |
| | 50,000 | | | | 3.500 | | | | 11/15/42 | | | | 37,261 | |
| | 40,000 | | | | 4.450 | | | | 01/20/49 | | | | 35,352 | |
| | Canadian Pacific Railway Co. (Canada) | |
| | 250,000 | | | | 2.450 | | | | 12/02/31 | | | | 222,358 | |
| | | | | | | | | | | | | | |
| | | | | | | | | | | | | 294,971 | |
| | |
| Wireless – 0.1% | |
| | Rogers Communications, Inc. (Canada) | |
| | 170,000 | | | | 4.500 | | | | 03/15/42 | | | | 136,977 | |
| | Vodafone Group PLC (United Kingdom) | |
| | 250,000 | | | | 4.125 | | | | 05/30/25 | | | | 244,299 | |
| | 300,000 | | | | 4.375 | | | | 05/30/28 | | | | 294,836 | |
| | | | | | | | | | | | | | |
| | | | | | | | | | | | | 676,112 | |
| | |
| Wirelines – 0.1% | |
| | Bell Telephone Co of Canada or Bell Canada/The (Canada) | |
| | 80,000 | | | | 4.300 | | | | 07/29/49 | | | | 63,872 | |
| | Deutsche Telekom International Finance BV (Germany) | |
| | 15,000 | | | | 8.750 | | | | 06/15/30 | | | | 17,640 | |
| | Orange SA (France) | |
| | 140,000 | | | | 9.000 | | | | 03/01/31 | | | | 169,907 | |
| | Telefonica Emisiones SA (Spain) | |
| | 260,000 | | | | 4.895 | | | | 03/06/48 | | | | 208,089 | |
| | Telefonica Europe BV (Spain) | |
| | 50,000 | | | | 8.250 | | | | 09/15/30 | | | | 57,049 | |
| | | | | | | | | | | | | | |
| | | | | | | | | | | | | 516,557 | |
| | |
| | TOTAL FOREIGN CORPORATE DEBT | |
| | (Cost $27,328,128) | | | | | | | $ | 25,351,586 | |
| | |
| | | | | | | | | | | | | | |
|
| Sovereign Debt Obligations – 2.3% | |
| Sovereign – 2.3% | |
| Abu Dhabi Government International Bond (United Arab
Emirates) |
|
| $ | 340,000 | | | | 2.125 | %(e) | | | 09/30/24 | | | $ | 327,467 | |
| | 200,000 | | | | 2.500 | (e) | | | 04/16/25 | | | | 191,024 | |
| | 200,000 | | | | 1.625 | (e) | | | 06/02/28 | | | | 174,856 | |
| | 200,000 | | | | 2.700 | (e) | | | 09/02/70 | | | | 117,268 | |
| | |
| | |
| The accompanying notes are an integral part of these financial statements. | | 105 |
GOLDMAN SACHS ACCESS U.S. AGGREGATE BOND ETF
Schedule of Investments (continued)
August 31, 2023
| | | | | | | | | | | | | | |
Principal
Amount | | | Interest
Rate | | | Maturity
Date | | | Value | |
|
| Sovereign Debt Obligations – (continued) | |
| Sovereign – (continued) | |
| | Chile Government International Bond (Chile) | |
| $ | 400,000 | | | | 2.750 | % | | | 01/31/27 | | | $ | 370,634 | |
| | 200,000 | | | | 2.450 | | | | 01/31/31 | | | | 169,168 | |
| | 200,000 | | | | 3.500 | | | | 01/25/50 | | | | 143,559 | |
| | China Government International Bond(e) (China) | |
| | 200,000 | | | | 0.750 | | | | 10/26/24 | | | | 190,392 | |
| | Colombia Government International Bond (Colombia) | |
| | 200,000 | | | | 3.875 | | | | 04/25/27 | | | | 184,257 | |
| | 200,000 | | | | 4.500 | | | | 03/15/29 | | | | 178,136 | |
| | 100,000 | | | | 6.125 | | | | 01/18/41 | | | | 82,746 | |
| | 220,000 | | | | 5.000 | | | | 06/15/45 | | | | 154,239 | |
| | Hungary Government International Bond(e) (Hungary) | |
| | 300,000 | | | | 6.125 | | | | 05/22/28 | | | | 304,559 | |
| | Indonesia Government International Bond (Indonesia) | |
| | 200,000 | | | | 3.850 | | | | 10/15/30 | | | | 185,190 | |
| | 200,000 | | | | 4.650 | | | | 09/20/32 | | | | 193,109 | |
| | 300,000 | | | | 4.850 | | | | 01/11/33 | | | | 294,301 | |
| | 200,000 | | | | 5.650 | | | | 01/11/53 | | | | 204,136 | |
| | Israel Government International Bond (Israel) | |
| | 200,000 | | | | 4.500 | | | | 01/17/33 | | | | 192,128 | |
| | Malaysia Sovereign Sukuk BHD(e) (Malaysia) | |
| | 300,000 | | | | 3.043 | | | | 04/22/25 | | | | 290,433 | |
| | Mexico Government International Bond (Mexico) | |
| | 400,000 | | | | 4.150 | | | | 03/28/27 | | | | 392,077 | |
| | 250,000 | | | | 3.250 | | | | 04/16/30 | | | | 221,315 | |
| | 400,000 | | | | 4.750 | | | | 04/27/32 | | | | 379,515 | |
| | 250,000 | | | | 3.500 | | | | 02/12/34 | | | | 207,595 | |
| | 320,000 | | | | 3.771 | | | | 05/24/61 | | | | 209,156 | |
| | Panama Government International Bond (Panama) | |
| | 250,000 | | | | 6.700 | | | | 01/26/36 | | | | 263,750 | |
| | 360,000 | | | | 4.500 | | | | 04/01/56 | | | | 264,150 | |
| | 200,000 | | | | 4.500 | | | | 01/19/63 | | | | 144,500 | |
| | Perusahaan Penerbit SBSN Indonesia III (Indonesia) | |
| | 400,000 | | | | 4.550 | (e) | | | 03/29/26 | | | | 395,000 | |
| | 200,000 | | | | 2.800 | (e) | | | 06/23/30 | | | | 173,617 | |
| | 200,000 | | | | 2.550 | (e) | | | 06/09/31 | | | | 167,902 | |
| | Peruvian Government International Bond (Peru) | |
| | 200,000 | | | | 2.783 | | | | 01/23/31 | | | | 169,018 | |
| | 350,000 | | | | 1.862 | | | | 12/01/32 | | | | 262,849 | |
| | 100,000 | | | | 8.750 | | | | 11/21/33 | | | | 123,494 | |
| | 100,000 | | | | 3.300 | | | | 03/11/41 | | | | 73,724 | |
| | Philippine Government International Bond (Philippines) | |
| | 200,000 | | | | 3.750 | | | | 01/14/29 | | | | 188,142 | |
| | 400,000 | | | | 2.457 | | | | 05/05/30 | | | | 340,714 | |
| | 220,000 | | | | 5.609 | | | | 04/13/33 | | | | 229,131 | |
| | 250,000 | | | | 6.375 | | | | 10/23/34 | | | | 273,783 | |
| | Province of Alberta Canada (Canada) | |
| | 50,000 | | | | 3.300 | | | | 03/15/28 | | | | 47,382 | |
| | Province of Ontario Canada (Canada) | |
| | 30,000 | | | | 1.050 | | | | 05/21/27 | | | | 26,372 | |
| | 30,000 | | | | 1.600 | | | | 02/25/31 | | | | 24,543 | |
| | Province of Quebec Canada (Canada) | |
| | 90,000 | | | | 0.600 | | | | 07/23/25 | | | | 82,880 | |
| | 25,000 | | | | 2.750 | | | | 04/12/27 | | | | 23,409 | |
| | Qatar Government International Bond (Qatar) | |
| | 280,000 | | | | 3.400 | (e) | | | 04/16/25 | | | | 272,063 | |
| | |
|
| Sovereign Debt Obligations – (continued) | |
| Sovereign – (continued) | |
| | Qatar Government International Bond (Qatar) – (continued) | |
| 300,000 | | | | 3.750 | %(e) | | | 04/16/30 | | | | 284,198 | |
| | 200,000 | | | | 4.817 | (e) | | | 03/14/49 | | | | 186,126 | |
| | Republic of Poland Government International Bond (Poland) | |
| | 30,000 | | | | 3.250 | | | | 04/06/26 | | | | 28,760 | |
| | 100,000 | | | | 5.750 | | | | 11/16/32 | | | | 103,991 | |
| | Romanian Government International Bond (Romania) | |
| | 16,000 | | | | 3.000 | (e) | | | 02/14/31 | | | | 13,216 | |
| | 50,000 | | | | 5.125 | (e) | | | 06/15/48 | | | | 41,506 | |
| | Saudi Government International Bond (Saudi Arabia) | |
| | 300,000 | | | | 2.900 | (e) | | | 10/22/25 | | | | 285,366 | |
| | 300,000 | | | | 4.750 | (e) | | | 01/18/28 | | | | 296,930 | |
| | 500,000 | | | | 4.875 | (e) | | | 07/18/33 | | | | 492,690 | |
| | 300,000 | | | | 5.000 | (e) | | | 01/18/53 | | | | 266,468 | |
| | Uruguay Government International Bond (Uruguay) | |
| | 15,000 | | | | 4.375 | | | | 01/23/31 | | | | 14,681 | |
| | 250,000 | | | | 5.100 | | | | 06/18/50 | | | | 240,469 | |
| | | | | | | | | | | | | | |
| | | | | | | | | | | | | 11,158,084 | |
| | |
| | TOTAL SOVEREIGN DEBT OBLIGATIONS | |
| | (Cost $11,959,747) | | | | | | | $ | 11,158,084 | |
| | |
| | | | | | | | | | | | | | |
|
| U.S. Treasury Obligations – 4.5%(f) | |
| | U.S. Treasury Bonds | |
| $ | 15,186,000 | | | | 2.750 | % | | | 08/15/42 | | | $ | 11,947,179 | |
| | 4,940,000 | | | | 2.375 | | | | 11/15/49 | | | | 3,455,821 | |
| | 10,551,000 | | | | 2.000 | | | | 02/15/50 | | | | 6,757,639 | |
| | |
| | TOTAL U.S. TREASURY OBLIGATIONS | |
| | (Cost $25,532,289) | | | | | | | $ | 22,160,639 | |
| | |
| | | | | | | | |
| Shares | | Dividend
Rate | | | Value | |
|
| Investment Company – 9.2%(g) | |
Goldman Sachs Financial Square Government Fund – Institutional Shares | |
| 45,185,528 | | | 5.234 | % | | $ | 45,185,528 | |
| (Cost $45,185,528) | | | | | |
| |
| TOTAL INVESTMENTS – 113.9% | |
| (Cost $591,799,923) | | | $ | 560,762,374 | |
| |
LIABILITIES IN EXCESS OF ASSETS – (13.9)% | | | | (68,129,640 | ) |
| |
| NET ASSETS – 100.0% | | | $ | 492,632,734 | |
| |
| | |
| 106 | | The accompanying notes are an integral part of these financial statements. |
GOLDMAN SACHS ACCESS U.S. AGGREGATE BOND ETF
| | |
|
| The percentage shown for each investment category reflects the value of investments in that category as a percentage of net assets. |
| |
(a) | | TBA (To Be Announced) Securities are purchased on a forward commitment basis with an approximate principal amount and no defined maturity date. The actual principal and maturity date will be determined upon settlement when the specific mortgage pools are assigned. Total market value of TBA securities (excluding forward sales contracts, if any) amounts to $77,133,374 which represents approximately 15.7% of the Fund’s net assets as of August 31, 2023. |
| |
(b) | | Variable rate security. Interest rate or distribution rate disclosed is that which is in effect on August 31, 2023. |
| |
(c) | | Step coupon. |
| |
(d) | | Issued with a zero coupon. Income is recognized through the accretion of discount. |
| |
(e) | | Exempt from registration under Rule 144A of the Securities Act of 1933. |
| |
(f) | | Interest rates represent either the stated coupon rate, annualized yield on date of purchase for discounted securities, or, for floating rate securities, the current reset rate, which is based upon current interest rate indices. |
| |
(g) | | Represents an affiliated issuer. |
| | |
|
Investment Abbreviations: |
CMT | | —Constant Maturity Treasury Index |
GMTN | | —Global Medium Term Note |
LIBOR | | —London Interbank Offered Rate |
LP | | —Limited Partnership |
MTN | | —Medium Term Note |
PLC | | —Public Limited Company |
REIT | | —Real Estate Investment Trust |
SOFR | | —Secured Overnight Financing Rate |
SOFRINDX | | —Secured Overnight Financing Rate Index |
|
FORWARD SALES CONTRACTS — At August 31, 2023, the Fund had the following forward sales contracts:
| | | | | | | | | | | | | | | | | | |
| Description | | Interest
Rate | | | Maturity
Date(a) | | Settlement
Date | | | Principal
Amount | | | Value | |
Federal National Mortgage Association | | | 2.000 | % | | TBA-30yr | | | 09/15/53 | | | $ | (14,000,000 | ) | | $ | (11,134,375 | ) |
Federal National Mortgage Association | | | 5.000 | | | TBA-30yr | | | 09/15/53 | | | | (15,000,000 | ) | | | (14,546,484 | ) |
| | |
| Total (Proceed Receivable $(25,777,793)) | | | | | | | $ | (25,680,859 | ) |
| | (a) | | TBA (To Be Announced) Securities are purchased on a forward commitment basis with an approximate principal amount and no defined maturity date. The actual principal and maturity date will be determined upon settlement when the specific mortgage pools are assigned. |
| | |
| The accompanying notes are an integral part of these financial statements. | | 107 |
GOLDMAN SACHS ACCESS ULTRA SHORT BOND ETF
Schedule of Investments
August 31, 2023
| | | | | | | | | | | | | | |
Principal
Amount | | | Interest
Rate | | | Maturity
Date | | | Value | |
|
| Asset-Backed Securities – 26.0% | |
| Access to Loans for Learning Student Loan Corp., Series 2010-I,
Class A3(a) |
|
| | (SOFR + 1.062%) | |
| $ | 421,504 | | | | 6.116 | % | | | 04/25/37 | | | $ | 422,437 | |
| Access to Loans for Learning Student Loan Corp., Series 2012-1,
Class A(a) |
|
| | (SOFR + 0.814%) | |
| | 14,917 | | | | 6.102 | | | | 07/25/36 | | | | 14,830 | |
| | Ally Auto Receivables Trust, Series 2022-1, Class A3 | |
| | 3,170,000 | | | | 3.310 | | | | 11/15/26 | | | | 3,105,791 | |
| American Express Credit Account Master Trust, Series 2022-2,
Class A |
|
| | 6,000,000 | | | | 3.390 | | | | 05/15/27 | | | | 5,814,920 | |
| American Express Credit Account Master Trust 2023-1,
Series 2023-1, Class A |
|
| | 2,100,000 | | | | 4.870 | | | | 05/15/28 | | | | 2,091,658 | |
| | Anchorage Capital CLO Ltd., Series 2014-4RA, Class A(a)(b) | |
| | (3M U.S. T-Bill MMY + 1.312%) (Cayman Islands) | |
| | 830,232 | | | | 6.677 | | | | 01/28/31 | | | | 826,780 | |
| | Atlas Senior Loan Fund III Ltd., Series 2013-1A, Class AR(a)(b) | |
| | (3M U.S. T-Bill MMY + 1.092%) (Cayman Islands) | |
| | 5,138 | | | | 6.468 | | | | 11/17/27 | | | | 5,132 | |
| | BA Credit Card Trust, Series 2021-A1, Class A1 | |
| | 500,000 | | | | 0.440 | | | | 09/15/26 | | | | 485,142 | |
| | BA Credit Card Trust, Series 2022-A2, Class A2 | |
| | 2,100,000 | | | | 5.000 | | | | 04/15/28 | | | | 2,094,001 | |
| | Barclays Dryrock Issuance Trust, Series 2021-1, Class A | |
| | 2,400,000 | | | | 0.630 | | | | 07/15/27 | | | | 2,285,177 | |
| | Barings CLO Ltd., Series 2018-3A, Class A1(a)(b) | |
| | (3M U.S. T-Bill MMY + 1.212%) (Cayman Islands) | |
| | 186,776 | | | | 6.538 | | | | 07/20/29 | | | | 186,591 | |
| | BBCMS Mortgage Trust, Series 2018-C2, Class ASB | |
| | 556,930 | | | | 4.236 | | | | 12/15/51 | | | | 532,340 | |
| | BlueMountain CLO Ltd., Series 2017-2A, Class A1R(a)(b) | |
| | (3M U.S. T-Bill MMY + 1.442%) (Cayman Islands) | |
| | 801,959 | | | | 6.787 | | | | 10/22/30 | | | | 799,299 | |
| | BSPDF Issuer Ltd., Series 2021-FL1, Class A(a)(b) | |
| | (1M U.S. T-Bill MMY + 1.314%) (Cayman Islands) | |
| | 1,150,000 | | | | 6.625 | | | | 10/15/36 | | | | 1,117,768 | |
| | BX, Series 2021-MFM1, Class A(a)(b) | |
| | (1M U.S. T-Bill MMY + 0.810%) | |
| | 90,425 | | | | 6.125 | | | | 01/15/34 | | | | 89,014 | |
| | BX Trust, Series 2021-ARIA, Class A(a)(b) | |
| | (1M U.S. T-Bill MMY + 1.014%) | |
| | 1,300,000 | | | | 6.324 | | | | 10/15/36 | | | | 1,266,818 | |
| | BXHPP Trust, Series 2021-FILM, Class A(a)(b) | |
| | (1M U.S. T-Bill MMY + 0.764%) | |
| | 1,850,000 | | | | 6.075 | | | | 08/15/36 | | | | 1,742,716 | |
| | CARDS II Trust, Series 2021-1A, Class A(b) | |
| | (Canada) | |
| | 3,125,000 | | | | 0.602 | | | | 04/15/27 | | | | 3,031,320 | |
| | Carlyle US CLO Ltd., Series 2017-2A, Class A1R(a)(b) | |
| | (3M U.S. T-Bill MMY + 1.312%) (Cayman Islands) | |
| | 2,000,000 | | | | 6.638 | | | | 07/20/31 | | | | 1,991,720 | |
| | CFCRE Commercial Mortgage Trust, Series 2016-C3, Class A3 | |
| | 245,000 | | | | 3.865 | | | | 01/10/48 | | | | 232,978 | |
| | |
|
| Asset-Backed Securities – (continued) | |
| | CIFC Funding Ltd., Series 2017-3A, Class A1(a)(b) | |
| | (3M U.S. T-Bill MMY + 1.482%) (Cayman Islands) | |
| 2,128,166 | | | | 6.808 | | | | 07/20/30 | | | | 2,124,880 | |
| | CIFC Funding Ltd., Series 2021-2A, Class AR(a)(b) | |
| | (3M U.S. T-Bill MMY + 1.212%) (Cayman Islands) | |
| | 484,345 | | | | 6.538 | | | | 04/20/30 | | | | 482,185 | |
| Citigroup Commercial Mortgage Trust, Series 2014-GC19,
Class A4 |
|
| | 2,400,000 | | | | 4.023 | | | | 03/11/47 | | | | 2,385,196 | |
| Citigroup Commercial Mortgage Trust, Series 2014-GC21,
Class A5 |
|
| | 600,000 | | | | 3.855 | | | | 05/10/47 | | | | 590,489 | |
| Citigroup Commercial Mortgage Trust, Series 2015-GC29,
Class AAB |
|
| | 106,155 | | | | 2.984 | | | | 04/10/48 | | | | 104,483 | |
| Citigroup Commercial Mortgage Trust, Series 2015-GC33,
Class A4 |
|
| | 3,000,000 | | | | 3.778 | | | | 09/10/58 | | | | 2,827,605 | |
| Citigroup Commercial Mortgage Trust, Series 2016-GC37,
Class A3 |
|
| | 2,738,532 | | | | 3.050 | | | | 04/10/49 | | | | 2,597,997 | |
| | COMM Mortgage Trust, Series 2013-CR12, Class A4 | |
| | 373,484 | | | | 4.046 | | | | 10/10/46 | | | | 317,077 | |
| | COMM Mortgage Trust, Series 2014-CR19, Class A5 | |
| | 3,350,000 | | | | 3.796 | | | | 08/10/47 | | | | 3,291,217 | |
| | COMM Mortgage Trust, Series 2014-UBS2, Class A5 | |
| | 5,000,000 | | | | 3.961 | | | | 03/10/47 | | | | 4,937,394 | |
| | COMM Mortgage Trust, Series 2015-CR24, Class ASB | |
| | 186,622 | | | | 3.445 | | | | 08/10/48 | | | | 183,519 | |
| | COMM Mortgage Trust, Series 2015-CR25, Class A3 | |
| | 1,967,088 | | | | 3.505 | | | | 08/10/48 | | | | 1,901,819 | |
| | COMM Mortgage Trust, Series 2015-CR26, Class ASB | |
| | 398,638 | | | | 3.373 | | | | 10/10/48 | | | | 382,551 | |
| | COMM Mortgage Trust, Series 2016-DC2, Class A4 | |
| | 486,012 | | | | 3.497 | | | | 02/10/49 | | | | 467,560 | |
| | CSAIL Commercial Mortgage Trust, Series 2015-C3, Class A4 | |
| | 1,300,000 | | | | 3.718 | | | | 08/15/48 | | | | 1,233,407 | |
| | DBJPM Mortgage Trust, Series 2016-C3, Class ASB | |
| | 206,837 | | | | 2.756 | | | | 08/10/49 | | | | 196,870 | |
| | Discover Card Execution Note Trust, Series 2017-A5, Class A5(a) | |
| | (1M U.S. T-Bill MMY + 0.714%) | |
| | 2,000,000 | | | | 6.025 | | | | 12/15/26 | | | | 2,005,188 | |
| | Discover Card Execution Note Trust, Series 2023-A1, Class A | |
| | 2,925,000 | | | | 4.310 | | | | 03/15/28 | | | | 2,866,557 | |
| | Dryden XXVI Senior Loan Fund, Series 2013-26A, Class AR(a)(b) | |
| | (3M U.S. T-Bill MMY + 1.162%) (Cayman Islands) | |
| | 194,814 | | | | 6.470 | | | | 04/15/29 | | | | 194,098 | |
| | Edsouth Indenture No 3 LLC, Series 2012-2, Class A(a)(b) | |
| | (SOFR + 0.844%) | |
| | 18,347 | | | | 6.132 | | | | 04/25/39 | | | | 18,283 | |
| | Educational Funding of the South, Inc., Series 2011-1, Class A2(a) | |
| | (SOFR + 0.912%) | |
| | 216,576 | | | | 5.966 | | | | 04/25/35 | | | | 216,347 | |
| | EFS Volunteer LLC, Series 2010-1, Class A2(a)(b) | |
| | (SOFR + 1.112%) | |
| | 161,846 | | | | 6.166 | | | | 10/25/35 | | | | 161,773 | |
| | |
| | |
| 108 | | The accompanying notes are an integral part of these financial statements. |
GOLDMAN SACHS ACCESS ULTRA SHORT BOND ETF
| | | | | | | | | | | | | | |
Principal
Amount | | | Interest
Rate | | | Maturity
Date | | | Value | |
|
| Asset-Backed Securities – (continued) | |
| | Extended Stay America Trust, Series 2021-ESH, Class A(a)(b) | |
| | (1M U.S. T-Bill MMY + 1.194%) | |
| $ | 1,383,747 | | | | 6.505 | % | | | 07/15/38 | | | $ | 1,369,924 | |
| | Flatiron CLO 19 Ltd., Series 2021-1A, Class AR(a)(b) | |
| | (3M U.S. T-Bill MMY + 1.342%) (Cayman Islands) | |
| | 1,000,000 | | | | 6.713 | | | | 11/16/34 | | | | 991,935 | |
| | Ford Credit Auto Owner Trust 2022-A, Series 2022-A, Class A3 | |
| | 2,908,652 | | | | 1.290 | | | | 06/15/26 | | | | 2,817,069 | |
| GM Financial Consumer Automobile Receivables Trust,
Series 2022-1, Class A3 |
|
| | 4,520,000 | | | | 1.260 | | | | 11/16/26 | | | | 4,350,211 | |
| | GMF Floorplan Owner Revolving Trust, Series 2020-2, Class A(b) | |
| | 1,000,000 | | | | 0.690 | | | | 10/15/25 | | | | 994,796 | |
| GMF Floorplan Owner Revolving Trust, Series 2023-1,
Class A1(b) |
|
| | 1,500,000 | | | | 5.340 | | | | 06/15/28 | | | | 1,497,361 | |
| | Goal Capital Funding Trust, Series 2010-1, Class A(a)(b) | |
| | (3M USD LIBOR + 0.700%) | |
| | 125,269 | | | | 6.353 | | | | 08/25/48 | | | | 122,322 | |
| | Great Wolf Trust, Series 2019-WOLF, Class A(a)(b) | |
| | (1M U.S. T-Bill MMY + 1.150%) | |
| | 3,250,000 | | | | 6.459 | | | | 12/15/36 | | | | 3,232,387 | |
| | GS Mortgage Securities Trust, Series 2014-GC18, Class A4 | |
| | 4,500,000 | | | | 4.074 | | | | 01/10/47 | | | | 4,374,023 | |
| | HalseyPoint CLO Ltd., Series 2020-3A, Class A1A(a)(b) | |
| | (3M U.S. T-Bill MMY + 1.712%) (Cayman Islands) | |
| | 500,000 | | | | 7.081 | | | | 11/30/32 | | | | 497,679 | |
| | Hayfin US Ltd., Series 2018-8A, Class A(a)(b) | |
| | (3M U.S. T-Bill MMY + 1.382%) (Cayman Islands) | |
| | 2,989,538 | | | | 6.708 | | | | 04/20/31 | | | | 2,973,592 | |
| Honda Auto Receivables 2021-3 Owner Trust, Series 2021-3,
Class A3 |
|
| | 829,030 | | | | 0.410 | | | | 11/18/25 | | | | 802,215 | |
| Honda Auto Receivables 2021-4 Owner Trust, Series 2021-4,
Class A3 |
|
| | 2,289,708 | | | | 0.880 | | | | 01/21/26 | | | | 2,209,107 | |
| Honda Auto Receivables 2023-2 Owner Trust, Series 2023-2,
Class A2 |
|
| | 1,900,000 | | | | 5.410 | | | | 04/15/26 | | | | 1,899,146 | |
| Hyundai Auto Lease Securitization Trust 2022-A, Series 2022-A,
Class A4(b) |
|
| | 3,800,000 | | | | 1.320 | | | | 12/15/25 | | | | 3,693,514 | |
| Hyundai Auto Lease Securitization Trust 2023-B, Series 2023-B,
Class A2A(b) |
|
| | 1,800,000 | | | | 5.470 | | | | 09/15/25 | | | | 1,798,637 | |
| Hyundai Auto Receivables Trust 2020-C, Series 2020-C,
Class A4 |
|
| | 4,000,000 | | | | 0.490 | | | | 11/16/26 | | | | 3,825,162 | |
| Hyundai Auto Receivables Trust 2021-C, Series 2021-C,
Class A3 |
|
| | 1,778,423 | | | | 0.740 | | | | 05/15/26 | | | | 1,717,837 | |
| Hyundai Auto Receivables Trust 2022-C, Series 2022-C,
Class A3 |
|
| | 3,625,000 | | | | 5.390 | | | | 06/15/27 | | | | 3,627,688 | |
| JPMBB Commercial Mortgage Securities Trust, Series 2014-C18,
Class ASB |
|
| | 6,092 | | | | 3.566 | | | | 02/15/47 | | | | 6,075 | |
| | |
|
| Asset-Backed Securities – (continued) | |
| | LCM XV LP, Series 2021-15A, Class AR2(a)(b) | |
| | (3M U.S. T-Bill MMY + 1.262%) (Cayman Islands) | |
| 1,689,278 | | | | 6.588 | | | | 07/20/30 | | | | 1,679,594 | |
| | LCM XX LP, Series 2018-20A, Class AR(a)(b) | |
| | (3M U.S. T-Bill MMY + 1.302%) (Cayman Islands) | |
| | 13,466 | | | | 6.628 | | | | 10/20/27 | | | | 13,460 | |
| | Madison Park Funding Ltd., Series 2021-37A, Class AR(a)(b) | |
| | (3M U.S. T-Bill MMY + 1.332%) (Cayman Islands) | |
| | 1,500,000 | | | | 6.640 | | | | 07/15/33 | | | | 1,492,474 | |
| | Madison Park Funding XLI Ltd., Series 2017-12A, Class AR(a)(b) | |
| | (3M U.S. T-Bill MMY + 1.092%) (Cayman Islands) | |
| | 143,303 | | | | 6.437 | | | | 04/22/27 | | | | 142,875 | |
| | Marathon CLO Ltd., Series 2021-1A, Class AANR(a)(b) | |
| | (3M U.S. T-Bill MMY + 1.582%) (Cayman Islands) | |
| | 2,200,000 | | | | 6.890 | | | | 04/15/32 | | | | 2,186,085 | |
| | Master Credit Card Trust, Series 2021-1A, Class A(b) | |
| | (Canada) | |
| | 1,400,000 | | | | 0.530 | | | | 11/21/25 | | | | 1,350,245 | |
| Mercedes-Benz Auto Lease Trust 2021-B, Series 2021-B,
Class A3 |
|
| | 414,640 | | | | 0.400 | | | | 11/15/24 | | | | 410,115 | |
| Mercedes-Benz Auto Receivables Trust 2022-1, Series 2022-1,
Class A2 |
|
| | 708,577 | | | | 5.260 | | | | 10/15/25 | | | | 707,909 | |
| Morgan Stanley Bank of America Merrill Lynch Trust 2016-C29,
Series 2016-C29, Class A3 |
|
| | 4,495,100 | | | | 3.058 | | | | 05/15/49 | | | | 4,253,842 | |
| | Morgan Stanley Capital I Trust, Series 2016-BNK2, Class ASB | |
| | 389,825 | | | | 2.860 | | | | 11/15/49 | | | | 371,770 | |
| | Nelnet Student Loan Trust, Series 2014-2A, Class A2(a)(b) | |
| | (SOFR + 0.714%) | |
| | 25,017 | | | | 6.002 | | | | 03/25/30 | | | | 25,011 | |
| | Nelnet Student Loan Trust, Series 2016-1A, Class A(a)(b) | |
| | (SOFR + 0.914%) | |
| | 330,408 | | | | 6.202 | | | | 09/25/65 | | | | 327,423 | |
| | Nissan Auto Lease Trust 2023-B, Series 2023-B, Class A2A | |
| | 1,800,000 | | | | 5.740 | | | | 08/15/25 | | | | 1,803,342 | |
| | Northstar Education Finance, Inc., Series 2012-1, Class A(a)(b) | |
| | (SOFR + 0.814%) | |
| | 37,670 | | | | 6.102 | | | | 12/26/31 | | | | 37,691 | |
| | NorthStar Student Loan Trust III, Series 2016-1, Class A(a)(b) | |
| | (1M U.S. T-Bill MMY + 1.364%) | |
| | 5,671 | | | | 6.679 | | | | 05/27/36 | | | | 5,672 | |
| | ONE PARK Mortgage Trust, Series 2021-PARK, Class A(a)(b) | |
| | (1M U.S. T-Bill MMY + 0.810%) | |
| | 908,000 | | | | 6.125 | | | | 03/15/36 | | | | 862,197 | |
| | OZLM Ltd., Series 2017-11A, Class A1R(a)(b) | |
| | (3M U.S. T-Bill MMY + 1.512%) (Cayman Islands) | |
| | 164,634 | | | | 6.881 | | | | 10/30/30 | | | | 164,398 | |
| | Regata Funding Ltd., Series 2021-1A, Class AR(a)(b) | |
| | (3M U.S. T-Bill MMY + 1.362%) (Cayman Islands) | |
| | 2,000,000 | | | | 6.670 | | | | 10/15/32 | | | | 1,983,662 | |
| | Rhode Island Student Loan Authority, Series 2012-1, Class A1(a) | |
| | (SOFR + 1.014%) | |
| | 543,198 | | | | 6.326 | | | | 07/01/31 | | | | 542,849 | |
| | Rhode Island Student Loan Authority, Series 2014-1, Class A1(a) | |
| | (SOFR + 0.814%) | |
| | 62,280 | | | | 6.126 | | | | 10/02/28 | | | | 61,006 | |
| | |
| | |
| The accompanying notes are an integral part of these financial statements. | | 109 |
GOLDMAN SACHS ACCESS ULTRA SHORT BOND ETF
Schedule of Investments (continued)
August 31, 2023
| | | | | | | | | | | | | | |
Principal
Amount | | | Interest
Rate | | | Maturity
Date | | | Value | |
|
| Asset-Backed Securities – (continued) | |
| | Shackleton 2015-VIII CLO Ltd., Series 2017-8A, Class A2R(a)(b) | |
| | (3M U.S. T-Bill MMY + 1.182%) (Cayman Islands) | |
| $ | 90,608 | | | | 6.508 | % | | | 10/20/27 | | | $ | 90,519 | |
| | SLC Student Loan Trust, Series 2007-1, Class A4(a) | |
| | (SOFR + 0.322%) | |
| | 745,908 | | | | 5.451 | | | | 05/15/29 | | | | 743,366 | |
| | SLC Student Loan Trust, Series 2010-1, Class A(a) | |
| | (SOFR + 1.137%) | |
| | 165,868 | | | | 6.300 | | | | 11/25/42 | | | | 165,884 | |
| | SLM Student Loan Trust, Series 2005-7, Class A4(a) | |
| | (SOFR + 0.412%) | |
| | 35,538 | | | | 5.466 | | | | 10/25/29 | | | | 35,423 | |
| | SLM Student Loan Trust, Series 2018-10, Class A7B(a)(b) | |
| | (SOFR + 0.862%) | |
| | 51,185 | | | | 5.916 | | | | 10/25/29 | | | | 50,897 | |
| | SOUND POINT CLO XXII Ltd., Series 2019-1A, Class AR(a)(b) | |
| | (3M U.S. T-Bill MMY + 1.342%) (Cayman Islands) | |
| | 600,000 | | | | 6.668 | | | | 01/20/32 | | | | 594,673 | |
| | Stratus CLO 2021-2 Ltd., Series 2021-2A, Class A(a)(b) | |
| | (3M U.S. T-Bill MMY + 1.162%) (Cayman Islands) | |
| | 3,529,559 | | | | 6.488 | | | | 12/28/29 | | | | 3,510,327 | |
| | STWD Trust, Series 2021-FLWR, Class A(a)(b) | |
| | (1M U.S. T-Bill MMY + 0.691%) | |
| | 1,350,000 | | | | 6.001 | | | | 07/15/36 | | | | 1,319,654 | |
| | Sycamore Tree CLO 2023-2 Ltd., Series 2023-2A, Class A(a)(b) | |
| | (3M U.S. T-Bill MMY + 2.330%) (Cayman Islands) | |
| | 2,200,000 | | | | 7.656 | | | | 04/20/35 | | | | 2,209,000 | |
| | TCW CLO 2019-2 Ltd., Series 2022-2A, Class A1R(a)(b) | |
| | (3M U.S. T-Bill MMY + 1.280%) (Cayman Islands) | |
| | 3,500,000 | | | | 6.606 | | | | 10/20/32 | | | | 3,472,249 | |
| | TCW CLO AMR Ltd., Series 2021-1A, Class ASNR(a)(b) | |
| | (3M U.S. T-Bill MMY + 1.482%) (Cayman Islands) | |
| | 1,100,000 | | | | 6.853 | | | | 08/16/34 | | | | 1,084,746 | |
| | TCW CLO Ltd., Series 2022-1A, Class A1(a)(b) | |
| | (3M U.S. T-Bill MMY + 1.340%) (Cayman Islands) | |
| | 3,500,000 | | | | 6.686 | | | | 04/22/33 | | | | 3,466,886 | |
| Toyota Auto Receivables 2021-D Owner Trust, Series 2021-D,
Class A3 |
|
| | 2,125,325 | | | | 0.710 | | | | 04/15/26 | | | | 2,046,639 | |
| Toyota Auto Receivables 2022-D Owner Trust, Series 2022-D,
Class A3 |
|
| | 1,825,000 | | | | 5.300 | | | | 09/15/27 | | | | 1,826,916 | |
| | Tralee CLO II Ltd., Series 2017-1A, Class AR(a)(b) | |
| | (3M USD LIBOR + 1.320%) (Cayman Islands) | |
| | 184,027 | | | | 6.908 | | | | 07/20/29 | | | | 183,964 | |
| | Trimaran Cavu Ltd., Series 2021-1A, Class A(a)(b) | |
| | (3M U.S. T-Bill MMY + 1.472%) (Cayman Islands) | |
| | 1,000,000 | | | | 6.817 | | | | 04/23/32 | | | | 991,710 | |
| | Trysail CLO Ltd., Series 2021-1A, Class A1(a)(b) | |
| | (3M U.S. T-Bill MMY + 1.582%) (Cayman Islands) | |
| | 3,000,000 | | | | 6.908 | | | | 07/20/32 | | | | 2,977,389 | |
| UBS Commercial Mortgage Trust 2017-C2, Series 2017-C2,
Class ASB |
|
| | 809,050 | | | | 3.264 | | | | 08/15/50 | | | | 772,825 | |
| | Voya CLO 2019-2 Ltd., Series 2019-2A, Class A(a)(b) | |
| | (3M U.S. T-Bill MMY + 1.532%) (Cayman Islands) | |
| | 700,000 | | | | 6.858 | | | | 07/20/32 | | | | 698,937 | |
| | |
|
| Asset-Backed Securities – (continued) | |
| | Voya CLO Ltd., Series 2015-1A, Class A1R(a)(b) | |
| | (3M U.S. T-Bill MMY + 1.162%) (Cayman Islands) | |
| 109,777 | | | | 6.472 | | | | 01/18/29 | | | | 109,471 | |
| Wells Fargo Commercial Mortgage Trust, Series 2015-C31,
Class ASB |
|
| | 61,782 | | | | 3.487 | | | | 11/15/48 | | | | 60,018 | |
| Wells Fargo Commercial Mortgage Trust 2016-C32,
Series 2016-C32, Class A3 |
|
| | 1,422,360 | | | | 3.294 | | | | 01/15/59 | | | | 1,353,254 | |
| World Omni Automobile Lease Securitization Trust 2023-A,
Series 2023-A, Class A2A |
|
| | 1,400,000 | | | | 5.470 | | | | 11/17/25 | | | | 1,399,753 | |
| | Zais CLO Ltd., Series 2021-15A, Class A1R(a)(b) | |
| | (3M U.S. T-Bill MMY + 1.612%) (Cayman Islands) | |
| | 1,000,000 | | | | 6.977 | | | | 07/28/32 | | | | 988,002 | |
| | |
| | TOTAL ASSET-BACKED SECURITIES | |
| | (Cost $149,932,389) | | | $ | 148,997,729 | |
| | |
| | | | | | | | | | | | | | |
|
| Mortgage-Backed Securities – 23.6% | |
| | Federal Home Loan Mortgage Corporation Series MTN | |
| $ | 1,438,000 | | | | 5.400 | % | | | 06/11/24 | | | $ | 1,434,061 | |
| | 1,438,000 | | | | 5.380 | | | | 06/12/24 | | | | 1,433,570 | |
| | FHLMC REMIC(a) (12M USD LIBOR + 1.618%) | |
| | 6,517,825 | | | | 4.795 | | | | 01/01/46 | | | | 6,549,101 | |
| | FHLMC REMIC(a) (12M USD LIBOR + 1.803%) | |
| | 3,406,143 | | | | 4.767 | | | | 10/01/43 | | | | 3,428,338 | |
| | FHLMC REMIC(a) (12M USD LIBOR + 1.779%) | |
| | 625,729 | | | | 4.872 | | | | 10/01/44 | | | | 629,132 | |
| | FHLMC REMIC Series 2003-2682, Class FB(a) (SOFR + 1.014%) | |
| | 151,653 | | | | 6.203 | | | | 10/15/33 | | | | 151,366 | |
| FHLMC REMIC Series 2003-2711, Class FA(a) (SOFR +
1.114%) |
|
| | 161,618 | | | | 6.303 | | | | 11/15/33 | | | | 164,401 | |
| FHLMC REMIC Series 2005-3033, Class FG(a) (SOFR +
0.464%) |
|
| | 449,834 | | | | 5.653 | | | | 09/15/35 | | | | 440,379 | |
| | FHLMC REMIC Series 2007-3298, Class FC(a) (SOFR + 0.534%) | |
| | 97,064 | | | | 5.723 | | | | 04/15/37 | | | | 94,508 | |
| | FHLMC REMIC Series 2007-3314, Class FC(a) (SOFR + 0.514%) | |
| | 21,406 | | | | 5.703 | | | | 12/15/36 | | | | 20,946 | |
| | FHLMC REMIC Series 2007-3316, Class FB(a) (SOFR + 0.414%) | |
| | 524,188 | | | | 5.603 | | | | 08/15/35 | | | | 512,665 | |
| FHLMC REMIC Series 2007-3371, Class FA(a) (SOFR +
0.714%) |
|
| | 104,684 | | | | 5.903 | | | | 09/15/37 | | | | 103,039 | |
| | FHLMC REMIC Series 2009-3593, Class CF(a) (SOFR + 0.714%) | |
| | 1,161,789 | | | | 5.903 | | | | 02/15/36 | | | | 1,159,888 | |
| FHLMC REMIC Series 2011-3895, Class FM(a) (SOFR +
0.464%) |
|
| | 37,545 | | | | 5.653 | | | | 12/15/40 | | | | 37,447 | |
| FHLMC REMIC Series 2012-4040, Class FW(a) (SOFR +
0.484%) |
|
| | 334,766 | | | | 5.673 | | | | 05/15/32 | | | | 330,289 | |
| | FHLMC REMIC Series 2012-4057, Class FE(a) (SOFR + 0.564%) | |
| | 705,065 | | | | 5.753 | | | | 06/15/42 | | | | 689,522 | |
| | |
| | |
| 110 | | The accompanying notes are an integral part of these financial statements. |
GOLDMAN SACHS ACCESS ULTRA SHORT BOND ETF
| | | | | | | | | | | | | | |
Principal
Amount | | | Interest
Rate | | | Maturity
Date | | | Value | |
|
| Mortgage-Backed Securities – (continued) | |
| FHLMC REMIC Series 2012-4068, Class UF(a) (SOFR +
0.614%) |
|
| $ | 178,446 | | | | 5.803 | % | | | 06/15/42 | | | $ | 170,607 | |
| FHLMC REMIC Series 2012-4098, Class MF(a) (SOFR +
0.414%) |
|
| | 145,989 | | | | 5.603 | | | | 11/15/41 | | | | 144,239 | |
| FHLMC REMIC Series 2012-4107, Class MF(a) (SOFR +
0.514%) |
|
| | 1,508,449 | | | | 5.703 | | | | 09/15/42 | | | | 1,466,660 | |
| FHLMC REMIC Series 2012-4126, Class GF(a) (SOFR +
0.514%) |
|
| | 1,999,249 | | | | 5.703 | | | | 11/15/42 | | | | 1,941,113 | |
| FHLMC REMIC Series 2013-4203, Class QF(a) (SOFR +
0.364%) |
|
| | 1,022,801 | | | | 5.553 | | | | 05/15/43 | | | | 994,688 | |
| FHLMC REMIC Series 2013-4215, Class NF(a) (SOFR +
0.464%) |
|
| | 697,032 | | | | 5.653 | | | | 06/15/43 | | | | 672,649 | |
| FHLMC REMIC Series 2013-4240, Class FA(a) (SOFR +
0.614%) |
|
| | 2,426,634 | | | | 5.803 | | | | 08/15/43 | | | | 2,348,925 | |
| | FHLMC REMIC Series 2013-4248, Class FL(a) (SOFR + 0.564%) | |
| | 74,715 | | | | 5.753 | | | | 05/15/41 | | | | 73,291 | |
| | FHLMC REMIC Series 2013-4263, Class FB(a) (SOFR + 0.514%) | |
| | 53,737 | | | | 5.703 | | | | 11/15/43 | | | | 51,828 | |
| FHLMC REMIC Series 2013-4272, Class FD(a) (SOFR +
0.464%) |
|
| | 58,334 | | | | 5.653 | | | | 11/15/43 | | | | 56,452 | |
| FHLMC REMIC Series 2017-4678, Class AF(a) (SOFR +
0.514%) |
|
| | 1,710,493 | | | | 4.613 | | | | 12/15/42 | | | | 1,691,078 | |
| FHLMC REMIC Series 2017-4719, Class AF(a) (SOFR +
0.464%) |
|
| | 2,946,812 | | | | 5.653 | | | | 09/15/47 | | | | 2,845,129 | |
| | FHLMC REMIC Series 2018-4787, Class ZS | |
| | 728,832 | | | | 5.000 | | | | 07/01/48 | | | | 719,434 | |
| | FHLMC REMIC Series 2018-4818, Class FC(a) (SOFR + 0.414%) | |
| | 197,545 | | | | 5.603 | | | | 04/15/48 | | | | 188,406 | |
| | FHLMC REMIC Series 2018-4852, Class BF(a) (SOFR + 0.514%) | |
| | 1,268,666 | | | | 5.703 | | | | 12/15/48 | | | | 1,223,082 | |
| | FHLMC REMIC Series 2019-4897, Class F(a) (SOFR + 0.514%) | |
| | 1,079,099 | | | | 5.703 | | | | 07/15/49 | | | | 1,048,764 | |
| | FHLMC REMIC Series 2019-4903, Class F(a) (SOFR + 0.564%) | |
| | 164,884 | | | | 5.753 | | | | 09/15/48 | | | | 158,193 | |
| FHLMC REMIC Series 2019-4906, Class NF(a) (SOFR +
0.514%) |
|
| | 1,415,920 | | | | 4.904 | | | | 03/15/38 | | | | 1,379,956 | |
| FHLMC REMIC Series 2019-4942, Class FA(a) (SOFR +
0.614%) |
|
| | 1,041,039 | | | | 5.902 | | | | 01/25/50 | | | | 998,078 | |
| | FHLMC REMIC Series 2020-5002, Class FJ(a) (SOFR + 0.514%) | |
| | 179,366 | | | | 5.802 | | | | 07/25/50 | | | | 169,418 | |
| FHLMC REMIC Series 2020-5031, Class FA(a) (SOFR +
0.300%) |
|
| | 2,355,866 | | | | 5.489 | | | | 08/15/43 | | | | 2,249,422 | |
| | FHLMC STRIPS Series 2006-239, Class F22(a) (SOFR + 0.464%) | |
| | 157,171 | | | | 5.653 | | | | 08/15/36 | | | | 153,691 | |
| | |
|
| Mortgage-Backed Securities – (continued) | |
| | FHLMC STRIPS Series 2006-239, Class F30(a) (SOFR + 0.414%) | |
| 392,927 | | | | 5.603 | | | | 08/15/36 | | | | 384,408 | |
| | FNMA REMIC Series 2002-53, Class FY(a) (SOFR + 0.614%) | |
| | 177,878 | | | | 5.902 | | | | 08/25/32 | | | | 176,279 | |
| | FNMA REMIC Series 2004-54, Class FL(a) (SOFR + 0.514%) | |
| | 87,443 | | | | 5.802 | | | | 07/25/34 | | | | 86,830 | |
| | FNMA REMIC Series 2004-54, Class FN(a) (SOFR + 0.564%) | |
| | 245,401 | | | | 5.852 | | | | 07/25/34 | | | | 242,879 | |
| | FNMA REMIC Series 2005-103, Class FC(a) (SOFR + 0.614%) | |
| | 7,717,685 | | | | 5.902 | | | | 07/25/35 | | | | 7,605,176 | |
| | FNMA REMIC Series 2005-120, Class FE(a) (SOFR + 0.634%) | |
| | 343,394 | | | | 5.922 | | | | 01/25/36 | | | | 338,230 | |
| | FNMA REMIC Series 2005-87, Class FE(a) (SOFR + 0.564%) | |
| | 392,533 | | | | 5.852 | | | | 10/25/35 | | | | 386,157 | |
| | FNMA REMIC Series 2006-110, Class AF(a) (SOFR + 0.444%) | |
| | 2,147,705 | | | | 5.732 | | | | 11/25/36 | | | | 2,101,435 | |
| | FNMA REMIC Series 2006-16, Class FC(a) (SOFR + 0.414%) | |
| | 91,074 | | | | 5.702 | | | | 03/25/36 | | | | 89,611 | |
| | FNMA REMIC Series 2006-36, Class FB(a) (SOFR + 0.414%) | |
| | 42,408 | | | | 5.702 | | | | 05/25/36 | | | | 41,374 | |
| | FNMA REMIC Series 2006-42, Class PF(a) (SOFR + 0.524%) | |
| | 80,213 | | | | 5.812 | | | | 06/25/36 | | | | 78,926 | |
| | FNMA REMIC Series 2006-44, Class FP(a) (SOFR + 0.514%) | |
| | 859,675 | | | | 5.802 | | | | 06/25/36 | | | | 844,473 | |
| | FNMA REMIC Series 2006-61, Class FD(a) (SOFR + 0.474%) | |
| | 158,141 | | | | 5.762 | | | | 07/25/36 | | | | 154,736 | |
| | FNMA REMIC Series 2006-79, Class DF(a) (SOFR + 0.464%) | |
| | 362,200 | | | | 5.752 | | | | 08/25/36 | | | | 356,020 | |
| | FNMA REMIC Series 2006-88, Class AF(a) (SOFR + 0.574%) | |
| | 328,265 | | | | 5.862 | | | | 09/25/36 | | | | 322,022 | |
| | FNMA REMIC Series 2007-35, Class PF(a) (SOFR + 0.364%) | |
| | 57,013 | | | | 5.652 | | | | 04/25/37 | | | | 55,513 | |
| | FNMA REMIC Series 2007-67, Class FB(a) (SOFR + 0.434%) | |
| | 140,162 | | | | 5.722 | | | | 07/25/37 | | | | 136,374 | |
| | FNMA REMIC Series 2008-1, Class CF(a) (SOFR + 0.814%) | |
| | 43,141 | | | | 6.102 | | | | 02/25/38 | | | | 42,530 | |
| | FNMA REMIC Series 2009-110, Class FG(a) (SOFR + 0.864%) | |
| | 182,253 | | | | 6.152 | | | | 01/25/40 | | | | 181,237 | |
| | FNMA REMIC Series 2010-113, Class FA(a) (SOFR + 0.514%) | |
| | 129,854 | | | | 5.802 | | | | 10/25/40 | | | | 127,707 | |
| | FNMA REMIC Series 2010-116, Class FE(a) (SOFR + 0.514%) | |
| | 161,724 | | | | 5.802 | | | | 10/25/40 | | | | 158,827 | |
| | FNMA REMIC Series 2010-141, Class FB(a) (SOFR + 0.584%) | |
| | 96,735 | | | | 5.872 | | | | 12/25/40 | | | | 94,619 | |
| | FNMA REMIC Series 2010-15, Class FJ(a) (SOFR + 1.044%) | |
| | 314,141 | | | | 6.332 | | | | 06/25/36 | | | | 314,167 | |
| | FNMA REMIC Series 2010-39, Class FE(a) (SOFR + 0.884%) | |
| | 496,586 | | | | 6.172 | | | | 06/25/37 | | | | 493,791 | |
| | FNMA REMIC Series 2010-39, Class FG(a) (SOFR + 1.034%) | |
| | 218,113 | | | | 6.322 | | | | 03/25/36 | | | | 217,956 | |
| | FNMA REMIC Series 2010-46, Class WF(a) (SOFR + 0.864%) | |
| | 1,550,795 | | | | 6.152 | | | | 05/25/40 | | | | 1,526,501 | |
| | FNMA REMIC Series 2010-49, Class FB(a) (SOFR + 0.864%) | |
| | 145,983 | | | | 6.152 | | | | 05/25/40 | | | | 144,402 | |
| | FNMA REMIC Series 2010-59, Class FN(a) (SOFR + 0.844%) | |
| | 1,689,712 | | | | 6.132 | | | | 06/25/40 | | | | 1,667,273 | |
| | |
| | |
| The accompanying notes are an integral part of these financial statements. | | 111 |
GOLDMAN SACHS ACCESS ULTRA SHORT BOND ETF
Schedule of Investments (continued)
August 31, 2023
| | | | | | | | | | | | | | |
Principal
Amount | | | Interest
Rate | | | Maturity
Date | | | Value | |
|
| Mortgage-Backed Securities – (continued) | |
| | FNMA REMIC Series 2011-53, Class FT(a) (SOFR + 0.694%) | |
| $ | 141,924 | | | | 5.982 | % | | | 06/25/41 | | | $ | 139,535 | |
| | FNMA REMIC Series 2011-87, Class FJ(a) (SOFR + 0.664%) | |
| | 132,755 | | | | 5.952 | | | | 09/25/41 | | | | 129,332 | |
| | FNMA REMIC Series 2012-101, Class FC(a) (SOFR + 0.614%) | |
| | 113,541 | | | | 5.902 | | | | 09/25/42 | | | | 110,170 | |
| | FNMA REMIC Series 2012-14, Class BF(a) (SOFR + 0.714%) | |
| | 717,135 | | | | 6.002 | | | | 03/25/42 | | | | 691,523 | |
| | FNMA REMIC Series 2012-37, Class BF(a) (SOFR + 0.614%) | |
| | 144,032 | | | | 5.902 | | | | 12/25/35 | | | | 141,806 | |
| | FNMA REMIC Series 2013-10, Class KF(a) (SOFR + 0.414%) | |
| | 94,327 | | | | 5.702 | | | | 02/25/43 | | | | 91,847 | |
| | FNMA REMIC Series 2013-130, Class FB(a) (SOFR + 0.564%) | |
| | 91,291 | | | | 5.852 | | | | 01/25/44 | | | | 88,668 | |
| | FNMA REMIC Series 2013-19, Class DF(a) (SOFR + 0.414%) | |
| | 504,669 | | | | 5.702 | | | | 09/25/41 | | | | 498,936 | |
| | FNMA REMIC Series 2013-2, Class QF(a) (SOFR + 0.614%) | |
| | 65,651 | | | | 5.902 | | | | 02/25/43 | | | | 63,926 | |
| | FNMA REMIC Series 2014-17, Class FE(a) (SOFR + 0.664%) | |
| | 759,822 | | | | 5.952 | | | | 04/25/44 | | | | 740,768 | |
| | FNMA REMIC Series 2014-28, Class FD(a) (SOFR + 0.564%) | |
| | 1,641,264 | | | | 5.852 | | | | 05/25/44 | | | | 1,607,294 | |
| | FNMA REMIC Series 2014-47, Class AF(a) (SOFR + 0.464%) | |
| | 320,033 | | | | 4.568 | | | | 08/25/44 | | | | 316,728 | |
| | FNMA REMIC Series 2015-27, Class KF(a) (SOFR + 0.414%) | |
| | 83,171 | | | | 5.702 | | | | 05/25/45 | | | | 80,662 | |
| | FNMA REMIC Series 2015-87, Class BF(a) (SOFR + 0.414%) | |
| | 360,847 | | | | 5.702 | | | | 12/25/45 | | | | 349,828 | |
| | FNMA REMIC Series 2016-49, Class EF(a) (SOFR + 0.514%) | |
| | 831,044 | | | | 5.802 | | | | 08/25/46 | | | | 814,517 | |
| FNMA REMIC Series 2016-9335, Class AL(a) (12M USD LIBOR
+ 1.797%) |
|
| | 8,838,479 | | | | 4.592 | | | | 12/01/40 | | | | 8,978,507 | |
| | FNMA REMIC Series 2017-16, Class FA(a) (SOFR + 0.564%) | |
| | 681,872 | | | | 5.852 | | | | 03/25/47 | | | | 657,360 | |
| | FNMA REMIC Series 2017-91, Class GF(a) (SOFR + 0.464%) | |
| | 1,644,844 | | | | 5.752 | | | | 11/25/47 | | | | 1,576,784 | |
| | FNMA REMIC Series 2018-15, Class JF(a) (SOFR + 0.414%) | |
| | 893,218 | | | | 5.702 | | | | 03/25/48 | | | | 853,529 | |
| | FNMA REMIC Series 2018-3385, Class MA | |
| | 838,750 | | | | 4.500 | | | | 06/01/48 | | | | 808,984 | |
| | FNMA REMIC Series 2018-4, Class FM(a) (SOFR + 0.414%) | |
| | 2,187,303 | | | | 5.702 | | | | 02/25/48 | | | | 2,089,918 | |
| | FNMA REMIC Series 2019-41, Class FM(a) (SOFR + 0.564%) | |
| | 1,062,094 | | | | 5.852 | | | | 08/25/49 | | | | 1,021,738 | |
| | FNMA REMIC Series 2019-6, Class KF(a) (SOFR + 0.564%) | |
| | 1,774,434 | | | | 5.852 | | | | 03/25/49 | | | | 1,720,009 | |
| FNMA REMIC Series 2020-6347, Class BM(a) (12M USD
LIBOR + 1.736%) |
|
| | 9,438,314 | | | | 4.336 | | | | 02/01/41 | | | | 9,575,675 | |
| FNMA REMIC Series 2023-7262, Class BM(a) (12M USD
LIBOR + 1.796%) |
|
| | 11,200,107 | | | | 4.658 | | | | 02/01/45 | | | | 11,361,649 | |
| FNMA REMIC Series 2023-7266, Class BM(a) (12M USD
LIBOR + 1.800%) |
|
| | 17,465,739 | | | | 4.422 | | | | 05/01/44 | | | | 17,731,103 | |
| | |
|
| Mortgage-Backed Securities – (continued) | |
| GNMA Series 2004-59, Class FP(a) (1M U.S. T-Bill MMY +
0.414%) |
|
| 374,384 | | | | 5.727 | | | | 08/16/34 | | | | 368,681 | |
| GNMA Series 2005-4, Class FA(a) (1M U.S. T-Bill MMY +
0.484%) |
|
| | 324,500 | | | | 5.797 | | | | 01/16/35 | | | | 319,624 | |
| GNMA Series 2007-26, Class FL(a) (1M U.S. T-Bill MMY +
0.314%) |
|
| | 2,275,857 | | | | 5.629 | | | | 05/20/37 | | | | 2,214,595 | |
| GNMA Series 2007-59, Class FA(a) (1M U.S. T-Bill MMY +
0.614%) |
|
| | 109,551 | | | | 5.929 | | | | 10/20/37 | | | | 107,954 | |
| GNMA Series 2013-99, Class PF(a) (1M U.S. T-Bill MMY +
0.414%) |
|
| | 1,545,725 | | | | 5.729 | | | | 07/20/43 | | | | 1,502,387 | |
| GNMA Series 2018-164, Class AF(a) (1M U.S. T-Bill MMY +
0.514%) |
|
| | 2,478,248 | | | | 5.829 | | | | 12/20/48 | | | | 2,406,240 | |
| GNMA Series 2019-110, Class F(a) (1M U.S. T-Bill MMY +
0.564%) |
|
| | 1,655,353 | | | | 5.879 | | | | 09/20/49 | | | | 1,602,531 | |
| GNMA Series 2019-56, Class FB(a) (1M U.S. T-Bill MMY +
0.564%) |
|
| | 1,880,647 | | | | 5.879 | | | | 05/20/49 | | | | 1,833,907 | |
| GNMA Series 2019-58, Class FA(a) (1M U.S. T-Bill MMY +
0.514%) |
|
| | 806,174 | | | | 5.829 | | | | 05/20/49 | | | | 782,813 | |
| JP Morgan Chase Commercial Mortgage Securities Trust
Series 2016-JP2, Class ASB |
|
| | 340,436 | | | | 2.713 | | | | 08/15/49 | | | | 325,642 | |
| JPMBB Commercial Mortgage Securities Trust Series 2015-C31,
Class ASB |
|
| | 287,298 | | | | 3.540 | | | | 08/15/48 | | | | 277,424 | |
| Morgan Stanley Bank of America Merrill Lynch Trust
Series 2014-C14, Class A5 |
|
| | 2,128,694 | | | | 4.064 | | | | 02/15/47 | | | | 2,113,391 | |
| Morgan Stanley Bank of America Merrill Lynch Trust
Series 2015-C23, Class A4 |
|
| | 550,000 | | | | 3.719 | | | | 07/15/50 | | | | 526,577 | |
| Morgan Stanley Bank of America Merrill Lynch Trust
Series 2015-C24, Class A3 |
|
| | 2,053,239 | | | | 3.479 | | | | 05/15/48 | | | | 1,959,154 | |
| | |
| | TOTAL MORTGAGE-BACKED SECURITIES | |
| | (Cost $138,011,715) | | | $ | 134,874,924 | |
| | |
| | | | | | | | | | | | | | |
|
| Foreign Corporate Debt – 17.2% | |
| Banks – 16.0% | |
| | ANZ New Zealand Int’l Ltd/London(a)(b) (New Zealand) | |
| | (SOFR + 0.600%) | |
| $ | 500,000 | | | | 5.935 | % | | | 02/18/25 | | | $ | 498,899 | |
| | Banco Santander SA (Spain) | |
| | 200,000 | | | | 3.892 | | | | 05/24/24 | | | | 196,950 | |
| | (SOFR + 1.240%) | |
| | 1,400,000 | | | | 6.575 | (a) | | | 05/24/24 | | | | 1,406,657 | |
| | |
| | |
| 112 | | The accompanying notes are an integral part of these financial statements. |
GOLDMAN SACHS ACCESS ULTRA SHORT BOND ETF
| | | | | | | | | | | | | | |
Principal
Amount | | | Interest
Rate | | | Maturity
Date | | | Value | |
|
| Foreign Corporate Debt – (continued) | |
| Banks – (continued) | |
| | Banco Santander SA (Spain) – (continued) | |
| | (US 1 Year CMT T-Note + 0.450%) | |
| $ | 1,000,000 | | | | 5.742 | %(a) | | | 06/30/24 | | | $ | 997,121 | |
| | 800,000 | | | | 3.496 | | | | 03/24/25 | | | | 771,680 | |
| | Bank of Montreal, MTN (Canada) | |
| | 573,000 | | | | 2.150 | | | | 03/08/24 | | | | 562,502 | |
| | 661,000 | | | | 0.625 | | | | 07/09/24 | | | | 632,976 | |
| | (SOFRINDX + 0.465%) | |
| | 3,000,000 | | | | 5.743 | (a) | | | 01/10/25 | | | | 2,987,470 | |
| | Bank of Montreal(a) (Canada) | |
| | (SOFRINDX + 1.330%) | |
| | 2,108,000 | | | | 6.665 | | | | 06/05/26 | | | | 2,120,130 | |
| | Bank of Nova Scotia (The) (Canada) | |
| | 1,620,000 | | | | 5.250 | | | | 12/06/24 | | | | 1,611,327 | |
| | 2,241,000 | | | | 5.450 | | | | 06/12/25 | | | | 2,229,534 | |
| | (SOFRINDX + 1.090%) | |
| | 1,191,000 | | | | 6.294 | (a) | | | 06/12/25 | | | | 1,194,218 | |
| | Banque Federative du Credit Mutuel SA(b) (France) | |
| | 1,298,000 | | | | 0.650 | | | | 02/27/24 | | | | 1,265,586 | |
| | Barclays PLC(a) (United Kingdom) | |
| | (US 1 Year CMT T-Note + 0.800%) | |
| | 2,073,000 | | | | 1.007 | | | | 12/10/24 | | | | 2,044,303 | |
| | BNP Paribas SA(b) (France) | |
| | 1,970,000 | | | | 3.800 | | | | 01/10/24 | | | | 1,953,087 | |
| | BPCE SA (France) | |
| | 238,000 | | | | 5.700 | (b) | | | 10/22/23 | | | | 237,560 | |
| | (SOFR + 0.570%) | |
| | 1,100,000 | | | | 5.865 | (a)(b) | | | 01/14/25 | | | | 1,095,118 | |
| | Credit Suisse AG (Switzerland) | |
| | 396,000 | | | | 7.950 | | | | 01/09/25 | | | | 404,199 | |
| | Credit Suisse AG(a), Series FRN (Switzerland) | |
| | (SOFRINDX + 1.260%) | |
| | 3,000,000 | | | | 6.595 | | | | 02/21/25 | | | | 2,956,919 | |
| | Deutsche Bank AG, Series E (Germany) | |
| | 929,000 | | | | 0.962 | | | | 11/08/23 | | | | 920,290 | |
| | (SOFR + 0.500%) | |
| | 2,648,000 | | | | 5.836 | (a) | | | 11/08/23 | | | | 2,645,703 | |
| | DNB Bank ASA(a)(b) (Norway) | |
| | (SOFRINDX + 0.810%) | |
| | 753,000 | | | | 2.968 | | | | 03/28/25 | | | | 739,899 | |
| | Federation des Caisses Desjardins du Quebec (Canada) | |
| | (SOFR + 0.430%) | |
| | 1,895,000 | | | | 5.765 | (a)(b) | | | 05/21/24 | | | | 1,891,244 | |
| | 1,493,000 | | | | 4.400 | (b) | | | 08/23/25 | | | | 1,451,046 | |
| | HSBC Holdings PLC (United Kingdom) | |
| | (SOFR + 0.580%) | |
| | 720,000 | | | | 5.915 | (a) | | | 11/22/24 | | | | 718,623 | |
| | (SOFR + 0.708%) | |
| | 1,033,000 | | | | 0.976 | (a) | | | 05/24/25 | | | | 993,573 | |
| | ING Groep NV (Netherlands) | |
| | 4,181,000 | | | | 3.550 | | | | 04/09/24 | | | | 4,123,418 | |
| | (SOFRINDX + 1.640%) | |
| | 3,020,000 | | | | 6.894 | (a) | | | 03/28/26 | | | | 3,038,959 | |
| | Intesa Sanpaolo SpA(b), Series XR (Italy) | |
| | 2,171,000 | | | | 3.250 | | | | 09/23/24 | | | | 2,099,329 | |
| | |
|
| Foreign Corporate Debt – (continued) | |
| Banks – (continued) | |
| | Lloyds Banking Group PLC (United Kingdom) | |
| 1,000,000 | | | | 4.450 | % | | | 05/08/25 | | | | 975,739 | |
| | (US 1 Year CMT T-Note + 3.500%) | |
| | 287,000 | | | | 3.870 | (a) | | | 07/09/25 | | | | 281,393 | |
| | Macquarie Bank Ltd.(a)(b) (Australia) | |
| | (SOFR + 1.240%) | |
| | 2,155,000 | | | | 6.458 | | | | 06/15/26 | | | | 2,163,901 | |
| | Mitsubishi UFJ Financial Group, Inc. (Japan) | |
| | 1,000,000 | | | | 2.193 | | | | 02/25/25 | | | | 948,995 | |
| | (US 1 Year CMT T-Note + 0.550%) | |
| | 1,040,000 | | | | 0.953 | (a) | | | 07/19/25 | | | | 993,789 | |
| | (SOFR + 1.385%) | |
| | 1,529,000 | | | | 6.581 | (a) | | | 09/12/25 | | | | 1,534,597 | |
| | (SOFR + 0.940%) | |
| | 2,400,000 | | | | 6.275 | (a) | | | 02/20/26 | | | | 2,396,682 | |
| | Mizuho Financial Group, Inc.(a) (Japan) | |
| | (3M U.S. T-Bill MMY + 0.872%) | |
| | 1,259,000 | | | | 0.849 | | | | 09/08/24 | | | | 1,258,377 | |
| | National Australia Bank Ltd.(a)(b) (Australia) | |
| | (SOFR + 0.380%) | |
| | 2,300,000 | | | | 5.670 | | | | 01/12/25 | | | | 2,293,620 | |
| | National Bank of Canada(a) (Canada) | |
| | (SOFR + 0.490%) | |
| | 655,000 | | | | 5.825 | | | | 08/06/24 | | | | 653,276 | |
| | Nordea Bank Abp(b) (Finland) | |
| | 200,000 | | | | 0.625 | | | | 05/24/24 | | | | 192,583 | |
| | Royal Bank of Canada, GMTN (Canada) | |
| | (SOFRINDX + 0.340%) | |
| | 819,000 | | | | 5.617 | (a) | | | 10/07/24 | | | | 815,666 | |
| | (SOFRINDX + 0.440%) | |
| | 2,000,000 | | | | 5.754 | (a) | | | 01/21/25 | | | | 1,990,569 | |
| | (SOFRINDX + 1.080%) | |
| | 1,218,000 | | | | 6.391 | (a) | | | 07/20/26 | | | | 1,218,147 | |
| | Santander UK Group Holdings PLC(a) (United Kingdom) | |
| | (SOFR + 0.787%) | |
| | 1,522,000 | | | | 1.089 | | | | 03/15/25 | | | | 1,474,983 | |
| | Standard Chartered PLC(a)(b) (United Kingdom) | |
| | (US 1 Year CMT T-Note + 0.780%) | |
| | 1,452,000 | | | | 0.991 | | | | 01/12/25 | | | | 1,422,490 | |
| | Sumitomo Mitsui Trust Bank Ltd. (Japan) | |
| | (SOFR + 0.440%) | |
| | 1,854,000 | | | | 5.655 | (a)(b) | | | 09/16/24 | | | | 1,847,001 | |
| | (SOFR + 1.120%) | |
| | 2,699,000 | | | | 6.306 | (a)(b) | | | 03/09/26 | | | | 2,704,822 | |
| | Svenska Handelsbanken AB(a)(b) (Sweden) | |
| | (SOFRINDX + 1.250%) | |
| | 2,950,000 | | | | 6.468 | | | | 06/15/26 | | | | 2,976,499 | |
| | Swedbank AB (Sweden) | |
| | 1,864,000 | | | | 0.850 | (b) | | | 03/18/24 | | | | 1,814,493 | |
| | (SOFRINDX + 1.380%) | |
| | 3,991,000 | | | | 6.598 | (a)(b) | | | 06/15/26 | | | | 4,019,893 | |
| | Toronto-Dominion Bank (The), MTN (Canada) | |
| | (SOFR + 0.410%) | |
| | 4,000,000 | | | | 5.688 | (a) | | | 01/10/25 | | | | 3,978,317 | |
| | (SOFR + 1.080%) | |
| | 2,000,000 | | | | 6.378 | (a) | | | 07/17/26 | | | | 2,001,061 | |
| | |
| | |
| The accompanying notes are an integral part of these financial statements. | | 113 |
GOLDMAN SACHS ACCESS ULTRA SHORT BOND ETF
Schedule of Investments (continued)
August 31, 2023
| | | | | | | | | | | | | | |
Principal
Amount | | | Interest
Rate | | | Maturity
Date | | | Value | |
|
| Foreign Corporate Debt – (continued) | |
| Banks – (continued) | |
| | Toronto-Dominion Bank (The), GMTN (Canada) | |
| $ | 859,000 | | | | 3.250 | % | | | 03/11/24 | | | $ | 847,547 | |
| | UBS AG/London (Switzerland) | |
| | 993,000 | | | | 0.700 | (b) | | | 08/09/24 | | | | 946,989 | |
| | (SOFR + 0.450%) | |
| | 1,462,000 | | | | 5.785 | (a)(b) | | | 08/09/24 | | | | 1,457,662 | |
| | (SOFR + 0.470%) | |
| | 3,500,000 | | | | 5.762 | (a)(b) | | | 01/13/25 | | | | 3,488,116 | |
| | Westpac Banking Corp.(a) (Australia) | |
| | (SOFR + 0.300%) | |
| | 1,186,000 | | | | 5.635 | | | | 11/18/24 | | | | 1,183,222 | |
| | | | | | | | | | | | | | |
| | | | | | | | | | | | | 91,668,749 | |
| | |
| Consumer Cyclical – 0.2% | |
| | BMW US Capital LLC(a)(b) (Germany) (SOFRINDX + 0.840%) | |
| | 1,231,000 | | | | 6.102 | | | | 04/01/25 | | | | 1,236,260 | |
| | |
| Distributors – 0.4% | |
| | Daimler Truck Finance North America LLC(b) (Germany) | |
| | 2,421,000 | | | | 5.600 | | | | 08/08/25 | | | | 2,419,703 | |
| | |
| Energy – 0.1% | |
| | Enbridge, Inc.(a) (Canada) (SOFRINDX + 0.630%) | |
| | 344,000 | | | | 5.965 | | | | 02/16/24 | | | | 344,039 | |
| | |
| Financial Company – 0.5% | |
| AerCap Ireland Capital DAC / AerCap Global Aviation Trust
(Ireland) |
|
| | 2,639,000 | | | | 1.650 | | | | 10/29/24 | | | | 2,507,687 | |
| | |
| | TOTAL FOREIGN CORPORATE DEBT | |
| | (Cost $98,209,613) | | | $ | 98,176,438 | |
| | |
| | | | | | | | | | | | | | |
|
| Corporate Obligations – 14.8% | |
| Banks – 7.9% | |
| | American Express Co. | |
| | (SOFR + 0.930%) | |
| $ | 1,854,000 | | | | 6.265 | %(a) | | | 03/04/25 | | | $ | 1,860,649 | |
| | (SOFR + 0.760%) | |
| | 2,800,000 | | | | 6.095 | (a) | | | 02/13/26 | | | | 2,793,643 | |
| | Bank of America Corp.(a) | |
| | (SOFR + 1.100%) | |
| | 737,000 | | | | 6.420 | | | | 04/25/25 | | | | 738,558 | |
| | Bank of America Corp.(a), MTN | |
| | (SOFR + 0.670%) | |
| | 1,608,000 | | | | 1.843 | | | | 02/04/25 | | | | 1,578,937 | |
| | Bank of America NA(a) | |
| | (SOFR + 1.020%) | |
| | 3,000,000 | | | | 6.355 | | | | 08/18/26 | | | | 3,009,377 | |
| | Capital One Financial Corp.(a) | |
| | (SOFR + 0.690%) | |
| | 3,534,000 | | | | 5.888 | | | | 12/06/24 | | | | 3,488,969 | |
| | Charles Schwab Corp. (The) | |
| | 1,250,000 | | | | 0.750 | | | | 03/18/24 | | | | 1,215,679 | |
| | (SOFRINDX + 0.500%) | |
| | 1,000,000 | | | | 5.722 | (a) | | | 03/18/24 | | | | 997,897 | |
| | |
|
| Corporate Obligations – (continued) | |
| Banks – (continued) | |
| | Huntington National Bank (The)(a) | |
| | (SOFRINDX + 1.190%) | |
| 1,600,000 | | | | 6.525 | | | | 05/16/25 | | | | 1,558,492 | |
| | JPMorgan Chase & Co. | |
| | (SOFR + 0.420%) | |
| | 1,780,000 | | | | 0.563 | %(a) | | | 02/16/25 | | | | 1,734,591 | |
| | (3M U.S. T-Bill MMY + 0.540%) | |
| | 1,043,000 | | | | 0.824 | (a) | | | 06/01/25 | | | | 1,001,373 | |
| | (3M U.S. T-Bill MMY + 0.580%) | |
| | 4,283,000 | | | | 0.969 | (a) | | | 06/23/25 | | | | 4,104,570 | |
| | KeyBank NA | |
| | (SOFRINDX + 0.340%) | |
| | 691,000 | | | | 5.602 | (a) | | | 01/03/24 | | | | 689,833 | |
| | (SOFRINDX + 0.320%) | |
| | 250,000 | | | | 5.535 | (a) | | | 06/14/24 | | | | 245,026 | |
| | Morgan Stanley(a) | |
| | (SOFR + 1.160%) | |
| | 1,430,000 | | | | 3.620 | | | | 04/17/25 | | | | 1,407,812 | |
| | Morgan Stanley(a), MTN | |
| | (SOFR + 1.152%) | |
| | 2,811,000 | | | | 2.720 | | | | 07/22/25 | | | | 2,727,924 | |
| | Morgan Stanley Bank NA(a) | |
| | (SOFR + 0.780%) | |
| | 5,913,000 | | | | 6.096 | | | | 07/16/25 | | | | 5,918,321 | |
| | State Street Corp.(a) | |
| | (SOFRINDX + 0.845%) | |
| | 2,785,000 | | | | 6.180 | | | | 08/03/26 | | | | 2,781,555 | |
| | US Bancorp | |
| | 960,000 | | | | 3.375 | | | | 02/05/24 | | | | 950,081 | |
| | US Bancorp, MTN | |
| | 936,000 | | | | 3.700 | | | | 01/30/24 | | | | 927,337 | |
| | Wells Fargo Bank NA(a) | |
| | (SOFR + 1.060%) | |
| | 5,573,000 | | | | 6.394 | | | | 08/07/26 | | | | 5,592,648 | |
| | | | | | | | | | | | | | |
| | | | | | | | | | | | | 45,323,272 | |
| | |
| Basic Industry – 0.1% | |
| | Ecolab, Inc. | |
| | 272,000 | | | | 0.900 | | | | 12/15/23 | | | | 268,142 | |
| | |
| Broadcasting – 0.1% | |
| | Fox Corp. | |
| | 705,000 | | | | 4.030 | | | | 01/25/24 | | | | 699,187 | |
| | |
| Consumer Cyclical – 1.2% | |
| | 7-Eleven, Inc.(b) | |
| | 544,000 | | | | 0.800 | | | | 02/10/24 | | | | 531,742 | |
| | General Motors Financial Co., Inc.(a) | |
| | (SOFRINDX + 1.300%) | |
| | 3,000,000 | | | | 6.576 | | | | 04/07/25 | | | | 3,002,139 | |
| | Starbucks Corp.(a) | |
| | (SOFRINDX + 0.420%) | |
| | 479,000 | | | | 5.755 | | | | 02/14/24 | | | | 478,994 | |
| | Toyota Motor Credit Corp.(a) | |
| | (SOFRINDX + 0.890%) | |
| | 2,461,000 | | | | 6.225 | | | | 05/18/26 | | | | 2,471,374 | |
| | |
| | |
| 114 | | The accompanying notes are an integral part of these financial statements. |
GOLDMAN SACHS ACCESS ULTRA SHORT BOND ETF
| | | | | | | | | | | | | | |
Principal
Amount | | | Interest
Rate | | | Maturity
Date | | | Value | |
|
| Corporate Obligations – (continued) | |
| Consumer Cyclical – (continued) | |
| | Toyota Motor Credit Corp.(a), MTN | |
| | (SOFR + 0.380%) | |
| $ | 568,000 | | | | 5.692 | % | | | 02/22/24 | | | $ | 567,681 | |
| | | | | | | | | | | | | | |
| | | | | | | | | | | | | 7,051,930 | |
| | |
| Consumer Noncyclical – 1.3% | |
| | AbbVie, Inc. | |
| | 2,000,000 | | | | 2.600 | | | | 11/21/24 | | | | 1,930,418 | |
| | Baxter International, Inc.(a) | |
| | (SOFRINDX + 0.440%) | |
| | 1,356,000 | | | | 5.776 | | | | 11/29/24 | | | | 1,341,304 | |
| | GE HealthCare Technologies, Inc. | |
| | 3,067,000 | | | | 5.550 | | | | 11/15/24 | | | | 3,058,565 | |
| | Pfizer Investment Enterprises Pte Ltd. | |
| | 1,373,000 | | | | 4.650 | | | | 05/19/25 | | | | 1,359,511 | |
| | | | | | | | | | | | | | |
| | | | | | | | | | | | | 7,689,798 | |
| | |
| Distributors – 0.2% | |
| | Hyundai Capital America(b) | |
| | 1,264,000 | | | | 5.800 | | | | 06/26/25 | | | | 1,264,743 | |
| | |
| Electric – 0.6% | |
| | CenterPoint Energy, Inc.(a) | |
| | (SOFRINDX + 0.650%) | |
| | 2,131,000 | | | | 5.985 | | | | 05/13/24 | | | | 2,129,777 | |
| | Eversource Energy | |
| | 1,002,000 | | | | 4.200 | | | | 06/27/24 | | | | 987,940 | |
| | NextEra Energy Capital Holdings, Inc. | |
| | 41,000 | | | | 6.051 | | | | 03/01/25 | | | | 41,170 | |
| | | | | | | | | | | | | | |
| | | | | | | | | | | | | 3,158,887 | |
| | |
| Energy – 0.1% | |
| | Baker Hughes Holdings LLC / Baker Hughes Co.-Obligor, Inc. | |
| | 373,000 | | | | 1.231 | | | | 12/15/23 | | | | 368,097 | |
| | |
| Food and Beverage – 0.3% | |
| | Kellogg Co. | |
| | 1,542,000 | | | | 2.650 | | | | 12/01/23 | | | | 1,529,602 | |
| | |
| Insurance – 2.7% | |
| | Corebridge Global Funding(a)(b) | |
| | (SOFR + 0.380%) | |
| | 1,390,000 | | | | 5.598 | | | | 12/15/23 | | | | 1,389,501 | |
| | Jackson National Life Global Funding(a)(b) | |
| | (SOFR + 1.150%) | |
| | 3,651,000 | | | | 6.404 | | | | 06/28/24 | | | | 3,652,141 | |
| | MassMutual Global Funding II | |
| | (SOFR + 0.360%) | |
| | 786,000 | | | | 5.650 | (a)(b) | | | 04/12/24 | | | | 785,046 | |
| | (SOFR + 0.980%) | |
| | 774,000 | | | | 6.280 | (a)(b) | | | 07/10/26 | | | | 774,525 | |
| | New York Life Global Funding(a)(b) | |
| | (SOFRINDX + 0.610%) | |
| | 219,000 | | | | 5.924 | | | | 04/21/25 | | | | 218,706 | |
| | Pacific Life Global Funding II | |
| | (SOFRINDX + 0.860%) | |
| | 1,004,000 | | | | 6.081 | (a)(b) | | | 06/16/25 | | | | 1,006,229 | |
| | (SOFRINDX + 1.050%) | |
| | 4,500,000 | | | | 6.383 | (a)(b) | | | 07/28/26 | | | | 4,515,446 | |
| | |
|
| Corporate Obligations – (continued) | |
| Insurance – (continued) | |
| | Principal Life Global Funding II(a)(b) | |
| | (SOFR + 0.900%) | |
| 2,340,000 | | | | 6.233 | | | | 08/28/25 | | | | 2,339,824 | |
| | Protective Life Global Funding(a)(b) | |
| | (SOFR + 0.980%) | |
| | 551,000 | | | | 6.234 | | | | 03/28/25 | | | | 552,262 | |
| | | | | | | | | | | | | | |
| | | | | | | | | | | | | 15,233,680 | |
| | |
| REITs and Real Estate – 0.2% | |
| | Public Storage Operating Co.(a) (SOFR + 0.470%) | |
| | 1,385,000 | | | | 5.786 | | | | 04/23/24 | | | | 1,384,812 | |
| | |
| Technology – 0.1% | |
| | Hewlett Packard Enterprise Co. | |
| | 785,000 | | | | 5.900 | | | | 10/01/24 | | | | 786,404 | |
| | Take-Two Interactive Software, Inc. | |
| | 23,000 | | | | 3.300 | | | | 03/28/24 | | | | 22,643 | |
| | | | | | | | | | | | | | |
| | | | | | | | | | | | | 809,047 | |
| | |
| | TOTAL CORPORATE OBLIGATIONS | |
| | (Cost $84,775,806) | | | $ | 84,781,197 | |
| | |
| | | | | | | | | | | | | | |
|
| U.S. Treasury Notes – 5.6%(c) | |
| | U.S. Treasury Floating Rate Notes (3M USD T-Bill + 0.309%) | |
| $ | 10,803,600 | | | | 5.553 | % | | | 10/31/24 | | | $ | 10,812,683 | |
| | 1,215,400 | | | | 5.582 | | | | 04/30/25 | | | | 1,215,747 | |
| | U.S. Treasury Notes | |
| | 8,149,000 | | | | 3.875 | | | | 03/31/25 | | | | 8,001,299 | |
| | 4,322,000 | | | | 3.875 | | | | 04/30/25 | | | | 4,243,157 | |
| | 3,460,400 | | | | 4.625 | | | | 06/30/25 | | | | 3,441,071 | |
| | 4,092,700 | | | | 4.750 | | | | 07/31/25 | | | | 4,081,509 | |
| | |
| | TOTAL U.S. TREASURY NOTES | |
| | (Cost $31,914,542) | | | $ | 31,795,466 | |
| | |
| | | | | | | | | | | | | | |
|
| Certificate of Deposits – 4.6%(c) | |
| | Banco Santander SA (SOFR + 0.490%) | |
| $ | 2,000,000 | | | | 5.790 | % | | | 02/09/24 | | | $ | 2,000,180 | |
| | Bayerische Landesbank/New York | |
| | 2,204,000 | | | | 5.810 | | | | 03/08/24 | | | | 2,202,854 | |
| | BNP Paribas | |
| | 2,403,000 | | | | 5.425 | | | | 02/16/24 | | | | 2,397,906 | |
| | Commonwealth Bank of Australia (SOFR + 0.400%) | |
| | 11,000 | | | | 5.700 | | | | 01/29/24 | | | | 11,004 | |
| | Cooperatieve Rabobank UA (SOFR + 0.490%) | |
| | 2,635,000 | | | | 5.790 | | | | 03/21/24 | | | | 2,636,528 | |
| | Landesbank Baden-Wuerttemberg/New York | |
| | 2,437,000 | | | | 5.215 | | | | 01/17/24 | | | | 2,431,273 | |
| | Lloyds Bank Corporate Markets PLC (SOFR + 0.670%) | |
| | 1,293,000 | | | | 5.970 | | | | 08/14/24 | | | | 1,294,098 | |
| | Mizuho Bank Ltd. (SOFR + 0.180%) | |
| | 65,000 | | | | 5.480 | | | | 09/05/23 | | | | 65,000 | |
| | Natixis NY | |
| | 2,000,000 | | | | 0.000 | (d) | | | 07/25/24 | | | | 2,000,680 | |
| | |
| | |
| The accompanying notes are an integral part of these financial statements. | | 115 |
GOLDMAN SACHS ACCESS ULTRA SHORT BOND ETF
Schedule of Investments (continued)
August 31, 2023
| | | | | | | | | | | | | | |
Principal
Amount | | | Interest
Rate | | | Maturity
Date | | | Value | |
|
| Certificate of Deposits – (continued) | |
| | Nordea Bank Abp (SOFR + 0.610%) | |
| $ | 11,000 | | | | 5.910 | % | | | 01/04/24 | | | $ | 11,013 | |
| | Royal Bank of Canada (SOFR + 0.700%) | |
| | 968,000 | | | | 6.000 | | | | 03/27/24 | | | | 969,713 | |
| | Standard Chartered Bank (SOFR + 0.640%) | |
| | 2,388,000 | | | | 5.940 | | | | 02/20/24 | | | | 2,390,483 | |
| | Sumitomo Mitsui Banking Corp. (SOFR + 0.700%) | |
| | 3,295,000 | | | | 6.000 | | | | 08/14/24 | | | | 3,295,817 | |
| | Svenska Handelsbanken (SOFR + 0.570%) | |
| | 1,884,000 | | | | 5.870 | | | | 01/09/24 | | | | 1,886,091 | |
| | Toronto Dominion Bank | |
| | 1,633,000 | | | | 5.510 | | | | 04/03/24 | | | | 1,635,343 | |
| | 1,282,000 | | | | 5.820 | | | | 05/23/24 | | | | 1,280,731 | |
| | |
| | TOTAL CERTIFICATE OF DEPOSITS | |
| | (Cost $26,509,320) | | | $ | 26,508,714 | |
| | |
| | | | | | | | | | | | | | |
|
| U.S. Government Agency Obligations – 1.2%(c) | |
| | Federal Farm Credit Banks Funding Corp. (SOFR + 0.160%) | |
| $ | 193,000 | | | | 5.460 | % | | | 08/04/25 | | | $ | 193,010 | |
| | Federal Farm Credit Banks Funding Corp. (SOFR + 0.125%) | |
| | 157,000 | | | | 5.425 | | | | 02/04/25 | | | | 157,005 | |
| | Federal Farm Credit Banks Funding Corp. (SOFR + 0.145%) | |
| | 123,000 | | | | 5.445 | | | | 04/28/25 | | | | 123,014 | |
| | Federal Farm Credit Banks Funding Corp. (FEDL01 + 0.155%) | |
| | 101,000 | | | | 5.485 | | | | 06/27/25 | | | | 101,024 | |
| | Federal Farm Credit Banks Funding Corp. (SOFR + 0.115%) | |
| | 58,000 | | | | 5.415 | | | | 12/03/24 | | | | 57,993 | |
| Federal Farm Credit Banks Funding Corp. (FCPR DLY +
-3.010%) |
|
| | 29,000 | | | | 5.490 | | | | 08/07/25 | | | | 28,993 | |
| | Federal Farm Credit Banks Funding Corp. (SOFR + 0.200%) | |
| | 25,000 | | | | 5.500 | | | | 12/05/24 | | | | 25,020 | |
| | Federal Home Loan Banks | |
| | 4,780,000 | | | | 5.340 | | | | 04/23/24 | | | | 4,766,459 | |
| | Federal Home Loan Banks (SOFR + 0.310%) | |
| | 160,000 | | | | 5.455 | | | | 07/08/25 | | | | 160,004 | |
| | 335,000 | | | | 5.455 | | | | 08/22/25 | | | | 334,872 | |
| | Federal Home Loan Banks (SOFR + 0.150%) | |
| | 300,000 | | | | 5.450 | | | | 05/28/25 | | | | 300,023 | |
| | Federal Home Loan Banks (SOFR + 0.120%) | |
| | 100,000 | | | | 5.420 | | | | 01/03/25 | | | | 100,011 | |
| | Federal Home Loan Banks (SOFR + 0.125%) | |
| | 100,000 | | | | 5.425 | | | | 02/03/25 | | | | 100,003 | |
| | Federal Home Loan Banks (SOFR + 0.135%) | |
| | 100,000 | | | | 5.435 | | | | 05/02/25 | | | | 99,988 | |
| | Federal Home Loan Banks (SOFR + 0.160%) | |
| | 65,000 | | | | 5.460 | | | | 08/08/25 | | | | 65,003 | |
| | Federal Home Loan Banks (SOFR + 0.115%) | |
| | 50,000 | | | | 5.415 | | | | 11/06/24 | | | | 50,003 | |
| | |
| | TOTAL U.S. GOVERNMENT AGENCY OBLIGATIONS | |
| | (Cost $6,676,021) | | | $ | 6,662,425 | |
| | |
| | | | | | | | |
| Shares | | Dividend
Rate | | | Value | |
| | | | | | | | |
|
| Investment Company – 0.3%(e) | |
Goldman Sachs Financial Square Government Fund – Institutional Shares | |
| 1,456,006 | | | 5.234 | % | | $ | 1,456,006 | |
| (Cost $1,456,006) | |
| |
| | | | | | | | | | | | | | |
| | | | | | | | | | | | | | |
Principal
Amount | | | Interest
Rate | | | Maturity
Date | | | Value | |
|
| Short-Term Investments – 6.2% | |
| Commercial Paper – 6.2% | |
| | Bank of Montreal | |
| $ | 1,211,000 | | | | 5.920 | % | | | 09/02/24 | | | $ | 1,210,904 | |
| | Bank of Nova Scotia | |
| | 2,951,000 | | | | 5.580 | | | | 02/09/24 | | | | 2,875,779 | |
| | Bayer Corp. | |
| | 1,200,000 | | | | 6.231 | | | | 07/08/24 | | | | 1,138,440 | |
| | 3,000,000 | | | | 6.231 | | | | 07/09/24 | | | | 2,845,650 | |
| | BofA Securities, Inc. | |
| | 964,000 | | | | 5.440 | | | | 02/08/24 | | | | 961,956 | |
| | Collateralized Commercial Paper FLEX Co. LLC | |
| | 2,861,000 | | | | 5.920 | | | | 02/28/24 | | | | 2,861,658 | |
| | Credit Suisse First Boston | |
| | 1,949,000 | | | | 7.117 | | | | 11/02/23 | | | | 1,930,777 | |
| | DNB Bank | |
| | 3,236,000 | | | | 5.841 | | | | 07/31/24 | | | | 3,068,343 | |
| | Equitable Short Term Funding LLC | |
| | 1,500,000 | | | | 5.944 | | | | 07/08/24 | | | | 1,427,580 | |
| | Federation des Caisses Desjardins du Quebec | |
| | 2,365,000 | | | | 5.452 | | | | 02/14/24 | | | | 2,303,936 | |
| | Glencore Funding LLC | |
| | 2,174,000 | | | | 6.031 | | | | 02/01/24 | | | | 2,120,368 | |
| | HSBC Bank USA NA(a) (SOFR + 0.610%) | |
| | 1,000,000 | | | | 5.910 | | | | 04/26/24 | | | | 1,000,730 | |
| | HSBC USA Inc. | |
| | 1,130,000 | | | | 6.484 | | | | 05/20/24 | | | | 1,080,823 | |
| | 1,053,000 | | | | 6.219 | | | | 05/24/24 | | | | 1,006,426 | |
| | ING (US) Funding Corp | |
| | 825,000 | | | | 5.956 | | | | 04/01/24 | | | | 797,445 | |
| | JP Morgan Securities LLC | |
| | 994,000 | | | | 5.960 | | | | 08/02/24 | | | | 994,354 | |
| | Lloyds Bank Corporate Markets PLC | |
| | 900,000 | | | | 6.094 | | | | 04/08/24 | | | | 869,175 | |
| | Macquarie Bank | |
| | 1,725,000 | | | | 5.570 | | | | 02/15/24 | | | | 1,726,000 | |
| | Nordea Bank Abp(a)(b) (SOFR + 0.450%) | |
| | 1,238,000 | | | | 5.749 | | | | 01/18/27 | | | | 1,238,693 | |
| | Skandinaviska Enskilda Banken AB | |
| | 1,900,000 | | | | 5.950 | | | | 05/31/24 | | | | 1,901,957 | |
| | 998,000 | | | | 5.880 | | | | 08/02/24 | | | | 997,544 | |
| | Societe Generale SA | |
| | 1,355,000 | | | | 5.413 | | | | 02/09/24 | | | | 1,321,057 | |
| | |
| | TOTAL SHORT-TERM INVESTMENTS | |
| | (Cost $35,678,679) | | | $ | 35,679,595 | |
| | |
| | TOTAL INVESTMENTS – 99.5% | |
| | (Cost $573,164,091) | | | $ | 568,932,494 | |
| | |
| OTHER ASSETS IN EXCESS OF
LIABILITIES – 0.5% |
| | | 3,376,499 | |
| | |
| | NET ASSETS – 100.0% | | | $ | 572,308,993 | |
| | |
| | |
| 116 | | The accompanying notes are an integral part of these financial statements. |
GOLDMAN SACHS ACCESS ULTRA SHORT BOND ETF
| | |
|
| The percentage shown for each investment category reflects the value of investments in that category as a percentage of net assets. |
| |
(a) | | Variable rate security. Interest rate or distribution rate disclosed is that which is in effect on August 31, 2023. |
| |
(b) | | Exempt from registration under Rule 144A of the Securities Act of 1933. |
| |
(c) | | Interest rates represent either the stated coupon rate, annualized yield on date of purchase for discounted securities, or, for floating rate securities, the current reset rate, which is based upon current interest rate indices. |
| |
(d) | | Issued with a zero coupon. Income is recognized through the accretion of discount. |
| |
(e) | | Represents an affiliated issuer. |
| | |
|
Investment Abbreviations: |
CLO | | —Collateralized Loan Obligation |
CMT | | —Constant Maturity Treasury Index |
FHLMC | | —Federal Home Loan Mortgage Corp. |
FNMA | | —Federal National Mortgage Association |
GNMA | | —Government National Mortgage Association |
GMTN | | —Global Medium Term Note |
LIBOR | | —London Interbank Offered Rate |
LP | | —Limited Partnership |
MTN | | —Medium Term Note |
PLC | | —Public Limited Company |
REIT | | —Real Estate Investment Trust |
SOFR | | —Secured Overnight Financing Rate |
SOFRINDX | | —Secured Overnight Financing Rate Index |
|
| | |
| The accompanying notes are an integral part of these financial statements. | | 117 |
GOLDMAN SACHS ACCESS FIXED INCOME ETFS
Statements of Assets and Liabilities
August 31, 2023
| | | | | | | | | | | | | | | | | | |
| | | | | Access
Emerging
Markets USD
Bond ETF | | | Access
High Yield
Corporate
Bond ETF | | | Access Inflation
Protected USD Bond ETF | | | Access
Investment
Grade
Corporate
1-5 Year
Bond ETF | |
| | Assets: | | | | | | | | | | | | | | | | |
| | | | | |
| | Investments in unaffiliated issuers, at value (cost $53,792,125, $103,471,231, $128,080,755 and $9,313,342, respectively) | | $ | 50,393,607 | | | $ | 98,479,122 | | | $ | 110,472,852 | | | $ | 9,046,635 | |
| | | | | |
| | Investments in affiliated issuers, at value (cost $255,051, $1,043,475, $536,220 and $—, respectively) | | | 255,051 | | | | 1,043,475 | | | | 536,220 | | | | — | |
| | | | | |
| | Cash | | | 64,871 | | | | 58,516 | | | | 50,001 | | | | 42,339 | |
| | | | | |
| | Foreign currency, at value (cost $107, $—, $— and $—, respectively) | | | 112 | | | | — | | | | — | | | | — | |
| | | | | |
| | Receivables: | | | | | | | | | | | | | | | | |
| | | | | |
| | Dividends and interest | | | 763,833 | | | | 1,597,277 | | | | 94,805 | | | | 92,084 | |
| | | | | |
| | Investments sold | | | — | | | | — | | | | — | | | | 297,970 | |
| | | | | |
| | Fund shares sold | | | — | | | | 4,303,637 | | | | — | | | | — | |
| | | | | |
| | Reimbursement from investment adviser | | | — | | | | — | | | | — | | | | 16,502 | |
| | | | | |
| | Total assets | | | 51,477,474 | | | | 105,482,027 | | | | 111,153,878 | | | | 9,495,530 | |
| | | | | | | | | | | | | | | | | | |
| | Liabilities: | | | | | | | | | | | | | | | | |
| | | | | |
| | Payables: | | | | | | | | | | | | | | | | |
| | | | | |
| | Management fees | | | 16,842 | | | | 27,694 | | | | 11,204 | | | | — | |
| | | | | |
| | Investments purchased | | | — | | | | 4,205,662 | | | | — | | | | 293,550 | |
| | | | | |
| | Fund shares redeemed | | | — | | | | 1,295 | | | | — | | | | — | |
| | | | | |
| | Total liabilities | | | 16,842 | | | | 4,234,651 | | | | 11,204 | | | | 293,550 | |
| | | | | | | | | | | | | | | | | | |
| | Net Assets: | | | | | | | | | | | | | | | | |
| | | | | |
| | Paid-in capital | | | 59,656,409 | | | | 109,313,052 | | | | 133,525,088 | | | | 9,692,603 | |
| | | | | |
| | Total distributable loss | | | (8,195,777 | ) | | | (8,065,676 | ) | | | (22,382,414 | ) | | | (490,623 | ) |
| | | | | |
| | NET ASSETS | | $ | 51,460,632 | | | $ | 101,247,376 | | | $ | 111,142,674 | | | $ | 9,201,980 | |
| | SHARES ISSUED AND OUTSTANDING | | | | | | | | | | | | | | | | |
| | | | | |
| | Shares outstanding no par value (unlimited shares authorized): | | | 1,300,000 | | | | 2,350,000 | | | | 2,300,000 | | | | 200,000 | |
| | | | | |
| | Net asset value per share: | | | $39.59 | | | | $43.08 | | | | $48.32 | | | | $46.01 | |
| | |
| 118 | | The accompanying notes are an integral part of these financial statements. |
GOLDMAN SACHS ACCESS FIXED INCOME ETFS
Statements of Assets and Liabilities (continued)
August 31, 2023
| | | | | | | | | | | | | | | | | | |
| | | | | Access Investment
Grade Corporate
Bond ETF | | | Access Treasury 0-1 Year ETF | | | Access U.S. Aggregate Bond ETF | | | Access Ultra
Short Bond ETF | |
| | Assets: | | | | | |
| | | | | |
| | Investments in unaffiliated issuers, at value (cost $750,937,865, $6,013,943,464, $546,614,395 and $571,708,085, respectively) | | $ | 673,621,775 | | | $ | 6,012,734,133 | | | $ | 515,576,846 | | | $ | 567,476,488 | |
| | | | | |
| | Investments in affiliated issuers, at value (cost $1,389,970, $—, $45,185,528 and $1,456,006, respectively) | | | 1,389,970 | | | | — | | | | 45,185,528 | | | | 1,456,006 | |
| | | | | |
| | Cash | | | 51,338 | | | | 18,267,931 | | | | 7,671,389 | | | | 680,041 | |
| | | | | |
| | Receivables: | | | | | | | | | | | | | | | | |
| | | | | |
| | Fund shares sold | | | 55,724,627 | | | | 60,041,396 | | | | — | | | | — | |
| | | | | |
| | Dividends and interest | | | 7,785,160 | | | | 70,615 | | | | 2,579,889 | | | | 3,144,810 | |
| | | | | |
| | Investments sold | | | — | | | | 15,008,883 | | | | 25,777,793 | | | | 198,976 | |
| | | | | |
| | Collateral on certain derivative contracts | | | — | | | | — | | | | 260,000 | | | | — | |
| | | | | |
| | Total assets | | | 738,572,870 | | | | 6,106,122,958 | | | | 597,051,445 | | | | 572,956,321 | |
| | | | | | | | | | | | | | | | | | |
| | Liabilities: | | | | | | | | | | | | | | | | |
| | | | | |
| | Payables: | | | | | | | | | | | | | | | | |
| | | | | |
| | Investments purchased | | | 55,658,665 | | | | 77,318,090 | | | | 78,686,039 | | | | 568,972 | |
| | | | | |
| | Management fees | | | 73,685 | | | | 578,290 | | | | 51,813 | | | | 78,356 | |
| | | | | |
| | Fund shares redeemed | | | — | | | | 15,010,349 | | | | — | | | | — | |
| | | | | |
| | Forward sale contract, at value (proceeds received $–, $–, $25,777,793 and $–) | | | — | | | | — | | | | 25,680,859 | | | | — | |
| | | | | |
| | Total liabilities | | | 55,732,350 | | | | 92,906,729 | | | | 104,418,711 | | | | 647,328 | |
| | | | | | | | | | | | | | | | | | |
| | Net Assets: | | | | | | | | | | | | | | | | |
| | | | | |
| | Paid-in capital | | | 766,932,292 | | | | 6,000,314,049 | | | | 556,101,479 | | | | 577,075,058 | |
| | | | | |
| | Total distributable earnings (loss) | | | (84,091,772 | ) | | | 12,902,180 | | | | (63,468,745 | ) | | | (4,766,065 | ) |
| | | | | |
| | NET ASSETS | | $ | 682,840,520 | | | $ | 6,013,216,229 | | | $ | 492,632,734 | | | $ | 572,308,993 | |
| | SHARES ISSUED AND OUTSTANDING | | | | | | | | | | | | | | | | |
| | | | | |
| | Shares outstanding no par value (unlimited shares authorized): | | | 15,300,000 | | | | 60,090,000 | | | | 12,050,000 | | | | 11,450,000 | |
| | | | | |
| | Net asset value per share: | | | $44.63 | | | | $100.07 | | | | $40.88 | | | | $49.98 | |
| | |
| The accompanying notes are an integral part of these financial statements. | | 119 |
GOLDMAN SACHS ACCESS FIXED INCOME ETFS
Statements of Operations
For the Fiscal Year Ended August 31, 2023
| | | | | | | | | | | | | | | | | | |
| | | | | Access
Emerging
Markets USD
Bond ETF | | | Access High Yield
Corporate
Bond ETF | | | Access
Inflation
Protected
USD Bond ETF | | | Access Investment
Grade
Corporate
1-5 Year
Bond ETF | |
| | Investment income: | | | | | | | | | | | | | | | | |
| | | | | |
| | Interest | | $ | 2,835,155 | | | $ | 7,442,384 | | | $ | 2,594,153 | | | $ | 233,715 | |
| | | | | |
| | Dividends from Affiliated Underlying Funds | | | 10,344 | | | | 65,895 | | | | 14,605 | | | | 456 | |
| | | | | |
| | Total investment income | | | 2,845,499 | | | | 7,508,279 | | | | 2,608,758 | | | | 234,171 | |
| | | | | | | | | | | | | | | | | | |
| | Expenses: | | | | | | | | | | | | | | | | |
| | | | | |
| | Management fees | | | 185,479 | | | | 375,372 | | | | 126,534 | | | | — | |
| | | | | |
| | Trustee fees | | | 19,539 | | | | 28,221 | | | | 28,627 | | | | 10,069 | |
| | | | | |
| | Total expenses | | | 205,018 | | | | 403,593 | | | | 155,161 | | | | 10,069 | |
| | | | | |
| | Less — expense reductions | | | (103,665 | ) | | | (2,766 | ) | | | (572 | ) | | | (25 | ) |
| | | | | |
| | Net expenses | | | 101,353 | | | | 400,827 | | | | 154,589 | | | | 10,044 | |
| | | | | |
| | NET INVESTMENT INCOME | | | 2,744,146 | | | | 7,107,452 | | | | 2,454,169 | | | | 224,127 | |
| | | | | | | | | | | | | | | | | | |
| | Realized and unrealized gain (loss): | | | | | | | | | | | | | | | | |
| | | | | |
| | Net realized gain (loss) from: | | | | | | | | | | | | | | | | |
| | | | | |
| | Investments — unaffiliated issuers | | | (598,489 | ) | | | (1,537,579 | ) | | | (5,216,590 | ) | | | (90,151 | ) |
| | | | | |
| | In-kind redemptions | | | (391,630 | ) | | | (8,514,627 | ) | | | (4,696,766 | ) | | | (734,944 | ) |
| | | | | |
| | Net change in unrealized gain (loss) on: | | | | | | | | | | | | | | | | |
| | | | | |
| | Investments — unaffiliated issuers | | | 802,190 | | | | 11,327,064 | | | | 1,518,317 | | | | 683,678 | |
| | | | | |
| | Foreign currency translations | | | 5 | | | | — | | | | — | | | | — | |
| | | | | |
| | Net realized and unrealized gain (loss) | | | (187,924 | ) | | | 1,274,858 | | | | (8,395,039 | ) | | | (141,417 | ) |
| | | | | |
| | NET INCREASE (DECREASE) IN NET ASSETS RESULTING FROM OPERATIONS | | $ | 2,556,222 | | | $ | 8,382,310 | | | $ | (5,940,870 | ) | | $ | 82,710 | |
| | |
| 120 | | The accompanying notes are an integral part of these financial statements. |
GOLDMAN SACHS ACCESS FIXED INCOME ETFS
Statements of Operations (continued)
For the Fiscal Year Ended August 31, 2023
| | | | | | | | | | | | | | | | | | |
| | | | | Access Investment
Grade
Corporate
Bond ETF | | | Access Treasury 0-1 Year ETF | | | Access U.S.
Aggregate
Bond ETF | | | Access Ultra
Short Bond ETF | |
| | Investment income: | | | | | | | | | | | | | | | | |
| | | | | |
| | Interest | | $ | 21,539,863 | | | $ | 209,636,255 | | | $ | 13,323,797 | | | $ | 23,524,441 | |
| | | | | |
| | Dividends from Affiliated Underlying Funds | | | 75,243 | | | | — | | | | 2,560,135 | | | | 468,432 | |
| | | | | |
| | Total investment income | | | 21,615,106 | | | | 209,636,255 | | | | 15,883,932 | | | | 23,992,873 | |
| | | | | | | | | | | | | | | | | | |
| | Expenses: | | | | | | | | | | | | | | | | |
| | | | | |
| | Management fees | | | 779,468 | | | | 6,699,821 | | | | 591,536 | | | | 1,051,424 | |
| | | | | |
| | Trustee fees | | | 39,683 | | | | 120,655 | | | | 35,579 | | | | 37,653 | |
| | | | | |
| | Total expenses | | | 819,151 | | | | 6,820,476 | | | | 627,115 | | | | 1,089,077 | |
| | | | | |
| | Less — expense reductions | | | (2,877 | ) | | | (974,746 | ) | | | (102,427 | ) | | | (235,958 | ) |
| | | | | |
| | Net expenses | | | 816,274 | | | | 5,845,730 | | | | 524,688 | | | | 853,119 | |
| | | | | |
| | NET INVESTMENT INCOME | | | 20,798,832 | | | | 203,790,525 | | | | 15,359,244 | | | | 23,139,754 | |
| | | | | | | | | | | | | | | | | | |
| | Realized and unrealized gain (loss): | | | | | | | | | | | | | | | | |
| | | | | |
| | Net realized gain (loss) from: | | | | | | | | | | | | | | | | |
| | | | | |
| | Investments — unaffiliated issuers | | | (2,811,388 | ) | | | (7,344,918 | ) | | | (23,783,112 | ) | | | (1,318,987 | ) |
| | | | | |
| | In-kind redemptions | | | (32,226,204 | ) | | | (1,857,001 | ) | | | (283,693 | ) | | | — | |
| | | | | |
| | Short sales | | | — | | | | — | | | | 831,523 | | | | — | |
| | | | | |
| | Net change in unrealized gain (loss) on: | | | | | | | | | | | | | | | | |
| | | | | |
| | Investments — unaffiliated issuers | | | 13,508,820 | | | | 3,865,995 | | | | 295,470 | | | | 1,300,628 | |
| | | | | |
| | Forward Sales Contracts | | | — | | | | — | | | | 96,934 | | | | — | |
| | | | | |
| | Net realized and unrealized loss | | | (21,528,772 | ) | | | (5,335,924 | ) | | | (22,842,878 | ) | | | (18,359 | ) |
| | | | | |
| | NET INCREASE (DECREASE) IN NET ASSETS RESULTING FROM OPERATIONS | | $ | (729,940 | ) | | $ | 198,454,601 | | | $ | (7,483,634 | ) | | $ | 23,121,395 | |
| | |
| The accompanying notes are an integral part of these financial statements. | | 121 |
GOLDMAN SACHS ACCESS FIXED INCOME ETFS
Statements of Changes in Net Assets
| | | | | | | | | | | | | | | | | | | | | | |
| | | | | Access Emerging Markets USD
Bond ETF | | | | | | Access High Yield Corporate
Bond ETF | |
| | | | | For the Fiscal
Year Ended
August 31, 2023 | | | For the Period
February 15, 2022*
to
August 31, 2022 | | | | | | For the Fiscal
Year Ended
August 31, 2023 | | | For the Fiscal
Year Ended
August 31, 2022 | |
| | From operations: | | | | | |
| | | | | | |
| | Net investment income | | $ | 2,744,146 | | | $ | 1,656,363 | | | | | | | $ | 7,107,452 | | | $ | 8,411,692 | |
| | | | | | |
| | Net realized loss | | | (990,119 | ) | | | (7,031,328 | ) | | | | | | | (10,052,206 | ) | | | (7,310,869 | ) |
| | | | | | |
| | Net change in unrealized gain (loss) | | | 802,195 | | | | (4,200,708 | ) | | | | | | | 11,327,064 | | | | (22,228,548 | ) |
| | | | | | |
| | Net increase (decrease) in net assets resulting from operations | | | 2,556,222 | | | | (9,575,673 | ) | | | | | | | 8,382,310 | | | | (21,127,725 | ) |
| | | | | | | | | | | | | | | | | | | | | | |
| | Distributions to shareholders: | | | | | | | | | | | | | | | | | | | | |
| | | | | | |
| | From distributable earnings | | | (2,675,655 | ) | | | (1,465,872 | ) | | | | | | | (7,421,417 | ) | | | (8,962,167 | ) |
| | | | | | | | | | | | | | | | | | | | | | |
| | From share transactions: | | | | | | | | | | | | | | | | | | | | |
| | | | | | |
| | Proceeds from sales of shares | | | 29,017,966 | | | | 80,817,061 | | | | | | | | 63,776,945 | | | | 114,021,025 | |
| | | | | | |
| | Cost of shares redeemed | | | (9,900,147 | ) | | | (37,313,270 | ) | | | | | | | (97,999,816 | ) | | | (181,256,065 | ) |
| | | | | | |
| | Net increase (decrease) in net assets resulting from share transactions | | | 19,117,819 | | | | 43,503,791 | | | | | | | | (34,222,871 | ) | | | (67,235,040 | ) |
| | | | | | |
| | TOTAL INCREASE (DECREASE) | | | 18,998,386 | | | | 32,462,246 | | | | | | | | (33,261,978 | ) | | | (97,324,932 | ) |
| | | | | | | | | | | | | | | | | | | | | | |
| | Net assets: | | | | | |
| | | | | | |
| | Beginning of period | | $ | 32,462,246 | | | $ | — | | | | | | | $ | 134,509,354 | | | $ | 231,834,286 | |
| | | | | | |
| | End of period | | $ | 51,460,632 | | | $ | 32,462,246 | | | | | | | $ | 101,247,376 | | | $ | 134,509,354 | |
| | * | | Commencement of operations. |
| | |
| 122 | | The accompanying notes are an integral part of these financial statements. |
GOLDMAN SACHS ACCESS FIXED INCOME ETFS
Statements of Changes in Net Assets (continued)
| | | | | | | | | | | | | | | | | | | | | | |
| | | | | Access Inflation Protected
USD Bond ETF | | | | | | Access Investment Grade Corporate
1-5 Year Bond ETF | |
| | | | | For the Fiscal
Year Ended
August 31, 2023 | | | For the Fiscal
Year Ended
August 31, 2022 | | | | | | For the Fiscal
Year Ended
August 31, 2023 | | | For the Fiscal
Year Ended
August 31, 2022 | |
| | From operations: | | | | | |
| | | | | | |
| | Net investment income | | $ | 2,454,169 | | | $ | 11,658,250 | | | | | | | $ | 224,127 | | | $ | 266,263 | |
| | | | | | |
| | Net realized loss | | | (9,913,356 | ) | | | (883,447 | ) | | | | | | | (825,095 | ) | | | (568,392 | ) |
| | | | | | |
| | Net change in unrealized gain (loss) | | | 1,518,317 | | | | (22,100,414 | ) | | | | | | | 683,678 | | | | (1,047,201 | ) |
| | | | | | |
| | Net increase (decrease) in net assets resulting from operations | | | (5,940,870 | ) | | | (11,325,611 | ) | | | | | | | 82,710 | | | | (1,349,330 | ) |
| | | | | | | | | | | | | | | | | | | | | | |
| | Distributions to shareholders: | | | | | | | | | | | | | | | | | | | | |
| | | | | | |
| | From distributable earnings | | | (4,179,323 | ) | | | (10,540,936 | ) | | | | | | | (224,601 | ) | | | (290,343 | ) |
| | | | | | | | | | | | | | | | | | | | | | |
| | From share transactions: | | | | | | | | | | | | | | | | | | | | |
| | | | | | |
| | Proceeds from sales of shares | | | 21,918,076 | | | | 93,221,061 | | | | | | | | 4,638,826 | | | | 9,666,322 | |
| | | | | | |
| | Cost of shares redeemed | | | (66,027,253 | ) | | | (52,293,928 | ) | | | | | | | (11,557,399 | ) | | | (21,931,891 | ) |
| | | | | | |
| | Net increase (decrease) in net assets resulting from share transactions | | | (44,109,177 | ) | | | 40,927,133 | | | | | | | | (6,918,573 | ) | | | (12,265,569 | ) |
| | | | | | |
| | TOTAL INCREASE (DECREASE) | | | (54,229,370 | ) | | | 19,060,586 | | | | | | | | (7,060,464 | ) | | | (13,905,242 | ) |
| | | | | | | | | | | | | | | | | | | | | | |
| | Net assets: | | | | | |
| | | | | | |
| | Beginning of year | | $ | 165,372,044 | | | $ | 146,311,458 | | | | | | | $ | 16,262,444 | | | $ | 30,167,686 | |
| | | | | | |
| | End of year | | $ | 111,142,674 | | | $ | 165,372,044 | | | | | | | $ | 9,201,980 | | | $ | 16,262,444 | |
| | |
| The accompanying notes are an integral part of these financial statements. | | 123 |
GOLDMAN SACHS ACCESS FIXED INCOME ETFS
Statements of Changes in Net Assets (continued)
| | | | | | | | | | | | | | | | | | | | | | |
| | | | | Access Investment Grade Corporate
Bond ETF | | | | | | Access Treasury 0-1 Year ETF | |
| | | | | For the Fiscal
Year Ended
August 31, 2023 | | | For the Fiscal
Year Ended
August 31, 2022 | | | | | | For the Fiscal
Year Ended
August 31, 2023 | | | For the Fiscal
Year Ended
August 31, 2022 | |
| | From operations: | | | | | |
| | | | | | |
| | Net investment income | | $ | 20,798,832 | | | $ | 18,155,167 | | | | | | | $ | 203,790,525 | | | $ | 11,318,812 | |
| | | | | | |
| | Net realized loss | | | (35,037,592 | ) | | | (23,226,589 | ) | | | | | | | (9,201,919 | ) | | | (4,211,303 | ) |
| | | | | | |
| | Net change in unrealized gain (loss) | | | 13,508,820 | | | | (114,811,678 | ) | | | | | | | 3,865,995 | | | | (5,114,563 | ) |
| | | | | | |
| | Net increase (decrease) in net assets resulting from operations | | | (729,940 | ) | | | (119,883,100 | ) | | | | | | | 198,454,601 | | | | 1,992,946 | |
| | | | | | | | | | | | | | | | | | | | | | |
| | Distributions to shareholders: | | | | | | | | | | | | | | | | | | | | |
| | | | | | |
| | From distributable earnings | | | (20,409,959 | ) | | | (18,399,303 | ) | | | | | | | (182,430,853 | ) | | | (6,806,393 | ) |
| | | | | | | | | | | | | | | | | | | | | | |
| | From share transactions: | | | | | | | | | | | | | | | | | | | | |
| | | | | | |
| | Proceeds from sales of shares | | | 313,013,296 | | | | 311,310,364 | | | | | | | | 5,065,135,094 | | | | 2,207,541,510 | |
| | | | | | |
| | Cost of shares redeemed | | | (243,562,494 | ) | | | (314,616,517 | ) | | | | | | | (2,155,004,089 | ) | | | (973,326,888 | ) |
| | | | | | |
| | Net increase (decrease) in net assets resulting from share transactions | | | 69,450,802 | | | | (3,306,153 | ) | | | | | | | 2,910,131,005 | | | | 1,234,214,622 | |
| | | | | | |
| | TOTAL INCREASE (DECREASE) | | | 48,310,903 | | | | (141,588,556 | ) | | | | | | | 2,926,154,753 | | | | 1,229,401,175 | |
| | | | | | | | | | | | | | | | | | | | | | |
| | Net assets: | | | | | |
| | | | | | |
| | Beginning of year | | $ | 634,529,617 | | | $ | 776,118,173 | | | | | | | $ | 3,087,061,476 | | | $ | 1,857,660,301 | |
| | | | | | |
| | End of year | | $ | 682,840,520 | | | $ | 634,529,617 | | | | | | | $ | 6,013,216,229 | | | $ | 3,087,061,476 | |
| | |
| 124 | | The accompanying notes are an integral part of these financial statements. |
GOLDMAN SACHS ACCESS FIXED INCOME ETFS
Statements of Changes in Net Assets (continued)
| | | | | | | | | | | | | | | | | | | | | | |
| | | | | Access U.S. Aggregate Bond ETF | | | | | | Access Ultra Short Bond ETF | |
| | | | | For the Fiscal
Year Ended
August 31, 2023 | | | For the Fiscal
Year Ended
August 31, 2022 | | | | | | For the Fiscal
Year Ended
August 31, 2023 | | | For the Fiscal
Year Ended
August 31, 2022 | |
| | From operations: | | | | | |
| | | | | | |
| | Net investment income | | $ | 15,359,244 | | | $ | 4,477,355 | | | | | | | $ | 23,139,754 | | | $ | 4,094,472 | |
| | | | | | |
| | Net realized loss | | | (23,235,282 | ) | | | (11,130,499 | ) | | | | | | | (1,318,987 | ) | | | (195,941 | ) |
| | | | | | |
| | Net change in unrealized gain (loss) | | | 392,404 | | | | (30,653,086 | ) | | | | | | | 1,300,628 | | | | (6,100,886 | ) |
| | | | | | |
| | Net increase (decrease) in net assets resulting from operations | | | (7,483,634 | ) | | | (37,306,230 | ) | | | | | | | 23,121,395 | | | | (2,202,355 | ) |
| | | | | | | | | | | | | | | | | | | | | | |
| | Distributions to shareholders: | | | | | | | | | | | | | | | | | | | | |
| | | | | | |
| | From distributable earnings | | | (14,281,841 | ) | | | (3,918,777 | ) | | | | | | | (22,160,976 | ) | | | (4,021,476 | ) |
| | | | | | | | | | | | | | | | | | | | | | |
| | From share transactions: | | | | | | | | | | | | | | | | | | | | |
| | | | | | |
| | Proceeds from sales of shares | | | 89,594,586 | | | | 254,499,846 | | | | | | | | 261,247,087 | | | | 290,217,807 | |
| | | | | | |
| | Cost of shares redeemed | | | (8,300,985 | ) | | | — | | | | | | | | (193,095,071 | ) | | | (111,670,925 | ) |
| | | | | | |
| | Net increase in net assets resulting from share transactions | | | 81,293,601 | | | | 254,499,846 | | | | | | | | 68,152,016 | | | | 178,546,882 | |
| | | | | | |
| | TOTAL INCREASE | | | 59,528,126 | | | | 213,274,839 | | | | | | | | 69,112,435 | | | | 172,323,051 | |
| | | | | | | | | | | | | | | | | | | | | | |
| | Net assets: | | | | | |
| | | | | | |
| | Beginning of year | | $ | 433,104,608 | | | $ | 219,829,769 | | | | | | | $ | 503,196,558 | | | $ | 330,873,507 | |
| | | | | | |
| | End of year | | $ | 492,632,734 | | | $ | 433,104,608 | | | | | | | $ | 572,308,993 | | | $ | 503,196,558 | |
| | |
| The accompanying notes are an integral part of these financial statements. | | 125 |
GOLDMAN SACHS ACCESS FIXED INCOME ETFS
Financial Highlights
Selected Data for a Share Outstanding Throughout Each Period
| | | | | | | | | | |
| | | | | Access Emerging Markets USD Bond ETF | |
| | | | | For the Fiscal
Year Ended
August 31, 2023 | | | For the Period
February 15, 2022*
to
August 31, 2022 | |
| | Per Share Operating Performance: | | | | | | | | |
| | | |
| | Net asset value, beginning of period | | $ | 40.58 | | | $ | 49.68 | |
| | | |
| | Net investment income(a) | | | 2.40 | | | | 1.33 | |
| | | |
| | Net realized and unrealized loss | | | (1.02 | ) | | | (9.29 | ) |
| | | |
| | Total gain (loss) from investment operations | | | 1.38 | | | | (7.96 | ) |
| | | |
| | Distributions to shareholders from net investment income | | | (2.37 | ) | | | (1.14 | ) |
| | | |
| | Net asset value, end of period | | $ | 39.59 | | | $ | 40.58 | |
| | | |
| | Market price, end of period | | $ | 39.64 | | | $ | 40.13 | |
| | | |
| | Total Return at Net Asset Value(b) | | | 3.54 | % | | | (16.11 | )% |
| | | |
| | Net assets, end of period (in 000’s) | | $ | 51,461 | | | $ | 32,462 | |
| | | |
| | Ratio of net expenses to average net assets | | | 0.22 | % | | | 0.00 | %(c) |
| | | |
| | Ratio of total expenses to average net assets | | | 0.45 | % | | | 0.45 | %(c) |
| | | |
| | Ratio of net investment income to average net assets | | | 6.02 | % | | | 5.67 | %(c) |
| | | |
| | Portfolio turnover rate(d) | | | 8 | % | | | 34 | % |
| | * | | Commencement of operations. |
| | (a) | | Calculated based on the average shares outstanding methodology. |
| | (b) | | Assumes investment at the net asset value at the beginning of the period, reinvestment of all distributions and a complete sale of the investment at the net asset value at the end of the period. Returns do not reflect the impact of taxes to shareholders relating to Fund distributions or the sale of Fund shares. Total returns for periods less than one full year are not annualized. |
| | (d) | | The Fund’s portfolio turnover rate is calculated in accordance with regulatory requirements and excludes portfolio securities received or delivered as a result of in-kind transactions and short term transactions. If such transactions were included, the Fund’s portfolio turnover rate may be higher. |
| | |
| 126 | | The accompanying notes are an integral part of these financial statements. |
GOLDMAN SACHS ACCESS FIXED INCOME ETFS
Financial Highlights (continued)
Selected Data for a Share Outstanding Throughout Each Year
| | | | | | | | | | | | | | | | | | | | | | |
| | | | | Access High Yield Corporate Bond ETF | |
| | | | | For the Fiscal Year Ended August 31, | |
| | | | | 2023 | | | 2022 | | | 2021 | | | 2020 | | | 2019 | |
| | Per Share Operating Performance: | | | | | | | | | | | | | | | | | | | | |
| | | | | | |
| | Net asset value, beginning of year | | $ | 42.70 | | | $ | 50.40 | | | $ | 49.29 | | | $ | 49.42 | | | $ | 48.86 | |
| | | | | | |
| | Net investment income(a) | | | 2.55 | | | | 2.21 | | | | 2.24 | | | | 2.49 | | | | 2.75 | |
| | | | | | |
| | Net realized and unrealized gain (loss) | | | 0.39 | | | | (7.63 | ) | | | 1.15 | | | | (0.15 | ) | | | 0.61 | |
| | | | | | |
| | Total gain (loss) from investment operations | | | 2.94 | | | | (5.42 | ) | | | 3.39 | | | | 2.34 | | | | 3.36 | |
| | | | | | |
| | Distributions to shareholders from net investment income | | | (2.56 | ) | | | (2.28 | ) | | | (2.28 | ) | | | (2.47 | ) | | | (2.80 | ) |
| | | | | | |
| | Net asset value, end of year | | $ | 43.08 | | | $ | 42.70 | | | $ | 50.40 | | | $ | 49.29 | | | $ | 49.42 | |
| | | | | | |
| | Market price, end of year | | $ | 43.04 | | | $ | 42.28 | | | $ | 50.38 | | | $ | 49.23 | | | $ | 49.24 | |
| | | | | | |
| | Total Return at Net Asset Value(b) | | | 7.13 | % | | | (11.07 | )% | | | 7.05 | % | | | 4.94 | % | | | 7.20 | % |
| | | | | | |
| | Net assets, end of year (in 000’s) | | $ | 101,247 | | | $ | 134,509 | | | $ | 231,834 | | | $ | 150,347 | | | $ | 76,602 | |
| | | | | | |
| | Ratio of net expenses to average net assets | | | 0.34 | % | | | 0.34 | % | | | 0.34 | % | | | 0.34 | % | | | 0.34 | % |
| | | | | | |
| | Ratio of net investment income to average net assets | | | 5.99 | % | | | 4.69 | % | | | 4.49 | % | | | 5.15 | % | | | 5.67 | % |
| | | | | | |
| | Portfolio turnover rate(c) | | | 14 | % | | | 15 | % | | | 22 | % | | | 22 | % | | | 23 | % |
| | (a) | | Calculated based on the average shares outstanding methodology. |
| | (b) | | Assumes investment at the net asset value at the beginning of the year, reinvestment of all distributions and a complete sale of the investment at the net asset value at the end of the year. Returns do not reflect the impact of taxes to shareholders relating to Fund distributions or the sale of Fund shares. |
| | (c) | | The Fund’s portfolio turnover rate is calculated in accordance with regulatory requirements and excludes portfolio securities received or delivered as a result of in-kind transactions and short-term transactions. If such transactions were included, the Fund’s portfolio turnover rate may be higher. |
| | |
| The accompanying notes are an integral part of these financial statements. | | 127 |
GOLDMAN SACHS ACCESS FIXED INCOME ETFS
Financial Highlights (continued)
Selected Data for a Share Outstanding Throughout Each Period
| | | | | | | | | | | | | | | | | | | | | | |
| | | | | Access Inflation Protected USD Bond ETF | |
| | | | | For the Fiscal Year Ended August 31, | | | For the Period
October 2, 2018*
to
August 31, 2019 | |
| | | | | 2023 | | | 2022 | | | 2021 | | | 2020 | |
| | Per Share Operating Performance: | | | | | | | | | | | | | | | | | | | | |
| | | | | | |
| | Net asset value, beginning of period | | $ | 51.68 | | | $ | 58.52 | | | $ | 56.96 | | | $ | 53.11 | | | $ | 50.00 | |
| | | | | | |
| | Net investment income(a) | | | 0.93 | | | | 3.70 | | | | 2.85 | | | | 0.33 | | | | 1.27 | |
| | | | | | |
| | Net realized and unrealized gain (loss) | | | (2.78 | ) | | | (7.14 | ) | | | 0.30 | | | | 4.18 | | | | 2.98 | |
| | | | | | |
| | Total gain (loss) from investment operations | | | (1.85 | ) | | | (3.44 | ) | | | 3.15 | | | | 4.51 | | | | 4.25 | |
| | | | | | |
| | Distributions to shareholders from net investment income | | | (1.51 | ) | | | (3.40 | ) | | | (1.59 | ) | | | (0.61 | ) | | | (1.14 | ) |
| | | | | | |
| | Distributions to shareholders from net realized gains | | | — | | | | — | | | | — | | | | (0.04 | ) | | | — | |
| | | | | | |
| | Distributions to shareholders from return of capital | | | — | | | | — | | | | — | | | | (0.01 | ) | | | — | |
| | | | | | |
| | Total distributions to shareholders | | | (1.51 | ) | | | (3.40 | ) | | | (1.59 | ) | | | (0.66 | ) | | | (1.14 | ) |
| | | | | | |
| | Net asset value, end of period | | $ | 48.32 | | | $ | 51.68 | | | $ | 58.52 | | | $ | 56.96 | | | $ | 53.11 | |
| | | | | | |
| | Market price, end of period | | $ | 48.36 | | | $ | 51.64 | | | $ | 58.54 | | | $ | 57.00 | | | $ | 53.08 | |
| | | | | | |
| | Total Return at Net Asset Value(b) | | | (3.64 | )% | | | (6.08 | )% | | | 5.62 | % | | | 8.57 | % | | | 8.61 | % |
| | | | | | |
| | Net assets, end of period (in 000’s) | | $ | 111,143 | | | $ | 165,372 | | | $ | 146,311 | | | $ | 31,330 | | | $ | 7,966 | |
| | | | | | |
| | Ratio of net expenses to average net assets | | | 0.12 | % | | | 0.12 | % | | | 0.12 | % | | | 0.12 | % | | | 0.12 | %(c) |
| | | | | | |
| | Ratio of net investment income to average net assets | | | 1.90 | % | | | 6.63 | % | | | 4.96 | % | | | 0.61 | % | | | 2.74 | %(c) |
| | | | | | |
| | Portfolio turnover rate(d) | | | 30 | % | | | 18 | % | | | 56 | % | | | 43 | % | | | 36 | % |
| | * | | Commencement of operations. |
| | (a) | | Calculated based on the average shares outstanding methodology. |
| | (b) | | Assumes investment at the net asset value at the beginning of the period, reinvestment of all distributions and a complete sale of the investment at the net asset value at the end of the period. Returns do not reflect the impact of taxes to shareholders relating to Fund distributions or the sale of Fund shares. Total returns for periods less than one full year are not annualized. |
| | (d) | | The Fund’s portfolio turnover rate is calculated in accordance with regulatory requirements and excludes portfolio securities received or delivered as a result of in-kind transactions and short term transactions. If such transactions were included, the Fund’s portfolio turnover rate may be higher. |
| | |
| 128 | | The accompanying notes are an integral part of these financial statements. |
GOLDMAN SACHS ACCESS FIXED INCOME ETFS
Financial Highlights (continued)
Selected Data for a Share Outstanding Throughout Each Period
| | | | | | | | | | | | | | | | | | |
| | | | | Access Investment Grade Corporate 1-5 Year Bond ETF | |
| | | | | For the Fiscal Year Ended August 31, | | | For the Period
July 7, 2020*
to
August 31, 2020 | |
| | | | | 2023 | | | 2022 | | | 2021 | |
| | Per Share Operating Performance: | | | | | | | | | | | | | | | | |
| | | | | |
| | Net asset value, beginning of period | | $ | 46.46 | | | $ | 50.28 | | | $ | 50.21 | | | $ | 49.89 | |
| | | | | |
| | Net investment income(a) | | | 1.43 | | | | 0.62 | | | | 0.41 | | | | 0.06 | |
| | | | | |
| | Net realized and unrealized gain (loss) | | | (0.47 | ) | | | (3.77 | ) | | | 0.14 | | | | 0.29 | |
| | | | | |
| | Total gain (loss) from investment operations | | | 0.96 | | | | (3.15 | ) | | | 0.55 | | | | 0.35 | |
| | | | | |
| | Distributions to shareholders from net investment income | | | (1.41 | ) | | | (0.67 | ) | | | (0.48 | ) | | | (0.03 | ) |
| | | | | |
| | Net asset value, end of period | | $ | 46.01 | | | $ | 46.46 | | | $ | 50.28 | | | $ | 50.21 | |
| | | | | |
| | Market price, end of period | | $ | 46.03 | | | $ | 46.38 | | | $ | 50.30 | | | $ | 50.28 | |
| | | | | |
| | Total Return at Net Asset Value(b) | | | 2.11 | % | | | (6.30 | )% | | | 1.10 | % | | | 0.70 | % |
| | | | | |
| | Net assets, end of period (in 000’s) | | $ | 9,202 | | | $ | 16,262 | | | $ | 30,168 | | | $ | 27,617 | |
| | | | | |
| | Ratio of net expenses to average net assets | | | 0.14 | % | | | 0.14 | % | | | 0.14 | % | | | 0.14 | %(c) |
| | | | | |
| | Ratio of net investment income to average net assets | | | 3.12 | % | | | 1.27 | % | | | 0.82 | % | | | 0.73 | %(c) |
| | | | | |
| | Portfolio turnover rate(d) | | | 37 | % | | | 45 | % | | | 32 | % | | | 3 | % |
| | * | | Commencement of operations. |
| | (a) | | Calculated based on the average shares outstanding methodology. |
| | (b) | | Assumes investment at the net asset value at the beginning of the period, reinvestment of all distributions and a complete sale of the investment at the net asset value at the end of the period. Returns do not reflect the impact of taxes to shareholders relating to Fund distributions or the sale of Fund shares. Total returns for periods less than one full year are not annualized. |
| | (d) | | The Fund’s portfolio turnover rate is calculated in accordance with regulatory requirements and excludes portfolio securities received or delivered as a result of in-kind transactions and short term transactions. If such transactions were included, the Fund’s portfolio turnover rate may be higher. |
| | |
| The accompanying notes are an integral part of these financial statements. | | 129 |
GOLDMAN SACHS ACCESS FIXED INCOME ETFS
Financial Highlights (continued)
Selected Data for a Share Outstanding Throughout Each Year
| | | | | | | | | | | | | | | | | | | | | | |
| | | | | Access Investment Grade Corporate Bond ETF | |
| | | | | For the Fiscal Year Ended August 31, | |
| | 2023 | | | 2022 | | | 2021 | | | 2020 | | | 2019 | |
| | Per Share Operating Performance: | | | | | | | | | | | | | | | | | | | | |
| | | | | | |
| | Net asset value, beginning of year | | $ | 45.81 | | | $ | 55.24 | | | $ | 55.39 | | | $ | 52.87 | | | $ | 48.31 | |
| | | | | | |
| | Net investment income(a) | | | 1.59 | | | | 1.27 | | | | 1.26 | | | | 1.59 | | | | 1.74 | |
| | | | | | |
| | Net realized and unrealized gain (loss) | | | (1.23 | ) | | | (9.43 | ) | | | (0.14 | ) | | | 2.54 | | | | 4.52 | |
| | | | | | |
| | Total gain (loss) from investment operations | | | 0.36 | | | | (8.16 | ) | | | 1.12 | | | | 4.13 | | | | 6.26 | |
| | | | | | |
| | Distributions to shareholders from net investment income | | | (1.54 | ) | | | (1.27 | ) | | | (1.27 | ) | | | (1.61 | ) | | | (1.70 | ) |
| | | | | | |
| | Net asset value, end of year | | $ | 44.63 | | | $ | 45.81 | | | $ | 55.24 | | | $ | 55.39 | | | $ | 52.87 | |
| | | | | | |
| | Market price, end of year | | $ | 44.63 | | | $ | 45.61 | | | $ | 55.19 | | | $ | 55.47 | | | $ | 52.90 | |
| | | | | | |
| | Total Return at Net Asset Value(b) | | | 0.84 | % | | | (14.96 | )% | | | 2.07 | % | | | 7.95 | % | | | 13.35 | % |
| | | | | | |
| | Net assets, end of year (in 000’s) | | $ | 682,841 | | | $ | 634,530 | | | $ | 776,118 | | | $ | 642,578 | | | $ | 526,049 | |
| | | | | | |
| | Ratio of net expenses to average net assets | | | 0.14 | % | | | 0.14 | % | | | 0.14 | % | | | 0.14 | % | | | 0.14 | % |
| | | | | | |
| | Ratio of net investment income to average net assets | | | 3.55 | % | | | 2.50 | % | | | 2.30 | % | | | 3.00 | % | | | 3.54 | % |
| | | | | | |
| | Portfolio turnover rate(c) | | | 5 | % | | | 12 | % | | | 11 | % | | | 9 | % | | | 13 | % |
| | (a) | | Calculated based on the average shares outstanding methodology. |
| | (b) | | Assumes investment at the net asset value at the beginning of the year, reinvestment of all distributions and a complete sale of the investment at the net asset value at the end of the year. Returns do not reflect the impact of taxes to shareholders relating to Fund distributions or the sale of Fund shares. |
| | (c) | | The Fund’s portfolio turnover rate is calculated in accordance with regulatory requirements and excludes portfolio securities received or delivered as a result of in-kind transactions and short term transactions. If such transactions were included, the Fund’s portfolio turnover rate may be higher. |
| | |
| 130 | | The accompanying notes are an integral part of these financial statements. |
GOLDMAN SACHS ACCESS FIXED INCOME ETFS
Financial Highlights (continued)
Selected Data for a Share Outstanding Throughout Each Year
| | | | | | | | | | | | | | | | | | | | | | |
| | | | | Access Treasury 0-1 Year ETF | |
| | | | | For the Fiscal Year Ended August 31, | |
| | 2023 | | | 2022 | | | 2021 | | | 2020 | | | 2019 | |
| | Per Share Operating Performance: | | | | | | | | | | | | | | | | | | | | |
| | | | | | |
| | Net asset value, beginning of year | | $ | 99.84 | | | $ | 100.09 | | | $ | 100.44 | | | $ | 100.38 | | | $ | 100.16 | |
| | | | | | |
| | Net investment income (loss)(a) | | | 4.17 | | | | 0.52 | | | | (0.02 | ) | | | 1.13 | | | | 2.23 | |
| | | | | | |
| | Net realized and unrealized gain (loss) | | | (0.26 | ) | | | (0.51 | ) | | | (0.01 | ) | | | 0.29 | | | | 0.15 | |
| | | | | | |
| | Total gain (loss) from investment operations | | | 3.91 | | | | 0.01 | | | | (0.03 | ) | | | 1.42 | | | | 2.38 | |
| | | | | | |
| | Distributions to shareholders from net investment income | | | (3.68 | ) | | | (0.26 | ) | | | (0.27 | ) | | | (1.36 | ) | | | (2.16 | ) |
| | | | | | |
| | Distributions to shareholders from return of capital | | | — | | | | — | | | | (0.05 | ) | | | — | | | | — | |
| | | | | | |
| | Total distributions to shareholders | | | (3.68 | ) | | | (0.26 | ) | | | (0.32 | ) | | | (1.36 | ) | | | (2.16 | ) |
| | | | | | |
| | Net asset value, end of year | | $ | 100.07 | | | $ | 99.84 | | | $ | 100.09 | | | $ | 100.44 | | | $ | 100.38 | |
| | | | | | |
| | Market price, end of year | | $ | 100.12 | | | $ | 99.88 | | | $ | 100.08 | | | $ | 100.45 | | | $ | 100.40 | |
| | | | | | |
| | Total Return at Net Asset Value(b) | | | 3.99 | % | | | 0.01 | % | | | (0.03 | )% | | | 1.42 | % | | | 2.40 | % |
| | | | | | |
| | Net assets, end of year (in 000’s) | | $ | 6,013,216 | | | $ | 3,087,061 | | | $ | 1,857,660 | | | $ | 3,045,396 | | | $ | 3,174,026 | |
| | | | | | |
| | Ratio of net expenses to average net assets | | | 0.12 | % | | | 0.12 | % | | | 0.12 | % | | | 0.12 | % | | | 0.12 | % |
| | | | | | |
| | Ratio of total expenses to average net assets | | | 0.14 | % | | | 0.14 | % | | | 0.14 | % | | | 0.14 | % | | | 0.14 | % |
| | | | | | |
| | Ratio of net investment income (loss) to average net assets | | | 4.18 | % | | | 0.52 | % | | | (0.02 | )% | | | 1.13 | % | | | 2.22 | % |
| | | | | | |
| | Portfolio turnover rate(c) | | | — | % | | | — | % | | | — | % | | | — | % | | | — | % |
| | (a) | | Calculated based on the average shares outstanding methodology. |
| | (b) | | Assumes investment at the net asset value at the beginning of the year, reinvestment of all distributions and a complete sale of the investment at the net asset value at the end of the year. Returns do not reflect the impact of taxes to shareholders relating to Fund distributions or the sale of Fund shares. |
| | (c) | | The Fund’s portfolio turnover rate is calculated in accordance with regulatory requirements and excludes portfolio securities received or delivered as a result of in-kind transactions and short term transactions. If such transactions were included, the Fund’s portfolio turnover rate may be higher. |
| | |
| The accompanying notes are an integral part of these financial statements. | | 131 |
GOLDMAN SACHS ACCESS FIXED INCOME ETFS
Financial Highlights (continued)
Selected Data for a Share Outstanding Throughout Each Period
| | | | | | | | | | | | | | |
| | | | | Access U.S. Aggregate Bond ETF | |
| | | | | For the Fiscal
Year Ended August 31, | | | For the Period
September 8, 2020*
to
August 31, 2021 | |
| | | | | 2023 | | | 2022 | |
| | Per Share Operating Performance: | | | | | | | | | | | | |
| | | | |
| | Net asset value, beginning of period | | $ | 42.88 | | | $ | 49.40 | | | $ | 50.03 | |
| | | | |
| | Net investment income(a) | | | 1.42 | | | | 0.67 | | | | 0.37 | |
| | | | |
| | Net realized and unrealized loss | | | (2.10 | ) | | | (6.62 | ) | | | (0.63 | ) |
| | | | |
| | Total loss from investment operations | | | (0.68 | ) | | | (5.95 | ) | | | (0.26 | ) |
| | | | |
| | Distributions to shareholders from net investment income | | | (1.32 | ) | | | (0.57 | ) | | | (0.37 | ) |
| | | | |
| | Net asset value, end of period | | $ | 40.88 | | | $ | 42.88 | | | $ | 49.40 | |
| | | | |
| | Market price, end of period | | $ | 40.99 | | | $ | 42.93 | | | $ | 49.38 | |
| | | | |
| | Total Return at Net Asset Value(b) | | | (1.58 | )% | | | (12.12 | )% | | | (0.52 | )% |
| | | | |
| | Net assets, end of period (in 000’s) | | $ | 492,633 | | | $ | 433,105 | | | $ | 219,827 | |
| | | | |
| | Ratio of net expenses to average net assets | | | 0.12 | % | | | 0.10 | % | | | 0.11 | %(c) |
| | | | |
| | Ratio of total expenses to average net assets | | | 0.14 | % | | | 0.14 | % | | | 0.14 | %(c) |
| | | | |
| | Ratio of net investment income to average net assets | | | 3.43 | % | | | 1.48 | % | | | 0.77 | %(c) |
| | | | |
| | Portfolio turnover rate(d) | | | 481 | % | | | 522 | % | | | 525 | % |
| | * | | Commencement of operations. |
| | (a) | | Calculated based on the average shares outstanding methodology. |
| | (b) | | Assumes investment at the net asset value at the beginning of the period, reinvestment of all distributions and a complete sale of the investment at the net asset value at the end of the period. Returns do not reflect the impact of taxes to shareholders relating to Fund distributions or the sale of Fund shares. Total returns for periods less than one full year are not annualized. |
| | (d) | | The Fund’s portfolio turnover rate is calculated in accordance with regulatory requirements and excludes portfolio securities received or delivered as a result of in-kind transactions and short term transactions. If such transactions were included, the Fund’s portfolio turnover rate may be higher. |
| | |
| 132 | | The accompanying notes are an integral part of these financial statements. |
GOLDMAN SACHS ACCESS FIXED INCOME ETFS
Financial Highlights (continued)
Selected Data for a Share Outstanding Throughout Each Period
| | | | | | | | | | | | | | | | | | | | | | |
| | | | | Access Ultra Short Bond ETF | |
| | | | | For the Fiscal Year Ended August 31, | | | For the Period
April 15, 2019*
to
August 31, 2019 | |
| | | | | 2023 | | | 2022 | | | 2021 | | | 2020 | |
| | Per Share Operating Performance: | | | | | | | | | | | | | | | | | | | | |
| | | | | | |
| | Net asset value, beginning of period | | $ | 49.95 | | | $ | 50.71 | | | $ | 50.77 | | | $ | 50.49 | | | $ | 50.00 | |
| | | | | | |
| | Net investment income(a) | | | 2.12 | | | | 0.49 | | | | 0.28 | | | | 0.73 | | | | 0.52 | |
| | | | | | |
| | Net realized and unrealized gain (loss) | | | (0.05 | ) | | | (0.79 | ) | | | 0.02 | | | | 0.42 | | | | 0.34 | |
| | | | | | |
| | Total gain (loss) from investment operations | | | 2.07 | | | | (0.30 | ) | | | 0.30 | | | | 1.15 | | | | 0.86 | |
| | | | | | |
| | Distributions to shareholders from net investment income | | | (2.04 | ) | | | (0.46 | ) | | | (0.36 | ) | | | (0.87 | ) | | | (0.37 | ) |
| | | | | | |
| | Net asset value, end of period | | $ | 49.98 | | | $ | 49.95 | | | $ | 50.71 | | | $ | 50.77 | | | $ | 50.49 | |
| | | | | | |
| | Market price, end of period | | $ | 49.99 | | | $ | 49.95 | | | $ | 50.71 | | | $ | 50.78 | | | $ | 50.51 | |
| | | | | | |
| | Total Return at Net Asset Value(b) | | | 4.25 | % | | | (0.58 | )% | | | 0.59 | % | | | 2.28 | % | | | 1.75 | % |
| | | | | | |
| | Net assets, end of period (in 000’s) | | $ | 572,309 | | | $ | 503,197 | | | $ | 330,874 | | | $ | 149,765 | | | $ | 15,148 | |
| | | | | | |
| | Ratio of net expenses to average net assets | | | 0.16 | % | | | 0.15 | % | | | 0.16 | % | | | 0.16 | % | | | 0.16 | %(c) |
| | | | | | |
| | Ratio of total expenses to average net assets | | | 0.20 | % | | | 0.20 | % | | | 0.20 | % | | | 0.20 | % | | | 0.20 | %(c) |
| | | | | | |
| | Ratio of net investment income to average net assets | | | 4.25 | % | | | 0.98 | % | | | 0.55 | % | | | 1.45 | % | | | 2.72 | %(c) |
| | | | | | |
| | Portfolio turnover rate(d) | | | 76 | % | | | 37 | % | | | 51 | % | | | 63 | % | | | 66 | % |
| | * | | Commencement of operations. |
| | (a) | | Calculated based on the average shares outstanding methodology. |
| | (b) | | Assumes investment at the net asset value at the beginning of the period, reinvestment of all distributions and a complete sale of the investment at the net asset value at the end of the period. Returns do not reflect the impact of taxes to shareholders relating to Fund distributions or the sale of Fund shares. Total returns for periods less than one full year are not annualized. |
| | (d) | | The Fund’s portfolio turnover rate is calculated in accordance with regulatory requirements and excludes portfolio securities received or delivered as a result of in-kind transactions and short term transactions. If such transactions were included, the Fund’s portfolio turnover rate may be higher. |
| | |
| The accompanying notes are an integral part of these financial statements. | | 133 |
GOLDMAN SACHS ACCESS FIXED INCOME ETFS
Notes to Financial Statements
August 31, 2023
Goldman Sachs ETF Trust (the “Trust”) is an open-end management investment company, registered under the Investment Company Act of 1940, as amended (the “Act”), consisting of multiple series. The Trust was organized as a Delaware statutory trust on December 16, 2009. The following table lists those series of the Trust that are included in this report (collectively, the “Funds” or individually a “Fund”) along with their respective diversification status under the Act:
| | |
| Fund | | Diversification Classification |
Goldman Sachs Access Emerging Markets USD Bond ETF (“Access Emerging Markets USD Bond ETF”) | | Diversified |
Goldman Sachs Access High Yield Corporate Bond ETF (“Access High Yield Corporate Bond ETF”) | | Diversified |
Goldman Sachs Access Inflation Protected USD Bond ETF (“Access Inflation Protected USD Bond ETF”) | | Diversified |
Goldman Sachs Access Investment Grade Corporate 1-5 Year Bond ETF (“Access Investment Grade Corporate 1-5 Year Bond ETF”) | | Diversified |
Goldman Sachs Access Investment Grade Corporate Bond ETF (“Access Investment Grade Corporate Bond ETF”) | | Diversified |
Goldman Sachs Access Treasury 0-1 Year ETF (“Access Treasury 0-1 Year ETF”) | | Diversified |
Goldman Sachs Access U.S. Aggregate Bond ETF (“Access U.S. Aggregate Bond ETF”) | | Diversified |
Goldman Sachs Access Ultra Short Bond ETF (“Access Ultra Short Bond ETF”) | | Diversified |
The investment objective of each Fund (except the Access Ultra Short Bond ETF) is to provide investment results that closely correspond, before fees and expenses, to the performance of its respective Index. The Access Ultra Short Bond ETF seeks to provide current income with preservation of capital.
Goldman Sachs Asset Management, L.P. (“GSAM”), an affiliate of Goldman Sachs & Co. LLC (“Goldman Sachs”), serves as investment adviser to the Funds pursuant to a management agreement (the “Agreement”) with the Trust. Each Fund is an exchange-traded fund (“ETF”). Shares of the Access High Yield Corporate Bond ETF, Access Investment Grade Corporate 1-5 Year Bond ETF, Access Investment Grade Corporate Bond ETF, Access Treasury 0-1 Year ETF and Access U.S. Aggregate Bond ETF are listed and traded on the NYSE Arca, Inc. (“NYSE Arca”), and shares of the Access Emerging Markets USD Bond ETF, Access Inflation Protected USD Bond ETF and Access Ultra Short Bond ETF are listed and traded on the Cboe BZX Exchange, Inc. (“Cboe BZX”). Market prices for the Funds’ shares may be different from their net asset value (“NAV”). The Funds issue and redeem shares at their respective NAV only in blocks of a specified number of shares, or multiples thereof, referred to as “Creation Units”. Creation Units are issued and redeemed generally for a designated portfolio of securities (including any portion of such securities for which cash may be substituted) and a specified amount of cash. Shares generally trade in the secondary market in quantities less than a Creation Unit at market prices that change throughout the day. Only those that have entered into an authorized participant agreement with ALPS Distributors, Inc. (the “Distributor”) may do business directly with the Funds.
|
| 2. SIGNIFICANT ACCOUNTING POLICIES |
The financial statements have been prepared in accordance with accounting principles generally accepted in the United States of America (“GAAP”) and require management to make estimates and assumptions that may affect the reported amounts and disclosures. Actual results may differ from those estimates and assumptions. Each Fund is an investment company under GAAP and follows the accounting and reporting guidance applicable to investment companies.
A. Investment Valuation — The Funds’ valuation policy is to value investments at fair value.
B. Investment Income and Investments — Investment income includes interest income, dividend income, and securities lending income, if any. Interest income is accrued daily and adjusted for amortization of premiums and accretion of discounts.
134
GOLDMAN SACHS ACCESS FIXED INCOME ETFS
|
| 2. SIGNIFICANT ACCOUNTING POLICIES (continued) |
Dividend income is recognized on ex-dividend date or, for certain foreign securities, as soon as such information is obtained subsequent to the ex-dividend date. Non-cash dividends, if any, are recorded at the fair market value of the securities received. Investment transactions are reflected on trade date. Realized gains and losses are calculated using identified cost. Investment transactions are recorded on the following business day for daily NAV calculations. Investment income is recorded net of any foreign withholding taxes, less any amounts reclaimable. The Funds may file withholding tax reclaims in certain jurisdictions to recover a portion of amounts previously withheld. Any foreign capital gains tax is accrued daily based upon net unrealized gains, and is payable upon sale of such investments. For treasury inflation protected securities, adjustments to principal due to inflation/deflation are reflected as increases/decreases to interest income with a corresponding adjustment to cost.
C. Expenses — Expenses incurred directly by a Fund are charged to the Fund, and certain expenses incurred by the Trust are allocated across the applicable Funds on a straight-line and/or pro-rata basis, depending upon the nature of the expenses, and are accrued daily.
D. Federal Taxes and Distributions to Shareholders — It is each Fund’s policy to comply with the requirements of the Internal Revenue Code of 1986, as amended (the “Code”), applicable to regulated investment companies and to distribute each year substantially all of its investment company taxable income and capital gains to its shareholders. Accordingly, each Fund is not required to make any provisions for the payment of federal income tax. Distributions to shareholders are recorded on the ex-dividend date. For each Fund, income distributions, if any, are declared and paid monthly. Capital gains distributions, if any, are declared and paid annually.
Net capital losses, if any, are carried forward to future fiscal years and may be used to the extent allowed by the Code to offset any future capital gains. Losses that are carried forward will retain their character as either short-term or long-term capital losses. Utilization of capital loss carryforwards will reduce the requirement of future capital gains distributions.
The characterization of distributions to shareholders for financial reporting purposes is determined in accordance with federal income tax rules, which may differ from GAAP. The source of each Fund’s distributions may be shown in the accompanying financial statements as either from distributable earnings or capital. Certain components of the Funds’ net assets on the Statements of Assets and Liabilities reflect permanent GAAP/tax differences based on the appropriate tax character.
|
| 3. INVESTMENTS AND FAIR VALUE MEASUREMENTS |
U.S. GAAP defines the fair value of a financial instrument as the amount that would be received to sell an asset or paid to transfer a liability in an orderly transaction between market participants at the measurement date (i.e., the exit price); the Funds’ policy is to use the market approach. GAAP establishes a fair value hierarchy that prioritizes the inputs to valuation techniques used to measure fair value. The hierarchy gives the highest priority to unadjusted quoted prices in active markets for identical assets or liabilities (Level 1 measurements) and the lowest priority to unobservable inputs (Level 3 measurements). The level in the fair value hierarchy within which the fair value measurement in its entirety falls shall be determined based on the lowest level input that is significant to the fair value measurement in its entirety. The levels used for classifying investments are not necessarily an indication of the risk associated with investing in these investments. The three levels of the fair value hierarchy are described below:
Level 1 — Unadjusted quoted prices in active markets that are accessible at the measurement date for identical, unrestricted assets or liabilities;
Level 2 — Quoted prices in markets that are not active or financial instruments for which significant inputs are observable (including, but not limited to, quoted prices for similar investments, interest rates, foreign exchange rates, volatility and credit spreads), either directly or indirectly;
Level 3 — Prices or valuations that require significant unobservable inputs (including GSAM’s assumptions in determining fair value measurement).
135
GOLDMAN SACHS ACCESS FIXED INCOME ETFS
Notes to Financial Statements (continued)
August 31, 2023
|
| 3. INVESTMENTS AND FAIR VALUE MEASUREMENTS (continued) |
The Board of Trustees (“Trustees”) has approved Valuation Procedures that govern the valuation of the portfolio investments held by the Funds, including investments for which market quotations are not readily available. With respect to a Fund’s investments that do not have readily available market quotations, the Trustees have designated the Adviser as the valuation designee to perform fair valuations pursuant to Rule 2a-5 under the Act (the “Valuation Designee”). GSAM has day-to-day responsibility for implementing and maintaining internal controls and procedures related to the valuation of the Funds’ investments. To assess the continuing appropriateness of pricing sources and methodologies, GSAM regularly performs price verification procedures and issues challenges as necessary to third party pricing vendors or brokers, and any differences are reviewed in accordance with the Valuation Procedures.
A. Level 1 and Level 2 Fair Value Investments — The valuation techniques and significant inputs used in determining the fair values for investments classified as Level 1 and Level 2 are as follows:
Debt Securities — Debt securities for which market quotations are readily available are valued daily on the basis of quotations supplied by dealers or an independent pricing service. The pricing services may use valuation models or matrix pricing, which consider: (i) yield or price with respect to bonds that are considered comparable in characteristics such as rating, interest rate and maturity date or (ii) quotations from securities dealers to determine current value. With the exception of treasury securities of G7 countries, which are generally classified as Level 1, these investments are generally classified as Level 2 of the fair value hierarchy.
i. Commercial Paper — Commercial paper normally represents short-term unsecured promissory notes issued in bearer form by banks or bank holding companies, corporations, finance companies and other issuers. Commercial paper consists of direct U.S. dollar-denominated obligations of domestic or foreign issuers. Asset-backed commercial paper is issued by a special purpose entity that is organized to issue the commercial paper and to purchase trade receivables or other financial assets.
ii. Mortgage-Backed and Asset-Backed Securities — Mortgage-backed securities represent direct or indirect participations in, or are collateralized by and payable from, mortgage loans secured by residential and/or commercial real estate property. Asset-backed securities include securities whose principal and interest payments are collateralized by pools of other assets or receivables. The value of certain mortgage-backed and asset-backed securities (including adjustable rate mortgage loans) may be particularly sensitive to changes in prevailing interest rates. The value of these securities may also fluctuate in response to the market’s perception of the creditworthiness of the issuers.
Asset-backed securities may present credit risks that are not presented by mortgage-backed securities because they generally do not have the benefit of a security interest in collateral that is comparable to mortgage assets. Some asset-backed securities may only have a subordinated claim on collateral.
Stripped mortgage-backed securities are usually structured with two different classes: one that receives substantially all interest payments (interest-only, or “IO” and/or high coupon rate with relatively low principal amount, or “IOette”), and the other that receives substantially all principal payments (principal-only, or “PO”) from a pool of mortgage loans. Little to no principal will be received at the maturity of an IO; as a result, periodic adjustments are recorded to reduce the cost of the security until maturity. These adjustments are included in interest income.
iii. Treasury Inflation Protected Securities — TIPS are treasury securities in which the principal amount is adjusted daily to keep pace with inflation, as measured by the U.S. Consumer Pricing Index for Urban Consumers. The repayment of the original bond principal upon maturity is guaranteed by the full faith and credit of the U.S. Government.
iv. When-Issued Securities and Forward Commitments — When-issued securities, including TBA (“To Be Announced”) securities, are securities that are authorized but not yet issued in the market and purchased in order to secure what is considered to be an advantageous price or yield to a Fund. A forward commitment involves entering into a contract to purchase or sell securities, typically on an extended settlement basis, for a fixed price at a future date. The purchase of securities on a when-issued or forward commitment basis involves a risk of loss if the value of the security to be purchased
136
GOLDMAN SACHS ACCESS FIXED INCOME ETFS
|
| 3. INVESTMENTS AND FAIR VALUE MEASUREMENTS (continued) |
declines before the settlement date. Conversely, the sale of securities on a forward commitment basis involves the risk that the value of the securities sold may increase before the settlement date. Although a Fund will generally purchase securities on a when-issued or forward commitment basis with the intention of acquiring the securities for its portfolio, the Fund may dispose of when-issued securities or forward commitments prior to settlement, which may result in a realized gain or loss. For financial reporting purposes, cash collateral that has been pledged to cover obligations of a Fund and cash collateral received, if any, is reported separately on the Statement(s) of Assets and Liabilities as receivables/payables for collateral on other investments. Non-cash collateral pledged by a Fund, if any, is noted in the Schedules of Investments.
Money Market Funds — Investments in the Goldman Sachs Financial Square Government Fund (“Underlying Money Market Fund”) are valued at the NAV per share of the Institutional Share class on the day of valuation. These investments are generally classified as Level 1 of the fair value hierarchy. For information regarding the Underlying Money Market Fund’s accounting policies and investment holdings, please see the Underlying Money Market Fund’s shareholder report.
B. Level 3 Fair Value Investments — To the extent that significant inputs to valuation models and other alternative pricing sources are unobservable, or if quotations are not readily available, or if GSAM believes that such quotations do not accurately reflect fair value, the fair value of a Fund’s investments may be determined under the Valuation Procedures. GSAM, consistent with its procedures and applicable regulatory guidance, may make an adjustment to the most recent valuation prices of either domestic or foreign securities in light of significant events to reflect what it believes to be the fair value of the securities at the time of determining a Fund’s NAV. To the extent investments are valued using single source broker quotations obtained directly from the broker or passed through from third party pricing vendors, such investments are classified as Level 3 investments.
C. Fair Value Hierarchy — The following is a summary of the Funds’ investments and derivatives classified in the fair value hierarchy as of August 31, 2023:
| | | | | | | | | | | | |
| | | |
| ACCESS EMERGING MARKETS USD BOND ETF | | | | | | | | | | | | |
| | | |
| Investment Type | | Level 1 | | | Level 2 | | | Level 3 | |
| | | |
| Assets | | | | | | | | | | | | |
| | | |
Fixed Income | | | | | | | | | | | | |
| | | |
Sovereign Debt Obligations | | $ | — | | | $ | 42,949,004 | | | $ | — | |
| | | |
Corporate Obligations | | | — | | | | 7,444,603 | | | | — | |
| | | |
Investment Company | | | 255,051 | | | | — | | | | — | |
| | | |
| Total | | $ | 255,051 | | | $ | 50,393,607 | | | $ | — | |
|
| ACCESS HIGH YIELD CORPORATE BOND ETF | |
| | | |
| Investment Type | | Level 1 | | | Level 2 | | | Level 3 | |
| | | |
| Assets | | | | | | | | | | | | |
| | | |
Fixed Income | | | | | | | | | | | | |
| | | |
Corporate Obligations | | $ | — | | | $ | 92,314,782 | | | $ | — | |
| | | |
Foreign Bonds | | | — | | | | 6,164,340 | | | | — | |
| | | |
Investment Company | | | 1,043,475 | | | | — | | | | — | |
| | | |
| Total | | $ | 1,043,475 | | | $ | 98,479,122 | | | $ | — | |
137
GOLDMAN SACHS ACCESS FIXED INCOME ETFS
Notes to Financial Statements (continued)
August 31, 2023
|
| 3. INVESTMENTS AND FAIR VALUE MEASUREMENTS (continued) |
| | | | | | | | | | | | |
|
| ACCESS INFLATION PROTECTED USD BOND ETF | |
| | | |
| Investment Type | | Level 1 | | | Level 2 | | | Level 3 | |
| | | |
| Assets | | | | | | | | | | | | |
| | | |
Fixed Income | | | | | | | | | | | | |
| | | |
U.S. Treasury Inflation Indexed Bonds | | $ | 110,472,852 | | | $ | — | | | $ | — | |
| | | |
Investment Company | | | 536,220 | | | | — | | | | — | |
| | | |
| Total | | $ | 111,009,072 | | | $ | — | | | $ | — | |
|
| ACCESS INVESTMENT GRADE CORPORATE 1-5 YEAR BOND ETF | |
| | | |
| Investment Type | | Level 1 | | | Level 2 | | | Level 3 | |
| | | |
| Assets | | | | | | | | | | | | |
| | | |
Fixed Income | | | | | | | | | | | | |
| | | |
Corporate Obligations | | $ | — | | | $ | 7,497,114 | | | $ | — | |
| | | |
Foreign Bonds | | | — | | | | 1,549,521 | | | | — | |
| | | |
| Total | | $ | — | | | $ | 9,046,635 | | | $ | — | |
|
| ACCESS INVESTMENT GRADE CORPORATE BOND ETF | |
| | | |
| Investment Type | | Level 1 | | | Level 2 | | | Level 3 | |
| | | |
| Assets | | | | | | | | | | | | |
| | | |
Fixed Income | | | | | | | | | | | | |
| | | |
Corporate Obligations | | $ | — | | | $ | 541,179,138 | | | $ | — | |
| | | |
Foreign Bonds | | | — | | | | 132,442,637 | | | | — | |
| | | |
Investment Company | | | 1,389,970 | | | | — | | | | — | |
| | | |
| Total | | $ | 1,389,970 | | | $ | 673,621,775 | | | $ | — | |
|
| ACCESS TREASURY 0-1 YEAR ETF | |
| | | |
| Investment Type | | Level 1 | | | Level 2 | | | Level 3 | |
| | | |
| Assets | | | | | | | | | | | | |
| | | |
Fixed Income | | | | | | | | | | | | |
| | | |
U.S. Treasury Bills | | $ | 5,752,215,364 | | | $ | — | | | $ | — | |
| | | |
U.S. Treasury Notes | | | 260,518,769 | | | | — | | | | — | |
| | | |
| Total | | $ | 6,012,734,133 | | | $ | — | | | $ | — | |
138
GOLDMAN SACHS ACCESS FIXED INCOME ETFS
|
| 3. INVESTMENTS AND FAIR VALUE MEASUREMENTS (continued) |
| | | | | | | | | | | | |
|
| ACCESS U.S. AGGREGATE BOND ETF | |
| | | |
| Investment Type | | Level 1 | | | Level 2 | | | Level 3 | |
| | | |
| Assets | | | | | | | | | | | | |
| | | |
Fixed Income | | | | | | | | | | | | |
| | | |
U.S. Treasury Notes | | $ | 157,549,320 | | | $ | — | | | $ | — | |
| | | |
Mortgage-Backed Securities | | | — | | | | 155,145,959 | | | | — | |
| | | |
Corporate Obligations | | | — | | | | 101,224,016 | | | | — | |
| | | |
U.S. Treasury Bonds | | | 42,987,242 | | | | — | | | | — | |
| | | |
Foreign Corporate Debt | | | — | | | | 25,351,586 | | | | — | |
| | | |
U.S. Treasury Obligations | | | 22,160,639 | | | | — | | | | — | |
| | | |
Sovereign Debt Obligations | | | 204,586 | | | | 10,953,498 | | | | — | |
| | | |
Investment Company | | | 45,185,528 | | | | — | | | | — | |
| | | |
| Total | | $ | 268,087,315 | | | $ | 292,675,059 | | | $ | — | |
| | | |
| Liabilities | | | | | | | | | | | | |
| | | |
Forward Sales Contracts | | $ | — | | | $ | (25,680,859 | ) | | $ | — | |
|
| ACCESS ULTRA SHORT BOND ETF | |
| | | |
| Investment Type | | Level 1 | | | Level 2 | | | Level 3 | |
| | | |
| Assets | | | | | | | | | | | | |
| | | |
Fixed Income | | | | | | | | | | | | |
| | | |
Asset- Backed Securities | | $ | — | | | $ | 148,997,729 | | | $ | — | |
| | | |
Mortgage-Backed Securities | | | — | | | | 134,874,924 | | | | — | |
| | | |
Foreign Corporate Debt | | | — | | | | 98,176,438 | | | | — | |
| | | |
Corporate Obligations | | | — | | | | 84,781,197 | | | | — | |
| | | |
Commercial Paper | | | — | | | | 35,679,595 | | | | — | |
| | | |
U.S. Treasury Notes | | | 31,795,466 | | | | — | | | | — | |
| | | |
U.S. Government Agency Obligations | | | — | | | | 6,662,425 | | | | — | |
| | | |
Investment Company | | | 1,456,006 | | | | — | | | | — | |
| | | |
Certificate of Deposits | | | — | | | | 26,508,714 | | | | — | |
| | | |
| Total | | $ | 33,251,472 | | | $ | 535,681,022 | | | $ | — | |
For further information regarding security characteristics, see the Schedules of Investments.
|
| 4. AGREEMENTS AND AFFILIATED TRANSACTIONS |
A. Management Agreement — Under the Agreement, GSAM manages the Funds, subject to the general supervision of the Trustees.
As compensation for the services rendered pursuant to the Agreement, the assumption of the expenses related thereto and administration of the Funds’ business affairs, including providing facilities, GSAM is entitled to a management fee, accrued daily and paid monthly, equal to an annual percentage rate of each Fund’s average daily net assets.
The Funds operate under a unitary management fee structure. Under the unitary fee structure, GSAM is responsible for paying substantially all the expenses of each such Fund, excluding payments under the Fund’s 12b-1 plan (if any), interest expenses, taxes, acquired fund fees and expenses, brokerage fees, costs of holding shareholder meetings, litigation, indemnification and
139
GOLDMAN SACHS ACCESS FIXED INCOME ETFS
Notes to Financial Statements (continued)
August 31, 2023
|
| 4. AGREEMENTS AND AFFILIATED TRANSACTIONS (continued) |
extraordinary expenses. As the Funds directly pay fees and expenses of the independent Trustees, the management fee collected by GSAM will be reduced by an amount equal to the fees and expenses paid by the Funds to the independent Trustees.
For the fiscal year ended August 31, 2023, contractual and effective net unitary management fees with GSAM were at the following rates:
| | | | | | |
| Fund | | | | Contractual Unitary Management Fee | | Effective Net Unitary Management Fee* |
Access Emerging Markets USD Bond ETF | | | | 0.45% | | 0.22% |
Access High Yield Corporate Bond ETF | | | | 0.34% | | 0.34% |
Access Inflation Protected USD Bond ETF | | | | 0.12% | | 0.12% |
Access Investment Grade Corporate 1-5 Year Bond ETF | | | | 0.14% | | 0.14% |
Access Investment Grade Corporate Bond ETF | | | | 0.14% | | 0.14% |
Access Treasury 0-1 Year ETF | | | | 0.14% | | 0.12% |
Access U.S. Aggregate Bond ETF | | | | 0.14% | | 0.12% |
Access Ultra Short Bond ETF | | | | 0.20% | | 0.16% |
| * | | Effective Net Unitary Management Fee includes the impact of management fee waivers, if any. |
GSAM has agreed to waive a portion of its management fee in order to achieve an effective net management fee rate of 0.39%, 0.12%, and 0.16% as an annual percentage rate of average daily net assets of the Access Emerging Markets USD Bond ETF, Access Treasury 0-1 Year ETF, and Access Ultra Short Bond ETF, respectively. These arrangements will remain in effect through at least December 29, 2023 for Access Treasury 0-1 Year ETF and Access Ultra Short Bond ETF and through at least February 17, 2025 for Access Emerging Markets USD Bond ETF and prior to such dates the Investment Adviser may not terminate the arrangements without the approval of the Board of Trustees. Prior to February 17, 2023, GSAM agreed to waive 100% of its management fee of the Access Emerging Markets USD Bond ETF. For the fiscal year ended August 31, 2023, GSAM waived $103,665, $974,746 and $217,815 of the Funds’ management fees for the Access Emerging Markets USD Bond ETF, Access Treasury 0-1 Year ETF and the Access Ultra Short Bond ETF, respectively.
The Access Emerging Markets USD Bond ETF, Access High Yield Corporate Bond ETF, Access Inflation Protected USD Bond ETF, Access Investment Grade Corporate 1-5 Year Bond ETF, Access Investment Grade Corporate Bond ETF, Access U.S. Aggregate Bond ETF and Access Ultra Short Bond ETF invest in Institutional Shares of the Goldman Sachs Financial Square Government Fund, which is an affiliated Underlying Fund. GSAM has agreed to waive a portion of its management fee payable by the Funds in an amount equal to the management fee it earns as an investment adviser to the affiliated Underlying Fund in which the Funds invest. For the fiscal year ended August 31, 2023, the management fee waived by GSAM for each Fund was as follows:
| | | | | | |
| Fund | | | | Management Fee
Waived | |
Access High Yield Corporate Bond ETF | | | | $ | 2,766 | |
Access Inflation Protected USD Bond ETF | | | | | 572 | |
Access Investment Grade Corporate 1-5 Year Bond ETF | | | | | 25 | |
Access Investment Grade Corporate Bond ETF | | | | | 2,877 | |
Access U.S. Aggregate Bond ETF | | | | | 102,427 | |
Access Ultra Short Bond ETF | | | | | 18,143 | |
140
GOLDMAN SACHS ACCESS FIXED INCOME ETFS
|
| 4. AGREEMENTS AND AFFILIATED TRANSACTIONS (continued) |
B. Other Transactions with Affiliates — The following table provides information about the Funds’ investments in the Goldman Sachs Financial Square Government Fund for the fiscal year ended August 31, 2023:
| | | | | | | | | | | | | | | | | | | | | | | | |
| Fund | | Beginning
value as of
August 31, 2022 | | | Purchases
at Cost | | | Proceeds
from Sales | | | Ending
value as of
August 31, 2023 | | | Shares
as of
August 31, 2023 | | | Dividend
Income | |
Access Emerging Markets USD Bond ETF | | $ | 483,412 | | | $ | 3,164,341 | | | $ | (3,392,702 | ) | | $ | 255,051 | | | $ | 255,051 | | | $ | 10,344 | |
Access High Yield Corporate Bond ETF | | | 3,157,357 | | | | 15,548,490 | | | | (17,662,372 | ) | | | 1,043,475 | | | | 1,043,475 | | | | 65,895 | |
Access Inflation Protected USD Bond ETF | | | 350,717 | | | | 4,939,299 | | | | (4,753,796 | ) | | | 536,220 | | | | 536,220 | | | | 14,605 | |
Access Investment Grade Corporate 1-5 Year Bond ETF | | | 155,769 | | | | 239,961 | | | | (395,730 | ) | | | — | | | | — | | | | 456 | |
Access Investment Grade Corporate Bond ETF | | | 1,956,966 | | | | 34,207,707 | | | | (34,774,703 | ) | | | 1,389,970 | | | | 1,389,970 | | | | 75,243 | |
Access U.S. Aggregate Bond ETF | | | 99,745,844 | | | | 69,852,001 | | | | (124,412,317 | ) | | | 45,185,528 | | | | 45,185,528 | | | | 2,560,135 | |
Access Ultra Short Bond ETF | | | 4,270,757 | | | | 446,255,166 | | | | (449,069,917 | ) | | | 1,456,006 | | | | 1,456,006 | | | | 468,432 | |
|
| 5. CREATION AND REDEMPTION OF CREATION UNITS |
The Trust issues and redeems shares of the Funds only in Creation Units on a continuous basis through the Distributor, without an initial sales load, at NAV next determined after receipt, on any Business Day (as defined in the Statement of Additional Information), of an order in proper form. Shares of the Funds may only be purchased or redeemed by certain financial institutions (each an “Authorized Participant”). An Authorized Participant is either (1) a “Participating Party” or other participant in the clearing process through the Continuous Net Settlement System of the National Securities Clearing Corporation; or (2) a Depository Trust Company participant; which, in either case, must have executed an agreement with the Distributor. Retail investors will typically not qualify as an Authorized Participant or have the resources to buy and sell whole Creation Units. Therefore, they will be unable to purchase or redeem the shares directly from the Funds. Rather, most retail investors will purchase shares in the secondary market at market prices with the assistance of a broker and may be subject to customary brokerage commissions or fees. Fixed creation and redemption transaction fees are imposed in connection with creations and redemptions.
Authorized Participants transacting in Creation Units for cash may also pay a variable charge to compensate the relevant fund for certain transaction costs (e.g. taxes on currency or other financial transactions, and brokerage costs) and market impact expenses relating to investing in portfolio securities. Such variable charges, if any, are included in “Proceeds from sale of shares” in the Statements of Changes in Net Assets.
Share activity is as follows:
| | | | | | | | | | | | | | | | |
| | | Access Emerging Markets USD Bond ETF | |
| | | | |
| | | For the Fiscal Year Ended
August 31, 2023 | | | For the Period February 15, 2022*
through August 31, 2022 | |
| | | | |
| | | Shares | | | Dollars | | | Shares | | | Dollars | |
| | | | |
| Fund Share Activity | | | | | | | | | | | | |
Shares Sold | | | 750,000 | | | $ | 28,984,486 | | | | 1,700,000 | | | $ | 80,549,718 | |
Shares Redeemed | | | (250,000 | ) | | | (9,894,477 | ) | | | (900,000 | ) | | | (37,275,101 | ) |
| | | | |
NET INCREASE IN SHARES | | | 500,000 | | | $ | 19,090,009 | | | | 800,000 | | | $ | 43,274,617 | |
* Commencement of operations. | | | | | | | | | | | | | | | | |
141
GOLDMAN SACHS ACCESS FIXED INCOME ETFS
Notes to Financial Statements (continued)
August 31, 2023
|
| 5. CREATION AND REDEMPTION OF CREATION UNITS (continued) |
| | | | | | | | | | | | | | | | |
| |
| | | Access High Yield Corporate Bond ETF | |
| | | | |
| | | For the Fiscal Year Ended
August 31, 2023 | | | For the Fiscal Year Ended
August 31, 2022 | |
| | | | |
| | | Shares | | | Dollars | | | Shares | | | Dollars | |
| | | | |
| Fund Share Activity | | | | | | | | | | | | |
Shares Sold | | | 1,500,000 | | | $ | 63,759,385 | | | | 2,450,000 | | | $ | 114,019,983 | |
Shares Redeemed | | | (2,300,000 | ) | | | (97,932,564 | ) | | | (3,900,000 | ) | | | (181,106,517 | ) |
| | | | |
NET INCREASE/(DECREASE) IN SHARES | | | (800,000 | ) | | $ | (34,173,179 | ) | | | (1,450,000 | ) | | $ | (67,086,534 | ) |
| |
| | | Access Inflation Protected USD Bond ETF | |
| | | | |
| | | For the Fiscal Year Ended
August 31, 2023 | | | For the Fiscal Year Ended
August 31, 2022 | |
| | | | |
| | | Shares | | | Dollars | | | Shares | | | Dollars | |
| | | | |
| Fund Share Activity | | | | | | | | | | | | |
Shares Sold | | | 450,000 | | | $ | 21,918,076 | | | | 1,625,000 | | | $ | 93,221,061 | |
Shares Redeemed | | | (1,350,000 | ) | | | (66,027,253 | ) | | | (925,000 | ) | | | (52,293,928 | ) |
| | | | |
NET INCREASE/(DECREASE) IN SHARES | | | (900,000 | ) | | $ | (44,109,177 | ) | | | 700,000 | | | $ | 40,927,133 | |
| |
| | | Access Investment Grade Corporate 1-5 Year Bond ETF | |
| | | | |
| | | For the Fiscal Year Ended
August 31, 2023 | | | For the Fiscal Year Ended
August 31, 2022 | |
| | | | |
| | | Shares | | | Dollars | | | Shares | | | Dollars | |
| | | | |
| Fund Share Activity | | | | | | | | | | | | |
Shares Sold | | | 100,000 | | | $ | 4,636,503 | | | | 200,000 | | | $ | 9,653,124 | |
Shares Redeemed | | | (250,000 | ) | | | (11,557,166 | ) | | | (450,000 | ) | | | (21,925,146 | ) |
| | | | |
NET INCREASE/(DECREASE) IN SHARES | | | (150,000 | ) | | $ | (6,920,663 | ) | | | (250,000 | ) | | $ | (12,272,022 | ) |
| |
| | | Access Investment Grade Corporate Bond ETF | |
| | | | |
| | | For the Fiscal Year Ended
August 31, 2023 | | | For the Fiscal Year Ended
August 31, 2022 | |
| | | | |
| | | Shares | | | Dollars | | | Shares | | | Dollars | |
| | | | |
| Fund Share Activity | | | | | | | | | | | | |
Shares Sold | | | 6,950,000 | | | $ | 312,852,286 | | | | 6,200,000 | | | $ | 311,310,364 | |
Shares Redeemed | | | (5,500,000 | ) | | | (243,392,273 | ) | | | (6,400,000 | ) | | | (314,616,517 | ) |
| | | | |
NET INCREASE/(DECREASE) IN SHARES | | | 1,450,000 | | | $ | 69,460,013 | | | | (200,000 | ) | | $ | (3,306,153 | ) |
142
GOLDMAN SACHS ACCESS FIXED INCOME ETFS
|
| 5. CREATION AND REDEMPTION OF CREATION UNITS (continued) |
| | | | | | | | | | | | | | | | |
| |
| | | Access Treasury 0-1 Year ETF | |
| | | | |
| | | For the Fiscal Year Ended
August 31, 2023 | | | For the Fiscal Year Ended
August 31, 2022 | |
| | | | |
| | | Shares | | | Dollars | | | Shares | | | Dollars | |
| | | | |
| Fund Share Activity | | | | | | | | | | | | |
Shares Sold | | | 50,760,000 | | | $ | 5,065,129,680 | | | | 22,100,000 | | | $ | 2,207,541,510 | |
Shares Redeemed | | | (21,590,000 | ) | | | (2,155,003,879 | ) | | | (9,740,000 | ) | | | (973,326,888 | ) |
| | | | |
NET INCREASE IN SHARES | | | 29,170,000 | | | $ | 2,910,125,801 | | | | 12,360,000 | | | $ | 1,234,214,622 | |
| |
| | | Access U.S. Aggregate Bond ETF | |
| | | | |
| | | For the Fiscal Year Ended
August 31, 2023 | | | For the Fiscal Year Ended
August 31, 2022 | |
| | | | |
| | | Shares | | | Dollars | | | Shares | | | Dollars | |
| | | | |
| Fund Share Activity | | | | | | | | | | | | |
Shares Sold | | | 2,150,000 | | | $ | 89,552,204 | | | | 5,650,000 | | | $ | 254,499,846 | |
Shares Redeemed | | | (200,000 | ) | | | (8,270,935 | ) | | | — | | | | — | |
| | | | |
NET INCREASE IN SHARES | | | 1,950,000 | | | $ | 81,281,269 | | | | 5,650,000 | | | $ | 254,499,846 | |
| |
| | | Access Ultra Short Bond ETF | |
| | | | |
| | | For the Fiscal Year Ended
August 31, 2023 | | | For the Fiscal Year Ended
August 31, 2022 | |
| | | | |
| | | Shares | | | Dollars | | | Shares | | | Dollars | |
| | | | |
| Fund Share Activity | | | | | | | | | | | | |
Shares Sold | | | 5,250,000 | | | $ | 261,247,087 | | | | 5,775,000 | | | $ | 290,217,807 | |
Shares Redeemed | | | (3,875,000 | ) | | | (193,095,071 | ) | | | (2,225,000 | ) | | | (111,670,925 | ) |
| | | | |
NET INCREASE IN SHARES | | | 1,375,000 | | | $ | 68,152,016 | | | | 3,550,000 | | | $ | 178,546,882 | |
143
GOLDMAN SACHS ACCESS FIXED INCOME ETFS
Notes to Financial Statements (continued)
August 31, 2023
|
| 6. PORTFOLIO SECURITIES TRANSACTIONS |
The cost of purchases and proceeds from sales and maturities of long-term securities for the fiscal year ended August 31, 2023, were as follows (with the exception of the Access Treasury 0-1 Year ETF which only owns short term securities):
| | | | | | | | | | | | | | | | | | |
| Fund | | | | Purchases of
U.S. Government and
Agency Obligations | | | Purchases (Excluding
U.S. Government and
Agency Obligations) | | | Sales and
Maturities of
U.S. Government and
Agency Obligations | | | Sales and
Maturities (Excluding
U.S. Government and
Agency Obligations) | |
Access Emerging Markets USD Bond ETF | | | | $ | — | | | $ | 32,271,215 | | | $ | — | | | $ | 3,502,945 | |
Access High Yield Corporate Bond ETF | | | | | — | | | | 79,666,430 | | | | — | | | | 16,353,404 | |
Access Inflation Protected USD Bond ETF | | | | | 38,533,702 | | | | — | | | | 40,525,584 | | | | — | |
Access Investment Grade Corporate 1-5 Year Bond ETF | | | | | — | | | | 7,314,223 | | | | — | | | | 2,745,800 | |
Access Investment Grade Corporate Bond ETF | | | | | — | | | | 329,850,597 | | | | — | | | | 29,084,305 | |
Access U.S. Aggregate Bond ETF | | | | | 229,152,486 | | | | 2,012,253,672 | | | | 188,732,658 | | | | 1,938,749,584 | |
Access Ultra Short Bond ETF | | | | | 49,433,991 | | | | 329,439,290 | | | | 33,129,432 | | | | 314,641,430 | |
The purchases and sales from in-kind creation and redemption transactions for the fiscal year ended August 31, 2023, were as follows (with the exception of the Access Treasury 0-1 Year ETF which only owns short term securities):
| | | | | | | | | | |
| Fund | | | | Purchases | | | Sales | |
Access Emerging Markets USD Bond ETF | | | | $ | — | | | $ | 9,785,342 | |
Access High Yield Corporate Bond ETF | | | | | — | | | | 95,617,321 | |
Access Inflation Protected USD Bond ETF | | | | | 21,817,347 | | | | 65,847,951 | |
Access Investment Grade Corporate 1-5 Year Bond ETF | | | | | — | | | | 11,278,974 | |
Access Investment Grade Corporate Bond ETF | | | | | — | | | | 229,136,278 | |
Access U.S. Aggregate Bond ETF | | | | | — | | | | 4,443,919 | |
The tax character of distributions paid during the fiscal year ended August 31, 2023 was as follows:
| | | | | | | | | | | | | | | | | | | | | | | | | | | | | | | | |
| | | Access
Emerging
Markets
USD
Bond ETF | | | Access
High Yield
Corporate
Bond ETF | | | Access
Inflation
Protected
USD
Bond ETF | | | Access
Investment
Grade
Corporate
1-5 Year
Bond ETF | | | Access
Investment
Grade
Corporate
Bond ETF | | | Access
Treasury
0-1 Year ETF | | | Access U.S.
Aggregate
Bond ETF | | | Access Ultra
Short
Bond ETF | |
Distributions paid from: | | | | | | | | | | | | | | | | | | | | | | | | | | | | | | | | |
Ordinary Income | | $ | 2,675,655 | | | $ | 7,421,417 | | | $ | 4,179,323 | | | $ | 224,601 | | | $ | 20,409,959 | | | $ | 182,430,853 | | | $ | 14,281,841 | | | $ | 22,160,976 | |
Total taxable distributions | | | 2,675,655 | | | | 7,421,417 | | | | 4,179,323 | | | | 224,601 | | | | 20,409,959 | | | | 182,430,853 | | | | 14,281,841 | | | | 22,160,976 | |
Return of Capital | | $ | — | | | $ | — | | | $ | — | | | $ | — | | | $ | — | | | $ | — | | | $ | — | | | $ | — | |
144
GOLDMAN SACHS ACCESS FIXED INCOME ETFS
|
| 7. TAX INFORMATION (continued) |
The tax character of distributions paid during the fiscal year ended August 31, 2022 was as follows:
| | | | | | | | | | | | | | | | | | | | | | | | | | | | | | | | |
| | | Access
Emerging
Markets
USD Bond
ETF | | | Access
High Yield
Corporate
Bond ETF | | | Access
Inflation
Protected
USD
Bond ETF | | | Access
Investment
Grade
Corporate
1-5 Year
Bond ETF | | | Access
Investment
Grade
Corporate
Bond ETF | | | Access
Treasury
0-1 Year ETF | | | Access U.S.
Aggregate
Bond ETF | | | Access Ultra
Short
Bond ETF | |
Distributions paid from: | | | | | | | | | | | | | | | | | | | | | | | | | | | | | | | | |
Ordinary Income | | $ | 1,465,872 | | | $ | 8,962,167 | | | $ | 10,540,936 | | | $ | 290,343 | | | $ | 18,399,303 | | | $ | 6,806,393 | | | $ | 3,918,777 | | | $ | 4,021,476 | |
Total taxable distributions | | | 1,465,872 | | | | 8,962,167 | | | | 10,540,936 | | | | 290,343 | | | | 18,399,303 | | | | 6,806,393 | | | | 3,918,777 | | | | 4,021,476 | |
Return of Capital | | $ | — | | | $ | — | | | $ | — | | | $ | — | | | $ | — | | | $ | — | | | $ | — | | | $ | — | |
As of August 31, 2023, the components of accumulated earnings (losses) on a tax basis were as follows:
| | | | | | | | | | | | | | | | | | | | | | | | | | | | | | | | |
| | | Access
Emerging
Markets USD
Bond ETF | | | Access
High Yield
Corporate
Bond ETF | | | Access
Inflation
Protected USD
Bond ETF | | | Access
Investment
Grade
Corporate
1-5 Year
Bond ETF | | | Access
Investment
Grade
Corporate
Bond ETF | | | Access
Treasury
0-1 Year ETF | | | Access U.S.
Aggregate
Bond ETF | | | Access Ultra
Short
Bond ETF | |
Undistributed ordinary income — net | | $ | 260,726 | | | $ | 542,646 | | | $ | 354,507 | | | $ | 32,773 | | | $ | 2,162,990 | | | $ | 25,025,838 | | | $ | 2,010,010 | | | $ | 2,709,490 | |
Total undistributed earnings | | $ | 260,726 | | | $ | 542,646 | | | $ | 354,507 | | | $ | 32,773 | | | $ | 2,162,990 | | | $ | 25,025,838 | | | $ | 2,010,010 | | | $ | 2,709,490 | |
Capital loss carryforwards: | | | | | | | | | | | | | | | | | | | | | | | | | | | | | | | | |
Perpetual Short-Term | | $ | (4,719,239 | ) | | $ | (1,711,525 | ) | | $ | (926,084 | ) | | $ | (43,914 | ) | | $ | (2,764,880 | ) | | $ | (5,045,995 | ) | | $ | (16,536,773 | ) | | $ | (1,050,052 | ) |
Perpetual Long-Term | | | — | | | | (158,574 | ) | | | (1,048,175 | ) | | | (108,292 | ) | | | (2,529,605 | ) | | | — | | | | (4,356,844 | ) | | | (326,419 | ) |
Timing differences (Post-October Capital Loss Deferral) | | | (338,513 | ) | | | (1,489,472 | ) | | | (3,009,073 | ) | | | (100,634 | ) | | | (2,846,078 | ) | | | (5,815,184 | ) | | | (13,375,400 | ) | | | (1,853,131 | ) |
Unrealized gains (losses) — net | | | (3,398,751 | ) | | | (5,248,751 | ) | | | (17,753,589 | ) | | | (270,556 | ) | | | (78,114,199 | ) | | | (1,262,479 | ) | | | (31,209,738 | ) | | | (4,245,951 | ) |
Total accumulated earnings (losses) net | | $ | (8,195,777 | ) | | $ | (8,065,676 | ) | | $ | (22,382,414 | ) | | $ | (490,623 | ) | | $ | (84,091,772 | ) | | $ | 12,902,180 | | | $ | (63,468,745 | ) | | $ | (4,766,063 | ) |
As of August 31, 2023, the Funds’ aggregate security unrealized gains and losses based on cost for U.S. federal income tax purposes were as follows:
| | | | | | | | | | | | | | | | | | | | | | | | | | | | | | | | |
| | | Access
Emerging
Markets USD
Bond ETF | | | Access
High Yield
Corporate
Bond ETF | | | Access
Inflation
Protected USD
Bond ETF | | | Access
Investment
Grade
Corporate
1-5 Year
Bond ETF | | | Access
Investment
Grade
Corporate
Bonds ETF | | | Access Treasury
0-1 Year ETF | | | Access U.S.
Aggregate
Bond ETF | | | Access Ultra
Short
Bond ETF | |
Tax Cost | | $ | 54,047,414 | | | $ | 104,771,348 | | | $ | 128,762,661 | | | $ | 9,317,191 | | | $ | 753,125,944 | | | $ | 6,013,996,612 | | | $ | 592,069,046 | | | $ | 573,178,445 | |
Gross unrealized gain | | | 681,153 | | | | 1,025,253 | | | | — | | | | 4,047 | | | | 70,076 | | | | 455,957 | | | | 679,249 | | | | 717,338 | |
Gross unrealized loss | | | (4,079,904 | ) | | | (6,274,004 | ) | | | (17,753,589 | ) | | | (274,603 | ) | | | (78,184,275 | ) | | | (1,718,436 | ) | | | (31,888,987 | ) | | | (4,963,289 | ) |
Net unrealized gains (losses) on securities | | $ | (3,398,751 | ) | | $ | (5,248,751 | ) | | $ | (17,753,589 | ) | | $ | (270,556 | ) | | $ | (78,114,199 | ) | | $ | (1,262,479 | ) | | $ | (31,209,738 | ) | | $ | (4,245,951 | ) |
145
GOLDMAN SACHS ACCESS FIXED INCOME ETFS
Notes to Financial Statements (continued)
August 31, 2023
|
| 7. TAX INFORMATION (continued) |
The difference between GAAP-basis and tax-basis unrealized gains (losses) is due to wash sales, and differences in tax treatment of market discount accretion and premium amortization, and inflation protected securities.
In order to present certain components of the Funds’ capital accounts on a tax-basis, certain reclassifications have been recorded to the Funds’ accounts. These reclassifications have no impact on the NAV of the Funds’ and result primarily from redemptions utilized as distributions and redemption in-kind transactions.
| | | | | | | | | | |
| Fund | | | | Paid-in
Capital | | | Total
Distributable
Earnings | |
Access Emerging Markets USD Bond ETF | | | | $ | (413,230 | ) | | $ | 413,230 | |
Access High Yield Corporate Bond ETF | | | | $ | (8,812,970 | ) | | $ | 8,812,970 | |
Access Inflation Protected USD Bond ETF | | | | $ | (6,204,261 | ) | | $ | 6,204,261 | |
Access Investment Grade Corporate 1-5 Year Bond ETF | | | | $ | (735,630 | ) | | $ | 735,630 | |
Access Investment Grade Corporate Bond ETF | | | | $ | (32,328,299 | ) | | $ | 32,328,299 | |
Access Treasury 0-1 Year ETF | | | | $ | (2,034,574 | ) | | $ | 2,034,574 | |
Access U.S. Aggregate Bond ETF | | | | $ | (283,693 | ) | | $ | 283,693 | |
GSAM has reviewed the Funds’ tax positions for all open tax years (the current year, and prior three tax years, as applicable) and has concluded that no provision for income tax is required in the Funds’ financial statements. Such open tax year remains subject to examination and adjustment by tax authorities.
The Funds’ risks include, but are not limited to, the following:
Calculation Methodology Risk — The Index relies on various sources of information to assess the criteria of issuers included in the Index (or a Reference Index if applicable), including fundamental information that may be based on assumptions and estimates. Neither the Fund, the Investment Adviser nor the Index Provider can offer assurances that the Index’s calculation methodology or sources of information will provide a correct valuation of securities, nor can they guarantee the availability or timeliness of the production of the Index.
Index Risk (each Fund except the Access Ultra Short Bond ETF) — FTSE Fixed Income LLC (the “Index Provider”) constructs each Fund’s Index in accordance with a rules-based methodology. A Fund will be negatively affected by general declines in the securities and asset classes represented in its Index. In addition, because the Funds are not “actively” managed, unless a specific security is removed from an Index, a Fund generally would not sell a security because the security’s issuer was in financial trouble. Market disruptions and regulatory restrictions could have an adverse effect on a Fund’s ability to adjust its exposure to the required levels in order to track the Index. A Fund also does not attempt to take defensive positions under any market conditions, including declining markets. Therefore, a Fund’s performance could be lower than funds that may actively shift their portfolio assets to take advantage of market opportunities or to lessen the impact of a market decline or a decline in the value of one or more issuers. When the Index is rebalanced and a Fund in turn rebalances its portfolio to attempt to increase the correlation between the Fund’s portfolio and the Index, any transaction costs and market exposure arising from such portfolio rebalancing may be borne directly by the Fund and its shareholders. The Index Provider may utilize third party data in constructing each Index, but it does not guarantee the accuracy or availability of any such third party data. Errors in index data, index computation or the construction of an Index in accordance with its methodology may occur from time to time and may not be identified and corrected by the Index Provider for a
146
GOLDMAN SACHS ACCESS FIXED INCOME ETFS
|
| 8. OTHER RISKS (continued) |
period of time or at all, which may have an adverse impact on the applicable Fund and its shareholders. In addition, neither a Fund, the Investment Adviser nor the Index Provider can guarantee the availability or timeliness of the production of the Index.
Industry Concentration Risk — In following its methodology, the Index from time to time may be concentrated to a significant degree in securities of issuers located in a single industry or group of industries. To the extent that the Index concentrates in the securities of issuers in a particular industry or group of industries, the Fund also may concentrate its investments to approximately the same extent. By concentrating its investments in an industry or group of industries, the Fund may face more risks than if it were diversified broadly over numerous industries or groups of industries. If the Index is not concentrated in a particular industry or group of industries, the Fund will not concentrate in a particular industry or group of industries.
Interest Rate Risk — When interest rates increase, fixed income securities or instruments held by a Fund will generally decline in value. Long-term fixed income securities or instruments will normally have more price volatility because of this risk than short-term fixed income securities or instruments. A wide variety of market factors can cause interest rates to rise, including central bank monetary policy, rising inflation and changes in general economic conditions. Changing interest rates may have unpredictable effects on the markets, may result in heightened market volatility and may detract from Fund’s performance. In addition, changes in monetary policy may exacerbate the risks associated with changing interest rates. Funds with longer average portfolio durations will generally be more sensitive to changes in interest rates than funds with a shorter average portfolio duration. Fluctuations in interest rates may also affect the liquidity of fixed income securities and instruments held by the Funds. A sudden or unpredictable increase in interest rates may cause volatility in the market and may decrease the liquidity of the Fund’s investments, which would make it harder for the Fund to sell its investments at an advantageous time.
Large Shareholder Transactions Risk — Certain shareholders, including other funds advised by the Investment Adviser, may from time to time own a substantial amount of the Fund’s Shares. In addition, a third party investor, the Investment Adviser or an affiliate of the Investment Adviser, an authorized participant, a lead market maker, or another entity (i.e., a seed investor) may invest in the Fund and hold its investment solely to facilitate commencement of the Fund or to facilitate the Fund’s achieving a specified size or scale. Any such investment may be held for a limited period of time. There can be no assurance that any large shareholder would not redeem its investment, that the size of the Fund would be maintained at such levels or that the Fund would continue to meet applicable listing requirements. Redemptions by large shareholders could have a significant negative impact on the Fund, including on the Fund’s liquidity. In addition, transactions by large shareholders may account for a large percentage of the trading volume on NYSE Arca and Cboe BZX and may, therefore, have a material upward or downward effect on the market price of the Shares.
Liquidity Risk — A Fund may make investments that are illiquid or that may become less liquid in response to market developments or adverse investor perceptions. Illiquid investments may be more difficult to value. To the extent a Fund engages in cash redemptions, then liquidity risk may also refer to the risk that a Fund will not be able to pay redemption proceeds within the allowable time period or without significant dilution to remaining investors’ interests because of unusual market conditions, declining prices of the securities sold, an unusually high volume of redemption requests, or other reasons. To meet redemption requests, a Fund may be forced to sell investments at an unfavorable time and/or under unfavorable conditions. If a Fund is forced to sell securities at an unfavorable time and/or under unfavorable conditions, such sales may adversely affect the Fund’s NAV and dilute remaining investors’ interests. Liquidity risk may be the result of, among other things, the reduced number and capacity of traditional market participants to make a market in fixed income securities or the lack of an active market. The potential for liquidity risk may be magnified by a rising interest rate environment or other circumstances where investor redemptions from fixed income funds may be higher than normal, potentially causing increased supply in the market due to selling activity. These risks may be more pronounced in connection with a Fund‘s investments in securities of issuers located in emerging market countries. Redemptions by large shareholders may have a negative impact on a Fund’s liquidity.
Market and Credit Risks — In the normal course of business, a Fund trades financial instruments and enters into financial transactions where risk of potential loss exists due to changes in the market (market risk). The value of the securities in which a
Fund invests may go up or down in response to the prospects of individual companies, particular sectors or governments and/or
147
GOLDMAN SACHS ACCESS FIXED INCOME ETFS
Notes to Financial Statements (continued)
August 31, 2023
|
| 8. OTHER RISKS (continued) |
general economic conditions throughout the world due to increasingly interconnected global economies and financial markets. Events such as war, military conflict, acts of terrorism, social unrest, natural disasters, recessions, inflation, rapid interest rate changes, supply chain disruptions, sanctions, the spread of infectious illness or other public health threats could also significantly impact a Fund and its investments. Additionally, a Fund may also be exposed to credit risk in the event that an issuer or guarantor fails to perform or that an institution or entity with which the Fund has unsettled or open transactions defaults.
Market Trading Risk — Each Fund faces numerous market trading risks, including disruptions to creations and redemptions, the existence of extreme market volatility or potential lack of an active trading market for Shares. If a shareholder purchases Shares at a time when the market price is at a premium to the NAV or sells Shares at a time when the market price is at a discount to the NAV, the shareholder may pay more for, or receive less than, the underlying value of the Shares, respectively. The Investment Adviser cannot predict whether Shares will trade below, at or above their NAV. Price differences may be due, in large part, to the fact that supply and demand forces at work in the secondary trading market for Shares will be closely related to, but not identical to, the same forces influencing the prices of the securities of a Fund’s Index trading individually or in the aggregate at any point in time.
Sampling Risk — The Fund’s use of a representative sampling approach will result in its holding a smaller number of securities than are in the Index. As a result, an adverse development respecting a security held by the Fund could result in a greater decline in NAV than would be the case if the Fund held all of the securities in the Index. Conversely, a positive development relating to a security in the Index that is not held by the Fund could cause the Fund to underperform the Index. To the extent the assets in the Fund are smaller, these risks will be greater.
Tracking Error Risk — Tracking error is the divergence of a Fund’s performance from that of its Index. The performance of a Fund may diverge from that of its Index for a number of reasons. Tracking error may occur because of transaction costs, a Fund’s holding of cash, differences in accrual of dividends, changes to its Index or the need to meet new or existing regulatory requirements. Unlike a Fund, the returns of an Index are not reduced by investment and other operating expenses, including the trading costs associated with implementing changes to its portfolio of investments. Tracking error risk may be heightened during times of market volatility or other unusual market conditions.
Under the Trust’s organizational documents, its Trustees, officers, employees and agents are indemnified, to the extent permitted by the Act and state law, against certain liabilities that may arise out of performance of their duties to the Funds. Additionally, in the course of business, the Funds enter into contracts that contain a variety of indemnification clauses. The Funds’ maximum exposure under these arrangements is unknown, as this would involve future claims that may be made against the Funds that have not yet occurred. However, GSAM believes the risk of loss under these arrangements to be remote.
Pursuant to an effort to consolidate the membership of the Board of Trustees of the Trust (the “Board”) with the Board of Trustees of each of Goldman Sachs ETF Trust II, Goldman Sachs Real Estate Diversified Income Fund, Goldman Sachs Trust, Goldman Sachs Trust II and Goldman Sachs Variable Insurance Trust, in July 2023, the Board voted to nominate Gregory G. Weaver, Dwight L. Bush, Kathryn A. Cassidy, John G. Chou, Joaquin Delgado, Eileen H. Dowling and Paul C. Wirth (the “Nominees”) for election as Trustees of the Trust at a virtual special joint meeting of shareholders to be held on November 16, 2023. Each of the Nominees currently serve as a Trustee of each of the Goldman Sachs Trust and Goldman Sachs Variable Insurance Trust. If elected, the Nominees will serve as Trustees alongside the current Trustees of the Trust. This annual report is not a proxy statement. Information regarding the election of the Nominees is contained in the proxy materials filed with the SEC. The proxy statement has been mailed to shareholders of record, and shareholders can also access the proxy statement, and any other relevant documents, on the SEC’s website.
148
GOLDMAN SACHS ACCESS FIXED INCOME ETFS
Subsequent events after the Statements of Assets and Liabilities date have been evaluated, and GSAM has concluded that there is no impact requiring adjustment or disclosure in the financial statements.
149
Report of Independent Registered Public Accounting Firm
To the Board of Trustees of Goldman Sachs ETF Trust and Shareholders of Goldman Sachs Access Emerging Markets USD Bond ETF, Goldman Sachs Access High Yield Corporate Bond ETF, Goldman Sachs Access Inflation Protected USD Bond ETF, Goldman Sachs Access Investment Grade Corporate 1-5 Year Bond ETF, Goldman Sachs Access Investment Grade Corporate Bond ETF, Goldman Sachs Access Treasury 0-1 Year ETF, Goldman Sachs Access U.S. Aggregate Bond ETF, and Goldman Sachs Access Ultra Short Bond ETF
Opinions on the Financial Statements
We have audited the accompanying statements of assets and liabilities, including the schedules of investments, of each of the funds indicated in the table below (eight of the funds constituting Goldman Sachs ETF Trust, hereafter collectively referred to as the “Funds”) as of August 31, 2023, the related statements of operations and of changes in net assets for each of the periods indicated in the table below, including the related notes, and the financial highlights for each of the periods indicated in the table below (collectively referred to as the “financial statements”). In our opinion, the financial statements present fairly, in all material respects, the financial position of each of the Funds as of August 31, 2023, the results of each of their operations, the changes in each of their net assets, and each of the financial highlights for each of the periods indicated in the table below, in conformity with accounting principles generally accepted in the United States of America.
| | | | | | |
| Fund | | Statement of
operations | | Statement of
changes in net assets | | Financial
highlights |
| Goldman Sachs Access High Yield Corporate Bond ETF, Goldman Sachs Access Inflation Protected USD Bond ETF, Goldman Sachs Access Investment Grade Corporate 1-5 Year Bond ETF, Goldman Sachs Access Investment Grade Corporate Bond ETF, Goldman Sachs Access Treasury 0-1 Year ETF, Goldman Sachs Access U.S. Aggregate Bond ETF, and Goldman Sachs Access Ultra Short Bond ETF | | For the year ended August 31, 2023 | | For the two years ended August 31, 2023 | | For each of the periods indicated therein |
Goldman Sachs Access Emerging Markets USD Bond ETF | | For the year ended August 31, 2023 | | For the year ended August 31, 2023, and for the period February 15, 2022 (commencement of operations) through August 31, 2022 |
Basis for Opinions
These financial statements are the responsibility of the Funds’ management. Our responsibility is to express an opinion on the Funds’ financial statements based on our audits. We are a public accounting firm registered with the Public Company Accounting Oversight Board (United States) (PCAOB) and are required to be independent with respect to the Funds in accordance with the U.S. federal securities laws and the applicable rules and regulations of the Securities and Exchange Commission and the PCAOB.
We conducted our audits of these financial statements in accordance with the standards of the PCAOB. Those standards require that we plan and perform the audit to obtain reasonable assurance about whether the financial statements are free of material misstatement, whether due to error or fraud.
Our audits included performing procedures to assess the risks of material misstatement of the financial statements, whether due to error or fraud, and performing procedures that respond to those risks. Such procedures included examining, on a test basis, evidence regarding the amounts and disclosures in the financial statements. Our audits also included evaluating the accounting principles used and significant estimates made by management, as well as evaluating the overall presentation of the financial statements. Our procedures included confirmation of securities owned as of August 31, 2023 by correspondence with the custodian, transfer agent and brokers; when replies were not received from brokers, we performed other auditing procedures. We believe that our audits provide a reasonable basis for our opinions.
/s/ PricewaterhouseCoopers LLP
Boston, Massachusetts
October 25, 2023
We have served as the auditor of one or more investment companies in the Goldman Sachs fund complex since 2000.
150
GOLDMAN SACHS ACCESS FIXED INCOME ETFS
Fund Expenses — Six Month Period Ended 8/31/2023 (Unaudited)
As a shareholder you incur ongoing costs, including management fees and other Fund expenses. This example is intended to help you understand your ongoing costs (in dollars) of investing in Shares of a Fund and to compare these costs with the ongoing costs of investing in other exchange-traded funds. This example does not take into account brokerage commissions that you may pay on your purchases and sales of Shares of a Fund.
This example is based on an investment of $1,000 invested at the beginning of the period from March 1, 2023 and held for the entire six months ended August 31, 2023, which represents a period of 184 days of a 365 day year (or less where indicated).
Actual Expenses — The first line in the table below provides information about actual account values and actual expenses. You may use the information in this line, together with the amount you invested, to estimate the expenses that you paid over the six months. Simply divide your account value by $1,000 (for example, an $8,600 account value divided by $1,000=8.6), then multiply the result by the number in the first line under the heading entitled “Expenses Paid” to estimate the expenses you paid on your account during this period.
Hypothetical Example for Comparison Purposes — The second line in the table below provides information about hypothetical account values and hypothetical expenses based on a Fund’s actual net expense ratios and an assumed rate of return of 5% per year before expenses, which is not the Fund’s actual return. The hypothetical account values and expenses may not be used to estimate the actual ending account balance or expenses you paid for the period. You may use this information to compare the ongoing costs of investing in a Fund and other funds. To do so, compare this 5% hypothetical example with the 5% hypothetical examples that appear in the shareholder reports of the other funds.
Please note that the expenses shown in the table are meant to highlight your ongoing costs only and do not reflect any transactional costs, such as redemption fees, or exchange fees. Therefore, the second line of the table is useful in comparing ongoing costs only, and will not help you determine the relative total costs of owning different funds. In addition, if these transactional costs were included, your costs would have been higher.
| | | | | | | | | | | | | | | | | | | | | | | | | | | | | | | | | | | | | | | | | | | | | | | | |
| | | Access Emerging Markets USD Bond ETF | | | Access High Yield Corporate Bond ETF | | | Access Inflation Protected USD Bond ETF | | | Access Investment Grade Corporate
1-5 Year Bond ETF | |
| | | Beginning
Account
Value
3/1/23 | | | Ending
Account
Value
8/31/23 | | | Expenses
Paid* | | | Beginning
Account
Value
3/1/23 | | | Ending
Account
Value
8/31/23 | | | Expenses
Paid* | | | Beginning
Account
Value
3/1/23 | | | Ending
Account
Value
8/31/23 | | | Expenses
Paid* | | | Beginning
Account
Value
3/1/23 | | | Ending
Account
Value
8/31/23 | | | Expenses
Paid* | |
Actual based on NAV | | $ | 1,000 | | | $ | 1,017.16 | | | $ | 2.06 | | | $ | 1,000 | | | $ | 1,044.34 | | | $ | 1.75 | | | $ | 1,000 | | | $ | 1,005.88 | | | $ | 0.60 | | | $ | 1,000 | | | $ | 1,022.39 | | | $ | 0.71 | |
Hypothetical 5% return | | | 1,000 | | | | 1,023.16 | + | | | 2.07 | | | | 1,000 | | | | 1,023.50 | + | | | 1.73 | | | | 1,000 | | | | 1,024.60 | + | | | 0.61 | | | | 1,000 | | | | 1,024.50 | + | | | 0.71 | |
| | | Access Investment Grade
Corporate Bond ETF | | | Access Treasury 0-1 Year ETF | | | Access U.S. Aggregate Bond ETF | | | Access Ultra Short Bond ETF | |
| | | Beginning
Account
Value
3/1/23 | | | Ending
Account
Value
8/31/23 | | | Expenses
Paid* | | | Beginning
Account
Value
3/1/23 | | | Ending
Account
Value
8/31/23 | | | Expenses
Paid* | | | Beginning
Account
Value
3/1/23 | | | Ending
Account
Value
8/31/23 | | | Expenses
Paid* | | | Beginning
Account
Value
3/1/23 | | | Ending
Account
Value
8/31/23 | | | Expenses
Paid* | |
Actual based on NAV | | $ | 1,000 | | | $ | 1,021.41 | | | $ | 0.71 | | | $ | 1,000 | | | $ | 1,023.93 | | | $ | 0.61 | | | $ | 1,000 | | | $ | 1,007.13 | | | $ | 0.63 | | | $ | 1,000 | | | $ | 1,025.28 | | | $ | 0.80 | |
Hypothetical 5% return | | | 1,000 | | | | 1,024.50 | + | | | 0.71 | | | | 1,000 | | | | 1,024.60 | + | | | 0.61 | | | | 1,000 | | | | 1,024.58 | + | | | 0.63 | | | | 1,000 | | | | 1,024.41 | + | | | 0.80 | |
| | + | | Hypothetical expenses are based on each Fund’s actual annualized net expense ratios and an assumed rate of return of 5% per year before expenses. | |
| | * | | Expenses for each Fund are calculated using the Fund’s annualized net expense ratio, which represents the ongoing expenses as a percentage of net assets for the six months ended August 31, 2023. Expenses are calculated by multiplying the annualized net expense ratio by the average account value for the period; then multiplying the result by the number of days in the most recent fiscal year; and then dividing that result by the number of days in the fiscal year. | |
| | | | The annualized net expense ratio for the period is as follows: | |
| | | | |
| Fund | | | |
Access Emerging Markets USD Bond ETF | | | 0.39 | % |
Access High Yield Corporate Bond ETF | | | 0.34 | |
Access Inflation Protected USD Bond ETF | | | 0.12 | |
Access Investment Grade Corporate 1-5 Year Bond ETF | | | 0.14 | |
Access Investment Grade Corporate Bond ETF | | | 0.14 | |
Access Treasury 0-1 Year ETF | | | 0.12 | |
Access U.S. Aggregate Bond ETF | | | 0.12 | |
Access Ultra Short Bond ETF | | | 0.16 | |
151
GOLDMAN SACHS ACCESS FIXED INCOME ETFS
Trustees and Officers (Unaudited)
Independent Trustees
| | | | | | | | | | |
Name, Address and Age1 | | Position(s) Held
with the Trust | | Term of Office and Length of
Time Served2 | | Principal Occupation(s) During Past 5 Years | | Number of
Portfolios in
Fund Complex
Overseen by
Trustee3 | | Other Directorships Held by Trustee4 |
| | | | | |
Cheryl K. Beebe Age: 67 | | Chair of the Board of Trustees | | Since 2021 | | Ms. Beebe is retired. She is Director, Packaging Corporation of America (2008-Present); Director, The Mosaic Company (2019-Present); Director, HanesBrands Inc. (2020-Present); and was formerly Director, Convergys Corporation (a global leader in customer experience outsourcing) (2015-2018); and formerly held the position of Executive Vice President, (2010-2014); and Chief Financial Officer, Ingredion, Inc. (a leading global ingredient solutions company) (2004-2014). Chair of the Board of Trustees — Goldman Sachs ETF Trust; Goldman Sachs Trust II; Goldman Sachs ETF Trust II; Goldman Sachs MLP and Energy Renaissance Fund; and Goldman Sachs Real Estate Diversified Income Fund. | | 68 | | Packaging Corporation of America (producer of container board); The Mosaic Company (producer of phosphate and potash fertilizer); HanesBrands Inc. (a multinational clothing company) |
| | | | | |
Lawrence Hughes Age: 65 | | Trustee | | Since 2021 | | Mr. Hughes is retired. Formerly, he held senior management positions with BNY Mellon Wealth Management, a division of The Bank of New York Mellon Corporation (a financial services company) (1991-2015), most recently as Chief Executive Officer (2010-2015). Previously, Mr. Hughes served as an Advisory Board Member of Goldman Sachs Trust II (February 2016-April 2016). Trustee — Goldman Sachs ETF Trust; Goldman Sachs ETF Trust II; Goldman Sachs Trust II; Goldman Sachs MLP and Energy Renaissance Fund; and Goldman Sachs Real Estate Diversified Income Fund. | | 68 | | None |
| | | | | |
John F. Killian Age: 68 | | Trustee | | Since 2021 | | Mr. Killian is retired. He is Director, Consolidated Edison, Inc. (2007-Present); and was formerly Director, Houghton Mifflin Harcourt Publishing Company (2011-2022). Previously, he held senior management positions with Verizon Communications, Inc., including Executive Vice President and Chief Financial Officer (2009-2010); and President, Verizon Business, Verizon Communications, Inc. (2005-2009). Trustee — Goldman Sachs ETF Trust; Goldman Sachs ETF Trust II; Goldman Sachs Trust II; Goldman Sachs MLP and Energy Renaissance Fund; and Goldman Sachs Real Estate Diversified Income Fund. | | 68 | | Consolidated Edison, Inc. (a utility holding company) |
| | | | | |
Steven D. Krichmar Age: 65 | | Trustee | | Since 2021 | | Mr. Krichmar is retired. Formerly, he held senior management and governance positions with Putnam Investments, LLC, a financial services company (2001-2016). He was most recently Chief of Operations and a member of the Operating Committee of Putnam Investments, LLC and Principal Financial Officer of The Putnam Funds. Previously, Mr. Krichmar served as an Audit Partner with PricewaterhouseCoopers LLP and its predecessor company (1990-2001). Trustee — Goldman Sachs ETF Trust; Goldman Sachs ETF Trust II; Goldman Sachs Trust II; Goldman Sachs MLP and Energy Renaissance Fund; and Goldman Sachs Real Estate Diversified Income Fund. | | 68 | | None |
| | | | | | | | | | |
152
GOLDMAN SACHS ACCESS FIXED INCOME ETFS
Trustees and Officers (Unaudited) (continued)
Independent Trustees
| | | | | | | | | | |
Name, Address and Age1 | | Position(s) Held
with the Trust | | Term of Office and Length of
Time Served2 | | Principal Occupation(s) During Past 5 Years | | Number of
Portfolios in
Fund Complex
Overseen by
Trustee3 | | Other Directorships Held by Trustee4 |
| | | | | |
Michael Latham Age: 57 | | Trustee | | Since 2015 | | Mr. Latham is retired. Formerly, he held senior management positions with the iShares exchange-traded fund business owned by BlackRock, Inc., including Chairman (2011-2014); Global Head (2010-2011); U.S. Head (2007-2010); and Chief Operating Officer (2003-2007). Trustee — Goldman Sachs ETF Trust; Goldman Sachs ETF Trust II; Goldman Sachs Trust II; Goldman Sachs MLP and Energy Renaissance Fund; Goldman Sachs Credit Income Fund; and Goldman Sachs Real Estate Diversified Income Fund. | | 69 | | None |
| | | | | |
Lawrence W. Stranghoener Age: 69 | | Trustee | | Since 2015 | | Mr. Stranghoener is retired. He is Chairman, Kennametal, Inc. (a global manufacturer and distributor of tooling and industrial materials) (2003-Present); and was formerly Director, Aleris Corporation and Aleris International, Inc. (a producer of aluminum rolled products) (2011-2020); Interim Chief Executive Officer (2014) and Executive Vice President and Chief Financial Officer (2004-2014), Mosaic Company (a fertilizer manufacturing company). Trustee — Goldman Sachs ETF Trust; Goldman Sachs Trust II; Goldman Sachs ETF Trust II; Goldman Sachs MLP and Energy Renaissance Fund; and Goldman Sachs Real Estate Diversified Income Fund. Chair of the Board of Trustees — Goldman Sachs Credit Income Fund. | | 69 | | Kennametal, Inc. (a global manufacturer and distributor of tooling and industrial materials) |
Interested Trustee*
| | | | | | | | | | |
Name, Address and Age1 | | Position(s) Held
with the Trust | | Term of Office and Length of
Time Served2 | | Principal Occupation(s) During Past 5 Years | | Number of
Portfolios in
Fund Complex
Overseen by
Trustee3 | | Other Directorships Held by Trustee4 |
| | | | | | | | | | |
| | | | | |
James A. McNamara Age: 60 | | President and Trustee | | Since 2014 | | Advisory Director, Goldman Sachs (January 2018-Present); Managing Director, Goldman Sachs (January 2000-December 2017); Director of Institutional Fund Sales, GSAM (April 1998-December 2000); and Senior Vice President and Manager, Dreyfus Institutional Service Corporation (January 1993-April 1998). President and Trustee — Goldman Sachs ETF Trust; Goldman Sachs ETF Trust II; Goldman Sachs Trust; Goldman Sachs Variable Insurance Trust; Goldman Sachs Trust II; Goldman Sachs MLP and Energy Renaissance Fund; Goldman Sachs Credit Income Fund; and Goldman Sachs Real Estate Diversified Income Fund. | | 172 | | None |
| | | | | | | | | | |
| * | | Mr. McNamara is considered to be an “Interested Trustee” because he holds a position with Goldman Sachs and owns securities issued by The Goldman Sachs Group, Inc. The Interested Trustee holds comparable positions with certain other companies of which Goldman Sachs, GSAM or an affiliate thereof is the investment adviser, administrator and/or distributor. |
| 1 | | Each Trustee may be contacted by writing to the Trustee, c/o Goldman Sachs, 200 West Street, New York, New York, 10282, Attn: Caroline Kraus. Information is provided as of August 31, 2023. |
| 2 | | Each Trustee holds office for an indefinite term, until the earliest of: (a) the election of his or her successor; (b) the date the Trustee resigns or is removed by the Board or shareholders, in accordance with the Trust’s Declaration of Trust; or (c) the termination of the Trust. The Board has adopted policies which provide that each Independent Trustee shall retire as of December 31st of the calendar year in which he or she reaches (a) his or her 74th birthday or (b) the 15th anniversary of the date he or she became a Trustee, whichever is earlier, unless a waiver of such requirements shall have been adopted by a majority of the other Trustees. These policies may be changed by the Trustees without shareholder vote. |
| 3 | | The Goldman Sachs Fund Complex includes certain other companies listed above for each respective Trustee. As of August 31, 2023, Goldman Sachs ETF Trust consisted of 67 portfolios (32 of which offered shares to the public); Goldman Sachs ETF Trust II consisted of 2 portfolios; Goldman Sachs Trust consisted of 87 portfolios; Goldman Sachs Variable Insurance Trust consisted of 15 portfolios (11 of which offered shares to the public); Goldman Sachs Trust II consisted of 18 portfolios (7 of which offered shares to the public); and Goldman Sachs MLP and Energy Renaissance Fund, Goldman Sachs Credit Income Fund and Goldman Sachs Real Estate Diversified Income Fund each consisted of one portfolio. Goldman Sachs MLP and Energy Renaissance Fund and Goldman Sachs Credit Income Fund each did not offer shares to the public. |
| 4 | | This column includes only directorships of companies required to report to the Securities and Exchange Commission under the Securities Exchange Act of 1934 (i.e., “public companies”) or other investment companies registered under the Act. |
Additional information about the Trustees is available in the Funds’ Statement of Additional Information, which can be obtained from Goldman Sachs free of charge by calling this toll-free number (in the United States of America): 1-800-526-7384.
153
GOLDMAN SACHS ACCESS FIXED INCOME ETFS
Trustees and Officers (Unaudited) (continued)
Officers of the Trust*
| | | | | | |
| Name, Address and Age1 | | Positions Held
with the Trust | | Term of
Office and
Length of
Time Served2 | | Principal Occupation(s) During Past 5 Years |
| | | |
James A. McNamara 200 West Street New York, NY 10282 Age: 60 | | Trustee and President | | Since 2014 | | Advisory Director, Goldman Sachs (January 2018-Present); Managing Director, Goldman Sachs (January 2000-December 2017); Director of Institutional Fund Sales, GSAM (April 1998-December 2000); and Senior Vice President and Manager, Dreyfus Institutional Service Corporation (January 1993-April 1998). President and Trustee — Goldman Sachs ETF Trust; Goldman Sachs Trust; Goldman Sachs Variable Insurance Trust; Goldman Sachs Trust II; Goldman Sachs ETF Trust II; Goldman Sachs MLP and Energy Renaissance Fund; Goldman Sachs Credit Income Fund; and Goldman Sachs Real Estate Diversified Income Fund. |
| | | |
Caroline L. Kraus 200 West Street New York, NY 10282 Age: 46 | | Secretary | | Since 2014 | | Managing Director, Goldman Sachs (January 2016-Present); Vice President, Goldman Sachs (August 2006-December 2015); Senior Counsel, Goldman Sachs (January 2020-Present); Associate General Counsel, Goldman Sachs (2012-December 2019); Assistant General Counsel, Goldman Sachs (August 2006-December 2011); and Associate, Weil, Gotshal & Manges, LLP (2002–2006). Secretary — Goldman Sachs ETF Trust; Goldman Sachs Trust (previously Assistant Secretary (2012)); Goldman Sachs Variable Insurance Trust (previously Assistant Secretary (2012)); Goldman Sachs Trust II; Goldman Sachs ETF Trust II; Goldman Sachs BDC, Inc.; Goldman Sachs Private Middle Market Credit LLC; Goldman Sachs Private Middle Market Credit II LLC; Goldman Sachs Middle Market Lending Corp.; Goldman Sachs MLP and Energy Renaissance Fund; Goldman Sachs Credit Income Fund; and Goldman Sachs Real Estate Diversified Income Fund. |
| | | |
Joseph F. DiMaria 30 Hudson Street Jersey City, NJ 07302 Age: 55 | | Treasurer, Principal Financial Officer and Principal Accounting Officer | | Since 2017 (Treasurer and Principal Financial Officer since 2019) | | Managing Director, Goldman Sachs (November 2015-Present) and Vice President-Mutual Fund Administration, Columbia Management Investment Advisers, LLC (May 2010-October 2015). Treasurer, Principal Financial Officer and Principal Accounting Officer — Goldman Sachs ETF Trust (previously Assistant Treasurer (2017)); Goldman Sachs Trust (previously Assistant Treasurer (2016)); Goldman Sachs Variable Insurance Trust (previously Assistant Treasurer (2016)); Goldman Sachs Trust II (previously Assistant Treasurer (2017)); Goldman Sachs MLP and Energy Renaissance Fund (previously Assistant Treasurer (2017)); Goldman Sachs ETF Trust II; Goldman Sachs Credit Income Fund; and Goldman Sachs Real Estate Diversified Income Fund. |
| | | | | | |
| * | | Represents a partial list of officers of the Trust. Additional information about all the officers is available in the Funds’ Statement of Additional Information, which can be obtained from Goldman Sachs free of charge by calling this toll-free number (in the United States): 1-800-621-2550. |
| 1 | | Information is provided as of August 31, 2023. |
| 2 | | Officers hold office at the pleasure of the Board of Trustees or until their successors are duly elected and qualified. Each officer holds comparable positions with certain other companies of which Goldman Sachs, GSAM or an affiliate thereof is the investment adviser, administrator and/or distributor. |
Goldman Sachs Access Fixed Income ETFs — Tax Information (Unaudited)
During the fiscal year ended August 31, 2022, 100% of the net investment company taxable income distributions paid by the Access Inflation Protected USD Bond ETF and Access Treasury 0-1 Year ETF were designated as interest-related dividends pursuant to Section 871(k) of the Internal Revenue Code.
For the fiscal year ended August 31, 2023, the Access Emerging Markets USD Bond ETF, Access High Yield Corporate Bond ETF, Access Inflation Protected USD Bond ETF, Access Investment Grade Corporate 1-5 Year Bond ETF, Access Investment Grade Corporate Bond ETF, Access Treasury 0-1 Year ETF, Access U.S. Aggregate Bond ETF and Access Ultra Short Bond ETF designated 100%, 99.05%, 100%, 100%, 100%, 100%, 100% and 100%, respectively, of the dividends paid from net investment company taxable income as section 163(j) Interest Dividends.
154
FUNDS PROFILE
Goldman Sachs ETFs

Goldman Sachs is a premier financial services firm, known since 1869 for creating thoughtful and customized investment solutions in complex global markets.
Today, the Asset Management Division of Goldman Sachs serves a diverse set of clients worldwide, including private institutions, public entities and individuals. With approximately $2.46 trillion in assets under supervision as of June 30, 2023, Goldman Sachs Asset Management has portfolio management teams located around the world and our investment professionals bring firsthand knowledge of local markets to every investment decision. Assets under supervision includes assets under management and other client assets for which Goldman Sachs does not have full discretion. Goldman Sachs Asset Management leverages the resources of Goldman Sachs & Co. LLC subject to legal, internal and regulatory restrictions.
|
|
| GOLDMAN SACHS EXCHANGE-TRADED FUNDS |
| Goldman Sachs ActiveBeta® Emerging Markets Equity ETF |
| Goldman Sachs ActiveBeta® Europe Equity ETF |
| Goldman Sachs ActiveBeta® International Equity ETF |
| Goldman Sachs ActiveBeta® Japan Equity ETF |
| Goldman Sachs ActiveBeta® Paris-Aligned Climate U.S. Large Cap Equity ETF |
| Goldman Sachs Community Municipal Bond ETF |
| Goldman Sachs Defensive Equity ETF |
| Goldman Sachs ActiveBeta® U.S. Large Cap Equity ETF |
| Goldman Sachs ActiveBeta® U.S. Small Cap Equity ETF |
| Goldman Sachs ActiveBeta® World Low Vol Plus Equity ETF |
| Goldman Sachs Bloomberg Clean Energy Equity ETF |
| Goldman Sachs Equal Weight U.S. Large Cap Equity ETF |
| Goldman Sachs Hedge Industry VIP ETF |
| Goldman Sachs Innovate Equity ETF |
| Goldman Sachs JUST U.S. Large Cap Equity ETF |
| Goldman Sachs Access Emerging Markets USD Bond ETF |
| Goldman Sachs Access High Yield Corporate Bond ETF |
| Goldman Sachs Access Inflation Protected USD Bond ETF |
| Goldman Sachs Access Investment Grade Corporate 1-5 Year Bond ETF |
| Goldman Sachs Access Investment Grade Corporate Bond ETF |
| Goldman Sachs Access Treasury 0-1 Year ETF |
| Goldman Sachs Access Ultra Short Bond ETF |
| Goldman Sachs Access U.S. Aggregate Bond ETF |
| Goldman Sachs MarketBeta® Emerging Markets Equity ETF |
| Goldman Sachs MarketBeta® International Equity ETF |
| Goldman Sachs MarketBeta® U.S. Equity ETF |
| Goldman Sachs MarketBeta® U.S. 1000 Equity ETF |
| Goldman Sachs MarketBeta® Total International Equity ETF |
| Goldman Sachs Future Planet Equity ETF |
| Goldman Sachs Future Tech Leaders Equity ETF |
| Goldman Sachs Future Health Care Equity ETF |
| Goldman Sachs Future Consumer Equity ETF |
| Goldman Sachs Future Real Estate and Infrastructure Equity ETF |
| Goldman Sachs North American Pipelines & Power Equity ETF |
Goldman Sachs Small Cap Core Equity ETF |
INDEX DISCLAIMERS
The Goldman Sachs Access Emerging Markets USD Bond ETF, Goldman Sachs Access High Yield Corporate Bond ETF, Goldman Sachs Access Inflation Protected USD Bond ETF, Goldman Sachs Access Investment Grade Corporate 1-5 Year Bond ETF, Goldman Sachs Access Investment Grade Corporate Bond ETF, Goldman Sachs Access Treasury 0-1 Year ETF and Goldman Sachs Access U.S. Aggregate Bond ETF (the “Funds”) have been developed solely by GSAM. The Funds are not in any way connected to or sponsored, endorsed, sold or promoted by the London Stock Exchange Group plc and its group undertakings (collectively, the “LSE Group”). FTSE Russell is a trading name of certain of the LSE Group companies.
All rights in the FTSE Goldman Sachs Access Emerging Markets USD Bond Index, FTSE Goldman Sachs High Yield Corporate Bond Index, FTSE Goldman Sachs Treasury Inflation Protected USD Bond Index, FTSE Goldman Sachs US Investment-Grade Corporate Bond 1-5 Years Index, FTSE Goldman Sachs Investment Grade Corporate Bond Index, FTSE US Treasury 0-1 Year Composite Select Index, FTSE Goldman Sachs US Broad Bond Market Index, and FTSE Goldman Sachs US Treasury Index (each, an “Index” and collectively, the “Indexes”) vest in the relevant LSE Group company which owns each Index. FTSE® is a trademark of the relevant LSE Group company and is used by any other LSE Group company under license.
Each Index is calculated by or on behalf of FTSE Fixed Income, LLC or its affiliate, agent or partner. The LSE Group does not accept any liability whatsoever to any person arising out of (a) the use of, reliance on or any error in the Index or (b) investment in or operation of the Funds. The LSE Group makes no claim, prediction, warranty or representation either as to the results to be obtained from the Funds or the suitability of any Index for the purpose to which it is being put by GSAM.
| | |
TRUSTEES Cheryl K. Beebe, Chair Lawrence Hughes John F. Killian Steven D. Krichmar Michael Latham James A. McNamara Lawrence W. Stranghoener | | OFFICERS James A. McNamara, President Joseph F. DiMaria, Principal Financial Officer, Principal Accounting Officer and Treasurer Robert Griffith, Secretary* * Effective September 20, 2023 |
| |
THE BANK OF NEW YORK MELLON Transfer Agent | | |
| |
ALPS DISTRIBUTORS, INC. Distributor | | GOLDMAN SACHS ASSET MANAGEMENT, L.P. Investment Adviser |
Visit our Website at www.GSAMFUNDS.com/ETFs to obtain the most recent month-end returns.
Goldman Sachs Asset Management, L.P., 200 West Street, New York, New York 10282
The reports concerning the Funds included in this shareholder report may contain certain forward-looking statements about the factors that may affect the performance of the Funds in the future. These statements are based on Fund management’s predictions and expectations concerning certain future events and their expected impact on the Funds, such as performance of the economy as a whole and of specific industry sectors, changes in the levels of interest rates, the impact of developing world events, and other factors that may influence the future performance of the Funds. Management believes these forward-looking statements to be reasonable, although they are inherently uncertain and difficult to predict. Actual events may cause adjustments in portfolio management strategies from those currently expected to be employed.
A description of the policies and procedures that the Funds use to determine how to vote proxies relating to portfolio securities and information regarding how the Funds voted proxies relating to portfolio securities for the most recent 12-month period ended June 30 are available (i) without charge, upon request by calling 1-800-621-2550; and (ii) on the Securities and Exchange Commission (“SEC”) web site at http://www.sec.gov.
The Funds will file their portfolio holdings information for each month in a fiscal quarter within 60 days after the end of the relevant fiscal quarter on Form N-PORT. Portfolio holdings information for the third month of each fiscal quarter will be made available on the SEC’s web site at http://www.sec.gov. Portfolio holdings information may be obtained upon request and without charge by calling 1-800-621-2550.
Fund holdings and allocations shown are as of August 31, 2023 and may not be representative of future investments. Fund holdings should not be relied on in making investment decisions and should not be construed as research or investment advice regarding particular securities. Current and future holdings are subject to risk.
ETF Fund shares are not individually redeemable and are issued and redeemed by the Funds at their net asset value (“NAV”) only in large, specified blocks of shares called creation units. Shares otherwise can be bought and sold only through exchange trading at market price (not NAV). Shares may trade at a premium or discount to their NAV in the secondary market. Brokerage commissions will reduce returns.
Economic and market forecasts presented herein reflect our judgment as of the date of this presentation and are subject to change without notice. These forecasts do not take into account the specific investment objectives, restrictions, tax and financial situation or other needs of any specific client. Actual data will vary and may not be reflected here. These forecasts are subject to high levels of uncertainty that may affect actual performance. Accordingly, these forecasts should be viewed as merely representative of a broad range of possible outcomes. These forecasts are estimated, based on assumptions, and are subject to significant revision and may change materially as economic and market conditions change. Goldman Sachs has no obligation to provide updates or changes to these forecasts. Case studies and examples are for illustrative purposes only.
ETF Fund shares are not individually redeemable and are issued and redeemed by the Funds at their net asset value (“NAV”) only in large, specified blocks of shares called creation units. Shares otherwise can be bought and sold only through exchange trading at market price (not NAV). Shares may trade at a premium or discount to their NAV in the secondary market. Brokerage commissions will reduce returns. Ordinary brokerage commissions apply.
This material is not authorized for distribution to prospective investors unless preceded or accompanied by a current Prospectus or Summary Prospectus, if applicable. Investors should consider the Funds’ objective, risks, and charges and expenses, and read the Summary Prospectus, if available, and/or the Prospectus carefully before investing or sending money. The Summary Prospectus, if available, and the Prospectus contain this and other information about the Funds and may be obtained from your authorized dealer or from Goldman Sachs & Co. LLC by calling 1-800-621-2550.
ALPS Distributors, Inc. is the distributor of the Goldman Sachs ETF Funds. ALPS Distributors, Inc. is unaffiliated with Goldman Sachs Asset Management.
©2023 Goldman Sachs. All rights reserved. 339815-OTU-10/2023 ACFIETFAR-23
Goldman Sachs Funds
| | | | |
| | |
| Annual Report | | | | August 31, 2023 |
| | |
| | | | Goldman Sachs ActiveBeta® ETFs |
| | | | ActiveBeta® Emerging Markets Equity ETF (GEM) |
| | | | ActiveBeta® Europe Equity ETF (GSEU) |
| | | | ActiveBeta® International Equity ETF (GSIE) |
| | | | ActiveBeta® Japan Equity ETF (GSJY) |
| | | | ActiveBeta® Paris-Aligned Climate U.S. Large Cap Equity ETF (GPAL) |
| | | | ActiveBeta® U.S. Large Cap Equity ETF (GSLC) |
| | | | ActiveBeta® U.S. Small Cap Equity ETF (GSSC) |
| | | | ActiveBeta® World Low Vol Plus Equity ETF (GLOV) |

Goldman Sachs ActiveBeta® ETFs
| ∎ | | ACTIVEBETA® EMERGING MARKETS EQUITY ETF (GEM) |
| ∎ | | ACTIVEBETA® EUROPE EQUITY ETF (GSEU) |
| ∎ | | ACTIVEBETA® INTERNATIONAL EQUITY ETF (GSIE) |
| ∎ | | ACTIVEBETA® JAPAN EQUITY ETF (GSJY) |
| ∎ | | ACTIVEBETA® PARIS-ALIGNED CLIMATE U.S. LARGE CAP EQUITY ETF (GPAL) |
| ∎ | | ACTIVEBETA® U.S. LARGE CAP EQUITY ETF (GSLC) |
| ∎ | | ACTIVEBETA® U.S. SMALL CAP EQUITY ETF (GSSC) |
| ∎ | | ACTIVEBETA® WORLD LOW VOL PLUS EQUITY ETF (GLOV) |
| | | | |
| | | |
| NOT FDIC-INSURED | | May Lose Value | | No Bank Guarantee |
INVESTMENT PROCESS
Goldman Sachs ActiveBeta® ETFs
Principal Investment Strategies
The investment objective of each of the ActiveBeta® Emerging Markets Equity ETF, ActiveBeta® Europe Equity ETF, ActiveBeta® International Equity ETF, ActiveBeta® Japan Equity ETF, ActiveBeta® Paris-Aligned Climate U.S. Large Cap Equity ETF, ActiveBeta® U.S. Large Cap Equity ETF, ActiveBeta® U.S. Small Cap Equity ETF and ActiveBeta® World Low Vol Plus Equity ETF (each, a “Fund”), is to seek to provide investment results that closely correspond, before fees and expenses, to the performance of its respective underlying index (each, an “Index”).
Each Fund seeks to achieve its investment objective by investing at least 80% of its assets (exclusive of collateral held from securities lending) in securities included in its underlying index, in depositary receipts representing securities included in its underlying index and in underlying stocks in respect of depositary receipts included in its underlying index.
Each Index is designed to deliver exposure to equity securities within its applicable universe of issuers. Each Index is constructed using the patented ActiveBeta® Portfolio Construction Methodology, which was developed to provide exposure to the “factors” (or characteristics) that are commonly tied to a stock’s outperformance relative to market returns. These factors include value (i.e., how attractively a stock is priced relative to its “fundamentals,” such as book value and free cash flow), momentum (i.e., whether a company’s share price is trending up or down), quality (i.e., profitability) and low volatility (i.e., a relatively low degree of fluctuation in a company’s share price over time). Given each Fund’s investment objective of attempting to track its Index, each Fund does not follow traditional methods of active investment management, which may involve buying and selling securities based upon analysis of economic and market factors.
Each Index is rebalanced on a quarterly basis in accordance with the published rebalancing schedule of the applicable Reference Index. The rules-based process used to construct each Index incorporates the ActiveBeta® Turnover Minimization Technique, which seeks to reduce turnover within each Index.
For the ActiveBeta® Emerging Markets Equity ETF, ActiveBeta® Europe Equity ETF, ActiveBeta® International Equity ETF, ActiveBeta® Japan Equity ETF, ActiveBeta® U.S. Large Cap Equity ETF and ActiveBeta® U.S. Small Cap Equity ETF, Goldman Sachs Asset Management, L.P. (the “Index Provider”) constructs each Index in accordance with a rules-based methodology that involves two steps.
Step 1
In the first step, individual factor subindexes for value, momentum, quality and low volatility (the “ActiveBeta® Factor Subindexes”) are created from the constituents of the applicable Reference Index, a market capitalization-weighted index. To construct each ActiveBeta® Factor Subindex, all constituents in the applicable Reference Index are assigned a “factor score” based on certain specified measurements (for example, in the case of the value factor, the factor score is based on a composite of book value-to-price, sales-to-price and free cash flow-to-price). Securities with a factor score that is above a fixed “Cut-off Score” receive an overweight in the applicable ActiveBeta® Factor Subindex relative to the applicable Reference Index and securities with a factor score that is below the Cut-off Score receive an underweight in the ActiveBeta® Factor Subindex relative to the applicable Reference Index. Accordingly, the magnitude of overweight or underweight that a security receives in constructing the applicable ActiveBeta® Factor Subindex is determined by its attractiveness when evaluated based on the relevant factor. Each Index only includes long positions (i.e., short positions are impermissible), so the smallest weight for any given security is zero.
Step 2
The ActiveBeta® Factor Subindexes are combined in equal weights to form each Index.
Goldman Sachs ActiveBeta® Paris-Aligned Climate U.S. Large Cap Equity ETF
For the Goldman Sachs ActiveBeta® Paris-Aligned Climate U.S. Large Cap Equity ETF, the Index aims to meet the minimum requirements to be an “EU Paris-Aligned Benchmark” as defined by the European Commission Delegated Regulation C(2020)4757. An “EU Paris-Aligned Benchmark” is an index whose constituent companies are aligned with the goals of the Paris Climate Agreement, an international treaty that seeks to combat climate change and its effects. The Index Provider constructs the Fund’s Index in accordance with a rules-based methodology that involves three steps.
1
INVESTMENT PROCESS
Step 1
In the first step, the following types of issuers are excluded from the constituents of the Solactive US Large Cap Index (the “Reference Index”) per the requirements for an “EU Paris-Aligned Benchmark”: companies involved with controversial weapons or tobacco, companies that violate global norms as indicated by violations of the United Nations Global Compact principles or the Organisation for Economic Co-operation and Development (“OECD”) Guidelines for Multinational Enterprises, and companies that derive more than 50% of revenue from fossil fuel activities or engage in activities that significantly obstruct the United Nations Sustainable Development Goals that correspond to the EU’s six environmental objectives.
In addition, issuers who derive significant revenue from the following activities are excluded (revenue percentages are shown in parentheses): exploration, mining, extraction, distribution or refining of hard coal and lignite (≥ 1%); exploration, extraction, distribution or refining of oil fuels (≥ 10%); exploration, extraction, manufacturing or distribution of gaseous fuels (≥ 50%); and electricity generation with a greenhouse gas (GHG) intensity of more than 100g CO2e/kWh (≥ 50%).
Step 2
In the second step, the ActiveBeta® Factor Subindexes are created from the Reference Index, a market capitalization-weighted index. To construct each ActiveBeta® Factor Subindex, all non-excluded constituents in the Reference Index are assigned a “factor score” based on certain specified measurements (for example, in the case of the value factor, the factor score is based on a composite of book value-to-price, sales-to-price and free cash flow-to-price). Securities with a factor score that is above a fixed “Cut-off Score” receive an overweight in the applicable ActiveBeta® Factor Subindex relative to the Reference Index and securities with a factor score that is below the Cut-off Score receive an underweight in the ActiveBeta® Factor Subindex relative to the Reference Index. Accordingly, the magnitude of overweight or underweight that a security receives in constructing the applicable ActiveBeta® Factor Subindex is determined by its attractiveness when evaluated based on the relevant factor. The ActiveBeta® Factor Subindexes are combined in equal weights to form the Factor Diversity Portfolio.
Step 3
In the third step, the weights of the individual issuers in the Factor Diversity Portfolio are adjusted upwards and downwards to target the following requirements: a 50-percent reduction in aggregate GHG emissions intensity relative to the Reference Index, where an issuer’s emission intensity is defined as the sum of the issuer’s direct and indirect emissions divided by the issuer’s enterprise value including cash; an inflation-adjusted seven-percent annualized reduction in absolute GHG emissions intensity; non-negative exposure to high carbon impact sectors relative to the Reference Index; and exposure to each of the four factors (value, momentum, quality, and low volatility) that are no lower than the corresponding factor exposures for the Factor Diversity Portfolio. The resulting Index only includes long positions (i.e., short positions are impermissible), so the smallest weight for any given security is zero.
Goldman Sachs ActiveBeta® World Low Vol Plus Equity ETF
For the ActiveBeta® World Low Vol Plus Equity ETF, the Index seeks to provide exposure to these factors with an emphasis on the low volatility factor. The Index Provider constructs the Fund’s Index in accordance with a rules-based methodology that involves three steps.
Step 1
In the first step, the individual factor subindex for low volatility (the “ActiveBeta® Low Volatility Factor Subindex”) is created from the constituents of the Solactive GBS Developed Markets Large & Mid Cap Index (the “Reference Index”), a market capitalization-weighted index. To construct the ActiveBeta® Low Volatility Factor Subindex, an equal-weighted index is constructed by equally weighting stocks within sectors by country (e.g. U.S. Financials). The weight of a stock in the reweighted Reference Index is the average of its weight in the Reference Index and its weight in the equal-weighted index. Each constituent is then assigned a “factor score” based on a specified volatility measurement that is a function of the volatility in the daily total stock returns over the past 12 months. Securities with a factor score that is above a fixed “Cut-off Score” receive an overweight in the ActiveBeta® Low Volatility Factor Subindex relative to the reweighted Reference Index and securities with a factor score that is
2
INVESTMENT PROCESS
below the Cut-off Score receive an underweight in the ActiveBeta® Low Volatility Factor Subindex relative to the reweighted Reference Index. Accordingly, the magnitude of overweight or underweight that a security receives in constructing the ActiveBeta® Low Volatility Factor Subindex is determined by the performance of its factor score relative to the fixed “Cut-off Score.” The Index includes only long positions (i.e., short positions are impermissible), so the smallest weight for any given security is zero.
Step 2
In the second step, individual factor subindexes for value, momentum and quality (the “ActiveBeta® Value Factor Subindex, ActiveBeta® Momentum Factor Subindex and ActiveBeta® Quality Factor Subindex,” respectively) are created from the constituents of the ActiveBeta® Low Volatility Factor Subindex. To construct each of these subindexes, all constituents in the ActiveBeta® Low Volatility Factor Subindex are assigned a “factor score” based on certain specified measurements (i.e., in the case of the value factor, the factor score is based on a composite of book value-to-price, sales-to-price and free cash flow-to-price). Securities with a factor score that is above a fixed “Cut-off Score” receive an overweight in the applicable ActiveBeta® Factor Subindex relative to the ActiveBeta® Low Volatility Factor Subindex and securities with a factor score that is below the Cut-off Score receive an underweight the applicable ActiveBeta® Factor Subindex relative to the Active- Beta® Low Volatility Factor Subindex.
Step 3
In the third step, the ActiveBeta® Value Factor Subindex, ActiveBeta® Momentum Factor Subindex, and ActiveBeta® Quality Factor Subindex are combined in equal weights to form the Index.
* * *
At the end of the Reporting Period, i.e. the 12 months ended August 31, 2023, we continued to believe in the existence and persistence of certain equity common factors. We further believed that in capturing common factors, investment efficiency (risk-adjusted returns) can be improved by enhancing the informational efficiency and diversification of individual common factor portfolios. Additionally, we advocate the pursuit of factor diversification strategies, which combine individual common factor portfolios, as such strategies tend to dominate individual factors. A passive capture of informationally-efficient and diversified common factor strategies potentially delivers attractive after-cost information ratios.
3
PORTFOLIO RESULTS
Goldman Sachs ActiveBeta® Emerging Markets Equity ETF
Investment Objective
The Goldman Sachs ActiveBeta® Emerging Markets Equity ETF (the “Fund”) seeks to provide investment results that closely correspond, before fees and expenses, to the performance of the Goldman Sachs ActiveBeta® Emerging Markets Equity Index (the “Index”).
Portfolio Management Discussion and Analysis
Below, the Goldman Sachs Quantitative Investment Strategies Team discusses the Fund’s performance and positioning for the 12-month period ended August 31, 2023 (the “Reporting Period”).
| Q | | How did the Fund perform during the Reporting Period? |
| A | | During the Reporting Period, the Fund returned 3.50% based on net asset value (“NAV”) and 4.36% based on market price. The Index returned 3.91%, and the MSCI Emerging Markets Index (Net, Unhedged) (“MSCI Emerging Markets Index”), a market-cap based index against which the performance of the Fund is measured, and the reference index for the Index, returned 1.25% during the same period. |
| | The Fund had an NAV of $29.42 per share on August 31, 2022 and ended the Reporting Period with an NAV of $29.61 per share. The Fund’s market price on August 31, 2023 was $29.48 per share. |
| Q | | What key factors were responsible for the Fund’s performance during the Reporting Period? |
| A | | The Fund seeks to provide investment results that closely correspond, before fees and expenses, to the performance of the Index. The Fund’s performance reflects Fund expenses, including management fees and brokerage expenses. The Fund’s relative performance also reflects the impact of any cash held in the Fund as well as any other differences between the Fund’s holdings and the constituents of the Index. The Index is unmanaged, and Index returns do not reflect fees and expenses, which would reduce returns. |
| | The Index is constructed using a rules-based methodology that was developed to provide exposure to the “factors” (or characteristics) that are commonly tied to a stock’s outperformance relative to market returns, and its performance is compared to that of the MSCI Emerging Markets Index. Because the Fund seeks to provide investment results that closely correspond, before fees and expenses, to the performance of the Index, the discussion below compared the performance of the Fund to that of the MSCI Emerging Markets Index. Given the Fund’s investment objective of attempting to track the Index, the Fund does not follow traditional methods of active investment management, which may involve buying and selling securities based upon analysis of economic and market factors. The Fund does not follow a strategy of seeking to outperform the MSCI Emerging Markets Index. |
| | During the Reporting Period, the Fund posted positive absolute returns that outperformed the MSCI Emerging Markets Index, as measured by NAV. Amongst underlying factors, Value and Low Volatility contributed most positively to relative results, followed by Quality. Momentum detracted from results during the Reporting Period. Value refers to how attractively a stock is priced relative to its fundamentals, such as book value and free cash flow. Low Volatility is a relatively low degree of fluctuation in a company’s share price over time. Quality refers to sustainable profitability over time. Momentum is whether a company’s share price is trending up or down. |
| Q | | Which sectors and countries contributed most positively to the Index’s relative performance during the Reporting Period, and which detracted most? |
| A | | Index constituents in the information technology, consumer staples and financials sectors contributed most positively to the Index’s results relative to the MSCI Emerging Markets Index during the Reporting Period. Index constituents in materials was the only sector to detract from the Index’s results relative to the MSCI Emerging Markets Index during the Reporting Period. |
| | | From a country perspective, Index constituents in China, India and Taiwan contributed most positively to the Index’s results relative to the MSCI Emerging Markets Index during the Reporting Period. Conversely, Index constituents in |
4
PORTFOLIO RESULTS
| | South Africa, Peru and Greece detracted the most from the Index’s results relative to the MSCI Emerging Markets Index during the Reporting Period. |
| Q | | Which individual stock positions contributed the most to the Index’s relative returns during the Reporting Period? |
| A | | Relative to the MSCI Emerging Markets Index, underweight positions in Chinese car company NIO, Chinese shopping platform Meituan and Chinese e-commerce company JD.com contributed most positively (0.00%1, 0.80% and 0.38% of Fund net assets as of August 31, 2023, respectively). NIO was not held in the Index during the Reporting Period; Meituan and JD.com each produced a double-digit negative return within the Index during the Reporting Period. |
| Q | | Which individual stock positions detracted the most from the Index’s results during the Reporting Period? |
| A | | Relative to the MSCI Emerging Markets Index, underweight positions in Chinese car company Li Auto, Singapore-based travel website Trip.com Group and Chinese e-commerce platform Pinduoduo detracted most (0.00%1, 0.08% and 0.00% of Fund net assets as of August 31, 2023, respectively). Li Auto posted a single-digit negative return within the Index during the Reporting Period, and Trip.com Group and Pinduoduo each delivered a double-digit positive return within the Index during the Reporting Period. |
| Q | | How did the Fund use derivatives and similar instruments during the Reporting Period? |
| A | | The Fund does not employ derivatives as a source of alpha generation, although it did use index futures to equitize excess cash. The use of futures was not material to the performance of the Fund during the Reporting Period. |
| Q | | What was the Fund’s sector positioning relative to the Index and the reference index at the end of the Reporting Period?2 |
| | | | | | | | | | | | | | |
| | | | |
| | | Sector Name | | Fund3 | | | GS
ActiveBeta®
Emerging Markets
Equity Index | | | MSCI Emerging
Markets Index | |
| | | | |
| | Consumer Discretionary | | | 11.91 | % | | | 11.71 | % | | | 13.88 | % |
| | Consumer Staples | | | 11.13 | | | | 11.52 | | | | 6.28 | |
| | Energy | | | 4.82 | | | | 4.73 | | | | 5.09 | |
| | Financials | | | 20.80 | | | | 20.66 | | | | 21.82 | |
| | Health Care | | | 4.88 | | | | 4.96 | | | | 3.79 | |
| | Industrials | | | 5.80 | | | | 6.24 | | | | 6.66 | |
| | Information Technology | | | 20.65 | | | | 20.47 | | | | 20.62 | |
| | Materials | | | 7.38 | | | | 7.09 | | | | 7.94 | |
| | Real Estate | | | 0.99 | | | | 1.11 | | | | 1.74 | |
| | Communication Services | | | 9.08 | | | | 8.96 | | | | 9.66 | |
| | | Utilities | | | 2.56 | | | | 2.55 | | | | 2.53 | |
| | 1 | | Some weights are 0.00% at August 31, 2023 either because those positions were taken out during the most recent rebalance given the Fund’s index construction methodology or because they were not components of the Index during the Reporting Period. |
| | 2 | | Country and sector classifications for securities may differ between the above listing and the Schedule of Investments due to differing classification methodologies. The classification methodology used for the above listing is as set forth by MSCI. The Fund’s composition may differ over time. Consequently, the Fund’s overall sector allocations may differ from percentages contained in the chart above. The percentage shown for each investment category reflects the value of investments in that category as a percentage of market value (excluding investment in the securities lending reinvestment vehicle, if any). Underlying sector allocation of exchange-traded funds held by the Fund are not reflected in the chart above. Investments in the securities lending vehicle represented 0.0% of the Fund’s net assets as of August 31, 2023. Figures above may not sum to 100% due to rounding due to the presence of cash. |
| | 3 | | The Fund seeks to provide investment results that closely correspond, before fees and expenses, to the performance of the Goldman Sachs ActiveBeta® Emerging Markets Equity Index. |
5
PORTFOLIO RESULTS
| Q | | What was the Fund’s country positioning relative to the Index and the reference index at the end of the Reporting Period?2 |
| | | | | | | | | | | | | | |
| | | | |
| | | Country Name | | Fund3 | | | GS
ActiveBeta®
Emerging
Markets
Equity Index | | | MSCI Emerging
Markets Index | |
| | | | |
| | Brazil | | | 5.33 | % | | | 5.33 | % | | | 5.32 | % |
| | Chile | | | 0.65 | | | | 0.64 | | | | 0.53 | |
| | China | | | 31.66 | | | | 31.17 | | | | 29.79 | |
| | Colombia | | | 0.06 | | | | 0.06 | | | | 0.10 | |
| | Czech | | | 0.19 | | | | 0.19 | | | | 0.16 | |
| | Egypt | | | 0.47 | | | | 0.46 | | | | 0.09 | |
| | Greece | | | 0.84 | | | | 0.83 | | | | 0.47 | |
| | Hong Kong | | | 0.00 | | | | 0.00 | | | | 0.00 | |
| | Hungary | | | 0.23 | | | | 0.22 | | | | 0.25 | |
| | India | | | 13.90 | | | | 13.56 | | | | 14.86 | |
| | Indonesia | | | 1.97 | | | | 1.94 | | | | 2.02 | |
| | Korea | | | 12.08 | | | | 11.97 | | | | 12.23 | |
| | Kuwait | | | 0.57 | | | | 0.61 | | | | 0.82 | |
| | Malaysia | | | 0.56 | | | | 1.39 | | | | 1.43 | |
| | Mexico | | | 2.91 | | | | 2.95 | | | | 2.81 | |
| | Peru | | | 0.00 | | | | 0.00 | | | | 0.28 | |
| | Philippines | | | 0.15 | | | | 0.15 | | | | 0.61 | |
| | Poland | | | 0.93 | | | | 0.87 | | | | 0.83 | |
| | Qatar | | | 0.98 | | | | 0.99 | | | | 0.91 | |
| | Saudi Arabia | | | 4.06 | | | | 3.97 | | | | 4.21 | |
| | South Africa | | | 3.62 | | | | 3.65 | | | | 3.20 | |
| | Taiwan | | | 14.74 | | | | 14.73 | | | | 15.02 | |
| | Thailand | | | 1.76 | | | | 1.78 | | | | 2.03 | |
| | Turkey | | | 0.84 | | | | 0.96 | | | | 0.72 | |
| | | United Arab Emirates | | | 1.51 | | | | 1.57 | | | | 1.32 | |
| | 2 | | Country and sector classifications for securities may differ between the above listing and the Schedule of Investments due to differing classification methodologies. The classification methodology used for the above listing is as set forth by MSCI. The Fund’s composition may differ over time. Consequently, the Fund’s overall sector allocations may differ from percentages contained in the chart above. The percentage shown for each investment category reflects the value of investments in that category as a percentage of market value (excluding investment in the securities lending reinvestment vehicle, if any). Underlying sector allocation of exchange-traded funds held by the Fund are not reflected in the chart above. Investments in the securities lending vehicle represented 0.0% of the Fund’s net assets as of August 31, 2023. Figures above may not sum to 100% due to rounding due to the presence of cash. |
| | 3 | | The Fund seeks to provide investment results that closely correspond, before fees and expenses, to the performance of the Goldman Sachs ActiveBeta® Emerging Markets Equity Index. |
6
FUND BASICS
ActiveBeta® Emerging Markets Equity ETF
as of August 31, 2023
| | | | | | |
| | FUND SNAPSHOT | |
| | |
| | | As of August 31, 2023 | | | |
| | |
| | Market Price1 | | $ | 29.48 | |
| | | Net Asset Value (NAV)1 | | $ | 29.61 | |
| 1 | | The Market Price is the price at which the Fund’s shares are trading on the NYSE Arca, Inc. The Market Price of the Fund’s shares will fluctuate and, at the time of sale, shares may be worth more or less than the original investment or the Fund’s then current net asset value (“NAV”). The NAV is the market value of one share of the Fund. This amount is derived by dividing the total value of all the securities in the Fund’s portfolio, plus other assets, less any liabilities, by the number of Fund shares outstanding. Fund shares are not individually redeemable and are issued and redeemed by the Fund at their NAV only in large, specified blocks of shares called creation units. Shares otherwise can be bought and sold only through exchange trading at market price (not NAV). Shares may trade at a premium or discount to their NAV in the secondary market. Information regarding how often shares of each Fund traded on NYSE Arca at a price above (i.e., at a premium) or below (i.e., at a discount) the NAV of the Fund can be found at www.GSAMFUNDS.com/ETFs. |
| | | | | | | | | | |
| | TOP 10 HOLDINGS AS OF 8/31/232 |
| | | | |
| | | Holding | | % of Net Assets | | | Line of Business | | Country |
| | | | |
| | Taiwan Semiconductor Manufacturing Co. Ltd. | | | 5.7 | % | | Information Technology | | Taiwan |
| | Samsung Electronics Co. Ltd. | | | 3.3 | | | Information Technology | | South Korea |
| | Tencent Holdings Ltd. | | | 3.3 | | | Communication Services | | China |
| | Alibaba Group Holding Ltd. | | | 2.2 | | | Consumer Discretionary | | China |
| | Reliance Industries Ltd. | | | 0.9 | | | Energy | | India |
| | Infosys Ltd. | | | 0.8 | | | Information Technology | | India |
| | Meituan, Class B | | | 0.8 | | | Consumer Discretionary | | China |
| | Vale SA | | | 0.7 | | | Materials | | Brazil |
| | China Construction Bank Corp., Class H | | | 0.7 | | | Financials | | China |
| | | Tata Consultancy Services Ltd. | | | 0.7 | | | Information Technology | | India |
| 2 | | The top 10 holdings may not be representative of the Fund’s future investments. |
For more information about the Fund, please refer to www.GSAMFUNDS.com/ETFs. There, you can learn more about the Fund’s investment strategies, holdings, and performance.
7
ACTIVEBETA® EMERGING MARKETS EQUITY ETF
Performance Summary
August 31, 2023
The following graph shows the value, as of August 31, 2023, of a $10,000 investment made on September 25, 2015 (commencement of operations) in Shares at NAV. For comparative purposes, the performance of the Fund’s underlying index and a market-cap based index against which the performance of the Fund is measured, the Goldman Sachs ActiveBeta® Emerging Markets Equity Index and the MSCI Emerging Markets Index (Net, Unhedged), respectively, are shown. Performance reflects applicable fee waivers and/or expense limitations in effect during the periods shown and in their absence, performance would be reduced. Returns do not reflect the deduction of taxes that a shareholder would pay on Fund distributions or the sale of Fund shares. In addition to the performance of constituents of the underlying index, other factors may affect Fund performance. These factors include, but are not limited to, Fund operating fees and expenses, portfolio turnover and creation and redemption in-kind transactions. The returns set forth below represent past performance. Past performance does not guarantee future results. The Fund’s NAV and investment return may fluctuate. These fluctuations may cause an investor’s shares to be worth more or less than their original cost. Current performance may be lower or higher than the performance quoted below. Please visit our web site at www.GSAMFUNDS.com/ETFs to obtain the most recent month-end returns.
|
| ActiveBeta® Emerging Markets Equity ETF’s Lifetime Performance |
Performance of a $10,000 Investment, with distributions reinvested, from September 25, 2015 through August 31, 2023.
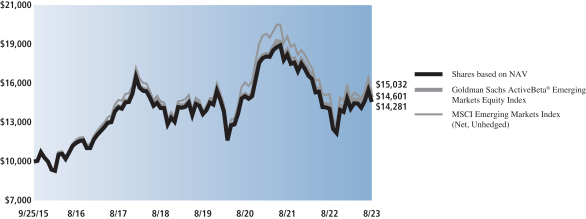
| | | | | | | | | | |
| Average Annual Total Return through August 31, 2023* | | | One Year | | | | Five Years | | | Since Inception |
Shares based on NAV (Commenced September 25, 2015) | | | 3.50% | | | | 0.63% | | | 4.59% |
|
Shares based on Market Price (Commenced September 25, 2015) | | | 4.36% | | | | 0.61% | | | 4.53% |
|
Goldman Sachs ActiveBeta® Emerging Markets Equity Index | | | 3.91% | | | | 0.84% | | | 4.88% |
|
MSCI Emerging Markets Index (Net, Unhedged) | | | 1.25% | | | | 0.98% | | | 5.27% |
|
| * | | Total returns are calculated assuming purchase of a share at the market price or NAV on the first day and sale of a share at the market price or NAV on the last day of each period reported. The Total Returns based on NAV and Market Price assume the reinvestment of dividends and do not reflect brokerage commissions in connection with the purchase or sale of Fund shares, which if included would lower the performance shown above. The NAV used in the Total Return calculation assumes all management fees and operating expenses incurred by the Fund. Market Price returns are based upon the last trade as of 4:00 pm EST and do not reflect the returns you would receive if you traded shares at other times. The first day of secondary market trading is typically several days after the date on which the Fund commenced investment operations; therefore, the NAV of the Fund is used as a proxy for the period from inception of investment operations to the first day of secondary market trading to calculate the Market Price returns. |
8
PORTFOLIO RESULTS
Goldman Sachs ActiveBeta® Europe Equity ETF
Investment Objective
The Goldman Sachs ActiveBeta® Europe Equity ETF (the “Fund”) seeks to provide investment results that closely correspond, before fees and expenses, to the performance of the Goldman Sachs ActiveBeta® Europe Equity Index (the “Index”).
Portfolio Management Discussion and Analysis
Below, the Goldman Sachs Quantitative Investment Strategies Team discusses the Fund’s performance and positioning for the 12-month period ended August 31, 2023 (the “Reporting Period”).
| Q | | How did the Fund perform during the Reporting Period? |
| A | | During the Reporting Period, the Fund returned 24.40% based on net asset value (“NAV”) and 25.14% based on market price. The Index returned 23.57%, and the MSCI Europe Index (Net, Unhedged) (“MSCI Europe Index”), a market-cap based index against which the performance of the Fund is measured, and the reference index for the Index, returned 22.51% during the same period. |
| | | The Fund had an NAV of $27.47 per share on August 31, 2022 and ended the Reporting Period with an NAV of $33.11 per share. The Fund’s market price on August 31, 2023 was $33.05 per share. |
| Q | | What key factors were responsible for the Fund’s performance during the Reporting Period? |
| A | | The Fund seeks to provide investment results that closely correspond, before fees and expenses, to the performance of the Index. The Fund’s performance reflects Fund expenses, including management fees and brokerage expenses. The Fund’s relative performance also reflects the impact of any cash held in the Fund as well as any other differences between the Fund’s holdings and the constituents of the Index. The Index is unmanaged, and Index returns do not reflect fees and expenses, which would reduce returns. |
| | | The Index is constructed using a rules-based methodology that was developed to provide exposure to the “factors” (or characteristics) that are commonly tied to a stock’s outperformance relative to market returns, and its performance is compared to that of the MSCI Europe Index. Because the Fund seeks to provide investment results that closely correspond, before fees and expenses, to the performance of the Index, the discussion below compared the performance of the Fund to that of the MSCI Europe Index. Given the Fund’s investment objective of attempting to track the Index, the Fund does not follow traditional methods of active investment management, which may involve buying and selling securities based upon analysis of economic and market factors. The Fund does not follow a strategy of seeking to outperform the MSCI Europe Index. |
| | | During the Reporting Period, the Fund posted double-digit positive absolute returns that outperformed the MSCI Europe Index, as measured by NAV. Amongst underlying factors, Value and Quality contributed positively to relative results during the Reporting Period. Low Volatility detracted most from relative results during the Reporting Period, followed by Momentum. Value refers to how attractively a stock is priced relative to its fundamentals, such as book value and free cash flow. Quality refers to sustainable profitability over time. Low Volatility is a relatively low degree of fluctuation in a company’s share price over time. Momentum is whether a company’s share price is trending up or down. |
| Q | | Which sectors and countries contributed most positively to the Index’s relative performance during the Reporting Period, and which detracted most? |
| A | | Index constituents in the consumer discretionary, consumer staples and materials sectors contributed most positively to the Index’s results relative to the MSCI Europe Index during the Reporting Period. Index constituents in the financials, communication services and industrials sectors detracted most from the Index’s results relative to the MSCI Europe Index during the Reporting Period. |
| | | From a country perspective, Index constituents in the U.K., Germany and Sweden contributed most positively to the Index’s results relative to the MSCI Europe Index during the Reporting Period. Conversely, Index constituents in France, Italy and Norway detracted the most from the Index’s results relative to the MSCI Europe Index during the Reporting Period. |
9
PORTFOLIO RESULTS
| Q | | Which individual stock positions contributed the most to the Index’s relative returns during the Reporting Period? |
| A | | Relative to the MSCI Europe Index, underweight positions in Dutch financial services company Adyen and Swiss multinational banking institution Credit Suisse Group and an overweight position in Spanish fashion retailer Industria de Diseno Textil contributed most positively (0.06%, 0.00%1 and 0.69% of Fund net assets as of August 31, 2023, respectively). Adyen and Credit Suisse Group each generated a double-digit negative return within the Index during the Reporting Period. Industria de Diseno Textil posted a robust double-digit gain within the Index during the Reporting Period. |
| Q | | Which individual stock positions detracted the most from the Index’s results during the Reporting Period? |
| A | | Relative to the MSCI Europe Index, an overweight position in Danish shipping and logistics company AP Moller-Maersk and underweight positions in Italian banking and financial services company UniCredit and Swiss investment bank and financial services company UBS Group detracted most (0.30%, 0.42% and 0.51% of Fund net assets as of August 31, 2023, respectively). AP Moller-Maersk posted a single-digit positive return within the Index during the Reporting Period, while UniCredit generated a triple-digit gain and UBS Group delivered a robust double-digit gain within the Index during the Reporting Period. |
| Q | | How did the Fund use derivatives and similar instruments during the Reporting Period? |
| A | | The Fund does not employ derivatives as a source of alpha generation, although it did use index futures to equitize excess cash. The use of futures was not material to the performance of the Fund during the Reporting Period. |
| Q | | What was the Fund’s sector positioning relative to the Index and reference index at the end of the Reporting Period?2 |
| | | | | | | | | | | | | | |
| | | | |
| | | Sector Name | | Fund3 | | | GS
ActiveBeta® Europe
Equity Index | | | MSCI Europe
Index | |
| | | | |
| | Consumer Discretionary | | | 12.97 | % | | | 13.43 | % | | | 11.32 | % |
| | Consumer Staples | | | 13.44 | | | | 13.63 | | | | 12.42 | |
| | Energy | | | 5.66 | | | | 5.68 | | | | 5.95 | |
| | Financials | | | 16.47 | | | | 16.10 | | | | 17.49 | |
| | Health Care | | | 16.15 | | | | 16.29 | | | | 16.10 | |
| | Industrials | | | 15.96 | | | | 15.70 | | | | 14.95 | |
| | Information Technology | | | 6.46 | | | | 6.46 | | | | 6.69 | |
| | Materials | | | 5.37 | | | | 5.30 | | | | 6.94 | |
| | Real Estate | | | 0.23 | | | | 0.31 | | | | 0.81 | |
| | Communication Services | | | 3.21 | | | | 3.20 | | | | 3.12 | |
| | | Utilities | | | 4.07 | | | | 3.90 | | | | 4.21 | |
| | 1 | | Some weights are 0.00% at August 31, 2023 either because those positions were taken out during the most recent rebalance given the Fund’s index construction methodology or because they were not components of the Index during the Reporting Period. |
| | 2 | | Country and sector classifications for securities may differ between the above listing and the Schedule of Investments due to differing classification methodologies. The classification methodology used for the above listing is as set forth by MSCI. The Fund’s composition may differ over time. Consequently, the Fund’s overall sector allocations may differ from percentages contained in the chart above. The percentage shown for each investment category reflects the value of investments in that category as a percentage of market value (excluding investment in the securities lending reinvestment vehicle, if any). Underlying sector allocation of exchange-traded funds held by the Fund are not reflected in the chart above. Investments in the securities lending vehicle represented 0.0% of the Fund’s net assets as of August 31, 2023. Figures above may not sum to 100% due to rounding due to the presence of cash. |
| | 3 | | The Fund seeks to provide investment results that closely correspond, before fees and expenses, to the performance of the Goldman Sachs ActiveBeta® Europe Equity Index. |
10
PORTFOLIO RESULTS
| Q | | What was the Fund’s country positioning relative to the Index and the reference index at the end of the Reporting Period?2 |
| | | | | | | | | | | | | | |
| | | | |
| | | Country Name | | Fund3 | | | GS
ActiveBeta® Europe
Equity
Index | | | MSCI
Europe
Index | |
| | Austria | | | 0.80 | % | | | 0.51 | % | | | 0.28 | % |
| | Belgium | | | 1.20 | | | | 1.19 | | | | 1.48 | |
| | Denmark | | | 4.90 | | | | 5.11 | | | | 4.97 | |
| | Finland | | | 1.30 | | | | 1.20 | | | | 1.34 | |
| | France | | | 17.20 | | | | 20.24 | | | | 18.83 | |
| | Germany | | | 13.80 | | | | 14.00 | | | | 13.07 | |
| | Ireland | | | 1.00 | | | | 0.98 | | | | 1.30 | |
| | Italy | | | 4.10 | | | | 4.55 | | | | 4.00 | |
| | Netherlands | | | 8.00 | | | | 6.96 | | | | 6.71 | |
| | Norway | | | 1.10 | | | | 1.27 | | | | 1.03 | |
| | Portugal | | | 0.50 | | | | 0.66 | | | | 0.32 | |
| | Spain | | | 4.30 | | | | 4.51 | | | | 4.00 | |
| | Sweden | | | 3.30 | | | | 3.72 | | | | 4.76 | |
| | Switzerland | | | 8.40 | | | | 14.11 | | | | 15.54 | |
| | | UK | | | 17.50 | | | | 20.99 | | | | 22.38 | |
| | 2 | | Country and sector classifications for securities may differ between the above listing and the Schedule of Investments due to differing classification methodologies. The classification methodology used for the above listing is as set forth by MSCI. The Fund’s composition may differ over time. Consequently, the Fund’s overall sector allocations may differ from percentages contained in the chart above. The percentage shown for each investment category reflects the value of investments in that category as a percentage of market value (excluding investment in the securities lending reinvestment vehicle, if any). Underlying sector allocation of exchange-traded funds held by the Fund are not reflected in the chart above. Investments in the securities lending vehicle represented 0.0% of the Fund’s net assets as of August 31, 2023. Figures above may not sum to 100% due to rounding due to the presence of cash. |
| | 3 | | The Fund seeks to provide investment results that closely correspond, before fees and expenses, to the performance of the Goldman Sachs ActiveBeta® Europe Equity Index. |
11
FUND BASICS
ActiveBeta® Europe Equity ETF
as of August 31, 2023
| | | | | | |
| | FUND SNAPSHOT | | | | |
| | |
| | | As of August 31, 2023 | | | |
| | |
| | Market Price1 | | $ | 33.05 | |
| | | Net Asset Value (NAV)1 | | $ | 33.11 | |
| 1 | | The Market Price is the price at which the Fund’s shares are trading on the NYSE Arca, Inc. The Market Price of the Fund’s shares will fluctuate and, at the time of sale, shares may be worth more or less than the original investment or the Fund’s then current net asset value (“NAV”). The NAV is the market value of one share of the Fund. This amount is derived by dividing the total value of all the securities in the Fund’s portfolio, plus other assets, less any liabilities, by the number of Fund shares outstanding. Fund shares are not individually redeemable and are issued and redeemed by the Fund at their NAV only in large, specified blocks of shares called creation units. Shares otherwise can be bought and sold only through exchange trading at market price (not NAV). Shares may trade at a premium or discount to their NAV in the secondary market. Information regarding how often shares of each Fund traded on NYSE Arca at a price above (i.e., at a premium) or below (i.e., at a discount) the NAV of the Fund can be found at www.GSAMFUNDS.com/ETFs. |
| | | | | | | | | | |
| | TOP 10 HOLDINGS AS OF 8/31/232 |
| | | | |
| | | Holding | | % of Net Assets | | | Line of Business | | Country |
| | | | |
| | Novo Nordisk A/S, Class B | | | 2.9 | % | | Health Care | | Denmark |
| | Nestle SA | | | 2.7 | | | Consumer Staples | | United States |
| | ASML Holding NV | | | 2.2 | | | Information Technology | | Netherlands |
| | LVMH Moet Hennessy Louis Vuitton SE | | | 2.1 | | | Consumer Discretionary | | France |
| | Roche Holding AG | | | 2.0 | | | Health Care | | United States |
| | Novartis AG | | | 1.9 | | | Health Care | | Switzerland |
| | AstraZeneca PLC | | | 1.7 | | | Health Care | | United Kingdom |
| | Shell PLC | | | 1.6 | | | Energy | | Netherlands |
| | TotalEnergies SE | | | 1.3 | | | Energy | | France |
| | | SAP SE | | | 1.2 | | | Information Technology | | Germany |
| 2 | | The top 10 holdings may not be representative of the Fund’s future investments. |
For more information about the Fund, please refer to www.GSAMFUNDS.com/ETFs. There, you can learn more about the Fund’s investment strategies, holdings, and performance.
12
ACTIVEBETA® EUROPE EQUITY ETF
Performance Summary
August 31, 2023
The following graph shows the value, as of August 31, 2023, of a $10,000 investment made on March 2, 2016 (commencement of operations) in Shares at NAV. For comparative purposes, the performance of the Fund’s underlying index and a market-cap based index against which the performance of the Fund is measured, the Goldman Sachs ActiveBeta® Europe Equity Index and the MSCI Europe Index (Net, Unhedged), respectively, are shown. Performance reflects applicable fee waivers and/or expense limitations in effect during the periods shown and in their absence, performance would be reduced. Returns do not reflect the deduction of taxes that a shareholder would pay on Fund distributions or the sale of Fund shares. In addition to the performance of constituents of the underlying index, other factors may affect Fund performance. These factors include, but are not limited to, Fund operating fees and expenses, portfolio turnover and creation and redemption in-kind transactions. The returns set forth below represent past performance. Past performance does not guarantee future results. The Fund’s NAV and investment return may fluctuate. These fluctuations may cause an investor’s shares to be worth more or less than their original cost. Current performance may be lower or higher than the performance quoted below. Please visit our web site at www.GSAMFUNDS.com/ETFs to obtain the most recent month-end returns.
|
| ActiveBeta® Europe Equity ETF’s Lifetime Performance |
Performance of a $10,000 Investment, with distributions reinvested, from March 2, 2016 through August 31, 2023.
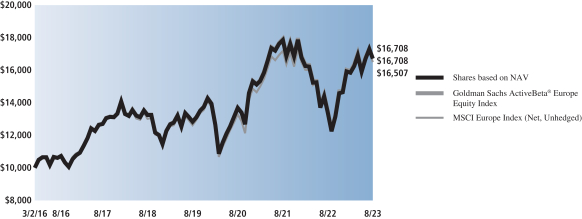
| | | | | | | | | | |
| Average Annual Total Return through August 31, 2023* | | | One Year | | | | Five Years | | | Since Inception |
Shares based on NAV (Commenced March 2, 2016) | | | 24.40% | | | | 4.75% | | | 7.08% |
|
Shares based on Market Price (Commenced March 2, 2016) | | | 25.14% | | | | 4.77% | | | 7.05% |
|
Goldman Sachs ActiveBeta® Europe Equity Index | | | 23.57% | | | | 4.72% | | | 7.08% |
|
MSCI Europe Index (Net, Unhedged) | | | 22.51% | | | | 4.87% | | | 6.91% |
|
| * | | Total returns are calculated assuming purchase of a share at the market price or NAV on the first day and sale of a share at the market price or NAV on the last day of each period reported. The Total Returns based on NAV and Market Price assume the reinvestment of dividends and do not reflect brokerage commissions in connection with the purchase or sale of Fund shares, which if included would lower the performance shown above. The NAV used in the Total Return calculation assumes all management fees incurred by the Fund. Market Price returns are based upon the last trade as of 4:00 pm EST and do not reflect the returns you would receive if you traded shares at other times. The first day of secondary market trading is typically several days after the date on which the Fund commenced investment operations; therefore, the NAV of the Fund is used as a proxy for the period from inception of investment operations to the first day of secondary market trading to calculate the Market Price returns. |
13
PORTFOLIO RESULTS
Goldman Sachs ActiveBeta® International Equity ETF
Investment Objective
The Goldman Sachs ActiveBeta® International Equity ETF (the “Fund”) seeks to provide investment results that closely correspond, before fees and expenses, to the performance of the Goldman Sachs ActiveBeta® International Equity Index (the “Index”).
Portfolio Management Discussion and Analysis
Below, the Goldman Sachs Quantitative Investment Strategies Team discusses the Fund’s performance and positioning for the 12-month period ended August 31, 2023 (the “Reporting Period”).
| Q | | How did the Fund perform during the Reporting Period? |
| A | | During the Reporting Period, the Fund returned 16.40% based on net asset value (“NAV”) and 16.95% based on market price. The Index returned 16.39%, and the MSCI World ex USA Index (Net, Unhedged, USD) (“MSCI World ex USA Index”), a market-cap based index against which the performance of the Fund is measured, and the reference index for the Index, returned 16.45% during the same period. |
| | | The Fund had an NAV of $27.64 per share on August 31, 2022 and ended the Reporting Period with an NAV of $31.20 per share. The Fund’s market price on August 31, 2023 was $31.21 per share. |
| Q | | What key factors were responsible for the Fund’s performance during the Reporting Period? |
| A | | The Fund seeks to provide investment results that closely correspond, before fees and expenses, to the performance of the Index. The Fund’s performance reflects Fund expenses, including management fees and brokerage expenses. The Fund’s relative performance also reflects the impact of any cash held in the Fund as well as any other differences between the Fund’s holdings and the constituents of the Index. The Index is unmanaged, and Index returns do not reflect fees and expenses, which would reduce returns. |
| | | The Index is constructed using a rules-based methodology that was developed to provide exposure to the “factors” (or characteristics) that are commonly tied to a stock’s outperformance relative to market returns, and its performance is compared to that of the MSCI World ex USA Index. Because the Fund seeks to provide investment results that closely correspond, before fees and expenses, to the performance of the Index, the discussion below compared the performance of the Fund to that of the MSCI World ex USA Index. Given the Fund’s investment objective of attempting to track the Index, the Fund does not follow traditional methods of active investment management, which may involve buying and selling securities based upon analysis of economic and market factors. The Fund does not follow a strategy of seeking to outperform the MSCI World ex USA Index. |
| | | During the Reporting Period, the Fund posted double-digit positive absolute returns that closely tracked the MSCI World ex USA Index, as measured by NAV. Amongst underlying factors, Value contributed positively to relative results during the Reporting Period. Low Volatility and Momentum detracted most from relative results during the Reporting Period, followed by Quality. Value refers to how attractively a stock is priced relative to its fundamentals, such as book value and free cash flow. Low Volatility is a relatively low degree of fluctuation in a company’s share price over time. Momentum is whether a company’s share price is trending up or down. Quality refers to sustainable profitability over time. |
| Q | | Which sectors and countries contributed most positively to the Index’s relative performance during the Reporting Period, and which detracted most? |
| A | | Index constituents in the consumer discretionary, energy and health care sectors contributed most positively to the Index’s results relative to the MSCI World ex USA Index during the Reporting Period. Index constituents in the consumer staples, materials and financials sectors detracted the most from the Index’s results relative to the MSCI World ex USA Index during the Reporting Period. |
| | | From a country perspective, Index constituents in the U.K., Sweden and Australia contributed most positively to the Fund’s results relative to the MSCI World ex USA Index |
14
PORTFOLIO RESULTS
| | during the Reporting Period. Conversely, Index constituents in Japan, Canada and France detracted the most from the Fund’s results relative to the MSCI World ex USA Index during the Reporting Period. |
| Q | | Which individual stock positions contributed the most to the Index’s relative returns during the Reporting Period? |
| A | | Relative to the MSCI World ex USA Index, underweight positions in Dutch financial services company Adyen, Swiss multinational banking institution Credit Suisse Group and Australia-based biopharmaceutical company CSL contributed most positively (0.00%,1 0.00% and 0.15% of Fund net assets as of August 31, 2023, respectively). Adyen and CSL each generated a double-digit negative return within the Index during the Reporting Period. Credit Suisse Group was not held in the Index during the Reporting Period. |
| Q | | Which individual stock positions detracted the most from the Index’s results during the Reporting Period? |
| A | | Relative to the MSCI World ex USA Index, an underweight position in Canadian e-commerce company Shopify and overweight positions in Canadian forestry company West Fraser Timber and Canadian conglomerate engaged mostly in food retail and corporate investments Empire detracted most (0.11%, 0.00%1 and 0.39% of Fund net assets as of August 31, 2023, respectively). Shopify posted a double-digit positive return within the Index during the Reporting Period, while West Fraser Timber and Empire each generated a negative return within the Index during the Reporting Period. |
| Q | | How did the Fund use derivatives and similar instruments during the Reporting Period? |
| A | | The Fund does not employ derivatives as a source of alpha generation, although it did use index futures to equitize excess cash. The use of futures was not material to the performance of the Fund during the Reporting Period. |
| Q | | What was the Fund’s sector positioning relative to the Index and the reference index at the end of the Reporting Period?2 |
| | | | | | | | | | | | | | |
| | | | |
| | | Sector Name | | Fund3 | | | GS
ActiveBeta®
International
Equity Index | | | MSCI World ex
USA Index | |
| | | | |
| | Consumer Discretionary | | | 12.21 | % | | | 12.34 | % | | | 11.38 | % |
| | Consumer Staples | | | 12.53 | | | | 12.14 | | | | 9.43 | |
| | Energy | | | 5.84 | | | | 6.15 | | | | 5.98 | |
| | Financials | | | 18.78 | | | | 18.66 | | | | 20.29 | |
| | Health Care | | | 12.46 | | | | 12.48 | | | | 11.99 | |
| | Industrials | | | 16.32 | | | | 16.10 | | | | 15.71 | |
| | Information Technology | | | 7.82 | | | | 7.77 | | | | 8.08 | |
| | Materials | | | 5.73 | | | | 6.20 | | | | 7.82 | |
| | Real Estate | | | 1.29 | | | | 1.41 | | | | 2.17 | |
| | Communication Services | | | 4.08 | | | | 4.04 | | | | 3.81 | |
| | | Utilities | | | 2.93 | | | | 2.72 | | | | 3.36 | |
| | 1 | | Some weights are 0.00% at August 31, 2023 either because those positions were taken out during the most recent rebalance given the Fund’s index construction methodology or because they were not components of the Index during the Reporting Period. |
| | 2 | | Country and sector classifications for securities may differ between the above listing and the Schedule of Investments due to differing classification methodologies. The classification methodology used for the above listing is as set forth by MSCI. The Fund’s composition may differ over time. Consequently, the Fund’s overall sector allocations may differ from percentages contained in the chart above. The percentage shown for each investment category reflects the value of investments in that category as a percentage of market value (excluding investment in the securities lending reinvestment vehicle, if any). Underlying sector allocation of exchange-traded funds held by the Fund are not reflected in the chart above. Investments in the securities lending vehicle represented 0.0% of the Fund’s net assets as of August 31, 2023. Figures above may not sum to 100% due to rounding due to the presence of cash. |
| | 3 | | The Fund seeks to provide investment results that closely correspond, before fees and expenses, to the performance of the Goldman Sachs ActiveBeta® International Equity Index. |
15
PORTFOLIO RESULTS
| Q | | What was the Fund’s country positioning relative to the Index and the reference index at the end of the Reporting Period?2 |
| | | | | | | | | | | | | | |
| | | | |
| | | Country Name | | Fund3 | | | GS ActiveBeta®
International
Equity Index | | | MSCI World ex
USA Index | |
| | | | |
| | Australia | | | 6.10 | % | | | 6.17 | % | | | 6.56 | % |
| | Austria | | | 0.40 | | | | 0.23 | | | | 0.16 | |
| | Belgium | | | 0.70 | | | | 0.77 | | | | 0.87 | |
| | Canada | | | 10.80 | | | | 11.47 | | | | 10.45 | |
| | Denmark | | | 3.00 | | | | 3.10 | | | | 2.91 | |
| | Finland | | | 0.70 | | | | 0.71 | | | | 0.78 | |
| | France | | | 10.40 | | | | 12.09 | | | | 11.02 | |
| | Germany | | | 7.80 | | | | 7.74 | | | | 7.65 | |
| | Hong Kong | | | 1.30 | | | | 2.02 | | | | 2.11 | |
| | Ireland | | | 0.60 | | | | 0.62 | | | | 0.76 | |
| | Israel | | | 0.80 | | | | 0.80 | | | | 0.59 | |
| | Italy | | | 2.40 | | | | 2.58 | | | | 2.34 | |
| | Japan | | | 20.40 | | | | 20.20 | | | | 20.37 | |
| | Netherlands | | | 4.50 | | | | 3.90 | | | | 3.92 | |
| | New Zealand | | | 0.20 | | | | 0.18 | | | | 0.17 | |
| | Norway | | | 0.70 | | | | 0.76 | | | | 0.60 | |
| | Portugal | | | 0.40 | | | | 0.40 | | | | 0.19 | |
| | Singapore | | | 1.60 | | | | 1.41 | | | | 1.24 | |
| | Spain | | | 2.50 | | | | 2.59 | | | | 2.34 | |
| | Sweden | | | 1.90 | | | | 2.18 | | | | 2.78 | |
| | Switzerland | | | 4.90 | | | | 7.91 | | | | 9.09 | |
| | | UK | | | 10.50 | | | | 12.18 | | | | 13.09 | |
| | 2 | | Country and sector classifications for securities may differ between the above listing and the Schedule of Investments due to differing classification methodologies. The classification methodology used for the above listing is as set forth by MSCI. The Fund’s composition may differ over time. Consequently, the Fund’s overall sector allocations may differ from percentages contained in the chart above. The percentage shown for each investment category reflects the value of investments in that category as a percentage of market value (excluding investment in the securities lending reinvestment vehicle, if any). Underlying sector allocation of exchange-traded funds held by the Fund are not reflected in the chart above. Investments in the securities lending vehicle represented 0.0% of the Fund’s net assets as of August 31, 2023. Figures above may not sum to 100% due to rounding due to the presence of cash. |
| | 3 | | The Fund seeks to provide investment results that closely correspond, before fees and expenses, to the performance of the Goldman Sachs ActiveBeta® International Equity Index. |
16
FUND BASICS
ActiveBeta® International Equity ETF
as of August 31, 2023
| | | | | | |
| | FUND SNAPSHOT | |
| |
| | | As of August 31, 2023 | |
| | |
| | Market Price1 | | $ | 31.21 | |
| | | Net Asset Value (NAV)1 | | $ | 31.20 | |
| 1 | | The Market Price is the price at which the Fund’s shares are trading on the NYSE Arca, Inc. The Market Price of the Fund’s shares will fluctuate and, at the time of sale, shares may be worth more or less than the original investment or the Fund’s then current net asset value (“NAV”). The NAV is the market value of one share of the Fund. This amount is derived by dividing the total value of all the securities in the Fund’s portfolio, plus other assets, less any liabilities, by the number of Fund shares outstanding. Fund shares are not individually redeemable and are issued and redeemed by the Fund at their NAV only in large, specified blocks of shares called creation units. Shares otherwise can be bought and sold only through exchange trading at market price (not NAV). Shares may trade at a premium or discount to their NAV in the secondary market. Information regarding how often shares of each Fund traded on NYSE Arca at a price above (i.e., at a premium) or below (i.e., at a discount) the NAV of the Fund can be found at www.GSAMFUNDS.com/ETFs. |
| | | | | | | | | | |
| | TOP 10 HOLDINGS AS OF 8/31/232 |
| | | | |
| | | Holding | | % of Net Assets | | | Line of Business | | Country |
| | | | |
| | Novo Nordisk A/S, Class B | | | 1.7 | % | | Health Care | | Denmark |
| | Nestle SA | | | 1.5 | | | Consumer Staples | | United States |
| | LVMH Moet Hennessy Louis Vuitton SE | | | 1.3 | | | Consumer Discretionary | | France |
| | Roche Holding AG | | | 1.1 | | | Health Care | | United States |
| | ASML Holding NV | | | 1.1 | | | Information Technology | | Netherlands |
| | Novartis AG | | | 1.0 | | | Health Care | | Switzerland |
| | Shell PLC | | | 0.9 | | | Energy | | Netherlands |
| | AstraZeneca PLC | | | 0.9 | | | Health Care | | United Kingdom |
| | TotalEnergies SE | | | 0.7 | | | Energy | | France |
| | | L’Oreal SA | | | 0.7 | | | Consumer Staples | | France |
| 2 | | The top 10 holdings may not be representative of the Fund’s future investments. |
For more information about the Fund, please refer to www.GSAMFUNDS.com/ETFs. There, you can learn more about the Fund’s investment strategies, holdings, and performance.
17
ACTIVEBETA® INTERNATIONAL EQUITY ETF
Performance Summary
August 31, 2023
The following graph shows the value, as of August 31, 2023, of a $10,000 investment made on November 6, 2015 (commencement of operations) in Shares at NAV. For comparative purposes, the performance of the Fund’s underlying index and a market-cap based index against which the performance of the Fund is measured, the Goldman Sachs ActiveBeta® International Equity Index and the MSCI World ex USA Index (Net, Unhedged, USD), respectively, are shown. Performance reflects applicable fee waivers and/or expense limitations in effect during the periods shown and in their absence, performance would be reduced. Returns do not reflect the deduction of taxes that a shareholder would pay on Fund distributions or the sale of Fund shares. In addition to the performance of constituents of the underlying index, other factors may affect Fund performance. These factors include, but are not limited to, Fund operating fees and expenses, portfolio turnover and creation and redemption in-kind transactions. The returns set forth below represent past performance. Past performance does not guarantee future results. The Fund’s NAV and investment return may fluctuate. These fluctuations may cause an investor’s shares to be worth more or less than their original cost. Current performance may be lower or higher than the performance quoted below. Please visit our web site at www.GSAMFUNDS.com/ETFs to obtain the most recent month-end returns.
|
| ActiveBeta® International Equity ETF’s Lifetime Performance |
Performance of a $10,000 Investment, with distributions reinvested, from November 6, 2015 through August 31, 2023.
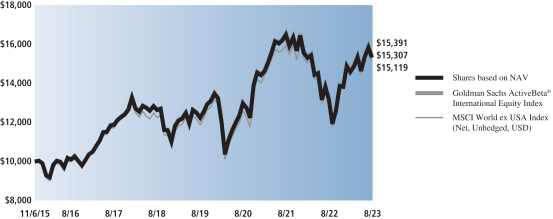
| | | | | | | | | | |
| Average Annual Total Return through August 31, 2023* | | | One Year | | | | Five Years | | | Since Inception |
Shares based on NAV (Commenced November 6, 2015) | | | 16.40% | | | | 3.93% | | | 5.59% |
|
Shares based on Market Price (Commenced November 6, 2015) | | | 16.95% | | | | 3.92% | | | 5.59% |
|
Goldman Sachs ActiveBeta® International Equity Index | | | 16.39% | | | | 3.99% | | | 5.67% |
|
MSCI World ex USA Index (Net, Unhedged, USD) | | | 16.45% | | | | 4.31% | | | 5.42% |
|
| * | | Total returns are calculated assuming purchase of a share at the market price or NAV on the first day and sale of a share at the market price or NAV on the last day of each period reported. The Total Returns based on NAV and Market Price assume the reinvestment of dividends and do not reflect brokerage commissions in connection with the purchase or sale of Fund shares, which if included would lower the performance shown above. The NAV used in the Total Return calculation assumes all management fees incurred by the Fund. Market Price returns are based upon the last trade as of 4:00 pm EST and do not reflect the returns you would receive if you traded shares at other times. The first day of secondary market trading is typically several days after the date on which the Fund commenced investment operations; therefore, the NAV of the Fund is used as a proxy for the period from inception of investment operations to the first day of secondary market trading to calculate the Market Price returns. |
18
PORTFOLIO RESULTS
Goldman Sachs ActiveBeta® Japan Equity ETF
Investment Objective
The Goldman Sachs ActiveBeta® Japan Equity ETF (the “Fund”) seeks to provide investment results that closely correspond, before fees and expenses, to the performance of the Goldman Sachs ActiveBeta® Japan Equity Index (the “Index”).
Portfolio Management Discussion and Analysis
Below, the Goldman Sachs Quantitative Investment Strategies Team discusses the Fund’s performance and positioning for the 12-month period ended August 31, 2023 (the “Reporting Period”).
| Q | | How did the Fund perform during the Reporting Period? |
| A | | During the Reporting Period, the Fund returned 15.69% based on net asset value (“NAV”) and 17.15% based on market price. The Index returned 15.70%, while the MSCI Japan Index (Unhedged) (“MSCI Japan Index”), a market-cap based index against which the performance of the Fund is measured, and the reference index for the Index, returned 15.30% during the same period. |
| | | The Fund had an NAV of $30.15 per share on August 31, 2022 and ended the Reporting Period with an NAV of $34.18 per share. The Fund’s market price on August 31, 2023 was $34.18 per share. |
| Q | | What key factors were responsible for the Fund’s performance during the Reporting Period? |
| A | | The Fund seeks to provide investment results that closely correspond, before fees and expenses, to the performance of the Index. The Fund’s performance reflects Fund expenses, including management fees and brokerage expenses. The Fund’s relative performance also reflects the impact of any cash held in the Fund as well as any other differences between the Fund’s holdings and the constituents of the Index. The Index is unmanaged, and Index returns do not reflect fees and expenses, which would reduce returns. |
| | | The Index is constructed using a rules-based methodology that was developed to provide exposure to the “factors” (or characteristics) that are commonly tied to a stock’s outperformance relative to market returns, and its performance is compared to that of the MSCI Japan Index. Because the Fund seeks to provide investment results that closely correspond, before fees and expenses, to the performance of the Index, the discussion below compared the performance of the Fund to that of the MSCI Japan Index. Given the Fund’s investment objective of attempting to track the Index, the Fund does not follow traditional methods of active investment management, which may involve buying and selling securities based upon analysis of economic and market factors. The Fund does not follow a strategy of seeking to outperform the MSCI Japan Index. |
| | | During the Reporting Period, the Fund posted double-digit positive absolute returns that outperformed the MSCI Japan Index, as measured by NAV. Amongst underlying factors, Value contributed most positively to results relative to the MSCI Japan Index, followed by Momentum. Quality detracted most from results relative to the MSCI Japan Index, followed by Low Volatility. Value refers to how attractively a stock is priced relative to its fundamentals, such as book value and free cash flow. Momentum is whether a company’s share price is trending up or down. Quality refers to sustainable profitability over time. Low Volatility is a relatively low degree of fluctuation in a company’s share price over time. |
| Q | | Which sectors contributed most positively to the Index’s relative performance during the Reporting Period, and which detracted most? |
| A | | Index constituents in the industrials, consumer discretionary and real estate sectors contributed most positively to the Index’s results relative to the MSCI Japan Index during the Reporting Period. Conversely, Index constituents in the financials, materials and consumer staples sectors detracted most from results relative to the MSCI Japan Index during the Reporting Period. |
| Q | | Which individual stock positions contributed the most to the Index’s relative returns during the Reporting Period? |
| A | | Relative to the MSCI Japan Index, overweight positions in integrated trading and investment company Marubeni and |
19
PORTFOLIO RESULTS
| | trading company Mitsui & Co. and an underweight position in electric motor manufacturer Nidec contributed most positively (1.16%, 1.68% and 0.20% of Fund net assets as of August 31, 2023, respectively). Marubeni and Mitsui & Co. each posted a double-digit gain within the Index during the Reporting Period, while Nidec generated a double-digit negative return within the Index during the Reporting Period. |
| Q | | Which individual stock positions detracted the most from the Index’s results during the Reporting Period? |
| A | | Relative to the MSCI Japan Index, underweight positions in bank holding and financial services company Mitsubishi UFJ Financial Group and industrial chemicals manufacturer Shin-Etsu Chemical and an overweight position in information security company Trend Micro detracted most (2.19%, 1.25% and 0.30% of Fund net assets as of August 31, 2023, respectively). Mitsubishi UFJ Financial Group and Shin-Etsu Chemical each posted a robust double-digit gain within the Index during the Reporting Period. Trend Micro delivered a double-digit negative return within the Index during the Reporting Period. |
| Q | | How did the Fund use derivatives and similar instruments during the Reporting Period? |
| A | | The Fund does not employ derivatives as a source of alpha generation, although it did use index futures to equitize excess cash. The use of futures was not material to the performance of the Fund during the Reporting Period. |
| Q | | What was the Fund’s sector positioning relative to the Index and the reference index at the end of the Reporting Period?1 |
| | | | | | | | | | | | | | |
| | | | |
| | | Sector Name | | Fund2 | | | GS ActiveBeta® Japan
Equity Index | | | MSCI Japan Index | |
| | | | |
| | Consumer Discretionary | | | 18.53 | % | | | 18.34 | % | | | 18.73 | % |
| | Consumer Staples | | | 7.71 | | | | 7.81 | | | | 6.28 | |
| | Energy | | | 1.15 | | | | 1.19 | | | | 0.82 | |
| | Financials | | | 12.03 | | | | 11.93 | | | | 11.88 | |
| | Health Care | | | 8.88 | | | | 8.97 | | | | 8.77 | |
| | Industrials | | | 22.76 | | | | 23.04 | | | | 23.51 | |
| | Information Technology | | | 14.38 | | | | 14.31 | | | | 13.96 | |
| | Materials | | | 4.05 | | | | 3.96 | | | | 4.67 | |
| | Real Estate | | | 1.70 | | | | 1.70 | | | | 3.01 | |
| | Communication Services | | | 7.46 | | | | 7.45 | | | | 7.20 | |
| | | Utilities | | | 1.34 | | | | 1.30 | | | | 1.15 | |
| | 1 | | Sector classifications for securities may differ between the above listing and the Schedule of Investments due to differing classification methodologies. The classification methodology used for the above listing is as set forth by MSCI. The Fund’s composition may differ over time. Consequently, the Fund’s overall sector allocations may differ from percentages contained in the chart above. The percentage shown for each investment category reflects the value of investments in that category as a percentage of market value (excluding investment in the securities lending reinvestment vehicle, if any). Underlying sector allocation of exchange-traded funds held by the Fund are not reflected in the chart above. Investments in the securities lending vehicle represented 0.0% of the Fund’s net assets as of August 31, 2023. Figures above may not sum to 100% due to rounding due to the presence of cash. |
| | 2 | | The Fund seeks to provide investment results that closely correspond, before fees and expenses, to the performance of the Goldman Sachs ActiveBeta® Japan Equity Index. |
20
FUND BASICS
ActiveBeta® Japan Equity ETF
as of August 31, 2023
| | | | | | |
| | FUND SNAPSHOT | |
| |
| | | As of August 31, 2023 | |
| | |
| | Market Price1 | | $ | 34.18 | |
| | | Net Asset Value (NAV)1 | | $ | 34.18 | |
| 1 | | The Market Price is the price at which the Fund’s shares are trading on the NYSE Arca, Inc. The Market Price of the Fund’s shares will fluctuate and, at the time of sale, shares may be worth more or less than the original investment or the Fund’s then current net asset value (“NAV”). The NAV is the market value of one share of the Fund. This amount is derived by dividing the total value of all the securities in the Fund’s portfolio, plus other assets, less any liabilities, by the number of Fund shares outstanding. Fund shares are not individually redeemable and are issued and redeemed by the Fund at their NAV only in large, specified blocks of shares called creation units. Shares otherwise can be bought and sold only through exchange trading at market price (not NAV). Shares may trade at a premium or discount to their NAV in the secondary market. Information regarding how often shares of each Fund traded on NYSE Arca at a price above (i.e., at a premium) or below (i.e., at a discount) the NAV of the Fund can be found at www.GSAMFUNDS.com/ETFs. |
| | | | | | | | | | |
| | TOP 10 HOLDINGS AS OF 8/31/232 | | |
| | | | |
| | | Holding | | % of Net Assets | | | Line of Business | | Country |
| | | | |
| | Toyota Motor Corp. | | | 4.0 | % | | Consumer Discretionary | | Japan |
| | Mitsubishi UFJ Financial Group, Inc. | | | 2.2 | | | Financials | | Japan |
| | Mitsubishi Corp. | | | 2.2 | | | Industrials | | Japan |
| | Sony Group Corp. | | | 2.2 | | | Consumer Discretionary | | Japan |
| | Honda Motor Co. Ltd. | | | 2.1 | | | Consumer Discretionary | | Japan |
| | Keyence Corp. | | | 1.8 | | | Information Technology | | Japan |
| | Mitsui & Co. Ltd. | | | 1.7 | | | Industrials | | Japan |
| | Tokyo Electron Ltd. | | | 1.7 | | | Information Technology | | Japan |
| | Hitachi Ltd. | | | 1.6 | | | Industrials | | Japan |
| | | Takeda Pharmaceutical Co. Ltd. | | | 1.6 | | | Health Care | | Japan |
| 2 | | The top 10 holdings may not be representative of the Fund’s future investments. |
For more information about the Fund, please refer to www.GSAMFUNDS.com/ETFs. There, you can learn more about the Fund’s investment strategies, holdings, and performance.
21
ACTIVEBETA® JAPAN EQUITY ETF
Performance Summary
August 31, 2023
The following graph shows the value, as of August 31, 2023, of a $10,000 investment made on March 2, 2016 (commencement of operations) in Shares at NAV. For comparative purposes, the performance of the Fund’s underlying index and a market-cap based index against which the performance of the Fund is measured, the Goldman Sachs ActiveBeta® Japan Index and the MSCI Japan Index (Unhedged), respectively, are shown. Performance reflects applicable fee waivers and/or expense limitations in effect during the periods shown and in their absence, performance would be reduced. Returns do not reflect the deduction of taxes that a shareholder would pay on Fund distributions or the sale of Fund shares. In addition to the performance of constituents of the underlying index, other factors may affect Fund performance. These factors include, but are not limited to, Fund operating fees and expenses, portfolio turnover and creation and redemption in-kind transactions. The returns set forth below represent past performance. Past performance does not guarantee future results. The Fund’s NAV and investment return may fluctuate. These fluctuations may cause an investor’s shares to be worth more or less than their original cost. Current performance may be lower or higher than the performance quoted below. Please visit our web site at www.GSAMFUNDS.com/ETFs to obtain the most recent month-end returns.
|
| ActiveBeta® Japan Equity ETF’s Lifetime Performance |
Performance of a $10,000 Investment, with distributions reinvested, from March 2, 2016 through August 31, 2023.
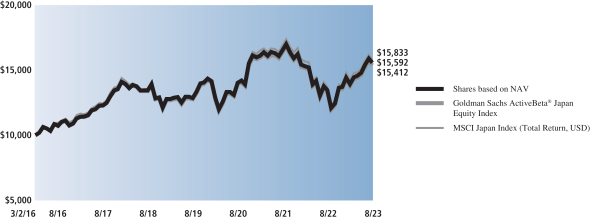
| | | | | | | | | | |
| Average Annual Total Return through August 31, 2023* | | | One Year | | | | Five Years | | | Since Inception |
Shares based on NAV (Commenced March 2, 2016) | | | 15.69% | | | | 2.99% | | | 6.10% |
|
Shares based on Market Price (Commenced March 2, 2016) | | | 17.15% | | | | 3.06% | | | 6.11% |
|
Goldman Sachs ActiveBeta® Japan Equity Index | | | 15.70% | | | | 2.82% | | | 5.93% |
|
MSCI Japan Index (Unhedged) | | | 15.30% | | | | 3.11% | | | 6.31% |
|
| * | | Total returns are calculated assuming purchase of a share at the market price or NAV on the first day and sale of a share at the market price or NAV on the last day of each period reported. The Total Returns based on NAV and Market Price assume the reinvestment of dividends and do not reflect brokerage commissions in connection with the purchase or sale of Fund shares, which if included would lower the performance shown above. The NAV used in the Total Return calculation assumes all management fees incurred by the Fund. Market Price returns are based upon the last trade as of 4:00 pm EST and do not reflect the returns you would receive if you traded shares at other times. The first day of secondary market trading is typically several days after the date on which the Fund commenced investment operations; therefore, the NAV of the Fund is used as a proxy for the period from inception of investment operations to the first day of secondary market trading to calculate the Market Price returns. |
22
PORTFOLIO RESULTS
Goldman Sachs ActiveBeta® Paris-Aligned Climate U.S. Large Cap Equity ETF
Investment Objective
The Goldman Sachs ActiveBeta® Paris-Aligned Climate U.S. Large Cap Equity ETF (the “Fund”) seeks to provide investment results that closely correspond, before fees and expenses, to the performance of the Goldman Sachs ActiveBeta® Paris-Aligned U.S. Large Cap Equity Index (the “Index”).
Portfolio Management Discussion and Analysis
Below, the Goldman Sachs Quantitative Investment Strategies Team discusses the Fund’s performance and positioning for the 12-month period ended August 31, 2023 (the “Reporting Period”).
| Q | | How did the Fund perform during the Reporting Period? |
| A | | During the Reporting Period, the Fund returned 15.48% based on net asset value (“NAV”) and 15.36% based on market price. The Index returned 15.68%, and the Solactive US Large Cap Index (“Solactive Index”), a market-cap based index against which the performance of the Fund is measured, and the reference index for the Index, returned 15.85% during the same period. |
| | The Fund had an NAV of $32.50 on August 31, 2022 and ended the Reporting Period with an NAV of $36.99 per share. The Fund’s market price on August 31, 2023 was $37.01 per share. |
| Q | | What key factors were responsible for the Fund’s performance during the Reporting Period? |
| A | | The Fund seeks to provide investment results that closely correspond, before fees and expenses, to the performance of the Index. The Fund’s performance reflects Fund expenses, including management fees and brokerage expenses. The Fund’s relative performance also reflects the impact of any cash held in the Fund as well as any other differences between the Fund’s holdings and the constituents of the Index. The Index is unmanaged, and Index returns do not reflect fees and expenses, which would reduce returns. |
| | The Index is designed to deliver exposure to equity securities of large capitalization U.S. issuers. The Index is constructed using the patented ActiveBeta® Portfolio Construction Methodology, which was developed to provide exposure to the “factors” (or characteristics) that are commonly tied to a stock’s outperformance relative to market returns. These factors include Value (i.e., how attractively a stock is priced relative to its “fundamentals,” such as book value and free cash flow), Momentum (i.e., whether a company’s share price is trending up or down), Quality (i.e., profitability) and Low Volatility (i.e., a relatively low degree of fluctuation in a company’s share price over time). Given the Fund’s investment objective of attempting to track its Index, the Fund does not follow traditional methods of active investment management, which may involve buying and selling securities based upon analysis of economic and market factors. The Fund does not follow a strategy of seeking to outperform the Solactive Index. |
| | The Index aims to meet the minimum requirements to be an “EU Paris-Aligned Benchmark” as defined by the European Commission Delegated Regulation C(2020)4757. An “EU Paris-Aligned Benchmark” is an index whose constituent companies are aligned with the goals of the Paris Climate Agreement, an international treaty that seeks to combat climate change and its effects. |
| | During the Reporting Period, the Fund posted double-digit positive absolute returns that closely tracked the Solactive Index, as measured by NAV. Step 1 of the construction of the Fund’s Index, wherein certain companies are excluded per the requirements for an “EU Paris-Aligned Benchmark,” contributed most positively to results relative to the Solactive Index. In the second step, wherein Factor Subindexes are created, Quality contributed positively to results relative to the Solactive Index. Low Volatility detracted most from results relative to the Solactive Index, followed by Value and then Momentum. Quality refers to sustainable profitability over time. Low Volatility is a relatively low degree of fluctuation in a company’s share price over time. Value refers to how attractively a stock is priced relative to its fundamentals, such as book value and free cash flow. Momentum is whether a company’s share price is trending up or down. The third step, wherein the weights of the individual issuers are adjusted to target certain emissions constraints, detracted modestly from results relative to the Solactive Index. |
23
PORTFOLIO RESULTS
| Q | | Which sectors contributed most positively to the Index’s relative performance during the Reporting Period, and which detracted most? |
| A | | Index constituents in the utilities, consumer discretionary and communication services sectors contributed most positively to the Index’s results relative to the Solactive Index during the Reporting Period. Conversely, Index constituents in the health care, consumer staples and real estate sectors detracted from the Index’s results relative to the Solactive Index during the Reporting Period. |
| Q | | Which individual stock positions contributed the most to the Index’s relative returns during the Reporting Period? |
| A | | Relative to the Solactive Index, underweight positions in electric vehicle maker Tesla, e-commerce retailer behemoth Amazon.com and entertainment and media company Walt Disney Company contributed most positively (0.00%,1 0.00% and 0.03% of Fund net assets as of August 31, 2023, respectively). Tesla and Amazon.com were not held in the Index during the Reporting Period. Walt Disney Company generated a double-digit negative return within the Index during the Reporting Period. |
| Q | | Which individual stock positions detracted the most from the Index’s results during the Reporting Period? |
| A | | Relative to the Solactive Index, an overweight position in health care and retail pharmacy company CVS Health and underweight positions in entertainment content streaming company Netflix and semiconductor company NVIDIA detracted most (0.48%, 0.31% and 2.96% of Fund net assets as of August 31, 2023, respectively). CVS Health posted a double-digit negative return within the Index during the Reporting Period. Netflix generated a robust double-digit gain within the Index and NVIDIA delivered a triple-digit gain within the Index during the Reporting Period. |
| Q | | How did the Fund use derivatives and similar instruments during the Reporting Period? |
| A | | The Fund does not employ derivatives as a source of alpha generation, although it did use index futures to equitize excess cash. The use of futures was not material to the performance of the Fund during the Reporting Period. |
| Q | | What was the Fund’s sector positioning relative to the Index and the Solactive US Large Cap Index at the end of the Reporting Period?2 |
| | | | | | | | | | | | | | |
| | | | |
| | | Sector Name | | Fund3 | | | GS
ActiveBeta® Paris-Aligned
Climate U.S.
Large Cap
Equity Index | | | Solactive
US Large
Cap Index | |
| | | | |
| | Consumer Discretionary | | | 8.87 | % | | | 8.84 | % | | | 10.48 | % |
| | Consumer Staples | | | 6.92 | | | | 6.93 | | | | 6.31 | |
| | Financials | | | 12.39 | | | | 12.40 | | | | 12.25 | |
| | Health Care | | | 17.54 | | | | 17.52 | | | | 13.42 | |
| | Industrials | | | 7.00 | | | | 7.01 | | | | 8.63 | |
| | Information Technology | | | 33.40 | | | | 33.41 | | | | 28.44 | |
| | Materials | | | 1.28 | | | | 1.28 | | | | 2.40 | |
| | Real Estate | | | 3.36 | | | | 3.36 | | | | 2.46 | |
| | Communication Services | | | 9.06 | | | | 9.07 | | | | 8.78 | |
| | Utilities | | | 0.18 | | | | 0.18 | | | | 2.38 | |
| | | Energy | | | — | | | | — | | | | 4.47 | |
| | 1 | | Some weights are 0.00% at August 31, 2023 either because those positions were taken out during the most recent rebalance given the Fund’s index construction methodology or because they were not components of the Index during the Reporting Period. |
| | 2 | | Sector and country classifications for securities may differ between the above listing and the Schedule of Investments due to differing classification methodologies. The classification methodology used for the above listing is as set forth by Solactive. The Fund’s composition may differ over time. Consequently, the Fund’s overall sector allocations may differ from percentages contained in the chart above. The percentage shown for each investment category reflects the value of investments in that category as a percentage of market value (excluding investment in the securities lending reinvestment vehicle, if any). Underlying sector allocation of exchange-traded funds held by the Fund are not reflected in the chart above. Investments in the securities lending vehicle represented 0.0% of the Fund’s net assets as of August 31, 2023. Figures above may not sum to 100% due to rounding due to the presence of cash. |
| | 3 | | The Fund seeks to provide investment results that closely correspond, before fees and expenses, to the performance of the Goldman Sachs ActiveBeta® Paris-Aligned U.S. Large Cap Equity Index. |
24
FUND BASICS
ActiveBeta® Paris-Aligned Climate U.S. Large Cap Equity ETF
as of August 31, 2023
| | | | | | |
| | FUND SNAPSHOT | |
| | |
| | | As of August 31, 2023 | | | |
| | |
| | Market Price1 | | $ | 37.01 | |
| | | Net Asset Value (NAV)1 | | $ | 36.99 | |
| 1 | | The Market Price is the price at which the Fund’s shares are trading on the NYSE Arca, Inc. The Market Price of the Fund’s shares will fluctuate and, at the time of sale, shares may be worth more or less than the original investment or the Fund’s then current net asset value (“NAV”). The NAV is the market value of one share of the Fund. This amount is derived by dividing the total value of all the securities in the Fund’s portfolio, plus other assets, less any liabilities, by the number of Fund shares outstanding. Fund shares are not individually redeemable and are issued and redeemed by the Fund at their NAV only in large, specified blocks of shares called creation units. Shares otherwise can be bought and sold only through exchange trading at market price (not NAV). Shares may trade at a premium or discount to their NAV in the secondary market. Information regarding how often shares of each Fund traded on NYSE Arca at a price above (i.e., at a premium) or below (i.e., at a discount) the NAV of the Fund can be found at www.GSAMFUNDS.com/ETFs. |
| | | | | | | | | | |
| | TOP 10 HOLDINGS AS OF 8/31/232 |
| | | | |
| | | Holding | | % of Net Assets | | | Line of Business | | Country |
| | | | |
| | Apple, Inc. | | | 7.8 | % | | Information Technology | | United States |
| | Microsoft Corp. | | | 6.5 | | | Information Technology | | United States |
| | NVIDIA Corp. | | | 3.0 | | | Information Technology | | United States |
| | Alphabet, Inc., Class A | | | 2.1 | | | Communication Services | | United States |
| | Alphabet, Inc., Class C | | | 2.1 | | | Communication Services | | United States |
| | Meta Platforms, Inc., Class A | | | 1.8 | | | Communication Services | | United States |
| | Eli Lilly & Co. | | | 1.4 | | | Health Care | | United States |
| | Johnson & Johnson | | | 1.1 | | | Health Care | | United States |
| | JPMorgan Chase & Co. | | | 1.1 | | | Financials | | United States |
| | | UnitedHealth Group, Inc. | | | 1.0 | | | Health Care | | United States |
| 2 | | The top 10 holdings may not be representative of the Fund’s future investments. |
For more information about the Fund, please refer to www.GSAMFUNDS.com/ETFs. There, you can learn more about the Fund’s investment strategies, holdings, and performance.
25
ACTIVEBETA® PARIS-ALIGNED CLIMATE U.S. LARGE CAP EQUITY ETF
Performance Summary
August 31, 2023
The following graph shows the value, as of August 31, 2023, of a $10,000 investment made on December 13, 2021 (commencement of operations) in Shares at NAV. For comparative purposes, the performance of the Fund’s underlying index and a market-cap based index against which the performance of the Fund is measured, the Goldman Sachs ActiveBeta® Paris-Aligned U.S. Large Cap Equity Index (USD, Unhedged) and Solactive US Large Cap Index, respectively, are shown. Performance reflects applicable fee waivers and/or expense limitations in effect during the periods shown and in their absence, performance would be reduced. Returns do not reflect the deduction of taxes that a shareholder would pay on Fund distributions or the sale of Fund shares. In addition to the performance of constituents of the underlying index, other factors may affect Fund performance. These factors include, but are not limited to, Fund operating fees and expenses, portfolio turnover and creation and redemption in-kind transactions. The returns set forth below represent past performance. Past performance does not guarantee future results. The Fund’s NAV and investment return may fluctuate. These fluctuations may cause an investor’s shares to be worth more or less than their original cost. Current performance may be lower or higher than the performance quoted below. Please visit our web site at www.GSAMFUNDS.com/ETFs to obtain the most recent month-end returns.
|
| ActiveBeta® Paris-Aligned Climate U.S. Large Cap Equity ETF’s Lifetime Performance |
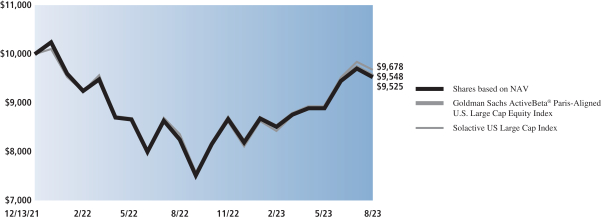
| | | | | | |
| Average Annual Total Return through August 31, 2023* | | | One Year | | | Since Inception |
Shares based on NAV (Commenced December 13, 2021) | | | 15.48% | | | -2.80% |
|
Shares based on Market Price (Commenced December 13, 2021) | | | 15.36% | | | -2.77% |
|
Goldman Sachs ActiveBeta® Paris-Aligned U.S. Large Cap Equity Index | | | 15.68% | | | -2.66% |
|
Solactive U.S. Large Cap Index | | | 15.85% | | | -1.34% |
|
| * | | Total returns are calculated assuming purchase of a share at the market price or NAV on the first day and sale of a share at the market price or NAV on the last day of each period reported. The Total Returns based on NAV and Market Price assume the reinvestment of dividends and do not reflect brokerage commissions in connection with the purchase or sale of Fund shares, which if included would lower the performance shown above. The NAV used in the Total Return calculation assumes all management fees incurred by the Fund. Market Price returns are based upon the last trade as of 4:00 pm EST and do not reflect the returns you would receive if you traded shares at other times. The first day of secondary market trading is typically several days after the date on which the Fund commenced investment operations; therefore, the NAV of the Fund is used as a proxy for the period from inception of investment operations to the first day of secondary market trading to calculate the Market Price returns. |
26
PORTFOLIO RESULTS
Goldman Sachs ActiveBeta® U.S. Large Cap Equity ETF
Investment Objective
The Goldman Sachs ActiveBeta® U.S. Large Cap Equity ETF (the “Fund”) seeks to provide investment results that closely correspond, before fees and expenses, to the performance of the Goldman Sachs ActiveBeta® U.S. Large Cap Equity Index (the “Index”).
Portfolio Management Discussion and Analysis
Below, the Goldman Sachs Quantitative Investment Strategies Team discusses the Fund’s performance and positioning for the 12-month period ended August 31, 2023 (the “Reporting Period”).
| Q | | How did the Fund perform during the Reporting Period? |
| A | | During the Reporting Period, the Fund returned 14.83% based on net asset value (“NAV”) and 14.90% based on market price. The Index returned 14.94%, and the S&P 500 Index (Total Return, USD) (“S&P 500 Index”), a market-cap based index against which the performance of the Fund is measured, returned 15.94% during the same period. |
| | The Fund had an NAV of $78.36 on August 31, 2022 and ended the Reporting Period with an NAV of $88.55 per share. The Fund’s market price on August 31, 2023 was $88.57 per share. |
| Q | | What key factors were responsible for the Fund’s performance during the Reporting Period? |
| A | | The Fund seeks to provide investment results that closely correspond, before fees and expenses, to the performance of the Index. The Fund’s performance reflects Fund expenses, including management fees and brokerage expenses. The Fund’s relative performance also reflects the impact of any cash held in the Fund as well as any other differences between the Fund’s holdings and the constituents of the Index. The Index is unmanaged, and Index returns do not reflect fees and expenses, which would reduce returns. |
| | The Index is constructed using a rules-based methodology that was developed to provide exposure to the “factors” (or characteristics) that are commonly tied to a stock’s outperformance relative to market returns, and its performance is compared to that of the S&P 500 Index. Because the Fund seeks to provide investment results that closely correspond, before fees and expenses, to the performance of the Index, the discussion below compared the performance of the Fund to that of the S&P 500 Index. Given the Fund’s investment objective of attempting to track the Index, the Fund does not follow traditional methods of active investment management, which may involve buying and selling securities based upon analysis of economic and market factors. The Fund does not follow a strategy of seeking to outperform the S&P 500 Index. |
| | During the Reporting Period, the Fund posted double-digit positive absolute returns that underperformed the S&P 500 Index, as measured by NAV. Amongst underlying factors, Low Volatility detracted most from relative returns, followed by Momentum and Value. Quality contributed positively to relative returns. Low Volatility is a relatively low degree of fluctuation in a company’s share price over time. Momentum is whether a company’s share price is trending up or down. Value refers to how attractively a stock is priced relative to its fundamentals, such as book value and free cash flow. Quality refers to sustainable profitability over time. |
| Q | | Which sectors contributed most positively to the Index’s relative performance during the Reporting Period, and which detracted most? |
| A | | Index constituents in the information technology, consumer staples and energy sectors detracted most from the Index’s results relative to the S&P 500 Index during the Reporting Period. Partially offsetting these detractors were Index constituents in financials, industrials and consumer discretionary, which contributed positively to the Index’s results relative to the S&P 500 Index during the Reporting Period. |
| Q | | Which individual stock positions detracted the most from the Index’s results during the Reporting Period? |
| A | | Relative to the S&P 500 Index, underweight positions in semiconductor company NVIDIA and entertainment content |
27
PORTFOLIO RESULTS
| | streaming company Netflix and an overweight position in health care and retail pharmacy company CVS Health detracted most (2.46%, 0.22% and 0.39% of Fund net assets as of August 31, 2023, respectively). NVIDIA generated a triple-digit gain and Netflix delivered a robust double-digit gain within the Index during the Reporting Period. CVS Health posted a double-digit negative return within the Index during the Reporting Period. |
| Q | | Which individual stock positions contributed the most to the Index’s relative returns during the Reporting Period? |
| A | | Relative to the S&P 500 Index, underweight positions in Walt Disney Company and payment transactions company PayPal Holdings and an overweight position in building materials manufacturer and supplier Builders FirstSource contributed most positively (0.09%, 0.00%1 and 0.65% of Fund net assets as of August 31, 2023, respectively). Walt Disney Company and PayPal Holdings each generated a double-digit negative return within the Index during the Reporting Period, while Builders FirstSource posted a robust double-digit gain within the Index during the Reporting Period. |
| Q | | How did the Fund use derivatives and similar instruments during the Reporting Period? |
| A | | The Fund does not employ derivatives as a source of alpha generation, although it did use index futures to equitize excess cash. The use of futures was not material to the performance of the Fund during the Reporting Period. |
| Q | | What was the Fund’s sector positioning relative to the Index and the S&P 500 Index at the end of the Reporting Period?2 |
| | | | | | | | | | | | | | |
| | | | |
| | | Sector Name | | Fund3 | | | GS ActiveBeta® U.S. Large Cap
Equity Index | | | S&P 500
Index | |
| | | | |
| | Consumer Discretionary | | | 12.12 | % | | | 12.48 | % | | | 10.61 | % |
| | Consumer Staples | | | 8.58 | | | | 8.55 | | | | 6.56 | |
| | Energy | | | 3.79 | | | | 3.78 | | | | 4.42 | |
| | Financials | | | 9.79 | | | | 9.75 | | | | 12.46 | |
| | Health Care | | | 13.97 | | | | 13.91 | | | | 13.16 | |
| | Industrials | | | 9.90 | | | | 9.87 | | | | 8.43 | |
| | Information Technology | | | 27.59 | | | | 27.48 | | | | 28.21 | |
| | Materials | | | 2.05 | | | | 2.04 | | | | 2.46 | |
| | Real Estate | | | 1.81 | | | | 1.80 | | | | 2.44 | |
| | Communication Services | | | 7.88 | | | | 7.85 | | | | 8.81 | |
| | | Utilities | | | 2.52 | | | | 2.51 | | | | 2.43 | |
| | 1 | | Some weights are 0.00% at August 31, 2023 either because those positions were taken out during the most recent rebalance given the Fund’s index construction methodology or because they were not components of the Index during the Reporting Period. |
| | 2 | | Sector classifications for securities may differ between the above listing and the Schedule of Investments due to differing classification methodologies. The classification methodology used for the above listing is as set forth by Standard & Poor’s. The Fund’s composition may differ over time. Consequently, the Fund’s overall sector allocations may differ from percentages contained in the chart above. The percentage shown for each investment category reflects the value of investments in that category as a percentage of market value (excluding investment in the securities lending reinvestment vehicle, if any). Underlying sector allocation of exchange-traded funds held by the Fund are not reflected in the chart above. Investments in the securities lending vehicle represented 0.0% of the Fund’s net assets as of August 31, 2023. Figures above may not sum to 100% due to rounding due to the presence of cash. |
| | 3 | | The Fund seeks to provide investment results that closely correspond, before fees and expenses, to the performance of the Goldman Sachs ActiveBeta® U.S. Large Cap Equity Index. |
28
FUND BASICS
ActiveBeta® U.S. Large Cap Equity ETF
as of August 31, 2023
| | | | | | |
| | FUND SNAPSHOT | |
| |
| | | As of August 31, 2023 | |
| | |
| | Market Price1 | | $ | 88.57 | |
| | | Net Asset Value (NAV)1 | | $ | 88.55 | |
| 1 | | The Market Price is the price at which the Fund’s shares are trading on the NYSE Arca, Inc. The Market Price of the Fund’s shares will fluctuate and, at the time of sale, shares may be worth more or less than the original investment or the Fund’s then current net asset value (“NAV”). The NAV is the market value of one share of the Fund. This amount is derived by dividing the total value of all the securities in the Fund’s portfolio, plus other assets, less any liabilities, by the number of Fund shares outstanding. Fund shares are not individually redeemable and are issued and redeemed by the Fund at their NAV only in large, specified blocks of shares called creation units. Shares otherwise can be bought and sold only through exchange trading at market price (not NAV). Shares may trade at a premium or discount to their NAV in the secondary market. Information regarding how often shares of each Fund traded on NYSE Arca at a price above (i.e., at a premium) or below (i.e., at a discount) the NAV of the Fund can be found at www.GSAMFUNDS.com/ETFs. |
| | | | | | | | | | |
| | TOP 10 HOLDINGS AS OF 8/31/232 | | |
| | | | |
| | | Holding | | % of Net Assets | | | Line of Business | | Country |
| | | | |
| | Apple, Inc. | | | 6.6 | % | | Information Technology | | United States |
| | Microsoft Corp. | | | 5.6 | | | Information Technology | | United States |
| | Amazon.com, Inc. | | | 2.7 | | | Consumer Discretionary | | United States |
| | NVIDIA Corp. | | | 2.5 | | | Information Technology | | United States |
| | Alphabet, Inc., Class A | | | 1.9 | | | Communication Services | | United States |
| | Alphabet, Inc., Class C | | | 1.8 | | | Communication Services | | United States |
| | Meta Platforms, Inc., Class A | | | 1.7 | | | Communication Services | | United States |
| | Eli Lilly & Co. | | | 1.2 | | | Health Care | | United States |
| | UnitedHealth Group, Inc. | | | 1.0 | | | Health Care | | United States |
| | | Home Depot, Inc. (The) | | | 0.9 | | | Consumer Discretionary | | United States |
| 2 | | The top 10 holdings may not be representative of the Fund’s future investments. |
For more information about the Fund, please refer to www.GSAMFUNDS.com/ETFs. There, you can learn more about the Fund’s investment strategies, holdings, and performance.
29
ACTIVEBETA® U.S. LARGE CAP EQUITY ETF
Performance Summary
August 31, 2023
The following graph shows the value, as of August 31, 2023, of a $10,000 investment made on September 17, 2015 (commencement of operations) in Shares at NAV. For comparative purposes, the performance of the Fund’s underlying index and a market-cap based index against which the performance of the Fund is measured, the Goldman Sachs ActiveBeta® U.S. Large Cap Equity Index and the S&P 500 Index (Total Return, USD), respectively, are shown. Performance reflects applicable fee waivers and/or expense limitations in effect during the periods shown and in their absence, performance would be reduced. Returns do not reflect the deduction of taxes that a shareholder would pay on Fund distributions or the sale of Fund shares. In addition to the performance of constituents of the underlying index, other factors may affect Fund performance. These factors include, but are not limited to, Fund operating fees and expenses, portfolio turnover and creation and redemption in-kind transactions. The returns set forth below represent past performance. Past performance does not guarantee future results. The Fund’s NAV and investment return may fluctuate. These fluctuations may cause an investor’s shares to be worth more or less than their original cost. Current performance may be lower or higher than the performance quoted below. Please visit our web site at www.GSAMFUNDS.com/ETFs to obtain the most recent month-end returns.
|
| ActiveBeta® U.S. Large Cap Equity ETF’s Lifetime Performance |
Performance of a $10,000 Investment, with distributions reinvested, from September 17, 2015 through August 31, 2023.
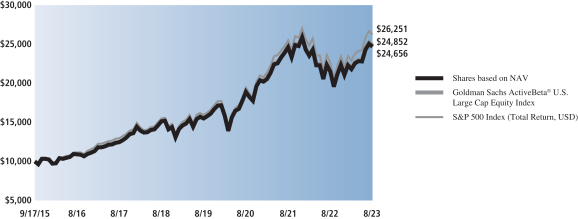
| | | | | | | | | | |
| Average Annual Total Return through August 31, 2023* | | | One Year | | | | Five Years | | | Since Inception |
Shares based on NAV (Commenced September 17, 2015) | | | 14.83% | | | | 10.25% | | | 12.00% |
|
Shares based on Market Price (Commenced September 17, 2015) | | | 14.90% | | | | 10.26% | | | 12.00% |
|
Goldman Sachs ActiveBeta® U.S. Large Cap Equity Index | | | 14.94% | | | | 10.35% | | | 12.11% |
|
S&P 500 Index (Total Return, USD) | | | 15.94% | | | | 11.12% | | | 12.89% |
|
| * | | Total returns are calculated assuming purchase of a share at the market price or NAV on the first day and sale of a share at the market price or NAV on the last day of each period reported. The Total Returns based on NAV and Market Price assume the reinvestment of dividends and do not reflect brokerage commissions in connection with the purchase or sale of Fund shares, which if included would lower the performance shown above. The NAV used in the Total Return calculation assumes all management fees incurred by the Fund. Market Price returns are based upon the last trade as of 4:00 pm EST and do not reflect the returns you would receive if you traded shares at other times. The first day of secondary market trading is typically several days after the date on which the Fund commenced investment operations; therefore, the NAV of the Fund is used as a proxy for the period from inception of investment operations to the first day of secondary market trading to calculate the Market Price returns. |
30
PORTFOLIO RESULTS
Goldman Sachs ActiveBeta® U.S. Small Cap Equity ETF
Investment Objective
The Goldman Sachs ActiveBeta® U.S. Small Cap Equity ETF (the “Fund”) seeks to provide investment results that closely correspond, before fees and expenses, to the performance of the Goldman Sachs ActiveBeta® U.S. Small Cap Equity Index (the “Index”).
Portfolio Management Discussion and Analysis
Below, the Goldman Sachs Quantitative Investment Strategies Team discusses the Fund’s performance and positioning for the for the 12-month period ended August 31, 2023 (the “Reporting Period”).
| Q | | How did the Fund perform during the Reporting Period? |
| A | | During the Reporting Period, the Fund returned 6.95% based on net asset value (“NAV”) and 6.81% based on market price. The Index returned 7.24%, and the Russell 2000® Index, a market-cap based index against which the performance of the Fund is measured, and the reference index for the Index, returned 4.65% during the same period. |
| | | The Fund had an NAV of $55.87 on August 31, 2022 and ended the Reporting Period with an NAV of $58.88 per share. The Fund’s market price on August 31, 2023 was $58.85 per share. |
| Q | | What key factors were responsible for the Fund’s performance during the Reporting Period? |
| A | | The Fund seeks to provide investment results that closely correspond, before fees and expenses, to the performance of the Index. The Fund’s performance reflects Fund expenses, including management fees and brokerage expenses. The Fund’s relative performance also reflects the impact of any cash held in the Fund as well as any other differences between the Fund’s holdings and the constituents of the Index. The Index is unmanaged, and Index returns do not reflect fees and expenses, which would reduce returns. |
| | | The Index is constructed using a rules-based methodology that was developed to provide exposure to the “factors” (or characteristics) that are commonly tied to a stock’s outperformance relative to market returns, and its performance is compared to that of the Russell 2000® Index. Because the Fund seeks to provide investment results that closely correspond, before fees and expenses, to the performance of the Index, the discussion below compared the performance of the Fund to that of the Russell 2000® Index. Given the Fund’s investment objective of attempting to track the Index, the Fund does not follow traditional methods of active investment management, which may involve buying and selling securities based upon analysis of economic and market factors. The Fund does not follow a strategy of seeking to outperform the Russell 2000® Index. |
| | | During the Reporting Period, the Fund posted solid positive absolute returns that outperformed the Russell 2000® Index, as measured by NAV. All four underlying factors contributed positively to relative returns, led by Value and then followed by Quality, Momentum and Low Volatility. Value refers to how attractively a stock is priced relative to its fundamentals, such as book value and free cash flow. Quality refers to sustainable profitability over time. Momentum is whether a company’s share price is trending up or down. Low Volatility is a relatively low degree of fluctuation in a company’s share price over time. |
| Q | | Which sectors contributed most positively to the Index’s relative performance during the Reporting Period, and which detracted most? |
| A | | Index constituents in the industrials, health care and materials sectors contributed most positively to the Index’s results relative to the Russell 2000® Index during the Reporting Period. Partially offsetting these positive contributors were Index constituents in the energy, real estate and utilities sectors, which detracted from the Index’s results relative to the Russell 2000® Index during the Reporting Period. |
| Q | | Which individual stock positions contributed the most to the Index’s relative returns during the Reporting Period? |
| A | | Relative to the Russell 2000® Index, overweight positions in pulp and paper products company Boise Cascade, capital |
31
PORTFOLIO RESULTS
| | equipment manufacturer for the semiconductor manufacturing industry Axcelis Technologies and software-driven networking solutions provider Extreme Networks contributed most positively (0.43%, 0.36% and 0.30% of Fund net assets as of August 31, 2023, respectively). Each generated either a robust double-digit or triple-digit gain within the Index during the Reporting Period. |
| Q | | Which individual stock positions detracted the most from the Index’s results during the Reporting Period? |
| A | | Relative to the Russell 2000® Index, underweight positions in biotechnology company Immunogen, pharmaceutical company Reata Pharmaceuticals and oil and natural gas service company Weatherford International detracted most (0.04%, 0.09% and 0.14% of Fund net assets as of August 31, 2023, respectively). Immunogen generated a double-digit negative return within the Index during the Reporting Period. Reata Pharmaceuticals and Weatherford International each delivered a triple-digit gain within the Index during the Reporting Period. |
| Q | | How did the Fund use derivatives and similar instruments during the Reporting Period? |
| A | | The Fund does not employ derivatives as a source of alpha generation, although it did use index futures to equitize excess cash. The use of futures was not material to the performance of the Fund during the Reporting Period. |
| Q | | What was the Fund’s sector positioning relative to the Index and the Russell 2000® Index at the end of the Reporting Period?1 |
| | | | | | | | | | | | | | |
| | | | |
| | | Sector Name | | Fund2 | | | GS ActiveBeta® U.S. Small Cap
Equity Index | | | Russell 2000®
Index | |
| | | | |
| | Consumer Discretionary | | | 11.21 | % | | | 11.20 | % | | | 10.73 | % |
| | Consumer Staples | | | 3.63 | | | | 3.74 | | | | 3.53 | |
| | Energy | | | 7.15 | | | | 7.13 | | | | 7.76 | |
| | Financials | | | 17.13 | | | | 17.04 | | | | 15.89 | |
| | Health Care | | | 12.46 | | | | 12.57 | | | | 15.40 | |
| | Industrials | | | 19.39 | | | | 19.36 | | | | 17.13 | |
| | Information Technology | | | 13.41 | | | | 13.41 | | | | 13.57 | |
| | Materials | | | 4.67 | | | | 4.65 | | | | 4.54 | |
| | Real Estate | | | 5.67 | | | | 5.65 | | | | 6.13 | |
| | Communication Services | | | 2.07 | | | | 2.06 | | | | 2.48 | |
| | | Utilities | | | 3.19 | | | | 3.18 | | | | 2.83 | |
| | 1 | | Sector classifications for securities may differ between the above listing and the Schedule of Investments due to differing classification methodologies. The classification methodology used for the above listing is as set forth by Russell Investments. The Fund’s composition may differ over time. Consequently, the Fund’s overall sector allocations may differ from percentages contained in the chart above. The percentage shown for each investment category reflects the value of investments in that category as a percentage of market value (excluding investment in the securities lending reinvestment vehicle, if any). Underlying sector allocation of exchange-traded funds held by the Fund are not reflected in the chart above. Investments in the securities lending vehicle represented 0.0% of the Fund’s net assets as of August 31, 2023. Figures above may not sum to 100% due to rounding due to the presence of cash. |
| | 2 | | The Fund seeks to provide investment results that closely correspond, before fees and expenses, to the performance of the Goldman Sachs ActiveBeta® U.S. Small Cap Equity Index. |
32
FUND BASICS
ActiveBeta® U.S. Small Cap Equity ETF
as of August 31, 2023
| | | | | | |
| | FUND SNAPSHOT | |
| |
| | | As of August 31, 2023 | |
| | |
| | Market Price1 | | $ | 58.85 | |
| | | Net Asset Value (NAV)1 | | $ | 58.88 | |
| 1 | | The Market Price is the price at which the Fund’s shares are trading on the NYSE Arca, Inc. The Market Price of the Fund’s shares will fluctuate and, at the time of sale, shares may be worth more or less than the original investment or the Fund’s then current net asset value (“NAV”). The NAV is the market value of one share of the Fund. This amount is derived by dividing the total value of all the securities in the Fund’s portfolio, plus other assets, less any liabilities, by the number of Fund shares outstanding. Fund shares are not individually redeemable and are issued and redeemed by the Fund at their NAV only in large, specified blocks of shares called creation units. Shares otherwise can be bought and sold only through exchange trading at market price (not NAV). Shares may trade at a premium or discount to their NAV in the secondary market. Information regarding how often shares of each Fund traded on NYSE Arca at a price above (i.e., at a premium) or below (i.e., at a discount) the NAV of the Fund can be found at www.GSAMFUNDS.com/ETFs. |
| | | | | | | | | | |
| | TOP 10 HOLDINGS AS OF 8/31/232 | | |
| | | | |
| | | Holding | | % of Net Assets | | | Line of Business | | Country |
| | | | |
| | Super Micro Computer, Inc. | | | 0.4 | % | | Information Technology | | United States |
| | Atkore, Inc. | | | 0.4 | | | Industrials | | United States |
| | Boise Cascade Co. | | | 0.4 | | | Industrials | | United States |
| | Corcept Therapeutics, Inc. | | | 0.4 | | | Health Care | | United States |
| | Applied Industrial Technologies, Inc. | | | 0.4 | | | Industrials | | United States |
| | Simpson Manufacturing Co., Inc. | | | 0.4 | | | Industrials | | United States |
| | UFP Industries, Inc. | | | 0.4 | | | Industrials | | United States |
| | Axcelis Technologies, Inc. | | | 0.4 | | | Information Technology | | United States |
| | Comfort Systems USA, Inc. | | | 0.4 | | | Industrials | | United States |
| | | Veritiv Corp. | | | 0.4 | | | Industrials | | United States |
| 2 | | The top 10 holdings may not be representative of the Fund’s future investments. |
For more information about the Fund, please refer to www.GSAMFUNDS.com/ETFs. There, you can learn more about the Fund’s investment strategies, holdings, and performance.
33
ACTIVEBETA® U.S. SMALL CAP EQUITY ETF
Performance Summary
August 31, 2023
The following graph shows the value, as of August 31, 2023, of a $10,000 investment made on June 28, 2017 (commencement of operations) in Shares at NAV. For comparative purposes, the performance of the Fund’s underlying index and a market-cap based index against which the performance of the Fund is measured, the Goldman Sachs ActiveBeta® U.S. Small Cap Equity Index and the Russell 2000® Index, respectively, are shown. Performance reflects applicable fee waivers and/or expense limitations in effect during the periods shown and in their absence, performance would be reduced. Returns do not reflect the deduction of taxes that a shareholder would pay on Fund distributions or the sale of Fund shares. In addition to the performance of constituents of the underlying index, other factors may affect Fund performance. These factors include, but are not limited to, Fund operating fees and expenses, portfolio turnover and creation and redemption in-kind transactions. The returns set forth below represent past performance. Past performance does not guarantee future results. The Fund’s NAV and investment return may fluctuate. These fluctuations may cause an investor’s shares to be worth more or less than their original cost. Current performance may be lower or higher than the performance quoted below. Please visit our web site at www.GSAMFUNDS.com/ETFs to obtain the most recent month-end returns.
|
| ActiveBeta® U.S. Small Cap Equity ETF’s Lifetime Performance |
Performance of a $10,000 Investment, with distributions reinvested, from June 28, 2017 through August 31, 2023.
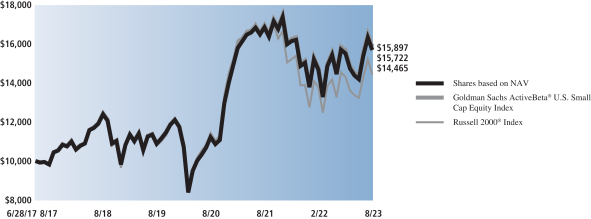
| | | | | | | | | | |
| Average Annual Total Return through August 31, 2023* | | | One Year | | | | Five Years | | | Since Inception |
Shares based on NAV (Commenced June 28, 2017) | | | 6.95% | | | | 4.85% | | | 7.60% |
|
Shares based on Market Price (Commenced June 28, 2017) | | | 6.81% | | | | 4.81% | | | 7.59% |
|
Goldman Sachs ActiveBeta® U.S. Small Cap Equity Index | | | 7.24% | | | | 5.01% | | | 7.79% |
|
Russell 2000® Index | | | 4.65% | | | | 3.14% | | | 6.15% |
|
| * | | Total returns are calculated assuming purchase of a share at the market price or NAV on the first day and sale of a share at the market price or NAV on the last day of each period reported. The Total Returns based on NAV and Market Price assume the reinvestment of dividends and do not reflect brokerage commissions in connection with the purchase or sale of Fund shares, which if included would lower the performance shown above. The NAV used in the Total Return calculation assumes all management fees incurred by the Fund. Market Price returns are based upon the last trade as of 4:00 pm EST and do not reflect the returns you would receive if you traded shares at other times. The first day of secondary market trading is typically several days after the date on which the Fund commenced investment operations; therefore, the NAV of the Fund is used as a proxy for the period from inception of investment operations to the first day of secondary market trading to calculate the Market Price returns. |
34
PORTFOLIO RESULTS
Goldman Sachs ActiveBeta® World Low Vol Plus Equity ETF
Investment Objective
The Goldman Sachs ActiveBeta® World Low Vol Plus Equity ETF (the “Fund”) seeks to provide investment results that closely correspond, before fees and expenses, to the performance of the Goldman Sachs ActiveBeta® World Low Vol Plus Equity Index (the “Index”).
Portfolio Management Discussion and Analysis
Below, the Goldman Sachs Quantitative Investment Strategies Team discusses the Fund’s performance and positioning for the 12-month period ended August 31, 2023 (the “Reporting Period”).
| Q | | How did the Fund perform during the Reporting Period? |
| A | | During the Reporting Period, the Fund returned 11.15% based on net asset value (“NAV”) and 11.22% based on market price. The Index returned 10.92%, and the Solactive GBS Developed Markets Large & Mid Cap Index (the “Solactive Index”), a market-cap based index against which the performance of the Fund is measured, and the reference index for the Index, returned 15.69% during the same period. |
| | | The Fund had an NAV of $37.97 on August 31, 2022 and ended the Reporting Period with an NAV of $41.30 per share. The Fund’s market price on August 31, 2023 was $41.34 per share. |
| Q | | What key factors were responsible for the Fund’s performance during the Reporting Period? |
| A | | The Fund seeks to provide investment results that closely correspond, before fees and expenses, to the performance of the Index. The Fund’s performance reflects Fund expenses, including management fees and brokerage expenses. The Fund’s relative performance also reflects the impact of any cash held in the Fund as well as any other differences between the Fund’s holdings and the constituents of the Index. The Index is unmanaged, and Index returns do not reflect fees and expenses, which would reduce returns. |
| | | The Index is designed to deliver exposure to large and mid-capitalization equity securities of developed market issuers, including the United States. The Index is constructed using the patented ActiveBeta® Portfolio Construction Methodology, which was developed to provide exposure to the “factors” (or characteristics) that are commonly tied to a stock’s outperformance relative to market returns. These factors include Low Volatility (i.e., a relatively low degree of fluctuation in a company’s share price over time), Value (i.e., how attractively a stock is priced relative to its “fundamentals,” such as book value and free cash flow), Momentum (i.e., whether a company’s share price is trending up or down), and Quality (i.e., profitability). The Index seeks to provide exposure to these factors with an emphasis on the Low Volatility factor. Given the Fund’s investment objective of attempting to track its Index, the Fund does not follow traditional methods of active investment management, which may involve buying and selling securities based upon analysis of economic and market factors. The Fund does not follow a strategy of seeking to outperform the Solactive Index. |
| | | During the Reporting Period, the Fund posted double-digit positive absolute returns but underperformed the Solactive Index, as measured by NAV. Step 1 of the construction of the Fund’s Index, wherein the individual factor subindex for Low Volatility is created from the constituents of the Solactive Index, detracted most from relative returns. Low Volatility is a relatively low degree of fluctuation in a company’s share price over time. In the second step, wherein individual factor subindexes for Value, Momentum and Quality are created, Quality contributed most positively to results relative to the Solactive Index, followed by Value. Momentum detracted from relative returns. Quality refers to sustainable profitability over time. Value refers to how attractively a stock is priced relative to its fundamentals, such as book value and free cash flow. Momentum is whether a company’s share price is trending up or down. |
| Q | | Which sectors and countries contributed most positively to the Index’s relative performance during the Reporting Period, and which detracted most? |
| A | | Index constituents in the information technology sector detracted most from the Index’s results relative to the |
35
PORTFOLIO RESULTS
| | Solactive Index, followed at some distance by Index constituents in the industrials and consumer staples sectors. Index constituents in the consumer discretionary, real estate and financials sectors contributed most positively to the Index’s results relative to the Solactive Index during the Reporting Period. |
| | | From a country perspective, Index constituents in the U.S. detracted most from the Index’s results relative to the Solactive Index during the Reporting Period, followed at some distance by Israel and France. Conversely, Index constituents in the U.K., Hong Kong and Belgium contributed most positively to the Index’s results relative to the Solactive Index during the Reporting Period. |
| Q | | Which individual stock positions detracted the most from the Index’s results during the Reporting Period? |
| A | | Relative to the Solactive Index, an underweight position in semiconductor company NVIDIA, an overweight position in health care and retail pharmacy company CVS Health and having no exposure to Danish pharmaceutical company Novo Nordisk detracted most (0.59%, 0.55% and 0.00%1 of Fund net assets as of August 31, 2023, respectively). NVIDIA delivered a triple digit gain within the Index during the Reporting Period. CVS Health posted a double-digit negative return within the Index during the Reporting Period. Novo Nordisk was not held in the Index during the Reporting Period. |
| Q | | Which individual stock positions contributed the most to the Index’s relative returns during the Reporting Period? |
| A | | Relative to the Solactive Index, having no exposure to electric vehicle maker Tesla and entertainment and media company Walt Disney Company and an overweight position in automotive parts company O’Reilly Automotive contributed most positively (0.00%,1 0.00% and 1.34% of Fund net assets as of August 31, 2023, respectively). Tesla and Walt Disney Company were not held in the Index during the Reporting Period. O’Reilly Automotive generated a robust double-digit gain within the Index during the Reporting Period. |
| Q | | How did the Fund use derivatives and similar instruments during the Reporting Period? |
| A | | The Fund does not employ derivatives as a source of alpha generation, although it did use index futures to equitize excess cash. The use of futures was not material to the performance of the Fund during the Reporting Period. |
| Q | | What was the Fund’s sector positioning relative to the Index and the Solactive Index at the end of the Reporting Period?2 |
| | | | | | | | | | | | | | |
| | | | |
| | | Sector Name | | Fund3 | | | GS ActiveBeta® World Low Vol Plus
Equity Index | | | Solactive GBS
Developed Markets
Large & Mid Cap
Index | |
| | | | |
| | Consumer Discretionary | | | 9.85 | % | | | 9.85 | % | | | 11.19 | % |
| | Consumer Staples | | | 12.30 | | | | 12.31 | | | | 7.26 | |
| | Energy | | | 1.03 | | | | 1.02 | | | | 4.77 | |
| | Financials | | | 16.88 | | | | 16.88 | | | | 14.55 | |
| | Health Care | | | 14.00 | | | | 14.00 | | | | 12.87 | |
| | Industrials | | | 13.03 | | | | 13.03 | | | | 10.78 | |
| | Information Technology | | | 21.16 | | | | 21.16 | | | | 22.11 | |
| | Materials | | | 1.89 | | | | 1.88 | | | | 4.02 | |
| | Real Estate | | | 0.93 | | | | 0.93 | | | | 2.29 | |
| | Communication Services | | | 7.57 | | | | 7.57 | | | | 7.51 | |
| | | Utilities | | | 1.36 | | | | 1.36 | | | | 2.64 | |
| | 1 | | Some weights are 0.00% at August 31, 2023 either because those positions were taken out during the most recent rebalance given the Fund’s index construction methodology or because they were not components of the Index during the Reporting Period. |
| | 2 | | Sector and country classifications for securities may differ between the above listing and the Schedule of Investments due to differing classification methodologies. The classification methodology used for the above listing is as set forth by Solactive Investments. The Fund’s composition may differ over time. Consequently, the Fund’s overall sector allocations may differ from percentages contained in the chart above. The percentage shown for each investment category reflects the value of investments in that category as a percentage of market value (excluding investment in the securities lending reinvestment vehicle, if any). Underlying sector allocation of exchange-traded funds held by the Fund are not reflected in the chart above. Investments in the securities lending vehicle represented 0.0% of the Fund’s net assets as of August 31, 2023. Figures above may not sum to 100% due to rounding due to the presence of cash. |
| | 3 | | The Fund seeks to provide investment results that closely correspond, before fees and expenses, to the performance of the Goldman Sachs ActiveBeta® World Low Vol Plus Equity Index. |
36
PORTFOLIO RESULTS
| Q | | What was the Fund’s country positioning relative to the Index and the reference index at the end of the Reporting Period?2 |
| | | | | | | | | | | | | | |
| | | | |
| | | Country Name | | Fund3 | | | GS ActiveBeta® World Low Vol Plus
Equity Index | | | Solactive GBS
Developed Markets
Large & Mid Cap
Index | |
| | | | |
| | UK | | | 2.62 | % | | | 2.62 | % | | | 3.86 | % |
| | Hong Kong | | | 0.16 | | | | 0.16 | | | | 0.52 | |
| | Belgium | | | 0.21 | | | | 0.21 | | | | 0.23 | |
| | Bermuda | | | 0.41 | | | | 0.41 | | | | 0.15 | |
| | Italy | | | 0.66 | | | | 0.65 | | | | 0.55 | |
| | Isle of Man | | | 0.00 | | | | 0.00 | | | | 0.02 | |
| | Faroe Islands | | | 0.00 | | | | 0.00 | | | | 0.00 | |
| | Cyprus | | | 0.00 | | | | 0.00 | | | | 0.00 | |
| | Austria | | | 0.14 | | | | 0.14 | | | | 0.08 | |
| | Jersey | | | 0.00 | | | | 0.00 | | | | 0.24 | |
| | Portugal | | | 0.01 | | | | 0.01 | | | | 0.05 | |
| | Panama | | | 0.00 | | | | 0.00 | | | | 0.03 | |
| | Luxembourg | | | 0.00 | | | | 0.00 | | | | 0.11 | |
| | Norway | | | 0.52 | | | | 0.52 | | | | 0.22 | |
| | Liberia | | | 0.00 | | | | 0.00 | | | | 0.04 | |
| | Poland | | | 0.00 | | | | 0.00 | | | | 0.08 | |
| | Guernsey | | | 0.38 | | | | 0.38 | | | | 0.02 | |
| | Curacao | | | 0.00 | | | | 0.00 | | | | 0.15 | |
| | Singapore | | | 1.05 | | | | 1.05 | | | | 0.38 | |
| | Cayman Islands | | | 0.47 | | | | 0.47 | | | | 0.20 | |
| | Finland | | | 0.50 | | | | 0.51 | | | | 0.31 | |
| | New Zealand | | | 0.22 | | | | 0.22 | | | | 0.10 | |
| | Ireland | | | 1.46 | | | | 1.46 | | | | 1.85 | |
| | Netherlands | | | 1.34 | | | | 1.34 | | | | 1.70 | |
| | Canada | | | 3.92 | | | | 3.93 | | | | 3.35 | |
| | Australia | | | 2.31 | | | | 2.31 | | | | 2.10 | |
| | Switzerland | | | 2.50 | | | | 2.49 | | | | 2.75 | |
| | Spain | | | 0.54 | | | | 0.54 | | | | 0.70 | |
| | Denmark | | | 0.02 | | | | 0.02 | | | | 0.86 | |
| | Germany | | | 1.90 | | | | 1.90 | | | | 2.17 | |
| | Japan | | | 8.58 | | | | 8.58 | | | | 6.98 | |
| | Sweden | | | 0.83 | | | | 0.82 | | | | 0.87 | |
| | France | | | 2.79 | | | | 2.79 | | | | 2.76 | |
| | Israel | | | 0.72 | | | | 0.72 | | | | 0.25 | |
| | | US | | | 65.76 | | | | 65.77 | | | | 66.29 | |
| | 2 | | Sector and country classifications for securities may differ between the above listing and the Schedule of Investments due to differing classification methodologies. The classification methodology used for the above listing is as set forth by Solactive Investments. The Fund’s composition may differ over time. Consequently, the Fund’s overall sector allocations may differ from percentages contained in the chart above. The percentage shown for each investment category reflects the value of investments in that category as a percentage of market value (excluding investment in the securities lending reinvestment vehicle, if any). Underlying sector allocation of exchange-traded funds held by the Fund are not reflected in the chart above. Investments in the securities lending vehicle represented 0.0% of the Fund’s net assets as of August 31, 2023. Figures above may not sum to 100% due to rounding due to the presence of cash. |
| | 3 | | The Fund seeks to provide investment results that closely correspond, before fees and expenses, to the performance of the Goldman Sachs ActiveBeta® World Low Vol Plus Equity Index. |
37
FUND BASICS
ActiveBeta® World Low Vol Plus Equity ETF
as of August 31, 2023
| | | | | | |
| | FUND SNAPSHOT | |
| |
| | | As of August 31, 2023 | |
| | |
| | Market Price1 | | $ | 41.34 | |
| | | Net Asset Value (NAV)1 | | $ | 41.30 | |
| 1 | | The Market Price is the price at which the Fund’s shares are trading on the NYSE Arca, Inc. The Market Price of the Fund’s shares will fluctuate and, at the time of sale, shares may be worth more or less than the original investment or the Fund’s then current net asset value (“NAV”). The NAV is the market value of one share of the Fund. This amount is derived by dividing the total value of all the securities in the Fund’s portfolio, plus other assets, less any liabilities, by the number of Fund shares outstanding. Fund shares are not individually redeemable and are issued and redeemed by the Fund at their NAV only in large, specified blocks of shares called creation units. Shares otherwise can be bought and sold only through exchange trading at market price (not NAV). Shares may trade at a premium or discount to their NAV in the secondary market. Information regarding how often shares of each Fund traded on NYSE Arca at a price above (i.e., at a premium) or below (i.e., at a discount) the NAV of the Fund can be found at www.GSAMFUNDS.com/ETFs. |
| | | | | | | | | | |
| | TOP 10 HOLDINGS AS OF 8/31/232 | | |
| | | | |
| | | Holding | | % of Net Assets | | | Line of Business | | Country |
| | | | |
| | Apple, Inc. | | | 3.3 | % | | Information Technology | | United States |
| | Microsoft Corp. | | | 2.5 | | | Information Technology | | United States |
| | O’Reilly Automotive, Inc. | | | 1.3 | | | Consumer Discretionary | | United States |
| | Walmart, Inc. | | | 1.1 | | | Consumer Staples | | United States |
| | AutoZone, Inc. | | | 1.0 | | | Consumer Discretionary | | United States |
| | Amazon.com, Inc. | | | 1.0 | | | Consumer Discretionary | | United States |
| | PepsiCo, Inc. | | | 0.9 | | | Consumer Staples | | United States |
| | Cisco Systems, Inc. | | | 0.9 | | | Information Technology | | United States |
| | Johnson & Johnson | | | 0.9 | | | Health Care | | United States |
| | | Meta Platforms, Inc., Class A | | | 0.9 | | | Communication Services | | United States |
| 2 | | The top 10 holdings may not be representative of the Fund’s future investments. |
For more information about the Fund, please refer to www.GSAMFUNDS.com/ETFs. There, you can learn more about the Fund’s investment strategies, holdings, and performance.
38
ACTIVEBETA® WORLD LOW VOL PLUS EQUITY ETF
Performance Summary
August 31, 2023
The following graph shows the value, as of August 31, 2023, of a $10,000 investment made on March 15, 2022 (commencement of operations) in Shares at NAV. For comparative purposes, the performance of the Fund’s underlying index and a market-cap based index against which the performance of the Fund is measured, the Goldman Sachs ActiveBeta® World Low Vol Plus Equity Index and the Solactive GBS Developed Markets Large & Mid Cap Index, respectively, are shown. Performance reflects applicable fee waivers and/or expense limitations in effect during the periods shown and in their absence, performance would be reduced. Returns do not reflect the deduction of taxes that a shareholder would pay on Fund distributions or the sale of Fund shares. In addition to the performance of constituents of the underlying index, other factors may affect Fund performance. These factors include, but are not limited to, Fund operating fees and expenses, portfolio turnover and creation and redemption in-kind transactions. The returns set forth below represent past performance. Past performance does not guarantee future results. The Fund’s NAV and investment return may fluctuate. These fluctuations may cause an investor’s shares to be worth more or less than their original cost. Current performance may be lower or higher than the performance quoted below. Please visit our web site at www.GSAMFUNDS.com/ETFs to obtain the most recent month-end returns.
|
| ActiveBeta® World Low Vol Plus Equity ETF’s Lifetime Performance |
Performance of a $10,000 Investment, with distributions reinvested, from March 15, 2022 through August 31, 2023.
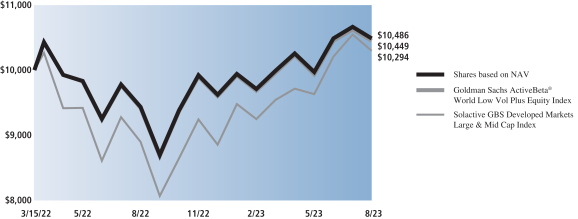
| | | | | | |
| Average Annual Total Return through August 31, 2023* | | | One Year | | | Since Inception |
Shares based on NAV (Commenced March 15, 2022) | | | 11.15% | | | 3.30% |
|
Shares based on Market Price (Commenced March 15, 2022) | | | 11.22% | | | 3.36% |
|
Goldman Sachs ActiveBeta® World Low Vol Plus Equity Index | | | 10.92% | | | 3.05% |
|
Solactive GBS Developed Markets Large & Mid Cap Index | | | -2.39% | | | 2.68% |
|
| * | | Total returns are calculated assuming purchase of a share at the market price or NAV on the first day and sale of a share at the market price or NAV on the last day of each period reported. The Total Returns based on NAV and Market Price assume the reinvestment of dividends and do not reflect brokerage commissions in connection with the purchase or sale of Fund shares, which if included would lower the performance shown above. The NAV used in the Total Return calculation assumes all management fees incurred by the Fund. Market Price returns are based upon the last trade as of 4:00 pm EST and do not reflect the returns you would receive if you traded shares at other times. The first day of secondary market trading is typically several days after the date on which the Fund commenced investment operations; therefore, the NAV of the Fund is used as a proxy for the period from inception of investment operations to the first day of secondary market trading to calculate the Market Price returns. |
39
FUND BASICS
Index Definitions and Industry Terms
Book Value: The total value of the company’s assets that shareholders would theoretically receive if a company were liquidated.
Free Cash Flow: A measure of financial performance calculated as operating cash flow minus capital expenditures.
Alpha: The excess returns of a fund relative to the return of a benchmark index is the fund’s alpha.
The Goldman Sachs ActiveBeta® Emerging Markets Equity Index is designed to deliver exposure to equity securities of emerging market issuers. The Index seeks to capture common sources of active equity returns, including value (i.e., how attractively a stock is priced relative to its “fundamentals,” such as book value and free cash flow), momentum (i.e., whether a company’s share price is trending up or down), quality (i.e., profitability) and low volatility (i.e., a relatively low degree of fluctuation in a company’s share price over time). The Index is reconstituted and rebalanced quarterly. It is not possible to invest directly in an unmanaged index.
The MSCI Emerging Markets Index captures large and mid cap representation across 24 Emerging Markets countries. It is not possible to invest directly in an unmanaged index.
The Goldman Sachs ActiveBeta® Europe Equity Index is designed to deliver exposure to equity securities of developed market issuers in Europe. The Index seeks to capture common sources of active equity returns, including value (i.e., how attractively a stock is priced relative to its “fundamentals,” such as book value and free cash flow), momentum (i.e., whether a company’s share price is trending up or down), quality (i.e., profitability) and low volatility (i.e., a relatively low degree of fluctuation in a company’s share price over time). The Index is reconstituted and rebalanced quarterly. It is not possible to invest directly in an unmanaged index.
The MSCI Europe Index captures large and mid-cap representation across 15 Developed Markets countries. It is not possible to invest directly in an unmanaged index.
The Goldman Sachs ActiveBeta® International Equity Index is designed to deliver exposure to equity securities of developed markets issuers outside of the United States. The Index seeks to capture common sources of active equity returns, including value (i.e., how attractively a stock is priced relative to its “fundamentals,” such as book value and free cash flow), momentum (i.e., whether a company’s share price is trending up or down), quality (i.e., profitability) and low volatility (i.e., a relatively low degree of fluctuation in a company’s share price over time). The Index is reconstituted and rebalanced quarterly. It is not possible to invest directly in an unmanaged index.
The MSCI World ex USA Index captures large and mid cap representation across 22 of 23 Developed Markets countries. It is not possible to invest directly in an unmanaged index.
The Goldman Sachs ActiveBeta® Japan Equity Index is designed to deliver exposure to equity securities of Japanese issuers. The Index seeks to capture common sources of active equity returns, including value (i.e., how attractively a stock is priced relative to its “fundamentals,” such as book value and free cash flow), momentum (i.e., whether a company’s share price is trending up or down), quality (i.e., profitability) and low volatility (i.e., a relatively low degree of fluctuation in a company’s share price over time). The Index is reconstituted and rebalanced quarterly. It is not possible to invest directly in an unmanaged index.
The MSCI Japan Index is designed to measure the performance of the large and mid cap segments of the Japanese market. It is not possible to invest directly in an unmanaged index.
The Goldman Sachs ActiveBeta® Paris-Aligned U.S. Large Cap Equity Index is designed to deliver exposure to equity securities of large capitalization U.S. issuers. The Index seeks to capture common sources of active equity returns, including value (i.e., how attractively a stock is priced relative to its “fundamentals,” such as book value and free cash flow), momentum (i.e., whether a company’s share price is trending up or down), quality (i.e., profitability) and low volatility (i.e., a relatively low degree of fluctuation in a company’s share price over time). The Index aims to meet the minimum requirements to be an “EU Paris-Aligned Benchmark” as defined by the European Commission Delegated Regulation C(2020)4757. An “EU Paris-Aligned Benchmark” is an index whose constituent companies are aligned with the goals of the Paris Climate Agreement, an international treaty that seeks to combat climate change and its effects. The Index is reconstituted and rebalanced quarterly. It is not possible to invest directly in an unmanaged index.
The Solactive US Large Cap Index intends to track the performance of the large cap segment in the United States. Constituents are selected and weighted based on free-float market capitalization. The index is calculated as a total return index in USD and reconstituted semi-annually with quarterly IPO reviews.
The Goldman Sachs ActiveBeta® U.S. Large Cap Equity Index is designed to deliver exposure to equity securities of large capitalization U.S. issuers. The Index seeks to capture common sources of active equity returns, including value (i.e., how attractively a
40
FUND BASICS
Index Definitions and Industry Terms (continued)
stock is priced relative to its “fundamentals,” such as book value and free cash flow), momentum (i.e., whether a company’s share price is trending up or down), quality (i.e., profitability) and low volatility (i.e., a relatively low degree of fluctuation in a company’s share price over time). The Index is reconstituted and rebalanced quarterly. It is not possible to invest directly in an unmanaged index.
The S&P 500 Index is the Standard & Poor’s 500 Composite Index of 500 stocks, an unmanaged index of common stock prices. The Index figures do not reflect any deduction for fees, expenses or taxes. It is not possible to invest directly in an unmanaged index.
The Goldman Sachs ActiveBeta® U.S. Small Cap Equity Index is designed to deliver exposure to equity securities of small capitalization U.S. issuers. The Index seeks to capture common sources of active equity returns, including value (i.e., how attractively a stock is priced relative to its “fundamentals,” such as book value and free cash flow), momentum (i.e., whether a company’s share price is trending up or down), quality (i.e., profitability) and low volatility (i.e., a relatively low degree of fluctuation in a company’s share price over time). The Index is reconstituted and rebalanced quarterly. It is not possible to invest directly in an unmanaged index.
The Russell 2000® Index is an unmanaged index of common stock prices that measures the performance of the 2000 smallest companies in the Russell 3000® Index. The Index is constructed to provide a comprehensive and unbiased small-cap barometer and is completely reconstituted annually to ensure larger stocks do not distort the performance and characteristics of the true small-cap opportunity set.
The Goldman Sachs ActiveBeta® World Low Vol Plus Equity Index is designed to deliver exposure to large and mid-capitalization equity securities of developed market issuers, including the United States. The Index seeks to capture common sources of active equity returns, including low volatility (i.e., a relatively low degree of fluctuation in a company’s share price over time), value (i.e., how attractively a stock is priced relative to its “fundamentals,” such as book value and free cash flow), momentum (i.e., whether a company’s share price is trending up or down), and quality (i.e., profitability). The Index seeks to provide exposure to these factors with an emphasis on the low volatility factor. The index is reconstituted and rebalanced quarterly. It is not possible to invest directly in an unmanaged index.
The Solactive GBS Developed Markets Large & Mid Cap Index is part of the Solactive Global Benchmark Series which includes benchmark indices for developed and emerging market countries. The index intends to track the performance of the large and mid cap segment covering approximately the largest 85% of the free-float market capitalization in the developed European market. It is calculated as a total return index in EUR and weighted by free-float market capitalization
41
GOLDMAN SACHS ACTIVEBETA® EMERGING MARKETS EQUITY ETF
Schedule of Investments
August 31, 2023
| | | | | | | | |
| Shares | | | Description | |
Value | |
|
| Common Stocks – 97.4% | |
| Australia – 0.1% | |
| | 28,700 | | | AngloGold Ashanti Ltd. (Materials) | | $ | 489,196 | |
| | |
| Brazil – 3.9% | |
| | 724,808 | | | Ambev SA (Consumer Staples) | | | 2,026,145 | |
| | 656,909 | | | B3 SA – Brasil Bolsa Balcao (Financials) | | | 1,715,597 | |
| | 437,338 | | | Banco Bradesco SA (Financials) | | | 1,169,544 | |
| | 99,860 | | | Banco do Brasil SA (Financials) | | | 950,001 | |
| | 70,430 | | | Banco Santander Brasil SA (Financials) | | | 385,655 | |
| | 594,717 | | | BB Seguridade Participacoes SA (Financials) | | | 3,649,300 | |
| | 206,138 | | | CCR SA (Industrials) | | | 518,785 | |
| | 131,782 | | | Centrais Eletricas Brasileiras SA (Utilities) | | | 938,534 | |
| | 102,109 | | | CPFL Energia SA (Utilities) | | | 704,314 | |
| | 52,148 | | | Energisa SA (Utilities) | | | 485,568 | |
| | 83,326 | | | Engie Brasil Energia SA (Utilities) | | | 708,892 | |
| | 303,101 | | | Equatorial Energia SA (Utilities) | | | 1,938,250 | |
| | 52,209 | | | Hypera SA (Health Care) | | | 411,159 | |
| | 91,954 | | | Klabin SA (Materials) | | | 422,722 | |
| | 144,994 | | | Lojas Renner SA (Consumer Discretionary) | | | 469,456 | |
| | 186,007 | | | Natura & Co. Holding SA (Consumer Staples)* | | | 570,312 | |
| | 535,525 | | | Petroleo Brasileiro SA (Energy) | | | 3,736,057 | |
| | 82,517 | | | PRIO SA (Energy)* | | | 773,678 | |
| | 604,332 | | | Raia Drogasil SA (Consumer Staples) | | | 3,354,315 | |
| | 147,217 | | | Suzano SA (Materials) | | | 1,491,215 | |
| | 218,870 | | | Telefonica Brasil SA (Communication Services) | | | 1,827,987 | |
| | 296,944 | | | TIM SA (Communication Services) | | | 864,271 | |
| | 499,962 | | | Vale SA (Materials) | | | 6,571,976 | |
| | 145,231 | | | Vibra Energia SA (Consumer Discretionary) | | | 541,505 | |
| | 256,975 | | | WEG SA (Industrials) | | | 1,862,322 | |
| | | | | | | | |
| | | | | | | 38,087,560 | |
| | |
| Chile – 0.6% | |
| | 996,909 | | | Cencosud SA (Consumer Staples) | | | 2,123,807 | |
| | 200,892 | | | Cia Cervecerias Unidas SA (Consumer Staples) | | | 1,477,640 | |
| | 251,234 | | | Empresas CMPC SA (Materials) | | | 453,990 | |
| | 89,026 | | | Empresas Copec SA (Energy) | | | 639,960 | |
| | 6,557,016 | | | Enel Americas SA (Utilities)* | | | 775,529 | |
| | | | | | | | |
| | | | | | | 5,470,926 | |
| | |
| China – 31.6% | |
| | 210,500 | | | 360 Security Technology, Inc., Class A (Information Technology)* | | | 323,334 | |
| | 389,045 | | | 37 Interactive Entertainment Network Technology Group Co. Ltd., Class A (Communication Services) | | | 1,319,177 | |
| | 1,240,869 | | | 3SBio, Inc. (Health Care)*(a) | | | 1,038,046 | |
| | 2,948,146 | | | Agricultural Bank of China Ltd., Class A (Financials) | | | 1,401,468 | |
| | |
|
| Common Stocks – (continued) | |
| China – (continued) | |
| | 4,625,520 | | | Agricultural Bank of China Ltd., Class H (Financials) | | | 1,586,718 | |
| | 136,315 | | | Aier Eye Hospital Group Co. Ltd., Class A (Health Care) | | | 337,487 | |
| | 21,568 | | | Airtac International Group (Industrials) | | | 623,069 | |
| | 89,422 | | | Akeso, Inc. (Health Care)*(a) | | | 392,844 | |
| | 1,850,974 | | | Alibaba Group Holding Ltd. (Consumer Discretionary)* | | | 21,290,892 | |
| | 666,738 | | | Alibaba Health Information Technology Ltd. (Consumer Staples)* | | | 393,662 | |
| | 487,500 | | | Aluminum Corp. of China Ltd., Class A (Materials) | | | 396,510 | |
| | 1,361,576 | | | Aluminum Corp. of China Ltd., Class H (Materials) | | | 658,064 | |
| | 68,579 | | | Anhui Conch Cement Co. Ltd., Class A (Materials) | | | 241,960 | |
| | 185,191 | | | ANTA Sports Products Ltd. (Consumer Discretionary) | | | 2,086,476 | |
| | 17,387 | | | Autohome, Inc. ADR (Communication Services) | | | 502,484 | |
| | 614,111 | | | AVIC Industry-Finance Holdings Co. Ltd., Class A (Financials) | | | 310,494 | |
| | 176,234 | | | Baidu, Inc., Class A (Communication Services)* | | | 3,132,849 | |
| | 1,977,428 | | | Bank of Beijing Co. Ltd., Class A (Financials) | | | 1,214,413 | |
| | 403,932 | | | Bank of Changsha Co. Ltd., Class A (Financials) | | | 451,187 | |
| | 3,171,742 | | | Bank of China Ltd., Class A (Financials) | | | 1,634,132 | |
| | 9,805,493 | | | Bank of China Ltd., Class H (Financials) | | | 3,326,121 | |
| | 2,097,834 | | | Bank of Communications Co. Ltd., Class A (Financials) | | | 1,599,640 | |
| | 2,587,460 | | | Bank of Communications Co. Ltd., Class H (Financials) | | | 1,481,518 | |
| | 210,104 | | | Bank of Hangzhou Co. Ltd., Class A (Financials) | | | 323,304 | |
| | 1,430,102 | | | Bank of Jiangsu Co. Ltd., Class A (Financials) | | | 1,400,924 | |
| | 660,264 | | | Bank of Nanjing Co. Ltd., Class A (Financials) | | | 718,457 | |
| | 1,082,468 | | | Bank of Shanghai Co. Ltd., Class A (Financials) | | | 884,892 | |
| | 372,420 | | | Bank of Suzhou Co. Ltd., Class A (Financials) | | | 344,866 | |
| | 495,006 | | | Baoshan Iron & Steel Co. Ltd., Class A (Materials) | | | 412,137 | |
| | 40,692 | | | BeiGene Ltd. (Health Care)* | | | 660,060 | |
| | 330,313 | | | Beijing Enterprises Holdings Ltd. (Utilities) | | | 1,238,397 | |
| | 6,982 | | | Beijing Kingsoft Office Software, Inc., Class A (Information Technology) | | | 378,525 | |
| | 70,268 | | | Beijing Wantai Biological Pharmacy Enterprise Co. Ltd., Class A (Health Care) | | | 481,647 | |
| | |
| | |
| 42 | | The accompanying notes are an integral part of these financial statements. |
GOLDMAN SACHS ACTIVEBETA® EMERGING MARKETS EQUITY ETF
| | | | | | | | |
| Shares | | | Description | |
Value | |
|
| Common Stocks – (continued) | |
| China – (continued) | |
| | 203,058 | | | Beijing Yanjing Brewery Co. Ltd., Class A (Consumer Staples) | | $ | 289,585 | |
| | 511,300 | | | Beijing-Shanghai High Speed Railway Co. Ltd., Class A (Industrials) | | | 358,265 | |
| | 67,585 | | | Bloomage Biotechnology Corp. Ltd., Class A (Health Care) | | | 859,472 | |
| | 47,940 | | | BOC Aviation Ltd. (Industrials)(a) | | | 359,775 | |
| | 1,131,218 | | | BOE Technology Group Co. Ltd., Class A (Information Technology) | | | 623,231 | |
| | 2,204,777 | | | Bosideng International Holdings Ltd. (Consumer Discretionary) | | | 865,969 | |
| | 13,523 | | | BYD Co. Ltd., Class A (Consumer Discretionary) | | | 463,370 | |
| | 61,251 | | | BYD Co. Ltd., Class H (Consumer Discretionary) | | | 1,919,915 | |
| | 124,516 | | | BYD Electronic International Co. Ltd. (Information Technology) | | | 577,187 | |
| | 181,093 | | | By-health Co. Ltd., Class A (Consumer Staples) | | | 480,941 | |
| | 147,662 | | | C&D International Investment Group Ltd. (Real Estate) | | | 375,852 | |
| | 394,044 | | | Caitong Securities Co. Ltd., Class A (Financials) | | | 433,646 | |
| | 102,526 | | | Canmax Technologies Co. Ltd., Class A (Materials) | | | 380,326 | |
| | 478,500 | | | CECEP Solar Energy Co. Ltd., Class A (Utilities) | | | 396,422 | |
| | 867,660 | | | CECEP Wind-Power Corp., Class A (Utilities) | | | 400,541 | |
| | 3,899,375 | | | CGN Power Co. Ltd., Class H (Utilities)(a) | | | 974,626 | |
| | 13,399 | | | Changchun High & New Technology Industry Group, Inc., Class A (Health Care) | | | 253,124 | |
| | 436,616 | | | Changjiang Securities Co. Ltd., Class A (Financials) | | | 358,723 | |
| | 4,083,915 | | | China Cinda Asset Management Co. Ltd., Class H (Financials) | | | 401,009 | |
| | 2,928,958 | | | China CITIC Bank Corp. Ltd., Class H (Financials) | | | 1,303,544 | |
| | 1,255,851 | | | China Communications Services Corp. Ltd., Class H (Industrials) | | | 565,327 | |
| | 1,263,813 | | | China Construction Bank Corp., Class A (Financials) | | | 1,041,819 | |
| | 12,130,170 | | | China Construction Bank Corp., Class H (Financials) | | | 6,496,855 | |
| | 1,363,524 | | | China Everbright Bank Co. Ltd., Class A (Financials) | | | 563,881 | |
| | 2,686,594 | | | China Everbright Bank Co. Ltd., Class H (Financials) | | | 774,279 | |
| | 1,671,434 | | | China Feihe Ltd. (Consumer Staples)(a) | | | 1,006,047 | |
| | 316,718 | | | China Galaxy Securities Co. Ltd., Class A (Financials) | | | 501,719 | |
| | |
|
| Common Stocks – (continued) | |
| China – (continued) | |
| | 1,147,321 | | | China Galaxy Securities Co. Ltd., Class H (Financials) | | | 617,425 | |
| | 327,700 | | | China Great Wall Securities Co. Ltd., Class A (Financials) | | | 395,302 | |
| | 73,800 | | | China Life Insurance Co. Ltd., Class A (Financials) | | | 361,269 | |
| | 636,029 | | | China Life Insurance Co. Ltd., Class H (Financials) | | | 965,186 | |
| | 1,275,665 | | | China Medical System Holdings Ltd. (Health Care) | | | 1,841,493 | |
| | 581,120 | | | China Mengniu Dairy Co. Ltd. (Consumer Staples)* | | | 1,956,396 | |
| | 217,230 | | | China Merchants Bank Co. Ltd., Class A (Financials) | | | 941,623 | |
| | 420,866 | | | China Merchants Bank Co. Ltd., Class H (Financials) | | | 1,663,767 | |
| | 318,130 | | | China Merchants Port Holdings Co. Ltd. (Industrials) | | | 380,535 | |
| | 188,296 | | | China Merchants Securities Co. Ltd., Class A (Financials) | | | 367,615 | |
| | 293,995 | | | China Merchants Shekou Industrial Zone Holdings Co. Ltd., Class A (Real Estate) | | | 551,758 | |
| | 1,864,957 | | | China Minsheng Banking Corp. Ltd., Class A (Financials) | | | 968,543 | |
| | 3,164,903 | | | China Minsheng Banking Corp. Ltd., Class H (Financials) | | | 1,017,063 | |
| | 72,200 | | | China National Medicines Corp. Ltd., Class A (Health Care) | | | 322,884 | |
| | 422,045 | | | China National Nuclear Power Co. Ltd., Class A (Utilities) | | | 417,493 | |
| | 45,396 | | | China National Software & Service Co. Ltd., Class A (Information Technology) | | | 269,438 | |
| | 310,169 | | | China Oilfield Services Ltd., Class H (Energy) | | | 351,631 | |
| | 133,800 | | | China Pacific Insurance Group Co. Ltd., Class A (Financials) | | | 509,207 | |
| | 184,990 | | | China Pacific Insurance Group Co. Ltd., Class H (Financials) | | | 423,684 | |
| | 1,889,414 | | | China Petroleum & Chemical Corp., Class A (Energy) | | | 1,575,701 | |
| | 3,807,864 | | | China Petroleum & Chemical Corp., Class H (Energy) | | | 2,228,851 | |
| | 624,604 | | | China Railway Group Ltd., Class A (Industrials) | | | 574,960 | |
| | 987,655 | | | China Railway Group Ltd., Class H (Industrials) | | | 522,685 | |
| | 626,251 | | | China Railway Signal & Communication Corp. Ltd., Class A (Information Technology) | | | 482,691 | |
| | 92,356 | | | China Resources Beer Holdings Co. Ltd. (Consumer Staples) | | | 542,942 | |
| | 81,666 | | | China Resources Land Ltd. (Real Estate) | | | 345,233 | |
| | 806,656 | | | China Resources Pharmaceutical Group Ltd. (Health Care)(a) | | | 539,022 | |
| | |
| | |
| The accompanying notes are an integral part of these financial statements. | | 43 |
GOLDMAN SACHS ACTIVEBETA® EMERGING MARKETS EQUITY ETF
Schedule of Investments (continued)
August 31, 2023
| | | | | | | | |
| Shares | | | Description | |
Value | |
|
| Common Stocks – (continued) | |
| China – (continued) | |
| | 109,048 | | | China Resources Sanjiu Medical & Pharmaceutical Co. Ltd., Class A (Health Care) | | $ | 712,853 | |
| | 171,599 | | | China Shenhua Energy Co. Ltd., Class A (Energy) | | | 664,140 | |
| | 592,894 | | | China Shenhua Energy Co. Ltd., Class H (Energy) | | | 1,727,628 | |
| | 1,028,537 | | | China State Construction Engineering Corp. Ltd., Class A (Industrials) | | | 795,585 | |
| | 319,414 | | | China Taiping Insurance Holdings Co. Ltd. (Financials) | | | 336,450 | |
| | 616,600 | | | China Three Gorges Renewables Group Co. Ltd., Class A (Utilities) | | | 416,799 | |
| | 12,327,016 | | | China Tower Corp. Ltd., Class H (Communication Services)(a) | | | 1,194,699 | |
| | 1,629,881 | | | China Traditional Chinese Medicine Holdings Co. Ltd. (Health Care) | | | 636,011 | |
| | 1,879,779 | | | China United Network Communications Ltd., Class A (Communication Services) | | | 1,345,559 | |
| | 262,727 | | | China Yangtze Power Co. Ltd., Class A (Utilities) | | | 796,285 | |
| | 2,783,727 | | | China Zheshang Bank Co. Ltd., Class A (Financials) | | | 982,919 | |
| | 66,708 | | | Chongqing Brewery Co. Ltd., Class A (Consumer Staples) | | | 837,505 | |
| | 798,239 | | | Chongqing Rural Commercial Bank Co. Ltd., Class A (Financials) | | | 412,362 | |
| | 75,968 | | | Chongqing Zhifei Biological Products Co. Ltd., Class A (Health Care) | | | 461,329 | |
| | 238,694 | | | Chow Tai Fook Jewellery Group Ltd. (Consumer Discretionary) | | | 362,223 | |
| | 1,471,308 | | | CITIC Ltd. (Industrials) | | | 1,461,598 | |
| | 150,982 | | | CITIC Securities Co. Ltd., Class A (Financials) | | | 460,507 | |
| | 103,336 | | | CITIC Securities Co. Ltd., Class H (Financials) | | | 201,882 | |
| | 1,182,300 | | | COSCO SHIPPING Development Co. Ltd., Class A (Industrials) | | | 386,601 | |
| | 281,098 | | | COSCO SHIPPING Holdings Co. Ltd., Class A (Industrials) | | | 378,479 | |
| | 518,595 | | | COSCO SHIPPING Holdings Co. Ltd., Class H (Industrials) | | | 532,367 | |
| | 776,785 | | | CRRC Corp. Ltd., Class A (Industrials) | | | 633,936 | |
| | 2,154,876 | | | CRRC Corp. Ltd., Class H (Industrials) | | | 1,060,710 | |
| | 2,361,298 | | | CSPC Pharmaceutical Group Ltd. (Health Care) | | | 1,776,601 | |
| | 1,382,466 | | | Dali Foods Group Co. Ltd. (Consumer Staples)(a) | | | 661,108 | |
| | 443,290 | | | Daqin Railway Co. Ltd., Class A (Industrials) | | | 434,246 | |
| | |
|
| Common Stocks – (continued) | |
| China – (continued) | |
| | 32,062 | | | Daqo New Energy Corp. ADR (Information Technology)* | | | 1,185,332 | |
| | 99,858 | | | DaShenLin Pharmaceutical Group Co. Ltd., Class A (Consumer Staples) | | | 364,804 | |
| | 469,331 | | | DHC Software Co. Ltd., Class A (Information Technology) | | | 433,318 | |
| | 112,996 | | | Dong-E-E-Jiao Co. Ltd., Class A (Health Care) | | | 804,641 | |
| | 924,049 | | | Dongfeng Motor Group Co. Ltd., Class H (Consumer Discretionary) | | | 339,371 | |
| | 347,546 | | | Dongxing Securities Co. Ltd., Class A (Financials) | | | 395,845 | |
| | 308,457 | | | Dongyue Group Ltd. (Materials) | | | 265,119 | |
| | 147,074 | | | East Buy Holding Ltd. (Consumer Discretionary)*(a)(b) | | | 745,521 | |
| | 86,017 | | | Ecovacs Robotics Co. Ltd., Class A (Consumer Discretionary) | | | 626,706 | |
| | 36,906 | | | ENN Energy Holdings Ltd. (Utilities) | | | 289,440 | |
| | 190,058 | | | ENN Natural Gas Co. Ltd., Class A (Utilities) | | | 455,920 | |
| | 441,919 | | | Fangda Carbon New Material Co. Ltd., Class A (Industrials)* | | | 353,972 | |
| | 487,349 | | | Far East Horizon Ltd. (Financials) | | | 333,113 | |
| | 464,400 | | | First Capital Securities Co. Ltd., Class A (Financials) | | | 384,102 | |
| | 414,100 | | | Founder Securities Co. Ltd., Class A (Financials) | | | 410,772 | |
| | 273,034 | | | Foxconn Industrial Internet Co. Ltd., Class A (Information Technology) | | | 821,897 | |
| | 67,297 | | | Fuyao Glass Industry Group Co. Ltd., Class A (Consumer Discretionary) | | | 351,348 | |
| | 12,057 | | | G-bits Network Technology Xiamen Co. Ltd., Class A (Communication Services) | | | 691,929 | |
| | 369,634 | | | Geely Automobile Holdings Ltd. (Consumer Discretionary) | | | 459,111 | |
| | 459,095 | | | GEM Co. Ltd., Class A (Materials) | | | 394,853 | |
| | 129,578 | | | GF Securities Co. Ltd., Class A (Financials) | | | 268,111 | |
| | 164,700 | | | Giant Network Group Co. Ltd., Class A (Communication Services) | | | 330,373 | |
| | 305,800 | | | Goldwind Science & Technology Co. Ltd., Class A (Industrials) | | | 399,134 | |
| | 81,247 | | | Gree Electric Appliances Inc of Zhuhai, Class A (Consumer Discretionary) | | | 399,510 | |
| | 56,000 | | | Guangdong Haid Group Co. Ltd., Class A (Consumer Staples) | | | 371,153 | |
| | 281,500 | | | Guangzhou Automobile Group Co. Ltd., Class A (Consumer Discretionary) | | | 389,850 | |
| | 172,204 | | | Guangzhou Baiyunshan Pharmaceutical Holdings Co. Ltd., Class A (Health Care) | | | 731,545 | |
| | 298,431 | | | Guangzhou Haige Communications Group, Inc. Co., Class A (Information Technology) | | | 434,208 | |
| | 82,014 | | | Guangzhou Kingmed Diagnostics Group Co. Ltd., Class A (Health Care) | | | 672,248 | |
| | |
| | |
| 44 | | The accompanying notes are an integral part of these financial statements. |
GOLDMAN SACHS ACTIVEBETA® EMERGING MARKETS EQUITY ETF
| | | | | | | | |
| Shares | | | Description | |
Value | |
|
| Common Stocks – (continued) | |
| China – (continued) | |
| | 66,586 | | | Guangzhou Tinci Materials Technology Co. Ltd., Class A (Materials) | | $ | 300,339 | |
| | 271,067 | | | Guosen Securities Co. Ltd., Class A (Financials) | | | 345,607 | |
| | 195,437 | | | Guotai Junan Securities Co. Ltd., Class A (Financials) | | | 390,955 | |
| | 414,097 | | | Guoyuan Securities Co. Ltd., Class A (Financials) | | | 395,408 | |
| | 13,026 | | | H World Group Ltd. ADR (Consumer Discretionary)* | | | 524,687 | |
| | 692,129 | | | Haidilao International Holding Ltd. (Consumer Discretionary)(a) | | | 1,884,395 | |
| | 234,901 | | | Haier Smart Home Co. Ltd., Class A (Consumer Discretionary) | | | 758,745 | |
| | 466,854 | | | Haier Smart Home Co. Ltd., Class H (Consumer Discretionary) | | | 1,443,710 | |
| | 295,330 | | | Haitong Securities Co. Ltd., Class A (Financials) | | | 398,859 | |
| | 558,493 | | | Haitong Securities Co. Ltd., Class H (Financials) | | | 346,844 | |
| | 238,400 | | | Hangzhou Binjiang Real Estate Group Co. Ltd., Class A (Real Estate) | | | 343,589 | |
| | 79,940 | | | Hangzhou Robam Appliances Co. Ltd., Class A (Consumer Discretionary) | | | 301,924 | |
| | 223,742 | | | Heilongjiang Agriculture Co. Ltd., Class A (Consumer Staples) | | | 412,532 | |
| | 110,523 | | | Henan Shuanghui Investment & Development Co. Ltd., Class A (Consumer Staples) | | | 407,865 | |
| | 81,210 | | | Hengan International Group Co. Ltd. (Consumer Staples) | | | 301,363 | |
| | 458,800 | | | Hengyi Petrochemical Co. Ltd., Class A (Materials)* | | | 483,478 | |
| | 1,322,980 | | | Hesteel Co. Ltd., Class A (Materials) | | | 410,790 | |
| | 53,157 | | | Hithink RoyalFlush Information Network Co. Ltd., Class A (Financials) | | | 1,222,206 | |
| | 122,584 | | | Huadong Medicine Co. Ltd., Class A (Health Care) | | | 639,825 | |
| | 408,900 | | | Huafon Chemical Co. Ltd., Class A (Materials) | | | 393,254 | |
| | 283,600 | | | Huaibei Mining Holdings Co. Ltd., Class A (Materials) | | | 457,049 | |
| | 205,825 | | | Huatai Securities Co. Ltd., Class A (Financials) | | | 449,062 | |
| | 358,529 | | | Huatai Securities Co. Ltd., Class H (Financials)(a) | | | 471,836 | |
| | 333,456 | | | Huaxi Securities Co. Ltd., Class A (Financials) | | | 390,334 | |
| | 1,442,777 | | | Huaxia Bank Co. Ltd., Class A (Financials) | | | 1,098,164 | |
| | 186,426 | | | Huayu Automotive Systems Co. Ltd., Class A (Consumer Discretionary) | | | 481,273 | |
| | 157,100 | | | Hubei Jumpcan Pharmaceutical Co. Ltd., Class A (Health Care) | | | 565,072 | |
| | |
|
| Common Stocks – (continued) | |
| China – (continued) | |
| | 99,242 | | | Hubei Xingfa Chemicals Group Co. Ltd., Class A (Materials) | | | 276,790 | |
| | 70,716 | | | Hygeia Healthcare Holdings Co. Ltd. (Health Care)(a)(b) | | | 357,559 | |
| | 1,982,248 | | | Industrial & Commercial Bank of China Ltd., Class A (Financials) | | | 1,258,224 | |
| | 6,741,668 | | | Industrial & Commercial Bank of China Ltd., Class H (Financials) | | | 3,094,973 | |
| | 451,024 | | | Industrial Bank Co. Ltd., Class A (Financials) | | | 979,692 | |
| | 1,603,100 | | | Inner Mongolia BaoTou Steel Union Co. Ltd., Class A (Materials)* | | | 394,250 | |
| | 109,554 | | | Inner Mongolia Yili Industrial Group Co. Ltd., Class A (Consumer Staples) | | | 391,345 | |
| | 138,304 | | | iQIYI, Inc. ADR (Communication Services)* | | | 697,052 | |
| | 162,300 | | | JA Solar Technology Co. Ltd., Class A (Information Technology) | | | 620,569 | |
| | 57,496 | | | JD Health International, Inc. (Consumer Staples)*(a) | | | 310,145 | |
| | 223,488 | | | JD.com, Inc., Class A (Consumer Discretionary) | | | 3,670,769 | |
| | 445,504 | | | Jiangsu Expressway Co. Ltd., Class H (Industrials) | | | 402,228 | |
| | 269,676 | | | Jiangsu Hengrui Pharmaceuticals Co. Ltd., Class A (Health Care) | | | 1,547,992 | |
| | 40,332 | | | Jiangsu Pacific Quartz Co. Ltd., Class A (Information Technology) | | | 530,076 | |
| | 199,775 | | | Jiangxi Copper Co. Ltd., Class A (Materials) | | | 518,754 | |
| | 344,897 | | | Jiangxi Copper Co. Ltd., Class H (Materials) | | | 538,341 | |
| | 26,835 | | | JiuGui Liquor Co. Ltd., Class A (Consumer Staples) | | | 330,345 | |
| | 463,378 | | | Jiumaojiu International Holdings Ltd. (Consumer Discretionary)(a) | | | 743,367 | |
| | 236,032 | | | Joincare Pharmaceutical Group Industry Co. Ltd., Class A (Health Care) | | | 369,687 | |
| | 489,776 | | | Jointown Pharmaceutical Group Co. Ltd., Class A (Health Care) | | | 695,114 | |
| | 16,860 | | | JOYY, Inc. ADR (Communication Services) | | | 578,635 | |
| | 319,131 | | | Kingboard Holdings Ltd. (Information Technology) | | | 724,396 | |
| | 105,500 | | | Kingsoft Corp. Ltd. (Communication Services) | | | 421,099 | |
| | 225,193 | | | Kuaishou Technology (Communication Services)*(a) | | | 1,843,643 | |
| | 66,000 | | | Kunlun Tech Co. Ltd., Class A (Communication Services)* | | | 328,073 | |
| | 10,353 | | | Kweichow Moutai Co. Ltd., Class A (Consumer Staples) | | | 2,627,188 | |
| | 2,392,771 | | | Lenovo Group Ltd. (Information Technology) | | | 2,706,523 | |
| | 279,113 | | | Li Ning Co. Ltd. (Consumer Discretionary) | | | 1,318,728 | |
| | |
| | |
| The accompanying notes are an integral part of these financial statements. | | 45 |
GOLDMAN SACHS ACTIVEBETA® EMERGING MARKETS EQUITY ETF
Schedule of Investments (continued)
August 31, 2023
| | | | | | | | |
| Shares | | | Description | |
Value | |
|
| Common Stocks – (continued) | |
| China – (continued) | |
| | 1,630,067 | | | Liaoning Port Co. Ltd., Class A (Industrials) | | $ | 353,851 | |
| | 163,436 | | | Longfor Group Holdings Ltd. (Real Estate)(a) | | | 344,306 | |
| | 196,800 | | | LONGi Green Energy Technology Co. Ltd., Class A (Information Technology) | | | 717,873 | |
| | 16,705 | | | Luzhou Laojiao Co. Ltd., Class A (Consumer Staples) | | | 533,155 | |
| | 468,989 | | | Meituan, Class B (Consumer Discretionary)*(a) | | | 7,685,158 | |
| | 1,182,296 | | | Metallurgical Corp. of China Ltd., Class A (Industrials) | | | 591,270 | |
| | 24,518 | | | MINISO Group Holding Ltd. ADR (Consumer Discretionary)* | | | 635,016 | |
| | 45,430 | | | Muyuan Foods Co. Ltd., Class A (Consumer Staples) | | | 253,287 | |
| | 214,876 | | | NetEase, Inc. (Communication Services) | | | 4,488,372 | |
| | 81,441 | | | New China Life Insurance Co. Ltd., Class A (Financials) | | | 453,165 | |
| | 177,184 | | | New China Life Insurance Co. Ltd., Class H (Financials) | | | 443,765 | |
| | 240,500 | | | New Hope Liuhe Co. Ltd., Class A (Consumer Staples)* | | | 385,606 | |
| | 274,714 | | | New Oriental Education & Technology Group, Inc. (Consumer Discretionary)* | | | 1,483,615 | |
| | 341,824 | | | Nongfu Spring Co. Ltd., Class H (Consumer Staples)(a) | | | 1,920,151 | |
| | 760,292 | | | Offshore Oil Engineering Co. Ltd., Class A (Energy) | | | 607,941 | |
| | 367,100 | | | Oriental Pearl Group Co. Ltd., Class A (Communication Services) | | | 401,977 | |
| | 57,148 | | | PDD Holdings, Inc. ADR (Consumer Discretionary)* | | | 5,655,938 | |
| | 548,723 | | | People’s Insurance Co. Group of China Ltd. (The), Class A (Financials) | | | 440,275 | |
| | 2,482,376 | | | People’s Insurance Co. Group of China Ltd. (The), Class H (Financials) | | | 845,212 | |
| | 2,822,830 | | | PetroChina Co. Ltd., Class A (Energy) | | | 3,005,692 | |
| | 4,758,089 | | | PetroChina Co. Ltd., Class H (Energy) | | | 3,434,282 | |
| | 1,665,960 | | | PICC Property & Casualty Co. Ltd., Class H (Financials) | | | 1,916,276 | |
| | 214,907 | | | Ping An Bank Co. Ltd., Class A (Financials) | | | 328,627 | |
| | 128,232 | | | Ping An Insurance Group Co. of China Ltd., Class A (Financials) | | | 859,578 | |
| | 632,977 | | | Ping An Insurance Group Co. of China Ltd., Class H (Financials) | | | 3,789,750 | |
| | 1,451,284 | | | Postal Savings Bank of China Co. Ltd., Class A (Financials) | | | 969,051 | |
| | 1,398,905 | | | Postal Savings Bank of China Co. Ltd., Class H (Financials)(a) | | | 690,377 | |
| | 61,914 | | | Qifu Technology, Inc. ADR (Financials) | | | 1,052,538 | |
| | |
|
| Common Stocks – (continued) | |
| China – (continued) | |
| | 281,496 | | | Qinghai Salt Lake Industry Co. Ltd., Class A (Materials)* | | | 692,283 | |
| | 211,167 | | | SAIC Motor Corp. Ltd., Class A (Consumer Discretionary) | | | 416,619 | |
| | 34,724 | | | Sangfor Technologies, Inc., Class A (Information Technology)* | | | 520,395 | |
| | 485,700 | | | SDIC Capital Co. Ltd., Class A (Financials) | | | 489,137 | |
| | 220,600 | | | SDIC Power Holdings Co. Ltd., Class A (Utilities) | | | 385,220 | |
| | 184,329 | | | Seazen Holdings Co. Ltd., Class A (Real Estate)* | | | 367,214 | |
| | 29,364 | | | SG Micro Corp., Class A (Information Technology) | | | 312,380 | |
| | 136,379 | | | Shaanxi Coal Industry Co. Ltd., Class A (Energy) | | | 311,788 | |
| | 193,997 | | | Shandong Buchang Pharmaceuticals Co. Ltd., Class A (Health Care) | | | 466,169 | |
| | 184,678 | | | Shandong Gold Mining Co. Ltd., Class A (Materials) | | | 665,536 | |
| | 229,792 | | | Shandong Weigao Group Medical Polymer Co. Ltd., Class H (Health Care) | | | 228,569 | |
| | 1,072,200 | | | Shanghai Construction Group Co. Ltd., Class A (Industrials) | | | 412,470 | |
| | 650,866 | | | Shanghai Electric Group Co. Ltd., Class A (Industrials)* | | | 399,721 | |
| | 704,498 | | | Shanghai International Port Group Co. Ltd., Class A (Industrials) | | | 493,637 | |
| | 189,383 | | | Shanghai Lingang Holdings Corp. Ltd., Class A (Real Estate) | | | 309,112 | |
| | 211,108 | | | Shanghai Pharmaceuticals Holding Co. Ltd., Class A (Health Care) | | | 518,597 | |
| | 1,052,592 | | | Shanghai Pudong Development Bank Co. Ltd., Class A (Financials) | | | 1,009,424 | |
| | 456,423 | | | Shanghai RAAS Blood Products Co. Ltd., Class A (Health Care) | | | 445,857 | |
| | 503,008 | | | Shanghai Rural Commercial Bank Co. Ltd., Class A (Financials) | | | 402,213 | |
| | 336,110 | | | Shanghai Yuyuan Tourist Mart Group Co. Ltd., Class A (Consumer Discretionary) | | | 339,874 | |
| | 489,739 | | | Shanxi Securities Co. Ltd., Class A (Financials) | | | 407,751 | |
| | 848,376 | | | Shanxi Taigang Stainless Steel Co. Ltd., Class A (Materials) | | | 459,243 | |
| | 28,941 | | | Shanxi Xinghuacun Fen Wine Factory Co. Ltd., Class A (Consumer Staples) | | | 962,447 | |
| | 718,069 | | | Shenwan Hongyuan Group Co. Ltd., Class A (Financials) | | | 430,141 | |
| | 417,900 | | | Shenzhen Energy Group Co. Ltd., Class A (Utilities) | | | 372,054 | |
| | 331,876 | | | Shenzhen International Holdings Ltd. (Industrials) | | | 236,155 | |
| | 54,704 | | | Shenzhen Kstar Science And Technology Co. Ltd., Class A (Industrials) | | | 227,579 | |
| | |
| | |
| 46 | | The accompanying notes are an integral part of these financial statements. |
GOLDMAN SACHS ACTIVEBETA® EMERGING MARKETS EQUITY ETF
| | | | | | | | |
| Shares | | | Description | |
Value | |
|
| Common Stocks – (continued) | |
| China – (continued) | |
| | 15,745 | | | Shenzhen Mindray Bio-Medical Electronics Co. Ltd., Class A (Health Care) | | $ | 584,070 | |
| | 720,193 | | | Shenzhen Overseas Chinese Town Co. Ltd., Class A (Real Estate)* | | | 430,424 | |
| | 75,218 | | | Shenzhen Salubris Pharmaceuticals Co. Ltd., Class A (Health Care) | | | 285,743 | |
| | 92,500 | | | Shenzhen SED Industry Co. Ltd., Class A (Information Technology) | | | 348,980 | |
| | 218,373 | | | Shijiazhuang Yiling Pharmaceutical Co. Ltd., Class A (Health Care) | | | 698,158 | |
| | 179,766 | | | Sichuan Chuantou Energy Co. Ltd., Class A (Utilities) | | | 369,485 | |
| | 212,731 | | | Sichuan Kelun Pharmaceutical Co. Ltd., Class A (Health Care) | | | 792,060 | |
| | 356,057 | | | Sichuan Road and Bridge Group Co. Ltd., Class A (Industrials) | | | 435,868 | |
| | 80,014 | | | Sichuan Swellfun Co. Ltd., Class A (Consumer Staples) | | | 727,310 | |
| | 65,469 | | | Silergy Corp. (Information Technology) | | | 590,005 | |
| | 227,100 | | | Sinoma International Engineering Co., Class A (Industrials) | | | 366,617 | |
| | 883,800 | | | Sinopec Shanghai Petrochemical Co. Ltd., Class A (Materials)* | | | 367,921 | |
| | 257,798 | | | Sinopharm Group Co. Ltd., Class H (Health Care) | | | 747,908 | |
| | 386,330 | | | SooChow Securities Co. Ltd., Class A (Financials) | | | 434,711 | |
| | 633,927 | | | Southwest Securities Co. Ltd., Class A (Financials) | | | 367,544 | |
| | 36,647 | | | Sunny Optical Technology Group Co. Ltd. (Information Technology) | | | 299,560 | |
| | 109,919 | | | TAL Education Group ADR (Consumer Discretionary)* | | | 774,929 | |
| | 318,223 | | | Tangshan Jidong Cement Co. Ltd., Class A (Materials) | | | 331,405 | |
| | 694,085 | | | TCL Technology Group Corp., Class A (Information Technology)* | | | 390,980 | |
| | 770,543 | | | Tencent Holdings Ltd. (Communication Services) | | | 31,935,024 | |
| | 139,443 | | | Tencent Music Entertainment Group ADR (Communication Services)* | | | 951,001 | |
| | 278,426 | | | Tianma Microelectronics Co. Ltd., Class A (Information Technology)* | | | 328,978 | |
| | 86,800 | | | Tianqi Lithium Corp., Class A (Materials) | | | 686,553 | |
| | 1,143,483 | | | Tingyi Cayman Islands Holding Corp. (Consumer Staples) | | | 1,679,845 | |
| | 234,227 | | | Tongwei Co. Ltd., Class A (Information Technology) | | | 1,032,356 | |
| | 2,081,775 | | | Topsports International Holdings Ltd. (Consumer Discretionary)(a) | | | 1,693,719 | |
| | 19,500 | | | Trip.com Group Ltd. (Consumer Discretionary)* | | | 769,382 | |
| | 1,359,640 | | | Uni-President China Holdings Ltd. (Consumer Staples) | | | 1,005,632 | |
| | |
|
| Common Stocks – (continued) | |
| China – (continued) | |
| | 188,339 | | | Vipshop Holdings Ltd. ADR (Consumer Discretionary)* | | | 2,973,873 | |
| | 30,600 | | | Wanhua Chemical Group Co. Ltd., Class A (Materials) | | | 394,140 | |
| | 1,850,241 | | | Want Want China Holdings Ltd. (Consumer Staples) | | | 1,224,567 | |
| | 396,042 | | | Western Securities Co. Ltd., Class A (Financials) | | | 367,285 | |
| | 1,844,200 | | | Wintime Energy Group Co. Ltd., Class A (Utilities)* | | | 369,930 | |
| | 911,065 | | | Wuchan Zhongda Group Co. Ltd., Class A (Consumer Discretionary) | | | 582,050 | |
| | 29,389 | | | Wuliangye Yibin Co. Ltd., Class A (Consumer Staples) | | | 629,531 | |
| | 529,717 | | | XCMG Construction Machinery Co. Ltd., Class A (Industrials) | | | 440,309 | |
| | 418,487 | | | Xiamen C & D, Inc., Class A (Industrials) | | | 624,410 | |
| | 368,994 | | | Xiaomi Corp., Class B (Information Technology)*(a) | | | 581,601 | |
| | 284,735 | | | Yadea Group Holdings Ltd. (Consumer Discretionary)(a) | | | 547,557 | |
| | 382,575 | | | Yankuang Energy Group Co. Ltd., Class H (Energy) | | | 601,055 | |
| | 229,056 | | | Yihai International Holding Ltd. (Consumer Staples)* | | | 429,384 | |
| | 81,500 | | | Yihai Kerry Arawana Holdings Co. Ltd., Class A (Consumer Staples) | | | 399,298 | |
| | 70,563 | | | YongXing Special Materials Technology Co. Ltd., Class A (Materials) | | | 483,282 | |
| | 460,136 | | | Youngor Group Co. Ltd., Class A (Real Estate) | | | 439,369 | |
| | 140,188 | | | YTO Express Group Co. Ltd., Class A (Industrials) | | | 290,834 | |
| | 724,354 | | | Yuexiu Property Co. Ltd. (Real Estate) | | | 897,851 | |
| | 63,053 | | | Yum China Holdings, Inc. (Consumer Discretionary) | | | 3,385,316 | |
| | 50,930 | | | Yunnan Baiyao Group Co. Ltd., Class A (Health Care) | | | 382,404 | |
| | 63,946 | | | Yunnan Botanee Bio-Technology Group Co. Ltd., Class A (Consumer Staples) | | | 894,286 | |
| | 172,869 | | | Yunnan Yuntianhua Co. Ltd., Class A (Materials) | | | 409,461 | |
| | 147,100 | | | Zangge Mining Co. Ltd., Class A (Materials) | | | 454,123 | |
| | 9,097 | | | Zhangzhou Pientzehuang Pharmaceutical Co. Ltd., Class A (Health Care) | | | 345,382 | |
| | 347,000 | | | Zhaojin Mining Industry Co. Ltd., Class H (Materials) | | | 490,294 | |
| | 681,300 | | | Zhefu Holding Group Co. Ltd., Class A (Industrials) | | | 369,738 | |
| | 352,400 | | | Zhejiang China Commodities City Group Co. Ltd., Class A (Real Estate) | | | 397,984 | |
| | |
| | |
| The accompanying notes are an integral part of these financial statements. | | 47 |
GOLDMAN SACHS ACTIVEBETA® EMERGING MARKETS EQUITY ETF
Schedule of Investments (continued)
August 31, 2023
| | | | | | | | |
| Shares | | | Description | |
Value | |
|
| Common Stocks – (continued) | |
| China – (continued) | |
| | 621,241 | | | Zhejiang Expressway Co. Ltd., Class H (Industrials)(b) | | $ | 464,242 | |
| | 298,100 | | | Zhejiang Longsheng Group Co. Ltd., Class A (Materials) | | | 377,617 | |
| | 68,836 | | | Zhejiang Supor Co. Ltd., Class A (Consumer Discretionary) | | | 450,269 | |
| | 279,281 | | | Zhejiang Weixing New Building Materials Co. Ltd., Class A (Industrials) | | | 775,471 | |
| | 270,500 | | | Zheshang Securities Co. Ltd., Class A (Financials) | | | 382,792 | |
| | 39,400 | | | Zhongji Innolight Co. Ltd., Class A, 02/28/23 (Information Technology) | | | 620,461 | |
| | 332,800 | | | Zhongjin Gold Corp. Ltd., Class A (Materials) | | | 508,448 | |
| | 162,762 | | | Zhongsheng Group Holdings Ltd. (Consumer Discretionary) | | | 496,064 | |
| | 371,064 | | | Zhongtai Securities Co. Ltd., Class A (Financials) | | | 372,670 | |
| | 464,400 | | | Zibo Qixiang Tengda Chemical Co. Ltd., Class A (Materials) | | | 391,121 | |
| | 425,540 | | | Zijin Mining Group Co. Ltd., Class H (Materials) | | | 669,642 | |
| | 470,937 | | | Zoomlion Heavy Industry Science and Technology Co. Ltd., Class A (Industrials) | | | 417,978 | |
| | 138,700 | | | ZTE Corp., Class H, 02/28/23 (Information Technology) | | | 446,606 | |
| | 14,100 | | | ZTO Express Cayman, Inc. ADR (Industrials) | | | 354,474 | |
| | | | | | | | |
| | | | | | | 306,540,977 | |
| | |
| Czech Republic – 0.2% | |
| | 14,671 | | | CEZ AS (Utilities) | | | 624,334 | |
| | 20,366 | | | Komercni banka AS (Financials) | | | 636,948 | |
| | 165,312 | | | Moneta Money Bank AS (Financials)(a) | | | 616,397 | |
| | | | | | | | |
| | | | | | | 1,877,679 | |
| | |
| Egypt – 0.5% | |
| | 1,476,533 | | | Commercial International Bank Egypt SAE (Financials) | | | 2,723,701 | |
| | 2,754,243 | | | Eastern Co. SAE (Consumer Staples) | | | 1,809,422 | |
| | | | | | | | |
| | | | | | | 4,533,123 | |
| | |
| Greece – 0.8% | |
| | 613,933 | | | Eurobank Ergasias Services and Holdings SA (Financials)* | | | 1,068,131 | |
| | 188,456 | | | Hellenic Telecommunications Organization SA (Communication Services) | | | 2,822,663 | |
| | 20,290 | | | JUMBO SA (Consumer Discretionary) | | | 628,060 | |
| | 15,332 | | | Motor Oil Hellas Corinth Refineries SA (Energy) | | | 391,054 | |
| | 26,298 | | | Mytilineos SA (Industrials) | | | 1,068,633 | |
| | 82,200 | | | National Bank of Greece SA (Financials)* | | | 559,740 | |
| | |
|
| Common Stocks – (continued) | |
| Greece – (continued) | |
| | 93,934 | | | OPAP SA (Consumer Discretionary) | | | 1,588,401 | |
| | | | | | | | |
| | | | | | | 8,126,682 | |
| | |
| Hong Kong – 0.2% | |
| | 52,357 | | | Orient Overseas International Ltd. (Industrials) | | | 702,389 | |
| | 2,540,206 | | | Sino Biopharmaceutical Ltd. (Health Care) | | | 965,322 | |
| | | | | | | | |
| | | | | | | 1,667,711 | |
| | |
| Hungary – 0.2% | |
| | 139,096 | | | MOL Hungarian Oil & Gas PLC (Energy) | | | 1,052,790 | |
| | 17,260 | | | OTP Bank Nyrt (Financials) | | | 704,962 | |
| | 16,810 | | | Richter Gedeon Nyrt (Health Care) | | | 421,795 | |
| | | | | | | | |
| | | | | | | 2,179,547 | |
| | |
| India – 14.2% | |
| | 8,300 | | | ABB India Ltd. (Industrials) | | | 439,286 | |
| | 228,797 | | | Adani Power Ltd. (Utilities)* | | | 887,979 | |
| | 7,000 | | | Apollo Hospitals Enterprise Ltd. (Health Care) | | | 407,057 | |
| | 55,803 | | | Asian Paints Ltd. (Materials) | | | 2,194,811 | |
| | 171,656 | | | Aurobindo Pharma Ltd. (Health Care) | | | 1,720,992 | |
| | 21,903 | | | Avenue Supermarts Ltd. (Consumer Staples)*(a) | | | 984,317 | |
| | 173,503 | | | Axis Bank Ltd. (Financials) | | | 2,040,256 | |
| | 13,630 | | | Bajaj Finance Ltd. (Financials) | | | 1,179,322 | |
| | 21,225 | | | Bajaj Finserv Ltd. (Financials) | | | 381,729 | |
| | 340,494 | | | Bank of Baroda (Financials) | | | 769,735 | |
| | 69,934 | | | Berger Paints India Ltd. (Materials) | | | 607,040 | |
| | 319,800 | | | Bharat Electronics Ltd. (Industrials) | | | 514,546 | |
| | 128,626 | | | Bharat Petroleum Corp. Ltd. (Energy) | | | 529,117 | |
| | 172,865 | | | Bharti Airtel Ltd. (Communication Services) | | | 1,788,239 | |
| | 52,929 | | | Britannia Industries Ltd. (Consumer Staples) | | | 2,856,435 | |
| | 159,292 | | | CG Power & Industrial Solutions Ltd. (Industrials) | | | 826,128 | |
| | 40,214 | | | Cholamandalam Investment and Finance Co. Ltd. (Financials) | | | 544,946 | |
| | 177,881 | | | Cipla Ltd. (Health Care) | | | 2,702,178 | |
| | 207,790 | | | Coal India Ltd. (Energy) | | | 577,416 | |
| | 103,464 | | | Colgate-Palmolive India Ltd. (Consumer Staples) | | | 2,427,121 | |
| | 208,472 | | | Dabur India Ltd. (Consumer Staples) | | | 1,392,814 | |
| | 23,198 | | | Divi’s Laboratories Ltd. (Health Care) | | | 1,006,562 | |
| | 33,199 | | | Dr. Reddy’s Laboratories Ltd. (Health Care) | | | 2,248,864 | |
| | 12,573 | | | Eicher Motors Ltd. (Consumer Discretionary) | | | 506,740 | |
| | 393,420 | | | GAIL India Ltd. (Utilities) | | | 546,507 | |
| | 46,272 | | | Grasim Industries Ltd. (Materials) | | | 1,001,022 | |
| | 90,913 | | | Havells India Ltd. (Industrials) | | | 1,520,465 | |
| | 292,895 | | | HCL Technologies Ltd. (Information Technology) | | | 4,147,028 | |
| | |
| | |
| 48 | | The accompanying notes are an integral part of these financial statements. |
GOLDMAN SACHS ACTIVEBETA® EMERGING MARKETS EQUITY ETF
| | | | | | | | |
| Shares | | | Description | |
Value | |
|
| Common Stocks – (continued) | |
| India – (continued) | |
| | 176,500 | | | HDFC Bank Ltd. (Financials) | | $ | 3,350,326 | |
| | 109,776 | | | HDFC Life Insurance Co. Ltd. (Financials)(a) | | | 854,950 | |
| | 217,913 | | | Hindalco Industries Ltd. (Materials) | | | 1,210,434 | |
| | 13,500 | | | Hindustan Aeronautics Ltd. (Industrials) | | | 636,024 | |
| | 89,335 | | | Hindustan Unilever Ltd. (Consumer Staples) | | | 2,703,210 | |
| | 452,387 | | | ICICI Bank Ltd. (Financials) | | | 5,239,107 | |
| | 47,039 | | | ICICI Lombard General Insurance Co. Ltd. (Financials)(a) | | | 746,442 | |
| | 154,034 | | | Indian Hotels Co. Ltd. (Consumer Discretionary) | | | 783,136 | |
| | 939,427 | | | Indian Oil Corp. Ltd. (Energy) | | | 1,011,073 | |
| | 449,099 | | | Infosys Ltd. (Information Technology) | | | 7,787,032 | |
| | 483,176 | | | ITC Ltd. (Consumer Staples) | | | 2,566,277 | |
| | 156,847 | | | Jindal Steel & Power Ltd. (Materials) | | | 1,296,855 | |
| | 283,238 | | | Jio Financial Services Ltd. (Financials)* | | | 798,877 | |
| | 103,916 | | | JSW Steel Ltd. (Materials) | | | 978,642 | |
| | 171,929 | | | Jubilant Foodworks Ltd. (Consumer Discretionary) | | | 1,063,416 | |
| | 25,454 | | | Kotak Mahindra Bank Ltd. (Financials) | | | 540,757 | |
| | 74,269 | | | Larsen & Toubro Ltd. (Industrials) | | | 2,424,640 | |
| | 44,477 | | | LTIMindtree Ltd. (Information Technology)(a) | | | 2,790,160 | |
| | 55,630 | | | Lupin Ltd. (Health Care) | | | 737,724 | |
| | 116,766 | | | Mahindra & Mahindra Ltd. (Consumer Discretionary) | | | 2,222,025 | |
| | 344,901 | | | Marico Ltd. (Consumer Staples) | | | 2,374,921 | |
| | 6,382 | | | Maruti Suzuki India Ltd. (Consumer Discretionary) | | | 771,194 | |
| | 33,729 | | | Mphasis Ltd. (Information Technology) | | | 989,548 | |
| | 412 | | | MRF Ltd. (Consumer Discretionary) | | | 540,896 | |
| | 60,896 | | | Muthoot Finance Ltd. (Financials) | | | 927,090 | |
| | 10,367 | | | Nestle India Ltd. (Consumer Staples) | | | 2,753,271 | |
| | 663,232 | | | NTPC Ltd. (Utilities) | | | 1,764,907 | |
| | 599,220 | | | Oil & Natural Gas Corp. Ltd. (Energy) | | | 1,260,525 | |
| | 4,617 | | | Page Industries Ltd. (Consumer Discretionary) | | | 2,239,349 | |
| | 9,410 | | | PI Industries Ltd. (Materials) | | | 412,415 | |
| | 51,754 | | | Pidilite Industries Ltd. (Materials) | | | 1,572,258 | |
| | 286,700 | | | Power Finance Corp. Ltd. (Financials) | | | 901,108 | |
| | 690,140 | | | Power Grid Corp. of India Ltd. (Utilities) | | | 2,038,669 | |
| | 268,900 | | | REC Ltd. (Financials) | | | 775,165 | |
| | 283,238 | | | Reliance Industries Ltd. (Energy) | | | 8,235,110 | |
| | 49,324 | | | SBI Life Insurance Co. Ltd. (Financials)(a) | | | 770,101 | |
| | 22,100 | | | Shriram Finance Ltd. (Financials) | | | 514,765 | |
| | 31,923 | | | Siemens Ltd. (Industrials) | | | 1,512,391 | |
| | 15,376 | | | SRF Ltd. (Materials) | | | 437,676 | |
| | 222,135 | | | State Bank of India (Financials) | | | 1,506,234 | |
| | 83,137 | | | Sun Pharmaceutical Industries Ltd. (Health Care) | | | 1,116,310 | |
| | 155,504 | | | Tata Consultancy Services Ltd. (Information Technology) | | | 6,305,344 | |
| | 80,673 | | | Tata Consumer Products Ltd. (Consumer Staples) | | | 813,052 | |
| | |
|
| Common Stocks – (continued) | |
| India – (continued) | |
| | 7,952 | | | Tata Elxsi Ltd. (Information Technology) | | | 696,117 | |
| | 367,337 | | | Tata Motors Ltd. (Consumer Discretionary) | | | 2,666,742 | |
| | 163,921 | | | Tata Power Co. Ltd. (The) (Utilities) | | | 485,310 | |
| | 2,086,344 | | | Tata Steel Ltd. (Materials) | | | 3,097,274 | |
| | 220,431 | | | Tech Mahindra Ltd. (Information Technology) | | | 3,200,375 | |
| | 25,092 | | | Titan Co. Ltd. (Consumer Discretionary) | | | 940,940 | |
| | 71,749 | | | Torrent Pharmaceuticals Ltd. (Health Care) | | | 1,596,854 | |
| | 21,994 | | | Tube Investments of India Ltd. (Consumer Discretionary) | | | 770,582 | |
| | 29,274 | | | TVS Motor Co. Ltd. (Consumer Discretionary) | | | 502,090 | |
| | 17,781 | | | UltraTech Cement Ltd. (Materials) | | | 1,782,143 | |
| | 149,700 | | | UPL Ltd. (Materials) | | | 1,068,960 | |
| | 118,096 | | | Varun Beverages Ltd. (Consumer Staples) | | | 1,283,152 | |
| | 385,772 | | | Vedanta Ltd. (Materials) | | | 1,082,484 | |
| | 289,060 | | | Wipro Ltd. (Information Technology) | | | 1,425,987 | |
| | | | | | | | |
| | | | | | | 137,621,068 | |
| | |
| Indonesia – 2.0% | |
| | 1,935,925 | | | Adaro Energy Indonesia Tbk PT (Energy) | | | 339,391 | |
| | 5,277,009 | | | Aneka Tambang Tbk (Materials) | | | 689,511 | |
| | 4,182,509 | | | Astra International Tbk PT (Industrials) | | | 1,771,318 | |
| | 4,156,205 | | | Bank Central Asia Tbk PT (Financials) | | | 2,503,820 | |
| | 3,135,396 | | | Bank Mandiri Persero Tbk PT (Financials) | | | 1,240,365 | |
| | 1,472,866 | | | Bank Negara Indonesia Persero Tbk PT (Financials) | | | 887,298 | |
| | 3,440,983 | | | Bank Rakyat Indonesia Persero Tbk PT (Financials) | | | 1,253,937 | |
| | 981,900 | | | Indah Kiat Pulp & Paper Tbk PT (Materials) | | | 586,690 | |
| | 2,294,037 | | | Indofood CBP Sukses Makmur Tbk PT (Consumer Staples) | | | 1,687,013 | |
| | 3,184,553 | | | Indofood Sukses Makmur Tbk PT (Consumer Staples) | | | 1,484,591 | |
| | 12,377,253 | | | Kalbe Farma Tbk PT (Health Care) | | | 1,475,030 | |
| | 7,139,334 | | | Sumber Alfaria Trijaya Tbk PT (Consumer Staples) | | | 1,359,427 | |
| | 10,998,929 | | | Telkom Indonesia Persero Tbk PT (Communication Services) | | | 2,693,763 | |
| | 4,256,801 | | | Unilever Indonesia Tbk PT (Consumer Staples) | | | 1,025,769 | |
| | | | | | | | |
| | | | | | | 18,997,923 | |
| | |
| | |
| The accompanying notes are an integral part of these financial statements. | | 49 |
GOLDMAN SACHS ACTIVEBETA® EMERGING MARKETS EQUITY ETF
Schedule of Investments (continued)
August 31, 2023
| | | | | | | | |
| Shares | | | Description | |
Value | |
|
| Common Stocks – (continued) | |
| Kuwait – 0.6% | |
| | 338,699 | | | Agility Public Warehousing Co. KSC (Industrials)* | | $ | 631,799 | |
| | 219,452 | | | Boubyan Bank KSCP (Financials) | | | 434,276 | |
| | 640,979 | | | Kuwait Finance House KSCP (Financials) | | | 1,549,163 | |
| | 953,098 | | | National Bank of Kuwait SAKP (Financials) | | | 2,844,607 | |
| | | | | | | | |
| | | | | | | 5,459,845 | |
| | |
| Luxembourg – 0.1% | |
| | 44,076 | | | Reinet Investments SCA (Financials) | | | 941,297 | |
| | |
| Mexico – 2.9% | |
| | 875,968 | | | Alfa SAB de CV, Class A (Industrials) | | | 586,520 | |
| | 3,673,702 | | | America Movil SAB de CV, Series B (Communication Services) | | | 3,503,077 | |
| | 55,392 | | | Arca Continental SAB de CV (Consumer Staples) | | | 546,293 | |
| | 2,752,752 | | | Cemex SAB de CV, Series CPO (Materials)* | | | 2,199,683 | |
| | 112,727 | | | Coca-Cola Femsa SAB de CV (Consumer Staples) | | | 967,556 | |
| | 358,189 | | | Fomento Economico Mexicano SAB de CV (Consumer Staples) | | | 4,060,756 | |
| | 141,888 | | | Gruma SAB de CV, Class B (Consumer Staples) | | | 2,399,369 | |
| | 699,986 | | | Grupo Bimbo SAB de CV, Series A (Consumer Staples) | | | 3,488,338 | |
| | 81,494 | | | Grupo Carso SAB de CV, Series A1 (Industrials) | | | 658,033 | |
| | 346,648 | | | Grupo Financiero Banorte SAB de CV, Class O (Financials) | | | 2,974,314 | |
| | 267,026 | | | Grupo Mexico SAB de CV, Series B (Materials) | | | 1,288,350 | |
| | 261,900 | | | Kimberly-Clark de Mexico SAB de CV, Class A (Consumer Staples) | | | 596,877 | |
| | 234,503 | | | Orbia Advance Corp. SAB de CV (Materials) | | | 528,726 | |
| | 44,502 | | | Promotora y Operadora de Infraestructura SAB de CV (Industrials) | | | 432,944 | |
| | 984,782 | | | Wal-Mart de Mexico SAB de CV (Consumer Staples) | | | 3,929,942 | |
| | | | | | | | |
| | | | | | | 28,160,778 | |
| | |
| Philippines – 0.2% | |
| | 624,614 | | | Bank of the Philippine Islands (Financials) | | | 1,213,485 | |
| | 41,420 | | | Manila Electric Co. (Utilities) | | | 251,359 | |
| | | | | | | | |
| | | | | | | 1,464,844 | |
| | |
| Poland – 0.9% | |
| | 34,816 | | | Bank Polska Kasa Opieki SA (Financials) | | | 911,531 | |
| | 15,868 | | | CD Projekt SA (Communication Services) | | | 568,110 | |
| | |
|
| Common Stocks – (continued) | |
| Poland – (continued) | |
| | 24,431 | | | Dino Polska SA (Consumer Staples)*(a) | | | 2,246,140 | |
| | 533 | | | LPP SA (Consumer Discretionary) | | | 1,795,096 | |
| | 27,900 | | | ORLEN SA (Energy) | | | 426,835 | |
| | 110,609 | | | Powszechna Kasa Oszczednosci Bank Polski SA (Financials)* | | | 1,002,426 | |
| | 199,836 | | | Powszechny Zaklad Ubezpieczen SA (Financials) | | | 2,004,058 | |
| | | | | | | | |
| | | | | | | 8,954,196 | |
| | |
| Qatar – 1.0% | |
| | 556,575 | | | Commercial Bank PSQC (The) (Financials) | | | 868,502 | |
| | 99,765 | | | Industries Qatar QSC (Industrials) | | | 338,762 | |
| | 711,550 | | | Ooredoo QPSC (Communication Services) | | | 2,111,192 | |
| | 397,873 | | | Qatar International Islamic Bank QSC (Financials) | | | 1,081,143 | |
| | 353,284 | | | Qatar Islamic Bank (Financials) | | | 1,875,123 | |
| | 752,212 | | | Qatar National Bank QPSC (Financials) | | | 3,223,766 | |
| | | | | | | | |
| | | | | | | 9,498,488 | |
| | |
| Romania – 0.1% | |
| | 126,372 | | | NEPI Rockcastle NV (Real Estate) | | | 756,430 | |
| | |
| Russia – 0.0% | |
| | 1,256,908 | | | Gazprom PJSC (Energy)(c) | | | — | |
| | 35,708,229 | | | Inter RAO UES PJSC (Utilities)(c) | | | — | |
| | 62,206 | | | LUKOIL PJSC (Energy)(c) | | | — | |
| | 11,906 | | | MMC Norilsk Nickel PJSC (Materials)*(c) | | | — | |
| | 824,628 | | | Moscow Exchange MICEX-RTS PJSC (Financials)(c) | | | — | |
| | 839,494 | | | Novolipetsk Steel PJSC (Materials)*(c) | | | — | |
| | 127,440 | | | PhosAgro PJSC GDR (Materials)*(c) | | | — | |
| | 820 | | | PhosAgro PJSC (Materials)*(c) | | | — | |
| | 70,023 | | | Polymetal International PLC (Materials)*(c) | | | — | |
| | 11,287 | | | Polyus PJSC (Materials)*(c) | | | — | |
| | 90,086 | | | Rosneft Oil Co. PJSC (Energy)(c) | | | — | |
| | 1,661,273 | | | Sberbank of Russia PJSC (Financials)(c) | | | — | |
| | 152,107 | | | Severstal PAO (Materials)*(c) | | | — | |
| | 3,362,523 | | | Surgutneftegas PJSC (Energy)(c) | | | — | |
| | 277,377 | | | Tatneft PJSC (Energy)(c) | | | — | |
| | 1,366 | | | TCS Group Holding PLC GDR (Financials)*(c) | | | — | |
| | 799,132,583 | | | VTB Bank PJSC (Financials)*(c) | | | — | |
| | 40,500 | | | Yandex NV, Class A (Communication Services)*(c) | | | — | |
| | | | | | | | |
| | | | | | | — | |
| | |
| | |
| 50 | | The accompanying notes are an integral part of these financial statements. |
GOLDMAN SACHS ACTIVEBETA® EMERGING MARKETS EQUITY ETF
| | | | | | | | |
| Shares | | | Description | |
Value | |
|
| Common Stocks – (continued) | |
| Saudi Arabia – 4.0% | |
| | 12,684 | | | ACWA Power Co. (Utilities) | | $ | 652,690 | |
| | 33,713 | | | Advanced Petrochemical Co. (Materials) | | | 382,464 | |
| | 216,865 | | | Al Rajhi Bank (Financials) | | | 4,174,651 | |
| | 78,414 | | | Alinma Bank (Financials) | | | 771,460 | |
| | 31,426 | | | Almarai Co. JSC (Consumer Staples) | | | 531,217 | |
| | 58,345 | | | Arab National Bank (Financials) | | | 401,344 | |
| | 5,200 | | | Arabian Internet & Co.mmunications Services Co. (Information Technology) | | | 489,408 | |
| | 43,996 | | | Bank AlBilad (Financials) | | | 503,227 | |
| | 61,208 | | | Bank Al-Jazira (Financials)* | | | 289,504 | |
| | 47,956 | | | Banque Saudi Fransi (Financials) | | | 490,345 | |
| | 32,869 | | | Bupa Arabia for Cooperative Insurance Co. (Financials) | | | 1,766,731 | |
| | 140,430 | | | Dar Al Arkan Real Estate Development Co. (Real Estate)* | | | 697,161 | |
| | 11,935 | | | Dr Sulaiman Al Habib Medical Services Group Co. (Health Care) | | | 773,254 | |
| | 5,176 | | | Elm Co. (Information Technology) | | | 1,173,023 | |
| | 203,477 | | | Etihad Etisalat Co. (Communication Services) | | | 2,449,438 | |
| | 95,620 | | | Jarir Marketing Co. (Consumer Discretionary) | | | 376,295 | |
| | 186,460 | | | Mobile Telecommunications Co Saudi Arabia (Communication Services) | | | 671,140 | |
| | 21,142 | | | Nahdi Medical Co. (Consumer Staples) | | | 855,680 | |
| | 160,670 | | | Rabigh Refining & Petrochemical Co. (Energy)* | | | 442,087 | |
| | 83,186 | | | Riyad Bank (Financials) | | | 675,353 | |
| | 31,590 | | | SABIC Agri-Nutrients Co. (Materials) | | | 1,158,942 | |
| | 110,087 | | | Sahara International Petrochemical Co. (Materials) | | | 1,069,860 | |
| | 102,725 | | | Saudi Arabian Mining Co. (Materials)* | | | 1,109,238 | |
| | 501,274 | | | Saudi Arabian Oil Co. (Energy)(a) | | | 4,664,382 | |
| | 113,797 | | | Saudi Awwal Bank (Financials) | | | 1,087,711 | |
| | 97,159 | | | Saudi Basic Industries Corp. (Materials) | | | 2,289,965 | |
| | 263,025 | | | Saudi Electricity Co. (Utilities) | | | 1,451,646 | |
| | 92,330 | | | Saudi Investment Bank (The) (Financials) | | | 408,643 | |
| | 315,033 | | | Saudi Kayan Petrochemical Co. (Materials)* | | | 1,023,050 | |
| | 303,315 | | | Saudi National Bank (The) (Financials) | | | 2,891,102 | |
| | 221,239 | | | Saudi Telecom Co. (Communication Services) | | | 2,347,676 | |
| | 113,831 | | | Savola Group (The) (Consumer Staples) | | | 1,150,253 | |
| | | | | | | | |
| | | | | | | 39,218,940 | |
| | |
| South Africa – 3.1% | |
| | 161,189 | | | Absa Group Ltd. (Financials) | | | 1,551,790 | |
| | 54,575 | | | African Rainbow Minerals Ltd. (Materials) | | | 515,919 | |
| | 121,658 | | | Aspen Pharmacare Holdings Ltd. (Health Care) | | | 1,106,391 | |
| | 91,702 | | | Bid Corp. Ltd. (Consumer Staples) | | | 2,057,447 | |
| | 46,635 | | | Bidvest Group Ltd. (The) (Industrials) | | | 701,803 | |
| | 7,777 | | | Capitec Bank Holdings Ltd. (Financials) | | | 650,869 | |
| | 95,507 | | | Clicks Group Ltd. (Consumer Staples) | | | 1,379,518 | |
| | |
|
| Common Stocks – (continued) | |
| South Africa – (continued) | |
| | 31,054 | | | Discovery Ltd. (Financials)* | | | 240,642 | |
| | 586,877 | | | FirstRand Ltd. (Financials) | | | 2,274,981 | |
| | 135,191 | | | Gold Fields Ltd. (Materials) | | | 1,734,029 | |
| | 202,470 | | | Impala Platinum Holdings Ltd. (Materials) | | | 1,042,130 | |
| | 56,544 | | | Kumba Iron Ore Ltd. (Materials)(b) | | | 1,240,414 | |
| | 287,467 | | | MTN Group Ltd. (Communication Services) | | | 1,826,672 | |
| | 9,670 | | | Naspers Ltd., Class N (Consumer Discretionary) | | | 1,642,899 | |
| | 126,320 | | | Nedbank Group Ltd. (Financials)(b) | | | 1,439,721 | |
| | 656,580 | | | Old Mutual Ltd. (Financials) | | | 440,032 | |
| | 304,522 | | | OUTsurance Group Ltd. (Financials) | | | 643,300 | |
| | 321,648 | | | Pepkor Holdings Ltd. (Consumer Discretionary)(a) | | | 276,887 | |
| | 99,899 | | | Remgro Ltd. (Financials) | | | 833,855 | |
| | 277,866 | | | Sanlam Ltd. (Financials) | | | 1,000,083 | |
| | 232,790 | | | Shoprite Holdings Ltd. (Consumer Staples) | | | 3,243,569 | |
| | 378,418 | | | Sibanye Stillwater Ltd. (Materials) | | | 574,372 | |
| | 205,664 | | | Standard Bank Group Ltd. (Financials) | | | 2,098,566 | |
| | 162,742 | | | Vodacom Group Ltd. (Communication Services) | | | 927,032 | |
| | 227,736 | | | Woolworths Holdings Ltd. (Consumer Discretionary) | | | 892,181 | |
| | | | | | | | |
| | | | | | | 30,335,102 | |
| | |
| South Korea – 11.5% | |
| | 16,014 | | | Amorepacific Corp. (Consumer Staples) | | | 1,622,300 | |
| | 10,544 | | | BGF retail Co. Ltd. (Consumer Staples) | | | 1,247,650 | |
| | 4,589 | | | Celltrion, Inc. (Health Care) | | | 499,608 | |
| | 3,655 | | | CJ CheilJedang Corp. (Consumer Staples) | | | 826,817 | |
| | 4,100 | | | CosmoAM&T Co. Ltd. (Information Technology)* | | | 489,177 | |
| | 44,635 | | | Coway Co. Ltd. (Consumer Discretionary) | | | 1,458,848 | |
| | 9,688 | | | DB Insurance Co. Ltd. (Financials) | | | 598,835 | |
| | 16,254 | | | Doosan Bobcat, Inc. (Industrials) | | | 661,596 | |
| | 31,222 | | | Doosan Enerbility Co. Ltd. (Industrials)* | | | 430,388 | |
| | 5,900 | | | Ecopro BM Co. Ltd. (Industrials) | | | 1,448,496 | |
| | 1,100 | | | Ecopro Co. Ltd. (Materials) | | | 1,046,113 | |
| | 16,785 | | | F&F Co. Ltd. (Consumer Discretionary) | | | 1,308,005 | |
| | 46,872 | | | GS Holdings Corp. (Industrials) | | | 1,331,601 | |
| | 47,866 | | | Hana Financial Group, Inc. (Financials) | | | 1,432,268 | |
| | 39,739 | | | Hankook Tire & Technology Co. Ltd. (Consumer Discretionary) | | | 1,165,036 | |
| | 6,573 | | | Hanmi Pharm Co. Ltd. (Health Care) | | | 1,464,534 | |
| | 4,900 | | | Hanwha Aerospace Co. Ltd. (Industrials) | | | 423,363 | |
| | 7,790 | | | HD Hyundai Co. Ltd. (Energy) | | | 348,318 | |
| | 75,016 | | | HMM Co. Ltd. (Industrials) | | | 945,539 | |
| | 27,750 | | | Hotel Shilla Co. Ltd. (Consumer Discretionary) | | | 1,851,750 | |
| | 1,900 | | | HYBE Co. Ltd. (Communication Services)* | | | 362,966 | |
| | |
| | |
| The accompanying notes are an integral part of these financial statements. | | 51 |
GOLDMAN SACHS ACTIVEBETA® EMERGING MARKETS EQUITY ETF
Schedule of Investments (continued)
August 31, 2023
| | | | | | | | |
| Shares | | | Description | |
Value | |
|
| Common Stocks – (continued) | |
| South Korea – (continued) | |
| | 7,117 | | | Hyundai Mobis Co. Ltd. (Consumer Discretionary) | | $ | 1,243,826 | |
| | 12,167 | | | Hyundai Motor Co. (Consumer Discretionary) | | | 1,740,707 | |
| | 21,533 | | | Hyundai Steel Co. (Materials) | | | 589,744 | |
| | 170,782 | | | Industrial Bank of Korea (Financials) | | | 1,390,289 | |
| | 13,800 | | | JYP Entertainment Corp. (Communication Services) | | | 1,171,447 | |
| | 15,826 | | | Kakao Corp. (Communication Services) | | | 575,926 | |
| | 66,160 | | | Kangwon Land, Inc. (Consumer Discretionary) | | | 776,351 | |
| | 47,226 | | | KB Financial Group, Inc. (Financials) | | | 1,932,988 | |
| | 39,668 | | | Kia Corp. (Consumer Discretionary) | | | 2,406,940 | |
| | 16,440 | | | Korea Aerospace Industries Ltd. (Industrials) | | | 629,366 | |
| | 47,244 | | | Korea Electric Power Corp. (Utilities)*(b) | | | 636,950 | |
| | 6,270 | | | Korea Investment Holdings Co. Ltd. (Financials) | | | 246,673 | |
| | 1,215 | | | Korea Zinc Co. Ltd. (Materials) | | | 484,437 | |
| | 25,546 | | | Korean Air Lines Co. Ltd. (Industrials) | | | 440,665 | |
| | 15,700 | | | KT Corp. (Communication Services) | | | 391,980 | |
| | 20,978 | | | KT&G Corp. (Consumer Staples) | | | 1,379,223 | |
| | 3,769 | | | Kumho Petrochemical Co. Ltd. (Materials) | | | 355,870 | |
| | 1,908 | | | L&F Co. Ltd. (Information Technology)(b) | | | 310,361 | |
| | 2,476 | | | LG Chem Ltd. (Materials) | | | 1,092,119 | |
| | 6,003 | | | LG Corp. (Industrials) | | | 372,874 | |
| | 33,065 | | | LG Electronics, Inc. (Consumer Discretionary) | | | 2,464,084 | |
| | 2,108 | | | LG Energy Solution Ltd. (Industrials)* | | | 867,601 | |
| | 3,486 | | | LG H&H Co. Ltd. (Consumer Staples) | | | 1,225,078 | |
| | 2,760 | | | LG Innotek Co. Ltd. (Information Technology) | | | 563,798 | |
| | 227,347 | | | LG Uplus Corp. (Communication Services) | | | 1,797,447 | |
| | 75,855 | | | Mirae Asset Securities Co. Ltd. (Financials) | | | 382,216 | |
| | 8,751 | | | NAVER Corp. (Communication Services) | | | 1,420,155 | |
| | 4,105 | | | NCSoft Corp. (Communication Services) | | | 781,091 | |
| | 93,120 | | | NH Investment & Securities Co. Ltd. (Financials) | | | 725,656 | |
| | 20,495 | | | Orion Corp. (Consumer Staples) | | | 1,888,626 | |
| | 11,187 | | | Pearl Abyss Corp. (Communication Services)* | | | 408,801 | |
| | 3,704 | | | POSCO Future M Co. Ltd. (Industrials) | | | 1,259,654 | |
| | 8,723 | | | POSCO Holdings, Inc. (Materials) | | | 3,821,159 | |
| | 1,176 | | | Samsung Biologics Co. Ltd. (Health Care)*(a) | | | 655,731 | |
| | 14,728 | | | Samsung C&T Corp. (Industrials) | | | 1,166,651 | |
| | 10,125 | | | Samsung Electro-Mechanics Co. Ltd. (Information Technology) | | | 1,037,204 | |
| | 639,989 | | | Samsung Electronics Co. Ltd. (Information Technology) | | | 32,392,861 | |
| | |
|
| Common Stocks – (continued) | |
| South Korea – (continued) | |
| | 26,174 | | | Samsung Engineering Co. Ltd. (Industrials)* | | | 673,286 | |
| | 10,792 | | | Samsung Fire & Marine Insurance Co. Ltd. (Financials) | | | 2,012,656 | |
| | 130,164 | | | Samsung Heavy Industries Co. Ltd. (Industrials)* | | | 867,596 | |
| | 7,237 | | | Samsung Life Insurance Co. Ltd. (Financials) | | | 370,131 | |
| | 3,702 | | | Samsung SDI Co. Ltd. (Information Technology) | | | 1,719,711 | |
| | 11,776 | | | Samsung SDS Co. Ltd. (Information Technology) | | | 1,265,135 | |
| | 46,896 | | | Samsung Securities Co. Ltd. (Financials) | | | 1,325,187 | |
| | 58,177 | | | Shinhan Financial Group Co. Ltd. (Financials) | | | 1,564,738 | |
| | 19,611 | | | SK Biopharmaceuticals Co. Ltd. (Health Care)* | | | 1,271,544 | |
| | 58,092 | | | SK Hynix, Inc. (Information Technology) | | | 5,353,210 | |
| | 18,509 | | | SK Square Co. Ltd. (Industrials)* | | | 631,554 | |
| | 2,379 | | | SK, Inc. (Industrials) | | | 260,084 | |
| | 119,585 | | | Woori Financial Group, Inc. (Financials) | | | 1,077,554 | |
| | 24,700 | | | Yuhan Corp. (Health Care) | | | 1,360,439 | |
| | | | | | | | |
| | | | | | | 111,742,582 | |
| | |
| Taiwan – 14.6% | |
| | 165,041 | | | Accton Technology Corp. (Information Technology) | | | 2,477,183 | |
| | 604,164 | | | Acer, Inc. (Information Technology) | | | 694,343 | |
| | 195,111 | | | Advantech Co. Ltd. (Information Technology) | | | 2,107,553 | |
| | 489,594 | | | ASE Technology Holding Co. Ltd. (Information Technology) | | | 1,814,080 | |
| | 471,030 | | | Asia Cement Corp. (Materials) | | | 590,146 | |
| | 89,946 | | | Asustek Computer, Inc. (Information Technology) | | | 1,136,805 | |
| | 352,602 | | | AUO Corp. (Information Technology)* | | | 197,080 | |
| | 205,634 | | | Catcher Technology Co. Ltd. (Information Technology) | | | 1,165,495 | |
| | 865,380 | | | Cathay Financial Holding Co. Ltd. (Financials)* | | | 1,239,110 | |
| | 251,561 | | | Chailease Holding Co. Ltd. (Financials) | | | 1,402,103 | |
| | 372,147 | | | Cheng Shin Rubber Industry Co. Ltd. (Consumer Discretionary) | | | 463,336 | |
| | 3,776,462 | | | China Development Financial Holding Corp. (Financials)* | | | 1,405,212 | |
| | 761,298 | | | China Steel Corp. (Materials) | | | 633,489 | |
| | 427,526 | | | Chunghwa Telecom Co. Ltd. (Communication Services) | | | 1,557,252 | |
| | 1,503,791 | | | Compal Electronics, Inc. (Information Technology) | | | 1,506,317 | |
| | 2,058,860 | | | CTBC Financial Holding Co. Ltd. (Financials) | | | 1,541,890 | |
| | |
| | |
| 52 | | The accompanying notes are an integral part of these financial statements. |
GOLDMAN SACHS ACTIVEBETA® EMERGING MARKETS EQUITY ETF
| | | | | | | | |
| Shares | | | Description | |
Value | |
|
| Common Stocks – (continued) | |
| Taiwan – (continued) | |
| | 268,724 | | | Delta Electronics, Inc. (Information Technology) | | $ | 2,919,583 | |
| | 62,296 | | | E Ink Holdings, Inc. (Information Technology) | | | 356,994 | |
| | 13,118 | | | eMemory Technology, Inc. (Information Technology) | | | 747,623 | |
| | 994,678 | | | E.Sun Financial Holding Co. Ltd. (Financials) | | | 763,659 | |
| | 374,493 | | | Evergreen Marine Corp. Taiwan Ltd. (Industrials) | | | 1,252,367 | |
| | 875,460 | | | Far Eastern New Century Corp. (Industrials) | | | 773,843 | |
| | 296,107 | | | Feng TAY Enterprise Co. Ltd. (Consumer Discretionary) | | | 1,562,055 | |
| | 1,100,163 | | | First Financial Holding Co. Ltd. (Financials) | | | 908,555 | |
| | 363,501 | | | Formosa Plastics Corp. (Materials) | | | 907,426 | |
| | 1,063,854 | | | Fubon Financial Holding Co. Ltd. (Financials) | | | 2,124,601 | |
| | 38,400 | | | Gigabyte Technology Co. Ltd. (Information Technology) | | | 411,172 | |
| | 18,500 | | | Global Unichip Corp. (Information Technology) | | | 848,131 | |
| | 32,531 | | | Globalwafers Co. Ltd. (Information Technology) | | | 468,866 | |
| | 1,253,332 | | | Hon Hai Precision Industry Co. Ltd. (Information Technology) | | | 4,191,351 | |
| | 924,069 | | | Hua Nan Financial Holdings Co. Ltd. (Financials) | | | 594,835 | |
| | 866,643 | | | Inventec Corp. (Information Technology) | | | 1,534,821 | |
| | 9,942 | | | Largan Precision Co. Ltd. (Information Technology) | | | 639,979 | |
| | 506,746 | | | Lite-On Technology Corp. (Information Technology) | | | 2,179,963 | |
| | 197,975 | | | MediaTek, Inc. (Information Technology) | | | 4,382,660 | |
| | 814,984 | | | Mega Financial Holding Co. Ltd. (Financials) | | | 918,717 | |
| | 401,790 | | | Micro-Star International Co. Ltd. (Information Technology) | | | 2,012,325 | |
| | 35,400 | | | momo.com, Inc. (Consumer Discretionary) | | | 578,023 | |
| | 458,279 | | | Nan Ya Plastics Corp. (Materials) | | | 951,195 | |
| | 53,325 | | | Nan Ya Printed Circuit Board Corp. (Information Technology) | | | 404,377 | |
| | 527,993 | | | Nanya Technology Corp. (Information Technology) | | | 1,104,182 | |
| | 132,392 | | | Nien Made Enterprise Co. Ltd. (Consumer Discretionary) | | | 1,243,000 | |
| | 212,013 | | | Novatek Microelectronics Corp. (Information Technology) | | | 2,659,608 | |
| | 553,788 | | | Pegatron Corp. (Information Technology) | | | 1,356,365 | |
| | 834,332 | | | Pou Chen Corp. (Consumer Discretionary) | | | 749,278 | |
| | |
| | 364,696 | | | President Chain Store Corp. (Consumer Staples) | | | 3,063,325 | |
| | 273,239 | | | Quanta Computer, Inc. (Information Technology) | | | 2,174,998 | |
| | 172,715 | | | Realtek Semiconductor Corp. (Information Technology) | | | 2,266,964 | |
| | 1,733,814 | | | SinoPac Financial Holdings Co. Ltd. (Financials) | | | 930,973 | |
| | 419,822 | | | Synnex Technology International Corp. (Information Technology) | | | 805,461 | |
| | 2,258,175 | | | Taishin Financial Holding Co. Ltd. (Financials) | | | 1,262,164 | |
| | 1,068,709 | | | Taiwan Business Bank (Financials) | | | 448,001 | |
| | 403,204 | | | Taiwan Cement Corp. (Materials) | | | 442,497 | |
| | 719,347 | | | Taiwan Cooperative Financial Holding Co. Ltd. (Financials) | | | 592,934 | |
| | 191,405 | | | Taiwan Mobile Co. Ltd. (Communication Services) | | | 560,154 | |
| | 3,194,226 | | | Taiwan Semiconductor Manufacturing Co. Ltd. (Information Technology) | | | 55,065,080 | |
| | 101,505 | | | Unimicron Technology Corp. (Information Technology) | | | 591,248 | |
| | 1,508,668 | | | Uni-President Enterprises Corp. (Consumer Staples) | | | 3,349,280 | |
| | 2,136,725 | | | United Microelectronics Corp. (Information Technology) | | | 3,052,800 | |
| | 197,309 | | | Vanguard International Semiconductor Corp. (Information Technology) | | | 423,161 | |
| | 9,300 | | | Voltronic Power Technology Corp. (Industrials) | | | 423,437 | |
| | 316,742 | | | Walsin Lihwa Corp. (Industrials) | | | 377,944 | |
| | 637,533 | | | Winbond Electronics Corp. (Information Technology)* | | | 527,499 | |
| | 498,000 | | | Wistron Corp. (Information Technology) | | | 1,829,589 | |
| | 407,391 | | | WPG Holdings Ltd. (Information Technology) | | | 702,299 | |
| | 474,306 | | | Yang Ming Marine Transport Corp. (Industrials) | | | 629,251 | |
| | 2,652,694 | | | Yuanta Financial Holding Co. Ltd. (Financials) | | | 2,032,429 | |
| | 104,950 | | | Zhen Ding Technology Holding Ltd. (Information Technology) | | | 318,674 | |
| | | | | | | | |
| | | | | | | 141,347,110 | |
| | |
| Thailand – 1.7% | |
| | 298,616 | | | Advanced Info Service PCL NVDR (Communication Services) | | | 1,841,966 | |
| | 329,200 | | | Airports of Thailand PCL NVDR (Industrials)* | | | 681,574 | |
| | 2,618,900 | | | Asset World Corp. PCL NVDR (Consumer Discretionary) | | | 326,077 | |
| | 1,734,200 | | | Bangkok Dusit Medical Services PCL NVDR (Health Care) | | | 1,386,667 | |
| | 356,000 | | | Berli Jucker PCL NVDR (Consumer Staples) | | | 343,114 | |
| | |
| | |
| The accompanying notes are an integral part of these financial statements. | | 53 |
GOLDMAN SACHS ACTIVEBETA® EMERGING MARKETS EQUITY ETF
Schedule of Investments (continued)
August 31, 2023
| | | | | | | | |
| Shares | | | Description | | Value | |
|
| Common Stocks – (continued) | |
| Thailand – (continued) | |
| | 192,400 | | | Bumrungrad Hospital PCL NVDR (Health Care) | | $ | 1,423,049 | |
| | 215,200 | | | Central Pattana PCL NVDR (Real Estate) | | | 422,503 | |
| | 759,100 | | | Charoen Pokphand Foods PCL NVDR (Consumer Staples) | | | 448,729 | |
| | 906,377 | | | CP ALL PCL NVDR (Consumer Staples) | | | 1,688,901 | |
| | 553,500 | | | Delta Electronics Thailand PCL NVDR (Information Technology) | | | 1,714,993 | |
| | 137,700 | | | Electricity Generating PCL NVDR (Utilities) | | | 524,965 | |
| | 301,800 | | | Gulf Energy Development PCL NVDR (Utilities) | | | 413,690 | |
| | 320,200 | | | Indorama Ventures PCL NVDR (Materials) | | | 265,176 | |
| | 289,900 | | | Intouch Holdings PCL NVDR (Communication Services) | | | 602,277 | |
| | 1,244,900 | | | Krung Thai Bank PCL NVDR (Financials) | | | 686,130 | |
| | 314,400 | | | Krungthai Card PCL NVDR (Financials) | | | 435,451 | |
| | 209,400 | | | Muangthai Capital PCL NVDR (Financials) | | | 243,680 | |
| | 197,400 | | | PTT Exploration & Production PCL NVDR (Energy) | | | 893,493 | |
| | 371,400 | | | PTT Global Chemical PCL NVDR (Materials) | | | 395,078 | |
| | 765,400 | | | PTT PCL NVDR (Energy) | | | 759,553 | |
| | 544,900 | | | Ratch Group PCL NVDR (Utilities) | | | 552,408 | |
| | 59,900 | | | Siam Cement PCL (The) NVDR (Materials) | | | 535,409 | |
| | 257,200 | | | Thai Oil PCL NVDR (Energy) | | | 378,262 | |
| | | | | | | | |
| | | | | | | 16,963,145 | |
| | |
| Turkey – 0.8% | |
| | 284,352 | | | BIM Birlesik Magazalar AS (Consumer Staples) | | | 2,690,179 | |
| | 361,212 | | | KOC Holding AS (Industrials) | | | 1,921,402 | |
| | 120,931 | | | Sasa Polyester Sanayi AS (Materials)* | | | 239,297 | |
| | 51,200 | | | Tofas Turk Otomobil Fabrikasi AS (Consumer Discretionary) | | | 518,385 | |
| | 118,157 | | | Turk Hava Yollari AO (Industrials)* | | | 1,085,939 | |
| | 186,866 | | | Turkiye Petrol Rafinerileri AS (Energy) | | | 989,093 | |
| | 359,910 | | | Turkiye Sise ve Cam Fabrikalari AS (Industrials) | | | 691,938 | |
| | | | | | | | |
| | | | | | | 8,136,233 | |
| | |
| United Arab Emirates – 1.5% | |
| | 541,952 | | | Abu Dhabi Commercial Bank PJSC (Financials) | | | 1,273,341 | |
| | 467,812 | | | Abu Dhabi Islamic Bank PJSC (Financials) | | | 1,327,126 | |
| | 1,253,866 | | | Abu Dhabi National Oil Co. for Distribution PJSC (Consumer Discretionary) | | | 1,300,617 | |
| | |
| | 655,375 | | | Aldar Properties PJSC (Real Estate) | | | 938,531 | |
| | 864,300 | | | Americana Restaurants International PLC (Consumer Discretionary) | | | 1,037,711 | |
| | 1,147,756 | | | Dubai Islamic Bank PJSC (Financials) | | | 1,762,389 | |
| | 1,020,176 | | | Emaar Properties PJSC (Real Estate) | | | 1,960,889 | |
| | 525,902 | | | Emirates NBD Bank PJSC (Financials) | | | 2,340,970 | |
| | 184,606 | | | Emirates Telecommunications Group Co. PJSC (Communication Services) | | | 997,150 | |
| | 447,660 | | | First Abu Dhabi Bank PJSC (Financials) | | | 1,667,276 | |
| | | | | | | | |
| | | | | | | 14,606,000 | |
| | |
| United Kingdom – 0.0% | |
| | 59,800 | | | Pepco Group NV (Consumer Discretionary)* | | | 469,549 | |
| | |
| United States – 0.1% | |
| | 133,272 | | | JBS SA (Consumer Staples) | | | 495,300 | |
| | 10,986 | | | Parade Technologies Ltd. (Information Technology) | | | 309,780 | |
| | | | | | | | |
| | | | | | | 805,080 | |
| | |
| | TOTAL COMMON STOCKS | | | | |
| | (Cost $881,888,114) | | $ | 944,452,011 | |
| | |
| | | | | | | | | | | | |
| Shares | | | Description | | Rate | | | Value | |
|
| Preferred Stocks – 2.1% | |
| Brazil – 1.3% | |
| | 585,774 | | | Banco Bradesco SA (Financials) | | | 6.74 | % | | | 1,768,816 | |
| | 42,106 | | | Centrais Eletricas Brasileiras SA, Class B (Utilities) | | | 3.86 | | | | 329,469 | |
| | 262,346 | | | Cia Energetica de Minas Gerais (Utilities) | | | 9.16 | | | | 653,355 | |
| | 111,984 | | | Gerdau SA (Materials) | | | 14.91 | | | | 584,693 | |
| | 643,983 | | | Itau Unibanco Holding SA (Financials) | | | 4.47 | | | | 3,567,892 | |
| | 820,299 | | | Itausa SA (Financials) | | | 6.42 | | | | 1,530,931 | |
| | 687,712 | | | Petroleo Brasileiro SA (Energy) | | | 11.38 | | | | 4,436,628 | |
| | | | | | | | | | | | |
| | | | | | | | | | | 12,871,784 | |
| | |
| Chile – 0.1% | |
| | 13,089 | | | Sociedad Quimica y Minera de Chile SA, Class B (Industrials) | | | 14.38 | | | | 806,746 | |
| | |
| Colombia – 0.1% | |
| | 81,467 | | | Bancolombia SA (Financials) | | | 12.24 | | | | 541,058 | |
| | |
| Russia – 0.0% | |
| | 3,212,489 | | | Surgutneftegas PJSC (Energy)(c) | | | 1.61 | | | | — | |
| | |
| | |
| 54 | | The accompanying notes are an integral part of these financial statements. |
GOLDMAN SACHS ACTIVEBETA® EMERGING MARKETS EQUITY ETF
| | | | | | | | | | | | |
| Shares | | | Description | | Rate | | |
Value | |
|
| Preferred Stocks – (continued) | |
| South Korea – 0.6% | |
| | 9,748 | | | Hyundai Motor Co. (Consumer Discretionary) | | | 7.34 | % | | $ | 767,745 | |
| | 9,479 | | | Hyundai Motor Co. (Consumer Discretionary) | | | 7.42 | | | | 730,064 | |
| | 114,688 | | | Samsung Electronics Co. Ltd. (Information Technology) | | | 2.54 | | | | 4,685,570 | |
| | | | | | | | | | | | |
| | | | | | | | | | | 6,183,379 | |
| | |
| | TOTAL PREFERRED STOCKS | | | | | | | | |
| | (Cost $17,487,554) | | | | | | $ | 20,402,967 | |
| | |
| | | | | | | | |
| Shares | | | Description | | Value | |
|
| Exchange-Traded Fund – 0.6% | |
| United States – 0.6% | | | |
| | 257,264 | | | iShares MSCI Malaysia ETF | | | | |
| | (Cost $7,732,869) | | $ | 5,423,125 | |
| | |
| TOTAL INVESTMENTS BEFORE SECURITIES LENDING
REINVESTMENT VEHICLE |
|
| | (Cost $907,108,537) | | $ | 970,278,103 | |
| | |
| | |
| Shares | | | Dividend
Rate | | Value | |
|
| Securities Lending Reinvestment Vehicle – 0.6%(d) | |
| Goldman Sachs Financial Square Government Fund –
Institutional Shares |
|
| | 5,450,496 | | | 5.234% | | $ | 5,450,496 | |
| (Cost $5,450,496) | | | |
| | |
| | TOTAL INVESTMENTS – 100.7% | | | | |
| | (Cost $912,559,033) | | $ | 975,728,599 | |
| | |
| LIABILITIES IN EXCESS OF OTHER
ASSETS – (0.7)% | | | (6,020,986 | ) |
| | |
| | NET ASSETS – 100.0% | | $ | 969,707,613 | |
| | |
| | |
|
| The percentage shown for each investment category reflects the value of investments in that category as a percentage of net assets. |
| |
* | | Non-income producing security. |
| |
(a) | | Exempt from registration under Rule 144A of the Securities Act of 1933. |
| |
(b) | | All or a portion of security is on loan. |
| |
(c) | | Significant unobservable inputs were used in the valuation of this portfolio security; i.e. Level 3. |
| |
(d) | | Represents an affiliated issuer. |
| | |
|
Investment Abbreviations: |
ADR | | —American Depositary Receipt |
GDR | | —Global Depositary Receipt |
NVDR | | —Non-Voting Depository Receipt |
PLC | | —Public Limited Company |
|
| | | | |
| Sector Name | | % of Market
Value | |
| |
Financials | | | 20.7 | % |
Information Technology | | | 20.5 | |
Consumer Discretionary | | | 11.8 | |
Consumer Staples | | | 11.0 | |
Communication Services | | | 8.9 | |
Materials | | | 7.2 | |
Industrials | | | 5.7 | |
Health Care | | | 4.8 | |
Energy | | | 4.7 | |
Utilities | | | 2.5 | |
Real Estate | | | 1.0 | |
Exchange-Traded Fund | | | 0.6 | |
Securities Lending Reinvestment Vehicle | | | 0.6 | |
| |
| |
| TOTAL INVESTMENTS | | | 100.0 | % |
| |
| | |
| The accompanying notes are an integral part of these financial statements. | | 55 |
GOLDMAN SACHS ACTIVEBETA® EUROPE EQUITY ETF
Schedule of Investments
August 31, 2023
| | | | | | | | |
| Shares | | | Description | | Value | |
|
| Common Stocks – 98.9% | |
| Australia – 1.1% | |
| | 87 | | | Flutter Entertainment PLC (Consumer Discretionary)* | | $ | 15,854 | |
| | 10,452 | | | Glencore PLC (Materials) | | | 55,818 | |
| | 935 | | | Rio Tinto PLC (Materials) | | | 57,729 | |
| | | | | | | | |
| | | | | | | 129,401 | |
| | |
| Austria – 0.8% | |
| | 395 | | | Erste Group Bank AG (Financials) | | | 14,135 | |
| | 292 | | | Mondi PLC (Materials) | | | 4,862 | |
| | 686 | | | OMV AG (Energy) | | | 31,844 | |
| | 1,507 | | | voestalpine AG (Materials) | | | 44,129 | |
| | | | | | | | |
| | | | | | | 94,970 | |
| | |
| Belgium – 1.2% | |
| | 497 | | | Ageas SA/NV (Financials) | | | 19,786 | |
| | 694 | | | Anheuser-Busch InBev SA/NV (Consumer Staples) | | | 39,545 | |
| | 20 | | | D’ieteren Group (Consumer Discretionary) | | | 3,273 | |
| | 50 | | | Elia Group SA/NV (Utilities) | | | 5,779 | |
| | 119 | | | Groupe Bruxelles Lambert NV (Financials) | | | 9,604 | |
| | 164 | | | KBC Group NV (Financials) | | | 10,780 | |
| | 1 | | | Lotus Bakeries NV (Consumer Staples) | | | 7,891 | |
| | 133 | | | Solvay SA (Materials) | | | 15,431 | |
| | 256 | | | UCB SA (Health Care) | | | 23,006 | |
| | | | | | | | |
| | | | | | | 135,095 | |
| | |
| Brazil – 0.1% | |
| | 247 | | | Yara International ASA (Materials) | | | 9,030 | |
| | |
| Chile – 0.0% | |
| | 153 | | | Antofagasta PLC (Materials) | | | 2,807 | |
| | |
| China – 0.2% | |
| | 309 | | | Prosus NV (Consumer Discretionary)* | | | 21,390 | |
| | |
| Denmark – 4.9% | |
| | 19 | | | AP Moller – Maersk A/S, Class A (Industrials)(a) | | | 34,088 | |
| | 20 | | | AP Moller – Maersk A/S, Class B (Industrials) | | | 36,421 | |
| | 158 | | | Carlsberg AS, Class B (Consumer Staples) | | | 22,917 | |
| | 75 | | | Chr Hansen Holding A/S (Materials) | | | 4,908 | |
| | 80 | | | Coloplast A/S, Class B (Health Care) | | | 9,148 | |
| | 1,010 | | | Danske Bank A/S (Financials) | | | 22,746 | |
| | 82 | | | Demant A/S (Health Care)* | | | 3,364 | |
| | 64 | | | DSV A/S (Industrials) | | | 12,186 | |
| | 56 | | | Genmab A/S (Health Care)* | | | 21,529 | |
| | 1,834 | | | Novo Nordisk A/S, Class B (Health Care) | | | 340,255 | |
| | 171 | | | Novozymes A/S, Class B (Materials) | | | 7,433 | |
| | 36 | | | Orsted AS (Utilities)(b) | | | 2,320 | |
| | 304 | | | Pandora A/S (Consumer Discretionary) | | | 31,600 | |
| | 33 | | | ROCKWOOL A/S, Class B (Industrials) | | | 8,451 | |
| | 679 | | | Tryg A/S (Financials) | | | 12,978 | |
| | 134 | | | Vestas Wind Systems A/S (Industrials)* | | | 3,102 | |
| | | | | | | | |
| | | | | | | 573,446 | |
| | |
|
| Common Stocks – (continued) | |
| Finland – 1.3% | |
| | 275 | | | Elisa OYJ (Communication Services) | | $ | 13,512 | |
| | 120 | | | Kesko OYJ, Class B (Consumer Staples) | | | 2,347 | |
| | 147 | | | Kone OYJ, Class B (Industrials) | | | 6,701 | |
| | 499 | | | Metso Corp. (Industrials) | | | 5,754 | |
| | 5,674 | | | Nokia OYJ (Information Technology) | | | 22,706 | |
| | 2,526 | | | Nordea Bank Abp (Financials) | | | 27,724 | |
| | 1,185 | | | Orion OYJ, Class B (Health Care) | | | 48,603 | |
| | 339 | | | Sampo OYJ, Class A (Financials) | | | 14,912 | |
| | 271 | | | UPM-Kymmene OYJ (Materials) | | | 9,300 | |
| | 307 | | | Wartsila OYJ Abp (Industrials) | | | 3,907 | |
| | | | | | | | |
| | | | | | | 155,466 | |
| | |
| France – 17.2% | |
| | 277 | | | Accor SA (Consumer Discretionary) | | | 9,948 | |
| | 49 | | | Aeroports de Paris (Industrials) | | | 6,467 | |
| | 380 | | | Air Liquide SA (Materials) | | | 68,819 | |
| | 328 | | | Airbus SE (Industrials) | | | 48,195 | |
| | 250 | | | Alstom SA (Industrials) | | | 6,922 | |
| | 75 | | | Amundi SA (Financials)(b) | | | 4,481 | |
| | 178 | | | Arkema SA (Materials) | | | 18,670 | |
| | 2,173 | | | AXA SA (Financials) | | | 65,506 | |
| | 195 | | | BioMerieux (Health Care) | | | 20,233 | |
| | 925 | | | BNP Paribas SA (Financials) | | | 59,946 | |
| | 3,352 | | | Bollore SE (Communication Services) | | | 19,882 | |
| | 416 | | | Bouygues SA (Industrials) | | | 14,403 | |
| | 636 | | | Bureau Veritas SA (Industrials) | | | 17,078 | |
| | 200 | | | Capgemini SE (Information Technology) | | | 37,412 | |
| | 2,474 | | | Carrefour SA (Consumer Staples) | | | 47,447 | |
| | 1,005 | | | Cie de Saint-Gobain SA (Industrials) | | | 65,621 | |
| | 555 | | | Cie Generale des Etablissements Michelin (Consumer Discretionary) | | | 17,414 | |
| | 63 | | | Covivio SA REIT (Real Estate) | | | 3,081 | |
| | 2,908 | | | Credit Agricole SA (Financials) | | | 36,789 | |
| | 725 | | | Danone SA (Consumer Staples) | | | 42,358 | |
| | 117 | | | Dassault Aviation SA (Industrials) | | | 23,061 | |
| | 561 | | | Dassault Systemes (Information Technology) | | | 22,291 | |
| | 350 | | | Edenred (Financials) | | | 22,352 | |
| | 646 | | | Eiffage SA (Industrials) | | | 64,028 | |
| | 2,280 | | | Engie SA (Utilities) | | | 36,847 | |
| | 240 | | | EssilorLuxottica SA (Health Care) | | | 45,298 | |
| | 636 | | | Eurazeo SE (Financials) | | | 37,586 | |
| | 50 | | | Gecina SA REIT (Real Estate) | | | 5,364 | |
| | 596 | | | Getlink SE (Industrials) | | | 9,997 | |
| | 41 | | | Hermes International SCA (Consumer Discretionary) | | | 84,584 | |
| | 524 | | | Ipsen SA (Health Care) | | | 68,133 | |
| | 59 | | | Kering (Consumer Discretionary) | | | 31,646 | |
| | 135 | | | Klepierre SA REIT (Real Estate) | | | 3,575 | |
| | 1,582 | | | La Francaise des Jeux SAEM (Consumer Discretionary)(b) | | | 57,349 | |
| | 292 | | | Legrand SA (Industrials) | | | 28,872 | |
| | 294 | | | L’Oreal SA (Consumer Staples) | | | 129,488 | |
| | 280 | | | LVMH Moet Hennessy Louis Vuitton SE (Consumer Discretionary) | | | 237,709 | |
| | 1,326 | | | Orange SA (Communication Services) | | | 14,907 | |
| | |
| | |
| 56 | | The accompanying notes are an integral part of these financial statements. |
GOLDMAN SACHS ACTIVEBETA® EUROPE EQUITY ETF
| | | | | | | | |
| Shares | | | Description | | Value | |
|
| Common Stocks – (continued) | |
| France – (continued) | |
| | 145 | | | Pernod Ricard SA (Consumer Staples) | | $ | 28,516 | |
| | | | | | | | |
| | 304 | | | Publicis Groupe SA (Communication Services) | | | 23,776 | |
| | 77 | | | Remy Cointreau SA (Consumer Staples)* | | | 11,947 | |
| | 270 | | | Renault SA (Consumer Discretionary) | | | 10,941 | |
| | 243 | | | Safran SA (Industrials) | | | 39,113 | |
| | 33 | | | Sartorius Stedim Biotech (Health Care) | | | 9,388 | |
| | 164 | | | SEB SA (Consumer Discretionary) | | | 18,067 | |
| | 822 | | | Societe Generale SA (Financials) | | | 23,388 | |
| | 158 | | | Sodexo SA (Consumer Discretionary) | | | 16,980 | |
| | 161 | | | Thales SA (Industrials) | | | 23,555 | |
| | 2,339 | | | TotalEnergies SE (Energy) | | | 147,418 | |
| | 684 | | | Valeo SE (Consumer Discretionary) | | | 13,363 | |
| | 589 | | | Veolia Environnement SA (Utilities) | | | 18,449 | |
| | 479 | | | Vinci SA (Industrials) | | | 53,527 | |
| | 1,102 | | | Vivendi SE (Communication Services) | | | 10,059 | |
| | 96 | | | Wendel SE (Financials) | | | 8,799 | |
| | | | | | | | |
| | | | | | | 1,991,045 | |
| | |
| Germany – 13.3% | |
| | 276 | | | adidas AG (Consumer Discretionary) | | | 55,244 | |
| | 293 | | | Allianz SE (Financials) | | | 71,345 | |
| | 463 | | | BASF SE (Materials) | | | 23,513 | |
| | 933 | | | Bayer AG (Health Care) | | | 51,178 | |
| | 467 | | | Bayerische Motoren Werke AG (Consumer Discretionary) | | | 49,251 | |
| | 94 | | | Bechtle AG (Information Technology) | | | 4,585 | |
| | 198 | | | Beiersdorf AG (Consumer Staples) | | | 25,960 | |
| | 253 | | | Brenntag SE (Industrials) | | | 20,523 | |
| | 60 | | | Carl Zeiss Meditec AG (Health Care) | | | 5,973 | |
| | 2,520 | | | Commerzbank AG (Financials) | | | 27,761 | |
| | 62 | | | Covestro AG (Materials)*(b) | | | 3,302 | |
| | 388 | | | Daimler Truck Holding AG (Industrials) | | | 13,682 | |
| | 4,183 | | | Deutsche Bank AG (Financials) | | | 45,636 | |
| | 141 | | | Deutsche Boerse AG (Financials) | | | 25,075 | |
| | 4,457 | | | Deutsche Lufthansa AG (Industrials)* | | | 39,894 | |
| | 2,578 | | | Deutsche Telekom AG (Communication Services) | | | 55,239 | |
| | 1,698 | | | DHL Group (Industrials) | | | 79,402 | |
| | 4,746 | | | E.ON SE (Utilities) | | | 58,619 | |
| | 262 | | | Evonik Industries AG (Materials) | | | 5,035 | |
| | 844 | | | Fresenius Medical Care AG & Co. KGaA (Health Care) | | | 40,809 | |
| | 1,302 | | | Fresenius SE & Co. KGaA (Health Care) | | | 41,843 | |
| | 236 | | | GEA Group AG (Industrials) | | | 9,324 | |
| | 94 | | | Hannover Rueck SE (Financials) | | | 20,022 | |
| | 437 | | | Heidelberg Materials AG (Materials) | | | 35,231 | |
| | 1,703 | | | HelloFresh SE (Consumer Staples)* | | | 55,118 | |
| | 142 | | | Henkel AG & Co. KGaA (Consumer Staples) | | | 9,830 | |
| | 681 | | | Infineon Technologies AG (Information Technology) | | | 24,402 | |
| | 258 | | | Knorr-Bremse AG (Industrials) | | | 17,669 | |
| | 799 | | | Mercedes-Benz Group AG (Consumer Discretionary) | | | 58,570 | |
| | 160 | | | Merck KGaA (Health Care) | | | 28,827 | |
| | 57 | | | MTU Aero Engines AG (Industrials) | | | 13,351 | |
| | |
|
| Common Stocks – (continued) | |
| Germany – (continued) | |
| | 110 | | | Muenchener Rueckversicherungs-Gesellschaft AG in Muenchen (Financials) | | | 42,765 | |
| | 622 | | | Nemetschek SE (Information Technology) | | | 43,030 | |
| | 483 | | | Puma SE (Consumer Discretionary) | | | 32,502 | |
| | 48 | | | Rational AG (Industrials) | | | 36,650 | |
| | 50 | | | Rheinmetall AG (Industrials) | | | 13,637 | |
| | 509 | | | RWE AG (Utilities) | | | 21,026 | |
| | 950 | | | SAP SE (Information Technology) | | | 132,824 | |
| | 83 | | | Scout24 SE (Communication Services)(b) | | | 5,731 | |
| | 581 | | | Siemens AG (Industrials) | | | 87,576 | |
| | 2,365 | | | Siemens Energy AG (Industrials)* | | | 33,780 | |
| | 145 | | | Siemens Healthineers AG (Health Care)(b) | | | 7,279 | |
| | 89 | | | Symrise AG (Materials) | | | 9,289 | |
| | 290 | | | Talanx AG (Financials) | | | 19,530 | |
| | 3,619 | | | Telefonica Deutschland Holding AG (Communication Services) | | | 6,890 | |
| | 998 | | | Zalando SE (Consumer Discretionary)*(b) | | | 31,120 | |
| | | | | | | | |
| | | | | | | 1,539,842 | |
| | |
| Hong Kong – 0.1% | |
| | 945 | | | Prudential PLC (Financials) | | | 11,570 | |
| | |
| Ireland – 1.0% | |
| | 272 | | | AerCap Holdings NV (Industrials)* | | | 16,734 | |
| | 2,765 | | | AIB Group PLC (Financials) | | | 12,610 | |
| | 1,199 | | | Bank of Ireland Group PLC (Financials) | | | 11,970 | |
| | 598 | | | CRH PLC (Materials) | | | 34,477 | |
| | 106 | | | Kerry Group PLC, Class A (Consumer Staples) | | | 9,910 | |
| | 177 | | | Kingspan Group PLC (Industrials) | | | 15,000 | |
| | 294 | | | Smurfit Kappa Group PLC (Materials) | | | 12,374 | |
| | | | | | | | |
| | | | | | | 113,075 | |
| | |
| Italy – 4.1% | |
| | 1,901 | | | Assicurazioni Generali SpA (Financials) | | | 39,470 | |
| | 571 | | | Coca-Cola HBC AG (Consumer Staples)* | | | 16,482 | |
| | 1,036 | | | Davide Campari-Milano NV (Consumer Staples) | | | 13,572 | |
| | 73 | | | DiaSorin SpA (Health Care) | | | 7,730 | |
| | 5,157 | | | Enel SpA (Utilities) | | | 34,758 | |
| | 3,576 | | | Eni SpA (Energy) | | | 55,439 | |
| | 169 | | | Ferrari NV (Consumer Discretionary) | | | 53,743 | |
| | 951 | | | FinecoBank Banca Fineco SpA (Financials) | | | 13,067 | |
| | 641 | | | Infrastrutture Wireless Italiane SpA (Communication Services)(b) | | | 7,942 | |
| | 8,999 | | | Intesa Sanpaolo SpA (Financials) | | | 24,144 | |
| | 1,007 | | | Mediobanca Banca di Credito Finanziario SpA (Financials) | | | 13,192 | |
| | 718 | | | Moncler SpA (Consumer Discretionary) | | | 48,814 | |
| | 2,625 | | | Poste Italiane SpA (Financials)(b) | | | 29,217 | |
| | 546 | | | Prysmian SpA (Industrials) | | | 22,394 | |
| | 391 | | | Recordati Industria Chimica e Farmaceutica SpA (Health Care) | | | 19,682 | |
| | 1,922 | | | Snam SpA (Utilities) | | | 9,938 | |
| | 1,592 | | | Terna – Rete Elettrica Nazionale (Utilities) | | | 13,167 | |
| | 1,938 | | | UniCredit SpA (Financials) | | | 47,464 | |
| | | | | | | | |
| | | | | | | 470,215 | |
| | |
| | |
| The accompanying notes are an integral part of these financial statements. | | 57 |
GOLDMAN SACHS ACTIVEBETA® EUROPE EQUITY ETF
Schedule of Investments (continued)
August 31, 2023
| | | | | | | | |
| Shares | | | Description | | Value | |
|
| Common Stocks – (continued) | |
| Jordan – 0.2% | |
| | 736 | | | Hikma Pharmaceuticals PLC (Health Care) | | $ | 20,415 | |
| | |
| Luxembourg – 0.7% | |
| | 2,470 | | | ArcelorMittal (Materials) | | | 65,761 | |
| | 174 | | | Eurofins Scientific SE (Health Care) | | | 10,734 | |
| | | | | | | | |
| | | | | | | 76,495 | |
| | |
| Netherlands – 8.0% | |
| | 884 | | | ABN AMRO Bank NV (Financials)(a)(b) | | | 13,044 | |
| | 8 | | | Adyen NV (Financials)*(b) | | | 6,707 | |
| | 1,177 | | | Aegon NV (Financials) | | | 6,055 | |
| | 190 | | | Akzo Nobel NV (Materials) | | | 15,474 | |
| | 27 | | | Argenx SE (Health Care)* | | | 13,621 | |
| | 50 | | | ASM International NV (Information Technology) | | | 24,160 | |
| | 392 | | | ASML Holding NV (Information Technology) | | | 258,636 | |
| | 151 | | | ASR Nederland NV (Financials) | | | 6,616 | |
| | 121 | | | BE Semiconductor Industries NV (Information Technology) | | | 13,934 | |
| | 94 | | | Euronext NV (Financials)(b) | | | 6,800 | |
| | 452 | | | EXOR NV (Financials) | | | 40,100 | |
| | 306 | | | Heineken Holding NV (Consumer Staples) | | | 24,543 | |
| | 206 | | | Heineken NV (Consumer Staples) | | | 20,082 | |
| | 61 | | | IMCD NV (Industrials) | | | 8,425 | |
| | 2,025 | | | ING Groep NV (Financials) | | | 28,792 | |
| | 514 | | | JDE Peet’s NV (Consumer Staples) | | | 14,326 | |
| | 2,706 | | | Koninklijke Ahold Delhaize NV (Consumer Staples) | | | 88,623 | |
| | 5,367 | | | Koninklijke KPN NV (Communication Services) | | | 18,798 | |
| | 612 | | | Koninklijke Philips NV (Health Care)* | | | 13,816 | |
| | 431 | | | NN Group NV (Financials) | | | 16,634 | |
| | 663 | | | Randstad NV (Industrials) | | | 38,987 | |
| | 5,941 | | | Shell PLC (Energy) | | | 181,541 | |
| | 472 | | | Universal Music Group NV (Communication Services) | | | 11,726 | |
| | 489 | | | Wolters Kluwer NV (Industrials) | | | 59,018 | |
| | | | | | | | |
| | | | | | | 930,458 | |
| | |
| Norway – 1.1% | |
| | 314 | | | Aker BP ASA (Energy) | | | 8,519 | |
| | 825 | | | DNB Bank ASA (Financials) | | | 16,334 | |
| | 1,702 | | | Equinor ASA (Energy) | | | 52,514 | |
| | 919 | | | Gjensidige Forsikring ASA (Financials) | | | 14,298 | |
| | 238 | | | Kongsberg Gruppen ASA (Industrials) | | | 9,863 | |
| | 205 | | | Mowi ASA (Consumer Staples) | | | 3,719 | |
| | 2,112 | | | Orkla ASA (Consumer Staples) | | | 16,138 | |
| | 702 | | | Telenor ASA (Communication Services) | | | 7,517 | |
| | | | | | | | |
| | | | | | | 128,902 | |
| | |
| Portugal – 0.5% | |
| | 1,510 | | | EDP – Energias de Portugal SA (Utilities) | | | 6,893 | |
| | 344 | | | Galp Energia SGPS SA (Energy) | | | 4,744 | |
| | 1,884 | | | Jeronimo Martins SGPS SA (Consumer Staples) | | | 48,053 | |
| | | | | | | | |
| | | | | | | 59,690 | |
| | |
|
| Common Stocks – (continued) | |
| Singapore – 0.3% | |
| | 742 | | | STMicroelectronics NV (Information Technology) | | | 35,165 | |
| | |
| South Africa – 0.0% | |
| | 148 | | | Anglo American PLC (Materials) | | | 3,939 | |
| | |
| Spain – 4.3% | |
| | 61 | | | Acciona SA (Utilities) | | | 8,729 | |
| | 1,483 | | | ACS Actividades de Construccion y Servicios SA (Industrials) | | | 52,134 | |
| | 27 | | | Aena SME SA (Industrials)(b) | | | 4,249 | |
| | 297 | | | Amadeus IT Group SA (Consumer Discretionary) | | | 20,405 | |
| | 6,370 | | | Banco Bilbao Vizcaya Argentaria SA (Financials) | | | 50,235 | |
| | 17,950 | | | Banco Santander SA (Financials) | | | 70,174 | |
| | 3,648 | | | CaixaBank SA (Financials) | | | 14,784 | |
| | 90 | | | Cellnex Telecom SA (Communication Services)*(b) | | | 3,448 | |
| | 101 | | | Corp ACCIONA Energias Renovables SA (Utilities) | | | 3,008 | |
| | 438 | | | Enagas SA (Utilities) | | | 7,485 | |
| | 368 | | | Endesa SA (Utilities) | | | 7,661 | |
| | 380 | | | Grifols SA (Health Care)* | | | 5,215 | |
| | 5,267 | | | Iberdrola SA (Utilities) | | | 62,653 | |
| | 2,060 | | | Industria de Diseno Textil SA (Consumer Discretionary) | | | 79,059 | |
| | 579 | | | Naturgy Energy Group SA (Utilities)(a) | | | 16,804 | |
| | 569 | | | Redeia Corp. SA (Utilities) | | | 9,267 | |
| | 3,662 | | | Repsol SA (Energy) | | | 56,518 | |
| | 5,717 | | | Telefonica SA (Communication Services) | | | 23,728 | |
| | | | | | | | |
| | | | | | | 495,556 | |
| | |
| Sweden – 3.3% | |
| | 303 | | | Alfa Laval AB (Industrials) | | | 10,659 | |
| | 567 | | | Assa Abloy AB, Class B (Industrials) | | | 12,785 | |
| | 1,666 | | | Atlas Copco AB, Class A (Industrials) | | | 22,054 | |
| | 1,167 | | | Atlas Copco AB, Class B (Industrials) | | | 13,466 | |
| | 238 | | | Epiroc AB, Class A (Industrials) | | | 4,577 | |
| | 178 | | | Epiroc AB, Class B (Industrials) | | | 2,920 | |
| | 697 | | | Essity AB, Class B (Consumer Staples) | | | 16,276 | |
| | 79 | | | Evolution AB (Consumer Discretionary)(b) | | | 8,558 | |
| | 134 | | | Getinge AB, Class B (Health Care) | | | 2,329 | |
| | 3,574 | | | H & M Hennes & Mauritz AB, Class B (Consumer Discretionary) | | | 54,665 | |
| | 1,576 | | | Hexagon AB, Class B (Information Technology) | | | 14,091 | |
| | 178 | | | Holmen AB, Class B (Materials) | | | 6,754 | |
| | 749 | | | Husqvarna AB, Class B (Industrials) | | | 6,464 | |
| | 297 | | | Industrivarden AB, Class A (Financials) | | | 7,749 | |
| | 304 | | | Industrivarden AB, Class C (Financials) | | | 7,918 | |
| | 1,171 | | | Investor AB, Class B (Financials) | | | 22,575 | |
| | 137 | | | L E Lundbergforetagen AB, Class B (Financials) | | | 5,578 | |
| | 346 | | | Lifco AB, Class B (Industrials) | | | 6,345 | |
| | 305 | | | Nibe Industrier AB, Class B (Industrials) | | | 2,289 | |
| | 134 | | | Saab AB, Class B (Industrials) | | | 7,081 | |
| | |
| | |
| 58 | | The accompanying notes are an integral part of these financial statements. |
GOLDMAN SACHS ACTIVEBETA® EUROPE EQUITY ETF
| | | | | | | | |
| Shares | | | Description | | Value | |
|
| Common Stocks – (continued) | |
| Sweden – (continued) | |
| | 225 | | | Sandvik AB (Industrials) | | $ | 4,262 | |
| | 1,491 | | | Skandinaviska Enskilda Banken AB, Class A (Financials) | | | 17,313 | |
| | 417 | | | Svenska Cellulosa AB SCA, Class B (Materials) | | | 5,560 | |
| | 1,498 | | | Svenska Handelsbanken AB, Class A (Financials) | | | 12,498 | |
| | 991 | | | Swedbank AB, Class A (Financials) | | | 17,571 | |
| | 572 | | | Swedish Orphan Biovitrum AB (Health Care)*(a) | | | 11,054 | |
| | 984 | | | Tele2 AB, Class B (Communication Services) | | | 6,950 | |
| | 4,479 | | | Telefonaktiebolaget LM Ericsson, Class B (Information Technology)(a) | | | 23,041 | |
| | 3,116 | | | Telia Co. AB (Communication Services) | | | 6,292 | |
| | 500 | | | Volvo AB, Class A (Industrials) | | | 10,247 | |
| | 1,028 | | | Volvo AB, Class B (Industrials) | | | 20,767 | |
| | 3,973 | | | Volvo Car AB, Class B (Consumer Discretionary)* | | | 15,137 | |
| | | | | | | | |
| | | | | | | 385,825 | |
| | |
| Switzerland – 8.4% | |
| | 1,071 | | | ABB Ltd. (Industrials) | | | 40,851 | |
| | 111 | | | Adecco Group AG (Industrials) | | | 4,792 | |
| | 170 | | | Alcon, Inc. (Health Care) | | | 14,227 | |
| | 86 | | | Baloise Holding AG (Financials) | | | 13,456 | |
| | 159 | | | Banque Cantonale Vaudoise (Financials) | | | 17,246 | |
| | 7 | | | Barry Callebaut AG (Consumer Staples) | | | 12,221 | |
| | 96 | | | BKW AG (Utilities) | | | 16,521 | |
| | 2 | | | Chocoladefabriken Lindt & Spruengli AG (Consumer Staples) | | | 23,934 | |
| | 400 | | | Cie Financiere Richemont SA, Class A (Consumer Discretionary) | | | 56,881 | |
| | 314 | | | Clariant AG (Materials)* | | | 5,240 | |
| | 74 | | | DSM-Firmenich AG (Materials) | | | 6,839 | |
| | 101 | | | Dufry AG (Consumer Discretionary)* | | | 4,501 | |
| | 11 | | | EMS-Chemie Holding AG (Materials)(a) | | | 8,276 | |
| | 63 | | | Geberit AG (Industrials) | | | 32,711 | |
| | 3 | | | Givaudan SA (Materials) | | | 10,013 | |
| | 65 | | | Helvetia Holding AG (Financials) | | | 9,905 | |
| | 183 | | | Julius Baer Group Ltd. (Financials) | | | 12,734 | |
| | 193 | | | Kuehne + Nagel International AG (Industrials) | | | 58,102 | |
| | 512 | | | Logitech International SA (Information Technology) | | | 35,511 | |
| | 23 | | | Lonza Group AG (Health Care) | | | 12,731 | |
| | 2,129 | | | Novartis AG (Health Care) | | | 215,274 | |
| | 37 | | | Partners Group Holding AG (Financials) | | | 40,014 | |
| | 35 | | | Schindler Holding AG (Industrials) | | | 7,367 | |
| | 42 | | | Schindler Holding AG Participation Certificates (Industrials) | | | 9,375 | |
| | 512 | | | SGS SA (Industrials) | | | 46,594 | |
| | 159 | | | SIG Group AG (Materials)* | | | 4,191 | |
| | 28 | | | Sika AG (Materials) | | | 7,938 | |
| | 39 | | | Sonova Holding AG (Health Care) | | | 10,319 | |
| | 182 | | | Straumann Holding AG (Health Care) | | | 27,612 | |
| | |
|
| Common Stocks – (continued) | |
| Switzerland – (continued) | |
| | 68 | | | Swatch Group AG (The) – Bearer (Consumer Discretionary) | | | 19,147 | |
| | 312 | | | Swatch Group AG (The) – Registered (Consumer Discretionary) | | | 16,655 | |
| | 37 | | | Swiss Life Holding AG (Financials) | | | 23,233 | |
| | 116 | | | Swiss Prime Site AG (Real Estate) | | | 11,150 | |
| | 26 | | | Swisscom AG (Communication Services) | | | 15,837 | |
| | 2,175 | | | UBS Group AG (Financials) | | | 57,869 | |
| | 36 | | | VAT Group AG (Industrials)(b) | | | 14,445 | |
| | 114 | | | Zurich Insurance Group AG (Financials) | | | 53,563 | |
| | | | | | | | |
| | | | | | | 977,275 | |
| | |
| United Kingdom – 17.5% | |
| | 1,565 | | | 3i Group PLC (Financials) | | | 39,533 | |
| | 1,873 | | | abrdn PLC (Financials) | | | 3,919 | |
| | 947 | | | Admiral Group PLC (Financials) | | | 29,880 | |
| | 262 | | | Ashtead Group PLC (Industrials) | | | 18,339 | |
| | 903 | | | Associated British Foods PLC (Consumer Staples) | | | 22,799 | |
| | 1,479 | | | AstraZeneca PLC (Health Care) | | | 199,818 | |
| | 6,946 | | | Auto Trader Group PLC (Communication Services)(b) | | | 53,373 | |
| | 1,639 | | | Aviva PLC (Financials) | | | 7,792 | |
| | 3,165 | | | BAE Systems PLC (Industrials) | | | 40,406 | |
| | 17,269 | | | Barclays PLC (Financials) | | | 32,246 | |
| | 3,061 | | | Barratt Developments PLC (Consumer Discretionary) | | | 17,582 | |
| | 286 | | | Berkeley Group Holdings PLC (Consumer Discretionary) | | | 14,717 | |
| | 16,139 | | | BP PLC (Energy) | | | 99,696 | |
| | 1,998 | | | British American Tobacco PLC (Consumer Staples) | | | 66,396 | |
| | 2,695 | | | BT Group PLC (Communication Services) | | | 3,948 | |
| | 547 | | | Bunzl PLC (Industrials) | | | 19,616 | |
| | 2,187 | | | Burberry Group PLC (Consumer Discretionary) | | | 60,524 | |
| | 28,512 | | | Centrica PLC (Utilities) | | | 54,826 | |
| | 1,755 | | | CNH Industrial NV (Industrials) | | | 24,343 | |
| | 349 | | | Coca-Cola Europacific Partners PLC (Consumer Staples) | | | 22,374 | |
| | 1,559 | | | Compass Group PLC (Consumer Discretionary) | | | 39,372 | |
| | 69 | | | Croda International PLC (Materials) | | | 4,828 | |
| | 404 | | | DCC PLC (Industrials) | | | 22,151 | |
| | 1,899 | | | Diageo PLC (Consumer Staples) | | | 78,049 | |
| | 155 | | | Entain PLC (Consumer Discretionary) | | | 2,273 | |
| | 268 | | | Halma PLC (Information Technology) | | | 7,281 | |
| | 3,226 | | | Hargreaves Lansdown PLC (Financials) | | | 31,117 | |
| | 15,136 | | | HSBC Holdings PLC (Financials) | | | 111,836 | |
| | 1,516 | | | Imperial Brands PLC (Consumer Staples) | | | 34,376 | |
| | 1,659 | | | Informa PLC (Communication Services) | | | 15,363 | |
| | 182 | | | InterContinental Hotels Group PLC (Consumer Discretionary) | | | 13,731 | |
| | 125 | | | Intertek Group PLC (Industrials) | | | 6,558 | |
| | 16,716 | | | J Sainsbury PLC (Consumer Staples) | | | 57,212 | |
| | 27,534 | | | JD Sports Fashion PLC (Consumer Discretionary) | | | 50,677 | |
| | |
| | |
| The accompanying notes are an integral part of these financial statements. | | 59 |
GOLDMAN SACHS ACTIVEBETA® EUROPE EQUITY ETF
Schedule of Investments (continued)
August 31, 2023
| | | | | | | | |
| Shares | | | Description | | Value | |
|
| Common Stocks – (continued) | |
| United Kingdom – (continued) | |
| | 173 | | | Johnson Matthey PLC (Materials) | | $ | 3,573 | |
| | 4,854 | | | Kingfisher PLC (Consumer Discretionary) | | | 14,393 | |
| | 403 | | | Land Securities Group PLC REIT (Real Estate) | | | 3,077 | |
| | 9,036 | | | Legal & General Group PLC (Financials) | | | 25,041 | |
| | 56,898 | | | Lloyds Banking Group PLC (Financials) | | | 30,537 | |
| | 245 | | | London Stock Exchange Group PLC (Financials) | | | 25,389 | |
| | 1,609 | | | M&G PLC (Financials) | | | 3,894 | |
| | 1,006 | | | Melrose Industries PLC (Industrials) | | | 6,534 | |
| | 2,637 | | | National Grid PLC (Utilities) | | | 33,087 | |
| | 4,313 | | | NatWest Group PLC (Financials) | | | 12,592 | |
| | 402 | | | Next PLC (Consumer Discretionary) | | | 35,597 | |
| | 613 | | | Pearson PLC (Consumer Discretionary) | | | 6,517 | |
| | 1,337 | | | Phoenix Group Holdings PLC (Financials) | | | 8,827 | |
| | 488 | | | Reckitt Benckiser Group PLC (Consumer Staples) | | | 35,260 | |
| | 1,785 | | | RELX PLC (Industrials) | | | 58,311 | |
| | 1,822 | | | Rentokil Initial PLC (Industrials) | | | 13,894 | |
| | 6,051 | | | Rolls-Royce Holdings PLC (Industrials)* | | | 17,045 | |
| | 4,293 | | | Sage Group PLC (The) (Information Technology) | | | 52,821 | |
| | 1,010 | | | Schroders PLC (Financials) | | | 5,270 | |
| | 321 | | | Severn Trent PLC (Utilities) | | | 9,762 | |
| | 1,104 | | | Smith & Nephew PLC (Health Care) | | | 14,969 | |
| | 706 | | | Smiths Group PLC (Industrials) | | | 14,672 | |
| | 53 | | | Spirax-Sarco Engineering PLC (Industrials) | | | 6,807 | |
| | 882 | | | SSE PLC (Utilities) | | | 18,178 | |
| | 1,544 | | | St James’s Place PLC (Financials) | | | 17,311 | |
| | 2,014 | | | Standard Chartered PLC (Financials) | | | 18,160 | |
| | 5,796 | | | Taylor Wimpey PLC (Consumer Discretionary) | | | 8,395 | |
| | 15,806 | | | Tesco PLC (Consumer Staples) | | | 53,216 | |
| | 1,921 | | | Unilever PLC (Consumer Staples) | | | 98,390 | |
| | 812 | | | United Utilities Group PLC (Utilities) | | | 9,744 | |
| | 38,261 | | | Vodafone Group PLC (Communication Services) | | | 35,494 | |
| | 220 | | | Whitbread PLC (Consumer Discretionary) | | | 9,590 | |
| | 911 | | | Wise PLC, Class A (Financials)* | | | 7,390 | |
| | 658 | | | WPP PLC (Communication Services) | | | 6,385 | |
| | | | | | | | |
| | | | | | | 2,027,073 | |
| | |
| United States – 9.3% | |
| | 897 | | | Experian PLC (Industrials) | | | 31,394 | |
| | 520 | | | Ferrovial SE (Industrials) | | | 16,508 | |
| | 4,516 | | | GSK PLC (Health Care) | | | 79,473 | |
| | 4,442 | | | Haleon PLC (Consumer Staples) | | | 18,152 | |
| | 644 | | | Holcim AG (Materials)* | | | 42,698 | |
| | 2,567 | | | Nestle SA (Consumer Staples) | | | 309,232 | |
| | 404 | | | QIAGEN NV (Health Care)* | | | 18,499 | |
| | 789 | | | Roche Holding AG (Health Care) | | | 232,524 | |
| | 88 | | | Roche Holding AG (Health Care)(a) | | | 27,518 | |
| | 1,171 | | | Sanofi (Health Care) | | | 125,366 | |
| | 503 | | | Schneider Electric SE (Industrials) | | | 86,574 | |
| | 2,894 | | | Stellantis NV (Consumer Discretionary) | | | 53,950 | |
| | |
|
| Common Stocks – (continued) | |
| United States – (continued) | |
| | 225 | | | Swiss Re AG (Financials) | | | 21,882 | |
| | 536 | | | Tenaris SA (Energy) | | | 8,587 | |
| | | | | | | | |
| | | | | | | 1,072,357 | |
| | |
| | TOTAL COMMON STOCKS | | | | |
| | (Cost $10,608,341) | | $ | 11,460,502 | |
| | |
| | | | | | | | | | | | |
| Shares | | | Description | | Rate | | | Value | |
|
| Preferred Stocks – 0.5% | |
| Germany – 0.5% | |
| | 295 | | | Bayerische Motoren Werke AG (Consumer Discretionary) | | | 9.84 | % | | $ | 28,416 | |
| | 237 | | | Henkel AG & Co. KGaA (Consumer Staples) | | | 2.60 | | | | 18,191 | |
| | 57 | | | Volkswagen AG (Consumer Discretionary) | | | 25.69 | | | | 6,993 | |
| | |
| | TOTAL PREFERRED STOCKS | | | | | | | | |
| | (Cost $61,472) | | | | | | $ | 53,600 | |
| | |
| | | | | | | | | | | | |
| Units | | | Description | | Expiration Month | | | Value | |
|
| Right – 0.0% | |
| Sweden – 0.0% | |
| | 510 | | | Swedish Orphan Biovitrum AB* | | | 09/23 | | | $ | 461 | |
| | (Cost $0) | | | | | | | | | | | |
| | |
| TOTAL INVESTMENTS BEFORE SECURITIES LENDING
REINVESTMENT VEHICLE |
|
| | (Cost $10,669,813) | | | | | | $ | 11,514,563 | |
| | |
| | | | | | | | |
| Shares | | | Dividend
Rate | | Value | |
|
| Securities Lending Reinvestment Vehicle – 1.1%(c) | |
| Goldman Sachs Financial Square Government Fund –
Institutional Shares |
|
| | 132,123 | | | 5.234% | | $ | 132,123 | |
| (Cost $132,123) | | | |
| | |
| | TOTAL INVESTMENTS – 100.5% | |
| | (Cost $10,801,936) | | $ | 11,646,686 | |
| | |
| LIABILITIES IN EXCESS OF OTHER
ASSETS – (0.5)% | | | (59,652 | ) |
| | |
| | NET ASSETS – 100.0% | | $ | 11,587,034 | |
| | |
| | |
| 60 | | The accompanying notes are an integral part of these financial statements. |
GOLDMAN SACHS ACTIVEBETA® EUROPE EQUITY ETF
| | |
|
| The percentage shown for each investment category reflects the value of investments in that category as a percentage of net assets. |
| |
* | | Non-income producing security. |
| |
(a) | | All or a portion of security is on loan. |
| |
(b) | | Exempt from registration under Rule 144A of the Securities Act of 1933. |
| |
(c) | | Represents an affiliated issuer. |
| | |
|
Investment Abbreviations: |
PLC | | —Public Limited Company |
REIT | | —Real Estate Investment Trust |
|
|
| ADDITIONAL INVESTMENT INFORMATION |
FUTURES CONTRACTS — At August 31, 2023, the Fund had the following futures contracts:
| | | | | | | | | | | | | | |
| Description | | Number of
Contracts | | Expiration
Date | | | Notional
Amount | | | Unrealized
Appreciation/
(Depreciation) | |
Long position contracts: | | | | | | | | | | | | | | |
| | | | |
MSCI Europe Index | | 2 | | | 09/15/23 | | | $ | 64,285 | | | $ | (711 | ) |
| | | | |
| Sector Name | | % of Market
Value | |
| |
Financials | | | 16.2 | % |
Health Care | | | 15.9 | |
Industrials | | | 15.7 | |
Consumer Staples | | | 13.3 | |
Consumer Discretionary | | | 13.2 | |
Information Technology | | | 6.5 | |
Energy | | | 5.5 | |
Materials | | | 5.3 | |
Utilities | | | 4.0 | |
Communication Services | | | 3.1 | |
Real Estate | | | 0.2 | |
Securities Lending Reinvestment Vehicle | | | 1.1 | |
| |
| |
| TOTAL INVESTMENTS | | | 100.0 | % |
| |
| | |
| The accompanying notes are an integral part of these financial statements. | | 61 |
GOLDMAN SACHS ACTIVEBETA® INTERNATIONAL EQUITY ETF
Schedule of Investments
August 31, 2023
| | | | | | | | |
| Shares | | | Description | |
Value | |
|
| Common Stocks – 99.3% | |
| Australia – 6.1% | |
| | 46,273 | | | Ampol Ltd. (Energy) | | $ | 1,057,896 | |
| | 431,219 | | | ANZ Group Holdings Ltd. (Financials) | | | 7,074,138 | |
| | 214,277 | | | APA Group (Utilities) | | | 1,247,601 | |
| | 87,589 | | | Aristocrat Leisure Ltd. (Consumer Discretionary) | | | 2,320,136 | |
| | 33,066 | | | ASX Ltd. (Financials) | | | 1,233,301 | |
| | 532,770 | | | Aurizon Holdings Ltd. (Industrials) | | | 1,259,427 | |
| | 646,842 | | | BHP Group Ltd. (Materials) | | | 18,788,890 | |
| | 711,882 | | | BlueScope Steel Ltd. (Materials) | | | 9,686,671 | |
| | 332,104 | | | Brambles Ltd. (Industrials) | | | 3,219,855 | |
| | 32,915 | | | Cochlear Ltd. (Health Care) | | | 5,787,462 | |
| | 655,693 | | | Coles Group Ltd. (Consumer Staples) | | | 6,909,213 | |
| | 239,122 | | | Commonwealth Bank of Australia (Financials) | | | 15,824,351 | |
| | 100,406 | | | Computershare Ltd. (Industrials) | | | 1,637,404 | |
| | 228,289 | | | Dexus REIT (Real Estate) | | | 1,145,848 | |
| | 262,055 | | | Endeavour Group Ltd. (Consumer Staples) | | | 933,460 | |
| | 14,874 | | | Flutter Entertainment PLC (Consumer Discretionary)* | | | 2,710,494 | |
| | 244,388 | | | Fortescue Metals Group Ltd. (Materials) | | | 3,391,896 | |
| | 1,944,067 | | | Glencore PLC (Materials) | | | 10,382,110 | |
| | 59,705 | | | Goodman Group REIT (Real Estate) | | | 903,283 | |
| | 403,503 | | | GPT Group (The) REIT (Real Estate) | | | 1,097,581 | |
| | 85,814 | | | IDP Education Ltd. (Consumer Discretionary) | | | 1,368,873 | |
| | 113,593 | | | IGO Ltd. (Materials) | | | 1,024,074 | |
| | 416,839 | | | Insurance Australia Group Ltd. (Financials) | | | 1,571,201 | |
| | 1,718,684 | | | Lottery Corp. Ltd. (The) (Consumer Discretionary) | | | 5,610,054 | |
| | 52,573 | | | Macquarie Group Ltd. (Financials) | | | 6,044,703 | |
| | 877,773 | | | Medibank Pvt Ltd. (Financials) | | | 2,080,673 | |
| | 436,273 | | | National Australia Bank Ltd. (Financials) | | | 8,182,714 | |
| | 46,824 | | | Newcrest Mining Ltd. (Materials) | | | 789,375 | |
| | 205,101 | | | Northern Star Resources Ltd. (Materials) | | | 1,582,049 | |
| | 67,652 | | | Orica Ltd. (Materials) | | | 688,331 | |
| | 1,684,938 | | | Pilbara Minerals Ltd. (Materials) | | | 5,096,139 | |
| | 205,481 | | | QBE Insurance Group Ltd. (Financials) | | | 1,993,535 | |
| | 28,128 | | | REA Group Ltd. (Communication Services) | | | 3,007,279 | |
| | 43,883 | | | Rio Tinto Ltd. (Materials) | | | 3,208,712 | |
| | 125,868 | | | Rio Tinto PLC (Materials) | | | 7,771,333 | |
| | 479,742 | | | Santos Ltd. (Energy) | | | 2,383,107 | |
| | 96,258 | | | Sonic Healthcare Ltd. (Health Care) | | | 2,004,903 | |
| | 302,545 | | | Stockland REIT (Real Estate) | | | 830,800 | |
| | 380,776 | | | Suncorp Group Ltd. (Financials) | | | 3,361,289 | |
| | 1,031,966 | | | Telstra Group Ltd. (Communication Services) | | | 2,680,095 | |
| | |
|
| Common Stocks – (continued) | |
| Australia – (continued) | |
| | 377,338 | | | Transurban Group (Industrials) | | | 3,240,519 | |
| | 152,084 | | | Treasury Wine Estates Ltd. (Consumer Staples) | | | 1,149,463 | |
| | 714,509 | | | Vicinity Ltd. REIT (Real Estate) | | | 865,346 | |
| | 97,662 | | | Washington H Soul Pattinson & Co. Ltd. (Financials) | | | 2,087,909 | |
| | 267,854 | | | Wesfarmers Ltd. (Consumer Discretionary) | | | 9,345,135 | |
| | 462,408 | | | Westpac Banking Corp. (Financials) | | | 6,573,555 | |
| | 28,110 | | | WiseTech Global Ltd. (Information Technology) | | | 1,265,278 | |
| | 248,682 | | | Woodside Energy Group Ltd. (Energy) | | | 5,962,402 | |
| | 419,762 | | | Woolworths Group Ltd. (Consumer Staples) | | | 10,365,981 | |
| | | | | | | | |
| | | | | | | 198,745,844 | |
| | |
| Austria – 0.4% | |
| | 39,185 | | | Erste Group Bank AG (Financials) | | | 1,402,196 | |
| | 51,203 | | | Mondi PLC (Materials) | | | 852,549 | |
| | 113,143 | | | OMV AG (Energy) | | | 5,252,147 | |
| | 173,382 | | | voestalpine AG (Materials) | | | 5,077,102 | |
| | | | | | | | |
| | | | | | | 12,583,994 | |
| | |
| Belgium – 0.7% | |
| | 85,378 | | | Ageas SA/NV (Financials) | | | 3,398,954 | |
| | 100,901 | | | Anheuser-Busch InBev SA/NV (Consumer Staples) | | | 5,749,429 | |
| | 8,228 | | | Elia Group SA/NV (Utilities) | | | 951,073 | |
| | 22,539 | | | Groupe Bruxelles Lambert NV (Financials) | | | 1,819,047 | |
| | 26,893 | | | KBC Group NV (Financials) | | | 1,767,645 | |
| | 132 | | | Lotus Bakeries NV (Consumer Staples) | | | 1,041,545 | |
| | 33,639 | | | Solvay SA (Materials) | | | 3,902,930 | |
| | 45,634 | | | UCB SA (Health Care) | | | 4,100,991 | |
| | | | | | | | |
| | | | | | | 22,731,614 | |
| | |
| Brazil – 0.1% | |
| | 28,226 | | | Wheaton Precious Metals Corp. (Materials) | | | 1,229,639 | |
| | 26,409 | | | Yara International ASA (Materials) | | | 965,528 | |
| | | | | | | | |
| | | | | | | 2,195,167 | |
| | |
| Canada – 10.8% | |
| | 20,901 | | | Agnico Eagle Mines Ltd. (Materials) | | | 1,013,574 | |
| | 184,670 | | | Alimentation Couche-Tard, Inc. (Consumer Staples) | | | 9,644,689 | |
| | 45,703 | | | AltaGas Ltd. (Utilities) | | | 892,474 | |
| | 570,330 | | | ARC Resources Ltd. (Energy) | | | 8,688,053 | |
| | 91,933 | | | Bank of Montreal (Financials) | | | 7,907,346 | |
| | 158,989 | | | Bank of Nova Scotia (The) (Financials) | | | 7,534,923 | |
| | 30,952 | | | BCE, Inc. (Communication Services) | | | 1,309,503 | |
| | 74,303 | | | Brookfield Asset Management Ltd., Class A (Financials) | | | 2,564,180 | |
| | 48,233 | | | Brookfield Corp. (Financials) | | | 1,644,189 | |
| | |
| | |
| 62 | | The accompanying notes are an integral part of these financial statements. |
GOLDMAN SACHS ACTIVEBETA® INTERNATIONAL EQUITY ETF
| | | | | | | | |
| Shares | | | Description | |
Value | |
|
| Common Stocks – (continued) | |
| Canada – (continued) | |
| | 37,383 | | | Cameco Corp. (Energy) | | $ | 1,381,537 | |
| | 31,380 | | | Canadian Apartment Properties REIT (Real Estate) | | | 1,124,202 | |
| | 132,462 | | | Canadian Imperial Bank of Commerce (Financials) | | | 5,241,890 | |
| | 43,202 | | | Canadian National Railway Co. (Industrials) | | | 4,860,006 | |
| | 150,661 | | | Canadian Natural Resources Ltd. (Energy) | | | 9,734,864 | |
| | 76,128 | | | Canadian Pacific Kansas City Ltd. (Industrials) | | | 6,035,322 | |
| | 8,300 | | | Canadian Tire Corp. Ltd., Class A (Consumer Discretionary) | | | 983,399 | |
| | 54,623 | | | Canadian Utilities Ltd., Class A (Utilities) | | | 1,292,752 | |
| | 31,658 | | | CCL Industries, Inc., Class B (Materials) | | | 1,413,080 | |
| | 628,659 | | | Cenovus Energy, Inc. (Energy) | | | 12,517,886 | |
| | 61,733 | | | CGI, Inc. (Information Technology)* | | | 6,429,047 | |
| | 8,794 | | | Constellation Software, Inc. (Information Technology) | | | 18,040,131 | |
| | 20,871 | | | Descartes Systems Group, Inc. (The) (Information Technology)* | | | 1,562,838 | |
| | 150,566 | | | Dollarama, Inc. (Consumer Discretionary) | | | 9,749,871 | |
| | 150,775 | | | Element Fleet Management Corp. (Financials) | | | 2,314,643 | |
| | 40,254 | | | Emera, Inc. (Utilities) | | | 1,506,977 | |
| | 482,794 | | | Empire Co. Ltd., Class A (Consumer Staples) | | | 12,560,959 | |
| | 176,178 | | | Enbridge, Inc. (Energy) | | | 6,177,526 | |
| | 9,276 | | | Fairfax Financial Holdings Ltd. (Financials) | | | 7,639,579 | |
| | 23,589 | | | FirstService Corp. (Real Estate) | | | 3,562,541 | |
| | 46,164 | | | Fortis, Inc. (Utilities) | | | 1,808,072 | |
| | 8,587 | | | Franco-Nevada Corp. (Materials) | | | 1,235,482 | |
| | 94,880 | | | George Weston Ltd. (Consumer Staples) | | | 10,508,717 | |
| | 26,214 | | | GFL Environmental, Inc. (Industrials) | | | 848,450 | |
| | 130,416 | | | Great-West Lifeco, Inc. (Financials)(a) | | | 3,742,972 | |
| | 98,946 | | | Hydro One Ltd. (Utilities)(b) | | | 2,568,449 | |
| | 128,179 | | | iA Financial Corp., Inc. (Financials) | | | 8,031,142 | |
| | 58,898 | | | IGM Financial, Inc. (Financials) | | | 1,676,892 | |
| | 114,761 | | | Imperial Oil Ltd. (Energy) | | | 6,508,453 | |
| | 22,876 | | | Intact Financial Corp. (Financials) | | | 3,221,019 | |
| | 73,800 | | | Ivanhoe Mines Ltd., Class A (Materials)* | | | 655,661 | |
| | 48,073 | | | Keyera Corp. (Energy) | | | 1,186,058 | |
| | 163,862 | | | Loblaw Cos. Ltd. (Consumer Staples) | | | 14,210,376 | |
| | 476,149 | | | Manulife Financial Corp. (Financials) | | | 8,791,309 | |
| | 68,074 | | | Metro, Inc. (Consumer Staples) | | | 3,503,953 | |
| | 75,079 | | | National Bank of Canada (Financials) | | | 5,225,758 | |
| | 66,888 | | | Northland Power, Inc. (Utilities) | | | 1,263,157 | |
| | 92,389 | | | Nutrien Ltd. (Materials) | | | 5,844,691 | |
| | 37,315 | | | Open Text Corp. (Information Technology) | | | 1,501,757 | |
| | |
|
| Common Stocks – (continued) | |
| Canada – (continued) | |
| | 153,504 | | | Parkland Corp. (Energy) | | | 4,056,150 | |
| | 86,181 | | | Pembina Pipeline Corp. (Energy) | | | 2,675,341 | |
| | 237,325 | | | Power Corp. of Canada (Financials) | | | 6,472,739 | |
| | 64,963 | | | Quebecor, Inc., Class B (Communication Services) | | | 1,483,209 | |
| | 23,740 | | | RB Global, Inc. (Industrials) | | | 1,466,214 | |
| | 48,339 | | | Restaurant Brands International, Inc. (Consumer Discretionary) | | | 3,353,128 | |
| | 37,992 | | | Rogers Communications, Inc., Class B (Communication Services) | | | 1,543,605 | |
| | 224,788 | | | Royal Bank of Canada (Financials) | | | 20,226,683 | |
| | 128,097 | | | Saputo, Inc. (Consumer Staples) | | | 2,765,596 | |
| | 58,338 | | | Shopify, Inc., Class A (Information Technology)* | | | 3,875,977 | |
| | 32,050 | | | Stantec, Inc. (Industrials) | | | 2,138,167 | |
| | 99,798 | | | Sun Life Financial, Inc. (Financials)(a) | | | 4,861,736 | |
| | 290,719 | | | Suncor Energy, Inc. (Energy)(a) | | | 9,834,960 | |
| | 46,994 | | | TC Energy Corp. (Energy) | | | 1,695,042 | |
| | 20,123 | | | Teck Resources Ltd., Class B (Materials) | | | 831,127 | |
| | 80,460 | | | TELUS Corp. (Communication Services) | | | 1,411,224 | |
| | 15,119 | | | TFI International, Inc. (Industrials) | | | 2,057,512 | |
| | 29,945 | | | Thomson Reuters Corp. (Industrials) | | | 3,850,941 | |
| | 90,211 | | | TMX Group Ltd. (Financials) | | | 1,993,650 | |
| | 30,604 | | | Toromont Industries Ltd. (Industrials) | | | 2,507,223 | |
| | 260,939 | | | Toronto-Dominion Bank (The) (Financials) | | | 15,896,073 | |
| | 41,421 | | | Tourmaline Oil Corp. (Energy) | | | 2,121,336 | |
| | 42,902 | | | West Fraser Timber Co. Ltd. (Materials) | | | 3,238,856 | |
| | 88,256 | | | WSP Global, Inc. (Industrials) | | | 12,345,859 | |
| | | | | | | | |
| | | | | | | 350,362,697 | |
| | |
| Chile – 0.0% | |
| | 35,878 | | | Antofagasta PLC (Materials) | | | 658,302 | |
| | 86,225 | | | Lundin Mining Corp. (Materials) | | | 667,902 | |
| | | | | | | | |
| | | | | | | 1,326,204 | |
| | |
| China – 0.7% | |
| | 1,520,763 | | | BOC Hong Kong Holdings Ltd. (Financials) | | | 4,227,708 | |
| | 42,991 | | | Prosus NV (Consumer Discretionary)* | | | 2,975,994 | |
| | 3,750,782 | | | SITC International Holdings Co. Ltd. (Industrials) | | | 6,992,882 | |
| | 3,367,209 | | | Wilmar International Ltd. (Consumer Staples) | | | 9,424,695 | |
| | | | | | | | |
| | | | | | | 23,621,279 | |
| | |
| Denmark – 3.0% | |
| | 3,496 | | | AP Moller – Maersk A/S, Class A (Industrials)(a) | | | 6,272,176 | |
| | 3,517 | | | AP Moller – Maersk A/S, Class B (Industrials) | | | 6,404,602 | |
| | |
| | |
| The accompanying notes are an integral part of these financial statements. | | 63 |
GOLDMAN SACHS ACTIVEBETA® INTERNATIONAL EQUITY ETF
Schedule of Investments (continued)
August 31, 2023
| | | | | | | | |
| Shares | | | Description | |
Value | |
|
| Common Stocks – (continued) | |
| Denmark – (continued) | |
| | 26,400 | | | Carlsberg AS, Class B (Consumer Staples) | | $ | 3,829,124 | |
| | 14,842 | | | Chr Hansen Holding A/S (Materials) | | | 971,318 | |
| | 24,078 | | | Coloplast A/S, Class B (Health Care) | | | 2,753,194 | |
| | 183,463 | | | Danske Bank A/S (Financials) | | | 4,131,755 | |
| | 56,374 | | | Demant A/S (Health Care)* | | | 2,312,607 | |
| | 10,079 | | | DSV A/S (Industrials) | | | 1,919,090 | |
| | 8,532 | | | Genmab A/S (Health Care)* | | | 3,280,129 | |
| | 303,164 | | | Novo Nordisk A/S, Class B (Health Care) | | | 56,244,903 | |
| | 30,663 | | | Novozymes A/S, Class B (Materials) | | | 1,332,892 | |
| | 55,259 | | | Pandora A/S (Consumer Discretionary) | | | 5,744,016 | |
| | 4,823 | | | ROCKWOOL A/S, Class B (Industrials) | | | 1,235,082 | |
| | 116,962 | | | Tryg A/S (Financials) | | | 2,235,529 | |
| | | | | | | | |
| | | | | | | 98,666,417 | |
| | |
| Finland – 0.7% | |
| | 32,520 | | | Elisa OYJ (Communication Services) | | | 1,597,832 | |
| | 24,641 | | | Kone OYJ, Class B (Industrials) | | | 1,123,253 | |
| | 101,166 | | | Metso Corp. (Industrials) | | | 1,166,631 | |
| | 800,903 | | | Nokia OYJ (Information Technology) | | | 3,204,963 | |
| | 414,320 | | | Nordea Bank Abp (Financials) | | | 4,547,345 | |
| | 177,740 | | | Orion OYJ, Class B (Health Care) | | | 7,290,075 | |
| | 64,826 | | | Sampo OYJ, Class A (Financials) | | | 2,851,647 | |
| | 44,414 | | | UPM-Kymmene OYJ (Materials) | | | 1,524,234 | |
| | 56,164 | | | Wartsila OYJ Abp (Industrials) | | | 714,728 | |
| | | | | | | | |
| | | | | | | 24,020,708 | |
| | |
| France – 10.4% | |
| | 44,330 | | | Accor SA (Consumer Discretionary) | | | 1,592,078 | |
| | 8,257 | | | Aeroports de Paris (Industrials) | | | 1,089,747 | |
| | 49,402 | | | Air Liquide SA (Materials) | | | 8,946,779 | |
| | 45,850 | | | Airbus SE (Industrials) | | | 6,736,957 | |
| | 91,708 | | | Alstom SA (Industrials) | | | 2,539,146 | |
| | 31,013 | | | Arkema SA (Materials) | | | 3,252,899 | |
| | 348,716 | | | AXA SA (Financials) | | | 10,512,255 | |
| | 43,641 | | | BioMerieux (Health Care) | | | 4,528,168 | |
| | 151,798 | | | BNP Paribas SA (Financials) | | | 9,837,462 | |
| | 1,028,094 | | | Bollore SE (Communication Services) | | | 6,098,077 | |
| | 66,796 | | | Bouygues SA (Industrials) | | | 2,312,656 | |
| | 76,466 | | | Bureau Veritas SA (Industrials) | | | 2,053,232 | |
| | 42,540 | | | Capgemini SE (Information Technology) | | | 7,957,538 | |
| | 477,564 | | | Carrefour SA (Consumer Staples) | | | 9,158,789 | |
| | 173,129 | | | Cie de Saint-Gobain SA (Industrials) | | | 11,304,402 | |
| | 71,459 | | | Cie Generale des Etablissements Michelin (Consumer Discretionary) | | | 2,242,203 | |
| | 369,466 | | | Credit Agricole SA (Financials) | | | 4,674,056 | |
| | 99,581 | | | Danone SA (Consumer Staples) | | | 5,817,961 | |
| | 16,617 | | | Dassault Aviation SA (Industrials) | | | 3,275,204 | |
| | |
|
| Common Stocks – (continued) | |
| France – (continued) | |
| | 109,326 | | | Dassault Systemes (Information Technology) | | | 4,344,033 | |
| | 63,290 | | | Edenred (Financials) | | | 4,041,827 | |
| | 108,885 | | | Eiffage SA (Industrials) | | | 10,792,049 | |
| | 374,485 | | | Engie SA (Utilities) | | | 6,052,002 | |
| | 41,092 | | | EssilorLuxottica SA (Health Care) | | | 7,755,804 | |
| | 101,945 | | | Eurazeo SE (Financials) | | | 6,024,677 | |
| | 8,376 | | | Gecina SA REIT (Real Estate) | | | 898,635 | |
| | 104,437 | | | Getlink SE (Industrials) | | | 1,751,836 | |
| | 7,538 | | | Hermes International SCA (Consumer Discretionary) | | | 15,551,149 | |
| | 118,423 | | | Ipsen SA (Health Care) | | | 15,397,947 | |
| | 10,694 | | | Kering (Consumer Discretionary) | | | 5,736,049 | |
| | 41,140 | | | Klepierre SA REIT (Real Estate) | | | 1,089,492 | |
| | 231,245 | | | La Francaise des Jeux SAEM (Consumer Discretionary)(b) | | | 8,382,793 | |
| | 37,070 | | | Legrand SA (Industrials) | | | 3,665,312 | |
| | 50,431 | | | L’Oreal SA (Consumer Staples) | | | 22,211,586 | |
| | 47,852 | | | LVMH Moet Hennessy Louis Vuitton SE (Consumer Discretionary) | | | 40,624,483 | |
| | 244,697 | | | Orange SA (Communication Services) | | | 2,750,898 | |
| | 20,667 | | | Pernod Ricard SA (Consumer Staples) | | | 4,064,485 | |
| | 54,526 | | | Publicis Groupe SA (Communication Services) | | | 4,264,497 | |
| | 17,671 | | | Remy Cointreau SA (Consumer Staples)* | | | 2,741,670 | |
| | 53,438 | | | Renault SA (Consumer Discretionary) | | | 2,165,391 | |
| | 38,380 | | | Safran SA (Industrials) | | | 6,177,547 | |
| | 9,867 | | | Sartorius Stedim Biotech (Health Care) | | | 2,806,869 | |
| | 30,197 | | | SEB SA (Consumer Discretionary) | | | 3,326,594 | |
| | 114,532 | | | Societe Generale SA (Financials) | | | 3,258,717 | |
| | 25,596 | | | Sodexo SA (Consumer Discretionary) | | | 2,750,838 | |
| | 23,948 | | | Thales SA (Industrials) | | | 3,503,717 | |
| | 376,295 | | | TotalEnergies SE (Energy) | | | 23,716,479 | |
| | 48,973 | | | Valeo SE (Consumer Discretionary) | | | 956,752 | |
| | 91,788 | | | Veolia Environnement SA (Utilities) | | | 2,875,095 | |
| | 84,544 | | | Vinci SA (Industrials) | | | 9,447,595 | |
| | 182,095 | | | Vivendi SE (Communication Services) | | | 1,662,126 | |
| | 16,688 | | | Wendel SE (Financials) | | | 1,529,586 | |
| | | | | | | | |
| | | | | | | 336,248,139 | |
| | |
| Germany – 7.5% | |
| | 45,214 | | | adidas AG (Consumer Discretionary) | | | 9,050,048 | |
| | 45,737 | | | Allianz SE (Financials) | | | 11,136,884 | |
| | 52,152 | | | BASF SE (Materials) | | | 2,648,463 | |
| | 155,349 | | | Bayer AG (Health Care) | | | 8,521,453 | |
| | 70,536 | | | Bayerische Motoren Werke AG (Consumer Discretionary) | | | 7,438,973 | |
| | 22,324 | | | Bechtle AG (Information Technology) | | | 1,088,867 | |
| | 39,867 | | | Beiersdorf AG (Consumer Staples) | | | 5,226,975 | |
| | 40,410 | | | Brenntag SE (Industrials) | | | 3,278,022 | |
| | 10,620 | | | Carl Zeiss Meditec AG (Health Care) | | | 1,057,203 | |
| | 432,691 | | | Commerzbank AG (Financials) | | | 4,766,656 | |
| | 12,140 | | | Covestro AG (Materials)*(b) | | | 646,554 | |
| | 31,192 | | | Daimler Truck Holding AG (Industrials) | | | 1,099,924 | |
| | |
| | |
| 64 | | The accompanying notes are an integral part of these financial statements. |
GOLDMAN SACHS ACTIVEBETA® INTERNATIONAL EQUITY ETF
| | | | | | | | |
| Shares | | | Description | |
Value | |
|
| Common Stocks – (continued) | |
| Germany – (continued) | |
| | 538,688 | | | Deutsche Bank AG (Financials) | | $ | 5,877,055 | |
| | 29,923 | | | Deutsche Boerse AG (Financials) | | | 5,321,346 | |
| | 488,075 | | | Deutsche Lufthansa AG (Industrials)* | | | 4,368,703 | |
| | 414,253 | | | Deutsche Telekom AG (Communication Services) | | | 8,876,193 | |
| | 306,752 | | | DHL Group (Industrials) | | | 14,344,435 | |
| | 763,479 | | | E.ON SE (Utilities) | | | 9,429,948 | |
| | 49,168 | | | Evonik Industries AG (Materials) | | | 944,819 | |
| | 104,627 | | | Fresenius Medical Care AG & Co. KGaA (Health Care) | | | 5,058,962 | |
| | 235,151 | | | Fresenius SE & Co. KGaA (Health Care) | | | 7,557,100 | |
| | 46,608 | | | GEA Group AG (Industrials) | | | 1,841,331 | |
| | 16,153 | | | Hannover Rueck SE (Financials) | | | 3,440,589 | |
| | 95,707 | | | Heidelberg Materials AG (Materials) | | | 7,715,881 | |
| | 261,743 | | | HelloFresh SE (Consumer Staples)* | | | 8,471,351 | |
| | 27,659 | | | Henkel AG & Co. KGaA (Consumer Staples) | | | 1,914,657 | |
| | 65,877 | | | Infineon Technologies AG (Information Technology) | | | 2,360,560 | |
| | 38,146 | | | Knorr-Bremse AG (Industrials) | | | 2,612,452 | |
| | 134,158 | | | Mercedes-Benz Group AG (Consumer Discretionary) | | | 9,834,393 | |
| | 32,565 | | | Merck KGaA (Health Care) | | | 5,867,176 | |
| | 8,811 | | | MTU Aero Engines AG (Industrials) | | | 2,063,700 | |
| | 17,648 | | | Muenchener Rueckversicherungs-Gesellschaft AG in Muenchen (Financials) | | | 6,861,057 | |
| | 93,813 | | | Nemetschek SE (Information Technology) | | | 6,490,005 | |
| | 87,685 | | | Puma SE (Consumer Discretionary) | | | 5,900,474 | |
| | 6,870 | | | Rational AG (Industrials) | | | 5,245,547 | |
| | 11,158 | | | Rheinmetall AG (Industrials) | | | 3,043,328 | |
| | 54,323 | | | RWE AG (Utilities) | | | 2,243,998 | |
| | 140,902 | | | SAP SE (Information Technology) | | | 19,700,189 | |
| | 11,769 | | | Scout24 SE (Communication Services)(b) | | | 812,649 | |
| | 79,666 | | | Siemens AG (Industrials) | | | 12,008,331 | |
| | 392,868 | | | Siemens Energy AG (Industrials)* | | | 5,611,416 | |
| | 25,403 | | | Siemens Healthineers AG (Health Care)(b) | | | 1,275,166 | |
| | 15,085 | | | Symrise AG (Materials) | | | 1,574,381 | |
| | 52,049 | | | Talanx AG (Financials) | | | 3,505,291 | |
| | 696,704 | | | Telefonica Deutschland Holding AG (Communication Services) | | | 1,326,319 | |
| | 168,582 | | | Zalando SE (Consumer Discretionary)*(b) | | | 5,256,743 | |
| | | | | | | | |
| | | | | | | 244,715,567 | |
| | |
| Hong Kong – 1.3% | |
| | 582,829 | | | AIA Group Ltd. (Financials) | | | 5,291,858 | |
| | 237,761 | | | CK Asset Holdings Ltd. (Real Estate) | | | 1,312,851 | |
| | 148,925 | | | CLP Holdings Ltd. (Utilities) | | | 1,167,965 | |
| | 16,224 | | | Futu Holdings Ltd. ADR (Financials)* | | | 966,950 | |
| | 78,537 | | | Hang Seng Bank Ltd. (Financials) | | | 1,001,524 | |
| | |
|
| Common Stocks – (continued) | |
| Hong Kong – (continued) | |
| | 1,285,211 | | | HKT Trust & HKT Ltd. (Communication Services) | | $ | 1,370,149 | |
| | 997,059 | | | Hong Kong & China Gas Co. Ltd. (Utilities) | | | 733,641 | |
| | 171,199 | | | Hong Kong Exchanges & Clearing Ltd. (Financials) | | | 6,636,847 | |
| | 179,620 | | | Hongkong Land Holdings Ltd. (Real Estate) | | | 637,651 | |
| | 49,970 | | | Jardine Matheson Holdings Ltd. (Industrials) | | | 2,376,573 | |
| | 219,732 | | | MTR Corp. Ltd. (Industrials) | | | 917,681 | |
| | 1,716,676 | | | New World Development Co. Ltd. (Real Estate) | | | 3,647,123 | |
| | 266,153 | | | Power Assets Holdings Ltd. (Utilities) | | | 1,311,801 | |
| | 167,049 | | | Prudential PLC (Financials) | | | 2,045,216 | |
| | 124,815 | | | Sun Hung Kai Properties Ltd. (Real Estate) | | | 1,405,447 | |
| | 173,149 | | | Swire Pacific Ltd., Class A (Real Estate) | | | 1,428,602 | |
| | 406,489 | | | Techtronic Industries Co. Ltd. (Industrials) | | | 4,017,330 | |
| | 13,748,207 | | | WH Group Ltd. (Consumer Staples)(b) | | | 7,082,954 | |
| | | | | | | | |
| | | | | | | 43,352,163 | |
| | |
| Ireland – 0.6% | |
| | 51,643 | | | AerCap Holdings NV (Industrials)* | | | 3,177,077 | |
| | 499,099 | | | AIB Group PLC (Financials) | | | 2,276,212 | |
| | 215,659 | | | Bank of Ireland Group PLC (Financials) | | | 2,152,935 | |
| | 97,125 | | | CRH PLC (Materials) | | | 5,599,626 | |
| | 16,843 | | | Kerry Group PLC, Class A (Consumer Staples) | | | 1,574,687 | |
| | 25,602 | | | Kingspan Group PLC (Industrials) | | | 2,169,620 | |
| | 83,511 | | | Smurfit Kappa Group PLC (Materials) | | | 3,514,969 | |
| | | | | | | | |
| | | | | | | 20,465,126 | |
| | |
| Israel – 0.8% | |
| | 206,393 | | | Bank Hapoalim BM (Financials) | | | 1,713,829 | |
| | 197,408 | | | Bank Leumi Le-Israel BM (Financials) | | | 1,536,833 | |
| | 28,881 | | | Check Point Software Technologies Ltd. (Information Technology)* | | | 3,887,094 | |
| | 215,921 | | | ICL Group Ltd. (Materials) | | | 1,296,106 | |
| | 296,999 | | | Israel Discount Bank Ltd., Class A (Financials) | | | 1,489,569 | |
| | 27,048 | | | Mizrahi Tefahot Bank Ltd. (Financials) | | | 891,559 | |
| | 1,075,016 | | | Teva Pharmaceutical Industries Ltd. ADR (Health Care)* | | | 10,492,156 | |
| | 35,105 | | | Wix.com Ltd. (Information Technology)* | | | 3,467,321 | |
| | | | | | | | |
| | | | | | | 24,774,467 | |
| | |
| | |
| The accompanying notes are an integral part of these financial statements. | | 65 |
GOLDMAN SACHS ACTIVEBETA® INTERNATIONAL EQUITY ETF
Schedule of Investments (continued)
August 31, 2023
| | | | | | | | |
| Shares | | | Description | |
Value | |
|
| Common Stocks – (continued) | |
| Italy – 2.4% | |
| | 308,952 | | | Assicurazioni Generali SpA (Financials) | | $ | 6,414,694 | |
| | 113,655 | | | Coca-Cola HBC AG (Consumer Staples)* | | | 3,280,731 | |
| | 151,801 | | | Davide Campari-Milano NV (Consumer Staples) | | | 1,988,620 | |
| | 16,835 | | | DiaSorin SpA (Health Care) | | | 1,782,604 | |
| | 759,756 | | | Enel SpA (Utilities) | | | 5,120,775 | |
| | 555,977 | | | Eni SpA (Energy) | | | 8,619,391 | |
| | 30,630 | | | Ferrari NV (Consumer Discretionary) | | | 9,740,574 | |
| | 201,448 | | | FinecoBank Banca Fineco SpA (Financials) | | | 2,768,003 | |
| | 93,211 | | | Infrastrutture Wireless Italiane SpA (Communication Services)(b) | | | 1,154,817 | |
| | 1,447,979 | | | Intesa Sanpaolo SpA (Financials) | | | 3,884,907 | |
| | 172,939 | | | Mediobanca Banca di Credito Finanziario SpA (Financials) | | | 2,265,532 | |
| | 118,206 | | | Moncler SpA (Consumer Discretionary) | | | 8,036,394 | |
| | 389,802 | | | Poste Italiane SpA (Financials)(b) | | | 4,338,600 | |
| | 99,672 | | | Prysmian SpA (Industrials) | | | 4,088,086 | |
| | 88,543 | | | Recordati Industria Chimica e Farmaceutica SpA (Health Care) | | | 4,457,126 | |
| | 337,172 | | | Snam SpA (Utilities) | | | 1,743,385 | |
| | 196,971 | | | Terna – Rete Elettrica Nazionale (Utilities) | | | 1,629,023 | |
| | 271,585 | | | UniCredit SpA (Financials) | | | 6,651,369 | |
| | | | | | | | |
| | | | | | | 77,964,631 | |
| | |
| Japan – 20.4% | |
| | 63,151 | | | Advantest Corp. (Information Technology) | | | 7,942,403 | |
| | 78,734 | | | Aeon Co. Ltd. (Consumer Staples)(a) | | | 1,632,709 | |
| | 80,436 | | | Aisin Corp. (Consumer Discretionary) | | | 2,689,027 | |
| | 78,602 | | | Ajinomoto Co., Inc. (Consumer Staples) | | | 3,332,831 | |
| | 58,068 | | | ANA Holdings, Inc. (Industrials)* | | | 1,312,249 | |
| | 97,089 | | | Asahi Group Holdings Ltd. (Consumer Staples) | | | 3,785,261 | |
| | 45,357 | | | Asahi Intecc Co. Ltd. (Health Care) | | | 924,369 | |
| | 551,645 | | | Astellas Pharma, Inc. (Health Care) | | | 8,391,097 | |
| | 41,799 | | | Azbil Corp. (Information Technology) | | | 1,395,358 | |
| | 194,913 | | | Bandai Namco Holdings, Inc. (Consumer Discretionary) | | | 4,527,910 | |
| | 156,347 | | | BayCurrent Consulting, Inc. (Industrials) | | | 5,383,573 | |
| | 84,825 | | | Bridgestone Corp. (Consumer Discretionary) | | | 3,298,378 | |
| | 231,663 | | | Brother Industries Ltd. (Information Technology) | | | 3,928,015 | |
| | 144,731 | | | Canon, Inc. (Information Technology) | | | 3,566,953 | |
| | 105,264 | | | Capcom Co. Ltd. (Communication Services) | | | 4,441,644 | |
| | |
|
| Common Stocks – (continued) | |
| Japan – (continued) | |
| | 10,654 | | | Central Japan Railway Co. (Industrials) | | | 1,367,746 | |
| | 248,639 | | | Chiba Bank Ltd. (The) (Financials) | | | 1,778,738 | |
| | 142,055 | | | Chubu Electric Power Co., Inc. (Utilities) | | | 1,897,840 | |
| | 111,892 | | | Chugai Pharmaceutical Co. Ltd. (Health Care) | | | 3,425,508 | |
| | 256,109 | | | Concordia Financial Group Ltd. (Financials) | | | 1,137,129 | |
| | 431,157 | | | CyberAgent, Inc. (Communication Services) | | | 2,748,317 | |
| | 91,124 | | | Dai-ichi Life Holdings, Inc. (Financials) | | | 1,697,172 | |
| | 191,814 | | | Daiichi Sankyo Co. Ltd. (Health Care) | | | 5,664,103 | |
| | 17,534 | | | Daikin Industries Ltd. (Industrials) | | | 3,038,054 | |
| | 28,086 | | | Daito Trust Construction Co. Ltd. (Real Estate) | | | 3,099,231 | |
| | 80,702 | | | Daiwa House Industry Co. Ltd. (Real Estate) | | | 2,243,924 | |
| | 547 | | | Daiwa House REIT Investment Corp. REIT (Real Estate) | | | 1,037,754 | |
| | 253,863 | | | Daiwa Securities Group, Inc. (Financials) | | | 1,445,564 | |
| | 31,673 | | | Denso Corp. (Consumer Discretionary) | | | 2,166,648 | |
| | 109,823 | | | Dentsu Group, Inc. (Communication Services) | | | 3,285,223 | |
| | 15,021 | | | Disco Corp. (Information Technology) | | | 2,965,818 | |
| | 40,720 | | | East Japan Railway Co. (Industrials) | | | 2,302,483 | |
| | 74,046 | | | Eisai Co. Ltd. (Health Care) | | | 4,708,712 | |
| | 316,325 | | | ENEOS Holdings, Inc. (Energy) | | | 1,186,993 | |
| | 22,768 | | | FANUC Corp. (Industrials) | | | 649,487 | |
| | 26,946 | | | Fast Retailing Co. Ltd. (Consumer Discretionary) | | | 6,196,738 | |
| | 55,943 | | | FUJIFILM Holdings Corp. (Information Technology) | | | 3,310,046 | |
| | 44,127 | | | Fujitsu Ltd. (Information Technology) | | | 5,517,959 | |
| | 1,238 | | | GLP J REIT (Real Estate) | | | 1,167,547 | |
| | 12,674 | | | GMO Payment Gateway, Inc. (Financials) | | | 803,350 | |
| | 172,445 | | | Hakuhodo DY Holdings, Inc. (Communication Services) | | | 1,638,752 | |
| | 26,186 | | | Hamamatsu Photonics KK (Information Technology) | | | 1,213,386 | |
| | 76,774 | | | Hankyu Hanshin Holdings, Inc. (Industrials) | | | 2,758,032 | |
| | 9,335 | | | Hikari Tsushin, Inc. (Industrials) | | | 1,555,566 | |
| | 6,496 | | | Hirose Electric Co. Ltd. (Information Technology) | | | 787,766 | |
| | 22,120 | | | Hitachi Construction Machinery Co. Ltd. (Industrials) | | | 689,954 | |
| | 117,312 | | | Hitachi Ltd. (Industrials) | | | 7,811,399 | |
| | 472,186 | | | Honda Motor Co. Ltd. (Consumer Discretionary) | | | 15,253,568 | |
| | 29,045 | | | Hoshizaki Corp. (Industrials) | | | 1,116,033 | |
| | 95,804 | | | Hoya Corp. (Health Care) | | | 10,630,996 | |
| | |
| | |
| 66 | | The accompanying notes are an integral part of these financial statements. |
GOLDMAN SACHS ACTIVEBETA® INTERNATIONAL EQUITY ETF
| | | | | | | | |
| Shares | | | Description | |
Value | |
|
| Common Stocks – (continued) | |
| Japan – (continued) | |
| | 52,758 | | | Ibiden Co. Ltd. (Information Technology) | | $ | 3,186,100 | |
| | 85,320 | | | Iida Group Holdings Co. Ltd. (Consumer Discretionary) | | | 1,399,193 | |
| | 672,835 | | | Inpex Corp. (Energy) | | | 9,404,947 | |
| | 179,207 | | | Isuzu Motors Ltd. (Consumer Discretionary) | | | 2,301,865 | |
| | 262,972 | | | ITOCHU Corp. (Industrials) | | | 9,884,142 | |
| | 27,176 | | | Itochu Techno-Solutions Corp. (Information Technology) | | | 807,337 | |
| | 206,688 | | | Japan Airlines Co. Ltd. (Industrials) | | | 4,260,540 | |
| | 49,006 | | | Japan Exchange Group, Inc. (Financials) | | | 856,010 | |
| | 1,761 | | | Japan Metropolitan Fund Invest REIT (Real Estate) | | | 1,182,991 | |
| | 266,361 | | | Japan Post Bank Co. Ltd. (Financials) | | | 2,137,877 | |
| | 877,664 | | | Japan Post Holdings Co. Ltd. (Financials) | | | 6,733,872 | |
| | 256,567 | | | Japan Post Insurance Co. Ltd. (Financials) | | | 4,137,040 | |
| | 280 | | | Japan Real Estate Investment Corp. REIT (Real Estate) | | | 1,163,581 | |
| | 195,248 | | | Japan Tobacco, Inc. (Consumer Staples) | | | 4,279,537 | |
| | 128,476 | | | JFE Holdings, Inc. (Materials) | | | 2,032,795 | |
| | 120,469 | | | Kajima Corp. (Industrials) | | | 2,013,678 | |
| | 149,729 | | | Kansai Electric Power Co., Inc. (The) (Utilities) | | | 2,133,035 | |
| | 82,603 | | | Kao Corp. (Consumer Staples) | | | 3,199,494 | |
| | 19,289 | | | Kawasaki Kisen Kaisha Ltd. (Industrials) | | | 647,361 | |
| | 288,213 | | | KDDI Corp. (Communication Services) | | | 8,562,154 | |
| | 50,936 | | | Keisei Electric Railway Co. Ltd. (Industrials) | | | 1,951,582 | |
| | 15,106 | | | Keyence Corp. (Information Technology) | | | 6,279,597 | |
| | 45,158 | | | Kikkoman Corp. (Consumer Staples) | | | 2,613,602 | |
| | 62,232 | | | Kintetsu Group Holdings Co. Ltd. (Industrials) | | | 1,970,171 | |
| | 129,772 | | | Kirin Holdings Co. Ltd. (Consumer Staples) | | | 1,823,770 | |
| | 18,380 | | | Kobayashi Pharmaceutical Co. Ltd. (Consumer Staples) | | | 909,247 | |
| | 79,464 | | | Komatsu Ltd. (Industrials) | | | 2,265,176 | |
| | 56,970 | | | Kose Corp. (Consumer Staples) | | | 4,731,032 | |
| | 37,873 | | | Kyocera Corp. (Information Technology) | | | 1,945,354 | |
| | 43,416 | | | Kyowa Kirin Co. Ltd. (Health Care) | | | 796,390 | |
| | 60,697 | | | M3, Inc. (Health Care) | | | 1,210,521 | |
| | 647,109 | | | Marubeni Corp. (Industrials) | | | 10,598,835 | |
| | 55,246 | | | MatsukiyoCocokara & Co. (Consumer Staples) | | | 3,254,006 | |
| | 647,727 | | | Mazda Motor Corp. (Consumer Discretionary) | | | 6,818,296 | |
| | 62,435 | | | McDonald’s Holdings Co. Japan Ltd. (Consumer Discretionary) | | | 2,483,076 | |
| | |
|
| Common Stocks – (continued) | |
| Japan – (continued) | |
| | 62,303 | | | MEIJI Holdings Co. Ltd. (Consumer Staples) | | | 1,562,871 | |
| | 150,812 | | | MISUMI Group, Inc. (Industrials) | | | 2,634,820 | |
| | 385,647 | | | Mitsubishi Chemical Group Corp. (Materials) | | | 2,305,379 | |
| | 285,254 | | | Mitsubishi Corp. (Industrials) | | | 14,099,583 | |
| | 220,152 | | | Mitsubishi Electric Corp. (Industrials) | | | 2,871,646 | |
| | 102,009 | | | Mitsubishi Estate Co. Ltd. (Real Estate) | | | 1,305,023 | |
| | 475,361 | | | Mitsubishi HC Capital, Inc. (Financials) | | | 3,091,797 | |
| | 27,480 | | | Mitsubishi Heavy Industries Ltd. (Industrials) | | | 1,561,010 | |
| | 1,144,453 | | | Mitsubishi UFJ Financial Group, Inc. (Financials) | | | 9,146,348 | |
| | 316,387 | | | Mitsui & Co. Ltd. (Industrials) | | | 11,804,885 | |
| | 57,957 | | | Mitsui Fudosan Co. Ltd. (Real Estate) | | | 1,270,727 | |
| | 82,202 | | | Mitsui OSK Lines Ltd. (Industrials) | | | 2,278,856 | |
| | 405,365 | | | Mizuho Financial Group, Inc. (Financials) | | | 6,710,373 | |
| | 362,532 | | | MonotaRO Co. Ltd. (Industrials) | | | 4,288,080 | |
| | 92,250 | | | MS&AD Insurance Group Holdings, Inc. (Financials) | | | 3,320,328 | |
| | 54,409 | | | Murata Manufacturing Co. Ltd. (Information Technology) | | | 3,058,953 | |
| | 139,610 | | | NEC Corp. (Information Technology) | | | 7,370,556 | |
| | 72,743 | | | Nexon Co. Ltd. (Communication Services) | | | 1,477,495 | |
| | 64,210 | | | NGK Insulators Ltd. (Industrials) | | | 852,987 | |
| | 114,611 | | | Nintendo Co. Ltd. (Communication Services) | | | 4,933,662 | |
| | 228 | | | Nippon Building Fund, Inc. REIT (Real Estate) | | | 963,149 | |
| | 35,474 | | | NIPPON EXPRESS HOLDINGS, Inc. (Industrials) | | | 1,844,302 | |
| | 400 | | | Nippon Prologis REIT, Inc. REIT (Real Estate) | | | 804,753 | |
| | 101,100 | | | Nippon Steel Corp. (Materials) | | | 2,393,734 | |
| | 11,410,893 | | | Nippon Telegraph & Telephone Corp. (Communication Services) | | | 13,191,285 | |
| | 191,107 | | | Nippon Yusen KK (Industrials) | | | 5,101,087 | |
| | 23,479 | | | Nissan Chemical Corp. (Materials) | | | 1,007,637 | |
| | 22,699 | | | Nissin Foods Holdings Co. Ltd. (Consumer Staples) | | | 1,983,249 | |
| | 34,865 | | | Nitori Holdings Co. Ltd. (Consumer Discretionary) | | | 3,980,192 | |
| | 20,370 | | | Nitto Denko Corp. (Materials) | | | 1,392,047 | |
| | 193,279 | | | Nomura Holdings, Inc. (Financials) | | | 749,033 | |
| | 39,817 | | | Nomura Real Estate Holdings, Inc. (Real Estate) | | | 1,003,185 | |
| | 1,030 | | | Nomura Real Estate Master Fund, Inc. REIT (Real Estate) | | | 1,210,516 | |
| | 65,367 | | | Nomura Research Institute Ltd. (Information Technology) | | | 1,879,046 | |
| | |
| | |
| The accompanying notes are an integral part of these financial statements. | | 67 |
GOLDMAN SACHS ACTIVEBETA® INTERNATIONAL EQUITY ETF
Schedule of Investments (continued)
August 31, 2023
| | | | | | | | |
| Shares | | | Description | |
Value | |
|
| Common Stocks – (continued) | |
| Japan – (continued) | |
| | 71,082 | | | NTT Data Group Corp. (Information Technology) | | $ | 957,460 | |
| | 561,812 | | | Obayashi Corp. (Industrials) | | | 5,090,016 | |
| | 5,717 | | | Obic Co. Ltd. (Information Technology) | | | 994,688 | |
| | 214,206 | | | Oji Holdings Corp. (Materials) | | | 876,923 | |
| | 285,972 | | | Olympus Corp. (Health Care) | | | 3,870,645 | |
| | 53,720 | | | Omron Corp. (Information Technology) | | | 2,596,980 | |
| | 120,701 | | | Ono Pharmaceutical Co. Ltd. (Health Care) | | | 2,289,493 | |
| | 47,713 | | | Oracle Corp. Japan (Information Technology) | | | 3,333,044 | |
| | 105,574 | | | Oriental Land Co. Ltd. (Consumer Discretionary) | | | 3,806,422 | |
| | 121,603 | | | ORIX Corp. (Financials) | | | 2,271,938 | |
| | 58,825 | | | Osaka Gas Co. Ltd. (Utilities) | | | 941,459 | |
| | 23,772 | | | Otsuka Corp. (Information Technology) | | | 1,060,543 | |
| | 123,102 | | | Otsuka Holdings Co. Ltd. (Health Care) | | | 4,689,519 | |
| | 71,090 | | | Pan Pacific International Holdings Corp. (Consumer Discretionary) | | | 1,418,284 | |
| | 334,878 | | | Panasonic Holdings Corp. (Consumer Discretionary) | | | 3,863,225 | |
| | 309,138 | | | Persol Holdings Co. Ltd. (Industrials) | | | 5,297,931 | |
| | 287,192 | | | Recruit Holdings Co. Ltd. (Industrials) | | | 10,297,367 | |
| | 319,035 | | | Renesas Electronics Corp. (Information Technology)* | | | 5,370,026 | |
| | 484,883 | | | Resona Holdings, Inc. (Financials) | | | 2,572,210 | |
| | 740,688 | | | Ricoh Co. Ltd. (Information Technology) | | | 6,044,148 | |
| | 54,931 | | | SBI Holdings, Inc. (Financials) | | | 1,122,692 | |
| | 27,449 | | | Secom Co. Ltd. (Industrials) | | | 1,922,194 | |
| | 176,230 | | | Seiko Epson Corp. (Information Technology) | | | 2,762,956 | |
| | 88,584 | | | Sekisui Chemical Co. Ltd. (Consumer Discretionary) | | | 1,360,537 | |
| | 106,613 | | | Sekisui House Ltd. (Consumer Discretionary) | | | 2,175,320 | |
| | 161,420 | | | Seven & i Holdings Co. Ltd. (Consumer Staples) | | | 6,631,542 | |
| | 60,736 | | | Shimadzu Corp. (Information Technology) | | | 1,788,058 | |
| | 211,726 | | | Shimizu Corp. (Industrials) | | | 1,424,789 | |
| | 132,482 | | | Shin-Etsu Chemical Co. Ltd. (Materials) | | | 4,239,679 | |
| | 25,611 | | | Shionogi & Co. Ltd. (Health Care) | | | 1,128,865 | |
| | 157,735 | | | Shiseido Co. Ltd. (Consumer Staples) | | | 6,409,728 | |
| | 236,279 | | | Shizuoka Financial Group, Inc. (Financials) | | | 1,923,211 | |
| | 381,195 | | | SoftBank Corp. (Communication Services) | | | 4,372,673 | |
| | 146,381 | | | SoftBank Group Corp. (Communication Services) | | | 6,580,785 | |
| | 39,290 | | | Sompo Holdings, Inc. (Financials) | | | 1,712,907 | |
| | |
|
| Common Stocks – (continued) | |
| Japan – (continued) | |
| | 66,336 | | | Sony Group Corp. (Consumer Discretionary) | | | 5,533,885 | |
| | 47,310 | | | Square Enix Holdings Co. Ltd. (Communication Services) | | | 1,797,055 | |
| | 342,652 | | | Subaru Corp. (Consumer Discretionary) | | | 6,612,500 | |
| | 75,069 | | | SUMCO Corp. (Information Technology) | | | 1,003,945 | |
| | 322,529 | | | Sumitomo Chemical Co. Ltd. (Materials) | | | 893,692 | |
| | 282,647 | | | Sumitomo Corp. (Industrials) | | | 5,822,429 | |
| | 89,179 | | | Sumitomo Electric Industries Ltd. (Consumer Discretionary) | | | 1,093,719 | |
| | 182,884 | | | Sumitomo Mitsui Financial Group, Inc. (Financials) | | | 8,392,678 | |
| | 67,352 | | | Sumitomo Mitsui Trust Holdings, Inc. (Financials) | | | 2,521,797 | |
| | 78,573 | | | Suntory Beverage & Food Ltd. (Consumer Staples) | | | 2,544,171 | |
| | 19,067 | | | Suzuki Motor Corp. (Consumer Discretionary) | | | 751,102 | |
| | 57,904 | | | Sysmex Corp. (Health Care) | | | 3,082,831 | |
| | 40,308 | | | T&D Holdings, Inc. (Financials) | | | 640,537 | |
| | 108,433 | | | Taisei Corp. (Industrials) | | | 3,651,798 | |
| | 418,622 | | | Takeda Pharmaceutical Co. Ltd. (Health Care) | | | 12,962,517 | |
| | 55,256 | | | Terumo Corp. (Health Care) | | | 1,674,930 | |
| | 53,828 | | | TIS, Inc. (Information Technology) | | | 1,270,782 | |
| | 86,801 | | | Tobu Railway Co. Ltd. (Industrials) | | | 2,380,715 | |
| | 30,107 | | | Toho Co. Ltd. (Communication Services) | | | 1,148,775 | |
| | 229,652 | | | Tokio Marine Holdings, Inc. (Financials) | | | 5,090,408 | |
| | 64,264 | | | Tokyo Electron Ltd. (Information Technology) | | | 9,523,617 | |
| | 223,725 | | | Tokyo Gas Co. Ltd. (Utilities) | | | 5,189,541 | |
| | 181,981 | | | Tokyu Corp. (Industrials) | | | 2,300,622 | |
| | 136,409 | | | TOPPAN, Inc. (Industrials) | | | 3,299,077 | |
| | 216,938 | | | Toray Industries, Inc. (Materials) | | | 1,171,377 | |
| | 33,234 | | | Toshiba Corp. (Industrials) | | | 1,050,540 | |
| | 64,452 | | | Tosoh Corp. (Materials) | | | 834,952 | |
| | 27,300 | | | TOTO Ltd. (Industrials) | | | 749,140 | |
| | 9,363 | | | Toyota Industries Corp. (Industrials) | | | 662,423 | |
| | 711,848 | | | Toyota Motor Corp. (Consumer Discretionary) | | | 12,297,268 | |
| | 47,423 | | | Toyota Tsusho Corp. (Industrials) | | | 2,832,318 | |
| | 45,359 | | | Trend Micro, Inc. (Information Technology) | | | 1,928,268 | |
| | 59,920 | | | Unicharm Corp. (Consumer Staples) | | | 2,392,108 | |
| | 97,890 | | | USS Co. Ltd. (Consumer Discretionary) | | | 1,710,898 | |
| | 306,145 | | | Welcia Holdings Co. Ltd. (Consumer Staples)(a) | | | 5,630,410 | |
| | 42,807 | | | West Japan Railway Co. (Industrials) | | | 1,853,593 | |
| | 39,892 | | | Yakult Honsha Co. Ltd. (Consumer Staples) | | | 2,091,806 | |
| | |
| | |
| 68 | | The accompanying notes are an integral part of these financial statements. |
GOLDMAN SACHS ACTIVEBETA® INTERNATIONAL EQUITY ETF
| | | | | | | | |
| Shares | | | Description | |
Value | |
|
| Common Stocks – (continued) | |
| Japan – (continued) | |
| | 38,369 | | | Yamaha Motor Co. Ltd. (Consumer Discretionary) | | $ | 995,957 | |
| | 64,831 | | | Yamato Holdings Co. Ltd. (Industrials) | | | 1,218,601 | |
| | 106,247 | | | Yokogawa Electric Corp. (Information Technology) | | | 2,108,009 | |
| | 159,563 | | | Zensho Holdings Co. Ltd. (Consumer Discretionary) | | | 7,525,223 | |
| | 320,366 | | | ZOZO, Inc. (Consumer Discretionary) | | | 6,402,479 | |
| | | | | | | | |
| | | | | | | 664,108,861 | |
| | |
| Jordan – 0.1% | |
| | 138,841 | | | Hikma Pharmaceuticals PLC (Health Care) | | | 3,851,162 | |
| | |
| Luxembourg – 0.4% | |
| | 451,810 | | | ArcelorMittal (Materials) | | | 12,028,828 | |
| | 36,531 | | | Eurofins Scientific SE (Health Care) | | | 2,253,646 | |
| | | | | | | | |
| | | | | | | 14,282,474 | |
| | |
| Macau – 0.1% | |
| | 145,777 | | | Galaxy Entertainment Group Ltd. (Consumer Discretionary)* | | | 964,813 | |
| | 481,463 | | | Sands China Ltd. (Consumer Discretionary)* | | | 1,630,101 | |
| | | | | | | | |
| | | | | | | 2,594,914 | |
| | |
| Netherlands – 4.5% | |
| | 128,833 | | | ABN AMRO Bank NV (Financials)(a)(b) | | | 1,900,974 | |
| | 183,183 | | | Aegon NV (Financials) | | | 942,396 | |
| | 22,490 | | | Akzo Nobel NV (Materials) | | | 1,831,691 | |
| | 2,483 | | | Argenx SE (Health Care)* | | | 1,252,601 | |
| | 8,408 | | | ASM International NV (Information Technology) | | | 4,062,728 | |
| | 52,669 | | | ASML Holding NV (Information Technology) | | | 34,750,188 | |
| | 25,152 | | | ASR Nederland NV (Financials) | | | 1,102,050 | |
| | 16,350 | | | BE Semiconductor Industries NV (Information Technology) | | | 1,882,795 | |
| | 14,645 | | | Euronext NV (Financials)(b) | | | 1,059,399 | |
| | 67,617 | | | EXOR NV (Financials) | | | 5,998,746 | |
| | 56,950 | | | Heineken Holding NV (Consumer Staples) | | | 4,567,811 | |
| | 34,439 | | | Heineken NV (Consumer Staples) | | | 3,357,326 | |
| | 7,265 | | | IMCD NV (Industrials) | | | 1,003,375 | |
| | 395,122 | | | ING Groep NV (Financials) | | | 5,617,880 | |
| | 101,534 | | | JDE Peet’s NV (Consumer Staples) | | | 2,829,935 | |
| | 499,678 | | | Koninklijke Ahold Delhaize NV (Consumer Staples) | | | 16,364,677 | |
| | 769,797 | | | Koninklijke KPN NV (Communication Services) | | | 2,696,157 | |
| | 95,483 | | | Koninklijke Philips NV (Health Care)* | | | 2,155,556 | |
| | 54,848 | | | NN Group NV (Financials) | | | 2,116,862 | |
| | 109,096 | | | Randstad NV (Industrials) | | | 6,415,312 | |
| | |
|
| Common Stocks – (continued) | |
| Netherlands – (continued) | |
| | 970,601 | | | Shell PLC (Energy) | | | 29,658,988 | |
| | 68,847 | | | Universal Music Group NV (Communication Services) | | | 1,710,412 | |
| | 103,046 | | | Wolters Kluwer NV (Industrials) | | | 12,436,720 | |
| | | | | | | | |
| | | | | | | 145,714,579 | |
| | |
| New Zealand – 0.2% | |
| | 191,206 | | | Fisher & Paykel Healthcare Corp. Ltd. (Health Care) | | | 2,585,616 | |
| | 358,292 | | | Spark New Zealand Ltd. (Communication Services) | | | 1,082,726 | |
| | 34,722 | | | Xero Ltd. (Information Technology)* | | | 2,813,212 | |
| | | | | | | | |
| | | | | | | 6,481,554 | |
| | |
| Norway – 0.7% | |
| | 54,018 | | | Aker BP ASA (Energy) | | | 1,465,580 | |
| | 152,664 | | | DNB Bank ASA (Financials) | | | 3,022,524 | |
| | 265,773 | | | Equinor ASA (Energy) | | | 8,200,194 | |
| | 251,044 | | | Gjensidige Forsikring ASA (Financials) | | | 3,905,913 | |
| | 41,460 | | | Kongsberg Gruppen ASA (Industrials) | | | 1,718,089 | |
| | 346,080 | | | Orkla ASA (Consumer Staples) | | | 2,644,447 | |
| | 96,742 | | | Telenor ASA (Communication Services) | | | 1,035,890 | |
| | | | | | | | |
| | | | | | | 21,992,637 | |
| | |
| Portugal – 0.4% | |
| | 246,747 | | | EDP – Energias de Portugal SA (Utilities) | | | 1,126,396 | |
| | 79,901 | | | Galp Energia SGPS SA (Energy) | | | 1,101,785 | |
| | 402,536 | | | Jeronimo Martins SGPS SA (Consumer Staples) | | | 10,266,975 | |
| | | | | | | | |
| | | | | | | 12,495,156 | |
| | |
| Singapore – 1.6% | |
| | 576,693 | | | CapitaLand Integrated Commercial Trust REIT (Real Estate) | | | 815,612 | |
| | 152,210 | | | City Developments Ltd. (Real Estate) | | | 752,879 | |
| | 391,888 | | | DBS Group Holdings Ltd. (Financials) | | | 9,662,992 | |
| | 2,248,719 | | | Genting Singapore Ltd. (Consumer Discretionary) | | | 1,456,964 | |
| | 58,030 | | | Jardine Cycle & Carriage Ltd. (Industrials) | | | 1,436,033 | |
| | 392,783 | | | Keppel Corp. Ltd. (Industrials) | | | 2,018,448 | |
| | 895,239 | | | Oversea-Chinese Banking Corp. Ltd. (Financials) | | | 8,319,326 | |
| | 7,502,151 | | | Seatrium Ltd. (Industrials)* | | | 805,488 | |
| | 334,930 | | | Sembcorp Industries Ltd. (Utilities) | | | 1,326,824 | |
| | 394,464 | | | Singapore Airlines Ltd. (Industrials) | | | 2,006,640 | |
| | 1,353,208 | | | Singapore Exchange Ltd. (Financials) | | | 9,649,310 | |
| | 1,034,456 | | | Singapore Telecommunications Ltd. (Communication Services) | | | 1,823,032 | |
| | |
| | |
| The accompanying notes are an integral part of these financial statements. | | 69 |
GOLDMAN SACHS ACTIVEBETA® INTERNATIONAL EQUITY ETF
Schedule of Investments (continued)
August 31, 2023
| | | | | | | | |
| Shares | | | Description | |
Value | |
|
| Common Stocks – (continued) | |
| Singapore – (continued) | |
| | 132,387 | | | STMicroelectronics NV (Information Technology) | | $ | 6,274,061 | |
| | 253,067 | | | United Overseas Bank Ltd. (Financials) | | | 5,329,304 | |
| | | | | | | | |
| | | | | | | 51,676,913 | |
| | |
| Spain – 2.5% | |
| | 9,266 | | | Acciona SA (Utilities) | | | 1,325,996 | |
| | 226,214 | | | ACS Actividades de Construccion y Servicios SA (Industrials) | | | 7,952,439 | |
| | 4,294 | | | Aena SME SA (Industrials)(b) | | | 675,772 | |
| | 46,522 | | | Amadeus IT Group SA (Consumer Discretionary) | | | 3,196,186 | |
| | 1,007,788 | | | Banco Bilbao Vizcaya Argentaria SA (Financials) | | | 7,947,573 | |
| | 2,611,426 | | | Banco Santander SA (Financials) | | | 10,209,192 | |
| | 545,779 | | | CaixaBank SA (Financials) | | | 2,211,877 | |
| | 23,483 | | | Corp ACCIONA Energias Renovables SA (Utilities) | | | 699,371 | |
| | 77,111 | | | Enagas SA (Utilities) | | | 1,317,738 | |
| | 74,468 | | | Endesa SA (Utilities) | | | 1,550,202 | |
| | 754,731 | | | Iberdrola SA (Utilities) | | | 8,977,857 | |
| | 395,473 | | | Industria de Diseno Textil SA (Consumer Discretionary) | | | 15,177,458 | |
| | 80,803 | | | Naturgy Energy Group SA (Utilities)(a) | | | 2,345,086 | |
| | 99,612 | | | Redeia Corp. SA (Utilities) | | | 1,622,249 | |
| | 680,775 | | | Repsol SA (Energy) | | | 10,506,865 | |
| | 948,273 | | | Telefonica SA (Communication Services) | | | 3,935,693 | |
| | | | | | | | |
| | | | | | | 79,651,554 | |
| | |
| Sweden – 1.9% | |
| | 50,974 | | | Alfa Laval AB (Industrials) | | | 1,793,184 | |
| | 80,045 | | | Assa Abloy AB, Class B (Industrials) | | | 1,804,867 | |
| | 355,645 | | | Atlas Copco AB, Class A (Industrials) | | | 4,707,873 | |
| | 243,774 | | | Atlas Copco AB, Class B (Industrials) | | | 2,812,888 | |
| | 73,818 | | | Epiroc AB, Class A (Industrials) | | | 1,419,745 | |
| | 54,846 | | | Epiroc AB, Class B (Industrials) | | | 899,583 | |
| | 116,451 | | | Essity AB, Class B (Consumer Staples) | | | 2,719,342 | |
| | 11,720 | | | Evolution AB (Consumer Discretionary)(b) | | | 1,269,625 | |
| | 572,888 | | | H & M Hennes & Mauritz AB, Class B (Consumer Discretionary) | | | 8,762,389 | |
| | 87,510 | | | Hexagon AB, Class B (Information Technology) | | | 782,403 | |
| | 30,748 | | | Holmen AB, Class B (Materials) | | | 1,166,750 | |
| | 130,149 | | | Husqvarna AB, Class B (Industrials)(a) | | | 1,123,214 | |
| | 50,857 | | | Industrivarden AB, Class A (Financials) | | | 1,326,939 | |
| | 61,282 | | | Industrivarden AB, Class C (Financials) | | | 1,596,145 | |
| | |
|
| Common Stocks – (continued) | |
| Sweden – (continued) | |
| | 186,845 | | | Investor AB, Class B (Financials) | | | 3,602,131 | |
| | 23,637 | | | L E Lundbergforetagen AB, Class B (Financials) | | | 962,326 | |
| | 36,559 | | | Lifco AB, Class B (Industrials) | | | 670,421 | |
| | 17,694 | | | Saab AB, Class B (Industrials) | | | 934,963 | |
| | 58,696 | | | Sandvik AB (Industrials) | | | 1,111,750 | |
| | 191,015 | | | Skandinaviska Enskilda Banken AB, Class A (Financials) | | | 2,218,062 | |
| | 83,520 | | | Svenska Cellulosa AB SCA, Class B (Materials) | | | 1,113,610 | |
| | 257,506 | | | Svenska Handelsbanken AB, Class A (Financials) | | | 2,148,490 | |
| | 165,005 | | | Swedbank AB, Class A (Financials) | | | 2,925,663 | |
| | 101,231 | | | Swedish Orphan Biovitrum AB (Health Care)*(a) | | | 1,956,226 | |
| | 190,307 | | | Tele2 AB, Class B (Communication Services) | | | 1,344,153 | |
| | 700,575 | | | Telefonaktiebolaget LM Ericsson, Class B (Information Technology) | | | 3,603,995 | |
| | 618,315 | | | Telia Co. AB (Communication Services) | | | 1,248,500 | |
| | 83,499 | | | Volvo AB, Class A (Industrials) | | | 1,711,173 | |
| | 179,414 | | | Volvo AB, Class B (Industrials) | | | 3,624,360 | |
| | 363,423 | | | Volvo Car AB, Class B (Consumer Discretionary)*(a) | | | 1,384,671 | |
| | | | | | | | |
| | | | | | | 62,745,441 | |
| | |
| Switzerland – 4.9% | |
| | 157,645 | | | ABB Ltd. (Industrials) | | | 6,013,088 | |
| | 27,408 | | | Adecco Group AG (Industrials) | | | 1,183,206 | |
| | 27,336 | | | Alcon, Inc. (Health Care) | | | 2,287,775 | |
| | 17,612 | | | Baloise Holding AG (Financials) | | | 2,755,707 | |
| | 26,542 | | | Banque Cantonale Vaudoise (Financials) | | | 2,878,827 | |
| | 1,020 | | | Barry Callebaut AG (Consumer Staples) | | | 1,780,742 | |
| | 12,746 | | | BKW AG (Utilities) | | | 2,193,481 | |
| | 375 | | | Chocoladefabriken Lindt & Spruengli AG (Consumer Staples) | | | 4,487,688 | |
| | 56,910 | | | Cie Financiere Richemont SA, Class A (Consumer Discretionary) | | | 8,092,721 | |
| | 42,804 | | | Clariant AG (Materials)* | | | 714,329 | |
| | 14,093 | | | DSM-Firmenich AG (Materials) | | | 1,302,441 | |
| | 15,507 | | | Dufry AG (Consumer Discretionary)* | | | 691,034 | |
| | 3,477 | | | EMS-Chemie Holding AG (Materials)(a) | | | 2,615,869 | |
| | 7,930 | | | Geberit AG (Industrials) | | | 4,117,405 | |
| | 576 | | | Givaudan SA (Materials) | | | 1,922,500 | |
| | 11,810 | | | Helvetia Holding AG (Financials) | | | 1,799,746 | |
| | 27,948 | | | Julius Baer Group Ltd. (Financials) | | | 1,944,731 | |
| | 34,333 | | | Kuehne + Nagel International AG (Industrials) | | | 10,335,856 | |
| | 68,391 | | | Logitech International SA (Information Technology) | | | 4,743,428 | |
| | 2,839 | | | Lonza Group AG (Health Care) | | | 1,571,454 | |
| | 334,986 | | | Novartis AG (Health Care) | | | 33,872,176 | |
| | |
| | |
| 70 | | The accompanying notes are an integral part of these financial statements. |
GOLDMAN SACHS ACTIVEBETA® INTERNATIONAL EQUITY ETF
| | | | | | | | |
| Shares | | | Description | |
Value | |
|
| Common Stocks – (continued) | |
| Switzerland – (continued) | |
| | 7,709 | | | Partners Group Holding AG (Financials) | | $ | 8,336,979 | |
| | 7,388 | | | Schindler Holding AG (Industrials) | | | 1,554,972 | |
| | 6,390 | | | Schindler Holding AG Participation Certificates (Industrials) | | | 1,426,310 | |
| | 71,228 | | | SGS SA (Industrials) | | | 6,482,091 | |
| | 5,158 | | | Sika AG (Materials) | | | 1,462,285 | |
| | 6,324 | | | Sonova Holding AG (Health Care) | | | 1,673,273 | |
| | 40,996 | | | Straumann Holding AG (Health Care) | | | 6,219,603 | |
| | 14,313 | | | Swatch Group AG (The) – Bearer (Consumer Discretionary) | | | 4,030,165 | |
| | 64,516 | | | Swatch Group AG (The) – Registered (Consumer Discretionary) | | | 3,444,019 | |
| | 6,365 | | | Swiss Life Holding AG (Financials) | | | 3,996,636 | |
| | 20,554 | | | Swiss Prime Site AG (Real Estate) | | | 1,975,697 | |
| | 4,449 | | | Swisscom AG (Communication Services) | | | 2,709,949 | |
| | 316,207 | | | UBS Group AG (Financials) | | | 8,413,093 | |
| | 5,510 | | | VAT Group AG (Industrials)(b) | | | 2,210,862 | |
| | 16,338 | | | Zurich Insurance Group AG (Financials) | | | 7,676,502 | |
| | | | | | | | |
| | | | | | | 158,916,640 | |
| | |
| United Kingdom – 10.5% | |
| | 310,083 | | | 3i Group PLC (Financials) | | | 7,832,899 | |
| | 398,970 | | | abrdn PLC (Financials) | | | 834,672 | |
| | 253,940 | | | Admiral Group PLC (Financials) | | | 8,012,329 | |
| | 24,209 | | | Ashtead Group PLC (Industrials) | | | 1,694,567 | |
| | 170,107 | | | Associated British Foods PLC (Consumer Staples) | | | 4,294,858 | |
| | 216,809 | | | AstraZeneca PLC (Health Care) | | | 29,291,682 | |
| | 1,225,542 | | | Auto Trader Group PLC (Communication Services)(b) | | | 9,417,068 | |
| | 275,053 | | | Aviva PLC (Financials) | | | 1,307,698 | |
| | 526,410 | | | BAE Systems PLC (Industrials) | | | 6,720,437 | |
| | 2,245,861 | | | Barclays PLC (Financials) | | | 4,193,637 | |
| | 1,059,875 | | | Barratt Developments PLC (Consumer Discretionary) | | | 6,087,917 | |
| | 60,936 | | | Berkeley Group Holdings PLC (Consumer Discretionary) | | | 3,135,705 | |
| | 2,686,129 | | | BP PLC (Energy) | | | 16,593,187 | |
| | 353,168 | | | British American Tobacco PLC (Consumer Staples) | | | 11,736,137 | |
| | 84,440 | | | Bunzl PLC (Industrials) | | | 3,028,050 | |
| | 393,333 | | | Burberry Group PLC (Consumer Discretionary) | | | 10,885,324 | |
| | 4,718,769 | | | Centrica PLC (Utilities) | | | 9,073,728 | |
| | 921,052 | | | CK Hutchison Holdings Ltd. (Industrials) | | | 5,021,197 | |
| | 352,428 | | | CNH Industrial NV (Industrials) | | | 4,888,450 | |
| | 75,612 | | | Coca-Cola Europacific Partners PLC (Consumer Staples) | | | 4,847,485 | |
| | 300,040 | | | Compass Group PLC (Consumer Discretionary) | | | 7,577,305 | |
| | |
|
| Common Stocks – (continued) | |
| United Kingdom – (continued) | |
| | 10,770 | | | Croda International PLC (Materials) | | $ | 753,599 | |
| | 72,120 | | | DCC PLC (Industrials) | | | 3,954,312 | |
| | 241,021 | | | Diageo PLC (Consumer Staples) | | | 9,905,973 | |
| | 44,898 | | | Halma PLC (Information Technology) | | | 1,219,776 | |
| | 477,241 | | | Hargreaves Lansdown PLC (Financials) | | | 4,603,253 | |
| | 2,192,220 | | | HSBC Holdings PLC (Financials) | | | 16,197,780 | |
| | 271,628 | | | Imperial Brands PLC (Consumer Staples) | | | 6,159,346 | |
| | 297,802 | | | Informa PLC (Communication Services) | | | 2,757,747 | |
| | 31,426 | | | InterContinental Hotels Group PLC (Consumer Discretionary) | | | 2,370,971 | |
| | 28,252 | | | Intertek Group PLC (Industrials) | | | 1,482,101 | |
| | 3,203,252 | | | J Sainsbury PLC (Consumer Staples) | | | 10,963,369 | |
| | 4,102,293 | | | JD Sports Fashion PLC (Consumer Discretionary) | | | 7,550,421 | |
| | 1,418,463 | | | Kingfisher PLC (Consumer Discretionary) | | | 4,205,932 | |
| | 96,945 | | | Land Securities Group PLC REIT (Real Estate) | | | 740,258 | |
| | 1,359,393 | | | Legal & General Group PLC (Financials) | | | 3,767,230 | |
| | 12,535,195 | | | Lloyds Banking Group PLC (Financials) | | | 6,727,661 | |
| | 39,288 | | | London Stock Exchange Group PLC (Financials) | | | 4,071,321 | |
| | 197,838 | | | Melrose Industries PLC (Industrials) | | | 1,285,040 | |
| | 243,172 | | | National Grid PLC (Utilities) | | | 3,051,159 | |
| | 811,005 | | | NatWest Group PLC (Financials) | | | 2,367,742 | |
| | 75,399 | | | Next PLC (Consumer Discretionary) | | | 6,676,469 | |
| | 101,461 | | | Pearson PLC (Consumer Discretionary) | | | 1,078,672 | |
| | 247,572 | | | Phoenix Group Holdings PLC (Financials) | | | 1,634,435 | |
| | 76,806 | | | Reckitt Benckiser Group PLC (Consumer Staples) | | | 5,549,460 | |
| | 296,353 | | | RELX PLC (Industrials) | | | 9,681,008 | |
| | 303,285 | | | Rentokil Initial PLC (Industrials) | | | 2,312,765 | |
| | 955,837 | | | Rolls-Royce Holdings PLC (Industrials)* | | | 2,692,475 | |
| | 825,576 | | | Sage Group PLC (The) (Information Technology) | | | 10,157,916 | |
| | 128,280 | | | Schroders PLC (Financials) | | | 669,381 | |
| | 57,061 | | | Severn Trent PLC (Utilities) | | | 1,735,318 | |
| | 233,720 | | | Smith & Nephew PLC (Health Care) | | | 3,168,896 | |
| | 121,376 | | | Smiths Group PLC (Industrials) | | | 2,522,348 | |
| | 9,293 | | | Spirax-Sarco Engineering PLC (Industrials) | | | 1,193,460 | |
| | 157,400 | | | SSE PLC (Utilities) | | | 3,244,047 | |
| | |
| | |
| The accompanying notes are an integral part of these financial statements. | | 71 |
GOLDMAN SACHS ACTIVEBETA® INTERNATIONAL EQUITY ETF
Schedule of Investments (continued)
August 31, 2023
| | | | | | | | |
| Shares | | | Description | |
Value | |
|
| Common Stocks – (continued) | |
| United Kingdom – (continued) | |
| | 285,073 | | | St James’s Place PLC (Financials) | | $ | 3,196,168 | |
| | 328,880 | | | Standard Chartered PLC (Financials) | | | 2,965,526 | |
| | 1,120,154 | | | Taylor Wimpey PLC (Consumer Discretionary) | | | 1,622,379 | |
| | 2,398,676 | | | Tesco PLC (Consumer Staples) | | | 8,075,910 | |
| | 262,125 | | | Unilever PLC (Consumer Staples) | | | 13,425,581 | |
| | 148,696 | | | United Utilities Group PLC (Utilities) | | | 1,784,340 | |
| | 4,918,088 | | | Vodafone Group PLC (Communication Services) | | | 4,562,418 | |
| | 39,521 | | | Whitbread PLC (Consumer Discretionary) | | | 1,722,720 | |
| | 139,628 | | | Wise PLC, Class A (Financials)* | | | 1,132,704 | |
| | 81,771 | | | WPP PLC (Communication Services) | | | 793,493 | |
| | | | | | | | |
| | | | | | | 342,207,212 | |
| | |
| United States – 5.5% | |
| | 38,176 | | | BRP, Inc. (Consumer Discretionary) | | | 2,915,648 | |
| | 27,650 | | | CSL Ltd. (Health Care) | | | 4,898,246 | |
| | 146,751 | | | Experian PLC (Industrials) | | | 5,136,095 | |
| | 88,616 | | | Ferrovial SE (Industrials) | | | 2,813,248 | |
| | 711,748 | | | GSK PLC (Health Care) | | | 12,525,478 | |
| | 789,949 | | | Haleon PLC (Consumer Staples) | | | 3,228,175 | |
| | 98,940 | | | Holcim AG (Materials)* | | | 6,559,781 | |
| | 94,104 | | | James Hardie Industries PLC CDI (Materials)* | | | 2,835,839 | |
| | 7,313 | | | Monday.com Ltd. (Information Technology)* | | | 1,297,619 | |
| | 392,676 | | | Nestle SA (Consumer Staples) | | | 47,303,398 | |
| | 60,669 | | | QIAGEN NV (Health Care)* | | | 2,778,090 | |
| | 14,224 | | | Roche Holding AG (Health Care) | | | 4,447,969 | |
| | 125,156 | | | Roche Holding AG (Health Care) | | | 36,884,355 | |
| | 179,476 | | | Sanofi (Health Care) | | | 19,214,513 | |
| | 68,414 | | | Schneider Electric SE (Industrials) | | | 11,775,066 | |
| | 412,340 | | | Stellantis NV (Consumer Discretionary) | | | 7,686,833 | |
| | 39,941 | | | Swiss Re AG (Financials) | | | 3,884,440 | |
| | 148,711 | | | Tenaris SA (Energy) | | | 2,382,316 | |
| | | | | | | | |
| | | | | | | 178,567,109 | |
| | |
| Zambia – 0.1% | |
| | 81,492 | | | First Quantum Minerals Ltd. (Materials) | | | 2,186,451 | |
| | |
| | TOTAL COMMON STOCKS | | | | |
| | (Cost $2,886,888,533) | | $ | 3,229,246,674 | |
| | |
| | | | | | | | | | |
| Shares | | | Description | | Rate | | Value | |
|
| Preferred Stocks – 0.3% | |
| Germany – 0.3% | | | |
| | 49,491 | | | Bayerische Motoren Werke AG (Consumer Discretionary) | | 9.84% | | $ | 4,767,213 | |
| | |
|
| Preferred Stocks – (continued) | |
| Germany – (continued) | | | |
| | 37,179 | | | Henkel AG & Co. KGaA (Consumer Staples) | | 2.60 | | $ | 2,853,710 | |
| | 9,139 | | | Volkswagen AG (Consumer Discretionary) | | 25.69 | | | 1,121,246 | |
| | |
| | TOTAL PREFERRED STOCKS | | | | | | |
| | (Cost $9,506,339) | | | | $ | 8,742,169 | |
| | |
| | | | | | | | | | |
| Units | | | Description | | Expiration
Month | | Value | |
| |
| Rights – 0.0% | | | |
| Canada – 0.0% | | | |
| | 8,785 | | | Constellation Software, Inc.* | | 10/23 | | $ | 4,870 | |
| | |
| Sweden – 0.0% | | | |
| | 88,015 | | | Swedish Orphan Biovitrum AB*(a) | | 09/23 | | | 79,495 | |
| | |
| | TOTAL RIGHTS | | | | |
| | (Cost $0) | | $ | 84,365 | |
| | |
| | | | | | | | | | | | |
Principal
Amount | | | | | Interest
Rate | | | Value | |
|
| Warrant – 0.0% | |
| Canada – 0.0% | | | | |
| | 8,722 | | | Constellation Software, Inc. (Information Technology)* | | | 08/28 | | | $ | — | |
| | (Cost $0) | | | | | | | | | | | |
| | |
| TOTAL INVESTMENTS BEFORE SECURITIES
LENDING REINVESTMENT VEHICLE |
|
| | (Cost $2,896,394,872) | | | $ | 3,238,073,208 | |
| | |
| | | | | | | | |
| Shares | | | Dividend
Rate | | Value | |
|
| Securities Lending Reinvestment Vehicle – 1.1%(c) | |
| Goldman Sachs Financial Square Government Fund –
Institutional Shares |
|
| | 37,159,558 | | | 5.234% | | $ | 37,159,558 | |
| (Cost $37,159,558) | | | |
| | |
| | TOTAL INVESTMENTS – 100.7% | | | | |
| | (Cost $2,933,554,430) | | $ | 3,275,232,766 | |
| | |
| LIABILITIES IN EXCESS OF
OTHER ASSETS – (0.7)% | | | (24,170,981 | ) |
| | |
| | NET ASSETS – 100.0% | | $ | 3,251,061,785 | |
| | |
| | |
| 72 | | The accompanying notes are an integral part of these financial statements. |
GOLDMAN SACHS ACTIVEBETA® INTERNATIONAL EQUITY ETF
| | |
|
| The percentage shown for each investment category reflects the value of investments in that category as a percentage of net assets. |
| |
* | | Non-income producing security. |
| |
(a) | | All or a portion of security is on loan. |
| |
(b) | | Exempt from registration under Rule 144A of the Securities Act of 1933. |
| |
(c) | | Represents an affiliated issuer. |
| | |
|
Investment Abbreviations: |
ADR | | —American Depositary Receipt |
CVA | | —Dutch Certification |
PLC | | —Public Limited Company |
REIT | | —Real Estate Investment Trust |
|
|
| ADDITIONAL INVESTMENT INFORMATION |
FUTURES CONTRACTS — At August 31, 2023, the Fund had the following futures contracts:
| | | | | | | | | | | | | | |
| Description | | Number of
Contracts | | Expiration
Date | | | Notional
Amount | | | Unrealized
Appreciation/
(Depreciation) | |
Long position contracts: | | | | | | | | | | | | | | |
| | | | |
E-Mini MSCI EAFE Index Future | | 91 | | | 09/15/23 | | | $ | 9,597,315 | | | $ | (92,712 | ) |
| | | | |
| Sector Name | | % of Market
Value | |
| |
Financials | | | 18.5 | % |
Industrials | | | 16.1 | |
Consumer Discretionary | | | 12.5 | |
Consumer Staples | | | 12.3 | |
Health Care | | | 12.2 | |
Information Technology | | | 7.7 | |
Energy | | | 5.9 | |
Materials | | | 5.6 | |
Communication Services | | | 4.0 | |
Utilities | | | 2.9 | |
Real Estate | | | 1.2 | |
Securities Lending Reinvestment Vehicle | | | 1.1 | |
| |
| |
| TOTAL INVESTMENTS | | | 100.0 | % |
| |
| | |
| The accompanying notes are an integral part of these financial statements. | | 73 |
GOLDMAN SACHS ACTIVEBETA® JAPAN EQUITY ETF
Schedule of Investments
August 31, 2023
| | | | | | | | |
| Shares | | | Description | |
Value | |
|
| Common Stocks – 99.8% | |
| Communication Services – 7.4% | | | |
| | 1,433 | | | Capcom Co. Ltd. | | $ | 60,466 | |
| | 3,625 | | | CyberAgent, Inc. | | | 23,107 | |
| | 1,312 | | | Dentsu Group, Inc. | | | 39,247 | |
| | 4,726 | | | Hakuhodo DY Holdings, Inc. | | | 44,911 | |
| | 5,325 | | | KDDI Corp. | | | 158,194 | |
| | 816 | | | Koei Tecmo Holdings Co. Ltd. | | | 12,681 | |
| | 268 | | | Konami Group Corp. | | | 15,566 | |
| | 1,272 | | | Nexon Co. Ltd. | | | 25,836 | |
| | 3,452 | | | Nintendo Co. Ltd. | | | 148,598 | |
| | 138,800 | | | Nippon Telegraph & Telephone Corp. | | | 160,456 | |
| | 10,333 | | | SoftBank Corp. | | | 118,529 | |
| | 3,336 | | | SoftBank Group Corp. | | | 149,975 | |
| | 686 | | | Square Enix Holdings Co. Ltd. | | | 26,058 | |
| | 357 | | | Toho Co. Ltd. | | | 13,622 | |
| | 5,452 | | | Z Holdings Corp. | | | 16,395 | |
| | | | | | | | |
| | | | | | | 1,013,641 | |
| | |
| Consumer Discretionary – 18.8% | | | |
| | 2,552 | | | Aisin Corp. | | | 85,315 | |
| | 2,278 | | | Bandai Namco Holdings, Inc. | | | 52,919 | |
| | 2,099 | | | Bridgestone Corp. | | | 81,619 | |
| | 1,027 | | | Denso Corp. | | | 70,254 | |
| | 584 | | | Fast Retailing Co. Ltd. | | | 134,302 | |
| | 8,655 | | | Honda Motor Co. Ltd. | | | 279,592 | |
| | 1,521 | | | Iida Group Holdings Co. Ltd. | | | 24,943 | |
| | 2,236 | | | Isuzu Motors Ltd. | | | 28,721 | |
| | 504 | | | Koito Manufacturing Co. Ltd. | | | 8,570 | |
| | 12,273 | | | Mazda Motor Corp. | | | 129,192 | |
| | 975 | | | McDonald’s Holdings Co. Japan Ltd. | | | 38,776 | |
| | 3,952 | | | Nissan Motor Co. Ltd. | | | 16,852 | |
| | 415 | | | Nitori Holdings Co. Ltd. | | | 47,376 | |
| | 180 | | | Open House Group Co. Ltd. | | | 6,090 | |
| | 2,787 | | | Oriental Land Co. Ltd. | | | 100,484 | |
| | 1,830 | | | Pan Pacific International Holdings Corp. | | | 36,510 | |
| | 9,883 | | | Panasonic Holdings Corp. | | | 114,012 | |
| | 1,417 | | | Rakuten Group, Inc. | | | 5,531 | |
| | 1,959 | | | Sekisui Chemical Co. Ltd. | | | 30,088 | |
| | 2,419 | | | Sekisui House Ltd. | | | 49,357 | |
| | 1,197 | | | Sharp Corp.* | | | 7,374 | |
| | 191 | | | Shimano, Inc. | | | 28,076 | |
| | 3,541 | | | Sony Group Corp. | | | 295,398 | |
| | 5,804 | | | Subaru Corp. | | | 112,006 | |
| | 4,594 | | | Sumitomo Electric Industries Ltd. | | | 56,342 | |
| | 829 | | | Suzuki Motor Corp. | | | 32,657 | |
| | 31,667 | | | Toyota Motor Corp. | | | 547,052 | |
| | 989 | | | USS Co. Ltd. | | | 17,286 | |
| | 410 | | | Yamaha Corp. | | | 12,670 | |
| | 1,380 | | | Yamaha Motor Co. Ltd. | | | 35,821 | |
| | 1,202 | | | Zensho Holdings Co. Ltd. | | | 56,688 | |
| | 1,626 | | | ZOZO, Inc. | | | 32,495 | |
| | | | | | | | |
| | | | | | | 2,574,368 | |
| | |
| Consumer Staples – 7.7% | | | |
| | 3,342 | | | Aeon Co. Ltd.(a) | | | 69,303 | |
| | 2,136 | | | Ajinomoto Co., Inc. | | | 90,569 | |
| | 2,043 | | | Asahi Group Holdings Ltd. | | | 79,651 | |
| | 4,884 | | | Japan Tobacco, Inc. | | | 107,050 | |
| | |
|
| Common Stocks – (continued) | |
| Consumer Staples – (continued) | | | |
| | 1,518 | | | Kao Corp. | | | 58,797 | |
| | 574 | | | Kikkoman Corp. | | | 33,221 | |
| | 3,646 | | | Kirin Holdings Co. Ltd. | | | 51,240 | |
| | 321 | | | Kobayashi Pharmaceutical Co. Ltd. | | | 15,880 | |
| | 308 | | | Kobe Bussan Co. Ltd. | | | 7,667 | |
| | 333 | | | Kose Corp. | | | 27,654 | |
| | 1,106 | | | MatsukiyoCocokara & Co. | | | 65,144 | |
| | 1,019 | | | MEIJI Holdings Co. Ltd. | | | 25,562 | |
| | 562 | | | Nissin Foods Holdings Co. Ltd. | | | 49,103 | |
| | 3,550 | | | Seven & i Holdings Co. Ltd. | | | 145,843 | |
| | 1,365 | | | Shiseido Co. Ltd. | | | 55,468 | |
| | 1,164 | | | Suntory Beverage & Food Ltd. | | | 37,690 | |
| | 1,278 | | | Unicharm Corp. | | | 51,020 | |
| | 1,559 | | | Welcia Holdings Co. Ltd.(a) | | | 28,672 | |
| | 921 | | | Yakult Honsha Co. Ltd. | | | 48,294 | |
| | | | | | | | |
| | | | | | | 1,047,828 | |
| | |
| Energy – 1.2% | | | |
| | 3,756 | | | ENEOS Holdings, Inc. | | | 14,094 | |
| | 254 | | | Idemitsu Kosan Co. Ltd. | | | 5,400 | |
| | 9,806 | | | Inpex Corp. | | | 137,069 | |
| | | | | | | | |
| | | | | | | 156,563 | |
| | |
| Financials – 12.0% | | | |
| | 4,408 | | | Chiba Bank Ltd. (The) | | | 31,534 | |
| | 5,926 | | | Concordia Financial Group Ltd. | | | 26,311 | |
| | 1,767 | | | Dai-ichi Life Holdings, Inc. | | | 32,910 | |
| | 3,952 | | | Daiwa Securities Group, Inc. | | | 22,504 | |
| | 282 | | | GMO Payment Gateway, Inc. | | | 17,875 | |
| | 2,081 | | | Japan Exchange Group, Inc. | | | 36,350 | |
| | 3,963 | | | Japan Post Bank Co. Ltd. | | | 31,808 | |
| | 16,107 | | | Japan Post Holdings Co. Ltd. | | | 123,581 | |
| | 6,976 | | | Japan Post Insurance Co. Ltd. | | | 112,485 | |
| | 11,473 | | | Mitsubishi HC Capital, Inc. | | | 74,622 | |
| | 37,255 | | | Mitsubishi UFJ Financial Group, Inc. | | | 297,738 | |
| | 10,922 | | | Mizuho Financial Group, Inc. | | | 180,802 | |
| | 1,413 | | | MS&AD Insurance Group Holdings, Inc. | | | 50,858 | |
| | 4,408 | | | Nomura Holdings, Inc. | | | 17,083 | |
| | 2,359 | | | ORIX Corp. | | | 44,074 | |
| | 8,986 | | | Resona Holdings, Inc. | | | 47,669 | |
| | 704 | | | SBI Holdings, Inc. | | | 14,388 | |
| | 4,465 | | | Shizuoka Financial Group, Inc. | | | 36,343 | |
| | 671 | | | Sompo Holdings, Inc. | | | 29,253 | |
| | 4,564 | | | Sumitomo Mitsui Financial Group, Inc. | | | 209,445 | |
| | 1,291 | | | Sumitomo Mitsui Trust Holdings, Inc. | | | 48,338 | |
| | 1,460 | | | T&D Holdings, Inc. | | | 23,201 | |
| | 5,644 | | | Tokio Marine Holdings, Inc. | | | 125,103 | |
| | | | | | | | |
| | | | | | | 1,634,275 | |
| | |
| Health Care – 8.8% | | | |
| | 1,196 | | | Asahi Intecc Co. Ltd. | | | 24,374 | |
| | 8,759 | | | Astellas Pharma, Inc. | | | 133,234 | |
| | 2,264 | | | Chugai Pharmaceutical Co. Ltd. | | | 69,311 | |
| | 5,846 | | | Daiichi Sankyo Co. Ltd. | | | 172,627 | |
| | 1,188 | | | Eisai Co. Ltd. | | | 75,547 | |
| | 1,242 | | | Hoya Corp. | | | 137,820 | |
| | |
| | |
| 74 | | The accompanying notes are an integral part of these financial statements. |
GOLDMAN SACHS ACTIVEBETA® JAPAN EQUITY ETF
| | | | | | | | |
| Shares | | | Description | |
Value | |
|
| Common Stocks – (continued) | |
| Health Care – (continued) | | | |
| | 1,287 | | | Kyowa Kirin Co. Ltd. | | $ | 23,608 | |
| | 1,191 | | | M3, Inc. | | | 23,753 | |
| | 4,501 | | | Olympus Corp. | | | 60,921 | |
| | 2,937 | | | Ono Pharmaceutical Co. Ltd. | | | 55,710 | |
| | 2,251 | | | Otsuka Holdings Co. Ltd. | | | 85,751 | |
| | 984 | | | Shionogi & Co. Ltd. | | | 43,372 | |
| | 684 | | | Sysmex Corp. | | | 36,416 | |
| | 6,875 | | | Takeda Pharmaceutical Co. Ltd. | | | 212,883 | |
| | 1,697 | | | Terumo Corp. | | | 51,440 | |
| | | | | | | | |
| | | | | | | 1,206,767 | |
| | |
| Industrials – 22.6% | | | |
| | 431 | | | AGC, Inc. | | | 15,137 | |
| | 1,169 | | | ANA Holdings, Inc.* | | | 26,418 | |
| | 707 | | | BayCurrent Consulting, Inc. | | | 24,344 | |
| | 234 | | | Central Japan Railway Co. | | | 30,041 | |
| | 622 | | | Dai Nippon Printing Co. Ltd. | | | 17,017 | |
| | 296 | | | Daifuku Co. Ltd. | | | 5,476 | |
| | 633 | | | Daikin Industries Ltd. | | | 109,678 | |
| | 747 | | | East Japan Railway Co. | | | 42,239 | |
| | 1,787 | | | FANUC Corp. | | | 50,977 | |
| | 286 | | | Fuji Electric Co. Ltd. | | | 13,506 | |
| | 798 | | | Hankyu Hanshin Holdings, Inc. | | | 28,667 | |
| | 74 | | | Hikari Tsushin, Inc. | | | 12,331 | |
| | 631 | | | Hitachi Construction Machinery Co. Ltd. | | | 19,682 | |
| | 3,237 | | | Hitachi Ltd. | | | 215,541 | |
| | 523 | | | Hoshizaki Corp. | | | 20,096 | |
| | 4,608 | | | ITOCHU Corp. | | | 173,198 | |
| | 2,046 | | | Japan Airlines Co. Ltd. | | | 42,175 | |
| | 2,363 | | | Kajima Corp. | | | 39,498 | |
| | 927 | | | Kawasaki Kisen Kaisha Ltd. | | | 31,111 | |
| | 281 | | | Keio Corp. | | | 9,728 | |
| | 984 | | | Keisei Electric Railway Co. Ltd. | | | 37,701 | |
| | 472 | | | Kintetsu Group Holdings Co. Ltd. | | | 14,943 | |
| | 2,375 | | | Komatsu Ltd. | | | 67,701 | |
| | 1,197 | | | Kubota Corp. | | | 19,198 | |
| | 402 | | | Kurita Water Industries Ltd. | | | 15,692 | |
| | 961 | | | Lixil Corp. | | | 12,043 | |
| | 127 | | | Makita Corp. | | | 3,488 | |
| | 9,588 | | | Marubeni Corp. | | | 157,039 | |
| | 404 | | | MINEBEA MITSUMI, Inc. | | | 6,870 | |
| | 1,345 | | | MISUMI Group, Inc. | | | 23,498 | |
| | 6,019 | | | Mitsubishi Corp. | | | 297,508 | |
| | 6,357 | | | Mitsubishi Electric Corp. | | | 82,920 | |
| | 531 | | | Mitsubishi Heavy Industries Ltd. | | | 30,164 | |
| | 6,119 | | | Mitsui & Co. Ltd. | | | 228,309 | |
| | 799 | | | Mitsui OSK Lines Ltd. | | | 22,150 | |
| | 1,934 | | | MonotaRO Co. Ltd. | | | 22,876 | |
| | 1,501 | | | NGK Insulators Ltd. | | | 19,940 | |
| | 528 | | | NIDEC Corp. | | | 27,679 | |
| | 1,438 | | | NIPPON EXPRESS HOLDINGS, Inc. | | | 74,762 | |
| | 2,626 | | | Nippon Yusen KK | | | 70,094 | |
| | 14,019 | | | Obayashi Corp. | | | 127,012 | |
| | 801 | | | Odakyu Electric Railway Co. Ltd. | | | 11,917 | |
| | 2,107 | | | Persol Holdings Co. Ltd. | | | 36,109 | |
| | 4,822 | | | Recruit Holdings Co. Ltd. | | | 172,894 | |
| | 593 | | | Secom Co. Ltd. | | | 41,527 | |
| | |
|
| Common Stocks – (continued) | |
| Industrials – (continued) | | | |
| | 693 | | | SG Holdings Co. Ltd. | | | 10,015 | |
| | 3,254 | | | Shimizu Corp. | | | 21,898 | |
| | 117 | | | SMC Corp. | | | 56,738 | |
| | 4,434 | | | Sumitomo Corp. | | | 91,339 | |
| | 1,143 | | | Taisei Corp. | | | 38,494 | |
| | 875 | | | Tobu Railway Co. Ltd. | | | 23,999 | |
| | 1,689 | | | Tokyu Corp. | | | 21,353 | |
| | 1,551 | | | TOPPAN, Inc. | | | 37,511 | |
| | 947 | | | Toshiba Corp. | | | 29,935 | |
| | 657 | | | TOTO Ltd. | | | 18,029 | |
| | 378 | | | Toyota Industries Corp. | | | 26,743 | |
| | 1,717 | | | Toyota Tsusho Corp. | | | 102,547 | |
| | 632 | | | West Japan Railway Co. | | | 27,366 | |
| | 651 | | | Yamato Holdings Co. Ltd. | | | 12,237 | |
| | 571 | | | Yaskawa Electric Corp. | | | 22,438 | |
| | | | | | | | |
| | | | | | | 3,091,536 | |
| | |
| Information Technology – 14.3% | | | |
| | 798 | | | Advantest Corp. | | | 100,363 | |
| | 628 | | | Azbil Corp. | | | 20,964 | |
| | 2,792 | | | Brother Industries Ltd. | | | 47,340 | |
| | 4,559 | | | Canon, Inc. | | | 112,358 | |
| | 398 | | | Disco Corp. | | | 78,583 | |
| | 1,152 | | | FUJIFILM Holdings Corp. | | | 68,162 | |
| | 728 | | | Fujitsu Ltd. | | | 91,034 | |
| | 803 | | | Hamamatsu Photonics KK | | | 37,209 | |
| | 139 | | | Hirose Electric Co. Ltd. | | | 16,857 | |
| | 512 | | | Ibiden Co. Ltd. | | | 30,920 | |
| | 680 | | | Itochu Techno-Solutions Corp. | | | 20,201 | |
| | 581 | | | Keyence Corp. | | | 241,523 | |
| | 942 | | | Kyocera Corp. | | | 48,386 | |
| | 126 | | | Lasertec Corp. | | | 19,625 | |
| | 1,773 | | | Murata Manufacturing Co. Ltd. | | | 99,681 | |
| | 1,617 | | | NEC Corp. | | | 85,368 | |
| | 1,339 | | | Nomura Research Institute Ltd. | | | 38,491 | |
| | 1,714 | | | NTT Data Group Corp. | | | 23,087 | |
| | 152 | | | Obic Co. Ltd. | | | 26,446 | |
| | 687 | | | Omron Corp. | | | 33,212 | |
| | 543 | | | Oracle Corp. Japan | | | 37,932 | |
| | 658 | | | Otsuka Corp. | | | 29,356 | |
| | 5,526 | | | Renesas Electronics Corp.* | | | 93,014 | |
| | 6,482 | | | Ricoh Co. Ltd. | | | 52,894 | |
| | 123 | | | Rohm Co. Ltd. | | | 10,282 | |
| | 1,031 | | | SCSK Corp. | | | 17,889 | |
| | 3,106 | | | Seiko Epson Corp. | | | 48,696 | |
| | 1,130 | | | Shimadzu Corp. | | | 33,267 | |
| | 1,015 | | | SUMCO Corp. | | | 13,574 | |
| | 716 | | | TDK Corp. | | | 26,135 | |
| | 1,597 | | | TIS, Inc. | | | 37,702 | |
| | 1,527 | | | Tokyo Electron Ltd. | | | 226,294 | |
| | 959 | | | Trend Micro, Inc. | | | 40,768 | |
| | 2,296 | | | Yokogawa Electric Corp. | | | 45,554 | |
| | | | | | | | |
| | | | | | | 1,953,167 | |
| | |
| | |
| The accompanying notes are an integral part of these financial statements. | | 75 |
GOLDMAN SACHS ACTIVEBETA® JAPAN EQUITY ETF
Schedule of Investments (continued)
August 31, 2023
| | | | | | | | |
| Shares | | | Description | |
Value | |
|
| Common Stocks – (continued) | |
| Materials – 4.0% | | | |
| | 2,662 | | | Asahi Kasei Corp. | | $ | 17,221 | |
| | 4,954 | | | JFE Holdings, Inc. | | | 78,384 | |
| | 120 | | | JSR Corp. | | | 3,355 | |
| | 9,720 | | | Mitsubishi Chemical Group Corp. | | | 58,106 | |
| | 301 | | | Mitsui Chemicals, Inc. | | | 8,179 | |
| | 1,404 | | | Nippon Paint Holdings Co. Ltd. | | | 10,859 | |
| | 453 | | | Nippon Sanso Holdings Corp. | | | 10,943 | |
| | 3,365 | | | Nippon Steel Corp. | | | 79,673 | |
| | 663 | | | Nissan Chemical Corp. | | | 28,453 | |
| | 452 | | | Nitto Denko Corp. | | | 30,889 | |
| | 3,463 | | | Oji Holdings Corp. | | | 14,177 | |
| | 5,288 | | | Shin-Etsu Chemical Co. Ltd. | | | 169,226 | |
| | 3,982 | | | Sumitomo Chemical Co. Ltd. | | | 11,034 | |
| | 155 | | | Sumitomo Metal Mining Co. Ltd. | | | 4,812 | |
| | 2,007 | | | Toray Industries, Inc. | | | 10,837 | |
| | 1,053 | | | Tosoh Corp. | | | 13,641 | |
| | | | | | | | |
| | | | | | | 549,789 | |
| | |
| Real Estate – 1.7% | | | |
| | 375 | | | Daito Trust Construction Co. Ltd. | | | 41,380 | |
| | 1,516 | | | Daiwa House Industry Co. Ltd. | | | 42,152 | |
| | 6 | | | Daiwa House REIT Investment Corp. REIT | | | 11,383 | |
| | 10 | | | GLP J REIT | | | 9,431 | |
| | 1,590 | | | Hulic Co. Ltd. | | | 14,285 | |
| | 16 | | | Japan Metropolitan Fund Invest REIT | | | 10,748 | |
| | 3 | | | Japan Real Estate Investment Corp. REIT | | | 12,467 | |
| | 1,197 | | | Mitsubishi Estate Co. Ltd. | | | 15,314 | |
| | 1,097 | | | Mitsui Fudosan Co. Ltd. | | | 24,052 | |
| | 3 | | | Nippon Building Fund, Inc. REIT | | | 12,673 | |
| | 4 | | | Nippon Prologis REIT, Inc. REIT | | | 8,048 | |
| | 394 | | | Nomura Real Estate Holdings, Inc. | | | 9,927 | |
| | 10 | | | Nomura Real Estate Master Fund, Inc. REIT | | | 11,753 | |
| | 284 | | | Sumitomo Realty & Development Co. Ltd. | | | 7,274 | |
| | | | | | | | |
| | | | | | | 230,887 | |
| | |
|
| Common Stocks – (continued) | |
| Utilities – 1.3% | | | |
| | 1,779 | | | Chubu Electric Power Co., Inc. | | | 23,767 | |
| | 1,493 | | | Kansai Electric Power Co., Inc. (The) | | | 21,269 | |
| | 646 | | | Osaka Gas Co. Ltd. | | | 10,339 | |
| | 5,439 | | | Tokyo Gas Co. Ltd. | | | 126,164 | |
| | | | | | | | |
| | | | | | | 181,539 | |
| | |
| TOTAL INVESTMENTS BEFORE SECURITIES LENDING
REINVESTMENT VEHICLE |
|
| | (Cost $11,912,892) | | $ | 13,640,360 | |
| | |
| | | | | | | | |
| Shares | | | Dividend
Rate | | Value | |
|
| Securities Lending Reinvestment Vehicle – 0.7%(b) | |
| Goldman Sachs Financial Square Government Fund –
Institutional Shares |
|
| | 96,777 | | | 5.234% | | $ | 96,777 | |
| (Cost $96,777) | | | |
| | |
| | TOTAL INVESTMENTS – 100.5% | | | | |
| | (Cost $12,009,669) | | $ | 13,737,137 | |
| | |
| LIABILITIES IN EXCESS OF OTHER
ASSETS – (0.5)% | | | (65,862 | ) |
| | |
| | NET ASSETS – 100.0% | | $ | 13,671,275 | |
| | |
| | |
|
| The percentage shown for each investment category reflects the value of investments in that category as a percentage of net assets. |
| |
* | | Non-income producing security. |
| |
(a) | | All or a portion of security is on loan. |
| |
(b) | | Represents an affiliated issuer. |
| | |
|
Investment Abbreviations: |
| REIT | | —Real Estate Investment Trust |
|
|
| ADDITIONAL INVESTMENT INFORMATION |
FUTURES CONTRACTS — At August 31, 2023, the Fund had the following futures contracts:
| | | | | | | | | | | | | | | | |
| Description | | Number of
Contracts | | | Expiration
Date | | | Notional
Amount | | | Unrealized
Appreciation/
(Depreciation) | |
Long position contracts: | | | | | | | | | | | | | | | | |
E-Mini Topix Index Future | | | 1 | | | | 09/07/23 | | | $ | 16,008 | | | $ | 942 | |
| | |
| 76 | | The accompanying notes are an integral part of these financial statements. |
GOLDMAN SACHS ACTIVEBETA® PARIS-ALIGNED CLIMATE U.S. LARGE CAP EQUITY ETF
Schedule of Investments
August 31, 2023
| | | | | | | | |
| Shares | | | Description | |
Value | |
|
| Common Stocks – 99.5% | |
| Communication Services – 9.0% | | | |
| | 129 | | | Activision Blizzard, Inc. | | $ | 11,867 | |
| | 1,160 | | | Alphabet, Inc., Class A* | | | 157,957 | |
| | 1,136 | | | Alphabet, Inc., Class C* | | | 156,029 | |
| | 2,182 | | | AT&T, Inc. | | | 32,272 | |
| | 17 | | | Charter Communications, Inc., Class A* | | | 7,448 | |
| | 1,014 | | | Comcast Corp., Class A | | | 47,415 | |
| | 69 | | | Electronic Arts, Inc. | | | 8,279 | |
| | 157 | | | Interpublic Group of Cos., Inc. (The) | | | 5,120 | |
| | 458 | | | Meta Platforms, Inc., Class A* | | | 135,518 | |
| | 52 | | | Netflix, Inc.* | | | 22,551 | |
| | 114 | | | Omnicom Group, Inc. | | | 9,235 | |
| | 241 | | | Pinterest, Inc., Class A* | | | 6,625 | |
| | 157 | | | Snap, Inc., Class A* | | | 1,625 | |
| | 9 | | | Spotify Technology SA* | | | 1,386 | |
| | 97 | | | T-Mobile US, Inc.* | | | 13,216 | |
| | 458 | | | Verizon Communications, Inc. | | | 16,021 | |
| | 28 | | | Walt Disney Co. (The)* | | | 2,343 | |
| | 2,440 | | | Warner Bros Discovery, Inc.* | | | 32,061 | |
| | | | | | | | |
| | | | | | | 666,968 | |
| | |
| Consumer Discretionary – 8.8% | | | |
| | 19 | | | AutoZone, Inc.* | | | 48,095 | |
| | 10 | | | Booking Holdings, Inc.* | | | 31,050 | |
| | 37 | | | Burlington Stores, Inc.* | | | 6,004 | |
| | 2 | | | Chipotle Mexican Grill, Inc.* | | | 3,853 | |
| | 56 | | | Darden Restaurants, Inc. | | | 8,709 | |
| | 43 | | | Deckers Outdoor Corp.* | | | 22,751 | |
| | 23 | | | Domino’s Pizza, Inc. | | | 8,910 | |
| | 148 | | | D.R. Horton, Inc. | | | 17,615 | |
| | 388 | | | eBay, Inc. | | | 17,375 | |
| | 193 | | | Etsy, Inc.* | | | 14,199 | |
| | 94 | | | Expedia Group, Inc.* | | | 10,189 | |
| | 96 | | | Garmin Ltd. | | | 10,178 | |
| | 179 | | | Genuine Parts Co. | | | 27,518 | |
| | 10 | | | Hilton Worldwide Holdings, Inc. | | | 1,486 | |
| | 118 | | | Home Depot, Inc. (The) | | | 38,975 | |
| | 59 | | | Las Vegas Sands Corp. | | | 3,237 | |
| | 273 | | | Lennar Corp., Class A | | | 32,512 | |
| | 360 | | | LKQ Corp. | | | 18,911 | |
| | 87 | | | Lowe’s Cos., Inc. | | | 20,052 | |
| | 62 | | | McDonald’s Corp. | | | 17,431 | |
| | 462 | | | MGM Resorts International | | | 20,319 | |
| | 234 | | | NIKE, Inc., Class B | | | 23,800 | |
| | 4 | | | NVR, Inc.* | | | 25,509 | |
| | 57 | | | O’Reilly Automotive, Inc.* | | | 53,563 | |
| | 40 | | | Pool Corp. | | | 14,624 | |
| | 172 | | | PulteGroup, Inc. | | | 14,114 | |
| | 213 | | | Ross Stores, Inc. | | | 25,945 | |
| | 82 | | | Royal Caribbean Cruises Ltd.* | | | 8,113 | |
| | 515 | | | TJX Cos., Inc. (The) | | | 47,627 | |
| | 74 | | | Tractor Supply Co. | | | 16,169 | |
| | 98 | | | Ulta Beauty, Inc.* | | | 40,673 | |
| | 23 | | | Yum! Brands, Inc. | | | 2,976 | |
| | | | | | | | |
| | | | | | | 652,482 | |
| | |
|
| Common Stocks – (continued) | |
| Consumer Staples – 6.9% | | | |
| | 120 | | | Brown-Forman Corp., Class B | | | 7,935 | |
| | 199 | | | Church & Dwight Co., Inc. | | | 19,257 | |
| | 121 | | | Clorox Co. (The) | | | 18,930 | |
| | 547 | | | Coca-Cola Co. (The) | | | 32,727 | |
| | 152 | | | Colgate-Palmolive Co. | | | 11,167 | |
| | 143 | | | Conagra Brands, Inc. | | | 4,273 | |
| | 66 | | | Constellation Brands, Inc., Class A | | | 17,197 | |
| | 72 | | | Dollar General Corp. | | | 9,972 | |
| | 103 | | | Dollar Tree, Inc.* | | | 12,603 | |
| | 90 | | | Estee Lauder Cos., Inc. (The), Class A | | | 14,448 | |
| | 253 | | | General Mills, Inc. | | | 17,118 | |
| | 129 | | | Hershey Co. (The) | | | 27,717 | |
| | 86 | | | J M Smucker Co. (The) | | | 12,466 | |
| | 187 | | | Kellogg Co. | | | 11,411 | |
| | 512 | | | Keurig Dr Pepper, Inc. | | | 17,229 | |
| | 72 | | | Kimberly-Clark Corp. | | | 9,276 | |
| | 231 | | | Kraft Heinz Co. (The) | | | 7,644 | |
| | 103 | | | Lamb Weston Holdings, Inc. | | | 10,033 | |
| | 70 | | | McCormick & Co., Inc. | | | 5,745 | |
| | 341 | | | Mondelez International, Inc., Class A | | | 24,300 | |
| | 402 | | | Monster Beverage Corp.* | | | 23,079 | |
| | 273 | | | PepsiCo, Inc. | | | 48,572 | |
| | 393 | | | Procter & Gamble Co. (The) | | | 60,656 | |
| | 211 | | | Sysco Corp. | | | 14,696 | |
| | 190 | | | Walgreens Boots Alliance, Inc. | | | 4,809 | |
| | 407 | | | Walmart, Inc. | | | 66,182 | |
| | | | | | | | |
| | | | | | | 509,442 | |
| | |
| Financials – 12.3% | | | |
| | 342 | | | Aflac, Inc. | | | 25,503 | |
| | 133 | | | American Express Co. | | | 21,013 | |
| | 474 | | | American International Group, Inc. | | | 27,738 | |
| | 56 | | | Ameriprise Financial, Inc. | | | 18,904 | |
| | 45 | | | Aon PLC, Class A | | | 15,003 | |
| | 108 | | | Apollo Global Management, Inc. | | | 9,433 | |
| | 252 | | | Arch Capital Group Ltd.* | | | 19,369 | |
| | 21 | | | Ares Management Corp., Class A | | | 2,172 | |
| | 49 | | | Arthur J Gallagher & Co. | | | 11,294 | |
| | 1,069 | | | Bank of America Corp. | | | 30,648 | |
| | 536 | | | Bank of New York Mellon Corp. (The) | | | 24,050 | |
| | 171 | | | Berkshire Hathaway, Inc., Class B* | | | 61,594 | |
| | 6 | | | BlackRock, Inc. | | | 4,203 | |
| | 106 | | | Brown & Brown, Inc. | | | 7,855 | |
| | 309 | | | Capital One Financial Corp. | | | 31,639 | |
| | 51 | | | Cboe Global Markets, Inc. | | | 7,635 | |
| | 164 | | | Charles Schwab Corp. (The) | | | 9,701 | |
| | 74 | | | Chubb Ltd. | | | 14,864 | |
| | 542 | | | Citigroup, Inc. | | | 22,379 | |
| | 144 | | | Citizens Financial Group, Inc. | | | 4,051 | |
| | 33 | | | CME Group, Inc. | | | 6,688 | |
| | 170 | | | Discover Financial Services | | | 15,312 | |
| | 20 | | | Everest Group Ltd. | | | 7,214 | |
| | 70 | | | Fifth Third Bancorp | | | 1,859 | |
| | 128 | | | Fiserv, Inc.* | | | 15,538 | |
| | |
| | |
| The accompanying notes are an integral part of these financial statements. | | 77 |
GOLDMAN SACHS ACTIVEBETA® PARIS-ALIGNED CLIMATE U.S. LARGE CAP EQUITY ETF
Schedule of Investments (continued)
August 31, 2023
| | | | | | | | |
| Shares | | | Description | |
Value | |
|
| Common Stocks – (continued) | |
| Financials – (continued) | | | |
| | 32 | | | FleetCor Technologies, Inc.* | | $ | 8,695 | |
| | 167 | | | Hartford Financial Services Group, Inc. (The) | | | 11,994 | |
| | 369 | | | Huntington Bancshares, Inc. | | | 4,092 | |
| | 51 | | | Intercontinental Exchange, Inc. | | | 6,017 | |
| | 9 | | | Jack Henry & Associates, Inc. | | | 1,411 | |
| | 560 | | | JPMorgan Chase & Co. | | | 81,945 | |
| | 435 | | | KeyCorp | | | 4,929 | |
| | 32 | | | LPL Financial Holdings, Inc. | | | 7,379 | |
| | 25 | | | M&T Bank Corp. | | | 3,126 | |
| | 3 | | | Markel Group, Inc.* | | | 4,437 | |
| | 125 | | | Marsh & McLennan Cos., Inc. | | | 24,374 | |
| | 135 | | | Mastercard, Inc., Class A | | | 55,706 | |
| | 177 | | | MetLife, Inc. | | | 11,211 | |
| | 28 | | | Moody’s Corp. | | | 9,430 | |
| | 170 | | | Morgan Stanley | | | 14,476 | |
| | 108 | | | Nasdaq, Inc. | | | 5,668 | |
| | 45 | | | Northern Trust Corp. | | | 3,423 | |
| | 26 | | | PNC Financial Services Group, Inc. (The) | | | 3,139 | |
| | 317 | | | Principal Financial Group, Inc. | | | 24,634 | |
| | 98 | | | Progressive Corp. (The) | | | 13,080 | |
| | 111 | | | Raymond James Financial, Inc. | | | 11,609 | |
| | 126 | | | Regions Financial Corp. | | | 2,311 | |
| | 8 | | | S&P Global, Inc. | | | 3,127 | |
| | 332 | | | State Street Corp. | | | 22,822 | |
| | 958 | | | Synchrony Financial | | | 30,924 | |
| | 23 | | | T. Rowe Price Group, Inc. | | | 2,581 | |
| | 75 | | | Travelers Cos., Inc. (The) | | | 12,092 | |
| | 91 | | | Truist Financial Corp. | | | 2,780 | |
| | 100 | | | US Bancorp | | | 3,653 | |
| | 242 | | | Visa, Inc., Class A | | | 59,455 | |
| | 183 | | | W R Berkley Corp. | | | 11,320 | |
| | 570 | | | Wells Fargo & Co. | | | 23,535 | |
| | 54 | | | Willis Towers Watson PLC | | | 11,165 | |
| | | | | | | | |
| | | | | | | 912,199 | |
| | |
| Health Care – 17.5% | | | |
| | 293 | | | Abbott Laboratories | | | 30,150 | |
| | 363 | | | AbbVie, Inc. | | | 53,346 | |
| | 105 | | | Agilent Technologies, Inc. | | | 12,712 | |
| | 45 | | | Align Technology, Inc.* | | | 16,656 | |
| | 73 | | | Amgen, Inc. | | | 18,713 | |
| | 296 | | | Avantor, Inc.* | | | 6,408 | |
| | 22 | | | Baxter International, Inc. | | | 893 | |
| | 63 | | | Becton Dickinson & Co. | | | 17,605 | |
| | 30 | | | Biogen, Inc.* | | | 8,021 | |
| | 39 | | | Bio-Techne Corp. | | | 3,058 | |
| | 458 | | | Boston Scientific Corp.* | | | 24,704 | |
| | 668 | | | Bristol-Myers Squibb Co. | | | 41,182 | |
| | 69 | | | Cencora, Inc. | | | 12,143 | |
| | 243 | | | Centene Corp.* | | | 14,981 | |
| | 31 | | | Charles River Laboratories International, Inc.* | | | 6,411 | |
| | 110 | | | Cigna Group (The) | | | 30,389 | |
| | 23 | | | Cooper Cos., Inc. (The) | | | 8,510 | |
| | 547 | | | CVS Health Corp. | | | 35,648 | |
| | 118 | | | Danaher Corp. | | | 31,270 | |
| | |
|
| Common Stocks – (continued) | |
| Health Care – (continued) | | | |
| | 93 | | | Dexcom, Inc.* | | | 9,391 | |
| | 246 | | | Edwards Lifesciences Corp.* | | | 18,812 | |
| | 59 | | | Elevance Health, Inc. | | | 26,079 | |
| | 183 | | | Eli Lilly & Co. | | | 101,419 | |
| | 16 | | | Exact Sciences Corp.* | | | 1,339 | |
| | 81 | | | GE HealthCare Technologies, Inc. | | | 5,706 | |
| | 407 | | | Gilead Sciences, Inc. | | | 31,127 | |
| | 44 | | | HCA Healthcare, Inc. | | | 12,201 | |
| | 165 | | | Hologic, Inc.* | | | 12,332 | |
| | 20 | | | Horizon Therapeutics PLC* | | | 2,255 | |
| | 58 | | | Humana, Inc. | | | 26,775 | |
| | 53 | | | IDEXX Laboratories, Inc.* | | | 27,105 | |
| | 165 | | | Incyte Corp.* | | | 10,647 | |
| | 15 | | | Insulet Corp.* | | | 2,876 | |
| | 53 | | | Intuitive Surgical, Inc.* | | | 16,572 | |
| | 51 | | | IQVIA Holdings, Inc.* | | | 11,354 | |
| | 514 | | | Johnson & Johnson | | | 83,103 | |
| | 36 | | | Laboratory Corp. of America Holdings | | | 7,492 | |
| | 141 | | | Medtronic PLC | | | 11,491 | |
| | 640 | | | Merck & Co., Inc. | | | 69,747 | |
| | 19 | | | Mettler-Toledo International, Inc.* | | | 23,056 | |
| | 65 | | | Moderna, Inc.* | | | 7,350 | |
| | 1,434 | | | Pfizer, Inc. | | | 50,735 | |
| | 88 | | | Quest Diagnostics, Inc. | | | 11,572 | |
| | 38 | | | Regeneron Pharmaceuticals, Inc.* | | | 31,407 | |
| | 46 | | | ResMed, Inc. | | | 7,341 | |
| | 38 | | | Revvity, Inc. | | | 4,447 | |
| | 507 | | | Royalty Pharma PLC, Class A | | | 15,119 | |
| | 19 | | | STERIS PLC | | | 4,362 | |
| | 82 | | | Stryker Corp. | | | 23,251 | |
| | 15 | | | Teleflex, Inc. | | | 3,191 | |
| | 56 | | | Thermo Fisher Scientific, Inc. | | | 31,198 | |
| | 159 | | | UnitedHealth Group, Inc. | | | 75,776 | |
| | 87 | | | Vertex Pharmaceuticals, Inc.* | | | 30,306 | |
| | 4,429 | | | Viatris, Inc. | | | 47,612 | |
| | 62 | | | Waters Corp.* | | | 17,410 | |
| | 20 | | | West Pharmaceutical Services, Inc. | | | 8,138 | |
| | 146 | | | Zimmer Biomet Holdings, Inc. | | | 17,391 | |
| | 107 | | | Zoetis, Inc. | | | 20,385 | |
| | | | | | | | |
| | | | | | | 1,290,670 | |
| | |
| Industrials – 7.0% | | | |
| | 31 | | | AMETEK, Inc. | | | 4,945 | |
| | 14 | | | Automatic Data Processing, Inc. | | | 3,564 | |
| | 37 | | | Axon Enterprise, Inc.* | | | 7,878 | |
| | 189 | | | Builders FirstSource, Inc.* | | | 27,413 | |
| | 68 | | | Carlisle Cos., Inc. | | | 17,885 | |
| | 281 | | | Carrier Global Corp. | | | 16,143 | |
| | 41 | | | C.H. Robinson Worldwide, Inc. | | | 3,708 | |
| | 33 | | | Cintas Corp. | | | 16,638 | |
| | 256 | | | Copart, Inc.* | | | 11,476 | |
| | 583 | | | CSX Corp. | | | 17,607 | |
| | 15 | | | Deere & Co. | | | 6,164 | |
| | 43 | | | Delta Air Lines, Inc. | | | 1,844 | |
| | 139 | | | Expeditors International of Washington, Inc. | | | 16,223 | |
| | 527 | | | Fastenal Co. | | | 30,345 | |
| | |
| | |
| 78 | | The accompanying notes are an integral part of these financial statements. |
GOLDMAN SACHS ACTIVEBETA® PARIS-ALIGNED CLIMATE U.S. LARGE CAP EQUITY ETF
| | | | | | | | |
| Shares | | | Description | |
Value | |
|
| Common Stocks – (continued) | |
| Industrials – (continued) | | | |
| | 47 | | | FedEx Corp. | | $ | 12,268 | |
| | 146 | | | General Electric Co. | | | 16,711 | |
| | 123 | | | Graco, Inc. | | | 9,710 | |
| | 403 | | | Howmet Aerospace, Inc. | | | 19,936 | |
| | 40 | | | IDEX Corp. | | | 9,056 | |
| | 68 | | | Illinois Tool Works, Inc. | | | 16,820 | |
| | 32 | | | J.B. Hunt Transport Services, Inc. | | | 6,012 | |
| | 47 | | | Masco Corp. | | | 2,773 | |
| | 51 | | | Norfolk Southern Corp. | | | 10,455 | |
| | 52 | | | Old Dominion Freight Line, Inc. | | | 22,223 | |
| | 224 | | | Otis Worldwide Corp. | | | 19,163 | |
| | 82 | | | Parker-Hannifin Corp. | | | 34,186 | |
| | 12 | | | Paychex, Inc. | | | 1,467 | |
| | 99 | | | Republic Services, Inc. | | | 14,269 | |
| | 36 | | | Rockwell Automation, Inc. | | | 11,235 | |
| | 42 | | | Snap-on, Inc. | | | 11,281 | |
| | 178 | | | SS&C Technologies Holdings, Inc. | | | 10,221 | |
| | 179 | | | Uber Technologies, Inc.* | | | 8,454 | |
| | 35 | | | Union Pacific Corp. | | | 7,720 | |
| | 462 | | | United Airlines Holdings, Inc.* | | | 23,012 | |
| | 81 | | | United Parcel Service, Inc., Class B | | | 13,721 | |
| | 22 | | | United Rentals, Inc. | | | 10,484 | |
| | 8 | | | Verisk Analytics, Inc. | | | 1,938 | |
| | 74 | | | Waste Management, Inc. | | | 11,602 | |
| | 29 | | | W.W. Grainger, Inc. | | | 20,710 | |
| | 77 | | | Xylem, Inc. | | | 7,973 | |
| | | | | | | | |
| | | | | | | 515,233 | |
| | |
| Information Technology – 33.2% | | | |
| | 145 | | | Accenture PLC, Class A | | | 46,947 | |
| | 84 | | | Adobe, Inc.* | | | 46,984 | |
| | 276 | | | Advanced Micro Devices, Inc.* | | | 29,179 | |
| | 166 | | | Akamai Technologies, Inc.* | | | 17,445 | |
| | 195 | | | Amphenol Corp., Class A | | | 17,234 | |
| | 100 | | | Analog Devices, Inc. | | | 18,178 | |
| | 2 | | | ANSYS, Inc.* | | | 638 | |
| | 3,088 | | | Apple, Inc. | | | 580,142 | |
| | 356 | | | Applied Materials, Inc. | | | 54,382 | |
| | 140 | | | Arista Networks, Inc.* | | | 27,332 | |
| | 38 | | | Atlassian Corp., Class A* | | | 7,754 | |
| | 37 | | | Autodesk, Inc.* | | | 8,212 | |
| | 74 | | | Broadcom, Inc. | | | 68,294 | |
| | 83 | | | Cadence Design Systems, Inc.* | | | 19,956 | |
| | 85 | | | CDW Corp. | | | 17,948 | |
| | 1,148 | | | Cisco Systems, Inc. | | | 65,838 | |
| | 343 | | | Cognizant Technology Solutions Corp., Class A | | | 24,562 | |
| | 71 | | | Corning, Inc. | | | 2,330 | |
| | 41 | | | Enphase Energy, Inc.* | | | 5,188 | |
| | 14 | | | Entegris, Inc. | | | 1,418 | |
| | 8 | | | EPAM Systems, Inc.* | | | 2,072 | |
| | 21 | | | Fair Isaac Corp.* | | | 18,996 | |
| | 55 | | | First Solar, Inc.* | | | 10,402 | |
| | 218 | | | Fortinet, Inc.* | | | 13,126 | |
| | 68 | | | Gartner, Inc.* | | | 23,778 | |
| | 387 | | | Gen Digital, Inc. | | | 7,837 | |
| | |
|
| Common Stocks – (continued) | |
| Information Technology – (continued) | | | |
| | 159 | | | GoDaddy, Inc., Class A* | | | 11,529 | |
| | 1,074 | | | Hewlett Packard Enterprise Co. | | | 18,247 | |
| | 14 | | | HubSpot, Inc.* | | | 7,651 | |
| | 426 | | | Intel Corp. | | | 14,970 | |
| | 237 | | | International Business Machines Corp. | | | 34,799 | |
| | 50 | | | Intuit, Inc. | | | 27,090 | |
| | 163 | | | Keysight Technologies, Inc.* | | | 21,728 | |
| | 69 | | | KLA Corp. | | | 34,629 | |
| | 59 | | | Lam Research Corp. | | | 41,442 | |
| | 196 | | | Lattice Semiconductor Corp.* | | | 19,063 | |
| | 103 | | | Marvell Technology, Inc. | | | 6,000 | |
| | 300 | | | Microchip Technology, Inc. | | | 24,552 | |
| | 103 | | | Micron Technology, Inc. | | | 7,204 | |
| | 1,462 | | | Microsoft Corp. | | | 479,185 | |
| | 24 | | | Monolithic Power Systems, Inc. | | | 12,509 | |
| | 103 | | | Motorola Solutions, Inc. | | | 29,208 | |
| | 308 | | | NetApp, Inc. | | | 23,624 | |
| | 442 | | | NVIDIA Corp. | | | 218,149 | |
| | 267 | | | ON Semiconductor Corp.* | | | 26,289 | |
| | 219 | | | Oracle Corp. | | | 26,365 | |
| | 39 | | | Palo Alto Networks, Inc.* | | | 9,489 | |
| | 36 | | | PTC, Inc.* | | | 5,298 | |
| | 335 | | | QUALCOMM, Inc. | | | 38,367 | |
| | 10 | | | Roper Technologies, Inc. | | | 4,991 | |
| | 137 | | | Salesforce, Inc.* | | | 30,340 | |
| | 17 | | | ServiceNow, Inc.* | | | 10,010 | |
| | 163 | | | Skyworks Solutions, Inc. | | | 17,725 | |
| | 15 | | | Splunk, Inc.* | | | 1,819 | |
| | 22 | | | Synopsys, Inc.* | | | 10,096 | |
| | 223 | | | Teradyne, Inc. | | | 24,055 | |
| | 186 | | | Texas Instruments, Inc. | | | 31,259 | |
| | 179 | | | Trimble, Inc.* | | | 9,807 | |
| | 66 | | | VeriSign, Inc.* | | | 13,714 | |
| | 89 | | | VMware, Inc., Class A* | | | 15,021 | |
| | 26 | | | Zebra Technologies Corp., Class A* | | | 7,150 | |
| | 122 | | | Zoom Video Communications, Inc., Class A* | | | 8,666 | |
| | | | | | | | |
| | | | | | | 2,458,212 | |
| | |
| Materials – 1.3% | | | |
| | 20 | | | Air Products and Chemicals, Inc. | | | 5,910 | |
| | 20 | | | Albemarle Corp. | | | 3,974 | |
| | 4 | | | Avery Dennison Corp. | | | 753 | |
| | 167 | | | Corteva, Inc. | | | 8,435 | |
| | 31 | | | DuPont de Nemours, Inc. | | | 2,384 | |
| | 37 | | | Ecolab, Inc. | | | 6,801 | |
| | 33 | | | FMC Corp. | | | 2,846 | |
| | 182 | | | Freeport-McMoRan, Inc. | | | 7,264 | |
| | 59 | | | Linde PLC | | | 22,835 | |
| | 4 | | | Martin Marietta Materials, Inc. | | | 1,786 | |
| | 169 | | | Mosaic Co. (The) | | | 6,566 | |
| | 16 | | | Packaging Corp. of America | | | 2,386 | |
| | 15 | | | PPG Industries, Inc. | | | 2,126 | |
| | 41 | | | Sherwin-Williams Co. (The) | | | 11,140 | |
| | 42 | | | Vulcan Materials Co. | | | 9,166 | |
| | | | | | | | |
| | | | | | | 94,372 | |
| | |
| | |
| The accompanying notes are an integral part of these financial statements. | | 79 |
GOLDMAN SACHS ACTIVEBETA® PARIS-ALIGNED CLIMATE U.S. LARGE CAP EQUITY ETF
Schedule of Investments (continued)
August 31, 2023
| | | | | | | | |
| Shares | | | Description | |
Value | |
|
| Common Stocks – (continued) | |
| Real Estate – 3.3% | | | |
| | 61 | | | Alexandria Real Estate Equities, Inc. REIT | | $ | 7,097 | |
| | 15 | | | American Tower Corp. REIT | | | 2,720 | |
| | 39 | | | AvalonBay Communities, Inc. REIT | | | 7,169 | |
| | 144 | | | Camden Property Trust REIT | | | 15,497 | |
| | 49 | | | CoStar Group, Inc.* | | | 4,018 | |
| | 17 | | | Crown Castle, Inc. REIT | | | 1,708 | |
| | 6 | | | Digital Realty Trust, Inc. REIT | | | 790 | |
| | 10 | | | Equinix, Inc. REIT | | | 7,814 | |
| | 72 | | | Equity LifeStyle Properties, Inc. REIT | | | 4,821 | |
| | 126 | | | Equity Residential REIT | | | 8,169 | |
| | 43 | | | Essex Property Trust, Inc. REIT | | | 10,251 | |
| | 176 | | | Gaming and Leisure Properties, Inc. REIT | | | 8,342 | |
| | 293 | | | Healthpeak Properties, Inc. REIT | | | 6,030 | |
| | 1,413 | | | Host Hotels & Resorts, Inc. REIT | | | 22,311 | |
| | 118 | | | Invitation Homes, Inc. REIT | | | 4,023 | |
| | 163 | | | Iron Mountain, Inc. REIT | | | 10,357 | |
| | 657 | | | Kimco Realty Corp. REIT | | | 12,444 | |
| | 71 | | | Mid-America Apartment Communities, Inc. REIT | | | 10,311 | |
| | 50 | | | Prologis, Inc. REIT | | | 6,210 | |
| | 17 | | | Public Storage REIT | | | 4,698 | |
| | 180 | | | Realty Income Corp. REIT | | | 10,087 | |
| | 3 | | | SBA Communications Corp. REIT | | | 674 | |
| | 111 | | | Simon Property Group, Inc. REIT | | | 12,597 | |
| | 114 | | | Sun Communities, Inc. REIT | | | 13,956 | |
| | 160 | | | UDR, Inc. REIT | | | 6,384 | |
| | 223 | | | Ventas, Inc. REIT | | | 9,741 | |
| | 552 | | | VICI Properties, Inc. REIT | | | 17,024 | |
| | 69 | | | Welltower, Inc. REIT | | | 5,719 | |
| | 279 | | | Weyerhaeuser Co. REIT | | | 9,137 | |
| | 107 | | | W.P. Carey, Inc. REIT | | | 6,960 | |
| | | | | | | | |
| | | | | | | 247,059 | |
| | |
| Utilities – 0.2% | | | |
| | 96 | | | Edison International | | | 6,609 | |
| | 102 | | | NextEra Energy, Inc. | | | 6,814 | |
| | | | | | | | |
| | | | | | | 13,423 | |
| | |
| | TOTAL INVESTMENTS – 99.5% | | | | |
| | (Cost $7,312,057) | | $ | 7,360,060 | |
| | |
| OTHER ASSETS IN EXCESS OF
LIABILITIES – 0.5% | | | 36,944 | |
| | |
| | NET ASSETS – 100.0% | | $ | 7,397,004 | |
| | |
| | |
|
| The percentage shown for each investment category reflects the value of investments in that category as a percentage of net assets. |
| |
* | | Non-income producing security. |
| | |
|
Investment Abbreviations: |
PLC | | —Public Limited Company |
REIT | | —Real Estate Investment Trust |
|
| | |
| 80 | | The accompanying notes are an integral part of these financial statements. |
GOLDMAN SACHS ACTIVEBETA® U.S. LARGE CAP EQUITY ETF
Schedule of Investments
August 31, 2023
| | | | | | | | |
| Shares | | | Description | | Value | |
|
| Common Stocks – 99.7% | |
| Communication Services – 7.8% | | | |
| | 142,735 | | | Activision Blizzard, Inc. | | $ | 13,130,193 | |
| | 1,558,926 | | | Alphabet, Inc., Class A* | | | 212,278,953 | |
| | 1,471,627 | | | Alphabet, Inc., Class C* | | | 202,127,968 | |
| | 1,688,890 | | | AT&T, Inc. | | | 24,978,683 | |
| | 32,686 | | | Charter Communications, Inc., Class A* | | | 14,320,390 | |
| | 1,391,516 | | | Comcast Corp., Class A | | | 65,067,288 | |
| | 161,576 | | | Electronic Arts, Inc. | | | 19,385,888 | |
| | 252,916 | | | Interpublic Group of Cos., Inc. (The) | | | 8,247,591 | |
| | 656,184 | | | Meta Platforms, Inc., Class A* | | | 194,158,284 | |
| | 56,901 | | | Netflix, Inc.* | | | 24,676,826 | |
| | 165,237 | | | Omnicom Group, Inc. | | | 13,385,849 | |
| | 368,483 | | | Pinterest, Inc., Class A* | | | 10,129,598 | |
| | 222,054 | | | Snap, Inc., Class A* | | | 2,298,259 | |
| | 28,283 | | | Spotify Technology SA* | | | 4,354,734 | |
| | 110,378 | | | T-Mobile US, Inc.* | | | 15,039,003 | |
| | 509,176 | | | Verizon Communications, Inc. | | | 17,810,976 | |
| | 124,294 | | | Walt Disney Co. (The)* | | | 10,400,922 | |
| | 3,110,507 | | | Warner Bros Discovery, Inc.* | | | 40,872,062 | |
| | | | | | | | |
| | | | | | | 892,663,467 | |
| | |
| Consumer Discretionary – 12.5% | | | |
| | 2,221,965 | | | Amazon.com, Inc.* | | | 306,653,390 | |
| | 25,350 | | | AutoZone, Inc.* | | | 64,169,216 | |
| | 323,259 | | | Best Buy Co., Inc. | | | 24,713,151 | |
| | 12,412 | | | Booking Holdings, Inc.* | | | 38,539,632 | |
| | 28,921 | | | Burlington Stores, Inc.* | | | 4,692,722 | |
| | 4,894 | | | Chipotle Mexican Grill, Inc.* | | | 9,428,976 | |
| | 92,564 | | | Darden Restaurants, Inc. | | | 14,394,628 | |
| | 35,869 | | | Deckers Outdoor Corp.* | | | 18,977,929 | |
| | 77,214 | | | Domino’s Pizza, Inc. | | | 29,912,704 | |
| | 77,636 | | | D.R. Horton, Inc. | | | 9,240,237 | |
| | 388,056 | | | eBay, Inc. | | | 17,377,148 | |
| | 124,468 | | | Etsy, Inc.* | | | 9,157,111 | |
| | 182,765 | | | Expedia Group, Inc.* | | | 19,809,898 | |
| | 1,645,741 | | | Ford Motor Co. | | | 19,962,838 | |
| | 109,316 | | | Garmin Ltd. | | | 11,589,682 | |
| | 181,573 | | | Genuine Parts Co. | | | 27,913,217 | |
| | 36,697 | | | Hilton Worldwide Holdings, Inc. | | | 5,455,009 | |
| | 324,057 | | | Home Depot, Inc. (The) | | | 107,036,027 | |
| | 101,410 | | | Las Vegas Sands Corp. | | | 5,563,353 | |
| | 361,448 | | | Lennar Corp., Class A | | | 43,044,842 | |
| | 372,780 | | | LKQ Corp. | | | 19,582,133 | |
| | 311,810 | | | Lowe’s Cos., Inc. | | | 71,865,969 | |
| | 35,384 | | | Marriott International, Inc., Class A | | | 7,200,998 | |
| | 153,594 | | | McDonald’s Corp. | | | 43,182,953 | |
| | 578,489 | | | MGM Resorts International | | | 25,441,946 | |
| | 342,516 | | | NIKE, Inc., Class B | | | 34,837,302 | |
| | 1,504 | | | NVR, Inc.* | | | 9,591,504 | |
| | 67,682 | | | O’Reilly Automotive, Inc.* | | | 63,600,775 | |
| | 51,038 | | | Pool Corp. | | | 18,659,493 | |
| | 203,993 | | | PulteGroup, Inc. | | | 16,739,666 | |
| | 89,894 | | | Ross Stores, Inc. | | | 10,949,988 | |
| | 113,484 | | | Royal Caribbean Cruises Ltd.* | | | 11,228,107 | |
| | 190,944 | | | Starbucks Corp. | | | 18,605,583 | |
| | 2,510,815 | | | Stellantis NV(a) | | | 46,575,618 | |
| | |
|
| Common Stocks – (continued) | |
| Consumer Discretionary – (continued) | | | |
| | 410,604 | | | Tesla, Inc.* | | | 105,968,680 | |
| | 421,235 | | | TJX Cos., Inc. (The) | | | 38,955,813 | |
| | 151,729 | | | Tractor Supply Co. | | | 33,152,787 | |
| | 63,847 | | | Ulta Beauty, Inc.* | | | 26,498,420 | |
| | 227,665 | | | Yum! Brands, Inc. | | | 29,455,298 | |
| | | | | | | | |
| | | | | | | 1,419,724,743 | |
| | |
| Consumer Staples – 8.5% | | | |
| | 485,073 | | | Altria Group, Inc. | | | 21,449,928 | |
| | 472,034 | | | Archer-Daniels-Midland Co. | | | 37,432,296 | |
| | 218,883 | | | Brown-Forman Corp., Class B | | | 14,474,733 | |
| | 64,357 | | | Bunge Ltd. | | | 7,357,292 | |
| | 155,175 | | | Church & Dwight Co., Inc. | | | 15,016,285 | |
| | 144,176 | | | Clorox Co. (The) | | | 22,556,335 | |
| | 668,878 | | | Coca-Cola Co. (The) | | | 40,018,971 | |
| | 383,684 | | | Colgate-Palmolive Co. | | | 28,189,264 | |
| | 378,515 | | | Conagra Brands, Inc. | | | 11,310,028 | |
| | 52,102 | | | Constellation Brands, Inc., Class A | | | 13,575,697 | |
| | 149,701 | | | Costco Wholesale Corp. | | | 82,227,765 | |
| | 118,073 | | | Dollar General Corp. | | | 16,353,111 | |
| | 149,286 | | | Dollar Tree, Inc.* | | | 18,266,635 | |
| | 124,446 | | | Estee Lauder Cos., Inc. (The), Class A | | | 19,977,316 | |
| | 232,880 | | | General Mills, Inc. | | | 15,756,661 | |
| | 155,640 | | | Hershey Co. (The) | | | 33,440,810 | |
| | 201,500 | | | Hormel Foods Corp. | | | 7,775,885 | |
| | 90,750 | | | J M Smucker Co. (The) | | | 13,154,213 | |
| | 171,450 | | | Kellogg Co. | | | 10,461,879 | |
| | 571,580 | | | Keurig Dr Pepper, Inc. | | | 19,233,667 | |
| | 157,209 | | | Kimberly-Clark Corp. | | | 20,253,236 | |
| | 537,903 | | | Kraft Heinz Co. (The) | | | 17,799,210 | |
| | 1,222,057 | | | Kroger Co. (The) | | | 56,691,224 | |
| | 137,068 | | | Lamb Weston Holdings, Inc. | | | 13,351,794 | |
| | 93,928 | | | McCormick & Co., Inc. | | | 7,709,610 | |
| | 330,119 | | | Mondelez International, Inc., Class A | | | 23,524,280 | |
| | 445,479 | | | Monster Beverage Corp.* | | | 25,574,949 | |
| | 379,733 | | | PepsiCo, Inc. | | | 67,562,095 | |
| | 475,883 | | | Philip Morris International, Inc. | | | 45,713,321 | |
| | 518,699 | | | Procter & Gamble Co. (The) | | | 80,056,004 | |
| | 267,824 | | | Sysco Corp. | | | 18,653,942 | |
| | 184,756 | | | Target Corp. | | | 23,380,872 | |
| | 322,594 | | | Tyson Foods, Inc., Class A | | | 17,184,582 | |
| | 483,899 | | | Walgreens Boots Alliance, Inc. | | | 12,247,484 | |
| | 582,776 | | | Walmart, Inc. | | | 94,765,205 | |
| | | | | | | | |
| | | | | | | 972,496,579 | |
| | |
| Energy – 3.8% | | | |
| | 234,531 | | | APA Corp. | | | 10,281,839 | |
| | 66,173 | | | Baker Hughes Co. | | | 2,394,801 | |
| | 63,002 | | | Cheniere Energy, Inc. | | | 10,281,926 | |
| | 311,345 | | | Chevron Corp. | | | 50,157,679 | |
| | 204,020 | | | ConocoPhillips | | | 24,284,501 | |
| | 238,446 | | | Coterra Energy, Inc. | | | 6,721,793 | |
| | 263,653 | | | Devon Energy Corp. | | | 13,470,032 | |
| | 42,162 | | | Diamondback Energy, Inc. | | | 6,399,348 | |
| | |
| | |
| The accompanying notes are an integral part of these financial statements. | | 81 |
GOLDMAN SACHS ACTIVEBETA® U.S. LARGE CAP EQUITY ETF
Schedule of Investments (continued)
August 31, 2023
| | | | | | | | |
| Shares | | | Description | | Value | |
|
| Common Stocks – (continued) | |
| Energy – (continued) | | | |
| | 121,417 | | | EOG Resources, Inc. | | $ | 15,616,655 | |
| | 325,643 | | | EQT Corp. | | | 14,074,290 | |
| | 878,567 | | | Exxon Mobil Corp. | | | 97,687,865 | |
| | 62,965 | | | Hess Corp. | | | 9,728,092 | |
| | 516,004 | | | Kinder Morgan, Inc. | | | 8,885,589 | |
| | 344,397 | | | Marathon Oil Corp. | | | 9,074,861 | |
| | 276,353 | | | Marathon Petroleum Corp. | | | 39,454,918 | |
| | 147,153 | | | Occidental Petroleum Corp. | | | 9,239,737 | |
| | 127,492 | | | ONEOK, Inc. | | | 8,312,478 | |
| | 206,818 | | | Phillips 66 | | | 23,610,343 | |
| | 53,157 | | | Pioneer Natural Resources Co. | | | 12,647,645 | |
| | 148,616 | | | Schlumberger NV | | | 8,762,399 | |
| | 42,246 | | | Targa Resources Corp. | | | 3,643,717 | |
| | 275,234 | | | Valero Energy Corp. | | | 35,752,897 | |
| | 262,250 | | | Williams Cos., Inc. (The) | | | 9,055,493 | |
| | | | | | | | |
| | | | | | | 429,538,898 | |
| | |
| Financials – 9.7% | | | |
| | 229,455 | | | Aflac, Inc. | | | 17,110,459 | |
| | 52,287 | | | Allstate Corp. (The) | | | 5,637,061 | |
| | 109,438 | | | American Express Co. | | | 17,290,110 | |
| | 486,766 | | | American International Group, Inc. | | | 28,485,546 | |
| | 56,120 | | | Ameriprise Financial, Inc. | | | 18,944,990 | |
| | 66,732 | | | Aon PLC, Class A | | | 22,247,781 | |
| | 188,613 | | | Apollo Global Management, Inc. | | | 16,473,459 | |
| | 256,020 | | | Arch Capital Group Ltd.* | | | 19,677,697 | |
| | 56,118 | | | Ares Management Corp., Class A | | | 5,804,846 | |
| | 104,893 | | | Arthur J Gallagher & Co. | | | 24,175,739 | |
| | 1,250,076 | | | Bank of America Corp. | | | 35,839,679 | |
| | 526,329 | | | Bank of New York Mellon Corp. (The) | | | 23,616,382 | |
| | 201,218 | | | Berkshire Hathaway, Inc., Class B* | | | 72,478,724 | |
| | 10,764 | | | BlackRock, Inc. | | | 7,540,613 | |
| | 92,520 | | | Brown & Brown, Inc. | | | 6,855,732 | |
| | 369,466 | | | Capital One Financial Corp. | | | 37,829,624 | |
| | 71,760 | | | Cboe Global Markets, Inc. | | | 10,743,190 | |
| | 241,222 | | | Charles Schwab Corp. (The) | | | 14,268,281 | |
| | 73,784 | | | Chubb Ltd. | | | 14,820,992 | |
| | 30,039 | | | Cincinnati Financial Corp. | | | 3,177,826 | |
| | 671,146 | | | Citigroup, Inc. | | | 27,711,618 | |
| | 267,607 | | | Citizens Financial Group, Inc. | | | 7,527,785 | |
| | 55,074 | | | CME Group, Inc. | | | 11,162,398 | |
| | 136,444 | | | Discover Financial Services | | | 12,289,511 | |
| | 13,819 | | | Everest Group Ltd. | | | 4,984,237 | |
| | 28,378 | | | FactSet Research Systems, Inc. | | | 12,384,443 | |
| | 167,293 | | | Fiserv, Inc.* | | | 20,307,697 | |
| | 26,964 | | | FleetCor Technologies, Inc.* | | | 7,326,928 | |
| | 178,648 | | | Hartford Financial Services Group, Inc. (The) | | | 12,830,499 | |
| | 90,241 | | | Intercontinental Exchange, Inc. | | | 10,647,536 | |
| | 68,113 | | | Jack Henry & Associates, Inc. | | | 10,678,756 | |
| | 609,758 | | | JPMorgan Chase & Co. | | | 89,225,888 | |
| | 276,741 | | | KeyCorp | | | 3,135,476 | |
| | 41,142 | | | LPL Financial Holdings, Inc. | | | 9,486,934 | |
| | 28,194 | | | M&T Bank Corp. | | | 3,525,660 | |
| | 6,442 | | | Markel Group, Inc.* | | | 9,527,203 | |
| | |
|
| Common Stocks – (continued) | |
| Financials – (continued) | | | |
| | 13,104 | | | MarketAxess Holdings, Inc. | | | 3,157,147 | |
| | 166,663 | | | Marsh & McLennan Cos., Inc. | | | 32,497,618 | |
| | 179,938 | | | Mastercard, Inc., Class A | | | 74,249,616 | |
| | 154,066 | | | MetLife, Inc. | | | 9,758,540 | |
| | 85,410 | | | Moody’s Corp. | | | 28,766,088 | |
| | 140,843 | | | Morgan Stanley | | | 11,992,781 | |
| | 147,064 | | | Nasdaq, Inc. | | | 7,717,919 | |
| | 43,237 | | | PNC Financial Services Group, Inc. (The) | | | 5,220,003 | |
| | 322,333 | | | Principal Financial Group, Inc. | | | 25,048,497 | |
| | 168,268 | | | Progressive Corp. (The) | | | 22,458,730 | |
| | 67,176 | | | Prudential Financial, Inc. | | | 6,359,552 | |
| | 111,127 | | | Raymond James Financial, Inc. | | | 11,622,773 | |
| | 27,861 | | | S&P Global, Inc. | | | 10,889,750 | |
| | 317,755 | | | State Street Corp. | | | 21,842,479 | |
| | 1,169,288 | | | Synchrony Financial | | | 37,744,617 | |
| | 83,882 | | | Travelers Cos., Inc. (The) | | | 13,524,295 | |
| | 85,700 | | | Truist Financial Corp. | | | 2,618,135 | |
| | 89,446 | | | US Bancorp | | | 3,267,462 | |
| | 329,841 | | | Visa, Inc., Class A | | | 81,035,337 | |
| | 134,087 | | | W R Berkley Corp. | | | 8,294,622 | |
| | 621,885 | | | Wells Fargo & Co. | | | 25,677,632 | |
| | 47,340 | | | Willis Towers Watson PLC | | | 9,788,018 | |
| | | | | | | | |
| | | | | | | 1,109,302,911 | |
| | |
| Health Care – 13.9% | | | |
| | 325,097 | | | Abbott Laboratories | | | 33,452,481 | |
| | 469,712 | | | AbbVie, Inc. | | | 69,028,876 | |
| | 122,096 | | | Agilent Technologies, Inc. | | | 14,782,163 | |
| | 37,593 | | | Align Technology, Inc.* | | | 13,914,673 | |
| | 161,916 | | | Amgen, Inc. | | | 41,505,547 | |
| | 157,697 | | | Avantor, Inc.* | | | 3,414,140 | |
| | 39,391 | | | Becton Dickinson & Co. | | | 11,007,815 | |
| | 64,397 | | | Biogen, Inc.* | | | 17,217,182 | |
| | 386,276 | | | Boston Scientific Corp.* | | | 20,835,727 | |
| | 701,232 | | | Bristol-Myers Squibb Co. | | | 43,230,953 | |
| | 199,507 | | | Cardinal Health, Inc. | | | 17,422,946 | |
| | 95,707 | | | Cencora, Inc. | | | 16,842,518 | |
| | 503,074 | | | Centene Corp.* | | | 31,014,512 | |
| | 19,851 | | | Charles River Laboratories International, Inc.* | | | 4,105,584 | |
| | 177,884 | | | Cigna Group (The) | | | 49,142,234 | |
| | 13,870 | | | Cooper Cos., Inc. (The) | | | 5,131,761 | |
| | 685,202 | | | CVS Health Corp. | | | 44,654,614 | |
| | 128,895 | | | Danaher Corp. | | | 34,157,175 | |
| | 83,863 | | | Dexcom, Inc.* | | | 8,468,486 | |
| | 308,419 | | | Edwards Lifesciences Corp.* | | | 23,584,801 | |
| | 79,703 | | | Elevance Health, Inc. | | | 35,229,523 | |
| | 245,688 | | | Eli Lilly & Co. | | | 136,160,290 | |
| | 40,453 | | | Exact Sciences Corp.* | | | 3,384,703 | |
| | 74,939 | | | Fortrea Holdings, Inc.* | | | 2,064,569 | |
| | 60,141 | | | GE HealthCare Technologies, Inc. | | | 4,236,933 | |
| | 392,094 | | | Gilead Sciences, Inc. | | | 29,987,349 | |
| | 51,382 | | | HCA Healthcare, Inc. | | | 14,248,229 | |
| | 143,375 | | | Hologic, Inc.* | | | 10,715,847 | |
| | 31,080 | | | Horizon Therapeutics PLC* | | | 3,503,959 | |
| | |
| | |
| 82 | | The accompanying notes are an integral part of these financial statements. |
GOLDMAN SACHS ACTIVEBETA® U.S. LARGE CAP EQUITY ETF
| | | | | | | | |
| Shares | | | Description | | Value | |
|
| Common Stocks – (continued) | |
| Health Care – (continued) | | | |
| | 59,312 | | | Humana, Inc. | | $ | 27,380,199 | |
| | 67,039 | | | IDEXX Laboratories, Inc.* | | | 34,284,415 | |
| | 201,977 | | | Incyte Corp.* | | | 13,033,576 | |
| | 30,460 | | | Insulet Corp.* | | | 5,839,487 | |
| | 50,379 | | | Intuitive Surgical, Inc.* | | | 15,752,506 | |
| | 57,452 | | | IQVIA Holdings, Inc.* | | | 12,790,539 | |
| | 660,911 | | | Johnson & Johnson | | | 106,856,090 | |
| | 57,808 | | | Laboratory Corp. of America Holdings | | | 12,029,845 | |
| | 56,421 | | | McKesson Corp. | | | 23,263,507 | |
| | 122,678 | | | Medtronic PLC | | | 9,998,257 | |
| | 661,316 | | | Merck & Co., Inc. | | | 72,070,218 | |
| | 24,432 | | | Mettler-Toledo International, Inc.* | | | 29,647,743 | |
| | 170,489 | | | Moderna, Inc.* | | | 19,277,191 | |
| | 24,513 | | | Molina Healthcare, Inc.* | | | 7,601,972 | |
| | 1,146,322 | | | Pfizer, Inc. | | | 40,556,872 | |
| | 81,061 | | | Quest Diagnostics, Inc. | | | 10,659,521 | |
| | 43,280 | | | Regeneron Pharmaceuticals, Inc.* | | | 35,770,487 | |
| | 57,485 | | | ResMed, Inc. | | | 9,174,031 | |
| | 51,057 | | | Revvity, Inc. | | | 5,975,201 | |
| | 241,803 | | | Royalty Pharma PLC, Class A | | | 7,210,565 | |
| | 88,542 | | | Seagen, Inc.* | | | 18,245,850 | |
| | 13,280 | | | STERIS PLC | | | 3,048,955 | |
| | 65,069 | | | Stryker Corp. | | | 18,450,315 | |
| | 63,222 | | | Thermo Fisher Scientific, Inc. | | | 35,220,976 | |
| | 228,597 | | | UnitedHealth Group, Inc. | | | 108,944,758 | |
| | 17,826 | | | Veeva Systems, Inc., Class A* | | | 3,720,286 | |
| | 100,144 | | | Vertex Pharmaceuticals, Inc.* | | | 34,884,161 | |
| | 5,222,142 | | | Viatris, Inc. | | | 56,138,027 | |
| | 54,202 | | | Waters Corp.* | | | 15,219,922 | |
| | 25,564 | | | West Pharmaceutical Services, Inc. | | | 10,401,992 | |
| | 77,942 | | | Zimmer Biomet Holdings, Inc. | | | 9,284,451 | |
| | 144,697 | | | Zoetis, Inc. | | | 27,566,225 | |
| | | | | | | | |
| | | | | | | 1,582,743,730 | |
| | |
| Industrials – 9.8% | | | |
| | 141,140 | | | 3M Co. | | | 15,055,404 | |
| | 104,291 | | | AMETEK, Inc. | | | 16,635,457 | |
| | 53,833 | | | Automatic Data Processing, Inc. | | | 13,706,420 | |
| | 39,568 | | | Axon Enterprise, Inc.* | | | 8,424,423 | |
| | 64,296 | | | Boeing Co. (The)* | | | 14,404,233 | |
| | 121,576 | | | Booz Allen Hamilton Holding Corp. | | | 13,775,777 | |
| | 40,302 | | | Broadridge Financial Solutions, Inc. | | | 7,504,635 | |
| | 513,650 | | | Builders FirstSource, Inc.* | | | 74,499,796 | |
| | 35,434 | | | Carlisle Cos., Inc. | | | 9,319,851 | |
| | 318,176 | | | Carrier Global Corp. | | | 18,279,211 | |
| | 64,156 | | | Caterpillar, Inc. | | | 18,036,176 | |
| | 93,961 | | | C.H. Robinson Worldwide, Inc. | | | 8,496,893 | |
| | 62,296 | | | Cintas Corp. | | | 31,407,774 | |
| | 291,521 | | | Copart, Inc.* | | | 13,068,886 | |
| | 227,644 | | | CSX Corp. | | | 6,874,849 | |
| | 72,863 | | | Cummins, Inc. | | | 16,761,405 | |
| | 38,901 | | | Deere & Co. | | | 15,985,977 | |
| | 140,449 | | | Delta Air Lines, Inc. | | | 6,022,453 | |
| | 70,965 | | | Dover Corp. | | | 10,524,109 | |
| | 84,035 | | | Eaton Corp. PLC | | | 19,359,143 | |
| | |
|
| Common Stocks – (continued) | |
| Industrials – (continued) | | | |
| | 129,308 | | | Emerson Electric Co. | | | 12,704,511 | |
| | 109,708 | | | Expeditors International of Washington, Inc. | | | 12,804,021 | |
| | 658,957 | | | Fastenal Co. | | | 37,942,744 | |
| | 59,202 | | | FedEx Corp. | | | 15,452,906 | |
| | 134,380 | | | Fortive Corp. | | | 10,595,863 | |
| | 99,388 | | | General Dynamics Corp. | | | 22,525,296 | |
| | 255,085 | | | General Electric Co. | | | 29,197,029 | |
| | 102,923 | | | Graco, Inc. | | | 8,124,742 | |
| | 105,912 | | | Honeywell International, Inc. | | | 19,905,101 | |
| | 252,229 | | | Howmet Aerospace, Inc. | | | 12,477,769 | |
| | 48,153 | | | Hubbell, Inc. | | | 15,700,286 | |
| | 36,484 | | | IDEX Corp. | | | 8,259,978 | |
| | 101,603 | | | Illinois Tool Works, Inc. | | | 25,131,502 | |
| | 126,508 | | | Ingersoll Rand, Inc. | | | 8,806,222 | |
| | 54,751 | | | Jacobs Solutions, Inc. | | | 7,381,530 | |
| | 17,334 | | | J.B. Hunt Transport Services, Inc. | | | 3,256,712 | |
| | 122,735 | | | Johnson Controls International PLC | | | 7,248,729 | |
| | 73,520 | | | L3Harris Technologies, Inc. | | | 13,093,177 | |
| | 192,100 | | | Leidos Holdings, Inc. | | | 18,731,671 | |
| | 61,679 | | | Lockheed Martin Corp. | | | 27,653,780 | |
| | 216,892 | | | Masco Corp. | | | 12,798,797 | |
| | 29,344 | | | Norfolk Southern Corp. | | | 6,015,813 | |
| | 35,730 | | | Northrop Grumman Corp. | | | 15,474,306 | |
| | 47,375 | | | Old Dominion Freight Line, Inc. | | | 20,246,654 | |
| | 101,286 | | | Otis Worldwide Corp. | | | 8,665,017 | |
| | 181,718 | | | PACCAR, Inc. | | | 14,953,574 | |
| | 56,581 | | | Parker-Hannifin Corp. | | | 23,588,619 | |
| | 130,822 | | | Paychex, Inc. | | | 15,990,373 | |
| | 58,920 | | | Quanta Services, Inc. | | | 12,365,540 | |
| | 133,128 | | | Republic Services, Inc. | | | 19,187,739 | |
| | 29,594 | | | Rockwell Automation, Inc. | | | 9,235,696 | |
| | 245,200 | | | RTX Corp. | | | 21,097,008 | |
| | 32,949 | | | Snap-on, Inc. | | | 8,850,101 | |
| | 431,826 | | | SS&C Technologies Holdings, Inc. | | | 24,795,449 | |
| | 487,403 | | | Textron, Inc. | | | 37,876,087 | |
| | 65,032 | | | Trane Technologies PLC | | | 13,348,468 | |
| | 15,440 | | | TransDigm Group, Inc.* | | | 13,955,444 | |
| | 172,014 | | | Uber Technologies, Inc.* | | | 8,124,221 | |
| | 42,649 | | | Union Pacific Corp. | | | 9,407,090 | |
| | 685,818 | | | United Airlines Holdings, Inc.* | | | 34,160,595 | |
| | 83,014 | | | United Parcel Service, Inc., Class B | | | 14,062,572 | |
| | 12,459 | | | United Rentals, Inc. | | | 5,937,212 | |
| | 41,025 | | | Verisk Analytics, Inc. | | | 9,937,075 | |
| | 113,593 | | | Waste Management, Inc. | | | 17,809,111 | |
| | 276,173 | | | Westinghouse Air Brake Technologies Corp. | | | 31,074,986 | |
| | 71,332 | | | W.W. Grainger, Inc. | | | 50,941,034 | |
| | 72,378 | | | Xylem, Inc. | | | 7,494,018 | |
| | | | | | | | |
| | | | | | | 1,122,529,040 | |
| | |
| Information Technology – 27.4% | | | |
| | 257,605 | | | Accenture PLC, Class A | | | 83,404,771 | |
| | 141,884 | | | Adobe, Inc.* | | | 79,361,397 | |
| | 321,380 | | | Advanced Micro Devices, Inc.* | | | 33,976,294 | |
| | 134,714 | | | Akamai Technologies, Inc.* | | | 14,157,094 | |
| | |
| | |
| The accompanying notes are an integral part of these financial statements. | | 83 |
GOLDMAN SACHS ACTIVEBETA® U.S. LARGE CAP EQUITY ETF
Schedule of Investments (continued)
August 31, 2023
| | | | | | | | |
| Shares | | | Description | | Value | |
|
| Common Stocks – (continued) | |
| Information Technology – (continued) | | | |
| | 164,764 | | | Amphenol Corp., Class A | | $ | 14,561,842 | |
| | 114,225 | | | Analog Devices, Inc. | | | 20,763,820 | |
| | 14,100 | | | ANSYS, Inc.* | | | 4,496,067 | |
| | 4,010,410 | | | Apple, Inc. | | | 753,435,727 | |
| | 313,081 | | | Applied Materials, Inc. | | | 47,826,254 | |
| | 100,336 | | | Arista Networks, Inc.* | | | 19,588,597 | |
| | 84,033 | | | Atlassian Corp., Class A* | | | 17,147,774 | |
| | 103,334 | | | Autodesk, Inc.* | | | 22,933,948 | |
| | 96,549 | | | Broadcom, Inc. | | | 89,104,107 | |
| | 208,964 | | | Cadence Design Systems, Inc.* | | | 50,243,304 | |
| | 46,483 | | | CDW Corp. | | | 9,814,885 | |
| | 1,012,780 | | | Cisco Systems, Inc. | | | 58,082,933 | |
| | 313,755 | | | Cognizant Technology Solutions Corp., Class A | | | 22,467,996 | |
| | 192,207 | | | Corning, Inc. | | | 6,308,234 | |
| | 25,461 | | | Crowdstrike Holdings, Inc., Class A* | | | 4,150,907 | |
| | 48,081 | | | Datadog, Inc., Class A* | | | 4,638,855 | |
| | 44,857 | | | Enphase Energy, Inc.* | | | 5,675,756 | |
| | 25,142 | | | EPAM Systems, Inc.* | | | 6,511,527 | |
| | 26,041 | | | Fair Isaac Corp.* | | | 23,556,428 | |
| | 50,476 | | | First Solar, Inc.* | | | 9,546,021 | |
| | 539,452 | | | Fortinet, Inc.* | | | 32,480,405 | |
| | 69,662 | | | Gartner, Inc.* | | | 24,359,408 | |
| | 251,118 | | | Gen Digital, Inc. | | | 5,085,139 | |
| | 114,591 | | | GoDaddy, Inc., Class A* | | | 8,308,993 | |
| | 1,504,303 | | | Hewlett Packard Enterprise Co. | | | 25,558,108 | |
| | 400,511 | | | HP, Inc. | | | 11,899,182 | |
| | 28,099 | | | HubSpot, Inc.* | | | 15,356,665 | |
| | 594,594 | | | Intel Corp. | | | 20,894,033 | |
| | 302,977 | | | International Business Machines Corp. | | | 44,486,113 | |
| | 69,918 | | | Intuit, Inc. | | | 37,882,272 | |
| | 82,544 | | | Keysight Technologies, Inc.* | | | 11,003,115 | |
| | 45,978 | | | KLA Corp. | | | 23,074,979 | |
| | 67,401 | | | Lam Research Corp. | | | 47,342,462 | |
| | 186,842 | | | Lattice Semiconductor Corp.* | | | 18,172,253 | |
| | 54,369 | | | Marvell Technology, Inc. | | | 3,166,994 | |
| | 153,286 | | | Microchip Technology, Inc. | | | 12,544,926 | |
| | 137,097 | | | Micron Technology, Inc. | | | 9,588,564 | |
| | 1,938,658 | | | Microsoft Corp. | | | 635,414,546 | |
| | 16,902 | | | Monolithic Power Systems, Inc. | | | 8,809,491 | |
| | 92,108 | | | Motorola Solutions, Inc. | | | 26,119,066 | |
| | 184,617 | | | NetApp, Inc. | | | 14,160,124 | |
| | 567,007 | | | NVIDIA Corp. | | | 279,846,305 | |
| | 279,436 | | | ON Semiconductor Corp.* | | | 27,513,269 | |
| | 293,697 | | | Oracle Corp. | | | 35,358,182 | |
| | 111,742 | | | Palo Alto Networks, Inc.* | | | 27,186,829 | |
| | 46,923 | | | PTC, Inc.* | | | 6,905,658 | |
| | 245,342 | | | QUALCOMM, Inc. | | | 28,099,019 | |
| | 22,833 | | | Roper Technologies, Inc. | | | 11,395,037 | |
| | 197,633 | | | Salesforce, Inc.* | | | 43,767,804 | |
| | 53,436 | | | ServiceNow, Inc.* | | | 31,464,720 | |
| | 132,121 | | | Skyworks Solutions, Inc. | | | 14,366,838 | |
| | 40,152 | | | Splunk, Inc.* | | | 4,868,831 | |
| | 75,405 | | | Synopsys, Inc.* | | | 34,602,600 | |
| | 22,856 | | | Teledyne Technologies, Inc.* | | | 9,560,665 | |
| | 139,584 | | | Teradyne, Inc. | | | 15,056,926 | |
| | |
|
| Common Stocks – (continued) | |
| Information Technology – (continued) | | | |
| | 271,196 | | | Texas Instruments, Inc. | | | 45,577,200 | |
| | 85,845 | | | Trimble, Inc.* | | | 4,703,448 | |
| | 8,719 | | | Tyler Technologies, Inc.* | | | 3,473,911 | |
| | 106,524 | | | VeriSign, Inc.* | | | 22,134,622 | |
| | 98,654 | | | VMware, Inc., Class A* | | | 16,650,822 | |
| | 117,947 | | | Western Digital Corp.* | | | 5,307,615 | |
| | 34,518 | | | Workday, Inc., Class A* | | | 8,439,651 | |
| | 20,611 | | | Zebra Technologies Corp., Class A* | | | 5,668,231 | |
| | 104,028 | | | Zoom Video Communications, Inc., Class A* | | | 7,389,109 | |
| | | | | | | | |
| | | | | | | 3,126,798,668 | |
| | |
| Materials – 2.0% | | | |
| | 39,461 | | | Air Products and Chemicals, Inc. | | | 11,660,331 | |
| | 23,210 | | | Avery Dennison Corp. | | | 4,372,300 | |
| | 81,006 | | | CF Industries Holdings, Inc. | | | 6,243,132 | |
| | 204,824 | | | Corteva, Inc. | | | 10,345,660 | |
| | 209,015 | | | Dow, Inc. | | | 11,403,858 | |
| | 44,331 | | | DuPont de Nemours, Inc. | | | 3,408,611 | |
| | 29,098 | | | Ecolab, Inc. | | | 5,348,503 | |
| | 40,444 | | | FMC Corp. | | | 3,487,486 | |
| | 104,172 | | | Freeport-McMoRan, Inc. | | | 4,157,505 | |
| | 149,343 | | | International Paper Co. | | | 5,215,058 | |
| | 73,579 | | | Linde PLC | | | 28,478,016 | |
| | 34,503 | | | LyondellBasell Industries NV, Class A | | | 3,407,861 | |
| | 9,628 | | | Martin Marietta Materials, Inc. | | | 4,298,036 | |
| | 385,540 | | | Mosaic Co. (The) | | | 14,978,229 | |
| | 225,402 | | | Nucor Corp. | | | 38,791,684 | |
| | 19,023 | | | Packaging Corp. of America | | | 2,836,329 | |
| | 42,179 | | | PPG Industries, Inc. | | | 5,979,295 | |
| | 45,696 | | | Reliance Steel & Aluminum Co. | | | 13,021,532 | |
| | 67,128 | | | RPM International, Inc. | | | 6,695,347 | |
| | 81,859 | | | Sherwin-Williams Co. (The) | | | 22,242,728 | |
| | 153,332 | | | Steel Dynamics, Inc. | | | 16,343,658 | |
| | 42,149 | | | Vulcan Materials Co. | | | 9,199,019 | |
| | | | | | | | |
| | | | | | | 231,914,178 | |
| | |
| Real Estate – 1.8% | | | |
| | 40,352 | | | Alexandria Real Estate Equities, Inc. REIT | | | 4,694,552 | |
| | 32,081 | | | American Tower Corp. REIT | | | 5,816,927 | |
| | 32,146 | | | AvalonBay Communities, Inc. REIT | | | 5,909,078 | |
| | 95,341 | | | Camden Property Trust REIT | | | 10,260,598 | |
| | 154,831 | | | CBRE Group, Inc., Class A* | | | 13,168,377 | |
| | 46,754 | | | Crown Castle, Inc. REIT | | | 4,698,777 | |
| | 7,953 | | | Equinix, Inc. REIT | | | 6,214,315 | |
| | 36,504 | | | Equity LifeStyle Properties, Inc. REIT | | | 2,444,308 | |
| | 122,162 | | | Equity Residential REIT | | | 7,919,762 | |
| | 30,904 | | | Essex Property Trust, Inc. REIT | | | 7,367,205 | |
| | 198,561 | | | Gaming and Leisure Properties, Inc. REIT | | | 9,411,791 | |
| | 144,919 | | | Healthpeak Properties, Inc. REIT | | | 2,982,433 | |
| | 1,156,172 | | | Host Hotels & Resorts, Inc. REIT | | | 18,255,956 | |
| | 157,002 | | | Invitation Homes, Inc. REIT | | | 5,352,198 | |
| | |
| | |
| 84 | | The accompanying notes are an integral part of these financial statements. |
GOLDMAN SACHS ACTIVEBETA® U.S. LARGE CAP EQUITY ETF
| | | | | | | | |
| Shares | | | Description | | Value | |
|
| Common Stocks – (continued) | |
| Real Estate – (continued) | | | |
| | 90,985 | | | Iron Mountain, Inc. REIT | | $ | 5,781,187 | |
| | 46,152 | | | Mid-America Apartment Communities, Inc. REIT | | | 6,702,655 | |
| | 46,301 | | | Prologis, Inc. REIT | | | 5,750,584 | |
| | 22,698 | | | Public Storage REIT | | | 6,273,273 | |
| | 154,013 | | | Realty Income Corp. REIT | | | 8,630,889 | |
| | 12,135 | | | SBA Communications Corp. REIT | | | 2,724,672 | |
| | 32,002 | | | Simon Property Group, Inc. REIT | | | 3,631,907 | |
| | 90,884 | | | Sun Communities, Inc. REIT | | | 11,126,019 | |
| | 123,275 | | | UDR, Inc. REIT | | | 4,918,672 | |
| | 139,486 | | | Ventas, Inc. REIT | | | 6,092,748 | |
| | 405,571 | | | VICI Properties, Inc. REIT | | | 12,507,810 | |
| | 53,402 | | | Welltower, Inc. REIT | | | 4,425,958 | |
| | 418,180 | | | Weyerhaeuser Co. REIT | | | 13,695,395 | |
| | 124,209 | | | W.P. Carey, Inc. REIT | | | 8,079,795 | |
| | | | | | | | |
| | | | | | | 204,837,841 | |
| | |
| Utilities – 2.5% | | | |
| | 181,416 | | | Alliant Energy Corp. | | | 9,101,641 | |
| | 127,028 | | | Ameren Corp. | | | 10,069,510 | |
| | 150,988 | | | American Electric Power Co., Inc. | | | 11,837,459 | |
| | 42,558 | | | American Water Works Co., Inc. | | | 5,904,497 | |
| | 90,788 | | | Atmos Energy Corp. | | | 10,526,869 | |
| | 387,975 | | | CenterPoint Energy, Inc. | | | 10,820,623 | |
| | 120,993 | | | CMS Energy Corp. | | | 6,798,597 | |
| | 174,293 | | | Consolidated Edison, Inc. | | | 15,505,105 | |
| | 129,165 | | | Constellation Energy Corp. | | | 13,453,826 | |
| | 156,188 | | | Dominion Energy, Inc. | | | 7,581,365 | |
| | 87,000 | | | DTE Energy Co. | | | 8,994,060 | |
| | 145,950 | | | Duke Energy Corp. | | | 12,960,360 | |
| | 196,128 | | | Edison International | | | 13,503,413 | |
| | 79,947 | | | Entergy Corp. | | | 7,614,952 | |
| | 185,932 | | | Evergy, Inc. | | | 10,220,682 | |
| | 88,711 | | | Eversource Energy | | | 5,661,536 | |
| | 432,931 | | | Exelon Corp. | | | 17,369,192 | |
| | 271,213 | | | FirstEnergy Corp. | | | 9,782,653 | |
| | 270,564 | | | NextEra Energy, Inc. | | | 18,073,675 | |
| | 140,910 | | | NiSource, Inc. | | | 3,770,752 | |
| | 806,781 | | | PG&E Corp.* | | | 13,150,530 | |
| | 227,033 | | | PPL Corp. | | | 5,657,662 | |
| | 161,009 | | | Public Service Enterprise Group, Inc. | | | 9,834,430 | |
| | 206,906 | | | Sempra | | | 14,528,939 | |
| | 244,918 | | | Southern Co. (The) | | | 16,588,296 | |
| | |
|
| Common Stocks – (continued) | |
| Utilities – (continued) | | | |
| | 85,238 | | | WEC Energy Group, Inc. | | | 7,170,221 | |
| | 160,826 | | | Xcel Energy, Inc. | | | 9,187,989 | |
| | | | | | | | |
| | | | | | | 285,668,834 | |
| | |
| TOTAL INVESTMENTS BEFORE SECURITIES LENDING
REINVESTMENT VEHICLE |
|
| | (Cost $8,454,987,939) | | $ | 11,378,218,889 | |
| | |
| | | | | | | | |
| Shares | | | Dividend
Rate | | Value | |
|
| Securities Lending Reinvestment Vehicle – 0.3%(b) | |
| Goldman Sachs Financial Square Government Fund –
Institutional Shares |
|
| | 39,027,450 | | | 5.234% | | $ | 39,027,450 | |
| | (Cost $39,027,450) | | | | |
| | |
| | TOTAL INVESTMENTS – 100.0% | | | | |
| | (Cost $8,494,015,389) | | $ | 11,417,246,339 | |
| | |
| LIABILITIES IN EXCESS OF OTHER
ASSETS – (0.0)% | | | (6,773,300 | ) |
| | |
| | NET ASSETS – 100.0% | | $ | 11,410,473,039 | |
| | |
| | |
|
| The percentage shown for each investment category reflects the value of investments in that category as a percentage of net assets. |
| |
* | | Non-income producing security. |
| |
(a) | | All or a portion of security is on loan. |
| |
(b) | | Represents an affiliated issuer. |
| | |
|
Investment Abbreviations: |
PLC | | —Public Limited Company |
REIT | | —Real Estate Investment Trust |
|
|
| ADDITIONAL INVESTMENT INFORMATION |
FUTURES CONTRACTS — At August 31, 2023, the Fund had the following futures contracts:
| | | | | | | | | | | | | | | | |
| Description | | Number of
Contracts | | | Expiration
Date | | | Notional
Amount | | | Unrealized
Appreciation/
(Depreciation) | |
Long position contracts: | | | | | | | | | | | | | | | | |
S&P 500 E-Mini Index | | | 61 | | | | 09/15/23 | | | $ | 13,773,800 | | | $ | 59,881 | |
| | |
| The accompanying notes are an integral part of these financial statements. | | 85 |
GOLDMAN SACHS ACTIVEBETA® U.S. SMALL CAP EQUITY ETF
Schedule of Investments
August 31, 2023
| | | | | | | | |
| Shares | | | Description | | Value | |
|
| Common Stocks – 99.1% | |
| Communication Services – 2.0% | | | |
| | 9,556 | | | AMC Networks, Inc., Class A* | | $ | 111,232 | |
| | 4,893 | | | Atlanta Braves Holdings, Inc., Class A*(a) | | | 204,723 | |
| | 4,554 | | | Atlanta Braves Holdings, Inc., Class C* | | | 167,769 | |
| | 22,779 | | | Cargurus, Inc.* | | | 412,528 | |
| | 27,282 | | | Cars.com, Inc.* | | | 509,901 | |
| | 10,758 | | | Cinemark Holdings, Inc.* | | | 175,140 | |
| | 7,965 | | | Cogent Communications Holdings, Inc. | | | 562,170 | |
| | 32,101 | | | DHI Group, Inc.* | | | 121,021 | |
| | 13,941 | | | EchoStar Corp., Class A* | | | 242,295 | |
| | 18,738 | | | EverQuote, Inc., Class A* | | | 115,801 | |
| | 18,981 | | | EW Scripps Co. (The), Class A* | | | 145,015 | |
| | 88,070 | | | Gannett Co., Inc.* | | | 256,284 | |
| | 15,535 | | | Gogo, Inc.* | | | 176,322 | |
| | 19,679 | | | Gray Television, Inc. | | | 158,613 | |
| | 14,031 | | | IDT Corp., Class B* | | | 328,045 | |
| | 36,386 | | | iHeartMedia, Inc., Class A* | | | 131,353 | |
| | 5,227 | | | IMAX Corp.* | | | 99,993 | |
| | 5,320 | | | Integral Ad Science Holding Corp.* | | | 75,916 | |
| | 13,040 | | | John Wiley & Sons, Inc., Class A | | | 484,566 | |
| | 11,148 | | | Liberty Latin America Ltd., Class A (Puerto Rico) * | | | 99,663 | |
| | 36,559 | | | Liberty Latin America Ltd., Class C (Puerto Rico) * | | | 327,569 | |
| | 35,841 | | | Loop Media, Inc.* | | | 31,214 | |
| | 83,750 | | | Lumen Technologies, Inc.* | | | 133,162 | |
| | 9,948 | | | Magnite, Inc.* | | | 82,071 | |
| | 9,307 | | | Marcus Corp. (The) | | | 141,373 | |
| | 21,296 | | | Ooma, Inc.* | | | 300,061 | |
| | 29,436 | | | Playstudios, Inc.* | | | 104,792 | |
| | 12,384 | | | QuinStreet, Inc.* | | | 122,602 | |
| | 12,534 | | | Scholastic Corp. | | | 544,602 | |
| | 7,747 | | | Shutterstock, Inc. | | | 326,226 | |
| | 7,828 | | | Sinclair, Inc. | | | 98,789 | |
| | 11,096 | | | Spok Holdings, Inc. | | | 158,007 | |
| | 25,618 | | | Stagwell, Inc.* | | | 139,618 | |
| | 40,993 | | | TEGNA, Inc. | | | 677,614 | |
| | 12,170 | | | Thryv Holdings, Inc.* | | | 248,146 | |
| | 120,050 | | | Tingo Group, Inc.* | | | 154,865 | |
| | 86,703 | | | TrueCar, Inc.* | | | 207,220 | |
| | 22,097 | | | Yelp, Inc.* | | | 946,856 | |
| | 6,518 | | | Ziff Davis, Inc.* | | | 434,425 | |
| | 8,069 | | | ZipRecruiter, Inc., Class A* | | | 122,568 | |
| | | | | | | | |
| | | | | | | 9,880,130 | |
| | |
| Consumer Discretionary – 11.1% | | | |
| | 20,814 | | | 1-800-Flowers.com, Inc., Class A* | | | 156,729 | |
| | 65,203 | | | 2U, Inc.* | | | 206,694 | |
| | 20,010 | | | Aaron’s Co., Inc. (The) | | | 241,521 | |
| | 18,041 | | | Abercrombie & Fitch Co., Class A* | | | 969,704 | |
| | 13,186 | | | Academy Sports & Outdoors, Inc. | | | 719,560 | |
| | 10,167 | | | Acushnet Holdings Corp. | | | 595,278 | |
| | 13,693 | | | Adient PLC* | | | 536,355 | |
| | 12,296 | | | Adtalem Global Education, Inc.* | | | 539,180 | |
| | 36,200 | | | American Axle & Manufacturing Holdings, Inc.* | | | 273,310 | |
| | |
|
| Common Stocks – (continued) | |
| Consumer Discretionary – (continued) | | | |
| | 18,473 | | | American Eagle Outfitters, Inc. | | | 313,302 | |
| | 4,540 | | | Asbury Automotive Group, Inc.* | | | 1,044,200 | |
| | 9,697 | | | Beazer Homes USA, Inc.* | | | 284,219 | |
| | 4,572 | | | BJ’s Restaurants, Inc.* | | | 134,463 | |
| | 14,540 | | | Bloomin’ Brands, Inc. | | | 407,992 | |
| | 8,136 | | | Bluegreen Vacations Holding Corp. | | | 291,757 | |
| | 4,895 | | | Boot Barn Holdings, Inc.* | | | 449,116 | |
| | 7,397 | | | Brinker International, Inc.* | | | 242,104 | |
| | 10,401 | | | Buckle, Inc. (The) | | | 380,053 | |
| | 4,630 | | | Build-A-Bear Workshop, Inc. | | | 122,093 | |
| | 15,874 | | | Caleres, Inc. | | | 455,108 | |
| | 5,655 | | | Camping World Holdings, Inc., Class A | | | 139,848 | |
| | 33,043 | | | CarParts.com, Inc.* | | | 159,598 | |
| | 6,088 | | | Carriage Services, Inc. | | | 187,632 | |
| | 27,128 | | | Carrols Restaurant Group, Inc.* | | | 189,353 | |
| | 3,708 | | | Carvana Co.* | | | 186,698 | |
| | 1,498 | | | Cavco Industries, Inc.* | | | 418,721 | |
| | 3,528 | | | Century Communities, Inc. | | | 261,954 | |
| | 5,468 | | | Cheesecake Factory, Inc. (The) | | | 174,156 | |
| | 11,115 | | | Chegg, Inc.* | | | 113,484 | |
| | 33,973 | | | Chico’s FAS, Inc.* | | | 174,281 | |
| | 4,760 | | | Chuy’s Holdings, Inc.* | | | 181,356 | |
| | 7,292 | | | Cooper-Standard Holdings, Inc.* | | | 108,942 | |
| | 7,724 | | | Coursera, Inc.* | | | 134,320 | |
| | 1,886 | | | Cracker Barrel Old Country Store, Inc. | | | 155,463 | |
| | 5,959 | | | Cricut, Inc., Class A | | | 56,372 | |
| | 25,592 | | | Dana, Inc. | | | 412,287 | |
| | 5,391 | | | Dave & Buster’s Entertainment, Inc.* | | | 211,705 | |
| | 17,775 | | | Denny’s Corp.* | | | 169,396 | |
| | 12,483 | | | Designer Brands, Inc., Class A | | | 131,196 | |
| | 29,522 | | | Destination XL Group, Inc.* | | | 134,620 | |
| | 2,265 | | | Dillard’s, Inc., Class A | | | 781,697 | |
| | 1,914 | | | Dine Brands Global, Inc. | | | 104,849 | |
| | 5,890 | | | Dorman Products, Inc.* | | | 485,984 | |
| | 1,175 | | | Duluth Holdings, Inc., Class B* | | | 7,467 | |
| | 2,428 | | | Duolingo, Inc.* | | | 357,304 | |
| | 12,287 | | | El Pollo Loco Holdings, Inc. | | | 116,849 | |
| | 19,907 | | | Ethan Allen Interiors, Inc. | | | 624,682 | |
| | 12,939 | | | Everi Holdings, Inc.* | | | 187,098 | |
| | 50,530 | | | Figs, Inc., Class A* | | | 312,275 | |
| | 5,882 | | | Foot Locker, Inc. | | | 115,405 | |
| | 41,590 | | | Fossil Group, Inc.* | | | 88,171 | |
| | 6,831 | | | Fox Factory Holding Corp.* | | | 756,943 | |
| | 21,139 | | | Frontdoor, Inc.* | | | 693,782 | |
| | 12,296 | | | Funko, Inc., Class A* | | | 85,703 | |
| | 9,569 | | | Genesco, Inc.* | | | 328,025 | |
| | 7,298 | | | Gentherm, Inc.* | | | 439,413 | |
| | 11,270 | | | G-III Apparel Group Ltd.* | | | 223,709 | |
| | 5,331 | | | Golden Entertainment, Inc. | | | 194,102 | |
| | 46,509 | | | Goodyear Tire & Rubber Co. (The)* | | | 600,431 | |
| | 39,749 | | | GoPro, Inc., Class A* | | | 144,488 | |
| | 847 | | | Graham Holdings Co., Class B | | | 496,622 | |
| | 6,759 | | | Green Brick Partners, Inc.* | | | 334,300 | |
| | 4,055 | | | Group 1 Automotive, Inc. | | | 1,072,223 | |
| | 8,883 | | | Guess?, Inc. | | | 213,725 | |
| | 14,391 | | | Haverty Furniture Cos., Inc. | | | 450,438 | |
| | |
| | |
| 86 | | The accompanying notes are an integral part of these financial statements. |
GOLDMAN SACHS ACTIVEBETA® U.S. SMALL CAP EQUITY ETF
| | | | | | | | |
| Shares | | | Description | | Value | |
|
| Common Stocks – (continued) | |
| Consumer Discretionary – (continued) | | | |
| | 3,396 | | | Helen of Troy Ltd.* | | $ | 417,436 | |
| | 6,353 | | | Hibbett, Inc. | | | 294,207 | |
| | 11,076 | | | Hilton Grand Vacations, Inc.* | | | 484,243 | |
| | 2,208 | | | Hovnanian Enterprises, Inc., Class A* | | | 262,399 | |
| | 21,163 | | | Inspired Entertainment, Inc.* | | | 278,928 | |
| | 4,401 | | | Installed Building Products, Inc. | | | 636,957 | |
| | 16,220 | | | International Game Technology PLC | | | 519,364 | |
| | 6,843 | | | iRobot Corp.* | | | 266,124 | |
| | 3,748 | | | Jack in the Box, Inc. | | | 301,227 | |
| | 7,102 | | | JAKKS Pacific, Inc.* | | | 139,767 | |
| | 4,024 | | | Johnson Outdoors, Inc., Class A | | | 224,982 | |
| | 9,590 | | | KB Home | | | 487,172 | |
| | 11,004 | | | Kontoor Brands, Inc. | | | 503,873 | |
| | 6,596 | | | Krispy Kreme, Inc. | | | 88,320 | |
| | 24,112 | | | Laureate Education, Inc. | | | 335,880 | |
| | 15,684 | | | La-Z-Boy, Inc. | | | 483,851 | |
| | 7,143 | | | LCI Industries | | | 894,875 | |
| | 14,025 | | | Leslie’s, Inc.* | | | 87,796 | |
| | 1,503 | | | LGI Homes, Inc.* | | | 185,019 | |
| | 4,727 | | | Life Time Group Holdings, Inc.* | | | 81,304 | |
| | 9,745 | | | Light & Wonder, Inc.* | | | 747,149 | |
| | 23,286 | | | Lincoln Educational Services Corp.* | | | 198,630 | |
| | 7,046 | | | Lovesac Co. (The)* | | | 161,494 | |
| | 19,143 | | | Luminar Technologies, Inc.*(a) | | | 110,264 | |
| | 6,631 | | | M/I Homes, Inc.* | | | 651,032 | |
| | 5,624 | | | Malibu Boats, Inc., Class A* | | | 273,101 | |
| | 490 | | | Marine Products Corp. | | | 6,855 | |
| | 5,696 | | | MarineMax, Inc.* | | | 189,506 | |
| | 15,083 | | | MasterCraft Boat Holdings, Inc.* | | | 328,206 | |
| | 8,949 | | | MDC Holdings, Inc. | | | 424,630 | |
| | 6,294 | | | Meritage Homes Corp. | | | 875,118 | |
| | 14,659 | | | Modine Manufacturing Co.* | | | 697,622 | |
| | 3,890 | | | Monarch Casino & Resort, Inc. | | | 262,186 | |
| | 4,212 | | | Monro, Inc. | | | 137,901 | |
| | 9,162 | | | Movado Group, Inc. | | | 250,581 | |
| | 2,289 | | | Nathan’s Famous, Inc. | | | 166,433 | |
| | 9,874 | | | National Vision Holdings, Inc.* | | | 180,793 | |
| | 26,458 | | | Nerdy, Inc.* | | | 123,823 | |
| | 9,729 | | | ODP Corp. (The)* | | | 479,834 | |
| | 12,406 | | | OneSpaWorld Holdings Ltd. (Bahamas) * | | | 141,925 | |
| | 741 | | | OneWater Marine, Inc., Class A* | | | 19,348 | |
| | 7,839 | | | Overstock.com, Inc.* | �� | | 204,676 | |
| | 6,716 | | | Oxford Industries, Inc. | | | 678,249 | |
| | 8,063 | | | Papa John’s International, Inc. | | | 610,369 | |
| | 8,445 | | | Patrick Industries, Inc. | | | 706,340 | |
| | 65,672 | | | Perdoceo Education Corp. | | | 1,088,185 | |
| | 8,353 | | | PetMed Express, Inc. | | | 94,138 | |
| | 17,743 | | | PlayAGS, Inc.* | | | 121,185 | |
| | 4,523 | | | Portillo’s, Inc., Class A* | | | 82,952 | |
| | 23,176 | | | Potbelly Corp.* | | | 185,176 | |
| | 33,053 | | | Purple Innovation, Inc. | | | 71,725 | |
| | 3,480 | | | RCI Hospitality Holdings, Inc. | | | 227,174 | |
| | 8,440 | | | Red Rock Resorts, Inc., Class A | | | 370,769 | |
| | 8,633 | | | Revolve Group, Inc.* | | | 126,473 | |
| | 27,376 | | | Rush Street Interactive, Inc.* | | | 125,930 | |
| | 25,354 | | | Sally Beauty Holdings, Inc.* | | | 257,597 | |
| | |
|
| Common Stocks – (continued) | |
| Consumer Discretionary – (continued) | | | |
| | 5,722 | | | SeaWorld Entertainment, Inc.* | | | 278,661 | |
| | 2,504 | | | Shake Shack, Inc., Class A* | | | 175,280 | |
| | 14,990 | | | Shoe Carnival, Inc. | | | 346,719 | |
| | 9,141 | | | Signet Jewelers Ltd. | | | 685,575 | |
| | 3,331 | | | Six Flags Entertainment Corp.* | | | 76,480 | |
| | 7,875 | | | Skyline Champion Corp.* | | | 561,251 | |
| | 9,694 | | | Sleep Number Corp.* | | | 247,973 | |
| | 23,186 | | | Smith & Wesson Brands, Inc. | | | 272,204 | |
| | 5,116 | | | Sonic Automotive, Inc., Class A | | | 272,785 | |
| | 24,908 | | | Sonos, Inc.* | | | 343,232 | |
| | 10,715 | | | Standard Motor Products, Inc. | | | 396,776 | |
| | 18,085 | | | Steven Madden Ltd. | | | 623,932 | |
| | 34,614 | | | Stitch Fix, Inc., Class A* | | | 151,955 | |
| | 15,342 | | | Stoneridge, Inc.* | | | 315,278 | |
| | 4,262 | | | Strategic Education, Inc. | | | 330,305 | |
| | 21,581 | | | Stride, Inc.* | | | 916,977 | |
| | 6,513 | | | Sturm Ruger & Co., Inc. | | | 335,941 | |
| | 21,945 | | | Target Hospitality Corp.* | | | 348,926 | |
| | 22,338 | | | Taylor Morrison Home Corp.* | | | 1,058,821 | |
| | 8,313 | | | Topgolf Callaway Brands Corp.* | | | 144,979 | |
| | 23,601 | | | Tri Pointe Homes, Inc.* | | | 733,991 | |
| | 23,753 | | | Udemy, Inc.* | | | 246,081 | |
| | 22,330 | | | Upbound Group, Inc. | | | 683,745 | |
| | 8,222 | | | Urban Outfitters, Inc.* | | | 273,053 | |
| | 23,235 | | | Vera Bradley, Inc.* | | | 166,595 | |
| | 13,948 | | | Vista Outdoor, Inc.* | | | 407,979 | |
| | 2,555 | | | Visteon Corp.* | | | 355,835 | |
| | 8,262 | | | Warby Parker, Inc., Class A*(a) | | | 99,227 | |
| | 1,986 | | | Winmark Corp. | | | 755,733 | |
| | 11,173 | | | Winnebago Industries, Inc. | | | 724,569 | |
| | 14,362 | | | Wolverine World Wide, Inc. | | | 116,045 | |
| | 44,051 | | | WW International, Inc.* | | | 427,735 | |
| | 9,072 | | | XPEL, Inc.* | | | 755,698 | |
| | 3,342 | | | Xponential Fitness, Inc., Class A* | | | 72,388 | |
| | 12,439 | | | Zumiez, Inc.* | | | 236,217 | |
| | | | | | | | |
| | | | | | | 53,569,839 | |
| | |
| Consumer Staples – 3.7% | | | |
| | 3,886 | | | Andersons, Inc. (The) | | | 199,585 | |
| | 11,386 | | | B&G Foods, Inc. | | | 145,627 | |
| | 18,254 | | | BellRing Brands, Inc.* | | | 757,541 | |
| | 2,992 | | | Calavo Growers, Inc. | | | 98,616 | |
| | 10,490 | | | Cal-Maine Foods, Inc. | | | 501,317 | |
| | 5,416 | | | Central Garden & Pet Co.* | | | 239,062 | |
| | 8,922 | | | Central Garden & Pet Co., Class A* | | | 364,018 | |
| | 4,123 | | | Chefs’ Warehouse, Inc. (The)* | | | 117,670 | |
| | 2,139 | | | Coca-Cola Consolidated, Inc. | | | 1,494,947 | |
| | 9,163 | | | Dole PLC | | | 109,223 | |
| | 11,877 | | | Edgewell Personal Care Co. | | | 457,977 | |
| | 6,961 | | | elf Beauty, Inc.* | | | 965,560 | |
| | 9,537 | | | Energizer Holdings, Inc. | | | 327,596 | |
| | 8,853 | | | Fresh Del Monte Produce, Inc. | | | 226,194 | |
| | 10,822 | | | Hain Celestial Group, Inc. (The)* | | | 114,605 | |
| | 21,801 | | | Herbalife Ltd.* | | | 327,451 | |
| | 32,712 | | | Hostess Brands, Inc.* | | | 931,638 | |
| | 9,168 | | | Ingles Markets, Inc., Class A | | | 716,296 | |
| | |
| | |
| The accompanying notes are an integral part of these financial statements. | | 87 |
GOLDMAN SACHS ACTIVEBETA® U.S. SMALL CAP EQUITY ETF
Schedule of Investments (continued)
August 31, 2023
| | | | | | | | |
| Shares | | | Description | | Value | |
|
| Common Stocks – (continued) | |
| Consumer Staples – (continued) | | | |
| | 4,040 | | | Inter Parfums, Inc. | | $ | 564,509 | |
| | 2,121 | | | J & J Snack Foods Corp. | | | 343,878 | |
| | 4,657 | | | John B. Sanfilippo & Son, Inc. | | | 467,330 | |
| | 3,614 | | | Lancaster Colony Corp. | | | 596,997 | |
| | 3,270 | | | Medifast, Inc. | | | 275,792 | |
| | 2,010 | | | MGP Ingredients, Inc. | | | 240,999 | |
| | 12,138 | | | National Beverage Corp.* | | | 622,801 | |
| | 10,937 | | | Nu Skin Enterprises, Inc., Class A | | | 261,285 | |
| | 2,619 | | | PriceSmart, Inc. | | | 208,158 | |
| | 37,367 | | | Primo Water Corp. | | | 570,220 | |
| | 10,600 | | | Simply Good Foods Co. (The)* | | | 382,448 | |
| | 18,584 | | | SpartanNash Co. | | | 404,388 | |
| | 24,736 | | | Sprouts Farmers Market, Inc.* | | | 1,008,982 | |
| | 11,199 | | | TreeHouse Foods, Inc.* | | | 520,978 | |
| | 7,699 | | | Turning Point Brands, Inc. | | | 189,549 | |
| | 17,707 | | | United Natural Foods, Inc.* | | | 356,442 | |
| | 6,915 | | | Universal Corp. | | | 329,292 | |
| | 5,672 | | | USANA Health Sciences, Inc.* | | | 364,653 | |
| | 7,815 | | | Utz Brands, Inc. | | | 120,664 | |
| | 40,816 | | | Vector Group Ltd. | | | 437,139 | |
| | 8,186 | | | Village Super Market, Inc., Class A | | | 184,594 | |
| | 3,255 | | | Vita Coco Co., Inc. (The)* | | | 92,084 | |
| | 18,194 | | | Vital Farms, Inc.* | | | 214,325 | |
| | 3,108 | | | WD-40 Co. | | | 667,816 | |
| | 5,940 | | | Weis Markets, Inc. | | | 385,328 | |
| | | | | | | | |
| | | | | | | 17,905,574 | |
| | |
| Energy – 7.1% | | | |
| | 34,485 | | | Amplify Energy Corp.* | | | 225,532 | |
| | 28,350 | | | Archrock, Inc. | | | 362,596 | |
| | 16,690 | | | Ardmore Shipping Corp. (Ireland) | | | 207,624 | |
| | 21,960 | | | Berry Corp. | | | 188,197 | |
| | 13,623 | | | Borr Drilling Ltd. (Mexico) * | | | 95,225 | |
| | 7,137 | | | Bristow Group, Inc.* | | | 197,695 | |
| | 6,914 | | | Cactus, Inc., Class A | | | 368,793 | |
| | 12,953 | | | California Resources Corp. | | | 723,296 | |
| | 10,620 | | | Callon Petroleum Co.* | | | 416,623 | |
| | 3,263 | | | Centrus Energy Corp., Class A* | | | 154,862 | |
| | 24,396 | | | ChampionX Corp. | | | 880,452 | |
| | 7,108 | | | Chord Energy Corp. | | | 1,147,942 | |
| | 13,748 | | | Civitas Resources, Inc. | | | 1,130,361 | |
| | 25,582 | | | CNX Resources Corp.* | | | 571,758 | |
| | 57,113 | | | Comstock Resources, Inc. | | | 700,205 | |
| | 12,962 | | | CONSOL Energy, Inc. | | | 1,115,250 | |
| | 4,149 | | | Core Laboratories, Inc. | | | 99,742 | |
| | 7,388 | | | CVR Energy, Inc. | | | 241,588 | |
| | 14,674 | | | Delek US Holdings, Inc. | | | 377,855 | |
| | 5,523 | | | Denbury, Inc.* | | | 505,796 | |
| | 34,635 | | | DHT Holdings, Inc. | | | 320,374 | |
| | 17,744 | | | Diamond Offshore Drilling, Inc.* | | | 263,853 | |
| | 10,834 | | | Dorian LPG Ltd. | | | 279,517 | |
| | 5,540 | | | Dril-Quip, Inc.* | | | 152,793 | |
| | 10,308 | | | Earthstone Energy, Inc., Class A* | | | 210,077 | |
| | 4,191 | | | Empire Petroleum Corp.* | | | 36,629 | |
| | 20,177 | | | Energy Fuels, Inc.*(a) | | | 143,862 | |
| | 58,209 | | | Equitrans Midstream Corp. | | | 558,806 | |
| | |
|
| Common Stocks – (continued) | |
| Energy – (continued) | | | |
| | 31,006 | | | Evolution Petroleum Corp. | | | 262,311 | |
| | 6,156 | | | Expro Group Holdings NV* | | | 144,728 | |
| | 3,659 | | | FLEX LNG Ltd. (Norway) (a) | | | 110,795 | |
| | 8,939 | | | Golar LNG Ltd. (Cameroon) | | | 197,552 | |
| | 4,485 | | | Green Plains, Inc.* | | | 139,214 | |
| | 5,193 | | | Gulfport Energy Corp.* | | | 612,774 | |
| | 53,232 | | | Helix Energy Solutions Group, Inc.* | | | 539,772 | |
| | 8,240 | | | Helmerich & Payne, Inc. | | | 329,518 | |
| | 6,330 | | | International Seaways, Inc. | | | 272,000 | |
| | 12,453 | | | KLX Energy Services Holdings, Inc.* | | | 129,573 | |
| | 74,474 | | | Kosmos Energy Ltd. (Ghana) * | | | 542,171 | |
| | 42,027 | | | Liberty Energy, Inc. | | | 670,331 | |
| | 58,241 | | | Magnolia Oil & Gas Corp., Class A | | | 1,327,895 | |
| | 23,357 | | | Matador Resources Co. | | | 1,483,169 | |
| | 21,973 | | | Murphy Oil Corp. | | | 997,574 | |
| | 2,220 | | | Nabors Industries Ltd.* | | | 245,732 | |
| | 3,919 | | | NACCO Industries, Inc., Class A | | | 127,759 | |
| | 47,600 | | | NexTier Oilfield Solutions, Inc.* | | | 505,036 | |
| | 11,019 | | | Noble Corp. PLC | | | 581,142 | |
| | 24,766 | | | Nordic American Tankers Ltd. | | | 96,835 | |
| | 9,355 | | | Northern Oil and Gas, Inc. | | | 391,320 | |
| | 20,567 | | | Oceaneering International, Inc.* | | | 468,722 | |
| | 26,949 | | | Oil States International, Inc.* | | | 211,280 | |
| | 24,381 | | | Overseas Shipholding Group, Inc., Class A* | | | 107,276 | |
| | 9,403 | | | Par Pacific Holdings, Inc.* | | | 322,993 | |
| | 17,121 | | | Patterson-UTI Energy, Inc. | | | 242,091 | |
| | 23,594 | | | PBF Energy, Inc., Class A | | | 1,106,323 | |
| | 17,877 | | | Peabody Energy Corp. | | | 385,786 | |
| | 48,526 | | | Permian Resources Corp. | | | 688,099 | |
| | 7,794 | | | ProFrac Holding Corp., Class A* | | | 85,734 | |
| | 41,637 | | | ProPetro Holding Corp.* | | | 401,381 | |
| | 7,157 | | | REX American Resources Corp.* | | | 282,630 | |
| | 58,127 | | | Ring Energy, Inc.* | | | 109,860 | |
| | 59,316 | | | RPC, Inc. | | | 473,935 | |
| | 21,646 | | | SandRidge Energy, Inc. | | | 346,120 | |
| | 7,236 | | | Scorpio Tankers, Inc. (Monaco) | | | 365,490 | |
| | 4,862 | | | Seadrill Ltd. (Norway) * | | | 236,536 | |
| | 21,776 | | | SFL Corp. Ltd. (Norway) | | | 246,069 | |
| | 10,914 | | | SilverBow Resources, Inc.* | | | 466,901 | |
| | 10,698 | | | Sitio Royalties Corp., Class A | | | 271,729 | |
| | 38,616 | | | SM Energy Co. | | | 1,633,843 | |
| | 5,506 | | | Solaris Oilfield Infrastructure, Inc., Class A | | | 57,923 | |
| | 32,186 | | | Talos Energy, Inc.* | | | 554,243 | |
| | 23,349 | | | Teekay Corp. (Bermuda) * | | | 149,667 | |
| | 3,511 | | | Teekay Tankers Ltd., Class A (Canada) | | | 142,827 | |
| | 47,491 | | | TETRA Technologies, Inc.* | | | 260,726 | |
| | 4,083 | | | Tidewater, Inc.* | | | 265,517 | |
| | 20,091 | | | US Silica Holdings, Inc.* | | | 247,722 | |
| | 49,184 | | | VAALCO Energy, Inc. | | | 203,622 | |
| | 7,063 | | | Valaris Ltd.* | | | 531,985 | |
| | 8,681 | | | Vital Energy, Inc.* | | | 523,377 | |
| | 89,091 | | | W&T Offshore, Inc.* | | | 363,491 | |
| | 7,559 | | | Weatherford International PLC* | | | 669,123 | |
| | 14,820 | | | World Kinect Corp. | | | 324,558 | |
| | | | | | | | |
| | | | | | | 34,132,083 | |
| | |
| | |
| 88 | | The accompanying notes are an integral part of these financial statements. |
GOLDMAN SACHS ACTIVEBETA® U.S. SMALL CAP EQUITY ETF
| | | | | | | | |
| Shares | | | Description | | Value | |
|
| Common Stocks – (continued) | |
| Financials – 16.9% | | | |
| | 3,829 | | | 1st Source Corp. | | $ | 171,118 | |
| | 1,545 | | | ACNB Corp. | | | 49,177 | |
| | 5,769 | | | Amalgamated Financial Corp. | | | 103,380 | |
| | 11,431 | | | A-Mark Precious Metals, Inc. | | | 390,026 | |
| | 22,850 | | | Ambac Financial Group, Inc.* | | | 294,308 | |
| | 5,033 | | | Amerant Bancorp, Inc. | | | 94,469 | |
| | 25,072 | | | American Equity Investment Life Holding Co. | | | 1,345,865 | |
| | 4,381 | | | American National Bankshares, Inc. | | | 171,735 | |
| | 14,284 | | | Ameris Bancorp | | | 582,073 | |
| | 6,827 | | | AMERISAFE, Inc. | | | 353,639 | |
| | 5,045 | | | Ames National Corp. | | | 90,558 | |
| | 29,487 | | | Apollo Commercial Real Estate Finance, Inc. REIT | | | 321,998 | |
| | 27,605 | | | Arbor Realty Trust, Inc. REIT | | | 440,576 | |
| | 15,526 | | | Ares Commercial Real Estate Corp. REIT | | | 160,694 | |
| | 4,925 | | | Argo Group International Holdings Ltd. | | | 146,519 | |
| | 20,726 | | | ARMOUR Residential REIT, Inc. REIT | | | 101,765 | |
| | 8,694 | | | Arrow Financial Corp. | | | 153,101 | |
| | 18,462 | | | Artisan Partners Asset Management, Inc., Class A | | | 709,310 | |
| | 4,926 | | | AssetMark Financial Holdings, Inc.* | | | 142,312 | |
| | 23,754 | | | Associated Banc-Corp. | | | 411,657 | |
| | 12,576 | | | Atlantic Union Bankshares Corp. | | | 373,381 | |
| | 2,535 | | | Atlanticus Holdings Corp.* | | | 88,471 | |
| | 7,796 | | | Avantax, Inc.* | | | 163,092 | |
| | 8,755 | | | AvidXchange Holdings, Inc.* | | | 90,001 | |
| | 20,756 | | | Axos Financial, Inc.* | | | 894,376 | |
| | 8,606 | | | Banc of California, Inc. | | | 107,833 | |
| | 6,748 | | | BancFirst Corp. | | | 644,974 | |
| | 11,375 | | | Banco Latinoamericano de Comercio Exterior SA, Class E (Panama) | | | 268,450 | |
| | 14,922 | | | Bancorp, Inc. (The)* | | | 547,787 | |
| | 2,511 | | | Bank First Corp.(a) | | | 194,929 | |
| | 6,039 | | | Bank of Hawaii Corp.(a) | | | 324,536 | |
| | 21,025 | | | Bank of NT Butterfield & Son Ltd. (The) (Bermuda) | | | 612,248 | |
| | 15,842 | | | BankUnited, Inc. | | | 415,852 | |
| | 5,447 | | | Bankwell Financial Group, Inc. | | | 141,731 | |
| | 5,891 | | | Banner Corp. | | | 256,553 | |
| | 1,122 | | | BayCom Corp. | | | 21,621 | |
| | 12,366 | | | BCB Bancorp, Inc. | | | 140,725 | |
| | 6,557 | | | Berkshire Hills Bancorp, Inc. | | | 137,041 | |
| | 30,660 | | | BGC Group, Inc., Class A | | | 151,460 | |
| | 20,951 | | | Blackstone Mortgage Trust, Inc., Class A REIT | | | 461,341 | |
| | 5,534 | | | Blue Ridge Bankshares, Inc. | | | 43,829 | |
| | 8,213 | | | Bread Financial Holdings, Inc. | | | 308,645 | |
| | 10,938 | | | Brightsphere Investment Group, Inc. | | | 226,526 | |
| | 23,914 | | | Brookline Bancorp, Inc. | | | 228,857 | |
| | 4,410 | | | BRP Group, Inc., Class A* | | | 117,262 | |
| | 5,655 | | | Byline Bancorp, Inc. | | | 119,773 | |
| | 32,160 | | | Cadence Bank | | | 735,821 | |
| | 1,686 | | | Cambridge Bancorp | | | 89,712 | |
| | 8,834 | | | Camden National Corp. | | | 289,667 | |
| | 6,138 | | | Cannae Holdings, Inc.* | | | 120,489 | |
| | |
|
| Common Stocks – (continued) | |
| Financials – (continued) | | | |
| | 8,688 | | | Capital City Bank Group, Inc. | | | 265,071 | |
| | 16,218 | | | Capitol Federal Financial, Inc. | | | 91,956 | |
| | 4,826 | | | Cass Information Systems, Inc. | | | 185,029 | |
| | 17,230 | | | Cathay General Bancorp | | | 613,905 | |
| | 11,750 | | | Central Pacific Financial Corp. | | | 199,397 | |
| | 6,010 | | | Central Valley Community Bancorp | | | 87,866 | |
| | 3,444 | | | Chemung Financial Corp. | | | 135,315 | |
| | 22,817 | | | Chimera Investment Corp. REIT | | | 138,043 | |
| | 3,864 | | | ChoiceOne Financial Services, Inc. | | | 92,891 | |
| | 6,427 | | | City Holding Co. | | | 587,171 | |
| | 10,837 | | | Civista Bancshares, Inc. | | | 184,121 | |
| | 16,003 | | | Claros Mortgage Trust, Inc. | | | 182,274 | |
| | 7,384 | | | CNB Financial Corp. | | | 134,463 | |
| | 34,359 | | | CNO Financial Group, Inc. | | | 804,001 | |
| | 4,666 | | | Codorus Valley Bancorp, Inc. | | | 94,486 | |
| | 9,088 | | | Cohen & Steers, Inc. | | | 592,356 | |
| | 1,680 | | | Colony Bankcorp, Inc. | | | 17,489 | |
| | 6,933 | | | Columbia Financial, Inc.* | | | 118,970 | |
| | 5,810 | | | Community Bank System, Inc. | | | 276,265 | |
| | 5,348 | | | Community Trust Bancorp, Inc. | | | 189,854 | |
| | 4,379 | | | Compass Diversified Holdings | | | 90,426 | |
| | 7,031 | | | ConnectOne Bancorp, Inc. | | | 134,433 | |
| | 8,802 | | | Consumer Portfolio Services, Inc.* | | | 81,595 | |
| | 16,422 | | | Customers Bancorp, Inc.* | | | 577,069 | |
| | 18,620 | | | CVB Financial Corp. | | | 325,105 | |
| | 1,846 | | | Diamond Hill Investment Group, Inc. | | | 311,531 | |
| | 11,061 | | | Dime Community Bancshares, Inc. | | | 235,710 | |
| | 12,127 | | | Donnelley Financial Solutions, Inc.* | | | 597,497 | |
| | 8,985 | | | Dynex Capital, Inc. REIT | | | 116,446 | |
| | 9,149 | | | Eagle Bancorp, Inc. | | | 220,125 | |
| | 9,323 | | | Eastern Bankshares, Inc. | | | 125,488 | |
| | 11,731 | | | Ellington Financial, Inc. REIT | | | 156,843 | |
| | 8,554 | | | Employers Holdings, Inc. | | | 335,573 | |
| | 10,272 | | | Enact Holdings, Inc. | | | 294,395 | |
| | 7,034 | | | Encore Capital Group, Inc.* | | | 329,613 | |
| | 17,694 | | | Enova International, Inc.* | | | 892,662 | |
| | 1,093 | | | Enstar Group Ltd.* | | | 276,846 | |
| | 7,175 | | | Enterprise Financial Services Corp. | | | 277,744 | |
| | 3,861 | | | Esquire Financial Holdings, Inc. | | | 180,540 | |
| | 24,230 | | | Essent Group Ltd. | | | 1,216,831 | |
| | 3,718 | | | Evans Bancorp, Inc. | | | 105,294 | |
| | 14,847 | | | EVERTEC, Inc. (Puerto Rico) | | | 587,496 | |
| | 2,627 | | | Farmers & Merchants Bancorp, Inc. | | | 50,176 | |
| | 12,224 | | | Farmers National Banc Corp. | | | 155,245 | |
| | 9,241 | | | FB Financial Corp. | | | 280,742 | |
| | 6,628 | | | Federal Agricultural Mortgage Corp., Class C | | | 1,115,625 | |
| | 2,265 | | | Fidelity D&D Bancorp, Inc.(a) | | | 107,327 | |
| | 10,503 | | | Financial Institutions, Inc. | | | 183,802 | |
| | 8,327 | | | First Bancorp | | | 246,812 | |
| | 48,393 | | | First BanCorp. (Puerto Rico) | | | 670,727 | |
| | 6,178 | | | First Bancorp, Inc. (The) | | | 152,102 | |
| | 4,349 | | | First Bancshares, Inc. (The) | | | 123,468 | |
| | 9,964 | | | First Busey Corp. | | | 201,273 | |
| | 7,725 | | | First Business Financial Services, Inc. | | | 243,569 | |
| | 22,624 | | | First Commonwealth Financial Corp. | | | 295,696 | |
| | |
| | |
| The accompanying notes are an integral part of these financial statements. | | 89 |
GOLDMAN SACHS ACTIVEBETA® U.S. SMALL CAP EQUITY ETF
Schedule of Investments (continued)
August 31, 2023
| | | | | | | | |
| Shares | | | Description | | Value | |
|
| Common Stocks – (continued) | |
| Financials – (continued) | | | |
| | 5,287 | | | First Community Corp/SC | | $ | 91,359 | |
| | 20,116 | | | First Financial Bancorp | | | 418,010 | |
| | 24,234 | | | First Financial Bankshares, Inc. | | | 696,000 | |
| | 4,252 | | | First Financial Corp. | | | 156,133 | |
| | 10,807 | | | First Interstate BancSystem, Inc., Class A | | | 280,009 | |
| | 13,900 | | | First Merchants Corp. | | | 414,776 | |
| | 4,797 | | | First Mid Bancshares, Inc. | | | 134,172 | |
| | 9,343 | | | First of Long Island Corp. (The) | | | 122,020 | |
| | 1,490 | | | First Western Financial, Inc.* | | | 30,277 | |
| | 5,632 | | | FirstCash Holdings, Inc. | | | 503,050 | |
| | 13,271 | | | Flushing Financial Corp. | | | 187,386 | |
| | 5,720 | | | Flywire Corp.* | | | 197,798 | |
| | 4,717 | | | Focus Financial Partners, Inc., Class A* | | | 250,001 | |
| | 9,812 | | | Franklin BSP Realty Trust, Inc. REIT | | | 138,742 | |
| | 3,203 | | | FS Bancorp, Inc. | | | 94,969 | |
| | 32,270 | | | Fulton Financial Corp. | | | 430,159 | |
| | 3,015 | | | FVCBankcorp, Inc.* | | | 36,693 | |
| | 112,671 | | | Genworth Financial, Inc., Class A* | | | 652,365 | |
| | 10,418 | | | German American Bancorp, Inc. | | | 301,393 | |
| | 19,038 | | | Glacier Bancorp, Inc. | | | 575,138 | |
| | 3,800 | | | Goosehead Insurance, Inc., Class A* | | | 265,468 | |
| | 6,603 | | | Great Southern Bancorp, Inc. | | | 333,253 | |
| | 8,027 | | | Green Dot Corp., Class A* | | | 119,121 | |
| | 6,547 | | | Greene County Bancorp, Inc. | | | 188,619 | |
| | 8,582 | | | Hamilton Lane, Inc., Class A | | | 796,324 | |
| | 14,501 | | | Hancock Whitney Corp. | | | 598,166 | |
| | 12,110 | | | Hanmi Financial Corp. | | | 209,745 | |
| | 5,002 | | | Hannon Armstrong Sustainable Infrastructure Capital, Inc. REIT | | | 111,895 | |
| | 15,365 | | | HarborOne Bancorp, Inc. | | | 153,189 | |
| | 8,498 | | | Heartland Financial USA, Inc. | | | 260,379 | |
| | 18,755 | | | Heritage Commerce Corp. | | | 162,606 | |
| | 6,475 | | | Heritage Financial Corp. | | | 111,499 | |
| | 13,785 | | | Hilltop Holdings, Inc. | | | 418,926 | |
| | 655 | | | Hingham Institution For Savings (The)(a) | | | 130,469 | |
| | 3,883 | | | Home Bancorp, Inc. | | | 126,819 | |
| | 29,749 | | | Home BancShares, Inc. | | | 659,833 | |
| | 6,122 | | | HomeTrust Bancshares, Inc. | | | 139,888 | |
| | 27,770 | | | Hope Bancorp, Inc. | | | 268,536 | |
| | 11,561 | | | Horace Mann Educators Corp. | | | 331,338 | |
| | 13,336 | | | Horizon Bancorp, Inc. | | | 149,230 | |
| | 4,266 | | | I3 Verticals, Inc., Class A* | | | 100,891 | |
| | 13,717 | | | Independent Bank Corp. | | | 261,858 | |
| | 7,404 | | | Independent Bank Corp. | | | 399,964 | |
| | 6,602 | | | Independent Bank Group, Inc. | | | 278,604 | |
| | 10,951 | | | International Bancshares Corp. | | | 490,386 | |
| | 12,263 | | | International Money Express, Inc.* | | | 212,150 | |
| | 1,199 | | | Investors Title Co. | | | 172,524 | |
| | 19,818 | | | Jackson Financial, Inc., Class A | | | 745,157 | |
| | 13,405 | | | KKR Real Estate Finance Trust, Inc. REIT | | | 167,697 | |
| | 15,094 | | | Ladder Capital Corp. REIT | | | 165,430 | |
| | 12,381 | | | Lakeland Bancorp, Inc. | | | 167,267 | |
| | 9,208 | | | Lakeland Financial Corp. | | | 480,013 | |
| | 31,215 | | | LendingClub Corp.* | | | 217,256 | |
| | |
|
| Common Stocks – (continued) | |
| Financials – (continued) | | | |
| | 9,809 | | | Live Oak Bancshares, Inc. | | | 317,223 | |
| | 20,933 | | | Macatawa Bank Corp. | | | 191,746 | |
| | 6,056 | | | MainStreet Bancshares, Inc. | | | 136,987 | |
| | 19,118 | | | Marqeta, Inc., Class A* | | | 117,576 | |
| | 33,813 | | | MBIA, Inc.* | | | 266,785 | |
| | 7,369 | | | Mercantile Bank Corp. | | | 245,977 | |
| | 3,706 | | | Metropolitan Bank Holding Corp.*(a) | | | 147,536 | |
| | 10,616 | | | MFA Financial, Inc. REIT | | | 116,351 | |
| | 3,362 | | | Middlefield Banc Corp. | | | 87,177 | |
| | 5,740 | | | Midland States Bancorp, Inc. | | | 127,428 | |
| | 4,730 | | | MidWestOne Financial Group, Inc. | | | 101,033 | |
| | 13,615 | | | Moelis & Co., Class A | | | 645,487 | |
| | 16,319 | | | Mr Cooper Group, Inc.* | | | 924,635 | |
| | 5,722 | | | National Bank Holdings Corp., Class A | | | 180,472 | |
| | 5,635 | | | National Bankshares, Inc. | | | 148,313 | |
| | 834 | | | National Western Life Group, Inc., Class A | | | 379,086 | |
| | 47,552 | | | Navient Corp. | | | 839,293 | |
| | 8,982 | | | NBT Bancorp, Inc. | | | 309,160 | |
| | 5,341 | | | Nelnet, Inc., Class A | | | 490,571 | |
| | 10,093 | | | New York Mortgage Trust, Inc. REIT | | | 96,085 | |
| | 5,663 | | | NewtekOne, Inc. | | | 101,424 | |
| | 7,579 | | | Nexpoint Real Estate Finance, Inc. REIT | | | 129,525 | |
| | 2,950 | | | Nicolet Bankshares, Inc. | | | 223,639 | |
| | 22,193 | | | NMI Holdings, Inc., Class A* | | | 635,164 | |
| | 6,498 | | | Northeast Bank | | | 276,100 | |
| | 6,253 | | | Northeast Community Bancorp, Inc. | | | 99,173 | |
| | 17,386 | | | Northwest Bancshares, Inc. | | | 191,246 | |
| | 4,444 | | | Norwood Financial Corp. | | | 120,566 | |
| | 6,617 | | | Oak Valley Bancorp | | | 166,153 | |
| | 8,713 | | | OceanFirst Financial Corp. | | | 146,988 | |
| | 17,310 | | | OFG Bancorp (Puerto Rico) | | | 522,070 | |
| | 43,870 | | | Old National Bancorp | | | 669,456 | |
| | 16,509 | | | Old Second Bancorp, Inc. | | | 238,885 | |
| | 19,255 | | | Open Lending Corp., Class A* | | | 158,854 | |
| | 3,331 | | | Origin Bancorp, Inc. | | | 102,228 | |
| | 10,607 | | | Oscar Health, Inc., Class A* | | | 66,506 | |
| | 12,773 | | | Pacific Premier Bancorp, Inc. | | | 294,034 | |
| | 18,386 | | | Pagseguro Digital Ltd., Class A (Brazil) * | | | 165,106 | |
| | 2,066 | | | Palomar Holdings, Inc.* | | | 105,387 | |
| | 4,391 | | | Park National Corp. | | | 446,828 | |
| | 9,773 | | | Parke Bancorp, Inc. | | | 168,780 | |
| | 11,747 | | | Pathward Financial, Inc. | | | 578,775 | |
| | 9,683 | | | Patria Investments Ltd., Class A (Cayman Islands) | | | 139,629 | |
| | 10,723 | | | PCB Bancorp | | | 172,104 | |
| | 7,736 | | | Peapack-Gladstone Financial Corp. | | | 210,961 | |
| | 8,680 | | | PennyMac Financial Services, Inc. | | | 622,964 | |
| | 11,846 | | | PennyMac Mortgage Investment Trust REIT | | | 158,855 | |
| | 14,334 | | | Peoples Bancorp, Inc. | | | 369,387 | |
| | 4,047 | | | Peoples Financial Services Corp. | | | 176,449 | |
| | 3,788 | | | Piper Sandler Cos. | | | 564,336 | |
| | 6,900 | | | PJT Partners, Inc., Class A | | | 545,031 | |
| | 2,884 | | | Plumas Bancorp | | | 100,767 | |
| | 9,372 | | | PRA Group, Inc.* | | | 182,567 | |
| | |
| | |
| 90 | | The accompanying notes are an integral part of these financial statements. |
GOLDMAN SACHS ACTIVEBETA® U.S. SMALL CAP EQUITY ETF
| | | | | | | | |
| Shares | | | Description | | Value | |
|
| Common Stocks – (continued) | |
| Financials – (continued) | | | |
| | 8,221 | | | Preferred Bank | | $ | 510,606 | |
| | 7,844 | | | Premier Financial Corp. | | | 147,781 | |
| | 7,135 | | | Primis Financial Corp. | | | 63,359 | |
| | 9,809 | | | ProAssurance Corp. | | | 173,423 | |
| | 13,984 | | | PROG Holdings, Inc.* | | | 479,651 | |
| | 15,924 | | | Provident Financial Services, Inc. | | | 262,428 | |
| | 6,591 | | | QCR Holdings, Inc. | | | 345,764 | |
| | 46,895 | | | Radian Group, Inc. | | | 1,269,917 | |
| | 37,389 | | | Ready Capital Corp. REIT | | | 408,288 | |
| | 6,712 | | | Regional Management Corp. | | | 184,446 | |
| | 15,852 | | | Remitly Global, Inc.* | | | 398,678 | |
| | 10,305 | | | Renasant Corp. | | | 286,994 | |
| | 1,759 | | | Repay Holdings Corp.* | | | 16,218 | |
| | 6,077 | | | Republic Bancorp, Inc., Class A | | | 270,062 | |
| | 8,326 | | | S&T Bancorp, Inc. | | | 235,876 | |
| | 3,836 | | | Safety Insurance Group, Inc. | | | 264,185 | |
| | 11,439 | | | Sandy Spring Bancorp, Inc. | | | 254,403 | |
| | 8,724 | | | Seacoast Banking Corp. of Florida | | | 205,974 | |
| | 12,443 | | | Selective Insurance Group, Inc. | | | 1,234,470 | |
| | 14,457 | | | ServisFirst Bancshares, Inc. | | | 810,170 | |
| | 3,830 | | | Shore Bancshares, Inc. | | | 42,436 | |
| | 7,194 | | | Sierra Bancorp | | | 143,017 | |
| | 16,678 | | | Simmons First National Corp., Class A | | | 297,202 | |
| | 25,096 | | | SiriusPoint Ltd. (Bermuda) * | | | 277,562 | |
| | 6,170 | | | Southern First Bancshares, Inc.* | | | 173,439 | |
| | 6,624 | | | Southern Missouri Bancorp, Inc. | | | 280,195 | |
| | 6,633 | | | Southside Bancshares, Inc. | | | 199,653 | |
| | 10,052 | | | SouthState Corp. | | | 726,760 | |
| | 8,366 | | | Stellar Bancorp, Inc. | | | 177,945 | |
| | 4,068 | | | StepStone Group, Inc., Class A | | | 125,579 | |
| | 10,432 | | | Stewart Information Services Corp. | | | 483,210 | |
| | 7,194 | | | Stock Yards Bancorp, Inc. | | | 329,485 | |
| | 36,800 | | | StoneCo Ltd., Class A (Brazil)* | | | 451,168 | |
| | 6,361 | | | StoneX Group, Inc.* | | | 597,171 | |
| | 7,562 | | | Texas Capital Bancshares, Inc.* | | | 472,171 | |
| | 3,690 | | | Timberland Bancorp, Inc. | | | 104,648 | |
| | 3,732 | | | Tompkins Financial Corp. | | | 193,803 | |
| | 13,881 | | | Towne Bank | | | 327,592 | |
| | 9,089 | | | TriCo Bancshares | | | 312,116 | |
| | 5,591 | | | Triumph Financial, Inc.* | | | 359,110 | |
| | 5,793 | | | TrustCo Bank Corp. | | | 164,927 | |
| | 12,826 | | | Trustmark Corp. | | | 295,511 | |
| | 7,719 | | | Two Harbors Investment Corp. REIT | | | 106,291 | |
| | 8,728 | | | UMB Financial Corp. | | | 551,697 | |
| | 17,869 | | | United Bankshares, Inc. | | | 537,500 | |
| | 18,125 | | | United Community Banks, Inc. | | | 489,375 | |
| | 6,807 | | | Unity Bancorp, Inc. | | | 164,491 | |
| | 8,477 | | | Universal Insurance Holdings, Inc. | | | 107,319 | |
| | 6,883 | | | Univest Financial Corp. | | | 123,825 | |
| | 70,029 | | | Valley National Bancorp | | | 642,866 | |
| | 10,139 | | | Veritex Holdings, Inc. | | | 190,715 | |
| | 4,444 | | | Victory Capital Holdings, Inc., Class A | | | 152,962 | |
| | 4,644 | | | Virginia National Bankshares Corp. | | | 153,438 | |
| | 2,476 | | | Virtus Investment Partners, Inc. | | | 512,780 | |
| | 5,628 | | | Walker & Dunlop, Inc. | | | 480,294 | |
| | 14,857 | | | Washington Federal, Inc. | | | 403,813 | |
| | |
|
| Common Stocks – (continued) | |
| Financials – (continued) | | | |
| | 6,808 | | | Washington Trust Bancorp, Inc. | | | 190,624 | |
| | 16,771 | | | Waterstone Financial, Inc. | | | 208,128 | |
| | 11,652 | | | WesBanco, Inc. | | | 295,495 | |
| | 12,996 | | | West BanCorp, Inc. | | | 240,686 | |
| | 8,076 | | | Westamerica BanCorp | | | 355,586 | |
| | 43,719 | | | WisdomTree, Inc. | | | 319,149 | |
| | 843 | | | World Acceptance Corp.* | | | 113,645 | |
| | 12,565 | | | WSFS Financial Corp. | | | 493,804 | |
| | | | | | | | |
| | | | | | | 81,853,696 | |
| | |
| Health Care – 12.4% | | | |
| | 4,572 | | | 4D Molecular Therapeutics, Inc.* | | | 74,432 | |
| | 4,692 | | | 89bio, Inc.* | | | 80,421 | |
| | 39,880 | | | ACADIA Pharmaceuticals, Inc.* | | | 1,077,558 | |
| | 6,891 | | | Accolade, Inc.* | | | 92,960 | |
| | 19,922 | | | AdaptHealth Corp.* | | | 237,669 | |
| | 3,635 | | | Addus HomeCare Corp.* | | | 318,790 | |
| | 23,885 | | | ADMA Biologics, Inc.* | | | 91,957 | |
| | 3,640 | | | Agios Pharmaceuticals, Inc.* | | | 99,845 | |
| | 2,909 | | | Akero Therapeutics, Inc.* | | | 144,374 | |
| | 8,921 | | | Aldeyra Therapeutics, Inc.* | | | 66,551 | |
| | 15,138 | | | Alignment Healthcare, Inc.* | | | 88,406 | |
| | 51,577 | | | Alkermes PLC* | | | 1,505,533 | |
| | 18,469 | | | Alphatec Holdings, Inc.* | | | 301,968 | |
| | 16,119 | | | Amicus Therapeutics, Inc.* | | | 206,646 | |
| | 13,363 | | | AMN Healthcare Services, Inc.* | | | 1,181,022 | |
| | 118,956 | | | Amneal Pharmaceuticals, Inc.* | | | 486,530 | |
| | 20,122 | | | Amphastar Pharmaceuticals, Inc.* | | | 1,072,704 | |
| | 3,932 | | | Amylyx Pharmaceuticals, Inc.* | | | 84,774 | |
| | 15,693 | | | AngioDynamics, Inc.* | | | 126,015 | |
| | 3,536 | | | ANI Pharmaceuticals, Inc.* | | | 227,683 | |
| | 12,546 | | | Anika Therapeutics, Inc.* | | | 223,946 | |
| | 3,015 | | | Apollo Medical Holdings, Inc.* | | | 114,148 | |
| | 5,027 | | | Arcellx, Inc.* | | | 180,168 | |
| | 13,290 | | | Arcturus Therapeutics Holdings, Inc.* | | | 403,352 | |
| | 25,165 | | | Ardelyx, Inc.* | | | 107,203 | |
| | 6,139 | | | Arrowhead Pharmaceuticals, Inc.* | | | 169,682 | |
| | 54,272 | | | Assertio Holdings, Inc.* | | | 178,012 | |
| | 9,567 | | | Astria Therapeutics, Inc.* | | | 85,146 | |
| | 7,227 | | | AtriCure, Inc.* | | | 326,299 | |
| | 238 | | | Atrion Corp. | | | 110,694 | |
| | 9,746 | | | Aurinia Pharmaceuticals, Inc. (Canada)* | | | 88,396 | |
| | 12,738 | | | Avanos Medical, Inc.* | | | 268,008 | |
| | 13,627 | | | Avita Medical, Inc.* | | | 222,120 | |
| | 3,201 | | | Axonics, Inc.* | | | 183,417 | |
| | 4,864 | | | Axsome Therapeutics, Inc.* | | | 393,011 | |
| | 3,636 | | | Beam Therapeutics, Inc.* | | | 84,282 | |
| | 3,968 | | | Biohaven Ltd.* | | | 72,575 | |
| | 3,973 | | | BioLife Solutions, Inc.* | | | 52,483 | |
| | 2,685 | | | Biomea Fusion, Inc.* | | | 45,296 | |
| | 4,666 | | | Bioxcel Therapeutics, Inc.* | | | 17,637 | |
| | 2,871 | | | Blueprint Medicines Corp.* | | | 143,148 | |
| | 6,253 | | | Bridgebio Pharma, Inc.* | | | 187,027 | |
| | 7,155 | | | Cabaletta Bio, Inc.* | | | 101,315 | |
| | 31,284 | | | CareDx, Inc.* | | | 291,254 | |
| | 74,024 | | | Catalyst Pharmaceuticals, Inc.* | | | 1,039,297 | |
| | |
| | |
| The accompanying notes are an integral part of these financial statements. | | 91 |
GOLDMAN SACHS ACTIVEBETA® U.S. SMALL CAP EQUITY ETF
Schedule of Investments (continued)
August 31, 2023
| | | | | | | | |
| Shares | | | Description | | Value | |
|
| Common Stocks – (continued) | |
| Health Care – (continued) | | | |
| | 4,166 | | | Celldex Therapeutics, Inc.* | | $ | 116,231 | |
| | 3,705 | | | Cerevel Therapeutics Holdings, Inc.* | | | 87,809 | |
| | 66,943 | | | Cerus Corp.* | | | 126,522 | |
| | 39,582 | | | Codexis, Inc.* | | | 68,873 | |
| | 7,731 | | | Cogent Biosciences, Inc.* | | | 94,396 | |
| | 30,153 | | | Coherus Biosciences, Inc.* | | | 160,715 | |
| | 32,841 | | | Collegium Pharmaceutical, Inc.* | | | 769,136 | |
| | 13,789 | | | Computer Programs and Systems, Inc.* | | | 224,347 | |
| | 2,059 | | | CONMED Corp. | | | 229,496 | |
| | 60,337 | | | Corcept Therapeutics, Inc.* | | | 1,974,830 | |
| | 18,334 | | | CorMedix, Inc.*(a) | | | 74,619 | |
| | 3,212 | | | CorVel Corp.* | | | 695,237 | |
| | 4,619 | | | Crinetics Pharmaceuticals, Inc.* | | | 80,001 | |
| | 28,309 | | | Cross Country Healthcare, Inc.* | | | 729,240 | |
| | 5,482 | | | CryoPort, Inc.* | | | 77,296 | |
| | 6,282 | | | CVRx, Inc.* | | | 108,993 | |
| | 11,489 | | | Cymabay Therapeutics, Inc.* | | | 157,974 | |
| | 6,564 | | | Cytokinetics, Inc.* | | | 229,346 | |
| | 4,967 | | | Denali Therapeutics, Inc.* | | | 114,688 | |
| | 64,290 | | | Dynavax Technologies Corp.* | | | 923,204 | |
| | 8,571 | | | Dyne Therapeutics, Inc.* | | | 97,709 | |
| | 10,026 | | | Eagle Pharmaceuticals, Inc.* | | | 169,941 | |
| | 17,345 | | | Embecta Corp. | | | 317,934 | |
| | 37,099 | | | Emergent BioSolutions, Inc.* | | | 173,994 | |
| | 4,564 | | | Enliven Therapeutics, Inc.* | | | 71,290 | |
| | 9,876 | | | Ensign Group, Inc. (The) | | | 989,773 | |
| | 18,703 | | | Entrada Therapeutics, Inc.* | | | 275,308 | |
| | 11,851 | | | Evolent Health, Inc., Class A* | | | 302,319 | |
| | 19,043 | | | Evolus, Inc.* | | | 188,335 | |
| | 5,613 | | | FibroGen, Inc.* | | | 5,388 | |
| | 10,413 | | | Fulgent Genetics, Inc.* | | | 341,130 | |
| | 39,465 | | | Geron Corp.* | | | 95,900 | |
| | 3,010 | | | Glaukos Corp.* | | | 226,171 | |
| | 2,529 | | | Guardant Health, Inc.* | | | 98,833 | |
| | 4,245 | | | Haemonetics Corp.* | | | 380,904 | |
| | 20,054 | | | Halozyme Therapeutics, Inc.* | | | 853,498 | |
| | 17,861 | | | Harmony Biosciences Holdings, Inc.* | | | 647,461 | |
| | 7,537 | | | Harrow Health, Inc.* | | | 114,336 | |
| | 38,456 | | | Harvard Bioscience, Inc.* | | | 169,591 | |
| | 8,945 | | | HealthEquity, Inc.* | | | 604,235 | |
| | 9,522 | | | HealthStream, Inc. | | | 200,248 | |
| | 10,851 | | | Hims & Hers Health, Inc.* | | | 72,810 | |
| | 3,900 | | | Ideaya Biosciences, Inc.* | | | 114,504 | |
| | 12,803 | | | ImmunoGen, Inc.* | | | 202,800 | |
| | 4,674 | | | Immunovant, Inc.* | | | 106,147 | |
| | 7,535 | | | Inari Medical, Inc.* | | | 501,982 | |
| | 17,658 | | | InfuSystem Holdings, Inc.* | | | 181,524 | |
| | 3,583 | | | Inhibrx, Inc.* | | | 76,676 | |
| | 11,044 | | | Inmode Ltd.* | | | 431,710 | |
| | 47,188 | | | Innoviva, Inc.* | | | 601,647 | |
| | 8,839 | | | Inogen, Inc.* | | | 54,890 | |
| | 7,154 | | | Insmed, Inc.* | | | 156,601 | |
| | 6,827 | | | Integer Holdings Corp.* | | | 582,411 | |
| | 3,997 | | | Intellia Therapeutics, Inc.* | | | 149,808 | |
| | 15,312 | | | Intra-Cellular Therapies, Inc.* | | | 850,122 | |
| | 2,722 | | | iRadimed Corp. | | | 125,838 | |
| | |
|
| Common Stocks – (continued) | |
| Health Care – (continued) | | | |
| | 6,558 | | | iRhythm Technologies, Inc.* | | | 677,900 | |
| | 63,206 | | | Ironwood Pharmaceuticals, Inc.* | | | 556,213 | |
| | 12,300 | | | iTeos Therapeutics, Inc.* | | | 148,400 | |
| | 10,862 | | | Joint Corp. (The)* | | | 100,908 | |
| | 111,334 | | | Karyopharm Therapeutics, Inc.* | | | 142,508 | |
| | 2,483 | | | Keros Therapeutics, Inc.* | | | 87,178 | |
| | 14,178 | | | Kiniksa Pharmaceuticals Ltd., Class A* | | | 244,287 | |
| | 1,309 | | | Krystal Biotech, Inc.* | | | 162,944 | |
| | 3,629 | | | Kymera Therapeutics, Inc.* | | | 69,241 | |
| | 11,865 | | | Lantheus Holdings, Inc.* | | | 812,041 | |
| | 7,575 | | | LeMaitre Vascular, Inc. | | | 437,911 | |
| | 10,476 | | | LifeStance Health Group, Inc.* | | | 86,008 | |
| | 5,898 | | | Ligand Pharmaceuticals, Inc.* | | | 387,911 | |
| | 10,875 | | | Liquidia Corp.* | | | 74,711 | |
| | 6,925 | | | LivaNova PLC* | | | 384,684 | |
| | 601 | | | Madrigal Pharmaceuticals, Inc.* | | | 108,180 | |
| | 24,887 | | | MannKind Corp.* | | | 114,729 | |
| | 9,726 | | | Marinus Pharmaceuticals, Inc.* | | | 69,152 | |
| | 7,986 | | | Merit Medical Systems, Inc.* | | | 521,326 | |
| | 1,705 | | | Mesa Laboratories, Inc. | | | 244,429 | |
| | 90,876 | | | MiMedx Group, Inc.* | | | 674,300 | |
| | 3,408 | | | Mirum Pharmaceuticals, Inc.* | | | 90,073 | |
| | 1,605 | | | Morphic Holding, Inc.* | | | 88,403 | |
| | 136,877 | | | Multiplan Corp.* | | | 234,060 | |
| | 37,769 | | | Myriad Genetics, Inc.* | | | 674,177 | |
| | 5,339 | | | National HealthCare Corp. | | | 352,107 | |
| | 8,370 | | | National Research Corp. | | | 349,866 | |
| | 8,575 | | | Neogen Corp.* | | | 198,254 | |
| | 12,187 | | | NeoGenomics, Inc.* | | | 183,171 | |
| | 6,313 | | | Nevro Corp.* | | | 126,513 | |
| | 37,257 | | | NextGen Healthcare, Inc.* | | | 678,450 | |
| | 2,169 | | | Nuvalent, Inc., Class A* | | | 98,841 | |
| | 48,788 | | | Ocular Therapeutix, Inc.* | | | 184,419 | |
| | 12,531 | | | Omega Therapeutics, Inc.* | | | 45,989 | |
| | 32,368 | | | Omeros Corp.*(a) | | | 111,993 | |
| | 1,368 | | | OmniAb, Inc. 12.5 Earnout*(b) | | | — | |
| | 1,368 | | | OmniAb, Inc. 15.00 Earnout*(b) | | | — | |
| | 6,044 | | | Omnicell, Inc.* | | | 343,662 | |
| | 91,016 | | | OPKO Health, Inc.* | | | 166,559 | |
| | 23,131 | | | Option Care Health, Inc.* | | | 805,653 | |
| | 26,550 | | | OraSure Technologies, Inc.* | | | 171,513 | |
| | 67,656 | | | Organogenesis Holdings, Inc.* | | | 189,437 | |
| | 17,082 | | | Orthofix Medical, Inc.* | | | 361,455 | |
| | 25,437 | | | Ovid therapeutics, Inc.* | | | 85,596 | |
| | 20,323 | | | Owens & Minor, Inc.* | | | 343,459 | |
| | 15,577 | | | Pacific Biosciences of California, Inc.* | | | 175,709 | |
| | 12,997 | | | Pacira BioSciences, Inc.* | | | 458,794 | |
| | 21,424 | | | Patterson Cos., Inc. | | | 643,577 | |
| | 17,891 | | | Pediatrix Medical Group, Inc.* | | | 252,800 | |
| | 15,896 | | | PetIQ, Inc.* | | | 303,296 | |
| | 7,757 | | | Phathom Pharmaceuticals, Inc.* | | | 111,623 | |
| | 19,716 | | | Phibro Animal Health Corp., Class A | | | 275,038 | |
| | 10,043 | | | Phreesia, Inc.* | | | 285,924 | |
| | 4,218 | | | Pliant Therapeutics, Inc.* | | | 71,200 | |
| | 9,726 | | | Point Biopharma Global, Inc.* | | | 77,419 | |
| | 39,944 | | | Poseida Therapeutics, Inc.* | | | 83,483 | |
| | |
| | |
| 92 | | The accompanying notes are an integral part of these financial statements. |
GOLDMAN SACHS ACTIVEBETA® U.S. SMALL CAP EQUITY ETF
| | | | | | | | |
| Shares | | | Description | | Value | |
|
| Common Stocks – (continued) | |
| Health Care – (continued) | | | |
| | 16,852 | | | Prestige Consumer Healthcare, Inc.* | | $ | 982,977 | |
| | 2,710 | | | PROCEPT BioRobotics Corp.* | | | 92,438 | |
| | 5,933 | | | Progyny, Inc.* | | | 221,538 | |
| | 3,388 | | | Protagonist Therapeutics, Inc.* | | | 67,150 | |
| | 55,214 | | | Protalix BioTherapeutics, Inc.* | | | 104,354 | |
| | 3,439 | | | Prothena Corp. PLC (Ireland) * | | | 181,648 | |
| | 15,172 | | | PTC Therapeutics, Inc.* | | | 599,294 | |
| | 7,437 | | | Pulmonx Corp.* | | | 77,791 | |
| | 4,158 | | | Quanterix Corp.* | | | 111,434 | |
| | 9,675 | | | RadNet, Inc.* | | | 323,242 | |
| | 2,624 | | | Reata Pharmaceuticals, Inc., Class A* | | | 443,456 | |
| | 10,523 | | | Recursion Pharmaceuticals, Inc., Class A*(a) | | | 91,550 | |
| | 5,557 | | | Revance Therapeutics, Inc.* | | | 97,970 | |
| | 3,946 | | | REVOLUTION Medicines, Inc.* | | | 134,046 | |
| | 5,096 | | | Rhythm Pharmaceuticals, Inc.* | | | 132,547 | |
| | 4,286 | | | Rocket Pharmaceuticals, Inc.* | | | 67,076 | |
| | 3,667 | | | RxSight, Inc.* | | | 106,380 | |
| | 3,559 | | | Sage Therapeutics, Inc.* | | | 71,180 | |
| | 3,733 | | | Sanara Medtech, Inc.* | | | 134,985 | |
| | 83,068 | | | Sangamo Therapeutics, Inc.* | | | 80,518 | |
| | 30,573 | | | Savara, Inc.* | | | 110,674 | |
| | 2,040 | | | Schrodinger, Inc.* | | | 75,256 | |
| | 8,774 | | | scPharmaceuticals, Inc.* | | | 67,384 | |
| | 15,253 | | | Select Medical Holdings Corp. | | | 445,540 | |
| | 4,917 | | | Semler Scientific, Inc.* | | | 129,612 | |
| | 17,446 | | | Seres Therapeutics, Inc.* | | | 60,189 | |
| | 10,896 | | | SI-BONE, Inc.* | | | 249,300 | |
| | 45,295 | | | SIGA Technologies, Inc. | | | 207,904 | |
| | 6,776 | | | Silk Road Medical, Inc.* | | | 130,912 | |
| | 3,418 | | | SpringWorks Therapeutics, Inc.* | | | 96,319 | |
| | 9,549 | | | STAAR Surgical Co.* | | | 414,045 | |
| | 34,147 | | | Supernus Pharmaceuticals, Inc.* | | | 1,087,240 | |
| | 6,610 | | | Surgery Partners, Inc.* | | | 239,679 | |
| | 6,742 | | | Surmodics, Inc.* | | | 248,240 | |
| | 8,184 | | | Syndax Pharmaceuticals, Inc.* | | | 151,486 | |
| | 18,748 | | | Tactile Systems Technology, Inc.* | | | 355,275 | |
| | 7,020 | | | Taro Pharmaceutical Industries Ltd.* | | | 278,132 | |
| | 12,617 | | | Tela Bio, Inc.* | | | 121,880 | |
| | 8,594 | | | Terns Pharmaceuticals, Inc.* | | | 45,290 | |
| | 8,649 | | | TG Therapeutics, Inc.* | | | 90,555 | |
| | 13,320 | | | Theravance Biopharma, Inc.* | | | 126,806 | |
| | 1,579 | | | TransMedics Group, Inc.* | | | 103,630 | |
| | 9,872 | | | Travere Therapeutics, Inc.* | | | 140,972 | |
| | 3,720 | | | Treace Medical Concepts, Inc.* | | | 57,846 | |
| | 2,106 | | | UFP Technologies, Inc.* | | | 370,045 | |
| | 19,231 | | | UroGen Pharma Ltd.* | | | 336,158 | |
| | 2,684 | | | US Physical Therapy, Inc. | | | 270,628 | |
| | 53,666 | | | Vanda Pharmaceuticals, Inc.* | | | 278,527 | |
| | 14,606 | | | Varex Imaging Corp.* | | | 287,300 | |
| | 4,389 | | | Vaxcyte, Inc.* | | | 227,877 | |
| | 2,935 | | | Ventyx Biosciences, Inc.* | | | 98,323 | |
| | 7,292 | | | Vera Therapeutics, Inc.* | | | 128,995 | |
| | 8,278 | | | Veracyte, Inc.* | | | 218,539 | |
| | 38,058 | | | Veradigm, Inc.* | | | 509,216 | |
| | 23,894 | | | Vericel Corp.* | | | 784,440 | |
| | |
|
| Common Stocks – (continued) | |
| Health Care – (continued) | | | |
| | 15,801 | | | Verrica Pharmaceuticals, Inc.* | | | 71,895 | |
| | 4,718 | | | Verve Therapeutics, Inc.* | | | 60,721 | |
| | 33,560 | | | Viemed Healthcare, Inc.* | | | 265,460 | |
| | 9,060 | | | Vigil Neuroscience, Inc.* | | | 54,632 | |
| | 7,095 | | | Viking Therapeutics, Inc.* | | | 97,982 | |
| | 33,431 | | | Vir Biotechnology, Inc.* | | | 423,236 | |
| | 3,461 | | | Viridian Therapeutics, Inc.* | | | 62,886 | |
| | 27,478 | | | Voyager Therapeutics, Inc.* | | | 275,330 | |
| | 11,396 | | | Xencor, Inc.* | | | 250,484 | |
| | 33,887 | | | Xeris Biopharma Holdings, Inc.* | | | 76,923 | |
| | 14,498 | | | Y-mAbs Therapeutics, Inc.* | | | 73,505 | |
| | 3,399 | | | Zentalis Pharmaceuticals, Inc.* | | | 90,277 | |
| | 11,621 | | | Zimvie, Inc.* | | | 137,128 | |
| | 19,372 | | | Zynex, Inc.* | | | 149,164 | |
| | | | | | | | |
| | | | | | | 59,713,360 | |
| | |
| Industrials – 19.3% | | | |
| | 9,843 | | | AAON, Inc. | | | 620,700 | |
| | 9,204 | | | AAR Corp.* | | | 566,966 | |
| | 12,586 | | | ABM Industries, Inc. | | | 571,656 | |
| | 28,184 | | | ACCO Brands Corp. | | | 150,221 | |
| | 15,198 | | | ACV Auctions, Inc., Class A* | | | 255,478 | |
| | 1,592 | | | AeroVironment, Inc.* | | | 154,472 | |
| | 6,261 | | | AerSale Corp.* | | | 92,725 | |
| | 3,167 | | | Alamo Group, Inc. | | | 543,616 | |
| | 4,334 | | | Albany International Corp., Class A | | | 401,848 | |
| | 37,820 | | | Alight, Inc., Class A* | | | 288,945 | |
| | 10,860 | | | Allient, Inc. | | | 369,566 | |
| | 7,641 | | | Alta Equipment Group, Inc. | | | 108,731 | |
| | 2,448 | | | Ameresco, Inc., Class A* | | | 106,464 | |
| | 4,226 | | | American Woodmark Corp.* | | | 328,233 | |
| | 26,351 | | | API Group Corp.* | | | 741,781 | |
| | 10,461 | | | Apogee Enterprises, Inc. | | | 527,862 | |
| | 12,381 | | | Applied Industrial Technologies, Inc. | | | 1,911,255 | |
| | 6,609 | | | ArcBest Corp. | | | 697,844 | |
| | 9,596 | | | Arcosa, Inc. | | | 750,599 | |
| | 3,367 | | | Argan, Inc. | | | 143,030 | |
| | 11,389 | | | Array Technologies, Inc.* | | | 283,244 | |
| | 12,359 | | | ASGN, Inc.* | | | 1,015,415 | |
| | 7,273 | | | Astec Industries, Inc. | | | 398,706 | |
| | 8,128 | | | Asure Software, Inc.* | | | 101,925 | |
| | 13,633 | | | Atkore, Inc.* | | | 2,099,073 | |
| | 5,150 | | | AZZ, Inc. | | | 252,865 | |
| | 22,698 | | | Babcock & Wilcox Enterprises, Inc.* | | | 119,164 | |
| | 7,380 | | | Barnes Group, Inc. | | | 290,034 | |
| | 2,624 | | | Barrett Business Services, Inc. | | | 251,064 | |
| | 13,076 | | | Beacon Roofing Supply, Inc.* | | | 1,044,119 | |
| | 8,792 | | | Bloom Energy Corp., Class A*(a) | | | 131,792 | |
| | 6,219 | | | Blue Bird Corp.* | | | 135,885 | |
| | 8,600 | | | BlueLinx Holdings, Inc.* | | | 767,636 | |
| | 18,762 | | | Boise Cascade Co. | | | 2,052,000 | |
| | 9,880 | | | Bowman Consulting Group Ltd.* | | | 291,756 | |
| | 5,138 | | | Brink’s Co. (The) | | | 389,512 | |
| | 5,403 | | | Casella Waste Systems, Inc., Class A* | | | 425,594 | |
| | 12,725 | | | CBIZ, Inc.* | | | 714,000 | |
| | 7,126 | | | CECO Environmental Corp.* | | | 98,196 | |
| | |
| | |
| The accompanying notes are an integral part of these financial statements. | | 93 |
GOLDMAN SACHS ACTIVEBETA® U.S. SMALL CAP EQUITY ETF
Schedule of Investments (continued)
August 31, 2023
| | | | | | | | |
| Shares | | | Description | | Value | |
|
| Common Stocks – (continued) | |
| Industrials – (continued) | | | |
| | 3,972 | | | Chart Industries, Inc.* | | $ | 717,264 | |
| | 9,487 | | | Cimpress PLC (Ireland) * | | | 612,955 | |
| | 5,659 | | | CIRCOR International, Inc.* | | | 315,150 | |
| | 8,407 | | | Columbus McKinnon Corp. | | | 316,692 | |
| | 9,197 | | | Comfort Systems USA, Inc. | | | 1,697,490 | |
| | 14,412 | | | Commercial Vehicle Group, Inc.* | | | 132,735 | |
| | 87,320 | | | Conduent, Inc.* | | | 274,185 | |
| | 2,854 | | | Construction Partners, Inc., Class A* | | | 99,176 | |
| | 34,968 | | | CoreCivic, Inc.* | | | 376,256 | |
| | 14,957 | | | Costamare, Inc. (Monaco) | | | 154,207 | |
| | 4,036 | | | Covenant Logistics Group, Inc. | | | 198,450 | |
| | 3,936 | | | CRA International, Inc. | | | 427,568 | |
| | 12,228 | | | CSG Systems International, Inc. | | | 664,103 | |
| | 4,395 | | | CSW Industrials, Inc. | | | 789,474 | |
| | 16,758 | | | Deluxe Corp. | | | 338,847 | |
| | 4,454 | | | Distribution Solutions Group, Inc.* | | | 229,515 | |
| | 3,400 | | | Douglas Dynamics, Inc. | | | 102,918 | |
| | 2,609 | | | Ducommun, Inc.* | | | 118,631 | |
| | 14,182 | | | DXP Enterprises, Inc.* | | | 504,454 | |
| | 4,082 | | | Dycom Industries, Inc.* | | | 407,914 | |
| | 5,276 | | | Eagle Bulk Shipping, Inc.(a) | | | 230,878 | |
| | 8,042 | | | Encore Wire Corp. | | | 1,325,402 | |
| | 22,943 | | | Energy Recovery, Inc.* | | | 623,591 | |
| | 13,515 | | | Enerpac Tool Group Corp. | | | 354,093 | |
| | 5,029 | | | EnerSys | | | 527,944 | |
| | 7,447 | | | Ennis, Inc. | | | 158,621 | |
| | 7,515 | | | Enovix Corp.* | | | 103,557 | |
| | 5,016 | | | EnPro Industries, Inc. | | | 684,132 | |
| | 10,260 | | | Enviri Corp.* | | | 76,437 | |
| | 3,511 | | | ESCO Technologies, Inc. | | | 375,712 | |
| | 4,288 | | | EVI Industries, Inc.* | | | 113,289 | |
| | 34,049 | | | ExlService Holdings, Inc.* | | | 995,252 | |
| | 4,551 | | | Exponent, Inc. | | | 408,953 | |
| | 8,860 | | | Federal Signal Corp. | | | 540,017 | |
| | 10,530 | | | First Advantage Corp. | | | 146,893 | |
| | 3,606 | | | Fluence Energy, Inc.* | | | 95,018 | |
| | 19,576 | | | Fluor Corp.* | | | 684,964 | |
| | 7,768 | | | Forrester Research, Inc.* | | | 237,934 | |
| | 10,549 | | | Forward Air Corp. | | | 747,080 | |
| | 11,993 | | | Franklin Covey Co.* | | | 511,741 | |
| | 11,952 | | | Franklin Electric Co., Inc. | | | 1,155,878 | |
| | 8,276 | | | FTAI Aviation Ltd. | | | 305,881 | |
| | 3,566 | | | GATX Corp. | | | 421,287 | |
| | 12,740 | | | Genco Shipping & Trading Ltd. | | | 174,156 | |
| | 7,874 | | | Gencor Industries, Inc.* | | | 112,441 | |
| | 50,540 | | | GEO Group, Inc. (The)* | | | 365,910 | |
| | 5,860 | | | Gibraltar Industries, Inc.* | | | 439,676 | |
| | 12,472 | | | Global Industrial Co. | | | 422,052 | |
| | 22,527 | | | GMS, Inc.* | | | 1,562,022 | |
| | 12,223 | | | Golden Ocean Group Ltd. (Norway) | | | 89,350 | |
| | 3,981 | | | Gorman-Rupp Co. (The) | | | 127,949 | |
| | 80,128 | | | GrafTech International Ltd. | | | 283,653 | |
| | 4,857 | | | Granite Construction, Inc. | | | 200,546 | |
| | 1,026 | | | Great Lakes Dredge & Dock Corp.* | | | 9,060 | |
| | 3,497 | | | Greenbrier Cos., Inc. (The) | | | 148,832 | |
| | 13,231 | | | Griffon Corp. | | | 553,982 | |
| | |
|
| Common Stocks – (continued) | |
| Industrials – (continued) | | | |
| | 7,138 | | | H&E Equipment Services, Inc. | | | 323,494 | |
| | 7,528 | | | Heartland Express, Inc. | | | 113,598 | |
| | 5,422 | | | Heidrick & Struggles International, Inc. | | | 143,629 | |
| | 3,443 | | | Helios Technologies, Inc. | | | 199,281 | |
| | 3,631 | | | Herc Holdings, Inc. | | | 472,538 | |
| | 6,917 | | | Heritage-Crystal Clean, Inc.* | | | 311,957 | |
| | 14,372 | | | Hillenbrand, Inc. | | | 696,180 | |
| | 3,496 | | | HireQuest, Inc. | | | 66,494 | |
| | 21,606 | | | HNI Corp. | | | 707,813 | |
| | 10,368 | | | Hub Group, Inc., Class A* | | | 809,119 | |
| | 39,015 | | | Hudson Technologies, Inc.* | | | 470,521 | |
| | 6,029 | | | Huron Consulting Group, Inc.* | | | 602,599 | |
| | 1,814 | | | Hyster-Yale Materials Handling, Inc. | | | 82,845 | |
| | 5,267 | | | ICF International, Inc. | | | 711,361 | |
| | 8,055 | | | IES Holdings, Inc.* | | | 603,964 | |
| | 23,585 | | | Innodata, Inc.* | | | 306,605 | |
| | 9,093 | | | Insperity, Inc. | | | 921,394 | |
| | 7,021 | | | Insteel Industries, Inc. | | | 243,980 | |
| | 23,582 | | | Interface, Inc. | | | 243,602 | |
| | 19,515 | | | Janus International Group, Inc.* | | | 223,447 | |
| | 11,827 | | | JELD-WEN Holding, Inc.* | | | 178,351 | |
| | 11,646 | | | JetBlue Airways Corp.* | | | 68,944 | |
| | 35,511 | | | Joby Aviation, Inc.*(a) | | | 264,557 | |
| | 5,133 | | | John Bean Technologies Corp. | | | 564,168 | |
| | 4,156 | | | Kadant, Inc. | | | 913,239 | |
| | 5,388 | | | Kaman Corp. | | | 120,853 | |
| | 16,911 | | | Kelly Services, Inc., Class A | | | 312,684 | |
| | 10,526 | | | Kennametal, Inc. | | | 278,623 | |
| | 15,042 | | | Kforce, Inc. | | | 942,381 | |
| | 10,605 | | | Korn Ferry | | | 540,643 | |
| | 35,236 | | | Legalzoom.com, Inc.* | | | 402,043 | |
| | 19,393 | | | Leonardo DRS, Inc.* | | | 332,008 | |
| | 17,103 | | | Li-Cycle Holdings Corp. (Canada) *(a) | | | 75,937 | |
| | 3,897 | | | Limbach Holdings, Inc.* | | | 140,799 | |
| | 2,070 | | | Lindsay Corp. | | | 256,887 | |
| | 25,724 | | | LSI Industries, Inc. | | | 405,153 | |
| | 11,847 | | | Manitowoc Co., Inc. (The)* | | | 200,451 | |
| | 7,835 | | | Marten Transport Ltd. | | | 164,535 | |
| | 4,947 | | | Masonite International Corp.* | | | 508,106 | |
| | 12,672 | | | Masterbrand, Inc.* | | | 162,328 | |
| | 12,178 | | | Matson, Inc. | | | 1,070,203 | |
| | 7,165 | | | Matthews International Corp., Class A | | | 302,220 | |
| | 11,723 | | | Maximus, Inc. | | | 947,453 | |
| | 6,691 | | | Mayville Engineering Co., Inc.* | | | 78,552 | |
| | 2,595 | | | McGrath RentCorp | | | 262,354 | |
| | 2,833 | | | Miller Industries, Inc. | | | 113,320 | |
| | 13,417 | | | MillerKnoll, Inc. | | | 256,265 | |
| | 18,849 | | | Mistras Group, Inc.* | | | 100,654 | |
| | 2,237 | | | Montrose Environmental Group, Inc.* | | | 85,990 | |
| | 5,835 | | | Moog, Inc., Class A | | | 677,794 | |
| | 28,509 | | | MRC Global, Inc.* | | | 265,704 | |
| | 17,716 | | | Mueller Industries, Inc. | | | 1,366,967 | |
| | 21,532 | | | Mueller Water Products, Inc., Class A | | | 304,032 | |
| | 5,724 | | | MYR Group, Inc.* | | | 813,209 | |
| | 1,389 | | | National Presto Industries, Inc. | | | 103,967 | |
| | 3,399 | | | NEXTracker, Inc., Class A* | | | 143,166 | |
| | |
| | |
| 94 | | The accompanying notes are an integral part of these financial statements. |
GOLDMAN SACHS ACTIVEBETA® U.S. SMALL CAP EQUITY ETF
| | | | | | | | |
| Shares | | | Description | | Value | |
|
| Common Stocks – (continued) | |
| Industrials – (continued) | | | |
| | 5,581 | | | Northwest Pipe Co.* | | $ | 184,675 | |
| | 66,816 | | | NOW, Inc.* | | | 746,335 | |
| | 4,832 | | | NV5 Global, Inc.* | | | 491,801 | |
| | 2,997 | | | Omega Flex, Inc. | | | 250,849 | |
| | 9,149 | | | OPENLANE, Inc.* | | | 142,816 | |
| | 3,846 | | | PAM Transportation Services, Inc.* | | | 88,689 | |
| | 13,967 | | | Pangaea Logistics Solutions Ltd.(a) | | | 78,774 | |
| | 10,958 | | | Parsons Corp.* | | | 624,825 | |
| | 21,224 | | | PGT Innovations, Inc.* | | | 598,305 | |
| | 5,497 | | | Powell Industries, Inc. | | | 461,583 | |
| | 2,418 | | | Preformed Line Products Co. | | | 409,827 | |
| | 12,537 | | | Primoris Services Corp. | | | 443,434 | |
| | 6,723 | | | Proto Labs, Inc.* | | | 198,328 | |
| | 15,373 | | | Quanex Building Products Corp. | | | 414,764 | |
| | 36,311 | | | Radiant Logistics, Inc.* | | | 245,099 | |
| | 27,250 | | | Resideo Technologies, Inc.* | | | 459,435 | |
| | 29,845 | | | Resources Connection, Inc. | | | 462,896 | |
| | 16,073 | | | REV Group, Inc. | | | 218,271 | |
| | 16,761 | | | Rocket Lab USA, Inc.* | | | 105,762 | |
| | 20,937 | | | Rush Enterprises, Inc., Class A | | | 867,001 | |
| | 9,198 | | | Rush Enterprises, Inc., Class B | | | 422,832 | |
| | 29,961 | | | RXO, Inc.* | | | 541,695 | |
| | 46,449 | | | Safe Bulkers, Inc. (Greece) | | | 149,101 | |
| | 7,887 | | | Shoals Technologies Group, Inc., Class A* | | | 155,216 | |
| | 13,769 | | | Shyft Group, Inc. (The) | | | 215,898 | |
| | 11,446 | | | Simpson Manufacturing Co., Inc. | | | 1,828,613 | |
| | 4,382 | | | SkyWest, Inc.* | | | 197,628 | |
| | 7,567 | | | SP Plus Corp.* | | | 296,399 | |
| | 6,519 | | | Spirit Airlines, Inc. | | | 107,564 | |
| | 6,673 | | | SPX Technologies, Inc.* | | | 527,300 | |
| | 2,423 | | | Standex International Corp. | | | 372,245 | |
| | 33,502 | | | Steelcase, Inc., Class A | | | 303,863 | |
| | 8,192 | | | Sterling Infrastructure, Inc.* | | | 677,970 | |
| | 7,930 | | | Tennant Co. | | | 653,670 | |
| | 12,471 | | | Terex Corp. | | | 755,867 | |
| | 9,611 | | | Textainer Group Holdings Ltd. (China) | | | 380,884 | |
| | 5,669 | | | Thermon Group Holdings, Inc.* | | | 155,784 | |
| | 15,384 | | | Titan International, Inc.* | | | 193,685 | |
| | 14,664 | | | Titan Machinery, Inc.* | | | 454,877 | |
| | 6,884 | | | Transcat, Inc.* | | | 701,893 | |
| | 6,396 | | | TriNet Group, Inc.* | | | 709,508 | |
| | 6,204 | | | Trinity Industries, Inc. | | | 155,534 | |
| | 8,435 | | | Triton International Ltd. (Bermuda) | | | 707,781 | |
| | 25,724 | | | TrueBlue, Inc.* | | | 389,204 | |
| | 5,074 | | | TTEC Holdings, Inc. | | | 151,002 | |
| | 17,311 | | | Tutor Perini Corp.* | | | 153,895 | |
| | 16,666 | | | UFP Industries, Inc. | | | 1,739,097 | |
| | 2,889 | | | UniFirst Corp. | | | 508,840 | |
| | 23,060 | | | Upwork, Inc.* | | | 341,519 | |
| | 6,946 | | | V2X, Inc.* | | | 349,453 | |
| | 10,065 | | | Veritiv Corp. | | | 1,694,241 | |
| | 21,346 | | | Verra Mobility Corp.* | | | 379,745 | |
| | 7,323 | | | Vicor Corp.* | | | 496,280 | |
| | 12,379 | | | Wabash National Corp. | | | 279,146 | |
| | 7,777 | | | Watts Water Technologies, Inc., Class A | | | 1,468,064 | |
| | |
|
| Common Stocks – (continued) | |
| Industrials – (continued) | | | |
| | 9,396 | | | Werner Enterprises, Inc. | | | 390,968 | |
| | 8,358 | | | Willdan Group, Inc.* | | | 201,762 | |
| | 10,367 | | | Zurn Elkay Water Solutions Corp. | | | 307,071 | |
| | | | | | | | |
| | | | | | | 92,974,663 | |
| | |
| Information Technology – 13.2% | | | |
| | 96,649 | | | 8x8, Inc.* | | | 314,109 | |
| | 45,972 | | | A10 Networks, Inc. | | | 684,523 | |
| | 19,520 | | | ACI Worldwide, Inc.* | | | 473,946 | |
| | 34,279 | | | Adeia, Inc. | | | 344,847 | |
| | 11,156 | | | ADTRAN Holdings, Inc. | | | 95,384 | |
| | 7,021 | | | Advanced Energy Industries, Inc. | | | 828,969 | |
| | 4,765 | | | Aehr Test Systems* | | | 243,063 | |
| | 8,760 | | | Agilysys, Inc.* | | | 617,974 | |
| | 10,115 | | | Alarm.com Holdings, Inc.* | | | 592,436 | |
| | 10,435 | | | Alpha & Omega Semiconductor Ltd.* | | | 329,224 | |
| | 9,992 | | | Altair Engineering, Inc., Class A* | | | 664,268 | |
| | 5,428 | | | Ambarella, Inc.* | | | 337,350 | |
| | 12,201 | | | American Software, Inc., Class A | | | 140,678 | |
| | 31,170 | | | Amkor Technology, Inc. | | | 871,513 | |
| | 5,248 | | | Appfolio, Inc., Class A* | | | 1,011,657 | |
| | 8,729 | | | Appian Corp., Class A* | | | 425,102 | |
| | 10,508 | | | Applied Digital Corp.* | | | 63,468 | |
| | 25,019 | | | Arlo Technologies, Inc.* | | | 244,436 | |
| | 10,164 | | | Asana, Inc., Class A* | | | 218,424 | |
| | 26,311 | | | Avid Technology, Inc.* | | | 701,451 | |
| | 8,896 | | | Axcelis Technologies, Inc.* | | | 1,709,366 | |
| | 7,664 | | | Badger Meter, Inc. | | | 1,272,837 | |
| | 3,220 | | | Bel Fuse, Inc., Class B | | | 168,406 | |
| | 7,531 | | | Belden, Inc. | | | 707,161 | |
| | 11,218 | | | Benchmark Electronics, Inc. | | | 288,751 | |
| | 10,434 | | | BigCommerce Holdings, Inc.Series 1* | | | 110,600 | |
| | 8,001 | | | Blackbaud, Inc.* | | | 608,956 | |
| | 2,419 | | | BlackLine, Inc.* | | | 145,285 | |
| | 32,173 | | | Box, Inc., Class A* | | | 851,941 | |
| | 38,248 | | | Brightcove, Inc.* | | | 147,255 | |
| | 3,164 | | | C3.ai, Inc., Class A*(a) | | | 98,147 | |
| | 14,173 | | | Calix, Inc.* | | | 659,186 | |
| | 8,658 | | | Cambium Networks Corp.* | | | 79,740 | |
| | 6,010 | | | Cerence, Inc.* | | | 156,861 | |
| | 5,753 | | | CEVA, Inc.* | | | 133,585 | |
| | 3,880 | | | Clear Secure, Inc., Class A | | | 84,351 | |
| | 6,544 | | | Clearfield, Inc.* | | | 230,022 | |
| | 2,980 | | | Climb Global Solutions, Inc. | | | 128,170 | |
| | 13,470 | | | Cohu, Inc.* | | | 503,643 | |
| | 19,077 | | | CommScope Holding Co., Inc.* | | | 63,717 | |
| | 13,199 | | | CommVault Systems, Inc.* | | | 901,624 | |
| | 2,520 | | | Comtech Telecommunications Corp. | | | 25,326 | |
| | 5,481 | | | Consensus Cloud Solutions, Inc.* | | | 175,008 | |
| | 5,585 | | | CoreCard Corp.* | | | 118,625 | |
| | 6,873 | | | Corsair Gaming, Inc.* | | | 108,044 | |
| | 7,942 | | | Couchbase, Inc.* | | | 135,808 | |
| | 4,186 | | | CPI Card Group, Inc.* | | | 86,525 | |
| | 5,207 | | | Credo Technology Group Holding Ltd.* | | | 85,707 | |
| | 6,695 | | | CTS Corp. | | | 298,932 | |
| | 13,947 | | | Daktronics, Inc.* | | | 116,597 | |
| | |
| | |
| The accompanying notes are an integral part of these financial statements. | | 95 |
GOLDMAN SACHS ACTIVEBETA® U.S. SMALL CAP EQUITY ETF
Schedule of Investments (continued)
August 31, 2023
| | | | | | | | |
| Shares | | | Description | | Value | |
|
| Common Stocks – (continued) | |
| Information Technology – (continued) | | | |
| | 11,878 | | | Digi International, Inc.* | | $ | 396,488 | |
| | 28,456 | | | Digital Turbine, Inc.* | | | 253,543 | |
| | 13,566 | | | Diodes, Inc.* | | | 1,110,377 | |
| | 21,246 | | | Domo, Inc., Class B* | | | 226,482 | |
| | 14,519 | | | Ebix, Inc. | | | 242,467 | |
| | 19,296 | | | eGain Corp.* | | | 128,511 | |
| | 6,158 | | | Envestnet, Inc.* | | | 336,412 | |
| | 8,586 | | | ePlus, Inc.* | | | 569,939 | |
| | 3,475 | | | Everbridge, Inc.* | | | 86,215 | |
| | 15,311 | | | Evolv Technologies Holdings, Inc.* | | | 107,024 | |
| | 52,097 | | | Extreme Networks, Inc.* | | | 1,430,063 | |
| | 6,367 | | | Fabrinet (Thailand) * | | | 1,023,623 | |
| | 5,460 | | | Fastly, Inc., Class A* | | | 129,893 | |
| | 19,611 | | | FormFactor, Inc.* | | | 692,661 | |
| | 8,068 | | | Freshworks, Inc., Class A* | | | 176,447 | |
| | 16,099 | | | Grid Dynamics Holdings, Inc.* | | | 187,231 | |
| | 22,130 | | | Hackett Group, Inc. (The) | | | 521,604 | |
| | 25,476 | | | Harmonic, Inc.* | | | 272,084 | |
| | 5,581 | | | Ichor Holdings Ltd.* | | | 204,432 | |
| | 12,912 | | | Immersion Corp. | | | 90,642 | |
| | 6,572 | | | Impinj, Inc.* | | | 437,498 | |
| | 9,548 | | | indie Semiconductor, Inc., Class A (China) * | | | 63,972 | |
| | 25,386 | | | Infinera Corp.* | | | 118,806 | |
| | 34,358 | | | Information Services Group, Inc. | | | 178,662 | |
| | 8,465 | | | Insight Enterprises, Inc.* | | | 1,355,162 | |
| | 1,953 | | | Intapp, Inc.* | | | 71,499 | |
| | 4,593 | | | InterDigital, Inc. | | | 398,259 | |
| | 10,551 | | | inTEST Corp.* | | | 184,854 | |
| | 9,677 | | | IonQ, Inc.* | | | 166,348 | |
| | 4,880 | | | Itron, Inc.* | | | 333,841 | |
| | 10,139 | | | Kimball Electronics, Inc.* | | | 306,096 | |
| | 23,400 | | | Knowles Corp.* | | | 375,102 | |
| | 16,375 | | | Kulicke & Soffa Industries, Inc. (Singapore) | | | 847,079 | |
| | 11,939 | | | LiveRamp Holdings, Inc.* | | | 386,107 | |
| | 23,466 | | | Luna Innovations, Inc.* | | | 161,681 | |
| | 6,409 | | | MACOM Technology Solutions Holdings, Inc.* | | | 541,945 | |
| | 9,404 | | | Marathon Digital Holdings, Inc.*(a) | | | 118,208 | |
| | 3,367 | | | Maxeon Solar Technologies Ltd.*(a) | | | 53,064 | |
| | 20,023 | | | MaxLinear, Inc.* | | | 470,541 | |
| | 9,897 | | | Methode Electronics, Inc. | | | 319,178 | |
| | 632 | | | MicroStrategy, Inc., Class A* | | | 225,959 | |
| | 20,925 | | | Mitek Systems, Inc.* | | | 233,732 | |
| | 8,001 | | | Model N, Inc.* | | | 216,027 | |
| | 6,459 | | | N-able, Inc.* | | | 86,357 | |
| | 20,132 | | | Napco Security Technologies, Inc. | | | 498,871 | |
| | 10,007 | | | Navitas Semiconductor Corp.* | | | 88,362 | |
| | 9,807 | | | NETGEAR, Inc.* | | | 129,256 | |
| | 18,187 | | | NetScout Systems, Inc.* | | | 520,694 | |
| | 5,910 | | | Novanta, Inc.* | | | 986,852 | |
| | 3,201 | | | NVE Corp. | | | 283,128 | |
| | 14,898 | | | OneSpan, Inc.* | | | 182,501 | |
| | 11,265 | | | Onto Innovation, Inc.* | | | 1,565,610 | |
| | 3,909 | | | OSI Systems, Inc.* | | | 532,992 | |
| | |
|
| Common Stocks – (continued) | |
| Information Technology – (continued) | | | |
| | 4,750 | | | PagerDuty, Inc.* | | | 122,360 | |
| | 10,860 | | | PC Connection, Inc. | | | 576,883 | |
| | 5,734 | | | PDF Solutions, Inc.* | | | 208,374 | |
| | 8,743 | | | Perficient, Inc.* | | | 557,716 | |
| | 27,208 | | | Photronics, Inc.* | | | 646,462 | |
| | 5,750 | | | Plexus Corp.* | | | 583,913 | |
| | 11,039 | | | Power Integrations, Inc. | | | 927,497 | |
| | 4,892 | | | PowerSchool Holdings, Inc., Class A* | | | 108,211 | |
| | 12,700 | | | Progress Software Corp. | | | 772,668 | |
| | 5,633 | | | PROS Holdings, Inc.* | | | 201,999 | |
| | 4,264 | | | Q2 Holdings, Inc.* | | | 146,724 | |
| | 6,988 | | | Qualys, Inc.* | | | 1,087,682 | |
| | 57,204 | | | Rackspace Technology, Inc.* | | | 143,010 | |
| | 24,561 | | | Rambus, Inc.* | | | 1,386,960 | |
| | 8,282 | | | Rapid7, Inc.* | | | 417,330 | |
| | 2,087 | | | Red Violet, Inc.* | | | 42,909 | |
| | 44,969 | | | Ribbon Communications, Inc.* | | | 133,108 | |
| | 7,782 | | | Richardson Electronics Ltd. | | | 97,975 | |
| | 9,025 | | | Riot Platforms, Inc.* | | | 102,434 | |
| | 959 | | | Rogers Corp.* | | | 138,585 | |
| | 14,839 | | | Sanmina Corp.* | | | 826,532 | |
| | 9,326 | | | Sapiens International Corp. NV (Israel) | | | 278,754 | |
| | 9,001 | | | ScanSource, Inc.* | | | 295,053 | |
| | 21,431 | | | SEMrush Holdings, Inc., Class A* | | | 202,523 | |
| | 7,819 | | | Semtech Corp.* | | | 204,467 | |
| | 3,767 | | | Silicon Laboratories, Inc.* | | | 508,018 | |
| | 18,227 | | | SMART Global Holdings, Inc.* | | | 470,803 | |
| | 13,478 | | | SolarWinds Corp.* | | | 143,541 | |
| | 5,330 | | | SoundThinking, Inc.* | | | 114,382 | |
| | 12,877 | | | Sprinklr, Inc., Class A* | | | 194,829 | |
| | 7,406 | | | Sprout Social, Inc., Class A* | | | 396,517 | |
| | 8,156 | | | SPS Commerce, Inc.* | | | 1,518,076 | |
| | 11,931 | | | Squarespace, Inc., Class A* | | | 359,720 | |
| | 7,775 | | | Super Micro Computer, Inc.* | | | 2,138,747 | |
| | 9,000 | | | Synaptics, Inc.* | | | 787,860 | |
| | 13,252 | | | Tenable Holdings, Inc.* | | | 601,243 | |
| | 20,595 | | | Thoughtworks Holding, Inc.* | | | 102,357 | |
| | 30,889 | | | TTM Technologies, Inc.* | | | 460,246 | |
| | 9,124 | | | Turtle Beach Corp.* | | | 99,178 | |
| | 12,334 | | | Ultra Clean Holdings, Inc.* | | | 433,663 | |
| | 32,100 | | | Unisys Corp.* | | | 129,363 | |
| | 14,959 | | | Varonis Systems, Inc.* | | | 477,641 | |
| | 10,680 | | | Veeco Instruments, Inc.* | | | 311,749 | |
| | 13,248 | | | Verint Systems, Inc.* | | | 429,103 | |
| | 39,302 | | | Viavi Solutions, Inc.* | | | 410,706 | |
| | 28,077 | | | Vishay Intertechnology, Inc. | | | 770,433 | |
| | 8,086 | | | Vishay Precision Group, Inc.* | | | 291,258 | |
| | 11,420 | | | Weave Communications, Inc.* | | | 116,598 | |
| | 7,873 | | | Workiva, Inc.* | | | 880,595 | |
| | 24,714 | | | Xerox Holdings Corp. | | | 392,705 | |
| | 12,817 | | | Xperi, Inc.* | | | 151,241 | |
| | 37,170 | | | Yext, Inc.* | | | 325,609 | |
| | 35,283 | | | Zeta Global Holdings Corp., Class A* | | | 286,851 | |
| | 24,401 | | | Zuora, Inc., Class A* | | | 222,293 | |
| | | | | | | | |
| | | | | | | 63,762,833 | |
| | |
| | |
| 96 | | The accompanying notes are an integral part of these financial statements. |
GOLDMAN SACHS ACTIVEBETA® U.S. SMALL CAP EQUITY ETF
| | | | | | | | |
| Shares | | | Description | | Value | |
|
| Common Stocks – (continued) | |
| Materials – 4.6% | | | |
| | 9,277 | | | AdvanSix, Inc. | | $ | 306,883 | |
| | 6,548 | | | Alpha Metallurgical Resources, Inc. | | | 1,328,196 | |
| | 19,474 | | | American Vanguard Corp. | | | 269,131 | |
| | 5,540 | | | Arch Resources, Inc. | | | 723,524 | |
| | 10,720 | | | ATI, Inc.* | | | 485,938 | |
| | 15,845 | | | Avient Corp. | | | 635,543 | |
| | 3,563 | | | Balchem Corp. | | | 500,601 | |
| | 9,092 | | | Cabot Corp. | | | 658,806 | |
| | 7,655 | | | Carpenter Technology Corp. | | | 479,433 | |
| | 4,452 | | | Chase Corp. | | | 563,178 | |
| | 6,139 | | | Clearwater Paper Corp.* | | | 235,062 | |
| | 27,972 | | | Commercial Metals Co. | | | 1,574,544 | |
| | 3,046 | | | Compass Minerals International, Inc. | | | 91,837 | |
| | 18,512 | | | Constellium SE* | | | 333,216 | |
| | 7,616 | | | Core Molding Technologies, Inc.* | | | 206,470 | |
| | 22,256 | | | Ecovyst, Inc.* | | | 227,901 | |
| | 5,739 | | | Greif, Inc., Class A | | | 416,594 | |
| | 5,149 | | | Hawkins, Inc. | | | 320,216 | |
| | 1,821 | | | Haynes International, Inc. | | | 88,883 | |
| | 8,902 | | | HB Fuller Co. | | | 645,662 | |
| | 39,402 | | | Hecla Mining Co. | | | 172,975 | |
| | 7,386 | | | Ingevity Corp.* | | | 398,032 | |
| | 7,683 | | | Innospec, Inc. | | | 825,308 | |
| | 1,665 | | | Kaiser Aluminum Corp. | | | 126,407 | |
| | 3,779 | | | Knife River Corp.* | | | 194,467 | |
| | 5,122 | | | Koppers Holdings, Inc. | | | 196,121 | |
| | 13,533 | | | Livent Corp.* | | | 290,553 | |
| | 12,975 | | | LSB Industries, Inc.* | | | 131,307 | |
| | 4,284 | | | Materion Corp. | | | 466,056 | |
| | 6,623 | | | Mativ Holdings, Inc. | | | 108,617 | |
| | 6,353 | | | Minerals Technologies, Inc. | | | 388,168 | |
| | 32,942 | | | Myers Industries, Inc. | | | 619,639 | |
| | 21,346 | | | Novagold Resources, Inc. (Canada) * | | | 87,946 | |
| | 23,388 | | | O-I Glass, Inc.* | | | 464,486 | |
| | 9,178 | | | Olympic Steel, Inc. | | | 491,207 | |
| | 24,661 | | | Orion SA (Germany) | | | 557,832 | |
| | 13,490 | | | Pactiv Evergreen, Inc. | | | 110,888 | |
| | 1,826 | | | Piedmont Lithium, Inc.* | | | 81,732 | |
| | 1,199 | | | Quaker Chemical Corp. | | | 212,799 | |
| | 21,502 | | | Ramaco Resources, Inc., Class A | | | 168,576 | |
| | 4,299 | | | Ramaco Resources, Inc., Class B | | | 46,601 | |
| | 38,167 | | | Rayonier Advanced Materials, Inc.* | | | 134,729 | |
| | 18,952 | | | Ryerson Holding Corp. | | | 590,165 | |
| | 14,701 | | | Schnitzer Steel Industries, Inc., Class A | | | 488,073 | |
| | 8,290 | | | Sensient Technologies Corp. | | | 510,747 | |
| | 3,946 | | | Stepan Co. | | | 344,367 | |
| | 15,791 | | | Summit Materials, Inc., Class A* | | | 590,741 | |
| | 40,084 | | | SunCoke Energy, Inc. | | | 372,781 | |
| | 4,558 | | | Sylvamo Corp. | | | 190,388 | |
| | 20,705 | | | TimkenSteel Corp.* | | | 453,647 | |
| | 963 | | | Tredegar Corp. | | | 4,844 | |
| | 9,805 | | | TriMas Corp. | | | 256,891 | |
| | 17,833 | | | Tronox Holdings PLC | | | 243,242 | |
| | 1,961 | | | United States Lime & Minerals, Inc. | | | 424,713 | |
| | 24,164 | | | Warrior Met Coal, Inc. | | | 955,928 | |
| | 7,070 | | | Worthington Industries, Inc. | | | 532,159 | |
| | | | | | | | |
| | | | | | | 22,324,750 | |
| | |
|
| Common Stocks – (continued) | |
| Real Estate – 5.6% | | | |
| | 15,753 | | | Acadia Realty Trust REIT | | | 234,562 | |
| | 25,197 | | | Alexander & Baldwin, Inc. REIT | | | 453,798 | |
| | 555 | | | Alexander’s, Inc. REIT | | | 106,421 | |
| | 5,846 | | | Alpine, Income Property Trust, Inc. REIT | | | 101,662 | |
| | 8,474 | | | American Assets Trust, Inc. REIT | | | 181,428 | |
| | 35,420 | | | Anywhere Real Estate, Inc.* | | | 232,355 | |
| | 61,131 | | | Apartment Investment and Management Co., Class A REIT | | | 465,207 | |
| | 43,440 | | | Apple Hospitality REIT, Inc. REIT | | | 652,469 | |
| | 11,192 | | | Armada Hoffler Properties, Inc. REIT | | | 127,477 | |
| | 27,724 | | | Braemar Hotels & Resorts, Inc. REIT | | | 75,409 | |
| | 28,521 | | | Brandywine Realty Trust REIT | | | 142,605 | |
| | 22,448 | | | Broadstone Net Lease, Inc. REIT | | | 362,984 | |
| | 9,212 | | | BRT Apartments Corp. REIT | | | 171,804 | |
| | 17,258 | | | CareTrust REIT, Inc. REIT | | | 347,749 | |
| | 8,481 | | | CBL & Associates Properties, Inc. REIT | | | 181,409 | |
| | 2,681 | | | Centerspace REIT | | | 173,568 | |
| | 16,956 | | | Chatham Lodging Trust REIT | | | 165,830 | |
| | 23,700 | | | City Office REIT, Inc. REIT | | | 119,448 | |
| | 6,226 | | | Community Healthcare Trust, Inc. REIT | | | 206,641 | |
| | 153,335 | | | Compass, Inc., Class A* | | | 552,006 | |
| | 18,016 | | | Corporate Office Properties Trust REIT | | | 466,254 | |
| | 11,525 | | | CTO Realty Growth, Inc. REIT | | | 203,070 | |
| | 38,209 | | | Cushman & Wakefield PLC* | | | 351,141 | |
| | 38,168 | | | DiamondRock Hospitality Co. REIT | | | 307,634 | |
| | 74,005 | | | Douglas Elliman, Inc. | | | 185,753 | |
| | 17,963 | | | Douglas Emmett, Inc. REIT | | | 245,554 | |
| | 14,603 | | | Easterly Government Properties, Inc. REIT | | | 195,242 | |
| | 10,781 | | | Elme Communities REIT | | | 165,812 | |
| | 40,811 | | | Empire State Realty Trust, Inc., Class A REIT | | | 356,280 | |
| | 10,695 | | | Equity Commonwealth REIT | | | 203,526 | |
| | 13,818 | | | Essential Properties Realty Trust, Inc. REIT | | | 331,908 | |
| | 49,732 | | | eXp World Holdings, Inc. | | | 955,849 | |
| | 11,622 | | | Farmland Partners, Inc. REIT | | | 129,004 | |
| | 11,491 | | | Forestar Group, Inc.* | | | 327,608 | |
| | 15,853 | | | Four Corners Property Trust, Inc. REIT | | | 398,861 | |
| | 3,882 | | | FRP Holdings, Inc.* | | | 221,158 | |
| | 8,818 | | | Getty Realty Corp. REIT | | | 264,716 | |
| | 11,803 | | | Gladstone Commercial Corp. REIT | | | 155,209 | |
| | 6,382 | | | Gladstone Land Corp. REIT | | | 100,389 | |
| | 9,913 | | | Global Medical REIT, Inc. REIT | | | 95,958 | |
| | 23,287 | | | Global Net Lease, Inc. REIT | | | 264,307 | |
| | 30,366 | | | Hersha Hospitality Trust, Class A REIT | | | 298,194 | |
| | 19,354 | | | Hudson Pacific Properties, Inc. REIT | | | 131,801 | |
| | 22,959 | | | Independence Realty Trust, Inc. REIT | | | 386,400 | |
| | 2,874 | | | Innovative Industrial Properties, Inc. REIT | | | 250,843 | |
| | 7,080 | | | InvenTrust Properties Corp. REIT | | | 169,283 | |
| | 6,864 | | | JBG SMITH Properties REIT | | | 107,628 | |
| | 8,594 | | | Kennedy-Wilson Holdings, Inc. | | | 137,246 | |
| | 37,922 | | | Kite Realty Group Trust REIT | | | 855,900 | |
| | 7,415 | | | LTC Properties, Inc. REIT | | | 243,657 | |
| | |
| | |
| The accompanying notes are an integral part of these financial statements. | | 97 |
GOLDMAN SACHS ACTIVEBETA® U.S. SMALL CAP EQUITY ETF
Schedule of Investments (continued)
August 31, 2023
| | | | | | | | |
| Shares | | | Description | | Value | |
|
| Common Stocks – (continued) | |
| Real Estate – (continued) | | | |
| | 39,493 | | | LXP Industrial Trust REIT | | $ | 387,821 | |
| | 28,603 | | | Macerich Co. (The) REIT | | | 334,369 | |
| | 23,747 | | | Marcus & Millichap, Inc. | | | 790,775 | |
| | 7,054 | | | National Health Investors, Inc. REIT | | | 360,671 | |
| | 35,917 | | | Necessity Retail REIT, Inc. (The) REIT | | | 269,377 | |
| | 5,631 | | | NETSTREIT Corp. REIT | | | 95,333 | |
| | 33,170 | | | Newmark Group, Inc., Class A | | | 235,175 | |
| | 6,195 | | | NexPoint Residential Trust, Inc. REIT | | | 232,622 | |
| | 18,289 | | | Office Properties Income Trust REIT | | | 135,339 | |
| | 17,913 | | | Orion Office REIT, Inc. REIT | | | 104,433 | |
| | 19,690 | | | Outfront Media, Inc. REIT | | | 223,481 | |
| | 43,875 | | | Paramount Group, Inc. REIT | | | 225,517 | |
| | 2,366 | | | Peakstone Realty Trust REIT | | | 46,492 | |
| | 22,016 | | | Pebblebrook Hotel Trust REIT | | | 318,572 | |
| | 9,910 | | | Phillips Edison & Co., Inc. REIT | | | 335,553 | |
| | 32,437 | | | Physicians Realty Trust REIT | | | 451,199 | |
| | 28,373 | | | Piedmont Office Realty Trust, Inc., Class A REIT | | | 194,923 | |
| | 6,678 | | | Plymouth Industrial REIT, Inc. REIT | | | 152,993 | |
| | 11,803 | | | Postal Realty Trust, Inc., Class A REIT | | | 170,317 | |
| | 21,566 | | | PotlatchDeltic Corp. REIT | | | 1,019,209 | |
| | 15,356 | | | RE/MAX Holdings, Inc., Class A | | | 248,767 | |
| | 12,104 | | | Redfin Corp.* | | | 115,230 | |
| | 20,825 | | | Retail Opportunity Investments Corp. REIT | | | 280,304 | |
| | 23,694 | | | RLJ Lodging Trust REIT | | | 236,703 | |
| | 11,485 | | | RMR Group, Inc. (The), Class A | | | 290,341 | |
| | 24,903 | | | RPT Realty REIT | | | 282,400 | |
| | 9,172 | | | Ryman Hospitality Properties, Inc. REIT | | | 779,895 | |
| | 36,630 | | | Sabra Health Care REIT, Inc. REIT | | | 458,974 | |
| | 2,610 | | | Saul Centers, Inc. REIT | | | 98,032 | |
| | 37,749 | | | Service Properties Trust REIT | | | 311,807 | |
| | 26,479 | | | SITE Centers Corp. REIT | | | 353,495 | |
| | 5,296 | | | SL Green Realty Corp. REIT | | | 207,921 | |
| | 6,088 | | | St Joe Co. (The) | | | 375,873 | |
| | 37,243 | | | Summit Hotel Properties, Inc. REIT | | | 216,382 | |
| | 37,114 | | | Sunstone Hotel Investors, Inc. REIT | | | 333,284 | |
| | 22,643 | | | Tanger Factory Outlet Centers, Inc. REIT | | | 526,450 | |
| | 10,524 | | | Terreno Realty Corp. REIT | | | 640,806 | |
| | 11,345 | | | UMH Properties, Inc. REIT | | | 169,608 | |
| | 55,438 | | | Uniti Group, Inc. REIT | | | 297,702 | |
| | 3,108 | | | Universal Health Realty Income Trust REIT | | | 144,926 | |
| | 12,728 | | | Urban Edge Properties REIT | | | 208,230 | |
| | 20,471 | | | Veris Residential, Inc. REIT* | | | 380,965 | |
| | 22,433 | | | Whitestone REIT | | | 224,330 | |
| | 20,740 | | | Xenia Hotels & Resorts, Inc. REIT | | | 244,732 | |
| | | | | | | | |
| | | | | | | 27,072,345 | |
| | |
| Utilities – 3.2% | | | |
| | 11,796 | | | ALLETE, Inc. | | | 647,600 | |
| | 11,308 | | | American States Water Co. | | | 952,247 | |
| | 14,010 | | | Avista Corp. | | | 466,393 | |
| | 12,651 | | | Black Hills Corp. | | | 695,805 | |
| | 23,563 | | | Brookfield Infrastructure Corp., Class A (Canada)(a) | | | 915,423 | |
| | | | | | | | |
| Shares | | | Description | | Value | |
|
| Common Stocks – (continued) | |
| Utilities – (continued) | | | |
| | 9,222 | | | California Water Service Group | | $ | 463,405 | |
| | 4,717 | | | Chesapeake Utilities Corp. | | | 519,342 | |
| | 14,633 | | | Consolidated Water Co. Ltd. (Cayman Islands) | | | 389,823 | |
| | 19,437 | | | Genie Energy Ltd., Class B | | | 297,580 | |
| | 7,614 | | | MGE Energy, Inc. | | | 551,482 | |
| | 3,187 | | | Middlesex Water Co. | | | 239,854 | |
| | 54,646 | | | Montauk Renewables, Inc.* | | | 521,869 | |
| | 17,103 | | | New Jersey Resources Corp. | | | 721,234 | |
| | 5,604 | | | Northwest Natural Holding Co. | | | 220,125 | |
| | 11,156 | | | NorthWestern Corp. | | | 562,262 | |
| | 13,808 | | | ONE Gas, Inc. | | | 1,000,666 | |
| | 10,502 | | | Ormat Technologies, Inc. | | | 797,522 | |
| | 13,591 | | | Otter Tail Corp. | | | 1,119,491 | |
| | 18,107 | | | PNM Resources, Inc. | | | 802,321 | |
| | 20,066 | | | Portland General Electric Co. | | | 880,095 | |
| | 18,826 | | | Pure Cycle Corp.* | | | 206,898 | |
| | 4,431 | | | RGC Resources, Inc. | | | 80,112 | |
| | 5,474 | | | SJW Group | | | 359,970 | |
| | 11,625 | | | Southwest Gas Holdings, Inc. | | | 719,936 | |
| | 9,537 | | | Spire, Inc. | | | 557,056 | |
| | 6,847 | | | Sunnova Energy International, Inc.*(a) | | | 95,242 | |
| | 5,318 | | | Unitil Corp. | | | 259,625 | |
| | 5,069 | | | York Water Co. (The) | | | 206,511 | |
| | | | | | | | |
| | | | | | | 15,249,889 | |
| | |
| | TOTAL COMMON STOCKS | |
| | (Cost $462,827,770) | | $ | 478,439,162 | |
| | |
| | | | | | | | | | | | |
| Units | | | Description | | Expiration
Month | | | Value | |
|
| Rights – 0.0% | |
| Health Care – 0.0% | | | | |
| | 4,104 | | | Chinook Therapeutics, Inc.* | | | 12/25 | | | $ | 1,601 | |
| | 45,824 | | | Radius Health, Inc.*(b) | | | 12/25 | | | | 3,666 | |
| | |
| Materials – 0.0% | | | | |
| | 15,501 | | | Resolute Forest Products*(b) | | | 09/23 | | | | 22,011 | |
| | |
| | TOTAL RIGHTS | | | | | |
| | (Cost $0) | | | | | | $ | 27,278 | |
| | |
| TOTAL INVESTMENTS BEFORE SECURITIES LENDING
REINVESTMENT VEHICLE |
|
| | (Cost $462,827,770) | | | | | | $ | 478,466,440 | |
| | |
| | |
| 98 | | The accompanying notes are an integral part of these financial statements. |
GOLDMAN SACHS ACTIVEBETA® U.S. SMALL CAP EQUITY ETF
| | | | | | | | |
| Shares | | | Dividend
Rate | | Value | |
|
| Securities Lending Reinvestment Vehicle – 0.6%(c) | |
| Goldman Sachs Financial Square Government Fund –
Institutional Shares |
|
| | 2,764,662 | | | 5.234% | | $ | 2,764,662 | |
| | (Cost $2,764,662) | | | | |
| | |
| | TOTAL INVESTMENTS – 99.7% | | | | |
| | (Cost $465,592,432) | | $ | 481,231,102 | |
| | |
| OTHER ASSETS IN EXCESS OF
LIABILITIES – 0.3% | | | 1,607,736 | |
| | |
| | NET ASSETS – 100.0% | | $ | 482,838,838 | |
| | |
| | |
|
| The percentage shown for each investment category reflects the value of investments in that category as a percentage of net assets. |
| |
* | | Non-income producing security. |
| |
(a) | | All or a portion of security is on loan. |
| |
(b) | | Significant unobservable inputs were used in the valuation of this portfolio security; i.e. Level 3. |
| |
(c) | | Represents an affiliated issuer. |
| | |
|
Investment Abbreviations: |
PLC | | —Public Limited Company |
REIT | | —Real Estate Investment Trust |
|
|
| ADDITIONAL INVESTMENT INFORMATION |
FUTURES CONTRACTS — At August 31, 2023, the Fund had the following futures contracts:
| | | | | | | | | | | | | | | | |
| Description | | Number of
Contracts | | | Expiration
Date | | | Notional
Amount | | | Unrealized
Appreciation/
(Depreciation) | |
Long position contracts: | | | | | | | | | | | | | | | | |
E-Mini Russell 2000 Index | | | 43 | | | | 09/15/23 | | | $ | 4,088,440 | | | $ | (3,714 | ) |
| | |
| The accompanying notes are an integral part of these financial statements. | | 99 |
GOLDMAN SACHS ACTIVEBETA® WORLD LOW VOL PLUS EQUITY ETF
Schedule of Investments
August 31, 2023
| | | | | | | | |
| Shares | | |
Description | | Value | |
|
| Common Stocks – 99.5% | |
| Australia – 2.4% | | | |
| | 50,922 | | | ANZ Group Holdings Ltd. (Financials) | | $ | 835,374 | |
| | 138,594 | | | Brambles Ltd. (Industrials) | | | 1,343,714 | |
| | 250,922 | | | Coles Group Ltd. (Consumer Staples) | | | 2,644,032 | |
| | 45,211 | | | Computershare Ltd. (Industrials) | | | 737,293 | |
| | 36,527 | | | EBOS Group Ltd. (Health Care) | | | 825,413 | |
| | 102,099 | | | Insurance Australia Group Ltd. (Financials) | | | 384,844 | |
| | 60,600 | | | Lottery Corp. Ltd. (The) (Consumer Discretionary) | | | 197,808 | |
| | 478,176 | | | Medibank Pvt Ltd. (Financials) | | | 1,133,468 | |
| | 60,480 | | | National Australia Bank Ltd. (Financials) | | | 1,134,360 | |
| | 30,973 | | | Sonic Healthcare Ltd. (Health Care) | | | 645,119 | |
| | 786,047 | | | Telstra Group Ltd. (Communication Services) | | | 2,041,425 | |
| | 77,481 | | | Wesfarmers Ltd. (Consumer Discretionary) | | | 2,703,228 | |
| | 28,820 | | | Westpac Banking Corp. (Financials) | | | 409,703 | |
| | 97,055 | | | Woolworths Group Ltd. (Consumer Staples) | | | 2,396,763 | |
| | | | | | | | |
| | | | | | | 17,432,544 | |
| | |
| Austria – 0.1% | | | |
| | 9,169 | | | Vienna Insurance Group AG Wiener Versicherung Gruppe (Financials) | | | 246,301 | |
| | 27,812 | | | Wienerberger AG (Materials) | | | 767,926 | |
| | | | | | | | |
| | | | | | | 1,014,227 | |
| | |
| Belgium – 0.2% | | | |
| | 5,683 | | | Ackermans & van Haaren NV (Industrials) | | | 895,600 | |
| | 21,926 | | | Warehouses De Pauw CVA REIT (Real Estate) | | | 628,251 | |
| | | | | | | | |
| | | | | | | 1,523,851 | |
| | |
| Canada – 3.8% | | | |
| | 10,148 | | | Atco Ltd., Class I (Utilities) | | | 279,774 | |
| | 14,673 | | | Bank of Montreal (Financials) | | | 1,262,055 | |
| | 35,335 | | | Bank of Nova Scotia (The) (Financials) | | | 1,674,622 | |
| | 5,050 | | | BCE, Inc. (Communication Services) | | | 213,653 | |
| | 5,899 | | | Brookfield Asset Management Ltd., Class A (Financials) | | | 203,573 | |
| | 30,553 | | | Canadian Imperial Bank of Commerce (Financials) | | | 1,209,067 | |
| | 2,294 | | | Canadian Utilities Ltd., Class A (Utilities) | | | 54,292 | |
| | 28,746 | | | CGI, Inc. (Information Technology)* | | | 2,993,689 | |
| | 7,802 | | | George Weston Ltd. (Consumer Staples) | | | 864,134 | |
| | 71,155 | | | Great-West Lifeco, Inc. (Financials)(a) | | | 2,042,166 | |
| | 23,216 | | | Hydro One Ltd. (Utilities)(b) | | | 602,643 | |
| | 10,990 | | | Intact Financial Corp. (Financials) | | | 1,547,430 | |
| | 31,777 | | | Loblaw Cos. Ltd. (Consumer Staples) | | | 2,755,753 | |
| | 11,361 | | | Manulife Financial Corp. (Financials) | | | 209,762 | |
| | 14,388 | | | Metro, Inc. (Consumer Staples) | | | 740,589 | |
| | 24,596 | | | National Bank of Canada (Financials) | | | 1,711,967 | |
| | 92,340 | | | Power Corp. of Canada (Financials) | | | 2,518,457 | |
| | |
|
| Common Stocks – (continued) | |
| Canada – (continued) | | | |
| | 20,438 | | | Quebecor, Inc., Class B (Communication Services) | | | 466,632 | |
| | 21,314 | | | Royal Bank of Canada (Financials) | | | 1,917,858 | |
| | 33,129 | | | Sun Life Financial, Inc. (Financials) | | | 1,613,905 | |
| | 10,003 | | | Thomson Reuters Corp. (Industrials) | | | 1,286,390 | |
| | 25,758 | | | Toronto-Dominion Bank (The) (Financials) | | | 1,569,145 | |
| | | | | | | | |
| | | | | | | 27,737,556 | |
| | |
| Denmark – 0.0% | | | |
| | 6,036 | | | Tryg A/S (Financials) | | | 115,368 | |
| | |
| Finland – 0.5% | | | |
| | 5,029 | | | Elisa OYJ (Communication Services) | | | 247,094 | |
| | 27,253 | | | Orion OYJ, Class B (Health Care) | | | 1,117,793 | |
| | 30,106 | | | Sampo OYJ, Class A (Financials) | | | 1,324,340 | |
| | 27,531 | | | UPM-Kymmene OYJ (Materials) | | | 944,830 | |
| | | | | | | | |
| | | | | | | 3,634,057 | |
| | |
| France – 2.4% | | | |
| | 7,733 | | | Air Liquide SA (Materials) | | | 1,400,458 | |
| | 83,181 | | | AXA SA (Financials) | | | 2,507,542 | |
| | 32,078 | | | Bouygues SA (Industrials) | | | 1,110,626 | |
| | 6,713 | | | Capgemini SE (Information Technology) | | | 1,255,735 | |
| | 73,753 | | | Cie Generale des Etablissements Michelin (Consumer Discretionary) | | | 2,314,183 | |
| | 4,239 | | | Dassault Systemes (Information Technology) | | | 168,435 | |
| | 3,508 | | | Legrand SA (Industrials) | | | 346,855 | |
| | 5,416 | | | L’Oreal SA (Consumer Staples) | | | 2,385,397 | |
| | 371,657 | | | Orange SA (Communication Services) | | | 4,178,190 | |
| | 2,083 | | | Pernod Ricard SA (Consumer Staples) | | | 409,654 | |
| | 8,675 | | | Thales SA (Industrials) | | | 1,269,198 | |
| | | | | | | | |
| | | | | | | 17,346,273 | |
| | |
| Germany – 1.8% | | | |
| | 3,656 | | | Allianz SE (Financials) | | | 890,230 | |
| | 12,548 | | | Beiersdorf AG (Consumer Staples) | | | 1,645,172 | |
| | 6,899 | | | Deutsche Boerse AG (Financials) | | | 1,226,881 | |
| | 127,969 | | | Deutsche Telekom AG (Communication Services) | | | 2,741,990 | |
| | 124,218 | | | E.ON SE (Utilities) | | | 1,534,252 | |
| | 43,559 | | | Evonik Industries AG (Materials) | | | 837,035 | |
| | 3,313 | | | Hannover Rueck SE (Financials) | | | 705,669 | |
| | 3,927 | | | Henkel AG & Co. KGaA (Consumer Staples) | | | 271,841 | |
| | 2,917 | | | Muenchener Rueckversicherungs-Gesellschaft AG in Muenchen (Financials) | | | 1,134,050 | |
| | 10,927 | | | SAP SE (Information Technology) | | | 1,527,757 | |
| | 11,645 | | | Talanx AG (Financials) | | | 784,244 | |
| | | | | | | | |
| | | | | | | 13,299,121 | |
| | |
| Hong Kong – 0.3% | | | |
| | 106,763 | | | CK Asset Holdings Ltd. (Real Estate) | | | 589,516 | |
| | 32,419 | | | CLP Holdings Ltd. (Utilities) | | | 254,250 | |
| | 46,712 | | | Link REIT (Real Estate) | | | 231,721 | |
| | |
| | |
| 100 | | The accompanying notes are an integral part of these financial statements. |
GOLDMAN SACHS ACTIVEBETA® WORLD LOW VOL PLUS EQUITY ETF
| | | | | | | | |
| Shares | | |
Description | | Value | |
|
| Common Stocks – (continued) | |
| Hong Kong – (continued) | | | |
| | 51,692 | | | Power Assets Holdings Ltd. (Utilities) | | $ | 254,777 | |
| | 37,277 | | | Sun Hung Kai Properties Ltd. (Real Estate) | | | 419,748 | |
| | | | | | | | |
| | | | | | | 1,750,012 | |
| | |
| Ireland – 0.1% | | | |
| | 4,892 | | | Kerry Group PLC, Class A (Consumer Staples) | | | 457,363 | |
| | |
| Israel – 0.7% | | | |
| | 20,207 | | | Check Point Software Technologies Ltd. (Information Technology)* | | | 2,719,660 | |
| | 13,338 | | | First International Bank Of Israel Ltd. (The) (Financials) | | | 540,431 | |
| | 142,855 | | | Mivne Real Estate KD Ltd. (Real Estate) | | | 342,818 | |
| | 38,501 | | | Mizrahi Tefahot Bank Ltd. (Financials) | | | 1,269,074 | |
| | 68,257 | | | Shufersal Ltd. (Consumer Staples)* | | | 318,256 | |
| | | | | | | | |
| | | | | | | 5,190,239 | |
| | |
| Italy – 0.7% | | | |
| | 174,669 | | | Assicurazioni Generali SpA (Financials) | | | 3,626,609 | |
| | 77,250 | | | Snam SpA (Utilities) | | | 399,429 | |
| | 49,377 | | | Terna – Rete Elettrica Nazionale (Utilities) | | | 408,366 | |
| | 108,796 | | | UnipolSai Assicurazioni SpA (Financials) | | | 275,603 | |
| | | | | | | | |
| | | | | | | 4,710,007 | |
| | |
| Japan – 8.5% | | | |
| | 48,533 | | | ANA Holdings, Inc. (Industrials)* | | | 1,096,772 | |
| | 19,069 | | | Asahi Kasei Corp. (Materials) | | | 123,359 | |
| | 135,799 | | | Astellas Pharma, Inc. (Health Care) | | | 2,065,645 | |
| | 32,278 | | | Bridgestone Corp. (Consumer Discretionary) | | | 1,255,114 | |
| | 36,549 | | | Brother Industries Ltd. (Information Technology) | | | 619,715 | |
| | 123,730 | | | Canon, Inc. (Information Technology) | | | 3,049,375 | |
| | 1,167 | | | Central Japan Railway Co. (Industrials) | | | 149,818 | |
| | 25,568 | | | Chubu Electric Power Co., Inc. (Utilities) | | | 341,586 | |
| | 36,014 | | | Daiwa House Industry Co. Ltd. (Real Estate) | | | 1,001,371 | |
| | 68 | | | Daiwa House REIT Investment Corp. REIT (Real Estate) | | | 129,008 | |
| | 104,494 | | | Daiwa Securities Group, Inc. (Financials) | | | 595,017 | |
| | 29,806 | | | FUJIFILM Holdings Corp. (Information Technology) | | | 1,763,567 | |
| | 12,115 | | | Hankyu Hanshin Holdings, Inc. (Industrials) | | | 435,220 | |
| | 2,458 | | | Hirose Electric Co. Ltd. (Information Technology) | | | 298,080 | |
| | 40,559 | | | Hulic Co. Ltd. (Real Estate) | | | 364,400 | |
| | 88,447 | | | Japan Post Bank Co. Ltd. (Financials) | | | 709,897 | |
| | 431,652 | | | Japan Post Holdings Co. Ltd. (Financials) | | | 3,311,847 | |
| | |
|
| Common Stocks – (continued) | |
| Japan – (continued) | | | |
| | 141,309 | | | Japan Tobacco, Inc. (Consumer Staples) | | | 3,097,277 | |
| | 31,768 | | | KDDI Corp. (Communication Services) | | | 943,755 | |
| | 46,581 | | | Kirin Holdings Co. Ltd. (Consumer Staples) | | | 654,633 | |
| | 43,484 | | | Kyocera Corp. (Information Technology) | | | 2,233,563 | |
| | 28,309 | | | Kyushu Railway Co. (Industrials) | | | 616,990 | |
| | 20,727 | | | McDonald’s Holdings Co. Japan Ltd. (Consumer Discretionary) | | | 824,325 | |
| | 34,436 | | | MEIJI Holdings Co. Ltd. (Consumer Staples) | | | 863,827 | |
| | 20,124 | | | Mitsubishi Estate Co. Ltd. (Real Estate) | | | 257,451 | |
| | 208,749 | | | Mitsubishi HC Capital, Inc. (Financials) | | | 1,357,725 | |
| | 233,981 | | | Mizuho Financial Group, Inc. (Financials) | | | 3,873,299 | |
| | 17,766 | | | MS&AD Insurance Group Holdings, Inc. (Financials) | | | 639,447 | |
| | 25,636 | | | NEC Corp. (Information Technology) | | | 1,353,424 | |
| | 5,527 | | | NH Foods Ltd. (Consumer Staples) | | | 171,522 | |
| | 13,966 | | | Nichirei Corp. (Consumer Staples) | | | 330,575 | |
| | 4,844,692 | | | Nippon Telegraph & Telephone Corp. (Communication Services) | | | 5,600,588 | |
| | 28,169 | | | Nisshin Seifun Group, Inc. (Consumer Staples) | | | 371,594 | |
| | 5,583 | | | Nissin Foods Holdings Co. Ltd. (Consumer Staples) | | | 487,796 | |
| | 129,979 | | | Nomura Holdings, Inc. (Financials) | | | 503,720 | |
| | 84,848 | | | Obayashi Corp. (Industrials) | | | 768,723 | |
| | 39,239 | | | Ono Pharmaceutical Co. Ltd. (Health Care) | | | 744,297 | |
| | 44,953 | | | Otsuka Holdings Co. Ltd. (Health Care) | | | 1,712,466 | |
| | 7,417 | | | Secom Co. Ltd. (Industrials) | | | 519,396 | |
| | 24,160 | | | Sekisui Chemical Co. Ltd. (Consumer Discretionary) | | | 371,067 | |
| | 131,037 | | | Sekisui House Ltd. (Consumer Discretionary) | | | 2,673,664 | |
| | 21,625 | | | Shimizu Corp. (Industrials) | | | 145,523 | |
| | 310,604 | | | SoftBank Corp. (Communication Services) | | | 3,562,927 | |
| | 69,361 | | | Sumitomo Mitsui Financial Group, Inc. (Financials) | | | 3,183,026 | |
| | 135,305 | | | Takeda Pharmaceutical Co. Ltd. (Health Care) | | | 4,189,683 | |
| | 12,926 | | | Tobu Railway Co. Ltd. (Industrials) | | | 354,525 | |
| | 34,414 | | | Trend Micro, Inc. (Information Technology) | | | 1,462,982 | |
| | 21,216 | | | USS Co. Ltd. (Consumer Discretionary) | | | 370,808 | |
| | 48,423 | | | Yamada Holdings Co. Ltd. (Consumer Discretionary) | | | 152,335 | |
| | | | | | | | |
| | | | | | | 61,702,724 | |
| | |
| | |
| The accompanying notes are an integral part of these financial statements. | | 101 |
GOLDMAN SACHS ACTIVEBETA® WORLD LOW VOL PLUS EQUITY ETF
Schedule of Investments (continued)
August 31, 2023
| | | | | | | | |
| Shares | | |
Description | | Value | |
|
| Common Stocks – (continued) | |
| Netherlands – 1.4% | | | |
| | 4,754 | | | HAL Trust (Financials) | | $ | 599,564 | |
| | 2,865 | | | Heineken Holding NV (Consumer Staples) | | | 229,794 | |
| | 151,930 | | | Koninklijke Ahold Delhaize NV (Consumer Staples) | | | 4,975,775 | |
| | 107,823 | | | Koninklijke KPN NV (Communication Services) | | | 377,642 | |
| | 31,054 | | | Wolters Kluwer NV (Industrials) | | | 3,747,937 | |
| | | | | | | | |
| | | | | | | 9,930,712 | |
| | |
| New Zealand – 0.1% | | | |
| | 18,573 | | | Mainfreight Ltd. (Industrials) | | | 725,047 | |
| | |
| Norway – 0.5% | | | |
| | 43,106 | | | DNB Bank ASA (Financials) | | | 853,436 | |
| | 47,111 | | | Gjensidige Forsikring ASA (Financials) | | | 732,985 | |
| | 44,254 | | | SpareBank 1 SR-Bank ASA (Financials) | | | 535,434 | |
| | 98,252 | | | Storebrand ASA (Financials) | | | 788,813 | |
| | 76,561 | | | Telenor ASA (Communication Services) | | | 819,796 | |
| | | | | | | | |
| | | | | | | 3,730,464 | |
| | |
| Portugal – 0.0% | | | |
| | 20,773 | | | EDP – Energias de Portugal SA (Utilities) | | | 94,828 | |
| | |
| Singapore – 1.1% | | | |
| | 7,908 | | | DBS Group Holdings Ltd. (Financials) | | | 194,992 | |
| | 1,034,249 | | | Genting Singapore Ltd. (Consumer Discretionary) | | | 670,098 | |
| | 251,894 | | | Oversea-Chinese Banking Corp. Ltd. (Financials) | | | 2,340,814 | |
| | 186,481 | | | Singapore Airlines Ltd. (Industrials) | | | 948,630 | |
| | 205,411 | | | Singapore Exchange Ltd. (Financials) | | | 1,464,723 | |
| | 41,587 | | | United Overseas Bank Ltd. (Financials) | | | 875,775 | |
| | 117,680 | | | UOL Group Ltd. (Real Estate) | | | 578,597 | |
| | 48,324 | | | Venture Corp. Ltd. (Information Technology) | | | 469,106 | |
| | | | | | | | |
| | | | | | | 7,542,735 | |
| | |
| Spain – 0.5% | | | |
| | 18,510 | | | ACS Actividades de Construccion y Servicios SA (Industrials) | | | 650,710 | |
| | 53,706 | | | Iberdrola SA (Utilities) | | | 638,856 | |
| | 32,493 | | | Naturgy Energy Group SA (Utilities) | | | 943,021 | |
| | 40,225 | | | Redeia Corp. SA (Utilities) | | | 655,092 | |
| | 235,067 | | | Telefonica SA (Communication Services) | | | 975,617 | |
| | | | | | | | |
| | | | | | | 3,863,296 | |
| | |
| Sweden – 0.8% | | | |
| | 27,367 | | | Axfood AB (Consumer Staples) | | | 661,563 | |
| | 9,228 | | | Essity AB, Class B (Consumer Staples) | | | 215,491 | |
| | |
|
| Common Stocks – (continued) | |
| Sweden – (continued) | | | |
| | 6,154 | | | Industrivarden AB, Class C (Financials) | | | 160,286 | |
| | 122,528 | | | Investor AB, Class A (Financials) | | | 2,342,041 | |
| | 19,423 | | | Investor AB, Class B (Financials) | | | 374,450 | |
| | 103,462 | | | Svenska Handelsbanken AB, Class A (Financials) | | | 863,231 | |
| | 57,768 | | | Swedbank AB, Class A (Financials) | | | 1,024,270 | |
| | 4,288 | | | Tele2 AB, Class B (Communication Services) | | | 30,286 | |
| | 128,986 | | | Telia Co. AB (Communication Services) | | | 260,448 | |
| | | | | | | | |
| | | | | | | 5,932,066 | |
| | |
| Switzerland – 1.5% | | | |
| | 34,340 | | | Novartis AG (Health Care) | | | 3,472,296 | |
| | 28,456 | | | SGS SA (Industrials) | | | 2,589,633 | |
| | 3,279 | | | Swisscom AG (Communication Services) | | | 1,997,285 | |
| | 5,087 | | | Zurich Insurance Group AG (Financials) | | | 2,390,156 | |
| | | | | | | | |
| | | | | | | 10,449,370 | |
| | |
| United Kingdom – 2.6% | | | |
| | 299,293 | | | BAE Systems PLC (Industrials) | | | 3,820,938 | |
| | 38,457 | | | British American Tobacco PLC (Consumer Staples) | | | 1,277,966 | |
| | 21,258 | | | Bunzl PLC (Industrials) | | | 762,320 | |
| | 515,437 | | | CK Hutchison Holdings Ltd. (Industrials) | | | 2,809,951 | |
| | 21,288 | | | Compass Group PLC (Consumer Discretionary) | | | 537,614 | |
| | 2,355 | | | Diageo PLC (Consumer Staples) | | | 96,790 | |
| | 2,514 | | | Halma PLC (Information Technology) | | | 68,300 | |
| | 11,476 | | | National Grid PLC (Utilities) | | | 143,993 | |
| | 101,276 | | | RELX PLC (Industrials) | | | 3,308,398 | |
| | 265,407 | | | Sage Group PLC (The) (Information Technology) | | | 3,265,577 | |
| | 632,183 | | | Tesco PLC (Consumer Staples) | | | 2,128,446 | |
| | 6,109 | | | Unilever PLC (Consumer Staples) | | | 312,892 | |
| | | | | | | | |
| | | | | | | 18,533,185 | |
| | |
| United States – 69.5% | | | |
| | 15,289 | | | 3M Co. (Industrials) | | | 1,630,878 | |
| | 6,588 | | | Abbott Laboratories (Health Care) | | | 677,905 | |
| | 26,467 | | | AbbVie, Inc. (Health Care) | | | 3,889,590 | |
| | 17,915 | | | Accenture PLC, Class A (Information Technology) | | | 5,800,340 | |
| | 14,838 | | | Activision Blizzard, Inc. (Communication Services) | | | 1,364,948 | |
| | 8,470 | | | Adobe, Inc. (Information Technology)* | | | 4,737,610 | |
| | 42,348 | | | Aflac, Inc. (Financials) | | | 3,157,890 | |
| | 3,208 | | | Agilent Technologies, Inc. (Health Care) | | | 388,393 | |
| | 4,225 | | | Air Products and Chemicals, Inc. (Materials) | | | 1,248,445 | |
| | 22,018 | | | Akamai Technologies, Inc. (Information Technology)* | | | 2,313,872 | |
| | 4,714 | | | Alexandria Real Estate Equities, Inc. REIT (Real Estate) | | | 548,427 | |
| | 36,375 | | | Alphabet, Inc., Class A (Communication Services)* | | | 4,953,184 | |
| | |
| | |
| 102 | | The accompanying notes are an integral part of these financial statements. |
GOLDMAN SACHS ACTIVEBETA® WORLD LOW VOL PLUS EQUITY ETF
| | | | | | | | |
| Shares | | |
Description | | Value | |
|
| Common Stocks – (continued) | |
| United States – (continued) | | | |
| | 35,368 | | | Alphabet, Inc., Class C (Communication Services)* | | $ | 4,857,795 | |
| | 12,051 | | | Altria Group, Inc. (Consumer Staples) | | | 532,895 | |
| | 52,705 | | | Amazon.com, Inc. (Consumer Discretionary)* | | | 7,273,817 | |
| | 30,877 | | | Amdocs Ltd. (Information Technology) | | | 2,754,228 | |
| | 11,865 | | | AMETEK, Inc. (Industrials) | | | 1,892,586 | |
| | 5,258 | | | Amgen, Inc. (Health Care) | | | 1,347,836 | |
| | 39,453 | | | Amphenol Corp., Class A (Information Technology) | | | 3,486,856 | |
| | 11,158 | | | Analog Devices, Inc. (Information Technology) | | | 2,028,301 | |
| | 2,246 | | | Aon PLC, Class A (Financials) | | | 748,794 | |
| | 128,008 | | | Apple, Inc. (Information Technology) | | | 24,048,863 | |
| | 20,752 | | | Arch Capital Group Ltd. (Financials)* | | | 1,594,999 | |
| | 40,466 | | | Archer-Daniels-Midland Co. (Consumer Staples) | | | 3,208,954 | |
| | 10,662 | | | Arthur J Gallagher & Co. (Financials) | | | 2,457,378 | |
| | 185,008 | | | AT&T, Inc. (Communication Services) | | | 2,736,268 | |
| | 1,564 | | | Automatic Data Processing, Inc. (Industrials) | | | 398,210 | |
| | 2,947 | | | AutoZone, Inc. (Consumer Discretionary)* | | | 7,459,830 | |
| | 70,448 | | | Bank of America Corp. (Financials) | | | 2,019,744 | |
| | 4,893 | | | Becton Dickinson & Co. (Health Care) | | | 1,367,349 | |
| | 6,666 | | | Berkshire Hathaway, Inc., Class B (Financials)* | | | 2,401,093 | |
| | 21,826 | | | Boston Scientific Corp. (Health Care)* | | | 1,177,294 | |
| | 60,223 | | | Bristol-Myers Squibb Co. (Health Care) | | | 3,712,748 | |
| | 3,007 | | | Broadcom, Inc. (Information Technology) | | | 2,775,130 | |
| | 5,091 | | | Broadridge Financial Solutions, Inc. (Industrials) | | | 947,995 | |
| | 9,053 | | | Campbell Soup Co. (Consumer Staples) | | | 377,510 | |
| | 37,126 | | | Cardinal Health, Inc. (Health Care) | | | 3,242,214 | |
| | 4,942 | | | Cboe Global Markets, Inc. (Financials) | | | 739,867 | |
| | 16,442 | | | CDW Corp. (Information Technology) | | | 3,471,728 | |
| | 14,142 | | | Cencora, Inc. (Health Care) | | | 2,488,709 | |
| | 29,982 | | | C.H. Robinson Worldwide, Inc. (Industrials) | | | 2,711,272 | |
| | 20,864 | | | Chevron Corp. (Energy) | | | 3,361,190 | |
| | 2,270 | | | Chubb Ltd. (Financials) | | | 455,975 | |
| | 12,046 | | | Church & Dwight Co., Inc. (Consumer Staples) | | | 1,165,691 | |
| | 8,216 | | | Cigna Group (The) (Health Care) | | | 2,269,752 | |
| | 5,601 | | | Cintas Corp. (Industrials) | | | 2,823,856 | |
| | 115,568 | | | Cisco Systems, Inc. (Information Technology) | | | 6,627,825 | |
| | 53,790 | | | Citigroup, Inc. (Financials) | | | 2,220,989 | |
| | 53,246 | | | Coca-Cola Co. (The) (Consumer Staples) | | | 3,185,708 | |
| | 60,953 | | | Cognizant Technology Solutions Corp., Class A (Information Technology) | | | 4,364,844 | |
| | 72,736 | | | Colgate-Palmolive Co. (Consumer Staples) | | | 5,343,914 | |
| | 66,211 | | | Comcast Corp., Class A (Communication Services) | | | 3,096,026 | |
| | |
|
| Common Stocks – (continued) | |
| United States – (continued) | | | |
| | 28,349 | | | Conagra Brands, Inc. (Consumer Staples) | | | 847,068 | |
| | 7,207 | | | Consolidated Edison, Inc. (Utilities) | | | 641,135 | |
| | 1,373 | | | Constellation Brands, Inc., Class A (Consumer Staples) | | | 357,749 | |
| | 784 | | | Cooper Cos., Inc. (The) (Health Care) | | | 290,072 | |
| | 23,835 | | | Corning, Inc. (Information Technology) | | | 782,265 | |
| | 1,813 | | | Corteva, Inc. (Materials) | | | 91,575 | |
| | 6,393 | | | Costco Wholesale Corp. (Consumer Staples) | | | 3,511,547 | |
| | 11,835 | | | CSX Corp. (Industrials) | | | 357,417 | |
| | 2,876 | | | Cummins, Inc. (Industrials) | | | 661,595 | |
| | 60,998 | | | CVS Health Corp. (Health Care) | | | 3,975,240 | |
| | 8,134 | | | Darden Restaurants, Inc. (Consumer Discretionary) | | | 1,264,918 | |
| | 444 | | | Deere & Co. (Industrials) | | | 182,457 | |
| | 57,259 | | | Dell Technologies, Inc., Class��C (Information Technology) | | | 3,220,246 | |
| | 4,970 | | | Dollar General Corp. (Consumer Staples) | | | 688,345 | |
| | 2,878 | | | Dover Corp. (Industrials) | | | 426,807 | |
| | 53,699 | | | Dow, Inc. (Materials) | | | 2,929,817 | |
| | 6,542 | | | Eaton Corp. PLC (Industrials) | | | 1,507,081 | |
| | 6,656 | | | Electronic Arts, Inc. (Communication Services) | | | 798,587 | |
| | 6,107 | | | Elevance Health, Inc. (Health Care) | | | 2,699,355 | |
| | 7,423 | | | Eli Lilly & Co. (Health Care) | | | 4,113,827 | |
| | 2,021 | | | Everest Group Ltd. (Financials) | | | 728,934 | |
| | 16,684 | | | Expeditors International of Washington, Inc. (Industrials) | | | 1,947,190 | |
| | 31,623 | | | Exxon Mobil Corp. (Energy) | | | 3,516,161 | |
| | 81,841 | | | Fastenal Co. (Industrials) | | | 4,712,405 | |
| | 8,734 | | | Ferrovial SE (Industrials) | | | 277,274 | |
| | 38,490 | | | Fidelity National Financial, Inc. (Financials) | | | 1,593,486 | |
| | 10,219 | | | Fiserv, Inc. (Financials)* | | | 1,240,484 | |
| | 8,804 | | | FleetCor Technologies, Inc. (Financials)* | | | 2,392,311 | |
| | 18,738 | | | Fortive Corp. (Industrials) | | | 1,477,491 | |
| | 12,040 | | | Fortrea Holdings, Inc. (Health Care)* | | | 331,702 | |
| | 7,827 | | | Gartner, Inc. (Information Technology)* | | | 2,736,945 | |
| | 1,831 | | | GE HealthCare Technologies, Inc. (Health Care) | | | 128,994 | |
| | 30,249 | | | Gen Digital, Inc. (Information Technology) | | | 612,542 | |
| | 13,019 | | | General Dynamics Corp. (Industrials) | | | 2,950,626 | |
| | 24,583 | | | General Mills, Inc. (Consumer Staples) | | | 1,663,286 | |
| | 33,764 | | | Genuine Parts Co. (Consumer Discretionary) | | | 5,190,540 | |
| | 60,948 | | | Gilead Sciences, Inc. (Health Care) | | | 4,661,303 | |
| | 125,249 | | | GSK PLC (Health Care) | | | 2,204,156 | |
| | 70,574 | | | Haleon PLC (Consumer Staples) | | | 288,405 | |
| | 19,958 | | | Hartford Financial Services Group, Inc. (The) (Financials) | | | 1,433,384 | |
| | 33,793 | | | Henry Schein, Inc. (Health Care)* | | | 2,586,516 | |
| | 26,680 | | | Hershey Co. (The) (Consumer Staples) | | | 5,732,465 | |
| | |
| | |
| The accompanying notes are an integral part of these financial statements. | | 103 |
GOLDMAN SACHS ACTIVEBETA® WORLD LOW VOL PLUS EQUITY ETF
Schedule of Investments (continued)
August 31, 2023
| | | | | | | | |
| Shares | | |
Description | | Value | |
|
| Common Stocks – (continued) | |
| United States – (continued) | | | |
| | 149,654 | | | Hewlett Packard Enterprise Co. (Information Technology) | | $ | 2,542,622 | |
| | 11,792 | | | Hologic, Inc. (Health Care)* | | | 881,334 | |
| | 17,340 | | | Home Depot, Inc. (The) (Consumer Discretionary) | | | 5,727,402 | |
| | 2,560 | | | Honeywell International, Inc. (Industrials) | | | 481,126 | |
| | 17,749 | | | Illinois Tool Works, Inc. (Industrials) | | | 4,390,215 | |
| | 10,277 | | | Intel Corp. (Information Technology) | | | 361,134 | |
| | 4,147 | | | Intercontinental Exchange, Inc. (Financials) | | | 489,305 | |
| | 28,547 | | | International Business Machines Corp. (Information Technology) | | | 4,191,556 | |
| | 58,127 | | | International Paper Co. (Materials) | | | 2,029,795 | |
| | 1,648 | | | Intuit, Inc. (Information Technology) | | | 892,903 | |
| | 3,378 | | | IQVIA Holdings, Inc. (Health Care)* | | | 752,044 | |
| | 8,216 | | | J M Smucker Co. (The) (Consumer Staples) | | | 1,190,909 | |
| | 6,187 | | | Johnson Controls International PLC (Industrials) | | | 365,404 | |
| | 40,138 | | | Johnson & Johnson (Health Care) | | | 6,489,512 | |
| | 22,407 | | | JPMorgan Chase & Co. (Financials) | | | 3,278,816 | |
| | 14,730 | | | Kellogg Co. (Consumer Staples) | | | 898,825 | |
| | 34,196 | | | Keurig Dr Pepper, Inc. (Consumer Staples) | | | 1,150,695 | |
| | 26,807 | | | Keysight Technologies, Inc. (Information Technology)* | | | 3,573,373 | |
| | 10,978 | | | Kimberly-Clark Corp. (Consumer Staples) | | | 1,414,296 | |
| | 28,015 | | | Kinder Morgan, Inc. (Energy) | | | 482,418 | |
| | 15,898 | | | Kraft Heinz Co. (The) (Consumer Staples) | | | 526,065 | |
| | 4,188 | | | L3Harris Technologies, Inc. (Industrials) | | | 745,841 | |
| | 12,040 | | | Laboratory Corp. of America Holdings (Health Care) | | | 2,505,524 | |
| | 3,249 | | | Leidos Holdings, Inc. (Industrials) | | | 316,810 | |
| | 3,584 | | | Linde PLC (Materials) | | | 1,387,151 | |
| | 13,103 | | | LKQ Corp. (Consumer Discretionary) | | | 688,301 | |
| | 4,938 | | | Lockheed Martin Corp. (Industrials) | | | 2,213,952 | |
| | 37,304 | | | Loews Corp. (Financials) | | | 2,316,205 | |
| | 24,756 | | | Lowe’s Cos., Inc. (Consumer Discretionary) | | | 5,705,763 | |
| | 394 | | | Markel Group, Inc. (Financials)* | | | 582,695 | |
| | 27,573 | | | Marsh & McLennan Cos., Inc. (Financials) | | | 5,376,459 | |
| | 55,354 | | | Masco Corp. (Industrials) | | | 3,266,440 | |
| | 11,086 | | | Mastercard, Inc., Class A (Financials) | | | 4,574,527 | |
| | 18,614 | | | McDonald’s Corp. (Consumer Discretionary) | | | 5,233,326 | |
| | 9,025 | | | McKesson Corp. (Health Care) | | | 3,721,188 | |
| | 42,110 | | | Merck & Co., Inc. (Health Care) | | | 4,589,148 | |
| | 21,804 | | | Meta Platforms, Inc., Class A (Communication Services)* | | | 6,451,586 | |
| | 12,783 | | | MetLife, Inc. (Financials) | | | 809,675 | |
| | 56,067 | | | Microsoft Corp. (Information Technology) | | | 18,376,520 | |
| | |
|
| Common Stocks – (continued) | |
| United States – (continued) | | | |
| | 36,589 | | | Mondelez International, Inc., Class A (Consumer Staples) | | | 2,607,332 | |
| | 12,764 | | | Monster Beverage Corp. (Consumer Staples)* | | | 732,781 | |
| | 11,597 | | | Moody’s Corp. (Financials) | | | 3,905,870 | |
| | 19,431 | | | Motorola Solutions, Inc. (Information Technology) | | | 5,510,049 | |
| | 14,522 | | | Nasdaq, Inc. (Financials) | | | 762,115 | |
| | 7,628 | | | Nestle SA (Consumer Staples) | | | 918,901 | |
| | 30,541 | | | NetApp, Inc. (Information Technology) | | | 2,342,495 | |
| | 4,602 | | | NiSource, Inc. (Utilities) | | | 123,150 | |
| | 1,462 | | | Northrop Grumman Corp. (Industrials) | | | 633,178 | |
| | 8,555 | | | NVIDIA Corp. (Information Technology) | | | 4,222,320 | |
| | 18,131 | | | Omnicom Group, Inc. (Communication Services) | | | 1,468,792 | |
| | 17,194 | | | Oracle Corp. (Information Technology) | | | 2,069,986 | |
| | 10,283 | | | O’Reilly Automotive, Inc. (Consumer Discretionary)* | | | 9,662,935 | |
| | 15,194 | | | Otis Worldwide Corp. (Industrials) | | | 1,299,847 | |
| | 32,469 | | | PACCAR, Inc. (Industrials) | | | 2,671,874 | |
| | 1,737 | | | Packaging Corp. of America (Materials) | | | 258,987 | |
| | 12,544 | | | Paychex, Inc. (Industrials) | | | 1,533,253 | |
| | 37,260 | | | PepsiCo, Inc. (Consumer Staples) | | | 6,629,299 | |
| | 49,035 | | | Pfizer, Inc. (Health Care) | | | 1,734,858 | |
| | 86,373 | | | PG&E Corp. (Utilities)* | | | 1,407,880 | |
| | 18,989 | | | Philip Morris International, Inc. (Consumer Staples) | | | 1,824,083 | |
| | 5,363 | | | PPL Corp. (Utilities) | | | 133,646 | |
| | 28,735 | | | Procter & Gamble Co. (The) (Consumer Staples) | | | 4,434,960 | |
| | 11,643 | | | Progressive Corp. (The) (Financials) | | | 1,553,991 | |
| | 11,176 | | | QUALCOMM, Inc. (Information Technology) | | | 1,279,987 | |
| | 16,828 | | | Quest Diagnostics, Inc. (Health Care) | | | 2,212,882 | |
| | 13,184 | | | Realty Income Corp. REIT (Real Estate) | | | 738,831 | |
| | 3,247 | | | Regeneron Pharmaceuticals, Inc. (Health Care)* | | | 2,683,613 | |
| | 22,372 | | | Republic Services, Inc. (Industrials) | | | 3,224,476 | |
| | 6,678 | | | Roche Holding AG (Health Care) | | | 1,968,054 | |
| | 6,055 | | | Roche Holding AG (Health Care) | | | 1,893,451 | |
| | 4,784 | | | Rockwell Automation, Inc. (Industrials) | | | 1,492,991 | |
| | 885 | | | Roper Technologies, Inc. (Information Technology) | | | 441,668 | |
| | 20,807 | | | Royalty Pharma PLC, Class A (Health Care) | | | 620,465 | |
| | 14,447 | | | RTX Corp. (Industrials) | | | 1,243,020 | |
| | 5,274 | | | Salesforce, Inc. (Information Technology)* | | | 1,167,980 | |
| | 25,409 | | | Sanofi (Health Care) | | | 2,720,261 | |
| | 5,652 | | | Sherwin-Williams Co. (The) (Materials) | | | 1,535,761 | |
| | 2,910 | | | Snap-on, Inc. (Industrials) | | | 781,626 | |
| | 12,725 | | | Southern Co. (The) (Utilities) | | | 861,864 | |
| | 33,450 | | | SS&C Technologies Holdings, Inc. (Industrials) | | | 1,920,699 | |
| | 13,811 | | | Starbucks Corp. (Consumer Discretionary) | | | 1,345,744 | |
| | |
| | |
| 104 | | The accompanying notes are an integral part of these financial statements. |
GOLDMAN SACHS ACTIVEBETA® WORLD LOW VOL PLUS EQUITY ETF
| | | | | | | | |
| Shares | | |
Description | | Value | |
|
| Common Stocks – (continued) | |
| United States – (continued) | | | |
| | 4,829 | | | Stryker Corp. (Health Care) | | $ | 1,369,263 | |
| | 11,392 | | | Swiss Re AG (Financials) | | | 1,107,923 | |
| | 8,592 | | | TE Connectivity Ltd. (Information Technology) | | | 1,137,495 | |
| | 16,311 | | | Texas Instruments, Inc. (Information Technology) | | | 2,741,227 | |
| | 13,139 | | | Textron, Inc. (Industrials) | | | 1,021,032 | |
| | 298 | | | Thermo Fisher Scientific, Inc. (Health Care) | | | 166,016 | |
| | 38,185 | | | TJX Cos., Inc. (The) (Consumer Discretionary) | | | 3,531,349 | |
| | 2,469 | | | T-Mobile US, Inc. (Communication Services)* | | | 336,401 | |
| | 7,787 | | | Travelers Cos., Inc. (The) (Financials) | | | 1,255,498 | |
| | 10,212 | | | Tyson Foods, Inc., Class A (Consumer Staples) | | | 543,993 | |
| | 12,043 | | | UnitedHealth Group, Inc. (Health Care) | | | 5,739,453 | |
| | 23,496 | | | VeriSign, Inc. (Information Technology)* | | | 4,882,234 | |
| | 113,200 | | | Verizon Communications, Inc. (Communication Services) | | | 3,959,736 | |
| | 7,683 | | | Vertex Pharmaceuticals, Inc. (Health Care)* | | | 2,676,296 | |
| | 15,937 | | | VICI Properties, Inc. REIT (Real Estate) | | | 491,497 | |
| | 20,516 | | | Visa, Inc., Class A (Financials) | | | 5,040,371 | |
| | 15,389 | | | VMware, Inc., Class A (Information Technology)* | | | 2,597,355 | |
| | 20,324 | | | W R Berkley Corp. (Financials) | | | 1,257,243 | |
| | 47,330 | | | Walmart, Inc. (Consumer Staples) | | | 7,696,331 | |
| | 3,737 | | | Waste Connections, Inc. (Industrials) | | | 511,654 | |
| | 22,099 | | | Waste Management, Inc. (Industrials) | | | 3,464,681 | |
| | 1,052 | | | Willis Towers Watson PLC (Financials) | | | 217,512 | |
| | 5,222 | | | W.P. Carey, Inc. REIT (Real Estate) | | | 339,691 | |
| | 8,301 | | | W.W. Grainger, Inc. (Industrials) | | | 5,928,076 | |
| | 8,786 | | | Xylem, Inc. (Industrials) | | | 909,702 | |
| | 43,865 | | | Yum! Brands, Inc. (Consumer Discretionary) | | | 5,675,254 | |
| | 3,129 | | | Zebra Technologies Corp., Class A (Information Technology)* | | | 860,506 | |
| | 8,730 | | | Zoetis, Inc. (Health Care) | | | 1,663,152 | |
| | | | | | | | |
| | | | | | | 502,308,974 | |
| | |
| | TOTAL COMMON STOCKS | | | | |
| | (Cost $694,468,676) | | $ | 719,024,019 | |
| | |
| | | | | | | | | | | | |
| Shares | | | Description | | Rate | | | Value | |
|
| Preferred Stock – 0.0% | |
| Germany – 0.0% | | | | |
| | 4,648 | | | Henkel AG & Co. KGaA (Consumer Staples) | | | | | | | | |
| | (Cost $380,331) | | | 2.60% | | | $ | 356,762 | |
| | |
| TOTAL INVESTMENTS BEFORE SECURITIES LENDING
REINVESTMENT VEHICLE |
|
| | (Cost $694,849,007) | | | | | | $ | 719,380,781 | |
| | |
| | | | | | | | |
| Shares | | | Dividend
Rate | | Value | |
|
| Securities Lending Reinvestment Vehicle – 0.3%(c) | |
| Goldman Sachs Financial Square Government Fund –
Institutional Shares |
|
| | 2,067,149 | | | 5.234% | | $ | 2,067,149 | |
| (Cost $2,067,149) | | | |
| | |
| | TOTAL INVESTMENTS – 99.8% | | | | |
| | (Cost $696,916,156) | | $ | 721,447,930 | |
| | |
| OTHER ASSETS IN EXCESS OF
LIABILITIES – 0.2% | | | 1,305,681 | |
| | |
| | NET ASSETS – 100.0% | | $ | 722,753,611 | |
| | |
| | |
|
| The percentage shown for each investment category reflects the value of investments in that category as a percentage of net assets. |
| |
* | | Non-income producing security. |
| |
(a) | | All or a portion of security is on loan. |
| |
(b) | | Exempt from registration under Rule 144A of the Securities Act of 1933. |
| |
(c) | | Represents an affiliated issuer. |
| | |
|
Investment Abbreviations: |
CVA | | —Dutch Certification |
PLC | | —Public Limited Company |
REIT | | —Real Estate Investment Trust |
|
| | |
| The accompanying notes are an integral part of these financial statements. | | 105 |
GOLDMAN SACHS ACTIVEBETA® WORLD LOW VOL PLUS EQUITY ETF
Schedule of Investments (continued)
August 31, 2023
|
| ADDITIONAL INVESTMENT INFORMATION |
FUTURES CONTRACTS — At August 31, 2023, the Fund had the following futures contracts:
| | | | | | | | | | | | | | | | |
| Description | | Number of
Contracts | | | Expiration
Date | | | Notional
Amount | | | Unrealized
Appreciation/
(Depreciation) | |
Long position contracts: | | | | | | | | | | | | | | | | |
E-Mini MSCI EAFE Index Future | | | 6 | | | | 09/15/23 | | | $ | 632,790 | | | $ | 5,113 | |
S&P 500 E-Mini Index | | | 5 | | | | 09/15/23 | | | | 1,129,000 | | | | 16,990 | |
| | | | |
| Total Futures Contracts | | | | | | | | | | | | | | $ | 22,103 | |
| | | | |
| Sector Name | | % of Market
Value | |
| |
Information Technology | | | 21.1 | % |
Financials | | | 16.8 | |
Health Care | | | 14.0 | |
Industrials | | | 13.0 | |
Consumer Staples | | | 12.3 | |
Consumer Discretionary | | | 9.8 | |
Communication Services | | | 7.5 | |
Materials | | | 1.9 | |
Utilities | | | 1.4 | |
Energy | | | 1.0 | |
Real Estate | | | 0.9 | |
Securities Lending Reinvestment Vehicle | | | 0.3 | |
| |
| |
| TOTAL INVESTMENTS | | | 100.0 | % |
| |
| | |
| 106 | | The accompanying notes are an integral part of these financial statements. |
GOLDMAN SACHS ACTIVEBETA® ETFS
Statements of Assets and Liabilities
August 31, 2023
| | | | | | | | | | | | | | | | | | |
| | | | |
ActiveBeta®
Emerging Markets
Equity ETF | | | ActiveBeta®
Europe
Equity ETF | | | ActiveBeta®
International
Equity ETF | | | ActiveBeta®
Japan
Equity ETF | |
| | Assets: | |
| | | | | |
| | Investments at value (cost $907,108,537, $10,669,813, $2,896,394,872 and $11,912,892, respectively)(a) | | $ | 970,278,103 | | | $ | 11,514,563 | | | $ | 3,238,073,208 | | | $ | 13,640,360 | |
| | | | | |
| | Investments in affiliated securities lending reinvestment vehicle, at value which equals cost | | | 5,450,496 | | | | 132,123 | | | | 37,159,558 | | | | 96,777 | |
| | | | | |
| | Cash | | | 21,336,315 | | | | 83,999 | | | | 8,918,604 | | | | 17,222 | |
| | | | | |
| | Foreign currency, at value (cost $86,637, $1,453, $587,671 and $—, respectively) | | | 86,782 | | | | 1,462 | | | | 589,841 | | | | — | |
| | | | | |
| | Variation margin on futures contracts | | | 60,494 | | | | 2,018 | | | | 96,196 | | | | 160 | |
| | | | | |
| | Receivables: | | | | | | | | | | | | | | | | |
| | | | | |
| | Investments sold | | | 18,692,210 | | | | 267,179 | | | | 91,264,966 | | | | 331,200 | |
| | | | | |
| | Dividends | | | 1,972,762 | | | | 20,854 | | | | 7,128,431 | | | | 17,952 | |
| | | | | |
| | Collateral on futures contracts | | | — | | | | 4,341 | | | | 331,647 | | | | 618 | |
| | | | | |
| | Foreign tax reclaims | | | 110,269 | | | | 29,379 | | | | 4,167,383 | | | | 945 | |
| | | | | |
| | Reimbursement from investment adviser | | | 37,990 | | | | 4,711 | | | | — | | | | 2,667 | |
| | | | | |
| | Securities lending income | | | 12,305 | | | | 32 | | | | 19,373 | | | | 14 | |
| | | | | |
| | Total assets | | | 1,018,037,726 | | | | 12,060,661 | | | | 3,387,749,207 | | | | 14,107,915 | |
| | | | | | | | | | | | | | | | | | |
| | Liabilities: | | | | | | | | | | | | | | | | |
| | | | | |
| | Payables: | | | | | | | | | | | | | | | | |
| | | | | |
| | Investments purchased | | | 37,154,189 | | | | 341,504 | | | | 98,800,691 | | | | 339,811 | |
| | | | | |
| | Upon return of securities loaned | | | 5,450,496 | | | | 132,123 | | | | 37,159,558 | | | | 96,777 | |
| | | | | |
| | Foreign capital gains tax | | | 4,427,902 | | | | — | | | | — | | | | — | |
| | | | | |
| | Management fees | | | 333,645 | | | | — | | | | 680,102 | | | | — | |
| | | | | |
| | Fund shares redeemed | | | — | | | | — | | | | 47,011 | | | | — | |
| | | | | |
| | Foreign bank overdraft (cost $—, $—, $— and $52, respectively) | | | — | | | | — | | | | — | | | | 52 | |
| | | | | |
| | Accrued expenses | | | 963,881 | | | | — | | | | 60 | | | | — | |
| | | | | |
| | Total liabilities | | | 48,330,113 | | | | 473,627 | | | | 136,687,422 | | | | 436,640 | |
| | | | | | | | | | | | | | | | | | |
| | Net Assets: | | | | | | | | | | | | | | | | |
| | | | | |
| | Paid-in capital | | | 982,910,608 | | | | 14,551,089 | | | | 3,196,904,719 | | | | 13,637,976 | |
| | | | | |
| | Total distributable earnings (loss) | | | (13,202,995 | ) | | | (2,964,055 | ) | | | 54,157,066 | | | | 33,299 | |
| | | | | |
| | NET ASSETS | | $ | 969,707,613 | | | $ | 11,587,034 | | | $ | 3,251,061,785 | | | $ | 13,671,275 | |
| | SHARES ISSUED AND OUTSTANDING | | | | | | | | | | | | | | | | |
| | | | | |
| | Shares outstanding no par value (unlimited shares authorized): | | | 32,750,000 | | | | 350,000 | | | | 104,200,000 | | | | 400,000 | |
| | | | | |
| | Net asset value per share: | | | $29.61 | | | | $33.11 | | | | $31.20 | | | | $34.18 | |
| | (a) | | Includes loaned securities having a market value of $4,433,693, $122,737, $33,125,560 and $92,313 for ActiveBeta® Emerging Markets Equity ETF, ActiveBeta® Europe Equity ETF, ActiveBeta® International Equity ETF and ActiveBeta® Japan Equity ETF, respectively. |
| | |
| The accompanying notes are an integral part of these financial statements. | | 107 |
GOLDMAN SACHS ACTIVEBETA® ETFS
Statements of Assets and Liabilities (continued)
August 31, 2023
| | | | | | | | | | | | | | | | | | |
| | | | | ActiveBeta®
Paris-Aligned Climate
U.S. Large Cap
Equity ETF | | | ActiveBeta®
U.S. Large Cap
Equity ETF | | | ActiveBeta®
U.S. Small Cap
Equity ETF | | | ActiveBeta®
World Low Vol Plus
Equity ETF | |
| | Assets: | |
| | | | | |
| | Investments at value (cost $7,312,057, $8,454,987,939, $462,827,770 and $694,849,007, respectively)(a) | | $ | 7,360,060 | | | $ | 11,378,218,889 | | | $ | 478,466,440 | | | $ | 719,380,781 | |
| | | | | |
| | Investments in affiliated securities lending reinvestment vehicle, at value which equals cost | | | — | | | | 39,027,450 | | | | 2,764,662 | | | | 2,067,149 | |
| | | | | |
| | Cash | | | 14,362 | | | | 14,932,201 | | | | 3,220,322 | | | | 876,196 | |
| | | | | |
| | Foreign currency, at value (cost $—, $—, $— and $824,650, respectively) | | | — | | | | — | | | | — | | | | 813,339 | |
| | | | | |
| | Receivables: | | | | | | | | | | | | | | | | |
| | | | | |
| | Reimbursement from investment adviser | | | 13,917 | | | | — | | | | — | | | | — | |
| | | | | |
| | Dividends | | | 8,665 | | | | 17,371,463 | | | | 549,765 | | | | 1,319,057 | |
| | | | | |
| | Investments sold | | | — | | | | 8,844,376 | | | | 481,219 | | | | 357 | |
| | | | | |
| | Securities lending income | | | — | | | | 114,126 | | | | 4,616 | | | | 9,760 | |
| | | | | |
| | Collateral on futures contracts | | | — | | | | 751,520 | | | | 293,260 | | | | 83,467 | |
| | | | | |
| | Foreign tax reclaims | | | — | | | | — | | | | 612 | | | | 428,267 | |
| | | | | |
| | Total assets | | | 7,397,004 | | | | 11,459,260,025 | | | | 485,780,896 | | | | 724,978,373 | |
| | | | | | | | | | | | | | | | | | |
| | Liabilities: | | | | | | | | | | | | | | | | |
| | | | | |
| | Variation margin on futures contracts | | | — | | | | 25,163 | | | | 95,795 | | | | 5,105 | |
| | | | | |
| | Payables: | | | | | | | | | | | | | | | | |
| | | | | |
| | Upon return of securities loaned | | | — | | | | 39,027,450 | | | | 2,764,662 | | | | 2,067,149 | |
| | | | | |
| | Fund shares redeemed | | | — | | | | 8,861,932 | | | | — | | | | — | |
| | | | | |
| | Management fees | | | — | | | | 866,502 | | | | 81,601 | | | | 152,000 | |
| | | | | |
| | Accrued expenses | | | — | | | | 5,939 | | | | — | | | | 508 | |
| | | | | |
| | Total liabilities | | | — | | | | 48,786,986 | | | | 2,942,058 | | | | 2,224,762 | |
| | | | | | | | | | | | | | | | | | |
| | Net Assets: | | | | | | | | | | | | | | | | |
| | | | | |
| | Paid-in capital | | | 7,938,620 | | | | 9,387,477,681 | | | | 497,139,412 | | | | 726,713,386 | |
| | | | | |
| | Total distributable earnings (loss) | | | (541,616 | ) | | | 2,022,995,358 | | | | (14,300,574 | ) | | | (3,959,775 | ) |
| | | | | |
| | NET ASSETS | | $ | 7,397,004 | | | $ | 11,410,473,039 | | | $ | 482,838,838 | | | $ | 722,753,611 | |
| | SHARES ISSUED AND OUTSTANDING | | | | | | | | | | | | | | | | |
| | | | | |
| | Shares outstanding no par value (unlimited shares authorized): | | | 200,000 | | | | 128,852,500 | | | | 8,200,000 | | | | 17,500,000 | |
| | | | | |
| | Net asset value per share: | | | $36.99 | | | | $88.55 | | | | $58.88 | | | | $41.30 | |
| | (a) | | Includes loaned securities having a market value of $–, $37,608,270, $2,683,736 and $1,980,891 for ActiveBeta® Paris-Aligned Climate U.S. Large Cap Equity ETF, ActiveBeta® U.S. Large Cap Equity ETF, ActiveBeta® U.S. Small Cap Equity ETF and ActiveBeta® World Low Vol Plus Equity ETF, respectively. |
| | |
| 108 | | The accompanying notes are an integral part of these financial statements. |
GOLDMAN SACHS ACTIVEBETA® ETFS
Statements of Operations
For the Fiscal Year Ended August 31, 2023
| | | | | | | | | | | | | | | | | | |
| | | | |
ActiveBeta®
Emerging Markets
Equity ETF | | | ActiveBeta®
Europe
Equity ETF | | | ActiveBeta®
International
Equity ETF | | | ActiveBeta®
Japan
Equity ETF | |
| | Investment income: | | | | | | | | | | | | | | | | |
| | | | | |
| | Dividends — unaffiliated issuers (net of foreign withholding taxes of $3,973,676, $61,142, $11,839,197 and $39,658, respectively) | | $ | 31,346,333 | | | $ | 362,365 | | | $ | 98,491,137 | | | $ | 304,590 | |
| | | | | |
| | Non cash dividend income | | | 2,802,480 | | | | — | | | | — | | | | — | |
| | | | | |
| | Securities lending income, net of rebates received or paid to borrowers — unaffiliated issuer | | | 123,715 | | | | 2,932 | | | | 815,832 | | | | 2,647 | |
| | | | | |
| | Other income | | | — | | | | 80,695 | | | | — | | | | — | |
| | | | | |
| | Total investment income | | | 34,272,528 | | | | 445,992 | | | | 99,306,969 | | | | 307,237 | |
| | | | | | | | | | | | | | | | | | |
| | Expenses: | | | | | | | | | | | | | | | | |
| | | | | |
| | Management fees | | | 3,808,775 | | | | 2,566 | | | | 7,350,354 | | | | 6,105 | |
| | | | | |
| | Custody, accounting and administrative services | | | 707,430 | | | | — | | | | — | | | | — | |
| | | | | |
| | Printing and mailing costs | | | 223,955 | | | | — | | | | — | | | | — | |
| | | | | |
| | Professional fees | | | 122,341 | | | | — | | | | — | | | | — | |
| | | | | |
| | Trustee fees | | | 47,355 | | | | 25,390 | | | | 94,095 | | | | 25,409 | |
| | | | | |
| | Shareholder meeting expense | | | 38,267 | | | | — | | | | — | | | | — | |
| | | | | |
| | Registration fees | | | 11,880 | | | | — | | | | — | | | | — | |
| | | | | |
| | Other | | | 27,733 | | | | — | | | | — | | | | — | |
| | | | | |
| | Total expenses | | | 4,987,736 | | | | 27,956 | | | | 7,444,449 | | | | 31,514 | |
| | | | | |
| | Less — expense reductions | | | (664,597 | ) | | | — | | | | — | | | | — | |
| | | | | |
| | Net expenses | | | 4,323,139 | | | | 27,956 | | | | 7,444,449 | | | | 31,514 | |
| | | | | |
| | NET INVESTMENT INCOME | | | 29,949,389 | | | | 418,036 | | | | 91,862,520 | | | | 275,723 | |
| | | | | | | | | | | | | | | | | | |
| | Realized and unrealized gain (loss): | | | | | | | | | | | | | | | | |
| | | | | |
| | Net realized gain (loss) from: | | | | | | | | | | | | | | | | |
| | | | | |
| | Investments — unaffiliated issuers | | | (34,125,268 | ) | | | (240,131 | ) | | | (67,756,323 | ) | | | (204,944 | ) |
| | | | | |
| | In-kind redemptions | | | 2,070,593 | | | | (177,083 | ) | | | 12,512,749 | | | | — | |
| | | | | |
| | Futures contracts | | | (1,041,154 | ) | | | 3,895 | | | | (1,185,868 | ) | | | 20,073 | |
| | | | | |
| | Foreign currency transactions | | | (431,538 | ) | | | (4,480 | ) | | | (93,753 | ) | | | (4,831 | ) |
| | | | | |
| | Net change in unrealized gain (loss) on: | | | | | | | | | | | | | | | | |
| | | | | |
| | Investments — unaffiliated issuers (including the effects of the net change in foreign capital gains tax liability of $282,843, $—, $— and $—, respectively) | | | 30,561,601 | | | | 2,121,270 | | | | 407,552,273 | | | | 1,784,839 | |
| | | | | |
| | Futures contracts | | | 8,434 | | | | 286 | | | | 606,664 | | | | 942 | |
| | | | | |
| | Foreign currency translations | | | 40,637 | | | | 9,124 | | | | 622,866 | | | | 324 | |
| | | | | |
| | Net realized and unrealized gain (loss) | | | (2,916,695 | ) | | | 1,712,881 | | | | 352,258,608 | | | | 1,596,403 | |
| | | | | |
| | NET INCREASE IN NET ASSETS RESULTING FROM OPERATIONS | | $ | 27,032,694 | | | $ | 2,130,917 | | | $ | 444,121,128 | | | $ | 1,872,126 | |
| | |
| The accompanying notes are an integral part of these financial statements. | | 109 |
GOLDMAN SACHS ACTIVEBETA® ETFS
Statements of Operations (continued)
For the Fiscal Year Ended August 31, 2023
| | | | | | | | | | | | | | | | | | |
| | | | | ActiveBeta®
Paris-Aligned Climate
U.S. Large Cap
Equity ETF | | | ActiveBeta®
U.S. Large Cap
Equity ETF | | | ActiveBeta®
U.S. Small Cap
Equity ETF | | | ActiveBeta®
World Low Vol Plus
Equity ETF | |
| | Investment income: | | | | | | | | | | | | | | | | |
| | | | | |
| | Dividends — unaffiliated issuers (net of foreign withholding taxes of $166, $572,591, $45,774 and $1,071,028, respectively) | | $ | 121,812 | | | $ | 176,793,084 | | | $ | 7,659,729 | | | $ | 15,490,905 | |
| | | | | |
| | Securities lending income, net of rebates received or paid to borrowers — unaffiliated issuer | | | 5 | | | | 287,892 | | | | 54,935 | | | | 92,383 | |
| | | | | |
| | Total investment income | | | 121,817 | | | | 177,080,976 | | | | 7,714,664 | | | | 15,583,288 | |
| | | | | | | | | | | | | | | | | | |
| | Expenses: | | | | | | | | | | | | | | | | |
| | | | | |
| | Trustee fees | | | 15,917 | | | | 292,956 | | | | 36,453 | | | | 39,271 | |
| | | | | |
| | Management fees | | | — | | | | 9,528,468 | | | | 875,427 | | | | 1,540,912 | |
| | | | | |
| | Total expenses | | | 15,917 | | | | 9,821,424 | | | | 911,880 | | | | 1,580,183 | |
| | | | | |
| | NET INVESTMENT INCOME | | | 105,900 | | | | 167,259,552 | | | | 6,802,784 | | | | 14,003,105 | |
| | | | | | | | | | | | | | | | | | |
| | Realized and unrealized gain (loss): | | | | | | | | | | | | | | | | |
| | | | | |
| | Net realized gain (loss) from: | | | | | | | | | | | | | | | | |
| | | | | |
| | Investments — unaffiliated issuers | | | (413,294 | ) | | | (346,785,616 | ) | | | (10,400,208 | ) | | | (24,516,842 | ) |
| | | | | |
| | In-kind redemptions | | | 331,542 | | | | 810,532,671 | | | | 19,296,164 | | | | — | |
| | | | | |
| | Futures contracts | | | — | | | | (432,733 | ) | | | (901,485 | ) | | | — | |
| | | | | |
| | Foreign currency transactions | | | (10 | ) | | | (32,889 | ) | | | — | | | | (44,421 | ) |
| | | | | |
| | Net change in unrealized gain (loss) on: | | | | | | | | | | | | | | | | |
| | | | | |
| | Investments — unaffiliated issuers | | | 1,267,897 | | | | 860,901,487 | | | | 13,578,626 | | | | 78,874,074 | |
| | | | | |
| | Futures contracts | | | — | | | | 59,881 | | | | (15,807 | ) | | | 22,103 | |
| | | | | |
| | Foreign currency translations | | | — | | | | — | | | | — | | | | (3,911 | ) |
| | | | | |
| | Net realized and unrealized gain | | | 1,186,135 | | | | 1,324,242,801 | | | | 21,557,290 | | | | 54,331,003 | |
| | | | | |
| | NET INCREASE IN NET ASSETS RESULTING FROM OPERATIONS | | $ | 1,292,035 | | | $ | 1,491,502,353 | | | $ | 28,360,074 | | | $ | 68,334,108 | |
| | |
| 110 | | The accompanying notes are an integral part of these financial statements. |
GOLDMAN SACHS ACTIVEBETA® ETFS
Statements of Changes in Net Assets
| | | | | | | | | | | | | | | | | | | | | | |
| | | | |
ActiveBeta® Emerging Markets Equity ETF | | | | | | ActiveBeta® Europe Equity ETF | |
| | | | | For the Fiscal
Year Ended
August 31, 2023 | | | For the Fiscal
Year Ended
August 31, 2022 | | | | | | For the Fiscal
Year Ended
August 31, 2023 | | | For the Fiscal
Year Ended
August 31, 2022 | |
| | From operations: | | | | | | | | | | | | | | | | | | | | |
| | | | | | |
| | Net investment income | | $ | 29,949,389 | | | $ | 40,487,439 | | | | | | | $ | 418,036 | | | $ | 552,625 | |
| | | | | | |
| | Net realized gain (loss) | | | (33,527,367 | ) | | | (13,373,376 | ) | | | | | | | (417,799 | ) | | | 72,961 | |
| | | | | | |
| | Net change in unrealized gain (loss) | | | 30,610,672 | | | | (329,818,743 | ) | | | | | | | 2,130,680 | | | | (5,677,140 | ) |
| | | | | | |
| | Net increase (decrease) in net assets resulting from operations | | | 27,032,694 | | | | (302,704,680 | ) | | | | | | | 2,130,917 | | | | (5,051,554 | ) |
| | | | | | | | | | | | | | | | | | | | | | |
| | Distributions to shareholders: | | | | | | | | | | | | | | | | | | | | |
| | | | | | |
| | From distributable earnings | | | (25,009,312 | ) | | | (53,609,786 | ) | | | | | | | (359,836 | ) | | | (658,039 | ) |
| | | | | | | | | | | | | | | | | | | | | | |
| | From share transactions: | | | | | | | | | | | | | | | | | | | | |
| | | | | | |
| | Proceeds from sales of shares | | | 62,411,100 | | | | 46,098,249 | | | | | | | | — | | | | 1,790,294 | |
| | | | | | |
| | Cost of shares redeemed | | | (119,934,568 | ) | | | (52,865,514 | ) | | | | | | | (2,547,509 | ) | | | (4,610,459 | ) |
| | | | | | |
| | Net decrease in net assets resulting from share transactions | | | (57,523,468 | ) | | | (6,767,265 | ) | | | | | | | (2,547,509 | ) | | | (2,820,165 | ) |
| | | | | | |
| | TOTAL DECREASE | | | (55,500,086 | ) | | | (363,081,731 | ) | | | | | | | (776,428 | ) | | | (8,529,758 | ) |
| | | | | | | | | | | | | | | | | | | | | | |
| | Net assets: | | | | | | | | | | | | | | | | | | | | |
| | | | | | |
| | Beginning of year | | $ | 1,025,207,699 | | | $ | 1,388,289,430 | | | | | | | $ | 12,363,462 | | | $ | 20,893,220 | |
| | | | | | |
| | End of year | | $ | 969,707,613 | | | $ | 1,025,207,699 | | | | | | | $ | 11,587,034 | | | $ | 12,363,462 | |
| | |
| The accompanying notes are an integral part of these financial statements. | | 111 |
GOLDMAN SACHS ACTIVEBETA® ETFS
Statements of Changes in Net Assets (continued)
| | | | | | | | | | | | | | | | | | | | | | |
| | | | |
ActiveBeta® International Equity ETF | | | | | | ActiveBeta® Japan Equity ETF | |
| | | | | For the Fiscal
Year Ended
August 31, 2023 | | | For the Fiscal
Year Ended
August 31, 2022 | | | | | | For the Fiscal
Year Ended
August 31, 2023 | | | For the Fiscal
Year Ended
August 31, 2022 | |
| | From operations: | | | | | | | | | | | | | | | | | | | | |
| | | | | | |
| | Net investment income | | $ | 91,862,520 | | | $ | 89,902,288 | | | | | | | $ | 275,723 | | | $ | 279,094 | |
| | | | | | |
| | Net realized loss | | | (56,523,195 | ) | | | (83,840,464 | ) | | | | | | | (189,702 | ) | | | (665,882 | ) |
| | | | | | |
| | Net change in unrealized gain (loss) | | | 408,781,803 | | | | (686,189,583 | ) | | | | | | | 1,786,105 | | | | (2,432,140 | ) |
| | | | | | |
| | Net increase (decrease) in net assets resulting from operations | | | 444,121,128 | | | | (680,127,759 | ) | | | | | | | 1,872,126 | | | | (2,818,928 | ) |
| | | | | | | | | | | | | | | | | | | | | | |
| | Distributions to shareholders: | | | | | | | | | | | | | | | | | | | | |
| | | | | | |
| | From distributable earnings | | | (90,840,491 | ) | | | (93,382,329 | ) | | | | | | | (259,624 | ) | | | (285,200 | ) |
| | | | | | | | | | | | | | | | | | | | | | |
| | From share transactions: | | | | | | | | | | | | | | | | | | | | |
| | | | | | |
| | Proceeds from sales of shares | | | 222,011,550 | | | | 495,342,351 | | | | | | | | — | | | | — | |
| | | | | | |
| | Cost of shares redeemed | | | (44,267,175 | ) | | | (95,030,975 | ) | | | | | | | — | | | | — | |
| | | | | | |
| | Net increase in net assets resulting from share transactions | | | 177,744,375 | | | | 400,311,376 | | | | | | | | — | | | | — | |
| | | | | | |
| | TOTAL INCREASE (DECREASE) | | | 531,025,012 | | | | (373,198,712 | ) | | | | | | | 1,612,502 | | | | (3,104,128 | ) |
| | | | | | | | | | | | | | | | | | | | | | |
| | Net assets: | | | | | | | | | | | | | | | | | | | | |
| | | | | | |
| | Beginning of year | | $ | 2,720,036,773 | | | $ | 3,093,235,485 | | | | | | | $ | 12,058,773 | | | $ | 15,162,901 | |
| | | | | | |
| | End of year | | $ | 3,251,061,785 | | | $ | 2,720,036,773 | | | | | | | $ | 13,671,275 | | | $ | 12,058,773 | |
| | |
| 112 | | The accompanying notes are an integral part of these financial statements. |
GOLDMAN SACHS ACTIVEBETA® ETFS
Statements of Changes in Net Assets (continued)
| | | | | | | | | | | | | | | | | | | | | | |
| | | | | ActiveBeta® Paris-Aligned Climate
U.S. Large Cap Equity ETF | | | | | | ActiveBeta® U.S. Large Cap Equity ETF | |
| | | | | For the Fiscal
Year Ended
August 31, 2023 | | | For the Period
December 13, 2021*
to
August 31, 2022 | | | | | | For the Fiscal
Year Ended
August 31, 2023 | | | For the Fiscal
Year Ended
August 31, 2022 | |
| | From operations: | | | | | | | | | | | | | | | | | | | | |
| | | | | | |
| | Net investment income | | $ | 105,900 | | | $ | 63,472 | | | | | | | $ | 167,259,552 | | | $ | 177,914,041 | |
| | | | | | |
| | Net realized gain (loss) | | | (81,762 | ) | | | (230,839 | ) | | | | | | | 463,281,433 | | | | 647,304,822 | |
| | | | | | |
| | Net change in unrealized gain (loss) | | | 1,267,897 | | | | (1,219,894 | ) | | | | | | | 860,961,368 | | | | (2,624,189,006 | ) |
| | | | | | |
| | Net increase (decrease) in net assets resulting from operations | | | 1,292,035 | | | | (1,387,261 | ) | | | | | | | 1,491,502,353 | | | | (1,798,970,143 | ) |
| | | | | | | | | | | | | | | | | | | | | | |
| | Distributions to shareholders: | | | | | | | | | | | | | | | | | | | | |
| | | | | | |
| | From distributable earnings | | | (106,659 | ) | | | (47,676 | ) | | | | | | | (170,189,662 | ) | | | (174,777,118 | ) |
| | | | | | | | | | | | | | | | | | | | | | |
| | From share transactions: | | | | | | | | | | | | | | | | | | | | |
| | | | | | |
| | Proceeds from sales of shares | | | 1,515,654 | | | | 7,934,654 | | | | | | | | 551,981,819 | | | | 1,516,359,247 | |
| | | | | | |
| | Cost of shares redeemed | | | (1,803,743 | ) | | | — | | | | | | | | (2,079,315,418 | ) | | | (1,695,965,517 | ) |
| | | | | | |
| | Net increase (decrease) in net assets resulting from share transactions | | | (288,089 | ) | | | 7,934,654 | | | | | | | | (1,527,333,599 | ) | | | (179,606,270 | ) |
| | | | | | |
| | TOTAL INCREASE (DECREASE) | | | 897,287 | | | | 6,499,717 | | | | | | | | (206,020,908 | ) | | | (2,153,353,531 | ) |
| | | | | | | | | | | | | | | | | | | | | | |
| | Net assets: | | | | | | | | | | | | | | | | | | | | |
| | | | | | |
| | Beginning of period | | $ | 6,499,717 | | | $ | — | | | | | | | $ | 11,616,493,947 | | | $ | 13,769,847,478 | |
| | | | | | |
| | End of period | | $ | 7,397,004 | | | $ | 6,499,717 | | | | | | | $ | 11,410,473,039 | | | $ | 11,616,493,947 | |
| | * | | Commencement of operations. |
| | |
| The accompanying notes are an integral part of these financial statements. | | 113 |
GOLDMAN SACHS ACTIVEBETA® ETFS
Statements of Changes in Net Assets (continued)
| | | | | | | | | | | | | | | | | | | | | | |
| | | | |
ActiveBeta® U.S. Small Cap Equity ETF | | | | | | ActiveBeta® World Low Vol Plus Equity ETF | |
| | | | | For the Fiscal
Year Ended
August 31, 2023 | | | For the Fiscal
Year Ended
August 31, 2022 | | | | | | For the Fiscal
Year Ended
August 31, 2023 | | | For the Period
March 15, 2022*
to
August 31, 2022 | |
| | From operations: | | | | | | | | | | | | | | | | | | | | |
| | | | | | |
| | Net investment income | | $ | 6,802,784 | | | $ | 5,489,225 | | | | | | | $ | 14,003,105 | | | $ | 6,264,424 | |
| | | | | | |
| | Net realized gain (loss) | | | 7,994,471 | | | | 3,891,164 | | | | | | | | (24,561,263 | ) | | | (6,378,645 | ) |
| | | | | | |
| | Net change in unrealized gain (loss) | | | 13,562,819 | | | | (71,373,057 | ) | | | | | | | 78,892,266 | | | | (54,360,729 | ) |
| | | | | | |
| | Net increase (decrease) in net assets resulting from operations | | | 28,360,074 | | | | (61,992,668 | ) | | | | | | | 68,334,108 | | | | (54,474,950 | ) |
| | | | | | | | | | | | | | | | | | | | | | |
| | Distributions to shareholders: | | | | | | | | | | | | | | | | | | | | |
| | | | | | |
| | From distributable earnings | | | (6,492,896 | ) | | | (5,603,655 | ) | | | | | | | (13,421,605 | ) | | | (4,397,328 | ) |
| | | | | | | | | | | | | | | | | | | | | | |
| | From share transactions: | | | | | | | | | | | | | | | | | | | | |
| | | | | | |
| | Proceeds from sales of shares | | | 40,329,686 | | | | 176,204,999 | | | | | | | | 109,729,323 | | | | 616,984,063 | |
| | | | | | |
| | Cost of shares redeemed | | | (62,627,817 | ) | | | (37,882,026 | ) | | | | | | | — | | | | — | |
| | | | | | |
| | Net increase (decrease) in net assets resulting from share transactions | | | (22,298,131 | ) | | | 138,322,973 | | | | | | | | 109,729,323 | | | | 616,984,063 | |
| | | | | | |
| | TOTAL INCREASE (DECREASE) | | | (430,953 | ) | | | 70,726,650 | | | | | | | | 164,641,826 | | | | 558,111,785 | |
| | | | | | | | | | | | | | | | | | | | | | |
| | Net assets: | | | | | | | | | | | | | | | | | | | | |
| | | | | | |
| | Beginning of period | | $ | 483,269,791 | | | $ | 412,543,141 | | | | | | | $ | 558,111,785 | | | $ | — | |
| | | | | | |
| | End of period | | $ | 482,838,838 | | | $ | 483,269,791 | | | | | | | $ | 722,753,611 | | | $ | 558,111,785 | |
| | * | | Commencement of operations. |
| | |
| 114 | | The accompanying notes are an integral part of these financial statements. |
GOLDMAN SACHS ACTIVEBETA® ETFS
Financial Highlights
Selected Data for a Share Outstanding Throughout Each Year
| | | | | | | | | | | | | | | | | | | | | | |
| | | | | ActiveBeta® Emerging Markets Equity ETF | |
| | | | | For the Fiscal
Year Ended August 31, | |
| | | | | 2023 | | | 2022 | | | 2021 | | | 2020 | | | 2019 | |
| | Per Share Operating Performance: | | | | | | | | | | | | | | | | | | | | |
| | | | | | |
| | Net asset value, beginning of year | | $ | 29.42 | | | $ | 39.33 | | | $ | 33.28 | | | $ | 31.12 | | | $ | 32.98 | |
| | | | | | |
| | Net investment income(a) | | | 0.91 | | | | 1.13 | | | | 0.67 | | | | 0.80 | (b) | | | 0.75 | |
| | | | | | |
| | Net realized and unrealized gain (loss) | | | 0.06 | | | | (9.55 | ) | | | 6.07 | | | | 2.17 | | | | (1.79 | ) |
| | | | | | |
| | Total gain (loss) from investment operations | | | 0.97 | | | | (8.42 | ) | | | 6.74 | | | | 2.97 | | | | (1.04 | ) |
| | | | | | |
| | Distributions to shareholders from net investment income | | | (0.78 | ) | | | (1.49 | ) | | | (0.69 | ) | | | (0.81 | ) | | | (0.82 | ) |
| | | | | | |
| | Net asset value, end of year | | $ | 29.61 | | | $ | 29.42 | | | $ | 39.33 | | | $ | 33.28 | | | $ | 31.12 | |
| | | | | | |
| | Market price, end of year | | $ | 29.48 | | | $ | 29.03 | | | $ | 39.16 | | | $ | 33.28 | | | $ | 31.14 | |
| | | | | | |
| | Total Return at Net Asset Value(c) | | | 3.50 | % | | | (21.97 | )% | | | 20.49 | % | | | 9.55 | % | | | (3.21 | )% |
| | | | | | |
| | Net assets, end of year (in 000’s) | | $ | 969,708 | | | $ | 1,025,208 | | | $ | 1,388,289 | | | $ | 1,710,477 | | | $ | 1,699,201 | |
| | | | | | |
| | Ratio of net expenses to average net assets | | | 0.45 | % | | | 0.45 | % | | | 0.45 | % | | | 0.45 | % | | | 0.45 | % |
| | | | | | |
| | Ratio of total expenses to average net assets | | | 0.52 | % | | | 0.51 | % | | | 0.51 | % | | | 0.52 | % | | | 0.51 | % |
| | | | | | |
| | Ratio of net investment income to average net assets | | | 3.15 | % | | | 3.29 | % | | | 1.76 | % | | | 2.55 | %(b) | | | 2.37 | % |
| | | | | | |
| | Portfolio turnover rate(d) | | | 21 | % | | | 18 | % | | | 46 | % | | | 38 | % | | | 28 | % |
| | (a) | | Calculated based on the average shares outstanding methodology. |
| | (b) | | Reflects income recognized from non-recurring special dividends which amounted to $0.03 per share and 0.09% of average net assets. |
| | (c) | | Assumes investment at the net asset value at the beginning of the year, reinvestment of all distributions and a complete sale of the investment at the net asset value at the end of the year. Returns do not reflect the impact of taxes to shareholders relating to Fund distributions or the sale of Fund shares. |
| | (d) | | The Fund’s portfolio turnover rate is calculated in accordance with regulatory requirements and excludes portfolio securities received or delivered as a result of in-kind transactions and short-term transactions. If such transactions were included, the Fund’s portfolio turnover rate may be higher. |
| | |
| The accompanying notes are an integral part of these financial statements. | | 115 |
GOLDMAN SACHS ACTIVEBETA® ETFS
Financial Highlights (continued)
Selected Data for a Share Outstanding Throughout Each Year
| | | | | | | | | | | | | | | | | | | | | | |
| | | | | ActiveBeta® Europe Equity ETF | |
| | | | | For the Fiscal
Year Ended August 31, | |
| | | | | 2023 | | | 2022 | | | 2021 | | | 2020 | | | 2019 | |
| | Per Share Operating Performance: | | | | | | | | | | | | | | | | | | | | |
| | | | | | |
| | Net asset value, beginning of year | | $ | 27.47 | | | $ | 37.99 | | | $ | 29.85 | | | $ | 28.59 | | | $ | 30.82 | |
| | | | | | |
| | Net investment income(a) | | | 1.16 | | | | 1.01 | | | | 0.84 | | | | 0.58 | | | | 0.89 | |
| | | | | | |
| | Net realized and unrealized gain (loss) | | | 5.50 | | | | (10.29 | ) | | | 8.15 | | | | 1.27 | | | | (1.84 | ) |
| | | | | | |
| | Total gain (loss) from investment operations | | | 6.66 | | | | (9.28 | ) | | | 8.99 | | | | 1.85 | | | | (0.95 | ) |
| | | | | | |
| | Distributions to shareholders from net investment income | | | (1.02 | ) | | | (1.24 | ) | | | (0.85 | ) | | | (0.59 | ) | | | (1.28 | ) |
| | | | | | |
| | Net asset value, end of year | | $ | 33.11 | | | $ | 27.47 | | | $ | 37.99 | | | $ | 29.85 | | | $ | 28.59 | |
| | | | | | |
| | Market price, end of year | | $ | 33.05 | | | $ | 27.26 | | | $ | 38.05 | | | $ | 29.81 | | | $ | 28.62 | |
| | | | | | |
| | Total Return at Net Asset Value(b) | | | 24.40 | % | | | (24.81 | )% | | | 30.45 | % | | | 6.69 | % | | | (3.15 | )% |
| | | | | | |
| | Net assets, end of year (in 000’s) | | $ | 11,587 | | | $ | 12,363 | | | $ | 20,893 | | | $ | 16,416 | | | $ | 18,584 | |
| | | | | | |
| | Ratio of total expenses to average net assets | | | 0.25 | % | | | 0.25 | % | | | 0.25 | % | | | 0.25 | % | | | 0.25 | % |
| | | | | | |
| | Ratio of net investment income to average net assets | | | 3.74 | % | | | 2.98 | % | | | 2.47 | % | | | 2.01 | % | | | 3.07 | % |
| | | | | | |
| | Portfolio turnover rate(c) | | | 14 | % | | | 19 | % | | | 19 | % | | | 18 | % | | | 17 | % |
| | (a) | | Calculated based on the average shares outstanding methodology. |
| | (b) | | Assumes investment at the net asset value at the beginning of the year, reinvestment of all distributions and a complete sale of the investment at the net asset value at the end of the year. Returns do not reflect the impact of taxes to shareholders relating to Fund distributions or the sale of Fund shares. |
| | (c) | | The Fund’s portfolio turnover rate is calculated in accordance with regulatory requirements and excludes portfolio securities received or delivered as a result of in-kind transactions and short-term transactions. If such transactions were included, the Fund’s portfolio turnover rate may be higher. |
| | |
| 116 | | The accompanying notes are an integral part of these financial statements. |
GOLDMAN SACHS ACTIVEBETA® ETFS
Financial Highlights (continued)
Selected Data for a Share Outstanding Throughout Each Year
| | | | | | | | | | | | | | | | | | | | | | |
| | | | | ActiveBeta® International Equity ETF | |
| | | | | For the Fiscal
Year Ended August 31, | |
| | | | | 2023 | | | 2022 | | | 2021 | | | 2020 | | | 2019 | |
| | Per Share Operating Performance: | | | | | | | | | | | | | | | | | | | | |
| | | | | | |
| | Net asset value, beginning of year | | $ | 27.64 | | | $ | 35.76 | | | $ | 28.72 | | | $ | 27.70 | | | $ | 29.42 | |
| | | | | | |
| | Net investment income(a) | | | 0.92 | | | | 0.96 | | | | 0.75 | | | | 0.57 | | | | 0.86 | |
| | | | | | |
| | Net realized and unrealized gain (loss) | | | 3.55 | | | | (8.07 | ) | | | 6.97 | | | | 1.05 | | | | (1.78 | ) |
| | | | | | |
| | Total gain (loss) from investment operations | | | 4.47 | | | | (7.11 | ) | | | 7.72 | | | | 1.62 | | | | (0.92 | ) |
| | | | | | |
| | Distributions to shareholders from net investment income | | | (0.91 | ) | | | (1.01 | ) | | | (0.68 | ) | | | (0.60 | ) | | | (0.80 | ) |
| | | | | | |
| | Net asset value, end of year | | $ | 31.20 | | | $ | 27.64 | | | $ | 35.76 | | | $ | 28.72 | | | $ | 27.70 | |
| | | | | | |
| | Market price, end of year | | $ | 31.21 | | | $ | 27.52 | | | $ | 35.75 | | | $ | 28.63 | | | $ | 27.73 | |
| | | | | | |
| | Total Return at Net Asset Value(b) | | | 16.40 | % | | | (20.18 | )% | | | 27.12 | % | | | 5.96 | % | | | (3.09 | )% |
| | | | | | |
| | Net assets, end of year (in 000’s) | | $ | 3,251,062 | | | $ | 2,720,037 | | | $ | 3,093,235 | | | $ | 1,743,562 | | | $ | 1,545,601 | |
| | | | | | |
| | Ratio of total expenses to average net assets | | | 0.25 | % | | | 0.25 | % | | | 0.25 | % | | | 0.25 | % | | | 0.25 | % |
| | | | | | |
| | Ratio of net investment income to average net assets | | | 3.08 | % | | | 2.97 | % | | | 2.31 | % | | | 2.08 | % | | | 3.10 | % |
| | | | | | |
| | Portfolio turnover rate(c) | | | 14 | % | | | 18 | % | | | 21 | % | | | 20 | % | | | 17 | % |
| | (a) | | Calculated based on the average shares outstanding methodology. |
| | (b) | | Assumes investment at the net asset value at the beginning of the year, reinvestment of all distributions and a complete sale of the investment at the net asset value at the end of the year. Returns do not reflect the impact of taxes to shareholders relating to Fund distributions or the sale of Fund shares. |
| | (c) | | The Fund’s portfolio turnover rate is calculated in accordance with regulatory requirements and excludes portfolio securities received or delivered as a result of in-kind transactions and short-term transactions. If such transactions were included, the Fund’s portfolio turnover rate may be higher. |
| | |
| The accompanying notes are an integral part of these financial statements. | | 117 |
GOLDMAN SACHS ACTIVEBETA® ETFS
Financial Highlights (continued)
Selected Data for a Share Outstanding Throughout Each Year
| | | | | | | | | | | | | | | | | | | | | | |
| | | | | ActiveBeta® Japan Equity ETF | |
| | | | | For the Fiscal
Year Ended August 31, | |
| | | | | 2023 | | | 2022 | | | 2021 | | | 2020 | | | 2019 | |
| | Per Share Operating Performance: | | | | | | | | | | | | | | | | | | | | |
| | | | | | |
| | Net asset value, beginning of year | | $ | 30.15 | | | $ | 37.91 | | | $ | 32.60 | | | $ | 30.59 | | | $ | 32.99 | |
| | | | | | |
| | Net investment income(a) | | | 0.69 | | | | 0.70 | | | | 0.60 | | | | 0.66 | | | | 0.82 | |
| | | | | | |
| | Net realized and unrealized gain (loss) | | | 3.99 | | | | (7.75 | ) | | | 5.25 | | | | 2.15 | | | | (2.29 | ) |
| | | | | | |
| | Total gain (loss) from investment operations | | | 4.68 | | | | (7.05 | ) | | | 5.85 | | | | 2.81 | | | | (1.47 | ) |
| | | | | | |
| | Distributions to shareholders from net investment income | | | (0.65 | ) | | | (0.71 | ) | | | (0.54 | ) | | | (0.80 | ) | | | (0.93 | ) |
| | | | | | |
| | Net asset value, end of year | | $ | 34.18 | | | $ | 30.15 | | | $ | 37.91 | | | $ | 32.60 | | | $ | 30.59 | |
| | | | | | |
| | Market price, end of year | | $ | 34.18 | | | $ | 29.78 | | | $ | 37.75 | | | $ | 32.51 | | | $ | 30.52 | |
| | | | | | |
| | Total Return at Net Asset Value(b) | | | 15.69 | % | | | (18.76 | )% | | | 18.02 | % | | | 9.15 | % | | | (4.32 | )% |
| | | | | | |
| | Net assets, end of year (in 000’s) | | $ | 13,671 | | | $ | 12,059 | | | $ | 15,163 | | | $ | 19,561 | | | $ | 24,468 | |
| | | | | | |
| | Ratio of total expenses to average net assets | | | 0.25 | % | | | 0.25 | % | | | 0.25 | % | | | 0.25 | % | | | 0.25 | % |
| | | | | | |
| | Ratio of net investment income to average net assets | | | 2.19 | % | | | 2.03 | % | | | 1.64 | % | | | 2.09 | % | | | 2.64 | % |
| | | | | | |
| | Portfolio turnover rate(c) | | | 17 | % | | | 21 | % | | | 21 | % | | | 18 | % | | | 33 | % |
| | (a) | | Calculated based on the average shares outstanding methodology. |
| | (b) | | Assumes investment at the net asset value at the beginning of the year, reinvestment of all distributions and a complete sale of the investment at the net asset value at the end of the year. Returns do not reflect the impact of taxes to shareholders relating to Fund distributions or the sale of Fund shares. |
| | (c) | | The Fund’s portfolio turnover rate is calculated in accordance with regulatory requirements and excludes portfolio securities received or delivered as a result of in-kind transactions and short-term transactions. If such transactions were included, the Fund’s portfolio turnover rate may be higher. |
| | |
| 118 | | The accompanying notes are an integral part of these financial statements. |
GOLDMAN SACHS ACTIVEBETA® ETFS
Financial Highlights (continued)
Selected Data for a Share Outstanding Throughout the Year
| | | | | | | | | | |
| | | | | ActiveBeta® Paris-Aligned Climate
U.S. Large Cap Equity ETF | |
| | | | | For the Fiscal
Year Ended
August 31, 2023 | | | For the Period
December 13, 2021*
to
August 31, 2022 | |
| | Per Share Operating Performance: | | | | | | | | |
| | | |
| | Net asset value, beginning of period | | $ | 32.50 | | | $ | 39.67 | |
| | | |
| | Net investment income(a) | | | 0.45 | | | | 0.32 | |
| | | |
| | Net realized and unrealized gain (loss) | | | 4.52 | | | | (7.25 | ) |
| | | |
| | Total gain (loss) from investment operations | | | 4.97 | | | | (6.93 | ) |
| | | |
| | Distributions to shareholders from net investment income | | | (0.48 | ) | | | (0.24 | ) |
| | | |
| | Net asset value, end of period | | $ | 36.99 | | | $ | 32.50 | |
| | | |
| | Market price, end of period | | $ | 37.01 | | | $ | 32.55 | |
| | | |
| | Total Return at Net Asset Value(b) | | | 15.48 | % | | | (17.52 | )% |
| | | |
| | Net assets, end of period (in 000’s) | | $ | 7,397 | | | $ | 6,500 | |
| | | |
| | Ratio of total expenses to average net assets | | | 0.20 | % | | | 0.20 | %(c) |
| | | |
| | Ratio of net investment income to average net assets | | | 1.33 | % | | | 1.24 | %(c) |
| | | |
| | Portfolio turnover rate(d) | | | 26 | % | | | 19 | % |
| | * | | Commencement of operations. |
| | (a) | | Calculated based on the average shares outstanding methodology. |
| | (b) | | Assumes investment at the net asset value at the beginning of the period, reinvestment of all distributions and a complete sale of the investment at the net asset value at the end of the period. Returns do not reflect the impact of taxes to shareholders relating to Fund distributions or the sale of Fund shares. Total returns for periods less than one full year are not annualized. |
| | (d) | | The Fund’s portfolio turnover rate is calculated in accordance with regulatory requirements and excludes portfolio securities received or delivered as a result of in-kind transactions and short-term transactions. If such transactions were included, the Fund’s portfolio turnover rate may be higher. |
| | |
| The accompanying notes are an integral part of these financial statements. | | 119 |
GOLDMAN SACHS ACTIVEBETA® ETFS
Financial Highlights (continued)
Selected Data for a Share Outstanding Throughout Each Year
| | | | | | | | | | | | | | | | | | | | | | |
| | | | | ActiveBeta® U.S. Large Cap Equity ETF | |
| | | | | For the Fiscal
Year Ended August 31, | |
| | | | | 2023 | | | 2022 | | | 2021 | | | 2020 | | | 2019 | |
| | Per Share Operating Performance: | | | | | | | | | | | | | | | | | | | | |
| | | | | | |
| | Net asset value, beginning of year | | $ | 78.36 | | | $ | 90.95 | | | $ | 70.70 | | | $ | 59.09 | | | $ | 58.75 | |
| | | | | | |
| | Net investment income(a) | | | 1.23 | | | | 1.17 | | | | 0.96 | | | | 1.06 | | | | 1.03 | |
| | | | | | |
| | Net realized and unrealized gain (loss) | | | 10.21 | | | | (12.61 | ) | | | 20.21 | | | | 11.62 | | | | 0.30 | |
| | | | | | |
| | Total gain (loss) from investment operations | | | 11.44 | | | | (11.44 | ) | | | 21.17 | | | | 12.68 | | | | 1.33 | |
| | | | | | |
| | Distributions to shareholders from net investment income | | | (1.25 | ) | | | (1.15 | ) | | | (0.92 | ) | | | (1.07 | ) | | | (0.99 | ) |
| | | | | | |
| | Net asset value, end of year | | $ | 88.55 | | | $ | 78.36 | | | $ | 90.95 | | | $ | 70.70 | | | $ | 59.09 | |
| | | | | | |
| | Market price, end of year | | $ | 88.57 | | | $ | 78.33 | | | $ | 90.91 | | | $ | 70.61 | | | $ | 59.07 | |
| | | | | | |
| | Total Return at Net Asset Value(b) | | | 14.83 | % | | | (12.70 | )% | | | 30.21 | % | | | 21.81 | % | | | 2.42 | % |
| | | | | | |
| | Net assets, end of year (in 000’s) | | $ | 11,410,473 | | | $ | 11,616,494 | | | $ | 13,769,847 | | | $ | 10,427,895 | | | $ | 6,606,050 | |
| | | | | | |
| | Ratio of total expenses to average net assets | | | 0.09 | % | | | 0.09 | % | | | 0.09 | % | | | 0.09 | % | | | 0.09 | % |
| | | | | | |
| | Ratio of net investment income to average net assets | | | 1.53 | % | | | 1.36 | % | | | 1.22 | % | | | 1.72 | % | | | 1.82 | % |
| | | | | | |
| | Portfolio turnover rate(c) | | | 11 | % | | | 12 | % | | | 16 | % | | | 17 | % | | | 16 | % |
| | (a) | | Calculated based on the average shares outstanding methodology. |
| | (b) | | Assumes investment at the net asset value at the beginning of the year, reinvestment of all distributions and a complete sale of the investment at the net asset value at the end of the year. Returns do not reflect the impact of taxes to shareholders relating to Fund distributions or the sale of Fund shares. |
| | (c) | | The Fund’s portfolio turnover rate is calculated in accordance with regulatory requirements and excludes portfolio securities received or delivered as a result of in-kind transactions and short-term transactions. If such transactions were included, the Fund’s portfolio turnover rate may be higher. |
| | |
| 120 | | The accompanying notes are an integral part of these financial statements. |
GOLDMAN SACHS ACTIVEBETA® ETFS
Financial Highlights (continued)
Selected Data for a Share Outstanding Throughout Each Year
| | | | | | | | | | | | | | | | | | | | | | |
| | | | | ActiveBeta® U.S. Small Cap Equity ETF | |
| | | | | For the Fiscal
Year Ended August 31, | |
| | | | | 2023 | | | 2022 | | | 2021 | | | 2020 | | | 2019 | |
| | Per Share Operating Performance: | | | | | | | | | | | | | | | | | | | | |
| | | | | | |
| | Net asset value, beginning of year | | $ | 55.87 | | | $ | 64.97 | | | $ | 43.57 | | | $ | 42.84 | | | $ | 49.49 | |
| | | | | | |
| | Net investment income(a) | | | 0.84 | (b) | | | 0.74 | (c) | | | 0.53 | (d) | | | 0.51 | | | | 0.57 | |
| | | | | | |
| | Net realized and unrealized gain (loss) | | | 2.97 | | | | (9.07 | ) | | | 21.35 | | | | 0.78 | | | | (6.66 | ) |
| | | | | | |
| | Total gain (loss) from investment operations | | | 3.81 | | | | (8.33 | ) | | | 21.88 | | | | 1.29 | | | | (6.09 | ) |
| | | | | | |
| | Distributions to shareholders from net investment income | | | (0.80 | ) | | | (0.77 | ) | | | (0.48 | ) | | | (0.56 | ) | | | (0.56 | ) |
| | | | | | |
| | Net asset value, end of year | | $ | 58.88 | | | $ | 55.87 | | | $ | 64.97 | | | $ | 43.57 | | | $ | 42.84 | |
| | | | | | |
| | Market price, end of year | | $ | 58.85 | | | $ | 55.92 | | | $ | 64.94 | | | $ | 43.63 | | | $ | 42.84 | |
| | | | | | |
| | Total Return at Net Asset Value(e) | | | 6.95 | % | | | (12.95 | )% | | | 50.45 | % | | | 3.13 | % | | | (12.28 | )% |
| | | | | | |
| | Net assets, end of year (in 000’s) | | $ | 482,839 | | | $ | 483,270 | | | $ | 412,543 | | | $ | 152,484 | | | $ | 96,399 | |
| | | | | | |
| | Ratio of total expenses to average net assets | | | 0.20 | % | | | 0.20 | % | | | 0.20 | % | | | 0.20 | % | | | 0.20 | % |
| | | | | | |
| | Ratio of net investment income to average net assets | | | 1.49 | %(b) | | | 1.22 | %(c) | | | 0.90 | %(d) | | | 1.21 | % | | | 1.32 | % |
| | | | | | |
| | Portfolio turnover rate(f) | | | 17 | % | | | 20 | % | | | 25 | % | | | 20 | % | | | 20 | % |
| | (a) | | Calculated based on the average shares outstanding methodology. |
| | (b) | | Reflects income recognized from non-recurring special dividends which amounted to $0.23 per share and 0.41% of average net assets. |
| | (c) | | Reflects income recognized from non-recurring special dividends which amounted to $0.21 per share and 0.34% of average net assets. |
| | (d) | | Reflects income recognized from non-recurring special dividends which amounted to $0.09 per share and 0.16% of average net assets. |
| | (e) | | Assumes investment at the net asset value at the beginning of the year, reinvestment of all distributions and a complete sale of the investment at the net asset value at the end of the year. Returns do not reflect the impact of taxes to shareholders relating to Fund distributions or the sale of Fund shares. |
| | (f) | | The Fund’s portfolio turnover rate is calculated in accordance with regulatory requirements and excludes portfolio securities received or delivered as a result of in-kind transactions and short-term transactions. If such transactions were included, the Fund’s portfolio turnover rate may be higher. |
| | |
| The accompanying notes are an integral part of these financial statements. | | 121 |
GOLDMAN SACHS ACTIVEBETA® ETFS
Financial Highlights (continued)
Selected Data for a Share Outstanding Throughout Each Year
| | | | | | | | | | |
| | | | | ActiveBeta® World Low Vol Plus
Equity ETF | |
| | | | | For the Fiscal
Year Ended
August 31, 2023 | | | For the Period
March 15, 2022*
to
August 31, 2022 | |
| | Per Share Operating Performance: | | | | | | | | |
| | | |
| | Net asset value, beginning of period | | $ | 37.97 | | | $ | 40.57 | |
| | | |
| | Net investment income(a) | | | 0.87 | | | | 0.47 | |
| | | |
| | Net realized and unrealized gain (loss) | | | 3.30 | | | | (2.76 | ) |
| | | |
| | Total gain (loss) from investment operations | | | 4.17 | | | | (2.29 | ) |
| | | |
| | Distributions to shareholders from net investment income | | | (0.84 | ) | | | (0.31 | ) |
| | | |
| | Net asset value, end of period | | $ | 41.30 | | | $ | 37.97 | |
| | | |
| | Market price, end of period | | $ | 41.34 | | | $ | 37.98 | |
| | | |
| | Total Return at Net Asset Value(b) | | | 11.15 | % | | | (5.65 | )% |
| | | |
| | Net assets, end of period (in 000’s) | | $ | 722,754 | | | $ | 558,112 | |
| | | |
| | Ratio of total expenses to average net assets | | | 0.25 | % | | | 0.25 | %(c) |
| | | |
| | Ratio of net investment income to average net assets | | | 2.22 | % | | | 2.54 | %(c) |
| | | |
| | Portfolio turnover rate(d) | | | 31 | % | | | 13 | % |
| | * | | Commencement of operations. |
| | (a) | | Calculated based on the average shares outstanding methodology. |
| | (b) | | Assumes investment at the net asset value at the beginning of the period, reinvestment of all distributions and a complete sale of the investment at the net asset value at the end of the period. Returns do not reflect the impact of taxes to shareholders relating to Fund distributions or the sale of Fund shares. Total returns for periods less than one full year are not annualized. |
| | (d) | | The Fund’s portfolio turnover rate is calculated in accordance with regulatory requirements and excludes portfolio securities received or delivered as a result of in-kind transactions and short-term transactions. If such transactions were included, the Fund’s portfolio turnover rate may be higher. |
| | |
| 122 | | The accompanying notes are an integral part of these financial statements. |
GOLDMAN SACHS ACTIVEBETA® ETFS
Notes to Financial Statements
August 31, 2023
Goldman Sachs ETF Trust (the “Trust”) is an open-end management investment company, registered under the Investment Company Act of 1940, as amended (the “Act”), consisting of multiple series. The Trust was organized as a Delaware statutory trust on December 16, 2009. The following table lists those series of the Trust that are included in this report (collectively, the “Funds” or individually a “Fund”) along with their respective diversification status under the Act:
| | | | |
| Fund | | | | Diversification
Classification |
Goldman Sachs ActiveBeta® Emerging Markets Equity ETF (“ActiveBeta® Emerging Markets Equity ETF”) | | | | Diversified |
Goldman Sachs ActiveBeta® Europe Equity ETF (“ActiveBeta® Europe Equity ETF”) | | | | Diversified |
Goldman Sachs ActiveBeta® International Equity ETF (“ActiveBeta® International Equity ETF”) | | | | Diversified |
Goldman Sachs ActiveBeta® Japan Equity ETF (“ActiveBeta® Japan Equity ETF”) | | | | Diversified |
Goldman Sachs ActiveBeta® Paris-Aligned Climate U.S. Large Cap Equity ETF (“ActiveBeta® Paris-Aligned Climate U.S. Large Cap Equity ETF”) | | | | Diversified |
Goldman Sachs ActiveBeta® U.S. Large Cap Equity ETF (“ActiveBeta® U.S. Large Cap Equity ETF”) | | | | Diversified |
Goldman Sachs ActiveBeta® U.S. Small Cap Equity ETF (“ActiveBeta® U.S. Small Cap Equity ETF”) | | | | Diversified |
Goldman Sachs ActiveBeta® World Low Vol Plus Equity ETF (“ActiveBeta® World Low Vol Plus Equity ETF”) | | | | Diversified |
The investment objective of each Fund is to provide investment results that closely correspond, before fees and expenses, to the performance of its respective Index.
Goldman Sachs Asset Management, L.P. (“GSAM”), an affiliate of Goldman Sachs & Co. LLC (“Goldman Sachs”), serves as investment adviser to the Funds pursuant to management agreements (each, an “Agreement” and together, the “Agreements”) with the Trust. Each Fund is an exchange-traded fund (“ETF”). Shares of the Funds are listed and traded on the NYSE Arca, Inc. (“NYSE Arca”), except for ActiveBeta® Paris-Aligned Climate U.S. Large Cap Equity ETF and ActiveBeta® World Low Vol Plus Equity ETF, which are listed and traded on the Cboe BZX Exchange, Inc. (“Cboe”). Market prices for the Funds’ shares may be different from their net asset value (“NAV”). The Funds issue and redeem shares at their respective NAV only in blocks of a specified number of shares, or multiples thereof, referred to as “Creation Units”. Creation Units are issued and redeemed generally for a designated portfolio of securities (including any portion of such securities for which cash may be substituted) and a specified amount of cash. Shares generally trade in the secondary market in quantities less than a Creation Unit at market prices that change throughout the day. Only those that have entered into an authorized participant agreement with ALPS Distributors, Inc. (the “Distributor”) may do business directly with the Funds.
| | |
| 2. SIGNIFICANT ACCOUNTING POLICIES | | |
The financial statements have been prepared in accordance with accounting principles generally accepted in the United States of America (“GAAP”) and require management to make estimates and assumptions that may affect the reported amounts and disclosures. Actual results may differ from those estimates and assumptions. Each Fund is an investment company under GAAP and follows the accounting and reporting guidance applicable to investment companies.
A. Investment Valuation — The Funds’ valuation policy is to value investments at fair value.
B. Investment Income and Investments — Investment income includes interest income, dividend income, and securities lending income, if any. Interest income is accrued daily and adjusted for amortization of premiums and accretion of discounts. Dividend income is recognized on ex-dividend date or, for certain foreign securities, as soon as such information is obtained subsequent to the ex-dividend date. Non-cash dividends, if any, are recorded at the fair market value of the securities received.
123
GOLDMAN SACHS ACTIVEBETA® ETFS
Notes to Financial Statements (continued)
August 31, 2023
|
| 2. SIGNIFICANT ACCOUNTING POLICIES (continued) |
Investment transactions are reflected on trade date. Realized gains and losses are calculated using identified cost. Investment transactions are recorded on the following business day for daily NAV calculations. Investment income is recorded net of any foreign withholding taxes, less any amounts reclaimable. The Funds may file withholding tax reclaims in certain jurisdictions to recover a portion of amounts previously withheld. These reclaims, if any, are recorded when the amount is known and there are no significant uncertainties on collectability. Such amounts recovered, if any, are reflected as other income in the Statements of Operations. Any foreign capital gains tax is accrued daily based upon net unrealized gains, and is payable upon sale of such investments. Distributions received from the Funds’ investments in U.S. real estate investment trusts (“REITs”) may be characterized as ordinary income, net capital gain and/or a return of capital. A return of capital is recorded by the Funds as a reduction to the cost basis of the REIT.
For derivative contracts, unrealized gains and losses are recorded daily and become realized gains and losses upon disposition or termination of the contract.
C. Expenses — Expenses incurred directly by a Fund are charged to the Fund, and certain expenses incurred by the Trust are allocated across the applicable Funds on a straight-line and/or pro-rata basis, depending upon the nature of the expenses, and are accrued daily.
D. Federal Taxes and Distributions to Shareholders — It is each Fund’s policy to comply with the requirements of the Internal Revenue Code of 1986, as amended (the “Code”), applicable to regulated investment companies and to distribute each year substantially all of its investment company taxable income and capital gains to its shareholders. Accordingly, each Fund is not required to make any provisions for the payment of federal income tax. Distributions to shareholders are recorded on the ex-dividend date. For each Fund, income distributions, if any, are declared and paid quarterly, with the exception of ActiveBeta® Europe Equity ETF and ActiveBeta® Japan Equity ETF, which are paid semiannually. Capital gains distributions, if any, are declared and paid at least annually. Net capital losses, if any, are carried forward to future fiscal years and may be used to the extent allowed by the Code to offset any future capital gains. Losses that are carried forward will retain their character as either short-term or long-term capital losses. Utilization of capital loss carryforwards will reduce the requirement of future capital gains distributions. The characterization of distributions to shareholders for financial reporting purposes is determined in accordance with federal income tax rules, which may differ from GAAP. The source of each Fund’s distributions may be shown in the accompanying financial statements as either from distributable earnings or capital. Certain components of the Funds’ net assets on the Statements of Assets and Liabilities reflect permanent GAAP/tax differences based on the appropriate tax character.
E. Foreign Currency Translation — The accounting records and reporting currency of a Fund are maintained in U.S. dollars. Assets and liabilities denominated in foreign currencies are translated into U.S. dollars using the current exchange rates at the close of each business day. The effect of changes in foreign currency exchange rates on investments is included within net realized and unrealized gain (loss) on investments. Changes in the value of other assets and liabilities as a result of fluctuations in foreign exchange rates are included in the Statements of Operations within net change in unrealized gain (loss) on foreign currency translation. Transactions denominated in foreign currencies are translated into U.S. dollars on the date the transaction occurred, the effects of which are included within net realized gain (loss) on foreign currency transactions.
| | |
| 3. INVESTMENTS AND FAIR VALUE MEASUREMENTS | | |
U.S. GAAP defines the fair value of a financial instrument as the amount that would be received to sell an asset or paid to transfer a liability in an orderly transaction between market participants at the measurement date (i.e., the exit price); the Funds’ policy is to use the market approach. GAAP establishes a fair value hierarchy that prioritizes the inputs to valuation techniques used to measure fair value. The hierarchy gives the highest priority to unadjusted quoted prices in active markets for identical assets or liabilities (Level 1 measurements) and the lowest priority to unobservable inputs (Level 3 measurements). The level in the fair value hierarchy within which the fair value measurement in its entirety falls shall be determined based on the lowest level input that is significant to
124
GOLDMAN SACHS ACTIVEBETA® ETFS
|
| 3. INVESTMENTS AND FAIR VALUE MEASUREMENTS (continued) |
the fair value measurement in its entirety. The levels used for classifying investments are not necessarily an indication of the risk associated with investing in these investments. The three levels of the fair value hierarchy are described below:
Level 1 — Unadjusted quoted prices in active markets that are accessible at the measurement date for identical, unrestricted assets or liabilities;
Level 2 — Quoted prices in markets that are not active or financial instruments for which significant inputs are observable (including, but not limited to, quoted prices for similar investments, interest rates, foreign exchange rates, volatility and credit spreads), either directly or indirectly;
Level 3 — Prices or valuations that require significant unobservable inputs (including GSAM’s assumptions in determining fair value measurement).
The Board of Trustees (“Trustees”) has approved Valuation Procedures that govern the valuation of the portfolio investments held by the Funds, including investments for which market quotations are not readily available. With respect to the Funds’ investments that do not have readily available market quotations, the Trustees have designated the Adviser as the valuation designee to perform fair valuations pursuant to Rule 2a-5 under the Investment Company Act of 1940 (the “Valuation Designee”). GSAM has day-to-day responsibility for implementing and maintaining internal controls and procedures related to the valuation of the Funds’ investments. To assess the continuing appropriateness of pricing sources and methodologies, GSAM regularly performs price verification procedures and issues challenges as necessary to third party pricing vendors or brokers, and any differences are reviewed in accordance with the Valuation Procedures.
A. Level 1 and Level 2 Fair Value Investments — The valuation techniques and significant inputs used in determining the fair values for investments classified as Level 1 and Level 2 are as follows:
Equity Securities — Equity securities traded on a United States (“U.S.”) securities exchange or the NASDAQ system, or those located on certain foreign exchanges, including but not limited to the Americas, are valued daily at their last sale price or official closing price on the principal exchange or system on which they are traded. If there is no sale or official closing price or such price is believed by GSAM to not represent fair value, equity securities will be valued at the valid closing bid price for long positions and at the valid closing ask price for short positions (i.e. where there is sufficient volume, during normal exchange trading hours). If no valid bid/ask price is available, the equity security will be valued pursuant to the Valuation Procedures and consistent with applicable regulatory guidance. To the extent these investments are actively traded, they are classified as Level 1 of the fair value hierarchy, otherwise they are generally classified as Level 2. Certain equity securities containing unique attributes may be classified as Level 2.
Unlisted equity securities for which market quotations are available are valued at the last sale price on the valuation date, or if no sale occurs, at the last bid price for long positions or the last ask price for short positions, and are generally classified as Level 2.
Underlying Funds (including Money Market Funds) — Underlying funds (“Underlying Funds”) include ETFs and other investment companies. Investments in the Underlying Funds (except ETFs) are valued at the NAV per share on the day of valuation. ETFs are valued daily at the last sale price or official closing price on the principal exchange or system on which the investment is traded. Because the Funds invest in Underlying Funds that fluctuate in value, the Funds’ shares will correspondingly fluctuate in value. Underlying Funds are generally classified as Level 1 of the fair value hierarchy. To the extent that underlying ETFs are actively traded, they are classified as Level 1 of the fair value hierarchy, otherwise they are generally classified as Level 2. For information regarding an Underlying Fund’s accounting policies and investment holdings, please see the Underlying Fund’s shareholder report.
Derivative Contracts — A derivative is an instrument whose value is derived from underlying assets, indices, reference rates or a combination of these factors. A Fund enters into derivative transactions to hedge against changes in interest rates, securities prices, and/or currency exchange rates, to increase total return, or to gain access to certain markets or attain exposure to other underliers. For financial reporting purposes, cash collateral that has been pledged to cover obligations of a Fund and cash collateral received, if any, is reported separately on the Statements of Assets and Liabilities as either due to broker/receivable for collateral on certain derivative contracts. Non-cash collateral pledged by a Fund, if any, is noted in the Schedules of Investments.
125
GOLDMAN SACHS ACTIVEBETA® ETFS
Notes to Financial Statements (continued)
August 31, 2023
|
| 3. INVESTMENTS AND FAIR VALUE MEASUREMENTS (continued) |
Exchange-traded derivatives, including futures and options contracts, are generally valued at the last sale or settlement price on the exchange where they are principally traded. Exchange-traded options without settlement prices are generally valued at the last bid price for long positions and the last ask price for short positions on the exchange where they are principally traded. Exchange-traded derivatives typically fall within Level 1 of the fair value hierarchy. Over-the-counter (“OTC”) and centrally cleared derivatives are valued using market transactions and other market evidence, including market-based inputs to models, calibration to market-clearing transactions, broker or dealer quotations, or other alternative pricing sources. Where models are used, the selection of a particular model to value OTC and centrally cleared derivatives depends upon the contractual terms of, and specific risks inherent in, the instrument, as well as the availability of pricing information in the market. Valuation models require a variety of inputs, including contractual terms, market prices, yield curves, credit curves, measures of volatility, voluntary and involuntary prepayment rates, loss severity rates and correlations of such inputs. For OTC and centrally cleared derivatives that trade in liquid markets, model inputs can generally be verified and model selection does not involve significant management judgment. OTC and centrally cleared derivatives are classified within Level 2 of the fair value hierarchy when significant inputs are corroborated by market evidence.
Futures Contracts — Futures contracts are contracts to buy or sell a standardized quantity of a specified commodity or security. Upon entering into a futures contract, a Fund deposits cash or securities in an account on behalf of the broker in an amount sufficient to meet the initial margin requirement. Subsequent payments are made or received by a Fund equal to the daily change in the contract value and are recorded as variation margin receivable or payable with a corresponding offset to unrealized gains or losses.
B. Level 3 Fair Value Investments — To the extent that significant inputs to valuation models and other alternative pricing sources are unobservable, or if quotations are not readily available, or if GSAM believes that such quotations do not accurately reflect fair value, the fair value of a Fund’s investments may be determined under the Valuation Procedures. GSAM, consistent with its procedures and applicable regulatory guidance, may make an adjustment to the most recent valuation prices of either domestic or foreign securities in light of significant events to reflect what it believes to be the fair value of the securities at the time of determining a Fund’s NAV. To the extent investments are valued using single source broker quotations obtained directly from the broker or passed through from third party pricing vendors, such investments are classified as Level 3 investments.
C. Fair Value Hierarchy — The following is a summary of the Funds’ investments and derivatives classified in the fair value hierarchy as of August 31, 2023:
| | | | | | | | | | | | |
|
| ACTIVEBETA® EMERGING MARKETS EQUITY ETF | |
| | | |
| Investment Type | | Level 1 | | | Level 2 | | | Level 3 | |
| | | |
| Assets | | | | | | | | | | | | |
|
Common Stock and/or Other Equity Investments(a) | |
| | | |
Africa | | $ | 34,868,225 | | | $ | — | | | $ | — | |
| | | |
Asia | | | 795,640,613 | | | | 23,807,632 | | | | — | |
| | | |
Europe | | | 23,305,380 | | | | — | | | | — | |
| | | |
North America | | | 34,388,983 | | | | — | | | | — | |
| | | |
Oceania | | | 489,196 | | | | — | | | | — | |
| | | |
South America | | | 44,365,232 | | | | 13,412,842 | | | | — | |
| | | |
Securities Lending Reinvestment Vehicle | | | 5,450,496 | | | | — | | | | — | |
| | | |
| Total | | $ | 938,508,125 | | | $ | 37,220,474 | | | $ | — | |
| (a) | | Amounts are disclosed by continent to highlight the impact of time zone differences between local market close and the calculation of NAV. Security valuations are based on the principal exchange or system on which they are traded, which may differ from country of domicile noted in table. |
126
GOLDMAN SACHS ACTIVEBETA® ETFS
|
| 3. INVESTMENTS AND FAIR VALUE MEASUREMENTS (continued) |
| | | | | | | | | | | | |
|
| ACTIVEBETA® EUROPE EQUITY ETF | |
| | | |
| Investment Type | | Level 1 | | | Level 2 | | | Level 3 | |
| | | |
| Assets | | | | | | | | | | | | |
|
Common Stock and/or Other Equity Investments(a) | |
| | | |
Africa | | $ | 3,939 | | | $ | — | | | $ | — | |
| | | |
Asia | | | 88,540 | | | | — | | | | — | |
| | | |
Europe | | | 10,141,384 | | | | 67,105 | | | | — | |
| | | |
North America | | | 1,072,357 | | | | — | | | | — | |
| | | |
Oceania | | | 129,401 | | | | — | | | | — | |
| | | |
South America | | | 11,837 | | | | — | | | | — | |
| | | |
Securities Lending Reinvestment Vehicle | | | 132,123 | | | | — | | | | — | |
| | | |
| Total | | $ | 11,579,581 | | | $ | 67,105 | | | $ | — | |
| | | |
| Derivative Type | | | | | | | | | |
| | | |
| Liabilities(b) | | | | | | | | | | | | |
| | | |
Futures Contracts | | $ | (711 | ) | | $ | — | | | $ | — | |
|
| ACTIVEBETA® INTERNATIONAL EQUITY ETF | |
| | | |
| Investment Type | | Level 1 | | | Level 2 | | | Level 3 | |
| | | |
| Assets | | | | | | | | | | | | |
|
Common Stock and/or Other Equity Investments(a) | |
| | | |
Africa | | $ | 2,186,451 | | | $ | — | | | $ | — | |
| | | |
Asia | | | 813,979,759 | | | | — | | | | — | |
| | | |
Europe | | | 1,673,500,915 | | | | 10,722,638 | | | | — | |
| | | |
North America | | | 526,093,967 | | | | 2,840,709 | | | | — | |
| | | |
Oceania | | | 205,227,398 | | | | — | | | | — | |
| | | |
South America | | | 3,521,371 | | | | — | | | | — | |
| | | |
Securities Lending Reinvestment Vehicle | | | 37,159,558 | | | | — | | | | — | |
| | | |
| Total | | $ | 3,261,669,419 | | | $ | 13,563,347 | | | $ | — | |
| | | |
| Derivative Type | | | | | | | | | |
| | | |
| Liabilities(b) | | | | | | | | | | | | |
| | | |
Futures Contracts | | $ | (92,712 | ) | | $ | — | | | $ | — | |
| (a) | | Amounts are disclosed by continent to highlight the impact of time zone differences between local market close and the calculation of NAV. Security valuations are based on the principal exchange or system on which they are traded, which may differ from country of domicile noted in table. |
| (b) | | Amount shown represents unrealized gain (loss) at fiscal year end. |
127
GOLDMAN SACHS ACTIVEBETA® ETFS
Notes to Financial Statements (continued)
August 31, 2023
|
| 3. INVESTMENTS AND FAIR VALUE MEASUREMENTS (continued) |
| | | | | | | | | | | | |
|
| ACTIVEBETA® JAPAN EQUITY ETF | |
| | | |
| Investment Type | | Level 1 | | | Level 2 | | | Level 3 | |
| | | |
| Assets | | | | | | | | | | | | |
|
Common Stock and/or Other Equity Investments(a) | |
| | | |
Asia | | $ | 13,640,360 | | | $ | — | | | $ | — | |
| | | |
Securities Lending Reinvestment Vehicle | | | 96,777 | | | | — | | | | — | |
| | | |
| Total | | $ | 13,737,137 | | | $ | — | | | $ | — | |
| | | |
| Derivative Type | | | | | | | | | |
| | | |
| Assets(b) | | | | | | | | | | | | |
| | | |
Futures Contracts | | $ | 942 | | | $ | — | | | $ | — | |
|
| ACTIVEBETA® PARIS-ALIGNED CLIMATE U.S. LARGE CAP EQUITY ETF | |
| | | |
| Investment Type | | Level 1 | | | Level 2 | | | Level 3 | |
| | | |
| Assets | | | | | | | | | | | | |
|
Common Stock and/or Other Equity Investments(a) | |
| | | |
North America | | $ | 7,360,060 | | | $ | — | | | $ | — | |
| | | |
| Total | | $ | 7,360,060 | | | $ | — | | | $ | — | |
|
| ACTIVEBETA® U.S. LARGE CAP EQUITY ETF | |
| | | |
| Investment Type | | Level 1 | | | Level 2 | | | Level 3 | |
| | | |
| Assets | | | | | | | | | | | | |
|
Common Stock and/or Other Equity Investments(a) | |
| | | |
North America | | $ | 11,378,218,889 | | | $ | — | | | $ | — | |
| | | |
Securities Lending Reinvestment Vehicle | | | 39,027,450 | | | | — | | | | — | |
| | | |
| Total | | $ | 11,417,246,339 | | | $ | — | | | $ | — | |
| | | |
| Derivative Type | | | | | | | | | |
| | | |
| Assets(b) | | | | | | | | | | | | |
| | | |
Futures Contracts | | $ | 59,881 | | | $ | — | | | $ | — | |
| (a) | | Amounts are disclosed by continent to highlight the impact of time zone differences between local market close and the calculation of NAV. Security valuations are based on the principal exchange or system on which they are traded, which may differ from country of domicile noted in table. |
| (b) | | Amount shown represents unrealized gain (loss) at fiscal year end. |
128
GOLDMAN SACHS ACTIVEBETA® ETFS
|
| 3. INVESTMENTS AND FAIR VALUE MEASUREMENTS (continued) |
| | | | | | | | | | | | |
|
| ACTIVEBETA® U.S. SMALL CAP EQUITY ETF | |
| | | |
| Investment Type | | Level 1 | | | Level 2 | | | Level 3 | |
| | | |
| Assets | | | | | | | | | | | | |
|
Common Stock and/or Other Equity Investments(a) | |
| | | |
Africa | | $ | 542,171 | | | $ | — | | | $ | — | |
| | | |
Asia | | | 2,594,311 | | | | — | | | | — | |
| | | |
Europe | | | 2,911,606 | | | | — | | | | — | |
| | | |
North America | | | 471,524,799 | | | | 251,602 | | | | 25,677 | |
| | | |
South America | | | 616,274 | | | | — | | | | — | |
| | | |
Securities Lending Reinvestment Vehicle | | | 2,764,662 | | | | — | | | | — | |
| | | |
| Total | | $ | 480,953,823 | | | $ | 251,602 | | | $ | 25,677 | |
| | | |
| Derivative Type | | | | | | | | | |
| | | |
| Liabilities(b) | | | | | | | | | | | | |
| | | |
Futures Contracts | | $ | (3,714 | ) | | $ | — | | | $ | — | |
|
| ACTIVEBETA® WORLD LOW VOL PLUS EQUITY ETF | |
| | | |
| Investment Type | | Level 1 | | | Level 2 | | | Level 3 | |
| | | |
| Assets | | | | | | | | | | | | |
|
Common Stock and/or Other Equity Investments(a) | |
| | | |
Asia | | $ | 76,185,710 | | | $ | — | | | $ | — | |
| | | |
Europe | | | 94,634,188 | | | | 356,762 | | | | — | |
| | | |
North America | | | 530,046,530 | | | | — | | | | — | |
| | | |
Oceania | | | 18,157,591 | | | | — | | | | — | |
| | | |
Securities Lending Reinvestment Vehicle | | | 2,067,149 | | | | — | | | | — | |
| | | |
| Total | | $ | 721,091,168 | | | $ | 356,762 | | | $ | — | |
| | | |
| Derivative Type | | | | | | | | | |
| | | |
| Assets(b) | | | | | | | | | | | | |
| | | |
Futures Contracts | | $ | 22,103 | | | $ | — | | | $ | — | |
| (a) | | Amounts are disclosed by continent to highlight the impact of time zone differences between local market close and the calculation of NAV. Security valuations are based on the principal exchange or system on which they are traded, which may differ from country of domicile noted in table. |
| (b) | | Amount shown represents unrealized gain (loss) at fiscal year end. |
For further information regarding security characteristics, see the Schedules of Investments.
|
| 4. INVESTMENTS IN DERIVATIVES |
The following tables set forth, by certain risk types, the gross value of derivative contracts (not considered to be hedging instruments for accounting disclosure purposes) as of August 31, 2023. These instruments were used as part of the Funds’ investment strategies and to obtain and/or manage exposure related to the risks below. The values in the tables below exclude the
129
GOLDMAN SACHS ACTIVEBETA® ETFS
Notes to Financial Statements (continued)
August 31, 2023
|
| 4. INVESTMENTS IN DERIVATIVES (continued) |
effects of cash collateral received or posted pursuant to these derivative contracts, and therefore are not representative of the Funds’ net exposure.
| | | | | | | | | | |
| Risk | | Fund | | Statement of Assets and Liabilities | | | Assets
(Liabilities)(a) | |
Equity | | Goldman Sachs ActiveBeta® Europe Equity ETF | | | Variation Margin on Futures Contracts | | | $ | (711 | ) |
Equity | | Goldman Sachs ActiveBeta® International Equity ETF | | | Variation Margin on Futures Contracts | | | | (92,712 | ) |
Equity | | Goldman Sachs ActiveBeta® Japan Equity ETF | | | Variation Margin on Futures Contracts | | | | 942 | |
Equity | | Goldman Sachs ActiveBeta® U.S. Large Cap Equity ETF | | | Variation Margin on Futures Contracts | | | | 59,881 | |
Equity | | Goldman Sachs ActiveBeta® U.S. Small Cap Equity ETF | | | Variation Margin on Futures Contracts | | | | (3,714 | ) |
Equity | | Goldman Sachs ActiveBeta® World Low Vol Plus Equity ETF | | | Variation Margin on Futures Contracts | | | | 22,103 | |
| (a) | | Includes unrealized gain (loss) on futures contracts described in the Additional Investment Information sections of the Schedules of Investments. Only the variation margin as of August 31, 2023 is reported within the Statements of Assets and Liabilities. |
The following tables set forth, by certain risk types, the Funds’ gains (losses) related to these derivatives and their indicative volumes for the fiscal year ended August 31, 2023. These gains (losses) should be considered in the context that these derivative contracts may have been executed to create investment opportunities and/or economically hedge certain investments, and accordingly, certain gains (losses) on such derivative contracts may offset certain (losses) gains attributable to investments. These gains (losses) are included in “Net realized gain (loss)” or “Net change in unrealized gain (loss)” on the Statements of Operations:
| | | | | | | | | | | | |
| Risk | | Fund | | | | Net Realized
Gain (Loss)
from Futures
Contracts | | | Net Change in
Unrealized Gain
(Loss) on
Futures Contracts | |
| Equity | | Goldman Sachs ActiveBeta® Emerging Markets Equity ETF | | $ | (1,041,154 | ) | | $ | 8,434 | |
| Equity | | Goldman Sachs ActiveBeta® Europe Equity ETF | | | 3,895 | | | | 286 | |
| Equity | | Goldman Sachs ActiveBeta® International Equity ETF | | | (1,185,868 | ) | | | 606,664 | |
| Equity | | Goldman Sachs ActiveBeta® Japan Equity ETF | | | 20,073 | | | | 942 | |
| Equity | | Goldman Sachs ActiveBeta® U.S. Large Cap Equity ETF | | | (432,733 | ) | | | 59,881 | |
| Equity | | Goldman Sachs ActiveBeta® U.S. Small Cap Equity ETF | | | (901,485 | ) | | | (15,807 | ) |
| Equity | | Goldman Sachs ActiveBeta® World Low Vol Plus Equity ETF | | | — | | | | 22,103 | |
For the fiscal year ended August 31, 2023, the relevant values for each derivative type was as follows:
| | | | | | |
| Fund | | | | Average
Number of
Contracts(a) | |
Goldman Sachs ActiveBeta® Emerging Markets Equity ETF | | | 50 | |
Goldman Sachs ActiveBeta® Europe Equity ETF | | | 2 | |
Goldman Sachs ActiveBeta® International Equity ETF | | | 84 | |
Goldman Sachs ActiveBeta® Japan Equity ETF | | | 5 | |
Goldman Sachs ActiveBeta® U.S. Large Cap Equity ETF | | | 28 | |
Goldman Sachs ActiveBeta® U.S. Small Cap Equity ETF | | | 36 | |
Goldman Sachs ActiveBeta® World Low Vol Plus Equity ETF | | | 11 | |
| (a) | | Amount disclosed represents average number of contracts for the months that the Fund held such derivatives during the fiscal year ended August 31, 2023. |
130
GOLDMAN SACHS ACTIVEBETA® ETFS
|
| 5. AGREEMENTS AND AFFILIATED TRANSACTIONS |
A. Management Agreement — Under the Agreements, GSAM manages the Funds, subject to the general supervision of the Trustees.
As compensation for the services rendered pursuant to the Agreements, the assumption of the expenses related thereto and administration of the Funds’ business affairs, including providing facilities, GSAM is entitled to a management fee, accrued daily and paid monthly, equal to an annual percentage rate of each Fund’s average daily net assets.
For each Fund except the Goldman Sachs ActiveBeta® Emerging Markets Equity ETF, the Funds operate under a unitary management fee structure. Under the unitary fee structure, GSAM is responsible for paying substantially all the expenses of each such Fund, excluding payments under the Fund’s 12b-1 plan (if any), interest expenses, taxes, acquired fund fees and expenses, brokerage fees, costs of holding shareholder meetings and litigation, indemnification and extraordinary expenses. As the Funds directly pay fees and expenses of the independent Trustees, the management fee collected by GSAM will be reduced by an amount equal to the fees and expenses paid by the Funds to the independent Trustees.
For the fiscal year ended August 31, 2023, unitary management fees with GSAM were at the following rates for each Fund except the ActiveBeta® Emerging Markets Equity ETF:
| | | | |
| Fund | | | | Unitary
Management Fee |
ActiveBeta® Europe Equity ETF | | | | 0.25% |
ActiveBeta® International Equity ETF | | | | 0.25% |
ActiveBeta® Japan Equity ETF | | | | 0.25% |
ActiveBeta® Paris-Aligned Climate U.S. Large Cap Equity ETF | | | | 0.20% |
ActiveBeta® U.S. Large Cap Equity ETF | | | | 0.09% |
ActiveBeta® U.S. Small Cap Equity ETF | | | | 0.20% |
ActiveBeta® World Low Vol Plus Equity ETF | | | | 0.25% |
For the fiscal year ended August 31, 2023, contractual and effective net management fees with GSAM were at the following rate for the ActiveBeta® Emerging Markets Equity ETF:
| | | | |
| Fund | | | | Contractual and Effective Net
Management Fee |
ActiveBeta® Emerging Markets Equity ETF | | | | 0.40% |
B. Other Expense Agreements and Affiliated Transactions — GSAM has agreed to reduce or limit certain “Other Expenses” of the ActiveBeta® Emerging Markets Equity ETF (excluding acquired fund fees and expenses, taxes, interest, brokerage fees, expenses of shareholder meetings, litigation and indemnification, and extraordinary expenses) to the extent such expenses exceed, on an annual basis, a percentage rate of the average daily net assets of the Fund. Such Other Expense reimbursements, if any, are accrued daily and paid monthly. In addition, the Fund is not obligated to reimburse GSAM for prior fiscal year expense reimbursements, if any. The Other Expense limitation as an annual percentage rate of average daily net assets for the ActiveBeta® Emerging Markets Equity ETF is 0.05%. This Other Expense limitation will remain in effect permanently and GSAM may not terminate the arrangement without the approval of the Trustees.
For the fiscal year ended August 31, 2023, these expense reimbursements amounted to $664,597.
131
GOLDMAN SACHS ACTIVEBETA® ETFS
Notes to Financial Statements (continued)
August 31, 2023
|
| 6. CREATION AND REDEMPTION OF CREATION UNITS |
The Trust issues and redeems shares of the Funds only in Creation Units on a continuous basis through the Distributor, without an initial sales load, at NAV next determined after receipt, on any Business Day (as defined in the Statement of Additional Information), of an order in proper form. Shares of the Funds may only be purchased or redeemed by certain financial institutions (each an “Authorized Participant”). An Authorized Participant is either (1) a “Participating Party” or other participant in the clearing process through the Continuous Net Settlement System of the National Securities Clearing Corporation; or (2) a Depository Trust Company participant; which, in either case, must have executed an agreement with the Distributor. Retail investors will typically not qualify as an Authorized Participant or have the resources to buy and sell whole Creation Units. Therefore, they will be unable to purchase or redeem the shares directly from the Funds. Rather, most retail investors will purchase shares in the secondary market at market prices with the assistance of a broker and may be subject to customary brokerage commissions or fees. Fixed creation and redemption transaction fees are imposed in connection with creations and redemptions.
Authorized Participants transacting in Creation Units for cash may also pay a variable charge to compensate the relevant fund for certain transaction costs (e.g. taxes on currency or other financial transactions, and brokerage costs) and market impact expenses relating to investing in portfolio securities. Such variable charges, if any, are included in “Proceeds from sale of shares” in the Statements of Changes in Net Assets.
| | | | | | | | | | | | | | | | |
| | | ActiveBeta® Emerging Markets Equity ETF | |
| | | | |
| | | For the Fiscal Year Ended
August 31, 2023 | | | For the Fiscal Year Ended
August 31, 2022 | |
| | | | |
| | | Shares | | | Dollars | | | Shares | | | Dollars | |
| | | | |
| Fund Share Activity | | | | | | | | | | | | | | | | |
Shares Sold | | | 2,100,000 | | | $ | 61,682,388 | | | | 1,200,000 | | | $ | 45,853,209 | |
Shares Redeemed | | | (4,200,000 | ) | | | (119,934,568 | ) | | | (1,650,000 | ) | | | (52,865,514 | ) |
| | | | |
NET DECREASE IN SHARES | | | (2,100,000 | ) | | $ | (58,252,180 | ) | | | (450,000 | ) | | $ | (7,012,305 | ) |
| |
| | | ActiveBeta® Europe Equity ETF | |
| | | | |
| | | For the Fiscal Year Ended
August 31, 2023 | | | For the Fiscal Year Ended
August 31, 2022 | |
| | | | |
| | | Shares | | | Dollars | | | Shares | | | Dollars | |
| | | | |
| Fund Share Activity | | | | | | | | | | | | | | | | |
Shares Sold | | | — | | | $ | — | | | | 50,000 | | | $ | 1,790,247 | |
Shares Redeemed | | | (100,000 | ) | | | (2,546,984 | ) | | | (150,000 | ) | | | (4,610,459 | ) |
| | | | |
NET DECREASE IN SHARES | | | (100,000 | ) | | $ | (2,546,984 | ) | | | (100,000 | ) | | $ | (2,820,212 | ) |
| |
| | | ActiveBeta® International Equity ETF | |
| | | | |
| | | For the Fiscal Year Ended
August 31, 2023 | | | For the Fiscal Year Ended
August 31, 2022 | |
| | | | |
| | | Shares | | | Dollars | | | Shares | | | Dollars | |
| | | | |
| Fund Share Activity | | | | | | | | | | | | | | | | |
Shares Sold | | | 7,300,000 | | | $ | 221,995,548 | | | | 15,100,000 | | | $ | 495,288,336 | |
Shares Redeemed | | | (1,500,000 | ) | | | (44,265,384 | ) | | | (3,200,000 | ) | | | (95,030,974 | ) |
| | | | |
NET INCREASE IN SHARES | | | 5,800,000 | | | $ | 177,730,164 | | | | 11,900,000 | | | $ | 400,257,362 | |
132
GOLDMAN SACHS ACTIVEBETA® ETFS
|
| 6. CREATION AND REDEMPTION OF CREATION UNITS (continued) |
| | | | | | | | | | | | | | | | |
| |
| | | ActiveBeta® Japan Equity ETF | |
| | | | |
| | | For the Fiscal Year Ended
August 31, 2023 | | | For the Fiscal Year Ended
August 31, 2022 | |
| | | | |
| | | Shares | | | Dollars | | | Shares | | | Dollars | |
| | | | |
| Fund Share Activity | | | | | | | | | | | | | | | | |
Shares Sold | | | — | | | $ | — | | | | — | | | $ | — | |
Shares Redeemed | | | — | | | | — | | | | — | | | | — | |
| | | | |
NET DECREASE IN SHARES | | | — | | | $ | — | | | | — | | | $ | — | |
| |
| | | ActiveBeta® Paris-Aligned Climate U.S. Large Cap Equity ETF | |
| | | | |
| | | For the Fiscal Year Ended
August 31, 2023 | | | For the Fiscal Year Ended
August 31, 2022 | |
| | | | |
| | | Shares | | | Dollars | | | Shares | | | Dollars | |
| | | | |
| Fund Share Activity | | | | | | | | | | | | | | | | |
Shares Sold | | | 50,000 | | | $ | 1,515,654 | | | | 200,001 | | | $ | 7,934,694 | |
Shares Redeemed | | | (50,000 | ) | | | (1,803,743 | ) | | | (1 | ) | | | (40 | ) |
| | | | |
NET DECREASE IN SHARES | | | — | | | $ | (288,089 | ) | | | 200,000 | | | $ | 7,934,654 | |
| |
| | | ActiveBeta® U.S. Large Cap Equity ETF | |
| | | | |
| | | For the Fiscal Year Ended
August 31, 2023 | | | For the Fiscal Year Ended
August 31, 2022 | |
| | | | |
| | | Shares | | | Dollars | | | Shares | | | Dollars | |
| | | | |
| Fund Share Activity | | | | | | | | | | | | | | | | |
Shares Sold | | | 6,700,000 | | | $ | 551,981,819 | | | | 17,200,000 | | | $ | 1,516,359,247 | |
Shares Redeemed | | | (26,100,000 | ) | | | (2,079,315,418 | ) | | | (20,350,000 | ) | | | (1,695,965,517 | ) |
| | | | |
NET DECREASE IN SHARES | | | (19,400,000 | ) | | $ | (1,527,333,599 | ) | | | (3,150,000 | ) | | $ | (179,606,270 | ) |
| |
| | | ActiveBeta® U.S. Small Cap Equity ETF | |
| | | | |
| | | For the Fiscal Year Ended
August 31, 2023 | | | For the Fiscal Year Ended
August 31, 2022 | |
| | | | |
| | | Shares | | | Dollars | | | Shares | | | Dollars | |
| | | | |
| Fund Share Activity | | | | | | | | | | | | | | | | |
Shares Sold | | | 700,000 | | | $ | 40,329,686 | | | | 2,950,000 | | | $ | 176,204,999 | |
Shares Redeemed | | | (1,150,000 | ) | | | (62,627,817 | ) | | | (650,000 | ) | | | (37,882,026 | ) |
| | | | |
NET INCREASE (DECREASE) IN SHARES | | | (450,000 | ) | | $ | (22,298,131 | ) | | | 2,300,000 | | | $ | 138,322,973 | |
133
GOLDMAN SACHS ACTIVEBETA® ETFS
Notes to Financial Statements (continued)
August 31, 2023
|
| 6. CREATION AND REDEMPTION OF CREATION UNITS (continued) |
| | | | | | | | | | | | | | | | |
| |
| | | ActiveBeta® World Low Vol Plus Equity ETF | |
| | | | |
| | | For the Fiscal Year Ended
August 31, 2023 | | | For the Fiscal Year Ended
August 31, 2022 | |
| | | | |
| | | Shares | | | Dollars | | | Shares | | | Dollars | |
| | | | |
| Fund Share Activity | | | | | | | | | | | | | | | | |
Shares Sold | | | 2,800,000 | | | $ | 109,727,326 | | | | 14,700,000 | | | $ | 616,984,063 | |
Shares Redeemed | | | — | | | | — | | | | — | | | | — | |
| | | | |
NET INCREASE IN SHARES | | | 2,800,000 | | | $ | 109,727,326 | | | | 14,700,000 | | | $ | 616,984,063 | |
|
| 7. PORTFOLIO SECURITIES TRANSACTIONS |
The cost of purchases and proceeds from sales of long-term securities for the fiscal year ended August 31, 2023, were as follows:
| | | | | | | | | | |
| Fund | | | | Purchases | | | Sales | |
ActiveBeta® Emerging Markets Equity ETF | | | | $ | 200,749,406 | | | $ | 235,385,698 | |
ActiveBeta® Europe Equity ETF | | | | | 1,633,708 | | | | 1,587,135 | |
ActiveBeta® International Equity ETF | | | | | 480,763,647 | | | | 412,638,539 | |
ActiveBeta® Japan Equity ETF | | | | | 2,099,571 | | | | 2,086,227 | |
ActiveBeta® Paris-Aligned Climate U.S. Large Cap Equity ETF | | | | | 2,033,353 | | | | 2,052,720 | |
ActiveBeta® U.S. Large Cap Equity ETF | | | | | 1,214,787,650 | | | | 1,180,849,456 | |
ActiveBeta® U.S. Small Cap Equity ETF | | | | | 83,785,372 | | | | 75,661,063 | |
ActiveBeta® World Low Vol Plus Equity ETF | | | | | 195,413,617 | | | | 195,430,578 | |
The purchases and sales from in-kind creation and redemption transactions for the fiscal year ended August 31, 2023, were as follows:
| | | | | | | | | | |
| Fund | | | | Purchases | | | Sales | |
ActiveBeta® Emerging Markets Equity ETF | | | | $ | 9,036,085 | | | $ | 23,143,649 | |
ActiveBeta® Europe Equity ETF | | | | | — | | | | 2,510,871 | |
ActiveBeta® International Equity ETF | | | | | 153,896,315 | | | | 44,059,815 | |
ActiveBeta® Japan Equity ETF | | | | | — | | | | — | |
ActiveBeta® Paris-Aligned Climate U.S. Large Cap Equity ETF | | | | | 1,521,899 | | | | 1,799,823 | |
ActiveBeta® U.S. Large Cap Equity ETF | | | | | 511,313,808 | | | | 2,074,826,737 | |
ActiveBeta® U.S. Small Cap Equity ETF | | | | | 39,995,198 | | | | 62,191,757 | |
ActiveBeta® World Low Vol Plus Equity ETF | | | | | 108,315,926 | | | | — | |
134
GOLDMAN SACHS ACTIVEBETA® ETFS
The Funds may lend their securities through a securities lending agent, the Bank of New York Mellon (“BNYM”), to certain qualified borrowers. In accordance with the Funds’ securities lending procedures, the Funds receive cash collateral at least equal to the market value of the securities on loan. The market value of the loaned securities is determined at the close of business of the Funds, at their last sale price or official closing price on the principal exchange or system on which they are traded, and any additional required collateral is delivered to the Funds on the next business day. As with other extensions of credit, the Funds may experience delay in the recovery of their securities or incur a loss should the borrower of the securities breach its agreement with the Funds or become insolvent at a time when the collateral is insufficient to cover the cost of repurchasing securities on loan. Dividend income received from securities on loan may not be subject to withholding taxes and therefore withholding taxes paid may differ from the amounts listed in the Statements of Operations. Loans of securities are terminable at any time and as such 1) the remaining contractual maturities of the outstanding securities lending transactions are considered to be overnight and continuous and 2) the borrower, after notice, is required to return borrowed securities within the standard time period for settlement of securities transactions.
The Funds invest the cash collateral received in connection with securities lending transactions in the Goldman Sachs Financial Square Government Fund (“Government Money Market Fund”), an affiliated series of the Goldman Sachs Trust. The Government Money Market Fund is registered under the Act as an open end investment company, is subject to Rule 2a-7 under the Act, and is managed by GSAM, for which GSAM may receive a management fee of up to 0.16% on an annualized basis of the average daily net assets of the Government Money Market Fund.
In the event of a default by a borrower with respect to any loan, BNYM may exercise any and all remedies provided under the applicable borrower agreement to make the Funds whole. These remedies include purchasing replacement securities by applying the collateral held from the defaulting broker against the purchase cost of the replacement securities. If BNYM is unable to purchase replacement securities, BNYM will indemnify the Funds by paying the Funds an amount equal to the market value of the securities loaned minus the value of cash collateral received from the borrower for the loan, subject to an exclusion for any shortfalls resulting from a loss of value in such cash collateral due to reinvestment risk. The Funds’ master netting agreements with certain borrowers provide the right, in the event of a default (including bankruptcy or insolvency), for the non-defaulting party to liquidate the collateral and calculate net exposure to the defaulting party or request additional collateral. However, in the event of a default by a borrower, a resolution authority could determine that such rights are not enforceable due to the restrictions or prohibitions against the right of set-off that may be imposed in accordance with a particular jurisdiction’s bankruptcy or insolvency laws. The Funds’ loaned securities were all subject to enforceable Securities Lending Agreements and the value of the collateral was at least equal to the value of the cash received. The amounts of the Funds’ overnight and continuous agreements, which represent the gross amounts of recognized liabilities for securities lending transactions outstanding as of August 31, 2023, are disclosed as “Payable upon return of securities loaned” on the Statements of Assets and Liabilities, where applicable.
Both the Funds and BNYM received compensation relating to the lending of the Funds’ securities. The amounts earned, if any, by the Funds for the fiscal year ended August 31, 2023, are reported under Investment Income on the Statements of Operations.
The following table provides information about the Funds’ investment in the Government Money Market Fund for the fiscal year ended August 31, 2023:
| | | | | | | | | | | | | | | | |
| Fund | | Beginning value as
of August 31, 2022 | | | Purchases
at Cost | | | Proceeds
from Sales | | | Ending value as of
August 31, 2023 | |
ActiveBeta® Emerging Markets Equity ETF | | $ | 10,851,775 | | | $ | 66,236,554 | | | $ | (71,637,833 | ) | | $ | 5,450,496 | |
ActiveBeta® Europe Equity ETF | | | 61,124 | | | | 2,814,927 | | | | (2,743,928 | ) | | | 132,123 | |
ActiveBeta® International Equity ETF | | | 59,641,107 | | | | 740,532,397 | | | | (763,013,946 | ) | | | 37,159,558 | |
ActiveBeta® Japan Equity ETF | | | 862,006 | | | | 5,835,762 | | | | (6,600,991 | ) | | | 96,777 | |
ActiveBeta® Paris-Aligned Climate U.S. Large Cap Equity ETF | | | — | | | | 8,426 | | | | (8,426 | ) | | | — | |
ActiveBeta® U.S. Large Cap Equity ETF | | | 20,073,500 | | | | 234,754,344 | | | | (215,800,394 | ) | | | 39,027,450 | |
ActiveBeta® U.S. Small Cap Equity ETF | | | 2,801,299 | | | | 31,474,494 | | | | (31,511,131 | ) | | | 2,764,662 | |
ActiveBeta® World Low Vol Plus Equity ETF | | | — | | | | 50,907,674 | | | | (48,840,525 | ) | | | 2,067,149 | |
135
GOLDMAN SACHS ACTIVEBETA® ETFS
Notes to Financial Statements (continued)
August 31, 2023
The tax character of distributions paid during the fiscal years ended August 31, 2023 and August 31, 2022 were as follows:
| | | | | | | | | | | | | | | | | | | | | | | | | | | | | | | | |
| | | Fiscal Year Ended August 31, 2023 | | | | |
| | | ActiveBeta®
Emerging
Markets
Equity ETF | | | ActiveBeta®
Europe
Equity ETF | | | ActiveBeta®
International
Equity ETF | | | ActiveBeta®
Japan
Equity ETF | | | ActiveBeta®
Paris-Aligned Climate
U.S. Large Cap
Equity ETF | | | ActiveBeta®
U.S. Large Cap
Equity ETF | | | ActiveBeta®
U.S. Small Cap
Equity ETF | | | ActiveBeta®
World Low Vol
Plus
Equity ETF | |
Distributions paid from: | | | | | | | | | | | | | | | | | | | | | | | | | | | | | | | | |
Ordinary Income | | $ | 25,009,312 | | | $ | 359,836 | | | $ | 90,840,491 | | | $ | 259,624 | | | $ | 106,659 | | | $ | 170,189,662 | | | $ | 6,492,896 | | | $ | 13,421,605 | |
Total taxable distributions | | $ | 25,009,312 | | | $ | 359,836 | | | $ | 90,840,491 | | | $ | 259,624 | | | $ | 106,659 | | | $ | 170,189,662 | | | $ | 6,492,896 | | | $ | 13,421,605 | |
| | | | | | | | | | | | | | | | | | | | | | | | | | | | | | | | |
| | | Fiscal Year Ended August 31, 2022 | | | | |
| | | ActiveBeta®
Emerging
Markets
Equity ETF | | | ActiveBeta®
Europe
Equity ETF | | | ActiveBeta®
International
Equity ETF | | | ActiveBeta®
Japan
Equity ETF | | | ActiveBeta®
Paris-Aligned Climate
U.S. Large Cap
Equity ETF | | | ActiveBeta®
U.S. Large Cap
Equity ETF | | | ActiveBeta®
U.S. Small Cap
Equity ETF | | | ActiveBeta®
World Low Vol
Plus
Equity ETF | |
Distributions paid from: | | | | | | | | | | | | | | | | | | | | | | | | | | | | | | | | |
Ordinary Income | | $ | 53,609,786 | | | $ | 658,039 | | | $ | 93,382,329 | | | $ | 285,200 | | | $ | 47,676 | | | $ | 174,777,118 | | | $ | 5,603,655 | | | $ | 4,397,328 | |
Total taxable distributions | | $ | 53,609,786 | | | $ | 658,039 | | | $ | 93,382,329 | | | $ | 285,200 | | | $ | 47,676 | | | $ | 174,777,118 | | | $ | 5,603,655 | | | $ | 4,397,328 | |
As of the Funds’ most recent fiscal year ended August 31, 2023, the components of accumulated earnings (losses) on a tax-basis were as follows:
| | | | | | | | | | | | | | | | | | | | | | | | | | | | | | | | |
| | | ActiveBeta®
Emerging
Markets
Equity ETF | | | ActiveBeta®
Europe
Equity ETF | | | ActiveBeta®
International
Equity ETF | | | ActiveBeta®
Japan
Equity ETF | | | ActiveBeta®
Paris-Aligned Climate
U.S. Large Cap
Equity ETF | | | ActiveBeta®
U.S. Large Cap
Equity ETF | | | ActiveBeta®
U.S. Small Cap
Equity ETF | | | ActiveBeta®
World Low Vol
Plus
Equity ETF | |
Undistributed ordinary income — net | | $ | 6,550,334 | | | $ | 64,824 | | | $ | 11,705,202 | | | $ | 36,881 | | | $ | 15,135 | | | $ | 28,038,168 | | | $ | 682,091 | | | $ | 2,351,799 | |
Undistributed long-term capital gains | | | — | | | | — | | | | — | | | | — | | | | — | | | | — | | | | — | | | | — | |
Total undistributed earnings | | $ | 6,550,334 | | | $ | 64,824 | | | $ | 11,705,202 | | | $ | 36,881 | | | $ | 15,135 | | | $ | 28,038,168 | | | $ | 682,091 | | | $ | 2,351,799 | |
Capital loss carryforwards: | | | | | | | | | | | | | | | | | | | | | | | | | | | | | | | | |
Perpetual Short-Term | | $ | (31,389,025 | ) | | $ | (1,208,253 | ) | | $ | (96,667,452 | ) | | $ | (559,539 | ) | | $ | (230,083 | ) | | $ | (276,490,779 | ) | | $ | (12,028,913 | ) | | $ | (5,514,785 | ) |
Perpetual Long-Term | | | — | | | | (2,369,425 | ) | | | (118,383,474 | ) | | | (905,890 | ) | | | — | | | | (248,471,968 | ) | | | (4,515,494 | ) | | | — | |
Timing differences (Post-October Capital Loss Deferral/Qualified Late Year Loss Deferral) | | | (31,927,009 | ) | | | (194,024 | ) | | | (65,186,861 | ) | | | (185,059 | ) | | | (351,977 | ) | | | (301,619,129 | ) | | | (9,760,708 | ) | | | (23,615,451 | ) |
Unrealized gains (losses) — net | | | 43,562,705 | | | | 742,823 | | | | 322,689,651 | | | | 1,646,906 | | | | 25,309 | | | | 2,821,539,066 | | | | 11,322,450 | | | | 22,818,662 | |
Total accumulated earnings (losses) net | | $ | (13,202,995 | ) | | $ | (2,964,055 | ) | | $ | 54,157,066 | | | $ | 33,299 | | | $ | (541,616 | ) | | $ | 2,022,995,358 | | | $ | (14,300,574 | ) | | $ | (3,959,775 | ) |
136
GOLDMAN SACHS ACTIVEBETA® ETFS
|
| 9. TAX INFORMATION (continued) |
As of August 31, 2023, the Funds’ aggregate security unrealized gains and losses based on cost for U.S. federal income tax purposes were as follows:
| | | | | | | | | | | | | | | | | | | | | | | | | | | | | | | | |
| | | ActiveBeta®
Emerging
Markets
Equity ETF | | | ActiveBeta®
Europe
Equity ETF | | | ActiveBeta®
International
Equity ETF | | | ActiveBeta®
Japan
Equity ETF | | | ActiveBeta®
Paris-Aligned
Climate
U.S. Large Cap
Equity ETF | | | ActiveBeta®
U.S. Large Cap
Equity ETF | | | ActiveBeta®
U.S. Small Cap
Equity ETF | | | ActiveBeta®
World Low
Vol Plus
Equity ETF | |
Tax Cost | | $ | 927,755,722 | | | $ | 10,902,134 | | | $ | 2,952,311,690 | | | $ | 12,091,241 | | | $ | 7,334,751 | | | $ | 8,595,767,154 | | | $ | 469,904,938 | | | $ | 698,629,031 | |
Gross unrealized gain | | | 208,995,792 | | | | 1,875,577 | | | | 541,256,048 | | | | 2,607,425 | | | | 613,055 | | | | 3,212,291,550 | | | | 79,432,183 | | | | 56,152,592 | |
Gross unrealized loss | | | (165,433,087 | ) | | | (1,132,754 | ) | | | (218,566,397 | ) | | | (960,519 | ) | | | (587,746 | ) | | | (390,752,484 | ) | | | (68,109,733 | ) | | | (33,333,930 | ) |
Net unrealized gains (losses) | | $ | 43,562,705 | | | $ | 742,823 | | | $ | 322,689,651 | | | $ | 1,646,906 | | | $ | 25,309 | | | $ | 2,821,539,066 | | | $ | 11,322,450 | | | $ | 22,818,662 | |
The difference between GAAP-basis and tax basis unrealized gains (losses) is attributable primarily to wash sales, net mark to market gains/(losses) on regulated futures contracts, differences in the tax treatment of partnership investments, and differences in the tax treatment of passive foreign investment company investments.
In order to present components of the Funds’ capital accounts on a tax-basis, certain reclassifications have been recorded to the Funds’ accounts. These reclassifications have no impact on the net asset value of the Funds and result primarily from redemption in-kind transactions.
| | | | | | | | | | |
| Fund | | | | Paid-in
Capital | | | Total
Distributable
Earnings | |
ActiveBeta® Emerging Markets Equity ETF | | | | $ | 868,971 | | | $ | (868,971 | ) |
ActiveBeta® Europe Equity ETF | | | | $ | (194,519 | ) | | $ | 194,519 | |
ActiveBeta® International Equity ETF | | | | $ | 12,128,712 | | | $ | (12,128,712 | ) |
ActiveBeta® Japan Equity ETF | | | | $ | — | | | $ | — | |
ActiveBeta® Paris-Aligned Climate U.S. Large Cap Equity ETF | | | | $ | 292,055 | | | $ | (292,055 | ) |
ActiveBeta® U.S. Large Cap Equity ETF | | | | $ | 784,838,843 | | | $ | (784,838,843 | ) |
ActiveBeta® U.S. Small Cap Equity ETF | | | | $ | 17,889,281 | | | $ | (17,889,281 | ) |
ActiveBeta® World Vol Equity ETF | | | | $ | — | | | $ | — | |
GSAM has reviewed the Funds’ tax positions for all open tax years (the current and prior three years, as applicable) and has concluded that no provision for income tax is required in the Funds’ financial statements. Such open tax years remain subject to examination and adjustment by tax authorities.
The Funds’ risks include, but are not limited to, the following:
Calculation Methodology Risk — The Index relies on various sources of information to assess the criteria of issuers included in the Index (or a Reference Index if applicable), including fundamental information that may be based on assumptions and estimates. Neither the Fund, the Investment Adviser nor the Index Provider can offer assurances that the Index’s calculation methodology or sources of information will provide a correct valuation of securities, nor can they guarantee the availability or timeliness of the production of the Index.
137
GOLDMAN SACHS ACTIVEBETA® ETFS
Notes to Financial Statements (continued)
August 31, 2023
|
| 10. OTHER RISKS (continued) |
Geographic Risk — If a Fund focuses its investments in securities of issuers located in a particular country or geographic region, the Fund may be subjected, to a greater extent than if its investments were less focused, to the risks of volatile economic cycles and/or conditions and developments that may be particular to that country or region, such as: adverse securities markets; adverse exchange rates; adverse social, political, regulatory, economic, business, environmental or other developments; or natural disasters.
Index Risk — GSAM (the “Index Provider”) constructs each Fund’s index (an “Index”) in accordance with a rules-based methodology. A Fund will be negatively affected by general declines in the securities and asset classes represented in its Index. In addition, because the Funds are not “actively” managed, unless a specific security is removed from an Index, a Fund generally would not sell a security because the security’s issuer was in financial trouble. Market disruptions and regulatory restrictions could have an adverse effect on a Fund’s ability to adjust its exposure to the required levels in order to track the Index. A Fund also does not attempt to take defensive positions under any market conditions, including declining markets. Therefore, a Fund’s performance could be lower than funds that may actively shift their portfolio assets to take advantage of market opportunities or to lessen the impact of a market decline or a decline in the value of one or more issuers. The Index Provider relies on third party data it believes to be reliable in constructing each Index, but it does not guarantee the accuracy or availability of such third party data. Errors in index data, index computation or the construction of an Index in accordance with its methodology may occur from time to time and may not be identified and corrected by the Index Provider for a period of time or at all, which may have an adverse impact on the applicable Fund and its shareholders. In addition, neither a Fund, the Investment Adviser, the Calculation Agent nor the Index Provider can guarantee the availability or timeliness of the production of the Index.
Industry Concentration Risk — In following its methodology, the Index from time to time may be concentrated to a significant degree in securities of issuers located in a single industry or group of industries. To the extent that the Index concentrates in the securities of issuers in a particular industry or group of industries, the Fund also may concentrate its investments to approximately the same extent. By concentrating its investments in an industry or group of industries, the Fund may face more risks than if it were diversified broadly over numerous industries or groups of industries. If the Index is not concentrated in a particular industry or group of industries, the Fund will not concentrate in a particular industry or group of industries.
Investment Style Risk — Different investment styles (e.g., “growth”, “value” or “quantitative”) tend to shift in and out of favor depending upon market and economic conditions and investor sentiment. The Fund may outperform or underperform other funds that invest in similar asset classes but employ different investment styles.
Large Shareholder Transactions Risk — Certain shareholders, including other funds advised by the Investment Adviser, may from time to time own a substantial amount of the Fund’s Shares. In addition, a third party investor, the Investment Adviser or an affiliate of the Investment Adviser, an authorized participant, a lead market maker, or another entity (i.e., a seed investor) may invest in the Fund and hold its investment solely to facilitate commencement of the Fund or to facilitate the Fund’s achieving a specified size or scale. Any such investment may be held for a limited period of time. There can be no assurance that any large shareholder would not redeem its investment, that the size of the Fund would be maintained at such levels or that the Fund would continue to meet applicable listing requirements. Redemptions by large shareholders could have a significant negative impact on the Fund, including on the Fund’s liquidity. In addition, transactions by large shareholders may account for a large percentage of the trading volume on Cboe or NYSE Arca and may, therefore, have a material upward or downward effect on the market price of the Shares.
Market and Credit Risks — In the normal course of business, a Fund trades financial instruments and enters into financial transactions where risk of potential loss exists due to changes in the market (market risk). The value of the securities in which a Fund invests may go up or down in response to the prospects of individual companies, particular sectors or governments and/or general economic conditions throughout the world due to increasingly interconnected global economies and financial markets. Events such as war, military conflict, acts of terrorism, social unrest, natural disasters, recessions, inflation, rapid interest rate changes, supply chain disruptions, sanctions, the spread of infectious illness or other public health threats could also significantly impact a Fund and its investments. Additionally, a Fund may also be exposed to credit risk in the event that an issuer or guarantor fails to perform or that an institution or entity with which the Fund has unsettled or open transactions defaults.
138
GOLDMAN SACHS ACTIVEBETA® ETFS
|
| 10. OTHER RISKS (continued) |
Market Trading Risk — Each Fund faces numerous market trading risks, including disruptions to creations and redemptions, the existence of extreme market volatility or potential lack of an active trading market for Shares. If a shareholder purchases Shares at a time when the market price is at a premium to the NAV or sells Shares at a time when the market price is at a discount to the NAV, the shareholder may pay more for, or receive less than, the underlying value of the Shares, respectively. The Investment Adviser cannot predict whether Shares will trade below, at or above their NAV. Price differences may be due, in large part, to the fact that supply and demand forces at work in the secondary trading market for Shares will be closely related to, but not identical to, the same forces influencing the prices of the securities of a Fund’s Index trading individually or in the aggregate at any point in time.
Tracking Error Risk — Tracking error is the divergence of a Fund’s performance from that of its Index. The performance of a Fund may diverge from that of its Index for a number of reasons. Tracking error may occur because of transaction costs, a Fund’s holding of cash, differences in accrual of dividends, changes to its Index or the need to meet new or existing regulatory requirements. Unlike a Fund, the returns of an Index are not reduced by investment and other operating expenses, including the trading costs associated with implementing changes to its portfolio of investments. Tracking error risk may be heightened during times of market volatility or other unusual market conditions.
Under the Trust’s organizational documents, its Trustees, officers, employees and agents are indemnified, to the extent permitted by the Act and state law, against certain liabilities that may arise out of performance of their duties to the Funds. Additionally, in the course of business, the Funds enter into contracts that contain a variety of indemnification clauses. The Funds’ maximum exposure under these arrangements is unknown, as this would involve future claims that may be made against the Funds that have not yet occurred. However, GSAM believes the risk of loss under these arrangements to be remote.
Pursuant to an effort to consolidate the membership of the Board of Trustees of the Trust (the “Board”) with the Board of Trustees of each of Goldman Sachs ETF Trust II, Goldman Sachs Real Estate Diversified Income Fund, Goldman Sachs Trust, Goldman Sachs Trust II and Goldman Sachs Variable Insurance Trust, in July 2023, the Board voted to nominate Gregory G. Weaver, Dwight L. Bush, Kathryn A. Cassidy, John G. Chou, Joaquin Delgado, Eileen H. Dowling and Paul C. Wirth (the “Nominees”) for election as Trustees of the Trust at a virtual special joint meeting of shareholders to be held on November 16, 2023. Each of the Nominees currently serve as a Trustee of each of the Goldman Sachs Trust and Goldman Sachs Variable Insurance Trust. If elected, the Nominees will serve as Trustees alongside the current Trustees of the Trust. This annual report is not a proxy statement. Information regarding the election of the Nominees is contained in the proxy materials filed with the SEC. The proxy statement has been mailed to shareholders of record, and shareholders can also access the proxy statement, and any other relevant documents, on the SEC’s website.
Subsequent events after the Statements of Assets and Liabilities date have been evaluated, and GSAM has concluded that there is no impact requiring adjustment or disclosure in the financial statements.
139
Report of Independent Registered Public
Accounting Firm
To the Board of Trustees of Goldman Sachs ETF Trust and Shareholders of Goldman Sachs ActiveBeta® Emerging Markets Equity ETF, Goldman Sachs ActiveBeta® Europe Equity ETF, Goldman Sachs ActiveBeta® International Equity ETF, Goldman Sachs ActiveBeta® Japan Equity ETF, Goldman Sachs ActiveBeta® Paris-Aligned Climate U.S. Large Cap Equity ETF, Goldman Sachs ActiveBeta® U.S. Large Cap Equity ETF, Goldman Sachs ActiveBeta® U.S. Small Cap Equity ETF, and Goldman Sachs ActiveBeta® World Low Vol Plus Equity ETF
Opinions on the Financial Statements
We have audited the accompanying statements of assets and liabilities, including the schedules of investments, of each of the funds indicated in the table below (eight of the funds constituting Goldman Sachs ETF Trust, hereafter collectively referred to as the “Funds”) as of August 31, 2023, the related statements of operations and of changes in net assets for each of the periods indicated in the table below including the related notes, and the financial highlights for each of the periods indicated in the table below (collectively referred to as the “financial statements”). In our opinion, the financial statements present fairly, in all material respects, the financial position of each of the Funds as of August 31, 2023, the results of each of their operations, the changes in each of their net assets, and each of the financial highlights for each of the periods indicated in the table below, in conformity with accounting principles generally accepted in the United States of America.
| | | | | | |
| Fund | | Statement of operations | | Statement of changes in net assets | | Financial highlights |
Goldman Sachs ActiveBeta® Emerging Markets Equity ETF, Goldman Sachs ActiveBeta® Europe Equity ETF, Goldman Sachs ActiveBeta® International Equity ETF, Goldman Sachs ActiveBeta® Japan Equity ETF, Goldman Sachs ActiveBeta® U.S. Large Cap Equity ETF, and Goldman Sachs ActiveBeta® U.S. Small Cap Equity ETF | | For the year ended August 31, 2023 | | For the two years ended August 31, 2023 | | For each of the five years in the period ended August 31, 2023 |
| Goldman Sachs ActiveBeta® Paris-Aligned Climate U.S. Large Cap Equity ETF | | For the year ended August 31, 2023 | | For the year ended August 31, 2023, and for the period December 13, 2021 (commencement of operations) through August 31, 2022 |
| ActiveBeta® World Low Vol Plus Equity ETF | | For the year ended August 31, 2023 | | For the year ended August 31, 2023, and for the period March 15, 2022 (commencement of operations) through August 31, 2022 |
Basis for Opinions
These financial statements are the responsibility of the Funds’ management. Our responsibility is to express an opinion on the Funds’ financial statements based on our audits. We are a public accounting firm registered with the Public Company Accounting Oversight Board (United States) (PCAOB) and are required to be independent with respect to the Funds in accordance with the U.S. federal securities laws and the applicable rules and regulations of the Securities and Exchange Commission and the PCAOB.
We conducted our audits of these financial statements in accordance with the standards of the PCAOB. Those standards require that we plan and perform the audit to obtain reasonable assurance about whether the financial statements are free of material misstatement, whether due to error or fraud.
140
Our audits included performing procedures to assess the risks of material misstatement of the financial statements, whether due to error or fraud, and performing procedures that respond to those risks. Such procedures included examining, on a test basis, evidence regarding the amounts and disclosures in the financial statements. Our audits also included evaluating the accounting principles used and significant estimates made by management, as well as evaluating the overall presentation of the financial statements. Our procedures included confirmation of securities owned as of August 31, 2023 by correspondence with the custodian and brokers; when replies were not received from brokers, we performed other auditing procedures. We believe that our audits provide a reasonable basis for our opinions.
/s/ PricewaterhouseCoopers LLP
Boston, Massachusetts
October 25, 2023
We have served as the auditor of one or more investment companies in the Goldman Sachs fund complex since 2000.
141
GOLDMAN SACHS ACTIVEBETA® ETFS
Fund Expenses — Six Month Period Ended 8/31/2023 (Unaudited)
As a shareholder you incur ongoing costs, including management fees and other Fund expenses. This example is intended to help you understand your ongoing costs (in dollars) of investing in Shares of the Funds and to compare these costs with the ongoing costs of investing in other exchange-traded funds. This example does not take into account brokerage commissions that you may pay on your purchases and sales of Shares of a Fund.
The example is based on an investment of $1,000 invested at the beginning of the period and held for the entire six-month period from from March 1, 2023 through August 31, 2023, which represents a period of 184 days of a 365 day year (or less where indicated).
Actual Expenses — The first line in the table below provides information about actual account values and actual expenses. You may use the information in this line, together with the amount you invested, to estimate the expenses that you paid over the six months. Simply divide your account value by $1,000 (for example, an $8,600 account value divided by $1,000=8.6), then multiply the result by the number in the first line under the heading entitled “Expenses Paid” to estimate the expenses you paid on your account during this period.
Hypothetical Example for Comparison Purposes — The second line in the table below provides information about hypothetical account values and hypothetical expenses based on a Fund’s actual net expense ratios and an assumed rate of return of 5% per year before expenses, which is not the Fund’s actual return. The hypothetical account values and expenses may not be used to estimate the actual ending account balance or expenses you paid for the period. You may use this information to compare the ongoing costs of investing in a Fund and other funds. To do so, compare this 5% hypothetical example with the 5% hypothetical examples that appear in the shareholder reports of the other funds.
Please note that the expenses shown in the table are meant to highlight your ongoing costs only and do not reflect any transactional costs, such as redemption fees, or exchange fees. Therefore, the second line of the table is useful in comparing ongoing costs only, and will not help you determine the relative total costs of owning different funds. In addition, if these transactional costs were included, your costs would have been higher.
| | | | | | | | | | | | | | | | | | | | | | | | | | | | | | | | | | | | | | | | | | | | | | | | |
| | | ActiveBeta® Emerging Markets Equity ETF | | | ActiveBeta® Europe Equity ETF | | | ActiveBeta® International Equity ETF | | | ActiveBeta® Japan Equity ETF | |
| | | Beginning
Account
Value
3/1/2023 | | | Ending
Account
Value
8/31/23 | | | Expenses
Paid* | | | Beginning
Account
Value
3/1/23 | | | Ending
Account
Value
8/31/23 | | | Expenses
Paid** | | | Beginning
Account
Value
3/1/23 | | | Ending
Account
Value
8/31/23 | | | Expenses
Paid** | | | Beginning
Account
Value
3/1/23 | | | Ending
Account
Value
8/31/23 | | | Expenses
Paid** | |
Actual based on NAV | | $ | 1,000 | | | $ | 1,036.06 | | | $ | 2.35 | | | $ | 1,000 | | | $ | 1,053.65 | | | $ | 1.29 | | | $ | 1,000 | | | $ | 1,050.04 | | | $ | 1.29 | | | $ | 1,000 | | | $ | 1,117.22 | | | $ | 1.33 | |
Hypothetical 5% return | | | 1,000 | | | $ | 1,022.90 | + | | | 2.33 | | | | 1,000 | | | $ | 1,023.94 | ++ | | | 1.28 | | | | 1,000 | | | $ | 1,023.95 | ++ | | | 1.28 | | | | 1,000 | | | $ | 1,023.95 | ++ | | | 1.28 | |
| | | ActiveBeta® Paris-Aligned Climate U.S.
Large Cap Equity ETF | | | ActiveBeta® U.S. Large Cap Equity ETF | | | ActiveBeta® U.S. Small Cap Equity ETF | | | ActiveBeta® World Low Vol Plus Equity ETF | |
| | | Beginning
Account
Value
3/1/23 | | | Ending
Account
Value
8/31/23 | | | Expenses
Paid** | | | Beginning
Account
Value
3/1/23 | | | Ending
Account
Value
2/28/23 | | | Expenses
Paid** | | | Beginning
Account
Value
3/1/23 | | | Ending
Account
Value
8/31/23 | | | Expenses
Paid** | | | Beginning
Account
Value
3/1/23 | | | Ending
Account
Value
8/31/23 | | | Expenses
Paid** | |
Actual based on NAV | | $ | 1,000 | | | $ | 1,119.81 | | | $ | 1.07 | | | $ | 1,000 | | | $ | 1,130.04 | | | $ | 0.48 | | | $ | 1,000 | | | $ | 1,011.15 | | | $ | 1.01 | | | $ | 1,000 | | | $ | 1,079.78 | | | $ | 1.31 | |
Hypothetical 5% return | | | 1,000 | | | $ | 1,024.20 | ++ | | | 1.02 | | | | 1,000 | | | $ | 1,024.75 | ++ | | | 0.46 | | | | 1,000 | | | $ | 1,024.20 | ++ | | | 1.02 | | | | 1,000 | | | $ | 1,023.94 | ++ | | | 1.28 | |
| | + | | Hypothetical expenses are based on the Fund’s actual annualized net expense ratios (excluding proxy fee which is not annualized) and an assumed rate of return of 5% per year before expenses. | |
| | * | | Expenses for the Fund is calculated using the Fund’s annualized net expense ratio (excluding proxy fee which is not annualized), which represents the ongoing expenses as a percentage of net assets for the six months ended August 31, 2023. Expenses are calculated by multiplying the annualized net expense ratio by the average account value for the period; then multiplying the result by the number of days in the most recent fiscal year; and then dividing that result by the number of days in the fiscal year. | |
| | ++ | | Hypothetical expenses are based on each Fund’s actual annualized net expense ratios and an assumed rate of return of 5% per year before expenses. | |
| | ** | | Expenses for each Fund is calculated using the Fund’s annualized net expense ratio, which represents the ongoing expenses as a percentage of net assets for the six months ended August 31, 2023. Expenses are calculated by multiplying the annualized net expense ratio by the average account value for the period; then multiplying the result by the number of days in the most recent fiscal year; and then dividing that result by the number of days in the fiscal year. The annualized net expense ratio for the period is as follows: | |
| | | | |
| Fund | | | |
Goldman Sachs ActiveBeta® Emerging Markets Equity ETF | | | 0.46 | % |
Goldman Sachs ActiveBeta® Europe Equity ETF | | | 0.25 | |
Goldman Sachs ActiveBeta® International Equity ETF | | | 0.25 | |
Goldman Sachs ActiveBeta® Japan Equity ETF | | | 0.25 | |
Goldman Sachs ActiveBeta® Paris-Aligned Climate U.S. Large Cap Equity ETF | | | 0.20 | |
Goldman Sachs ActiveBeta® U.S. Large Cap Equity ETF | | | 0.09 | |
Goldman Sachs ActiveBeta® U.S. Small Cap Equity ETF | | | 0.20 | |
Goldman Sachs ActiveBeta® World Low Vol Plus Equity ETF | | | 0.25 | |
142
GOLDMAN SACHS ACTIVEBETA® ETFS
Trustees and Officers (Unaudited)
Independent Trustees
| | | | | | | | | | |
Name, Address and Age1 | | Position(s) Held
with the Trust | | Term of
Office and Length of
Time Served2 | | Principal Occupation(s) During Past 5 Years | | Number of
Portfolios in
Fund Complex
Overseen by
Trustee3 | | Other Directorships Held by Trustee4 |
| | | | | |
Cheryl K. Beebe Age: 67 | | Chair of the Board of Trustees | | Since 2021 | | Ms. Beebe is retired. She is Director, Packaging Corporation of America (2008-Present); Director, The Mosaic Company (2019-Present); Director, HanesBrands Inc. (2020-Present); and was formerly Director, Convergys Corporation (a global leader in customer experience outsourcing) (2015-2018); and formerly held the position of Executive Vice President, (2010-2014); and Chief Financial Officer, Ingredion, Inc. (a leading global ingredient solutions company) (2004-2014). Chair of the Board of Trustees — Goldman Sachs ETF Trust; Goldman Sachs Trust II; Goldman Sachs ETF Trust II; Goldman Sachs MLP and Energy Renaissance Fund; and Goldman Sachs Real Estate Diversified Income Fund. | | 68 | | Packaging Corporation of America (producer of container board); The Mosaic Company (producer of phosphate and potash fertilizer); HanesBrands Inc. (a multinational clothing company) |
| | | | | |
Lawrence Hughes Age: 65 | | Trustee | | Since 2021 | | Mr. Hughes is retired. Formerly, he held senior management positions with BNY Mellon Wealth Management, a division of The Bank of New York Mellon Corporation (a financial services company) (1991-2015), most recently as Chief Executive Officer (2010-2015). Previously, Mr. Hughes served as an Advisory Board Member of Goldman Sachs Trust II (February 2016-April 2016). Trustee — Goldman Sachs ETF Trust; Goldman Sachs ETF Trust II; Goldman Sachs Trust II; Goldman Sachs MLP and Energy Renaissance Fund; and Goldman Sachs Real Estate Diversified Income Fund. | | 68 | | None |
| | | | | |
John F. Killian Age: 68 | | Trustee | | Since 2021 | | Mr. Killian is retired. He is Director, Consolidated Edison, Inc. (2007-Present); and was formerly Director, Houghton Mifflin Harcourt Publishing Company (2011-2022). Previously, he held senior management positions with Verizon Communications, Inc., including Executive Vice President and Chief Financial Officer (2009-2010); and President, Verizon Business, Verizon Communications, Inc. (2005-2009). Trustee — Goldman Sachs ETF Trust; Goldman Sachs ETF Trust II; Goldman Sachs Trust II; Goldman Sachs MLP and Energy Renaissance Fund; and Goldman Sachs Real Estate Diversified Income Fund. | | 68 | | Consolidated Edison, Inc. (a utility holding company) |
| | | | | |
Steven D. Krichmar Age: 65 | | Trustee | | Since 2021 | | Mr. Krichmar is retired. Formerly, he held senior management and governance positions with Putnam Investments, LLC, a financial services company (2001-2016). He was most recently Chief of Operations and a member of the Operating Committee of Putnam Investments, LLC and Principal Financial Officer of The Putnam Funds. Previously, Mr. Krichmar served as an Audit Partner with PricewaterhouseCoopers LLP and its predecessor company (1990-2001). Trustee — Goldman Sachs ETF Trust; Goldman Sachs ETF Trust II; Goldman Sachs Trust II; Goldman Sachs MLP and Energy Renaissance Fund; and Goldman Sachs Real Estate Diversified Income Fund. | | 68 | | None |
| | | | | | | | | | |
143
GOLDMAN SACHS ACTIVEBETA® ETFS
Trustees and Officers (Unaudited) (continued)
Independent Trustees
| | | | | | | | | | |
Name, Address and Age1 | | Position(s) Held
with the Trust | | Term of
Office and Length of
Time Served2 | | Principal Occupation(s) During Past 5 Years | | Number of
Portfolios in
Fund Complex
Overseen by
Trustee3 | | Other Directorships Held by Trustee4 |
| | | | | |
Michael Latham Age: 57 | | Trustee | | Since 2015 | | Mr. Latham is retired. Formerly, he held senior management positions with the iShares exchange-traded fund business owned by BlackRock, Inc., including Chairman (2011-2014); Global Head (2010-2011); U.S. Head (2007-2010); and Chief Operating Officer (2003-2007). Trustee — Goldman Sachs ETF Trust; Goldman Sachs ETF Trust II; Goldman Sachs Trust II; Goldman Sachs MLP and Energy Renaissance Fund; Goldman Sachs Credit Income Fund; and Goldman Sachs Real Estate Diversified Income Fund. | | 69 | | None |
| | | | | |
Lawrence W. Stranghoener Age: 69 | | Trustee | | Since 2015 | | Mr. Stranghoener is retired. He is Chairman, Kennametal, Inc. (a global manufacturer and distributor of tooling and industrial materials) (2003-Present); and was formerly Director, Aleris Corporation and Aleris International, Inc. (a producer of aluminum rolled products) (2011-2020); Interim Chief Executive Officer (2014) and Executive Vice President and Chief Financial Officer (2004-2014), Mosaic Company (a fertilizer manufacturing company). Trustee — Goldman Sachs ETF Trust; Goldman Sachs Trust II; Goldman Sachs ETF Trust II; Goldman Sachs MLP and Energy Renaissance Fund; and Goldman Sachs Real Estate Diversified Income Fund. Chair of the Board of Trustees — Goldman Sachs Credit Income Fund. | | 69 | | Kennametal, Inc. (a global manufacturer and distributor of tooling and industrial materials) |
| | | | | | | | | | |
Interested Trustee*
| | | | | | | | | | |
Name, Address and Age1 | | Position(s) Held with the Trust | | Term of Office and Length of
Time Served2 | | Principal Occupation(s) During Past 5 Years | | Number of
Portfolios in
Fund Complex
Overseen by
Trustee3 | | Other Directorships Held by Trustee4 |
| | | | | |
James A. McNamara Age: 60 | | President and Trustee | | Since 2014 | | Advisory Director, Goldman Sachs (January 2018-Present); Managing Director, Goldman Sachs (January 2000-December 2017); Director of Institutional Fund Sales, GSAM (April 1998-December 2000); and Senior Vice President and Manager, Dreyfus Institutional Service Corporation (January 1993-April 1998). President and Trustee — Goldman Sachs ETF Trust; Goldman Sachs ETF Trust II; Goldman Sachs Trust; Goldman Sachs Variable Insurance Trust; Goldman Sachs Trust II; Goldman Sachs MLP and Energy Renaissance Fund; Goldman Sachs Credit Income Fund; and Goldman Sachs Real Estate Diversified Income Fund. | | 172 | | None |
| | | | | | | | | | |
| * | | Mr. McNamara is considered to be an “Interested Trustee” because he holds a position with Goldman Sachs and owns securities issued by The Goldman Sachs Group, Inc. The Interested Trustee holds comparable positions with certain other companies of which Goldman Sachs, GSAM or an affiliate thereof is the investment adviser, administrator and/or distributor. |
| 1 | | Each Trustee may be contacted by writing to the Trustee, c/o Goldman Sachs, 200 West Street, New York, New York, 10282, Attn: Caroline Kraus. Information is provided as of August 31, 2023. |
| 2 | | Each Trustee holds office for an indefinite term, until the earliest of: (a) the election of his or her successor; (b) the date the Trustee resigns or is removed by the Board or shareholders, in accordance with the Trust’s Declaration of Trust; or (c) the termination of the Trust. The Board has adopted policies which provide that each Independent Trustee shall retire as of December 31st of the calendar year in which he or she reaches (a) his or her 74th birthday or (b) the 15th anniversary of the date he or she became a Trustee, whichever is earlier, unless a waiver of such requirements shall have been adopted by a majority of the other Trustees. These policies may be changed by the Trustees without shareholder vote. |
| 3 | | The Goldman Sachs Fund Complex includes certain other companies listed above for each respective Trustee. As of August 31, 2023, Goldman Sachs ETF Trust consisted of 67 portfolios (32 of which offered shares to the public); Goldman Sachs ETF Trust II consisted of 2 portfolios; Goldman Sachs Trust consisted of 87 portfolios; Goldman Sachs Variable Insurance Trust consisted of 15 portfolios (11 of which offered shares to the public); Goldman Sachs Trust II consisted of 18 portfolios (7 of which offered shares to the public); and Goldman Sachs MLP and Energy Renaissance Fund, Goldman Sachs Credit Income Fund and Goldman Sachs Real Estate Diversified Income Fund each consisted of one portfolio. Goldman Sachs MLP and Energy Renaissance Fund and Goldman Sachs Credit Income Fund each did not offer shares to the public. |
| 4 | | This column includes only directorships of companies required to report to the Securities and Exchange Commission under the Securities Exchange Act of 1934 (i.e., “public companies”) or other investment companies registered under the Act. |
Additional information about the Trustees is available in the Funds’ Statement of Additional Information, which can be obtained from Goldman Sachs free of charge by calling this toll-free number (in the United States of America): 1-800-526-7384.
144
GOLDMAN SACHS ACTIVEBETA® ETFS
Trustees and Officers (Unaudited) (continued)
Officers of the Trust*
| | | | | | |
| Name, Address and Age1 | | Positions Held with the Trust | | Term of
Office and
Length of
Time Served2 | | Principal Occupation(s) During Past 5 Years |
| | | |
James A. McNamara 200 West Street New York, NY 10282 Age: 60 | | Trustee and President | | Since 2014 | | Advisory Director, Goldman Sachs (January 2018-Present); Managing Director, Goldman Sachs (January 2000-December 2017); Director of Institutional Fund Sales, GSAM (April 1998-December 2000); and Senior Vice President and Manager, Dreyfus Institutional Service Corporation (January 1993-April 1998). President and Trustee — Goldman Sachs ETF Trust; Goldman Sachs Trust; Goldman Sachs Variable Insurance Trust; Goldman Sachs Trust II; Goldman Sachs ETF Trust II; Goldman Sachs MLP and Energy Renaissance Fund; Goldman Sachs Credit Income Fund; and Goldman Sachs Real Estate Diversified Income Fund. |
| | | |
Caroline L. Kraus 200 West Street New York, NY 10282 Age: 46 | | Secretary | | Since 2014 | | Managing Director, Goldman Sachs (January 2016-Present); Vice President, Goldman Sachs (August 2006-December 2015); Senior Counsel, Goldman Sachs (January 2020-Present); Associate General Counsel, Goldman Sachs (2012-December 2019); Assistant General Counsel, Goldman Sachs (August 2006-December 2011); and Associate, Weil, Gotshal & Manges, LLP (2002-2006). Secretary — Goldman Sachs ETF Trust; Goldman Sachs Trust (previously Assistant Secretary (2012)); Goldman Sachs Variable Insurance Trust (previously Assistant Secretary (2012)); Goldman Sachs Trust II; Goldman Sachs ETF Trust II; Goldman Sachs BDC, Inc.; Goldman Sachs Private Middle Market Credit LLC; Goldman Sachs Private Middle Market Credit II LLC; Goldman Sachs Middle Market Lending Corp.; Goldman Sachs MLP and Energy Renaissance Fund; Goldman Sachs Credit Income Fund; and Goldman Sachs Real Estate Diversified Income Fund. |
| | | |
Joseph F. DiMaria 30 Hudson Street Jersey City, NJ 07302 Age: 55 | | Treasurer, Principal Financial Officer and Principal Accounting Officer | | Since 2017 (Treasurer and Principal Financial Officer since 2019) | | Managing Director, Goldman Sachs (November 2015-Present) and Vice President-Mutual Fund Administration, Columbia Management Investment Advisers, LLC (May 2010-October 2015). Treasurer, Principal Financial Officer and Principal Accounting Officer — Goldman Sachs ETF Trust (previously Assistant Treasurer (2017)); Goldman Sachs Trust (previously Assistant Treasurer (2016)); Goldman Sachs Variable Insurance Trust (previously Assistant Treasurer (2016)); Goldman Sachs Trust II (previously Assistant Treasurer (2017)); Goldman Sachs MLP and Energy Renaissance Fund (previously Assistant Treasurer (2017)); Goldman Sachs ETF Trust II; Goldman Sachs Credit Income Fund; and Goldman Sachs Real Estate Diversified Income Fund. |
| | | | | | |
| * | | Represents a partial list of officers of the Trust. Additional information about all the officers is available in the Funds’ Statement of Additional Information, which can be obtained from Goldman Sachs free of charge by calling this toll-free number (in the United States): 1-800-621-2550. |
| 1 | | Information is provided as of August 31, 2023. |
| 2 | | Officers hold office at the pleasure of the Board of Trustees or until their successors are duly elected and qualified. Each officer holds comparable positions with certain other companies of which Goldman Sachs, GSAM or an affiliate thereof is the investment adviser, administrator and/or distributor. |
Goldman Sachs ActiveBeta® ETFs - Tax Information (Unaudited)
From distributions paid during the fiscal year ended August 31, 2023, the total amount of income received by the ActiveBeta® Emerging Markets Equity ETF, ActiveBeta® Europe Equity ETF, ActiveBeta® International Equity ETF and ActiveBeta® Japan Equity ETF from sources within foreign countries and possessions of the United States was $1.3946, $1.4573, $0.7919 and $0.65 per share, respectively, all of which is attributable to qualified passive income. The percentage of net investment income dividends paid from foreign sources by the ActiveBeta® Emerging Markets Equity ETF, ActiveBeta® Europe Equity ETF, ActiveBeta® International Equity ETF and ActiveBeta® Japan Equity ETF was 96.81%, 78.04%, 80.59% and 82.47%, respectively. The total amount of taxes paid by the ActiveBeta® Emerging Markets Equity ETF, ActiveBeta® Europe Equity ETF, ActiveBeta® International Equity ETF and ActiveBeta® Japan Equity ETF to foreign countries was $0.203, $0.2123, $0.0726 and $0.0905 per share, respectively.
For the fiscal year ended August 31, 2023, 77.93%, 100%, 100%, 100%, 100%, 100%, 100% and 100% of the dividends paid from net investment company taxable income by the ActiveBeta® Emerging Markets Equity ETF, ActiveBeta® Europe Equity ETF, ActiveBeta® International Equity ETF, ActiveBeta® Japan Equity ETF, ActiveBeta® Paris-Aligned Climate U.S. Large Cap Equity ETF, ActiveBeta® U.S. Large Cap Equity ETF, ActiveBeta® U.S. Small Cap Equity ETF, and ActiveBeta® World Low Vol Plus Equity ETF, respectively, qualify for the reduced tax rate under the Jobs and Growth Tax Relief and Reconciliation Act of 2003.
For the fiscal year ended August 31, 2023, 94.44%, 84.41%, 47.02%, and 85.64% of the dividends paid from net investment company taxable income by the ActiveBeta® U.S. Large Cap Equity ETF, ActiveBeta® U.S. Small Cap Equity ETF, ActiveBeta® World Low Vol Plus Equity ETF, and ActiveBeta® Paris-Aligned Climate U.S. Large Cap Equity ETF, respectively, qualify for the dividends received deduction available to corporations.
145
FUNDS PROFILE
Goldman Sachs ETFs

Goldman Sachs is a premier financial services firm, known since 1869 for creating thoughtful and customized investment solutions in complex global markets.
Today, the Asset Management Division of Goldman Sachs serves a diverse set of clients worldwide, including private institutions, public entities and individuals. With approximately $2.46 trillion in assets under supervision as of June 30, 2023, Goldman Sachs Asset Management has portfolio management teams located around the world and our investment professionals bring firsthand knowledge of local markets to every investment decision. Assets under supervision includes assets under management and other client assets for which Goldman Sachs does not have full discretion. Goldman Sachs Asset Management leverages the resources of Goldman Sachs & Co. LLC subject to legal, internal and regulatory restrictions.
|
|
| GOLDMAN SACHS EXCHANGE-TRADED FUNDS |
| Goldman Sachs ActiveBeta® Emerging Markets Equity ETF |
| Goldman Sachs ActiveBeta® Europe Equity ETF |
| Goldman Sachs ActiveBeta® International Equity ETF |
| Goldman Sachs ActiveBeta® Japan Equity ETF |
| Goldman Sachs ActiveBeta® Paris-Aligned Climate U.S. Large Cap Equity ETF |
| Goldman Sachs ActiveBeta® U.S. Large Cap Equity ETF |
| Goldman Sachs ActiveBeta® U.S. Small Cap Equity ETF |
| Goldman Sachs ActiveBeta® World Low Vol Plus Equity ETF |
| Goldman Sachs Bloomberg Clean Energy Equity ETF |
| Goldman Sachs Community Municipal Bond ETF |
| Goldman Sachs Defensive Equity ETF |
| Goldman Sachs Equal Weight U.S. Large Cap Equity ETF |
| Goldman Sachs Hedge Industry VIP ETF |
| Goldman Sachs Innovate Equity ETF |
| Goldman Sachs JUST U.S. Large Cap Equity ETF |
| Goldman Sachs Access Emerging Markets USD Bond ETF |
| Goldman Sachs Access High Yield Corporate Bond ETF |
| Goldman Sachs Access Inflation Protected USD Bond ETF |
| Goldman Sachs Access Investment Grade Corporate 1-5 Year Bond ETF |
| Goldman Sachs Access Investment Grade Corporate Bond ETF |
| Goldman Sachs Access Treasury 0-1 Year ETF |
| Goldman Sachs Access Ultra Short Bond ETF |
| Goldman Sachs Access U.S. Aggregate Bond ETF |
| Goldman Sachs MarketBeta® Emerging Markets Equity ETF |
| Goldman Sachs MarketBeta® International Equity ETF |
| Goldman Sachs MarketBeta® U.S. Equity ETF |
| Goldman Sachs MarketBeta U.S. 1000 Equity ETF |
| Goldman Sachs MarketBeta® Total International Equity ETF |
| Goldman Sachs Future Planet Equity ETF |
| Goldman Sachs Future Tech Leaders Equity ETF |
| Goldman Sachs Future Health Care Equity ETF |
| Goldman Sachs Future Consumer Equity ETF |
| Goldman Sachs Future Real Estate and Infrastructure Equity ETF |
Goldman Sachs North American Pipelines & Power Equity ETF |
| Goldman Sachs Small Cap Core Equity ETF |
INDEX DISCLAIMERS
The MSCI Emerging Markets Index, MSCI Europe Index, MSCI World ex USA Index and MSCI Japan Index (the “MSCI Indices”) were used by GSAM as the reference universe for selection of the companies included in the Goldman Sachs ActiveBeta® Emerging Markets Equity Index, Goldman Sachs ActiveBeta® Europe Equity Index, Goldman Sachs ActiveBeta® International Equity Index and Goldman Sachs ActiveBeta® Japan Equity Index (the “ActiveBeta® Indices”), respectively. MSCI Inc. does not in any way sponsor, support, promote or endorse the ActiveBeta® Indices or the Goldman Sachs ActiveBeta® Emerging Markets Equity ETF, Goldman Sachs ActiveBeta® Europe Equity ETF, Goldman Sachs ActiveBeta® International Equity ETF or Goldman Sachs ActiveBeta® Japan Equity ETF (the “ActiveBeta® ETFs” or the “Funds”). MSCI Inc. was not and is not involved in any way in the creation, calculation, maintenance or review of the ActiveBeta® Indices. The MSCI Indices were provided on an “as is” basis. MSCI Inc., its affiliates and any other person or entity involved in or related to compiling, computing or creating the MSCI Indices (collectively, the “MSCI Parties”) expressly disclaim all warranties (including, without limitation, any warranties of originality, accuracy, completeness, timeliness, non-infringement, merchantability and fitness for a particular purpose). Without limiting any of the foregoing, in no event shall any MSCI Party have any liability for any direct, indirect, special, incidental, punitive, consequential (including without limitation lost profits) or any other damages in connection with the MSCI Indices, the ActiveBeta® ETFs or the ActiveBeta® Indices.
The Russell 2000® Index was used by Goldman Sachs Asset Management or its affiliate as the starting universe for selection of the companies included in the Goldman Sachs ActiveBeta® U.S. Small Cap Equity Index. Frank Russell Company (“Russell”) does not in any way sponsor, support, promote or endorse the Goldman Sachs ActiveBeta® U.S. Small Cap Equity Index or the Goldman Sachs ActiveBeta® U.S. Small Cap Equity ETF. In no event shall any Russell Party have any liability for any direct, indirect, special, incidental, punitive, consequential (including without limitation lost profits) or any other damages in connection with the Russell 2000® Index or the Goldman Sachs ActiveBeta® U.S. Small Cap Equity Index.
The ActiveBeta® Indices are trademarks of Goldman Sachs Asset Management, L.P. and have been licensed for use by Goldman Sachs ETF Trust.
Solactive US Large Cap Index intends to track the performance of the large cap segment in the United States. Constituents are selected and weighted based on free-float market capitalization. The index is calculated as a total return index in USD and reconstituted semi-annually with quarterly IPO reviews.
Solactive GBS Developed Markets Large & Mid Cap Index is part of the Solactive Global Benchmark Series which includes benchmark indices for developed and emerging market countries. The index intends to track the performance of the large and mid cap segment covering approximately the largest 85% of the free-float market capitalization in the developed European market. It is calculated as a total return index in EUR and weighted by free-float market capitalization.
GOLDMAN SACHS ASSET MANAGEMENT, L.P., THE GOLDMAN SACHS GROUP, INC., AND GOLDMAN SACHS & CO. LLC (COLLECTIVELY, “GOLDMAN SACHS”) DOES NOT GUARANTEE NOR MAKE ANY REPRESENTATION OR WARRANTY, EXPRESS OR IMPLIED, TO THE OWNERS OR SHAREHOLDERS OF THE FUNDS OR ANY MEMBER OF THE PUBLIC REGARDING THE ADVISABILITY OF INVESTING IN SECURITIES GENERALLY OR IN A FUND PARTICULARLY OR THE ABILITY OF THE ACTIVEBETA® INDICES TO TRACK GENERAL MARKET PERFORMANCE. GOLDMAN SACHS, IN ITS CAPACITY AS THE INDEX PROVIDER OF THE ACTIVEBETA® INDICES, LICENSES CERTAIN TRADEMARKS AND TRADE NAMES TO THE FUNDS. GOLDMAN SACHS HAS NO OBLIGATION TO TAKE THE NEEDS OF THE FUNDS OR THE SHAREHOLDERS OF THE FUNDS INTO CONSIDERATION IN DETERMINING, COMPOSING OR CALCULATING THE ACTIVEBETA® INDICES. GOLDMAN SACHS OR ANY OF ITS AFFILIATES MAY HOLD LONG OR SHORT POSITIONS IN SECURITIES HELD BY A FUND OR IN RELATED DERIVATIVES.
GOLDMAN SACHS DOES NOT GUARANTEE THE ADEQUACY, TIMELINESS, ACCURACY AND/OR THE COMPLETENESS OF THE ACTIVEBETA® INDICES OR ANY DATA RELATED THERETO. GOLDMAN SACHS HEREBY EXPRESSLY DISCLAIMS ANY AND ALL LIABILITY FOR ANY ERRORS, OMISSIONS, OR INTERRUPTIONS THEREIN OR IN THE CALCULATION THEREOF. GOLDMAN SACHS MAKES NO WARRANTY, EXPRESS OR IMPLIED, AND EXPRESSLY DISCLAIMS ALL WARRANTIES OF MERCHANTABILITY OR FITNESS FOR A PARTICULAR PURPOSE OR USE WITH RESPECT TO THE MARKS, THE ACTIVEBETA® INDICES OR ANY DATA INCLUDED THEREIN AS TO THE RESULTS TO BE OBTAINED BY A FUND, THE SHAREHOLDERS, OR ANY OTHER PERSON OR ENTITY FROM USE OF THE ACTIVEBETA® INDICES OR ANY DATA INCLUDED THEREIN. WITHOUT LIMITING ANY OF THE FOREGOING, GOLDMAN SACHS HEREBY EXPRESSLY DISCLAIMS ANY AND ALL LIABILITY FOR ANY SPECIAL, PUNITIVE, INDIRECT, OR CONSEQUENTIAL DAMAGES (INCLUDING LOST PROFITS), EVEN IF ADVISED OF THE POSSIBILITY OF SUCH DAMAGES.
| | |
TRUSTEES Cheryl K. Beebe, Chair Lawrence Hughes John F. Killian Steven D. Kirchmar Michael Latham James A. McNamara Lawrence W. Stranghoener | | OFFICERS James A. McNamara, President Joseph F. DiMaria, Treasurer, Principal Financial Officer and Principal Accounting Officer Robert Griffith, Secretary* * Effective September 20, 2023 |
| |
THE BANK OF NEW YORK MELLON Transfer Agent | | |
| |
ALPS DISTRIBUTORS, INC. Distributor | | GOLDMAN SACHS ASSET MANAGEMENT, L.P. Investment Adviser |
Visit our Website at www.GSAMFUNDS.com/ETFs to obtain the most recent month-end returns.
Goldman Sachs Asset Management, L.P., 200 West Street, New York, New York 10282
The reports concerning the Funds included in this shareholder report may contain certain forward-looking statements about the factors that may affect the performance of the Funds in the future. These statements are based on Fund management’s predictions and expectations concerning certain future events and their expected impact on the Funds, such as performance of the economy as a whole and of specific industry sectors, changes in the levels of interest rates, the impact of developing world events, and other factors that may influence the future performance of the Funds. Management believes these forward-looking statements to be reasonable, although they are inherently uncertain and difficult to predict. Actual events may cause adjustments in portfolio management strategies from those currently expected to be employed.
Neither MSCI nor any other party involved in or related to compiling, computing, or creating the MSCI data makes any express or implied warranties or representations with respect to such data (or the results to be obtained by the use thereof), and all such parties hereby expressly disclaim all warranties of originality, accuracy, completeness, merchantability, or fitness for a particular purpose with respect to any of such data. Without limiting any of the foregoing, in no event shall MSCI, any of its affiliates or any third party involved in or related to compiling, computing or creating the data have any liability for any direct, indirect, special, punitive, consequential or any other damages (including lost profits) even if notified of the possibility of such damages. No further distribution or dissemination of the MSCI data is permitted without MSCI’s express written consent.
A description of the policies and procedures that the Funds use to determine how to vote proxies relating to portfolio securities and information regarding how a Fund voted proxies relating to portfolio securities during the most recent 12-month period ended June 30 is available (i) without charge, upon request by calling 1-800-621-2550; and (ii) on the Securities and Exchange Commission (“SEC”) web site at http://www.sec.gov.
The Funds will file their portfolio holdings information for each month in a fiscal quarter within 60 days after the end of the relevant fiscal quarter on the Form N-PORT. Portfolio holdings information for the third month of each fiscal quarter will be made available on the SEC’s web site at http://www.sec.gov. Portfolio holdings information may be obtained upon request and without charge by calling 1-800-621-2550.
Fund holdings and allocations shown are as of August 31, 2023 and may not be representative of future investments. Fund holdings should not be relied on in making investment decisions and should not be construed as research or investment advice regarding particular securities. Current and future holdings are subject to risk.
Economic and market forecasts presented herein reflect our judgment as of the date of this presentation and are subject to change without notice. These forecasts do not take into account the specific investment objectives, restrictions, tax and financial situation or other needs of any specific client. Actual data will vary and may not be reflected here. These forecasts are subject to high levels of uncertainty that may affect actual performance. Accordingly, these forecasts should be viewed as merely representative of a broad range of possible outcomes. These forecasts are estimated, based on assumptions, and are subject to significant revision and may change materially as economic and market conditions change. Goldman Sachs has no obligation to provide updates or changes to these forecasts. Case studies and examples are for illustrative purposes only.
ETF Fund shares are not individually redeemable and are issued and redeemed by the Fund at their net asset value (“NAV”) only in large, specified blocks of shares called creation units. Shares otherwise can be bought and sold only through exchange trading at market price (not NAV). Shares may trade at a premium or discount to their NAV in the secondary market. Brokerage commissions will reduce returns. Ordinary brokerage commissions apply. ALPS Distributors, Inc. is the distributor of the Goldman Sachs ETF Funds. ALPS Distributors, Inc. is unaffiliated with Goldman Sachs Asset Management.
This material is not authorized for distribution to prospective investors unless preceded or accompanied by a current Prospectus or summary prospectus, if applicable. Investors should consider a Fund’s objective, risks, and charges and expenses, and read the summary prospectus, if available, and/or the Prospectus carefully before investing or sending money. The summary prospectus, if available, and the Prospectus contain this and other information about a Fund and may be obtained from your authorized dealer or from Goldman Sachs & Co. LLC by calling 1-800-621-2550.
MarketBeta® and ActiveBeta® are registered trademarks of GSAM.
© 2023 Goldman Sachs. All rights reserved. 339797-OTU-10/23 ACTBETAAR-23
Goldman Sachs Funds
| | | | |
| | |
| Annual Report | | | | August 31, 2023 |
| | |
| | | | Goldman Sachs Equity ETFs |
| | | | Bloomberg Clean Energy Equity ETF (GCLN) |
| | | | Equal Weight U.S. Large Cap Equity ETF (GSEW) |
| | | | Hedge Industry VIP ETF (GVIP) |
| | | | Innovate Equity ETF (GINN) |
| | | | JUST U.S. Large Cap Equity ETF (JUST) |
| | | | North America Pipelines & Power Equity ETF (GPOW) |
| | | | Defensive Equity ETF (GDEF) |

Goldman Sachs Equity ETFs
| ∎ | | BLOOMBERG CLEAN ENERGY EQUITY ETF (GCLN) |
| ∎ | | EQUAL WEIGHT U.S. LARGE CAP EQUITY ETF (GSEW) |
| ∎ | | HEDGE INDUSTRY VIP ETF (GVIP) |
| ∎ | | INNOVATE EQUITY ETF (GINN) |
| ∎ | | JUST U.S. LARGE CAP EQUITY ETF (JUST) |
| ∎ | | NORTH AMERICA PIPELINES & POWER EQUITY ETF (GPOW) |
| ∎ | | DEFENSIVE EQUITY ETF (GDEF) |
| | | | |
| | | |
| NOT FDIC-INSURED | | May Lose Value | | No Bank Guarantee |
INVESTMENT PROCESS
Goldman Sachs Bloomberg Clean Energy Equity ETF
Principal Investment Strategies
The Goldman Sachs Bloomberg Clean Energy Equity ETF (the “Fund”) seeks to achieve its investment objective by investing at least 80% of its assets (exclusive of collateral held from securities lending) in securities included in its underlying index, in depositary receipts representing securities included in its underlying index and in underlying stocks in respect of depositary receipts included in its underlying index.
The Bloomberg Goldman Sachs Global Clean Energy Index (the “Index”) is designed to deliver exposure to companies that are expected to have a significant impact on energy decarbonization through their exposure to clean energy which includes, but is not limited to, clean power infrastructure (generation, transmission and distribution), solar energy, wind energy, energy storage, hydrogen energy, energy digitalization and bioenergy. The Index is a free float-adjusted market capitalization-weighted index designed to identify relevant companies using curated data acquired from a variety of sources by Bloomberg Professional Services (the “Index Provider”). Some of the clean energy companies in which the Fund invests may have operations that involve traditional energy facilities (including oil, gas or other hydrocarbons). The Index Provider constructs the Index in accordance with a rules-based methodology that involves three steps.
Step 1 — In the first step, the Index Provider defines a universe of potential index constituents (the “Universe”) by identifying securities that are constituents of the Bloomberg Global Equity Index and classified to be within clean energy sectors by Bloomberg New Energy Finance (“BNEF”). BNEF is a strategic research provider covering global commodity markets and the disruptive technologies driving the transition to a low-carbon economy.
Step 2 — In the second step, the Index Provider screens the Universe for thematic relevance to clean energy and estimates the proportion of an issuer’s value attributable to clean energy activities. The Index Provider’s estimates are based on quarterly data reviews by sector specialists using reported segment revenues, along with any other available metrics such as segmented earnings before interest, taxes, depreciation and amortization (“EBITDA”), alignment with the European Union’s Taxonomy Regulation, current and planned activities of the issuer, and expected growth of clean energy-relevant business lines relative to other business lines.
Thematic relevance is then divided into four categories based on percentage of a company’s value attributed to clean energy activities: A4 (Minor Driver of Decarbonization) – 10% or Less, A3 (Moderate Driver of Decarbonization) – 10% to 24%, A2 (Considerable Driver of Decarbonization) – 25% to 49% and A1 (Main Driver of Decarbonization) – 50% to 100%. Securities of issuers within category A4 (Minor) or Environmental, Social, and Governance (“ESG”)-controversial securities, and securities with high carbon impact and poor mitigation plans are excluded from the Index.
Step 3 — In the third step, the Index constituents are grouped by thematic relevance categories to maximize relevance and impact. Each thematic category is assigned a weighting to maximize exposure to securities with the greatest impact to de-carbonization as follows:
| ∎ | | 60% of the Index weight is in securities classified as A1 (Main Driver of Decarbonization). |
| ∎ | | 30% of the Index weight is in securities classified as A2 (Considerable Driver of Decarbonization). |
| ∎ | | 10% of the index weight is in securities classified as A3 (Moderate Driver of Decarbonization). |
Within each category, the weight for a single security is capped at a specified level that varies by category. Any excess weight resulted from capping is redistributed proportionally across the remaining uncapped securities in the Index.
The Index is normally rebalanced and reconstituted quarterly in March, June, September, and December.
As of August 31, 2023, the Index consisted of 191 securities with a market capitalization range of between approximately $630.2 million and $819.1 billion. The components of the Index may change over time. The percentage of the portfolio exposed to any country or geographic region will vary from time to time as the weightings of the securities within the Index change, and the Fund may not be invested in each country or geographic region at all times.
1
INVESTMENT PROCESS
The Index is comprised of equity securities, including American Depositary Receipts (“ADRs”) and Global Depositary Receipts (“GDRs”). The Fund seeks to invest in the Index components in approximately the same weighting that such components have within the Index at the applicable time. The Fund may purchase a sample of securities in its Index. There may also be instances in which Goldman Sachs Asset Management, L.P. (“GSAM” or the “Investment Adviser”) may choose to underweight or overweight a security in the Fund’s Index, purchase securities not in the Fund’s Index that the Investment Adviser believes are appropriate to substitute for certain securities in such Index or utilize various combinations of other available investment techniques.
Given the Fund’s investment objective of attempting to track the Index, the Fund does not follow traditional methods of active investment management, which may involve buying and selling securities based upon analysis of economic and market factors.
The Fund is classified as “diversified” under the Investment Company Act of 1940, as amended (the “Investment Company Act”). However, the Fund may become “non-diversified” solely as a result of a change in the relative market capitalization or index weighting of one or more constituents of the Index. A non-diversified fund may invest a larger percentage of its assets in fewer issuers than diversified funds.
The Fund may concentrate its investments (i.e., hold more than 25% of its total assets) in a particular industry or group of industries to the extent that the Index is concentrated. The degree to which components of the Index represent certain sectors or industries may change over time.
* * *
At the end of the Reporting Period, i.e. the 12 months ended August 31, 2023, we believed that static, clean energy indices developed by index generalists may be missing investment opportunities. To solve for this, the Fund’s underlying index was designed by energy specialists at Goldman Sachs and BNEF to evolve with the low carbon transition. The Fund’s dynamic index leverages BNEF’s more than 200 research analysts to provide exposure to growth-oriented pure-play and “transitioning” clean energy companies.
2
INVESTMENT PROCESS
Goldman Sachs Equal Weight U.S. Large Cap Equity ETF
Principal Investment Strategies
The Goldman Sachs Equal Weight U.S. Large Cap Equity ETF (the “Fund”) seeks to achieve its investment objective by investing at least 80% of its assets (exclusive of collateral held from securities lending) in securities included in its underlying index.
The Solactive US Large Cap Equal Weight Index (GTR) (the “Index”) is designed to measure the performance of equity securities of large capitalization U.S. issuers. The Index is an equal-weight version of the Solactive US Large Cap Index, a market capitalization-weighted index that includes equity securities of approximately 500 of the largest U.S. companies. The Index includes the same constituents as the Solactive US Large Cap Index. However, unlike the Solactive US Large Cap Index, in which each security is weighted based on its market value, each security in the Index is given the same weight, approximately 0.2% of the Index, at each rebalance.
As of August 31, 2023, the Index consisted of 494 securities with a market capitalization range of between approximately $9.1 billion and $2,937.2 billion. The Index is reconstituted on a semi-annual basis in May and November to reflect changes in the constituents of the Solactive US Large Cap Index. New securities from initial public offerings are also added on a semi-annual basis in February and August, subject to fulfillment of certain eligibility criteria. The Index is rebalanced on a monthly basis to weight all constituents equally.
Given the Fund’s investment objective of attempting to track the Index, the Fund does not follow traditional methods of active investment management, which may involve buying and selling securities based upon analysis of economic and market factors.
* * *
At the end of the Reporting Period, i.e. the 12 months ended August 31, 2023, we believed that while mega-cap stocks may drive performance in market cap-weighted equity indices, many top performers may be found among non-mega-cap stocks. We maintain conviction in our methodology for providing meaningful access to opportunities among non-mega-cap stocks and avoiding concentration in mega-cap stocks by equally weighting the largest U.S. equities and rebalancing on a monthly basis. We believe this approach allows investors to participate in a broad range of market cycles and potentially reduce exposure to isolated market incidents.
3
INVESTMENT PROCESS
Goldman Sachs Hedge Industry VIP ETF
Principal Investment Strategies
The Goldman Sachs Hedge Industry VIP ETF (the “Fund”) seeks to achieve its investment objective by investing at least 80% of its assets (exclusive of collateral held from securities lending) in securities included in its underlying index, in depositary receipts representing securities included in its underlying index and in underlying stocks in respect of depositary receipts included in its underlying index. The Goldman Sachs Hedge Fund VIP IndexTM (the “Index”) is designed to deliver exposure to equity securities whose performance is expected to influence the long portfolios of hedge funds. Such equity securities are defined as those that appear most frequently among the top ten equity holdings of U.S. hedge fund managers that select their investments based upon fundamental analysis. Goldman Sachs Asset Management, L.P. (the “Index Provider”) is the provider of the Index, which is constructed in accordance with a rules-based methodology.
Hedge fund managers report their U.S. equity holdings, which are made public 45 days after the end of each calendar quarter. The Index is normally reconstituted and rebalanced on a quarterly basis once the information has been fully disseminated. The construction of the Index involves accessing the identifiers and share counts of U.S. equity holdings disclosed by hedge fund managers in their quarterly 13F filings with the Securities and Exchange Commission (“SEC”). The Index is constructed to then apply share prices at the time of data collection to the numbers of shares listed in each 13F disclosure filing to calculate the dollar market value of each reported position. U.S. hedge fund managers that select their investments based upon fundamental analysis are assumed to be U.S. hedge fund managers with no fewer than 10 and no more than 200 distinct U.S. equity positions, as reported in the hedge fund managers’ most recent Form 13F filings. Managers with less than $10 million of disclosed equity assets are excluded.
The equity positions are then ranked within each individual hedge fund manager’s portfolio by descending market value. The approximately 50 stocks that appear most frequently in the top 10 holdings of this universe then become the Index constituents. Constituents are equal dollar-weighted at each rebalance.
Given the Fund’s investment objective of attempting to track the Index, the Fund does not follow traditional methods of active investment management, which may involve buying and selling securities based upon analysis of economic and market factors.
The Index does not include hedge funds (i.e., unlisted, privately offered funds) and is not designed to approximate the performance of any hedge fund manager, hedge fund or group of hedge fund managers or hedge funds. The Index should not be considered a hedge fund replication strategy. As of August 31, 2023, the Index consisted of 50 securities with a market capitalization range of between approximately $5.6 billion and $2,937.2 billion. The components of the Index may change over time. The percentage of the portfolio exposed to any asset class will vary from time to time as the weightings of the securities within the Index change, and the Fund may not be invested in each asset class at all times.
THE FUND IS NOT A HEDGE FUND AND DOES NOT INVEST IN HEDGE FUNDS.
* * *
At the end of the Reporting Period, i.e. the 12 months ended August 31, 2023, we continued to believe the most effective way to identify the most important positions of hedge fund managers is to know what equities they are holding. We also maintained conviction in our methodology for extracting these important positions — by obtaining information from quarterly 13F filings of hedge funds and identifying stocks that appear among top holdings the most frequently. Through an efficient implementation, we believe investors are able to access top hedge fund long equity ideas and gain exposure to evolving U.S. market themes.
4
INVESTMENT PROCESS
Goldman Sachs Innovate Equity ETF
Principal Investment Strategies
The Goldman Sachs Innovate Equity ETF (the “Fund”) seeks to provide investment results that closely correspond, before fees and expenses, to the performance of the Solactive Innovative Global Equity Index (the “Index”). The Fund seeks to provide investors exposure to the beneficiaries of technological innovation across all sectors, geographies and market capitalizations.
The Index is designed to deliver exposure to companies that may benefit from technological innovation and the resulting changes in the economy across five key themes (the “Key Themes”) that are potential drivers of changes in the economy. Each Key Theme is divided into multiple sub-themes (the “Sub-Themes”). The Key Themes are:
Data-Driven World Theme — Companies that are positioned to potentially benefit from the unprecedented proliferation of data, capitalizing on data storage, security and analysis as well as artificial intelligence and machine learning.
Finance Reimagined Theme — Companies that are positioned to potentially benefit from the evolving financial landscape, from the digitization of traditional financial services to the development of blockchain technology.
Human Evolution Theme — Companies that are positioned to potentially benefit from advances in medical treatment and technology, from robotic surgery and precision medicine to gene therapy and care for an older population.
Manufacturing Revolution Theme — Companies that are positioned to potentially benefit from the technology-driven transformation of the manufacturing industry, including the emergence of new processes, products and energy sources.
New Age Consumer Theme — Companies that are positioned to potentially benefit from structural shifts in the way we consume goods and services due to changes in demographics, technology and consumer preferences.
The Index is comprised entirely of securities that compose the Solactive Data Driven World Index, the Solactive Finance Reimagined Index, the Solactive Human Evolution Index, the Solactive Manufacturing Revolution Index, and the Solactive New Age Consumer Index (the “Solactive Thematic Indexes”), which are designed to provide exposure to the Data Driven World Theme, the Finance Reimagined Theme, the Human Evolution Theme, the Manufacturing Revolution Theme and the New Age Consumer Theme, respectively. The weight of each index constituent within the Index is equal to the average weight of such index constituent across the Solactive Thematic Indexes, subject to specified minimum and maximum weights.
Solactive AG (the “Index Provider”) determines the components of each Solactive Thematic Index in accordance with a rules-based methodology that involves four steps. The following index methodology applies to each Solactive Thematic Index.
Step 1 — In the first step, the Index Provider defines a universe of potential index constituents (the “Universe”). The Universe is comprised of companies that meet all the below criteria:
| ∎ | | The company’s primary listing must be on a regulated stock exchange approved by the Index Provider; |
| ∎ | | The company’s stock must have an average daily trading volume over the most recent 1-month period (“ADTV”) of at least $1,000,000 in U.S. dollars; |
| ∎ | | The company must have a total market capitalization of at least $500,000,000 in U.S. dollars; and |
| ∎ | | The company must not be classified as within certain industries by the FactSet Industries and Economic Sectors classification in order to minimize non-theme-relevant exposures in the Index. |
Step 2 — In the second step, the Index Provider screens publicly available information, such as financial news, business profiles and company publications, using keywords that describe the Key Theme and its proprietary natural language processing algorithm to identify companies within the Universe that have or are expected to have significant exposure to a Sub-Theme. In addition, additional company and/or third-party information is screened in order to verify a company’s relevance to at least one of the Sub-Themes. Securities of issuers whose relevance to at least one of the Sub-Themes cannot be verified is removed from the Universe.
Step 3 — In the third step, each company identified in Step 2 is assigned a thematic relevance score with respect to each Sub-Theme. For each Sub-Theme, the Index Provider identifies 50 companies with the highest thematic relevance scores. The Index Provider then combines the thematic relevance scores for all Sub-Themes of each company identified to calculate such
5
INVESTMENT PROCESS
company’s overall score. The top 100 companies with the highest overall scores are included in the Solactive Thematic Index. In addition, certain buffer rules are applied to prevent excessive turnover.
Step 4 — In the fourth step, the Index Provider calculates a thematic beta for each index constituent, which is a quantitative measurement of the exposure of the index constituents to the applicable Key Theme. Index constituents are then weighted according to a function of its market capitalization and thematic beta, subject to specified minimum and maximum weights.
The Fund seeks to achieve its investment objective by investing at least 80% of its assets (exclusive of collateral held from securities lending) in securities included in its Index, in depositary receipts representing securities included in its Index and in underlying stocks in respect of depositary receipts included in its Index. The Fund may concentrate its investments (i.e., hold more than 25% of its total assets) in a particular industry or group of industries to the extent that the Index is concentrated. The degree to which components of the Index represent certain sectors or industries may change over time.
Given the Fund’s investment objective of attempting to track the Index, the Fund does not follow traditional methods of active investment management, which may involve buying and selling securities based upon analysis of economic and market factors. Also, unlike many investment companies, the Fund does not attempt to outperform the Index and does not seek temporary defensive positions when markets decline or appear overvalued.
The Index is normally rebalanced quarterly on the third Friday of each January, April, July and October.
* * *
At the end of the Reporting Period, i.e., the 12-month period ended August 31, 2023, the pace of technological innovation was faster than ever before, creating significant disruption across industries as new entrants and business models emerged and incumbents faced the threat of being dislodged. In our view, the Fund presented an attractive long-term opportunity, as we thought its underlying secular growth Key Themes and Sub-Themes would drive the financial markets during the coming decades. We believed fundamentally sound companies that could benefit from these Key Themes and Sub-Themes may be well-positioned to outperform. Although the Fund’s growth style and its exposure to the emerging markets can lead to short-term volatility, we remained confident overall in the long-term strength of these Key Themes and Sub-Themes at the end of the Reporting Period.
6
INVESTMENT PROCESS
Goldman Sachs JUST U.S. Large Cap Equity ETF
Principal Investment Strategies
The Goldman Sachs JUST U.S. Large Cap Equity ETF (the “Fund”) seeks to provide investment results that closely correspond, before fees and expenses, to the performance of the JUST US Large Cap Diversified Index (the “Index”).
The Fund seeks to achieve its investment objective by investing at least 80% of its assets (exclusive of collateral held from securities lending) in securities included in its underlying index, in depositary receipts representing securities included in its underlying index and in underlying stocks in respect of depositary receipts included in its underlying index.
The Index is designed to deliver exposure to equity securities of large capitalization U.S. issuers that engage in “just business behavior” based on rankings produced by JUST Capital Foundation, Inc. (the “Index Provider”). The Index Provider publishes an annual ranking of issuers in the Russell 1000® Index (the “Reference Index”) based on its quantitative performance assessment of seven issue areas: how they treat their workers, their customers, the communities they interact with, the environment, and their shareholders, their commitment to making quality and beneficial products, and job creation.
The Index Provider seeks to encourage greater accountability in the business community and drive positive change among large publicly-traded U.S. corporations by (a) defining business behaviors that the American public cares most about (through extensive qualitative and quantitative survey research), (b) developing metrics that correspond to these issues in accordance with a robust, transparent methodology, (c) ranking the largest publicly-traded U.S. companies on the basis of these metrics, and (d) developing tools and products that allow investors to direct capital towards more “just” companies.
The Index is a market capitalization-weighted index that consists of the top-ranked 50% of companies in the Reference Index by industry, based on the most recent rankings by the Index Provider. On the annual Index reconstitution date, Index constituent weights are adjusted such that the Index is industry neutral and matches the Reference Index’s industry weights, based on the Industry Classification Benchmark (“ICB”) industry classification.
As of August 31, 2023, the Index consisted of 459 securities with a market capitalization range of between approximately $1.3 billion and $2,937.2 billion. The Index is normally reconstituted annually in December and rebalanced in March, June and September on dates corresponding to the rebalance dates for the Reference Index. The components of the Index may change over time. The Index Provider determines whether an issuer is a U.S. issuer by reference to the index methodology of the Reference Index. FTSE Russell, which constructs the Reference Index, will deem an issuer to be a U.S. issuer if it is incorporated in, has a stated headquarters in, and trades in the U.S.; if any of these do not match, the Reference Index methodology providers for consideration of certain additional factors.
Given the Fund’s investment objective of attempting to track the Index, the Fund does not follow traditional methods of active investment management, which may involve buying and selling securities based upon analysis of economic and market factors.
The Fund seeks to invest in the Index components in approximately the same weighting that such components have within the Index at the applicable time. However, under various circumstances, it may not be possible or practicable to purchase all of the securities in the Index in the approximate Index weight. In these circumstances, the Fund may purchase a sample of securities in the Index. There may also be instances in which the Investment Adviser may choose to underweight or overweight a security in the Fund’s Index, purchase securities not in the Fund’s Index that the Investment Adviser believes are appropriate to substitute for certain securities in such Index or utilize various combinations of other available investment techniques.
The Index is calculated by Frank Russell Company (“Russell” or the “Calculation Agent”) in accordance with the methodology and constituent list developed and provided by the Index Provider.
The Fund may concentrate its investments (i.e., hold more than 25% of its total assets) in a particular industry or group of industries to the extent that the Index is concentrated. The degree to which components of the Index represent certain sectors or industries may change over time. The Fund may lend securities representing up to one-third of the value of the Fund’s total assets (including the value of any collateral received).
7
INVESTMENT PROCESS
For a complete overview of and more in-depth information about the Index Provider’s processes, please view its Full Ranking Methodology and Survey Research Appendices at https://justcapital.com/methodology/full-ranking-methodology/.
* * *
At the end of the Reporting Period, i.e. the 12 months ended August 31, 2023, we believed a focus on just business behavior via a data-driven approach may provide a suitable core U.S. equity allocation for investors seeking to encourage greater accountability in the business community through their investments. The Fund’s data-driven approach collects and analyzes data from a diverse range of sources, utilizing more than 150,000 data points across 66 unique metrics to score the performance of Russell 1000® Index companies. These companies are scored across a variety of issues, including worker treatment, customer concerns and environment impacts to provide broad market exposure.
8
INVESTMENT PROCESS
Goldman Sachs North American Pipelines & Power Equity ETF
Principal Investment Strategies
The Goldman Sachs North American Pipelines & Power Equity ETF (the “Fund”) seeks to achieve its investment objective by investing at least 80% of its assets (exclusive of collateral held from securities lending) in securities included in its underlying index, in depositary receipts representing securities included in its underlying index and in underlying stocks in respect of depositary receipts included in its underlying index.
The Solactive Energy Infrastructure Enhanced Index (the “Index”) is designed to deliver exposure to equity securities of U.S. and Canadian listed companies, including companies structured as master limited partnerships (“MLPs”), operating in the pipelines and power universe. The universe of pipelines and power companies will include those that are classified by a third party as operating within the “Midstream Energy,” “Liquefied Petroleum Gas (LPG), Propane and other Distributors,” or “Oil and Gas Transportation and Infrastructure” subsector or industry groups or derive a specified percentage of revenue from certain “Alternative Wholesale Power” sub-industries (subject to certain exclusions).
Investments in MLP securities taxed as partnerships will not exceed 25% of the Fund’s total assets as measured at the time of investment.
Given the Fund’s investment objective of attempting to track the Index, the Fund does not follow traditional methods of active investment management, which may involve buying and selling securities based upon analysis of economic and market factors.
The Index is owned and calculated by Solactive AG (“Solactive” or the “Index Provider”). Solactive constructs the Index in accordance with a rules-based methodology that involves three steps.
Step 1 — The starting universe (“Universe”) is made up of listed equity securities primarily listed on an exchange in the United States or Canada issued by pipelines and power companies. Under the Index methodology, pipelines and power companies are those assigned by FactSet RBICS to the Midstream Energy, LPG, Propane & Other Distributors, or Oil and Gas Transportation and Infrastructure subsectors or industry groups or deriving a cumulative revenue above 50% from certain Alternative Wholesale Power RBICS sub-industries, in each case subject to certain additional screens and filters.
Step 2 — The Index Provider removes constituents with average daily market capitalizations and trading values below specific thresholds from the Universe. As of August 31, 2023, the Index includes issuers with public stock market capitalizations of at least $395.6 million.
Step 3 — The remaining securities are weighted by float-adjusted market capitalization in the Index. The securities are then measured by two fundamental factors, Growth and Quality. The Index determines Growth and Quality rankings using various sub-factors designed to measure a security’s performance based on these factors (for example, earnings per share growth for Growth and return on investment capital for Quality). The Index Provider ranks each security based on the two fundamental factors, and the index is then reweighted in proportion to scoring on these fundamental factors with higher scores having higher weights in the index. The weights of the constituents are adjusted at each rebalance to ensure compliance by the Fund with the diversification requirements of the Internal Revenue Code of 1986, as applicable to regulated investment companies (“RICs”).
The Index is rebalanced on a quarterly basis. The components of the Index may change over time. The Fund seeks to invest in the Index components in approximately the same weighting that such components have within the Index at the applicable time. The Fund may purchase a sample of securities in its Index. There may also be instances in which the Investment Adviser may choose to underweight or overweight a security in the Fund’s Index, purchase securities not in the Fund’s Index that the Investment Adviser believes are appropriate to substitute for certain securities in such Index or utilize various combinations of other available investment techniques.
The Fund may concentrate its investments (i.e., hold more than 25% of its total assets) in a particular industry or group of industries to the extent that its Index is concentrated. As of the date of this Prospectus, the Index is concentrated in the energy sector. The degree to which components of the Index represent certain sectors or industries may change over time.
The Fund is structured as a RIC under the Code.
9
INVESTMENT PROCESS
THE FUND IS NON-DIVERSIFIED UNDER THE INVESTMENT COMPANY ACT OF 1940, AS AMENDED (THE “INVESTMENT COMPANY ACT”), AND MAY INVEST A LARGER PERCENTAGE OF ITS ASSETS IN FEWER ISSUERS THAN DIVERSIFIED FUNDS. PRINCIPAL RISKS OF THE FUND
* * *
At the end of the Reporting Period, i.e. the 12 months ended August 31, 2023, we believed that the Fund provides exposure to the full opportunity set of energy infrastructure securities, including those structured as both MLPs and common stocks. Further, we believed the Fund is enhanced with smart factors. More specifically, the Index, developed with input from energy specialists at Goldman Sachs Asset Management, applies quality and growth tilts that seek to apply the principles of active management in a rules-based framework. Finally, we believed the Fund provides a tax efficient structure, as its RIC structure avoids taxation at the fund level with an aim to maximize investor tax efficiency.
10
INVESTMENT PROCESS
Goldman Sachs Defensive Equity ETF
Principal Investment Strategies
The Goldman Sachs Defensive Equity ETF (the “Fund”) seeks long-term growth of capital with lower volatility than equity markets. In seeking to achieve this objective, the Fund invests, under normal circumstances, at least 80% of its net assets plus any borrowings for investment purposes (measured at the time of purchase) in a diversified portfolio of equity investments in U.S. issuers with public stock market capitalizations within the range of the market capitalization of the S&P 500® Index at the time of investment and other instruments with similar economic exposures. The Fund’s investments in fixed income securities are limited to cash equivalents (including money market funds) and U.S. Treasury securities.
In an effort to provide lower volatility and enhanced downside protection, the Fund uses an options-based overlay strategy. Specifically, the Fund employs a “put option spread collar” overlay strategy whereby the Fund simultaneously purchases a near-the-money put while selling (writing) an out-of-the-money call and put on the S&P 500® Index or other national or regional stock market indices (or ETFs that seek to track such indices). The difference between strike prices in the put option spread is designed to provide the Fund with downside protection to the extent of the difference between the strike prices of the near-the-money put option bought and the out-of-the-money put option sold. (A put option is an option contract that gives the holder the right, but not the obligation, to sell a specified amount of an underlying asset at a specified price within a specified time. A call option is an option that gives the holder the right to buy a certain quantity of an underlying security at an agreed-upon price at any time up to an agreed-upon date. “Near-the-money” is a term used to describe an options contract with a strike price that is close to the market price of the underlying asset. “Out-of-the-money” is a term used to describe a put option with a strike price that is lower than the market price of the underlying asset.)
As the seller of S&P 500® Index call and put options, the Fund will receive cash (the “premium”) from the purchaser. If the purchaser exercises the call option, the Fund pays the purchaser the difference between the price of the index and the exercise price of the option. If the purchaser exercises the put option, the Fund pays the purchaser the difference between the exercise price of the option and the price of the index. The premium, the exercise price and the market price of the index determine the gain or loss realized by the Fund as the seller of call and put options.
During periods in which the U.S. equity markets are generally unchanged or falling, a diversified portfolio with limited downside protection from its put spread collar strategy may outperform the same portfolio without such an options strategy. However, in strong rising markets where the aggregate appreciation of the underlying index exceeds the exercise price of the short call, a portfolio with a put spread collar strategy could significantly underperform the same portfolio without these options.
In addition to the use of the put spread collar overlay strategy described earlier, the Fund may use future contracts, primarily futures on indexes, options on futures, and total return swaps to more effectively gain targeted equity exposure from its cash positions and to hedge the Fund’s portfolio if it is unable to purchase or write the necessary options for its overlay strategy. Derivative positions may be listed or over-the-counter (“OTC”) and may or may not be centrally cleared.
The Fund is an actively managed exchange-traded fund (“ETF”), which is a fund that trades like other publicly traded securities. The Fund is not an index fund and does not seek to replicate the performance of a specified index.
* * *
At the end of the Reporting Period, i.e., the 12-month period ended August 31, 2023, we continued to employ our options-based overlay strategy, which may provide lower volatility and enhanced downside protection for the Fund, as we seek to provide investors with favorable risk-adjusted returns.
11
PORTFOLIO RESULTS
Goldman Sachs Bloomberg Clean Energy Equity ETF
Investment Objective
The Goldman Sachs Bloomberg Clean Energy Equity ETF seeks to provide investment results that closely correspond, before fees and expenses, to the performance of the Bloomberg Goldman Sachs Global Clean Energy Index (the “Index”).
Portfolio Management Discussion and Analysis
Below, the Goldman Sachs Quantitative Investment Strategies Team discusses the Fund’s performance and positioning for the 12-month period ended August 31, 2023 (the “Reporting Period”).
| Q | | How did the Fund perform during the Reporting Period? |
| A | | During the Reporting Period, the Fund returned -10.11% based on net asset value (“NAV”) and -9.54% based on market price. The Index returned -9.55% during the same period. |
| | The Fund had an NAV of $39.57 on August 31, 2022 and ended the Reporting Period with an NAV of $35.04 per share. The Fund’s market price on August 31, 2023 was $35.22 per share. |
| Q | | What key factors were responsible for the Fund’s performance during the Reporting Period? |
| A | | The Fund seeks to provide investment results that closely correspond, before fees and expenses, to the performance of the Index. The Fund’s performance reflects Fund expenses, including management fees and brokerage expenses. The Fund’s relative performance also reflects the impact of any cash held in the Fund as well as any other differences between the Fund’s holdings and the constituents of the Index. The Index is unmanaged, and Index returns do not reflect fees and expenses, which would reduce returns. |
| | Given the Fund’s investment objective of attempting to track the Index, the Fund does not follow traditional methods of active investment management, which may involve buying and selling securities based upon analysis of economic and market factors. The Fund does not follow a strategy of seeking to outperform the Index. |
| | During the Reporting Period, the Fund posted a negative absolute result that modestly underperformed the Bloomberg Goldman Sachs Clean Energy Index as measured by NAV. |
| Q | | Which sectors contributed most positively to the Index’s relative performance during the Reporting Period, and which detracted most? |
| A | | Index constituents in the information technology, utilities and industrials sectors detracted most from the Index’ results during the Reporting Period. Partially offsetting these detractors were Index constituents in the consumer discretionary, materials and health care sectors, which contributed positively to the Index’s results during the Reporting Period. |
| Q | | Which individual stock positions detracted the most from the Index’s results during the Reporting Period? |
| A | | Positions in U.S.-based information technology company Enphase Energy, U.S.-based industrials company Plug Power and India-based utilities company Adani Green Energy detracted most (2.13%, 0.62% and 0.67% of Fund net assets as of August 31, 2023, respectively). Each of these companies posted a double-digit negative return within the Index during the Reporting Period. |
| Q | | Which individual stock positions contributed the most to the Index’s relative returns during the Reporting Period? |
| A | | Positions in South Korea-based materials company Ecopro, U.S.-based industrials company General Electric and U.S.-based electric vehicle maker Tesla contributed most positively (2.39%, 2.98% and 7.43% of Fund net assets as of August 31, 2023, respectively). Ecopro posted a four-digit gain within the Index during the Reporting Period. General Electric generated a triple-digit gain within the Index during the Reporting Period, and Tesla posted a single-digit negative return within the Index during the Reporting Period. |
12
PORTFOLIO RESULTS
| Q | | How did the Fund use derivatives and similar instruments during the Reporting Period? |
| A | | The Fund did not invest in derivatives or similar instruments during the Reporting Period. The Fund does not employ derivatives as a source of alpha generation, although it may use them to equitize cash. |
| Q | | What was the Fund’s sector positioning relative to the Index at the end of the Reporting Period?1 |
| | | | | | | | | | |
| | | |
| | | Sector Name | | Fund2 | | | Bloomberg
Goldman Sachs
Global Clean
Energy Index | |
| | | |
| | Utilities | | | 38.49 | % | | | 38.50 | % |
| | Industrials | | | 24.04 | | | | 24.04 | |
| | Information Technology | | | 20.02 | | | | 20.08 | |
| | Consumer Discretionary | | | 9.15 | | | | 9.12 | |
| | Materials | | | 5.76 | | | | 5.77 | |
| | Energy | | | 1.78 | | | | 1.78 | |
| | Consumer Staples | | | 0.46 | | | | 0.47 | |
| | | Financials | | | 0.25 | | | | 0.25 | |
| Q | | What was the Fund’s country positioning relative to the Index at the end of the Reporting Period?1 |
| | | | | | | | | | |
| | | |
| | | Country Name | | Fund2 | | | Bloomberg
Goldman Sachs
Global Clean
Energy Index | |
| | | |
| | U.S. | | | 37.61 | % | | | 37.61 | % |
| | China | | | 17.74 | | | | 17.83 | |
| | South Korea | | | 7.06 | | | | 7.04 | |
| | Denmark | | | 4.31 | | | | 4.30 | |
| | U.K. | | | 4.20 | | | | 4.19 | |
| | France | | | 3.98 | | | | 3.97 | |
| | Italy | | | 3.95 | | | | 3.95 | |
| | Germany | | | 3.84 | | | | 3.84 | |
| | Canada | | | 3.30 | | | | 3.31 | |
| | Spain | | | 2.93 | | | | 2.92 | |
| | Japan | | | 2.31 | | | | 2.32 | |
| | Israel | | | 1.38 | | | | 1.37 | |
| | India | | | 1.23 | | | | 1.24 | |
| | Finland | | | 1.14 | | | | 1.14 | |
| | Switzerland | | | 0.89 | | | | 0.89 | |
| | Belgium | | | 0.88 | | | | 0.88 | |
| | Brazil | | | 0.75 | | | | 0.76 | |
| | Taiwan | | | 0.54 | | | | 0.54 | |
| | Hong Kong | | | 0.44 | | | | 0.44 | |
| | Czech Republic | | | 0.43 | | | | 0.43 | |
| | Netherlands | | | 0.42 | | | | 0.42 | |
| | Thailand | | | 0.33 | | | | 0.33 | |
| | Norway | | | 0.15 | | | | 0.15 | |
| | Portugal | | | 0.11 | | | | 0.11 | |
| | | Singapore | | | 0.03 | | | | 0.03 | |
| | 1 | | Sector classifications for securities may differ between the above listing and the Schedule of Investments due to differing classification methodologies. The classification methodology used for the above listing is as set forth by Bloomberg Professional Services. The Fund’s composition may differ over time. Consequently, the Fund’s overall sector allocations may differ from percentages contained in the chart above. The percentage shown for each investment category reflects the value of investments in that category as a percentage of market value (excluding investment in the securities lending reinvestment vehicle, if any). Underlying sector allocation of exchange-traded funds held by the Fund are not reflected in the chart above. Investments in the securities lending vehicle represented 1.4% of the Fund’s net assets as of August 31, 2023. Figures above may not sum to 100% due to rounding due to the presence of cash. |
| | 2 | | The Fund seeks to provide investment results that closely correspond, before fees and expenses, to the performance of the Bloomberg Goldman Sachs Global Clean Energy Index. |
13
FUND BASICS
Bloomberg Clean Energy Equity ETF
as of August 31, 2023
| | | | | | |
| | FUND SNAPSHOT | |
| | |
| | | As of August 31, 2023 | | | |
| | |
| | Market Price1 | | $ | 35.22 | |
| | | Net Asset Value (NAV)1 | | $ | 35.04 | |
| 1 | | The Market Price is the price at which the Fund’s shares are trading on the Cboe BZX Exchange, Inc. (“Cboe BZX”). The Market Price of the Fund’s shares will fluctuate and, at the time of sale, shares may be worth more or less than the original investment or the Fund’s then current net asset value (“NAV”). The NAV is the market value of one share of the Fund. This amount is derived by dividing the total value of all the securities in the Fund’s portfolio, plus other assets, less any liabilities, by the number of Fund shares outstanding. Fund shares are not individually redeemable and are issued and redeemed by the Fund at their NAV only in large, specified blocks of shares called creation units. Shares otherwise can be bought and sold only through exchange trading at market price (not NAV). Shares may trade at a premium or discount to their NAV in the secondary market. Information regarding how often shares of the Fund traded on Cboe BZX at a price above (i.e., at a premium) or below (i.e., at a discount) the NAV of the Fund can be found at www.GSAMFUNDS.com/ETFs. |
| | | | | | | | | | |
| | TOP 10 HOLDINGS AS OF 8/31/232 |
| | | | |
| | | Holding | | % of Net Assets | | | Line of Business | | Country |
| | | | |
| | Tesla, Inc. | | | 7.4 | % | | Consumer Discretionary | | United States |
| | Contemporary Amperex Technology Co. Ltd., Class A | | | 5.0 | | | Industrials | | China |
| | NextEra Energy, Inc. | | | 4.7 | | | Utilities | | United States |
| | Edison International | | | 3.3 | | | Utilities | | United States |
| | General Electric Co. | | | 3.0 | | | Industrials | | United States |
| | Vestas Wind Systems A/S | | | 2.9 | | | Industrials | | Denmark |
| | Enel SpA | | | 2.8 | | | Utilities | | Italy |
| | Samsung SDI Co. Ltd. | | | 2.7 | | | Information Technology | | South Korea |
| | Schneider Electric SE | | | 2.7 | | | Industrials | | United States |
| | | Sempra | | | 2.5 | | | Utilities | | United States |
| 2 | | The top 10 holdings may not be representative of the Fund’s future investments. |
For more information about the Fund, please refer to www.GSAMFUNDS.com/ETFs. There, you can learn more about the Fund’s investment strategies, holdings, and performance.
14
GOLDMAN SACHS BLOOMBERG CLEAN ENERGY EQUITY ETF
Performance Summary
August 31, 2023
The following graph shows the value, as of August 31, 2023, of a $10,000 investment made on February 8, 2022 (commencement of operations) in Shares at NAV. For comparative purposes, the performance of the Fund’s underlying index, a market cap-based index against which the performance of the Fund is measured, Bloomberg Goldman Sachs Global Clean Energy Index (Total Return, Unhedged, USD) is shown. Performance reflects applicable fee waivers and/or expense limitations in effect during the periods shown and in their absence, performance would be reduced. Returns do not reflect the deduction of taxes that a shareholder would pay on Fund distributions or the sale of Fund shares. In addition to the performance of constituents of the underlying index, other factors may affect Fund performance. These factors include, but are not limited to, Fund operating fees and expenses, portfolio turnover and creation and redemption in-kind transactions. The returns set forth below represent past performance. Past performance does not guarantee future results. The Fund’s NAV and investment return may fluctuate. These fluctuations may cause an investor’s shares to be worth more or less than their original cost. Current performance may be lower or higher than the performance quoted below. Please visit our web site at www.GSAMFUNDS.com/ETFs to obtain the most recent month-end returns.
|
| Goldman Sachs Bloomberg Clean Energy Equity ETF’s Lifetime Performance |
Performance of a $10,000 Investment, with distributions reinvested, from February 8, 2022 through August 31, 2023.
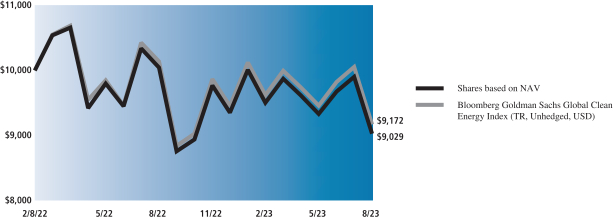
| | | | | | |
| Average Annual Total Return through August 31, 2023* | | | 1 Year | | | Since Inception |
Shares based on NAV (Commenced February 8, 2022) | | | -10.11% | | | -6.34% |
|
Shares based on Market Price (Commenced February 8, 2022) | | | -9.54% | | | -6.03% |
|
Bloomberg Goldman Sachs Global Clean Energy Index (TR, unhedged, USD) | | | -9.55% | | | -5.40% |
|
| * | | Total returns are calculated assuming purchase of a share at the market price or NAV on the first day and sale of a share at the market price or NAV on the last day of each period reported. The Total Returns based on NAV and Market Price assume the reinvestment of dividends and do not reflect brokerage commissions in connection with the purchase or sale of Fund shares, which if included would lower the performance shown above. The NAV used in the Total Return calculations assumes all management fees incurred by the Fund. Market Price returns are based upon the last trade at 4:00 pm EST and do not reflect the returns you would receive if you traded shares at other times. The first day of secondary market trading is typically several days after the date on which the Fund commenced investment operations; therefore, the NAV of the Fund is used as a proxy for the period from inception of investment operations to the first day of secondary market trading to calculate the Market Price returns. |
15
PORTFOLIO RESULTS
Goldman Sachs Equal Weight U.S. Large Cap Equity ETF
Investment Objective
The Goldman Sachs Equal Weight U.S. Large Cap Equity ETF (the “Fund”) seeks to provide investment results that closely correspond, before fees and expenses, to the performance of the Solactive US Large Cap Equal Weight Index (GTR) (the “Index”).
Portfolio Management Discussion and Analysis
Below, the Goldman Sachs Quantitative Investment Strategies Team discusses the Fund’s performance and positioning for the 12-month period ended August 31, 2023 (the “Reporting Period”).
| Q | | How did the Fund perform during the Reporting Period? |
| A | | During the Reporting Period, the Fund returned 8.58% based on net asset value (“NAV”) and 8.56% based on market price. The Index returned 8.75%, and the S&P 500® Index (Total Return, USD) (“S&P 500® Index”), a market-cap based index against which the performance of the Fund is measured, returned 15.94% during the same period. |
| | The Fund had an NAV of $58.98 on August 31, 2022 and ended the Reporting Period with an NAV of $62.93 per share. The Fund’s market price on August 31, 2023 was $62.93 per share. |
| Q | | What key factors were responsible for the Fund’s performance during the Reporting Period? |
| A | | The Fund seeks to provide investment results that closely correspond, before fees and expenses, to the performance of the Index. The Fund’s performance reflects Fund expenses, including management fees and brokerage expenses. The Fund’s relative performance also reflects the impact of any cash held in the Fund as well as any other differences between the Fund’s holdings and the constituents of the Index. The Index is unmanaged, and Index returns do not reflect fees and expenses, which would reduce returns. |
| | The Index’s performance is compared to that of the S&P 500® Index below. Given the Fund’s investment objective of attempting to track the Index, the Fund does not follow traditional methods of active investment management, which may involve buying and selling securities based upon analysis of economic and market factors. The Fund does not follow a strategy of seeking to outperform the S&P 500® Index. |
| | During the Reporting Period, the Index posted a positive absolute return but underperformed the S&P 500® Index. The Fund also underperformed the S&P 500® Index during the Reporting Period, as measured by NAV. |
| Q | | Which sectors contributed most positively to the Index’s relative performance during the Reporting Period, and which detracted most? |
| A | | Index constituents in the utilities, real estate and consumer staples sectors detracted most from the Index’s results relative to the S&P 500® Index during the Reporting Period. Index constituents in the information technology, industrials and consumer discretionary sectors contributed most positively to the Index’s results relative to the S&P 500® Index. |
| Q | | Which individual stock positions detracted the most from the Index’s results during the Reporting Period? |
| A | | Relative to the S&P 500® Index, positions in regional bank First Republic Bank, industrials company Plug Power and communication services company ZoomInfo Technologies detracted most (0.00%1, 0.00% and 0.00% of Fund net assets as of August 31, 2023, respectively). Each of these holdings posted a double-digit negative return within the Index during the Reporting Period. |
| | 1 | | Some weights are 0.00% at August 31, 2023 either because those positions were eliminated during the most recent rebalance given the Index construction methodology or were not held at all during the Reporting Period as they did not meet the Fund’s investment criteria. |
16
PORTFOLIO RESULTS
| Q | | Which individual stock positions contributed the most to the Index’s relative returns during the Reporting Period? |
| A | | Relative to the S&P 500® Index, positions in information technology companies NVIDIA and Palantir Technologies and in consumer discretionary company Royal Caribbean Cruises contributed most positively (0.23%, 0.16% and 0.19% of Fund net assets as of August 31, 2023, respectively). NVIDIA and Royal Caribbean Cruises each posted a triple-digit positive return within the Index during the Reporting Period, and Palantir Technologies generated a robust double-digit positive return within the Index during the Reporting Period. |
| Q | | How did the Fund use derivatives and similar instruments during the Reporting Period? |
| A | | The Fund did not invest in derivatives or similar instruments during the Reporting Period. The Fund does not employ derivatives as a source of alpha generation, although it may use them to equitize cash. |
| Q | | What was the Fund’s sector positioning relative to the Index and the S&P 500® Index at the end of the Reporting Period?1 |
| | | | | | | | | | | | | | |
| | | | |
| | | Sector Name | | Fund2 | | | Solactive
US Large
Cap Equal
Weight Index | | | S&P 500®
Index | |
| | | | |
| | Information Technology | | | 15.68 | % | | | 15.68 | % | | | 27.32 | % |
| | Industrials | | | 14.68 | | | | 14.66 | | | | 7.92 | |
| | Financials | | | 14.29 | | | | 14.23 | | | | 10.86 | |
| | Health Care | | | 13.32 | | | | 13.37 | | | | 14.07 | |
| | Consumer Discretionary | | | 8.37 | | | | 8.38 | | | | 11.43 | |
| | Consumer Staples | | | 6.78 | | | | 6.81 | | | | 6.77 | |
| | Real Estate | | | 6.37 | | | | 6.38 | | | | 2.86 | |
| | Utilities | | | 5.45 | | | | 5.44 | | | | 3.13 | |
| | Materials | | | 5.41 | | | | 5.45 | | | | 2.54 | |
| | Energy | | | 5.36 | | | | 5.33 | | | | 4.67 | |
| | | Communication Services | | | 4.27 | | | | 4.27 | | | | 8.42 | |
| | 1 | | Sector classifications for securities may differ between the above listing and the Schedule of Investments due to differing classification methodologies. The classification methodology used for the above listing is as set forth by Standard & Poor’s. The Fund’s composition may differ over time. Consequently, the Fund’s overall sector allocations may differ from percentages contained in the chart above. The percentage shown for each investment category reflects the value of investments in that category as a percentage of market value (excluding investment in the securities lending reinvestment vehicle, if any). Underlying sector allocation of exchange-traded funds held by the Fund are not reflected in the chart above. Investments in the securities lending vehicle represented 0.1% of the Fund’s net assets as of August 31, 2023. Figures above may not sum to 100% due to rounding due to the presence of cash. |
| | 2 | | The Fund seeks to provide investment results that closely correspond, before fees and expenses, to the performance of the Solactive US Large Cap Equal Weight Index. |
17
FUND BASICS
Equal Weight U.S. Large Cap Equity ETF
as of August 31, 2023
| | | | | | |
| | FUND SNAPSHOT | |
| | |
| | | As of August 31, 2023 | | | |
| | |
| | Market Price1 | | $ | 62.93 | |
| | | Net Asset Value (NAV)1 | | $ | 62.93 | |
| 1 | | The Market Price is the price at which the Fund’s shares are trading on the Cboe BZX Exchange, Inc. (“Cboe BZX”). The Market Price of the Fund’s shares will fluctuate and, at the time of sale, shares may be worth more or less than the original investment or the Fund’s then current net asset value (“NAV”). The NAV is the market value of one share of the Fund. This amount is derived by dividing the total value of all the securities in the Fund’s portfolio, plus other assets, less any liabilities, by the number of Fund shares outstanding. Fund shares are not individually redeemable and are issued and redeemed by the Fund at their NAV only in large, specified blocks of shares called creation units. Shares otherwise can be bought and sold only through exchange trading at market price (not NAV). Shares may trade at a premium or discount to their NAV in the secondary market. Information regarding how often shares of the Fund traded on Cboe BZX at a price above (i.e., at a premium) or below (i.e., at a discount) the NAV of the Fund can be found at www.GSAMFUNDS.com/ETFs. |
| | | | | | | | |
| | TOP TEN HOLDINGS AS OF 8/31/232 |
| | | |
| | | Holding | | % of Net Assets | | | Line of Business |
| | Texas Pacific Land Corp. | | | 0.3 | % | | Energy |
| | Eli Lilly & Co. | | | 0.3 | | | Health Care |
| | Atlassian Corp., Class A | | | 0.3 | | | Information Technology |
| | Axon Enterprise, Inc. | | | 0.3 | | | Industrials |
| | Splunk, Inc. | | | 0.2 | | | Information Technology |
| | Zebra Technologies Corp., Class A | | | 0.2 | | | Information Technology |
| | Horizon Therapeutics PLC | | | 0.2 | | | Health Care |
| | Akamai Technologies, Inc. | | | 0.2 | | | Information Technology |
| | APA Corp. | | | 0.2 | | | Energy |
| | | NVIDIA Corp. | | | 0.2 | | | Information Technology |
| 2 | | The top 10 holdings may not be representative of the Fund’s future investments. |
For more information about the Fund, please refer to www.GSAMFUNDS.com/ETFs. There, you can learn more about the Fund’s investment strategies, holdings, and performance.
18
GOLDMAN SACHS EQUAL WEIGHT U.S. LARGE CAP EQUITY ETF
Performance Summary
August 31, 2023
The following graph shows the value, as of August 31, 2023, of a $10,000 investment made on September 12, 2017 (commencement of operations) in Shares at NAV. For comparative purposes, the performance of the Fund’s underlying index and a market cap-based index against which the performance of the Fund is measured, the Solactive US Large Cap Equal Weight Index (GTR) and the S&P® 500 Index (Total Return, Unhedged, USD), respectively, are shown. Performance reflects applicable fee waivers and/or expense limitations in effect during the periods shown and in their absence, performance would be reduced. Returns do not reflect the deduction of taxes that a shareholder would pay on Fund distributions or the sale of Fund shares. In addition to the performance of constituents of the underlying index, other factors may affect Fund performance. These factors include, but are not limited to, Fund operating fees and expenses, portfolio turnover and creation and redemption in-kind transactions. The returns set forth below represent past performance. Past performance does not guarantee future results. The Fund’s NAV and investment return may fluctuate. These fluctuations may cause an investor’s shares to be worth more or less than their original cost. Current performance may be lower or higher than the performance quoted below. Please visit our web site at www.GSAMFUNDS.com/ETFs to obtain the most recent month-end returns.
|
| Goldman Sachs Equal Weight U.S. Large Cap Equity ETF’s Lifetime Performance |
Performance of a $10,000 Investment, with distributions reinvested, from September 12, 2017 through August 31, 2023.

| | | | | | | | | | |
| Average Annual Total Return through August 31, 2023* | | | 1 Year | | | | 5 Year | | | Since Inception |
Shares based on NAV (Commenced September 12, 2017) | | | 8.58% | | | | 8.10% | | | 9.36% |
|
Shares based on Market Price (Commenced September 12, 2017) | | | 8.56% | | | | 8.09% | | | 9.36% |
|
Solactive US Large Cap Equal Weight Index (GTR) | | | 8.75% | | | | 8.27% | | | 9.53% |
|
S&P 500® Index (TR, unhedged, USD) | | | 15.94% | | | | 11.12% | | | 12.37% |
|
| * | | Total returns are calculated assuming purchase of a share at the market price or NAV on the first day and sale of a share at the market price or NAV on the last day of each period reported. The Total Returns based on NAV and Market Price assume the reinvestment of dividends and do not reflect brokerage commissions in connection with the purchase or sale of Fund shares, which if included would lower the performance shown above. The NAV used in the Total Return calculation assumes all management fees and operating expenses incurred by the Fund. Market Price returns are based upon the last trade at 4:00 pm EST and do not reflect the returns you would receive if you traded shares at other times. The first day of secondary market trading is typically several days after the date on which the Fund commenced investment operations; therefore, the NAV of the Fund is used as a proxy for the period from inception of investment operations to the first day of secondary market trading to calculate the Market Price returns. |
19
PORTFOLIO RESULTS
Goldman Sachs Hedge Industry VIP ETF
Investment Objective
The Goldman Sachs Hedge Industry VIP ETF (the “Fund”) seeks to provide investment results that closely correspond, before fees and expenses, to the performance of the Goldman Sachs Hedge Fund VIP Index® (the “Index”).
Portfolio Management Discussion and Analysis
Below, the Goldman Sachs Quantitative Investment Strategies Team discusses the Fund’s performance and positioning for the 12-month period ended August 31, 2023 (the “Reporting Period”).
| Q | | How did the Fund perform during the Reporting Period? |
| A | | During the Reporting Period, the Fund returned 17.90% based on net asset value (“NAV”) and 17.81% based on market price. The Index returned 18.42%, and the S&P 500® Index (Total Return, USD) (“S&P 500® Index”), a market-cap based index against which the performance of the Fund is measured, returned 15.94% during the same period. |
| | | The Fund had an NAV of $75.37 on August 31, 2022 and ended the Reporting Period with an NAV of $88.85 per share. The Fund’s market price on August 31, 2023 was $88.90 per share. |
| Q | | What key factors were responsible for the Fund’s performance during the Reporting Period?1 |
| A | | The Fund seeks to provide investment results that closely correspond, before fees and expenses, to the performance of the Index. The Fund’s performance reflects Fund expenses, including management fees and brokerage expenses. The Fund’s relative performance also reflects the impact of any cash held in the Fund as well as any other differences between the Fund’s holdings and the constituents of the Index. The Index is unmanaged, and Index returns do not reflect fees and expenses, which would reduce returns. |
| | | The Index is designed to deliver exposure to equity securities whose performance is expected to influence the long portfolios of hedge funds. Such equity securities are defined as those that appear most frequently among the top ten equity holdings of U.S. hedge fund managers that select their investments based upon fundamental analysis. Goldman Sachs Asset Management, L.P. (the “Index Provider”) is the provider of the Index, which is constructed in accordance with a rules-based methodology. Hedge fund managers report their U.S. equity holdings, which are made public 45 days after the end of each calendar quarter. The Index is reconstituted and rebalanced on a quarterly basis once the information has been fully disseminated. The construction of the Index involves accessing the identifiers and share counts of U.S. equity holdings disclosed by hedge fund managers in their quarterly 13F filings with the Securities and Exchange Commission (“SEC”). The Index is constructed to then apply share prices at the time of data collection to the numbers of shares listed in each 13F disclosure filing to calculate the dollar market value of each reported position. U.S. hedge fund managers that select their investments based upon fundamental analysis are assumed to be U.S. hedge fund managers with no fewer than 10 and more than 200 distinct U.S. equity positions, as reported in the hedge fund managers’ most recent Form 13F filings. Managers with less than $10 million of disclosed equity assets are excluded. The equity positions are then ranked within each individual hedge fund manager’s portfolio by descending market value. The approximately 50 stocks that appear most frequently in the top 10 holdings of this universe then become the Index constituents. Constituents are equal dollar-weighted at each rebalance. |
| | | The Index’s performance is compared to that of the S&P 500® Index below. Given the Fund’s investment objective of attempting to track the Index, the Fund does not follow traditional methods of active investment management, which may involve buying and selling securities based upon analysis of economic and market factors. The Fund does not follow a strategy of seeking to outperform the S&P 500® Index. |
| | | During the Reporting Period, the Index posted a double-digit positive absolute return and outperformed the S&P 500® Index. The Fund also outperformed the S&P 500® Index during the Reporting Period, as measured by NAV. |
| | 1 | | Some weights are 0.00% at August 31, 2023 either because those positions were eliminated during the most recent rebalance given the Index construction methodology or were not held at all during the Reporting Period as they did not meet the Fund’s investment criteria. |
20
PORTFOLIO RESULTS
| Q | | Which sectors contributed most positively to the Index’s relative performance during the Reporting Period, and which detracted most? |
| A | | Index constituents in the information technology, industrials and communication services sectors contributed most positively to the Index’s results relative to the S&P 500® Index during the Reporting Period. Only partially offsetting these positive contributors were Index constituents in the materials sector, the only sector to detract from the Index’s results relative to the S&P 500® Index during the Reporting Period. |
| Q | | Which individual stock positions contributed the most to the Index’s relative returns during the Reporting Period? |
| A | | Relative to the S&P 500® Index, positions in information technology company NVIDIA and in communication services companies Meta Platforms (Class A) and Netflix contributed most positively (2.21%, 1.89% and 1.99% of Fund net assets as of August 31, 2023, respectively). NVIDIA generated a triple-digit gain within the Index during the Reporting Period. Meta Platforms (Class A) and Netflix each posted a robust double-digit positive return within the Index during the Reporting Period. |
| Q | | Which individual stock positions detracted the most from the Index’s results during the Reporting Period? |
| A | | Relative to the S&P 500® Index, positions in financials company First Horizon and in information technology companies Atlassian and Five9, each of which is not a component of the S&P 500® Index, detracted most (0.00%1, 0.00% and 0.00% of Fund net assets as of August 31, 2023, respectively). Each of these holdings generated a double-digit negative return within the Index during the Reporting Period. |
| Q | | How did the Fund use derivatives and similar instruments during the Reporting Period? |
| A | | The Fund did not invest in derivatives or similar instruments during the Reporting Period. The Fund does not employ derivatives as a source of alpha generation, although it may use them to equitize excess cash. |
| | 1 | | Some weights are 0.00% at August 31, 2023 either because those positions were eliminated during the most recent rebalance given the Index construction methodology or were not held at all during the Reporting Period as they did not meet the Fund’s investment criteria. |
| Q | | What was the Fund’s sector positioning relative to the Index and the S&P 500® Index at the end of the Reporting Period?2 |
| | | | | | | | | | | | | | |
| | | | |
| | | Sector Name | | Fund3 | | | GS Hedge
Fund VIP
IndexTM | | | S&P 500®
Index | |
| | | | |
| | Information Technology | | | 26.59 | % | | | 26.59 | % | | | 27.32 | % |
| | Financials | | | 19.41 | | | | 19.41 | | | | 10.86 | |
| | Health Care | | | 13.94 | | | | 13.94 | | | | 14.07 | |
| | Communication Services | | | 9.91 | | | | 9.91 | | | | 8.42 | |
| | Consumer Discretionary | | | 9.82 | | | | 9.82 | | | | 11.43 | |
| | Industrials | | | 8.20 | | | | 8.20 | | | | 7.92 | |
| | Energy | | | 8.09 | | | | 8.09 | | | | 4.67 | |
| | Utilities | | | 2.03 | | | | 2.03 | | | | 3.13 | |
| | Consumer Staples | | | 2.02 | | | | 2.02 | | | | 6.77 | |
| | Real Estate | | | 0.00 | | | | 0.00 | | | | 2.86 | |
| | | Materials | | | 0.00 | | | | 0.00 | | | | 2.54 | |
| | 2 | | Sector classifications for securities may differ between the above listing and the Schedule of Investments due to differing classification methodologies. The classification methodology used for the above listing is as set forth by Standard & Poor’s. The Fund’s composition may differ over time. Consequently, the Fund’s overall sector allocations may differ from percentages contained in the chart above. The percentage shown for each investment category reflects the value of investments in that category as a percentage of market value (excluding investment in the securities lending reinvestment vehicle, if any). Figures above may not sum to 100% due to rounding due to the presence of cash. |
| | 3 | | The Fund seeks to provide investment results that closely correspond, before fees and expenses, to the performance of the Goldman Sachs Hedge Fund VIP Index®. |
21
FUND BASICS
Hedge Industry VIP ETF
as of August 31, 2023
| | | | | | |
| | FUND SNAPSHOT | |
| | |
| | | As of August 31, 2023 | | | |
| | |
| | Market Price1 | | $ | 88.90 | |
| | | Net Asset Value (NAV)1 | | $ | 88.85 | |
| 1 | | The Market Price is the price at which the Fund’s shares are trading on the NYSE Arca, Inc. The Market Price of the Fund’s shares will fluctuate and, at the time of sale, shares may be worth more or less than the original investment or the Fund’s then current net asset value (“NAV”). The NAV is the market value of one share of the Fund. This amount is derived by dividing the total value of all the securities in the Fund’s portfolio, plus other assets, less any liabilities, by the number of Fund shares outstanding. Fund shares are not individually redeemable and are issued and redeemed by the Fund at their NAV only in large, specified blocks of shares called creation units. Shares otherwise can be bought and sold only through exchange trading at market price (not NAV). Shares may trade at a premium or discount to their NAV in the secondary market. Information regarding how often shares of the Fund traded on NYSE Arca at a price above (i.e., at a premium) or below (i.e., at a discount) the NAV of the Fund can be found at www.GSAMFUNDS.com/ETFs. |
| | | | | | | | |
| | TOP 10 HOLDINGS AS OF 8/31/232 |
| | | |
| | | Holding | | % of Net Assets | | | Line of Business |
| | | |
| | Vertiv Holdings Co. | | | 2.2 | % | | Industrials |
| | NVIDIA Corp. | | | 2.2 | | | Information Technology |
| | Palo Alto Networks, Inc. | | | 2.2 | | | Information Technology |
| | Horizon Therapeutics PLC | | | 2.1 | | | Health Care |
| | Broadcom, Inc. | | | 2.1 | | | Information Technology |
| | VMware, Inc., Class A | | | 2.1 | | | Information Technology |
| | Workday, Inc., Class A | | | 2.1 | | | Information Technology |
| | Apollo Global Management, Inc. | | | 2.1 | | | Financials |
| | Seagen, Inc. | | | 2.1 | | | Health Care |
| | | Tenet Healthcare Corp. | | | 2.1 | | | Health Care |
| 2 | | The top 10 holdings may not be representative of the Fund’s future investments. |
For more information about the Fund, please refer to www.GSAMFUNDS.com/ETFs. There, you can learn more about the Fund’s investment strategies, holdings, and performance.
22
GOLDMAN SACHS HEDGE INDUSTRY VIP ETF
Performance Summary
August 31, 2023
The following graph shows the value, as of August 31, 2023, of a $10,000 investment made on November 1, 2016 (commencement of operations) in Shares at NAV. For comparative purposes, the performance of the Fund’s underlying index and a market cap- based index against which the performance of the Fund is measured, the Goldman Sachs Hedge Fund VIP Index™ and the S&P 500® Index (Total Return, USD), respectively, are shown. Performance reflects applicable fee waivers and/or expense limitations in effect during the periods shown and in their absence, performance would be reduced. Returns do not reflect the deduction of taxes that a shareholder would pay on Fund distributions or the sale of Fund shares. In addition to the performance of constituents of the underlying index, other factors may affect Fund performance. These factors include, but are not limited to, Fund operating fees and expenses, portfolio turnover and creation and redemption in-kind transactions. The returns set forth below represent past performance. Past performance does not guarantee future results. The Fund’s NAV and investment return may fluctuate. These fluctuations may cause an investor’s shares to be worth more or less than their original cost. Current performance may be lower or higher than the performance quoted below. Please visit our web site at www.GSAMFUNDS.com/ETFs to obtain the most recent month-end returns.
|
| Goldman Sachs Hedge Industry VIP ETF’s Lifetime Performance |
Performance of a $10,000 Investment, with distributions reinvested, from November 1, 2016 through August 31, 2023.
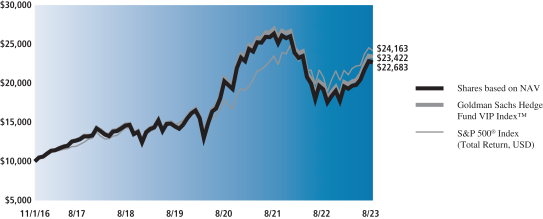
| | | | | | | | | | |
| Average Annual Total Return through August 31, 2023* | | | 1 Year | | | | 5 Year | | | Since Inception |
Shares based on NAV (Commenced November 1, 2016) | | | 17.90% | | | | 9.21% | | | 12.73% |
|
Shares based on Market Price (Commenced November 1, 2016) | | | 17.81% | | | | 9.22% | | | 12.74% |
|
Goldman Sachs Hedge Fund VIP Index™ | | | 18.42% | | | | 9.72% | | | 13.26% |
|
S&P 500® Index (Total Return, USD) | | | 15.94% | | | | 11.12% | | | 13.78% |
|
| * | | Total returns are calculated assuming purchase of a share at the market price or NAV on the first day and sale of a share at the market price or NAV on the last day of each period reported. The Total Returns based on NAV and Market Price assume the reinvestment of dividends and do not reflect brokerage commissions in connection with the purchase or sale of Fund shares, which if included would lower the performance shown above. The NAV used in the Total Return calculations assumes all management fees incurred by the Fund. Market Price returns are based upon the last trade at 4:00 pm EST and do not reflect the returns you would receive if you traded shares at other times. The first day of secondary market trading is typically several days after the date on which the Fund commenced investment operations; therefore, the NAV of the Fund is used as a proxy for the period from inception of investment operations to the first day of secondary market trading to calculate the Market Price returns. |
23
PORTFOLIO RESULTS
Goldman Sachs Innovate Equity ETF
Investment Objective
The Goldman Sachs Innovate Equity ETF (the “Fund”) seeks to provide investment results that closely correspond, before fees and expenses, to the performance of the Solactive Innovative Global Equity Index (the “Index”).
Portfolio Management Discussion and Analysis
Below, the Goldman Sachs Quantitative Investment Strategies Team discusses the Fund’s performance and positioning for the 12-month period ended August 31, 2022 (the “Reporting Period”).
| Q | | How did the Fund perform during the Reporting Period? |
| A | | During the Reporting Period, the Fund returned 13.38% based on net asset value (“NAV”) and 13.51% based on market price. The Index returned 13.35% during the same period. |
| | | The Fund had an NAV of $43.67 per share on August 31, 2022 and ended the Reporting Period with an NAV of $49.42 per share. The Fund’s market price on August 31, 2023 was $49.42 per share. |
| Q | | What key factors were responsible for the Fund’s performance during the Reporting Period? |
| A | | The Fund seeks to provide investment results that closely correspond, before fees and expenses, to the performance of the Index. The Fund’s performance reflects Fund expenses, including management fees and brokerage expenses. The Fund’s relative performance also reflects the impact of any cash held in the Fund as well as any other differences between the Fund’s holdings and the constituents of the Index. The Index is unmanaged, and Index returns do not reflect fees and expenses, which would reduce returns. |
| | | Given the Fund’s investment objective of attempting to track the Index, the Fund does not follow traditional methods of active investment management, which may involve buying and selling securities based upon analysis of economic and market factors. Also, unlike many investment companies, the Fund does not attempt to outperform the Index and does not seek temporary defensive positions when markets decline or appear overvalued. |
| | | During the Reporting Period, the Fund recorded positive absolute returns that closely tracked the Index, as measured by NAV. During the Reporting Period, all five of the Key Themes — Data-Driven World, Finance Reimagined, Human Evolution, Manufacturing Revolution Theme and New Age Consumer — added to the Index’s performance. |
| Q | | Which individual stock positions contributed the most to the Index’s returns during the Reporting Period? |
| A | | During the Reporting Period, the Index benefited most from investments in NVIDIA, a U.S. designer and manufacturer of graphics processors, chipsets and related multimedia software; Meta Platforms, a U.S. technology conglomerate; and Microsoft, a U.S. developer of personal computer software systems and applications (2.24%, 1.47% and 2.03% of Fund net assets as of August 31, 2023, respectively). NVIDIA posted a triple-digit positive return within the Index, while Meta Platforms and Microsoft each recorded a double-digit positive return within the Index during the Reporting Period. |
| Q | | Which individual stock positions contributed the least to the Index’s returns during the Reporting Period? |
| A | | Positions in Lucid Group, a U.S. manufacturer of electric vehicles; NIO, a Chinese automobile maker; and PayPal Holdings, a U.S. digital payments platform provider (0.20%, 0.19% and 0.44% of Fund net assets as of August 31, 2023, respectively) detracted from the Index’s returns. Each of these holdings posted a double-digit negative return within the Index during the Reporting Period. |
| Q | | How did the Fund use derivatives and similar instruments during the Reporting Period? |
| A | | During the Reporting Period, the Fund did not invest in derivatives or similar instruments. The Fund does not employ derivatives as a source of alpha generation, although it may use them to equitize excess cash. |
24
PORTFOLIO RESULTS
| Q | | What was the Fund’s sector positioning relative to the Index at the end of the Reporting Period?1 |
| | | | | | | | | | |
| | | |
| | | Sector Name | | Fund2 | | | Index | |
| | | |
| | Information Technology | | | 25.99 | % | | | 26.26 | % |
| | Health Care | | | 21.75 | | | | 21.70 | |
| | Consumer Discretionary | | | 14.75 | | | | 14.71 | |
| | Financials | | | 14.44 | | | | 14.40 | |
| | Communication Services | | | 11.62 | | | | 11.60 | |
| | Industrials | | | 7.40 | | | | 7.38 | |
| | Utilities | | | 1.21 | | | | 1.30 | |
| | Energy | | | 1.00 | | | | 1.00 | |
| | Consumer Staples | | | 0.83 | | | | 0.82 | |
| | | Real Estate | | | 0.81 | | | | 0.81 | |
| Q | | What was the Fund’s country positioning relative to the Index at the end of the Reporting Period?1 |
| | | | | | | | | | |
| | | |
| | | Country Name | | Fund2 | | | Index | |
| | | |
| | U.S. | | | 72.81 | % | | | 69.71 | % |
| | China | | | 6.09 | | | | 6.09 | |
| | Japan | | | 3.92 | | | | 3.91 | |
| | Hong Kong | | | 3.03 | | | | — | |
| | Germany | | | 2.40 | | | | 2.39 | |
| | U.K. | | | 2.36 | | | | 2.44 | |
| | Switzerland | | | 2.01 | | | | 2.18 | |
| | South Korea | | | 1.90 | | | | 1.90 | |
| | France | | | 1.76 | | | | 1.58 | |
| | Canada | | | 1.50 | | | | 2.31 | |
| | Argentina | | | 0.74 | | | | — | |
| | Denmark | | | 0.71 | | | | 0.71 | |
| | Singapore | | | 0.71 | | | | 0.05 | |
| | Netherlands | | | 0.66 | | | | 1.07 | |
| | Taiwan | | | 0.62 | | | | 0.62 | |
| | Israel | | | 0.34 | | | | 0.56 | |
| | Finland | | | 0.22 | | | | 0.22 | |
| | Belgium | | | 0.09 | | | | 0.09 | |
| | Australia | | | 0.08 | | | | 0.08 | |
| | Sweden | | | 0.07 | | | | — | |
| | | Kazakhstan | | | 0.04 | | | | 0.04 | |
| | 1 | | Country and sector classifications for securities may differ between the above listing and the Schedule of Investments due to differing classification methodologies. The classification methodology used for the above listing is as set forth by Solactive. The Fund’s composition may differ over time. Consequently, the Fund’s overall sector allocations may differ from percentages contained in the chart above. Figures above may not sum to 100% due to rounding due to the presence of cash. |
| | 2 | | The Fund seeks to provide investment results that closely correspond, before fees and expenses, to the performance of the Index. |
25
FUND BASICS
Innovate Equity ETF
as of August 31, 2023
| | | | | | |
| | FUND SNAPSHOT | |
| | |
| | | As of August 31, 2023 | | | |
| | |
| | Market Price1 | | $ | 49.42 | |
| | | Net Asset Value (NAV)1 | | $ | 49.42 | |
| 1 | | The Market Price is the price at which the Fund’s shares are trading on the NYSE Arca, Inc. The Market Price of the Fund’s shares will fluctuate and, at the time of sale, shares may be worth more or less than the original investment or the Fund’s then current net asset value (“NAV”). The NAV is the market value of one share of the Fund. This amount is derived by dividing the total value of all the securities in the Fund’s portfolio, plus other assets, less any liabilities, by the number of Fund shares outstanding. Fund shares are not individually redeemable and are issued and redeemed by the Fund at their NAV only in large, specified blocks of shares called creation units. Shares otherwise can be bought and sold only through exchange trading at market price (not NAV). Shares may trade at a premium or discount to their NAV in the secondary market. Information regarding how often shares of the Fund traded on NYSE Arca at a price above (i.e., at a premium) or below (i.e., at a discount) the NAV of the Fund can be found at www.GSAMFUNDS.com/ETFs. |
| | | | | | | | |
| | TOP 10 HOLDINGS AS OF 8/31/232 |
| | | |
| | | Holding | | % of Net Assets | | | Line of Business |
| | | |
| | NVIDIA Corp. | | | 2.2 | % | | Information Technology |
| | Alphabet, Inc., Class A | | | 2.2 | | | Communication Services |
| | Apple, Inc. | | | 2.1 | | | Information Technology |
| | Microsoft Corp. | | | 2.0 | | | Information Technology |
| | Amazon.com, Inc. | | | 2.0 | | | Consumer Discretionary |
| | Meta Platforms, Inc., Class A | | | 1.5 | | | Communication Services |
| | Alibaba Group Holding Ltd. ADR | | | 1.1 | | | Consumer Discretionary |
| | Tesla, Inc. | | | 1.0 | | | Consumer Discretionary |
| | Eli Lilly & Co. | | | 0.9 | | | Health Care |
| | | Advanced Micro Devices, Inc. | | | 0.9 | | | Information Technology |
| 2 | | The top 10 holdings may not be representative of the Fund’s future investments. |
For more information about the Fund, please refer to www.GSAMFUNDS.com/ETFs. There, you can learn more about the Fund’s investment strategies, holdings, and performance.
26
GOLDMAN SACHS INNOVATE EQUITY ETF
Performance Summary
August 31, 2023
The following graph shows the value, as of August 31, 2023, of a $10,000 investment made on November 6, 2020 (commencement of operations) in Shares at NAV. For comparative purposes, the performance of the Fund’s underlying index, the Solactive Innovative Global Equity Index (Net Total Return, USD), a market-cap based index against which the performance of the Fund is measured, is shown. Performance reflects applicable fee waivers and/or expense limitations in effect during the periods shown and in their absence, performance would be reduced. Returns do not reflect the deduction of taxes that a shareholder would pay on Fund distributions or the sale of Fund shares. In addition to the performance of constituents of the underlying index, other factors may affect Fund performance. These factors include, but are not limited to, Fund operating fees and expenses, portfolio turnover and creation and redemption in-kind transactions. The returns set forth below represent past performance. Past performance does not guarantee future results. The Fund’s NAV and investment return may fluctuate. These fluctuations may cause an investor’s shares to be worth more or less than their original cost. Current performance may be lower or higher than the performance quoted below. Please visit our web site at www.GSAMFUNDS.com/ETFs to obtain the most recent month-end returns.
|
| Goldman Sachs Innovate Equity ETF’s Lifetime Performance |
Performance of a $10,000 Investment, with distributions reinvested, from November 6, 2020 through August 31, 2023.
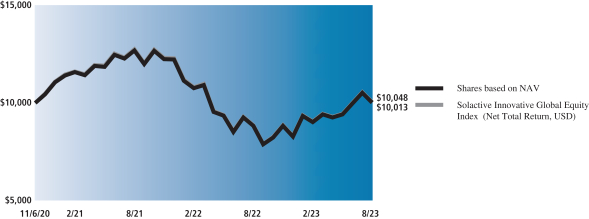
| | | | | | |
| Average Annual Total Return through August 31, 2023* | | | 1 Year Return | | | Since Inception |
Shares based on NAV (Commenced November 6, 2020) | | | 13.38% | | | 0.05% |
|
Shares based on Market Price (Commenced November 6, 2020) | | | 13.51% | | | 0.05% |
|
Solactive Innovative Global Equity Index (Net Total Return, USD) | | | 13.35% | | | 0.17% |
|
| * | | Total returns are calculated assuming purchase of a share at the market price or NAV on the first day and sale of a share at the market price or NAV on the last day of each period reported. The Total Returns based on NAV and Market Price assume the reinvestment of dividends and do not reflect brokerage commissions in connection with the purchase or sale of Fund shares, which if included would lower the performance shown above. The NAV used in the Total Return calculations assumes all management fees incurred by the Fund. Market Price returns are based upon the last trade at 4:00 pm EST and do not reflect the returns you would receive if you traded shares at other times. The first day of secondary market trading is typically several days after the date on which the Fund commenced investment operations; therefore, the NAV of the Fund is used as a proxy for the period from inception of investment operations to the first day of secondary market trading to calculate the Market Price returns. |
27
PORTFOLIO RESULTS
Goldman Sachs JUST U.S. Large Cap Equity ETF
Investment Objective
The Goldman Sachs JUST U.S. Large Cap Equity ETF (the “Fund”) seeks to provide investment results that closely correspond, before fees and expenses, to the performance of the JUST US Large Cap Diversified Index (the “Index”).
Portfolio Management Discussion and Analysis
Below, the Goldman Sachs Quantitative Investment Strategies Team discusses the Fund’s performance and positioning for the 12-month period ended August 31, 2023 (the “Reporting Period”).
| Q | | How did the Fund perform during the Reporting Period? |
| A | | During the Reporting Period, the Fund returned 15.00% based on net asset value (“NAV”) and 14.84% based on market price. The Index returned 15.20%, and the Russell 1000® Index (Total Return, USD) (“Russell 1000® Index”), a market-cap based index against which the performance of the Fund is measured, returned 15.40% during the same period. |
| | | The Fund had an NAV of $56.72 on August 31, 2022 and ended the Reporting Period with an NAV of $64.22 per share. The Fund’s market price on August 31, 2023 was $64.27 per share. |
| Q | | What key factors were responsible for the Fund’s performance during the Reporting Period? |
| A | | The Fund seeks to provide investment results that closely correspond, before fees and expenses, to the performance of the Index. The Fund’s performance reflects Fund expenses, including management fees and brokerage expenses. The Fund’s relative performance also reflects the impact of any cash held in the Fund as well as any other differences between the Fund’s holdings and the constituents of the Index. The Index is unmanaged, and Index returns do not reflect fees and expenses, which would reduce returns. |
| | | The Index’s performance is compared to that of the Russell 1000® Index below. Given the Fund’s investment objective of attempting to track the Index, the Fund does not follow traditional methods of active investment management, which may involve buying and selling securities based upon analysis of economic and market factors. The Fund does not follow a strategy of seeking to outperform the Russell 1000® Index. |
| | | During the Reporting Period, the Index posted a double-digit positive absolute return that performed in line with the Russell 1000® Index. The Fund also performed in line with the Russell 1000® Index during the Reporting Period, as measured by NAV. |
| Q | | Which sectors contributed most positively to the Index’s relative performance during the Reporting Period, and which detracted most? |
| A | | Index constituents in the information technology, industrials and consumer discretionary sectors contributed most positively to the Index’s results relative to the Russell 1000® Index during the Reporting Period. Index constituents in the utilities and real estate sectors detracted from the Index’s results relative to the Russell 1000® Index during the Reporting Period, the only two sectors to do so. |
| Q | | Which individual stock positions contributed the most to the Index’s relative returns during the Reporting Period? |
| A | | Relative to the Russell 1000® Index, positions in information technology companies NVIDIA, Microsoft and Apple contributed most positively (3.26%, 6.77% and 7.79% of Fund net assets as of August 31, 2023, respectively). NVIDIA generated a triple-digit gain within the Index during the Reporting Period, and Microsoft and Apple each posted a double-digit positive return within the Index during the Reporting Period. |
| Q | | Which individual stock positions detracted the most from the Index’s results during the Reporting Period? |
| A | | Relative to the Russell 1000® Index, positions in entertainment and media company The Walt Disney Company and in real estate companies American Tower and Crown Castle detracted most (0.52%, 0.41% and 0.21% of Fund net assets as of August 31, 2023, respectively). Each of |
| | these holdings generated a double-digit negative return within the Index during the Reporting Period. |
28
PORTFOLIO RESULTS
| Q | | How did the Fund use derivatives and similar instruments during the Reporting Period? |
| A | | The Fund did not invest in derivatives or similar instruments during the Reporting Period. The Fund does not employ derivatives as a source of alpha generation, although it may use them to equitize excess cash. |
| Q | | What was the Fund’s sector positioning relative to the Index and the Russell 1000® Index at the end of the Reporting Period?1 |
| | | | | | | | | | | | | | |
| | | | |
| | | Sector Name | | Fund2 | | | JUST
US Large Cap
Diversified
Index | | | Russell
1000®
Index | |
| | | | |
| | Information Technology | | | 28.63 | % | | | 28.63 | % | | | 27.06 | % |
| | Health Care | | | 14.25 | | | | 14.25 | | | | 13.01 | |
| | Financials | | | 10.79 | | | | 10.79 | | | | 12.97 | |
| | Consumer Discretionary | | | 10.58 | | | | 10.58 | | | | 10.89 | |
| | Industrials | | | 8.17 | | | | 8.17 | | | | 9.46 | |
| | Communication Services | | | 7.38 | | | | 7.38 | | | | 8.41 | |
| | Consumer Staples | | | 6.51 | | | | 6.51 | | | | 6.18 | |
| | Energy | | | 4.91 | | | | 4.91 | | | | 4.32 | |
| | Real Estate | | | 3.34 | | | | 3.34 | | | | 2.74 | |
| | Utilities | | | 2.97 | | | | 2.97 | | | | 2.33 | |
| | | Materials | | | 2.46 | | | | 2.46 | | | | 2.63 | |
| | 1 | | Sector classifications for securities may differ between the above listing and the Schedule of Investments due to differing classification methodologies. The classification methodology used for the above listing is as set forth by GICS. The Fund’s composition may differ over time. Consequently, the Fund’s overall sector allocations may differ from percentages contained in the chart above. The percentage shown for each investment category reflects the value of investments in that category as a percentage of market value (excluding investment in the securities lending reinvestment vehicle, if any). Underlying sector allocation of exchange-traded funds held by the Fund are not reflected in the chart above. Figures above may not sum to 100% due to rounding due to the presence of cash. |
| | 2 | | The Fund seeks to provide investment results that closely correspond, before fees and expenses, to the performance of the JUST US Large Cap Diversified Index. |
29
FUND BASICS
JUST U.S. Large Cap Equity ETF
as of August 31, 2023
| | | | | | |
| | FUND SNAPSHOT | |
| | |
| | | As of August 31, 2023 | | | |
| | |
| | Market Price1 | | $ | 64.27 | |
| | | Net Asset Value (NAV)1 | | $ | 64.22 | |
| 1 | | The Market Price is the price at which the Fund’s shares are trading on the NYSE Arca, Inc. The Market Price of the Fund’s shares will fluctuate and, at the time of sale, shares may be worth more or less than the original investment or the Fund’s then current net asset value (“NAV”). The NAV is the market value of one share of the Fund. This amount is derived by dividing the total value of all the securities in the Fund’s portfolio, plus other assets, less any liabilities, by the number of Fund shares outstanding. Fund shares are not individually redeemable and are issued and redeemed by the Fund at their NAV only in large, specified blocks of shares called creation units. Shares otherwise can be bought and sold only through exchange trading at market price (not NAV). Shares may trade at a premium or discount to their NAV in the secondary market. Information regarding how often shares of the Fund traded on NYSE Arca at a price above (i.e., at a premium) or below (i.e., at a discount) the NAV of the Fund can be found at www.GSAMFUNDS.com/ETFs. |
| | | | | | | | |
| | TOP 10 HOLDINGS AS OF 8/31/232 |
| | | |
| | | Holding | | % of Net Assets | | | Line of Business |
| | | |
| | Apple, Inc. | | | 7.8 | % | | Information Technology |
| | Microsoft Corp. | | | 6.8 | | | Information Technology |
| | Amazon.com, Inc. | | | 4.3 | | | Consumer Discretionary |
| | NVIDIA Corp. | | | 3.3 | | | Information Technology |
| | Alphabet, Inc., Class A | | | 2.3 | | | Communication Services |
| | Alphabet, Inc., Class C | | | 2.0 | | | Communication Services |
| | JPMorgan Chase & Co. | | | 1.5 | | | Financials |
| | Exxon Mobil Corp. | | | 1.4 | | | Energy |
| | Eli Lilly & Co. | | | 1.3 | | | Health Care |
| | | Visa, Inc., Class A | | | 1.3 | | | Financials |
| 2 | | The top 10 holdings may not be representative of the Fund’s future investments. |
For more information about the Fund, please refer to www.GSAMFUNDS.com/ETFs. There, you can learn more about the Fund’s investment strategies, holdings, and performance.
30
GOLDMAN SACHS JUST U.S. LARGE CAP EQUITY ETF
Performance Summary
August 31, 2023
The following graph shows the value, as of August 31, 2023, of a $10,000 investment made on June 7, 2018 (commencement of operations) in Shares at NAV. For comparative purposes, the performance of the Fund’s underlying index and a market-cap based index against which the performance of the Fund is measured, the JUST US Large Cap Diversified Index and the Russell 1000® Index (Total Return, USD), respectively, are shown. Performance reflects applicable fee waivers and/or expense limitations in effect during the periods shown and in their absence, performance would be reduced. Returns do not reflect the deduction of taxes that a shareholder would pay on Fund distributions or the sale of Fund shares. In addition to the performance of constituents of the underlying index, other factors may affect Fund performance. These factors include, but are not limited to, Fund operating fees and expenses, portfolio turnover and creation and redemption in-kind transactions. The returns set forth below represent past performance. Past performance does not guarantee future results. The Fund’s NAV and investment return may fluctuate. These fluctuations may cause an investor’s shares to be worth more or less than their original cost. Current performance may be lower or higher than the performance quoted below. Please visit our web site at www.GSAMFUNDS.com/ETFs to obtain the most recent month-end returns.
|
| Goldman Sachs JUST U.S. Large Cap Equity ETF’s Lifetime Performance |
Performance of a $10,000 Investment, with distributions reinvested, from June 7, 2018 through August 31, 2023.
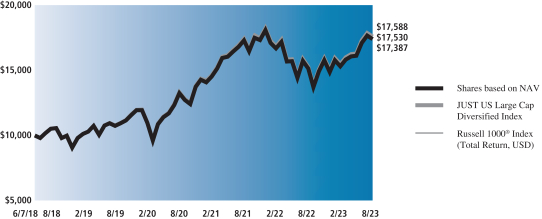
| | | | | | | | | | |
| Average Annual Total Return through August 31, 2023* | | | 1 Year Return | | | | 5 Year Return | | | Since Inception |
Shares based on NAV (Commenced June 7, 2018) | | | 15.00% | | | | 10.58% | | | 11.14% |
|
Shares based on Market Price (Commenced June 7, 2018) | | | 14.84% | | | | 10.60% | | | 11.15% |
|
JUST US Large Cap Diversified Index | | | 15.20% | | | | 10.83% | | | 11.38% |
|
Russell 1000® Index | | | 15.40% | | | | 10.77% | | | 11.31% |
|
| * | | Total returns are calculated assuming purchase of a share at the market price or NAV on the first day and sale of a share at the market price or NAV on the last day of each period reported. The Total Returns based on NAV and Market Price assume the reinvestment of dividends and do not reflect brokerage commissions in connection with the purchase or sale of Fund shares, which if included would lower the performance shown above. The NAV used in the Total Return calculation assumes all management fees and operating expenses incurred by the Fund. Market Price returns are based upon the last trade at 4:00 pm EST and do not reflect the returns you would receive if you traded shares at other times. The first day of secondary market trading is typically several days after the date on which the Fund commenced investment operations; therefore, the NAV of the Fund is used as a proxy for the period from inception of investment operations to the first day of secondary market trading to calculate the Market Price returns. |
31
PORTFOLIO RESULTS
Goldman Sachs North America Pipelines & Power Equity ETF
Investment Objective
The Goldman Sachs North American Pipelines & Power Equity ETF seeks to provide investment results that closely correspond, before fees and expenses, to the performance of the Solactive Energy Infrastructure Enhanced Index (the “Index”).
Portfolio Management Discussion and Analysis
Below, the Goldman Sachs Quantitative Investment Strategies Team discusses the Fund’s performance and positioning from its inception on July 11, 2023 through August 31, 2023 (the “Reporting Period”).
| Q | | How did the Fund perform during the Reporting Period? |
| A | | During the Reporting Period, the Fund returned 1.16% based on net asset value (“NAV”) and 1.24% based on market price. The Index returned 0.98% during the same period. |
| | | The Fund had an NAV of $40.46 on July 11, 2023 and ended the Reporting Period with an NAV of $40.93 per share. The Fund’s market price on August 31, 2023 was $40.96 per share. |
| Q | | What key factors were responsible for the Fund’s performance during the Reporting Period? |
| A | | The Fund seeks to provide investment results that closely correspond, before fees and expenses, to the performance of the Index. The Fund’s performance reflects Fund expenses, including management fees and brokerage expenses. The Fund’s relative performance also reflects the impact of any cash held in the Fund as well as any other differences between the Fund’s holdings and the constituents of the Index. The Index is unmanaged, and Index returns do not reflect fees and expenses, which would reduce returns. |
| | | Given the Fund’s investment objective of attempting to track the Index, the Fund does not follow traditional methods of active investment management, which may involve buying and selling securities based upon analysis of economic and market factors. The Fund does not follow a strategy of seeking to outperform the Index. |
| | | During the Reporting Period, the Fund posted a positive absolute return and outperformed the Index, as measured by NAV. |
| Q | | Which sectors and countries contributed positively to the Index’s relative performance during the Reporting Period, and which detracted? |
| A | | Index constituents in the energy sector contributed positively to the Index’s results during the Reporting Period. Index constituents in the utilities sector detracted from the Index’s results during the Reporting Period. |
| | | From a country perspective, Index constituents in the U.S. contributed positively to the Index’s results during the Reporting Period. Index constituents in the U.K. and Canada detracted from the Index’s results during the Reporting Period. |
| Q | | Which individual stock positions contributed the most to the Index’s relative returns during the Reporting Period? |
| A | | Positions in energy companies Targa Resources, Cheniere Energy and Oneok contributed most positively (8.45%, 9.30% and 8.67% of Fund net assets as of August 31, 2023, respectively). Targa Resources posted a double-digit gain within the Index during the Reporting Period. Cheniere Energy and Oneok each generated a single-digit positive return within the Index during the Reporting Period. |
| Q | | Which individual stock positions detracted the most from the Index’s results during the Reporting Period? |
| A | | Positions in U.S.-based utilities company AES, Canada-based energy company TC Energy and U.S.-based utilities company Nextera Energy Partners L.P. detracted most (3.92%, 4.27%, 1.26% of Fund net assets as of August 31, 2023, respectively). AES and Nextera each posted a double-digit negative return within the Index during the Reporting Period. TC Energy generated a single-digit negative return within the Index during the Reporting Period. |
32
PORTFOLIO RESULTS
| Q | | How did the Fund use derivatives and similar instruments during the Reporting Period? |
| A | | The Fund did not invest in derivatives or similar instruments during the Reporting Period. The Fund does not employ derivatives as a source of alpha generation, although it may use them to equitize excess cash. |
| Q | | What was the Fund’s sector positioning relative to the Index at the end of the Reporting Period?1 |
| | | | | | | | | | |
| | | |
| | | Sector Name | | Fund2 | | | Solactive Energy
Infrastructure
Enhanced
Index | |
| | | |
| | Energy | | | 81.25 | % | | | 81.27 | % |
| | | Utilities | | | 18.72 | | | | 18.72 | |
| Q | | What was the Fund’s country positioning relative to the Index at the end of the Reporting Period?1 |
| | | | | | | | | | |
| | | |
| | | Country Name | | Fund2 | | | Solactive
Energy Infrastructure
Enhanced Index | |
| | | |
| | U.S. | | | 75.87 | % | | | 75.89 | % |
| | Canada | | | 23.51 | | | | 23.51 | |
| | | U.K. | | | 0.59 | | | | 0.59 | |
| | 1 | | Sector classifications for securities may differ between the above listing and the Schedule of Investments due to differing classification methodologies. The classification methodology used for the above listing is as set forth by Bloomberg Professional Services. The Fund’s composition may differ over time. Consequently, the Fund’s overall sector allocations may differ from percentages contained in the chart above. The percentage shown for each investment category reflects the value of investments in that category as a percentage of market value (excluding investment in the securities lending reinvestment vehicle, if any). Underlying sector allocation of exchange-traded funds held by the Fund are not reflected in the chart above. Investments in the securities lending vehicle represented 0.0% of the Fund’s net assets as of August 31, 2023. Figures above may not sum to 100% due to rounding due to the presence of cash. |
| | 2 | | The Fund seeks to provide investment results that closely correspond, before fees and expenses, to the performance of the Solactive Energy Infrastructure Enhanced Index. |
33
FUND BASICS
North America Pipelines & Power Equity ETF
as of August 31, 2023
| | | | | | |
| | FUND SNAPSHOT | |
| | |
| | | As of August 31, 2023 | | | |
| | |
| | Market Price1 | | $ | 40.96 | |
| | | Net Asset Value (NAV)1 | | $ | 40.93 | |
| 1 | | The Market Price is the price at which the Fund’s shares are trading on the Cboe BZX Exchange, Inc. (“Cboe BZX”). The Market Price of the Fund’s shares will fluctuate and, at the time of sale, shares may be worth more or less than the original investment or the Fund’s then current net asset value (“NAV”). The NAV is the market value of one share of the Fund. This amount is derived by dividing the total value of all the securities in the Fund’s portfolio, plus other assets, less any liabilities, by the number of Fund shares outstanding. Fund shares are not individually redeemable and are issued and redeemed by the Fund at their NAV only in large, specified blocks of shares called creation units. Shares otherwise can be bought and sold only through exchange trading at market price (not NAV). Shares may trade at a premium or discount to their NAV in the secondary market. Information regarding how often shares of the Fund traded on Cboe BZX at a price above (i.e., at a premium) or below (i.e., at a discount) the NAV of the Fund can be found at www.GSAMFUNDS.com/ETFs. |
| | | | | | | | |
| | TOP 10 HOLDINGS AS OF 8/31/232 |
| | | |
| | | Holding | | % of Net Assets | | | Line of Business |
| | | |
| | Cheniere Energy, Inc. | | | 9.3 | % | | Energy |
| | ONEOK, Inc. | | | 8.7 | | | Energy |
| | Targa Resources Corp. | | | 8.4 | | | Energy |
| | Williams Cos., Inc. (The) | | | 5.6 | | | Energy |
| | Kinder Morgan, Inc. | | | 5.4 | | | Energy |
| | Enbridge, Inc. | | | 4.9 | | | Energy |
| | Pembina Pipeline Corp. | | | 4.7 | | | Energy |
| | Energy Transfer LP | | | 4.7 | | | Energy |
| | TC Energy Corp. | | | 4.3 | | | Energy |
| | | Enterprise Products Partners LP | | | 4.2 | | | Energy |
| 2 | | The top 10 holdings may not be representative of the Fund’s future investments. |
For more information about the Fund, please refer to www.GSAMFUNDS.com/ETFs. There, you can learn more about the Fund’s investment strategies, holdings, and performance.
34
GOLDMAN SACHS NORTH AMERICA PIPELINES & POWER EQUITY ETF
Performance Summary
August 31, 2023
| | |
| Cumulative Total Return through August 31, 2023* | | Since Inception |
Shares based on NAV (Commenced July 11, 2023) | | 1.16% |
|
Shares based on Market Price (Commenced July 11, 2023) | | 1.16% |
|
| * | | Total return for periods of less than one year represents cumulative total return. Total returns are calculated assuming purchase of a share at the market price or NAV on the first day and sale of a share at the market price or NAV on the last day of each period reported. The Total Returns based on NAV and Market Price assume the reinvestment of dividends and do not reflect brokerage commissions in connection with the purchase or sale of Fund shares, which if included would lower the performance shown above. The NAV used in the Total Return calculation assumes all management fees incurred by the Fund. Market Price returns are based upon the last trade as of 4:00pm EST and do not reflect the returns you would receive if you traded shares at other times. The first day of secondary market trading is typically several days after the date on which the Fund commenced investment operations; therefore, the NAV of the Fund is used as a proxy for the period from inception of investment operations to the first day of secondary market trading to calculate the Market Price returns. Total returns for periods of less than one year are not annualized. |
The returns set forth above represent past performance. Past performance does not guarantee future results. The Fund’s NAV and investment return may fluctuate. These fluctuations may cause an investor’s shares to be worth more or less than their original cost. Current performance may be lower or higher than the performance quoted above. Please visit our web site at www.GSAMFUNDS.com/ETFs to obtain the most recent month-end returns.
35
PORTFOLIO RESULTS
Goldman Sachs Defensive Equity ETF
Investment Objective
The Goldman Sachs Defensive Equity ETF (the “Fund”) seeks long-term growth of capital with lower volatility than equity markets.
Portfolio Management Discussion and Analysis
Below, the Goldman Sachs Quantitative Investment Strategies (“QIS”) Team discusses performance and positioning for the periods from January 1, 2023 through January 20, 2023 and from the Fund’s inception on January 23, 2023 through August 31, 2023 (the “Reporting Period”).
| Q | | How did the Fund perform during the Reporting Period? |
| A | | During the Reporting Period, the Fund returned 7.25% based on net asset value (“NAV”) and 11.90% based on market price. By comparison, the S&P 500® Index returned 14.66% during the same period. |
| | The predecessor fund had an NAV of $41.72 per share on December 31, 2022 and ended the Reporting Period with an NAV of $44.52 per share. The Fund’s market price on August 31, 2023 was $44.53 per share. |
| | The Goldman Sachs Defensive Equity Fund (the “predecessor fund”), which was reorganized into the Fund on January 20, 2023, generated a cumulative total return of 0.93%* between January 1, 2023 and January 20, 2023 compared to the cumulative total return of 3.55% of the benchmark, the S&P 500® Index, during the same period. |
| Q | | What key factors were responsible for the Fund’s performance during the Reporting Period? |
| A | | The Fund seeks to achieve its investment objective by investing, under normal circumstances, at least 80% of its net assets plus any borrowings for investment purposes (measured at the time of purchase) (“Net Assets”) in a diversified portfolio of equity investments in U.S. issuers with public stock market capitalizations within the range of the market capitalization of the S&P 500® Index at the time of investment and other instruments with similar economic exposures. The Fund’s investments in fixed income securities are limited to cash equivalents (including money market funds) and U.S. Treasury securities. |
| | The Fund also uses an options-based overlay strategy in an effort to provide lower volatility and enhanced downside protection. The QIS Team uses a variety of quantitative techniques, in combination with a qualitative overlay, when selecting investments for the Fund. Because of the impact of the options-based overlay strategy, the returns of the Fund are not expected to closely track the S&P 500® Index, even if the returns of the portfolio securities held by the Fund resemble the returns of the S&P 500® Index. In addition, the Fund’s returns may trail the returns of the S&P 500® Index for short or extended periods of time. |
| | The Fund is an actively managed exchange-traded fund (“ETF”), which is a fund that trades like other publicly traded securities. The Fund is not an index fund and does not seek to replicate the performance of a specified index. |
| | During the Reporting Period, the Fund produced a positive absolute return but underperformed the S&P 500® Index. The relative underperformance was due primarily to the Fund’s options-based overlay strategy. Specifically, the Fund’s put option spread collar detracted from relative returns, as the S&P 500® Index appreciated through the strike price of the call options. (The put option spread collar refers to the strategy whereby the Fund simultaneously purchases a near-the-money put while selling an out-of-the-money call and put on the S&P 500® Index. A put option is an option contract that gives the holder the right, but not the obligation, to sell a specified amount of an underlying asset at a specified price within a specified time. A call option is an option that gives the holder the right to buy a certain quantity of an underlying security at an agreed-upon price at any time up to an agreed-upon date. “Near-the-money” is a term used to describe an options contract with a strike price that is close to the market price of the underlying asset. “Out-of-the-money” is a term used to describe a put option with a strike price that is lower than the market price of the underlying asset.) |
36
| * | | As measured by Institutional Shares. |
PORTFOLIO RESULTS
| | The Fund was also hampered during the Reporting Period by stock selection. In terms of market capitalization, investments in large-cap stocks detracted most from relative performance. Among sectors, the Fund was hurt most by selection in information technology and consumer discretionary, though underweighted allocations compared to the S&P 500® Index in the energy and financials sectors contributed positively. |
| | As for the predecessor fund, during the period from January 1, 2023 through January 20, 2023, the options-based overlay strategy held back relative performance as the S&P 500® Index rallied. The equity strategy, which aimed to pick defensive stocks, detracted from returns. |
| Q | | How did the Fund use derivatives and similar instruments during the Reporting Period? |
| A | | During the Reporting Period, the Fund used equity index call options and equity index put options as part of the options-based overlay. The use of these derivatives had a negative impact on the Fund’s performance. In addition, the Fund employed equity index futures to gain exposure to the U.S. equity market, which had a positive impact on performance during the Reporting Period. |
| Q | | What was the Fund’s sector positioning relative to the S&P 500® Index at the end of the Reporting Period? |
| | | | | | | | | | |
| | | |
| | | Sector Name | | Fund | | | S&P 500®
Index | |
| | Information Technology | | | 24.37 | % | | | 27.34 | % |
| | Health Care | | | 17.86 | | | | 14.00 | |
| | Industrials | | | 12.92 | | | | 8.46 | |
| | Financials | | | 10.21 | | | | 12.27 | |
| | Consumer Discretionary | | | 9.79 | | | | 10.40 | |
| | Consumer Staples | | | 9.53 | | | | 6.86 | |
| | Communication Services | | | 6.41 | | | | 8.30 | |
| | Materials | | | 2.40 | | | | 2.49 | |
| | Energy | | | 1.72 | | | | 4.51 | |
| | | Real Estate | | | 1.58 | | | | 2.54 | |
37
FUND BASICS
Defensive Equity ETF
as of August 31, 2023
| | | | | | |
| | FUND SNAPSHOT | |
| | |
| | | As of August 31, 2023 | | | |
| | |
| | Market Price1 | | $ | 44.53 | |
| | | Net Asset Value (NAV)1 | | $ | 44.52 | |
| 1 | | The Market Price is the price at which the Fund’s shares are trading on the NYSE Arca, Inc. (“NYSE Arca”). The Market Price of the Fund’s shares will fluctuate and, at the time of sale, shares may be worth more or less than the original investment or the Fund’s then current net asset value (“NAV”). The NAV is the market value of one share of the Fund. This amount is derived by dividing the total value of all the securities in the Fund’s portfolio, plus other assets, less any liabilities, by the number of Fund shares outstanding. Fund shares are not individually redeemable and are issued and redeemed by the Fund at their NAV only in large, specified blocks of shares called creation units. Shares otherwise can be bought and sold only through exchange trading at market price (not NAV). Shares may trade at a premium or discount to their NAV in the secondary market. Information regarding how often shares of the Fund traded on NYSE Arca at a price above (i.e., at a premium) or below (i.e., at a discount) the NAV of the Fund can be found at www.GSAMFUNDS.com/ETFs. |
| | | | | | | | |
| | TOP 10 HOLDINGS AS OF 8/31/232 |
| | | |
| | | Holding | | % of Net Assets | | | Line of Business |
| | Apple, Inc. | | | 6.3 | % | | Information Technology |
| | Alphabet, Inc., Class A | | | 3.5 | | | Communication Services |
| | Amazon.com, Inc. | | | 2.8 | | | Consumer Discretionary |
| | NVIDIA Corp. | | | 2.7 | | | Information Technology |
| | Meta Platforms, Inc., Class A | | | 1.6 | | | Communication Services |
| | Berkshire Hathaway, Inc., Class B | | | 1.2 | | | Financials |
| | UnitedHealth Group, Inc. | | | 1.2 | | | Health Care |
| | Eli Lilly & Co. | | | 1.1 | | | Health Care |
| | JPMorgan Chase & Co. | | | 1.1 | | | Financials |
| | | Johnson & Johnson | | | 1.0 | | | Health Care |
| 2 | | The top 10 holdings may not be representative of the Fund’s future investments. |
For more information about the Fund, please refer to www.GSAMFUNDS.com/ETFs. There, you can learn more about the Fund’s investment strategies, holdings, and performance.
38
GOLDMAN SACHS DEFENSIVE EQUITY ETF
Performance Summary
August 31, 2023
The following graph shows the value as of August 31, 2023, of a $10,000 investment made on September 30, 2020 (commencement of operations) in Shares at NAV1. For comparative purposes, the performance of the Fund’s benchmark, the S&P 500® (TR, Unhedged, USD) is shown. Performance reflects applicable fee waivers and/or expense limitations in effect during the periods shown and in their absence, performance would be reduced. Returns do not reflect the deduction of taxes that a shareholder would pay on Fund distributions or the redemption of Fund shares. The returns set forth below represent past performance. Past performance does not guarantee future results. The Fund’s investment return and principal value will fluctuate so that an investor’s shares, when redeemed, may be worth more or less than their original cost. Current performance may be lower or higher than the performance quoted below. Please visit our web site at www.GSAMFUNDS.com to obtain the most recent month-end returns.
| 1 | | Commencement date for Institutional Class Shares of the Predecessor Fund (as defined below). |
|
| Defensive Equity ETF’s Lifetime Performance |
Performance of a $10,000 investment, with distributions reinvested, from September 30, 2020 through August 31, 2023.
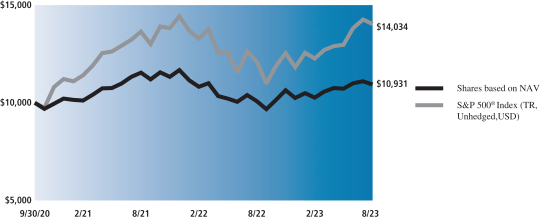
| | | | | | |
| Average Annual Total Return through August 31, 2023* | | | One Year | | | Since Inception |
Shares Based on NAV (Commenced September 30, 2020)** | | | 8.51% | | | 3.10% |
|
Shares Based on Market Price (Commenced January 23, 2023) | | | N/A | | | 11.90% |
|
S&P 500® Index (TR, unhedged, USD) | | | 15.94% | | | 12.32% |
|
| * | | Total returns are calculated assuming purchase of a share at the market price or NAV on the first day and sale of a share at the market price or NAV on the last day of each period reported. The Total Returns based on NAV and Market Price assume the reinvestment of dividends and do not reflect brokerage commissions in connection with the purchase or sale of Fund shares, which if included would lower the performance shown above. The NAV used in the Total Return calculation assumes all management fees and operating expenses incurred by the Fund. Market Price returns are based upon the last trade at 4:00 pm EST and do not reflect the returns you would receive if you traded shares at other times. The first day of secondary market trading is typically several days after the date on which the Fund commenced investment operations; therefore, the NAV of the Fund is used as a proxy for the period from inception of investment operations to the first day of secondary market trading to calculate the Market Price returns. On January 23, 2023, the Goldman Sachs Defensive Equity ETF acquired the assets and liabilities, and assumed the NAV, performance, financial and other historical information, of the Goldman Sachs Defensive Equity Fund (the “Predecessor Fund”), an open-end mutual fund that had operated since September 30, 2020. The Fund’s performance prior to January 23, 2023 is linked to the Predecessor Fund’s Institutional Class Shares. There were no changes to the investment strategy or objective of the Fund. The Fund was listed on the NYSE Arca on January 23, 2023. |
| | | Performance for the Fund’s shares has not been adjusted to reflect the Fund’s shares’ lower expenses than those of the Predecessor Fund’s Institutional Class Shares. Had the Predecessor Fund been structured as an exchange-traded fund (“ETF”), its performance may have differed. Performance for the Predecessor Fund is based on the net asset value (“NAV”) per share of the Predecessor Fund Shares rather than on market-determined prices. |
| ** | | Commencement date for Institutional Class Shares of the Predecessor Fund. |
39
FUND BASICS
Index Definitions and Industry Terms
Alpha: The excess returns of a fund relative to the return of a benchmark index is the fund’s alpha.
Russell 1000® Index is an index of approximately 1,000 of the largest companies in the U.S. equity market. The Russell 1000® is a
subset of the Russell 3000® Index. It represents the top companies by market capitalization. The Russell 1000® typically comprises
approximately 90% of the total market capitalization of all listed U.S. stocks. It is considered a bellwether index for large cap investing. It
is not possible to invest directly in an unmanaged index.
S&P 500® Index is the Standard & Poor’s 500 Composite Index of 500 stocks, an unmanaged index of common stock prices. The Index figures do not reflect any deduction for fees, expenses or taxes. It is not possible to invest directly in an unmanaged index.
Bloomberg Goldman Sachs Global Clean Energy Index is service marks of Bloomberg Finance L.P. and its affiliates, including Bloomberg Index Services Limited (“BISL”), the administrator of the index (collectively, “Bloomberg”) and have been licensed for use for certain purposes by Goldman Sachs. “Goldman Sachs®” is a trademark of Goldman Sachs and has been licensed by Bloomberg for use in the name of the Index. Bloomberg is not affiliated with Goldman Sachs, and Bloomberg does not approve, endorse, review, or recommend Goldman Sachs Bloomberg Clean Energy ETF (the “ETF”). Bloomberg does not guarantee the timeliness, accurateness, or completeness of any data or information relating to the ETF.
Solactive US Large Cap Equal Weight Index is calculated and published by Solactive AG. Solactive AG uses its best efforts to ensure that the Solactive Index is calculated correctly. Irrespective of its obligations towards Goldman Sachs Equal Weight U.S. Large Cap Equity ETF, Solactive AG has no obligation to point out errors in the Solactive Index to third parties including but not limited to investors and/or financial intermediaries of Goldman Sachs Equal Weight U.S. Large Cap Equity ETF. Neither publication of a Solactive Index by Solactive AG nor the licensing of the Solactive Index or Solactive Index trade mark for the purpose of use in connection with the Goldman Sachs Equal Weight U.S. Large Cap Equity ETF constitutes a recommendation by Solactive AG to invest capital in said fund nor does it in any way represent an assurance or opinion of Solactive AG with regard to any investment in this fund.
The Goldman Sachs Hedge Fund VIP IndexTM is owned and maintained by the Index Provider. The Index is calculated by Solactive AG. The Index consists of the US-Iisted stocks whose performance is expected to influence the long portfolios of hedge funds. Those stocks are defined as the positions that appear most frequently among the top 10 long equity holdings within the portfolios of fundamentally driven hedge fund managers. It is not possible to invest directly in an unmanaged index.
Solactive Innovative Global Equity Index is calculated and published by Solactive AG. Solactive AG uses its best efforts to ensure that the Solactive Index is calculated correctly. Irrespective of its obligations towards Goldman Sachs Equal Weight U.S. Large Cap Equity ETF, Solactive AG has no obligation to point out errors in the Solactive Index to third parties including but not limited to investors and/or financial intermediaries of Goldman Sachs Equal Weight U.S. Large Cap Equity ETF. Neither publication of a Solactive Index by Solactive AG nor the licensing of the Solactive Index or Solactive Index trade mark for the purpose of use in connection with the Goldman Sachs Equal Weight U.S. Large Cap Equity ETF constitutes a recommendation by Solactive AG to invest capital in said fund nor does it in any way represent an assurance or opinion of Solactive AG with regard to any investment in this fund.
JUST US Large Cap Diversified Index “JUST” and “JUST Capital” are trademarks of JUST Capital Foundation, Inc. or its affiliates and have been licensed for use in connection with the issuance and distribution of the Goldman Sachs JUST U.S. Large Cap Equity ETF. JUST Capital Foundation, Inc. and its affiliates do not in any way recommend the purchase, sale or holding of any security based on the JUST US Large Cap Diversified Index including the Goldman Sachs JUST U.S. Large Cap Equity ETF, or have any involvement in their operations or distribution. JUST Capital Foundation, Inc., its affiliates, calculation agent, and data providers expressly disclaim all representations, warranties, and liabilities relating to or in connection with the Goldman Sachs JUST U.S. Large Cap Equity ETF (including, without limitation, any warranties of originality, accuracy, completeness, timeliness, non-infringement, merchantability, and fitness for a particular purpose). Frank Russell Company (“Russell”) acts solely as calculation agent in respect of the JUST US Large Cap Diversified Index. Russell does not in any way sponsor, support, promote or endorse the JUST US Large Cap Diversified Index or the Goldman Sachs JUST U.S. Large Cap Equity ETF. In no event shall any Russell party have any liability for any direct, indirect, special, incidental, punitive, consequential (including without limitation, lost profits) or any other damages in connection with the JUST US Large Cap Diversified Index. The index provider may delay or change a scheduled rebalancing or reconstitution of the Index or the implementation of certain rules at its sole discretion.
Solactive Energy Infrastructure Enhanced Index is calculated and published by Solactive AG. Solactive AG uses its best efforts to ensure that the Solactive Index is calculated correctly. Irrespective of its obligations towards Goldman Sachs North American Pipelines & Power Equity ETF, Solactive AG has no obligation to point out errors in the Solactive Index to third parties including but not limited to investors and/or financial intermediaries of Goldman Sachs North American Pipelines & Power Equity ETF. Neither publication of a Solactive Index by Solactive AG nor the licensing of the Solactive Index or Solactive Index trade mark for the purpose of use in connection with the Goldman Sachs North American Pipelines & Power Equity ETF constitutes a recommendation by Solactive AG to invest capital in said fund nor does it in any way represent an assurance or opinion of Solactive AG with regard to any investment in this fund.
40
GOLDMAN SACHS BLOOMBERG CLEAN ENERGY EQUITY ETF
Schedule of Investments
August 31, 2023
| | | | | | | | |
| Shares | | | Description | |
Value | |
|
| Common Stocks – 99.4% | |
| Belgium – 0.9% | |
| | 158 | | | Elia Group SA/NV (Utilities) | | $ | 18,263 | |
| | 2,196 | | | Umicore SA (Materials) | | | 58,323 | |
| | | | | | | | |
| | | | | | | 76,586 | |
| | |
| Brazil – 0.6% | |
| | 3,314 | | | AES Brasil Energia SA (Utilities)* | | | 7,390 | |
| | 3,340 | | | Alupar Investimento SA (Utilities) | | | 19,085 | |
| | 3,345 | | | Centrais Eletricas Brasileiras SA (Utilities) | | | 23,822 | |
| | 817 | | | Cosan SA (Energy) | | | 2,891 | |
| | 279 | | | Energisa SA (Utilities) | | | 2,598 | |
| | | | | | | | |
| | | | | | | 55,786 | |
| | |
| Canada – 3.3% | |
| | 3,730 | | | Algonquin Power & Utilities Corp. (Utilities) | | | 28,204 | |
| | 556 | | | Atco Ltd., Class I (Utilities) | | | 15,329 | |
| | 1,107 | | | Boralex, Inc., Class A (Utilities) | | | 26,821 | |
| | 80 | | | Capital Power Corp. (Utilities) | | | 2,405 | |
| | 2,636 | | | Fortis, Inc. (Utilities) | | | 103,242 | |
| | 1,702 | | | Hydro One Ltd. (Utilities)(a) | | | 44,181 | |
| | 2,719 | | | Northland Power, Inc. (Utilities) | | | 51,347 | |
| | 120 | | | SNC-Lavalin Group, Inc. (Industrials) | | | 3,905 | |
| | 85 | | | WSP Global, Inc. (Industrials) | | | 11,890 | |
| | | | | | | | |
| | | | | | | 287,324 | |
| | |
| China – 18.5% | |
| | 1,500 | | | Beijing Easpring Material Technology Co. Ltd., Class A (Industrials) | | | 9,134 | |
| | 7,400 | | | Beijing Jingyuntong Technology Co. Ltd., Class A (Information Technology)* | | | 4,809 | |
| | 2,800 | | | BYD Co. Ltd., Class A (Consumer Discretionary) | | | 95,943 | |
| | 12,000 | | | CECEP Solar Energy Co. Ltd., Class A (Utilities) | | | 9,942 | |
| | 19,900 | | | CECEP Wind-Power Corp., Class A (Utilities) | | | 9,187 | |
| | 7,900 | | | China Baoan Group Co. Ltd., Class A (Industrials) | | | 11,570 | |
| | 24,239 | | | China Datang Corp Renewable Power Co. Ltd., Class H (Utilities) | | | 6,028 | |
| | 36,345 | | | China Longyuan Power Group Corp. Ltd., Class H (Utilities) | | | 28,782 | |
| | 57,500 | | | China National Nuclear Power Co. Ltd., Class A (Utilities) | | | 56,880 | |
| | 87,300 | | | China Three Gorges Renewables Group Co. Ltd., Class A (Utilities) | | | 59,012 | |
| | 13,580 | | | Contemporary Amperex Technology Co. Ltd., Class A (Industrials) | | | 441,348 | |
| | 1,900 | | | Dajin Heavy Industry Co. Ltd., Class A (Industrials) | | | 6,440 | |
| | 630 | | | Daqo New Energy Corp. ADR (Information Technology)* | | | 23,291 | |
| | 6,200 | | | Eve Energy Co. Ltd., Class A (Industrials) | | | 42,080 | |
| | 300 | | | Ganfeng Lithium Group Co. Ltd., Class A (Materials) | | | 1,954 | |
| | 18,000 | | | GCL System Integration Technology Co. Ltd., Class A (Information Technology)* | | | 7,122 | |
| | |
|
| Common Stocks – (continued) | |
| China – (continued) | |
| | 220,153 | | | GCL Technology Holdings Ltd. (Information Technology) | | | 38,181 | |
| | 15,800 | | | GEM Co. Ltd., Class A (Materials) | | | 13,589 | |
| | 1,250 | | | Ginlong Technologies Co. Ltd., Class A (Industrials) | | | 12,887 | |
| | 10,600 | | | Goldwind Science & Technology Co. Ltd., Class A (Industrials) | | | 13,835 | |
| | 436 | | | GoodWe Technologies Co. Ltd., Class A (Industrials) | | | 8,292 | |
| | 5,400 | | | Gotion High-tech Co. Ltd., Class A (Industrials)* | | | 17,969 | |
| | 1,400 | | | Guangzhou Great Power Energy & Technology Co. Ltd., Class A (Industrials)* | | | 6,888 | |
| | 5,900 | | | Guangzhou Tinci Materials Technology Co. Ltd., Class A (Materials) | | | 26,612 | |
| | 5,732 | | | Hangzhou First Applied Material Co. Ltd., Class A (Information Technology) | | | 24,484 | |
| | 2,500 | | | Hengdian Group DMEGC Magnetics Co. Ltd., Class A (Information Technology) | | | 5,636 | |
| | 1,704 | | | Hoyuan Green Energy Co. Ltd., Class A (Information Technology) | | | 9,758 | |
| | 10,104 | | | JA Solar Technology Co. Ltd., Class A (Information Technology) | | | 38,634 | |
| | 4,300 | | | Jilin Electric Power Co. Ltd., Class A (Utilities)* | | | 2,960 | |
| | 368 | | | JinkoSolar Holding Co. Ltd. ADR (Information Technology)* | | | 12,339 | |
| | 23,160 | | | LONGi Green Energy Technology Co. Ltd., Class A (Information Technology) | | | 84,481 | |
| | 1,020 | | | Luoyang Xinqianglian Slewing Bearing Co. Ltd., Class A (Industrials) | | | 4,206 | |
| | 6,900 | | | Ming Yang Smart Energy Group Ltd., Class A (Industrials) | | | 14,154 | |
| | 1,300 | | | Ningbo Ronbay New Energy Technology Co. Ltd., Class A (Industrials) | | | 9,098 | |
| | 176 | | | NXP Semiconductors NV (Information Technology) | | | 36,207 | |
| | 3,500 | | | Risen Energy Co. Ltd., Class A (Information Technology) | | | 9,656 | |
| | 5,600 | | | Shanghai Aiko Solar Energy Co. Ltd., Class A (Information Technology) | | | 17,088 | |
| | 335 | | | Shanghai Putailai New Energy Technology Co. Ltd., Class A (Materials) | | | 1,506 | |
| | 1,100 | | | Shenzhen Capchem Technology Co. Ltd., Class A (Materials) | | | 7,251 | |
| | 900 | | | Shenzhen Dynanonic Co. Ltd., Class A (Materials) | | | 11,597 | |
| | 1,800 | | | Shenzhen Kstar Science And Technology Co. Ltd., Class A (Industrials) | | | 7,488 | |
| | 500 | | | Shenzhen SC New Energy Technology Corp., Class A (Information Technology) | | | 6,085 | |
| | 3,896 | | | Shenzhen Senior Technology Material Co. Ltd., Class A (Materials) | | | 7,521 | |
| | 4,600 | | | Sungrow Power Supply Co. Ltd., Class A (Industrials) | | | 63,042 | |
| | |
| | |
| The accompanying notes are an integral part of these financial statements. | | 41 |
GOLDMAN SACHS BLOOMBERG CLEAN ENERGY EQUITY ETF
Schedule of Investments (continued)
August 31, 2023
| | | | | | | | |
| Shares | | | Description | |
Value | |
|
| Common Stocks – (continued) | |
| China – (continued) | |
| | 868 | | | Suzhou Maxwell Technologies Co. Ltd., Class A (Industrials) | | $ | 18,194 | |
| | 7,800 | | | TBEA Co. Ltd., Class A (Industrials) | | | 15,753 | |
| | 12,275 | | | TCL Zhonghuan Renewable Energy Technology Co. Ltd., Class A (Information Technology) | | | 43,258 | |
| | 5,500 | | | Titan Wind Energy Suzhou Co. Ltd., Class A (Industrials)* | | | 9,831 | |
| | 13,700 | | | Tongwei Co. Ltd., Class A (Information Technology) | | | 60,383 | |
| | 6,679 | | | Trina Solar Co. Ltd., Class A (Information Technology) | | | 31,181 | |
| | 768 | | | Wuhan DR Laser Technology Corp. Ltd., Class A (Information Technology) | | | 5,321 | |
| | 451 | | | Wuxi Autowell Technology Co. Ltd., Class A (Information Technology) | | | 10,429 | |
| | 2,200 | | | Xiamen Tungsten Co. Ltd., Class A (Materials) | | | 5,244 | |
| | 4,880 | | | Xinjiang Daqo New Energy Co. Ltd., Class A (Information Technology) | | | 27,871 | |
| | 1,834 | | | Xinte Energy Co. Ltd., Class H (Industrials)*(b) | | | 3,246 | |
| | 23,042 | | | Xinyi Solar Holdings Ltd. (Information Technology) | | | 19,246 | |
| | 3,300 | | | Zhejiang Chint Electrics Co. Ltd., Class A (Industrials) | | | 11,235 | |
| | 4,000 | | | Zhejiang Jingsheng Mechanical & Electrical Co. Ltd., Class A (Information Technology) | | | 30,957 | |
| | | | | | | | |
| | | | | | | 1,617,115 | |
| | |
| Czech Republic – 0.4% | |
| | 876 | | | CEZ AS (Utilities) | | | 37,279 | |
| | |
| Denmark – 4.3% | |
| | 1,964 | | | Orsted AS (Utilities)(a) | | | 126,558 | |
| | 10,772 | | | Vestas Wind Systems A/S (Industrials)* | | | 249,388 | |
| | | | | | | | |
| | | | | | | 375,946 | |
| | |
| Finland – 1.2% | |
| | 290 | | | Fortum OYJ (Utilities) | | | 3,903 | |
| | 2,619 | | | Neste OYJ (Energy) | | | 96,021 | |
| | | | | | | | |
| | | | | | | 99,924 | |
| | |
| France – 1.1% | |
| | 1,184 | | | Engie SA (Utilities) | | | 19,135 | |
| | 1,047 | | | Neoen SA (Utilities)(a) | | | 31,523 | |
| | 383 | | | Vinci SA (Industrials) | | | 42,799 | |
| | | | | | | | |
| | | | | | | 93,457 | |
| | |
| Germany – 3.8% | |
| | 607 | | | BASF SE (Materials) | | | 30,826 | |
| | 1,143 | | | Encavis AG (Utilities)* | | | 17,572 | |
| | 12,243 | | | E.ON SE (Utilities) | | | 151,217 | |
| | 832 | | | Infineon Technologies AG (Information Technology) | | | 29,813 | |
| | 1,161 | | | Nordex SE (Industrials)* | | | 13,918 | |
| | 427 | | | RWE AG (Utilities) | | | 17,639 | |
| | |
|
| Common Stocks – (continued) | |
| Germany – (continued) | |
| | 2,862 | | | Siemens Energy AG (Industrials)* | | | 40,878 | |
| | 114 | | | SMA Solar Technology AG (Information Technology)* | | | 9,193 | |
| | 216 | | | VERBIO Vereinigte BioEnergie AG (Energy) | | | 10,242 | |
| | 95 | | | Wacker Chemie AG (Materials) | | | 14,033 | |
| | | | | | | | |
| | | | | | | 335,331 | |
| | |
| India – 1.2% | |
| | 5,225 | | | Adani Green Energy Ltd. (Utilities)* | | | 58,611 | |
| | 26,454 | | | NHPC Ltd. (Utilities) | | | 16,041 | |
| | 2,053 | | | Power Grid Corp. of India Ltd. (Utilities) | | | 6,064 | |
| | 83,092 | | | Suzlon Energy Ltd. (Industrials)* | | | 24,641 | |
| | 975 | | | Tata Power Co. Ltd. (The) (Utilities) | | | 2,887 | |
| | | | | | | | |
| | | | | | | 108,244 | |
| | |
| Israel – 0.2% | |
| | 1,250 | | | Enlight Renewable Energy Ltd. (Utilities)* | | | 20,371 | |
| | |
| Italy – 3.9% | |
| | 35,733 | | | Enel SpA (Utilities) | | | 240,841 | |
| | 1,756 | | | Eni SpA (Energy) | | | 27,224 | |
| | 486 | | | ERG SpA (Utilities) | | | 13,345 | |
| | 7,704 | | | Terna – Rete Elettrica Nazionale (Utilities) | | | 63,715 | |
| | | | | | | | |
| | | | | | | 345,125 | |
| | |
| Japan – 2.3% | |
| | 293 | | | Denso Corp. (Consumer Discretionary) | | | 20,043 | |
| | 621 | | | Hitachi Ltd. (Industrials) | | | 41,350 | |
| | 226 | | | Kyocera Corp. (Information Technology) | | | 11,609 | |
| | 1,114 | | | Marubeni Corp. (Industrials) | | | 18,246 | |
| | 337 | | | NIDEC Corp. (Industrials) | | | 17,667 | |
| | 1,471 | | | Panasonic Holdings Corp. (Consumer Discretionary) | | | 16,970 | |
| | 789 | | | Renesas Electronics Corp. (Information Technology)* | | | 13,280 | |
| | 58 | | | Rohm Co. Ltd. (Information Technology) | | | 4,848 | |
| | 3,700 | | | SUMCO Corp. (Information Technology) | | | 49,482 | |
| | 286 | | | Toshiba Corp. (Industrials) | | | 9,041 | |
| | | | | | | | |
| | | | | | | 202,536 | |
| | |
| Norway – 0.2% | |
| | 11,663 | | | NEL ASA (Industrials)* | | | 12,817 | |
| | |
| Portugal – 0.1% | |
| | 2,044 | | | EDP – Energias de Portugal SA (Utilities) | | | 9,331 | |
| | |
| Singapore – 0.3% | |
| | 614 | | | Sembcorp Industries Ltd. (Utilities) | | | 2,433 | |
| | 437 | | | STMicroelectronics NV (Information Technology) | | | 20,710 | |
| | | | | | | | |
| | | | | | | 23,143 | |
| | |
| South Korea – 7.0% | |
| | 178 | | | CS Wind Corp. (Industrials) | | | 8,551 | |
| | 270 | | | Doosan Enerbility Co. Ltd. (Industrials)* | | | 3,722 | |
| | 219 | | | Ecopro Co. Ltd. (Materials) | | | 208,272 | |
| | 462 | | | Hanwha Solutions Corp. (Materials)* | | | 12,741 | |
| | |
| | |
| 42 | | The accompanying notes are an integral part of these financial statements. |
GOLDMAN SACHS BLOOMBERG CLEAN ENERGY EQUITY ETF
| | | | | | | | |
| Shares | | | Description | |
Value | |
|
| Common Stocks – (continued) | |
| South Korea – (continued) | |
| | 263 | | | L&F Co. Ltd. (Information Technology) | | $ | 42,780 | |
| | 232 | | | LG Chem Ltd. (Materials) | | | 102,331 | |
| | 511 | | | Samsung SDI Co. Ltd. (Information Technology) | | | 237,378 | |
| | | | | | | | |
| | | | | | | 615,775 | |
| | |
| Spain – 2.9% | |
| | 131 | | | Acciona SA (Utilities) | | | 18,747 | |
| | 216 | | | Endesa SA (Utilities) | | | 4,496 | |
| | 18,375 | | | Iberdrola SA (Utilities) | | | 218,579 | |
| | 891 | | | Solaria Energia y Medio Ambiente SA (Utilities)* | | | 13,287 | |
| | | | | | | | |
| | | | | | | 255,109 | |
| | |
| Switzerland – 0.9% | |
| | 1,086 | | | ABB Ltd. (Industrials) | | | 41,424 | |
| | 108 | | | BKW AG (Utilities) | | | 18,586 | |
| | 39,237 | | | Meyer Burger Technology AG (Information Technology)* | | | 17,636 | |
| | | | | | | | |
| | | | | | | 77,646 | |
| | |
| Taiwan – 0.6% | |
| | 1,238 | | | Delta Electronics, Inc. (Information Technology) | | | 13,450 | |
| | 5,329 | | | Sino-American Silicon Products, Inc. (Information Technology) | | | 26,188 | |
| | 15,066 | | | United Renewable Energy Co. Ltd. (Information Technology) | | | 7,782 | |
| | | | | | | | |
| | | | | | | 47,420 | |
| | |
| Thailand – 0.3% | |
| | 15,928 | | | Energy Absolute PCL NVDR (Utilities) | | | 28,770 | |
| | |
| United Kingdom – 4.2% | |
| | 4,356 | | | Drax Group PLC (Utilities) | | | 30,469 | |
| | 16,884 | | | National Grid PLC (Utilities) | | | 211,849 | |
| | 6,028 | | | SSE PLC (Utilities) | | | 124,238 | |
| | | | | | | | |
| | | | | | | 366,556 | |
| | |
| United States – 41.2% | |
| | 3,587 | | | AES Corp. (The) (Utilities) | | | 64,315 | |
| | 171 | | | Alliant Energy Corp. (Utilities) | | | 8,579 | |
| | 347 | | | Ameresco, Inc., Class A (Industrials)* | | | 15,091 | |
| | 351 | | | American Electric Power Co., Inc. (Utilities) | | | 27,518 | |
| | 367 | | | Archer-Daniels-Midland Co. (Consumer Staples) | | | 29,103 | |
| | 33 | | | Arcosa, Inc. (Industrials) | | | 2,581 | |
| | 1,557 | | | Array Technologies, Inc. (Industrials)* | | | 38,723 | |
| | 390 | | | Avangrid, Inc. (Utilities) | | | 13,455 | |
| | 51 | | | Avista Corp. (Utilities) | | | 1,698 | |
| | 1,945 | | | Bloom Energy Corp., Class A (Industrials)* | | | 29,156 | |
| | 1,386 | | | Brookfield Renewable Corp., Class A (Utilities) | | | 38,641 | |
| | 102 | | | Bunge Ltd. (Consumer Staples) | | | 11,661 | |
| | 449 | | | Clearway Energy, Inc., Class C (Utilities) | | | 11,122 | |
| | |
|
| Common Stocks – (continued) | |
| United States – (continued) | |
| | 236 | | | Consolidated Edison, Inc. (Utilities) | | | 20,995 | |
| | 566 | | | Dominion Energy, Inc. (Utilities) | | | 27,474 | |
| | 124 | | | DTE Energy Co. (Utilities) | | | 12,819 | |
| | 522 | | | Duke Energy Corp. (Utilities) | | | 46,354 | |
| | 19 | | | Dycom Industries, Inc. (Industrials)* | | | 1,899 | |
| | 4,204 | | | Edison International (Utilities) | | | 289,445 | |
| | 32 | | | EMCOR Group, Inc. (Industrials) | | | 7,176 | |
| | 386 | | | Emerson Electric Co. (Industrials) | | | 37,924 | |
| | 1,277 | | | Enovix Corp. (Industrials)* | | | 17,597 | |
| | 1,467 | | | Enphase Energy, Inc. (Information Technology)* | | | 185,619 | |
| | 667 | | | Exelon Corp. (Utilities) | | | 26,760 | |
| | 1,112 | | | First Solar, Inc. (Information Technology)* | | | 210,301 | |
| | 426 | | | Fluence Energy, Inc. (Industrials)* | | | 11,225 | |
| | 4,439 | | | FuelCell Energy, Inc. (Industrials)*(b) | | | 6,215 | |
| | 333 | | | Generac Holdings, Inc. (Industrials)* | | | 39,564 | |
| | 2,272 | | | General Electric Co. (Industrials) | | | 260,053 | |
| | 630 | | | Green Plains, Inc. (Energy)* | | | 19,555 | |
| | 982 | | | Hannon Armstrong Sustainable Infrastructure Capital, Inc. REIT (Financials) | | | 21,967 | |
| | 487 | | | Itron, Inc. (Information Technology)* | | | 33,316 | |
| | 42 | | | MasTec, Inc. (Industrials)* | | | 4,179 | |
| | 6,180 | | | NextEra Energy, Inc. (Utilities) | | | 412,824 | |
| | 40 | | | NorthWestern Corp. (Utilities) | | | 2,016 | |
| | 294 | | | ON Semiconductor Corp. (Information Technology)* | | | 28,947 | |
| | 552 | | | Ormat Technologies, Inc. (Utilities) | | | 41,919 | |
| | 6,353 | | | Plug Power, Inc. (Industrials)*(b) | | | 53,746 | |
| | 340 | | | Public Service Enterprise Group, Inc. (Utilities) | | | 20,767 | |
| | 96 | | | Quanta Services, Inc. (Industrials) | | | 20,147 | |
| | 2,462 | | | QuantumScape Corp. (Consumer Discretionary)* | | | 17,579 | |
| | 1,352 | | | Schneider Electric SE (Industrials) | | | 232,699 | |
| | 3,148 | | | Sempra (Utilities) | | | 221,053 | |
| | 614 | | | SolarEdge Technologies, Inc. (Information Technology)* | | | 99,818 | |
| | 1,084 | | | Sunnova Energy International, Inc. (Utilities)*(b) | | | 15,078 | |
| | 941 | | | SunPower Corp. (Industrials)* | | | 6,738 | |
| | 2,270 | | | Sunrun, Inc. (Industrials)* | | | 35,480 | |
| | 2,509 | | | Tesla, Inc. (Consumer Discretionary)* | | | 647,523 | |
| | 544 | | | Texas Instruments, Inc. (Information Technology) | | | 91,425 | |
| | 45 | | | Timken Co. (The) (Industrials) | | | 3,439 | |
| | 14 | | | Valmont Industries, Inc. (Industrials) | | | 3,549 | |
| | 1,343 | | | Wolfspeed, Inc. (Information Technology)* | | | 64,222 | |
| | 372 | | | Xcel Energy, Inc. (Utilities) | | | 21,252 | |
| | | | | | | | |
| | | | | | | 3,612,301 | |
| | |
| | TOTAL COMMON STOCKS | |
| | (Cost $9,555,938) | | $ | 8,703,892 | |
| | |
| | |
| The accompanying notes are an integral part of these financial statements. | | 43 |
GOLDMAN SACHS BLOOMBERG CLEAN ENERGY EQUITY ETF
Schedule of Investments (continued)
August 31, 2023
| | | | | | | | | | |
| Shares | | | Description | | Rate | |
Value | |
|
| Preferred Stock – 0.1% | |
| Brazil – 0.1% | |
| | 1,340 | | | Centrais Eletricas Brasileiras SA, Class B (Utilities) | |
| | (Cost $11,133) | | 3.86% | | $ | 10,485 | |
| | |
| TOTAL INVESTMENTS BEFORE SECURITIES LENDING
REINVESTMENT VEHICLE |
|
| | (Cost $9,567,071) | | | | $ | 8,714,377 | |
| | |
| | | | | | |
| | |
| Shares | | Dividend
Rate | | Value | |
|
| Securities Lending Reinvestment Vehicle – 1.4%(c) | |
Goldman Sachs Financial Square Government Fund – Institutional Shares | |
| 119,761 | | 5.234% | | $ | 119,761 | |
| (Cost $119,761) | |
| |
| TOTAL INVESTMENTS – 100.9% | |
| (Cost $9,686,832) | | $ | 8,834,138 | |
| |
| LIABILITIES IN EXCESS OF OTHER ASSETS – (0.9)% | | | (74,394 | ) |
| |
| NET ASSETS – 100.0% | | $ | 8,759,744 | |
| |
| | |
|
| The percentage shown for each investment category reflects the value of investments in that category as a percentage of net assets. |
| |
* | | Non-income producing security. |
| |
(a) | | Exempt from registration under Rule 144A of the Securities Act of 1933. |
| |
(b) | | All or a portion of security is on loan. |
| |
(c) | | Represents an affiliated issuer. |
| | |
|
Investment Abbreviations: |
ADR | | —American Depositary Receipt |
NVDR | | —Non-Voting Depository Receipt |
PLC | | —Public Limited Company |
REIT | | —Real Estate Investment Trust |
|
| | | | |
| Sector Name | | % of Market
Value | |
| |
Utilities | | | 38.0 | % |
Industrials | | | 23.7 | |
Information Technology | | | 19.7 | |
Consumer Discretionary | | | 9.0 | |
Materials | | | 5.7 | |
Energy | | | 1.8 | |
Consumer Staples | | | 0.5 | |
Financials | | | 0.2 | |
Securities Lending Reinvestment Vehicle | | | 1.4 | |
| |
| |
| TOTAL INVESTMENTS | | | 100.0 | % |
| |
| | |
| 44 | | The accompanying notes are an integral part of these financial statements. |
GOLDMAN SACHS EQUAL WEIGHT U.S. LARGE CAP EQUITY ETF
Schedule of Investments
August 31, 2023
| | | | | | | | |
| Shares | | | Description | |
Value | |
|
| Common Stocks – 99.7% | |
| Communication Services – 4.2% | |
| | 10,374 | | | Activision Blizzard, Inc. | | $ | 954,304 | |
| | 7,433 | | | Alphabet, Inc., Class A* | | | 1,012,152 | |
| | 65,436 | | | AT&T, Inc. | | | 967,798 | |
| | 2,263 | | | Charter Communications, Inc., Class A* | | | 991,466 | |
| | 21,069 | | | Comcast Corp., Class A | | | 985,186 | |
| | 7,489 | | | Electronic Arts, Inc. | | | 898,530 | |
| | 28,097 | | | Interpublic Group of Cos., Inc. (The) | | | 916,243 | |
| | 3,046 | | | Meta Platforms, Inc., Class A* | | | 901,281 | |
| | 2,221 | | | Netflix, Inc.* | | | 963,203 | |
| | 11,351 | | | Omnicom Group, Inc. | | | 919,545 | |
| | 59,916 | | | Paramount Global, Class B | | | 904,132 | |
| | 34,497 | | | Pinterest, Inc., Class A* | | | 948,323 | |
| | 25,713 | | | ROBLOX Corp., Class A* | | | 727,421 | |
| | 86,485 | | | Snap, Inc., Class A* | | | 895,120 | |
| | 6,594 | | | Spotify Technology SA* | | | 1,015,278 | |
| | 6,474 | | | Take-Two Interactive Software, Inc.* | | | 920,603 | |
| | 6,993 | | | T-Mobile US, Inc.* | | | 952,796 | |
| | 11,063 | | | Trade Desk, Inc. (The), Class A* | | | 885,372 | |
| | 28,440 | | | Verizon Communications, Inc. | | | 994,831 | |
| | 10,941 | | | Walt Disney Co. (The)* | | | 915,543 | |
| | 75,090 | | | Warner Bros Discovery, Inc.* | | | 986,683 | |
| | | | | | | | |
| | | | | | | 19,655,810 | |
| | |
| Consumer Discretionary – 8.4% | |
| | 6,596 | | | Airbnb, Inc., Class A* | | | 867,704 | |
| | 7,464 | | | Amazon.com, Inc.* | | | 1,030,107 | |
| | 386 | | | AutoZone, Inc.* | | | 977,093 | |
| | 11,727 | | | Best Buy Co., Inc. | | | 896,529 | |
| | 330 | | | Booking Holdings, Inc.* | | | 1,024,660 | |
| | 5,586 | | | Burlington Stores, Inc.* | | | 906,384 | |
| | 490 | | | Chipotle Mexican Grill, Inc.* | | | 944,054 | |
| | 5,762 | | | Darden Restaurants, Inc. | | | 896,049 | |
| | 1,758 | | | Deckers Outdoor Corp.* | | | 930,140 | |
| | 2,380 | | | Domino’s Pizza, Inc. | | | 922,012 | |
| | 11,213 | | | DoorDash, Inc., Class A* | | | 943,350 | |
| | 7,576 | | | D.R. Horton, Inc. | | | 901,696 | |
| | 21,757 | | | eBay, Inc. | | | 974,279 | |
| | 9,983 | | | Etsy, Inc.* | | | 734,449 | |
| | 8,094 | | | Expedia Group, Inc.* | | | 877,309 | |
| | 73,016 | | | Ford Motor Co. | | | 885,684 | |
| | 8,786 | | | Garmin Ltd. | | | 931,492 | |
| | 25,351 | | | General Motors Co. | | | 849,512 | |
| | 6,077 | | | Genuine Parts Co. | | | 934,217 | |
| | 6,142 | | | Hilton Worldwide Holdings, Inc. | | | 913,008 | |
| | 2,889 | | | Home Depot, Inc. (The) | | | 954,237 | |
| | 16,491 | | | Las Vegas Sands Corp. | | | 904,696 | |
| | 7,617 | | | Lennar Corp., Class A | | | 907,109 | |
| | 17,211 | | | LKQ Corp. | | | 904,094 | |
| | 4,124 | | | Lowe’s Cos., Inc. | | | 950,500 | |
| | 4,620 | | | Marriott International, Inc., Class A | | | 940,216 | |
| | 3,265 | | | McDonald’s Corp. | | | 917,955 | |
| | 19,352 | | | MGM Resorts International | | | 851,101 | |
| | 8,809 | | | NIKE, Inc., Class B | | | 895,963 | |
| | 152 | | | NVR, Inc.* | | | 969,354 | |
| | |
|
| Common Stocks – (continued) | |
| Consumer Discretionary – (continued) | |
| | 1,029 | | | O’Reilly Automotive, Inc.* | | | 966,951 | |
| | 2,505 | | | Pool Corp. | | | 915,828 | |
| | 11,424 | | | PulteGroup, Inc. | | | 937,453 | |
| | 8,482 | | | Ross Stores, Inc. | | | 1,033,192 | |
| | 9,113 | | | Royal Caribbean Cruises Ltd.* | | | 901,640 | |
| | 9,169 | | | Starbucks Corp. | | | 893,427 | |
| | 48,130 | | | Stellantis NV(a) | | | 892,812 | |
| | 3,780 | | | Tesla, Inc.* | | | 975,542 | |
| | 11,034 | | | TJX Cos., Inc. (The) | | | 1,020,424 | |
| | 4,190 | | | Tractor Supply Co. | | | 915,515 | |
| | 2,160 | | | Ulta Beauty, Inc.* | | | 896,465 | |
| | 6,951 | | | Yum! Brands, Inc. | | | 899,320 | |
| | | | | | | | |
| | | | | | | 38,783,522 | |
| | |
| Consumer Staples – 6.8% | |
| | 21,219 | | | Altria Group, Inc. | | | 938,304 | |
| | 11,126 | | | Archer-Daniels-Midland Co. | | | 882,292 | |
| | 13,368 | | | Brown-Forman Corp., Class B | | | 884,026 | |
| | 8,311 | | | Bunge Ltd. | | | 950,114 | |
| | 9,771 | | | Church & Dwight Co., Inc. | | | 945,540 | |
| | 6,183 | | | Clorox Co. (The) | | | 967,330 | |
| | 15,241 | | | Coca-Cola Co. (The) | | | 911,869 | |
| | 12,245 | | | Colgate-Palmolive Co. | | | 899,640 | |
| | 28,767 | | | Conagra Brands, Inc. | | | 859,558 | |
| | 3,509 | | | Constellation Brands, Inc., Class A | | | 914,305 | |
| | 1,713 | | | Costco Wholesale Corp. | | | 940,917 | |
| | 5,609 | | | Dollar General Corp. | | | 776,847 | |
| | 6,191 | | | Dollar Tree, Inc.* | | | 757,531 | |
| | 5,526 | | | Estee Lauder Cos., Inc. (The), Class A | | | 887,089 | |
| | 12,565 | | | General Mills, Inc. | | | 850,148 | |
| | 4,050 | | | Hershey Co. (The) | | | 870,183 | |
| | 22,859 | | | Hormel Foods Corp. | | | 882,129 | |
| | 6,236 | | | J M Smucker Co. (The) | | | 903,908 | |
| | 14,146 | | | Kellogg Co. | | | 863,189 | |
| | 27,536 | | | Keurig Dr Pepper, Inc. | | | 926,586 | |
| | 7,310 | | | Kimberly-Clark Corp. | | | 941,747 | |
| | 26,144 | | | Kraft Heinz Co. (The) | | | 865,105 | |
| | 19,339 | | | Kroger Co. (The) | | | 897,136 | |
| | 9,262 | | | Lamb Weston Holdings, Inc. | | | 902,211 | |
| | 10,732 | | | McCormick & Co., Inc. | | | 880,883 | |
| | 12,627 | | | Mondelez International, Inc., Class A | | | 899,800 | |
| | 16,445 | | | Monster Beverage Corp.* | | | 944,107 | |
| | 5,022 | | | PepsiCo, Inc. | | | 893,514 | |
| | 9,684 | | | Philip Morris International, Inc. | | | 930,245 | |
| | 6,038 | | | Procter & Gamble Co. (The) | | | 931,905 | |
| | 12,442 | | | Sysco Corp. | | | 866,585 | |
| | 7,104 | | | Target Corp. | | | 899,011 | |
| | 17,061 | | | Tyson Foods, Inc., Class A | | | 908,839 | |
| | 31,119 | | | Walgreens Boots Alliance, Inc. | | | 787,622 | |
| | 5,939 | | | Walmart, Inc. | | | 965,741 | |
| | | | | | | | |
| | | | | | | 31,325,956 | |
| | |
| Energy – 5.4% | |
| | 24,540 | | | APA Corp. | | | 1,075,834 | |
| | 26,989 | | | Baker Hughes Co. | | | 976,732 | |
| | 5,997 | | | Cheniere Energy, Inc. | | | 978,710 | |
| | 5,992 | | | Chevron Corp. | | | 965,311 | |
| | |
| | |
| The accompanying notes are an integral part of these financial statements. | | 45 |
GOLDMAN SACHS EQUAL WEIGHT U.S. LARGE CAP EQUITY ETF
Schedule of Investments (continued)
August 31, 2023
| | | | | | | | |
| Shares | | | Description | |
Value | |
|
| Common Stocks – (continued) | |
| Energy – (continued) | |
| | 8,243 | | | ConocoPhillips | | $ | 981,164 | |
| | 35,257 | | | Coterra Energy, Inc. | | | 993,895 | |
| | 19,160 | | | Devon Energy Corp. | | | 978,884 | |
| | 6,512 | | | Diamondback Energy, Inc. | | | 988,391 | |
| | 7,346 | | | EOG Resources, Inc. | | | 944,843 | |
| | 23,509 | | | EQT Corp. | | | 1,016,059 | |
| | 9,083 | | | Exxon Mobil Corp. | | | 1,009,939 | |
| | 24,514 | | | Halliburton Co. | | | 946,731 | |
| | 6,424 | | | Hess Corp. | | | 992,508 | |
| | 54,873 | | | Kinder Morgan, Inc. | | | 944,913 | |
| | 37,391 | | | Marathon Oil Corp. | | | 985,253 | |
| | 7,064 | | | Marathon Petroleum Corp. | | | 1,008,527 | |
| | 15,633 | | | Occidental Petroleum Corp. | | | 981,596 | |
| | 14,551 | | | ONEOK, Inc. | | | 948,725 | |
| | 8,655 | | | Phillips 66 | | | 988,055 | |
| | 4,151 | | | Pioneer Natural Resources Co. | | | 987,648 | |
| | 16,740 | | | Schlumberger NV | | | 986,990 | |
| | 11,763 | | | Targa Resources Corp. | | | 1,014,559 | |
| | 639 | | | Texas Pacific Land Corp. | | | 1,204,355 | |
| | 7,480 | | | Valero Energy Corp. | | | 971,652 | |
| | 28,281 | | | Williams Cos., Inc. (The) | | | 976,543 | |
| | | | | | | | |
| | | | | | | 24,847,817 | |
| | |
| Financials – 14.2% | |
| | 12,332 | | | Aflac, Inc. | | | 919,597 | |
| | 8,732 | | | Allstate Corp. (The) | | | 941,397 | |
| | 5,715 | | | American Express Co. | | | 902,913 | |
| | 15,447 | | | American International Group, Inc. | | | 903,958 | |
| | 2,735 | | | Ameriprise Financial, Inc. | | | 923,281 | |
| | 2,951 | | | Aon PLC, Class A | | | 983,834 | |
| | 11,768 | | | Apollo Global Management, Inc. | | | 1,027,817 | |
| | 12,223 | | | Arch Capital Group Ltd.* | | | 939,460 | |
| | 9,423 | | | Ares Management Corp., Class A | | | 974,715 | |
| | 4,299 | | | Arthur J Gallagher & Co. | | | 990,834 | |
| | 30,609 | | | Bank of America Corp. | | | 877,560 | |
| | 21,200 | | | Bank of New York Mellon Corp. (The) | | | 951,244 | |
| | 2,701 | | | Berkshire Hathaway, Inc., Class B* | | | 972,900 | |
| | 1,324 | | | BlackRock, Inc. | | | 927,515 | |
| | 9,204 | | | Blackstone, Inc. | | | 979,029 | |
| | 12,726 | | | Block, Inc.* | | | 733,654 | |
| | 13,470 | | | Brown & Brown, Inc. | | | 998,127 | |
| | 8,439 | | | Capital One Financial Corp. | | | 864,069 | |
| | 6,764 | | | Cboe Global Markets, Inc. | | | 1,012,638 | |
| | 14,581 | | | Charles Schwab Corp. (The) | | | 862,466 | |
| | 4,599 | | | Chubb Ltd. | | | 923,801 | |
| | 8,629 | | | Cincinnati Financial Corp. | | | 912,862 | |
| | 20,572 | | | Citigroup, Inc. | | | 849,418 | |
| | 30,647 | | | Citizens Financial Group, Inc. | | | 862,100 | |
| | 4,769 | | | CME Group, Inc. | | | 966,581 | |
| | 9,235 | | | Discover Financial Services | | | 831,796 | |
| | 2,643 | | | Everest Group Ltd. | | | 953,277 | |
| | 2,177 | | | FactSet Research Systems, Inc. | | | 950,065 | |
| | 15,790 | | | Fidelity National Information Services, Inc. | | | 882,029 | |
| | 33,685 | | | Fifth Third Bancorp | | | 894,337 | |
| | 7,600 | | | Fiserv, Inc.* | | | 922,564 | |
| | |
|
| Common Stocks – (continued) | |
| Financials – (continued) | |
| | 3,880 | | | FleetCor Technologies, Inc.* | | | 1,054,312 | |
| | 7,693 | | | Global Payments, Inc. | | | 974,626 | |
| | 2,711 | | | Goldman Sachs Group, Inc. (The)(b) | | | 888,422 | |
| | 13,080 | | | Hartford Financial Services Group, Inc. (The) | | | 939,406 | |
| | 79,017 | | | Huntington Bancshares, Inc. | | | 876,299 | |
| | 8,270 | | | Intercontinental Exchange, Inc. | | | 975,777 | |
| | 5,542 | | | Jack Henry & Associates, Inc. | | | 868,875 | |
| | 6,134 | | | JPMorgan Chase & Co. | | | 897,588 | |
| | 80,420 | | | KeyCorp | | | 911,159 | |
| | 16,255 | | | KKR & Co., Inc. | | | 1,020,977 | |
| | 4,102 | | | LPL Financial Holdings, Inc. | | | 945,880 | |
| | 6,838 | | | M&T Bank Corp. | | | 855,092 | |
| | 659 | | | Markel Group, Inc.* | | | 974,608 | |
| | 3,618 | | | MarketAxess Holdings, Inc. | | | 871,685 | |
| | 5,000 | | | Marsh & McLennan Cos., Inc. | | | 974,950 | |
| | 2,432 | | | Mastercard, Inc., Class A | | | 1,003,540 | |
| | 15,090 | | | MetLife, Inc. | | | 955,801 | |
| | 2,757 | | | Moody’s Corp. | | | 928,558 | |
| | 10,647 | | | Morgan Stanley | | | 906,592 | |
| | 1,760 | | | MSCI, Inc. | | | 956,771 | |
| | 19,125 | | | Nasdaq, Inc. | | | 1,003,680 | |
| | 11,931 | | | Northern Trust Corp. | | | 907,591 | |
| | 13,049 | | | PayPal Holdings, Inc.* | | | 815,693 | |
| | 7,084 | | | PNC Financial Services Group, Inc. (The) | | | 855,251 | |
| | 12,130 | | | Principal Financial Group, Inc. | | | 942,622 | |
| | 7,480 | | | Progressive Corp. (The) | | | 998,356 | |
| | 10,040 | | | Prudential Financial, Inc. | | | 950,487 | |
| | 8,790 | | | Raymond James Financial, Inc. | | | 919,346 | |
| | 47,152 | | | Regions Financial Corp. | | | 864,768 | |
| | 2,406 | | | S&P Global, Inc. | | | 940,409 | |
| | 13,180 | | | State Street Corp. | | | 905,993 | |
| | 28,030 | | | Synchrony Financial | | | 904,808 | |
| | 8,021 | | | T. Rowe Price Group, Inc. | | | 900,197 | |
| | 5,526 | | | Travelers Cos., Inc. (The) | | | 890,957 | |
| | 29,489 | | | Truist Financial Corp. | | | 900,889 | |
| | 24,918 | | | US Bancorp | | | 910,255 | |
| | 4,000 | | | Visa, Inc., Class A | | | 982,720 | |
| | 15,137 | | | W R Berkley Corp. | | | 936,375 | |
| | 21,195 | | | Wells Fargo & Co. | | | 875,142 | |
| | 4,455 | | | Willis Towers Watson PLC | | | 921,116 | |
| | | | | | | | |
| | | | | | | 65,743,411 | |
| | |
| Health Care – 13.3% | |
| | 8,724 | | | Abbott Laboratories | | | 897,700 | |
| | 6,339 | | | AbbVie, Inc. | | | 931,579 | |
| | 7,466 | | | Agilent Technologies, Inc. | | | 903,909 | |
| | 2,606 | | | Align Technology, Inc.* | | | 964,585 | |
| | 5,088 | | | Alnylam Pharmaceuticals, Inc.* | | | 1,006,508 | |
| | 4,102 | | | Amgen, Inc. | | | 1,051,507 | |
| | 45,463 | | | Avantor, Inc.* | | | 984,274 | |
| | 21,599 | | | Baxter International, Inc. | | | 876,919 | |
| | 3,423 | | | Becton Dickinson & Co. | | | 956,557 | |
| | 3,483 | | | Biogen, Inc.* | | | 931,215 | |
| | 10,630 | | | BioMarin Pharmaceutical, Inc.* | | | 971,369 | |
| | 11,725 | | | Bio-Techne Corp. | | | 919,240 | |
| | |
| | |
| 46 | | The accompanying notes are an integral part of these financial statements. |
GOLDMAN SACHS EQUAL WEIGHT U.S. LARGE CAP EQUITY ETF
| | | | | | | | |
| Shares | | | Description | |
Value | |
|
| Common Stocks – (continued) | |
| Health Care – (continued) | |
| | 18,664 | | | Boston Scientific Corp.* | | $ | 1,006,736 | |
| | 15,303 | | | Bristol-Myers Squibb Co. | | | 943,430 | |
| | 10,247 | | | Cardinal Health, Inc. | | | 894,870 | |
| | 4,972 | | | Cencora, Inc. | | | 874,973 | |
| | 13,960 | | | Centene Corp.* | | | 860,634 | |
| | 4,604 | | | Charles River Laboratories International, Inc.* | | | 952,199 | |
| | 3,160 | | | Cigna Group (The) | | | 872,982 | |
| | 2,450 | | | Cooper Cos., Inc. (The) | | | 906,475 | |
| | 12,388 | | | CVS Health Corp. | | | 807,326 | |
| | 3,690 | | | Danaher Corp. | | | 977,850 | |
| | 7,724 | | | Dexcom, Inc.* | | | 779,970 | |
| | 11,715 | | | Edwards Lifesciences Corp.* | | | 895,846 | |
| | 2,003 | | | Elevance Health, Inc. | | | 885,346 | |
| | 2,078 | | | Eli Lilly & Co. | | | 1,151,628 | |
| | 10,892 | | | Exact Sciences Corp.* | | | 911,334 | |
| | 12,385 | | | GE HealthCare Technologies, Inc. | | | 872,523 | |
| | 12,510 | | | Gilead Sciences, Inc. | | | 956,765 | |
| | 3,517 | | | HCA Healthcare, Inc. | | | 975,264 | |
| | 12,539 | | | Hologic, Inc.* | | | 937,165 | |
| | 9,573 | | | Horizon Therapeutics PLC* | | | 1,079,260 | |
| | 1,962 | | | Humana, Inc. | | | 905,718 | |
| | 1,855 | | | IDEXX Laboratories, Inc.* | | | 948,666 | |
| | 5,013 | | | Illumina, Inc.* | | | 828,248 | |
| | 14,426 | | | Incyte Corp.* | | | 930,910 | |
| | 3,544 | | | Insulet Corp.* | | | 679,420 | |
| | 3,018 | | | Intuitive Surgical, Inc.* | | | 943,668 | |
| | 4,327 | | | IQVIA Holdings, Inc.* | | | 963,320 | |
| | 5,564 | | | Johnson & Johnson | | | 899,588 | |
| | 4,419 | | | Laboratory Corp. of America Holdings | | | 919,594 | |
| | 2,310 | | | McKesson Corp. | | | 952,459 | |
| | 11,084 | | | Medtronic PLC | | | 903,346 | |
| | 8,907 | | | Merck & Co., Inc. | | | 970,685 | |
| | 732 | | | Mettler-Toledo International, Inc.* | | | 888,267 | |
| | 8,553 | | | Moderna, Inc.* | | | 967,088 | |
| | 3,122 | | | Molina Healthcare, Inc.* | | | 968,195 | |
| | 26,574 | | | Pfizer, Inc. | | | 940,188 | |
| | 7,101 | | | Quest Diagnostics, Inc. | | | 933,781 | |
| | 1,288 | | | Regeneron Pharmaceuticals, Inc.* | | | 1,064,519 | |
| | 4,259 | | | ResMed, Inc. | | | 679,694 | |
| | 7,614 | | | Revvity, Inc. | | | 891,066 | |
| | 30,787 | | | Royalty Pharma PLC, Class A | | | 918,068 | |
| | 4,935 | | | Seagen, Inc.* | | | 1,016,955 | |
| | 4,162 | | | STERIS PLC | | | 955,554 | |
| | 3,458 | | | Stryker Corp. | | | 980,516 | |
| | 3,862 | | | Teleflex, Inc. | | | 821,602 | |
| | 1,719 | | | Thermo Fisher Scientific, Inc. | | | 957,655 | |
| | 1,875 | | | UnitedHealth Group, Inc. | | | 893,587 | |
| | 4,788 | | | Veeva Systems, Inc., Class A* | | | 999,256 | |
| | 2,646 | | | Vertex Pharmaceuticals, Inc.* | | | 921,708 | |
| | 91,035 | | | Viatris, Inc. | | | 978,626 | |
| | 3,212 | | | Waters Corp.* | | | 901,930 | |
| | 2,575 | | | West Pharmaceutical Services, Inc. | | | 1,047,767 | |
| | 7,396 | | | Zimmer Biomet Holdings, Inc. | | | 881,012 | |
| | 5,193 | | | Zoetis, Inc. | | | 989,318 | |
| | | | | | | | |
| | | | | | | 61,379,912 | |
| | |
|
| Common Stocks – (continued) | |
| Industrials – 14.6% | |
| | 8,726 | | | 3M Co. | | | 930,803 | |
| | 5,947 | | | AMETEK, Inc. | | | 948,606 | |
| | 3,843 | | | Automatic Data Processing, Inc. | | | 978,466 | |
| | 5,320 | | | Axon Enterprise, Inc.* | | | 1,132,681 | |
| | 4,101 | | | Boeing Co. (The)* | | | 918,747 | |
| | 7,733 | | | Booz Allen Hamilton Holding Corp. | | | 876,226 | |
| | 5,715 | | | Broadridge Financial Solutions, Inc. | | | 1,064,190 | |
| | 6,422 | | | Builders FirstSource, Inc.* | | | 931,447 | |
| | 3,437 | | | Carlisle Cos., Inc. | | | 904,000 | |
| | 16,258 | | | Carrier Global Corp. | | | 934,022 | |
| | 3,318 | | | Caterpillar, Inc. | | | 932,789 | |
| | 9,718 | | | C.H. Robinson Worldwide, Inc. | | | 878,799 | |
| | 1,898 | | | Cintas Corp. | | | 956,915 | |
| | 21,480 | | | Copart, Inc.* | | | 962,948 | |
| | 28,864 | | | CSX Corp. | | | 871,693 | |
| | 3,617 | | | Cummins, Inc. | | | 832,055 | |
| | 2,198 | | | Deere & Co. | | | 903,246 | |
| | 21,247 | | | Delta Air Lines, Inc. | | | 911,071 | |
| | 6,621 | | | Dover Corp. | | | 981,894 | |
| | 4,297 | | | Eaton Corp. PLC | | | 989,900 | |
| | 9,968 | | | Emerson Electric Co. | | | 979,356 | |
| | 4,709 | | | Equifax, Inc. | | | 973,350 | |
| | 7,645 | | | Expeditors International of Washington, Inc. | | | 892,248 | |
| | 16,383 | | | Fastenal Co. | | | 943,333 | |
| | 3,569 | | | FedEx Corp. | | | 931,580 | |
| | 12,172 | | | Fortive Corp. | | | 959,762 | |
| | 4,217 | | | General Dynamics Corp. | | | 955,741 | |
| | 8,423 | | | General Electric Co. | | | 964,097 | |
| | 12,053 | | | Graco, Inc. | | | 951,464 | |
| | 4,889 | | | Honeywell International, Inc. | | | 918,839 | |
| | 19,830 | | | Howmet Aerospace, Inc. | | | 980,990 | |
| | 3,038 | | | Hubbell, Inc. | | | 990,540 | |
| | 4,299 | | | IDEX Corp. | | | 973,294 | |
| | 3,768 | | | Illinois Tool Works, Inc. | | | 932,015 | |
| | 14,528 | | | Ingersoll Rand, Inc. | | | 1,011,294 | |
| | 7,464 | | | Jacobs Solutions, Inc. | | | 1,006,297 | |
| | 4,648 | | | J.B. Hunt Transport Services, Inc. | | | 873,266 | |
| | 15,088 | | | Johnson Controls International PLC | | | 891,097 | |
| | 5,068 | | | L3Harris Technologies, Inc. | | | 902,560 | |
| | 9,638 | | | Leidos Holdings, Inc. | | | 939,801 | |
| | 2,109 | | | Lockheed Martin Corp. | | | 945,570 | |
| | 15,744 | | | Masco Corp. | | | 929,054 | |
| | 4,130 | | | Norfolk Southern Corp. | | | 846,691 | |
| | 2,129 | | | Northrop Grumman Corp. | | | 922,049 | |
| | 2,328 | | | Old Dominion Freight Line, Inc. | | | 994,917 | |
| | 10,632 | | | Otis Worldwide Corp. | | | 909,568 | |
| | 11,018 | | | PACCAR, Inc. | | | 906,671 | |
| | 2,323 | | | Parker-Hannifin Corp. | | | 968,459 | |
| | 7,619 | | | Paychex, Inc. | | | 931,270 | |
| | 3,157 | | | Paycom Software, Inc. | | | 930,810 | |
| | 4,712 | | | Quanta Services, Inc. | | | 988,908 | |
| | 6,240 | | | Republic Services, Inc. | | | 899,371 | |
| | 3,120 | | | Rockwell Automation, Inc. | | | 973,690 | |
| | 11,005 | | | RTX Corp. | | | 946,870 | |
| | 3,467 | | | Snap-on, Inc. | | | 931,236 | |
| | |
| | |
| The accompanying notes are an integral part of these financial statements. | | 47 |
GOLDMAN SACHS EQUAL WEIGHT U.S. LARGE CAP EQUITY ETF
Schedule of Investments (continued)
August 31, 2023
| | | | | | | | |
| Shares | | | Description | |
Value | |
|
| Common Stocks – (continued) | |
| Industrials – (continued) | |
| | 28,416 | | | Southwest Airlines Co. | | $ | 897,946 | |
| | 16,792 | | | SS&C Technologies Holdings, Inc. | | | 964,197 | |
| | 9,177 | | | Stanley Black & Decker, Inc. | | | 866,125 | |
| | 12,285 | | | Textron, Inc. | | | 954,667 | |
| | 4,610 | | | Trane Technologies PLC | | | 946,249 | |
| | 1,070 | | | TransDigm Group, Inc.* | | | 967,120 | |
| | 11,996 | | | TransUnion | | | 974,315 | |
| | 20,679 | | | Uber Technologies, Inc.* | | | 976,669 | |
| | 4,123 | | | Union Pacific Corp. | | | 909,410 | |
| | 18,114 | | | United Airlines Holdings, Inc.* | | | 902,258 | |
| | 5,170 | | | United Parcel Service, Inc., Class B | | | 875,798 | |
| | 2,017 | | | United Rentals, Inc. | | | 961,181 | |
| | 4,133 | | | Verisk Analytics, Inc. | | | 1,001,095 | |
| | 5,803 | | | Waste Management, Inc. | | | 909,794 | |
| | 8,055 | | | Westinghouse Air Brake Technologies Corp. | | | 906,349 | |
| | 1,309 | | | W.W. Grainger, Inc. | | | 934,809 | |
| | 8,369 | | | Xylem, Inc. | | | 866,526 | |
| | | | | | | | |
| | | | | | | 67,651,064 | |
| | |
| Information Technology – 15.6% | |
| | 2,984 | | | Accenture PLC, Class A | | | 966,130 | |
| | 1,799 | | | Adobe, Inc.* | | | 1,006,253 | |
| | 8,735 | | | Advanced Micro Devices, Inc.* | | | 923,464 | |
| | 10,265 | | | Akamai Technologies, Inc.* | | | 1,078,749 | |
| | 10,752 | | | Amphenol Corp., Class A | | | 950,262 | |
| | 4,909 | | | Analog Devices, Inc. | | | 892,358 | |
| | 2,920 | | | ANSYS, Inc.* | | | 931,100 | |
| | 4,949 | | | Apple, Inc. | | | 929,769 | |
| | 6,446 | | | Applied Materials, Inc. | | | 984,691 | |
| | 5,309 | | | Arista Networks, Inc.* | | | 1,036,476 | |
| | 5,599 | | | Atlassian Corp., Class A* | | | 1,142,532 | |
| | 4,652 | | | Autodesk, Inc.* | | | 1,032,465 | |
| | 1,062 | | | Broadcom, Inc. | | | 980,109 | |
| | 4,178 | | | Cadence Design Systems, Inc.* | | | 1,004,558 | |
| | 4,749 | | | CDW Corp. | | | 1,002,751 | |
| | 17,956 | | | Cisco Systems, Inc. | | | 1,029,777 | |
| | 14,862 | | | Cloudflare, Inc., Class A* | | | 966,476 | |
| | 14,540 | | | Cognizant Technology Solutions Corp., Class A | | | 1,041,209 | |
| | 28,005 | | | Corning, Inc. | | | 919,124 | |
| | 6,180 | | | Crowdstrike Holdings, Inc., Class A* | | | 1,007,525 | |
| | 8,954 | | | Datadog, Inc., Class A* | | | 863,882 | |
| | 6,737 | | | Enphase Energy, Inc.* | | | 852,433 | |
| | 9,175 | | | Entegris, Inc. | | | 929,152 | |
| | 4,065 | | | EPAM Systems, Inc.* | | | 1,052,794 | |
| | 1,170 | | | Fair Isaac Corp.* | | | 1,058,370 | |
| | 4,956 | | | First Solar, Inc.* | | | 937,279 | |
| | 12,779 | | | Fortinet, Inc.* | | | 769,424 | |
| | 2,804 | | | Gartner, Inc.* | | | 980,503 | |
| | 50,532 | | | Gen Digital, Inc. | | | 1,023,273 | |
| | 12,679 | | | GoDaddy, Inc., Class A* | | | 919,354 | |
| | 54,715 | | | Hewlett Packard Enterprise Co. | | | 929,608 | |
| | 29,093 | | | HP, Inc. | | | 864,353 | |
| | 1,732 | | | HubSpot, Inc.* | | | 946,573 | |
| | 27,536 | | | Intel Corp. | | | 967,615 | |
| | |
|
| Common Stocks – (continued) | |
| Information Technology – (continued) | |
| | 6,608 | | | International Business Machines Corp. | | | 970,253 | |
| | 1,918 | | | Intuit, Inc. | | | 1,039,191 | |
| | 5,909 | | | Keysight Technologies, Inc.* | | | 787,670 | |
| | 1,908 | | | KLA Corp. | | | 957,568 | |
| | 1,386 | | | Lam Research Corp. | | | 973,526 | |
| | 10,468 | | | Lattice Semiconductor Corp.* | | | 1,018,118 | |
| | 15,467 | | | Marvell Technology, Inc. | | | 900,953 | |
| | 10,489 | | | Microchip Technology, Inc. | | | 858,420 | |
| | 13,989 | | | Micron Technology, Inc. | | | 978,391 | |
| | 2,905 | | | Microsoft Corp. | | | 952,143 | |
| | 2,388 | | | MongoDB, Inc.* | | | 910,544 | |
| | 1,793 | | | Monolithic Power Systems, Inc. | | | 934,529 | |
| | 3,295 | | | Motorola Solutions, Inc. | | | 934,363 | |
| | 12,022 | | | NetApp, Inc. | | | 922,087 | |
| | 2,176 | | | NVIDIA Corp. | | | 1,073,965 | |
| | 9,160 | | | ON Semiconductor Corp.* | | | 901,894 | |
| | 8,304 | | | Oracle Corp. | | | 999,718 | |
| | 51,350 | | | Palantir Technologies, Inc., Class A* | | | 769,223 | |
| | 4,029 | | | Palo Alto Networks, Inc.* | | | 980,256 | |
| | 6,668 | | | PTC, Inc.* | | | 981,329 | |
| | 7,298 | | | QUALCOMM, Inc. | | | 835,840 | |
| | 1,937 | | | Roper Technologies, Inc. | | | 966,679 | |
| | 4,335 | | | Salesforce, Inc.* | | | 960,029 | |
| | 14,643 | | | Seagate Technology Holdings PLC | | | 1,036,578 | |
| | 1,681 | | | ServiceNow, Inc.* | | | 989,823 | |
| | 8,510 | | | Skyworks Solutions, Inc. | | | 925,377 | |
| | 5,725 | | | Snowflake, Inc., Class A* | | | 897,966 | |
| | 9,272 | | | Splunk, Inc.* | | | 1,124,323 | |
| | 2,158 | | | Synopsys, Inc.* | | | 990,285 | |
| | 2,441 | | | Teledyne Technologies, Inc.* | | | 1,021,070 | |
| | 8,843 | | | Teradyne, Inc. | | | 953,894 | |
| | 5,510 | | | Texas Instruments, Inc. | | | 926,011 | |
| | 17,825 | | | Trimble, Inc.* | | | 976,632 | |
| | 15,534 | | | Twilio, Inc., Class A* | | | 989,671 | |
| | 2,442 | | | Tyler Technologies, Inc.* | | | 972,966 | |
| | 4,585 | | | VeriSign, Inc.* | | | 952,717 | |
| | 6,033 | | | VMware, Inc., Class A* | | | 1,018,250 | |
| | 22,318 | | | Western Digital Corp.* | | | 1,004,310 | |
| | 4,168 | | | Workday, Inc., Class A* | | | 1,019,076 | |
| | 3,985 | | | Zebra Technologies Corp., Class A* | | | 1,095,915 | |
| | 13,556 | | | Zoom Video Communications, Inc., Class A* | | | 962,883 | |
| | | | | | | | |
| | | | | | | 72,384,827 | |
| | |
| Materials – 5.4% | |
| | 3,157 | | | Air Products and Chemicals, Inc. | | | 932,862 | |
| | 4,678 | | | Albemarle Corp. | | | 929,565 | |
| | 5,111 | | | Avery Dennison Corp. | | | 962,810 | |
| | 16,565 | | | Ball Corp. | | | 901,964 | |
| | 7,651 | | | Celanese Corp. | | | 966,780 | |
| | 11,672 | | | CF Industries Holdings, Inc. | | | 899,561 | |
| | 16,911 | | | Corteva, Inc. | | | 854,175 | |
| | 17,271 | | | Dow, Inc. | | | 942,306 | |
| | 12,441 | | | DuPont de Nemours, Inc. | | | 956,589 | |
| | 5,106 | | | Ecolab, Inc. | | | 938,534 | |
| | 10,100 | | | FMC Corp. | | | 870,923 | |
| | |
| | |
| 48 | | The accompanying notes are an integral part of these financial statements. |
GOLDMAN SACHS EQUAL WEIGHT U.S. LARGE CAP EQUITY ETF
| | | | | | | | |
| Shares | | | Description | |
Value | |
|
| Common Stocks – (continued) | |
| Materials – (continued) | |
| | 22,444 | | | Freeport-McMoRan, Inc. | | $ | 895,740 | |
| | 11,453 | | | International Flavors & Fragrances, Inc. | | | 806,864 | |
| | 25,769 | | | International Paper Co. | | | 899,853 | |
| | 2,470 | | | Linde PLC | | | 955,989 | |
| | 9,820 | | | LyondellBasell Industries NV, Class A | | | 969,921 | |
| | 2,111 | | | Martin Marietta Materials, Inc. | | | 942,372 | |
| | 22,968 | | | Mosaic Co. (The) | | | 892,307 | |
| | 23,239 | | | Newmont Corp. | | | 916,081 | |
| | 5,606 | | | Nucor Corp. | | | 964,793 | |
| | 6,104 | | | Packaging Corp. of America | | | 910,106 | |
| | 6,685 | | | PPG Industries, Inc. | | | 947,666 | |
| | 3,305 | | | Reliance Steel & Aluminum Co. | | | 941,793 | |
| | 9,160 | | | RPM International, Inc. | | | 913,618 | |
| | 3,414 | | | Sherwin-Williams Co. (The) | | | 927,652 | |
| | 8,970 | | | Steel Dynamics, Inc. | | | 956,112 | |
| | 4,251 | | | Vulcan Materials Co. | | | 927,781 | |
| | | | | | | | |
| | | | | | | 24,924,717 | |
| | |
| Real Estate – 6.4% | |
| | 7,803 | | | Alexandria Real Estate Equities, Inc. REIT | | | 907,801 | |
| | 5,023 | | | American Tower Corp. REIT | | | 910,770 | |
| | 5,110 | | | AvalonBay Communities, Inc. REIT | | | 939,320 | |
| | 8,842 | | | Camden Property Trust REIT | | | 951,576 | |
| | 11,390 | | | CBRE Group, Inc., Class A* | | | 968,720 | |
| | 11,566 | | | CoStar Group, Inc.* | | | 948,296 | |
| | 8,898 | | | Crown Castle, Inc. REIT | | | 894,249 | |
| | 7,659 | | | Digital Realty Trust, Inc. REIT | | | 1,008,844 | |
| | 1,177 | | | Equinix, Inc. REIT | | | 919,684 | |
| | 13,425 | | | Equity LifeStyle Properties, Inc. REIT | | | 898,938 | |
| | 14,484 | | | Equity Residential REIT | | | 938,998 | |
| | 3,889 | | | Essex Property Trust, Inc. REIT | | | 927,099 | |
| | 6,924 | | | Extra Space Storage, Inc. REIT | | | 890,980 | |
| | 19,914 | | | Gaming and Leisure Properties, Inc. REIT | | | 943,924 | |
| | 44,053 | | | Healthpeak Properties, Inc. REIT | | | 906,611 | |
| | 52,367 | | | Host Hotels & Resorts, Inc. REIT | | | 826,875 | |
| | 26,944 | | | Invitation Homes, Inc. REIT | | | 918,521 | |
| | 15,476 | | | Iron Mountain, Inc. REIT | | | 983,345 | |
| | 47,316 | | | Kimco Realty Corp. REIT | | | 896,165 | |
| | 6,466 | | | Mid-America Apartment Communities, Inc. REIT | | | 939,057 | |
| | 7,694 | | | Prologis, Inc. REIT | | | 955,595 | |
| | 3,414 | | | Public Storage REIT | | | 943,561 | |
| | 15,710 | | | Realty Income Corp. REIT | | | 880,388 | |
| | 4,194 | | | SBA Communications Corp. REIT | | | 941,679 | |
| | 7,676 | | | Simon Property Group, Inc. REIT | | | 871,149 | |
| | 7,338 | | | Sun Communities, Inc. REIT | | | 898,318 | |
| | 23,457 | | | UDR, Inc. REIT | | | 935,934 | |
| | 19,664 | | | Ventas, Inc. REIT | | | 858,924 | |
| | 30,287 | | | VICI Properties, Inc. REIT | | | 934,051 | |
| | 11,326 | | | Welltower, Inc. REIT | | | 938,699 | |
| | 28,483 | | | Weyerhaeuser Co. REIT | | | 932,818 | |
| | 14,187 | | | W.P. Carey, Inc. REIT | | | 922,864 | |
| | | | | | | | |
| | | | | | | 29,533,753 | |
| | |
|
| Common Stocks – (continued) | |
| Utilities – 5.4% | |
| | 45,225 | | | AES Corp. (The) | | | 810,884 | |
| | 17,762 | | | Alliant Energy Corp. | | | 891,120 | |
| | 11,201 | | | Ameren Corp. | | | 887,903 | |
| | 11,234 | | | American Electric Power Co., Inc. | | | 880,746 | |
| | 6,524 | | | American Water Works Co., Inc. | | | 905,140 | |
| | 7,764 | | | Atmos Energy Corp. | | | 900,236 | |
| | 32,192 | | | CenterPoint Energy, Inc. | | | 897,835 | |
| | 15,710 | | | CMS Energy Corp. | | | 882,745 | |
| | 10,127 | | | Consolidated Edison, Inc. | | | 900,898 | |
| | 9,978 | | | Constellation Energy Corp. | | | 1,039,309 | |
| | 18,014 | | | Dominion Energy, Inc. | | | 874,400 | |
| | 8,389 | | | DTE Energy Co. | | | 867,255 | |
| | 10,235 | | | Duke Energy Corp. | | | 908,868 | |
| | 13,242 | | | Edison International | | | 911,712 | |
| | 9,333 | | | Entergy Corp. | | | 888,968 | |
| | 15,893 | | | Evergy, Inc. | | | 873,638 | |
| | 13,503 | | | Eversource Energy | | | 861,761 | |
| | 22,898 | | | Exelon Corp. | | | 918,668 | |
| | 24,610 | | | FirstEnergy Corp. | | | 887,683 | |
| | 13,168 | | | NextEra Energy, Inc. | | | 879,622 | |
| | 34,046 | | | NiSource, Inc. | | | 911,071 | |
| | 54,371 | | | PG&E Corp.* | | | 886,247 | |
| | 34,743 | | | PPL Corp. | | | 865,796 | |
| | 15,106 | | | Public Service Enterprise Group, Inc. | | | 922,674 | |
| | 12,884 | | | Sempra | | | 904,714 | |
| | 13,292 | | | Southern Co. (The) | | | 900,267 | |
| | 10,565 | | | WEC Energy Group, Inc. | | | 888,728 | |
| | 15,072 | | | Xcel Energy, Inc. | | | 861,063 | |
| | | | | | | | |
| | | | | | | 25,009,951 | |
| | |
| TOTAL INVESTMENTS BEFORE SECURITIES LENDING
REINVESTMENT VEHICLE |
|
| | (Cost $431,298,489) | | $ | 461,240,740 | |
| | |
| | |
| Shares | | | Dividend
Rate | | Value | |
|
| Securities Lending Reinvestment Vehicle – 0.1%(b) | |
| Goldman Sachs Financial Square Government Fund –
Institutional Shares |
|
| | |
| | 542,850 | | | 5.234% | | $ | 542,850 | |
| (Cost $542,850) | |
| | |
| | TOTAL INVESTMENTS – 99.8% | |
| | (Cost $431,841,339) | | $ | 461,783,590 | |
| | |
| OTHER ASSETS IN EXCESS OF
LIABILITIES – 0.2% | | | 750,500 | |
| | |
| | NET ASSETS – 100.0% | | $ | 462,534,090 | |
| | |
| | |
| The accompanying notes are an integral part of these financial statements. | | 49 |
GOLDMAN SACHS EQUAL WEIGHT U.S. LARGE CAP EQUITY ETF
Schedule of Investments (continued)
August 31, 2023
| | |
|
| The percentage shown for each investment category reflects the value of investments in that category as a percentage of net assets. |
| |
* | | Non-income producing security. |
| |
(a) | | All or a portion of security is on loan. |
| |
(b) | | Represents an affiliated issuer. |
| | |
|
Investment Abbreviations: |
PLC | | —Public Limited Company |
REIT | | —Real Estate Investment Trust |
|
| | |
| 50 | | The accompanying notes are an integral part of these financial statements. |
GOLDMAN SACHS HEDGE INDUSTRY VIP ETF
Schedule of Investments
August 31, 2023
| | | | | | | | |
| Shares | | | Description | | Value | |
|
| Common Stocks – 99.9% | |
| Communication Services – 9.9% | |
| | 30,669 | | | Activision Blizzard, Inc. | | $ | 2,821,241 | |
| | 21,202 | | | Alphabet, Inc., Class A* | | | 2,887,077 | |
| | 6,517 | | | Charter Communications, Inc., Class A* | | | 2,855,228 | |
| | 32,274 | | | GCI Liberty Inc., Class A*(a) | | | — | |
| | 9,094 | | | Meta Platforms, Inc., Class A* | | | 2,690,824 | |
| | 6,509 | | | Netflix, Inc.* | | | 2,822,823 | |
| | | | | | | | |
| | | | | | | 14,077,193 | |
| | |
| Consumer Discretionary – 9.8% | |
| | 29,793 | | | Alibaba Group Holding Ltd. ADR (China)* | | | 2,767,770 | |
| | 19,808 | | | Amazon.com, Inc.* | | | 2,733,702 | |
| | 861 | | | Booking Holdings, Inc.* | | | 2,673,431 | |
| | 50,802 | | | Caesars Entertainment, Inc.* | | | 2,807,318 | |
| | 2,148 | | | MercadoLibre, Inc. (Brazil)* | | | 2,947,829 | |
| | | | | | | | |
| | | | | | | 13,930,050 | |
| | |
| Consumer Staples – 2.0% | |
| | 127,963 | | | Albertsons Cos., Inc., Class A | | | 2,866,371 | |
| | |
| Energy – 8.1% | |
| | 33,019 | | | Chesapeake Energy Corp. | | | 2,912,606 | |
| | 218,905 | | | Energy Transfer LP | | | 2,948,650 | |
| | 64,906 | | | EQT Corp. | | | 2,805,237 | |
| | 37,330 | | | Valaris Ltd.* | | | 2,811,696 | |
| | | | | | | | |
| | | | | | | 11,478,189 | |
| | |
| Financials – 19.4% | |
| | 33,974 | | | Apollo Global Management, Inc. | | | 2,967,289 | |
| | 7,767 | | | Berkshire Hathaway, Inc., Class B* | | | 2,797,673 | |
| | 63,140 | | | Citigroup, Inc. | | | 2,607,051 | |
| | 1,906 | | | First Citizens BancShares, Inc., Class A | | | 2,592,922 | |
| | 22,371 | | | Fiserv, Inc.* | | | 2,715,616 | |
| | 17,991 | | | JPMorgan Chase & Co. | | | 2,632,623 | |
| | 6,986 | | | Mastercard, Inc., Class A | | | 2,882,703 | |
| | 44,009 | | | PayPal Holdings, Inc.* | | | 2,751,003 | |
| | 7,164 | | | S&P Global, Inc. | | | 2,800,121 | |
| | 11,463 | | | Visa, Inc., Class A | | | 2,816,230 | |
| | | | | | | | |
| | | | | | | 27,563,231 | |
| | |
| Health Care – 13.9% | |
| | 5,492 | | | Argenx SE ADR (Netherlands)* | | | 2,759,675 | |
| | 9,607 | | | Cigna Group (The) | | | 2,654,030 | |
| | 5,176 | | | Eli Lilly & Co. | | | 2,868,539 | |
| | 26,771 | | | Horizon Therapeutics PLC* | | | 3,018,163 | |
| | 5,600 | | | Humana, Inc. | | | 2,585,128 | |
| | 14,331 | | | Seagen, Inc.* | | | 2,953,189 | |
| | 38,034 | | | Tenet Healthcare Corp.* | | | 2,949,917 | |
| | | | | | | | |
| | | | | | | 19,788,641 | |
| | |
| Industrials – 8.2% | |
| | 11,763 | | | Boeing Co. (The)* | | | 2,635,265 | |
| | 3,219 | | | TransDigm Group, Inc.* | | | 2,909,493 | |
| | 62,084 | | | Uber Technologies, Inc.* | | | 2,932,227 | |
| | 80,523 | | | Vertiv Holdings Co. | | | 3,171,801 | |
| | | | | | | | |
| | | | | | | 11,648,786 | |
| | |
|
| Common Stocks – (continued) | |
| Information Technology – 26.6% | |
| | 24,866 | | | Advanced Micro Devices, Inc.* | | | 2,628,834 | |
| | 15,516 | | | Apple, Inc. | | | 2,914,991 | |
| | 37,226 | | | Black Knight, Inc.* | | | 2,820,242 | |
| | 3,260 | | | Broadcom, Inc. | | | 3,008,621 | |
| | 39,223 | | | GoDaddy, Inc., Class A* | | | 2,844,060 | |
| | 8,593 | | | Microsoft Corp. | | | 2,816,442 | |
| | 47,019 | | | National Instruments Corp. | | | 2,802,332 | |
| | 6,364 | | | NVIDIA Corp. | | | 3,140,952 | |
| | 12,695 | | | Palo Alto Networks, Inc.* | | | 3,088,694 | |
| | 13,131 | | | Salesforce, Inc.* | | | 2,907,991 | |
| | 29,918 | | | Taiwan Semiconductor Manufacturing Co. Ltd. ADR (Taiwan) | | | 2,799,427 | |
| | 17,798 | | | VMware, Inc., Class A* | | | 3,003,946 | |
| | 12,207 | | | Workday, Inc., Class A* | | | 2,984,612 | |
| | | | | | | | |
| | | | | | | 37,761,144 | |
| | |
| Utilities – 2.0% | |
| | 91,836 | | | Vistra Corp. | | | 2,885,487 | |
| | |
| | TOTAL INVESTMENTS – 99.9% | |
| | (Cost $121,238,082) | | $ | 141,999,092 | |
| | |
| OTHER ASSETS IN EXCESS OF
LIABILITIES – 0.1% | | | 164,431 | |
| | |
| | NET ASSETS – 100.0% | | $ | 142,163,523 | |
| | |
| | |
|
| The percentage shown for each investment category reflects the value of investments in that category as a percentage of net assets. |
| |
* | | Non-income producing security. |
| |
(a) | | Significant unobservable inputs were used in the valuation of this portfolio security; i.e. Level 3. |
| | |
|
Investment Abbreviations: |
ADR | | —American Depositary Receipt |
LP | | —Limited Partnership |
PLC | | —Public Limited Company |
|
| | |
| The accompanying notes are an integral part of these financial statements. | | 51 |
GOLDMAN SACHS INNOVATE EQUITY ETF
Schedule of Investments
August 31, 2023
| | | | | | | | |
Shares | | | Description | | Value | |
|
| Common Stocks – 99.6% | |
| Communication Services – 11.6% | | | |
| | 10,578 | | | Activision Blizzard, Inc. | | $ | 973,070 | |
| | 3,674 | | | AfreecaTV Co. Ltd. (South Korea) | | | 227,097 | |
| | 53,069 | | | Alphabet, Inc., Class A* | | | 7,226,406 | |
| | 7,335 | | | Atlanta Braves Holdings, Inc., Class C* | | | 270,221 | |
| | 14,238 | | | Baidu, Inc. ADR (China)* | | | 2,033,613 | |
| | 19,161 | | | Bilibili, Inc. ADR (China)*(a) | | | 289,906 | |
| | 19,046 | | | Bumble, Inc., Class A* | | | 319,592 | |
| | 35,063 | | | Comcast Corp., Class A | | | 1,639,546 | |
| | 7,050 | | | CTS Eventim AG & Co. KGaA (Germany) | | | 439,974 | |
| | 7,504 | | | Electronic Arts, Inc. | | | 900,330 | |
| | 35,660 | | | Gree, Inc. (Japan) | | | 151,864 | |
| | 28,387 | | | Hello Group, Inc. ADR (China) | | | 244,980 | |
| | 8,981 | | | IDT Corp., Class B* | | | 209,976 | |
| | 14,202 | | | IMAX Corp.* | | | 271,684 | |
| | 6,842 | | | Infocom Corp. (Japan) | | | 133,376 | |
| | 5,557 | | | Iridium Communications, Inc. | | | 272,015 | |
| | 10,970 | | | JOYY, Inc. ADR (China) | | | 376,490 | |
| | 101,188 | | | Kuaishou Technology (China)*(b) | | | 828,421 | |
| | 8,906 | | | Liberty Media Corp.-Liberty Formula One, Class A* | | | 540,149 | |
| | 26,227 | | | Liberty Media Corp.-Liberty SiriusXM, Class A* | | | 630,235 | |
| | 7,774 | | | Live Nation Entertainment, Inc.* | | | 657,136 | |
| | 8,285 | | | Madison Square Garden Entertainment Corp.* | | | 265,866 | |
| | 1,384 | | | Madison Square Garden Sports Corp. | | | 246,352 | |
| | 11,465 | | | Match Group, Inc.* | | | 537,364 | |
| | 16,675 | | | Meta Platforms, Inc., Class A* | | | 4,933,966 | |
| | 11,752 | | | MIXI, Inc. (Japan) | | | 196,237 | |
| | 11,793 | | | NetEase, Inc. ADR (China) | | | 1,220,340 | |
| | 3,450 | | | Netflix, Inc.* | | | 1,496,196 | |
| | 27,636 | | | Pinterest, Inc., Class A* | | | 759,714 | |
| | 38,579 | | | Playtika Holding Corp.* | | | 376,531 | |
| | 75,166 | | | Rightmove PLC (United Kingdom) | | | 533,381 | |
| | 19,286 | | | Rumble, Inc.*(a) | | | 161,424 | |
| | 7,163 | | | Scout24 SE (Germany)(b) | | | 494,605 | |
| | 30,776 | | | Sea Ltd. ADR (Singapore)* | | | 1,158,101 | |
| | 51,236 | | | Snap, Inc., Class A* | | | 530,292 | |
| | 4,695 | | | Spotify Technology SA* | | | 722,889 | |
| | 3,525 | | | Take-Two Interactive Software, Inc.* | | | 501,255 | |
| | 33,437 | | | TELUS Corp. (Canada) | | | 586,467 | |
| | 46,219 | | | Tencent Holdings Ltd. (China) | | | 1,915,539 | |
| | 80,830 | | | Tencent Music Entertainment Group ADR (China)* | | | 551,261 | |
| | 9,157 | | | Ubisoft Entertainment SA (France)* | | | 277,882 | |
| | 22,119 | | | Vivid Seats, Inc., Class A* | | | 160,584 | |
| | 18,997 | | | Walt Disney Co. (The)* | | | 1,589,669 | |
| | 23,400 | | | Weibo Corp. ADR (China) | | | 301,860 | |
| | 4,696 | | | World Wrestling Entertainment, Inc., Class A | | | 453,399 | |
| | 4,422 | | | Ziff Davis, Inc.* | | | 294,726 | |
| | | | | | | | |
| | | | | | | 38,901,981 | |
| | |
| Consumer Discretionary – 14.7% | |
| | 6,036 | | | Academy Sports & Outdoors, Inc. | | | 329,384 | |
| | 2,945 | | | adidas AG (Germany) | | | 589,472 | |
| | |
|
| Common Stocks – (continued) | |
| Consumer Discretionary – (continued) | |
| | 6,583 | | | Airbnb, Inc., Class A* | | | 865,994 | |
| | 39,193 | | | Alibaba Group Holding Ltd. ADR (China)* | | | 3,641,030 | |
| | 48,711 | | | Amazon.com, Inc.* | | | 6,722,605 | |
| | 57,078 | | | ANTA Sports Products Ltd. (China) | | | 643,076 | |
| | 9,314 | | | Aptiv PLC* | | | 944,905 | |
| | 19,276 | | | Atour Lifestyle Holdings Ltd. ADR (China)*(a) | | | 374,340 | |
| | 28,659 | | | Bandai Namco Holdings, Inc. (Japan) | | | 665,760 | |
| | 24,135 | | | Chegg, Inc.* | | | 246,418 | |
| | 11,471 | | | Chewy, Inc., Class A* | | | 275,075 | |
| | 3,562 | | | Columbia Sportswear Co. | | | 261,237 | |
| | 8,232 | | | Continental AG (Germany) | | | 613,092 | |
| | 15,794 | | | Coursera, Inc.* | | | 274,658 | |
| | 2,658 | | | Dick’s Sporting Goods, Inc. | | | 309,232 | |
| | 2,440 | | | Duolingo, Inc.* | | | 359,070 | |
| | 94,090 | | | East Buy Holding Ltd. (China)*(a)(b) | | | 476,944 | |
| | 15,252 | | | eBay, Inc. | | | 682,985 | |
| | 7,343 | | | Etsy, Inc.* | | | 540,224 | |
| | 21,152 | | | Everi Holdings, Inc.* | | | 305,858 | |
| | 39,085 | | | EVgo, Inc.* | | | 157,122 | |
| | 41,122 | | | Fisker, Inc.*(a) | | | 241,386 | |
| | 93,764 | | | Ford Motor Co. | | | 1,137,357 | |
| | 24,714 | | | GameStop Corp., Class A* | | | 458,445 | |
| | 32,428 | | | General Motors Co. | | | 1,086,662 | |
| | 580 | | | Graham Holdings Co., Class B | | | 340,071 | |
| | 6,669 | | | Hyundai Motor Co. (South Korea) | | | 954,120 | |
| | 5,606 | | | iRobot Corp.* | | | 218,017 | |
| | 256,845 | | | JD Sports Fashion PLC (United Kingdom) | | | 472,733 | |
| | 21,918 | | | JD.com, Inc. ADR (China) | | | 727,897 | |
| | 17,041 | | | Just Eat Takeaway.com NV (United Kingdom)*(b) | | | 240,478 | |
| | 12,490 | | | Kia Corp. (South Korea) | | | 757,857 | |
| | 13,235 | | | Las Vegas Sands Corp. | | | 726,072 | |
| | 16,432 | | | Li Auto, Inc. ADR (China)* | | | 684,393 | |
| | 89,749 | | | Li Ning Co. Ltd. (China) | | | 424,038 | |
| | 104,053 | | | Lucid Group, Inc.*(a) | | | 653,453 | |
| | 2,862 | | | Lululemon Athletica, Inc.* | | | 1,091,166 | |
| | 51,176 | | | Meituan, Class B (China)*(b) | | | 838,603 | |
| | 1,811 | | | MercadoLibre, Inc. (Brazil)* | | | 2,485,344 | |
| | 14,503 | | | MGM Resorts International | | | 637,842 | |
| | 10,537 | | | New Oriental Education & Technology Group, Inc. ADR (China)* | | | 571,527 | |
| | 381,623 | | | Nexteer Automotive Group Ltd. (China) | | | 245,761 | |
| | 11,005 | | | NIKE, Inc., Class B | | | 1,119,319 | |
| | 62,095 | | | NIO, Inc. ADR (China)* | | | 637,716 | |
| | 10,000 | | | Overstock.com, Inc.* | | | 261,100 | |
| | 11,909 | | | PDD Holdings, Inc. ADR (China)* | | | 1,178,634 | |
| | 30,765 | | | Pearson PLC (United Kingdom) | | | 327,075 | |
| | 41,527 | | | Peloton Interactive, Inc., Class A* | | | 264,942 | |
| | 10,099 | | | Penn Entertainment, Inc.* | | | 239,245 | |
| | 4,756 | | | Planet Fitness, Inc., Class A* | | | 289,165 | |
| | 13,346 | | | Playtech PLC (United Kingdom)* | | | 88,785 | |
| | 68,073 | | | Polestar Automotive Holding UK PLC, Class A ADR (Hong Kong)*(a) | | | 226,683 | |
| | |
| | |
| 52 | | The accompanying notes are an integral part of these financial statements. |
GOLDMAN SACHS INNOVATE EQUITY ETF
| | | | | | | | |
Shares | | | Description | | Value | |
|
| Common Stocks – (continued) | |
| Consumer Discretionary – (continued) | |
| | 252,097 | | | Rakuten Group, Inc. (Japan) | | $ | 984,076 | |
| | 33,183 | | | Rivian Automotive, Inc., Class A* | | | 754,250 | |
| | 43,590 | | | Sabre Corp.* | | | 217,950 | |
| | 58,633 | | | Sharp Corp. (Japan)*(a) | | | 361,218 | |
| | 5,913 | | | Skechers USA, Inc., Class A* | | | 297,483 | |
| | 6,672 | | | Stride, Inc.* | | | 283,493 | |
| | 39,459 | | | TAL Education Group ADR (China)* | | | 278,186 | |
| | 13,025 | | | Tesla, Inc.* | | | 3,361,492 | |
| | 94,310 | | | Toyota Motor Corp. (Japan) | | | 1,629,218 | |
| | 26,544 | | | Udemy, Inc.* | | | 274,996 | |
| | 4,122 | | | Wayfair, Inc., Class A* | | | 284,871 | |
| | 35,715 | | | XPeng, Inc. ADR (China)*(a) | | | 635,370 | |
| | 9,767 | | | Xponential Fitness, Inc., Class A* | | | 211,553 | |
| | 19,087 | | | Yamaha Motor Co. Ltd. (Japan) | | | 495,448 | |
| | 12,546 | | | Zalando SE (Germany)*(b) | | | 391,211 | |
| | | | | | | | |
| | | | | | | 49,365,182 | |
| | |
| Consumer Staples – 0.8% | |
| | 854,784 | | | Alibaba Health Information Technology Ltd. (China)* | | | 504,690 | |
| | 15,766 | | | Beyond Meat, Inc.* | | | 186,039 | |
| | 16,958 | | | Curexo, Inc. (South Korea)* | | | 298,296 | |
| | 10,913 | | | Walmart, Inc. | | | 1,774,563 | |
| | | | | | | | |
| | | | | | | 2,763,588 | |
| | |
| Energy – 1.0% | |
| | 452,806 | | | China Suntien Green Energy Corp. Ltd., Class H (China) | | | 159,371 | |
| | 29,577 | | | Enbridge, Inc. (Canada) | | | 1,037,091 | |
| | 5,969 | | | HD Hyundai Co. Ltd. (South Korea) | | | 266,895 | |
| | 20,031 | | | Oceaneering International, Inc.* | | | 456,506 | |
| | 22,878 | | | TotalEnergies SE (France) | | | 1,441,916 | |
| | | | | | | | |
| | | | | | | 3,361,779 | |
| | |
| Financials – 14.4% | |
| | 33,222 | | | 3i Group PLC (United Kingdom) | | | 839,209 | |
| | 555 | | | Adyen NV (Netherlands)*(b) | | | 465,330 | |
| | 27,278 | | | Affirm Holdings, Inc.* | | | 567,655 | |
| | 51,058 | | | Allfunds Group PLC (United Kingdom) | | | 303,125 | |
| | 2,796 | | | Ameriprise Financial, Inc. | | | 943,874 | |
| | 14,194 | | | Apollo Global Management, Inc. | | | 1,239,704 | |
| | 36,399 | | | AvidXchange Holdings, Inc.* | | | 374,182 | |
| | 2,278 | | | BlackRock, Inc. | | | 1,595,830 | |
| | 13,785 | | | Blackstone, Inc. | | | 1,466,310 | |
| | 27,967 | | | Block, Inc.* | | | 1,612,298 | |
| | 41,710 | | | Blue Owl Capital Corp.(a) | | | 580,603 | |
| | 14,666 | | | Carlyle Group, Inc. (The) | | | 474,445 | |
| | 18,749 | | | Charles Schwab Corp. (The) | | | 1,109,003 | |
| | 32,131 | | | CI Financial Corp. (Canada) | | | 411,805 | |
| | 3,841 | | | CME Group, Inc. | | | 778,494 | |
| | 10,749 | | | Coinbase Global, Inc., Class A*(a) | | | 855,620 | |
| | 31,509 | | | Corebridge Financial, Inc. | | | 561,806 | |
| | 7,263 | | | Discover Financial Services | | | 654,178 | |
| | 5,636 | | | DWS Group GmbH & Co. KGaA (Germany)(b) | | | 194,522 | |
| | 5,953 | | | Eurazeo SE (France) | | | 351,806 | |
| | |
|
| Common Stocks – (continued) | |
| Financials – (continued) | |
| | 5,501 | | | Euronet Worldwide, Inc.* | | | 480,567 | |
| | 3,077 | | | Evercore, Inc., Class A | | | 430,934 | |
| | 18,121 | | | Fidelity National Information Services, Inc. | | | 1,012,239 | |
| | 2,414 | | | FleetCor Technologies, Inc.* | | | 655,956 | |
| | 7,308 | | | Global Payments, Inc. | | | 925,851 | |
| | 4,593 | | | GMO Payment Gateway, Inc. (Japan) | | | 291,130 | |
| | 5,166 | | | Goldman Sachs Group, Inc. (The)(c) | | | 1,692,950 | |
| | 3,788 | | | Hamilton Lane, Inc., Class A | | | 351,489 | |
| | 33,115 | | | Hargreaves Lansdown PLC (United Kingdom) | | | 319,412 | |
| | 8,428 | | | Interactive Brokers Group, Inc., Class A | | | 767,622 | |
| | 3,758 | | | Jack Henry & Associates, Inc. | | | 589,179 | |
| | 1,321 | | | Kaspi.KZ JSC GDR (Kazakhstan) | | | 134,478 | |
| | 21,402 | | | KKR & Co., Inc. | | | 1,344,260 | |
| | 10,124 | | | Lazard Ltd., Class A | | | 351,708 | |
| | 8,041 | | | London Stock Exchange Group PLC (United Kingdom) | | | 833,270 | |
| | 69,915 | | | Marqeta, Inc., Class A* | | | 429,977 | |
| | 6,414 | | | Mastercard, Inc., Class A | | | 2,646,673 | |
| | 13,196 | | | Morgan Stanley | | | 1,123,639 | |
| | 2,271 | | | Morningstar, Inc. | | | 528,394 | |
| | 2,119 | | | MSCI, Inc. | | | 1,151,931 | |
| | 8,505 | | | Northern Trust Corp. | | | 646,975 | |
| | 139,154 | | | NU Holdings Ltd., Class A (Brazil)* | | | 953,205 | |
| | 13,048 | | | Nuvei Corp. (Canada)(b) | | | 235,220 | |
| | 12,481 | | | P10, Inc., Class A | | | 150,396 | |
| | 28,627 | | | Pagseguro Digital Ltd., Class A (Brazil)* | | | 257,070 | |
| | 58,764 | | | Payoneer Global, Inc.* | | | 363,749 | |
| | 23,796 | | | PayPal Holdings, Inc.* | | | 1,487,488 | |
| | 38,902 | | | Paysafe Ltd.* | | | 509,616 | |
| | 16,318 | | | Plus500 Ltd. (Israel) | | | 295,273 | |
| | 29,985 | | | Repay Holdings Corp.* | | | 276,462 | |
| | 55,301 | | | Robinhood Markets, Inc., Class A* | | | 602,228 | |
| | 23,648 | | | Rocket Cos., Inc., Class A*(a) | | | 252,561 | |
| | 3,269 | | | S&P Global, Inc. | | | 1,277,721 | |
| | 8,689 | | | Shift4 Payments, Inc., Class A* | | | 493,448 | |
| | 75,836 | | | SoFi Technologies, Inc.* | | | 656,740 | |
| | 7,779 | | | State Street Corp. | | | 534,728 | |
| | 6,607 | | | Stifel Financial Corp. | | | 429,587 | |
| | 30,704 | | | StoneCo Ltd., Class A (Brazil)* | | | 376,431 | |
| | 50,376 | | | TP ICAP Group PLC (United Kingdom) | | | 105,454 | |
| | 10,435 | | | TPG, Inc. | | | 293,432 | |
| | 8,076 | | | Tradeweb Markets, Inc., Class A | | | 698,009 | |
| | 56,940 | | | UBS Group AG (Switzerland) | | | 1,514,962 | |
| | 50,068 | | | Up Fintech Holding Ltd. ADR (China)* | | | 245,834 | |
| | 4,877 | | | Upstart Holdings, Inc.*(a) | | | 156,893 | |
| | 12,397 | | | Virtu Financial, Inc., Class A | | | 232,320 | |
| | 10,962 | | | Visa, Inc., Class A | | | 2,693,144 | |
| | 76,670 | | | Waterdrop, Inc. ADR (China)*(a) | | | 123,439 | |
| | 3,229 | | | WEX, Inc.* | | | 633,465 | |
| | 54,372 | | | WisdomTree, Inc. | | | 396,916 | |
| | | | | | | | |
| | | | | | | 48,334,224 | |
| | |
| | |
| The accompanying notes are an integral part of these financial statements. | | 53 |
GOLDMAN SACHS INNOVATE EQUITY ETF
Schedule of Investments (continued)
August 31, 2023
| | | | | | | | |
Shares | | | Description | | Value | |
|
| Common Stocks – (continued) | |
| Health Care – 21.7% | |
| | 8,070 | | | 10X Genomics, Inc., Class A* | | $ | 418,430 | |
| | 416,565 | | | 3SBio, Inc. (China)*(b) | | | 348,477 | |
| | 19,759 | | | Abbott Laboratories | | | 2,033,201 | |
| | 15,439 | | | AbbVie, Inc. | | | 2,268,915 | |
| | 27,395 | | | AdaptHealth Corp.* | | | 326,822 | |
| | 35,899 | | | Adaptive Biotechnologies Corp.* | | | 243,036 | |
| | 7,756 | | | Agilent Technologies, Inc. | | | 939,019 | |
| | 6,001 | | | Amgen, Inc. | | | 1,538,296 | |
| | 14,738 | | | AstraZeneca PLC (United Kingdom) | | | 1,991,157 | |
| | 16,365 | | | Baxter International, Inc. | | | 664,419 | |
| | 10,239 | | | Beam Therapeutics, Inc.* | | | 237,340 | |
| | 2,724 | | | Biogen, Inc.* | | | 728,289 | |
| | 9,318 | | | BioNTech SE ADR (Germany)* | | | 1,126,826 | |
| | 7,626 | | | Bio-Techne Corp. | | | 597,878 | |
| | 15,418 | | | Boston Scientific Corp.* | | | 831,647 | |
| | 26,192 | | | Bristol-Myers Squibb Co. | | | 1,614,737 | |
| | 36,017 | | | Caribou Biosciences, Inc.* | | | 212,140 | |
| | 9,108 | | | Celltrion Healthcare Co. Ltd. (South Korea) | | | 445,839 | |
| | 26,485 | | | Chugai Pharmaceutical Co. Ltd. (Japan) | | | 810,823 | |
| | 2,372 | | | CompuGroup Medical SE & Co KgaA (Germany) | | | 111,371 | |
| | 11,378 | | | CRISPR Therapeutics AG (Switzerland)* | | | 569,014 | |
| | 4,312 | | | Danaher Corp. | | | 1,142,680 | |
| | 10,853 | | | Dexcom, Inc.* | | | 1,095,936 | |
| | 26,402 | | | DocGo, Inc.* | | | 236,298 | |
| | 30,223 | | | Editas Medicine, Inc.* | | | 269,287 | |
| | 10,758 | | | Edwards Lifesciences Corp.* | | | 822,664 | |
| | 5,476 | | | Eli Lilly & Co. | | | 3,034,799 | |
| | 9,871 | | | Exact Sciences Corp.* | | | 825,907 | |
| | 20,886 | | | Exelixis, Inc.* | | | 467,638 | |
| | 29,068 | | | Exscientia PLC ADR (United Kingdom)*(a) | | | 174,989 | |
| | 9,431 | | | Fulgent Genetics, Inc.* | | | 308,960 | |
| | 7,522 | | | Galapagos NV (Belgium)* | | | 285,740 | |
| | 14,189 | | | GE HealthCare Technologies, Inc. | | | 999,615 | |
| | 3,925 | | | Genelux Corp.* | | | 94,906 | |
| | 20,161 | | | Gilead Sciences, Inc. | | | 1,541,913 | |
| | 6,474 | | | Globus Medical, Inc., Class A* | | | 350,243 | |
| | 15,367 | | | Guardant Health, Inc.* | | | 600,542 | |
| | 95,294 | | | HUTCHMED China Ltd. (China)* | | | 292,866 | |
| | 52,669 | | | Hygeia Healthcare Holdings Co. Ltd. (China)(b) | | | 266,309 | |
| | 17,455 | | | Ideaya Biosciences, Inc.* | | | 512,479 | |
| | 5,115 | | | Illumina, Inc.* | | | 845,100 | |
| | 4,784 | | | Immunocore Holdings PLC ADR (United Kingdom)* | | | 269,196 | |
| | 3,089 | | | Insulet Corp.* | | | 592,192 | |
| | 10,882 | | | Intellia Therapeutics, Inc.* | | | 407,857 | |
| | 5,016 | | | Intuitive Surgical, Inc.* | | | 1,568,403 | |
| | 2,923 | | | iRhythm Technologies, Inc.* | | | 302,151 | |
| | 9,439 | | | i-SENS, Inc. (South Korea) | | | 237,448 | |
| | 16,143 | | | Johnson & Johnson | | | 2,610,000 | |
| | 49,158 | | | Keymed Biosciences, Inc. (China)*(b) | | | 334,438 | |
| | 35,824 | | | Koninklijke Philips NV (Netherlands)* | | | 808,737 | |
| | |
|
| Common Stocks – (continued) | |
| Health Care – (continued) | |
| | 26,648 | | | M3, Inc. (Japan) | | | 531,459 | |
| | 31,919 | | | Maravai LifeSciences Holdings, Inc., Class A* | | | 330,042 | |
| | 5,071 | | | Masimo Corp.* | | | 579,514 | |
| | 21,222 | | | Medtronic PLC | | | 1,729,593 | |
| | 19,809 | | | Merck & Co., Inc. | | | 2,158,785 | |
| | 8,004 | | | Mezzion Pharma Co. Ltd. (South Korea)* | | | 299,753 | |
| | 11,216 | | | Moderna, Inc.* | | | 1,268,193 | |
| | 14,719 | | | Myriad Genetics, Inc.* | | | 262,734 | |
| | 14,054 | | | NextGen Healthcare, Inc.* | | | 255,923 | |
| | 15,841 | | | Novartis AG (Switzerland) | | | 1,601,766 | |
| | 12,871 | | | Novo Nordisk A/S ADR (Denmark) | | | 2,389,115 | |
| | 24,884 | | | Ono Pharmaceutical Co. Ltd. (Japan) | | | 472,007 | |
| | 33,317 | | | Pacific Biosciences of California, Inc.* | | | 375,816 | |
| | 14,168 | | | Pediatrix Medical Group, Inc.* | | | 200,194 | |
| | 60,021 | | | Pfizer, Inc. | | | 2,123,543 | |
| | 12,498 | | | PHC Holdings Corp. (Japan) | | | 122,503 | |
| | 10,387 | | | PROCEPT BioRobotics Corp.* | | | 354,301 | |
| | 15,904 | | | Pulmonx Corp.* | | | 166,356 | |
| | 10,971 | | | QIAGEN NV* | | | 499,071 | |
| | 1,543 | | | Regeneron Pharmaceuticals, Inc.* | | | 1,275,274 | |
| | 10,156 | | | REGENXBIO, Inc.* | | | 179,761 | |
| | 27,655 | | | ResMed, Inc. CDI | | | 456,545 | |
| | 9,966 | | | REVOLUTION Medicines, Inc.* | | | 338,545 | |
| | 7,576 | | | Roche Holding AG | | | 2,232,701 | |
| | 22,231 | | | Rocket Pharmaceuticals, Inc.* | | | 347,915 | |
| | 63,387 | | | Sana Biotechnology, Inc.* | | | 339,120 | |
| | 15,023 | | | Sanofi | | | 1,608,347 | |
| | 5,618 | | | Sarepta Therapeutics, Inc.* | | | 679,834 | |
| | 159 | | | Scilex Holding Co. (Singapore)* | | | 456 | |
| | 23,159 | | | Scilex Holding Co.* | | | 58,416 | |
| | 4,825 | | | Seagen, Inc.* | | | 994,288 | |
| | 109,092 | | | Shanghai MicroPort MedBot Group Co. Ltd. (China)*(a) | | | 259,314 | |
| | 24,682 | | | Siemens Healthineers AG (Germany)(b) | | | 1,238,974 | |
| | 30,695 | | | Smith & Nephew PLC (United Kingdom) | | | 416,179 | |
| | 4,885 | | | Stryker Corp. | | | 1,385,142 | |
| | 11,962 | | | Takara Bio, Inc. (Japan) | | | 117,332 | |
| | 12,169 | | | Tandem Diabetes Care, Inc.* | | | 332,944 | |
| | 15,482 | | | Teladoc Health, Inc.* | | | 350,512 | |
| | 2,817 | | | Thermo Fisher Scientific, Inc. | | | 1,569,351 | |
| | 1,529 | | | UFP Technologies, Inc.* | | | 268,661 | |
| | 15,982 | | | Veracyte, Inc.* | | | 421,925 | |
| | 17,114 | | | Veradigm, Inc.* | | | 228,985 | |
| | 15,279 | | | Verona Pharma PLC ADR (United Kingdom)* | | | 296,871 | |
| | 4,809 | | | Vertex Pharmaceuticals, Inc.* | | | 1,675,167 | |
| | 11,820 | | | Verve Therapeutics, Inc.* | | | 152,123 | |
| | 124,725 | | | Well Health Technologies Corp. (Canada)* | | | 435,125 | |
| | 244,913 | | | Yidu Tech, Inc. (China)*(a)(b) | | | 123,991 | |
| | | | | | | | |
| | | | | | | 72,861,435 | |
| | |
| | |
| 54 | | The accompanying notes are an integral part of these financial statements. |
GOLDMAN SACHS INNOVATE EQUITY ETF
| | | | | | | | |
Shares | | | Description | | Value | |
|
| Common Stocks – (continued) | |
| Industrials – 7.3% | |
| | 37,935 | | | 3D Systems Corp.* | | $ | 239,370 | |
| | 36,434 | | | ABB Ltd. (Switzerland) | | | 1,389,710 | |
| | 4,861 | | | AeroVironment, Inc.* | | | 471,663 | |
| | 3,705 | | | Alfen N.V. (Netherlands)*(a)(b) | | | 214,894 | |
| | 3,260 | | | ASGN, Inc.* | | | 267,842 | |
| | 1,046 | | | CACI International, Inc., Class A* | | | 343,098 | |
| | 42,008 | | | ChargePoint Holdings, Inc.*(a) | | | 300,777 | |
| | 6,179 | | | Daihen Corp. (Japan) | | | 226,219 | |
| | 131,429 | | | Desktop Metal, Inc., Class A*(a) | | | 236,572 | |
| | 53,098 | | | Doosan Enerbility Co. Ltd. (South Korea)* | | | 731,943 | |
| | 11,845 | | | ExlService Holdings, Inc.* | | | 346,229 | |
| | 33,515 | | | FANUC Corp. (Japan) | | | 956,059 | |
| | 58,625 | | | Full Truck Alliance Co. Ltd. ADR (China)* | | | 392,788 | |
| | 14,290 | | | General Electric Co. | | | 1,635,633 | |
| | 398,899 | | | Goldwind Science & Technology Co. Ltd. (China) | | | 209,579 | |
| | 322,348 | | | Grab Holdings Ltd., Class A (Singapore)* | | | 1,215,252 | |
| | 11,407 | | | Johnson Controls International PLC | | | 673,697 | |
| | 6,230 | | | Kaman Corp. | | | 139,739 | |
| | 14,979 | | | Kawasaki Heavy Industries Ltd. (Japan) | | | 384,700 | |
| | 11,624 | | | Korea Aerospace Industries Ltd. (South Korea) | | | 444,997 | |
| | 161,253 | | | Learning Technologies Group PLC (United Kingdom) | | | 156,518 | |
| | 4,484 | | | Leidos Holdings, Inc. | | | 437,235 | |
| | 2,156 | | | LG Energy Solution Ltd. (South Korea)* | | | 887,357 | |
| | 6,374 | | | LIG Nex1 Co. Ltd. (South Korea) | | | 408,939 | |
| | 1,942 | | | Lockheed Martin Corp. | | | 870,696 | |
| | 29,428 | | | Lyft, Inc., Class A* | | | 346,662 | |
| | 13,988 | | | Meitec Corp. (Japan) | | | 245,152 | |
| | 53,771 | | | Mitsubishi Electric Corp. (Japan) | | | 701,385 | |
| | 4,583 | | | Moog, Inc., Class A | | | 532,361 | |
| | 14,175 | | | Nabtesco Corp. (Japan) | | | 268,632 | |
| | 17,913 | | | NIDEC Corp. (Japan) | | | 939,053 | |
| | 144,350 | | | Nikola Corp.*(a) | | | 170,333 | |
| | 31,817 | | | Nordex SE (Germany)* | | | 381,412 | �� |
| | 5,520 | | | Parsons Corp.* | | | 314,750 | |
| | 6,509 | | | PNE AG (Germany) | | | 90,002 | |
| | 9,474 | | | Proto Labs, Inc.* | | | 279,483 | |
| | 3,561 | | | Rainbow Robotics (South Korea)* | | | 408,165 | |
| | 5,978 | | | Shibaura Machine Co. Ltd. (Japan) | | | 173,281 | |
| | 42,078 | | | Siemens Energy AG (Germany)* | | | 601,009 | |
| | 57,156 | | | SOS Ltd. ADR (China)*(a) | | | 266,919 | |
| | 12,103 | | | SS&C Technologies Holdings, Inc. | | | 694,954 | |
| | 24,983 | | | SunPower Corp.* | | | 178,878 | |
| | 15,825 | | | Sunrun, Inc.* | | | 247,345 | |
| | 60,093 | | | TELUS International CDA, Inc. (Philippines)*(a) | | | 528,217 | |
| | 6,099 | | | Textron, Inc. | | | 473,953 | |
| | 4,088 | | | Thales SA (France) | | | 598,096 | |
| | 20,998 | | | Uber Technologies, Inc.* | | | 991,736 | |
| | 3,059 | | | Verisk Analytics, Inc. | | | 740,951 | |
| | |
|
| Common Stocks – (continued) | |
| Industrials – (continued) | |
| | 93,143 | | | Xinte Energy Co. Ltd., Class H (China)*(a) | | | 164,864 | |
| | 14,165 | | | Xometry, Inc., Class A* | | | 269,843 | |
| | 14,497 | | | Yaskawa Electric Corp. (Japan)(a) | | | 569,683 | |
| | | | | | | | |
| | | | | | | 24,758,625 | |
| | |
| Information Technology – 26.2% | |
| | 18,231 | | | ACI Worldwide, Inc.* | | | 442,649 | |
| | 2,793 | | | Adobe, Inc.* | | | 1,562,237 | |
| | 27,469 | | | Advanced Micro Devices, Inc.* | | | 2,904,023 | |
| | 4,669 | | | Akamai Technologies, Inc.* | | | 490,665 | |
| | 4,830 | | | Alarm.com Holdings, Inc.* | | | 282,893 | |
| | 19,853 | | | Alkami Technology, Inc.* | | | 345,839 | |
| | 4,025 | | | Altair Engineering, Inc., Class A* | | | 267,582 | |
| | 11,846 | | | Ambarella, Inc.* | | | 736,229 | |
| | 6,555 | | | Amphenol Corp., Class A | | | 579,331 | |
| | 37,358 | | | Apple, Inc. | | | 7,018,447 | |
| | 4,933 | | | Arista Networks, Inc.* | | | 963,070 | |
| | 30,445 | | | Atos SE (France)*(a) | | | 256,484 | |
| | 139,076 | | | Aurora Innovation, Inc.* | | | 440,871 | |
| | 3,433 | | | Autodesk, Inc.* | | | 761,920 | |
| | 3,897 | | | Belden, Inc. | | | 365,928 | |
| | 23,872 | | | BigCommerce Holdings, Inc.Series 1* | | | 253,043 | |
| | 84,983 | | | BlackBerry Ltd. (Canada)* | | | 472,505 | |
| | 1,965 | | | Broadcom, Inc. | | | 1,813,479 | |
| | 10,522 | | | C3.ai, Inc., Class A*(a) | | | 326,392 | |
| | 8,749 | | | Canadian Solar, Inc. (Canada)*(a) | | | 245,059 | |
| | 7,381 | | | CEVA, Inc.* | | | 171,387 | |
| | 7,714 | | | Ciena Corp.* | | | 385,546 | |
| | 64,037 | | | Cipher Mining, Inc.*(a) | | | 204,278 | |
| | 32,096 | | | Cisco Systems, Inc. | | | 1,840,706 | |
| | 41,295 | | | Cleanspark, Inc.* | | | 203,584 | |
| | 9,056 | | | Cloudflare, Inc., Class A* | | | 588,912 | |
| | 9,205 | | | Cognex Corp. | | | 433,371 | |
| | 8,943 | | | Coherent Corp.* | | | 336,525 | |
| | 5,403 | | | Consensus Cloud Solutions, Inc.* | | | 172,518 | |
| | 40,921 | | | Converge Technology Solutions Corp. (Canada) | | | 86,503 | |
| | 14,516 | | | Corning, Inc. | | | 476,415 | |
| | 5,994 | | | Crowdstrike Holdings, Inc., Class A* | | | 977,202 | |
| | 2,912 | | | CyberArk Software Ltd.* | | | 483,508 | |
| | 19,431 | | | Dassault Systemes (France) | | | 772,084 | |
| | 8,733 | | | Digi International, Inc.* | | | 291,508 | |
| | 9,853 | | | Digital Garage, Inc. (Japan) | | | 253,795 | |
| | 6,780 | | | DocuSign, Inc.* | | | 341,034 | |
| | 27,225 | | | EngageSmart, Inc.* | | | 482,155 | |
| | 13,211 | | | Extreme Networks, Inc.* | | | 362,642 | |
| | 661 | | | Fair Isaac Corp.* | | | 597,934 | |
| | 3,096 | | | First Solar, Inc.* | | | 585,515 | |
| | 16,868 | | | Fortinet, Inc.* | | | 1,015,622 | |
| | 25,285 | | | Gen Digital, Inc. | | | 512,021 | |
| | 2,124 | | | Globant SA* | | | 434,294 | |
| | 25,375 | | | Hewlett Packard Enterprise Co. | | | 431,121 | |
| | 18,266 | | | HP, Inc. | | | 542,683 | |
| | 1,007 | | | HubSpot, Inc.* | | | 550,346 | |
| | 58,448 | | | Hut 8 Mining Corp. (Canada)* | | | 142,561 | |
| | |
| | |
| The accompanying notes are an integral part of these financial statements. | | 55 |
GOLDMAN SACHS INNOVATE EQUITY ETF
Schedule of Investments (continued)
August 31, 2023
| | | | | | | | |
Shares | | | Description | | Value | |
|
| Common Stocks – (continued) | |
| Information Technology – (continued) | |
| | 33,384 | | | indie Semiconductor, Inc., Class A (China)* | | $ | 223,673 | |
| | 24,924 | | | Infineon Technologies AG (Germany) | | | 893,098 | |
| | 44,645 | | | Infinera Corp.* | | | 208,939 | |
| | 72,044 | | | Innoviz Technologies Ltd. (Israel)*(a) | | | 164,981 | |
| | 7,137 | | | Instructure Holdings, Inc.* | | | 184,920 | |
| | 11,725 | | | Intapp, Inc.* | | | 429,252 | |
| | 75,231 | | | Intel Corp. | | | 2,643,617 | |
| | 3,947 | | | InterDigital, Inc. | | | 342,244 | |
| | 8,236 | | | International Business Machines Corp. | | | 1,209,292 | |
| | 15,353 | | | Juniper Networks, Inc. | | | 447,079 | |
| | 12,033 | | | Kainos Group PLC (United Kingdom) | | | 185,259 | |
| | 2,462 | | | Keyence Corp. (Japan) | | | 1,023,459 | |
| | 5,011 | | | Keysight Technologies, Inc.* | | | 667,966 | |
| | 5,455 | | | Kontron AG (Austria) | | | 119,004 | |
| | 16,440 | | | Lightspeed Commerce, Inc. (Canada)* | | | 268,056 | |
| | 24,001 | | | Marathon Digital Holdings, Inc.*(a) | | | 301,693 | |
| | 15,178 | | | Marvell Technology, Inc. | | | 884,118 | |
| | 11,201 | | | Maxeon Solar Technologies Ltd.* | | | 176,528 | |
| | 20,741 | | | Microsoft Corp. | | | 6,798,070 | |
| | 894 | | | MicroStrategy, Inc., Class A* | | | 319,632 | |
| | 78,481 | | | Nano Dimension Ltd. ADR (Israel)* | | | 249,570 | |
| | 11,305 | | | nCino, Inc.* | | | 371,595 | |
| | 17,464 | | | NCR Corp.* | | | 537,193 | |
| | 5,345 | | | Nemetschek SE (Germany) | | | 369,768 | |
| | 12,127 | | | NetScout Systems, Inc.* | | | 347,196 | |
| | 31,266 | | | NEXTDC Ltd. (Australia)* | | | 274,177 | |
| | 2,000 | | | Nice Ltd. ADR (Israel)* | | | 389,600 | |
| | 184,048 | | | Nokia OYJ ADR (Finland) | | | 734,352 | |
| | 2,150 | | | Novanta, Inc.* | | | 359,007 | |
| | 15,216 | | | NVIDIA Corp. | | | 7,509,857 | |
| | 2,864 | | | NXP Semiconductors NV (China) | | | 589,182 | |
| | 7,825 | | | Okta, Inc.* | | | 653,466 | |
| | 10,340 | | | OneSpan, Inc.* | | | 126,665 | |
| | 12,351 | | | Open Text Corp. (Canada) | | | 497,251 | |
| | 2,111 | | | OSI Systems, Inc.* | | | 287,835 | |
| | 4,624 | | | Palo Alto Networks, Inc.* | | | 1,125,019 | |
| | 3,686 | | | PTC, Inc.* | | | 542,469 | |
| | 12,211 | | | Q2 Holdings, Inc.* | | | 420,180 | |
| | 3,105 | | | Qorvo, Inc.* | | | 333,446 | |
| | 11,868 | | | QUALCOMM, Inc. | | | 1,359,242 | |
| | 5,491 | | | Rapid7, Inc.* | | | 276,691 | |
| | 28,289 | | | Riot Platforms, Inc.* | | | 321,080 | |
| | 6,923 | | | Salesforce, Inc.* | | | 1,533,168 | |
| | 27,217 | | | Seiko Epson Corp. (Japan) | | | 426,712 | |
| | 11,593 | | | Semtech Corp.* | | | 303,157 | |
| | 28,249 | | | SentinelOne, Inc., Class A* | | | 469,781 | |
| | 2,484 | | | ServiceNow, Inc.* | | | 1,462,654 | |
| | 21,307 | | | Shopify, Inc., Class A (Canada)* | | | 1,416,702 | |
| | 1,926 | | | Silicon Laboratories, Inc.* | | | 259,740 | |
| | 6,546 | | | Skyworks Solutions, Inc. | | | 711,812 | |
| | 6,516 | | | Snowflake, Inc., Class A* | | | 1,022,035 | |
| | 10,709 | | | Software AG (Germany) | | | 371,472 | |
| | 113,858 | | | Spirent Communications PLC (United Kingdom) | | | 226,368 | |
| | 5,884 | | | Splunk, Inc.* | | | 713,494 | |
| | |
|
| Common Stocks – (continued) | |
| Information Technology – (continued) | |
| | 4,943 | | | Sprout Social, Inc., Class A* | | | 264,648 | |
| | 12,561 | | | STMicroelectronics NV (Singapore) | | | 595,289 | |
| | 20,752 | | | Stratasys Ltd.* | | | 305,054 | |
| | 2,611 | | | Synaptics, Inc.* | | | 228,567 | |
| | 22,178 | | | Taiwan Semiconductor Manufacturing Co. Ltd. ADR (Taiwan) | | | 2,075,195 | |
| | 5,621 | | | TD SYNNEX Corp. | | | 571,937 | |
| | 7,515 | | | Tenable Holdings, Inc.* | | | 340,956 | |
| | 12,317 | | | Teradyne, Inc. | | | 1,328,635 | |
| | 100,334 | | | Terawulf, Inc.*(a) | | | 209,698 | |
| | 22,772 | | | TomTom NV (Netherlands)* | | | 181,165 | |
| | 63,511 | | | UiPath, Inc., Class A* | | | 1,004,109 | |
| | 4,699 | | | VMware, Inc., Class A* | | | 793,097 | |
| | 91,028 | | | Yangtze Optical Fibre and Cable Joint Stock Ltd. Co., Class H (China)(b) | | | 127,225 | |
| | 2,428 | | | Zebra Technologies Corp., Class A* | | | 667,724 | |
| | 30,679 | | | Zeta Global Holdings Corp., Class A* | | | 249,420 | |
| | 4,692 | | | Zscaler, Inc.* | | | 732,187 | |
| | | | | | | | |
| | | | | | | 87,962,138 | |
| | |
| Real Estate – 0.8% | |
| | 5,766 | | | American Tower Corp. REIT | | | 1,045,491 | |
| | 6,575 | | | Digital Realty Trust, Inc. REIT | | | 866,059 | |
| | 1,036 | | | Equinix, Inc. REIT | | | 809,510 | |
| | | | | | | | |
| | | | | | | 2,721,060 | |
| | |
| Utilities – 1.1% | |
| | 10,970 | | | Atlantica Sustainable Infrastructure PLC (Spain) | | | 246,277 | |
| | 16,406 | | | Avangrid, Inc. | | | 566,007 | |
| | 16,211 | | | Brookfield Renewable Corp., Class A(a) | | | 453,097 | |
| | 11,713 | | | Brookfield Renewable Partners LP (Canada) | | | 295,736 | |
| | 32,576 | | | Innergex Renewable Energy, Inc. (Canada) | | | 310,362 | |
| | 22,765 | | | NextEra Energy, Inc. | | | 1,520,702 | |
| | 47,875 | | | ReNew Energy Global PLC, Class A (India)* | | | 292,038 | |
| | | | | | | | |
| | | | | | | 3,684,219 | |
| | |
| | TOTAL COMMON STOCKS | |
| | (Cost $319,267,467) | | $ | 334,714,231 | |
| | |
| | | | | | | | |
|
| Exchange-Traded Funds – 0.2% | |
| | 179,533 | | | Greencoat UK Wind PLC/Funds | | $ | 322,361 | |
| | 261,948 | | | Renewables Infrastructure Group Ltd. (The) | | | 361,137 | |
| | |
| | TOTAL EXCHANGE-TRADED FUNDS | |
| | (Cost $705,644) | | $ | 683,498 | |
| | |
| | |
| 56 | | The accompanying notes are an integral part of these financial statements. |
GOLDMAN SACHS INNOVATE EQUITY ETF
| | | | | | | | | | | | |
| Units | | Description | | | Expiration
Month | | | Value | |
| | | | | | | | | | | | |
|
| Right – 0.0% | |
| Health Care – 0.0% | | | | |
| 9,282 | | | AstraZeneca PLC*(d) | | | | | |
| (Cost $0) | | | | 12/28 | | | $ | 28,403 | |
| |
| TOTAL INVESTMENTS BEFORE SECURITIES LENDING REINVESTMENT VEHICLE | |
| (Cost $319,973,111) | | | | | | | $ | 335,426,132 | |
| |
| | | | | | |
| | |
| Shares | | Dividend
Rate | | Value | |
|
| Securities Lending Reinvestment Vehicle – 2.5%(c) | |
Goldman Sachs Financial Square Government Fund – Institutional Shares | |
| 8,259,180 | | 5.234% | | $ | 8,259,180 | |
| (Cost $8,259,180) | | | | |
| |
| TOTAL INVESTMENTS – 102.3% | |
| (Cost $328,232,291) | | $ | 343,685,312 | |
| |
| LIABILITIES IN EXCESS OF OTHER ASSETS – (2.3)% | | | (7,609,751 | ) |
| |
| NET ASSETS – 100.0% | | $ | 336,075,561 | |
| |
| | |
|
| The percentage shown for each investment category reflects the value of investments in that category as a percentage of net assets. |
| |
* | | Non-income producing security. |
| |
(a) | | All or a portion of security is on loan. |
| |
(b) | | Exempt from registration under Rule 144A of the Securities Act of 1933. |
| |
(c) | | Represents an affiliated issuer. |
| |
(d) | | Significant unobservable inputs were used in the valuation of this portfolio security; i.e. Level 3. |
| | |
|
Investment Abbreviations: |
ADR | | —American Depositary Receipt |
GDR | | —Global Depositary Receipt |
LP | | —Limited Partnership |
PLC | | —Public Limited Company |
REIT | | —Real Estate Investment Trust |
|
| | |
| The accompanying notes are an integral part of these financial statements. | | 57 |
GOLDMAN SACHS JUST U.S. LARGE CAP EQUITY ETF
Schedule of Investments
August 31, 2023
| | | | | | | | |
| Shares | | |
Description | | Value | |
|
| Common Stocks – 99.8% | |
| Communication Services – 7.2% | |
| | 7,347 | | | Activision Blizzard, Inc. | | $ | 675,851 | |
| | 45,889 | | | Alphabet, Inc., Class A* | | | 6,248,705 | |
| | 39,769 | | | Alphabet, Inc., Class C* | | | 5,462,272 | |
| | 63,919 | | | AT&T, Inc. | | | 945,362 | |
| | 917 | | | Charter Communications, Inc., Class A* | | | 401,756 | |
| | 2,583 | | | Electronic Arts, Inc. | | | 309,908 | |
| | 2,757 | | | Fox Corp., Class A | | | 91,146 | |
| | 1,268 | | | Fox Corp., Class B | | | 38,699 | |
| | 3,639 | | | Interpublic Group of Cos., Inc. (The) | | | 118,668 | |
| | 4,137 | | | Netflix, Inc.* | | | 1,794,134 | |
| | 1,519 | | | New York Times Co. (The), Class A | | | 67,246 | |
| | 79 | | | Paramount Global, Class A | | | 1,451 | |
| | 5,411 | | | Paramount Global, Class B | | | 81,652 | |
| | 1,102 | | | Roku, Inc.* | | | 89,482 | |
| | 1,555 | | | Take-Two Interactive Software, Inc.* | | | 221,121 | |
| | 4,849 | | | T-Mobile US, Inc.* | | | 660,676 | |
| | 1,047 | | | TripAdvisor, Inc.* | | | 15,820 | |
| | 37,572 | | | Verizon Communications, Inc. | | | 1,314,269 | |
| | 17,251 | | | Walt Disney Co. (The)* | | | 1,443,564 | |
| | 2,391 | | | ZoomInfo Technologies, Inc.* | | | 43,086 | |
| | | | | | | | |
| | | | | | | 20,024,868 | |
| | |
| Consumer Discretionary – 10.7% | |
| | 3,824 | | | Airbnb, Inc., Class A* | | | 503,047 | |
| | 85,521 | | | Amazon.com, Inc.* | | | 11,802,753 | |
| | 2,550 | | | Aptiv PLC* | | | 258,698 | |
| | 1,834 | | | Best Buy Co., Inc. | | | 140,209 | |
| | 350 | | | Booking Holdings, Inc.* | | | 1,086,760 | |
| | 2,196 | | | BorgWarner, Inc. | | | 89,487 | |
| | 634 | | | Brunswick Corp. | | | 50,162 | |
| | 1,486 | | | CarMax, Inc.* | | | 121,376 | |
| | 257 | | | Chipotle Mexican Grill, Inc.* | | | 495,146 | |
| | 1,135 | | | Darden Restaurants, Inc. | | | 176,504 | |
| | 250 | | | Deckers Outdoor Corp.* | | | 132,273 | |
| | 568 | | | Dick’s Sporting Goods, Inc. | | | 66,081 | |
| | 3,939 | | | DraftKings, Inc., Class A* | | | 116,791 | |
| | 5,040 | | | eBay, Inc. | | | 225,691 | |
| | 1,154 | | | Etsy, Inc.* | | | 84,900 | |
| | 1,353 | | | Expedia Group, Inc.* | | | 146,652 | |
| | 36,983 | | | Ford Motor Co. | | | 448,604 | |
| | 1,817 | | | Gap, Inc. (The) | | | 21,041 | |
| | 1,451 | | | Garmin Ltd. | | | 153,835 | |
| | 13,081 | | | General Motors Co. | | | 438,344 | |
| | 282 | | | Grand Canyon Education, Inc.* | | | 33,065 | |
| | 1,433 | | | H&R Block, Inc. | | | 57,291 | |
| | 1,236 | | | Harley-Davidson, Inc. | | | 41,715 | |
| | 1,234 | | | Hasbro, Inc. | | | 88,848 | |
| | 2,424 | | | Hilton Worldwide Holdings, Inc. | | | 360,328 | |
| | 9,613 | | | Home Depot, Inc. (The) | | | 3,175,174 | |
| | 437 | | | Hyatt Hotels Corp., Class A | | | 49,123 | |
| | 1,042 | | | Kohl’s Corp. | | | 27,759 | |
| | 3,120 | | | Las Vegas Sands Corp. | | | 171,163 | |
| | 554 | | | Lear Corp. | | | 79,826 | |
| | 257 | | | Lithia Motors, Inc. | | | 79,161 | |
| | 5,627 | | | Lowe’s Cos., Inc. | | | 1,296,911 | |
| | 1,050 | | | Lululemon Athletica, Inc.* | | | 400,323 | |
| | |
|
| Common Stocks – (continued) | |
| Consumer Discretionary – (continued) | |
| | 2,520 | | | Macy’s, Inc. | | | 30,820 | |
| | 2,378 | | | Marriott International, Inc., Class A | | | 483,947 | |
| | 344 | | | Marriott Vacations Worldwide Corp. | | | 37,389 | |
| | 6,923 | | | McDonald’s Corp. | | | 1,946,401 | |
| | 2,830 | | | MGM Resorts International | | | 124,463 | |
| | 468 | | | Mohawk Industries, Inc.* | | | 47,451 | |
| | 11,218 | | | NIKE, Inc., Class B | | | 1,140,983 | |
| | 1,050 | | | Nordstrom, Inc. | | | 17,031 | |
| | 2,885 | | | Peloton Interactive, Inc., Class A* | | | 18,406 | |
| | 436 | | | Phinia, Inc.* | | | 12,121 | |
| | 508 | | | Polaris, Inc. | | | 56,942 | |
| | 2,092 | | | PulteGroup, Inc. | | | 171,670 | |
| | 590 | | | PVH Corp. | | | 49,324 | |
| | 2,773 | | | QuantumScape Corp.* | | | 19,799 | |
| | 383 | | | Ralph Lauren Corp. | | | 44,669 | |
| | 2,205 | | | Royal Caribbean Cruises Ltd.* | | | 218,163 | |
| | 1,404 | | | Service Corp. International | | | 88,606 | |
| | 10,641 | | | Starbucks Corp. | | | 1,036,859 | |
| | 2,223 | | | Tapestry, Inc. | | | 74,070 | |
| | 10,864 | | | TJX Cos., Inc. (The) | | | 1,004,703 | |
| | 1,032 | | | Tractor Supply Co. | | | 225,492 | |
| | 380 | | | Vail Resorts, Inc. | | | 86,002 | |
| | 778 | | | Wayfair, Inc., Class A* | | | 53,768 | |
| | 504 | | | Whirlpool Corp. | | | 70,540 | |
| | 615 | | | Williams-Sonoma, Inc. | | | 86,838 | |
| | 804 | | | YETI Holdings, Inc.* | | | 40,160 | |
| | | | | | | | |
| | | | | | | 29,605,658 | |
| | |
| Consumer Staples – 6.4% | |
| | 4,992 | | | Archer-Daniels-Midland Co. | | | 395,865 | |
| | 1,373 | | | Bunge Ltd. | | | 156,961 | |
| | 1,761 | | | Campbell Soup Co. | | | 73,434 | |
| | 2,248 | | | Church & Dwight Co., Inc. | | | 217,539 | |
| | 1,135 | | | Clorox Co. (The) | | | 177,571 | |
| | 36,082 | | | Coca-Cola Co. (The) | | | 2,158,786 | |
| | 7,554 | | | Colgate-Palmolive Co. | | | 554,992 | |
| | 4,205 | | | Costco Wholesale Corp. | | | 2,309,722 | |
| | 5,409 | | | General Mills, Inc. | | | 365,973 | |
| | 1,355 | | | Hershey Co. (The) | | | 291,135 | |
| | 2,666 | | | Hormel Foods Corp. | | | 102,881 | |
| | 603 | | | Ingredion, Inc. | | | 62,055 | |
| | 2,390 | | | Kellogg Co. | | | 145,838 | |
| | 8,771 | | | Keurig Dr Pepper, Inc. | | | 295,144 | |
| | 3,101 | | | Kimberly-Clark Corp. | | | 399,502 | |
| | 5,997 | | | Kroger Co. (The) | | | 278,201 | |
| | 2,315 | | | McCormick & Co., Inc. | | | 190,015 | |
| | 1,606 | | | Molson Coors Beverage Co., Class B | | | 101,965 | |
| | 6,846 | | | Monster Beverage Corp.* | | | 393,029 | |
| | 12,763 | | | PepsiCo, Inc. | | | 2,270,793 | |
| | 21,811 | | | Procter & Gamble Co. (The) | | | 3,366,310 | |
| | 4,671 | | | Sysco Corp. | | | 325,335 | |
| | 4,340 | | | Target Corp. | | | 549,227 | |
| | 2,549 | | | Tyson Foods, Inc., Class A | | | 135,785 | |
| | 6,593 | | | Walgreens Boots Alliance, Inc. | | | 166,869 | |
| | 13,549 | | | Walmart, Inc. | | | 2,203,203 | |
| | | | | | | | |
| | | | | | | 17,688,130 | |
| | |
| | |
| 58 | | The accompanying notes are an integral part of these financial statements. |
GOLDMAN SACHS JUST U.S. LARGE CAP EQUITY ETF
| | | | | | | | |
| Shares | | |
Description | | Value | |
|
| Common Stocks – (continued) | |
| Energy – 4.4% | |
| | 2,676 | | | APA Corp. | | $ | 117,316 | |
| | 8,734 | | | Baker Hughes Co. | | | 316,083 | |
| | 2,091 | | | Cheniere Energy, Inc. | | | 341,251 | |
| | 15,352 | | | Chevron Corp. | | | 2,473,207 | |
| | 10,459 | | | ConocoPhillips | | | 1,244,935 | |
| | 5,524 | | | Devon Energy Corp. | | | 282,221 | |
| | 3,106 | | | EQT Corp. | | | 134,241 | |
| | 35,244 | | | Exxon Mobil Corp. | | | 3,918,780 | |
| | 7,742 | | | Halliburton Co. | | | 298,996 | |
| | 16,904 | | | Kinder Morgan, Inc. | | | 291,087 | |
| | 3,805 | | | Marathon Petroleum Corp. | | | 543,240 | |
| | 6,012 | | | Occidental Petroleum Corp. | | | 377,494 | |
| | 3,854 | | | ONEOK, Inc. | | | 251,281 | |
| | 3,972 | | | Phillips 66 | | | 453,444 | |
| | 2,004 | | | Pioneer Natural Resources Co. | | | 476,812 | |
| | 2,013 | | | Range Resources Corp. | | | 65,181 | |
| | 3,107 | | | Valero Energy Corp. | | | 403,599 | |
| | 10,496 | | | Williams Cos., Inc. (The) | | | 362,427 | |
| | | | | | | | |
| | | | | | | 12,351,595 | |
| | |
| Financials – 12.7% | |
| | 2,592 | | | Allstate Corp. (The) | | | 279,443 | |
| | 2,675 | | | Ally Financial, Inc. | | | 74,071 | |
| | 5,267 | | | American Express Co. | | | 832,133 | |
| | 7,250 | | | American International Group, Inc. | | | 424,270 | |
| | 1,039 | | | Ameriprise Financial, Inc. | | | 350,746 | |
| | 1,996 | | | Aon PLC, Class A | | | 665,446 | |
| | 3,537 | | | Arch Capital Group Ltd.* | | | 271,854 | |
| | 523 | | | Assurant, Inc. | | | 72,870 | |
| | 771 | | | Axis Capital Holdings Ltd. | | | 42,297 | |
| | 68,868 | | | Bank of America Corp. | | | 1,974,446 | |
| | 7,810 | | | Bank of New York Mellon Corp. (The) | | | 350,435 | |
| | 1,472 | | | BlackRock, Inc. | | | 1,031,195 | |
| | 4,821 | | | Block, Inc.* | | | 277,931 | |
| | 3,368 | | | Capital One Financial Corp. | | | 344,849 | |
| | 1,040 | | | Cboe Global Markets, Inc. | | | 155,698 | |
| | 14,651 | | | Charles Schwab Corp. (The) | | | 866,607 | |
| | 19,230 | | | Citigroup, Inc. | | | 794,007 | |
| | 3,546 | | | CME Group, Inc. | | | 718,703 | |
| | 2,036 | | | Columbia Banking System, Inc. | | | 41,697 | |
| | 1,296 | | | Comerica, Inc. | | | 62,351 | |
| | 352 | | | Evercore, Inc., Class A | | | 49,298 | |
| | 421 | | | Everest Group Ltd. | | | 151,846 | |
| | 5,268 | | | Fidelity National Information Services, Inc. | | | 294,270 | |
| | 6,691 | | | Fifth Third Bancorp | | | 177,646 | |
| | 3,533 | | | FNB Corp. | | | 41,089 | |
| | 2,807 | | | Franklin Resources, Inc. | | | 75,059 | |
| | 3,195 | | | Goldman Sachs Group, Inc. (The)(a) | | | 1,047,034 | |
| | 348 | | | Hanover Insurance Group, Inc. (The) | | | 37,139 | |
| | 3,012 | | | Hartford Financial Services Group, Inc. (The) | | | 216,322 | |
| | 14,211 | | | Huntington Bancshares, Inc. | | | 157,600 | |
| | 5,476 | | | Intercontinental Exchange, Inc. | | | 646,113 | |
| | 1,974 | | | Jefferies Financial Group, Inc. | | | 70,452 | |
| | 29,083 | | | JPMorgan Chase & Co. | | | 4,255,715 | |
| | |
|
| Common Stocks – (continued) | |
| Financials – (continued) | |
| | 9,205 | | | KeyCorp | | | 104,293 | |
| | 1,082 | | | Lazard Ltd., Class A | | | 37,589 | |
| | 1,661 | | | Lincoln National Corp. | | | 42,621 | |
| | 774 | | | LPL Financial Holdings, Inc. | | | 178,477 | |
| | 367 | | | MarketAxess Holdings, Inc. | | | 88,421 | |
| | 4,895 | | | Marsh & McLennan Cos., Inc. | | | 954,476 | |
| | 7,511 | | | Mastercard, Inc., Class A | | | 3,099,339 | |
| | 6,392 | | | MetLife, Inc. | | | 404,869 | |
| | 2,848 | | | MGIC Investment Corp. | | | 50,068 | |
| | 1,569 | | | Moody’s Corp. | | | 528,439 | |
| | 11,885 | | | Morgan Stanley | | | 1,012,008 | |
| | 256 | | | Morningstar, Inc. | | | 59,563 | |
| | 770 | | | MSCI, Inc. | | | 418,587 | |
| | 3,372 | | | Nasdaq, Inc. | | | 176,963 | |
| | 2,022 | | | Northern Trust Corp. | | | 153,814 | |
| | 1,111 | | | OneMain Holdings, Inc. | | | 46,118 | |
| | 9,988 | | | PayPal Holdings, Inc.* | | | 624,350 | |
| | 740 | | | Pinnacle Financial Partners, Inc. | | | 49,254 | |
| | 3,935 | | | PNC Financial Services Group, Inc. (The) | | | 475,073 | |
| | 361 | | | Primerica, Inc. | | | 72,547 | |
| | 2,387 | | | Principal Financial Group, Inc. | | | 185,494 | |
| | 5,781 | | | Progressive Corp. (The) | | | 771,590 | |
| | 3,627 | | | Prudential Financial, Inc. | | | 343,368 | |
| | 9,237 | | | Regions Financial Corp. | | | 169,407 | |
| | 653 | | | Reinsurance Group of America, Inc. | | | 90,519 | |
| | 1,237 | | | Rocket Cos., Inc., Class A*(b) | | | 13,211 | |
| | 3,174 | | | S&P Global, Inc. | | | 1,240,590 | |
| | 3,793 | | | Synchrony Financial | | | 122,438 | |
| | 1,417 | | | Synovus Financial Corp. | | | 43,870 | |
| | 1,130 | | | Tradeweb Markets, Inc., Class A | | | 97,666 | |
| | 2,280 | | | Travelers Cos., Inc. (The) | | | 367,604 | |
| | 13,108 | | | Truist Financial Corp. | | | 400,449 | |
| | 1,950 | | | Unum Group | | | 95,920 | |
| | 15,146 | | | US Bancorp | | | 553,283 | |
| | 14,497 | | | Visa, Inc., Class A | | | 3,561,623 | |
| | 2,106 | | | W R Berkley Corp. | | | 130,277 | |
| | 37,368 | | | Wells Fargo & Co. | | | 1,542,925 | |
| | 3,327 | | | Western Union Co. (The) | | | 41,088 | |
| | | | | | | | |
| | | | | | | 35,198,823 | |
| | |
| Health Care – 12.9% | |
| | 691 | | | 10X Genomics, Inc., Class A* | | | 35,828 | |
| | 13,079 | | | Abbott Laboratories | | | 1,345,829 | |
| | 13,417 | | | AbbVie, Inc. | | | 1,971,762 | |
| | 2,230 | | | Agilent Technologies, Inc. | | | 269,986 | |
| | 579 | | | Align Technology, Inc.* | | | 214,311 | |
| | 938 | | | Alnylam Pharmaceuticals, Inc.* | | | 185,555 | |
| | 4,039 | | | Amgen, Inc. | | | 1,035,357 | |
| | 3,818 | | | Baxter International, Inc. | | | 155,011 | |
| | 2,144 | | | Becton Dickinson & Co. | | | 599,141 | |
| | 1,090 | | | Biogen, Inc.* | | | 291,422 | |
| | 1,414 | | | BioMarin Pharmaceutical, Inc.* | | | 129,211 | |
| | 10,848 | | | Boston Scientific Corp.* | | | 585,141 | |
| | 15,885 | | | Bristol-Myers Squibb Co. | | | 979,310 | |
| | 1,485 | | | Cencora, Inc. | | | 261,330 | |
| | |
| | |
| The accompanying notes are an integral part of these financial statements. | | 59 |
GOLDMAN SACHS JUST U.S. LARGE CAP EQUITY ETF
Schedule of Investments (continued)
August 31, 2023
| | | | | | | | |
| Shares | | |
Description | | Value | |
|
| Common Stocks – (continued) | |
| Health Care – (continued) | |
| | 4,141 | | | Centene Corp.* | | $ | 255,293 | |
| | 2,205 | | | Cigna Group (The) | | | 609,153 | |
| | 11,793 | | | CVS Health Corp. | | | 768,550 | |
| | 4,972 | | | Danaher Corp. | | | 1,317,580 | |
| | 410 | | | DaVita, Inc.* | | | 41,992 | |
| | 1,597 | | | DENTSPLY SIRONA, Inc. | | | 59,233 | |
| | 2,921 | | | Dexcom, Inc.* | | | 294,963 | |
| | 4,551 | | | Edwards Lifesciences Corp.* | | | 348,015 | |
| | 1,794 | | | Elevance Health, Inc. | | | 792,966 | |
| | 6,434 | | | Eli Lilly & Co. | | | 3,565,723 | |
| | 667 | | | Fortrea Holdings, Inc.* | | | 18,376 | |
| | 2,945 | | | GE HealthCare Technologies, Inc. | | | 207,475 | |
| | 9,442 | | | Gilead Sciences, Inc. | | | 722,124 | |
| | 1,544 | | | HCA Healthcare, Inc. | | | 428,151 | |
| | 1,832 | | | Hologic, Inc.* | | | 136,924 | |
| | 1,690 | | | Horizon Therapeutics PLC* | | | 190,531 | |
| | 947 | | | Humana, Inc. | | | 437,164 | |
| | 619 | | | IDEXX Laboratories, Inc.* | | | 316,563 | |
| | 1,193 | | | Illumina, Inc.* | | | 197,107 | |
| | 1,392 | | | Incyte Corp.* | | | 89,826 | |
| | 524 | | | Insulet Corp.* | | | 100,456 | |
| | 2,641 | | | Intuitive Surgical, Inc.* | | | 825,788 | |
| | 1,394 | | | IQVIA Holdings, Inc.* | | | 310,346 | |
| | 18,341 | | | Johnson & Johnson | | | 2,965,373 | |
| | 667 | | | Laboratory Corp. of America Holdings | | | 138,803 | |
| | 821 | | | Maravai LifeSciences Holdings, Inc., Class A* | | | 8,489 | |
| | 10,038 | | | Medtronic PLC | | | 818,097 | |
| | 19,313 | | | Merck & Co., Inc. | | | 2,104,731 | |
| | 2,538 | | | Moderna, Inc.* | | | 286,972 | |
| | 731 | | | Neurocrine Biosciences, Inc.* | | | 79,599 | |
| | 42,699 | | | Pfizer, Inc. | | | 1,510,691 | |
| | 780 | | | Regeneron Pharmaceuticals, Inc.* | | | 644,662 | |
| | 421 | | | Repligen Corp.* | | | 73,216 | |
| | 1,099 | | | ResMed, Inc. | | | 175,389 | |
| | 2,681 | | | Stryker Corp. | | | 760,198 | |
| | 2,914 | | | Thermo Fisher Scientific, Inc. | | | 1,623,389 | |
| | 510 | | | Ultragenyx Pharmaceutical, Inc.* | | | 18,763 | |
| | 7,068 | | | UnitedHealth Group, Inc. | | | 3,368,467 | |
| | 1,096 | | | Veeva Systems, Inc., Class A* | | | 228,735 | |
| | 1,949 | | | Vertex Pharmaceuticals, Inc.* | | | 678,915 | |
| | 521 | | | Waters Corp.* | | | 146,297 | |
| | 1,590 | | | Zimmer Biomet Holdings, Inc. | | | 189,401 | |
| | | | | | | | |
| | | | | | | 35,913,680 | |
| | |
| Industrials – 9.0% | |
| | 4,894 | | | 3M Co. | | | 522,043 | |
| | 278 | | | Acuity Brands, Inc. | | | 44,836 | |
| | 1,160 | | | AECOM | | | 101,790 | |
| | 777 | | | Allegion PLC | | | 88,430 | |
| | 6,125 | | | American Airlines Group, Inc.* | | | 90,221 | |
| | 2,044 | | | AMETEK, Inc. | | | 326,038 | |
| | 405 | | | Armstrong World Industries, Inc. | | | 31,019 | |
| | 3,682 | | | Automatic Data Processing, Inc. | | | 937,474 | |
| | 193 | | | Avis Budget Group, Inc.* | | | 41,184 | |
| | 1,092 | | | AZEK Co., Inc. (The)* | | | 37,139 | |
| | |
|
| Common Stocks – (continued) | |
| Industrials – (continued) | |
| | 4,959 | | | Boeing Co. (The)* | | | 1,110,965 | |
| | 1,156 | | | Booz Allen Hamilton Holding Corp. | | | 130,986 | |
| | 1,156 | | | Broadridge Financial Solutions, Inc. | | | 215,259 | |
| | 7,409 | | | Carrier Global Corp. | | | 425,647 | |
| | 4,592 | | | Caterpillar, Inc. | | | 1,290,949 | |
| | 1,128 | | | Ceridian HCM Holding, Inc.* | | | 81,803 | |
| | 1,025 | | | C.H. Robinson Worldwide, Inc. | | | 92,691 | |
| | 2,406 | | | ChargePoint Holdings, Inc.*(b) | | | 17,227 | |
| | 774 | | | Cintas Corp. | | | 390,228 | |
| | 18,064 | | | CSX Corp. | | | 545,533 | |
| | 1,263 | | | Cummins, Inc. | | | 290,541 | |
| | 2,427 | | | Deere & Co. | | | 997,351 | |
| | 6,051 | | | Delta Air Lines, Inc. | | | 259,467 | |
| | 3,546 | | | Eaton Corp. PLC | | | 816,892 | |
| | 5,080 | | | Emerson Electric Co. | | | 499,110 | |
| | 2,063 | | | FedEx Corp. | | | 538,484 | |
| | 3,146 | | | Fortive Corp. | | | 248,062 | |
| | 1,120 | | | Fortune Brands Innovations, Inc. | | | 77,302 | |
| | 294 | | | FTI Consulting, Inc.* | | | 54,631 | |
| | 9,645 | | | General Electric Co. | | | 1,103,967 | |
| | 1,600 | | | Genpact Ltd. | | | 59,728 | |
| | 1,269 | | | Hertz Global Holdings, Inc.* | | | 21,510 | |
| | 5,926 | | | Honeywell International, Inc. | | | 1,113,732 | |
| | 475 | | | Hubbell, Inc. | | | 154,874 | |
| | 670 | | | IDEX Corp. | | | 151,688 | |
| | 2,695 | | | Illinois Tool Works, Inc. | | | 666,608 | |
| | 3,598 | | | Ingersoll Rand, Inc. | | | 250,457 | |
| | 1,121 | | | Jacobs Solutions, Inc. | | | 151,133 | |
| | 6,113 | | | Johnson Controls International PLC | | | 361,034 | |
| | 1,039 | | | KBR, Inc. | | | 63,919 | |
| | 1,680 | | | L3Harris Technologies, Inc. | | | 299,191 | |
| | 1,047 | | | Leidos Holdings, Inc. | | | 102,093 | |
| | 282 | | | Lennox International, Inc. | | | 106,260 | |
| | 493 | | | Lincoln Electric Holdings, Inc. | | | 94,883 | |
| | 2,010 | | | Lockheed Martin Corp. | | | 901,183 | |
| | 1,791 | | | MDU Resources Group, Inc. | | | 36,465 | |
| | 428 | | | Mercury Systems, Inc.* | | | 16,799 | |
| | 1,276 | | | Northrop Grumman Corp. | | | 552,623 | |
| | 1,466 | | | nVent Electric PLC | | | 82,888 | |
| | 586 | | | Oshkosh Corp. | | | 60,844 | |
| | 3,678 | | | Otis Worldwide Corp. | | | 314,653 | |
| | 795 | | | Owens Corning | | | 114,408 | |
| | 1,021 | | | Rockwell Automation, Inc. | | | 318,634 | |
| | 13,004 | | | RTX Corp. | | | 1,118,864 | |
| | 474 | | | Schneider National, Inc., Class B | | | 13,703 | |
| | 423 | | | SiteOne Landscape Supply, Inc.* | | | 72,413 | |
| | 5,607 | | | Southwest Airlines Co. | | | 177,181 | |
| | 928 | | | Spirit AeroSystems Holdings, Inc., Class A | | | 19,785 | |
| | 1,360 | | | Stanley Black & Decker, Inc. | | | 128,357 | |
| | 2,224 | | | Sunrun, Inc.* | | | 34,761 | |
| | 1,793 | | | Textron, Inc. | | | 139,334 | |
| | 544 | | | Timken Co. (The) | | | 41,572 | |
| | 2,023 | | | Trane Technologies PLC | | | 415,241 | |
| | 1,716 | | | TransUnion | | | 139,374 | |
| | 18,295 | | | Uber Technologies, Inc.* | | | 864,073 | |
| | |
| | |
| 60 | | The accompanying notes are an integral part of these financial statements. |
GOLDMAN SACHS JUST U.S. LARGE CAP EQUITY ETF
| | | | | | | | |
| Shares | | |
Description | | Value | |
|
| Common Stocks – (continued) | |
| Industrials – (continued) | |
| | 5,426 | | | Union Pacific Corp. | | $ | 1,196,813 | |
| | 3,078 | | | United Airlines Holdings, Inc.* | | | 153,315 | |
| | 6,445 | | | United Parcel Service, Inc., Class B | | | 1,091,783 | |
| | 607 | | | United Rentals, Inc. | | | 289,260 | |
| | 1,271 | | | Verisk Analytics, Inc. | | | 307,862 | |
| | 4,292 | | | Waste Management, Inc. | | | 672,900 | |
| | 1,749 | | | WillScot Mobile Mini Holdings Corp.* | | | 71,744 | |
| | 526 | | | Woodward, Inc. | | | 68,049 | |
| | 399 | | | W.W. Grainger, Inc. | | | 284,942 | |
| | 2,110 | | | Xylem, Inc. | | | 218,469 | |
| | | | | | | | |
| | | | | | | 24,922,671 | |
| | |
| Information Technology – 28.9% | |
| | 5,619 | | | Accenture PLC, Class A | | | 1,819,264 | |
| | 3,519 | | | Adobe, Inc.* | | | 1,968,317 | |
| | 12,303 | | | Advanced Micro Devices, Inc.* | | | 1,300,673 | |
| | 1,179 | | | Akamai Technologies, Inc.* | | | 123,901 | |
| | 3,883 | | | Analog Devices, Inc. | | | 705,852 | |
| | 665 | | | ANSYS, Inc.* | | | 212,049 | |
| | 115,243 | | | Apple, Inc. | | | 21,650,702 | |
| | 6,482 | | | Applied Materials, Inc. | | | 990,190 | |
| | 1,645 | | | Autodesk, Inc.* | | | 365,091 | |
| | 3,152 | | | Broadcom, Inc. | | | 2,908,949 | |
| | 2,074 | | | Cadence Design Systems, Inc.* | | | 498,673 | |
| | 1,320 | | | Ciena Corp.* | | | 65,974 | |
| | 424 | | | Cirrus Logic, Inc.* | | | 34,785 | |
| | 36,831 | | | Cisco Systems, Inc. | | | 2,112,258 | |
| | 2,204 | | | Cloudflare, Inc., Class A* | | | 143,326 | |
| | 5,832 | | | Corning, Inc. | | | 191,406 | |
| | 1,551 | | | DocuSign, Inc.* | | | 78,015 | |
| | 2,005 | | | Dropbox, Inc., Class A* | | | 55,719 | |
| | 1,674 | | | Dynatrace, Inc.* | | | 80,687 | |
| | 596 | | | Elastic NV* | | | 36,880 | |
| | 460 | | | F5, Inc.* | | | 75,284 | |
| | 919 | | | First Solar, Inc.* | | | 173,801 | |
| | 5,040 | | | Fortinet, Inc.* | | | 303,458 | |
| | 591 | | | Gartner, Inc.* | | | 206,661 | |
| | 4,261 | | | Gen Digital, Inc. | | | 86,285 | |
| | 1,181 | | | GoDaddy, Inc., Class A* | | | 85,634 | |
| | 9,923 | | | Hewlett Packard Enterprise Co. | | | 168,592 | |
| | 6,630 | | | HP, Inc. | | | 196,977 | |
| | 32,044 | | | Intel Corp. | | | 1,126,026 | |
| | 6,976 | | | International Business Machines Corp. | | | 1,024,286 | |
| | 2,098 | | | Intuit, Inc. | | | 1,136,717 | |
| | 2,841 | | | Juniper Networks, Inc. | | | 82,730 | |
| | 1,579 | | | Keysight Technologies, Inc.* | | | 210,481 | |
| | 1,029 | | | Lam Research Corp. | | | 722,770 | |
| | 217 | | | Littelfuse, Inc. | | | 57,956 | |
| | 6,556 | | | Marvell Technology, Inc. | | | 381,887 | |
| | 8,384 | | | Micron Technology, Inc. | | | 586,377 | |
| | 57,471 | | | Microsoft Corp. | | | 18,836,695 | |
| | 503 | | | MongoDB, Inc.* | | | 191,794 | |
| | 1,471 | | | Motorola Solutions, Inc. | | | 417,131 | |
| | 1,643 | | | NetApp, Inc. | | | 126,018 | |
| | 425 | | | New Relic, Inc.* | | | 36,172 | |
| | 18,349 | | | NVIDIA Corp. | | | 9,056,149 | |
| | |
|
| Common Stocks – (continued) | |
| Information Technology – (continued) | |
| | 1,149 | | | Okta, Inc.* | | | 95,953 | |
| | 3,312 | | | ON Semiconductor Corp.* | | | 326,100 | |
| | 11,673 | | | Oracle Corp. | | | 1,405,312 | |
| | 2,290 | | | Palo Alto Networks, Inc.* | | | 557,157 | |
| | 313 | | | Pegasystems, Inc. | | | 15,544 | |
| | 2,152 | | | Pure Storage, Inc., Class A* | | | 78,742 | |
| | 8,559 | | | QUALCOMM, Inc. | | | 980,262 | |
| | 7,265 | | | Salesforce, Inc.* | | | 1,608,907 | |
| | 1,563 | | | ServiceNow, Inc.* | | | 920,341 | |
| | 964 | | | Smartsheet, Inc., Class A* | | | 40,228 | |
| | 1,235 | | | Splunk, Inc.* | | | 149,756 | |
| | 1,164 | | | Synopsys, Inc.* | | | 534,148 | |
| | 773 | | | Teradata Corp.* | | | 35,767 | |
| | 1,193 | | | Teradyne, Inc. | | | 128,689 | |
| | 6,969 | | | Texas Instruments, Inc. | | | 1,171,210 | |
| | 2,188 | | | Trimble, Inc.* | | | 119,881 | |
| | 1,295 | | | Twilio, Inc., Class A* | | | 82,504 | |
| | 318 | | | Tyler Technologies, Inc.* | | | 126,701 | |
| | 1,647 | | | VMware, Inc., Class A* | | | 277,981 | |
| | 2,451 | | | Western Digital Corp.* | | | 110,295 | |
| | 946 | | | Wolfspeed, Inc.* | | | 45,238 | |
| | 1,516 | | | Workday, Inc., Class A* | | | 370,662 | |
| | 451 | | | Zebra Technologies Corp., Class A* | | | 124,030 | |
| | 1,896 | | | Zoom Video Communications, Inc., Class A* | | | 134,673 | |
| | 668 | | | Zscaler, Inc.* | | | 104,241 | |
| | | | | | | | |
| | | | | | | 80,176,914 | |
| | |
| Materials – 2.5% | |
| | 1,929 | | | Air Products and Chemicals, Inc. | | | 570,000 | |
| | 1,016 | | | Albemarle Corp. | | | 201,889 | |
| | 584 | | | AptarGroup, Inc. | | | 77,415 | |
| | 702 | | | Avery Dennison Corp. | | | 132,243 | |
| | 1,956 | | | Axalta Coating Systems Ltd.* | | | 55,355 | |
| | 2,738 | | | Ball Corp. | | | 149,084 | |
| | 858 | | | Celanese Corp. | | | 108,417 | |
| | 1,697 | | | CF Industries Holdings, Inc. | | | 130,788 | |
| | 4,408 | | | Cleveland-Cliffs, Inc.* | | | 67,398 | |
| | 6,565 | | | Corteva, Inc. | | | 331,598 | |
| | 6,148 | | | Dow, Inc. | | | 335,435 | |
| | 4,081 | | | DuPont de Nemours, Inc. | | | 313,788 | |
| | 1,033 | | | Eastman Chemical Co. | | | 87,815 | |
| | 2,162 | | | Ecolab, Inc. | | | 397,397 | |
| | 12,417 | | | Freeport-McMoRan, Inc. | | | 495,563 | |
| | 2,217 | | | International Flavors & Fragrances, Inc. | | | 156,188 | |
| | 3,011 | | | International Paper Co. | | | 105,144 | |
| | 4,263 | | | Linde PLC | | | 1,649,952 | |
| | 2,248 | | | LyondellBasell Industries NV, Class A | | | 222,035 | |
| | 550 | | | Martin Marietta Materials, Inc. | | | 245,526 | |
| | 6,916 | | | Newmont Corp. | | | 272,629 | |
| | 2,185 | | | Nucor Corp. | | | 376,039 | |
| | 783 | | | Packaging Corp. of America | | | 116,745 | |
| | 359 | | | Scotts Miracle-Gro Co. (The) | | | 20,341 | |
| | 1,784 | | | SSR Mining, Inc. (Canada) | | | 26,492 | |
| | 1,177 | | | Vulcan Materials Co. | | | 256,880 | |
| | 2,240 | | | Westrock Co. | | | 73,270 | |
| | | | | | | | |
| | | | | | | 6,975,426 | |
| | |
| | |
| The accompanying notes are an integral part of these financial statements. | | 61 |
GOLDMAN SACHS JUST U.S. LARGE CAP EQUITY ETF
Schedule of Investments (continued)
August 31, 2023
| | | | | | | | |
| Shares | | |
Description | | Value | |
|
| Common Stocks – (continued) | |
| Real Estate – 2.8% | |
| | 4,419 | | | American Homes 4 Rent, Class A REIT | | $ | 159,261 | |
| | 6,186 | | | American Tower Corp. REIT | | | 1,121,646 | |
| | 1,984 | | | Apartment Income REIT Corp. REIT | | | 67,575 | |
| | 1,854 | | | AvalonBay Communities, Inc. REIT | | | 340,802 | |
| | 2,083 | | | Boston Properties, Inc. REIT | | | 139,082 | |
| | 1,378 | | | Camden Property Trust REIT | | | 148,300 | |
| | 4,114 | | | CBRE Group, Inc., Class A* | | | 349,896 | |
| | 5,751 | | | Crown Castle, Inc. REIT | | | 577,975 | |
| | 3,864 | | | Digital Realty Trust, Inc. REIT | | | 508,966 | |
| | 1,242 | | | Equinix, Inc. REIT | | | 970,474 | |
| | 5,006 | | | Equity Residential REIT | | | 324,539 | |
| | 847 | | | Essex Property Trust, Inc. REIT | | | 201,916 | |
| | 3,848 | | | Iron Mountain, Inc. REIT | | | 244,502 | |
| | 625 | | | Jones Lang LaSalle, Inc.* | | | 108,000 | |
| | 8,038 | | | Kimco Realty Corp. REIT | | | 152,240 | |
| | 12,261 | | | Prologis, Inc. REIT | | | 1,522,816 | |
| | 1,428 | | | SBA Communications Corp. REIT | | | 320,629 | |
| | 4,359 | | | UDR, Inc. REIT | | | 173,924 | |
| | 9,725 | | | Weyerhaeuser Co. REIT | | | 318,494 | |
| | 736 | | | Zillow Group, Inc., Class A* | | | 37,477 | |
| | 2,050 | | | Zillow Group, Inc., Class C* | | | 106,928 | |
| | | | | | | | |
| | | | | | | 7,895,442 | |
| | |
| Utilities – 2.3% | |
| | 7,044 | | | AES Corp. (The) | | | 126,299 | |
| | 2,763 | | | Ameren Corp. | | | 219,023 | |
| | 5,439 | | | American Electric Power Co., Inc. | | | 426,418 | |
| | 2,055 | | | American Water Works Co., Inc. | | | 285,111 | |
| | 748 | | | Avangrid, Inc. | | | 25,806 | |
| | 8,823 | | | Dominion Energy, Inc. | | | 428,268 | |
| | 2,171 | | | DTE Energy Co. | | | 224,438 | |
| | 8,138 | | | Duke Energy Corp. | | | 722,654 | |
| | 3,989 | | | Edison International | | | 274,643 | |
| | 2,233 | | | Entergy Corp. | | | 212,693 | |
| | 3,680 | | | Eversource Energy | | | 234,858 | |
| | 10,489 | | | Exelon Corp. | | | 420,819 | |
| | 21,369 | | | NextEra Energy, Inc. | | | 1,427,449 | |
| | 2,435 | | | NRG Energy, Inc. | | | 91,434 | |
| | 5,250 | | | Public Service Enterprise Group, Inc. | | | 320,670 | |
| | 6,652 | | | Sempra | | | 467,103 | |
| | 3,959 | | | Vistra Corp. | | | 124,392 | |
| | 5,812 | | | Xcel Energy, Inc. | | | 332,039 | |
| | | | | | | | |
| | | | | | | 6,364,117 | |
| | |
| TOTAL INVESTMENTS BEFORE SECURITIES LENDING
REINVESTMENT VEHICLE |
|
| | (Cost $222,314,822) | | $ | 277,117,324 | |
| | |
| Shares | | | Dividend
Rate | | Value | |
|
| Securities Lending Reinvestment Vehicle – 0.0%(a) | |
| Goldman Sachs Financial Square Government Fund –
Institutional Shares |
|
| | 30,687 | | | 5.234% | | $ | 30,687 | |
| | (Cost $30,687) | | | | |
| | |
| | TOTAL INVESTMENTS – 99.8% | | | | |
| | (Cost $222,345,509) | | $ | 277,148,011 | |
| | |
| OTHER ASSETS IN EXCESS OF
LIABILITIES – 0.2% | | | 598,542 | |
| | |
| | NET ASSETS – 100.0% | | $ | 277,746,553 | |
| | |
| | |
|
| The percentage shown for each investment category reflects the value of investments in that category as a percentage of net assets. |
| |
* | | Non-income producing security. |
| |
(a) | | Represents an affiliated issuer. |
| |
(b) | | All or a portion of security is on loan. |
| | |
|
Investment Abbreviations: |
PLC | | —Public Limited Company |
REIT | | —Real Estate Investment Trust |
|
| | |
| 62 | | The accompanying notes are an integral part of these financial statements. |
NORTH AMERICAN PIPELINES & POWER EQUITY ETF
Schedule of Investments
August 31, 2023
| | | | | | | | |
Shares | | | Description | | Value | |
|
| Common Stocks – 99.8% | |
| Energy – 81.1% | | | |
| | 16,916 | | | Antero Midstream Corp. (United States) | | $ | 205,022 | |
| | 464 | | | Cheniere Energy Partners LP (United States) | | | 24,082 | |
| | 4,655 | | | Cheniere Energy, Inc. (United States) | | | 759,696 | |
| | 3,452 | | | Clean Energy Fuels Corp. (United States)* | | | 14,706 | |
| | 468 | | | Crestwood Equity Partners LP (United States) | | | 13,385 | |
| | 504 | | | CrossAmerica Partners LP (United States) | | | 9,838 | |
| | 252 | | | Delek Logistics Partners LP (United States) | | | 10,521 | |
| | 516 | | | DT Midstream, Inc. (United States) | | | 26,982 | |
| | 11,418 | | | Enbridge, Inc. (Canada) | | | 400,362 | |
| | 28,489 | | | Energy Transfer LP (United States) | | | 383,747 | |
| | 6,100 | | | EnLink Midstream LLC (United States)* | | | 75,884 | |
| | 13,043 | | | Enterprise Products Partners LP (United States) | | | 347,074 | |
| | 4,288 | | | Equitrans Midstream Corp. (United States) | | | 41,165 | |
| | 588 | | | Excelerate Energy, Inc., Class A (United States) | | | 10,937 | |
| | 2,984 | | | Gibson Energy, Inc. (Canada) | | | 44,817 | |
| | 340 | | | Global Partners LP (United States) | | | 10,635 | |
| | 1,256 | | | Hess Midstream LP, Class A (United States) | | | 36,298 | |
| | 392 | | | Holly Energy Partners LP (United States) | | | 8,350 | |
| | 9,313 | | | Keyera Corp. (Canada) | | | 229,770 | |
| | 25,483 | | | Kinder Morgan, Inc. (United States) | | | 438,817 | |
| | 192 | | | Kinetik Holdings, Inc. (United States) | | | 6,741 | |
| | 2,001 | | | Magellan Midstream Partners LP (United States) | | | 132,906 | |
| | 3,446 | | | MPLX LP (United States) | | | 120,231 | |
| | 3,008 | | | New Fortress Energy, Inc. (United States) | | | 93,368 | |
| | 2,160 | | | NextDecade Corp. (United States)* | | | 13,111 | |
| | 768 | | | NuStar Energy LP (United States) | | | 12,872 | |
| | 10,865 | | | ONEOK, Inc. (United States) | | | 708,398 | |
| | 12,429 | | | Pembina Pipeline Corp. (Canada) | | | 385,837 | |
| | 9,139 | | | Plains All American Pipeline LP (United States) | | | 139,370 | |
| | 13,007 | | | Plains GP Holdings LP, Class A (United States)* | | | 208,632 | |
| | 6,468 | | | Secure Energy Services, Inc. (Canada) | | | 35,759 | |
| | 1,383 | | | Sunoco LP (United States) | | | 63,563 | |
| | 8,004 | | | Targa Resources Corp. (United States) | | | 690,345 | |
| | 9,677 | | | TC Energy Corp. (Canada) | | | 349,043 | |
| | 1,440 | | | Vertex Energy, Inc. (United States)* | | | 6,106 | |
| | 2,304 | | | Western Midstream Partners LP (United States) | | | 61,494 | |
| | 13,150 | | | Williams Cos., Inc. (The) (United States) | | | 454,069 | |
| | 3,008 | | | World Kinect Corp. (United States) | | | 65,875 | |
| | | | | | | | |
| | | | | | | 6,639,808 | |
| | |
| Utilities – 18.7% | | | |
| | 17,840 | | | AES Corp. (The) (United States) | | | 319,871 | |
| | 1,164 | | | AltaGas Ltd. (Canada) | | | 22,730 | |
| | 2,140 | | | Atlantica Sustainable Infrastructure PLC (Spain) | | | 48,043 | |
| | |
|
| Common Stocks – (continued) | |
| Utilities – (continued) | | | |
| | 4,374 | | | Boralex, Inc., Class A (Canada) | | | 105,976 | |
| | 1,500 | | | Brookfield Renewable Corp., Class A (United States) | | | 41,925 | |
| | 2,232 | | | Brookfield Renewable Partners LP (Canada) | | | 56,355 | |
| | 2,104 | | | Clearway Energy, Inc., Class C (United States) | | | 52,116 | |
| | 3,404 | | | Innergex Renewable Energy, Inc. (Canada) | | | 32,431 | |
| | 2,059 | | | NextEra Energy Partners LP (United States) | | | 102,703 | |
| | 8,588 | | | Northland Power, Inc. (Canada) | | | 162,181 | |
| | 1,951 | | | Ormat Technologies, Inc. (United States) | | | 148,159 | |
| | 348 | | | Suburban Propane Partners LP (United States) | | | 5,053 | |
| | 12,560 | | | Superior Plus Corp. (Canada) | | | 94,784 | |
| | 13,345 | | | UGI Corp. (United States) | | | 336,027 | |
| | | | | | | | |
| | | | | | | 1,528,354 | |
| | |
| | TOTAL INVESTMENTS – 99.8% | |
| | (Cost $8,100,891) | | $ | 8,168,162 | |
| | |
| OTHER ASSETS IN EXCESS OF
LIABILITIES – 0.2% | | | 18,161 | |
| | |
| | NET ASSETS – 100.0% | | $ | 8,186,323 | |
| | |
| | |
|
| The percentage shown for each investment category reflects the value of investments in that category as a percentage of net assets. |
| |
* | | Non-income producing security. |
| | |
|
Investment Abbreviations: |
LP | | —Limited Partnership |
PLC | | —Public Limited Company |
|
| | |
| The accompanying notes are an integral part of these financial statements. | | 63 |
GOLDMAN SACHS DEFENSIVE EQUITY ETF
Schedule of Investments
August 31, 2023
| | | | | | | | |
| Shares | | | Description | |
Value | |
|
| Common Stocks – 90.2% | |
| Communication Services – 7.1% | |
| | 1,743 | | | Alphabet, Inc., Class A* | | $ | 237,344 | |
| | 162 | | | Electronic Arts, Inc. | | | 19,437 | |
| | 353 | | | Fox Corp., Class A | | | 11,670 | |
| | 355 | | | Meta Platforms, Inc., Class A* | | | 105,041 | |
| | 75 | | | Netflix, Inc.* | | | 32,526 | |
| | 80 | | | Omnicom Group, Inc. | | | 6,481 | |
| | 49 | | | Spotify Technology SA* | | | 7,545 | |
| | 150 | | | T-Mobile US, Inc.* | | | 20,437 | |
| | 441 | | | Walt Disney Co. (The)* | | | 36,903 | |
| | 147 | | | Warner Music Group Corp., Class A | | | 4,895 | |
| | | | | | | | |
| | | | | | | 482,279 | |
| | |
| Consumer Discretionary – 10.2% | |
| | 101 | | | Airbnb, Inc., Class A* | | | 13,287 | |
| | 1,367 | | | Amazon.com, Inc.* | | | 188,660 | |
| | 10 | | | AutoZone, Inc.* | | | 25,313 | |
| | 102 | | | Best Buy Co., Inc. | | | 7,798 | |
| | 8 | | | Booking Holdings, Inc.* | | | 24,840 | |
| | 14 | | | Chipotle Mexican Grill, Inc.* | | | 26,973 | |
| | 85 | | | Darden Restaurants, Inc. | | | 13,218 | |
| | 21 | | | Deckers Outdoor Corp.* | | | 11,111 | |
| | 21 | | | Domino’s Pizza, Inc. | | | 8,135 | |
| | 81 | | | Garmin Ltd. | | | 8,588 | |
| | 77 | | | Genuine Parts Co. | | | 11,837 | |
| | 118 | | | Hilton Worldwide Holdings, Inc. | | | 17,541 | |
| | 190 | | | Home Depot, Inc. (The) | | | 62,757 | |
| | 190 | | | LKQ Corp. | | | 9,981 | |
| | 134 | | | Lowe’s Cos., Inc. | | | 30,884 | |
| | 28 | | | Lululemon Athletica, Inc.* | | | 10,675 | |
| | 154 | | | McDonald’s Corp. | | | 43,297 | |
| | 300 | | | NIKE, Inc., Class B | | | 30,513 | |
| | 2 | | | NVR, Inc.* | | | 12,755 | |
| | 25 | | | O’Reilly Automotive, Inc.* | | | 23,492 | |
| | 130 | | | Ross Stores, Inc. | | | 15,835 | |
| | 261 | | | Starbucks Corp. | | | 25,432 | |
| | 359 | | | TJX Cos., Inc. (The) | | | 33,200 | |
| | 47 | | | Tractor Supply Co. | | | 10,270 | |
| | 30 | | | Ulta Beauty, Inc.* | | | 12,451 | |
| | 135 | | | Yum! Brands, Inc. | | | 17,466 | |
| | | | | | | | |
| | | | | | | 696,309 | |
| | |
| Consumer Staples – 8.0% | |
| | 134 | | | Archer-Daniels-Midland Co. | | | 10,626 | |
| | 87 | | | Clorox Co. (The) | | | 13,611 | |
| | 869 | | | Coca-Cola Co. (The) | | | 51,992 | |
| | 334 | | | Colgate-Palmolive Co. | | | 24,539 | |
| | 90 | | | Constellation Brands, Inc., Class A | | | 23,450 | |
| | 94 | | | Costco Wholesale Corp. | | | 51,632 | |
| | 95 | | | Dollar Tree, Inc.* | | | 11,624 | |
| | 187 | | | General Mills, Inc. | | | 12,653 | |
| | 50 | | | Hershey Co. (The) | | | 10,743 | |
| | 101 | | | Kellogg Co. | | | 6,163 | |
| | 207 | | | Kenvue, Inc. | | | 4,771 | |
| | 489 | | | Keurig Dr Pepper, Inc. | | | 16,455 | |
| | 130 | | | Kimberly-Clark Corp. | | | 16,748 | |
| | 267 | | | Kraft Heinz Co. (The) | | | 8,835 | |
| | |
|
| Common Stocks – (continued) | |
| Consumer Staples – (continued) | |
| | 232 | | | Kroger Co. (The) | | | 10,763 | |
| | 90 | | | McCormick & Co., Inc. | | | 7,387 | |
| | 160 | | | Molson Coors Beverage Co., Class B | | | 10,158 | |
| | 434 | | | Mondelez International, Inc., Class A | | | 30,927 | |
| | 262 | | | Monster Beverage Corp.* | | | 15,042 | |
| | 287 | | | PepsiCo, Inc. | | | 51,063 | |
| | 411 | | | Procter & Gamble Co. (The) | | | 63,434 | |
| | 156 | | | Reynolds Consumer Products, Inc. | | | 4,257 | |
| | 229 | | | Sysco Corp. | | | 15,950 | |
| | 109 | | | Target Corp. | | | 13,794 | |
| | 334 | | | Walmart, Inc. | | | 54,312 | |
| | | | | | | | |
| | | | | | | 540,929 | |
| | |
| Energy – 1.1% | |
| | 63 | | | Chesapeake Energy Corp. | | | 5,557 | |
| | 223 | | | ConocoPhillips | | | 26,544 | |
| | 190 | | | ONEOK, Inc. | | | 12,388 | |
| | 133 | | | Phillips 66 | | | 15,183 | |
| | 447 | | | Williams Cos., Inc. (The) | | | 15,435 | |
| | | | | | | | |
| | | | | | | 75,107 | |
| | |
| Financials – 11.7% | |
| | 127 | | | American Express Co. | | | 20,065 | |
| | 83 | | | Aon PLC, Class A | | | 27,671 | |
| | 85 | | | Arthur J Gallagher & Co. | | | 19,591 | |
| | 222 | | | Berkshire Hathaway, Inc., Class B* | | | 79,964 | |
| | 33 | | | BlackRock, Inc. | | | 23,118 | |
| | 162 | | | Brown & Brown, Inc. | | | 12,004 | |
| | 63 | | | Cboe Global Markets, Inc. | | | 9,432 | |
| | 403 | | | Charles Schwab Corp. (The) | | | 23,837 | |
| | 128 | | | Chubb Ltd. | | | 25,711 | |
| | 103 | | | CME Group, Inc. | | | 20,876 | |
| | 88 | | | CNA Financial Corp. | | | 3,461 | |
| | 30 | | | FactSet Research Systems, Inc. | | | 13,092 | |
| | 158 | | | Fidelity National Information Services, Inc. | | | 8,826 | |
| | 194 | | | Fiserv, Inc.* | | | 23,550 | |
| | 228 | | | Franklin Resources, Inc. | | | 6,097 | |
| | 151 | | | Hartford Financial Services Group, Inc. (The) | | | 10,845 | |
| | 198 | | | Intercontinental Exchange, Inc. | | | 23,362 | |
| | 269 | | | Jefferies Financial Group, Inc. | | | 9,601 | |
| | 511 | | | JPMorgan Chase & Co. | | | 74,775 | |
| | 34 | | | MarketAxess Holdings, Inc. | | | 8,192 | |
| | 153 | | | Marsh & McLennan Cos., Inc. | | | 29,833 | |
| | 163 | | | Mastercard, Inc., Class A | | | 67,260 | |
| | 67 | | | Moody’s Corp. | | | 22,566 | |
| | 36 | | | MSCI, Inc. | | | 19,570 | |
| | 290 | | | PayPal Holdings, Inc.* | | | 18,128 | |
| | 109 | | | PNC Financial Services Group, Inc. (The) | | | 13,160 | |
| | 127 | | | Progressive Corp. (The) | | | 16,951 | |
| | 68 | | | S&P Global, Inc. | | | 26,578 | |
| | 135 | | | SEI Investments Co. | | | 8,378 | |
| | 114 | | | T. Rowe Price Group, Inc. | | | 12,794 | |
| | 78 | | | Tradeweb Markets, Inc., Class A | | | 6,742 | |
| | 90 | | | Travelers Cos., Inc. (The) | | | 14,511 | |
| | 280 | | | Visa, Inc., Class A | | | 68,790 | |
| | 139 | | | W R Berkley Corp. | | | 8,599 | |
| | |
| | |
| 64 | | The accompanying notes are an integral part of these financial statements. |
GOLDMAN SACHS DEFENSIVE EQUITY ETF
| | | | | | | | |
| Shares | | | Description | |
Value | |
|
| Common Stocks – (continued) | |
| Financials – (continued) | |
| | 30 | | | WEX, Inc.* | | $ | 5,885 | |
| | 70 | | | Willis Towers Watson PLC | | | 14,473 | |
| | | | | | | | |
| | | | | | | 798,288 | |
| | |
| Health Care – 15.4% | |
| | 429 | | | Abbott Laboratories | | | 44,144 | |
| | 316 | | | AbbVie, Inc. | | | 46,439 | |
| | 106 | | | Agilent Technologies, Inc. | | | 12,833 | |
| | 24 | | | Align Technology, Inc.* | | | 8,883 | |
| | 45 | | | Alnylam Pharmaceuticals, Inc.* | | | 8,902 | |
| | 101 | | | Amgen, Inc. | | | 25,890 | |
| | 63 | | | Becton Dickinson & Co. | | | 17,605 | |
| | 319 | | | Boston Scientific Corp.* | | | 17,207 | |
| | 453 | | | Bristol-Myers Squibb Co. | | | 27,927 | |
| | 177 | | | Cardinal Health, Inc. | | | 15,457 | |
| | 57 | | | Cencora, Inc. | | | 10,031 | |
| | 156 | | | Centene Corp.* | | | 9,617 | |
| | 37 | | | Cooper Cos., Inc. (The) | | | 13,690 | |
| | 294 | | | CVS Health Corp. | | | 19,160 | |
| | 131 | | | Danaher Corp. | | | 34,715 | |
| | 218 | | | DENTSPLY SIRONA, Inc. | | | 8,086 | |
| | 175 | | | Dexcom, Inc.* | | | 17,672 | |
| | 286 | | | Edwards Lifesciences Corp.* | | | 21,870 | |
| | 49 | | | Elevance Health, Inc. | | | 21,659 | |
| | 137 | | | Eli Lilly & Co. | | | 75,925 | |
| | 289 | | | Gilead Sciences, Inc. | | | 22,103 | |
| | 79 | | | HCA Healthcare, Inc. | | | 21,907 | |
| | 76 | | | Henry Schein, Inc.* | | | 5,817 | |
| | 128 | | | Hologic, Inc.* | | | 9,567 | |
| | 42 | | | Humana, Inc. | | | 19,389 | |
| | 36 | | | IDEXX Laboratories, Inc.* | | | 18,411 | |
| | 90 | | | Intuitive Surgical, Inc.* | | | 28,141 | |
| | 436 | | | Johnson & Johnson | | | 70,493 | |
| | 36 | | | McKesson Corp. | | | 14,844 | |
| | 359 | | | Medtronic PLC | | | 29,259 | |
| | 433 | | | Merck & Co., Inc. | | | 47,188 | |
| | 10 | | | Mettler-Toledo International, Inc.* | | | 12,135 | |
| | 107 | | | Moderna, Inc.* | | | 12,099 | |
| | 192 | | | QIAGEN NV* | | | 8,734 | |
| | 120 | | | Quest Diagnostics, Inc. | | | 15,780 | |
| | 54 | | | ResMed, Inc. | | | 8,618 | |
| | 67 | | | Revvity, Inc. | | | 7,841 | |
| | 34 | | | STERIS PLC | | | 7,806 | |
| | 88 | | | Stryker Corp. | | | 24,952 | |
| | 79 | | | Thermo Fisher Scientific, Inc. | | | 44,011 | |
| | 164 | | | UnitedHealth Group, Inc. | | | 78,159 | |
| | 79 | | | Veeva Systems, Inc., Class A* | | | 16,487 | |
| | 77 | | | Vertex Pharmaceuticals, Inc.* | | | 26,822 | |
| | 47 | | | West Pharmaceutical Services, Inc. | | | 19,124 | |
| | 96 | | | Zoetis, Inc. | | | 18,289 | |
| | | | | | | | |
| | | | | | | 1,045,688 | |
| | |
| Industrials – 12.9% | |
| | 132 | | | 3M Co. | | | 14,080 | |
| | 176 | | | A O Smith Corp. | | | 12,760 | |
| | 102 | | | AMETEK, Inc. | | | 16,270 | |
| | |
|
| Common Stocks – (continued) | |
| Industrials – (continued) | |
| | 106 | | | Automatic Data Processing, Inc. | | | 26,989 | |
| | 118 | | | Boeing Co. (The)* | | | 26,435 | |
| | 63 | | | Booz Allen Hamilton Holding Corp. | | | 7,138 | |
| | 100 | | | BWX Technologies, Inc. | | | 7,376 | |
| | 32 | | | Carlisle Cos., Inc. | | | 8,417 | |
| | 279 | | | Carrier Global Corp. | | | 16,028 | |
| | 67 | | | C.H. Robinson Worldwide, Inc. | | | 6,059 | |
| | 28 | | | Cintas Corp. | | | 14,117 | |
| | 38 | | | Clean Harbors, Inc.* | | | 6,435 | |
| | 722 | | | CSX Corp. | | | 21,804 | |
| | 67 | | | Dover Corp. | | | 9,936 | |
| | 81 | | | Eaton Corp. PLC | | | 18,660 | |
| | 78 | | | Equifax, Inc. | | | 16,123 | |
| | 64 | | | Expeditors International of Washington, Inc. | | | 7,469 | |
| | 373 | | | Fastenal Co. | | | 21,477 | |
| | 79 | | | FedEx Corp. | | | 20,621 | |
| | 78 | | | Ferguson PLC | | | 12,602 | |
| | 148 | | | Flowserve Corp. | | | 5,856 | |
| | 168 | | | Fortive Corp. | | | 13,247 | |
| | 52 | | | General Dynamics Corp. | | | 11,785 | |
| | 223 | | | General Electric Co. | | | 25,525 | |
| | 190 | | | Honeywell International, Inc. | | | 35,709 | |
| | 269 | | | Howmet Aerospace, Inc. | | | 13,307 | |
| | 32 | | | Hubbell, Inc. | | | 10,434 | |
| | 37 | | | IDEX Corp. | | | 8,377 | |
| | 102 | | | Illinois Tool Works, Inc. | | | 25,230 | |
| | 196 | | | Ingersoll Rand, Inc. | | | 13,643 | |
| | 45 | | | J.B. Hunt Transport Services, Inc. | | | 8,455 | |
| | 389 | | | Johnson Controls International PLC | | | 22,974 | |
| | 71 | | | Lockheed Martin Corp. | | | 31,833 | |
| | 34 | | | Nordson Corp. | | | 8,301 | |
| | 64 | | | Norfolk Southern Corp. | | | 13,121 | |
| | 52 | | | Northrop Grumman Corp. | | | 22,521 | |
| | 30 | | | Old Dominion Freight Line, Inc. | | | 12,821 | |
| | 270 | | | Otis Worldwide Corp. | | | 23,098 | |
| | 137 | | | Paychex, Inc. | | | 16,745 | |
| | 42 | | | Paycom Software, Inc. | | | 12,383 | |
| | 105 | | | Republic Services, Inc. | | | 15,134 | |
| | 49 | | | Rockwell Automation, Inc. | | | 15,292 | |
| | 231 | | | Rollins, Inc. | | | 9,141 | |
| | 405 | | | RTX Corp. | | | 34,846 | |
| | 83 | | | Trane Technologies PLC | | | 17,037 | |
| | 21 | | | TransDigm Group, Inc.* | | | 18,981 | |
| | 139 | | | Union Pacific Corp. | | | 30,659 | |
| | 162 | | | United Parcel Service, Inc., Class B | | | 27,443 | |
| | 78 | | | Verisk Analytics, Inc. | | | 18,893 | |
| | 165 | | | Waste Management, Inc. | | | 25,869 | |
| | 123 | | | Westinghouse Air Brake Technologies Corp. | | | 13,840 | |
| | 28 | | | W.W. Grainger, Inc. | | | 19,996 | |
| | | | | | | | |
| | | | | | | 873,292 | |
| | |
| Information Technology – 17.3% | |
| | 149 | | | Accenture PLC, Class A | | | 48,242 | |
| | 81 | | | Amdocs Ltd. | | | 7,225 | |
| | 248 | | | Amphenol Corp., Class A | | | 21,918 | |
| | 46 | | | ANSYS, Inc.* | | | 14,668 | |
| | |
| | |
| The accompanying notes are an integral part of these financial statements. | | 65 |
GOLDMAN SACHS DEFENSIVE EQUITY ETF
Schedule of Investments (continued)
August 31, 2023
| | | | | | | | |
| Shares | | | Description | |
Value | |
|
| Common Stocks – (continued) | |
| Information Technology – (continued) | |
| | 2,290 | | | Apple, Inc. | | $ | 430,222 | |
| | 62 | | | Arista Networks, Inc.* | | | 12,104 | |
| | 72 | | | Cadence Design Systems, Inc.* | | | 17,312 | |
| | 676 | | | Cisco Systems, Inc. | | | 38,769 | |
| | 102 | | | Datadog, Inc., Class A* | | | 9,841 | |
| | 235 | | | Dynatrace, Inc.* | | | 11,327 | |
| | 12 | | | Fair Isaac Corp.* | | | 10,855 | |
| | 311 | | | Fortinet, Inc.* | | | 18,725 | |
| | 55 | | | Gartner, Inc.* | | | 19,232 | |
| | 898 | | | Intel Corp. | | | 31,556 | |
| | 137 | | | Keysight Technologies, Inc.* | | | 18,262 | |
| | 68 | | | Lattice Semiconductor Corp.* | | | 6,614 | |
| | 58 | | | Manhattan Associates, Inc.* | | | 11,752 | |
| | 70 | | | Motorola Solutions, Inc. | | | 19,850 | |
| | 368 | | | NVIDIA Corp. | | | 181,626 | |
| | 298 | | | Oracle Corp. | | | 35,876 | |
| | 95 | | | Palo Alto Networks, Inc.* | | | 23,114 | |
| | 113 | | | PTC, Inc.* | | | 16,630 | |
| | 47 | | | Roper Technologies, Inc. | | | 23,456 | |
| | 163 | | | Salesforce, Inc.* | | | 36,098 | |
| | 35 | | | Synopsys, Inc.* | | | 16,061 | |
| | 163 | | | TE Connectivity Ltd. | | | 21,580 | |
| | 18 | | | Teledyne Technologies, Inc.* | | | 7,529 | |
| | 163 | | | Texas Instruments, Inc. | | | 27,394 | |
| | 39 | | | Tyler Technologies, Inc.* | | | 15,539 | |
| | 93 | | | VeriSign, Inc.* | | | 19,324 | |
| | | | | | | | |
| | | | | | | 1,172,701 | |
| | |
| Materials – 2.6% | |
| | 52 | | | Air Products and Chemicals, Inc. | | | 15,366 | |
| | 40 | | | AptarGroup, Inc. | | | 5,302 | |
| | 135 | | | Ball Corp. | | | 7,351 | |
| | 94 | | | Ecolab, Inc. | | | 17,278 | |
| | 103 | | | International Flavors & Fragrances, Inc. | | | 7,256 | |
| | 105 | | | Linde PLC | | | 40,639 | |
| | 221 | | | Newmont Corp. | | | 8,712 | |
| | 58 | | | Packaging Corp. of America | | | 8,648 | |
| | 110 | | | PPG Industries, Inc. | | | 15,594 | |
| | 28 | | | Reliance Steel & Aluminum Co. | | | 7,979 | |
| | 60 | | | RPM International, Inc. | | | 5,984 | |
| | 81 | | | Sherwin-Williams Co. (The) | | | 22,009 | |
| | 74 | | | Southern Copper Corp. (Mexico) | | | 5,969 | |
| | 41 | | | Vulcan Materials Co. | | | 8,948 | |
| | | | | | | | |
| | | | | | | 177,035 | |
| | |
| Real Estate – 1.3% | |
| | 78 | | | AvalonBay Communities, Inc. REIT | | | 14,338 | |
| | 136 | | | CoStar Group, Inc.* | | | 11,151 | |
| | 25 | | | Equinix, Inc. REIT | | | 19,534 | |
| | 202 | | | Equity Residential REIT | | | 13,096 | |
| | 41 | | | Essex Property Trust, Inc. REIT | | | 9,774 | |
| | 70 | | | Public Storage REIT | | | 19,346 | |
| | | | | | | | |
| | | | | | | 87,239 | |
| | |
|
| Common Stocks – (continued) | |
| Utilities – 2.6% | |
| | 90 | | | Ameren Corp. | | | 7,134 | |
| | 142 | | | American Electric Power Co., Inc. | | | 11,133 | |
| | 316 | | | CenterPoint Energy, Inc. | | | 8,813 | |
| | 111 | | | Consolidated Edison, Inc. | | | 9,875 | |
| | 94 | | | Constellation Energy Corp. | | | 9,791 | |
| | 104 | | | DTE Energy Co. | | | 10,752 | |
| | 190 | | | Duke Energy Corp. | | | 16,872 | |
| | 360 | | | Exelon Corp. | | | 14,443 | |
| | 431 | | | NextEra Energy, Inc. | | | 28,791 | |
| | 397 | | | PPL Corp. | | | 9,893 | |
| | 216 | | | Public Service Enterprise Group, Inc. | | | 13,193 | |
| | 360 | | | Southern Co. (The) | | | 24,383 | |
| | 198 | | | Xcel Energy, Inc. | | | 11,312 | |
| | | | | | | | |
| | | | | | | 176,385 | |
| | |
| | TOTAL INVESTMENTS – 90.2% | |
| | (Cost $5,718,625) | | $ | 6,125,252 | |
| | |
| OTHER ASSETS IN EXCESS OF
LIABILITIES – 9.8% | | | 667,508 | |
| | |
| | NET ASSETS – 100.0% | | $ | 6,792,760 | |
| | |
| | |
|
| The percentage shown for each investment category reflects the value of investments in that category as a percentage of net assets. |
| |
* | | Non-income producing security. |
| | |
|
Investment Abbreviations: |
PLC | | —Public Limited Company |
REIT | | —Real Estate Investment Trust |
|
| | |
| 66 | | The accompanying notes are an integral part of these financial statements. |
GOLDMAN SACHS DEFENSIVE EQUITY ETF
|
| ADDITIONAL INVESTMENT INFORMATION |
FUTURES CONTRACTS — At August 31, 2023, the Fund had the following futures contracts:
| | | | | | | | | | | | | | |
| Description | | Number of
Contracts | | | Expiration
Date | | Notional
Amount | | | Unrealized
Appreciation/
(Depreciation) | |
Long position contracts: | | | | | | | | | | | | | | |
S&P 500 E-Mini Index | | | 3 | | | 09/15/23 | | | $677,400 | | | | $11,957 | |
PURCHASED & WRITTEN OPTIONS CONTRACTS — At August 31, 2023, the Fund had the following purchased and written option contracts:
EXCHANGE TRADED OPTIONS ON EQUITIES CONTRACTS
| | | | | | | | | | | | | | | | | | | | | | | | | | |
| Description | | Exercise
Rate | | | Expiration
Date | | Number of
Contracts | | | Notional
Amount | | | Market
Value | | | Premiums Paid
(Received) by
the Portfolio | | | Unrealized
Appreciation/
(Depreciation) | |
Purchased Option Contracts: | |
Puts | | | | | | | | | | | | | | | | | | | | | | | | | | |
S&P 500 E-Mini | | | 4,460.000 | | | 09/29/2023 | | | 29 | | | | $6,467,000 | | | $ | 39,150 | | | $ | 40,634 | | | $ | (1,484 | ) |
| | | | | | | |
| Total purchased option contract | | | | | | | | | 29 | | | $ | 6,467,000 | | | $ | 39,150 | | | $ | 40,634 | | | $ | (1,484 | ) |
EXCHANGE TRADED OPTIONS ON EQUITIES CONTRACTS
| | | | | | | | | | | | | | | | | | | | | | | | | | |
| Description | | Exercise
Rate | | | Expiration
Date | | Number of
Contracts | | | Notional
Amount | | | Market
Value | | | Premiums Paid
(Received) by
the Portfolio | | | Unrealized
Appreciation/
(Depreciation) | |
Written Option Contracts: | |
Calls | | | | | | | | | | | | | | | | | | | | | | | | | | |
S&P 500 E-Mini | | | 4,640.000 | | | 09/29/2023 | | | (29 | ) | | $ | (6,728,000 | ) | | $ | (35,162 | ) | | $ | (42,378 | ) | | $ | 7,216 | |
Puts | | | | | | | | | | | | | | | | | | | | | | | | | | |
S&P 500 E-Mini | | | 4,270.000 | | | 09/29/2023 | | | (29) | | | | (6,191,500 | ) | | | (11,963 | ) | | | (13,379 | ) | | | 1,416 | |
| | | | | | | |
| Total written option contracts | | | | | | | | | (58 | ) | | $ | (12,919,500 | ) | | $ | (47,125 | ) | | $ | (55,757 | ) | | $ | 8,632 | |
| | |
| The accompanying notes are an integral part of these financial statements. | | 67 |
GOLDMAN SACHS EQUITY ETFS
Statements of Assets and Liabilities
August 31, 2023
| | | | | | | | | | | | | | | | | | |
| | | | | Bloomberg Clean
Energy Equity
ETF | | | Equal Weight U.S.
Large Cap Equity
ETF | | | Hedge Industry
VIP ETF | | | Innovate Equity
ETF | |
| | Assets: | | | | | | | | | | | | | | | | |
| | | | | |
| | Investments in unaffiliated issuers, at value (cost $9,567,071, $430,421,894, $121,238,082 and $318,613,051, respectively)(a) | | $ | 8,714,377 | | | $ | 460,352,318 | | | $ | 141,999,092 | | | $ | 333,733,182 | |
| | | | | |
| | Investments in affiliated issuers, at value (cost $—, $876,595, $— and $1,360,060, respectively) | | | — | | | | 888,422 | | | | — | | | | 1,692,950 | |
| | | | | |
| | Investments in affiliated securities lending reinvestment vehicle, at value which equals cost | | | 119,761 | | | | 542,850 | | | | — | | | | 8,259,180 | |
| | | | | |
| | Cash | | | 27,045 | | | | 566,969 | | | | 145,379 | | | | 229,020 | |
| | | | | |
| | Foreign currency, at value (cost $15, $—, $— and $105,574, respectively) | | | 15 | | | | — | | | | — | | | | 105,130 | |
| | | | | |
| | Receivables: | | | | | | | | | | | | | | | | |
| | | | | |
| | Dividends | | | 14,031 | | | | 761,396 | | | | 71,860 | | | | 314,284 | |
| | | | | |
| | Foreign capital gains tax | | | 64 | | | | — | | | | — | | | | — | |
| | | | | |
| | Foreign tax reclaims | | | 5,112 | | | | — | | | | 634 | | | | 76,906 | |
| | | | | |
| | Securities lending income | | | 85 | | | | 389 | | | | — | | | | 65,381 | |
| | | | | |
| | Total assets | | | 8,880,490 | | | | 463,112,344 | | | | 142,216,965 | | | | 344,476,033 | |
| | | | | | | | | | | | | | | | | | |
| | Liabilities: | | | | | | | | | | | | | | | | |
| | | | | |
| | Payables: | | | | | | | | | | | | | | | | |
| | | | | |
| | Upon return of securities loaned | | | 119,761 | | | | 542,850 | | | | — | | | | 8,259,180 | |
| | | | | |
| | Management fees | | | 985 | | | | 35,404 | | | | 53,442 | | | | 141,277 | |
| | | | | |
| | Investments purchased | | | — | | | | — | | | | — | | | | 15 | |
| | | | | |
| | Total liabilities | | | 120,746 | | | | 578,254 | | | | 53,442 | | | | 8,400,472 | |
| | | | | | | | | | | | | | | | | | |
| | Net Assets: | | | | | | | | | | | | | | | | |
| | | | | |
| | Paid-in capital | | | 9,767,293 | | | | 505,530,335 | | | | 187,914,915 | | | | 398,325,408 | |
| | | | | |
| | Total distributable loss | | | (1,007,549 | ) | | | (42,996,245 | ) | | | (45,751,392 | ) | | | (62,249,847 | ) |
| | | | | |
| | NET ASSETS | | $ | 8,759,744 | | | $ | 462,534,090 | | | $ | 142,163,523 | | | $ | 336,075,561 | |
| | SHARES ISSUED AND OUTSTANDING | | | | | | | | | | | | | | | | |
| | | | | |
| | Shares outstanding no par value (unlimited shares authorized): | | | 250,000 | | | | 7,350,000 | | | | 1,600,000 | | | | 6,800,000 | |
| | | | | |
| | Net asset value per share: | | | $35.04 | | | | $62.93 | | | | $88.85 | | | | $49.42 | |
| | (a) | | Includes loaned securities having a market value of $115,376, $523,110, $— and $7,835,629 for Bloomberg Clean Energy Equity ETF, Equal Weight U.S. Large Cap Equity ETF, Hedge Industry VIP ETF and Innovate Equity ETF, respectively. |
| | |
| 68 | | The accompanying notes are an integral part of these financial statements. |
GOLDMAN SACHS EQUITY ETFS
Statements of Assets and Liabilities (continued)
August 31, 2023
| | | | | | | | | | | | | | |
| | | | | JUST U.S. Large
Cap Equity ETF | | | North American
Pipelines & Power
Equity ETF | | | Defensive Equity
ETF | |
| | Assets: | | | | | | | | | |
| | | | |
| | Investments in unaffiliated issuers, at value (cost $221,420,972, $8,100,891 and $5,718,625)(a) | | $ | 276,070,290 | | | $ | 8,168,162 | | | $ | 6,125,252 | |
| | | | |
| | Investments in affiliated issuers, at value (cost $893,850, $— and $—) | | | 1,047,034 | | | | — | | | | — | |
| | | | |
| | Investments in affiliated securities lending reinvestment vehicle, at value which equals cost | | | 30,687 | | | | — | | | | — | |
| | | | |
| | Purchased options, at value (premiums paid $—, $— and $40,634) | | | — | | | | — | | | | 39,150 | |
| | | | |
| | Cash | | | 202,658 | | | | 3,700 | | | | 406,537 | |
| | | | |
| | Variation margin on futures contracts | | | — | | | | — | | | | 8,344 | |
| | | | |
| | Receivables: | | | | | | | | | | | | |
| | | | |
| | Dividends | | | 469,455 | | | | 18,256 | | | | 7,056 | |
| | | | |
| | Securities lending income | | | 3,689 | | | | — | | | | — | |
| | | | |
| | Collateral on futures contracts | | | — | | | | — | | | | 284,000 | |
| | | | |
| | Investments sold | | | — | | | | — | | | | 1,281,626 | |
| | | | |
| | Reimbursement from investment adviser | | | — | | | | — | | | | 702 | |
| | | | |
| | Total assets | | | 277,823,813 | | | | 8,190,118 | | | | 8,152,667 | |
| | | | | | | | | | | | | | |
| | Liabilities: | | | | | | | | | | | | |
| | | | |
| | Written options, at value (premiums received $—, $— and $55,757) | | | — | | | | — | | | | 47,125 | |
| | | | |
| | Payables: | | | | | | | | | | | | |
| | | | |
| | Management fees | | | 46,573 | | | | 3,795 | | | | — | |
| | | | |
| | Upon return of securities loaned | | | 30,687 | | | | — | | | | — | |
| | | | |
| | Investments purchased | | | — | | | | — | | | | 1,312,782 | |
| | | | |
| | Total liabilities | | | 77,260 | | | | 3,795 | | | | 1,359,907 | |
| | | | | | | | | | | | | | |
| | Net Assets: | | | | | | | | | | | | |
| | | | |
| | Paid-in capital | | | 237,079,492 | | | | 8,096,206 | | | | 6,996,749 | |
| | | | |
| | Total distributable earnings (loss) | | | 40,667,061 | | | | 90,117 | | | | (203,989 | ) |
| | | | |
| | NET ASSETS | | $ | 277,746,553 | | | $ | 8,186,323 | | | $ | 6,792,760 | |
| | SHARES ISSUED AND OUTSTANDING | | | | | | | | | | | | |
| | | | |
| | Shares outstanding no par value (unlimited shares authorized)(b): | | | 4,325,000 | | | | 200,000 | | | | 152,572 | |
| | | | |
| | Net asset value per share: | | | $64.22 | | | | $40.93 | | | | $44.52 | |
| | (a) | | Includes loaned securities having a market value of $29,510, $— and $— for JUST U.S. Large Cap Equity ETF, North American Pipelines & Power Equity ETF, and Defensive Equity ETF, respectively. |
| | (b) | | Goldman Sachs Defensive Equity ETF acquired all of the assets and liabilities of the Goldman Sachs Defensive Equity Fund (“Predecessor Fund”) in a reorganization that occurred as of the close of business on January 23, 2023. Performance and financial history of the Predecessor Fund’s Institutional Class Shares have been adopted by Goldman Sachs Defensive Equity ETF and will be used going forward. As a result, the information prior to January 23, 2023, reflects that of the Predecessor Fund’s Institutional Class Shares. The Predecessor Fund ceased operations as of the date of the reorganization. (See Note 1). |
| | |
| The accompanying notes are an integral part of these financial statements. | | 69 |
GOLDMAN SACHS EQUITY ETFS
Statements of Operations
For the Fiscal Year Ended August 31, 2023
| | | | | | | | | | | | | | | | | | |
| | | | | Bloomberg Clean
Energy Equity
ETF | | | Equal Weight U.S.
Large Cap Equity
ETF | | | Hedge Industry
VIP ETF | | | Innovate Equity
ETF | |
| | Investment income: | |
| | | | | |
| | Dividends — unaffiliated issuers (net of foreign withholding taxes of $22,452, $11,635, $5,657 and $179,228, respectively) | | $ | 155,246 | | | $ | 9,320,659 | | | $ | 820,938 | | | $ | 3,878,778 | |
| | | | | |
| | Non cash dividend income | | | 17,278 | | | | — | | | | 76,438 | | | | — | |
| | | | | |
| | Securities lending income, net of rebates received or paid to borrowers — unaffiliated issuer | | | 2,224 | | | | 12,845 | | | | 15 | | | | 819,380 | |
| | | | | |
| | Dividends — affiliated issuers | | | — | | | | 29,688 | | | | — | | | | 46,392 | |
| | | | | |
| | Total investment income | | | 174,748 | | | | 9,363,192 | | | | 897,391 | | | | 4,744,550 | |
| | | |
| | Expenses: | |
| | | | | |
| | Trustee fees | | | 25,307 | | | | 39,054 | | | | 28,469 | | | | 33,099 | |
| | | | | |
| | Management fees | | | 13,813 | | | | 426,187 | | | | 567,067 | | | | 1,585,924 | |
| | | | | |
| | Total expenses | | | 39,120 | | | | 465,241 | | | | 595,536 | | | | 1,619,023 | |
| | | | | |
| | NET INVESTMENT INCOME | | | 135,628 | | | | 8,897,951 | | | | 301,855 | | | | 3,125,527 | |
| | | | | | | | | | | | | | | | | | |
| | Realized and unrealized gain (loss): | |
| | | | | |
| | Net realized gain (loss) from: | | | | | | | | | | | | | | | | |
| | | | | |
| | Investments — unaffiliated issuers | | | (171,534 | ) | | | (49,400,975 | ) | | | (17,960,410 | ) | | | (41,067,623 | ) |
| | | | | |
| | Investments — affiliated issuers | | | — | | | | (14,730 | ) | | | — | | | | 222,390 | |
| | | | | |
| | In-kind redemptions — unaffiliated issuers | | | — | | | | 39,231,216 | | | | 14,049,461 | | | | 10,015,745 | |
| | | | | |
| | In-kind redemptions — affiliated issuers | | | — | | | | 175,053 | | | | — | | | | 99,771 | |
| | | | | |
| | Foreign currency transactions | | | (403 | ) | | | (668 | ) | | | 74 | | | | (27,947 | ) |
| | | | | |
| | Net change in unrealized gain (loss) on: | | | | | | | | | | | | | | | | |
| | | | | |
| | Investments — unaffiliated issuers (including the effects of the net change in foreign capital gains tax liability of $2,688, $—, $— and $—, respectively) | | | (835,912 | ) | | | 42,709,324 | | | | 23,892,864 | | | | 67,819,739 | |
| | | | | |
| | Investments — affiliated issuers | | | — | | | | (141,643 | ) | | | — | | | | (313,562 | ) |
| | | | | |
| | Foreign currency translations | | | 193 | | | | — | | | | — | | | | 4,460 | |
| | | | | |
| | Net realized and unrealized gain (loss) | | | (1,007,656 | ) | | | 32,557,577 | | | | 19,981,989 | | | | 36,752,973 | |
| | | | | |
| | NET INCREASE (DECREASE) IN NET ASSETS RESULTING FROM OPERATIONS | | $ | (872,028 | ) | | $ | 41,455,528 | | | $ | 20,283,844 | | | $ | 39,878,500 | |
| | |
| 70 | | The accompanying notes are an integral part of these financial statements. |
GOLDMAN SACHS EQUITY ETFS
Statements of Operations (continued)
For the Fiscal Year Ended August 31, 2023
| | | | | | | | | | |
| | | | | JUST U.S. Large
Cap Equity ETF | | | North American
Pipelines & Power
Equity ETF* | |
| | Investment income: | | | | | |
| | | |
| | Dividends — unaffiliated issuers (net of foreign withholding taxes of $54 and $1,540) | | $ | 4,601,670 | | | $ | 32,592 | |
| | | |
| | Dividends — affiliated issuers | | | 34,609 | | | | — | |
| | | |
| | Securities lending income, net of rebates received or paid to borrowers — unaffiliated issuer | | | 9,647 | | | | — | |
| | | |
| | Total investment income | | | 4,645,926 | | | | 32,592 | |
| | | | | | | | | | |
| | Expenses: | | | | | | | | |
| | | |
| | Management fees | | | 509,324 | | | | 6,394 | |
| | | |
| | Trustee fees | | | 31,646 | | | | — | |
| | | |
| | Total expenses | | | 540,970 | | | | 6,394 | |
| | | |
| | NET INVESTMENT INCOME | | | 4,104,956 | | | | 26,198 | |
| | | | | | | | | | |
| | Realized and unrealized gain (loss): | | | | | |
| | | |
| | Net realized gain (loss) from: | | | | | | | | |
| | | |
| | Investments — unaffiliated issuers | | | (6,879,486 | ) | | | — | |
| | | |
| | Investments — affiliated issuers | | | (2,495 | ) | | | — | |
| | | |
| | In-kind redemptions — unaffiliated issuers | | | 15,059,338 | | | | — | |
| | | |
| | In-kind redemptions — affiliated issuers | | | 59,355 | | | | — | |
| | | |
| | Foreign currency transactions | | | — | | | | (3,319 | ) |
| | | |
| | Net change in unrealized gain (loss) on: | | | | | | | | |
| | | |
| | Investments — unaffiliated issuers | | | 25,725,580 | | | | 67,271 | |
| | | |
| | Investments — affiliated issuers | | | (77,977 | ) | | | — | |
| | | |
| | Foreign currency translations | | | — | | | | (33 | ) |
| | | |
| | Net realized and unrealized gain | | | 33,884,315 | | | | 63,919 | |
| | | |
| | NET INCREASE IN NET ASSETS RESULTING FROM OPERATIONS | | $ | 37,989,271 | | | $ | 90,117 | |
| | * | | For the period July 11, 2023 (commencement of operations) through August 31, 2023. |
| | |
| The accompanying notes are an integral part of these financial statements. | | 71 |
GOLDMAN SACHS EQUITY ETFS
Statements of Operations (continued)
| | | | | | | | | | |
| | | | | Defensive Equity ETF | |
| | | | | For the Period
January 1, 2023
to
August 31, 2023†(a) | | | For the Fiscal
Year Ended
December 31, 2022†(a) | |
| | Investment income: | | | | | | | | |
| | | |
| | Dividends — unaffiliated issuers (net of foreign withholding taxes of $9 and $—, respectively) | | $ | 68,212 | | | $ | 78,788 | |
| | | |
| | Dividends — affiliated issuers | | | 289 | | | | 3,394 | |
| | | |
| | Securities lending income, net of rebates received or paid to borrowers — unaffiliated issuer | | | 6 | | | | — | |
| | | |
| | Interest | | | — | | | | 232 | |
| | | |
| | Total investment income | | | 68,507 | | | | 82,414 | |
| | | | | | | | | | |
| | Expenses: | | | | | | | | |
| | | |
| | Registration fees | | | 50,545 | | | | 75,855 | |
| | | |
| | Trustee fees | | | 19,354 | | | | 27,444 | |
| | | |
| | Custody, accounting and administrative services | | | 4,216 | | | | 41,071 | |
| | | |
| | Printing and mailing costs | | | 4,130 | | | | 36,522 | |
| | | |
| | Professional fees | | | 3,753 | | | | 141,458 | |
| | | |
| | Management fees | | | 2,808 | | | | 31,475 | |
| | | |
| | Transfer Agency fees | | | 163 | | | | 3,099 | (b) |
| | | |
| | Service fees — Class C | | | 159 | | | | 713 | |
| | | |
| | Distribution and/or Service (12b-1) fees | | | — | | | | 2,954 | (c) |
| | | |
| | Other | | | 13,331 | | | | 82 | |
| | | |
| | Total expenses | | | 98,459 | | | | 360,673 | |
| | | |
| | Less — expense reductions | | | (74,198 | ) | | | (322,522 | ) |
| | | |
| | Net expenses | | | 24,261 | | | | 38,151 | |
| | | |
| | NET INVESTMENT INCOME | | | 44,246 | | | | 44,263 | |
| | | | | | | | | | |
| | Realized and unrealized gain (loss): | | | | | | | | |
| | | |
| | Net realized gain (loss) from: | | | | | | | | |
| | | |
| | Investments — unaffiliated issuers | | | (7,801 | ) | | | (717,576 | ) |
| | | |
| | In-kind redemptions | | | 77,586 | | | | — | |
| | | |
| | Futures contracts | | | 61,783 | | | | (68,240 | ) |
| | | |
| | Written options | | | 60,850 | | | | 653,925 | |
| | | |
| | Purchased options | | | (445,039 | ) | | | (213,568 | ) |
| | | |
| | Net change in unrealized gain (loss) on: | | | | | | | | |
| | | |
| | Investments — unaffiliated issuers | | | 595,526 | | | | (597,312 | ) |
| | | |
| | Futures contracts | | | 28,346 | | | | (26,273 | ) |
| | | |
| | Written options | | | 17,209 | | | | (26,632 | ) |
| | | |
| | Purchased Options | | | 18,173 | | | | 70,661 | |
| | | |
| | Net realized and unrealized gain (loss) | | | 406,633 | | | | (925,015 | ) |
| | | |
| | NET INCREASE (DECREASE) IN NET ASSETS RESULTING FROM OPERATIONS | | $ | 450,879 | | | $ | (880,752 | ) |
| | † | | The Fund changed its fiscal year end from December 31 to August 31 on February 1, 2023. |
| | (a) | | Goldman Sachs Defensive Equity ETF acquired all of the assets and liabilities of the Goldman Sachs Defensive Equity Fund (“Predecessor Fund”) in a reorganization that occurred as of the close of business on January 23, 2023. Performance and financial history of the Predecessor Fund’s Institutional Class Shares have been adopted by Goldman Sachs Defensive Equity ETF and will be used going forward. As a result, the information prior to January 23, 2023, reflects that of the Predecessor Fund’s Institutional Class Shares. The Predecessor Fund ceased operations as of the date of the reorganization. (See Note 1). |
| | (b) | | Class specific Transfer Agency fees were $383, $457, $2,097, $69, $13, $68 and $12 for Class A, Class C, Institutional, Investor, Class R6, Class R and Class P, respectively. |
| | (c) | | Class specific Distribution and/or Service (12b-1) fees were $601, $2,140 and $213 for Class A, Class C and Class R, respectively. |
| | |
| 72 | | The accompanying notes are an integral part of these financial statements. |
GOLDMAN SACHS EQUITY ETFS
Statements of Changes in Net Assets
| | | | | | | | | | | | | | | | | | | | | | |
| | | | | Bloomberg Clean Energy Equity ETF | | | | | | Equal Weight U.S. Large Cap Equity
ETF | |
| | | | | For the Fiscal
Year Ended
August 31, 2023 | | | For the Period
February 8, 2022*
to
August 31, 2022 | | | | | | For the Fiscal
Year Ended
August 31, 2023 | | | For the Fiscal
Year Ended
August 31, 2022 | |
| | From operations: | | | | | | | | | | | | | | | | | | | | |
| | | | | | |
| | Net investment income | | $ | 135,628 | | | $ | 63,220 | | | | | | | $ | 8,897,951 | | | $ | 11,259,384 | |
| | | | | | |
| | Net realized gain (loss) | | | (171,937 | ) | | | (18,185 | ) | | | | | | | (10,010,104 | ) | | | 39,577,340 | |
| | | | | | |
| | Net change in unrealized gain (loss) | | | (835,719 | ) | | | (16,978 | ) | | | | | | | 42,567,681 | | | | (169,980,290 | ) |
| | | | | | |
| | Net increase (decrease) in net assets resulting from operations | | | (872,028 | ) | | | 28,057 | | | | | | | | 41,455,528 | | | | (119,143,566 | ) |
| | | | | | | | | | | | | | | | | | | | | | |
| | Distributions to shareholders: | | | | | | | | | | | | | | | | | | | | |
| | | | | | |
| | From distributable earnings | | | (123,162 | ) | | | (40,416 | ) | | | | | | | (9,019,245 | ) | | | (11,856,146 | ) |
| | | | | | | | | | | | | | | | | | | | | | |
| | From share transactions: | | | | | | | | | | | | | | | | | | | | |
| | | | | | |
| | Proceeds from sales of shares | | | 1,839,938 | | | | 7,927,355 | | | | | | | | 49,832,589 | | | | 169,051,301 | |
| | | | | | |
| | Cost of shares redeemed | | | — | | | | — | | | | | | | | (233,144,465 | ) | | | (282,145,961 | ) |
| | | | | | |
| | Net increase (decrease) in net assets resulting from share transactions | | | 1,839,938 | | | | 7,927,355 | | | | | | | | (183,311,876 | ) | | | (113,094,660 | ) |
| | | | | | |
| | TOTAL INCREASE (DECREASE) | | | 844,748 | | | | 7,914,996 | | | | | | | | (150,875,593 | ) | | | (244,094,372 | ) |
| | | | | | | | | | | | | | | | | | | | | | |
| | Net assets: | | | | | | | | | | | | | | | | | | | | |
| | | | | | |
| | Beginning of period | | $ | 7,914,996 | | | $ | — | | | | | | | $ | 613,409,683 | | | $ | 857,504,055 | |
| | | | | | |
| | End of period | | $ | 8,759,744 | | | $ | 7,914,996 | | | | | | | $ | 462,534,090 | | | $ | 613,409,683 | |
| | * | | Commencement of operations. |
| | |
| The accompanying notes are an integral part of these financial statements. | | 73 |
GOLDMAN SACHS EQUITY ETFS
Statements of Changes in Net Assets (continued)
| | | | | | | | | | | | | | | | | | | | | | |
| | | | | Hedge Industry VIP ETF | | | | | | Innovate Equity ETF | |
| | | | | For the Fiscal
Year Ended
August 31, 2023 | | | For the Fiscal
Year Ended
August 31, 2022 | | | | | | For the Fiscal
Year Ended
August 31, 2023 | | | For the Fiscal
Year Ended
August 31, 2022 | |
| | From operations: | | | | | | | | | | | | | | | | | | | | |
| | | | | | |
| | Net investment income (loss) | | $ | 301,855 | | | $ | (89,049 | ) | | | | | | $ | 3,125,527 | | | $ | 2,584,544 | |
| | | | | | |
| | Net realized loss | | | (3,910,875 | ) | | | (23,516,016 | ) | | | | | | | (30,757,664 | ) | | | (19,394,355 | ) |
| | | | | | |
| | Net change in unrealized gain (loss) | | | 23,892,864 | | | | (35,121,455 | ) | | | | | | | 67,510,637 | | | | (133,254,318 | ) |
| | | | | | |
| | Net increase (decrease) in net assets resulting from operations | | | 20,283,844 | | | | (58,726,520 | ) | | | | | | | 39,878,500 | | | | (150,064,129 | ) |
| | | | | | | | | | | | | | | | | | | | | | |
| | Distributions to shareholders: | | | | | | | | | | | | | | | | | | | | |
| | | | | | |
| | From distributable earnings | | | (20,653 | ) | | | — | | | | | | | | (558,596 | ) | | | (3,566,370 | ) |
| | | | | | | | | | | | | | | | | | | | | | |
| | From share transactions: | | | | | | | | | | | | | | | | | | | | |
| | | | | | |
| | Proceeds from sales of shares | | | 62,131,240 | | | | 59,701,538 | | | | | | | | 33,362,172 | | | | 51,102,318 | |
| | | | | | |
| | Cost of shares redeemed | | | (85,315,250 | ) | | | (77,725,146 | ) | | | | | | | (64,136,814 | ) | | | (63,125,867 | ) |
| | | | | | |
| | Net decrease in net assets resulting from share transactions | | | (23,184,010 | ) | | | (18,023,608 | ) | | | | | | | (30,774,642 | ) | | | (12,023,549 | ) |
| | | | | | |
| | TOTAL INCREASE (DECREASE) | | | (2,920,819 | ) | | | (76,750,128 | ) | | | | | | | 8,545,262 | | | | (165,654,048 | ) |
| | | | | | | | | | | | | | | | | | | | | | |
| | Net assets: | | | | | | | | | | | | | | | | | | | | |
| | | | | | |
| | Beginning of year | | $ | 145,084,342 | | | $ | 221,834,470 | | | | | | | $ | 327,530,299 | | | $ | 493,184,347 | |
| | | | | | |
| | End of year | | $ | 142,163,523 | | | $ | 145,084,342 | | | | | | | $ | 336,075,561 | | | $ | 327,530,299 | |
| | |
| 74 | | The accompanying notes are an integral part of these financial statements. |
GOLDMAN SACHS EQUITY ETFS
Statements of Changes in Net Assets (continued)
| | | | | | | | | | | | | | | | | | |
| | | | | JUST U.S. Large Cap Equity ETF | | | | | | North American
Pipelines & Power
Equity ETF | |
| | | | | For the Fiscal
Year Ended
August 31, 2023 | | | For the Fiscal
Year Ended
August 31, 2022 | | | | | | For the Period
July 11, 2023*
to
August 31, 2023 | |
| | From operations: | | | | | | | | | | | | | | | | |
| | | | | |
| | Net investment income | | $ | 4,104,956 | | | $ | 3,579,609 | | | | | | | $ | 26,198 | |
| | | | | |
| | Net realized gain (loss) | | | 8,236,712 | | | | 8,987,322 | | | | | | | | (3,319 | ) |
| | | | | |
| | Net change in unrealized gain (loss) | | | 25,647,603 | | | | (49,885,593 | ) | | | | | | | 67,238 | |
| | | | | |
| | Net increase (decrease) in net assets resulting from operations | | | 37,989,271 | | | | (37,318,662 | ) | | | | | | | 90,117 | |
| | | | | | | | | | | | | | | | | | |
| | Distributions to shareholders: | | | | | | | | | | | | | | | | |
| | | | | |
| | From distributable earnings | | | (4,101,726 | ) | | | (3,381,618 | ) | | | | | | | — | |
| | | | | | | | | | | | | | | | | | |
| | From share transactions: | | | | | | | | | | | | | | | | |
| | | | | |
| | Proceeds from sales of shares | | | 15,631,778 | | | | 73,677,046 | | | | | | | | 8,096,206 | |
| | | | | |
| | Cost of shares redeemed | | | (41,200,389 | ) | | | (27,788,985 | ) | | | | | | | — | |
| | | | | |
| | Net increase (decrease) in net assets resulting from share transactions | | | (25,568,611 | ) | | | 45,888,061 | | | | | | | | 8,096,206 | |
| | | | | |
| | TOTAL INCREASE | | | 8,318,934 | | | | 5,187,781 | | | | | | | | 8,186,323 | |
| | | | | | | | | | | | | | | | | | |
| | Net assets: | | | | | | | | | | | | | | | | |
| | | | | |
| | Beginning of period | | $ | 269,427,619 | | | $ | 264,239,838 | | | | | | | $ | — | |
| | | | | |
| | End of period | | $ | 277,746,553 | | | $ | 269,427,619 | | | | | | | $ | 8,186,323 | |
| | * | | Commencement of operations. |
| | |
| The accompanying notes are an integral part of these financial statements. | | 75 |
GOLDMAN SACHS EQUITY ETFS
Statements of Changes in Net Assets (continued)
| | | | | | | | | | | | | | |
| | | | | Defensive Equity ETF(a) | |
| | | | | For the Period
January 1, 2023
to
August 31, 2023(b) | | | For the Fiscal
Year Ended
December 31, 2022 | | | For the Fiscal
Year Ended
December 31, 2021 | |
| | From operations: | | | | | | | | | | | | |
| | | | |
| | Net investment income | | $ | 44,246 | | | $ | 44,263 | | | $ | 30,609 | |
| | | | |
| | Net realized gain (loss) | | | (252,621 | ) | | | (345,459 | ) | | | 783,924 | |
| | | | |
| | Net change in unrealized gain (loss) | | | 659,254 | | | | (579,556 | ) | | | 3,547 | |
| | | | |
| | Net increase (decrease) in net assets resulting from operations | | | 450,879 | | | | (880,752 | ) | | | 818,080 | |
| | | | | | | | | | | | | | |
| | Distributions to shareholders: | | | | | | | | | | | | |
| | | | |
| | From distributable earnings | | | | | | | | | | | | |
| | | | |
| | Class A Shares | | | — | | | | (1,254 | ) | | | (17,059 | ) |
| | | | |
| | Class C Shares | | | — | | | | — | | | | (7,588 | ) |
| | | | |
| | Institutional Shares/Fund | | | (33,649 | ) | | | (45,517 | ) | | | (497,162 | ) |
| | | | |
| | Investor Shares | | | — | | | | — | | | | (4,551 | ) |
| | | | |
| | Class R6 Shares | | | — | | | | — | | | | (4,623 | ) |
| | | | |
| | Class R Shares | | | — | | | | — | | | | (4,340 | ) |
| | | | |
| | Class P Shares | | | — | | | | — | | | | (4,623 | ) |
| | | | |
| | Total distributions to shareholders | | | (33,649 | ) | | | (46,771 | ) | | | (539,946 | ) |
| | | | | | | | | | | | | | |
| | From share transactions: | | | | | | | | | | | | |
| | | | |
| | Proceeds from sales of shares | | | 2,623,015 | | | | 438,545 | | | | 1,097,648 | |
| | | | |
| | Reinvestment of distributions | | | — | | | | 46,771 | | | | 539,946 | |
| | | | |
| | Cost of shares redeemed | | | (1,816,084 | ) | | | (920,363 | ) | | | (519,323 | ) |
| | | | |
| | Net increase (decrease) in net assets resulting from share transactions | | | 806,931 | | | | (435,047 | ) | | | 1,118,271 | |
| | | | |
| | TOTAL INCREASE (DECREASE) | | | 1,224,161 | | | | (1,362,570 | ) | | | 1,396,405 | |
| | | | | | | | | | | | | | |
| | Net assets: | | | | | | | | | | | | |
| | | | |
| | Beginning of period | | $ | 5,568,599 | | | $ | 6,931,169 | | | $ | 5,534,764 | |
| | | | |
| | End of period | | $ | 6,792,760 | | | $ | 5,568,599 | | | $ | 6,931,169 | |
| | (a) | | The Fund changed its fiscal year end from December 31 to August 31 on February 1, 2023. |
| | (b) | | Goldman Sachs Defensive Equity ETF acquired all of the assets and liabilities of the Goldman Sachs Defensive Equity Fund (“Predecessor Fund”) in a reorganization that occurred as of the close of business on January 23, 2023. Performance and financial history of the Predecessor Fund’s Institutional Class Shares have been adopted by Goldman Sachs Defensive Equity ETF and will be used going forward. As a result, the information prior to January 23, 2023, reflects that of the Predecessor Fund’s Institutional Class Shares. The Predecessor Fund ceased operations as of the date of the reorganization. (See Note 1). |
| | |
| 76 | | The accompanying notes are an integral part of these financial statements. |
GOLDMAN SACHS BLOOMBERG CLEAN ENERGY EQUITY ETF
Financial Highlights
Selected Data for a Share Outstanding Throughout Each Period
| | | | | | | | | | |
| | | | | Bloomberg Clean Energy Equity ETF | |
| | | | | For the Fiscal
Year Ended
August 31, 2023 | | | For the Period
February 8, 2022*
to
August 31, 2022 | |
| | Per Share Operating Performance: | | | | | | | | |
| | | |
| | Net asset value, beginning of period | | $ | 39.57 | | | $ | 39.60 | |
| | | |
| | Net investment income(a) | | | 0.58 | | | | 0.32 | |
| | | |
| | Net realized and unrealized loss | | | (4.56 | ) | | | (0.15 | ) |
| | | |
| | Total gain (loss) from investment operations | | | (3.98 | ) | | | 0.17 | |
| | | |
| | Distributions to shareholders from net investment income | | | (0.55 | ) | | | (0.20 | ) |
| | | |
| | Net asset value, end of period | | $ | 35.04 | | | $ | 39.57 | |
| | | |
| | Market price, end of period | | $ | 35.22 | | | $ | 39.52 | |
| | | |
| | Total Return at Net Asset Value(b) | | | (10.11 | )% | | | 0.45 | % |
| | | |
| | Net assets, end of period (in 000’s) | | $ | 8,760 | | | $ | 7,915 | |
| | | |
| | Ratio of total expenses to average net assets | | | 0.45 | % | | | 0.45 | %(c) |
| | | |
| | Ratio of net investment income to average net assets | | | 1.56 | % | | | 1.43 | %(c) |
| | | |
| | Portfolio turnover rate(d) | | | 23 | % | | | 19 | % |
| | * | | Commencement of operations. |
| | (a) | | Calculated based on the average shares outstanding methodology. |
| | (b) | | Assumes investment at the net asset value at the beginning of the period, reinvestment of all distributions and a complete sale of the investment at the net asset value at the end of the period. Returns do not reflect the impact of taxes to shareholders relating to Fund distributions or the sale of Fund shares. Total returns for periods less than one full year are not annualized. |
| | (d) | | The Fund’s portfolio turnover rate is calculated in accordance with regulatory requirements and excludes portfolio securities received or delivered as a result of in-kind transactions and short-term transactions. If such transactions were included, the Fund’s portfolio turnover rate may be higher. |
| | |
| The accompanying notes are an integral part of these financial statements. | | 77 |
GOLDMAN SACHS EQUAL WEIGHT U.S. LARGE CAP EQUITY ETF
Financial Highlights (continued)
Selected Data for a Share Outstanding Throughout Each Year
| | | | | | | | | | | | | | | | | | | | | | |
| | | | | Equal Weight U.S. Large Cap Equity ETF | |
| | | | | For the Fiscal
Year Ended August 31, | |
| | | | | 2023 | | | 2022 | | | 2021 | | | 2020 | | | 2019 | |
| | Per Share Operating Performance: | | | | | | | | | | | | | | | | | | | | |
| | | | | | |
| | Net asset value, beginning of year | | $ | 58.98 | | | $ | 70.00 | | | $ | 50.86 | | | $ | 46.30 | | | $ | 46.33 | |
| | | | | | |
| | Net investment income(a) | | | 1.03 | | | | 0.94 | | | | 0.85 | | | | 0.93 | | | | 0.81 | |
| | | | | | |
| | Net realized and unrealized gain (loss) | | | 3.94 | | | | (10.98 | ) | | | 19.09 | | | | 4.52 | | | | (0.10 | ) |
| | | | | | |
| | Total gain (loss) from investment operations | | | 4.97 | | | | (10.04 | ) | | | 19.94 | | | | 5.45 | | | | 0.71 | |
| | | | | | |
| | Distributions to shareholders from net investment income | | | (1.02 | ) | | | (0.98 | ) | | | (0.80 | ) | | | (0.89 | ) | | | (0.74 | ) |
| | | | | | |
| | Net asset value, end of year | | $ | 62.93 | | | $ | 58.98 | | | $ | 70.00 | | | $ | 50.86 | | | $ | 46.30 | |
| | | | | | |
| | Market price, end of year | | $ | 62.93 | | | $ | 58.99 | | | $ | 69.99 | | | $ | 50.95 | | | $ | 46.32 | |
| | | | | | |
| | Total Return at Net Asset Value(b) | | | 8.58 | % | | | (14.48 | )% | | | 39.56 | % | | | 12.08 | % | | | 1.62 | % |
| | | | | | |
| | Net assets, end of year (in 000’s) | | $ | 462,534 | | | $ | 613,410 | | | $ | 857,504 | | | $ | 320,433 | | | $ | 168,989 | |
| | | | | | |
| | Ratio of total expenses to average net assets | | | 0.09 | % | | | 0.09 | % | | | 0.09 | % | | | 0.09 | % | | | 0.09 | % |
| | | | | | |
| | Ratio of net investment income to average net assets | | | 1.72 | % | | | 1.43 | % | | | 1.39 | % | | | 1.98 | % | | | 1.81 | % |
| | | | | | |
| | Portfolio turnover rate(c) | | | 44 | % | | | 47 | % | | | 43 | % | | | 48 | % | | | 39 | % |
| | (a) | | Calculated based on the average shares outstanding methodology. |
| | (b) | | Assumes investment at the net asset value at the beginning of the year, reinvestment of all distributions and a complete sale of the investment at the net asset value at the end of the year. Returns do not reflect the impact of taxes to shareholders relating to Fund distributions or the sale of Fund shares. |
| | (c) | | The Fund’s portfolio turnover rate is calculated in accordance with regulatory requirements and excludes portfolio securities received or delivered as a result of in-kind transactions and short-term transactions. If such transactions were included, the Fund’s portfolio turnover rate may be higher. |
| | |
| 78 | | The accompanying notes are an integral part of these financial statements. |
GOLDMAN SACHS HEDGE INDUSTRY VIP ETF
Financial Highlights (continued)
Selected Data for a Share Outstanding Throughout Each Year
| | | | | | | | | | | | | | | | | | | | | | |
| | | | | Hedge Industry VIP ETF | |
| | | | | For the Fiscal
Year Ended August 31, | |
| | | | | 2023 | | | 2022 | | | 2021 | | | 2020 | | | 2019 | |
| | Per Share Operating Performance: | | | | | | | | | | | | | | | | | | | | |
| | | | | | |
| | Net asset value, beginning of year | | $ | 75.37 | | | $ | 103.18 | | | $ | 79.37 | | | $ | 56.86 | | | $ | 57.98 | |
| | | | | | |
| | Net investment income (loss)(a) | | | 0.17 | | | | (0.04 | )(b) | | | (0.07 | ) | | | 0.16 | (c) | | | 0.51 | |
| | | | | | |
| | Net realized and unrealized gain (loss) | | | 13.32 | | | | (27.77 | ) | | | 23.88 | | | | 22.59 | | | | (1.11 | ) |
| | | | | | |
| | Total gain (loss) from investment operations | | | 13.49 | | | | (27.81 | ) | | | 23.81 | | | | 22.75 | | | | (0.60 | ) |
| | | | | | |
| | Distributions to shareholders from net investment income | | | (0.01 | ) | | | — | | | | — | (d) | | | (0.24 | ) | | | (0.52 | ) |
| | | | | | |
| | Distributions to shareholders from return of capital | | | — | | | | — | | | | — | | | | — | (d) | | | — | |
| | | | | | |
| | Total distributions to shareholders | | | (0.01 | ) | | | — | | | | — | (d) | | | (0.24 | ) | | | (0.52 | ) |
| | | | | | |
| | Net asset value, end of year | | $ | 88.85 | | | $ | 75.37 | | | $ | 103.18 | | | $ | 79.37 | | | $ | 56.86 | |
| | | | | | |
| | Market price, end of year | | $ | 88.90 | | | $ | 75.47 | | | $ | 103.21 | | | $ | 79.50 | | | $ | 57.03 | |
| | | | | | |
| | Total Return at Net Asset Value(e) | | | 17.90 | % | | | (26.95 | )% | | | 30.00 | % | | | 40.07 | % | | | (0.99 | )% |
| | | | | | |
| | Net assets, end of year (in 000’s) | | $ | 142,164 | | | $ | 145,084 | | | $ | 221,834 | | | $ | 115,085 | | | $ | 79,608 | |
| | | | | | |
| | Ratio of total expenses to average net assets | | | 0.45 | % | | | 0.45 | % | | | 0.45 | % | | | 0.45 | % | | | 0.45 | % |
| | | | | | |
| | Ratio of net investment income (loss) to average net assets | | | 0.23 | % | | | (0.05 | )%(b) | | | (0.08 | )% | | | 0.26 | %(c) | | | 0.91 | % |
| | | | | | |
| | Portfolio turnover rate(f) | | | 120 | % | | | 117 | % | | | 136 | % | | | 124 | % | | | 103 | % |
| | (a) | | Calculated based on the average shares outstanding methodology. |
| | (b) | | Reflects income recognized from non-recurring special dividends which amounted to $0.05 per share and 0.05% of average net assets. |
| | (c) | | Reflects income recognized from non-recurring special dividends which amounted to $0.07 per share and 0.11% of average net assets. |
| | (d) | | Amount is less than $0.005 per share. |
| | (e) | | Assumes investment at the net asset value at the beginning of the year, reinvestment of all distributions and a complete sale of the investment at the net asset value at the end of the year. Returns do not reflect the impact of taxes to shareholders relating to Fund distributions or the sale of Fund shares. |
| | (f) | | The Fund’s portfolio turnover rate is calculated in accordance with regulatory requirements and excludes portfolio securities received or delivered as a result of in-kind transactions and short-term transactions. If such transactions were included, the Fund’s portfolio turnover rate may be higher. |
| | |
| The accompanying notes are an integral part of these financial statements. | | 79 |
GOLDMAN SACHS INNOVATE EQUITY ETF
Financial Highlights (continued)
Selected Data for a Share Outstanding Throughout Each Period
| | | | | | | | | | | | | | | | | | |
| | | | | Innovate Equity ETF | |
| | | | | For the Fiscal
Year Ended August 31, | | | | | | For the Period
November 6, 2020*
to
August 31, 2021 | |
| | | | | 2023 | | | 2022 | | | | |
| | Per Share Operating Performance: | | | | | | | | | | | | | | | | |
| | | | | |
| | Net asset value, beginning of period | | $ | 43.67 | | | $ | 63.23 | | | | | | | $ | 50.03 | |
| | | | | |
| | Net investment income(a) | | | 0.43 | | | | 0.33 | | | | | | | | 0.24 | |
| | | | | |
| | Net realized and unrealized gain (loss) | | | 5.39 | | | | (19.43 | ) | | | | | | | 13.15 | |
| | | | | |
| | Total gain (loss) from investment operations | | | 5.82 | | | | (19.10 | ) | | | | | | | 13.39 | |
| | | | | |
| | Distributions to shareholders from net investment income | | | (0.07 | ) | | | (0.46 | ) | | | | | | | (0.19 | ) |
| | | | | |
| | Net asset value, end of period | | $ | 49.42 | | | $ | 43.67 | | | | | | | $ | 63.23 | |
| | | | | |
| | Market price, end of period | | $ | 49.42 | | | $ | 43.62 | | | | | | | $ | 63.34 | |
| | | | | |
| | Total Return at Net Asset Value(b) | | | 13.38 | % | | | (30.35 | )% | | | | | | | 26.80 | % |
| | | | | |
| | Net assets, end of period (in 000’s) | | $ | 336,076 | | | $ | 327,530 | | | | | | | $ | 493,184 | |
| | | | | |
| | Ratio of total expenses to average net assets | | | 0.50 | % | | | 0.50 | % | | | | | | | 0.50 | %(c) |
| | | | | |
| | Ratio of net investment income to average net assets | | | 0.97 | % | | | 0.62 | % | | | | | | | 0.50 | %(c) |
| | | | | |
| | Portfolio turnover rate(d) | | | 45 | % | | | 38 | % | | | | | | | 38 | % |
| | * | | Commencement of operations. |
| | (a) | | Calculated based on the average shares outstanding methodology. |
| | (b) | | Assumes investment at the net asset value at the beginning of the period, reinvestment of all distributions and a complete sale of the investment at the net asset value at the end of the period. Returns do not reflect the impact of taxes to shareholders relating to Fund distributions or the sale of Fund shares. Total returns for periods less than one full year are not annualized. |
| | (d) | | The Fund’s portfolio turnover rate is calculated in accordance with regulatory requirements and excludes portfolio securities received or delivered as a result of in-kind transactions and short-term transactions. If such transactions were included, the Fund’s portfolio turnover rate may be higher. |
| | |
| 80 | | The accompanying notes are an integral part of these financial statements. |
GOLDMAN SACHS JUST U.S. LARGE CAP EQUITY ETF
Financial Highlights (continued)
Selected Data for a Share Outstanding Throughout Each Year
| | | | | | | | | | | | | | | | | | | | | | |
| | | | | JUST U.S. Large Cap Equity ETF | |
| | | | | For the Fiscal
Year Ended August 31, | |
| | | | | 2023 | | | 2022 | | | 2021 | | | 2020 | | | 2019 | |
| | Per Share Operating Performance: | | | | | | | | | | | | | | | | | | | | |
| | | | | | |
| | Net asset value, beginning of year | | $ | 56.72 | | | $ | 65.65 | | | $ | 50.92 | | | $ | 42.04 | | | $ | 42.13 | |
| | | | | | |
| | Net investment income(a) | | | 0.89 | | | | 0.82 | | | | 0.74 | | | | 0.74 | | | | 0.72 | |
| | | | | | |
| | Net realized and unrealized gain (loss) | | | 7.49 | | | | (8.97 | ) | | | 14.70 | | | | 8.90 | | | | 0.08 | |
| | | | | | |
| | Total gain (loss) from investment operations | | | 8.38 | | | | (8.15 | ) | | | 15.44 | | | | 9.64 | | | | 0.80 | |
| | | | | | |
| | Distributions to shareholders from net investment income | | | (0.88 | ) | | | (0.78 | ) | | | (0.71 | ) | | | (0.76 | ) | | | (0.89 | ) |
| | | | | | |
| | Net asset value, end of year | | $ | 64.22 | | | $ | 56.72 | | | $ | 65.65 | | | $ | 50.92 | | | $ | 42.04 | |
| | | | | | |
| | Market price, end of year | | $ | 64.27 | | | $ | 56.84 | | | $ | 65.68 | | | $ | 50.88 | | | $ | 42.06 | |
| | | | | | |
| | Total Return at Net Asset Value(b) | | | 15.00 | % | | | (12.53 | )% | | | 30.61 | % | | | 23.29 | % | | | 2.06 | % |
| | | | | | |
| | Net assets, end of year (in 000’s) | | $ | 277,747 | | | $ | 269,428 | | | $ | 264,240 | | | $ | 152,754 | | | $ | 129,275 | |
| | | | | | |
| | Ratio of total expenses to average net assets | | | 0.20 | % | | | 0.20 | % | | | 0.20 | % | | | 0.20 | % | | | 0.20 | % |
| | | | | | |
| | Ratio of net investment income to average net assets | | | 1.52 | % | | | 1.31 | % | | | 1.29 | % | | | 1.69 | % | | | 1.79 | % |
| | | | | | |
| | Portfolio turnover rate(c) | | | 9 | % | | | 12 | % | | | 11 | % | | | 14 | % | | | 17 | % |
| | (a) | | Calculated based on the average shares outstanding methodology. |
| | (b) | | Assumes investment at the net asset value at the beginning of the year, reinvestment of all distributions and a complete sale of the investment at the net asset value at the end of the year. Returns do not reflect the impact of taxes to shareholders relating to Fund distributions or the sale of Fund shares. |
| | (c) | | The Fund’s portfolio turnover rate is calculated in accordance with regulatory requirements and excludes portfolio securities received or delivered as a result of in-kind transactions and short-term transactions. If such transactions were included, the Fund’s portfolio turnover rate may be higher. |
| | |
| The accompanying notes are an integral part of these financial statements. | | 81 |
GOLDMAN SACHS NORTH AMERICAN PIPELINES & POWER EQUITY ETF
Financial Highlights (continued)
Selected Data for a Share Outstanding Throughout the Period
| | | | | | |
| | | | | North American
Pipelines & Power
Equity ETF | |
| | | | | For the Period
July 11, 2023*
to
August 31, 2023 | |
| | Per Share Operating Performance: | | | | |
| | |
| | Net asset value, beginning of period | | $ | 40.46 | |
| | |
| | Net investment income(a) | | | 0.13 | |
| | |
| | Net realized and unrealized gain | | | 0.34 | |
| | |
| | Total gain from investment operations | | | 0.47 | |
| | |
| | Net asset value, end of period | | $ | 40.93 | |
| | |
| | Market price, end of period | | $ | 40.96 | |
| | |
| | Total Return at Net Asset Value(b) | | | 1.16 | % |
| | |
| | Net assets, end of period (in 000’s) | | $ | 8,186 | |
| | |
| | Ratio of total expenses to average net assets | | | 0.55 | %(c) |
| | |
| | Ratio of net investment income to average net assets | | | 2.25 | %(c) |
| | |
| | Portfolio turnover rate(d) | | | — | % |
| | * | | Commencement of operations. |
| | (a) | | Calculated based on the average shares outstanding methodology. |
| | (b) | | Assumes investment at the net asset value at the beginning of the period, reinvestment of all distributions and a complete sale of the investment at the net asset value at the end of the period. Returns do not reflect the impact of taxes to shareholders relating to Fund distributions or the sale of Fund shares. Total returns for periods less than one full year are not annualized. |
| | (d) | | The Fund’s portfolio turnover rate is calculated in accordance with regulatory requirements and excludes portfolio securities received or delivered as a result of in-kind transactions and short-term transactions. If such transactions were included, the Fund’s portfolio turnover rate may be higher. |
| | |
| 82 | | The accompanying notes are an integral part of these financial statements. |
GOLDMAN SACHS DEFENSIVE EQUITY ETF
Financial Highlights (continued)
Selected Data for a Share Outstanding Throughout Each Period
| | | | | | | | | | | | | | | | | | |
| | | | | Defensive Equity ETF(a)(b) | |
| | | | | For the Period
January 1, 2023
to†
August 31, 2023 | | | For the Fiscal
Year Ended
December 31, | | | For the Period
September 30, 2020*
to
December 31, 2020 | |
| | | | | 2022 | | | 2021 | |
| | Per Share Operating Performance: | | | | | | | | | | | | | | | | |
| | | | | |
| | Net asset value, beginning of period | | $ | 41.72 | | | $ | 48.24 | | | $ | 45.86 | | | $ | 45.00 | |
| | | | | |
| | Net investment income(c) | | | 0.24 | | | | 0.35 | | | | 0.27 | | | | 0.09 | |
| | | | | |
| | Net realized and unrealized gain (loss) | | | 2.78 | | | | (6.49 | ) | | | 6.26 | | | | 0.86 | |
| | | | | |
| | Total gain (loss) from investment operations | | | 3.02 | | | | (6.14 | ) | | | 6.53 | | | | 0.95 | |
| | | | | |
| | Distributions to shareholders from net investment income | | | (0.22 | ) | | | (0.38 | ) | | | (0.23 | ) | | | (0.09 | ) |
| | | | | |
| | Distributions to shareholders from net realized gains | | | — | | | | — | | | | (3.92 | ) | | | — | (d) |
| | | | | |
| | Total distributions to shareholders | | | (0.22 | ) | | | (0.38 | ) | | | (4.15 | ) | | | (0.09 | ) |
| | | | | |
| | Net asset value, end of period | | $ | 44.52 | | | $ | 41.72 | | | $ | 48.24 | | | $ | 45.86 | |
| | | | | |
| | Market price, end of period | | $ | 44.53 | | | $ | — | | | $ | — | | | $ | — | |
| | | | | |
| | Total Return at Net Asset Value(e) | | | 7.25 | % | | | (12.57 | )% | | | 14.24 | % | | | 2.11 | % |
| | | | | |
| | Net assets, end of period (in 000’s) | | $ | 6,793 | | | $ | 5,031 | | | $ | 6,283 | | | $ | 5,201 | |
| | | | | |
| | Ratio of net expenses to average net assets | | | 0.56 | %(f) | | | 0.57 | % | | | 0.57 | % | | | 0.57 | %(f) |
| | | | | |
| | Ratio of total expenses to average net assets | | | 2.26 | %(f) | | | 6.01 | % | | | 9.46 | % | | | 10.45 | %(f) |
| | | | | |
| | Ratio of net investment income to average net assets | | | 1.01 | %(f) | | | 0.82 | % | | | 0.52 | % | | | 0.84 | %(f) |
| | | | | |
| | Portfolio turnover rate(g) | | | 160 | % | | | 178 | % | | | 305 | % | | | 26 | % |
| | * | | Commencement of operations of Goldman Sachs Defensive Equity Fund, the predecessor fund. |
| | † | | The Fund changed its fiscal year end from December 31 to August 31 on February 1, 2023. |
| | (a) | | On January 18, 2023, the Fund effected a 4.5 -for-1 reverse share split. All per share data has been adjusted to reflect the reverse share split. |
| | (b) | | Goldman Sachs Defensive Equity ETF acquired all of the assets and liabilities of the Goldman Sachs Defensive Equity Fund (“Predecessor Fund”) in a reorganization that occurred as of the close of business on January 23, 2023. Performance and financial history of the Predecessor Fund’s Institutional Class Shares have been adopted by Goldman Sachs Defensive Equity ETF and will be used going forward. As a result, the information prior to January 23, 2023, reflects that of the Predecessor Fund’s Institutional Class Shares. The Predecessor Fund ceased operations as of the date of the reorganization. (See Note 1). |
| | (c) | | Calculated based on the average shares outstanding methodology. |
| | (d) | | Amount is less than $0.005 per share. |
| | (e) | | Assumes investment at the net asset value at the beginning of the period, reinvestment of all distributions and a complete sale of the investment at the net asset value at the end of the period. Returns do not reflect the impact of taxes to shareholders relating to Fund distributions or the sale of Fund shares. Total returns for periods less than one full year are not annualized. |
| | (g) | | The Fund’s portfolio turnover rate is calculated in accordance with regulatory requirements and excludes portfolio securities received or delivered as a result of in-kind transactions and short-term transactions. If such transactions were included, the Fund’s portfolio turnover rate may be higher. |
| | |
| The accompanying notes are an integral part of these financial statements. | | 83 |
GOLDMAN SACHS EQUITY ETFS
Notes to Financial Statements
August 31, 2023
Goldman Sachs ETF Trust (the “Trust”) is an open-end management investment company, registered under the Investment Company Act of 1940, as amended (the “Act”), consisting of multiple series. The Trust was organized as a Delaware statutory trust on December 16, 2009. The following table lists those series of the Trust that are included in this report (collectively, the “Funds” or individually a “Fund”) along with their respective diversification status under the Act:
| | |
| Fund | | Diversification
Classification |
Goldman Sachs Bloomberg Clean Energy Equity ETF | | Diversified |
Goldman Sachs Equal Weight U.S. Large Cap Equity ETF | | Diversified |
Goldman Sachs Hedge Industry VIP ETF | | Diversified |
Goldman Sachs Innovate Equity ETF | | Diversified |
Goldman Sachs JUST U.S. Large Cap Equity ETF | | Diversified |
Goldman Sachs North American Pipelines & Power Equity ETF* | | Non-Diversified |
Goldman Sachs Defensive Equity ETF** | | Diversified |
| * | | The Goldman Sachs North American Pipelines & Power Equity ETF commenced operations on July 11, 2023. |
| ** | | The Goldman Sachs Defensive Equity ETF commenced operations on January 23, 2023. |
Pursuant to an Agreement and Plan of Reorganization and Liquidation previously approved by the Board of Trustees of Goldman Sachs Trust, the Goldman Sachs Defensive Equity Fund (the “Acquired Fund”) was reorganized into the Goldman Sachs Defensive Equity ETF (the “Acquiring Fund”) (the “Reorganization”) as of the close of business on January 23, 2023 (the “Closing Date”). Prior to the Reorganization, Class A Shares and Class C Shares were converted to Institutional Shares on January 13, 2023.
Following the Reorganization, the Acquired Fund’s performance (Institutional Class Shares) and financial history were adopted by the Acquiring Fund. In connection with the Reorganization, each shareholder of the Acquired Fund (except as noted below) received shares of the surviving Acquiring Fund equal in value to the number of shares of the Acquired Fund they owned on the Closing Date, including a cash payment in lieu of fractional shares of the Acquiring Fund. The cash payment might have been taxable. Shareholders of the Acquired Fund who held their shares through a fund direct individual retirement account and did not take action prior to the Reorganization had their Acquired Fund shares exchanged for shares of Goldman Sachs Financial Square Government Fund equal in value to their Acquired Fund shares. The Acquiring Fund has the same investment adviser, investment objective and fundamental investment policies and substantially similar investment strategies as the Acquired Fund. Effective as of the close of business on the Closing Date, the Acquired Fund ceased operations in connection with the consummation of its Reorganization.
Costs incurred by the Acquiring Fund and the Acquired Fund associated with the Reorganization (including the legal costs associated with the Reorganization) were borne by the Adviser by waiving fees or reimbursing expenses to offset the costs incurred by the Acquiring Fund or Acquired Fund associated with the Reorganization, including any brokerage fees and expenses incurred by the Acquiring Fund or Acquired Fund related to the disposition and acquisition of assets as part of the Reorganization. Brokerage fees and expenses related to the disposition and acquisition of assets (including any disposition to raise cash to pay redemption proceeds) that were incurred in the ordinary course of business were borne by the Acquiring Fund and the Acquired Fund. The management fee of the Acquiring Fund is slightly higher than the Acquired Fund, but the Acquiring Fund employs a unitary fee structure pursuant to which GSAM bears all operating expenses of the Fund, subject to limited exceptions, and thus is expected to result in a lower net expense ratio than each share class of the Acquired Fund. The Reorganization did not result in the material change to the Acquired Fund’s portfolio holdings. There are no material differences in accounting policies of the Acquired Fund as compared to those of the Acquiring Fund.
The Acquiring Fund did not purchase or sell securities following the Reorganization for purposes of realigning its investment portfolio. Accordingly, the Reorganization of the Acquired Fund did not affect the corresponding Acquiring Fund’s portfolio turnover ratio for the fiscal year ended August 31, 2023.
84
GOLDMAN SACHS EQUITY ETFS
|
| 1. ORGANIZATION (continued) |
The investment objective of each Fund (except Goldman Sachs Defensive Equity ETF) is to provide investment results that closely correspond, before fees and expenses, to the performance of its respective Index. The Goldman Sachs Defensive Equity ETF seeks long-term growth of capital with lower volatility than equity markets.
Goldman Sachs Asset Management, L.P. (“GSAM”), an affiliate of Goldman Sachs & Co. LLC (“Goldman Sachs”), serves as investment adviser to the Funds pursuant to management agreements (each, an “Agreement” and together, the “Agreements”) with the Trust. Each Fund is an exchange-traded fund (“ETF”). Shares of the Goldman Sachs Hedge Industry VIP ETF, Goldman Sachs Innovate Equity ETF, Goldman Sachs JUST U.S. Large Cap Equity ETF and Goldman Sachs Defensive Equity ETF are listed and traded on the NYSE Arca, Inc. (“NYSE Arca”), and shares of the Goldman Sachs Bloomberg Clean Energy Equity ETF, Goldman Sachs Equal Weight U.S. Large Cap Equity ETF and Goldman Sachs North American Pipelines & Power Equity ETF are listed and traded on the Cboe BZX Exchange, Inc. (“Cboe”). Market prices for the Funds’ shares may be different from their net asset value (“NAV”). The Funds issue and redeem shares at their respective NAV only in blocks of a specified number of shares, or multiples thereof, referred to as “Creation Units”. Creation Units are issued and redeemed generally for a designated portfolio of securities (including any portion of such securities for which cash may be substituted) and a specified amount of cash. Shares generally trade in the secondary market in quantities less than a Creation Unit at market prices that change throughout the day. Only those that have entered into an authorized participant agreement with ALPS Distributors, Inc. (the “Distributor”) may do business directly with the Funds.
|
| 2. SIGNIFICANT ACCOUNTING POLICIES |
The financial statements have been prepared in accordance with accounting principles generally accepted in the United States of America (“GAAP”) and require management to make estimates and assumptions that may affect the reported amounts and disclosures. Actual results may differ from those estimates and assumptions. Each Fund is an investment company under GAAP and follows the accounting and reporting guidance applicable to investment companies.
A. Investment Valuation — The Funds’ valuation policy is to value investments at fair value.
B. Investment Income and Investments — Investment income includes interest income, dividend income, and securities lending income, if any. Interest income is accrued daily and adjusted for amortization of premiums and accretion of discounts. Dividend income is recognized on ex-dividend date or, for certain foreign securities, as soon as such information is obtained subsequent to the ex-dividend date. Non-cash dividends, if any, are recorded at the fair market value of the securities received. Investment transactions are reflected on trade date. Realized gains and losses are calculated using identified cost. Investment transactions are recorded on the following business day for daily NAV calculations. Investment income is recorded net of any foreign withholding taxes, less any amounts reclaimable. The Funds may file withholding tax reclaims in certain jurisdictions to recover a portion of amounts previously withheld. Any foreign capital gains tax is accrued daily based upon net unrealized gains, and is payable upon sale of such investments. Distributions received from the Funds’ investments in U.S. real estate investment trusts (“REITs”) may be characterized as ordinary income, net capital gain and/or a return of capital. A return of capital is recorded by the Funds as a reduction to the cost basis of the REIT. Distributions from master limited partnerships (“MLPs”) are generally recorded based on the characterization reported on the MLP’s tax return. A Fund records its pro-rata share of the income/loss and capital gains/losses, allocated from the underlying partnerships and adjusts the cost basis of the underlying partnerships accordingly. For derivative contracts, unrealized gains and losses are recorded daily and become realized gains and losses upon disposition or termination of the contract.
C. Expenses — Expenses incurred directly by a Fund are charged to the Fund, and certain expenses incurred by the Trust are allocated across the applicable Funds on a straight-line and/or pro-rata basis, depending upon the nature of the expenses, and are accrued daily.
D. Federal Taxes and Distributions to Shareholders — It is each Fund’s policy to comply with the requirements of the Internal Revenue Code of 1986, as amended (the “Code”), applicable to regulated investment companies and to distribute each
85
GOLDMAN SACHS EQUITY ETFS
Notes to Financial Statements (continued)
August 31, 2023
|
| 2. SIGNIFICANT ACCOUNTING POLICIES (continued) |
year substantially all of its investment company taxable income and capital gains to its shareholders. Accordingly, each Fund is not required to make any provisions for the payment of federal income tax. Distributions to shareholders are recorded on the ex-dividend date. For each Fund, income distributions, if any, are declared and paid quarterly with respect to Goldman Sachs Equal Weight U.S. Large Cap Equity ETF, Goldman Sachs JUST U.S. Large Cap Equity ETF, Goldman Sachs North American Pipelines & Power Equity ETF and Goldman Sachs Defensive Equity ETF, semi-annually with respect to Goldman Sachs Bloomberg Clean Energy Equity ETF, and annually for Goldman Sachs Hedge Industry VIP ETF and Goldman Sachs Innovate Equity ETF. Capital gains distributions, if any, are declared and paid annually.
The characterization of distributions to shareholders for financial reporting purposes is determined in accordance with federal income tax rules, which may differ from GAAP. The source of each Fund’s distributions may be shown in the accompanying financial statements as either from distributable earnings or capital. Certain components of the Funds’ net assets on the Statements of Assets and Liabilities reflect permanent GAAP/tax differences based on the appropriate tax character.
Return of Capital Estimates — Distributions received from the Goldman Sachs North American Pipelines & Power Equity ETF’s investments in MLPs generally are comprised of income and return of capital. The Fund records investment income and return of capital based on estimates made at the time such distributions are received. Such estimates are based on historical information available from each MLP and other industry sources. These estimates may subsequently be revised based on information received from MLPs after their tax reporting periods are concluded.
E. Foreign Currency Translation — The accounting records and reporting currency of a Fund are maintained in U.S. dollars. Assets and liabilities denominated in foreign currencies are translated into U.S. dollars using the current exchange rates at the close of each business day. The effect of changes in foreign currency exchange rates on investments is included within net realized and unrealized gain (loss) on investments. Changes in the value of other assets and liabilities as a result of fluctuations in foreign exchange rates are included in the Statements of Operations within net change in unrealized gain (loss) on foreign currency translation. Transactions denominated in foreign currencies are translated into U.S. dollars on the date the transaction occurred, the effects of which are included within net realized gain (loss) on foreign currency transactions.
|
| 3. INVESTMENTS AND FAIR VALUE MEASUREMENTS |
U.S. GAAP defines the fair value of a financial instrument as the amount that would be received to sell an asset or paid to transfer a liability in an orderly transaction between market participants at the measurement date (i.e., the exit price); the Funds’ policy is to use the market approach. GAAP establishes a fair value hierarchy that prioritizes the inputs to valuation techniques used to measure fair value. The hierarchy gives the highest priority to unadjusted quoted prices in active markets for identical assets or liabilities (Level 1 measurements) and the lowest priority to unobservable inputs (Level 3 measurements). The level in the fair value hierarchy within which the fair value measurement in its entirety falls shall be determined based on the lowest level input that is significant to the fair value measurement in its entirety. The levels used for classifying investments are not necessarily an indication of the risk associated with investing in these investments. The three levels of the fair value hierarchy are described below:
Level 1 — Unadjusted quoted prices in active markets that are accessible at the measurement date for identical, unrestricted assets or liabilities;
Level 2 — Quoted prices in markets that are not active or financial instruments for which significant inputs are observable (including, but not limited to, quoted prices for similar investments, interest rates, foreign exchange rates, volatility and credit spreads), either directly or indirectly;
Level 3 — Prices or valuations that require significant unobservable inputs (including GSAM’s assumptions in determining fair value measurement).
The Board of Trustees (“Trustees”) has approved Valuation Procedures that govern the valuation of the portfolio investments held by the Funds, including investments for which market quotations are not readily available. With respect to the Funds’ investments that do not have readily available market quotations, the Trustees have designated the Adviser as the valuation designee to perform
86
GOLDMAN SACHS EQUITY ETFS
|
| 3. INVESTMENTS AND FAIR VALUE MEASUREMENTS (continued) |
fair valuations pursuant to Rule 2a-5 under the Investment Company Act of 1940 (the “Valuation Designee”). GSAM has day-to-day responsibility for implementing and maintaining internal controls and procedures related to the valuation of the Funds’ investments. To assess the continuing appropriateness of pricing sources and methodologies, GSAM regularly performs price verification procedures and issues challenges as necessary to third party pricing vendors or brokers, and any differences are reviewed in accordance with the Valuation Procedures.
A. Level 1 and Level 2 Fair Value Investments — The valuation techniques and significant inputs used in determining the fair values for investments classified as Level 1 and Level 2 are as follows:
Equity Securities — Equity securities traded on a United States (“U.S.”) securities exchange or the NASDAQ system, or those located on certain foreign exchanges, including but not limited to the Americas, are valued daily at their last sale price or official closing price on the principal exchange or system on which they are traded. If there is no sale or official closing price or such price is believed by GSAM to not represent fair value, equity securities will be valued at the valid closing bid price for long positions and at the valid closing ask price for short positions (i.e. where there is sufficient volume, during normal exchange trading hours). If no valid bid/ask price is available, the equity security will be valued pursuant to the Valuation Procedures and consistent with applicable regulatory guidance. To the extent these investments are actively traded, they are classified as Level 1 of the fair value hierarchy, otherwise they are generally classified as Level 2. Certain equity securities containing unique attributes may be classified as Level 2.
Unlisted equity securities for which market quotations are available are valued at the last sale price on the valuation date, or if no sale occurs, at the last bid price for long positions or the last ask price for short positions, and are generally classified as Level 2.
Underlying Funds (including Money Market Funds) — Underlying funds (“Underlying Funds”) include exchange-traded funds (“ETFs”) and other investment companies. Investments in the Underlying Funds (except ETFs) are valued at the NAV per share on the day of valuation. ETFs are valued daily at the last sale price or official closing price on the principal exchange or system on which the investment is traded. Because the Funds invest in Underlying Funds that fluctuate in value, the Funds’ shares will correspondingly fluctuate in value. Underlying Funds are generally classified as Level 1 of the fair value hierarchy. To the extent that underlying ETFs are actively traded, they are classified as Level 1 of the fair value hierarchy, otherwise they are generally classified as Level 2. For information regarding an Underlying Fund’s accounting policies and investment holdings, please see the Underlying Fund’s shareholder report.
Derivative Contracts — A derivative is an instrument whose value is derived from underlying assets, indices, reference rates or a combination of these factors. A Fund enters into derivative transactions to hedge against changes in interest rates, securities prices, and/or currency exchange rates, to increase total return, or to gain access to certain markets or attain exposure to other underliers. For financial reporting purposes, cash collateral that has been pledged to cover obligations of a Fund and cash collateral received, if any, is reported separately on the Statements of Assets and Liabilities as either due to broker/receivable for collateral on certain derivative contracts. Non-cash collateral pledged by a Fund, if any, is noted in the Schedules of Investments.
Exchange-traded derivatives, including futures and options contracts, are generally valued at the last sale or settlement price on the exchange where they are principally traded. Exchange-traded options without settlement prices are generally valued at the last bid price for long positions and the last ask price for short positions on the exchange where they are principally traded. Exchange-traded derivatives typically fall within Level 1 of the fair value hierarchy. Over-the-counter (“OTC”) and centrally cleared derivatives are valued using market transactions and other market evidence, including market-based inputs to models, calibration to market-clearing transactions, broker or dealer quotations, or other alternative pricing sources. Where models are used, the selection of a particular model to value OTC and centrally cleared derivatives depends upon the contractual terms of, and specific risks inherent in, the instrument, as well as the availability of pricing information in the market. Valuation models require a variety of inputs, including contractual terms, market prices, yield curves, credit curves, measures of volatility, voluntary and involuntary prepayment rates, loss severity rates and correlations of such inputs. For OTC and centrally cleared derivatives that trade in liquid markets, model inputs can generally be verified and model selection does not involve significant management judgment. OTC and centrally cleared derivatives are classified within Level 2 of the fair value hierarchy when significant inputs are corroborated by market evidence.
87
GOLDMAN SACHS EQUITY ETFS
Notes to Financial Statements (continued)
August 31, 2023
|
| 3. INVESTMENTS AND FAIR VALUE MEASUREMENTS (continued) |
i. Futures Contracts — Futures contracts are contracts to buy or sell a standardized quantity of a specified commodity or security. Upon entering into a futures contract, a Fund deposits cash or securities in an account on behalf of the broker in an amount sufficient to meet the initial margin requirement. Subsequent payments are made or received by a Fund equal to the daily change in the contract value and are recorded as variation margin receivable or payable with a corresponding offset to unrealized gains or losses.
ii. Options — When a Fund writes call or put options, an amount equal to the premium received is recorded as a liability and is subsequently marked-to-market to reflect the current value of the option written. Swaptions are options on swap contracts.
Upon the purchase of a call option or a put option by a Fund, the premium paid is recorded as an investment and subsequently marked-to-market to reflect the current value of the option. Certain options may be purchased with premiums to be determined on a future date. The premiums for these options are based upon implied volatility parameters at specified terms.
B. Level 3 Fair Value Investments — To the extent that significant inputs to valuation models and other alternative pricing sources are unobservable, or if quotations are not readily available, or if GSAM believes that such quotations do not accurately reflect fair value, the fair value of a Fund’s investments may be determined under the Valuation Procedures. GSAM, consistent with its procedures and applicable regulatory guidance, may make an adjustment to the most recent valuation prices of either domestic or foreign securities in light of significant events to reflect what it believes to be the fair value of the securities at the time of determining a Fund’s NAV. To the extent investments are valued using single source broker quotations obtained directly from the broker or passed through from third party pricing vendors, such investments are classified as Level 3 investments.
C. Fair Value Hierarchy — The following is a summary of the Funds’ investments and derivatives classified in the fair value hierarchy as of August 31, 2023:
| | | | | | | | | | | | |
| | | |
| BLOOMBERG CLEAN ENERGY EQUITY ETF | | | | | | | | | | | | |
| | | |
| Investment Type | | Level 1 | | | Level 2 | | | Level 3 | |
| | | |
| Assets | | | | | | | | | | | | |
| | | |
Common Stock and/or Other Equity Investments(a) | | | | | | | | | | | | |
| | | |
Asia | | $ | 2,634,604 | | | $ | 28,770 | | | $ | — | |
| | | |
Europe | | | 2,085,107 | | | | — | | | | — | |
| | | |
North America | | | 3,899,625 | | | | — | | | | — | |
| | | |
South America | | | 55,786 | | | | 10,485 | | | | — | |
| | | |
Securities Lending Reinvestment Vehicle | | | 119,761 | | | | — | | | | — | |
| | | |
| Total | | $ | 8,794,883 | | | $ | 39,255 | | | $ | — | |
|
| EQUAL WEIGHT U.S. LARGE CAP EQUITY ETF | |
| | | |
| Investment Type | | Level 1 | | | Level 2 | | | Level 3 | |
| | | |
| Assets | | | | | | | | | | | | |
| | | |
Common Stock and/or Other Equity Investments(a) | | | | | | | | | | | | |
| | | |
North America | | $ | 461,240,740 | | | $ | — | | | $ | — | |
| | | |
Securities Lending Reinvestment Vehicle | | | 542,850 | | | | — | | | | — | |
| | | |
| Total | | $ | 461,783,590 | | | $ | — | | | $ | — | |
| (a) | | Amounts are disclosed by continent to highlight the impact of time zone differences between local market close and the calculation of NAV. Security valuations are based on the principal exchange or system on which they are traded, which may differ from country of domicile noted in table. |
88
GOLDMAN SACHS EQUITY ETFS
|
| 3. INVESTMENTS AND FAIR VALUE MEASUREMENTS (continued) |
| | | | | | | | | | | | |
| | | |
| HEDGE INDUSTRY VIP ETF | | | | | | | | | | | | |
| | | |
| Investment Type | | Level 1 | | | Level 2 | | | Level 3 | |
| | | |
| Assets | | | | | | | | | | | | |
| | | |
Common Stock and/or Other Equity Investments(a) | | | | | | | | | | | | |
| | | |
Asia | | $ | 5,567,197 | | | $ | — | | | $ | — | |
| | | |
Europe | | | 2,759,675 | | | | — | | | | — | |
| | | |
North America | | | 130,724,391 | | | | — | | | | — | |
| | | |
South America | | | 2,947,829 | | | | — | | | | — | |
| | | |
| Total | | $ | 141,999,092 | | | $ | — | | | $ | — | |
| | | |
| INNOVATE EQUITY ETF | | | | | | | | | | | | |
| | | |
| Investment Type | | Level 1 | | | Level 2 | | | Level 3 | |
| | | |
| Assets | | | | | | | | | | | | |
| | | |
Common Stock and/or Other Equity Investments(a) | | | | | | | | | | | | |
| | | |
Asia | | $ | 50,442,826 | | | $ | 192,894 | | | $ | — | |
| | | |
Europe | | | 29,904,601 | | | | — | | | | — | |
| | | |
North America | | | 249,371,138 | | | | 456,545 | | | | — | |
| | | |
Oceania | | | 274,177 | | | | — | | | | — | |
| | | |
South America | | | 4,072,050 | | | | — | | | | — | |
| | | |
Right | | | — | | | | — | | | | 28,403 | |
| | | |
Exchange-Traded Funds | | | 683,498 | | | | — | | | | — | |
| | | |
Securities Lending Reinvestment Vehicle | | | 8,259,180 | | | | — | | | | — | |
| | | |
| Total | | $ | 343,007,470 | | | $ | 649,439 | | | $ | 28,403 | |
|
| JUST U.S. LARGE CAP EQUITY ETF | |
| | | |
| Investment Type | | Level 1 | | | Level 2 | | | Level 3 | |
| | | |
| Assets | | | | | | | | | | | | |
| | | |
Common Stock and/or Other Equity Investments(a) | | | | | | | | | | | | |
| | | |
North America | | $ | 277,117,324 | | | $ | — | | | $ | — | |
| | | |
Securities Lending Reinvestment Vehicle | | | 30,687 | | | | — | | | | — | |
| | | |
| Total | | $ | 277,148,011 | | | $ | — | | | $ | — | |
|
| NORTH AMERICAN PIPELINES & POWER EQUITY ETF | |
| | | |
| Investment Type | | Level 1 | | | Level 2 | | | Level 3 | |
| | | |
| Assets | | | | | | | | | | | | |
| | | |
Common Stock and/or Other Equity Investments(a) | | | | | | | | | | | | |
| | | |
Europe | | $ | 48,043 | | | $ | — | | | $ | — | |
| | | |
North America | | | 8,120,119 | | | | — | | | | — | |
| | | |
| Total | | $ | 8,168,162 | | | $ | — | | | $ | — | |
| (a) | | Amounts are disclosed by continent to highlight the impact of time zone differences between local market close and the calculation of NAV. Security valuations are based on the principal exchange or system on which they are traded, which may differ from country of domicile noted in table. |
89
GOLDMAN SACHS EQUITY ETFS
Notes to Financial Statements (continued)
August 31, 2023
|
| 3. INVESTMENTS AND FAIR VALUE MEASUREMENTS (continued) |
| | | | | | | | | | | | |
|
| DEFENSIVE EQUITY ETF | |
| | | |
| Investment Type | | Level 1 | | | Level 2 | | | Level 3 | |
| | | |
| Assets | | | | | | | | | | | | |
| | | |
Common Stock and/or Other Equity Investments(a) | | | | | | | | | | | | |
| | | |
North America | | $ | 6,125,252 | | | $ | — | | | $ | — | |
| | | |
| Total | | $ | 6,125,252 | | | $ | — | | | $ | — | |
| | | |
| Derivative Type | | Level 1 | | | Level 2 | | | Level 3 | |
| | | |
| Assets | | | | | | | | | | | | |
| | | |
Futures Contracts(b) | | $ | 11,957 | | | $ | — | | | $ | — | |
| | | |
Purchased Put Options | | | 39,150 | | | | — | | | | — | |
| | | |
| Total | | $ | 51,107 | | | $ | — | | | $ | — | |
| | | |
| Derivative Type | | | | | | | | | |
| | | |
| Liabilities | | | | | | | | | | | | |
| | | |
Written Put Options | | $ | (47,125 | ) | | $ | — | | | $ | — | |
| | | |
| Total | | $ | (47,125 | ) | | $ | — | | | $ | — | |
| (a) | | Amounts are disclosed by continent to highlight the impact of time zone differences between local market close and the calculation of NAV. Security valuations are based on the principal exchange or system on which they are traded, which may differ from country of domicile noted in table. |
| (b) | | Amount shown represents unrealized gain (loss) at period end. |
For further information regarding security characteristics, see the Schedules of Investments.
|
| 4. INVESTMENTS IN DERIVATIVES |
The following tables set forth, by certain risk types, the gross value of derivative contracts (not considered to be hedging instruments for accounting disclosure purposes) as of August 31, 2023. These instruments were used as part of the Fund’s investment strategies and to obtain and/or manage exposure related to the risks below. The values in the tables below exclude the effects of cash collateral received or posted pursuant to these derivative contracts, and therefore are not representative of the Fund’s net exposure.
| | | | | | | | | | | | |
| Defensive Equity ETF | | | | | | | | | | |
| Risk | | Statement of Assets and Liabilities | | Assets | | | Statement of Assets and Liabilities | | Liabilities | |
Equity | | Variation margin on futures contracts, Purchased options, at value | | $ | 51,107 | (a) | | Written Options, at value | | $ | (47,125) | |
| (a) | | Includes unrealized gain (loss) on futures contracts described in the Additional Investment Information sections of the Schedules of Investments. Only the variation margin as of August 31, 2023 is reported within the Statements of Assets and Liabilities. |
The following tables set forth, by certain risk types, the Fund’s gains (losses) related to these derivatives and their indicative volumes for the fiscal year ended August 31, 2023. These gains (losses) should be considered in the context that these derivative contracts may have been executed to create investment opportunities and/or economically hedge certain investments, and
90
GOLDMAN SACHS EQUITY ETFS
|
| 4. INVESTMENTS IN DERIVATIVES (continued) |
accordingly, certain gains (losses) on such derivative contracts may offset certain (losses) gains attributable to investments. These gains (losses) are included in “Net realized gain (loss)” or “Net change in unrealized gain (loss)” on the Statements of Operations:
| | | | | | | | | | |
| | |
| Defensive Equity ETF | | | | | | | | |
| Risk | | Statement of Operations | | Net Realized
Gain (Loss) from
Futures Contracts,
Purchased Options and
Written Options | | | Net Change in
Unrealized Gain
(Loss) on Futures Contracts,
Purchased Options and
Written Options | |
| Equity | | Net realized gain (loss) from futures contracts, purchased options and written options/Net change in unrealized gain (loss) on futures contracts, purchased options and written options | | $ | (322,406 | ) | | $ | 63,728 | |
For the fiscal year ended August 31, 2023, the relevant values for each derivative type were as follows:
| | | | | | | | | | |
| | | Average
Number of
Contracts(a) | | | | | | |
| | | Futures
Contracts | | Purchased
Options | | | Written
Options | |
Defensive Equity ETF | | 4 | | | 31 | | | | 62 | |
| (a) | | Amount disclosed represents average number of contracts for the months that the Fund held such derivatives during the fiscal year ended August 31, 2023. |
|
| 5. AGREEMENTS AND AFFILIATED TRANSACTIONS |
A. Management Agreement — Under the Agreement, GSAM manages the Funds, subject to the general supervision of the Trustees.
As compensation for the services rendered pursuant to the Agreement, the assumption of the expenses related thereto and administration of the Funds’ business affairs, including providing facilities, GSAM is entitled to a management fee, accrued daily and paid monthly, equal to an annual percentage rate of each Fund’s average daily net assets.
The Funds operate under a unitary management fee structure. Under the unitary fee structure, GSAM is responsible for paying substantially all the expenses of the Fund, excluding payments under the Fund’s 12b-1 plan (if any), interest expenses, taxes, acquired fund fees and expenses, brokerage fees, costs of holding shareholder meetings, litigation, indemnification and extraordinary expenses. As the Funds directly pay fees and expenses of the independent Trustees, the management fee collected by GSAM will be reduced by an amount equal to the fees and expenses paid by the Funds to the independent Trustees.
For the fiscal year ended August 31, 2023, contractual and effective net unitary management fees with GSAM were at the following rates:
| | | | |
| Fund | | | | Unitary
Management Fee |
Goldman Sachs Bloomberg Clean Energy Equity ETF | | | | 0.45% |
Goldman Sachs Equal Weight U.S. Large Cap Equity ETF | | | | 0.09% |
Goldman Sachs Hedge Industry VIP ETF | | | | 0.45% |
Goldman Sachs Innovate Equity ETF | | | | 0.50% |
Goldman Sachs JUST U.S. Large Cap Equity ETF | | | | 0.20% |
Goldman Sachs North American Pipelines & Power Equity ETF | | | | 0.55% |
Goldman Sachs Defensive Equity ETF(1) | | | | 0.55% |
| (1) | | For the period January 23, 2023 through August 31, 2023. Prior to January 23, 2023 the effective management rate and net management rate for the Acquired Fund with GSAM was 0.53% and 0.52%, respectively. |
91
GOLDMAN SACHS EQUITY ETFS
Notes to Financial Statements (continued)
August 31, 2023
|
| 5. AGREEMENTS AND AFFILIATED TRANSACTIONS (continued) |
B. Distribution and/or Service (12b-1) Plans — Prior to January 23, 2023, the Goldman Sachs Trust, on behalf of Class A Shares of the Acquired Fund, had adopted a Distribution and Service Plan subject to Rule 12b-1 under the Act. Under the Distribution and Service Plan, Goldman Sachs, which served as distributor (the “Distributor”), was entitled to a fee accrued daily and paid monthly for distribution services and personal and account maintenance services, which may then be paid by Goldman Sachs to authorized dealers. These fees are equal to an annual percentage rate of the average daily net assets attributable to Class A Shares of the Acquired Fund, as set forth below.
Prior to January 23, 2023, the Goldman Sachs Trust, on behalf of Class C Shares of the Acquired Fund, had adopted a Distribution Plan subject to Rule 12b-1 under the Act. Under the Distribution Plan, Goldman Sachs as Distributor was entitled to a fee accrued daily and paid monthly for distribution services, which may then be paid by Goldman Sachs to authorized dealers. These fees were equal to an annual percentage rate of the average daily net assets attributable to Class C Shares of the Acquired Fund, as set forth below.
| | | | | | | | |
| | | Distribution and/or Service Plan | |
| | | Class A* | | | Class C | |
Distribution and/or Service Plan | | | 0.25 | % | | | 0.75 | % |
| * | | With respect to Class A Shares, the Distributor at its discretion may use compensation for distribution services paid under the Distribution and /or Service Plan to compensate service organizations for personal and account maintenance services and expenses as long as such total compensation does not exceed the maximum cap on “service fees” imposed by the Financial Industry Regulatory Authority. |
C. Distribution Agreement — Prior to January 23, 2023, Goldman Sachs, as Distributor of the shares of the Acquired Fund pursuant to a Distribution Agreement, could retain a portion of the Class A Shares’ front end sales charge and Class C Shares’ CDSC. During the period January 1, 2023 to January 22, 2023, Goldman Sachs did not retain any front end sales charges.
D. Service Plan — Prior to January 23, 2023, the Goldman Sachs Trust, on behalf of the Acquired Fund, had adopted a Service Plan to allow Class C Shares to compensate service organizations (including Goldman Sachs) for providing varying levels of personal and account maintenance services to their customers who are beneficial owners of such shares. The Service Plan provided for compensation to the service organizations equal to an annual percentage rate of 0.25% of the average daily net assets attributable to Class C Shares of the Funds.
E. Transfer Agency Agreement — Prior to January 23, 2023, Goldman Sachs also served as the transfer agent of the Acquired Fund for a fee pursuant to the Transfer Agency Agreement. The fees charged for such transfer agency services were accrued daily and paid monthly at annual rates as follows: 0.16% of the average daily net assets of Class A and Class C Shares of the Acquired Fund and 0.04% of the average daily net assets of Institutional Shares.
F. Other Expense Agreements and Affiliated Transactions — Prior to January 23, 2023, GSAM had agreed to reduce or limit certain “Other Expenses” of the Funds (excluding acquired fund fees and expenses, transfer agency fees and expenses, service fees and shareholder administration fees (as applicable), taxes, interest, brokerage fees, expenses of shareholder meetings, litigation and indemnification, and extraordinary expenses) to the extent such expenses exceed, on an annual basis, a percentage rate of the average daily net assets of the Acquired Fund. Such Other Expense reimbursements, if any, were accrued daily and paid monthly. In addition, the Acquired Fund was not obligated to reimburse GSAM for prior fiscal year expense reimbursements, if any. The Other Expense limitations as an annual percentage rate of average daily net assets for the Acquired Fund was 0.004%. These Other Expense limitations remained in place until January 23, 2023. In addition, the Acquired Fund had entered into certain offset arrangements with the transfer agent, which may resulted in a reduction of the Acquired Fund’s expenses and were received irrespective of the application of the “Other Expense” limitations described above.
For the period January 1, 2023 to January 22, 2023, these Other Expense reimbursements were $74,198.
92
GOLDMAN SACHS EQUITY ETFS
|
| 5. AGREEMENTS AND AFFILIATED TRANSACTIONS (continued) |
G. Other Transactions with Affiliates — The Funds may purchase securities from, or sell securities to, an affiliated fund provided the affiliation is solely due to having a common investment adviser, common officers, or common trustees. The following table provides information about the Funds’ investments in The Goldman Sachs Group, Inc. for the fiscal year ended August 31, 2023:
| | | | | | | | | | | | | | | | | | | | | | | | | | | | | | | | |
| Fund | | Beginning
value as of
August 31,
2022 | | | Purchases
at Cost | | | Proceeds
from Sales | | | Realized
Gain | | | Change in
Unrealized
Depreciation | | | Ending
value as of
August 31,
2023 | | | Shares as of
August 31,
2023 | | | Dividend
Income | |
Goldman Sachs Equal Weight U.S. Large Cap Equity ETF | | $ | 1,291,758 | | | $ | 328,917 | | | $ | (750,933 | ) | | $ | 160,323 | | | $ | (141,643 | ) | | $ | 888,422 | | | | 2,711 | | | $ | 29,688 | |
Goldman Sachs Innovate Equity ETF | | | 1,601,141 | | | | 847,251 | | | | (764,041 | ) | | | 322,161 | | | | (313,562 | ) | | | 1,692,950 | | | | 5,166 | | | | 46,392 | |
Goldman Sachs JUST U.S. Large Cap Equity ETF | | | 1,137,066 | | | | 75,567 | | | | (144,482 | ) | | | 56,860 | | | | (77,977 | ) | | | 1,047,034 | | | | 3,195 | | | | 34,609 | |
The following table provides information about the Funds’ investments in the Underlying Money Market Fund for the period ended August 31, 2023:
| | | | | | | | | | | | | | | | | | | | | | |
| Fund | | Beginning Value as of December 31, 2022 | | Purchases at Cost | | | Proceeds from Sales | | | Ending Value as of
August 31,
2023 | | | Shares as of
August 31,
2023 | | | Dividend Income | |
Goldman Sachs Defensive Equity ETF* | | $278,504 | | $ | 123,864 | | | $ | (402,368 | ) | | $ | — | | | | — | | | | 289 | |
| * | | For the period January 1, 2023 through August 31, 2023 (amounts include the Predecessor Fund). |
|
| 6. CREATION AND REDEMPTION OF CREATION UNITS |
The Trust issues and redeems shares of the Funds only in Creation Units on a continuous basis through the Distributor, without an initial sales load, at NAV next determined after receipt, on any Business Day (as defined in the Statement of Additional Information), of an order in proper form. Shares of the Funds may only be purchased or redeemed by certain financial institutions (each an “Authorized Participant”). An Authorized Participant is either (1) a “Participating Party” or other participant in the clearing process through the Continuous Net Settlement System of the National Securities Clearing Corporation; or (2) a Depository Trust Company participant; which, in either case, must have executed an agreement with the Distributor. Retail investors will typically not qualify as an Authorized Participant or have the resources to buy and sell whole Creation Units. Therefore, they will be unable to purchase or redeem the shares directly from the Funds. Rather, most retail investors will purchase shares in the secondary market at market prices with the assistance of a broker and may be subject to customary brokerage commissions or fees. Fixed creation and redemption transaction fees are imposed in connection with creations and redemptions.
Authorized Participants transacting in Creation Units for cash may also pay a variable charge to compensate the relevant fund for certain transaction costs (e.g. taxes on currency or other financial transactions, and brokerage costs) and market impact expenses relating to investing in portfolio securities. Such variable charges, if any, are included in “Proceeds from sale of shares” in the Statements of Changes in Net Assets.
93
GOLDMAN SACHS EQUITY ETFS
Notes to Financial Statements (continued)
August 31, 2023
|
| 6. CREATION AND REDEMPTION OF CREATION UNITS (continued) |
Share activity is as follows:
| | | | | | | | | | | | | | | | |
| | | Goldman Sachs Bloomberg Clean Energy Equity ETF | |
| | | | |
| | | For the Fiscal Year Ended August 31, 2023 | | | For the period February 8, 2022*
through August 31, 2022 | |
| | | | |
| | | Shares | | | Dollars | | | Shares | | | Dollars | |
| | | | |
| Fund Share Activity | | | | | | | | | | | | |
Shares Sold | | | 50,000 | | | $ | 1,839,938 | | | | 200,000 | | | $ | 7,927,355 | |
Shares Redeemed | | | — | | | | — | | | | — | | | | — | |
| | | | |
NET INCREASE (DECREASE) IN SHARES | | | 50,000 | | | $ | 1,839,938 | | | | 200,000 | | | $ | 7,927,355 | |
| |
| | | Goldman Sachs Equal Weight U.S. Large Cap Equity ETF | |
| | | | |
| | | For the Fiscal Year Ended
August 31, 2023 | | | For the Fiscal Year Ended
August 31, 2022 | |
| | | | |
| | | Shares | | | Dollars | | | Shares | | | Dollars | |
| | | | |
| Fund Share Activity | | | | | | | | | | | | |
Shares Sold | | | 850,000 | | | $ | 49,832,589 | | | | 2,500,000 | | | $ | 169,051,301 | |
Shares Redeemed | | | (3,900,000 | ) | | | (233,144,465 | ) | | | (4,350,000 | ) | | | (282,145,961 | ) |
| | | | |
NET INCREASE (DECREASE) IN SHARES | | | (3,050,000 | ) | | $ | (183,311,876 | ) | | | (1,850,000 | ) | | $ | (113,094,660 | ) |
| |
| | | Goldman Sachs Hedge Industry VIP ETF | |
| | | | |
| | | For the Fiscal Year Ended
August 31, 2023 | | | For the Fiscal Year Ended
August 31, 2022 | |
| | | | |
| | | Shares | | | Dollars | | | Shares | | | Dollars | |
| | | | |
| Fund Share Activity | | | | | | | | | | | | |
Shares Sold | | | 775,000 | | | $ | 62,131,240 | | | | 625,000 | | | $ | 59,701,538 | |
Shares Redeemed | | | (1,100,000 | ) | | | (85,315,250 | ) | | | (850,000 | ) | | | (77,725,146 | ) |
| | | | |
NET INCREASE (DECREASE) IN SHARES | | | (325,000 | ) | | $ | (23,184,010 | ) | | | (225,000 | ) | | $ | (18,023,608 | ) |
| |
| | | Goldman Sachs Innovate Equity ETF | |
| | | | |
| | | For the Fiscal Year Ended
August 31, 2023 | | | For the Fiscal Year Ended
August 31, 2022 | |
| | | | |
| | | Shares | | | Dollars | | | Shares | | | Dollars | |
| | | | |
| Fund Share Activity | | | | | | | | | | | | |
Shares Sold | | | 750,000 | | | $ | 33,353,298 | | | | 900,000 | | | $ | 51,102,318 | |
Shares Redeemed | | | (1,450,000 | ) | | | (64,136,240 | ) | | | (1,200,000 | ) | | | (63,125,867 | ) |
| | | | |
NET INCREASE (DECREASE) IN SHARES | | | (700,000 | ) | | $ | (30,782,942 | ) | | | (300,000 | ) | | $ | (12,023,549 | ) |
94
GOLDMAN SACHS EQUITY ETFS
|
| 6. CREATION AND REDEMPTION OF CREATION UNITS (continued) |
| | | | | | | | | | | | | | | | |
| | | Goldman Sachs JUST U.S. Large Cap Equity ETF | |
| | | | |
| | | For the Fiscal Year Ended
August 31, 2023 | | | For the Fiscal Year Ended
August 31, 2022 | |
| | | | |
| | | Shares | | | Dollars | | | Shares | | | Dollars | |
| | | | |
| Fund Share Activity | | | | | | | | | | | | |
Shares Sold | | | 275,000 | | | $ | 15,631,778 | | | | 1,150,000 | | | $ | 73,677,046 | |
Shares Redeemed | | | (700,000 | ) | | | (41,200,389 | ) | | | (425,000 | ) | | | (27,788,985 | ) |
| | | | |
NET INCREASE (DECREASE) IN SHARES | | | (425,000 | ) | | $ | (25,568,611 | ) | | | 725,000 | | | $ | 45,888,061 | |
| | | | | | | | |
| | | Goldman Sachs North American
Pipelines & Power Equity ETF | |
| | | | |
| | | For the period July 11, 2023*
through August 31, 2023 | |
| | | | |
| | | Shares | | | Dollars | |
| | | | |
| Fund Share Activity | | | | |
Shares Sold | | | 200,000 | | | $ | 8,096,206 | |
Shares Redeemed | | | — | | | | — | |
| | |
NET INCREASE IN SHARES | | | 200,000 | | | $ | 8,096,206 | |
| * | | Commencement of operations |
95
GOLDMAN SACHS EQUITY ETFS
Notes to Financial Statements (continued)
August 31, 2023
|
| 6. CREATION AND REDEMPTION OF CREATION UNITS (continued) |
| | | | | | | | | | | | | | | | | | | | | | | | |
| | | Goldman Sachs Defensive Equity ETF(a) | |
| | | | |
| | | For the Period
January 1, 2023 to
August 31, 2023† | | | For the Fiscal Year Ended
December 31, 2022 | | | For the Fiscal Year Ended
December 31, 2021 | |
| | | | |
| | | Shares | | | Dollars | | | Shares | | | Dollars | | | Shares | | | Dollars | |
| | | | |
| Class A Shares | | | | | | | | | | | | | | | | | | | | | | | | |
Shares sold | | | — | | | $ | — | | | | 5,398 | | | $ | 51,806 | | | | 66,277 | | | $ | 733,989 | |
Reinvestment of distributions | | | — | | | | — | | | | 134 | | | | 1,254 | | | | 1,613 | | | | 17,059 | |
Shares redeemed | | | (25,524 | )* | | | (240,345 | )* | | | (9,452 | ) | | | (94,513 | ) | | | (46,157 | ) | | | (519,069 | ) |
| | | | (25,524 | ) | | | (240,345 | ) | | | (3,920 | ) | | | (41,453 | ) | | | 21,733 | | | | 231,979 | |
| Class C Shares | | | | | | | | | | | | | | | | | | | | | | | | |
Shares sold | | | — | | | | — | | | | 24,307 | | | | 241,850 | | | | 3,747 | | | | 42,642 | |
Reinvestment of distributions | | | — | | | | — | | | | — | | | | — | | | | 725 | | | | 7,588 | |
Shares redeemed | | | (32,815 | )* | | | (306,081 | )* | | | (940 | ) | | | (8,516 | ) | | | (24 | ) | | | (254 | ) |
| | | | (32,815 | ) | | | (306,081 | ) | | | 23,367 | | | | 233,334 | | | | 4,448 | | | | 49,976 | |
| Fund Share Activity (formerly Institutional Shares)** | | | | | | | | | | | | | | | | | | | | | | | | |
Shares sold | | | 60,477 | | | | 2,623,015 | | | | 3,112 | | | | 144,889 | | | | 6,431 | | | | 321,017 | |
Reinvestment of distributions | | | — | | | | — | | | | 1,080 | | | | 45,517 | | | | 10,416 | | | | 497,162 | |
Shares redeemed | | | (28,520 | ) | | | (1,269,658 | ) | | | (13,844 | ) | | | (617,012 | ) | | | — | | | | — | |
| | | | 31,957 | | | | 1,353,357 | | | | (9,652 | ) | | | (426,606 | ) | | | 16,847 | | | | 818,179 | |
| Investor Shares | | | | | | | | | | | | | | | | | | | | | | | | |
Reinvestment of distributions | | | — | | | | — | | | | — | | | | — | | | | 429 | | | | 4,551 | |
Shares redeemed | | | — | | | | — | | | | (5,438 | ) | | | (50,140 | ) | | | — | | | | — | |
| | | | — | | | | — | | | | (5,438 | ) | | | (50,140 | ) | | | 429 | | | | 4,551 | |
| Class R6 Shares | | | | | | | | | | | | | | | | | | | | | | | | |
Reinvestment of distributions | | | — | | | | — | | | | — | | | | — | | | | 436 | | | | 4,623 | |
Shares redeemed | | | — | | | | — | | | | (5,446 | ) | | | (50,268 | ) | | | — | | | | — | |
| | | | — | | | | — | | | | (5,446 | ) | | | (50,268 | ) | | | 436 | | | | 4,623 | |
| Class R Shares | | | | | | | | | | | | | | | | | | | | | | | | |
Reinvestment of distributions | | | — | | | | — | | | | — | | | | — | | | | 411 | | | | 4,340 | |
Shares redeemed | | | — | | | | — | | | | (5,414 | ) | | | (49,649 | ) | | | — | | | | — | |
| | | | — | | | | — | | | | (5,414 | ) | | | (49,649 | ) | | | 411 | | | | 4,340 | |
| Class P Shares | | | | | | | | | | | | | | | | | | | | | | | | |
Reinvestment of distributions | | | — | | | | — | | | | — | | | | — | | | | 436 | | | | 4,623 | |
Shares redeemed | | | — | | | | — | | | | (5,446 | ) | | | (50,265 | ) | | | — | | | | — | |
| | | | — | | | | — | | | | (5,446 | ) | | | (50,265 | ) | | | 436 | | | | 4,623 | |
| | | | | | |
NET INCREASE (DECREASE) IN SHARES | | | (26,382 | ) | | $ | 806,931 | | | | (11,949 | ) | | $ | (435,047 | ) | | | 44,740 | | | $ | 1,118,271 | |
| † | | The Fund changed its fiscal year end from December 31 to August 31 on February 1, 2023. |
| * | | Class A Shares and Class C Shares were converted to Institutional Shares on January 13, 2023. |
| ** | | On January 18, 2023, the Goldman Sachs Defensive Equity Fund Institutional Shares effected a 4.5-for-1 reverse share split. Shares outstanding have been adjusted to reflect the reverse share split. |
| (a) | | Goldman Sachs Defensive Equity ETF acquired all of the assets and liabilities of the Goldman Sachs Defensive Equity Fund (“Predecessor Fund”) in a reorganization that occurred as of the close of business on January 23, 2023. Performance and financial history of the Predecessor Fund’s Institutional Class Shares have been adopted by Goldman Sachs Defensive Equity ETF and will be used going forward. As a result, the information prior to January 23, 2023, reflects that of the Predecessor Fund’s Institutional Class Shares. The Predecessor Fund ceased operations as of the date of the reorganization. (See Note 1). |
96
GOLDMAN SACHS EQUITY ETFS
|
| 7. PORTFOLIO SECURITIES TRANSACTIONS |
The cost of purchases and proceeds from sales of long-term securities for the fiscal year ended August 31, 2023, were as follows:
| | | | | | | | | | |
| Fund | | | | Purchases | | | Sales | |
Goldman Sachs Bloomberg Clean Energy Equity ETF | | | | $ | 2,447,892 | | | $ | 1,940,295 | |
Goldman Sachs Equal Weight U.S. Large Cap Equity ETF | | | | | 229,695,943 | | | | 229,199,981 | |
Goldman Sachs Hedge Industry VIP ETF | | | | | 162,511,799 | | | | 161,992,334 | |
Goldman Sachs Innovate Equity ETF | | | | | 147,260,340 | | | | 145,627,064 | |
Goldman Sachs JUST U.S. Large Cap Equity ETF | | | | | 25,366,000 | | | | 24,870,790 | |
Goldman Sachs North American Pipelines & Power Equity ETF* | | | | | 536,217 | | | | — | |
Goldman Sachs Defensive Equity ETF** | | | | | 9,588,001 | | | | 9,848,088 | |
| * | | Commenced operations on July 11, 2023. |
| ** | | For the period January 1, 2023 through August 31, 2023 (amounts include the Predecessor Fund). |
The purchases and sales from in-kind creation and redemption transactions for the fiscal year ended August 31, 2023, were as follows:
| | | | | | | | | | |
| Fund | | | | Purchases | | | Sales | |
Goldman Sachs Bloomberg Clean Energy Equity ETF | | | | $ | 1,323,134 | | | $ | — | |
Goldman Sachs Equal Weight U.S. Large Cap Equity ETF | | | | | 49,757,813 | | | | 232,789,393 | |
Goldman Sachs Hedge Industry VIP ETF | | | | | 62,083,559 | | | | 84,928,462 | |
Goldman Sachs Innovate Equity ETF | | | | | 32,800,222 | | | | 62,790,680 | |
Goldman Sachs JUST U.S. Large Cap Equity ETF | | | | | 15,468,186 | | | | 41,159,306 | |
Goldman Sachs North American Pipelines & Power Equity ETF* | | | | | 7,607,538 | | �� | | — | |
Goldman Defensive Equity ETF** | | | | | 971,349 | | | | 565,796 | |
| * | | Commenced operations on July 11, 2023. |
| ** | | For the period January 1, 2023 through August 31, 2023 (amounts include the Predecessor Fund). |
The Funds may lend their securities through a securities lending agent, the Bank of New York Mellon (“BNYM”), to certain qualified borrowers. In accordance with the Funds’ securities lending procedures, the Funds receive cash collateral at least equal to the market value of the securities on loan. The market value of the loaned securities is determined at the close of business of the Funds, at their last sale price or official closing price on the principal exchange or system on which they are traded, and any additional required collateral is delivered to the Funds on the next business day. As with other extensions of credit, the Funds may experience delay in the recovery of their securities or incur a loss should the borrower of the securities breach its agreement with the Funds or become insolvent at a time when the collateral is insufficient to cover the cost of repurchasing securities on loan.
Dividend income received from securities on loan may not be subject to withholding taxes and therefore withholding taxes paid may differ from the amounts listed in the Statements of Operations. Loans of securities are terminable at any time and as such 1) the remaining contractual maturities of the outstanding securities lending transactions are considered to be overnight and continuous and 2) the borrower, after notice, is required to return borrowed securities within the standard time period for settlement of securities transactions.
97
GOLDMAN SACHS EQUITY ETFS
Notes to Financial Statements (continued)
August 31, 2023
|
| 8. SECURITIES LENDING (continued) |
The Funds invest the cash collateral received in connection with securities lending transactions in the Goldman Sachs Financial Square Government Fund (“Government Money Market Fund”), an affiliated series of the Goldman Sachs Trust. The Government Money Market Fund is registered under the Act as an open end investment company, is subject to Rule 2a-7 under the Act, and is managed by GSAM, for which GSAM may receive a management fee of up to 0.16% on an annualized basis of the average daily net assets of the Government Money Market Fund.
In the event of a default by a borrower with respect to any loan, BNYM may exercise any and all remedies provided under the applicable borrower agreement to make the Funds whole. These remedies include purchasing replacement securities by applying the collateral held from the defaulting broker against the purchase cost of the replacement securities. If BNYM is unable to purchase replacement securities, BNYM will indemnify the Funds by paying the Funds an amount equal to the market value of the securities loaned minus the value of cash collateral received from the borrower for the loan, subject to an exclusion for any shortfalls resulting from a loss of value in such cash collateral due to reinvestment risk. The Funds’ master netting agreements with certain borrowers provide the right, in the event of a default (including bankruptcy or insolvency), for the non-defaulting party to liquidate the collateral and calculate net exposure to the defaulting party or request additional collateral. However, in the event of a default by a borrower, a resolution authority could determine that such rights are not enforceable due to the restrictions or prohibitions against the right of set-off that may be imposed in accordance with a particular jurisdiction’s bankruptcy or insolvency laws. The Funds’ loaned securities were all subject to enforceable Securities Lending Agreements, and the value of the collateral was at least equal to the value of the cash received. The amounts of the Funds’ overnight and continuous agreements, which represent the gross amounts of recognized liabilities for securities lending transactions outstanding as of August 31, 2023, are disclosed as “Payable upon return of securities loaned” on the Statements of Assets and Liabilities, where applicable.
Both the Funds and BNYM received compensation relating to the lending of the Funds’ securities. The amounts earned, if any, by the Funds for the fiscal year ended August 31, 2023, are reported under Investment Income on the Statements of Operations.
The following table provides information about the Funds’ investment in the Government Money Market Fund for the fiscal year ended August 31, 2023:
| | | | | | | | | | | | | | | | | | |
| Fund | | | | Beginning
value as of
August 31, 2022 | | | Purchases
at Cost | | | Proceeds from
Sales | | | Ending
value as of
August 31, 2023 | |
Goldman Sachs Bloomberg Clean Energy Equity ETF | | | | $ | 45,842 | | | $ | 1,811,511 | | | $ | (1,737,592 | ) | | $ | 119,761 | |
Goldman Sachs Equal Weight U.S. Large Cap Equity ETF | | | | | — | | | | 19,702,182 | | | | (19,159,332 | ) | | | 542,850 | |
Goldman Sachs Hedge Industry VIP ETF | | | | | — | | | | 300,600 | | | | (300,600 | ) | | | — | |
Goldman Sachs Innovate Equity ETF | | | | | 6,943,097 | | | | 68,555,228 | | | | (67,239,145 | ) | | | 8,259,180 | |
Goldman Sachs JUST U.S. Large Cap Equity ETF | | | | | 36,658 | | | | 5,980,980 | | | | (5,986,951 | ) | | | 30,687 | |
The tax character of distributions paid during the fiscal year ended August 31, 2023 were as follows:
| | | | | | | | | | | | | | | | | | | | | | | | | | | | |
| | | Fiscal Year Ended August 31, 2023 | |
| | | Goldman Sachs
Bloomberg
Clean Energy
Equity ETF | | | Goldman Sachs
Equal Weight
U.S. Large Cap
Equity ETF | | | Goldman Sachs
Hedge Industry
VIP ETF | | | Goldman Sachs
Innovate
Equity ETF | | | Goldman Sachs
JUST U.S.
Large Cap
Equity ETF | | | Goldman Sachs
North American
Pipelines & Power
Equity ETF* | | | Goldman Sachs
Defensive
Equity ETF** | |
Distributions paid from: | | | | | | | | | | | | | | | | | | | | | | | | | | | | |
Ordinary Income | | $ | 123,162 | | | $ | 9,019,245 | | | $ | 20,653 | | | $ | 558,596 | | | $ | 4,101,726 | | | $ | — | | | $ | 33,649 | |
Total taxable distributions | | $ | 123,162 | | | $ | 9,019,245 | | | $ | 20,653 | | | $ | 558,596 | | | $ | 4,101,726 | | | $ | — | | | $ | 33,649 | |
| * | | Commenced operations on July 11, 2023. |
| ** | | For the period January 1, 2023 through August 31, 2023 (amounts include the Predecessor Fund). |
98
GOLDMAN SACHS EQUITY ETFS
|
| 9. TAX INFORMATION (continued) |
The tax character of distributions paid during the fiscal year ended August 31, 2022 were as follows:
| | | | | | | | | | | | | | | | | | | | | | | | |
| | | Fiscal Year Ended August 31, 2022 | |
| | | Goldman Sachs
Bloomberg
Clean Energy
Equity ETF* | | | Goldman Sachs
Equal Weight
U.S. Large Cap
Equity ETF | | | Goldman Sachs
Hedge Industry
VIP ETF | | | Goldman Sachs
Innovate
Equity ETF | | | Goldman Sachs
JUST U.S.
Large Cap
Equity ETF | | | Goldman Sachs
Defensive
Equity ETF** | |
Distributions paid from: | | | | | | | | | | | | | | | | | | | | | | | | |
Ordinary Income | | $ | 40,416 | | | $ | 11,856,146 | | | $ | — | | | $ | 3,566,370 | | | $ | 3,381,618 | | | $ | 46,771 | |
Total taxable distributions | | $ | 40,416 | | | $ | 11,856,146 | | | $ | — | | | $ | 3,566,370 | | | $ | 3,381,618 | | | $ | 46,771 | |
| * | | Commenced operations on February 8, 2022. |
| ** | | Amounts reflect the Predecessor Fund as of December 31, 2022. |
As of August 31, 2023, the components of accumulated earnings (losses) on a tax basis were as follows:
| | | | | | | | | | | | | | | | | | | | | | | | | | | | |
| | | Goldman Sachs
Bloomberg
Clean Energy
Equity ETF | | | Goldman Sachs
Equal Weight
U.S. Large Cap
Equity ETF | | | Goldman Sachs
Hedge Industry
VIP ETF | | | Goldman Sachs
Innovate
Equity ETF | | | Goldman Sachs
JUST U.S.
Large Cap
Equity ETF | | | Goldman Sachs
North American
Pipelines & Power
Equity ETF* | | | Goldman Sachs
Defensive
Equity ETF | |
Undistributed ordinary income — net | | $ | 52,719 | | | $ | 1,135,929 | | | $ | 189,327 | | | $ | 2,756,640 | | | $ | 695,143 | | | $ | 22,126 | | | $ | 10,541 | |
Total undistributed earnings | | $ | 52,719 | | | $ | 1,135,929 | | | $ | 189,327 | | | $ | 2,756,640 | | | $ | 695,143 | | | $ | 22,126 | | | $ | 10,541 | |
Capital loss carryforwards: | | | | | | | | | | | | | | | | | | | | | | | | | | | | |
Perpetual Short-Term | | $ | (4,035 | ) | | $ | (19,879,124 | ) | | $ | (43,746,330 | ) | | $ | (19,152,011 | ) | | $ | (4,416,220 | ) | | $ | — | | | $ | (96,743 | ) |
Perpetual Long-Term | | | — | | | | (5,158,552 | ) | | | (4,687,451 | ) | | | (19,652,908 | ) | | | (1,495,913 | ) | | | — | | | | (381,935 | ) |
Timing differences (Qualified Late Year Ordinary Loss Deferral/Post October Capital Loss Deferral) | | | (129,221 | ) | | | (38,647,844 | ) | | | (15,225,001 | ) | | | (36,330,003 | ) | | | (4,487,849 | ) | | | — | | | | | |
Unrealized gains (losses) — net | | | (927,012 | ) | | | 19,553,346 | | | | 17,718,063 | | | | 10,128,435 | | | | 50,371,900 | | | | 67,991 | | | | 264,148 | |
Total accumulated earnings (losses) net | | $ | (1,007,549 | ) | | $ | (42,996,245 | ) | | $ | (45,751,392 | ) | | $ | (62,249,847 | ) | | $ | 40,667,061 | | | $ | 90,117 | | | $ | (203,989 | ) |
| * | | Commenced operations on July 11, 2023. |
As of August 31, 2023, the Funds’ aggregate security unrealized gains and losses based on cost for U.S. federal income tax purposes were as follows:
| | | | | | | | | | | | | | | | | | | | | | | | | | | | |
| | | Goldman Sachs
Bloomberg
Clean Energy
Equity ETF | | | Goldman Sachs
Equal Weight
U.S. Large Cap
Equity ETF | | | Goldman Sachs
Hedge Industry
VIP ETF | | | Goldman Sachs
Innovate
Equity ETF | | | Goldman Sachs
JUST U.S.
Large Cap
Equity ETF | | | Goldman Sachs
North American
Pipelines & Power
Equity ETF* | | | Goldman Sachs
Defensive
Equity ETF | |
Tax Cost | | $ | 9,761,147 | | | $ | 442,230,244 | | | $ | 124,281,029 | | | $ | 333,554,082 | | | $ | 226,776,111 | | | $ | 8,100,138 | | | $ | 5,920,843 | |
Gross unrealized gain | | | 837,134 | | | | 51,951,957 | | | | 19,764,151 | | | | 54,580,573 | | | | 67,873,781 | | | | 273,413 | | | | 379,451 | |
Gross unrealized loss | | | (1,764,146 | ) | | | (32,398,611 | ) | | | (2,046,088 | ) | | | (44,452,138 | ) | | | (17,501,881 | ) | | | (205,422 | ) | | | (115,303 | ) |
Net unrealized gains (losses) on securities | | $ | (927,012 | ) | | $ | 19,553,346 | | | $ | 17,718,063 | | | $ | 10,128,435 | | | $ | 50,371,900 | | | $ | 67,991 | | | $ | 264,148 | |
| * | | Commenced operations on July 11, 2023. |
The difference between GAAP-basis and tax-basis unrealized gains (losses) is attributable primarily to wash sales, net mark to market gains (losses) on regulated futures, net mark to market gains (losses) on regulated options, and differences in the tax treatment of partnership investments and passive foreign investment company investments.
99
GOLDMAN SACHS EQUITY ETFS
Notes to Financial Statements (continued)
August 31, 2023
|
| 9. TAX INFORMATION (continued) |
In order to present components of the Funds’ capital accounts on a tax-basis, certain reclassifications have been recorded to the Funds’ accounts. These reclassifications have no impact on the net asset value of the Funds and result primarily from redemption in-kind transactions.
| | | | | | | | | | |
| Fund | | | | Paid-in Capital | | | Total
Distributable
Earnings | |
Goldman Sachs Bloomberg Clean Energy Equity ETF | | | | $ | — | | | $ | — | |
Goldman Sachs Equal Weight U.S. Large Cap Equity ETF | | | | $ | 24,522,281 | | | $ | (24,522,281 | ) |
Goldman Sachs Hedge Industry VIP ETF | | | | $ | 12,864,800 | | | $ | (12,864,800 | ) |
Goldman Sachs Innovate Equity ETF | | | | $ | 8,042,921 | | | $ | (8,042,921 | ) |
Goldman Sachs JUST U.S. Large Cap Equity ETF | | | | $ | 14,222,660 | | | $ | (14,222,660 | ) |
Goldman Sachs North American Pipelines & Power Equity ETF | | | | $ | — | | | $ | — | |
Goldman Sachs Defensive Equity ETF | | | | $ | 71,576 | | | $ | (71,576 | ) |
GSAM has reviewed the Funds’ tax positions for all open tax years (the current year, and prior three tax years, as applicable) and has concluded that no provision for income tax is required in the Funds’ financial statements. Such open tax year remains subject to examination and adjustment by tax authorities.
The Funds’ risks include, but are not limited to, the following:
Calculation Methodology Risk — The Index relies on various sources of information to assess the criteria of issuers included in the Index, (or a Reference Index if applicable) including fundamental information that may be based on assumptions and estimates. Neither the Fund, the Investment Adviser nor the Index Provider can offer assurances that the Index’s calculation methodology or sources of information will provide a correct valuation of securities, nor can they guarantee the availability or timeliness of the production of the Index.
Index Risk (each Fund except Goldman Sachs Defensive Equity ETF) — Bloomberg Professional Services, GSAM, JUST Capital Foundation, Inc. and Solactive AG (the “Index Providers”) construct the respective Fund’s Index in accordance with a rules-based methodology. A Fund will be negatively affected by general declines in the securities and asset classes represented in its Index. In addition, because the Funds are not “actively” managed, unless a specific security is removed from an Index, a Fund generally would not sell a security because the security’s issuer was in financial trouble. Market disruptions and regulatory restrictions could have an adverse effect on a Fund’s ability to adjust its exposure to the required levels in order to track the Index. A Fund also does not attempt to take defensive positions under any market conditions, including declining markets. Therefore, a Fund’s performance could be lower than funds that may actively shift their portfolio assets to take advantage of market opportunities or to lessen the impact of a market decline or a decline in the value of one or more issuers. The Index Providers rely on third party data they believe to be reliable in constructing each respective Index, but they do not guarantee the accuracy or availability of such third party data. Errors in index data, index computation or the construction of an Index in accordance with its methodology may occur from time to time and may not be identified and corrected by the Index Providers for a period of time or at all, which may have an adverse impact on the applicable Fund and its shareholders. In addition, neither a Fund, the Investment Adviser, the Calculation Agent nor the Index Providers can guarantee the availability or timeliness of the production of the Index. Furthermore, Bloomberg Professional Services, the index provider for Goldman Sachs Bloomberg Clean Energy Equity ETF, Solactive AG, the index provider for the Goldman Sachs Equal Weight U.S. Large Cap Equity ETF, Goldman Sachs Innovate
100
GOLDMAN SACHS EQUITY ETFS
|
| 10. OTHER RISKS (continued) |
Equity ETF and Goldman Sachs North American Pipeline & Power Equity ETF and JUST Capital Foundation, Inc., the index provider for the Goldman Sachs JUST U.S. Large Cap Equity ETF, may delay or change a scheduled rebalancing or reconstitution of an Index or the implementation of certain rules at its sole discretion. In such circumstances, a Fund, in replicating the composition of its Index, may have more or less exposure to a particular sector or individual company than had the Index been constructed in accordance with its stated methodology.
Industry Concentration Risk — In following its methodology, the Index from time to time may be concentrated to a significant degree in securities of issuers located in a single industry or group of industries. To the extent that the Index concentrates in the securities of issuers in a particular industry or group of industries, the Fund also may concentrate its investments to approximately the same extent. By concentrating its investments in an industry or group of industries, the Fund may face more risks than if it were diversified broadly over numerous industries or groups of industries. If the Index is not concentrated in a particular industry or group of industries, the Fund will not concentrate in a particular industry or group of industries.
Large Shareholder Transactions Risk — Certain shareholders, including other funds advised by the Investment Adviser, may from time to time own a substantial amount of the Fund’s Shares. In addition, a third party investor, the Investment Adviser or an affiliate of the Investment Adviser, an authorized participant, a lead market maker, or another entity (i.e., a seed investor) may invest in the Fund and hold its investment solely to facilitate commencement of the Fund or to facilitate the Fund’s achieving a specified size or scale. Any such investment may be held for a limited period of time. There can be no assurance that any large shareholder would not redeem its investment, that the size of the Fund would be maintained at such levels or that the Fund would continue to meet applicable listing requirements. Redemptions by large shareholders could have a significant negative impact on the Fund, including on the Fund’s liquidity. In addition, transactions by large shareholders may account for a large percentage of the trading volume on Cboe or NYSE Arca and may, therefore, have a material upward or downward effect on the market price of the Shares.
Market and Credit Risks — In the normal course of business, a Fund trades financial instruments and enters into financial transactions where risk of potential loss exists due to changes in the market (market risk). The value of the securities in which a Fund invests may go up or down in response to the prospects of individual companies, particular sectors or governments and/or general economic conditions throughout the world due to increasingly interconnected global economies and financial markets. Events such as war, military conflict, acts of terrorism, social unrest, natural disasters, recessions, inflation, rapid interest rate changes, supply chain disruptions, sanctions, the spread of infectious illness or other public health threats could also significantly impact a Fund and its investments. Additionally, a Fund may also be exposed to credit risk in the event that an issuer or guarantor fails to perform or that an institution or entity with which the Fund has unsettled or open transactions defaults.
Market Trading Risk — Each Fund faces numerous market trading risks, including disruptions to creations and redemptions, the existence of extreme market volatility or potential lack of an active trading market for Shares. If a shareholder purchases Shares at a time when the market price is at a premium to the NAV or sells Shares at a time when the market price is at a discount to the NAV, the shareholder may pay more for, or receive less than, the underlying value of the Shares, respectively. The Investment Adviser cannot predict whether Shares will trade below, at or above their NAV. Price differences may be due, in large part, to the fact that supply and demand forces at work in the secondary trading market for Shares will be closely related to, but not identical to, the same forces influencing the prices of the securities of a Fund’s Index (except Goldman Sachs Defensive Equity ETF) trading individually or in the aggregate at any point in time.
Master Limited Partnership Risk — Investments in securities of MLPs involve risks that differ from investments in common stocks, including risks related to limited control and limited rights to vote on matters affecting the MLP, risks related to potential conflicts of interest between the MLP and the MLP’s general partner, cash flow risks, dilution risks, limited liquidity and risks related to the general partner’s right to require unit-holders to sell their common units at an undesirable time or price.
Non-Diversification Risk — The Goldman Sachs North American Pipelines & Power Equity ETF is non-diversified, meaning that it is permitted to invest a larger percentage of their assets in one or more issuers or in fewer issuers than diversified mutual
101
GOLDMAN SACHS EQUITY ETFS
Notes to Financial Statements (continued)
August 31, 2023
|
| 10. OTHER RISKS (continued) |
funds. Thus, the Fund may be more susceptible to adverse developments affecting any single issuer held in its portfolio, and may be more susceptible to greater losses because of these developments.
Tracking Error Risk (each Fund except Goldman Sachs Defensive Equity ETF) — Tracking error is the divergence of a Fund’s performance from that of its Index. The performance of a Fund may diverge from that of its Index for a number of reasons. Tracking error may occur because of transaction costs, a Fund’s holding of cash, differences in accrual of dividends, changes to its Index or the need to meet new or existing regulatory requirements. Unlike a Fund, the returns of an Index are not reduced by investment and other operating expenses, including the trading costs associated with implementing changes to its portfolio of investments. Tracking error risk may be heightened during times of market volatility or other unusual market conditions.
Under the Trust’s organizational documents, its Trustees, officers, employees and agents are indemnified, to the extent permitted by the Act and state law, against certain liabilities that may arise out of performance of their duties to the Funds. Additionally, in the course of business, the Funds enter into contracts that contain a variety of indemnification clauses. The Funds’ maximum exposure under these arrangements is unknown, as this would involve future claims that may be made against the Funds that have not yet occurred. However, GSAM believes the risk of loss under these arrangements to be remote.
Pursuant to an effort to consolidate the membership of the Board of Trustees of the Trust (the “Board”) with the Board of Trustees of each of Goldman Sachs ETF Trust II, Goldman Sachs Real Estate Diversified Income Fund, Goldman Sachs Trust, Goldman Sachs Trust II and Goldman Sachs Variable Insurance Trust, in July 2023, the Board voted to nominate Gregory G. Weaver, Dwight L. Bush, Kathryn A. Cassidy, John G. Chou, Joaquin Delgado, Eileen H. Dowling and Paul C. Wirth (the “Nominees”) for election as Trustees of the Trust at a virtual special joint meeting of shareholders to be held on November 16, 2023. Each of the Nominees currently serve as a Trustee of each of the Goldman Sachs Trust and Goldman Sachs Variable Insurance Trust. If elected, the Nominees will serve as Trustees alongside the current Trustees of the Trust. This annual report is not a proxy statement. Information regarding the election of the Nominees is contained in the proxy materials filed with the SEC. The proxy statement has been mailed to shareholders of record, and shareholders can also access the proxy statement, and any other relevant documents, on the SEC’s website.
Mergers and Reorganizations — Pursuant to an Agreement and Plan of Reorganization (a “Reorganization Agreement”) between the Goldman Sachs Defensive Equity Fund (the “Acquired Fund”), and the Goldman Sachs Defensive Equity ETF (the “Acquiring Fund”), as of the close of business on January 23, 2023, all of the assets and liabilities of the Institutional Class Shares of the Acquired Fund were transferred to the Acquiring Fund in exchange for shares of the Acquiring Fund having an aggregate NAV equal to the NAV of such Acquired Fund as of the time of valuation specified in the applicable Reorganization Agreement, which were then distributed to shareholders of record of such Acquired Fund in a tax-free exchange (the “Reorganization”) as follows:
| | | | | | | | | | | | |
| Acquired Fund/Acquiring Fund | | Exchanged Shares
of Acquiring Fund
Issued | | | Value of Exchanged
Shares | | | Acquired Fund’s
Shares Outstanding
as of January 22,
2023 | |
Goldman Sachs Defensive Equity Fund, Institutional Class/Goldman Sachs Defensive Equity ETF | | | 127,650 | | | $ | 5,398,399 | | | | 127,650 | |
The Acquiring Fund has been organized solely in connection with the Reorganization to acquire all of the assets and liabilities of the Acquired Fund and continue the business of the Acquired Fund. Therefore, after the Reorganization, the Acquired Fund will remain the “accounting survivor.” This means that the Acquiring Fund will continue to show the historical investment performance and returns of the Acquired Fund (even after conversion of the Acquired Fund).
102
GOLDMAN SACHS EQUITY ETFS
|
| 12. OTHER MATTERS (continued) |
The following chart shows Acquiring Fund’s and Acquired Fund’s aggregate net assets (immediately before and after the completion of the acquisition) and the Acquired Fund’s unrealized depreciation:
| | | | | | | | | | | | | | | | | | | | |
| Acquired Fund/Acquiring Fund | | Acquiring
Fund’s
Aggregate
Net Assets
before
acquisition | | | Acquired
Fund’s
Aggregate
Net Assets
before
acquisition | | | Acquiring
Fund’s
Aggregate
Net Assets
immediately
after
acquisition | | | Acquired
Fund’s
Unrealized
Appreciation
(Depreciation)(1) | | | Acquired
Fund’s
Capital Loss
Carryforward(2) | |
Goldman Sachs Defensive Equity Fund, Institutional Class/Goldman Sachs Defensive Equity ETF | | | — | | | $ | 5,398,399 | | | $ | 5,398,399 | | | $ | (339,771 | ) | | $ | 129,676 | |
| (1) | | The Acquiring Fund has elected to carry forward the assets of the Acquired Fund at the Acquired Fund’s historical cost basis for purposes of measuring unrealized depreciation and future realized gain or loss of those acquired assets. |
| (2) | | Represents Capital Loss Carryforward of Acquired Fund as of December 31, 2022. |
Subsequent events after the Statements of Assets and Liabilities date have been evaluated, and GSAM has concluded that there is no impact requiring adjustment or disclosure in the financial statements.
103
Report of Independent Registered Public
Accounting Firm
To the Board of Trustees of Goldman Sachs ETF Trust and Shareholders of Goldman Sachs Bloomberg Clean Energy Equity ETF, Goldman Sachs Equal Weight U.S. Large Cap Equity ETF, Goldman Sachs Hedge Industry VIP ETF, Goldman Sachs Innovate Equity ETF, Goldman Sachs JUST U.S. Large Cap Equity ETF, Goldman Sachs North American Pipelines & Power Equity ETF, and Goldman Sachs Defensive Equity ETF
Opinions on the Financial Statements
We have audited the accompanying statements of assets and liabilities, including the schedules of investments, of each of the funds indicated in the table below (seven of the funds constituting Goldman Sachs ETF Trust, hereafter collectively referred to as the “Funds”) as of August 31, 2023, the related statements of operations and of changes in net assets for each of the periods indicated in the table below, including the related notes, and the financial highlights for each of the periods indicated in the table below (collectively referred to as the “financial statements”). In our opinion, the financial statements present fairly, in all material respects, the financial position of each of the Funds as of August 31, 2023, the results of each of their operations, the changes in each of their net assets, and each of the financial highlights for each of the periods indicated in the table below, in conformity with accounting principles generally accepted in the United States of America.
| | | | | | |
| Fund | | Statements of operations | | Statements of
changes in net assets | | Financial
highlights |
| Goldman Sachs Equal Weight U.S. Large Cap Equity ETF, Goldman Sachs Hedge Industry VIP ETF, Goldman Sachs Innovate Equity ETF, and Goldman Sachs JUST U.S. Large Cap Equity ETF | | For the year ended August 31, 2023 | | For the two years ended August 31, 2023 | | For each of the periods indicated therein |
| Goldman Sachs Bloomberg Clean Energy Equity ETF | | For the year ended August 31, 2023 | | For the year ended August 31, 2023, and for the period February 8, 2022 to August 31, 2022 |
| Goldman Sachs Defensive Equity ETF | | For the period January 1, 2023 to August 31, 2023 and the year ended December 31, 2022 | | For the period January 1, 2023 through August 31, 2023 and the two years ended December 31, 2022 | | For each of the periods indicated therein |
| Goldman Sachs North American Pipelines and Power Equity ETF | | For the period July 11, 2023 (commencement of operations) through August 31, 2023 |
Basis for Opinions
These financial statements are the responsibility of the Funds’ management. Our responsibility is to express an opinion on the Funds’ financial statements based on our audits. We are a public accounting firm registered with the Public Company Accounting Oversight Board (United States) (PCAOB) and are required to be independent with respect to the Funds in accordance with the U.S. federal securities laws and the applicable rules and regulations of the Securities and Exchange Commission and the PCAOB.
We conducted our audits of these financial statements in accordance with the standards of the PCAOB. Those standards require that we plan and perform the audit to obtain reasonable assurance about whether the financial statements are free of material misstatement, whether due to error or fraud.
Our audits included performing procedures to assess the risks of material misstatement of the financial statements, whether due to error or fraud, and performing procedures that respond to those risks. Such procedures included examining, on a test basis, evidence regarding the amounts and disclosures in the financial statements. Our audits also included evaluating the accounting principles used and significant estimates made by management, as well as evaluating the overall presentation of the financial statements. Our procedures included confirmation of securities owned as of August 31, 2023 by correspondence with the custodian, transfer agent and brokers; when replies were not received from brokers, we performed other auditing procedures. We believe that our audits provide a reasonable basis for our opinions.
/s/ PricewaterhouseCoopers LLP
Boston, Massachusetts
October 25, 2023
We have served as the auditor of one or more investment companies in the Goldman Sachs fund complex since 2000.
104
GOLDMAN SACHS EQUITY ETFS
Statement Regarding Basis for Initial Approval of Management Agreement for the Goldman Sachs North American Pipelines & Power Equity ETF (Unaudited)
Background
The Goldman Sachs North American Pipelines & Power Equity ETF (the “Fund”) is a newly-organized investment portfolio of Goldman Sachs ETF Trust (the “Trust”) that commenced investment operations on July 11, 2023. At a meeting held on June 6-7, 2023 (the “Meeting”) in connection with the Fund’s organization, the Board of Trustees, including all of the Trustees present who are not parties to the Fund’s investment management agreement (the “Management Agreement”) or “interested persons” (as defined in the Investment Company Act of 1940, as amended) of any party thereto (the “Independent Trustees”) approved the Management Agreement with Goldman Sachs Asset Management, L.P. (the “Investment Adviser”) on behalf of the Fund. At the Meeting, the Trustees reviewed the Management Agreement with respect to the Fund, including information regarding the terms of the Management Agreement; the nature, extent and quality of the Investment Adviser’s anticipated services; the fees and expenses to be paid by the Fund; a comparison of the Fund’s proposed management fee and anticipated expenses with those paid by other similar exchange-traded funds (“ETFs”); potential benefits to be derived by the Investment Adviser and its affiliates from their relationships with the Fund; and potential benefits to be derived by the Fund from its relationship with the Investment Adviser. Various information was also provided at prior meetings at which the Fund was discussed.
In connection with the Meeting, the Trustees received written materials and oral presentations on the topics covered, and were advised by their independent legal counsel regarding their responsibilities and other regulatory requirements related to the approval of registered fund investment management agreements under applicable law. In evaluating the Management Agreement at the Meeting, the Trustees relied upon information included in a presentation made by the Investment Adviser at the Meeting and information received at prior Board meetings, as well as on their knowledge of the Investment Adviser resulting from their meetings and other interactions over time.
Nature, Extent, and Quality of the Services Provided Under the Management Agreement
As part of their review, the Trustees considered the nature, extent, and quality of the services to be provided to the Fund by the Investment Adviser. In this regard, the Trustees considered both the investment advisory services and non-advisory services that would be provided by the Investment Adviser and its affiliates. The Trustees noted the ongoing recruitment efforts aimed at bringing high quality investment talent to the Investment Adviser. They also noted the significant resources that the Investment Adviser devotes to risk management and the control environment in which the Fund would operate, the Investment Adviser’s commitment to maintaining high quality systems and expending substantial resources to respond to ongoing changes to the market, regulatory and control environment in which the Fund and its service providers would operate, including developments associated with the COVID-19 pandemic, geopolitical events, and economic sanctions, as well as the efforts of the Investment Adviser and its affiliates to combat cyber security risks. The Trustees considered that under the Management Agreement, the Fund pays a single management fee to the Investment Adviser, and the Investment Adviser pays all of the Fund’s ordinary operating expenses, excluding payments under the Fund’s 12b-1 plan (if any), interest expenses, taxes, acquired fund fees and expenses, brokerage fees, costs of holding shareholder meetings and litigation, indemnification and extraordinary expenses. The Trustees also considered information about the Fund’s structure, investment objective, strategies and other characteristics. In particular, they noted that the Fund would operate as a passively-managed ETF that seeks to track an index owned and calculated by a third-party service provider. The Trustees noted the experience and capabilities of the key personnel of the Investment Adviser who would provide services to the Fund. In particular, the Trustees considered the Investment Adviser’s extensive experience in managing quantitative investment strategies. The Trustees also considered information regarding the Investment Adviser’s business continuity planning and remote operations capabilities. The Trustees concluded that the Investment Adviser would be able to commit substantial financial and operational resources to the Fund. They also considered that although the Fund was new (and therefore had no performance data to evaluate), the Investment Adviser has committed substantial financial and operational resources to ETFs and has extensive experience managing other types of registered investment companies. The Trustees also recognized that the Investment Adviser had made significant commitments to address regulatory compliance requirements applicable to the Fund and the Investment Adviser and its affiliates.
Unitary Fee Structure and Profitability
The Trustees considered the unitary management fee rate payable by the Fund, noting that the Management Agreement provides for a unitary fee structure, pursuant to which the Fund pays a single management fee to the Investment Adviser and the Investment Adviser then pays all of the Fund’s ordinary operating expenses. In addition, the Trustees considered information on the services to be rendered by the Investment Adviser to the Fund, which would include both advisory and non-advisory services directed to the needs and operations of the Fund as an ETF. The Trustees noted that a license fee would be payable by the
105
GOLDMAN SACHS EQUITY ETFS
Statement Regarding Basis for Initial Approval of Management Agreement for the Goldman Sachs North American Pipelines & Power Equity ETF (Unaudited) (continued)
Investment Adviser to Solactive AG for the use of its index. The Trustees also considered information provided regarding fees and expenses of comparable ETFs advised by other, unaffiliated investment management firms, as well as the Fund’s peer group and category medians. The comparisons of the Fund’s unitary management fee rate and projected expense ratio were prepared by the Investment Adviser and a third-party provider of mutual fund and ETF data. In particular, the Trustees referred to an analysis comparing the Fund’s unitary management fee rate and projected expense ratio to those of relevant peer funds. The Trustees concluded that the comparisons were useful in evaluating the reasonableness of the management fee and total expenses to be paid by the Fund. The Trustees concluded that the Investment Adviser’s management of the Fund likely would benefit the Fund and its shareholders.
In addition, the Trustees recognized that there was not yet profitability data to evaluate for the Fund, but considered the Investment Adviser’s representations that (i) such data would be provided after the Fund commenced operations, and (ii) the Fund was not expected to be profitable to the Investment Adviser and its affiliates initially.
Economies of Scale
The Trustees noted that the Fund, similar to many other ETFs, would not have management fee breakpoints. The Trustees considered the Fund’s projected asset levels and information comparing the fee rates charged by the Investment Adviser with fee rates charged to other ETFs in the Fund’s peer group. They further noted that the Investment Adviser’s assertion that future economies of scale (among several factors) had been taken into consideration in determining the Fund’s unitary management fee rate.
Other Benefits to the Investment Adviser and Its Affiliates
The Trustees also considered the other benefits expected to be derived by the Investment Adviser and its affiliates from their relationships with the Fund as stated above, including: (a) trading efficiencies resulting from aggregation of orders of the Fund with those for other funds or accounts managed by the Investment Adviser; (b) fees earned by the Investment Adviser for managing the fund in which the Fund’s securities lending cash collateral is invested; (c) the Investment Adviser’s ability to leverage the infrastructure designed to service the Fund on behalf of its other clients; (d) the Investment Adviser’s ability to cross-market other products and services to Fund shareholders; (e) the Investment Adviser’s ability to negotiate better pricing with custodians on behalf of its other clients, as a result of the relationship with the Fund; (f) the investment of cash and cash collateral in money market funds managed by the Investment Adviser that will result in increased assets under management for those money market funds; and (g) the possibility that the working relationship between the Investment Adviser and the Fund’s third party service providers may cause those service providers to be more likely to do business with other areas of Goldman Sachs & Co. LLC (“Goldman Sachs”).
Other Benefits to the Fund and Its Shareholders
The Trustees also noted that the Fund is expected to receive certain potential benefits as a result of its relationship with the Investment Adviser, including: (a) trading efficiencies resulting from aggregation of orders of the Fund with those for other funds or accounts managed by the Investment Adviser; (b) enhanced servicing from vendors due to the volume of business generated by the Investment Adviser and its affiliates; (c) the advantages received from the Investment Adviser’s knowledge and experience gained from managing other accounts and products; (d) the Investment Adviser’s ability to hire and retain qualified personnel to provide services to the Fund because of the reputation of the Goldman Sachs organization; (e) the Fund’s access, through the Investment Adviser, to certain firm-wide resources (e.g., proprietary risk management systems and databases), subject to certain restrictions; and (f) the Fund’s access to certain affiliated distribution channels.
Conclusion
In connection with their consideration of the Management Agreement, the Trustees gave weight to each of the factors described above, but did not identify any particular factor as controlling their decision. After deliberation and consideration of all of the information provided, including the factors described above, the Trustees concluded, in the exercise of their business judgment, that the unitary management fee to be paid by the Fund was reasonable in light of the services to be provided to it by the Investment Adviser, the Investment Adviser’s costs and the Fund’s reasonably foreseeable asset levels. The Trustees unanimously concluded that the engagement of the Investment Adviser likely would benefit the Fund and its shareholders and that the Management Agreement should be approved for an initial two-year period from its effective date.
106
GOLDMAN SACHS EQUITY ETFS
Fund Expenses — Six Months ended 8/31/2023 (Unaudited)
As a shareholder you incur ongoing costs, including management fees and other Fund expenses. This example is intended to help you understand your ongoing costs (in dollars) of investing in Shares of the Funds and to compare these costs with the ongoing costs of investing in other exchange-traded funds. This example does not take into account brokerage commissions that you may pay on your purchases and sales of Shares of a Fund.
Except with respect to the North American Pipelines & Power Equity ETF fund, which commenced operations on July 13, 2023, the example is based on an investment of $1,000 invested at the beginning of the period from March 1, 2023 and held for the six months ended August 31, 2023, which represents a period of 184 days of a 365 day year (or less where indicated).
Actual Expenses — The first line in the table below provides information about actual account values and actual expenses. You may use the information in this line, together with the amount you invested, to estimate the expenses that you paid over the six months. Simply divide your account value by $1,000 (for example, an $8,600 account value divided by $1,000=8.6), then multiply the result by the number in the first line under the heading entitled “Expenses Paid” to estimate the expenses you paid on your account during this period.
Hypothetical Example for Comparison Purposes — The second line in the table below provides information about hypothetical account values and hypothetical expenses based on a Fund’s actual net expense ratios and an assumed rate of return of 5% per year before expenses, which is not the Fund’s actual return. The hypothetical account values and expenses may not be used to estimate the actual ending account balance or expenses you paid for the period. You may use this information to compare the ongoing costs of investing in a Fund and other funds. To do so, compare this 5% hypothetical example with the 5% hypothetical examples that appear in the shareholder reports of the other funds.
Please note that the expenses shown in the table are meant to highlight your ongoing costs only and do not reflect any transactional costs, such as redemption fees, or exchange fees. Therefore, the second line of the table is useful in comparing ongoing costs only, and will not help you determine the relative total costs of owning different funds. In addition, if these transactional costs were included, your costs would have been higher.
| | | | | | | | | | | | | | | | | | | | | | | | | | | | | | | | | | | | | | | | | | | | | | | | | | | | | | | | | | | | | | | | | | | | | | | | | | | | | | | | | | | | |
| | | Goldman Sachs Bloomberg Clean
Energy Equity ETF | | | Goldman Sachs Equal Weight U.S.
Large Cap Equity ETF | | | Goldman Sachs Hedge Industry VIP ETF | | | Goldman Sachs Innovate Equity ETF | | | Goldman Sachs JUST US Large Cap Equity ETF | | | Goldman Sachs North American Pipelines & Power Equity ETF** | | | Goldman Sachs Defensive Equity ETF | |
| | | Beginning
Account
Value
3/1/2023 | | | Ending
Account
Value
8/31/23 | | | Expenses
Paid* | | | Beginning
Account
Value
3/1/23 | | | Ending
Account
Value
8/31/23 | | | Expenses
Paid* | | | Beginning
Account
Value
3/1/23 | | | Ending
Account
Value
8/31/23 | | | Expenses
Paid* | | | Beginning
Account
Value
3/1/23 | | | Ending
Account
Value
8/31/23 | | | Expenses
Paid* | | | Beginning
Account
Value
3/1/23 | | | Ending
Account
Value
8/31/23 | | | Expenses
Paid* | | | Beginning
Account
Value
7/11/23 | | | Ending
Account
Value
8/31/23 | | | Expenses
Paid* | | | Beginning
Account
Value
3/1/23 | | | Ending
Account
Value
8/31/23 | | | Expenses
Paid* | |
Actual based on NAV | | $ | 1,000 | | | $ | 949.99 | | | $ | 2.21 | | | $ | 1,000 | | | $ | 1,048.43 | | | $ | 0.46 | | | $ | 1,000 | | | $ | 1,175.73 | | | $ | 2.47 | | | $ | 1,000 | | | $ | 1,109.56 | | | $ | 2.66 | | | $ | 1,000 | | | $ | 1,135.44 | | | $ | 1.08 | | | $ | 1,000 | | | $ | 1,011.60 | | | $ | 0.79 | | | $ | 1,000 | | | $ | 1,064.38 | | | $ | 2.87 | |
Hypothetical 5% return | | | 1,000 | | | | 1,022.94 | + | | | 2.30 | | | | 1,000 | | | | 1,024.75 | + | | | 0.46 | | | | 1,000 | | | | 1,022.94 | + | | | 2.30 | | | | 1,000 | | | | 1,022.68 | + | | | 2.55 | | | | 1,000 | | | | 1,024.20 | + | | | 1.02 | | | | 1,000 | | | | 1,006.34 | + | | | 0.79 | | | | 1,000 | | | | 1,022.43 | + | | | 2.81 | |
| + | | Hypothetical expenses are based on the Fund’s actual annualized net expense ratios and an assumed rate of return of 5% per year before expenses. |
| * | | Expenses for each Fund is calculated using the Fund’s annualized net expense ratio, which represents the ongoing expenses as a percentage of net assets for the fiscal year ended August 31, 2023. Expenses are calculated by multiplying the annualized net expense ratio by the average account value for the period; then multiplying the result by the number of days in the most recent fiscal year; and then dividing that result by the number of days in the fiscal year. The annualized net expense ratio for the period is as follows: |
| ** | | Fund commenced operations on July 11, 2023. Expenses are calculated using the Fund’s annualized expense ratio, multiplied by the ending value for the period, multiplied by 52/365, which represents a period of 52 days of a 365 day year (to reflect he Fund’s commencement of operation). |
| | | | |
| Fund | | | |
Goldman Sachs Bloomberg Clean Energy Equity ETF | | | 0.45 | % |
Goldman Sachs Equal Weight U.S. Large Cap Equity ETF | | | 0.09 | |
Goldman Sachs Hedge Industry VIP ETF | | | 0.45 | |
Goldman Sachs Innovate Equity ETF | | | 0.50 | |
Goldman Sachs JUST US Large Cap Equity ETF | | | 0.20 | |
Goldman Sachs North American Pipelines & Power Equity ETF | | | 0.55 | |
Goldman Sachs Defensive Equity ETF | | | 0.55 | |
107
GOLDMAN SACHS EQUITY ETFS
Trustees and Officers (Unaudited)
Independent Trustees
| | | | | | | | | | |
Name,
Address and Age1 | | Position(s) Held with the Trust | | Term of Office and Length of
Time Served2 | | Principal Occupation(s)
During Past 5 Years | | Number of
Portfolios in
Fund Complex
Overseen by
Trustee3 | | Other
Directorships Held by Trustee4 |
| | | | | |
Cheryl K. Beebe Age: 67 | | Chair of the Board of Trustees | | Since 2021 | | Ms. Beebe is retired. She is Director, Packaging Corporation of America (2008-Present); Director, The Mosaic Company (2019-Present); Director, HanesBrands Inc. (2020-Present); and was formerly Director, Convergys Corporation (a global leader in customer experience outsourcing) (2015-2018); and formerly held the position of Executive Vice President, (2010-2014); and Chief Financial Officer, Ingredion, Inc. (a leading global ingredient solutions company) (2004-2014). Chair of the Board of Trustees — Goldman Sachs ETF Trust; Goldman Sachs Trust II; Goldman Sachs ETF Trust II; Goldman Sachs MLP and Energy Renaissance Fund; and Goldman Sachs Real Estate Diversified Income Fund. | | 68 | | Packaging Corporation of America (producer of container board); The Mosaic Company (producer of phosphate and potash fertilizer); HanesBrands Inc. (a multinational clothing company) |
| | | | | |
Lawrence Hughes Age: 65 | | Trustee | | Since 2021 | | Mr. Hughes is retired. Formerly, he held senior management positions with BNY Mellon Wealth Management, a division of The Bank of New York Mellon Corporation (a financial services company) (1991-2015), most recently as Chief Executive Officer (2010-2015). Previously, Mr. Hughes served as an Advisory Board Member of Goldman Sachs Trust II (February 2016-April 2016). Trustee — Goldman Sachs ETF Trust; Goldman Sachs ETF Trust II; Goldman Sachs Trust II; Goldman Sachs MLP and Energy Renaissance Fund; and Goldman Sachs Real Estate Diversified Income Fund. | | 68 | | None |
| | | | | |
John F. Killian Age: 68 | | Trustee | | Since 2021 | | Mr. Killian is retired. He is Director, Consolidated Edison, Inc. (2007-Present); and was formerly Director, Houghton Mifflin Harcourt Publishing Company (2011-2022). Previously, he held senior management positions with Verizon Communications, Inc., including Executive Vice President and Chief Financial Officer (2009-2010); and President, Verizon Business, Verizon Communications, Inc. (2005-2009). Trustee — Goldman Sachs ETF Trust; Goldman Sachs ETF Trust II; Goldman Sachs Trust II; Goldman Sachs MLP and Energy Renaissance Fund; and Goldman Sachs Real Estate Diversified Income Fund. | | 68 | | Consolidated Edison, Inc. (a utility holding company) |
| | | | | |
Steven D. Krichmar Age: 65 | | Trustee | | Since 2021 | | Mr. Krichmar is retired. Formerly, he held senior management and governance positions with Putnam Investments, LLC, a financial services company (2001-2016). He was most recently Chief of Operations and a member of the Operating Committee of Putnam Investments, LLC and Principal Financial Officer of The Putnam Funds. Previously, Mr. Krichmar served as an Audit Partner with PricewaterhouseCoopers LLP and its predecessor company (1990-2001). Trustee — Goldman Sachs ETF Trust; Goldman Sachs ETF Trust II; Goldman Sachs Trust II; Goldman Sachs MLP and Energy Renaissance Fund; and Goldman Sachs Real Estate Diversified Income Fund. | | 68 | | None |
| | | | | |
Michael Latham Age: 57 | | Trustee | | Since 2015 | | Mr. Latham is retired. Formerly, he held senior management positions with the iShares exchange-traded fund business owned by BlackRock, Inc., including Chairman (2011-2014); Global Head (2010-2011); U.S. Head (2007-2010); and Chief Operating Officer (2003-2007). Trustee — Goldman Sachs ETF Trust; Goldman Sachs ETF Trust II; Goldman Sachs Trust II; Goldman Sachs MLP and Energy Renaissance Fund; Goldman Sachs Credit Income Fund; and Goldman Sachs Real Estate Diversified Income Fund. | | 69 | | None |
| | | | | | | | | | |
108
GOLDMAN SACHS EQUITY ETFS
Trustees and Officers (Unaudited) (continued)
Independent Trustees
| | | | | | | | | | |
Name,
Address and Age1 | | Position(s) Held with the Trust | | Term of Office and Length of
Time Served2 | | Principal Occupation(s)
During Past 5 Years | | Number of
Portfolios in
Fund Complex
Overseen by
Trustee3 | | Other
Directorships Held by Trustee4 |
| | | | | |
Lawrence W. Stranghoener Age: 69 | | Trustee | | Since 2015 | | Mr. Stranghoener is retired. He is Chairman, Kennametal, Inc. (a global manufacturer and distributor of tooling and industrial materials) (2003-Present); and was formerly Director, Aleris Corporation and Aleris International, Inc. (a producer of aluminum rolled products) (2011-2020); Interim Chief Executive Officer (2014) and Executive Vice President and Chief Financial Officer (2004-2014), Mosaic Company (a fertilizer manufacturing company). Trustee — Goldman Sachs ETF Trust; Goldman Sachs Trust II; Goldman Sachs ETF Trust II; Goldman Sachs MLP and Energy Renaissance Fund; and Goldman Sachs Real Estate Diversified Income Fund. Chair of the Board of Trustees — Goldman Sachs Credit Income Fund. | | 69 | | Kennametal, Inc. (a global manufacturer and distributor of tooling and industrial materials) |
| | | | | | | | | | |
109
GOLDMAN SACHS EQUITY ETFS
Trustees and Officers (Unaudited) (continued)
Interested Trustee*
| | | | | | | | | | |
Name, Address and Age1 | | Position(s) Held with the Trust | | Term of Office and
Length of
Time Served2 | | Principal Occupation(s)
During Past 5 Years | | Number of
Portfolios in
Fund Complex
Overseen by
Trustee3 | | Other
Directorships Held by Trustee4 |
| | | | | |
James A. McNamara Age: 60 | | President and Trustee | | Since 2014 | | Advisory Director, Goldman Sachs (January 2018-Present); Managing Director, Goldman Sachs (January 2000-December 2017); Director of Institutional Fund Sales, GSAM (April 1998-December 2000); and Senior Vice President and Manager, Dreyfus Institutional Service Corporation (January 1993-April 1998). President and Trustee — Goldman Sachs ETF Trust; Goldman Sachs ETF Trust II; Goldman Sachs Trust; Goldman Sachs Variable Insurance Trust; Goldman Sachs Trust II; Goldman Sachs MLP and Energy Renaissance Fund; Goldman Sachs Credit Income Fund; and Goldman Sachs Real Estate Diversified Income Fund. | | 172 | | None |
| | | | | | | | | | |
| * | | Mr. McNamara is considered to be an “Interested Trustee” because he holds a position with Goldman Sachs and owns securities issued by The Goldman Sachs Group, Inc. The Interested Trustee holds comparable positions with certain other companies of which Goldman Sachs, GSAM or an affiliate thereof is the investment adviser, administrator and/or distributor. |
| 1 | | Each Trustee may be contacted by writing to the Trustee, c/o Goldman Sachs, 200 West Street, New York, New York, 10282, Attn: Caroline Kraus. Information is provided as of August 31, 2023. |
| 2 | | Each Trustee holds office for an indefinite term, until the earliest of: (a) the election of his or her successor; (b) the date the Trustee resigns or is removed by the Board or shareholders, in accordance with the Trust’s Declaration of Trust; or (c) the termination of the Trust. The Board has adopted policies which provide that each Independent Trustee shall retire as of December 31st of the calendar year in which he or she reaches (a) his or her 74th birthday or (b) the 15th anniversary of the date he or she became a Trustee, whichever is earlier, unless a waiver of such requirements shall have been adopted by a majority of the other Trustees. These policies may be changed by the Trustees without shareholder vote. |
| 3 | | The Goldman Sachs Fund Complex includes certain other companies listed above for each respective Trustee. As of August 31, 2023, Goldman Sachs ETF Trust consisted of 67 portfolios (32 of which offered shares to the public); Goldman Sachs ETF Trust II consisted of 2 portfolios; Goldman Sachs Trust consisted of 87 portfolios; Goldman Sachs Variable Insurance Trust consisted of 15 portfolios (11 of which offered shares to the public); Goldman Sachs Trust II consisted of 18 portfolios (7 of which offered shares to the public); and Goldman Sachs MLP and Energy Renaissance Fund, Goldman Sachs Credit Income Fund and Goldman Sachs Real Estate Diversified Income Fund each consisted of one portfolio. Goldman Sachs MLP and Energy Renaissance Fund and Goldman Sachs Credit Income Fund each did not offer shares to the public. |
| 4 | | This column includes only directorships of companies required to report to the Securities and Exchange Commission under the Securities Exchange Act of 1934 (i.e., “public companies”) or other investment companies registered under the Act. |
Additional information about the Trustees is available in the Funds’ Statement of Additional Information, which can be obtained from Goldman Sachs free of charge by calling this toll-free number (in the United States of America): 1-800-526-7384.
110
GOLDMAN SACHS EQUITY ETFS
Trustees and Officers (Unaudited) (continued)
Officers of the Trust*
| | | | | | |
Name, Address and Age1 | | Positions Held with the Trust | | Term of
Office and
Length of
Time Served2 | | Principal Occupation(s) During Past 5 Years |
| | | |
James A. McNamara 200 West Street New York, NY 10282 Age: 60 | | Trustee and President | | Since 2014 | | Advisory Director, Goldman Sachs (January 2018-Present); Managing Director, Goldman Sachs (January 2000-December 2017); Director of Institutional Fund Sales, GSAM (April 1998-December 2000); and Senior Vice President and Manager, Dreyfus Institutional Service Corporation (January 1993-April 1998). President and Trustee — Goldman Sachs ETF Trust; Goldman Sachs Trust; Goldman Sachs Variable Insurance Trust; Goldman Sachs Trust II; Goldman Sachs ETF Trust II; Goldman Sachs MLP and Energy Renaissance Fund; Goldman Sachs Credit Income Fund; and Goldman Sachs Real Estate Diversified Income Fund. |
| | | |
Caroline L. Kraus 200 West Street New York, NY 10282 Age: 46 | | Secretary | | Since 2014 | | Managing Director, Goldman Sachs (January 2016-Present); Vice President, Goldman Sachs (August 2006-December 2015); Senior Counsel, Goldman Sachs (January 2020-Present); Associate General Counsel, Goldman Sachs (2012-December 2019); Assistant General Counsel, Goldman Sachs (August 2006-December 2011); and Associate, Weil, Gotshal & Manges, LLP (2002–2006). Secretary — Goldman Sachs ETF Trust; Goldman Sachs Trust (previously Assistant Secretary (2012)); Goldman Sachs Variable Insurance Trust (previously Assistant Secretary (2012)); Goldman Sachs Trust II; Goldman Sachs ETF Trust II; Goldman Sachs BDC, Inc.; Goldman Sachs Private Middle Market Credit LLC; Goldman Sachs Private Middle Market Credit II LLC; Goldman Sachs Middle Market Lending Corp.; Goldman Sachs MLP and Energy Renaissance Fund; Goldman Sachs Credit Income Fund; and Goldman Sachs Real Estate Diversified Income Fund. |
| | | |
Joseph F. DiMaria 30 Hudson Street Jersey City, NJ 07302 Age: 55 | | Treasurer, Principal Financial Officer and Principal Accounting Officer | | Since 2017 (Treasurer and Principal Financial Officer since 2019) | | Managing Director, Goldman Sachs (November 2015-Present) and Vice President-Mutual Fund Administration, Columbia Management Investment Advisers, LLC (May 2010-October 2015). Treasurer, Principal Financial Officer and Principal Accounting Officer — Goldman Sachs ETF Trust (previously Assistant Treasurer (2017)); Goldman Sachs Trust (previously Assistant Treasurer (2016)); Goldman Sachs Variable Insurance Trust (previously Assistant Treasurer (2016)); Goldman Sachs Trust II (previously Assistant Treasurer (2017)); Goldman Sachs MLP and Energy Renaissance Fund (previously Assistant Treasurer (2017)); Goldman Sachs ETF Trust II; Goldman Sachs Credit Income Fund; and Goldman Sachs Real Estate Diversified Income Fund. |
| | | | | | |
| * | | Represents a partial list of officers of the Trust. Additional information about all the officers is available in the Funds’ Statement of Additional Information, which can be obtained from Goldman Sachs free of charge by calling this toll-free number (in the United States): 1-800-621-2550. |
| 1 | | Information is provided as of August 31, 2023. |
| 2 | | Officers hold office at the pleasure of the Board of Trustees or until their successors are duly elected and qualified. Each officer holds comparable positions with certain other companies of which Goldman Sachs, GSAM or an affiliate thereof is the investment adviser, administrator and/or distributor. |
Goldman Sachs ETF Trust – Equity ETFs — Tax Information (Unaudited)
From distributions paid during the fiscal year ended August 31, 2023, the total amount of income received by the Bloomberg Clean Energy Equity ETF from sources within foreign countries and possessions of the United States was $0.2884 per share, all of which is attributable to qualified passive income. The percentage of net investment income dividends paid from foreign sources by the Bloomberg Clean Energy Equity ETF was 61.37%. The total amount of taxes paid by the Bloomberg Clean Energy Equity ETF to foreign countries was $0.0538 per share.
For the fiscal year ended August 31, 2023, 28.04%, 88.33%, 100%, 75.06%, 100% and 100% of the dividends paid from net investment company taxable income by the Bloomberg Clean Energy Equity ETF, Equal Weight U.S. Large Cap Equity ETF, Hedge Industry VIP ETF, Innovate Equity ETF, JUST U.S. Large Cap Equity ETF, and Defensive Equity ETF, respectively, qualify for the dividends received deduction available to corporations.
For the fiscal year ended August 31, 2023, 100%, 97.50%, 100%, 100%, 100% and 100% of the dividends paid from net investment company taxable income by the Bloomberg Clean Energy Equity ETF, Equal Weight U.S. Large Cap Equity ETF, Hedge Industry VIP ETF, Innovate Equity ETF, JUST U.S. Large Cap Equity ETF, and Defensive Equity ETF, respectively, qualify for the reduced tax rate under the Jobs and Growth Tax Relief and Reconciliation Act of 2003.
For the fiscal year ended August 31, 2023, 2.50% of the dividends paid from net investment company taxable income by the Equal Weight U.S. Large Cap Equity ETF qualify as section 199A dividends.
111
FUNDS PROFILE
Goldman Sachs ETFs

Goldman Sachs is a premier financial services firm, known since 1869 for creating thoughtful and customized investment solutions in complex global markets.
Today, the Asset Management Division of Goldman Sachs serves a diverse set of clients worldwide, including private institutions, public entities and individuals. With approximately $2.46 trillion in assets under supervision as of June 30, 2023, Goldman Sachs Asset Management has portfolio management teams located around the world and our investment professionals bring firsthand knowledge of local markets to every investment decision. Assets under supervision includes assets under management and other client assets for which Goldman Sachs does not have full discretion. Goldman Sachs Asset Management leverages the resources of Goldman Sachs & Co. LLC subject to legal, internal and regulatory restrictions.
|
|
| GOLDMAN SACHS EXCHANGE-TRADED FUNDS |
| Goldman Sachs ActiveBeta® Emerging Markets Equity ETF |
| Goldman Sachs ActiveBeta® Europe Equity ETF |
| Goldman Sachs ActiveBeta® International Equity ETF |
| Goldman Sachs ActiveBeta® Japan Equity ETF |
| Goldman Sachs ActiveBeta® Paris-Aligned Climate U.S. Large Cap Equity ETF |
| Goldman Sachs ActiveBeta® U.S. Large Cap Equity ETF |
| Goldman Sachs ActiveBeta® U.S. Small Cap Equity ETF |
| Goldman Sachs ActiveBeta® World Low Vol Plus Equity ETF |
| Goldman Sachs Bloomberg Clean Energy Equity ETF |
| Goldman Sachs Community Municipal Bond ETF |
| Goldman Sachs Defensive Equity ETF |
| Goldman Sachs Equal Weight U.S. Large Cap Equity ETF |
| Goldman Sachs Hedge Industry VIP ETF |
| Goldman Sachs Innovate Equity ETF |
| Goldman Sachs JUST U.S. Large Cap Equity ETF |
| Goldman Sachs Access Emerging Markets USD Bond ETF |
| Goldman Sachs Access High Yield Corporate Bond ETF |
| Goldman Sachs Access Inflation Protected USD Bond ETF |
| Goldman Sachs Access Investment Grade Corporate 1-5 Year Bond ETF |
| Goldman Sachs Access Investment Grade Corporate Bond ETF |
| Goldman Sachs Access Treasury 0-1 Year ETF |
| Goldman Sachs Access U.S. Aggregate Bond ETF |
| Goldman Sachs Access Ultra Short Bond ETF |
| Goldman Sachs MarketBeta® Emerging Markets Equity ETF |
| Goldman Sachs MarketBeta® International Equity ETF |
| Goldman Sachs MarketBeta® U.S. Equity ETF |
| Goldman Sachs MarketBeta® U.S. 1000 Equity ETF |
| Goldman Sachs MarketBeta® Total International Equity ETF |
Goldman Sachs Future Planet Equity ETF Goldman Sachs Future Tech Leaders Equity ETF |
| Goldman Sachs Future Health Care Equity ETF |
| Goldman Sachs Future Consumer Equity ETF |
| Goldman Sachs Future Real Estate and Infrastructure Equity ETF |
| Goldman Sachs North American Pipelines & Power Equity ETF |
Goldman Sachs Small Cap Core Equity ETF |
INDEX DISCLAIMERS
“Bloomberg®” and the Bloomberg Goldman Sachs Global Clean Energy Index are service marks of Bloomberg Finance L.P. and its affiliates, including Bloomberg Index Services Limited (“BISL”), the administrator of the index (collectively, “Bloomberg”), and have been licensed for use for certain purposes by GSAM. The Fund is not sponsored, endorsed, sold or promoted by Bloomberg. Bloomberg does not make any representation or warranty, express or implied, to the owners of or counterparties to the Fund or any member of the public regarding the advisability of investing in securities generally or in the Fund particularly. The only relationship of Bloomberg to GSAM. is the licensing of certain trademarks, trade names and service marks and of the Index, which is determined, composed and calculated by BISL without regard to GSAM or the Fund. Bloomberg has no obligation to take the needs of GSAM or the owners of the Fund into consideration in determining, composing or calculating the Index. Bloomberg is not responsible for and has not participated in the determination of the timing of, prices at, or quantities of the Fund to be issued. Bloomberg shall not have any obligation or liability, including, without limitation, to Fund customers, in connection with the administration, marketing or trading of the Fund.
BLOOMBERG DOES NOT GUARANTEE THE ACCURACY AND/OR THE COMPLETENESS OF THE INDEX OR ANY DATA RELATED THERETO AND SHALL HAVE NO LIABILITY FOR ANY ERRORS, OMISSIONS OR INTERRUPTIONS THEREIN. BLOOMBERG DOES NOT MAKE ANY WARRANTY, EXPRESS OR IMPLIED, AS TO RESULTS TO BE OBTAINED BY GSAM, OWNERS OF THE FUND OR ANY OTHER PERSON OR ENTITY FROM THE USE OF THE INDEX OR ANY DATA RELATED THERETO. BLOOMBERG DOES NOT MAKE ANY EXPRESS OR IMPLIED WARRANTIES AND EXPRESSLY DISCLAIMS ALL WARRANTIES OF MERCHANTABILITY OR FITNESS FOR A PARTICULAR PURPOSE OR USE WITH RESPECT TO THE INDEX OR ANY DATA RELATED THERETO. WITHOUT LIMITING ANY OF THE FOREGOING, TO THE MAXIMUM EXTENT ALLOWED BY LAW, BLOOMBERG, ITS LICENSORS, AND ITS AND THEIR RESPECTIVE EMPLOYEES,
FUNDS PROFILE
CONTRACTORS, AGENTS, SUPPLIERS, AND VENDORS SHALL HAVE NO LIABILITY OR RESPONSIBILITY WHATSOEVER FOR ANY INJURY OR DAMAGES — WHETHER DIRECT, INDIRECT, CONSEQUENTIAL, INCIDENTAL, PUNITIVE OR OTHERWISE — ARISING IN CONNECTION WITH THE FUND OR THE INDEX OR ANY DATA OR VALUES RELATING THERETO — WHETHER ARISING FROM THEIR NEGLIGENCE OR OTHERWISE, EVEN IF NOTIFIED OF THE POSSIBILITY THEREOF.
The Goldman Sachs Equal Weight U.S. Large Cap Equity ETF is not sponsored, promoted, sold or supported in any other manner by Solactive AG nor does Solactive AG offer any express or implicit guarantee or assurance either with regard to the results of using the Solactive US Large Cap Equal Weight Index (GTR) (“Solactive Index”) and/or Solactive Index trade mark or the Solactive Index Price at any time or in any other respect. The Solactive Index is calculated and published by Solactive AG. Solactive AG uses its best efforts to ensure that the Solactive Index is calculated correctly. Irrespective of its obligations towards Goldman Sachs Equal Weight U.S. Large Cap Equity ETF, Solactive AG has no obligation to point out errors in the Solactive Index to third parties including but not limited to investors and/or financial intermediaries of Goldman Sachs Equal Weight U.S. Large Cap Equity ETF. Neither publication of a Solactive Index by Solactive AG nor the licensing of the Solactive Index or Solactive Index trade mark for the purpose of use in connection with the Goldman Sachs Equal Weight U.S. Large Cap Equity ETF constitutes a recommendation by Solactive AG to invest capital in said fund nor does it in any way represent an assurance or opinion of Solactive AG with regard to any investment in this fund.
GOLDMAN SACHS ASSET MANAGEMENT, L.P., THE GOLDMAN SACHS GROUP, INC., AND GOLDMAN SACHS & CO. LLC (COLLECTIVELY, “GOLDMAN SACHS”) DOES NOT GUARANTEE NOR MAKE ANY REPRESENTATION OR WARRANTY, EXPRESS OR IMPLIED, TO THE OWNERS OR SHAREHOLDERS OF THE FUND OR ANY MEMBER OF THE PUBLIC REGARDING THE ADVISABILITY OF INVESTING IN SECURITIES GENERALLY OR IN THE FUND PARTICULARLY OR THE ABILITY OF THE INDEX TO TRACK GENERAL MARKET PERFORMANCE. GOLDMAN SACHS, IN ITS CAPACITY AS THE INDEX PROVIDER OF THE INDEX, LICENSES CERTAIN TRADEMARKS AND TRADE NAMES TO THE FUND. GOLDMAN SACHS HAS NO OBLIGATION TO TAKE THE NEEDS OF THE FUND OR THE SHAREHOLDERS OF THE FUND INTO CONSIDERATION IN DETERMINING, COMPOSING OR CALCULATING THE INDEX. GOLDMAN SACHS, ITS AFFILIATES AND ANY OF ITS CLIENTS MAY HOLD LONG OR SHORT POSITIONS IN SECURITIES HELD BY THE FUND OR IN RELATED DERIVATIVES, INCLUDING THOSE LINKED TO THE INDEX. GOLDMAN SACHS DOES NOT GUARANTEE THE ADEQUACY, TIMELINESS, ACCURACY AND/OR THE COMPLETENESS OF THE INDEX OR ANY DATA RELATED THERETO. GOLDMAN SACHS HEREBY EXPRESSLY DISCLAIMS ANY AND ALL LIABILITY FOR ANY ERRORS, OMISSIONS, OR INTERRUPTIONS THEREIN OR IN THE CALCULATION THEREOF. GOLDMAN SACHS MAKES NO WARRANTY, EXPRESS OR IMPLIED, AND EXPRESSLY DISCLAIMS ALL WARRANTIES OF MERCHANTABILITY OR FITNESS FOR A PARTICULAR PURPOSE OR USE WITH RESPECT TO THE MARKS, THE INDEX OR ANY DATA INCLUDED THEREIN AS TO THE RESULTS TO BE OBTAINED BY THE FUND, THE SHAREHOLDERS, OR ANY OTHER PERSON OR ENTITY FROM USE OF THE INDEX OR ANY DATA INCLUDED THEREIN. WITHOUT LIMITING ANY OF THE FOREGOING, GOLDMAN SACHS HEREBY EXPRESSLY DISCLAIMS ANY AND ALL LIABILITY FOR ANY SPECIAL, PUNITIVE, INDIRECT, OR CONSEQUENTIAL DAMAGES (INCLUDING LOST PROFITS), EVEN IF ADVISED OF THE POSSIBILITY OF SUCH DAMAGES.
The Goldman Sachs Innovate Equity ETF is not sponsored, promoted, sold or supported in any other manner by Solactive AG nor does Solactive AG offer any express or implicit guarantee or assurance either with regard to the results of using the Solactive Innovative Global Equity Index (“Solactive Index”) and/or Solactive Index trade mark or the Solactive Index Price at any time or in any other respect. The Solactive Index is calculated and published by Solactive AG. Solactive AG uses its best efforts to ensure that the Solactive Index is calculated correctly. Irrespective of its obligations towards Goldman Sachs Innovate Equity ETF, Solactive AG has no obligation to point out errors in the Solactive Index to third parties including but not limited to investors and/ or financial intermediaries of Goldman Sachs Innovate Equity ETF. Neither publication of a Solactive Index by Solactive AG nor the licensing of the Solactive Index or Solactive Index trade mark for the purpose of use in connection with the Goldman Sachs Innovate Equity ETF constitutes a recommendation by Solactive AG to invest capital in said fund nor does it in any way represent an assurance or opinion of Solactive AG with regard to any investment in this fund.
Neither JUST Capital Foundation, Inc. (“JUST Capital”) nor any of its affiliates (collectively, the “JUST Parties”) in any way sells, sponsors, supports, promotes, or endorses the Goldman Sachs JUST U.S. Large Cap Equity ETF (the “GS ETF”), or has involvement in its operations or distribution. The JUST US Large Cap Diversified Index (the “JUST Index”) has been licensed by Russell on an “as is” basis to Goldman Sachs Asset Management L.P. (“Goldman Sachs”) in connection with Goldman Sachs’ sponsorship of the GS ETF, and JUST Capital’s only relationship with Goldman Sachs is the licensing of certain trademarks and trade names of JUST Capital or its affiliates. The JUST Parties and any other person or entity involved in or related to compiling, computing, or creating the JUST Index expressly disclaim all representations, warranties, and liabilities relating to or in connection with the GS ETF (including, without limitation, any warranties of originality, accuracy, completeness, timeliness, non-infringement, merchantability, and fitness for a particular purpose).
FUNDS PROFILE
Goldman Sachs ETFs
No JUST Party makes any claim, prediction, warranty, or representation whatsoever, expressly or impliedly, either as to (i) the results to be obtained from the use of the JUST Index, the GS ETF, or any of the data included in either of the foregoing, (ii) the level at which the JUST Index or GS ETF is said to stand at any particular time on any particular day or otherwise, (iii) the suitability of the JUST Index for the purpose to which it is being put in connection with the GS ETF, or (iv) the advisability of investing in securities generally or in any index or ETF, including those provided by Goldman Sachs.
No JUST Party has provided, nor will any provide, any financial or investment advice or recommendation in relation to the JUST Index or the GS ETF to Goldman Sachs Asset Management or to its clients. No JUST Party shall be (i) liable (whether in negligence or otherwise) to any person for any error in the JUST Index or (ii) under any obligation to advise any person of any error therein. Without limiting any of the foregoing, in no event shall any JUST Party have any liability for any direct, indirect, special, incidental, punitive, consequential (including without limitation lost profits), or any other damages in connection with the JUST Index or the GS ETF.
Data and information regarding the JUST Index is proprietary to JUST Capital or its licensors, and reproduction of such data and information is prohibited except with the prior written permission of JUST Capital. JUST Index® and JUST Capital Index® are trademarks of JUST Capital and have been licensed for use by Goldman Sachs Asset Management L.P. by JUST Capital and/or its agent.
Frank Russell Company (“Russell”) acts solely as calculation agent in respect of the JUST US Large Cap Diversified Index and does not in any way sponsor, support, promote or endorse the JUST US Large Cap Diversified Index or the Goldman Sachs JUST U.S. Large Cap Equity ETF. The JUST US Large Cap Diversified Index was provided on an “as is” basis. Russell, its affiliates and any other person or entity involved in or related to compiling, computing or creating the JUST US Large Cap Diversified Index (collectively, the “Russell Parties”) expressly disclaim all warranties (including, without limitation, any warranties of originality, accuracy, completeness, timeliness, non-infringement, merchantability and fitness for a particular purpose).
Russell does not make any claim, prediction, warranty or representation whatsoever, expressly or impliedly, either as to (i) the results to be obtained from the use of the JUST US Large Cap Diversified Index (upon which the Goldman Sachs JUST U.S. Large Cap Equity ETF is based), (ii) the figure at which the JUST US Large Cap Diversified Index is said to stand at any particular time on any particular day or otherwise, or (iii) the suitability of the JUST US Large Cap Diversified Index for the purpose to which it is being put in connection with the Goldman Sachs JUST U.S. Large Cap Equity ETF.
Russell has not provided and will not provide any financial or investment advice or recommendation in relation to the JUST US Large Cap Diversified Index to Goldman Sachs Asset Management or to its clients. The JUST US Large Cap Diversified Index is calculated by Russell or its agent as calculation agent. Russell shall not be (a) liable (whether in negligence or otherwise) to any person for any error in the Index or (b) under any obligation to advise any person of any error therein.
Without limiting any of the foregoing, in no event shall any Russell Party have any liability for any direct, indirect, special, incidental, punitive, consequential (including without limitation lost profits) or any other damages in connection with the JUST US Large Cap Diversified Index or the Goldman Sachs JUST U.S. Large Cap Equity ETF.
The Goldman Sachs North American Pipelines & Power Equity ETF is not sponsored, promoted, sold or supported in any other manner by Solactive AG nor does Solactive AG offer any express or implicit guarantee or assurance either with regard to the results of using the Solactive Energy Infrastructure Enhanced Index (“Solactive Index”) and/or Solactive Index trade mark or the Solactive Index Price at any time or in any other respect. The Solactive Index is calculated and published by Solactive AG. Solactive AG uses its best efforts to ensure that the Solactive Index is calculated correctly. Irrespective of its obligations towards Goldman Sachs North American Pipelines & Power Equity ETF, Solactive AG has no obligation to point out errors in the Solactive Index to third parties including but not limited to investors and/or financial intermediaries of Goldman Sachs North American Pipelines & Power Equity ETF. Neither publication of a Solactive Index by Solactive AG nor the licensing of the Solactive Index or Solactive Index trade mark for the purpose of use in connection with the Goldman Sachs North American Pipelines & Power Equity ETF constitutes a recommendation by Solactive AG to invest capital in said fund nor does it in any way represent an assurance or opinion of Solactive AG with regard to any investment in this fund.
| | |
TRUSTEES Cheryl K. Beebe, Chair Lawrence Hughes John F. Killian Steven D. Kirchmar Michael Latham James A. McNamara Lawrence W. Stranghoener | | OFFICERS James A. McNamara, President Joseph F. DiMaria, Principal Financial Officer, Principal Accounting Officer and Treasurer Robert Griffith, Secretary* * Effective September 20, 2023 |
| |
THE BANK OF NEW YORK MELLON Transfer Agent | | |
| |
ALPS DISTRIBUTORS, INC. Distributor | | GOLDMAN SACHS ASSET MANAGEMENT, L.P. Investment Adviser |
Visit our Website at www.GSAMFUNDS.com/ETFs to obtain the most recent month-end returns.
Goldman Sachs Asset Management, L.P., 200 West Street, New York, New York 10282
The reports concerning the Funds included in this shareholder report may contain certain forward-looking statements about the factors that may affect the performance of the Funds in the future. These statements are based on Fund management’s predictions and expectations concerning certain future events and their expected impact on the Funds, such as performance of the economy as a whole and of specific industry sectors, changes in the levels of interest rates, the impact of developing world events, and other factors that may influence the future performance of the Funds. Management believes these forward-looking statements to be reasonable, although they are inherently uncertain and difficult to predict. Actual events may cause adjustments in portfolio management strategies from those currently expected to be employed.
The Global Industry Classification Standard (“GICS”) was developed by and is the exclusive property and a service mark of MSCI Inc. (“MSCI”) and S&P Global Market Intelligence (“S&P”) and is licensed for use by Goldman Sachs. Neither MSCI, S&P, nor any other party involved in making or compiling the GICS or any GICS classifications makes any express or implied warranties or representations with respect to such standard or classification (or the results to be obtained by the use thereof), and all such parties hereby expressly disclaim all warranties of originality, accuracy, completeness, merchantability and fitness for a particular purpose with respect to any of such standard or classification. Without limiting any of the foregoing, in no event shall MSCI, S&P, any of their affiliates or any third party involved in making or compiling the GICS or any GICS classifications have any liability for any direct, indirect, special, punitive, consequential or any other damages (including lost profits) even if notified of the possibility of such damages.
A description of the policies and procedures that the Funds use to determine how to vote proxies relating to portfolio securities and information regarding how the Funds voted proxies relating to portfolio securities for the most recent 12-month period ended June 30 are available (i) without charge, upon request by calling 1-800-621-2550; and (ii) on the Securities and Exchange Commission (“SEC”) web site at http://www.sec.gov.
The Funds will file their portfolio holdings information for each month in a fiscal quarter within 60 days after the end of the relevant fiscal quarter on Form N-PORT. Portfolio holdings information for the third month of each fiscal quarter will be made available on the SEC’s web site at http://www.sec.gov. Portfolio holdings information may be obtained upon request and without charge by calling 1-800-621-2550.
Fund holdings and allocations shown are as of August 31, 2023 and may not be representative of future investments. Fund holdings should not be relied on in making investment decisions and should not be construed as research or investment advice regarding particular securities. Current and future holdings are subject to risk.
ETF Fund shares are not individually redeemable and are issued and redeemed by the Funds at their net asset value (“NAV”) only in large, specified blocks of shares called creation units. Shares otherwise can be bought and sold only through exchange trading at market price (not NAV). Shares may trade at a premium or discount to their NAV in the secondary market. Brokerage commissions will reduce returns. Ordinary brokerage commissions apply.
This material is not authorized for distribution to prospective investors unless preceded or accompanied by a current prospectus or summary prospectus, if applicable. Investors should consider the Funds’ objective, risks, and charges and expenses, and read the summary prospectus, if available, and/or the prospectus carefully before investing or sending money. The summary prospectus, if available, and the Prospectus contain this and other information about the Funds and may be obtained from your authorized dealer or from Goldman Sachs & Co. LLC by calling 1-800-621-2550.
ALPS Distributors, Inc. is the distributor of the Goldman Sachs ETF Funds. ALPS Distributors, Inc. is unaffiliated with Goldman Sachs Asset Management.
©2023 Goldman Sachs. All rights reserved. 339806-OTU-10/2023 EQTYETFAR-23
Goldman Sachs Funds
| | | | |
| | |
| Annual Report | | | | August 31, 2023 |
| | |
| | | | Goldman Sachs MarketBeta® ETFs |
| | | | MarketBeta® Emerging Markets Equity ETF (GSEE) |
| | | | MarketBeta® International Equity ETF (GSID) |
| | | | MarketBeta® U.S. Equity ETF (GSUS) |

Goldman Sachs MarketBeta® ETFs
| ∎ | | MarketBeta® Emerging Markets Equity ETF |
| ∎ | | MarketBeta® International Equity ETF |
| ∎ | | MarketBeta® U.S. Equity ETF |
| | | | |
| | | |
| NOT FDIC-INSURED | | May Lose Value | | No Bank Guarantee |
INVESTMENT PROCESS
Goldman Sachs MarketBeta® Equity ETFs
Principal Investment Strategies
The investment objective of each of the MarketBeta® Emerging Markets Equity ETF, MarketBeta® International Equity ETF and MarketBeta® U.S. Equity ETF (each, a “Fund”), is to seek to provide investment results that closely correspond, before fees and expenses, to the performance of its respective underlying index (each, an “Index”).
Each Fund seeks to achieve its investment objective by investing at least 80% of its assets (exclusive of collateral held from securities lending) in securities included in its underlying index, in depositary receipts representing securities included in its underlying index and in underlying stocks in respect of depositary receipts included in its underlying index.
MarketBeta® Emerging Markets Equity ETF
The Solactive GBS Emerging Markets Large & Mid Cap Index (the “Index”) consists of equity securities of large and mid-capitalization issuers covering approximately the largest 85% of the free-float market capitalization in emerging markets. It is calculated as a net total return index in U.S. dollars and weighted by free-float market capitalization.
As of August 31, 2023, the Index consisted of 1,770 securities with a market capitalization range of between approximately $50.9 million and $2,251.7 billion from issuers in the following emerging market countries: Brazil, Chile, China, Colombia, the Czech Republic, Egypt, Greece, Hong Kong, Hungary, India, Indonesia, Kuwait, Luxembourg, Malaysia, Mexico, Pakistan, Peru, the Philippines, Qatar, Saudi Arabia, Singapore, South Africa, South Korea, Taiwan, Thailand, Turkey and the United Arab Emirates. The components of the Index may change over time. The percentage of the portfolio exposed to any asset class, country or geographic region will vary from time to time as the weightings of the securities within the Index change, and the Fund may not be invested in each asset class, country or geographic region at all times. Solactive AG (“Solactive” or the “Index Provider”) will generally deem an issuer to be located in an emerging market country if it is organized under the laws of the emerging market country and it is primarily listed in the emerging market country; in the event that these factors point to more than one country, the Index methodology provides for consideration of certain additional factors. The Index is reconstituted on a semi-annual basis in May and November. New securities from initial public offerings are also added on a semi-annual basis in February and August, subject to fulfillment of certain eligibility criteria.
Given the Fund’s investment objective of attempting to track the Index, the Fund does not follow traditional methods of active investment management, which may involve buying and selling securities based upon analysis of economic and market factors.
MarketBeta® International Equity ETF
The Solactive GBS Developed Markets ex North America Large & Mid Cap Index (the “Index”) consists of equity securities of large and mid-capitalization issuers covering approximately the largest 85% of the free-float market capitalization in developed markets excluding North America. It is calculated as a net total return index in U.S. dollars and weighted by free-float market capitalization.
As of August 31, 2023, the Index consisted of 977 securities with a market capitalization range of between approximately $1.063 billion and $425.7 billion from issuers in the following developed market countries: Australia, Austria, Belgium, Chile, China, Curacao, the Czech Republic, Denmark, Faeroe Island, Finland, France, Germany, Hong Kong, Ireland, Israel, Italy, Japan, Jordan, Luxembourg, Macao, Malaysia, Mexico, the Netherlands, New Zealand, Norway, Poland, Portugal, Singapore, Spain, Sweden, Switzerland, the United Kingdom and the United States. The components of the Index may change over time. The percentage of the portfolio exposed to any asset class, country or geographic region will vary from time to time as the weightings of the securities within the Index change, and the Fund may not be invested in each asset class, country or geographic region at all times. Solactive AG (“Solactive” or the “Index Provider”) will generally deem an issuer to be located in a developed market country if it is organized under the laws of the developed market country and it is primarily listed in the developed market country; in the event that these factors point to more than one country, the Index methodology provides for consideration of certain additional factors. The Index is reconstituted on a semi-annual basis in May and November. New securities from initial public offerings are also added on a semi-annual basis in February and August, subject to fulfillment of certain eligibility criteria.
1
INVESTMENT PROCESS
Given the Fund’s investment objective of attempting to track the Index, the Fund does not follow traditional methods of active investment management, which may involve buying and selling securities based upon analysis of economic and market factors.
MarketBeta® U.S. Equity ETF
The Solactive GBS United States Large & Mid Cap Index (the “Index”) consists of equity securities of large and mid-capitalization equity issuers covering approximately the largest 85% of the free-float market capitalization in the United States. It is calculated as a total return index in U.S. dollars and weighted by free-float market capitalization.
As of August 31, 2023, the Index consisted of 497 securities with a market capitalization range of between approximately $2.5 billion and $2,937.2 billion. The components of the Index may change over time. The percentage of the portfolio exposed to any asset class will vary from time to time as the weightings of the securities within the Index change, and the Fund may not be invested in each asset class at all times. Solactive AG (“Solactive” or the “Index Provider”) will deem an issuer to be a U.S. issuer if it is organized under the laws of the U.S. and it is primarily listed in the U.S.; in the event that these factors point to more than one country, the Index methodology provides for consideration of certain additional factors. The Index is reconstituted on a semi-annual basis in May and November. New securities from initial public offerings are also added on a semi-annual basis in February and August, subject to fulfillment of certain eligibility criteria.
Given the Fund’s investment objective of attempting to track the Index, the Fund does not follow traditional methods of active investment management, which may involve buying and selling securities based upon analysis of economic and market factors.
All Above Funds
Each Fund seeks to invest in the respective Index components in approximately the same weighting that such components have within the respective Index at the applicable time. However, under various circumstances, it may not be possible or practicable to purchase all of the securities in the respective Index in the approximate respective Index weight. In these circumstances, the Fund may purchase a sample of securities in the respective Index. There may also be instances in which the Investment Adviser may choose to underweight or overweight a security in each Fund’s Index, purchase securities not in each Fund’s Index that the Investment Adviser believes are appropriate to substitute for certain securities in such Index or utilize various combinations of other available investment techniques.
Each Index is owned and calculated by Solactive.
Each Fund is classified as “diversified” under the Investment Company Act of 1940, as amended (the “Investment Company Act”). However, each Fund may become “non-diversified” solely as a result of a change in the relative market capitalization or index weighting of one or more constituents of the respective Index. A non-diversified fund may invest a larger percentage of its assets in fewer issuers than diversified funds.
Each Fund may concentrate its investments (i.e., hold more than 25% of its total assets) in a particular industry or group of industries to the extent that the respective Index is concentrated. The degree to which components of the respective Index represent certain sectors or industries may change over time.
* * *
At the end of the Reporting Period, i.e. August 31, 2023, we maintained conviction in our principal investment strategies, as each Fund continues to seek to provide efficient and diversified access to approximately 85% of the broad equity market represented by each respective Index in one portfolio.
2
PORTFOLIO RESULTS
Goldman Sachs MarketBeta® Emerging Markets Equity ETF
Investment Objective
The Goldman Sachs MarketBeta® Emerging Markets Equity ETF (the “Fund”) seeks to provide investment results that closely correspond, before fees and expenses, to the performance of the Solactive GBS Emerging Markets Large & Mid Cap Index (the “Index”).
Portfolio Management Discussion and Analysis
Below, the Goldman Sachs Quantitative Investment Strategies Team discusses the Fund’s performance and positioning for the 12-month period ended August 31, 2023 (the “Reporting Period”).
| Q | | How did the Fund perform during the Reporting Period? |
| A | | During the Reporting Period, the Fund returned 1.61% based on net asset value (“NAV”) and 1.79% based on market price. The Index returned 2.05% during the same period. |
| | The Fund had an NAV of $41.23 per share on August 31, 2022 and ended the Reporting Period with an NAV of $40.80 per share. The Fund’s market price on August 31, 2023 was $40.81 per share. |
| Q | | What key factors were responsible for the Fund’s performance during the Reporting Period? |
| A | | The Fund seeks to provide investment results that closely correspond, before fees and expenses, to the performance of the Index. The Fund’s performance reflects Fund expenses, including management fees and brokerage expenses. The Fund’s relative performance also reflects the impact of any cash held in the Fund as well as any other differences between the Fund’s holdings and the constituents of the Index. The Index is unmanaged, and Index returns do not reflect fees and expenses, which would reduce returns. |
| | Given the Fund’s investment objective of attempting to track the Index, the Fund does not follow traditional methods of active investment management, which may involve buying and selling securities based upon analysis of economic and market factors. The Fund does not follow a strategy of seeking to outperform the Index. |
| Q | | Which sectors and countries contributed most to the Index’s performance during the Reporting Period, and which contributed least? |
| A | | Index constituents in the utilities sector contributed most positively to the Index’s results during the Reporting Period — the only sector to do so. Index constituents in the information technology, consumer discretionary and communication services sectors contributed least to the Index’s results during the Reporting Period. |
| | From a country perspective, Index constituents in United Arab Emirates, Saudi Arabia and Indonesia contributed most to the Index’s results during the Reporting Period. Conversely, Index constituents in China, South Korea and Taiwan contributed least to the Index’s results during the Reporting Period. |
| Q | | Which individual stock positions contributed the most to the Index’s returns during the Reporting Period? |
| A | | Positions in United Arab Emirates-based health care supply chain company International Holding Company, Brazil-based energy company Petroleo Brasileiro (“Petrobras”)-Preferred and Petrobras contributed most positively (0.56%, 0.42% and 0.37% of Fund net assets as of August 31, 2023, respectively). Each of these holdings posted either a double-digit or triple-digit positive return within the Index during the Reporting Period. |
| Q | | Which individual stock positions contributed the least to the Index’s results during the Reporting Period? |
| A | | Positions in Taiwan-based semiconductor company Taiwan Semiconductor Manufacturing, China-based e-commerce retailer Alibaba Group Holding and China-based communication services company Tencent Holdings contributed least (6.0%, 3.0% and 3.7% of Fund net assets as of August 31, 2023, respectively). Each of these holdings posted a double-digit negative return within the Index during the Reporting Period. |
| Q | | How did the Fund use derivatives and similar instruments during the Reporting Period? |
| A | | The Fund does not employ derivatives as a source of alpha generation, although it did use index futures to equitize |
3
PORTFOLIO RESULTS
| | excess cash. The use of futures was not material to the performance of the Fund during the Reporting Period. |
| Q | | What was the Fund’s sector positioning relative to the Index at the end of the Reporting Period?1 |
| | | | | | | | | | |
| | | |
| | | Sector Name | | Fund2 | | | Solactive
Index | |
| | Financials | | | 20.83 | % | | | 21.36 | % |
| | Information Technology | | | 19.52 | | | | 20.04 | |
| | Consumer Discretionary | | | 12.74 | | | | 13.08 | |
| | Communication Services | | | 9.10 | | | | 9.27 | |
| | Materials | | | 8.29 | | | | 8.19 | |
| | Industrials | | | 7.71 | | | | 8.03 | |
| | Energy | | | 6.65 | | | | 5.37 | |
| | Consumer Staples | | | 5.83 | | | | 6.04 | |
| | Health Care | | | 3.47 | | | | 3.58 | |
| | Utilities | | | 2.56 | | | | 2.75 | |
| | | Real Estate | | | 1.63 | | | | 1.67 | |
| Q | | What was the Fund’s country positioning relative to the Index at the end of the Reporting Period?1 |
| | | | | | | | | | |
| | | |
| | | Country Name | | Fund2 | | | Solactive
Index | |
| | China | | | 24.63 | % | | | 25.08 | % |
| | India | | | 15.43 | | | | 15.87 | |
| | Taiwan | | | 14.88 | | | | 15.27 | |
| | South Korea | | | 12.45 | | | | 12.79 | |
| | Brazil | | | 5.60 | | | | 5.72 | |
| | Saudi Arabia | | | 3.95 | | | | 4.06 | |
| | South Africa | | | 2.81 | | | | 2.89 | |
| | Mexico | | | 2.81 | | | | 2.86 | |
| | Russia | | | 2.49 | | | | 0.00 | |
| | United Arab Emirates | | | 2.11 | | | | 2.16 | |
| | Thailand | | | 2.00 | | | | 1.99 | |
| | Indonesia | | | 1.97 | | | | 2.01 | |
| | U.S. | | | 1.19 | | | | 0.19 | |
| | Turkey | | | 1.12 | | | | 1.14 | |
| | Hong Kong | | | 1.04 | | | | 1.06 | |
| | Qatar | | | 0.86 | | | | 0.9 | |
| | Kuwait | | | 0.84 | | | | 0.85 | |
| | Ireland | | | 0.83 | | | | 0.85 | |
| | Philippines | | | 0.67 | | | | 0.71 | |
| | Chile | | | 0.49 | | | | 0.49 | |
| | Greece | | | 0.47 | | | | 0.47 | |
| | Hungary | | | 0.23 | | | | 0.23 | |
| | Czech Republic | | | 0.13 | | | | 0.13 | |
| | Colombia | | | 0.12 | | | | 0.12 | |
| | Egypt | | | 0.11 | | | | 0.11 | |
| | Luxembourg | | | 0.04 | | | | 0.04 | |
| | Kazakhstan | | | 0.03 | | | | 0.00 | |
| | Singapore | | | 0.02 | | | | 0.02 | |
| | Australia | | | 0.01 | | | | 0.01 | |
| | | Malaysia | | | 0.00 | | | | 1.36 | |
| | 1 | | Country and sector classifications for securities may differ between the above listing and the Schedule of Investments due to differing classification methodologies. The classification methodology used for the above listing is as set forth by Solactive. The Fund’s composition may differ over time. Consequently, the Fund’s overall sector allocations may differ from percentages contained in the chart above. The percentage shown for each investment category reflects the value of investments in that category as a percentage of market value (excluding investment in the securities lending reinvestment vehicle, if any). Underlying sector allocation of exchange-traded funds held by the Fund are not reflected in the chart above. Country classification in this listing is based on the country of incorporation rather than being based on country of domicile or country of highest revenue. Investments in the securities lending vehicle represented 0.4% of the Fund’s net assets as of August 31, 2023. Figures above may not sum to 100% due to rounding due to the presence of cash. |
| | 2 | | The Fund seeks to provide investment results that closely correspond, before fees and expenses, to the performance of the Solactive GBS Emerging Markets Large & Mid Cap Index. |
4
FUND BASICS
MarketBeta® Emerging Markets Equity ETF
as of August 31, 2023
| | | | | | |
| | FUND SNAPSHOT | |
| | |
| | | As of August 31, 2023 | | | |
| | |
| | Market Price1 | | $ | 40.81 | |
| | | Net Asset Value (NAV)1 | | $ | 40.80 | |
| 1 | | The Market Price is the price at which the Fund’s shares are trading on the Cboe BZX Exchange, Inc. The Market Price of the Fund’s shares will fluctuate and, at the time of sale, shares may be worth more or less than the original investment or the Fund’s then current net asset value (“NAV”). The NAV is the market value of one share of the Fund. This amount is derived by dividing the total value of all the securities in the Fund’s portfolio, plus other assets, less any liabilities, by the number of Fund shares outstanding. Fund shares are not individually redeemable and are issued and redeemed by the Fund at their NAV only in large, specified blocks of shares called creation units. Shares otherwise can be bought and sold only through exchange trading at market price (not NAV). Shares may trade at a premium or discount to their NAV in the secondary market. Information regarding how often shares of each Fund traded on Cboe BZX at a price above (i.e., at a premium) or below (i.e., at a discount) the NAV of the Fund can be found at www.GSAMFUNDS.com/ETFs. |
| | | | | | | | | | |
| | TOP 10 HOLDINGS AS OF 8/31/232 |
| | | | |
| | | Holding | | % of Net Assets | | | Line of Business | | Country |
| | | | |
| | Taiwan Semiconductor Manufacturing Co. Ltd. | | | 6.0 | % | | Information Technology | | Taiwan |
| | Tencent Holdings Ltd. | | | 3.7 | | | Communication Services | | China |
| | Samsung Electronics Co. Ltd. | | | 3.6 | | | Information Technology | | South Korea |
| | Alibaba Group Holding Ltd. | | | 3.0 | | | Consumer Discretionary | | China |
| | Reliance Industries Ltd. | | | 1.4 | | | Energy | | India |
| | Meituan, Class B | | | 1.1 | | | Consumer Discretionary | | China |
| | iShares MSCI Malaysia ETF | | | 1.0 | | | Exchange-Traded Fund | | United States |
| | Infosys Ltd. | | | 0.9 | | | Information Technology | | India |
| | ICICI Bank Ltd. | | | 0.9 | | | Financials | | India |
| | | PDD Holdings, Inc. ADR | | | 0.9 | | | Consumer Discretionary | | China |
| 2 | | The top 10 holdings may not be representative of the Fund’s future investments. |
For more information about the Fund, please refer to www.GSAMFUNDS.com/ETFs. There, you can learn more about the Fund’s investment strategies, holdings, and performance.
5
MARKETBETA® EMERGING MARKETS EQUITY ETF
Performance Summary
August 31, 2023
The following graph shows the value, as of August 31, 2023, of a $10,000 investment made on May 12, 2020 (commencement of operations) in Shares at NAV. For comparative purposes, the performance of the Fund’s underlying index and reference index, the Solactive GBS Emerging Markets Large & Mid Cap Index, is shown. Performance reflects applicable fee waivers and/or expense limitations in effect during the periods shown and in their absence, performance would be reduced. Returns do not reflect the deduction of taxes that a shareholder would pay on Fund distributions or the sale of Fund shares. In addition to the performance of constituents of the underlying index, other factors may affect Fund performance. These factors include, but are not limited to, Fund operating fees and expenses, portfolio turnover and creation and redemption in-kind transactions. The returns set forth below represent past performance. Past performance does not guarantee future results. The Fund’s NAV and investment return may fluctuate. These fluctuations may cause an investor’s shares to be worth more or less than their original cost. Current performance may be lower or higher than the performance quoted below. Please visit our web site at www.GSAMFUNDS.com/ETFs to obtain the most recent month-end returns.
|
| MarketBeta® Emerging Markets Equity ETF’s Lifetime Performance |
Performance of a $10,000 Investment, with distributions reinvested, from May 12, 2020 through August 31, 2023.
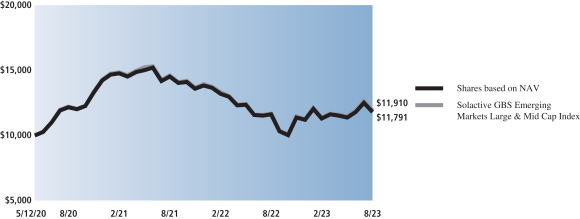
| | | | | | |
| Average Annual Total Return through August 31, 2023* | | | One Year | | | Since Inception |
Shares based on NAV (Commenced May 12, 2020) | | | 1.61% | | | 5.11% |
|
Shares based on Market Price (Commenced May 12, 2020) | | | 1.79% | | | 5.09% |
|
Solactive GBS Emerging Markets Large & Mid Cap Index | | | 2.05% | | | 5.43% |
|
| * | | Total returns are calculated assuming purchase of a share at the market price or NAV on the first day and sale of a share at the market price or NAV on the last day of each period reported. The Total Returns based on NAV and Market Price assume the reinvestment of dividends and do not reflect brokerage commissions in connection with the purchase or sale of Fund shares, which if included would lower the performance shown above. The NAV used in the Total Return calculation assumes all management fees incurred by the Fund. Market Price returns are based upon the last trade as of 4:00 pm EST and do not reflect the returns you would receive if you traded shares at other times. The first day of secondary market trading is typically several days after the date on which the Fund commenced investment operations; therefore, the NAV of the Fund is used as a proxy for the period from inception of investment operations to the first day of secondary market trading to calculate the Market Price returns. |
6
PORTFOLIO RESULTS
Goldman Sachs MarketBeta® International Equity ETF
Investment Objective
The Goldman Sachs MarketBeta® International Equity ETF (the “Fund”) seeks to provide investment results that closely correspond, before fees and expenses, to the performance of the Solactive GBS Developed Markets ex North America Large & Mid Cap Index (the “Index”).
Portfolio Management Discussion and Analysis
Below, the Goldman Sachs Quantitative Investment Strategies Team discusses the Fund’s performance and positioning for the 12-month period ended August 31, 2023 (the “Reporting Period”).
| Q | | How did the Fund perform during the Reporting Period? |
| A | | During the Reporting Period, the Fund returned 17.22% based on net asset value (“NAV”) and 17.94% based on market price. The Index returned 17.36% during the same period. |
| | The Fund had an NAV of $44.63 per share on August 31, 2022 and ended the Reporting Period with an NAV of $50.87 per share. The Fund’s market price on August 31, 2023 was $50.84 per share. |
| Q | | What key factors were responsible for the Fund’s performance during the Reporting Period? |
| A | | The Fund seeks to provide investment results that closely correspond, before fees and expenses, to the performance of the Index. The Fund’s performance reflects Fund expenses, including management fees and brokerage expenses. The Fund’s relative performance also reflects the impact of any cash held in the Fund as well as any other differences between the Fund’s holdings and the constituents of the Index. The Index is unmanaged, and Index returns do not reflect fees and expenses, which would reduce returns. |
| | Given the Fund’s investment objective of attempting to track the Index, the Fund does not follow traditional methods of active investment management, which may involve buying and selling securities based upon analysis of economic and market factors. The Fund does not follow a strategy of seeking to outperform the Index. |
| Q | | Which sectors and countries contributed most positively to the Index’s performance during the Reporting Period, and which contributed least? |
| A | | Index constituents in the financials, industrials and consumer discretionary sectors contributed most to the Index’s results during the Reporting Period. Index constituents in the real estate, communication services and utilities sectors contributed least to the Index’s results during the Reporting Period. |
| | From a country perspective, Index constituents in Japan, France and Germany contributed most to the Fund’s results during the Reporting Period. Index constituents in Hong Kong, Israel and Norway contributed least to the Fund’s results during the Reporting Period. |
| Q | | Which individual stock positions contributed the most to the Index’s returns during the Reporting Period? |
| A | | Positions in Denmark-based health care company Novo Nordisk, Netherlands-based photolithography systems supplier ASML Holding and Germany-based enterprise software developer SAP contributed most (1.90%, 1.68% and 0.92% of Fund net assets as of August 31, 2023, respectively). Each of these holdings posted a robust double-digit positive return within the Index during the Reporting Period. |
| Q | | Which individual stock positions contributed the least to the Index’s results during the Reporting Period? |
| A | | Positions in Netherlands-based financials company Adyen, France-based financial institution Credit Suisse Group and Switzerland-based health care company Roche Holding contributed least (0.16%, 0.09% and 0.06% of Fund net assets as of August 31, 2023, respectively). Adyen and Credit Suisse Group each generated a double-digit negative return within the Index during the Reporting Period, while Roche Holding posted a single-digit negative return within the Index during the Reporting Period. |
7
PORTFOLIO RESULTS
| Q | | How did the Fund use derivatives and similar instruments during the Reporting Period? |
| A | | The Fund did not invest in derivatives or similar instruments during the Reporting Period. The Fund does not employ derivatives as a source of alpha generation, although it may use them to equitize excess cash. |
| Q | | What was the Fund’s sector positioning relative to the Index at the end of the Reporting Period?1 |
| | | | | | | | | | |
| | | |
| | | Sector Name | | Fund2 | | | Solactive
Index | |
| | Financials | | | 17.89 | % | | | 17.9 | % |
| | Industrials | | | 16.41 | | | | 16.46 | |
| | Health Care | | | 13.28 | | | | 13.29 | |
| | Consumer Discretionary | | | 12.42 | | | | 12.44 | |
| | Consumer Staples | | | 9.88 | | | | 9.91 | |
| | Information Technology | | | 8.13 | | | | 8.13 | |
| | Materials | | | 7.39 | | | | 7.40 | |
| | Energy | | | 4.43 | | | | 4.44 | |
| | Communication Services | | | 4.41 | | | | 4.42 | |
| | Utilities | | | 3.25 | | | | 3.24 | |
| | | Real Estate | | | 2.40 | | | | 2.39 | |
| Q | | What was the Fund’s country positioning relative to the Index at the end of the Reporting Period?1 |
| | | | | | | | | | |
| | | |
| | | Country Name | | Fund2 | | | Solactive
Index | |
| | Japan | | | 24.81 | % | | | 24.83 | % |
| | U.K. | | | 13.67 | | | | 13.69 | |
| | France | | | 10.62 | | | | 10.62 | |
| | Switzerland | | | 9.22 | | | | 9.22 | |
| | Germany | | | 7.72 | | | | 7.73 | |
| | Australia | | | 7.43 | | | | 7.47 | |
| | Netherlands | | | 4.57 | | | | 4.57 | |
| | Sweden | | | 3.09 | | | | 3.11 | |
| | Denmark | | | 3.08 | | | | 3.08 | |
| | Spain | | | 2.55 | | | | 2.54 | |
| | Hong Kong | | | 2.55 | | | | 2.56 | |
| | Italy | | | 2.26 | | | | 2.26 | |
| | Singapore | | | 1.49 | | | | 1.49 | |
| | Ireland | | | 1.45 | | | | 1.45 | |
| | Finland | | | 1.12 | | | | 1.12 | |
| | Israel | | | 0.89 | | | | 0.89 | |
| | Norway | | | 0.81 | | | | 0.81 | |
| | Belgium | | | 0.81 | | | | 0.81 | |
| | New Zealand | | | 0.36 | | | | 0.36 | |
| | Poland | | | 0.33 | | | | 0.33 | |
| | Austria | | | 0.27 | | | | 0.28 | |
| | Luxembourg | | | 0.19 | | | | 0.19 | |
| | Portugal | | | 0.18 | | | | 0.19 | |
| | China | | | 0.15 | | | | 0.15 | |
| | Curacao | | | 0.07 | | | | 0.07 | |
| | Macau | | | 0.05 | | | | 0.05 | |
| | Chile | | | 0.04 | | | | 0.04 | |
| | Malaysia | | | 0.03 | | | | 0.03 | |
| | Jordan | | | 0.03 | | | | 0.03 | |
| | Bermuda | | | 0.02 | | | | 0.02 | |
| | Faroe Islands | | | 0.02 | | | | 0.02 | |
| | Mexico | | | 0.01 | | | | 0.01 | |
| | Russia | | | 0.00 | | | | 0.00 | |
| | | United States | | | 0.01 | | | | 0.01 | |
| | 1 | | Country and sector classifications for securities may differ between the above listing and the Schedule of Investments due to differing classification methodologies. The classification methodology used for the above listing is as set forth by Solactive. The Fund’s composition may differ over time. Consequently, the Fund’s overall sector allocations may differ from percentages contained in the chart above. The percentage shown for each investment category reflects the value of investments in that category as a percentage of market value (excluding investment in the securities lending reinvestment vehicle, if any). Underlying sector allocation of exchange-traded funds held by the Fund are not reflected in the chart above. Country classification in this listing is based on the country of incorporation rather than being based on country of domicile or country of highest revenue. Investments in the securities lending vehicle represented 0.4% of the Fund’s net assets as of August 31, 2023. Figures above may not sum to 100% due to rounding due to the presence of cash. |
| | 2 | | The Fund seeks to provide investment results that closely correspond, before fees and expenses, to the performance of the Solactive GBS Developed Markets ex North America Large & Mid Cap Index. |
8
FUND BASICS
MarketBeta® International Equity ETF
as of August 31, 2023
| | | | | | |
| | FUND SNAPSHOT | | | | |
| | |
| | | As of August 31, 2023 | | | |
| | |
| | Market Price1 | | $ | 50.84 | |
| | | Net Asset Value (NAV)1 | | $ | 50.87 | |
| 1 | | The Market Price is the price at which the Fund’s shares are trading on the Cboe BZX Exchange, Inc. The Market Price of the Fund’s shares will fluctuate and, at the time of sale, shares may be worth more or less than the original investment or the Fund’s then current net asset value (“NAV”). The NAV is the market value of one share of the Fund. This amount is derived by dividing the total value of all the securities in the Fund’s portfolio, plus other assets, less any liabilities, by the number of Fund shares outstanding. Fund shares are not individually redeemable and are issued and redeemed by the Fund at their NAV only in large, specified blocks of shares called creation units. Shares otherwise can be bought and sold only through exchange trading at market price (not NAV). Shares may trade at a premium or discount to their NAV in the secondary market. Information regarding how often shares of each Fund traded on Cboe BZX at a price above (i.e., at a premium) or below (i.e., at a discount) the NAV of the Fund can be found at www.GSAMFUNDS.com/ETFs. |
| | | | | | | | | | |
| | TOP 10 HOLDINGS AS OF 8/31/232 |
| | | | |
| | | Holding | | % of Net Assets | | | Line of Business | | Country |
| | | | |
| | Nestle SA | | | 2.1 | % | | Consumer Staples | | United States |
| | Novo Nordisk A/S, Class B | | | 1.9 | | | Health Care | | Denmark |
| | ASML Holding NV | | | 1.7 | | | Information Technology | | Netherlands |
| | LVMH Moet Hennessy Louis Vuitton SE | | | 1.4 | | | Consumer Discretionary | | France |
| | Roche Holding AG | | | 1.3 | | | Health Care | | United States |
| | Shell PLC | | | 1.3 | | | Energy | | Netherlands |
| | AstraZeneca PLC | | | 1.3 | | | Health Care | | United Kingdom |
| | Novartis AG | | | 1.3 | | | Health Care | | Switzerland |
| | Toyota Motor Corp. | | | 1.3 | | | Consumer Discretionary | | Japan |
| | | BHP Group Ltd. | | | 0.9 | | | Materials | | Australia |
| 2 | | The top 10 holdings may not be representative of the Fund’s future investments. |
For more information about the Fund, please refer to www.GSAMFUNDS.com/ETFs. There, you can learn more about the Fund’s investment strategies, holdings, and performance.
9
MARKETBETA® INTERNATIONAL EQUITY ETF
Performance Summary
August 31, 2023
The following graph shows the value, as of August 31, 2023, of a $10,000 investment made on May 12, 2020 (commencement of operations) in Shares at NAV. For comparative purposes, the performance of the Fund’s underlying index and reference index, the Solactive GBS Developed Markets ex North America Large & Mid Cap Index, is shown. Performance reflects applicable fee waivers and/or expense limitations in effect during the periods shown and in their absence, performance would be reduced. Returns do not reflect the deduction of taxes that a shareholder would pay on Fund distributions or the sale of Fund shares. In addition to the performance of constituents of the underlying index, other factors may affect Fund performance. These factors include, but are not limited to, Fund operating fees and expenses, portfolio turnover and creation and redemption in-kind transactions. The returns set forth below represent past performance. Past performance does not guarantee future results. The Fund’s NAV and investment return may fluctuate. These fluctuations may cause an investor’s shares to be worth more or less than their original cost. Current performance may be lower or higher than the performance quoted below. Please visit our web site at www.GSAMFUNDS.com/ETFs to obtain the most recent month-end returns.
|
| MarketBeta® International Equity ETF’s Lifetime Performance |
Performance of a $10,000 Investment, with distributions reinvested, from May 12, 2020 through August 31, 2023.
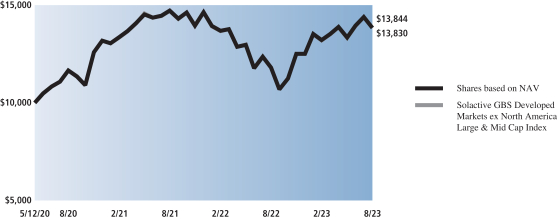
| | | | | | |
| Average Annual Total Return through August 31, 2023* | | | One Year | | | Since Inception |
Shares based on NAV (Commenced May 12, 2020) | | | 17.22% | | | 10.31% |
|
Shares based on Market Price (Commenced May 12, 2020) | | | 17.94% | | | 10.28% |
|
Solactive GBS Developed Markets ex North America Large & Mid Cap Index | | | 17.36% | | | 10.35% |
|
| * | | Total returns are calculated assuming purchase of a share at the market price or NAV on the first day and sale of a share at the market price or NAV on the last day of each period reported. The Total Returns based on NAV and Market Price assume the reinvestment of dividends and do not reflect brokerage commissions in connection with the purchase or sale of Fund shares, which if included would lower the performance shown above. The NAV used in the Total Return calculation assumes all management fees incurred by the Fund. Market Price returns are based upon the last trade as of 4:00 pm EST and do not reflect the returns you would receive if you traded shares at other times. The first day of secondary market trading is typically several days after the date on which the Fund commenced investment operations; therefore, the NAV of the Fund is used as a proxy for the period from inception of investment operations to the first day of secondary market trading to calculate the Market Price returns. |
10
PORTFOLIO RESULTS
Goldman Sachs MarketBeta® U.S. Equity ETF
Investment Objective
The Goldman Sachs MarketBeta® U.S. Equity ETF (the “Fund”) seeks to provide investment results that closely correspond, before fees and expenses, to the performance of the Solactive GBS United States Large & Mid Cap Index (the “Index”).
Portfolio Management Discussion and Analysis
Below, the Goldman Sachs Quantitative Investment Strategies Team discusses the Fund’s performance and positioning for the 12-month period ended August 31, 2023 (the “Reporting Period”).
| Q | | How did the Fund perform during the Reporting Period? |
| A | | During the Reporting Period, the Fund returned 16.12% based on net asset value (“NAV”) and 16.19% based on market price. The Index returned 16.19% during the same period. |
| | The Fund had an NAV of $53.96 per share on August 31, 2022 and ended the Reporting Period with an NAV of $61.63 per share. The Fund’s market price on August 31, 2023 was $61.68 per share. |
| Q | | What key factors were responsible for the Fund’s performance during the Reporting Period? |
| A | | The Fund seeks to provide investment results that closely correspond, before fees and expenses, to the performance of the Index. The Fund’s performance reflects Fund expenses, including management fees and brokerage expenses. The Fund’s relative performance also reflects the impact of any cash held in the Fund as well as any other differences between the Fund’s holdings and the constituents of the Index. The Index is unmanaged, and Index returns do not reflect fees and expenses, which would reduce returns. |
| | Given the Fund’s investment objective of attempting to track the Index, the Fund does not follow traditional methods of active investment management, which may involve buying and selling securities based upon analysis of economic and market factors. The Fund does not follow a strategy of seeking to outperform the Index. |
| Q | | Which sectors contributed most positively to the Index’s relative performance A during the Reporting Period, and which contributed least? |
| A | | Index constituents in the information technology, communication services and industrials sectors contributed most to the Index’s results during the Reporting Period. Index constituents in the utilities, real estate and consumer staples sectors contributed least to the Index’s results during the Reporting Period. |
| Q | | Which individual stock positions contributed the most to the Index’s returns during the Reporting Period? |
| A | | Positions in information technology companies NVIDIA, Microsoft and Apple contributed most (3.09%, 6.33% and 7.34% of Fund net assets as of August 31, 2023, respectively). NVIDIA posted a triple-digit positive return within the Index during the Reporting Period. Microsoft and Apple each generated a double-digit positive return within the Index during the Reporting Period. |
| Q | | Which individual stock positions contributed the least to the Index’s results during the Reporting Period? |
| A | | Positions in electric vehicle maker Tesla, entertainment and media company The Walt Disney Company and pharmaceuticals company Pfizer contributed least (1.87%, 0.40% and 0.53% of Fund net assets as of August 31, 2023, respectively). Tesla generated a single-digit negative return within the Index during the Reporting Period. The Walt Disney Company and Pfizer each posted a double-digit negative return within the Index during the Reporting Period. |
| Q | | How did the Fund use derivatives and similar instruments during the Reporting Period? |
| A | | The Fund did not invest in derivatives or similar instruments during the Reporting Period. The Fund does not employ derivatives as a source of alpha generation, although it may use them to equitize excess cash. |
11
PORTFOLIO RESULTS
| Q | | What was the Fund’s sector positioning relative to the Index at the end of the Reporting Period?1 |
| | | | | | | | | | |
| | | |
| | | Sector Name | | Fund2 | | | Solactive
Index | |
| | Information Technology | | | 28.21 | % | | | 28.21 | % |
| | Health Care | | | 14.07 | | | | 14.07 | |
| | Consumer Discretionary | | | 11.68 | | | | 11.68 | |
| | Financials | | | 10.54 | | | | 10.54 | |
| | Communication Services | | | 8.43 | | | | 8.43 | |
| | Industrials | | | 7.72 | | | | 7.72 | |
| | Consumer Staples | | | 6.66 | | | | 6.66 | |
| | Energy | | | 4.55 | | | | 4.55 | |
| | Utilities | | | 3.08 | | | | 3.08 | |
| | Real Estate | | | 2.71 | | | | 2.71 | |
| | | Materials | | | 2.34 | | | | 2.34 | |
| | 1 | | Sector classifications for securities may differ between the above listing and the Schedule of Investments due to differing classification methodologies. The classification methodology used for the above listing is as set forth by Solactive. The Fund’s composition may differ over time. Consequently, the Fund’s overall sector allocations may differ from percentages contained in the chart above. The percentage shown for each investment category reflects the value of investments in that category as a percentage of market value (excluding investment in the securities lending reinvestment vehicle, if any). Underlying sector allocation of exchange-traded funds held by the Fund are not reflected in the chart above. Investments in the securities lending vehicle represented 0.1% of the Fund’s net assets as of August 31, 2023. Figures above may not sum to 100% due to rounding due to the presence of cash. |
| | 2 | | The Fund seeks to provide investment results that closely correspond, before fees and expenses, to the performance of the Solactive GBS United States Large & Mid Cap Index. |
12
FUND BASICS
MarketBeta® U.S. Equity ETF
as of August 31, 2023
| | | | | | |
| | FUND SNAPSHOT | |
| |
| | | As of August 31, 2023 | |
| | |
| | Market Price1 | | $ | 61.68 | |
| | | Net Asset Value (NAV)1 | | $ | 61.63 | |
| 1 | | The Market Price is the price at which the Fund’s shares are trading on the Cboe BZX Exchange, Inc. The Market Price of the Fund’s shares will fluctuate and, at the time of sale, shares may be worth more or less than the original investment or the Fund’s then current net asset value (“NAV”). The NAV is the market value of one share of the Fund. This amount is derived by dividing the total value of all the securities in the Fund’s portfolio, plus other assets, less any liabilities, by the number of Fund shares outstanding. Fund shares are not individually redeemable and are issued and redeemed by the Fund at their NAV only in large, specified blocks of shares called creation units. Shares otherwise can be bought and sold only through exchange trading at market price (not NAV). Shares may trade at a premium or discount to their NAV in the secondary market. Information regarding how often shares of each Fund traded on Cboe BZX at a price above (i.e., at a premium) or below (i.e., at a discount) the NAV of the Fund can be found at www.GSAMFUNDS.com/ETFs. |
| | | | | | | | | | |
| | TOP 10 HOLDINGS AS OF 8/31/232 |
| | | | |
| | | Holding | | % of Net Assets | | | Line of Business | | Country |
| | | | |
| | Apple, Inc. | | | 7.3 | % | | Information Technology | | United States |
| | Microsoft Corp. | | | 6.3 | | | Information Technology | | United States |
| | Amazon.com, Inc. | | | 3.3 | | | Consumer Discretionary | | United States |
| | NVIDIA Corp. | | | 3.1 | | | Information Technology | | United States |
| | Alphabet, Inc., Class A | | | 2.1 | | | Communication Services | | United States |
| | Tesla, Inc. | | | 1.9 | | | Consumer Discretionary | | United States |
| | Alphabet, Inc., Class C | | | 1.8 | | | Communication Services | | United States |
| | Meta Platforms, Inc., Class A | | | 1.7 | | | Communication Services | | United States |
| | Eli Lilly & Co. | | | 1.2 | | | Health Care | | United States |
| | | Berkshire Hathaway, Inc., Class B | | | 1.2 | | | Financials | | United States |
| 2 | | The top 10 holdings may not be representative of the Fund’s future investments. |
For more information about the Fund, please refer to www.GSAMFUNDS.com/ETFs. There, you can learn more about the Fund’s investment strategies, holdings, and performance.
13
MARKETBETA® U.S. EQUITY ETF
Performance Summary
August 31, 2023
The following graph shows the value, as of August 31, 2023, of a $10,000 investment made on May 12, 2020 (commencement of operations) in Shares at NAV. For comparative purposes, the performance of the Fund’s underlying index and reference index, the Solactive GBS United States Large & Mid Cap Index, is shown. Performance reflects applicable fee waivers and/or expense limitations in effect during the periods shown and in their absence, performance would be reduced. Returns do not reflect the deduction of taxes that a shareholder would pay on Fund distributions or the sale of Fund shares. In addition to the performance of constituents of the underlying index, other factors may affect Fund performance. These factors include, but are not limited to, Fund operating fees and expenses, portfolio turnover and creation and redemption in-kind transactions. The returns set forth below represent past performance. Past performance does not guarantee future results. The Fund’s NAV and investment return may fluctuate. These fluctuations may cause an investor’s shares to be worth more or less than their original cost. Current performance may be lower or higher than the performance quoted below. Please visit our web site at www.GSAMFUNDS.com/ETFs to obtain the most recent month-end returns.
|
| MarketBeta® U.S. Equity ETF’s Lifetime Performance |
Performance of a $10,000 Investment, with distributions reinvested, from May 12, 2020 through August 31, 2023.
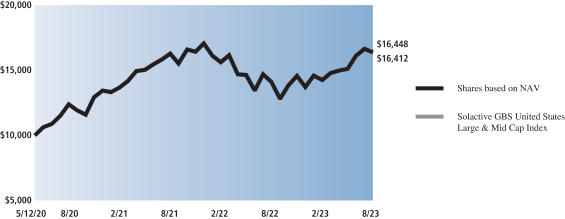
| | | | | | |
| Average Annual Total Return through August 31, 2023* | | | One Year | | | Since Inception |
Shares based on NAV (Commenced May 12, 2020) | | | 16.12% | | | 16.18% |
|
Shares based on Market Price (Commenced May 12, 2020) | | | 16.19% | | | 16.20% |
|
Solactive GBS United States Large & Mid Cap Index | | | 16.19% | | | 16.25% |
|
| * | | Total returns are calculated assuming purchase of a share at the market price or NAV on the first day and sale of a share at the market price or NAV on the last day of each period reported. The Total Returns based on NAV and Market Price assume the reinvestment of dividends and do not reflect brokerage commissions in connection with the purchase or sale of Fund shares, which if included would lower the performance shown above. The NAV used in the Total Return calculation assumes all management fees incurred by the Fund. Market Price returns are based upon the last trade as of 4:00 pm EST and do not reflect the returns you would receive if you traded shares at other times. The first day of secondary market trading is typically several days after the date on which the Fund commenced investment operations; therefore, the NAV of the Fund is used as a proxy for the period from inception of investment operations to the first day of secondary market trading to calculate the Market Price returns. |
14
FUND BASICS
Index Definitions and Industry Terms
Alpha: The excess returns of a fund relative to the return of a benchmark index is the fund’s alpha.
The Solactive GBS Emerging Markets Large & Mid Cap Index is designed to measure the performance of equity securities of large and mid-capitalization issuers covering approximately the largest 85% of the free-float market capitalization in emerging markets. It is calculated as a net total return index in U.S. dollars and weighted by free-float market capitalization.
The Solactive GBS Developed Markets ex North America Large & Mid Cap Index is designed to measure the performance of equity securities of large and mid-capitalization issuers covering approximately the largest 85% of the free-float market capitalization in developed markets excluding North America. It is calculated as a net total return index in U.S. dollars and weighted by free-float market capitalization.
The Solactive GBS United States Large & Mid Cap Index is designed to measure the performance of equity securities of large and mid-capitalization equity issuers covering approximately the largest 85% of the free-float market capitalization in the United States. It is calculated as a total return index in U.S. dollars and weighted by free-float market capitalization.
15
GOLDMAN SACHS MARKETBETA® EMERGING MARKETS EQUITY ETF
Schedule of Investments
August 31, 2023
| | | | | | | | |
Shares | | | Description | | Value | |
| |
| Common Stocks – 96.5% | | | |
| Australia – 0.1% | | | |
| | 1,591 | | | AngloGold Ashanti Ltd. (Materials) | | $ | 27,119 | |
| | 840 | | | Yancoal Australia Ltd. (Energy)(a) | | | 2,817 | |
| | | | | | | | |
| | | | | | | 29,936 | |
| | |
| Brazil – 4.3% | | | |
| | 16,931 | | | Ambev SA (Consumer Staples) | | | 47,329 | |
| | 2,117 | | | Atacadao SA (Consumer Staples) | | | 4,387 | |
| | 21,663 | | | B3 SA – Brasil Bolsa Balcao (Financials) | | | 56,576 | |
| | 5,528 | | | Banco Bradesco SA (Financials) | | | 14,783 | |
| | 5,734 | | | Banco BTG Pactual SA (Financials) | | | 37,606 | |
| | 3,302 | | | Banco do Brasil SA (Financials) | | | 31,413 | |
| | 1,416 | | | Banco Santander Brasil SA (Financials) | | | 7,754 | |
| | 2,639 | | | BB Seguridade Participacoes SA (Financials) | | | 16,193 | |
| | 2,044 | | | Caixa Seguridade Participacoes SA (Financials) | | | 4,459 | |
| | 3,787 | | | CCR SA (Industrials) | | | 9,531 | |
| | 4,400 | | | Centrais Eletricas Brasileiras SA (Utilities) | | | 31,336 | |
| | 1,343 | | | Cia de Saneamento Basico do Estado de Sao Paulo SABESP (Utilities) | | | 15,711 | |
| | 1,108 | | | Cia Energetica de Minas Gerais (Utilities) | | | 4,407 | |
| | 2,377 | | | Cia Siderurgica Nacional SA (Materials) | | | 5,814 | |
| | 4,430 | | | Cosan SA (Energy) | | | 15,676 | |
| | 741 | | | CPFL Energia SA (Utilities) | | | 5,111 | |
| | 1,679 | | | CSN Mineracao SA (Materials) | | | 1,451 | |
| | 1,139 | | | Energisa SA (Utilities) | | | 10,606 | |
| | 2,276 | | | Eneva SA (Utilities)* | | | 5,480 | |
| | 691 | | | Engie Brasil Energia SA (Utilities) | | | 5,879 | |
| | 3,717 | | | Equatorial Energia SA (Utilities) | | | 23,769 | |
| | 18,065 | | | Hapvida Participacoes e Investimentos SA (Health Care)*(a) | | | 15,544 | |
| | 1,590 | | | Hypera SA (Health Care) | | | 12,522 | |
| | 1,778 | | | Itau Unibanco Holding SA (Financials) | | | 8,371 | |
| | 3,229 | | | Klabin SA (Materials) | | | 14,844 | |
| | 3,280 | | | Localiza Rent a Car SA (Industrials) | | | 41,903 | |
| | 3,616 | | | Lojas Renner SA (Consumer Discretionary) | | | 11,708 | |
| | 11,398 | | | Magazine Luiza SA (Consumer Discretionary)* | | | 6,354 | |
| | 1,078 | | | Multiplan Empreendimentos Imobiliarios SA (Real Estate) | | | 5,387 | |
| | 3,222 | | | Natura & Co. Holding SA (Consumer Staples)* | | | 9,879 | |
| | 777 | | | Neoenergia SA (Utilities) | | | 2,863 | |
| | 8,830 | | | NU Holdings Ltd., Class A (Financials)* | | | 60,485 | |
| | 795 | | | Pagseguro Digital Ltd., Class A (Financials)* | | | 7,139 | |
| | 14,220 | | | Petroleo Brasileiro SA (Energy) | | | 99,205 | |
| | 748 | | | Porto Seguro SA (Financials) | | | 3,943 | |
| | 2,764 | | | PRIO SA (Energy)* | | | 25,915 | |
| | 4,770 | | | Raia Drogasil SA (Consumer Staples) | | | 26,476 | |
| | 4,206 | | | Rede D’Or Sao Luiz SA (Health Care)(a) | | | 24,348 | |
| | 4,757 | | | Rumo SA (Industrials) | | | 21,474 | |
| | 3,559 | | | Sendas Distribuidora SA (Consumer Staples) | | | 8,346 | |
| | 909 | | | StoneCo Ltd., Class A (Financials)* | | | 11,144 | |
| | |
| |
| Common Stocks – (continued) | | | |
| Brazil – (continued) | | | |
| | 2,628 | | | Suzano SA (Materials) | | | 26,620 | |
| | 1,540 | | | Telefonica Brasil SA (Communication Services) | | | 12,862 | |
| | 3,194 | | | TIM SA (Communication Services) | | | 9,296 | |
| | 1,977 | | | TOTVS SA (Information Technology) | | | 11,077 | |
| | 2,779 | | | Ultrapar Participacoes SA (Energy) | | | 10,193 | |
| | 15,073 | | | Vale SA (Materials) | | | 198,134 | |
| | 4,282 | | | Vibra Energia SA (Consumer Discretionary) | | | 15,966 | |
| | 5,704 | | | WEG SA (Industrials) | | | 41,337 | |
| | 1,470 | | | XP, Inc., Class A (Financials)* | | | 37,250 | |
| | | | | | | | |
| | | | | | | 1,135,856 | |
| | |
| Chile – 0.4% | | | |
| | 169,077 | | | Banco de Chile (Financials) | | | 18,355 | |
| | 304 | | | Banco de Credito e Inversiones SA (Financials) | | | 8,704 | |
| | 245,969 | | | Banco Santander Chile (Financials) | | | 11,715 | |
| | 4,971 | | | Cencosud SA (Consumer Staples) | | | 10,590 | |
| | 498 | | | Cia Cervecerias Unidas SA (Consumer Staples) | | | 3,663 | |
| | 57,281 | | | Cia Sud Americana de Vapores SA (Industrials) | | | 3,805 | |
| | 4,466 | | | Empresas CMPC SA (Materials) | | | 8,070 | |
| | 1,566 | | | Empresas Copec SA (Energy) | | | 11,257 | |
| | 73,064 | | | Enel Americas SA (Utilities)* | | | 8,642 | |
| | 98,102 | | | Enel Chile SA (Utilities) | | | 6,579 | |
| | 4,474 | | | Falabella SA (Consumer Discretionary) | | | 10,968 | |
| | 1,088 | | | Quinenco SA (Industrials) | | | 3,405 | |
| | | | | | | | |
| | | | | | | 105,753 | |
| | |
| China – 27.9% | | | |
| | 1,665 | | | 360 Security Technology, Inc., Class A (Information Technology)* | | | 2,557 | |
| | 368 | | | 37 Interactive Entertainment Network Technology Group Co. Ltd., Class A (Communication Services) | | | 1,248 | |
| | 162 | | | Advanced Micro-Fabrication Equipment Inc China, Class A (Information Technology)* | | | 3,391 | |
| | 224 | | | AECC Aero-Engine Control Co. Ltd., Class A (Industrials) | | | 690 | |
| | 662 | | | AECC Aviation Power Co. Ltd., Class A (Industrials) | | | 3,569 | |
| | 20,744 | | | Agricultural Bank of China Ltd., Class A (Financials) | | | 9,861 | |
| | 107,293 | | | Agricultural Bank of China Ltd., Class H (Financials) | | | 36,805 | |
| | 2,202 | | | Aier Eye Hospital Group Co. Ltd., Class A (Health Care) | | | 5,452 | |
| | 841 | | | AIM Vaccine Co. Ltd. (Health Care)* | | | 5,298 | |
| | 150 | | | AIMA Technology Group Co. Ltd., Class A (Consumer Discretionary) | | | 585 | |
| | 1,584 | | | Air China Ltd., Class A (Industrials)* | | | 1,882 | |
| | 6,735 | | | Air China Ltd., Class H (Industrials)* | | | 4,990 | |
| | 645 | | | Airtac International Group (Industrials) | | | 18,633 | |
| | |
| | |
| 16 | | The accompanying notes are an integral part of these financial statements. |
GOLDMAN SACHS MARKETBETA® EMERGING MARKETS EQUITY ETF
| | | | | | | | |
Shares | | | Description | | Value | |
| |
| Common Stocks – (continued) | | | |
| China – (continued) | | | |
| | 400 | | | Aisino Corp., Class A (Information Technology) | | $ | 707 | |
| | 1,757 | | | Akeso, Inc. (Health Care)*(a) | | | 7,719 | |
| | 67,916 | | | Alibaba Group Holding Ltd. (Consumer Discretionary)* | | | 781,206 | |
| | 3,264 | | | Aluminum Corp. of China Ltd., Class A (Materials) | | | 2,655 | |
| | 14,073 | | | Aluminum Corp. of China Ltd., Class H (Materials) | | | 6,802 | |
| | 162 | | | Amlogic Shanghai Co. Ltd., Class A (Information Technology)* | | | 1,949 | |
| | 1,454 | | | Angang Steel Co. Ltd., Class A (Materials) | | | 551 | |
| | 5,518 | | | Angang Steel Co. Ltd., Class H (Materials) | | | 1,414 | |
| | 231 | | | Angel Yeast Co. Ltd., Class A (Consumer Staples) | | | 1,052 | |
| | 973 | | | Anhui Conch Cement Co. Ltd., Class A (Materials) | | | 3,433 | |
| | 4,625 | | | Anhui Conch Cement Co. Ltd., Class H (Materials) | | | 12,857 | |
| | 295 | | | Anhui Gujing Distillery Co. Ltd., Class A (Consumer Staples) | | | 11,675 | |
| | 500 | | | Anhui Jianghuai Automobile Group Corp. Ltd., Class A (Consumer Discretionary)* | | | 881 | |
| | 105 | | | Anhui Kouzi Distillery Co. Ltd., Class A (Consumer Staples) | | | 822 | |
| | 162 | | | Anhui Yingjia Distillery Co. Ltd., Class A (Consumer Staples) | | | 1,706 | |
| | 81 | | | Anjoy Foods Group Co. Ltd., Class A (Consumer Staples) | | | 1,452 | |
| | 100 | | | Anker Innovations Technology Co. Ltd., Class A (Information Technology) | | | 1,150 | |
| | 4,918 | | | ANTA Sports Products Ltd. (Consumer Discretionary) | | | 55,409 | |
| | 243 | | | Apeloa Pharmaceutical Co. Ltd., Class A (Health Care) | | | 586 | |
| | 74 | | | Asymchem Laboratories Tianjin Co. Ltd., Class A (Health Care) | | | 1,353 | |
| | 87 | | | Asymchem Laboratories Tianjin Co. Ltd., Class H (Health Care)(a) | | | 1,096 | |
| | 100 | | | Autobio Diagnostics Co. Ltd., Class A (Health Care) | | | 630 | |
| | 267 | | | Autohome, Inc. ADR (Communication Services) | | | 7,716 | |
| | 439 | | | Avary Holding Shenzhen Co. Ltd., Class A (Information Technology) | | | 1,290 | |
| | 2,130 | | | AVIC Industry-Finance Holdings Co. Ltd., Class A (Financials) | | | 1,077 | |
| | 8,926 | | | AviChina Industry & Technology Co. Ltd., Class H (Industrials) | | | 4,007 | |
| | 1,082 | | | Baidu, Inc. ADR (Communication Services)* | | | 154,542 | |
| | 5,223 | | | Bank of Beijing Co. Ltd., Class A (Financials) | | | 3,208 | |
| | 900 | | | Bank of Changsha Co. Ltd., Class A (Financials) | | | 1,005 | |
| | 895 | | | Bank of Chengdu Co. Ltd., Class A (Financials) | | | 1,683 | |
| | |
| |
| Common Stocks – (continued) | | | |
| China – (continued) | | | |
| | 9,711 | | | Bank of China Ltd., Class A (Financials) | | | 5,003 | |
| | 321,203 | | | Bank of China Ltd., Class H (Financials) | | | 108,955 | |
| | 9,203 | | | Bank of Communications Co. Ltd., Class A (Financials) | | | 7,017 | |
| | 28,405 | | | Bank of Communications Co. Ltd., Class H (Financials) | | | 16,264 | |
| | 1,410 | | | Bank of Hangzhou Co. Ltd., Class A (Financials) | | | 2,170 | |
| | 3,462 | | | Bank of Jiangsu Co. Ltd., Class A (Financials) | | | 3,391 | |
| | 2,384 | | | Bank of Nanjing Co. Ltd., Class A (Financials) | | | 2,594 | |
| | 1,552 | | | Bank of Ningbo Co. Ltd., Class A (Financials) | | | 5,580 | |
| | 3,454 | | | Bank of Shanghai Co. Ltd., Class A (Financials) | | | 2,824 | |
| | 1,736 | | | Bank of Zhengzhou Co. Ltd., Class A (Financials)* | | | 510 | |
| | 5,759 | | | Bank of Zhengzhou Co. Ltd., Class H (Financials)*(a) | | | 698 | |
| | 4,747 | | | Baoshan Iron & Steel Co. Ltd., Class A (Materials) | | | 3,952 | |
| | 2,027 | | | BBMG Corp., Class A (Materials) | | | 613 | |
| | 8,441 | | | BBMG Corp., Class H (Materials) | | | 883 | |
| | 205 | | | BeiGene Ltd. ADR (Health Care)* | | | 42,548 | |
| | 1,054 | | | Beijing Dabeinong Technology Group Co. Ltd., Class A (Consumer Staples) | | | 940 | |
| | 81 | | | Beijing Easpring Material Technology Co. Ltd., Class A (Industrials) | | | 493 | |
| | 200 | | | Beijing E-Hualu Information Technology Co. Ltd., Class A (Information Technology)* | | | 829 | |
| | 649 | | | Beijing Enlight Media Co. Ltd., Class A (Communication Services) | | | 833 | |
| | 1,870 | | | Beijing Enterprises Holdings Ltd. (Utilities) | | | 7,011 | |
| | 15,223 | | | Beijing Enterprises Water Group Ltd. (Utilities) | | | 3,514 | |
| | 162 | | | Beijing Kingsoft Office Software, Inc., Class A (Information Technology) | | | 8,783 | |
| | 311 | | | Beijing New Building Materials PLC, Class A (Industrials) | | | 1,278 | |
| | 730 | | | Beijing Originwater Technology Co. Ltd., Class A (Industrials) | | | 534 | |
| | 443 | | | Beijing Shiji Information Technology Co. Ltd., Class A (Information Technology)* | | | 827 | |
| | 568 | | | Beijing Shougang Co. Ltd., Class A (Materials) | | | 290 | |
| | 400 | | | Beijing Tiantan Biological Products Corp. Ltd., Class A (Health Care) | | | 1,379 | |
| | 324 | | | Beijing Tongrentang Co. Ltd., Class A (Health Care) | | | 2,503 | |
| | 171 | | | Beijing United Information Technology Co. Ltd., Class A (Industrials) | | | 848 | |
| | 190 | | | Beijing Wantai Biological Pharmacy Enterprise Co. Ltd., Class A (Health Care) | | | 1,302 | |
| | |
| | |
| The accompanying notes are an integral part of these financial statements. | | 17 |
GOLDMAN SACHS MARKETBETA® EMERGING MARKETS EQUITY ETF
Schedule of Investments (continued)
August 31, 2023
| | | | | | | | |
Shares | | | Description | | Value | |
| |
| Common Stocks – (continued) | | | |
| China – (continued) | | | |
| | 600 | | | Beijing Yanjing Brewery Co. Ltd., Class A (Consumer Staples) | | $ | 856 | |
| | 10,300 | | | Beijing-Shanghai High Speed Railway Co. Ltd., Class A (Industrials) | | | 7,217 | |
| | 1,800 | | | Beiqi Foton Motor Co. Ltd., Class A (Consumer Discretionary)* | | | 885 | |
| | 81 | | | Bethel Automotive Safety Systems Co. Ltd., Class A (Consumer Discretionary) | | | 839 | |
| | 81 | | | Betta Pharmaceuticals Co. Ltd., Class A (Health Care) | | | 550 | |
| | 134 | | | BGI Genomics Co. Ltd., Class A (Health Care) | | | 989 | |
| | 935 | | | Bilibili, Inc., Class Z (Communication Services)* | | | 13,986 | |
| | 162 | | | Bloomage Biotechnology Corp. Ltd., Class A (Health Care) | | | 2,060 | |
| | 821 | | | BOC Aviation Ltd. (Industrials)(a) | | | 6,161 | |
| | 13,784 | | | BOC Hong Kong Holdings Ltd. (Financials) | | | 38,319 | |
| | 568 | | | BOC International China Co. Ltd., Class A (Financials) | | | 927 | |
| | 8,937 | | | BOE Technology Group Co. Ltd., Class A (Information Technology) | | | 4,924 | |
| | 300 | | | BTG Hotels Group Co. Ltd., Class A (Consumer Discretionary)* | | | 716 | |
| | 395 | | | BYD Co. Ltd., Class A (Consumer Discretionary) | | | 13,535 | |
| | 3,717 | | | BYD Co. Ltd., Class H (Consumer Discretionary) | | | 116,510 | |
| | 249 | | | By-health Co. Ltd., Class A (Consumer Staples) | | | 661 | |
| | 2,071 | | | C&D International Investment Group Ltd. (Real Estate) | | | 5,271 | |
| | 1,057 | | | Caitong Securities Co. Ltd., Class A (Financials) | | | 1,163 | |
| | 659 | | | CALB Group Co. Ltd. (Consumer Discretionary)*(a) | | | 1,333 | |
| | 210 | | | Canmax Technologies Co. Ltd., Class A (Materials) | | | 779 | |
| | 341 | | | CanSino Biologics, Inc., Class H (Health Care)*(a) | | | 1,000 | |
| | 1,297 | | | CECEP Wind-Power Corp., Class A (Utilities) | | | 599 | |
| | 162 | | | CETC Cyberspace Security Technology Co. Ltd., Class A (Information Technology) | | | 557 | |
| | 3,486 | | | CGN Power Co. Ltd., Class A (Utilities) | | | 1,504 | |
| | 38,857 | | | CGN Power Co. Ltd., Class H (Utilities)(a) | | | 9,712 | |
| | 81 | | | Changchun High & New Technology Industry Group, Inc., Class A (Health Care) | | | 1,530 | |
| | 1,288 | | | Changjiang Securities Co. Ltd., Class A (Financials) | | | 1,058 | |
| | 81 | | | Changzhou Xingyu Automotive Lighting Systems Co. Ltd., Class A (Consumer Discretionary) | | | 1,645 | |
| | |
| |
| Common Stocks – (continued) | | | |
| China – (continued) | | | |
| | 421 | | | Chaozhou Three-Circle Group Co. Ltd., Class A (Information Technology) | | | 1,857 | |
| | 243 | | | Chengxin Lithium Group Co. Ltd., Class A (Materials) | | | 763 | |
| | 400 | | | Chifeng Jilong Gold Mining Co. Ltd., Class A (Materials)* | | | 831 | |
| | 649 | | | China Baoan Group Co. Ltd., Class A (Industrials) | | | 951 | |
| | 10,245 | | | China Bohai Bank Co. Ltd., Class H (Financials)*(a) | | | 1,581 | |
| | 33,517 | | | China Cinda Asset Management Co. Ltd., Class H (Financials) | | | 3,291 | |
| | 1,401 | | | China CITIC Bank Corp. Ltd., Class A (Financials) | | | 1,051 | |
| | 39,293 | | | China CITIC Bank Corp. Ltd., Class H (Financials) | | | 17,487 | |
| | 805 | | | China Coal Energy Co. Ltd., Class A (Energy) | | | 891 | |
| | 8,272 | | | China Coal Energy Co. Ltd., Class H (Energy) | | | 5,644 | |
| | 5,469 | | | China Conch Venture Holdings Ltd. (Industrials) | | | 5,377 | |
| | 2,288 | | | China Construction Bank Corp., Class A (Financials) | | | 1,886 | |
| | 361,755 | | | China Construction Bank Corp., Class H (Financials) | | | 193,754 | |
| | 968 | | | China CSSC Holdings Ltd., Class A (Industrials) | | | 3,776 | |
| | 1,891 | | | China Eastern Airlines Corp. Ltd., Class A (Industrials)* | | | 1,128 | |
| | 7,786 | | | China Eastern Airlines Corp. Ltd., Class H (Industrials)* | | | 2,750 | |
| | 7,357 | | | China Energy Engineering Corp. Ltd., Class A (Industrials) | | | 2,315 | |
| | 23,187 | | | China Energy Engineering Corp. Ltd., Class H (Industrials) | | | 2,691 | |
| | 9,951 | | | China Everbright Bank Co. Ltd., Class A (Financials) | | | 4,115 | |
| | 28,839 | | | China Everbright Bank Co. Ltd., Class H (Financials) | | | 8,311 | |
| | 13,867 | | | China Everbright Environment Group Ltd. (Industrials) | | | 5,057 | |
| | 12,614 | | | China Feihe Ltd. (Consumer Staples)(a) | | | 7,592 | |
| | 400 | | | China Film Co. Ltd., Class A (Communication Services)* | | | 816 | |
| | 805 | | | China Galaxy Securities Co. Ltd., Class A (Financials) | | | 1,275 | |
| | 13,235 | | | China Galaxy Securities Co. Ltd., Class H (Financials) | | | 7,122 | |
| | 568 | | | China Great Wall Securities Co. Ltd., Class A (Financials) | | | 685 | |
| | 737 | | | China Greatwall Technology Group Co. Ltd., Class A (Information Technology) | | | 1,103 | |
| | 9,026 | | | China Hongqiao Group Ltd. (Materials) | | | 9,001 | |
| | 44,203 | | | China Huarong Asset Management Co. Ltd., Class H (Financials)*(a) | | | 2,029 | |
| | |
| | |
| 18 | | The accompanying notes are an integral part of these financial statements. |
GOLDMAN SACHS MARKETBETA® EMERGING MARKETS EQUITY ETF
| | | | | | | | |
Shares | | | Description | | Value | |
| |
| Common Stocks – (continued) | | | |
| China – (continued) | | | |
| | 405 | | | China International Capital Corp. Ltd., Class A (Financials) | | $ | 2,170 | |
| | 5,631 | | | China International Capital Corp. Ltd., Class H (Financials)(a) | | | 10,829 | |
| | 674 | | | China International Marine Containers Group Co. Ltd., Class A (Industrials) | | | 653 | |
| | 26,305 | | | China Jinmao Holdings Group Ltd. (Real Estate) | | | 3,723 | |
| | 962 | | | China Jushi Co. Ltd., Class A (Materials) | | | 1,845 | |
| | 3,836 | | | China Lesso Group Holdings Ltd. (Industrials) | | | 2,113 | |
| | 474 | | | China Life Insurance Co. Ltd., Class A (Financials) | | | 2,320 | |
| | 28,582 | | | China Life Insurance Co. Ltd., Class H (Financials) | | | 43,374 | |
| | 1,369 | | | China Literature Ltd. (Communication Services)*(a) | | | 5,499 | |
| | 13,194 | | | China Longyuan Power Group Corp. Ltd., Class H (Utilities) | | | 10,449 | |
| | 4,691 | | | China Medical System Holdings Ltd. (Health Care) | | | 6,772 | |
| | 4,798 | | | China Merchants Bank Co. Ltd., Class A (Financials) | | | 20,798 | |
| | 14,536 | | | China Merchants Bank Co. Ltd., Class H (Financials) | | | 57,464 | |
| | 1,946 | | | China Merchants Energy Shipping Co. Ltd., Class A (Energy) | | | 1,575 | |
| | 868 | | | China Merchants Expressway Network & Technology Holdings Co. Ltd., Class A (Industrials) | | | 1,158 | |
| | 4,766 | | | China Merchants Port Holdings Co. Ltd. (Industrials) | | | 5,701 | |
| | 1,779 | | | China Merchants Securities Co. Ltd., Class A (Financials) | | | 3,473 | |
| | 1,743 | | | China Merchants Securities Co. Ltd., Class H (Financials)(a) | | | 1,607 | |
| | 1,541 | | | China Merchants Shekou Industrial Zone Holdings Co. Ltd., Class A (Real Estate) | | | 2,892 | |
| | 8,432 | | | China Minsheng Banking Corp. Ltd., Class A (Financials) | | | 4,379 | |
| | 26,209 | | | China Minsheng Banking Corp. Ltd., Class H (Financials) | | | 8,422 | |
| | 16,348 | | | China National Building Material Co. Ltd., Class H (Materials) | | | 8,318 | |
| | 1,459 | | | China National Chemical Engineering Co. Ltd., Class A (Industrials) | | | 1,560 | |
| | 200 | | | China National Medicines Corp. Ltd., Class A (Health Care) | | | 894 | |
| | 4,459 | | | China National Nuclear Power Co. Ltd., Class A (Utilities) | | | 4,411 | |
| | 160 | | | China National Software & Service Co. Ltd., Class A (Information Technology) | | | 950 | |
| | 872 | | | China Northern Rare Earth Group High-Tech Co. Ltd., Class A (Materials) | | | 2,645 | |
| | 243 | | | China Oilfield Services Ltd., Class A (Energy) | | | 495 | |
| | |
| |
| Common Stocks – (continued) | | | |
| China – (continued) | | | |
| | 7,155 | | | China Oilfield Services Ltd., Class H (Energy) | | | 8,111 | |
| | 14,072 | | | China Overseas Land & Investment Ltd. (Real Estate) | | | 29,681 | |
| | 4,839 | | | China Overseas Property Holdings Ltd. (Real Estate) | | | 5,782 | |
| | 1,572 | | | China Pacific Insurance Group Co. Ltd., Class A (Financials) | | | 5,983 | |
| | 9,581 | | | China Pacific Insurance Group Co. Ltd., Class H (Financials) | | | 21,943 | |
| | 7,238 | | | China Petroleum & Chemical Corp., Class A (Energy) | | | 6,036 | |
| | 92,237 | | | China Petroleum & Chemical Corp., Class H (Energy) | | | 53,989 | |
| | 19,667 | | | China Power International Development Ltd. (Utilities) | | | 7,022 | |
| | 4,886 | | | China Railway Group Ltd., Class A (Industrials) | | | 4,498 | |
| | 15,798 | | | China Railway Group Ltd., Class H (Industrials) | | | 8,361 | |
| | 1,501 | | | China Railway Signal & Communication Corp. Ltd., Class A (Information Technology) | | | 1,157 | |
| | 6,403 | | | China Railway Signal & Communication Corp. Ltd., Class H (Information Technology)(a) | | | 2,123 | |
| | 243 | | | China Rare Earth Resources And Technology Co. Ltd., Class A (Materials) | | | 954 | |
| | 5,917 | | | China Resources Beer Holdings Co. Ltd. (Consumer Staples) | | | 34,785 | |
| | 8,681 | | | China Resources Cement Holdings Ltd. (Materials) | | | 2,878 | |
| | 3,519 | | | China Resources Gas Group Ltd. (Utilities) | | | 9,895 | |
| | 11,079 | | | China Resources Land Ltd. (Real Estate) | | | 46,835 | |
| | 243 | | | China Resources Microelectronics Ltd., Class A (Information Technology) | | | 1,954 | |
| | 2,275 | | | China Resources Mixc Lifestyle Services Ltd. (Real Estate)(a) | | | 9,820 | |
| | 6,169 | | | China Resources Pharmaceutical Group Ltd. (Health Care)(a) | | | 4,122 | |
| | 7,019 | | | China Resources Power Holdings Co. Ltd. (Utilities) | | | 13,748 | |
| | 243 | | | China Resources Sanjiu Medical & Pharmaceutical Co. Ltd., Class A (Health Care) | | | 1,588 | |
| | 1,568 | | | China Shenhua Energy Co. Ltd., Class A (Energy) | | | 6,069 | |
| | 12,809 | | | China Shenhua Energy Co. Ltd., Class H (Energy) | | | 37,324 | |
| | 2,589 | | | China Southern Airlines Co. Ltd., Class A (Industrials)* | | | 2,248 | |
| | 6,540 | | | China Southern Airlines Co. Ltd., Class H (Industrials)* | | | 3,478 | |
| | 600 | | | China Southern Power Grid Energy Efficiency & Clean Energy Co. Ltd., Class A (Industrials) | | | 498 | |
| | |
| | |
| The accompanying notes are an integral part of these financial statements. | | 19 |
GOLDMAN SACHS MARKETBETA® EMERGING MARKETS EQUITY ETF
Schedule of Investments (continued)
August 31, 2023
| | | | | | | | |
Shares | | | Description | | Value | |
| |
| Common Stocks – (continued) | | | |
| China – (continued) | | | |
| | 300 | | | China Southern Power Grid Energy Storage Co. Ltd., Class A (Utilities) | | $ | 406 | |
| | 9,973 | | | China State Construction Engineering Corp. Ltd., Class A (Industrials) | | | 7,714 | |
| | 6,974 | | | China State Construction International Holdings Ltd. (Industrials) | | | 7,764 | |
| | 405 | | | China Suntien Green Energy Corp. Ltd., Class A (Energy) | | | 458 | |
| | 6,834 | | | China Suntien Green Energy Corp. Ltd., Class H (Energy) | | | 2,405 | |
| | 5,536 | | | China Taiping Insurance Holdings Co. Ltd. (Financials) | | | 5,831 | |
| | 6,811 | | | China Three Gorges Renewables Group Co. Ltd., Class A (Utilities) | | | 4,604 | |
| | 404 | | | China Tourism Group Duty Free Corp. Ltd., Class A (Consumer Discretionary) | | | 6,046 | |
| | 338 | | | China Tourism Group Duty Free Corp. Ltd., Class H (Consumer Discretionary)(a) | | | 4,539 | |
| | 164,556 | | | China Tower Corp. Ltd., Class H (Communication Services)(a) | | | 15,948 | |
| | 7,541 | | | China United Network Communications Ltd., Class A (Communication Services) | | | 5,398 | |
| | 2,361 | | | China Vanke Co. Ltd., Class A (Real Estate) | | | 4,425 | |
| | 8,368 | | | China Vanke Co. Ltd., Class H (Real Estate) | | | 9,764 | |
| | 1,200 | | | China XD Electric Co. Ltd., Class A (Industrials) | | | 793 | |
| | 4,327 | | | China Yangtze Power Co. Ltd., Class A (Utilities) | | | 13,114 | |
| | 162 | | | China Zhenhua Group Science & Technology Co. Ltd., Class A (Information Technology) | | | 2,041 | |
| | 4,376 | | | China Zheshang Bank Co. Ltd., Class A (Financials) | | | 1,545 | |
| | 147 | | | Chongqing Brewery Co. Ltd., Class A (Consumer Staples) | | | 1,846 | |
| | 3,097 | | | Chongqing Changan Automobile Co. Ltd., Class A (Consumer Discretionary) | | | 5,336 | |
| | 1,421 | | | Chongqing Hongjiu Fruit Co. Ltd., Class H (Consumer Staples)* | | | 1,113 | |
| | 2,270 | | | Chongqing Rural Commercial Bank Co. Ltd., Class A (Financials) | | | 1,173 | |
| | 9,210 | | | Chongqing Rural Commercial Bank Co. Ltd., Class H (Financials) | | | 3,253 | |
| | 522 | | | Chongqing Zhifei Biological Products Co. Ltd., Class A (Health Care) | | | 3,170 | |
| | 24,129 | | | CITIC Ltd. (Industrials) | | | 23,970 | |
| | 405 | | | Citic Pacific Special Steel Group Co. Ltd., Class A (Materials) | | | 790 | |
| | 2,687 | | | CITIC Securities Co. Ltd., Class A (Financials) | | | 8,196 | |
| | 7,344 | | | CITIC Securities Co. Ltd., Class H (Financials) | | | 14,348 | |
| | 4,098 | | | CMOC Group Ltd., Class A (Materials) | | | 3,226 | |
| | 14,192 | | | CMOC Group Ltd., Class H (Materials) | | | 8,488 | |
| | |
| |
| Common Stocks – (continued) | | | |
| China – (continued) | | | |
| | 162 | | | CNGR Advanced Material Co. Ltd., Class A (Materials) | | | 1,221 | |
| | 1,400 | | | CNOOC Energy Technology & Services Ltd., Class A (Energy) | | | 594 | |
| | 892 | | | CNPC Capital Co. Ltd., Class A (Financials) | | | 825 | |
| | 1,060 | | | Contemporary Amperex Technology Co. Ltd., Class A (Industrials) | | | 34,450 | |
| | 2,351 | | | COSCO SHIPPING Development Co. Ltd., Class A (Industrials) | | | 769 | |
| | 892 | | | COSCO SHIPPING Energy Transportation Co. Ltd., Class A (Energy) | | | 1,624 | |
| | 5,118 | | | COSCO SHIPPING Energy Transportation Co. Ltd., Class H (Energy) | | | 5,365 | |
| | 3,033 | | | COSCO SHIPPING Holdings Co. Ltd., Class A (Industrials) | | | 4,084 | |
| | 12,452 | | | COSCO SHIPPING Holdings Co. Ltd., Class H (Industrials) | | | 12,783 | |
| | 51,536 | | | Country Garden Holdings Co. Ltd. (Real Estate)*(b) | | | 5,849 | |
| | 8,473 | | | Country Garden Services Holdings Co. Ltd. (Real Estate) | | | 9,746 | |
| | 5,700 | | | CRRC Corp. Ltd., Class A (Industrials) | | | 4,652 | |
| | 17,089 | | | CRRC Corp. Ltd., Class H (Industrials) | | | 8,412 | |
| | 692 | | | CSC Financial Co. Ltd., Class A (Financials) | | | 2,451 | |
| | 3,592 | | | CSC Financial Co. Ltd., Class H (Financials)(a) | | | 3,825 | |
| | 8,115 | | | Dali Foods Group Co. Ltd. (Consumer Staples)(a) | | | 3,881 | |
| | 3,568 | | | Daqin Railway Co. Ltd., Class A (Industrials) | | | 3,495 | |
| | 218 | | | DaShenLin Pharmaceutical Group Co. Ltd., Class A (Consumer Staples) | | | 796 | |
| | 1,454 | | | Datang International Power Generation Co. Ltd., Class A (Utilities) | | | 555 | |
| | 11,084 | | | Datang International Power Generation Co. Ltd., Class H (Utilities) | | | 1,753 | |
| | 730 | | | DHC Software Co. Ltd., Class A (Information Technology) | | | 674 | |
| | 226 | | | Do-Fluoride New Materials Co. Ltd., Class A (Materials) | | | 509 | |
| | 158 | | | Dong-E-E-Jiao Co. Ltd., Class A (Health Care) | | | 1,125 | |
| | 603 | | | Dongfang Electric Corp. Ltd., Class A (Industrials) | | | 1,390 | |
| | 1,344 | | | Dongfang Electric Corp. Ltd., Class H (Industrials) | | | 1,551 | |
| | 10,486 | | | Dongfeng Motor Group Co. Ltd., Class H (Consumer Discretionary) | | | 3,851 | |
| | 765 | | | Dongxing Securities Co. Ltd., Class A (Financials) | | | 871 | |
| | 3,581 | | | East Money Information Co. Ltd., Class A (Financials) | | | 7,808 | |
| | 81 | | | Eastroc Beverage Group Co. Ltd., Class A (Consumer Staples) | | | 2,185 | |
| | |
| | |
| 20 | | The accompanying notes are an integral part of these financial statements. |
GOLDMAN SACHS MARKETBETA® EMERGING MARKETS EQUITY ETF
| | | | | | | | |
Shares | | | Description | | Value | |
| |
| Common Stocks – (continued) | | | |
| China – (continued) | | | |
| | 162 | | | Ecovacs Robotics Co. Ltd., Class A (Consumer Discretionary) | | $ | 1,180 | |
| | 2,890 | | | ENN Energy Holdings Ltd. (Utilities) | | | 22,665 | |
| | 530 | | | ENN Natural Gas Co. Ltd., Class A (Utilities) | | | 1,271 | |
| | 140 | | | Eoptolink Technology, Inc. Ltd., Class A (Information Technology) | | | 877 | |
| | 500 | | | Eve Energy Co. Ltd., Class A (Industrials) | | | 3,394 | |
| | 947 | | | Everbright Securities Co. Ltd., Class A (Financials) | | | 2,233 | |
| | 1,120 | | | Fangda Carbon New Material Co. Ltd., Class A (Industrials)* | | | 897 | |
| | 583 | | | FAW Jiefang Group Co. Ltd., Class A (Industrials)* | | | 687 | |
| | 1,054 | | | First Capital Securities Co. Ltd., Class A (Financials) | | | 872 | |
| | 279 | | | Flat Glass Group Co. Ltd., Class A (Information Technology) | | | 1,184 | |
| | 1,683 | | | Flat Glass Group Co. Ltd., Class H (Information Technology)(b) | | | 4,181 | |
| | 3,440 | | | Focus Media Information Technology Co. Ltd., Class A (Communication Services) | | | 3,639 | |
| | 992 | | | Foshan Haitian Flavouring & Food Co. Ltd., Class A (Consumer Staples) | | | 5,329 | |
| | 1,900 | | | Founder Securities Co. Ltd., Class A (Financials) | | | 1,885 | |
| | 2,394 | | | Foxconn Industrial Internet Co. Ltd., Class A (Information Technology) | | | 7,206 | |
| | 264 | | | Fujian Sunner Development Co. Ltd., Class A (Consumer Staples) | | | 707 | |
| | 3,048 | | | Full Truck Alliance Co. Ltd. ADR (Industrials)* | | | 20,422 | |
| | 474 | | | Fuyao Glass Industry Group Co. Ltd., Class A (Consumer Discretionary) | | | 2,475 | |
| | 2,397 | | | Fuyao Glass Industry Group Co. Ltd., Class H (Consumer Discretionary)(a) | | | 10,851 | |
| | 322 | | | Ganfeng Lithium Group Co. Ltd., Class A (Materials) | | | 2,097 | |
| | 1,531 | | | Ganfeng Lithium Group Co. Ltd., Class H (Materials)(a) | | | 7,321 | |
| | 4,378 | | | GD Power Development Co. Ltd., Class A (Utilities) | | | 2,111 | |
| | 419 | | | GDS Holdings Ltd. ADR (Information Technology)*(b) | | | 5,011 | |
| | 1,135 | | | GEM Co. Ltd., Class A (Materials) | | | 976 | |
| | 1,024 | | | Gemdale Corp., Class A (Real Estate) | | | 1,013 | |
| | 4,335 | | | Genscript Biotech Corp. (Health Care)* | | | 10,161 | |
| | 1,452 | | | GF Securities Co. Ltd., Class A (Financials) | | | 3,004 | |
| | 3,843 | | | GF Securities Co. Ltd., Class H (Financials) | | | 5,489 | |
| | 1,494 | | | Giant Biogene Holding Co. Ltd. (Consumer Staples)*(a) | | | 7,163 | |
| | 500 | | | Giant Network Group Co. Ltd., Class A (Communication Services) | | | 1,003 | |
| | 148 | | | GigaDevice Semiconductor, Inc., Class A (Information Technology) | | | 1,911 | |
| | |
| |
| Common Stocks – (continued) | | | |
| China – (continued) | | | |
| | 122 | | | Ginlong Technologies Co. Ltd., Class A (Industrials) | | | 1,258 | |
| | 790 | | | GoerTek, Inc., Class A (Information Technology) | | | 1,663 | |
| | 3,056 | | | Goldwind Science & Technology Co. Ltd. (Industrials) | | | 1,606 | |
| | 761 | | | Goldwind Science & Technology Co. Ltd., Class A (Industrials) | | | 993 | |
| | 48 | | | Gongniu Group Co. Ltd., Class A (Industrials) | | | 699 | |
| | 324 | | | Gotion High-tech Co. Ltd., Class A (Industrials)* | | | 1,078 | |
| | 555 | | | Great Wall Motor Co. Ltd., Class A (Consumer Discretionary) | | | 1,991 | |
| | 8,794 | | | Great Wall Motor Co. Ltd., Class H (Consumer Discretionary) | | | 10,429 | |
| | 1,297 | | | Gree Electric Appliances Inc of Zhuhai, Class A (Consumer Discretionary) | | | 6,378 | |
| | 2,300 | | | Greenland Holdings Corp. Ltd., Class A (Real Estate)* | | | 926 | |
| | 3,942 | | | Greentown China Holdings Ltd. (Real Estate) | | | 4,685 | |
| | 600 | | | GRG Banking Equipment Co. Ltd., Class A (Information Technology) | | | 1,035 | |
| | 500 | | | Guangdong Electric Power Development Co. Ltd., Class A (Utilities)* | | | 432 | |
| | 368 | | | Guangdong Haid Group Co. Ltd., Class A (Consumer Staples) | | | 2,439 | |
| | 11,077 | | | Guangdong Investment Ltd. (Utilities) | | | 8,659 | |
| | 81 | | | Guangdong Kinlong Hardware Products Co. Ltd., Class A (Industrials) | | | 634 | |
| | 1,622 | | | Guanghui Energy Co. Ltd., Class A (Energy) | | | 1,466 | |
| | 597 | | | Guangzhou Automobile Group Co. Ltd., Class A (Consumer Discretionary) | | | 827 | |
| | 11,159 | | | Guangzhou Automobile Group Co. Ltd., Class H (Consumer Discretionary) | | | 5,877 | |
| | 500 | | | Guangzhou Baiyun International Airport Co. Ltd., Class A (Industrials)* | | | 810 | |
| | 316 | | | Guangzhou Baiyunshan Pharmaceutical Holdings Co. Ltd., Class A (Health Care) | | | 1,342 | |
| | 868 | | | Guangzhou Baiyunshan Pharmaceutical Holdings Co. Ltd., Class H (Health Care) | | | 2,441 | |
| | 81 | | | Guangzhou Great Power Energy & Technology Co. Ltd., Class A (Industrials)* | | | 399 | |
| | 147 | | | Guangzhou Kingmed Diagnostics Group Co. Ltd., Class A (Health Care) | | | 1,205 | |
| | 158 | | | Guangzhou Shiyuan Electronic Technology Co. Ltd., Class A (Information Technology) | | | 1,157 | |
| | 486 | | | Guangzhou Tinci Materials Technology Co. Ltd., Class A (Materials) | | | 2,192 | |
| | 685 | | | Guangzhou Yuexiu Capital Holdings Group Co. Ltd., Class A (Financials) | | | 647 | |
| | |
| | |
| The accompanying notes are an integral part of these financial statements. | | 21 |
GOLDMAN SACHS MARKETBETA® EMERGING MARKETS EQUITY ETF
Schedule of Investments (continued)
August 31, 2023
| | | | | | | | |
Shares | | | Description | | Value | |
| |
| Common Stocks – (continued) | | | |
| China – (continued) | | | |
| | 500 | | | Guolian Securities Co. Ltd., Class A (Financials)* | | $ | 746 | |
| | 1,162 | | | Guosen Securities Co. Ltd., Class A (Financials) | | | 1,482 | |
| | 1,742 | | | Guotai Junan Securities Co. Ltd., Class A (Financials) | | | 3,485 | |
| | 3,272 | | | Guotai Junan Securities Co. Ltd., Class H (Financials)(a) | | | 3,839 | |
| | 1,136 | | | Guoyuan Securities Co. Ltd., Class A (Financials) | | | 1,085 | |
| | 729 | | | H World Group Ltd. ADR (Consumer Discretionary)* | | | 29,364 | |
| | 6,405 | | | Haidilao International Holding Ltd. (Consumer Discretionary)(a) | | | 17,438 | |
| | 1,455 | | | Haier Smart Home Co. Ltd., Class A (Consumer Discretionary) | | | 4,700 | |
| | 8,951 | | | Haier Smart Home Co. Ltd., Class H (Consumer Discretionary) | | | 27,680 | |
| | 9,700 | | | Hainan Airlines Holding Co. Ltd., Class A (Industrials)* | | | 2,079 | |
| | 2,397 | | | Haitian International Holdings Ltd. (Industrials) | | | 5,147 | |
| | 2,226 | | | Haitong Securities Co. Ltd., Class A (Financials) | | | 3,006 | |
| | 9,986 | | | Haitong Securities Co. Ltd., Class H (Financials) | | | 6,202 | |
| | 205 | | | Han’s Laser Technology Industry Group Co. Ltd., Class A (Industrials) | | | 629 | |
| | 730 | | | Hangzhou Binjiang Real Estate Group Co. Ltd., Class A (Real Estate) | | | 1,052 | |
| | 162 | | | Hangzhou Chang Chuan Technology Co. Ltd., Class A (Information Technology) | | | 832 | |
| | 466 | | | Hangzhou First Applied Material Co. Ltd., Class A (Information Technology) | | | 1,991 | |
| | 162 | | | Hangzhou Lion Electronics Co. Ltd., Class A (Information Technology) | | | 734 | |
| | 243 | | | Hangzhou Oxygen Plant Group Co. Ltd., Class A (Materials) | | | 1,022 | |
| | 211 | | | Hangzhou Robam Appliances Co. Ltd., Class A (Consumer Discretionary) | | | 797 | |
| | 243 | | | Hangzhou Silan Microelectronics Co. Ltd., Class A (Information Technology) | | | 846 | |
| | 174 | | | Hangzhou Tigermed Consulting Co. Ltd., Class A (Health Care) | | | 1,592 | |
| | 486 | | | Hangzhou Tigermed Consulting Co. Ltd., Class H (Health Care)(a) | | | 2,649 | |
| | 4,236 | | | Hansoh Pharmaceutical Group Co. Ltd. (Health Care)(a) | | | 5,510 | |
| | 162 | | | Haohua Chemical Science & Technology Co. Ltd., Class A (Materials) | | | 748 | |
| | 200 | | | Hebei Hengshui Laobaigan Liquor Co. Ltd., Class A (Consumer Staples) | | | 647 | |
| | 300 | | | Hebei Yangyuan Zhihui Beverage Co. Ltd., Class A (Consumer Staples) | | | 1,012 | |
| | 200 | | | Hefei Meiya Optoelectronic Technology, Inc., Class A (Industrials) | | | 644 | |
| | |
| |
| Common Stocks – (continued) | | | |
| China – (continued) | | | |
| | 568 | | | Henan Shenhuo Coal & Power Co. Ltd., Class A (Materials) | | | 1,239 | |
| | 730 | | | Henan Shuanghui Investment & Development Co. Ltd., Class A (Consumer Staples) | | | 2,694 | |
| | 2,343 | | | Hengan International Group Co. Ltd. (Consumer Staples) | | | 8,695 | |
| | 405 | | | Hengdian Group DMEGC Magnetics Co. Ltd., Class A (Information Technology) | | | 913 | |
| | 1,459 | | | Hengli Petrochemical Co. Ltd., Class A (Materials)* | | | 2,878 | |
| | 568 | | | Hengtong Optic-electric Co. Ltd., Class A (Information Technology) | | | 1,103 | |
| | 1,052 | | | Hengyi Petrochemical Co. Ltd., Class A (Materials)* | | | 1,109 | |
| | 2,399 | | | Hesteel Co. Ltd., Class A (Materials) | | | 745 | |
| | 124 | | | Hithink RoyalFlush Information Network Co. Ltd., Class A (Financials) | | | 2,851 | |
| | 146 | | | Hongfa Technology Co. Ltd., Class A (Industrials) | | | 704 | |
| | 500 | | | Hongta Securities Co. Ltd., Class A (Financials) | | | 549 | |
| | 162 | | | Hoshine Silicon Industry Co. Ltd., Class A (Materials) | | | 1,375 | |
| | 159 | | | Hoyuan Green Energy Co. Ltd., Class A (Information Technology) | | | 910 | |
| | 2,998 | | | Hua Hong Semiconductor Ltd. (Information Technology)*(a) | | | 7,837 | |
| | 1,595 | | | Huadian Power International Corp. Ltd., Class A (Utilities) | | | 1,118 | |
| | 6,942 | | | Huadian Power International Corp. Ltd., Class H (Utilities) | | | 2,797 | |
| | 421 | | | Huadong Medicine Co. Ltd., Class A (Health Care) | | | 2,197 | |
| | 1,173 | | | Huafon Chemical Co. Ltd., Class A (Materials) | | | 1,128 | |
| | 200 | | | Huagong Tech Co. Ltd., Class A (Information Technology) | | | 864 | |
| | 568 | | | Huaibei Mining Holdings Co. Ltd., Class A (Materials) | | | 915 | |
| | 402 | | | Hualan Biological Engineering, Inc., Class A (Health Care) | | | 1,173 | |
| | 100 | | | Huali Industrial Group Co. Ltd., Class A (Consumer Discretionary) | | | 710 | |
| | 1,211 | | | Huaneng Lancang River Hydropower, Inc., Class A (Utilities) | | | 1,206 | |
| | 1,765 | | | Huaneng Power International, Inc., Class A (Utilities)* | | | 1,976 | |
| | 15,148 | | | Huaneng Power International, Inc., Class H (Utilities)* | | | 7,572 | |
| | 1,865 | | | Huatai Securities Co. Ltd., Class A (Financials) | | | 4,069 | |
| | 5,030 | | | Huatai Securities Co. Ltd., Class H (Financials)(a) | | | 6,620 | |
| | 713 | | | Huaxi Securities Co. Ltd., Class A (Financials) | | | 835 | |
| | |
| | |
| 22 | | The accompanying notes are an integral part of these financial statements. |
GOLDMAN SACHS MARKETBETA® EMERGING MARKETS EQUITY ETF
| | | | | | | | |
Shares | | | Description | | Value | |
| |
| Common Stocks – (continued) | | | |
| China – (continued) | | | |
| | 3,048 | | | Huaxia Bank Co. Ltd., Class A (Financials) | | $ | 2,320 | |
| | 324 | | | Huaxin Cement Co. Ltd., Class A (Materials) | | | 586 | |
| | 731 | | | Huayu Automotive Systems Co. Ltd., Class A (Consumer Discretionary) | | | 1,887 | |
| | 973 | | | Hubei Energy Group Co. Ltd., Class A (Utilities) | | | 580 | |
| | 200 | | | Hubei Jumpcan Pharmaceutical Co. Ltd., Class A (Health Care) | | | 719 | |
| | 243 | | | Hubei Xingfa Chemicals Group Co. Ltd., Class A (Materials) | | | 678 | |
| | 162 | | | Huizhou Desay Sv Automotive Co. Ltd., Class A (Consumer Discretionary) | | | 3,239 | |
| | 324 | | | Humanwell Healthcare Group Co. Ltd., Class A (Health Care) | | | 1,040 | |
| | 439 | | | Hunan Changyuan Lico Co. Ltd., Class A (Materials) | | | 568 | |
| | 1,784 | | | Hunan Valin Steel Co. Ltd., Class A (Materials) | | | 1,451 | |
| | 454 | | | Hundsun Technologies, Inc., Class A (Information Technology) | | | 2,246 | |
| | 1,315 | | | Hygeia Healthcare Holdings Co. Ltd. (Health Care)(a) | | | 6,649 | |
| | 566 | | | Iflytek Co. Ltd., Class A (Information Technology) | | | 4,264 | |
| | 81 | | | Imeik Technology Development Co. Ltd., Class A (Health Care) | | | 4,880 | |
| | 14,158 | | | Industrial & Commercial Bank of China Ltd., Class A (Financials) | | | 8,987 | |
| | 265,477 | | | Industrial & Commercial Bank of China Ltd., Class H (Financials) | | | 121,875 | |
| | 5,011 | | | Industrial Bank Co. Ltd., Class A (Financials) | | | 10,885 | |
| | 1,603 | | | Industrial Securities Co. Ltd., Class A (Financials) | | | 1,412 | |
| | 81 | | | Ingenic Semiconductor Co. Ltd., Class A (Information Technology) | | | 822 | |
| | 10,821 | | | Inner Mongolia BaoTou Steel Union Co. Ltd., Class A (Materials)* | | | 2,661 | |
| | 500 | | | Inner Mongolia Dian Tou Energy Corp. Ltd., Class A (Energy) | | | 910 | |
| | 1,611 | | | Inner Mongolia ERDOS Resources Co. Ltd., Class A (Materials) | | | 1,926 | |
| | 2,000 | | | Inner Mongolia Junzheng Energy & Chemical Industry Group Co. Ltd., Class A (Materials) | | | 1,149 | |
| | 1,487 | | | Inner Mongolia Yili Industrial Group Co. Ltd., Class A (Consumer Staples) | | | 5,312 | |
| | 2,558 | | | Inner Mongolia Yitai Coal Co. Ltd., Class H (Energy)* | | | 5,709 | |
| | 892 | | | Inner Mongolia Yuan Xing Energy Co. Ltd., Class A (Materials) | | | 865 | |
| | 4,621 | | | Innovent Biologics, Inc. (Health Care)*(a) | | | 20,684 | |
| | 324 | | | Inspur Electronic Information Industry Co. Ltd., Class A (Information Technology) | | | 1,742 | |
| | |
| |
| Common Stocks – (continued) | | | |
| China – (continued) | | | |
| | 1,755 | | | iQIYI, Inc. ADR (Communication Services)* | | | 8,845 | |
| | 150 | | | Isoftstone Information Technology Group Co. Ltd., Class A (Information Technology) | | | 425 | |
| | 800 | | | JA Solar Technology Co. Ltd., Class A (Information Technology) | | | 3,059 | |
| | 174 | | | Jafron Biomedical Co. Ltd., Class A (Health Care) | | | 511 | |
| | 211 | | | Jason Furniture Hangzhou Co. Ltd., Class A (Consumer Discretionary) | | | 1,207 | |
| | 405 | | | JCET Group Co. Ltd., Class A (Information Technology) | | | 1,814 | |
| | 3,741 | | | JD Health International, Inc. (Consumer Staples)*(a) | | | 20,180 | |
| | 6,807 | | | JD Logistics, Inc. (Industrials)*(a) | | | 9,080 | |
| | 4,713 | | | JD.com, Inc. ADR (Consumer Discretionary) | | | 156,519 | |
| | 1,473 | | | Jiangsu Eastern Shenghong Co. Ltd., Class A (Materials) | | | 2,329 | |
| | 243 | | | Jiangsu Expressway Co. Ltd., Class A (Industrials) | | | 323 | |
| | 4,828 | | | Jiangsu Expressway Co. Ltd., Class H (Industrials) | | | 4,359 | |
| | 318 | | | Jiangsu Hengli Hydraulic Co. Ltd., Class A (Industrials) | | | 2,715 | |
| | 1,441 | | | Jiangsu Hengrui Pharmaceuticals Co. Ltd., Class A (Health Care) | | | 8,272 | |
| | 264 | | | Jiangsu King’s Luck Brewery JSC Ltd., Class A (Consumer Staples) | | | 2,173 | |
| | 100 | | | Jiangsu Pacific Quartz Co. Ltd., Class A (Information Technology) | | | 1,314 | |
| | 500 | | | Jiangsu Phoenix Publishing & Media Corp. Ltd., Class A (Communication Services) | | | 751 | |
| | 373 | | | Jiangsu Yanghe Brewery Joint-Stock Co. Ltd., Class A (Consumer Staples) | | | 6,877 | |
| | 105 | | | Jiangsu Yangnong Chemical Co. Ltd., Class A (Materials) | | | 922 | |
| | 100 | | | Jiangsu Yoke Technology Co. Ltd., Class A (Materials) | | | 933 | |
| | 211 | | | Jiangsu Yuyue Medical Equipment & Supply Co. Ltd., Class A (Health Care) | | | 983 | |
| | 730 | | | Jiangsu Zhongtian Technology Co. Ltd., Class A (Industrials) | | | 1,461 | |
| | 455 | | | Jiangxi Copper Co. Ltd., Class A (Materials) | | | 1,181 | |
| | 4,218 | | | Jiangxi Copper Co. Ltd., Class H (Materials) | | | 6,584 | |
| | 405 | | | Jiangxi Special Electric Motor Co. Ltd., Class A (Industrials)* | | | 505 | |
| | 600 | | | Jinduicheng Molybdenum Co. Ltd., Class A (Materials) | | | 896 | |
| | 81 | | | JiuGui Liquor Co. Ltd., Class A (Consumer Staples) | | | 997 | |
| | 159 | | | Joinn Laboratories China Co. Ltd., Class A (Health Care) | | | 524 | |
| | 344 | | | Joinn Laboratories China Co. Ltd., Class H (Health Care)(a) | | | 689 | |
| | |
| | |
| The accompanying notes are an integral part of these financial statements. | | 23 |
GOLDMAN SACHS MARKETBETA® EMERGING MARKETS EQUITY ETF
Schedule of Investments (continued)
August 31, 2023
| | | | | | | | |
Shares | | | Description | | Value | |
| |
| Common Stocks – (continued) | | | |
| China – (continued) | | | |
| | 724 | | | Jointown Pharmaceutical Group Co. Ltd., Class A (Health Care) | | $ | 1,028 | |
| | 162 | | | Jonjee Hi-Tech Industrial And Commercial Holding Co. Ltd., Class A (Consumer Staples)* | | | 752 | |
| | 162 | | | Juewei Food Co. Ltd., Class A (Consumer Staples) | | | 794 | |
| | 486 | | | Juneyao Airlines Co. Ltd., Class A (Industrials)* | | | 1,060 | |
| | 1,002 | | | Kanzhun Ltd. ADR (Communication Services)* | | | 14,830 | |
| | 3,419 | | | KE Holdings, Inc. ADR (Real Estate)* | | | 58,807 | |
| | 486 | | | Keda Industrial Group Co. Ltd., Class A (Industrials) | | | 672 | |
| | 10,818 | | | Kingdee International Software Group Co. Ltd. (Information Technology)* | | | 16,720 | |
| | 500 | | | Kingnet Network Co. Ltd., Class A (Communication Services)* | | | 1,040 | |
| | 3,587 | | | Kingsoft Corp. Ltd. (Communication Services) | | | 14,317 | |
| | 7,805 | | | Kuaishou Technology (Communication Services)*(a) | | | 63,899 | |
| | 542 | | | Kuang-Chi Technologies Co. Ltd., Class A (Industrials) | | | 1,110 | |
| | 14,510 | | | Kunlun Energy Co. Ltd. (Utilities) | | | 10,621 | |
| | 300 | | | Kunlun Tech Co. Ltd., Class A (Communication Services)* | | | 1,491 | |
| | 336 | | | Kweichow Moutai Co. Ltd., Class A (Consumer Staples) | | | 85,264 | |
| | 583 | | | LB Group Co. Ltd., Class A (Materials) | | | 1,452 | |
| | 27,408 | | | Lenovo Group Ltd. (Information Technology) | | | 31,002 | |
| | 1,198 | | | Lens Technology Co. Ltd., Class A (Information Technology) | | | 2,024 | |
| | 486 | | | Lepu Medical Technology Beijing Co. Ltd., Class A (Health Care) | | | 1,081 | |
| | 162 | | | Levima Advanced Materials Corp., Class A (Materials) | | | 450 | |
| | 4,292 | | | Li Auto, Inc., Class A (Consumer Discretionary)* | | | 88,448 | |
| | 9,063 | | | Li Ning Co. Ltd. (Consumer Discretionary) | | | 42,820 | |
| | 3,359 | | | Liaoning Port Co. Ltd., Class A (Industrials) | | | 729 | |
| | 1,622 | | | Lingyi iTech Guangdong Co., Class A (Information Technology) | | | 1,342 | |
| | 105 | | | Livzon Pharmaceutical Group, Inc., Class A (Health Care) | | | 496 | |
| | 543 | | | Livzon Pharmaceutical Group, Inc., Class H (Health Care) | | | 1,721 | |
| | 6,899 | | | Longfor Group Holdings Ltd. (Real Estate)(a) | | | 14,534 | |
| | 1,764 | | | LONGi Green Energy Technology Co. Ltd., Class A (Information Technology) | | | 6,435 | |
| | 2,616 | | | Lufax Holding Ltd. ADR (Financials) | | | 3,165 | |
| | |
| |
| Common Stocks – (continued) | | | |
| China – (continued) | | | |
| | 486 | | | Luxi Chemical Group Co. Ltd., Class A (Materials) | | | 679 | |
| | 1,687 | | | Luxshare Precision Industry Co. Ltd., Class A (Information Technology) | | | 7,649 | |
| | 319 | | | Luzhou Laojiao Co. Ltd., Class A (Consumer Staples) | | | 10,181 | |
| | 406 | | | Mango Excellent Media Co. Ltd., Class A (Communication Services) | | | 1,648 | |
| | 130 | | | Maxscend Microelectronics Co. Ltd., Class A (Information Technology) | | | 2,217 | |
| | 700 | | | Meihua Holdings Group Co. Ltd., Class A (Consumer Staples) | | | 878 | |
| | 973 | | | Meinian Onehealth Healthcare Holdings Co. Ltd., Class A (Health Care)* | | | 909 | |
| | 17,513 | | | Meituan, Class B (Consumer Discretionary)*(a) | | | 286,979 | |
| | 4,474 | | | Metallurgical Corp. of China Ltd., Class A (Industrials) | | | 2,237 | |
| | 11,342 | | | Metallurgical Corp. of China Ltd., Class H (Industrials) | | | 2,473 | |
| | 2,919 | | | Microport Scientific Corp. (Health Care)* | | | 4,995 | |
| | 486 | | | Ming Yang Smart Energy Group Ltd., Class A (Industrials) | | | 997 | |
| | 243 | | | Montage Technology Co. Ltd., Class A (Information Technology) | | | 1,711 | |
| | 1,228 | | | Muyuan Foods Co. Ltd., Class A (Consumer Staples) | | | 6,846 | |
| | 316 | | | Nanjing King-Friend Biochemical Pharmaceutical Co. Ltd., Class A (Health Care) | | | 514 | |
| | 800 | | | Nanjing Securities Co. Ltd., Class A (Financials) | | | 907 | |
| | 1,900 | | | NARI Technology Co. Ltd., Class A (Industrials) | | | 6,218 | |
| | 622 | | | National Silicon Industry Group Co. Ltd., Class A (Information Technology)* | | | 1,740 | |
| | 105 | | | NAURA Technology Group Co. Ltd., Class A (Information Technology) | | | 3,913 | |
| | 568 | | | NavInfo Co. Ltd., Class A (Information Technology)* | | | 804 | |
| | 6,813 | | | NetEase, Inc. (Communication Services) | | | 142,311 | |
| | 402 | | | New China Life Insurance Co. Ltd., Class A (Financials) | | | 2,237 | |
| | 3,482 | | | New China Life Insurance Co. Ltd., Class H (Financials) | | | 8,721 | |
| | 1,135 | | | New Hope Liuhe Co. Ltd., Class A (Consumer Staples)* | | | 1,820 | |
| | 571 | | | New Oriental Education & Technology Group, Inc. ADR (Consumer Discretionary)* | | | 30,971 | |
| | 345 | | | Ninestar Corp., Class A (Information Technology) | | | 1,326 | |
| | 145 | | | Ningbo Deye Technology Co. Ltd., Class A (Industrials) | | | 1,837 | |
| | 162 | | | Ningbo Orient Wires & Cables Co. Ltd., Class A (Industrials) | | | 824 | |
| | |
| | |
| 24 | | The accompanying notes are an integral part of these financial statements. |
GOLDMAN SACHS MARKETBETA® EMERGING MARKETS EQUITY ETF
| | | | | | | | |
Shares | | | Description | | Value | |
| |
| Common Stocks – (continued) | | | |
| China – (continued) | | | |
| | 162 | | | Ningbo Ronbay New Energy Technology Co. Ltd., Class A (Industrials) | | $ | 1,134 | |
| | 486 | | | Ningbo Shanshan Co. Ltd., Class A (Materials) | | | 909 | |
| | 279 | | | Ningbo Tuopu Group Co. Ltd., Class A (Consumer Discretionary) | | | 2,986 | |
| | 1,288 | | | Ningbo Zhoushan Port Co. Ltd., Class A (Industrials) | | | 598 | |
| | 1,476 | | | Ningxia Baofeng Energy Group Co. Ltd., Class A (Materials) | | | 2,780 | |
| | 5,126 | | | NIO, Inc. ADR (Consumer Discretionary)* | | | 52,644 | |
| | 6,937 | | | Nongfu Spring Co. Ltd., Class H (Consumer Staples)(a) | | | 38,968 | |
| | 300 | | | North Industries Group Red Arrow Co. Ltd., Class A (Industrials) | | | 629 | |
| | 1,386 | | | Offcn Education Technology Co. Ltd., Class A (Consumer Discretionary)* | | | 813 | |
| | 1,000 | | | Offshore Oil Engineering Co. Ltd., Class A (Energy) | | | 800 | |
| | 730 | | | OFILM Group Co. Ltd., Class A (Information Technology)* | | | 579 | |
| | 449 | | | Onewo, Inc., Class H (Real Estate) | | | 1,592 | |
| | 74 | | | Oppein Home Group, Inc., Class A (Consumer Discretionary) | | | 995 | |
| | 1,473 | | | Orient Securities Co. Ltd., Class A (Financials) | | | 2,016 | |
| | 3,448 | | | Orient Securities Co. Ltd., Class H (Financials)(a) | | | 1,917 | |
| | 800 | | | Oriental Pearl Group Co. Ltd., Class A (Communication Services) | | | 876 | |
| | 162 | | | Ovctek China, Inc., Class A (Health Care) | | | 588 | |
| | 2,189 | | | Pangang Group Vanadium Titanium & Resources Co. Ltd., Class A (Materials)* | | | 1,131 | |
| | 2,287 | | | PDD Holdings, Inc. ADR (Consumer Discretionary)* | | | 226,344 | |
| | 1,865 | | | People’s Insurance Co. Group of China Ltd. (The), Class A (Financials) | | | 1,496 | |
| | 34,701 | | | People’s Insurance Co. Group of China Ltd. (The), Class H (Financials) | | | 11,815 | |
| | 486 | | | Perfect World Co. Ltd., Class A (Communication Services) | | | 923 | |
| | 5,618 | | | PetroChina Co. Ltd., Class A (Energy) | | | 5,982 | |
| | 81,044 | | | PetroChina Co. Ltd., Class H (Energy) | | | 58,496 | |
| | 300 | | | Pharmaron Beijing Co. Ltd., Class A (Health Care) | | | 1,228 | |
| | 1,071 | | | Pharmaron Beijing Co. Ltd., Class H (Health Care)(a) | | | 2,499 | |
| | 26,166 | | | PICC Property & Casualty Co. Ltd., Class H (Financials) | | | 30,098 | |
| | 4,632 | | | Ping An Bank Co. Ltd., Class A (Financials) | | | 7,083 | |
| | 2,495 | | | Ping An Insurance Group Co. of China Ltd., Class A (Financials) | | | 16,725 | |
| | 23,767 | | | Ping An Insurance Group Co. of China Ltd., Class H (Financials) | | | 142,297 | |
| | |
| |
| Common Stocks – (continued) | | | |
| China – (continued) | | | |
| | 568 | | | Pingdingshan Tianan Coal Mining Co. Ltd., Class A (Energy) | | | 667 | |
| | 2,838 | | | Poly Developments and Holdings Group Co. Ltd., Class A (Real Estate) | | | 5,451 | |
| | 575 | | | Poly Property Services Co. Ltd., Class H (Real Estate) | | | 2,673 | |
| | 2,623 | | | Pop Mart International Group Ltd. (Consumer Discretionary)(a) | | | 8,530 | |
| | 5,872 | | | Postal Savings Bank of China Co. Ltd., Class A (Financials) | | | 3,921 | |
| | 42,513 | | | Postal Savings Bank of China Co. Ltd., Class H (Financials)(a) | | | 20,981 | |
| | 3,665 | | | Power Construction Corp. of China Ltd., Class A (Industrials) | | | 2,593 | |
| | 1,297 | | | Qinghai Salt Lake Industry Co. Ltd., Class A (Materials)* | | | 3,190 | |
| | 162 | | | Raytron Technology Co. Ltd., Class A (Information Technology) | | | 1,140 | |
| | 232 | | | Red Star Macalline Group Corp. Ltd., Class A (Real Estate) | | | 152 | |
| | 549 | | | Remegen Co. Ltd., Class H (Health Care)*(a) | | | 2,562 | |
| | 300 | | | Risen Energy Co. Ltd., Class A (Information Technology) | | | 828 | |
| | 81 | | | Rockchip Electronics Co. Ltd., Class A (Information Technology) | | | 729 | |
| | 2,029 | | | Rongsheng Petrochemical Co. Ltd., Class A (Materials) | | | 3,359 | |
| | 1,786 | | | SAIC Motor Corp. Ltd., Class A (Consumer Discretionary) | | | 3,524 | |
| | 700 | | | Sailun Group Co. Ltd., Class A (Consumer Discretionary) | | | 1,187 | |
| | 1,100 | | | Sanan Optoelectronics Co. Ltd., Class A (Information Technology) | | | 2,374 | |
| | 53 | | | Sangfor Technologies, Inc., Class A (Information Technology)* | | | 794 | |
| | 2,010 | | | Sany Heavy Industry Co. Ltd., Class A (Industrials) | | | 4,278 | |
| | 634 | | | Satellite Chemical Co. Ltd., Class A (Materials) | | | 1,333 | |
| | 1,400 | | | SDIC Capital Co. Ltd., Class A (Financials) | | | 1,410 | |
| | 1,600 | | | SDIC Power Holdings Co. Ltd., Class A (Utilities) | | | 2,794 | |
| | 514 | | | Seazen Holdings Co. Ltd., Class A (Real Estate)* | | | 1,024 | |
| | 54,367 | | | SenseTime Group, Inc., Class B (Information Technology)*(a)(b) | | | 10,816 | |
| | 300 | | | Seres Group Co. Ltd., Class A (Consumer Discretionary)* | | | 1,485 | |
| | 1,171 | | | SF Holding Co. Ltd., Class A (Industrials) | | | 6,995 | |
| | 153 | | | SG Micro Corp., Class A (Information Technology) | | | 1,628 | |
| | 2,239 | | | Shaanxi Coal Industry Co. Ltd., Class A (Energy) | | | 5,119 | |
| | |
| | |
| The accompanying notes are an integral part of these financial statements. | | 25 |
GOLDMAN SACHS MARKETBETA® EMERGING MARKETS EQUITY ETF
Schedule of Investments (continued)
August 31, 2023
| | | | | | | | |
Shares | | | Description | | Value | |
| |
| Common Stocks – (continued) | | | |
| China – (continued) | | | |
| | 852 | | | Shan Xi Hua Yang Group New Energy Co. Ltd., Class A (Energy) | | $ | 886 | |
| | 892 | | | Shandong Gold Mining Co. Ltd., Class A (Materials) | | | 3,215 | |
| | 2,983 | | | Shandong Gold Mining Co. Ltd., Class H (Materials)(a) | | | 6,033 | |
| | 500 | | | Shandong Hi-speed Co. Ltd., Class A (Industrials) | | | 465 | |
| | 503 | | | Shandong Hualu Hengsheng Chemical Co. Ltd., Class A (Materials) | | | 2,287 | |
| | 324 | | | Shandong Linglong Tyre Co. Ltd., Class A (Consumer Discretionary) | | | 970 | |
| | 3,000 | | | Shandong Nanshan Aluminum Co. Ltd., Class A (Materials) | | | 1,286 | |
| | 600 | | | Shandong Sun Paper Industry JSC Ltd., Class A (Materials) | | | 946 | |
| | 9,564 | | | Shandong Weigao Group Medical Polymer Co. Ltd., Class H (Health Care) | | | 9,513 | |
| | 420 | | | Shanghai Aiko Solar Energy Co. Ltd., Class A (Information Technology) | | | 1,282 | |
| | 259 | | | Shanghai Bairun Investment Holding Group Co. Ltd., Class A (Consumer Staples) | | | 1,143 | |
| | 1,281 | | | Shanghai Baosight Software Co. Ltd., Class A (Information Technology) | | | 8,436 | |
| | 2,730 | | | Shanghai Electric Group Co. Ltd., Class A (Industrials)* | | | 1,677 | |
| | 10,246 | | | Shanghai Electric Group Co. Ltd., Class H (Industrials)* | | | 2,300 | |
| | 600 | | | Shanghai Electric Power Co. Ltd., Class A (Utilities) | | | 757 | |
| | 474 | | | Shanghai Fosun Pharmaceutical Group Co. Ltd., Class A (Health Care) | | | 1,819 | |
| | 1,872 | | | Shanghai Fosun Pharmaceutical Group Co. Ltd., Class H (Health Care) | | | 4,407 | |
| | 162 | | | Shanghai Fudan Microelectronics Group Co. Ltd., Class A (Information Technology) | | | 1,176 | |
| | 1,069 | | | Shanghai Fudan Microelectronics Group Co. Ltd., Class H (Information Technology) | | | 2,563 | |
| | 568 | | | Shanghai International Airport Co. Ltd., Class A (Industrials)* | | | 3,061 | |
| | 1,810 | | | Shanghai International Port Group Co. Ltd., Class A (Industrials) | | | 1,268 | |
| | 243 | | | Shanghai Jinjiang International Hotels Co. Ltd., Class A (Consumer Discretionary) | | | 1,286 | |
| | 162 | | | Shanghai Junshi Biosciences Co. Ltd., Class A (Health Care)* | | | 846 | |
| | 620 | | | Shanghai Junshi Biosciences Co. Ltd., Class H (Health Care)*(a) | | | 1,692 | |
| | 577 | | | Shanghai Lingang Holdings Corp. Ltd., Class A (Real Estate) | | | 942 | |
| | 325 | | | Shanghai Lujiazui Finance & Trade Zone Development Co. Ltd., Class A (Real Estate) | | | 446 | |
| | |
| |
| Common Stocks – (continued) | | | |
| China – (continued) | | | |
| | 211 | | | Shanghai M&G Stationery, Inc., Class A (Industrials) | | | 1,093 | |
| | 924 | | | Shanghai MicroPort MedBot Group Co. Ltd. (Health Care)*(b) | | | 2,196 | |
| | 555 | | | Shanghai Pharmaceuticals Holding Co. Ltd., Class A (Health Care) | | | 1,363 | |
| | 2,623 | | | Shanghai Pharmaceuticals Holding Co. Ltd., Class H (Health Care) | | | 4,315 | |
| | 6,961 | | | Shanghai Pudong Development Bank Co. Ltd., Class A (Financials) | | | 6,676 | |
| | 500 | | | Shanghai Putailai New Energy Technology Co. Ltd., Class A (Materials) | | | 2,248 | |
| | 1,184 | | | Shanghai RAAS Blood Products Co. Ltd., Class A (Health Care) | | | 1,157 | |
| | 2,270 | | | Shanghai Rural Commercial Bank Co. Ltd., Class A (Financials) | | | 1,815 | |
| | 1,109 | | | Shanghai Yuyuan Tourist Mart Group Co. Ltd., Class A (Consumer Discretionary) | | | 1,121 | |
| | 500 | | | Shanxi Coal International Energy Group Co. Ltd., Class A (Industrials) | | | 1,156 | |
| | 973 | | | Shanxi Coking Coal Energy Group Co. Ltd., Class A (Energy) | | | 1,115 | |
| | 730 | | | Shanxi Lu’an Environmental Energy Development Co. Ltd., Class A (Energy) | | | 1,633 | |
| | 1,057 | | | Shanxi Meijin Energy Co. Ltd., Class A (Materials)* | | | 1,041 | |
| | 1,340 | | | Shanxi Taigang Stainless Steel Co. Ltd., Class A (Materials) | | | 725 | |
| | 302 | | | Shanxi Xinghuacun Fen Wine Factory Co. Ltd., Class A (Consumer Staples) | | | 10,043 | |
| | 100 | | | Shede Spirits Co. Ltd., Class A (Consumer Staples) | | | 1,848 | |
| | 1,100 | | | Shenergy Co. Ltd., Class A (Utilities) | | | 985 | |
| | 568 | | | Shengyi Technology Co. Ltd., Class A (Information Technology) | | | 1,157 | |
| | 162 | | | Shennan Circuits Co. Ltd., Class A (Information Technology) | | | 1,473 | |
| | 5,000 | | | Shenwan Hongyuan Group Co. Ltd., Class A (Financials) | | | 2,995 | |
| | 146 | | | Shenzhen Capchem Technology Co. Ltd., Class A (Materials) | | | 962 | |
| | 29 | | | Shenzhen Dynanonic Co. Ltd., Class A (Materials) | | | 374 | |
| | 892 | | | Shenzhen Energy Group Co. Ltd., Class A (Utilities) | | | 794 | |
| | 100 | | | Shenzhen Goodix Technology Co. Ltd., Class A (Information Technology)* | | | 814 | |
| | 162 | | | Shenzhen Hepalink Pharmaceutical Group Co. Ltd., Class A (Health Care) | | | 259 | |
| | 597 | | | Shenzhen Inovance Technology Co. Ltd., Class A (Industrials) | | | 5,600 | |
| | 400 | | | Shenzhen Kaifa Technology Co. Ltd., Class A (Information Technology) | | | 982 | |
| | 153 | | | Shenzhen Kangtai Biological Products Co. Ltd., Class A (Health Care)* | | | 586 | |
| | |
| | |
| 26 | | The accompanying notes are an integral part of these financial statements. |
GOLDMAN SACHS MARKETBETA® EMERGING MARKETS EQUITY ETF
| | | | | | | | |
Shares | | | Description | | Value | |
| |
| Common Stocks – (continued) | | | |
| China – (continued) | | | |
| | 81 | | | Shenzhen Kedali Industry Co. Ltd., Class A (Consumer Discretionary) | | $ | 1,295 | |
| | 100 | | | Shenzhen Kstar Science And Technology Co. Ltd., Class A (Industrials) | | | 416 | |
| | 292 | | | Shenzhen Mindray Bio-Medical Electronics Co. Ltd., Class A (Health Care) | | | 10,832 | |
| | 200 | | | Shenzhen New Industries Biomedical Engineering Co. Ltd., Class A (Health Care) | | | 1,670 | |
| | 2,192 | | | Shenzhen Overseas Chinese Town Co. Ltd., Class A (Real Estate)* | | | 1,310 | |
| | 300 | | | Shenzhen Salubris Pharmaceuticals Co. Ltd., Class A (Health Care) | | | 1,140 | |
| | 81 | | | Shenzhen SC New Energy Technology Corp., Class A (Information Technology) | | | 986 | |
| | 300 | | | Shenzhen SED Industry Co. Ltd., Class A (Information Technology) | | | 1,132 | |
| | 162 | | | Shenzhen Transsion Holdings Co. Ltd., Class A (Information Technology) | | | 3,268 | |
| | 2,991 | | | Shenzhou International Group Holdings Ltd. (Consumer Discretionary) | | | 30,704 | |
| | 405 | | | Shijiazhuang Yiling Pharmaceutical Co. Ltd., Class A (Health Care) | | | 1,295 | |
| | 400 | | | Shuangliang Eco-Energy Systems Co. Ltd., Class A (Industrials) | | | 559 | |
| | 725 | | | Sichuan Chuantou Energy Co. Ltd., Class A (Utilities) | | | 1,490 | |
| | 216 | | | Sichuan Kelun Pharmaceutical Co. Ltd., Class A (Health Care) | | | 804 | |
| | 1,475 | | | Sichuan Road and Bridge Group Co. Ltd., Class A (Industrials) | | | 1,806 | |
| | 81 | | | Sichuan Swellfun Co. Ltd., Class A (Consumer Staples) | | | 736 | |
| | 243 | | | Sichuan Yahua Industrial Group Co. Ltd., Class A (Materials) | | | 523 | |
| | 200 | | | Sieyuan Electric Co. Ltd., Class A (Industrials) | | | 1,406 | |
| | 800 | | | Sinolink Securities Co. Ltd., Class A (Financials) | | | 1,032 | |
| | 600 | | | Sinoma International Engineering Co., Class A (Industrials) | | | 969 | |
| | 324 | | | Sinoma Science & Technology Co. Ltd., Class A (Materials) | | | 977 | |
| | 213 | | | Sinomine Resource Group Co. Ltd., Class A (Materials) | | | 1,089 | |
| | 1,559 | | | Sinopec Oilfield Service Corp., Class A (Energy)* | | | 443 | |
| | 1,378 | | | Sinopec Shanghai Petrochemical Co. Ltd., Class A (Materials)* | | | 574 | |
| | 12,838 | | | Sinopec Shanghai Petrochemical Co. Ltd., Class H (Materials)* | | | 1,801 | |
| | 5,245 | | | Sinopharm Group Co. Ltd., Class H (Health Care) | | | 15,216 | |
| | 919 | | | Sinotrans Ltd., Class A (Industrials) | | | 720 | |
| | 7,530 | | | Sinotrans Ltd., Class H (Industrials) | | | 3,054 | |
| | |
| |
| Common Stocks – (continued) | | | |
| China – (continued) | | | |
| | 2,618 | | | Sinotruk Hong Kong Ltd. (Industrials) | | | 4,854 | |
| | 113 | | | Skshu Paint Co. Ltd., Class A (Materials)* | | | 1,170 | |
| | 6,729 | | | Smoore International Holdings Ltd. (Consumer Staples)(a) | | | 6,805 | |
| | 649 | | | Songcheng Performance Development Co. Ltd., Class A (Consumer Discretionary) | | | 1,106 | |
| | 1,109 | | | SooChow Securities Co. Ltd., Class A (Financials) | | | 1,248 | |
| | 200 | | | Spring Airlines Co. Ltd., Class A (Industrials)* | | | 1,610 | |
| | 81 | | | StarPower Semiconductor Ltd., Class A (Information Technology) | | | 2,204 | |
| | 900 | | | State Grid Yingda Co. Ltd., Class A (Industrials) | | | 626 | |
| | 343 | | | Sungrow Power Supply Co. Ltd., Class A (Industrials) | | | 4,701 | |
| | 2,620 | | | Sunny Optical Technology Group Co. Ltd. (Information Technology) | | | 21,416 | |
| | 150 | | | Sunresin New Materials Co. Ltd., Class A (Materials) | | | 1,254 | |
| | 329 | | | Sunwoda Electronic Co. Ltd., Class A (Industrials) | | | 716 | |
| | 324 | | | Suzhou Dongshan Precision Manufacturing Co. Ltd., Class A (Information Technology) | | | 837 | |
| | 29 | | | Suzhou Maxwell Technologies Co. Ltd., Class A (Industrials) | | | 608 | |
| | 1,669 | | | TAL Education Group ADR (Consumer Discretionary)* | | | 11,766 | |
| | 368 | | | Tangshan Jidong Cement Co. Ltd., Class A (Materials) | | | 383 | |
| | 1,163 | | | TBEA Co. Ltd., Class A (Industrials) | | | 2,349 | |
| | 3,628 | | | TCL Technology Group Corp., Class A (Information Technology)* | | | 2,044 | |
| | 956 | | | TCL Zhonghuan Renewable Energy Technology Co. Ltd., Class A (Information Technology) | | | 3,369 | |
| | 23,592 | | | Tencent Holdings Ltd. (Communication Services) | | | 977,766 | |
| | 2,493 | | | Tencent Music Entertainment Group ADR (Communication Services)* | | | 17,002 | |
| | 81 | | | Thunder Software Technology Co. Ltd., Class A (Information Technology) | | | 891 | |
| | 555 | | | Tianma Microelectronics Co. Ltd., Class A (Information Technology)* | | | 656 | |
| | 324 | | | Tianqi Lithium Corp., Class A (Materials) | | | 2,563 | |
| | 532 | | | Tianqi Lithium Corp., Class H (Materials) | | | 2,917 | |
| | 1,135 | | | Tianshan Aluminum Group Co. Ltd., Class A (Materials) | | | 986 | |
| | 700 | | | Tianshui Huatian Technology Co. Ltd., Class A (Information Technology) | | | 864 | |
| | 7,281 | | | Tingyi Cayman Islands Holding Corp. (Consumer Staples) | | | 10,696 | |
| | 247 | | | Toly Bread Co. Ltd., Class A (Consumer Staples) | | | 296 | |
| | 4,630 | | | Tongcheng Travel Holdings Ltd. (Consumer Discretionary)* | | | 10,380 | |
| | |
| | |
| The accompanying notes are an integral part of these financial statements. | | 27 |
GOLDMAN SACHS MARKETBETA® EMERGING MARKETS EQUITY ETF
Schedule of Investments (continued)
August 31, 2023
| | | | | | | | |
Shares | | | Description | | Value | |
| |
| Common Stocks – (continued) | | | |
| China – (continued) | | | |
| | 300 | | | TongFu Microelectronics Co. Ltd., Class A (Information Technology) | | $ | 840 | |
| | 568 | | | Tongkun Group Co. Ltd., Class A (Materials)* | | | 1,158 | |
| | 2,676 | | | Tongling Nonferrous Metals Group Co. Ltd., Class A (Materials) | | | 1,180 | |
| | 1,061 | | | Tongwei Co. Ltd., Class A (Information Technology) | | | 4,676 | |
| | 53 | | | Topchoice Medical Corp., Class A (Health Care)* | | | 680 | |
| | 10,555 | | | Topsports International Holdings Ltd. (Consumer Discretionary)(a) | | | 8,587 | |
| | 3,646 | | | TravelSky Technology Ltd., Class H (Consumer Discretionary) | | | 6,537 | |
| | 514 | | | Trina Solar Co. Ltd., Class A (Information Technology) | | | 2,400 | |
| | 2,145 | | | Trip.com Group Ltd. ADR (Consumer Discretionary)* | | | 84,320 | |
| | 800 | | | Tsinghua Tongfang Co. Ltd., Class A (Information Technology)* | | | 788 | |
| | 158 | | | Tsingtao Brewery Co. Ltd., Class A (Consumer Staples) | | | 1,978 | |
| | 2,339 | | | Tsingtao Brewery Co. Ltd., Class H (Consumer Staples) | | | 19,492 | |
| | 183 | | | Unigroup Guoxin Microelectronics Co. Ltd., Class A (Information Technology)* | | | 2,331 | |
| | 4,713 | | | Uni-President China Holdings Ltd. (Consumer Staples) | | | 3,486 | |
| | 649 | | | Unisplendour Corp. Ltd., Class A (Information Technology)* | | | 2,401 | |
| | 243 | | | Universal Scientific Industrial Shanghai Co. Ltd., Class A (Information Technology) | | | 492 | |
| | 200 | | | Venustech Group, Inc., Class A (Information Technology) | | | 802 | |
| | 1,589 | | | Vipshop Holdings Ltd. ADR (Consumer Discretionary)* | | | 25,090 | |
| | 368 | | | Walvax Biotechnology Co. Ltd., Class A (Health Care) | | | 1,197 | |
| | 500 | | | Wanda Film Holding Co. Ltd., Class A (Communication Services)* | | | 924 | |
| | 300 | | | Wangfujing Group Co. Ltd., Class A (Consumer Discretionary) | | | 852 | |
| | 765 | | | Wanhua Chemical Group Co. Ltd., Class A (Materials) | | | 9,853 | |
| | 16,993 | | | Want Want China Holdings Ltd. (Consumer Staples) | | | 11,247 | |
| | 270 | | | Weibo Corp. ADR (Communication Services) | | | 3,483 | |
| | 1,712 | | | Weichai Power Co. Ltd., Class A (Industrials) | | | 2,776 | |
| | 7,676 | | | Weichai Power Co. Ltd., Class H (Industrials) | | | 9,965 | |
| | 259 | | | Weihai Guangwei Composites Co. Ltd., Class A (Materials) | | | 995 | |
| | 1,522 | | | Wens Foodstuffs Group Co. Ltd., Class A (Consumer Staples) | | | 3,484 | |
| | |
| |
| Common Stocks – (continued) | | | |
| China – (continued) | | | |
| | 568 | | | Western Mining Co. Ltd., Class A (Materials) | | | 997 | |
| | 1,086 | | | Western Securities Co. Ltd., Class A (Financials) | | | 1,007 | |
| | 226 | | | Western Superconducting Technologies Co. Ltd., Class A (Materials) | | | 1,473 | |
| | 242 | | | Will Semiconductor Co. Ltd. Shanghai, Class A (Information Technology) | | | 3,060 | |
| | 264 | | | Wingtech Technology Co. Ltd., Class A (Information Technology)* | | | 1,675 | |
| | 140 | | | Winner Medical Co. Ltd., Class A (Health Care) | | | 814 | |
| | 500 | | | Winning Health Technology Group Co. Ltd., Class A (Health Care) | | | 495 | |
| | 5,100 | | | Wintime Energy Group Co. Ltd., Class A (Utilities)* | | | 1,023 | |
| | 977 | | | Wuhan Guide Infrared Co. Ltd., Class A (Information Technology) | | | 1,035 | |
| | 927 | | | Wuliangye Yibin Co. Ltd., Class A (Consumer Staples) | | | 19,857 | |
| | 486 | | | WUS Printed Circuit Kunshan Co. Ltd., Class A (Information Technology) | | | 1,411 | |
| | 638 | | | WuXi AppTec Co. Ltd., Class A (Health Care) | | | 7,144 | |
| | 1,374 | | | WuXi AppTec Co. Ltd., Class H (Health Care)(a) | | | 15,051 | |
| | 13,930 | | | Wuxi Biologics Cayman, Inc. (Health Care)*(a) | | | 78,428 | |
| | 405 | | | Wuxi Lead Intelligent Equipment Co. Ltd., Class A (Industrials) | | | 1,642 | |
| | 2,353 | | | XCMG Construction Machinery Co. Ltd., Class A (Industrials) | | | 1,956 | |
| | 649 | | | Xiamen C & D, Inc., Class A (Industrials) | | | 968 | |
| | 81 | | | Xiamen Faratronic Co. Ltd., Class A (Information Technology) | | | 1,265 | |
| | 324 | | | Xiamen Tungsten Co. Ltd., Class A (Materials) | | | 772 | |
| | 500 | | | Xiangcai Co. Ltd., Class A (Real Estate) | | | 585 | |
| | 300 | | | Xiangtan Electric Manufacturing Co. Ltd., Class A (Industrials)* | | | 704 | |
| | 60,918 | | | Xiaomi Corp., Class B (Information Technology)*(a) | | | 96,018 | |
| | 384 | | | Xinjiang Daqo New Energy Co. Ltd., Class A (Information Technology) | | | 2,193 | |
| | 900 | | | Xinjiang Tianshan Cement Co. Ltd., Class A (Materials) | | | 953 | |
| | 17,231 | | | Xinyi Solar Holdings Ltd. (Information Technology) | | | 14,393 | |
| | 4,291 | | | XPeng, Inc., Class A (Consumer Discretionary)* | | | 40,247 | |
| | 4,414 | | | Yadea Group Holdings Ltd. (Consumer Discretionary)(a) | | | 8,488 | |
| | 162 | | | Yangzhou Yangjie Electronic Technology Co. Ltd., Class A (Information Technology) | | | 795 | |
| | |
| | |
| 28 | | The accompanying notes are an integral part of these financial statements. |
GOLDMAN SACHS MARKETBETA® EMERGING MARKETS EQUITY ETF
| | | | | | | | |
Shares | | | Description | | Value | |
| |
| Common Stocks – (continued) | | | |
| China – (continued) | | | |
| | 789 | | | Yankuang Energy Group Co. Ltd., Class A (Energy) | | $ | 1,868 | |
| | 8,220 | | | Yankuang Energy Group Co. Ltd., Class H (Energy) | | | 12,914 | |
| | 162 | | | Yantai Jereh Oilfield Services Group Co. Ltd., Class A (Energy) | | | 636 | |
| | 234 | | | Yealink Network Technology Corp. Ltd., Class A (Information Technology) | | | 1,190 | |
| | 247 | | | Yifeng Pharmacy Chain Co. Ltd., Class A (Consumer Staples) | | | 1,207 | |
| | 424 | | | Yihai Kerry Arawana Holdings Co. Ltd., Class A (Consumer Staples) | | | 2,077 | |
| | 649 | | | Yintai Gold Co. Ltd., Class A (Materials) | | | 1,288 | |
| | 2,100 | | | Yonghui Superstores Co. Ltd., Class A (Consumer Staples)* | | | 929 | |
| | 105 | | | YongXing Special Materials Technology Co. Ltd., Class A (Materials) | | | 719 | |
| | 752 | | | Yonyou Network Technology Co. Ltd., Class A (Information Technology) | | | 1,875 | |
| | 1,100 | | | Youngor Group Co. Ltd., Class A (Real Estate) | | | 1,050 | |
| | 649 | | | YTO Express Group Co. Ltd., Class A (Industrials) | | | 1,346 | |
| | 5,651 | | | Yuexiu Property Co. Ltd. (Real Estate) | | | 7,005 | |
| | 730 | | | Yunda Holding Co. Ltd., Class A (Industrials) | | | 988 | |
| | 730 | | | Yunnan Aluminium Co. Ltd., Class A (Materials) | | | 1,448 | |
| | 463 | | | Yunnan Baiyao Group Co. Ltd., Class A (Health Care) | | | 3,476 | |
| | 81 | | | Yunnan Botanee Bio-Technology Group Co. Ltd., Class A (Consumer Staples) | | | 1,133 | |
| | 1,200 | | | Yunnan Chihong Zinc&Germanium Co. Ltd., Class A (Materials) | | | 866 | |
| | 239 | | | Yunnan Energy New Material Co. Ltd., Class A (Materials) | | | 2,180 | |
| | 405 | | | Yunnan Tin Co. Ltd., Class A (Materials) | | | 779 | |
| | 405 | | | Yunnan Yuntianhua Co. Ltd., Class A (Materials) | | | 959 | |
| | 333 | | | Zai Lab Ltd. ADR (Health Care)* | | | 8,481 | |
| | 324 | | | Zangge Mining Co. Ltd., Class A (Materials) | | | 1,000 | |
| | 105 | | | Zhangzhou Pientzehuang Pharmaceutical Co. Ltd., Class A (Health Care) | | | 3,986 | |
| | 5,470 | | | Zhaojin Mining Industry Co. Ltd., Class H (Materials) | | | 7,729 | |
| | 1,054 | | | Zhefu Holding Group Co. Ltd., Class A (Industrials) | | | 572 | |
| | 1,265 | | | Zhejiang Century Huatong Group Co. Ltd., Class A (Communication Services)* | | | 942 | |
| | 1,200 | | | Zhejiang China Commodities City Group Co. Ltd., Class A (Real Estate) | | | 1,355 | |
| | 526 | | | Zhejiang Chint Electrics Co. Ltd., Class A (Industrials) | | | 1,791 | |
| | 656 | | | Zhejiang Dahua Technology Co. Ltd., Class A (Information Technology) | | | 1,945 | |
| | |
| |
| Common Stocks – (continued) | | | |
| China – (continued) | | | |
| | 81 | | | Zhejiang Dingli Machinery Co. Ltd., Class A (Industrials) | | | 591 | |
| | 4,488 | | | Zhejiang Expressway Co. Ltd., Class H (Industrials) | | | 3,354 | |
| | 324 | | | Zhejiang Huahai Pharmaceutical Co. Ltd., Class A (Health Care) | | | 748 | |
| | 342 | | | Zhejiang Huayou Cobalt Co. Ltd., Class A (Materials) | | | 1,875 | |
| | 324 | | | Zhejiang Jingsheng Mechanical & Electrical Co. Ltd., Class A (Information Technology) | | | 2,507 | |
| | 800 | | | Zhejiang Jinke Tom Culture Industry Co. Ltd., Class A (Communication Services)* | | | 599 | |
| | 162 | | | Zhejiang Jiuzhou Pharmaceutical Co. Ltd., Class A (Health Care) | | | 605 | |
| | 649 | | | Zhejiang Juhua Co. Ltd., Class A (Materials) | | | 1,461 | |
| | 2,583 | | | Zhejiang Leapmotor Technologies Ltd. (Consumer Discretionary)*(a) | | | 12,945 | |
| | 700 | | | Zhejiang Longsheng Group Co. Ltd., Class A (Materials) | | | 887 | |
| | 670 | | | Zhejiang NHU Co. Ltd., Class A (Health Care) | | | 1,499 | |
| | 811 | | | Zhejiang Sanhua Intelligent Controls Co. Ltd., Class A (Industrials) | | | 3,309 | |
| | 234 | | | Zhejiang Supcon Technology Co. Ltd., Class A (Information Technology) | | | 1,622 | |
| | 81 | | | Zhejiang Supor Co. Ltd., Class A (Consumer Discretionary) | | | 530 | |
| | 316 | | | Zhejiang Weiming Environment Protection Co. Ltd., Class A (Industrials) | | | 777 | |
| | 405 | | | Zhejiang Weixing New Building Materials Co. Ltd., Class A (Industrials) | | | 1,125 | |
| | 162 | | | Zhejiang Yongtai Technology Co. Ltd., Class A (Materials) | | | 288 | |
| | 2,700 | | | Zhejiang Zheneng Electric Power Co. Ltd., Class A (Utilities)* | | | 1,636 | |
| | 991 | | | Zheshang Securities Co. Ltd., Class A (Financials) | | | 1,402 | |
| | 2,622 | | | ZhongAn Online P&C Insurance Co. Ltd., Class H (Financials)*(a) | | | 7,791 | |
| | 162 | | | Zhongji Innolight Co. Ltd., Class A (Information Technology) | | | 2,551 | |
| | 1,100 | | | Zhongjin Gold Corp. Ltd., Class A (Materials) | | | 1,681 | |
| | 2,782 | | | Zhongsheng Group Holdings Ltd. (Consumer Discretionary) | | | 8,479 | |
| | 1,378 | | | Zhongtai Securities Co. Ltd., Class A (Financials) | | | 1,384 | |
| | 162 | | | Zhuzhou CRRC Times Electric Co. Ltd., Class A (Industrials) | | | 971 | |
| | 1,929 | | | Zhuzhou CRRC Times Electric Co. Ltd., Class H (Industrials) | | | 6,728 | |
| | 649 | | | Zhuzhou Kibing Group Co. Ltd., Class A (Industrials) | | | 778 | |
| | 4,867 | | | Zijin Mining Group Co. Ltd., Class A (Materials) | | | 8,265 | |
| | |
| | |
| The accompanying notes are an integral part of these financial statements. | | 29 |
GOLDMAN SACHS MARKETBETA® EMERGING MARKETS EQUITY ETF
Schedule of Investments (continued)
August 31, 2023
| | | | | | | | |
Shares | | | Description | | Value | |
| |
| Common Stocks – (continued) | | | |
| China – (continued) | | | |
| | 21,758 | | | Zijin Mining Group Co. Ltd., Class H (Materials) | | $ | 34,239 | |
| | 1,885 | | | ZJLD Group, Inc. (Consumer Staples)*(a) | | | 2,103 | |
| | 1,839 | | | Zoomlion Heavy Industry Science and Technology Co. Ltd., Class A (Industrials) | | | 1,632 | |
| | 6,229 | | | Zoomlion Heavy Industry Science and Technology Co. Ltd., Class H (Industrials) | | | 2,979 | |
| | 973 | | | ZTE Corp., Class A (Information Technology) | | | 4,739 | |
| | 2,984 | | | ZTE Corp., Class H (Information Technology) | | | 9,608 | |
| | 1,579 | | | ZTO Express Cayman, Inc. ADR (Industrials) | | | 39,696 | |
| | | | | | | | |
| | | | | | | 7,413,505 | |
| | |
| Colombia – 0.1% | | | |
| | 896 | | | Bancolombia SA (Financials) | | | 6,367 | |
| | 17,946 | | | Ecopetrol SA (Energy) | | | 10,328 | |
| | 1,691 | | | Interconexion Electrica SA ESP (Utilities) | | | 6,185 | |
| | | | | | | | |
| | | | | | | 22,880 | |
| | |
| Czech Republic – 0.1% | | | |
| | 626 | | | CEZ AS (Utilities) | | | 26,640 | |
| | 295 | | | Komercni banka AS (Financials) | | | 9,226 | |
| | | | | | | | |
| | | | | | | 35,866 | |
| | |
| Egypt – 0.1% | | | |
| | 1,130 | | | Abou Kir Fertilizers & Chemical Industries (Materials) | | | 1,929 | |
| | 8,871 | | | Commercial International Bank Egypt SAE (Financials) | | | 16,364 | |
| | 3,827 | | | Eastern Co. SAE (Consumer Staples) | | | 2,514 | |
| | 3,853 | | | EFG Holding S.A.E. (Financials)* | | | 1,988 | |
| | 1,917 | | | ElSewedy Electric Co. (Industrials) | | | 1,436 | |
| | 730 | | | Ezz Steel Co. SAE (Materials)* | | | 1,199 | |
| | 1,967 | | | Telecom Egypt Co. (Communication Services) | | | 1,674 | |
| | | | | | | | |
| | | | | | | 27,104 | |
| | |
| Greece – 0.5% | | | |
| | 7,515 | | | Alpha Services and Holdings SA (Financials)* | | | 12,695 | |
| | 9,166 | | | Eurobank Ergasias Services and Holdings SA (Financials)* | | | 15,947 | |
| | 668 | | | Hellenic Telecommunications Organization SA (Communication Services) | | | 10,005 | |
| | 396 | | | JUMBO SA (Consumer Discretionary) | | | 12,258 | |
| | 224 | | | Motor Oil Hellas Corinth Refineries SA (Energy) | | | 5,713 | |
| | 399 | | | Mytilineos SA (Industrials) | | | 16,214 | |
| | 2,154 | | | National Bank of Greece SA (Financials)* | | | 14,668 | |
| | 728 | | | OPAP SA (Consumer Discretionary) | | | 12,310 | |
| | 2,530 | | | Piraeus Financial Holdings SA (Financials)* | | | 8,765 | |
| | 843 | | | Public Power Corp. SA (Utilities)* | | | 9,241 | |
| | |
| |
| Common Stocks – (continued) | | | |
| Greece – (continued) | | | |
| | 266 | | | Star Bulk Carriers Corp. (Industrials) | | | 4,679 | |
| | 210 | | | Terna Energy SA (Utilities) | | | 3,784 | |
| | | | | | | | |
| | | | | | | 126,279 | |
| | |
| Hong Kong – 0.0% | | | |
| | 497 | | | Orient Overseas International Ltd. (Industrials) | | | 6,667 | |
| | 229 | | | Star CM Holdings Ltd. (Communication Services)* | | | 723 | |
| | | | | | | | |
| | | | | | | 7,390 | |
| | |
| Hungary – 0.2% | | | |
| | 1,676 | | | MOL Hungarian Oil & Gas PLC (Energy) | | | 12,685 | |
| | 874 | | | OTP Bank Nyrt (Financials) | | | 35,698 | |
| | 548 | | | Richter Gedeon Nyrt (Health Care) | | | 13,750 | |
| | | | | | | | |
| | | | | | | 62,133 | |
| | |
| India – 15.8% | | | |
| | 751 | | | Aarti Industries Ltd. (Materials) | | | 4,461 | |
| | 198 | | | ABB India Ltd. (Industrials) | | | 10,479 | |
| | 262 | | | ACC Ltd. (Materials) | | | 6,348 | |
| | 1,126 | | | Adani Energy Solutions Ltd. (Utilities)* | | | 11,046 | |
| | 1,198 | | | Adani Enterprises Ltd. (Industrials) | | | 35,009 | |
| | 1,186 | | | Adani Green Energy Ltd. (Utilities)* | | | 13,304 | |
| | 2,748 | | | Adani Ports & Special Economic Zone Ltd. (Industrials) | | | 26,296 | |
| | 3,110 | | | Adani Power Ltd. (Utilities)* | | | 12,070 | |
| | 1,049 | | | Adani Total Gas Ltd. (Utilities) | | | 8,056 | |
| | 628 | | | Adani Wilmar Ltd. (Consumer Staples)* | | | 2,727 | |
| | 1,748 | | | Aditya Birla Capital Ltd. (Financials)* | | | 3,825 | |
| | 121 | | | Alkem Laboratories Ltd. (Health Care) | | | 5,324 | |
| | 2,360 | | | Ambuja Cements Ltd. (Materials) | | | 12,212 | |
| | 384 | | | Apollo Hospitals Enterprise Ltd. (Health Care) | | | 22,330 | |
| | 5,443 | | | Ashok Leyland Ltd. (Industrials) | | | 12,088 | |
| | 1,564 | | | Asian Paints Ltd. (Materials) | | | 61,514 | |
| | 452 | | | Astral Ltd. (Industrials) | | | 10,669 | |
| | 1,734 | | | AU Small Finance Bank Ltd. (Financials)(a) | | | 15,155 | |
| | 1,070 | | | Aurobindo Pharma Ltd. (Health Care) | | | 10,728 | |
| | 547 | | | Avenue Supermarts Ltd. (Consumer Staples)*(a) | | | 24,582 | |
| | 8,754 | | | Axis Bank Ltd. (Financials) | | | 102,940 | |
| | 258 | | | Bajaj Auto Ltd. (Consumer Discretionary) | | | 14,379 | |
| | 1,021 | | | Bajaj Finance Ltd. (Financials) | | | 88,341 | |
| | 1,468 | | | Bajaj Finserv Ltd. (Financials) | | | 26,402 | |
| | 105 | | | Bajaj Holdings & Investment Ltd. (Financials) | | | 9,433 | |
| | 306 | | | Balkrishna Industries Ltd. (Consumer Discretionary) | | | 8,587 | |
| | 2,882 | | | Bandhan Bank Ltd. (Financials)(a) | | | 7,993 | |
| | 4,086 | | | Bank of Baroda (Financials) | | | 9,237 | |
| | 773 | | | Berger Paints India Ltd. (Materials) | | | 6,710 | |
| | 13,732 | | | Bharat Electronics Ltd. (Industrials) | | | 22,094 | |
| | 979 | | | Bharat Forge Ltd. (Consumer Discretionary) | | | 12,658 | |
| | |
| | |
| 30 | | The accompanying notes are an integral part of these financial statements. |
GOLDMAN SACHS MARKETBETA® EMERGING MARKETS EQUITY ETF
| | | | | | | | |
Shares | | | Description | | Value | |
| |
| Common Stocks – (continued) | | | |
| India – (continued) | | | |
| | 3,647 | | | Bharat Petroleum Corp. Ltd. (Energy) | | $ | 15,002 | |
| | 9,158 | | | Bharti Airtel Ltd. (Communication Services) | | | 94,737 | |
| | 1,697 | | | Biocon Ltd. (Health Care) | | | 5,316 | |
| | 33 | | | Bosch Ltd. (Consumer Discretionary) | | | 7,404 | |
| | 452 | | | Britannia Industries Ltd. (Consumer Staples) | | | 24,393 | |
| | 1,442 | | | Canara Bank (Financials) | | | 5,581 | |
| | 2,363 | | | CG Power & Industrial Solutions Ltd. (Industrials) | | | 12,255 | |
| | 1,510 | | | Cholamandalam Investment and Finance Co. Ltd. (Financials) | | | 20,462 | |
| | 2,037 | | | Cipla Ltd. (Health Care) | | | 30,944 | |
| | 7,916 | | | Coal India Ltd. (Energy) | | | 21,997 | |
| | 505 | | | Colgate-Palmolive India Ltd. (Consumer Staples) | | | 11,847 | |
| | 1,020 | | | Container Corp. Of India Ltd. (Industrials) | | | 8,285 | |
| | 515 | | | Cummins India Ltd. (Industrials) | | | 10,624 | |
| | 2,244 | | | Dabur India Ltd. (Consumer Staples) | | | 14,992 | |
| | 305 | | | Dalmia Bharat Ltd. (Materials) | | | 7,682 | |
| | 281 | | | Deepak Nitrite Ltd. (Materials) | | | 7,535 | |
| | 1,155 | | | Delhivery Ltd. (Industrials)* | | | 6,104 | |
| | 480 | | | Divi’s Laboratories Ltd. (Health Care) | | | 20,827 | |
| | 2,447 | | | DLF Ltd. (Real Estate) | | | 14,900 | |
| | 461 | | | Dr. Reddy’s Laboratories Ltd. (Health Care) | | | 31,228 | |
| | 527 | | | Eicher Motors Ltd. (Consumer Discretionary) | | | 21,240 | |
| | 2,309 | | | Embassy Office Parks REIT (Real Estate) | | | 8,512 | |
| | 3,883 | | | FSN E-Commerce Ventures Ltd. (Consumer Discretionary)* | | | 6,264 | |
| | 10,228 | | | GAIL India Ltd. (Utilities) | | | 14,208 | |
| | 234 | | | Gland Pharma Ltd. (Health Care)*(a) | | | 4,922 | |
| | 1,450 | | | Godrej Consumer Products Ltd. (Consumer Staples)* | | | 17,605 | |
| | 437 | | | Godrej Properties Ltd. (Real Estate)* | | | 8,688 | |
| | 1,179 | | | Grasim Industries Ltd. (Materials) | | | 25,506 | |
| | 140 | | | Gujarat Fluorochemicals Ltd. (Materials) | | | 5,152 | |
| | 681 | | | Gujarat Gas Ltd. (Utilities)* | | | 3,696 | |
| | 832 | | | Havells India Ltd. (Industrials) | | | 13,915 | |
| | 4,069 | | | HCL Technologies Ltd. (Information Technology) | | | 57,612 | |
| | 299 | | | HDFC Asset Management Co. Ltd. (Financials)(a) | | | 9,117 | |
| | 3,699 | | | HDFC Life Insurance Co. Ltd. (Financials)(a) | | | 28,808 | |
| | 512 | | | Hero MotoCorp Ltd. (Consumer Discretionary) | | | 18,034 | |
| | 5,529 | | | Hindalco Industries Ltd. (Materials) | | | 30,712 | |
| | 315 | | | Hindustan Aeronautics Ltd. (Industrials) | | | 14,841 | |
| | 2,457 | | | Hindustan Petroleum Corp. Ltd. (Energy)* | | | 7,363 | |
| | 3,438 | | | Hindustan Unilever Ltd. (Consumer Staples) | | | 104,031 | |
| | 8 | | | Honeywell Automation India Ltd. (Information Technology) | | | 3,831 | |
| | 19,888 | | | ICICI Bank Ltd. (Financials) | | | 230,324 | |
| | |
| |
| Common Stocks – (continued) | | | |
| India – (continued) | | | |
| | 897 | | | ICICI Lombard General Insurance Co. Ltd. (Financials)(a) | | | 14,234 | |
| | 1,457 | | | ICICI Prudential Life Insurance Co. Ltd. (Financials)(a) | | | 9,924 | |
| | 2,185 | | | IDBI Bank Ltd. (Financials) | | | 1,578 | |
| | 10,784 | | | IDFC First Bank Ltd. (Financials)* | | | 12,160 | |
| | 3,335 | | | Indian Hotels Co. Ltd. (Consumer Discretionary) | | | 16,956 | |
| | 14,218 | | | Indian Oil Corp. Ltd. (Energy) | | | 15,302 | |
| | 1,140 | | | Indian Railway Catering & Tourism Corp. Ltd. (Industrials) | | | 9,254 | |
| | 1,327 | | | Indraprastha Gas Ltd. (Utilities) | | | 7,497 | |
| | 3,167 | | | Indus Towers Ltd. (Communication Services)* | | | 6,702 | |
| | 2,206 | | | IndusInd Bank Ltd. (Financials) | | | 36,724 | |
| | 264 | | | Info Edge India Ltd. (Communication Services) | | | 13,813 | |
| | 13,787 | | | Infosys Ltd. (Information Technology) | | | 239,056 | |
| | 425 | | | InterGlobe Aviation Ltd. (Industrials)*(a) | | | 12,501 | |
| | 11,457 | | | ITC Ltd. (Consumer Staples) | | | 60,851 | |
| | 1,444 | | | Jindal Steel & Power Ltd. (Materials) | | | 11,939 | |
| | 12,987 | | | Jio Financial Services Ltd. (Financials)* | | | 36,630 | |
| | 1,407 | | | JSW Energy Ltd. (Utilities) | | | 5,965 | |
| | 3,596 | | | JSW Steel Ltd. (Materials) | | | 33,866 | |
| | 1,481 | | | Jubilant Foodworks Ltd. (Consumer Discretionary) | | | 9,160 | |
| | 4,197 | | | Kotak Mahindra Bank Ltd. (Financials) | | | 89,163 | |
| | 96 | | | L&T Technology Services Ltd. (Industrials)(a) | | | 5,107 | |
| | 2,645 | | | Larsen & Toubro Ltd. (Industrials) | | | 86,351 | |
| | 878 | | | Life Insurance Corp. of India (Financials) | | | 6,844 | |
| | 78 | | | Linde India Ltd. (Materials) | | | 5,906 | |
| | 357 | | | LTIMindtree Ltd. (Information Technology)(a) | | | 22,396 | |
| | 911 | | | Lupin Ltd. (Health Care) | | | 12,081 | |
| | 874 | | | Macrotech Developers Ltd. (Real Estate)*(a) | | | 7,077 | |
| | 3,404 | | | Mahindra & Mahindra Ltd. (Consumer Discretionary) | | | 64,777 | |
| | 164 | | | Mankind Pharma Ltd. (Health Care)* | | | 3,572 | |
| | 1,979 | | | Marico Ltd. (Consumer Staples) | | | 13,627 | |
| | 506 | | | Maruti Suzuki India Ltd. (Consumer Discretionary) | | | 61,145 | |
| | 839 | | | Max Financial Services Ltd. (Financials)* | | | 9,463 | |
| | 2,843 | | | Max Healthcare Institute Ltd. (Health Care)* | | | 20,246 | |
| | 321 | | | Mphasis Ltd. (Information Technology) | | | 9,418 | |
| | 9 | | | MRF Ltd. (Consumer Discretionary) | | | 11,816 | |
| | 421 | | | Muthoot Finance Ltd. (Financials) | | | 6,409 | |
| | 138 | | | Nestle India Ltd. (Consumer Staples) | | | 36,650 | |
| | 10,455 | | | NHPC Ltd. (Utilities) | | | 6,340 | |
| | 4,357 | | | NMDC Ltd. (Materials) | | | 6,476 | |
| | 18,173 | | | NTPC Ltd. (Utilities) | | | 48,360 | |
| | 467 | | | Oberoi Realty Ltd. (Real Estate) | | | 6,323 | |
| | 14,687 | | | Oil & Natural Gas Corp. Ltd. (Energy) | | | 30,896 | |
| | |
| | |
| The accompanying notes are an integral part of these financial statements. | | 31 |
GOLDMAN SACHS MARKETBETA® EMERGING MARKETS EQUITY ETF
Schedule of Investments (continued)
August 31, 2023
| | | | | | | | |
Shares | | | Description | | Value | |
| |
| Common Stocks – (continued) | | | |
| India – (continued) | | | |
| | 763 | | | One 97 Communications Ltd. (Financials)* | | $ | 7,870 | |
| | 89 | | | Oracle Financial Services Software Ltd. (Information Technology) | | | 4,418 | |
| | 20 | | | Page Industries Ltd. (Consumer Discretionary) | | | 9,700 | |
| | 275 | | | Patanjali Foods Ltd. (Consumer Staples) | | | 4,076 | |
| | 896 | | | PB Fintech Ltd. (Financials)* | | | 8,384 | |
| | 188 | | | Persistent Systems Ltd. (Information Technology) | | | 12,196 | |
| | 2,752 | | | Petronet LNG Ltd. (Energy) | | | 7,157 | |
| | 306 | | | PI Industries Ltd. (Materials) | | | 13,411 | |
| | 578 | | | Pidilite Industries Ltd. (Materials) | | | 17,559 | |
| | 167 | | | Polycab India Ltd. (Industrials) | | | 10,334 | |
| | 4,406 | | | Power Finance Corp. Ltd. (Financials) | | | 13,848 | |
| | 13,038 | | | Power Grid Corp. of India Ltd. (Utilities) | | | 38,514 | |
| | 8,055 | | | Punjab National Bank (Financials) | | | 6,130 | |
| | 4,730 | | | REC Ltd. (Financials) | | | 13,635 | |
| | 13,154 | | | Reliance Industries Ltd. (Energy) | | | 382,451 | |
| | 7,776 | | | Samvardhana Motherson International Ltd. (Consumer Discretionary) | | | 8,998 | |
| | 1,111 | | | SBI Cards & Payment Services Ltd. (Financials) | | | 10,958 | |
| | 1,691 | | | SBI Life Insurance Co. Ltd. (Financials)(a) | | | 26,402 | |
| | 159 | | | Schaeffler India Ltd. (Industrials) | | | 5,862 | |
| | 38 | | | Shree Cement Ltd. (Materials) | | | 10,925 | |
| | 906 | | | Shriram Finance Ltd. (Financials) | | | 21,103 | |
| | 338 | | | Siemens Ltd. (Industrials) | | | 16,013 | |
| | 96 | | | Solar Industries India Ltd. (Materials) | | | 5,611 | |
| | 1,044 | | | Sona Blw Precision Forgings Ltd. (Consumer Discretionary)(a) | | | 7,511 | |
| | 561 | | | SRF Ltd. (Materials) | | | 15,969 | |
| | 6,856 | | | State Bank of India (Financials) | | | 46,489 | |
| | 5,483 | | | Steel Authority of India Ltd. (Materials) | | | 6,007 | |
| | 4,140 | | | Sun Pharmaceutical Industries Ltd. (Health Care) | | | 55,589 | |
| | 431 | | | Tata Communications Ltd. (Communication Services) | | | 9,314 | |
| | 3,892 | | | Tata Consultancy Services Ltd. (Information Technology) | | | 157,812 | |
| | 2,299 | | | Tata Consumer Products Ltd. (Consumer Staples) | | | 23,170 | |
| | 139 | | | Tata Elxsi Ltd. (Information Technology) | | | 12,168 | |
| | 6,629 | | | Tata Motors Ltd. (Consumer Discretionary) | | | 48,124 | |
| | 1,763 | | | Tata Motors Ltd., Class A (Consumer Discretionary) | | | 8,508 | |
| | 6,436 | | | Tata Power Co. Ltd. (The) (Utilities) | | | 19,055 | |
| | 31,008 | | | Tata Steel Ltd. (Materials) | | | 46,033 | |
| | 2,356 | | | Tech Mahindra Ltd. (Information Technology) | | | 34,206 | |
| | 1,419 | | | Titan Co. Ltd. (Consumer Discretionary) | | | 53,212 | |
| | 356 | | | Torrent Pharmaceuticals Ltd. (Health Care) | | | 7,923 | |
| | 696 | | | Trent Ltd. (Consumer Discretionary) | | | 17,223 | |
| | |
| |
| Common Stocks – (continued) | | | |
| India – (continued) | | | |
| | 387 | | | Tube Investments of India Ltd. (Consumer Discretionary) | | | 13,559 | |
| | 881 | | | TVS Motor Co. Ltd. (Consumer Discretionary) | | | 15,110 | |
| | 442 | | | UltraTech Cement Ltd. (Materials) | | | 44,301 | |
| | 4,278 | | | Union Bank of India Ltd. (Financials) | | | 4,439 | |
| | 281 | | | United Breweries Ltd. (Consumer Staples) | | | 5,148 | |
| | 1,128 | | | United Spirits Ltd. (Consumer Staples)* | | | 13,728 | |
| | 1,972 | | | UPL Ltd. (Materials) | | | 14,081 | |
| | 1,762 | | | Varun Beverages Ltd. (Consumer Staples) | | | 19,145 | |
| | 144 | | | Vedant Fashions Ltd. (Consumer Discretionary) | | | 2,192 | |
| | 4,242 | | | Vedanta Ltd. (Materials) | | | 11,903 | |
| | 875 | | | Voltas Ltd. (Industrials) | | | 9,194 | |
| | 5,592 | | | Wipro Ltd. (Information Technology) | | | 27,586 | |
| | 161 | | | WNS Holdings Ltd. ADR (Industrials)* | | | 10,521 | |
| | 48,123 | | | Yes Bank Ltd. (Financials)* | | | 9,766 | |
| | 14,362 | | | Zomato Ltd. (Consumer Discretionary)* | | | 16,932 | |
| | 959 | | | Zydus Lifesciences Ltd. (Health Care) | | | 7,250 | |
| | | | | | | | |
| | | | | | | 4,196,771 | |
| | |
| Indonesia – 2.0% | | | |
| | 41,741 | | | Adaro Energy Indonesia Tbk PT (Energy) | | | 7,318 | |
| | 25,377 | | | Adaro Minerals Indonesia Tbk PT (Materials)* | | | 2,266 | |
| | 32,944 | | | Aneka Tambang Tbk (Materials) | | | 4,305 | |
| | 76,571 | | | Astra International Tbk PT (Industrials) | | | 32,428 | |
| | 201,031 | | | Bank Central Asia Tbk PT (Financials) | | | 121,107 | |
| | 14,481 | | | Bank Jago Tbk PT (Financials)* | | | 2,215 | |
| | 138,980 | | | Bank Mandiri Persero Tbk PT (Financials) | | | 54,981 | |
| | 29,235 | | | Bank Negara Indonesia Persero Tbk PT (Financials) | | | 17,612 | |
| | 269,920 | | | Bank Rakyat Indonesia Persero Tbk PT (Financials) | | | 98,362 | |
| | 101,810 | | | Barito Pacific Tbk PT (Materials) | | | 7,153 | |
| | 26,052 | | | Chandra Asri Petrochemical Tbk PT (Materials) | | | 3,729 | |
| | 28,602 | | | Charoen Pokphand Indonesia Tbk PT (Consumer Staples)* | | | 9,719 | |
| | 85,786 | | | Dayamitra Telekomunikasi PT (Communication Services) | | | 4,224 | |
| | 58,239 | | | Elang Mahkota Teknologi Tbk PT (Communication Services) | | | 2,180 | |
| | 2,859,889 | | | GoTo Gojek Tokopedia Tbk PT (Consumer Discretionary)* | | | 18,027 | |
| | 1,807 | | | Gudang Garam Tbk PT (Consumer Staples) | | | 2,853 | |
| | 10,031 | | | Indah Kiat Pulp & Paper Tbk PT (Materials) | | | 5,994 | |
| | 6,178 | | | Indocement Tunggal Prakarsa Tbk PT (Materials) | | | 4,340 | |
| | |
| | |
| 32 | | The accompanying notes are an integral part of these financial statements. |
GOLDMAN SACHS MARKETBETA® EMERGING MARKETS EQUITY ETF
| | | | | | | | |
Shares | | | Description | | Value | |
| |
| Common Stocks – (continued) | | | |
| Indonesia – (continued) | | | |
| | 8,968 | | | Indofood CBP Sukses Makmur Tbk PT (Consumer Staples) | | $ | 6,595 | |
| | 17,315 | | | Indofood Sukses Makmur Tbk PT (Consumer Staples) | | | 8,072 | |
| | 5,160 | | | Indosat Tbk PT (Communication Services) | | | 3,252 | |
| | 71,991 | | | Kalbe Farma Tbk PT (Health Care) | | | 8,579 | |
| | 136,558 | | | Merdeka Battery Materials Tbk PT (Materials)* | | | 7,263 | |
| | 46,993 | | | Merdeka Copper Gold Tbk PT (Materials)* | | | 10,429 | |
| | 75,987 | | | Sarana Menara Nusantara Tbk PT (Communication Services) | | | 5,139 | |
| | 12,654 | | | Semen Indonesia Persero Tbk PT (Materials) | | | 5,650 | |
| | 74,431 | | | Sumber Alfaria Trijaya Tbk PT (Consumer Staples) | | | 14,173 | |
| | 182,293 | | | Telkom Indonesia Persero Tbk PT (Communication Services) | | | 44,646 | |
| | 18,454 | | | Tower Bersama Infrastructure Tbk PT (Communication Services) | | | 2,545 | |
| | 22,454 | | | Unilever Indonesia Tbk PT (Consumer Staples) | | | 5,411 | |
| | 5,357 | | | United Tractors Tbk PT (Energy) | | | 9,145 | |
| | 7,988 | | | Vale Indonesia Tbk PT (Materials) | | | 3,094 | |
| | | | | | | | |
| | | | | | | 532,806 | |
| | |
| Kuwait – 0.9% | | | |
| | 5,765 | | | Agility Public Warehousing Co. KSC (Industrials)* | | | 10,754 | |
| | 4,915 | | | Boubyan Bank KSCP (Financials) | | | 9,726 | |
| | 7,941 | | | Gulf Bank KSCP (Financials) | | | 6,492 | |
| | 39,668 | | | Kuwait Finance House KSCP (Financials) | | | 95,873 | |
| | 2,476 | | | Mabanee Co KPSC (Real Estate) | | | 6,715 | |
| | 7,956 | | | Mobile Telecommunications Co. KSCP (Communication Services) | | | 13,163 | |
| | 28,669 | | | National Bank of Kuwait SAKP (Financials) | | | 85,565 | |
| | | | | | | | |
| | | | | | | 228,288 | |
| | |
| Luxembourg – 0.0% | | | |
| | 513 | | | Reinet Investments SCA (Financials) | | | 10,956 | |
| | |
| Mexico – 2.9% | | | |
| | 19,031 | | | Alfa SAB de CV, Class A (Industrials) | | | 12,743 | |
| | 123,700 | | | America Movil SAB de CV, Series B (Communication Services) | | | 117,955 | |
| | 1,769 | | | Arca Continental SAB de CV (Consumer Staples) | | | 17,446 | |
| | 6,941 | | | Becle SAB de CV (Consumer Staples) | | | 18,986 | |
| | 58,066 | | | Cemex SAB de CV, Series CPO (Materials)* | | | 46,400 | |
| | 1,979 | | | Coca-Cola Femsa SAB de CV (Consumer Staples) | | | 16,986 | |
| | 19,031 | | | Controladora Axtel SAB de CV (Communication Services)* | | | 202 | |
| | |
| |
| Common Stocks – (continued) | | | |
| Mexico – (continued) | | | |
| | 812 | | | El Puerto de Liverpool SAB de CV, Class C1 (Consumer Discretionary) | | | 5,119 | |
| | 11,220 | | | Fibra Uno Administracion SA de CV REIT (Real Estate) | | | 16,558 | |
| | 8,301 | | | Fomento Economico Mexicano SAB de CV (Consumer Staples) | | | 94,108 | |
| | 716 | | | Gruma SAB de CV, Class B (Consumer Staples) | | | 12,108 | |
| | 1,455 | | | Grupo Aeroportuario del Pacifico SAB de CV, Class B (Industrials) | | | 27,079 | |
| | 690 | | | Grupo Aeroportuario del Sureste SAB de CV, Class B (Industrials) | | | 19,045 | |
| | 5,228 | | | Grupo Bimbo SAB de CV, Series A (Consumer Staples) | | | 26,053 | |
| | 1,878 | | | Grupo Carso SAB de CV, Series A1 (Industrials) | | | 15,164 | |
| | 1,775 | | | Grupo Comercial Chedraui SA de CV (Consumer Staples) | | | 10,067 | |
| | 199 | | | Grupo Elektra SAB DE CV (Financials) | | | 13,871 | |
| | 11,076 | | | Grupo Financiero Banorte SAB de CV, Class O (Financials) | | | 95,034 | |
| | 7,427 | | | Grupo Financiero Inbursa SAB de CV, Class O (Financials)* | | | 16,251 | |
| | 11,848 | | | Grupo Mexico SAB de CV, Series B (Materials) | | | 57,164 | |
| | 9,708 | | | Grupo Televisa SAB, Series CPO (Communication Services) | | | 8,727 | |
| | 712 | | | Industrias Penoles SAB de CV (Materials)* | | | 10,201 | |
| | 6,149 | | | Kimberly-Clark de Mexico SAB de CV, Class A (Consumer Staples) | | | 14,014 | |
| | 4,834 | | | Operadora De Sites Mexicanos SAB de CV, Class A-1 (Communication Services) | | | 4,572 | |
| | 3,699 | | | Orbia Advance Corp. SAB de CV (Materials) | | | 8,340 | |
| | 19,136 | | | Wal-Mart de Mexico SAB de CV (Consumer Staples) | | | 76,366 | |
| | | | | | | | |
| | | | | | | 760,559 | |
| | |
| Philippines – 0.7% | | | |
| | 8,018 | | | Aboitiz Equity Ventures, Inc. (Industrials) | | | 6,656 | |
| | 28,344 | | | ACEN Corp. (Utilities) | | | 2,508 | |
| | 977 | | | Ayala Corp. (Industrials) | | | 10,629 | |
| | 23,526 | | | Ayala Land, Inc. (Real Estate) | | | 11,281 | |
| | 7,598 | | | Bank of the Philippine Islands (Financials) | | | 14,761 | |
| | 8,232 | | | BDO Unibank, Inc. (Financials) | | | 20,253 | |
| | 12,567 | | | Emperador, Inc. (Consumer Staples) | | | 4,639 | |
| | 144 | | | Globe Telecom, Inc. (Communication Services) | | | 4,583 | |
| | 3,242 | | | International Container Terminal Services, Inc. (Industrials) | | | 11,864 | |
| | 11,712 | | | JG Summit Holdings, Inc. (Industrials) | | | 7,560 | |
| | 1,757 | | | Jollibee Foods Corp. (Consumer Discretionary) | | | 7,354 | |
| | 1,117 | | | Manila Electric Co. (Utilities) | | | 6,779 | |
| | 7,105 | | | Metropolitan Bank & Trust Co. (Financials) | | | 6,927 | |
| | |
| | |
| The accompanying notes are an integral part of these financial statements. | | 33 |
GOLDMAN SACHS MARKETBETA® EMERGING MARKETS EQUITY ETF
Schedule of Investments (continued)
August 31, 2023
| | | | | | | | |
Shares | | | Description | | Value | |
| |
| Common Stocks – (continued) | | | |
| Philippines – (continued) | | | |
| | 28,545 | | | Monde Nissin Corp. (Consumer Staples)(a) | | $ | 3,630 | |
| | 344 | | | PLDT, Inc. (Communication Services) | | | 6,987 | |
| | 1,884 | | | SM Investments Corp. (Industrials) | | | 27,718 | |
| | 43,811 | | | SM Prime Holdings, Inc. (Real Estate) | | | 22,594 | |
| | 3,487 | | | Universal Robina Corp. (Consumer Staples) | | | 6,879 | |
| | | | | | | | |
| | | | | | | 183,602 | |
| | |
| Qatar – 0.9% | | | |
| | 12,773 | | | Commercial Bank PSQC (The) (Financials) | | | 19,931 | |
| | 6,703 | | | Dukhan Bank (Financials) | | | 7,697 | |
| | 7,534 | | | Industries Qatar QSC (Industrials) | | | 25,582 | |
| | 26,186 | | | Masraf Al Rayan QSC (Financials) | | | 15,971 | |
| | 17,034 | | | Mesaieed Petrochemical Holding Co. (Materials) | | | 8,611 | |
| | 2,651 | | | Ooredoo QPSC (Communication Services) | | | 7,866 | |
| | 1,845 | | | Qatar Electricity & Water Co. QSC (Utilities) | | | 9,078 | |
| | 2,221 | | | Qatar Fuel QSC (Energy) | | | 9,763 | |
| | 13,396 | | | Qatar Gas Transport Co. Ltd. (Energy) | | | 13,643 | |
| | 4,212 | | | Qatar International Islamic Bank QSC (Financials) | | | 11,445 | |
| | 6,222 | | | Qatar Islamic Bank (Financials) | | | 33,024 | |
| | 17,053 | | | Qatar National Bank QPSC (Financials) | | | 73,084 | |
| | | | | | | | |
| | | | | | | 235,695 | |
| | |
| Russia – 0.0%(c) | | | |
| | 12,708 | | | Alrosa PJSC (Materials)* | | | — | |
| | 801 | | | Gazprom Neft PJSC (Energy) | | | — | |
| | 49,291 | | | Gazprom PJSC (Energy) | | | — | |
| | 1,413 | | | LUKOIL PJSC (Energy) | | | — | |
| | 263 | | | MMC Norilsk Nickel PJSC (Materials)* | | | — | |
| | 4,560 | | | Mobile TeleSystems PJSC (Communication Services) | | | — | |
| | 3,099 | | | Novatek PJSC (Energy) | | | — | |
| | 5,287 | | | Novolipetsk Steel PJSC (Materials)* | | | — | |
| | 780 | | | PIK Group PJSC (Consumer Discretionary)* | | | — | |
| | 1,389 | | | Polymetal International PLC (Materials)* | | | — | |
| | 128 | | | Polyus PJSC (Materials)* | | | — | |
| | 5,078 | | | Rosneft Oil Co. PJSC (Energy) | | | — | |
| | 44,370 | | | Sberbank of Russia PJSC (Financials) | | | — | |
| | 969 | | | Severstal PAO (Materials)* | | | — | |
| | 146,300 | | | Surgutneftegas PJSC (Energy) | | | — | |
| | 6,047 | | | Tatneft PJSC (Energy) | | | — | |
| | 6,503 | | | United Co RUSAL International PJSC (Materials) | | | — | |
| | 1,289 | | | Yandex NV, Class A (Communication Services)* | | | — | |
| | | | | | | | |
| | | | | | | — | |
| | |
| |
| Common Stocks – (continued) | | | |
| Saudi Arabia – 4.0% | | | |
| | 505 | | | ACWA Power Co. (Utilities) | | | 25,986 | |
| | 504 | | | Advanced Petrochemical Co. (Materials) | | | 5,718 | |
| | 7,534 | | | Al Rajhi Bank (Financials) | | | 145,029 | |
| | 3,717 | | | Alinma Bank (Financials) | | | 36,569 | |
| | 933 | | | Almarai Co. JSC (Consumer Staples) | | | 15,771 | |
| | 2,524 | | | Arab National Bank (Financials) | | | 17,362 | |
| | 95 | | | Arabian Internet & Co.mmunications Services Co. (Information Technology) | | | 8,941 | |
| | 1,922 | | | Bank AlBilad (Financials) | | | 21,984 | |
| | 2,269 | | | Banque Saudi Fransi (Financials) | | | 23,200 | |
| | 281 | | | Bupa Arabia for Cooperative Insurance Co. (Financials) | | | 15,104 | |
| | 325 | | | Dr Sulaiman Al Habib Medical Services Group Co. (Health Care) | | | 21,056 | |
| | 100 | | | Elm Co. (Information Technology) | | | 22,663 | |
| | 1,480 | | | Etihad Etisalat Co. (Communication Services) | | | 17,816 | |
| | 2,300 | | | Jarir Marketing Co. (Consumer Discretionary) | | | 9,051 | |
| | 374 | | | Mouwasat Medical Services Co. (Health Care) | | | 10,989 | |
| | 148 | | | Nahdi Medical Co. (Consumer Staples) | | | 5,990 | |
| | 1,655 | | | Rabigh Refining & Petrochemical Co. (Energy)* | | | 4,554 | |
| | 5,646 | | | Riyad Bank (Financials) | | | 45,838 | |
| | 885 | | | SABIC Agri-Nutrients Co. (Materials) | | | 32,468 | |
| | 1,409 | | | Sahara International Petrochemical Co. (Materials) | | | 13,693 | |
| | 4,653 | | | Saudi Arabian Mining Co. (Materials)* | | | 50,244 | |
| | 16,825 | | | Saudi Arabian Oil Co. (Energy)(a) | | | 156,558 | |
| | 190 | | | Saudi Aramco Base Oil Co. (Materials) | | | 7,416 | |
| | 3,797 | | | Saudi Awwal Bank (Financials) | | | 36,293 | |
| | 3,457 | | | Saudi Basic Industries Corp. (Materials) | | | 81,479 | |
| | 3,070 | | | Saudi Electricity Co. (Utilities) | | | 16,943 | |
| | 1,481 | | | Saudi Industrial Investment Group (Materials) | | | 10,188 | |
| | 2,883 | | | Saudi Kayan Petrochemical Co. (Materials)* | | | 9,362 | |
| | 11,288 | | | Saudi National Bank (The) (Financials) | | | 107,594 | |
| | 6,913 | | | Saudi Telecom Co. (Communication Services) | | | 73,357 | |
| | 1,026 | | | Savola Group (The) (Consumer Staples) | | | 10,368 | |
| | 1,059 | | | Yanbu National Petrochemical Co. (Materials) | | | 11,943 | |
| | | | | | | | |
| | | | | | | 1,071,527 | |
| | |
| South Africa – 2.8% | | | |
| | 2,910 | | | Absa Group Ltd. (Financials) | | | 28,015 | |
| | 404 | | | African Rainbow Minerals Ltd. (Materials) | | | 3,819 | |
| | 211 | | | Anglo American Platinum Ltd. (Materials)(b) | | | 7,367 | |
| | 1,422 | | | Aspen Pharmacare Holdings Ltd. (Health Care) | | | 12,932 | |
| | 1,283 | | | Bid Corp. Ltd. (Consumer Staples) | | | 28,786 | |
| | |
| | |
| 34 | | The accompanying notes are an integral part of these financial statements. |
GOLDMAN SACHS MARKETBETA® EMERGING MARKETS EQUITY ETF
| | | | | | | | |
Shares | | | Description | | Value | |
| |
| Common Stocks – (continued) | | | |
| South Africa – (continued) | | | |
| | 1,309 | | | Bidvest Group Ltd. (The) (Industrials) | | $ | 19,699 | |
| | 370 | | | Capitec Bank Holdings Ltd. (Financials) | | | 30,966 | |
| | 929 | | | Clicks Group Ltd. (Consumer Staples) | | | 13,419 | |
| | 2,017 | | | Discovery Ltd. (Financials)* | | | 15,630 | |
| | 914 | | | Exxaro Resources Ltd. (Energy) | | | 8,101 | |
| | 19,220 | | | FirstRand Ltd. (Financials) | | | 74,505 | |
| | 3,379 | | | Gold Fields Ltd. (Materials) | | | 43,341 | |
| | 3,312 | | | Impala Platinum Holdings Ltd. (Materials) | | | 17,047 | |
| | 803 | | | Investec Ltd. (Financials) | | | 4,701 | |
| | 215 | | | Kumba Iron Ore Ltd. (Materials) | | | 4,716 | |
| | 6,459 | | | MTN Group Ltd. (Communication Services) | | | 41,043 | |
| | 1,208 | | | MultiChoice Group (Communication Services) | | | 4,994 | |
| | 810 | | | Naspers Ltd., Class N (Consumer Discretionary) | | | 137,616 | |
| | 1,701 | | | Nedbank Group Ltd. (Financials)(b) | | | 19,387 | |
| | 1,262 | | | Northam Platinum Holdings Ltd. (Materials)* | | | 8,298 | |
| | 18,719 | | | Old Mutual Ltd. (Financials) | | | 12,545 | |
| | 3,204 | | | OUTsurance Group Ltd. (Financials) | | | 6,768 | |
| | 6,072 | | | Pepkor Holdings Ltd. (Consumer Discretionary)(a) | | | 5,227 | |
| | 1,923 | | | Remgro Ltd. (Financials) | | | 16,051 | |
| | 6,316 | | | Sanlam Ltd. (Financials) | | | 22,732 | |
| | 2,204 | | | Sasol Ltd. (Materials) | | | 28,431 | |
| | 1,798 | | | Shoprite Holdings Ltd. (Consumer Staples) | | | 25,052 | |
| | 10,743 | | | Sibanye Stillwater Ltd. (Materials) | | | 16,306 | |
| | 5,188 | | | Standard Bank Group Ltd. (Financials) | | | 52,938 | |
| | 2,246 | | | Vodacom Group Ltd. (Communication Services) | | | 12,794 | |
| | 3,440 | | | Woolworths Holdings Ltd. (Consumer Discretionary) | | | 13,477 | |
| | | | | | | | |
| | | | | | | 736,703 | |
| | |
| South Korea – 12.1% | | | |
| | 139 | | | Alteogen, Inc. (Health Care)* | | | 4,759 | |
| | 110 | | | Amorepacific Corp. (Consumer Staples) | | | 11,144 | |
| | 97 | | | AMOREPACIFIC Group (Consumer Staples) | | | 2,469 | |
| | 29 | | | BGF retail Co. Ltd. (Consumer Staples) | | | 3,432 | |
| | 1,089 | | | BNK Financial Group, Inc. (Financials) | | | 5,619 | |
| | 373 | | | Celltrion Healthcare Co. Ltd. (Health Care) | | | 18,258 | |
| | 72 | | | Celltrion Pharm, Inc. (Health Care)* | | | 3,742 | |
| | 419 | | | Celltrion, Inc. (Health Care) | | | 45,617 | |
| | 262 | | | Cheil Worldwide, Inc. (Communication Services) | | | 3,737 | |
| | 17 | | | Chunbo Co. Ltd. (Materials) | | | 1,937 | |
| | 30 | | | CJ CheilJedang Corp. (Consumer Staples) | | | 6,786 | |
| | 51 | | | CJ Corp. (Industrials) | | | 2,713 | |
| | 37 | | | CJ ENM Co. Ltd. (Communication Services)* | | | 1,629 | |
| | 29 | | | CJ Logistics Corp. (Industrials) | | | 1,731 | |
| | 82 | | | CosmoAM&T Co. Ltd. (Information Technology)* | | | 9,784 | |
| | |
| |
| Common Stocks – (continued) | | | |
| South Korea – (continued) | | | |
| | 205 | | | Coway Co. Ltd. (Consumer Discretionary) | | | 6,700 | |
| | 89 | | | CS Wind Corp. (Industrials) | | | 4,276 | |
| | 734 | | | Daewoo Engineering & Construction Co. Ltd. (Industrials)* | | | 2,554 | |
| | 136 | | | DB HiTek Co. Ltd. (Information Technology) | | | 5,505 | |
| | 166 | | | DB Insurance Co. Ltd. (Financials) | | | 10,261 | |
| | 98 | | | DL E&C Co. Ltd. (Industrials) | | | 2,298 | |
| | 121 | | | Dongsuh Cos., Inc. (Consumer Staples) | | | 1,640 | |
| | 186 | | | Doosan Bobcat, Inc. (Industrials) | | | 7,571 | |
| | 24 | | | Doosan Co. Ltd. (Industrials) | | | 2,135 | |
| | 1,618 | | | Doosan Enerbility Co. Ltd. (Industrials)* | | | 22,304 | |
| | 161 | | | Doosan Fuel Cell Co. Ltd. (Industrials)* | | | 3,015 | |
| | 176 | | | Ecopro BM Co. Ltd. (Industrials) | | | 43,209 | |
| | 74 | | | Ecopro Co. Ltd. (Materials) | | | 70,375 | |
| | 67 | | | E-MART, Inc. (Consumer Staples) | | | 3,741 | |
| | 60 | | | F&F Co. Ltd. (Consumer Discretionary) | | | 4,676 | |
| | 156 | | | Fila Holdings Corp. (Consumer Discretionary) | | | 4,473 | |
| | 19 | | | Green Cross Corp. (Health Care) | | | 1,663 | |
| | 223 | | | GS Engineering & Construction Corp. (Industrials) | | | 2,451 | |
| | 169 | | | GS Holdings Corp. (Industrials) | | | 4,801 | |
| | 159 | | | GS Retail Co. Ltd. (Consumer Staples) | | | 2,845 | |
| | 1,108 | | | Hana Financial Group, Inc. (Financials) | | | 33,154 | |
| | 89 | | | Hanjin Kal Corp. (Industrials) | | | 2,993 | |
| | 257 | | | Hankook Tire & Technology Co. Ltd. (Consumer Discretionary) | | | 7,535 | |
| | 24 | | | Hanmi Pharm Co. Ltd. (Health Care) | | | 5,347 | |
| | 74 | | | Hanmi Science Co. Ltd. (Health Care) | | | 2,016 | |
| | 607 | | | Hanon Systems (Consumer Discretionary) | | | 4,184 | |
| | 35 | | | Hansol Chemical Co. Ltd. (Materials) | | | 4,277 | |
| | 27 | | | Hanssem Co. Ltd. (Consumer Discretionary) | | | 1,209 | |
| | 126 | | | Hanwha Aerospace Co. Ltd. (Industrials) | | | 10,886 | |
| | 128 | | | Hanwha Corp. (Industrials) | | | 2,421 | |
| | 1,045 | | | Hanwha Life Insurance Co. Ltd. (Financials)* | | | 1,988 | |
| | 569 | | | Hanwha Ocean Co. Ltd. (Industrials)* | | | 16,509 | |
| | 208 | | | Hanwha Systems Co. Ltd. (Industrials) | | | 2,113 | |
| | 156 | | | HD Hyundai Co. Ltd. (Energy) | | | 6,975 | |
| | 73 | | | HD Hyundai Heavy Industries Co. Ltd. (Industrials)* | | | 7,224 | |
| | 468 | | | HD Hyundai Infracore Co. Ltd. (Industrials) | | | 3,728 | |
| | 171 | | | HD Korea Shipbuilding & Offshore Engineering Co. Ltd. (Industrials)* | | | 16,004 | |
| | 100 | | | Hite Jinro Co. Ltd. (Consumer Staples) | | | 1,469 | |
| | 121 | | | HL Mando Co. Ltd. (Consumer Discretionary) | | | 3,836 | |
| | 437 | | | HLB, Inc. (Health Care)* | | | 9,538 | |
| | 956 | | | HMM Co. Ltd. (Industrials) | | | 12,050 | |
| | 109 | | | Hotel Shilla Co. Ltd. (Consumer Discretionary) | | | 7,274 | |
| | 29 | | | Hugel, Inc. (Health Care)* | | | 2,466 | |
| | 69 | | | HYBE Co. Ltd. (Communication Services)* | | | 13,181 | |
| | |
| | |
| The accompanying notes are an integral part of these financial statements. | | 35 |
GOLDMAN SACHS MARKETBETA® EMERGING MARKETS EQUITY ETF
Schedule of Investments (continued)
August 31, 2023
| | | | | | | | |
Shares | | | Description | | Value | |
| |
| Common Stocks – (continued) | | | |
| South Korea – (continued) | | | |
| | 8 | | | Hyosung Advanced Materials Corp. (Materials) | | $ | 2,736 | |
| | 9 | | | Hyosung TNC Corp. (Materials) | | | 2,254 | |
| | 25 | | | Hyundai Autoever Corp. (Information Technology) | | | 3,323 | |
| | 49 | | | Hyundai Department Store Co. Ltd. (Consumer Discretionary) | | | 2,573 | |
| | 95 | | | Hyundai Elevator Co. Ltd. (Industrials) | | | 3,234 | |
| | 275 | | | Hyundai Engineering & Construction Co. Ltd. (Industrials) | | | 7,386 | |
| | 71 | | | Hyundai Glovis Co. Ltd. (Industrials) | | | 9,266 | |
| | 223 | | | Hyundai Marine & Fire Insurance Co. Ltd. (Financials) | | | 5,104 | |
| | 86 | | | Hyundai Mipo Dockyard Co. Ltd. (Industrials)* | | | 5,921 | |
| | 239 | | | Hyundai Mobis Co. Ltd. (Consumer Discretionary) | | | 41,770 | |
| | 520 | | | Hyundai Motor Co. (Consumer Discretionary) | | | 74,395 | |
| | 262 | | | Hyundai Rotem Co. Ltd. (Industrials)* | | | 6,095 | |
| | 315 | | | Hyundai Steel Co. (Materials) | | | 8,627 | |
| | 948 | | | Industrial Bank of Korea (Financials) | | | 7,717 | |
| | 1,160 | | | Kakao Corp. (Communication Services) | | | 42,214 | |
| | 139 | | | Kakao Games Corp. (Communication Services)* | | | 2,992 | |
| | 821 | | | KakaoBank Corp. (Financials) | | | 16,367 | |
| | 84 | | | Kakaopay Corp. (Financials)* | | | 2,876 | |
| | 455 | | | Kangwon Land, Inc. (Consumer Discretionary) | | | 5,339 | |
| | 1,435 | | | KB Financial Group, Inc. (Financials) | | | 58,735 | |
| | 15 | | | KCC Corp. (Materials) | | | 2,480 | |
| | 49 | | | KEPCO Engineering & Construction Co., Inc. (Industrials) | | | 2,454 | |
| | 66 | | | KEPCO Plant Service & Engineering Co. Ltd. (Industrials) | | | 1,675 | |
| | 956 | | | Kia Corp. (Consumer Discretionary) | | | 58,007 | |
| | 49 | | | KIWOOM Securities Co. Ltd. (Financials) | | | 3,830 | |
| | 266 | | | Korea Aerospace Industries Ltd. (Industrials) | | | 10,183 | |
| | 986 | | | Korea Electric Power Corp. (Utilities)* | | | 13,293 | |
| | 109 | | | Korea Gas Corp. (Utilities)* | | | 2,070 | |
| | 152 | | | Korea Investment Holdings Co. Ltd. (Financials) | | | 5,980 | |
| | 36 | | | Korea Zinc Co. Ltd. (Materials) | | | 14,354 | |
| | 714 | | | Korean Air Lines Co. Ltd. (Industrials) | | | 12,316 | |
| | 110 | | | Krafton, Inc. (Communication Services)* | | | 12,900 | |
| | 485 | | | KT Corp. (Communication Services) | | | 12,109 | |
| | 431 | | | KT&G Corp. (Consumer Staples) | | | 28,337 | |
| | 111 | | | Kum Yang Co. Ltd. (Materials)* | | | 10,833 | |
| | 60 | | | Kumho Petrochemical Co. Ltd. (Materials) | | | 5,665 | |
| | 95 | | | L&F Co. Ltd. (Information Technology) | | | 15,453 | |
| | 36 | | | LEENO Industrial, Inc. (Information Technology) | | | 4,578 | |
| | 181 | | | LG Chem Ltd. (Materials) | | | 79,836 | |
| | 342 | | | LG Corp. (Industrials) | | | 21,243 | |
| | |
| |
| Common Stocks – (continued) | | | |
| South Korea – (continued) | | | |
| | 843 | | | LG Display Co. Ltd. (Information Technology)* | | | 8,546 | |
| | 414 | | | LG Electronics, Inc. (Consumer Discretionary) | | | 30,852 | |
| | 133 | | | LG Energy Solution Ltd. (Industrials)* | | | 54,740 | |
| | 35 | | | LG H&H Co. Ltd. (Consumer Staples) | | | 12,300 | |
| | 53 | | | LG Innotek Co. Ltd. (Information Technology) | | | 10,827 | |
| | 851 | | | LG Uplus Corp. (Communication Services) | | | 6,728 | |
| | 74 | | | Lotte Chemical Corp. (Materials) | | | 7,648 | |
| | 118 | | | Lotte Corp. (Industrials) | | | 2,227 | |
| | 75 | | | Lotte Energy Materials Corp. (Information Technology) | | | 2,763 | |
| | 39 | | | Lotte Shopping Co. Ltd. (Consumer Discretionary) | | | 2,095 | |
| | 68 | | | LS Corp. (Industrials) | | | 5,510 | |
| | 401 | | | Meritz Financial Group, Inc. (Financials)* | | | 16,595 | |
| | 972 | | | Mirae Asset Securities Co. Ltd. (Financials) | | | 4,898 | |
| | 522 | | | NAVER Corp. (Communication Services) | | | 84,713 | |
| | 52 | | | NCSoft Corp. (Communication Services) | | | 9,894 | |
| | 82 | | | Netmarble Corp. (Communication Services)*(a) | | | 2,658 | |
| | 506 | | | NH Investment & Securities Co. Ltd. (Financials) | | | 3,943 | |
| | 12 | | | NongShim Co. Ltd. (Consumer Staples) | | | 4,163 | |
| | 21 | | | OCI Co. Ltd. (Materials)* | | | 2,027 | |
| | 46 | | | OCI Holdings Co. Ltd. (Materials) | | | 3,205 | |
| | 84 | | | Orion Corp. (Consumer Staples) | | | 7,741 | |
| | 809 | | | Pan Ocean Co. Ltd. (Industrials) | | | 2,730 | |
| | 113 | | | Pearl Abyss Corp. (Communication Services)* | | | 4,129 | |
| | 109 | | | POSCO Future M Co. Ltd. (Industrials) | | | 37,069 | |
| | 274 | | | POSCO Holdings, Inc. (Materials) | | | 120,027 | |
| | 194 | | | Posco International Corp. (Industrials) | | | 11,625 | |
| | 67 | | | S-1 Corp. (Industrials) | | | 2,829 | |
| | 68 | | | Samsung Biologics Co. Ltd. (Health Care)*(a) | | | 37,916 | |
| | 316 | | | Samsung C&T Corp. (Industrials) | | | 25,031 | |
| | 92 | | | Samsung Card Co. Ltd. (Financials) | | | 2,085 | |
| | 209 | | | Samsung Electro-Mechanics Co. Ltd. (Information Technology) | | | 21,410 | |
| | 18,665 | | | Samsung Electronics Co. Ltd. (Information Technology) | | | 944,724 | |
| | 588 | | | Samsung Engineering Co. Ltd. (Industrials)* | | | 15,125 | |
| | 119 | | | Samsung Fire & Marine Insurance Co. Ltd. (Financials) | | | 22,193 | |
| | 2,454 | | | Samsung Heavy Industries Co. Ltd. (Industrials)* | | | 16,357 | |
| | 291 | | | Samsung Life Insurance Co. Ltd. (Financials) | | | 14,883 | |
| | 197 | | | Samsung SDI Co. Ltd. (Information Technology) | | | 91,514 | |
| | |
| | |
| 36 | | The accompanying notes are an integral part of these financial statements. |
GOLDMAN SACHS MARKETBETA® EMERGING MARKETS EQUITY ETF
| | | | | | | | |
Shares | | | Description | | Value | |
| |
| Common Stocks – (continued) | | | |
| South Korea – (continued) | | | |
| | 139 | | | Samsung SDS Co. Ltd. (Information Technology) | | $ | 14,933 | |
| | 235 | | | Samsung Securities Co. Ltd. (Financials) | | | 6,641 | |
| | 139 | | | SD Biosensor, Inc. (Health Care) | | | 1,316 | |
| | 129 | | | Seegene, Inc. (Health Care) | | | 2,167 | |
| | 1,730 | | | Shinhan Financial Group Co. Ltd. (Financials) | | | 46,530 | |
| | 27 | | | Shinsegae, Inc. (Consumer Discretionary) | | | 4,147 | |
| | 106 | | | SK Biopharmaceuticals Co. Ltd. (Health Care)* | | | 6,873 | |
| | 90 | | | SK Bioscience Co. Ltd. (Health Care)* | | | 4,998 | |
| | 37 | | | SK Chemicals Co. Ltd. (Materials) | | | 1,761 | |
| | 2,065 | | | SK Hynix, Inc. (Information Technology) | | | 190,291 | |
| | 103 | | | SK IE Technology Co. Ltd. (Materials)*(a) | | | 7,037 | |
| | 203 | | | SK Innovation Co. Ltd. (Energy)* | | | 27,261 | |
| | 379 | | | SK Networks Co. Ltd. (Industrials) | | | 2,067 | |
| | 380 | | | SK Square Co. Ltd. (Industrials)* | | | 12,966 | |
| | 212 | | | SK Telecom Co. Ltd. (Communication Services) | | | 7,707 | |
| | 140 | | | SK, Inc. (Industrials) | | | 15,305 | |
| | 66 | | | SKC Co. Ltd. (Materials) | | | 4,569 | |
| | 156 | | | S-Oil Corp. (Energy) | | | 8,616 | |
| | 51 | | | Solus Advanced Materials Co. Ltd. (Information Technology) | | | 1,262 | |
| | 17 | | | Soulbrain Co. Ltd. (Materials) | | | 2,926 | |
| | 329 | | | SSANGYONG C&E Co. Ltd. (Materials) | | | 1,369 | |
| | 46 | | | Studio Dragon Corp. (Communication Services)* | | | 1,796 | |
| | 67 | | | Wemade Co. Ltd. (Communication Services) | | | 1,830 | |
| | 121 | | | WONIK IPS Co. Ltd. (Information Technology) | | | 2,824 | |
| | 2,375 | | | Woori Financial Group, Inc. (Financials) | | | 21,401 | |
| | 200 | | | Yuhan Corp. (Health Care) | | | 11,016 | |
| | | | | | | | |
| | | | | | | 3,198,076 | |
| | |
| Taiwan – 15.1% | | | |
| | 1,915 | | | Accton Technology Corp. (Information Technology) | | | 28,743 | |
| | 11,345 | | | Acer, Inc. (Information Technology) | | | 13,038 | |
| | 1,632 | | | Advantech Co. Ltd. (Information Technology) | | | 17,629 | |
| | 266 | | | Alchip Technologies Ltd. (Information Technology) | | | 20,631 | |
| | 14,031 | | | ASE Technology Holding Co. Ltd. (Information Technology) | | | 51,989 | |
| | 9,743 | | | Asia Cement Corp. (Materials) | | | 12,207 | |
| | 101 | | | ASMedia Technology, Inc. (Information Technology) | | | 3,118 | |
| | 114 | | | ASPEED Technology, Inc. (Information Technology) | | | 9,665 | |
| | 2,661 | | | Asustek Computer, Inc. (Information Technology) | | | 33,632 | |
| | 22,185 | | | AUO Corp. (Information Technology)* | | | 12,400 | |
| | 2,507 | | | Catcher Technology Co. Ltd. (Information Technology) | | | 14,209 | |
| | |
| |
| Common Stocks – (continued) | | | |
| Taiwan – (continued) | | | |
| | 39,856 | | | Cathay Financial Holding Co. Ltd. (Financials)* | | | 57,068 | |
| | 5,806 | | | Chailease Holding Co. Ltd. (Financials) | | | 32,360 | |
| | 22,306 | | | Chang Hwa Commercial Bank Ltd. (Financials) | | | 12,117 | |
| | 8,203 | | | Cheng Shin Rubber Industry Co. Ltd. (Consumer Discretionary) | | | 10,213 | |
| | 2,396 | | | Chicony Electronics Co. Ltd. (Information Technology) | | | 7,787 | |
| | 10,843 | | | China Airlines Ltd. (Industrials) | | | 7,695 | |
| | 61,057 | | | China Development Financial Holding Corp. (Financials)* | | | 22,719 | |
| | 46,761 | | | China Steel Corp. (Materials) | | | 38,911 | |
| | 1,547 | | | Chroma ATE, Inc. (Information Technology) | | | 13,601 | |
| | 14,601 | | | Chunghwa Telecom Co. Ltd. (Communication Services) | | | 53,184 | |
| | 15,111 | | | Compal Electronics, Inc. (Information Technology) | | | 15,136 | |
| | 69,840 | | | CTBC Financial Holding Co. Ltd. (Financials) | | | 52,303 | |
| | 7,380 | | | Delta Electronics, Inc. (Information Technology) | | | 80,181 | |
| | 3,418 | | | E Ink Holdings, Inc. (Information Technology) | | | 19,587 | |
| | 855 | | | Eclat Textile Co. Ltd. (Consumer Discretionary) | | | 13,665 | |
| | 238 | | | eMemory Technology, Inc. (Information Technology) | | | 13,564 | |
| | 53,698 | | | E.Sun Financial Holding Co. Ltd. (Financials) | | | 41,226 | |
| | 10,091 | | | Eva Airways Corp. (Industrials) | | | 9,981 | |
| | 3,930 | | | Evergreen Marine Corp. Taiwan Ltd. (Industrials) | | | 13,143 | |
| | 11,829 | | | Far Eastern New Century Corp. (Industrials) | | | 10,456 | |
| | 6,307 | | | Far EasTone Telecommunications Co. Ltd. (Communication Services) | | | 13,982 | |
| | 1,852 | | | Feng TAY Enterprise Co. Ltd. (Consumer Discretionary) | | | 9,770 | |
| | 41,554 | | | First Financial Holding Co. Ltd. (Financials) | | | 34,317 | |
| | 16,826 | | | Formosa Chemicals & Fibre Corp. (Materials) | | | 32,757 | |
| | 5,259 | | | Formosa Petrochemical Corp. (Energy) | | | 13,095 | |
| | 20,801 | | | Formosa Plastics Corp. (Materials) | | | 51,927 | |
| | 373 | | | Formosa Sumco Technology Corp. (Information Technology) | | | 1,687 | |
| | 2,956 | | | Formosa Taffeta Co. Ltd. (Consumer Discretionary) | | | 2,367 | |
| | 3,586 | | | Foxconn Technology Co. Ltd. (Information Technology) | | | 6,272 | |
| | 30,811 | | | Fubon Financial Holding Co. Ltd. (Financials) | | | 61,532 | |
| | 1,217 | | | Giant Manufacturing Co. Ltd. (Consumer Discretionary) | | | 7,490 | |
| | |
| | |
| The accompanying notes are an integral part of these financial statements. | | 37 |
GOLDMAN SACHS MARKETBETA® EMERGING MARKETS EQUITY ETF
Schedule of Investments (continued)
August 31, 2023
| | | | | | | | |
Shares | | | Description | | Value | |
| |
| Common Stocks – (continued) | | | |
| Taiwan – (continued) | | | |
| | 335 | | | Global Unichip Corp. (Information Technology) | | $ | 15,358 | |
| | 784 | | | Globalwafers Co. Ltd. (Information Technology) | | | 11,300 | |
| | 6,081 | | | Highwealth Construction Corp. (Real Estate) | | | 8,211 | |
| | 1,060 | | | Hiwin Technologies Corp. (Industrials) | | | 6,823 | |
| | 45,859 | | | Hon Hai Precision Industry Co. Ltd. (Information Technology) | | | 153,360 | |
| | 1,213 | | | Hotai Motor Co. Ltd. (Consumer Discretionary) | | | 25,862 | |
| | 37,637 | | | Hua Nan Financial Holdings Co. Ltd. (Financials) | | | 24,227 | |
| | 32,704 | | | Innolux Corp. (Information Technology)* | | | 14,839 | |
| | 11,895 | | | Inventec Corp. (Information Technology) | | | 21,066 | |
| | 361 | | | Largan Precision Co. Ltd. (Information Technology) | | | 23,238 | |
| | 8,545 | | | Lite-On Technology Corp. (Information Technology) | | | 36,760 | |
| | 334 | | | Lotes Co. Ltd. (Information Technology) | | | 9,072 | |
| | 6,895 | | | Macronix International Co. Ltd. (Information Technology) | | | 7,296 | |
| | 5,778 | | | MediaTek, Inc. (Information Technology) | | | 127,910 | |
| | 41,414 | | | Mega Financial Holding Co. Ltd. (Financials) | | | 46,685 | |
| | 838 | | | Merida Industry Co. Ltd. (Consumer Discretionary) | | | 5,078 | |
| | 2,733 | | | Micro-Star International Co. Ltd. (Information Technology) | | | 13,688 | |
| | 291 | | | momo.com, Inc. (Consumer Discretionary) | | | 4,751 | |
| | 21,534 | | | Nan Ya Plastics Corp. (Materials) | | | 44,696 | |
| | 809 | | | Nan Ya Printed Circuit Board Corp. (Information Technology) | | | 6,135 | |
| | 4,412 | | | Nanya Technology Corp. (Information Technology) | | | 9,227 | |
| | 715 | | | Nien Made Enterprise Co. Ltd. (Consumer Discretionary) | | | 6,713 | |
| | 2,147 | | | Novatek Microelectronics Corp. (Information Technology) | | | 26,933 | |
| | 1,187 | | | Oneness Biotech Co. Ltd. (Health Care) | | | 7,399 | |
| | 7,346 | | | Pegatron Corp. (Information Technology) | | | 17,992 | |
| | 952 | | | PharmaEssentia Corp. (Health Care)* | | | 10,687 | |
| | 625 | | | Phison Electronics Corp. (Information Technology) | | | 8,311 | |
| | 1,007 | | | Polaris Group (Health Care)* | | | 2,732 | |
| | 8,908 | | | Pou Chen Corp. (Consumer Discretionary) | | | 8,000 | |
| | 11,225 | | | Powerchip Semiconductor Manufacturing Corp. (Information Technology) | | | 9,816 | |
| | 2,525 | | | Powertech Technology, Inc. (Information Technology) | | | 7,905 | |
| | 2,111 | | | President Chain Store Corp. (Consumer Staples) | | | 17,732 | |
| | 9,073 | | | Quanta Computer, Inc. (Information Technology) | | | 72,222 | |
| | 1,744 | | | Realtek Semiconductor Corp. (Information Technology) | | | 22,891 | |
| | |
| |
| Common Stocks – (continued) | | | |
| Taiwan – (continued) | | | |
| | 7,004 | | | Ruentex Development Co. Ltd. (Real Estate)* | | | 8,104 | |
| | 2,589 | | | Ruentex Industries Ltd. (Consumer Discretionary)* | | | 5,065 | |
| | 17,234 | | | Shanghai Commercial & Savings Bank Ltd. (The) (Financials) | | | 23,053 | |
| | 50,789 | | | Shin Kong Financial Holding Co. Ltd. (Financials)* | | | 15,103 | |
| | 122 | | | Silicon Motion Technology Corp. ADR (Information Technology)* | | | 6,626 | |
| | 1,995 | | | Sino-American Silicon Products, Inc. (Information Technology) | | | 9,804 | |
| | 41,402 | | | SinoPac Financial Holdings Co. Ltd. (Financials) | | | 22,231 | |
| | 4,789 | | | Synnex Technology International Corp. (Information Technology) | | | 9,188 | |
| | 8,614 | | | TA Chen Stainless Pipe (Materials) | | | 9,819 | |
| | 43,722 | | | Taishin Financial Holding Co. Ltd. (Financials) | | | 24,438 | |
| | 23,412 | | | Taiwan Business Bank (Financials) | | | 9,814 | |
| | 24,131 | | | Taiwan Cement Corp. (Materials) | | | 26,483 | |
| | 38,746 | | | Taiwan Cooperative Financial Holding Co. Ltd. (Financials) | | | 31,937 | |
| | 2,818 | | | Taiwan Fertilizer Co. Ltd. (Materials) | | | 5,274 | |
| | 7,986 | | | Taiwan High Speed Rail Corp. (Industrials) | | | 7,460 | |
| | 6,540 | | | Taiwan Mobile Co. Ltd. (Communication Services) | | | 19,140 | |
| | 91,962 | | | Taiwan Semiconductor Manufacturing Co. Ltd. (Information Technology) | | | 1,585,328 | |
| | 7,827 | | | Tatung Co. Ltd. (Industrials)* | | | 12,436 | |
| | 6,597 | | | Teco Electric and Machinery Co. Ltd. (Industrials) | | | 10,337 | |
| | 1,802 | | | Tripod Technology Corp. (Information Technology) | | | 10,694 | |
| | 4,944 | | | Unimicron Technology Corp. (Information Technology) | | | 28,798 | |
| | 18,181 | | | Uni-President Enterprises Corp. (Consumer Staples) | | | 40,362 | |
| | 44,324 | | | United Microelectronics Corp. (Information Technology) | | | 63,327 | |
| | 3,533 | | | Vanguard International Semiconductor Corp. (Information Technology) | | | 7,577 | |
| | 371 | | | VisEra Technologies Co. Ltd. (Information Technology) | | | 2,476 | |
| | 268 | | | Voltronic Power Technology Corp. (Industrials) | | | 12,202 | |
| | 9,659 | | | Walsin Lihwa Corp. (Industrials) | | | 11,525 | |
| | 1,448 | | | Walsin Technology Corp. (Information Technology) | | | 4,483 | |
| | 5,320 | | | Wan Hai Lines Ltd. (Industrials) | | | 7,567 | |
| | 1,327 | | | Win Semiconductors Corp. (Information Technology) | | | 5,667 | |
| | 10,762 | | | Winbond Electronics Corp. (Information Technology)* | | | 8,905 | |
| | 10,481 | | | Wistron Corp. (Information Technology) | | | 38,506 | |
| | |
| | |
| 38 | | The accompanying notes are an integral part of these financial statements. |
GOLDMAN SACHS MARKETBETA® EMERGING MARKETS EQUITY ETF
| | | | | | | | |
Shares | | | Description | | Value | |
| |
| Common Stocks – (continued) | | | |
| Taiwan – (continued) | | | |
| | 354 | | | Wiwynn Corp. (Information Technology) | | $ | 17,341 | |
| | 5,901 | | | WPG Holdings Ltd. (Information Technology) | | | 10,173 | |
| | 1,474 | | | Yageo Corp. (Information Technology) | | | 22,448 | |
| | 6,825 | | | Yang Ming Marine Transport Corp. (Industrials) | | | 9,055 | |
| | 41,923 | | | Yuanta Financial Holding Co. Ltd. (Financials) | | | 32,120 | |
| | 1,354 | | | Yulon Finance Corp. (Financials) | | | 7,568 | |
| | 2,174 | | | Yulon Motor Co. Ltd. (Consumer Discretionary) | | | 5,693 | |
| | 2,415 | | | Zhen Ding Technology Holding Ltd. (Information Technology) | | | 7,333 | |
| | | | | | | | |
| | | | | | | 4,007,729 | |
| | |
| Thailand – 2.1% | | | |
| | 4,088 | | | Advanced Info Service PCL NVDR (Communication Services) | | | 25,216 | |
| | 16,254 | | | Airports of Thailand PCL NVDR (Industrials)* | | | 33,652 | |
| | 31,837 | | | Asset World Corp. PCL NVDR (Consumer Discretionary) | | | 3,964 | |
| | 3,878 | | | B Grimm Power PCL NVDR (Utilities) | | | 3,765 | |
| | 3,883 | | | Bangkok Bank PCL NVDR (Financials) | | | 18,795 | |
| | 6,881 | | | Bangkok Commercial Asset Management PCL NVDR (Financials) | | | 2,338 | |
| | 23,366 | | | Bangkok Dusit Medical Services PCL NVDR (Health Care) | | | 18,684 | |
| | 31,469 | | | Bangkok Expressway & Metro PCL NVDR (Industrials) | | | 7,774 | |
| | 1,003 | | | Bangkok Life Assurance PCL NVDR (Financials) | | | 702 | |
| | 15,940 | | | Banpu PCL NVDR (Energy) | | | 3,915 | |
| | 3,869 | | | Berli Jucker PCL NVDR (Consumer Staples) | | | 3,729 | |
| | 30,615 | | | BTS Group Holdings PCL NVDR (Industrials) | | | 6,426 | |
| | 2,027 | | | Bumrungrad Hospital PCL NVDR (Health Care) | | | 14,992 | |
| | 1,416 | | | Carabao Group PCL NVDR (Consumer Staples) | | | 3,478 | |
| | 6,566 | | | Central Pattana PCL NVDR (Real Estate) | | | 12,891 | |
| | 2,285 | | | Central Plaza Hotel PCL NVDR (Consumer Discretionary)* | | | 3,116 | |
| | 12,615 | | | Central Retail Corp. PCL NVDR (Consumer Discretionary) | | | 14,860 | |
| | 14,777 | | | Charoen Pokphand Foods PCL NVDR (Consumer Staples) | | | 8,735 | |
| | 3,251 | | | Com7 PCL NVDR (Consumer Discretionary) | | | 2,994 | |
| | 20,845 | | | CP ALL PCL NVDR (Consumer Staples) | | | 38,842 | |
| | 5,431 | | | CP Axtra PCL NVDR (Consumer Staples) | | | 5,622 | |
| | 1,485 | | | Delta Electronics Thailand PCL NVDR (Information Technology) | | | 4,601 | |
| | 852 | | | Electricity Generating PCL NVDR (Utilities) | | | 3,248 | |
| | |
| |
| Common Stocks – (continued) | | | |
| Thailand – (continued) | | | |
| | 6,018 | | | Energy Absolute PCL NVDR (Utilities) | | | 10,870 | |
| | 2,551 | | | Global Power Synergy PCL NVDR (Utilities) | | | 3,843 | |
| | 18,025 | | | Gulf Energy Development PCL NVDR (Utilities) | | | 24,708 | |
| | 19,511 | | | Home Product Center PCL NVDR (Consumer Discretionary) | | | 7,633 | |
| | 6,563 | | | Indorama Ventures PCL NVDR (Materials) | | | 5,435 | |
| | 3,453 | | | Intouch Holdings PCL NVDR (Communication Services) | | | 7,174 | |
| | 40,336 | | | IRPC PCL NVDR (Energy) | | | 2,695 | |
| | 2,450 | | | JMT Network Services PCL NVDR (Financials) | | | 3,253 | |
| | 5,594 | | | Kasikornbank PCL NVDR (Financials) | | | 20,847 | |
| | 2,522 | | | KCE Electronics PCL NVDR (Information Technology) | | | 3,673 | |
| | 17,575 | | | Krung Thai Bank PCL NVDR (Financials) | | | 9,687 | |
| | 3,518 | | | Krungthai Card PCL NVDR (Financials) | | | 4,873 | |
| | 23,143 | | | Land & Houses PCL NVDR (Real Estate) | | | 5,486 | |
| | 12,103 | | | Minor International PCL NVDR (Consumer Discretionary) | | | 11,492 | |
| | 2,720 | | | Muangthai Capital PCL NVDR (Financials) | | | 3,165 | |
| | 5,018 | | | Ngern Tid Lor PCL NVDR (Financials) | | | 3,382 | |
| | 6,317 | | | Osotspa PCL NVDR (Consumer Staples) | | | 5,412 | |
| | 40,226 | | | PSG Corp. PCL NVDR (Industrials)* | | | 1,149 | |
| | 5,227 | | | PTT Exploration & Production PCL NVDR (Energy) | | | 23,659 | |
| | 7,486 | | | PTT Global Chemical PCL NVDR (Materials) | | | 7,963 | |
| | 10,919 | | | PTT Oil & Retail Business PCL NVDR (Consumer Discretionary) | | | 6,361 | |
| | 37,237 | | | PTT PCL NVDR (Energy) | | | 36,953 | |
| | 2,770 | | | Ratch Group PCL NVDR (Utilities) | | | 2,808 | |
| | 4,081 | | | SCB X PCL NVDR (Financials) | | | 13,752 | |
| | 4,442 | | | SCG Packaging PCL NVDR (Materials) | | | 5,201 | |
| | 1,578 | | | Siam Cement PCL (The) NVDR (Materials) | | | 14,105 | |
| | 6,315 | | | Siam Global House PCL NVDR (Consumer Discretionary) | | | 3,390 | |
| | 3,205 | | | Srisawad Corp. PCL NVDR (Financials) | | | 4,668 | |
| | 32,622 | | | Thai Beverage PCL (Consumer Staples) | | | 13,769 | |
| | 9,456 | | | Thai Life Insurance PCL NVDR (Financials) | | | 3,186 | |
| | 4,277 | | | Thai Oil PCL NVDR (Energy) | | | 6,290 | |
| | 10,271 | | | Thai Union Group PCL NVDR (Consumer Staples) | | | 4,194 | |
| | 1,402 | | | Thonburi Healthcare Group PCL NVDR (Health Care) | | | 2,622 | |
| | 1,889 | | | Tisco Financial Group PCL NVDR (Financials) | | | 5,556 | |
| | 151,950 | | | TMBThanachart Bank PCL NVDR (Financials) | | | 7,420 | |
| | |
| | |
| The accompanying notes are an integral part of these financial statements. | | 39 |
GOLDMAN SACHS MARKETBETA® EMERGING MARKETS EQUITY ETF
Schedule of Investments (continued)
August 31, 2023
| | | | | | | | |
Shares | | | Description | | Value | |
| |
| Common Stocks – (continued) | | | |
| Thailand – (continued) | | | |
| | 2,201 | | | TOA Paint Thailand PCL NVDR (Materials) | | $ | 1,666 | |
| | 38,263 | | | True Corp. PCL NVDR (Communication Services) | | | 7,540 | |
| | 20,941 | | | VGI PCL NVDR (Communication Services) | | | 1,770 | |
| | | | | | | | |
| | | | | | | 549,989 | |
| | |
| Turkey – 1.2% | | | |
| | 496 | | | AG Anadolu Grubu Holding AS (Industrials) | | | 3,855 | |
| | 2,500 | | | Ahlatci Dogal Gaz Dagitim Enerji VE Yatirim AS (Utilities)* | | | 1,313 | |
| | 12,252 | | | Akbank TAS (Financials) | | | 13,227 | |
| | 501 | | | Aksa Akrilik Kimya Sanayii AS (Consumer Discretionary) | | | 1,508 | |
| | 750 | | | Aksa Enerji Uretim AS (Utilities) | | | 1,124 | |
| | 515 | | | Alarko Holding AS (Industrials) | | | 2,483 | |
| | 771 | | | Anadolu Efes Biracilik Ve Malt Sanayii AS (Consumer Staples) | | | 3,121 | |
| | 10 | | | Anadolu Isuzu Otomotiv Sanayi Ve Ticaret AS, Class C (Industrials) | | | 89 | |
| | 707 | | | Arcelik AS (Consumer Discretionary)* | | | 4,318 | |
| | 4,650 | | | Aselsan Elektronik Sanayi Ve Ticaret AS (Industrials) | | | 6,719 | |
| | 807 | | | Astor Transformator Enerji Turizm Insaat Ve Petrol Sanayi Ticaret AS (Industrials) | | | 4,359 | |
| | 553 | | | Aydem Yenilenebilir Enerji AS (Utilities)* | | | 383 | |
| | 285 | | | Aygaz AS (Utilities) | | | 1,291 | |
| | 309 | | | Baskent Dogalgaz Dagitim Gayrimenkul Yatirim Ortakligi AS (Utilities) | | | 220 | |
| | 2,507 | | | Bera Holding AS (Industrials)* | | | 1,269 | |
| | 1,746 | | | BIM Birlesik Magazalar AS (Consumer Staples) | | | 16,518 | |
| | 102 | | | Borusan Mannesmann Boru Sanayi ve Ticaret AS (Materials)* | | | 2,908 | |
| | 26 | | | Borusan Yatirim ve Pazarlama AS (Financials) | | | 1,948 | |
| | 188 | | | Brisa Bridgestone Sabanci Sanayi ve Ticaret AS (Consumer Discretionary) | | | 514 | |
| | 790 | | | Can2 Termik AS (Utilities)* | | | 554 | |
| | 10 | | | Celebi Hava Servisi AS (Industrials) | | | 326 | |
| | 210 | | | Cimsa Cimento Sanayi VE Ticaret AS (Materials) | | | 1,687 | |
| | 274 | | | Coca-Cola Icecek AS (Consumer Staples) | | | 4,040 | |
| | 110 | | | CW Enerji Muhendislik Ticaret VE Sanayi AS (Industrials)* | | | 1,407 | |
| | 151 | | | Deva Holding AS (Health Care) | | | 508 | |
| | 3,708 | | | Dogan Sirketler Grubu Holding AS (Consumer Discretionary) | | | 1,970 | |
| | 175 | | | Dogu Aras Enerji Yatirimlari AS (Utilities) | | | 336 | |
| | 209 | | | Dogus Otomotiv Servis ve Ticaret AS (Consumer Discretionary) | | | 2,238 | |
| | 71 | | | Eczacibasi Yatirim Holding Ortakligi AS (Industrials) | | | 575 | |
| | |
| |
| Common Stocks – (continued) | | | |
| Turkey – (continued) | | | |
| | 4 | | | EGE Endustri VE Ticaret AS (Consumer Discretionary) | | | 1,079 | |
| | 576 | | | EIS Eczacibasi Ilac ve Sinai ve Finansal Yatirimlar Sanayi ve Ticaret AS (Consumer Staples) | | | 1,085 | |
| | 7,605 | | | Emlak Konut Gayrimenkul Yatirim Ortakligi AS REIT (Real Estate) | | | 2,451 | |
| | 933 | | | Enerjisa Enerji AS (Utilities)(a) | | | 1,794 | |
| | 6,122 | | | Enka Insaat ve Sanayi AS (Industrials) | | | 7,533 | |
| | 5,393 | | | Eregli Demir ve Celik Fabrikalari TAS (Materials)* | | | 8,703 | |
| | 230 | | | Europower Enerji VE Otomasyon Teknolojileri Sanayi Ticaret AS (Industrials)* | | | 1,717 | |
| | 250 | | | Ford Otomotiv Sanayi AS (Consumer Discretionary) | | | 8,091 | |
| | 342 | | | GEN Ilac VE Saglik Urunleri Sanayi VE Ticaret AS (Health Care) | | | 834 | |
| | 496 | | | Girisim Elektrik Taahhut Ticaret Ve Sanayi AS (Industrials)* | | | 1,727 | |
| | 202 | | | Gubre Fabrikalari TAS (Materials)* | | | 2,707 | |
| | 5,226 | | | Haci Omer Sabanci Holding AS (Financials) | | | 11,723 | |
| | 3,779 | | | Hektas Ticaret TAS (Materials)* | | | 3,638 | |
| | 71 | | | Investco Holding AS (Financials)* | | | 836 | |
| | 1,828 | | | Is Gayrimenkul Yatirim Ortakligi AS REIT (Real Estate)* | | | 1,306 | |
| | 2,185 | | | Is Yatirim Menkul Degerler AS (Financials) | | | 3,484 | |
| | 2,188 | | | Izmir Demir Celik Sanayi AS (Materials)* | | | 665 | |
| | 85 | | | Jantsa Jant Sanayi Ve Ticaret AS (Industrials) | | | 444 | |
| | 881 | | | Kardemir Karabuk Demir Celik Sanayi ve Ticaret AS, Class A (Materials) | | | 790 | |
| | 159 | | | Kardemir Karabuk Demir Celik Sanayi ve Ticaret AS, Class B (Materials) | | | 135 | |
| | 2,945 | | | Kardemir Karabuk Demir Celik Sanayi ve Ticaret AS, Class D (Materials) | | | 2,762 | |
| | 69 | | | Kartonsan Karton Sanayi ve Ticaret AS (Materials) | | | 218 | |
| | 882 | | | Kiler Holding AS (Industrials)* | | | 738 | |
| | 126 | | | Kizilbuk Gayrimenkul Yatirim Ortakligi AS (Real Estate)* | | | 106 | |
| | 4,182 | | | KOC Holding AS (Industrials) | | | 22,245 | |
| | 267 | | | Kontrolmatik Enerji Ve Muhendislik AS (Industrials) | | | 2,754 | |
| | 3 | | | Konya Cimento Sanayii AS (Materials)* | | | 660 | |
| | 252 | | | Kordsa Teknik Tekstil AS (Consumer Discretionary) | | | 774 | |
| | 3,797 | | | Koza Altin Isletmeleri AS (Materials) | | | 4,054 | |
| | 732 | | | Koza Anadolu Metal Madencilik Isletmeleri AS (Materials)* | | | 1,800 | |
| | 296 | | | Logo Yazilim Sanayi Ve Ticaret AS (Information Technology) | | | 823 | |
| | 352 | | | Margun Enerji Uretim Sanayi VE Ticaret AS (Utilities) | | | 685 | |
| | |
| | |
| 40 | | The accompanying notes are an integral part of these financial statements. |
GOLDMAN SACHS MARKETBETA® EMERGING MARKETS EQUITY ETF
| | | | | | | | |
Shares | | | Description | | Value | |
| |
| Common Stocks – (continued) | | | |
| Turkey – (continued) | | | |
| | 348 | | | Migros Ticaret AS (Consumer Staples) | | $ | 4,529 | |
| | 299 | | | MLP Saglik Hizmetleri AS (Health Care)*(a) | | | 1,424 | |
| | 228 | | | Nuh Cimento Sanayi AS (Materials) | | | 1,625 | |
| | 4,387 | | | ODAS Elektrik Uretim ve Sanayi Ticaret AS (Utilities)* | | | 2,166 | |
| | 165 | | | Otokar Otomotiv Ve Savunma Sanayi A.S. (Industrials)* | | | 2,222 | |
| | 984 | | | Oyak Cimento Fabrikalari AS (Materials)* | | | 2,340 | |
| | 165 | | | Pegasus Hava Tasimaciligi AS (Industrials)* | | | 5,415 | |
| | 606 | | | Penta Teknoloji Urunleri Dagitim Ticaret AS (Information Technology)* | | | 525 | |
| | 4,031 | | | Petkim Petrokimya Holding AS (Materials)* | | | 3,091 | |
| | 2,475 | | | Qua Granite Hayal (Industrials)* | | | 645 | |
| | 1,565 | | | Sarkuysan Elektrolitik Bakir Sanayi ve Ticaret AS (Industrials) | | | 2,212 | |
| | 4,566 | | | Sasa Polyester Sanayi AS (Materials)* | | | 9,034 | |
| | 465 | | | Selcuk Ecza Deposu Ticaret ve Sanayi A.S. (Health Care) | | | 1,031 | |
| | 598 | | | Smart Gunes Enerjisi Teknolojileri ArGE Uretim Sanayi ve Ticaret AS (Information Technology)* | | | 1,700 | |
| | 1,026 | | | Sok Marketler Ticaret AS (Consumer Staples) | | | 2,392 | |
| | 688 | | | TAV Havalimanlari Holding AS (Industrials)* | | | 3,167 | |
| | 723 | | | Tekfen Holding AS (Industrials) | | | 1,294 | |
| | 484 | | | Tofas Turk Otomobil Fabrikasi AS (Consumer Discretionary) | | | 4,900 | |
| | 713 | | | Torunlar Gayrimenkul Yatirim Ortakligi AS REIT (Real Estate) | | | 682 | |
| | 2,697 | | | Turk Hava Yollari AO (Industrials)* | | | 24,787 | |
| | 122 | | | Turk Prysmian Kablo ve Sistemleri AS (Industrials) | | | 159 | |
| | 1,983 | | | Turk Telekomunikasyon AS (Communication Services)* | | | 1,910 | |
| | 99 | | | Turk Traktor ve Ziraat Makineleri AS (Industrials) | | | 3,380 | |
| | 4,693 | | | Turkcell Iletisim Hizmetleri AS (Communication Services)* | | | 9,823 | |
| | 2,447 | | | Turkiye Halk Bankasi AS (Financials)* | | | 1,225 | |
| | 13,666 | | | Turkiye Is Bankasi AS, Class C (Financials) | | | 10,796 | |
| | 3,453 | | | Turkiye Petrol Rafinerileri AS (Energy) | | | 18,277 | |
| | 814 | | | Turkiye Sigorta AS (Financials)* | | | 824 | |
| | 4,043 | | | Turkiye Sinai Kalkinma Bankasi AS (Financials)* | | | 1,078 | |
| | 5,192 | | | Turkiye Sise ve Cam Fabrikalari AS (Industrials) | | | 9,982 | |
| | 4,501 | | | Turkiye Vakiflar Bankasi TAO, Class D (Financials)* | | | 2,293 | |
| | 555 | | | Ulker Biskuvi Sanayi AS (Consumer Staples)* | | | 1,270 | |
| | |
| |
| Common Stocks – (continued) | | | |
| Turkey – (continued) | | | |
| | 108 | | | Verusa Holding AS (Financials) | | | 675 | |
| | 1,009 | | | Vestel Beyaz Esya Sanayi ve Ticaret AS (Consumer Discretionary) | | | 686 | |
| | 356 | | | Vestel Elektronik Sanayi ve Ticaret AS (Consumer Discretionary)* | | | 919 | |
| | 10,434 | | | Yapi ve Kredi Bankasi AS (Financials) | | | 6,223 | |
| | 646 | | | Yayla Agro Gida Sanayi VE Nakliyat AS (Consumer Staples) | | | 577 | |
| | 5,414 | | | Zorlu Enerji Elektrik Uretim AS (Utilities)* | | | 985 | |
| | | | | | | | |
| | | | | | | 325,432 | |
| | |
| United Arab Emirates – 2.2% | | | |
| | 11,369 | | | Abu Dhabi Commercial Bank PJSC (Financials) | | | 26,712 | |
| | 5,510 | | | Abu Dhabi Islamic Bank PJSC (Financials) | | | 15,631 | |
| | 11,410 | | | Abu Dhabi National Energy Co. PJSC (Utilities) | | | 10,686 | |
| | 11,432 | | | Abu Dhabi National Oil Co. for Distribution PJSC (Consumer Discretionary) | | | 11,858 | |
| | 6,999 | | | ADNOC Drilling Co. PJSC (Energy) | | | 7,813 | |
| | 29,481 | | | Adnoc Gas PLC (Energy)* | | | 27,610 | |
| | 14,089 | | | Aldar Properties PJSC (Real Estate) | | | 20,176 | |
| | 5,257 | | | Alpha Dhabi Holding PJSC (Industrials)* | | | 28,768 | |
| | 12,033 | | | Borouge PLC (Materials) | | | 8,944 | |
| | 34,133 | | | Dubai Electricity & Water Authority PJSC (Utilities) | | | 23,697 | |
| | 11,323 | | | Dubai Islamic Bank PJSC (Financials) | | | 17,387 | |
| | 23,858 | | | Emaar Properties PJSC (Real Estate) | | | 45,858 | |
| | 9,441 | | | Emirates NBD Bank PJSC (Financials) | | | 42,025 | |
| | 13,362 | | | Emirates Telecommunications Group Co. PJSC (Communication Services) | | | 72,175 | |
| | 16,974 | | | First Abu Dhabi Bank PJSC (Financials) | | | 63,218 | |
| | 1,375 | | | International Holding Co. PJSC (Industrials)* | | | 153,108 | |
| | | | | | | | |
| | | | | | | 575,666 | |
| | |
| United States – 0.1% | | | |
| | 2,586 | | | JBS SA (Consumer Staples) | | | 9,611 | |
| | 284 | | | Parade Technologies Ltd. (Information Technology) | | | 8,008 | |
| | | | | | | | |
| | | | | | | 17,619 | |
| | |
| | TOTAL COMMON STOCKS | | | | |
| | (Cost $22,065,546) | | $ | 25,598,120 | |
| | |
| | | | | | | | | | |
Shares | | Description | | Rate | | | Value | |
|
| Preferred Stocks – 2.2% | |
| Brazil – 1.4% | |
| 19,944 | | Banco Bradesco SA (Financials) | | | 6.74 | % | | $ | 60,223 | |
| 765 | | Braskem SA, Class A
(Materials)* | | | 0.00 | | | | 3,437 | |
| |
| | |
| The accompanying notes are an integral part of these financial statements. | | 41 |
GOLDMAN SACHS MARKETBETA® EMERGING MARKETS EQUITY ETF
Schedule of Investments (continued)
August 31, 2023
| | | | | | | | | | |
Shares | | Description | | Rate | | | Value | |
|
| Preferred Stocks – (continued) | |
| Brazil – (continued) | |
| 959 | | Centrais Eletricas Brasileiras
SA, Class B (Utilities) | | | 3.86 | % | | $ | 7,504 | |
| 5,667 | | Cia Energetica de Minas
Gerais (Utilities) | | | 9.16 | | | | 14,113 | |
| 4,470 | | Gerdau SA (Materials) | | | 14.91 | | | | 23,339 | |
| 18,600 | | Itau Unibanco Holding SA
(Financials) | | | 4.47 | | | | 103,051 | |
| 19,505 | | Itausa SA (Financials) | | | 6.42 | | | | 36,402 | |
| 17,541 | | Petroleo Brasileiro SA
(Energy) | | | 11.38 | | | | 113,162 | |
| 4,620 | | Raizen SA (Energy) | | | 6.44 | | | | 3,387 | |
| | | | | | | | | | |
| | | | | | | | | 364,618 | |
| |
| Chile – 0.1% | | | | |
| 522 | | Sociedad Quimica y Minera
de Chile SA, Class B
(Industrials) | | | 14.38 | | | | 32,174 | |
| |
| Colombia – 0.1% | | | | |
| 1,798 | | Bancolombia SA (Financials) | | | 12.24 | | | | 11,941 | |
| |
| Russia – 0.0%(c) | | | | |
| 4,252 | | Sberbank of Russia PJSC
(Financials) | | | 9.44 | | | | — | |
| 31,665 | | Surgutneftegas PJSC
(Energy) | | | 1.61 | | | | — | |
| 640 | | Tatneft PJSC (Energy) | | | 14.16 | | | | — | |
| | | | | | | | | | |
| | | | | | | | | — | |
| |
| South Korea – 0.6% | | | | |
| 132 | | Hyundai Motor Co.
(Consumer Discretionary) | | | 7.34 | | | | 10,396 | |
| 88 | | Hyundai Motor Co.
(Consumer Discretionary) | | | 7.42 | | | | 6,778 | |
| 31 | | LG Chem Ltd. (Materials) | | | 2.99 | | | | 8,009 | |
| 73 | | LG Electronics, Inc.
(Consumer Discretionary) | | | 1.58 | | | | 2,588 | |
| 8 | | LG H&H Co. Ltd.
(Consumer Staples) | | | 2.07 | | | | 1,157 | |
| 3,157 | | Samsung Electronics Co.
Ltd. (Information Technology) | | | 2.54 | | | | 128,979 | |
| 5 | | Samsung SDI Co. Ltd.
(Information Technology) | | | 0.37 | | | | 1,135 | |
| | | | | | | | | | |
| | | | | | | | | 159,042 | |
| |
| TOTAL PREFERRED STOCKS | |
| (Cost $480,171) | | | $ | 567,775 | |
| |
| | | | | | | | |
| Shares | | | Description | | Value | |
|
| Exchange-Traded Fund – 1.0% | |
| United States – 1.0% | | | |
| | 12,873 | | | iShares MSCI Malaysia ETF | | | | |
| | (Cost $302,162) | | $ | 271,363 | |
| | |
| TOTAL INVESTMENTS BEFORE SECURITIES LENDING
REINVESTMENT VEHICLE |
|
| | (Cost $22,847,879) | | $ | 26,437,258 | |
| | |
| Shares | | Dividend
Rate | | | Value | |
| | | | | | | | |
|
| Securities Lending Reinvestment Vehicle – 0.4%(d) | |
Goldman Sachs Financial Square Government Fund – Institutional Shares | |
| 104,477 | | | 5.234% | | | $ | 104,477 | |
| (Cost $104,477) | | | | | |
| |
| TOTAL INVESTMENTS – 100.1% | |
| (Cost $22,952,356) | | | $ | 26,541,735 | |
| |
LIABILITIES IN EXCESS OF OTHER ASSETS – (0.1)% | | | | (18,048 | ) |
| |
| NET ASSETS – 100.0% | | | $ | 26,523,687 | |
| |
| | |
|
| The percentage shown for each investment category reflects the value of investments in that category as a percentage of net assets. |
| |
* | | Non-income producing security. |
| |
(a) | | Exempt from registration under Rule 144A of the Securities Act of 1933. |
| |
(b) | | All or a portion of security is on loan. |
| |
(c) | | Significant unobservable inputs were used in the valuation of this portfolio security; i.e. Level 3. |
| |
(d) | | Represents an affiliated issuer. |
| | |
|
Investment Abbreviations: |
ADR | | — American Depositary Receipt |
NVDR | | — Non-Voting Depository Receipt |
PLC | | — Public Limited Company |
REIT | | — Real Estate Investment Trust |
|
|
| | | | |
| Sector Name | | % of Market
Value | |
| |
Financials | | | 20.9 | % |
Information Technology | | | 20.1 | |
Consumer Discretionary | | | 13.1 | |
Communication Services | | | 9.1 | |
Materials | | | 8.2 | |
Industrials | | | 8.0 | |
Consumer Staples | | | 6.0 | |
Energy | | | 5.3 | |
Health Care | | | 3.5 | |
Utilities | | | 2.7 | |
Real Estate | | | 1.7 | |
Exchange-Traded Fund | | | 1.0 | |
Securities Lending Reinvestment Vehicle | | | 0.4 | |
| |
| |
| TOTAL INVESTMENTS | | | 100.0 | % |
| |
| | |
| 42 | | The accompanying notes are an integral part of these financial statements. |
GOLDMAN SACHS MARKETBETA® EMERGING MARKETS EQUITY ETF
|
| ADDITIONAL INVESTMENT INFORMATION |
FUTURES CONTRACTS — At August 31, 2023, the Fund had the following futures contracts:
| | | | | | | | | | | | | | |
| Description | | Number of
Contracts | | | Expiration
Date | | Notional
Amount | | | Unrealized
Appreciation/
(Depreciation) | |
Long position contracts: | | | | | | | | | | | | | | |
MSCI Emerging Markets Index | | | 1 | | | 09/15/23 | | $ | 48,965 | | | $ | (342 | ) |
| | |
| The accompanying notes are an integral part of these financial statements. | | 43 |
GOLDMAN SACHS MARKETBETA® INTERNATIONAL EQUITY ETF
Schedule of Investments
August 31, 2023
| | | | | | | | |
Shares | | | Description | | Value | |
| |
| Common Stocks – 98.9% | | | |
| Australia – 7.9% | | | |
| | 16,519 | | | AGL Energy Ltd. (Utilities) | | $ | 118,647 | |
| | 16,141 | | | Allkem Ltd. (Materials)* | | | 146,770 | |
| | 65,216 | | | Alumina Ltd. (Materials)* | | | 45,616 | |
| | 6,635 | | | Ampol Ltd. (Energy) | | | 151,690 | |
| | 84,040 | | | ANZ Group Holdings Ltd. (Financials) | | | 1,378,674 | |
| | 32,862 | | | APA Group (Utilities) | | | 191,335 | |
| | 16,519 | | | Aristocrat Leisure Ltd. (Consumer Discretionary) | | | 437,570 | |
| | 5,338 | | | ASX Ltd. (Financials) | | | 199,098 | |
| | 32,967 | | | Atlas Arteria Ltd. (Industrials) | | | 129,815 | |
| | 51,141 | | | Aurizon Holdings Ltd. (Industrials) | | | 120,893 | |
| | 141,781 | | | BHP Group Ltd. (Materials) | | | 4,118,328 | |
| | 12,819 | | | BlueScope Steel Ltd. (Materials) | | | 174,430 | |
| | 38,671 | | | Brambles Ltd. (Industrials) | | | 374,928 | |
| | 9,378 | | | carsales.com Ltd. (Communication Services) | | | 174,557 | |
| | 12,953 | | | Charter Hall Group REIT (Real Estate) | | | 90,937 | |
| | 1,823 | | | Cochlear Ltd. (Health Care) | | | 320,539 | |
| | 36,265 | | | Coles Group Ltd. (Consumer Staples) | | | 382,134 | |
| | 46,893 | | | Commonwealth Bank of Australia (Financials) | | | 3,103,233 | |
| | 14,653 | | | Computershare Ltd. (Industrials) | | | 238,959 | |
| | 29,618 | | | Dexus REIT (Real Estate) | | | 148,661 | |
| | 1,633 | | | Domino’s Pizza Enterprises Ltd. (Consumer Discretionary) | | | 57,164 | |
| | 4,352 | | | EBOS Group Ltd. (Health Care) | | | 98,344 | |
| | 37,585 | | | Endeavour Group Ltd. (Consumer Staples) | | | 133,881 | |
| | 49,699 | | | Evolution Mining Ltd. (Materials) | | | 119,416 | |
| | 4,944 | | | Flutter Entertainment PLC (Consumer Discretionary)* | | | 900,947 | |
| | 44,158 | | | Fortescue Metals Group Ltd. (Materials) | | | 612,875 | |
| | 261,922 | | | Glencore PLC (Materials) | | | 1,398,770 | |
| | 51,444 | | | Goodman Group REIT (Real Estate) | | | 778,302 | |
| | 53,072 | | | GPT Group (The) REIT (Real Estate) | | | 144,363 | |
| | 5,697 | | | IDP Education Ltd. (Consumer Discretionary) | | | 90,876 | |
| | 18,619 | | | IGO Ltd. (Materials) | | | 167,856 | |
| | 68,124 | | | Insurance Australia Group Ltd. (Financials) | | | 256,781 | |
| | 19,166 | | | Lendlease Corp. Ltd. (Real Estate) | | | 96,944 | |
| | 61,985 | | | Lottery Corp. Ltd. (The) (Consumer Discretionary) | | | 202,329 | |
| | 25,778 | | | Lynas Rare Earths Ltd. (Materials)* | | | 120,038 | |
| | 10,143 | | | Macquarie Group Ltd. (Financials) | | | 1,166,215 | |
| | 76,674 | | | Medibank Pvt Ltd. (Financials) | | | 181,748 | |
| | 4,679 | | | Mineral Resources Ltd. (Materials) | | | 216,761 | |
| | 109,357 | | | Mirvac Group REIT (Real Estate) | | | 171,397 | |
| | 87,441 | | | National Australia Bank Ltd. (Financials) | | | 1,640,039 | |
| | 24,937 | | | Newcrest Mining Ltd. (Materials) | | | 420,396 | |
| | 31,305 | | | Northern Star Resources Ltd. (Materials) | | | 241,471 | |
| | 12,595 | | | Orica Ltd. (Materials) | | | 128,149 | |
| | 47,577 | | | Origin Energy Ltd. (Utilities) | | | 268,383 | |
| | 76,284 | | | Pilbara Minerals Ltd. (Materials) | | | 230,723 | |
| | |
| |
| Common Stocks – (continued) | | | |
| Australia – (continued) | | | |
| | 50,290 | | | Qantas Airways Ltd. (Industrials)* | | | 192,491 | |
| | 41,723 | | | QBE Insurance Group Ltd. (Financials) | | | 404,788 | |
| | 5,044 | | | Ramsay Health Care Ltd. (Health Care) | | | 168,074 | |
| | 1,396 | | | REA Group Ltd. (Communication Services) | | | 149,252 | |
| | 8,208 | | | Reece Ltd. (Industrials) | | | 108,445 | |
| | 10,370 | | | Rio Tinto Ltd. (Materials) | | | 758,251 | |
| | 29,908 | | | Rio Tinto PLC (Materials) | | | 1,846,578 | |
| | 91,863 | | | Santos Ltd. (Energy) | | | 456,327 | |
| | 144,221 | | | Scentre Group REIT (Real Estate) | | | 256,863 | |
| | 9,496 | | | SEEK Ltd. (Communication Services) | | | 142,128 | |
| | 4,293 | | | Seven Group Holdings Ltd. (Industrials) | | | 77,739 | |
| | 12,595 | | | Sonic Healthcare Ltd. (Health Care) | | | 262,334 | |
| | 126,317 | | | South32 Ltd. (Materials) | | | 278,151 | |
| | 66,196 | | | Stockland REIT (Real Estate) | | | 181,777 | |
| | 35,177 | | | Suncorp Group Ltd. (Financials) | | | 310,524 | |
| | 322,908 | | | Telstra Group Ltd. (Communication Services) | | | 838,617 | |
| | 10,913 | | | TPG Telecom Ltd. (Communication Services) | | | 39,792 | |
| | 86,122 | | | Transurban Group (Industrials) | | | 739,602 | |
| | 20,047 | | | Treasury Wine Estates Ltd. (Consumer Staples) | | | 151,517 | |
| | 106,913 | | | Vicinity Ltd. REIT (Real Estate) | | | 129,483 | |
| | 6,448 | | | Washington H Soul Pattinson & Co. Ltd. (Financials) | | | 137,851 | |
| | 31,474 | | | Wesfarmers Ltd. (Consumer Discretionary) | | | 1,098,094 | |
| | 97,748 | | | Westpac Banking Corp. (Financials) | | | 1,389,578 | |
| | 23,511 | | | Whitehaven Coal Ltd. (Energy) | | | 92,732 | |
| | 4,768 | | | WiseTech Global Ltd. (Information Technology) | | | 214,616 | |
| | 53,080 | | | Woodside Energy Group Ltd. (Energy) | | | 1,272,646 | |
| | 33,820 | | | Woolworths Group Ltd. (Consumer Staples) | | | 835,181 | |
| | | | | | | | |
| | | | | | | 34,424,413 | |
| | |
| Austria – 0.3% | | | |
| | 7,257 | | | ams-OSRAM AG (Information Technology)* | | | 50,990 | |
| | 1,983 | | | ANDRITZ AG (Industrials) | | | 105,632 | |
| | 2,173 | | | BAWAG Group AG (Financials)*(a) | | | 102,688 | |
| | 1,216 | | | CA Immobilien Anlagen AG (Real Estate) | | | 40,385 | |
| | 9,106 | | | Erste Group Bank AG (Financials) | | | 325,849 | |
| | 989 | | | EVN AG (Utilities) | | | 24,528 | |
| | 240 | | | Mayr Melnhof Karton AG (Materials) | | | 34,071 | |
| | 13,524 | | | Mondi PLC (Materials) | | | 225,180 | |
| | 3,938 | | | OMV AG (Energy) | | | 182,804 | |
| | 4,145 | | | Raiffeisen Bank International AG (Financials)* | | | 59,609 | |
| | 902 | | | Verbund AG (Utilities) | | | 74,011 | |
| | 980 | | | Vienna Insurance Group AG Wiener Versicherung Gruppe (Financials) | | | 26,325 | |
| | 3,113 | | | voestalpine AG (Materials) | | | 91,157 | |
| | |
| | |
| 44 | | The accompanying notes are an integral part of these financial statements. |
GOLDMAN SACHS MARKETBETA® INTERNATIONAL EQUITY ETF
| | | | | | | | |
Shares | | | Description | | Value | |
| |
| Common Stocks – (continued) | | | |
| Austria – (continued) | | | |
| | 2,978 | | | Wienerberger AG (Materials) | | $ | 82,227 | |
| | | | | | | | |
| | | | | | | 1,425,456 | |
| | |
| Belgium – 0.8% | | | |
| | 615 | | | Ackermans & van Haaren NV (Industrials) | | | 96,920 | |
| | 4,263 | | | Ageas SA/NV (Financials) | | | 169,713 | |
| | 23,897 | | | Anheuser-Busch InBev SA/NV (Consumer Staples) | | | 1,361,672 | |
| | 3,197 | | | Azelis Group NV (Industrials) | | | 70,924 | |
| | 613 | | | D’ieteren Group (Consumer Discretionary) | | | 100,330 | |
| | 779 | | | Elia Group SA/NV (Utilities) | | | 90,044 | |
| | 1,403 | | | Etablissements Franz Colruyt NV (Consumer Staples) | | | 53,646 | |
| | 2,674 | | | Groupe Bruxelles Lambert NV (Financials) | | | 215,810 | |
| | 6,996 | | | KBC Group NV (Financials) | | | 459,839 | |
| | 3,942 | | | Proximus SADP (Communication Services) | | | 29,855 | |
| | 417 | | | Sofina SA (Financials) | | | 93,958 | |
| | 1,947 | | | Solvay SA (Materials) | | | 225,899 | |
| | 3,346 | | | UCB SA (Health Care) | | | 300,695 | |
| | 5,623 | | | Umicore SA (Materials) | | | 149,339 | |
| | 4,527 | | | Warehouses De Pauw CVA REIT (Real Estate) | | | 129,713 | |
| | | | | | | | |
| | | | | | | 3,548,357 | |
| | |
| Brazil – 0.0% | | | |
| | 4,281 | | | Yara International ASA (Materials) | | | 156,516 | |
| | |
| Chile – 0.0% | | | |
| | 9,635 | | | Antofagasta PLC (Materials) | | | 176,786 | |
| | |
| China – 1.0% | | | |
| | 140,125 | | | Alibaba Health Information Technology Ltd. (Consumer Staples)* | | | 82,734 | |
| | 47,142 | | | Budweiser Brewing Co. APAC Ltd. (Consumer Staples)(a) | | | 102,198 | |
| | 21,044 | | | BYD Electronic International Co. Ltd. (Information Technology) | | | 97,548 | |
| | 75,106 | | | China Gas Holdings Ltd. (Utilities) | | | 76,622 | |
| | 83,632 | | | China Mengniu Dairy Co. Ltd. (Consumer Staples)* | | | 281,555 | |
| | 48,660 | | | Chow Tai Fook Jewellery Group Ltd. (Consumer Discretionary) | | | 73,842 | |
| | 233,488 | | | CSPC Pharmaceutical Group Ltd. (Health Care) | | | 175,672 | |
| | 83,045 | | | ESR Group Ltd. (Real Estate)(a) | | | 124,751 | |
| | 60,614 | | | Fosun International Ltd. (Industrials) | | | 37,953 | |
| | 162,055 | | | Geely Automobile Holdings Ltd. (Consumer Discretionary) | | | 201,284 | |
| | 7,262 | | | NXP Semiconductors NV (Information Technology) | | | 1,493,939 | |
| | 19,692 | | | Prosus NV (Consumer Discretionary)* | | | 1,363,152 | |
| | 26,809 | | | Wharf Holdings Ltd. (The) (Real Estate) | | | 56,820 | |
| | |
| |
| Common Stocks – (continued) | | | |
| China – (continued) | | | |
| | 58,121 | | | Wilmar International Ltd. (Consumer Staples) | | | 162,678 | |
| | 43,940 | | | Xinyi Glass Holdings Ltd. (Industrials) | | | 64,887 | |
| | 73,865 | | | Yangzijiang Shipbuilding Holdings Ltd. (Industrials) | | | 92,434 | |
| | | | | | | | |
| | | | | | | 4,488,069 | |
| | |
| Denmark – 3.1% | | | |
| | 76 | | | AP Moller – Maersk A/S, Class A (Industrials) | | | 136,352 | |
| | 119 | | | AP Moller – Maersk A/S, Class B (Industrials) | | | 216,704 | |
| | 2,537 | | | Carlsberg AS, Class B (Consumer Staples) | | | 367,973 | |
| | 2,857 | | | Chr Hansen Holding A/S (Materials) | | | 186,973 | |
| | 3,449 | | | Coloplast A/S, Class B (Health Care) | | | 394,375 | |
| | 18,747 | | | Danske Bank A/S (Financials) | | | 422,200 | |
| | 2,416 | | | Demant A/S (Health Care)* | | | 99,110 | |
| | 4,956 | | | DSV A/S (Industrials) | | | 943,646 | |
| | 1,813 | | | Genmab A/S (Health Care)* | | | 697,008 | |
| | 44,415 | | | Novo Nordisk A/S, Class B (Health Care)* | | | 8,240,152 | |
| | 5,702 | | | Novozymes A/S, Class B (Materials) | | | 247,861 | |
| | 5,282 | | | Orsted AS (Utilities)(a) | | | 340,367 | |
| | 2,481 | | | Pandora A/S (Consumer Discretionary) | | | 257,893 | |
| | 9,320 | | | Tryg A/S (Financials) | | | 178,136 | |
| | 28,164 | | | Vestas Wind Systems A/S (Industrials)* | | | 652,038 | |
| | | | | | | | |
| | | | | | | 13,380,788 | |
| | |
| Faroe Islands – 0.0% | | | |
| | 1,381 | | | Bakkafrost P/F (Consumer Staples) | | | 69,782 | |
| | |
| Finland – 1.1% | | | |
| | 3,914 | | | Elisa OYJ (Communication Services) | | | 192,310 | |
| | 12,004 | | | Fortum OYJ (Utilities) | | | 161,554 | |
| | 2,906 | | | Huhtamaki OYJ (Materials) | | | 100,014 | |
| | 7,504 | | | Kesko OYJ, Class B (Consumer Staples) | | | 146,763 | |
| | 9,285 | | | Kone OYJ, Class B (Industrials) | | | 423,254 | |
| | 19,387 | | | Metso Corp. (Industrials) | | | 223,568 | |
| | 12,012 | | | Neste OYJ (Energy) | | | 440,398 | |
| | 147,860 | | | Nokia OYJ (Information Technology) | | | 591,689 | |
| | 89,164 | | | Nordea Bank Abp (Financials) | | | 979,161 | |
| | 2,943 | | | Orion OYJ, Class B (Health Care) | | | 120,708 | |
| | 12,972 | | | Sampo OYJ, Class A (Financials) | | | 570,629 | |
| | 15,885 | | | Stora Enso OYJ, Class R (Materials) | | | 202,666 | |
| | 14,777 | | | UPM-Kymmene OYJ (Materials) | | | 507,129 | |
| | 13,511 | | | Wartsila OYJ Abp (Industrials) | | | 171,937 | |
| | | | | | | | |
| | | | | | | 4,831,780 | |
| | |
| France – 9.0% | | | |
| | 5,477 | | | Adevinta ASA (Communication Services)* | | | 39,029 | |
| | 763 | | | Aeroports de Paris (Industrials) | | | 100,700 | |
| | 14,269 | | | Air Liquide SA (Materials) | | | 2,584,138 | |
| | 16,391 | | | Airbus SE (Industrials) | | | 2,408,407 | |
| | 49,797 | | | AXA SA (Financials) | | | 1,501,161 | |
| | 1,171 | | | BioMerieux (Health Care) | | | 121,502 | |
| | |
| | |
| The accompanying notes are an integral part of these financial statements. | | 45 |
GOLDMAN SACHS MARKETBETA® INTERNATIONAL EQUITY ETF
Schedule of Investments (continued)
August 31, 2023
| | | | | | | | |
Shares | | | Description | | Value | |
| |
| Common Stocks – (continued) | | | |
| France – (continued) | | | |
| | 30,021 | | | BNP Paribas SA (Financials) | | $ | 1,945,549 | |
| | 22,127 | | | Bollore SE (Communication Services) | | | 131,245 | |
| | 5,446 | | | Bouygues SA (Industrials) | | | 188,555 | |
| | 4,429 | | | Capgemini SE (Information Technology) | | | 828,489 | |
| | 16,434 | | | Carrefour SA (Consumer Staples) | | | 315,174 | |
| | 13,002 | | | Cie de Saint-Gobain SA (Industrials) | | | 848,961 | |
| | 18,794 | | | Cie Generale des Etablissements Michelin (Consumer Discretionary) | | | 589,708 | |
| | 30,866 | | | Credit Agricole SA (Financials) | | | 390,481 | |
| | 17,646 | | | Danone SA (Consumer Staples) | | | 1,030,957 | |
| | 18,999 | | | Dassault Systemes (Information Technology) | | | 754,919 | |
| | 48,994 | | | Engie SA (Utilities) | | | 791,785 | |
| | 8,026 | | | EssilorLuxottica SA (Health Care) | | | 1,514,847 | |
| | 908 | | | Hermes International SCA (Consumer Discretionary) | | | 1,873,235 | |
| | 1,994 | | | Kering (Consumer Discretionary) | | | 1,069,542 | |
| | 6,271 | | | L’Oreal SA (Consumer Staples) | | | 2,761,969 | |
| | 7,171 | | | Legrand SA (Industrials) | | | 709,036 | |
| | 7,273 | | | LVMH Moet Hennessy Louis Vuitton SE (Consumer Discretionary) | | | 6,174,493 | |
| | 52,407 | | | Orange SA (Communication Services) | | | 589,163 | |
| | 5,451 | | | Pernod Ricard SA (Consumer Staples) | | | 1,072,023 | |
| | 9,920 | | | Safran SA (Industrials) | | | 1,596,698 | |
| | 678 | | | Sartorius Stedim Biotech (Health Care) | | | 192,871 | |
| | 20,915 | | | Societe Generale SA (Financials) | | | 595,083 | |
| | 2,258 | | | Sodexo SA (Consumer Discretionary) | | | 242,670 | |
| | 1,615 | | | Teleperformance SE (Industrials) | | | 224,101 | |
| | 2,709 | | | Thales SA (Industrials) | | | 396,341 | |
| | 63,923 | | | TotalEnergies SE (Energy) | | | 4,028,830 | |
| | 13,574 | | | Vinci SA (Industrials) | | | 1,516,863 | |
| | 6,659 | | | Worldline SA (Financials)*(a) | | | 217,399 | |
| | | | | | | | |
| | | | | | | 39,345,924 | |
| | |
| Germany – 7.2% | | | |
| | 4,639 | | | adidas AG (Consumer Discretionary) | | | 928,544 | |
| | 11,250 | | | Allianz SE (Financials) | | | 2,739,356 | |
| | 24,986 | | | BASF SE (Materials) | | | 1,268,878 | |
| | 27,505 | | | Bayer AG (Health Care) | | | 1,508,748 | |
| | 8,517 | | | Bayerische Motoren Werke AG (Consumer Discretionary) | | | 898,233 | |
| | 2,726 | | | Beiersdorf AG (Consumer Staples) | | | 357,407 | |
| | 2,590 | | | BioNTech SE ADR (Health Care)* | | | 319,055 | |
| | 1,018 | | | Carl Zeiss Meditec AG (Health Care) | | | 101,340 | |
| | 3,008 | | | Continental AG (Consumer Discretionary) | | | 224,026 | |
| | 12,032 | | | Daimler Truck Holding AG (Industrials) | | | 424,285 | |
| | 54,541 | | | Deutsche Bank AG (Financials) | | | 595,039 | |
| | 5,140 | | | Deutsche Boerse AG (Financials) | | | 914,070 | |
| | 90,377 | | | Deutsche Telekom AG (Communication Services) | | | 1,936,507 | |
| | 26,459 | | | DHL Group (Industrials) | | | 1,237,284 | |
| | 61,949 | | | E.ON SE (Utilities) | | | 765,150 | |
| | 5,593 | | | Evonik Industries AG (Materials) | | | 107,476 | |
| | 5,544 | | | Fresenius Medical Care AG & Co. KGaA (Health Care) | | | 268,065 | |
| | |
| |
| Common Stocks – (continued) | | | |
| Germany – (continued) | | | |
| | 11,459 | | | Fresenius SE & Co. KGaA (Health Care) | | | 368,260 | |
| | 1,674 | | | Hannover Rueck SE (Financials) | | | 356,562 | |
| | 176 | | | Hapag-Lloyd AG (Industrials)(a)(b) | | | 35,033 | |
| | 3,838 | | | Heidelberg Materials AG (Materials) | | | 309,419 | |
| | 2,679 | | | Henkel AG & Co. KGaA (Consumer Staples) | | | 185,450 | |
| | 36,457 | | | Infineon Technologies AG (Information Technology) | | | 1,306,358 | |
| | 1,853 | | | Knorr-Bremse AG (Industrials) | | | 126,904 | |
| | 22,007 | | | Mercedes-Benz Group AG (Consumer Discretionary) | | | 1,613,213 | |
| | 3,616 | | | Merck KGaA (Health Care) | | | 651,488 | |
| | 1,504 | | | MTU Aero Engines AG (Industrials) | | | 352,265 | |
| | 3,816 | | | Muenchener Rueckversicherungs-Gesellschaft AG in Muenchen (Financials) | | | 1,483,556 | |
| | 2,803 | | | Puma SE (Consumer Discretionary) | | | 188,619 | |
| | 20,823 | | | RWE AG (Utilities) | | | 860,165 | |
| | 28,653 | | | SAP SE (Information Technology) | | | 4,006,114 | |
| | 20,718 | | | Siemens AG (Industrials) | | | 3,122,896 | |
| | 13,953 | | | Siemens Energy AG (Industrials)* | | | 199,294 | |
| | 7,541 | | | Siemens Healthineers AG (Health Care)(a) | | | 378,539 | |
| | 3,697 | | | Symrise AG (Materials) | | | 385,846 | |
| | 1,248 | | | Talanx AG (Financials) | | | 84,048 | |
| | 24,802 | | | Telefonica Deutschland Holding AG (Communication Services) | | | 47,216 | |
| | 796 | | | Volkswagen AG (Consumer Discretionary) | | | 113,953 | |
| | 19,706 | | | Vonovia SE (Real Estate) | | | 472,887 | |
| | 6,129 | | | Zalando SE (Consumer Discretionary)*(a) | | | 191,115 | |
| | | | | | | | |
| | | | | | | 31,432,663 | |
| | |
| Guatemala – 0.0% | | | |
| | 3,623 | | | Millicom International Cellular SA SDR (Communication Services)* | | | 57,737 | |
| | |
| Hong Kong – 2.2% | | | |
| | 324,374 | | | AIA Group Ltd. (Financials) | | | 2,945,188 | |
| | 16,868 | | | Cathay Pacific Airways Ltd. (Industrials)* | | | 17,983 | |
| | 53,107 | | | CK Asset Holdings Ltd. (Real Estate) | | | 293,242 | |
| | 17,074 | | | CK Infrastructure Holdings Ltd. (Utilities) | | | 86,440 | |
| | 53,084 | | | CLP Holdings Ltd. (Utilities) | | | 416,318 | |
| | 1,973 | | | Futu Holdings Ltd. ADR (Financials)* | | | 117,591 | |
| | 49,173 | | | Hang Lung Properties Ltd. (Real Estate) | | | 65,717 | |
| | 20,162 | | | Hang Seng Bank Ltd. (Financials) | | | 257,111 | |
| | 36,660 | | | Henderson Land Development Co. Ltd. (Real Estate) | | | 100,746 | |
| | 63,317 | | | HK Electric Investments & HK Electric Investments Ltd. (Utilities) | | | 36,738 | |
| | 101,524 | | | HKT Trust & HKT Ltd. (Communication Services) | | | 108,234 | |
| | |
| | |
| 46 | | The accompanying notes are an integral part of these financial statements. |
GOLDMAN SACHS MARKETBETA® INTERNATIONAL EQUITY ETF
| | | | | | | | |
Shares | | | Description | | Value | |
| |
| Common Stocks – (continued) | | | |
| Hong Kong – (continued) | | | |
| | 256,190 | | | Hong Kong & China Gas Co. Ltd. (Utilities) | | $ | 188,506 | |
| | 33,395 | | | Hong Kong Exchanges & Clearing Ltd. (Financials) | | | 1,294,619 | |
| | 29,123 | | | Hongkong Land Holdings Ltd. (Real Estate) | | | 103,387 | |
| | 5,489 | | | Jardine Matheson Holdings Ltd. (Industrials) | | | 261,057 | |
| | 71,136 | | | Link REIT (Real Estate) | | | 352,879 | |
| | 43,674 | | | MTR Corp. Ltd. (Industrials) | | | 182,398 | |
| | 38,413 | | | New World Development Co. Ltd. (Real Estate) | | | 81,609 | |
| | 6,813 | | | Polestar Automotive Holding UK PLC, Class A ADR (Consumer Discretionary)* | | | 22,687 | |
| | 37,981 | | | Power Assets Holdings Ltd. (Utilities) | | | 187,199 | |
| | 77,032 | | | Prudential PLC (Financials) | | | 943,119 | |
| | 273,097 | | | Sino Biopharmaceutical Ltd. (Health Care) | | | 103,782 | |
| | 92,747 | | | Sino Land Co. Ltd. (Real Estate) | | | 106,328 | |
| | 40,759 | | | Sun Hung Kai Properties Ltd. (Real Estate) | | | 458,956 | |
| | 11,782 | | | Swire Pacific Ltd., Class A (Real Estate) | | | 97,210 | |
| | 22,415 | | | Swire Pacific Ltd., Class B (Real Estate) | | | 29,556 | |
| | 29,338 | | | Swire Properties Ltd. (Real Estate) | | | 61,357 | |
| | 38,180 | | | Techtronic Industries Co. Ltd. (Industrials) | | | 377,333 | |
| | 211,091 | | | WH Group Ltd. (Consumer Staples)(a) | | | 108,752 | |
| | 43,153 | | | Wharf Real Estate Investment Co. Ltd. (Real Estate) | | | 179,947 | |
| | | | | | | | |
| | | | | | | 9,585,989 | |
| | |
| Ireland – 0.8% | | | |
| | 4,633 | | | AerCap Holdings NV (Industrials)* | | | 285,022 | |
| | 29,545 | | | Bank of Ireland Group PLC (Financials) | | | 294,949 | |
| | 20,358 | | | CRH PLC (Materials) | | | 1,173,716 | |
| | 4,390 | | | Kerry Group PLC, Class A (Consumer Staples) | | | 410,430 | |
| | 4,264 | | | Kingspan Group PLC (Industrials) | | | 361,349 | |
| | 5,230 | | | Ryanair Holdings PLC ADR (Industrials)* | | | 519,078 | |
| | 7,206 | | | Smurfit Kappa Group PLC (Materials) | | | 303,300 | |
| | | | | | | | |
| | | | | | | 3,347,844 | |
| | |
| Israel – 0.8% | | | |
| | 1,608 | | | Airport City Ltd. (Real Estate)* | | | 24,702 | |
| | 4,256 | | | Alony Hetz Properties & Investments Ltd. (Real Estate) | | | 32,439 | |
| | 6,013 | | | Amot Investments Ltd. (Real Estate) | | | 28,495 | |
| | 1,071 | | | Ashtrom Group Ltd. (Industrials) | | | 14,719 | |
| | 1,018 | | | Azrieli Group Ltd. (Real Estate) | | | 54,729 | |
| | 34,606 | | | Bank Hapoalim BM (Financials) | | | 287,358 | |
| | 40,999 | | | Bank Leumi Le-Israel BM (Financials) | | | 319,180 | |
| | 55,745 | | | Bezeq The Israeli Telecommunication Corp. Ltd. (Communication Services) | | | 75,554 | |
| | |
| |
| Common Stocks – (continued) | | | |
| Israel – (continued) | | | |
| | 317 | | | Big Shopping Centers Ltd. (Real Estate)* | | | 26,540 | |
| | 2,565 | | | Check Point Software Technologies Ltd. (Information Technology)* | | | 345,223 | |
| | 261 | | | Delek Group Ltd. (Energy) | | | 37,546 | |
| | 690 | | | Elbit Systems Ltd. (Industrials) | | | 135,936 | |
| | 7,224 | | | Energix-Renewable Energies Ltd. (Utilities) | | | 22,538 | |
| | 3,230 | | | Enlight Renewable Energy Ltd. (Utilities)* | | | 52,660 | |
| | 183 | | | Fattal Holdings 1998 Ltd. (Consumer Discretionary)* | | | 17,971 | |
| | 1,443 | | | First International Bank Of Israel Ltd. (The) (Financials) | | | 58,468 | |
| | 1,896 | | | Global-e Online Ltd. (Consumer Discretionary)* | | | 75,138 | |
| | 3,075 | | | Harel Insurance Investments & Financial Services Ltd. (Financials) | | | 22,433 | |
| | 19,421 | | | ICL Group Ltd. (Materials) | | | 116,578 | |
| | 104 | | | Israel Corp. Ltd. (Materials) | | | 28,969 | |
| | 34,457 | | | Israel Discount Bank Ltd., Class A (Financials) | | | 172,816 | |
| | 1,336 | | | Maytronics Ltd. (Consumer Discretionary) | | | 14,477 | |
| | 699 | | | Melisron Ltd. (Real Estate) | | | 43,891 | |
| | 16,318 | | | Mivne Real Estate KD Ltd. (Real Estate) | | | 39,159 | |
| | 4,186 | | | Mizrahi Tefahot Bank Ltd. (Financials) | | | 137,979 | |
| | 1,771 | | | Nice Ltd. (Information Technology)* | | | 350,628 | |
| | 798 | | | Nova Ltd. (Information Technology)* | | | 103,450 | |
| | 2,832 | | | OPC Energy Ltd. (Utilities)* | | | 17,522 | |
| | 4,553 | | | Phoenix Holdings Ltd. (The) (Financials) | | | 45,682 | |
| | 2,472 | | | Plus500 Ltd. (Financials) | | | 44,731 | |
| | 3,951 | | | Shapir Engineering and Industry Ltd. (Industrials) | | | 27,170 | |
| | 7,386 | | | Shufersal Ltd. (Consumer Staples)* | | | 34,438 | |
| | 1,393 | | | Strauss Group Ltd. (Consumer Staples)* | | | 30,286 | |
| | 31,200 | | | Teva Pharmaceutical Industries Ltd. (Health Care)* | | | 303,925 | |
| | 3,043 | | | Tower Semiconductor Ltd. (Information Technology)* | | | 89,008 | |
| | 1,540 | | | Wix.com Ltd. (Information Technology)* | | | 152,106 | |
| | 2,655 | | | ZIM Integrated Shipping Services Ltd. (Industrials)(b) | | | 32,046 | |
| | | | | | | | |
| | | | | | | 3,416,490 | |
| | |
| Italy – 2.3% | | | |
| | 43,310 | | | A2A SpA (Utilities) | | | 83,178 | |
| | 3,387 | | | Amplifon SpA (Health Care) | | | 110,430 | |
| | 29,096 | | | Assicurazioni Generali SpA (Financials) | | | 604,113 | |
| | 5,648 | | | Banca Mediolanum SpA (Financials) | | | 51,738 | |
| | 13,639 | | | Davide Campari-Milano NV (Consumer Staples) | | | 178,673 | |
| | 627 | | | DiaSorin SpA (Health Care) | | | 66,391 | |
| | 214,976 | | | Enel SpA (Utilities) | | | 1,448,944 | |
| | |
| | |
| The accompanying notes are an integral part of these financial statements. | | 47 |
GOLDMAN SACHS MARKETBETA® INTERNATIONAL EQUITY ETF
Schedule of Investments (continued)
August 31, 2023
| | | | | | | | |
Shares | | | Description | | Value | |
| |
| Common Stocks – (continued) | | | |
| Italy – (continued) | | | |
| | 59,381 | | | Eni SpA (Energy) | | $ | 920,592 | |
| | 3,656 | | | Ferrari NV (Consumer Discretionary) | | | 1,162,636 | |
| | 16,995 | | | FinecoBank Banca Fineco SpA (Financials) | | | 233,520 | |
| | 19,466 | | | Hera SpA (Utilities) | | | 59,072 | |
| | 8,664 | | | Infrastrutture Wireless Italiane SpA (Communication Services)(a) | | | 107,341 | |
| | 2,005 | | | Interpump Group SpA (Industrials) | | | 101,734 | |
| | 434,302 | | | Intesa Sanpaolo SpA (Financials) | | | 1,165,226 | |
| | 11,150 | | | Leonardo SpA (Industrials) | | | 161,134 | |
| | 16,844 | | | Mediobanca Banca di Credito Finanziario SpA (Financials) | | | 220,659 | |
| | 5,404 | | | Moncler SpA (Consumer Discretionary) | | | 367,398 | |
| | 13,529 | | | Nexi SpA (Financials)*(a) | | | 97,382 | |
| | 7,020 | | | Pirelli & C SpA (Consumer Discretionary)(a) | | | 35,101 | |
| | 12,696 | | | Poste Italiane SpA (Financials)(a) | | | 141,310 | |
| | 14,272 | | | PRADA SpA (Consumer Discretionary) | | | 93,275 | |
| | 7,155 | | | Prysmian SpA (Industrials) | | | 293,465 | |
| | 2,719 | | | Recordati Industria Chimica e Farmaceutica SpA (Health Care) | | | 136,871 | |
| | 57,030 | | | Snam SpA (Utilities) | | | 294,880 | |
| | 922 | | | Stevanato Group SpA (Health Care) | | | 29,541 | |
| | 300,021 | | | Telecom Italia SpA (Communication Services)* | | | 93,292 | |
| | 167,902 | | | Telecom Italia SpA-RSP (Communication Services)* | | | 51,572 | |
| | 39,078 | | | Terna – Rete Elettrica Nazionale (Utilities) | | | 323,190 | |
| | 50,537 | | | UniCredit SpA (Financials) | | | 1,237,698 | |
| | 11,646 | | | UnipolSai Assicurazioni SpA (Financials) | | | 29,502 | |
| | | | | | | | |
| | | | | | | 9,899,858 | |
| | |
| Japan – 24.7% | | | |
| | 2,553 | | | ABC-Mart, Inc. (Consumer Discretionary)(b) | | | 46,480 | |
| | 10,577 | | | Acom Co. Ltd. (Financials) | | | 25,116 | |
| | 5,133 | | | Advantest Corp. (Information Technology) | | | 645,569 | |
| | 21,914 | | | Aeon Co. Ltd. (Consumer Staples)(b) | | | 454,431 | |
| | 2,554 | | | Aeon Mall Co. Ltd. (Real Estate) | | | 30,630 | |
| | 5,668 | | | AGC, Inc. (Industrials) | | | 199,062 | |
| | 5,630 | | | Air Water, Inc. (Materials) | | | 70,885 | |
| | 4,056 | | | Aisin Corp. (Consumer Discretionary) | | | 135,595 | |
| | 14,642 | | | Ajinomoto Co., Inc. (Consumer Staples) | | | 620,840 | |
| | 5,224 | | | Alfresa Holdings Corp. (Health Care) | | | 89,492 | |
| | 9,407 | | | Amada Co. Ltd. (Industrials) | | | 99,766 | |
| | 12,442 | | | ANA Holdings, Inc. (Industrials)* | | | 281,170 | |
| | 13,323 | | | Asahi Group Holdings Ltd. (Consumer Staples) | | | 519,431 | |
| | 5,941 | | | Asahi Intecc Co. Ltd. (Health Care) | | | 121,077 | |
| | 37,808 | | | Asahi Kasei Corp. (Materials) | | | 244,583 | |
| | 4,722 | | | Asics Corp. (Consumer Discretionary) | | | 172,260 | |
| | 50,001 | | | Astellas Pharma, Inc. (Health Care) | | | 760,567 | |
| | 3,641 | | | Azbil Corp. (Information Technology) | | | 121,546 | |
| | |
| |
| Common Stocks – (continued) | | | |
| Japan – (continued) | | | |
| | 16,148 | | | Bandai Namco Holdings, Inc. (Consumer Discretionary) | | | 375,125 | |
| | 3,596 | | | BayCurrent Consulting, Inc. (Industrials) | | | 123,823 | |
| | 15,344 | | | Bridgestone Corp. (Consumer Discretionary) | | | 596,644 | |
| | 7,001 | | | Brother Industries Ltd. (Information Technology) | | | 118,707 | |
| | 2,161 | | | Calbee, Inc. (Consumer Staples) | | | 43,128 | |
| | 28,013 | | | Canon, Inc. (Information Technology) | | | 690,391 | |
| | 4,656 | | | Capcom Co. Ltd. (Communication Services) | | | 196,461 | |
| | 6,198 | | | Casio Computer Co. Ltd. (Consumer Discretionary) | | | 54,983 | |
| | 5,215 | | | Central Japan Railway Co. (Industrials) | | | 669,494 | |
| | 20,359 | | | Chiba Bank Ltd. (The) (Financials) | | | 145,646 | |
| | 20,161 | | | Chubu Electric Power Co., Inc. (Utilities) | | | 269,349 | |
| | 17,898 | | | Chugai Pharmaceutical Co. Ltd. (Health Care) | | | 547,937 | |
| | 3,910 | | | Coca-Cola Bottlers Japan Holdings, Inc. (Consumer Staples) | | | 50,988 | |
| | 32,076 | | | Concordia Financial Group Ltd. (Financials) | | | 142,418 | |
| | 530 | | | Cosmos Pharmaceutical Corp. (Consumer Staples) | | | 62,307 | |
| | 11,513 | | | CyberAgent, Inc. (Communication Services) | | | 73,387 | |
| | 6,614 | | | Dai Nippon Printing Co. Ltd. (Industrials) | | | 180,950 | |
| | 9,523 | | | Daifuku Co. Ltd. (Industrials) | | | 176,187 | |
| | 27,018 | | | Dai-ichi Life Holdings, Inc. (Financials) | | | 503,206 | |
| | 53,640 | | | Daiichi Sankyo Co. Ltd. (Health Care) | | | 1,583,943 | |
| | 7,613 | | | Daikin Industries Ltd. (Industrials) | | | 1,319,078 | |
| | 1,671 | | | Daito Trust Construction Co. Ltd. (Real Estate) | | | 184,391 | |
| | 17,184 | | | Daiwa House Industry Co. Ltd. (Real Estate) | | | 477,802 | |
| | 60 | | | Daiwa House REIT Investment Corp. REIT (Real Estate) | | | 113,830 | |
| | 39,840 | | | Daiwa Securities Group, Inc. (Financials) | | | 226,860 | |
| | 12,465 | | | Denso Corp. (Consumer Discretionary) | | | 852,690 | |
| | 5,540 | | | Dentsu Group, Inc. (Communication Services) | | | 165,722 | |
| | 2,494 | | | Disco Corp. (Information Technology) | | | 492,427 | |
| | 10,200 | | | East Japan Railway Co. (Industrials) | | | 576,752 | |
| | 2,565 | | | Ebara Corp. (Industrials) | | | 127,893 | |
| | 7,916 | | | Eisai Co. Ltd. (Health Care) | | | 503,392 | |
| | 4,680 | | | Electric Power Development Co. Ltd. (Utilities) | | | 73,036 | |
| | 77,464 | | | ENEOS Holdings, Inc. (Energy) | | | 290,680 | |
| | 26,364 | | | FANUC Corp. (Industrials) | | | 752,067 | |
| | 4,675 | | | Fast Retailing Co. Ltd. (Consumer Discretionary) | | | 1,075,104 | |
| | 2,994 | | | Food & Life Cos. Ltd. (Consumer Discretionary) | | | 56,935 | |
| | 3,790 | | | Fuji Electric Co. Ltd. (Industrials) | | | 178,976 | |
| | 8,557 | | | FUJIFILM Holdings Corp. (Information Technology) | | | 506,302 | |
| | |
| | |
| 48 | | The accompanying notes are an integral part of these financial statements. |
GOLDMAN SACHS MARKETBETA® INTERNATIONAL EQUITY ETF
| | | | | | | | |
Shares | | | Description | | Value | |
| |
| Common Stocks – (continued) | | | |
| Japan – (continued) | | | |
| | 5,320 | | | Fujitsu Ltd. (Information Technology) | | $ | 665,251 | |
| | 5,097 | | | Fukuoka Financial Group, Inc. (Financials) | | | 120,681 | |
| | 125 | | | GLP J REIT (Real Estate) | | | 117,886 | |
| | 1,222 | | | GMO Payment Gateway, Inc. (Financials) | | | 77,457 | |
| | 6,090 | | | Hakuhodo DY Holdings, Inc. (Communication Services) | | | 57,874 | |
| | 3,889 | | | Hamamatsu Photonics KK (Information Technology) | | | 180,205 | |
| | 6,576 | | | Hankyu Hanshin Holdings, Inc. (Industrials) | | | 236,236 | |
| | 1,254 | | | Harmonic Drive Systems, Inc. (Industrials) | | | 33,033 | |
| | 7,092 | | | Haseko Corp. (Consumer Discretionary) | | | 88,123 | |
| | 534 | | | Hikari Tsushin, Inc. (Industrials) | | | 88,985 | |
| | 7,768 | | | Hino Motors Ltd. (Industrials)* | | | 30,472 | |
| | 838 | | | Hirose Electric Co. Ltd. (Information Technology) | | | 101,624 | |
| | 1,993 | | | Hisamitsu Pharmaceutical Co., Inc. (Health Care) | | | 67,654 | |
| | 2,878 | | | Hitachi Construction Machinery Co. Ltd. (Industrials) | | | 89,769 | |
| | 25,653 | | | Hitachi Ltd. (Industrials) | | | 1,708,144 | |
| | 47,478 | | | Honda Motor Co. Ltd. (Consumer Discretionary) | | | 1,533,737 | |
| | 3,012 | | | Hoshizaki Corp. (Industrials) | | | 115,734 | |
| | 9,728 | | | Hoya Corp. (Health Care) | | | 1,079,478 | |
| | 13,368 | | | Hulic Co. Ltd. (Real Estate) | | | 120,104 | |
| | 3,470 | | | Ibiden Co. Ltd. (Information Technology) | | | 209,556 | |
| | 6,600 | | | Idemitsu Kosan Co. Ltd. (Energy) | | | 140,310 | |
| | 4,082 | | | IHI Corp. (Industrials) | | | 101,808 | |
| | 4,710 | | | Iida Group Holdings Co. Ltd. (Consumer Discretionary) | | | 77,241 | |
| | 25,982 | | | Inpex Corp. (Energy) | | | 363,179 | |
| | 9,435 | | | Isetan Mitsukoshi Holdings Ltd. (Consumer Discretionary) | | | 108,293 | |
| | 16,818 | | | Isuzu Motors Ltd. (Consumer Discretionary) | | | 216,023 | |
| | 1,547 | | | Ito En Ltd. (Consumer Staples) | | | 45,788 | |
| | 34,783 | | | ITOCHU Corp. (Industrials) | | | 1,307,364 | |
| | 2,369 | | | Itochu Techno-Solutions Corp. (Information Technology) | | | 70,378 | |
| | 6,942 | | | J Front Retailing Co. Ltd. (Consumer Discretionary)(b) | | | 73,194 | |
| | 11,960 | | | Japan Airlines Co. Ltd. (Industrials) | | | 246,536 | |
| | 14,723 | | | Japan Exchange Group, Inc. (Financials) | | | 257,173 | |
| | 194 | | | Japan Metropolitan Fund Invest REIT (Real Estate) | | | 130,324 | |
| | 10,947 | | | Japan Post Bank Co. Ltd. (Financials) | | | 87,863 | |
| | 59,968 | | | Japan Post Holdings Co. Ltd. (Financials) | | | 460,104 | |
| | 5,303 | | | Japan Post Insurance Co. Ltd. (Financials) | | | 85,509 | |
| | 31,019 | | | Japan Tobacco, Inc. (Consumer Staples) | | | 679,889 | |
| | 14,759 | | | JFE Holdings, Inc. (Materials) | | | 233,522 | |
| | 6,267 | | | JGC Holdings Corp. (Industrials) | | | 83,813 | |
| | |
| |
| Common Stocks – (continued) | | | |
| Japan – (continued) | | | |
| | 5,607 | | | JSR Corp. (Materials) | | | 156,750 | |
| | 6,237 | | | JTEKT Corp. (Consumer Discretionary) | | | 56,529 | |
| | 12,320 | | | Kajima Corp. (Industrials) | | | 205,933 | |
| | 3,445 | | | Kakaku.com, Inc. (Communication Services) | | | 41,056 | |
| | 20,416 | | | Kansai Electric Power Co., Inc. (The) (Utilities) | | | 290,846 | |
| | 5,463 | | | Kansai Paint Co. Ltd. (Materials) | | | 89,646 | |
| | 12,647 | | | Kao Corp. (Consumer Staples) | | | 489,861 | |
| | 4,353 | | | Kawasaki Heavy Industries Ltd. (Industrials) | | | 111,796 | |
| | 3,516 | | | Kawasaki Kisen Kaisha Ltd. (Industrials) | | | 118,001 | |
| | 43,123 | | | KDDI Corp. (Communication Services) | | | 1,281,086 | |
| | 2,987 | | | Keihan Holdings Co. Ltd. (Industrials) | | | 85,311 | |
| | 7,240 | | | Keikyu Corp. (Industrials) | | | 66,813 | |
| | 3,060 | | | Keio Corp. (Industrials) | | | 105,934 | |
| | 4,397 | | | Keisei Electric Railway Co. Ltd. (Industrials) | | | 168,468 | |
| | 2,871 | | | Kewpie Corp. (Consumer Staples) | | | 47,852 | |
| | 5,146 | | | Keyence Corp. (Information Technology) | | | 2,139,203 | |
| | 4,281 | | | Kikkoman Corp. (Consumer Staples) | | | 247,771 | |
| | 5,266 | | | Kintetsu Group Holdings Co. Ltd. (Industrials) | | | 166,714 | |
| | 22,719 | | | Kirin Holdings Co. Ltd. (Consumer Staples) | | | 319,285 | |
| | 1,408 | | | Kobayashi Pharmaceutical Co. Ltd. (Consumer Staples) | | | 69,653 | |
| | 3,935 | | | Kobe Bussan Co. Ltd. (Consumer Staples) | | | 97,953 | |
| | 3,149 | | | Koei Tecmo Holdings Co. Ltd. (Communication Services) | | | 48,938 | |
| | 6,672 | | | Koito Manufacturing Co. Ltd. (Consumer Discretionary) | | | 113,449 | |
| | 25,088 | | | Komatsu Ltd. (Industrials) | | | 715,151 | |
| | 2,664 | | | Konami Group Corp. (Communication Services) | | | 154,733 | |
| | 933 | | | Kose Corp. (Consumer Staples) | | | 77,480 | |
| | 29,753 | | | Kubota Corp. (Industrials) | | | 477,201 | |
| | 9,035 | | | Kuraray Co. Ltd. (Materials) | | | 102,740 | |
| | 3,132 | | | Kurita Water Industries Ltd. (Industrials) | | | 122,260 | |
| | 9,314 | | | Kyocera Corp. (Information Technology) | | | 478,415 | |
| | 6,926 | | | Kyowa Kirin Co. Ltd. (Health Care) | | | 127,045 | |
| | 12,866 | | | Kyushu Electric Power Co., Inc. (Utilities)* | | | 84,999 | |
| | 3,914 | | | Kyushu Railway Co. (Industrials) | | | 85,305 | |
| | 2,185 | | | Lasertec Corp. (Information Technology) | | | 340,316 | |
| | 1,245 | | | Lawson, Inc. (Consumer Staples) | | | 59,443 | |
| | 7,098 | | | Lion Corp. (Consumer Staples) | | | 77,301 | |
| | 7,749 | | | Lixil Corp. (Industrials) | | | 97,112 | |
| | 11,386 | | | M3, Inc. (Health Care) | | | 227,079 | |
| | 6,791 | | | Makita Corp. (Industrials) | | | 186,492 | |
| | 46,942 | | | Marubeni Corp. (Industrials) | | | 768,851 | |
| | 4,950 | | | Marui Group Co. Ltd. (Financials) | | | 85,767 | |
| | 3,300 | | | MatsukiyoCocokara & Co. (Consumer Staples) | | | 194,371 | |
| | |
| | |
| The accompanying notes are an integral part of these financial statements. | | 49 |
GOLDMAN SACHS MARKETBETA® INTERNATIONAL EQUITY ETF
Schedule of Investments (continued)
August 31, 2023
| | | | | | | | |
Shares | | | Description | | Value | |
| |
| Common Stocks – (continued) | | | |
| Japan – (continued) | | | |
| | 16,020 | | | Mazda Motor Corp. (Consumer Discretionary) | | $ | 168,634 | |
| | 2,376 | | | McDonald’s Holdings Co. Japan Ltd. (Consumer Discretionary) | | | 94,495 | |
| | 29,465 | | | Mebuki Financial Group, Inc. (Financials) | | | 81,584 | |
| | 5,110 | | | Medipal Holdings Corp. (Health Care) | | | 87,644 | |
| | 7,465 | | | MEIJI Holdings Co. Ltd. (Consumer Staples) | | | 187,260 | |
| | 3,031 | | | Mercari, Inc. (Consumer Discretionary)* | | | 69,079 | |
| | 10,784 | | | MINEBEA MITSUMI, Inc. (Industrials) | | | 183,369 | |
| | 7,927 | | | MISUMI Group, Inc. (Industrials) | | | 138,492 | |
| | 39,677 | | | Mitsubishi Chemical Group Corp. (Materials) | | | 237,187 | |
| | 34,368 | | | Mitsubishi Corp. (Industrials) | | | 1,698,747 | |
| | 54,855 | | | Mitsubishi Electric Corp. (Industrials) | | | 715,525 | |
| | 35,649 | | | Mitsubishi Estate Co. Ltd. (Real Estate) | | | 456,065 | |
| | 5,045 | | | Mitsubishi Gas Chemical Co., Inc. (Materials) | | | 68,821 | |
| | 23,180 | | | Mitsubishi HC Capital, Inc. (Financials) | | | 150,765 | |
| | 9,077 | | | Mitsubishi Heavy Industries Ltd. (Industrials) | | | 515,622 | |
| | 3,561 | | | Mitsubishi Materials Corp. (Materials) | | | 59,841 | |
| | 18,058 | | | Mitsubishi Motors Corp. (Consumer Discretionary) | | | 71,036 | |
| | 320,091 | | | Mitsubishi UFJ Financial Group, Inc. (Financials) | | | 2,558,134 | |
| | 41,845 | | | Mitsui & Co. Ltd. (Industrials) | | | 1,561,301 | |
| | 4,949 | | | Mitsui Chemicals, Inc. (Materials) | | | 134,480 | |
| | 24,687 | | | Mitsui Fudosan Co. Ltd. (Real Estate) | | | 541,271 | |
| | 10,064 | | | Mitsui OSK Lines Ltd. (Industrials) | | | 279,001 | |
| | 2,810 | | | Miura Co. Ltd. (Industrials) | | | 64,949 | |
| | 70,632 | | | Mizuho Financial Group, Inc. (Financials) | | | 1,169,235 | |
| | 6,873 | | | MonotaRO Co. Ltd. (Industrials) | | | 81,295 | |
| | 11,906 | | | MS&AD Insurance Group Holdings, Inc. (Financials) | | | 428,529 | |
| | 17,259 | | | Murata Manufacturing Co. Ltd. (Information Technology) | | | 970,326 | |
| | 3,011 | | | Nabtesco Corp. (Industrials) | | | 57,062 | |
| | 5,475 | | | Nagoya Railroad Co. Ltd. (Industrials) | | | 87,963 | |
| | 7,074 | | | NEC Corp. (Information Technology) | | | 373,464 | |
| | 12,613 | | | Nexon Co. Ltd. (Communication Services) | | | 256,185 | |
| | 8,053 | | | NGK Insulators Ltd. (Industrials)(b) | | | 106,979 | |
| | 2,702 | | | NH Foods Ltd. (Consumer Staples) | | | 83,852 | |
| | 3,531 | | | Nichirei Corp. (Consumer Staples) | | | 83,579 | |
| | 13,426 | | | NIDEC Corp. (Industrials) | | | 703,831 | |
| | 8,397 | | | Nihon M&A Center Holdings, Inc. (Industrials) | | | 46,725 | |
| | 9,068 | | | Nikon Corp. (Consumer Discretionary) | | | 98,039 | |
| | 32,219 | | | Nintendo Co. Ltd. (Communication Services) | | | 1,386,932 | |
| | 47 | | | Nippon Building Fund, Inc. REIT (Real Estate) | | | 198,544 | |
| | |
| |
| Common Stocks – (continued) | | | |
| Japan – (continued) | | | |
| | 2,302 | | | NIPPON EXPRESS HOLDINGS, Inc. (Industrials) | | | 119,682 | |
| | 24,769 | | | Nippon Paint Holdings Co. Ltd. (Materials) | | | 191,571 | |
| | 64 | | | Nippon Prologis REIT, Inc. REIT (Real Estate) | | | 128,761 | |
| | 5,197 | | | Nippon Sanso Holdings Corp. (Materials) | | | 125,548 | |
| | 1,696 | | | Nippon Shinyaku Co. Ltd. (Health Care) | | | 74,545 | |
| | 23,890 | | | Nippon Steel Corp. (Materials) | | | 565,641 | |
| | 1,500,599 | | | Nippon Telegraph & Telephone Corp. (Communication Services) | | | 1,734,731 | |
| | 4,509 | | | Nippon Television Holdings, Inc. (Communication Services) | | | 42,059 | |
| | 13,761 | | | Nippon Yusen KK (Industrials) | | | 367,313 | |
| | 3,656 | | | Nissan Chemical Corp. (Materials) | | | 156,903 | |
| | 61,234 | | | Nissan Motor Co. Ltd. (Consumer Discretionary) | | | 261,113 | |
| | 7,116 | | | Nisshin Seifun Group, Inc. (Consumer Staples) | | | 93,871 | |
| | 1,694 | | | Nissin Foods Holdings Co. Ltd. (Consumer Staples) | | | 148,008 | |
| | 5,351 | | | Niterra Co. Ltd. (Consumer Discretionary) | | | 124,416 | |
| | 2,280 | | | Nitori Holdings Co. Ltd. (Consumer Discretionary) | | | 260,285 | |
| | 4,120 | | | Nitto Denko Corp. (Materials) | | | 281,553 | |
| | 83,148 | | | Nomura Holdings, Inc. (Financials) | | | 322,232 | |
| | 2,875 | | | Nomura Real Estate Holdings, Inc. (Real Estate) | | | 72,435 | |
| | 119 | | | Nomura Real Estate Master Fund, Inc. REIT (Real Estate) | | | 139,856 | |
| | 10,812 | | | Nomura Research Institute Ltd. (Information Technology) | | | 310,803 | |
| | 13,523 | | | NSK Ltd. (Industrials) | | | 78,889 | |
| | 17,284 | | | NTT Data Group Corp. (Information Technology) | | | 232,812 | |
| | 19,252 | | | Obayashi Corp. (Industrials) | | | 174,423 | |
| | 800 | | | OBIC Business Consultants Co. Ltd. (Information Technology) | | | 34,344 | |
| | 1,812 | | | Obic Co. Ltd. (Information Technology) | | | 315,266 | |
| | 8,839 | | | Odakyu Electric Railway Co. Ltd. (Industrials) | | | 131,506 | |
| | 25,859 | | | Oji Holdings Corp. (Materials) | | | 105,862 | |
| | 35,096 | | | Olympus Corp. (Health Care) | | | 475,026 | |
| | 5,216 | | | Omron Corp. (Information Technology) | | | 252,157 | |
| | 12,246 | | | Ono Pharmaceutical Co. Ltd. (Health Care) | | | 232,286 | |
| | 2,081 | | | Open House Group Co. Ltd. (Consumer Discretionary) | | | 70,413 | |
| | 928 | | | Oracle Corp. Japan (Information Technology) | | | 64,826 | |
| | |
| | |
| 50 | | The accompanying notes are an integral part of these financial statements. |
GOLDMAN SACHS MARKETBETA® INTERNATIONAL EQUITY ETF
| | | | | | | | |
Shares | | | Description | | Value | |
| |
| Common Stocks – (continued) | | | |
| Japan – (continued) | | | |
| | 30,829 | | | Oriental Land Co. Ltd. (Consumer Discretionary) | | $ | 1,111,525 | |
| | 32,176 | | | ORIX Corp. (Financials) | | | 601,152 | |
| | 77 | | | Orix JREIT, Inc. REIT (Real Estate) | | | 95,784 | |
| | 11,440 | | | Osaka Gas Co. Ltd. (Utilities) | | | 183,090 | |
| | 3,060 | | | Otsuka Corp. (Information Technology) | | | 136,516 | |
| | 12,393 | | | Otsuka Holdings Co. Ltd. (Health Care) | | | 472,106 | |
| | 10,636 | | | Pan Pacific International Holdings Corp. (Consumer Discretionary) | | | 212,194 | |
| | 63,092 | | | Panasonic Holdings Corp. (Consumer Discretionary) | | | 727,843 | |
| | 3,551 | | | Park24 Co. Ltd. (Industrials)* | | | 50,148 | |
| | 5,204 | | | Persol Holdings Co. Ltd. (Industrials) | | | 89,185 | |
| | 2,301 | | | Pola Orbis Holdings, Inc. (Consumer Staples) | | | 29,722 | |
| | 2,418 | | | Rakus Co. Ltd. (Information Technology) | | | 39,380 | |
| | 39,741 | | | Rakuten Group, Inc. (Consumer Discretionary) | | | 155,131 | |
| | 40,295 | | | Recruit Holdings Co. Ltd. (Industrials) | | | 1,444,791 | |
| | 33,767 | | | Renesas Electronics Corp. (Information Technology)* | | | 568,369 | |
| | 66,094 | | | Resona Holdings, Inc. (Financials) | | | 350,616 | |
| | 4,927 | | | Resonac Holdings Corp. (Materials) | | | 80,241 | |
| | 15,756 | | | Ricoh Co. Ltd. (Information Technology) | | | 128,572 | |
| | 3,032 | | | Rinnai Corp. (Consumer Discretionary) | | | 58,761 | |
| | 2,446 | | | Rohm Co. Ltd. (Information Technology) | | | 204,470 | |
| | 5,508 | | | Rohto Pharmaceutical Co. Ltd. (Consumer Staples) | | | 143,654 | |
| | 7,169 | | | Ryohin Keikaku Co. Ltd. (Consumer Discretionary) | | | 92,502 | |
| | 10,148 | | | Santen Pharmaceutical Co. Ltd. (Health Care) | | | 94,415 | |
| | 6,722 | | | SBI Holdings, Inc. (Financials) | | | 137,386 | |
| | 2,083 | | | SBI Shinsei Bank Ltd. (Financials) | | | 40,434 | |
| | 1,297 | | | SCREEN Holdings Co. Ltd. (Information Technology) | | | 132,297 | |
| | 3,993 | | | SCSK Corp. (Information Technology) | | | 69,281 | |
| | 5,785 | | | Secom Co. Ltd. (Industrials) | | | 405,111 | |
| | 4,308 | | | Sega Sammy Holdings, Inc. (Consumer Discretionary) | | | 86,065 | |
| | 6,211 | | | Seibu Holdings, Inc. (Industrials) | | | 65,721 | |
| | 7,660 | | | Seiko Epson Corp. (Information Technology) | | | 120,094 | |
| | 10,598 | | | Sekisui Chemical Co. Ltd. (Consumer Discretionary) | | | 162,772 | |
| | 17,178 | | | Sekisui House Ltd. (Consumer Discretionary) | | | 350,498 | |
| | 21,358 | | | Seven & i Holdings Co. Ltd. (Consumer Staples) | | | 877,441 | |
| | 16,867 | | | Seven Bank Ltd. (Financials) | | | 35,892 | |
| | 12,611 | | | SG Holdings Co. Ltd. (Industrials) | | | 182,255 | |
| | 7,721 | | | Sharp Corp. (Consumer Discretionary)*(b) | | | 47,566 | |
| | 7,633 | | | Shimadzu Corp. (Information Technology) | | | 224,714 | |
| | 658 | | | Shimamura Co. Ltd. (Consumer Discretionary) | | | 67,841 | |
| | |
| |
| Common Stocks – (continued) | | | |
| Japan – (continued) | | | |
| | 2,203 | | | Shimano, Inc. (Consumer Discretionary) | | | 323,826 | |
| | 16,009 | | | Shimizu Corp. (Industrials) | | | 107,731 | |
| | 54,857 | | | Shin-Etsu Chemical Co. Ltd. (Materials) | | | 1,755,530 | |
| | 1,775 | | | Shinko Electric Industries Co. Ltd. (Information Technology) | | | 72,861 | |
| | 8,171 | | | Shionogi & Co. Ltd. (Health Care) | | | 360,156 | |
| | 10,958 | | | Shiseido Co. Ltd. (Consumer Staples) | | | 445,290 | |
| | 15,274 | | | Shizuoka Financial Group, Inc. (Financials) | | | 124,324 | |
| | 1,576 | | | SMC Corp. (Industrials) | | | 764,266 | |
| | 78,252 | | | SoftBank Corp. (Communication Services) | | | 897,626 | |
| | 27,300 | | | SoftBank Group Corp. (Communication Services) | | | 1,227,314 | |
| | 9,860 | | | Sohgo Security Services Co. Ltd. (Industrials) | | | 62,898 | |
| | 6,488 | | | Sojitz Corp. (Industrials) | | | 139,578 | |
| | 9,064 | | | Sompo Holdings, Inc. (Financials) | | | 395,159 | |
| | 34,484 | | | Sony Group Corp. (Consumer Discretionary) | | | 2,876,726 | |
| | 2,454 | | | Square Enix Holdings Co. Ltd. (Communication Services) | | | 93,214 | |
| | 4,199 | | | Stanley Electric Co. Ltd. (Consumer Discretionary) | | | 73,793 | |
| | 17,089 | | | Subaru Corp. (Consumer Discretionary) | | | 329,784 | |
| | 950 | | | Sugi Holdings Co. Ltd. (Consumer Staples) | | | 42,670 | |
| | 9,480 | | | SUMCO Corp. (Information Technology) | | | 126,782 | |
| | 39,863 | | | Sumitomo Chemical Co. Ltd. (Materials) | | | 110,456 | |
| | 33,040 | | | Sumitomo Corp. (Industrials) | | | 680,612 | |
| | 20,306 | | | Sumitomo Electric Industries Ltd. (Consumer Discretionary) | | | 249,039 | |
| | 3,190 | | | Sumitomo Heavy Industries Ltd. (Industrials) | | | 80,043 | |
| | 6,955 | | | Sumitomo Metal Mining Co. Ltd. (Materials) | | | 215,933 | |
| | 34,840 | | | Sumitomo Mitsui Financial Group, Inc. (Financials) | | | 1,598,833 | |
| | 9,369 | | | Sumitomo Mitsui Trust Holdings, Inc. (Financials) | | | 350,795 | |
| | 4,274 | | | Sumitomo Pharma Co. Ltd. (Health Care) | | | 14,928 | |
| | 10,416 | | | Sumitomo Realty & Development Co. Ltd. (Real Estate) | | | 266,794 | |
| | 4,874 | | | Sumitomo Rubber Industries Ltd. (Consumer Discretionary) | | | 51,474 | |
| | 1,889 | | | Sundrug Co. Ltd. (Consumer Staples) | | | 55,832 | |
| | 3,488 | | | Suntory Beverage & Food Ltd. (Consumer Staples) | | | 112,940 | |
| | 11,111 | | | Suzuki Motor Corp. (Consumer Discretionary) | | | 437,693 | |
| | 4,421 | | | Sysmex Corp. (Health Care) | | | 235,376 | |
| | 15,044 | | | T&D Holdings, Inc. (Financials) | | | 239,065 | |
| | 4,645 | | | Taisei Corp. (Industrials) | | | 156,434 | |
| | 1,356 | | | Taisho Pharmaceutical Holdings Co. Ltd. (Health Care) | | | 56,183 | |
| | |
| | |
| The accompanying notes are an integral part of these financial statements. | | 51 |
GOLDMAN SACHS MARKETBETA® INTERNATIONAL EQUITY ETF
Schedule of Investments (continued)
August 31, 2023
| | | | | | | | |
Shares | | | Description | | Value | |
| |
| Common Stocks – (continued) | | | |
| Japan – (continued) | | | |
| | 3,418 | | | Taiyo Yuden Co. Ltd. (Information Technology) | | $ | 95,249 | |
| | 42,749 | | | Takeda Pharmaceutical Co. Ltd. (Health Care) | | | 1,323,711 | |
| | 3,749 | | | TBS Holdings, Inc. (Communication Services) | | | 66,348 | |
| | 10,424 | | | TDK Corp. (Information Technology) | | | 380,487 | |
| | 20,102 | | | Terumo Corp. (Health Care) | | | 609,336 | |
| | 3,415 | | | THK Co. Ltd. (Industrials) | | | 62,525 | |
| | 6,562 | | | TIS, Inc. (Information Technology) | | | 154,917 | |
| | 5,815 | | | Tobu Railway Co. Ltd. (Industrials) | | | 159,490 | |
| | 260 | | | Toei Animation Co. Ltd. (Communication Services) | | | 21,949 | |
| | 2,999 | | | Toho Co. Ltd. (Communication Services) | | | 114,431 | |
| | 12,846 | | | Tohoku Electric Power Co., Inc. (Utilities)* | | | 89,825 | |
| | 53,245 | | | Tokio Marine Holdings, Inc. (Financials) | | | 1,180,215 | |
| | 1,140 | | | Tokyo Century Corp. (Financials) | | | 43,843 | |
| | 41,503 | | | Tokyo Electric Power Co. Holdings, Inc. (Utilities)* | | | 182,450 | |
| | 12,660 | | | Tokyo Electron Ltd. (Information Technology) | | | 1,876,151 | |
| | 11,499 | | | Tokyo Gas Co. Ltd. (Utilities) | | | 266,732 | |
| | 15,336 | | | Tokyu Corp. (Industrials) | | | 193,879 | |
| | 16,556 | | | Tokyu Fudosan Holdings Corp. (Real Estate) | | | 103,088 | |
| | 7,276 | | | TOPPAN, Inc. (Industrials) | | | 175,971 | |
| | 42,117 | | | Toray Industries, Inc. (Materials) | | | 227,415 | |
| | 11,663 | | | Toshiba Corp. (Industrials) | | | 368,672 | |
| | 8,347 | | | Tosoh Corp. (Materials) | | | 108,132 | |
| | 4,254 | | | TOTO Ltd. (Industrials) | | | 116,734 | |
| | 2,543 | | | Toyo Suisan Kaisha Ltd. (Consumer Staples) | | | 105,014 | |
| | 2,025 | | | Toyota Boshoku Corp. (Consumer Discretionary) | | | 38,355 | |
| | 4,626 | | | Toyota Industries Corp. (Industrials) | | | 327,285 | |
| | 318,704 | | | Toyota Motor Corp. (Consumer Discretionary) | | | 5,505,653 | |
| | 6,489 | | | Toyota Tsusho Corp. (Industrials) | | | 387,553 | |
| | 3,684 | | | Trend Micro, Inc. (Information Technology) | | | 156,611 | |
| | 1,051 | | | Tsuruha Holdings, Inc. (Consumer Staples) | | | 76,956 | |
| | 11,567 | | | Unicharm Corp. (Consumer Staples) | | | 461,774 | |
| | 86 | | | United Urban Investment Corp. REIT (Real Estate) | | | 92,448 | |
| | 5,524 | | | USS Co. Ltd. (Consumer Discretionary) | | | 96,547 | |
| | 2,560 | | | Welcia Holdings Co. Ltd. (Consumer Staples)(b) | | | 47,082 | |
| | 6,621 | | | West Japan Railway Co. (Industrials) | | | 286,697 | |
| | 583 | | | Workman Co. Ltd. (Consumer Discretionary) | | | 21,064 | |
| | 3,696 | | | Yakult Honsha Co. Ltd. (Consumer Staples) | | | 193,806 | |
| | |
| |
| Common Stocks – (continued) | | | |
| Japan – (continued) | | | |
| | 18,078 | | | Yamada Holdings Co. Ltd. (Consumer Discretionary) | | | 56,872 | |
| | 4,517 | | | Yamaha Corp. (Consumer Discretionary) | | | 139,588 | |
| | 8,517 | | | Yamaha Motor Co. Ltd. (Consumer Discretionary) | | | 221,079 | |
| | 8,580 | | | Yamato Holdings Co. Ltd. (Industrials) | | | 161,275 | |
| | 3,688 | | | Yamazaki Baking Co. Ltd. (Consumer Staples) | | | 69,904 | |
| | 7,291 | | | Yaskawa Electric Corp. (Industrials)(b) | | | 286,512 | |
| | 6,668 | | | Yokogawa Electric Corp. (Information Technology) | | | 132,297 | |
| | 3,659 | | | Yokohama Rubber Co. Ltd. (The) (Consumer Discretionary) | | | 74,507 | |
| | 72,813 | | | Z Holdings Corp. (Communication Services) | | | 218,962 | |
| | 3,258 | | | ZOZO, Inc. (Consumer Discretionary) | | | 65,111 | |
| | | | | | | | |
| | | | | | | 107,985,707 | |
| | |
| Jordan – 0.0% | | | |
| | 4,385 | | | Hikma Pharmaceuticals PLC (Health Care) | | | 121,631 | |
| | |
| Luxembourg – 0.1% | | | |
| | 12,837 | | | ArcelorMittal (Materials) | | | 341,768 | |
| | 3,608 | | | Eurofins Scientific SE (Health Care) | | | 222,582 | |
| | | | | | | | |
| | | | | | | 564,350 | |
| | |
| Macau – 0.1% | | | |
| | 52,049 | | | Galaxy Entertainment Group Ltd. (Consumer Discretionary)* | | | 344,482 | |
| | 67,839 | | | Sands China Ltd. (Consumer Discretionary)* | | | 229,684 | |
| | | | | | | | |
| | | | | | | 574,166 | |
| | |
| Mexico – 0.0% | | | |
| | 5,134 | | | Fresnillo PLC (Materials) | | | 37,433 | |
| | |
| Netherlands – 5.0% | | | |
| | 841 | | | Adyen NV (Financials)*(a) | | | 705,122 | |
| | 4,776 | | | Akzo Nobel NV (Materials) | | | 388,980 | |
| | 1,558 | | | Argenx SE ADR (Health Care)* | | | 782,879 | |
| | 1,288 | | | ASM International NV (Information Technology) | | | 622,359 | |
| | 11,050 | | | ASML Holding NV (Information Technology) | | | 7,290,618 | |
| | 2,964 | | | EXOR NV (Financials) | | | 262,956 | |
| | 2,515 | | | HAL Trust (Financials) | | | 317,186 | |
| | 3,086 | | | Heineken Holding NV (Consumer Staples) | | | 247,520 | |
| | 8,045 | | | Heineken NV (Consumer Staples) | | | 784,276 | |
| | 98,413 | | | ING Groep NV (Financials) | | | 1,399,245 | |
| | 2,714 | | | JDE Peet’s NV (Consumer Staples) | | | 75,644 | |
| | 26,865 | | | Koninklijke Ahold Delhaize NV (Consumer Staples) | | | 879,841 | |
| | 89,355 | | | Koninklijke KPN NV (Communication Services) | | | 312,959 | |
| | |
| | |
| 52 | | The accompanying notes are an integral part of these financial statements. |
GOLDMAN SACHS MARKETBETA® INTERNATIONAL EQUITY ETF
| | | | | | | | |
Shares | | | Description | | Value | |
| |
| Common Stocks – (continued) | | | |
| Netherlands – (continued) | | | |
| | 25,751 | | | Koninklijke Philips NV (Health Care)* | | $ | 581,336 | |
| | 6,962 | | | NN Group NV (Financials) | | | 268,699 | |
| | 188,269 | | | Shell PLC (Energy) | | | 5,753,001 | |
| | 21,517 | | | Universal Music Group NV (Communication Services) | | | 534,561 | |
| | 6,932 | | | Wolters Kluwer NV (Industrials) | | | 836,630 | |
| | | | | | | | |
| | | | | | | 22,043,812 | |
| | |
| New Zealand – 0.4% | | | |
| | 18,813 | | | a2 Milk Co. Ltd. (The) (Consumer Staples)* | | | 56,011 | |
| | 33,607 | | | Auckland International Airport Ltd. (Industrials)* | | | 156,288 | |
| | 11,442 | | | Chorus Ltd. (Communication Services) | | | 54,675 | |
| | 21,592 | | | Contact Energy Ltd. (Utilities) | | | 107,613 | |
| | 15,278 | | | Fisher & Paykel Healthcare Corp. Ltd. (Health Care) | | | 206,599 | |
| | 22,586 | | | Infratil Ltd. (Industrials) | | | 135,699 | |
| | 2,307 | | | Mainfreight Ltd. (Industrials) | | | 90,060 | |
| | 18,163 | | | Mercury NZ Ltd. (Utilities) | | | 67,108 | |
| | 35,231 | | | Meridian Energy Ltd. (Utilities) | | | 112,549 | |
| | 16,699 | | | Ryman Healthcare Ltd. (Health Care) | | | 66,024 | |
| | 51,649 | | | Spark New Zealand Ltd. (Communication Services) | | | 156,079 | |
| | 3,558 | | | Xero Ltd. (Information Technology)* | | | 288,273 | |
| | | | | | | | |
| | | | | | | 1,496,978 | |
| | |
| Norway – 0.8% | | | |
| | 615 | | | Aker ASA, Class A (Industrials) | | | 37,927 | |
| | 8,588 | | | Aker BP ASA (Energy) | | | 233,004 | |
| | 20,529 | | | AutoStore Holdings Ltd. (Industrials)*(a) | | | 35,183 | |
| | 24,875 | | | DNB Bank ASA (Financials) | | | 492,489 | |
| | 27,650 | | | Equinor ASA (Energy) | | | 853,117 | |
| | 3,984 | | | Frontline PLC (Energy) | | | 71,267 | |
| | 5,043 | | | Gjensidige Forsikring ASA (Financials) | | | 78,462 | |
| | 2,345 | | | Kongsberg Gruppen ASA (Industrials) | | | 97,176 | |
| | 7,472 | | | Leroy Seafood Group ASA (Consumer Staples) | | | 30,922 | |
| | 12,331 | | | Mowi ASA (Consumer Staples) | | | 223,733 | |
| | 46,460 | | | NEL ASA (Industrials)*(b) | | | 51,058 | |
| | 4,593 | | | Nordic Semiconductor ASA (Information Technology)* | | | 56,176 | |
| | 36,887 | | | Norsk Hydro ASA (Materials) | | | 204,944 | |
| | 22,146 | | | Orkla ASA (Consumer Staples) | | | 169,221 | |
| | 1,810 | | | Salmar ASA (Consumer Staples) | | | 88,482 | |
| | 1,908 | | | Schibsted ASA, Class A (Communication Services) | | | 40,628 | |
| | 2,657 | | | Schibsted ASA, Class B (Communication Services) | | | 52,255 | |
| | 2,019 | | | Seadrill Ltd. (Energy)* | | | 98,699 | |
| | 4,737 | | | SpareBank 1 SR-Bank ASA (Financials) | | | 57,313 | |
| | 12,109 | | | Storebrand ASA (Financials) | | | 97,217 | |
| | 17,934 | | | Telenor ASA (Communication Services) | | | 192,033 | |
| | 6,497 | | | TOMRA Systems ASA (Industrials) | | | 89,266 | |
| | 10,851 | | | Var Energi ASA (Energy) | | | 31,480 | |
| | |
| |
| Common Stocks – (continued) | | | |
| Norway – (continued) | | | |
| | 2,853 | | | Wallenius Wilhelmsen ASA (Industrials) | | | 23,147 | |
| | | | | | | | |
| | | | | | | 3,405,199 | |
| | |
| Poland – 0.3% | | | |
| | 11,689 | | | Allegro.eu SA (Consumer Discretionary)*(a) | | | 93,654 | |
| | 4,912 | | | Bank Polska Kasa Opieki SA (Financials) | | | 128,603 | |
| | 1,944 | | | CD Projekt SA (Communication Services) | | | 69,600 | |
| | 6,761 | | | Cyfrowy Polsat SA (Communication Services) | | | 22,245 | |
| | 1,335 | | | Dino Polska SA (Consumer Staples)*(a) | | | 122,737 | |
| | 5,008 | | | InPost SA (Industrials)* | | | 59,002 | |
| | 3,798 | | | KGHM Polska Miedz SA (Materials) | | | 105,151 | |
| | 364 | | | mBank SA (Financials)* | | | 37,890 | |
| | 16,200 | | | ORLEN SA (Energy) | | | 247,840 | |
| | 24,460 | | | PGE Polska Grupa Energetyczna SA (Utilities)* | | | 50,365 | |
| | 23,885 | | | Powszechna Kasa Oszczednosci Bank Polski SA (Financials)* | | | 216,465 | |
| | 15,830 | | | Powszechny Zaklad Ubezpieczen SA (Financials) | | | 158,751 | |
| | 928 | | | Santander Bank Polska SA (Financials)* | | | 83,675 | |
| | | | | | | | |
| | | | | | | 1,395,978 | |
| | |
| Portugal – 0.2% | | | |
| | 204,031 | | | Banco Comercial Portugues SA, Class R (Financials)* | | | 57,000 | |
| | 78,120 | | | EDP – Energias de Portugal SA (Utilities) | | | 356,617 | |
| | 13,269 | | | Galp Energia SGPS SA (Energy) | | | 182,971 | |
| | 7,657 | | | Jeronimo Martins SGPS SA (Consumer Staples) | | | 195,297 | |
| | 5,951 | | | Navigator Co SA (The) (Materials) | | | 21,792 | |
| | | | | | | | |
| | | | | | | 813,677 | |
| | |
| Russia – 0.0% | | | |
| | 12,172 | | | Evraz PLC (Materials)*(c) | | | — | |
| | |
| Singapore – 1.6% | | | |
| | 66,853 | | | Capital and Investment Ltd. (Real Estate) | | | 160,388 | |
| | 99,392 | | | CapitaLand Ascendas REIT REIT (Real Estate) | | | 203,862 | |
| | 141,492 | | | CapitaLand Integrated Commercial Trust REIT (Real Estate) | | | 200,111 | |
| | 12,286 | | | City Developments Ltd. (Real Estate) | | | 60,770 | |
| | 51,171 | | | DBS Group Holdings Ltd. (Financials) | | | 1,261,751 | |
| | 77,435 | | | Frasers Logistics & Commercial Trust REIT (Real Estate) | | | 68,806 | |
| | 157,928 | | | Genting Singapore Ltd. (Consumer Discretionary) | | | 102,323 | |
| | 51,467 | | | Grab Holdings Ltd., Class A (Industrials)* | | | 194,031 | |
| | |
| | |
| The accompanying notes are an integral part of these financial statements. | | 53 |
GOLDMAN SACHS MARKETBETA® INTERNATIONAL EQUITY ETF
Schedule of Investments (continued)
August 31, 2023
| | | | | | | | |
Shares | | | Description | | Value | |
| |
| Common Stocks – (continued) | | | |
| Singapore – (continued) | | | |
| | 2,641 | | | Jardine Cycle & Carriage Ltd. (Industrials) | | $ | 65,355 | |
| | 40,015 | | | Keppel Corp. Ltd. (Industrials) | | | 205,631 | |
| | 38,537 | | | Keppel DC REIT (Real Estate) | | | 62,778 | |
| | 56,015 | | | Mapletree Industrial Trust REIT (Real Estate) | | | 95,398 | |
| | 92,823 | | | Mapletree Logistics Trust REIT (Real Estate) | | | 115,470 | |
| | 60,543 | | | Mapletree Pan Asia Commercial Trust REIT (Real Estate) | | | 68,142 | |
| | 24,933 | | | Olam Group Ltd. (Consumer Staples) | | | 23,077 | |
| | 89,893 | | | Oversea-Chinese Banking Corp. Ltd. (Financials) | | | 835,362 | |
| | 24,197 | | | SATS Ltd. (Industrials)* | | | 46,405 | |
| | 10,185 | | | Sea Ltd. ADR (Communication Services)* | | | 383,261 | |
| | 1,797,967 | | | Seatrium Ltd. (Industrials)* | | | 193,043 | |
| | 25,098 | | | Sembcorp Industries Ltd. (Utilities) | | | 99,426 | |
| | 36,886 | | | Singapore Airlines Ltd. (Industrials) | | | 187,639 | |
| | 22,784 | | | Singapore Exchange Ltd. (Financials) | | | 162,466 | |
| | 42,284 | | | Singapore Technologies Engineering Ltd. (Industrials) | | | 119,291 | |
| | 199,942 | | | Singapore Telecommunications Ltd. (Communication Services) | | | 352,360 | |
| | 18,210 | | | STMicroelectronics NV (Information Technology) | | | 863,005 | |
| | 49,463 | | | Suntec Real Estate Investment Trust REIT (Real Estate) | | | 44,317 | |
| | 37,438 | | | United Overseas Bank Ltd. (Financials) | | | 788,402 | |
| | 14,630 | | | UOL Group Ltd. (Real Estate) | | | 71,931 | |
| | 7,528 | | | Venture Corp. Ltd. (Information Technology) | | | 73,078 | |
| | | | | | | | |
| | | | | | | 7,107,879 | |
| | |
| South Africa – 0.2% | | | |
| | 32,324 | | | Anglo American PLC (Materials) | | | 860,352 | |
| | |
| South Korea – 0.1% | | | |
| | 5,593 | | | Delivery Hero SE (Consumer Discretionary)*(a) | | | 204,723 | |
| | |
| Spain – 2.4% | | | |
| | 5,681 | | | ACS Actividades de Construccion y Servicios SA (Industrials) | | | 199,713 | |
| | 2,048 | | | Aena SME SA (Industrials)(a) | | | 322,306 | |
| | 12,577 | | | Amadeus IT Group SA (Consumer Discretionary) | | | 864,074 | |
| | 167,604 | | | Banco Bilbao Vizcaya Argentaria SA (Financials) | | | 1,321,751 | |
| | 443,229 | | | Banco Santander SA (Financials) | | | 1,732,774 | |
| | 105,694 | | | CaixaBank SA (Financials) | | | 428,346 | |
| | 15,936 | | | Cellnex Telecom SA (Communication Services)*(a) | | | 610,554 | |
| | 1,590 | | | Corp ACCIONA Energias Renovables SA (Utilities) | | | 47,353 | |
| | 8,220 | | | EDP Renovaveis SA (Utilities) | | | 150,819 | |
| | |
| |
| Common Stocks – (continued) | | | |
| Spain – (continued) | | | |
| | 8,810 | | | Endesa SA (Utilities) | | | 183,398 | |
| | 8,219 | | | Grifols SA (Health Care)* | | | 112,800 | |
| | 162,686 | | | Iberdrola SA (Utilities) | | | 1,935,221 | |
| | 30,929 | | | Industria de Diseno Textil SA (Consumer Discretionary) | | | 1,186,993 | |
| | 25,451 | | | Mapfre SA (Financials) | | | 53,893 | |
| | 3,479 | | | Naturgy Energy Group SA (Utilities)(b) | | | 100,968 | |
| | 11,251 | | | Redeia Corp. SA (Utilities) | | | 183,230 | |
| | 35,714 | | | Repsol SA (Energy) | | | 551,198 | |
| | 144,615 | | | Telefonica SA (Communication Services) | | | 600,207 | |
| | | | | | | | |
| | | | | | | 10,585,598 | |
| | |
| Sweden – 3.1% | | | |
| | 4,888 | | | AAK AB (Consumer Staples) | | | 90,708 | |
| | 6,652 | | | AddTech AB, Class B (Industrials)(b) | | | 112,629 | |
| | 7,864 | | | Alfa Laval AB (Industrials) | | | 276,643 | |
| | 27,181 | | | Assa Abloy AB, Class B (Industrials) | | | 612,881 | |
| | 70,868 | | | Atlas Copco AB, Class A (Industrials) | | | 938,120 | |
| | 42,104 | | | Atlas Copco AB, Class B (Industrials) | | | 485,835 | |
| | 3,301 | | | Avanza Bank Holding AB (Financials) | | | 63,910 | |
| | 2,929 | | | Axfood AB (Consumer Staples) | | | 70,805 | |
| | 10,407 | | | Beijer Ref AB (Industrials) | | | 119,563 | |
| | 7,517 | | | Boliden AB (Materials) | | | 200,146 | |
| | 10,601 | | | Castellum AB (Real Estate) | | | 113,272 | |
| | 5,820 | | | Electrolux AB, Class B (Consumer Discretionary) | | | 64,127 | |
| | 9,646 | | | Elekta AB, Class B (Health Care) | | | 69,047 | |
| | 20,011 | | | Embracer Group AB (Communication Services)*(b) | | | 48,520 | |
| | 17,299 | | | Epiroc AB, Class A (Industrials) | | | 332,713 | |
| | 10,502 | | | Epiroc AB, Class B (Industrials) | | | 172,254 | |
| | 12,449 | | | EQT AB (Financials) | | | 251,029 | |
| | 16,867 | | | Essity AB, Class B (Consumer Staples) | | | 393,875 | |
| | 5,001 | | | Evolution AB (Consumer Discretionary)(a) | | | 541,757 | |
| | 7,001 | | | Fabege AB (Real Estate) | | | 60,024 | |
| | 17,802 | | | Fastighets AB Balder, Class B (Real Estate)* | | | 85,353 | |
| | 6,058 | | | Getinge AB, Class B (Health Care) | | | 105,311 | |
| | 17,366 | | | H & M Hennes & Mauritz AB, Class B (Consumer Discretionary) | | | 265,615 | |
| | 54,000 | | | Hexagon AB, Class B (Information Technology) | | | 482,799 | |
| | 2,525 | | | Holmen AB, Class B (Materials) | | | 95,812 | |
| | 10,685 | | | Husqvarna AB, Class B (Industrials) | | | 92,214 | |
| | 4,326 | | | Industrivarden AB, Class A (Financials) | | | 112,872 | |
| | 3,595 | | | Industrivarden AB, Class C (Financials) | | | 93,635 | |
| | 7,439 | | | Indutrade AB (Industrials) | | | 143,143 | |
| | 3,755 | | | Investment AB Latour, Class B (Industrials) | | | 68,396 | |
| | 13,360 | | | Investor AB, Class A (Financials) | | | 255,367 | |
| | 50,777 | | | Investor AB, Class B (Financials) | | | 978,915 | |
| | 6,620 | | | Kinnevik AB, Class B (Financials)* | | | 77,959 | |
| | 1,254 | | | L E Lundbergforetagen AB, Class B (Financials) | | | 51,054 | |
| | |
| | |
| 54 | | The accompanying notes are an integral part of these financial statements. |
GOLDMAN SACHS MARKETBETA® INTERNATIONAL EQUITY ETF
| | | | | | | | |
Shares | | | Description | | Value | |
| |
| Common Stocks – (continued) | | | |
| Sweden – (continued) | | | |
| | 6,271 | | | Lifco AB, Class B (Industrials) | | $ | 114,998 | |
| | 41,076 | | | Nibe Industrier AB, Class B (Industrials) | | | 308,279 | |
| | 2,143 | | | Saab AB, Class B (Industrials) | | | 113,237 | |
| | 5,713 | | | Sagax AB, Class B (Real Estate) | | | 119,009 | |
| | 29,297 | | | Sandvik AB (Industrials) | | | 554,909 | |
| | 13,985 | | | Securitas AB, Class B (Industrials) | | | 114,001 | |
| | 44,972 | | | Skandinaviska Enskilda Banken AB, Class A (Financials) | | | 522,214 | |
| | 9,224 | | | Skanska AB, Class B (Industrials) | | | 135,287 | |
| | 10,380 | | | SKF AB, Class B (Industrials) | | | 168,499 | |
| | 6,134 | | | SSAB AB, Class A (Materials) | | | 35,236 | |
| | 17,666 | | | SSAB AB, Class B (Materials) | | | 97,898 | |
| | 16,639 | | | Svenska Cellulosa AB SCA, Class B (Materials) | | | 221,855 | |
| | 40,787 | | | Svenska Handelsbanken AB, Class A (Financials) | | | 340,304 | |
| | 980 | | | Svenska Handelsbanken AB, Class B (Financials) | | | 9,881 | |
| | 5,035 | | | Sweco AB, Class B (Industrials) | | | 49,109 | |
| | 27,892 | | | Swedbank AB, Class A (Financials) | | | 494,546 | |
| | 5,621 | | | Swedish Orphan Biovitrum AB (Health Care)*(b) | | | 108,622 | |
| | 15,392 | | | Tele2 AB, Class B (Communication Services) | | | 108,715 | |
| | 81,458 | | | Telefonaktiebolaget LM Ericsson, Class B (Information Technology) | | | 419,048 | |
| | 64,468 | | | Telia Co. AB (Communication Services) | | | 130,174 | |
| | 2,912 | | | Thule Group AB (Consumer Discretionary)(a) | | | 84,382 | |
| | 5,861 | | | Trelleborg AB, Class B (Industrials) | | | 149,015 | |
| | 2,063 | | | Vitrolife AB (Health Care) | | | 28,166 | |
| | 5,290 | | | Volvo AB, Class A (Industrials) | | | 108,410 | |
| | 41,789 | | | Volvo AB, Class B (Industrials) | | | 844,184 | |
| | 13,225 | | | Volvo Car AB, Class B (Consumer Discretionary)* | | | 50,388 | |
| | 9,709 | | | Wallenstam AB, Class B (Real Estate) | | | 35,059 | |
| | | | | | | | |
| | | | | | | 13,391,728 | |
| | |
| Switzerland – 5.0% | | | |
| | 43,806 | | | ABB Ltd. (Industrials) | | | 1,670,902 | |
| | 13,762 | | | Alcon, Inc. (Health Care) | | | 1,151,754 | |
| | 14,105 | | | Cie Financiere Richemont SA, Class A (Consumer Discretionary) | | | 2,005,761 | |
| | 7,355 | | | DSM-Firmenich AG (Materials) | | | 679,731 | |
| | 937 | | | Geberit AG (Industrials) | | | 486,508 | |
| | 258 | | | Givaudan SA (Materials) | | | 861,120 | |
| | 1,434 | | | Kuehne + Nagel International AG (Industrials) | | | 431,702 | |
| | 2,075 | | | Lonza Group AG (Health Care) | | | 1,148,562 | |
| | 55,051 | | | Novartis AG (Health Care) | | | 5,566,493 | |
| | 603 | | | Partners Group Holding AG (Financials) | | | 652,121 | |
| | 549 | | | Schindler Holding AG (Industrials) | | | 115,549 | |
| | 1,132 | | | Schindler Holding AG Participation Certificates (Industrials) | | | 252,673 | |
| | 4,131 | | | SGS SA (Industrials) | | | 375,941 | |
| | 4,079 | | | Sika AG (Materials) | | | 1,156,390 | |
| | |
| |
| Common Stocks – (continued) | | | |
| Switzerland – (continued) | | | |
| | 2,982 | | | Straumann Holding AG (Health Care) | | | 452,406 | |
| | 783 | | | Swatch Group AG (The) – Bearer (Consumer Discretionary) | | | 220,472 | |
| | 1,469 | | | Swatch Group AG (The) – Registered (Consumer Discretionary) | | | 78,419 | |
| | 707 | | | Swisscom AG (Communication Services) | | | 430,644 | |
| | 83,422 | | | UBS Group AG (Financials) | | | 2,219,549 | |
| | 4,145 | | | Zurich Insurance Group AG (Financials) | | | 1,947,552 | |
| | | | | | | | |
| | | | | | | 21,904,249 | |
| | |
| United Kingdom – 11.2% | | | |
| | 26,401 | | | 3i Group PLC (Financials) | | | 666,906 | |
| | 55,750 | | | abrdn PLC (Financials) | | | 116,633 | |
| | 5,316 | | | Admiral Group PLC (Financials) | | | 167,731 | |
| | 8,275 | | | Allfunds Group PLC (Financials) | | | 49,128 | |
| | 12,248 | | | Ashtead Group PLC (Industrials) | | | 857,328 | |
| | 9,717 | | | Associated British Foods PLC (Consumer Staples) | | | 245,335 | |
| | 41,936 | | | AstraZeneca PLC (Health Care) | | | 5,665,706 | |
| | 25,351 | | | Auto Trader Group PLC (Communication Services)(a) | | | 194,797 | |
| | 77,543 | | | Aviva PLC (Financials) | | | 368,667 | |
| | 25,960 | | | B&M European Value Retail SA (Consumer Discretionary) | | | 190,003 | |
| | 85,345 | | | BAE Systems PLC (Industrials) | | | 1,089,561 | |
| | 435,504 | | | Barclays PLC (Financials) | | | 813,205 | |
| | 27,377 | | | Barratt Developments PLC (Consumer Discretionary) | | | 157,253 | |
| | 2,939 | | | Berkeley Group Holdings PLC (Consumer Discretionary) | | | 151,238 | |
| | 436,997 | | | BP PLC (Energy) | | | 2,699,488 | |
| | 57,395 | | | British American Tobacco PLC (Consumer Staples) | | | 1,907,295 | |
| | 25,003 | | | British Land Co. PLC (The) REIT (Real Estate) | | | 102,525 | |
| | 176,429 | | | BT Group PLC (Communication Services) | | | 258,438 | |
| | 9,349 | | | Bunzl PLC (Industrials) | | | 335,259 | |
| | 10,533 | | | Burberry Group PLC (Consumer Discretionary) | | | 291,496 | |
| | 74,238 | | | CK Hutchison Holdings Ltd. (Industrials) | | | 404,715 | |
| | 26,742 | | | CNH Industrial NV (Industrials) | | | 370,932 | |
| | 5,650 | | | Coca-Cola Europacific Partners PLC (Consumer Staples) | | | 362,222 | |
| | 48,582 | | | Compass Group PLC (Consumer Discretionary) | | | 1,226,905 | |
| | 45,909 | | | ConvaTec Group PLC (Health Care)(a) | | | 135,196 | |
| | 3,880 | | | Croda International PLC (Materials) | | | 271,492 | |
| | 2,750 | | | DCC PLC (Industrials) | | | 150,781 | |
| | 62,868 | | | Diageo PLC (Consumer Staples) | | | 2,583,877 | |
| | 38,612 | | | Dowlais Group PLC (Consumer Discretionary)* | | | 55,581 | |
| | 37,157 | | | DS Smith PLC (Materials) | | | 147,042 | |
| | 17,864 | | | Entain PLC (Consumer Discretionary) | | | 262,016 | |
| | |
| | |
| The accompanying notes are an integral part of these financial statements. | | 55 |
GOLDMAN SACHS MARKETBETA® INTERNATIONAL EQUITY ETF
Schedule of Investments (continued)
August 31, 2023
| | | | | | | | |
Shares | | | Description | | Value | |
| |
| Common Stocks – (continued) | | | |
| United Kingdom – (continued) | | | |
| | 10,508 | | | Halma PLC (Information Technology) | | $ | 285,478 | |
| | 9,842 | | | Hargreaves Lansdown PLC (Financials) | | | 94,932 | |
| | 554,641 | | | HSBC Holdings PLC (Financials) | | | 4,098,107 | |
| | 24,439 | | | Imperial Brands PLC (Consumer Staples) | | | 554,171 | |
| | 39,188 | | | Informa PLC (Communication Services) | | | 362,894 | |
| | 4,666 | | | InterContinental Hotels Group PLC (Consumer Discretionary) | | | 352,032 | |
| | 8,053 | | | Intermediate Capital Group PLC (Financials) | | | 138,014 | |
| | 52,145 | | | International Consolidated Airlines Group SA ADR (Industrials)* | | | 211,187 | |
| | 4,481 | | | Intertek Group PLC (Industrials) | | | 235,073 | |
| | 48,700 | | | J Sainsbury PLC (Consumer Staples) | | | 166,679 | |
| | 69,555 | | | JD Sports Fashion PLC (Consumer Discretionary) | | | 128,019 | |
| | 5,076 | | | Johnson Matthey PLC (Materials) | | | 104,843 | |
| | 53,958 | | | Kingfisher PLC (Consumer Discretionary) | | | 159,993 | |
| | 18,742 | | | Land Securities Group PLC REIT (Real Estate) | | | 143,111 | |
| | 166,188 | | | Legal & General Group PLC (Financials) | | | 460,550 | |
| | 4,616 | | | Liberty Global PLC, Class A (Communication Services)* | | | 85,119 | |
| | 7,000 | | | Liberty Global PLC, Class C (Communication Services)* | | | 138,880 | |
| | 1,799,963 | | | Lloyds Banking Group PLC (Financials) | | | 966,043 | |
| | 10,065 | | | London Stock Exchange Group PLC (Financials) | | | 1,043,012 | |
| | 62,074 | | | M&G PLC (Financials) | | | 150,235 | |
| | 37,260 | | | Melrose Industries PLC (Industrials) | | | 242,019 | |
| | 103,046 | | | National Grid PLC (Utilities) | | | 1,292,952 | |
| | 125,946 | | | NatWest Group PLC (Financials) | | | 367,701 | |
| | 3,368 | | | Next PLC (Consumer Discretionary) | | | 298,231 | |
| | 16,404 | | | Ocado Group PLC (Consumer Staples)* | | | 181,174 | |
| | 19,920 | | | Pearson PLC (Consumer Discretionary) | | | 211,777 | |
| | 8,894 | | | Persimmon PLC (Consumer Discretionary) | | | 120,139 | |
| | 20,820 | | | Phoenix Group Holdings PLC (Financials) | | | 137,451 | |
| | 20,020 | | | Reckitt Benckiser Group PLC (Consumer Staples) | | | 1,446,504 | |
| | 52,834 | | | RELX PLC (Industrials) | | | 1,725,936 | |
| | 70,165 | | | Rentokil Initial PLC (Industrials) | | | 535,058 | |
| | 22,836 | | | Rightmove PLC (Communication Services) | | | 162,045 | |
| | 235,607 | | | Rolls-Royce Holdings PLC (Industrials)* | | | 663,676 | |
| | 28,392 | | | Sage Group PLC (The) (Information Technology) | | | 349,336 | |
| | |
| |
| Common Stocks – (continued) | | | |
| United Kingdom – (continued) | | | |
| | 24,510 | | | Schroders PLC (Financials) | | | 127,896 | |
| | 34,235 | | | Segro PLC REIT (Real Estate) | | | 319,891 | |
| | 6,997 | | | Severn Trent PLC (Utilities) | | | 212,790 | |
| | 24,323 | | | Smith & Nephew PLC (Health Care) | | | 329,784 | |
| | 9,816 | | | Smiths Group PLC (Industrials) | | | 203,989 | |
| | 2,047 | | | Spirax-Sarco Engineering PLC (Industrials) | | | 262,887 | |
| | 30,508 | | | SSE PLC (Utilities) | | | 628,776 | |
| | 15,230 | | | St James’s Place PLC (Financials) | | | 170,755 | |
| | 66,312 | | | Standard Chartered PLC (Financials) | | | 597,938 | |
| | 98,289 | | | Taylor Wimpey PLC (Consumer Discretionary) | | | 142,357 | |
| | 203,832 | | | Tesco PLC (Consumer Staples) | | | 686,266 | |
| | 69,753 | | | Unilever PLC (Consumer Staples) | | | 3,572,626 | |
| | 18,993 | | | United Utilities Group PLC (Utilities) | | | 227,914 | |
| | 681,970 | | | Vodafone Group PLC (Communication Services) | | | 632,651 | |
| | 7,224 | | | Weir Group PLC (The) (Industrials) | | | 167,928 | |
| | 5,623 | | | Whitbread PLC (Consumer Discretionary) | | | 245,107 | |
| | 16,322 | | | Wise PLC, Class A (Financials)* | | | 132,409 | |
| | 29,894 | | | WPP PLC (Communication Services) | | | 290,087 | |
| | | | | | | | |
| | | | | | | 48,863,173 | |
| | |
| United States – 7.2% | | | |
| | 13,429 | | | CSL Ltd. (Health Care) | | | 2,378,971 | |
| | 1,123 | | | CyberArk Software Ltd. (Information Technology)* | | | 186,463 | |
| | 25,726 | | | Experian PLC (Industrials) | | | 900,377 | |
| | 13,250 | | | Ferrovial SE (Industrials) | | | 420,641 | |
| | 867 | | | Fiverr International Ltd. (Industrials)* | | | 24,406 | |
| | 114,580 | | | GSK PLC (Health Care) | | | 2,016,401 | |
| | 142,320 | | | Haleon PLC (Consumer Staples) | | | 581,599 | |
| | 14,346 | | | Holcim AG (Materials)* | | | 951,148 | |
| | 2,279 | | | ICON PLC (Health Care)* | | | 592,403 | |
| | 2,007 | | | Inmode Ltd. (Health Care)* | | | 78,454 | |
| | 12,314 | | | James Hardie Industries PLC CDI (Materials)* | | | 371,084 | |
| | 565 | | | Monday.com Ltd. (Information Technology)* | | | 100,254 | |
| | 74,638 | | | Nestle SA (Consumer Staples) | | | 8,991,206 | |
| | 19,664 | | | Roche Holding AG (Health Care) | | | 5,795,119 | |
| | 798 | | | Roche Holding AG (Health Care) | | | 249,542 | |
| | 30,951 | | | Sanofi (Health Care) | | | 3,313,582 | |
| | 15,070 | | | Schneider Electric SE (Industrials) | | | 2,593,771 | |
| | 61,266 | | | Stellantis NV (Consumer Discretionary) | | | 1,142,119 | |
| | 8,085 | | | Swiss Re AG (Financials) | | | 786,302 | |
| | 12,980 | | | Tenaris SA (Energy) | | | 207,937 | |
| | | | | | | | |
| | | | | | | 31,681,779 | |
| | |
| | TOTAL COMMON STOCKS | | | | |
| | (Cost $408,936,929) | | $ | 432,626,864 | |
| | |
| | |
| 56 | | The accompanying notes are an integral part of these financial statements. |
GOLDMAN SACHS MARKETBETA® INTERNATIONAL EQUITY ETF
| | | | | | | | | | | | |
Shares | | | Description | | Rate | | | Value | |
|
| Preferred Stocks – 0.5% | |
| Germany – 0.5% | | | | |
| | 1,650 | | | Bayerische Motoren Werke AG (Consumer Discretionary) | | | 9.84 | % | | $ | 158,936 | |
| | 3,172 | | | Dr. Ing hc F Porsche AG (Consumer Discretionary)(a) | | | 1.03 | | | | 350,642 | |
| | 4,592 | | | Henkel AG & Co. KGaA (Consumer Staples) | | | 2.60 | | | | 352,464 | |
| | 4,266 | | | Porsche Automobil Holding SE (Consumer Discretionary) | | | 5.27 | | | | 229,514 | |
| | 685 | | | Sartorius AG (Health Care) | | | 0.39 | | | | 280,584 | |
| | 5,125 | | | Volkswagen AG (Consumer Discretionary) | | | 25.69 | | | | 628,776 | |
| | | | | | | | | | | | |
| | | | | | | | | | | 2,000,916 | |
| | |
| Spain – 0.0% | | | | |
| | 7,282 | | | Grifols SA, Class B (Health Care)* | | | 0.00 | | | | 69,195 | |
| | |
| | TOTAL PREFERRED STOCKS | | | | | |
| | (Cost $2,385,337) | | | | | | $ | 2,070,111 | |
| | |
| | | |
| Units | | | Description | | Expiration
Month | | | Value | |
|
| Right – 0.0% | |
| Sweden – 0.0% | | | | |
| | 5,621 | | | Swedish Orphan Biovitrum AB* | | | | | | | | |
| | (Cost $0) | | | 09/23 | | | $ | 5,077 | |
| | |
| TOTAL INVESTMENTS BEFORE SECURITIES LENDING
REINVESTMENT VEHICLE |
|
| | (Cost $411,322,266) | | | | | | $ | 434,702,052 | |
| | |
| | | | | | |
| Shares | | Dividend
Rate | | Value | |
|
| Securities Lending Reinvestment Vehicle – 0.4%(d) | |
Goldman Sachs Financial Square Government Fund – Institutional Shares | |
| 1,807,609 | | 5.234% | | $ | 1,807,609 | |
| (Cost $1,807,609) | |
| |
| TOTAL INVESTMENTS – 99.8% | |
| (Cost $413,129,875) | | $ | 436,509,661 | |
| |
OTHER ASSETS IN EXCESS OF
LIABILITIES – 0.2% | | | 969,106 | |
| |
| NET ASSETS – 100.0% | | $ | 437,478,767 | |
| |
| | |
|
| The percentage shown for each investment category reflects the value of investments in that category as a percentage of net assets. |
| |
* | | Non-income producing security. |
| |
(a) | | Exempt from registration under Rule 144A of the Securities Act of 1933. |
| |
(b) | | All or a portion of security is on loan. |
| |
(c) | | Significant unobservable inputs were used in the valuation of this portfolio security; i.e. Level 3. |
| |
(d) | | Represents an affiliated issuer. |
| | |
|
Investment Abbreviations: |
ADR | | —American Depositary Receipt |
CVA | | —Dutch Certification |
PLC | | —Public Limited Company |
REIT | | —Real Estate Investment Trust |
SDR | | —Swedish Depositary Receipt |
|
|
| ADDITIONAL INVESTMENT INFORMATION |
FUTURES CONTRACTS — At August 31, 2023, the Fund had the following futures contracts:
| | | | | | | | | | | | |
Description | | Number of
Contracts | | Expiration
Date | | Notional
Amount | | | Unrealized
Appreciation/
(Depreciation) | |
Long position contracts: | | | | | | | | | | | | |
| | | | |
E-Mini MSCI EAFE Index Future | | 19 | | 09/15/23 | | $ | 2,003,835 | | | $ | (24,986 | ) |
| | |
| The accompanying notes are an integral part of these financial statements. | | 57 |
GOLDMAN SACHS MARKETBETA® INTERNATIONAL EQUITY ETF
Schedule of Investments (continued)
August 31, 2023
| | | | |
| Sector Name | | % of Market
Value | |
| |
Financials | | | 17.8 | % |
Industrials | | | 16.4 | |
Health Care | | | 13.2 | |
Consumer Discretionary | | | 12.4 | |
Consumer Staples | | | 9.9 | |
Information Technology | | | 8.1 | |
Materials | | | 7.4 | |
Energy | | | 4.4 | |
Communication Services | | | 4.4 | |
Utilities | | | 3.2 | |
Real Estate | | | 2.4 | |
Securities Lending Reinvestment Vehicle | | | 0.4 | |
| |
| |
| TOTAL INVESTMENTS | | | 100.0 | % |
| |
| | |
| 58 | | The accompanying notes are an integral part of these financial statements. |
GOLDMAN SACHS MARKETBETA® U.S. EQUITY ETF
Schedule of Investments
August 31, 2023
| | | | | | | | |
| Shares | | | Description | | Value | |
| |
| Common Stocks – 99.7% | | | |
| Communication Services – 8.9% | | | |
| | 19,383 | | | Activision Blizzard, Inc. | | $ | 1,783,042 | |
| | 159,066 | | | Alphabet, Inc., Class A* | | | 21,660,017 | |
| | 136,579 | | | Alphabet, Inc., Class C* | | | 18,759,126 | |
| | 190,343 | | | AT&T, Inc. | | | 2,815,173 | |
| | 2,682 | | | Charter Communications, Inc., Class A* | | | 1,175,038 | |
| | 110,210 | | | Comcast Corp., Class A | | | 5,153,420 | |
| | 7,265 | | | Electronic Arts, Inc. | | | 871,655 | |
| | 7,802 | | | Fox Corp., Class A | | | 257,934 | |
| | 3,489 | | | Fox Corp., Class B | | | 106,484 | |
| | 436 | | | Liberty Broadband Corp., Class A* | | | 40,827 | |
| | 3,076 | | | Liberty Broadband Corp., Class C* | | | 287,790 | |
| | 3,926 | | | Live Nation Entertainment, Inc.* | | | 331,865 | |
| | 7,435 | | | Match Group, Inc.* | | | 348,478 | |
| | 58,889 | | | Meta Platforms, Inc., Class A* | | | 17,424,666 | |
| | 11,609 | | | Netflix, Inc.* | | | 5,034,591 | |
| | 5,364 | | | Omnicom Group, Inc. | | | 434,538 | |
| | 12,974 | | | Paramount Global, Class B | | | 195,778 | |
| | 14,428 | | | Pinterest, Inc., Class A* | | | 396,626 | |
| | 9,363 | | | ROBLOX Corp., Class A* | | | 264,879 | |
| | 17,623 | | | Sirius XM Holdings, Inc.(a) | | | 77,541 | |
| | 25,962 | | | Snap, Inc., Class A* | | | 268,707 | |
| | 3,527 | | | Spotify Technology SA* | | | 543,052 | |
| | 4,466 | | | Take-Two Interactive Software, Inc.* | | | 635,065 | |
| | 14,975 | | | T-Mobile US, Inc.* | | | 2,040,344 | |
| | 11,824 | | | Trade Desk, Inc. (The), Class A* | | | 946,275 | |
| | 112,160 | | | Verizon Communications, Inc. | | | 3,923,357 | |
| | 48,786 | | | Walt Disney Co. (The)* | | | 4,082,412 | |
| | 59,484 | | | Warner Bros Discovery, Inc.* | | | 781,620 | |
| | 3,319 | | | Warner Music Group Corp., Class A | | | 110,523 | |
| | | | | | | | |
| | | | | | | 90,750,823 | |
| | |
| Consumer Discretionary – 11.0% | |
| | 10,629 | | | Airbnb, Inc., Class A* | | | 1,398,245 | |
| | 240,657 | | | Amazon.com, Inc.* | | | 33,213,073 | |
| | 7,540 | | | Aptiv PLC* | | | 764,933 | |
| | 485 | | | AutoZone, Inc.* | | | 1,227,695 | |
| | 5,200 | | | Best Buy Co., Inc. | | | 397,540 | |
| | 986 | | | Booking Holdings, Inc.* | | | 3,061,560 | |
| | 1,728 | | | Burlington Stores, Inc.* | | | 280,385 | |
| | 5,499 | | | Caesars Entertainment, Inc.* | | | 303,875 | |
| | 4,211 | | | CarMax, Inc.* | | | 343,954 | |
| | 26,495 | | | Carnival Corp.* | | | 419,151 | |
| | 2,578 | | | Chewy, Inc., Class A* | | | 61,820 | |
| | 729 | | | Chipotle Mexican Grill, Inc.* | | | 1,404,521 | |
| | 29,071 | | | Coupang, Inc. (South Korea) * | | | 551,768 | |
| | 3,221 | | | Darden Restaurants, Inc. | | | 500,898 | |
| | 222 | | | Dillard’s, Inc., Class A | | | 76,617 | |
| | 943 | | | Domino’s Pizza, Inc. | | | 365,318 | |
| | 7,009 | | | DoorDash, Inc., Class A* | | | 589,667 | |
| | 8,216 | | | D.R. Horton, Inc. | | | 977,868 | |
| | 14,308 | | | eBay, Inc. | | | 640,712 | |
| | 3,285 | | | Etsy, Inc.* | | | 241,677 | |
| | 3,931 | | | Expedia Group, Inc.* | | | 426,081 | |
| | 104,381 | | | Ford Motor Co. | | | 1,266,142 | |
| | 4,074 | | | Garmin Ltd. | | | 431,925 | |
| | 37,094 | | | General Motors Co. | | | 1,243,020 | |
| | |
| |
| Common Stocks – (continued) | | | |
| Consumer Discretionary – (continued) | |
| | 3,679 | | | Genuine Parts Co. | | | 565,573 | |
| | 3,403 | | | Hasbro, Inc. | | | 245,016 | |
| | 6,987 | | | Hilton Worldwide Holdings, Inc. | | | 1,038,618 | |
| | 26,845 | | | Home Depot, Inc. (The) | | | 8,866,903 | |
| | 8,713 | | | Las Vegas Sands Corp. | | | 477,995 | |
| | 6,623 | | | Lennar Corp., Class A | | | 788,733 | |
| | 371 | | | Lennar Corp., Class B | | | 39,571 | |
| | 6,768 | | | LKQ Corp. | | | 355,523 | |
| | 15,659 | | | Lowe’s Cos., Inc. | | | 3,609,086 | |
| | 19,982 | | | Lucid Group, Inc.*(a) | | | 125,487 | |
| | 2,964 | | | Lululemon Athletica, Inc.* | | | 1,130,055 | |
| | 7,219 | | | Marriott International, Inc., Class A | | | 1,469,139 | |
| | 19,504 | | | McDonald’s Corp. | | | 5,483,550 | |
| | 1,197 | | | MercadoLibre, Inc. (Brazil) * | | | 1,642,715 | |
| | 8,150 | | | MGM Resorts International | | | 358,437 | |
| | 2,247 | | | Mobileye Global, Inc., Class A (Israel)* | | | 79,791 | |
| | 32,561 | | | NIKE, Inc., Class B | | | 3,311,779 | |
| | 78 | | | NVR, Inc.* | | | 497,432 | |
| | 1,632 | | | O’Reilly Automotive, Inc.* | | | 1,533,590 | |
| | 5,628 | | | PulteGroup, Inc. | | | 461,834 | |
| | 17,694 | | | Rivian Automotive, Inc., Class A* | | | 402,185 | |
| | 8,957 | | | Ross Stores, Inc. | | | 1,091,052 | |
| | 5,882 | | | Royal Caribbean Cruises Ltd.* | | | 581,965 | |
| | 30,097 | | | Starbucks Corp. | | | 2,932,652 | |
| | 73,330 | | | Tesla, Inc.* | | | 18,925,006 | |
| | 30,758 | | | TJX Cos., Inc. (The) | | | 2,844,500 | |
| | 2,934 | | | Tractor Supply Co. | | | 641,079 | |
| | 1,316 | | | Ulta Beauty, Inc.* | | | 546,179 | |
| | 1,061 | | | Vail Resorts, Inc. | | | 240,125 | |
| | 1,414 | | | Whirlpool Corp. | | | 197,903 | |
| | 10,807 | | | Yum China Holdings, Inc. (China) | | | 580,228 | |
| | 7,462 | | | Yum! Brands, Inc. | | | 965,434 | |
| | | | | | | | |
| | | | | | | 112,217,580 | |
| | |
| Consumer Staples – 6.3% | |
| | 47,650 | | | Altria Group, Inc. | | | 2,107,083 | |
| | 14,525 | | | Archer-Daniels-Midland Co. | | | 1,151,832 | |
| | 8,159 | | | Brown-Forman Corp., Class B | | | 539,555 | |
| | 5,130 | | | Campbell Soup Co. | | | 213,921 | |
| | 6,510 | | | Church & Dwight Co., Inc. | | | 629,973 | |
| | 3,283 | | | Clorox Co. (The) | | | 513,625 | |
| | 103,954 | | | Coca-Cola Co. (The) | | | 6,219,568 | |
| | 22,162 | | | Colgate-Palmolive Co. | | | 1,628,242 | |
| | 12,670 | | | Conagra Brands, Inc. | | | 378,580 | |
| | 4,227 | | | Constellation Brands, Inc., Class A | | | 1,101,387 | |
| | 11,819 | | | Costco Wholesale Corp. | | | 6,491,940 | |
| | 5,821 | | | Dollar General Corp. | | | 806,208 | |
| | 5,552 | | | Dollar Tree, Inc.* | | | 679,343 | |
| | 5,710 | | | Estee Lauder Cos., Inc. (The), Class A | | | 916,626 | |
| | 15,647 | | | General Mills, Inc. | | | 1,058,676 | |
| | 3,917 | | | Hershey Co. (The) | | | 841,607 | |
| | 7,715 | | | Hormel Foods Corp. | | | 297,722 | |
| | 2,714 | | | J M Smucker Co. (The) | | | 393,394 | |
| | 6,825 | | | Kellogg Co. | | | 416,461 | |
| | 5,313 | | | Kenvue, Inc. | | | 122,465 | |
| | 24,190 | | | Keurig Dr Pepper, Inc. | | | 813,993 | |
| | |
| | |
| The accompanying notes are an integral part of these financial statements. | | 59 |
GOLDMAN SACHS MARKETBETA® U.S. EQUITY ETF
Schedule of Investments (continued)
August 31, 2023
| | | | | | | | |
| Shares | | | Description | | Value | |
| |
| Common Stocks – (continued) | | | |
| Consumer Staples – (continued) | |
| | 8,987 | | | Kimberly-Clark Corp. | | $ | 1,157,795 | |
| | 21,010 | | | Kraft Heinz Co. (The) | | | 695,221 | |
| | 18,917 | | | Kroger Co. (The) | | | 877,560 | |
| | 6,698 | | | McCormick & Co., Inc. | | | 549,772 | |
| | 4,650 | | | Molson Coors Beverage Co., Class B | | | 295,229 | |
| | 36,309 | | | Mondelez International, Inc., Class A | | | 2,587,379 | |
| | 13,530 | | | Monster Beverage Corp.* | | | 776,757 | |
| | 36,742 | | | PepsiCo, Inc. | | | 6,537,137 | |
| | 41,345 | | | Philip Morris International, Inc. | | | 3,971,601 | |
| | 62,946 | | | Procter & Gamble Co. (The) | | | 9,715,086 | |
| | 13,542 | | | Sysco Corp. | | | 943,200 | |
| | 12,266 | | | Target Corp. | | | 1,552,262 | |
| | 7,508 | | | Tyson Foods, Inc., Class A | | | 399,951 | |
| | 19,016 | | | Walgreens Boots Alliance, Inc. | | | 481,295 | |
| | 37,947 | | | Walmart, Inc. | | | 6,170,562 | |
| | | | | | | | |
| | | | | | | 64,033,008 | |
| | |
| Energy – 4.3% | |
| | 26,983 | | | Baker Hughes Co. | | | 976,515 | |
| | 6,443 | | | Cheniere Energy, Inc. | | | 1,051,498 | |
| | 46,182 | | | Chevron Corp. | | | 7,439,920 | |
| | 32,535 | | | ConocoPhillips | | | 3,872,641 | |
| | 20,183 | | | Coterra Energy, Inc. | | | 568,959 | |
| | 17,333 | | | Devon Energy Corp. | | | 885,543 | |
| | 4,659 | | | Diamondback Energy, Inc. | | | 707,143 | |
| | 15,647 | | | EOG Resources, Inc. | | | 2,012,517 | |
| | 108,092 | | | Exxon Mobil Corp. | | | 12,018,749 | |
| | 24,061 | | | Halliburton Co. | | | 929,236 | |
| | 7,369 | | | Hess Corp. | | | 1,138,510 | |
| | 52,466 | | | Kinder Morgan, Inc. | | | 903,465 | |
| | 11,336 | | | Marathon Petroleum Corp. | | | 1,618,441 | |
| | 18,810 | | | Occidental Petroleum Corp. | | | 1,181,080 | |
| | 11,871 | | | ONEOK, Inc. | | | 773,989 | |
| | 12,366 | | | Phillips 66 | | | 1,411,703 | |
| | 6,240 | | | Pioneer Natural Resources Co. | | | 1,484,683 | |
| | 37,858 | | | Schlumberger NV | | | 2,232,108 | |
| | 9,626 | | | Valero Energy Corp. | | | 1,250,417 | |
| | 32,482 | | | Williams Cos., Inc. (The) | | | 1,121,603 | |
| | | | | | | | |
| | | | | | | 43,578,720 | |
| | |
| Financials – 12.3% | |
| | 14,816 | | | Aflac, Inc. | | | 1,104,829 | |
| | 6,903 | | | Allstate Corp. (The) | | | 744,212 | |
| | 7,213 | | | Ally Financial, Inc. | | | 199,728 | |
| | 15,807 | | | American Express Co. | | | 2,497,348 | |
| | 19,667 | | | American International Group, Inc. | | | 1,150,913 | |
| | 2,810 | | | Ameriprise Financial, Inc. | | | 948,600 | |
| | 5,413 | | | Aon PLC, Class A | | | 1,804,640 | |
| | 10,866 | | | Apollo Global Management, Inc. | | | 949,036 | |
| | 9,499 | | | Arch Capital Group Ltd.* | | | 730,093 | |
| | 5,600 | | | Arthur J Gallagher & Co. | | | 1,290,688 | |
| | 186,033 | | | Bank of America Corp. | | | 5,333,566 | |
| | 20,802 | | | Bank of New York Mellon Corp. (The) | | | 933,386 | |
| | 34,533 | | | Berkshire Hathaway, Inc., Class B* | | | 12,438,787 | |
| | 3,968 | | | BlackRock, Inc. | | | 2,779,743 | |
| | 18,761 | | | Blackstone, Inc. | | | 1,995,608 | |
| | |
| |
| Common Stocks – (continued) | | | |
| Financials – (continued) | |
| | 14,344 | | | Block, Inc.* | | | 826,932 | |
| | 10,041 | | | Capital One Financial Corp. | | | 1,028,098 | |
| | 2,817 | | | Cboe Global Markets, Inc. | | | 421,733 | |
| | 37,329 | | | Charles Schwab Corp. (The) | | | 2,208,010 | |
| | 10,998 | | | Chubb Ltd. | | | 2,209,168 | |
| | 4,100 | | | Cincinnati Financial Corp. | | | 433,739 | |
| | 50,421 | | | Citigroup, Inc. | | | 2,081,883 | |
| | 12,892 | | | Citizens Financial Group, Inc. | | | 362,652 | |
| | 9,575 | | | CME Group, Inc. | | | 1,940,661 | |
| | 3,918 | | | Coinbase Global, Inc., Class A*(a) | | | 311,873 | |
| | 6,970 | | | Discover Financial Services | | | 627,788 | |
| | 1,150 | | | Everest Group Ltd. | | | 414,782 | |
| | 6,914 | | | Fidelity National Financial, Inc. | | | 286,240 | |
| | 15,775 | | | Fidelity National Information Services, Inc. | | | 881,192 | |
| | 18,066 | | | Fifth Third Bancorp | | | 479,652 | |
| | 16,597 | | | Fiserv, Inc.* | | | 2,014,710 | |
| | 1,907 | | | FleetCor Technologies, Inc.* | | | 518,189 | |
| | 7,581 | | | Franklin Resources, Inc. | | | 202,716 | |
| | 6,980 | | | Global Payments, Inc. | | | 884,296 | |
| | 2,529 | | | Globe Life, Inc. | | | 282,161 | |
| | 8,915 | | | Goldman Sachs Group, Inc. (The)(b) | | | 2,921,535 | |
| | 8,328 | | | Hartford Financial Services Group, Inc. (The) | | | 598,117 | |
| | 38,353 | | | Huntington Bancshares, Inc. | | | 425,335 | |
| | 2,603 | | | Interactive Brokers Group, Inc., Class A | | | 237,081 | |
| | 14,758 | | | Intercontinental Exchange, Inc. | | | 1,741,296 | |
| | 77,530 | | | JPMorgan Chase & Co. | | | 11,344,965 | |
| | 24,801 | | | KeyCorp | | | 280,995 | |
| | 17,435 | | | KKR & Co., Inc. | | | 1,095,092 | |
| | 5,132 | | | Loews Corp. | | | 318,646 | |
| | 4,470 | | | M&T Bank Corp. | | | 558,974 | |
| | 353 | | | Markel Group, Inc.* | | | 522,059 | |
| | 13,184 | | | Marsh & McLennan Cos., Inc. | | | 2,570,748 | |
| | 22,417 | | | Mastercard, Inc., Class A | | | 9,250,151 | |
| | 17,406 | | | MetLife, Inc. | | | 1,102,496 | |
| | 4,228 | | | Moody’s Corp. | | | 1,423,990 | |
| | 34,475 | | | Morgan Stanley | | | 2,935,546 | |
| | 2,069 | | | MSCI, Inc. | | | 1,124,750 | |
| | 9,114 | | | Nasdaq, Inc. | | | 478,303 | |
| | 5,543 | | | Northern Trust Corp. | | | 421,656 | |
| | 30,172 | | | PayPal Holdings, Inc.* | | | 1,886,052 | |
| | 10,642 | | | PNC Financial Services Group, Inc. (The) | | | 1,284,809 | |
| | 6,486 | | | Principal Financial Group, Inc. | | | 504,027 | |
| | 15,586 | | | Progressive Corp. (The) | | | 2,080,263 | |
| | 9,769 | | | Prudential Financial, Inc. | | | 924,831 | |
| | 5,211 | | | Raymond James Financial, Inc. | | | 545,018 | |
| | 24,911 | | | Regions Financial Corp. | | | 456,868 | |
| | 2,734 | | | Rocket Cos., Inc., Class A*(a) | | | 29,199 | |
| | 8,587 | | | S&P Global, Inc. | | | 3,356,315 | |
| | 9,173 | | | State Street Corp. | | | 630,552 | |
| | 11,604 | | | Synchrony Financial | | | 374,577 | |
| | 5,887 | | | T. Rowe Price Group, Inc. | | | 660,698 | |
| | 6,177 | | | Travelers Cos., Inc. (The) | | | 995,918 | |
| | 35,379 | | | Truist Financial Corp. | | | 1,080,828 | |
| | |
| | |
| 60 | | The accompanying notes are an integral part of these financial statements. |
GOLDMAN SACHS MARKETBETA® U.S. EQUITY ETF
| | | | | | | | |
| Shares | | | Description | | Value | |
| |
| Common Stocks – (continued) | | | |
| Financials – (continued) | |
| | 39,451 | | | US Bancorp | | $ | 1,441,145 | |
| | 43,256 | | | Visa, Inc., Class A | | | 10,627,134 | |
| | 5,383 | | | W R Berkley Corp. | | | 332,992 | |
| | 99,741 | | | Wells Fargo & Co. | | | 4,118,306 | |
| | 2,834 | | | Willis Towers Watson PLC | | | 585,958 | |
| | | | | | | | |
| | | | | | | 124,584,877 | |
| | |
| Health Care – 13.2% | |
| | 46,186 | | | Abbott Laboratories | | | 4,752,539 | |
| | 47,218 | | | AbbVie, Inc. | | | 6,939,157 | |
| | 7,882 | | | Agilent Technologies, Inc. | | | 954,274 | |
| | 1,917 | | | Align Technology, Inc.* | | | 709,558 | |
| | 3,300 | | | Alnylam Pharmaceuticals, Inc.* | | | 652,806 | |
| | 14,225 | | | Amgen, Inc. | | | 3,646,436 | |
| | 17,383 | | | Avantor, Inc.* | | | 376,342 | |
| | 13,475 | | | Baxter International, Inc. | | | 547,085 | |
| | 7,748 | | | Becton Dickinson & Co. | | | 2,165,179 | |
| | 3,839 | | | Biogen, Inc.* | | | 1,026,395 | |
| | 4,917 | | | BioMarin Pharmaceutical, Inc.* | | | 449,315 | |
| | 39,000 | | | Boston Scientific Corp.* | | | 2,103,660 | |
| | 56,012 | | | Bristol-Myers Squibb Co. | | | 3,453,140 | |
| | 6,875 | | | Cardinal Health, Inc. | | | 600,394 | |
| | 4,799 | | | Catalent, Inc.* | | | 239,806 | |
| | 4,493 | | | Cencora, Inc. | | | 790,678 | |
| | 14,693 | | | Centene Corp.* | | | 905,823 | |
| | 7,885 | | | Cigna Group (The) | | | 2,178,310 | |
| | 1,313 | | | Cooper Cos., Inc. (The) | | | 485,797 | |
| | 34,253 | | | CVS Health Corp. | | | 2,232,268 | |
| | 17,980 | | | Danaher Corp. | | | 4,764,700 | |
| | 10,278 | | | Dexcom, Inc.* | | | 1,037,872 | |
| | 16,118 | | | Edwards Lifesciences Corp.* | | | 1,232,543 | |
| | 6,318 | | | Elevance Health, Inc. | | | 2,792,619 | |
| | 22,594 | | | Eli Lilly & Co. | | | 12,521,595 | |
| | 2,356 | | | Fortrea Holdings, Inc.* | | | 64,908 | |
| | 9,703 | | | GE HealthCare Technologies, Inc. | | | 683,576 | |
| | 33,261 | | | Gilead Sciences, Inc. | | | 2,543,801 | |
| | 5,550 | | | HCA Healthcare, Inc. | | | 1,539,015 | |
| | 3,483 | | | Henry Schein, Inc.* | | | 266,589 | |
| | 6,541 | | | Hologic, Inc.* | | | 488,874 | |
| | 6,049 | | | Horizon Therapeutics PLC* | | | 681,964 | |
| | 3,328 | | | Humana, Inc. | | | 1,536,305 | |
| | 2,198 | | | IDEXX Laboratories, Inc.* | | | 1,124,079 | |
| | 4,218 | | | Illumina, Inc.* | | | 696,898 | |
| | 4,971 | | | Incyte Corp.* | | | 320,779 | |
| | 9,300 | | | Intuitive Surgical, Inc.* | | | 2,907,924 | |
| | 4,842 | | | IQVIA Holdings, Inc.* | | | 1,077,974 | |
| | 68,435 | | | Johnson & Johnson | | | 11,064,571 | |
| | 2,356 | | | Laboratory Corp. of America Holdings | | | 490,284 | |
| | 3,652 | | | McKesson Corp. | | | 1,505,793 | |
| | 35,528 | | | Medtronic PLC | | | 2,895,532 | |
| | 67,757 | | | Merck & Co., Inc. | | | 7,384,158 | |
| | 585 | | | Mettler-Toledo International, Inc.* | | | 709,886 | |
| | 8,840 | | | Moderna, Inc.* | | | 999,539 | |
| | 150,955 | | | Pfizer, Inc. | | | 5,340,788 | |
| | 2,957 | | | Quest Diagnostics, Inc. | | | 388,846 | |
| | 2,746 | | | Regeneron Pharmaceuticals, Inc.* | | | 2,269,542 | |
| | 3,877 | | | ResMed, Inc. | | | 618,730 | |
| | |
| |
| Common Stocks – (continued) | | | |
| Health Care – (continued) | |
| | 9,915 | | | Royalty Pharma PLC, Class A | | | 295,665 | |
| | 3,677 | | | Seagen, Inc.* | | | 757,719 | |
| | 2,643 | | | STERIS PLC | | | 606,806 | |
| | 8,434 | | | Stryker Corp. | | | 2,391,461 | |
| | 1,255 | | | Teleflex, Inc. | | | 266,989 | |
| | 10,281 | | | Thermo Fisher Scientific, Inc. | | | 5,727,545 | |
| | 24,814 | | | UnitedHealth Group, Inc. | | | 11,825,856 | |
| | 3,855 | | | Veeva Systems, Inc., Class A* | | | 804,539 | |
| | 6,860 | | | Vertex Pharmaceuticals, Inc.* | | | 2,389,612 | |
| | 31,890 | | | Viatris, Inc. | | | 342,818 | |
| | 1,570 | | | Waters Corp.* | | | 440,856 | |
| | 1,968 | | | West Pharmaceutical Services, Inc. | | | 800,779 | |
| | 5,605 | | | Zimmer Biomet Holdings, Inc. | | | 667,668 | |
| | 12,360 | | | Zoetis, Inc. | | | 2,354,704 | |
| | | | | | | | |
| | | | | | | 134,831,663 | |
| | |
| Industrials – 8.3% | |
| | 14,648 | | | 3M Co. | | | 1,562,502 | |
| | 3,330 | | | A O Smith Corp. | | | 241,425 | |
| | 6,131 | | | AMETEK, Inc. | | | 977,956 | |
| | 11,023 | | | Automatic Data Processing, Inc. | | | 2,806,566 | |
| | 14,906 | | | Boeing Co. (The)* | | | 3,339,391 | |
| | 3,112 | | | Broadridge Financial Solutions, Inc. | | | 579,485 | |
| | 22,247 | | | Carrier Global Corp. | | | 1,278,090 | |
| | 13,778 | | | Caterpillar, Inc. | | | 3,873,409 | |
| | 3,052 | | | C.H. Robinson Worldwide, Inc. | | | 275,992 | |
| | 2,308 | | | Cintas Corp. | | | 1,163,624 | |
| | 22,667 | | | Copart, Inc.* | | | 1,016,162 | |
| | 54,194 | | | CSX Corp. | | | 1,636,659 | |
| | 3,733 | | | Cummins, Inc. | | | 858,739 | |
| | 7,270 | | | Deere & Co. | | | 2,987,534 | |
| | 17,070 | | | Delta Air Lines, Inc. | | | 731,962 | |
| | 3,712 | | | Dover Corp. | | | 550,490 | |
| | 10,573 | | | Eaton Corp. PLC | | | 2,435,702 | |
| | 15,212 | | | Emerson Electric Co. | | | 1,494,579 | |
| | 3,265 | | | Equifax, Inc. | | | 674,875 | |
| | 4,101 | | | Expeditors International of Washington, Inc. | | | 478,628 | |
| | 15,219 | | | Fastenal Co. | | | 876,310 | |
| | 6,165 | | | FedEx Corp. | | | 1,609,188 | |
| | 9,423 | | | Fortive Corp. | | | 743,004 | |
| | 6,027 | | | General Dynamics Corp. | | | 1,365,959 | |
| | 28,896 | | | General Electric Co. | | | 3,307,436 | |
| | 17,834 | | | Honeywell International, Inc. | | | 3,351,722 | |
| | 8,130 | | | Illinois Tool Works, Inc. | | | 2,010,955 | |
| | 10,800 | | | Ingersoll Rand, Inc. | | | 751,788 | |
| | 2,199 | | | J.B. Hunt Transport Services, Inc. | | | 413,148 | |
| | 18,223 | | | Johnson Controls International PLC | | | 1,076,250 | |
| | 5,057 | | | L3Harris Technologies, Inc. | | | 900,601 | |
| | 3,637 | | | Leidos Holdings, Inc. | | | 354,644 | |
| | 6,817 | | | Lockheed Martin Corp. | | | 3,056,402 | |
| | 5,996 | | | Masco Corp. | | | 353,824 | |
| | 6,071 | | | Norfolk Southern Corp. | | | 1,244,616 | |
| | 4,050 | | | Northrop Grumman Corp. | | | 1,754,014 | |
| | 2,559 | | | Old Dominion Freight Line, Inc. | | | 1,093,640 | |
| | 11,080 | | | Otis Worldwide Corp. | | | 947,894 | |
| | 13,772 | | | PACCAR, Inc. | | | 1,133,298 | |
| | |
| | |
| The accompanying notes are an integral part of these financial statements. | | 61 |
GOLDMAN SACHS MARKETBETA® U.S. EQUITY ETF
Schedule of Investments (continued)
August 31, 2023
| | | | | | | | |
| Shares | | | Description | | Value | |
| |
| Common Stocks – (continued) | | | |
| Industrials – (continued) | |
| | 3,402 | | | Parker-Hannifin Corp. | | $ | 1,418,294 | |
| | 8,591 | | | Paychex, Inc. | | | 1,050,078 | |
| | 1,365 | | | Paycom Software, Inc. | | | 402,457 | |
| | 3,797 | | | Quanta Services, Inc. | | | 796,876 | |
| | 5,523 | | | Republic Services, Inc. | | | 796,030 | |
| | 3,057 | | | Rockwell Automation, Inc. | | | 954,029 | |
| | 6,309 | | | Rollins, Inc. | | | 249,647 | |
| | 39,075 | | | RTX Corp. | | | 3,362,013 | |
| | 1,391 | | | Snap-on, Inc. | | | 373,623 | |
| | 15,825 | | | Southwest Airlines Co. | | | 500,070 | |
| | 5,847 | | | SS&C Technologies Holdings, Inc. | | | 335,735 | |
| | 4,039 | | | Stanley Black & Decker, Inc. | | | 381,201 | |
| | 5,468 | | | Textron, Inc. | | | 424,918 | |
| | 6,111 | | | Trane Technologies PLC | | | 1,254,344 | |
| | 1,368 | | | TransDigm Group, Inc.* | | | 1,236,467 | |
| | 5,147 | | | TransUnion | | | 418,039 | |
| | 51,662 | | | Uber Technologies, Inc.* | | | 2,439,996 | |
| | 16,306 | | | Union Pacific Corp. | | | 3,596,614 | |
| | 8,695 | | | United Airlines Holdings, Inc.* | | | 433,098 | |
| | 19,364 | | | United Parcel Service, Inc., Class B | | | 3,280,262 | |
| | 1,851 | | | United Rentals, Inc. | | | 882,076 | |
| | 3,850 | | | Verisk Analytics, Inc. | | | 932,547 | |
| | 10,880 | | | Waste Management, Inc. | | | 1,705,766 | |
| | 4,757 | | | Westinghouse Air Brake Technologies Corp. | | | 535,258 | |
| | 1,078 | | | W.W. Grainger, Inc. | | | 769,843 | |
| | 6,391 | | | Xylem, Inc. | | | 661,724 | |
| | | | | | | | |
| | | | | | | 84,499,468 | |
| | |
| Information Technology – 28.4% | |
| | 17,757 | | | Accenture PLC, Class A | | | 5,749,184 | |
| | 12,168 | | | Adobe, Inc.* | | | 6,806,049 | |
| | 42,699 | | | Advanced Micro Devices, Inc.* | | | 4,514,138 | |
| | 4,097 | | | Akamai Technologies, Inc.* | | | 430,554 | |
| | 3,230 | | | Amdocs Ltd. | | | 288,116 | |
| | 15,792 | | | Amphenol Corp., Class A | | | 1,395,697 | |
| | 13,464 | | | Analog Devices, Inc. | | | 2,447,486 | |
| | 2,315 | | | ANSYS, Inc.* | | | 738,184 | |
| | 396,054 | | | Apple, Inc. | | | 74,406,665 | |
| | 22,513 | | | Applied Materials, Inc. | | | 3,439,086 | |
| | 6,271 | | | Arista Networks, Inc.* | | | 1,224,287 | |
| | 3,995 | | | Atlassian Corp., Class A* | | | 815,220 | |
| | 5,729 | | | Autodesk, Inc.* | | | 1,271,494 | |
| | 10,792 | | | Broadcom, Inc. | | | 9,959,829 | |
| | 7,199 | | | Cadence Design Systems, Inc.* | | | 1,730,928 | |
| | 3,613 | | | CDW Corp. | | | 762,885 | |
| | 109,380 | | | Cisco Systems, Inc. | | | 6,272,943 | |
| | 7,490 | | | Cloudflare, Inc., Class A* | | | 487,075 | |
| | 13,590 | | | Cognizant Technology Solutions Corp., Class A | | | 973,180 | |
| | 20,543 | | | Corning, Inc. | | | 674,221 | |
| | 5,727 | | | Crowdstrike Holdings, Inc., Class A* | | | 933,673 | |
| | 7,584 | | | Datadog, Inc., Class A* | | | 731,704 | |
| | 6,677 | | | Dell Technologies, Inc., Class C | | | 375,515 | |
| | 5,316 | | | DocuSign, Inc.* | | | 267,395 | |
| | 3,529 | | | Enphase Energy, Inc.* | | | 446,524 | |
| | 1,499 | | | EPAM Systems, Inc.* | | | 388,226 | |
| | |
| |
| Common Stocks – (continued) | | | |
| Information Technology – (continued) | |
| | 655 | | | Fair Isaac Corp.* | | | 592,506 | |
| | 18,037 | | | Fortinet, Inc.* | | | 1,086,008 | |
| | 2,040 | | | Gartner, Inc.* | | | 713,347 | |
| | 16,502 | | | Gen Digital, Inc. | | | 334,166 | |
| | 2,016 | | | GLOBALFOUNDRIES, Inc.*(a) | | | 111,384 | |
| | 34,478 | | | Hewlett Packard Enterprise Co. | | | 585,781 | |
| | 26,279 | | | HP, Inc. | | | 780,749 | |
| | 1,258 | | | HubSpot, Inc.* | | | 687,522 | |
| | 111,507 | | | Intel Corp. | | | 3,918,356 | |
| | 24,209 | | | International Business Machines Corp. | | | 3,554,607 | |
| | 7,283 | | | Intuit, Inc. | | | 3,946,002 | |
| | 4,739 | | | Keysight Technologies, Inc.* | | | 631,709 | |
| | 3,689 | | | KLA Corp. | | | 1,851,398 | |
| | 3,593 | | | Lam Research Corp. | | | 2,523,723 | |
| | 22,792 | | | Marvell Technology, Inc. | | | 1,327,634 | |
| | 14,329 | | | Microchip Technology, Inc. | | | 1,172,685 | |
| | 29,103 | | | Micron Technology, Inc. | | | 2,035,464 | |
| | 196,008 | | | Microsoft Corp. | | | 64,243,582 | |
| | 1,791 | | | MongoDB, Inc.* | | | 682,908 | |
| | 4,443 | | | Motorola Solutions, Inc. | | | 1,259,902 | |
| | 5,701 | | | NetApp, Inc. | | | 437,267 | |
| | 63,425 | | | NVIDIA Corp. | | | 31,303,409 | |
| | 3,991 | | | Okta, Inc.* | | | 333,288 | |
| | 11,494 | | | ON Semiconductor Corp.* | | | 1,131,699 | |
| | 41,560 | | | Oracle Corp. | | | 5,003,408 | |
| | 47,111 | | | Palantir Technologies, Inc., Class A* | | | 705,723 | |
| | 8,049 | | | Palo Alto Networks, Inc.* | | | 1,958,322 | |
| | 29,738 | | | QUALCOMM, Inc. | | | 3,405,893 | |
| | 2,835 | | | Roper Technologies, Inc. | | | 1,414,835 | |
| | 25,146 | | | Salesforce, Inc.* | | | 5,568,833 | |
| | 5,140 | | | Seagate Technology Holdings PLC | | | 363,861 | |
| | 5,408 | | | ServiceNow, Inc.* | | | 3,184,393 | |
| | 4,236 | | | Skyworks Solutions, Inc. | | | 460,623 | |
| | 7,285 | | | Snowflake, Inc., Class A* | | | 1,142,652 | |
| | 4,066 | | | Splunk, Inc.* | | | 493,043 | |
| | 4,039 | | | Synopsys, Inc.* | | | 1,853,457 | |
| | 8,442 | | | TE Connectivity Ltd. | | | 1,117,636 | |
| | 4,159 | | | Teradyne, Inc. | | | 448,631 | |
| | 24,124 | | | Texas Instruments, Inc. | | | 4,054,279 | |
| | 6,571 | | | Trimble, Inc.* | | | 360,025 | |
| | 4,712 | | | Twilio, Inc., Class A* | | | 300,202 | |
| | 6,386 | | | Unity Software, Inc.* | | | 236,729 | |
| | 2,425 | | | VeriSign, Inc.* | | | 503,891 | |
| | 5,795 | | | VMware, Inc., Class A* | | | 978,080 | |
| | 8,517 | | | Western Digital Corp.* | | | 383,265 | |
| | 5,402 | | | Workday, Inc., Class A* | | | 1,320,789 | |
| | 1,363 | | | Zebra Technologies Corp., Class A* | | | 374,839 | |
| | 6,701 | | | Zoom Video Communications, Inc., Class A* | | | 475,972 | |
| | 2,316 | | | Zscaler, Inc.* | | | 361,412 | |
| | | | | | | | |
| | | | | | | 289,246,147 | |
| | |
| Materials – 2.3% | |
| | 5,847 | | | Air Products and Chemicals, Inc. | | | 1,727,730 | |
| | 3,114 | | | Albemarle Corp. | | | 618,783 | |
| | 39,354 | | | Amcor PLC | | | 383,308 | |
| | 8,274 | | | Ball Corp. | | | 450,519 | |
| | |
| | |
| 62 | | The accompanying notes are an integral part of these financial statements. |
GOLDMAN SACHS MARKETBETA® U.S. EQUITY ETF
| | | | | | | | |
| Shares | | | Description | | Value | |
| |
| Common Stocks – (continued) | | | |
| Materials – (continued) | |
| | 2,894 | | | Celanese Corp. | | $ | 365,686 | |
| | 19,020 | | | Corteva, Inc. | | | 960,700 | |
| | 18,810 | | | Dow, Inc. | | | 1,026,274 | |
| | 11,189 | | | DuPont de Nemours, Inc. | | | 860,322 | |
| | 3,161 | | | Eastman Chemical Co. | | | 268,717 | |
| | 6,729 | | | Ecolab, Inc. | | | 1,236,858 | |
| | 3,329 | | | FMC Corp. | | | 287,060 | |
| | 38,053 | | | Freeport-McMoRan, Inc. | | | 1,518,695 | |
| | 6,807 | | | International Flavors & Fragrances, Inc. | | | 479,553 | |
| | 9,251 | | | International Paper Co. | | | 323,045 | |
| | 13,089 | | | Linde PLC | | | 5,065,967 | |
| | 6,823 | | | LyondellBasell Industries NV, Class A | | | 673,908 | |
| | 1,651 | | | Martin Marietta Materials, Inc. | | | 737,023 | |
| | 8,951 | | | Mosaic Co. (The) | | | 347,746 | |
| | 21,178 | | | Newmont Corp. | | | 834,837 | |
| | 6,711 | | | Nucor Corp. | | | 1,154,963 | |
| | 2,361 | | | Packaging Corp. of America | | | 352,025 | |
| | 6,269 | | | PPG Industries, Inc. | | | 888,693 | |
| | 6,336 | | | Sherwin-Williams Co. (The) | | | 1,721,618 | |
| | 2,278 | | | Southern Copper Corp. (Mexico) | | | 183,743 | |
| | 3,541 | | | Vulcan Materials Co. | | | 772,823 | |
| | | | | | | | |
| | | | | | | 23,240,596 | |
| | |
| Real Estate – 2.3% | |
| | 4,571 | | | Alexandria Real Estate Equities, Inc. REIT | | | 531,790 | |
| | 12,425 | | | American Tower Corp. REIT | | | 2,252,901 | |
| | 3,721 | | | AvalonBay Communities, Inc. REIT | | | 683,994 | |
| | 8,238 | | | CBRE Group, Inc., Class A* | | | 700,642 | |
| | 10,762 | | | CoStar Group, Inc.* | | | 882,376 | |
| | 11,522 | | | Crown Castle, Inc. REIT | | | 1,157,961 | |
| | 7,771 | | | Digital Realty Trust, Inc. REIT | | | 1,023,596 | |
| | 2,496 | | | Equinix, Inc. REIT | | | 1,950,324 | |
| | 9,942 | | | Equity Residential REIT | | | 644,540 | |
| | 1,708 | | | Essex Property Trust, Inc. REIT | | | 407,170 | |
| | 3,556 | | | Extra Space Storage, Inc. REIT | | | 457,586 | |
| | 14,567 | | | Healthpeak Properties, Inc. REIT | | | 299,789 | |
| | 18,833 | | | Host Hotels & Resorts, Inc. REIT | | | 297,373 | |
| | 15,262 | | | Invitation Homes, Inc. REIT | | | 520,282 | |
| | 7,702 | | | Iron Mountain, Inc. REIT | | | 489,385 | |
| | 3,093 | | | Mid-America Apartment Communities, Inc. REIT | | | 449,196 | |
| | 24,574 | | | Prologis, Inc. REIT | | | 3,052,091 | |
| | 4,215 | | | Public Storage REIT | | | 1,164,942 | |
| | 17,990 | | | Realty Income Corp. REIT | | | 1,008,160 | |
| | 2,854 | | | SBA Communications Corp. REIT | | | 640,809 | |
| | 8,602 | | | Simon Property Group, Inc. REIT | | | 976,241 | |
| | 8,739 | | | UDR, Inc. REIT | | | 348,686 | |
| | 10,649 | | | Ventas, Inc. REIT | | | 465,148 | |
| | 26,762 | | | VICI Properties, Inc. REIT | | | 825,340 | |
| | 13,099 | | | Welltower, Inc. REIT | | | 1,085,645 | |
| | 19,520 | | | Weyerhaeuser Co. REIT | | | 639,280 | |
| | 5,571 | | | W.P. Carey, Inc. REIT | | | 362,394 | |
| | | | | | | | |
| | | | | | | 23,317,641 | |
| | |
| Utilities – 2.4% | |
| | 6,697 | | | Alliant Energy Corp. | | | 335,988 | |
| | |
| |
| Common Stocks – (continued) | | | |
| Utilities – (continued) | |
| | 6,960 | | | Ameren Corp. | | | 551,719 | |
| | 13,739 | | | American Electric Power Co., Inc. | | | 1,077,138 | |
| | 5,194 | | | American Water Works Co., Inc. | | | 720,616 | |
| | 3,844 | | | Atmos Energy Corp. | | | 445,712 | |
| | 1,894 | | | Avangrid, Inc. | | | 65,343 | |
| | 16,809 | | | CenterPoint Energy, Inc. | | | 468,803 | |
| | 7,744 | | | CMS Energy Corp. | | | 435,135 | |
| | 9,478 | | | Consolidated Edison, Inc. | | | 843,163 | |
| | 8,740 | | | Constellation Energy Corp. | | | 910,358 | |
| | 22,298 | | | Dominion Energy, Inc. | | | 1,082,345 | |
| | 5,466 | | | DTE Energy Co. | | | 565,075 | |
| | 20,545 | | | Duke Energy Corp. | | | 1,824,396 | |
| | 10,210 | | | Edison International | | | 702,958 | |
| | 5,624 | | | Entergy Corp. | | | 535,686 | |
| | 6,048 | | | Evergy, Inc. | | | 332,459 | |
| | 9,290 | | | Eversource Energy | | | 592,888 | |
| | 26,493 | | | Exelon Corp. | | | 1,062,899 | |
| | 15,272 | | | FirstEnergy Corp. | | | 550,861 | |
| | 53,927 | | | NextEra Energy, Inc. | | | 3,602,324 | |
| | 10,985 | | | NiSource, Inc. | | | 293,959 | |
| | 62,677 | | | PG&E Corp.* | | | 1,021,635 | |
| | 19,681 | | | PPL Corp. | | | 490,450 | |
| | 13,309 | | | Public Service Enterprise Group, Inc. | | | 812,914 | |
| | 16,781 | | | Sempra | | | 1,178,362 | |
| | 29,014 | | | Southern Co. (The) | | | 1,965,118 | |
| | 8,419 | | | WEC Energy Group, Inc. | | | 708,206 | |
| | 14,669 | | | Xcel Energy, Inc. | | | 838,040 | |
| | | | | | | | |
| | | | | | | 24,014,550 | |
| | |
| TOTAL INVESTMENTS BEFORE SECURITIES LENDING
REINVESTMENT VEHICLE |
|
| | (Cost $893,048,158) | | $ | 1,014,315,073 | |
| | |
| | |
| Shares | | | Dividend
Rate | | Value | |
|
| Securities Lending Reinvestment Vehicle – 0.1%(b) | |
| Goldman Sachs Financial Square Government Fund –
Institutional Shares |
|
| | 605,811 | | | 5.234% | | $ | 605,811 | |
| | (Cost $605,811) | |
| | |
| | TOTAL INVESTMENTS – 99.8% | |
| | (Cost $893,653,969) | | $ | 1,014,920,884 | |
| | |
| OTHER ASSETS IN EXCESS OF
LIABILITIES – 0.2% | | | 2,015,996 | |
| | |
| | NET ASSETS – 100.0% | | $ | 1,016,936,880 | |
| | |
| | |
|
| The percentage shown for each investment category reflects the value of investments in that category as a percentage of net assets. |
| |
* | | Non-income producing security. |
| |
(a) | | All or a portion of security is on loan. |
| |
(b) | | Represents an affiliated issuer. |
| | |
| The accompanying notes are an integral part of these financial statements. | | 63 |
GOLDMAN SACHS MARKETBETA® U.S. EQUITY ETF
Schedule of Investments (continued)
August 31, 2023
| | |
|
Investment Abbreviations: |
PLC | | —Public Limited Company |
REIT | | —Real Estate Investment Trust |
|
|
| ADDITIONAL INVESTMENT INFORMATION |
FUTURES CONTRACTS — At August 31, 2023, the Fund had the following futures contracts:
| | | | | | | | | | | | | | |
| Description | | Number of
Contracts | | Expiration
Date | | | Notional
Amount | | | Unrealized
Appreciation/
(Depreciation) | |
Long position contracts: | | | | | | | | | | | | | | |
| | | | |
S&P 500 E-Mini Index | | 4 | | | 09/15/23 | | | $ | 903,200 | | | $ | 3,992 | |
| | |
| 64 | | The accompanying notes are an integral part of these financial statements. |
GOLDMAN SACHS MARKETBETA ETFS
Statements of Assets and Liabilities
August 31, 2023
| | | | | | | | | | | | | | |
| | | | | MarketBeta®
Emerging
Markets
Equity ETF | | | MarketBeta®
International
Equity ETF | | | MarketBeta®
U.S. Equity ETF | |
| | Assets: | |
| | Investments in unaffiliated issuers, at value (cost $22,847,879, $411,322,266 and $890,276,885, respectively)(a) | | $ | 26,437,258 | | | $ | 434,702,052 | | | $ | 1,011,393,538 | |
| | Investments in affiliated issuers, at value (cost $—, $— and $2,771,273, respectively) | | | — | | | | — | | | | 2,921,535 | |
| | Investments in affiliated securities lending reinvestment vehicle, at value which equals cost | | | 104,477 | | | | 1,807,609 | | | | 605,811 | |
| | Cash | | | 162,798 | | | | 1,189,718 | | | | 1,079,989 | |
| | Foreign currency, at value (cost $27,775, $83,246 and $—, respectively) | | | 27,770 | | | | 83,221 | | | | — | |
| | Receivables: | | | | | | | | | | | | |
| | Dividends | | | 48,879 | | | | 1,055,967 | | | | 1,538,420 | |
| | Collateral on futures contracts | | | 1,566 | | | | 69,245 | | | | 49,280 | |
| | Investments sold | | | 401 | | | | 284 | | | | — | |
| | Securities lending income | | | 233 | | | | 945 | | | | 14,655 | |
| | Foreign tax reclaims | | | — | | | | 459,884 | | | | — | |
| | | | |
| | Fund shares sold | | | — | | | | — | | | | 3,082,555 | |
| | Total assets | | | 26,783,382 | | | | 439,368,925 | | | | 1,020,685,783 | |
| | | | | | | | | | | | | | |
| | Liabilities: | |
| | | | |
| | Variation margin on futures contracts | | | 634 | | | | 9,635 | | | | 1,650 | |
| | Payables: | | | | | | | | | | | | |
| | Foreign capital gains tax | | | 145,530 | | | | — | | | | — | |
| | Upon return of securities loaned | | | 104,477 | | | | 1,807,609 | | | | 605,811 | |
| | Management fees | | | 8,152 | | | | 72,822 | | | | 58,895 | |
| | Fund shares redeemed | | | — | | | | — | | | | 3,082,547 | |
| | | | |
| | Accrued expenses | | | 902 | | | | 92 | | | | — | |
| | Total liabilities | | | 259,695 | | | | 1,890,158 | | | | 3,748,903 | |
| | | | | | | | | | | | | | |
| | Net Assets: | | | | | | | | | | | | |
| | | | |
| | Paid-in capital | | | 24,967,544 | | | | 421,537,660 | | | | 903,504,634 | |
| | | | |
| | Total distributable earnings | | | 1,556,143 | | | | 15,941,107 | | | | 113,432,246 | |
| | | | |
| | NET ASSETS | | $ | 26,523,687 | | | $ | 437,478,767 | | | $ | 1,016,936,880 | |
| | SHARES ISSUED AND OUTSTANDING | | | | | | | | | | | | |
| | | | |
| | Shares outstanding no par value (unlimited shares authorized): | | | 650,000 | | | | 8,600,000 | | | | 16,500,000 | |
| | | | |
| | Net asset value per share: | | | $40.81 | | | | $50.87 | | | | $61.63 | |
| | (a) | | Includes loaned securities having a market value of $51,584, $1,425,157 and $571,169 for MarketBeta® Emerging Market Equity ETF, for MarketBeta® International Equity ETF, and for MarketBeta® U.S. Equity ETF, respectively. |
| | |
| The accompanying notes are an integral part of these financial statements. | | 65 |
GOLDMAN SACHS MARKETBETA ETFS
Statements of Operations
For the Fiscal Year Ended August 31, 2023
| | | | | | | | | | | | | | |
| | | | |
| | | | | MarketBeta®
Emerging
Markets
Equity ETF | | | MarketBeta®
International
Equity ETF | | | MarketBeta®
U.S. Equity ETF | |
| | Investment income: | | | | | | | | | | | | |
| | | | |
| | Dividends — unaffiliated issuers (net of foreign withholding taxes of $96,981, $1,444,336 and $–, respectively) | | $ | 747,350 | | | $ | 11,868,734 | | | $ | 13,584,208 | |
| | | | |
| | Non cash dividend income | | | 51,580 | | | | — | | | | — | |
| | | | |
| | Securities lending income, net of rebates received or paid to borrowers — unaffiliated issuer | | | 4,144 | | | | 79,756 | | | | 39,524 | |
| | | | |
| | Dividends — affiliated issuers | | | — | | | | — | | | | 86,247 | |
| | | | |
| | Total investment income | | | 803,074 | | | | 11,948,490 | | | | 13,709,979 | |
| | | | | | | | | | | | | | |
| | Expenses: | | | | | | | | | | | | |
| | | | |
| | Management fees | | | 105,166 | | | | 910,376 | | | | 699,098 | |
| | | | |
| | Trustee fees | | | 25,886 | | | | 33,755 | | | | 43,913 | |
| | | | |
| | Total expenses | | | 131,052 | | | | 944,131 | | | | 743,011 | |
| | | | |
| | Less — expense reductions | | | (26,210 | ) | | | (189,009 | ) | | | (165,113 | ) |
| | | | |
| | Net expenses | | | 104,842 | | | | 755,122 | | | | 577,898 | |
| | | | |
| | NET INVESTMENT INCOME | | | 698,232 | | | | 11,193,368 | | | | 13,132,081 | |
| | | | | | | | | | | | | | |
| | Realized and unrealized gain (loss): | |
| | | | |
| | Net realized gain (loss) from: | | | | | | | | | | | | |
| | | | |
| | Investments — unaffiliated issuers | | | (1,532,772 | ) | | | (4,176,494 | ) | | | (7,451,916 | ) |
| | | | |
| | Investments — affiliated issuers | | | — | | | | — | | | | (1,852 | ) |
| | | | |
| | In-kind redemptions — unaffiliated issuers | | | 377,036 | | | | 9,830,858 | | | | 40,954,127 | |
| | | | |
| | In-kind redemptions — affiliated issuers | | | — | | | | — | | | | 187,757 | |
| | | | |
| | Futures contracts | | | 16,053 | | | | 136,194 | | | | (71,069 | ) |
| | | | |
| | Foreign currency transactions | | | (11,078 | ) | | | (85,608 | ) | | | — | |
| | | | |
| | Net change in unrealized gain (loss) on: | | | | | | | | | | | | |
| | | | |
| | Investments — unaffiliated issuers (including the effects of the net change in foreign capital gains tax liability of $239,957, $– and $–, respectively) | | | 750,713 | | | | 40,036,957 | | | | 98,331,649 | |
| | | | |
| | Investments — affiliated issuers | | | — | | | | — | | | | (183,254 | ) |
| | | | |
| | Futures contracts | | | (342 | ) | | | (16,340 | ) | | | 3,992 | |
| | | | |
| | Foreign currency translations | | | 1,096 | | | | 44,977 | | | | — | |
| | | | |
| | Net realized and unrealized gain (loss) | | | (399,294 | ) | | | 45,770,544 | | | | 131,769,434 | |
| | | | |
| | NET INCREASE IN NET ASSETS RESULTING FROM OPERATIONS | | $ | 298,938 | | | $ | 56,963,912 | | | $ | 144,901,515 | |
| | |
| 66 | | The accompanying notes are an integral part of these financial statements. |
GOLDMAN SACHS MARKETBETA ETFS
Statements of Changes in Net Assets
| | | | | | | | | | | | | | | | | | | | | | |
| | | | | MarketBeta® Emerging Markets Equity ETF | | | | | | MarketBeta® International Equity ETF | |
| | | | | For the Fiscal
Year Ended
August 31, 2023 | | | For the Fiscal
Year Ended
August 31, 2022 | | | | | | For the Fiscal
Year Ended
August 31, 2023 | | | For the Fiscal
Year Ended
August 31, 2022 | |
| | From operations: | |
| | | | | | |
| | Net investment income | | $ | 698,232 | | | $ | 950,088 | | | | | | | $ | 11,193,368 | | | $ | 11,504,193 | |
| | | | | | |
| | Net realized gain (loss) | | | (1,150,761 | ) | | | (127,326 | ) | | | | | | | 5,704,950 | | | | (2,402,327 | ) |
| | | | | | |
| | Net change in unrealized gain (loss) | | | 751,467 | | | | (8,206,380 | ) | | | | | | | 40,065,594 | | | | (88,828,407 | ) |
| | | | | | |
| | Net increase (decrease) in net assets resulting from operations | | | 298,938 | | | | (7,383,618 | ) | | | | | | | 56,963,912 | | | | (79,726,541 | ) |
| | | | | | | | | | | | | | | | | | | | | | |
| | Distributions to shareholders: | | | | | | | | | | | | | | | | | | | | |
| | | | | | |
| | From distributable earnings | | | (708,842 | ) | | | (2,556,833 | ) | | | | | | | (10,832,595 | ) | | | (12,795,314 | ) |
| | | | | | | | | | | | | | | | | | | | | | |
| | From share transactions: | |
| | | | | | |
| | Proceeds from sales of shares | | | — | | | | 6,730,275 | | | | | | | | 108,284,224 | | | | 106,009,495 | |
| | | | | | |
| | Cost of shares redeemed | | | (6,047,689 | ) | | | — | | | | | | | | (73,987,067 | ) | | | (13,629,357 | ) |
| | | | | | |
| | Net increase (decrease) in net assets resulting from share transactions | | | (6,047,689 | ) | | | 6,730,275 | | | | | | | | 34,297,157 | | | | 92,380,138 | |
| | | | | | |
| | TOTAL INCREASE (DECREASE) | | | (6,457,593 | ) | | | (3,210,176 | ) | | | | | | | 80,428,474 | | | | (141,717 | ) |
| | | | | | | | | | | | | | | | | | | | | | |
| | Net assets: | |
| | | | | | |
| | Beginning of year | | $ | 32,981,280 | | | $ | 36,191,456 | | | | | | | $ | 357,050,293 | | | $ | 357,192,010 | |
| | | | | | |
| | End of year | | $ | 26,523,687 | | | $ | 32,981,280 | | | | | | | $ | 437,478,767 | | | $ | 357,050,293 | |
| | |
| The accompanying notes are an integral part of these financial statements. | | 67 |
GOLDMAN SACHS MARKETBETA ETFS
Statements of Changes in Net Assets (continued)
| | | | | | | | | | |
| | | | | MarketBeta® U.S. Equity ETF | |
| | | | | For the Fiscal
Year Ended
August 31, 2023 | | | For the Fiscal
Year Ended
August 31, 2022 | |
| | From operations: | |
| | | |
| | Net investment income | | $ | 13,132,081 | | | $ | 7,408,353 | |
| | | |
| | Net realized gain | | | 33,617,047 | | | | 7,403,369 | |
| | | |
| | Net change in unrealized gain (loss) | | | 98,152,387 | | | | (89,478,740 | ) |
| | | |
| | Net increase (decrease) in net assets resulting from operations | | | 144,901,515 | | | | (74,667,018 | ) |
| | | | | | | | | | |
| | Distributions to shareholders: | | | | | | | | |
| | | |
| | From distributable earnings | | | (12,492,359 | ) | | | (6,429,882 | ) |
| | | | | | | | | | |
| | From share transactions: | | | | | | | | |
| | | |
| | Proceeds from sales of shares | | | 351,057,391 | | | | 367,338,844 | |
| | | |
| | Cost of shares redeemed | | | (151,765,428 | ) | | | (29,867,204 | ) |
| | | |
| | Net increase in net assets resulting from share transactions | | | 199,291,963 | | | | 337,471,640 | |
| | | |
| | TOTAL INCREASE | | | 331,701,119 | | | | 256,374,740 | |
| | | | | | | | | | |
| | Net assets: | | | | | | | | |
| | | |
| | Beginning of year | | $ | 685,235,761 | | | $ | 428,861,021 | |
| | | |
| | End of year | | $ | 1,016,936,880 | | | $ | 685,235,761 | |
| | |
| 68 | | The accompanying notes are an integral part of these financial statements. |
GOLDMAN SACHS MARKETBETA® EMERGING MARKETS EQUITY ETF
Financial Highlights
Selected Data for a Share Outstanding Throughout Each Period
| | | | | | | | | | | | | | | | | | |
| | | | | MarketBeta® Emerging Markets Equity ETF | |
| | | | | For the Fiscal
Year Ended August 31, | | | For the Period
May 12, 2020*
to
August 31, 2020 | |
| | | | | 2023 | | | 2022 | | | 2021 | |
| | Per Share Operating Performance: | | | | | | | | | | | | | | | | |
| | | | | |
| | Net asset value, beginning of period | | $ | 41.23 | | | $ | 55.68 | | | $ | 48.15 | | | $ | 39.60 | |
| | | | | |
| | Net investment income(a) | | | 0.96 | | | | 1.35 | (b) | | | 0.89 | | | | 0.49 | |
| | | | | |
| | Net realized and unrealized gain (loss) | | | (0.34 | ) | | | (11.93 | ) | | | 8.14 | | | | 8.06 | |
| | | | | |
| | Total gain (loss) from investment operations | | | 0.62 | | | | (10.58 | ) | | | 9.03 | | | | 8.55 | |
| | | | | |
| | Distributions to shareholders from net investment income | | | (1.04 | ) | | | (3.87 | ) | | | (1.50 | ) | | | — | |
| | | | | |
| | Net asset value, end of period | | $ | 40.81 | | | $ | 41.23 | | | $ | 55.68 | | | $ | 48.15 | |
| | | | | |
| | Market price, end of period | | $ | 40.81 | | | $ | 41.16 | | | $ | 55.72 | | | $ | 48.36 | |
| | | | | |
| | Total Return at Net Asset Value(c) | | | 1.61 | % | | | (20.01 | )% | | | 19.35 | % | | | 21.54 | % |
| | | | | |
| | Net assets, end of period (in 000’s) | | $ | 26,524 | | | $ | 32,981 | | | $ | 36,191 | | | $ | 38,517 | |
| | | | | |
| | Ratio of net expenses to average net assets | | | 0.36 | % | | | 0.36 | % | | | 0.36 | % | | | 0.36 | %(d) |
| | | | | |
| | Ratio of total expenses to average net assets | | | 0.45 | % | | | 0.45 | % | | | 0.45 | % | | | 0.45 | %(d) |
| | | | | |
| | Ratio of net investment income to average net assets | | | 2.40 | % | | | 2.87 | %(b) | | | 1.63 | % | | | 3.60 | %(d) |
| | | | | |
| | Portfolio turnover rate(e) | | | 13 | % | | | 18 | % | | | 21 | % | | | 23 | % |
| | * | | Commencement of operations. |
| | (a) | | Calculated based on the average shares outstanding methodology. |
| | (b) | | Reflects income recognized from non-recurring special dividends which amounted to $0.32 per share and 0.67% of average net assets. |
| | (c) | | Assumes investment at the net asset value at the beginning of the period, reinvestment of all distributions and a complete sale of the investment at the net asset value at the end of the period. Returns do not reflect the impact of taxes to shareholders relating to Fund distributions or the sale of Fund shares. Total returns for periods less than one full year are not annualized. |
| | (e) | | The Fund’s portfolio turnover rate is calculated in accordance with regulatory requirements and excludes portfolio securities received or delivered as a result of in-kind transactions and short-term transactions. If such transactions were included, the Fund’s portfolio turnover rate may be higher. |
| | |
| The accompanying notes are an integral part of these financial statements. | | 69 |
GOLDMAN SACHS MARKETBETA® INTERNATIONAL EQUITY ETF
Financial Highlights (continued)
Selected Data for a Share Outstanding Throughout Each Period
| | | | | | | | | | | | | | | | | | |
| | | | | MarketBeta® International Equity ETF | |
| | | | | For the Fiscal
Year Ended August 31, | | | For the Period
May 12, 2020*
to
August 31, 2020 | |
| | | | | 2023 | | | 2022 | | | 2021 | |
| | Per Share Operating Performance: | | | | | | | | | | | | | | | | |
| | | | | |
| | Net asset value, beginning of period | | $ | 44.63 | | | $ | 57.61 | | | $ | 46.79 | | | $ | 40.14 | |
| | | | | |
| | Net investment income(a) | | | 1.45 | | | | 1.63 | | | | 1.28 | | | | 0.30 | |
| | | | | |
| | Net realized and unrealized gain (loss) | | | 6.17 | | | | (12.83 | ) | | | 10.84 | | | | 6.35 | |
| | | | | |
| | Total gain (loss) from investment operations | | | 7.62 | | | | (11.20 | ) | | | 12.12 | | | | 6.65 | |
| | | | | |
| | Distributions to shareholders from net investment income | | | (1.38 | ) | | | (1.78 | ) | | | (1.30 | ) | | | — | |
| | | | | |
| | Net asset value, end of period | | $ | 50.87 | | | $ | 44.63 | | | $ | 57.61 | | | $ | 46.79 | |
| | | | | |
| | Market price, end of period | | $ | 50.84 | | | $ | 44.33 | | | $ | 57.80 | | | $ | 46.82 | |
| | | | | |
| | Total Return at Net Asset Value(b) | | | 17.22 | % | | | (19.80 | )% | | | 26.20 | % | | | 16.57 | % |
| | | | | |
| | Net assets, end of period (in 000’s) | | $ | 437,479 | | | $ | 357,050 | | | $ | 357,192 | | | $ | 280,723 | |
| | | | | |
| | Ratio of net expenses to average net assets | | | 0.20 | % | | | 0.20 | % | | | 0.20 | % | | | 0.20 | %(c) |
| | | | | |
| | Ratio of total expenses to average net assets | | | 0.25 | % | | | 0.25 | % | | | 0.25 | % | | | 0.25 | %(c) |
| | | | | |
| | Ratio of net investment income to average net assets | | | 2.96 | % | | | 3.15 | % | | | 2.41 | % | | | 2.15 | %(c) |
| | | | | |
| | Portfolio turnover rate(d) | | | 4 | % | | | 7 | % | | | 5 | % | | | 1 | % |
| | * | | Commencement of operations. |
| | (a) | | Calculated based on the average shares outstanding methodology. |
| | (b) | | Assumes investment at the net asset value at the beginning of the period, reinvestment of all distributions and a complete sale of the investment at the net asset value at the end of the period. Returns do not reflect the impact of taxes to shareholders relating to Fund distributions or the sale of Fund shares. Total returns for periods less than one full year are not annualized. |
| | (d) | | The Fund’s portfolio turnover rate is calculated in accordance with regulatory requirements and excludes portfolio securities received or delivered as a result of in-kind transactions and short-term transactions. If such transactions were included, the Fund’s portfolio turnover rate may be higher. |
| | |
| 70 | | The accompanying notes are an integral part of these financial statements. |
GOLDMAN SACHS MARKETBETA® U.S. EQUITY ETF
Financial Highlights (continued)
Selected Data for a Share Outstanding Throughout Each Period
| | | | | | | | | | | | | | | | | | |
| | | | | MarketBeta® U.S. Equity ETF | |
| | | | | For the Fiscal
Year Ended August 31, | | | For the Period
May 12, 2020*
to
August 31, 2020 | |
| | | | | 2023 | | | 2022 | | | 2021 | |
| | Per Share Operating Performance: | | | | | | | | | | | | | | | | |
| | | | | |
| | Net asset value, beginning of period | | $ | 53.96 | | | $ | 63.07 | | | $ | 48.62 | | | $ | 39.20 | |
| | | | | |
| | Net investment income(a) | | | 0.89 | | | | 0.82 | | | | 0.74 | | | | 0.22 | |
| | | | | |
| | Net realized and unrealized gain (loss) | | | 7.67 | | | | (9.20 | ) | | | 14.46 | | | | 9.20 | |
| | | | | |
| | Total gain (loss) from investment operations | | | 8.56 | | | | (8.38 | ) | | | 15.20 | | | | 9.42 | |
| | | | | |
| | Distributions to shareholders from net investment income | | | (0.89 | ) | | | (0.73 | ) | | | (0.75 | ) | | | — | |
| | | | | |
| | Net asset value, end of period | | $ | 61.63 | | | $ | 53.96 | | | $ | 63.07 | | | $ | 48.62 | |
| | | | | |
| | Market price, end of period | | $ | 61.68 | | | $ | 53.97 | | | $ | 63.09 | | | $ | 48.69 | |
| | | | | |
| | Total Return at Net Asset Value(b) | | | 16.12 | % | | | (13.41 | )% | | | 31.60 | % | | | 24.03 | % |
| | | | | |
| | Net assets, end of period (in 000’s) | | $ | 1,016,937 | | | $ | 685,236 | | | $ | 428,861 | | | $ | 257,663 | |
| | | | | |
| | Ratio of net expenses to average net assets | | | 0.07 | % | | | 0.07 | % | | | 0.07 | % | | | 0.07 | %(c) |
| | | | | |
| | Ratio of total expenses to average net assets | | | 0.09 | % | | | 0.09 | % | | | 0.09 | % | | | 0.09 | %(c) |
| | | | | |
| | Ratio of net investment income to average net assets | | | 1.59 | % | | | 1.40 | % | | | 1.36 | % | | | 1.62 | %(c) |
| | | | | |
| | Portfolio turnover rate(d) | | | 3 | % | | | 3 | % | | | 4 | % | | | 1 | % |
| | * | | Commencement of operations. |
| | (a) | | Calculated based on the average shares outstanding methodology. |
| | (b) | | Assumes investment at the net asset value at the beginning of the period, reinvestment of all distributions and a complete sale of the investment at the net asset value at the end of the period. Returns do not reflect the impact of taxes to shareholders relating to Fund distributions or the sale of Fund shares. Total returns for periods less than one full year are not annualized. |
| | (d) | | The Fund’s portfolio turnover rate is calculated in accordance with regulatory requirements and excludes portfolio securities received or delivered as a result of in-kind transactions and short-term transactions. If such transactions were included, the Fund’s portfolio turnover rate may be higher. |
| | |
| The accompanying notes are an integral part of these financial statements. | | 71 |
GOLDMAN SACHS MARKETBETA ETFS
Notes to Financial Statements
August 31, 2023
Goldman Sachs ETF Trust (the “Trust”) is an open-end management investment company, registered under the Investment Company Act of 1940, as amended (the “Act”), consisting of multiple series. The Trust was organized as a Delaware statutory trust on December 16, 2009. The following table lists those series of the Trust that are included in this report (collectively, the “Funds” or individually a “Fund”) along with their respective diversification status under the Act:
| | | | |
| Fund | | | | Diversification
Classification |
Goldman Sachs MarketBeta® Emerging Markets Equity ETF (“MarketBeta® Emerging Markets Equity ETF”) | | | | Diversified |
Goldman Sachs MarketBeta® International Equity ETF (“MarketBeta® International Equity ETF”) | | | | Diversified |
Goldman Sachs MarketBeta® U.S. Equity ETF (“MarketBeta® U.S. Equity ETF”) | | | | Diversified |
The investment objective of each Fund is to provide investment results that closely correspond, before fees and expenses, to the performance of its respective Index.
Goldman Sachs Asset Management, L.P. (“GSAM”), an affiliate of Goldman Sachs & Co. LLC (“Goldman Sachs”), serves as investment adviser to the Funds pursuant to a management agreement (the “Agreement”) with the Trust. Each Fund is an exchange-traded fund (“ETF”). Shares of the Funds are listed and traded on the Cboe BZX Exchange, Inc. Market prices for the Funds’ shares may be different from their net asset value (“NAV”). The Funds issue and redeem shares at their respective NAV only in blocks of a specified number of shares, or multiples thereof, referred to as “Creation Units”. Creation Units are issued and redeemed generally for a designated portfolio of securities (including any portion of such securities for which cash may be substituted) and a specified amount of cash. Shares generally trade in the secondary market in quantities less than a Creation Unit at market prices that change throughout the day. Only those that have entered into an authorized participant agreement with ALPS Distributors, Inc. (the “Distributor”) may do business directly with the Funds.
|
| 2. SIGNIFICANT ACCOUNTING POLICIES |
The financial statements have been prepared in accordance with accounting principles generally accepted in the United States of America (“GAAP”) and require management to make estimates and assumptions that may affect the reported amounts and disclosures. Actual results may differ from those estimates and assumptions. Each Fund is an investment company under GAAP and follows the accounting and reporting guidance applicable to investment companies.
A. Investment Valuation — The Funds’ valuation policy is to value investments at fair value.
B. Investment Income and Investments — Investment income includes interest income, dividend income, and securities lending income, if any. Interest income is accrued daily and adjusted for amortization of premiums and accretion of discounts. Dividend income is recognized on ex-dividend date or, for certain foreign securities, as soon as such information is obtained subsequent to the ex-dividend date. Non-cash dividends, if any, are recorded at the fair market value of the securities received. Investment transactions are reflected on trade date. Realized gains and losses are calculated using identified cost. Investment transactions are recorded on the following business day for daily NAV calculations. Investment income is recorded net of any foreign withholding taxes, less any amounts reclaimable. The Funds may file withholding tax reclaims in certain jurisdictions to recover a portion of amounts previously withheld. Any foreign capital gains tax is accrued daily based upon net unrealized gains, and is payable upon sale of such investments. Distributions received from the Funds’ investments in U.S. real estate investment trusts (“REITs”) may be characterized as ordinary income, net capital gain and/or a return of capital. A return of capital is recorded by the Funds as a reduction to the cost basis of the REIT.
For derivative contracts, unrealized gains and losses are recorded daily and become realized gains and losses upon disposition or termination of the contract.
72
GOLDMAN SACHS MARKETBETA ETFS
|
| 2. SIGNIFICANT ACCOUNTING POLICIES (continued) |
C. Expenses — Expenses incurred directly by a Fund are charged to the Fund, and certain expenses incurred by the Trust are allocated across the applicable Funds on a straight-line and/or pro-rata basis, depending upon the nature of the expenses, and are accrued daily.
D. Federal Taxes and Distributions to Shareholders — It is each Fund’s policy to comply with the requirements of the Internal Revenue Code of 1986, as amended (the “Code”), applicable to regulated investment companies and to distribute each year substantially all of its investment company taxable income and capital gains to its shareholders. Accordingly, each Fund is not required to make any provisions for the payment of federal income tax. Distributions to shareholders are recorded on the ex-dividend date. For each Fund, income distributions, if any, are declared and paid quarterly. Capital gains distributions, if any, are declared and paid annually.
Net capital losses, if any, are carried forward to future fiscal years and may be used to the extent allowed by the Code to offset any future capital gains. Losses that are carried forward will retain their character as either short-term or long-term capital losses. Utilization of capital loss carryforwards will reduce the requirement of future capital gains distributions.
The characterization of distributions to shareholders for financial reporting purposes is determined in accordance with federal income tax rules, which may differ from GAAP. The source of each Fund’s distributions may be shown in the accompanying financial statements as either from distributable earnings or capital. Certain components of the Funds’ net assets on the Statements of Assets and Liabilities reflect permanent GAAP/tax differences based on the appropriate tax character.
E. Foreign Currency Translation — The accounting records and reporting currency of a Fund are maintained in U.S. dollars. Assets and liabilities denominated in foreign currencies are translated into U.S. dollars using the current exchange rates at the close of each business day. The effect of changes in foreign currency exchange rates on investments is included within net realized and unrealized gain (loss) on investments. Changes in the value of other assets and liabilities as a result of fluctuations in foreign exchange rates are included in the Statements of Operations within net change in unrealized gain (loss) on foreign currency translation. Transactions denominated in foreign currencies are translated into U.S. dollars on the date the transaction occurred, the effects of which are included within net realized gain (loss) on foreign currency transactions.
| | |
| 3. INVESTMENTS AND FAIR VALUE MEASUREMENTS | | |
U.S. GAAP defines the fair value of a financial instrument as the amount that would be received to sell an asset or paid to transfer a liability in an orderly transaction between market participants at the measurement date (i.e., the exit price); the Funds’ policy is to use the market approach. GAAP establishes a fair value hierarchy that prioritizes the inputs to valuation techniques used to measure fair value. The hierarchy gives the highest priority to unadjusted quoted prices in active markets for identical assets or liabilities (Level 1 measurements) and the lowest priority to unobservable inputs (Level 3 measurements). The level in the fair value hierarchy within which the fair value measurement in its entirety falls shall be determined based on the lowest level input that is significant to the fair value measurement in its entirety. The levels used for classifying investments are not necessarily an indication of the risk associated with investing in these investments. The three levels of the fair value hierarchy are described below:
Level 1 — Unadjusted quoted prices in active markets that are accessible at the measurement date for identical, unrestricted assets or liabilities;
Level 2 — Quoted prices in markets that are not active or financial instruments for which significant inputs are observable (including, but not limited to, quoted prices for similar investments, interest rates, foreign exchange rates, volatility and credit spreads), either directly or indirectly;
Level 3 — Prices or valuations that require significant unobservable inputs (including GSAM’s assumptions in determining fair value measurement).
The Board of Trustees (“Trustees”) has approved Valuation Procedures that govern the valuation of the portfolio investments held by the Funds, including investments for which market quotations are not readily available. With respect to the Funds’ investments
73
GOLDMAN SACHS MARKETBETA ETFS
Notes to Financial Statements (continued)
August 31, 2023
|
| 3. INVESTMENTS AND FAIR VALUE MEASUREMENTS (continued) |
that do not have readily available market quotations, the Trustees have designated the Adviser as the valuation designee to perform fair valuations pursuant to Rule 2a-5 under the Investment Company Act of 1940 (the “Valuation Designee”). GSAM has day-to-day responsibility for implementing and maintaining internal controls and procedures related to the valuation of the Funds’ investments. To assess the continuing appropriateness of pricing sources and methodologies, GSAM regularly performs price verification procedures and issues challenges as necessary to third party pricing vendors or brokers, and any differences are reviewed in accordance with the Valuation Procedures.
A. Level 1 and Level 2 Fair Value Investments — The valuation techniques and significant inputs used in determining the fair values for investments classified as Level 1 and Level 2 are as follows:
Equity Securities — Equity securities traded on a United States (“U.S.”) securities exchange or the NASDAQ system, or those located on certain foreign exchanges, including but not limited to the Americas, are valued daily at their last sale price or official closing price on the principal exchange or system on which they are traded. If there is no sale or official closing price or such price is believed by GSAM to not represent fair value, equity securities will be valued at the valid closing bid price for long positions and at the valid closing ask price for short positions (i.e. where there is sufficient volume, during normal exchange trading hours). If no valid bid/ask price is available, the equity security will be valued pursuant to the Valuation Procedures and consistent with applicable regulatory guidance. To the extent these investments are actively traded, they are classified as Level 1 of the fair value hierarchy, otherwise they are generally classified as Level 2. Certain equity securities containing unique attributes may be classified as Level 2.
Unlisted equity securities for which market quotations are available are valued at the last sale price on the valuation date, or if no sale occurs, at the last bid price for long positions or the last ask price for short positions, and are generally classified as Level 2.
Derivative Contracts — A derivative is an instrument whose value is derived from underlying assets, indices, reference rates or a combination of these factors. A Fund enters into derivative transactions to hedge against changes in interest rates, securities prices, and/or currency exchange rates, to increase total return, or to gain access to certain markets or attain exposure to other underliers. For financial reporting purposes, cash collateral that has been pledged to cover obligations of a Fund and cash collateral received, if any, is reported separately on the Statements of Assets and Liabilities as either due to broker/receivable for collateral on certain derivative contracts. Non-cash collateral pledged by a Fund, if any, is noted in the Schedules of Investments.
Exchange-traded derivatives, including futures and options contracts, are generally valued at the last sale or settlement price on the exchange where they are principally traded. Exchange-traded options without settlement prices are generally valued at the last bid price for long positions and the last ask price for short positions on the exchange where they are principally traded. Exchange-traded derivatives typically fall within Level 1 of the fair value hierarchy.
Over-the-counter (“OTC”) and centrally cleared derivatives are valued using market transactions and other market evidence, including market-based inputs to models, calibration to market-clearing transactions, broker or dealer quotations, or other alternative pricing sources. Where models are used, the selection of a particular model to value OTC and centrally cleared derivatives depends upon the contractual terms of, and specific risks inherent in, the instrument, as well as the availability of pricing information in the market. Valuation models require a variety of inputs, including contractual terms, market prices, yield curves, credit curves, measures of volatility, voluntary and involuntary prepayment rates, loss severity rates and correlations of such inputs. For OTC and centrally cleared derivatives that trade in liquid markets, model inputs can generally be verified and model selection does not involve significant management judgment. OTC and centrally cleared derivatives are classified within Level 2 of the fair value hierarchy when significant inputs are corroborated by market evidence.
i. Futures Contracts — Futures contracts are contracts to buy or sell a standardized quantity of a specified commodity or security. Upon entering into a futures contract, a Fund deposits cash or securities in an account on behalf of the broker in an amount sufficient to meet the initial margin requirement. Subsequent payments are made or received by a Fund equal to the daily change in the contract value and are recorded as variation margin receivable or payable with a corresponding offset to unrealized gains or losses.
74
GOLDMAN SACHS MARKETBETA ETFS
|
| 3. INVESTMENTS AND FAIR VALUE MEASUREMENTS (continued) |
Underlying Funds (including Money Market Funds) — Underlying funds (“Underlying Funds”) include exchange-traded funds (“ETFs”) and other investment companies. Investments in the Underlying Funds (except ETFs) are valued at the NAV per share on the day of valuation. ETFs are valued daily at the last sale price or official closing price on the principal exchange or system on which the investment is traded. Because the Funds invest in Underlying Funds that fluctuate in value, the Funds’ shares will correspondingly fluctuate in value. Underlying Funds are generally classified as Level 1 of the fair value hierarchy. To the extent that underlying ETFs are actively traded, they are classified as Level 1 of the fair value hierarchy, otherwise they are generally classified as Level 2. For information regarding an Underlying Fund’s accounting policies and investment holdings, please see the Underlying Fund’s shareholder report.
B. Level 3 Fair Value Investments — To the extent that significant inputs to valuation models and other alternative pricing sources are unobservable, or if quotations are not readily available, or if GSAM believes that such quotations do not accurately reflect fair value, the fair value of a Fund’s investments may be determined under the Valuation Procedures. GSAM, consistent with its procedures and applicable regulatory guidance, may make an adjustment to the most recent valuation prices of either domestic or foreign securities in light of significant events to reflect what it believes to be the fair value of the securities at the time of determining a Fund’s NAV. To the extent investments are valued using single source broker quotations obtained directly from the broker or passed through from third party pricing vendors, such investments are classified as Level 3 investments.
C. Fair Value Hierarchy — The following is a summary of the Funds’ investments and derivatives classified in the fair value hierarchy as of August 31, 2023:
| | | | | | | | | | | | |
| | | |
| MARKETBETA® EMERGING MARKETS EQUITY ETF | | | | | | | | | | | | |
| | | |
| Investment Type | | Level 1 | | | Level 2 | | | Level 3 | |
| | | |
| Assets | | | | | | | | | | | | |
| | | |
Common Stock and/or Other Equity Investments(a) | | | | | | | | | | | | |
| | | |
Africa | | $ | 763,806 | | | $ | — | | | $ | — | |
| | | |
Asia | | | 21,983,854 | | | | 701,666 | | | | — | |
| | | |
Europe | | | 235,234 | | | | — | | | | — | |
| | | |
North America | | | 1,049,541 | | | | — | | | | — | |
| | | |
Oceania | | | 29,936 | | | | — | | | | — | |
| | | |
South America | | | 1,296,662 | | | | 376,559 | | | | — | |
| | | |
Securities Lending Reinvestment Vehicle | | | 104,477 | | | | — | | | | — | |
| | | |
| Total | | $ | 25,463,510 | | | $ | 1,078,225 | | | $ | — | |
| | | |
| Derivative Type | | | | | | | | | |
| | | |
| Liabilities(b) | | | | | | | | | | | | |
| | | |
Futures Contracts | | $ | (342 | ) | | $ | — | | | $ | — | |
| (a) | | Amounts are disclosed by continent to highlight the impact of time zone differences between local market close and the calculation of NAV. Security valuations are based on the principal exchange or system on which they are traded, which may differ from country of domicile noted in table. |
| (b) | | Amount shown represents unrealized loss at fiscal year end. |
75
GOLDMAN SACHS MARKETBETA ETFS
Notes to Financial Statements (continued)
August 31, 2023
|
| 3. INVESTMENTS AND FAIR VALUE MEASUREMENTS (continued) |
| | | | | | | | | | | | |
| | | |
| MARKETBETA® INTERNATIONAL EQUITY ETF | | | | | | | | | | | | |
| | | |
| Investment Type | | Level 1 | | | Level 2 | | | Level 3 | |
| | | |
| Assets | | | | | | | | | | | | |
| | | |
Common Stock and/or Other Equity Investments(a) | | | | | | | | | | | | |
| | | |
Africa | | $ | 860,352 | | | $ | — | | | $ | — | |
| | | |
Asia | | | 133,484,654 | | | | — | | | | — | |
| | | |
Europe | | | 230,670,053 | | | | 1,655,351 | | | | — | |
| | | |
North America | | | 31,348,128 | | | | 428,821 | | | | — | |
| | | |
Oceania | | | 35,921,391 | | | | — | | | | — | |
| | | |
South America | | | 333,302 | | | | — | | | | — | |
| | | |
Securities Lending Reinvestment Vehicle | | | 1,807,609 | | | | — | | | | — | |
| | | |
| Total | | $ | 434,425,489 | | | $ | 2,084,172 | | | $ | — | |
| | | |
| Derivative Type | | | | | | | | | |
| | | |
| Liabilities(b) | | | | | | | | | | | | |
| | | |
Futures Contracts | | $ | (24,986 | ) | | $ | — | | | $ | — | |
| | | |
| MARKETBETA® U.S. EQUITY ETF | | | | | | | | | | | | |
| | | |
| Investment Type | | Level 1 | | | Level 2 | | | Level 3 | |
| | | |
| Assets | | | | | | | | | | | | |
| | | |
Common Stock and/or Other Equity Investments(a) | | | | | | | | | | | | |
| | | |
Asia | | $ | 1,211,787 | | | $ | — | | | $ | — | |
| | | |
North America | | | 1,011,460,571 | | | | — | | | | — | |
| | | |
South America | | | 1,642,715 | | | | — | | | | — | |
| | | |
Securities Lending Reinvestment Vehicle | | | 605,811 | | | | — | | | | — | |
| | | |
| Total | | $ | 1,014,920,884 | | | $ | — | | | $ | — | |
| | | |
| Derivative Type | | | | | | | | | |
| | | |
| Assets(b) | | | | | | | | | | | | |
| | | |
Futures Contracts | | $ | 3,992 | | | $ | — | | | $ | — | |
| (a) | | Amounts are disclosed by continent to highlight the impact of time zone differences between local market close and the calculation of NAV. Security valuations are based on the principal exchange or system on which they are traded, which may differ from country of domicile noted in table. |
| (b) | | Amount shown represents unrealized gain (loss) at fiscal year end. |
For further information regarding security characteristics, see the Schedules of Investments.
|
| 4. INVESTMENTS IN DERIVATIVES |
The following table sets forth, by certain risk types, the gross value of derivative contracts (not considered to be hedging instruments for accounting disclosure purposes) as of August 31, 2023. These instruments were used as part of the Funds’ investment strategies and to obtain and/or manage exposure related to the risks below. The values in the table below exclude the
76
GOLDMAN SACHS MARKETBETA ETFS
|
| 4. INVESTMENTS IN DERIVATIVES (continued) |
effects of cash collateral received or posted pursuant to these derivative contracts, and therefore are not representative of the Funds’ net exposure.
| | | | | | | | | | | | |
| Fund | | Risk | | Statement of Assets
and Liabilities | | Assets(a) | | Statement of Assets
and Liabilities | | Liabilities(a) | |
MarketBeta® Emerging Markets Equity ETF | | Equity | | Variation Margin on Futures Contracts | | $ — | | Variation Margin on Futures
Contracts | | $ | 342 | |
MarketBeta® International Equity ETF | | Equity | | Variation Margin on Futures Contracts | | — | | Variation Margin on Futures
Contracts | | | 24,986 | |
| MarketBeta® U.S. Equity ETF | | Equity | | Variation Margin on Futures Contracts | | 3,992 | | Variation Margin on Futures
Contracts | | | — | |
| (a) | | Includes unrealized gain (loss) on futures contracts described in the Additional Investment Information sections of the Schedules of Investments. Only the variation margin as of August 31, 2023 is reported within the Statements of Assets and Liabilities. |
The following table sets forth, by certain risk types, the Funds’ gains (losses) related to these derivatives and their indicative volumes for the fiscal year ended August 31, 2023. These gains (losses) should be considered in the context that these derivative contracts may have been executed to create investment opportunities and/or economically hedge certain investments, and accordingly, certain gains (losses) on such derivative contracts may offset certain (losses) gains attributable to investments. These gains (losses) are included in “Net realized gain (loss)” or “Net change in unrealized gain (loss)” on the Statements of Operations:
| | | | | | | | | | | | | | |
| Risk | | | | Fund | | | | Net Realized
Gain (Loss)
from Futures
Contracts | | | Net Change in
Unrealized
Gain (Loss) on
Futures Contracts | |
| Equity | | | | MarketBeta® Emerging Markets Equity ETF | | | | $ | 16,053 | | | $ | (342 | ) |
| Equity | | | | MarketBeta® International Equity ETF | | | | | 136,194 | | | | (16,340 | ) |
| Equity | | | | MarketBeta® U.S. Equity ETF | | | | | (71,069 | ) | | | 3,992 | |
For the fiscal year ended August 31, 2023, the relevant values for each derivative type was as follows:
| | | | | | |
| Fund | | | | Number of
Contracts(a) | |
MarketBeta® Emerging Markets Equity ETF | | | | | 3 | |
MarketBeta® International Equity ETF | | | | | 18 | |
MarketBeta® U.S. Equity ETF | | | | | 4 | |
| (a) | | Amount disclosed represents average number of contracts for the months that the Fund held such derivatives during the fiscal year ended August 31, 2023. |
|
| 5. AGREEMENTS AND AFFILIATED TRANSACTIONS |
A. Management Agreement — Under the Agreement, GSAM manages the Funds, subject to the general supervision of the Trustees.
As compensation for the services rendered pursuant to the Agreement, the assumption of the expenses related thereto and administration of the Funds’ business affairs, including providing facilities, GSAM is entitled to a management fee, accrued daily and paid monthly, equal to an annual percentage rate of each Fund’s average daily net assets.
77
GOLDMAN SACHS MARKETBETA ETFS
Notes to Financial Statements (continued)
August 31, 2023
|
| 5. AGREEMENTS AND AFFILIATED TRANSACTIONS (continued) |
The Funds operate under a unitary management fee structure. Under the unitary fee structure, GSAM is responsible for paying substantially all the expenses of the Fund, excluding payments under the Fund’s 12b-1 plan (if any), interest expenses, taxes, acquired fund fees and expenses, brokerage fees, costs of holding shareholder meetings, litigation, indemnification and extraordinary expenses. As the Funds directly pay fees and expenses of the independent Trustees, the management fee collected by GSAM will be reduced by an amount equal to the fees and expenses paid by the Funds to the independent Trustees.
For the fiscal year ended August 31, 2023, contractual and effective net unitary management fees with GSAM were at the following rates:
| | | | | | | | | | |
| Fund | | | | Contractual Unitary
Management Fee | | | Effective Net Unitary
Management Fee* | |
MarketBeta® Emerging Markets Equity ETF | | | | | 0.45 | % | | | 0.36 | % |
MarketBeta® International Equity ETF | | | | | 0.25 | % | | | 0.20 | % |
MarketBeta® U.S. Equity ETF | | | | | 0.09 | % | | | 0.07 | % |
| * | | Effective Net Unitary Management Fee includes the impact of management fee waivers, if any. |
GSAM has agreed to waive a portion of its management fee in order to achieve an effective net management fee rate of 0.36%, 0.20% and 0.07% as an annual percentage rate of average daily net assets of the MarketBeta® Emerging Markets Equity ETF, MarketBeta® International Equity ETF and MarketBeta® U.S. Equity ETF, respectively. These arrangements will remain in effect through at least December 29, 2023 and prior to such date, the Investment Adviser may not terminate the arrangement without the approval of the Board of Trustees. For the fiscal year ended August 31, 2023, GSAM waived $26,210, $189,009 and $165,113 of the Funds’ management fees for the MarketBeta® Emerging Markets Equity ETF, MarketBeta® International Equity ETF and MarketBeta® U.S. Equity ETF, respectively.
B. Other Transactions with Affiliates — The following table provides information about the MarketBeta® U.S. Equity ETF’s investment in shares of The Goldman Sachs Group, Inc. of which the MarketBeta® U.S. Equity ETF is an affiliate as of and for the fiscal year ended August 31, 2023:
| | | | | | | | | | | | | | | | | | | | | | | | | | | | | | | | |
| Fund | | Beginning
value as of
August 31,
2022 | | | Purchases
at Cost | | | Proceeds
from Sales | | | Realized
Gain | | | Change in
Unrealized
Depreciation | | | Ending
value as of
August 31,
2023 | | | Shares as of
August 31,
2023 | | | Dividend
Income | |
MarketBeta® U.S. Equity ETF | | $ | 2,296,421 | | | $ | 1,154,115 | | | $ | (531,652 | ) | | $ | 185,905 | | | $ | (183,254 | ) | | $ | 2,921,535 | | | | 8,915 | | | $ | 86,247 | |
|
| 6. CREATION AND REDEMPTION OF CREATION UNITS |
The Trust issues and redeems shares of the Funds only in Creation Units on a continuous basis through the Distributor, without an initial sales load, at NAV next determined after receipt, on any Business Day (as defined in the Statement of Additional Information), of an order in proper form. Shares of the Funds may only be purchased or redeemed by certain financial institutions (each an “Authorized Participant”). An Authorized Participant is either (1) a “Participating Party” or other participant in the clearing process through the Continuous Net Settlement System of the National Securities Clearing Corporation; or (2) a Depository Trust Company participant; which, in either case, must have executed an agreement with the Distributor. Retail investors will typically not qualify as an Authorized Participant or have the resources to buy and sell whole Creation Units.
Therefore, they will be unable to purchase or redeem the shares directly from the Funds. Rather, most retail investors will purchase shares in the secondary market at market prices with the assistance of a broker and may be subject to customary brokerage commissions or fees. Fixed creation and redemption transaction fees are imposed in connection with creations and redemptions.
78
GOLDMAN SACHS MARKETBETA ETFS
|
| 6. CREATION AND REDEMPTION OF CREATION UNITS (continued) |
Authorized Participants transacting in Creation Units for cash may also pay a variable charge to compensate the relevant fund for certain transaction costs (e.g. taxes on currency or other financial transactions, and brokerage costs) and market impact expenses relating to investing in portfolio securities. Such variable charges, if any, are included in “Proceeds from sale of shares” in the Statements of Changes in Net Assets. Share activity is as follows:
| | | | | | | | | | | | | | | | |
| | | MarketBeta® Emerging Markets Equity ETF | |
| | | | |
| | | For the Fiscal Year Ended
August 31, 2023 | | | For the Fiscal Year Ended
August 31, 2022 | |
| | | | |
| | | Shares | | | Dollars | | | Shares | | | Dollars | |
| | | | |
| Fund Share Activity | | | | | | | | | | | | | | | | |
Shares Sold | | | — | | | $ | — | | | | 150,000 | | | $ | 6,730,275 | |
Shares Redeemed | | | (150,000 | ) | | | (6,047,689 | ) | | | — | | | | — | |
| | | | |
NET DECREASE | | | (150,000 | ) | | $ | (6,047,689 | ) | | | 150,000 | | | $ | 6,730,275 | |
| |
| | | MarketBeta® International Equity ETF | |
| | | | |
| | | For the Fiscal Year Ended
August 31, 2023 | | | For the Fiscal Year Ended
August 31, 2022 | |
| | | | |
| | | Shares | | | Dollars | | | Shares | | | Dollars | |
| | | | |
| Fund Share Activity | | | | | | | | | | | | | | | | |
Shares Sold | | | 2,200,000 | | | $ | 108,284,224 | | | | 2,100,000 | | | $ | 106,009,495 | |
Shares Redeemed | | | (1,600,000 | ) | | | (73,987,067 | ) | | | (300,000 | ) | | | (13,629,357 | ) |
| | | | |
NET INCREASE IN SHARES | | | 600,000 | | | $ | 34,297,157 | | | | 1,800,000 | | | $ | 92,380,138 | |
| |
| | | MarketBeta® U.S. Equity ETF | |
| | | | |
| | | For the Fiscal Year Ended
August 31, 2023 | | | For the Fiscal Year Ended
August 31, 2022 | |
| | | | |
| | | Shares | | | Dollars | | | Shares | | | Dollars | |
| | | | |
| Fund Share Activity | | | | | | | | | | | | | | | | |
Shares Sold | | | 6,600,000 | | | $ | 351,057,391 | | | | 6,400,000 | | | $ | 367,338,844 | |
Shares Redeemed | | | (2,800,000 | ) | | | (151,765,428 | ) | | | (500,000 | ) | | | (29,867,204 | ) |
| | | | |
NET INCREASE IN SHARES | | | 3,800,000 | | | $ | 199,291,963 | | | | 5,900,000 | | | $ | 337,471,640 | |
|
| 7. PORTFOLIO SECURITIES TRANSACTIONS |
The cost of purchases and proceeds from sales of long-term securities for the fiscal year ended August 31, 2023, were as follows:
| | | | | | | | | | |
| Fund | | | | Purchases | | | Sales | |
MarketBeta® Emerging Markets Equity ETF | | | | $ | 3,795,329 | | | $ | 7,469,187 | |
MarketBeta® International Equity ETF | | | | | 23,190,769 | | | | 15,720,641 | |
MarketBeta® U.S. Equity ETF | | | | | 21,728,976 | | | | 21,845,340 | |
79
GOLDMAN SACHS MARKETBETA ETFS
Notes to Financial Statements (continued)
August 31, 2023
|
| 7. PORTFOLIO SECURITIES TRANSACTIONS (continued) |
The purchases and sales from in-kind creation and redemption transactions for the fiscal year ended August 31, 2023, were as follows:
| | | | | | | | | | |
| Fund | | | | Purchases | | | Sales | |
MarketBeta® Emerging Markets Equity ETF | | | | $ | — | | | $ | 2,301,936 | |
MarketBeta® International Equity ETF | | | | | 99,839,440 | | | | 73,688,345 | |
MarketBeta® U.S. Equity ETF | | | | | 351,053,913 | | | | 151,758,692 | |
The Funds may lend their securities through a securities lending agent, the Bank of New York Mellon (“BNYM”), to certain qualified borrowers. In accordance with the Funds’ securities lending procedures, the Funds receive cash collateral at least equal to the market value of the securities on loan. The market value of the loaned securities is determined at the close of business of the Funds, at their last sale price or official closing price on the principal exchange or system on which they are traded, and any additional required collateral is delivered to the Funds on the next business day. As with other extensions of credit, the Funds may experience delay in the recovery of their securities or incur a loss should the borrower of the securities breach its agreement with the Funds or become insolvent at a time when the collateral is insufficient to cover the cost of repurchasing securities on loan. Dividend income received from securities on loan may not be subject to withholding taxes and therefore withholding taxes paid may differ from the amounts listed in the Statements of Operations. Loans of securities are terminable at any time and as such 1) the remaining contractual maturities of the outstanding securities lending transactions are considered to be overnight and continuous and 2) the borrower, after notice, is required to return borrowed securities within the standard time period for settlement of securities transactions.
The Funds invest the cash collateral received in connection with securities lending transactions in the Goldman Sachs Financial Square Government Fund (“Government Money Market Fund”), an affiliated series of the Goldman Sachs Trust. The Government Money Market Fund is registered under the Act as an open end investment company, is subject to Rule 2a-7 under the Act, and is managed by GSAM, for which GSAM may receive a management fee of up to 0.16% on an annualized basis of the average daily net assets of the Government Money Market Fund.
In the event of a default by a borrower with respect to any loan, BNYM may exercise any and all remedies provided under the applicable borrower agreement to make the Funds whole. These remedies include purchasing replacement securities by applying the collateral held from the defaulting broker against the purchase cost of the replacement securities. If BNYM is unable to purchase replacement securities, BNYM will indemnify the Funds by paying the Funds an amount equal to the market value of the securities loaned minus the value of cash collateral received from the borrower for the loan, subject to an exclusion for any shortfalls resulting from a loss of value in such cash collateral due to reinvestment risk. The Funds’ master netting agreements with certain borrowers provide the right, in the event of a default (including bankruptcy or insolvency), for the non-defaulting party to liquidate the collateral and calculate net exposure to the defaulting party or request additional collateral. However, in the event of a default by a borrower, a resolution authority could determine that such rights are not enforceable due to the restrictions or prohibitions against the right of set-off that may be imposed in accordance with a particular jurisdiction’s bankruptcy or insolvency laws. The Funds’ loaned securities were all subject to enforceable Securities Lending Agreements and the value of the collateral was at least equal to the value of the cash received. The amounts of the Funds’ overnight and continuous agreements, which represent the gross amounts of recognized liabilities for securities lending transactions outstanding as of August 31, 2023, are disclosed as “Payable upon return of securities loaned” on the Statements of Assets and Liabilities, where applicable.
Each of the Funds and BNYM received compensation relating to the lending of the Funds’ securities. The amounts earned, if any, by the Funds for the fiscal year ended August 31, 2023, are reported under Investment Income on the Statements of Operations.
80
GOLDMAN SACHS MARKETBETA ETFS
|
| 8. SECURITIES LENDING (continued) |
The following table provides information about the Funds’ investment in the Government Money Market Fund for the fiscal year ended August 31, 2023:
| | | | | | | | | | | | | | | | | | |
| Fund | | | | Beginning value
as of August 31,
2022 | | | Purchases
at Cost | | | Proceeds
from Sales | | | Ending value
as of August 31,
2023 | |
MarketBeta® Emerging Markets Equity ETF | | | | $ | 140,256 | | | $ | 3,884,332 | | | $ | (3,920,111 | ) | | $ | 104,477 | |
MarketBeta® International Equity ETF | | | | | 6,986,472 | | | | 71,527,014 | | | | (76,705,877 | ) | | | 1,807,609 | |
MarketBeta® U.S. Equity ETF | | | | | 1,947,872 | | | | 20,884,884 | | | | (22,226,945 | ) | | | 605,811 | |
The tax character of distributions paid during the fiscal year ended August 31, 2023 were as follows:
| | | | | | | | | | | | |
| | | MarketBeta®
Emerging
Markets
Equity ETF | | | MarketBeta®
International
Equity ETF | | | MarketBeta®
U.S. Equity ETF | |
Distributions paid from: | | | | | | | | | | | | |
Ordinary Income | | $ | 708,842 | | | $ | 10,832,595 | | | $ | 12,492,359 | |
Realized capital gain | | | — | | | | — | | | | — | |
Total taxable distributions | | $ | 708,842 | | | $ | 10,832,595 | | | $ | 12,492,359 | |
The tax character of distributions paid during the fiscal year ended August 31, 2022 were as follows:
| | | | | | | | | | | | |
| | | MarketBeta®
Emerging
Markets
Equity ETF | | | MarketBeta®
International
Equity ETF | | | MarketBeta®
U.S. Equity ETF | |
Distributions paid from: | | | | | | | | | | | | |
Ordinary Income | | $ | 2,556,833 | | | $ | 12,795,314 | | | $ | 6,429,882 | |
Realized capital gain | | | — | | | | — | | | | — | |
Total taxable distributions | | $ | 2,556,833 | | | $ | 12,795,314 | | | $ | 6,429,882 | |
81
GOLDMAN SACHS MARKETBETA ETFS
Notes to Financial Statements (continued)
August 31, 2023
|
| 9. TAX INFORMATION (continued) |
As of August 31, 2023, the components of accumulated earnings (losses) on a tax-basis were as follows:
| | | | | | | | | | | | |
| | | MarketBeta®
Emerging Markets
Equity ETF | | | MarketBeta®
International
Equity ETF | | | MarketBeta®
U.S. Equity ETF | |
Undistributed ordinary income — net | | $ | 305,389 | | | $ | 973,332 | | | $ | 2,559,256 | |
Undistributed long-term capital gains | | | — | | | | — | | | | — | |
Total undistributed earnings | | $ | 305,389 | | | $ | 973,332 | | | $ | 2,559,256 | |
Capital loss carryforwards: | | | | | | | | | | | | |
Perpetual Short-Term | | $ | (174,736 | ) | | $ | (1,532,205 | ) | | $ | (541,006 | ) |
Perpetual Long-Term | | | — | | | | (906,218 | ) | | | (62,686 | ) |
Timing differences (Late Year Ordinary Loss Deferral and Post-October Capital Loss Deferral) | | | (1,577,217 | ) | | | (3,249,661 | ) | | | (6,112,011 | ) |
Miscellaneous adjustment | | | (87,572 | ) | | | — | | | | — | |
Unrealized gains (losses) — net | | | 3,090,279 | | | | 20,655,859 | | | | 117,588,693 | |
Total accumulated earnings (losses) net | | $ | 1,556,143 | | | $ | 15,941,107 | | | $ | 113,432,246 | |
As of August 31, 2023, the Funds’ aggregate security unrealized gains and losses based on cost for U.S. federal income tax purposes were as follows:
| | | | | | | | | | | | | | |
| | | | | MarketBeta®
Emerging Markets
Equity ETF | | | MarketBeta®
International
Equity ETF | | | MarketBeta®
U.S. Equity ETF | |
Tax Cost | | | | $ | 23,305,542 | | | $ | 415,808,079 | | | $ | 897,336,183 | |
Gross unrealized gain | | | | | 6,363,452 | | | | 58,017,658 | | | | 168,081,992 | |
Gross unrealized loss | | | | | (3,273,173 | ) | | | (37,361,799 | ) | | | (50,493,299 | ) |
Net unrealized gains (losses) | | | | $ | 3,090,279 | | | $ | 20,655,859 | | | $ | 117,588,693 | |
The difference between GAAP-basis and tax-basis unrealized gains (losses) is attributable primarily to wash sales, net mark to market gains/(losses) on regulated future contracts, and differences in the tax treatment of partnership investments and passive foreign investment company investments.
In order to present certain components of the Funds’ capital accounts on a tax-basis, certain reclassifications have been recorded to the Funds’ accounts. These reclassifications have no impact on the net asset value of the Funds and result primarily from redemptions utilized as distributions and redemption in-kind transactions.
| | | | | | | | | | |
| Fund | | | | Paid-in Capital | | | Total
Distributable
Earnings | |
MarketBeta® Emerging Markets Equity ETF | | | | $ | 311,473 | | | $ | (311,473 | ) |
MarketBeta® International Equity ETF | | | | $ | 9,367,080 | | | $ | (9,367,080 | ) |
MarketBeta® U.S. Equity ETF | | | | $ | 40,812,510 | | | $ | (40,812,510 | ) |
GSAM has reviewed the Funds’ tax positions for all open tax years (the current and prior years, as applicable) and has concluded that no provision for income tax is required in the Funds’ financial statements. Such open tax year remains subject to examination and adjustment by tax authorities.
82
GOLDMAN SACHS MARKETBETA ETFS
The Funds’ risks include, but are not limited to, the following:
Calculation Methodology Risk — The Index relies on various sources of information to assess the criteria of issuers included in the Index, (or a Reference Index if applicable) including fundamental information that may be based on assumptions and estimates. Neither the Fund, the Investment Adviser nor the Index Provider can offer assurances that the Index’s calculation methodology or sources of information will provide a correct valuation of securities, nor can they guarantee the availability or timeliness of the production of the Index.
Depositary Receipts Risk — Foreign securities may trade in the form of depositary receipts, which include American Depositary Receipts (“ADRs”) and Global Depositary Receipts (“GDRs”) (collectively “Depositary Receipts”). To the extent the Fund acquires Depositary Receipts through banks which do not have a contractual relationship with the foreign issuer of the security underlying the Depositary Receipts to issue and service such unsponsored Depositary Receipts, there may be an increased possibility that the Fund would not become aware of and be able to respond to corporate actions such as stock splits or rights offerings involving the foreign issuer in a timely manner. In addition, the lack of information may result in inefficiencies in the valuation of such instruments. Investment in Depositary Receipts does not eliminate all the risks inherent in investing in securities of non-U.S. issuers. The market value of Depositary Receipts is dependent upon the market value of the underlying securities and fluctuations in the relative value of the currencies in which the Depositary Receipts and the underlying securities are quoted. The issuers of Depositary Receipts may discontinue issuing new Depositary Receipts and withdraw existing Depositary Receipts at any time, which may result in costs and delays in the distribution of the underlying assets to the Fund and may negatively impact the Fund’s performance.
Foreign and Emerging Countries Risk — Investing in foreign markets may involve special risks and considerations not typically associated with investing in the U.S. Foreign securities may be subject to risk of loss because of more or less foreign government regulation; less public information; less stringent investor protections; less stringent accounting, corporate governance, financial reporting and disclosure standards; and less economic, political and social stability in the countries in which a Fund invests. The imposition of sanctions, exchange controls (including repatriation restrictions), confiscation of assets and property, trade restrictions (including tariffs) and other government restrictions by the U.S. or other governments, or from problems in share registration, settlement or custody, may also result in losses. The type and severity of sanctions and other similar measures, including counter sanctions and other retaliatory actions, that may be imposed could vary broadly in scope, and their impact is impossible to predict. For example, the imposition of sanctions and other similar measures could, among other things, cause a decline in the value and/or liquidity of securities issued by the sanctioned country or companies located in or economically tied to the sanctioned country and increase market volatility and disruption in the sanctioned country and throughout the world. Sanctions and other similar measures could limit or prevent a Fund from buying and selling securities (in the sanctioned country and other markets), significantly delay or prevent the settlement of securities transactions, and significantly impact the Fund’s liquidity and performance. Foreign risk also involves the risk of negative foreign currency exchange rate fluctuations, which may cause the value of securities denominated in such foreign currency (or other instruments through which a Fund has exposure to foreign currencies) to decline in value. Currency exchange rates may fluctuate significantly over short periods of time. To the extent that a Fund also invests in securities of issuers located in, or economically tied to, emerging markets, these risks may be more pronounced.
Geographic Risk — If the Fund focuses its investments in securities of issuers located in a particular country or geographic region, the Fund may be subjected, to a greater extent than if its investments were less focused, to the risks of volatile economic cycles and/or conditions and developments that may be particular to that country or region, such as: adverse securities markets; adverse exchange rates; adverse social, political, regulatory, economic, business, environmental or other developments; or natural disasters.
Index Risk — Solactive AG (the “Index Provider”) constructs each Fund’s Index in accordance with a rules-based methodology. A Fund will be negatively affected by general declines in the securities and asset classes represented in its Index. In addition, because the Funds are not “actively” managed, unless a specific security is removed from an Index, a Fund generally would not sell a security because the security’s issuer was in financial trouble. Market disruptions and regulatory restrictions could have an
83
GOLDMAN SACHS MARKETBETA ETFS
Notes to Financial Statements (continued)
August 31, 2023
|
| 10. OTHER RISKS (continued) |
adverse effect on a Fund’s ability to adjust its exposure to the required levels in order to track the Index. A Fund also does not attempt to take defensive positions under any market conditions, including declining markets. Therefore, a Fund’s performance could be lower than funds that may actively shift their portfolio assets to take advantage of market opportunities or to lessen the impact of a market decline or a decline in the value of one or more issuers. The Index Provider relies on third party data it believes to be reliable in constructing each Index, but it does not guarantee the accuracy or availability of such third party data. Errors in index data, index computation or the construction of an Index in accordance with its methodology may occur from time to time and may not be identified and corrected by the Index Provider for a period of time or at all, which may have an adverse impact on the applicable Fund and its shareholders. In addition, neither a Fund, the Investment Adviser, the Calculation Agent nor the Index Provider can guarantee the availability or timeliness of the production of the Index.
Industry Concentration Risk — In following its methodology, an Index from time to time may be concentrated to a significant degree in securities of issuers located in a single industry or group of industries. To the extent that an Index concentrates in the securities of issuers in a particular industry or group of industries, the Fund also will concentrate its investments to approximately the same extent. By concentrating its investments in an industry or group of industries, the applicable Fund may face more risks than if it were diversified broadly over numerous industries or groups of industries. If an Index is not concentrated in a particular industry or group of industries, the applicable Fund will not concentrate in a particular industry or group of industries.
Large Shareholder Transactions Risk — Certain shareholders, including other funds advised by the Investment Adviser, may from time to time own a substantial amount of the Fund’s Shares. In addition, a third party investor, the Investment Adviser or an affiliate of the Investment Adviser, an authorized participant, a lead market maker, or another entity (i.e., a seed investor) may invest in the Fund and hold its investment solely to facilitate commencement of the Fund or to facilitate the Fund’s achieving a specificed size or scale. Any such investment may be held for a limited period of time. There can be no assurance that any large shareholder would not redeem its investment, that the size of the Fund would be maintained at such levels or that the Fund would continue to meet applicable listing requirements. Redemptions by large shareholders could have a significant negative impact on the Fund, including on the Fund’s liquidity. In addition, transactions by large shareholders may account for a large percentage of the trading volume on Cboe BZX Exchange, Inc. and may, therefore, have a material upward or downward effect on the market price of the Shares.
Market and Credit Risks — In the normal course of business, a Fund trades financial instruments and enters into financial transactions where risk of potential loss exists due to changes in the market (market risk). The value of the securities in which a Fund invests may go up or down in response to the prospects of individual companies, particular sectors or governments and/or general economic conditions throughout the world due to increasingly interconnected global economies and financial markets. Events such as war, military conflict, acts of terrorism, social unrest, natural disasters, recessions, inflation, rapid interest rate changes, supply chain disruptions, sanctions, the spread of infectious illness or other public health threats could also significantly impact a Fund and its investments. Additionally, a Fund may also be exposed to credit risk in the event that an issuer or guarantor fails to perform or that an institution or entity with which the Fund has unsettled or open transactions defaults.
Market Trading Risk — Each Fund faces numerous market trading risks, including disruptions to creations and redemptions, the existence of extreme market volatility or potential lack of an active trading market for Shares. If a shareholder purchases Shares at a time when the market price is at a premium to the NAV or sells Shares at a time when the market price is at a discount to the NAV, the shareholder may pay more for, or receive less than, the underlying value of the Shares, respectively. The Investment Adviser cannot predict whether Shares will trade below, at or above their NAV. Price differences may be due, in large part, to the fact that supply and demand forces at work in the secondary trading market for Shares will be closely related to, but not identical to, the same forces influencing the prices of the securities of a Fund’s Index trading individually or in the aggregate at any point in time.
Mid-Cap Risk — Investments in mid-capitalization companies involve greater risks than those associated with larger, more established companies. These securities may be subject to more abrupt or erratic price movements and may lack sufficient market liquidity, and these issuers often face greater business risks.
Tracking Error Risk — Tracking error is the divergence of a Fund’s performance from that of its Index. The performance of a Fund may diverge from that of its Index for a number of reasons. Tracking error may occur because of transaction costs, a Fund’s holding of cash, differences in accrual of dividends, changes to its Index or the need to meet new or existing regulatory
84
GOLDMAN SACHS MARKETBETA ETFS
|
| 10. OTHER RISKS (continued) |
requirements. Unlike a Fund, the returns of an Index are not reduced by investment and other operating expenses, including the trading costs associated with implementing changes to its portfolio of investments. Tracking error risk may be heightened during times of market volatility or other unusual market conditions.
Under the Trust’s organizational documents, its Trustees, officers, employees and agents are indemnified, to the extent permitted by the Act and state law, against certain liabilities that may arise out of performance of their duties to the Funds. Additionally, in the course of business, the Funds enter into contracts that contain a variety of indemnification clauses. The Funds’ maximum exposure under these arrangements is unknown, as this would involve future claims that may be made against the Funds that have not yet occurred. However, GSAM believes the risk of loss under these arrangements to be remote.
Pursuant to an effort to consolidate the membership of the Board of Trustees of the Trust (the “Board”) with the Board of Trustees of each of Goldman Sachs ETF Trust II, Goldman Sachs Real Estate Diversified Income Fund, Goldman Sachs Trust, Goldman Sachs Trust II and Goldman Sachs Variable Insurance Trust, in July 2023, the Board voted to nominate Gregory G. Weaver, Dwight L. Bush, Kathryn A. Cassidy, John G. Chou, Joaquin Delgado, Eileen H. Dowling and Paul C. Wirth (the “Nominees”) for election as Trustees of the Trust at a virtual special joint meeting of shareholders to be held on November 16, 2023. Each of the Nominees currently serve as a Trustee of each of the Goldman Sachs Trust and Goldman Sachs Variable Insurance Trust. If elected, the Nominees will serve as Trustees alongside the current Trustees of the Trust. This annual report is not a proxy statement. Information regarding the election of the Nominees is contained in the proxy materials filed with the SEC. The proxy statement has been mailed to shareholders of record, and shareholders can also access the proxy statement, and any other relevant documents, on the SEC’s website.
Subsequent events after the Statements of Assets and Liabilities date have been evaluated, and GSAM has concluded that there is no impact requiring adjustment or disclosure in the financial statements.
85
Report of Independent Registered Public
Accounting Firm
To the Board of Trustees of Goldman Sachs ETF Trust and Shareholders of Goldman Sachs MarketBeta® Emerging Markets Equity ETF, Goldman Sachs MarketBeta® International Equity ETF, and Goldman Sachs MarketBeta® U.S. Equity ETF
Opinions on the Financial Statements
We have audited the accompanying statements of assets and liabilities, including the schedules of investments, of Goldman Sachs MarketBeta® Emerging Markets Equity ETF, Goldman Sachs MarketBeta® International Equity ETF, and Goldman Sachs MarketBeta® U.S. Equity ETF (three of the Funds constituting Goldman Sachs ETF Trust, hereafter collectively referred to as the “Funds”) as of August 31, 2023, the related statements of operations for the year ended August 31, 2023, the statements of changes in net assets for each of the two years in the period ended August 31, 2023, including the related notes, and the financial highlights for each of the periods indicated therein (collectively referred to as the “financial statements”). In our opinion, the financial statements present fairly, in all material respects, the financial position of each of the Funds as of August 31, 2023, the results of each of their operations for the year then ended, the changes in each of their net assets for each of the two years in the period ended August 31, 2023 and each of the financial highlights for each of the periods indicated therein in conformity with accounting principles generally accepted in the United States of America.
Basis for Opinions
These financial statements are the responsibility of the Funds’ management. Our responsibility is to express an opinion on the Funds’ financial statements based on our audits. We are a public accounting firm registered with the Public Company Accounting Oversight Board (United States) (PCAOB) and are required to be independent with respect to the Funds in accordance with the U.S. federal securities laws and the applicable rules and regulations of the Securities and Exchange Commission and the PCAOB.
We conducted our audits of these financial statements in accordance with the standards of the PCAOB. Those standards require that we plan and perform the audit to obtain reasonable assurance about whether the financial statements are free of material misstatement, whether due to error or fraud.
Our audits included performing procedures to assess the risks of material misstatement of the financial statements, whether due to error or fraud, and performing procedures that respond to those risks. Such procedures included examining, on a test basis, evidence regarding the amounts and disclosures in the financial statements. Our audits also included evaluating the accounting principles used and significant estimates made by management, as well as evaluating the overall presentation of the financial statements. Our procedures included confirmation of securities owned as of August 31, 2023 by correspondence with the custodian, transfer agent and brokers; when replies were not received from brokers, we performed other auditing procedures. We believe that our audits provide a reasonable basis for our opinions.
/s/ PricewaterhouseCoopers LLP
Boston, Massachusetts
October 25, 2023
We have served as the auditor of one or more investment companies in the Goldman Sachs fund complex since 2000.
86
GOLDMAN SACHS MARKETBETA ETFS
| | |
| | |
Fund Expenses — Six Months ended 8/31/2023 (Unaudited) | | |
As a shareholder you incur ongoing costs, including management fees and other Fund expenses. This example is intended to help you understand your ongoing costs (in dollars) of investing in Shares of the Funds and to compare these costs with the ongoing costs of investing in other exchange-traded funds. This example does not take into account brokerage commissions that you may pay on your purchases and sales of Shares of a Fund.
The example is based on an investment of $1,000 invested at the beginning of the period from March 1, 2023 and held for the six months ended August 31, 2023, which represents a period of 184 days of a 365 day year (or less where indicated).
Actual Expenses — The first line in the table below provides information about actual account values and actual expenses. You may use the information in this line, together with the amount you invested, to estimate the expenses that you paid over the six months. Simply divide your account value by $1,000 (for example, an $8,600 account value divided by $1,000=8.6), then multiply the result by the number in the first line under the heading entitled “Expenses Paid” to estimate the expenses you paid on your account during this period.
Hypothetical Example for Comparison Purposes — The second line in the table below provides information about hypothetical account values and hypothetical expenses based on a Fund’s actual net expense ratios and an assumed rate of return of 5% per year before expenses, which is not the Fund’s actual return. The hypothetical account values and expenses may not be used to estimate the actual ending account balance or expenses you paid for the period. You may use this information to compare the ongoing costs of investing in a Fund and other funds. To do so, compare this 5% hypothetical example with the 5% hypothetical examples that appear in the shareholder reports of the other funds.
Please note that the expenses shown in the table are meant to highlight your ongoing costs only and do not reflect any transactional costs, such as redemption fees, or exchange fees. Therefore, the second line of the table is useful in comparing ongoing costs only, and will not help you determine the relative total costs of owning different funds. In addition, if these transactional costs were included, your costs would have been higher.
| | | | | | | | | | | | | | | | | | | | | | | | | | | | | | | | | | | | |
| | | MarketBeta® Emerging Markets Equity ETF | | | MarketBeta® International Equity ETF | | | MarketBeta® U.S. Equity ETF | |
| | | Beginning
Account
Value
3/1/2023 | | | Ending
Account
Value
8/31/23 | | | Expenses
Paid* | | | Beginning
Account
Value
3/1/23 | | | Ending
Account
Value
8/31/23 | | | Expenses
Paid* | | | Beginning
Account
Value
3/1/23 | | | Ending
Account
Value
8/31/23 | | | Expenses
Paid* | |
Actual based on NAV | | $ | 1,000 | | | $ | 1,044.91 | | | $ | 1.86 | | | $ | 1,000 | | | $ | 1,048.29 | | | $ | 1.03 | | | $ | 1,000 | | | $ | 1,149.77 | | | $ | 0.38 | |
Hypothetical 5% return | | $ | 1,000 | | | $ | 1,023.39 | + | | $ | 1.84 | | | $ | 1,000 | | | $ | 1,024.20 | + | | $ | 1.02 | | | $ | 1,000 | | | $ | 1,024.85 | + | | $ | 0.36 | |
| | + | | Hypothetical expenses are based on the Fund’s actual annualized net expense ratios and an assumed rate of return of 5% per year before expenses. | |
| | * | | Expenses for the Fund are calculated using the Fund’s annualized net expense ratio, which represents the ongoing expenses as a percentage of net assets for the six months ended August 31, 2023. Expenses are calculated by multiplying the annualized net expense ratio by the average account value for the period; then multiplying the result by the number of days in the most recent fiscal year; and then dividing that result by the number of days in the fiscal year. The annualized net expense ratio for the period is as follows: | |
| | | | |
| Fund | | | |
MarketBeta® Emerging Markets Equity ETF | | | 0.36 | % |
MarketBeta® International Equity ETF | | | 0.20 | |
MarketBeta® U.S. Equity ETF | | | 0.07 | |
87
GOLDMAN SACHS ETF TRUST
Trustees and Officers (Unaudited)
Independent Trustees
| | | | | | | | | | |
Name, Address and Age1 | | Position(s) Held
with the Trust | | Term of
Office and Length of
Time Served2 | | Principal Occupation(s)
During Past 5 Years | | Number of
Portfolios in
Fund Complex
Overseen by
Trustee3 | | Other
Directorships
Held by Trustee4 |
| | | | | |
Cheryl K. Beebe Age: 67 | | Chair of the Board of Trustees | | Since 2021 | | Ms. Beebe is retired. She is Director, Packaging Corporation of America (2008-Present); Director, The Mosaic Company (2019-Present); Director, HanesBrands Inc. (2020-Present); and was formerly Director, Convergys Corporation (a global leader in customer experience outsourcing) (2015-2018); and formerly held the position of Executive Vice President, (2010-2014); and Chief Financial Officer, Ingredion, Inc. (a leading global ingredient solutions company) (2004-2014). Chair of the Board of Trustees — Goldman Sachs ETF Trust; Goldman Sachs Trust II; Goldman Sachs ETF Trust II; Goldman Sachs MLP and Energy Renaissance Fund; and Goldman Sachs Real Estate Diversified Income Fund. | | 68 | | Packaging Corporation of America (producer of container board); The Mosaic Company (producer of phosphate and potash fertilizer); HanesBrands Inc. (a multinational clothing company) |
| | | | | |
Lawrence Hughes Age: 65 | | Trustee | | Since 2021 | | Mr. Hughes is retired. Formerly, he held senior management positions with BNY Mellon Wealth Management, a division of The Bank of New York Mellon Corporation (a financial services company) (1991-2015), most recently as Chief Executive Officer (2010-2015). Previously, Mr. Hughes served as an Advisory Board Member of Goldman Sachs Trust II (February 2016-April 2016). Trustee — Goldman Sachs ETF Trust; Goldman Sachs ETF Trust II; Goldman Sachs Trust II; Goldman Sachs MLP and Energy Renaissance Fund; and Goldman Sachs Real Estate Diversified Income Fund. | | 68 | | None |
| | | | | |
John F. Killian Age: 68 | | Trustee | | Since 2021 | | Mr. Killian is retired. He is Director, Consolidated Edison, Inc. (2007-Present); and was formerly Director, Houghton Mifflin Harcourt Publishing Company (2011-2022). Previously, he held senior management positions with Verizon Communications, Inc., including Executive Vice President and Chief Financial Officer (2009-2010); and President, Verizon Business, Verizon Communications, Inc. (2005-2009). Trustee — Goldman Sachs ETF Trust; Goldman Sachs ETF Trust II; Goldman Sachs Trust II; Goldman Sachs MLP and Energy Renaissance Fund; and Goldman Sachs Real Estate Diversified Income Fund. | | 68 | | Consolidated Edison, Inc. (a utility holding company) |
| | | | | |
Steven D. Krichmar Age: 65 | | Trustee | | Since 2021 | | Mr. Krichmar is retired. Formerly, he held senior management and governance positions with Putnam Investments, LLC, a financial services company (2001-2016). He was most recently Chief of Operations and a member of the Operating Committee of Putnam Investments, LLC and Principal Financial Officer of The Putnam Funds. Previously, Mr. Krichmar served as an Audit Partner with PricewaterhouseCoopers LLP and its predecessor company (1990-2001). Trustee — Goldman Sachs ETF Trust; Goldman Sachs ETF Trust II; Goldman Sachs Trust II; Goldman Sachs MLP and Energy Renaissance Fund; and Goldman Sachs Real Estate Diversified Income Fund. | | 68 | | None |
| | | | | |
Michael Latham Age: 57 | | Trustee | | Since 2015 | | Mr. Latham is retired. Formerly, he held senior management positions with the iShares exchange-traded fund business owned by BlackRock, Inc., including Chairman (2011-2014); Global Head (2010-2011); U.S. Head (2007-2010); and Chief Operating Officer (2003-2007). Trustee — Goldman Sachs ETF Trust; Goldman Sachs ETF Trust II; Goldman Sachs Trust II; Goldman Sachs MLP and Energy Renaissance Fund; Goldman Sachs Credit Income Fund; and Goldman Sachs Real Estate Diversified Income Fund. | | 69 | | None |
| | | | | | | | | | |
88
GOLDMAN SACHS ETF TRUST
Trustees and Officers (Unaudited) (continued)
Independent Trustees
| | | | | | | | | | |
Name, Address and Age1 | | Position(s) Held
with the Trust | | Term of
Office and Length of
Time Served2 | | Principal Occupation(s)
During Past 5 Years | | Number of
Portfolios in
Fund Complex
Overseen by
Trustee3 | | Other
Directorships
Held by Trustee4 |
| | | | | |
Lawrence W. Stranghoener Age: 69 | | Trustee | | Since 2015 | | Mr. Stranghoener is retired. He is Chairman, Kennametal, Inc. (a global manufacturer and distributor of tooling and industrial materials) (2003-Present); and was formerly Director, Aleris Corporation and Aleris International, Inc. (a producer of aluminum rolled products) (2011-2020); Interim Chief Executive Officer (2014) and Executive Vice President and Chief Financial Officer (2004-2014), Mosaic Company (a fertilizer manufacturing company). Trustee — Goldman Sachs ETF Trust; Goldman Sachs Trust II; Goldman Sachs ETF Trust II; Goldman Sachs MLP and Energy Renaissance Fund; and Goldman Sachs Real Estate Diversified Income Fund. Chair of the Board of Trustees — Goldman Sachs Credit Income Fund. | | 69 | | Kennametal, Inc. (a global manufacturer and distributor of tooling and industrial materials) |
| | | | | | | | | | |
Interested Trustee*
| | | | | | | | | | |
Name, Address and Age1 | | Position(s) Held
with the Trust | | Term of
Office and
Length of
Time Served2 | | Principal Occupation(s)
During Past 5 Years | | Number of
Portfolios in
Fund Complex
Overseen by
Trustee3 | | Other
Directorships
Held by Trustee4 |
| | | | | |
James A. McNamara Age: 60 | | President and Trustee | | Since 2014 | | Advisory Director, Goldman Sachs (January 2018-Present); Managing Director, Goldman Sachs (January 2000-December 2017); Director of Institutional Fund Sales, GSAM (April 1998-December 2000); and Senior Vice President and Manager, Dreyfus Institutional Service Corporation (January 1993-April 1998). President and Trustee — Goldman Sachs ETF Trust; Goldman Sachs ETF Trust II; Goldman Sachs Trust; Goldman Sachs Variable Insurance Trust; Goldman Sachs Trust II; Goldman Sachs MLP and Energy Renaissance Fund; Goldman Sachs Credit Income Fund; and Goldman Sachs Real Estate Diversified Income Fund. | | 172 | | None |
| | | | | | | | | | |
| * | | Mr. McNamara is considered to be an “Interested Trustee” because he holds a position with Goldman Sachs and owns securities issued by The Goldman Sachs Group, Inc. The Interested Trustee holds comparable positions with certain other companies of which Goldman Sachs, GSAM or an affiliate thereof is the investment adviser, administrator and/or distributor. |
| 1 | | Each Trustee may be contacted by writing to the Trustee, c/o Goldman Sachs, 200 West Street, New York, New York, 10282, Attn: Caroline Kraus. Information is provided as of August 31, 2023. |
| 2 | | Each Trustee holds office for an indefinite term, until the earliest of: (a) the election of his or her successor; (b) the date the Trustee resigns or is removed by the Board or shareholders, in accordance with the Trust’s Declaration of Trust; or (c) the termination of the Trust. The Board has adopted policies which provide that each Independent Trustee shall retire as of December 31st of the calendar year in which he or she reaches (a) his or her 74th birthday or (b) the 15th anniversary of the date he or she became a Trustee, whichever is earlier, unless a waiver of such requirements shall have been adopted by a majority of the other Trustees. These policies may be changed by the Trustees without shareholder vote. |
| 3 | | The Goldman Sachs Fund Complex includes certain other companies listed above for each respective Trustee. As of August 31, 2023, Goldman Sachs ETF Trust consisted of 67 portfolios (32 of which offered shares to the public); Goldman Sachs ETF Trust II consisted of 2 portfolios; Goldman Sachs Trust consisted of 87 portfolios; Goldman Sachs Variable Insurance Trust consisted of 15 portfolios (11 of which offered shares to the public); Goldman Sachs Trust II consisted of 18 portfolios (7 of which offered shares to the public); and Goldman Sachs MLP and Energy Renaissance Fund, Goldman Sachs Credit Income Fund and Goldman Sachs Real Estate Diversified Income Fund each consisted of one portfolio. Goldman Sachs MLP and Energy Renaissance Fund and Goldman Sachs Credit Income Fund each did not offer shares to the public. |
| 4 | | This column includes only directorships of companies required to report to the Securities and Exchange Commission under the Securities Exchange Act of 1934 (i.e., “public companies”) or other investment companies registered under the Act. |
Additional information about the Trustees is available in the Funds’ Statement of Additional Information, which can be obtained from Goldman Sachs free of charge by calling this toll-free number (in the United States of America): 1-800-526-7384.
89
GOLDMAN SACHS ETF TRUST
Trustees and Officers (Unaudited) (continued)
Officers of the Trust*
| | | | | | |
| Name, Address and Age1 | | Positions Held
with the Trust | | Term of
Office and
Length of
Time Served2 | | Principal Occupation(s) During Past 5 Years |
| | | |
James A. McNamara 200 West Street New York, NY 10282 Age: 60 | | Trustee and President | | Since 2014 | | Advisory Director, Goldman Sachs (January 2018-Present); Managing Director, Goldman Sachs (January 2000-December 2017); Director of Institutional Fund Sales, GSAM (April 1998-December 2000); and Senior Vice President and Manager, Dreyfus Institutional Service Corporation (January 1993-April 1998). President and Trustee — Goldman Sachs ETF Trust; Goldman Sachs Trust; Goldman Sachs Variable Insurance Trust; Goldman Sachs Trust II; Goldman Sachs ETF Trust II; Goldman Sachs MLP and Energy Renaissance Fund; Goldman Sachs Credit Income Fund; and Goldman Sachs Real Estate Diversified Income Fund. |
| | | |
Caroline L. Kraus 200 West Street New York, NY 10282 Age: 46 | | Secretary | | Since 2014 | | Managing Director, Goldman Sachs (January 2016-Present); Vice President, Goldman Sachs (August 2006-December 2015); Senior Counsel, Goldman Sachs (January 2020-Present); Associate General Counsel, Goldman Sachs (2012-December 2019); Assistant General Counsel, Goldman Sachs (August 2006-December 2011); and Associate, Weil, Gotshal & Manges, LLP (2002-2006). Secretary — Goldman Sachs ETF Trust; Goldman Sachs Trust (previously Assistant Secretary (2012)); Goldman Sachs Variable Insurance Trust (previously Assistant Secretary (2012)); Goldman Sachs Trust II; Goldman Sachs ETF Trust II; Goldman Sachs BDC, Inc.; Goldman Sachs Private Middle Market Credit LLC; Goldman Sachs Private Middle Market Credit II LLC; Goldman Sachs Middle Market Lending Corp.; Goldman Sachs MLP and Energy Renaissance Fund; Goldman Sachs Credit Income Fund; and Goldman Sachs Real Estate Diversified Income Fund. |
| | | |
Joseph F. DiMaria 30 Hudson Street Jersey City, NJ 07302 Age: 55 | | Treasurer, Principal Financial Officer and Principal Accounting Officer | | Since 2017 (Treasurer and Principal Financial Officer since 2019) | | Managing Director, Goldman Sachs (November 2015-Present) and Vice President — Mutual Fund Administration, Columbia Management Investment Advisers, LLC (May 2010-October 2015). Treasurer, Principal Financial Officer and Principal Accounting Officer — Goldman Sachs ETF Trust (previously Assistant Treasurer (2017)); Goldman Sachs Trust (previously Assistant Treasurer (2016)); Goldman Sachs Variable Insurance Trust (previously Assistant Treasurer (2016)); Goldman Sachs Trust II (previously Assistant Treasurer (2017)); Goldman Sachs MLP and Energy Renaissance Fund (previously Assistant Treasurer (2017)); Goldman Sachs ETF Trust II; Goldman Sachs Credit Income Fund; and Goldman Sachs Real Estate Diversified Income Fund. |
| | | | | | |
| * | | Represents a partial list of officers of the Trust. Additional information about all the officers is available in the Funds’ Statement of Additional Information, which can be obtained from Goldman Sachs free of charge by calling this toll-free number (in the United States): 1-800-621-2550. |
| 1 | | Information is provided as of August 31, 2023. |
| 2 | | Officers hold office at the pleasure of the Board of Trustees or until their successors are duly elected and qualified. Each officer holds comparable positions with certain other companies of which Goldman Sachs, GSAM or an affiliate thereof is the investment adviser, administrator and/or distributor. |
Goldman Sachs MarketBeta® ETFs — Tax Information (Unaudited)
From distributions paid during the fiscal year ended August 31, 2023, the total amount of income received by the MarketBeta® Emerging Markets Equity ETF and the MarketBeta® International Equity ETF, from sources within foreign countries and possessions of the United States was $1.2940 and $1.5787 per share, respectively, all of which is attributable to qualified passive income. The percentage of net investment income dividends paid from foreign sources by the MarketBeta® Emerging Markets Equity ETF and the MarketBeta® International Equity ETF was 96.90% and 86.00%, respectively. The total amount of taxes paid by the MarketBeta® Emerging Markets Equity ETF and the MarketBeta® International Equity ETF to foreign countries was $0.1880 and $0.1438 per share, respectively.
For the year ended August 31, 2023, 0.90% of the dividends paid from net investment company taxable income by the MarketBeta® U.S. Equity ETF qualify as section 199A dividends.
For the fiscal year ended August 31, 2023, 72.94%, 100%, and 99.10% of the dividends paid from net investment company taxable income by the MarketBeta® Emerging Markets Equity ETF, MarketBeta® International Equity ETF, and the MarketBeta® U.S. Equity ETF, respectively, qualify for the reduced tax rate under the Jobs and Growth Tax Relief and Reconciliation Act of 2003.
For the fiscal year ended August 31, 2023, 95.81% of the dividends paid from net investment company taxable income by the MarketBeta® U.S. Equity ETF qualify for the dividends received deduction available to corporations.
90
FUNDS PROFILE
Goldman Sachs ETFs

Goldman Sachs is a premier financial services firm, known since 1869 for creating thoughtful and customized investment solutions in complex global markets.
Today, the Asset Management Division of Goldman Sachs serves a diverse set of clients worldwide, including private institutions, public entities and individuals. With approximately $2.46 trillion in assets under supervision as of June 30, 2023, Goldman Sachs Asset Management has portfolio management teams located around the world and our investment professionals bring firsthand knowledge of local markets to every investment decision. Assets under supervision includes assets under management and other client assets for which Goldman Sachs does not have full discretion. Goldman Sachs Asset Management leverages the resources of Goldman Sachs & Co. LLC subject to legal, internal and regulatory restrictions.
|
|
| GOLDMAN SACHS EXCHANGE-TRADED FUNDS |
| Goldman Sachs ActiveBeta® Emerging Markets Equity ETF |
| Goldman Sachs ActiveBeta® Europe Equity ETF |
| Goldman Sachs ActiveBeta® International Equity ETF |
| Goldman Sachs ActiveBeta® Japan Equity ETF |
| Goldman Sachs ActiveBeta® Paris-Aligned Climate U.S. Large Cap Equity ETF |
| Goldman Sachs Community Municipal Bond ETF |
| Goldman Sachs Defensive Equity ETF |
| Goldman Sachs ActiveBeta® U.S. Large Cap Equity ETF |
| Goldman Sachs ActiveBeta® U.S. Small Cap Equity ETF |
| Goldman Sachs ActiveBeta® World Low Vol Plus Equity ETF |
| Goldman Sachs Bloomberg Clean Energy Equity ETF |
| Goldman Sachs Equal Weight U.S. Large Cap Equity ETF |
| Goldman Sachs Hedge Industry VIP ETF |
| Goldman Sachs Innovate Equity ETF |
| Goldman Sachs JUST U.S. Large Cap Equity ETF |
| Goldman Sachs Access Emerging Markets USD Bond ETF |
| Goldman Sachs Access High Yield Corporate Bond ETF |
| Goldman Sachs Access Inflation Protected USD Bond ETF |
| Goldman Sachs Access Investment Grade Corporate 1-5 Year Bond ETF |
| Goldman Sachs Access Investment Grade Corporate Bond ETF |
| Goldman Sachs Access Treasury 0-1 Year ETF |
| Goldman Sachs Access Ultra Short Bond ETF |
| Goldman Sachs Access U.S. Aggregate Bond ETF |
| Goldman Sachs MarketBeta® Emerging Markets Equity ETF |
| Goldman Sachs MarketBeta® International Equity ETF |
| Goldman Sachs MarketBeta Total International Equity ETF |
| Goldman Sachs MarketBeta® U.S. Equity ETF |
| Goldman Sachs MarketBeta® U.S. 1000 Equity ETF |
| Goldman Sachs MarketBeta® Total International Equity ETF |
| Goldman Sachs Future Planet Equity ETF |
| Goldman Sachs Future Tech Leaders Equity ETF |
| Goldman Sachs Future Health Care Equity ETF |
| Goldman Sachs Future Consumer Equity ETF |
| Goldman Sachs Future Real Estate and Infrastructure Equity ETF |
| Goldman Sachs North American Pipelines & Power Equity ETF |
| Goldman Sachs Small Cap Core Equity ETF |
INDEX DISCLAIMERS
The Goldman Sachs MarketBeta® International Equity ETF, Goldman Sachs MarketBeta® Emerging Markets Equity ETF, and Goldman Sachs MarketBeta® U.S. Equity ETF are not sponsored, promoted, sold or supported in any other manner by Solactive AG nor does Solactive AG offer any express or implicit guarantee or assurance either with regard to the results of using the Solactive GBS Developed Markets ex North America Large & Mid Cap Index, the Solactive GBS Emerging Markets Large & Mid Cap Index, Solactive GBS United States Large & Mid Cap Index (“Solactive Indexes”) and/ or Solactive Index trade mark or the Solactive Index Price at any time or in any other respect. The Solactive Indexes are calculated and published by Solactive AG. Solactive AG uses its best efforts to ensure that the Solactive Indexes are calculated correctly. Irrespective of its obligations towards the Funds, Solactive AG has no obligation to point out errors in the Solactive Indexes to third parties including but not limited to investors and/or financial intermediaries of the Funds. Neither publication of a Solactive Index by Solactive AG nor the licensing of the Solactive Index or Solactive Index trade mark for the purpose of use in connection with a Fund constitutes a recommendation by Solactive AG to invest capital in said fund nor does it in any way represent an assurance or opinion of Solactive AG with regard to any investment in this fund. Solactive AG is registered as a benchmark administrator under the Regulation (EU) 2016/2011 (BMR). Solactive appears on the ESMA register of administrators.
| | |
TRUSTEES Cheryl K. Beebe, Chair Lawrence Hughes John F. Killian Steven D. Krichmar Michael Latham James A. McNamara Lawrence W. Stranghoener | | OFFICERS James A. McNamara, President Joseph F. DiMaria, Treasurer, Principal Financial Officer and Principal Accounting Officer Robert Griffith, Secretary* * Effective September 20, 2023 |
| |
THE BANK OF NEW YORK MELLON Transfer Agent | | |
| |
ALPS DISTRIBUTORS, INC. Distributor | | GOLDMAN SACHS ASSET MANAGEMENT, L.P. Investment Adviser |
Visit our Website at www.GSAMFUNDS.com/ETFs to obtain the most recent month-end returns.
Goldman Sachs Asset Management, L.P., 200 West Street, New York, New York 10282
The reports concerning the Funds included in this shareholder report may contain certain forward-looking statements about the factors that may affect the performance of the Funds in the future. These statements are based on Fund management’s predictions and expectations concerning certain future events and their expected impact on the Funds, such as performance of the economy as a whole and of specific industry sectors, changes in the levels of interest rates, the impact of developing world events, and other factors that may influence the future performance of the Funds. Management believes these forward-looking statements to be reasonable, although they are inherently uncertain and difficult to predict. Actual events may cause adjustments in portfolio management strategies from those currently expected to be employed.
A description of the policies and procedures that the Funds use to determine how to vote proxies relating to portfolio securities and information regarding how a Fund voted proxies relating to portfolio securities during the most recent 12-month period ended June 30 is available (i) without charge, upon request by calling 1-800-621-2550; and (ii) on the Securities and Exchange Commission (“SEC”) web site at http://www.sec.gov.
The Funds will file their portfolio holdings information for each month in a fiscal quarter within 60 days after the end of the relevant fiscal quarter on the Form N-PORT. Portfolio holdings information for the third month of each fiscal quarter will be made available on the SEC’s web site at http://www.sec.gov. Portfolio holdings information may be obtained upon request and without charge by calling 1-800-621-2550.
Fund holdings and allocations shown are as of August 31, 2023 and may not be representative of future investments. Fund holdings should not be relied on in making investment decisions and should not be construed as research or investment advice regarding particular securities. Current and future holdings are subject to risk.
Economic and market forecasts presented herein reflect our judgment as of the date of this presentation and are subject to change without notice. These forecasts do not take into account the specific investment objectives, restrictions, tax and financial situation or other needs of any specific client. Actual data will vary and may not be reflected here. These forecasts are subject to high levels of uncertainty that may affect actual performance. Accordingly, these forecasts should be viewed as merely representative of a broad range of possible outcomes. These forecasts are estimated, based on assumptions, and are subject to significant revision and may change materially as economic and market conditions change. Goldman Sachs has no obligation to provide updates or changes to these forecasts. Case studies and examples are for illustrative purposes only.
ETF Fund shares are not individually redeemable and are issued and redeemed by the Fund at their net asset value (“NAV”) only in large, specified blocks of shares called creation units. Shares otherwise can be bought and sold only through exchange trading at market price (not NAV). Shares may trade at a premium or discount to their NAV in the secondary market. Brokerage commissions will reduce returns. Ordinary brokerage commissions apply. ALPS Distributors, Inc. is the distributor of the Goldman Sachs ETF Funds. ALPS Distributors, Inc. is unaffiliated with Goldman Sachs Asset Management.
This material is not authorized for distribution to prospective investors unless preceded or accompanied by a current Prospectus or Summary Prospectus, if applicable. Investors should consider a Fund’s objective, risks, and charges and expenses, and read the Summary Prospectus, if available, and/or the Prospectus carefully before investing or sending money. The Summary Prospectus, if available, and the Prospectus contain this and other information about a Fund and may be obtained from your authorized dealer or from Goldman Sachs & Co. LLC by calling 1-800-621-2550.
MarketBeta® and ActiveBeta® are registered trademarks of GSAM.
© 2023 Goldman Sachs. All rights reserved. 341793- OTU-10/2023 MCEQWGETFAR-23
Goldman Sachs Funds
| | | | |
| | |
| Annual Report | | | | August 31, 2023 |
| | |
| | | | Goldman Sachs Future Thematic Equity ETFs |
| | | | Goldman Sachs Future Consumer Equity ETF (GBUY) |
| | | | Goldman Sachs Future Health Care Equity ETF (GDOC) |
| | | | Goldman Sachs Future Planet Equity ETF (GSFP) |
| | | | Goldman Sachs Future Real Estate and Infrastructure Equity ETF (GREI) |
| | | | Goldman Sachs Future Tech Leaders Equity ETF (GTEK) |

Goldman Sachs Future Thematic Equity ETFs
| ∎ | | GOLDMAN SACHS FUTURE CONSUMER EQUITY ETF |
| ∎ | | GOLDMAN SACHS FUTURE HEALTH CARE EQUITY ETF |
| ∎ | | GOLDMAN SACHS FUTURE PLANET EQUITY ETF |
| ∎ | | GOLDMAN SACHS FUTURE REAL ESTATE AND INFRASTRUCTURE EQUITY ETF |
| ∎ | | GOLDMAN SACHS FUTURE TECH LEADERS EQUITY ETF |
| | | | |
| | | |
| NOT FDIC-INSURED | | May Lose Value | | No Bank Guarantee |
INVESTMENT PROCESS
Goldman Sachs Future Thematic Equity ETFs
Principal Investment Strategies
The Goldman Sachs Future Consumer Equity ETF, the Goldman Sachs Future Health Care Equity ETF, the Goldman Sachs Future Planet Equity ETF and the Goldman Sachs Future Real Estate and Infrastructure Equity ETF (each, a “Fund” and together the “Funds”) seek to achieve their respective investment objectives by investing, under normal circumstances, at least 80% of their net assets plus any borrowings for investment purposes (measured at the time of purchase) in equity investments in U.S. and non-U.S. companies that Goldman Sachs Asset Management, L.P. (the “Investment Adviser”) believes are aligned, at the time the investment is first added to a Fund’s portfolio, with certain key themes (the “Key Themes”). The Goldman Sachs Future Tech Leaders Equity ETF does not use Key Themes within its investment process, but instead seeks to achieve its investment objective by investing in companies that the Investment Adviser believes are driving technological innovation or benefiting from the enablement of technology and have the potential to grow their business over many years.
The Key Themes and related areas of investment may change over time at the sole discretion of the Investment Adviser without prior notice to shareholders. In addition, each Fund is permitted to make investments that are not aligned with the Key Themes. In selecting investments, the Investment Adviser will not seek to allocate a specified portion of the Fund’s portfolio to each particular Key Theme, and the allocation of the Fund’s investments across the Key Themes will vary over time in the Investment Adviser’s sole discretion. Each Fund may not allocate its investments to each Key Theme at all times and an investment may be aligned with multiple Key Themes at the same time.
The Investment Adviser’s belief may be informed by, among other things, company disclosure, third-party research, engagement with the companies, or subjective criteria including the Investment Adviser’s own research, expectations or opinions.
Goldman Sachs Future Consumer Equity ETF
The Goldman Sachs Future Consumer Equity ETF (the “Fund”) intends to invest in companies that the Investment Adviser believes are aligned with the Key Themes associated with the different and evolving priorities and spending habits of younger consumers, which include, but are not limited to:
| • | | Tech-Enabled Consumption |
| | • | | Digital Enabler — Companies that provide or help create products, services or technologies in areas including but not limited to Internet and communications infrastructure, digital components and fintech infrastructure. |
| | • | | Digital Services — Companies that provide or help create products, services or technologies in areas including but not limited to e-commerce, social media, digital entertainment and gaming, fintech services, mobility and the digital workforce. |
| | • | | Consumption — Companies that provide or help create products, services or technologies in areas including but not limited to health and wellness, luxury and sustainable living. |
| | • | | Lifestyle — Companies that provide or help create products, services or technologies in areas including but not limited to experiences, health and wellness, sustainable living, education, pet care and childcare. |
Goldman Sachs Future Health Care Equity ETF
The Goldman Sachs Future Health Care Equity ETF (the “Fund”) intends to invest in companies that the Investment Adviser believes are aligned with the Key Themes associated with innovation in health care, which include, but are not limited to:
| • | | Genomics — Companies that provide, invest in or help create products, services or technologies in areas including but not limited to sequencing, diagnostic testing and the genomics supply chain. |
| • | | Precision Medicine — Companies that provide, invest in or help create products, services or technologies in areas including but not limited to targeted oncology, gene/cell therapy and rare diseases. |
| • | | Technology-Enabled Procedures — Companies that provide, invest in or help create products, services or technologies in areas including but not limited to robotic surgery and minimally invasive procedures. |
1
INVESTMENT PROCESS
| • | | Digital Healthcare — Companies that provide, invest in or help create products, services or technologies in areas including but not limited to connected devices, digital transformation and online health. |
Goldman Sachs Future Planet Equity ETF
The Goldman Sachs Future Planet Equity ETF (the “Fund”) intends to invest in companies that the Investment Adviser are aligned with the Key Themes associated with seeking to address environmental problems, which include, but are not limited to:
| • | | Clean Energy — Companies that provide, invest in or help create products, services or technologies in areas including but not limited to solar energy, wind energy, bioenergy, energy storage, grid services and carbon sequestration. |
| • | | Resource Efficiency — Companies that provide, invest in or help create products, services or technologies in areas including but not limited to electric and autonomous vehicles, sustainable manufacturing, logistics and smart cities. |
| • | | Sustainable Consumption — Companies that provide, invest in or help create products, services or technologies in areas including but not limited to agriculture, food, tourism and fashion. |
| • | | Circular Economy — Companies that provide, invest in or help create products, services or technologies in areas including but not limited to recycling and reuse, waste management and single-use substitution. |
| • | | Water Sustainability — Companies that provide, invest in or help create products, services or technologies in areas including but not limited to water treatment, water distribution and desalination. |
Goldman Sachs Future Real Estate and Infrastructure Equity ETF
The Goldman Sachs Future Real Estate and Infrastructure Equity ETF (the “Fund”) intends to invest in companies that the Investment Adviser are aligned with the Key Themes associated with secular growth drivers for real estate and infrastructure assets, which include, but are not limited to:
| • | | Technological Innovation — Real estate and infrastructure companies that facilitate technological innovation-driven demand including but not limited to towers and digital storage. |
| • | | Environmental Sustainability — Real estate and infrastructure companies that facilitate environmental sustainability-driven demand drivers in areas including but not limited to utilities enabling energy transition, alternative energy producers, water utilities, energy storage and grid services. |
| • | | New Age Consumer — Real estate and infrastructure companies that facilitate different and evolving priorities and spending habits of younger consumers, including but not limited to logistics, cold storage, transportation infrastructure, self storage, rental housing, leisure hotels and studio office. |
| • | | Future of Health Care — Real estate and infrastructure companies that facilitate health care innovation and aging demographic trends including but not limited to lab office, life science office and senior housing. |
Goldman Sachs Future Tech Leaders Equity ETF
The Goldman Sachs Future Tech Leaders Equity ETF (the “Fund”) intends to invest in companies that the Investment Adviser believes are driving technological innovation or benefiting from the enablement of technology and have the potential to grow their business over many years.
The Investment Adviser seeks to:
| • | | Identify companies at various growth stages that are developing differentiated technology to either disrupt existing markets, serve existing markets more efficiently or apply proven business models to new geographies. |
| • | | Invest in companies that use technology to drive long-term compounding revenue growth, as well as more mature technology companies that are evolving their business models to exploit new growth opportunities. |
* * *
2
INVESTMENT PROCESS
At the end of the Reporting Period, i.e., the 12-month period ended August 31, 2023, we noted that during the 2022 calendar year, innovation equities — which we define as companies on the right side of long-term secular growth themes — had experienced some of the sharpest declines in the broad equity market. This was, in our view, due to their greater sensitivity to interest rate movements and their starting point of elevated valuations. However, during the 2023 calendar year to date, innovation equities had generally rebounded, driven by key tailwinds, such as the rise of generative artificial intelligence and softening recessionary concerns. We believed at the end of the Reporting Period that going forward, innovation equities were likely to offer higher margins and faster earnings growth than the equity market broadly, and we thought the equities in which the Funds invest could offer even faster earnings growth than market consensus estimates. In our view, innovation equities may also be well-positioned in an inflationary environment given that companies with innovative products typically exert greater pricing power and that inflation encourages businesses to invest in innovative solutions to reduce costs and improve efficiency. Additionally, global events may further accelerate key secular themes, providing additional tailwinds to certain innovation equities, in our opinion.
In our view, active management is especially critical in this environment, as the market was, at the end of the Reporting Period, differentiating between profitable and unprofitable as well as between high-growth, high-margin and high-growth, low-margin stocks. In managing the Funds, we intended to continue following our disciplined process of stock-level due diligence, portfolio construction and risk management. We planned to remain highly focused on understanding the fundamental drivers of the companies in which we consider investing and expected to invest in them only if we have conviction that their business models can be successful over the long term. Additionally, we intended to maintain balanced and diversified allocations across Key Themes, market capitalizations, regions and sectors to avoid concentrated risk exposures.
3
PORTFOLIO RESULTS
Goldman Sachs Future Consumer Equity ETF
Investment Objective
The Goldman Sachs Future Consumer Equity ETF (the “Fund”) seeks long-term growth of capital.
Portfolio Management Discussion and Analysis
Below, the Goldman Sachs Fundamental Equity Team discusses the Fund’s performance and positioning for the 12-month period ended August 31, 2023 (the “Reporting Period”).
| Q | | How did the Fund perform during the Reporting Period? |
| A | | During the Reporting Period, the Fund returned 6.84% based on net asset value (“NAV”) and 7.51% based on market price. The Fund’s benchmark, the MSCI All Country World Index Growth Index (the “MSCI ACWI Growth Index”), returned 17.86% during the same period. |
| | The Fund had an NAV of $25.43 per share on August 31, 2022 and ended the Reporting Period with an NAV of $27.17 per share. The Fund’s market price on August 31, 2023 was $27.20 per share. |
| Q | | What key factors were responsible for the Fund’s performance during the Reporting Period? |
| A | | The Fund is an actively managed exchange-traded fund (“ETF”) that seeks long-term growth of capital by investing in companies that may be aligned, at the time a given investment is first added to the Fund’s portfolio, with the key themes associated with the different and evolving priorities and spending habits of younger consumers, which include, but are not limited to, Tech-Enabled Consumption and Lifestyle and Values (the “Key Themes”). Additionally, as part of its investment process, the Goldman Sachs Fundamental Equity Team divides these Key Themes into multiple sub-themes. |
| | During the Reporting Period, the Fund produced a positive absolute return, as the broad global equity market advanced. At the start of 2023, investors pivoted away from energy stocks and into other segments of the global equity market; energy had been the only sector in the MSCI ACWI Growth Index to generate gains during calendar year 2022. Growth-oriented stocks, in which the Fund holds a considerable position, also performed well during the Reporting Period overall, bolstering the Fund’s absolute performance. |
| | On a relative basis, the Fund underperformed the MSCI ACWI Growth Index during the Reporting Period. The Lifestyle and Values Key Theme detracted from the Fund’s relative performance, though this was offset somewhat by the Tech-Enabled Consumption Key Theme, which contributed positively. Among sub-themes, sustainable consumption detracted most, while digital components and luxury each added to returns. In addition, the Fund was hampered by its limited exposure to certain mega-cap stocks and to stocks that were, in our opinion, already overvalued. Recession worries, driven by high inflation, also dampened the performance of some of the Fund’s holdings among consumer discretionary stocks. |
| | Within sectors, the Fund was hurt by stock selection in the communication services and utilities sectors. On the positive side, the Fund benefited from stock selection in the information technology and consumer staples sectors. |
| | From a country perspective, stock selection in the U.S., Netherlands and China detracted from relative performance. Stock selection in Italy and France added to the Fund’s returns during the Reporting Period. |
| Q | | Which individual stock positions detracted most from the Fund’s relative returns during the Reporting Period? |
| A | | Relative to the MSCI ACWI Growth Index, the Fund’s overweight positions in American Tower, a real estate investment trust that owns and operates wireless communications and broadcast towers in the U.S.; NextEra Energy, a U.S. electric utility and renewable energy company; and EDP Renovaveis, a Spanish renewable energy company (3.01%, 3.27% and 2.17% of Fund net assets as of August 31, 2023, respectively) detracted most from relative performance. All three stocks generated double-digit negative returns within the MSCI ACWI Growth Index during the Reporting Period. |
4
PORTFOLIO RESULTS
| Q | | Which individual stock positions contributed most positively to the Fund’s relative returns during the Reporting Period? |
| A | | Compared to the MSCI ACWI Growth Index, the Fund was helped most by overweight positions in NVIDIA, a U.S. designer and manufacturer of graphics processors, chipsets and related multimedia software; Meta Platforms, U.S. technology company; and Moncler, an Italian apparel manufacturer (6.10%, 5.10% and 2.48% of Fund net assets as of August 31, 2023, respectively). NVIDIA delivered a triple-digit positive return within the MSCI ACWI Growth Index, while Meta Platforms and Moncler each produced a double-digit positive return within the MSCI ACWI Growth Index during the Reporting Period. |
| Q | | How did the Fund use derivatives and similar instruments during the Reporting Period? |
| A | | During the Reporting Period, the Fund did not invest in derivatives or similar instruments. The Fund does not employ derivatives as a source of alpha generation, although it may use them to equitize excess cash. |
| Q | | Were there any changes to the Fund’s portfolio management team during the Reporting Period? |
| A | | Effective January 3, 2023, Laura Destribats no longer served as a portfolio manager for the Fund. As of February 2, 2023, Jennifer Sullivan became a portfolio manager for the Fund, joining Alexis Deladerrière, Raj Garigipati and Nathan Lin. Mr. Deladerrière, Mr. Garigipati and Mr. Lin have been portfolio managers for the Fund since 2021. By design, the Fund is managed within a team structure. This has been a cornerstone of our approach and helps ensure continuity in the Fund. |
| Q | | What was the Fund’s sector positioning relative to the MSCI ACWI Growth Index at the end of the Reporting Period?1 |
| | | | | | | | | | |
| | | |
| | | Sector Name | | Fund | | | MSCI ACWI
Growth Index | |
| | Communication Services | | | 30.40 | % | | | 10.95 | % |
| | Consumer Discretionary | | | 26.54 | | | | 14.80 | |
| | Information Technology | | | 14.23 | | | | 33.36 | |
| | Financials | | | 5.89 | | | | 8.52 | |
| | Consumer Staples | | | 5.52 | | | | 5.97 | |
| | Utilities | | | 5.44 | | | | 0.34 | |
| | Materials | | | 4.48 | | | | 2.75 | |
| | Real Estate | | | 3.01 | | | | 0.88 | |
| | Industrials | | | 2.53 | | | | 9.90 | |
| | Health Care | | | 1.32 | | | | 10.78 | |
| | Energy | | | 0.00 | | | | 1.75 | |
| | | Cash | | | 0.62 | | | | 0.00 | |
| Q | | What was the Fund’s country positioning relative to the MSCI ACWI Growth Index at the end of the Reporting Period?1 |
| | | | | | | | | | |
| | | |
| | | Country Name | | Fund | | | MSCI ACWI
Growth Index | |
| | U.S. | | | 61.45 | % | | | 64.08 | % |
| | China | | | 8.79 | | | | 3.18 | |
| | Italy | | | 5.60 | | | | 0.31 | |
| | Taiwan | | | 5.08 | | | | 1.58 | |
| | Netherlands | | | 3.56 | | | | 1.49 | |
| | France | | | 3.22 | | | | 3.32 | |
| | U.K. | | | 2.82 | | | | 2.26 | |
| | Hong Kong | | | 2.62 | | | | 0.58 | |
| | Portugal | | | 2.17 | | | | 0.04 | |
| �� | Germany | | | 1.88 | | | | 1.67 | |
| | South Korea | | | 1.01 | | | | 1.15 | |
| | Brazil | | | 0.68 | | | | 0.53 | |
| | | Singapore | | | 0.48 | | | | 0.30 | |
| | 1 | | Country and sector classifications for securities may differ between the above listing and the Schedule of Investments due to differing classification methodologies. The classification methodology used for the above listing is as set forth by MSCI. The Fund’s composition may differ over time. Consequently, the Fund’s overall country and sector allocations may differ from percentages contained in the chart above. The percentage shown for each investment category reflects the value of investments in that category as a percentage of market value. Figures above may not sum to 100% due to rounding due to the presence of cash. |
5
FUND BASICS
Goldman Sachs Future Consumer Equity ETF
as of August 31, 2023
| | | | | | |
| | FUND SNAPSHOT | |
| |
| | | As of August 31, 2023 | |
| | |
| | Market Price1 | | $ | 27.20 | |
| | | Net Asset Value (NAV)1 | | $ | 27.17 | |
| 1 | | The Market Price is the price at which the Fund’s shares are trading on the NYSE Arca, Inc. The Market Price of the Fund’s shares will fluctuate and, at the time of sale, shares may be worth more or less than the original investment or the Fund’s then current net asset value (“NAV”). The NAV is the market value of one share of the Fund. This amount is derived by dividing the total value of all the securities in the Fund’s portfolio, plus other assets, less any liabilities, by the number of Fund shares outstanding. Fund shares are not individually redeemable and are issued and redeemed by the Fund at their NAV only in large, specified blocks of shares called creation units. Shares otherwise can be bought and sold only through exchange trading at market price (not NAV). Shares may trade at a premium or discount to their NAV in the secondary market. Information regarding how often shares of the Fund traded on NYSE Arca at a price above (i.e., at a premium) or below (i.e., at a discount) the NAV of the Fund can be found at www.GSAMFUNDS.com/ETFs. |
| | | | | | | | | | |
| | TOP TEN HOLDINGS AS OF 8/31/232 |
| | | | |
| | | Holding | | % of Net Assets | | | Line of Business | | Country |
| | | | |
| | Amazon.com, Inc. | | | 7.7 | % | | Consumer Discretionary | | United States |
| | Alphabet, Inc., Class C | | | 7.1 | | | Communication Services | | United States |
| | NVIDIA Corp. | | | 6.1 | | | Information Technology | | United States |
| | Meta Platforms, Inc., Class A | | | 5.1 | | | Communication Services | | United States |
| | Mastercard, Inc., Class A | | | 5.1 | | | Financials | | United States |
| | Taiwan Semiconductor Manufacturing Co. Ltd. | | | 4.3 | | | Information Technology | | Taiwan |
| | NextEra Energy, Inc. | | | 3.3 | | | Utilities | | United States |
| | LVMH Moet Hennessy Louis Vuitton SE | | | 3.2 | | | Consumer Discretionary | | France |
| | Davide Campari-Milano NV | | | 3.1 | | | Consumer Staples | | Italy |
| | | American Tower Corp. REIT | | | 3.0 | | | Real Estate | | United States |
| 2 | | The top 10 holdings may not be representative of the Fund’s future investments. |
For more information about the Fund, please refer to www.GSAMFUNDS.com/ETFs. There, you can learn more about the Fund’s investment strategies, holdings, and performance.
6
GOLDMAN SACHS FUTURE CONSUMER EQUITY ETF
Performance Summary
August 31, 2023
The following graph shows the value, as of August 31, 2023, of a $10,000 investment made on November 9, 2021 (commencement of operations) in Shares at NAV. For comparative purposes, the performance of the Fund’s benchmark, the MSCI ACWI Growth Index, is shown. Performance reflects applicable fee waivers and/or expense limitations in effect during the periods shown and in their absence, performance would be reduced. Returns do not reflect the deduction of taxes that a shareholder would pay on Fund distributions or the sale of Fund shares. Certain factors may affect Fund performance including, but not limited to, Fund operating fees and expenses, portfolio turnover and creation and redemption in-kind transactions. The returns set forth below represent past performance. Past performance does not guarantee future results. The Fund’s NAV and investment return may fluctuate. These fluctuations may cause an investor’s shares to be worth more or less than their original cost. Current performance may be lower or higher than the performance quoted below. Please visit our web site at www.GSAMFUNDS.com/ETFs to obtain the most recent month-end returns.
| | |
| Goldman Sachs Future Consumer Equity ETF’s Lifetime Performance | | |
Performance of a $10,000 Investment, with distributions reinvested, from November 9, 2021 through August 31, 2023.
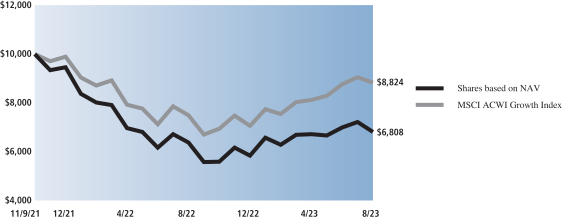
| | | | | | |
| Average Annual Total Return through August 31, 2023* | | | 1 Year Return | | | Since Inception |
Shares based on NAV (Commenced November 9, 2021) | | | 6.84% | | | -19.15% |
|
Shares based on Market Price (Commenced November 9, 2021) | | | 7.51% | | | -19.10% |
|
MSCI ACWI Growth Index | | | 17.86% | | | -6.69% |
|
| * | | Total returns are calculated assuming purchase of a share at the market price or NAV on the first day and sale of a share at the market price or NAV on the last day of each period reported. The Total Returns based on NAV and Market Price assume the reinvestment of dividends and do not reflect brokerage commissions in connection with the purchase or sale of Fund shares, which if included would lower the performance shown above. The NAV used in the Total Return calculation assumes all management fees incurred by the Fund. Market Price returns are based upon the last trade at 4:00 pm EST and do not reflect the returns you would receive if you traded shares at other times. The first day of secondary market trading is typically several days after the date on which the Fund commenced investment operations; therefore, the NAV of the Fund is used as a proxy for the period from inception of investment operations to the first day of secondary market trading to calculate the Market Price returns. |
7
PORTFOLIO RESULTS
Goldman Sachs Future Health Care Equity ETF
Investment Objective
The Goldman Sachs Future Health Care Equity ETF (the “Fund”) seeks long-term growth of capital.
Portfolio Management Discussion and Analysis
Below, the Goldman Sachs Fundamental Equity Team discusses the Fund’s performance and positioning for the 12-month period ended August 31, 2023 (the “Reporting Period”).
| Q | | How did the Fund perform during the Reporting Period? |
| A | | During the Reporting Period, the Fund returned 8.28% based on net asset value (“NAV”) and 8.06% based on market price. The Fund’s benchmark, the MSCI All Country World Index Health Care Index (the “MSCI ACWI Health Care Index”), returned 9.41% during the same period. |
| | The Fund had an NAV of $29.94 per share on August 31, 2022 and ended the Reporting Period with an NAV of $32.42 per share. The Fund’s market price on August 31, 2023 was $32.42 per share. |
| Q | | What key factors were responsible for the Fund’s performance during the Reporting Period? |
| A | | The Fund is an actively managed exchange-traded fund (“ETF”) that seeks long-term growth of capital by investing in companies that may be aligned, at the time a given investment is first added to the Fund’s portfolio, with the key themes associated with innovation in health care, which include, but are not limited to, Genomics, Precision Medicine, Technology-Enabled Procedures and Digital Healthcare (the “Key Themes”). Additionally, as part of its investment process, the Goldman Sachs Fundamental Equity Team divides these Key Themes into multiple sub-themes. |
| | During the Reporting Period, the Fund generated a positive absolute return, as ongoing innovation across the health care ecosystem, coupled with demand normalization and a favorable mergers and acquisitions backdrop, fueled gains. In addition, sectors that had lagged during 2022, including health care, generally rebounded in 2023, adding further to the Fund’s absolute performance. |
| | Relative to the MSCI ACWI Health Care Index, the Fund underperformed during the Reporting Period. These results can be largely attributed to persistent inflation, elevated interest rates, recession concerns and elongated supply-chain disruptions. Given that the Fund is primarily invested in what we consider the most innovative parts of the health care ecosystem, it is acutely sensitive to rising interest rates and inflation. When inflation is heightened, investors tend to apply a steeper discount to future earnings, which can hurt the growth outlook for innovative companies. In addition, the MSCI ACWI Health Care Index’s market capitalization weighting skews towards the more defensive parts of the health care ecosystem, which remained resilient relative to innovation equities during the Reporting Period. |
| | Two of the Fund’s four Key Themes detracted from relative returns during the Reporting Period. The largest detractor was Genomics, which was hurt by a slowdown in COVID-19-related business segments and revenues amid waning demand for COVID-19 vaccines and diagnostic supplies. On the positive side, the Fund was helped by its two other Key Themes. Precision Medicine added most to relative performance, driven primarily by the development of novel drugs and treatments for chronic diseases, such as diabetes and Alzheimer’s disease. Within sub-themes, genomics supply chain detracted most from relative performance. The chronic diseases sub-theme contributed most positively to results. |
| | From an industry perspective, the Fund was hampered by stock selection and an overweight position versus the MSCI ACWI Health Care Index in biotechnology. Biotechnology, which is generally considered the growth engine of the health care ecosystem, was weak amid elevated interest rates. On the positive side, the Fund was aided by its lack of exposure to health care providers and services as well as by stock selection among leading pharmaceutical companies. |
| | From a country perspective, stock selection and an underweight position relative to the MSCI ACWI Health Care Index in Denmark detracted from the Fund’s relative returns. The Fund benefited from stock selection in and an overweight allocation to the U.S., as well as from an underweight position in China, during the Reporting Period. |
8
PORTFOLIO RESULTS
| Q | | Which individual stock positions detracted most from the Fund’s relative returns during the Reporting Period? |
| A | | Relative to the MSCI ACWI Health Care Index, the Fund was hurt by its lack of exposure to Novo Nordisk, a Danish pharmaceutical company, as well as by overweight positions in Insulet, a U.S. medical device company that specializes in insulin-delivery systems, and 2seventy Bio, a U.S. immuno-oncology cell therapy company (0.00%,1 2.33% and 0.41% of Fund net assets as of August 31, 2023, respectively). During the Reporting Period, Novo Nordisk posted a double-digit positive return within the MSCI ACWI Health Care Index. Insulet and 2seventy Bio each generated a double-digit negative return within the MSCI ACWI Health Care Index during the Reporting Period. |
| Q | | Which individual stock positions contributed most positively to the Fund’s relative returns during the Reporting Period? |
| A | | Relative to the MSCI ACWI Health Care Index, the Fund benefited most from an overweight position in Intuitive Surgical, a U.S. company that develops, manufactures and markets robotic products for minimally invasive surgery, as well as from its lack of exposure to United Health Group. a U.S. managed health care and insurance company, and Pfizer, a U.S. pharmaceutical and biotechnology company (5.05%, 0.00%1 and 0.00%1 of Fund net assets as of August 31, 2023, respectively). During the Reporting Period, Intuitive Surgical delivered a double-digit positive return within the MSCI ACWI Health Care Index. United Health Group recorded a single-digit negative return, and Pfizer produced a double-digit negative return within the MSCI ACWI Health Care Index during the Reporting Period. |
| Q | | How did the Fund use derivatives and similar instruments during the Reporting Period? |
| A | | During the Reporting Period, the Fund did not invest in derivatives or similar instruments. The Fund does not employ derivatives as a source of alpha generation, although it may use them to equitize excess cash. |
| Q | | Were there any changes to the Fund’s portfolio management team during the Reporting Period? |
| A | | Effective January 18, 2023, Anant Padmanabhan no longer served as a portfolio manager for the Fund. Jenny Chang and Raj Garigipati continued to serve as portfolio managers for the Fund. Ms. Chang and Mr. Garigipati have been portfolio managers for the Fund since 2021. By design, the Fund is managed within a team structure. This has been a cornerstone of our approach and helps ensure continuity in the Fund. |
| Q | | What was the Fund’s industry positioning relative to the MSCI ACWI Health Care Index at the end of the Reporting Period?2 |
| | | | | | | | | | |
| | | |
| | | Industry Name | | Fund | | | MSCI ACWI
Health
Care Index | |
| | Health Care Equipment and Supplies | | | 29.34 | % | | | 17.71 | % |
| | Biotechnology | | | 28.37 | | | | 14.44 | |
| | Pharmaceuticals | | | 22.28 | | | | 41.58 | |
| | Life Sciences Tools and Services | | | 12.32 | | | | 10.33 | |
| | Health Care Technology | | | 2.31 | | | | 0.52 | |
| | Electronic Equipment Instruments and Components | | | 2.03 | | | | 0.00 | |
| | Office Real Estate Investment Trusts | | | 1.66 | | | | 0.00 | |
| | Health Care Providers & Services | | | 0.00 | | | | 15.42 | |
| | | Cash | | | 1.69 | | | | 0.00 | |
| | 1 | | Some weights are 0.00% at August 31, 2023 either because those positions were eliminated during the most recent rebalance given the Index construction methodology or were not held at all during the Reporting Period as they did not meet the Fund’s investment criteria. |
9
PORTFOLIO RESULTS
| Q | | What was the Fund’s country positioning relative to the MSCI ACWI Health Care Index at the end of the Reporting Period?2 |
| | | | | | | | | | |
| | | |
| | | Country Name | | Fund | | | MSCI ACWI
Health
Care Index | |
| | U.S. | | | 81.8 | % | | | 69.17 | % |
| | Japan | | | 6.01 | | | | 4.10 | |
| | U.K. | | | 5.29 | | | | 3.97 | |
| | Australia | | | 2.86 | | | | 1.50 | |
| | Denmark | | | 1.76 | | | | 4.66 | |
| | Belgium | | | 1.00 | | | | 0.53 | |
| | Switzerland | | | 0.80 | | | | 7.22 | |
| | France | | | 0.61 | | | | 2.69 | |
| | Brazil | | | 0.00 | | | | 0.15 | |
| | China | | | 0.00 | | | | 1.47 | |
| | Finland | | | 0.00 | | | | 0.06 | |
| | Germany | | | 0.00 | | | | 1.87 | |
| | Hungary | | | 0.00 | | | | 0.05 | |
| | India | | | 0.00 | | | | 0.70 | |
| | Indonesia | | | 0.00 | | | | 0.03 | |
| | Israel | | | 0.00 | | | | 0.14 | |
| | Italy | | | 0.00 | | | | 0.16 | |
| | Malaysia | | | 0.00 | | | | 0.05 | |
| | Netherlands | | | 0.00 | | | | 0.28 | |
| | New Zealand | | | 0.00 | | | | 0.15 | |
| | Saudi Arabia | | | 0.00 | | | | 0.13 | |
| | South Korea | | | 0.00 | | | | 0.51 | |
| | South Africa | | | 0.00 | | | | 0.05 | |
| | Spain | | | 0.00 | | | | 0.05 | |
| | Sweden | | | 0.00 | | | | 0.10 | |
| | Taiwan | | | 0.00 | | | | 0.04 | |
| | | Thailand | | | 0.00 | | | | 0.18 | |
| | 2 | | Country and industry classifications for securities may differ between the above listing and the Schedule of Investments due to differing classification methodologies. The classification methodology used for the above listing is as set forth by MSCI. The Fund’s composition may differ over time. Consequently, the Fund’s overall country and industry allocations may differ from percentages contained in the chart above. The percentage shown for each investment category reflects the value of investments in that category as a percentage of market value. Figures above may not sum to 100% due to rounding due to the presence of cash. |
10
FUND BASICS
Goldman Sachs Future Health Care Equity ETF
as of August 31, 2023
| | | | | | |
| | FUND SNAPSHOT | |
| |
| | | As of August 31, 2023 | |
| | |
| | Market Price1 | | $ | 32.42 | |
| | | Net Asset Value (NAV)1 | | $ | 32.42 | |
| 1 | | The Market Price is the price at which the Fund’s shares are trading on the NYSE Arca, Inc. The Market Price of the Fund’s shares will fluctuate and, at the time of sale, shares may be worth more or less than the original investment or the Fund’s then current net asset value (“NAV”). The NAV is the market value of one share of the Fund. This amount is derived by dividing the total value of all the securities in the Fund’s portfolio, plus other assets, less any liabilities, by the number of Fund shares outstanding. Fund shares are not individually redeemable and are issued and redeemed by the Fund at their NAV only in large, specified blocks of shares called creation units. Shares otherwise can be bought and sold only through exchange trading at market price (not NAV). Shares may trade at a premium or discount to their NAV in the secondary market. Information regarding how often shares of the Fund traded on NYSE Arca at a price above (i.e., at a premium) or below (i.e., at a discount) the NAV of the Fund can be found at www.GSAMFUNDS.com/ETFs. |
| | | | | | | | | | |
| | TOP TEN HOLDINGS AS OF 8/31/232 |
| | | | |
| | | Holding | | % of Net Assets | | | Line of Business | | Country |
| | | | |
| | Eli Lilly & Co. | | | 7.9 | % | | Health Care | | United States |
| | Boston Scientific Corp. | | | 5.5 | | | Health Care | | United States |
| | Intuitive Surgical, Inc. | | | 5.1 | | | Health Care | | United States |
| | AstraZeneca PLC | | | 5.0 | | | Health Care | | United Kingdom |
| | Biogen, Inc. | | | 3.5 | | | Health Care | | United States |
| | Chugai Pharmaceutical Co. Ltd. | | | 3.2 | | | Health Care | | Japan |
| | Seagen, Inc. | | | 3.0 | | | Health Care | | United States |
| | Dexcom, Inc. | | | 3.0 | | | Health Care | | United States |
| | Gilead Sciences, Inc. | | | 2.9 | | | Health Care | | United States |
| | | BioMarin Pharmaceutical, Inc. | | | 2.9 | | | Health Care | | United States |
| 2 | | The top 10 holdings may not be representative of the Fund’s future investments. |
For more information about the Fund, please refer to www.GSAMFUNDS.com/ETFs. There, you can learn more about the Fund’s investment strategies, holdings, and performance.
11
GOLDMAN SACHS FUTURE HEALTH CARE EQUITY ETF
Performance Summary
August 31, 2023
The following graph shows the value, as of August 31, 2023, of a $10,000 investment made on November 9, 2021 (commencement of operations) in Shares at NAV. For comparative purposes, the performance of the Fund’s benchmark, the MSCI ACWI Health Care Index, is shown. Performance reflects applicable fee waivers and/or expense limitations in effect during the periods shown and in their absence, performance would be reduced. Returns do not reflect the deduction of taxes that a shareholder would pay on Fund distributions or the sale of Fund shares. Certain factors may affect Fund performance including, but not limited to, Fund operating fees and expenses, portfolio turnover and creation and redemption in-kind transactions. The returns set forth below represent past performance. Past performance does not guarantee future results. The Fund’s NAV and investment return may fluctuate. These fluctuations may cause an investor’s shares to be worth more or less than their original cost. Current performance may be lower or higher than the performance quoted below. Please visit our web site at www.GSAMFUNDS.com/ETFs to obtain the most recent month-end returns.
| | |
| Goldman Sachs Future Health Care Equity ETF’s Lifetime Performance | | |
Performance of a $10,000 Investment, with distributions reinvested, from November 9, 2021 through August 31, 2023.
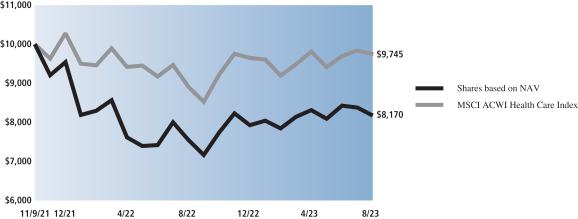
| | | | | | |
| Average Annual Total Return through August 31, 2023* | | | 1 Year Return | | | Since Inception |
Shares based on NAV (Commenced November 9, 2021) | | | 8.28% | | | -10.57% |
|
Shares based on Market Price (Commenced November 9, 2021) | | | 8.06% | | | -10.57% |
|
MSCI ACWI Health Care Index | | | 9.41% | | | -1.42% |
|
| * | | Total returns are calculated assuming purchase of a share at the market price or NAV on the first day and sale of a share at the market price or NAV on the last day of each period reported. The Total Returns based on NAV and Market Price assume the reinvestment of dividends and do not reflect brokerage commissions in connection with the purchase or sale of Fund shares, which if included would lower the performance shown above. The NAV used in the Total Return calculation assumes all management fees incurred by the Fund. Market Price returns are based upon the last trade at 4:00 pm EST and do not reflect the returns you would receive if you traded shares at other times. The first day of secondary market trading is typically several days after the date on which the Fund commenced investment operations; therefore, the NAV of the Fund is used as a proxy for the period from inception of investment operations to the first day of secondary market trading to calculate the Market Price returns. |
12
PORTFOLIO RESULTS
Goldman Sachs Future Planet Equity ETF
Investment Objective
The Goldman Sachs Future Planet Equity ETF (the “Fund”) seeks long-term capital appreciation.
Portfolio Management Discussion and Analysis
Below, the Goldman Sachs Fundamental Equity Team discusses the Fund’s performance and positioning for the 12-month period ended August 31, 2023 (the “Reporting Period”).
| Q | | How did the Fund perform during the Reporting Period? |
| A | | During the Reporting Period, the Fund returned 0.13% based on net asset value (“NAV”) and 0.26% based on market price. The Fund’s benchmark, the MSCI All Country World Index (Net, USD, Unhedged) (the “MSCI ACWI Index”), returned 13.95% during the same period. |
| | The Fund had an NAV of $30.23 per share on August 31, 2022 and ended the Reporting Period with an NAV of $30.15 per share. The Fund’s market price on August 31, 2023 was $30.11 per share. |
| Q | | What key factors were responsible for the Fund’s performance during the Reporting Period? |
| A | | The Fund is an actively managed exchange-traded fund (“ETF”) that seeks long-term capital appreciation by investing in companies that may be associated, at the time a given investment is first added to the Fund’s portfolio, with seeking to address environmental problems, which include, but are not limited to, Clean Energy, Resource Efficiency, Sustainable Consumption, Circular Economy and Water Sustainability (the “Key Themes”). Additionally, as part of its investment process, the Goldman Sachs Fundamental Equity Team divides these Key Themes into multiple sub-themes. |
| | During the Reporting Period, the Fund generated a slightly positive absolute return, with gains limited by a broad-based sell-off among clean energy and clean technology stocks. The decline was driven by slowing growth and earnings per share due to tough supply and demand fundamentals, certain end markets experiencing a destocking cycle, rising interest rates and increased geopolitical risk factors that dampened sentiment about Asian supply chains. (Destocking refers to the process of reducing inventory or of stocking less.) |
| | On a relative basis, the Fund underperformed the MSCI ACWI Index during the Reporting Period overall. U.S. large-cap technology stocks drove more than 50% of MSCI ACWI Index returns between the beginning of 2023 and the end of the Reporting Period. However, the Fund had no exposure to that market segment because it is not aligned with any of the Fund’s Key Themes. |
| | Among Key Themes, Sustainable Consumption, Clean Energy and Circular Economy detracted from relative performance, while Resource Efficiency and Water Sustainability contributed positively during the Reporting Period. Food and agriculture was the leading detractor among sub-themes, and smart cities was the most successful sub-theme during the Reporting Period. |
| | Regarding sectors, stock selection in information technology, especially U.S. large-cap companies, had a negative impact on the Fund’s relative results. In addition, the Fund’s lack of exposure to real estate, which does not align with the Key Themes, also hampered its performance. Overweight positions versus the MSCI ACWI Index in materials, industrials and utilities, which were hurt more than other sectors by supply-chain disruptions, inflation and rising interest rates, detracted further from the Fund’s relative returns. |
| | From a country perspective, the Fund’s allocation to the U.S. hurt its relative performance most given the rally in the information technology sector during the Reporting Period. Also detracting was stock selection in the Netherlands, specifically an investment in a bioscience company that was struggling amid restocking challenges and the completion of a merger. On the positive side, the Fund benefited from stock selection in Italy and Switzerland. In Switzerland, stock selection driven by the grid services and smart cities sub-themes was particularly advantageous. |
13
PORTFOLIO RESULTS
| Q | | Which individual stock positions detracted most from the Fund’s relative returns during the Reporting Period? |
| A | | Relative to the MSCI ACWI Index, the Fund was hampered by its overweight positions in DSM Firmenich, a Swiss-Dutch health, nutrition and bioscience company; Wolfspeed, a U.S. developer and manufacturer of wide bandgap semiconductors; and NextEra Energy, a U.S. electric utility and renewable energy company (3.76%, 0.83% and 3.14% of Fund net assets as of August 31, 2023, respectively). All three stocks produced double-digit negative returns within the MSCI ACWI Index during the Reporting Period. |
| Q | | Which individual stock positions contributed most positively to the Fund’s relative returns during the Reporting Period? |
| A | | Relative to the MSCI ACWI Index, the Fund benefited most from overweight positions in Enel, an Italian company involved in electricity generation and distribution as well as natural gas distribution; Schneider Electric, a French company engaged in energy and automation digital solutions for efficiency and sustainability; and Infineon Technologies, a German semiconductor manufacturer (4.23%, 3.36% and 3.15% of Fund net assets as of August 31, 2023, respectively). Each of these stocks recorded a double-digit positive return within the MSCI ACWI Index during the Reporting Period. |
| Q | | How did the Fund use derivatives and similar instruments during the Reporting Period? |
| A | | During the Reporting Period, the Fund did not invest in derivatives or similar instruments. The Fund does not employ derivatives as a source of alpha generation, although it may use them to equitize excess cash. |
| Q | | Were there any changes to the Fund’s portfolio management team during the Reporting Period? |
| A | | Effective May 1, 2023, Saurabh Jain became a portfolio manager for the Fund, joining Alexis Deladerrière and Raj Garigipati. Mr. Deladerrière and Mr. Garigipati have been portfolio managers for the Fund since 2021. By design, the Fund is managed within a team structure. This has been a cornerstone of our approach and helps ensure continuity in the Fund. |
| Q | | What was the Fund’s sector positioning relative to the MSCI ACWI Index at the end of the Reporting Period?1 |
| | | | | | | | | | |
| | | |
| | | Sector Name | | Fund | | | MSCI ACWI Index | |
| | | |
| | Industrials | | | 34.82 | % | | | 10.45 | % |
| | Materials | | | 24.89 | | | | 4.48 | |
| | Information Technology | | | 16.61 | | | | 22.06 | |
| | Utilities | | | 12.50 | | | | 2.63 | |
| | Health Care | | | 3.68 | | | | 11.76 | |
| | Consumer Staples | | | 2.39 | | | | 7.15 | |
| | Consumer Discretionary | | | 1.90 | | | | 11.32 | |
| | Communication Services | | | 0.00 | | | | 7.51 | |
| | Energy | | | 0.00 | | | | 4.90 | |
| | Financials | | | 0.00 | | | | 15.42 | |
| | Real Estate | | | 0.00 | | | | 2.33 | |
| | | Cash | | | 3.22 | | | | 0.00 | |
| Q | | What was the Fund’s country positioning relative to the MSCI ACWI Index at the end of the Reporting Period?1 |
| | | | | | | | | | |
| | | |
| | | Country Name | | Fund | | | MSCI ACWI Index | |
| | | |
| | U.S. | | | 41.96 | % | | | 62.21 | % |
| | | |
| | Japan | | | 9.95 | | | | 5.49 | |
| | | |
| | Netherlands | | | 5.58 | | | | 1.06 | |
| | | |
| | Denmark | | | 4.48 | | | | 0.78 | |
| | | |
| | China | | | 4.48 | | | | 3.10 | |
| | | |
| | France | | | 4.33 | | | | 2.97 | |
| | | |
| | Italy | | | 4.23 | | | | 0.63 | |
| | | |
| | Switzerland | | | 4.13 | | | | 2.45 | |
| | | |
| | Spain | | | 3.99 | | | | 0.63 | |
| | | |
| | U.K. | | | 3.18 | | | | 3.53 | |
| | | |
| | Germany | | | 3.15 | | | | 2.06 | |
| | | |
| | Ireland | | | 2.67 | | | | 0.50 | |
| | | |
| | Taiwan | | | 2.05 | | | | 1.56 | |
| | | |
| | Belgium | | | 1.03 | | | | 0.23 | |
| | | |
| | Norway | | | 0.83 | | | | 0.16 | |
| | | |
| | Sweden | | | 0.70 | | | | 0.75 | |
| | | Australia | | | 0.05 | | | | 1.82 | |
| | 1 | | Country and sector classifications for securities may differ between the above listing and the Schedule of Investments due to differing classification methodologies. The classification methodology used for the above listing is as set forth by MSCI. The Fund’s composition may differ over time. Consequently, the Fund’s overall country and sector allocations may differ from percentages contained in the chart above. The percentage shown for each investment category reflects the value of investments in that category as a percentage of market value. Investments in the securities lending vehicle represented 0.80% of the Fund’s net assets as of August 31, 2023. Figures above may not sum to 100% due to rounding due to the presence of cash. |
14
FUND BASICS
Goldman Sachs Future Planet Equity ETF
as of August 31, 2023
| | | | | | |
| | FUND SNAPSHOT | | | | |
| | |
| | | As of August 31, 2023 | | | |
| | |
| | Market Price1 | | $ | 30.11 | |
| | | Net Asset Value (NAV)1 | | $ | 30.15 | |
| 1 | | The Market Price is the price at which the Fund’s shares are trading on the NYSE Arca, Inc. The Market Price of the Fund’s shares will fluctuate and, at the time of sale, shares may be worth more or less than the original investment or the Fund’s then current net asset value (“NAV”). The NAV is the market value of one share of the Fund. This amount is derived by dividing the total value of all the securities in the Fund’s portfolio, plus other assets, less any liabilities, by the number of Fund shares outstanding. Fund shares are not individually redeemable and are issued and redeemed by the Fund at their NAV only in large, specified blocks of shares called creation units. Shares otherwise can be bought and sold only through exchange trading at market price (not NAV). Shares may trade at a premium or discount to their NAV in the secondary market. Information regarding how often shares of the Fund traded on NYSE Arca at a price above (i.e., at a premium) or below (i.e., at a discount) the NAV of the Fund can be found at www.GSAMFUNDS.com/ETFs. |
| | | | | | | | | | |
| | TOP TEN HOLDINGS AS OF 8/31/232 |
| | | | |
| | | Holding | | % of Net Assets | | | Line of Business | | Country |
| | | | |
| | Enel SpA | | | 4.2 | % | | Utilities | | Italy |
| | Iberdrola SA | | | 4.0 | | | Utilities | | Spain |
| | DSM-Firmenich AG | | | 3.8 | | | Materials | | Switzerland |
| | Danaher Corp. | | | 3.7 | | | Health Care | | United States |
| | Contemporary Amperex Technology Co. Ltd., Class A | | | 3.4 | | | Industrials | | China |
| | Schneider Electric SE | | | 3.4 | | | Industrials | | United States |
| | Waste Management, Inc. | | | 3.4 | | | Industrials | | United States |
| | Ecolab, Inc. | | | 3.2 | | | Materials | | United States |
| | DS Smith PLC | | | 3.2 | | | Materials | | United Kingdom |
| | | Infineon Technologies AG | | | 3.2 | | | Information Technology | | Germany |
| 2 | | The top 10 holdings may not be representative of the Fund’s future investments. |
For more information about the Fund, please refer to www.GSAMFUNDS.com/ETFs. There, you can learn more about the Fund’s investment strategies, holdings, and performance.
15
GOLDMAN SACH FUTURE PLANET EQUITY ETF
Performance Summary
August 31, 2023
The following graph shows the value, as of August 31, 2023, of a $10,000 investment made on July 13, 2021 (commencement of operations) in Shares at NAV. For comparative purposes, the performance of the Fund’s benchmark, the MSCI ACWI Index, is shown. Performance reflects applicable fee waivers and/or expense limitations in effect during the periods shown and in their absence, performance would be reduced. Returns do not reflect the deduction of taxes that a shareholder would pay on Fund distributions or the sale of Fund shares. Certain factors may affect Fund performance including, but not limited to, Fund operating fees and expenses, portfolio turnover and creation and redemption in-kind transactions. The returns set forth below represent past performance. Past performance does not guarantee future results. The Fund’s NAV and investment return may fluctuate. These fluctuations may cause an investor’s shares to be worth more or less than their original cost. Current performance may be lower or higher than the performance quoted below. Please visit our web site at www.GSAMFUNDS.com/ETFs to obtain the most recent month-end returns.
| | |
| Goldman Sachs Future Planet Equity ETF’s Lifetime Performance | | |
Performance of a $10,000 Investment, with distributions reinvested, from July 13, 2021 through August 31, 2023.
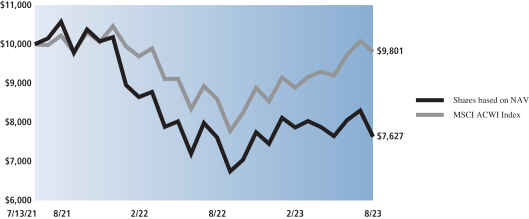
| | | | | | |
| Average Annual Total Return through August 31, 2023* | | | 1 Year Return | | | Since Inception |
Shares based on NAV (Commenced July 13, 2021) | | | 0.13% | | | -11.92% |
|
Shares based on Market Price (Commenced July 13, 2021) | | | 0.26% | | | -11.98% |
|
MSCI ACWI Index | | | 13.95% | | | -1.99% |
|
| * | | Total returns are calculated assuming purchase of a share at the market price or NAV on the first day and sale of a share at the market price or NAV on the last day of each period reported. The Total Returns based on NAV and Market Price assume the reinvestment of dividends and do not reflect brokerage commissions in connection with the purchase or sale of Fund shares, which if included would lower the performance shown above. The NAV used in the Total Return calculations assumes all management fees incurred by the Fund. Market Price returns are based upon the last trade at 4:00 pm EST and do not reflect the returns you would receive if you traded shares at other times. The first day of secondary market trading is typically several days after the date on which the Fund commenced investment operations; therefore, the NAV of the Fund is used as a proxy for the period from inception of investment operations to the first day of secondary market trading to calculate the Market Price returns. |
16
PORTFOLIO RESULTS
Goldman Sachs Future Real Estate and Infrastructure Equity ETF
Investment Objective
The Goldman Sachs Future Real Estate and Infrastructure Equity ETF (the “Fund”) seeks long-term growth of capital.
Portfolio Management Discussion and Analysis
Below, the Goldman Sachs Fundamental Equity Team discusses the Fund’s performance and positioning for the 12-month period ended August 31, 2023 (the “Reporting Period”).
| Q | | How did the Fund perform during the Reporting Period? |
| A | | During the Reporting Period, the Fund returned -3.77% based on net asset value (“NAV”) and -4.15% based on market price. The Fund’s benchmark, which is comprised 50% of FTSE Global Core Infrastructure 50/50 Index and 50% of FTSE EPRA Nareit Developed Index (the “Index”), returned -5.10% during the same period. |
| | The Fund had an NAV of $34.25 per share on August 31, 2022 and ended the Reporting Period with an NAV of $32.32 per share. The Fund’s market price on August 31, 2023 was $32.19 per share. |
| Q | | What key factors were responsible for the Fund’s performance during the Reporting Period? |
| A | | The Fund is an actively managed exchange-traded fund (“ETF”) that seeks long-term growth of capital by investing in companies that may be aligned, at the time a given investment is first added to the Fund’s portfolio, with the key themes associated with secular growth drivers for real estate and infrastructure assets, which include, but are not limited to, Technological Innovation, Environmental Sustainability, New Age Consumer and Future of Health Care (the “Key Themes”). Additionally, as part of its investment process, the Goldman Sachs Fundamental Equity Team divides these Key Themes into multiple sub-themes. |
| | During the Reporting Period, the Fund generated a negative absolute return, as real estate and infrastructure equities, which tend to be characterized by steady compounding growth, lagged the strong rally in growth-oriented, technology-focused stocks. |
| | On a relative basis, the Fund outperformed the Index during the Reporting Period, benefiting from its focus on sectors exposed to secular growth and its avoidance of sectors we consider to be on the wrong side of disruption. For example, the Fund was helped by its smaller allocation than the Index in retail and office real estate investment trusts (“REITs”), which generally posted negative returns during the Reporting Period, and by its selective exposure to health care real estate securities, which performed well overall. That said, at the sector level as a whole, the Fund benefited most during the Reporting Period from its allocation to utilities. The utilities sector outperformed the broader equity market during the Reporting Period, as many investors adopted defensive stances heading into 2023. Conversely, the Fund was hurt by its underweight position compared to the Index in hotel real estate securities, which gained on positive U.S. employment news, driven by an increase in nonfarm payrolls, led, in turn, by leisure, hospitality, professional and business services. |
| | Among Key Themes, New Age Consumer contributed most positively to the Fund’s relative returns during the Reporting Period, as young consumers, with different lifestyles and values from previous generations, fueled demand for experiences over things. The Fund’s three other Key Themes detracted from relative results. Tech Innovation was the weakest performing Key Theme during the Reporting Period, as central bank interest rate hikes put downward pressure on sectors with longer-duration assets, such as telecommunications towers. (Duration is a measure of interest rate sensitivity.) Among sub-themes, the Fund’s best performer was increased leisure time, while its most notable detractor was digitization. |
| | On the country level, an overweight exposure relative to the Index in France contributed most positively to the Fund’s relative returns. European utilities performed well amid relatively milder weather, which reduced energy demand and calmed fears about potential shortages. However, an underweight position in Japan weighed on the Fund’s performance, as Japanese stocks rose in line with global equities on expectations of the potential peaking of inflation in the U.S. and Europe, the slowing pace of central bank interest rate hikes and receding concerns about recession. Additionally, as Japan relaxed entry rules from China, inbound tourism saw a sharp recovery, with the number of foreign visitors reaching 60% of pre-COVID levels. |
17
PORTFOLIO RESULTS
| Q | | Which individual stock positions contributed most positively to the Fund’s relative returns during the Reporting Period? |
| A | | Relative to the Index, the Fund benefited most from overweight positions in VINCI, a French infrastructure and construction firm; ENGIE, a France-based power, gas and infrastructure company; and Veolia Environnement, a French environmental management services provider (2.00%, 1.54% and 1.56% of Fund net assets as of August 31, 2023, respectively). Each of these stocks generated a double-digit positive return within the Index during the Reporting Period. |
| Q | | Which individual stock positions detracted most from the Fund’s relative returns during the Reporting Period? |
| A | | Relative to the Index, the Fund’s overweight positions in American Tower, a REIT that owns and operates wireless communications and broadcast towers in the U.S.; SBA Communications, a U.S. provider of wireless communications infrastructure; and Eversource Energy, a U.S. utility company that provides electricity, natural gas and water services (3.70%, 2.50% and 1.72% of Fund net assets as of August 31, 2023, respectively) detracted most from relative performance. All three stocks recorded double-digit negative returns within the Index during the Reporting Period. |
| Q | | How did the Fund use derivatives and similar instruments during the Reporting Period? |
| A | During the Reporting Period, the Fund did not invest in derivatives or similar instruments. The Fund does not employ derivatives as a source of alpha generation, although it may use them to equitize excess cash. |
| Q | | Were there any changes to the Fund’s portfolio management team during the Reporting Period? |
| A | | There were no changes to the Fund’s portfolio management team during the Reporting Period. |
| Q | | What was the Fund’s sector positioning relative to the Index at the end of the Reporting Period?1 |
| | | | | | | | | | |
| | | |
| | | Sector Name | | Fund | | | Index | |
| | Real Estate | | | 53.35 | % | | | 52.88 | % |
| | Utilities | | | 24.79 | | | | 25.34 | |
| | Industrials | | | 13.56 | | | | 15.21 | |
| | Energy | | | 2.28 | | | | 5.45 | |
| | Communication Services | | | 2.16 | | | | 1.04 | |
| | Health Care | | | 1.51 | | | | 0.06 | |
| | Materials | | | 1.26 | | | | 0.00 | |
| | Financials | | | 0.00 | | | | 0.02 | |
| | Consumer Discretionary | | | 0.00 | | | | 0.00 | |
| | | Cash | | | 1.08 | | | | 0.00 | |
| Q | | What was the Fund’s country positioning relative to the Index at the end of the Reporting Period?1 |
| | | | | | | | | | |
| | | |
| | | Country Name | | Fund | | | Index | |
| | U.S. | | | 62.07 | % | | | 58.07 | % |
| | U.K. | | | 10.31 | | | | 3.59 | |
| | Australia | | | 5.81 | | | | 4.75 | |
| | France | | | 5.11 | | | | 1.18 | |
| | Spain | | | 3.97 | | | | 1.83 | |
| | Japan | | | 2.87 | | | | 6.59 | |
| | Italy | | | 2.33 | | | | 0.60 | |
| | Germany | | | 1.71 | | | | 1.10 | |
| | Canada | | | 1.51 | | | | 5.49 | |
| | Thailand | | | 1.28 | | | | 1.03 | |
| | Netherlands | | | 1.19 | | | | 0.29 | |
| | Denmark | | | 0.77 | | | | 0.00 | |
| | | Cash | | | 1.08 | | | | 0.00 | |
| | 1 | | Country and sector classifications for securities may differ between the above listing and the Schedule of Investments due to differing classification methodologies. The classification methodology used for the above listing is as set forth by FTSE Russell Group. The Fund’s composition may differ over time. Consequently, the Fund’s overall country and sector allocations may differ from percentages contained in the chart above. The percentage shown for each investment category reflects the value of investments in that category as a percentage of market value. Figures above may not sum to 100% due to rounding due to the presence of cash. |
18
FUND BASICS
Goldman Sachs Future Real Estate and Infrastructure Equity ETF
as of August 31, 2023
| | | | | | |
| | FUND SNAPSHOT | |
| |
| | | As of August 31, 2023 | |
| | |
| | Market Price1 | | $ | 32.19 | |
| | | Net Asset Value (NAV)1 | | $ | 32.32 | |
| 1 | | The Market Price is the price at which the Fund’s shares are trading on the NYSE Arca, Inc. The Market Price of the Fund’s shares will fluctuate and, at the time of sale, shares may be worth more or less than the original investment or the Fund’s then current net asset value (“NAV”). The NAV is the market value of one share of the Fund. This amount is derived by dividing the total value of all the securities in the Fund’s portfolio, plus other assets, less any liabilities, by the number of Fund shares outstanding. Fund shares are not individually redeemable and are issued and redeemed by the Fund at their NAV only in large, specified blocks of shares called creation units. Shares otherwise can be bought and sold only through exchange trading at market price (not NAV). Shares may trade at a premium or discount to their NAV in the secondary market. Information regarding how often shares of the Fund traded on NYSE Arca at a price above (i.e., at a premium) or below (i.e., at a discount) the NAV of the Fund can be found at www.GSAMFUNDS.com/ETFs. |
| | | | | | | | | | |
| | TOP TEN HOLDINGS AS OF 8/31/232 |
| | | | |
| | | Holding | | % of Net Assets | | | Line of Business | | Country |
| | Prologis, Inc. REIT | | | 5.6 | % | | Real Estate | | United States |
| | Transurban Group | | | 4.3 | | | Industrials | | Australia |
| | National Grid PLC | | | 4.1 | | | Utilities | | United Kingdom |
| | NextEra Energy, Inc. | | | 3.9 | | | Utilities | | United States |
| | Equinix, Inc. REIT | | | 3.7 | | | Real Estate | | United States |
| | American Tower Corp. REIT | | | 3.7 | | | Real Estate | | United States |
| | AvalonBay Communities, Inc. REIT | | | 2.8 | | | Real Estate | | United States |
| | Alexandria Real Estate Equities, Inc. REIT | | | 2.8 | | | Real Estate | | United States |
| | Welltower, Inc. REIT | | | 2.7 | | | Real Estate | | United States |
| | | Digital Realty Trust, Inc. REIT | | | 2.6 | | | Real Estate | | United States |
| 2 | | The top 10 holdings may not be representative of the Fund’s future investments. |
For more information about the Fund, please refer to www.GSAMFUNDS.com/ETFs. There, you can learn more about the Fund’s investment strategies, holdings, and performance.
19
GOLDMAN SACHS FUTURE REAL ESTATE AND INFRASTRUCTURE EQUITY ETF
Performance Summary
August 31, 2023
The following graph shows the value, as of August 31, 2023, of a $10,000 investment made on November 9, 2021 (commencement of operations) in Shares at NAV. For comparative purposes, the performance of the Fund’s benchmark, the 50% FTSE Global Core Infrastructure 50/50 Index and 50% FTSE EPRA Nareit Developed Index, is shown. Performance reflects applicable fee waivers and/or expense limitations in effect during the periods shown and in their absence, performance would be reduced. Returns do not reflect the deduction of taxes that a shareholder would pay on Fund distributions or the sale of Fund shares. Certain factors may affect Fund performance including, but not limited to, Fund operating fees and expenses, portfolio turnover and creation and redemption in-kind transactions. The returns set forth below represent past performance. Past performance does not guarantee future results. The Fund’s NAV and investment return may fluctuate. These fluctuations may cause an investor’s shares to be worth more or less than their original cost. Current performance may be lower or higher than the performance quoted below. Please visit our web site at www.GSAMFUNDS.com/ETFs to obtain the most recent month-end returns.
| | |
| Goldman Sachs Future Real Estate and Infrastructure Equity ETF’s Lifetime Performance | | |
Performance of a $10,000 Investment, with distributions reinvested, from November 9, 2021 through August 31, 2023.
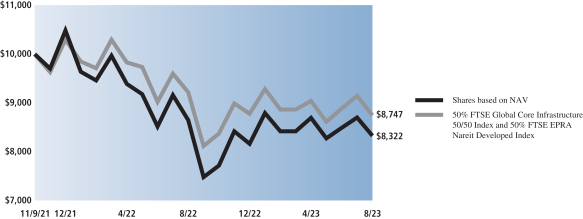
| | | | | | |
| Average Annual Total Return through August 31, 2023* | | | 1 Year Return | | | Since Inception |
Shares based on NAV (Commenced November 9, 2021) | | | -3.77% | | | -9.66% |
|
Shares based on Market Price (Commenced November 9, 2021) | | | -4.15% | | | -9.86% |
|
50% FTSE Global Core Infrastructure 50/50 Index and 50% FTSE EPRA Nareit Developed Index | | | -5.10% | | | -7.13% |
|
| * | | Total returns are calculated assuming purchase of a share at the market price or NAV on the first day and sale of a share at the market price or NAV on the last day of each period reported. The Total Returns based on NAV and Market Price assume the reinvestment of dividends and do not reflect brokerage commissions in connection with the purchase or sale of Fund shares, which if included would lower the performance shown above. The NAV used in the Total Return calculations assumes all management fees incurred by the Fund. Market Price returns are based upon the last trade at 4:00 pm EST and do not reflect the returns you would receive if you traded shares at other times. The first day of secondary market trading is typically several days after the date on which the Fund commenced investment operations; therefore, the NAV of the Fund is used as a proxy for the period from inception of investment operations to the first day of secondary market trading to calculate the Market Price returns. |
20
PORTFOLIO RESULTS
Goldman Sachs Future Tech Leaders Equity ETF
Investment Objective
The Goldman Sachs Future Tech Leaders Equity ETF (the “Fund”) seeks long-term growth of capital.
Portfolio Management Discussion and Analysis
Effective June 1, 2023, the Fund’s secondary benchmark changed from the custom MSCI ACWI Select Information Technology + Communication Services + Internet & Direct Marketing Retail (Excluding >$100B Market Capitalization) Index to the custom MSCI ACWI Select Information Technology + Communication Services (excluding >$100B Market Cap) Index. Below, the Goldman Sachs Fundamental Equity Team discusses the Fund’s performance and positioning for the 12-month period ended August 31, 2023 (the “Reporting Period”).
| Q | | How did the Fund perform during the Reporting Period? |
| A | | During the Reporting Period, the Fund returned 4.05% based on net asset value (“NAV”) and 4.09% based on market price. The Fund’s primary benchmark, the MSCI All Country World Index (Net, USD, Unhedged) (the “MSCI ACWI Index”), returned 13.95% during the same period. The Fund’s new secondary benchmark, which returned 10.12% during the Reporting Period, is comprised of those companies classified within the information technology sector and communication services sector within the MSCI ACWI Index and excludes companies with a market capitalization more than $100 billion. |
| | The Fund had an NAV of $24.12 per share on August 31, 2022 and ended the Reporting Period with an NAV of $25.09 per share. The Fund’s market price on August 31, 2023 was $25.06 per share. |
| Q | | What key factors were responsible for the Fund’s performance during the Reporting Period? |
| A | | The Fund is an actively managed exchange-traded fund (“ETF”) that seeks long-term growth of capital by investing in companies that, at the time a given investment is first added to the Fund’s portfolio, are driving technological innovation or benefiting from the enablement of technology and have the potential to grow their business over many years. |
| | During the Reporting Period, the Fund recorded a positive absolute return, as global information technology stocks |
| | advanced. The gains were driven primarily by rising investor enthusiasm around generative artificial intelligence (“AI”) as well as by resilient fundamentals and corporate earnings. Easing market concerns about interest rates provided an additional tailwind for the sector overall and for large-cap and mid-cap companies in particular. Investors continued to focus on identifying early winners among semiconductor companies and public cloud companies that offered technologies critical for the buildout of AI. (A public cloud company provides computing resources to users over the public internet.) Moreover, multiple compression during 2022 appeared to have created compelling investment opportunities across the information technology sector, though stock dispersion continued to be a factor. (Multiple compression is when a company’s multiples, such as the price/earnings ratio, is reduced due to increased earnings without an increase in stock price. Stock dispersion is a measure of how much a stock’s return differs from the market average; the higher the dispersion, the riskier the investment is considered.) |
| | On a relative basis, the Fund underperformed the MSCI ACWI Index during the Reporting Period. The underperformance can be attributed to persistent inflation, elevated interest rates, recessionary concerns and China’s weaker than market expected economic recovery. Overall, growth stocks tend to be sensitive to interest rate movements, and as interest rates rose during the Reporting Period, investors seemed to retreat from more growth-oriented sectors into more value- and defensive-oriented sectors. This trend was exacerbated by sticky inflation data that heightened investors’ recessionary concerns, further increasing the appeal of more defensive positioning. Additionally, investors may have been discouraged by the weak macroeconomic recovery in China following the reopening of that country’s economy. Lastly, large-cap equities broadly outperformed equities further down the market capitalization spectrum, which benefited market-cap weighted indices and contributed to the relative |
21
PORTFOLIO RESULTS
| | underperformance of the Fund, which focuses on small-cap and mid-cap equities. |
| | From a sector perspective, the Fund’s overweight compared to the MSCI ACWI Index in information technology hurt relative performance the most, with exposure to China a notable detractor. The Fund benefited from stock selection and an underweight position in the consumer discretionary sector. |
| | As for countries, stock selection in the U.S., along with an overweight position in China, detracted from the Fund’s relative returns during the Reporting Period. The Fund’s lack of exposure to large-cap and mega-cap U.S. stocks was the primary driver of its relative underperformance. On the positive side, the Fund was helped by stock selection in Taiwan and by an overweight allocation versus the MSCI ACWI Index to Argentina. |
| Q | | Which individual stock positions detracted most from the Fund’s relative returns during the Reporting Period? |
| A | | During the Reporting Period, the Fund was hindered by its exposure to U.S.-based BILL Holdings, a provider of software-as-a-service, cloud-based payments, and spending and expense management products; NVIDIA, a U.S. supplier of AI hardware and software; and Silergy, a China-headquartered semiconductor manufacturer (0.00%,1 0.00% and 0.86% of Fund net assets as of August 31, 2023, respectively.) All three stocks posted single-digit negative returns within the MSCI ACWI Index during the Reporting Period. |
| Q | | Which individual stock positions contributed most positively to the Fund’s relative returns during the Reporting Period? |
| A | | Compared to the Index, the Fund benefited most from its exposure to HubSpot, a U.S. provider of cloud-based marketing, sales and consumer services platforms; AppLovin, a creator of software platforms for mobile application developers to enhance the marketing and monetization of their applications; and MercadoLibre, an Argentina-based operator of online marketplaces dedicated to e-commerce and online auctions (2.76%, 2.11% and 2.57% of Fund net assets as of August 31, 2023, respectively). During the Reporting Period, HubSpot recorded a single-digit positive return with the MSCI ACWI Index. AppLovin and MercadoLibre each recorded a modest positive return within the MSCI ACWI Index during the Reporting Period. |
| Q | | How did the Fund use derivatives and similar instruments during the Reporting Period? |
| A | | During the Reporting Period, the Fund did not invest in derivatives or similar instruments. The Fund does not employ derivatives as a source of alpha generation, although it may use them to equitize excess cash. |
| Q | | Were there any changes to the Fund’s portfolio management team during the Reporting Period? |
| A | | There were no changes to the Fund’s portfolio management team during the Reporting Period. |
| Q | | What was the Fund’s sector positioning relative to the MSCI ACWI Index at the end of the Reporting Period?2 |
| | | | | | | | | | |
| | | |
| | | Sector Name | | Fund | | | MSCI ACWI
Index | |
| | | |
| | Information Technology | | | 71.14 | % | | | 22.06 | % |
| | Communication Services | | | 12.34 | | | | 7.51 | |
| | Consumer Discretionary | | | 5.41 | | | | 11.32 | |
| | Financials | | | 3.81 | | | | 15.42 | |
| | Industrials | | | 3.46 | | | | 10.45 | |
| | Real Estate | | | 1.43 | | | | 2.33 | |
| | Health Care | | | 1.02 | | | | 11.76 | |
| | Consumer Staples | | | 0.00 | | | | 7.15 | |
| | Energy | | | 0.00 | | | | 4.90 | |
| | Materials | | | 0.00 | | | | 4.48 | |
| | Utilities | | | 0.00 | | | | 2.63 | |
| | | Cash | | | 1.39 | | | | 0.00 | |
| | 1 | | Some weights are 0.00% at August 31, 2023 either because those positions were eliminated during the most recent rebalance given the Index construction methodology or were not held at all during the Reporting Period as they did not meet the Fund’s investment criteria. |
22
PORTFOLIO RESULTS
| Q | | What was the Fund’s country positioning relative to the MSCI AWCI Index at the end of the Reporting Period?2 |
| | | | | | | | | | |
| | | |
| | | Country Name | | Fund | | | MSCI ACWI
Index | |
| | U.S. | | | 61.10 | % | | | 62.21 | % |
| | Taiwan | | | 9.81 | | | | 1.56 | |
| | China | | | 9.62 | | | | 3.10 | |
| | Japan | | | 6.68 | | | | 5.49 | |
| | Argentina | | | 2.57 | | | | 0.10 | |
| | Netherlands | | | 2.47 | | | | 1.06 | |
| | Spain | | | 1.70 | | | | 0.63 | |
| | Germany | | | 1.47 | | | | 2.06 | |
| | South Korea | | | 1.39 | | | | 1.27 | |
| | Australia | | | 1.20 | | | | 1.82 | |
| | Singapore | | | 0.58 | | | | 0.34 | |
| | Austria | | | 0.00 | | | | 0.04 | |
| | Belgium | | | 0.00 | | | | 0.23 | |
| | Brazil | | | 0.00 | | | | 0.55 | |
| | Canada | | | 0.00 | | | | 2.82 | |
| | Chile | | | 0.00 | | | | 0.05 | |
| | Colombia | | | 0.00 | | | | 0.01 | |
| | Czech Republic | | | 0.00 | | | | 0.02 | |
| | Denmark | | | 0.00 | | | | 0.78 | |
| | Egypt | | | 0.00 | | | | 0.01 | |
| | Finland | | | 0.00 | | | | 0.21 | |
| | France | | | 0.00 | | | | 2.97 | |
| | Greece | | | 0.00 | | | | 0.05 | |
| | Hong Kong | | | 0.00 | | | | 0.57 | |
| | Hungary | | | 0.00 | | | | 0.03 | |
| | India | | | 0.00 | | | | 1.54 | |
| | Indonesia | | | 0.00 | | | | 0.21 | |
| | Ireland | | | 0.00 | | | | 0.50 | |
| | Israel | | | 0.00 | | | | 0.16 | |
| | Italy | | | 0.00 | | | | 0.63 | |
| | Kuwait | | | 0.00 | | | | 0.09 | |
| | Malaysia | | | 0.00 | | | | 0.15 | |
| | Mexico | | | 0.00 | | | | 0.29 | |
| | New Zealand | | | 0.00 | | | | 0.05 | |
| | Norway | | | 0.00 | | | | 0.16 | |
| | Peru | | | 0.00 | | | | 0.03 | |
| | Philippines | | | 0.00 | | | | 0.06 | |
| | Poland | | | 0.00 | | | | 0.09 | |
| | Portugal | | | 0.00 | | | | 0.05 | |
| | Qatar | | | 0.00 | | | | 0.09 | |
| | Saudi Arabia | | | 0.00 | | | | 0.44 | |
| | South Africa | | | 0.00 | | | | 0.33 | |
| | Sweden | | | 0.00 | | | | 0.75 | |
| | Switzerland | | | 0.00 | | | | 2.45 | |
| | Thailand | | | 0.00 | | | | 0.21 | |
| | Turkey | | | 0.00 | | | | 0.07 | |
| | United Arab Emirates | | | 0.00 | | | | 0.14 | |
| | | U.K. | | | 0.00 | | | | 3.53 | |
| | 2 | | Country and sector classifications for securities may differ between the above listing and the Schedule of Investments due to differing classification methodologies. The classification methodology used for the above listing is as set forth by MSCI. The Fund’s composition may differ over time. Consequently, the Fund’s overall country and sector allocations may differ from percentages contained in the chart above. The percentage shown for each investment category reflects the value of investments in that category as a percentage of market value. Investments in the securities lending vehicle represented 0.00% of the Fund’s net assets as of August 31, 2023. Figures above may not sum to 100% due to rounding due to the presence of cash. |
23
FUND BASICS
Goldman Sachs Future Tech Leaders Equity ETF
as of August 31, 2023
| | | | | | |
| | FUND SNAPSHOT | |
| | |
| | | As of August 31, 2023 | | | |
| | |
| | Market Price1 | | $ | 25.06 | |
| | | Net Asset Value (NAV)1 | | $ | 25.09 | |
| 1 | | The Market Price is the price at which the Fund’s shares are trading on the NYSE Arca, Inc. The Market Price of the Fund’s shares will fluctuate and, at the time of sale, shares may be worth more or less than the original investment or the Fund’s then current net asset value (“NAV”). The NAV is the market value of one share of the Fund. This amount is derived by dividing the total value of all the securities in the Fund’s portfolio, plus other assets, less any liabilities, by the number of Fund shares outstanding. Fund shares are not individually redeemable and are issued and redeemed by the Fund at their NAV only in large, specified blocks of shares called creation units. Shares otherwise can be bought and sold only through exchange trading at market price (not NAV). Shares may trade at a premium or discount to their NAV in the secondary market. Information regarding how often shares of the Fund traded on NYSE Arca at a price above (i.e., at a premium) or below (i.e., at a discount) the NAV of the Fund can be found at www.GSAMFUNDS.com/ETFs. |
| | | | | | | | | | |
| | TOP TEN HOLDINGS AS OF 8/31/232 | | | | | |
| | | | |
| | | Holding | | % of Net Assets | | | Line of Business | | Country |
| | | | |
| | Workday, Inc., Class A | | | 3.3 | % | | Information Technology | | United States |
| | KLA Corp. | | | 3.1 | | | Information Technology | | United States |
| | Marvell Technology, Inc. | | | 3.0 | | | Information Technology | | United States |
| | Motorola Solutions, Inc. | | | 2.8 | | | Information Technology | | United States |
| | HubSpot, Inc. | | | 2.8 | | | Information Technology | | United States |
| | Datadog, Inc., Class A | | | 2.6 | | | Information Technology | | United States |
| | MercadoLibre, Inc. | | | 2.6 | | | Consumer Discretionary | | Brazil |
| | NetEase, Inc. | | | 2.4 | | | Communication Services | | China |
| | United Microelectronics Corp. | | | 2.3 | | | Information Technology | | Taiwan |
| | | Dynatrace, Inc. | | | 2.3 | | | Information Technology | | United States |
| 2 | | The top 10 holdings may not be representative of the Fund’s future investments. |
For more information about the Fund, please refer to www.GSAMFUNDS.com/ETFs. There, you can learn more about the Fund’s investment strategies, holdings, and performance.
24
GOLDMAN SACHS FUTURE TECH LEADERS EQUITY ETF
Performance Summary
August 31, 2023
The following graph shows the value, as of August 31, 2023, of a $10,000 investment made on September 14, 2021 (commencement of operations) in Shares at NAV. For comparative purposes, the performance of the Fund’s benchmark, the MSCI ACWI Index, and the Fund’s secondary custom benchmark, MSCI ACWI Select Information Technology + Communication Services (excluding >$100B Market Cap) Index, are shown. Performance reflects applicable fee waivers and/or expense limitations in effect during the periods shown and in their absence, performance would be reduced. Returns do not reflect the deduction of taxes that a shareholder would pay on Fund distributions or the sale of Fund shares. Certain factors may affect Fund performance including, but not limited to, Fund operating fees and expenses, portfolio turnover and creation and redemption in-kind transactions. The returns set forth below represent past performance. Past performance does not guarantee future results. The Fund’s NAV and investment return may fluctuate. These fluctuations may cause an investor’s shares to be worth more or less than their original cost. Current performance may be lower or higher than the performance quoted below. Please visit our web site at www.GSAMFUNDS.com/ETFs to obtain the most recent month-end returns.
| | |
| Goldman Sachs Future Tech Leaders Equity ETF’s Lifetime Performance | | |
Performance of a $10,000 Investment, with distributions reinvested, from September 14, 2021 through August 31, 2023.
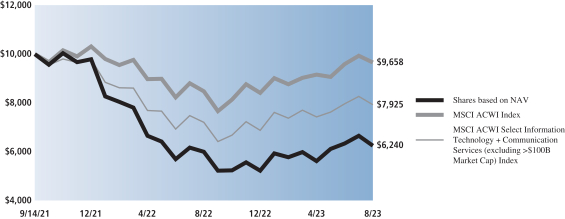
| | | | | | |
| Average Annual Total Return through August 31, 2023* | | | 1 Year Return | | | Since Inception |
Shares based on NAV (Commenced September 14, 2021) | | | 4.05% | | | -21.37% |
|
Shares based on Market Price (Commenced September 14, 2021) | | | 4.09% | | | -21.42% |
|
MSCI ACWI Index | | | 13.95% | | | -1.76% |
|
MSCI ACWI Select Information Technology + Communication Services (excluding >$100B Market Cap) Index | | | 10.12% | | | -11.18% |
|
| * | | Total returns are calculated assuming purchase of a share at the market price or NAV on the first day and sale of a share at the market price or NAV on the last day of each period reported. The Total Returns based on NAV and Market Price assume the reinvestment of dividends and do not reflect brokerage commissions in connection with the purchase or sale of Fund shares, which if included would lower the performance shown above. The NAV used in the Total Return calculation assumes all management fees incurred by the Fund. Market Price returns are based upon the last trade at 4:00 pm EST and do not reflect the returns you would receive if you traded shares at other times. The first day of secondary market trading is typically several days after the date on which the Fund commenced investment operations; therefore, the NAV of the Fund is used as a proxy for the period from inception of investment operations to the first day of secondary market trading to calculate the Market Price returns. |
25
FUND BASICS
Index Definitions and Industry Terms
Alpha: The excess returns of a fund relative to the return of a benchmark index is the fund’s alpha.
Goldman Sachs Future Consumer Equity ETF
MSCI ACWI Growth Index captures large and mid cap securities exhibiting overall growth style characteristics across 23 developed markets and 24 emerging markets countries.
Goldman Sachs Future Health Care ETF
MSCI ACWI Health Care Index includes large and mid cap securities across 23 developed markets and 24 emerging markets countries.
Goldman Sachs Future Planet Equity ETF
MSCI ACWI Index captures large, mid and small cap representation across 23 developed markets and 24 emerging markets countries.
Goldman Sachs Future Real Estate and Infrastructure Equity ETF
50% FTSE Global Core Infrastructure 50/50 Index give participants an industry-defined interpretation of infrastructure and adjust the exposure to certain infrastructure sub-sectors.
50% FTSE EPRA Nareit Developed Index is designed to represent general trends in eligible real estate equities worldwide.
Goldman Sachs Future Tech Leaders Equity ETF
MSCI ACWI Index captures large, mid and small cap representation across 23 developed markets and 24 emerging markets countries.
MSCI ACWI Select Information Technology + Communication Services (excluding >$100B Market Cap) Index is comprised of those companies classified within the Information Technology sector and Communication Services sector within the MSCI ACWI Index and excludes companies with a market capitalization over $100 billion.
26
GOLDMAN SACHS FUTURE CONSUMER EQUITY ETF
Schedule of Investments
August 31, 2023
| | | | | | | | |
| Shares | | | Description | |
Value | |
|
| Common Stocks – 99.4% | |
| Communication Services – 30.4% | |
| | 80,378 | | | Alphabet, Inc., Class C* | | $ | 11,039,918 | |
| | 82,112 | | | Bumble, Inc., Class A* | | | 1,377,839 | |
| | 47,131 | | | CTS Eventim AG & Co. KGaA (Germany) | | | 2,941,335 | |
| | 25,726 | | | Electronic Arts, Inc. | | | 3,086,606 | |
| | 44,783 | | | Live Nation Entertainment, Inc.* | | | 3,785,507 | |
| | 26,942 | | | Meta Platforms, Inc., Class A* | | | 7,971,868 | |
| | 9,758 | | | NAVER Corp. (South Korea) | | | 1,583,576 | |
| | 110,160 | | | NetEase, Inc. (China) | | | 2,301,044 | |
| | 20,063 | | | Sea Ltd. ADR (Singapore)* | | | 754,971 | |
| | 63,143 | | | Snap, Inc., Class A* | | | 653,530 | |
| | 98,247 | | | Tencent Holdings Ltd. (China) | | | 4,071,830 | |
| | 32,633 | | | T-Mobile US, Inc.* | | | 4,446,246 | |
| | 41,678 | | | Walt Disney Co. (The)* | | | 3,487,615 | |
| | | | | | | | |
| | | | | | | 47,501,885 | |
| | |
| Consumer Discretionary – 26.6% | |
| | 87,256 | | | Amazon.com, Inc.* | | | 12,042,201 | |
| | 23,781 | | | Basic-Fit NV (Netherlands)*(a) | | | 726,830 | |
| | 10,415 | | | Etsy, Inc.* | | | 766,231 | |
| | 158,716 | | | Farfetch Ltd., Class A (United Kingdom)*(b) | | | 452,341 | |
| | 44,629 | | | Foot Locker, Inc. | | | 875,621 | |
| | 5,929 | | | LVMH Moet Hennessy Louis Vuitton SE (France) | | | 5,033,490 | |
| | 201,194 | | | Meituan, Class B (China)*(a) | | | 3,296,895 | |
| | 2,028 | | | MercadoLibre, Inc. (Brazil)* | | | 2,783,146 | |
| | 56,961 | | | Moncler SpA (Italy) | | | 3,872,570 | |
| | 44,026 | | | NIKE, Inc., Class B | | | 4,477,884 | |
| | 660,939 | | | Samsonite International SA*(a) | | | 2,212,472 | |
| | 241,626 | | | Shenzhou International Group Holdings Ltd. (China) | | | 2,480,428 | |
| | 5,901 | | | Ulta Beauty, Inc.* | | | 2,449,092 | |
| | | | | | | | |
| | | | | | | 41,469,201 | |
| | |
| Consumer Staples – 5.5% | |
| | 866,367 | | | Budweiser Brewing Co. APAC Ltd. (China)(a) | | | 1,878,183 | |
| | 372,560 | | | Davide Campari-Milano NV (Italy) | | | 4,880,602 | |
| | 6,735 | | | Oddity Tech Ltd., Class A (Israel)*(b) | | | 280,109 | |
| | 103,068 | | | Proya Cosmetics Co. Ltd., Class A (China) | | | 1,582,448 | |
| | | | | | | | |
| | | | | | | 8,621,342 | |
| | |
| Financials – 5.9% | |
| | 1,553 | | | Adyen NV (Netherlands)*(a) | | | 1,302,087 | |
| | 19,140 | | | Mastercard, Inc., Class A | | | 7,897,929 | |
| | | | | | | | |
| | | | | | | 9,200,016 | |
| | |
| Health Care – 1.3% | |
| | 12,526 | | | Illumina, Inc.* | | | 2,069,546 | |
| | |
| Industrials – 2.5% | |
| | 113,138 | | | Experian PLC | | | 3,959,684 | |
| | |
|
| Common Stocks – (continued) | |
| Information Technology – 14.2% | |
| | 19,643 | | | Apple, Inc. | | | 3,690,330 | |
| | 745,725 | | | Locaweb Servicos de Internet SA (Brazil)(a) | | | 1,064,902 | |
| | 58,835 | | | MediaTek, Inc. (Taiwan) | | | 1,302,456 | |
| | 19,322 | | | NVIDIA Corp. | | | 9,536,373 | |
| | 384,742 | | | Taiwan Semiconductor Manufacturing Co. Ltd. (Taiwan) | | | 6,632,546 | |
| | | | | | | | |
| | | | | | | 22,226,607 | |
| | |
| Materials – 4.5% | |
| | 63,658 | | | Ball Corp. | | | 3,466,178 | |
| | 38,252 | | | DSM-Firmenich AG (Switzerland) | | | 3,535,157 | |
| | | | | | | | |
| | | | | | | 7,001,335 | |
| | |
| Real Estate – 3.0% | |
| | 25,964 | | | American Tower Corp. REIT | | | 4,707,792 | |
| | |
| Utilities – 5.5% | |
| | 184,890 | | | EDP Renovaveis SA (Spain) | | | 3,392,333 | |
| | 76,521 | | | NextEra Energy, Inc. | | | 5,111,603 | |
| | | | | | | | |
| | | | | | | 8,503,936 | |
| | |
| | TOTAL COMMON STOCKS | | | | |
| | (Cost $161,557,638) | | $ | 155,261,344 | |
| | |
| TOTAL INVESTMENTS BEFORE SECURITIES LENDING
REINVESTMENT VEHICLE |
|
| | (Cost $161,557,638) | | $ | 155,261,344 | |
| | |
| | | | | | | | |
| Shares | | Dividend Rate | | | Value | |
|
| Securities Lending Reinvestment Vehicle – 0.5%(c) | |
Goldman Sachs Financial Square Government Fund – Institutional Shares | |
| 747,637 | | | 5.234 | % | | $ | 747,637 | |
| (Cost $747,637) | | | | | |
| |
| TOTAL INVESTMENTS – 99.9% | |
| (Cost $162,305,275) | | | $ | 156,008,981 | |
| |
OTHER ASSETS IN EXCESS OF
LIABILITIES – 0.1% | | | | 199,549 | |
| |
| NET ASSETS – 100.0% | | | $ | 156,208,530 | |
| |
| | |
| The accompanying notes are an integral part of these financial statements. | | 27 |
GOLDMAN SACHS FUTURE CONSUMER EQUITY ETF
Schedule of Investments (continued)
August 31, 2023
| | |
|
| The percentage shown for each investment category reflects the value of investments in that category as a percentage of net assets. |
| |
* | | Non-income producing security. |
| |
(a) | | Exempt from registration under Rule 144A of the Securities Act of 1933. |
| |
(b) | | All or a portion of security is on loan. |
| |
(c) | | Represents an affiliated issuer. |
| | |
|
Investment Abbreviations: |
ADR | | —American Depositary Receipt |
PLC | | —Public Limited Company |
REIT | | —Real Estate Investment Trust |
|
| | |
| 28 | | The accompanying notes are an integral part of these financial statements. |
GOLDMAN SACHS FUTURE HEALTH CARE EQUITY ETF
Schedule of Investments
August 31, 2023
| | | | | | | | |
Shares | | | Description | | Value | |
|
| Common Stocks – 98.3% | |
| Denmark – 1.7% | |
| | 51,327 | | | Genmab A/S ADR (Health Care)* | | $ | 1,965,311 | |
| | |
| France – 0.6% | |
| | 2,411 | | | Sartorius Stedim Biotech (Health Care) | | | 685,858 | |
| | |
| Italy – 1.1% | |
| | 37,056 | | | Stevanato Group SpA (Health Care) | | | 1,187,274 | |
| | |
| Japan – 6.0% | |
| | 115,978 | | | Chugai Pharmaceutical Co. Ltd. (Health Care) | | | 3,550,599 | |
| | 18,565 | | | Hoya Corp. (Health Care) | | | 2,060,086 | |
| | 60,307 | | | Kyowa Kirin Co. Ltd. (Health Care) | | | 1,106,225 | |
| | | | | | | | |
| | | | | | | 6,716,910 | |
| | |
| Netherlands – 1.0% | |
| | 2,227 | | | Argenx SE ADR (Health Care)* | | | 1,119,045 | |
| | |
| Switzerland – 0.8% | |
| | 1,625 | | | Lonza Group AG (Health Care) | | | 899,477 | |
| | |
| United Kingdom – 5.3% | |
| | 41,396 | | | AstraZeneca PLC (Health Care) | | | 5,592,750 | |
| | 108,317 | | | Oxford Nanopore Technologies PLC (Health Care)* | | | 326,664 | |
| | | | | | | | |
| | | | | | | 5,919,414 | |
| | |
| United States – 81.8% | |
| | 87,574 | | | 2seventy bio, Inc. (Health Care)* | | | 454,509 | |
| | 6,932 | | | Agilent Technologies, Inc. (Health Care) | | | 839,257 | |
| | 15,965 | | | Alexandria Real Estate Equities, Inc. REIT (Real Estate) | | | 1,857,368 | |
| | 4,597 | | | Align Technology, Inc. (Health Care)* | | | 1,701,534 | |
| | 8,456 | | | Alnylam Pharmaceuticals, Inc. (Health Care)* | | | 1,672,766 | |
| | 10,722 | | | Axonics, Inc. (Health Care)* | | | 614,371 | |
| | 13,043 | | | Beam Therapeutics, Inc. (Health Care)* | | | 302,337 | |
| | 14,487 | | | Biogen, Inc. (Health Care)* | | | 3,873,244 | |
| | 35,133 | | | BioMarin Pharmaceutical, Inc. (Health Care)* | | | 3,210,453 | |
| | 113,839 | | | Boston Scientific Corp. (Health Care)* | | | 6,140,476 | |
| | 52,004 | | | Bristol-Myers Squibb Co. (Health Care) | | | 3,206,047 | |
| | 8,216 | | | Cooper Cos., Inc. (The) (Health Care) | | | 3,039,838 | |
| | 18,054 | | | CSL Ltd. (Health Care) | | | 3,198,298 | |
| | 6,358 | | | Cytokinetics, Inc. (Health Care)* | | | 222,148 | |
| | 9,119 | | | Danaher Corp. (Health Care) | | | 2,416,535 | |
| | 32,623 | | | Dexcom, Inc. (Health Care)* | | | 3,294,271 | |
| | 25,867 | | | Edwards Lifesciences Corp. (Health Care)* | | | 1,978,049 | |
| | 15,872 | | | Eli Lilly & Co. (Health Care) | | | 8,796,262 | |
| | 25,262 | | | Exact Sciences Corp. (Health Care)* | | | 2,113,672 | |
| | 42,258 | | | Gilead Sciences, Inc. (Health Care) | | | 3,231,892 | |
| | 34,086 | | | Halozyme Therapeutics, Inc. (Health Care)* | | | 1,450,700 | |
| | 3,250 | | | IDEXX Laboratories, Inc. (Health Care)* | | | 1,662,082 | |
| | 12,760 | | | Illumina, Inc. (Health Care)* | | | 2,108,207 | |
| | 13,599 | | | Insulet Corp. (Health Care)* | | | 2,607,064 | |
| | |
|
| Common Stocks – (continued) | |
| United States – (continued) | |
| | 18,051 | | | Intuitive Surgical, Inc. (Health Care)* | | $ | 5,644,187 | |
| | 3,852 | | | iRhythm Technologies, Inc. (Health Care)* | | | 398,181 | |
| | 2,088 | | | Mettler-Toledo International, Inc. (Health Care)* | | | 2,533,746 | |
| | 7,676 | | | MoonLake Immunotherapeutics (Health Care)* | | | 441,907 | |
| | 26,683 | | | Neurocrine Biosciences, Inc. (Health Care)* | | | 2,905,512 | |
| | 13,599 | | | Novanta, Inc. (Information Technology)* | | | 2,270,761 | |
| | 13,366 | | | Sarepta Therapeutics, Inc. (Health Care)* | | | 1,617,420 | |
| | 16,334 | | | Seagen, Inc. (Health Care)* | | | 3,365,947 | |
| | 3,251 | | | Shockwave Medical, Inc. (Health Care)* | | | 716,488 | |
| | 15,916 | | | Ultragenyx Pharmaceutical, Inc. (Health Care)* | | | 585,550 | |
| | 12,388 | | | Veeva Systems, Inc., Class A (Health Care)* | | | 2,585,376 | |
| | 6,825 | | | West Pharmaceutical Services, Inc. (Health Care) | | | 2,777,092 | |
| | 24,799 | | | Zimmer Biomet Holdings, Inc. (Health Care) | | | 2,954,057 | |
| | 13,968 | | | Zoetis, Inc. (Health Care) | | | 2,661,044 | |
| | | | | | | | |
| | | | | | | 91,448,648 | |
| | |
| | TOTAL INVESTMENTS – 98.3% | |
| | (Cost $109,924,337) | | $ | 109,941,937 | |
| | |
| OTHER ASSETS IN EXCESS OF
LIABILITIES – 1.7% | | | 1,898,708 | |
| | |
| | NET ASSETS – 100.0% | | $ | 111,840,645 | |
| | |
| | |
|
| The percentage shown for each investment category reflects the value of investments in that category as a percentage of net assets. |
| |
* | | Non-income producing security. |
| | |
|
Investment Abbreviations: |
ADR | | —American Depositary Receipt |
PLC | | —Public Limited Company |
REIT | | —Real Estate Investment Trust |
|
The below table represents the sector breakdown of investments as a percentage of total market value of the Fund.
| | | | |
| Sector Name | | % of Market
Value | |
| |
Health Care | | | 96.2 | % |
Information Technology | | | 2.1 | |
Real Estate | | | 1.7 | |
| |
| |
| TOTAL INVESTMENTS | | | 100.0 | % |
| |
| | |
| The accompanying notes are an integral part of these financial statements. | | 29 |
GOLDMAN SACHS FUTURE PLANET EQUITY ETF
Schedule of Investments
August 31, 2023
| | | | | | | | |
| Shares | | |
Description | | Value | |
|
| Common Stocks – 96.6% | |
| Australia – 0.0% | |
| | 590,949 | | | Carbon Revolution Ltd. (Consumer Discretionary)* | | $ | 65,064 | |
| | |
| Belgium – 1.0% | |
| | 55,405 | | | Umicore SA (Materials) | | | 1,471,475 | |
| | |
| China – 4.5% | |
| | 149,788 | | | Contemporary Amperex Technology Co. Ltd., Class A (Industrials) | | | 4,868,084 | |
| | 1,803,246 | | | Xinyi Solar Holdings Ltd. (Information Technology) | | | 1,506,202 | |
| | | | | | | | |
| | | | | | | 6,374,286 | |
| | |
| Denmark – 4.5% | |
| | 39,008 | | | Chr Hansen Holding A/S (Materials) | | | 2,552,836 | |
| | 50,642 | | | Novozymes A/S, Class B (Materials) | | | 2,201,361 | |
| | 25,045 | | | Orsted AS (Utilities)(a) | | | 1,613,877 | |
| | | | | | | | |
| | | | | | | 6,368,074 | |
| | |
| France – 1.0% | |
| | 40,181 | | | Imerys SA (Materials) | | | 1,371,985 | |
| | |
| Germany – 3.1% | |
| | 125,075 | | | Infineon Technologies AG (Information Technology) | | | 4,481,793 | |
| | |
| Ireland – 2.7% | |
| | 44,740 | | | Kingspan Group PLC (Industrials) | | | 3,791,453 | |
| | |
| Italy – 4.2% | |
| | 893,357 | | | Enel SpA (Utilities) | | | 6,021,249 | |
| | |
| Japan – 9.9% | |
| | 21,953 | | | Daikin Industries Ltd. (Industrials) | | | 3,803,719 | |
| | 51,175 | | | Horiba Ltd. (Information Technology) | | | 2,665,171 | |
| | 7,306 | | | Keyence Corp. (Information Technology) | | | 3,037,120 | |
| | 73,110 | | | Kurita Water Industries Ltd. (Industrials) | | | 2,853,894 | |
| | 34,111 | | | NIDEC Corp. (Industrials) | | | 1,788,200 | |
| | | | | | | | |
| | | | | | | 14,148,104 | |
| | |
| Netherlands – 1.8% | |
| | 62,169 | | | Aalberts NV (Industrials) | | | 2,591,720 | |
| | |
| Norway – 0.8% | |
| | 975,479 | | | Aker Carbon Capture ASA (Industrials)* | | | 1,129,804 | |
| | 146,428 | | | Circa Group AS (Materials)* | | | 55,063 | |
| | | | | | | | |
| | | | | | | 1,184,867 | |
| | |
| Spain – 4.0% | |
| | 477,155 | | | Iberdrola SA (Utilities) | | | 5,675,968 | |
| | |
| Sweden – 0.4% | |
| | 62,049 | | | Re:NewCell AB (Materials)*(b) | | | 524,163 | |
| | |
| Switzerland – 7.9% | |
| | 77,980 | | | ABB Ltd. (Industrials) | | | 2,974,408 | |
| | 57,867 | | | DSM-Firmenich AG (Materials) | | | 5,347,928 | |
| | |
|
| Common Stocks – (continued) | |
| Switzerland – (continued) | |
| | 10,213 | | | Sika AG (Materials) | | | 2,895,370 | |
| | | | | | | | |
| | | | | | | 11,217,706 | |
| | |
| Taiwan – 2.0% | |
| | 268,299 | | | Delta Electronics, Inc. (Information Technology) | | | 2,914,966 | |
| | |
| United Kingdom – 3.2% | |
| | 1,141,063 | | | DS Smith PLC (Materials) | | | 4,515,543 | |
| | |
| United States – 45.6% | |
| | 9,537 | | | Albemarle Corp. (Materials) | | | 1,895,097 | |
| | 25,970 | | | Aptiv PLC (Consumer Discretionary)* | | | 2,634,657 | |
| | 76,300 | | | Ball Corp. (Materials) | | | 4,154,535 | |
| | 140,905 | | | Bloom Energy Corp., Class A (Industrials)* | | | 2,112,166 | |
| | 19,730 | | | Danaher Corp. (Health Care) | | | 5,228,450 | |
| | 53,300 | | | Danimer Scientific, Inc. (Materials)*(b) | | | 103,935 | |
| | 47,437 | | | Darling Ingredients, Inc. (Consumer Staples)* | | | 2,929,709 | |
| | 46,642 | | | DocuSign, Inc. (Information Technology)* | | | 2,346,093 | |
| | 24,899 | | | Ecolab, Inc. (Materials) | | | 4,576,685 | |
| | 54,446 | | | Energy Recovery, Inc. (Industrials)* | | | 1,479,842 | |
| | 39,061 | | | Itron, Inc. (Information Technology)* | | | 2,672,163 | |
| | 66,844 | | | NextEra Energy, Inc. (Utilities) | | | 4,465,179 | |
| | 107,862 | | | Nuvve Holding Corp. (Industrials)* | | | 52,745 | |
| | 377,706 | | | Oatly Group AB ADR (Consumer Staples)*(b) | | | 464,578 | |
| | 27,845 | | | Schneider Electric SE (Industrials) | | | 4,792,538 | |
| | 128,687 | | | Shoals Technologies Group, Inc., Class A (Industrials)* | | | 2,532,560 | |
| | 17,345 | | | SolarEdge Technologies, Inc. (Information Technology)* | | | 2,819,777 | |
| | 15,864 | | | Trane Technologies PLC (Industrials) | | | 3,256,245 | |
| | 19,926 | | | Waste Connections, Inc. (Industrials) | | | 2,729,663 | |
| | 30,413 | | | Waste Management, Inc. (Industrials) | | | 4,768,150 | |
| | 114,135 | | | Westrock Co. (Materials) | | | 3,733,356 | |
| | 24,681 | | | Wolfspeed, Inc. (Information Technology)* | | | 1,180,245 | |
| | 38,643 | | | Xylem, Inc. (Industrials) | | | 4,001,096 | |
| | | | | | | | |
| | | | | | | 64,929,464 | |
| | |
| TOTAL INVESTMENTS BEFORE SECURITIES LENDING
REINVESTMENT VEHICLE |
|
| | (Cost $171,789,377) | | $ | 137,647,880 | |
| | |
| | |
| 30 | | The accompanying notes are an integral part of these financial statements. |
GOLDMAN SACHS FUTURE PLANET EQUITY ETF
| | | | | | | | |
| Shares | | Dividend
Rate | | | Value | |
|
| Securities Lending Reinvestment Vehicle – 0.8%(c) | |
Goldman Sachs Financial Square Government Fund – Institutional Shares | |
| 1,110,381 | | | 5.234 | % | | $ | 1,110,381 | |
| (Cost $1,110,381) | | | | | |
| |
| TOTAL INVESTMENTS – 97.4% | |
| (Cost $172,899,758) | | | $ | 138,758,261 | |
| |
| OTHER ASSETS IN EXCESS OF LIABILITIES – 2.6% | | | | 3,711,632 | |
| |
| NET ASSETS – 100.0% | | | $ | 142,469,893 | |
| |
| | |
|
| The percentage shown for each investment category reflects the value of investments in that category as a percentage of net assets. |
| |
* | | Non-income producing security. |
| |
(a) | | Exempt from registration under Rule 144A of the Securities Act of 1933. |
| |
(b) | | All or a portion of security is on loan. |
| |
(c) | | Represents an affiliated issuer. |
| | |
|
Investment Abbreviations: |
ADR | | —American Depositary Receipt |
PLC | | —Public Limited Company |
|
The below table represents the sector breakdown of investments as a percentage of total market value of the Fund.
| | | | |
| Sector Name | | % of Market
Value | |
| |
Industrials | | | 35.7 | % |
Materials | | | 25.5 | |
Information Technology | | | 17.0 | |
Utilities | | | 12.8 | |
Health Care | | | 3.8 | |
Consumer Staples | | | 2.5 | |
Consumer Discretionary | | | 1.9 | |
Securities Lending Reinvestment Vehicle | | | 0.8 | |
| |
| |
| TOTAL INVESTMENTS | | | 100.0 | % |
| |
| | |
| The accompanying notes are an integral part of these financial statements. | | 31 |
GOLDMAN SACHS FUTURE REAL ESTATE AND INFRASTRUCTURE EQUITY ETF
Schedule of Investments
August 31, 2023
| | | | | | | | |
Shares | | | Description | | Value | |
|
| Common Stocks – 98.8% | |
| Communication Services – 2.2% | |
| | 13,217 | | | Cellnex Telecom SA (Spain)*(a) | | $ | 506,381 | |
| | |
| Energy – 2.3% | |
| | 3,264 | | | Cheniere Energy, Inc. | | | 532,685 | |
| | |
| Health Care – 1.5% | |
| | 46,566 | | | Chartwell Retirement Residences (Canada) | | | 353,474 | |
| | |
| Industrials – 13.5% | |
| | 144,950 | | | Airports of Thailand PCL NVDR (Thailand)* | | | 300,103 | |
| | 134,630 | | | Enav SpA (Italy)(a) | | | 544,154 | |
| | 13,296 | | | Ferrovial SE | | | 422,101 | |
| | 2,106 | | | Norfolk Southern Corp. | | | 431,751 | |
| | 117,285 | | | Transurban Group (Australia) | | | 1,007,225 | |
| | 4,189 | | | Vinci SA (France) | | | 468,111 | |
| | | | | | | | |
| | | | | | | 3,173,445 | |
| | �� |
| Materials – 1.2% | |
| | 763 | | | Linde PLC | | | 295,311 | |
| | |
| Real Estate – 53.3% | |
| | 5,626 | | | Alexandria Real Estate Equities, Inc. REIT | | | 654,529 | |
| | 10,068 | | | American Homes 4 Rent, Class A REIT | | | 362,851 | |
| | 4,781 | | | American Tower Corp. REIT | | | 866,891 | |
| | 3,590 | | | AvalonBay Communities, Inc. REIT | | | 659,914 | |
| | 27,467 | | | Big Yellow Group PLC REIT (United Kingdom) | | | 374,152 | |
| | 19,516 | | | CTP NV (Netherlands)(a) | | | 277,480 | |
| | 4,692 | | | Digital Realty Trust, Inc. REIT | | | 618,030 | |
| | 1,116 | | | Equinix, Inc. REIT | | | 872,020 | |
| | 8,970 | | | Equity LifeStyle Properties, Inc. REIT | | | 600,631 | |
| | 3,309 | | | Extra Space Storage, Inc. REIT | | | 425,802 | |
| | 23,340 | | | Goodman Group REIT (Australia) | | | 353,113 | |
| | 68 | | | Hoshino Resorts REIT, Inc. REIT (Japan) | | | 292,860 | |
| | 14,375 | | | Invitation Homes, Inc. REIT | | | 490,044 | |
| | 188 | | | Nippon Prologis REIT, Inc. REIT (Japan) | | | 378,234 | |
| | 10,495 | | | Prologis, Inc. REIT | | | 1,303,479 | |
| | 847 | | | Public Storage REIT | | | 234,094 | |
| | 2,611 | | | SBA Communications Corp. REIT | | | 586,248 | |
| | 45,779 | | | Segro PLC REIT (United Kingdom) | | | 427,758 | |
| | 6,761 | | | Terreno Realty Corp. REIT | | | 411,677 | |
| | 32,429 | | | UNITE Group PLC (The) REIT (United Kingdom) | | | 386,474 | |
| | 7,571 | | | Ventas, Inc. REIT | | | 330,701 | |
| | 18,101 | | | VICI Properties, Inc. REIT | | | 558,235 | |
| | 16,710 | | | Vonovia SE (Germany) | | | 400,992 | |
| | 7,484 | | | Welltower, Inc. REIT | | | 620,274 | |
| | | | | | | | |
| | | | | | | 12,486,483 | |
| | |
| Utilities – 24.8% | |
| | 15,571 | | | AES Corp. (The) | | | 279,188 | |
| | 4,140 | | | Ameren Corp. | | | 328,178 | |
| | 2,893 | | | American Water Works Co., Inc. | | | 401,375 | |
| | 8,020 | | | CMS Energy Corp. | | | 450,644 | |
| | |
|
| Common Stocks – (continued) | |
| Utilities – (continued) | |
| | 22,369 | | | Engie SA (France) | | $ | 361,502 | |
| | 6,307 | | | Eversource Energy | | | 402,513 | |
| | 76,120 | | | National Grid PLC (United Kingdom) | | | 955,103 | |
| | 13,568 | | | NextEra Energy, Inc. | | | 906,342 | |
| | 2,784 | | | Orsted AS (Denmark)(a) | | | 179,398 | |
| | 8,848 | | | Severn Trent PLC (United Kingdom) | | | 269,082 | |
| | 11,676 | | | Veolia Environnement SA (France) | | | 365,730 | |
| | 5,423 | | | WEC Energy Group, Inc. | | | 456,183 | |
| | 7,831 | | | Xcel Energy, Inc. | | | 447,385 | |
| | | | | | | | |
| | | | | | | 5,802,623 | |
| | |
| | TOTAL INVESTMENTS – 98.8% | | | | |
| | (Cost $25,754,590) | | $ | 23,150,402 | |
| | |
| OTHER ASSETS IN EXCESS OF
LIABILITIES – 1.2% | | | 279,643 | |
| | |
| | NET ASSETS – 100.0% | | $ | 23,430,045 | |
| | |
| | |
|
| The percentage shown for each investment category reflects the value of investments in that category as a percentage of net assets. |
| |
* | | Non-income producing security. |
| |
(a) | | Exempt from registration under Rule 144A of the Securities Act of 1933. |
| | |
|
Investment Abbreviations: |
NVDR | | —Non-Voting Depository Receipt |
PLC | | —Public Limited Company |
REIT | | —Real Estate Investment Trust |
|
| | |
| 32 | | The accompanying notes are an integral part of these financial statements. |
GOLDMAN SACHS FUTURE TECH LEADERS EQUITY ETF
Schedule of Investments
August 31, 2023
| | | | | | | | |
| Shares | | | Description | |
Value | |
|
| Common Stocks – 98.6% | |
| Communication Services – 12.3% | |
| | 113,804 | | | Cellnex Telecom SA (Spain)*(a) | | $ | 4,360,157 | |
| | 30,355 | | | Electronic Arts, Inc. | | | 3,641,993 | |
| | 80,551 | | | Match Group, Inc.* | | | 3,775,425 | |
| | 21,972 | | | NAVER Corp. (South Korea) | | | 3,565,723 | |
| | 292,774 | | | NetEase, Inc. (China) | | | 6,115,520 | |
| | 39,296 | | | Sea Ltd. ADR (Singapore)* | | | 1,478,709 | |
| | 316,886 | | | Snap, Inc., Class A* | | | 3,279,770 | |
| | 66,994 | | | Trade Desk, Inc. (The), Class A* | | | 5,361,530 | |
| | | | | | | | |
| | | | | | | 31,578,827 | |
| | |
| Consumer Discretionary – 5.4% | |
| | 30,503 | | | Etsy, Inc.* | | | 2,244,106 | |
| | 4,785 | | | MercadoLibre, Inc. (Brazil)* | | | 6,566,742 | |
| | 60,713 | | | Mobileye Global, Inc., Class A (Israel)* | | | 2,155,919 | |
| | 72,680 | | | Trip.com Group Ltd. (China)* | | | 2,867,624 | |
| | | | | | | | |
| | | | | | | 13,834,391 | |
| | |
| Financials – 3.8% | |
| | 3,232 | | | Adyen NV (Netherlands)*(a) | | | 2,709,816 | |
| | 81,612 | | | Fidelity National Information Services, Inc. | | | 4,558,846 | |
| | 15,868 | | | Jack Henry & Associates, Inc. | | | 2,487,785 | |
| | | | | | | | |
| | | | | | | 9,756,447 | |
| | |
| Health Care – 1.0% | |
| | 23,488 | | | Hoya Corp. (Japan) | | | 2,606,372 | |
| | |
| Industrials – 3.5% | |
| | 29,052 | | | Booz Allen Hamilton Holding Corp. | | | 3,291,882 | |
| | 154,057 | | | Daifuku Co. Ltd. (Japan) | | | 2,850,242 | |
| | 51,885 | | | NIDEC Corp. (Japan) | | | 2,719,967 | |
| | | | | | | | |
| | | | | | | 8,862,091 | |
| | |
| Information Technology – 71.2% | |
| | 125,052 | | | AppLovin Corp., Class A* | | | 5,404,747 | |
| | 23,496 | | | Arista Networks, Inc.* | | | 4,587,124 | |
| | 7,489 | | | ASM International NV (Netherlands) | | | 3,618,670 | |
| | 15,103 | | | Atlassian Corp., Class A* | | | 3,081,918 | |
| | 23,923 | | | Cadence Design Systems, Inc.* | | | 5,752,046 | |
| | 12,665 | | | CDW Corp. | | | 2,674,215 | |
| | 400,057 | | | Chroma ATE, Inc. (Taiwan) | | | 3,517,371 | |
| | 69,224 | | | Datadog, Inc., Class A* | | | 6,678,732 | |
| | 483,284 | | | Delta Electronics, Inc. (Taiwan) | | | 5,250,695 | |
| | 33,547 | | | DocuSign, Inc.* | | | 1,687,414 | |
| | 123,299 | | | Dynatrace, Inc.* | | | 5,943,012 | |
| | 16,435 | | | Enphase Energy, Inc.* | | | 2,079,521 | |
| | 45,277 | | | Entegris, Inc. | | | 4,585,202 | |
| | 50,537 | | | Hamamatsu Photonics KK (Japan) | | | 2,341,743 | |
| | 12,905 | | | HubSpot, Inc.* | | | 7,052,841 | |
| | 334,740 | | | Hundsun Technologies, Inc., Class A (China) | | | 1,655,649 | |
| | 105,255 | | | Infineon Technologies AG (Germany) | | | 3,771,586 | |
| | 182,482 | | | Jentech Precision Industrial Co. Ltd. (Taiwan) | | | 3,707,342 | |
| | 19,226 | | | Keysight Technologies, Inc.* | | | 2,562,826 | |
| | 2,251,304 | | | Kingdee International Software Group Co. Ltd. (China)* | | | 3,479,556 | |
| | |
|
| Common Stocks – (continued) | |
| Information Technology – (continued) | |
| | 15,734 | | | KLA Corp. | | | 7,896,423 | |
| | 426,506 | | | Luxshare Precision Industry Co. Ltd., Class A (China) | | | 1,933,736 | |
| | 129,986 | | | Marvell Technology, Inc. | | | 7,571,684 | |
| | 162,356 | | | MediaTek, Inc. (Taiwan) | | | 3,594,146 | |
| | 66,925 | | | Micron Technology, Inc. | | | 4,680,734 | |
| | 46,042 | | | MKS Instruments, Inc. | | | 4,614,790 | |
| | 6,958 | | | MongoDB, Inc.* | | | 2,653,085 | |
| | 25,127 | | | Motorola Solutions, Inc. | | | 7,125,263 | |
| | 47,703 | | | Murata Manufacturing Co. Ltd. (Japan) | | | 2,681,932 | |
| | 18,665 | | | Palo Alto Networks, Inc.* | | | 4,541,194 | |
| | 40,870 | | | Procore Technologies, Inc.* | | | 2,760,768 | |
| | 56,633 | | | RingCentral, Inc., Class A* | | | 1,751,659 | |
| | 173,362 | | | Sangfor Technologies, Inc., Class A (China)* | | | 2,598,108 | |
| | 6,976 | | | ServiceNow, Inc.* | | | 4,107,678 | |
| | 242,868 | | | Silergy Corp. (China) | | | 2,188,721 | |
| | 22,091 | | | Snowflake, Inc., Class A* | | | 3,464,973 | |
| | 26,265 | | | Tokyo Electron Ltd. (Japan) | | | 3,892,347 | |
| | 282,148 | | | UiPath, Inc., Class A* | | | 4,460,760 | |
| | 528,806 | | | Unimicron Technology Corp. (Taiwan) | | | 3,080,198 | |
| | 4,170,932 | | | United Microelectronics Corp. (Taiwan) | | | 5,959,129 | |
| | 948,786 | | | Venustech Group, Inc., Class A (China) | | | 3,803,747 | |
| | 314,073 | | | Viavi Solutions, Inc.* | | | 3,282,063 | |
| | 34,163 | | | Workday, Inc., Class A* | | | 8,352,854 | |
| | 36,107 | | | Zscaler, Inc.* | | | 5,634,497 | |
| | | | | | | | |
| | | | | | | 182,062,699 | |
| | |
| Real Estate – 1.4% | |
| | 16,259 | | | SBA Communications Corp. REIT | | | 3,650,633 | |
| | |
| | TOTAL INVESTMENTS – 98.6% | | | | |
| | (Cost $277,361,998) | | $ | 252,351,460 | |
| | |
| OTHER ASSETS IN EXCESS OF
LIABILITIES – 1.4% | | | 3,543,914 | |
| | |
| | NET ASSETS – 100.0% | | $ | 255,895,374 | |
| | |
| | |
|
| The percentage shown for each investment category reflects the value of investments in that category as a percentage of net assets. |
| |
* | | Non-income producing security. |
| |
(a) | | Exempt from registration under Rule 144A of the Securities Act of 1933. |
| | |
|
Investment Abbreviations: |
ADR | | —American Depositary Receipt |
REIT | | —Real Estate Investment Trust |
|
| | |
| The accompanying notes are an integral part of these financial statements. | | 33 |
GOLDMAN SACHS FUTURE ETFS
Statements of Assets and Liabilities
August 31, 2023
| | | | | | | | | | | | | | | | | | |
| | | | | Future
Consumer
Equity ETF | | | Future
Health Care
Equity ETF | | | Future
Planet
Equity ETF | | | Future Real
Estate and
Infrastructure
Equity ETF | |
| | Assets: | |
| | | | | |
| | Investments at value (cost $161,557,638, $109,924,337, $171,789,377 and $25,754,590, respectively)(a) | | $ | 155,261,344 | | | $ | 109,941,937 | | | $ | 137,647,880 | | | $ | 23,150,402 | |
| | | | | |
| | Investments in affiliated securities lending reinvestment vehicle, at value which equals cost | | | 747,637 | | | | — | | | | 1,110,381 | | | | — | |
| | | | | |
| | Cash | | | 1,172,281 | | | | 1,616,237 | | | | 4,680,609 | | | | 257,425 | |
| | | | | |
| | Foreign currency, at value (cost $885,140, $277,807, $— and $102, respectively) | | | 874,656 | | | | 277,467 | | | | — | | | | 102 | |
| | | | | |
| | Receivables: | | | | | | | | | | | | | | | | |
| | | | | |
| | Dividends | | | 53,393 | | | | 70,862 | | | | 114,450 | | | | 28,675 | |
| | | | | |
| | Foreign tax reclaims | | | 18,576 | | | | 4,596 | | | | 129,670 | | | | 8,398 | |
| | | | | |
| | Securities lending income | | | 1,835 | | | | 185 | | | | 3,754 | | | | — | |
| | | | | |
| | Total assets | | | 158,129,722 | | | | 111,911,284 | | | | 143,686,744 | | | | 23,445,002 | |
| | | | | | | | | | | | | | | | | | |
| | Liabilities: | | | | | | | | | | | | | | | | |
| | | | | |
| | Payables: | | | | | | | | | | | | | | | | |
| | | | | |
| | Investments purchased | | | 1,073,501 | | | | — | | | | — | | | | — | |
| | | | | |
| | Upon return of securities loaned | | | 747,637 | | | | — | | | | 1,110,381 | | | | — | |
| | | | | |
| | Management fees | | | 100,054 | | | | 70,639 | | | | 91,931 | | | | 14,957 | |
| | | | | |
| | Foreign bank overdraft (cost $—, $—, $14,511 and $—, respectively) | | | — | | | | — | | | | 14,539 | | | | — | |
| | | | | |
| | Total liabilities | | | 1,921,192 | | | | 70,639 | | | | 1,216,851 | | | | 14,957 | |
| | | | | | | | | | | | | | | | | | |
| | Net Assets: | | | | | | | | | | | | | | | | |
| | | | | |
| | Paid-in capital | | | 170,684,842 | | | | 122,408,232 | | | | 183,841,499 | | | | 27,868,983 | |
| | | | | |
| | Total distributable loss | | | (14,476,312 | ) | | | (10,567,587 | ) | | | (41,371,606 | ) | | | (4,438,938 | ) |
| | | | | |
| | NET ASSETS | | $ | 156,208,530 | | | $ | 111,840,645 | | | $ | 142,469,893 | | | $ | 23,430,045 | |
| | SHARES ISSUED AND OUTSTANDING | | | | | | | | | | | | | | | | |
| | | | | |
| | Shares outstanding no par value (unlimited shares authorized): | | | 5,750,000 | | | | 3,450,000 | | | | 4,725,000 | | | | 725,000 | |
| | | | | |
| | Net asset value per share: | | | $27.17 | | | | $32.42 | | | | $30.15 | | | | $32.32 | |
| | (a) | | Includes loaned securities having a market value of $710,435, $—, $1,039,913 and $— for Future Consumer Equity ETF, Future Health Care Equity ETF, Future Planet Equity ETF and Future Real Estate and Infrastructure Equity ETF, respectively. |
| | |
| 34 | | The accompanying notes are an integral part of these financial statements. |
GOLDMAN SACHS FUTURE ETFS
Statements of Assets and Liabilities (continued)
August 31, 2023
| | | | | | |
| | | | |
Future
Tech Leaders
Equity ETF | |
| | Assets: | | | | |
| | |
| | Investments at value (cost $277,361,998) | | $ | 252,351,460 | |
| | |
| | Cash | | | 3,562,663 | |
| | |
| | Receivables: | | | | |
| | |
| | Dividends | | | 110,427 | |
| | |
| | Foreign tax reclaims | | | 32,619 | |
| | |
| | Total assets | | | 256,057,169 | |
| | | | | | |
| | Liabilities: | | | | |
| | |
| | Payables: | | | | |
| | |
| | Management fees | | | 161,598 | |
| | |
| | Foreign bank overdraft (cost $200) | | | 197 | |
| | |
| | Total liabilities | | | 161,795 | |
| | | | | | |
| | Net Assets: | | | | |
| | |
| | Paid-in capital | | | 378,032,778 | |
| | |
| | Total distributable loss | | | (122,137,404 | ) |
| | |
| | NET ASSETS | | $ | 255,895,374 | |
| | SHARES ISSUED AND OUTSTANDING | | | | |
| | |
| | Shares outstanding no par value (unlimited shares authorized): | | | 10,200,000 | |
| | |
| | Net asset value per share: | | | $25.09 | |
| | |
| The accompanying notes are an integral part of these financial statements. | | 35 |
GOLDMAN SACHS FUTURE ETFS
Statements of Operations
For the Fiscal Year Ended August 31, 2023
| | | | | | | | | | | | | | | | | | |
| | | | | Future
Consumer
Equity ETF | | | Future
Health Care
Equity ETF | | | Future
Planet
Equity ETF | | | Future Real
Estate and
Infrastructure
Equity ETF | |
| | Investment income: | |
| | | | | |
| | Dividends — unaffiliated issuers (net of foreign withholding taxes of $112,131, $13,160, $326,249 and $90,208, respectively) | | $ | 1,073,419 | | | $ | 655,503 | | | $ | 2,722,301 | | | $ | 591,426 | |
| | | | | |
| | Non cash dividend income | | | 146,738 | | | | — | | | | — | | | | — | |
| | | | | |
| | Securities lending income, net of rebates received or paid to borrowers—unaffiliated issuer | | | 16,163 | | | | 1,646 | | | | 74,601 | | | | 2,262 | |
| | | | | |
| | Total investment income | | | 1,236,320 | | | | 657,149 | | | | 2,796,902 | | | | 593,688 | |
| | | | | | | | | | | | | | | | | | |
| | Expenses: | | | | | | | | | | | | | | | | |
| | | | | |
| | Management fees | | | 840,972 | | | | 775,714 | | | | 1,186,549 | | | | 149,454 | |
| | | | | |
| | Trustee fees | | | 27,376 | | | | 27,680 | | | | 29,190 | | | | 25,681 | |
| | | | | |
| | Total expenses | | | 868,348 | | | | 803,394 | | | | 1,215,739 | | | | 175,135 | |
| | | | | |
| | NET INVESTMENT INCOME (LOSS) | | | 367,972 | | | | (146,245 | ) | | | 1,581,163 | | | | 418,553 | |
| | | | | | | | | | | | | | | | | | |
| | Realized and unrealized gain (loss): | |
| | | | | |
| | Net realized gain (loss) from: | | | | | | | | | | | | | | | | |
| | | | | |
| | Investments — unaffiliated issuers | | | (5,093,639 | ) | | | (7,593,401 | ) | | | (8,043,524 | ) | | | (1,368,943 | ) |
| | | | | |
| | In-kind redemptions | | | 1,128,072 | | | | 1,237,202 | | | | 2,138,533 | | | | 3,714 | |
| | | | | |
| | Foreign currency transactions | | | (7,327 | ) | | | (1,997 | ) | | | (36,864 | ) | | | 5,823 | |
| | | | | |
| | Net change in unrealized gain (loss) on: | | | | | | | | | | | | | | | | |
| | | | | |
| | Investments — unaffiliated issuers | | | 12,121,334 | | | | 14,700,063 | | | | 5,734,563 | | | | 36,048 | |
| | | | | |
| | Foreign currency translations | | | (8,491 | ) | | | (186 | ) | | | 4,484 | | | | 3,511 | |
| | | | | |
| | Net realized and unrealized gain (loss) | | | 8,139,949 | | | | 8,341,681 | | | | (202,808 | ) | | | (1,319,847 | ) |
| | | | | |
| | NET INCREASE (DECREASE) IN NET ASSETS RESULTING FROM OPERATIONS | | $ | 8,507,921 | | | $ | 8,195,436 | | | $ | 1,378,355 | | | $ | (901,294 | ) |
| | |
| 36 | | The accompanying notes are an integral part of these financial statements. |
GOLDMAN SACHS FUTURE ETFS
Statements of Operations (continued)
For the Fiscal Year Ended August 31, 2023
| | | | | | |
| | | | |
Future
Tech Leaders
Equity ETF | |
| | Investment income: | | | | |
| | |
| | Dividends — unaffiliated issuers (net of foreign withholding taxes of $348,407) | | $ | 2,257,357 | |
| | |
| | Securities lending income, net of rebates received or paid to borrowers — unaffiliated issuer | | | 366 | |
| | |
| | Total investment income | | | 2,257,723 | |
| | | | | | |
| | Expenses: | | | | |
| | |
| | Management fees | | | 1,761,177 | |
| | |
| | Trustee fees | | | 30,796 | |
| | |
| | Total expenses | | | 1,791,973 | |
| | |
| | NET INVESTMENT INCOME | | | 465,750 | |
| | | | | | |
| | Realized and unrealized gain (loss): | |
| | |
| | Net realized gain (loss) from: | | | | |
| | |
| | Investments — unaffiliated issuers | | | (64,061,816 | ) |
| | |
| | In-kind redemptions | | | 1,783,598 | |
| | |
| | Foreign currency transactions | | | (36,103 | ) |
| | |
| | Net change in unrealized gain (loss) on: | | | | |
| | |
| | Investments — unaffiliated issuers | | | 74,034,201 | |
| | |
| | Foreign currency translations | | | (227 | ) |
| | |
| | Net realized and unrealized gain | | | 11,719,653 | |
| | |
| | NET INCREASE IN NET ASSETS RESULTING FROM OPERATIONS | | $ | 12,185,403 | |
| | |
| The accompanying notes are an integral part of these financial statements. | | 37 |
GOLDMAN SACHS FUTURE ETFS
Statements of Changes in Net Assets
| | | | | | | | | | | | | | | | | | | | | | |
| | | | | Future Consumer Equity ETF | | | | | | Future Health Care Equity ETF | |
| | | | | For the Fiscal
Year Ended
August 31, 2023 | | | For the Period
November 9, 2021*
to
August 31, 2022 | | | | | | For the Fiscal
Year Ended
August 31, 2023 | | | For the Period
November 9, 2021*
to
August 31, 2022 | |
| | From operations: | | | | | | | | | | | | | |
| | | | | | |
| | Net investment income (loss) | | $ | 367,972 | | | $ | 198,811 | | | | | | | $ | (146,245 | ) | | $ | (162,050 | ) |
| | | | | | |
| | Net realized loss | | | (3,972,894 | ) | | | (4,106,857 | ) | | | | | | | (6,358,196 | ) | | | (2,416,068 | ) |
| | | | | | |
| | Net change in unrealized gain (loss) | | | 12,112,843 | | | | (18,419,972 | ) | | | | | | | 14,699,877 | | | | (14,682,986 | ) |
| | | | | | |
| | Net increase (decrease) in net assets resulting from operations | | | 8,507,921 | | | | (22,328,018 | ) | | | | | | | 8,195,436 | | | | (17,261,104 | ) |
| | | | | | | | | | | | | | | | | | | | | | |
| | Distributions to shareholders: | | | | | | | | | | | | | | | | | | | | |
| | | | | | |
| | From distributable earnings | | | — | | | | (202,678 | ) | | | | | | | (102 | ) | | | — | |
| | | | | | |
| | From return of capital | | | — | | | | (74,347 | ) | | | | | | | — | | | | — | |
| | | | | | |
| | Total distributions to shareholders | | | — | | | | (277,025 | ) | | | | | | | (102 | ) | | | — | |
| | | | | | | | | | | | | | | | | | | | | | |
| | From share transactions: | | | | | | | | | | | | | |
| | | | | | |
| | Proceeds from sales of shares | | | 61,459,027 | | | | 120,508,199 | | | | | | | | 12,109,470 | | | | 129,642,436 | |
| | | | | | |
| | Cost of shares redeemed | | | (2,758,951 | ) | | | (8,902,623 | ) | | | | | | | (10,245,168 | ) | | | (10,600,323 | ) |
| | | | | | |
| | Net increase in net assets resulting from share transactions | | | 58,700,076 | | | | 111,605,576 | | | | | | | | 1,864,302 | | | | 119,042,113 | |
| | | | | | |
| | TOTAL INCREASE | | | 67,207,997 | | | | 89,000,533 | | | | | | | | 10,059,636 | | | | 101,781,009 | |
| | | | | | | | | | | | | | | | | | | | | | |
| | Net assets: | | | | | | | | | | | | | |
| | | | | | |
| | Beginning of period | | $ | 89,000,533 | | | $ | — | | | | | | | $ | 101,781,009 | | | $ | — | |
| | | | | | |
| | End of period | | $ | 156,208,530 | | | $ | 89,000,533 | | | | | | | $ | 111,840,645 | | | $ | 101,781,009 | |
| | * | | Commencement of operations. |
| | |
| 38 | | The accompanying notes are an integral part of these financial statements. |
GOLDMAN SACHS FUTURE ETFS
Statements of Changes in Net Assets (continued)
| | | | | | | | | | | | | | | | | | | | | | |
| | | | | Future Planet Equity ETF | | | | | | Future Real Estate and Infrastructure
Equity ETF | |
| | | | | For the Fiscal
Year Ended
August 31, 2023 | | | For the Fiscal
Year Ended
August 31, 2022 | | | | | | For the Fiscal
Year Ended
August 31, 2023 | | | For the Period
November 9, 2021*
to
August 31, 2022 | |
| | From operations: | |
| | | | | | |
| | Net investment income | | $ | 1,581,163 | | | $ | 1,061,992 | | | | | | | $ | 418,553 | | | $ | 276,661 | |
| | | | | | |
| | Net realized loss | | | (5,941,855 | ) | | | (2,878,218 | ) | | | | | | | (1,359,406 | ) | | | (547,285 | ) |
| | | | | | |
| | Net change in unrealized gain (loss) | | | 5,739,047 | | | | (42,812,576 | ) | | | | | | | 39,559 | | | | (2,643,761 | ) |
| | | | | | |
| | Net increase (decrease) in net assets resulting from operations | | | 1,378,355 | | | | (44,628,802 | ) | | | | | | | (901,294 | ) | | | (2,914,385 | ) |
| | | | | | | | | | | | | | | | | | | | | | |
| | Distributions to shareholders: | | | | | | | | | | | | | | | | | | | | |
| | | | | | |
| | From distributable earnings | | | (617,909 | ) | | | (755,496 | ) | | | | | | | (445,287 | ) | | | (211,263 | ) |
| | | | | | | | | | | | | | | | | | | | | | |
| | From share transactions: | |
| | | | | | |
| | Proceeds from sales of shares | | | 7,651,164 | | | | 191,443,464 | | | | | | | | 1,628,238 | | | | 27,100,977 | |
| | | | | | |
| | Cost of shares redeemed | | | (39,765,858 | ) | | | (32,339,953 | ) | | | | | | | (826,941 | ) | | | — | |
| | | | | | |
| | Net increase (decrease) in net assets resulting from share transactions | | | (32,114,694 | ) | | | 159,103,511 | | | | | | | | 801,297 | | | | 27,100,977 | |
| | | | | | |
| | TOTAL INCREASE (DECREASE) | | | (31,354,248 | ) | | | 113,719,213 | | | | | | | | (545,284 | ) | | | 23,975,329 | |
| | | | | | | | | | | | | | | | | | | | | | |
| | Net assets: | |
| | | | | | |
| | Beginning of period | | $ | 173,824,141 | | | $ | 60,104,928 | | | | | | | $ | 23,975,329 | | | $ | — | |
| | | | | | |
| | End of period | | $ | 142,469,893 | | | $ | 173,824,141 | | | | | | | $ | 23,430,045 | | | $ | 23,975,329 | |
| | * | | Commencement of operations. |
| | |
| The accompanying notes are an integral part of these financial statements. | | 39 |
GOLDMAN SACHS FUTURE ETFS
Statements of Changes in Net Assets (continued)
| | | | | | | | | | | | | | |
| | | | | Future Tech Leaders Equity ETF | |
| | | | | For the Fiscal
Year Ended
August 31, 2023 | | | | | | For the Period
September 14, 2021*
to
August 31, 2022 | |
| | From operations: | |
| | | | |
| | Net investment income | | $ | 465,750 | | | | | | | $ | 74,214 | |
| | | | |
| | Net realized loss | | | (62,314,321 | ) | | | | | | | (38,383,334 | ) |
| | | | |
| | Net change in unrealized gain (loss) | | | 74,033,974 | | | | | | | | (99,046,678 | ) |
| | | | |
| | Net increase (decrease) in net assets resulting from operations | | | 12,185,403 | | | | | | | | (137,355,798 | ) |
| | | | | | | | | | | | | | |
| | Distributions to shareholders: | | | | | | | | | | | | |
| | | | |
| | From distributable earnings | | | (48,204 | ) | | | | | | | (9,965 | ) |
| | | | | | | | | | | | | | |
| | From share transactions: | | | | | | | | | | | | |
| | | | |
| | Proceeds from sales of shares | | | 16,960,331 | | | | | | | | 422,677,334 | |
| | | | |
| | Cost of shares redeemed | | | (15,609,588 | ) | | | | | | | (42,904,139 | ) |
| | | | |
| | Net increase in net assets resulting from share transactions | | | 1,350,743 | | | | | | | | 379,773,195 | |
| | | | |
| | TOTAL INCREASE | | | 13,487,942 | | | | | | | | 242,407,432 | |
| | | | | | | | | | | | | | |
| | Net assets: | |
| | Beginning of period | | $ | 242,407,432 | | | | | | | $ | — | |
| | | | |
| | End of period | | $ | 255,895,374 | | | | | | | $ | 242,407,432 | |
| | * | | Commencement of operations. |
| | |
| 40 | | The accompanying notes are an integral part of these financial statements. |
GOLDMAN SACHS FUTURE CONSUMER EQUITY ETF
Financial Highlights
Selected Data for a Share Outstanding Throughout Each Period
| | | | | | | | | | |
| | | | | Future Consumer Equity ETF | |
| | | | | For the Fiscal
Year Ended
August 31, 2023 | | | For the Period
November 9, 2021*
to
August 31, 2022 | |
| | Per Share Operating Performance: | |
| | | |
| | Net asset value, beginning of period | | $ | 25.43 | | | $ | 40.03 | |
| | | |
| | Net investment income(a) | | | 0.08 | | | | 0.10 | |
| | | |
| | Net realized and unrealized gain (loss) | | | 1.66 | | | | (14.62 | ) |
| | | |
| | Total gain (loss) from investment operations | | | 1.74 | | | | (14.52 | ) |
| | | |
| | Distributions to shareholders from net investment income | | | — | | | | (0.06 | ) |
| | | |
| | Distributions to shareholders from return of capital | | | — | | | | (0.02 | ) |
| | | |
| | Total distributions to shareholders | | | — | | | | (0.08 | ) |
| | | |
| | Net asset value, end of period | | $ | 27.17 | | | $ | 25.43 | |
| | | |
| | Market price, end of period | | $ | 27.20 | | | $ | 25.30 | |
| | | |
| | Total Return at Net Asset Value(b) | | | 6.84 | % | | | (36.28 | )% |
| | | |
| | Net assets, end of period (in 000’s) | | $ | 156,209 | | | $ | 89,001 | |
| | | |
| | Ratio of total expenses to average net assets | | | 0.75 | % | | | 0.75 | %(c) |
| | | |
| | Ratio of net investment income to average net assets | | | 0.32 | % | | | 0.46 | %(c) |
| | | |
| | Portfolio turnover rate(d) | | | 16 | % | | | 24 | % |
| | * | | Commencement of operations. |
| | (a) | | Calculated based on the average shares outstanding methodology. |
| | (b) | | Assumes investment at the net asset value at the beginning of the period, reinvestment of all distributions and a complete sale of the investment at the net asset value at the end of the period. Returns do not reflect the impact of taxes to shareholders relating to Fund distributions or the sale of Fund shares. Total returns for periods less than one full year are not annualized. |
| | (d) | | The Fund’s portfolio turnover rate is calculated in accordance with regulatory requirements and excludes portfolio securities received or delivered as a result of in-kind transactions and short-term transactions. If such transactions were included, the Fund’s portfolio turnover rate may be higher. |
| | |
| The accompanying notes are an integral part of these financial statements. | | 41 |
GOLDMAN SACHS FUTURE HEALTH CARE EQUITY ETF
Financial Highlights (continued)
Selected Data for a Share Outstanding Throughout Each Period
| | | | | | | | | | |
| | | | | Future Health Care Equity ETF | |
| | | | | For the Fiscal
Year Ended
August 31, 2023 | | | For the Period
November 9, 2021*
to
August 31, 2022 | |
| | Per Share Operating Performance: | | | | | | | | |
| | | |
| | Net asset value, beginning of period | | $ | 29.94 | | | $ | 39.68 | |
| | | |
| | Net investment loss(a) | | | (0.04 | ) | | | (0.08 | ) |
| | | |
| | Net realized and unrealized gain (loss) | | | 2.52 | | | | (9.66 | ) |
| | | |
| | Total gain (loss) from investment operations | | | 2.48 | | | | (9.74 | ) |
| | | |
| | Distributions to shareholders from net investment income | | | (0.00 | )(b) | | | — | |
| | | |
| | Net asset value, end of period | | $ | 32.42 | | | $ | 29.94 | |
| | | |
| | Market price, end of period | | $ | 32.42 | | | $ | 30.00 | |
| | | |
| | Total Return at Net Asset Value(c) | | | 8.28 | % | | | (24.55 | )% |
| | | |
| | Net assets, end of period (in 000’s) | | $ | 111,841 | | | $ | 101,781 | |
| | | |
| | Ratio of total expenses to average net assets | | | 0.75 | % | | | 0.75 | %(d) |
| | | |
| | Ratio of net investment loss to average net assets | | | (0.14 | )% | | | (0.33 | )%(d) |
| | | |
| | Portfolio turnover rate(e) | | | 28 | % | | | 24 | % |
| | * | | Commencement of operations. |
| | (a) | | Calculated based on the average shares outstanding methodology. |
| | (b) | | Amount is less than $0.005 per share. |
| | (c) | | Assumes investment at the net asset value at the beginning of the period, reinvestment of all distributions and a complete sale of the investment at the net asset value at the end of the period. Returns do not reflect the impact of taxes to shareholders relating to Fund distributions or the sale of Fund shares. Total returns for periods less than one full year are not annualized. |
| | (e) | | The Fund’s portfolio turnover rate is calculated in accordance with regulatory requirements and excludes portfolio securities received or delivered as a result of in-kind transactions and short-term transactions. If such transactions were included, the Fund’s portfolio turnover rate may be higher. |
| | |
| 42 | | The accompanying notes are an integral part of these financial statements. |
GOLDMAN SACHS FUTURE PLANET EQUITY ETF
Financial Highlights (continued)
Selected Data for a Share Outstanding Throughout Each Period
| | | | | | | | | | | | | | |
| | | | | Future Planet Equity ETF | |
| | | | | For the Fiscal
Year Ended August 31, | | | For the Period
July 13, 2021*
to
August 31, 2021 | |
| | | | | 2023 | | | 2022 | |
| | Per Share Operating Performance: | |
| | | | |
| | Net asset value, beginning of period | | $ | 30.23 | | | $ | 42.18 | | | $ | 39.89 | |
| | | | |
| | Net investment income(a) | | | 0.30 | | | | 0.27 | | | | 0.02 | |
| | | | |
| | Net realized and unrealized gain (loss) | | | (0.27 | ) | | | (12.05 | ) | | | 2.27 | |
| | | | |
| | Total gain (loss) from investment operations | | | 0.03 | | | | (11.78 | ) | | | 2.29 | |
| | | | |
| | Distributions to shareholders from net investment income | | | (0.11 | ) | | | (0.17 | ) | | | — | |
| | | | |
| | Net asset value, end of period | | $ | 30.15 | | | $ | 30.23 | | | $ | 42.18 | |
| | | | |
| | Market price, end of period | | $ | 30.11 | | | $ | 30.15 | | | $ | 42.25 | |
| | | | |
| | Total Return at Net Asset Value(b) | | | 0.13 | % | | | (27.97 | )% | | | 5.74 | % |
| | | | |
| | Net assets, end of period (in 000’s) | | $ | 142,470 | | | $ | 173,824 | | | $ | 60,104 | |
| | | | |
| | Ratio of total expenses to average net assets | | | 0.75 | % | | | 0.75 | % | | | 0.75 | %(c) |
| | | | |
| | Ratio of net investment income to average net assets | | | 0.97 | % | | | 0.81 | % | | | 0.42 | %(c) |
| | | | |
| | Portfolio turnover rate(d) | | | 20 | % | | | 15 | % | | | 2 | % |
| | * | | Commencement of operations. |
| | (a) | | Calculated based on the average shares outstanding methodology. |
| | (b) | | Assumes investment at the net asset value at the beginning of the period, reinvestment of all distributions and a complete sale of the investment at the net asset value at the end of the period. Returns do not reflect the impact of taxes to shareholders relating to Fund distributions or the sale of Fund shares. Total returns for periods less than one full year are not annualized. |
| | (d) | | The Fund’s portfolio turnover rate is calculated in accordance with regulatory requirements and excludes portfolio securities received or delivered as a result of in-kind transactions and short-term transactions. If such transactions were included, the Fund’s portfolio turnover rate may be higher. |
| | |
| The accompanying notes are an integral part of these financial statements. | | 43 |
GOLDMAN SACHS FUTURE REAL ESTATE AND INFRASTRUCTURE EQUITY ETF
Financial Highlights (continued)
Selected Data for a Share Outstanding Throughout Each Period
| | | | | | | | | | |
| | | | | Future Real Estate and
Infrastructure Equity ETF | |
| | | | | For the Fiscal
Year Ended
August 31, 2023 | | | For the Period
November 9, 2021*
to
August 31, 2022 | |
| | Per Share Operating Performance: | | | | | | | | |
| | | |
| | Net asset value, beginning of period | | $ | 34.25 | | | $ | 40.05 | |
| | | |
| | Net investment income(a) | | | 0.59 | | | | 0.56 | |
| | | |
| | Net realized and unrealized loss | | | (1.90 | ) | | | (5.95 | ) |
| | | |
| | Total loss from investment operations | | | (1.31 | ) | | | (5.39 | ) |
| | | |
| | Distributions to shareholders from net investment income | | | (0.62 | ) | | | (0.41 | ) |
| | | |
| | Net asset value, end of period | | $ | 32.32 | | | $ | 34.25 | |
| | | |
| | Market price, end of period | | $ | 32.19 | | | $ | 34.25 | |
| | | |
| | Total Return at Net Asset Value(b) | | | (3.77 | )% | | | (13.52 | )% |
| | | |
| | Net assets, end of period (in 000’s) | | $ | 23,430 | | | $ | 23,975 | |
| | | |
| | Ratio of total expenses to average net assets | | | 0.75 | % | | | 0.75 | %(c) |
| | | |
| | Ratio of net investment income to average net assets | | | 1.79 | % | | | 1.85 | %(c) |
| | | |
| | Portfolio turnover rate(d) | | | 30 | % | | | 40 | % |
| | * | | Commencement of operations. |
| | (a) | | Calculated based on the average shares outstanding methodology. |
| | (b) | | Assumes investment at the net asset value at the beginning of the period, reinvestment of all distributions and a complete sale of the investment at the net asset value at the end of the period. Returns do not reflect the impact of taxes to shareholders relating to Fund distributions or the sale of Fund shares. Total returns for periods less than one full year are not annualized. |
| | (d) | | The Fund’s portfolio turnover rate is calculated in accordance with regulatory requirements and excludes portfolio securities received or delivered as a result of in-kind transactions and short-term transactions. If such transactions were included, the Fund’s portfolio turnover rate may be higher. |
| | |
| 44 | | The accompanying notes are an integral part of these financial statements. |
GOLDMAN SACHS FUTURE TECH LEADERS EQUITY ETF
Financial Highlights (continued)
Selected Data for a Share Outstanding Throughout Each Period
| | | | | | | | | | |
| | | | | Future Tech Leaders Equity ETF | |
| | | | | For the Fiscal
Year Ended
August 31, 2023 | | | For the Period
September 14, 2021*
to
August 31, 2022 | |
| | Per Share Operating Performance: | | | | | | | | |
| | | |
| | Net asset value, beginning of period | | $ | 24.12 | | | $ | 40.22 | |
| | | |
| | Net investment income(a) | | | 0.05 | | | | 0.01 | |
| | | |
| | Net realized and unrealized gain (loss) | | | 0.92 | | | | (16.11 | ) |
| | | |
| | Total gain (loss) from investment operations | | | 0.97 | | | | (16.10 | ) |
| | | |
| | Distributions to shareholders from net investment income | | | 0.00 | (b) | | | 0.00 | (b) |
| | | |
| | Net asset value, end of period | | $ | 25.09 | | | $ | 24.12 | |
| | | |
| | Market price, end of period | | $ | 25.06 | | | $ | 24.08 | |
| | | |
| | Total Return at Net Asset Value(c) | | | 4.05 | % | | | (40.03 | )% |
| | | |
| | Net assets, end of period (in 000’s) | | $ | 255,895 | | | $ | 242,407 | |
| | | |
| | Ratio of total expenses to average net assets | | | 0.75 | % | | | 0.75 | %(d) |
| | | |
| | Ratio of net investment income to average net assets | | | 0.19 | % | | | 0.03 | %(d) |
| | | |
| | Portfolio turnover rate(e) | | | 44 | % | | | 55 | % |
| | * | | Commencement of operations. |
| | (a) | | Calculated based on the average shares outstanding methodology. |
| | (b) | | Amount is less than $0.005 per share. |
| | (c) | | Assumes investment at the net asset value at the beginning of the period, reinvestment of all distributions and a complete sale of the investment at the net asset value at the end of the period. Returns do not reflect the impact of taxes to shareholders relating to Fund distributions or the sale of Fund shares. Total returns for periods less than one full year are not annualized. |
| | (e) | | The Fund’s portfolio turnover rate is calculated in accordance with regulatory requirements and excludes portfolio securities received or delivered as a result of in-kind transactions and short-term transactions. If such transactions were included, the Fund’s portfolio turnover rate may be higher. |
| | |
| The accompanying notes are an integral part of these financial statements. | | 45 |
GOLDMAN SACHS FUTURE ETFS
Notes to Financial Statements
August 31, 2023
Goldman Sachs ETF Trust (the “Trust”) is an open-end management investment company, registered under the Investment Company Act of 1940, as amended (the “Act”), consisting of multiple series. The Trust was organized as a Delaware statutory trust on December 16, 2009. The following table lists those series of the Trust that are included in this report (collectively, the “Funds” or individually a “Fund”) along with their respective diversification status under the Act:
| | | | |
| Fund | | | | Diversification
Classification |
Goldman Sachs Future Consumer Equity ETF | | | | Non-Diversified |
Goldman Sachs Future Health Care Equity ETF | | | | Non-Diversified |
Goldman Sachs Future Planet Equity ETF | | | | Non-Diversified |
Goldman Sachs Future Real Estate and Infrastructure Equity ETF | | | | Non-Diversified |
Goldman Sachs Future Tech Leaders Equity ETF | | | | Non-Diversified |
The investment objective of each Fund (except the Goldman Sachs Future Planet Equity ETF) is to seek long-term growth of capital. The investment objective of the Goldman Sachs Future Planet Equity ETF is to seek long-term capital appreciation.
Goldman Sachs Asset Management, L.P. (“GSAM”), an affiliate of Goldman Sachs & Co. LLC (“Goldman Sachs”), serves as investment adviser to the Funds pursuant to a management agreement (the “Agreement”) with the Trust. Each Fund is an exchange-traded fund (“ETF”). Shares of the Funds are listed and traded on the NYSE Arca, Inc. (“NYSE Arca”). Market prices for the Funds’ shares may be different from their net asset value (“NAV”). The Funds issue and redeem shares at their respective NAV only in blocks of a specified number of shares, or multiples thereof, referred to as “Creation Units”. Creation Units are issued and redeemed generally for a designated portfolio of securities (including any portion of such securities for which cash may be substituted) and a specified amount of cash. Shares generally trade in the secondary market in quantities less than a Creation Unit at market prices that change throughout the day. Only those that have entered into an authorized participant agreement with ALPS Distributors, Inc. (the “Distributor”) may do business directly with the Funds.
|
| 2. SIGNIFICANT ACCOUNTING POLICIES |
The financial statements have been prepared in accordance with accounting principles generally accepted in the United States of America (“GAAP”) and require management to make estimates and assumptions that may affect the reported amounts and disclosures. Actual results may differ from those estimates and assumptions. Each Fund is an investment company under GAAP and follows the accounting and reporting guidance applicable to investment companies.
A. Investment Valuation — The Funds’ valuation policy is to value investments at fair value.
B. Investment Income and Investments — Investment income includes interest income, dividend income, and securities lending income, if any. Interest income is accrued daily and adjusted for amortization of premiums and accretion of discounts. Dividend income is recognized on ex-dividend date or, for certain foreign securities, as soon as such information is obtained subsequent to the ex-dividend date. Non-cash dividends, if any, are recorded at the fair market value of the securities received. Investment transactions are reflected on trade date. Realized gains and losses are calculated using identified cost. Investment transactions are recorded on the following business day for daily NAV calculations. Investment income is recorded net of any foreign withholding taxes, less any amounts reclaimable. The Funds may file withholding tax reclaims in certain jurisdictions to recover a portion of amounts previously withheld. These reclaims, if any, are recorded when the amount is known and there are no significant uncertainties on collectability. Such amounts recovered, if any, are reflected as other income in the Statements of Operations. Any foreign capital gains tax is accrued daily based upon net unrealized gains, and is payable upon sale of such investments. Distributions received from the Funds’ investments in U.S. real estate investment trusts (“REITs”) may be characterized as ordinary income, net capital gain and/or a return of capital. A return of capital is recorded by the Funds as a reduction to the cost basis of the REIT.
46
GOLDMAN SACHS FUTURE ETFS
|
| 2. SIGNIFICANT ACCOUNTING POLICIES (continued) |
C. Expenses — Expenses incurred directly by a Fund are charged to the Fund, and certain expenses incurred by the Trust are allocated across the applicable Funds on a straight-line and/or pro-rata basis, depending upon the nature of the expenses, and are accrued daily.
D. Federal Taxes and Distributions to Shareholders — It is each Fund’s policy to comply with the requirements of the Internal Revenue Code of 1986, as amended (the “Code”), applicable to regulated investment companies and to distribute each year substantially all of its investment company taxable income and capital gains to its shareholders. Accordingly, each Fund is not required to make any provisions for the payment of federal income tax. Distributions to shareholders are recorded on the ex- dividend date. For Goldman Sachs Future Consumer Equity ETF, Goldman Sachs Future Health Care Equity ETF, Goldman Sachs Future Planet Equity ETF and Goldman Sachs Future Tech Leaders Equity ETF, income distributions, if any, are declared and paid annually. For Goldman Sachs Future Real Estate and Infrastructure Equity ETF income distributions, if any, are declared and paid semi-annually. Capital gains distributions, if any, are declared and paid annually.
Net capital losses, if any, are carried forward to future fiscal years and may be used to the extent allowed by the Code to offset any future capital gains. Losses that are carried forward will retain their character as either short-term or long-term capital losses. Utilization of capital loss carryforwards will reduce the requirement of future capital gains distributions.
The characterization of distributions to shareholders for financial reporting purposes is determined in accordance with federal income tax rules, which may differ from GAAP. The source of each Fund’s distributions may be shown in the accompanying financial statements as either from distributable earnings or capital. Certain components of the Funds’ net assets on the Statements of Assets and Liabilities reflect permanent GAAP/tax differences based on the appropriate tax character.
E. Foreign Currency Translation — The accounting records and reporting currency of a Fund are maintained in U.S. dollars. Assets and liabilities denominated in foreign currencies are translated into U.S. dollars using the current exchange rates at the close of each business day. The effect of changes in foreign currency exchange rates on investments is included within net realized and unrealized gain (loss) on investments. Changes in the value of other assets and liabilities as a result of fluctuations in foreign exchange rates are included in the Statements of Operations within net change in unrealized gain (loss) on foreign currency translation. Transactions denominated in foreign currencies are translated into U.S. dollars on the date the transaction occurred, the effects of which are included within net realized gain (loss) on foreign currency transactions.
|
| 3. INVESTMENTS AND FAIR VALUE MEASUREMENTS |
U.S. GAAP defines the fair value of a financial instrument as the amount that would be received to sell an asset or paid to transfer a liability in an orderly transaction between market participants at the measurement date (i.e., the exit price); the Funds’ policy is to use the market approach. GAAP establishes a fair value hierarchy that prioritizes the inputs to valuation techniques used to measure fair value. The hierarchy gives the highest priority to unadjusted quoted prices in active markets for identical assets or liabilities (Level 1 measurements) and the lowest priority to unobservable inputs (Level 3 measurements). The level in the fair value hierarchy within which the fair value measurement in its entirety falls shall be determined based on the lowest level input that is significant to the fair value measurement in its entirety. The levels used for classifying investments are not necessarily an indication of the risk associated with investing in these investments. The three levels of the fair value hierarchy are described below:
Level 1 — Unadjusted quoted prices in active markets that are accessible at the measurement date for identical, unrestricted assets or liabilities;
Level 2 — Quoted prices in markets that are not active or financial instruments for which significant inputs are observable (including, but not limited to, quoted prices for similar investments, interest rates, foreign exchange rates, volatility and credit spreads), either directly or indirectly;
Level 3 — Prices or valuations that require significant unobservable inputs (including GSAM’s assumptions in determining fair value measurement).
The Board of Trustees (“Trustees”) has approved Valuation Procedures that govern the valuation of the portfolio investments held by the Funds, including investments for which market quotations are not readily available. With respect to the Funds’
47
GOLDMAN SACHS FUTURE ETFS
Notes to Financial Statements (continued)
August 31, 2023
|
| 3. INVESTMENTS AND FAIR VALUE MEASUREMENTS (continued) |
investments that do not have readily available market quotations, the Trustees have designated the Adviser as the valuation designee to perform fair valuations pursuant to Rule 2a-5 under the Investment Company Act of 1940 (the “Valuation Designee”). GSAM has day-to-day responsibility for implementing and maintaining internal controls and procedures related to the valuation of the Funds’ investments. To assess the continuing appropriateness of pricing sources and methodologies, GSAM regularly performs price verification procedures and issues challenges as necessary to third party pricing vendors or brokers, and any differences are reviewed in accordance with the Valuation Procedures.
A. Level 1 and Level 2 Fair Value Investments — The valuation techniques and significant inputs used in determining the fair values for investments classified as Level 1 and Level 2 are as follows:
Equity Securities — Equity securities traded on a United States (“U.S.”) securities exchange or the NASDAQ system, or those located on certain foreign exchanges, including but not limited to the Americas, are valued daily at their last sale price or official closing price on the principal exchange or system on which they are traded. If there is no sale or official closing price or such price is believed by GSAM to not represent fair value, equity securities will be valued at the valid closing bid price for long positions and at the valid closing ask price for short positions (i.e. where there is sufficient volume, during normal exchange trading hours). If no valid bid/ask price is available, the equity security will be valued pursuant to the Valuation Procedures and consistent with applicable regulatory guidance. To the extent these investments are actively traded, they are classified as Level 1 of the fair value hierarchy, otherwise they are generally classified as Level 2. Certain equity securities containing unique attributes may be classified as Level 2.
Unlisted equity securities for which market quotations are available are valued at the last sale price on the valuation date, or if no sale occurs, at the last bid price for long positions or the last ask price for short positions, and are generally classified as Level 2.
Money Market Funds — Investments in the Goldman Sachs Financial Square Government Fund (“Underlying Money Market Fund”) are valued at the NAV per share of the Institutional Share class on the day of valuation. These investments are generally classified as Level 1 of the fair value hierarchy. For information regarding the Underlying Money Market Fund’s accounting policies and investment holdings, please see the Underlying Money Market Fund’s shareholder report.
B. Level 3 Fair Value Investments — To the extent that significant inputs to valuation models and other alternative pricing sources are unobservable, or if quotations are not readily available, or if GSAM believes that such quotations do not accurately reflect fair value, the fair value of a Fund’s investments may be determined under the Valuation Procedures. GSAM, consistent with its procedures and applicable regulatory guidance, may make an adjustment to the most recent valuation prices of either domestic or foreign securities in light of significant events to reflect what it believes to be the fair value of the securities at the time of determining a Fund’s NAV. To the extent investments are valued using single source broker quotations obtained directly from the broker or passed through from third party pricing vendors, such investments are classified as Level 3 investments.
C. Fair Value Hierarchy — The following is a summary of the Funds’ investments classified in the fair value hierarchy as of August 31, 2023:
| | | | | | | | | | | | |
|
| FUTURE CONSUMER EQUITY ETF | |
| | | |
| Investment Type | | Level 1 | | | Level 2 | | | Level 3 | |
| | | |
| Assets | | | | | | | | | | | | |
| | | |
Common Stock and/or Other Equity Investments(a) | | | | | | | | | | | | |
| | | |
Asia | | $ | 26,164,484 | | | $ | — | | | $ | — | |
| | | |
Europe | | | 26,136,745 | | | | — | | | | — | |
| | | |
North America | | | 99,112,067 | | | | — | | | | — | |
| | | |
South America | | | 3,848,048 | | | | — | | | | — | |
| | | |
Securities Lending Reinvestment Vehicle | | | 747,637 | | | | — | | | | — | |
| | | |
| Total | | $ | 156,008,981 | | | $ | — | | | $ | — | |
| (a) | | Amounts are disclosed by continent to highlight the impact of time zone differences between local market close and the calculation of NAV. Security valuations are based on the principal exchange or system on which they are traded, which may differ from country of domicile noted in table. The Fund utilizes fair value model prices provided by an independent fair value service for international equities, resulting in a Level 2 classification. |
48
GOLDMAN SACHS FUTURE ETFS
|
| 3. INVESTMENTS AND FAIR VALUE MEASUREMENTS (continued) |
| | | | | | | | | | | | |
|
| FUTURE HEALTH CARE EQUITY ETF | |
| | | |
| Investment Type | | Level 1 | | | Level 2 | | | Level 3 | |
| | | |
| Assets | | | | | | | | | | | | |
| | | |
Common Stock and/or Other Equity Investments(a) | | | | | | | | | | | | |
| | | |
Asia | | $ | 6,716,910 | | | $ | — | | | $ | — | |
| | | |
Europe | | | 11,776,379 | | | | — | | | | — | |
| | | |
North America | | | 91,448,648 | | | | — | | | | — | |
| | | |
| Total | | $ | 109,941,937 | | | $ | — | | | $ | — | |
|
| FUTURE PLANET EQUITY ETF | |
| | | |
| Investment Type | | Level 1 | | | Level 2 | | | Level 3 | |
| | | |
| Assets | | | | | | | | | | | | |
| | | |
Common Stock and/or Other Equity Investments(a) | | | | | | | | | | | | |
| | | |
Asia | | $ | 23,437,356 | | | $ | — | | | $ | — | |
| | | |
Europe | | | 49,215,996 | | | | — | | | | — | |
| | | |
North America | | | 64,929,464 | | | | — | | | | — | |
| | | |
Oceania | | | 65,064 | | | | — | | | | — | |
| | | |
Securities Lending Reinvestment Vehicle | | | 1,110,381 | | | | — | | | | — | |
| | | |
| Total | | $ | 138,758,261 | | | $ | — | | | $ | — | |
|
| FUTURE REAL ESTATE AND INFRASTRUCTURE EQUITY ETF | |
| | | |
| Investment Type | | Level 1 | | | Level 2 | | | Level 3 | |
| | | |
| Assets | | | | | | | | | | | | |
| | | |
Common Stock and/or Other Equity Investments(a) | | | | | | | | | | | | |
| | | |
Asia | | $ | 671,094 | | | $ | 300,103 | | | $ | — | |
| | | |
Europe | | | 5,516,317 | | | | — | | | | — | |
| | | |
North America | | | 15,302,550 | | | | — | | | | — | |
| | | |
Oceania | | | 1,360,338 | | | | — | | | | — | |
| | | |
| Total | | $ | 22,850,299 | | | $ | 300,103 | | | $ | — | |
|
| FUTURE TECH LEADERS EQUITY ETF | |
| | | |
| Investment Type | | Level 1 | | | Level 2 | | | Level 3 | |
| | | |
| Assets | | | | | | | | | | | | |
| | | |
Common Stock and/or Other Equity Investments(a) | | | | | | | | | | | | |
| | | |
Asia | | $ | 74,044,496 | | | $ | — | | | $ | — | |
| | | |
Europe | | | 14,460,229 | | | | — | | | | — | |
| | | |
North America | | | 157,279,993 | | | | — | | | | — | |
| | | |
South America | | | 6,566,742 | | | | — | | | | — | |
| | | |
| Total | | $ | 252,351,460 | | | $ | — | | | $ | — | |
| (a) | | Amounts are disclosed by continent to highlight the impact of time zone differences between local market close and the calculation of NAV. Security valuations are based on the principal exchange or system on which they are traded, which may differ from country of domicile noted in table. The Fund utilizes fair value model prices provided by an independent fair value service for international equities, resulting in a Level 2 classification. |
For further information regarding security characteristics, see the Schedules of Investments.
49
GOLDMAN SACHS FUTURE ETFS
Notes to Financial Statements (continued)
August 31, 2023
|
| 4. AGREEMENTS AND AFFILIATED TRANSACTIONS |
A. Management Agreement — Under the Agreement, GSAM manages the Funds, subject to the general supervision of the Trustees.
As compensation for the services rendered pursuant to the Agreement, the assumption of the expenses related thereto and administration of the Funds’ business affairs, including providing facilities, GSAM is entitled to a management fee, accrued daily and paid monthly, equal to an annual percentage rate of each Fund’s average daily net assets.
The Funds operate under a unitary management fee structure. Under the unitary fee structure, GSAM is responsible for paying substantially all the expenses of each Fund, excluding payments under a Fund’s 12b-1 plan (if any), interest expenses, taxes, acquired fund fees and expenses, brokerage fees, costs of holding shareholder meetings and litigation, indemnification and extraordinary expenses. As the Funds directly pay fees and expenses of the independent Trustees, the management fee collected by GSAM will be reduced by an amount equal to the fees and expenses paid by the Funds to the independent Trustees.
For the fiscal year ended August 31, 2023, contractual and effective net unitary management fee rates with GSAM for each Fund were at the following rates:
| | | | | | |
Fund | | | | Unitary Management Fee | |
Future Consumer Equity ETF | | | | | 0.75 | % |
Future Health Care Equity ETF | | | | | 0.75 | % |
Future Planet Equity ETF | | | | | 0.75 | % |
Future Real Estate and Infrastructure Equity ETF | | | | | 0.75 | % |
Future Tech Leaders Equity ETF | | | | | 0.75 | % |
|
| 5. CREATION AND REDEMPTION OF CREATION UNITS |
The Trust issues and redeems shares of the Funds only in Creation Units on a continuous basis through the Distributor, without an initial sales load, at NAV next determined after receipt, on any Business Day (as defined in the Statement of Additional Information), of an order in proper form. Shares of the Funds may only be purchased or redeemed by certain financial institutions (each an “Authorized Participant”). An Authorized Participant is either (1) a “Participating Party” or other participant in the clearing process through the Continuous Net Settlement System of the National Securities Clearing Corporation; or (2) a Depository Trust Company participant; which, in either case, must have executed an agreement with the Distributor. Retail investors will typically not qualify as an Authorized Participant or have the resources to buy and sell whole Creation Units.
Therefore, they will be unable to purchase or redeem the shares directly from the Funds. Rather, most retail investors will purchase shares in the secondary market at market prices with the assistance of a broker and may be subject to customary brokerage commissions or fees. Fixed creation and redemption transaction fees are imposed in connection with creations and redemptions.
50
GOLDMAN SACHS FUTURE ETFS
|
| 5. CREATION AND REDEMPTION OF CREATION UNITS (continued) |
Authorized Participants transacting in Creation Units for cash may also pay a variable charge to compensate the relevant fund for certain transaction costs (e.g. taxes on currency or other financial transactions, and brokerage costs) and market impact expenses relating to investing in portfolio securities. Such variable charges, if any, are included in “Proceeds from sale of shares” in the Statements of Changes in Net Assets.
Share activity is as follows:
| | | | | | | | | | | | | | | | |
| | | Goldman Sachs Future Consumer Equity ETF | |
| | | | |
| | | For the Fiscal Year Ended
August 31, 2023 | | | For the Period November 9,
2021* to August 31, 2022 | |
| | | | |
| | | Shares | | | Dollars | | | Shares | | | Dollars | |
| | | | |
| Fund Share Activity | | | | | | | | | | | | | | | | |
Shares Sold | | | 2,350,000 | | | $ | 61,441,718 | | | | 3,800,001 | | | $ | 120,483,990 | |
Shares Redeemed | | | (100,000 | ) | | | (2,754,101 | ) | | | (300,001 | ) | | | (8,899,985 | ) |
| | | | |
NET INCREASE IN SHARES | | | 2,250,000 | | | $ | 58,687,617 | | | | 3,500,000 | | | $ | 111,584,005 | |
| |
| | | Goldman Sachs Future Health Care Equity ETF | |
| | | | |
| | | For the Fiscal Year Ended
August 31, 2023 | | | For the Period November 9,
2021* to August 31, 2022 | |
| | | | |
| | | Shares | | | Dollars | | | Shares | | | Dollars | |
| | | | |
| Fund Share Activity | | | | | | | | | | | | | | | | |
Shares Sold | | | 375,000 | | | $ | 12,109,471 | | | | 3,725,001 | | | $ | 129,641,934 | |
Shares Redeemed | | | (325,000 | ) | | | (10,245,168 | ) | | | (325,001 | ) | | | (10,600,323 | ) |
| | | | |
NET INCREASE IN SHARES | | | 50,000 | | | $ | 1,864,303 | | | | 3,400,000 | | | $ | 119,041,611 | |
| |
| | | Goldman Sachs Future Planet Equity ETF | |
| | | | |
| | | For the Fiscal Year Ended
August 31, 2023 | | | For the Fiscal Year Ended
August 31, 2022 | |
| | | | |
| | | Shares | | | Dollars | | | Shares | | | Dollars | |
| | | | |
| Fund Share Activity | | | | | | | | | | | | | | | | |
Shares Sold | | | 250,000 | | | $ | 7,613,215 | | | | 5,375,000 | | | $ | 191,424,437 | |
Shares Redeemed | | | (1,275,000 | ) | | | (39,760,858 | ) | | | (1,050,000 | ) | | | (32,343,100 | ) |
| | | | |
NET INCREASE/(DECREASE) IN SHARES | | | (1,025,000 | ) | | $ | (32,147,643 | ) | | | 4,325,000 | | | $ | 159,081,337 | |
| |
| | | Goldman Sachs Future Real Estate and Infrastructure Equity ETF | |
| | | | |
| | | For the Fiscal Year Ended
August 31, 2023 | | | For the Period November 9,
2021* to August 31, 2022 | |
| | | | |
| | | Shares | | | Dollars | | | Shares | | | Dollars | |
| | | | |
| Fund Share Activity | | | | | | | | | | | | | | | | |
Shares Sold | | | 50,000 | | | $ | 1,628,238 | | | | 700,001 | | | $ | 27,101,017 | |
Shares Redeemed | | | (25,000 | ) | | | (826,941 | ) | | | (1 | ) | | | (40 | ) |
| | | | |
NET INCREASE IN SHARES | | | 25,000 | | | $ | 801,297 | | | | 700,000 | | | $ | 27,100,977 | |
| * | | Commencement of operations |
51
GOLDMAN SACHS FUTURE ETFS
Notes to Financial Statements (continued)
August 31, 2023
|
| 5. CREATION AND REDEMPTION OF CREATION UNITS (continued) |
| | | | | | | | | | | | | | | | |
| | | Goldman Sachs Future Tech Leaders Equity ETF | |
| | | | |
| | | For the Fiscal Year Ended
August 31, 2023 | | | For the Period September 14,
2021* to August 31, 2022 | |
| | | | |
| | | Shares | | | Dollars | | | Shares | | | Dollars | |
| | | | |
| Fund Share Activity | | | | | | | | | | | | | | | | |
Shares Sold | | | 800,000 | | | $ | 16,946,509 | | | | 11,700,000 | | | $ | 422,462,591 | |
Shares Redeemed | | | (650,000 | ) | | | (15,575,293 | ) | | | (1,650,000 | ) | | | (42,748,691 | ) |
| | | | |
NET INCREASE IN SHARES | | | 150,000 | | | $ | 1,371,216 | | | | 10,050,000 | | | $ | 379,713,900 | |
| * | | Commencement of operations |
|
| 6. PORTFOLIO SECURITIES TRANSACTIONS |
The cost of purchases and proceeds from sales and maturities of long-term securities for the fiscal year ended August 31, 2023, were as follows:
| | | | | | | | | | |
| Fund | | | | Purchases | | | Sales | |
Goldman Sachs Future Consumer Equity ETF | | | | $ | 29,785,455 | | | $ | 17,974,512 | |
Goldman Sachs Future Health Care Equity ETF | | | | | 29,552,384 | | | | 29,572,806 | |
Goldman Sachs Future Planet Equity ETF | | | | | 31,074,028 | | | | 33,749,711 | |
Goldman Sachs Future Real Estate and Infrastructure Equity ETF | | | | | 7,186,720 | | | | 6,940,989 | |
Goldman Sachs Future Tech Leaders Equity ETF | | | | | 106,374,772 | | | | 105,412,965 | |
The purchases and sales from in-kind creation and redemption transactions for the fiscal year ended August 31, 2023, were as follows:
| | | | | | | | | | |
| Fund | | | | Purchases | | | Sales | |
Goldman Sachs Future Consumer Equity ETF | | | | $ | 50,821,631 | | | $ | 2,496,721 | |
Goldman Sachs Future Health Care Equity ETF | | | | | 11,965,227 | | | | 10,076,416 | |
Goldman Sachs Future Planet Equity ETF | | | | | 7,101,493 | | | | 37,041,298 | |
Goldman Sachs Future Real Estate and Infrastructure Equity ETF | | | | | 1,603,791 | | | | 808,867 | |
Goldman Sachs Future Tech Leaders Equity ETF | | | | | 13,371,833 | | | | 12,547,687 | |
The Funds may lend their securities through a securities lending agent, the Bank of New York Mellon (“BNYM”), to certain qualified borrowers. In accordance with the Funds’ securities lending procedures, the Funds receive cash collateral at least equal to the market value of the securities on loan. The market value of the loaned securities is determined at the close of business of the Funds, at their last sale price or official closing price on the principal exchange or system on which they are traded, and any additional required collateral is delivered to the Funds on the next business day. As with other extensions of credit, the Funds may experience delay in the recovery of their securities or incur a loss should the borrower of the securities breach its agreement with
52
GOLDMAN SACHS FUTURE ETFS
|
| 7. SECURITIES LENDING (continued) |
the Funds or become insolvent at a time when the collateral is insufficient to cover the cost of repurchasing securities on loan. Dividend income received from securities on loan may not be subject to withholding taxes and therefore withholding taxes paid may differ from the amounts listed in the Statements of Operations. Loans of securities are terminable at any time and as such 1) the remaining contractual maturities of the outstanding securities lending transactions are considered to be overnight and continuous and 2) the borrower, after notice, is required to return borrowed securities within the standard time period for settlement of securities transactions.
The Funds invest the cash collateral received in connection with securities lending transactions in the Goldman Sachs Financial Square Government Fund (“Government Money Market Fund”), an affiliated series of the Goldman Sachs Trust. The Government Money Market Fund is registered under the Act as an open end investment company, is subject to Rule 2a-7 under the Act, and is managed by GSAM, for which GSAM may receive a management fee of up to 0.16% on an annualized basis of the average daily net assets of the Government Money Market Fund.
In the event of a default by a borrower with respect to any loan, BNYM may exercise any and all remedies provided under the applicable borrower agreement to make the Funds whole. These remedies include purchasing replacement securities by applying the collateral held from the defaulting broker against the purchase cost of the replacement securities. If BNYM is unable to purchase replacement securities, BNYM will indemnify the Funds by paying the Funds an amount equal to the market value of the securities loaned minus the value of cash collateral received from the borrower for the loan, subject to an exclusion for any shortfalls resulting from a loss of value in such cash collateral due to reinvestment risk. The Funds’ master netting agreements with certain borrowers provide the right, in the event of a default (including bankruptcy or insolvency), for the non-defaulting party to liquidate the collateral and calculate net exposure to the defaulting party or request additional collateral. However, in the event of a default by a borrower, a resolution authority could determine that such rights are not enforceable due to the restrictions or prohibitions against the right of set-off that may be imposed in accordance with a particular jurisdiction’s bankruptcy or insolvency laws. The Funds’ loaned securities were all subject to enforceable Securities Lending Agreements, and the value of the collateral was at least equal to the value of the cash received. The amounts of the Funds’ overnight and continuous agreements, which represent the gross amounts of recognized liabilities for securities lending transactions outstanding as of August 31, 2023, are disclosed as “Payable upon return of securities loaned” on the Statements of Assets and Liabilities, where applicable.
Both the Funds and BNYM received compensation relating to the lending of the Funds’ securities. The amounts earned, if any, by the Funds for the fiscal year ended August 31, 2023, are reported under Investment Income on the Statements of Operations.
The following table provides information about the Funds’ investment in the Government Money Market Fund for the fiscal year ended August 31, 2023:
| | | | | | | | | | | | | | | | | | |
| Fund | | | | Beginning
value as of
August 31, 2022 | | | Purchases
at Cost | | | Proceeds
from Sales | | | Ending
value as of
August 31, 2023 | |
Goldman Sachs Future Consumer Equity ETF | | | | $ | — | | | $ | 3,377,543 | | | $ | (2,629,906 | ) | | $ | 747,637 | |
Goldman Sachs Future Health Care Equity ETF | | | | | — | | | | 4,199,233 | | | | (4,199,233 | ) | | | — | |
Goldman Sachs Future Planet Equity ETF | | | | | 1,990,428 | | | | 20,203,676 | | | | (21,083,723 | ) | | | 1,110,381 | |
Goldman Sachs Future Real Estate and Infrastructure Equity ETF | | | | | — | | | | 2,569,199 | | | | (2,569,199 | ) | | | — | |
Goldman Sachs Future Tech Leaders Equity ETF | | | | | 706,501 | | | | 4,848,214 | | | | (5,554,715 | ) | | | — | |
53
GOLDMAN SACHS FUTURE ETFS
Notes to Financial Statements (continued)
August 31, 2023
The tax character of distributions paid during the fiscal years ended August 31, 2023 and August 31, 2022 were as follows:
| | | | | | | | | | | | | | | | | | | | |
| | | Goldman Sachs
Future
Consumer
Equity ETF | | | Goldman Sachs
Future
Health Care
Equity ETF | | | Goldman Sachs
Future Planet
Equity ETF | | | Goldman Sachs
Future Real Estate
and Infrastructure
Equity ETF | | | Goldman Sachs
Future Tech
Leaders
Equity ETF | |
Distributions paid from: | | | | | | | | | | | | | | | | | | | | |
Ordinary Income | | $ | — | | | $ | 102 | | | $ | 617,909 | | | $ | 445,287 | | | $ | 48,204 | |
Capital Gains | | | — | | | | — | | | | — | | | | — | | | | — | |
Total taxable distributions | | $ | — | | | $ | 102 | | | $ | 617,909 | | | $ | 445,287 | | | $ | 48,204 | |
| | | | | | | | | | | | | | | | | | | | |
| | | Goldman Sachs
Future
Consumer
Equity ETF* | | | Goldman Sachs
Future
Health Care
Equity ETF* | | | Goldman Sachs
Future Planet
Equity ETF | | | Goldman Sachs
Future Real Estate and Infrastructure
Equity ETF* | | | Goldman Sachs
Future Tech Leaders
Equity ETF** | |
Distributions paid from: | | | | | | | | | | | | | | | | | | | | |
Ordinary Income | | $ | 202,678 | | | $ | — | | | $ | 755,496 | | | $ | 211,263 | | | $ | 9,965 | |
Capital Gains | | | — | | | | — | | | | — | | | | — | | | | — | |
Total taxable distributions | | $ | 202,678 | | | $ | — | | | $ | 755,496 | | | $ | 211,263 | | | $ | 9,965 | |
Return of Capital | | $ | 74,347 | | | $ | — | | | $ | — | | | $ | — | | | $ | — | |
| * | | Commenced operations on November 9, 2021. |
| ** | | Commenced operations on September 14, 2021. |
As of August 31, 2023, the components of accumulated earnings (losses) on a tax basis were as follows:
| | | | | | | | | | | | | | | | | | | | |
| | | Goldman Sachs
Future
Consumer
Equity ETF | | | Goldman Sachs
Future
Health Care
Equity ETF | | | Goldman Sachs
Future Planet
Equity ETF | | | Goldman Sachs
Future Real Estate
and Infrastructure
Equity ETF | | | Goldman Sachs
Future Tech
Leaders
Equity ETF | |
Undistributed ordinary income — net | | $ | 360,645 | | | $ | 134,205 | | | $ | 1,310,874 | | | $ | 40,716 | | | $ | 431,476 | |
Undistributed long-term capital gains | | | — | | | | — | | | | — | | | | — | | | | — | |
Total undistributed earnings | | $ | 360,645 | | | $ | 134,205 | | | $ | 1,310,874 | | | $ | 40,716 | | | $ | 431,476 | |
Capital loss carryforwards: | | | | | | | | | | | | | | | | | | | | |
Perpetual Short-Term | | $ | (4,207,635 | ) | | $ | (3,732,076 | ) | | $ | (1,689,183 | ) | | $ | (619,615 | ) | | $ | (35,991,302 | ) |
Perpetual Long-Term | | | — | | | | — | | | | (434,932 | ) | | | — | | | | (6,921,885 | ) |
Timing differences (Late Year Ordinary Loss Deferral/Post October Capital Loss Deferral) | | | (2,589,572 | ) | | | (5,683,882 | ) | | | (4,661,043 | ) | | | (962,910 | ) | | | (41,838,379 | ) |
Unrealized gains (losses) — net | | | (8,039,750 | ) | | | (1,285,834 | ) | | | (35,897,322 | ) | | | (2,897,129 | ) | | | (37,817,314 | ) |
Total accumulated earnings (losses) net | | $ | (14,476,312 | ) | | $ | (10,567,587 | ) | | $ | (41,371,606 | ) | | $ | (4,438,938 | ) | | $ | (122,137,404 | ) |
54
GOLDMAN SACHS FUTURE ETFS
|
| 8. TAX INFORMATION (continued) |
As of August 31, 2023, each Fund’s aggregate security unrealized gains and losses based on cost for U.S. federal income tax purposes were as follows:
| | | | | | | | | | | | | | | | | | | | |
| | | Goldman Sachs
Future
Consumer
Equity ETF | | | Goldman Sachs
Future
Health Care
Equity ETF | | | Goldman Sachs
Future Planet
Equity ETF | | | Goldman Sachs
Future Real Estate
and Infrastructure
Equity ETF | | | Goldman Sachs
Future Tech
Leaders
Equity ETF | |
Tax Cost | | $ | 164,037,896 | | | $ | 111,227,062 | | | $ | 174,656,070 | | | $ | 26,047,517 | | | $ | 290,166,607 | |
Gross unrealized gain | | | 15,888,751 | | | | 11,573,296 | | | | 4,636,883 | | | | 806,619 | | | | 28,107,859 | |
Gross unrealized loss | | | (23,928,501 | ) | | | (12,859,130 | ) | | | (40,534,205 | ) | | | (3,703,748 | ) | | | (65,925,173 | ) |
Net unrealized gains (losses) | | $ | (8,039,750 | ) | | $ | (1,285,834 | ) | | $ | (35,897,322 | ) | | $ | (2,897,129 | ) | | $ | (37,817,314 | ) |
The difference between GAAP-basis and tax-basis unrealized gains (losses) is attributable primarily to wash sales and differences in the tax treatment of partnership investments, and passive foreign investment company investments.
In order to present certain components of the Fund’s capital accounts on a tax-basis, certain reclassifications have been recorded to the Fund’s accounts. These reclassifications have no impact on the net asset value of the Fund and result primarily from net operating losses and redemption in-kind transactions.
| | | | | | | | | | |
| Fund | | | | Paid-in Capital | | | Total
Distributable
Earnings | |
Goldman Sachs Future Consumer Equity ETF | | | | $ | 1,115,471 | | | $ | (1,115,471 | ) |
Goldman Sachs Future Health Care Equity ETF | | | | $ | 846,947 | | | $ | (846,947 | ) |
Goldman Sachs Future Planet Equity ETF | | | | $ | 244,800 | | | $ | (244,800 | ) |
Goldman Sachs Future Real Estate and Infrastructure Equity ETF | | | | $ | (33,291 | ) | | $ | 33,291 | |
Goldman Sachs Future Tech Leaders Equity ETF | | | | $ | 394,151 | | | $ | (394,151 | ) |
GSAM has reviewed the Funds’ tax positions for all open tax years (the current and prior years, as applicable) and has concluded that no provision for income tax is required in the Funds’ financial statements. Such open tax year remains subject to examination and adjustment by tax authorities.
The Funds’ risks include, but are not limited to, the following:
Foreign and Emerging Countries Risk — Investing in foreign markets may involve special risks and considerations not typically associated with investing in the U.S. Foreign securities may be subject to risk of loss because of more or less foreign government regulation, less public information, less stringent investor protections, less stringent accounting, corporate governance, financial reporting and disclosure standards, and less economic, political and social stability in the countries in which a Fund invests. The imposition of sanctions, exchange controls (including repatriation restrictions), confiscation of assets and property, trade restrictions (including tariffs) and other government restrictions by the U.S. or other governments, or from problems in registration, settlement or custody, may also result in losses. The type and severity of sanctions and other similar measures, including counter sanctions and other retaliatory actions, that may be imposed could vary broadly in scope, and their impact is impossible to predict. For example, the imposition of sanctions and other similar measures could, among other things, cause a decline in the value and/or liquidity of securities issued by the sanctioned country or companies located in or economically tied to the sanctioned country and increase market volatility and disruption in the sanctioned country and throughout the world. Sanctions and other similar measures could limit or prevent a Fund
55
GOLDMAN SACHS FUTURE ETFS
Notes to Financial Statements (continued)
August 31, 2023
|
| 9. OTHER RISKS (continued) |
from buying and selling securities (in the sanctioned country and other markets), significantly delay or prevent the settlement of securities transactions, and significantly impact a Fund’s liquidity and performance. Foreign risk also involves the risk of negative foreign currency exchange rate fluctuations, which may cause the value of securities denominated in such foreign currency (or other instruments through which a Fund has exposure to foreign currencies) to decline in value. Currency exchange rates may fluctuate significantly over short periods of time. To the extent that a Fund also invests in securities of issuers located in, or economically tied to, emerging markets, these risks may be more pronounced.
Foreign Custody Risk — If a Fund invests in foreign securities, the Fund may hold such securities and cash with foreign banks, agents, and securities depositories appointed by the Fund’s custodian (each a “Foreign Custodian”). Some foreign custodians may be recently organized or new to the foreign custody business. In some countries, Foreign Custodians may be subject to little or no regulatory oversight over, or independent evaluation of, their operations. Further, the laws of certain countries may place limitations on a Fund’s ability to recover its assets if a Foreign Custodian enters bankruptcy. Investments in emerging markets may be subject to even greater custody risks than investments in more developed markets. Custody services in emerging market countries are very often undeveloped and may be considerably less well regulated than in more developed countries, and thus may not afford the same level of investor protection as would apply in developed countries.
Geographic Risk — If a Fund focuses its investments in securities of issuers located in a particular country or geographic region, the Fund may be subjected, to a greater extent than if its investments were less focused, to the risks of volatile economic cycles and/or conditions and developments that may be particular to that country or region, such as: adverse securities markets; adverse exchange rates; adverse social, political, regulatory, economic, business, environmental or other developments; or natural disasters.
Investment Style Risk — Different investment styles (e.g., “growth”, “value” or “quantitative”) tend to shift in and out of favor depending upon market and economic conditions and investor sentiment. The Fund may outperform or underperform other funds that invest in similar asset classes but employ different investment styles.
Issuer Concentration Risk — The Fund’s portfolio may be comprised of a relatively small number of companies in comparison to other funds. This relatively small number of issuers may subject the Fund to greater risks, because a decline in the value of any single investment held by the Fund may adversely affect the Fund’s overall value more than it would affect that of a fund holding a greater number of investments.
Large Shareholder Transactions Risk — Certain shareholders, including other funds advised by the Investment Adviser, may from time to time own a substantial amount of the Fund’s Shares. In addition, a third party investor, the Investment Adviser or an affiliate of the Investment Adviser, an authorized participant, a lead market maker, or another entity (i.e., a seed investor) may invest in the Fund and hold its investment solely to facilitate commencement of the Fund or to facilitate the Fund’s achieving a specificed size or scale. Any such investment may be held for a limited period of time. There can be no assurance that any large shareholder would not redeem its investment, that the size of the Fund would be maintained at such levels or that the Fund would continue to meet applicable listing requirements. Redemptions by large shareholders could have a significant negative impact on the Fund, including on the Fund’s liquidity. In addition, transactions by large shareholders may account for a large percentage of the trading volume on NYSE Arca and may, therefore, have a material upward or downward effect on the market price of the Shares.
Market and Credit Risks — In the normal course of business, a Fund trades financial instruments and enters into financial transactions where risk of potential loss exists due to changes in the market (market risk). The value of the securities in which a Fund invests may go up or down in response to the prospects of individual companies, particular sectors or governments and/or general economic conditions throughout the world due to increasingly interconnected global economies and financial markets. Events such as war, military conflict, acts of terrorism, social unrest, natural disasters, recessions, inflation, rapid interest rate changes, supply chain disruptions, sanctions, the spread of infectious illness or other public health threats could also significantly impact a Fund and its investments. Additionally, a Fund may also be exposed to credit risk in the event that an issuer or guarantor fails to perform or that an institution or entity with which the Fund has unsettled or open transactions defaults.
56
GOLDMAN SACHS FUTURE ETFS
|
| 9. OTHER RISKS (continued) |
Market Trading Risk — Each Fund faces numerous market trading risks, including disruptions to creations and redemptions, the existence of extreme market volatility or potential lack of an active trading market for Shares. If a shareholder purchases Shares at a time when the market price is at a premium to the NAV or sells Shares at a time when the market price is at a discount to the NAV, the shareholder may pay more for, or receive less than, the underlying value of the Shares, respectively. The Investment Adviser cannot predict whether Shares will trade below, at or above their NAV. Price differences may be due, in large part, to the fact that supply and demand forces at work in the secondary trading market for Shares will be closely related to, but not identical to, the same forces influencing the prices of the securities of a Fund’s portfolio trading individually or in the aggregate at any point in time.
Mid-Cap and Small-Cap Risk — Investments in mid-capitalization and small-capitalization companies involve greater risks than those associated with larger, more established companies. These securities may be subject to more abrupt or erratic price movements and may lack sufficient market liquidity, and these issuers often face greater business risks.
Non-Diversification Risk — The Funds are non-diversified, meaning that they are permitted to invest a larger percentage of their assets in one or more issuers or in fewer issuers than diversified mutual funds. Thus, a Fund may be more susceptible to adverse developments affecting any single issuer held in its portfolio, and may be more susceptible to greater losses because of these developments.
Seed Investor Risk — GSAM and/or its affiliates may make payments to one or more investors that contribute seed capital to the Fund. Such payments may continue for a specified period of time and/or until a specified dollar amount is reached. Those payments will be made from the assets of GSAM and/or such affiliates (and not the Fund). There is a risk that such seed investors may redeem their investments in the Fund, particularly after payments from GSAM and/or its affiliates have ceased. As with redemptions by other large shareholders, such redemptions could have a significant negative impact on the Fund, including on the Fund’s liquidity and the market price of the Fund’s Shares. For more information, see the section entitled Tax Advantaged Product Structure in the Prospectus.
Thematic Investing Risk — The Fund’s thematic investment strategy limits the universe of investment opportunities available to the Fund and will affect the Fund’s exposure to certain companies, sectors, regions, and countries, which may result in the Fund forgoing opportunities to buy or sell certain securities when it might otherwise be advantageous to do so. Adhering to the Fund’s thematic investment strategy may also affect the Fund’s performance relative to similar funds that do not seek to invest in companies exposed to certain themes. There is no guarantee that the Investment Adviser’s views, security selection criteria or investment judgment will reflect the beliefs or values of any particular investor. In addition, the Investment Adviser is not required to monitor on an ongoing basis whether a current holding continues to be aligned with one or more themes or otherwise associated with certain themes. The Fund is not required to sell, and may instead add to, positions in holdings that no longer continue to be aligned with one or more of the Key Themes or associated with these themes.
Under the Trust’s organizational documents, its Trustees, officers, employees and agents are indemnified, to the extent permitted by the Act and state law, against certain liabilities that may arise out of performance of their duties to the Funds. Additionally, in the course of business, the Funds enter into contracts that contain a variety of indemnification clauses. The Funds’ maximum exposure under these arrangements is unknown, as this would involve future claims that may be made against the Funds that have not yet occurred. However, GSAM believes the risk of loss under these arrangements to be remote.
Pursuant to an effort to consolidate the membership of the Board of Trustees of the Trust (the “Board”) with the Board of Trustees of each of Goldman Sachs ETF Trust II, Goldman Sachs Real Estate Diversified Income Fund, Goldman Sachs Trust, Goldman
57
GOLDMAN SACHS FUTURE ETFS
Notes to Financial Statements (continued)
August 31, 2023
|
| 11. OTHER MATTERS (continued) |
Sachs Trust II and Goldman Sachs Variable Insurance Trust, in July 2023, the Board voted to nominate Gregory G. Weaver, Dwight L. Bush, Kathryn A. Cassidy, John G. Chou, Joaquin Delgado, Eileen H. Dowling and Paul C. Wirth (the “Nominees”) for election as Trustees of the Trust at a virtual special joint meeting of shareholders to be held on November 16, 2023. Each of the Nominees currently serve as a Trustee of each of the Goldman Sachs Trust and Goldman Sachs Variable Insurance Trust. If elected, the Nominees will serve as Trustees alongside the current Trustees of the Trust. This annual report is not a proxy statement. Information regarding the election of the Nominees is contained in the proxy materials filed with the SEC. The proxy statement has been mailed to shareholders of record, and shareholders can also access the proxy statement, and any other relevant documents, on the SEC’s website.
Subsequent events after the Statements of Assets and Liabilities date have been evaluated, and GSAM has concluded that there is no impact requiring adjustment or disclosure in the financial statements.
58
GOLDMAN SACHS FUTURE ETFS
Report of Independent Registered Public Accounting Firm
To the Board of Trustees of Goldman Sachs ETF Trust and Shareholders of Goldman Sachs Future Consumer Equity ETF, Goldman Sachs Future Health Care Equity ETF, Goldman Sachs Future Planet Equity ETF, Goldman Sachs Future Real Estate and Infrastructure Equity ETF, and Goldman Sachs Future Tech Leaders Equity ETF
Opinions on the Financial Statements
We have audited the accompanying statements of assets and liabilities, including the schedules of investments, of each of the funds indicated in the table below (five of the funds constituting Goldman Sachs ETF Trust, hereafter collectively referred to as the “Funds”) as of August 31, 2023, the related statements of operations and of changes in net assets for each of the periods indicated in the table below, including the related notes, and the financial highlights for each of the periods indicated in the table below (collectively referred to as the “financial statements”). In our opinion, the financial statements present fairly, in all material respects, the financial position of each of the Funds as of August 31, 2023, the results of each of their operations, the changes in each of their net assets, and each of the financial highlights for each of the periods indicated in the table below, in conformity with accounting principles generally accepted in the United States of America.
| | | | | | |
| Fund | | Statement of
operations | | Statement of
changes in net assets | | Financial
highlights |
| Goldman Sachs Future Planet Equity ETF | | For the year ended August 31, 2023 | | For the two years ended August 31, 2023 | | For the periods indicated therein |
| Goldman Sachs Future Tech Leaders Equity ETF | | For the year ended August 31, 2023 | | For the year ended August 31, 2023, and for the period September 14, 2021 (commencement of operations) through August 31, 2022 |
| Goldman Sachs Future Consumer Equity ETF, Goldman Sachs Future Health Care Equity ETF, and Goldman Sachs Future Real Estate and Infrastructure Equity ETF | | For the year ended August 31, 2023 | | For the year ended August 31, 2023, and for the period November 9, 2021 (commencement of operations) through August 31, 2022 |
Basis for Opinions
These financial statements are the responsibility of the Funds’ management. Our responsibility is to express an opinion on the Funds’ financial statements based on our audits. We are a public accounting firm registered with the Public Company Accounting Oversight Board (United States) (PCAOB) and are required to be independent with respect to the Funds in accordance with the U.S. federal securities laws and the applicable rules and regulations of the Securities and Exchange Commission and the PCAOB.
We conducted our audits of these financial statements in accordance with the standards of the PCAOB. Those standards require that we plan and perform the audit to obtain reasonable assurance about whether the financial statements are free of material misstatement, whether due to error or fraud.
Our audits included performing procedures to assess the risks of material misstatement of the financial statements, whether due to error or fraud, and performing procedures that respond to those risks. Such procedures included examining, on a test basis, evidence regarding the amounts and disclosures in the financial statements. Our audits also included evaluating the accounting principles used and significant estimates made by management, as well as evaluating the overall presentation of the financial statements. Our procedures included confirmation of securities owned as of August 31, 2023 by correspondence with the custodian and brokers; when replies were not received from brokers, we performed other auditing procedures. We believe that our audits provide a reasonable basis for our opinions.
/s/ PricewaterhouseCoopers LLP
Boston, Massachusetts
October 25, 2023
We have served as the auditor of one or more investment companies in the Goldman Sachs fund complex since 2000.
59
GOLDMAN SACHS FUTURE ETFS
Fund Expenses — Six Month Period ended 08/31/2023 (Unaudited)
As a shareholder you incur ongoing costs, including management fees and other Fund expenses. This example is intended to help you understand your ongoing costs (in dollars) of investing in Shares of the Funds and to compare these costs with the ongoing costs of investing in other exchange-traded funds. This example does not take into account brokerage commissions that you may pay on your purchases and sales of Shares of a Fund.
The example is based on an investment of $1,000 invested at the beginning of the period from March 1, 2023 and held for the six months ended August 31, 2023, which represents a period of 184 days of a 365 day year (or less where indicated).
Actual Expenses — The first line in the table below provides information about actual account values and actual expenses. You may use the information in this line, together with the amount you invested, to estimate the expenses that you paid over the six months. Simply divide your account value by $1,000 (for example, an $8,600 account value divided by $1,000=8.6), then multiply the result by the number in the first line under the heading entitled “Expenses Paid” to estimate the expenses you paid on your account during this period.
Hypothetical Example for Comparison Purposes — The second line in the table below provides information about hypothetical account values and hypothetical expenses based on a Fund’s actual net expense ratios and an assumed rate of return of 5% per year before expenses, which is not the Fund’s actual return. The hypothetical account values and expenses may not be used to estimate the actual ending account balance or expenses you paid for the period. You may use this information to compare the ongoing costs of investing in a Fund and other funds. To do so, compare this 5% hypothetical example with the 5% hypothetical examples that appear in the shareholder reports of the other funds.
Please note that the expenses shown in the table are meant to highlight your ongoing costs only and do not reflect any transactional costs, such as redemption fees, or exchange fees. Therefore, the second line of the table is useful in comparing ongoing costs only and will not help you determine the relative total costs of owning different funds. In addition, if these transactional costs were included, your costs would have been higher.
| | | | | | | | | | | | | | | | | | | | | | | | | | | | | | | | | | | | | | | | | | | | | | | | | | | | | | | | | | | | |
| | | Goldman Sachs Future Consumer
Equity ETF | | | Goldman Sachs Future Health Care
Equity ETF | | | Goldman Sachs Future Planet Equity ETF | | | Goldman Sachs Future Real Estate and
Infrastructure Equity ETF | | | Goldman Sachs Future Tech Leaders
Equity ETF | |
| | | Beginning
Account
Value
3/1/23 | | | Ending
Account
Value
8/31/23 | | | Expenses
Paid* | | | Beginning
Account
Value
3/1/23 | | | Ending
Account
Value
8/31/23 | | | Expenses
Paid* | | | Beginning
Account
Value
3/1/23 | | | Ending
Account
Value
8/31/23 | | | Expenses
Paid* | | | Beginning
Account
Value
3/1/23 | | | Ending
Account
Value
8/31/23 | | | Expenses
Paid* | | | Beginning
Account
Value
3/1/23 | | | Ending
Account
Value
8/31/23 | | | Expenses
Paid* | |
Actual based on NAV | | $ | 1,000 | | | $ | 1,084.20 | | | $ | 3.94 | | | $ | 1,000 | | | $ | 1,041.44 | | | $ | 3.86 | | | $ | 1,000 | | | $ | 969.45 | | | $ | 3.72 | | | $ | 1,000 | | | $ | 988.62 | | | $ | 3.76 | | | $ | 1,000 | | | $ | 1,081.47 | | | $ | 3.94 | |
Hypothetical 5% return | | | 1,000 | | | | 1,021.42 | + | | | 3.82 | | | | 1,000 | | | | 1,021.42 | + | | | 3.82 | | | | 1,000 | | | | 1,021.42 | + | | | 3.82 | | | | 1,000 | | | | 1,021.42 | + | | | 3.82 | | | | 1,000 | | | | 1,021.42 | + | | | 3.82 | |
| + | | Hypothetical expenses are based on the Fund’s actual annualized net expense ratios and an assumed rate of return of 5% per year before expenses. |
| * | | Expenses for each Fund is calculated using the Fund’s annualized net expense ratio, which represents the ongoing expenses as a percentage of net assets for the fiscal year ended August 31, 2023. Expenses are calculated by multiplying the annualized net expense ratio by the average account value for the period; then multiplying the result by the number of days in the most recent fiscal year; and then dividing that result by the number of days in the fiscal year. The annualized net expense ratio for the period is as follows: |
| | | | |
| Fund | | | |
Goldman Sachs Future Consumer Equity ETF | | | 0.75 | % |
Goldman Sachs Future Health Care Equity ETF | | | 0.75 | |
Goldman Sachs Future Planet Equity ETF | | | 0.75 | |
Goldman Sachs Future Real Estate and Infrastructure Equity ETF | | | 0.75 | |
Goldman Sachs Future Tech Leaders Equity ETF | | | 0.75 | |
60
GOLDMAN SACHS FUTURE ETFS
Trustees and Officers (Unaudited) Independent Trustees
| | | | | | | | | | |
Name, Address and Age1 | | Position(s) Held
with the Trust | | Term of
Office and Length of
Time Served2 | | Principal Occupation(s)
During Past 5 Years | | Number of
Portfolios in
Fund Complex
Overseen by
Trustee3 | | Other
Directorships
Held by Trustee4 |
| | | | | |
Cheryl K. Beebe Age: 67 | | Chair of the
Board of Trustees | | Since 2021 | | Ms. Beebe is retired. She is Director, Packaging Corporation of America (2008-Present); Director, The Mosaic Company (2019-Present); Director, HanesBrands Inc. (2020-Present); and was formerly Director, Convergys Corporation (a global leader in customer experience outsourcing) (2015-2018); and formerly held the position of Executive Vice President, (2010-2014); and Chief Financial Officer, Ingredion, Inc. (a leading global ingredient solutions company) (2004-2014). Chair of the Board of Trustees — Goldman Sachs ETF Trust; Goldman Sachs Trust II; Goldman Sachs ETF Trust II; Goldman Sachs MLP and Energy Renaissance Fund; and Goldman Sachs Real Estate Diversified Income Fund. | | 68 | | Packaging Corporation of America (producer of container board); The Mosaic Company (producer of phosphate and potash fertilizer); HanesBrands Inc. (a multinational clothing company) |
| | | | | |
Lawrence Hughes Age: 65 | | Trustee | | Since 2021 | | Mr. Hughes is retired. Formerly, he held senior management positions with BNY Mellon Wealth Management, a division of The Bank of New York Mellon Corporation (a financial services company) (1991-2015), most recently as Chief Executive Officer (2010-2015). Previously, Mr. Hughes served as an Advisory Board Member of Goldman Sachs Trust II (February 2016-April 2016). Trustee — Goldman Sachs ETF Trust; Goldman Sachs ETF Trust II; Goldman Sachs Trust II; Goldman Sachs MLP and Energy Renaissance Fund; and Goldman Sachs Real Estate Diversified Income Fund. | | 68 | | None |
| | | | | |
John F. Killian Age: 68 | | Trustee | | Since 2021 | | Mr. Killian is retired. He is Director, Consolidated Edison, Inc. (2007-Present); and was formerly Director, Houghton Mifflin Harcourt Publishing Company (2011-2022). Previously, he held senior management positions with Verizon Communications, Inc., including Executive Vice President and Chief Financial Officer (2009-2010); and President, Verizon Business, Verizon Communications, Inc. (2005-2009). Trustee — Goldman Sachs ETF Trust; Goldman Sachs ETF Trust II; Goldman Sachs Trust II; Goldman Sachs MLP and Energy Renaissance Fund; and Goldman Sachs Real Estate Diversified Income Fund. | | 68 | | Consolidated Edison, Inc. (a utility holding company) |
| | | | | |
Steven D. Krichmar Age: 65 | | Trustee | | Since 2021 | | Mr. Krichmar is retired. Formerly, he held senior management and governance positions with Putnam Investments, LLC, a financial services company (2001-2016). He was most recently Chief of Operations and a member of the Operating Committee of Putnam Investments, LLC and Principal Financial Officer of The Putnam Funds. Previously, Mr. Krichmar served as an Audit Partner with PricewaterhouseCoopers LLP and its predecessor company (1990-2001). Trustee — Goldman Sachs ETF Trust; Goldman Sachs ETF Trust II; Goldman Sachs Trust II; Goldman Sachs MLP and Energy Renaissance Fund; and Goldman Sachs Real Estate Diversified Income Fund. | | 68 | | None |
| | | | | |
Michael Latham Age: 57 | | Trustee | | Since 2015 | | Mr. Latham is retired. Formerly, he held senior management positions with the iShares exchange-traded fund business owned by BlackRock, Inc., including Chairman (2011-2014); Global Head (2010-2011); U.S. Head (2007-2010); and Chief Operating Officer (2003-2007). Trustee — Goldman Sachs ETF Trust; Goldman Sachs ETF Trust II; Goldman Sachs Trust II; Goldman Sachs MLP and Energy Renaissance Fund; Goldman Sachs Credit Income Fund; and Goldman Sachs Real Estate Diversified Income Fund. | | 69 | | None |
| | | | | | | | | | |
61
GOLDMAN SACHS FUTURE ETFS
Trustees and Officers (Unaudited) (continued) Independent Trustees
| | | | | | | | | | |
Name, Address and Age1 | | Position(s) Held
with the Trust | | Term of
Office and Length of
Time Served2 | | Principal Occupation(s)
During Past 5 Years | | Number of
Portfolios in
Fund Complex
Overseen by
Trustee3 | | Other
Directorships
Held by Trustee4 |
| | | | | |
Lawrence W. Stranghoener Age: 69 | | Trustee | | Since 2015 | | Mr. Stranghoener is retired. He is Chairman, Kennametal, Inc. (a global manufacturer and distributor of tooling and industrial materials) (2003-Present); and was formerly Director, Aleris Corporation and Aleris International, Inc. (a producer of aluminum rolled products) (2011-2020); Interim Chief Executive Officer (2014) and Executive Vice President and Chief Financial Officer (2004-2014), Mosaic Company (a fertilizer manufacturing company). Trustee — Goldman Sachs ETF Trust; Goldman Sachs Trust II; Goldman Sachs ETF Trust II; Goldman Sachs MLP and Energy Renaissance Fund; and Goldman Sachs Real Estate Diversified Income Fund. Chair of the Board of Trustees — Goldman Sachs Credit Income Fund. | | 69 | | Kennametal, Inc. (a global manufacturer and distributor of tooling and industrial materials) |
| | | | | | | | | | |
Interested Trustee*
| | | | | | | | | | |
Name, Address and Age1 | | Position(s) Held
with the Trust | | Term of
Office and
Length of
Time Served2 | | Principal Occupation(s)
During Past 5 Years | | Number of
Portfolios in
Fund Complex
Overseen by
Trustee3 | | Other
Directorships
Held by Trustee4 |
| | | | | |
James A. McNamara Age: 60 | | President and Trustee | | Since 2014 | | Advisory Director, Goldman Sachs (January 2018-Present); Managing Director, Goldman Sachs (January 2000-December 2017); Director of Institutional Fund Sales, GSAM (April 1998-December 2000); and Senior Vice President and Manager, Dreyfus Institutional Service Corporation (January 1993-April 1998). President and Trustee — Goldman Sachs ETF Trust; Goldman Sachs ETF Trust II; Goldman Sachs Trust; Goldman Sachs Variable Insurance Trust; Goldman Sachs Trust II; Goldman Sachs MLP and Energy Renaissance Fund; Goldman Sachs Credit Income Fund; and Goldman Sachs Real Estate Diversified Income Fund. | | 172 | | None |
| | | | | | | | | | |
| * | | Mr. McNamara is considered to be an “Interested Trustee” because he holds a position with Goldman Sachs and owns securities issued by The Goldman Sachs Group, Inc. The Interested Trustee holds comparable positions with certain other companies of which Goldman Sachs, GSAM or an affiliate thereof is the investment adviser, administrator and/or distributor. |
| 1 | | Each Trustee may be contacted by writing to the Trustee, c/o Goldman Sachs, 200 West Street, New York, New York, 10282, Attn: Caroline Kraus. Information is provided as of August 31, 2023. |
| 2 | | Each Trustee holds office for an indefinite term, until the earliest of: (a) the election of his or her successor; (b) the date the Trustee resigns or is removed by the Board or shareholders, in accordance with the Trust’s Declaration of Trust; or (c) the termination of the Trust. The Board has adopted policies which provide that each Independent Trustee shall retire as of December 31st of the calendar year in which he or she reaches (a) his or her 74th birthday or (b) the 15th anniversary of the date he or she became a Trustee, whichever is earlier, unless a waiver of such requirements shall have been adopted by a majority of the other Trustees. These policies may be changed by the Trustees without shareholder vote. |
| 3 | | The Goldman Sachs Fund Complex includes certain other companies listed above for each respective Trustee. As of August 31, 2023, Goldman Sachs ETF Trust consisted of 67 portfolios (32 of which offered shares to the public); Goldman Sachs ETF Trust II consisted of 2 portfolios; Goldman Sachs Trust consisted of 87 portfolios; Goldman Sachs Variable Insurance Trust consisted of 15 portfolios (11 of which offered shares to the public); Goldman Sachs Trust II consisted of 18 portfolios (7 of which offered shares to the public); and Goldman Sachs MLP and Energy Renaissance Fund, Goldman Sachs Credit Income Fund and Goldman Sachs Real Estate Diversified Income Fund each consisted of one portfolio. Goldman Sachs MLP and Energy Renaissance Fund and Goldman Sachs Credit Income Fund each did not offer shares to the public. |
| 4 | | This column includes only directorships of companies required to report to the Securities and Exchange Commission under the Securities Exchange Act of 1934 (i.e., “public companies”) or other investment companies registered under the Act. |
Additional information about the Trustees is available in the Funds’ Statement of Additional Information, which can be obtained from Goldman Sachs free of charge by calling this toll-free number (in the United States of America): 1-800-526-7384.
62
GOLDMAN SACHS FUTURE ETFS
Trustees and Officers (Unaudited) (continued) Officers of the Trust*
| | | | | | |
| Name, Address and Age1 | | Positions Held with the Trust | | Term of Office and
Length of
Time Served2 | | Principal Occupation(s) During Past 5 Years |
| | | |
James A. McNamara 200 West Street New York, NY 10282 Age: 60 | | Trustee and President | | Since 2014 | | Advisory Director, Goldman Sachs (January 2018-Present); Managing Director, Goldman Sachs (January 2000-December 2017); Director of Institutional Fund Sales, GSAM (April 1998-December 2000); and Senior Vice President and Manager, Dreyfus Institutional Service Corporation (January 1993-April 1998). President and Trustee — Goldman Sachs ETF Trust; Goldman Sachs Trust; Goldman Sachs Variable Insurance Trust; Goldman Sachs Trust II; Goldman Sachs ETF Trust II; Goldman Sachs MLP and Energy Renaissance Fund; Goldman Sachs Credit Income Fund; and Goldman Sachs Real Estate Diversified Income Fund. |
| | | |
Caroline L. Kraus 200 West Street New York, NY 10282 Age: 46 | | Secretary | | Since 2014 | | Managing Director, Goldman Sachs (January 2016-Present); Vice President, Goldman Sachs (August 2006-December 2015); Senior Counsel, Goldman Sachs (January 2020-Present); Associate General Counsel, Goldman Sachs (2012-December 2019); Assistant General Counsel, Goldman Sachs (August 2006-December 2011); and Associate, Weil, Gotshal & Manges, LLP (2002-2006). Secretary — Goldman Sachs ETF Trust; Goldman Sachs Trust (previously Assistant Secretary (2012)); Goldman Sachs Variable Insurance Trust (previously Assistant Secretary (2012)); Goldman Sachs Trust II; Goldman Sachs ETF Trust II; Goldman Sachs BDC, Inc.; Goldman Sachs Private Middle Market Credit LLC; Goldman Sachs Private Middle Market Credit II LLC; Goldman Sachs Middle Market Lending Corp.; Goldman Sachs MLP and Energy Renaissance Fund; Goldman Sachs Credit Income Fund; and Goldman Sachs Real Estate Diversified Income Fund. |
| | | |
Joseph F. DiMaria 30 Hudson Street Jersey City, NJ 07302 Age: 55 | | Treasurer, Principal Financial Officer and Principal Accounting Officer | | Since 2017 (Treasurer and Principal Financial Officer since 2019) | | Managing Director, Goldman Sachs (November 2015-Present) and Vice President-Mutual Fund Administration, Columbia Management Investment Advisers, LLC (May 2010-October 2015). Treasurer, Principal Financial Officer and Principal Accounting Officer — Goldman Sachs ETF Trust (previously Assistant Treasurer (2017)); Goldman Sachs Trust (previously Assistant Treasurer (2016)); Goldman Sachs Variable Insurance Trust (previously Assistant Treasurer (2016)); Goldman Sachs Trust II (previously Assistant Treasurer (2017)); Goldman Sachs MLP and Energy Renaissance Fund (previously Assistant Treasurer (2017)); Goldman Sachs ETF Trust II; Goldman Sachs Credit Income Fund; and Goldman Sachs Real Estate Diversified Income Fund. |
| | | | | | |
| * | | Represents a partial list of officers of the Trust. Additional information about all the officers is available in the Funds’ Statement of Additional Information, which can be obtained from Goldman Sachs free of charge by calling this toll-free number (in the United States): 1-800-621-2550. |
| 1 | | Information is provided as of August 31, 2023. |
| 2 | | Officers hold office at the pleasure of the Board of Trustees or until their successors are duly elected and qualified. Each officer holds comparable positions with certain other companies of which Goldman Sachs, GSAM or an affiliate thereof is the investment adviser, administrator and/or distributor. |
Goldman Sachs ETF Trust — Future ETFs — Tax Information (Unaudited)
For the fiscal year ended August 31, 2023, 100%, 100%, 100%, 62.68%, and 100% of the dividends paid from net investment company taxable income by the Future Consumer Equity ETF, Future Health Care Equity ETF, Future Planet Equity ETF, Future Real Estate and Infrastructure Equity ETF, and Future Tech Leaders ETF, respectively, qualify for the reduced tax rate under the Jobs and Growth Tax Relief and Reconciliation Act of 2003.
For the year ended August 31, 2023, 37.32% of the dividends paid from net investment company taxable income by the Future Real Estate and Infrastructure Equity ETF qualify as section 199A dividends.
For the fiscal year ended August 31, 2023, 100%, 36.33%, 27.73%, and 100% of the dividends paid from net investment company taxable income by the Future Health Care Equity ETF, Future Planet Equity ETF, Future Real Estate and Infrastructure Equity ETF, and Future Tech Leaders ETF, respectively, qualify for the dividends received deduction available to corporations.
63
FUNDS PROFILE
Goldman Sachs ETFs

Goldman Sachs is a premier financial services firm, known since 1869 for creating thoughtful and customized investment solutions in complex global markets.
Today, the Asset Management Division of Goldman Sachs serves a diverse set of clients worldwide, including private institutions, public entities and individuals. With approximately $2.46 trillion in assets under supervision as of June 30, 2023, Goldman Sachs Asset Management has portfolio management teams located around the world and our investment professionals bring firsthand knowledge of local markets to every investment decision. Assets under supervision includes assets under management and other client assets for which Goldman Sachs does not have full discretion. Goldman Sachs Asset Management leverages the resources of Goldman Sachs & Co. LLC subject to legal, internal and regulatory restrictions.
|
|
| GOLDMAN SACHS EXCHANGE-TRADED FUNDS |
| Goldman Sachs ActiveBeta® Emerging Markets Equity ETF |
| Goldman Sachs ActiveBeta® Europe Equity ETF |
| Goldman Sachs ActiveBeta® International Equity ETF |
| Goldman Sachs ActiveBeta® Japan Equity ETF |
| Goldman Sachs ActiveBeta® U.S. Large Cap Equity ETF |
| Goldman Sachs ActiveBeta® U.S. Small Cap Equity ETF |
| Goldman Sachs ActiveBeta® Paris-Aligned Climate U.S. Large Cap Equity ETF |
| Goldman Sachs ActiveBeta® World Low Vol Plus Equity ETF |
| Goldman Sachs Bloomberg Clean Energy Equity ETF |
| Goldman Sachs Community Municipal Bond ETF |
| Goldman Sachs Defensive Equity ETF |
| Goldman Sachs Equal Weight U.S. Large Cap Equity ETF |
| Goldman Sachs Hedge Industry VIP ETF |
| Goldman Sachs Innovate Equity ETF |
| Goldman Sachs JUST U.S. Large Cap Equity ETF |
| Goldman Sachs Access Emerging Markets USD Bond ETF |
| Goldman Sachs Access High Yield Corporate Bond ETF |
| Goldman Sachs Access Inflation Protected USD Bond ETF |
| Goldman Sachs Access Investment Grade Corporate 1-5 Year Bond ETF |
| Goldman Sachs Access Investment Grade Corporate Bond ETF |
| Goldman Sachs Access Treasury 0-1 Year ETF |
| Goldman Sachs Access U.S. Aggregate Bond ETF |
| Goldman Sachs Access Ultra Short Bond ETF |
| Goldman Sachs Community Municipal Bond ETF |
| Goldman Sachs MarketBeta® Emerging Markets Equity ETF |
| Goldman Sachs MarketBeta® International Equity ETF |
Goldman Sachs MarketBeta(R) U.S. Equity ETF |
| Goldman Sachs MarketBeta® U.S. 1000 Equity ETF |
| Goldman Sachs MarketBeta® Total International Equity ETF |
Goldman Sachs Future Planet Equity ETF Goldman Sachs Future Tech Leaders Equity ETF |
| Goldman Sachs Future Health Care Equity ETF |
| Goldman Sachs Future Consumer Equity ETF |
| Goldman Sachs Future Real Estate and Infrastructure Equity ETF |
| Goldman Sachs North American Pipelines & Power Equity ETF |
Goldman Sachs Small Cap Core Equity ETF |
| | |
TRUSTEES Cheryl K. Beebe, Chair Lawrence Hughes John F. Killian Steven D. Krichmar Michael Latham James A. McNamara Lawrence W. Stranghoener | | OFFICERS James A. McNamara, President Joseph F. DiMaria, Principal Financial Officer, Principal Accounting Officer and Treasurer Robert Griffith, Secretary* * Effective September 20, 2023 |
| |
THE BANK OF NEW YORK MELLON Transfer Agent | | |
| |
ALPS DISTRIBUTORS, INC. Distributor | | GOLDMAN SACHS ASSET MANAGEMENT, L.P. Investment Adviser |
Visit our Website at www.GSAMFUNDS.com/ETFs to obtain the most recent month-end returns.
Goldman Sachs Asset Management, L.P., 200 West Street, New York, New York 10282
The reports concerning the Funds included in this shareholder report may contain certain forward-looking statements about the factors that may affect the performance of the Funds in the future. These statements are based on Fund management’s predictions and expectations concerning certain future events and their expected impact on the Funds, such as performance of the economy as a whole and of specific industry sectors, changes in the levels of interest rates, the impact of developing world events, and other factors that may influence the future performance of the Funds. Management believes these forward-looking statements to be reasonable, although they are inherently uncertain and difficult to predict. Actual events may cause adjustments in portfolio management strategies from those currently expected to be employed.
A description of the policies and procedures that the Funds use to determine how to vote proxies relating to portfolio securities and information regarding how the Funds voted proxies relating to portfolio securities for the most recent 12-month period ended June 30, are available (i) without charge, upon request by calling 1-800-621-2550; and (ii) on the Securities and Exchange Commission (“SEC’’) web site at http://www.sec.gov.
The Funds will file portfolio holdings information for each month in a fiscal quarter within 60 days after the end of the relevant fiscal quarter on the Form N-PORT. Portfolio holdings information for the third month of each fiscal quarter will be made available on the SEC’s web site at http://www.sec.gov. Portfolio holdings information may be obtained upon request and without charge by calling 1-800-621-2550.
Fund holdings and allocations shown are as of August 31, 2023 and may not be representative of future investments. Fund holdings should not be relied on in making investment decisions and should not be construed as research or investment advice regarding particular securities. Current and future holdings are subject to risk.
Economic and market forecasts presented herein reflect our judgment as of the date of this presentation and are subject to change without notice. These forecasts do not take into account the specific investment objectives, restrictions, tax and financial situation or other needs of any specific client. Actual data will vary and may not be reflected here. These forecasts are subject to high levels of uncertainty that may affect actual performance. Accordingly, these forecasts should be viewed as merely representative of a broad range of possible outcomes. These forecasts are estimated, based on assumptions, and are subject to significant revision and may change materially as economic and market conditions change. Goldman Sachs has no obligation to provide updates or changes to these forecasts. Case studies and examples are for illustrative purposes only.
ETF Fund shares are not individually redeemable and are issued and redeemed by the Fund at their net asset value (“NAV”) only in large, specified blocks of shares called creation units. Shares otherwise can be bought and sold only through exchange trading at market price (not NAV). Shares may trade at a premium or discount to their NAV in the secondary market. Brokerage commissions will reduce returns. Ordinary brokerage commissions apply. ALPS Distributors, Inc. is the distributor of the Goldman Sachs ETF Funds. ALPS Distributors, Inc. is unaffiliated with Goldman Sachs Asset Management.
This material is not authorized for distribution to prospective investors unless preceded or accompanied by a current Prospectus or Summary Prospectus, if applicable. Investors should consider a Fund’s objective, risks, and charges and expenses, and read the Summary Prospectus, if available, and/or the Prospectus carefully before investing or sending money. The Summary Prospectus, if available, and the Prospectus contain this and other information about a Fund and may be obtained from your authorized dealer or from Goldman Sachs & Co. LLC by calling 1-800-621-2550.
© 2023 Goldman Sachs. All rights reserved. 339623-OTU-10/23 FTRETFAR-23
Goldman Sachs Funds
| | | | |
| | |
| Annual Report | | | | August 31, 2023 |
| | |
| | | | Goldman Sachs Community Municipal Bond ETF |

Goldman Sachs Community Municipal Bond ETF
| | | | |
| | | |
| NOT FDIC-INSURED | | May Lose Value | | No Bank Guarantee |
INVESTMENT PROCESS
Goldman Sachs Community Municipal Bond ETF
Principal Investment Strategies
The Goldman Sachs Community Municipal Bond ETF (the “Fund”) seeks to achieve its investment objective by investing at least 80% of its assets (exclusive of collateral held from securities lending) in securities included in its underlying index, the Bloomberg Goldman Sachs Community Municipal Index (the “Index”). The Fund also has a policy to invest, under normal circumstances, at least 80% of its net assets plus any borrowings for investment purposes (measured at the time of purchase) in municipal securities, the interest on which is exempt from regular federal income tax (i.e., excluded from gross income for federal income tax purposes).
The Index is a rules-based index that is designed to measure the performance of the municipal securities market with remaining maturities between one and 15 years with screens that take into account certain social or environmental factors. These screens may exclude negative sectors, sources of funds and use of proceeds and include securities with potentially environmentally or socially beneficial outcomes. Municipal securities include fixed income securities issued by or on behalf of states, territories and possessions of the U.S. (including the District of Columbia) and the political subdivisions, agencies and instrumentalities, the interest on which is exempt from regular federal income tax (i.e., excluded from gross income for federal income tax purposes). As of August 31, 2023, there were 24,440 constituents in the Index and the Index had a weighted average maturity of 6.18 years.
The Index is owned and calculated by Bloomberg Professional Services (the “Index Provider”). The components of the Index are market-value weighted.
The Index Provider constructs the Index in accordance with a rules-based methodology that involves three steps.
Step 1 — In the first step, the Index Provider defines a universe of potential index constituents (the “Universe”) by identifying municipal securities that are constituents of the Bloomberg 1-10 Year Blend Index (the “Reference Index”). The Reference Index covers the intermediate-term segment of the U.S. dollar-denominated tax-exempt municipal bond market. Securities must be rated investment grade (Baa3/BBB-/BBB- or higher) using the middle rating of Moody’s Investors Services, Inc., S&P Global Ratings and Fitch Ratings, Inc.; when a rating from only two agencies is available, the lower is used; when only one agency rates a bond, that rating is used.
Step 2 — In the second step, exclusionary screens are applied. The Index attempts to create a subset of sectors within the Reference Index that focus on fostering community and investing in essential services (including education, healthcare and clean water). This is done by applying the exclusionary screens below—absent their re-inclusion in Step 3:
| ∎ | | 1st screen, based on specific sources of funds and specific uses of proceeds: Sources of funds, such as auto parking revenue; casino revenues; fuel sales tax; highway tolls; lottery revenue; natural gas revenue; nuclear revenue; pari-mutuel betting revenues; port, airport and marina revenues; tobacco and liquor taxes; tobacco settlements; and severance tax. Uses of proceeds, such as bridges; casinos; correctional facilities; highways; lawsuits/settlements; natural gas utilities; parking facilities; nuclear power plants; port, airport and marinas; swap terminations; oil, gas, coal; and steel manufacturing. |
| ∎ | | 2nd screen, based on “sector codes,” (another way Bloomberg classifies bonds), such as GARVEE (grant anticipation revenue vehicles), airports, jails, gas forwards, lottery, nuclear power, parking facilities, ports and tolls. |
| ∎ | | 3rd screen, (1) Texas Permanent School Fund bonds, which are financed primarily through royalties on oil and gas extraction, and (2) any refunding bond where the refunded bond’s purpose is a value on the exclusion list from the 2nd screen, which helps ensure that any bond that had originally financed a project with use of proceeds excluded in the 2nd screen, but was later refunded, would not be overlooked. |
Step 3 — In the third step, the Index incorporates securities labeled green, social or sustainable (“GSS”), as well as pre-refunded bonds with a maximum maturity of 15 years. A bond can receive a GSS classification from Bloomberg even if unlabeled by the issuer if 100% of the use of proceeds is applied to an eligible green, social or sustainability project as defined by the International Capital Market Association (“ICMA”) Principles. Bloomberg sources the supporting data for classification from bond offering statements. A bond receives a GSS classification based on its offering statement if: (1) the issuer “self-labels” the bond as defined under the ICMA Principles, (2) the issuer cites an independent environmental, social and governance assurance provider who has verified that the bonds are in alignment with ICMA Principles, or (3) Bloomberg analysts verify that the offering statement clearly shows that 100% of the use of proceeds will be used to finance or refinance ICMA eligible projects, even though the bond is not
1
INVESTMENT PROCESS
self-labeled or third-party verified. GSS bonds are also benchmark eligible (within the Bloomberg indices suite) and ultimately come from the Bloomberg US Municipal Impact Index.
Given the Fund’s investment objective of attempting to track the Index, the Fund does not follow traditional methods of active investment management, which may involve buying and selling securities based upon analysis of economic and market factors.
The Index is normally rebalanced monthly on the last business day of each month, to account for indicative changes to securities (including credit rating change, sector reclassification, amount outstanding changes, corporate actions and ticker changes, for example).
Goldman Sachs Asset Management, L.P. (the “Investment Adviser”) uses a representative sampling strategy to manage the Fund. “Representative sampling” is an indexing strategy in which the Fund invests in a representative sample of constituent securities that has a collective investment profile similar to that of the Index. The securities selected for investment by the Fund are expected to have, in the aggregate, investment characteristics, fundamental characteristics and liquidity measures similar to those of the Index. The Fund may or may not hold all of the securities in the Index.
The Fund may concentrate its investments (i.e., hold more than 25% of its total assets) in a particular industry or group of industries to the extent that the Index is concentrated. The degree to which components of the Index represent certain sectors or industries may change over time.
* * *
At the end of the Reporting Period, i.e. the period since the Fund’s inception on March 7, 2023 through August 31, 2023, we believed Federal Reserve monetary policy, as well as broader macroeconomic conditions, would drive municipal bond performance in the near term. From a credit perspective, we expected the investment grade municipal bond market to remain resilient relative to other fixed income assets, in line with broader economic conditions. We believed demand would remain robust given the attractive after-tax yields offered by municipal securities, along with strong fundamentals. As for supply, our expectations were slightly below those of previous years at the end of the Reporting Period, driven by the decrease in refunding activity and taxable municipal bond issuance. Events that could affect our views included dramatic changes in the macroeconomic picture that might fuel market volatility; increased supply of municipal bonds; policy changes at the federal or state level to municipal bonds’ tax exempt status; and headline events that could challenge investor demand and/or confidence.
2
PORTFOLIO RESULTS
Goldman Sachs Community Municipal Bond ETF
Investment Objective
The Goldman Sachs Community Municipal Bond ETF (the “Fund”) seeks to provide investment results that closely correspond, before fees and expenses, to the performance of the Bloomberg Goldman Sachs Community Municipal Index (the “Index”).
Portfolio Management Discussion and Analysis
Below, the Goldman Sachs Municipal Fixed Income Investment Team and Goldman Sachs U.S. Fixed Income Team discuss the Fund’s performance and positioning from its inception on March 7, 2023 through August 31, 2023 (the “Reporting Period”).
| Q | | How did the Fund perform during the Reporting Period? |
| A | | During the Reporting Period, the Fund returned 0.23% based on net asset value (“NAV”) and 0.33% based on market price. The Index returned 0.72% during the same period. |
| | | The Fund had an NAV of $49.91 per share on the date of its inception and ended the Reporting Period with an NAV of $49.58 per share. The Fund’s market price on August 31, 2023 was $49.63 per share. |
| Q | | What key factors were responsible for the Fund’s performance during the Reporting Period? |
| A | | The Fund seeks to provide investment results that closely correspond, before fees and expenses, to the performance of the Index. The Fund’s performance reflects Fund expenses, including management fees and brokerage expenses. The Fund’s relative performance also reflects the impact of any cash held in the Fund as well as any other differences between the Fund’s holdings and the constituents of the Index. The Index is unmanaged, and Index returns do not reflect fees and expenses, which would reduce returns. |
| | | The Index is a rules-based index that is designed to measure the performance of the municipal securities market with remaining maturities of between one and 15 years with screens that take into account certain social or environmental factors. These screens may exclude negative sectors, sources of funds and use of proceeds and include securities with potentially environmentally or socially beneficial outcomes. Municipal securities include fixed income securities issued by or on behalf of states, territories and possessions of the U.S. (including the District of Columbia) and the political subdivisions, agencies and instrumentalities, the interest on which is exempt from regular federal income tax (i.e., excluded from gross income for federal income tax purposes). The Index is normally rebalanced monthly on the last business day of each month. |
| Q | | Given the Fund’s investment objective of attempting to track the Index, the Fund does not follow traditional methods of active investment management, which may involve buying and selling securities based upon analysis of economic and market factors. |
| A | | During the Reporting Period, the Fund generated positive absolute returns but modestly underperformed the Index, as measured by NAV. The Fund is passively managed to the Index and aims to minimize tracking error to the Index. |
| | | Overall, municipal bond returns are driven by three key factors — supply and demand dynamics, credit quality and interest rate movements. |
| | | During the Reporting Period, the primary driver of municipal bond performance was interest rate volatility, fueled by Federal Reserve (the “Fed”) monetary policy tightening and idiosyncratic events, such as the U.S. regional banking crisis and federal debt ceiling negotiations. In March 2023, when the Reporting Period began, the Fed raised the targeted federal funds rate by 25 basis points. (A basis point is 1/100th of a percentage point.) Despite the interest rate hike, municipal bond yields fell mid-month and into early April amid a broad flight to quality on concerns about the health of the banking sector. From mid-April through the end of August 2023, municipal bond yields marched higher due to positive economic news and fewer investor anxieties about the potential of a near-term recession. During the Reporting Period overall, the municipal bond market saw a significant drop in supply and robust, though somewhat erratic, demand. Solid credit fundamentals for the majority of municipal bond issuers, along with higher yields, may have made the municipal bond market attractive to certain investors. |
3
PORTFOLIO RESULTS
| Q | | How did the Fund use derivatives and similar instruments during the Reporting Period? |
| A | | The Fund does not employ derivatives. During the Reporting Period, the Fund did not invest in derivatives or similar instruments. The Fund does not employ derivatives as a source of alpha generation, although it may use them to equitize excess cash. |
| Q | | What was the Fund’s weighted average duration, weighted average maturity, weighted average coupon, weighted average yield to maturity and 30-day standardized yield at the end of the Reporting Period?1 |
| A | | The Fund had a weighted average duration of 3.96 years, a weighted average maturity of 5.91 years and a weighted average coupon of 4.51% as of August 31, 2023. The Fund’s weighted average yield to maturity was 3.37% on August 31, 2023. The 30-day standardized yield of the Fund at the end of the Reporting Period was 3.03%. |
| Q | | What was the Fund’s credit allocation at the end of the Reporting Period?2 |
| | | | | | |
| | |
| | AAA | | | 18.71 | % |
| | AA | | | 55.02 | |
| | A | | | 15.80 | |
| | BBB | | | 5.23 | |
| | | Not Rated | | | 4.26 | |
| Q | | What was the Fund’s sector positioning relative to the Index at the end of the Reporting Period?3 |
| | | | | | | | | | |
| | | |
| | | Sector | | Fund | | | Index | |
| | | |
| | Local General Obligation | | | 20.15 | % | | | 19.18 | % |
| | State General Obligation | | | 18.92 | | | | 18.48 | |
| | Water and Sewer | | | 13.34 | | | | 12.22 | |
| | Special Tax | | | 11.94 | | | | 11.31 | |
| | Education | | | 9.82 | | | | 8.70 | |
| | Leasing | | | 7.19 | | | | 8.40 | |
| | Health Care | | | 7.02 | | | | 8.70 | |
| | Power | | | 3.71 | | | | 4.70 | |
| | Transportation | | | 3.69 | | | | 2.89 | |
| | Housing | | | 1.72 | | | | 2.30 | |
| | Industrial Revenue | | | 1.53 | | | | 3.24 | |
| | | Not Classified | | | 0.98 | | | | 0.00 | |
| | 1Duration | | is a time measure of a bond’s interest-rate sensitivity, based on the weighted average of the time periods over which a bond’s cash flows accrue to the bondholder. Time periods are weighted by multiplying by the present value of its cash flow divided by the bond’s price. (A bond’s cash flows consist of coupon payments and repayment of capital.) |
| | A | | bond’s duration will almost always be shorter than its maturity, with the exception of zero-coupon bonds, for which maturity and duration are equal. Weighted average duration is a measure of the duration for the securities in the portfolio overall. Weighted average maturity (“WAM”) is the weighted average amount of time until the debt securities in a portfolio mature, or the weighted average of the remaining terms to maturity of the debt securities within a portfolio. The higher the WAM, the longer it takes for all of the bonds in the portfolio to mature, and WAM is used to manage debt portfolios and to assess the performance of debt portfolio managers. Coupons are fixed percentages paid out on a fixed income security on an annual basis. Weighted average coupon is calculated by weighting the coupon of each debt security by its relative size in the portfolio. Yield to maturity is the annual return that a bond is expected to generate if it is held till its maturity given its coupon rate, payment frequency and current market price. Yield to maturity is essentially the internal rate of return of a bond, i.e. the discount rate at which the present value of a bond’s coupon payments and maturity value is equal to its current market price. The 30-day standardized yield calculation is based on a 30-day period ending on the last day of the Reporting Period. It is computed by dividing the net investment income per share earned during the period by the maximum offering price per share on the last day of the period. |
| | 2The | | Fund and the Index have not been rated by an independent rating agency. The credit allocation provided refers to the Fund’s underlying portfolio securities. For the purpose of determining compliance with any credit rating requirement, the Fund assigns a security, at the time of purchase, the highest rating by a Nationally Recognized Statistical Rating Organization (“NRSRO”) if the security is rated by more than one NRSRO. For this purpose, the Fund relies only on the ratings of the following NRSROs: S&P, Moody’s and Fitch, Inc. This method may differ from the method independently used by the Index Provider. Goldman Sachs Asset Management will use a single rating if that is the only one available. Securities that are not rated by all three agencies are reflected as such in the breakdown. Unrated securities may be purchased by the Fund if they are determined by the Investment Adviser to be of a credit quality consistent with the Fund’s credit rating requirements. Unrated securities do not necessarily indicate low quality, and for such securities the Investment Adviser will evaluate the credit quality. Goldman Sachs Asset Management converts all ratings to the equivalent S&P major rating category when illustrating credit rating breakdowns. Ratings and Fund/Index credit quality may change over time. |
| | 3The | | Fund seeks to provide investment results that closely correspond, before fees and expenses, to the performance of the Index. |
4
PORTFOLIO RESULTS
| Q | | What was the Fund’s state positioning relative to the Index at the end of the Reporting Period?3 |
| | | | | | | | | | |
| | | |
| | | State | | Fund | | | Index | |
| | | |
| | New York | | | 16.93 | % | | | 15.16 | % |
| | California | | | 10.62 | | | | 19.81 | |
| | Texas | | | 10.56 | | | | 6.86 | |
| | Florida | | | 5.57 | | | | 3.28 | |
| | Hawaii | | | 4.17 | | | | 1.17 | |
| | Washington | | | 3.34 | | | | 3.20 | |
| | Ohio | | | 3.32 | | | | 2.79 | |
| | Virginia | | | 3.25 | | | | 2.19 | |
| | New Jersey | | | 2.82 | | | | 4.08 | |
| | Pennsylvania | | | 2.76 | | | | 3.32 | |
| | Illinois | | | 2.71 | | | | 4.65 | |
| | Connecticut | | | 2.37 | | | | 2.31 | |
| | Maryland | | | 1.93 | | | | 2.10 | |
| | District of Columbia | | | 1.94 | | | | 1.43 | |
| | Nevada | | | 1.85 | | | | 1.00 | |
| | Missouri | | | 1.83 | | | | 0.85 | |
| | Tennessee | | | 1.74 | | | | 0.99 | |
| | Massachusetts | | | 1.73 | | | | 4.27 | |
| | Michigan | | | 1.65 | | | | 1.39 | |
| | Utah | | | 1.50 | | | | 0.62 | |
| | Alabama | | | 1.47 | | | | 0.90 | |
| | Oregon | | | 1.37 | | | | 1.30 | |
| | New Mexico | | | 1.15 | | | | 0.31 | |
| | Louisiana | | | 1.06 | | | | 1.01 | |
| | Wisconsin | | | 1.04 | | | | 1.13 | |
| | North Carolina | | | 1.03 | | | | 1.48 | |
| | Colorado | | | 0.96 | | | | 2.05 | |
| | Iowa | | | 0.82 | | | | 0.26 | |
| | North Dakota | | | 0.81 | | | | 0.04 | |
| | Kentucky | | | 0.64 | | | | 0.52 | |
| | Oklahoma | | | 0.63 | | | | 0.32 | |
| | Arizona | | | 0.60 | | | | 1.60 | |
| | Mississippi | | | 0.58 | | | | 0.27 | |
| | Nebraska | | | 0.58 | | | | 0.36 | |
| | Indiana | | | 0.52 | | | | 1.10 | |
| | South Carolina | | | 0.47 | | | | 0.61 | |
| | Montana | | | 0.45 | | | | 0.09 | |
| | Minnesota | | | 0.44 | | | | 1.19 | |
| | Delaware | | | 0.37 | | | | 0.36 | |
| | Alaska | | | 0.31 | | | | 0.15 | |
| | Kansas | | | 0.31 | | | | 0.37 | |
| | Arkansas | | | 0.28 | | | | 0.11 | |
| | Georgia | | | 0.28 | | | | 2.21 | |
| | New Hampshire | | | 0.26 | | | | 0.25 | |
| | Rhode Island | | | 0.00 | | | | 0.13 | |
| | Puerto Rico | | | 0.00 | | | | 0.10 | |
| | West Virginia | | | 0.00 | | | | 0.09 | |
| | South Dakota | | | 0.00 | | | | 0.08 | |
| | Guam | | | 0.00 | | | | 0.04 | |
| | Idaho | | | 0.00 | | | | 0.04 | |
| | Maine | | | 0.00 | | | | 0.03 | |
| | Wyoming | | | 0.00 | % | | | 0.03 | % |
| | Virgin Islands | | | 0.00 | | | | 0.02 | |
| | Vermont | | | 0.00 | | | | 0.02 | |
| | | Non classified | | | 0.98 | | | | 0.00 | |
| Q | | What was the Fund’s municipal bond allocation relative to the Index at the end of the Reporting Period?3 |
| A | | While the Index was 100% invested in municipal bond securities, the Fund was 97.8% invested in municipal bond securities and 0.96% in cash at the end of the Reporting Period. |
| | 3The | | Fund seeks to provide investment results that closely correspond, before fees and expenses, to the performance of the Index. |
5
FUND BASICS
Community Municipal Bond ETF
as of August 31, 2023
| | | | | | |
| | FUND SNAPSHOT | |
| | |
| | | As of August 31, 2023 | | | |
| | |
| | Market Price1 | | $ | 49.63 | |
| | | Net Asset Value (NAV)1 | | $ | 49.58 | |
| 1 | | The Market Price is the price at which the Fund’s shares are trading on the NYSE Arca, Inc. The Market Price of the Fund’s shares will fluctuate and, at the time of sale, shares may be worth more or less than the original investment or the Fund’s then current net asset value (“NAV”). The NAV is the market value of one share of the Fund. This amount is derived by dividing the total value of all the securities in the Fund’s portfolio, plus other assets, less any liabilities, by the number of Fund shares outstanding. Fund shares are not individually redeemable and are issued and redeemed by the Fund at their NAV only in large, specified blocks of shares called creation units. Shares otherwise can be bought and sold only through exchange trading at market price (not NAV). Shares may trade at a premium or discount to their NAV in the secondary market. Information regarding how often shares of the Fund traded on NYSE Arca at a price above (i.e., at a premium) or below (i.e., at a discount) the NAV of the Fund can be found at www.GSAMFUNDS.com/ETFs. |
| | | | | | | | |
| | TOP 10 HOLDINGS AS OF 8/31/232 |
| | | |
| | | Holding | | % of Net Assets | | | State |
| | | |
| | The School District Of Springfield R-Xii Springfield Missouri GO School Refunding Bonds 2017 Missouri Direct Deposit Program, 4.00%, 03/01/29 | | | 1.0 | % | | Missouri |
| | State of California GO Various Purpose Bonds, 5.00%, 11/01/31 | | | 0.7 | | | California |
| | Fairfax County Public Improvement Bonds Series 2022A, 4.00%, 10/01/25 | | | 0.6 | | | Virginia |
| | State Of Hawaii GO Bonds Of 2015 Series ET, 3.25%, 10/01/25 | | | 0.6 | | | Hawaii |
| | New York City Municipal Water Finance Authority, 5.00%, 06/15/32 | | | 0.6 | | | New York |
| | State of California Tax Exempt Various Purpose GO Refunding Bonds, 5.00%, 09/01/28 | | | 0.6 | | | California |
| | Commonwealth of Massachusetts, 5.00%, 05/01/29 | | | 0.5 | | | Massachusetts |
| | Commonwealth Of Pennsylvania GO Bonds: First Series Of 2016 And First Refunding Series Of 2016, 5.00%, 09/15/26 | | | 0.5 | | | Pennsylvania |
| | City And County Of Honolulu Wastewater System RB Junior Series 2015A Refunding Second Bond Resolution, 5.00%, 07/01/26 | | | 0.5 | | | Hawaii |
| | | New Mexico Hospital Equipment Loan Council Hospital System RB Presbyterian Healthcare Services Series 2015A, 5.00%, 08/01/25 | | | 0.5 | | | New Mexico |
| 2 | | The top 10 holdings may not be representative of the Fund’s future investments. |
For more information about the Fund, please refer to www.GSAMFUNDS.com/ETFs. There, you can learn more about the Fund’s investment strategies, holdings, and performance.
6
GOLDMAN SACHS COMMUNITY MUNICIPAL BOND ETF
Performance Summary
August 31, 2023
| | |
| Cumulative Total Return through August 31, 2023* | | Since Inception |
Shares based on NAV (Commenced March 7, 2023) | | 0.42% |
|
Shares based on Market Price (Commenced March 7, 2023) | | 0.33% |
|
| * | | Total return for periods of less than one year represents cumulative total return. Total returns are calculated assuming purchase of a share at the market price or NAV on the first day and sale of a share at the market price or NAV on the last day of each period reported. The total returns based on NAV and Market Price assume the reinvestment of dividends and do not reflect brokerage commissions in connection with the purchase or sale of Fund shares, which if included would lower the performance shown above. The NAV used in the total return calculation assumes all management fees incurred by the Fund. Market Price returns are based upon the last trade as of 4:00pm EST and do not reflect the returns you would receive if you traded shares at other times. The first day of secondary market trading is typically several days after the date on which the Fund commenced investment operations; therefore, the NAV of the Fund is used as a proxy for the period from inception of investment operations to the first day of secondary market trading to calculate the Market Price returns. |
The returns set forth above represent past performance. Past performance does not guarantee future results. The Fund’s NAV and investment return may fluctuate. These fluctuations may cause an investor’s shares to be worth more or less than their original cost. Current performance may be lower or higher than the performance quoted above. Please visit our web site at www.GSAMFUNDS.com/ETFs to obtain the most recent month-end returns.
7
FUND BASICS
Index Definitions and Industry Terms
“Bloomberg®” and the Bloomberg Goldman Sachs Community Municipal Index (the “Index”) are service marks of Bloomberg Finance L.P. and its affiliates, including Bloomberg Index Services Limited (“BISL”), the administrator of the index (collectively, “Bloomberg”), and have been licensed for use for certain purposes by GSAM. The Goldman Sachs Community Municipal Bond ETF is not sponsored, endorsed, sold or promoted by Bloomberg. Bloomberg does not make any representation or warranty, express or implied, to the owners of or counterparties to the Goldman Sachs Community Municipal Bond ETF or any member of the public regarding the advisability of investing in securities generally or in the Goldman Sachs Community Municipal Bond ETF particularly. The only relationship of Bloomberg to GSAM is the licensing of certain trademarks, trade names and service marks and of the Index, which is determined, composed and calculated by BISL without regard to GSAM or the Goldman Sachs Community Municipal Bond ETF. Bloomberg has no obligation to take the needs of GSAM or the owners of the Goldman Sachs Community Municipal Bond ETF into consideration in determining, composing or calculating the Index. Bloomberg is not responsible for and has not participated in the determination of the timing of, prices at, or quantities of the Goldman Sachs Community Municipal Bond ETF to be issued. Bloomberg shall not have any obligation or liability, including, without limitation, to Goldman Sachs Community Municipal Bond ETF customers, in connection with the administration, marketing or trading of the Goldman Sachs Community Municipal Bond ETF.
8
GOLDMAN SACHS COMMUNITY MUNICIPAL BOND ETF
Schedule of Investments
August 31, 2023
| | | | | | | | | | | | | | |
Principal
Amount | | | Interest
Rate | | | Maturity
Date | | | Value | |
|
| Municipal Bonds – 97.8% | |
| Alabama – 1.4% | |
| Alabama Public School and College Authority Tax Exempt
Capital improvement and RB, Series 2020-A (Aa1/AA) |
|
| $ | 50,000 | | | | 5.000 | % | | | 11/01/2026 | | | $ | 52,873 | |
| | 50,000 | | | | 5.000 | | | | 11/01/2031 | | | | 56,375 | |
| | 50,000 | | | | 5.000 | | | | 11/01/2034 | | | | 55,994 | |
| | 50,000 | | | | 5.000 | | | | 11/01/2035 | | | | 55,511 | |
| | 65,000 | | | | 4.000 | | | | 11/01/2036 | | | | 65,717 | |
| | | | | | | | | | | | | | |
| | | | | | | | | | | | | 286,470 | |
| | |
| Alaska – 0.3% | |
| Municipality of Anchorage, Alaska 2014 GO Refunding Bonds
Series B (NR/AA) |
|
| | 60,000 | | | | 5.000 | | | | 09/01/2024 | | | | 60,920 | |
| | |
| Arizona – 0.6% | |
| | Arizona Health Facilities Authority RB Series 2014A (A2/NR) | |
| | 50,000 | | | | 5.000 | | | | 12/01/2024 | | | | 50,842 | |
| City of Mesa Utility Systems Revenue Refunding Bonds
Series 2019C (Aa2/AA-) |
|
| | 60,000 | | | | 5.000 | | | | 07/01/2034 | | | | 65,986 | |
| | | | | | | | | | | | | | |
| | | | | | | | | | | | | 116,828 | |
| | |
| Arkansas – 0.3% | |
| City of Fort Smith Water and Sewer Refunding and Construction
RB Series 2018 (NR/A) |
|
| | 50,000 | | | | 5.000 | | | | 10/01/2030 | | | | 53,435 | |
| | |
| California – 10.5% | |
| California Health Facilities Financing Authority RB Series 2013A
(NR/A-) |
|
| | 60,000 | | | | 4.000 | | | | 03/01/2033 | | | | 57,452 | |
| California Health Facilities Financing Authority, Refunding RB
(Cedars-Sinai Medical Center) Series 2015 (Aa3/NR) |
|
| | 50,000 | | | | 3.500 | | | | 11/15/2034 | | | | 49,534 | |
| California Infrastructure and Economic Development Bank Lease
RB (California State Teachers Retirement System Headquarters
Expansion) Green Bond Series 2019 (NR/A+) |
|
| | 50,000 | | | | 5.000 | | | | 08/01/2035 | | | | 54,884 | |
| California Infrastructure and Economic Development Bank,
California Clean Water and Drinking Water State Revolving
Fund RB Breen Bond Series 2023 (Aaa/AAA) |
|
| | 50,000 | | | | 5.000 | | | | 10/01/2028 | | | | 55,315 | |
| City of Los Angeles Department of Water and Power Water
System RB 2017 Series A (Aa2/AA+) |
|
| | 50,000 | | | | 5.000 | | | | 07/01/2033 | | | | 53,490 | |
| Department of Water and Power of the City of Los Angeles RB
Series 2018 D (Aa2/AA-) |
|
| | 70,000 | | | | 5.000 | | | | 07/01/2034 | | | | 76,825 | |
| Golden State Tobacco Securitization Corp. California Tobacco
Settlement Revenue Enhanced Asset Backed Bonds 2005A
(Aa3/A+)(b) |
|
| | 100,000 | | | | 0.000 | (a) | | | 06/01/2024 | | | | 97,668 | |
| Golden State Tobacco Securitization Corp. Enhanced Tobacco
Settlement Asset Backed Bonds 2015A (Aa3/A+)(b) |
|
| | 20,000 | | | | 4.000 | | | | 06/01/2025 | | | | 20,367 | |
| Los Angeles Unified School District 2014 GO Refunding Bond
Series D (Aa3/AA-) |
|
| | 80,000 | | | | 5.000 | | | | 07/01/2025 | | | | 82,797 | |
| | |
|
| Municipal Bonds – (continued) | |
| California – (continued) | |
| Los Angeles Unified School District GO Bonds, Measure Q
Series C (Aa3/NR) |
|
| 50,000 | | | | 5.000 | | | | 07/01/2025 | | | | 50,771 | |
| Palomar Community College District 2015 GO Refunding Bonds
(AA2/AA)(b) |
|
| | 80,000 | | | | 5.000 | | | | 05/01/2025 | | | | 82,611 | |
| San Bernadino Community College District, San Bernardino and
Riverside Counties Election of 2002 GO Bonds Series D
(Aa1/AA) |
|
| | 50,000 | | | | 0.000 | (a) | | | 08/01/2032 | | | | 36,936 | |
| San Bernardino Community College District, San Bernardino and
Riverside Counties Election Of 2002 GO Bonds Series D
(Aa1/AA) |
|
| | 100,000 | | | | 0.000 | (a) | | | 08/01/2033 | | | | 70,782 | |
| San Diego Unified School District 2015 GO Refunding Bonds
Dedicated Unlimited Ad Valorem Property Tax Bonds
Series R-4 (Aa2/AA-) |
|
| | 80,000 | | | | 5.000 | | | | 07/01/2025 | | | | 82,783 | |
| San Diego Unified School District GO Refunding Bonds
Series 2012 R-1 (Aa2/AA-) |
|
| | 50,000 | | | | 0.000 | (a) | | | 07/01/2031 | | | | 38,018 | |
| San Francisco Bay Area Rapid Transit District GO Bonds
Election of 2016 2017 Series A-1 Green Bonds (Aaa/A+) |
|
| | 50,000 | | | | 5.000 | | | | 08/01/2031 | | | | 53,881 | |
| | 45,000 | | | | 4.000 | | | | 08/01/2036 | | | | 45,608 | |
| San Francisco Bay Area Rapid Transit District Sales Tax Revenue
Bonds 2015 Refunding Series A (NR/AA+) |
|
| | 50,000 | | | | 5.000 | | | | 07/01/2027 | | | | 51,710 | |
| San Jose Evergreen California Community College District GO
Bonds Election of 2004 B (Aa1/AA+) |
|
| | 50,000 | | | | 0.000 | (a) | | | 09/01/2031 | | | | 37,660 | |
| | State of California GO Various Purpose Bonds (Aa2/AA-) | |
| | 50,000 | | | | 5.000 | | | | 03/01/2030 | | | | 56,373 | |
| | 120,000 | | | | 5.000 | | | | 11/01/2031 | | | | 135,988 | |
| | 50,000 | | | | 5.000 | | | | 03/01/2032 | | | | 56,289 | |
| | 50,000 | | | | 5.000 | | | | 11/01/2032 | | | | 54,986 | |
| | 50,000 | | | | 5.000 | | | | 03/01/2034 | | | | 56,104 | |
| State of California GO Various Purpose Refunding Bonds
(Aa2/AA-) |
|
| | 50,000 | | | | 5.000 | | | | 11/01/2030 | | | | 53,867 | |
| | 50,000 | | | | 5.000 | | | | 11/01/2032 | | | | 58,595 | |
| State of California Tax Exempt Various Purpose GO Refunding
Bonds (Aa2/AA-) |
|
| | 110,000 | | | | 5.000 | | | | 09/01/2028 | | | | 114,300 | |
| | 60,000 | | | | 5.000 | | | | 10/01/2028 | | | | 66,049 | |
| State Public Works Board of the State of California Lease
Revenue Refunding Bonds 2015 Series G (Aa3/A+) |
|
| | 60,000 | | | | 5.000 | | | | 05/01/2025 | | | | 61,879 | |
| The Metropolitan Water District of Southern California Water
Revenue Bonds 2015 Authorization Series A (Aa1/AAA) |
|
| | 100,000 | | | | 5.000 | | | | 07/01/2024 | | | | 101,635 | |
| The Regents of the University of California General Revenue
Bonds 2017 Series AY (AA2/AA) |
|
| | 70,000 | | | | 5.000 | | | | 05/15/2032 | | | | 75,053 | |
| | |
| | |
| The accompanying notes are an integral part of these financial statements. | | 9 |
GOLDMAN SACHS COMMUNITY MUNICIPAL BOND ETF
Schedule of Investments (continued)
August 31, 2023
| | | | | | | | | | | | | | |
Principal
Amount | | | Interest
Rate | | | Maturity
Date | | | Value | |
|
| Municipal Bonds – (continued) | |
| California – (continued) | |
| Trustees of the California State University System Wide RB
Series 2015A (Aa2/AA-) |
|
| $ | 50,000 | | | | 5.000 | % | | | 11/01/2032 | | | $ | 51,843 | |
| WM S Hart High School District GO Bonds Election 2001
2005 B (Aa2/AA) |
|
| | 50,000 | | | | 0.000 | (a) | | | 09/01/2029 | | | | 40,216 | |
| | | | | | | | | | | | | | |
| | | | | | | | | | | | | 2,082,269 | |
| | |
| Colorado – 1.0% | |
| Colorado Health Facilities Authority Hospital RB Series 2015
(NR/A+) |
|
| | 50,000 | | | | 5.000 | | | | 01/15/2035 | | | | 51,366 | |
| | Colorado Health Facilities Authority RB Series 2019A (NR/A+) | |
| | 50,000 | | | | 5.000 | | | | 11/01/2034 | | | | 53,403 | |
| State of Colorado Higher Education Capital Construction Lease
Purchase Financing program Certificates of Participation
Series 2014 A (Aa2/AA-) |
|
| | 80,000 | | | | 5.000 | | | | 11/01/2025 | | | | 82,982 | |
| | | | | | | | | | | | | | |
| | | | | | | | | | | | | 187,751 | |
| | |
| Connecticut – 2.3% | |
| Connecticut State Health & Educational Facilities Authority RB
Quinnipiac University Issue Series L (A3/A-) |
|
| | 65,000 | | | | 5.000 | | | | 07/01/2032 | | | | 66,526 | |
| | State of Connecticut GO Bonds (Aa3/AA-) | |
| | 50,000 | | | | 5.000 | | | | 11/15/2030 | | | | 51,760 | |
| | 50,000 | | | | 5.000 | | | | 11/15/2032 | | | | 51,648 | |
| | State of Connecticut GO Bonds 2015 Series A (Aa3 /AA-) | |
| | 60,000 | | | | 4.000 | | | | 03/15/2032 | | | | 60,514 | |
| State Of Connecticut GO Refunding Bonds Series 2016 B
(Aa3/AA-) |
|
| | 50,000 | | | | 5.000 | | | | 05/15/2027 | | | | 52,355 | |
| State Of Connecticut Tax Exempt GO Bonds 2018 Series E
(Aa3/AA-) |
|
| | 70,000 | | | | 5.000 | | | | 09/15/2034 | | | | 75,708 | |
| State Of Connecticut Tax Exempt GO Bonds Series 2018 E
(Aa3/AA-) |
|
| | 50,000 | | | | 5.000 | | | | 09/15/2025 | | | | 51,700 | |
| | University Of Connecticut GO Bonds Series 2013 A (Aa3/AA-) | |
| | 50,000 | | | | 4.000 | | | | 08/15/2029 | | | | 50,001 | |
| | | | | | | | | | | | | | |
| | | | | | | | | | | | | 460,212 | |
| | |
| Delaware – 0.4% | |
| The State Of Delaware GO Refunding Bonds Series 2017A
(Aaa/AAA) |
|
| | 67,000 | | | | 5.000 | | | | 01/01/2028 | | | | 72,818 | |
| | |
| District of Columbia – 1.9% | |
| District Of Columbia Hospital RB Refunding Children’s Hospital
Obligated Group Issue Series 2015 (A1/NR) |
|
| | 50,000 | | | | 5.000 | | | | 07/15/2031 | | | | 51,509 | |
| District Of Columbia Washington D.C. GO Bonds Series 2015B
(Aaa/AA+) |
|
| | 60,000 | | | | 5.000 | | | | 06/01/2026 | | | | 61,600 | |
| District Of Columbia Washington D.C. GO Bonds Series 2017D
(Aaa/AA+) |
|
| | 100,000 | | | | 4.000 | | | | 06/01/2033 | | | | 101,929 | |
| | |
|
| Municipal Bonds – (continued) | |
| District of Columbia – (continued) | |
| District Of Columbia Washington D.C. GO Bonds Series 2021D
(Aaa/AA+) |
|
| 50,000 | | | | 5.000 | | | | 02/01/2029 | | | | 55,170 | |
| District Of Columbia Washington D.C. Income Tax Secured RB
Series 2019A Tax Exempt (Aa1/AAA) |
|
| | 50,000 | | | | 5.000 | | | | 03/01/2028 | | | | 54,329 | |
| | 50,000 | | | | 5.000 | | | | 03/01/2030 | | | | 55,501 | |
| | | | | | | | | | | | | | |
| | | | | | | | | | | | | 380,038 | |
| | |
| Florida – 5.5% | |
| City Of Cape Coral Fl Water And Sewer Refunding RB
Series 2017 (A1/A+) |
|
| | 60,000 | | | | 5.000 | | | | 10/01/2032 | | | | 63,726 | |
| City Of Jacksonville Transportation RB Refunding Series 2015
(Aa3/AA-) |
|
| | 50,000 | | | | 3.000 | | | | 10/01/2031 | | | | 48,025 | |
| City Of Jacksonville Transportation Refunding RB Series 2015
(Aa3/AA-) |
|
| | 70,000 | | | | 5.000 | | | | 10/01/2027 | | | | 71,897 | |
| Florida State Board Of Education Florida Public Education
Capital Outlay Refunding Bonds 2019 Series C (Aaa/AAA) |
|
| | 50,000 | | | | 5.000 | | | | 06/01/2031 | | | | 55,411 | |
| Greater Orlando Aviation Authority Priority Subordinated Airport
Facilities RB Series 2017A Amt Of The City Of Orlando
Florida (A1/A+)(b) |
|
| | 60,000 | | | | 5.000 | | | | 10/01/2027 | | | | 63,415 | |
| | JEA Water And Sewer System RB 2017 Series A (Aa2/AA+) | |
| | 75,000 | | | | 5.000 | | | | 10/01/2025 | | | | 77,552 | |
| Miami-Dade County Water And Sewer System Revenue
Refunding Bonds Series 2017B (Aa3/AA-) |
|
| | 50,000 | | | | 5.000 | | | | 10/01/2032 | | | | 51,224 | |
| Orange County Florida Tourist Development Tax RB Refunding
Series 2010 (NR/AA-) |
|
| | 50,000 | | | | 5.000 | | | | 10/01/2024 | | | | 50,631 | |
| Orlando Utilities Commission Utility System RB Series 2018A
(Aa2/AA) |
|
| | 70,000 | | | | 5.000 | | | | 10/01/2032 | | | | 75,177 | |
| Orlando Utilities Commission Utility System Revenue Refunding
Bonds Series 2013A (Aa2/AA) |
|
| | 70,000 | | | | 5.000 | | | | 10/01/2024 | | | | 71,194 | |
| Reedy Creek Improvement District Florida Ad Valorem Tax
Bonds Series 2017A (Aa3/AA-) |
|
| | 60,000 | | | | 5.000 | | | | 06/01/2030 | | | | 63,635 | |
| School District Of Pasco County Sales Tax RB Series 2013
(A1/NR) |
|
| | 50,000 | | | | 5.000 | | | | 10/01/2024 | | | | 50,816 | |
| Seminole County Water And Sewer Refunding RB Series 2015 A
(Aa2/AA+) |
|
| | 50,000 | | | | 4.000 | | | | 10/01/2030 | | | | 50,663 | |
| State Of Florida Full Faith And Credit State Board Of Education
Public Education Capital Outlay Refunding Bonds 2022
Series B Forward Delivery (Aaa/AAA) |
|
| | 50,000 | | | | 5.000 | | | | 06/01/2028 | | | | 54,617 | |
| State Of Florida State Board Of Education Full Faith And Credit
Public Education Capital Outlay Refunding Bonds 2015
Series A (Aaa/AAA) |
|
| | 100,000 | | | | 5.000 | | | | 06/01/2026 | | | | 101,477 | |
| | |
| | |
| 10 | | The accompanying notes are an integral part of these financial statements. |
GOLDMAN SACHS COMMUNITY MUNICIPAL BOND ETF
| | | | | | | | | | | | | | |
Principal
Amount | | | Interest
Rate | | | Maturity
Date | | | Value | |
|
| Municipal Bonds – (continued) | |
| Florida – (continued) | |
| Tampa Bay Wtr Fla Util Sys Rev Ref & Impt Rev Bonds 2001 A
(Aa1/AA+) |
|
| $ | 50,000 | | | | 6.000 | % | | | 10/01/2029 | | | $ | 58,550 | |
| The School Board Of Miami-Dade County Florida Certificates Of
Participation Series 2015D (Aaa/AAA) |
|
| | 75,000 | | | | 4.000 | | | | 02/01/2032 | | | | 76,183 | |
| | | | | | | | | | | | | | |
| | | | | | | | | | | | | 1,084,193 | |
| | |
| Georgia – 0.3% | |
| Forsyth County School District Georgia GO Bonds Series 2020
(Aa2/NR) |
|
| | 50,000 | | | | 5.000 | | | | 02/01/2030 | | | | 56,324 | |
| | |
| Hawaii – 4.1% | |
| | City And County Of Honolulu GO Bonds Series C (Aa2/NR) | |
| | 50,000 | | | | 4.000 | | | | 10/01/2033 | | | | 50,461 | |
| City And County Of Honolulu GO Bonds Series 2017D Tax-
Exempt Refunding Bonds (Aa2/NR) |
|
| | 50,000 | | | | 5.000 | | | | 09/01/2032 | | | | 53,434 | |
| City And County Of Honolulu GO Bonds Series 2018A Tax
Exempt (Aa2/NR) |
|
| | 50,000 | | | | 5.000 | | | | 09/01/2029 | | | | 54,401 | |
| City And County Of Honolulu GO Bonds Series 2021E Honolulu
Rail Transit Project (Aa2/NR) |
|
| | 50,000 | | | | 5.000 | | | | 03/01/2029 | | | | 54,927 | |
| City And County Of Honolulu GO Bonds Series 2022A Tax
Exempt Forward Refunding (Aa2/NR) |
|
| | 50,000 | | | | 5.000 | | | | 11/01/2027 | | | | 53,874 | |
| City And County Of Honolulu GO Tax Exempt Refunding Bonds
Series 2017D (Aa2/NR) |
|
| | 50,000 | | | | 5.000 | | | | 09/01/2033 | | | | 53,415 | |
| City And County Of Honolulu Wastewater System RB Junior
Series 2015A Refunding Second Bond Resolution (Aa3/NR) |
|
| | 100,000 | | | | 5.000 | | | | 07/01/2026 | | | | 102,934 | |
| | State Of Hawaii GO Bonds Of 2015 Series ET (Aa2/AA+)(b) | |
| | 120,000 | | | | 3.250 | | | | 10/01/2025 | | | | 119,862 | |
| | State Of Hawaii GO Bonds Of 2017 Series FK (Aa2/AA+) | |
| | 60,000 | | | | 5.000 | | | | 05/01/2024 | | | | 60,634 | |
| | State Of Hawaii GO Bonds Of 2018 Series FT (Aa2/AA+) | |
| | 50,000 | | | | 5.000 | | | | 01/01/2034 | | | | 53,708 | |
| | State Of Hawaii GO Bonds Series 2017 FK (Aa2/AA+) | |
| | 50,000 | | | | 5.000 | | | | 05/01/2033 | | | | 53,115 | |
| State Of Hawaii GO Refunding Bonds Of 2017 Series FN
(Aa2/AA+) |
|
| | 50,000 | | | | 5.000 | | | | 10/01/2029 | | | | 53,588 | |
| State Of Hawaii GO Refunding Bonds Series 2017 FN
(Aa2/AA+) |
|
| | 50,000 | | | | 5.000 | | | | 10/01/2026 | | | | 52,728 | |
| | | | | | | | | | | | | | |
| | | | | | | | | | | | | 817,081 | |
| | |
| Illinois – 2.7% | |
| Illinois Finance Authority RB Rush University Medical Center
Obligated Group Series 2015A (A1/A+) |
|
| | 50,000 | | | | 5.000 | | | | 11/15/2029 | | | | 50,999 | |
| | 70,000 | | | | 5.000 | | | | 11/15/2034 | | | | 71,167 | |
| | Illinois St GO Bonds October 2020 B (A3/A-) | |
| | 100,000 | | | | 4.000 | | | | 10/01/2032 | | | | 101,220 | |
| | |
|
| Municipal Bonds – (continued) | |
| Illinois – (continued) | |
| | Illinois St GO Bonds October 2020 B (A3/A-) – (continued) | |
| 60,000 | | | | 4.000 | | | | 10/01/2034 | | | | 60,170 | |
| | Regional Transn Auth Ill Go Bonds 2004A (Aa3/AA) | |
| | 50,000 | | | | 5.750 | | | | 06/01/2029 | | | | 56,078 | |
| Sales Tax Securitization Corp. Sales Tax Securitization Bonds
Series 2023A Social Bonds (NR/AA-) |
|
| | 60,000 | | | | 3.000 | | | | 01/01/2027 | | | | 57,939 | |
| | State Of Illinois GO Bonds Series November 2019A (A3/A-) | |
| | 50,000 | | | | 5.000 | | | | 11/01/2026 | | | | 51,975 | |
| | State Of Illinois GO Bonds Series Of December 2017B (A3/A-) | |
| | 75,000 | | | | 5.000 | | | | 12/01/2025 | | | | 77,064 | |
| | | | | | | | | | | | | | |
| | | | | | | | | | | | | 526,612 | |
| | |
| Indiana – 0.5% | |
| Indiana Revenues Special Program Carmel Jr Waterworks Project
Series 2008 B (A1/AA) |
|
| | 55,000 | | | | 0.000 | (a) | | | 06/01/2031 | | | | 40,956 | |
| The Trustees Of Indiana University Indiana University
Consolidated RB Series 2015A (Aaa/AAA) |
|
| | 60,000 | | | | 5.000 | | | | 06/01/2026 | | | | 61,713 | |
| | | | | | | | | | | | | | |
| | | | | | | | | | | | | 102,669 | |
| | |
| Iowa – 0.8% | |
| Board Of Regents State Of Iowa Hospital Revenue Refunding
Bonds Series S.U.I. 2022C University Of Iowa Hospitals And
Clinics (Aa2/AA+) |
|
| | 50,000 | | | | 5.000 | | | | 09/01/2028 | | | | 54,356 | |
| Iowa Finance Authority State Revolving Fund RB Series 2017
Green Bonds (Aaa/AAA) |
|
| | 50,000 | | | | 5.000 | | | | 08/01/2027 | | | | 53,691 | |
| | 50,000 | | | | 5.000 | | | | 08/01/2030 | | | | 53,773 | |
| | | | | | | | | | | | | | |
| | | | | | | | | | | | | 161,820 | |
| | |
| Kansas – 0.3% | |
| Johnson County Kansas GO Internal Improvement Bonds
Series 2018A (Aaa/AAA) |
|
| | 60,000 | | | | 5.000 | | | | 09/01/2024 | | | | 60,984 | |
| | |
| Kentucky – 0.6% | |
| Kentucky Municipal Power Agency Power System Revenue
Refunding Bonds for Prairie State Project Series 2015A
(Baa1/NR) |
|
| | 50,000 | | | | 5.000 | | | | 09/01/2025 | | | | 51,207 | |
| Kentucky Municipal Power Agency Power System Revenue
Refunding Bonds Prairie State Project Series 2015A (Baa1/NR) |
|
| | 75,000 | | | | 5.000 | | | | 09/01/2024 | | | | 75,974 | |
| | | | | | | | | | | | | | |
| | | | | | | | | | | | | 127,181 | |
| | |
| Louisiana – 1.1% | |
| | City of New Orleans GO Refunding Bonds Series 2022 (A2/A+) | |
| | 50,000 | | | | 5.000 | | | | 12/01/2025 | | | | 51,738 | |
| City of Shreveport La Water & Sewer RB Junior Lien
Series 2018C (Baa2/AA) |
|
| | 60,000 | | | | 5.000 | | | | 12/01/2026 | | | | 62,739 | |
| Louisiana Local Government Environmental Facilities and
Community Development Authority Revenue Refunding Bonds
Series 2017 GO Zone Non-Amt (NR/BBB) |
|
| | 100,000 | | | | 3.500 | | | | 11/01/2032 | | | | 94,358 | |
| | | | | | | | | | | | | | |
| | | | | | | | | | | | | 208,835 | |
| | |
| | |
| The accompanying notes are an integral part of these financial statements. | | 11 |
GOLDMAN SACHS COMMUNITY MUNICIPAL BOND ETF
Schedule of Investments (continued)
August 31, 2023
| | | | | | | | | | | | | | |
Principal
Amount | | | Interest
Rate | | | Maturity
Date | | | Value | |
|
| Municipal Bonds – (continued) | |
| Maryland – 1.9% | |
| Montgomery County GO Consolidated Public Improvement
Bonds Series 2020 A (Aaa/AAA) |
|
| $ | 50,000 | | | | 4.000 | % | | | 08/01/2031 | | | $ | 53,181 | |
| State Of Maryland GO Bonds State And Local Facilities Loan Of
2019 First Series Tax Exempt Bonds Bidding Group 1 (Aaa/
AAA) |
|
| | 70,000 | | | | 5.000 | | | | 03/15/2027 | | | | 74,717 | |
| State Of Maryland GO Bonds State And Local Facilities Loan Of
2020 Second Series A Tax Exempt Bonds Bidding Group 2
(Aaa/AAA) |
|
| | 50,000 | | | | 5.000 | | | | 08/01/2032 | | | | 56,593 | |
| State Of Maryland GO Bonds State And Local Facilities Loan Of
2020 Second Series A Tax Exempt Bonds Second Series A
Bidding Group 1 Bonds (Aaa/AAA) |
|
| | 50,000 | | | | 5.000 | | | | 08/01/2028 | | | | 54,870 | |
| | 75,000 | | | | 5.000 | | | | 08/01/2030 | | | | 84,895 | |
| Washington Suburban Sanitary District Maryland Consolidated
Public Improvement Refunding Bonds Of 2020 Montgomery
And Prince George’s Counties Maryland (Aaa/AAA) |
|
| | 50,000 | | | | 5.000 | | | | 06/01/2030 | | | | 56,508 | |
| | | | | | | | | | | | | | |
| | | | | | | | | | | | | 380,764 | |
| | |
| Massachusetts – 1.7% | |
| Commonwealth Of Massachusetts GO Bonds Consolidated Loan
of 2019 Series F (Aa1/AA+) |
|
| | 95,000 | | | | 5.000 | | | | 05/01/2029 | | | | 105,670 | |
| Commonwealth Of Massachusetts GO Refunding Bonds 2018
Series C (Aa1/AA+) |
|
| | 60,000 | | | | 5.000 | | | | 09/01/2032 | | | | 69,847 | |
| Massachusetts Bay Transportation Authority RB Series 2005 A
(Aa2/AA+) |
|
| | 50,000 | | | | 5.000 | | | | 07/01/2025 | | | | 51,550 | |
| Massachusetts Water Pollution Abatement Trust State Revolving
Fund Refunding Bonds Series 2014 (Aaa/AAA) |
|
| | 60,000 | | | | 5.000 | | | | 08/01/2024 | | | | 60,931 | |
| School Building Authority Senior Dedicated Sales Tax Refunding
Bonds Series 2015 C (Aa2/AA+) |
|
| | 50,000 | | | | 5.000 | | | | 08/15/2025 | | | | 51,699 | |
| | | | | | | | | | | | | | |
| | | | | | | | | | | | | 339,697 | |
| | |
| Michigan – 1.6% | |
| Michigan Financial Authority Sparrow Obligated Group
Refunding Bonds 2015 (NR/A-) |
|
| | 30,000 | | | | 5.000 | | | | 11/15/2031 | | | | 30,371 | |
| Michigan Financial Authority Sparrow Obligated Group
Refunding Bonds 2015 (NR/NR)(b) |
|
| | 20,000 | | | | 5.000 | | | | 05/15/2025 | | | | 20,567 | |
| Michigan State Building Authority 2013 RB and Refunding
Bonds Series 1-A (Aa2-/AA-) |
|
| | 50,000 | | | | 5.000 | | | | 10/15/2029 | | | | 50,076 | |
| Michigan State Housing Development Authority Rental Housing
RB 2019 Series A-1 Non-Amt (NR/AA+) |
|
| | 75,000 | | | | 2.875 | | | | 10/01/2034 | | | | 66,362 | |
| Royal Oak Hospital Finance Authority RB Refunding Bonds for
William Beaumont Hospital Obligated Group Series 2014D
(Aa3/AA)(b) |
|
| | 75,000 | | | | 5.000 | | | | 03/01/2024 | | | | 75,557 | |
| | |
|
| Municipal Bonds – (continued) | |
| Michigan – (continued) | |
| State Of Michigan GO Environmental Program And Refunding
Bonds Series 2017A Tax Exempt (Aa1/AA) |
|
| 75,000 | | | | 5.000 | | | | 05/01/2026 | | | | 78,464 | |
| | | | | | | | | | | | | | |
| | | | | | | | | | | | | 321,397 | |
| | |
| Minnesota – 0.4% | |
| State Of Minnesota GO State Various Purpose Bonds
Series 2018A (Aaa/AAA) |
|
| | 80,000 | | | | 5.000 | | | | 08/01/2031 | | | | 87,999 | |
| | |
| Mississippi – 0.6% | |
| Mississippi Development Bank Special Obligation Bonds
Series 2015A Jackson Public School District GO Refunding
Bond Project Series 2015B Jackson Public School District
Limited Tax Refunding Note Project (NR/A+) |
|
| | 60,000 | | | | 5.000 | | | | 04/01/2026 | | | | 62,069 | |
| State Of Mississippi Tax Exempt GO Bonds Series 2015A
(Aa2/AA)(b) |
|
| | 50,000 | | | | 4.000 | | | | 10/01/2025 | | | | 50,668 | |
| | | | | | | | | | | | | | |
| | | | | | | | | | | | | 112,737 | |
| | |
| Missouri – 1.8% | |
| Jackson County Special Obligation Refunding Bonds for Harry S.
Truman Sports Complex Project Series 2014 (Aa3/NR) |
|
| | 50,000 | | | | 5.000 | | | | 12/01/2024 | | | | 50,794 | |
| Joint Municipal Electric Utility Commission Power Project
Revenue Refunding Bonds for Plum Point Project
Series 2014A (A3/A-) |
|
| | 50,000 | | | | 5.000 | | | | 01/01/2026 | | | | 50,902 | |
| Missouri Joint Municipal Electric Utility Commission Power
Project RB Refunding Bonds for Prairie State Project
Series 2015A (A2/NR) |
|
| | 50,000 | | | | 5.000 | | | | 12/01/2030 | | | | 51,055 | |
| The School District Of Springfield R-Xii Springfield Missouri
GO School Refunding Bonds 2017 Missouri Direct Deposit
Program (NR/AA+) |
|
| | 200,000 | | | | 4.000 | | | | 03/01/2029 | | | | 207,044 | |
| | | | | | | | | | | | | | |
| | | | | | | | | | | | | 359,795 | |
| | |
| Montana – 0.4% | |
| City Of Forsyth Rosebud County Montana Pollution Control
Revenue Refunding Bonds Puget Sound Energy Project
Series 2013A Non-Amt (NR/A-)(c) |
|
| | 90,000 | | | | 3.900 | | | | 03/01/2031 | | | | 85,314 | |
| | |
| Nebraska – 0.6% | |
| The University Of Nebraska Facilities Corp. Facilities Bonds
Series 2018 (Aa1/AA) |
|
| | 60,000 | | | | 5.000 | | | | 07/15/2026 | | | | 63,027 | |
| The University Of Nebraska Facilities Corporation Facilities
Bonds Series 2018 (Aa1/AA) |
|
| | 50,000 | | | | 5.000 | | | | 07/15/2025 | | | | 51,613 | |
| | | | | | | | | | | | | | |
| | | | | | | | | | | | | 114,640 | |
| | |
| Nevada – 1.8% | |
| Clark County Nevada GO Limited Tax Detention Center Bonds
Additionally Secured By Pledged Revenues Series 2019
(Aa1/AA+) |
|
| | 80,000 | | | | 5.000 | | | | 06/01/2025 | | | | 82,293 | |
| | 50,000 | | | | 5.000 | | | | 06/01/2031 | | | | 55,237 | |
| | |
| | |
| 12 | | The accompanying notes are an integral part of these financial statements. |
GOLDMAN SACHS COMMUNITY MUNICIPAL BOND ETF
| | | | | | | | | | | | | | |
Principal
Amount | | | Interest
Rate | | | Maturity
Date | | | Value | |
|
| Municipal Bonds – (continued) | |
| Nevada – (continued) | |
| Clark County School District GO Limited Tax Building And
Refunding Bonds Series 2017C (A1/A+) |
|
| $ | 50,000 | | | | 5.000 | % | | | 06/15/2026 | | | $ | 52,232 | |
| | 50,000 | | | | 5.000 | | | | 06/15/2027 | | | | 53,018 | |
| | 50,000 | | | | 5.000 | | | | 06/15/2029 | | | | 53,284 | |
| Clark County School District Nevada GO Limited Tax School
Bonds Additionally Secured By Pledged Revenues
Series 2015D (A1/A+) |
|
| | 65,000 | | | | 4.000 | | | | 06/15/2032 | | | | 65,403 | |
| | | | | | | | | | | | | | |
| | | | | | | | | | | | | 361,467 | |
| | |
| New Hampshire – 0.3% | |
| | New Hampshire Municipal Bond Bank Series 2022 C (NR/AA+) | |
| | 50,000 | | | | 5.000 | | | | 08/15/2024 | | | | 50,805 | |
| | |
| New Jersey – 2.8% | |
| Higher Education Student Assistance Authority Senior Student
Loan Revenue Refunding Bonds Series 2018B (NR/AA) |
|
| | 50,000 | | | | 5.000 | | | | 12/01/2027 | | | | 51,839 | |
| New Jersey Economic Development Authority School Facilities
Construction Bonds Series 2015 WW (A2/A-)(b) |
|
| | 50,000 | | | | 4.625 | | | | 06/15/2025 | | | | 51,300 | |
| New Jersey Health Care Facilities Financing Authority RB Valley
Health System Obligated Group Series 2019 (NR/A) |
|
| | 50,000 | | | | 5.000 | | | | 07/01/2032 | | | | 53,635 | |
| New Jersey State Transportation Authority System Bonds
Series 2006C (A1/AA) |
|
| | 60,000 | | | | 0.000 | (a) | | | 12/15/2029 | | | | 47,492 | |
| New Jersey State Transportation Authority System Bonds
Series 2006C (A2/A-) |
|
| | 65,000 | | | | 0.000 | (a) | | | 12/15/2028 | | | | 53,540 | |
| New Jersey Transportation Trust Fund Authority Bonds
Series 2006 C (A2/A-) |
|
| | 80,000 | | | | 0.000 | (a) | | | 12/15/2027 | | | | 68,351 | |
| New Jersey Transportation Trust Fund Authority Bonds
Series 2006 C (A2/A-) |
|
| | 60,000 | | | | 0.000 | (a) | | | 12/15/2025 | | | | 55,099 | |
| New Jersey Transportation Trust Fund Authority Capital
Appreciation Bonds Series 2010 A (A2/A-) |
|
| | 50,000 | | | | 0.000 | (a) | | | 12/15/2034 | | | | 31,585 | |
| New Jersey Transportation Trust Fund Authority RB Capital
Appreciation for Transportation System Bonds Series 2010 A
(Baa1/BBB) |
|
| | 50,000 | | | | 0.000 | (a) | | | 12/15/2031 | | | | 36,176 | |
| New Jersey Transportation Trust Fund Authority RB for
Transportation System Series 2019 A (Baa1/BBB) |
|
| | 50,000 | | | | 5.000 | | | | 12/15/2025 | | | | 51,617 | |
| New Jersey Transportation Trust Fund Authority Transportation
System Bonds Series 2009A (A2/A-) |
|
| | 80,000 | | | | 0.000 | (a) | | | 12/15/2033 | | | | 53,026 | |
| | | | | | | | | | | | | | |
| | | | | | | | | | | | | 553,660 | |
| | |
| New Mexico – 1.1% | |
| Albuquerque Bernalillo County Water Utility Authority Senior
Lien Joint Water And Sewer System Refunding And
Improvement RB (Aa2/AA+) |
|
| | 70,000 | | | | 5.000 | | | | 07/01/2025 | | | | 72,158 | |
| | |
|
| Municipal Bonds – (continued) | |
| New Mexico – (continued) | |
| | New Mexico Capital Projects GO Bonds Series 2015 (Aa2/AA) | |
| 50,000 | | | | 5.000 | | | | 03/01/2025 | | | | 51,273 | |
| New Mexico Hospital Equipment Loan Council Hospital System
RB Presbyterian Healthcare Services Series 2015A (Aa3/AA)(b) |
|
| | 100,000 | | | | 5.000 | | | | 08/01/2025 | | | | 102,747 | |
| | | | | | | | | | | | | | |
| | | | | | | | | | | | | 226,178 | |
| | |
| New York – 16.7% | |
| Dormitory Authority Of The State Of New York New York State
Personal Income Tax RB General Purpose Series 2020A
Bidding Group 2 Bonds Tax Exempt (Aa1/NR) |
|
| | 50,000 | | | | 5.000 | | | | 03/15/2031 | | | | 55,892 | |
| | 50,000 | | | | 5.000 | | | | 03/15/2032 | | | | 55,814 | |
| | 50,000 | | | | 5.000 | | | | 03/15/2033 | | | | 55,705 | |
| | 90,000 | | | | 4.000 | | | | 03/15/2034 | | | | 94,189 | |
| Dormitory Authority Of The State Of New York New York
University RB Series 2015A (Aa2/AA-) |
|
| | 100,000 | | | | 2.800 | | | | 07/01/2027 | | | | 98,325 | |
| Dormitory Authority Of The State Of New York School Districts
RB Financing Program RB Series 2017B (Aa3/AA) |
|
| | 50,000 | | | | 5.000 | | | | 10/01/2028 | | | | 53,645 | |
| | 70,000 | | | | 5.000 | | | | 10/01/2032 | | | | 74,905 | |
| Dormitory Authority Of The State Of New York State Personal
Income Tax RB General Purpose Series 2014C Tax Exempt
Group B (Aa1/AA+)(b) |
|
| | 60,000 | | | | 5.000 | | | | 03/15/2024 | | | | 60,544 | |
| Dormitory Authority Of The State Of New York State Sales Tax
RB Series 2018A (Aa1/AA+) |
|
| | 50,000 | | | | 5.000 | | | | 03/15/2028 | | | | 54,370 | |
| Hudson Yards Infrastructure Corp. Hudson Yards RB Fiscal 2022
Series A Green Bonds (Aa2/AA-) |
|
| | 60,000 | | | | 5.000 | | | | 02/15/2032 | | | | 69,565 | |
| Hudson Yards Infrastructure Corporation Revenue Bonds Fiscal
Green Bonds Series 2022 A (Aa2/AA-) |
|
| | 50,000 | | | | 4.000 | | | | 02/15/2038 | | | | 49,471 | |
| Long Island Power Authority Electric System RB Series C
(A2/AA) |
|
| | 50,000 | | | | 5.250 | | | | 09/01/2029 | | | | 55,657 | |
| Metropolitan Transportation Authority RB Series 2014B
(A3/BBB+)(b) |
|
| | 50,000 | | | | 5.000 | | | | 05/15/2024 | | | | 50,594 | |
| Metropolitan Transportation Authority Dedicated Tax
Fund Refunding Green Bonds Subseries 2017B-2 (NR/AA) |
|
| | 65,000 | | | | 3.125 | | | | 11/15/2033 | | | | 60,275 | |
| Metropolitan Transportation Authority RB Refunding for Climate
Bond Certified Series 2020 E (A3/BBB+) |
|
| | 50,000 | | | | 5.000 | | | | 11/15/2029 | | | | 53,447 | |
| | 50,000 | | | | 5.000 | | | | 11/15/2033 | | | | 54,162 | |
| Metropolitan Transportation Authority Revenue Refunding Bonds
Series 2015C (A3/BBB+) |
|
| | 50,000 | | | | 5.250 | | | | 11/15/2029 | | | | 51,403 | |
| Metropolitan Transportation Authority Revenue Refunding for
Climate Bond Certified Series 2017B (A3/BBB+) |
|
| | 50,000 | | | | 5.000 | | | | 11/15/2027 | | | | 52,564 | |
| Metropolitan Transportation Authority Revenue Refunding for
Climate Bond Certified Series 2017C-1 (A3/BBB+) |
|
| | 50,000 | | | | 5.000 | | | | 11/15/2025 | | | | 51,353 | |
| | |
| | |
| The accompanying notes are an integral part of these financial statements. | | 13 |
GOLDMAN SACHS COMMUNITY MUNICIPAL BOND ETF
Schedule of Investments (continued)
August 31, 2023
| | | | | | | | | | | | | | |
Principal
Amount | | | Interest
Rate | | | Maturity
Date | | | Value | |
|
| Municipal Bonds – (continued) | |
| New York – (continued) | |
| Metropolitan Transportation Authority Transportation Revenue
Refunding Green Bonds Series 2017C-1 (A3/BBB+) |
|
| $ | 50,000 | | | | 5.000 | % | | | 11/15/2027 | | | $ | 52,564 | |
| | 130,000 | | | | 0.000 | (a) | | | 11/15/2033 | | | | 85,285 | |
| | 55,000 | | | | 5.000 | | | | 11/15/2034 | | | | 57,734 | |
| | 50,000 | | | | 3.250 | | | | 11/15/2036 | | | | 42,973 | |
| Monroe County Industrial Development Corp. Tax Exempt RB
The Rochester General Hospital Project Series 2013
Series 2013B (NR/BBB+) |
|
| | 70,000 | | | | 3.600 | | | | 12/01/2032 | | | | 64,443 | |
| | New York City GO Bonds Fiscal 2019 Series A (Aa2/AA) | |
| | 50,000 | | | | 5.000 | | | | 08/01/2025 | | | | 51,691 | |
| New York City Housing Development Corp. Multi-Family
Housing RB 2017 Series G-1 Sustainable Neighborhood Bonds
(Aa2/AA+) |
|
| | 75,000 | | | | 3.450 | | | | 11/01/2037 | | | | 67,512 | |
| New York City Municipal Water Finance Authority Water &
Sewer System Second General Resolution RB Fiscal 2021
Series CC Subseries CC-3 (Aa1/AA+) |
|
| | 100,000 | | | | 5.000 | | | | 06/15/2032 | | | | 116,777 | |
| New York City Municipal Water Finance Authority Water &
Sewer System Second General Resolution RB Fiscal
Series 2015 FF (Aa1/AA+) |
|
| | 50,000 | | | | 5.000 | | | | 06/15/2032 | | | | 51,424 | |
| New York City Transitional Finance Authority Building Aid RB
Fiscal 2015 Series S-1 (Aa2/AA) |
|
| | 50,000 | | | | 5.000 | | | | 07/15/2029 | | | | 51,118 | |
| New York City Transitional Finance Authority Building Aid RB
Fiscal 2023 Series S-1 Subseries S-1A Tax Exempt Bonds
(Aa2/AA) |
|
| | 80,000 | | | | 5.000 | | | | 07/15/2030 | | | | 90,223 | |
| New York City Transitional Finance Authority Future Tax
Secured Subordinate Bonds Fiscal 2001 Series C (Aa1/AAA) |
|
| | 50,000 | | | | 5.000 | | | | 02/01/2030 | | | | 55,367 | |
| New York City Transitional Finance Authority Future Tax
Secured Subordinate Bonds Fiscal 2010 Subseries G-5
(Aa1/AAA) |
|
| | 50,000 | | | | 5.000 | | | | 05/01/2030 | | | | 55,567 | |
| New York City Transitional Finance Authority Future Tax
Secured Subordinate Bonds Fiscal 2019 Series A Subseries A-1
(Aa1/AAA) |
|
| | 50,000 | | | | 5.000 | | | | 08/01/2034 | | | | 53,938 | |
| New York City Transitional Finance Authority Future Tax
Secured Subordinate Bonds Fiscal 2021 Series D Subseries D-1
Tax Exempt Bonds (Aa1/AAA) |
|
| | 50,000 | | | | 5.000 | | | | 11/01/2034 | | | | 55,554 | |
| New York City Transitional Finance Authority Future Tax
Secured Subordinate Bonds Fiscal 2022 Series A Subseries A-1
Tax Exempt Bonds (Aa1/AAA) |
|
| | 50,000 | | | | 5.000 | | | | 11/01/2027 | | | | 54,017 | |
| | 50,000 | | | | 5.000 | | | | 11/01/2028 | | | | 54,792 | |
| | 65,000 | | | | 5.000 | | | | 11/01/2034 | | | | 73,103 | |
| New York City Transitional Finance Authority Future Tax
Secured Subordinate Bonds Fiscal 2022 Series C Subseries C-1
Tax Exempt (Aa1/AAA) |
|
| | 50,000 | | | | 5.000 | | | | 02/01/2035 | | | | 56,261 | |
| | |
|
| Municipal Bonds – (continued) | |
| New York – (continued) | |
| New York City Transitional Finance Authority Future Tax
Secured Tax Exempt Subordinate Bonds Fiscal 2016 Series C
(Aa1/AAA) |
|
| 60,000 | | | | 5.000 | | | | 11/01/2027 | | | | 62,008 | |
| New York Convention Center Development Corp. RB for New
York City Hotel Unit Fee Revenue Series 2015 (A2/NR) |
|
| | 50,000 | | | | 5.000 | | | | 11/15/2032 | | | | 51,150 | |
| | 50,000 | | | | 3.500 | | | | 11/15/2034 | | | | 47,744 | |
| New York State Dormitory Authority RB for Memorial Sloan-
Kettering Cancer Center (NR/NR) |
|
| | 55,000 | | | | 0.000 | (a) | | | 07/01/2026 | | | | 50,082 | |
| | 90,000 | | | | 0.000 | (a) | | | 07/01/2027 | | | | 79,501 | |
| New York State Environmental Facilities Corp. State Clean Water
And Drinking Water Revolving Funds RB New York City
Municipal Water Finance Authority Projects – Second
Resolution Bonds Series 2017 E Subordinated Srf Bonds (Aaa/
AAA) |
|
| | 60,000 | | | | 5.000 | | | | 06/15/2030 | | | | 64,450 | |
| Sales Tax Asset Receivable Corp. Sales Tax Asset RB Fiscal
2015 Series A (NR/AA+)(b) |
|
| | 65,000 | | | | 5.000 | | | | 10/15/2024 | | | | 66,205 | |
| | 60,000 | | | | 5.000 | | | | 10/15/2024 | | | | 61,112 | |
| The City Of New York GO Bonds Fiscal 2014 Series I
Subseries I-1 (Aa2/AA) |
|
| | 70,000 | | | | 5.000 | | | | 03/01/2025 | | | | 70,614 | |
| | The City Of New York GO Bonds Fiscal 2018 Series 1 (Aa2/AA) | |
| | 50,000 | | | | 5.000 | | | | 08/01/2025 | | | | 51,691 | |
| | 50,000 | | | | 5.000 | | | | 08/01/2026 | | | | 52,641 | |
| | 50,000 | | | | 5.000 | | | | 08/01/2031 | | | | 53,309 | |
| | The City Of New York GO Bonds Fiscal 2021 Series C (Aa2/AA) | |
| | 70,000 | | | | 5.000 | | | | 08/01/2030 | | | | 78,443 | |
| | 50,000 | | | | 5.000 | | | | 08/01/2034 | | | | 55,374 | |
| | The City Of New York GO BondsFiscal 2019 Series A (Aa2/AA) | |
| | 70,000 | | | | 5.000 | | | | 08/01/2026 | | | | 73,697 | |
| Triborough Bridge And Tunnel Authority MTA Bridges And
Tunnels Payroll Mobility Tax Senior Lien Refunding Green
Bonds Series 2023A Climate Bond Certified (NR/AA+) |
|
| | 50,000 | | | | 5.000 | | | | 11/15/2029 | | | | 55,792 | |
| | | | | | | | | | | | | | |
| | | | | | | | | | | | | 3,316,036 | |
| | |
| North Carolina – 1.0% | |
| County Of Wake Limited Obligation Bonds Series 2021
(Aa1/AA+) |
|
| | 50,000 | | | | 4.000 | | | | 03/01/2034 | | | | 52,642 | |
| County Of Wake North Carolina GO Public Improvement Bonds
Series 2014 (Aaa/AAA) |
|
| | 60,000 | | | | 5.000 | | | | 09/01/2024 | | | | 61,019 | |
| North Carolina Medical Care Commission Health Care Facilities
RB Vidant Health Series 2015 (A2/A+) |
|
| | 90,000 | | | | 4.000 | | | | 06/01/2034 | | | | 90,169 | |
| | | | | | | | | | | | | | |
| | | | | | | | | | | | | 203,830 | |
| | |
| North Dakota – 0.8% | |
| North Dakota Public Finance Authority Revolving Fund Program
Bonds Series 2022A (Aaa/AAA) |
|
| | 70,000 | | | | 5.000 | | | | 10/01/2031 | | | | 80,217 | |
| | |
| | |
| 14 | | The accompanying notes are an integral part of these financial statements. |
GOLDMAN SACHS COMMUNITY MUNICIPAL BOND ETF
| | | | | | | | | | | | | | |
Principal
Amount | | | Interest
Rate | | | Maturity
Date | | | Value | |
|
| Municipal Bonds – (continued) | |
| North Dakota – (continued) | |
| State Of North Dakota North Dakota Housing Finance Agency
Housing Finance Program Bonds Home Mortgage Finance
Program 2021 Series B Nonamt Social Bonds (Aa1/NR) |
|
| $ | 100,000 | | | | 2.300 | % | | | 07/01/2036 | | | $ | 79,714 | |
| | | | | | | | | | | | | | |
| | | | | | | | | | | | | 159,931 | |
| | |
| Ohio – 3.3% | |
| American Municipal Power Inc. Prairie State Energy Campus
Project RB Refunding Series 2019C (A1/A) |
|
| | 50,000 | | | | 5.000 | | | | 02/15/2033 | | | | 54,840 | |
| City Of Columbus Ohio Various Purpose Limited Tax Bonds
Series 2015A (Aaa/AAA) |
|
| | 80,000 | | | | 5.000 | | | | 07/01/2025 | | | | 82,582 | |
| City Of Columbus Sewerage System RB Refunding Series 2015
(Aa1/AA) |
|
| | 50,000 | | | | 5.000 | | | | 06/01/2030 | | | | 52,271 | |
| Cuyahoga County Certificates Of Participation for Convention
Hotel Project Series 2014 (A1/AA-) |
|
| | 35,000 | | | | 5.000 | | | | 12/01/2028 | | | | 35,248 | |
| Hamilton County Ohio Sewer System Refunding RB 2014
Series A The Metropolitan Sewer District Of Greater
Cincinnati (Aa2/AA+) |
|
| | 80,000 | | | | 5.000 | | | | 12/01/2027 | | | | 81,572 | |
| Ohio Housing Finance Agency Residential Mortgage RB
Mortgage-Backed Securities Program 2022 Series A Non-Amt
Social Bonds (Aaa/NR) |
|
| | 50,000 | | | | 2.300 | | | | 03/01/2033 | | | | 42,965 | |
| Ohio Water Development Authority State Of Ohio Water
Pollution Control Loan Fund RB Series 2020B (Aaa/AAA) |
|
| | 50,000 | | | | 5.250 | | | | 12/01/2035 | | | | 56,542 | |
| | 85,000 | | | | 4.000 | | | | 12/01/2037 | | | | 85,480 | |
| State Of Ohio Higher Education GO Bonds Series 2015C
(Aa1/AA+)(b) |
|
| | 50,000 | | | | 5.000 | | | | 05/01/2025 | | | | 51,427 | |
| State Of Ohio Infrastructure Improvement GO Refunding Bonds
Series 2015C (Aa1/AA+) |
|
| | 50,000 | | | | 5.000 | | | | 09/01/2026 | | | | 52,732 | |
| State Of Ohio Higher Education GO Refunding Bonds
Series 2017C (Aa1/AA+) |
|
| | 50,000 | | | | 5.000 | | | | 08/01/2027 | | | | 53,653 | |
| | | | | | | | | | | | | | |
| | | | | | | | | | | | | 649,312 | |
| | |
| Oklahoma – 0.6% | |
| Board of Regents of The Oklahoma A&M University General
Revenue Refunding Bonds Series 2017A (NR/AA-) |
|
| | 75,000 | | | | 4.000 | | | | 07/01/2034 | | | | 75,175 | |
| | Grand River Dam Authority RB Series 2014A (A1/AA-) | |
| | 50,000 | | | | 3.375 | | | | 06/01/2034 | | | | 48,777 | |
| | | | | | | | | | | | | | |
| | | | | | | | | | | | | 123,952 | |
| | |
| Oregon – 1.4% | |
| City Of Portland Oregon Second Lien Sewer System RB 2020
Series A (Aa2/AA) |
|
| | 60,000 | | | | 5.000 | | | | 03/01/2027 | | | | 63,910 | |
| Hillsboro School District No. 1J Washington Yamhill And
Multnomah Counties Oregon GO Bonds Series 2017 (Aa1/NR) |
|
| | 60,000 | | | | 5.000 | | | | 06/15/2025 | | | | 61,761 | |
| | |
|
| Municipal Bonds – (continued) | |
| Oregon – (continued) | |
| Medford Hospital Facilities Authority RB Refunding for Asante
Health System Obligated Group Series 2020 A (NR/A+) |
|
| 60,000 | | | | 5.000 | | | | 08/15/2026 | | | | 62,345 | |
| State Of Oregon Housing And Community Services Department
Mortgage RB Single-Family Mortgage Program 2017 Series D
Non-Amt (Aa2/NR) |
|
| | 85,000 | | | | 3.150 | | | | 07/01/2032 | | | | 82,874 | |
| | | | | | | | | | | | | | |
| | | | | | | | | | | | | 270,890 | |
| | |
| Pennsylvania – 2.7% | |
| Commonwealth Financing Authority Tax Exempt RB
Series 2015 A (A1/A) |
|
| | 70,000 | | | | 5.000 | | | | 06/01/2033 | | | | 71,299 | |
| Commonwealth Of Pennsylvania GO Bonds First Series Of 2018
(Aa3/A+) |
|
| | 50,000 | | | | 5.000 | | | | 03/01/2025 | | | | 51,251 | |
| Commonwealth Of Pennsylvania GO Bonds: First Series Of 2016
And First Refunding Series Of 2016 (Aa3/A+) |
|
| | 100,000 | | | | 5.000 | | | | 09/15/2026 | | | | 105,575 | |
| Department of Water and Power of the City of Los Angeles RB
Series 2018 D (Aa2/AA-) |
|
| | 50,000 | | | | 3.250 | | | | 07/01/2032 | | | | 47,720 | |
| Philadelphia Authority For Industrial Development City
Agreement Revenue Refunding Bonds Cultural And
Commercial Corridors Program Series A (A1/A) |
|
| | 85,000 | | | | 5.000 | | | | 12/01/2031 | | | | 87,178 | |
| Port Authority Of Allegheny County Pennsylvania Special
Revenue Transportation Bonds Refunding Series Of 2020
(Aa3/AA-) |
|
| | 50,000 | | | | 5.000 | | | | 03/01/2029 | | | | 54,610 | |
| Sports And Exhibition Authority Of Pittsburgh And Allegheny
County Allegheny County Pennsylvania Hotel Room Excise
Tax RB Refunding Series A Of 2022 (A2/AA) |
|
| | 50,000 | | | | 5.000 | | | | 02/01/2031 | | | | 55,781 | |
| | 60,000 | | | | 5.000 | | | | 02/01/2032 | | | | 67,524 | |
| | | | | | | | | | | | | | |
| | | | | | | | | | | | | 540,938 | |
| | |
| South Carolina – 0.5% | |
| Scago Educational Facilities Corp. For Pickens School District
Installment Purchase Refunding RB School District Of Pickens
County Project Series 2015 (A1/A) |
|
| | 90,000 | | | | 5.000 | | | | 12/01/2027 | | | | 92,107 | |
| | |
| Tennessee – 1.7% | |
| | State Of Tennessee GO Bonds Series 2015 A (Aaa/AAA)(b) | |
| | 50,000 | | | | 5.000 | | | | 08/01/2025 | | | | 51,607 | |
| Tennessee State School Bond Authority Higher Educational
Facilities Second Program Bonds 2017 Refunding Series B
(Aa1/AA+) |
|
| | 50,000 | | | | 5.000 | | | | 11/01/2027 | | | | 53,935 | |
| Tennessee State School Bond Authority Higher Educational
Facilities Second Program Bonds 2017 Series A (Aa1/AA+) |
|
| | 50,000 | | | | 5.000 | | | | 11/01/2033 | | | | 53,355 | |
| The Health And Educational Facilities Board Of The
Metropolitan Government Of Nashville And Davidson County
Tennessee RB Vanderbilt University Medical Center
Series 2021A (NR/A) |
|
| | 50,000 | | | | 5.000 | | | | 07/01/2031 | | | | 54,406 | |
| | |
| | |
| The accompanying notes are an integral part of these financial statements. | | 15 |
GOLDMAN SACHS COMMUNITY MUNICIPAL BOND ETF
Schedule of Investments (continued)
August 31, 2023
| | | | | | | | | | | | | | |
Principal
Amount | | | Interest
Rate | | | Maturity
Date | | | Value | |
|
| Municipal Bonds – (continued) | |
| Tennessee – (continued) | |
| The Metropolitan Government Of Nashville And Davidson
County GO Improvement Bonds Series 2015C (Aa2/AA) |
|
| $ | 50,000 | | | | 5.000 | % | | | 07/01/2027 | | | $ | 51,505 | |
| The Metropolitan Government Of Nashville And Davidson
County GO Improvement Bonds Series 2021C (Aa2/AA) |
|
| | 80,000 | | | | 3.000 | | | | 01/01/2034 | | | | 76,115 | |
| | | | | | | | | | | | | | |
| | | | | | | | | | | | | 340,923 | |
| | |
| Texas – 10.5% | |
| Austin Independent School District A Political Subdivision Of
The State Of Texas Located In Travis County Texas Unlimited
Tax School Building Bonds Series 2023 Non-Psf (Aaa/NR) |
|
| | 90,000 | | | | 5.000 | | | | 08/01/2028 | | | | 98,121 | |
| | Austin Tex Pub Impt Refunding Bonds 2020 (NR/AAA) | |
| | 50,000 | | | | 5.000 | | | | 09/01/2029 | | | | 55,435 | |
| Austin Tex Wtr & Wastewater Sys Rev Ref Bonds 2014
(Aa2/AA) |
|
| | 80,000 | | | | 5.000 | | | | 11/15/2028 | | | | 81,016 | |
| Bexar County Texas Flood Control Tax Refunding Bonds
Series 2014 (Aaa/AAA)(b) |
|
| | 80,000 | | | | 4.000 | | | | 06/15/2024 | | | | 80,394 | |
| Board Of Regents Of The Texas A&M University System
Revenue Financing System Bonds Series 2017E (Aaa/AAA) |
|
| | 50,000 | | | | 5.000 | | | | 05/15/2028 | | | | 53,183 | |
| Board Of Regents Of The University Of Houston System
Consolidated Revenue And Refunding Bonds Series 2022A
(Aa2/AA) |
|
| | 60,000 | | | | 5.000 | | | | 02/15/2031 | | | | 67,735 | |
| Board Of Regents Of The University Of Texas System Revenue
Financing System Refunding Bonds Series 2019A (Aaa/AAA) |
|
| | 50,000 | | | | 5.000 | | | | 08/15/2032 | | | | 54,946 | |
| City Of Austin Travis, Williamson And Hays Counties Electric
Utility System RB Refunding Bonds Series 2015A (Aa3/AA-) |
|
| | 50,000 | | | | 5.000 | | | | 11/15/2025 | | | | 51,795 | |
| City Of Dallas Texas GO Refunding Bonds Series 2019B
(NR/AA-) |
|
| | 75,000 | | | | 5.000 | | | | 02/15/2026 | | | | 78,038 | |
| City Of Houston Texas Combined Utility System First Lien
Revenue Refunding Bonds Series 2017B (Aa2/NR) |
|
| | 80,000 | | | | 5.000 | | | | 11/15/2025 | | | | 82,855 | |
| City Of Houston Texas Combined Utility System First Lien
Revenue Refunding Bonds Series 2018D (Aa2/NR) |
|
| | 70,000 | | | | 5.000 | | | | 11/15/2032 | | | | 75,852 | |
| City Of Waco Texas Mclennan County GO Refunding Bonds
Series 2015 (Aa1/AA+) |
|
| | 90,000 | | | | 5.000 | | | | 02/01/2026 | | | | 90,566 | |
| Collin County Community College District Texas Limited Tax
Bonds Series 2018 (Aaa/AAA) |
|
| | 75,000 | | | | 4.000 | | | | 08/15/2031 | | | | 76,701 | |
| Dallas Area Rapid Transit Senior Lien Sales Tax Revenue
Refunding Bonds Series 2014A (Aa2/AA+)(b) |
|
| | 65,000 | | | | 5.000 | | | | 12/01/2024 | | | | 66,270 | |
| Harris County Cultural Education Facilities Finance Corporation
Hospital RB for Memorial Hermann Health System
Series 2019A (A1/A+) |
|
| | 50,000 | | | | 5.000 | | | | 12/01/2027 | | | | 53,282 | |
| | |
|
| Municipal Bonds – (continued) | |
| Texas – (continued) | |
| Harris County Flood Control District Improvement Refunding
Bonds Series 2015A (Aaa/AAA) |
|
| 70,000 | | | | 5.000 | | | | 10/01/2027 | | | | 72,277 | |
| Harris County Permanent Improvement Refunding Bonds
Series 2022A (Aaa/NR) |
|
| | 50,000 | | | | 5.000 | | | | 10/01/2026 | | | | 52,667 | |
| Harris County Texas Tax And Subordinate Lien Revenue
Refunding Bonds Series 2022A (Aaa/NR) |
|
| | 50,000 | | | | 5.000 | | | | 08/15/2027 | | | | 53,561 | |
| | 60,000 | | | | 5.000 | | | | 08/15/2032 | | | | 68,588 | |
| Hurst-Euless-Bedford Independent School District Unlimited Tax
Refunding Bonds Series 2017A (NR/AA+) |
|
| | 60,000 | | | | 5.000 | | | | 08/15/2027 | | | | 64,182 | |
| | 60,000 | | | | 5.000 | | | | 08/15/2028 | | | | 64,308 | |
| North Texas Municipal Water District Water System RB
Refunding Bonds Series 2021A (Aa1/AAA) |
|
| | 50,000 | | | | 4.000 | | | | 09/01/2030 | | | | 52,847 | |
| | 50,000 | | | | 3.000 | | | | 09/01/2032 | | | | 47,073 | |
| North Texas Municipal Water District Water System Revenue
Refunding and Improvement Bonds Series 2015 (Aa1/AAA) |
|
| | 60,000 | | | | 5.000 | | | | 09/01/2028 | | | | 62,254 | |
| Northwest Independent School District Unlimited Tax Refunding
Bonds Series 2015 (AAA/NR)(b) |
|
| | 50,000 | | | | 5.000 | | | | 02/15/2025 | | | | 51,131 | |
| Tarrant Regional Water District Revenue Refunding Bonds
Series 2015 (NR/AAA) |
|
| | 80,000 | | | | 5.000 | | | | 03/01/2029 | | | | 81,901 | |
| Texas Water Development Board State Revolving Fund RB New
Series 2022 (NR/AAA) |
|
| | 65,000 | | | | 5.000 | | | | 08/01/2032 | | | | 74,326 | |
| Texas Water Development Board State Water Implementation
Revenue Fund For Texas RB Series 2015A (NR/AAA) |
|
| | 50,000 | | | | 5.000 | | | | 10/15/2029 | | | | 51,857 | |
| | 50,000 | | | | 5.000 | | | | 10/15/2030 | | | | 51,877 | |
| | 50,000 | | | | 4.000 | | | | 10/15/2032 | | | | 50,312 | |
| Trinity River Authority Of Texas Regional Wastewater System
Revenue Improvement And Refunding Bonds Series 2018
(NR/AAA) |
|
| | 50,000 | | | | 5.000 | | | | 08/01/2033 | | | | 53,963 | |
| Trinity River Authority Regional Wastewater System Revenue
Improvement And Refunding Bonds Series 2017b (NR/AAA) |
|
| | 50,000 | | | | 5.000 | | | | 08/01/2030 | | | | 53,014 | |
| | | | | | | | | | | | | | |
| | | | | | | | | | | | | 2,072,327 | |
| | |
| Utah – 1.5% | |
| Central Valley Water Reclamation Facility Sewer RB
Series 2021C Green Bonds (NR/AA) |
|
| | 75,000 | | | | 4.000 | | | | 03/01/2036 | | | | 77,041 | |
| State Board Of Regents Of The State Of Utah University Of Utah
General Revenue Series 2017A (Aa1/AA+) |
|
| | 50,000 | | | | 5.000 | | | | 08/01/2031 | | | | 53,219 | |
| Utah Board Of Higher Education University Of Utah General RB
Series 2022B Green Bonds (Aa1/AA+) |
|
| | 50,000 | | | | 5.000 | | | | 08/01/2030 | | | | 56,296 | |
| Utah Transit Authority Sales Tax Revenue Refunding Bonds
Series 2006 C (Aa2/AA+) |
|
| | 50,000 | | | | 5.250 | | | | 06/15/2032 | | | | 57,338 | |
| | |
| | |
| 16 | | The accompanying notes are an integral part of these financial statements. |
GOLDMAN SACHS COMMUNITY MUNICIPAL BOND ETF
| | | | | | | | | | | | | | |
Principal
Amount | | | Interest
Rate | | | Maturity
Date | | | Value | |
|
| Municipal Bonds – (continued) | |
| Utah – (continued) | |
| Utah Transit Authority Subordinate Sales Tax RB Refunding
Series 2015A Series 2015A (Aa3/AA)(b) |
|
| $ | 50,000 | | | | 5.000 | % | | | 06/15/2025 | | | $ | 51,535 | |
| | | | | | | | | | | | | | |
| | | | | | | | | | | | | 295,429 | |
| | |
| Virginia – 3.2% | |
| Fairfax County Economic Development Authority Virginia
Fairfax County Facilities Revenue And Refunding Bonds
Series 2014 A County Facilities Projects (Aa1/SS+)(b) |
|
| | 100,000 | | | | 5.000 | | | | 10/01/2024 | | | | 101,791 | |
| Fairfax County Public Improvement Bonds Series 2022A (Aaa/
AAA) |
|
| | 120,000 | | | | 4.000 | | | | 10/01/2025 | | | | 121,915 | |
| Fairfax County Virginia Public Improvement Bonds Series 2023A
(Aaa/AAA) |
|
| | 50,000 | | | | 4.000 | | | | 10/01/2031 | | | | 53,730 | |
| | 90,000 | | | | 4.000 | | | | 10/01/2034 | | | | 95,652 | |
| Upper Occoquan Sewage Authority Regional Sewerage System
RB Refunding Series 2014 (Aa1/AAA)(b) |
|
| | 50,000 | | | | 4.000 | | | | 07/01/2025 | | | | 50,655 | |
| Virginia College Building Authority Educational Facilities
Revenue Refunding Bonds 21St Century College And
Equipment Programs Series 2017E (Aa1/AA+) |
|
| | 50,000 | | | | 5.000 | | | | 02/01/2029 | | | | 54,182 | |
| Virginia College Building Authority Virginia Educational
Facilities Revenue Refunding Bonds Public Higher Education
Financing Program Series 2016A (Aa1/AA+) |
|
| | 55,000 | | | | 3.000 | | | | 09/01/2026 | | | | 54,084 | |
| Virginia Educational Facilities RB Refunding for Public Higher
Education Financing Program Series 2016A (Aa1/AA+) |
|
| | 50,000 | | | | 5.000 | | | | 09/01/2028 | | | | 52,542 | |
| Virginia Port Authority Port Facilities RB Refunding
Series 2015A (NR/NR)(b) |
|
| | 50,000 | | | | 5.000 | | | | 07/01/2025 | | | | 51,354 | |
| | | | | | | | | | | | | | |
| | | | | | | | | | | | | 635,905 | |
| | |
| Washington – 3.3% | |
| Federal Way School District No. 210 Washington Unlimited Tax
GO And Refunding Bonds 2019 Washington State School
Credit Enhancement Program (Aaa/NR) |
|
| | 75,000 | | | | 3.000 | | | | 12/01/2033 | | | | 70,772 | |
| Northshore School District No. 417 King and Snohomish
Counties Unlimited Tax GO Bonds Series 2014 (Aaa/AA+) |
|
| | 50,000 | | | | 4.000 | | | | 12/01/2033 | | | | 50,110 | |
| State Of Washington Various Purpose GO Bonds Series 2015B
(Aaa/AA+) |
|
| | 90,000 | | | | 5.000 | | | | 02/01/2026 | | | | 91,951 | |
| State Of Washington Various Purpose GO Bonds Series 2016A-1
(Aaa/AA+) |
|
| | 50,000 | | | | 5.000 | | | | 08/01/2030 | | | | 51,393 | |
| State Of Washington Various Purpose GO Bonds Series 2019A
(Aaa/AA+) |
|
| | 50,000 | | | | 5.000 | | | | 08/01/2032 | | | | 54,431 | |
| | 65,000 | | | | 5.000 | | | | 08/01/2034 | | | | 70,519 | |
| State Of Washington Various Purpose GO Bonds Series 2023B
(Aaa/AA+) |
|
| | 60,000 | | | | 5.000 | | | | 02/01/2027 | | | | 63,801 | |
| | |
|
| Municipal Bonds – (continued) | |
| Washington – (continued) | |
| State Of Washington Various Purpose GO Refunding Bonds
Series R-2018D (Aaa/AA+) |
|
| 50,000 | | | | 5.000 | | | | 08/01/2031 | | | | 53,464 | |
| The Central Puget Sound Regional Transit Authority Sales Tax
and Motor Vehicle Excise Tax Improvement and Refunding
Bonds Series 2021S-1 Green Bonds (Aa1/AAA) |
|
| | 50,000 | | | | 5.000 | | | | 11/01/2030 | | | | 56,686 | |
| University Of Washington General Revenue And Refunding
Bonds 2015C (Aaa/AA+) |
|
| | 90,000 | | | | 4.000 | | | | 12/01/2028 | | | | 90,886 | |
| | | | | | | | | | | | | | |
| | | | | | | | | | | | | 654,013 | |
| | |
| Wisconsin – 1.0% | |
| Public Finance Authority Lease Development RB for Ku Campus
Development Corp. Central District Development Project
Series 2016 (Aa2/NR) |
|
| | 50,000 | | | | 5.000 | | | | 03/01/2030 | | | | 51,712 | |
| | State Of Wisconsin GO Refunding Bonds Series 2016 (NR/NR)(b) | |
| | 50,000 | | | | 5.000 | | | | 05/01/2026 | | | | 52,400 | |
| Wisconsin Health And Educational Facilities Authority Revenue
Refunding Bonds Series 2015 Prohealth Care Inc. Obligated
Group (A1/A+) |
|
| | 105,000 | | | | 3.150 | | | | 08/15/2027 | | | | 101,606 | |
| | | | | | | | | | | | | | |
| | | | | | | | | | | | | 205,718 | |
| | |
| | TOTAL MUNICIPAL BONDS | |
| | (Cost $19,581,478) | | | $ | 19,402,204 | |
| | |
| | | |
| Shares | | | Dividend
Rate | | | | | | Value | |
|
| Investment Company – 0.6%(d) | |
| Goldman Sachs Financial Square Government Fund –
Institutional Shares |
|
| | 114,880 | | | | 5.234 | % | | | | | | $ | 114,880 | |
| | (Cost $114,880) | |
| | |
| | TOTAL INVESTMENTS – 98.4% | |
| | (Cost $19,696,358) | | | $ | 19,517,084 | |
| | |
| OTHER ASSETS IN EXCESS OF
LIABILITIES – 1.6% |
| | | 313,859 | |
| | |
| | NET ASSETS – 100.0% | | | $ | 19,830,943 | |
| | |
| | |
|
| The percentage shown for each investment category reflects the value of investments in that category as a percentage of net assets. |
| |
(a) | | Issued with a zero coupon. Income is recognized through the accretion of discount. |
| |
(b) | | Pre-refunded security. Maturity date disclosed is pre-refunding date. |
| |
(c) | | Variable Rate Demand Instruments – rate shown is that which is in effect on August 31, 2023. Certain variable rate securities are not based on published reference rate and spread but are determined by the issuer or agent and are based on current market conditions. |
| |
(d) | | Represents an affiliated issuer. |
| | |
| The accompanying notes are an integral part of these financial statements. | | 17 |
GOLDMAN SACHS COMMUNITY MUNICIPAL BOND ETF
Schedule of Investments (continued)
August 31, 2023
| | |
|
Investment Abbreviations: |
AMT | | —Alternative Minimum Tax (subject to) |
GO | | —General Obligation |
MTA | | —Metropolitan Transportation Authority |
NR | | —Not Rated |
RB | | —Revenue Bond |
|
| | |
| 18 | | The accompanying notes are an integral part of these financial statements. |
GOLDMAN SACHS COMMUNITY MUNICIPAL BOND ETF
Statement of Assets and Liabilities
August 31, 2023
| | | | | | |
| | | | | Community
Municipal
Bond ETF | |
| | Assets: | |
| | |
| | Investments in unaffiliated issuers, at value (cost $19,581,478) | | $ | 19,402,204 | |
| | |
| | Investments in affiliated issuers, at value (cost $114,880) | | | 114,880 | |
| | |
| | Cash | | | 50,001 | |
| | |
| | Receivables: | | | | |
| | |
| | Dividends and interest | | | 236,017 | |
| | Investments sold | | | 226,931 | |
| | |
| | Total assets | | | 20,030,033 | |
| | | | | | |
| | Liabilities: | | | | |
| | |
| | Payables: | | | | |
| | |
| | Investments purchased | | | 196,091 | |
| | Management fees | | | 2,999 | |
| | |
| | Total liabilities | | | 199,090 | |
| | | | | | |
| | Net Assets: | | | | |
| | |
| | Paid-in capital | | | 19,964,233 | |
| | |
| | Total distributable loss | | | (133,290 | ) |
| | |
| | NET ASSETS | | $ | 19,830,943 | |
| | SHARES ISSUED AND OUTSTANDING | | | | |
| | |
| | Shares outstanding no par value (unlimited shares authorized): | | | 400,000 | |
| | |
| | Net asset value per share: | | | $49.58 | |
| | |
| The accompanying notes are an integral part of these financial statements. | | 19 |
GOLDMAN SACHS COMMUNITY MUNICIPAL BOND ETF
Statement of Operations
For the Period Ended August 31, 2023
| | | | | | |
| | | | | Community
Municipal
Bond ETF* | |
| | Investment income: | | | | |
| | |
| | Interest | | $ | 289,250 | |
| | |
| | Dividends — affiliated issuers | | | 1,060 | |
| | |
| | Total investment income | | | 290,310 | |
| | | | | | |
| | Expenses: | | | | |
| | |
| | Trustee fees | | | 19,413 | |
| | |
| | Management fees | | | 5,037 | |
| | |
| | Total expenses | | | 24,450 | |
| | |
| | Less — expense reductions | | | (32 | ) |
| | |
| | Net expenses | | | 24,418 | |
| | |
| | NET INVESTMENT INCOME | | | 265,892 | |
| | |
| | | | | | |
| | Realized and unrealized gain (loss): | |
| | |
| | Net realized gain (loss) from: | | | | |
| | |
| | Investments — unaffiliated issuers | | | (4,812 | ) |
| | |
| | Net change in unrealized gain (loss) on: | | | | |
| | |
| | Investments — unaffiliated issuers | | | (179,274 | ) |
| | |
| | Net realized and unrealized loss | | | (184,086 | ) |
| | |
| | NET INCREASE IN NET ASSETS RESULTING FROM OPERATIONS | | $ | 81,806 | |
| | * | | For the period March 7, 2023 (commencement of operations) through August 31, 2023. |
| | |
| 20 | | The accompanying notes are an integral part of these financial statements. |
GOLDMAN SACHS COMMUNITY MUNICIPAL BOND ETF
Statement of Changes in Net Assets
| | | | | | |
| | | | | Community
Municipal
Bond ETF | |
| | | | | For the Period
March 7, 2023*
to
August 31, 2023 | |
| | From operations: | | | | |
| | |
| | Net investment income | | $ | 265,892 | |
| | |
| | Net realized loss | | | (4,812 | ) |
| | |
| | Net change in unrealized loss | | | (179,274 | ) |
| | |
| | Net increase in net assets resulting from operations | | | 81,806 | |
| | | | | | |
| | Distributions to shareholders: | | | | |
| | |
| | From distributable earnings | | | (215,096 | ) |
| | | | | | |
| | From share transactions: | | | | |
| | |
| | Proceeds from sales of shares | | | 19,964,233 | |
| | |
| | Net increase in net assets resulting from share transactions | | | 19,964,233 | |
| | |
| | TOTAL INCREASE | | | 19,830,943 | |
| | | | | | |
| | Net assets: | | | | |
| | |
| | Beginning of period | | $ | — | |
| | |
| | End of period | | $ | 19,830,943 | |
| | * | | Commencement of operations. |
| | |
| The accompanying notes are an integral part of these financial statements. | | 21 |
GOLDMAN SACHS COMMUNITY MUNICIPAL BOND ETF
Financial Highlights
Selected Data for a Share Outstanding Throughout the Period
| | | | | | |
| | | | | Community Municipal
Bond ETF | |
| | | | | For the Period
March 7, 2023*
to
August 31, 2023 | |
| | Per Share Operating Performance: | | | | |
| | |
| | Net asset value, beginning of period | | $ | 49.91 | |
| | |
| | Net investment income(a) | | | 0.66 | |
| | |
| | Net realized and unrealized loss | | | (0.45 | ) |
| | |
| | Total gain from investment operations | | | 0.21 | |
| | |
| | Distributions to shareholders from net investment income | | | (0.54 | ) |
| | |
| | Net asset value, end of period | | $ | 49.58 | |
| | |
| | Market price, end of period | | $ | 49.63 | |
| | |
| | Total Return at Net Asset Value(b) | | | 0.42 | % |
| | |
| | Net assets, end of period (in 000’s) | | $ | 19,831 | |
| | |
| | Ratio of net expenses to average net assets | | | 0.25 | %(c) |
| | |
| | Ratio of total expenses to average net assets | | | 0.25 | %(c) |
| | |
| | Ratio of net investment income to average net assets | | | 2.72 | %(c) |
| | |
| | Portfolio turnover rate(d) | | | 10 | % |
| | * | | Commencement of operations. |
| | (a) | | Calculated based on the average shares outstanding methodology. |
| | (b) | | Assumes investment at the net asset value at the beginning of the period, reinvestment of all distributions and a complete sale of the investment at the net asset value at the end of the period. Returns do not reflect the impact of taxes to shareholders relating to Fund distributions or the sale of Fund shares. Total returns for periods less than one full year are not annualized. |
| | (d) | | The Fund’s portfolio turnover rate is calculated in accordance with regulatory requirements and excludes portfolio securities received or delivered as a result of in-kind transactions and short-term transactions. If such transactions were included, the Fund’s portfolio turnover rate may be higher. |
| | |
| 22 | | The accompanying notes are an integral part of these financial statements. |
GOLDMAN SACHS COMMUNITY MUNICIPAL BOND ETF
Notes to Financial Statements
August 31, 2023
Goldman Sachs Community Municipal Bond ETF (the “Fund”) is a diversified series of the Goldman Sachs ETF Trust (the “Trust”) which is an open-end management investment company, registered under the Investment Company Act of 1940, as amended (the “Act”), consisting of multiple series. The Trust was organized as a Delaware statutory trust on December 16, 2009. The Fund commenced operations on March 7, 2023.
The investment objective of the Fund is to provide investment results that closely correspond, before fees and expenses, to the performance of the Bloomberg Goldman Sachs Community Municipal Index (the “Index”).
Goldman Sachs Asset Management, L.P. (“GSAM”), an affiliate of Goldman Sachs & Co. LLC (“Goldman Sachs”), serves as investment adviser to the Fund pursuant to a management agreement (the “Agreement”) with the Trust. The Fund is an exchange-traded fund (“ETF”). Shares of the Fund are listed and traded on the NYSE Arca, Inc. Market prices for the Fund’s shares may be different from their net asset value (“NAV”). The Fund issues and redeems shares at its respective NAV only in blocks of a specified number of shares, or multiples thereof, referred to as “Creation Units”. Creation Units are issued and redeemed generally for a designated portfolio of securities (including any portion of such securities for which cash may be substituted) and a specified amount of cash. Shares generally trade in the secondary market in quantities less than a Creation Unit at market prices that change throughout the day. Only those that have entered into an authorized participant agreement with ALPS Distributors, Inc. (the “Distributor”) may do business directly with the Fund.
|
| 2. SIGNIFICANT ACCOUNTING POLICIES |
The financial statements have been prepared in accordance with accounting principles generally accepted in the United States of America (“GAAP”) and require management to make estimates and assumptions that may affect the reported amounts and disclosures. Actual results may differ from those estimates and assumptions. The Fund is an investment company under GAAP and follows the accounting and reporting guidance applicable to investment companies.
A. Investment Valuation — The Fund’s valuation policy is to value investments at fair value.
B. Investment Income and Investments — Investment income includes interest income, dividend income, and securities lending income, if any. Interest income is accrued daily and adjusted for amortization of premiums and accretion of discounts. Dividend income is recognized on ex-dividend date or, for certain foreign securities, as soon as such information is obtained subsequent to the ex-dividend date. Non-cash dividends, if any, are recorded at the fair market value of the securities received. Investment transactions are reflected on trade date. Realized gains and losses are calculated using identified cost. Investment transactions are recorded on the following business day for daily NAV calculations.
C. Expenses — Expenses incurred directly by a Fund are charged to the Fund, and certain expenses incurred by the Trust that may not solely relate to the Fund are allocated to the Fund and the other applicable funds of the Trust on a straight-line and/or pro-rata basis, depending upon the nature of the expenses, and are accrued daily.
D. Federal Taxes and Distributions to Shareholders — It is the Fund’s policy to comply with the requirements of the Internal Revenue Code of 1986, as amended (the “Code”), applicable to regulated investment companies and to distribute each year substantially all of its investment company taxable income and capital gains to its shareholders. Accordingly, the Fund is not required to make any provisions for the payment of federal income tax. Distributions to shareholders are recorded on the ex-dividend date. Income and capital gains distributions, if any, are declared and paid quarterly and annually, respectively.
Net capital losses, if any, are carried forward to future fiscal years and may be used to the extent allowed by the Code to offset any future capital gains. Losses that are carried forward will retain their character as either short-term or long-term capital losses. Utilization of capital loss carryforwards will reduce the requirement of future capital gains distributions.
The characterization of distributions to shareholders for financial reporting purposes is determined in accordance with federal income tax rules, which may differ from GAAP. The source of the Fund’s distributions may be shown in the accompanying financial statements as either from distributable earnings or capital. Certain components of the Fund’s net assets on the Statement of Assets and Liabilities reflect permanent GAAP/tax differences based on the appropriate tax character.
23
GOLDMAN SACHS COMMUNITY MUNICIPAL BOND ETF
Notes to Financial Statements (continued)
August 31, 2023
|
| 3. INVESTMENTS AND FAIR VALUE MEASUREMENTS |
U.S. GAAP defines the fair value of a financial instrument as the amount that would be received to sell an asset or paid to transfer a liability in an orderly transaction between market participants at the measurement date (i.e., the exit price); the Fund’s policy is to use the market approach. GAAP establishes a fair value hierarchy that prioritizes the inputs to valuation techniques used to measure fair value. The hierarchy gives the highest priority to unadjusted quoted prices in active markets for identical assets or liabilities (Level 1 measurements) and the lowest priority to unobservable inputs (Level 3 measurements). The level in the fair value hierarchy within which the fair value measurement in its entirety falls shall be determined based on the lowest level input that is significant to the fair value measurement in its entirety. The levels used for classifying investments are not necessarily an indication of the risk associated with investing in these investments. The three levels of the fair value hierarchy are described below:
Level 1 — Unadjusted quoted prices in active markets that are accessible at the measurement date for identical, unrestricted assets or liabilities;
Level 2 — Quoted prices in markets that are not active or financial instruments for which significant inputs are observable (including, but not limited to, quoted prices for similar investments, interest rates, foreign exchange rates, volatility and credit spreads), either directly or indirectly;
Level 3 — Prices or valuations that require significant unobservable inputs (including GSAM’s assumptions in determining fair value measurement).
The Board of Trustees (“Trustees”) has approved Valuation Procedures that govern the valuation of the portfolio investments held by the Fund, including investments for which market quotations are not readily available. With respect to the Fund’s investments that do not have readily available market quotations, the Trustees have designated the Adviser as the valuation designee to perform fair valuations pursuant to Rule 2a-5 under the Investment Company Act of 1940 (the “Valuation Designee”). GSAM has day-to-day responsibility for implementing and maintaining internal controls and procedures related to the valuation of the Fund’s investments. To assess the continuing appropriateness of pricing sources and methodologies, GSAM regularly performs price verification procedures and issues challenges as necessary to third party pricing vendors or brokers, and any differences are reviewed in accordance with the Valuation Procedures.
A. Level 1 and Level 2 Fair Value Investments — The valuation techniques and significant inputs used in determining the fair values for investments classified as Level 1 and Level 2 are as follows:
Debt Securities — Debt securities for which market quotations are readily available are valued daily on the basis of quotations supplied by dealers or an independent pricing service. The pricing services may use valuation models or matrix pricing, which consider: (i) yield or price with respect to bonds that are considered comparable in characteristics such as rating, interest rate and maturity date or (ii) quotations from securities dealers to determine current value. With the exception of treasury securities of G7 countries, which are generally classified as Level 1, these investments are generally classified as Level 2 of the fair value hierarchy.
Money Market Funds — Investments in the Goldman Sachs Financial Square Government Fund (“Underlying Money Market Fund”) are valued at the NAV per share of the Institutional Share class on the day of valuation. These investments are generally classified as Level 1 of the fair value hierarchy. For information regarding the Underlying Money Market Fund’s accounting policies and investment holdings, please see the Underlying Money Market Fund’s shareholder report.
B. Level 3 Fair Value Investments — To the extent that significant inputs to valuation models and other alternative pricing sources are unobservable, or if quotations are not readily available, or if GSAM believes that such quotations do not accurately reflect fair value, the fair value of the Fund’s investments may be determined under the Valuation Procedures. GSAM, consistent with its procedures and applicable regulatory guidance, may make an adjustment to the most recent valuation prices of either domestic or foreign securities in light of significant events to reflect what it believes to be the fair value of the securities at the time of determining the Fund’s NAV. To the extent investments are valued using single source broker quotations obtained directly from the broker or passed through from third party pricing vendors, such investments are classified as Level 3 investments.
24
GOLDMAN SACHS COMMUNITY MUNICIPAL BOND ETF
|
| 3. INVESTMENTS AND FAIR VALUE MEASUREMENTS (continued) |
C. Fair Value Hierarchy — The following is a summary of the Fund’s investments classified in the fair value hierarchy as of August 31, 2023:
| | | | | | | | | | | | |
|
| COMMUNITY MUNICIPAL BOND ETF | |
| | | |
| Investment Type | | Level 1 | | | Level 2 | | | Level 3 | |
| | | |
| Assets | | | | | | | | | | | | |
| | | |
Fixed Income | | | | | | | | | | | | |
| | | |
Municipal Bonds | | $ | — | | | $ | 19,402,204 | | | $ | — | |
| | | |
Investment Company | | | 114,880 | | | | — | | | | — | |
| | | |
| Total | | $ | 114,880 | | | $ | 19,402,204 | | | $ | — | |
For further information regarding security characteristics, see the Schedule of Investments.
|
| 4. AGREEMENTS AND AFFILIATED TRANSACTIONS |
A. Management Agreement — Under the Agreement, GSAM manages the Fund, subject to the general supervision of the Trustees.
As compensation for the services rendered pursuant to the Agreement, the assumption of the expenses related thereto and administration of the Fund’s business affairs, including providing facilities, GSAM is entitled to a management fee, accrued daily and paid monthly, equal to an annual percentage rate of the Fund’s average daily net assets.
The Fund operates under a unitary management fee structure. Under the unitary fee structure, GSAM is responsible for paying substantially all the expenses of the Fund, excluding payments under the Fund’s 12b-1 plan (if any), interest expenses, taxes, acquired fund fees and expenses, brokerage fees, costs of holding shareholder meetings, litigation, indemnification and extraordinary expenses. As the Funds directly pay fees and expenses of the independent Trustees, the management fee collected by GSAM will be reduced by an amount equal to the fees and expenses paid by the Funds to the independent Trustees.
For the period ended August 31, 2023, contractual and effective net unitary management fees with GSAM was 0.25%.
The Fund invests in Institutional Shares of the Goldman Sachs Financial Square Government Fund, which is an affiliated Underlying Money Market Fund. GSAM has agreed to waive a portion of its management fee payable by the Fund in an amount equal to the management fee it earns as an investment adviser to the affiliated Underlying Money Market Fund in which the Fund invests. For the period ended August 31, 2023, the management fee waived by GSAM for each Fund was $32.
B. Other Transactions with Affiliates — For the period ended August 31, 2023, Goldman Sachs did not earn any brokerage commissions from portfolio transactions on behalf of the Fund.
The following table provides information about the Fund’s investments in the Goldman Sachs Financial Square Government Fund — Institutional Shares as of and for the period ended August 31, 2023.
| | | | | | | | | | | | | | | | | | | | | | | | |
| Fund | | | | Beginning
value as of
March 7,
2023* | | Purchases
at Cost | | | Proceeds
from Sales | | | Ending
value as of
August 31,
2023 | | | Shares
as of
August 31,
2023 | | | Dividend
Income | |
Community Municipal Bond ETF | | | | $— | | $ | 484,837 | | | $ | (369,957 | ) | | $ | 114,880 | | | | 114,880 | | | $ | 1,060 | |
| * | | Commencement of operations. |
25
GOLDMAN SACHS COMMUNITY MUNICIPAL BOND ETF
Notes to Financial Statements (continued)
August 31, 2023
|
| 5. CREATION AND REDEMPTION OF CREATION UNITS |
The Trust issues and redeems shares of the Fund only in Creation Units on a continuous basis through the Distributor, without an initial sales load, at NAV next determined after receipt, on any Business Day (as defined in the Statement of Additional Information), of an order in proper form. Shares of the Fund may only be purchased or redeemed by certain financial institutions (each an “Authorized Participant”). An Authorized Participant is either (1) a “Participating Party” or other participant in the clearing process through the Continuous Net Settlement System of the National Securities Clearing Corporation; or (2) a Depository Trust Company participant; which, in either case, must have executed an agreement with the Distributor. Retail investors will typically not qualify as an Authorized Participant or have the resources to buy and sell whole Creation Units. Therefore, they will be unable to purchase or redeem the shares directly from the Fund. Rather, most retail investors will purchase shares in the secondary market at market prices with the assistance of a broker and may be subject to customary brokerage commissions or fees. Fixed creation and redemption transaction fees are imposed in connection with creations and redemptions.
Authorized Participants transacting in Creation Units for cash may also pay a variable charge to compensate the Fund for certain transaction costs (e.g. taxes on currency or other financial transactions, and brokerage costs) and market impact expenses relating to investing in portfolio securities. Such variable charges, if any, are included in “Proceeds from sale of shares” in the Statement of Changes in Net Assets.
| | | | | | | | | | | | |
| | | Community Municipal Bond ETF | |
| | | | |
| | | For the period* March 7, 2023
through August 31, 2023 | |
| | | | |
| | | Shares | | | | | | Dollars | |
| | | | |
| Fund Share Activity | | | | | | | | | | | | |
Shares Sold | | | 400,000 | | | | | | | $ | 19,964,233 | |
Shares Redeemed | | | — | | | | | | | | — | |
| | | |
NET INCREASE IN SHARES | | | 400,000 | | | | | | | $ | 19,964,233 | |
| * | | Commencement of operations. |
|
| 6. PORTFOLIO SECURITIES TRANSACTIONS |
The cost of purchases and proceeds from sales and maturities of long-term securities for the period ended August 31, 2023, were as follows:
| | | | | | | | | | |
| Fund | | | | Purchases | | | Sales | |
Community Municipal Bond ETF | | | | $ | 21,618,509 | | | $ | 1,918,569 | |
The tax character of distributions paid during the period ended August 31, 2023 were as follows:
| | | | |
| | | Community
Municipal
Bond ETF | |
Distributions paid from: | | | | |
Tax-exempt income | | $ | 214,013 | |
Ordinary income | | | 1,083 | |
Total taxable distributions | | $ | 215,096 | |
26
GOLDMAN SACHS COMMUNITY MUNICIPAL BOND ETF
|
| 7. TAX INFORMATION (continued) |
As of August 31, 2023, the components of accumulated earnings (losses) on a tax-basis were as follows:
| | | | |
| | | Community
Municipal
Bond ETF | |
Undistributed tax exempt income— net | | $ | 48,484 | |
Capital loss carryforwards: | | | | |
Perpetual Short-Term | | $ | (4,824 | ) |
Unrealized gains (losses) — net | | | (176,950 | ) |
Total accumulated earnings (losses) net | | $ | (133,290 | ) |
As of August 31, 2023, the Fund’s aggregate security unrealized gains and losses based on cost for U.S. federal income tax purposes were as follows:
| | | | |
| | | Community
Municipal
Bond ETF | |
Tax Cost | | $ | 19,694,034 | |
Gross unrealized gain | | | 7,461 | |
Gross unrealized loss | | | (184,411 | ) |
Net unrealized gains (losses) | | $ | (176,950 | ) |
The difference between GAAP-basis and tax-basis unrealized gains (losses) is attributable to differences in the tax treatment of market discount accretion and premium amortization.
GSAM has reviewed the Fund’s tax positions for all open tax years (the current year) and has concluded that no provision for income tax is required in the Fund’s financial statements. Such open tax year remains subject to examination and adjustment by tax authorities.
The Fund’s risks include, but are not limited to, the following:
Calculation Methodology Risk — The Index relies on various sources of information to assess the criteria of issuers included in the Index, (or a Reference Index if applicable) including fundamental information that may be based on assumptions and estimates. Neither the Fund, the Investment Adviser nor the Index Provider can offer assurances that the Index’s calculation methodology or sources of information will provide a correct valuation of securities, nor can they guarantee the availability or timeliness of the production of the Index.
ESG Standards Risk — The application of the Index Provider’s methodology when constructing the Index generally will affect the Fund’s exposure to certain issuers, sectors, and regions and may affect the Fund’s performance depending on whether such investments are in or out of favor. For example, the Fund generally will not invest in issuers that the Index Provider’s methodology screens as a result of certain social or environmental factors (e.g., funds tied to alcohol, tobacco, gambling, transportation, or correctional facilities). Application of the Index’s ESG criteria may also affect the Fund’s performance relative to similar funds that do not seek to track indexes that utilize such criteria. The Fund and GSAM rely on the Index Provider to determine whether the Index’s ESG criteria are met and do not perform a separate ESG analysis of Index constituents. When assessing whether an issuer meets the Index’s ESG criteria, the Index Provider generally will rely on third-party data that it believes to be reliable, but it
27
GOLDMAN SACHS COMMUNITY MUNICIPAL BOND ETF
Notes to Financial Statements (continued)
August 31, 2023
|
| 8. OTHER RISKS (continued) |
does not guarantee the accuracy of such third-party data. ESG information from the Index Provider and other third-party data providers may be incomplete, inaccurate or unavailable and may vary significantly from one third-party data provider to another, which may adversely impact the Fund’s investments. Certain investments may be dependent on U.S. government policies, including tax incentives and subsidies, which may change without notice. The Index’s ESG criteria may be changed without shareholder approval.
Index Risk — Bloomberg Professional Services (the “Index Provider”) constructs the Fund’s Index in accordance with a rules-based methodology. The Fund will be negatively affected by general declines in the securities and asset classes represented in its Index. In addition, because the Fund is not “actively” managed, unless a specific security is removed from an Index, the Fund generally would not sell a security because the security’s issuer was in financial trouble. Market disruptions and regulatory restrictions could have an adverse effect on the Fund’s ability to adjust its exposure to the required levels in order to track the Index. The Fund also does not attempt to take defensive positions under any market conditions, including declining markets. Therefore, the Fund’s performance could be lower than funds that may actively shift their portfolio assets to take advantage of market opportunities or to lessen the impact of a market decline or a decline in the value of one or more issuers. The Index Provider relies on third party data it believes to be reliable in constructing the Index, but it does not guarantee the accuracy or availability of such third party data. Errors in index data, index computation or the construction of an Index in accordance with its methodology may occur from time to time and may not be identified and corrected by the Index Provider for a period of time or at all, which may have an adverse impact on the Fund and its shareholders. In addition, neither the Fund, the Investment Adviser, the Calculation Agent nor the Index Provider can guarantee the availability or timeliness of the production of the Index.
Interest Rate Risk — When interest rates increase, fixed income securities or instruments held by the Fund will generally decline in value. Long-term fixed income securities or instruments will normally have more price volatility because of this risk than short-term fixed income securities or instruments. A wide variety of market factors can cause interest rates to rise, including central bank monetary policy, rising inflation and changes in general economic conditions. Changing interest rates may have unpredictable effects on the markets, may result in heightened market volatility and may detract from Fund performance. In addition, changes in monetary policy may exacerbate the risks associated with changing interest rates. Funds with longer average portfolio durations will generally be more sensitive to changes in interest rates than funds with a shorter average portfolio duration Fluctuations in interest rates may also affect the liquidity of fixed income securities and instruments held by the Fund. A sudden or unpredictable increase in interest rates may cause volatility in the market and may decrease the liquidity of the Fund’s investments, which would make it harder for the Fund to sell its investments at an advantageous time.
Large Shareholder Transactions Risk — Certain shareholders, including other funds advised by the Investment Adviser, may from time to time own a substantial amount of the Fund’s Shares. In addition, a third party investor, the Investment Adviser or an affiliate of the Investment Adviser, an authorized participant, a lead market maker, or another entity (i.e., a seed investor) may invest in the Fund and hold it sinvestment solely to facilitate commencement of the Fund or to facilitate the Fund’s achieving a specified size or scale. Any such investment may be held for a limited period of time. There can be no assurance that any large shareholder would not redeem its investment, that the size of the Fund would be maintained at such levels or that the Fund would continue to meet applicable listing requirements. Redemptions by large shareholders could have a significant negative impact on the Fund, including on the Fund’s liquidity. In addition, transactions by large shareholders may account for a large percentage of the trading volume on (insert exchange for the fund/funds here) and may, therefore, have a material upward or downward effect on the market price of the Shares.
Liquidity Risk — The Fund may make investments that are illiquid or that may become less liquid in response to market developments or adverse investor perceptions. Illiquid investments may be more difficult to value. To the extent a Fund engages in cash redemptions, then liquidity risk may also refer to the risk that the Fund will not be able to pay redemption proceeds within the allowable time period or without significant dilution to remaining investors’ interests because of unusual market conditions, declining prices of the securities sold, an unusually high volume of redemption requests, or other reasons. To meet redemption requests, the Fund may be forced to sell investments at an unfavorable time and/or under unfavorable conditions. If the Fund is forced to sell securities at an unfavorable time and/or under unfavorable conditions, such sales may adversely affect the Fund’s
28
GOLDMAN SACHS COMMUNITY MUNICIPAL BOND ETF
|
| 8. OTHER RISKS (continued) |
NAV and dilute remaining investors’ interests. Liquidity risk may be the result of, among other things, the reduced number and capacity of traditional market participants to make a market in fixed income securities or the lack of an active market. The potential for liquidity risk may be magnified by a rising interest rate environment or other circumstances where investor redemptions from fixed income funds may be higher than normal, potentially causing increased supply in the market due to selling activity. Redemptions by large shareholders may have a negative impact on a Fund’s liquidity.
Market and Credit Risks — In the normal course of business, a Fund trades financial instruments and enters into financial transactions where risk of potential loss exists due to changes in the market (market risk). The value of the securities in which a Fund invests may go up or down in response to the prospects of individual companies, particular sectors or governments and/or general economic conditions throughout the world due to increasingly interconnected global economies and financial markets. Events such as war, military conflict, acts of terrorism, social unrest, natural disasters, recessions, inflation, rapid interest rate changes, supply chain disruptions, sanctions, the spread of infectious illness or other public health threats could also significantly impact a Fund and its investments. Additionally, a Fund may also be exposed to credit risk in the event that an issuer or guarantor fails to perform or that an institution or entity with which the Fund has unsettled or open transactions defaults.
Market Trading Risk — The Fund faces numerous market trading risks, including disruptions to creations and redemptions, the existence of extreme market volatility or potential lack of an active trading market for Shares. If a shareholder purchases Shares at a time when the market price is at a premium to the NAV or sells Shares at a time when the market price is at a discount to the NAV, the shareholder may pay more for, or receive less than, the underlying value of the Shares, respectively. The Investment Adviser cannot predict whether Shares will trade below, at or above their NAV. Price differences may be due, in large part, to the fact that supply and demand forces at work in the secondary trading market for Shares will be closely related to, but not identical to, the same forces influencing the prices of the securities of a Fund’s Index trading individually or in the aggregate at any point in time.
Municipal Securities Risk — Municipal securities are subject to credit/default risk, interest rate risk and certain additional risks. The Fund may be more sensitive to adverse economic, business or political developments if it invests a substantial portion of its assets in the bonds of similar projects (such as those relating to education, health care, housing, transportation, and utilities), industrial development bonds, or in particular types of municipal securities (such as general obligation bonds, private activity bonds and moral obligation bonds). While interest earned on municipal securities is generally not subject to federal tax, any interest earned on taxable municipal securities is fully taxable at the federal level and may be subject to tax at the state level.
Seed Investor Risk — GSAM and/or its affiliates may make payments to one or more investors that contribute seed capital to the Fund. Such payments may continue for a specified period of time and/or until a specified dollar amount is reached. Those payments will be made from the assets of GSAM and/or such affiliates (and not the Fund). There is a risk that such seed investors may redeem their investments in the Fund, particularly after payments from GSAM and/or its affiliates have ceased. As with redemptions by other large shareholders, such redemptions could have a significant negative impact on the Fund, including on the Fund’s liquidity and the market price of the Fund’s Shares.
State/Territory Specific Risk — The Fund’s investments in municipal obligations of issuers located in a particular state or U.S. territory may be adversely affected by political, economic and regulatory developments within that state or U.S. territory. Such developments may affect the financial condition of a state’s or territory’s political subdivisions, agencies, instrumentalities and public authorities and heighten the risks associated with investing in bonds issued by such parties, which could, in turn, adversely affect the Fund’s income, NAV, liquidity, and/or ability to preserve or realize capital appreciation.
Tax Risk — Any proposed or actual changes in income tax rates or the tax-exempt status of interest income from municipal securities can significantly affect the demand for and supply, liquidity and marketability of municipal securities. Such changes may affect the Fund’s net asset value and ability to acquire and dispose of municipal securities at desirable yield and price levels.
Tracking Error Risk — Tracking error is the divergence of the Fund’s performance from that of its Index. The performance of the Fund may diverge from that of its Index for a number of reasons. Tracking error may occur because of transaction costs, the Fund’s
29
GOLDMAN SACHS COMMUNITY MUNICIPAL BOND ETF
Notes to Financial Statements (continued)
August 31, 2023
|
| 8. OTHER RISKS (continued) |
holding of cash, differences in accrual of dividends, changes to its Index or the need to meet new or existing regulatory requirements. Unlike the Fund, the returns of the Index are not reduced by investment and other operating expenses, including the trading costs associated with implementing changes to its portfolio of investments. Tracking error risk may be heightened during times of market volatility or other unusual market conditions.
Under the Trust’s organizational documents, its Trustees, officers, employees and agents are indemnified, to the extent permitted by the Act and state law, against certain liabilities that may arise out of performance of their duties to the Fund. Additionally, in the course of business, the Fund enters into contracts that contain a variety of indemnification clauses. The Fund’s maximum exposure under these arrangements is unknown, as this would involve future claims that may be made against the Fund that have not yet occurred. However, GSAM believes the risk of loss under these arrangements to be remote.
Pursuant to an effort to consolidate the membership of the Board of Trustees of the Trust (the “Board”) with the Board of Trustees of each of Goldman Sachs ETF Trust II, Goldman Sachs Real Estate Diversified Income Fund, Goldman Sachs Trust, Goldman Sachs Trust II and Goldman Sachs Variable Insurance Trust, in July 2023, the Board voted to nominate Gregory G. Weaver, Dwight L. Bush, Kathryn A. Cassidy, John G. Chou, Joaquin Delgado, Eileen H. Dowling and Paul C. Wirth (the “Nominees”) for election as Trustees of the Trust at a virtual special joint meeting of shareholders to be held on November 16, 2023. Each of the Nominees currently serve as a Trustee of each of the Goldman Sachs Trust and Goldman Sachs Variable Insurance Trust. If elected, the Nominees will serve as Trustees alongside the current Trustees of the Trust. This annual report is not a proxy statement. Information regarding the election of the Nominees is contained in the proxy materials filed with the SEC. The proxy statement has been mailed to shareholders of record, and shareholders can also access the proxy statement, and any other relevant documents, on the SEC’s website.
Subsequent events after the Statement of Assets and Liabilities date have been evaluated, and GSAM has concluded that there is no impact requiring adjustment or disclosure in the financial statements.
30
Report of Independent Registered Public
Accounting Firm
To the Board of Trustees and Shareholders of Goldman Sachs Community Municipal Bond ETF
Opinion on the Financial Statements
We have audited the accompanying statement of assets and liabilities, including the schedule of investments, of Goldman Sachs Community Municipal Bond ETF (the “Fund”) as of August 31, 2023, the related statements of operations and changes in net assets, including the related notes, and the financial highlights for the period March 7, 2023 (commencement of operations) through August 31, 2023 (collectively referred to as the “financial statements”). In our opinion, the financial statements present fairly, in all material respects, the financial position of the Fund as of August 31, 2023, and the results of its operations, changes in its net assets, and the financial highlights for the period March 7, 2023 (commencement of operations) through August 31, 2023 in conformity with accounting principles generally accepted in the United States of America.
Basis for Opinion
These financial statements are the responsibility of the Fund’s management. Our responsibility is to express an opinion on the Fund’s financial statements based on our audit. We are a public accounting firm registered with the Public Company Accounting Oversight Board (United States) (PCAOB) and are required to be independent with respect to the Fund in accordance with the U.S. federal securities laws and the applicable rules and regulations of the Securities and Exchange Commission and the PCAOB.
We conducted our audit of these financial statements in accordance with the standards of the PCAOB. Those standards require that we plan and perform the audit to obtain reasonable assurance about whether the financial statements are free of material misstatement, whether due to error or fraud.
Our audit included performing procedures to assess the risks of material misstatement of the financial statements, whether due to error or fraud, and performing procedures that respond to those risks. Such procedures included examining, on a test basis, evidence regarding the amounts and disclosures in the financial statements. Our audit also included evaluating the accounting principles used and significant estimates made by management, as well as evaluating the overall presentation of the financial statements. Our procedures included confirmation of securities owned as of August 31, 2023 by correspondence with the custodian, transfer agent and brokers; when replies were not received from brokers, we performed other auditing procedures. We believe that our audit provides a reasonable basis for our opinion.
/s/ PricewaterhouseCoopers LLP
Boston, Massachusetts
October 25, 2023
We have served as the auditor of one or more investment companies in Goldman Sachs fund complex since 2000.
31
GOLDMAN SACHS COMMUNITY MUNICIPAL BOND ETF
Statement Regarding Basis for Initial Approval of Management Agreement for the Goldman Sachs Community Municipal Bond ETF (Unaudited)
Background
The Goldman Sachs Community Municipal Bond ETF (the “Fund”) is a newly-organized investment portfolio of Goldman Sachs ETF Trust (the “Trust”) that commenced investment operations on March 9, 2023. At a meeting held on September 19-20, 2022 (the “Meeting”) in connection with the Fund’s organization, the Board of Trustees, including all of the Trustees present who are not parties to the Fund’s investment management agreement (the “Management Agreement”) or “interested persons” (as defined in the Investment Company Act of 1940, as amended) of any party thereto (the “Independent Trustees”) approved the Management Agreement with Goldman Sachs Asset Management, L.P. (the “Investment Adviser”) on behalf of the Fund. At the Meeting, the Trustees reviewed the Management Agreement with respect to the Fund, including information regarding the terms of the Management Agreement; the nature, extent and quality of the Investment Adviser’s anticipated services; the fees and expenses to be paid by the Fund; a comparison of the Fund’s proposed management fee and anticipated expenses with those paid by other similar exchange-traded funds (“ETFs”); potential benefits to be derived by the Investment Adviser and its affiliates from their relationships with the Fund; and potential benefits to be derived by the Fund from its relationship with the Investment Adviser. Various information was also provided at prior meetings at which the Fund was discussed.
In connection with the Meeting, the Trustees received written materials and oral presentations on the topics covered, and were advised by their independent legal counsel regarding their responsibilities and other regulatory requirements related to the approval of registered fund investment management agreements under applicable law. In evaluating the Management Agreement at the Meeting, the Trustees relied upon information included in a presentation made by the Investment Adviser at the Meeting and information received at prior Board meetings, as well as on their knowledge of the Investment Adviser resulting from their meetings and other interactions over time.
Nature, Extent, and Quality of the Services Provided Under the Management Agreement
As part of their review, the Trustees considered the nature, extent, and quality of the services to be provided to the Fund by the Investment Adviser. In this regard, the Trustees considered both the investment advisory services and non-advisory services that would be provided by the Investment Adviser and its affiliates. The Trustees noted the ongoing recruitment efforts aimed at bringing high quality investment talent to the Investment Adviser. They also noted the significant resources that the Investment Adviser devotes to risk management and the control environment in which the Fund would operate, the Investment Adviser’s commitment to maintaining high quality systems and expending substantial resources to respond to ongoing changes to the market, regulatory and control environment in which the Fund and its service providers would operate, including developments associated with the COVID-19 pandemic, geopolitical events, and economic sanctions, as well as the efforts of the Investment Adviser and its affiliates to combat cyber security risks. The Trustees considered that under the Management Agreement, the Fund pays a single management fee to the Investment Adviser, and the Investment Adviser pays all of the Fund’s ordinary operating expenses, excluding payments under the Fund’s 12b-1 plan (if any), interest expenses, taxes, acquired fund fees and expenses, brokerage fees, costs of holding shareholder meetings and litigation, indemnification and extraordinary expenses. The Trustees also considered information about the Fund’s structure, investment objective, strategies and other characteristics. In particular, they noted that the Fund would operate as a passively-managed ETF that seeks to track an index owned and calculated by a third-party service provider. The Trustees noted the experience and capabilities of the key personnel of the Investment Adviser who would provide services to the Fund. In particular, the Trustees considered the Investment Adviser’s extensive experience in managing fixed income investment strategies. The Trustees also considered information regarding the Investment Adviser’s business continuity planning and remote operations capabilities. The Trustees concluded that the Investment Adviser would be able to commit substantial financial and operational resources to the Fund. They also considered that although the Fund was new (and therefore had no performance data to evaluate), the Investment Adviser has committed substantial financial and operational resources to ETFs and has extensive experience managing other types of registered investment companies. The Trustees also recognized that the Investment Adviser had made significant commitments to address regulatory compliance requirements applicable to the Fund and the Investment Adviser and its affiliates.
Unitary Fee Structure and Profitability
The Trustees considered the unitary management fee rate payable by the Fund, noting that the Management Agreement provides for a unitary fee structure, pursuant to which the Fund pays a single management fee to the Investment Adviser and the Investment Adviser then pays all of the Fund’s ordinary operating expenses. In addition, the Trustees considered information on the services to be rendered by the Investment Adviser to the Fund, which would include both advisory and non-advisory services directed to the needs and operations of the Fund as an ETF. The Trustees noted that a license fee would be payable by the Investment Adviser to Bloomberg Professional Services for the use of its index. The Trustees also considered information provided
32
GOLDMAN SACHS COMMUNITY MUNICIPAL BOND ETF
Statement Regarding Basis for Initial Approval of Management Agreement for the Goldman Sachs Community Municipal Bond ETF (Unaudited) (continued)
regarding fees and expenses of comparable ETFs advised by other, unaffiliated investment management firms, as well as the Fund’s peer group and category medians. The comparisons of the Fund’s unitary management fee rate and projected expense ratio were prepared by the Investment Adviser and a third-party provider of mutual fund and ETF data. In particular, the Trustees referred to an analysis comparing the Fund’s unitary management fee rate and projected expense ratio to those of relevant peer funds. The Trustees concluded that the comparisons were useful in evaluating the reasonableness of the management fee and total expenses to be paid by the Fund. The Trustees concluded that the Investment Adviser’s management of the Fund likely would benefit the Fund and its shareholders.
In addition, the Trustees recognized that there was not yet profitability data to evaluate for the Fund, but considered the Investment Adviser’s representations that (i) such data would be provided after the Fund commenced operations, and (ii) the Fund was not expected to be profitable to the Investment Adviser and its affiliates initially.
Economies of Scale
The Trustees noted that the Fund, similar to many other ETFs, would not have management fee breakpoints. The Trustees considered the Fund’s projected asset levels and information comparing the fee rates charged by the Investment Adviser with fee rates charged to other ETFs in the Fund’s peer group. They further noted that the Investment Adviser’s assertion that future economies of scale (among several factors) had been taken into consideration in determining the Fund’s unitary management fee rate.
Other Benefits to the Investment Adviser and Its Affiliates
The Trustees also considered the other benefits expected to be derived by the Investment Adviser and its affiliates from their relationships with the Fund as stated above, including: (a) trading efficiencies resulting from aggregation of orders of the Fund with those for other funds or accounts managed by the Investment Adviser; (b) the Investment Adviser’s ability to leverage the infrastructure designed to service the Fund on behalf of its other clients; (c) the Investment Adviser’s ability to cross-market other products and services to Fund shareholders; (d) the Investment Adviser’s ability to negotiate better pricing with custodians on behalf of its other clients, as a result of the relationship with the Fund; and (e) the possibility that the working relationship between the Investment Adviser and the Fund’s third party service providers may cause those service providers to be more likely to do business with other areas of Goldman Sachs & Co. LLC (“Goldman Sachs”).
Other Benefits to the Fund and Its Shareholders
The Trustees also noted that the Fund is expected to receive certain potential benefits as a result of its relationship with the Investment Adviser, including: (a) enhanced servicing from vendors due to the volume of business generated by the Investment Adviser and its affiliates; (b) the advantages received from the Investment Adviser’s knowledge and experience gained from managing other accounts and products; (c) the Investment Adviser’s ability to hire and retain qualified personnel to provide services to the Fund because of the reputation of the Goldman Sachs organization; (d) the Fund’s access, through the Investment Adviser, to certain firm-wide resources (e.g., proprietary risk management systems and databases), subject to certain restrictions; and (e) the Fund’s access to certain affiliated distribution channels.
Conclusion
In connection with their consideration of the Management Agreement, the Trustees gave weight to each of the factors described above, but did not identify any particular factor as controlling their decision. After deliberation and consideration of all of the information provided, including the factors described above, the Trustees concluded, in the exercise of their business judgment, that the unitary management fee to be paid by the Fund was reasonable in light of the services to be provided to it by the Investment Adviser, the Investment Adviser’s costs and the Fund’s reasonably foreseeable asset levels. The Trustees unanimously concluded that the engagement of the Investment Adviser likely would benefit the Fund and its shareholders and that the Management Agreement should be approved for an initial two-year period from its effective date.
33
GOLDMAN SACHS COMMUNITY MUNICIPAL BOND ETF
| | |
| | |
Fund Expenses — For the Period Ended August 31, 2023 (Unaudited) | | |
As a shareholder you incur ongoing costs, including management fees and other Fund expenses. This example is intended to help you understand your ongoing costs (in dollars) of investing in Shares of the Fund and to compare these costs with the ongoing costs of investing in other exchange-traded funds. This example does not take into account brokerage commissions that you may pay on your purchases and sales of Shares of the Fund.
The example is based on an investment of $1,000 invested at the beginning of the period from March 7, 2023 (commencement of operations) and held for the entire period ended August 31, 2023, which represents a period of 178 days of a 365 day year (or less where indicated).
Actual Expenses — The first line under each share class in the table below provides information about actual account values and actual expenses. You may use the information in this line, together with the amount you invested, to estimate the expenses that you paid over the period. Simply divide your account value by $1,000 (for example, an $8,600 account value divided by $1,000=8.6), then multiply the result by the number in the first line under the heading entitled “Expenses Paid” to estimate the expenses you paid on your account during this period.
Hypothetical Example for Comparison Purposes — The second line under each share class in the table below provides information about hypothetical account values and hypothetical expenses based on the Fund’s actual net expense ratio and an assumed rate of return of 5% per year before expenses, which is not the Fund’s actual return. The hypothetical account values and expenses may not be used to estimate the actual ending account balance or expenses you paid for the period. You may use this information to compare the ongoing costs of investing in the Fund and other funds. To do so, compare this 5% hypothetical example with the 5% hypothetical examples that appear in the shareholder reports of the other funds.
Please note that the expenses shown in the table are meant to highlight your ongoing costs only and do not reflect any transactional costs, such as sales charges, redemption fees, or exchange fees. Therefore, the second line of the table is useful in comparing ongoing costs only, and will not help you determine the relative total costs of owning different funds. In addition, if these transactional costs were included, your costs would have been higher.
| | | | | | | | | | | | |
| | | Community Municipal Bond ETF* | |
| | | Beginning
Account Value
3/7/23 | | | Ending
Account Value
8/31/23 | | | Expenses Paid for the
6 months ended
8/31/23** | |
Actual based on NAV | | $ | 1,000.00 | | | $ | 1,004.20 | | | $ | 1.22 | |
Hypothetical 5% return | | | 1,000.00 | | | | 1,023.17 | + | | | 1.23 | |
| | + | | Hypothetical expenses are based on the Fund’s actual annualized net expense ratios and an assumed rate of return of 5% per year before expenses. | |
| | * | | Fund commenced operations on March 7, 2023. | |
| | ** | | Expenses are calculated using the Fund’s annualized net expense ratio, which represents the ongoing expenses as a percentage of net assets for the period ended August 31, 2023. Expenses are calculated by multiplying the annualized net expense ratio by the average account value for the period; then multiplying the result by the number of days in the most recent fiscal year; and then dividing that result by the number of days in the fiscal year. The annualized net expense ratio for the period is as follows: | |
| | | | |
| Fund | | | |
| |
Community Municipal Bond ETF | | | 0.25% | |
34
GOLDMAN SACHS COMMUNITY MUNICIPAL BOND ETF
Trustees and Officers (Unaudited)
Independent Trustees
| | | | | | | | | | |
Name,
Address and Age1 | | Position(s) Held
with the Trust | | Term of
Office and
Length of
Time Served2 | | Principal Occupation(s)
During Past 5 Years | | Number of
Portfolios in
Fund Complex
Overseen by
Trustee3 | | Other
Directorships
Held by Trustee4 |
| | | | | |
Cheryl K. Beebe Age: 67 | | Chair of the Board of Trustees | | Since 2021 | | Ms. Beebe is retired. She is Director, Packaging Corporation of America (2008-Present); Director, The Mosaic Company (2019-Present); Director, HanesBrands Inc. (2020-Present); and was formerly Director, Convergys Corporation (a global leader in customer experience outsourcing) (2015-2018); and formerly held the position of Executive Vice President, (2010-2014); and Chief Financial Officer, Ingredion, Inc. (a leading global ingredient solutions company) (2004-2014). Chair of the Board of Trustees — Goldman Sachs ETF Trust; Goldman Sachs Trust II; Goldman Sachs ETF Trust II; Goldman Sachs MLP and Energy Renaissance Fund; and Goldman Sachs Real Estate Diversified Income Fund. | | 68 | | Packaging Corporation of America (producer of container board); The Mosaic Company (producer of phosphate and potash fertilizer); HanesBrands Inc. (a multinational clothing company) |
| | | | | |
Lawrence Hughes Age: 65 | | Trustee | | Since 2021 | | Mr. Hughes is retired. Formerly, he held senior management positions with BNY Mellon Wealth Management, a division of The Bank of New York Mellon Corporation (a financial services company) (1991-2015), most recently as Chief Executive Officer (2010-2015). Previously, Mr. Hughes served as an Advisory Board Member of Goldman Sachs Trust II (February 2016-April 2016). Trustee — Goldman Sachs ETF Trust; Goldman Sachs ETF Trust II; Goldman Sachs Trust II; Goldman Sachs MLP and Energy Renaissance Fund; and Goldman Sachs Real Estate Diversified Income Fund. | | 68 | | None |
| | | | | |
John F. Killian Age: 68 | | Trustee | | Since 2021 | | Mr. Killian is retired. He is Director, Consolidated Edison, Inc. (2007-Present); and was formerly Director, Houghton Mifflin Harcourt Publishing Company (2011-2022). Previously, he held senior management positions with Verizon Communications, Inc., including Executive Vice President and Chief Financial Officer (2009-2010); and President, Verizon Business, Verizon Communications, Inc. (2005-2009). Trustee — Goldman Sachs ETF Trust; Goldman Sachs ETF Trust II; Goldman Sachs Trust II; Goldman Sachs MLP and Energy Renaissance Fund; and Goldman Sachs Real Estate Diversified Income Fund. | | 68 | | Consolidated Edison, Inc. (a utility holding company) |
| | | | | |
Steven D. Krichmar Age: 65 | | Trustee | | Since 2021 | | Mr. Krichmar is retired. Formerly, he held senior management and governance positions with Putnam Investments, LLC, a financial services company (2001-2016). He was most recently Chief of Operations and a member of the Operating Committee of Putnam Investments, LLC and Principal Financial Officer of The Putnam Funds. Previously, Mr. Krichmar served as an Audit Partner with PricewaterhouseCoopers LLP and its predecessor company (1990-2001). Trustee — Goldman Sachs ETF Trust; Goldman Sachs ETF Trust II; Goldman Sachs Trust II; Goldman Sachs MLP and Energy Renaissance Fund; and Goldman Sachs Real Estate Diversified Income Fund. | | 68 | | None |
| | | | | |
Michael Latham Age: 57 | | Trustee | | Since 2015 | | Mr. Latham is retired. Formerly, he held senior management positions with the iShares exchange-traded fund business owned by BlackRock, Inc., including Chairman (2011-2014); Global Head (2010-2011); U.S. Head (2007-2010); and Chief Operating Officer (2003-2007). Trustee — Goldman Sachs ETF Trust; Goldman Sachs ETF Trust II; Goldman Sachs Trust II; Goldman Sachs MLP and Energy Renaissance Fund; Goldman Sachs Credit Income Fund; and Goldman Sachs Real Estate Diversified Income Fund. | | 69 | | None |
35
GOLDMAN SACHS COMMUNITY MUNICIPAL BOND ETF
Trustees and Officers (Unaudited) (continued)
Independent Trustees
| | | | | | | | | | |
Name,
Address and Age1 | | Position(s) Held
with the Trust | | Term of
Office and
Length of
Time Served2 | | Principal Occupation(s)
During Past 5 Years | | Number of
Portfolios in
Fund Complex
Overseen by
Trustee3 | | Other
Directorships
Held by Trustee4 |
| | | | | |
Lawrence W. Stranghoener Age: 69 | | Trustee | | Since 2015 | | Mr. Stranghoener is retired. He is Chairman, Kennametal, Inc. (a global manufacturer and distributor of tooling and industrial materials) (2003-Present); and was formerly Director, Aleris Corporation and Aleris International, Inc. (a producer of aluminum rolled products) (2011-2020); Interim Chief Executive Officer (2014) and Executive Vice President and Chief Financial Officer (2004-2014), Mosaic Company (a fertilizer manufacturing company). Trustee — Goldman Sachs ETF Trust; Goldman Sachs Trust II; Goldman Sachs ETF Trust II; Goldman Sachs MLP and Energy Renaissance Fund; and Goldman Sachs Real Estate Diversified Income Fund. Chair of the Board of Trustees — Goldman Sachs Credit Income Fund. | | 69 | | Kennametal, Inc. (a global manufacturer and distributor of tooling and industrial materials) |
Interested Trustee*
| | | | | | | | | | |
Name, Address and Age1 | | Position(s) Held
with the Trust | | Term of
Office and
Length of
Time Served2 | | Principal Occupation(s)
During Past 5 Years | | Number of
Portfolios in
Fund Complex
Overseen by
Trustee3 | | Other
Directorships
Held by Trustee4 |
| | | | | |
James A. McNamara Age: 60 | | President and Trustee | | Since 2014 | | Advisory Director, Goldman Sachs (January 2018-Present); Managing Director, Goldman Sachs (January 2000-December 2017); Director of Institutional Fund Sales, GSAM (April 1998-December 2000); and Senior Vice President and Manager, Dreyfus Institutional Service Corporation (January 1993-April 1998). President and Trustee — Goldman Sachs ETF Trust; Goldman Sachs ETF Trust II; Goldman Sachs Trust; Goldman Sachs Variable Insurance Trust; Goldman Sachs Trust II; Goldman Sachs MLP and Energy Renaissance Fund; Goldman Sachs Credit Income Fund; and Goldman Sachs Real Estate Diversified Income Fund. | | 172 | | None |
| | | | | | | | | | |
| * | | Mr. McNamara is considered to be an “Interested Trustee” because he holds a position with Goldman Sachs and owns securities issued by The Goldman Sachs Group, Inc. The Interested Trustee holds comparable positions with certain other companies of which Goldman Sachs, GSAM or an affiliate thereof is the investment adviser, administrator and/or distributor. |
| 1 | | Each Trustee may be contacted by writing to the Trustee, c/o Goldman Sachs, 200 West Street, New York, New York, 10282, Attn: Caroline Kraus. Information is provided as of August 31, 2023. |
| 2 | | Each Trustee holds office for an indefinite term, until the earliest of: (a) the election of his or her successor; (b) the date the Trustee resigns or is removed by the Board or shareholders, in accordance with the Trust’s Declaration of Trust; or (c) the termination of the Trust. The Board has adopted policies which provide that each Independent Trustee shall retire as of December 31st of the calendar year in which he or she reaches (a) his or her 74th birthday or (b) the 15th anniversary of the date he or she became a Trustee, whichever is earlier, unless a waiver of such requirements shall have been adopted by a majority of the other Trustees. These policies may be changed by the Trustees without shareholder vote. |
| 3 | | The Goldman Sachs Fund Complex includes certain other companies listed above for each respective Trustee. As of August 31, 2023, Goldman Sachs ETF Trust consisted of 67 portfolios (32 of which offered shares to the public); Goldman Sachs ETF Trust II consisted of 2 portfolios; Goldman Sachs Trust consisted of 87 portfolios; Goldman Sachs Variable Insurance Trust consisted of 15 portfolios (11 of which offered shares to the public); Goldman Sachs Trust II consisted of 18 portfolios (7 of which offered shares to the public); and Goldman Sachs MLP and Energy Renaissance Fund, Goldman Sachs Credit Income Fund and Goldman Sachs Real Estate Diversified Income Fund each consisted of one portfolio. Goldman Sachs MLP and Energy Renaissance Fund and Goldman Sachs Credit Income Fund each did not offer shares to the public. |
| 4 | | This column includes only directorships of companies required to report to the Securities and Exchange Commission under the Securities Exchange Act of 1934 (i.e., “public companies”) or other investment companies registered under the Act. |
Additional information about the Trustees is available in the Funds’ Statement of Additional Information, which can be obtained from Goldman Sachs free of charge by calling this toll-free number (in the United States of America): 1-800-526-7384.
36
GOLDMAN SACHS COMMUNITY MUNICIPAL BOND ETF
Trustees and Officers (Unaudited) (continued)
Officers of the Trust*
| | | | | | |
| Name, Address and Age1 | | Positions Held with the Trust | | Term of
Office and
Length of
Time Served2 | | Principal Occupation(s) During Past 5 Years |
| | | |
James A. McNamara 200 West Street New York, NY 10282 Age: 60 | | Trustee and President | | Since 2014 | | Advisory Director, Goldman Sachs (January 2018-Present); Managing Director, Goldman Sachs (January 2000-December 2017); Director of Institutional Fund Sales, GSAM (April 1998-December 2000); and Senior Vice President and Manager, Dreyfus Institutional Service Corporation (January 1993-April 1998). President and Trustee — Goldman Sachs ETF Trust; Goldman Sachs Trust; Goldman Sachs Variable Insurance Trust; Goldman Sachs Trust II; Goldman Sachs ETF Trust II; Goldman Sachs MLP and Energy Renaissance Fund; Goldman Sachs Credit Income Fund; and Goldman Sachs Real Estate Diversified Income Fund. |
| | | |
Caroline L. Kraus 200 West Street New York, NY 10282 Age: 46 | | Secretary | | Since 2014 | | Managing Director, Goldman Sachs (January 2016-Present); Vice President, Goldman Sachs (August 2006-December 2015); Senior Counsel, Goldman Sachs (January 2020-Present); Associate General Counsel, Goldman Sachs (2012-December 2019); Assistant General Counsel, Goldman Sachs (August 2006-December 2011); and Associate, Weil, Gotshal & Manges, LLP (2002–2006). Secretary — Goldman Sachs ETF Trust; Goldman Sachs Trust (previously Assistant Secretary (2012)); Goldman Sachs Variable Insurance Trust (previously Assistant Secretary (2012)); Goldman Sachs Trust II; Goldman Sachs ETF Trust II; Goldman Sachs BDC, Inc.; Goldman Sachs Private Middle Market Credit LLC; Goldman Sachs Private Middle Market Credit II LLC; Goldman Sachs Middle Market Lending Corp.; Goldman Sachs MLP and Energy Renaissance Fund; Goldman Sachs Credit Income Fund; and Goldman Sachs Real Estate Diversified Income Fund. |
| | | |
Joseph F. DiMaria 30 Hudson Street Jersey City, NJ 07302 Age: 55 | | Treasurer, Principal Financial Officer and Principal Accounting Officer | | Since 2017 (Treasurer and Principal Financial Officer since 2019) | | Managing Director, Goldman Sachs (November 2015-Present) and Vice President-Mutual Fund Administration, Columbia Management Investment Advisers, LLC (May 2010-October 2015). Treasurer, Principal Financial Officer and Principal Accounting Officer — Goldman Sachs ETF Trust (previously Assistant Treasurer (2017)); Goldman Sachs Trust (previously Assistant Treasurer (2016)); Goldman Sachs Variable Insurance Trust (previously Assistant Treasurer (2016)); Goldman Sachs Trust II (previously Assistant Treasurer (2017)); Goldman Sachs MLP and Energy Renaissance Fund (previously Assistant Treasurer (2017)); Goldman Sachs ETF Trust II; Goldman Sachs Credit Income Fund; and Goldman Sachs Real Estate Diversified Income Fund. |
| | | | | | |
| * | | Represents a partial list of officers of the Trust. Additional information about all the officers is available in the Funds’ Statement of Additional Information, which can be obtained from Goldman Sachs free of charge by calling this toll-free number (in the United States): 1-800-621-2550. |
| 1 | | Information is provided as of August 31, 2023. |
| 2 | | Officers hold office at the pleasure of the Board of Trustees or until their successors are duly elected and qualified. Each officer holds comparable positions with certain other companies of which Goldman Sachs, GSAM or an affiliate thereof is the investment adviser, administrator and/or distributor. |
Goldman Sachs Community Municipal Bond ETF Fund (Unaudited)
During the year ended August 31, 2023, 99.50% of the distributions from net investment income paid by the Fund were exempt-interest dividends and as such, are not subject to U.S. Federal income tax.
37
FUNDS PROFILE
Goldman Sachs ETFs

Goldman Sachs is a premier financial services firm, known since 1869 for creating thoughtful and customized investment solutions in complex global markets.
Today, the Asset Management Division of Goldman Sachs serves a diverse set of clients worldwide, including private institutions, public entities and individuals. With approximately $2.46 trillion in assets under supervision as of June 30, 2023, Goldman Sachs Asset Management has portfolio management teams located around the world and our investment professionals bring firsthand knowledge of local markets to every investment decision. Assets under supervision includes assets under management and other client assets for which Goldman Sachs does not have full discretion. Goldman Sachs Asset Management leverages the resources of Goldman Sachs & Co. LLC subject to legal, internal and regulatory restrictions.
|
|
| GOLDMAN SACHS EXCHANGE-TRADED FUNDS |
| Goldman Sachs ActiveBeta® Emerging Markets Equity ETF |
| Goldman Sachs ActiveBeta® Europe Equity ETF |
| Goldman Sachs ActiveBeta® International Equity ETF |
| Goldman Sachs ActiveBeta® Japan Equity ETF |
| Goldman Sachs ActiveBeta® Paris-Aligned Climate U.S. Large Cap Equity ETF |
| Goldman Sachs ActiveBeta® U.S. Large Cap Equity ETF |
| Goldman Sachs ActiveBeta® U.S. Small Cap Equity ETF |
| Goldman Sachs ActiveBeta® World Low Vol Plus Equity ETF |
| Goldman Sachs Bloomberg Clean Energy Equity ETF |
| Goldman Sachs Community Municipal Bond ETF |
| Goldman Sachs Defensive Equity ETF |
| Goldman Sachs Equal Weight U.S. Large Cap Equity ETF |
| Goldman Sachs Hedge Industry VIP ETF |
| Goldman Sachs Innovate Equity ETF |
| Goldman Sachs JUST U.S. Large Cap Equity ETF |
| Goldman Sachs Access Emerging Markets USD Bond ETF |
| Goldman Sachs Access High Yield Corporate Bond ETF |
| Goldman Sachs Access Inflation Protected USD Bond ETF |
| Goldman Sachs Access Investment Grade Corporate 1-5 Year Bond ETF |
| Goldman Sachs Access Investment Grade Corporate Bond ETF |
| Goldman Sachs Access Treasury 0-1 Year ETF |
| Goldman Sachs Access U.S. Aggregate Bond ETF |
| Goldman Sachs Access Ultra Short Bond ETF |
| Goldman Sachs MarketBeta® Emerging Markets Equity ETF |
| Goldman Sachs MarketBeta® International Equity ETF |
| Goldman Sachs MarketBeta® U.S. Equity ETF |
| Goldman Sachs MarketBeta® U.S. 1000 Equity ETF |
| Goldman Sachs MarketBeta® Total International Equity ETF |
Goldman Sachs Future Planet Equity ETF Goldman Sachs Future Tech Leaders Equity ETF |
| Goldman Sachs Future Health Care Equity ETF |
| Goldman Sachs Future Consumer Equity ETF |
| Goldman Sachs Future Real Estate and Infrastructure Equity ETF |
| Goldman Sachs North American Pipelines & Power Equity ETF |
Goldman Sachs Small Cap Core Equity ETF |
INDEX DISCLAIMERS
“Bloomberg®” and the Bloomberg Goldman Sachs Community Municipal Index (the “Index”) are service marks of Bloomberg Finance L.P. and its affiliates, including Bloomberg Index Services Limited (“BISL”), the administrator of the index (collectively, “Bloomberg”) and have been licensed for use for certain purposes by Goldman Sachs. “Goldman Sachs®” is a trademark of Goldman Sachs and has been licensed by Bloomberg for use in the name of the Index. Bloomberg is not affiliated with Goldman Sachs, and Bloomberg does not approve, endorse, review, or recommend Goldman Sachs Community Municipal Bond ETF (the “ETF”). Bloomberg does not guarantee the timeliness, accurateness, or completeness of any data or information relating to the ETF.
Solactive US Large Cap Index intends to track the performance of the large cap segment in the United States. Constituents are selected and weighted based on free-float market capitalization. The index is calculated as a total return index in USD and reconstituted semi-annually with quarterly IPO reviews.
Solactive GBS Developed Markets Large & Mid Cap Index is part of the Solactive Global Benchmark Series which includes benchmark indices for developed and emerging market countries. The index intends to track the performance of the large and mid cap segment covering approximately the largest 85% of the free-float market capitalization in the developed European market. It is calculated as a total return index in EUR and weighted by free-float market capitalization.
BLOOMBERG DOES NOT GUARANTEE THE ACCURACY AND/OR THE COMPLETENESS OF THE INDEX OR ANY DATA RELATED THERETO AND SHALL HAVE NO LIABILITY FOR ANY ERRORS, OMISSIONS OR INTERRUPTIONS THEREIN. BLOOMBERG DOES NOT MAKE ANY WARRANTY, EXPRESS OR IMPLIED, AS TO RESULTS TO BE OBTAINED BY GSAM, OWNERS OF THE FUND OR ANY OTHER PERSON OR ENTITY FROM THE USE OF THE INDEX OR ANY DATA RELATED THERETO. BLOOMBERG DOES NOT MAKE ANY EXPRESS OR IMPLIED WARRANTIES AND EXPRESSLY DISCLAIMS ALL WARRANTIES OF MERCHANTABILITY OR FITNESS FOR A PARTICULAR PURPOSE OR USE WITH RESPECT TO THE INDEX OR ANY DATA RELATED THERETO. WITHOUT LIMITING ANY OF THE FOREGOING, TO THE MAXIMUM EXTENT ALLOWED BY LAW, BLOOMBERG, ITS LICENSORS, AND ITS AND THEIR RESPECTIVE EMPLOYEES, CONTRACTORS, AGENTS, SUPPLIERS, AND VENDORS SHALL HAVE NO LIABILITY OR RESPONSIBILITY WHATSOEVER FOR ANY INJURY OR DAMAGES — WHETHER DIRECT, INDIRECT, CONSEQUENTIAL, INCIDENTAL, PUNITIVE OR OTHERWISE — ARISING IN CONNECTION WITH THE FUND OR THE INDEX OR ANY DATA OR VALUES RELATING THERETO — WHETHER ARISING FROM THEIR NEGLIGENCE OR OTHERWISE, EVEN IF NOTIFIED OF THE POSSIBILITY THEREOF.
GOLDMAN SACHS ASSET MANAGEMENT, L.P., THE GOLDMAN SACHS GROUP, INC., AND GOLDMAN SACHS & CO. LLC (COLLECTIVELY, “GOLDMAN SACHS”) DOES NOT GUARANTEE NOR MAKE ANY REPRESENTATION OR WARRANTY, EXPRESS OR IMPLIED, TO THE OWNERS OR SHAREHOLDERS OF THE FUND OR ANY MEMBER OF THE PUBLIC REGARDING THE ADVISABILITY OF INVESTING IN SECURITIES GENERALLY OR IN THE FUND PARTICULARLY OR THE ABILITY OF THE INDEX TO TRACK GENERAL MARKET PERFORMANCE. GOLDMAN SACHS, IN ITS CAPACITY AS THE INDEX PROVIDER OF THE INDEX, LICENSES CERTAIN TRADEMARKS AND TRADE NAMES TO THE FUND. GOLDMAN SACHS HAS NO OBLIGATION TO TAKE THE NEEDS OF THE FUND OR THE SHAREHOLDERS OF THE FUND INTO
FUNDS PROFILE
CONSIDERATION IN DETERMINING, COMPOSING OR CALCULATING THE INDEX. GOLDMAN SACHS, ITS AFFILIATES AND ANY OF ITS CLIENTS MAY HOLD LONG OR SHORT POSITIONS IN SECURITIES HELD BY THE FUND OR IN RELATED DERIVATIVES, INCLUDING THOSE LINKED TO THE INDEX. GOLDMAN SACHS DOES NOT GUARANTEE THE ADEQUACY, TIMELINESS, ACCURACY AND/OR THE COMPLETENESS OF THE INDEX OR ANY DATA RELATED THERETO. GOLDMAN SACHS HEREBY EXPRESSLY DISCLAIMS ANY AND ALL LIABILITY FOR ANY ERRORS, OMISSIONS, OR INTERRUPTIONS THEREIN OR IN THE CALCULATION THEREOF. GOLDMAN SACHS MAKES NO WARRANTY, EXPRESS OR IMPLIED, AND EXPRESSLY DISCLAIMS ALL WARRANTIES OF MERCHANTABILITY OR FITNESS FOR A PARTICULAR PURPOSE OR USE WITH RESPECT TO THE MARKS, THE INDEX OR ANY DATA INCLUDED THEREIN AS TO THE RESULTS TO BE OBTAINED BY THE FUND, THE SHAREHOLDERS, OR ANY OTHER PERSON OR ENTITY FROM USE OF THE INDEX OR ANY DATA INCLUDED THEREIN. WITHOUT LIMITING ANY OF THE FOREGOING, GOLDMAN SACHS HEREBY EXPRESSLY DISCLAIMS ANY AND ALL LIABILITY FOR ANY SPECIAL, PUNITIVE, INDIRECT, OR CONSEQUENTIAL DAMAGES (INCLUDING LOST PROFITS), EVEN IF ADVISED OF THE POSSIBILITY OF SUCH DAMAGES.
| | |
TRUSTEES Cheryl K. Beebe, Chair Lawrence Hughes John F. Killian Steven D. Kirchmar Michael Latham James A. McNamara Lawrence W. Stranghoener | | OFFICERS James A. McNamara, President Joseph F. DiMaria, Principal Financial Officer, Principal Accounting Officer and Treasurer Robert Griffith, Secretary* * Effective September 20, 2023 |
| |
THE BANK OF NEW YORK MELLON Transfer Agent | | |
| |
ALPS DISTRIBUTORS, INC. Distributor | | GOLDMAN SACHS ASSET MANAGEMENT, L.P. Investment Adviser |
Visit our Website at www.GSAMFUNDS.com/ETFs to obtain the most recent month-end returns.
Goldman Sachs Asset Management, L.P., 200 West Street, New York, New York 10282
The reports concerning the Funds included in this shareholder report may contain certain forward-looking statements about the factors that may affect the performance of the Funds in the future. These statements are based on Fund management’s predictions and expectations concerning certain future events and their expected impact on the Funds, such as performance of the economy as a whole and of specific industry sectors, changes in the levels of interest rates, the impact of developing world events, and other factors that may influence the future performance of the Funds. Management believes these forward-looking statements to be reasonable, although they are inherently uncertain and difficult to predict. Actual events may cause adjustments in portfolio management strategies from those currently expected to be employed.
A description of the policies and procedures that the Funds use to determine how to vote proxies relating to portfolio securities and information regarding how the Funds voted proxies relating to portfolio securities for the most recent 12-month period ended June 30 are available (i) without charge, upon request by calling 1-800-621-2550; and (ii) on the Securities and Exchange Commission (“SEC”) web site at http://www.sec.gov.
The Funds will file their portfolio holdings information for each month in a fiscal quarter within 60 days after the end of the relevant fiscal quarter on Form N-PORT. Portfolio holdings information for the third month of each fiscal quarter will be made available on the SEC’s web site at http://www.sec.gov. Portfolio holdings information may be obtained upon request and without charge by calling 1-800-621-2550.
Fund holdings and allocations shown are as of August 31, 2023 and may not be representative of future investments. Fund holdings should not be relied on in making investment decisions and should not be construed as research or investment advice regarding particular securities. Current and future holdings are subject to risk.
ETF Fund shares are not individually redeemable and are issued and redeemed by the Funds at their net asset value (“NAV”) only in large, specified blocks of shares called creation units. Shares otherwise can be bought and sold only through exchange trading at market price (not NAV). Shares may trade at a premium or discount to their NAV in the secondary market. Brokerage commissions will reduce returns. Ordinary brokerage commissions apply.
This material is not authorized for distribution to prospective investors unless preceded or accompanied by a current prospectus or summary prospectus, if applicable. Investors should consider the Funds’ objective, risks, and charges and expenses, and read the summary prospectus, if available, and/or the prospectus carefully before investing or sending money. The summary prospectus, if available, and the Prospectus contain this and other information about the Funds and may be obtained from your authorized dealer or from Goldman Sachs & Co. LLC by calling 1-800-621-2550.
MarketBeta® and ActiveBeta® are registered trademarks of GSAM.
ALPS Distributors, Inc. is the distributor of the Goldman Sachs ETF Funds. ALPS Distributors, Inc. is unaffiliated with Goldman Sachs Asset Management.
©2023 Goldman Sachs. All rights reserved. 339818-OTU-10/2023 COMMMUNETFAR-23
(a) As of the end of the period covered by this report, the registrant has adopted a code of ethics that applies to the registrant’s principal executive officer, principal financial officer, principal accounting officer or controller, or persons performing similar functions, regardless of whether these individuals are employed by the registrant or a third party (the “Code of Ethics”).
(b) Not applicable.
(c) During the period covered by this report, no amendments were made to the provisions of the Code of Ethics.
(d) During the period covered by this report, the registrant did not grant any waivers, including an implicit waiver, from any provision of the Code of Ethics.
(e) Not applicable.
(f) A copy of the Code of Ethics is available as provided in Item 13(a)(1) of this report.
| ITEM 3. | AUDIT COMMITTEE FINANCIAL EXPERT. |
The registrant’s board of trustees has determined that the registrant has at least one “audit committee financial expert” (as defined in Item 3 of Form N-CSR) serving on its audit committee. Michael Latham is the “audit committee financial expert” and is “independent” (as each term is defined in Item 3 of Form N-CSR).
| ITEM 4. | PRINCIPAL ACCOUNTANT FEES AND SERVICES. |
Table 1 — Items 4(a) - 4(d). The accountant fees below reflect the aggregate fees billed by the Funds of the Goldman Sachs ETF Trust to which this certified shareholder report relates.
| | | | | | | | | | | | |
| | | 2023 | | 2022 | | Description of Services Rendered |
| | | |
| | | | | | | | | | | | |
| | | |
Audit Fees: | | | | | | | | | | | | |
| | | |
• PricewaterhouseCoopers LLP
(“PwC”) | | | | $789,503 | | | | | $531,450 | | | Financial Statement audits. |
| | | |
Audit-Related Fees: | | | | | | | | | | | | |
| | | |
• PwC | | | | $176,400 | | | | | $112,000 | | | Other attest services. |
| | | |
Tax Fees: | | | | | | | | | | | | |
| | | |
• PwC | | | | $ 0 | | | | | $ 0 | | | |
Table 2 — Items 4(b)(c) & (d). Non-Audit Services to the Goldman Sachs ETF Trust’s service affiliates* that were pre-approved by the Audit Committee of the Goldman Sachs ETF Trust pursuant to Rule 2-01(c)(7)(ii) of Regulation S-X. |
| | | 2023 | | 2022 | | Description of Services Rendered |
| | | |
| | | | | | | | | | | | |
| | | |
Audit-Related Fees: | | | | | | | | | | | | |
| | | |
• PwC | | | | $2,075,449 | | | | | $1,906,448 | | | Internal control review performanced in accordance with Statement on Standards for Attestation Engagements No. 16 and semi-annual updates related to withholding tax accrual for non-US jurisdictions. These fees are borne by the Funds’ Adviser. |
| * | These include the advisor (excluding sub-advisors) and any entity controlling, controlled by or under common control with the advisor that provides ongoing services to the registrant (hereinafter referred to as “service affiliates”). |
Item 4(e)(1) — Audit Committee Pre-Approval Policies and Procedures
Pre-Approval of Audit and Non-Audit Services Provided to the Funds of the Goldman Sachs ETF Trust. The Audit and Non-Audit Services Pre-Approval Policy (the “Policy”) adopted by the Audit Committee of Goldman Sachs ETF Trust (“GS ETF”) sets forth the procedures and the conditions pursuant to which services performed by an independent auditor for GS ETF may be pre-approved. Services may be pre-approved specifically by the Audit Committee as a whole or, in certain circumstances, by the Audit Committee Chairman or the person designated as the Audit Committee Financial Expert. In addition, subject to specified cost limitations, certain services may be pre-approved under the provisions of the Policy. The Policy provides that the Audit Committee will consider whether the services provided by an independent auditor are consistent with the Securities and Exchange Commission’s rules on auditor independence. The Policy provides for periodic review and pre-approval by the Audit Committee of the services that may be provided by the independent auditor.
De Minimis Waiver. The pre-approval requirements of the Policy may be waived with respect to the provision of non-audit services that are permissible for an independent auditor to perform, provided (1) the aggregate amount of all such services provided constitutes no more than five percent of the total amount of revenues subject to pre-approval that was paid to the independent auditors during the fiscal year in which the services are provided; (2) such services were not recognized by GS ETF at the time of the engagement to be non-audit services; and (3) such services are promptly brought to the attention of the Audit Committee and approved prior to the completion of the audit by the Audit Committee or by one or more members of the Audit Committee to whom authority to grant such approvals has been delegated by the Audit Committee, pursuant to the pre-approval provisions of the Policy.
Pre-Approval of Non-Audit Services Provided to the Goldman Sachs ETF Trust’s Investment Advisers. The Policy provides that, in addition to requiring pre-approval of audit and non-audit services provided to GS ETF, the Audit Committee will pre-approve those non-audit services provided to GS ETF’s investment advisers (and entities controlling, controlled by or under common control with the investment advisers that provide ongoing services to GS ETF) where the engagement relates directly to the operations or financial reporting of GS ETF.
Item 4(e)(2) – 0% of the audit-related fees, tax fees and other fees listed in Table 1 were approved by GS ETF’s Audit Committee pursuant to the “de minimis” exception of Rule 2-01(c)(7)(i)(C) of Regulation S-X. In addition, 0% of the non-audit services to the GS ETF’s service affiliates listed in Table 2 were approved by GS ETF’s Audit Committee pursuant to the “de minimis” exception of Rule 2-01(c)(7)(i)(C) of Regulation S-X.
Item 4(f) – Not applicable.
Item 4(g) Aggregate Non-Audit Fees Disclosure
The aggregate non-audit fees billed to GS ETF by PwC for the twelve months ended August 31, 2023 and August 31, 2022 were approximately $176,400 and $112,000, respectively. The aggregate non-audit fees billed to GS ETF’s adviser and service affiliates by PwC for non-audit services for the twelve months ended December 31, 2022 and December 31, 2021 were approximately $17.1 million and $14.4 million, respectively. With regard to the aggregate non-audit fees billed to GS ETF’s adviser and service affiliates, the 2022 and 2021 amounts include fees for non-audit services required to be pre-approved [see Table 2] and fees for non-audit services that did not require pre-approval since they did not directly relate to GS ETF’s operations or financial reporting.
Item 4(h) — GS ETF’s Audit Committee has considered whether the provision of non-audit services to GS ETF’s investment adviser and service affiliates that did not require pre-approval pursuant to paragraph (c)(7)(ii) of Rule 2-01 of Regulation S-X is compatible with maintaining the auditors’ independence.
Item 4(i) – Not applicable.
Item 4(j) – Not applicable.
| ITEM 5. | AUDIT COMMITTEE OF LISTED REGISTRANTS. |
| | The Registrant has a separately-designated standing Audit Committee established in accordance with Section 3(a)(58)(A) of the Securities Exchange Act of 1934, as amended. The members of the Audit Committee are Michael Latham, Cheryl K. Beebe, Lawrence Hughes, John F. Killian, Steven D. Krichmar, and Lawrence W. Stranghoener, each a Trustee of the Registrant. |
| ITEM 6. | SCHEDULE OF INVESTMENTS. |
| | Schedule of Investments is included as part of the Report to Shareholders filed under Item 1. |
| ITEM 7. | DISCLOSURE OF PROXY VOTING POLICIES AND PROCEDURES FOR CLOSED-END MANAGEMENT INVESTMENT COMPANIES. |
| ITEM 8. | PORTFOLIO MANAGERS OF CLOSED-END MANAGEMENT INVESTMENT COMPANIES. |
| ITEM 9. | PURCHASES OF EQUITY SECURITIES BY CLOSED-END MANAGEMENT INVESTMENT COMPANY AND AFFILIATED PURCHASERS. |
| ITEM 10. | SUBMISSION OF MATTERS TO A VOTE OF SECURITY HOLDERS. |
| | There have been no material changes to the procedures by which shareholders may recommend nominees to the registrant’s board of trustees. |
| ITEM 11. | CONTROLS AND PROCEDURES. |
| | (a) | The registrant’s principal executive and principal financial officers, or persons performing similar functions have concluded that the registrant’s disclosure controls and procedures (as defined in Rule 30a-3(c) under the Investment Company Act of 1940, as amended (the “1940 Act”)) are effective as of a date within 90 days of the filing of this report that includes the disclosure required by this paragraph, based on the evaluation of these controls and procedures required by Rule 30a-3(b) under the 1940 Act and 15d-15(b) under the Securities Exchange Act of 1934, as amended. |
| | (b) | There were no changes in the registrant’s internal control over financial reporting (as defined in Rule 30a-3(d) under the 1940 Act) that occurred during the period covered by this report that have materially affected, or are reasonably likely to materially affect, the registrant’s internal control over financial reporting. |
| ITEM 12. | DISCLOSURE OF SECURITIES LENDING ACTIVITIES FOR CLOSED-END MANAGEMENT INVESTMENT COMPANIES. |
SIGNATURES
Pursuant to the requirements of the Securities Exchange Act of 1934 and the Investment Company Act of 1940, the registrant has duly caused this report to be signed on its behalf by the undersigned, thereunto duly authorized.
| | |
| | | Goldman Sachs ETF Trust |
| |
| By: | | /s/ James A. McNamara |
| |
| | |
| | James A. McNamara |
| | President/Chief Executive Officer |
| | Goldman Sachs ETF Trust |
| |
| Date: | | November 3, 2023 |
Pursuant to the requirements of the Securities Exchange Act of 1934 and the Investment Company Act of 1940, this report has been signed below by the following persons on behalf of the registrant and in the capacities and on the dates indicated.
| | |
| By: | | /s/ James A. McNamara |
| |
| | |
| | James A. McNamara |
| | President/Chief Executive Officer |
| | Goldman Sachs ETF Trust |
| |
| Date: | | November 3, 2023 |
| |
| By: | | /s/ Joseph F. DiMaria |
| |
| | |
| | Joseph F. DiMaria |
| | Principal Financial Officer |
| | Goldman Sachs ETF Trust |
| |
| Date: | | November 3, 2023 |