Table of Contents
UNITED STATES
SECURITIES AND EXCHANGE COMMISSION
Washington, D.C. 20549
FORM N-CSR
CERTIFIED SHAREHOLDER REPORT OF REGISTERED MANAGEMENT INVESTMENT COMPANIES
Investment Company Act file number: 811-22376
PIMCO Equity Series VIT
(Exact name of registrant as specified in charter)
650 Newport Center Drive, Newport Beach, CA 92660
(Address of principal executive office)
Trent W. Walker
Treasurer (Principal Financial & Accounting Officer)
PIMCO Equity Series VIT
650 Newport Center Drive, Newport Beach, CA 92660
(Name and address of agent for service)
Copies to:
Brendan C. Fox
Dechert LLP
1900 K Street, N.W.
Washington, D.C. 20006
Registrant’s telephone number, including area code: (888) 877-4626
Date of fiscal year end: December 31
Date of reporting period: December 31, 2015
Form N-CSR is to be used by management investment companies to file reports with the Commission not later than 10 days after the transmission to stockholders of any report that is required to be transmitted to stockholders under Rule 30e-1 under the Investment Company Act of 1940 (17 CFR 270.30e-1). The Commission may use the information provided on Form N-CSR in its regulatory, disclosure review, inspection, and policymaking roles.
A registrant is required to disclose the information specified by Form N-CSR, and the Commission will make this information public. A registrant is not required to respond to the collection of information contained in Form N-CSR unless the Form displays a currently valid Office of Management and Budget (“OMB”) control number. Please direct comments concerning the accuracy of the information collection burden estimate and any suggestions for reducing the burden to Secretary, Securities and Exchange Commission, 450 Fifth Street, NW, Washington, DC 20549-0609. The OMB has reviewed this collection of information under the clearance requirements of 44 U.S.C. § 3507
Table of Contents
| Item 1. | Reports to Shareholders. |
The following is a copy of the report transmitted to shareholders pursuant to Rule 30e-1 under the Investment Company Act of 1940, as amended (the “1940 Act”) (17 CFR 270.30e-1).
• PIMCO Equity Series VIT—Institutional and Advisor Classes
Table of Contents

PIMCO Equity Series VIT®
Annual Report
December 31, 2015

PIMCO Global Dividend Portfolio
Share Classes
| n | Institutional |
| n | Advisor |

Table of Contents
| Page | ||||
| 2 | ||||
| 4 | ||||
| 6 | ||||
| 8 | ||||
| 10 | ||||
| 12 | ||||
| 13 | ||||
| 14 | ||||
| 15 | ||||
| 20 | ||||
| 33 | ||||
| 34 | ||||
| 35 | ||||
| 36 | ||||
| | 38 | | ||
| 39 | ||||
Approval of Investment Advisory Contract and Other Agreements | 40 | |||
Prior to July 13, 2015 the Portfolio’s name was PIMCO EqS Pathfinder PorfolioTM
This material is authorized for use only when preceded or accompanied by the current PIMCO Equity Series VIT (the “Trust”) prospectus for the Portfolio. The variable product prospectus may be obtained by contacting your Investment Consultant.
Table of Contents
Dear Shareholder,
Please find enclosed the Annual Report for the PIMCO Equity Series VIT covering the twelve-month reporting period ended December 31, 2015. The following pages contain specific details about the investment performance of the Portfolio and a discussion of the factors that most affected performance during the reporting period.
Highlights of the financial markets during the twelve-month reporting period include:
| n | Heightened market volatility throughout the reporting period was sparked by a mix of investor concerns including geopolitical developments, monetary policy and the potential for slowing global economic growth, which generally contributed to dampened investor sentiment. In particular, increasing concern over the outlook for Chinese growth sent commodity prices and inflation expectations lower, while also negatively impacting prices of emerging market (“EM”) debt and equities. In addition, the Chinese equity market began a strong decline in June 2015, which prompted the Chinese government to prop-up equity share prices and devalue the Chinese yuan. Volatility in Chinese equity markets continued into January 2016 on renewed concern over slowing Chinese economic growth. Furthermore, rising tension in the Middle East and the continued debt crisis in Greece also contributed to investor unease throughout the reporting period. |
| n | Economic data in the U.S. continued to confirm a healthy economy, particularly labor market indicators such as employment and wages. Still, signs of caution remained, particularly as U.S. consumers appeared to be more selective in their spending and chose to save rather than spend their windfall from lower gas prices. Additionally, consumer sentiment and certain housing indicators softened towards the end of the reporting period, and December 2015 U.S. manufacturing data indicated the fastest contraction in six years. Within the Eurozone, volatility increased despite gradual improvement in the underlying economies. Eurozone economic data also showed generally positive signs of an early recovery but were tempered slightly by sluggish inflation. |
| n | The theme of divergent global central bank monetary policy continued throughout the reporting period. The European Central Bank (“ECB”) expressed its commitment to increase quantitative easing (or large-scale asset purchases), along with the Bank of Japan and the People’s Bank of China who also indicated their intent to accelerate such measures. The Federal Reserve (“Fed”), on the other hand, moved on December 16 to raise the Federal Funds Rate by 0.25% to a new range of 0.25% - 0.50%, marking its first rate hike in nine years. However, the Fed noted that future increases in its target rate would be “gradual” and in-line with their previous projections, which helped to ease investor concerns. Outside of the reporting period on January 27, the Fed opted to leave the Federal Funds Rate unchanged, noting their intent to closely monitor how the global economy and markets influence the U.S. economic outlook. |
| n | Equity markets showed mixed performance globally amid a period marked by economic uncertainty, increased volatility and divergent central bank monetary policy. U.S. equities, as represented by the S&P 500 Index, returned 1.38% (on a total return basis) and developed market equities outside the U.S., as represented by the MSCI EAFE Net Dividend Index (USD Unhedged), declined 0.81% over the reporting period. However, ultra-easy monetary policy in Europe and Japan benefited European and Japanese equity markets, which generally posted positive returns. |
| n | EM equities, as represented by the MSCI Emerging Markets Index (Net Dividends in USD), declined 14.92% over the same period, due to headwinds from a stronger U.S. dollar, falling commodity prices, concerns over slower Chinese economic growth, and declining Chinese equities. Chinese stocks reached all-time highs midway through the reporting period before declining over the second half of the reporting period as several attempts to support the Chinese equity market by the People’s Bank of China, along with persistently weak economic data, highlighted the country’s decelerating growth. In addition, Brazil’s economic and political woes continued throughout the year as the Brazilian real fell 33% against the U.S. dollar and the country’s credit rating was downgraded by S&P and Fitch to sub-investment grade. These events, along with general anticipation of the |
| 2 | PIMCO EQUITY SERIES VIT |
Table of Contents
Fed’s first rate hike in nearly a decade, were contributing factors to EM equity underperformance relative to most developed market equities. |
| n | Style-wise, growth equities outperformed value globally as the MSCI All Country World Growth Index (Net Dividends in USD) returned 1.55% and the MSCI All Country World Value Index (Net Dividends in USD) declined 6.26% over the reporting period. The healthcare and consumer staples sectors were the top performing equity sectors, while the energy and materials sectors were the worst performing equity sectors over the reporting period. |
| n | U.S. Treasuries, as represented by the Barclays U.S. Treasury Index, returned 0.84% for the reporting period as yields generally rose slightly across the Treasury yield curve. The benchmark ten-year U.S. Treasury note yielded 2.27% at the end of the reporting period, up from 2.17% on December 31, 2014. The Barclays U.S. Aggregate Index, a widely used index of U.S. investment-grade bonds, returned 0.55% for the reporting period. |
Thank you again for the trust you have placed in us. We value your commitment and will continue to work diligently to meet your broad investment needs.
 | Sincerely,
Brent R. Harris Chairman of the Board, PIMCO Equity Series VIT
February 18, 2016 |

| ANNUAL REPORT | DECEMBER 31, 2015 | 3 |
Table of Contents
Important Information About the Portfolio
PIMCO Equity Series VIT (the “Trust”) is an open-end management investment company currently consisting of one investment portfolio, the PIMCO Global Dividend Portfolio (formerly known as the PIMCO EqS Pathfinder Portfolio®) (the “Portfolio”). The Portfolio is only available as a funding vehicle under variable life insurance policies or variable annuity contracts issued by insurance companies (“Variable Contracts”). Individuals may not purchase shares of the Portfolio directly. Shares of the Portfolio also may be sold to qualified pension and retirement plans outside of the separate account context.
The Portfolio seeks to provide current income that exceeds the average yield on global stocks by investing under normal circumstances at least 75% of its assets in equity and equity-related securities, including common and preferred stock (and securities convertible into, or that PIMCO expects to be exchanged for, common or preferred stock), as well as securities issued by real estate investment trusts, master limited partnerships and other equity trusts and depositary receipts. When making equity investments, PIMCO may use bottom-up, fundamental analysis to seek to identify attractively valued issuers that currently pay dividends and have the potential for earnings and dividend growth over time. In pursuing its objective to provide current income, the Portfolio may employ a so-called “dividend capture” strategy. As described in greater detail in the Portfolio’s prospectus, this strategy is designed to opportunistically increase the Portfolio’s income through a short-term holding.
The values of equity securities, such as common stocks and preferred stocks, have historically risen and fallen in periodic cycles and may decline due to general market conditions, which are not specifically related to a particular company, such as real or perceived adverse economic conditions, changes in the general outlook for corporate earnings, changes in interest or currency rates or adverse investor sentiment generally. Equity securities may also decline due to factors that affect a particular industry or industries, such as labor shortages, increased production costs and competitive conditions within an industry. In addition, the value of an equity security may decline for a number of reasons that directly relate to the issuer, such as management performance, financial leverage and reduced demand for the issuer’s goods or services, as well as the historical and prospective earnings of the issuer and the value of its assets. Different types of equity securities may react differently to these developments and a change in the financial condition of a single issuer may affect securities markets as a whole.
During a general downturn in the securities markets, multiple asset classes, including equity securities, may decline in value simultaneously. The market price of equity securities owned by a Portfolio may go up or down, sometimes rapidly or unpredictably. Equity securities generally have greater price volatility than fixed income securities and common
stocks generally have the greatest appreciation and depreciation potential of all corporate securities. As of the date of this report, Europe is one of the worst performing regions for equity markets, as deflationary concerns weighed on the values of equity securities.
The Portfolio may be subject to various risks as described in the Portfolio’s prospectus. Some of these risks may include, but are not limited to, the following: equity risk, dividend-oriented stocks risk, value investing risk, foreign (non-U.S.) investment risk, emerging markets risk, sovereign debt risk, market risk, issuer risk, interest rate risk, call risk, credit risk, high yield and distressed company risk, currency risk, real estate risk, liquidity risk, leveraging risk, management risk, small-cap and mid-cap company risk, derivatives risk, short sale risk and convertible securities risk. A complete description of these and other risks is contained in the Portfolio’s prospectus.
The Portfolio may use derivative instruments for hedging purposes or as part of an investment strategy. Use of these instruments may involve certain costs and risks such as liquidity risk, interest rate risk, market risk, credit risk, leverage risk, management risk and the risk that the Portfolio may not be able to close out a position when it would be most advantageous to do so. Certain derivative transactions may have a leveraging effect on the Portfolio. For example, a small investment in a derivative instrument may have a significant impact on the Portfolio’s exposure to interest rates, currency exchange rates or other investments. As a result, a relatively small price movement in an asset, investment or component of the index underlying a derivative instrument may cause an immediate and substantial loss or gain, which translates into heightened volatility for the Portfolio. The Portfolio may engage in such transactions regardless of whether the Portfolio owns the asset, instrument or components of the index underlying the derivative instrument. The Portfolio may invest a significant portion of its assets in these types of instruments. If it does, the Portfolio’s investment exposure could far exceed the value of its portfolio securities and its investment performance could be primarily dependent upon securities it does not own. The Portfolio’s investment in foreign (non-U.S.) securities may entail risk due to foreign (non-U.S.) economic and political developments; this risk may be increased when investing in emerging markets.
The value of an equity security of an issuer that has paid dividends in the past may decrease if the issuer reduces or eliminates future payments to its shareholders. If the dividends or distributions received by a Portfolio decrease, the Portfolio may have less income to distribute to the Portfolio’s shareholders. In addition, during certain market conditions, the equity securities of issuers that have paid regular dividends or distributions may not be widely available or may be highly concentrated in particular sectors of the market. A Portfolio may invest a significant portion of its assets in value stocks. Value stocks may
| 4 | PIMCO EQUITY SERIES VIT |
Table of Contents
perform differently from other types of stocks and the market as a whole. A value stock may decrease in price or may not increase in price as anticipated by PIMCO if it continues to be undervalued by the market or the factors that the portfolio manager believes will cause the stock price to increase do not occur.
The geographical classification of foreign (non-U.S.) securities in this report are classified by the country of incorporation of a holding. In certain instances, a security’s country of incorporation may be different from its country of economic exposure.
On the Portfolio Summary page in this Shareholder Report, the Average Annual Total Return table and Cumulative Returns chart measure
performance assuming that any dividend and capital gain distributions were reinvested. The Cumulative Returns chart reflects only Institutional Class performance. Performance for the Class M, Administrative Class and Advisor Class shares, if applicable, may be higher or lower based on each class’s expense ratios. The Portfolio’s total annual operating expense ratios on the Portfolio Summary page are as of the currently effective prospectus, as supplemented to date. The Portfolio measures its performance against a broad-based securities market index (benchmark index). The benchmark index does not take into account fees, expenses, or taxes. The Portfolio’s past performance, before and after taxes, is not necessarily an indication of how the Portfolio will perform in the future.
The following table discloses the inception dates of the Portfolio and its respective share classes along with the Portfolio’s diversification status as of period end:
| Portfolio Name | Portfolio Inception | Institutional Class | Class M | Administrative Class | Advisor Class | Diversification Status | ||||||||||||||||||||
PIMCO Global Dividend Portfolio | 04/14/10 | 04/14/10 | — | — | 04/14/10 | Diversified | ||||||||||||||||||||
An investment in the Portfolio is not a deposit of a bank and is not guaranteed or insured by the Federal Deposit Insurance Corporation or any other government agency. It is possible to lose money on investments in the Portfolio.
The Trustees are responsible generally for overseeing the management of the Trust. The Trustees authorize the Trust to enter into service agreements with the Adviser, the Distributor, the Administrator and other service providers in order to provide, and in some cases authorize service providers to procure through other parties, necessary or desirable services on behalf of the Trust and the Portfolio. Shareholders are not parties to or third-party beneficiaries of such service agreements. Neither this Portfolio’s prospectus nor summary prospectus, the Trust’s Statement of Additional Information (“SAI”), any contracts filed as exhibits to the Trust’s registration statement, nor any other communications, disclosure documents or regulatory filings (including this report) from or on behalf of the Trust or the Portfolio creates a contract between or among any shareholder of the Portfolio, on the one hand, and the Trust, the Portfolio, a service provider to the Trust or the Portfolio, and/or the Trustees or officers of the Trust, on the other hand. The Trustees (or the Trust and its officers, service providers or other delegates acting under authority of the Trustees) may amend the most recent prospectus or use a new prospectus, summary prospectus or SAI with respect to the Portfolio or the Trust, and/or amend, file and/or issue any other communications, disclosure documents or regulatory filings, and may amend or enter into any contracts to which the Trust or the Portfolio is a party, and interpret the investment objectives, policies, restrictions and contractual provisions applicable to the Portfolio, without shareholder input or approval,
except in circumstances in which shareholder approval is specifically required by law (such as changes to fundamental investment policies) or where a shareholder approval requirement is specifically disclosed in the Trust’s then-current prospectus or SAI.
PIMCO has adopted written proxy voting policies and procedures (“Proxy Policy”) as required by Rule 206(4)-6 under the Investment Advisers Act of 1940, as amended. The Proxy Policy has been adopted by the Trust as the policies and procedures that PIMCO will use when voting proxies on behalf of the Portfolio. A description of the policies and procedures that PIMCO uses to vote proxies relating to portfolio securities of the Portfolio, and information about how the Portfolio voted proxies relating to portfolio securities held during the most recent twelve-month period ended June 30, are available without charge, upon request, by calling the Trust at (888) 87-PIMCO, on the Portfolio’s website at pvit.pimco-funds.com, and on the Securities and Exchange Commission’s (“SEC”) website at www.sec.gov.
The Portfolio files a complete schedule of the Portfolio’s holdings with the SEC for the first and third quarters of each fiscal year on Form N-Q. A copy of the Portfolio’s Form N-Q is available on the SEC’s website at www.sec.gov and may be reviewed and copied at the SEC’s Public Reference Room in Washington, D.C. The Portfolio’s Form N-Q will also be available without charge, upon request, by calling the Trust at (888) 87-PIMCO and on the Portfolio’s website at pvit.pimco-funds.com. Information on the operation of the Public Reference Room may be obtained by calling 1-800-SEC-0330.
PIMCO Equity Series VIT is distributed by PIMCO Investments LLC, 1633 Broadway, New York, New York 10019.
| ANNUAL REPORT | DECEMBER 31, 2015 | 5 |
Table of Contents
PIMCO Global Dividend Portfolio (Consolidated)
Cumulative Returns Through December 31, 2015
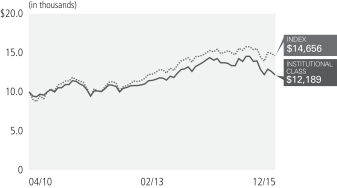
Investment Objective and Strategy Overview
| » | The PIMCO Global Dividend Portfolio seeks to provide current income that exceeds the average yield on global stocks. The Portfolio’s secondary objective is to seek to provide long-term capital appreciation. The Portfolio seeks to achieve its investment objective by investing under normal circumstances at least 75% of its assets in equity and equity-related securities, including common and preferred stock (and securities convertible into, or that Pacific Investment Management Company LLC (“PIMCO”) expects to be exchanged for, common or preferred stock), as well as securities issued by real estate investment trusts, master limited partnerships and other equity trusts and depositary receipts. The Portfolio may invest in securities issued by large-capitalization, mid-capitalization and small-capitalization companies. In pursuing its investment objective to provide current income, the Portfolio may use a so-called “dividend capture” strategy, which is designed to opportunistically increase the Portfolio’s income though a short-term holding. |
| Average Annual Total Return for the period ended December 31, 2015 | ||||||||||||||
| 1 Year | 5 Year | Fund Inception (04/14/2010) | ||||||||||||
 | PIMCO Global Dividend Portfolio Institutional Class | (8.75)% | 2.97% | 3.18% | ||||||||||
| PIMCO Global Dividend Portfolio Advisor Class | (8.98)% | 2.74% | 2.94% | |||||||||||
 | MSCI All Country World Index± | (2.36)% | 6.09% | 6.34% | ||||||||||
All Portfolio returns are net of fees and expenses.
Performance quoted represents past performance. Past performance is not a guarantee or a reliable indicator of future results. Current performance may be lower or higher than performance shown. Investment return and the principal value of an investment will fluctuate. Shares may be worth more or less than original cost when redeemed. The Portfolio’s performance does not reflect the deduction of additional charges and expenses imposed in connection with investing in Variable Contracts, which will reduce returns. For performance current to the most recent month-end, visit pvit.pimco-funds.com. The Portfolio’s total annual operating expense ratio as stated in the Portfolio’s current prospectus, as supplemented to date, is 1.07% for Institutional Class shares, and 1.32% for Advisor Class shares.
± The MSCI All Country World Index is a free float-adjusted market capitalization weighted index that is designed to measure the equity market performance of developed and emerging markets. The Index consists of 46 country indices comprising 23 developed and 23 emerging market country indices.
It is not possible to invest in an unmanaged index.
| 6 | PIMCO EQUITY SERIES VIT |
Table of Contents
Top 10 Holdings1
Vodafone Group PLC | 3.7% | |||||
Aegon NV | 3.1% | |||||
QUALCOMM, Inc. | 3.0% | |||||
AT&T, Inc. | 3.0% | |||||
PG&E Corp. | 3.0% | |||||
Lloyds Banking Group PLC | 2.9% | |||||
Western Digital Corp. | 2.9% | |||||
China Mobile Ltd. | 2.8% | |||||
Pfizer, Inc. | 2.7% | |||||
HSBC Holdings PLC | 2.7% |
Geographic Breakdown1
United States | 52.2% | |||||
United Kingdom | 12.9% | |||||
Netherlands | 4.1% | |||||
Italy | 3.9% | |||||
Japan | 3.8% | |||||
France | 3.5% | |||||
Australia | 3.3% | |||||
Hong Kong | 2.8% | |||||
Switzerland | 2.2% | |||||
Spain | 1.6% | |||||
Taiwan | 1.5% | |||||
Canada | 1.4% | |||||
Greece | 1.2% | |||||
Germany | 1.1% | |||||
Brazil | 1.1% | |||||
Other | 0.9% |
1 % of Investments, at value as of 12/31/2015. Top 10 Holdings and Geographic Breakdown solely reflect long positions. Securities sold short, financial derivative instruments and short-term instruments are not taken into consideration.
Portfolio Insights
| » | Stock selection in the software and technology hardware storage & peripherals industries detracted from relative returns, as the Portfolio’s holdings within these industries significantly underperformed the MSCI All Country World Index over the reporting period. |
| » | Stock selection in the oil gas & consumable fuels industry also detracted from relative returns as the Portfolio’s holdings, notably Golar LNG Partners LP and Targa Resources Corp., underperformed the MSCI All Country World Index over the reporting period. |
| » | Overweight exposure to the tobacco and chemicals industries positively contributed to relative returns, as the Portfolio’s holdings within these industries outperformed the MSCI All Country World Index over the reporting period. |
| » | Over the reporting period, the top three contributors to performance were Aena SA, Imperial Tobacco Group PLC and NN Group NV, while the top three detractors from performance were Targa Resources Corp., Tronox Ltd. and Golar LNG Partners LP. |
| ANNUAL REPORT | DECEMBER 31, 2015 | 7 |
Table of Contents
Expense Example PIMCO Global Dividend Portfolio (Consolidated)
Example
As a shareholder of the Portfolio, you incur two types of costs: (1) transaction costs and (2) ongoing costs, including management fees, distribution and/or service (12b-1) fees (if applicable), and other Portfolio expenses. The Example is intended to help you understand your ongoing costs (in dollars) of investing in the Portfolio and to compare these costs with the ongoing costs of investing in other mutual funds.
The Expense Example does not reflect any fees or other expenses imposed by the Variable Contracts. If it did, the expenses reflected in the Expense Example would be higher. The Example is based on an investment of $1,000 invested at the beginning of the period and held from July 1, 2015 to December 31, 2015 unless noted otherwise in the table and footnotes below.
Actual Expenses
The information in the table under the heading “Actual” provides information about actual account values and actual expenses. You may use the information in these columns, together with the amount you invested, to estimate the expenses that you paid over the period. Simply divide your account value by $1,000 (for example, an $8,600 account value divided by $1,000 = $8.60), then multiply the result by the number in the appropriate column for your share class, in the column titled “Expenses Paid During Period” to estimate the expenses you paid on your account during this period.
Hypothetical Example for Comparison Purposes
The information in the table under the heading “Hypothetical (5% return before expenses)” provides information about hypothetical account values and hypothetical expenses based on the Portfolio’s actual expense ratio and an assumed rate of return of 5% per year before expenses, which is not the Portfolio’s actual return. The hypothetical account values and expenses may not be used to estimate the actual ending account balance or expenses you paid for the period. You may use this information to compare the ongoing costs of investing in the Portfolio and other portfolios. To do so, compare this 5% hypothetical example with the 5% hypothetical examples that appear in the shareholder reports of the other portfolios.
Please note that the expenses shown in the table are meant to highlight your ongoing costs only and do not reflect any transactional costs. Therefore, the information under the heading “Hypothetical (5% return before expenses)” is useful in comparing ongoing costs only, and will not help you determine the relative total costs of owning different portfolios. In addition, if these transactional costs were included, your costs would have been higher.
Expense ratios may vary period to period because of various factors, such as an increase in expenses that are not covered by the management fees such as fees and expenses of the independent trustees and their counsel, extraordinary expenses and interest expense.
| Actual | Hypothetical (5% return before expenses) | |||||||||||||||||||||||||||||||||
| Beginning Account Value (07/01/15) | Ending Account Value (12/31/15) | Expenses Paid During Period* | Beginning Account Value (07/01/15) | Ending Account Value (12/31/15) | Expenses Paid During Period* | Net Annualized Expense Ratio** | ||||||||||||||||||||||||||||
| Institutional Class | $ | 1,000.00 | $ | 876.60 | $ | 4.28 | $ | 1,000.00 | $ | 1,021.06 | $ | 4.61 | 0.89 | % | ||||||||||||||||||||
| Advisor Class | 1,000.00 | 875.60 | 5.48 | 1,000.00 | 1,019.78 | 5.90 | 1.14 | |||||||||||||||||||||||||||
* Expenses Paid During Period are equal to the net annualized expense ratio for the class, multiplied by the average account value over the period, multiplied by 187/365 (to reflect the one-half year period). Overall fees and expenses of investing in the Portfolio will be higher because the example does not reflect variable contract fees and expenses.
** Net Annualized Expense Ratio is reflective of any applicable contractual fee waivers and/or expense reimbursements or voluntary fee waivers. Details regarding fee waivers can be found in Note 9 in the Notes to Financial Statements.
| 8 | PIMCO EQUITY SERIES VIT |
Table of Contents
(THIS PAGE INTENTIONALLY LEFT BLANK)
| ANNUAL REPORT | DECEMBER 31, 2015 | 9 |
Table of Contents
Financial Highlights PIMCO Global Dividend Portfolio (Consolidated)
| Selected Per Share Data for the Year Ended: | Net Asset Value Beginning of Year | Net Investment Income (a) | Net Realized/ Unrealized Gain (Loss) | Total from Investment Operations | Dividends from Net Investment Income (b) | Distributions from Net Realized Capital Gains (b) | Total Distributions | |||||||||||||||||||||
| Institutional Class | ||||||||||||||||||||||||||||
12/31/2015 | $ | 12.46 | $ | 0.34 | $ | (1.43 | ) | $ | (1.09 | ) | $ | (0.63 | ) | $ | (1.22 | ) | $ | (1.85 | ) | |||||||||
12/31/2014 | 12.53 | 0.29 | (0.16 | ) | 0.13 | 0.00 | (0.20 | ) | (0.20 | ) | ||||||||||||||||||
12/31/2013 | 10.72 | 0.27 | 1.83 | 2.10 | (0.29 | ) | 0.00 | (0.29 | ) | |||||||||||||||||||
12/31/2012 | 9.85 | 0.21 | 0.77 | 0.98 | (0.11 | ) | 0.00 | (0.11 | ) | |||||||||||||||||||
12/31/2011 | 10.33 | 0.11 | (0.58 | ) | (0.47 | ) | (0.01 | ) | 0.00 | (0.01 | ) | |||||||||||||||||
| Advisor Class | ||||||||||||||||||||||||||||
12/31/2015 | 12.39 | 0.30 | (1.42 | ) | (1.12 | ) | (0.61 | ) | (1.22 | ) | (1.83 | ) | ||||||||||||||||
12/31/2014 | 12.48 | 0.25 | (0.14 | ) | 0.11 | 0.00 | (0.20 | ) | (0.20 | ) | ||||||||||||||||||
12/31/2013 | 10.69 | 0.24 | 1.81 | 2.05 | (0.26 | ) | 0.00 | (0.26 | ) | |||||||||||||||||||
12/31/2012 | 9.82 | 0.18 | 0.78 | 0.96 | (0.09 | ) | 0.00 | (0.09 | ) | |||||||||||||||||||
12/31/2011 | 10.31 | 0.08 | (0.57 | ) | (0.49 | ) | 0.00 | 0.00 | 0.00 | |||||||||||||||||||
| (a) | Per share amounts based on average number of shares outstanding during the year. |
| (b) | Determined in accordance with federal income tax regulations, see Note 2(d) in the Notes to Financial Statements for more information. |
| (c) | Effective July 13, 2015, the Portfolio’s advisory fee was decreased by 0.06% to an annual rate of 0.69%. |
| 10 | PIMCO EQUITY SERIES VIT | See Accompanying Notes |
Table of Contents
| Net Asset Value End of Year | Total Return | Net Assets End of Year (000s) | Ratio of Expenses to Average Net Assets | Ratio of Expenses to Average Net Assets Excluding Waivers | Ratio of Expenses to Average Net Assets Excluding Interest Expense | Ratio of Expenses to Average Net Assets Excluding Interest Expense and Waivers | Ratio of Net Investment Income to Average Net Assets | Portfolio Turnover Rate | ||||||||||||||||||||||||||
| $ | 9.52 | (8.75 | )% | $ | 40,582 | 0.95 | %(c) | 1.10 | %(c) | 0.93 | %(c) | 1.08 | %(c) | 2.68 | % | 152 | % | |||||||||||||||||
| 12.46 | 1.06 | 52,234 | 0.98 | 1.12 | 0.97 | 1.11 | 2.22 | 31 | ||||||||||||||||||||||||||
| 12.53 | 19.60 | 57,768 | 0.98 | 1.15 | 0.97 | 1.14 | 2.29 | 29 | ||||||||||||||||||||||||||
| 10.72 | 9.98 | 58,740 | 0.99 | 1.15 | 0.97 | 1.13 | 2.02 | 26 | ||||||||||||||||||||||||||
| 9.85 | (4.54 | ) | 66,439 | 0.98 | 1.18 | 0.97 | 1.17 | 1.14 | 238 | |||||||||||||||||||||||||
| 9.44 | (8.98 | ) | 284,406 | 1.20 | (c) | 1.35 | (c) | 1.18 | (c) | 1.33 | (c) | 2.43 | 152 | |||||||||||||||||||||
| 12.39 | 0.90 | 380,293 | 1.23 | 1.37 | 1.22 | 1.36 | 1.98 | 31 | ||||||||||||||||||||||||||
| 12.48 | 19.19 | 449,196 | 1.23 | 1.40 | 1.22 | 1.39 | 2.05 | 29 | ||||||||||||||||||||||||||
| 10.69 | 9.77 | 413,524 | 1.24 | 1.40 | 1.22 | 1.38 | 1.77 | 26 | ||||||||||||||||||||||||||
| 9.82 | (4.72 | ) | 387,651 | 1.23 | 1.43 | 1.22 | 1.42 | 0.83 | 238 | |||||||||||||||||||||||||
| See Accompanying Notes | ANNUAL REPORT | DECEMBER 31, 2015 | 11 |
Table of Contents
Consolidated Statement of Assets and Liabilities PIMCO Global Dividend Portfolio
| (Amounts in thousands, except per share amounts) | December 31, 2015 | |||
Assets: | ||||
Investments, at value | ||||
Investments in securities* | $ | 321,783 | ||
Investments in Affiliates | 5,659 | |||
Financial Derivative Instruments | ||||
Over the counter | 854 | |||
Foreign currency, at value | 76 | |||
Receivable for investments sold | 2,978 | |||
Interest and dividends receivable | 1,039 | |||
Dividends receivable from Affiliates | 3 | |||
Reimbursement receivable from PIMCO | 11 | |||
Total Assets | 332,403 | |||
Liabilities: | ||||
Financial Derivative Instruments | ||||
Over the counter | $ | 1,166 | ||
Payable for investments purchased | 5,229 | |||
Payable for investments in Affiliates purchased | 3 | |||
Deposits from counterparty | 450 | |||
Payable for Portfolio shares redeemed | 135 | |||
Accrued investment advisory fees | 160 | |||
Accrued supervisory and administrative fees | 106 | |||
Accrued distribution fees | 66 | |||
Other liabilities | 100 | |||
Total Liabilities | 7,415 | |||
Net Assets | $ | 324,988 | ||
Net Assets Consist of: | ||||
Paid in capital | $ | 292,521 | ||
Undistributed net investment income | 14,673 | |||
Accumulated undistributed net realized gain | 52,343 | |||
Net unrealized (depreciation) | (34,549 | ) | ||
| $ | 324,988 | |||
Net Assets: | ||||
Institutional Class | $ | 40,582 | ||
Advisor Class | 284,406 | |||
Shares Issued and Outstanding: | ||||
Institutional Class | 4,261 | |||
Advisor Class | 30,136 | |||
Net Asset Value and Redemption Price Per Share Outstanding: | ||||
Institutional Class | $ | 9.52 | ||
Advisor Class | 9.44 | |||
Cost of investments in securities | $ | 356,005 | ||
Cost of investments in Affiliates | $ | 5,659 | ||
Cost of foreign currency held | $ | 76 | ||
* Includes repurchase agreements of: | $ | 1,716 | ||
| 12 | PIMCO EQUITY SERIES VIT | See Accompanying Notes |
Table of Contents
Consolidated Statement of Operations PIMCO Global Dividend Portfolio
| (Amounts in thousands) | Year Ended December 31, 2015 | |||
Investment Income: | ||||
Interest | $ | 2 | ||
Dividends, net of foreign taxes* | 14,440 | |||
Dividends from Investments in Affiliates | 67 | |||
Total Income | 14,509 | |||
Expenses: | ||||
Investment advisory fees | 2,886 | |||
Supervisory and administrative fees | 1,395 | |||
Distribution and/or servicing fees - Advisor Class | 873 | |||
Dividends on short sales | 74 | |||
Trustee fees | 47 | |||
Interest expense | 9 | |||
Miscellaneous expense | 20 | |||
Total Expenses | 5,304 | |||
Waiver and/or Reimbursement by PIMCO | (616 | ) | ||
Net Expenses | 4,688 | |||
Net Investment Income | 9,821 | |||
Net Realized Gain (Loss): | ||||
Investments in securities | 51,958 | |||
Investments in Affiliates | (109 | ) | ||
Exchange-traded or centrally cleared financial derivative instruments | (362 | ) | ||
Over the counter financial derivative instruments | 8,933 | |||
Short sales | 771 | |||
Foreign currency | (295 | ) | ||
Net Realized Gain | 60,896 | |||
Net Change in Unrealized Appreciation (Depreciation): | ||||
Investments in securities | (98,116 | ) | ||
Investments in Affiliates | 72 | |||
Over the counter financial derivative instruments | (4,186 | ) | ||
Short sales | 489 | |||
Foreign currency assets and liabilities | 38 | |||
Net Change in Unrealized (Depreciation) | (101,703 | ) | ||
Net (Decrease) in Net Assets Resulting from Operations | $ | (30,986 | ) | |
* Foreign tax withholdings - Dividends | $ | 504 | ||
| See Accompanying Notes | ANNUAL REPORT | DECEMBER 31, 2015 | 13 |
Table of Contents
Consolidated Statements of Changes in Net Assets PIMCO Global Dividend Portfolio
| (Amounts in thousands†) | Year Ended December 31, 2015 | Year Ended December 31, 2014 | ||||||
(Decrease) in Net Assets from: | ||||||||
Operations: | ||||||||
Net investment income | $ | 9,821 | $ | 9,672 | ||||
Net realized gain | 60,896 | 39,750 | ||||||
Net change in unrealized (depreciation) | (101,703 | ) | (43,148 | ) | ||||
Net Increase (Decrease) in Net Assets Resulting from Operations | (30,986 | ) | 6,274 | |||||
Distributions to Shareholders: | ||||||||
From net investment income (a) | ||||||||
Institutional Class | (2,489 | ) | 0 | |||||
Advisor Class | (17,274 | ) | 0 | |||||
From net realized capital gains (a) | ||||||||
Institutional Class | (4,384 | ) | (841 | ) | ||||
Advisor Class | (30,972 | ) | (6,209 | ) | ||||
Total Distributions | (55,119 | ) | (7,050 | ) | ||||
Portfolio Share Transactions: | ||||||||
Net (decrease) resulting from Portfolio share transactions** | (21,434 | ) | (73,661 | ) | ||||
Total (Decrease) in Net Assets | (107,539 | ) | (74,437 | ) | ||||
Net Assets: | ||||||||
Beginning of year | 432,527 | 506,964 | ||||||
End of year* | $ | 324,988 | $ | 432,527 | ||||
* Including undistributed net investment income of: | $ | 14,673 | $ | 16,322 | ||||
| † | A zero balance may reflect actual amounts rounding to less than one thousand. |
| ** | See Note 13 in the Notes to Financial Statements. |
| (a) | Determined in accordance with federal income tax regulations, see Note 2(d) in the Notes to Financial Statements for more information. |
| 14 | PIMCO EQUITY SERIES VIT | See Accompanying Notes |
Table of Contents
Consolidated Schedule of Investments PIMCO Global Dividend Portfolio
December 31, 2015
| SHARES | MARKET VALUE (000S) | |||||||||||
| INVESTMENTS IN SECURITIES 99.1% | ||||||||||||
| COMMON STOCKS 95.2% | ||||||||||||
| AUSTRALIA 3.4% | ||||||||||||
| CONSUMER DISCRETIONARY 1.2% | ||||||||||||
G8 Education Ltd. | 1,486,026 | $ | 3,843 | |||||||||
|
| |||||||||||
| HEALTH CARE 1.0% | ||||||||||||
Sonic Healthcare Ltd. | 253,434 | 3,281 | ||||||||||
|
| |||||||||||
| INDUSTRIALS 1.2% | ||||||||||||
Spotless Group Holdings Ltd. | 4,911,980 | 3,849 | ||||||||||
|
| |||||||||||
Total Australia | 10,973 | |||||||||||
|
| |||||||||||
| BRAZIL 1.1% | ||||||||||||
| HEALTH CARE 0.5% | ||||||||||||
Qualicorp S.A. | 424,006 | 1,508 | ||||||||||
|
| |||||||||||
| UTILITIES 0.6% | ||||||||||||
Light S.A. | 790,900 | 1,974 | ||||||||||
|
| |||||||||||
Total Brazil | 3,482 | |||||||||||
|
| |||||||||||
| CANADA 1.4% | ||||||||||||
| UTILITIES 1.4% | ||||||||||||
Capital Power Corp. | 362,476 | 4,655 | ||||||||||
|
| |||||||||||
Total Canada | 4,655 | |||||||||||
|
| |||||||||||
| FRANCE 3.5% | ||||||||||||
| CONSUMER STAPLES 1.2% | ||||||||||||
Carrefour S.A. | 138,095 | 3,985 | ||||||||||
|
| |||||||||||
| UTILITIES 2.3% | ||||||||||||
Engie S.A. | 419,384 | 7,429 | ||||||||||
|
| |||||||||||
Total France | 11,414 | |||||||||||
|
| |||||||||||
| GERMANY 1.1% | ||||||||||||
| MATERIALS 1.1% | ||||||||||||
Covestro AG (a) | 95,849 | 3,503 | ||||||||||
|
| |||||||||||
Total Germany | 3,503 | |||||||||||
|
| |||||||||||
| GREECE 1.2% | ||||||||||||
| CONSUMER DISCRETIONARY 1.2% | ||||||||||||
OPAP S.A. | 436,492 | 3,830 | ||||||||||
|
| |||||||||||
Total Greece | 3,830 | |||||||||||
|
| |||||||||||
| HONG KONG 2.8% | ||||||||||||
| TELECOMMUNICATION SERVICES 2.8% | ||||||||||||
China Mobile Ltd. | 801,000 | 9,016 | ||||||||||
|
| |||||||||||
Total Hong Kong | 9,016 | |||||||||||
|
| |||||||||||
| ITALY 3.9% | ||||||||||||
| FINANCIALS 2.7% | ||||||||||||
Intesa Sanpaolo SpA | 2,606,475 | 8,656 | ||||||||||
|
| |||||||||||
| SHARES | MARKET VALUE (000S) | |||||||||||
| INDUSTRIALS 1.2% | ||||||||||||
Societa Iniziative Autostradali e Servizi SpA | 380,886 | $ | 4,047 | |||||||||
|
| |||||||||||
Total Italy | 12,703 | |||||||||||
|
| |||||||||||
| JAPAN 3.8% | ||||||||||||
| CONSUMER DISCRETIONARY 1.5% | ||||||||||||
Bridgestone Corp. | 144,385 | 4,952 | ||||||||||
|
| |||||||||||
| TELECOMMUNICATION SERVICES 2.3% | ||||||||||||
Nippon Telegraph & Telephone Corp. | 188,925 | 7,519 | ||||||||||
|
| |||||||||||
Total Japan | 12,471 | |||||||||||
|
| |||||||||||
| MEXICO 0.5% | ||||||||||||
| CONSUMER STAPLES 0.5% | ||||||||||||
Coca-Cola Femsa S.A.B. de C.V. ‘L’ | 225,800 | 1,615 | ||||||||||
|
| |||||||||||
Total Mexico | 1,615 | |||||||||||
|
| |||||||||||
| NETHERLANDS 4.1% | ||||||||||||
| FINANCIALS 4.1% | ||||||||||||
Aegon NV | 1,775,701 | 10,043 | ||||||||||
NN Group NV | 92,542 | 3,265 | ||||||||||
|
| |||||||||||
Total Netherlands | 13,308 | |||||||||||
|
| |||||||||||
| RUSSIA 0.5% | ||||||||||||
| CONSUMER STAPLES 0.5% | ||||||||||||
Magnit PJSC SP - GDR | 35,479 | 1,427 | ||||||||||
|
| |||||||||||
Total Russia | 1,427 | |||||||||||
|
| |||||||||||
| SPAIN 1.6% | ||||||||||||
| CONSUMER STAPLES 1.6% | ||||||||||||
Ebro Foods S.A. | 270,685 | 5,325 | ||||||||||
|
| |||||||||||
Total Spain | 5,325 | |||||||||||
|
| |||||||||||
| SWITZERLAND 2.3% | ||||||||||||
| HEALTH CARE 2.3% | ||||||||||||
Roche Holding AG | 26,491 | 7,341 | ||||||||||
|
| |||||||||||
Total Switzerland | 7,341 | |||||||||||
|
| |||||||||||
| TAIWAN 1.5% | ||||||||||||
| INFORMATION TECHNOLOGY 1.5% | ||||||||||||
Taiwan Semiconductor Manufacturing Co. Ltd. | 1,149,652 | 4,960 | ||||||||||
|
| |||||||||||
Total Taiwan | 4,960 | |||||||||||
|
| |||||||||||
| UNITED KINGDOM 13.0% | ||||||||||||
| CONSUMER STAPLES 1.1% | ||||||||||||
Imperial Tobacco Group PLC | 64,789 | 3,422 | ||||||||||
|
| |||||||||||
| ENERGY 1.0% | ||||||||||||
Golar LNG Partners LP | 255,140 | 3,414 | ||||||||||
|
| |||||||||||
| SHARES | MARKET VALUE (000S) | |||||||||||
| FINANCIALS 7.2% | ||||||||||||
HSBC Holdings PLC | 1,116,392 | $ | 8,813 | |||||||||
ICAP PLC | 645,828 | 4,848 | ||||||||||
Lloyds Banking Group PLC | 8,969,857 | 9,651 | ||||||||||
|
| |||||||||||
| 23,312 | ||||||||||||
|
| |||||||||||
| TELECOMMUNICATION SERVICES 3.7% | ||||||||||||
Vodafone Group PLC | 3,730,644 | 12,098 | ||||||||||
|
| |||||||||||
Total United Kingdom | 42,246 | |||||||||||
|
| |||||||||||
| UNITED STATES 49.5% | ||||||||||||
| CONSUMER DISCRETIONARY 8.8% | ||||||||||||
Comcast Corp. ‘A’ | 128,740 | 7,265 | ||||||||||
General Motors Co. | 236,850 | 8,055 | ||||||||||
Kohl’s Corp. | 69,565 | 3,313 | ||||||||||
Macy’s, Inc. | 92,407 | 3,233 | ||||||||||
SeaWorld Entertainment, Inc. | 179,073 | 3,526 | ||||||||||
Time Warner, Inc. | 50,908 | 3,292 | ||||||||||
|
| |||||||||||
| 28,684 | ||||||||||||
|
| |||||||||||
| ENERGY 1.9% | ||||||||||||
Schlumberger Ltd. | 88,822 | 6,195 | ||||||||||
|
| |||||||||||
| FINANCIALS 6.7% | ||||||||||||
Blackstone Group LP | 253,121 | 7,401 | ||||||||||
Navient Corp. | 260,095 | 2,978 | ||||||||||
Prudential Financial, Inc. | 79,418 | 6,466 | ||||||||||
Regions Financial Corp. | 506,387 | 4,861 | ||||||||||
|
| |||||||||||
| 21,706 | ||||||||||||
|
| |||||||||||
| HEALTH CARE 7.5% | ||||||||||||
AbbVie, Inc. | 140,181 | 8,304 | ||||||||||
Merck & Co., Inc. | 135,051 | 7,134 | ||||||||||
Pfizer, Inc. | 276,397 | 8,922 | ||||||||||
|
| |||||||||||
| 24,360 | ||||||||||||
|
| |||||||||||
| INDUSTRIALS 2.0% | ||||||||||||
Neilsen Holdings PLC | 141,080 | 6,574 | ||||||||||
|
| |||||||||||
| INFORMATION TECHNOLOGY 12.3% | ||||||||||||
Apple, Inc. | 68,285 | 7,188 | ||||||||||
Cisco Systems, Inc. | 292,650 | 7,947 | ||||||||||
QUALCOMM, Inc. | 198,466 | 9,920 | ||||||||||
Symantec Corp. | 261,597 | 5,494 | ||||||||||
Western Digital Corp. | 157,135 | 9,436 | ||||||||||
|
| |||||||||||
| 39,985 | ||||||||||||
|
| |||||||||||
| MATERIALS 3.3% | ||||||||||||
International Paper Co. | 191,472 | 7,219 | ||||||||||
Steel Dynamics, Inc. | 193,787 | 3,463 | ||||||||||
|
| |||||||||||
| 10,682 | ||||||||||||
|
| |||||||||||
| TELECOMMUNICATION SERVICES 4.0% | ||||||||||||
AT&T, Inc. | 286,684 | 9,865 | ||||||||||
CenturyLink, Inc. | 127,347 | 3,204 | ||||||||||
|
| |||||||||||
| 13,069 | ||||||||||||
|
| |||||||||||
| See Accompanying Notes | ANNUAL REPORT | DECEMBER 31, 2015 | 15 |
Table of Contents
Consolidated Schedule of Investments PIMCO Global Dividend Portfolio (Cont.)
| SHARES | MARKET VALUE (000S) | |||||||||||
| UTILITIES 3.0% | ||||||||||||
PG&E Corp. | 182,315 | $ | 9,697 | |||||||||
|
| |||||||||||
| Total United States | 160,952 | |||||||||||
|
| |||||||||||
| Total Common Stocks (Cost $341,573) | 309,221 | |||||||||||
|
| |||||||||||
| REAL ESTATE INVESTMENT TRUSTS 3.1% | ||||||||||||
| UNITED STATES 3.1% | ||||||||||||
| FINANCIALS 3.1% | ||||||||||||
Colony Capital, Inc. ‘A’ | 322,957 | 6,291 | ||||||||||
Outfront Media, Inc. | 165,873 | 3,621 | ||||||||||
|
| |||||||||||
| 9,912 | ||||||||||||
|
| |||||||||||
Total Real Estate Investment Trusts |
| 9,912 | ||||||||||
|
| |||||||||||
| MARKET VALUE (000S) | ||||||||||||
| SHORT-TERM INSTRUMENTS 0.8% | ||||||||||||
| REPURCHASE AGREEMENTS (c) 0.5% | ||||||||||||
| $ | 1,716 | |||||||||||
|
| |||||||||||
| PRINCIPAL AMOUNT (000S) | ||||||||||||
| U.S. TREASURY BILLS 0.3% | ||||||||||||
0.195% due 01/14/2016 - 01/21/2016 (b)(e) | $ | 934 | 934 | |||||||||
|
| |||||||||||
| Total Short-Term Instruments (Cost $2,650) | 2,650 | |||||||||||
|
| |||||||||||
| Total Investments in Securities (Cost $356,005) | 321,783 | |||||||||||
|
| |||||||||||
| SHARES | MARKET VALUE (000S) | |||||||||||
| INVESTMENTS IN AFFILIATES 1.7% | ||||||||||||
| SHORT-TERM INSTRUMENTS 1.7% | ||||||||||||
| CENTRAL FUNDS USED FOR CASH MANAGEMENT PURPOSES 1.7% | ||||||||||||
PIMCO Short-Term | 573,086 | $ | 5,659 | |||||||||
|
| |||||||||||
| Total Short-Term Instruments (Cost $5,659) | 5,659 | |||||||||||
|
| |||||||||||
| Total Investments in Affiliates (Cost $5,659) | 5,659 | |||||||||||
| Total Investments 100.8% (Cost $361,664) | $ | 327,442 | ||||||||||
Financial Derivative (Cost or Premiums, net $0) |
| (312 | ) | |||||||||
| Other Assets and Liabilities, net (0.7%) | (2,142 | ) | ||||||||||
|
| |||||||||||
| Net Assets 100.0% | $ | 324,988 | ||||||||||
|
| |||||||||||
NOTES TO CONSOLIDATED SCHEDULE OF INVESTMENTS (AMOUNTS IN THOUSANDS*):
| * | A zero balance may reflect actual amounts rounding to less than one thousand. |
| (a) | Security did not produce income within the last twelve months. |
| (b) | Coupon represents a weighted average yield to maturity. |
BORROWINGS AND OTHER FINANCING TRANSACTIONS
(c) REPURCHASE AGREEMENTS:
| Counterparty | Lending Rate | Settlement Date | Maturity Date | Principal Amount | Collateralized By | Collateral (Received) | Repurchase Agreements, at Value | Repurchase Agreement Proceeds to be Received (1) | ||||||||||||||||||||
SSB | 0.010% | 12/31/2015 | 01/04/2016 | $ | 1,716 | Fannie Mae 2.140% due 11/7/2022 | $ | (1,751 | ) | $ | 1,716 | $ | 1,719 | |||||||||||||||
|
|
|
|
|
| |||||||||||||||||||||||
Total Repurchase Agreements |
| $ | (1,751 | ) | $ | 1,716 | $ | 1,719 | ||||||||||||||||||||
|
|
|
|
|
| |||||||||||||||||||||||
| (1) | Includes accrued interest. |
BORROWINGS AND OTHER FINANCING TRANSACTIONS SUMMARY
The following is a summary by counterparty of the market value of Borrowings and Other Financing Transactions and collateral (received) as of December 31, 2015:
| Counterparty | Repurchase Agreement Proceeds to be Received | Payable for Reverse Repurchase Agreements | Payable for Sale-Buyback Transactions | Total Borrowings and Other Financing Transactions | Collateral (Received) | Net Exposure (2) | ||||||||||||||||||
Global/Master Repurchase Agreement | ||||||||||||||||||||||||
SSB | $ | 1,719 | $ | 0 | $ | 0 | $ | 1,719 | $ | (1,751 | ) | $ | (32 | ) | ||||||||||
|
|
|
|
|
| |||||||||||||||||||
Total Borrowings and Other Financing Transactions | $ | 1,719 | $ | 0 | $ | 0 | ||||||||||||||||||
|
|
|
|
|
| |||||||||||||||||||
| (2) | Net Exposure represents the net receivable/(payable) that would be due from/to the counterparty in the event of default. Exposure from borrowings and other financing transactions can only be netted across transactions governed under the same master agreement with the same legal entity. The Portfolio and Subsidiary are recognized as two separate legal entities. As such, exposure cannot be netted. See Note 7, Principal Risks, in the Notes to Financial Statements for more information regarding master netting arrangements. |
| 16 | PIMCO EQUITY SERIES VIT | See Accompanying Notes |
Table of Contents
December 31, 2015
(d) FINANCIAL DERIVATIVE INSTRUMENTS: OVER THE COUNTER
FORWARD FOREIGN CURRENCY CONTRACTS:
| Counterparty | Settlement Month | Currency to be Delivered | Currency to be Received | Unrealized Appreciation/ (Depreciation) | ||||||||||||||||||||||||
| Asset | Liability | |||||||||||||||||||||||||||
BOA | 01/2016 | EUR | 12,482 | $ | 13,715 | $ | 150 | $ | 0 | |||||||||||||||||||
| 02/2016 | $ | 13,725 | EUR | 12,482 | 0 | (151 | ) | |||||||||||||||||||||
CBK | 01/2016 | 13,639 | 12,482 | 0 | (74 | ) | ||||||||||||||||||||||
| 01/2016 | 18,054 | GBP | 12,165 | 0 | (120 | ) | ||||||||||||||||||||||
| 02/2016 | GBP | 12,165 | $ | 18,054 | 119 | 0 | ||||||||||||||||||||||
DUB | 01/2016 | TRY | 4,391 | 1,503 | 5 | 0 | ||||||||||||||||||||||
HUS | 01/2016 | EUR | 30,866 | 32,894 | 0 | (650 | ) | |||||||||||||||||||||
| 02/2016 | HKD | 36,100 | 4,660 | 0 | 0 | |||||||||||||||||||||||
| 02/2016 | SGD | 232 | 164 | 1 | 0 | |||||||||||||||||||||||
MSB | 01/2016 | GBP | 12,165 | 18,341 | 407 | 0 | ||||||||||||||||||||||
UAG | 01/2016 | $ | 33,715 | EUR | 30,866 | 0 | (171 | ) | ||||||||||||||||||||
| 02/2016 | EUR | 30,866 | $ | 33,739 | 172 | 0 | ||||||||||||||||||||||
|
|
|
| |||||||||||||||||||||||||
Total Forward Foreign Currency Contracts |
| $ | 854 | $ | (1,166 | ) | ||||||||||||||||||||||
|
|
|
| |||||||||||||||||||||||||
WRITTEN OPTIONS:
AS OF DECEMBER 31, 2015, THERE WERE NO OPEN WRITTEN OPTIONS. TRANSACTIONS IN WRITTEN CALL AND PUT OPTIONS FOR PERIOD ENDED DECEMBER 31, 2015:
| # of Contracts | Notional Amount | Premiums | ||||||||||
Balance at Beginning of Period | 0 | $ | 3,082 | $ | (338 | ) | ||||||
Sales | 7,573 | 0 | (1,364 | ) | ||||||||
Closing Buys | (7,356 | ) | (3,082 | ) | 1,655 | |||||||
Expirations | (217 | ) | 0 | 47 | ||||||||
Exercised | 0 | 0 | 0 | |||||||||
|
|
|
|
|
| |||||||
Balance at End of Period | 0 | $ | 0 | $ | 0 | |||||||
|
|
|
|
|
| |||||||
FINANCIAL DERIVATIVE INSTRUMENTS: OVER THE COUNTER SUMMARY
The following is a summary by counterparty of the market value of OTC financial derivative instruments and collateral (received)/pledged as of December 31, 2015:
| (e) | Securities with an aggregate market value of $934 have been pledged as collateral for financial derivative instruments as governed by International Swaps and Derivatives Association, Inc. master agreements as of December 31, 2015. |
| Financial Derivative Assets | Financial Derivative Liabilities | |||||||||||||||||||||||||||||||||||||||||||||
| Counterparty | Forward Foreign Currency Contracts | Purchased Options | Swap Agreements | Total Over the Counter | Forward Foreign Currency Contracts | Written Options | Swap Agreements | Total Over the Counter | Net Market Value of OTC Derivatives | Collateral (Received)/ Pledged | Net Exposure (1) | |||||||||||||||||||||||||||||||||||
BOA | $ | 150 | $ | 0 | $ | 0 | $ | 150 | $ | (151 | ) | $ | 0 | $ | 0 | $ | (151 | ) | $ | (1 | ) | $ | 0 | $ | (1 | ) | ||||||||||||||||||||
CBK | 119 | 0 | 0 | 119 | (194 | ) | 0 | 0 | (194 | ) | (75 | ) | 0 | (75 | ) | |||||||||||||||||||||||||||||||
DUB | 5 | 0 | 0 | 5 | 0 | 0 | 0 | 0 | 5 | (160 | ) | (155 | ) | |||||||||||||||||||||||||||||||||
HUS | 1 | 0 | 0 | 1 | (650 | ) | 0 | 0 | (650 | ) | (649 | ) | 934 | 285 | ||||||||||||||||||||||||||||||||
MSB | 407 | 0 | 0 | 407 | 0 | 0 | 0 | 0 | 407 | (290 | ) | 117 | ||||||||||||||||||||||||||||||||||
UAG | 172 | 0 | 0 | 172 | (171 | ) | 0 | 0 | (171 | ) | 1 | 0 | 1 | |||||||||||||||||||||||||||||||||
|
|
|
|
|
|
|
|
|
|
|
|
|
|
|
| |||||||||||||||||||||||||||||||
Total Over the Counter | $ | 854 | $ | 0 | $ | 0 | $ | 854 | $ | (1,166 | ) | $ | 0 | $ | 0 | $ | (1,166 | ) | ||||||||||||||||||||||||||||
|
|
|
|
|
|
|
|
|
|
|
|
|
|
|
| |||||||||||||||||||||||||||||||
| (1) | Net Exposure represents the net receivable/(payable) that would be due from/to the counterparty in the event of default. Exposure from OTC derivatives can only be netted across transactions governed under the same master agreement with the same legal entity. The Portfolio and Subsidiary are recognized as two separate legal entities. As such, exposure cannot be netted. See Note 7, Principal Risks, in the Notes to Financial Statements for more information regarding master netting agreements. |
| See Accompanying Notes | ANNUAL REPORT | DECEMBER 31, 2015 | 17 |
Table of Contents
Consolidated Schedule of Investments PIMCO Global Dividend Portfolio (Cont.)
FAIR VALUE OF FINANCIAL DERIVATIVE INSTRUMENTS
The following is a summary of the fair valuation of the Portfolio’s derivative instruments categorized by risk exposure. See Note 7, Principal Risks, in the Notes to Financial Statements on risks of the Portfolio.
Fair Values of Financial Derivative Instruments on the Consolidated Statement of Assets and Liabilities as of December 31, 2015:
| Derivatives not accounted for as hedging instruments | ||||||||||||||||||||||||
| Commodity Contracts | Credit Contracts | Equity Contracts | Foreign Exchange Contracts | Interest Rate Contracts | Total | |||||||||||||||||||
Financial Derivative Instruments - Assets | ||||||||||||||||||||||||
Over the counter | ||||||||||||||||||||||||
Forward Foreign Currency Contracts | $ | 0 | $ | 0 | $ | 0 | $ | 854 | $ | 0 | $ | 854 | ||||||||||||
|
|
|
|
|
|
|
|
|
|
|
| |||||||||||||
Financial Derivative Instruments - Liabilities | ||||||||||||||||||||||||
Over the counter | ||||||||||||||||||||||||
Forward Foreign Currency Contracts | $ | 0 | $ | 0 | $ | 0 | $ | 1,166 | $ | 0 | $ | 1,166 | ||||||||||||
|
|
|
|
|
|
|
|
|
|
|
| |||||||||||||
The Effect of Financial Derivative Instruments on the Consolidated Statement of Operations for the period ended December 31, 2015:
| Derivatives not accounted for as hedging instruments | ||||||||||||||||||||||||
| Commodity Contracts | Credit Contracts | Equity Contracts | Foreign Exchange Contracts | Interest Rate Contracts | Total | |||||||||||||||||||
Net Realized Gain (Loss) on Financial Derivative Instruments | ||||||||||||||||||||||||
Exchange-traded or centrally cleared | ||||||||||||||||||||||||
Purchased Options | $ | 0 | $ | 0 | $ | (81 | ) | $ | 0 | $ | 0 | $ | (81 | ) | ||||||||||
Written Options | 0 | 0 | (281 | ) | 0 | 0 | (281 | ) | ||||||||||||||||
|
|
|
|
|
|
|
|
|
|
|
| |||||||||||||
| $ | 0 | $ | 0 | $ | (362 | ) | $ | 0 | $ | 0 | $ | (362 | ) | |||||||||||
|
|
|
|
|
|
|
|
|
|
|
| |||||||||||||
Over the counter | ||||||||||||||||||||||||
Forward Foreign Currency Contracts | $ | 0 | $ | 0 | $ | 0 | $ | 8,932 | $ | 0 | $ | 8,932 | ||||||||||||
Written Options | 0 | 0 | (29 | ) | 0 | 0 | (29 | ) | ||||||||||||||||
Swap Agreements | 0 | 0 | 30 | 0 | 0 | 30 | ||||||||||||||||||
|
|
|
|
|
|
|
|
|
|
|
| |||||||||||||
| $ | 0 | $ | 0 | $ | 1 | $ | 8,932 | $ | 0 | $ | 8,933 | |||||||||||||
|
|
|
|
|
|
|
|
|
|
|
| |||||||||||||
| $ | 0 | $ | 0 | $ | (361 | ) | $ | 8,932 | $ | 0 | $ | 8,571 | ||||||||||||
|
|
|
|
|
|
|
|
|
|
|
| |||||||||||||
Net Change in Unrealized Appreciation (Depreciation) on Financial Derivative Instruments |
| |||||||||||||||||||||||
Over the counter | ||||||||||||||||||||||||
Forward Foreign Currency Contracts | $ | 0 | $ | 0 | $ | 0 | $ | (4,093 | ) | $ | 0 | $ | (4,093 | ) | ||||||||||
Written Options | 0 | 0 | 53 | 0 | 0 | 53 | ||||||||||||||||||
Swap Agreements | 0 | 0 | (146 | ) | 0 | 0 | (146 | ) | ||||||||||||||||
|
|
|
|
|
|
|
|
|
|
|
| |||||||||||||
| $ | 0 | $ | 0 | $ | (93 | ) | $ | (4,093 | ) | $ | 0 | $ | (4,186 | ) | ||||||||||
|
|
|
|
|
|
|
|
|
|
|
| |||||||||||||
FAIR VALUE MEASUREMENTS
The following is a summary of the fair valuations according to the inputs used as of December 31, 2015 in valuing the Portfolio’s assets and liabilities:
| Category and Subcategory | Level 1 | Level 2 | Level 3 | Fair Value at 12/31/2015 | ||||||||||||
Investments in Securities, at Value | ||||||||||||||||
Common Stocks | ||||||||||||||||
Australia | ||||||||||||||||
Consumer Discretionary | $ | 0 | $ | 3,843 | $ | 0 | $ | 3,843 | ||||||||
Health Care | 0 | 3,281 | 0 | 3,281 | ||||||||||||
Industrials | 0 | 3,849 | 0 | 3,849 | ||||||||||||
Brazil | ||||||||||||||||
Health Care | 0 | 1,508 | 0 | 1,508 | ||||||||||||
Utilities | 0 | 1,974 | 0 | 1,974 | ||||||||||||
Canada | ||||||||||||||||
Utilities | 4,655 | 0 | 0 | 4,655 | ||||||||||||
France | ||||||||||||||||
Consumer Staples | 0 | 3,985 | 0 | 3,985 | ||||||||||||
Utilities | 0 | 7,429 | 0 | 7,429 | ||||||||||||
Germany | ||||||||||||||||
Materials | 3,503 | 0 | 0 | 3,503 | ||||||||||||
Greece | ||||||||||||||||
Consumer Discretionary | 0 | 3,830 | 0 | 3,830 | ||||||||||||
| Category and Subcategory | Level 1 | Level 2 | Level 3 | Fair Value at 12/31/2015 | ||||||||||||
Hong Kong | ||||||||||||||||
Telecommunication Services | $ | 0 | $ | 9,016 | $ | 0 | $ | 9,016 | ||||||||
Italy | ||||||||||||||||
Financials | 0 | 8,656 | 0 | 8,656 | ||||||||||||
Industrials | 0 | 4,047 | 0 | 4,047 | ||||||||||||
Japan | ||||||||||||||||
Consumer Discretionary | 0 | 4,952 | 0 | 4,952 | ||||||||||||
Telecommunication Services | 0 | 7,519 | 0 | 7,519 | ||||||||||||
Mexico | ||||||||||||||||
Consumer Staples | 1,615 | 0 | 0 | 1,615 | ||||||||||||
Netherlands | ||||||||||||||||
Financials | 0 | 13,308 | 0 | 13,308 | ||||||||||||
Russia | ||||||||||||||||
Consumer Staples | 1,427 | 0 | 0 | 1,427 | ||||||||||||
Spain | ||||||||||||||||
Consumer Staples | 0 | 5,325 | 0 | 5,325 | ||||||||||||
Switzerland | ||||||||||||||||
Health Care | 0 | 7,341 | 0 | 7,341 | ||||||||||||
| 18 | PIMCO EQUITY SERIES VIT | See Accompanying Notes |
Table of Contents
December 31, 2015
| Category and Subcategory | Level 1 | Level 2 | Level 3 | Fair Value at 12/31/2015 | ||||||||||||
Taiwan | ||||||||||||||||
Information Technology | $ | 0 | $ | 4,960 | $ | 0 | $ | 4,960 | ||||||||
United Kingdom | ||||||||||||||||
Consumer Staples | 0 | 3,422 | 0 | 3,422 | ||||||||||||
Energy | 3,414 | 0 | 0 | 3,414 | ||||||||||||
Financials | 0 | 23,312 | 0 | 23,312 | ||||||||||||
Telecommunication Services | 0 | 12,098 | 0 | 12,098 | ||||||||||||
United States | ||||||||||||||||
Consumer Discretionary | 28,684 | 0 | 0 | 28,684 | ||||||||||||
Energy | 6,195 | 0 | 0 | 6,195 | ||||||||||||
Financials | 21,706 | 0 | 0 | 21,706 | ||||||||||||
Health Care | 24,360 | 0 | 0 | 24,360 | ||||||||||||
Industrials | 6,574 | 0 | 0 | 6,574 | ||||||||||||
Information Technology | 39,985 | 0 | 0 | 39,985 | ||||||||||||
Materials | 10,682 | 0 | 0 | 10,682 | ||||||||||||
Telecommunication Services | 13,069 | 0 | 0 | 13,069 | ||||||||||||
Utilities | 9,697 | 0 | 0 | 9,697 | ||||||||||||
Real Estate Investment Trusts | ||||||||||||||||
United States | ||||||||||||||||
Financials | 9,912 | 0 | 0 | 9,912 | ||||||||||||
Short-Term Instruments | ||||||||||||||||
Repurchase Agreements | 0 | 1,716 | 0 | 1,716 | ||||||||||||
U.S. Treasury Bills | 0 | 934 | 0 | 934 | ||||||||||||
| $ | 185,478 | $ | 136,305 | $ | 0 | $ | 321,783 | |||||||||
| Category and Subcategory | Level 1 | Level 2 | Level 3 | Fair Value at 12/31/2015 | ||||||||||||
Investments in Affiliates, at Value | ||||||||||||||||
Short-Term Instruments | ||||||||||||||||
Central Funds Used for Cash Management Purposes | $ | 5,659 | $ | 0 | $ | 0 | $ | 5,659 | ||||||||
Total Investments | $ | 191,137 | $ | 136,305 | $ | 0 | $ | 327,442 | ||||||||
Financial Derivative Instruments - Assets |
| |||||||||||||||
Over the counter | $ | 0 | $ | 854 | $ | 0 | $ | 854 | ||||||||
Financial Derivative Instruments - Liabilities |
| |||||||||||||||
Over the counter | $ | 0 | $ | (1,166 | ) | $ | 0 | $ | (1,166 | ) | ||||||
Totals | $ | 191,137 | $ | 135,993 | $ | 0 | $ | 327,130 | ||||||||
There were no significant transfers between Levels 1, 2, or 3 during the period ended December 31, 2015.
| See Accompanying Notes | ANNUAL REPORT | DECEMBER 31, 2015 | 19 |
Table of Contents
1. ORGANIZATION
The PIMCO Global Dividend Portfolio (the “Portfolio”) is a series of the PIMCO Equity Series VIT (the “Trust”). The Trust is registered under the Investment Company Act of 1940, as amended (the “Act”), as an open-end management investment company organized as a Delaware statutory trust on December 28, 2009. The Portfolio offers two classes of shares: Institutional and Advisor. The Trust is designed to be used as an investment vehicle by separate accounts of insurance companies that fund variable annuity contracts and variable life insurance policies and by qualified pension and retirement plans. Pacific Investment Management Company LLC (“PIMCO”) serves as the investment adviser (the “Adviser”) for the Portfolio.
2. SIGNIFICANT ACCOUNTING POLICIES
The following is a summary of significant accounting policies consistently followed by the Portfolio in the preparation of its financial statements in conformity with accounting principles generally accepted in the United States of America (“U.S. GAAP”). The Portfolio is treated as an investment company under the reporting requirements of U.S. GAAP. The preparation of financial statements in accordance with U.S. GAAP requires management to make estimates and assumptions that affect the reported amounts of assets and liabilities and disclosure of contingent assets and liabilities at the date of the financial statements and the reported amounts of increases and decreases in net assets from operations during the reporting period. Actual results could differ from those estimates.
(a) Securities Transactions and Investment Income Securities transactions are recorded as of the trade date for financial reporting purposes. Realized gains and losses from securities sold are recorded on the identified cost basis. Dividend income is recorded on the ex-dividend date, except certain dividends from foreign securities where the ex-dividend date may have passed, which are recorded as soon as the Portfolio is informed of the ex-dividend date. Interest income, adjusted for the accretion of discounts and amortization of premiums, is recorded on the accrual basis from settlement date, with the exception of securities with a forward starting effective date, where interest income is recorded on the accrual basis from effective date. For convertible securities, premiums attributable to the conversion feature are not amortized. Estimated tax liabilities on certain foreign securities are recorded on an accrual basis and are reflected as components of interest income or net change in unrealized appreciation (depreciation) on investments on the Consolidated Statement of Operations, as appropriate. Tax liabilities realized as a result of such security sales are reflected as a component of net realized gain (loss) on investments on the Consolidated Statement of Operations. Paydown gains and losses on mortgage-related and other asset-backed securities are recorded as components of interest income on the Consolidated Statement of
Operations. Income or short-term capital gain distributions received from registered investment companies are recorded as dividend income. Long-term capital gain distributions received from registered investment companies are recorded as realized gains.
Distributions received from investments such as real estate investment trust securities, may include a return of capital invested. Such distributions reduce the cost basis of the respective securities. Return of capital distributions, if any, in excess of the cost basis of the security are recognized as capital gain.
(b) Cash and Foreign Currency The functional and reporting currency for the Portfolio is the U.S. dollar. The market values of foreign securities, currency holdings and other assets and liabilities are translated into U.S. dollars based on the current exchange rates each business day. Purchases and sales of securities and income and expense items denominated in foreign currencies, if any, are translated into U.S. dollars at the exchange rate in effect on the transaction date. The Portfolio does not separately report the effects of changes in foreign exchange rates from changes in market prices on securities held. Such changes are included in net realized gain (loss) and net change in unrealized appreciation (depreciation) from investments on the Consolidated Statement of Operations. The Portfolio may invest in foreign currency-denominated securities and may engage in foreign currency transactions either on a spot (cash) basis at the rate prevailing in the currency exchange market at the time or through a forward foreign currency contract (see Financial Derivative Instruments, if any). Realized foreign exchange gains or losses arising from sales of spot foreign currencies, currency gains or losses realized between the trade and settlement dates on securities transactions and the difference between the recorded amounts of dividends, interest, and foreign withholding taxes and the U.S. dollar equivalent of the amounts actually received or paid are included in net realized gain (loss) on foreign currency transactions on the Consolidated Statement of Operations. Net unrealized foreign exchange gains and losses arising from changes in foreign exchange rates on foreign denominated assets and liabilities other than investments in securities held at the end of the reporting period are included in net change in unrealized appreciation (depreciation) on foreign currency assets and liabilities on the Consolidated Statement of Operations.
(c) Multiclass Operations Each class offered by the Portfolio has equal rights as to assets and voting privileges (except that shareholders of a class have exclusive voting rights regarding any matter relating solely to that class of shares). Income and non-class specific expenses are allocated daily to each class on the basis of the relative net assets. Realized and unrealized capital gains and losses are allocated daily based on the relative net assets of each class of the Portfolio. Class specific expenses, where applicable, currently include supervisory and
| 20 | PIMCO EQUITY SERIES VIT |
Table of Contents
December 31, 2015
administrative and distribution and servicing fees. Under certain circumstances, the per share net asset value (“NAV”) of a class of the Portfolio’s shares may be different from the per share NAV of another class of shares as a result of the different daily expense accruals applicable to each class of shares.
(d) Dividends and Distributions to Shareholders Dividends from net investment income, if any, are declared daily and distributed to shareholders quarterly. Net realized capital gains earned by the Portfolio, if any, will be distributed no less frequently than once each year.
Income dividends and capital gain distributions are determined in accordance with income tax regulations which may differ from U.S. GAAP. Differences between tax regulations and U.S. GAAP may cause timing differences between income and capital gain recognition. Examples of events that give rise to timing differences include wash sales, straddles and capital loss carryforwards. Further, the character of investment income and capital gains may be different for certain transactions under the two methods of accounting. Examples of transactions that may cause character differences include the treatment of paydowns on mortgage-backed securities, swaps, foreign currency transactions and contingent debt instruments. As a result, income dividends and capital gain distributions declared during a fiscal period may differ significantly from the net investment income (loss) and realized gains (losses) reported on the Portfolio’s annual financial statements presented under U.S. GAAP.
Distributions classified as a tax basis return of capital, if any, are reflected on the Consolidated Statements of Changes in Net Assets and have been recorded to paid in capital. In addition, other amounts have been reclassified between undistributed (overdistributed) net investment income (loss), accumulated undistributed (overdistributed) net realized gains (losses) and/or paid in capital to more appropriately conform financial accounting to tax characterizations of dividend distributions.
(e) New Accounting Pronouncements In June 2014, the Financial Accounting Standards Board (“FASB”) issued an Accounting Standards Update (“ASU”), ASU 2014-11, that expanded secured borrowing accounting for certain repurchase agreements. The ASU also sets forth additional disclosure requirements for certain transactions accounted for as sales in order to provide financial statement users with information to compare to similar transactions accounted for as secured borrowings. The ASU became effective prospectively for annual periods beginning after December 15, 2014, and interim periods beginning after March 15, 2015. The Portfolio has adopted the ASU. The financial statements have been modified to provide enhanced disclosures surrounding secured borrowing transactions, if any. See the Notes to Consolidated Schedule of Investments for additional details.
In August 2014, the FASB issued ASU 2014-15 requiring management to evaluate whether there are conditions or events, considered in the aggregate, that raise substantial doubt about the entity’s ability to continue as a going concern. The ASU is effective prospectively for annual periods ending after December 15, 2016, and interim periods thereafter. At this time, management is evaluating the implications of these changes on the financial statements.
In May 2015, the FASB issued ASU 2015-07 which removes the requirement to categorize within the fair value hierarchy all investments for which fair value is measured using the NAV per share practical expedient. The ASU also removes the requirement to make certain disclosures for all investments that are eligible to be measured at fair value using the NAV per share practical expedient. The ASU is effective for annual periods beginning after December 15, 2015 and interim periods within those annual periods. At this time, management is evaluating the implications of these changes on the financial statements.
3. INVESTMENT VALUATION AND FAIR VALUE MEASUREMENTS
(a) Investment Valuation Policies The price of the Portfolio’s shares is based on the Portfolio’s NAV. The NAV of the Portfolio, or each of its share classes, as applicable, is determined by dividing the total value of portfolio investments and other assets attributable to the Portfolio or class, less any liabilities, by the total number of shares outstanding of the Portfolio or class.
On each day that the New York Stock Exchange (“NYSE”) is open, Portfolio shares are ordinarily valued as of the close of regular trading (“NYSE Close”). Information that becomes known to the Portfolio or its agents after the time as of which NAV has been calculated on a particular day will not generally be used to retroactively adjust the price of a security or the NAV determined earlier that day. The Portfolio reserves the right to change the time its NAV is calculated if the Portfolio closes earlier, or as permitted by the SEC.
For purposes of calculating NAV, portfolio securities and other assets for which market quotes are readily available are valued at market value. Market value is generally determined on the basis of official closing prices or the last reported sales prices, or if no sales are reported, based on quotes obtained from established market makers or prices (including evaluated prices) supplied by the Portfolio’s approved pricing services, quotation reporting systems and other third-party sources (together, “Pricing Services”). The Portfolio will normally use pricing data for domestic equity securities received shortly after the NYSE Close and does not normally take into account trading, clearances or settlements that take place after the NYSE Close. A foreign (non-U.S.) equity security traded on a foreign exchange or on more than one exchange is typically valued using pricing information
| ANNUAL REPORT | DECEMBER 31, 2015 | 21 |
Table of Contents
Notes to Financial Statements (Cont.)
from the exchange considered by the Adviser to be the primary exchange. A foreign (non-U.S.) equity security will be valued as of the close of trading on the foreign exchange, or the NYSE Close, if the NYSE Close occurs before the end of trading on the foreign exchange. Domestic and foreign (non-U.S.) fixed income securities, non-exchange traded derivatives, and equity options are normally valued on the basis of quotes obtained from brokers and dealers or Pricing Services using data reflecting the earlier closing of the principal markets for those securities. Prices obtained from Pricing Services may be based on, among other things, information provided by market makers or estimates of market values obtained from yield data relating to investments or securities with similar characteristics. Certain fixed income securities purchased on a delayed-delivery basis are marked to market daily until settlement at the forward settlement date. Exchange-traded options, except equity options, futures and options on futures are valued at the settlement price determined by the relevant exchange. Swap agreements are valued on the basis of bid quotes obtained from brokers and dealers or market-based prices supplied by Pricing Services or other pricing sources. With respect to any portion of the Portfolio’s assets that are invested in one or more open-end management investment companies (other than exchange-traded funds (“ETFs”)), a Portfolio’s NAV will be calculated based upon the NAVs of such investments.
If a foreign (non-U.S.) equity security’s value has materially changed after the close of the security’s primary exchange or principal market but before the NYSE Close, the security may be valued at fair value based on procedures established and approved by the Board of Trustees of the Trust (the “Board”). Foreign (non-U.S.) equity securities that do not trade when the NYSE is open are also valued at fair value. With respect to foreign (non-U.S.) equity securities, the Portfolio may determine the fair value of investments based on information provided by Pricing Services and other third-party vendors, which may recommend fair value or adjustments with reference to other securities, indices or assets. In considering whether fair valuation is required and in determining fair values, the Portfolio may, among other things, consider significant events (which may be considered to include changes in the value of U.S. securities or securities indices) that occur after the close of the relevant market and before the NYSE Close. The Portfolio may utilize modeling tools provided by third-party vendors to determine fair values of non-U.S. securities. Foreign (non-U.S.) exchanges may permit trading in foreign (non-U.S.) equity securities on days when the Trust is not open for business, which may result in the Portfolio’s portfolio investments being affected when shareholders are unable to buy or sell shares.
Senior secured floating rate loans for which an active secondary market exists to a reliable degree will be valued at the mean of the last available bid/ask prices in the market for such loans, as provided by a
Pricing Service. Senior secured floating rate loans for which an active secondary market does not exist to a reliable degree will be valued at fair value, which is intended to approximate market value. In valuing a senior secured floating rate loan at fair value, the factors considered may include, but are not limited to, the following: (a) the creditworthiness of the borrower and any intermediate participants, (b) the terms of the loan, (c) recent prices in the market for similar loans, if any, and (d) recent prices in the market for instruments of similar quality, rate, period until next interest rate reset and maturity.
Investments valued in currencies other than the U.S. dollar are converted to the U.S. dollar using exchange rates obtained from Pricing Services. As a result, the value of such investments and, in turn, the NAV of the Portfolio’s shares may be affected by changes in the value of currencies in relation to the U.S. dollar. The value of investments traded in markets outside the United States or denominated in currencies other than the U.S. dollar may be affected significantly on a day that the Trust is not open for business. As a result, to the extent that the Portfolio holds foreign (non-U.S.) investments, the value of those investments may change at times when shareholders are unable to buy or sell shares and the value of such investments will be reflected in the Portfolio’s next calculated NAV.
Investments for which market quotes or market based valuations are not readily available are valued at fair value as determined in good faith by the Board or persons acting at their direction. The Board has adopted methods for valuing securities and other assets in circumstances where market quotes are not readily available, and has delegated to the Adviser the responsibility for applying the fair valuation methods. In the event that market quotes or market based valuations are not readily available, and the security or asset cannot be valued pursuant to a Board approved valuation method, the value of the security or asset will be determined in good faith by the Valuation Oversight Committee of the Board (“Valuation Oversight Committee”), generally based on recommendations provided by the Adviser. Market quotes are considered not readily available in circumstances where there is an absence of current or reliable market-based data (e.g., trade information, bid/ask information, indicative market quotations (“Broker Quotes”), Pricing Services’ prices), including where events occur after the close of the relevant market, but prior to the NYSE Close, that materially affect the values of a Portfolio’s securities or assets. In addition, market quotes are considered not readily available when, due to extraordinary circumstances, the exchanges or markets on which the securities trade do not open for trading for the entire day and no other market prices are available. The Board has delegated to the Adviser the responsibility for monitoring significant events that may materially affect the values of a Portfolio’s securities or assets and for determining whether the value of the applicable securities or assets should be reevaluated in light of such significant events.
| 22 | PIMCO EQUITY SERIES VIT |
Table of Contents
December 31, 2015
When a Portfolio uses fair valuation to determine the value of a portfolio security or other asset for purposes of calculating its NAV, such investments will not be priced on the basis of quotes from the primary market in which they are traded, but rather may be priced by another method that the Board or persons acting at their direction believe reflects fair value. Fair valuation may require subjective determinations about the value of a security. While the Trust’s policy is intended to result in a calculation of the Portfolio’s NAV that fairly reflects security values as of the time of pricing, the Trust cannot ensure that fair values determined by the Board or persons acting at their direction would accurately reflect the price that a Portfolio could obtain for a security if it were to dispose of that security as of the time of pricing (for instance, in a forced or distressed sale). The prices used by a Portfolio may differ from the value that would be realized if the securities were sold. The Portfolio’s use of fair valuation may also help to deter “stale price arbitrage” as discussed under the “Frequent or Excessive Purchases, Exchanges and Redemptions” section in the Portfolio’s prospectus.
(b) Fair Value Hierarchy U.S. GAAP describes fair value as the price that the Portfolio would receive to sell an asset or pay to transfer a liability in an orderly transaction between market participants at the measurement date. It establishes a fair value hierarchy that prioritizes inputs to valuation methods and requires disclosure of the fair value hierarchy, separately for each major category of assets and liabilities, that segregates fair value measurements into levels (Level 1, 2, or 3). The inputs or methodology used for valuing securities are not necessarily an indication of the risks associated with investing in those securities. Levels 1, 2, and 3 of the fair value hierarchy are defined as follows:
| n | Level 1 — Inputs using (unadjusted) quoted prices in active markets or exchanges for identical assets and liabilities. |
| n | Level 2 — Significant other observable inputs, which may include, but are not limited to, quoted prices for similar assets or liabilities in markets that are active, quoted prices for identical or similar assets or liabilities in markets that are not active, inputs other than quoted prices that are observable for the assets or liabilities (such as interest rates, yield curves, volatilities, prepayment speeds, loss severities, credit risks and default rates) or other market corroborated inputs. |
| n | Level 3 — Significant unobservable inputs based on the best information available in the circumstances, to the extent observable inputs are not available, which may include assumptions made by the Board or persons acting at their direction that are used in determining the fair value of investments. |
In accordance with the requirements of U.S. GAAP, the amounts of transfers between Levels 1 and 2 and transfers in and out of Level 3, if
material, are disclosed in the Notes to Consolidated Schedule of Investments for the Portfolio.
For fair valuations using significant unobservable inputs, U.S. GAAP requires a reconciliation of the beginning to ending balances for reported fair values that presents changes attributable to realized gain (loss), unrealized appreciation (depreciation), purchases and sales, accrued discounts (premiums), and transfers in and out of the Level 3 category during the period. The end of period timing recognition is used for the transfers between Levels of the Portfolio’s assets and liabilities. Additionally, U.S. GAAP requires quantitative information regarding the significant unobservable inputs used in the determination of fair value of assets or liabilities categorized as Level 3 in the fair value hierarchy. In accordance with the requirements of U.S. GAAP, a fair value hierarchy, and if material, a Level 3 reconciliation and details of significant unobservable inputs, have been included in the Notes to Consolidated Schedule of Investments for the Portfolio.
(c) Valuation Techniques and the Fair Value Hierarchy Level 1 and Level 2 trading assets and trading liabilities, at fair value The valuation methods (or “techniques”) and significant inputs used in determining the fair values of portfolio securities or other assets and liabilities categorized as Level 1 and Level 2 of the fair value hierarchy are as follows:
Fixed income securities including corporate, convertible and municipal bonds and notes, U.S. government agencies, U.S. treasury obligations, sovereign issues, bank loans, convertible preferred securities and non-U.S. bonds are normally valued on the basis of quotes obtained from brokers and dealers or Pricing Services that use broker-dealer quotations, reported trades or valuation estimates from their internal pricing models. The Pricing Services’ internal models use inputs that are observable such as issuer details, interest rates, yield curves, prepayment speeds, credit risks/spreads, default rates and quoted prices for similar assets. Securities that use similar valuation techniques and inputs as described above are categorized as Level 2 of the fair value hierarchy.
Fixed income securities purchased on a delayed-delivery basis or as a repurchase commitment in a sale-buyback transaction are marked to market daily until settlement at the forward settlement date and are categorized as Level 2 of the fair value hierarchy.
Common stocks, ETFs, exchange-traded notes and financial derivative instruments, such as futures contracts, rights and warrants, or options on futures that are traded on a national securities exchange, are stated at the last reported sale or settlement price on the day of valuation. To the extent these securities are actively traded and valuation adjustments are not applied, they are categorized as Level 1 of the fair value hierarchy.
| ANNUAL REPORT | DECEMBER 31, 2015 | 23 |
Table of Contents
Notes to Financial Statements (Cont.)
Valuation adjustments may be applied to certain securities that are solely traded on a foreign exchange to account for the market movement between the close of the foreign market and the NYSE Close. These securities are valued using Pricing Services that consider the correlation of the trading patterns of the foreign security to the intraday trading in the U.S. markets for investments. Securities using these valuation adjustments are categorized as Level 2 of the fair value hierarchy. Preferred securities and other equities traded on inactive markets or valued by reference to similar instruments are also categorized as Level 2 of the fair value hierarchy.
Investments in registered open-end investment companies (other than ETFs) will be valued based upon the NAVs of such investments and are categorized as Level 1 of the fair value hierarchy. Investments in unregistered open-end investment companies will be calculated based upon the NAVs of such investments and are considered Level 1 provided that the NAVs are observable, calculated daily and are the value at which both purchases and sales will be conducted. Investments in privately held investment funds with significant restrictions on redemption where the inputs to the NAVs are observable will be valued based upon the NAVs of such investments and are categorized as Level 2 of the fair value hierarchy.
Short-term debt instruments (such as commercial paper) having a remaining maturity of 60 days or less may be valued at amortized cost, so long as the amortized cost of such short-term debt instrument is approximately the same as the fair value of the instrument as determined without the use of amortized cost valuation. Prior to July 31, 2015, short-term investments having a maturity of 60 days or less and repurchase agreements were generally valued at amortized cost which approximates fair value. Short-term debt instruments having a remaining maturity of 60 days or less are categorized as Level 2 of the fair value hierarchy.
Equity exchange-traded options and over the counter financial derivative instruments, such as foreign currency contracts, options contracts, or swap agreements, derive their value from underlying asset
prices, indices, reference rates, and other inputs or a combination of these factors. Other than swap agreements, which are valued using a broker-dealer bid quotation or on market-based prices provided by Pricing Services or other pricing sources, these contracts are normally valued on the basis of quotes obtained from a quotation reporting system, established market makers or Pricing Services (normally determined as of the NYSE Close). Depending on the product and the terms of the transaction, financial derivative instruments can be valued by Pricing Services using a series of techniques, including simulation pricing models. The pricing models use inputs that are observed from actively quoted markets such as quoted prices, issuer details, indices, bid/ask spreads, interest rates, implied volatilities, yield curves, dividends and exchange rates. Financial derivative instruments that use similar valuation techniques and inputs as described above are categorized as Level 2 of the fair value hierarchy.
The validity of the fair value is reviewed by the Adviser on a periodic basis and may be amended in accordance with the Trust’s valuation procedures.
4. SECURITIES AND OTHER INVESTMENTS
(a) Investments in Affiliates
The Portfolio may invest in the PIMCO Short-Term Floating NAV Portfolio and PIMCO Short-Term Floating NAV Portfolio III (“Central Funds”) to the extent permitted by the Act and rules thereunder. The Central Funds are registered investment companies created for use solely by the series of the Trust and other series of registered investment companies advised by the Adviser, in connection with their cash management activities. The main investments of the Central Funds are money market and short maturity fixed income instruments. The Central Funds may incur expenses related to their investment activities, but do not pay Investment Advisory Fees or Supervisory and Administrative Fees to the Adviser. The Central Funds are considered to be affiliated with the Portfolio. The tables below show the Portfolio’s transactions in and earnings from investments in these affiliated Funds for the period ended December 31, 2015 (amounts in thousands†):
Investments in PIMCO Short-Term Floating NAV Portfolio*
| Fund Name | Market Value 12/31/2014 | Purchases at Cost | Proceeds from Sales | Net Realized Gain (Loss) | Change in Unrealized Appreciation (Depreciation) | Market Value 12/31/2015 | Dividend Income (1) | Realized Net Capital Gain Distributions (1) | ||||||||||||||||||||||||||
PIMCO Global Dividend Portfolio | $ | 4 | $ | 0 | $ | (4 | ) | $ | 0 | $ | 0 | $ | 0 | $ | 0 | $ | 0 | |||||||||||||||||
| † | A zero balance may reflect actual amounts rounding to less than one thousand. |
| * | Effective July 1, 2015, the Portfolio was liquidated. |
| (1) | A portion of this may be recharacterized to return of capital and reflected as such on tax forms mailed to shareholders on or about January 31st following each calendar year. |
| 24 | PIMCO EQUITY SERIES VIT |
Table of Contents
December 31, 2015
Investments in PIMCO Short-Term Floating NAV Portfolio III
| Fund Name | Market Value 12/31/2014 | Purchases at Cost | Proceeds from Sales | Net Realized Gain/(Loss) | Change in Unrealized Appreciation (Depreciation) | Market Value 12/31/2015 | Dividend Income (1) | Realized Net Capital Gain Distributions (1) | ||||||||||||||||||||||||||
PIMCO Global Dividend Portfolio | $ | 9,803 | $ | 259,967 | $ | (264,074 | ) | $ | (109 | ) | $ | 72 | $ | 5,659 | $ | 67 | $ | 0 | ||||||||||||||||
| † | A zero balance may reflect actual amounts rounding to less than one thousand. |
| (1) | A portion of this may be recharacterized to return of capital and reflected as such on tax forms mailed to shareholders on or about January 31st following each calendar year. |
(b) Investments in Securities
U.S. Government Agencies or Government-Sponsored Enterprises The Portfolio may invest in securities of U.S. Government agencies or government-sponsored enterprises. U.S. Government securities are obligations of and, in certain cases, guaranteed by, the U.S. Government, its agencies or instrumentalities. Some U.S. Government securities, such as Treasury bills, notes and bonds, and securities guaranteed by the Government National Mortgage Association (“GNMA” or “Ginnie Mae”), are supported by the full faith and credit of the U.S. Government; others, such as those of the Federal Home Loan Banks, are supported by the right of the issuer to borrow from the U.S. Department of the Treasury (the “U.S. Treasury”); and others, such as those of the Federal National Mortgage Association (“FNMA” or “Fannie Mae”), are supported by the discretionary authority of the U.S. Government to purchase the agency’s obligations. U.S. Government securities may include zero coupon securities. Zero coupon securities do not distribute interest on a current basis and tend to be subject to a greater risk than interest-paying securities.
Government-related guarantors (i.e., not backed by the full faith and credit of the U.S. Government) include FNMA and the Federal Home Loan Mortgage Corporation (“FHLMC” or “Freddie Mac”). FNMA is a government-sponsored corporation. FNMA purchases conventional (i.e., not insured or guaranteed by any government agency) residential mortgages from a list of approved seller/servicers which include state and federally chartered savings and loan associations, mutual savings banks, commercial banks and credit unions and mortgage bankers. Pass-through securities issued by FNMA are guaranteed as to timely payment of principal and interest by FNMA, but are not backed by the full faith and credit of the U.S. Government. FHLMC issues Participation Certificates (“PCs”), which are pass-through securities, each representing an undivided interest in a pool of residential mortgages. FHLMC guarantees the timely payment of interest and ultimate collection of principal, but PCs are not backed by the full faith and credit of the U.S. Government.
5. BORROWINGS AND OTHER FINANCING TRANSACTIONS
The following disclosures contain information on the Portfolio’s ability to lend or borrow cash or securities to the extent permitted under the Act, which may be viewed as borrowing or financing transactions by
the Portfolio. The location of these instruments is described below. For a detailed description of credit and counterparty risks that can be associated with borrowings and other financing transactions, please see Note 7, Principal Risks.
(a) Repurchase Agreements The Portfolio may engage in repurchase agreements. Under the terms of a typical repurchase agreement, the Portfolio takes possession of an underlying debt obligation (collateral) subject to an obligation of the seller to repurchase, and the Portfolio to resell, the obligation at an agreed-upon price and time. The underlying securities for all repurchase agreements are held in safekeeping at the Portfolio’s custodian or designated subcustodians under tri-party repurchase agreements. The market value of the collateral must be equal to or exceed the total amount of the repurchase obligations, including interest. Repurchase agreements, including accrued interest, are included on the Consolidated Statement of Assets and Liabilities. Interest earned is recorded as a component of interest income on the Consolidated Statement of Operations. In periods of increased demand for collateral, the Portfolio may pay a fee for the receipt of collateral, which may result in interest expense to the Portfolio.
6. FINANCIAL DERIVATIVE INSTRUMENTS
The following disclosures contain information on how and why the Portfolio uses financial derivative instruments, and how financial derivative instruments affect the Portfolio’s financial position, results of operations and cash flows. The location and fair value amounts of these instruments on the Consolidated Statement of Assets and Liabilities and the net realized gain (loss) and net change in unrealized appreciation (depreciation) on the Consolidated Statement of Operations, each categorized by type of financial derivative contract and related risk exposure, are included in a table in the Notes to Consolidated Schedule of Investments. The financial derivative instruments outstanding as of period end and the amounts of net realized gain (loss) and net change in unrealized appreciation (depreciation) on financial derivative instruments during the period, as disclosed in the Notes to Consolidated Schedule of Investments, serve as indicators of the volume of financial derivative activity for the Portfolio.
(a) Forward Foreign Currency Contracts The Portfolio may enter into forward foreign currency contracts in connection with settling planned purchases or sales of securities, to hedge the currency exposure
| ANNUAL REPORT | DECEMBER 31, 2015 | 25 |
Table of Contents
Notes to Financial Statements (Cont.)
associated with some or all of the Portfolio’s securities or as a part of an investment strategy. A forward foreign currency contract is an agreement between two parties to buy and sell a currency at a set price on a future date. The market value of a forward foreign currency contract fluctuates with changes in foreign currency exchange rates. Forward foreign currency contracts are marked to market daily, and the change in value is recorded by the Portfolio as an unrealized gain or loss. Realized gains or losses are equal to the difference between the value of the contract at the time it was opened and the value at the time it was closed and are recorded upon delivery or receipt of the currency. These contracts may involve market risk in excess of the unrealized gain or loss reflected on the Consolidated Statement of Assets and Liabilities. In addition, the Portfolio could be exposed to risk if the counterparties are unable to meet the terms of the contracts or if the value of the currency changes unfavorably to the U.S. dollar. To mitigate such risk, cash or securities may be exchanged as collateral pursuant to the terms of the underlying contracts.
7. PRINCIPAL RISKS
In the normal course of business, the Portfolio trades financial instruments and enters into financial transactions where risk of potential loss exists due to such things as changes in the market (market risk) or failure or inability of the other party to a transaction to perform (credit and counterparty risk). See below for a detailed description of select principal risks. For a more comprehensive list of potential risks the Portfolio may be subject to, please see the Important Information About the Portfolio.
Market Risks The Portfolio’s investments in financial derivative instruments and other financial instruments expose the Portfolio to various risks such as, but not limited to, interest rate, foreign currency, equity and commodity risks.
The market values of equities, such as common stocks and preferred securities or equity related investments such as futures and options, have historically risen and fallen in periodic cycles and may decline due to general market conditions which are not specifically related to a particular company, such as real or perceived adverse economic conditions, changes in the general outlook for corporate earnings, changes in interest or currency rates or adverse investor sentiment generally. They may also decline due to factors which affect a particular industry or industries, such as labor shortages or increased production costs and competitive conditions within an industry. Different types of equity securities may react differently to these developments. Equity securities and equity related investments generally have greater market price volatility than fixed income securities.
Issuers that have paid regular dividends or distributions to shareholders may not continue to do so in the future. An issuer may reduce or
eliminate future dividends or distributions at any time and for any reason. Moreover, the Portfolio may use a dividend capture strategy (i.e., purchasing an equity security shortly before the issuer pays a dividend and selling it shortly thereafter) which may expose the Portfolio to higher portfolio turnover, increased trading costs and the potential for capital loss or gain, particularly in the event of significant short-term price movements of stocks subject to dividend capture trading. Also, securities purchased to capture a dividend often decline in value at the time of sale (i.e., shortly following the dividend) and the resulting realized loss to the Portfolio may exceed the amount of the dividend received, thereby negatively impacting the Portfolio’s net asset value.
Interest rate risk is the risk that fixed income securities will decline in value because of an increase in interest rates. As nominal interest rates rise, the value of certain fixed income securities held by the Portfolio is likely to decrease. A nominal interest rate can be described as the sum of a real interest rate and an expected inflation rate. Interest rate changes can be sudden and unpredictable, and the Portfolio may lose money if these changes are not anticipated by the Portfolio’s management. The Portfolio may not be able to hedge against changes in interest rates or may choose not to do so for cost or other reasons. In addition, any hedges may not work as intended.
Duration is a measure of the sensitivity of a fixed income security’s market price to interest rate (i.e., yield) movements that incorporates a security’s yield, coupon, final maturity and call features, among other characteristics. Convexity is an additional measure of interest rate sensitivity that measures the rate of change of duration in response to changes in interest rates. Fixed income securities with longer durations tend to be more sensitive to changes in interest rates, usually making them more volatile than securities with shorter durations. A wide variety of factors can cause interest rates to rise (e.g., central bank monetary policies, inflation rates, general economic conditions). At present, the U.S. is experiencing historically low interest rates. The Portfolio may be subject to heightened interest rate risk because the Fed has ended its quantitative easing program and has begun, and may continue, to raise interest rates. Further, while U.S. bond markets have steadily grown over the past three decades, dealer “market making” ability has remained relatively stagnant. Given the importance of intermediary “market making” in creating a robust and active market, fixed income securities are currently facing increased volatility and liquidity risks. All of these factors, collectively and/or individually, could cause the Portfolio to lose value. If the Portfolio lost enough value, the Portfolio could face increased redemptions by shareholders, which could further impair its performance.
If the Portfolio invests directly in foreign (non-U.S.) currencies or in securities that trade in, and receive revenues in, foreign (non-U.S.)
| 26 | PIMCO EQUITY SERIES VIT |
Table of Contents
December 31, 2015
currencies, or in financial derivative instruments that provide exposure to foreign (non-U.S.) currencies, it will be subject to the risk that those currencies will decline in value relative to the base currency of the Portfolio, or, in the case of hedging positions, that the Portfolio’s base currency will decline in value relative to the currency being hedged. Currency rates in foreign countries may fluctuate significantly over short periods of time for a number of reasons, including changes in interest rates, intervention (or the failure to intervene) by U.S. or foreign governments, central banks or supranational entities such as the International Monetary Fund, or by the imposition of currency controls or other political developments in the United States or abroad. As a result, the Portfolio’s investments in foreign currency-denominated securities may reduce the Portfolio’s returns.
The Portfolio’s investments in commodity-linked financial derivative instruments may subject the Portfolio to greater market price volatility than investments in traditional securities. The value of commodity-linked financial derivative instruments may be affected by changes in overall market movements, commodity index volatility, changes in interest rates, or factors affecting a particular industry or commodity, such as drought, floods, weather, livestock disease, embargoes, tariffs and international economic, political and regulatory developments.
Credit and Counterparty Risks The Portfolio will be exposed to credit risk to parties with whom it trades and will also bear the risk of settlement default. The Portfolio minimizes concentrations of credit risk by undertaking transactions with a large number of customers and counterparties on recognized and reputable exchanges, where applicable. For financial derivative instruments traded on exchanges or clearinghouses, the primary credit risk is the creditworthiness of the Portfolio’s clearing broker or the exchange or clearinghouse itself. The Portfolio could lose money if the issuer or guarantor of a fixed income security, or the counterparty to a financial derivative instruments contract, repurchase agreement or a loan of portfolio securities, is unable or unwilling to make timely principal and/or interest payments, or to otherwise honor its obligations. Securities and financial derivative instruments are subject to varying degrees of credit risk, which may be reflected in credit ratings.
Similar to credit risk, the Portfolio may be exposed to counterparty risk, or the risk that an institution or other entity with which the Portfolio has unsettled or open transactions will default. PIMCO, as the Adviser, minimizes counterparty risks to the Portfolio through a number of ways. Prior to entering into transactions with a new counterparty, the PIMCO Counterparty Risk Committee conducts an extensive credit review of such counterparty and must approve the use of such counterparty. Furthermore, pursuant to the terms of the underlying contract, to the extent that unpaid amounts owed to the Portfolio exceed a predetermined threshold, such counterparty shall advance collateral to
the Portfolio in the form of cash or securities equal in value to the unpaid amount owed to the Portfolio. The Portfolio may invest such collateral in securities or other instruments and will typically pay interest to the counterparty on the collateral received. If the unpaid amount owed to the Portfolio subsequently decreases, the Portfolio would be required to return to the counterparty all or a portion of the collateral previously advanced.
All transactions in listed securities are settled/paid for upon delivery using approved counterparties. The risk of default is considered minimal, as delivery of securities sold is only made once the Portfolio has received payment. Payment is made on a purchase once the securities have been delivered by the counterparty. The trade will fail if either party fails to meet its obligation.
Master Netting Arrangements The Portfolio may be subject to various netting arrangements (“Master Agreements”) with select counterparties. Master Agreements govern the terms of certain transactions, and reduce the counterparty risk associated with relevant transactions by specifying credit protection mechanisms and providing standardization that improves legal certainty. Each type of Master Agreement governs certain types of transactions. Different types of transactions may be traded out of different legal entities or affiliates of a particular organization, resulting in the need for multiple agreements with a single counterparty. As the Master Agreements are specific to unique operations of different asset types, they allow the Portfolio to close out and net its total exposure to a counterparty in the event of a default with respect to all the transactions governed under a single Master Agreement with a counterparty. For financial reporting purposes the Consolidated Statement of Assets and Liabilities generally presents derivative assets and liabilities on a gross basis, which reflects the full risks and exposures prior to netting.
Master Agreements can also help limit counterparty risk by specifying collateral posting arrangements at pre-arranged exposure levels. Under most Master Agreements, collateral is routinely transferred if the total net exposure to certain transactions (net of existing collateral already in place) governed under the relevant Master Agreement with a counterparty in a given account exceeds a specified threshold, which typically ranges from zero to $250,000 depending on the counterparty and the type of Master Agreement. United States Treasury Bills and U.S. dollar cash are generally the preferred forms of collateral, although other forms of AAA rated paper or sovereign securities may be used depending on the terms outlined in the applicable Master Agreement. Securities and cash pledged as collateral are reflected as assets on the Consolidated Statement of Assets and Liabilities as either a component of Investments at value (securities) or Deposits with counterparty. Cash collateral received is not typically held in a segregated account and as such is reflected as a liability on the Consolidated Statement of Assets
| ANNUAL REPORT | DECEMBER 31, 2015 | 27 |
Table of Contents
Notes to Financial Statements (Cont.)
and Liabilities as Deposits from counterparty. The market value of any securities received as collateral is not reflected as a component of NAV. The Portfolio’s overall exposure to counterparty risk can change substantially within a short period, as it is affected by each transaction subject to the relevant Master Agreement.
Master Repurchase Agreements and Global Master Repurchase Agreements (individually and collectively “Master Repo Agreements”) govern repurchase, reverse repurchase, and sale-buyback transactions between the Portfolio and select counterparties. Master Repo Agreements maintain provisions for, among other things, initiation, income payments, events of default, and maintenance of collateral. The market value of transactions under the Master Repo Agreement, collateral pledged or received, and the net exposure by counterparty as of period end are disclosed in the Notes to Consolidated Schedule of Investments.
Master Securities Forward Transaction Agreements (“Master Forward Agreements”) govern certain forward settling transactions, such as To-Be-Announced securities, delayed-delivery or sale-buyback transactions by and between the Portfolio and select counterparties. The Master Forward Agreements maintain provisions for, among other things, initiation and confirmation, payment and transfer, events of default, termination, and maintenance of collateral. The market value of forward settling transactions, collateral pledged or received, and the net exposure by counterparty as of period end is disclosed in the Notes to Consolidated Schedule of Investments.
Customer Account Agreements and related addenda govern cleared derivatives transactions such as futures, options on futures, and cleared over the counter (“OTC”) derivatives. Such transactions require posting of initial margin as determined by each relevant clearing agency which is segregated in an account at a futures commission merchant (“FCM”) registered with the Commodity Futures Trading Commission (“CFTC”). In the United States, counterparty risk is significantly reduced as creditors of an FCM cannot have a claim to Portfolio assets in the segregated account. Additionally, portability of exposure in the event of an FCM default scenario further reduces risk to the Portfolio. Variation margin, or changes in market value, are exchanged daily, but may not be netted between futures and cleared OTC derivatives. The market value or accumulated unrealized appreciation (depreciation), initial margin posted, and any unsettled variation margin as of period end is disclosed in the Notes to Consolidated Schedule of Investments.
International Swaps and Derivatives Association, Inc. Master Agreements and Credit Support Annexes (“ISDA Master Agreements”)
govern bilateral OTC derivative transactions entered into by the Portfolio with select counterparties. ISDA Master Agreements maintain provisions for general obligations, representations, agreements, collateral and events of default or termination. Events of termination include conditions that may entitle counterparties to elect to terminate early and cause settlement of all outstanding transactions under the applicable ISDA Master Agreement. Any election to terminate early could be material to the financial statements. In limited circumstances, the ISDA Master Agreement may contain additional provisions that add counterparty protection beyond coverage of existing daily exposure if the counterparty has a decline in credit quality below a predefined level. These amounts, if any, may be segregated with a third-party custodian. The market value of OTC financial derivative instruments, collateral received or pledged, and net exposure by counterparty as of period end are disclosed in the Notes to Consolidated Schedule of Investments.
8. BASIS FOR CONSOLIDATION
PIMCO Cayman Commodity Portfolio III, Ltd. (the “Commodity Subsidiary”), a Cayman Islands exempted company, was incorporated as a wholly owned subsidiary acting as an investment vehicle for the Portfolio in order to effect certain investments for the Portfolio consistent with the Portfolio’s investment objectives and policies as specified in its prospectus and statement of additional information. The Portfolio’s investment portfolio has been consolidated and includes the portfolio holdings of the Portfolio and the Commodity Subsidiary, if any. PIMCO Cayman Commodity Portfolio III, Ltd. was liquidated on May 26, 2015 at its net asset value. The Commodity Subsidiary’s operations have been consolidated with the operations of the Consolidated Fund through its liquidation date. The consolidated financial statements include the accounts of the Portfolio and the Commodity Subsidiary, if any. All inter-company transactions and balances have been eliminated. A subscription agreement was entered into between the Portfolio and the Commodity Subsidiary, comprising the entire issued share capital of the Commodity Subsidiary, with the intent that the Portfolio will remain the sole shareholder and retain all rights. Under the Memorandum and Articles of Association, shares issued by the Commodity Subsidiary confer upon a shareholder the right to receive notice of, to attend and to vote at general meetings of the Commodity Subsidiary and shall confer upon the shareholder rights in a winding-up or repayment of capital and the right to participate in the profits or assets of the Commodity Subsidiary. See the table below for details regarding the structure, incorporation and relationship as of period end of the Commodity Subsidiary to the Portfolio (amounts in thousands†).
| 28 | PIMCO EQUITY SERIES VIT |
Table of Contents
December 31, 2015
Date of Incorporation | 06/06/2011 | |||||
Subscription Agreement | 06/20/2011 | |||||
Consolidated Portfolio Net Assets | $ | 324,988 | ||||
Subsidiary % of Consolidated Portfolio Net Assets | 0.0% | |||||
Subsidiary Financial Statement Information | ||||||
Total assets | $ | 0 | ||||
Total liabilities | 0 | |||||
Net assets | $ | 0 | ||||
Total income | 0 | |||||
Net investment income (loss) | 0 | |||||
Net realized gain (loss) | 0 | |||||
Net change in unrealized appreciation (depreciation) | 0 | |||||
Increase (decrease) in net assets resulting from operations | $ | 0 |
| † | A zero balance may reflect actual amounts rounding to less than one thousand. |
9. FEES AND EXPENSES
(a) Investment Advisory Fee PIMCO is a majority-owned subsidiary of Allianz Asset Management of America L.P. (“Allianz Asset Management”) and serves as the Adviser to the Trust, pursuant to an investment advisory contract. The Adviser receives a monthly fee from the Portfolio at an annual rate based on average daily net assets (the “Investment Advisory Fee”). The Investment Advisory Fee for all classes is charged at an annual rate of 0.75%. Effective July 13, 2015, the advisory fee decreased from 0.75% to 0.69%.
(b) Supervisory and Administrative Fee PIMCO serves as administrator (the “Administrator”) and provides supervisory and administrative services to the Trust for which it receives a monthly supervisory and administrative fee based on each share class’s average daily net assets (the “Supervisory and Administrative Fee”). As the Administrator, PIMCO bears the costs of various third-party services, including audit, custodial, portfolio accounting, legal, transfer agency and printing costs. The Supervisory and Administrative Fee for all classes is charged at the annual rate of 0.35%.
(c) Distribution and Servicing Fees PIMCO Investments LLC (“PI”), a wholly-owned subsidiary of PIMCO, serves as the distributor (“Distributor”) of the Trust’s shares. The Trust has adopted a Distribution and Servicing Plan with respect to the Advisor Class shares of the Portfolio pursuant to Rule 12b-1 under the Act (the “Distribution and Servicing Plan”). The Distribution and Servicing Plan allows the Portfolio to compensate the Distributor for providing or procuring through financial intermediaries distribution, administrative, recordkeeping, shareholder and/or related services with respect to Advisor Class shares. The Distribution and Servicing Plan permits the Portfolio to make total payments at an annual rate of up to 0.25% of its average daily net assets attributable to its Advisor Class shares.
(d) Portfolio Expenses The Trust is responsible for the following expenses: (i) taxes and governmental fees; (ii) brokerage fees and
commissions and other portfolio transaction expenses; (iii) the costs of borrowing money, including interest expense; (iv) fees and expenses of the Trustees who are not “interested persons” of PIMCO or the Trust, and any counsel retained exclusively for their benefit; (v) extraordinary expense, including costs of litigation and indemnification expenses; (vi) organizational expenses; and (vii) any expenses allocated or allocable to a specific class of shares (“class-specific expenses”). The ratio of expenses to average net assets per share class, as disclosed on the Financial Highlights, may differ from the annual portfolio operating expenses per share class.
Each Trustee, other than those affiliated with PIMCO or its affiliates, receives an annual retainer of $10,500, plus $1,875 for each Board meeting attended in person, $250 ($375 in the case of the audit committee chair with respect to audit committee meetings) for each committee meeting attended and $375 for each Board meeting attended telephonically, plus reimbursement of related expenses. In addition, the audit committee chair receives an additional annual retainer of $2,400, the valuation oversight committee lead receives an additional annual retainer of $1,000 (to the extent there are co-leads of the valuation oversight committee, the annual retainer will be split evenly between the co-leads) and the governance committee chair receives an additional annual retainer of $250.
These expenses are allocated on a pro rata basis to the various portfolios of the Trust according to their respective net assets. The Trust pays no compensation directly to any Trustee or any other officer who is affiliated with the Administrator, all of whom receive remuneration for their services to the Trust from the Administrator or its affiliates.
(e) Expense Limitation PIMCO has contractually agreed, through May 1, 2016, to reduce total annual operating expenses for each of the Portfolio’s separate classes of shares, by reducing the Portfolio’s Supervisory and Administrative fee or reimbursing the Portfolio, to the extent that organizational expenses and pro rata Trustees’ fees attributable to a class of shares of the Portfolio exceed 0.0049% of the Portfolio’s average net assets attributable to separate classes of shares. This Expense Limitation Agreement renews annually for a full year unless terminated by PIMCO upon at least 30 days prior notice to the end of the contract term.
PIMCO has contractually agreed, through May 1, 2016, to reduce its advisory fee by 0.13% of the average daily net assets of the Portfolio. Under the Fee Limitation Agreement, PIMCO is entitled to reimbursement by the Portfolio of any portion of the Supervisory and Administrative Fee and/or Investment Advisory Fee waived, reduced or reimbursed pursuant to the Fee Limitation Agreement (the “Reimbursement Amount”) during the previous three years, provided that such amount paid to PIMCO will not: 1) together with any recoupment of organizational expenses and pro rata Trustees’ fees pursuant to the Expense Limitation Agreement, exceed
| ANNUAL REPORT | DECEMBER 31, 2015 | 29 |
Table of Contents
Notes to Financial Statements (Cont.)
the Expense Limit; 2) exceed the total Reimbursement Amount; or 3) include any amounts previously reimbursed to PIMCO. This Fee Limitation Agreement renews annually unless terminated by PIMCO upon at least 30 days’ prior notice to the end of the contract term. Effective July 13, 2015, the amount of the waiver set forth in the Fee Limitation Agreement, stated as a percentage of the Portfolio’s average daily net assets, will change from 0.13% to 0.16%. Accordingly, the change to the Fee Limitation Agreement, together with the advisory fee reduction, will cause the Portfolio’s net advisory fee to decrease, through May 1, 2016, from 0.62% to 0.53% of the average daily net assets of the Portfolio.
PIMCO had also contractually agreed, through September 16, 2013, to reduce total annual operating expenses for the Portfolio’s Institutional Class and Advisor Class shares, by reducing the Portfolio’s Investment Advisory or Supervisory and Administrative Fees or reimbursing the Portfolio to the extent that total annual portfolio operating expenses net of acquired fund fees and expenses, after taking into account other applicable fee waivers and reimbursements exceed 1.00% and 1.25% of the Portfolio’s average net assets attributable to the Institutional Class and Advisor Class shares, respectively. PIMCO may recoup these waivers and reimbursements for a period not exceeding three years, provided that total expenses, including such recoupment, do not exceed the annual expense limit. As of December 31, 2015, the remaining recoverable amount to PIMCO was $206,021.
(f) Acquired Fund Fees and Expenses The Commodity Subsidiary has entered into a separate contract with PIMCO for the management of the Commodity Subsidiary’s portfolio pursuant to which the Commodity Subsidiary pays PIMCO a management fee and administrative services fee at the annual rates of 0.49% and 0.20%, respectively, of its net assets. PIMCO has contractually agreed to waive the Investment Advisory Fee and the Supervisory and Administrative Fee it receives from the Portfolio in an amount equal to the management fee and administrative services fee, respectively, paid to PIMCO by the Commodity Subsidiary. This waiver may not be terminated by PIMCO and will remain in effect for as long as PIMCO’s contract with the Commodity Subsidiary is in place. The waiver is reflected in the Consolidated Statement of Operations as a component of Waiver and/or Reimbursement by PIMCO. For the period ended December 31, 2015, the amount was $26.
10. RELATED PARTY TRANSACTIONS
The Adviser, Administrator, and Distributor are related parties. Fees payable to these parties are disclosed in Note 9 and the accrued related party fee amounts are disclosed on the Consolidated Statement of Assets and Liabilities.
11. GUARANTEES AND INDEMNIFICATIONS
Under the Trust’s organizational documents, each Trustee or officer of the Trust is indemnified and each employee or other agent of the Trust (including the Trust’s investment manager) is indemnified, to the extent permitted by the Act, against certain liabilities that may arise out of performance of their duties to the Portfolio. Additionally, in the normal course of business, the Portfolio enters into contracts that contain a variety of indemnification clauses. The Portfolio’s maximum exposure under these arrangements is unknown as this would involve future claims that may be made against the Portfolio that have not yet occurred. However, the Portfolio has not had prior claims or losses pursuant to these contracts.
12. PURCHASES AND SALES OF SECURITIES
The length of time the Portfolio has held a particular security is not generally a consideration in investment decisions. A change in the securities held by the Portfolio is known as “portfolio turnover.” The Portfolio may engage in frequent and active trading of portfolio securities to achieve its investment objective, particularly during periods of volatile market movements. High portfolio turnover may involve correspondingly greater transaction costs to the Portfolio, including brokerage commissions or dealer mark-ups and other transaction costs on the sale of securities and reinvestments in other securities. Such sales may also result in realization of taxable capital gains, including short-term capital gains (which are generally taxed at ordinary income tax rates). The transaction costs and tax effects associated with portfolio turnover may adversely affect the Portfolio’s performance. The portfolio turnover rates are reported in the Financial Highlights.
Purchases and sales of securities (excluding short-term investments) for the period ended December 31, 2015, were as follows (amounts in thousands):
| Purchases | Sales | |||||
| $ | 589,953 | $ | 631,372 | |||
| 30 | PIMCO EQUITY SERIES VIT |
Table of Contents
December 31, 2015
13. SHARES OF BENEFICIAL INTEREST
The Portfolio may issue an unlimited number of shares of beneficial interest with a $0.001 par value. Changes in shares of beneficial interest were as follows (shares and amounts in thousands):
| Year Ended 12/31/2015 | Year Ended 12/31/2014 | |||||||||||||||||
| Shares | Amount | Shares | Amount | |||||||||||||||
Receipts for shares sold | ||||||||||||||||||
Institutional Class | 8 | $ | 99 | 13 | $ | 150 | ||||||||||||
Advisor Class | 546 | 6,678 | 515 | 6,591 | ||||||||||||||
Issued as reinvestment of distributions | ||||||||||||||||||
Institutional Class | 697 | 6,873 | 67 | 841 | ||||||||||||||
Advisor Class | 4,936 | 48,246 | 501 | 6,209 | ||||||||||||||
Cost of shares redeemed | ||||||||||||||||||
Institutional Class | (635 | ) | (7,925 | ) | (500 | ) | (6,441 | ) | ||||||||||
Advisor Class | (6,049 | ) | (75,405 | ) | (6,302 | ) | (81,011 | ) | ||||||||||
Net (decrease) resulting from Portfolio share transactions | (497 | ) | $ | (21,434 | ) | (5,706 | ) | $ | (73,661 | ) | ||||||||
As of December 31, 2015, one shareholder owned 10% or more of the Portfolio’s total outstanding shares comprising 93% of the Portfolio, and the shareholder is a related party of the Portfolio. Related parties may include, but are not limited to, the investment manager and its affiliates, affiliated broker dealers, fund of funds and directors or employees of the Trust or Adviser.
14. REGULATORY AND LITIGATION MATTERS
The Portfolio is not named as a defendant in any material litigation or arbitration proceedings and is not aware of any material litigation or claim pending or threatened against it.
PIMCO has received a Wells Notice from the staff of the U.S. Securities and Exchange Commission (“SEC”) that relates to the PIMCO Total Return Active Exchange-Traded Fund (“BOND”), a series of PIMCO ETF Trust. The notice indicates the staff’s preliminary determination to recommend that the SEC commence a civil action against PIMCO stemming from a non-public investigation relating to BOND. A Wells Notice is neither a formal allegation of wrongdoing nor a finding that any law was violated.
This matter principally pertains to the valuation of smaller sized positions in non-agency mortgage-backed securities purchased by BOND between its inception on February 29, 2012 and June 30, 2012, BOND’s performance disclosures for that period, and PIMCO’s compliance policies and procedures related to these matters.
The Wells process provides PIMCO with the opportunity to demonstrate to the SEC staff why it believes its conduct was appropriate, in keeping with industry standards, and that no action should be taken. PIMCO believes that this matter is unlikely to have a material adverse effect on any Portfolio or on PIMCO’s ability to provide investment management services to any Portfolio.
The foregoing speaks only as of the date of this report.
15. FEDERAL INCOME TAX MATTERS
The Portfolio intends to qualify as a regulated investment company under Subchapter M of the Internal Revenue Code (the “Code”) and distribute all of its taxable income and net realized gains, if applicable, to shareholders. Accordingly, no provision for Federal income taxes has been made.
In accordance with U.S. GAAP, the Adviser has reviewed the Portfolio’s tax positions for all open tax years. As of December 31, 2015, the Portfolio has recorded no liability for net unrecognized tax benefits relating to uncertain income tax positions it has taken or expects to take in future tax returns.
The Portfolio files U.S. tax returns. While the statute of limitations remains open to examine the Portfolio’s U.S. tax returns filed for the fiscal years ending in 2012-2014, no examinations are in progress or anticipated at this time. The Portfolio is not aware of any tax positions for which it is reasonably possible that the total amounts of unrecognized tax benefits will significantly change in the next twelve months.
The Portfolio may gain exposure to the commodities markets primarily through index-linked notes, and may invest in other commodity-linked derivative investments, including commodity swap agreements, options, futures contracts, options on futures contracts and foreign funds investing in similar commodity-linked derivatives.
One of the requirements for favorable tax treatment as a regulated investment company under the Code is that the Portfolio must derive at least 90% of its gross income from certain qualifying sources of income. The IRS has issued a revenue ruling which holds that income derived from commodity index-linked swaps is not qualifying income under Subchapter M of the Code. The IRS has also issued private letter
| ANNUAL REPORT | DECEMBER 31, 2015 | 31 |
Table of Contents
Notes to Financial Statements (Cont.)
December 31, 2015
rulings in which the IRS specifically concluded that income from certain commodity index-linked notes is qualifying income. The IRS has also issued private rulings in which the IRS specifically concluded that income derived from investment in a subsidiary, which invests primarily in commodity-linked swaps, will also be qualifying income. Based on the reasoning in such rulings, the Portfolio will continue to seek to gain exposure to the commodity markets primarily through investments in commodity-linked notes and through investments in its Commodity Subsidiary. Effective May 26, 2015, the Commodity Subsidiary was liquidated (see Note 8).
It should be noted, however, that the IRS currently has suspended the issuance of such rulings pending further review. There can be no assurance that the IRS will not change its position that income derived from commodity-linked notes and wholly-owned subsidiaries is qualifying income. Furthermore, the tax treatment of commodity-linked notes, other commodity-linked derivatives, and the Portfolio’s investments in its Commodity Subsidiary may otherwise be adversely affected by future legislation, Treasury
Regulations and/or guidance issued by the IRS. Such developments could affect the character, timing and/or amount of the Portfolio��s taxable income or any distributions made by the Portfolio or result in the inability of the Portfolio to operate as described in its Prospectus.
If, during a taxable year, the Commodity Subsidiary’s taxable losses (and other deductible items) exceed its income and gains, the net loss will not pass through to the Portfolio as a deductible amount for income tax purposes. In the event that the Commodity Subsidiary’s taxable gains exceed its losses and other deductible items during a taxable year, the net gain will pass through to the Portfolio as income for Federal income tax purposes.
Shares of the Portfolio currently are sold to segregated asset accounts (“Separate Accounts”) of insurance companies that fund variable annuity contracts and variable life insurance policies (“Variable Contracts”). Please refer to the prospectus for the Separate Account and Variable Contract for information regarding Federal income tax treatment of distributions to the Separate Account.
As of December 31, 2015, the components of distributable taxable earnings are as follows (amounts in thousands):
| Undistributed Ordinary Income | Undistributed Long-Term Capital Gains | Net Tax Basis Unrealized Appreciation/ (Depreciation) (1) | Other Book-to-Tax Accounting Differences (2) | Accumulated Capital Losses (3) | Qualified Late-Year Loss Deferral - Capital (4) | Qualified Late-Year Loss Deferral - Ordinary (5) | ||||||||||||||||||||||||
PIMCO Global Dividend Portfolio | $ | 14,352 | $ | 52,502 | $ | (34,387 | ) | $ | — | $ | — | $ | — | $ | — | |||||||||||||||
| (1) | Adjusted for open wash sale loss deferrals and the accelerated recognition of unrealized gain or loss on certain forward contracts and real estate investment trusts for federal income tax purposes. Also adjusted for differences between book and tax realized and unrealized gain (loss) on swap contracts. |
| (2) | Represents differences in income tax regulations and financial accounting principles generally accepted in the United States of America, namely for straddle loss deferrals and distributions payable at fiscal year-end. |
| (3) | Capital losses available to offset future net capital gains expire in varying amounts in the years shown below. |
| (4) | Capital losses realized during the period November 1, 2015 through December 31, 2015 which the Portfolio elected to defer to the following taxable year pursuant to income tax regulations. |
| (5) | Specified losses realized during the period November 1, 2015 through December 31, 2015, which the Portfolio elected to defer to the following taxable year pursuant to income tax regulations. |
As of December 31, 2015, the aggregate cost and the net unrealized appreciation/(depreciation) of investments for federal income tax purposes are as follows (amounts in thousands):
| Federal Tax Cost | Unrealized Appreciation | Unrealized (Depreciation) | Net Unrealized Appreciation/ (Depreciation) (6) | |||||||||||||||
PIMCO Global Dividend Portfolio | $ | 361,814 | $ | 6,989 | $ | (41,361 | ) | $ | (34,372 | ) | ||||||||
| (6) | Primary differences, if any, between book and tax net unrealized appreciation/(depreciation) on investments are attributable to open wash sale loss deferrals and real estate investment trusts. |
For the years ended December 31, 2015 and December 31, 2014, respectively, the Portfolio made the following tax basis distributions (amounts in thousands):
| Fiscal Year Ended | Ordinary Income Distributions (7) | Long-Term Capital Gain Distributions | Return of Capital (8) | |||||||||||||||
PIMCO Global Dividend Portfolio | 12/31/2015 | $ | 21,881 | $ | 33,238 | $ | — | |||||||||||
| 12/31/2014 | $ | — | $ | 7,050 | $ | — | ||||||||||||
| (7) | Includes short-term capital gains, if any, distributed. |
| (8) | A portion of the distributions made represents a tax return of capital. Return of capital distributions have been reclassified from undistributed net investment income to paid-in capital to more appropriately conform to financial accounting to tax accounting. |
| 32 | PIMCO EQUITY SERIES VIT |
Table of Contents
Report of Independent Registered Public Accounting Firm
To the Board of Trustees of PIMCO Equity Series VIT and Shareholders of PIMCO Global
Dividend Portfolio:
In our opinion, the accompanying statement of assets and liabilities, including the schedule of investments, and the related statements of operations and of changes in net assets and the financial highlights present fairly, in all material respects, the financial position of PIMCO Global Dividend Portfolio (formerly PIMCO EqS Pathfinder Portfolio) (constituting PIMCO Equity Series VIT, hereinafter referred to as the “Portfolio”) at December 31, 2015, the results of its operations for the year then ended, the changes in its net assets for each of the two years in the period then ended and the financial highlights for each of the periods presented, in conformity with accounting principles generally accepted in the United States of America. These financial statements and financial highlights (hereafter referred to as “financial statements”) are the responsibility of the Portfolio’s management. Our responsibility is to express an opinion on these financial statements based on our audits. We conducted our audits of these financial statements in accordance with the standards of the Public Company Accounting Oversight Board (United States). Those standards require that we plan and perform the audit to obtain reasonable assurance about whether the financial statements are free of material misstatement. An audit includes examining, on a test basis, evidence supporting the amounts and disclosures in the financial statements, assessing the accounting principles used and significant estimates made by management, and evaluating the overall financial statement presentation. We believe that our audits, which included confirmation of securities at December 31, 2015 by correspondence with the custodian and brokers, provide a reasonable basis for our opinion.
PricewaterhouseCoopers LLP
Kansas City, Missouri
February 18, 2016
| ANNUAL REPORT | DECEMBER 31, 2015 | 33 |
Table of Contents
Glossary: (abbreviations that may be used in the preceding statements)
(Unaudited)
| Counterparty Abbreviations: | ||||||||||
| BOA | Bank of America N.A. | HUS | HSBC Bank USA N.A. | SSB | State Street Bank and Trust Co. | |||||
| CBK | Citibank N.A. | MSB | Morgan Stanley Bank, N.A | UAG | UBS AG Stamford | |||||
| DUB | Deutsche Bank AG | |||||||||
| Currency Abbreviations: | ||||||||||
| EUR | Euro | SGD | Singapore Dollar | TRY | Turkish New Lira | |||||
| GBP | British Pound | SP - GDR | Sponsored Global Depositary Receipt | USD (or $) | United States Dollar | |||||
| HKD | Hong Kong Dollar | |||||||||
| 34 | PIMCO EQUITY SERIES VIT |
Table of Contents
Federal Income Tax Information
(Unaudited)
As required by the Internal Revenue Code (“Code”) and Treasury Regulations, if applicable, shareholders must be notified within 60 days of the Portfolio’s fiscal year end regarding the status of qualified dividend income and the dividend received deduction.
Qualified Dividend Income. Under the Jobs and Growth Tax Relief Reconciliation Act of 2003 (the “Act”), the following percentage of ordinary dividends paid during the calendar year was designated as “qualified dividend income”, as defined in the Act, subject to reduced tax rates in 2015:
PIMCO Global Dividend Portfolio | 100.00% |
Dividend Received Deduction. Corporate shareholders are generally entitled to take the dividend received deduction on the portion of a Portfolio’s dividend distribution that qualifies under tax law. The percentage of the following Portfolio’s calendar year ordinary income dividend that qualifies for the corporate dividend
PIMCO Global Dividend Portfolio | 20.00% |
Shareholders are advised to consult their own tax advisor with respect to the tax consequences of their investment in the Trust. However, income received by tax-exempt recipients need not be reported as taxable income.
| ANNUAL REPORT | DECEMBER 31, 2015 | 35 |
Table of Contents
The charts below identify the Trustees and executive officers of the Trust. Unless otherwise indicated, the address of all persons below is 650 Newport Center Drive, Newport Beach, CA 92660.
The Portfolio’s Statement of Additional Information includes more information about the Trustees and Officers. To request a free copy, call PIMCO at (888) 87-PIMCO or visit the Portfolio’s website at pvit.pimco-funds.com.
| Name, Year of Birth and Position Held with Trust | Term of Office and Length of Time Served** | Principal Occupation(s) During Past 5 Years | Number of Funds in Fund Complex Overseen by Trustee | Other Public Company and Investment Company Directorships Held by Trustee During the Past 5 Years | ||||
Interested Trustees* | ||||||||
Brent R. Harris (1959) Chairman of the Board and Trustee | 03/2010 to present | Managing Director, PIMCO. Formerly, member of Executive Committee, PIMCO. | 168 | Chairman and Trustee, PIMCO Equity Series, PIMCO Funds, PIMCO Variable Insurance Trust, PIMCO ETF Trust; Director, StocksPLUS® Management, Inc; and member of Board of Governors, Investment Company Institute. | ||||
Independent Trustees | ||||||||
E. Philip Cannon (1940) Trustee | 03/2010 to present | Private Investor. Formerly, President, Houston Zoo. | 168 | Trustee, PIMCO Funds; Trustee, PIMCO Variable Insurance Trust; Trustee, PIMCO ETF Trust; and Trustee, PIMCO Equity Series. Formerly, Trustee, Allianz Funds (formerly, PIMCO Funds: Multi-Manager Series. | ||||
Jennifer Holden Dunbar *** (1963) Trustee | 02/2016 to present | Managing Director, Dunbar Partners, LLC (business consulting and investments). | 168 | Trustee, PIMCO Funds; Trustee, PIMCO Variable Insurance Trust; Trustee, PIMCO ETF Trust; and Trustee, PIMCO Equity Series. Director, PS Business Parks; Director, Big 5 Sporting Goods Corporation. | ||||
Peter B. McCarthy (1950) Trustee | 09/2011 to present | Formerly, Assistant Secretary and Chief Financial Officer, United States Department of Treasury; Deputy Managing Director, Institute of International Finance. | 168 | Trustee, PIMCO Funds; Trustee, PIMCO Variable Insurance Trust; Trustee, PIMCO ETF Trust; and Trustee, PIMCO Equity Series. | ||||
Ronald C. Parker*** (1951) Trustee | 02/2016 to present | Director of Roseburg Forest Products Company. Formerly, Chairman of the Board, The Ford Family Foundation. Formerly President, Chief Executive Officer, Hampton Affiliates (forestry products). | 168 | Trustee, PIMCO Funds; Trustee, PIMCO Variable Insurance Trust; Trustee, PIMCO ETF Trust; and Trustee, PIMCO Equity Series. | ||||
(*) Mr. Harris is an “interested persons” of the Trust (as that term is defined in the 1940 Act) because of his affiliations with PIMCO.
(**) Trustees serve until their successors are duly elected and qualified.
(***) The Information for the individuals listed is as of December 31, 2015. Mr. Parker and Ms. Dunbar became Trustees of the Trust effective February 5, 2016.
| 36 | PIMCO EQUITY SERIES VIT |
Table of Contents
(Unaudited)
Executive Officers
Name, Year of Birth and Position Held with Trust | Term of Office and Length of Time Served | Principal Occupation(s) During Past 5 Years* | ||
Peter G. Strelow (1970) President | 02/2014 to present Senior Vice President 11/2013 to 02/2014 Vice President 03/2010 to 11/2013 | Managing Director, PIMCO. President, PIMCO Funds, PIMCO Variable Insurance Trust, PIMCO ETF Trust, PIMCO Equity Series, PIMCO Managed Accounts Trust and PIMCO Closed-End Funds. | ||
David C. Flattum (1964) Chief Legal Officer | 03/2010 to present | Managing Director and General Counsel, PIMCO. Chief Legal Officer, PIMCO Funds, PIMCO Variable Insurance Trust, PIMCO ETF Trust and PIMCO Equity Series. Formerly, Managing Director, Chief Operating Officer and General Counsel, Allianz Asset Management of America L.P. | ||
Jennifer E. Durham (1970) Chief Compliance Officer | 03/2010 to present | Managing Director and Chief Compliance Officer, PIMCO. Chief Compliance Officer, PIMCO Funds, PIMCO Variable Insurance Trust, PIMCO ETF Trust and PIMCO Equity Series. | ||
Brent R. Harris (1959) Senior Vice President | 03/2010 to present | Managing Director and current member of Executive Committee, PIMCO. Senior Vice President, PIMCO Funds, PIMCO Variable Insurance Trust, PIMCO ETF Trust and PIMCO Equity Series. | ||
Douglas M. Hodge (1957) Senior Vice President | 02/2014 to present President 05/2013 to 02/2014 | Managing Director, Chief Executive Officer, PIMCO (since 2/14); Chief Operating Officer, PIMCO (7/09 — 2/14); Member of Executive Committee and Head of PIMCO’s Asia Pacific region. Member Global Executive Committee, Allianz Asset Management. Senior Vice President, PIMCO Funds, PIMCO Variable Insurance Trust, PIMCO ETF Trust and PIMCO Equity Series. | ||
Kevin M. Broadwater (1964) Vice President — Senior Counsel | 05/2012 to present | Executive Vice President and Deputy General Counsel, PIMCO. Vice President — Senior Counsel, PIMCO Funds, PIMCO Variable Insurance Trust, PIMCO ETF Trust and PIMCO Equity Series. | ||
Joshua D. Ratner (1976)** Vice President — Senior Counsel, Secretary | 11/2013 to present Assistant Secretary 03/2010 to 01/2011 | Executive Vice President and Senior Counsel, PIMCO. Chief Legal Officer, PIMCO Investments LLC. Vice President — Senior Counsel, Secretary, PIMCO Funds, PIMCO Variable Insurance Trust, PIMCO ETF Trust and PIMCO Equity Series. Vice President, Secretary and Chief Legal Officer, PIMCO Managed Accounts Trust and PIMCO Closed-End Funds. | ||
Ryan G. Leshaw (1980) Assistant Secretary | 05/2012 to present | Senior Vice President and Senior Counsel, PIMCO. Assistant Secretary, PIMCO Funds, PIMCO Variable Insurance Trust, PIMCO ETF Trust, PIMCO Equity Series, PIMCO Managed Accounts Trust and PIMCO Closed-End Funds. Formerly, Associate, Willkie Farr & Gallagher LLP. | ||
Stacie D. Anctil (1969) Vice President | 05/2015 to present Assistant Treasurer 03/2010 to 05/2015 | Senior Vice President, PIMCO. Vice President, PIMCO Funds, PIMCO Variable Insurance Trust, PIMCO ETF Trust, PIMCO Equity Series, PIMCO Managed Accounts Trust and PIMCO Closed-End Funds. | ||
William G. Galipeau (1974) Vice President | 11/2013 to present | Executive Vice President, PIMCO. Vice President, PIMCO Funds, PIMCO Variable Insurance Trust, PIMCO ETF Trust and PIMCO Equity Series. Treasurer, PIMCO Managed Accounts Trust and PIMCO Closed-End Funds. Formerly, Vice President, Fidelity Investments. | ||
Eric D. Johnson (1970)** Vice President | 05/2011 to present | Executive Vice President, PIMCO. Vice President, PIMCO Funds, PIMCO Variable Insurance Trust, PIMCO ETF Trust, PIMCO Equity Series, PIMCO Managed Accounts Trust and PIMCO Closed-End Funds. | ||
Henrik P. Larsen (1970) Vice President | 03/2010 to present | Senior Vice President, PIMCO. Vice President, PIMCO Funds, PIMCO Variable Insurance Trust, PIMCO ETF Trust and PIMCO Equity Series. | ||
Greggory S. Wolf (1970) Vice President | 05/2011 to present | Senior Vice President, PIMCO. Vice President, PIMCO Funds, PIMCO Variable Insurance Trust, PIMCO ETF Trust and PIMCO Equity Series. | ||
Trent W. Walker (1974) Treasurer | 11/2013 to present Assistant Treasurer 03/2010 to 11/2013 | Executive Vice President, PIMCO. Treasurer, PIMCO Funds, PIMCO Variable Insurance Trust, PIMCO ETF Trust and PIMCO Equity Series. Assistant Treasurer, PIMCO Managed Accounts Trust and PIMCO Closed-End Funds. | ||
Erik C. Brown (1967) Assistant Treasurer | 03/2010 to present | Executive Vice President, PIMCO. Assistant Treasurer, PIMCO Funds, PIMCO Variable Insurance Trust, PIMCO ETF Trust, PIMCO Equity Series, PIMCO Managed Accounts Trust and PIMCO Closed-End Funds. | ||
Jason J. Nagler (1982)** Assistant Treasurer | 05/2015 to present | Vice President, PIMCO. Assistant Treasurer, PIMCO Funds, PIMCO Variable Insurance Trust, PIMCO ETF Trust, PIMCO Equity Series, PIMCO Managed Accounts Trust and PIMCO Closed-End Funds. Formerly, Head of Mutual Fund Reporting, GMO and Assistant Treasurer, GMO Trust and GMO Series Trust Funds. | ||
(*) The term “PIMCO Closed-End Funds” as used herein includes: PIMCO California Municipal Income Fund, PIMCO California Municipal Income Fund II, PIMCO California Municipal Income Fund III, PIMCO Municipal Income Fund, PIMCO Municipal Income Fund II, PIMCO Municipal Income Fund III, PIMCO New York Municipal Income Fund, PIMCO New York Municipal Income Fund II, PIMCO New York Municipal Income Fund III, PCM Fund Inc., PIMCO Corporate & Income Opportunity Fund, PIMCO Corporate & Income Strategy Fund, PIMCO Dynamic Credit Income Fund, PIMCO Dynamic Income Fund, PIMCO Global StocksPLUS & Income Fund, PIMCO High Income Fund, PIMCO Income Opportunity Fund, PIMCO Income Strategy Fund, PIMCO Income Strategy Fund II and PIMCO Strategic Income Fund, Inc.
(**) The address of these officers is Pacific Investment Management Company LLC, 1633 Broadway, New York, New York 10019.
| ANNUAL REPORT | DECEMBER 31, 2015 | 37 |
Table of Contents
(Unaudited)
A special meeting of shareholders of the series of the Trust was held on February 5, 2016. The special meeting was held for the purpose of electing two (2) Trustees to the Trust’s Board of Trustees. Shareholders of the series of the Trust voted on the proposal, and elected the following two (2) Trustees at the special meeting:
| n | Jennifer Holden Dunbar |
| n | Ronald C. Parker |
The results of the proxy solicitation on the preceding matter were as follows:
PIMCO Equity Series VIT
| Trustee Nominee | For | Withheld | ||||||||
Jennifer Holden Dunbar | 28,167,158 | 1,130,926 | ||||||||
Ronald C. Parker | 27,897,365 | 1,400,719 | ||||||||
| 38 | PIMCO EQUITY SERIES VIT |
Table of Contents
(Unaudited)
The Trust2 considers customer privacy to be a fundamental aspect of its relationships with shareholders and is committed to maintaining the confidentiality, integrity and security of its current, prospective and former shareholders’ non-public personal information. The Trust has developed policies that are designed to protect this confidentiality, while allowing shareholder needs to be served.
Obtaining Personal Information
In the course of providing shareholders with products and services, the Trust and certain service providers to the Trust, such as the Trust’s investment advisers or sub-advisers (“Advisers”), may obtain non-public personal information about shareholders, which may come from sources such as account applications and other forms, from other written, electronic or verbal correspondence, from shareholder transactions, from a shareholder’s brokerage or financial advisory firm, financial advisor or consultant, and/or from information captured on applicable websites.
Respecting Your Privacy
As a matter of policy, the Trust does not disclose any non-public personal information provided by shareholders or gathered by the Trust to non-affiliated third parties, except as required or permitted by law or as necessary for such third parties to perform their agreements with respect to the Trust. As is common in the industry, non-affiliated companies may from time to time be used to provide certain services, such as preparing and mailing prospectuses, reports, account statements and other information, conducting research on shareholder satisfaction and gathering shareholder proxies. The Trust or its affiliates may also retain non-affiliated companies to market the Trust’s shares or products which use the Trust’s shares and enter into joint marketing arrangements with them and other companies. These companies may have access to a shareholder’s personal and account information, but are permitted to use this information solely to provide the specific service or as otherwise permitted by law. In most cases, the shareholders will be clients of a third party, but the Trust may also provide a shareholder’s personal and account information to the shareholder’s respective brokerage or financial advisory firm and/or financial advisor or consultant.
Sharing Information with Third Parties
The Trust reserves the right to disclose or report personal or account information to non-affiliated third parties in limited circumstances where the Trust believes in good faith that disclosure is required under law, to cooperate with regulators or law enforcement authorities, to protect its rights or property, or upon reasonable request by any fund advised by PIMCO in which a shareholder has invested. In addition, the Trust may disclose information about a shareholder or a shareholder’s accounts to a non-affiliated third party at the shareholder’s request or with the consent of the shareholder.
Sharing Information with Affiliates
The Trust may share shareholder information with its affiliates in connection with servicing shareholders’ accounts, and subject to
applicable law may provide shareholders with information about products and services that the Trust or its Advisers, distributors or their affiliates (“Service Affiliates”) believe may be of interest to such shareholders. The information that the Trust may share may include, for example, a shareholder’s participation in the Trust or in other investment programs sponsored by a Service Affiliate, a shareholder’s ownership of certain types of accounts (such as IRAs), information about the Trust’s experiences or transactions with a shareholder, information captured on applicable websites, or other data about a shareholder’s accounts, subject to applicable law. The Trust’s Service Affiliates, in turn, are not permitted to share shareholder information with non-affiliated entities, except as required or permitted by law.
Procedures to Safeguard Private Information
The Trust takes seriously the obligation to safeguard shareholder non-public personal information. In addition to this policy, the Trust has implemented procedures that are designed to restrict access to a shareholder’s non-public personal information to internal personnel who need to know that information to perform their jobs, such as servicing shareholder accounts or notifying shareholders of new products or services. Physical, electronic and procedural safeguards are in place to guard a shareholder’s non-public personal information.
Information Collected from Websites
Websites maintained by the Trust or its service providers may use a variety of technologies to collect information that help the Trust and its service providers understand how the website is used. Information collected from your web browser (including small files stored on your device that are commonly referred to as “cookies”) allow the websites to recognize your web browser and help to personalize and improve your user experience and enhance navigation of the website. In addition, the Trust or its Service Affiliates may use third parties to place advertisements for the Trust on other websites, including banner advertisements. Such third parties may collect anonymous information through the use of cookies or action tags (such as web beacons). The information these third parties collect is generally limited to technical and web navigation information, such as your IP address, web pages visited and browser type, and does not include personally identifiable information such as name, address, phone number or email address.
You can change your cookie preferences by changing the setting on your web browser to delete or reject cookies. If you delete or reject cookies, some website pages may not function properly.
Changes to the Privacy Policy
From time to time, the Trust may update or revise this privacy policy. If there are changes to the terms of this privacy policy, documents containing the revised policy on the relevant website will be updated.
1 Effective as of September 5, 2014.
2 When distributing this Policy, the Trust may combine the distribution with any similar distribution of its investment adviser’s privacy policy. The distributed, combined policy may be written in the first person (i.e., by using “we” instead of “the Trust”).
| ANNUAL REPORT | DECEMBER 31, 2015 | 39 |
Table of Contents
Approval of Investment Advisory Contract and Other Agreements
Approval of Renewal of the Amended and Restated Investment Advisory Contract, Supervision and Administration Agreement and Amended and Restated Asset Allocation Sub-Advisory Agreement.
At a meeting held on August 12, 2015, the Board of Trustees (the “Board”) of PIMCO Equity Series VIT (the “Trust”), including all of the Trustees who are not “interested persons” of the Trust under the Investment Company Act of 1940, as amended (the “Independent Trustees”), considered and unanimously approved the Investment Advisory Contract (the “Investment Advisory Contract”) between the Trust, on behalf of the PIMCO Global Dividend Portfolio (the “Portfolio”), and Pacific Investment Management Company LLC (“PIMCO”) for an additional one-year term through August 31, 2016. The Board also considered and unanimously approved for an additional one-year term through August 31, 2016, the Supervision and Administration Agreement (together with the Investment Advisory Contract, the “Agreements”) between the Trust, on behalf of the Portfolio, and PIMCO.
The information, material factors and conclusions that formed the basis for the Board’s approvals are summarized below.
1. Information Received
(a) Materials Reviewed: During the course of the past year, the Trustees received a wide variety of materials relating to the services provided by PIMCO to the Trust. At each of its quarterly meetings, the Board reviewed the Portfolio’s investment performance and a significant amount of information relating to Portfolio operations, including shareholder services, valuation and custody, the Portfolio’s compliance program and other information relating to the nature, extent and quality of services provided by PIMCO to the Trust. In considering whether to approve the renewal of the Agreements, the Board also reviewed supplementary information, including, but not limited to, comparative industry data with regard to investment performance, advisory and supervisory and administrative fees and expenses, financial information for PIMCO, information regarding the profitability to PIMCO of its relationship with the Portfolio, information about the personnel providing investment management services, other advisory services and supervisory and administrative services to the Portfolio, and information about the fees charged and services provided to other clients with similar investment mandates as the Portfolio (where applicable). In addition, the Board reviewed materials provided by counsel to the Trust and the Independent Trustees, which included, among other things, memoranda outlining legal duties of the Board in considering the continuation of the Agreements.
(b) Review Process: In connection with the renewal of the Agreements, the Board reviewed written materials prepared by PIMCO in response to requests from counsel to the Trust and the Independent Trustees. The Board requested and received assistance and advice
regarding applicable legal standards from counsel to the Trust and the Independent Trustees, and reviewed comparative fee and performance data prepared at the Board’s request by Lipper, Inc. (“Lipper”), an independent provider of investment company performance and fee and expense data. The Board heard oral presentations on matters related to the Agreements and met both as a full Board and in a separate session of the Independent Trustees, without management present, at the August 12, 2015 meeting. The Independent Trustees also conducted a telephonic meeting with counsel to the Trust and the Independent Trustees on July 30, 2015 to discuss the materials presented. In addition, the Independent Trustees requested and received from PIMCO additional information including, but not limited to, information related to profitability and comparative performance information.
The approval determinations were made on the basis of each Trustee’s business judgment after consideration of all the information presented. Individual Trustees may have given different weights to certain factors and assigned various degrees of materiality to information received in connection with the approval process. In deciding to approve the renewal of the Agreements, the Board did not identify any single factor or particular information that, in isolation, was controlling. This summary describes the most important, but not all, of the factors considered by the Board.
2. Nature, Extent and Quality of Services
(a) PIMCO, its Personnel, and Resources: The Board considered the depth and quality of PIMCO’s investment management process, including: the experience, capability and integrity of its senior management and other personnel; the overall financial strength and stability of its organization; and the ability of its organizational structure to address changes in assets under management. The Board also considered the various services in addition to portfolio management that PIMCO provides under the Investment Advisory Contract. The Board noted that PIMCO makes available to its investment professionals a variety of resources and systems relating to investment management, compliance, trading, performance and portfolio accounting. The Board also noted that PIMCO is making a long-term commitment to building an equity asset management platform, and that PIMCO continues to invest in personnel and global infrastructure necessary to support the equity business. In this regard, the Board considered PIMCO’s commitment to investing in information technology supporting investment management and compliance, as well as PIMCO’s continuing efforts to attract and retain qualified personnel, including personnel with relevant equities experience, and to maintain and enhance its resources and systems. The Board considered PIMCO’s policies, procedures and systems to reasonably
| 40 | PIMCO EQUITY SERIES VIT |
Table of Contents
(Unaudited)
assure compliance with applicable laws and regulations and its commitment to these programs, its oversight of matters that may involve conflicts of interest between the Portfolio’s investments and those of other accounts managed by PIMCO, and its efforts to keep the Trustees informed about matters relevant to the Portfolio and its shareholders.
The Trustees considered information they had received about the steps that PIMCO has taken in recent years with respect to active management of counterparty risk, such as implementing procedures requiring daily collateral adjustments and frequent communication between credit analysts and the counterparty risk committee, which oversees counterparty risk on a firm-wide basis, continually evaluating requests to add or remove approved counterparties as market needs and conditions warrant. The Trustees also considered that, over the last several years, PIMCO has continued to strengthen the process it uses to assess the financial stability of counterparties with which the Portfolio does business, to manage collateral and to protect portfolios from an unforeseen deterioration in the creditworthiness of trading counterparties. The Trustees noted that, consistent with its fiduciary duty, PIMCO executes transactions through a competitive best execution process and uses only those counterparties that meet its stringent and monitored criteria. The Trustees considered that PIMCO’s collateral management team utilizes a counterparty risk system to analyze portfolio level exposure and collateral being exchanged with counterparties.
In addition, the Trustees considered new services and service enhancements that PIMCO has implemented since the Board renewed the Agreements in 2014, including, but not limited to: conducting a targeted review of quality and efficiency in the valuation process; expanding the analytical review of shareholder reports by State Street Bank and Trust Company, the Portfolio’s custodian; developing a process for monthly forecasts of taxable and book income to enhance portfolio management of investment income; continuing the expansion of a proprietary performance reconciliation tool, which includes next-day comparison of daily internal performance to custodian bank performance to identify potential errors and guardrail net asset value calculations; developing and implementing the Global Process Monitor application, which includes real-time tracking and escalation protocols for critical activities; and implementing monthly cash flow reporting processes to support client and media demands for information about investor flows and assets under management data.
Ultimately, the Board concluded that the nature, extent and quality of services proposed to be provided by PIMCO under the Agreements are likely to benefit the Portfolio and its shareholders.
(b) Other Services: The Board also considered the nature, extent, quality and cost of supervisory and administrative services provided by
PIMCO to the Portfolio under the Supervision and Administration Agreement. The Board considered the terms of the Supervision and Administration Agreement, under which the Trust pays for the supervisory and administrative services provided pursuant to that agreement under what is essentially an all-in fee structure (the “unified fee”). In return, PIMCO provides or procures certain supervisory and administrative services and bears the costs of various third party services required by the Portfolio, including audit, custodial, portfolio accounting, legal, transfer agency and printing costs. The Board noted that the scope and complexity of the supervisory and administrative services provided by PIMCO under the Supervision and Administration Agreement continue to increase. The Board considered PIMCO’s provision of these services and its supervision of the Trust’s third party service providers to assure that these service providers continue to provide a high level of service relative to alternatives available in the market.
Ultimately, the Board concluded that the nature, extent and quality of the services provided by PIMCO has benefited, and will likely continue to benefit, the Portfolio and its shareholders.
3. Investment Performance
The Board received and examined information from PIMCO concerning the Portfolio’s performance, as available, over short- and long-term periods ended May 31, 2015 and other performance data, as available, over short- and long-term periods ended June 30, 2015 (the “PIMCO Report”) and from Lipper concerning the Portfolio’s performance, as available, over short- and long-term periods ended May 31, 2015 (the “Lipper Report”). The Board considered information regarding both the short and long-term investment performance of the Portfolio relative to its peer group and benchmark index as provided to the Board in advance of each of its quarterly meetings throughout the year, including the PIMCO Report and Lipper Report, which were provided in advance of the August 12, 2015 meeting.
The Board considered that during its May 2015 meeting, the Trustees approved certain changes relating to the Portfolio effective July 13, 2015, including changes to the Portfolio’s name, investment objective, advisory fee, and certain non-fundamental investment policies of the Portfolio. The Board also considered that, in connection with these changes, the Portfolio (formerly known as PIMCO EqS Pathfinder Portfolio®) transitioned its principal investment strategy to pursue a global dividend strategy. The Board received information regarding this transition.
The Board noted that, according to Lipper, the Portfolio underperformed in comparison to its peer group and benchmark index over most short- and long-term periods. The Board discussed with PIMCO the reasons for the underperformance of the Portfolio over most short- and long-term
| ANNUAL REPORT | DECEMBER 31, 2015 | 41 |
Table of Contents
Approval of Investment Advisory Contract and Other Agreements (Cont.)
periods. The Board noted that the peer group in the Lipper Report comprises equity income funds and that the Portfolio did not adopt a global dividend strategy until after the performance periods shown in the Lipper Report. The Board also discussed actions that have been taken by PIMCO to attempt to improve performance and took note of PIMCO’s plans to monitor performance going forward.
The Board ultimately concluded, within the context of all of its considerations in connection with the Agreements, that PIMCO’s performance record and process in managing the Portfolio indicates that its continued management is likely to benefit the Portfolio and its shareholders, and merits the approval of the continuation of the Agreements.
4. Advisory Fees, Supervisory and Administrative Fees and Total Expenses
The Board considered that PIMCO seeks to price funds to scale at the outset with reference to the total expense ratios of the respective Lipper median (if available), while providing a premium for innovative investment offerings. PIMCO reported to the Board that, in proposing fees for the Portfolio or class of shares, it considers a number of factors, including the type and complexity of the services provided, the cost of providing services, the risk assumed by PIMCO in the development of products and the provision of services, the impact on potential returns from different levels of fees, the competitive marketplace for financial products, and the attractiveness of potential Portfolio returns to current and potential investors. Fees charged to or proposed for different funds for advisory services and supervisory and administrative services may vary in light of these various factors. The Board also considered that PIMCO reviews the Portfolio’s fee levels and carefully considers reductions where appropriate.
The Board reviewed the advisory fees, supervisory and administrative fees and total expenses of the Portfolio (each as a percentage of average net assets) and compared such amounts with the average and median fee and expense levels of other similar funds. With respect to advisory fees, the Board reviewed data from Lipper that compared the average and median advisory fees of other funds in a “Peer Group” of comparable funds, as well as the universe of other similar funds. The Board noted that PIMCO had contractually agreed to reduce its advisory fee by 0.13% of the average daily net assets of the Portfolio. However, the Board further noted that in connection with the changes to the Portfolio’s strategy and objective (effective July 13, 2015), as referenced above, PIMCO contractually agreed to reduce its advisory fee by 0.16% of the average daily net assets of the Portfolio for an initial term scheduled to expire on April 30, 2016.
The Board also reviewed data comparing the Portfolio’s advisory fees to the standard fee rate PIMCO charges to separate accounts and to
other investment companies with a similar investment strategy, including differences in advisory services provided. The Board discussed separate account and/or U.S. and non-U.S. registered fund comparisons for the Portfolio. The Trustees noted that the fees for the separate account were lower than those charged to the Portfolio and that the differences in fees were attributable to various factors, including differences in the advisory and other services provided by PIMCO to the Portfolio, the manner in which similar portfolios may be managed, different requirements with respect to liquidity management and the implementation of other regulatory requirements, and the fact that separate accounts may have other contractual arrangements that justify different levels of fees. The Board noted that the advisory fee for the Portfolio was similar to the fee rates charged to other investment companies with the same investment strategies as the Portfolio.
The Board considered the Portfolio’s supervisory and administrative fees, comparing them to similar funds in the report supplied by Lipper. The Board also considered that as the Portfolio’s business has become increasingly complex, PIMCO has provided an increasingly broad array of fund supervisory and administrative functions. In addition, the Board considered the Trust’s unified fee structure, under which the Trust pays for the supervisory and administrative services it requires for one set fee and, in return, PIMCO provides or procures supervisory and administrative services and bears the costs of various third party services required by the Portfolio, including audit, custodial, portfolio accounting, legal, transfer agency and printing costs. The Board further considered that many other funds pay for these services separately, and thus it is difficult to directly compare the Trust’s unified supervisory and administrative fees with the fees paid by other funds for administrative services alone. The Board also considered that the unified supervisory and administrative fee leads to Portfolio fees that are fixed, rather than variable. The Board noted that, although the unified fee structure does not have breakpoints, it implicitly reflects economies of scale by fixing the absolute level of Portfolio fees at competitive levels even if the Portfolio’s operating costs rise when assets remain flat or decrease. The Board also considered that the Portfolio’s unified fee structure meant that fees were not impacted by the Portfolio’s recent outflows, unlike funds without a unified fee structure, which may see increased expense ratios when fixed costs are passed through to a smaller asset base. The Board concluded that the Portfolio’s supervisory and administrative fees were reasonable in relation to the value of the services provided, including the services provided to different classes of shareholders, and that the expenses assumed contractually by PIMCO under the Supervision and Administration Agreement represent, in effect, a cap on overall Portfolio fees, which is beneficial to the Portfolio and its shareholders.
The Board noted that the Portfolio’s total expenses were higher than those of the competitor funds and discussed the Portfolio’s expenses
| 42 | PIMCO EQUITY SERIES VIT |
Table of Contents
(Unaudited)
with PIMCO, noting that in connection with the Portfolio’s transition to the global dividend strategy, the Portfolio’s advisory fee was reduced from 0.75% to 0.69% and PIMCO’s contractual advisory fee waiver increased from 0.13% to 0.16%. Upon comparing the Portfolio’s pro forma total expenses effective July 13, 2015 to other funds in the “Peer Group” provided by Lipper, the Board found total expenses of the Portfolio to be reasonable.
Based on the information presented by PIMCO and Lipper, members of the Board determined, in the exercise of their business judgment, that the level of the advisory fees and supervisory and administrative fees charged by PIMCO under the Agreements, as well as the total expenses of the Portfolio, are reasonable.
5. Adviser Costs, Level of Profits and Economies of Scale
The Board reviewed information regarding PIMCO’s costs of providing services to the Portfolio and considered that PIMCO continues to invest in the equity asset management platform and does not expect to derive any profit from the Portfolio during its fiscal year ended December 31, 2015. The Board noted that it had received information regarding the structure and manner in which PIMCO’s investment professionals were compensated, and PIMCO’s view of the relationship of such compensation to the attraction and retention of quality personnel. The Board considered PIMCO’s need to invest in technology, cyber security, information security, shareholder privacy, business continuity planning, infrastructure and staff to reinforce and offer new services and to accommodate changing regulatory requirements.
With respect to potential economies of scale, the Board noted that PIMCO shares the benefits of economies of scale with the Portfolio and its shareholders in a number of ways, including through the pricing of the Portfolio to scale from inception, and the enhancement of services provided to the Portfolio in return for fees paid. The Board considered that the Portfolio’s unified fee rate had been set competitively and/or priced to scale from inception and continued to be competitive compared with peers. The Board also considered that the unified fee is a transparent means of informing Portfolio shareholders of the fees associated with the Portfolio, and that the Portfolio bears certain expenses that are not covered by the advisory fee or the unified fee.
The Trustees considered that the unified fee has provided inherent economies of scale because the Portfolio maintains competitive fixed unified fees even if the Portfolio’s assets decline and/or operating costs rise. The Trustees further considered that, in contrast, breakpoints are a proxy for charging higher fees on lower asset levels and that when a fund’s assets decline, breakpoints may reverse, which causes expense ratios to increase. The Trustees also considered that, unlike the Portfolio’s unified fee structure, funds with “pass through” administrative fee structures may experience increased expense ratios
when fixed dollar fees are charged against declining fund assets. The Trustees also considered that the unified fee protects shareholders from a rise in operating costs that may result from, among other things, PIMCO’s investments in various business enhancements and infrastructure, including those referenced above. The Trustees noted that PIMCO’s investments in these areas are extensive.
The Board concluded that the Portfolio’s cost structure was reasonable and that the unified fee structure inherently involves the sharing of economies of scale between PIMCO and the Portfolio, to the benefit of its shareholders.
6. Ancillary Benefits
The Board considered other benefits received by PIMCO and its affiliates as a result of PIMCO’s relationship with the Trust, including possible ancillary benefits to PIMCO’s institutional investment management business due to the reputation and market penetration of the Trust. The Board also considered that affiliates of PIMCO provide distribution and shareholder services to the Portfolio and its shareholders, for which they may be compensated through distribution and servicing fees paid pursuant to the Portfolio’s Rule 12b-1 plans or otherwise. The Board reviewed PIMCO’s soft dollar policies and procedures, noting that while PIMCO has the authority to receive the benefit of research provided by broker-dealers executing portfolio transactions on behalf of the Portfolio, it has adopted a policy not to enter into contractual soft dollar arrangements.
7. Conclusions
Based on their review, including their consideration of each of the factors summarized above, the Independent Trustees and the Board as a whole concluded that the nature, extent and quality of the services rendered to the Portfolio by PIMCO favored the renewal of the Agreements. The Independent Trustees and the Board as a whole concluded that the Agreements continued to be fair and reasonable to the Portfolio and its shareholders, that the Portfolio’s shareholders received reasonable value in return for the fees paid to PIMCO by the Portfolio under the Agreements, and that the renewal of the Agreements was in the best interests of the Portfolio and its shareholders.
| ANNUAL REPORT | DECEMBER 31, 2015 | 43 |
Table of Contents
General Information
Investment Adviser and Administrator
Pacific Investment Management Company LLC
650 Newport Center Drive
Newport Beach, CA 92660
Distributor
PIMCO Investments LLC
1633 Broadway
New York, NY 10019
Custodian
State Street Bank and Trust Company
801 Pennsylvania Avenue
Kansas City, MO 64105
Transfer Agent
Boston Financial Data Services
330 W. 9th Street, 5th Floor
Kansas City, MO 64105
Legal Counsel
Dechert LLP
1900 K Street, N.W.
Washington, D.C. 20006
Independent Registered Public Accounting Firm
PricewaterhouseCoopers LLP
1100 Walnut Street, Suite 1300
Kansas City, MO 64106
This report is submitted for the general information of the shareholders of the PIMCO Equity Series VIT.
Table of Contents
pvit.pimco-funds.com

EVIT01AR_123115
Table of Contents
| Item 2. | Code of Ethics. |
As of the end of the period covered by this report, the Registrant has adopted a code of ethics (the “Code”) that applies to the Registrant’s principal executive officer and principal financial officer. The Registrant did not grant any waivers, including implicit waivers, from any provisions of the Code to the principal executive officer or principal financial officer during the period covered by this report.
A copy of the Code is included as an exhibit to this report.
| Item 3. | Audit Committee Financial Expert. |
| (a) | The Board of Trustees has determined that Peter B. McCarthy, who serves on the Board’s audit committee, qualifies as an “audit committee financial expert” as such term is defined in the instructions to this Item 3. The Board has also determined that Mr. McCarthy is “independent” as such term is interpreted under this Item 3. |
| Item 4. | Principal Accountant Fees and Services. |
(a) | Fiscal Year Ended | Audit Fees | ||||||||
| December 31, 2015 | $49,580 | |||||||||
| December 31, 2014 | $45,331 | |||||||||
| (b) | Fiscal Year Ended | Audit-Related Fees (1) | ||||||||
| December 31, 2015 | $— | |||||||||
| December 31, 2014 | $— | |||||||||
| (c) | Fiscal Year Ended | Tax Fees | ||||||||
| December 31, 2015 | $1,500 | |||||||||
| December 31, 2014 | $1,500 | |||||||||
| (d) | Fiscal Year Ended | All Other Fees (2) | ||||||||
| December 31, 2015 | $— | |||||||||
| December 31, 2014 | $— | |||||||||
“Audit Fees” represents aggregate fees billed for each of the last two fiscal years for professional services rendered for the audit of the PIMCO Equity Series VIT (the “Trust” or “Registrant”) annual financial statements for those fiscal years or services that are normally provided by the accountant in connection with statutory or regulatory filings or engagements for those fiscal years.
“Audit-Related Fees” represents aggregate fees billed for each of the last two fiscal years for assurance and related services reasonably related to the performance of the audit of the Trust’s annual financial statements for those years.
“Tax Fees” represents aggregate fees billed for each of the last two fiscal years for professional services related to tax compliance, tax advice and tax planning, including review of federal and state income tax returns, review of excise tax distribution requirements and preparation of excise tax returns.
“All Other Fees” represents aggregate fees, if any, billed for other products and services rendered by the principal accountant to the Trust for the last two fiscal years.
| (1) | There were no “Audit-Related Fees” for the last two fiscal years. |
| (2) | There were no “All Other Fees” for the last two fiscal years. |
| (e) | Pre-approval policies and procedures |
(1) The Registrant’s Audit Committee has adopted pre-approval policies and procedures (the “Procedures”) to govern the Audit Committee’s pre-approval of (i) all audit services and permissible non-audit services to be provided to the Registrant by its independent accountant, and (ii) all permissible non-audit services to be provided by such independent accountant to the Registrant’s investment adviser and to any entity controlling, controlled by, or under common control with the investment adviser that provides ongoing services to the Registrant (collectively, the “Service Affiliates”) if the services provided directly relate to the Registrant’s operations and financial reporting. In accordance with the Procedures, the Audit Committee is responsible for the engagement of the independent accountant to certify the Registrant’s financial statements for each fiscal year. With respect to the pre-approval of non-audit services provided to the Registrant and its Service Affiliates, the Procedures provide that the Audit
Table of Contents
Committee may annually pre-approve a list of types or categories of non-audit services that may be provided to the Registrant or its Service Affiliates, or the Audit Committee may pre-approve such services on a project-by-project basis as they arise. Unless a type of service has received general pre-approval, it will require specific pre-approval by the Audit Committee if it is to be provided by the independent accountant. The Procedures also permit the Audit Committee to delegate authority to one or more of its members to pre-approve any proposed non-audit services that have not been previously pre-approved by the Audit Committee, subject to the ratification by the full Audit Committee no later than its next scheduled meeting.
(2) With respect to the services described in paragraphs (b) through (d) of this Item 4, no amount was approved by the Audit Committee pursuant to paragraph (c)(7)(i)(C) of Rule 2-01 of Regulation S-X.
| (f) | Not applicable. |
| (g) |
| Aggregate Non-Audit Fees Billed to Entity | ||||||||||||
| Entity | December 31, 2015 | December 31, 2014 | ||||||||||
PIMCO Equity Series VIT | $ | 1,500 | $ | 1,500 | ||||||||
Pacific Investment Management Company LLC (“PIMCO”) | 9,180,305 | 8,200,269 | ||||||||||
|
| |||||||||||
Totals | $ | 9,181,805 | $ | 8,201,769 | ||||||||
|
|
|
| |||||||||
| (h) | The Registrant’s Audit Committee has considered whether the provision of non-audit services that were rendered to the Registrant’s investment adviser, and any entity controlling, controlled by, or under common control with the investment adviser that provides ongoing services to the Registrant which were not pre-approved (not requiring preapproval) is compatible with maintaining the principal accountant’s independence. |
| Item 5. | Audit Committee of Listed Registrants. |
The Registrant has a separately-designated standing audit committee established in accordance with Section 3(a)(58)(A) of the Securities Exchange Act of 1934, as amended. The audit committee is comprised of:
E. Philip Cannon;
Peter B. McCarthy.
| Item 6. | Schedule of Investments. |
The Schedule of Investments is included as part of the report to shareholders under Item 1.
| Item 7. | Disclosure of Proxy Voting Policies and Procedures for Closed-End Management Investment Companies. |
Not applicable.
| Item 8. | Portfolio Managers of Closed-End Management Investment Companies. |
Not applicable.
| Item 9. | Purchases of Equity Securities by Closed-End Management Investment Company and Affiliated Purchasers. |
Not applicable.
| Item 10. | Submission of Matters to a Vote of Security Holders. |
There have been no material changes to the procedures by which shareholders may recommend nominees to the Trust’s Board of Trustees since the Trust last provided disclosure in response to this item.
Table of Contents
| Item 11. | Controls and Procedures. |
| (a) | The principal executive officer and principal financial & accounting officer have concluded that the Registrant’s disclosure controls and procedures (as defined in Rule 30a-3(c) under the 1940 Act) provide reasonable assurances that material information relating to the Registrant is made known to them by the appropriate persons, based on their evaluation of these controls and procedures as of a date within 90 days of the filing of this report. |
| (b) | There were no changes in the Registrant’s internal control over financial reporting (as defined in Rule 30a-3(d) under the 1940 Act) that occurred during the second fiscal quarter of the period covered by this report that have materially affected, or are reasonably likely to materially affect, the Registrant’s internal control over financial reporting. |
| Item 12. | Exhibits. |
| (a)(1) | Exhibit 99.CODE—Code of Ethics to Section 406 of the Sarbanes-Oxley Act of 2002. | |
| (a)(2) | Exhibit 99.CERT—Certifications pursuant to Section 302 of the Sarbanes-Oxley Act of 2002. | |
| (b) | Exhibit 99.906CERT—Certifications pursuant to Section 906 of the Sarbanes-Oxley Act of 2002. | |
Table of Contents
Signatures
Pursuant to the requirements of the Securities Exchange Act of 1934 and the Investment Company Act of 1940, the registrant has duly caused this report to be signed on its behalf by the undersigned, thereunto duly authorized.
| PIMCO Equity Series VIT | ||
| By: | /s/ Peter G. Strelow
| |
Peter G. Strelow | ||
| President (Principal Executive Officer) | ||
| Date: February 26, 2016 | ||
Pursuant to the requirements of the Securities Exchange Act of 1934 and the Investment Company Act of 1940, this report has been signed below by the following persons on behalf of the registrant and in the capacities and on the dates indicated.
| By: | /s/ Peter G. Strelow | |
Peter G. Strelow | ||
| President (Principal Executive Officer) | ||
| Date: February 26, 2016 | ||
| By: | /s/ Trent W. Walker | |
Trent W. Walker | ||
Treasurer (Principal Financial & Accounting Officer) | ||
| Date: February 26, 2016 | ||