Table of Contents
UNITED STATES
SECURITIES AND EXCHANGE COMMISSION
Washington, D.C. 20549
FORM N-CSR
CERTIFIED SHAREHOLDER REPORT OF REGISTERED MANAGEMENT
INVESTMENT COMPANIES
Investment Company Act file number: 811-22375
PIMCO Equity Series
(Exact name of registrant as specified in charter)
840 Newport Center Drive, Newport Beach, CA 92660
(Address of principal executive offices)
John P. Hardaway
Treasurer and Principal Financial Officer
PIMCO Equity Series
840 Newport Center Drive
Newport Beach, CA 92660
(Name and address of agent for service)
Copies to:
Brendan C. Fox
Dechert LLP
1900 K Street, N.W.
Washington, D.C. 20006
Registrant’s telephone number, including area code: (888) 877-4626
Date of fiscal year end: June 30
Date of reporting period: December 31, 2012
Form N-CSR is to be used by management investment companies to file reports with the Commission not later than 10 days after the transmission to stockholders of any report that is required to be transmitted to stockholders under Rule 30e-1 under the Investment Company Act of 1940 (17 CFR 270.30e-1). The Commission may use the information provided on Form N-CSR in its regulatory, disclosure review, inspection, and policymaking roles.
A registrant is required to disclose the information specified by Form N-CSR, and the Commission will make this information public. A registrant is not required to respond to the collection of information contained in Form N-CSR unless the Form displays a currently valid Office of Management and Budget (“OMB”) control number. Please direct comments concerning the accuracy of the information collection burden estimate and any suggestions for reducing the burden to Secretary, Securities and Exchange Commission, 450 Fifth Street, NW, Washington, DC 20549-0609. The OMB has reviewed this collection of information under the clearance requirements of 44 U.S.C. § 3507.
Table of Contents
Item 1. Reports to Stockholders.
The following is a copy of the report transmitted to stockholders pursuant to Rule 30e-1 under the Investment Company Act of 1940, as amended (the “1940 Act”) (17 CFR 270.30e-1).
| • | PIMCO Equity Series—Institutional, P, Administrative, D, A, C and R Classes |
Table of Contents

Your Global Investment Authority
PIMCO Equity Series®
Semiannual Report
December 31, 2012

PIMCO Dividend and Income Builder Fund
PIMCO EqS® Dividend Fund
PIMCO EqS® Emerging Markets Fund
PIMCO EqS® Long/Short Fund
PIMCO Emerging Multi-Asset Fund
PIMCO EqS Pathfinder Fund®
Share Classes
| n | Institutional |
| n | P |
| n | Administrative |
| n | D |
| n | A |
| n | C |
| n | R |

Table of Contents
| Page | ||||||
| 2 | ||||||
| 4 | ||||||
| 27 | ||||||
| 30 | ||||||
| 36 | ||||||
| 38 | ||||||
| 40 | ||||||
| 41 | ||||||
| 42 | ||||||
| 43 | ||||||
| 44 | ||||||
| 77 | ||||||
| 95 | ||||||
| 96 | ||||||
| Fund | Insights from the Portfolio Managers | Fund Summary | Schedule of Investments | |||||||||
| 5 | 8 | 45 | ||||||||||
| 9 | 12 | 52 | ||||||||||
| 13 | 15 | 56 | ||||||||||
| 16 | 18 | 63 | ||||||||||
| 19 | 22 | 66 | ||||||||||
| 23 | 26 | 70 | ||||||||||
This material is authorized for use only when preceded or accompanied by the current PIMCO Equity Series prospectus.
Table of Contents
Dear Shareholder,
Please find enclosed the Semiannual Report for the PIMCO Equity Series covering the six-month reporting period ended December 31, 2012. On the following pages are specific details about the investment performance of each fund and a discussion of the factors that influenced performance during the reporting period. In addition, the letters from the portfolio managers provide a further review of such factors as well as an overview of each fund’s investment strategy.
Over the six-month reporting period, equity markets posted positive returns, helped by expanded monetary policies announced by the Western central banks designed to stimulate economic growth. As a result, low yields in “safe assets1” (such as U.S. Treasuries and German Bunds) encouraged investors to move further out the risk spectrum. The Federal Reserve (“Fed”) initiated a third round of quantitative easing, referred to as QE3, which expanded the types of assets the Fed can purchase beyond U.S. Treasuries to include Agency mortgage-backed securities. In an unprecedented move, the Fed also announced that it would tie forward policy guidance to unemployment and inflation targets. Within Europe, the European Central Bank (“ECB”) announced the Outright Monetary Transactions (“OMT”) program, which spurred investor confidence in European policymakers’ ability and willingness to stabilize the euro and the eurozone. The OMT program would entail unlimited, but conditional, purchases of eurozone-member government bonds in the secondary market that have maturities of one to three years.
Signs of improving investor sentiment, positive U.S. housing starts, and the resolution of the U.S. Presidential election also contributed to increased investor risk appetite. Just outside of the reporting period, the U.S. Congress largely averted going over the “fiscal cliff” by passing the American Taxpayers Relief Act, but set the stage for potential fiscal uncertainty into 2013 due to their delay of the sequestration and debt ceiling debate. In response, both Moody’s and Standard & Poor’s (two independent ratings agencies) noted that while the compromise reduces near-term economic risk, meaningful deficit reduction measures would be needed in order for them to remove their “rating-risk” opinion on U.S. sovereign debt.
Highlights of the financial markets during our six-month reporting period include:
| n | U.S. equities, as measured by the S&P 500 Index, returned 5.95% despite a volatile period marked by uncertainty over the “fiscal cliff” and the U.S. Presidential election. Global equities, as represented by the MSCI All Country World Index and MSCI World Index, returned 9.91% and 9.36%, respectively. Emerging market equities, as represented by the MSCI Emerging Markets Index, returned 13.75%. This differential in performance increased over the period, as the fiscal cliff began to drag on U.S. equity returns, while improved industrial production figures and more positive sentiment led Chinese equity performance, which benefited emerging market equities. |
| n | U.S. interest rates declined to their lowest level in July 2012, but rose thereafter to end the period higher. The benchmark ten-year U.S. Treasury note yielded 1.76% at the end of the reporting period, as compared to 1.64% on June 30, 2012. The Barclays U.S. Aggregate Index, a widely used index of U.S. investment-grade bonds, returned 1.80% for the period. |
| 1 | All investments contain risk and may lose value |
| 2 | PIMCO EQUITY SERIES |
Table of Contents
All of our active equity strategies are global, high-conviction portfolios that are unconstrained by geography, benchmark or market capitalization and incorporate downside risk management. Each strategy is managed by experienced equity investors who benefit from PIMCO’s global investment resources and macroeconomic insights. We believe the long-term potential of equities to grow earnings and dividends is an important component of an investor’s overall portfolio. As such, we remain committed to a steady and focused build-out of PIMCO’s actively managed equity suite and look forward to keeping you informed of our progress.
If you have any questions regarding the PIMCO Equity Series, please contact your account manager or financial adviser, or call one of our shareholder associates at 888.87.PIMCO (888.877.4626). We also invite you to visit our website at www.pimco.com/investments to learn more about our views and global thought leadership.
Thank you again for the trust you have placed in us. We value your commitment and will continue to work diligently to meet your broad investment needs.
 | Sincerely,
Brent R. Harris Chairman of the Board, PIMCO Equity Series
January 24, 2013 |

| SEMIANNUAL REPORT | DECEMBER 31, 2012 | 3 |
Table of Contents
Important Information About the Funds
PIMCO Equity Series (the “Trust”) is an open-end management investment company currently consisting of six separate investment portfolios (the “Funds”). Each Fund is an actively managed equity strategy. While we believe that equity funds have an important role to play in a well diversified investment portfolio, they are subject to notable risks. Among other things, equity and equity-related securities may decline in value due to both real and perceived general market, economic, and industry conditions.
The Funds may be subject to various risks as described in the Funds’ prospectus. Some of these risks may include, but are not limited to, the following: allocation risk, acquired fund risk, equity risk, dividend-oriented stocks risk, value investing risk, foreign (non-U.S.) investment risk, emerging markets risk, market risk, issuer risk, interest rate risk, credit risk, high yield and distressed company risk, cash holdings risk, currency risk, real estate risk, liquidity risk, leveraging risk, management risk, small-cap and mid-cap company risk, arbitrage risk, derivatives risk, short sale risk, commodity risk, convertible securities risk, tax risk, subsidiary risk and issuer non-diversification risk. A complete description of these risks and other risks is contained in the Funds’ prospectus. The Funds may use derivative instruments for hedging purposes or as part of an investment strategy. Use of these instruments may involve certain costs and risks such as liquidity risk, interest rate risk, market risk, credit risk, management risk, leverage risk, mispricing or improper valuation risk and the risk that the Funds could not close out a position when it would be most advantageous to do so. Certain derivative transactions may have a leveraging effect on a Fund. For example, a small investment in a derivative instrument may have a significant impact on a Fund’s exposure to interest rates, currency exchange rates or other investments. As a result, a relatively small price movement in a derivative instrument may cause an immediate and substantial loss or gain. A Fund may engage in such transactions regardless of whether the Fund owns the asset, instrument
or components of the index underlying the derivative instrument. A Fund may invest a significant portion of its assets in these types of instruments. If it does, the Fund’s investment exposure could far exceed the value of its portfolio securities and its investment performance could be primarily dependent upon securities it does not own.
On each individual Fund Summary page in this Semiannual Report (“Shareholder Report”), the Average Annual Total Return table and Cumulative Returns chart measure performance assuming that any dividend and capital gain distributions were reinvested. Class A shares are subject to an initial sales charge. A Contingent Deferred Sales Charge (“CDSC”) may be imposed in certain circumstances on Class A shares that are purchased without an initial sales charge and then redeemed during the first 18 months after purchase. The Cumulative Returns chart reflects only Institutional Class performance. Performance for Class P, Administrative Class, Class D, Class A, Class C and Class R shares is typically lower than Institutional Class performance due to the lower expenses paid by Institutional Class shares. Performance shown is net of fees and expenses. A Fund’s total annual operating expense ratios on each individual Fund summary page are as of the currently effective prospectus, as supplemented to date. The Cumulative Returns chart assumes the initial investment of $1,000,000 was made at the end of the month that the Institutional Class of the relevant Fund commenced operations. The minimum initial investment amount for Institutional Class, Class P or Administrative Class shares is $1,000,000. The minimum initial investment amount for Class A, Class C and Class D shares is $1,000. There is no minimum initial investment for Class R shares. Each Fund measures its performance against a broad-based securities market index (benchmark index). The benchmark index does not take into account fees, expenses, or taxes. A Fund’s past performance, before and after taxes, is not necessarily an indication of how the Fund will perform in the future.
The following table discloses the inception dates of each Fund and its respective share classes:
| Fund Name | Fund Inception | Institutional Class | Class P | Administrative Class | Class D | Class A | Class C | Class R | ||||||||||||||||||||||||||
PIMCO Dividend and Income Builder Fund | 12/14/11 | 12/14/11 | 12/14/11 | — | 12/14/11 | 12/14/11 | 12/14/11 | 12/14/11 | ||||||||||||||||||||||||||
PIMCO EqS® Dividend Fund | 12/14/11 | 12/14/11 | 12/14/11 | — | 12/14/11 | 12/14/11 | 12/14/11 | 12/14/11 | ||||||||||||||||||||||||||
PIMCO EqS® Emerging Markets Fund | 03/22/11 | 03/22/11 | 03/22/11 | 04/19/11 | 03/22/11 | 03/22/11 | 03/22/11 | 03/22/11 | ||||||||||||||||||||||||||
PIMCO EqS® Long/Short Fund | 04/20/12 | 04/20/12 | 04/30/12 | — | 04/30/12 | 04/30/12 | 04/30/12 | — | ||||||||||||||||||||||||||
PIMCO Emerging Multi-Asset Fund | 04/12/11 | 04/12/11 | 04/12/11 | 04/19/11 | 04/12/11 | 04/12/11 | 04/12/11 | 04/12/11 | ||||||||||||||||||||||||||
PIMCO EqS Pathfinder Fund® | 04/14/10 | 04/14/10 | 04/14/10 | — | 04/14/10 | 04/14/10 | 04/14/10 | 04/14/10 | ||||||||||||||||||||||||||
For periods prior to the inception date of the Class P, Administrative Class, Class D, Class A, Class C and Class R shares (if applicable), performance information shown is based on the performance of the Fund’s Institutional Class shares. The prior Institutional Class performance has been adjusted to reflect the distribution and/or service fees and other expenses paid by the Class P, Administrative Class, Class D, Class A, Class C and Class R shares, respectively.
An investment in a Fund is not a bank deposit and is not guaranteed or insured by the Federal Deposit Insurance Corporation (“FDIC”) or any other government agency. It is possible to lose money on investments in a Fund.
PIMCO has adopted written proxy voting policies and procedures (“Proxy Policy”) as required by Rule 206(4)-6 under the Investment Advisers Act of 1940, as amended. The Proxy Policy has been adopted by PIMCO Equity Series as the policies and procedures that PIMCO will use when voting proxies on behalf of a Fund. A description of the policies and procedures that PIMCO uses to vote proxies relating to portfolio securities of a Fund, and information about how the Fund
voted proxies relating to portfolio securities held during the most recent twelve-month period ended June 30th, are available without charge, upon request, by calling the Trust at (888) 87-PIMCO, on the Fund’s website at http://www.pimco.com/investments, and on the Securities and Exchange Commission’s (“SEC”) website at http://www.sec.gov.
PIMCO Equity Series files a complete schedule of each Fund’s portfolio holdings with the SEC for the first and third quarters of each fiscal year on Form N-Q. A copy of a Fund’s Form N-Q is available on the SEC’s website at http://www.sec.gov and may be reviewed and copied at the SEC’s Public Reference Room in Washington, D.C. A Fund’s Form N-Q will also be available without charge, upon request, by calling the Trust at (888) 87-PIMCO and on the Fund’s website at http://www.pimco.com/investments. Information on the operation of the Public Reference Room may be obtained by calling 1-800-SEC-0330.
Effective January 25, 2013, Neel T. Kashkari no longer serves as President or Trustee of the Trust.
| 4 | PIMCO EQUITY SERIES |
Table of Contents
Insights from the Portfolio Managers PIMCO Dividend and Income Builder Fund
Dear Shareholder,
We appreciate your investment in the PIMCO Dividend and Income Builder Fund (the “Fund”). In the following letter, please find a discussion of the recent market environment and a review of portfolio performance.
Market Overview
During the six-month reporting period ended December 31, 2012, the MSCI All Country World Index (the “Index”), which tracks the performance of stocks in developed and emerging markets countries, returned 9.91%. While overall market performance was positive, the intra-period performance was volatile due to political uncertainty in the U.S. and Europe.
Global equity market performance was strong during most of the third quarter of 2012 after Mario Draghi, President of the European Central Bank, vowed on July 26 to do “whatever it takes” to stabilize Europe. Following the U.S. Federal Reserve’s (“Fed”) announcement of plans for more stimulus action in mid-September 2012, however, global equity markets declined and remained volatile through October 2012, possibly implying a decreasing effectiveness of Fed actions. Global equity markets resumed the decline during the first half of November 2012 following the U.S. presidential election as the focus turned to the “fiscal cliff” in the U.S. Markets began to rally in mid-November 2012 as hope grew that U.S. lawmakers could reach an agreement that would avoid the $600 billion of automatic tax hikes and spending cuts that were scheduled to take effect in the new year. Market performance faded at the end of December 2012 as hope for an agreement waned before a deal was finally reached in early January 2013.
While global equity market performance was positive in each of the ten Global Industry Classification Standard (“GICS”) sectors, performance was strongest in the more economically sensitive financials, materials, and consumer discretionary sectors. Utilities, telecommunication services, and information technology were the poorest performing sectors. Europe was the strongest performing region globally, while U.S. equities lagged most other major markets. U.S. dividend stocks trailed global equities as investors worried about an increased tax rate on qualified dividends in the U.S.; however, we did not see this dynamic for dividend-paying stocks in international markets.
Fund Review
During the reporting period, the Fund paid ordinary quarterly dividends of 17.4 cents per share on its Institutional Class shares. The dividend per share was slightly lower for the other share classes to
account for varying class specific expenses. For the twelve months ended December 31, 2012, the Fund paid ordinary quarterly dividends of 41.3 cents per share on its Institutional Class shares. Over time, we seek to grow the total dividends paid by the Fund each year, while pursuing our other goals of providing an attractive current yield and total returns.
The net asset value of the Fund’s Institutional Class shares increased by $0.73 per share (from $10.47 to $11.20) over the reporting period.
On a relative basis, the Fund underperformed its primary benchmark (MSCI All Country World Index) but outperformed its blended secondary benchmark index (a blend of 75% MSCI All Country World Index/25% Barclays Global Aggregate Index). For the most part, the Fund’s equity holdings participated in the global equity rally, while the Fund’s fixed income holdings outperformed the Barclays Global Aggregate Index. Given PIMCO’s secular outlook for lower global economic growth and coupled with where we are finding value in individual companies, we are conservatively positioned and selectively opportunistic. Over time, we seek to participate in market upsides and limit losses in market downsides.
From a holdings perspective, the Fund’s position in Baxter International, a U.S.-based pharmaceutical and medical device company, was the largest contributor to relative performance. Baxter’s stock outperformed as its core blood and kidney therapies continued to perform well, and the market began to expect positive data in 2013 on its potential therapy to treat Alzheimer’s disease, which could possibly open up a significant new market for the company. In late November 2012, Baxter disclosed that the company was in advanced talks to acquire privately-owned Gambro AB. The deal would significantly expand the company’s presence in the dialysis equipment market. We have trimmed our position after the most recent advance.
Marathon Petroleum was another top contributor to performance. The U.S. oil refining and marketing company outperformed after announcing quarterly earnings in November 2012 that exceeded market expectations as it continues to benefit from growing oil production in America’s heartland. The company also announced that it had entered into a $500 million share repurchase program.
The largest detractor from performance for the reporting period was the Fund’s holding of Poseidon Concepts. The Canada-based fluid management company underperformed after announcing quarterly earnings in November 2012 that were below consensus estimates. The disappointment was due mainly to a decline in water tank utilization, lower North American rig counts, and a revision to the company’s ability to collect accounts receivable fully. Our concerns, including that the company might eliminate its dividend, prompted us to exit the position.
| SEMIANNUAL REPORT | DECEMBER 31, 2012 | 5 |
Table of Contents
Insights from the Portfolio Managers PIMCO Dividend and Income Builder Fund (Cont.)
Microsoft was another detractor from performance. The U.S.-based software company underperformed in response to the tepid sales of its newest operating system, Windows 8. The company also announced that its longtime Windows division president was leaving the company. Over time, we anticipate that future tablets and ultrabooks developed by the marketplace will adopt the new operating system, improving uptake. The PIMCO Dividend team continues to like Microsoft’s core business and strong, growing cash flow generation.
The Fund’s fixed income holdings outperformed the Barclays Global Aggregate Index. Performance was helped mostly by an overweight position to investment grade credit, high yield, and emerging market securities, as spreads within these sectors narrowed over the reporting period.
Investment Process and Portfolio Construction
Our bottom-up investment strategy is focused on providing attractive income today and long-term capital appreciation. As we seek to achieve these goals, we employ fundamental research that aims to identify attractively priced companies exhibiting the ability and willingness to increase dividend payments. We then construct a portfolio that is diversified across three types of businesses:
| n | Consistent Earners: Blue-chip industry leaders that consistently create value year after year. |
| n | Basic Value: Traditional value companies such as cyclicals, turnarounds, and companies with low valuations. |
| n | Emerging Franchises: Companies with the potential to be significantly larger over time. |
Our total return focused approach to dividend investing means that we do not advocate selecting equity investments based on yield alone. Instead, we believe that an investment process that seeks out attractively valued income generating opportunities is critical in an environment where certain sectors commonly targeted by investors for yield are expensive relative to history. Additionally, we believe that dividend growth is a vital ingredient to investment success with benefits including excess returns over the broad market and an increasing yield on cost over time.
Conclusion
We maintain our long-term view that dividend-paying equities have the potential to be an attractive long-term investment solution, especially given PIMCO’s secular outlook for lower returns across asset classes. With ten-year U.S. Treasury yields at historical lows, the dividend yield on global stocks can be particularly attractive, in our opinion.
The Fund remains defensively positioned, though we do intend to be selectively opportunistic through allocations to Basic Value (i.e. more cyclical) and Emerging Franchise (i.e. growth) companies. We continue to emphasize valuation in a market that has recently been characterized by overreactions to both positive and negative news.
We thank you for your investment in the Fund.
Sincerely,
 |  | |
 |  | |
| Brad Kinkelaar | Cliff Remily, CFA | |
| Co-Portfolio Manager | Co-Portfolio Manager | |
 | ||
 | ||
| Eve Tournier | ||
| Fixed Income Portfolio Manager | ||
| 6 | PIMCO EQUITY SERIES |
Table of Contents
Top 10 Holdings1
Roche Holding AG | 3.6% | |||||
Pfizer, Inc. | 3.2% | |||||
Microsoft Corp. | 3.2% | |||||
Medtronic, Inc. | 2.8% | |||||
Baxter International, Inc. | 2.6% | |||||
Marathon Petroleum Corp. | 2.5% | |||||
Total S.A. | 2.5% | |||||
Enagas S.A. | 2.4% | |||||
JPMorgan Chase & Co. | 2.4% | |||||
Walgreen Co. | 2.4% |
Geographic Breakdown1
United States | 37.3% | |||||
United Kingdom | 10.2% | |||||
South Africa | 6.3% | |||||
Switzerland | 6.0% | |||||
France | 4.8% | |||||
Brazil | 2.6% | |||||
Canada | 2.5% | |||||
Spain | 2.4% | |||||
Netherlands | 2.4% | |||||
Hong Kong | 2.3% | |||||
Germany | 2.2% | |||||
Australia | 2.2% | |||||
Norway | 1.8% | |||||
Cyprus | 1.6% | |||||
Other | 8.9% |
Sector Breakdown1
Health Care | 17.8% | |||||
Financials | 14.4% | |||||
Industrials | 14.4% | |||||
Energy | 9.9% | |||||
Telecommunication Services | 8.1% | |||||
Information Technology | 6.4% | |||||
Utilities | 6.2% | |||||
Consumer Staples | 5.2% | |||||
Materials | 4.0% | |||||
Consumer Discretionary | 3.6% | |||||
Mortgage-Backed Securities | 2.3% | |||||
Other | 1.2% |
| 1 | % of Total Investments as of 12/31/2012. Top Holdings, Geographic and Sector Breakdown solely reflect long positions. Securities sold short, financial derivative instruments and short-term instruments are not taken into consideration. |
| SEMIANNUAL REPORT | DECEMBER 31, 2012 | 7 |
Table of Contents
PIMCO Dividend and Income Builder Fund
| Institutional Class - PQIIX | Class A - PQIZX | |
| Class P - PQIPX | Class C - PQICX | |
| Class D - PQIDX | Class R - PQIBX |
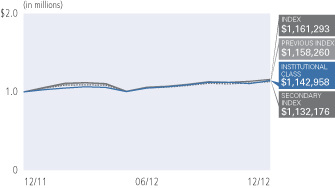
Cumulative Returns Through December 31, 2012
| Average Annual Total Return for the period ended December 31, 2012 | ||||||||||||||
| 6 Months* | 1 Year | Fund Inception (12/14/11) | ||||||||||||
 | PIMCO Dividend and Income Builder Fund Institutional Class | 8.87% | 14.29% | 15.88% | ||||||||||
| PIMCO Dividend and Income Builder Fund Class P | 8.82% | 14.29% | 15.87% | |||||||||||
| PIMCO Dividend and Income Builder Fund Class D | 8.71% | 13.94% | 15.52% | |||||||||||
| PIMCO Dividend and Income Builder Fund Class A | 8.71% | 13.83% | 15.52% | |||||||||||
| PIMCO Dividend and Income Builder Fund Class A (adjusted) | 2.73% | 7.57% | 9.44% | |||||||||||
| PIMCO Dividend and Income Builder Fund Class C | 8.37% | 13.08% | 14.65% | |||||||||||
| PIMCO Dividend and Income Builder Fund Class C (adjusted) | 7.37% | 12.08% | 14.65% | |||||||||||
| PIMCO Dividend and Income Builder Fund Class R | 8.60% | 13.69% | 15.26% | |||||||||||
 | MSCI All Country World Index Net USD±** | 9.91% | 16.13% | 19.24% | ||||||||||
 | MSCI World Index** | 9.36% | 15.83% | 19.29% | ||||||||||
 | 75% MSCI All Country World Index Net USD/25% Barclays Global Aggregate USD Unhedged±±** | 8.10% | 13.22% | 15.69% | ||||||||||
All Fund returns are net of fees and expenses.
* Cumulative return.
± The MSCI All Country World Index Net USD is a free float-adjusted market capitalization weighted index that is designed to measure the equity market performance of developed and emerging markets. The Index consists of 45 country indices comprising 24 developed and 21 emerging market country indices. It is not possible to invest directly in an unmanaged index.
±± The benchmark is a blend of 75% MSCI All Country World Index Net USD/25% Barclays Global Aggregate USD Unhedged. The MSCI All Country World Index Net USD is a free float-adjusted market capitalization weighted index that is designed to measure the equity market performance of developed and emerging markets. The Index consists of 45 country indices comprising 24 developed and 21 emerging market country indices. Barclays Global Aggregate USD Unhedged Index provides a broad-based measure of the global investment-grade fixed income markets. The three major components of this index are the U.S. Aggregate, the Pan-European Aggregate, and the Asian-Pacific Aggregate Indices. The index also includes Eurodollar and Euro-Yen corporate bonds, Canadian Government securities, and USD investment grade 144A securities. It is not possible to invest directly in an unmanaged index.
** Prior to July 17, 2012, the Fund’s primary benchmark was the MSCI World Index and the Fund’s secondary benchmark was the 75% MSCI World Index/25% Barclays Capital Global Aggregate USD Unhedged Index. The primary benchmark was changed from the MSCI World Index to the MSCI All Country World Index Net USD because the MSCI All Country World Index Net USD contains both developed markets and emerging markets securities, and thus more accurately represents the Fund’s investable universe than the MSCI World Index, which contains only developed markets securities. The secondary blended benchmark was changed accordingly to reflect the updated primary benchmark.
Performance quoted represents past performance. Past performance is not a guarantee or a reliable indicator of future results. Current performance may be lower or higher than performance shown. Investment return and the principal value of an investment will fluctuate. Shares may be worth more or less than original cost when redeemed. Returns shown do not reflect the deduction of taxes that a shareholder would pay on fund distributions or the redemption of fund shares. The adjusted returns take into account the maximum sales charge of 5.50% on Class A shares and 1.00% CDSC on Class C shares. The Fund’s total annual operating expense ratio as stated in the Fund’s current prospectus, as supplemented to date, is 0.99% for the Institutional Class shares, 1.09% for the Class P shares, 1.34% for the Class D shares, 1.34% for the Class A shares, 2.09% for the Class C shares and 1.59% for the Class R shares. Details regarding any Fund’s operating expenses can be found in the Fund’s prospectus. For performance current to the most recent month-end, visit www.pimco.com/investments.
Portfolio Insights
| » | The PIMCO Dividend and Income Builder Fund seeks to provide current income that exceeds the average yield on global stocks, and to provide a growing stream of income per share over time, with a secondary objective to seek to provide long-term capital appreciation, by investing under normal circumstances at least 80% of its assets in a diversified portfolio of income-producing investments, and will typically invest at least 50% of its assets in equity and equity-related securities. The Fund’s investments in equity and equity-related securities include common and preferred stock (and securities convertible into, or that PIMCO expects to be exchanged for, common or preferred stock), as well as securities issued by real estate investment trusts, master limited partnerships and other equity trusts and depositary receipts. |
| » | The Fund’s Institutional Class shares returned 8.87% after fees, and the Fund’s benchmark index, the MSCI All Country World Index, returned 9.91%, and the Fund’s secondary benchmark index, a blend of 75% MSCI All Country World Index/25% Barclays Global Aggregate Index, returned 8.10%. |
| » | During the reporting period, the Fund paid ordinary quarterly dividends of 17.4 cents per share on its Institutional Class shares. The dividend per share was slightly lower for the other share classes to account for varying class specific expenses. The net asset value of the Fund’s Institutional Class shares increased by $0.73 per share (from $10.47 to $11.20) over the reporting period, bringing the six-month total return to 8.87%. |
| » | Security selection contributed to performance. The largest single contributor to relative performance was the Fund’s holding of Baxter, the U.S.-based pharmaceutical and medical device company. |
| » | The largest single detractor from relative performance was the Fund’s holding of Poseidon Concepts. The Canada-based fluid management company underperformed after announcing quarterly earnings in November 2012 that were below consensus estimates. The earnings disappointment was due mainly to a decline in water tank utilization, lower North American rig counts, and a revision on the company’s ability to fully collect accounts receivable. |
| » | The Fund’s defensive equity sector positioning was a drag on relative performance. Specifically, the Fund’s underweight to financials detracted from relative performance. |
| » | The Fund’s fixed income allocation performed positively, driven mainly by an overweight to investment grade, high yield, and emerging market credit securities, as these sectors outperformed during the reporting period. |
| 8 | PIMCO EQUITY SERIES |
Table of Contents
Insights from the Portfolio Managers PIMCO EqS® Dividend Fund
Dear Shareholder,
We appreciate your investment in the PIMCO EqS® Dividend Fund (the “Fund”). In the following letter, please find a discussion of the recent market environment and a review of portfolio performance.
Market Overview
During the six-month reporting period ended December 31, 2012, the MSCI All Country World Index (the “Index”), which tracks the performance of stocks in developed and emerging markets countries, returned 9.91%. While overall market performance was positive, the intra-period performance was volatile due to political uncertainty in the U.S. and Europe.
Global equity market performance was strong during most of the third quarter of 2012 after Mario Draghi, President of the European Central Bank, vowed on July 26 to do “whatever it takes” to stabilize Europe. Following the U.S. Federal Reserve’s (“Fed”) announcement of plans for more stimulus action in mid-September 2012, however, global equity markets declined and remained volatile through October, possibly implying a decreasing effectiveness of Fed actions. Global equity markets resumed the decline during the first half of November 2012 following the U.S. presidential election as the focus turned to the “fiscal cliff” in the U.S. Markets began to rally in mid-November 2012 as hope grew that U.S. lawmakers could reach an agreement that would avoid the $600 billion of automatic tax hikes and spending cuts that were scheduled to take effect in the new year. Market performance faded at the end of December 2012 as hope for an agreement waned before a deal was finally reached in early January 2013.
While global equity market performance was positive in each of the ten Global Industry Classification Standard (“GICS”) sectors, performance was strongest in the more economically sensitive financials, materials, and consumer discretionary sectors. Utilities, telecommunication services, and information technology were the poorest performing sectors. Europe was the strongest performing region globally, while U.S. equities lagged most other major markets. U.S. dividend stocks trailed global equities as investors worried about an increased tax rate on qualified dividends in the U.S.; however, we did not see this dynamic for dividend-paying stocks in international markets.
Fund Review
During the reporting period, the Fund paid ordinary quarterly dividends of 14.4 cents per share on its Institutional Class shares. The dividend per share was slightly lower for the other share classes to account for varying class specific expenses. For the twelve months
ended December 31, 2012, the Fund paid ordinary quarterly dividends of 36.8 cents per share on its Institutional Class shares. Over time, we seek to provide attractive current yield and total returns.
The net asset value of the Fund’s Institutional Class shares increased by $0.71 per share (from $10.47 to $11.18) over the reporting period.
On a relative basis, the Fund underperformed the MSCI All Country World Index. One driver of our underperformance was the nature of the strong equity market. While the Fund participated in the risk rally towards the end of the period, our more conservative positioning and less economically sensitive holdings caused the Fund to underperform its benchmark index. Given PIMCO’s secular outlook for lower global economic growth, coupled with where we are finding value in individual companies, we remain conservatively positioned and selectively opportunistic. Over time, we seek to participate in market upsides and limit losses in market downsides.
From a holdings perspective, the Fund’s position in Baxter International, a U.S.-based pharmaceutical and medical device company, was the largest contributor to relative performance. Baxter’s stock outperformed as its core blood and kidney therapies continued to perform well and the market began to expect positive data in 2013 on its potential therapy to treat Alzheimer’s disease, which could possibly open up a significant new market for the company. In late November 2012, Baxter disclosed that the company was in advanced talks to acquire privately-owned Gambro AB. The deal would significantly expand the company’s presence in the dialysis equipment market. We have trimmed our position after the most recent advance in the stock price.
Marathon Petroleum was another top contributor to performance. The U.S. oil refining and marketing company outperformed after announcing quarterly earnings in November 2012 that exceeded market expectations as it continues to benefit from growing oil production in America’s heartland. The company also announced that it had entered into a $500 million share repurchase program.
The largest detractor from performance for the reporting period was the Fund’s holding of Poseidon Concepts. The Canada-based fluid management company underperformed after announcing quarterly earnings in November 2012 that were below consensus estimates. The disappointment was due mainly to a decline in water tank utilization, lower North American rig counts, and a revision to the company’s ability to fully collect accounts receivable. Our concerns, including that the company might eliminate its dividend, prompted us to exit the position.
Microsoft was another detractor from performance. The U.S.-based software company underperformed in response to the tepid sales of its
| SEMIANNUAL REPORT | DECEMBER 31, 2012 | 9 |
Table of Contents
Insights from the Portfolio Managers PIMCO EqS® Dividend Fund (Cont.)
newest operating system, Windows 8. The company also announced that its longtime Windows division president was leaving the company. Over time, we anticipate that future tablets and ultrabooks developed by the marketplace will adopt the new operating system, potentially improving uptake. The PIMCO Dividend team continues to like Microsoft’s core business and strong, growing cash flow generation.
Investment Process and Portfolio Construction
Our bottom-up investment strategy is focused on providing attractive income today and long-term capital appreciation. As we seek to achieve these goals, we employ fundamental research that aims to identify attractively priced companies exhibiting the ability and willingness to increase dividend payments. We then construct a portfolio that is diversified across three types of businesses:
| n | Consistent Earners: Blue-chip industry leaders that consistently create value year after year. |
| n | Basic Value: Traditional value companies such as cyclicals, turnarounds, and companies with low valuations. |
| n | Emerging Franchises: Companies with the potential to be significantly larger over time. |
Our total return focused approach to dividend investing means that we do not advocate selecting equity investments based on yield alone. Instead, we believe that an investment process that seeks out attractively valued income generating opportunities is critical in an environment where certain sectors commonly targeted by investors for yield are expensive relative to history. Additionally, we believe that dividend growth is a vital ingredient to investment success with benefits including excess returns over the broad market and an increasing yield on cost over time.
Conclusion
Despite the Fund’s relative underperformance compared to its benchmark index over the reporting period, we maintain our long-term view that dividend-paying equities have the potential to be an attractive long-term investment solution, especially given PIMCO’s secular outlook for lower returns across asset classes. With ten-year U.S. Treasury yields at historical lows, the dividend yield on global stocks can be particularly attractive, in our opinion.
The Fund remains defensively positioned, though we do intend to be selectively opportunistic through allocations to Basic Value (i.e. more cyclical) and Emerging Franchise (i.e. growth) companies. We continue to emphasize valuation in a market that has recently been characterized by overreactions to both positive and negative news.
We thank you for your investment in the Fund.
Sincerely,
| | |
 |  | |
Brad Kinkelaar Co-Portfolio Manager | Cliff Remily, CFA Co-Portfolio Manager | |
Top 10 Holdings1
Roche Holding AG | 4.5% | |||||
Pfizer, Inc. | 3.6% | |||||
Microsoft Corp. | 3.6% | |||||
Baxter International, Inc. | 3.5% | |||||
Marathon Petroleum Corp. | 3.4% | |||||
Medtronic, Inc. | 3.2% | |||||
Walgreen Co. | 3.1% | |||||
Enagas S.A. | 3.1% | |||||
JPMorgan Chase & Co. | 3.1% | |||||
Cisco Systems, Inc. | 2.7% |
Geographic Breakdown1
United States | 39.8% | |||||
United Kingdom | 10.9% | |||||
South Africa | 7.7% | |||||
Switzerland | 6.9% | |||||
France | 5.1% | |||||
Spain | 3.1% | |||||
Brazil | 2.8% | |||||
Netherlands | 2.5% | |||||
Canada | 2.4% | |||||
Hong Kong | 2.2% | |||||
Australia | 2.1% | |||||
Norway | 2.0% |
| 10 | PIMCO EQUITY SERIES |
Table of Contents
Geographic Breakdown1 (Cont.)
Panama | 1.9% | |||||
Cyprus | 1.9% | |||||
Other | 6.0% |
Sector Breakdown1
Health Care | 21.3% | |||||
Financials | 13.5% | |||||
Industrials | 12.6% | |||||
Energy | 12.0% | |||||
Telecommunication Services | 8.9% | |||||
Information Technology | 7.9% | |||||
Consumer Staples | 6.7% | |||||
Utilities | 5.5% | |||||
Materials | 4.7% | |||||
Consumer Discretionary | 4.2% |
| 1 | % of Total Investments as of 12/31/2012. Top Holdings, Geographic and Sector Breakdown solely reflect long positions. Securities sold short, financial derivative instruments and short-term instruments are not taken into consideration. |
| SEMIANNUAL REPORT | DECEMBER 31, 2012 | 11 |
Table of Contents
| Institutional Class - PQDIX | Class A - PQDAX | |
| Class P - PQDPX | Class C - PQDCX | |
| Class D - PQDDX | Class R - PQDRX |
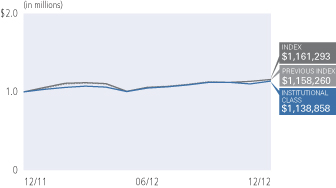
Cumulative Returns Through December 31, 2012
| Average Annual Total Return for the period ended December 31, 2012 | ||||||||||||||
| 6 Months* | 1 Year | Fund Inception (12/14/11) | ||||||||||||
| PIMCO EqS® Dividend Fund Institutional Class | 8.42% | 13.88% | 15.20% | ||||||||||
| PIMCO EqS® Dividend Fund Class P | 8.37% | 13.88% | 15.19% | |||||||||||
| PIMCO EqS® Dividend Fund Class D | 8.25% | 13.63% | 14.94% | |||||||||||
| PIMCO EqS® Dividend Fund Class A | 8.25% | 13.63% | 14.94% | |||||||||||
| PIMCO EqS® Dividend Fund Class A (adjusted) | 2.30% | 7.38% | 8.89% | |||||||||||
| PIMCO EqS® Dividend Fund Class C | 7.93% | 12.58% | 13.91% | |||||||||||
| PIMCO EqS® Dividend Fund Class C (adjusted) | 6.93% | 11.58% | 13.91% | |||||||||||
| PIMCO EqS® Dividend Fund Class R | 8.15% | 13.28% | 14.59% | |||||||||||
| MSCI All Country World Index Net USD±** | 9.91% | 16.13% | 19.24% | ||||||||||
 | MSCI World Index | 9.36% | 15.83% | 19.29% | ||||||||||
All Fund returns are net of fees and expenses.
* Cumulative return.
± The MSCI All Country World Index Net USD is a free float-adjusted market capitalization weighted index that is designed to measure the equity market performance of developed and emerging markets. The Index consists of 45 country indices comprising 24 developed and 21 emerging market country indices. It is not possible to invest directly in an unmanaged index.
** Prior to July 17, 2012, the Fund’s primary benchmark was the MSCI World Index. The benchmark was changed from the MSCI World Index to the MSCI All Country World Index Net USD because the MSCI All Country World Index Net USD contains both developed markets and emerging markets securities, and thus more accurately represents the Fund’s investable universe than the MSCI World Index, which contains only developed markets securities.
Performance quoted represents past performance. Past performance is not a guarantee or a reliable indicator of future results. Current performance may be lower or higher than performance shown. Investment return and the principal value of an investment will fluctuate. Shares may be worth more or less than original cost when redeemed. Returns shown do not reflect the deduction of taxes that a shareholder would pay on fund distributions or the redemption of fund shares. The adjusted returns take into account the maximum sales charge of 5.50% on Class A shares and 1.00% CDSC on Class C shares. The Fund’s total annual operating expense ratio as stated in the Fund’s current prospectus, as supplemented to date, is 0.99% for the Institutional Class shares, 1.09% for the Class P shares, 1.34% for the Class D shares, 1.34% for the Class A shares, 2.09% for the Class C shares and 1.59% for the Class R shares. Details regarding any Fund’s operating expenses can be found in the Fund’s prospectus. For performance current to the most recent month-end, visit www.pimco.com/investments.
Portfolio Insights
| » | The PIMCO EqS® Dividend Fund seeks to provide current income that exceeds the average yield on global stocks, and as a secondary objective, seeks to provide long-term capital appreciation, by investing under normal circumstances at least 75% of its assets in equity and equity-related securities, including common and preferred stock (and securities convertible into, or that PIMCO expects to be exchanged for, common or preferred stock), as well as securities issued by real estate investment trusts, master limited partnerships and other equity trusts and depositary receipts. |
| » | The Fund’s Institutional Class shares returned 8.42% after fees, and the Fund’s benchmark index, the MSCI All Country World Index, returned 9.91%. |
| » | During the reporting period, the Fund paid ordinary quarterly dividends of 14.4 cents per share on its Institutional Class shares. The dividend per share was slightly lower for the other share classes to account for varying class specific expenses. The net asset value of the Fund’s Institutional Class shares increased by $0.71 per share (from $10.47 to $11.18) over the reporting period, bringing the six-month total return to 8.42%. |
| » | Security selection contributed to performance. The largest single contributor to relative performance was the Fund’s holding of Baxter, the U.S.-based pharmaceutical and medical device company. |
| » | The largest single detractor from performance was the Fund’s holding of Poseidon Concepts. The Canada-based fluid management company underperformed after announcing quarterly earnings in November 2012 that were below consensus estimates. The earnings disappointment was due mainly to a decline in water tank utilization, lower North American rig counts, and a revision on the company’s ability to fully collect accounts receivable. |
| » | The Fund’s defensive sector positioning was a drag on relative performance. Specifically, the Fund’s underweight to financials detracted from relative performance. |
| 12 | PIMCO EQUITY SERIES |
Table of Contents
Insights from the Portfolio Managers PIMCO EqS® Emerging Markets Fund
Dear Shareholder,
We appreciate your investment in the PIMCO EqS® Emerging Markets Fund (the “Fund”). In the following letter, please find a discussion of the recent market environment and a review of recent portfolio performance.
Market Overview
Over the six-month reporting period, equity markets rallied, as central bank actions designed to stimulate economic growth were announced, and a more positive growth outlook emerged. While concerns over a Greek exit from the eurozone had weighed on markets in the previous twelve months, the actions by the European Central Bank in September 2012, which announced a plan to purchase bonds of the peripheral nations, spurred risk taking. At a similar time, the Federal Reserve announced further purchases of mortgage debt and maintained its pledge to keep interest rates low. These announcements induced a risk asset rally in which emerging market equities outperformed developed markets. This differential in performance increased over the period, as the fiscal cliff began to drag on U.S. equity returns, while improved industrial production figures and more positive sentiment led Chinese equity performance.
The outperformance of emerging markets over developed markets during the period is consistent with our long-term view, which maintains that emerging market economic growth will exceed that of developed markets. We believe that the advantages of emerging market economies, including higher current account balances and foreign currency reserves, together with a lower degree of indebtedness, should provide long-term support for emerging market companies, in our opinion. Furthermore, while emerging market equity returns have outperformed the developed markets over the past six months, we believe that valuations remain attractive on a historical basis.
Fund Review
In this environment, the PIMCO EqS® Emerging Markets Fund underperformed its benchmark index over the reporting period. This underperformance can in part be explained by our early move into more cyclical companies. As global economic prospects stalled in early 2012, investors became increasingly wary of sectors that were more highly leveraged to the business cycle, and instead focused on more defensive sectors with earnings less dependent on economic growth. This led to an increase in valuations among less cyclical sectors, such as consumer staples, and a decrease in valuations among more cyclical sectors, such as materials and industrials. We believed that these cyclical sectors were trading at attractive levels and hence increased our exposure moving into the second half of 2012. While it is always
difficult to judge the stage of a business cycle, in retrospect we made this move too early, and certain positions in materials and industrials detracted from Fund performance. However, towards the end of the period we began to see a turnaround in some of these firms, partly spurred by better growth prospects in China.
This improved outlook in China had contrasting effects on our portfolio over the period. On the one hand we benefited from positions in the consumer discretionary sector, notably in Chinese casinos. We continue to view real wage growth as one of the key components of future earnings growth and are focused on identifying companies that we believe will benefit from this trend. We also saw strong performance in certain consumer discretionary holdings in Brazil. On the other hand, the improved outlook in China led to a rally in the Chinese banking sector, in which we maintain an underweight position. While we agree with an improved economic outlook, we continue to avoid Chinese banks given the dramatic expansion in credit witnessed in recent years, and the potential for sharp rises in non-performing loans.
In terms of specific holdings, the top contributor for the period was Sakari Resources, a coal producer in South East Asia, which was acquired by its parent company, PTT International, at a significant premium to the market price. The largest detractor for the reporting period was TNK-BP, a Russian energy company. In October 2012, the British oil company BP announced it would sell its stake in TNK-BP to Rosneft, a government-owned Russian firm. This triggered a fall in the share price due to concerns that Rosneft would cut TNK’s dividend. While this has been a recent detractor from Fund performance, we believe that the dividend will be retained and that there remains attractive value in the investment.
Conclusion
At the end of 2012, we remain mindful of the continued headwinds to global economic growth, but are more cautiously optimistic, driven by an improved cyclical outlook in China. We believe that emerging market equities remain attractively valued on a historical basis and that real wage growth and an emerging consuming class should continue to drive equity returns. To take advantage of these trends we are focusing our positioning on the consumer sectors, where instead of buying richly valued consumer staples, we are looking for what we believe are high quality consumer discretionary companies demonstrating attractive returns on capital and free cash flow generation. Two sectors in which we anticipate finding opportunities include Chinese gaming and autos. Within consumer staples we continue to avoid richly valued names and are instead looking for developed market companies with emerging market exposure, and turnarounds. In addition, we continue to see attractive value in high quality cyclical companies in the industrial and materials sectors.
| SEMIANNUAL REPORT | DECEMBER 31, 2012 | 13 |
Table of Contents
Insights from the Portfolio Managers PIMCO EqS® Emerging Markets Fund (Cont.)
Again, we thank you for your continued investment in the Fund and we look forward to serving your investment needs.
Sincerely,
Maria (Masha) Gordon Portfolio Manager |

Top 10 Holdings1
Samsung Electronics Co. Ltd. | 5.5% | |||||
Itau Unibanco Holding S.A. SP—ADR | 2.8% | |||||
China Mobile Ltd. | 2.8% | |||||
Cia de Bebidas das Americas SP—ADR | 2.4% | |||||
NovaTek OAO SP—GDR | 2.3% | |||||
Israel Chemicals Ltd. | 2.3% | |||||
Kia Motors Corp. | 2.2% | |||||
China Shenhua Energy Co. Ltd. | 2.2% | |||||
Dongfeng Motor Group Co. Ltd. | 2.1% | |||||
Iluka Resources Ltd. | 2.1% |
Geographic Breakdown1
China | 12.8% | |||||
South Korea | 8.8% | |||||
Russia | 8.3% | |||||
Hong Kong | 8.1% | |||||
Brazil | 6.4% | |||||
India | 3.6% | |||||
United Kingdom | 3.6% | |||||
Israel | 3.4% | |||||
Mexico | 2.4% | |||||
Thailand | 2.2% |
Geographic Breakdown1 (Cont.)
South Africa | 2.2% | |||||
Cyprus | 2.1% | |||||
Kazakhstan | 2.1% | |||||
Australia | 2.0% | |||||
Peru | 2.0% | |||||
Norway | 2.0% | |||||
Denmark | 2.0% | |||||
Taiwan | 1.8% | |||||
Macau | 1.7% | |||||
Italy | 1.7% | |||||
Japan | 1.7% | |||||
Netherlands | 1.7% | |||||
Luxembourg | 1.6% | |||||
Other | 9.1% |
Sector Breakdown1
Financials | 20.8% | |||||
Consumer Discretionary | 15.5% | |||||
Consumer Staples | 12.9% | |||||
Materials | 9.1% | |||||
Information Technology | 9.1% | |||||
Telecommunication Services | 7.9% | |||||
Energy | 7.3% | |||||
Industrials | 5.7% | |||||
Exchange-Traded Funds | 2.8% | |||||
Other | 2.1% |
| 1 | % of Total Investments as of 12/31/2012. Top Holdings, Geographic and Sector Breakdown solely reflect long positions. Securities sold short, financial derivative instruments and short-term instruments are not taken into consideration. |
| 14 | PIMCO EQUITY SERIES |
Table of Contents
PIMCO EqS® Emerging Markets Fund
| Institutional Class - PEQWX | Class A - PEQAX | |
| Class P - PEQQX | Class C - PEQEX | |
| Administrative Class - PEQTX | Class R - PEQHX | |
| Class D - PEQDX |
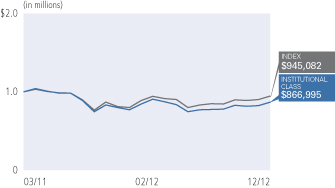
Cumulative Returns Through December 31, 2012
| Average Annual Total Return for the period ended December 31, 2012 | ||||||||||||||
| 6 Months* | 1 Year | Fund Inception (03/22/11) | ||||||||||||
| PIMCO EqS® Emerging Markets Fund Institutional Class | 12.41% | 12.84% | -5.81% | ||||||||||
| PIMCO EqS® Emerging Markets Fund Class P | 12.32% | 12.61% | -5.86% | |||||||||||
| PIMCO EqS® Emerging Markets Fund Administrative Class | 12.22% | 12.50% | -6.10% | |||||||||||
| PIMCO EqS® Emerging Markets Fund Class D | 12.19% | 12.34% | -6.18% | |||||||||||
| PIMCO EqS® Emerging Markets Fund Class A | 12.24% | 12.38% | -6.20% | |||||||||||
| PIMCO EqS® Emerging Markets Fund Class A (adjusted) | 6.09% | 6.22% | -9.13% | |||||||||||
| PIMCO EqS® Emerging Markets Fund Class C | 11.84% | 11.55% | -6.80% | |||||||||||
| PIMCO EqS® Emerging Markets Fund Class C (adjusted) | 10.84% | 10.55% | -6.80% | |||||||||||
| PIMCO EqS® Emerging Markets Fund Class R | 12.04% | 12.04% | -6.37% | |||||||||||
| MSCI Emerging Markets Index± | 13.75% | 18.22% | -0.65% | ||||||||||
All Fund returns are net of fees and expenses.
* Cumulative return.
± The MSCI Emerging Markets Index is a free float-adjusted market capitalization index that is designed to measure equity market performance of emerging markets. The MSCI Emerging Markets Index consists of the following 21 emerging market country indices: Brazil, Chile, China, Colombia, Czech Republic, Egypt, Hungary, India, Indonesia, Korea, Malaysia, Mexico, Morocco, Peru, Philippines, Poland, Russia, South Africa, Taiwan, Thailand, and Turkey. It is not possible to invest directly in an unmanaged index.
Performance quoted represents past performance. Past performance is not a guarantee or a reliable indicator of future results. Current performance may be lower or higher than performance shown. Investment return and the principal value of an investment will fluctuate. Shares may be worth more or less than original cost when redeemed. Returns shown do not reflect the deduction of taxes that a shareholder would pay on fund distributions or the redemption of fund shares. The adjusted returns take into account the maximum sales charge of 5.50% on Class A shares and 1.00% CDSC on Class C shares. The Fund’s total annual operating expense ratio as stated in the Fund’s current prospectus, as supplemented to date, is 1.49% for the Institutional Class shares, 1.59% for the Class P shares, 1.74% for the Administrative Class shares, 1.84% for the Class D shares, 1.84% for the Class A shares, 2.59% for the Class C shares and 2.09% for the Class R shares. Details regarding any Fund’s operating expenses can be found in the Fund’s prospectus. For performance current to the most recent month-end, visit www.pimco.com/investments.
Portfolio Insights
| » | The PIMCO EqS® Emerging Markets Fund seeks capital appreciation by investing under normal circumstances at least 80% of its assets in a diversified portfolio of investments economically tied to emerging market countries. The Fund will invest a substantial portion of its assets in equity and equity-related securities, including common and preferred stock (and securities convertible into, or that PIMCO expects to be exchanged for, common or preferred stock). The Fund may also invest in fixed income securities, including debt securities issued by both corporate and government issuers. The Fund may invest in commodity related instruments, including exchange-traded funds, futures and other investment companies. The Fund may also invest in derivative instruments, such as options, futures contracts or swap agreements. |
| » | The Fund’s Institutional Class shares returned 12.41% after fees, and the Fund’s benchmark index, the MSCI Emerging Markets Index, returned 13.75%. |
| » | From a sector perspective, positioning in the utilities and energy sectors contributed to relative performance. In the energy sector, our avoidance of state-owned enterprises together with positions in an Asian coal mining company and an African oil and gas company were positive drivers of performance. |
| » | The Fund also benefited from stock selection in consumer discretionary firms in Asia, specifically in the retail and gaming sectors. The outlooks for these companies improved on the back of a more optimistic growth outlook in China that developed during the reporting period. |
| » | On the downside, an underweight to financials detracted from performance as the sector outperformed the Fund’s benchmark index. Stock selection within the financial sector also detracted from performance, as did certain industrials and materials holdings, which suffered due to ongoing concerns about muted world economic growth. |
| » | From a country perspective, stock selection in Brazil and Singapore contributed to relative performance. In Brazil, holdings in consumer discretionary and utilities firms contributed to performance, while in Singapore, the notable driver of performance was exposure to an Asian coal mining company that significantly outperformed the Fund’s benchmark index. |
| » | On the downside, stock selection in Russia and China detracted from performance. In Russia, notable detractors included an energy joint venture that suffered when a takeover by a state owned enterprise was announced, while in China, an underweight to Chinese banks and positions in technology companies detracted from performance. |
| SEMIANNUAL REPORT | DECEMBER 31, 2012 | 15 |
Table of Contents
Insights from the Portfolio Managers PIMCO EqS® Long/Short Fund
Dear Shareholder,
We appreciate your investment in the PIMCO EqS® Long/Short Fund (the “Fund”). In the following letter, please find a discussion of the recent market environment and a review of portfolio performance.
Market Overview
Over the six-month reporting period, equity markets rallied, as central bank actions designed to stimulate economic growth were announced, and a more positive growth outlook emerged. While concerns over a Greek exit from the eurozone had weighed on markets in the previous twelve months, the actions by the European Central Bank in September 2012, which announced a plan to purchase bonds of the peripheral nations, spurred risk taking. At a similar time, the Federal Reserve announced further purchases of mortgage debt and maintained its pledge to keep interest rates low. These announcements induced a rally in risk assets as equity markets rose meaningfully over the past six months.
Fund Review
In this environment, the PIMCO EqS® Long/Short Fund underperformed its benchmark index over the reporting period. The relative underperformance resulted from a combination of underinvestment to an upward trending market and stock-specific events. Earlier in the year, we continued to believe risks in Europe were high and the benefits of the previous round of quantitative easing were fading. As a result, we maintained a relatively low net equity market exposure, approximately 32% as of June 30, 2012. As we perceived these risks declining, we have been increasing the portfolio’s net equity exposure. However, given the market rally, the high cash position ultimately weighed on performance relative to the broader market.
The underperformance was also due to stock specific issues. In terms of specific holdings, one of our largest positions was in Herbalife, a health and nutritional supplements company, which detracted from performance during the reporting period. Prior to the Fund initiating a position in Herbalife, the company announced that its growth rate was moderating and shares traded off meaningfully as a result. At the time of the Fund’s purchase, our investment thesis was that the company continued to have attractive growth prospects but also a depressed valuation multiple versus its peer group. Since that time, multiples for Herbalife’s peers have also contracted and we believe the controversial headlines for the company make it less likely that the multiple expands in the near future. As a result, we believe the opportunity is less compelling and have decided to exit the position.
Another top holding, Spirit Airlines also detracted from performance. The company is an ultra-low cost carrier, which we believe will benefit in a moderate to slow growth environment as consumers look for ways to lower travel expenses. Shares of Spirit Airlines fell during the summer after the company reported earnings that were slightly below market expectations. The company has been successful in carving out a market niche with the lowest fares for its routes by charging for everything beyond basic fares. We continue to believe Spirit Airlines will be able to expand its footprint using this business model resulting in attractive earnings growth.
On the positive side, Apple was the top contributor to performance during the period. While we continue to view Apple positively, we sold out of the position as we believe the company’s growth rates may have reached an inflection point and will likely slow as smartphone penetration reaches saturation levels in key markets. With an anticipated slowdown in growth we find the current valuation less compelling.
Domino’s Pizza also contributed to performance. Shares of Domino’s Pizza rose after the company reported strong international expansion and improving operating margins, driven in part by an increasing percentage of earnings coming from franchisees and less company-owned stores. We believe Domino’s Pizza continues to have attractive opportunities to expand internationally, particularly in rapidly growing emerging markets. In addition, we believe the company’s conversion to more franchisees will improve operating margins and partially insulate earnings from moves in commodity prices. Going forward, an important theme in the portfolio is identifying higher yielding equities that also have capital appreciation potential. We believe such opportunities are attractive as investors seek to enhance yield in the current low rate environment.
Conclusion
Since the Fund’s inception, we have employed a combination of fundamental bottom-up and top-down research, with a focus on balancing capital appreciation and capital preservation. While we expect the Fund to perform well in most market environments, we would expect it to perform best when economic trends are clearly positive or negative as these periods allow stock selection to most directly drive performance. The Fund is unlikely to perform as well at economic inflection points or during periods when the direction of the economy is unclear. However, we believe our approach of opportunistically buying fundamentally strong companies, selectively shorting and managing equity market exposure can generate (and has historically generated) attractive risk-adjusted returns over the long term.
| 16 | PIMCO EQUITY SERIES |
Table of Contents
Again, we thank you for your continued investment in the Fund and look forward to serving your investment needs.
Sincerely,


Geoffrey Johnson, CFA
Portfolio Manager
Top 10 Holdings1
Iron Mountain, Inc. | 6.9% | |||||
Corrections Corp. of America | 6.8% | |||||
Spirit Airlines, Inc. | 6.2% | |||||
Northern Tier Energy LP | 4.8% | |||||
Enstar Group Ltd. | 4.4% | |||||
Noble Corp. | 4.4% | |||||
Oaktree Capital Group LLC | 3.7% | |||||
Charter Communications, Inc. ‘A’ | 3.1% | |||||
Domino’s Pizza, Inc. | 2.9% | |||||
Ocean Rig UDW, Inc. | 2.3% |
Sector Breakdown2
Industrials | 24.5% | |||||
Energy | 12.1% | |||||
Consumer Discretionary | 10.7% | |||||
Financials | 6.7% | |||||
Real Estate Investment Trusts | 2.0% | |||||
Materials | 0.6% | |||||
Information Technology | (1.6% | ) |
| 1 | % of Total Investments as of 12/31/2012. Top Holdings solely reflect long positions. Securities sold short, financial derivative instruments and short-term instruments are not taken into consideration. |
| 2 | % of net exposure (Total Investments less Securities Sold Short). Financial derivative instruments and short-term instruments are not taken into consideration. |
| SEMIANNUAL REPORT | DECEMBER 31, 2012 | 17 |
Table of Contents
| Institutional Class - PMHIX | Class A - PMHAX | |
| Class P - PMHBX | Class C - PMHCX | |
| Class D - PMHDX |
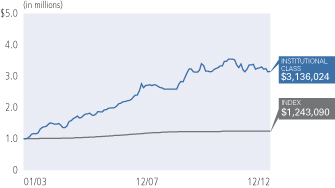
Cumulative Returns Through December 31, 2012
| Average Annual Total Return for the period ended December 31, 2012* | ||||||||||||||||||
| 6 Months** | 1 Year | 5 Year | Fund Inception (01/01/03) | |||||||||||||||
| PIMCO EqS® Long/Short Fund Institutional Class | -3.02% | 0.26% | 3.10% | 12.25% | |||||||||||||
| PIMCO EqS® Long/Short Fund Class P | -2.95% | 0.20% | 3.00% | 12.14% | ||||||||||||||
| PIMCO EqS® Long/Short Fund Class D | -3.16% | -0.10% | 2.73% | 11.86% | ||||||||||||||
| PIMCO EqS® Long/Short Fund Class A | -3.21% | -0.14% | 2.72% | 11.85% | ||||||||||||||
| PIMCO EqS® Long/Short Fund Class A (adjusted) | -8.49% | -5.64% | 1.57% | 11.22% | ||||||||||||||
| PIMCO EqS® Long/Short Fund Class C | -3.63% | -0.91% | 1.95% | 11.01% | ||||||||||||||
| PIMCO EqS® Long/Short Fund Class C (adjusted) | -4.59% | -1.90% | 1.95% | 11.01% | ||||||||||||||
| 3 Month USD LIBOR Index± | 0.21% | 0.47% | 1.11% | 2.21% | |||||||||||||
All Fund returns are net of fees and expenses.
** Cumulative return.
± 3 Month USD LIBOR Index. LIBOR (London Interbank Offered Rate) is an average interest rate, determined by the British Bankers Association, that banks charge one another for the use of short-term money (3 months) in the U.K. Eurodollar market. It is not possible to invest directly in an unmanaged index.
Performance quoted represents past performance. Past performance is not a guarantee or a reliable indicator of future results. Current performance may be lower or higher than performance shown. Investment return and the principal value of an investment will fluctuate. Shares may be worth more or less than original cost when redeemed. Returns shown do not reflect the deduction of taxes that a shareholder would pay on fund distributions or the redemption of fund shares. The adjusted returns take into account the maximum sales charge of 5.50% on Class A shares and 1.00% CDSC on Class C shares. The Fund’s total annual operating expense ratio as stated in the Fund’s current prospectus, as supplemented to date, is 1.61% for the Institutional Class shares, 1.71% for the Class P shares, 1.96% for the Class D shares, 1.96% for the Class A shares, and 2.71% for the Class C shares. Details regarding any Fund’s operating expenses can be found in the Fund’s prospectus. For performance current to the most recent month-end, visit www.pimco.com/investments.
* For periods prior to April 20, 2012, the Fund’s performance reflects the performance when the Fund was a partnership, net of actual fees and expenses charged to individual partnership accounts in the aggregate. If the performance had been restated to reflect the applicable fees and expenses of each share class, the performance may have been higher or lower. The Fund began operations as a partnership on January 1, 2003 and, on April 20, 2012, was reorganized into a newly-formed fund that was registered as an investment company under the Investment Company Act of 1940. Prior to the reorganization, the Fund had an investment objective, investment strategies, investment guidelines, and restrictions that were substantially similar to those currently applicable to the Fund; however, the Fund was not registered as an investment company under the Investment Company Act of 1940 and was not subject to its requirements or requirements imposed by the Internal Revenue Code of 1986 which, if applicable, may have adversely affected its performance. The performance of Class P, D, A and C shares for the period from April 20, 2012 to April 30, 2012 is based on the performance of the Institutional Class shares of the Fund. The performance of each class of shares will differ as a result of the different levels of fees and expenses applicable to each class of shares.
Portfolio Insights
| » | The PIMCO EqS® Long/Short Fund seeks long-term capital appreciation by investing under normal circumstances in long and short positions of equity and equity-related securities, including common and preferred stock (and securities convertible into, or that PIMCO expects to be exchanged for, common or preferred stock), utilizing a fundamental investing style that integrates bottom-up and top-down research. The Fund will normally invest a substantial portion of its assets in equity and equity-related securities. The Fund may also invest in fixed income securities of varying maturities, cash and cash equivalents. |
| » | The Fund’s Institutional Class shares declined 3.02% after fees, and the Fund’s benchmark index, 3-Month USD LIBOR Index, returned 0.21%. |
| » | At the beginning of the reporting period, the Fund was defensively positioned with a long equity exposure of 44% and short equity exposure of 11%, resulting in a total net equity exposure of approximately 33% of net assets. |
| » | Over the course of the reporting period, the Fund increased its long equity positions to 59% and reduced its short equity positions to 5%, raising overall net equity exposure to 54% of net assets. |
| » | Broad equity markets rose during the reporting period; however, the Fund’s long equity positions declined in value in aggregate due to stock specific issues, which detracted from performance. |
| » | The Fund’s short holdings detracted from performance in aggregate as the overall equity markets rose during the reporting period. |
| 18 | PIMCO EQUITY SERIES |
Table of Contents
Insights from the Portfolio Managers PIMCO Emerging Multi-Asset Fund
Dear Shareholder,
We appreciate your investment in the PIMCO Emerging Multi-Asset Fund (the “Fund”). Below is our semiannual update that includes a discussion of our investment outlook with a focus on emerging markets (“EM”), as well as an update on the portfolio over the six-month reporting period ended December 31, 2012.
Emerging Market Asset Classes Benefit from Central Bank Provisions
Despite perturbations from some adverse events in Europe and the U.S., generous central bank-provided liquidity and worldwide easing measures helped spark a general risk rally in the second half of 2012. This renewed risk appetite fueled gains in EM asset classes over the reporting period.
EM equities, as represented by the MSCI Emerging Markets Index, led other asset classes with a 13.75% gain over the reporting period after a decisive December. The MSCI Emerging Markets Index gained 4.89% in December 2012, propelling it ahead of other asset classes. This strong finish also pushed EM equity returns well above the returns of developed market (“DM”) equities over the full period. The difference between EM and DM equity returns was largely driven by the U.S. Presidential election and concern over the fiscal cliff which weighed on U.S. equity returns in particular. By contrast, improved industrial production figures and more positive sentiment regarding Chinese equities helped EM equities stand out attractively and in stark contrast. Continued improvements in market sentiment, driven by monetary authorities’ support of global markets (especially in Europe) and attractive valuations encouraged us to continue to add to our equity allocation. We are now slightly overweight equities.
EM external debt followed equities with a 10.32% return over the period (as measured by the JPMorgan Emerging Markets Bond Index (EMBI) Global). The late November approval of another Greek aid package and a late December short-term bargain over the U.S. fiscal cliff led to spread compression. Record-breaking inflows into EM debt strategies—external debt in particular—pushed spreads even tighter. By the end of the period, spreads on EM external debt hovered around 150 basis points off the all-time lows of 2007 and yields reached new all-time lows at 4.48%. With U.S. Treasury interest rates already near zero, sources of future returns look limited in U.S. dollar-denominated sovereign bonds. We have thus trimmed our external debt allocation further to acknowledge the relatively full valuations of the asset class, but we have substituted in tactical allocations to EM corporates where we see more appealing spreads to offset some of that reduction.
EM local debt markets also fared well, benefiting from the same improved risk sentiment and supportive investor inflows. Though
several EM central banks appear close to the end of their easing cycles, local yields in many EM countries continued to decline. The attraction of emerging markets’ higher nominal and real yields, relative to those found in developed markets, was a key driver of these inflows and returns. We continue to maintain an overweight to EM local rates as well since we believe select yield curves offer attractive carry and roll opportunities and choice emerging market countries retain greater flexibility to respond with both fiscal and monetary stimuli. In addition, floating exchange rates may add a tailwind to performance during strong risk appetite periods, while helping to preserve competiveness and economic flexibility during economic contractions.
EM to Continue Growing in an Uncertain Global Landscape
PIMCO expects the global economic backdrop to remain weak in 2013 due to continued deleveraging dynamics in the U.S. and Europe. Despite their stronger balance sheets, lower debt levels, and scope for flexible policy, emerging market countries will not likely escape the gravitational pull of lower growth rates in the large, industrialized economies. In addition, the export-led growth models in many EM countries are increasingly under pressure from domestic over-investment, rising idle capacity, diminishing productivity and cost increases that are caused by importing stimulative monetary policies from the likes of the U.S. Federal Reserve, the European Central Bank, the Bank of England, and the Bank of Japan. Nonetheless, as in prior quarters, we continue to expect EM countries to grow more strongly than developed markets. Our BRIM (Brazil, Russia, India, Mexico) countries real gross domestic product (“GDP”) growth forecast for the period from the fourth quarter of 2012 through the fourth quarter of 2013 stands at 3.5% to 4.0%, representing a significant potential outperformance versus an overall global growth expectation of 1.5% to 2.0%.
In this environment, the link between political and economic outcomes is highly relevant for EM countries and the global economy’s outlook. During the first quarter of 2013, our cyclical economic stance depends critically on whether we see a structural policy breakthrough somewhere in the world: either a fiscal “grand bargain” in the U.S. or a political agreement on deeper banking and fiscal integration in Europe. Likewise, the still unaddressed structural issues in the U.S. and eurozone and the potential for a further deterioration in these regions’ economic growth will pose challenges to EM countries. Regulatory responses to the side-effects of unconventional monetary policies in the industrialized economies are also on the rise and can potentially adversely affect the investment landscape in EM. Moreover, as geopolitical events linger—from the democratic transition in Egypt to the unsettling situation in the Israeli-Palestinian conflict and in other
| SEMIANNUAL REPORT | DECEMBER 31, 2012 | 19 |
Table of Contents
Insights from the Portfolio Managers PIMCO Emerging Multi-Asset Fund (Cont.)
Middle Eastern countries such as Syria—they continue to be important not only for EM investment directly, but also for their repercussions in different asset classes, particularly the oil market.
Growth prospects certainly affect all asset classes, but there are some clear implications for equity markets in particular. Over the long run, the rate of corporate profit growth is constrained by the rate of GDP growth (since profits are a component of GDP). Since earnings growth is a component of total return on equities (in addition to income and multiple expansion), GDP growth rates in each country effectively put a ceiling on the prospects for local equities. For emerging markets to sustain current growth rates, rebalancing in key economies may be necessary. Growth in emerging markets has been strongly driven by exports to developed countries and to China. Household consumption has largely lagged in EM countries, but an increase may be necessary to maintain the relatively high growth rates these countries have boasted. The growth of the emerging market consumer will likely become an increasingly important driver of earnings growth and, consequently, equity returns.
In the external debt space, with increased country differentiation, we continue to favor sovereigns that are well-equipped to weather whatever market shocks may come. But amid global dislocations we see attractive risk-return opportunities in certain weaker credits that offer ample compensation for those risks assumed. We also see a growing opportunity set in Asian credit, which we believe offers yield pick-up relative to traditional bond alternatives. In general, EM corporates offer good “higher carry (incremented income), higher quality” alternatives to EM sovereigns and developed world corporates with more limited sensitivity to a duration sell-off given the generally shorter maturities of these bonds. These credits will likely benefit from a more positive tone for EM assets. At the same time, rigorous credit analysis is essential to differentiate sound versus unsound credits as not all sovereigns and companies will be reliable guardians of bondholders’ investments.
In the local markets space we see investment opportunities in countries with positive real rates, high nominal yields, steep yield curves, and credibly managed inflation expectations where central banks are focused on the risks to growth. Central banks in some countries such as Brazil have become more data-dependent, waiting for signs on developed markets and China’s economic situation as well the effects of quantitative easing in the developed world. In Brazil we expect rates to be lower-for-longer as opposed to the hiking cycle that is currently priced in by the market. In the currency space, as global quantitative easing policies in developed market central banks have underpinned expectations of weakness in major currencies, we see investment opportunities in many EM currencies. In addition, due to
the currency selloff that occurred in the second half of 2011, EM policy makers now have the scope for using foreign exchange appreciation as a tool for managing monetary conditions without undue concern about competiveness becoming a constraint. In Asia for example, we favor a diversified basket of EM Asia currencies as a preferred alternative to developed currencies.
Again, we thank you for your continued investment in the Fund and look forward to serving your investment needs.
Sincerely,
 |  | |
 |  | |
| Curtis Mewbourne | Maria (Masha) Gordon | |
| Portfolio Manager, Generalist | Portfolio Manager, Emerging Markets Equities | |
 |  | |
 |  | |
| Michael Gomez | Ramin Toloui | |
| Portfolio Manager, Emerging Markets Debt | Portfolio Manager, Emerging Markets Debt | |
| 20 | PIMCO EQUITY SERIES |
Table of Contents
Top Holdings1
PIMCO EqS® Emerging Markets Fund | 50.5% | |||||
PIMCO Emerging Local Bond Fund | 28.9% | |||||
PIMCO Emerging Markets Bond Fund | 15.6% | |||||
PIMCO Emerging Markets Corporate Bond Fund | 3.3% |
| 1 | % of Total Investments as of 12/31/2012. Top Holdings solely reflect long positions. Securities sold short, financial derivative instruments and short-term instruments are not taken into consideration. |
| SEMIANNUAL REPORT | DECEMBER 31, 2012 | 21 |
Table of Contents
PIMCO Emerging Multi-Asset Fund
| Institutional Class - PEAWX | Class A - PEAAX | |
| Class P - PEAQX | Class C - PEACX | |
| Administrative Class - PEAMX | Class R - PEARX | |
| Class D - PEAEX |
Cumulative Returns Through December 31, 2012
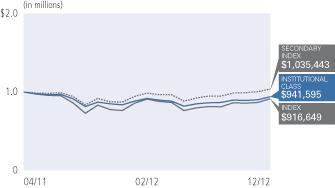
| Average Annual Total Return for the period ended December 31, 2012 | ||||||||||||||
| 6 Months* | 1 Year | Fund Inception (04/12/11) | ||||||||||||
| PIMCO Emerging Multi-Asset Fund Institutional Class | 9.99% | 11.65% | -2.15% | ||||||||||
| PIMCO Emerging Multi-Asset Fund Class P | 9.93% | 11.47% | -2.28% | |||||||||||
| PIMCO Emerging Multi-Asset Fund Administrative Class | 9.89% | 11.42% | -2.41% | |||||||||||
| PIMCO Emerging Multi-Asset Fund Class D | 9.79% | 11.32% | -2.46% | |||||||||||
| PIMCO Emerging Multi-Asset Fund Class A | 9.76% | 11.30% | -2.50% | |||||||||||
| PIMCO Emerging Multi-Asset Fund Class A (adjusted) | 3.72% | 5.18% | -5.65% | |||||||||||
| PIMCO Emerging Multi-Asset Fund Class C | 9.47% | 10.50% | -3.16% | |||||||||||
| PIMCO Emerging Multi-Asset Fund Class C (adjusted) | 8.47% | 9.50% | -3.16% | |||||||||||
| PIMCO Emerging Multi-Asset Fund Class R | 9.62% | 11.03% | -2.74% | |||||||||||
| MSCI Emerging Markets Index± | 13.75% | 18.22% | -3.58% | ||||||||||
| 50% MSCI Emerging Markets Index, 25% JPMorgan Emerging Markets Bond Index (EMBI) Global, 25% JPMorgan Government Bond Index-Emerging Markets Global Diversified Index (Unhedged)±± | 11.76% | 18.18% | 3.28% | ||||||||||
All Fund returns are net of fees and expenses.
* Cumulative return.
± The MSCI Emerging Markets Index is a free float-adjusted market capitalization index that is designed to measure equity market performance of emerging markets. The MSCI Emerging Markets Index consists of the following 21 emerging market country indices: Brazil, Chile, China, Colombia, Czech Republic, Egypt, Hungary, India, Indonesia, Korea, Malaysia, Mexico, Morocco, Peru, Philippines, Poland, Russia, South Africa, Taiwan, Thailand, and Turkey. It is not possible to invest directly in an unmanaged index.
±± The benchmark is a blend of 50% MSCI Emerging Markets Index, 25% JPMorgan Emerging Markets Bond Index (EMBI) Global, 25% JPMorgan Government Bond Index-Emerging Markets Global Diversified Index (Unhedged). The MSCI Emerging Markets Index is a free float-adjusted market capitalization index that is designed to measure equity market performance in the global emerging markets. The MSCI Emerging Markets Index consists of the following 21 emerging market country indices: Brazil, Chile, China, Colombia, Czech Republic, Egypt, Hungary, India, Indonesia, Korea, Malaysia, Mexico, Morocco, Peru, Philippines, Poland, Russia, South Africa, Taiwan, Thailand, and Turkey. JPMorgan Emerging Markets Bond Index (EMBI) Global tracks total returns for United States Dollar denominated debt instruments issued by emerging market sovereign and quasi-sovereign entities: Brady bonds, loans, Eurobonds and local market instruments. It is not possible to invest directly in an unmanaged index. JPMorgan Government Bond Index-Emerging Markets Global Diversified Index (Unhedged) is a comprehensive global local emerging markets index, and consists of regularly traded, liquid fixed-rate, domestic currency government bonds to which international investors can gain exposure.
Performance quoted represents past performance. Past performance is not a guarantee or a reliable indicator of future results. Current performance may be lower or higher than performance shown. Investment return and the principal value of an investment will fluctuate. Shares may be worth more or less than original cost when redeemed. Returns shown do not reflect the deduction of taxes that a shareholder would pay on fund distributions or the redemption of fund shares. The adjusted returns take into account the maximum sales charge of 5.50% on Class A shares and 1.00% CDSC on Class C shares. The Fund’s total annual operating expense ratio as stated in the Fund’s current prospectus, as supplemented to date, is 2.18% for the Institutional Class shares, 2.28% for the Class P shares, 2.43% for the Administrative Class shares, 2.53% for the Class D shares, 2.53% for the Class A shares, 3.28% for the Class C shares and 2.78% for the Class R shares. Details regarding any Fund’s operating expenses can be found in the Fund’s prospectus. For performance current to the most recent month-end, visit www.pimco.com/investments.
Portfolio Insights
| » | The PIMCO Emerging Multi-Asset Fund seeks maximum total return, consistent with prudent investment management, by investing under normal circumstances at least 80% of its assets in investments economically tied to emerging market countries. The Fund will typically invest 20% to 80% of its total assets in equity-related instruments (including investments in common stock, preferred stock, and equity-related Underlying PIMCO Funds or Acquired Funds). The Fund is designed to provide concurrent exposure to a broad spectrum of emerging market asset classes, such as equity, fixed income and currencies, and other investments, including commodities. |
| » | The Fund’s Institutional Class shares returned 9.99% after fees, while the Fund’s primary benchmark index (MSCI Emerging Markets Index) returned 13.75%, and the Fund’s secondary benchmark index (a blended index consisting of 50% MSCI Emerging Markets Index, 25% JPMorgan Emerging Markets Bond Index (EMBI) Global, 25% JPMorgan Government Bond Index-Emerging Markets Global Diversified Index (Unhedged) returned 11.76%. |
| » | The relative performance of the PIMCO EqS Emerging Markets Fund detracted from performance as this Underlying PIMCO Fund underperformed its respective primary benchmark, the MSCI Emerging Markets Index, over the reporting period. |
| » | A tactical allocation to emerging market corporates detracted from relative performance as the asset class underperformed the Fund’s blended secondary benchmark over the reporting period per the JPMorgan Corporate Emerging Markets Bond Index Diversified (CEMBI). However, the relative performance of the PIMCO Emerging Markets Corporate Bond Fund positively contributed to performance as this Underlying PIMCO Fund outperformed its respective benchmark, the JPMorgan Corporate Emerging Markets Bond Index Diversified (CEMBI), over the reporting period. |
| » | The relative performance of the PIMCO Emerging Local Bond Fund detracted from performance as this Underlying PIMCO Fund underperformed its respective benchmark, the JPMorgan Government Bond Index-Emerging Markets (GBI-EM) Global Diversified (Unhedged), over the reporting period. |
| » | An asset allocation decision to underweight external debt positively contributed to performance as the JPMorgan Emerging Markets Bond Index (EMBI) Global underperformed the Fund’s blended secondary benchmark index over the reporting period. |
| 22 | PIMCO EQUITY SERIES |
Table of Contents
Insights from the Portfolio Managers PIMCO EqS Pathfinder Fund®
Dear Shareholder,
It is our pleasure to be speaking with you again and we thank you for your investment in the PIMCO EqS Pathfinder Fund® (the “Fund”). We are committed to seeking an absolute return that beats the market over a full market cycle and doing so with less volatility than the overall market. In our following letter to you, we have organized our thoughts to provide you with a review of the equity market, the Fund itself, and our outlook for 2013.
The Last Six Months in Review
There were clearly many economic and geopolitical worries last year—the financial crisis in peripheral eurozone countries and concern about the value and viability of the euro itself, the never-ending U.S. Presidential campaign, and a slowdown in growth in the emerging markets—but, through it all the world equity indices posted strong gains for the second half of the year with the MSCI World Index returning 9.36% for the six-month reporting period. Conversely, however, if the earnings for the companies in the index come in close to street estimates, there will actually have been a decline in earnings year-over-year, which means that the increase in the price of the index was driven entirely by Price/Earnings (“PE”) multiple expansion that was mostly seen in the latter half of the year, and not by an increase in underlying corporate earnings. With the world awash in liquidity due to the beneficence of the world’s central banks and with 200-year lows in interest rates in the U.S., investors’ cash found its way into both the fixed income and equity markets. Although the Fund had a good absolute return over the reporting period, it lagged the overall broad market index as represented by the MSCI World Index.
Review of Fund Performance
We began the reporting period with a relatively cautious stance in our portfolios that included a heavy weighting in consumer staples companies such as British American Tobacco and Danone; stable, high quality business models which have evidenced consistent earnings growth and which also provide good dividend yields, in our opinion. We have a predilection to own these types of businesses as we have found that their cash flows are steady and reliable, and the stocks of these companies tend to be less volatile than the market. These companies have been held in our portfolios over the long-term (i.e. since inclusion in the Fund) and have delivered very attractive total returns.
Two notable performers in the portfolio during the reporting period were consumer staples companies Carrefour and Marine Harvest.
Carrefour is the second largest retailer in the world with dominant positions in France, Spain, Latin America, and China. Under the
leadership of the new CEO, we believe the portfolio of Carrefour is being reshaped at a greater speed and magnitude than investors anticipated. The Colombian assets were disposed at a 50% higher price than estimated and the Indonesian assets were sold at the top end of the range of estimates. More asset disposals are expected to follow soon and we believe this will give Carrefour additional financial flexibility. In our view, significant cost synergies are also expected through reducing central operating costs, giving more autonomy to store managers, streamlining the supply chain, and reallocating expenses away from advertising into providing customers “Every Day Low Prices”. At a multiple of 13X 2013 depressed earnings with a 3.2% dividend yield, we view the company’s stock price as attractively priced.
Marine Harvest is the largest salmon farmer/producer in the world with operations in Norway, Chile, Scotland and Canada and an estimated market share in excess of 20%. With a strong outlook for salmon prices in 2013 (per industry reports), anticipated flat volume growth, and expected demand growth of approximately 6% (as it has been for the last 15 years), the price of the stock rose as investors warmed to prospects for a better 2013. With the worldwide increase in grain prices, the premium at which salmon has been selling compared to other sources of proteins has disappeared, which means the consumption of salmon may accelerate. The company trades at 12X 2013 and 8.5X 2014 expected earnings, with an expected dividend yield, at current prices (as of December 31, 2012), of 5% and 8.5%, respectively.
London based Lloyd’s Banking Group was also one of our best performing stocks last year as it appreciated by 54% in the second half of 2012 on the back of an exceedingly low initial valuation and active progress towards reducing their “bad bank” as rapidly as possible. The stock recovered to trade at approximately 75% of book value and is trading at a price which we view as an attractive discount to fair value.
We also had a few stocks in the portfolio which did not perform as we expected, which included the Fund’s holdings of KPN, Nintendo and Dell.
KPN, a long held Dutch telecommunications provider, declined over the second half of the year as a result of ongoing pricing pressure in many of its end markets, paying a high price in a home market spectrum auction, and concerns over their interest coverage. Even with a substantial dividend cut, the stock continues to be in a severe operating environment that also includes the entry of a fourth mobile operator as a competitor.
| SEMIANNUAL REPORT | DECEMBER 31, 2012 | 23 |
Table of Contents
Insights from the Portfolio Managers PIMCO EqS Pathfinder Fund® (Cont.)
Nintendo is one of the world’s largest manufacturers of video game hardware and software. The company’s stock price was under pressure for much of the reporting period due to struggling sales, weaker than expected profits, and a continued shift of gamers away from portable gaming devices towards smartphones. In addition, Nintendo lost some market share in video consoles ahead of its latest product launch of Wii U. Now, post the Wii U launch, Nintendo’s sales are improving and the weaker Japanese yen is aiding sales. In addition, we believe there is potential for an upside surprise if Nintendo is able to incorporate its own game universe (called “Miiverse”) and can capitalize on its library of intellectual property. The stock is trading at a modest premium to the cash it holds on its balance sheet and we continue to hold the stock.
Dell is one of the largest personal computer (“PC”) manufacturers in the world, and offers a wide range of products in personal computers, servers and networking products, storage systems, software and peripherals. Weak PC demand from both consumers and government contractors negatively affected Dell’s sales in 2012 and the stock price declined as a result.
Looking Ahead
PIMCO expects global growth to moderate in the years ahead as developed global economies simply have too much sovereign debt. At the same time, there is in many countries an almost institutionalized unwillingness to address the problem either by its governments or its citizens. Conversely, corporate balance sheets in developed markets are generally in good health and many companies are well positioned to generate growth even in difficult times. Given the concerns facing investors in this environment—slower growth, elevated levels of developed countries’ sovereign debt, and geopolitical dysfunction—we believe our focus on quality companies provides the benefit of more consistent business performance. Better, quality businesses, we believe, also tend to have less volatility in their earnings and stock prices over time, and this lower volatility can lead to better compounding of returns over the long-term.
To close our letter, we repeat our thanks for investing with us in the PIMCO EqS Pathfinder Fund®. We maintain our value-driven discipline, seeking the twin goals of capital appreciation and downside risk mitigation. We are privileged to have the opportunity to manage your capital and we look forward to the challenges and the opportunities in the months and years ahead.
Sincerely,
 |  | |
|  | |
Charles Lahr, CFA Co-Portfolio Manager | Anne Gudefin, CFA Co-Portfolio Manager | |

Top 10 Holdings1
SPDR Gold Trust | 3.8% | |||||
Imperial Tobacco Group PLC | 3.3% | |||||
British American Tobacco PLC | 3.0% | |||||
Danone S.A. | 2.5% | |||||
Intel Corp. | 2.4% | |||||
Microsoft Corp. | 2.3% | |||||
AIA Group Ltd. | 2.3% | |||||
Lancashire Holdings Ltd. | 2.2% | |||||
Berkshire Hathaway, Inc. ‘B’ | 2.0% | |||||
Carlsberg A/S ‘B’ | 2.0% |
Geographic Breakdown1
United States | 33.2% | |||||
United Kingdom | 14.3% | |||||
France | 10.5% | |||||
Norway | 4.8% | |||||
Netherlands | 4.6% | |||||
Switzerland | 4.5% | |||||
Hong Kong | 3.7% | |||||
Bermuda | 2.9% |
| 24 | PIMCO EQUITY SERIES |
Table of Contents
Geographic Breakdown1 (Cont.)
Japan | 2.3% | |||||
Germany | 2.0% | |||||
Denmark | 2.0% | |||||
Canada | 1.7% | |||||
Other | 6.7% |
Sector Breakdown1
Consumer Staples | 26.4% | |||||
Financials | 21.6% | |||||
Energy | 10.2% | |||||
Industrials | 8.4% | |||||
Information Technology | 8.0% | |||||
Health Care | 4.8% | |||||
Exchange-Traded Funds | 3.8% | |||||
Consumer Discretionary | 3.4% | |||||
Materials | 3.0% | |||||
Utilities | 2.6% | |||||
Other | 1.0% |
| 1 | % of Total Investments as of 12/31/2012. Top Holdings, Geographic and Sector Breakdown solely reflect long positions. Securities sold short, financial derivative instruments and short-term instruments are not taken into consideration. |
| SEMIANNUAL REPORT | DECEMBER 31, 2012 | 25 |
Table of Contents
| Institutional Class - PTHWX | Class A - PATHX | |
| Class P - PTHPX | Class C - PTHCX | |
| Class D - PTHDX | Class R - PTHRX |
Cumulative Returns Through December 31, 2012
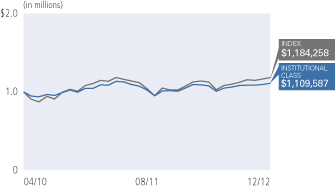
| Average Annual Total Return for the period ended December 31, 2012 | ||||||||||||||
| 6 Months* | 1 Year | Fund Inception (04/14/10) | ||||||||||||
| PIMCO EqS Pathfinder Fund® Institutional Class | 5.60% | 9.95% | 3.25% | ||||||||||
| PIMCO EqS Pathfinder Fund® Class P | 5.53% | 9.89% | 3.13% | |||||||||||
| PIMCO EqS Pathfinder Fund® Class D | 5.39% | 9.53% | 2.83% | |||||||||||
| PIMCO EqS Pathfinder Fund® Class A | 5.40% | 9.53% | 2.85% | |||||||||||
| PIMCO EqS Pathfinder Fund® Class A (adjusted) | -0.40% | 3.50% | 0.73% | |||||||||||
| PIMCO EqS Pathfinder Fund® Class C | 4.94% | 8.65% | 2.13% | |||||||||||
| PIMCO EqS Pathfinder Fund® Class C (adjusted) | 3.94% | 7.65% | 2.13% | |||||||||||
| PIMCO EqS Pathfinder Fund® Class R | 5.27% | 9.20% | 2.53% | |||||||||||
| MSCI World Index± | 9.36% | 15.83% | 5.16% | ||||||||||
All Fund returns are net of fees and expenses.
* Cumulative return.
± The MSCI World Index is a free float-adjusted market capitalization weighted index that is designed to measure the equity market performance of developed markets. The MSCI World Index consists of the following 24 developed market country indices: Australia, Austria, Belgium, Canada, Denmark, Finland, France, Germany, Greece, Hong Kong, Ireland, Israel, Italy, Japan, Netherlands, New Zealand, Norway, Portugal, Singapore, Spain, Sweden, Switzerland, the United Kingdom, and the United States. It is not possible to invest directly in an unmanaged index.
Performance quoted represents past performance. Past performance is not a guarantee or a reliable indicator of future results. Current performance may be lower or higher than performance shown. Investment return and the principal value of an investment will fluctuate. Shares may be worth more or less than original cost when redeemed. Returns shown do not reflect the deduction of taxes that a shareholder would pay on fund distributions or the redemption of fund shares. The adjusted returns take into account the maximum sales charge of 5.50% on Class A shares and 1.00% CDSC on Class C shares. The Fund’s total annual operating expense ratio as stated in the Fund’s current prospectus, as supplemented to date, is 1.08% for the Institutional Class shares, 1.18% for the Class P shares, 1.43% for the Class D shares, 1.43% for the Class A shares, 2.18% for the Class C shares and 1.68% for the Class R shares. Details regarding any Fund’s operating expenses can be found in the Fund’s prospectus. For performance current to the most recent month-end, visit www.pimco.com/investments.
Portfolio Insights
| » | The PIMCO EqS Pathfinder Fund® seeks capital appreciation by investing under normal circumstances in equity securities, including common and preferred stock (and securities convertible into, or that PIMCO expects to be exchanged for, common or preferred stock), of issuers that PIMCO believes are undervalued. The Fund’s bottom-up value investment style attempts to identify securities that are undervalued by the market in comparison to PIMCO’s own determination of the company’s value, taking into account criteria such as asset value, book value, cash flow and earnings estimates. |
| » | The Fund’s Institutional Class shares returned 5.60% after fees, and the Fund’s benchmark index, the MSCI World Index, returned 9.36%. |
| » | Stock selection in the energy and industrials sectors contributed positively to the Fund’s returns; however, security selection in the information technology and financials sectors detracted from returns and weighed on the Fund’s overall performance. |
| » | Holdings in GS Home Shopping, Lloyds Banking Group, and Carrefour were positive contributors to returns as prices on these securities appreciated during the reporting period. |
| » | Holdings in KPN, Intel, and Rhoen Klinikum detracted from returns as prices on these securities declined during the reporting period. |
| » | Given the appreciation in the equity markets over the reporting period, the Fund’s market and tail risk hedging strategies, including its position in a gold exchange-traded fund, detracted from returns as these hedging strategies declined in value or failed to keep up with the rally in the equity markets. |
| » | At the end of the reporting period, the Fund held approximately 88% in equities we believe are undervalued, 3% (on the long side only) in merger arbitrage investments, 7% in cash equivalents, and held the balance of the portfolio in currency and market risk hedges, including an approximate 4% position in gold. |
| 26 | PIMCO EQUITY SERIES |
Table of Contents
(Unaudited)
Example
As a shareholder of a Fund, you incur two types of costs: (1) transaction costs, including sales charges (loads) on purchase payments and exchange fees and (2) ongoing costs, including management fees, distribution and/or service (12b-1) fees, and other Fund expenses. The Example is intended to help you understand your ongoing costs (in dollars) of investing in a Fund and to compare these costs with the ongoing costs of investing in other mutual funds.
The Example is based on an investment of $1,000 invested at the beginning of the period and held for the entire period indicated, which for all Funds and share classes is from July 1, 2012 to December 31, 2012 unless noted otherwise in the table and footnotes below.
Actual Expenses
The information in the table under the heading “Actual Performance” provides information about actual account values and actual expenses. You may use the information in these columns, together with the amount you invested, to estimate the expenses that you paid over the period. Simply divide your account value by $1,000 (for example, an $8,600 account value divided by $1,000 = $8.60), then multiply the result by the number in the appropriate column for your share class, in the row entitled “Expenses Paid During Period” to estimate the expenses you paid on your account during this period.
Hypothetical Example for Comparison Purposes
The information in the table under the heading “Hypothetical Performance (5% return before expenses)” provides information about hypothetical account values and hypothetical expenses based on a Fund’s actual expense ratio and an assumed rate of return of 5% per year before expenses, which is not the Fund’s actual return. The hypothetical account values and expenses may not be used to estimate the actual ending account balance or expenses you paid for the period. You may use this information to compare the ongoing costs of investing in a Fund and other funds. To do so, compare this 5% hypothetical example with the 5% hypothetical examples that appear in the shareholder reports of the other funds.
Please note that the expenses shown in the table are meant to highlight your ongoing costs only and do not reflect any transactional costs, such as sales charges (loads) on purchase payments and exchange fees. Therefore, the information under the heading “Hypothetical Performance (5% return before expenses)” is useful in comparing ongoing costs only, and will not help you determine the relative total costs of owning different funds. In addition, if these transactional costs were included, your costs would have been higher.
Expense ratios may vary from period to period because of various factors such as an increase in expenses that are not covered by the management fees, such as fees and expenses of the independent trustees and their counsel, extraordinary expenses and interest expense.
| Actual Performance | Hypothetical Performance (5% return before expenses) | |||||||||||||||||||||||||||||||||
| Beginning Account Value (07/01/12) | Ending Account Value (12/31/12) | Expenses Paid During Period* | Beginning Account Value (07/01/12) | Ending Account Value (12/31/12) | Expenses Paid During Period* | Net Annualized Expense Ratio** | ||||||||||||||||||||||||||||
PIMCO Dividend and Income Builder Fund | ||||||||||||||||||||||||||||||||||
| Institutional Class | $ | 1,000.00 | $ | 1,088.70 | $ | 4.42 | $ | 1,000.00 | $ | 1,020.97 | $ | 4.28 | 0.84 | % | ||||||||||||||||||||
| Class P | 1,000.00 | 1,088.20 | 4.95 | 1,000.00 | 1,020.47 | 4.79 | 0.94 | |||||||||||||||||||||||||||
| Class D | 1,000.00 | 1,087.10 | 6.26 | 1,000.00 | 1,019.21 | 6.06 | 1.19 | |||||||||||||||||||||||||||
| Class A | 1,000.00 | 1,087.10 | 6.26 | 1,000.00 | 1,019.21 | 6.06 | 1.19 | |||||||||||||||||||||||||||
| Class C | 1,000.00 | 1,083.70 | 10.19 | 1,000.00 | 1,015.43 | 9.86 | 1.94 | |||||||||||||||||||||||||||
| Class R | 1,000.00 | 1,086.00 | 7.57 | 1,000.00 | 1,017.95 | 7.32 | 1.44 | |||||||||||||||||||||||||||
PIMCO EqS® Dividend Fund | ||||||||||||||||||||||||||||||||||
| Institutional Class | $ | 1,000.00 | $ | 1,084.20 | $ | 4.36 | $ | 1,000.00 | $ | 1,021.02 | $ | 4.23 | 0.83 | % | ||||||||||||||||||||
| Class P | 1,000.00 | 1,083.70 | 4.88 | 1,000.00 | 1,020.52 | 4.74 | 0.93 | |||||||||||||||||||||||||||
| Class D | 1,000.00 | 1,082.50 | 6.19 | 1,000.00 | 1,019.26 | 6.01 | 1.18 | |||||||||||||||||||||||||||
| Class A | 1,000.00 | 1,082.50 | 6.19 | 1,000.00 | 1,019.26 | 6.01 | 1.18 | |||||||||||||||||||||||||||
| Class C | 1,000.00 | 1,079.30 | 10.12 | 1,000.00 | 1,015.48 | 9.80 | 1.93 | |||||||||||||||||||||||||||
| Class R | 1,000.00 | 1,081.50 | 7.50 | 1,000.00 | 1,018.00 | 7.27 | 1.43 | |||||||||||||||||||||||||||
| SEMIANNUAL REPORT | DECEMBER 31, 2012 | 27 |
Table of Contents
Expense Examples (Cont.)
(Unaudited)
| Actual Performance | Hypothetical Performance (5% return before expenses) | |||||||||||||||||||||||||||||||||
| Beginning Account Value (07/01/12) | Ending Account Value (12/31/12) | Expenses Paid During Period* | Beginning Account Value (07/01/12) | Ending Account Value (12/31/12) | Expenses Paid During Period* | Net Annualized Expense Ratio** | ||||||||||||||||||||||||||||
PIMCO EqS® Emerging Markets Fund | ||||||||||||||||||||||||||||||||||
| Institutional Class | $ | 1,000.00 | $ | 1,124.10 | $ | 6.69 | $ | 1,000.00 | $ | 1,018.90 | $ | 6.36 | 1.25 | % | ||||||||||||||||||||
| Class P | 1,000.00 | 1,123.20 | 7.22 | 1,000.00 | 1,018.40 | 6.87 | 1.35 | |||||||||||||||||||||||||||
| Administrative Class | 1,000.00 | 1,122.20 | 8.02 | 1,000.00 | 1,017.64 | 7.63 | 1.50 | |||||||||||||||||||||||||||
| Class D | 1,000.00 | 1,121.90 | 8.56 | 1,000.00 | 1,017.14 | 8.13 | 1.60 | |||||||||||||||||||||||||||
| Class A | 1,000.00 | 1,122.40 | 8.56 | 1,000.00 | 1,017.14 | 8.13 | 1.60 | |||||||||||||||||||||||||||
| Class C | 1,000.00 | 1,118.40 | 12.55 | 1,000.00 | 1,013.36 | 11.93 | 2.35 | |||||||||||||||||||||||||||
| Class R | 1,000.00 | 1,120.40 | 9.89 | 1,000.00 | 1,015.88 | 9.40 | 1.85 | |||||||||||||||||||||||||||
PIMCO EqS® Long/Short Fund | ||||||||||||||||||||||||||||||||||
| Institutional Class | $ | 1,000.00 | $ | 969.80 | $ | 9.88 | $ | 1,000.00 | $ | 1,015.17 | $ | 10.11 | 1.99 | % | ||||||||||||||||||||
| Class P | 1,000.00 | 970.50 | 10.38 | 1,000.00 | 1,014.67 | 10.61 | 2.09 | |||||||||||||||||||||||||||
| Class D | 1,000.00 | 968.40 | 11.61 | 1,000.00 | 1,013.41 | 11.88 | 2.34 | |||||||||||||||||||||||||||
| Class A | 1,000.00 | 967.90 | 11.61 | 1,000.00 | 1,013.41 | 11.88 | 2.34 | |||||||||||||||||||||||||||
| Class C | 1,000.00 | 963.70 | 15.29 | 1,000.00 | 1,009.63 | 15.65 | 3.09 | |||||||||||||||||||||||||||
PIMCO Emerging Multi-Asset Fund | ||||||||||||||||||||||||||||||||||
| Institutional Class | $ | 1,000.00 | $ | 1,099.90 | $ | 2.17 | $ | 1,000.00 | $ | 1,023.14 | $ | 2.09 | 0.41 | % | ||||||||||||||||||||
| Class P | 1,000.00 | 1,099.30 | 2.70 | 1,000.00 | 1,022.63 | 2.60 | 0.51 | |||||||||||||||||||||||||||
| Administrative Class | 1,000.00 | 1,098.90 | 3.49 | 1,000.00 | 1,021.88 | 3.36 | 0.66 | |||||||||||||||||||||||||||
| Class D | 1,000.00 | 1,097.90 | 4.02 | 1,000.00 | 1,021.37 | 3.87 | 0.76 | |||||||||||||||||||||||||||
| Class A | 1,000.00 | 1,097.60 | 4.02 | 1,000.00 | 1,021.37 | 3.87 | 0.76 | |||||||||||||||||||||||||||
| Class C | 1,000.00 | 1,094.70 | 7.97 | 1,000.00 | 1,017.59 | 7.68 | 1.51 | |||||||||||||||||||||||||||
| Class R | 1,000.00 | 1,096.20 | 5.34 | 1,000.00 | 1,020.11 | 5.14 | 1.01 | |||||||||||||||||||||||||||
PIMCO EqS Pathfinder Fund® | ||||||||||||||||||||||||||||||||||
| Institutional Class | $ | 1,000.00 | $ | 1,056.00 | $ | 4.66 | $ | 1,000.00 | $ | 1,020.67 | $ | 4.58 | 0.90 | % | ||||||||||||||||||||
| Class P | 1,000.00 | 1,055.30 | 5.18 | 1,000.00 | 1,020.16 | 5.09 | 1.00 | |||||||||||||||||||||||||||
| Class D | 1,000.00 | 1,053.90 | 6.47 | 1,000.00 | 1,018.90 | 6.36 | 1.25 | |||||||||||||||||||||||||||
| Class A | 1,000.00 | 1,054.00 | 6.47 | 1,000.00 | 1,018.90 | 6.36 | 1.25 | |||||||||||||||||||||||||||
| Class C | 1,000.00 | 1,049.40 | 10.33 | 1,000.00 | 1,015.12 | 10.16 | 2.00 | |||||||||||||||||||||||||||
| Class R | 1,000.00 | 1,052.70 | 7.76 | 1,000.00 | 1,017.64 | 7.63 | 1.50 | |||||||||||||||||||||||||||
* Expenses Paid During Period are equal to the net annualized expense ratio for the class, multiplied by the average account value over the period, multiplied by 184/365 (to reflect the one-half year period).
** The Net Annualized Expense Ratio is reflective of any applicable waivers related to contractual agreements for contractual fee waivers or voluntary fee waivers. Details regarding fee waivers can be found in note 9 in the Notes to Financial Statements.
| 28 | PIMCO EQUITY SERIES |
Table of Contents
(THIS PAGE INTENTIONALLY LEFT BLANK)
| SEMIANNUAL REPORT | DECEMBER 31, 2012 | 29 |
Table of Contents
| Selected Per Share Data for the Year or Period Ended: | Year or | Net Investment Income (Loss) (a) | Net Realized/ Unrealized Gain (Loss) | Total Income (Loss) from Investment Operations | Dividends from Net Investment Income | Distributions from Net Realized Capital Gains | Total Distributions | |||||||||||||||||||||
PIMCO Dividend and Income Builder Fund | ||||||||||||||||||||||||||||
| Institutional Class | ||||||||||||||||||||||||||||
07/01/2012 - 12/31/2012+ | $ | 10.47 | $ | 0.16 | $ | 0.76 | $ | 0.92 | $ | (0.17 | ) | $ | (0.02 | ) | $ | (0.19 | ) | |||||||||||
12/14/2011 - 06/30/2012 | 10.00 | 0.25 | 0.47 | 0.72 | (0.25 | ) | 0.00 | (0.25 | ) | |||||||||||||||||||
| Class P | ||||||||||||||||||||||||||||
07/01/2012 - 12/31/2012+ | 10.48 | 0.15 | 0.77 | 0.92 | (0.17 | ) | (0.02 | ) | (0.19 | ) | ||||||||||||||||||
12/14/2011 - 06/30/2012 | 10.00 | 0.30 | 0.42 | 0.72 | (0.24 | ) | 0.00 | (0.24 | ) | |||||||||||||||||||
| Class D | ||||||||||||||||||||||||||||
07/01/2012 - 12/31/2012+ | 10.47 | 0.14 | 0.77 | 0.91 | (0.16 | ) | (0.02 | ) | (0.18 | ) | ||||||||||||||||||
12/14/2011 - 06/30/2012 | 10.00 | 0.26 | 0.44 | 0.70 | (0.23 | ) | 0.00 | (0.23 | ) | |||||||||||||||||||
| Class A | ||||||||||||||||||||||||||||
07/01/2012 - 12/31/2012+ | 10.47 | 0.14 | 0.77 | 0.91 | (0.16 | ) | (0.02 | ) | (0.18 | ) | ||||||||||||||||||
12/14/2011 - 06/30/2012 | 10.00 | 0.26 | 0.44 | 0.70 | (0.23 | ) | 0.00 | (0.23 | ) | |||||||||||||||||||
| Class C | ||||||||||||||||||||||||||||
07/01/2012 - 12/31/2012+ | 10.46 | 0.10 | 0.77 | 0.87 | (0.12 | ) | (0.02 | ) | (0.14 | ) | ||||||||||||||||||
12/14/2011 - 06/30/2012 | 10.00 | 0.24 | 0.41 | 0.65 | (0.19 | ) | 0.00 | (0.19 | ) | |||||||||||||||||||
| Class R | ||||||||||||||||||||||||||||
07/01/2012 - 12/31/2012+ | 10.47 | 0.14 | 0.75 | 0.89 | (0.14 | ) | (0.02 | ) | (0.16 | ) | ||||||||||||||||||
12/14/2011 - 06/30/2012 | 10.00 | 0.25 | 0.43 | 0.68 | (0.21 | ) | 0.00 | (0.21 | ) | |||||||||||||||||||
PIMCO EqS® Dividend Fund | ||||||||||||||||||||||||||||
| Institutional Class | ||||||||||||||||||||||||||||
07/01/2012 - 12/31/2012+ | $ | 10.47 | $ | 0.14 | $ | 0.74 | $ | 0.88 | $ | (0.14 | ) | $ | (0.03 | ) | $ | (0.17 | ) | |||||||||||
12/14/2011 - 06/30/2012 | 10.00 | 0.28 | 0.42 | 0.70 | (0.23 | ) | 0.00 | (0.23 | ) | |||||||||||||||||||
| Class P | ||||||||||||||||||||||||||||
07/01/2012 - 12/31/2012+ | 10.48 | 0.16 | 0.72 | 0.88 | (0.14 | ) | (0.03 | ) | (0.17 | ) | ||||||||||||||||||
12/14/2011 - 06/30/2012 | 10.00 | 0.29 | 0.41 | 0.70 | (0.22 | ) | 0.00 | (0.22 | ) | |||||||||||||||||||
| Class D | ||||||||||||||||||||||||||||
07/01/2012 - 12/31/2012+ | 10.48 | 0.12 | 0.75 | 0.87 | (0.13 | ) | (0.03 | ) | (0.16 | ) | ||||||||||||||||||
12/14/2011 - 06/30/2012 | 10.00 | 0.30 | 0.39 | 0.69 | (0.21 | ) | 0.00 | (0.21 | ) | |||||||||||||||||||
| Class A | ||||||||||||||||||||||||||||
07/01/2012 - 12/31/2012+ | 10.48 | 0.12 | 0.75 | 0.87 | (0.13 | ) | (0.03 | ) | (0.16 | ) | ||||||||||||||||||
12/14/2011 - 06/30/2012 | 10.00 | 0.27 | 0.42 | 0.69 | (0.21 | ) | 0.00 | (0.21 | ) | |||||||||||||||||||
| Class C | ||||||||||||||||||||||||||||
07/01/2012 - 12/31/2012+ | 10.45 | 0.08 | 0.75 | 0.83 | (0.09 | ) | (0.03 | ) | (0.12 | ) | ||||||||||||||||||
12/14/2011 - 06/30/2012 | 10.00 | 0.23 | 0.39 | 0.62 | (0.17 | ) | 0.00 | (0.17 | ) | |||||||||||||||||||
| Class R | ||||||||||||||||||||||||||||
07/01/2012 - 12/31/2012+ | 10.47 | 0.11 | 0.74 | 0.85 | (0.11 | ) | (0.03 | ) | (0.14 | ) | ||||||||||||||||||
12/14/2011 - 06/30/2012 | 10.00 | 0.18 | 0.48 | 0.66 | (0.19 | ) | 0.00 | (0.19 | ) | |||||||||||||||||||
PIMCO EqS® Emerging Markets Fund | ||||||||||||||||||||||||||||
| Institutional Class | ||||||||||||||||||||||||||||
07/01/2012 - 12/31/2012+ | $ | 7.97 | $ | 0.02 | $ | 0.97 | $ | 0.99 | $ | (0.09 | ) | $ | 0.00 | $ | (0.09 | ) | ||||||||||||
06/30/2012 | 10.19 | 0.08 | (2.27 | ) | (2.19 | ) | (0.02 | ) | (0.01 | ) | (0.03 | ) | ||||||||||||||||
03/22/2011 - 06/30/2011 | 10.00 | 0.05 | 0.14 | 0.19 | 0.00 | 0.00 | 0.00 | |||||||||||||||||||||
| Class P | ||||||||||||||||||||||||||||
07/01/2012 - 12/31/2012+ | 7.97 | 0.00 | ^ | 0.98 | 0.98 | (0.09 | ) | 0.00 | (0.09 | ) | ||||||||||||||||||
06/30/2012 | 10.19 | 0.06 | (2.25 | ) | (2.19 | ) | (0.02 | ) | (0.01 | ) | (0.03 | ) | ||||||||||||||||
03/22/2011 - 06/30/2011 | 10.00 | 0.04 | 0.15 | 0.19 | 0.00 | 0.00 | 0.00 | |||||||||||||||||||||
| Administrative Class | ||||||||||||||||||||||||||||
07/01/2012 - 12/31/2012+ | 7.96 | 0.00 | ^ | 0.97 | 0.97 | (0.08 | ) | 0.00 | (0.08 | ) | ||||||||||||||||||
06/30/2012 | 10.18 | 0.06 | (2.27 | ) | (2.21 | ) | 0.00 | ^ | (0.01 | ) | (0.01 | ) | ||||||||||||||||
04/19/2011 - 06/30/2011 | 10.51 | 0.04 | (0.37 | ) | (0.33 | ) | 0.00 | 0.00 | 0.00 | |||||||||||||||||||
| Class D | ||||||||||||||||||||||||||||
07/01/2012 - 12/31/2012+ | 7.93 | 0.00 | ^ | 0.97 | 0.97 | (0.08 | ) | 0.00 | (0.08 | ) | ||||||||||||||||||
06/30/2012 | 10.18 | 0.00 | ^ | (2.22 | ) | (2.22 | ) | (0.02 | ) | (0.01 | ) | (0.03 | ) | |||||||||||||||
03/22/2011 - 06/30/2011 | 10.00 | 0.06 | 0.12 | 0.18 | 0.00 | 0.00 | 0.00 | |||||||||||||||||||||
Please see footnotes on pages 34 and 35.
| 30 | PIMCO EQUITY SERIES | See Accompanying Notes |
Table of Contents
(Unaudited)
| Net Asset Value End of Year or Period | Total Return | Net Assets End of Year or Period (000s) | Ratio of Expenses to Average Net Assets | Ratio of Expenses to Average Net Assets Excluding Waivers | Ratio of Expenses to Average Net Asset Excluding Interest Expense and Dividends on Securities Sold Short | Ratio of Expenses to Average Net Asset Excluding Interest Expense and Dividends on Securities Sold Short and Waivers | Ratio of Net Investment Income (Loss) to Average Net Assets | Portfolio Turnover Rate** | ||||||||||||||||||||||||||
| $ | 11.20 | 8.87 | % | $ | 30,667 | 0.84 | %* | 1.00 | %* | 0.84 | %* | 1.00 | %* | 2.95 | %* | 28 | % | |||||||||||||||||
| 10.47 | 7.17 | 11,170 | 0.83 | * | 1.57 | * | 0.83 | * | 1.57 | * | 4.35 | * | 28 | |||||||||||||||||||||
| 11.21 | 8.82 | 23,477 | 0.94 | * | 1.10 | * | 0.94 | * | 1.10 | * | 2.78 | * | 28 | |||||||||||||||||||||
| 10.48 | 7.21 | 8,207 | 0.93 | * | 2.47 | * | 0.93 | * | 2.47 | * | 5.28 | * | 28 | |||||||||||||||||||||
| 11.20 | 8.71 | 13,659 | 1.19 | * | 1.35 | * | 1.19 | * | 1.35 | * | 2.54 | * | 28 | |||||||||||||||||||||
| 10.47 | 6.98 | 2,306 | 1.18 | * | 2.26 | * | 1.18 | * | 2.26 | * | 4.52 | * | 28 | |||||||||||||||||||||
| 11.20 | 8.71 | 32,667 | 1.19 | * | 1.35 | * | 1.19 | * | 1.35 | * | 2.50 | * | 28 | |||||||||||||||||||||
| 10.47 | 6.98 | 13,314 | 1.18 | * | 2.43 | * | 1.18 | * | 2.43 | * | 4.62 | * | 28 | |||||||||||||||||||||
| 11.19 | 8.37 | 18,160 | 1.94 | * | 2.10 | * | 1.94 | * | 2.10 | * | 1.74 | * | 28 | |||||||||||||||||||||
| 10.46 | 6.46 | 8,000 | 1.93 | * | 3.46 | * | 1.93 | * | 3.46 | * | 4.27 | * | 28 | |||||||||||||||||||||
| 11.20 | 8.60 | 204 | 1.44 | * | 1.60 | * | 1.44 | * | 1.60 | * | 2.52 | * | 28 | |||||||||||||||||||||
| 10.47 | 6.84 | 415 | 1.43 | * | 2.32 | * | 1.43 | * | 2.32 | * | 4.30 | * | 28 | |||||||||||||||||||||
| $ | 11.18 | 8.42 | % | $ | 356,521 | 0.83 | %* | 0.99 | %* | 0.83 | %* | 0.99 | %* | 2.59 | %* | 35 | % | |||||||||||||||||
| 10.47 | 6.95 | 315,513 | 0.83 | * | 1.20 | * | 0.83 | * | 1.20 | * | 4.98 | * | 21 | |||||||||||||||||||||
| 11.19 | 8.37 | 1,000 | 0.93 | * | 1.09 | * | 0.93 | * | 1.09 | * | 2.85 | * | 35 | |||||||||||||||||||||
| 10.48 | 7.00 | 71 | 0.93 | * | 1.33 | * | 0.93 | * | 1.33 | * | 5.11 | * | 21 | |||||||||||||||||||||
| 11.19 | 8.25 | 4,245 | 1.18 | * | 1.34 | * | 1.18 | * | 1.34 | * | 2.24 | * | 35 | |||||||||||||||||||||
| 10.48 | 6.86 | 1,251 | 1.18 | * | 1.67 | * | 1.18 | * | 1.67 | * | 5.25 | * | 21 | |||||||||||||||||||||
| 11.19 | 8.25 | 7,835 | 1.18 | * | 1.34 | * | 1.18 | * | 1.34 | * | 2.25 | * | 35 | |||||||||||||||||||||
| 10.48 | 6.86 | 2,529 | 1.18 | * | 1.51 | * | 1.18 | * | 1.51 | * | 4.74 | * | 21 | |||||||||||||||||||||
| 11.16 | 7.93 | 3,227 | 1.93 | * | 2.09 | * | 1.93 | * | 2.09 | * | 1.49 | * | 35 | |||||||||||||||||||||
| 10.45 | 6.19 | 1,275 | 1.93 | * | 2.26 | * | 1.93 | * | 2.26 | * | 4.11 | * | 21 | |||||||||||||||||||||
| 11.18 | 8.15 | 12 | 1.43 | * | 1.59 | * | 1.43 | * | 1.59 | * | 2.00 | * | 35 | |||||||||||||||||||||
| 10.47 | 6.63 | 11 | 1.43 | * | 1.67 | * | 1.43 | * | 1.67 | * | 3.24 | * | 21 | |||||||||||||||||||||
| $ | 8.87 | 12.41 | % | $ | 594,643 | 1.25 | %* | 1.45 | %* | 1.25 | %* | 1.45 | %* | 0.41 | %* | 46 | % | |||||||||||||||||
| 7.97 | (21.51 | ) | 514,884 | 1.25 | 1.46 | 1.25 | 1.45 | 0.94 | 92 | |||||||||||||||||||||||||
| 10.19 | 1.90 | 353,099 | 1.25 | * | 1.62 | * | 1.25 | * | 1.62 | * | 1.77 | * | 41 | |||||||||||||||||||||
| 8.86 | 12.32 | 215 | 1.35 | * | 1.55 | * | 1.35 | * | 1.55 | * | 0.09 | * | 46 | |||||||||||||||||||||
| 7.97 | (21.52 | ) | 63 | 1.35 | 1.56 | 1.35 | 1.55 | 0.68 | 92 | |||||||||||||||||||||||||
| 10.19 | 1.90 | 37 | 1.35 | * | 1.94 | * | 1.35 | * | 1.94 | * | 1.42 | * | 41 | |||||||||||||||||||||
| 8.85 | 12.22 | 46 | 1.50 | * | 1.70 | * | 1.50 | * | 1.70 | * | 0.12 | * | 46 | |||||||||||||||||||||
| 7.96 | (21.72 | ) | 34 | 1.50 | 1.72 | 1.50 | 1.72 | 0.74 | 92 | |||||||||||||||||||||||||
| 10.18 | (3.14 | ) | 10 | 1.50 | * | 1.90 | * | 1.50 | * | 1.90 | * | 1.72 | * | 41 | ||||||||||||||||||||
| 8.82 | 12.19 | 1,155 | 1.60 | * | 1.80 | * | 1.60 | * | 1.80 | * | 0.03 | * | 46 | |||||||||||||||||||||
| 7.93 | (21.83 | ) | 989 | 1.60 | 1.82 | 1.60 | 1.81 | (0.02 | ) | 92 | ||||||||||||||||||||||||
| 10.18 | 1.80 | 1,080 | 1.60 | * | 2.11 | * | 1.60 | * | 2.11 | * | 1.98 | * | 41 | |||||||||||||||||||||
Please see footnotes on pages 34 and 35.
| SEMIANNUAL REPORT | DECEMBER 31, 2012 | 31 |
Table of Contents
Financial Highlights (Cont.)
| Selected Per Share Data for the Year or Period Ended: | Year or | Net Investment Income (Loss) (a) | Net Realized/ Unrealized Gain (Loss) | Total Income (Loss) from Investment Operations | Dividends from Net Investment Income | Distributions from Net Realized Capital Gains | Total Distributions | |||||||||||||||||||||
PIMCO EqS® Emerging Markets Fund (Cont.) | ||||||||||||||||||||||||||||
| Class A | ||||||||||||||||||||||||||||
07/01/2012 - 12/31/2012+ | $ | 7.94 | $ | 0.00 | ^ | $ | 0.97 | $ | 0.97 | $ | (0.08 | ) | $ | 0.00 | $ | (0.08 | ) | |||||||||||
06/30/2012 | 10.18 | 0.08 | (2.31 | ) | (2.23 | ) | 0.00 | ^ | (0.01 | ) | (0.01 | ) | ||||||||||||||||
03/22/2011 - 06/30/2011 | 10.00 | 0.05 | 0.13 | 0.18 | 0.00 | 0.00 | 0.00 | |||||||||||||||||||||
| Class C | ||||||||||||||||||||||||||||
07/01/2012 - 12/31/2012+ | 7.88 | (0.03 | ) | 0.96 | 0.93 | (0.05 | ) | 0.00 | (0.05 | ) | ||||||||||||||||||
06/30/2012 | 10.17 | 0.01 | (2.29 | ) | (2.28 | ) | 0.00 | ^ | (0.01 | ) | (0.01 | ) | ||||||||||||||||
03/22/2011 - 06/30/2011 | 10.00 | 0.03 | 0.14 | 0.17 | 0.00 | 0.00 | 0.00 | |||||||||||||||||||||
| Class R | ||||||||||||||||||||||||||||
07/01/2012 - 12/31/2012+ | 7.93 | (0.01 | ) | 0.96 | 0.95 | (0.06 | ) | 0.00 | (0.06 | ) | ||||||||||||||||||
06/30/2012 | 10.18 | 0.01 | (2.25 | ) | (2.24 | ) | 0.00 | ^ | (0.01 | ) | (0.01 | ) | ||||||||||||||||
03/22/2011 - 06/30/2011 | 10.00 | 0.06 | 0.12 | 0.18 | 0.00 | 0.00 | 0.00 | |||||||||||||||||||||
PIMCO EqS® Long/Short Fund | ||||||||||||||||||||||||||||
| Institutional Class | ||||||||||||||||||||||||||||
07/01/2012 - 12/31/2012+ | $ | 9.71 | $ | 0.05 | $ | (0.34 | ) | $ | (0.29 | ) | $ | (0.04 | ) | $ | 0.00 | $ | (0.04 | ) | ||||||||||
04/20/2012 - 06/30/2012 | 10.00 | (0.02 | ) | (0.27 | ) | (0.29 | ) | 0.00 | 0.00 | 0.00 | ||||||||||||||||||
| Class P | ||||||||||||||||||||||||||||
07/01/2012 - 12/31/2012+ | 9.70 | 0.10 | (0.39 | ) | (0.29 | ) | (0.04 | ) | 0.00 | (0.04 | ) | |||||||||||||||||
04/30/2012 - 06/30/2012 | 10.00 | (0.02 | ) | (0.28 | ) | (0.30 | ) | 0.00 | 0.00 | 0.00 | ||||||||||||||||||
| Class D | ||||||||||||||||||||||||||||
07/01/2012 - 12/31/2012+ | 9.70 | 0.02 | (0.33 | ) | (0.31 | ) | (0.02 | ) | 0.00 | (0.02 | ) | |||||||||||||||||
04/30/2012 - 06/30/2012 | 10.00 | (0.03 | ) | (0.27 | ) | (0.30 | ) | 0.00 | 0.00 | 0.00 | ||||||||||||||||||
| Class A | ||||||||||||||||||||||||||||
07/01/2012 - 12/31/2012+ | 9.70 | 0.04 | (0.35 | ) | (0.31 | ) | (0.03 | ) | 0.00 | (0.03 | ) | |||||||||||||||||
04/30/2012 - 06/30/2012 | 10.00 | (0.03 | ) | (0.27 | ) | (0.30 | ) | 0.00 | 0.00 | 0.00 | ||||||||||||||||||
| Class C | ||||||||||||||||||||||||||||
07/01/2012 - 12/31/2012+ | 9.69 | 0.02 | (0.37 | ) | (0.35 | ) | (0.01 | ) | 0.00 | (0.01 | ) | |||||||||||||||||
04/30/2012 - 06/30/2012 | 10.00 | (0.04 | ) | (0.27 | ) | (0.31 | ) | 0.00 | 0.00 | 0.00 | ||||||||||||||||||
PIMCO Emerging Multi-Asset Fund | ||||||||||||||||||||||||||||
| Institutional Class | ||||||||||||||||||||||||||||
07/01/2012 - 12/31/2012+ | $ | 8.71 | $ | 0.17 | $ | 0.70 | $ | 0.87 | $ | (0.27 | ) | $ | 0.00 | $ | (0.27 | ) | ||||||||||||
06/30/2012 | 9.89 | 0.14 | (1.27 | ) | (1.13 | ) | (0.05 | ) | 0.00 | (0.05 | ) | |||||||||||||||||
04/12/2011 - 06/30/2011 | 10.00 | 0.02 | (0.13 | ) | (0.11 | ) | 0.00 | 0.00 | 0.00 | |||||||||||||||||||
| Class P | ||||||||||||||||||||||||||||
07/01/2012 - 12/31/2012+ | 8.69 | 0.17 | 0.69 | 0.86 | (0.26 | ) | 0.00 | (0.26 | ) | |||||||||||||||||||
06/30/2012 | 9.90 | 0.15 | (1.31 | ) | (1.16 | ) | (0.05 | ) | 0.00 | (0.05 | ) | |||||||||||||||||
04/12/2011 - 06/30/2011 | 10.00 | 0.02 | (0.12 | ) | (0.10 | ) | 0.00 | 0.00 | 0.00 | |||||||||||||||||||
| Administrative Class | ||||||||||||||||||||||||||||
07/01/2012 - 12/31/2012+ | 8.69 | 0.29 | 0.57 | 0.86 | (0.28 | ) | 0.00 | (0.28 | ) | |||||||||||||||||||
06/30/2012 | 9.89 | 0.12 | (1.28 | ) | (1.16 | ) | (0.04 | ) | 0.00 | (0.04 | ) | |||||||||||||||||
04/19/2011 - 06/30/2011 | 10.02 | 0.02 | (0.15 | ) | (0.13 | ) | 0.00 | 0.00 | 0.00 | |||||||||||||||||||
| Class D | ||||||||||||||||||||||||||||
07/01/2012 - 12/31/2012+ | 8.70 | 0.15 | 0.70 | 0.85 | (0.25 | ) | 0.00 | (0.25 | ) | |||||||||||||||||||
06/30/2012 | 9.89 | 0.11 | (1.27 | ) | (1.16 | ) | (0.03 | ) | 0.00 | (0.03 | ) | |||||||||||||||||
04/12/2011 - 06/30/2011 | 10.00 | 0.02 | (0.13 | ) | (0.11 | ) | 0.00 | 0.00 | 0.00 | |||||||||||||||||||
| Class A | ||||||||||||||||||||||||||||
07/01/2012 - 12/31/2012+ | 8.68 | 0.17 | 0.67 | 0.84 | (0.25 | ) | 0.00 | (0.25 | ) | |||||||||||||||||||
06/30/2012 | 9.88 | 0.12 | (1.28 | ) | (1.16 | ) | (0.04 | ) | 0.00 | (0.04 | ) | |||||||||||||||||
04/12/2011 - 06/30/2011 | 10.00 | 0.02 | (0.14 | ) | (0.12 | ) | 0.00 | 0.00 | 0.00 | |||||||||||||||||||
| Class C | ||||||||||||||||||||||||||||
07/01/2012 - 12/31/2012+ | 8.62 | 0.13 | 0.68 | 0.81 | (0.22 | ) | 0.00 | (0.22 | ) | |||||||||||||||||||
06/30/2012 | 9.88 | 0.05 | (1.29 | ) | (1.24 | ) | (0.02 | ) | 0.00 | (0.02 | ) | |||||||||||||||||
04/12/2011 - 06/30/2011 | 10.00 | 0.00 | ^ | (0.12 | ) | (0.12 | ) | 0.00 | 0.00 | 0.00 | ||||||||||||||||||
Please see footnotes on pages 34 and 35.
| 32 | PIMCO EQUITY SERIES | See Accompanying Notes |
Table of Contents
(Unaudited)
| Net Asset Value End of Year or Period | Total Return | Net Assets End of Year or Period (000s) | Ratio of Expenses to Average Net Assets | Ratio of Expenses to Average Net Assets Excluding Waivers | Ratio of Expenses to Average Net Asset Excluding Interest Expense and Dividends on Securities Sold Short | Ratio of Expenses to Average Net Asset Excluding Interest Expense and Dividends on Securities Sold Short and Waivers | Ratio of Net Investment Income (Loss) to Average Net Assets | Portfolio Turnover Rate** | ||||||||||||||||||||||||||
| $ | 8.83 | 12.24 | % | $ | 3,644 | 1.60 | %* | 1.80 | %* | 1.60 | %* | 1.80 | %* | 0.07 | %* | 46 | % | |||||||||||||||||
| 7.94 | (21.89 | ) | 2,469 | 1.60 | 1.81 | 1.60 | 1.80 | 0.90 | 92 | |||||||||||||||||||||||||
| 10.18 | 1.80 | 764 | 1.60 | * | 2.02 | * | 1.60 | * | 2.02 | * | 1.89 | * | 41 | |||||||||||||||||||||
| 8.76 | 11.84 | 936 | 2.35 | * | 2.55 | * | 2.35 | * | 2.55 | * | (0.70 | )* | 46 | |||||||||||||||||||||
| 7.88 | (22.43 | ) | 675 | 2.35 | 2.57 | 2.35 | 2.56 | 0.12 | 92 | |||||||||||||||||||||||||
| 10.17 | 1.70 | 98 | 2.35 | * | 2.80 | * | 2.35 | * | 2.80 | * | 0.98 | * | 41 | |||||||||||||||||||||
| 8.82 | 12.04 | 27 | 1.85 | * | 2.05 | * | 1.85 | * | 2.05 | * | (0.18 | )* | 46 | |||||||||||||||||||||
| 7.93 | (22.01 | ) | 24 | 1.85 | 2.07 | 1.85 | 2.06 | 0.06 | 92 | |||||||||||||||||||||||||
| 10.18 | 1.80 | 39 | 1.85 | * | 2.34 | * | 1.85 | * | 2.34 | * | 1.97 | * | 41 | |||||||||||||||||||||
| $ | 9.38 | (3.02 | )% | $ | 261,808 | 1.99 | %* | 2.08 | %* | 1.40 | %* | 1.49 | %* | 0.95 | %* | 223 | % | |||||||||||||||||
| 9.71 | (2.90 | ) | 212,229 | 1.52 | * | 2.41 | * | 1.40 | * | 2.29 | * | (1.30 | )* | 113 | ||||||||||||||||||||
| 9.37 | (2.95 | ) | 2,042 | 2.09 | * | 2.18 | * | 1.50 | * | 1.59 | * | 2.06 | * | 223 | ||||||||||||||||||||
| 9.70 | (3.00 | ) | 10 | 1.62 | * | 2.40 | * | 1.50 | * | 2.28 | * | (1.34 | )* | 113 | ||||||||||||||||||||
| 9.37 | (3.16 | ) | 770 | 2.34 | * | 2.43 | * | 1.75 | * | 1.84 | * | 0.36 | * | 223 | ||||||||||||||||||||
| 9.70 | (3.00 | ) | 111 | 1.87 | * | 3.97 | * | 1.77 | * | 3.87 | * | (1.72 | )* | 113 | ||||||||||||||||||||
| 9.36 | (3.21 | ) | 4,990 | 2.34 | * | 2.43 | * | 1.75 | * | 1.84 | * | 0.91 | * | 223 | ||||||||||||||||||||
| 9.70 | (3.00 | ) | 1,219 | 1.87 | * | 3.17 | * | 1.74 | * | 3.04 | * | (1.70 | )* | 113 | ||||||||||||||||||||
| 9.33 | (3.63 | ) | 1,706 | 3.09 | * | 3.18 | * | 2.50 | * | 2.59 | * | 0.47 | * | 223 | ||||||||||||||||||||
| 9.69 | (3.10 | ) | 53 | 2.62 | * | 4.50 | * | 2.52 | * | 4.40 | * | (2.46 | )* | 113 | ||||||||||||||||||||
| $ | 9.31 | 9.99 | % | $ | 27,146 | 0.41 | %* | 1.35 | %* | 0.41 | %* | 1.35 | %* | 3.79 | %* | 38 | % | |||||||||||||||||
| 8.71 | (11.45 | ) | 29,987 | 0.53 | 1.38 | 0.53 | 1.38 | 1.62 | 41 | |||||||||||||||||||||||||
| 9.89 | (1.10 | ) | 9,755 | 0.53 | * | 6.96 | * | 0.53 | * | 6.96 | * | 1.13 | * | 0 | ||||||||||||||||||||
| 9.29 | 9.93 | 1,754 | 0.51 | * | 1.45 | * | 0.51 | * | 1.45 | * | 3.62 | * | 38 | |||||||||||||||||||||
| 8.69 | (11.69 | ) | 2,019 | 0.63 | 1.48 | 0.63 | 1.48 | 1.71 | 41 | |||||||||||||||||||||||||
| 9.90 | (1.00 | ) | 74 | 0.63 | * | 17.34 | * | 0.63 | * | 17.34 | * | 0.96 | * | 0 | ||||||||||||||||||||
| 9.27 | 9.89 | 76 | 0.66 | * | 1.60 | * | 0.66 | * | 1.60 | * | 6.26 | * | 38 | |||||||||||||||||||||
| 8.69 | (11.75 | ) | 28 | 0.78 | 1.63 | 0.78 | 1.63 | 1.36 | 41 | |||||||||||||||||||||||||
| 9.89 | (1.30 | ) | 10 | 0.78 | * | 6.47 | * | 0.78 | * | 6.47 | * | 0.88 | * | 0 | ||||||||||||||||||||
| 9.30 | 9.79 | 3,073 | 0.76 | * | 1.70 | * | 0.76 | * | 1.70 | * | 3.37 | * | 38 | |||||||||||||||||||||
| 8.70 | (11.77 | ) | 4,912 | 0.88 | 1.73 | 0.88 | 1.73 | 1.20 | 41 | |||||||||||||||||||||||||
| 9.89 | (1.10 | ) | 2,745 | 0.88 | * | 8.20 | * | 0.88 | * | 8.20 | * | 0.81 | * | 0 | ||||||||||||||||||||
| 9.27 | 9.76 | 12,415 | 0.76 | * | 1.70 | * | 0.76 | * | 1.70 | * | 3.70 | * | 38 | |||||||||||||||||||||
| 8.68 | (11.72 | ) | 10,147 | 0.88 | 1.73 | 0.88 | 1.73 | 1.32 | 41 | |||||||||||||||||||||||||
| 9.88 | (1.20 | ) | 1,801 | 0.88 | * | 9.28 | * | 0.88 | * | 9.28 | * | 0.82 | * | 0 | ||||||||||||||||||||
| 9.21 | 9.47 | 4,382 | 1.51 | * | 2.45 | * | 1.51 | * | 2.45 | * | 2.97 | * | 38 | |||||||||||||||||||||
| 8.62 | (12.51 | ) | 3,868 | 1.63 | 2.48 | 1.63 | 2.48 | 0.57 | 41 | |||||||||||||||||||||||||
| 9.88 | (1.20 | ) | 649 | 1.63 | * | 9.73 | * | 1.63 | * | 9.73 | * | 0.08 | * | 0 | ||||||||||||||||||||
Please see footnotes on pages 34 and 35.
| SEMIANNUAL REPORT | DECEMBER 31, 2012 | 33 |
Table of Contents
Financial Highlights (Cont.)
| Selected Per Share Data for the Year or Period Ended: | Year or | Net Investment Income (Loss) (a) | Net Realized/ Unrealized Gain (Loss) | Total Income (Loss) from Investment Operations | Dividends from Net Investment Income | Distributions from Net Realized Capital Gains | Total Distributions | |||||||||||||||||||||
PIMCO Emerging Multi-Asset Fund (Cont.) | ||||||||||||||||||||||||||||
| Class R | ||||||||||||||||||||||||||||
07/01/2012 - 12/31/2012+ | $ | 8.68 | $ | 0.29 | $ | 0.54 | $ | 0.83 | $ | (0.27 | ) | $ | 0.00 | $ | (0.27 | ) | ||||||||||||
06/30/2012 | 9.88 | 0.09 | (1.27 | ) | (1.18 | ) | (0.02 | ) | 0.00 | (0.02 | ) | |||||||||||||||||
04/12/2011 - 06/30/2011 | 10.00 | 0.01 | (0.13 | ) | (0.12 | ) | 0.00 | 0.00 | 0.00 | |||||||||||||||||||
PIMCO EqS Pathfinder Fund® | ||||||||||||||||||||||||||||
| Institutional Class | ||||||||||||||||||||||||||||
07/01/2012 - 12/31/2012+ | $ | 10.11 | $ | 0.09 | $ | 0.48 | $ | 0.57 | $ | (0.31 | ) | $ | 0.00 | $ | (0.31 | ) | ||||||||||||
06/30/2012 | 10.65 | 0.18 | (0.62 | ) | (0.44 | ) | (0.07 | ) | (0.03 | ) | (0.10 | ) | ||||||||||||||||
06/30/2011 | 9.23 | 0.19 | 1.34 | 1.53 | (0.09 | ) | (0.02 | ) | (0.11 | ) | ||||||||||||||||||
04/14/2010 - 06/30/2010 | 10.00 | 0.07 | (0.84 | ) | (0.77 | ) | 0.00 | 0.00 | 0.00 | |||||||||||||||||||
| Class P | ||||||||||||||||||||||||||||
07/01/2012 - 12/31/2012+ | 10.09 | 0.09 | 0.47 | 0.56 | (0.30 | ) | 0.00 | (0.30 | ) | |||||||||||||||||||
06/30/2012 | 10.64 | 0.17 | (0.63 | ) | (0.46 | ) | (0.06 | ) | (0.03 | ) | (0.09 | ) | ||||||||||||||||
06/30/2011 | 9.23 | 0.18 | 1.34 | 1.52 | (0.09 | ) | (0.02 | ) | (0.11 | ) | ||||||||||||||||||
04/14/2010 - 06/30/2010 | 10.00 | 0.07 | (0.84 | ) | (0.77 | ) | 0.00 | 0.00 | 0.00 | |||||||||||||||||||
| Class D | ||||||||||||||||||||||||||||
07/01/2012 - 12/31/2012+ | 10.05 | 0.08 | 0.46 | 0.54 | (0.29 | ) | 0.00 | (0.29 | ) | |||||||||||||||||||
06/30/2012 | 10.61 | 0.13 | (0.61 | ) | (0.48 | ) | (0.05 | ) | (0.03 | ) | (0.08 | ) | ||||||||||||||||
06/30/2011 | 9.21 | 0.16 | 1.34 | 1.50 | (0.08 | ) | (0.02 | ) | (0.10 | ) | ||||||||||||||||||
04/14/2010 - 06/30/2010 | 10.00 | 0.06 | (0.85 | ) | (0.79 | ) | 0.00 | 0.00 | 0.00 | |||||||||||||||||||
| Class A | ||||||||||||||||||||||||||||
07/01/2012 - 12/31/2012+ | 10.08 | 0.08 | 0.46 | 0.54 | (0.28 | ) | 0.00 | (0.28 | ) | |||||||||||||||||||
06/30/2012 | 10.64 | 0.14 | (0.62 | ) | (0.48 | ) | (0.05 | ) | (0.03 | ) | (0.08 | ) | ||||||||||||||||
06/30/2011 | 9.22 | 0.17 | 1.33 | 1.50 | (0.06 | ) | (0.02 | ) | (0.08 | ) | ||||||||||||||||||
04/14/2010 - 06/30/2010 | 10.00 | 0.07 | (0.85 | ) | (0.78 | ) | 0.00 | 0.00 | 0.00 | |||||||||||||||||||
| Class C | ||||||||||||||||||||||||||||
07/01/2012 - 12/31/2012+ | 9.96 | 0.03 | 0.46 | 0.49 | (0.24 | ) | 0.00 | (0.24 | ) | |||||||||||||||||||
06/30/2012 | 10.55 | 0.06 | (0.61 | ) | (0.55 | ) | (0.01 | ) | (0.03 | ) | (0.04 | ) | ||||||||||||||||
06/30/2011 | 9.21 | 0.11 | 1.31 | 1.42 | (0.06 | ) | (0.02 | ) | (0.08 | ) | ||||||||||||||||||
04/14/2010 - 06/30/2010 | 10.00 | 0.05 | (0.84 | ) | (0.79 | ) | 0.00 | 0.00 | 0.00 | |||||||||||||||||||
| Class R | ||||||||||||||||||||||||||||
07/01/2012 - 12/31/2012+ | 10.00 | 0.06 | 0.47 | 0.53 | (0.28 | ) | 0.00 | (0.28 | ) | |||||||||||||||||||
06/30/2012 | 10.59 | 0.07 | (0.59 | ) | (0.52 | ) | (0.04 | ) | (0.03 | ) | (0.07 | ) | ||||||||||||||||
06/30/2011 | 9.21 | 0.12 | 1.35 | 1.47 | (0.07 | ) | (0.02 | ) | (0.09 | ) | ||||||||||||||||||
04/14/2010 - 06/30/2010 | 10.00 | 0.06 | (0.85 | ) | (0.79 | ) | 0.00 | 0.00 | 0.00 | |||||||||||||||||||
| + | Unaudited |
| * | Annualized |
| ** | The ratio excludes PIMCO Short-Term Floating NAV Portfolio. |
| 34 | PIMCO EQUITY SERIES | See Accompanying Notes |
Table of Contents
(Unaudited)
| Net Asset Value End of Year or Period | Total Return | Net Assets End of Year or Period (000s) | Ratio of Expenses to Average Net Assets | Ratio of Expenses to Average Net Assets Excluding Waivers | Ratio of Expenses to Average Net Asset Excluding Interest Expense and Dividends on Securities Sold Short | Ratio of Expenses to Average Net Asset Excluding Interest Expense and Dividends on Securities Sold Short and Waivers | Ratio of Net Investment Income (Loss) to Average Net Assets | Portfolio Turnover Rate** | ||||||||||||||||||||||||||
| $ | 9.24 | 9.62 | % | $ | 27 | 1.01 | %* | 1.95 | %* | 1.01 | %* | 1.95 | %* | 6.43 | %* | 38 | % | |||||||||||||||||
| 8.68 | (11.98 | ) | 9 | 1.13 | 1.98 | 1.13 | 1.98 | 0.99 | 41 | |||||||||||||||||||||||||
| 9.88 | (1.20 | ) | 10 | 1.13 | * | 6.40 | * | 1.13 | * | 6.40 | * | 0.50 | * | 0 | ||||||||||||||||||||
| $ | 10.37 | 5.60 | % | $ | 2,037,175 | 0.90 | %* | 1.09 | %* | 0.89 | %* | 1.08 | %* | 1.79 | %* | 14 | % | |||||||||||||||||
| 10.11 | (4.09 | ) | 1,930,637 | 0.92 | 1.09 | 0.90 | 1.07 | 1.80 | 32 | |||||||||||||||||||||||||
| 10.65 | 16.68 | 1,338,509 | 0.92 | 1.10 | 0.89 | 1.07 | 1.87 | 35 | ||||||||||||||||||||||||||
| 9.23 | (7.70 | ) | 542,879 | 0.98 | * | 1.21 | * | 0.89 | * | 1.12 | * | 3.53 | * | 4 | ||||||||||||||||||||
| 10.35 | 5.53 | 55,472 | 1.00 | * | 1.19 | * | 0.99 | * | 1.18 | * | 1.66 | * | 14 | |||||||||||||||||||||
| 10.09 | (4.23 | ) | 67,977 | 1.02 | 1.19 | 1.00 | 1.17 | 1.70 | 32 | |||||||||||||||||||||||||
| 10.64 | 16.55 | 45,785 | 1.02 | 1.20 | 0.99 | 1.17 | 1.72 | 35 | ||||||||||||||||||||||||||
| 9.23 | (7.70 | ) | 970 | 1.08 | * | 1.31 | * | 0.99 | * | 1.22 | * | 3.36 | * | 4 | ||||||||||||||||||||
| 10.30 | 5.39 | 22,875 | 1.25 | * | 1.44 | * | 1.24 | * | 1.43 | * | 1.45 | * | 14 | |||||||||||||||||||||
| 10.05 | (4.52 | ) | 18,469 | 1.27 | 1.45 | 1.26 | 1.42 | 1.33 | 32 | |||||||||||||||||||||||||
| 10.61 | 16.39 | 24,352 | 1.27 | 1.45 | 1.24 | 1.42 | 1.55 | 35 | ||||||||||||||||||||||||||
| 9.21 | (7.90 | ) | 7,084 | 1.33 | * | 1.56 | * | 1.24 | * | 1.47 | * | 3.13 | * | 4 | ||||||||||||||||||||
| 10.34 | 5.40 | 59,945 | 1.25 | * | 1.44 | * | 1.24 | * | 1.43 | * | 1.43 | * | 14 | |||||||||||||||||||||
| 10.08 | (4.50 | ) | 69,910 | 1.27 | 1.43 | 1.26 | 1.42 | 1.37 | 32 | |||||||||||||||||||||||||
| 10.64 | 16.30 | 89,571 | 1.27 | 1.45 | 1.24 | 1.42 | 1.64 | 35 | ||||||||||||||||||||||||||
| 9.22 | (7.80 | ) | 15,436 | 1.33 | * | 1.56 | * | 1.24 | * | 1.47 | * | 3.28 | * | 4 | ||||||||||||||||||||
| 10.21 | 4.94 | 39,644 | 2.00 | * | 2.19 | * | 1.99 | * | 2.18 | * | 0.65 | * | 14 | |||||||||||||||||||||
| 9.96 | (5.15 | ) | 47,006 | 2.02 | 2.21 | 2.00 | 2.17 | 0.65 | 32 | |||||||||||||||||||||||||
| 10.55 | 15.50 | 50,672 | 2.02 | 2.20 | 1.99 | 2.17 | 1.04 | 35 | ||||||||||||||||||||||||||
| 9.21 | (7.90 | ) | 6,668 | 2.08 | * | 2.31 | * | 1.99 | * | 2.22 | * | 2.43 | * | 4 | ||||||||||||||||||||
| 10.25 | 5.27 | 12 | 1.50 | * | 1.69 | * | 1.49 | * | 1.68 | * | 1.13 | * | 14 | |||||||||||||||||||||
| 10.00 | (4.86 | ) | 11 | 1.52 | 1.67 | 1.51 | 1.66 | 0.71 | 32 | |||||||||||||||||||||||||
| 10.59 | 16.02 | 102 | 1.52 | 1.70 | 1.49 | 1.67 | 1.21 | 35 | ||||||||||||||||||||||||||
| 9.21 | (7.90 | ) | 9 | 1.58 | * | 1.81 | * | 1.49 | * | 1.72 | * | 2.91 | * | 4 | ||||||||||||||||||||
| ^ | Reflects an amount rounding to less than one cent. |
| (a) | Per share amounts based on average number of shares outstanding during the year or period. |
| SEMIANNUAL REPORT | DECEMBER 31, 2012 | 35 |
Table of Contents
Statements of Assets and Liabilities
| (Amounts in thousands, except per share amounts) | PIMCO Dividend and Income Builder Fund | PIMCO EqS® Dividend Fund | PIMCO EqS® Emerging Markets Fund | PIMCO EqS® Long/Short Fund | ||||||||||||
Assets: | ||||||||||||||||
Investments, at value | $ | 112,625 | $ | 364,684 | $ | 566,946 | $ | 209,005 | ||||||||
Investments in Affiliates, at value | 4,315 | 6,533 | 34,545 | 71,635 | ||||||||||||
Repurchase agreements, at value | 3,507 | 524 | 601 | 507 | ||||||||||||
Cash | 100 | 0 | 0 | 0 | ||||||||||||
Deposits with counterparty | 77 | 0 | 0 | 11,708 | ||||||||||||
Foreign currency, at value | 309 | 777 | 2,101 | 52 | ||||||||||||
Receivable for investments sold | 3 | 6 | 1,755 | 3,523 | ||||||||||||
Unrealized appreciation on foreign currency contracts | 227 | 1,187 | 5,148 | 0 | ||||||||||||
Unrealized appreciation on OTC swap agreements | 0 | 0 | 930 | 0 | ||||||||||||
Receivable for Fund shares sold | 1,415 | 3,697 | 226 | 73 | ||||||||||||
Interest and dividends receivable | 344 | 507 | 435 | 216 | ||||||||||||
Dividends receivable from Affiliates | 2 | 2 | 14 | 26 | ||||||||||||
| 122,924 | 377,917 | 612,701 | 296,745 | |||||||||||||
Liabilities: | ||||||||||||||||
Payable for investments purchased | $ | 2,570 | $ | 0 | $ | 0 | $ | 8,574 | ||||||||
Payable for investments in Affiliates purchased | 2 | 2 | 14 | 26 | ||||||||||||
Payable for short sales | 0 | 0 | 0 | 14,999 | ||||||||||||
Written options outstanding | 0 | 0 | 13 | 0 | ||||||||||||
OTC swap premiums received | 0 | 0 | 25 | 0 | ||||||||||||
Variation margin payable on financial derivative instruments | 19 | 0 | 0 | 0 | ||||||||||||
Unrealized depreciation on foreign currency contracts | 999 | 4,700 | 6,260 | 69 | ||||||||||||
Unrealized depreciation on OTC swap agreements | 0 | 0 | 84 | 0 | ||||||||||||
Deposits from counterparty | 0 | 0 | 4,815 | 0 | ||||||||||||
Payable for Fund shares redeemed | 252 | 28 | 12 | 1,371 | ||||||||||||
Dividends payable | 144 | 4 | 0 | 0 | ||||||||||||
Overdraft due to custodian | 0 | 83 | 0 | 0 | ||||||||||||
Accrued investment advisory fees | 47 | 157 | 386 | 212 | ||||||||||||
Accrued supervisory and administrative fees | 33 | 90 | 218 | 101 | ||||||||||||
Accrued distribution fees | 13 | 3 | 1 | 1 | ||||||||||||
Accrued servicing fees | 9 | 2 | 1 | 1 | ||||||||||||
Accrued taxes payable | 0 | 0 | 175 | 0 | ||||||||||||
Reimbursement to PIMCO | 2 | 8 | 14 | 6 | ||||||||||||
Other liabilities | 0 | 0 | 17 | 69 | ||||||||||||
| 4,090 | 5,077 | 12,035 | 25,429 | |||||||||||||
Net Assets | $ | 118,834 | $ | 372,840 | $ | 600,666 | $ | 271,316 | ||||||||
Net Assets Consist of: | ||||||||||||||||
Paid in capital | $ | 114,150 | $ | 348,933 | $ | 648,405 | $ | 284,477 | ||||||||
(Overdistributed) net investment income | (38 | ) | (23 | ) | (4,527 | ) | (181 | ) | ||||||||
Accumulated undistributed net realized (loss) | (1,473 | ) | (4,997 | ) | (78,515 | ) | (17,073 | ) | ||||||||
Net unrealized appreciation | 6,195 | 28,927 | 35,303 | 4,093 | ||||||||||||
| $ | 118,834 | $ | 372,840 | $ | 600,666 | $ | 271,316 | |||||||||
| 36 | PIMCO EQUITY SERIES | See Accompanying Notes |
Table of Contents
December 31, 2012 (Unaudited)
| PIMCO Dividend and Income Builder Fund | PIMCO EqS® Dividend Fund | PIMCO EqS® Emerging Markets Fund | PIMCO EqS® Long/Short Fund | |||||||||||||
Net Assets: | ||||||||||||||||
Institutional Class | $ | 30,667 | $ | 356,521 | $ | 594,643 | $ | 261,808 | ||||||||
Class P | 23,477 | 1,000 | 215 | 2,042 | ||||||||||||
Administrative Class | NA | NA | 46 | NA | ||||||||||||
Class D | 13,659 | 4,245 | 1,155 | 770 | ||||||||||||
Class A | 32,667 | 7,835 | 3,644 | 4,990 | ||||||||||||
Class C | 18,160 | 3,227 | 936 | 1,706 | ||||||||||||
Class R | 204 | 12 | 27 | NA | ||||||||||||
Shares Issued and Outstanding: | ||||||||||||||||
Institutional Class | 2,738 | 31,887 | 67,033 | 27,913 | ||||||||||||
Class P | 2,095 | 89 | 24 | 218 | ||||||||||||
Administrative Class | NA | NA | 5 | NA | ||||||||||||
Class D | 1,219 | 380 | 131 | 82 | ||||||||||||
Class A | 2,917 | 700 | 413 | 533 | ||||||||||||
Class C | 1,623 | 289 | 107 | 183 | ||||||||||||
Class R | 18 | 1 | 3 | NA | ||||||||||||
Net Asset Value and Redemption Price* Per Share Outstanding: | ||||||||||||||||
Institutional Class | $ | 11.20 | $ | 11.18 | $ | 8.87 | $ | 9.38 | ||||||||
Class P | 11.21 | 11.19 | 8.86 | 9.37 | ||||||||||||
Administrative Class | NA | NA | 8.85 | NA | ||||||||||||
Class D | 11.20 | 11.19 | 8.82 | 9.37 | ||||||||||||
Class A | 11.20 | 11.19 | 8.83 | 9.36 | ||||||||||||
Class C | 11.19 | 11.16 | 8.76 | 9.33 | ||||||||||||
Class R | 11.20 | 11.18 | 8.82 | NA | ||||||||||||
Cost of Investments | $ | 105,581 | $ | 332,246 | $ | 532,587 | $ | 203,880 | ||||||||
Cost of Investments in Affiliates | $ | 4,315 | $ | 6,539 | $ | 34,561 | $ | 71,738 | ||||||||
Cost of Repurchase Agreements | $ | 3,507 | $ | 524 | $ | 601 | $ | 507 | ||||||||
Cost of Foreign Currency Held | $ | 309 | $ | 774 | $ | 2,087 | $ | 51 | ||||||||
Proceeds Received on Short Sales | $ | 0 | $ | 0 | $ | 0 | $ | 14,157 | ||||||||
Premiums Received on Written Options | $ | 0 | $ | 0 | $ | 1,400 | $ | 0 | ||||||||
| * | With respect to the A and C Classes, the redemption price varies by the length of time the shares are held. |
| SEMIANNUAL REPORT | DECEMBER 31, 2012 | 37 |
Table of Contents
Consolidated Statements of Assets and Liabilities
| (Amounts in thousands, except per share amounts) | PIMCO Emerging Multi-Asset Fund | PIMCO EqS Pathfinder Fund® | ||||||
Assets: | ||||||||
Investments, at value | $ | 792 | $ | 2,098,512 | ||||
Investments in Affiliates, at value | 47,797 | 131,292 | ||||||
Repurchase agreements, at value | 0 | 604 | ||||||
Cash | 66 | 8 | ||||||
Deposits with counterparty | 10 | 22,627 | ||||||
Foreign currency, at value | 1 | 92 | ||||||
Receivable for investments sold | 0 | 4,486 | ||||||
OTC swap premiums paid | 1 | 0 | ||||||
Unrealized appreciation on foreign currency contracts | 122 | 5,525 | ||||||
Unrealized appreciation on OTC swap agreements | 238 | 40 | ||||||
Receivable for Fund shares sold | 442 | 1,440 | ||||||
Interest and dividends receivable | 0 | 3,806 | ||||||
Dividends receivable from Affiliates | 93 | 42 | ||||||
| 49,562 | 2,268,474 | |||||||
Liabilities: | ||||||||
Payable for investments purchased | $ | 22 | $ | 5,133 | ||||
Payable for investments in Affiliates purchased | 92 | 42 | ||||||
Payable for short sales | 0 | 22,467 | ||||||
Written options outstanding | 221 | 6 | ||||||
OTC swap premiums received | 5 | 0 | ||||||
Unrealized depreciation on foreign currency contracts | 88 | 22,849 | ||||||
Unrealized depreciation on OTC swap agreements | 0 | 142 | ||||||
Deposits from counterparty | 0 | 555 | ||||||
Payable for Fund shares redeemed | 246 | 387 | ||||||
Accrued investment advisory fees | 0 | 1,103 | ||||||
Accrued supervisory and administrative fees | 8 | 572 | ||||||
Accrued distribution fees | 3 | 29 | ||||||
Accrued servicing fees | 3 | 21 | ||||||
Reimbursement to PIMCO | 1 | 6 | ||||||
Other liabilities | 0 | 39 | ||||||
| 689 | 53,351 | |||||||
Net Assets | $ | 48,873 | $ | 2,215,123 | ||||
Net Assets Consist of: | ||||||||
Paid in capital | $ | 49,286 | $ | 2,120,190 | ||||
Undistributed (overdistributed) net investment income | (217 | ) | 13,463 | |||||
Accumulated undistributed net realized (loss) | (1,039 | ) | (79,662 | ) | ||||
Net unrealized appreciation | 843 | 161,132 | ||||||
| $ | 48,873 | $ | 2,215,123 | |||||
| 38 | PIMCO EQUITY SERIES | See Accompanying Notes |
Table of Contents
December 31, 2012 (Unaudited)
| PIMCO Emerging Multi-Asset Fund | PIMCO EqS Pathfinder Fund® | |||||||
Net Assets: | ||||||||
Institutional Class | $ | 27,146 | $ | 2,037,175 | ||||
Class P | 1,754 | 55,472 | ||||||
Administrative Class | 76 | NA | ||||||
Class D | 3,073 | 22,875 | ||||||
Class A | 12,415 | 59,945 | ||||||
Class C | 4,382 | 39,644 | ||||||
Class R | 27 | 12 | ||||||
Shares Issued and Outstanding: | ||||||||
Institutional Class | 2,917 | 196,537 | ||||||
Class P | 189 | 5,361 | ||||||
Administrative Class | 8 | NA | ||||||
Class D | 331 | 2,220 | ||||||
Class A | 1,339 | 5,796 | ||||||
Class C | 476 | 3,882 | ||||||
Class R | 3 | 1 | ||||||
Net Asset Value and Redemption Price* Per Share Outstanding: | ||||||||
Institutional Class | $ | 9.31 | $ | 10.37 | ||||
Class P | 9.29 | 10.35 | ||||||
Administrative Class | 9.27 | NA | ||||||
Class D | 9.30 | 10.30 | ||||||
Class A | 9.27 | 10.34 | ||||||
Class C | 9.21 | 10.21 | ||||||
Class R | 9.24 | 10.25 | ||||||
Cost of Investments | $ | 1,029 | $ | 1,919,296 | ||||
Cost of Investments in Affiliates | $ | 47,154 | $ | 131,445 | ||||
Cost of Repurchase Agreements | $ | 0 | $ | 604 | ||||
Cost of Foreign Currency Held | $ | 1 | $ | 87 | ||||
Proceeds Received on Short Sales | $ | 0 | $ | 22,011 | ||||
Premiums Received on Written Options | $ | 386 | $ | 6 | ||||
| * | With respect to the A and C Classes, the redemption price varies by the length of time the shares are held. |
| SEMIANNUAL REPORT | DECEMBER 31, 2012 | 39 |
Table of Contents
| Period Ended December 31, 2012 (Unaudited) | ||||||||||||||||
| PIMCO Dividend and Income Builder Fund | PIMCO EqS® Dividend Fund | PIMCO EqS® Emerging Markets Fund | PIMCO EqS® Long/Short Fund | |||||||||||||
Investment Income: | ||||||||||||||||
Interest | $ | 362 | $ | 1 | $ | 7 | $ | 68 | ||||||||
Dividends, net of foreign taxes* | 1,048 | 5,952 | 4,548 | 3,461 | ||||||||||||
Dividends from Affiliate investments | 8 | 17 | 147 | 209 | ||||||||||||
Miscellaneous income | 0 | 0 | 0 | 3 | ||||||||||||
Total Income | 1,418 | 5,970 | 4,702 | 3,741 | ||||||||||||
Expenses: | ||||||||||||||||
Investment advisory fees | 263 | 1,201 | 2,810 | 1,318 | ||||||||||||
Supervisory and administrative fees | 145 | 528 | 1,267 | 573 | ||||||||||||
Distribution and/or servicing fees - Class D | 14 | 4 | 1 | 1 | ||||||||||||
Distribution fees - Class C | 50 | 9 | 3 | 4 | ||||||||||||
Servicing fees - Class A | 26 | 6 | 4 | 5 | ||||||||||||
Servicing fees - Class C | 17 | 3 | 1 | 1 | ||||||||||||
Dividends on short sales | 0 | 0 | 0 | 495 | ||||||||||||
Interest expense | 0 | 1 | 7 | 250 | ||||||||||||
Miscellaneous expense | 2 | 9 | 22 | 6 | ||||||||||||
Total Expenses | 517 | 1,761 | 4,115 | 2,653 | ||||||||||||
Waiver and/or Reimbursement by PIMCO | (61 | ) | (279 | ) | (562 | ) | (114 | ) | ||||||||
Net Expenses | 456 | 1,482 | 3,553 | 2,539 | ||||||||||||
Net Investment Income | 962 | 4,488 | 1,149 | 1,202 | ||||||||||||
Net Realized and Unrealized Gain (Loss): | ||||||||||||||||
Net realized (loss) on investments | (1,126 | ) | (3,999 | ) | (24,289 | ) | (7,968 | ) | ||||||||
Net realized (loss) on Affiliate investments | (5 | ) | (4 | ) | (30 | ) | (3 | ) | ||||||||
Net capital gain distributions received from Affiliate investments | 0 | 1 | 3 | 7 | ||||||||||||
Net realized (loss) on futures contracts | (86 | ) | 0 | (86 | ) | 0 | ||||||||||
Net realized gain on written options | 0 | 0 | 1,651 | 0 | ||||||||||||
Net realized gain on swaps | 0 | 0 | 6,399 | 0 | ||||||||||||
Net realized gain (loss) on short sales | 0 | 0 | 0 | (3,249 | ) | |||||||||||
Net realized (loss) on foreign currency transactions | (335 | ) | (2,612 | ) | (116 | ) | (209 | ) | ||||||||
Net change in unrealized appreciation on investments | 7,389 | 32,234 | 79,188 | 2,263 | ||||||||||||
Net change in unrealized appreciation (depreciation) on Affiliate investments | 0 | (5 | ) | (11 | ) | (96 | ) | |||||||||
Net change in unrealized (depreciation) on futures contracts | (58 | ) | 0 | 0 | 0 | |||||||||||
Net change in unrealized appreciation on written options | 0 | 0 | 672 | 0 | ||||||||||||
Net change in unrealized (depreciation) on swaps | 0 | 0 | (477 | ) | 0 | |||||||||||
Net change in unrealized (depreciation) on short sales | 0 | 0 | 0 | (286 | ) | |||||||||||
Net change in unrealized appreciation (depreciation) on translation of assets and liabilities denominated in foreign currencies | (708 | ) | (2,436 | ) | 2,039 | (111 | ) | |||||||||
Net Gain (Loss) | 5,071 | 23,179 | 64,943 | (9,652 | ) | |||||||||||
Net Increase (Decrease) in Net Assets Resulting from Operations | $ | 6,033 | $ | 27,667 | $ | 66,092 | $ | (8,450 | ) | |||||||
* Foreign tax withholdings - Dividends | $ | 66 | $ | 364 | $ | 476 | $ | 0 | ||||||||
| 40 | PIMCO EQUITY SERIES | See Accompanying Notes |
Table of Contents
Consolidated Statements of Operations
| Period Ended December 31, 2012 (Unaudited) | ||||||||
| PIMCO Emerging Multi-Asset Fund | PIMCO EqS Pathfinder Fund® | |||||||
Investment Income: | ||||||||
Interest | $ | 0 | $ | 4 | ||||
Dividends, net of foreign taxes* | 46 | 29,313 | ||||||
Dividends from Affiliate investments | 1,036 | 479 | ||||||
Miscellaneous income | 0 | 1 | ||||||
Total Income | 1,082 | 29,797 | ||||||
Expenses: | ||||||||
Investment advisory fees | 228 | 8,502 | ||||||
Supervisory and administrative fees | 124 | 3,498 | ||||||
Distribution and/or servicing fees - Class D | 4 | 26 | ||||||
Distribution fees - Class C | 15 | 166 | ||||||
Servicing fees - Class A | 15 | 84 | ||||||
Servicing fees - Class C | 5 | 56 | ||||||
Dividends on short sales | 0 | 60 | ||||||
Interest expense | 0 | 18 | ||||||
Miscellaneous expense | 1 | 55 | ||||||
Total Expenses | 392 | 12,465 | ||||||
Waiver and/or Reimbursement by PIMCO | (239 | ) | (2,066 | ) | ||||
Net Expenses | 153 | 10,399 | ||||||
Net Investment Income | 929 | 19,398 | ||||||
Net Realized and Unrealized Gain (Loss): | ||||||||
Net realized (loss) on investments | (609 | ) | (48,631 | ) | ||||
Net realized (loss) on Affiliate investments | (132 | ) | (14 | ) | ||||
Net capital gain distributions received from Affiliate investments | 9 | 13 | ||||||
Net realized gain on written options | 448 | 4,429 | ||||||
Net realized gain (loss) on swaps | (2 | ) | 461 | |||||
Net realized (loss) on short sales | 0 | (92 | ) | |||||
Net realized (loss) on foreign currency transactions | (5 | ) | (5,574 | ) | ||||
Net change in unrealized appreciation (depreciation) on investments | (140 | ) | 172,375 | |||||
Net change in unrealized appreciation (depreciation) on Affiliate investments | 3,710 | (144 | ) | |||||
Net change in unrealized appreciation (depreciation) on written options | 180 | (3,594 | ) | |||||
Net change in unrealized appreciation (depreciation) on swaps | 192 | (406 | ) | |||||
Net change in unrealized (depreciation) on short sales | 0 | (395 | ) | |||||
Net change in unrealized appreciation (depreciation) on translation of assets and liabilities denominated in foreign currencies | 57 | (19,402 | ) | |||||
Net Gain | 3,708 | 99,026 | ||||||
Net Increase in Net Assets Resulting from Operations | $ | 4,637 | $ | 118,424 | ||||
* Foreign tax withholdings - Dividends | $ | 0 | $ | 820 | ||||
| SEMIANNUAL REPORT | DECEMBER 31, 2012 | 41 |
Table of Contents
Statements of Changes in Net Assets
| PIMCO Dividend and Income Builder Fund | PIMCO EqS® Dividend Fund | PIMCO EqS® Emerging Markets Fund | PIMCO EqS® Long/Short Fund | |||||||||||||||||||||||||||||
| (Amounts in thousands) | Six Months Ended December 31, 2012 (Unaudited) | Period from December 14, 2011 to June 30, 2012 | Six Months Ended December 31, 2012 (Unaudited) | Period from December 14, 2011 to June 30, 2012 | Six Months Ended December 31, 2012 (Unaudited) | Year Ended June 30, 2012 | Six Months Ended December 31, 2012 (Unaudited) | Period from | ||||||||||||||||||||||||
Increase in Net Assets from: | ||||||||||||||||||||||||||||||||
Operations: | ||||||||||||||||||||||||||||||||
Net investment income (loss) | $ | 962 | $ | 590 | $ | 4,488 | $ | 3,537 | $ | 1,149 | $ | 4,368 | $ | 1,202 | $ | (396 | ) | |||||||||||||||
Net realized gain (loss) | (1,547 | ) | 404 | (6,611 | ) | 2,518 | (16,441 | ) | (62,201 | ) | (11,426 | ) | (5,107 | ) | ||||||||||||||||||
Net realized gain (loss) | (5 | ) | 0 | (4 | ) | 8 | (30 | ) | 32 | (3 | ) | 0 | ||||||||||||||||||||
Net capital gain distributions received | 0 | 0 | 1 | 0 | 3 | 1 | 7 | 0 | ||||||||||||||||||||||||
Net change in unrealized | 6,623 | (428 | ) | 29,798 | (865 | ) | 81,422 | (35,695 | ) | 1,866 | 2,330 | |||||||||||||||||||||
Net change in unrealized | 0 | 0 | (5 | ) | (1 | ) | (11 | ) | 1 | (96 | ) | (7 | ) | |||||||||||||||||||
Net increase (decrease) | 6,033 | 566 | 27,667 | 5,197 | 66,092 | (93,494 | ) | (8,450 | ) | (3,180 | ) | |||||||||||||||||||||
Distributions to Shareholders: | ||||||||||||||||||||||||||||||||
From net investment income | ||||||||||||||||||||||||||||||||
Institutional Class | (223 | ) | (250 | ) | (4,388 | ) | (3,523 | ) | (5,839 | ) | (1,138 | ) | (1,029 | ) | 0 | |||||||||||||||||
Class P | (250 | ) | (87 | ) | (3 | ) | (1 | ) | (2 | ) | (0 | )^ | (9 | ) | 0 | |||||||||||||||||
Administrative Class | 0 | 0 | 0 | 0 | (0 | )^ | (0 | )^ | 0 | 0 | ||||||||||||||||||||||
Class D | (164 | ) | (32 | ) | (36 | ) | (9 | ) | (10 | ) | (14 | ) | (2 | ) | 0 | |||||||||||||||||
Class A | (298 | ) | (160 | ) | (58 | ) | (32 | ) | (33 | ) | (0 | )^ | (15 | ) | 0 | |||||||||||||||||
Class C | (149 | ) | (68 | ) | (18 | ) | (13 | ) | (6 | ) | (0 | )^ | (2 | ) | 0 | |||||||||||||||||
Class R | (4 | ) | (7 | ) | (0 | )^ | (0 | )^ | (0 | )^ | (0 | )^ | 0 | 0 | ||||||||||||||||||
From net realized capital gains | ||||||||||||||||||||||||||||||||
Institutional Class | (52 | ) | 0 | (839 | ) | 0 | 0 | (468 | ) | 0 | 0 | |||||||||||||||||||||
Class P | (48 | ) | 0 | (2 | ) | 0 | 0 | (0 | )^ | 0 | 0 | |||||||||||||||||||||
Administrative Class | 0 | 0 | 0 | 0 | 0 | (0 | )^ | 0 | 0 | |||||||||||||||||||||||
Class D | (28 | ) | 0 | (9 | ) | 0 | 0 | (7 | ) | 0 | 0 | |||||||||||||||||||||
Class A | (60 | ) | 0 | (18 | ) | 0 | 0 | (1 | ) | 0 | 0 | |||||||||||||||||||||
Class C | (36 | ) | 0 | (7 | ) | 0 | 0 | (0 | )^ | 0 | 0 | |||||||||||||||||||||
Class R | (0 | )^ | 0 | (0 | )^ | 0 | 0 | (0 | )^ | 0 | 0 | |||||||||||||||||||||
Total Distributions | (1,312 | ) | (604 | ) | (5,378 | ) | (3,578 | ) | (5,890 | ) | (1,628 | ) | (1,057 | ) | 0 | |||||||||||||||||
Portfolio Share Transactions: | ||||||||||||||||||||||||||||||||
Net increase resulting from Fund share transactions** | 70,701 | 43,450 | 29,901 | 319,031 | 21,326 | 259,133 | 67,201 | 216,802 | ||||||||||||||||||||||||
Total Increase in Net Assets | 75,422 | 43,412 | 52,190 | 320,650 | 81,528 | 164,011 | 57,694 | 213,622 | ||||||||||||||||||||||||
Net Assets: | ||||||||||||||||||||||||||||||||
Beginning of period | 43,412 | 0 | 320,650 | 0 | 519,138 | 355,127 | 213,622 | 0 | ||||||||||||||||||||||||
End of period* | $ | 118,834 | $ | 43,412 | $ | 372,840 | $ | 320,650 | $ | 600,666 | $ | 519,138 | $ | 271,316 | $ | 213,622 | ||||||||||||||||
*Including undistributed (overdistributed) net investment income of: | $ | (38 | ) | $ | 88 | $ | (23 | ) | $ | (8 | ) | $ | (4,527 | ) | $ | 214 | $ | (181 | ) | $ | (326 | ) | ||||||||||
| ** | See Note 13 in the Notes to Financial Statements. |
| ^ | Amount is less than $500. |
| 42 | PIMCO EQUITY SERIES | See Accompanying Notes |
Table of Contents
Consolidated Statements of Changes in Net Assets
| PIMCO Emerging Multi-Asset Fund | PIMCO EqS Pathfinder Fund® | |||||||||||||||
| (Amounts in thousands) | Six Months Ended December 31, 2012 (Unaudited) | Year Ended June 30, 2012 | Six Months Ended | Year Ended June 30, 2012 | ||||||||||||
Increase (Decrease) in Net Assets from: | ||||||||||||||||
Operations: | ||||||||||||||||
Net investment income | $ | 929 | $ | 557 | $ | 19,398 | $ | 35,581 | ||||||||
Net realized gain (loss) | (168 | ) | (730 | ) | (49,407 | ) | 8,144 | |||||||||
Net realized (loss) on Affiliate investments | (132 | ) | (208 | ) | (14 | ) | (1 | ) | ||||||||
Net capital gain distributions received from Affiliate investments | 9 | 2 | 13 | 1 | ||||||||||||
Net change in unrealized appreciation (depreciation) | 289 | (9 | ) | 148,578 | (84,207 | ) | ||||||||||
Net change in unrealized appreciation (depreciation) on Affiliate investments | 3,710 | (2,951 | ) | (144 | ) | 3 | ||||||||||
Net increase (decrease) resulting from operations | 4,637 | (3,339 | ) | 118,424 | (40,479 | ) | ||||||||||
Distributions to Shareholders: | ||||||||||||||||
From net investment income | ||||||||||||||||
Institutional Class | (773 | ) | (105 | ) | (58,239 | ) | (13,284 | ) | ||||||||
Class P | (47 | ) | (56 | ) | (1,444 | ) | (693 | ) | ||||||||
Administrative Class | (2 | ) | 0 | 0 | 0 | |||||||||||
Class D | (84 | ) | (8 | ) | (632 | ) | (95 | ) | ||||||||
Class A | (327 | ) | (27 | ) | (1,599 | ) | (350 | ) | ||||||||
Class C | (104 | ) | (5 | ) | (920 | ) | (67 | ) | ||||||||
Class R | (1 | ) | 0 | (0 | )^ | (0 | )^ | |||||||||
From net realized capital gains | ||||||||||||||||
Institutional Class | 0 | 0 | 0 | (5,792 | ) | |||||||||||
Class P | 0 | 0 | 0 | (338 | ) | |||||||||||
Administrative Class | 0 | 0 | 0 | 0 | ||||||||||||
Class D | 0 | 0 | 0 | (66 | ) | |||||||||||
Class A | 0 | 0 | 0 | (241 | ) | |||||||||||
Class C | 0 | 0 | 0 | (151 | ) | |||||||||||
Class R | 0 | 0 | 0 | (0 | )^ | |||||||||||
Total Distributions | (1,338 | ) | (201 | ) | (62,834 | ) | (21,077 | ) | ||||||||
Portfolio Share Transactions: | ||||||||||||||||
Net increase (decrease) resulting from Fund share transactions** | (5,396 | ) | 39,466 | 25,523 | 646,575 | |||||||||||
Total Increase (Decrease) in Net Assets | (2,097 | ) | 35,926 | 81,113 | 585,019 | |||||||||||
Net Assets: | ||||||||||||||||
Beginning of period | 50,970 | 15,044 | 2,134,010 | 1,548,991 | ||||||||||||
End of period* | $ | 48,873 | $ | 50,970 | $ | 2,215,123 | $ | 2,134,010 | ||||||||
*Including undistributed (overdistributed) net investment income of: | $ | (217 | ) | $ | 192 | $ | 13,463 | $ | 56,899 | |||||||
| ** | See Note 13 in the Notes to Financial Statements. |
| ^ | Amount is less than $500. |
| SEMIANNUAL REPORT | DECEMBER 31, 2012 | 43 |
Table of Contents
| Six Months Ended December 31, 2012 (Unaudited) | ||||
| (Amounts in thousands) | PIMCO EqS® Long/Short Fund | |||
Cash flows (used for) operating activities: | ||||
Net (decrease) in net assets resulting from operations | $ | (8,450 | ) | |
Adjustments to reconcile net (decrease) in net assets from operations to net cash used for operating activities: | ||||
Purchases of long-term securities | (439,454 | ) | ||
Proceeds from sales of long-term securities | 364,303 | |||
Purchases of short-term portfolio investments, net | (3,218 | ) | ||
Decrease in deposits with counterparty | 14,403 | |||
Decrease in receivable for investments sold | 7,591 | |||
Increase in interest and dividends receivable | (213 | ) | ||
Decrease in payable for investments purchased | (2,512 | ) | ||
Increase in accrued investment advisory fees | 43 | |||
Increase in accrued supervisory and administrative fees | 21 | |||
Increase in accrued distribution fee | 1 | |||
Increase in accrued servicing fee | 1 | |||
Increase in reimbursement to PIMCO | 4 | |||
Increase in other liabilities | 55 | |||
Payment from currency transactions | (208 | ) | ||
Payment from short sale transactions | (9,505 | ) | ||
Net change in unrealized appreciation on investments | (2,263 | ) | ||
Net change in unrealized (depreciation) on Affiliate investments | 96 | |||
Net change in unrealized (depreciation) on short sales | 286 | |||
Net change in unrealized (depreciation) on translation of assets and liabilities denominated in foreign currencies | 111 | |||
Net realized (loss) on investments and short sales | 11,422 | |||
Net cash (used for) operating activities | (67,486 | ) | ||
Cash flows received from financing activities: | ||||
Proceeds from shares sold | 76,733 | |||
Payment on shares redeemed | (9,195 | ) | ||
Cash dividend paid* | (1 | ) | ||
Net cash received from financing activities | 67,537 | |||
Net Increase in Cash and Foreign Currency | 51 | |||
Cash and Foreign Currency: | ||||
Beginning of year | 1 | |||
End of period | $ | 52 | ||
* Reinvestment of dividends | $ | 1,056 | ||
Supplemental disclosure of cash flow information: | ||||
Interest expense paid during the period | $ | 331 | ||
| 44 | PIMCO EQUITY SERIES | See Accompanying Notes |
Table of Contents
Schedule of Investments PIMCO Dividend and Income Builder Fund
December 31, 2012 (Unaudited)
| PRINCIPAL AMOUNT (000S) | MARKET VALUE (000S) | |||||||||||
| ASSET-BACKED SECURITIES 0.1% | ||||||||||||
| UNITED STATES 0.1% | ||||||||||||
Amortizing Residential Collateral Trust |
| |||||||||||
0.750% due 06/25/2032 | $ | 30 | $ | 25 | ||||||||
Countrywide Asset-Backed Certificates |
| |||||||||||
0.770% due 04/25/2034 | 16 | 15 | ||||||||||
Credit Suisse First Boston Mortgage Securities Corp. |
| |||||||||||
0.830% due 01/25/2032 | 17 | 15 | ||||||||||
EMC Mortgage Loan Trust |
| |||||||||||
0.760% due 11/25/2041 | 16 | 15 | ||||||||||
0.860% due 02/25/2041 | 82 | 74 | ||||||||||
Structured Asset Securities Corp. |
| |||||||||||
0.260% due 02/25/2037 | 5 | 5 | ||||||||||
|
| |||||||||||
Total Asset-Backed Securities (Cost $125) | 149 | |||||||||||
|
| |||||||||||
| SHARES | ||||||||||||
| COMMON STOCKS 82.0% | ||||||||||||
| AUSTRALIA 1.8% | ||||||||||||
| INDUSTRIALS 1.0% | ||||||||||||
Ausdrill Ltd. | 379,360 | 1,133 | ||||||||||
|
| |||||||||||
| MATERIALS 0.8% | ||||||||||||
Kingsgate Consolidated Ltd. | 209,082 | 974 | ||||||||||
|
| |||||||||||
Total Australia | 2,107 | |||||||||||
|
| |||||||||||
| BRAZIL 2.4% | ||||||||||||
| INDUSTRIALS 0.8% | ||||||||||||
Arteris S.A. | 106,300 | 984 | ||||||||||
|
| |||||||||||
| UTILITIES 1.6% | ||||||||||||
Cia de Saneamento Basico do Estado de Sao Paulo SP - ADR | 23,096 | 1,930 | ||||||||||
|
| |||||||||||
Total Brazil | 2,914 | |||||||||||
|
| |||||||||||
| CANADA 2.1% | ||||||||||||
| CONSUMER DISCRETIONARY 2.1% | ||||||||||||
Aimia, Inc. | 163,518 | 2,444 | ||||||||||
|
| |||||||||||
Total Canada | 2,444 | |||||||||||
|
| |||||||||||
| CHINA 1.2% | ||||||||||||
| INDUSTRIALS 1.2% | ||||||||||||
Guangshen Railway Co. Ltd. ‘H’ | 1,236,000 | 496 | ||||||||||
Zhejiang Expressway Co. Ltd. ‘H’ | 1,158,000 | 924 | ||||||||||
|
| |||||||||||
Total China | 1,420 | |||||||||||
|
| |||||||||||
| CYPRUS 1.6% | ||||||||||||
| ENERGY 1.6% | ||||||||||||
ProSafe SE | 221,505 | 1,901 | ||||||||||
|
| |||||||||||
Total Cyprus | 1,901 | |||||||||||
|
| |||||||||||
| FRANCE 4.5% | ||||||||||||
| ENERGY 2.5% | ||||||||||||
Total S.A. | 56,668 | 2,948 | ||||||||||
|
| |||||||||||
| HEALTH CARE 2.0% | ||||||||||||
Sanofi | 25,285 | 2,398 | ||||||||||
|
| |||||||||||
Total France | 5,346 | |||||||||||
|
| |||||||||||
| SHARES | MARKET VALUE (000S) | |||||||||||
| GERMANY 2.0% | ||||||||||||
| TELECOMMUNICATION SERVICES 2.0% | ||||||||||||
Telefonica Deutschland Holding AG (a) | 313,738 | $ | 2,391 | |||||||||
|
| |||||||||||
Total Germany | 2,391 | |||||||||||
|
| |||||||||||
| HONG KONG 2.4% | ||||||||||||
| CONSUMER DISCRETIONARY 0.4% | ||||||||||||
Tianneng Power International Ltd. | 700,000 | 456 | ||||||||||
|
| |||||||||||
| INDUSTRIALS 0.8% | ||||||||||||
Yuexiu Transport Infrastructure Ltd. | 1,968,000 | 970 | ||||||||||
|
| |||||||||||
| MATERIALS 0.8% | ||||||||||||
Huabao International Holdings Ltd. | 1,912,000 | 955 | ||||||||||
|
| |||||||||||
| TELECOMMUNICATION SERVICES 0.4% | ||||||||||||
SmarTone Telecommunications Holdings Ltd. | 238,000 | 436 | ||||||||||
|
| |||||||||||
Total Hong Kong | 2,817 | |||||||||||
|
| |||||||||||
| ITALY 1.2% | ||||||||||||
| INDUSTRIALS 1.2% | ||||||||||||
Societa Iniziative Autostradali e Servizi SpA | 153,507 | 1,438 | ||||||||||
|
| |||||||||||
Total Italy | 1,438 | |||||||||||
|
| |||||||||||
| MACAU 1.2% | ||||||||||||
| CONSUMER DISCRETIONARY 1.2% | ||||||||||||
Wynn Macau Ltd. (a) | 528,400 | 1,455 | ||||||||||
|
| |||||||||||
Total Macau | 1,455 | |||||||||||
|
| |||||||||||
| NETHERLANDS 2.2% | ||||||||||||
| ENERGY 2.2% | ||||||||||||
Royal Dutch Shell PLC ‘A’ | 76,725 | 2,663 | ||||||||||
|
| |||||||||||
Total Netherlands | 2,663 | |||||||||||
|
| |||||||||||
| NORWAY 1.6% | ||||||||||||
| INDUSTRIALS 1.6% | ||||||||||||
Orkla ASA | 219,179 | 1,921 | ||||||||||
|
| |||||||||||
Total Norway | 1,921 | |||||||||||
|
| |||||||||||
| PANAMA 0.8% | ||||||||||||
| INDUSTRIALS 0.8% | ||||||||||||
Copa Holdings S.A. | 9,458 | 941 | ||||||||||
|
| |||||||||||
Total Panama | 941 | |||||||||||
|
| |||||||||||
| QATAR 0.4% | ||||||||||||
| UTILITIES 0.4% | ||||||||||||
Qatar Electricity & Water Co. | 13,103 | 479 | ||||||||||
|
| |||||||||||
Total Qatar | 479 | |||||||||||
|
| |||||||||||
| SHARES | MARKET VALUE (000S) | |||||||||||
| SOUTH AFRICA 6.2% | ||||||||||||
| HEALTH CARE 1.2% | ||||||||||||
Life Healthcare Group Holdings Ltd. | 355,202 | $ | 1,425 | |||||||||
|
| |||||||||||
| MATERIALS 2.4% | ||||||||||||
Gold Fields Ltd. | 21,478 | 267 | ||||||||||
Gold Fields Ltd. SP - ADR | 205,295 | 2,564 | ||||||||||
|
| |||||||||||
| 2,831 | ||||||||||||
|
| |||||||||||
| TELECOMMUNICATION SERVICES 2.6% | ||||||||||||
MTN Group Ltd. | 56,298 | 1,185 | ||||||||||
Vodacom Group Ltd. | 131,433 | 1,934 | ||||||||||
|
| |||||||||||
| 3,119 | ||||||||||||
|
| |||||||||||
Total South Africa | 7,375 | |||||||||||
|
| |||||||||||
| SPAIN 2.5% | ||||||||||||
| UTILITIES 2.5% | ||||||||||||
Enagas S.A. | 136,631 | 2,927 | ||||||||||
|
| |||||||||||
Total Spain | 2,927 | |||||||||||
|
| |||||||||||
| SWITZERLAND 6.1% | ||||||||||||
| HEALTH CARE 6.1% | ||||||||||||
Novartis AG | 45,142 | 2,852 | ||||||||||
Roche Holding AG | 21,715 | 4,390 | ||||||||||
|
| |||||||||||
Total Switzerland | 7,242 | |||||||||||
|
| |||||||||||
| THAILAND 0.4% | ||||||||||||
| INDUSTRIALS 0.4% | ||||||||||||
Bangkok Expressway PCL | 423,600 | 482 | ||||||||||
|
| |||||||||||
Total Thailand | 482 | |||||||||||
|
| |||||||||||
| UNITED KINGDOM 9.2% | ||||||||||||
| CONSUMER STAPLES 2.1% | ||||||||||||
Imperial Tobacco Group PLC | 63,544 | 2,464 | ||||||||||
|
| |||||||||||
| FINANCIALS 2.7% | ||||||||||||
HSBC Holdings PLC | 206,278 | 2,186 | ||||||||||
IG Group Holdings PLC | 133,805 | 984 | ||||||||||
|
| |||||||||||
| 3,170 | ||||||||||||
|
| |||||||||||
| INDUSTRIALS 1.3% | ||||||||||||
Carillion PLC | 288,618 | 1,504 | ||||||||||
|
| |||||||||||
| TELECOMMUNICATION SERVICES 3.1% | ||||||||||||
BT Group PLC | 645,421 | 2,462 | ||||||||||
Inmarsat PLC | 132,966 | 1,282 | ||||||||||
|
| |||||||||||
| 3,744 | ||||||||||||
|
| |||||||||||
Total United Kingdom | 10,882 | |||||||||||
|
| |||||||||||
| UNITED STATES 32.2% | ||||||||||||
| CONSUMER STAPLES 3.2% | ||||||||||||
Wal-Mart Stores, Inc. | 13,719 | 936 | ||||||||||
Walgreen Co. | 78,141 | 2,892 | ||||||||||
|
| |||||||||||
| 3,828 | ||||||||||||
|
| |||||||||||
| See Accompanying Notes | SEMIANNUAL REPORT | DECEMBER 31, 2012 | 45 |
Table of Contents
Schedule of Investments PIMCO Dividend and Income Builder Fund (Cont.)
| SHARES | MARKET VALUE (000S) | |||||||||||
| ENERGY 3.8% | ||||||||||||
Marathon Petroleum Corp. | 47,263 | $ | 2,978 | |||||||||
MPLX LP (a) | 47,236 | 1,473 | ||||||||||
|
| |||||||||||
| 4,451 | ||||||||||||
|
| |||||||||||
| FINANCIALS 8.4% | ||||||||||||
JPMorgan Chase & Co. | 66,563 | 2,927 | ||||||||||
KeyCorp | 233,538 | 1,966 | ||||||||||
Solar Capital Ltd. | 82,705 | 1,977 | ||||||||||
Solar Senior Capital Ltd. | 50,525 | 943 | ||||||||||
U.S. Bancorp | 68,247 | 2,180 | ||||||||||
|
| |||||||||||
| 9,993 | ||||||||||||
|
| |||||||||||
| HEALTH CARE 8.8% | ||||||||||||
Baxter International, Inc. | 47,241 | 3,149 | ||||||||||
Medtronic, Inc. | 82,494 | 3,384 | ||||||||||
Pfizer, Inc. | 154,713 | 3,880 | ||||||||||
|
| |||||||||||
| 10,413 | ||||||||||||
|
| |||||||||||
| INDUSTRIALS 1.6% | ||||||||||||
Lockheed Martin Corp. | 21,177 | 1,955 | ||||||||||
|
| |||||||||||
| INFORMATION TECHNOLOGY 6.4% | ||||||||||||
Cisco Systems, Inc. | 112,680 | 2,214 | ||||||||||
Intel Corp. | 77,119 | 1,591 | ||||||||||
Microsoft Corp. | 143,946 | 3,848 | ||||||||||
|
| |||||||||||
| 7,653 | ||||||||||||
|
| |||||||||||
Total United States | 38,293 | |||||||||||
|
| |||||||||||
Total Common Stocks (Cost $91,608) |
| 97,438 | ||||||||||
|
| |||||||||||
| PRINCIPAL AMOUNT (000S) | ||||||||||||
| CORPORATE BONDS & NOTES 9.2% | ||||||||||||
| AUSTRALIA 0.3% | ||||||||||||
| INDUSTRIALS 0.3% | ||||||||||||
Asciano Finance Ltd. | ||||||||||||
5.000% due 04/07/2018 | $ | 100 | 108 | |||||||||
FMG Resources Pty. Ltd. | ||||||||||||
7.000% due 11/01/2015 | 100 | 106 | ||||||||||
6.375% due 02/01/2016 | 100 | 104 | ||||||||||
|
| |||||||||||
Total Australia | 318 | |||||||||||
|
| |||||||||||
| AUSTRIA 0.1% | ||||||||||||
| INDUSTRIALS 0.1% | ||||||||||||
OGX Austria GmbH | ||||||||||||
8.500% due 06/01/2018 | 200 | 181 | ||||||||||
|
| |||||||||||
Total Austria | 181 | |||||||||||
|
| |||||||||||
| BRAZIL 0.2% | ||||||||||||
| INDUSTRIALS 0.2% | ||||||||||||
Braskem Finance Ltd. | ||||||||||||
7.000% due 05/07/2020 | 100 | 113 | ||||||||||
Petrobras International Finance Co. | ||||||||||||
5.375% due 01/27/2021 | 100 | 113 | ||||||||||
|
| |||||||||||
Total Brazil | 226 | |||||||||||
|
| |||||||||||
| PRINCIPAL AMOUNT (000S) | MARKET VALUE (000S) | |||||||||||
| CAYMAN ISLANDS 0.3% | ||||||||||||
| BANKING & FINANCE 0.2% | ||||||||||||
IPIC GMTN Ltd. | ||||||||||||
5.000% due 11/15/2020 | $ | 250 | $ | 286 | ||||||||
|
| |||||||||||
| UTILITIES 0.1% | ||||||||||||
Odebrecht Drilling Norbe Ltd. |
| |||||||||||
6.350% due 06/30/2021 | 95 | 107 | ||||||||||
|
| |||||||||||
Total Cayman Islands | 393 | |||||||||||
|
| |||||||||||
| FINLAND 0.2% | ||||||||||||
| INDUSTRIALS 0.2% | ||||||||||||
Nokia OYJ | ||||||||||||
5.375% due 05/15/2019 | 100 | 96 | ||||||||||
5.500% due 02/04/2014 | EUR | 100 | 136 | |||||||||
|
| |||||||||||
| 232 | ||||||||||||
|
| |||||||||||
Total Finland | 232 | |||||||||||
|
| |||||||||||
| FRANCE 0.3% | ||||||||||||
| BANKING & FINANCE 0.3% | ||||||||||||
Banque PSA Finance S.A. |
| |||||||||||
2.206% due 04/04/2014 | $ | 50 | 50 | |||||||||
Caisse Centrale du Credit Immobilier de France S.A. |
| |||||||||||
3.096% due 08/09/2013 | EUR | 200 | 266 | |||||||||
RCI Banque S.A. |
| |||||||||||
4.600% due 04/12/2016 | $ | 100 | 105 | |||||||||
|
| |||||||||||
| 421 | ||||||||||||
|
| |||||||||||
Total France | 421 | |||||||||||
|
| |||||||||||
| GERMANY 0.2% | ||||||||||||
| INDUSTRIALS 0.2% | ||||||||||||
Kloeckner Pentaplast GmbH & Co. KG |
| |||||||||||
11.625% due 07/15/2017 | EUR | 100 | 148 | |||||||||
Orion Engineered Carbons Bondco GmbH |
| |||||||||||
10.000% due 06/15/2018 | 90 | 132 | ||||||||||
|
| |||||||||||
| 280 | ||||||||||||
|
| |||||||||||
Total Germany | 280 | |||||||||||
|
| |||||||||||
| IRELAND 0.5% | ||||||||||||
| INDUSTRIALS 0.1% | ||||||||||||
RZD Capital Ltd. |
| |||||||||||
5.739% due 04/03/2017 | $ | 100 | 112 | |||||||||
|
| |||||||||||
| UTILITIES 0.4% | ||||||||||||
AK Transneft OJSC Via TransCapitalInvest Ltd. |
| |||||||||||
8.700% due 08/07/2018 | 100 | 130 | ||||||||||
Novatek OAO via Novatek Finance Ltd. |
| |||||||||||
5.326% due 02/03/2016 | 300 | 323 | ||||||||||
|
| |||||||||||
| 453 | ||||||||||||
|
| |||||||||||
Total Ireland | 565 | |||||||||||
|
| |||||||||||
| ITALY 0.1% | ||||||||||||
| BANKING & FINANCE 0.1% | ||||||||||||
Intesa Sanpaolo SpA |
| |||||||||||
6.500% due 02/24/2021 | 100 | 105 | ||||||||||
|
| |||||||||||
Total Italy | 105 | |||||||||||
|
| |||||||||||
| PRINCIPAL AMOUNT (000S) | MARKET VALUE (000S) | |||||||||||
| JAPAN 0.2% | ||||||||||||
| UTILITIES 0.2% | ||||||||||||
Tokyo Electric Power Co., Inc. |
| |||||||||||
4.500% due 03/24/2014 | EUR | 200 | $ | 268 | ||||||||
|
| |||||||||||
Total Japan | 268 | |||||||||||
|
| |||||||||||
| LUXEMBOURG 0.9% | ||||||||||||
| BANKING & FINANCE 0.3% | ||||||||||||
Fiat Finance & Trade S.A. |
| |||||||||||
7.625% due 09/15/2014 | 100 | 140 | ||||||||||
Sberbank of Russia Via SB Capital S.A. |
| |||||||||||
6.125% due 02/07/2022 | $ | 200 | 229 | |||||||||
|
| |||||||||||
| 369 | ||||||||||||
|
| |||||||||||
| INDUSTRIALS 0.4% | ||||||||||||
ArcelorMittal |
| |||||||||||
7.500% due 10/15/2039 | 100 | 94 | ||||||||||
6.000% due 03/01/2021 | 100 | 100 | ||||||||||
INEOS Group Holdings S.A. |
| |||||||||||
8.500% due 02/15/2016 | 100 | 100 | ||||||||||
OXEA Finance & Cy S.C.A. |
| |||||||||||
9.625% due 07/15/2017 | EUR | 86 | 125 | |||||||||
|
| |||||||||||
| 419 | ||||||||||||
|
| |||||||||||
| UTILITIES 0.2% | ||||||||||||
Gazprom OAO Via Gaz Capital S.A. |
| |||||||||||
6.510% due 03/07/2022 | $ | 200 | 239 | |||||||||
|
| |||||||||||
Total Luxembourg | 1,027 | |||||||||||
|
| |||||||||||
| MEXICO 0.1% | ||||||||||||
| INDUSTRIALS 0.1% | ||||||||||||
America Movil S.A.B. de C.V. |
| |||||||||||
8.460% due 12/18/2036 | MXN | 1,000 | 86 | |||||||||
|
| |||||||||||
Total Mexico | 86 | |||||||||||
|
| |||||||||||
| NETHERLANDS 0.2% | ||||||||||||
| INDUSTRIALS 0.2% | ||||||||||||
Schaeffler Finance BV |
| |||||||||||
7.750% due 02/15/2017 | $ | 100 | 112 | |||||||||
UPC Holding BV |
| |||||||||||
9.875% due 04/15/2018 | 100 | 113 | ||||||||||
|
| |||||||||||
Total Netherlands | 225 | |||||||||||
|
| |||||||||||
| NORWAY 0.2% | ||||||||||||
| BANKING & FINANCE 0.2% | ||||||||||||
Eksportfinans ASA |
| |||||||||||
1.600% due 03/20/2014 | JPY | 10,000 | 113 | |||||||||
3.000% due 11/17/2014 | $ | 135 | 134 | |||||||||
|
| |||||||||||
Total Norway | 247 | |||||||||||
|
| |||||||||||
| PUERTO RICO 0.1% | ||||||||||||
| INDUSTRIALS 0.1% | ||||||||||||
Warner Chilcott Co. LLC |
| |||||||||||
7.750% due 09/15/2018 | 100 | 107 | ||||||||||
|
| |||||||||||
Total Puerto Rico | 107 | |||||||||||
|
| |||||||||||
| 46 | PIMCO EQUITY SERIES | See Accompanying Notes |
Table of Contents
December 31, 2012 (Unaudited)
| PRINCIPAL AMOUNT (000S) | MARKET VALUE (000S) | |||||||||||
| QATAR 0.5% | ||||||||||||
| INDUSTRIALS 0.2% | ||||||||||||
Nakilat, Inc. |
| |||||||||||
6.067% due 12/31/2033 | $ | 200 | $ | 244 | ||||||||
|
| |||||||||||
| UTILITIES 0.3% | ||||||||||||
Ras Laffan Liquefied Natural Gas Co. Ltd. |
| |||||||||||
6.332% due 09/30/2027 | 250 | 321 | ||||||||||
|
| |||||||||||
Total Qatar | 565 | |||||||||||
|
| |||||||||||
| SOUTH KOREA 0.1% | ||||||||||||
| BANKING & FINANCE 0.1% | ||||||||||||
Export-Import Bank of Korea |
| |||||||||||
4.125% due 09/09/2015 | 100 | 108 | ||||||||||
|
| |||||||||||
Total South Korea | 108 | |||||||||||
|
| |||||||||||
| UNITED ARAB EMIRATES 0.1% | ||||||||||||
| INDUSTRIALS 0.1% | ||||||||||||
Dolphin Energy Ltd. |
| |||||||||||
5.888% due 06/15/2019 | 76 | 85 | ||||||||||
|
| |||||||||||
Total United Arab Emirates | 85 | |||||||||||
|
| |||||||||||
| UNITED KINGDOM 1.1% | ||||||||||||
| BANKING & FINANCE 1.1% | ||||||||||||
Abbey National Treasury Services PLC |
| |||||||||||
1.893% due 04/25/2014 | 100 | 100 | ||||||||||
Barclays Bank PLC |
| |||||||||||
10.000% due 05/21/2021 | GBP | 100 | 219 | |||||||||
FCE Bank PLC |
| |||||||||||
5.125% due 11/16/2015 | 100 | 175 | ||||||||||
LBG Capital PLC |
| |||||||||||
15.000% due 12/21/2019 | 100 | 232 | ||||||||||
7.869% due 08/25/2020 | 100 | 174 | ||||||||||
Royal Bank of Scotland Group PLC |
| |||||||||||
6.934% due 04/09/2018 | EUR | 200 | 299 | |||||||||
Virgin Media Secured Finance PLC |
| |||||||||||
7.000% due 01/15/2018 | GBP | 100 | 176 | |||||||||
|
| |||||||||||
Total United Kingdom | 1,375 | |||||||||||
|
| |||||||||||
| UNITED STATES 3.0% | ||||||||||||
| BANKING & FINANCE 1.1% | ||||||||||||
Ally Financial, Inc. |
| |||||||||||
6.750% due 12/01/2014 | $ | 100 | 108 | |||||||||
American International Group, Inc. |
| |||||||||||
6.765% due 11/15/2017 | GBP | 100 | 192 | |||||||||
Bank of America Corp. |
| |||||||||||
6.000% due 09/01/2017 | $ | 100 | 117 | |||||||||
Cantor Fitzgerald LP |
| |||||||||||
7.875% due 10/15/2019 | 100 | 104 | ||||||||||
Goldman Sachs Group, Inc. |
| |||||||||||
5.250% due 07/27/2021 | 100 | 114 | ||||||||||
International Lease Finance Corp. |
| |||||||||||
6.500% due 09/01/2014 | 100 | 107 | ||||||||||
Merrill Lynch & Co., Inc. |
| |||||||||||
7.750% due 04/30/2018 | GBP | 100 | 198 | |||||||||
Morgan Stanley |
| |||||||||||
6.250% due 08/28/2017 | $ | 100 | 115 | |||||||||
7.300% due 05/13/2019 | 100 | 122 | ||||||||||
SLM Corp. |
| |||||||||||
0.513% due 06/17/2013 | EUR | 100 | 131 | |||||||||
|
| |||||||||||
| 1,308 | ||||||||||||
|
| |||||||||||
| PRINCIPAL AMOUNT (000S) | MARKET VALUE (000S) | |||||||||||
| INDUSTRIALS 1.5% | ||||||||||||
Altria Group, Inc. |
| |||||||||||
10.200% due 02/06/2039 | $ | 100 | $ | 167 | ||||||||
Brocade Communications Systems, Inc. |
| |||||||||||
6.625% due 01/15/2018 | 100 | 104 | ||||||||||
CONSOL Energy, Inc. |
| |||||||||||
8.000% due 04/01/2017 | 100 | 109 | ||||||||||
Crown Castle Towers LLC |
| |||||||||||
6.113% due 01/15/2040 | 100 | 121 | ||||||||||
CVS Pass-Through Trust |
| |||||||||||
8.353% due 07/10/2031 | 94 | 129 | ||||||||||
Delta Air Lines Pass-Through Trust |
| |||||||||||
4.750% due 05/07/2021 | 100 | 107 | ||||||||||
HCA, Inc. |
| |||||||||||
6.500% due 02/15/2020 | 100 | 113 | ||||||||||
HD Supply, Inc. |
| |||||||||||
8.125% due 04/15/2019 | 100 | 114 | ||||||||||
Hexion U.S. Finance Corp. |
| |||||||||||
8.875% due 02/01/2018 | 200 | 206 | ||||||||||
Reynolds Group Issuer, Inc. |
| |||||||||||
8.500% due 05/15/2018 | 100 | 103 | ||||||||||
9.875% due 08/15/2019 | 100 | 107 | ||||||||||
Rockies Express Pipeline LLC |
| |||||||||||
5.625% due 04/15/2020 | 100 | 99 | ||||||||||
6.850% due 07/15/2018 | 100 | 105 | ||||||||||
Tyson Foods, Inc. |
| |||||||||||
4.500% due 06/15/2022 | 100 | 109 | ||||||||||
U.S. Airways Pass-Through Trust |
| |||||||||||
5.900% due 04/01/2026 | 100 | 109 | ||||||||||
|
| |||||||||||
| 1,802 | ||||||||||||
|
| |||||||||||
| UTILITIES 0.4% | ||||||||||||
NGPL PipeCo LLC |
| |||||||||||
9.625% due 06/01/2019 | 100 | 115 | ||||||||||
7.119% due 12/15/2017 | 100 | 110 | ||||||||||
NRG Energy, Inc. |
| |||||||||||
7.875% due 05/15/2021 | 100 | 111 | ||||||||||
7.625% due 01/15/2018 | 100 | 112 | ||||||||||
|
| |||||||||||
| 448 | ||||||||||||
|
| |||||||||||
Total United States | 3,558 | |||||||||||
|
| |||||||||||
| VENEZUELA 0.1% | ||||||||||||
| INDUSTRIALS 0.1% | ||||||||||||
Petroleos de Venezuela S.A. |
| |||||||||||
8.500% due 11/02/2017 | 100 | 99 | ||||||||||
|
| |||||||||||
Total Venezuela | 99 | |||||||||||
|
| |||||||||||
| VIRGIN ISLANDS (BRITISH) 0.4% | ||||||||||||
| INDUSTRIALS 0.2% | ||||||||||||
Gold Fields Orogen Holding BVI Ltd. |
| |||||||||||
4.875% due 10/07/2020 | 200 | 197 | ||||||||||
|
| |||||||||||
| UTILITIES 0.2% | ||||||||||||
TNK-BP Finance S.A. |
| |||||||||||
7.875% due 03/13/2018 | 200 | 244 | ||||||||||
|
| |||||||||||
Total Virgin Islands (British) | 441 | |||||||||||
|
| |||||||||||
Total Corporate Bonds & Notes | 10,912 | |||||||||||
|
| |||||||||||
| MORTGAGE-BACKED SECURITIES 2.4% | ||||||||||||
| UNITED STATES 2.4% | ||||||||||||
Banc of America Funding Corp. |
| |||||||||||
5.496% due 05/20/2036 | 77 | 76 | ||||||||||
| PRINCIPAL AMOUNT (000S) | MARKET VALUE (000S) | |||||||||||
Banc of America Mortgage Trust |
| |||||||||||
5.648% due 11/20/2046 | $ | 46 | $ | 40 | ||||||||
Chase Mortgage Finance Corp. |
| |||||||||||
3.079% due 09/25/2036 | 149 | 128 | ||||||||||
Countrywide Alternative Loan Trust |
| |||||||||||
6.000% due 06/25/2037 ^ | 1,083 | 897 | ||||||||||
Countrywide Home Loan Mortgage Pass-Through Trust |
| |||||||||||
0.710% due 07/25/2037 ^ | 91 | 58 | ||||||||||
Credit Suisse First Boston Mortgage Securities Corp. |
| |||||||||||
6.000% due 11/25/2035 ^ | 34 | 23 | ||||||||||
CSMC Mortgage-Backed Trust |
| |||||||||||
5.000% due 03/25/2037 | 9 | 9 | ||||||||||
Deutsche ALT-A Securities, Inc. |
| |||||||||||
0.410% due 02/25/2047 | 39 | 28 | ||||||||||
First Horizon Alternative Mortgage Securities |
| |||||||||||
2.502% due 06/25/2036 | 973 | 700 | ||||||||||
GSR Mortgage Loan Trust |
| |||||||||||
1.956% due 04/25/2032 | 106 | 105 | ||||||||||
Harborview Mortgage Loan Trust |
| |||||||||||
0.551% due 06/20/2035 | 6 | 6 | ||||||||||
Merrill Lynch Mortgage Investors Trust |
| |||||||||||
2.765% due 02/25/2036 | 22 | 20 | ||||||||||
Morgan Stanley Mortgage Loan Trust |
| |||||||||||
2.690% due 06/25/2037 | 1,056 | 571 | ||||||||||
Residential Accredit Loans, Inc. Trust |
| |||||||||||
0.610% due 10/25/2045 | 229 | 158 | ||||||||||
|
| |||||||||||
Total Mortgage-Backed Securities | 2,819 | |||||||||||
|
| |||||||||||
| MUNICIPAL BONDS & NOTES 0.1% | ||||||||||||
| MICHIGAN 0.1% | ||||||||||||
Michigan Tobacco Settlement Finance Authority Revenue Bonds, Series 2006 |
| |||||||||||
7.309% due 06/01/2034 | 100 | 84 | ||||||||||
|
| |||||||||||
Total Michigan | 84 | |||||||||||
|
| |||||||||||
| VIRGINIA 0.0% | ||||||||||||
Tobacco Settlement Financing Corp. Virginia Revenue Bonds, Series 2007 |
| |||||||||||
6.706% due 06/01/2046 | 100 | 71 | ||||||||||
|
| |||||||||||
Total Virginia | 71 | |||||||||||
|
| |||||||||||
Total Municipal Bonds & Notes | 155 | |||||||||||
|
| |||||||||||
| SOVEREIGN ISSUES 1.0% | ||||||||||||
| AUSTRALIA 0.2% | ||||||||||||
New South Wales Treasury Corp. |
| |||||||||||
6.000% due 03/01/2022 | AUD | 200 | 240 | |||||||||
|
| |||||||||||
Total Australia | 240 | |||||||||||
|
| |||||||||||
| CANADA 0.5% | ||||||||||||
Province of Ontario |
| |||||||||||
3.150% due 06/02/2022 | CAD | 250 | 260 | |||||||||
Province of Quebec |
| |||||||||||
4.500% due 12/01/2018 | 250 | 284 | ||||||||||
|
| |||||||||||
Total Canada | 544 | |||||||||||
|
| |||||||||||
| MEXICO 0.2% | ||||||||||||
Mexico Government International Bond |
| |||||||||||
6.000% due 06/18/2015 | MXN | 2,500 | 199 | |||||||||
|
| |||||||||||
Total Mexico | 199 | |||||||||||
|
| |||||||||||
| See Accompanying Notes | SEMIANNUAL REPORT | DECEMBER 31, 2012 | 47 |
Table of Contents
Schedule of Investments PIMCO Dividend and Income Builder Fund (Cont.)
| PRINCIPAL AMOUNT (000S) | MARKET VALUE (000S) | |||||||||||
| SOUTH AFRICA 0.1% | ||||||||||||
South Africa Government International Bond |
| |||||||||||
8.000% due 12/21/2018 | ZAR | 1,300 | $ | 169 | ||||||||
|
| |||||||||||
Total South Africa | 169 | |||||||||||
|
| |||||||||||
Total Sovereign Issues (Cost $1,146) | 1,152 | |||||||||||
|
| |||||||||||
| SHORT-TERM INSTRUMENTS 6.6% | ||||||||||||
| REPURCHASE AGREEMENTS 3.0% | ||||||||||||
Barclays, Inc. |
| |||||||||||
0.160% due 01/11/2013 | $ | 700 | 700 | |||||||||
(Dated 12/21/2012. Collateralized by U.S. Treasury Notes 0.250% due 09/15/2015 valued at $715. Repurchase proceeds are $700.) | ||||||||||||
| PRINCIPAL AMOUNT (000S) | MARKET VALUE (000S) | |||||||||||
Credit Suisse Securities (USA) LLC |
| |||||||||||
0.220% due 01/02/2013 | $ | 1,300 | $ | 1,300 | ||||||||
(Dated 12/31/2012. Collateralized by U.S. Treasury Notes 2.125% due 12/31/2015 valued at $1,331. Repurchase proceeds are $1,300.) | ||||||||||||
State Street Bank and Trust Co. |
| |||||||||||
0.010% due 01/02/2013 | 1,507 | 1,507 | ||||||||||
(Dated 12/31/2012. Collateralized by Fannie Mae 2.170% due 10/17/2022 valued at $1,542. Repurchase proceeds are $1,507.) | ||||||||||||
|
| |||||||||||
| 3,507 | ||||||||||||
|
| |||||||||||
| SHARES | MARKET VALUE (000S) | |||||||||||
| CENTRAL FUNDS USED FOR CASH MANAGEMENT PURPOSES (b) 3.6% | ||||||||||||
PIMCO Short-Term Floating NAV Portfolio | 431,184 | $ | 4,315 | |||||||||
|
| |||||||||||
| Total Short-Term Instruments (Cost $7,822) | 7,822 | |||||||||||
|
| |||||||||||
| Total Investments 101.4% (Cost $113,403) | $ | 120,447 | ||||||||||
| Other Assets and Liabilities (Net) (1.4%) | (1,613 | ) | ||||||||||
|
| |||||||||||
| Net Assets 100.0% | $ | 118,834 | ||||||||||
|
| |||||||||||
Notes to Schedule of Investments (amounts in thousands*, except number of contracts):
| * | A zero balance may reflect actual amounts rounding to less than one thousand. |
| ^ | Security is in default. |
| (a) | Non-income producing security. |
| (b) | Affiliated to the Fund. |
| (c) | Cash of $77 has been pledged as collateral for the following open futures contracts as of December 31, 2012: |
| Description | Type | Expiration Month | # of Contracts | Unrealized Appreciation/ (Depreciation) | ||||||||||
Australian dollar currency March Futures | Short | 03/2013 | 1 | $ | 1 | |||||||||
British pound currency March Futures | Short | 03/2013 | 4 | (3 | ) | |||||||||
Canadian dollar currency March Futures | Short | 03/2013 | 2 | 2 | ||||||||||
Euro currency March Futures | Long | 03/2013 | 10 | 24 | ||||||||||
Japanese yen currency March Futures | Long | 03/2013 | 14 | (102 | ) | |||||||||
|
| |||||||||||||
| $ | (78 | ) | ||||||||||||
|
| |||||||||||||
| (d) | Foreign currency contracts outstanding as of December 31, 2012: |
| Settlement Month | Currency to be Delivered | Currency to be Received | Counterparty | Unrealized Appreciation | Unrealized (Depreciation) | Net Unrealized Appreciation/ (Depreciation) | ||||||||||||||||||||||||
01/2013 | AUD | 550 | $ | 574 | BRC | $ | 3 | $ | 0 | $ | 3 | |||||||||||||||||||
01/2013 | 549 | 573 | DUB | 3 | 0 | 3 | ||||||||||||||||||||||||
01/2013 | CAD | 1,619 | 1,629 | BRC | 2 | 0 | 2 | |||||||||||||||||||||||
01/2013 | CHF | 2,453 | 2,642 | BRC | 0 | (40 | ) | (40 | ) | |||||||||||||||||||||
01/2013 | EUR | 2,314 | 2,985 | BOA | 0 | (69 | ) | (69 | ) | |||||||||||||||||||||
01/2013 | 999 | 1,305 | GLM | 0 | (13 | ) | (13 | ) | ||||||||||||||||||||||
01/2013 | GBP | 111 | 179 | BOA | 0 | (2 | ) | (2 | ) | |||||||||||||||||||||
01/2013 | 1,646 | 2,666 | CBK | 0 | (7 | ) | (7 | ) | ||||||||||||||||||||||
01/2013 | 1,451 | 2,322 | GLM | 0 | (35 | ) | (35 | ) | ||||||||||||||||||||||
01/2013 | JPY | 144,276 | 1,711 | HUS | 44 | 0 | 44 | |||||||||||||||||||||||
01/2013 | 144,276 | 1,710 | JPM | 45 | 0 | 45 | ||||||||||||||||||||||||
01/2013 | 144,275 | 1,711 | UAG | 45 | 0 | 45 | ||||||||||||||||||||||||
01/2013 | NOK | 19,105 | 3,366 | GLM | 0 | (71 | ) | (71 | ) | |||||||||||||||||||||
01/2013 | THB | 2,791 | 90 | UAG | 0 | (1 | ) | (1 | ) | |||||||||||||||||||||
01/2013 | $ | 675 | AUD | 645 | CBK | 0 | (6 | ) | (6 | ) | ||||||||||||||||||||
01/2013 | 474 | 454 | JPM | 0 | (3 | ) | (3 | ) | ||||||||||||||||||||||
01/2013 | 62 | BRL | 128 | JPM | 0 | 0 | 0 | |||||||||||||||||||||||
01/2013 | 67 | CAD | 66 | BRC | 0 | 0 | 0 | |||||||||||||||||||||||
01/2013 | 627 | 623 | CBK | 0 | (1 | ) | (1 | ) | ||||||||||||||||||||||
01/2013 | 1,011 | 996 | GLM | 0 | (10 | ) | (10 | ) | ||||||||||||||||||||||
01/2013 | 95 | CHF | 87 | BRC | 0 | 0 | 0 | |||||||||||||||||||||||
01/2013 | 2,677 | 2,453 | CBK | 5 | 0 | 5 | ||||||||||||||||||||||||
01/2013 | 4,403 | EUR | 3,313 | UAG | 0 | (30 | ) | (30 | ) | |||||||||||||||||||||
01/2013 | 5,224 | GBP | 3,208 | GLM | 0 | (13 | ) | (13 | ) | |||||||||||||||||||||
01/2013 | 5,293 | JPY | 432,827 | JPM | 0 | (296 | ) | (296 | ) | |||||||||||||||||||||
01/2013 | 95 | NOK | 529 | BRC | 0 | 0 | 0 | |||||||||||||||||||||||
01/2013 | 153 | 870 | GLM | 4 | 0 | 4 | ||||||||||||||||||||||||
01/2013 | 91 | THB | 2,791 | JPM | 0 | 0 | 0 | |||||||||||||||||||||||
01/2013 | ZAR | 4,568 | $ | 520 | CBK | 0 | (17 | ) | (17 | ) | ||||||||||||||||||||
01/2013 | 33,774 | 3,800 | DUB | 0 | (169 | ) | (169 | ) | ||||||||||||||||||||||
| 48 | PIMCO EQUITY SERIES | See Accompanying Notes |
Table of Contents
December 31, 2012 (Unaudited)
| Settlement Month | Currency to be Delivered | Currency to be Received | Counterparty | Unrealized Appreciation | Unrealized (Depreciation) | Net Unrealized Appreciation/ (Depreciation) | ||||||||||||||||||||||||
01/2013 | ZAR | 3,375 | $ | 384 | HUS | $ | 0 | $ | (13 | ) | $ | (13 | ) | |||||||||||||||||
01/2013 | 11,913 | 1,379 | JPM | 0 | (21 | ) | (21 | ) | ||||||||||||||||||||||
02/2013 | BRL | 1,289 | 624 | HUS | 0 | (2 | ) | (2 | ) | |||||||||||||||||||||
02/2013 | 384 | 181 | MSC | 0 | (6 | ) | (6 | ) | ||||||||||||||||||||||
02/2013 | CHF | 2,453 | 2,679 | CBK | 0 | (5 | ) | (5 | ) | |||||||||||||||||||||
02/2013 | 1,135 | 1,244 | GLM | 2 | 0 | 2 | ||||||||||||||||||||||||
02/2013 | CZK | 1,455 | 74 | BRC | 0 | (3 | ) | (3 | ) | |||||||||||||||||||||
02/2013 | 19,978 | 1,030 | JPM | 0 | (21 | ) | (21 | ) | ||||||||||||||||||||||
02/2013 | EUR | 3,313 | 4,404 | UAG | 30 | 0 | 30 | |||||||||||||||||||||||
02/2013 | GBP | 3,208 | 5,223 | GLM | 13 | 0 | 13 | |||||||||||||||||||||||
02/2013 | NOK | 18,235 | 3,276 | JPM | 0 | (2 | ) | (2 | ) | |||||||||||||||||||||
02/2013 | $ | 573 | AUD | 550 | BRC | 0 | (3 | ) | (3 | ) | ||||||||||||||||||||
02/2013 | 572 | 549 | DUB | 0 | (3 | ) | (3 | ) | ||||||||||||||||||||||
02/2013 | 128 | BRL | 264 | HUS | 0 | 0 | 0 | |||||||||||||||||||||||
02/2013 | 1,628 | CAD | 1,619 | BRC | 0 | (2 | ) | (2 | ) | |||||||||||||||||||||
02/2013 | 1,097 | CZK | 21,433 | DUB | 31 | 0 | 31 | |||||||||||||||||||||||
02/2013 | 1,711 | JPY | 144,276 | HUS | 0 | (45 | ) | (45 | ) | |||||||||||||||||||||
02/2013 | 1,710 | 144,276 | JPM | 0 | (45 | ) | (45 | ) | ||||||||||||||||||||||
02/2013 | 1,711 | 144,275 | UAG | 0 | (45 | ) | (45 | ) | ||||||||||||||||||||||
04/2013 | THB | 2,791 | $ | 90 | JPM | 0 | 0 | 0 | ||||||||||||||||||||||
|
|
|
|
|
| |||||||||||||||||||||||||
| $ | 227 | $ | (999 | ) | $ | (772 | ) | |||||||||||||||||||||||
|
|
|
|
|
| |||||||||||||||||||||||||
| (e) | Fair Value Measurements (1) |
(i) The following is a summary of the fair valuations according to the inputs used as of December 31, 2012 in valuing the Fund’s assets and liabilities:
| Category and Subcategory | Level 1 | Level 2 | Level 3 | Fair Value at 12/31/2012 | ||||||||||||
Investments, at value | ||||||||||||||||
Asset-Backed Securities | ||||||||||||||||
United States | $ | 0 | $ | 149 | $ | 0 | $ | 149 | ||||||||
Common Stocks | ||||||||||||||||
Australia | ||||||||||||||||
Industrials | 0 | 1,133 | 0 | 1,133 | ||||||||||||
Materials | 0 | 974 | 0 | 974 | ||||||||||||
Brazil | ||||||||||||||||
Industrials | 984 | 0 | 0 | 984 | ||||||||||||
Utilities | 1,930 | 0 | 0 | 1,930 | ||||||||||||
Canada | ||||||||||||||||
Consumer Discretionary | 2,444 | 0 | 0 | 2,444 | ||||||||||||
China | ||||||||||||||||
Industrials | 0 | 1,420 | 0 | 1,420 | ||||||||||||
Cyprus | ||||||||||||||||
Energy | 0 | 1,901 | 0 | 1,901 | ||||||||||||
France | ||||||||||||||||
Energy | 0 | 2,948 | 0 | 2,948 | ||||||||||||
Health Care | 0 | 2,398 | 0 | 2,398 | ||||||||||||
Germany | ||||||||||||||||
Telecommunication Services | 2,391 | 0 | 0 | 2,391 | ||||||||||||
Hong Kong | ||||||||||||||||
Consumer Discretionary | 0 | 456 | 0 | 456 | ||||||||||||
Industrials | 0 | 970 | 0 | 970 | ||||||||||||
Materials | 0 | 955 | 0 | 955 | ||||||||||||
Telecommunication Services | 0 | 436 | 0 | 436 | ||||||||||||
Italy | ||||||||||||||||
Industrials | 0 | 1,438 | 0 | 1,438 | ||||||||||||
Macau | ||||||||||||||||
Consumer Discretionary | 0 | 1,455 | 0 | 1,455 | ||||||||||||
Netherlands | ||||||||||||||||
Energy | 0 | 2,663 | 0 | 2,663 | ||||||||||||
Norway | ||||||||||||||||
Industrials | 0 | 1,921 | 0 | 1,921 | ||||||||||||
Panama | ||||||||||||||||
Industrials | 941 | 0 | 0 | 941 | ||||||||||||
Qatar | ||||||||||||||||
Utilities | 0 | 479 | 0 | 479 | ||||||||||||
South Africa | ||||||||||||||||
Health Care | 1,425 | 0 | 0 | 1,425 | ||||||||||||
Materials | 2,564 | 267 | 0 | 2,831 | ||||||||||||
| Category and Subcategory | Level 1 | Level 2 | Level 3 | Fair Value at 12/31/2012 | ||||||||||||
Telecommunication Services | $ | 0 | $ | 3,119 | $ | 0 | $ | 3,119 | ||||||||
Spain | ||||||||||||||||
Utilities | 0 | 2,927 | 0 | 2,927 | ||||||||||||
Switzerland | ||||||||||||||||
Health Care | 0 | 7,242 | 0 | 7,242 | ||||||||||||
Thailand | ||||||||||||||||
Industrials | 0 | 482 | 0 | 482 | ||||||||||||
United Kingdom | ||||||||||||||||
Consumer Staples | 0 | 2,464 | 0 | 2,464 | ||||||||||||
Financials | 0 | 3,170 | 0 | 3,170 | ||||||||||||
Industrials | 0 | 1,504 | 0 | 1,504 | ||||||||||||
Telecommunication Services | 0 | 3,744 | 0 | 3,744 | ||||||||||||
United States | ||||||||||||||||
Consumer Staples | 3,828 | 0 | 0 | 3,828 | ||||||||||||
Energy | 4,451 | 0 | 0 | 4,451 | ||||||||||||
Financials | 9,993 | 0 | 0 | 9,993 | ||||||||||||
Health Care | 10,413 | 0 | 0 | 10,413 | ||||||||||||
Industrials | 1,954 | 0 | 0 | 1,954 | ||||||||||||
Information Technology | 7,653 | 0 | 0 | 7,653 | ||||||||||||
Corporate Bonds & Notes | ||||||||||||||||
Australia | ||||||||||||||||
Industrials | 0 | 318 | 0 | 318 | ||||||||||||
Austria | ||||||||||||||||
Industrials | 0 | 181 | 0 | 181 | ||||||||||||
Brazil | ||||||||||||||||
Industrials | 0 | 226 | 0 | 226 | ||||||||||||
Cayman Islands | ||||||||||||||||
Banking & Finance | 0 | 286 | 0 | 286 | ||||||||||||
Utilities | 0 | 107 | 0 | 107 | ||||||||||||
Finland | ||||||||||||||||
Industrials | 0 | 232 | 0 | 232 | ||||||||||||
France | ||||||||||||||||
Banking & Finance | 0 | 421 | 0 | 421 | ||||||||||||
Germany | ||||||||||||||||
Industrials | 0 | 280 | 0 | 280 | ||||||||||||
Ireland | ||||||||||||||||
Industrials | 0 | 112 | 0 | 112 | ||||||||||||
Utilities | 0 | 453 | 0 | 453 | ||||||||||||
Italy | ||||||||||||||||
Banking & Finance | 0 | 105 | 0 | 105 | ||||||||||||
| See Accompanying Notes | SEMIANNUAL REPORT | DECEMBER 31, 2012 | 49 |
Table of Contents
Schedule of Investments PIMCO Dividend and Income Builder Fund (Cont.)
| Category and Subcategory | Level 1 | Level 2 | Level 3 | Fair Value at 12/31/2012 | ||||||||||||
Japan | ||||||||||||||||
Utilities | $ | 0 | $ | 268 | $ | 0 | $ | 268 | ||||||||
Luxembourg | ||||||||||||||||
Banking & Finance | 0 | 369 | 0 | 369 | ||||||||||||
Industrials | 0 | 419 | 0 | 419 | ||||||||||||
Utilities | 0 | 239 | 0 | 239 | ||||||||||||
Mexico | ||||||||||||||||
Industrials | 0 | 86 | 0 | 86 | ||||||||||||
Netherlands | ||||||||||||||||
Industrials | 0 | 225 | 0 | 225 | ||||||||||||
Norway | ||||||||||||||||
Banking & Finance | 0 | 247 | 0 | 247 | ||||||||||||
Puerto Rico | ||||||||||||||||
Industrials | 0 | 107 | 0 | 107 | ||||||||||||
Qatar | ||||||||||||||||
Industrials | 0 | 244 | 0 | 244 | ||||||||||||
Utilities | 0 | 321 | 0 | 321 | ||||||||||||
South Korea | ||||||||||||||||
Banking & Finance | 0 | 108 | 0 | 108 | ||||||||||||
United Arab Emirates | �� | |||||||||||||||
Industrials | 0 | 86 | 0 | 86 | ||||||||||||
United Kingdom | ||||||||||||||||
Banking & Finance | 0 | 1,375 | 0 | 1,375 | ||||||||||||
United States | ||||||||||||||||
Banking & Finance | 0 | 1,308 | 0 | 1,308 | ||||||||||||
Industrials | 0 | 1,586 | 216 | 1,802 | ||||||||||||
Utilities | 0 | 448 | 0 | 448 | ||||||||||||
Venezuela | ||||||||||||||||
Industrials | 0 | 99 | 0 | 99 | ||||||||||||
| Category and Subcategory | Level 1 | Level 2 | Level 3 | Fair Value at 12/31/2012 | ||||||||||||
Virgin Islands (British) | ||||||||||||||||
Industrials | $ | 0 | $ | 197 | $ | 0 | $ | 197 | ||||||||
Utilities | 0 | 244 | 0 | 244 | ||||||||||||
Mortgage-Backed Securities | ||||||||||||||||
United States | 0 | 2,819 | 0 | 2,819 | ||||||||||||
Municipal Bonds & Notes | ||||||||||||||||
Michigan | 0 | 84 | 0 | 84 | ||||||||||||
Virginia | 0 | 71 | 0 | 71 | ||||||||||||
Sovereign Issues | ||||||||||||||||
Australia | 0 | 240 | 0 | 240 | ||||||||||||
Canada | 0 | 544 | 0 | 544 | ||||||||||||
Mexico | 0 | 199 | 0 | 199 | ||||||||||||
South Africa | 0 | 169 | 0 | 169 | ||||||||||||
Short-Term Instruments | ||||||||||||||||
Repurchase Agreements | 0 | 3,507 | 0 | 3,507 | ||||||||||||
Central Funds Used for Cash Management Purposes | 4,315 | 0 | 0 | 4,315 | ||||||||||||
| $ | 55,286 | $ | 64,945 | $ | 216 | $ | 120,447 | |||||||||
Financial Derivative Instruments - Assets |
| |||||||||||||||
Foreign Exchange Contracts | $ | 27 | $ | 227 | $ | 0 | $ | 254 | ||||||||
Financial Derivative Instruments - Liabilities |
| |||||||||||||||
Foreign Exchange Contracts | $ | (105 | ) | $ | (999 | ) | $ | 0 | $ | (1,104 | ) | |||||
Totals | $ | 55,208 | $ | 64,173 | $ | 216 | $ | 119,597 | ||||||||
(ii) There were assets and liabilities valued at $1,425 transferred from Level 2 to Level 1 during the period ended December 31, 2012.
(iii) The following is a reconciliation of the fair valuations using significant unobservable inputs (Level 3) for the Fund during the period ended December 31, 2012:
| Category and Subcategory | Beginning Balance at 06/30/2012 | Net Purchases | Net Sales | Accrued Discounts/ (Premiums) | Realized Gain/(Loss) | Net Change in Unrealized Appreciation/ (Depreciation) (2) | Transfers into Level 3 | Transfers out of Level 3 | Ending Balance at 12/31/2012 | Net Change in Unrealized Appreciation/ (Depreciation) on Investments Held at 12/31/2012 (2) | ||||||||||||||||||||||||||||||
Investments, at value |
| |||||||||||||||||||||||||||||||||||||||
Corporate Bonds & Notes | ||||||||||||||||||||||||||||||||||||||||
United States | $ | 0 | $ | 102 | $ | 0 | $ | 0 | $ | 0 | $ | 12 | $ | 0 | $ | 0 | $ | 216 | $ | 12 | ||||||||||||||||||||
|
|
|
|
|
|
|
|
|
|
|
|
|
|
|
|
|
|
|
| |||||||||||||||||||||
(iv) The following is a summary of significant unobservable inputs used in the fair valuations of assets and liabilities categorized within Level 3 of the fair value hierarchy:
| Category and Subcategory | Ending Balance at 12/31/2012 | Valuation Technique | Unobservable Inputs | Input Value(s) (% Unless Noted Otherwise) | ||||||||
Investments, at value | ||||||||||||
Corporate Bonds & Notes | ||||||||||||
United States | ||||||||||||
Industrials | $ | 216 | Third Party Vendor | Broker Quote | 107.00-109.00 | |||||||
|
| |||||||||||
| (1) | See note 3 in the Notes to Financial Statements for more information regarding pricing inputs and valuation techniques. |
| (2) | Any difference between Net Change in Unrealized Appreciation/(Depreciation) and Net Change in Unrealized Appreciation/(Depreciation) on Investments Held at December 31, 2012 may be due to an investment no longer held or categorized as level 3 at period end. |
| 50 | PIMCO EQUITY SERIES | See Accompanying Notes |
Table of Contents
December 31, 2012 (Unaudited)
| (f) | Fair Value of Financial Derivative Instruments (1) |
The following is a summary of the fair valuation of the Fund’s derivative instruments categorized by risk exposure:
Fair Values of Financial Derivative Instruments on the Statements of Assets and Liabilities as of December 31, 2012:
| Derivatives not accounted for as hedging instruments | ||||||||||||||||||||||||
| Commodity Contracts | Credit Contracts | Equity Contracts | Foreign Exchange Contracts | Interest Rate Contracts | Total | |||||||||||||||||||
Assets: | ||||||||||||||||||||||||
Unrealized appreciation on foreign currency contracts | $ | 0 | $ | 0 | $ | 0 | $ | 227 | $ | 0 | $ | 227 | ||||||||||||
|
|
|
|
|
|
|
|
|
|
|
| |||||||||||||
Liabilities: | ||||||||||||||||||||||||
Variation margin payable on financial derivative instruments (2) | $ | 0 | $ | 0 | $ | 0 | $ | 19 | $ | 0 | $ | 19 | ||||||||||||
Unrealized depreciation on foreign currency contracts | 0 | 0 | 0 | 999 | 0 | 999 | ||||||||||||||||||
|
|
|
|
|
|
|
|
|
|
|
| |||||||||||||
| $ | 0 | $ | 0 | $ | 0 | $ | 1,018 | $ | 0 | $ | 1,018 | |||||||||||||
|
|
|
|
|
|
|
|
|
|
|
| |||||||||||||
The Effect of Financial Derivative Instruments on the Statements of Operations for the Period Ended December 31, 2012:
| Derivatives not accounted for as hedging instruments | ||||||||||||||||||||||||
| Commodity Contracts | Credit Contracts | Equity Contracts | Foreign Exchange Contracts | Interest Rate Contracts | Total | |||||||||||||||||||
Realized (Loss) on Derivatives: | ||||||||||||||||||||||||
Net realized (loss) on futures contracts | $ | 0 | $ | 0 | $ | 0 | $ | (86 | ) | $ | 0 | $ | (86 | ) | ||||||||||
Net realized (loss) on foreign currency transactions | 0 | 0 | 0 | (407 | ) | 0 | (407 | ) | ||||||||||||||||
|
|
|
|
|
|
|
|
|
|
|
| |||||||||||||
| $ | 0 | $ | 0 | $ | 0 | $ | (493 | ) | $ | 0 | $ | (493 | ) | |||||||||||
|
|
|
|
|
|
|
|
|
|
|
| |||||||||||||
Net Change in Unrealized (Depreciation) on Derivatives: | ||||||||||||||||||||||||
Net change in unrealized (depreciation) on futures contracts | $ | 0 | $ | 0 | $ | 0 | $ | (58 | ) | $ | 0 | $ | (58 | ) | ||||||||||
Net change in unrealized (depreciation) on translation of assets and liabilities denominated in foreign currencies | 0 | 0 | 0 | (708 | ) | 0 | (708 | ) | ||||||||||||||||
|
|
|
|
|
|
|
|
|
|
|
| |||||||||||||
| $ | 0 | $ | 0 | $ | 0 | $ | (766 | ) | $ | 0 | $ | (766 | ) | |||||||||||
|
|
|
|
|
|
|
|
|
|
|
| |||||||||||||
| (1) | See note 6 in the Notes to Financial Statements for additional information. |
| (2) | Only current day’s variation margin is reported within the Statements of Assets and Liabilities. The variation margin is included in the open futures cumulative appreciation/(depreciation) of $(78) as reported in the Notes to Schedule of Investments. |
| (g) | Collateral (Received)/Pledged for OTC Financial Derivative Instruments |
The following is a summary by counterparty of the market value of OTC financial derivative instruments and collateral (received)/pledged as of December 31, 2012:
| Counterparty | Total Market Value of OTC Derivatives | Collateral (Received)/Pledged | Net Exposures (1) | |||||||||
BOA | $ | (71 | ) | $ | 0 | $ | (71 | ) | ||||
BRC | (42 | ) | 0 | (42 | ) | |||||||
CBK | (31 | ) | 0 | (31 | ) | |||||||
DUB | (138 | ) | 0 | (138 | ) | |||||||
GLM | (123 | ) | 0 | (123 | ) | |||||||
HUS | (15 | ) | 0 | (15 | ) | |||||||
JPM | (344 | ) | 0 | (344 | ) | |||||||
MSC | (6 | ) | 0 | (6 | ) | |||||||
UAG | (1 | ) | 0 | (1 | ) | |||||||
| (1) | Net Exposure represents the net receivable/(payable) that would be due from/to the counterparty in the event of default. See note 7, Principal Risks, in the Notes to Financial Statements for more information regarding credit and counterparty risks. |
| See Accompanying Notes | SEMIANNUAL REPORT | DECEMBER 31, 2012 | 51 |
Table of Contents
Schedule of Investments PIMCO EqS® Dividend Fund
| SHARES | MARKET VALUE (000S) | |||||||||||
| COMMON STOCKS 97.0% | ||||||||||||
| AUSTRALIA 2.1% | ||||||||||||
| INDUSTRIALS 1.2% | ||||||||||||
Ausdrill Ltd. | 1,494,564 | $ | 4,463 | |||||||||
|
| |||||||||||
| MATERIALS 0.9% | ||||||||||||
Kingsgate Consolidated Ltd. | 743,790 | 3,467 | ||||||||||
|
| |||||||||||
Total Australia | 7,930 | |||||||||||
|
| |||||||||||
| BRAZIL 2.8% | ||||||||||||
| INDUSTRIALS 0.9% | ||||||||||||
Arteris S.A. | 351,500 | 3,253 | ||||||||||
|
| |||||||||||
| UTILITIES 1.9% | ||||||||||||
Cia de Saneamento Basico do Estado de Sao Paulo SP - ADR | 86,834 | 7,257 | ||||||||||
|
| |||||||||||
Total Brazil | 10,510 | |||||||||||
|
| |||||||||||
| CANADA 2.3% | ||||||||||||
| CONSUMER DISCRETIONARY 2.3% | ||||||||||||
Aimia, Inc. | 584,943 | 8,744 | ||||||||||
|
| |||||||||||
Total Canada | 8,744 | |||||||||||
|
| |||||||||||
| CHINA 1.1% | ||||||||||||
| INDUSTRIALS 1.1% | ||||||||||||
Guangshen Railway Co. Ltd. ‘H’ | 5,374,000 | 2,157 | ||||||||||
Zhejiang Expressway Co. Ltd. ‘H’ | 2,352,000 | 1,876 | ||||||||||
|
| |||||||||||
Total China | 4,033 | |||||||||||
|
| |||||||||||
| CYPRUS 1.9% | ||||||||||||
| ENERGY 1.9% | ||||||||||||
ProSafe SE | 807,010 | 6,924 | ||||||||||
|
| |||||||||||
Total Cyprus | 6,924 | |||||||||||
|
| |||||||||||
| FRANCE 5.1% | ||||||||||||
| ENERGY 2.5% | ||||||||||||
Total S.A. | 179,880 | 9,360 | ||||||||||
|
| |||||||||||
| HEALTH CARE 2.6% | ||||||||||||
Sanofi | 102,705 | 9,739 | ||||||||||
|
| |||||||||||
Total France | 19,099 | |||||||||||
|
| |||||||||||
| GERMANY 1.3% | ||||||||||||
| TELECOMMUNICATION SERVICES 1.3% | ||||||||||||
Telefonica Deutschland Holding AG (a) | 625,805 | 4,770 | ||||||||||
|
| |||||||||||
Total Germany | 4,770 | |||||||||||
|
| |||||||||||
| HONG KONG 2.2% | ||||||||||||
| CONSUMER DISCRETIONARY 0.5% | ||||||||||||
Tianneng Power International Ltd. | 2,716,000 | 1,770 | ||||||||||
|
| |||||||||||
| SHARES | MARKET VALUE (000S) | |||||||||||
| INDUSTRIALS 0.5% | ||||||||||||
Yuexiu Transport Infrastructure Ltd. | 3,548,000 | $ | 1,748 | |||||||||
|
| |||||||||||
| MATERIALS 0.8% | ||||||||||||
Huabao International Holdings Ltd. | 6,253,000 | 3,122 | ||||||||||
|
| |||||||||||
| TELECOMMUNICATION SERVICES 0.4% | ||||||||||||
SmarTone Telecommunications Holdings Ltd. | 787,000 | 1,443 | ||||||||||
|
| |||||||||||
Total Hong Kong | 8,083 | |||||||||||
|
| |||||||||||
| ITALY 1.2% | ||||||||||||
| INDUSTRIALS 1.2% | ||||||||||||
Societa Iniziative Autostradali e Servizi SpA | 475,770 | 4,458 | ||||||||||
|
| |||||||||||
Total Italy | 4,458 | |||||||||||
|
| |||||||||||
| MACAU 1.4% | ||||||||||||
| CONSUMER DISCRETIONARY 1.4% | ||||||||||||
Wynn Macau Ltd. (a) | 1,843,200 | 5,076 | ||||||||||
|
| |||||||||||
Total Macau | 5,076 | |||||||||||
|
| |||||||||||
| NETHERLANDS 2.5% | ||||||||||||
| ENERGY 2.5% | ||||||||||||
Royal Dutch Shell PLC ‘A’ | 271,059 | 9,409 | ||||||||||
|
| |||||||||||
Total Netherlands | 9,409 | |||||||||||
|
| |||||||||||
| NORWAY 2.0% | ||||||||||||
| INDUSTRIALS 2.0% | ||||||||||||
Orkla ASA | 849,503 | 7,445 | ||||||||||
|
| |||||||||||
Total Norway | 7,445 | |||||||||||
|
| |||||||||||
| PANAMA 1.9% | ||||||||||||
| INDUSTRIALS 1.9% | ||||||||||||
Copa Holdings S.A. | 71,864 | 7,147 | ||||||||||
|
| |||||||||||
Total Panama | 7,147 | |||||||||||
|
| |||||||||||
| QATAR 0.4% | ||||||||||||
| UTILITIES 0.4% | ||||||||||||
Qatar Electricity & Water Co. | 44,901 | 1,640 | ||||||||||
|
| |||||||||||
Total Qatar | 1,640 | |||||||||||
|
| |||||||||||
| SOUTH AFRICA 7.7% | ||||||||||||
| HEALTH CARE 1.5% | ||||||||||||
Life Healthcare Group Holdings Ltd. | 1,406,004 | 5,639 | ||||||||||
|
| |||||||||||
| MATERIALS 2.9% | ||||||||||||
Gold Fields Ltd. | 215,455 | 2,675 | ||||||||||
Gold Fields Ltd. SP - ADR | 654,699 | 8,177 | ||||||||||
|
| |||||||||||
| 10,852 | ||||||||||||
|
| |||||||||||
| TELECOMMUNICATION SERVICES 3.3% | ||||||||||||
MTN Group Ltd. | 248,328 | 5,227 | ||||||||||
Vodacom Group Ltd. | 470,947 | 6,930 | ||||||||||
|
| |||||||||||
| 12,157 | ||||||||||||
|
| |||||||||||
Total South Africa | 28,648 | |||||||||||
|
| |||||||||||
| SHARES | MARKET VALUE (000S) | |||||||||||
| SPAIN 3.1% | ||||||||||||
| UTILITIES 3.1% | ||||||||||||
Enagas S.A. | 542,930 | $ | 11,632 | |||||||||
|
| |||||||||||
Total Spain | 11,632 | |||||||||||
|
| |||||||||||
| SWITZERLAND 6.8% | ||||||||||||
| HEALTH CARE 6.8% | ||||||||||||
Novartis AG | 141,100 | 8,914 | ||||||||||
Roche Holding AG | 81,908 | 16,560 | ||||||||||
|
| |||||||||||
Total Switzerland | 25,474 | |||||||||||
|
| |||||||||||
| THAILAND 0.6% | ||||||||||||
| INDUSTRIALS 0.6% | ||||||||||||
Bangkok Expressway PCL | 1,860,700 | 2,119 | ||||||||||
|
| |||||||||||
Total Thailand | 2,119 | |||||||||||
|
| |||||||||||
| UNITED KINGDOM 10.9% | ||||||||||||
| CONSUMER STAPLES 1.9% | ||||||||||||
Imperial Tobacco Group PLC | 177,551 | 6,884 | ||||||||||
|
| |||||||||||
| FINANCIALS 3.6% | ||||||||||||
HSBC Holdings PLC | 927,769 | 9,831 | ||||||||||
IG Group Holdings PLC | 488,879 | 3,598 | ||||||||||
|
| |||||||||||
| 13,429 | ||||||||||||
|
| |||||||||||
| INDUSTRIALS 1.5% | ||||||||||||
Carillion PLC | 1,058,249 | 5,514 | ||||||||||
|
| |||||||||||
| TELECOMMUNICATION SERVICES 3.9% | ||||||||||||
BT Group PLC | 2,410,797 | 9,198 | ||||||||||
Inmarsat PLC | 567,179 | 5,467 | ||||||||||
|
| |||||||||||
| 14,665 | ||||||||||||
|
| |||||||||||
Total United Kingdom | 40,492 | |||||||||||
|
| |||||||||||
| UNITED STATES 39.7% | ||||||||||||
| CONSUMER STAPLES 4.9% | ||||||||||||
Wal-Mart Stores, Inc. | 94,719 | 6,463 | ||||||||||
Walgreen Co. | 316,001 | 11,695 | ||||||||||
|
| |||||||||||
| 18,158 | ||||||||||||
|
| |||||||||||
| ENERGY 5.0% | ||||||||||||
Marathon Petroleum Corp. | 198,907 | 12,531 | ||||||||||
MPLX LP (a) | 198,998 | 6,207 | ||||||||||
|
| |||||||||||
| 18,738 | ||||||||||||
|
| |||||||||||
| FINANCIALS 9.9% | ||||||||||||
JPMorgan Chase & Co. | 264,351 | 11,624 | ||||||||||
KeyCorp | 811,544 | 6,833 | ||||||||||
Solar Capital Ltd. | 296,808 | 7,097 | ||||||||||
Solar Senior Capital Ltd. | 96,294 | 1,797 | ||||||||||
U.S. Bancorp | 292,876 | 9,354 | ||||||||||
|
| |||||||||||
| 36,705 | ||||||||||||
|
| |||||||||||
| HEALTH CARE 10.2% | ||||||||||||
Baxter International, Inc. | 193,460 | 12,896 | ||||||||||
Medtronic, Inc. | 287,074 | 11,776 | ||||||||||
Pfizer, Inc. | 539,036 | 13,519 | ||||||||||
|
| |||||||||||
| 38,191 | ||||||||||||
|
| |||||||||||
| 52 | PIMCO EQUITY SERIES | See Accompanying Notes |
Table of Contents
December 31, 2012 (Unaudited)
| SHARES | MARKET VALUE (000S) | |||||||||||
| INDUSTRIALS 1.8% | ||||||||||||
Lockheed Martin Corp. | 72,938 | $ | 6,731 | |||||||||
|
| |||||||||||
| INFORMATION TECHNOLOGY 7.9% | ||||||||||||
Cisco Systems, Inc. | 501,071 | 9,846 | ||||||||||
Intel Corp. | 298,516 | 6,158 | ||||||||||
Microsoft Corp. | 502,741 | 13,438 | ||||||||||
|
| |||||||||||
| 29,442 | ||||||||||||
|
| |||||||||||
Total United States | 147,965 | |||||||||||
|
| |||||||||||
Total Common Stocks (Cost $329,160) | 361,598 | |||||||||||
|
| |||||||||||
| PRINCIPAL AMOUNT (000S) | MARKET VALUE (000S) | |||||||||||
| SHORT-TERM INSTRUMENTS 2.7% | ||||||||||||
| REPURCHASE AGREEMENTS 0.1% | ||||||||||||
State Street Bank and Trust Co. |
| |||||||||||
0.010% due 01/02/2013 | $ | 524 | $ | 524 | ||||||||
|
| |||||||||||
(Dated 12/31/2012. Collateralized by Fannie Mae 2.170% due 10/17/2022 valued at $537. Repurchase proceeds are $524.) | ||||||||||||
| U.S. TREASURY BILLS 0.8% | ||||||||||||
0.148% due 05/16/2013 - 12/12/2013 (b)(d) | 3,090 | 3,086 | ||||||||||
|
| |||||||||||
| SHARES | MARKET VALUE (000S) | |||||||||||
| CENTRAL FUNDS USED FOR CASH MANAGEMENT PURPOSES (c) 1.8% | ||||||||||||
PIMCO Short-Term | 652,805 | $ | 6,533 | |||||||||
|
| |||||||||||
Total Short-Term Instruments (Cost $10,149) | 10,143 | |||||||||||
|
| |||||||||||
| Total Investments 99.7% (Cost $339,309) | $ | 371,741 | ||||||||||
| Other Assets and Liabilities (Net) 0.3% | 1,099 | |||||||||||
|
| |||||||||||
| Net Assets 100.0% | $ | 372,840 | ||||||||||
|
| |||||||||||
Notes to Schedule of Investments (amounts in thousands*):
| * | A zero balance may reflect actual amounts rounding to less than one thousand. |
| (a) | Non-income producing security. |
| (b) | Coupon represents a weighted average yield to maturity. |
| (c) | Affiliated to the Fund. |
| (d) | Securities with an aggregate market value of $3,086 have been pledged as collateral for foreign currency contracts as governed by International Swaps and Derivatives Association, Inc. Master Agreements as of December 31, 2012. |
| (e) | Foreign currency contracts outstanding as of December 31, 2012: |
| Settlement Month | Currency to be Delivered | Currency to be Received | Counterparty | Unrealized Appreciation | Unrealized (Depreciation) | Net Unrealized Appreciation/ (Depreciation) | ||||||||||||||||||||||||
01/2013 | AUD | 1,755 | $ | 1,832 | BRC | $ | 10 | $ | 0 | $ | 10 | |||||||||||||||||||
01/2013 | 1,755 | 1,832 | DUB | 9 | 0 | 9 | ||||||||||||||||||||||||
01/2013 | CAD | 6,713 | 6,756 | BRC | 7 | 0 | 7 | �� | ||||||||||||||||||||||
01/2013 | CHF | 11,969 | 12,891 | BRC | 0 | (195 | ) | (195 | ) | |||||||||||||||||||||
01/2013 | EUR | 13,260 | 17,104 | BOA | 0 | (398 | ) | (398 | ) | |||||||||||||||||||||
01/2013 | 526 | 687 | GLM | 0 | (7 | ) | (7 | ) | ||||||||||||||||||||||
01/2013 | GBP | 4,159 | 6,696 | BOA | 0 | (60 | ) | (60 | ) | |||||||||||||||||||||
01/2013 | 2,322 | 3,761 | CBK | 0 | (11 | ) | (11 | ) | ||||||||||||||||||||||
01/2013 | 7,565 | 12,107 | GLM | 0 | (182 | ) | (182 | ) | ||||||||||||||||||||||
01/2013 | JPY | 270,552 | 3,294 | BOA | 171 | 0 | 171 | |||||||||||||||||||||||
01/2013 | 602,453 | 7,144 | HUS | 190 | 0 | 190 | ||||||||||||||||||||||||
01/2013 | 602,453 | 7,141 | JPM | 187 | 0 | 187 | ||||||||||||||||||||||||
01/2013 | 602,454 | 7,143 | UAG | 189 | 0 | 189 | ||||||||||||||||||||||||
01/2013 | NOK | 83,912 | 14,753 | GLM | 0 | (345 | ) | (345 | ) | |||||||||||||||||||||
01/2013 | THB | 24,109 | 776 | UAG | 0 | (11 | ) | (11 | ) | |||||||||||||||||||||
01/2013 | $ | 1,642 | AUD | 1,568 | CBK | 0 | (14 | ) | (14 | ) | ||||||||||||||||||||
01/2013 | 2,028 | 1,942 | JPM | 0 | (11 | ) | (11 | ) | ||||||||||||||||||||||
01/2013 | 2,559 | CAD | 2,542 | CBK | 0 | (3 | ) | (3 | ) | |||||||||||||||||||||
01/2013 | 4,234 | 4,171 | GLM | 0 | (40 | ) | (40 | ) | ||||||||||||||||||||||
01/2013 | 13,064 | CHF | 11,969 | CBK | 22 | 0 | 22 | |||||||||||||||||||||||
01/2013 | 6,166 | EUR | 4,714 | CBK | 56 | 0 | 56 | |||||||||||||||||||||||
01/2013 | 12,057 | 9,072 | UAG | 0 | (82 | ) | (82 | ) | ||||||||||||||||||||||
01/2013 | 22,872 | GBP | 14,046 | GLM | 0 | (56 | ) | (56 | ) | |||||||||||||||||||||
01/2013 | 25,412 | JPY | 2,077,912 | JPM | 0 | (1,427 | ) | (1,427 | ) | |||||||||||||||||||||
01/2013 | 2,112 | NOK | 12,009 | GLM | 48 | 0 | 48 | |||||||||||||||||||||||
01/2013 | 27 | THB | 831 | BRC | 0 | 0 | 0 | |||||||||||||||||||||||
01/2013 | 758 | 23,278 | JPM | 2 | 0 | 2 | ||||||||||||||||||||||||
01/2013 | ZAR | 9,136 | $ | 1,035 | BRC | 0 | (39 | ) | (39 | ) | ||||||||||||||||||||
01/2013 | 11,948 | 1,360 | CBK | 0 | (44 | ) | (44 | ) | ||||||||||||||||||||||
01/2013 | 188,911 | 21,179 | HUS | 0 | (1,022 | ) | (1,022 | ) | ||||||||||||||||||||||
01/2013 | 625 | 73 | JPM | 0 | 0 | 0 | ||||||||||||||||||||||||
02/2013 | BRL | 6,938 | 3,361 | HUS | 0 | (13 | ) | (13 | ) | |||||||||||||||||||||
02/2013 | 220 | 104 | MSC | 0 | (3 | ) | (3 | ) | ||||||||||||||||||||||
02/2013 | CHF | 11,969 | 13,072 | CBK | 0 | (22 | ) | (22 | ) | |||||||||||||||||||||
02/2013 | 435 | 477 | GLM | 1 | 0 | 1 | ||||||||||||||||||||||||
02/2013 | CZK | 109,595 | 5,652 | JPM | 0 | (116 | ) | (116 | ) | |||||||||||||||||||||
02/2013 | EUR | 9,072 | 12,060 | UAG | 83 | 0 | 83 | |||||||||||||||||||||||
02/2013 | GBP | 14,046 | 22,870 | GLM | 55 | 0 | 55 | |||||||||||||||||||||||
02/2013 | NOK | 71,903 | 12,916 | JPM | 0 | (6 | ) | (6 | ) | |||||||||||||||||||||
02/2013 | $ | 1,827 | AUD | 1,755 | BRC | 0 | (9 | ) | (9 | ) | ||||||||||||||||||||
02/2013 | 1,827 | 1,755 | DUB | 0 | (9 | ) | (9 | ) | ||||||||||||||||||||||
02/2013 | 174 | BRL | 359 | HUS | 0 | 0 | 0 | |||||||||||||||||||||||
02/2013 | 6,751 | CAD | 6,713 | BRC | 0 | (7 | ) | (7 | ) | |||||||||||||||||||||
| See Accompanying Notes | SEMIANNUAL REPORT | DECEMBER 31, 2012 | 53 |
Table of Contents
Schedule of Investments PIMCO EqS® Dividend Fund (Cont.)
| Settlement Month | Currency to be Delivered | Currency to be Received | Counterparty | Unrealized Appreciation | Unrealized (Depreciation) | Net Unrealized Appreciation/ (Depreciation) | ||||||||||||||||||||||||
02/2013 | $ | 5,611 | CZK | 109,595 | DUB | $ | 157 | $ | 0 | $ | 157 | |||||||||||||||||||
02/2013 | 142 | HKD | 1,100 | JPM | 0 | 0 | 0 | |||||||||||||||||||||||
02/2013 | 7,145 | JPY | 602,453 | HUS | 0 | (190 | ) | (190 | ) | |||||||||||||||||||||
02/2013 | 7,142 | 602,453 | JPM | 0 | (187 | ) | (187 | ) | ||||||||||||||||||||||
02/2013 | 7,145 | 602,454 | UAG | 0 | (189 | ) | (189 | ) | ||||||||||||||||||||||
04/2013 | THB | 23,112 | $ | 749 | JPM | 0 | (2 | ) | (2 | ) | ||||||||||||||||||||
|
|
|
|
|
| |||||||||||||||||||||||||
| $ | 1,187 | $ | (4,700 | ) | $ | (3,513 | ) | |||||||||||||||||||||||
|
|
|
|
|
| |||||||||||||||||||||||||
| (f) | Fair Value Measurements (1) |
(i) The following is a summary of the fair valuations according to the inputs used as of December 31, 2012 in valuing the Fund’s assets and liabilities:
| Category and Subcategory | Level 1 | Level 2 | Level 3 | Fair Value at 12/31/2012 | ||||||||||||
Investments, at value | ||||||||||||||||
Common Stocks | ||||||||||||||||
Australia | ||||||||||||||||
Industrials | $ | 0 | $ | 4,463 | $ | 0 | $ | 4,463 | ||||||||
Materials | 0 | 3,467 | 0 | 3,467 | ||||||||||||
Brazil | ||||||||||||||||
Industrials | 3,253 | 0 | 0 | 3,253 | ||||||||||||
Utilities | 7,257 | 0 | 0 | 7,257 | ||||||||||||
Canada | ||||||||||||||||
Consumer Discretionary | 8,744 | 0 | 0 | 8,744 | ||||||||||||
China | ||||||||||||||||
Industrials | 0 | 4,033 | 0 | 4,033 | ||||||||||||
Cyprus | ||||||||||||||||
Energy | 0 | 6,924 | 0 | 6,924 | ||||||||||||
France | ||||||||||||||||
Energy | 0 | 9,360 | 0 | 9,360 | ||||||||||||
Health Care | 0 | 9,739 | 0 | 9,739 | ||||||||||||
Germany | ||||||||||||||||
Telecommunication Services | 4,770 | 0 | 0 | 4,770 | ||||||||||||
Hong Kong | ||||||||||||||||
Consumer Discretionary | 0 | 1,770 | 0 | 1,770 | ||||||||||||
Industrials | 0 | 1,748 | 0 | 1,748 | ||||||||||||
Materials | 0 | 3,122 | 0 | 3,122 | ||||||||||||
Telecommunication Services | 0 | 1,443 | 0 | 1,443 | ||||||||||||
Italy | ||||||||||||||||
Industrials | 0 | 4,458 | 0 | 4,458 | ||||||||||||
Macau | ||||||||||||||||
Consumer Discretionary | 0 | 5,076 | 0 | 5,076 | ||||||||||||
Netherlands | ||||||||||||||||
Energy | 0 | 9,409 | 0 | 9,409 | ||||||||||||
Norway | ||||||||||||||||
Industrials | 0 | 7,445 | 0 | 7,445 | ||||||||||||
Panama | ||||||||||||||||
Industrials | 7,147 | 0 | 0 | 7,147 | ||||||||||||
Qatar | ||||||||||||||||
Utilities | 0 | 1,640 | 0 | 1,640 | ||||||||||||
South Africa | ||||||||||||||||
Health Care | 5,639 | 0 | 0 | 5,639 | ||||||||||||
| Category and Subcategory | Level 1 | Level 2 | Level 3 | Fair Value at 12/31/2012 | ||||||||||||
Materials | $ | 8,177 | $ | 2,675 | $ | 0 | $ | 10,852 | ||||||||
Telecommunication Services | 0 | 12,157 | 0 | 12,157 | ||||||||||||
Spain | ||||||||||||||||
Utilities | 0 | 11,632 | 0 | 11,632 | ||||||||||||
Switzerland | ||||||||||||||||
Health Care | 0 | 25,474 | 0 | 25,474 | ||||||||||||
Thailand | ||||||||||||||||
Industrials | 2,119 | 0 | 0 | 2,119 | ||||||||||||
United Kingdom | ||||||||||||||||
Consumer Staples | 0 | 6,884 | 0 | 6,884 | ||||||||||||
Financials | 0 | 13,429 | 0 | 13,429 | ||||||||||||
Industrials | 0 | 5,514 | 0 | 5,514 | ||||||||||||
Telecommunication Services | 0 | 14,665 | 0 | 14,665 | ||||||||||||
United States | ||||||||||||||||
Consumer Staples | 18,158 | 0 | 0 | 18,158 | ||||||||||||
Energy | 18,738 | 0 | 0 | 18,738 | ||||||||||||
Financials | 36,705 | 0 | 0 | 36,705 | ||||||||||||
Health Care | 38,191 | 0 | 0 | 38,191 | ||||||||||||
Industrials | 6,731 | 0 | 0 | 6,731 | ||||||||||||
Information Technology | 29,442 | 0 | 0 | 29,442 | ||||||||||||
Short-Term Instruments | ||||||||||||||||
Repurchase Agreements | 0 | 524 | 0 | 524 | ||||||||||||
U.S. Treasury Bills | 0 | 3,086 | 0 | 3,086 | ||||||||||||
Central Funds Used for Cash Management Purposes | 6,533 | 0 | 0 | 6,533 | ||||||||||||
| $ | 201,604 | $ | 170,137 | $ | 0 | $ | 371,741 | |||||||||
Financial Derivative Instruments - Assets | ||||||||||||||||
Foreign Exchange Contracts | 0 | 1,187 | 0 | 1,187 | ||||||||||||
Financial Derivative Instruments - Liabilities |
| |||||||||||||||
Foreign Exchange Contracts | 0 | (4,700 | ) | 0 | (4,700 | ) | ||||||||||
Totals | $ | 201,604 | $ | 166,624 | $ | 0 | $ | 368,228 | ||||||||
(ii) There were assets and liabilities valued at $5,639 transferred from Level 2 to Level 1 during the period ended December 31, 2012.
| (1) | See note 3 in the Notes to Financial Statements for more information regarding pricing inputs and valuation techniques. |
| 54 | PIMCO EQUITY SERIES | See Accompanying Notes |
Table of Contents
December 31, 2012 (Unaudited)
| (g) | Fair Value of Financial Derivative Instruments (1) |
The following is a summary of the fair valuation of the Fund’s derivative instruments categorized by risk exposure:
Fair Values of Financial Derivative Instruments on the Statements of Assets and Liabilities as of December 31, 2012:
| Derivatives not accounted for as hedging instruments | ||||||||||||||||||||||||
| Commodity Contracts | Credit Contracts | Equity Contracts | Foreign Exchange Contracts | Interest Rate Contracts | Total | |||||||||||||||||||
Assets: | ||||||||||||||||||||||||
Unrealized appreciation on foreign currency contracts | $ | 0 | $ | 0 | $ | 0 | $ | 1,187 | $ | 0 | $ | 1,187 | ||||||||||||
|
|
|
|
|
|
|
|
|
|
|
| |||||||||||||
Liabilities: | ||||||||||||||||||||||||
Unrealized depreciation on foreign currency contracts | $ | 0 | $ | 0 | $ | 0 | $ | 4,700 | $ | 0 | $ | 4,700 | ||||||||||||
|
|
|
|
|
|
|
|
|
|
|
| |||||||||||||
The Effect of Financial Derivative Instruments on the Statements of Operations for the Period Ended December 31, 2012:
| Derivatives not accounted for as hedging instruments | ||||||||||||||||||||||||
| Commodity Contracts | Credit Contracts | Equity Contracts | Foreign Exchange Contracts | Interest Rate Contracts | Total | |||||||||||||||||||
Realized (Loss) on Derivatives: | ||||||||||||||||||||||||
Net realized (loss) on foreign currency transactions | $ | 0 | $ | 0 | $ | 0 | $ | (2,643 | ) | $ | 0 | $ | (2,643 | ) | ||||||||||
|
|
|
|
|
|
|
|
|
|
|
| |||||||||||||
Net Change in Unrealized (Depreciation) on Derivatives: | ||||||||||||||||||||||||
Net change in unrealized (depreciation) on translation of assets and liabilities denominated in foreign currencies | $ | 0 | $ | 0 | $ | 0 | $ | (2,431 | ) | $ | 0 | $ | (2,431 | ) | ||||||||||
|
|
|
|
|
|
|
|
|
|
|
| |||||||||||||
| (1) | See note 6 in the Notes to Financial Statements for additional information. |
| (h) | Collateral Pledged for OTC Financial Derivative Instruments |
The following is a summary by counterparty of the market value of OTC financial derivative instruments and collateral pledged as of December 31, 2012:
| Counterparty | Total Market Value of OTC Derivatives | Collateral Pledged | Net Exposures (1) | |||||||||
BOA | $ | (287 | ) | $ | 260 | $ | (27 | ) | ||||
BRC | (233 | ) | 270 | 37 | ||||||||
CBK | (16 | ) | 0 | (16 | ) | |||||||
DUB | 157 | 0 | 157 | |||||||||
GLM | (526 | ) | 280 | 246 | ||||||||
HUS | (1,035 | ) | 979 | (56 | ) | |||||||
JPM | (1,560 | ) | 1,298 | (262 | ) | |||||||
MSC | (3 | ) | 0 | (3 | ) | |||||||
UAG | (10 | ) | 0 | (10 | ) | |||||||
| (1) | Net Exposure represents the net receivable/(payable) that would be due from/to the counterparty in the event of default. See note 7, Principal Risks, in the Notes to Financial Statements for more information regarding credit and counterparty risks. |
| See Accompanying Notes | SEMIANNUAL REPORT | DECEMBER 31, 2012 | 55 |
Table of Contents
Schedule of Investments PIMCO EqS® Emerging Markets Fund
| SHARES | MARKET VALUE (000S) | |||||||||||
| COMMON STOCKS 82.8% | ||||||||||||
| AUSTRALIA 2.0% | ||||||||||||
| MATERIALS 2.0% | ||||||||||||
Iluka Resources Ltd. | 1,276,690 | $ | 12,338 | |||||||||
|
| |||||||||||
Total Australia | 12,338 | |||||||||||
|
| |||||||||||
| BRAZIL 6.5% | ||||||||||||
| CONSUMER DISCRETIONARY 1.3% | ||||||||||||
Anhanguera Educacional Participacoes S.A. | 446,800 | 7,544 | ||||||||||
|
| |||||||||||
| CONSUMER STAPLES 2.4% | ||||||||||||
Cia de Bebidas das Americas SP - ADR | 343,647 | 14,430 | ||||||||||
|
| |||||||||||
| FINANCIALS 2.8% | ||||||||||||
Itau Unibanco Holding S.A. SP - ADR | 1,025,327 | 16,877 | ||||||||||
|
| |||||||||||
Total Brazil | 38,851 | |||||||||||
|
| |||||||||||
| CAMBODIA 0.7% | ||||||||||||
| CONSUMER DISCRETIONARY 0.7% | ||||||||||||
NagaCorp Ltd. | 6,856,000 | 4,189 | ||||||||||
|
| |||||||||||
Total Cambodia | 4,189 | |||||||||||
|
| |||||||||||
| CANADA 1.1% | ||||||||||||
| MATERIALS 1.1% | ||||||||||||
Turquoise Hill Resources Ltd. (a) | 889,648 | 6,770 | ||||||||||
|
| |||||||||||
Total Canada | 6,770 | |||||||||||
|
| |||||||||||
| CHINA 12.8% | ||||||||||||
| CONSUMER DISCRETIONARY 3.0% | ||||||||||||
Dongfeng Motor Group Co. Ltd. | 7,908,000 | 12,450 | ||||||||||
Xingda International Holdings Ltd. | 10,222,000 | 5,360 | ||||||||||
|
| |||||||||||
| 17,810 | ||||||||||||
|
| |||||||||||
| CONSUMER STAPLES 1.2% | ||||||||||||
Shenguan Holdings Group Ltd. | 13,230,000 | 7,221 | ||||||||||
|
| |||||||||||
| ENERGY 2.2% | ||||||||||||
China Shenhua Energy Co. Ltd. | 2,895,500 | 12,989 | ||||||||||
|
| |||||||||||
| INDUSTRIALS 3.5% | ||||||||||||
China Automation Group Ltd. | 7,231,000 | 2,051 | ||||||||||
First Tractor Co. Ltd. ‘H’ (a) | 4,568,000 | 4,544 | ||||||||||
Jiangsu Expressway Co. Ltd. ‘H’ | 5,318,000 | 5,509 | ||||||||||
Shanghai Electric Group Co. Ltd. | 21,054,000 | 9,170 | ||||||||||
|
| |||||||||||
| 21,274 | ||||||||||||
|
| |||||||||||
| INFORMATION TECHNOLOGY 1.3% | ||||||||||||
Baidu, Inc. ADR (a) | 44,534 | 4,467 | ||||||||||
Hollysys Automation Technologies Ltd. (a) | 296,648 | 3,521 | ||||||||||
|
| |||||||||||
| 7,988 | ||||||||||||
|
| |||||||||||
| SHARES | MARKET VALUE (000S) | |||||||||||
| MATERIALS 1.6% | ||||||||||||
China Shanshui Cement Group Ltd. | 13,102,000 | $ | 9,788 | |||||||||
|
| |||||||||||
Total China | 77,070 | |||||||||||
|
| |||||||||||
| CYPRUS 2.1% | ||||||||||||
| INDUSTRIALS 2.1% | ||||||||||||
Global Ports Investment PLC SP - GDR | 308,215 | 4,404 | ||||||||||
Globaltrans Investment PLC SP - GDR | 511,327 | 8,442 | ||||||||||
|
| |||||||||||
Total Cyprus | 12,846 | |||||||||||
|
| |||||||||||
| DENMARK 2.0% | ||||||||||||
| CONSUMER STAPLES 2.0% | ||||||||||||
Carlsberg A/S ‘B’ | 120,730 | 11,894 | ||||||||||
|
| |||||||||||
Total Denmark | 11,894 | |||||||||||
|
| |||||||||||
| FINLAND 0.4% | ||||||||||||
| MATERIALS 0.4% | ||||||||||||
Kemira OYJ | 150,082 | 2,357 | ||||||||||
|
| |||||||||||
Total Finland | 2,357 | |||||||||||
|
| |||||||||||
| HONG KONG 8.1% | ||||||||||||
| CONSUMER DISCRETIONARY 1.3% | ||||||||||||
Melco Crown Entertainment Ltd. ADR (a) | 480,230 | 8,087 | ||||||||||
|
| |||||||||||
| CONSUMER STAPLES 0.7% | ||||||||||||
China Mengniu Dairy Co. Ltd. | 1,553,000 | 4,439 | ||||||||||
|
| |||||||||||
| FINANCIALS 3.1% | ||||||||||||
AIA Group Ltd. | 3,068,184 | 12,170 | ||||||||||
Glorious Property Holdings Ltd. | 32,691,000 | 6,249 | ||||||||||
|
| |||||||||||
| 18,419 | ||||||||||||
|
| |||||||||||
| INFORMATION TECHNOLOGY 0.2% | ||||||||||||
China High Precision Automation Group Ltd. | 8,446,000 | 1,130 | ||||||||||
|
| |||||||||||
| TELECOMMUNICATION SERVICES 2.8% | ||||||||||||
China Mobile Ltd. | 1,423,500 | 16,751 | ||||||||||
|
| |||||||||||
Total Hong Kong | 48,826 | |||||||||||
|
| |||||||||||
| INDIA 3.6% | ||||||||||||
| CONSUMER DISCRETIONARY 0.5% | ||||||||||||
Tata Motors Ltd. | 551,290 | 3,172 | ||||||||||
|
| |||||||||||
| FINANCIALS 3.1% | ||||||||||||
Housing Development Finance Corp. | 769,880 | 11,749 | ||||||||||
Yes Bank Ltd. | 771,232 | 6,550 | ||||||||||
|
| |||||||||||
| 18,299 | ||||||||||||
|
| |||||||||||
Total India | 21,471 | |||||||||||
|
| |||||||||||
| INDONESIA 1.1% | ||||||||||||
| FINANCIALS 1.1% | ||||||||||||
Bank Mandiri Tbk PT | 7,502,500 | 6,338 | ||||||||||
|
| |||||||||||
Total Indonesia | 6,338 | |||||||||||
|
| |||||||||||
| SHARES | MARKET VALUE (000S) | |||||||||||
| ISRAEL 3.4% | ||||||||||||
| HEALTH CARE 1.1% | ||||||||||||
Teva Pharmaceutical Industries Ltd. SP - ADR | 172,501 | $ | 6,441 | |||||||||
|
| |||||||||||
| MATERIALS 2.3% | ||||||||||||
Israel Chemicals Ltd. | 1,149,774 | 13,847 | ||||||||||
|
| |||||||||||
Total Israel | 20,288 | |||||||||||
|
| |||||||||||
| ITALY 1.7% | ||||||||||||
| CONSUMER DISCRETIONARY 1.7% | ||||||||||||
Prada SpA | 1,058,500 | 10,292 | ||||||||||
|
| |||||||||||
Total Italy | 10,292 | |||||||||||
|
| |||||||||||
| JAPAN 1.7% | ||||||||||||
| CONSUMER DISCRETIONARY 1.7% | ||||||||||||
Honda Motor Co. Ltd. | 277,100 | 10,262 | ||||||||||
|
| |||||||||||
Total Japan | 10,262 | |||||||||||
|
| |||||||||||
| KAZAKHSTAN 2.1% | ||||||||||||
| ENERGY 0.9% | ||||||||||||
KazMunaiGas Exploration Production SP - GDR | 279,851 | 5,037 | ||||||||||
|
| |||||||||||
| TELECOMMUNICATION SERVICES 1.2% | ||||||||||||
KCell JSC GDR (a) | 625,325 | 7,348 | ||||||||||
|
| |||||||||||
Total Kazakhstan | 12,385 | |||||||||||
|
| |||||||||||
| MACAU 1.7% | ||||||||||||
| CONSUMER DISCRETIONARY 1.7% | ||||||||||||
Wynn Macau Ltd. (a) | 3,745,600 | 10,314 | ||||||||||
|
| |||||||||||
Total Macau | 10,314 | |||||||||||
|
| |||||||||||
| MEXICO 2.4% | ||||||||||||
| CONSUMER DISCRETIONARY 0.3% | ||||||||||||
Urbi Desarrollos Urbanos S.A.B. de C.V. (a) | 3,303,600 | 2,073 | ||||||||||
|
| |||||||||||
| FINANCIALS 2.1% | ||||||||||||
Bolsa Mexicana de Valores S.A.B. de C.V. | 4,885,100 | 12,320 | ||||||||||
|
| |||||||||||
Total Mexico | 14,393 | |||||||||||
|
| |||||||||||
| NORWAY 2.0% | ||||||||||||
| CONSUMER STAPLES 1.1% | ||||||||||||
Marine Harvest ASA (a) | 7,018,603 | 6,538 | ||||||||||
|
| |||||||||||
| ENERGY 0.9% | ||||||||||||
Seadrill Ltd. | 149,774 | 5,518 | ||||||||||
|
| |||||||||||
Total Norway | 12,056 | |||||||||||
|
| |||||||||||
| PERU 2.0% | ||||||||||||
| FINANCIALS 2.0% | ||||||||||||
Credicorp Ltd. | 83,558 | 12,246 | ||||||||||
|
| |||||||||||
Total Peru | 12,246 | |||||||||||
|
| |||||||||||
| PHILIPPINES 1.1% | ||||||||||||
| UTILITIES 1.1% | ||||||||||||
First Gen Corp. (a) | 12,362,500 | 6,722 | ||||||||||
|
| |||||||||||
Total Philippines | 6,722 | |||||||||||
|
| |||||||||||
| 56 | PIMCO EQUITY SERIES | See Accompanying Notes |
Table of Contents
December 31, 2012 (Unaudited)
| SHARES | MARKET VALUE (000S) | |||||||||||
| QATAR 1.3% | ||||||||||||
| FINANCIALS 1.3% | ||||||||||||
Commercial Bank of Qatar QSC | 404,184 | $ | 7,890 | |||||||||
|
| |||||||||||
Total Qatar | 7,890 | |||||||||||
|
| |||||||||||
| RUSSIA 8.3% | ||||||||||||
| CONSUMER STAPLES 1.0% | ||||||||||||
X5 Retail Group NV SP - GDR (a) | 325,703 | 5,896 | ||||||||||
|
| |||||||||||
| ENERGY 2.4% | ||||||||||||
NovaTek OAO SP - GDR | 121,027 | 14,511 | ||||||||||
|
| |||||||||||
| FINANCIALS 1.7% | ||||||||||||
Sberbank of Russia ADR | 820,012 | 10,299 | ||||||||||
|
| |||||||||||
| MATERIALS 1.7% | ||||||||||||
Magnitogorsk Iron & Steel Works SP - GDR | 1,930,184 | 8,617 | ||||||||||
Mechel SP - ADR | 665,418 | 1,291 | ||||||||||
|
| |||||||||||
| 9,908 | ||||||||||||
|
| |||||||||||
| TELECOMMUNICATION SERVICES 1.5% | ||||||||||||
MegaFon OAO GDR (a) | 384,725 | 9,156 | ||||||||||
|
| |||||||||||
Total Russia | 49,770 | |||||||||||
|
| |||||||||||
| SOUTH AFRICA 2.2% | ||||||||||||
| CONSUMER STAPLES 1.2% | ||||||||||||
Tongaat Hulett Ltd. | 437,517 | 6,957 | ||||||||||
|
| |||||||||||
| TELECOMMUNICATION SERVICES 1.0% | ||||||||||||
Vodacom Group Ltd. | 416,067 | 6,123 | ||||||||||
|
| |||||||||||
Total South Africa | 13,080 | |||||||||||
|
| |||||||||||
| SOUTH KOREA 3.3% | ||||||||||||
| CONSUMER DISCRETIONARY 3.3% | ||||||||||||
GS Home Shopping, Inc. | 44,057 | 6,339 | ||||||||||
Kia Motors Corp. | 250,005 | 13,294 | ||||||||||
|
| |||||||||||
Total South Korea | 19,633 | |||||||||||
|
| |||||||||||
| SWITZERLAND 0.3% | ||||||||||||
| INFORMATION TECHNOLOGY 0.3% | ||||||||||||
Logitech International S.A. | 213,964 | 1,638 | ||||||||||
|
| |||||||||||
Total Switzerland | 1,638 | |||||||||||
|
| |||||||||||
| TAIWAN 1.8% | ||||||||||||
| INFORMATION TECHNOLOGY 1.8% | ||||||||||||
Chicony Electronics Co. Ltd. | 2,510,025 | 5,853 | ||||||||||
Hon Hai Precision Industry Co. Ltd. | 1,552,390 | 4,805 | ||||||||||
|
| |||||||||||
Total Taiwan | 10,658 | |||||||||||
|
| |||||||||||
| THAILAND 2.2% | ||||||||||||
| CONSUMER STAPLES 0.9% | ||||||||||||
Thai Beverage PCL | 16,604,000 | 5,398 | ||||||||||
|
| |||||||||||
| SHARES | MARKET VALUE (000S) | |||||||||||
| FINANCIALS 1.3% | ||||||||||||
Kasikornbank PCL | 1,227,900 | $ | 7,814 | |||||||||
|
| |||||||||||
Total Thailand | 13,212 | |||||||||||
|
| |||||||||||
| TURKEY 1.3% | ||||||||||||
| TELECOMMUNICATION SERVICES 1.3% | ||||||||||||
Turk Telekomunikasyon A/S | 2,057,080 | 7,998 | ||||||||||
|
| |||||||||||
Total Turkey | 7,998 | |||||||||||
|
| |||||||||||
| UNITED KINGDOM 3.6% | ||||||||||||
| CONSUMER STAPLES 1.8% | ||||||||||||
British American Tobacco PLC | 207,645 | 10,556 | ||||||||||
|
| |||||||||||
| ENERGY 1.0% | ||||||||||||
Afren PLC (a) | 2,766,914 | 6,004 | ||||||||||
|
| |||||||||||
| FINANCIALS 0.8% | ||||||||||||
Standard Chartered PLC | 191,003 | 4,943 | ||||||||||
|
| |||||||||||
Total United Kingdom | 21,503 | |||||||||||
|
| |||||||||||
Total Common Stocks (Cost $475,426) | 497,290 | |||||||||||
|
| |||||||||||
| EQUITY-LINKED SECURITIES 2.4% | ||||||||||||
| INDIA 0.0% | ||||||||||||
| FINANCIALS 0.0% | ||||||||||||
Merrill Lynch International & Co., Yes Bank Ltd. - Exp. 09/14/2015 | 35,317 | 299 | ||||||||||
|
| |||||||||||
Total India | 299 | |||||||||||
|
| |||||||||||
| NETHERLANDS 1.7% | ||||||||||||
| FINANCIALS 1.7% | ||||||||||||
JPMorgan Chase & Co., JPHCNCBI Index - Exp. 12/06/2013 | 56,559 | 6,120 | ||||||||||
JPMorgan Chase & Co., JPHCNCBI Index - Exp. 12/09/2013 | 36,862 | 3,872 | ||||||||||
|
| |||||||||||
Total Netherlands | 9,992 | |||||||||||
|
| |||||||||||
| NIGERIA 0.7% | ||||||||||||
| CONSUMER STAPLES 0.7% | ||||||||||||
HSBC Bank PLC, Guinness Nigeria PLC - Exp. 12/09/2014 | 545,745 | 961 | ||||||||||
HSBC Bank PLC, Nigerian Breweries PLC - Exp. 12/09/2014 | 3,066,979 | 2,887 | ||||||||||
Merrill Lynch International & Co., Guinness Nigeria PLC - Exp. 11/10/2014 | 9,882 | 17 | ||||||||||
Merrill Lynch International & Co., Nigerian Breweries PLC - Exp. 11/10/2014 | 251,197 | 237 | ||||||||||
|
| |||||||||||
Total Nigeria | 4,102 | |||||||||||
|
| |||||||||||
Total Equity-Linked Securities | 14,393 | |||||||||||
|
| |||||||||||
| SHARES | MARKET VALUE (000S) | |||||||||||
| EXCHANGE-TRADED FUNDS 2.8% | ||||||||||||
| LUXEMBOURG 1.6% | ||||||||||||
db x-trackers - CSI300 Index ETF | 12,318,300 | $ | 9,822 | |||||||||
|
| |||||||||||
Total Luxembourg | 9,822 | |||||||||||
|
| |||||||||||
| UNITED STATES 1.2% | ||||||||||||
ETFS Palladium Trust | 98,603 | 6,825 | ||||||||||
|
| |||||||||||
Total United States | 6,825 | |||||||||||
|
| |||||||||||
Total Exchange-Traded Funds | 16,647 | |||||||||||
|
| |||||||||||
| PREFERRED STOCKS 5.5% | ||||||||||||
| SOUTH KOREA 5.5% | ||||||||||||
| INFORMATION TECHNOLOGY 5.5% | ||||||||||||
Samsung Electronics Co. Ltd. | 41,428 | 33,290 | ||||||||||
|
| |||||||||||
Total Preferred Stocks (Cost $23,098) | 33,290 | |||||||||||
|
| |||||||||||
| PRINCIPAL AMOUNT (000S) | ||||||||||||
| SHORT-TERM INSTRUMENTS 6.7% | ||||||||||||
| REPURCHASE AGREEMENTS 0.1% | ||||||||||||
State Street Bank and Trust Co. |
| |||||||||||
0.010% due 01/02/2013 | $ | 601 | 601 | |||||||||
|
| |||||||||||
(Dated 12/31/2012. Collateralized by Fannie Mae 2.170% due 10/17/2022 valued at $618. Repurchase proceeds are $601.) | ||||||||||||
| U.S. TREASURY BILLS 0.9% | ||||||||||||
0.135% due 05/02/2013 - 12/12/2013 (b)(d)(e) | 5,330 | 5,326 | ||||||||||
|
| |||||||||||
| SHARES | ||||||||||||
| CENTRAL FUNDS USED FOR CASH MANAGEMENT PURPOSES (c) 5.7% | ||||||||||||
PIMCO Short-Term | 3,452,086 | 34,545 | ||||||||||
|
| |||||||||||
Total Short-Term Instruments | 40,472 | |||||||||||
|
| |||||||||||
| Total Investments 100.2% (Cost $567,749) | $ | 602,092 | ||||||||||
| Written Options (g) (0.0%) (Premiums $1,400) | (13 | ) | ||||||||||
| Other Assets and Liabilities (Net) (0.2%) | (1,413 | ) | ||||||||||
|
| |||||||||||
| Net Assets 100.0% | $ | 600,666 | ||||||||||
|
| |||||||||||
| See Accompanying Notes | SEMIANNUAL REPORT | DECEMBER 31, 2012 | 57 |
Table of Contents
Schedule of Investments PIMCO EqS® Emerging Markets Fund (Cont.)
Notes to Schedule of Investments (amounts in thousands*, except number of contracts, shares and units):
| * | A zero balance may reflect actual amounts rounding to less than one thousand. |
| (a) | Non-income producing security. |
| (b) | Coupon represents a weighted average yield to maturity. |
| (c) | Affiliated to the Fund. |
| (d) | Securities with an aggregate market value of $2,649 have been pledged as collateral as of December 31, 2012 for equity short sales and equity options as governed by prime brokerage agreements and agreements governing listed equity option transactions. |
| (e) | Securities with an aggregate market value of $2,677 have been pledged as collateral for OTC swap agreements, foreign currency options and foreign currency contracts as governed by International Swaps and Derivatives Association, Inc. Master Agreements as of December 31, 2012. |
| (f) | OTC swap agreements outstanding as of December 31, 2012: |
Credit Default Swaps on Credit Indices - Buy Protection (1)
| Index/Tranches | Counterparty | Fixed Deal (Pay) Rate | Maturity Date | Notional Amount (2) | Market Value (3) | Premiums (Received) | Unrealized (Depreciation) | |||||||||||||||||
CDX.IG-9 10-Year Index 15-30% | BPS | (1.000%) | 12/20/2017 | $ 3,100 | $ | (39 | ) | $ | (25 | ) | $ | (14 | ) | |||||||||||
|
|
|
|
|
| |||||||||||||||||||
| (1) | If the Fund is a buyer of protection and a credit event occurs, as defined under the terms of that particular swap agreement, the Fund will either (i) receive from the seller of protection an amount equal to the notional amount of the swap and deliver the referenced obligation or underlying securities comprising the referenced index or (ii) receive a net settlement amount in the form of cash or securities equal to the notional amount of the swap less the recovery value of the referenced obligation or underlying securities comprising the referenced index. |
| (2) | The maximum potential amount the Fund could be required to pay as a seller of credit protection or receive as a buyer of credit protection if a credit event occurs as defined under the terms of that particular swap agreement. |
| (3) | The prices and resulting values for credit default swap agreements on credit indices serve as an indicator of the current status of the payment/performance risk and represent the likelihood of an expected liability (or profit) for the credit derivative should the notional amount of the swap agreement be closed/sold as of the period end. Increasing market values, in absolute terms when compared to the notional amount of the swap, represent a deterioration of the referenced entity’s credit soundness and a greater likelihood or risk of default or other credit event occurring as defined under the terms of the agreement. |
| Total Return Swaps on Indices | ||||||||||||||||||||||||||
| Pay/Receive | Underlying Reference | # of Units | Financing Rate | Notional Amount | Maturity Date | Counterparty | Unrealized Appreciation | |||||||||||||||||||
| Receive | Goldman Sachs Earnings Growth Recovery Basket | 159,739 | 1-Month USD-LIBOR plus a specified spread | $ | 17,477 | 12/13/2013 | GST | $ | 564 | |||||||||||||||||
|
| |||||||||||||||||||||||||
| Total Return Swaps on Securities | ||||||||||||||||||||||||||
| Pay/Receive | Underlying Reference | # of Shares | Financing Rate | Notional | Maturity Date | Counterparty | Unrealized Appreciation/ (Depreciation) | |||||||||||||||||||
| Receive | TNK-BP Holding | 1,493,502 | 1-Month USD-LIBOR plus a specified spread | $ | 2,824 | 07/11/2013 | BOA | $ | 39 | |||||||||||||||||
| Receive | AK Transneft OAO | 2,225 | 1-Month USD-LIBOR plus a specified spread | 4,940 | 01/14/2013 | GST | 93 | |||||||||||||||||||
| Receive | TNK-BP Holding | 967,915 | 1-Month USD-LIBOR plus a specified spread | 1,830 | 05/24/2013 | GST | 25 | |||||||||||||||||||
| Receive | Logitech International S.A. | 238,991 | 1-Month USD-LIBOR less a specified spread | 1,854 | 09/16/2013 | GST | (28 | ) | ||||||||||||||||||
| Receive | Logitech International S.A. | 640,560 | 1-Month USD-LIBOR less a specified spread | 4,899 | 12/09/2013 | GST | (42 | ) | ||||||||||||||||||
| Receive | TNK-BP Holding | 998,344 | 1-Month USD-LIBOR plus a specified spread | 1,888 | 04/12/2013 | ULO | 26 | |||||||||||||||||||
| Receive | TNK-BP Holding | 1,060,468 | 1-Month USD-LIBOR plus a specified spread | 2,005 | 05/17/2013 | ULO | 27 | |||||||||||||||||||
| Receive | Bashneft OAO | 205,910 | 1-Month USD-LIBOR plus a specified spread | 8,877 | 09/23/2013 | ULO | 156 | |||||||||||||||||||
|
| |||||||||||||||||||||||||
| $ | 296 | |||||||||||||||||||||||||
|
| |||||||||||||||||||||||||
| (g) | Written options outstanding as of December 31, 2012: |
| Description | Counterparty | Exercise Price | Expiration Date | Notional Amount | Premium | Market Value | ||||||||||||||||||||||||
Call - OTC USD versus ZAR | UAG | ZAR | 9.709 | 01/08/2013 | $ | 11,600 | $ | 199 | $ | 0 | ||||||||||||||||||||
|
|
|
| |||||||||||||||||||||||||||
Options on Exchange-Traded Funds
| Description | Strike Price | Expiration Date | # of Contracts | Premium | Market Value | |||||||||||||||
Put - CBOE iShares MSCI Emerging Markets Index Fund | $ 33.000 | 01/19/2013 | 6,525 | $ 1,201 | $ | (13 | ) | |||||||||||||
|
|
|
| |||||||||||||||||
| 58 | PIMCO EQUITY SERIES | See Accompanying Notes |
Table of Contents
December 31, 2012 (Unaudited)
Transactions in written call and put options for the period ended December 31, 2012:
| # of Contracts | Notional Amount in $ | Notional Amount in EUR | Notional Amount in HKD | Notional Amount in TRY | Premium | |||||||||||||||||||
Balance at 12/31/2011 | 16,384 | $ | 2,704 | EUR | 17,315 | HKD | 0 | TRY | 182,062 | $ | 2,324 | |||||||||||||
Sales | 11,602 | 11,600 | 0 | 297,963 | 337,203 | 856 | ||||||||||||||||||
Closing Buys | (21,461 | ) | (2,704 | ) | (17,315 | ) | (148,981 | ) | (519,265 | ) | (1,696 | ) | ||||||||||||
Expirations | 0 | 0 | 0 | 0 | 0 | 0 | ||||||||||||||||||
Exercised | 0 | 0 | 0 | (148,982 | ) | 0 | (84 | ) | ||||||||||||||||
|
|
|
|
|
|
|
|
|
|
|
| |||||||||||||
Balance at 12/31/2012 | 6,525 | $ | 11,600 | EUR | 0 | HKD | 0 | TRY | 0 | $ | 1,400 | |||||||||||||
|
|
|
|
|
|
|
|
|
|
|
| |||||||||||||
| (h) | Foreign currency contracts outstanding as of December 31, 2012: |
| Settlement Month | Currency to | Currency to | Counterparty | Unrealized Appreciation | Unrealized (Depreciation) | Net Unrealized Appreciation/ (Depreciation) | ||||||||||||||||||||||||
01/2013 | IDR | 7,790,633 | $ | 804 | CBK | $ | 8 | $ | 0 | $ | 8 | |||||||||||||||||||
01/2013 | 5,792,928 | 598 | DUB | 6 | 0 | 6 | ||||||||||||||||||||||||
01/2013 | 17,400,326 | 1,799 | FBF | 22 | 0 | 22 | ||||||||||||||||||||||||
01/2013 | 4,821,859 | 498 | JPM | 5 | 0 | 5 | ||||||||||||||||||||||||
01/2013 | 28,890,680 | 2,984 | UAG | 33 | 0 | 33 | ||||||||||||||||||||||||
01/2013 | MYR | 608 | 197 | CBK | 0 | (2 | ) | (2 | ) | |||||||||||||||||||||
01/2013 | RUB | 36,678 | 1,178 | BRC | 0 | (20 | ) | (20 | ) | |||||||||||||||||||||
01/2013 | 93,586 | 2,999 | CBK | 0 | (58 | ) | (58 | ) | ||||||||||||||||||||||
01/2013 | 228,287 | 7,097 | DUB | 0 | (359 | ) | (359 | ) | ||||||||||||||||||||||
01/2013 | 81,463 | 2,470 | HUS | 0 | (190 | ) | (190 | ) | ||||||||||||||||||||||
01/2013 | 1,136,908 | 34,824 | JPM | 0 | (2,311 | ) | (2,311 | ) | ||||||||||||||||||||||
01/2013 | 40,418 | 1,295 | UAG | 0 | (25 | ) | (25 | ) | ||||||||||||||||||||||
01/2013 | THB | 89,849 | 2,910 | BRC | 0 | (23 | ) | (23 | ) | |||||||||||||||||||||
01/2013 | 128,764 | 4,174 | JPM | 0 | (30 | ) | (30 | ) | ||||||||||||||||||||||
01/2013 | 31,876 | 1,026 | UAG | 0 | (15 | ) | (15 | ) | ||||||||||||||||||||||
01/2013 | TWD | 10,002 | 346 | FBF | 0 | 0 | 0 | |||||||||||||||||||||||
01/2013 | $ | 350 | IDR | 3,409,000 | DUB | 0 | (2 | ) | (2 | ) | ||||||||||||||||||||
01/2013 | 2,023 | 19,816,404 | MSC | 1 | 0 | 1 | ||||||||||||||||||||||||
01/2013 | 13,500 | 131,625,000 | UAG | 0 | (57 | ) | (57 | ) | ||||||||||||||||||||||
01/2013 | 25,060 | INR | 1,395,314 | JPM | 307 | 0 | 307 | |||||||||||||||||||||||
01/2013 | 179 | MYR | 550 | CBK | 1 | 0 | 1 | |||||||||||||||||||||||
01/2013 | 20,610 | 63,502 | UAG | 156 | 0 | 156 | ||||||||||||||||||||||||
01/2013 | 874 | RUB | 27,059 | DUB | 10 | 0 | 10 | |||||||||||||||||||||||
01/2013 | 7,538 | 238,928 | HUS | 266 | 0 | 266 | ||||||||||||||||||||||||
01/2013 | 1,972 | THB | 61,044 | BRC | 22 | 0 | 22 | |||||||||||||||||||||||
01/2013 | 6,140 | 189,445 | JPM | 46 | 0 | 46 | ||||||||||||||||||||||||
01/2013 | 8,700 | TWD | 252,196 | BRC | 18 | 0 | 18 | |||||||||||||||||||||||
01/2013 | 28,009 | 810,861 | UAG | 20 | 0 | 20 | ||||||||||||||||||||||||
01/2013 | 624 | ZAR | 5,583 | BPS | 32 | 0 | 32 | |||||||||||||||||||||||
01/2013 | 4,939 | 43,177 | CBK | 135 | 0 | 135 | ||||||||||||||||||||||||
01/2013 | 13,137 | 114,262 | DUB | 291 | 0 | 291 | ||||||||||||||||||||||||
01/2013 | 10,294 | 90,059 | GLM | 290 | 0 | 290 | ||||||||||||||||||||||||
01/2013 | 4,818 | 42,052 | UAG | 124 | 0 | 124 | ||||||||||||||||||||||||
01/2013 | ZAR | 72,661 | $ | 8,315 | DUB | 0 | (225 | ) | (225 | ) | ||||||||||||||||||||
02/2013 | AUD | 10,280 | 10,669 | GLM | 27 | 0 | 27 | |||||||||||||||||||||||
02/2013 | 2,580 | 2,666 | RBC | 0 | (5 | ) | (5 | ) | ||||||||||||||||||||||
02/2013 | CHF | 5,251 | 5,635 | BOA | 10 | (121 | ) | (111 | ) | |||||||||||||||||||||
02/2013 | DKK | 66,480 | 11,383 | MSC | 0 | (387 | ) | (387 | ) | |||||||||||||||||||||
02/2013 | EUR | 1,590 | 2,066 | CBK | 0 | (33 | ) | (33 | ) | |||||||||||||||||||||
02/2013 | 5,190 | 6,623 | MSC | 0 | (230 | ) | (230 | ) | ||||||||||||||||||||||
02/2013 | 120 | 158 | UAG | 0 | (1 | ) | (1 | ) | ||||||||||||||||||||||
02/2013 | GBP | 2,554 | 4,098 | CBK | 0 | (50 | ) | (50 | ) | |||||||||||||||||||||
02/2013 | 12,840 | 20,445 | GLM | 0 | (410 | ) | (410 | ) | ||||||||||||||||||||||
02/2013 | HKD | 225,117 | 29,050 | BRC | 2 | 0 | 2 | |||||||||||||||||||||||
02/2013 | 33,322 | 4,300 | HUS | 0 | 0 | 0 | ||||||||||||||||||||||||
02/2013 | JPY | 1,028,560 | 12,998 | UAG | 1,122 | 0 | 1,122 | |||||||||||||||||||||||
02/2013 | NOK | 71,030 | 12,317 | MSC | 0 | (443 | ) | (443 | ) | |||||||||||||||||||||
02/2013 | $ | 2,184 | AUD | 2,091 | GLM | 0 | (20 | ) | (20 | ) | ||||||||||||||||||||
02/2013 | 6,800 | BRL | 14,258 | BOA | 134 | 0 | 134 | |||||||||||||||||||||||
02/2013 | 6,950 | 14,524 | BRC | 114 | 0 | 114 | ||||||||||||||||||||||||
02/2013 | 600 | 1,236 | DUB | 1 | 0 | 1 | ||||||||||||||||||||||||
02/2013 | 18,041 | 38,043 | FBF | 461 | 0 | 461 | ||||||||||||||||||||||||
02/2013 | 3,300 | 6,931 | UAG | 71 | 0 | 71 | ||||||||||||||||||||||||
02/2013 | 2,375 | CZK | 46,046 | JPM | 49 | 0 | 49 | |||||||||||||||||||||||
02/2013 | 586 | DKK | 3,360 | BOA | 8 | 0 | 8 | |||||||||||||||||||||||
02/2013 | 2,592 | GBP | 1,630 | BOA | 56 | 0 | 56 | |||||||||||||||||||||||
02/2013 | 578 | 360 | CBK | 7 | 0 | 7 | ||||||||||||||||||||||||
| See��Accompanying Notes | SEMIANNUAL REPORT | DECEMBER 31, 2012 | 59 |
Table of Contents
Schedule of Investments PIMCO EqS® Emerging Markets Fund (Cont.)
| Settlement Month | Currency to | Currency to | Counterparty | Unrealized Appreciation | Unrealized (Depreciation) | Net Unrealized Appreciation/ (Depreciation) | ||||||||||||||||||||||||
02/2013 | $ | 2,716 | JPY | 232,800 | BPS | $ | 0 | $ | (28 | ) | $ | (28 | ) | |||||||||||||||||
02/2013 | 630 | 52,600 | CBK | 0 | (23 | ) | (23 | ) | ||||||||||||||||||||||
02/2013 | 34,039 | KRW | 37,067,193 | JPM | 640 | 0 | 640 | |||||||||||||||||||||||
02/2013 | 585 | NOK | 3,290 | DUB | 7 | 0 | 7 | |||||||||||||||||||||||
02/2013 | 8,767 | PLN | 28,310 | JPM | 342 | 0 | 342 | |||||||||||||||||||||||
04/2013 | ILS | 104,650 | $ | 26,833 | DUB | 0 | (1,108 | ) | (1,108 | ) | ||||||||||||||||||||
04/2013 | MXN | 60,029 | 4,600 | JPM | 0 | (5 | ) | (5 | ) | |||||||||||||||||||||
04/2013 | PEN | 16,971 | 6,549 | DUB | 0 | (68 | ) | (68 | ) | |||||||||||||||||||||
04/2013 | THB | 45,982 | 1,491 | JPM | 0 | (4 | ) | (4 | ) | |||||||||||||||||||||
04/2013 | $ | 799 | ILS | 3,099 | GLM | 28 | 0 | 28 | ||||||||||||||||||||||
04/2013 | 5,026 | 18,940 | RBC | 31 | 0 | 31 | ||||||||||||||||||||||||
04/2013 | 25,790 | MXN | 339,349 | FBF | 243 | 0 | 243 | |||||||||||||||||||||||
04/2013 | 1,479 | 19,232 | JPM | 2 | (6 | ) | (4 | ) | ||||||||||||||||||||||
04/2013 | 2,900 | THB | 89,190 | DUB | 0 | (1 | ) | (1 | ) | |||||||||||||||||||||
|
|
|
|
|
| |||||||||||||||||||||||||
| $ | 5,148 | $ | (6,260 | ) | $ | (1,112 | ) | |||||||||||||||||||||||
|
|
|
|
|
| |||||||||||||||||||||||||
| (i) | Fair Value Measurements (1) |
(i) The following is a summary of the fair valuations according to the inputs used as of December 31, 2012 in valuing the Fund’s assets and liabilities:
| Category and Subcategory | Level 1 | Level 2 | Level 3 | Fair Value at 12/31/2012 | ||||||||||||
Investments, at value | ||||||||||||||||
Common Stocks | ||||||||||||||||
Australia | ||||||||||||||||
Materials | $ | 0 | $ | 12,338 | $ | 0 | $ | 12,338 | ||||||||
Brazil | ||||||||||||||||
Consumer Discretionary | 7,544 | 0 | 0 | 7,544 | ||||||||||||
Consumer Staples | 14,430 | 0 | 0 | 14,430 | ||||||||||||
Financials | 16,877 | 0 | 0 | 16,877 | ||||||||||||
Cambodia | ||||||||||||||||
Consumer Discretionary | 0 | 4,189 | 0 | 4,189 | ||||||||||||
Canada | ||||||||||||||||
Materials | 6,770 | 0 | 0 | 6,770 | ||||||||||||
China | ||||||||||||||||
Consumer Discretionary | 0 | 17,810 | 0 | 17,810 | ||||||||||||
Consumer Staples | 0 | 7,221 | 0 | 7,221 | ||||||||||||
Energy | 0 | 12,989 | 0 | 12,989 | ||||||||||||
Industrials | 0 | 21,274 | 0 | 21,274 | ||||||||||||
Information Technology | 7,988 | 0 | 0 | 7,988 | ||||||||||||
Materials | 0 | 9,788 | 0 | 9,788 | ||||||||||||
Cyprus | ||||||||||||||||
Industrials | 10,982 | 1,864 | 0 | 12,846 | ||||||||||||
Denmark | ||||||||||||||||
Consumer Staples | 0 | 11,894 | 0 | 11,894 | ||||||||||||
Finland | ||||||||||||||||
Materials | 0 | 2,357 | 0 | 2,357 | ||||||||||||
Hong Kong | ||||||||||||||||
Consumer Discretionary | 8,087 | 0 | 0 | 8,087 | ||||||||||||
Consumer Staples | 0 | 4,439 | 0 | 4,439 | ||||||||||||
Financials | 0 | 18,419 | 0 | 18,419 | ||||||||||||
Information Technology | 0 | 0 | 1,130 | 1,130 | ||||||||||||
Telecommunication Services | 0 | 16,751 | 0 | 16,751 | ||||||||||||
India | ||||||||||||||||
Consumer Discretionary | 0 | 3,172 | 0 | 3,172 | ||||||||||||
Financials | 0 | 18,299 | 0 | 18,299 | ||||||||||||
Indonesia | ||||||||||||||||
Financials | 0 | 6,338 | 0 | 6,338 | ||||||||||||
Israel | ||||||||||||||||
Health Care | 6,441 | 0 | 0 | 6,441 | ||||||||||||
Materials | 0 | 13,847 | 0 | 13,847 | ||||||||||||
Italy | ||||||||||||||||
Consumer Discretionary | 0 | 10,292 | 0 | 10,292 | ||||||||||||
Japan | ||||||||||||||||
Consumer Discretionary | 0 | 10,262 | 0 | 10,262 | ||||||||||||
Kazakhstan | ||||||||||||||||
Energy | 5,037 | 0 | 0 | 5,037 | ||||||||||||
Telecommunication Services | 7,348 | 0 | 0 | 7,348 | ||||||||||||
| Category and Subcategory | Level 1 | Level 2 | Level 3 | Fair Value at 12/31/2012 | ||||||||||||
Macau | ||||||||||||||||
Consumer Discretionary | $ | 0 | $ | 10,314 | $ | 0 | $ | 10,314 | ||||||||
Mexico | ||||||||||||||||
Consumer Discretionary | 2,073 | 0 | 0 | 2,073 | ||||||||||||
Financials | 12,320 | 0 | 0 | 12,320 | ||||||||||||
Norway | ||||||||||||||||
Consumer Staples | 0 | 6,538 | 0 | 6,538 | ||||||||||||
Energy | 0 | 5,518 | 0 | 5,518 | ||||||||||||
Peru | ||||||||||||||||
Financials | 12,246 | 0 | 0 | 12,246 | ||||||||||||
Philippines | ||||||||||||||||
Utilities | 0 | 6,722 | 0 | 6,722 | ||||||||||||
Qatar | ||||||||||||||||
Financials | 0 | 7,890 | 0 | 7,890 | ||||||||||||
Russia | ||||||||||||||||
Consumer Staples | 0 | 5,896 | 0 | 5,896 | ||||||||||||
Energy | 13,888 | 623 | 0 | 14,511 | ||||||||||||
Financials | 10,299 | 0 | 0 | 10,299 | ||||||||||||
Materials | 3,710 | 6,198 | 0 | 9,908 | ||||||||||||
Telecommunication Services | 9,156 | 0 | 0 | 9,156 | ||||||||||||
South Africa | ||||||||||||||||
Consumer Staples | 6,957 | 0 | 0 | 6,957 | ||||||||||||
Telecommunication Services | 0 | 6,123 | 0 | 6,123 | ||||||||||||
South Korea | ||||||||||||||||
Consumer Discretionary | 0 | 19,633 | 0 | 19,633 | ||||||||||||
Switzerland | ||||||||||||||||
Information Technology | 243 | 1,395 | 0 | 1,638 | ||||||||||||
Taiwan | ||||||||||||||||
Information Technology | 0 | 10,658 | 0 | 10,658 | ||||||||||||
Thailand | ||||||||||||||||
Consumer Staples | 0 | 5,398 | 0 | 5,398 | ||||||||||||
Financials | 0 | 7,814 | 0 | 7,814 | ||||||||||||
Turkey | ||||||||||||||||
Telecommunication Services | 0 | 7,998 | 0 | 7,998 | ||||||||||||
United Kingdom | ||||||||||||||||
Consumer Staples | 0 | 10,556 | 0 | 10,556 | ||||||||||||
Energy | 0 | 6,004 | 0 | 6,004 | ||||||||||||
Financials | 4,943 | 0 | 0 | 4,943 | ||||||||||||
Equity-Linked Securities | ||||||||||||||||
India | ||||||||||||||||
Financials | 0 | 299 | 0 | 299 | ||||||||||||
Netherlands | ||||||||||||||||
Financials | 0 | 9,992 | 0 | 9,992 | ||||||||||||
Nigeria | ||||||||||||||||
Consumer Staples | 0 | 4,102 | 0 | 4,102 | ||||||||||||
Exchange-Traded Funds | ||||||||||||||||
Luxembourg | 9,822 | 0 | 0 | 9,822 | ||||||||||||
United States | 6,825 | 0 | 0 | 6,825 | ||||||||||||
| 60 | PIMCO EQUITY SERIES | See Accompanying Notes |
Table of Contents
December 31, 2012 (Unaudited)
| Category and Subcategory | Level 1 | Level 2 | Level 3 | Fair Value at 12/31/2012 | ||||||||||||
Preferred Stocks | ||||||||||||||||
South Korea | ||||||||||||||||
Information Technology | $ | 0 | $ | 33,290 | $ | 0 | $ | 33,290 | ||||||||
Short-Term Instruments | ||||||||||||||||
Repurchase Agreements | 0 | 601 | 0 | 601 | ||||||||||||
U.S. Treasury Bills | 0 | 5,326 | 0 | 5,326 | ||||||||||||
Central Funds Used for Cash Management Purposes | 34,545 | 0 | 0 | 34,545 | ||||||||||||
| $ | 218,531 | $ | 382,431 | $ | 1,130 | $ | 602,092 | |||||||||
| Category and Subcategory | Level 1 | Level 2 | Level 3 | Fair Value at 12/31/2012 | ||||||||||||
Financial Derivative Instruments - Assets |
| |||||||||||||||
Equity Contracts | $ | 0 | $ | 930 | $ | 0 | $ | 930 | ||||||||
Foreign Exchange Contracts | 0 | 5,148 | 0 | 5,148 | ||||||||||||
| $ | 0 | $ | 6,078 | $ | 0 | $ | 6,078 | |||||||||
Financial Derivative Instruments - Liabilities |
| |||||||||||||||
Credit Contracts | 0 | (14 | ) | 0 | (14 | ) | ||||||||||
Equity Contracts | (13 | ) | (70 | ) | 0 | (83 | ) | |||||||||
Foreign Exchange Contracts | 0 | (6,260 | ) | 0 | (6,260 | ) | ||||||||||
| $ | (13 | ) | $ | (6,344 | ) | $ | 0 | $ | (6,357 | ) | ||||||
Totals | $ | 218,518 | $ | 382,165 | $ | 1,130 | $ | 601,813 | ||||||||
(ii) There were assets and liabilities valued at $2,932 transferred from Level 2 to Level 1 and assets and liabilities valued at $7,263 transferred from Level 1 to Level 2 during the period ended December 31, 2012.
(iii) The following is a reconciliation of the fair valuations using significant unobservable inputs (Level 3) for the Fund during the period ended December 31, 2012:
| Category and Subcategory | Beginning Balance at 06/30/2012 | Net Purchases | Net Sales | Accrued Discounts/ (Premiums) | Realized Gain/(Loss) | Net Change in Unrealized Appreciation/ (Depreciation) (2) | Transfers into Level 3 | Transfers out of Level 3 | Ending Balance at 12/31/2012 | Net Change in Unrealized Appreciation/ (Depreciation) on Investments Held at 12/31/2012 (2) | ||||||||||||||||||||||||||||||
Investments, at value | ||||||||||||||||||||||||||||||||||||||||
Common Stocks | ||||||||||||||||||||||||||||||||||||||||
Hong Kong | $ | 2,983 | $ | 0 | $ | 0 | $ | 0 | $ | 0 | $ | (1,853 | ) | $ | 0 | $ | 0 | $ | 1,130 | $ | (1,853 | ) | ||||||||||||||||||
|
|
|
|
|
|
|
|
|
|
|
|
|
|
|
|
|
|
|
| |||||||||||||||||||||
(iv) The following is a summary of significant unobservable inputs used in the fair valuations of assets and liabilities categorized within Level 3 of the fair value hierarchy:
| Category and Subcategory | Ending Balance at 12/31/2012 | Valuation Technique | Unobservable Inputs | Input Value(s) (% Unless Noted Otherwise) | ||||||||||||
Investments, at value | ||||||||||||||||
Common Stocks | ||||||||||||||||
Hong Kong | ||||||||||||||||
Information Technology | $ | 1,130 | Other Valuation Techniques | (3) | — | — | ||||||||||
|
| |||||||||||||||
| (1) | See note 3 in the Notes to Financial Statements for more information regarding pricing inputs and valuation techniques. |
| (2) | Any difference between Net Change in Unrealized Appreciation/(Depreciation) and Net Change in Unrealized Appreciation/(Depreciation) on Investments Held at December 31, 2012 may be due to an investment no longer held or categorized as level 3 at period end. |
| (3) | Includes valuation techniques not defined in the Notes to Financial Statements as the securities valued using such techniques are not considered significant to the Fund. |
| (j) | Fair Value of Financial Derivative Instruments (1) |
The following is a summary of the fair valuation of the Fund’s derivative instruments categorized by risk exposure:
Fair Values of Financial Derivative Instruments on the Statements of Assets and Liabilities as of December 31, 2012:
| Derivatives not accounted for as hedging instruments | ||||||||||||||||||||||||
| Commodity Contracts | Credit Contracts | Equity Contracts | Foreign Exchange Contracts | Interest Rate Contracts | Total | |||||||||||||||||||
Assets: | ||||||||||||||||||||||||
Unrealized appreciation on foreign currency contracts | $ | 0 | $ | 0 | $ | 0 | $ | 5,148 | $ | 0 | $ | 5,148 | ||||||||||||
Unrealized appreciation on OTC swap agreements | 0 | 0 | 930 | 0 | 0 | 930 | ||||||||||||||||||
|
|
|
|
|
|
|
|
|
|
|
| |||||||||||||
| $ | 0 | $ | 0 | $ | 930 | $ | 5,148 | $ | 0 | $ | 6,078 | |||||||||||||
|
|
|
|
|
|
|
|
|
|
|
| |||||||||||||
Liabilities: | ||||||||||||||||||||||||
Written options outstanding | $ | 0 | $ | 0 | $ | 13 | $ | 0 | $ | 0 | $ | 13 | ||||||||||||
Unrealized depreciation on foreign currency contracts | 0 | 0 | 0 | 6,260 | 0 | 6,260 | ||||||||||||||||||
Unrealized depreciation on OTC swap agreements | 0 | 14 | 70 | 0 | 0 | 84 | ||||||||||||||||||
|
|
|
|
|
|
|
|
|
|
|
| |||||||||||||
| $ | 0 | $ | 14 | $ | 83 | $ | 6,260 | $ | 0 | $ | 6,357 | |||||||||||||
|
|
|
|
|
|
|
|
|
|
|
| |||||||||||||
| See Accompanying Notes | SEMIANNUAL REPORT | DECEMBER 31, 2012 | 61 |
Table of Contents
Schedule of Investments PIMCO EqS® Emerging Markets Fund (Cont.)
December 31, 2012 (Unaudited)
The Effect of Financial Derivative Instruments on the Statements of Operations for the Period Ended December 31, 2012:
| Derivatives not accounted for as hedging instruments | ||||||||||||||||||||||||
| Commodity Contracts | Credit Contracts | Equity Contracts | Foreign Exchange Contracts | Interest Rate Contracts | Total | |||||||||||||||||||
Realized Gain (Loss) on Derivatives: | ||||||||||||||||||||||||
Net realized gain (loss) on investments (purchased options) | $ | 0 | $ | 0 | $ | (2,888 | ) | $ | 25 | $ | 0 | $ | (2,863 | ) | ||||||||||
Net realized (loss) on futures contracts | 0 | 0 | (86 | ) | 0 | 0 | (86 | ) | ||||||||||||||||
Net realized gain on written options | 0 | 0 | 1,411 | 240 | 0 | 1,651 | ||||||||||||||||||
Net realized gain (loss) on swaps | 0 | (16 | ) | 6,415 | 0 | 0 | 6,399 | |||||||||||||||||
Net realized (loss) on foreign currency transactions | 0 | 0 | 0 | (485 | ) | 0 | (485 | ) | ||||||||||||||||
|
|
|
|
|
|
|
|
|
|
|
| |||||||||||||
| $ | 0 | $ | (16 | ) | $ | 4,852 | $ | (220 | ) | $ | 0 | $ | 4,616 | |||||||||||
|
|
|
|
|
|
|
|
|
|
|
| |||||||||||||
Net Change in Unrealized Appreciation (Depreciation) on Derivatives: | ||||||||||||||||||||||||
Net change in unrealized appreciation on investments (purchased options) | $ | 0 | $ | 0 | $ | 474 | $ | 262 | $ | 0 | $ | 736 | ||||||||||||
Net change in unrealized appreciation on written options | 0 | 0 | 644 | 28 | 0 | 672 | ||||||||||||||||||
Net change in unrealized appreciation (depreciation) on swaps | 0 | (1,336 | ) | 859 | 0 | 0 | (477 | ) | ||||||||||||||||
Net change in unrealized appreciation on translation of assets and liabilities denominated in foreign currencies | 0 | 0 | 0 | 2,043 | 0 | 2,043 | ||||||||||||||||||
|
|
|
|
|
|
|
|
|
|
|
| |||||||||||||
| $ | 0 | $ | (1,336 | ) | $ | 1,977 | $ | 2,333 | $ | 0 | $ | 2,974 | ||||||||||||
|
|
|
|
|
|
|
|
|
|
|
| |||||||||||||
| (1) | See note 6 in the Notes to Financial Statements for additional information. |
| (k) | Collateral (Received)/Pledged for OTC Financial Derivative Instruments |
The following is a summary by counterparty of the market value of OTC financial derivative instruments and collateral (received)/pledged as of December 31, 2012:
| Counterparty | Total Market Value of OTC Derivatives | Collateral (Received)/Pledged | Net Exposures (1) | |||||||||
BOA | $ | 126 | $ | 0 | $ | 126 | ||||||
BPS | (35 | ) | 260 | 225 | ||||||||
BRC | 113 | 0 | 113 | |||||||||
CBK | (15 | ) | 0 | (15 | ) | |||||||
DUB | (1,448 | ) | 0 | (1,448 | ) | |||||||
FBF | 726 | (750 | ) | (24 | ) | |||||||
GLM | (85 | ) | 0 | (85 | ) | |||||||
GST | 612 | (1,160 | ) | (548 | ) | |||||||
HUS | 76 | 0 | 76 | |||||||||
JPM | (965 | ) | 1,268 | 303 | ||||||||
MSC | (1,059 | ) | (146 | ) | (1,205 | ) | ||||||
RBC | 26 | 0 | 26 | |||||||||
UAG | 1,428 | (1,280 | ) | 148 | ||||||||
ULO | 209 | 0 | 209 | |||||||||
| (1) | Net Exposure represents the net receivable/(payable) that would be due from/to the counterparty in the event of default. See note 7, Principal Risks, in the Notes to Financial Statements for more information regarding credit and counterparty risks. |
| 62 | PIMCO EQUITY SERIES | See Accompanying Notes |
Table of Contents
Schedule of Investments PIMCO EqS® Long/Short Fund
December 31, 2012 (Unaudited)
| SHARES | MARKET VALUE (000S) | |||||||||||
| COMMON STOCKS 57.5% | ||||||||||||
| BERMUDA 4.6% | ||||||||||||
| FINANCIALS 4.6% | ||||||||||||
Enstar Group Ltd. (a) | 111,000 | $ | 12,430 | |||||||||
|
| |||||||||||
Total Bermuda | 12,430 | |||||||||||
|
| |||||||||||
| CANADA 0.6% | ||||||||||||
| MATERIALS 0.6% | ||||||||||||
Yamana Gold, Inc. | 100,000 | 1,697 | ||||||||||
|
| |||||||||||
Total Canada | 1,697 | |||||||||||
|
| |||||||||||
| CYPRUS 2.3% | ||||||||||||
| ENERGY 2.3% | ||||||||||||
Ocean Rig UDW, Inc. (a) | 425,000 | 6,362 | ||||||||||
|
| |||||||||||
Total Cyprus | 6,362 | |||||||||||
|
| |||||||||||
| SOUTH KOREA 1.5% | ||||||||||||
| CONSUMER DISCRETIONARY 1.5% | ||||||||||||
Kia Motors Corp. | 75,000 | 3,988 | ||||||||||
|
| |||||||||||
Total South Korea | 3,988 | |||||||||||
|
| |||||||||||
| SWITZERLAND 4.6% | ||||||||||||
| ENERGY 4.6% | ||||||||||||
Noble Corp. | 355,000 | 12,361 | ||||||||||
|
| |||||||||||
Total Switzerland | 12,361 | |||||||||||
|
| |||||||||||
| UNITED STATES 43.9% | ||||||||||||
| CONSUMER DISCRETIONARY 10.3% | ||||||||||||
Biglari Holdings, Inc. (a) | 15,000 | 5,850 | ||||||||||
CEC Entertainment, Inc. | 73,589 | 2,442 | ||||||||||
| SHARES | MARKET VALUE (000S) | |||||||||||
Charter Communications, Inc. ‘A’ (a) | 115,000 | $ | 8,768 | |||||||||
Domino’s Pizza, Inc. | 185,000 | 8,057 | ||||||||||
Family Dollar Stores, Inc. | 45,000 | 2,854 | ||||||||||
|
| |||||||||||
| 27,971 | ||||||||||||
|
| |||||||||||
| ENERGY 5.0% | ||||||||||||
Northern Tier Energy LP | 530,000 | 13,483 | ||||||||||
|
| |||||||||||
| FINANCIALS 3.8% | ||||||||||||
Oaktree Capital Group LLC | 230,000 | 10,463 | ||||||||||
|
| |||||||||||
| INDUSTRIALS 24.8% | ||||||||||||
ADT Corp. | 120,000 | 5,579 | ||||||||||
Corrections Corp. of America | 540,000 | 19,154 | ||||||||||
Geo Group, Inc. | 200,000 | 5,640 | ||||||||||
Iron Mountain, Inc. | 626,000 | 19,437 | ||||||||||
Spirit Airlines, Inc. (a)(d) | 980,000 | 17,365 | ||||||||||
|
| |||||||||||
| 67,175 | ||||||||||||
|
| |||||||||||
Total United States | 119,092 | |||||||||||
|
| |||||||||||
Total Common Stocks (Cost $151,110) | 155,930 | |||||||||||
|
| |||||||||||
| REAL ESTATE INVESTMENT TRUSTS 2.0% | ||||||||||||
| UNITED STATES 2.0% | ||||||||||||
American Realty Capital Trust, Inc. | 470,000 | 5,428 | ||||||||||
|
| |||||||||||
Total Real Estate Investment Trusts | 5,428 | |||||||||||
|
| |||||||||||
| PRINCIPAL AMOUNT (000S) | MARKET VALUE (000S) | |||||||||||
| SHORT-TERM INSTRUMENTS 44.1% | ||||||||||||
| REPURCHASE AGREEMENTS 0.2% | ||||||||||||
State Street Bank and Trust Co. |
| |||||||||||
0.010% due 01/02/2013 | $ | 507 | $ | 507 | ||||||||
|
| |||||||||||
(Dated 12/31/2012. Collateralized by Fannie Mae 2.170% due 10/17/2022 valued at $517. Repurchase proceeds are $507.) | ||||||||||||
| U.S. TREASURY BILLS 17.5% | ||||||||||||
0.143% due 10/17/2013 - 12/12/2013 (b)(d)(e) | 47,711 | 47,647 | ||||||||||
|
| |||||||||||
| SHARES | ||||||||||||
| CENTRAL FUNDS USED FOR CASH MANAGEMENT PURPOSES (c) 26.4% | ||||||||||||
PIMCO Short-Term | 7,158,491 | 71,635 | ||||||||||
|
| |||||||||||
Total Short-Term Instruments | 119,789 | |||||||||||
|
| |||||||||||
| Total Investments 103.6% (Cost $276,125) | $ | 281,147 | ||||||||||
| Securities Sold Short (f) (5.5%) (Proceeds $14,157) | (14,999 | ) | ||||||||||
| Other Assets and Liabilities (Net) 1.9% | 5,168 | |||||||||||
|
| |||||||||||
| Net Assets 100.0% | $ | 271,316 | ||||||||||
|
| |||||||||||
Notes to Schedule of Investments (amounts in thousands*, except number of shares):
| * | A zero balance may reflect actual amounts rounding to less than one thousand. |
| (a) | Non-income producing security. |
| (b) | Coupon represents a weighted average yield to maturity. |
| (c) | Affiliated to the Fund. |
| (d) | Securities with an aggregate market value of $15,085 and cash of $11,708 have been pledged as collateral as of December 31, 2012 for equity short sales and equity options as governed by prime brokerage agreements and agreements governing listed equity option transactions. |
| (e) | Securities with an aggregate market value of $261 have been pledged as collateral for foreign currency contracts as governed by International Swaps and Derivatives Association, Inc. Master Agreements as of December 31, 2012. |
| (f) | Short sales outstanding as of December 31, 2012: |
| Description | Shares | Proceeds | Market Value (1) | |||||||||
Expeditors International of Washington, Inc. | 30,000 | $ | 1,027 | $ | (1,186 | ) | ||||||
Gentex Corp. | 70,000 | 1,276 | (1,317 | ) | ||||||||
Home Capital Group, Inc. | 85,100 | 4,446 | (5,054 | ) | ||||||||
MICROS Systems, Inc. | 50,000 | 2,369 | (2,122 | ) | ||||||||
Monro Muffler Brake, Inc. | 15,000 | 499 | (525 | ) | ||||||||
O’Reilly Automotive, Inc. | 10,000 | 815 | (894 | ) | ||||||||
RealPage, Inc. | 100,000 | 2,125 | (2,157 | ) | ||||||||
Ritchie Bros. Auctioneers, Inc. | 40,000 | 775 | (836 | ) | ||||||||
Sturm Ruger & Co., Inc. | 20,000 | 825 | (908 | ) | ||||||||
|
|
|
| |||||||||
| $ | 14,157 | $ | (14,999 | ) | ||||||||
|
|
|
| |||||||||
| (1) | Individual short sales may have been part of a hedging strategy rather than fundamental, stand-alone investment positions. |
| See Accompanying Notes | SEMIANNUAL REPORT | DECEMBER 31, 2012 | 63 |
Table of Contents
Schedule of Investments PIMCO EqS® Long/Short Fund (Cont.)
| (g) | Foreign currency contracts outstanding as of December 31, 2012: |
| Settlement Month | Currency to be Delivered | Currency to be Received | Counterparty | Unrealized Appreciation | Unrealized (Depreciation) | Net Unrealized Appreciation/ (Depreciation) | ||||||||||||||||||||
02/2013 | KRW | 3,418,110 | $ | 3,138 | BRC | $ | 0 | $ | (60 | ) | $ | (60 | ) | |||||||||||||
02/2013 | 996,425 | 923 | UAG | 0 | (9 | ) | (9 | ) | ||||||||||||||||||
|
|
|
|
|
| |||||||||||||||||||||
| $ | 0 | $ | (69 | ) | $ | (69 | ) | |||||||||||||||||||
|
|
|
|
|
| |||||||||||||||||||||
| (h) | Fair Value Measurements (1) |
(i) The following is a summary of the fair valuations according to the inputs used as of December 31, 2012 in valuing the Fund’s assets and liabilities:
| Category and Subcategory | Level 1 | Level 2 | Level 3 | Fair Value at 12/31/2012 | ||||||||||||
Investments, at value | ||||||||||||||||
Common Stocks | ||||||||||||||||
Bermuda | ||||||||||||||||
Financials | $ | 12,430 | $ | 0 | $ | 0 | $ | 12,430 | ||||||||
Canada | ||||||||||||||||
Materials | 1,697 | 0 | 0 | 1,697 | ||||||||||||
Cyprus | ||||||||||||||||
Energy | 6,362 | 0 | 0 | 6,362 | ||||||||||||
South Korea | ||||||||||||||||
Consumer Discretionary | 0 | 3,988 | 0 | 3,988 | ||||||||||||
Switzerland | ||||||||||||||||
Energy | 12,361 | 0 | 0 | 12,361 | ||||||||||||
United States | ||||||||||||||||
Consumer Discretionary | 27,971 | 0 | 0 | 27,971 | ||||||||||||
Energy | 13,483 | 0 | 0 | 13,483 | ||||||||||||
Financials | 10,463 | 0 | 0 | 10,463 | ||||||||||||
Industrials | 67,175 | 0 | 0 | 67,175 | ||||||||||||
| Category and Subcategory | Level 1 | Level 2 | Level 3 | Fair Value at 12/31/2012 | ||||||||||||
Real Estate Investment Trusts | ||||||||||||||||
United States | $ | 5,428 | $ | 0 | $ | 0 | $ | 5,428 | ||||||||
Short-Term Instruments | ||||||||||||||||
Repurchase Agreements | 0 | 507 | 0 | 507 | ||||||||||||
U.S. Treasury Bills | 0 | 47,647 | 0 | 47,647 | ||||||||||||
Central Funds Used for Cash Management Purposes | 71,635 | 0 | 0 | 71,635 | ||||||||||||
| $ | 229,005 | $ | 52,142 | $ | 0 | $ | 281,147 | |||||||||
Short Sales, at value | $ | (14,999 | ) | $ | 0 | $ | 0 | $ | (14,999 | ) | ||||||
Financial Derivative Instruments - Liabilities |
| |||||||||||||||
Foreign Exchange Contracts | 0 | (69 | ) | 0 | (69 | ) | ||||||||||
Totals | $ | 214,006 | $ | 52,073 | $ | 0 | $ | 266,079 | ||||||||
(ii) There were no transfers between Level 1 and 2 during the period ended December 31, 2012.
| (1) | See note 3 in the Notes to Financial Statements for more information regarding pricing inputs and valuation techniques. |
| (i) | Fair Value of Financial Derivative Instruments (1) |
The following is a summary of the fair valuation of the Fund’s derivative instruments categorized by risk exposure:
Fair Values of Financial Derivative Instruments on the Statements of Assets and Liabilities as of December 31, 2012:
| Derivatives not accounted for as hedging instruments | ||||||||||||||||||||||||
| Commodity Contracts | Credit Contracts | Equity Contracts | Foreign Exchange Contracts | Interest Rate Contracts | Total | |||||||||||||||||||
Liabilities: | ||||||||||||||||||||||||
Unrealized depreciation on foreign currency contracts | $ | 0 | $ | 0 | $ | 0 | $ | 69 | $ | 0 | $ | 69 | ||||||||||||
|
|
|
|
|
|
|
|
|
|
|
| |||||||||||||
The Effect of Financial Derivative Instruments on the Statements of Operations for the Period Ended December 31, 2012:
| Derivatives not accounted for as hedging instruments | ||||||||||||||||||||||||
| Commodity Contracts | Credit Contracts | Equity Contracts | Foreign Exchange Contracts | Interest Rate Contracts | Total | |||||||||||||||||||
Realized (Loss) on Derivatives: | ||||||||||||||||||||||||
Net realized (loss) on investments (purchased options) | $ | 0 | $ | 0 | $ | (791 | ) | $ | 0 | $ | 0 | $ | (791 | ) | ||||||||||
Net realized (loss) on foreign currency transactions | 0 | 0 | 0 | (192 | ) | 0 | (192 | ) | ||||||||||||||||
|
|
|
|
|
|
|
|
|
|
|
| |||||||||||||
| $ | 0 | $ | 0 | $ | (791 | ) | $ | (192 | ) | $ | 0 | $ | (983 | ) | ||||||||||
|
|
|
|
|
|
|
|
|
|
|
| |||||||||||||
Net Change in Unrealized (Depreciation) on Derivatives: | ||||||||||||||||||||||||
Net change in unrealized (depreciation) on translation of assets and liabilities denominated in foreign currencies | $ | 0 | $ | 0 | $ | 0 | $ | (93 | ) | $ | 0 | $ | (93 | ) | ||||||||||
|
|
|
|
|
|
|
|
|
|
|
| |||||||||||||
| (1) | See note 6 in the Notes to Financial Statements for additional information. |
| 64 | PIMCO EQUITY SERIES | See Accompanying Notes |
Table of Contents
December 31, 2012 (Unaudited)
| (j) | Collateral Pledged for OTC Financial Derivative Instruments |
The following is a summary by counterparty of the market value of OTC financial derivative instruments and collateral pledged as of December 31, 2012:
| Counterparty | Total Market Value of OTC Derivatives | Collateral Pledged | Net Exposures (1) | |||||||||
BRC | $ | (60 | ) | $ | 261 | $ | 201 | |||||
UAG | (9 | ) | 0 | (9 | ) | |||||||
| (1) | Net Exposure represents the net receivable/(payable) that would be due from/to the counterparty in the event of default. See note 7, Principal Risks, in the Notes to Financial Statements for more information regarding credit and counterparty risks. |
| See Accompanying Notes | SEMIANNUAL REPORT | DECEMBER 31, 2012 | 65 |
Table of Contents
Consolidated Schedule of Investments PIMCO Emerging Multi-Asset Fund
| SHARES | MARKET VALUE (000S) | |||||||||
| COMMON STOCKS 0.3% | ||||||||||
| UNITED KINGDOM 0.3% | ||||||||||
| FINANCIALS 0.3% | ||||||||||
Standard Chartered PLC | 4,919 | $ | 127 | |||||||
|
| |||||||||
Total Common Stocks (Cost $103) | 127 | |||||||||
|
| |||||||||
| MUTUAL FUNDS (b)(c) 97.7% | ||||||||||
| UNITED STATES 97.7% | ||||||||||
PIMCO Emerging Local Bond Fund | 1,278,863 | 14,042 | ||||||||
PIMCO Emerging Markets Bond Fund | 607,728 | 7,597 | ||||||||
| SHARES | MARKET VALUE (000S) | |||||||||
PIMCO Emerging Markets Corporate Bond Fund | 131,931 | $ | 1,609 | |||||||
PIMCO EqS® Emerging Markets Fund | 2,765,368 | 24,529 | ||||||||
|
| |||||||||
Total Mutual Funds (Cost $47,134) | 47,777 | |||||||||
|
| |||||||||
| PRINCIPAL AMOUNT (000S) | ||||||||||
| SHORT-TERM INSTRUMENTS 0.5% | ||||||||||
| U.S. TREASURY BILLS 0.5% | ||||||||||
0.161% due 06/06/2013 - 11/14/2013 (a)(d) | $ | 248 | 248 | |||||||
|
| |||||||||
| SHARES | MARKET VALUE (000S) | |||||||||
| CENTRAL FUNDS USED FOR CASH MANAGEMENT PURPOSES (b) 0.0% | ||||||||||
PIMCO Short-Term Floating NAV Portfolio | 2,014 | $ | 20 | |||||||
|
| |||||||||
Total Short-Term Instruments (Cost $267) | 268 | |||||||||
|
| |||||||||
| PURCHASED OPTIONS (f) 0.9% | ||||||||||
(Cost $679) | 417 | |||||||||
| Total Investments 99.4% (Cost $48,183) | $ | 48,589 | ||||||||
| Written Options (g) (0.5%) (Premiums $386) | (221 | ) | ||||||||
| Other Assets and Liabilities (Net) 1.1% | 505 | |||||||||
|
| |||||||||
| Net Assets 100.0% | $ | 48,873 | ||||||||
|
| |||||||||
Notes to Consolidated Schedule of Investments (amounts in thousands*, except number of contracts and shares):
| * | A zero balance may reflect actual amounts rounding to less than one thousand. |
| (a) | Coupon represents a weighted average yield to maturity. |
| (b) | Affiliated to the Fund. |
| (c) | Institutional Class Shares of each Fund. |
| (d) | Securities with an aggregate market value of $248 and cash of $10 have been pledged as collateral as of December 31, 2012 for equity short sales and equity options as governed by prime brokerage agreements and agreements governing listed equity option transactions. |
| (e) | OTC swap agreements outstanding as of December 31, 2012: |
| Credit Default Swaps on Sovereign Issues - Sell Protection (1) | ||||||||||||||||||||||||||||||||||
| Reference Entity | Counterparty | Fixed Deal Receive Rate | Maturity Date | Implied Credit Spread at December 31, 2012 (2) | Notional | Market Value | Premiums Paid/(Received) | Unrealized Appreciation/ (Depreciation) | ||||||||||||||||||||||||||
Brazil Government International Bond | CBK | 1.000% | 03/20/2013 | 0.297% | $ | 100 | $ | 0 | $ | 0 | $ | 0 | ||||||||||||||||||||||
China Government International Bond | DUB | 1.000% | 03/20/2013 | 0.136% | 100 | 1 | 1 | 0 | ||||||||||||||||||||||||||
China Government International Bond | RYL | 1.000% | 12/20/2016 | 0.453% | 100 | 2 | (5 | ) | 7 | |||||||||||||||||||||||||
|
|
|
|
|
| |||||||||||||||||||||||||||||
| $ | 3 | $ | (4 | ) | $ | 7 | ||||||||||||||||||||||||||||
|
|
|
|
|
| |||||||||||||||||||||||||||||
| (1) | If the Fund is a seller of protection and a credit event occurs, as defined under the terms of that particular swap agreement, the Fund will either (i) pay to the buyer of protection an amount equal to the notional amount of the swap and take delivery of the referenced obligation or underlying securities comprising the referenced index or (ii) pay a net settlement amount in the form of cash or securities equal to the notional amount of the swap less the recovery value of the referenced obligation or underlying securities comprising the referenced index. |
| (2) | Implied credit spreads, represented in absolute terms, utilized in determining the market value of credit default swap agreements on sovereign issues as of period end serve as an indicator of the current status of the payment/performance risk and represent the likelihood or risk of default for the credit derivative. The implied credit spread of a particular referenced entity reflects the cost of buying/selling protection and may include upfront payments required to be made to enter into the agreement. Wider credit spreads represent a deterioration of the referenced entity’s credit soundness and a greater likelihood or risk of default or other credit event occurring as defined under the terms of the agreement. |
| (3) | The maximum potential amount the Fund could be required to pay as a seller of credit protection or receive as a buyer of credit protection if a credit event occurs as defined under the terms of that particular swap agreement. |
| Total Return Swaps on Exchange-Traded Funds | ||||||||||||||||||||||||||
| Pay/Receive | Underlying Reference | # of Shares | Financing Rate | Notional Amount | Maturity Date | Counterparty | Unrealized Appreciation | |||||||||||||||||||
| Receive | iShares MSCI Emerging Markets Index Fund | 78,063 | 3-Month USD-LIBOR plus a specified spread | $ | 3,250 | 09/30/2013 | JPM | $ | 231 | |||||||||||||||||
|
| |||||||||||||||||||||||||
| (f) | Purchased options outstanding as of December 31, 2012: |
| Foreign Currency Options | ||||||||||||||||||||||||||||||
| Description | Counterparty | Exercise Price | Expiration Date | Notional Amount | Cost | Market Value | ||||||||||||||||||||||||
Put - OTC USD versus ZAR | FBF | ZAR | 8.190 | 04/12/2013 | $ | 1,000 | $ | 16 | $ | 10 | ||||||||||||||||||||
|
|
|
| |||||||||||||||||||||||||||
| 66 | PIMCO EQUITY SERIES | See Accompanying Notes |
Table of Contents
December 31, 2012 (Unaudited)
| Options on Exchange-Traded Funds | ||||||||||||||||||||
| Description | Strike Price | Expiration Date | # of Contracts | Cost | Market Value | |||||||||||||||
Put - CBOE iShares MSCI Emerging Markets Index Fund | $ 37.000 | 06/22/2013 | 595 | $ | 124 | $ | 43 | |||||||||||||
Put - CBOE iShares MSCI Emerging Markets Index Fund | 35.000 | 01/18/2014 | 2,273 | 539 | 364 | |||||||||||||||
|
|
|
| |||||||||||||||||
| $ | 663 | $ | 407 | |||||||||||||||||
|
|
|
| |||||||||||||||||
| (g) | Written options outstanding as of December 31, 2012: |
| Foreign Currency Options | ||||||||||||||||||||||||||||||
| Description | Counterparty | Exercise Price | Expiration Date | Notional Amount | Premium | Market Value | ||||||||||||||||||||||||
Call - OTC USD versus ZAR | FBF | ZAR | 9.783 | 04/12/2013 | $ | 1,000 | $ | 22 | $ | (5 | ) | |||||||||||||||||||
|
|
|
| |||||||||||||||||||||||||||
| Options on Exchange-Traded Funds | ||||||||||||||||||||
| Description | Strike Price | Expiration Date | # of Contracts | Premium | Market Value | |||||||||||||||
Put - CBOE iShares MSCI Emerging Markets Index Fund | $ 38.000 | 01/19/2013 | 324 | $ | 21 | $ | (1 | ) | ||||||||||||
Put - CBOE iShares MSCI Emerging Markets Index Fund | 33.000 | 06/22/2013 | 595 | 66 | (24 | ) | ||||||||||||||
Put - CBOE iShares MSCI Emerging Markets Index Fund | 30.000 | 01/18/2014 | 2,273 | 277 | (191 | ) | ||||||||||||||
|
|
|
| |||||||||||||||||
| $ | 364 | $ | (216 | ) | ||||||||||||||||
|
|
|
| |||||||||||||||||
Transactions in written call and put options for the period ended December 31, 2012:
| # of Contracts | Notional Amount in $ | Premium | ||||||||||
Balance at 12/31/2011 | 2,638 | $ | 0 | $ | 459 | |||||||
Sales | 5,760 | 1,000 | 470 | |||||||||
Closing Buys | (4,841 | ) | 0 | (496 | ) | |||||||
Expirations | 0 | 0 | 0 | |||||||||
Exercised | (365 | ) | 0 | (47 | ) | |||||||
|
|
|
|
|
| |||||||
Balance at 12/31/2012 | 3,192 | $ | 1,000 | $ | 386 | |||||||
|
|
|
|
|
| |||||||
| (h) | Foreign currency contracts outstanding as of December 31, 2012: |
| Settlement Month | Currency to be Delivered | Currency to be Received | Counterparty | Unrealized Appreciation | Unrealized (Depreciation) | Net Unrealized Appreciation/ (Depreciation) | ||||||||||||||||||||||||
01/2013 | CLP | 109,474 | $ | 227 | GLM | $ | 0 | $ | (1 | ) | $ | (1 | ) | |||||||||||||||||
01/2013 | IDR | 5,818,335 | 600 | JPM | 6 | 0 | 6 | |||||||||||||||||||||||
01/2013 | INR | 6,412 | 116 | JPM | 0 | (1 | ) | (1 | ) | |||||||||||||||||||||
01/2013 | JPY | 25,903 | 316 | DUB | 17 | 0 | 17 | |||||||||||||||||||||||
01/2013 | MYR | 897 | 293 | BRC | 0 | 0 | 0 | |||||||||||||||||||||||
01/2013 | 1,072 | 350 | JPM | 0 | (1 | ) | (1 | ) | ||||||||||||||||||||||
01/2013 | RUB | 18,848 | 590 | HUS | 0 | (26 | ) | (26 | ) | |||||||||||||||||||||
01/2013 | 2,379 | 78 | JPM | 0 | 0 | 0 | ||||||||||||||||||||||||
01/2013 | THB | 15,137 | 492 | JPM | 0 | (2 | ) | (2 | ) | |||||||||||||||||||||
01/2013 | TRY | 220 | 122 | DUB | 0 | (1 | ) | (1 | ) | |||||||||||||||||||||
01/2013 | TWD | 11,312 | 391 | JPM | 0 | 0 | 0 | |||||||||||||||||||||||
01/2013 | $ | 226 | CLP | 109,474 | JPM | 2 | 0 | 2 | ||||||||||||||||||||||
01/2013 | 70 | EUR | 54 | BOA | 1 | 0 | 1 | |||||||||||||||||||||||
01/2013 | 173 | IDR | 1,712,200 | BPS | 2 | 0 | 2 | |||||||||||||||||||||||
01/2013 | 218 | 2,131,554 | JPM | 0 | (1 | ) | (1 | ) | ||||||||||||||||||||||
01/2013 | 290 | MYR | 897 | BRC | 3 | 0 | 3 | |||||||||||||||||||||||
01/2013 | 352 | RUB | 11,692 | JPM | 30 | 0 | 30 | |||||||||||||||||||||||
01/2013 | 187 | THB | 5,743 | BRC | 0 | 0 | 0 | |||||||||||||||||||||||
01/2013 | 306 | 9,394 | JPM | 1 | 0 | 1 | ||||||||||||||||||||||||
01/2013 | 199 | TWD | 5,760 | UAG | 0 | 0 | 0 | |||||||||||||||||||||||
01/2013 | 412 | ZAR | 3,643 | JPM | 16 | 0 | 16 | |||||||||||||||||||||||
01/2013 | ZAR | 1,277 | $ | 150 | DUB | 0 | 0 | 0 | ||||||||||||||||||||||
01/2013 | 4,216 | 466 | HUS | 0 | (29 | ) | (29 | ) | ||||||||||||||||||||||
02/2013 | BRL | 905 | 440 | FBF | 0 | 0 | 0 | |||||||||||||||||||||||
02/2013 | 305 | 145 | HUS | 0 | (3 | ) | (3 | ) | ||||||||||||||||||||||
02/2013 | CNY | 1,778 | 282 | FBF | 0 | (1 | ) | (1 | ) | |||||||||||||||||||||
02/2013 | 4,451 | 708 | JPM | 0 | 0 | 0 | ||||||||||||||||||||||||
02/2013 | 1,884 | 300 | UAG | 1 | 0 | 1 | ||||||||||||||||||||||||
02/2013 | CZK | 5,945 | 305 | DUB | 0 | (8 | ) | (8 | ) | |||||||||||||||||||||
02/2013 | HKD | 5,316 | 686 | DUB | 0 | 0 | 0 | |||||||||||||||||||||||
02/2013 | 14,199 | 1,832 | HUS | 0 | 0 | 0 | ||||||||||||||||||||||||
| See Accompanying Notes | SEMIANNUAL REPORT | DECEMBER 31, 2012 | 67 |
Table of Contents
Consolidated Schedule of Investments PIMCO Emerging Multi-Asset Fund (Cont.)
| Settlement Month | Currency to be Delivered | Currency to be Received | Counterparty | Unrealized Appreciation | Unrealized (Depreciation) | Net Unrealized Appreciation/ (Depreciation) | ||||||||||||||||||||||||
02/2013 | HUF | 69,807 | $ | 318 | DUB | $ | 3 | $ | 0 | $ | 3 | |||||||||||||||||||
02/2013 | 78,515 | 350 | UAG | 0 | (4 | ) | (4 | ) | ||||||||||||||||||||||
02/2013 | KRW | 242,831 | 225 | JPM | 0 | (2 | ) | (2 | ) | |||||||||||||||||||||
02/2013 | $ | 471 | BRL | 973 | HUS | 2 | 0 | 2 | ||||||||||||||||||||||
02/2013 | 580 | 1,219 | UAG | 13 | 0 | 13 | ||||||||||||||||||||||||
02/2013 | 402 | CNY | 2,533 | BRC | 1 | 0 | 1 | |||||||||||||||||||||||
02/2013 | 754 | HKD | 5,844 | HUS | 0 | 0 | 0 | |||||||||||||||||||||||
02/2013 | 1,006 | 7,795 | UAG | 0 | 0 | 0 | ||||||||||||||||||||||||
02/2013 | 343 | HUF | 76,392 | JPM | 2 | 0 | 2 | |||||||||||||||||||||||
02/2013 | 333 | SGD | 405 | DUB | 0 | (1 | ) | (1 | ) | |||||||||||||||||||||
03/2013 | GBP | 66 | $ | 106 | DUB | 0 | (1 | ) | (1 | ) | ||||||||||||||||||||
03/2013 | $ | 29 | PHP | 1,187 | HUS | 0 | 0 | 0 | ||||||||||||||||||||||
04/2013 | IDR | 2,131,554 | $ | 217 | JPM | 1 | 0 | 1 | ||||||||||||||||||||||
04/2013 | ILS | 240 | 62 | DUB | 0 | (2 | ) | (2 | ) | |||||||||||||||||||||
04/2013 | INR | 5,146 | 92 | FBF | 0 | 0 | 0 | |||||||||||||||||||||||
04/2013 | MXN | 4,251 | 329 | HUS | 3 | 0 | 3 | |||||||||||||||||||||||
04/2013 | PEN | 520 | 200 | UAG | 0 | (3 | ) | (3 | ) | |||||||||||||||||||||
04/2013 | THB | 5,743 | 187 | BRC | 0 | 0 | 0 | |||||||||||||||||||||||
04/2013 | 9,394 | 304 | JPM | 0 | (1 | ) | (1 | ) | ||||||||||||||||||||||
04/2013 | $ | 686 | MXN | 9,155 | UAG | 16 | 0 | 16 | ||||||||||||||||||||||
04/2013 | 291 | MYR | 897 | BRC | 1 | 0 | 1 | |||||||||||||||||||||||
06/2013 | 223 | CLP | 109,474 | GLM | 1 | 0 | 1 | |||||||||||||||||||||||
|
|
|
|
|
| |||||||||||||||||||||||||
| $ | 122 | $ | (88 | ) | $ | 34 | ||||||||||||||||||||||||
|
|
|
|
|
| |||||||||||||||||||||||||
| (i) | Fair Value Measurements (1) |
(i) The following is a summary of the fair valuations according to the inputs used as of December 31, 2012 in valuing the Fund’s assets and liabilities:
| Category and Subcategory | Level 1 | Level 2 | Level 3 | Fair Value at 12/31/2012 | ||||||||||||
Investments, at value | ||||||||||||||||
Common Stocks | ||||||||||||||||
United Kingdom | ||||||||||||||||
Financials | $ | 127 | $ | 0 | $ | 0 | $ | 127 | ||||||||
Mutual Funds | ||||||||||||||||
United States | 47,777 | 0 | 0 | 47,777 | ||||||||||||
Short-Term Instruments | ||||||||||||||||
U.S. Treasury Bills | 0 | 248 | 0 | 248 | ||||||||||||
Central Funds Used for Cash Management Purposes | 20 | 0 | 0 | 20 | ||||||||||||
Purchased Options | ||||||||||||||||
Equity Contracts | 407 | 0 | 0 | 407 | ||||||||||||
Foreign Exchange Contracts | 0 | 10 | 0 | 10 | ||||||||||||
| $ | 48,331 | $ | 258 | $ | 0 | $ | 48,589 | |||||||||
| Category and Subcategory | Level 1 | Level 2 | Level 3 | Fair Value at 12/31/2012 | ||||||||||||
Financial Derivative Instruments - Assets |
| |||||||||||||||
Credit Contracts | $ | 0 | $ | 7 | $ | 0 | $ | 7 | ||||||||
Equity Contracts | 0 | 231 | 0 | 231 | ||||||||||||
Foreign Exchange Contracts | 0 | 122 | 0 | 122 | ||||||||||||
| $ | 0 | $ | 360 | $ | 0 | $ | 360 | |||||||||
Financial Derivative Instruments - Liabilities |
| |||||||||||||||
Equity Contracts | (216 | ) | 0 | 0 | (216 | ) | ||||||||||
Foreign Exchange Contracts | 0 | (93 | ) | 0 | (93 | ) | ||||||||||
| $ | (216 | ) | $ | (93 | ) | $ | 0 | $ | (309 | ) | ||||||
Totals | $ | 48,115 | $ | 525 | $ | 0 | $ | 48,640 | ||||||||
(ii) There were no transfers between Level 1 and 2 during the period ended December 31, 2012.
| (1) | See note 3 in the Notes to Financial Statements for more information regarding pricing inputs and valuation techniques. |
| 68 | PIMCO EQUITY SERIES | See Accompanying Notes |
Table of Contents
December 31, 2012 (Unaudited)
| (j) | Fair Value of Financial Derivative Instruments (1) |
The following is a summary of the fair valuation of the Fund’s derivative instruments categorized by risk exposure:
Fair Values of Financial Derivative Instruments on the Consolidated Statements of Assets and Liabilities as of December 31, 2012:
| Derivatives not accounted for as hedging instruments | ||||||||||||||||||||||||
| Commodity Contracts | Credit Contracts | Equity Contracts | Foreign Exchange Contracts | Interest Rate Contracts | Total | |||||||||||||||||||
Assets: | ||||||||||||||||||||||||
Investments, at value (purchased options) | $ | 0 | $ | 0 | $ | 407 | $ | 10 | $ | 0 | $ | 417 | ||||||||||||
Unrealized appreciation on foreign currency contracts | 0 | 0 | 0 | 122 | 0 | 122 | ||||||||||||||||||
Unrealized appreciation on OTC swap agreements | 0 | 7 | 231 | 0 | 0 | 238 | ||||||||||||||||||
|
|
|
|
|
|
|
|
|
|
|
| |||||||||||||
| $ | 0 | $ | 7 | $ | 638 | $ | 132 | $ | 0 | $ | 777 | |||||||||||||
|
|
|
|
|
|
|
|
|
|
|
| |||||||||||||
Liabilities: | ||||||||||||||||||||||||
Written options outstanding | $ | 0 | $ | 0 | $ | 216 | $ | 5 | $ | 0 | $ | 221 | ||||||||||||
Unrealized depreciation on foreign currency contracts | 0 | 0 | 0 | 88 | 0 | 88 | ||||||||||||||||||
|
|
|
|
|
|
|
|
|
|
|
| |||||||||||||
| $ | 0 | $ | 0 | $ | 216 | $ | 93 | $ | 0 | $ | 309 | |||||||||||||
|
|
|
|
|
|
|
|
|
|
|
| |||||||||||||
The Effect of Financial Derivative Instruments on the Consolidated Statements of Operations for the Period Ended December 31, 2012:
| Derivatives not accounted for as hedging instruments | ||||||||||||||||||||||||
| Commodity Contracts | Credit Contracts | Equity Contracts | Foreign Exchange Contracts | Interest Rate Contracts | Total | |||||||||||||||||||
Realized Gain (Loss) on Derivatives: | ||||||||||||||||||||||||
Net realized (loss) on investments (purchased options) | $ | 0 | $ | 0 | $ | (524 | ) | $ | 0 | $ | 0 | $ | (524 | ) | ||||||||||
Net realized gain on written options | 0 | 0 | 448 | 0 | 0 | 448 | ||||||||||||||||||
Net realized gain (loss) on swaps | 0 | 8 | (56 | ) | 0 | 46 | (2 | ) | ||||||||||||||||
Net realized (loss) on foreign currency transactions | 0 | 0 | 0 | (6 | ) | 0 | (6 | ) | ||||||||||||||||
|
|
|
|
|
|
|
|
|
|
|
| |||||||||||||
| $ | 0 | $ | 8 | $ | (132 | ) | $ | (6 | ) | $ | 46 | $ | (84 | ) | ||||||||||
|
|
|
|
|
|
|
|
|
|
|
| |||||||||||||
Net Change in Unrealized Appreciation (Depreciation) on Derivatives: | ||||||||||||||||||||||||
Net change in unrealized (depreciation) on investments (purchased options) | $ | 0 | $ | 0 | $ | (313 | ) | $ | (6 | ) | $ | 0 | $ | (319 | ) | |||||||||
Net change in unrealized appreciation on written options | 0 | 0 | 162 | 18 | 0 | 180 | ||||||||||||||||||
Net change in unrealized appreciation (depreciation) on swaps | 0 | (2 | ) | 231 | 0 | (37 | ) | 192 | ||||||||||||||||
Net change in unrealized appreciation on translation of assets and liabilities denominated in foreign currencies | 0 | 0 | 0 | 57 | 0 | 57 | ||||||||||||||||||
|
|
|
|
|
|
|
|
|
|
|
| |||||||||||||
| $ | 0 | $ | (2 | ) | $ | 80 | $ | 69 | $ | (37 | ) | $ | 110 | |||||||||||
|
|
|
|
|
|
|
|
|
|
|
| |||||||||||||
| (1) | See note 6 in the Notes to Financial Statements for additional information. |
| (k) | Collateral (Received)/Pledged for OTC Financial Derivative Instruments |
The following is a summary by counterparty of the market value of OTC financial derivative instruments and collateral (received)/pledged as of December 31, 2012:
Counterparty | Total Market Value of OTC Derivatives | Collateral (Received)/Pledged | Net Exposures (1) | Total Market Value of OTC Derivatives | Collateral (Received)/Pledged | Net Exposures (1) | ||||||||||||||||||||||
| PIMCO Emerging Multi-Asset Fund | PIMCO Cayman Commodity V, Ltd. (Subsidiary) | |||||||||||||||||||||||||||
BOA | $ | 1 | $ | 0 | $ | 1 | $ | 0 | $ | 0 | $ | 0 | ||||||||||||||||
BPS | 2 | 0 | 2 | 0 | 0 | 0 | ||||||||||||||||||||||
BRC | 5 | 0 | 5 | 0 | 0 | 0 | ||||||||||||||||||||||
DUB | 8 | 0 | 8 | 0 | 0 | 0 | ||||||||||||||||||||||
FBF | 4 | 0 | 4 | 0 | 0 | 0 | ||||||||||||||||||||||
HUS | (53 | ) | 0 | (53 | ) | 0 | 0 | 0 | ||||||||||||||||||||
JPM | 281 | 0 | 281 | 0 | 0 | 0 | ||||||||||||||||||||||
RYL | 2 | 0 | 2 | 0 | 0 | 0 | ||||||||||||||||||||||
UAG | 23 | 0 | 23 | 0 | 0 | 0 | ||||||||||||||||||||||
| (1) | Net Exposure represents the net receivable/(payable) that would be due from/to the counterparty in the event of default. Exposure from OTC derivatives can only be netted across transactions governed under the same Master Agreement with the same legal entity. The Fund and Subsidiary are recognized as two separate legal entities. As such, exposure cannot be netted. See note 7, Principal Risks, in the Notes to Financial Statements for more information regarding credit and counterparty risks. |
| See Accompanying Notes | SEMIANNUAL REPORT | DECEMBER 31, 2012 | 69 |
Table of Contents
Consolidated Schedule of Investments PIMCO EqS Pathfinder Fund®
| SHARES | MARKET VALUE (000S) | |||||||||||
| COMMON STOCKS 88.7% | ||||||||||||
| BERMUDA 2.9% | ||||||||||||
| ENERGY 1.3% | ||||||||||||
North Atlantic Drilling Ltd. | 2,835,668 | $ | 29,593 | |||||||||
|
| |||||||||||
| FINANCIALS 1.6% | ||||||||||||
Hiscox Ltd. | 4,592,721 | 34,191 | ||||||||||
|
| |||||||||||
Total Bermuda | 63,784 | |||||||||||
|
| |||||||||||
| BRAZIL 0.8% | ||||||||||||
| FINANCIALS 0.8% | ||||||||||||
Itau Unibanco Holding S.A. SP - ADR | 1,144,605 | 18,840 | ||||||||||
|
| |||||||||||
Total Brazil | 18,840 | |||||||||||
|
| |||||||||||
| CANADA 1.8% | ||||||||||||
| ENERGY 1.2% | ||||||||||||
Cameco Corp. | 734,043 | 14,475 | ||||||||||
Nexen, Inc. | 433,549 | 11,680 | ||||||||||
|
| |||||||||||
| 26,155 | ||||||||||||
|
| |||||||||||
| MATERIALS 0.6% | ||||||||||||
Silver Wheaton Corp. | 350,366 | 12,641 | ||||||||||
|
| |||||||||||
Total Canada | 38,796 | |||||||||||
|
| |||||||||||
| DENMARK 2.0% | ||||||||||||
| CONSUMER STAPLES 2.0% | ||||||||||||
Carlsberg A/S ‘B’ | 453,058 | 44,634 | ||||||||||
|
| |||||||||||
Total Denmark | 44,634 | |||||||||||
|
| |||||||||||
| FAEROE ISLANDS 0.5% | ||||||||||||
| CONSUMER STAPLES 0.4% | ||||||||||||
Bakkafrost P/F | 810,885 | 8,827 | ||||||||||
|
| |||||||||||
| FINANCIALS 0.1% | ||||||||||||
BankNordik P/F | 236,546 | 3,181 | ||||||||||
|
| |||||||||||
Total Faeroe Islands | 12,008 | |||||||||||
|
| |||||||||||
| FRANCE 10.4% | ||||||||||||
| CONSUMER DISCRETIONARY 2.3% | ||||||||||||
Eutelsat Communications S.A. | 1,149,653 | 38,238 | ||||||||||
JCDecaux S.A. | 518,652 | 12,379 | ||||||||||
|
| |||||||||||
| 50,617 | ||||||||||||
|
| |||||||||||
| CONSUMER STAPLES 4.3% | ||||||||||||
Carrefour S.A. | 1,516,464 | 39,045 | ||||||||||
Danone S.A. | 846,850 | 55,784 | ||||||||||
|
| |||||||||||
| 94,829 | ||||||||||||
|
| |||||||||||
| ENERGY 1.4% | ||||||||||||
Bourbon S.A. | 377,191 | 10,453 | ||||||||||
Total S.A. | 393,174 | 20,458 | ||||||||||
|
| |||||||||||
| 30,911 | ||||||||||||
|
| |||||||||||
| SHARES | MARKET VALUE (000S) | |||||||||||
| UTILITIES 2.4% | ||||||||||||
Suez Environnement Co. | 2,201,783 | $ | 26,560 | |||||||||
Veolia Environnement S.A. | 2,179,914 | 26,427 | ||||||||||
|
| |||||||||||
| 52,987 | ||||||||||||
|
| |||||||||||
Total France | 229,344 | |||||||||||
|
| |||||||||||
| GERMANY 2.0% | ||||||||||||
| HEALTH CARE 1.6% | ||||||||||||
Rhoen Klinikum AG | 1,728,125 | 34,934 | ||||||||||
|
| |||||||||||
| INDUSTRIALS 0.2% | ||||||||||||
Kloeckner & Co. SE | 383,249 | 4,582 | ||||||||||
|
| |||||||||||
| UTILITIES 0.2% | ||||||||||||
E.ON AG | 312,901 | 5,869 | ||||||||||
|
| |||||||||||
Total Germany | 45,385 | |||||||||||
|
| |||||||||||
| GUERNSEY, CHANNEL ISLANDS 0.9% | ||||||||||||
| FINANCIALS 0.9% | ||||||||||||
Resolution Ltd. | 5,137,075 | 20,900 | ||||||||||
|
| |||||||||||
Total Guernsey, Channel Islands | 20,900 | |||||||||||
|
| |||||||||||
| HONG KONG 3.7% | ||||||||||||
| CONSUMER DISCRETIONARY 0.4% | ||||||||||||
Television Broadcasts Ltd. | 1,338,000 | 10,069 | ||||||||||
|
| |||||||||||
| FINANCIALS 2.9% | ||||||||||||
AIA Group Ltd. | 12,877,300 | 51,076 | ||||||||||
First Pacific Co. Ltd. | 11,094,000 | 12,294 | ||||||||||
|
| |||||||||||
| 63,370 | ||||||||||||
|
| |||||||||||
| INDUSTRIALS 0.4% | ||||||||||||
Jardine Matheson Holdings Ltd. | 89,300 | 5,572 | ||||||||||
Jardine Strategic Holdings Ltd. | 96,500 | 3,453 | ||||||||||
|
| |||||||||||
| 9,025 | ||||||||||||
|
| |||||||||||
Total Hong Kong | 82,464 | |||||||||||
|
| |||||||||||
| ISRAEL 0.5% | ||||||||||||
| HEALTH CARE 0.5% | ||||||||||||
Teva Pharmaceutical Industries Ltd. SP - ADR | 314,971 | 11,761 | ||||||||||
|
| |||||||||||
Total Israel | 11,761 | |||||||||||
|
| |||||||||||
| JAPAN 2.3% | ||||||||||||
| INDUSTRIALS 1.2% | ||||||||||||
FANUC Corp. | 146,600 | 27,275 | ||||||||||
|
| |||||||||||
| INFORMATION TECHNOLOGY 1.1% | ||||||||||||
Nintendo Co. Ltd. | 225,442 | 24,072 | ||||||||||
|
| |||||||||||
Total Japan | 51,347 | |||||||||||
|
| |||||||||||
| NETHERLANDS 4.7% | ||||||||||||
| CONSUMER STAPLES 1.6% | ||||||||||||
CSM | 1,670,633 | 35,957 | ||||||||||
|
| |||||||||||
| SHARES | MARKET VALUE (000S) | |||||||||||
| ENERGY 0.8% | ||||||||||||
Royal Dutch Shell PLC ‘A’ | 506,320 | $ | 17,574 | |||||||||
|
| |||||||||||
| FINANCIALS 1.7% | ||||||||||||
ING Groep NV - Dutch Certificate (a) | 3,805,425 | 36,144 | ||||||||||
|
| |||||||||||
| INFORMATION TECHNOLOGY 0.6% | ||||||||||||
Gemalto NV | 152,232 | 13,741 | ||||||||||
|
| |||||||||||
Total Netherlands | 103,416 | |||||||||||
|
| |||||||||||
| NORWAY 4.8% | ||||||||||||
| CONSUMER STAPLES 2.5% | ||||||||||||
Cermaq ASA | 849,640 | 12,887 | ||||||||||
Marine Harvest ASA (a) | 45,119,615 | 42,031 | ||||||||||
|
| |||||||||||
| 54,918 | ||||||||||||
|
| |||||||||||
| ENERGY 1.7% | ||||||||||||
Seadrill Ltd. | 1,036,617 | 38,191 | ||||||||||
|
| |||||||||||
| INDUSTRIALS 0.6% | ||||||||||||
Orkla ASA | 1,453,514 | 12,738 | ||||||||||
|
| |||||||||||
Total Norway | 105,847 | |||||||||||
|
| |||||||||||
| SINGAPORE 0.9% | ||||||||||||
| FINANCIALS 0.1% | ||||||||||||
Great Eastern Holdings Ltd. | 85,220 | 1,096 | ||||||||||
|
| |||||||||||
| INDUSTRIALS 0.8% | ||||||||||||
Keppel Corp. Ltd. | 1,992,300 | 18,193 | ||||||||||
|
| |||||||||||
Total Singapore | 19,289 | |||||||||||
|
| |||||||||||
| SOUTH AFRICA 0.9% | ||||||||||||
| MATERIALS 0.9% | ||||||||||||
AngloGold Ashanti Ltd. SP - ADR | 614,314 | 19,271 | ||||||||||
|
| |||||||||||
Total South Africa | 19,271 | |||||||||||
|
| |||||||||||
| SOUTH KOREA 0.6% | ||||||||||||
| CONSUMER DISCRETIONARY 0.6% | ||||||||||||
GS Home Shopping, Inc. | 98,475 | 14,169 | ||||||||||
|
| |||||||||||
Total South Korea | 14,169 | |||||||||||
|
| |||||||||||
| SPAIN 0.3% | ||||||||||||
| CONSUMER STAPLES 0.3% | ||||||||||||
Distribuidora Internacional de Alimentacion S.A. | 1,131,881 | 7,232 | ||||||||||
|
| |||||||||||
Total Spain | 7,232 | |||||||||||
|
| |||||||||||
| SWEDEN 1.0% | ||||||||||||
| INDUSTRIALS 1.0% | ||||||||||||
Loomis AB ‘B’ | 1,348,428 | 21,697 | ||||||||||
|
| |||||||||||
Total Sweden | 21,697 | |||||||||||
|
| |||||||||||
| SWITZERLAND 4.6% | ||||||||||||
| CONSUMER STAPLES 1.5% | ||||||||||||
Nestle S.A. | 490,296 | 31,989 | ||||||||||
|
| |||||||||||
| 70 | PIMCO EQUITY SERIES | See Accompanying Notes |
Table of Contents
December 31, 2012 (Unaudited)
| SHARES | MARKET VALUE (000S) | |||||||||||
| FINANCIALS 0.6% | ||||||||||||
Swiss Re AG | 191,122 | $ | 13,856 | |||||||||
|
| |||||||||||
| HEALTH CARE 1.1% | ||||||||||||
Roche Holding AG | 121,782 | 24,622 | ||||||||||
|
| |||||||||||
| INDUSTRIALS 0.4% | ||||||||||||
Schindler Holding AG | 62,477 | 8,860 | ||||||||||
|
| |||||||||||
| INFORMATION TECHNOLOGY 0.5% | ||||||||||||
Logitech International S.A. | 1,289,782 | 9,902 | ||||||||||
|
| |||||||||||
| MATERIALS 0.5% | ||||||||||||
Sika AG | 5,009 | 11,585 | ||||||||||
|
| |||||||||||
Total Switzerland | 100,814 | |||||||||||
|
| |||||||||||
| UNITED KINGDOM 14.4% | ||||||||||||
| CONSUMER STAPLES 8.1% | ||||||||||||
British American Tobacco PLC | 1,302,707 | 66,223 | ||||||||||
Imperial Tobacco Group PLC | 1,894,396 | 73,449 | ||||||||||
Reckitt Benckiser Group PLC | 631,252 | 40,071 | ||||||||||
|
| |||||||||||
| 179,743 | ||||||||||||
|
| |||||||||||
| ENERGY 2.7% | ||||||||||||
BP PLC | 5,568,040 | 38,714 | ||||||||||
Ensco PLC ‘A’ | 351,649 | 20,846 | ||||||||||
|
| |||||||||||
| 59,560 | ||||||||||||
|
| |||||||||||
| FINANCIALS 3.6% | ||||||||||||
Lancashire Holdings Ltd. | 3,795,125 | 48,321 | ||||||||||
Lloyds Banking Group PLC (a) | 38,253,017 | 30,483 | ||||||||||
|
| |||||||||||
| 78,804 | ||||||||||||
|
| |||||||||||
Total United Kingdom | 318,107 | |||||||||||
|
| |||||||||||
| UNITED STATES 28.7% | ||||||||||||
| CONSUMER STAPLES 5.9% | ||||||||||||
Altria Group, Inc. | 942,768 | 29,622 | ||||||||||
Lorillard, Inc. | 378,366 | 44,144 | ||||||||||
Philip Morris International, Inc. | 285,716 | 23,897 | ||||||||||
Reynolds American, Inc. | 479,177 | 19,852 | ||||||||||
Wal-Mart Stores, Inc. | 185,812 | 12,678 | ||||||||||
|
| |||||||||||
| 130,193 | ||||||||||||
|
| |||||||||||
| ENERGY 1.2% | ||||||||||||
Halliburton Co. | 344,367 | 11,946 | ||||||||||
Phillips 66 | 105,502 | 5,602 | ||||||||||
Rentech, Inc. | 3,211,564 | 8,447 | ||||||||||
|
| |||||||||||
| 25,995 | ||||||||||||
|
| |||||||||||
| SHARES | MARKET VALUE (000S) | |||||||||||
| FINANCIALS 9.3% | ||||||||||||
Alleghany Corp. (a) | 59,780 | $ | 20,051 | |||||||||
BankUnited, Inc. | 932,691 | 22,795 | ||||||||||
Berkshire Hathaway, Inc. ‘B’ (a) | 499,815 | 44,833 | ||||||||||
Capitol Federal Financial, Inc. | 753,253 | 8,806 | ||||||||||
Northwest Bancshares, Inc. | 824,859 | 10,014 | ||||||||||
NYSE Euronext | 378,154 | 11,927 | ||||||||||
SLM Corp. | 1,232,877 | 21,119 | ||||||||||
TFS Financial Corp. (a) | 1,811,733 | 17,429 | ||||||||||
ViewPoint Financial Group, Inc. | 688,711 | 14,422 | ||||||||||
White Mountains Insurance Group Ltd. | 66,529 | 34,262 | ||||||||||
|
| |||||||||||
| 205,658 | ||||||||||||
|
| |||||||||||
| HEALTH CARE 1.4% | ||||||||||||
Merck & Co., Inc. | 287,061 | 11,752 | ||||||||||
Pfizer, Inc. | 763,184 | 19,141 | ||||||||||
|
| |||||||||||
| 30,893 | ||||||||||||
|
| |||||||||||
| INDUSTRIALS 3.9% | ||||||||||||
3M Co. | 380,918 | 35,368 | ||||||||||
Deere & Co. | 375,708 | 32,469 | ||||||||||
General Dynamics Corp. | 256,913 | 17,796 | ||||||||||
|
| |||||||||||
| 85,633 | ||||||||||||
|
| |||||||||||
| INFORMATION TECHNOLOGY 5.8% | ||||||||||||
Dell, Inc. (d) | 2,436,132 | 24,678 | ||||||||||
Intel Corp. | 2,609,740 | 53,839 | ||||||||||
Microsoft Corp. | 1,921,633 | 51,365 | ||||||||||
|
| |||||||||||
| 129,882 | ||||||||||||
|
| |||||||||||
| MATERIALS 1.1% | ||||||||||||
PPG Industries, Inc. | 178,467 | 24,156 | ||||||||||
|
| |||||||||||
| TELECOMMUNICATION SERVICES 0.1% | ||||||||||||
Sprint Nextel Corp. (a) | 592,200 | 3,358 | ||||||||||
|
| |||||||||||
Total United States | 635,768 | |||||||||||
|
| |||||||||||
Total Common Stocks (Cost $1,787,503) | 1,964,873 | |||||||||||
|
| |||||||||||
| EXCHANGE-TRADED FUNDS 3.8% | ||||||||||||
| UNITED STATES 3.8% | ||||||||||||
SPDR Gold Trust | 523,594 | 84,828 | ||||||||||
|
| |||||||||||
Total Exchange-Traded Funds | 84,828 | |||||||||||
|
| |||||||||||
| PREFERRED STOCKS 0.3% | ||||||||||||
| BRAZIL 0.3% | ||||||||||||
| BANKING & FINANCE 0.3% | ||||||||||||
Itau Unibanco Holding S.A. | 362,000 | 5,903 | ||||||||||
|
| |||||||||||
Total Preferred Stocks (Cost $5,003) | 5,903 | |||||||||||
|
| |||||||||||
| SHARES | MARKET VALUE (000S) | |||||||||||
| REAL ESTATE INVESTMENT TRUSTS 0.9% | ||||||||||||
| UNITED STATES 0.9% | ||||||||||||
American Capital Agency Corp. | 661,142 | $ | 19,133 | |||||||||
|
| |||||||||||
Total Real Estate Investment Trusts | 19,133 | |||||||||||
|
| |||||||||||
| RIGHTS 0.2% | ||||||||||||
| FRANCE 0.2% | ||||||||||||
| HEALTH CARE 0.2% | ||||||||||||
Sanofi - Exp. 12/31/2020 | 2,638,315 | 4,498 | ||||||||||
|
| |||||||||||
Total Rights (Cost $5,483) | 4,498 | |||||||||||
|
| |||||||||||
| PRINCIPAL AMOUNT (000S) | ||||||||||||
| SHORT-TERM INSTRUMENTS 6.6% | ||||||||||||
| REPURCHASE AGREEMENTS 0.0% | ||||||||||||
State Street Bank and Trust Co. |
| |||||||||||
0.010% due 01/02/2013 | $ | 604 | 604 | |||||||||
|
| |||||||||||
(Dated 12/31/2012. Collateralized by Fannie Mae 2.170% due 10/17/2022 valued at $618. Repurchase proceeds are $604.) | ||||||||||||
| U.S. TREASURY BILLS 0.7% | ||||||||||||
0.143% due 06/06/2013 - 12/12/2013 (b)(e) | 15,560 | 15,540 | ||||||||||
|
| |||||||||||
| SHARES | ||||||||||||
| CENTRAL FUNDS USED FOR CASH MANAGEMENT PURPOSES (c) 5.9% | ||||||||||||
PIMCO Short-Term Floating NAV Portfolio | 13,119,995 | 131,292 | ||||||||||
|
| |||||||||||
Total Short-Term Instruments | 147,436 | |||||||||||
|
| |||||||||||
| PURCHASED OPTIONS (g) 0.2% | ||||||||||||
(Cost $3,737) | 3,737 | |||||||||||
| Total Investments 100.7% (Cost $2,051,345) | $ | 2,230,408 | ||||||||||
| Securities Sold Short (i) (1.0%) (Proceeds $22,011) | (22,467 | ) | ||||||||||
| Written Options (h) (0.0%) (Premiums $6) | (6 | ) | ||||||||||
| Other Assets and Liabilities (Net) (1.7%) | 7,188 | |||||||||||
|
| |||||||||||
| Net Assets 100.0% | $ | 2,215,123 | ||||||||||
|
| |||||||||||
| See Accompanying Notes | SEMIANNUAL REPORT | DECEMBER 31, 2012 | 71 |
Table of Contents
Consolidated Schedule of Investments PIMCO EqS Pathfinder Fund® (Cont.)
Notes to Consolidated Schedule of Investments (amounts in thousands*, except number of contracts and shares):
| * | A zero balance may reflect actual amounts rounding to less than one thousand. |
| (a) | Non-income producing security. |
| (b) | Coupon represents a weighted average yield to maturity. |
| (c) | Affiliated to the Fund. |
| (d) | Securities with an aggregate market value of $16,816 and cash of $22,627 have been pledged as collateral as of December 31, 2012 for equity short sales and equity options as governed by prime brokerage agreements and agreements governing listed equity option transactions. |
| (e) | Securities with an aggregate market value of $15,540 have been pledged as collateral for OTC swap agreements and foreign currency contracts as governed by International Swaps and Derivatives Association, Inc. Master Agreements as of December 31, 2012. |
| (f) | OTC swap agreements outstanding as of December 31, 2012: |
| Total Return Swaps on Securities | ||||||||||||||||||||||||||
| Pay/Receive | Underlying Reference | # of Shares | Financing Rate | Notional Amount | Maturity Date | Counterparty | Unrealized Appreciation/ (Depreciation) | |||||||||||||||||||
| Receive | Logitech International S.A. | 1,132,799 | 1-Month USD-LIBOR less a specified spread | $ | 8,787 | 09/16/2013 | GST | $ | (138 | ) | ||||||||||||||||
| Receive | CVR Energy, Inc. | 70,118 | 1-Month USD-LIBOR plus a specified spread | 3,380 | 09/11/2013 | MYI | 40 | |||||||||||||||||||
| Pay | CVR Partners LP | 40,543 | 1-Month USD-LIBOR less a specified spread | 1,020 | 09/11/2013 | MYI | (4 | ) | ||||||||||||||||||
|
| |||||||||||||||||||||||||
| $ | (102 | ) | ||||||||||||||||||||||||
|
| |||||||||||||||||||||||||
| (g) | Purchased options outstanding as of December 31, 2012: |
| Options on Securities | ||||||||||||||||||||
| Description | Strike Price | Expiration Date | # of Contracts | Cost | Market Value | |||||||||||||||
Put - CBOE Sprint Nextel Corp. | $ | 10.000 | 08/17/2013 | 5,922 | $ | 3,737 | $ | 3,737 | ||||||||||||
|
|
|
| |||||||||||||||||
| (h) | Written options outstanding as of December 31, 2012: |
| Options on Securities | ||||||||||||||||||||
| Description | Strike Price | Expiration Date | # of Contracts | Premium | Market Value | |||||||||||||||
Call - CBOE Sprint Nextel Corp. | $ | 10.000 | 08/17/2013 | 5,922 | $ | 6 | $ | (6 | ) | |||||||||||
|
|
|
| |||||||||||||||||
Transactions in written call and put options for the period ended December 31, 2012:
| # of Contracts | Notional Amount in CHF | Notional Amount in EUR | Premium | |||||||||||||
Balance at 12/31/2011 | 1,830 | CHF | 0 | EUR | 438,169 | $ | 3,968 | |||||||||
Sales | 27,470 | 595 | 0 | 866 | ||||||||||||
Closing Buys | (16,406 | ) | 0 | (438,169 | ) | (4,470 | ) | |||||||||
Expirations | 0 | 0 | 0 | 0 | ||||||||||||
Exercised | (6,972 | ) | (595 | ) | 0 | (358 | ) | |||||||||
|
|
|
|
|
|
|
| |||||||||
Balance at 12/31/2012 | 5,922 | CHF | 0 | EUR | 0 | $ | 6 | |||||||||
|
|
|
|
|
|
|
| |||||||||
| (i) | Short sales outstanding as of December 31, 2012: |
| Description | Shares | Proceeds | Market Value (1) | |||||||||
Georgia Gulf Corp. | 125,497 | $ | 5,454 | $ | (5,191 | ) | ||||||
Materials Select Sector SPDR Fund | 152,330 | 5,544 | (5,768 | ) | ||||||||
Sherwin-Williams Co. | 37,580 | 5,551 | (5,781 | ) | ||||||||
Valspar Corp. | 91,776 | 5,462 | (5,727 | ) | ||||||||
|
|
|
| |||||||||
| $ | 22,011 | $ | (22,467 | ) | ||||||||
|
|
|
| |||||||||
| (1) | Market value includes $60 of dividends payable on short sales. |
| 72 | PIMCO EQUITY SERIES | See Accompanying Notes |
Table of Contents
December 31, 2012 (Unaudited)
| (j) | Foreign currency contracts outstanding as of December 31, 2012: |
| Settlement Month | Currency to be Delivered | Currency to be Received | Counterparty | Unrealized Appreciation | Unrealized (Depreciation) | Net Unrealized Appreciation/ (Depreciation) | ||||||||||||||||||||||||
01/2013 | AUD | 6,920 | $ | 7,223 | BRC | $ | 37 | $ | 0 | $ | 37 | |||||||||||||||||||
01/2013 | 35,559 | 36,979 | CBK | 52 | 0 | 52 | ||||||||||||||||||||||||
01/2013 | 5,801 | 6,054 | DUB | 31 | 0 | 31 | ||||||||||||||||||||||||
01/2013 | 35,557 | 36,993 | FBF | 69 | 0 | 69 | ||||||||||||||||||||||||
01/2013 | CAD | 106,017 | 106,691 | BRC | 109 | 0 | 109 | |||||||||||||||||||||||
01/2013 | 3,815 | 3,861 | RBC | 26 | 0 | 26 | ||||||||||||||||||||||||
01/2013 | CHF | 3,776 | 4,047 | BPS | 0 | (81 | ) | (81 | ) | |||||||||||||||||||||
01/2013 | 25,785 | 27,770 | BRC | 0 | (421 | ) | (421 | ) | ||||||||||||||||||||||
01/2013 | DKK | 192,007 | 33,286 | UAG | 0 | (684 | ) | (684 | ) | |||||||||||||||||||||
01/2013 | EUR | 116,877 | 151,360 | BPS | 0 | (2,912 | ) | (2,912 | ) | |||||||||||||||||||||
01/2013 | GBP | 95,931 | 153,953 | BPS | 0 | (1,882 | ) | (1,882 | ) | |||||||||||||||||||||
01/2013 | JPY | 6,898,626 | 81,879 | BOA | 2,251 | 0 | 2,251 | |||||||||||||||||||||||
01/2013 | 415,673 | 4,929 | HUS | 131 | 0 | 131 | ||||||||||||||||||||||||
01/2013 | 461,193 | 5,466 | JPM | 143 | 0 | 143 | ||||||||||||||||||||||||
01/2013 | 1,672,009 | 19,771 | RYL | 471 | 0 | 471 | ||||||||||||||||||||||||
01/2013 | 172,693 | 2,048 | UAG | 54 | 0 | 54 | ||||||||||||||||||||||||
01/2013 | NOK | 736,117 | 129,329 | GLM | 0 | (3,119 | ) | (3,119 | ) | |||||||||||||||||||||
01/2013 | SGD | 717 | 586 | GLM | 0 | (1 | ) | (1 | ) | |||||||||||||||||||||
01/2013 | $ | 87,537 | AUD | 83,834 | JPM | 0 | (479 | ) | (479 | ) | ||||||||||||||||||||
01/2013 | 110,562 | CAD | 109,832 | CBK | 0 | (145 | ) | (145 | ) | |||||||||||||||||||||
01/2013 | 553 | CHF | 516 | BRC | 11 | 0 | 11 | |||||||||||||||||||||||
01/2013 | 29,709 | 27,240 | CBK | 73 | 0 | 73 | ||||||||||||||||||||||||
01/2013 | 623 | 578 | DUB | 9 | 0 | 9 | ||||||||||||||||||||||||
01/2013 | 935 | 869 | FBF | 16 | 0 | 16 | ||||||||||||||||||||||||
01/2013 | 50 | 46 | JPM | 1 | 0 | 1 | ||||||||||||||||||||||||
01/2013 | 337 | 312 | RYL | 4 | 0 | 4 | ||||||||||||||||||||||||
01/2013 | 155,330 | EUR | 116,877 | UAG | 0 | (1,058 | ) | (1,058 | ) | |||||||||||||||||||||
01/2013 | 152,749 | GBP | 93,803 | GLM | 0 | (371 | ) | (371 | ) | |||||||||||||||||||||
01/2013 | 3,447 | 2,128 | MSC | 10 | 0 | 10 | ||||||||||||||||||||||||
01/2013 | 117,069 | JPY | 9,609,436 | BPS | 0 | (6,150 | ) | (6,150 | ) | |||||||||||||||||||||
01/2013 | 130 | 10,758 | UAG | 0 | (6 | ) | (6 | ) | ||||||||||||||||||||||
01/2013 | 11,866 | SEK | 79,139 | RYL | 304 | 0 | 304 | |||||||||||||||||||||||
01/2013 | 326 | SGD | 400 | DUB | 1 | 0 | 1 | |||||||||||||||||||||||
01/2013 | 115 | 141 | UAG | 0 | 0 | 0 | ||||||||||||||||||||||||
01/2013 | ZAR | 172,585 | $ | 19,749 | DUB | 0 | (534 | ) | (534 | ) | ||||||||||||||||||||
02/2013 | AUD | 28 | 29 | FBF | 0 | 0 | 0 | |||||||||||||||||||||||
02/2013 | BRL | 2,165 | 1,049 | HUS | 0 | (4 | ) | (4 | ) | |||||||||||||||||||||
02/2013 | CHF | 25,056 | 27,365 | CBK | 0 | (46 | ) | (46 | ) | |||||||||||||||||||||
02/2013 | CNY | 64,440 | 10,055 | BPS | 0 | (189 | ) | (189 | ) | |||||||||||||||||||||
02/2013 | 95,571 | 15,140 | CBK | 0 | (52 | ) | (52 | ) | ||||||||||||||||||||||
02/2013 | 94,540 | 14,750 | DUB | 0 | (278 | ) | (278 | ) | ||||||||||||||||||||||
02/2013 | 23,658 | 3,692 | HUS | 0 | (69 | ) | (69 | ) | ||||||||||||||||||||||
02/2013 | 19,826 | 3,094 | JPM | 0 | (58 | ) | (58 | ) | ||||||||||||||||||||||
02/2013 | 75,632 | 11,800 | RYL | 0 | (222 | ) | (222 | ) | ||||||||||||||||||||||
02/2013 | DKK | 192,007 | 34,183 | FBF | 198 | 0 | 198 | |||||||||||||||||||||||
02/2013 | EUR | 116,877 | 155,377 | UAG | 1,063 | 0 | 1,063 | |||||||||||||||||||||||
02/2013 | GBP | 210 | 339 | BRC | 0 | (2 | ) | (2 | ) | |||||||||||||||||||||
02/2013 | 82 | 133 | FBF | 0 | 0 | 0 | ||||||||||||||||||||||||
02/2013 | 93,803 | 152,733 | GLM | 368 | 0 | 368 | ||||||||||||||||||||||||
02/2013 | HKD | 335,782 | 43,336 | UAG | 7 | 0 | 7 | |||||||||||||||||||||||
02/2013 | NOK | 366,585 | 65,850 | BPS | 0 | (33 | ) | (33 | ) | |||||||||||||||||||||
02/2013 | 366,586 | 65,850 | JPM | 0 | (33 | ) | (33 | ) | ||||||||||||||||||||||
02/2013 | PLN | 2,574 | 797 | JPM | 0 | (31 | ) | (31 | ) | |||||||||||||||||||||
02/2013 | $ | 7,205 | AUD | 6,920 | BRC | 0 | (36 | ) | (36 | ) | ||||||||||||||||||||
02/2013 | 36,888 | 35,559 | CBK | 0 | (49 | ) | (49 | ) | ||||||||||||||||||||||
02/2013 | 6,038 | 5,800 | DUB | 0 | (30 | ) | (30 | ) | ||||||||||||||||||||||
02/2013 | 36,903 | 35,557 | FBF | 0 | (67 | ) | (67 | ) | ||||||||||||||||||||||
02/2013 | 608 | 581 | HUS | 0 | (6 | ) | (6 | ) | ||||||||||||||||||||||
02/2013 | 110,841 | CAD | 110,188 | BRC | 0 | (138 | ) | (138 | ) | |||||||||||||||||||||
02/2013 | 72 | CHF | 66 | BRC | 0 | 0 | 0 | |||||||||||||||||||||||
02/2013 | 230 | 210 | CBK | 0 | (1 | ) | (1 | ) | ||||||||||||||||||||||
02/2013 | 478 | 436 | HUS | 0 | (1 | ) | (1 | ) | ||||||||||||||||||||||
02/2013 | 40 | 37 | RYL | 0 | 0 | 0 | ||||||||||||||||||||||||
02/2013 | 60,829 | CNY | 381,967 | JPM | 65 | (177 | ) | (112 | ) | |||||||||||||||||||||
02/2013 | 3,200 | EUR | 2,420 | BPS | 0 | (4 | ) | (4 | ) | |||||||||||||||||||||
02/2013 | 2,737 | 2,076 | BRC | 4 | 0 | 4 | ||||||||||||||||||||||||
02/2013 | 442 | 334 | DUB | 0 | (1 | ) | (1 | ) | ||||||||||||||||||||||
02/2013 | 261 | 197 | HUS | 0 | (1 | ) | (1 | ) | ||||||||||||||||||||||
02/2013 | 8,568 | 6,497 | RYL | 11 | 0 | 11 | ||||||||||||||||||||||||
| See Accompanying Notes | SEMIANNUAL REPORT | DECEMBER 31, 2012 | 73 |
Table of Contents
Consolidated Schedule of Investments PIMCO EqS Pathfinder Fund® (Cont.)
| Settlement Month | Currency to be Delivered | Currency to be Received | Counterparty | Unrealized Appreciation | Unrealized (Depreciation) | Net Unrealized Appreciation/ (Depreciation) | ||||||||||||||||||||||||
02/2013 | $ | 1,169 | GBP | 719 | HUS | $ | 0 | $ | (1 | ) | $ | (1 | ) | |||||||||||||||||
02/2013 | 776 | HKD | 6,014 | JPM | 0 | 0 | 0 | |||||||||||||||||||||||
02/2013 | 40,941 | JPY | 3,449,313 | BOA | 0 | (1,118 | ) | (1,118 | ) | |||||||||||||||||||||
02/2013 | 4,930 | 415,673 | HUS | 0 | (131 | ) | (131 | ) | ||||||||||||||||||||||
02/2013 | 5,467 | 461,193 | JPM | 0 | (143 | ) | (143 | ) | ||||||||||||||||||||||
02/2013 | 19,775 | 1,672,009 | RYL | 0 | (471 | ) | (471 | ) | ||||||||||||||||||||||
02/2013 | 2,048 | 172,693 | UAG | 0 | (54 | ) | (54 | ) | ||||||||||||||||||||||
02/2013 | 1,891 | NOK | 10,558 | BRC | 6 | 0 | 6 | |||||||||||||||||||||||
02/2013 | 12,180 | SEK | 79,139 | BRC | 0 | (20 | ) | (20 | ) | |||||||||||||||||||||
03/2013 | 40,966 | JPY | 3,449,313 | BOA | 0 | (1,133 | ) | (1,133 | ) | |||||||||||||||||||||
04/2013 | ILS | 29,038 | $ | 7,446 | DUB | 0 | (307 | ) | (307 | ) | ||||||||||||||||||||
04/2013 | $ | 20,139 | MXN | 261,217 | MSC | 0 | (100 | ) | (100 | ) | ||||||||||||||||||||
|
|
|
|
|
| |||||||||||||||||||||||||
| $ | 5,525 | $ | (22,849 | ) | $ | (17,324 | ) | |||||||||||||||||||||||
|
|
|
|
|
| |||||||||||||||||||||||||
| (k) | Fair Value Measurements (1) |
(i) The following is a summary of the fair valuations according to the inputs used as of December 31, 2012 in valuing the Fund’s assets and liabilities:
| Category and Subcategory | Level 1 | Level 2 | Level 3 | Fair Value at 12/31/2012 | ||||||||||||
Investments, at value | ||||||||||||||||
Common Stocks | ||||||||||||||||
Bermuda | ||||||||||||||||
Energy | $ | 29,593 | $ | 0 | $ | 0 | $ | 29,593 | ||||||||
Financials | 0 | 34,191 | 0 | 34,191 | ||||||||||||
Brazil | ||||||||||||||||
Financials | 18,840 | 0 | 0 | 18,840 | ||||||||||||
Canada | ||||||||||||||||
Energy | 26,155 | 0 | 0 | 26,155 | ||||||||||||
Materials | 12,641 | 0 | 0 | 12,641 | ||||||||||||
Denmark | ||||||||||||||||
Consumer Staples | 0 | 44,634 | 0 | 44,634 | ||||||||||||
Faeroe Islands | ||||||||||||||||
Consumer Staples | 8,827 | 0 | 0 | 8,827 | ||||||||||||
Financials | 3,181 | 0 | 0 | 3,181 | ||||||||||||
France | ||||||||||||||||
Consumer Discretionary | 0 | 50,617 | 0 | 50,617 | ||||||||||||
Consumer Staples | 55,784 | 39,045 | 0 | 94,829 | ||||||||||||
Energy | 0 | 30,911 | 0 | 30,911 | ||||||||||||
Utilities | 0 | 52,987 | 0 | 52,987 | ||||||||||||
Germany | ||||||||||||||||
Health Care | 34,934 | 0 | 0 | 34,934 | ||||||||||||
Industrials | 0 | 4,582 | 0 | 4,582 | ||||||||||||
Utilities | 0 | 5,869 | 0 | 5,869 | ||||||||||||
Guernsey, Channel Islands | ||||||||||||||||
Financials | 0 | 20,900 | 0 | 20,900 | ||||||||||||
Hong Kong | ||||||||||||||||
Consumer Discretionary | 0 | 10,069 | 0 | 10,069 | ||||||||||||
Financials | 0 | 63,370 | 0 | 63,370 | ||||||||||||
Industrials | 0 | 9,025 | 0 | 9,025 | ||||||||||||
Israel | ||||||||||||||||
Health Care | 11,761 | 0 | 0 | 11,761 | ||||||||||||
Japan | ||||||||||||||||
Industrials | 0 | 27,275 | 0 | 27,275 | ||||||||||||
Information Technology | 0 | 24,072 | 0 | 24,072 | ||||||||||||
Netherlands | ||||||||||||||||
Consumer Staples | 0 | 35,957 | 0 | 35,957 | ||||||||||||
Energy | 0 | 17,574 | 0 | 17,574 | ||||||||||||
Financials | 0 | 36,144 | 0 | 36,144 | ||||||||||||
Information Technology | 0 | 13,741 | 0 | 13,741 | ||||||||||||
Norway | ||||||||||||||||
Consumer Staples | 0 | 54,918 | 0 | 54,918 | ||||||||||||
Energy | 0 | 38,191 | 0 | 38,191 | ||||||||||||
Industrials | 0 | 12,738 | 0 | 12,738 | ||||||||||||
Singapore | ||||||||||||||||
Financials | 0 | 1,096 | 0 | 1,096 | ||||||||||||
Industrials | 0 | 18,193 | 0 | 18,193 | ||||||||||||
| Category and Subcategory | Level 1 | Level 2 | Level 3 | Fair Value at 12/31/2012 | ||||||||||||
South Africa | ||||||||||||||||
Materials | $ | 19,271 | $ | 0 | $ | 0 | $ | 19,271 | ||||||||
South Korea | ||||||||||||||||
Consumer Discretionary | 0 | 14,169 | 0 | 14,169 | ||||||||||||
Spain | ||||||||||||||||
Consumer Staples | 0 | 7,232 | 0 | 7,232 | ||||||||||||
Sweden | ||||||||||||||||
Industrials | 0 | 21,697 | 0 | 21,697 | ||||||||||||
Switzerland | ||||||||||||||||
Consumer Staples | 0 | 31,989 | 0 | 31,989 | ||||||||||||
Financials | 0 | 13,856 | 0 | 13,856 | ||||||||||||
Health Care | 0 | 24,622 | 0 | 24,622 | ||||||||||||
Industrials | 0 | 8,860 | 0 | 8,860 | ||||||||||||
Information Technology | 0 | 9,902 | 0 | 9,902 | ||||||||||||
Materials | 0 | 11,585 | 0 | 11,585 | ||||||||||||
United Kingdom | ||||||||||||||||
Consumer Staples | 0 | 179,743 | 0 | 179,743 | ||||||||||||
Energy | 20,846 | 38,714 | 0 | 59,560 | ||||||||||||
Financials | 0 | 78,804 | 0 | 78,804 | ||||||||||||
United States | ||||||||||||||||
Consumer Staples | 130,193 | 0 | 0 | 130,193 | ||||||||||||
Energy | 25,995 | 0 | 0 | 25,995 | ||||||||||||
Financials | 205,658 | 0 | 0 | 205,658 | ||||||||||||
Health Care | 30,893 | 0 | 0 | 30,893 | ||||||||||||
Industrials | 85,633 | 0 | 0 | 85,633 | ||||||||||||
Information Technology | 129,882 | 0 | 0 | 129,882 | ||||||||||||
Materials | 24,156 | 0 | 0 | 24,156 | ||||||||||||
Telecommunication Services | 3,358 | 0 | 0 | 3,358 | ||||||||||||
Exchange-Traded Funds | ||||||||||||||||
United States | 84,828 | 0 | 0 | 84,828 | ||||||||||||
Preferred Stocks | ||||||||||||||||
Brazil | ||||||||||||||||
Banking & Finance | 5,903 | 0 | 0 | 5,903 | ||||||||||||
Real Estate Investment Trusts | ||||||||||||||||
United States | 19,133 | 0 | 0 | 19,133 | ||||||||||||
Rights | ||||||||||||||||
France | ||||||||||||||||
Health Care | 4,498 | 0 | 0 | 4,498 | ||||||||||||
Short-Term Instruments | ||||||||||||||||
Repurchase Agreements | 0 | 604 | 0 | 604 | ||||||||||||
U.S. Treasury Bills | 0 | 15,540 | 0 | 15,540 | ||||||||||||
Central Funds Used for Cash Management Purposes | 131,292 | 0 | 0 | 131,292 | ||||||||||||
Purchased Options | ||||||||||||||||
Equity Contracts | 3,737 | 0 | 0 | 3,737 | ||||||||||||
| $ | 1,126,992 | $ | 1,103,416 | $ | 0 | $ | 2,230,408 | |||||||||
Short Sales, at value | $ | (22,467 | ) | $ | 0 | $ | 0 | $ | (22,467 | ) | ||||||
| 74 | PIMCO EQUITY SERIES | See Accompanying Notes |
Table of Contents
December 31, 2012 (Unaudited)
| Category and Subcategory | Level 1 | Level 2 | Level 3 | Fair Value at 12/31/2012 | ||||||||||||
Financial Derivative Instruments - Assets |
| |||||||||||||||
Equity Contracts | $ | 0 | $ | 40 | $ | 0 | $ | 40 | ||||||||
Foreign Exchange Contracts | 0 | 5,525 | 0 | 5,525 | ||||||||||||
| $ | 0 | $ | 5,565 | $ | 0 | $ | 5,565 | |||||||||
| Category and Subcategory | Level 1 | Level 2 | Level 3 | Fair Value at 12/31/2012 | ||||||||||||
Financial Derivative Instruments - Liabilities |
| |||||||||||||||
Equity Contracts | $ | (6 | ) | $ | (142 | ) | $ | 0 | $ | (148 | ) | |||||
Foreign Exchange Contracts | 0 | (22,849 | ) | 0 | (22,849 | ) | ||||||||||
| $ | (6 | ) | $ | (22,991 | ) | $ | 0 | $ | (22,997 | ) | ||||||
Totals | $ | 1,104,519 | $ | 1,085,990 | $ | 0 | $ | 2,190,509 | ||||||||
(ii) There were assets and liabilities valued at $93,899 transferred from Level 2 to Level 1 during the period ended December 31, 2012.
| (1) | See note 3 in the Notes to Financial Statements for more information regarding pricing inputs and valuation techniques. |
| (l) | Fair Value of Financial Derivative Instruments (1) |
The following is a summary of the fair valuation of the Fund’s derivative instruments categorized by risk exposure:
Fair Values of Financial Derivative Instruments on the Consolidated Statements of Assets and Liabilities as of December 31, 2012:
| Derivatives not accounted for as hedging instruments | ||||||||||||||||||||||||
| Commodity Contracts | Credit Contracts | Equity Contracts | Foreign Exchange Contracts | Interest Rate Contracts | Total | |||||||||||||||||||
Assets: | ||||||||||||||||||||||||
Investments, at value (purchased options) | $ | 0 | $ | 0 | $ | 3,737 | $ | 0 | $ | 0 | $ | 3,737 | ||||||||||||
Unrealized appreciation on foreign currency contracts | 0 | 0 | 0 | 5,525 | 0 | 5,525 | ||||||||||||||||||
Unrealized appreciation on OTC swap agreements | 0 | 0 | 40 | 0 | 0 | 40 | ||||||||||||||||||
|
|
|
|
|
|
|
|
|
|
|
| |||||||||||||
| $ | 0 | $ | 0 | $ | 3,777 | $ | 5,525 | $ | 0 | $ | 9,302 | |||||||||||||
|
|
|
|
|
|
|
|
|
|
|
| |||||||||||||
Liabilities: | ||||||||||||||||||||||||
Written options outstanding | $ | 0 | $ | 0 | $ | 6 | $ | 0 | $ | 0 | $ | 6 | ||||||||||||
Unrealized depreciation on foreign currency contracts | 0 | 0 | 0 | 22,849 | 0 | 22,849 | ||||||||||||||||||
Unrealized depreciation on OTC swap agreements | 0 | 0 | 142 | 0 | 0 | 142 | ||||||||||||||||||
|
|
|
|
|
|
|
|
|
|
|
| |||||||||||||
| $ | 0 | $ | 0 | $ | 148 | $ | 22,849 | $ | 0 | $ | 22,997 | |||||||||||||
|
|
|
|
|
|
|
|
|
|
|
| |||||||||||||
The Effect of Financial Derivative Instruments on the Consolidated Statements of Operations for the Period Ended December 31, 2012:
| Derivatives not accounted for as hedging instruments | ||||||||||||||||||||||||
| Commodity Contracts | Credit Contracts | Equity Contracts | Foreign Exchange Contracts | Interest Rate Contracts | Total | |||||||||||||||||||
Realized Gain (Loss) on Derivatives: | ||||||||||||||||||||||||
Net realized (loss) on investments (purchased options) | $ | 0 | $ | 0 | $ | (7,485 | ) | $ | (90 | ) | $ | 0 | $ | (7,575 | ) | |||||||||
Net realized gain on written options | 0 | 0 | 4,429 | 0 | 0 | 4,429 | ||||||||||||||||||
Net realized gain on swaps | 0 | 0 | 461 | 0 | 0 | 461 | ||||||||||||||||||
Net realized (loss) on foreign currency transactions | 0 | 0 | 0 | (6,836 | ) | 0 | (6,836 | ) | ||||||||||||||||
|
|
|
|
|
|
|
|
|
|
|
| |||||||||||||
| $ | 0 | $ | 0 | $ | (2,595 | ) | $ | (6,926 | ) | $ | 0 | $ | (9,521 | ) | ||||||||||
|
|
|
|
|
|
|
|
|
|
|
| |||||||||||||
Net Change in Unrealized Appreciation (Depreciation) on Derivatives: | ||||||||||||||||||||||||
Net change in unrealized appreciation on investments (purchased options) | $ | 0 | $ | 0 | $ | 4,334 | $ | 78 | $ | 0 | $ | 4,412 | ||||||||||||
Net change in unrealized (depreciation) on written options | 0 | 0 | (3,594 | ) | 0 | 0 | (3,594 | ) | ||||||||||||||||
Net change in unrealized (depreciation) on swaps | 0 | 0 | (406 | ) | 0 | 0 | (406 | ) | ||||||||||||||||
Net change in unrealized (depreciation) on translation of assets and liabilities denominated in foreign currencies | 0 | 0 | 0 | (19,375 | ) | 0 | (19,375 | ) | ||||||||||||||||
|
|
|
|
|
|
|
|
|
|
|
| |||||||||||||
| $ | 0 | $ | 0 | $ | 334 | $ | (19,297 | ) | $ | 0 | $ | (18,963 | ) | |||||||||||
|
|
|
|
|
|
|
|
|
|
|
| |||||||||||||
| (1) | See note 6 in the Notes to Financial Statements for additional information. |
| See Accompanying Notes | SEMIANNUAL REPORT | DECEMBER 31, 2012 | 75 |
Table of Contents
Consolidated Schedule of Investments PIMCO EqS Pathfinder Fund® (Cont.)
December 31, 2012 (Unaudited)
| (m) | Collateral (Received)/Pledged for OTC Financial Derivative Instruments |
The following is a summary by counterparty of the market value of OTC financial derivative instruments and collateral (received)/pledged as of December 31, 2012:
Counterparty | Total Market Value of OTC Derivatives | Collateral (Received)/Pledged | Net Exposures (1) | Total Market Value of OTC Derivatives | Collateral (Received)/Pledged | Net Exposures (1) | ||||||||||||||||||||||
| PIMCO EqS Pathfinder Fund® | PIMCO Cayman Commodity Fund VI, Ltd. (Subsidiary) | |||||||||||||||||||||||||||
BPS | $ | (11,251 | ) | $ | 9,847 | $ | (1,404 | ) | $ | 0 | $ | 0 | $ | 0 | ||||||||||||||
BRC | (450 | ) | 330 | (120 | ) | 0 | 0 | 0 | ||||||||||||||||||||
CBK | (168 | ) | 0 | (168 | ) | 0 | 0 | 0 | ||||||||||||||||||||
DUB | (1,109 | ) | 1,049 | (60 | ) | 0 | 0 | 0 | ||||||||||||||||||||
FBF | 216 | 0 | 216 | 0 | 0 | 0 | ||||||||||||||||||||||
GLM | (3,122 | ) | 2,567 | (555 | ) | 0 | 0 | 0 | ||||||||||||||||||||
GST | (138 | ) | (290 | ) | (428 | ) | 0 | 0 | 0 | |||||||||||||||||||
HUS | (82 | ) | 80 | (2 | ) | 0 | 0 | 0 | ||||||||||||||||||||
JPM | (712 | ) | 929 | 217 | 0 | 0 | 0 | |||||||||||||||||||||
MSC | (90 | ) | (195 | ) | (285 | ) | 0 | 0 | 0 | |||||||||||||||||||
MYI | 36 | (70 | ) | (34 | ) | 0 | 0 | 0 | ||||||||||||||||||||
RBC | 26 | 0 | 26 | 0 | 0 | 0 | ||||||||||||||||||||||
RYL | 97 | 0 | 97 | 0 | 0 | 0 | ||||||||||||||||||||||
UAG | (678 | ) | 739 | 61 | 0 | 0 | 0 | |||||||||||||||||||||
| (1) | Net Exposure represents the net receivable/(payable) that would be due from/to the counterparty in the event of default. Exposure from OTC derivatives can only be netted across transactions governed under the same Master Agreement with the same legal entity. The Fund and Subsidiary are recognized as two separate legal entities. As such, exposure cannot be netted. See note 7, Principal Risks, in the Notes to Financial Statements for more information regarding credit and counterparty risks. |
| 76 | PIMCO EQUITY SERIES | See Accompanying Notes |
Table of Contents
December 31, 2012 (Unaudited)
1. ORGANIZATION
PIMCO Equity Series (the “Trust”) was established as a Delaware statutory trust on December 28, 2009. The Trust is registered under the Investment Company Act of 1940, as amended (the “Act”), as an open-end management investment company (“Mutual Fund”). Information presented in these financial statements pertains to the Institutional Class, Class P, Administrative Class, Class D, Class A, Class C and Class R shares of the six funds (each a “Fund” and collectively the “Funds”) offered by the Trust.
2. SIGNIFICANT ACCOUNTING POLICIES
The following is a summary of significant accounting policies consistently followed by the Trust in the preparation of its financial statements in conformity with accounting principles generally accepted in the United States of America (“U.S. GAAP”). The preparation of financial statements in accordance with U.S. GAAP requires management to make estimates and assumptions that affect the reported amounts of assets and liabilities and disclosure of contingent assets and liabilities at the date of the financial statements and the reported amounts of increases and decreases in net assets from operations during the reporting period. Actual results could differ from those estimates.
(a) Securities Transactions and Investment Income Securities transactions are recorded as of the trade date for financial reporting purposes. Realized gains and losses from securities sold are recorded on the identified cost basis. Dividend income is recorded on the ex-dividend date, except certain dividends from foreign securities where the ex-dividend date may have passed, which are recorded as soon as the Fund is informed of the ex-dividend date. Interest income, adjusted for the accretion of discounts and amortization of premiums, is recorded on the accrual basis from settlement date. Estimated tax liabilities on certain foreign securities are recorded on an accrual basis and are reflected as components of interest income or net change in unrealized gain/loss on investments on the Statements of Operations, as appropriate. Tax liabilities realized as a result of such security sales are reflected as a component of net realized gain/loss on investments on the Statements of Operations.
Debt obligations may be placed on non-accrual status and related interest income may be reduced by ceasing current accruals and writing off interest receivable when the collection of all or a portion of interest has become doubtful based on consistently applied procedures. A debt obligation is removed from non-accrual status when the issuer resumes interest payments or when collectability of interest is reasonably assured.
(b) Foreign Currency Translation The functional and reporting currency for the Funds is the U.S. dollar. Portfolio securities and other
assets and liabilities denominated in foreign currencies are translated into U.S. dollars based on the exchange rate of such currencies against U.S. dollars on the date of valuation. Purchases and sales of securities, income and expense items denominated in foreign currencies are translated into U.S. dollars at the exchange rate in effect on the transaction date.
A Fund does not separately report the effect of changes in foreign exchange rates from changes in market prices on securities held. Such changes are included in net realized and unrealized gain or loss from investments on the Statements of Operations.
Realized foreign exchange gains or losses arise from sales of foreign currencies, currency gains or losses realized between the trade and settlement dates on securities transactions and the difference between the recorded amounts of dividend, interest, and foreign withholding taxes and the U.S. dollar equivalent of the amounts actually received or paid. Net unrealized foreign exchange gains and losses arise from changes in foreign exchange rates on foreign denominated assets and liabilities other than investments in securities held at the end of the reporting period.
(c) Multiclass Operations Each class offered by the Trust has equal rights as to assets and voting privileges (except that shareholders of a class have exclusive voting rights regarding any matter relating solely to that class of shares). Income and non-class specific expenses are allocated daily to each class on the basis of the relative net assets. Realized and unrealized capital gains and losses are allocated daily based on the relative net assets of each class of the respective Fund. Class specific expenses, where applicable, currently include supervisory and administrative and distribution and servicing fees.
(d) Dividends and Distributions to Shareholders Dividends from net investment income, if any, of each Fund, except the PIMCO Dividend and Income Builder Fund and PIMCO EqS® Dividend Fund, are declared and distributed to shareholders annually. Dividends from net investment income, if any, of the PIMCO Dividend and Income Builder Fund and PIMCO EqS® Dividend Fund are declared daily and distributed to shareholders quarterly. Net realized capital gains earned by each Fund, if any, will be distributed no less frequently than once each year.
Income dividends and capital gain distributions are determined in accordance with income tax regulations which may differ from U.S. GAAP. Differences between tax regulations and U.S. GAAP may change the fiscal year when income and capital items are recognized for tax and U.S. GAAP purposes. Examples of events that give rise to timing differences include wash sales, straddles and capital loss carryforwards. Further, the character of investment income and capital gains may be different for certain transactions under the two methods of accounting.
| SEMIANNUAL REPORT | DECEMBER 31, 2012 | 77 |
Table of Contents
Notes to Financial Statements (Cont.)
Examples of characterization differences include the treatment of swaps, foreign currency transactions and investments in passive foreign investment companies. As a result, income dividends and capital gain distributions declared during a fiscal period may differ significantly from the net investment income and realized gains reported on each Fund’s annual financial statements presented under U.S. GAAP.
Distributions classified as a tax basis return of capital, if any, are reflected on the accompanying Statements of Changes in Net Assets and have been recorded to paid in capital. In addition, other amounts have been reclassified between undistributed net investment income, accumulated undistributed net realized gains or losses and/or paid in capital to more appropriately conform financial accounting to tax characterizations of dividend distributions.
(e) Statement of Cash Flows U.S. GAAP requires entities providing financial statements that report both a financial position and results of operations to also provide a statement of cash flows for each period for which results of operations are provided, but exempts investment companies meeting certain conditions. One of the conditions is that the enterprise had little or no debt, based on the average debt outstanding during the period, in relation to average total assets. Funds with certain degrees of borrowing activity, typically through the use of short sale transactions, have been determined to be at a level requiring a Statement of Cash Flows. Statements of Cash Flows have been prepared using the indirect method which requires net assets to be adjusted to reconcile to net cash flows from operating activities.
(f) New Accounting Pronouncements In April 2011, the Financial Accounting Standards Board (“FASB”) issued an Accounting Standards Update (“ASU”) related to the accounting for repurchase agreements and similar agreements that both entitle and obligate a transferor to repurchase or redeem financial assets before their maturity. The ASU modifies the criteria for determining effective control of transferred assets. Effective July 1, 2012, the Funds began accounting for the sale and simultaneous repurchase of certain securities (“sale-buybacks”) as financing transactions. These transactions were previously accounted for as purchases and sales. As such, the Funds may have recorded additional interest expense.
In May 2011, the FASB issued an ASU to develop common requirements for measuring fair value and for disclosing information about fair value measurements in accordance with U.S. GAAP and International Financial Reporting Standards (“IFRS”). The FASB concluded that the amendments in this ASU will improve the comparability of fair value measurements presented and disclosed in financial statements prepared in accordance with U.S. GAAP and IFRS. The financial statements have been modified to provide enhanced quantitative and qualitative disclosures surrounding fair value
measurements. See Fair Value Measurements in the Notes to Schedules of Investments and Note 3 in the Notes to Financial Statements for additional details.
In December 2011, the FASB issued an ASU to enhance disclosures about financial instruments and derivative instruments that are subject to offsetting (“netting”) on the Statements of Assets and Liabilities. This information will enable users of the entity’s financial statements to evaluate the effect or potential effect of netting arrangements on the entity’s financial position. The ASU is effective prospectively during interim or annual periods beginning on or after January 1, 2013. At this time, management is evaluating the implications of these changes on the financial statements.
3. INVESTMENT VALUATION AND FAIR VALUE MEASUREMENTS
(a) Investment Valuation Policies The Net Asset Value (“NAV”) of a Fund’s shares is valued as of the close of regular trading (normally 4:00 p.m., Eastern time) (the “NYSE Close”) on each day that the New York Stock Exchange (“NYSE”) is open (each a “Business Day”). Information that becomes known to a Fund or its agents after the NAV has been calculated on a particular day will not generally be used to retroactively adjust the price of a security or the NAV determined earlier that day.
For purposes of calculating the NAV, portfolio securities and other financial derivative instruments are valued on each Business Day using valuation methods as adopted by the Board of Trustees (the “Board”) of the Trust. Where market quotes are readily available, fair market value is generally determined on the basis of last reported sales prices, or if no sales are reported, based on quotes obtained from a quotation reporting system, established market makers, or pricing services. Where market quotes are not readily available, portfolio securities and other financial derivative instruments are valued at fair value, as determined in good faith by the Board, its Valuation Committee, or the investment adviser (the “Adviser”) pursuant to instructions from the Board or its Valuation Committee.
Market quotes are considered not readily available in circumstances where there is an absence of current or reliable market-based data (e.g., trade information, bid/ask information, or broker quotes), including where events occur after the close of the relevant market, but prior to the NYSE Close, that materially affect the values of a Fund’s securities or financial derivative instruments. In addition, market quotes are considered not readily available when, due to extraordinary circumstances, the exchanges or markets on which securities trade do not open for trading for the entire day and no other market prices are available. The Board has delegated to the Adviser, Pacific Investment Management Company LLC (“PIMCO”), the responsibility for
| 78 | PIMCO EQUITY SERIES |
Table of Contents
December 31, 2012 (Unaudited)
monitoring significant events that may materially affect the values of a Fund’s securities or financial derivative instruments and for determining whether the value of the applicable securities or financial derivative instruments should be re-evaluated in light of such significant events.
The Board has adopted methods for valuing securities and other financial derivative instruments in circumstances where market quotes are not readily available, and has delegated the responsibility for applying the valuation methods to PIMCO. The Valuation Committee has been established by the Board to oversee the implementation of a Fund’s valuation methods and to make fair value determinations on behalf of the Board as instructed. The Board has adopted methods for valuing securities and other financial derivative instruments that may require fair valuation under particular circumstances. The Adviser monitors the continual appropriateness of methods applied and determines if adjustments should be made in light of market changes, events affecting the issuer, or other factors. If the Adviser determines that a valuation method may no longer be appropriate, another valuation method may be selected, or the Valuation Committee will take any appropriate action in accordance with procedures set forth by the Board. The Board shall review the appropriateness of the valuation methods from time to time and these methods may be amended or supplemented from time to time by the Valuation Committee.
For instances in which daily market quotes are not readily available, investments may be valued, pursuant to guidelines established by the Board, with reference to other securities or indices. In the event that the security or asset cannot be valued pursuant to the established guidelines, the value of the security or asset will be determined in good faith by the Valuation Committee of the Board, generally based upon recommendations provided by PIMCO. These methods may require subjective determinations about the value of a security. While the Trust’s policy is intended to result in a calculation of a Fund’s NAV that fairly reflects security values as of the time of pricing, the Trust cannot guarantee that values determined by the Board or persons acting at their direction would accurately reflect the price that a Fund could obtain for a security if it were to dispose of that security as of the time of pricing (for instance, in a forced or distressed sale). The prices used by a Fund may differ from the value that would be realized if the securities were sold.
(b) Fair Value Hierarchy U.S. GAAP defines fair market value as the price that a Fund would receive to sell an asset or pay to transfer a liability in an orderly transaction between market participants at the measurement date. It establishes a fair value hierarchy that prioritizes inputs to valuation methods and requires disclosure of the fair value hierarchy, separately for each major category of assets and liabilities, that segregates fair value measurements into levels (Level 1, 2, and 3). The inputs or methodology used for valuing securities are not necessarily an
indication of the risk associated with investing in those securities. Levels 1, 2, and 3 of the fair value hierarchy are defined as follows:
| n | Level 1—Inputs using (unadjusted) quoted prices in active markets or exchanges for identical assets and liabilities. |
| n | Level 2—Significant other observable inputs, which may include, but are not limited to, quoted prices for similar assets or liabilities in markets that are active, quoted prices for identical or similar assets or liabilities in markets that are not active, inputs other than quoted prices that are observable for the assets or liabilities (such as interest rates, yield curves, volatilities, prepayment speeds, loss severities, credit risks and default rates) or other market corroborated inputs. |
| n | Level 3—Significant unobservable inputs based on the best information available in the circumstances, to the extent observable inputs are not available, which may include assumptions made by the Board or persons acting at their direction that are used in determining the fair value of investments. |
Assets categorized as Level 1 or 2 as of period end may have been transferred between Levels 1 and 2 since the prior period due to changes in the valuation method utilized in valuing the investments. Transfers from Level 1 to Level 2 are typically a result of a change, in the normal course of business, from the use of the trade price on the initial purchase date (Level 1) to valuation methods used by third-party pricing services (Level 2). Transfers from Level 2 to Level 1 are typically a result of exchange traded products for which quoted prices from an active market were not available (Level 2) and have become available (Level 1). Assets or liabilities categorized as Level 2 or 3 as of period end may have been transferred between Levels 2 and 3 since the prior period due to changes in the valuation method utilized in valuing the investments. Transfers from Level 2 to Level 3 are typically as a result of a change, in the normal course of business, from the use of valuation methods used by third party pricing services (Level 2) to the use of a broker quote or valuation technique which utilizes significant unobservable inputs due to an absence of current or reliable market-based data. Transfers out of Level 3 to Level 2 are typically as a result of the availability of current and reliable market-based data provided by third party pricing services or other valuation techniques which utilize significant observable inputs. In accordance with the requirements of U.S. GAAP, the amounts of such transfers between Levels 1 and 2 and transfers in and out of Level 3, if any, are disclosed in the Notes to Schedule of Investments for each respective Fund.
For fair valuations using significant unobservable inputs, U.S. GAAP requires a reconciliation of the beginning to ending balances for reported fair values that presents changes attributable to total realized and unrealized gains or losses, purchases and sales, and transfers in or out of the Level 3 category during the period. The end of period timing
| SEMIANNUAL REPORT | DECEMBER 31, 2012 | 79 |
Table of Contents
Notes to Financial Statements (Cont.)
recognition is used for the transfers between Levels of the Fund’s assets and liabilities. Additionally, U.S. GAAP requires quantitative information regarding the significant unobservable inputs used in the determination of fair value of assets categorized as Level 3 in the fair value hierarchy. In accordance with the requirements of U.S. GAAP, a fair value hierarchy, Level 3 reconciliation, and details of significant unobservable inputs, if any, have been included in the Notes to Schedule of Investments for each respective Fund.
(c) Valuation Techniques and the Fair Value Hierarchy Level 1 and Level 2 trading assets and trading liabilities, at fair market value The valuation methods (or “techniques”) and significant inputs used in determining the fair market values of portfolio securities or financial derivative instruments categorized as Level 1 and Level 2 of the fair value hierarchy are as follows:
Fixed income securities including corporate, convertible and municipal bonds and notes, U.S. government agencies, U.S. treasury obligations, sovereign issues, bank loans, convertible preferred securities and non-U.S. bonds are normally valued by pricing service providers that use broker-dealer quotations, reported trades or valuation estimates from their internal pricing models. The service providers’ internal models use inputs that are observable such as issuer details, interest rates, yield curves, prepayment speeds, credit risks/spreads, default rates and quoted prices for similar assets. Securities that use similar valuation techniques and inputs as described above are categorized as Level 2 of the fair value hierarchy.
Fixed income securities purchased on a delayed-delivery basis or as a repurchase commitment in a sale-buyback transaction are marked to market daily until settlement at the forward settlement date and are categorized as Level 2 of the fair value hierarchy.
Mortgage-related and asset-backed securities are usually issued as separate tranches, or classes, of securities within each deal. These securities are also normally valued by pricing service providers that use broker-dealer quotations or valuation estimates from their internal pricing models. The pricing models for these securities usually consider tranche-level attributes, current market data, estimated cash flows and market-based yield spreads for each tranche, and incorporate deal collateral performance, as available. Mortgage-related and asset-backed securities that use similar valuation techniques and inputs as described above are categorized as Level 2 of the fair value hierarchy.
Common stocks, exchange-traded funds and financial derivative instruments, such as futures contracts or options contracts that are traded on a national securities exchange, are stated at the last reported sale or settlement price on the day of valuation. To the extent these securities are actively traded and valuation adjustments are not applied, they are categorized as Level 1 of the fair value hierarchy.
Investments initially valued in currencies other than the U.S. dollar are converted to the U.S. dollar using exchange rates obtained from pricing service providers. As a result, the NAV of a Fund’s shares may be affected by changes in the value of currencies in relation to the U.S. dollar. The value of securities traded in markets outside the United States or denominated in currencies other than the U.S. dollar may be affected significantly on a day that the NYSE is closed and the NAV may change on days when an investor is not able to purchase, redeem or exchange shares. Valuation adjustments may be applied to certain securities that are solely traded on a foreign exchange to account for the market movement between the close of the foreign market and the NYSE Close. These securities are valued using pricing service providers that consider the correlation of the trading patterns of the foreign security to the intraday trading in the U.S. markets for investments. Securities using these valuation adjustments are categorized as Level 2 of the fair value hierarchy. Preferred securities and other equities traded on inactive markets or valued by reference to similar instruments are also categorized as Level 2 of the fair value hierarchy.
Equity-linked securities are valued by referencing the last reported sale or settlement price of the linked referenced equity on the day of valuation. Foreign exchange adjustments are applied to the last reported price to convert the linked equity’s trading currency to the contract’s settling currency. These investments are categorized as Level 2 of the fair value hierarchy.
Physical commodities such as gold derive their value from the underlying asset’s price of which the commodity is delivered against. The asset is typically a future contract or similar instrument which is agreed upon between the Investment Manager and trading counterparty and is detailed in the trade agreement. Physical commodities that use similar valuation techniques and inputs as described above are categorized as Level 2 of the fair value hierarchy.
Investments in registered open-end investment management companies will be valued based upon the NAVs of such investments and are categorized as Level 1 of the fair value hierarchy. Investments in unregistered open-end management investment companies will be calculated based upon the NAVs of such investments and are considered Level 1 provided that the NAVs are observable, calculated daily and are the value at which both purchases and sales will be conducted. Investments in privately held investment funds with significant restrictions on redemptions where the inputs of NAVs are observable will be valued based upon the NAVs of such investments and are categorized as Level 2 of the fair value hierarchy.
Short-term investments having a maturity of 60 days or less are generally valued at amortized cost which approximates fair market value. These investments are categorized as Level 2 of the fair value hierarchy.
| 80 | PIMCO EQUITY SERIES |
Table of Contents
December 31, 2012 (Unaudited)
Over-the-counter financial derivative instruments, such as foreign currency contracts, options contracts, or swap agreements, derive their value from underlying asset prices, indices, reference rates, and other inputs or a combination of these factors. These contracts are normally valued on the basis of broker dealer quotations or by pricing service providers. Depending on the product and the terms of the transaction, the value of financial derivative instruments can be estimated by a pricing service provider using a series of techniques, including simulation pricing models. The pricing models use inputs that are observed from actively quoted markets such as issuer details, indices, spreads, interest rates, yield curves, dividends and exchange rates. Financial derivative instruments that use similar valuation techniques and inputs as described above are categorized as Level 2 of the fair value hierarchy.
Centrally cleared swaps listed or traded on a multilateral or trade facility platform, such as a registered exchange, are valued at the daily settlement price determined by the respective exchange. For centrally cleared credit default swaps the clearing facility requires its members to provide actionable levels across complete term structures. These levels along with external third party prices are used to produce daily settlement prices. These securities are categorized as Level 2 of the fair value hierarchy. Centrally cleared interest rate swaps are valued using a pricing model that references the underlying rates including the overnight index swap rate and London Interbank Offered Rate (“LIBOR”) forward rate to produce the daily settlement price. These securities are categorized as Level 2 of the fair value hierarchy.
Level 3 trading assets and trading liabilities, at fair value When a fair valuation method is applied by PIMCO that uses significant unobservable inputs, securities will be priced by a method that the Board or persons acting at their direction believe accurately reflects fair value and are categorized as Level 3 of the fair value hierarchy. The valuation techniques and significant inputs used in determining the fair values of portfolio assets and financial derivative instruments categorized as Level 3 of the fair value hierarchy are as follows:
Investments in privately held investment funds with significant restrictions on redemptions where the inputs of the NAVs are unobservable will be calculated based upon the NAVs of such investments and are categorized as Level 3 of the fair value hierarchy.
If third party evaluated vendor pricing is neither available nor deemed to be indicative of fair value, the Adviser may elect to obtain indicative market quotations (“broker quotes”) directly from the broker-dealer or passed through from a third party vendor. In the event that the source of fair value is from a single sourced broker quote, these securities are categorized as Level 3 of the fair value hierarchy. Indicative market quotations are typically received from established market participants. Although independently received, the Adviser does not have the
transparency to view the underlying inputs which support the market quotation. Significant changes in the broker quote would have direct and proportional changes in the fair value of the security.
4. SECURITIES AND OTHER INVESTMENTS
(a) Exchange-Traded Funds The Funds may invest in exchange-traded funds (“ETFs”), which generally are index-based investment companies that hold substantially all of their assets in securities representing their specific index. Shares of ETFs trade throughout the day on an exchange and represent an investment in a portfolio of securities and assets. As a shareholder of another investment company, the Funds would bear their pro rata portion of the other investment company’s expenses, including advisory fees, in addition to the expenses the Funds bear directly in connection with their own operations.
(b) Mortgage-Related and Other Asset-Backed Securities Certain Funds may invest in mortgage-related and other asset-backed securities. These securities include mortgage pass-through securities, collateralized mortgage obligations, commercial mortgage-backed securities, stripped mortgage-backed securities, asset-backed securities, collateralized debt obligations and other securities that directly or indirectly represent a participation in, or are secured by and payable from, mortgage loans on real property. Mortgage-related and other asset-backed securities are interests in pools of loans or other receivables. Mortgage-related securities are created from pools of residential or commercial mortgage loans, including mortgage loans made by savings and loan institutions, mortgage bankers, commercial banks and others. Asset-backed securities are created from many types of assets, including auto loans, credit card receivables, home equity loans, and student loans. These securities provide a monthly payment which consists of both interest and principal payments. Interest payments may be determined by fixed or adjustable rates. The rate of prepayments on underlying mortgages will affect the price and volatility of a mortgage-related security, and may have the effect of shortening or extending the effective duration of the security relative to what was anticipated at the time of purchase. The timely payment of principal and interest of certain mortgage-related securities is guaranteed with the full faith and credit of the U.S. Government. Pools created and guaranteed by non-governmental issuers, including government-sponsored corporations, may be supported by various forms of insurance or guarantees, but there can be no assurance that the private insurers or guarantors can meet their obligations under the insurance policies or guarantee arrangements.
Collateralized Mortgage Obligations (“CMOs”) are debt obligations of a legal entity that are collateralized by mortgages and divided into classes. CMOs are structured into multiple classes, often referred to as “tranches,” with each class bearing a different stated maturity and entitled to a different schedule for payments of principal and interest, including prepayments. Commercial Mortgage-Backed Securities
| SEMIANNUAL REPORT | DECEMBER 31, 2012 | 81 |
Table of Contents
Notes to Financial Statements (Cont.)
(“CMBS”) include securities that reflect an interest in, and are secured by, mortgage loans on commercial real property. Many of the risks of investing in CMBS reflect the risks of investing in the real estate securing the underlying mortgage loans. These risks reflect the effects of local and other economic conditions on real estate markets, the ability of tenants to make loan payments, and the ability of a property to attract and retain tenants. CMOs and CMBS may be less liquid and may exhibit greater price volatility than other types of mortgage-related or asset-backed securities.
(c) U.S. Government Agencies or Government-Sponsored Enterprises Certain Funds may invest in securities of U.S. Government agencies or government-sponsored enterprises. U.S. Government securities are obligations of and, in certain cases, guaranteed by, the U.S. Government, its agencies or instrumentalities. Some U.S. Government securities, such as Treasury bills, notes and bonds, and securities guaranteed by the Government National Mortgage Association (“GNMA” or “Ginnie Mae”), are supported by the full faith and credit of the U.S. Government; others, such as those of the Federal Home Loan Banks, are supported by the right of the issuer to borrow from the U.S. Department of the Treasury (the “U.S. Treasury”); others, such as those of the Federal National Mortgage Association (“FNMA” or “Fannie Mae”), are supported by the discretionary authority of the U.S. Government to purchase the agency’s obligations. U.S. Government securities may include zero coupon securities, which do not distribute interest on a current basis and tend to be subject to greater risk than interest-paying securities of similar maturities.
5. BORROWINGS AND OTHER FINANCING TRANSACTIONS
The following disclosures contain information on a Fund’s ability to lend or borrow cash or securities to the extent permitted under the Act, which may be viewed as borrowing or financing transactions by a Fund. The location and fair value amounts of these instruments are described below. For a detailed description of credit and counterparty risks that can be associated with borrowings and other financing transactions, please see Note 7, Principal Risks.
(a) Repurchase Agreements Each Fund may engage in repurchase agreements. Under the terms of a typical repurchase agreement, a Fund takes possession of an underlying debt obligation (collateral) subject to an obligation of the seller to repurchase, and a Fund to resell, the obligation at an agreed-upon price and time. The underlying securities for all repurchase agreements are held in safekeeping at the Fund’s custodian or designated subcustodians under tri-party repurchase agreements. The market value of the collateral must be equal to or exceed the total amount of the repurchase obligations, including interest. Securities purchased under repurchase agreements are reflected as an asset on the Statements of Assets and Liabilities.
Interest earned is recorded as a component of interest income on the Statements of Operations. In periods of increased demand for collateral, a Fund may pay a fee for receipt of collateral, which may result in interest expense to the Fund.
(b) Short Sales Certain Funds may enter into short sales transactions. Short sales are transactions in which a Fund sells a security that it may not own. A Fund may make short sales of securities to (i) offset potential declines in long positions in similar securities, (ii) to increase the flexibility of the Fund, (iii) for investment return, (iv) as part of a risk arbitrage strategy, and (v) as part of its overall portfolio management strategies involving the use of derivative instruments. When a Fund engages in a short sale, it may borrow the security sold short and deliver it to the counterparty. A Fund will ordinarily have to pay a fee or premium to borrow a security and be obligated to repay the lender of the security any dividend or interest that accrues on the security during the period of the loan. Securities sold in short sale transactions and the dividend or interest payable on such securities, if any, are reflected as payable for short sales on the Statements of Assets and Liabilities. Short sales expose a Fund to the risk that it will be required to cover its short position at a time when the security or other asset has appreciated in value, thus resulting in losses to the Fund. A short sale is “against the box” if a Fund holds in its portfolio or has the right to acquire the security sold short at no additional cost. A Fund will be subject to additional risks to the extent that it engages in short sales that are not “against the box.” A Fund’s loss on a short sale could theoretically be unlimited in cases where the Fund is unable, for whatever reason, to close out its short position.
6. FINANCIAL DERIVATIVE INSTRUMENTS
The following disclosures contain information on how and why the Funds use financial derivative instruments, the credit-risk-related contingent features in certain financial derivative instruments, and how financial derivative instruments affect the Funds’ financial position, results of operations and cash flows. The location and fair value amounts of these instruments on the Statements of Assets and Liabilities and the realized and changes in unrealized gains and losses on the Statements of Operations, each categorized by type of financial derivative contract and related risk exposure, are included in a table in the Notes to Schedules of Investments. The financial derivative instruments outstanding as of period end as disclosed in the Notes to Schedules of Investments and the amounts of realized and changes in unrealized gains and losses on financial derivative instruments during the period as disclosed on the Statements of Operations serve as indicators of the volume of financial derivative activity for the Funds.
(a) Foreign Currency Contracts Certain Funds may enter into foreign currency contracts in connection with settling planned purchases or sales of securities, to hedge the currency exposure associated with
| 82 | PIMCO EQUITY SERIES |
Table of Contents
December 31, 2012 (Unaudited)
some or all of a Fund’s securities or as a part of an investment strategy. A foreign currency contract is an agreement between two parties to buy and sell a currency at a set price on a future date. The market value of a foreign currency contract fluctuates with changes in foreign currency exchange rates. Foreign currency contracts are marked to market daily and the change in value is recorded by a Fund as an unrealized gain or loss. Realized gains or losses equal to the difference between the value of the contract at the time it was opened and the value at the time it was closed are recorded upon delivery or receipt of the currency. These contracts may involve market risk in excess of the unrealized gain or loss reflected on the Statements of Assets and Liabilities. In addition, a Fund could be exposed to risk if the counterparties are unable to meet the terms of the contracts or if the value of the currency changes unfavorably to the U.S. dollar. In connection with these contracts, securities may be identified as collateral in accordance with the terms of the respective contracts.
(b) Futures Contracts Certain Funds may enter into futures contracts. A Fund may use futures contracts to manage its exposure to the securities markets or to movements in interest rates and currency values. The primary risks associated with the use of futures contracts are the imperfect correlation between the change in market value of the securities held by a Fund and the prices of futures contracts and the possibility of an illiquid market. Futures contracts are valued based upon their quoted daily settlement prices. Upon entering into a futures contract, a Fund is required to deposit with its futures broker, an amount of cash, or U.S. Government and Agency Obligations, or select sovereign debt, in accordance with the initial margin requirements of the broker or exchange. Futures contracts are marked to market daily and an appropriate payable or receivable for the change in value (“variation margin”) is recorded by the Fund. Gains or losses are recognized but not considered realized until the contracts expire or are closed. Futures contracts involve, to varying degrees, risk of loss in excess of the variation margin disclosed on the Statements of Assets and Liabilities.
(c) Options Contracts Certain Funds may write call and put options on securities and financial derivative instruments they own or in which they may invest. Writing put options tends to increase a Fund’s exposure to the underlying instrument. Writing call options tends to decrease a Fund’s exposure to the underlying instrument. When a Fund writes a call or put, an amount equal to the premium received is recorded as a liability and subsequently marked to market to reflect the current value of the option written. These liabilities are reflected as written options outstanding on the Statements of Assets and Liabilities. Premiums received from writing options which expire are treated as realized gains. Premiums received from writing options which are exercised or closed are added to the proceeds or offset against amounts paid on the underlying futures, swap, security or currency
transaction to determine the realized gain or loss. Certain options may be written with premiums to be determined on a future date. The premiums for these options are based upon implied volatility parameters at specified terms. A Fund as a writer of an option has no control over whether the underlying instrument may be sold (call) or purchased (put) and as a result bears the market risk of an unfavorable change in the price of the instrument underlying the written option. There is the risk a Fund may not be able to enter into a closing transaction because of an illiquid market.
Certain Funds may also purchase put and call options. Purchasing call options tends to increase a Fund’s exposure to the underlying instrument. Purchasing put options tends to decrease a Fund’s exposure to the underlying instrument. A Fund pays a premium which is included on the Fund’s Statement of Assets and Liabilities as an investment and subsequently marked to market to reflect the current value of the option. Premiums paid for purchasing options which expire are treated as realized losses. Certain options may be purchased with premiums to be determined on a future date. The premiums for these options are based upon implied volatility parameters at specified terms. The risk associated with purchasing put and call options is limited to the premium paid. Premiums paid for purchasing options which are exercised or closed are added to the amounts paid or offset against the proceeds on the underlying investment transaction to determine the realized gain or loss when the underlying transaction is sold.
Foreign Currency Options Certain Funds may write or purchase foreign currency options. Purchasing foreign currency options gives a Fund the right, but not the obligation to buy or sell the currency and will specify the amount of currency and a rate of exchange that may be exercised by a specified date. These options may be used as a short or long hedge against possible variations in foreign exchange rates or to gain exposure to foreign currencies.
Options on Securities Certain Funds may write or purchase options on securities (“Equity Option”). An Equity Option uses a specified equity security as the underlying instrument for the option contract. A Fund may write or purchase options to enhance returns for a Fund or to hedge an existing position or future investment.
Options on Exchange-Traded Funds Certain Funds may write or purchase options on exchange-traded funds (“ETF Option”). An ETF Option uses a specified exchange-traded fund as the underlying instrument for the option contract. A Fund may write or purchase options to enhance returns or to hedge an existing position or future investment.
(d) Swap Agreements Certain Funds may invest in swap agreements. Swap agreements are bilaterally negotiated agreements between a Fund and a counterparty to exchange or swap investment cash flows,
| SEMIANNUAL REPORT | DECEMBER 31, 2012 | 83 |
Table of Contents
Notes to Financial Statements (Cont.)
assets, foreign currencies or market-linked returns at specified, future intervals. Swap agreements are privately negotiated in the over-the-counter market (“OTC swaps”) or may be executed in a multilateral or other trade facility platform, such as a registered exchange (“centrally cleared swaps”). A Fund may enter into asset, credit default, cross-currency, interest rate, total return, variance and other forms of swap agreements to manage its exposure to credit, currency, interest rate, commodity, equity and inflation risk. In connection with these agreements, securities or cash may be identified as collateral or margin in accordance with the terms of the respective swap agreements to provide assets of value and recourse in the event of default or bankruptcy/insolvency.
Swaps are marked to market daily based upon values from third party vendors, which may include a registered exchange, or quotations from market makers to the extent available. In the event that market quotes are not readily available and the swap cannot be valued pursuant to one of the valuation methods, the value of the swap will be determined in good faith by the Valuation Committee of the Board of Trustees, generally based upon recommendations provided by PIMCO. Changes in market value, if any, are reflected as a component of net changes in unrealized appreciation/(depreciation) on the Statements of Operations. Daily changes in valuation of centrally cleared swaps, if any, are recorded as a receivable or payable for the change in value as appropriate (“variation margin”) on the Statements of Assets and Liabilities. OTC swap payments received or made at the beginning of the measurement period are reflected as such on the Statements of Assets and Liabilities and represent premiums paid or received upon entering into the swap agreement to compensate for differences between the stated terms of the swap agreement and prevailing market conditions (credit spreads, currency exchange rates, interest rates, and other relevant factors). These upfront premiums are recorded as realized gains or losses on the Statements of Operations upon termination or maturity of the swap. A liquidation payment received or made at the termination of the swap is recorded as realized gain or loss on the Statements of Operations. Net periodic payments received or paid by a Fund are included as part of realized gains or losses on the Statements of Operations.
Entering into these agreements involves, to varying degrees, elements of interest, credit, market and documentation risk in excess of the amounts recognized on the Statements of Assets and Liabilities. Such risks involve the possibility that there will be no liquid market for these agreements, that the counterparty to the agreements may default on its obligation to perform or disagree as to the meaning of contractual terms in the agreements and that there may be unfavorable changes in interest rates.
A Fund’s maximum risk of loss from counterparty credit risk is the discounted net value of the cash flows to be received from the counterparty over the contract’s remaining life, to the extent that
amount is positive. The risk is mitigated by having a master netting arrangement between a Fund and the counterparty and by the posting of collateral to a Fund to cover a Fund’s exposure to the counterparty.
Credit Default Swap Agreements Credit default swap agreements involve one party making a stream of payments (referred to as the buyer of protection) to another party (the seller of protection) in exchange for the right to receive a specified return in the event of a default or other credit event for the referenced entity, obligation or index. As a seller of protection on credit default swap agreements, a Fund will generally receive from the buyer of protection a fixed rate of income throughout the term of the swap provided that there is no credit event. As the seller, a Fund would effectively add leverage to its portfolio because, in addition to its total net assets, a Fund would be subject to investment exposure on the notional amount of the swap.
If a Fund is a seller of protection and a credit event occurs, as defined under the terms of that particular swap agreement, a Fund will either (i) pay to the buyer of protection an amount equal to the notional amount of the swap and take delivery of the referenced obligation, other deliverable obligations or underlying securities comprising the referenced index or (ii) pay a net settlement amount in the form of cash or securities equal to the notional amount of the swap less the recovery value of the referenced obligation or underlying securities comprising the referenced index. If a Fund is a buyer of protection and a credit event occurs, as defined under the terms of that particular swap agreement, a Fund will either (i) receive from the seller of protection an amount equal to the notional amount of the swap and deliver the referenced obligation, other deliverable obligations or underlying securities comprising the referenced index or (ii) receive a net settlement amount in the form of cash or securities equal to the notional amount of the swap less the recovery value of the referenced obligation or underlying securities comprising the referenced index. Recovery values are estimated by market makers considering either industry standard recovery rates or entity specific factors and considerations until a credit event occurs. If a credit event has occurred, the recovery value is determined by a facilitated auction whereby a minimum number of allowable broker bids, together with a specified valuation method, are used to calculate the settlement value.
Credit default swap agreements on sovereign issues involve one party making a stream of payments to another party in exchange for the right to receive a specified return in the event of a default or other credit event. If a credit event occurs and cash settlement is not elected, a variety of other deliverable obligations may be delivered in lieu of the specific referenced obligation. The ability to deliver other obligations may result in a cheapest-to-deliver option (the buyer of protection’s right to choose the deliverable obligation with the lowest value following a credit event). A Fund may use credit default swaps on sovereign issues to provide a measure of protection against defaults of
| 84 | PIMCO EQUITY SERIES |
Table of Contents
December 31, 2012 (Unaudited)
the issuers (i.e., to reduce risk where a Fund owns or has exposure to the referenced obligation) or to take an active long or short position with respect to the likelihood of a particular issuer’s default.
Credit default swap agreements on credit indices involve one party making a stream of payments to another party in exchange for the right to receive a specified return in the event of a write-down, principal shortfall, interest shortfall or default of all or part of the referenced entities comprising the credit index. A credit index is a basket of credit instruments or exposures designed to be representative of some part of the credit market as a whole. These indices are made up of reference credits that are judged by a poll of dealers to be the most liquid entities in the credit default swap market based on the sector of the index. Components of the indices may include, but are not limited to, investment grade securities, high yield securities, asset-backed securities, emerging markets, and/or various credit ratings within each sector. Credit indices are traded using credit default swaps with standardized terms including a fixed spread and standard maturity dates. An index credit default swap references all the names in the index, and if there is a default, the credit event is settled based on that name’s weight in the index. The composition of the indices changes periodically, usually every six months, and for most indices, each name has an equal weight in the index. A Fund may use credit default swaps on credit indices to hedge a portfolio of credit default swaps or bonds, which is less expensive than it would be to buy many credit default swaps to achieve a similar effect. Credit default swaps on indices are benchmarks for protecting investors owning bonds against default, and traders use them to speculate on changes in credit quality.
Implied credit spreads, represented in absolute terms, utilized in determining the market value of credit default swap agreements on sovereign issues as of period end are disclosed in the Notes to Schedules of Investments and serve as an indicator of the current status of the payment/performance risk and represent the likelihood or risk of default for the credit derivative. The implied credit spread of a particular referenced entity reflects the cost of buying/selling protection and may include upfront payments required to be made to enter into the agreement. Wider credit spreads represent a deterioration of the referenced entity’s credit soundness and a greater likelihood or risk of default or other credit event occurring as defined under the terms of the agreement. For credit default swap agreements on asset-backed securities and credit indices, the quoted market prices and resulting values serve as the indicator of the current status of the payment/performance risk. Increasing market values, in absolute terms when compared to the notional amount of the swap, represent a deterioration of the referenced entity’s credit soundness and a greater likelihood or risk of default or other credit event occurring as defined under the terms of the agreement.
The maximum potential amount of future payments (undiscounted) that a Fund as a seller of protection could be required to make under a credit default swap agreement would be an amount equal to the notional amount of the agreement. Notional amounts of each individual credit default swap agreement outstanding as of December 31, 2012 for which a Fund is the seller of protection are disclosed in the Notes to Schedules of Investments. These potential amounts would be partially offset by any recovery values of the respective referenced obligations, upfront payments received upon entering into the agreement, or net amounts received from the settlement of buy protection credit default swap agreements entered into by a Fund for the same referenced entity or entities.
Total Return Swap Agreements Certain Funds may enter into total return swap agreements to gain or mitigate exposure of the underlying reference. Total return swap agreements involve commitments where cash flows are exchanged based on the price of an underlying reference and based on a fixed or variable rate. Total return swap agreements may involve commitments to pay interest in exchange for a market-linked return. One counterparty pays out the total return of a specific reference asset, which may include an underlying equity, index, or bond, and in return receives a fixed or variable rate. At the maturity date, a net cash flow is exchanged where the total return is equivalent to the return of the underlying reference less a financing rate, if any. As a receiver, a Fund would receive payments based on any positive total return and would owe payments in the event of a negative total return. As the payer, a Fund would owe payments on any net positive total return, and would receive payment in the event of a negative total return.
7. PRINCIPAL RISKS
In the normal course of business the Funds (or Underlying PIMCO Funds and/or Acquired Funds in the case of the mutual funds that pursue their investment objective by investing in other mutual funds (“PIMCO Fund of Funds”)) trade financial instruments and enter into financial transactions where risk of potential loss exists due to changes in the market (market risk), or failure or inability of the other party to a transaction to perform (credit and counterparty risk). See below for a detailed description of select principal risks. For a list of potential risks the Funds may be subject to, please see the Important Information About the Funds.
PIMCO Fund of Funds Because the PIMCO Fund of Funds invest substantially all of their respective assets in Underlying PIMCO Funds (or Acquired Funds), the risks associated with investing in the PIMCO Fund of Funds are closely related to the risks associated with the securities and other investments held by the Underlying PIMCO Funds (or Acquired Funds). The ability of the PIMCO Fund of Funds to achieve their respective investment objectives will depend upon the ability of
| SEMIANNUAL REPORT | DECEMBER 31, 2012 | 85 |
Table of Contents
Notes to Financial Statements (Cont.)
the Underlying PIMCO Funds (or Acquired Funds) to achieve their respective investment objectives. There can be no assurance that the investment objective of any Underlying PIMCO Fund (or Acquired Fund) will be achieved. The net asset value of a PIMCO Fund of Funds will fluctuate in response to changes in the respective net asset values of the Underlying PIMCO Funds (or Acquired Funds) in which it invests. The extent to which the investment performance and risks associated with the PIMCO Fund of Funds correlate to those of a particular Underlying PIMCO Fund (or Acquired Fund) will depend upon the extent to which the assets of the PIMCO Fund of Funds are allocated from time to time for investment in the Underlying PIMCO Funds (or Acquired Funds), which will vary.
Investing in Underlying PIMCO Funds (or Acquired Funds) involves certain additional expenses and tax results that would not be present in a direct investment in the Underlying PIMCO Funds (or Acquired Funds).
The investment performance depends upon how its assets are allocated and reallocated according to the PIMCO Fund of Fund’s asset allocation targets and ranges. A principal risk of investing in each PIMCO Fund of Funds is that the PIMCO Fund of Fund’s asset allocation sub-adviser will make less than optimal or poor asset allocation decisions. The asset allocation sub-adviser attempts to identify investment allocations for the Underlying PIMCO Funds (or Acquired Funds) that will provide consistent, quality performance for the PIMCO Fund of Funds, but there is no guarantee that such allocation techniques will produce the desired results. It is possible that the asset allocation sub-adviser will focus on an Underlying PIMCO Fund (or Acquired Fund) that performs poorly or underperforms other Underlying PIMCO Funds (or Acquired Funds) under various market conditions.
In the normal course of business the Underlying PIMCO Funds (or Acquired Funds) trade financial instruments and enter into financial transactions where risk of potential loss exists due to changes in the market (market risk), or failure or inability of the other party to a transaction to perform (credit and counterparty risk).
Market Risks A Fund’s (or Underlying PIMCO Fund’s and/or Acquired Fund’s in the case of the PIMCO Fund of Funds) investments in financial derivatives and other financial instruments expose the Fund to various risks such as, but not limited to, equity, interest rate, foreign currency and commodity risks.
The market values of equities, such as common stocks and preferred securities or equity related investments such as futures and options, may decline due to general market conditions which are not specifically related to a particular company, such as real or perceived adverse economic conditions, changes in the general outlook for corporate earnings, changes in interest or currency rates or adverse investor
sentiment generally. They may also decline due to factors which affect a particular industry or industries, such as labor shortages or increased production costs and competitive conditions within an industry. Equity securities and equity related investments generally have greater market price volatility than fixed income securities.
Interest rate risk is the risk that fixed income securities will decline in value because of changes in interest rates. As nominal interest rates rise, the value of certain fixed income securities held by a Fund (or Underlying PIMCO Fund and/or Acquired Fund in the case of the PIMCO Fund of Funds) is likely to decrease. A nominal interest rate can be described as the sum of a real interest rate and an expected inflation rate. Fixed income securities with longer durations tend to be more sensitive to changes in interest rates, usually making them more volatile than securities with shorter durations. Duration is useful primarily as a measure of the sensitivity of a fixed income’s market price to interest rate (i.e. yield) movements.
If a Fund (or Underlying PIMCO Fund and/or Acquired Fund in the case of the PIMCO Fund of Funds) invests directly in foreign currencies or in securities that trade in, and receive revenues in, foreign currencies, or in financial derivatives that provide exposure to foreign currencies, it will be subject to the risk that those currencies will decline in value relative to the base currency of the Fund (or Underlying PIMCO Fund and/or Acquired Fund in the case of the PIMCO Fund of Funds), or, in the case of hedging positions, that the Fund’s (or Underlying PIMCO Fund’s and/or Acquired Fund’s in the case of the PIMCO Fund of Funds) base currency will decline in value relative to the currency being hedged. Currency rates in foreign countries may fluctuate significantly over short periods of time for a number of reasons, including changes in interest rates, intervention (or the failure to intervene) by U.S. or foreign governments, central banks or supranational entities such as the International Monetary Fund, or by the imposition of currency controls or other political developments in the United States or abroad. As a result, a Fund’s (or Underlying PIMCO Fund’s and/or Acquired Fund’s in the case of a PIMCO Fund of Funds) investments in foreign currency denominated securities may reduce the returns of the Fund (or Underlying PIMCO Fund and/or Acquired Fund in the case of the PIMCO Fund of Funds).
A Fund’s (or Underlying PIMCO Fund’s and/or Acquired Fund’s in the case of a PIMCO Fund of Funds) investments in commodity-linked financial derivative instruments may subject the Fund to greater market price volatility than investments in traditional securities. The value of commodity-linked financial derivative instruments may be affected by changes in overall market movements, commodity index volatility, changes in interest rates, or factors affecting a particular industry or commodity, such as drought, floods, weather, livestock disease, embargoes, tariffs and international economic, political and regulatory developments.
| 86 | PIMCO EQUITY SERIES |
Table of Contents
December 31, 2012 (Unaudited)
Credit and Counterparty Risks A Fund (or Underlying PIMCO Fund and/or Acquired Fund in the case of a PIMCO Fund of Funds) will be exposed to credit risk on parties with whom it trades and will also bear the risk of settlement default. A Fund (or Underlying PIMCO Fund and/or Acquired Fund in the case of a PIMCO Fund of Funds) minimizes concentrations of credit risk by undertaking transactions with a large number of customers and counterparties on recognized and reputable exchanges. A Fund (or Underlying PIMCO Fund and/or Acquired Fund in the case of a PIMCO Fund of Funds) could lose money if the issuer or guarantor of a fixed income security, or the counterparty to a financial derivatives contract, repurchase agreement or a loan of portfolio securities, is unable or unwilling to make timely principal and/or interest payments, or to otherwise honor its obligations. Securities are subject to varying degrees of credit risk, which are often reflected in credit ratings.
Similar to credit risk, a Fund (or Underlying PIMCO Fund and/or Acquired Fund in the case of a PIMCO Fund of Funds) may be exposed to counterparty risk, or the risk that an institution or other entity with which the Fund (or Underlying PIMCO Fund and/or Acquired Fund in the case of the PIMCO Fund of Funds) has unsettled or open transactions will default. Financial assets, which potentially expose a Fund to counterparty risk, consist principally of cash due from counterparties and investments. PIMCO, as the investment adviser, minimizes counterparty risks to the Funds by performing extensive reviews of each counterparty and obtaining approval from the PIMCO Counterparty Risk Committee prior to entering into transactions with a third party. Furthermore, to the extent that unpaid amounts owed to a Fund (or Underlying PIMCO Fund and/or Acquired Fund in the case of a PIMCO Fund of Funds) exceed a predetermined threshold agreed to with the counterparty, such counterparty shall advance collateral to the Fund (or Underlying PIMCO Fund and/or Acquired Fund in the case of the PIMCO Fund of Funds) in the form of cash or cash equivalents equal in value to the unpaid amount owed to the Fund (or Underlying PIMCO Fund and/or Acquired Fund in the case of the PIMCO Fund of Funds). A Fund (or Underlying PIMCO Fund and/or Acquired Fund in the case of a PIMCO Fund of Funds) may invest such collateral in securities or other instruments and will typically pay interest to the counterparty on the collateral received. If the unpaid amount owed to a Fund (or Underlying PIMCO Fund and/or Acquired Fund in the case of a PIMCO Fund of Funds) subsequently decreases, the Fund (or Underlying PIMCO Fund and/or Acquired Fund in the case of the PIMCO Fund of Funds) would be required to return to the counterparty all or a portion of the collateral previously advanced to the Fund (or Underlying PIMCO Fund and/or Acquired Fund in the case of the PIMCO Fund of Funds).
All transactions in listed securities are settled/paid for upon delivery using approved counterparties. The risk of default is considered minimal, as delivery of securities sold is only made once a Fund has
received payment. Payment is made on a purchase once the securities have been delivered by the counterparty. The trade will fail if either party fails to meet its obligation.
A Fund is subject to various Master Agreements, which govern the terms of certain transactions with select counterparties. These Master Agreements reduce the counterparty risk associated with relevant transactions by specifying credit protection mechanisms and providing standardization that improves legal certainty. Since different types of forward and OTC financial derivative transactions have different mechanics and are sometimes traded out of different legal entities of a particular counterparty organization, each type of transaction may be covered by a different Master Agreement, resulting in the need for multiple agreements with a single counterparty. As the Master Agreements are specific to unique operations of different asset types, they allow a Fund to close out and net its total exposure to a counterparty in the event of a default with respect to all the transactions governed under a single agreement with a counterparty.
Master Agreements can also help limit counterparty risk by specifying collateral posting arrangements at pre-arranged exposure levels. Under the Master Agreements, collateral is routinely transferred if the total net exposure to certain transactions (net of existing collateral already in place) governed under the relevant master agreement with a counterparty in a given account exceeds a specified threshold, which typically ranges from zero to $250,000 depending on the counterparty and the type of Master Agreement. United States Treasury Bills and U.S. dollar cash are generally the preferred forms of collateral, although other forms of AAA rated paper may be used. A Fund’s overall exposure to counterparty risk can change substantially within a short period, as it is affected by each transaction subject to the relevant Master Agreement.
Master Repurchase Agreements (“Master Repo Agreements”) govern transactions between a Fund and select counterparties. The Master
Repo Agreements maintain provisions for, among other things, initiation, income payments, events of default, and maintenance of collateral for Repurchase and Reverse Repurchase Agreements.
Master Securities Forward Transaction Agreements (“Master Forward Agreements”) govern the considerations and factors surrounding the settlement of certain forward settling transactions, such as delayed-delivery or sale-buyback financing transactions by and between a Fund and select counterparties. The Master Forward Agreements maintain provisions for, among other things, initiation and confirmation, payment and transfer, events of default, termination, and maintenance of collateral.
International Swaps and Derivatives Association, Inc. Master Agreements (“ISDA Master Agreements”) govern OTC financial
| SEMIANNUAL REPORT | DECEMBER 31, 2012 | 87 |
Table of Contents
Notes to Financial Statements (Cont.)
derivative transactions entered into by a Fund and select counterparties. The ISDA Master Agreements maintain provisions for general obligations, representations, agreements, collateral and events of default or termination. Events of termination include conditions that may entitle counterparties to elect to terminate early and cause settlement of all outstanding transactions under the applicable ISDA Master Agreement. Any election to terminate early could be material to the financial statements. The market value of OTC financial derivative transactions, net of collateral received in or pledged by counterparty as of period end, is disclosed in the Notes to Schedules of Investments.
Prime Broker Account Agreements and agreements governing listed equity option transactions between a Fund and selected counterparties or brokers govern the considerations and factors surrounding accounts opened for short selling and listed equity option transactions and activities, including, but not limited to, margin, execution, and settlement. These agreements maintain provisions for, among other things, payments, maintenance of collateral, events of default, and termination. See Note 5(d) for additional information.
8. BASIS FOR CONSOLIDATION FOR THE PIMCO EMERGING MULTI-ASSET FUND AND PIMCO EqS PATHFINDER FUND® (“Consolidated Funds”)
PIMCO Cayman Commodity Fund V and VI (each a “Commodity Subsidiary”), Cayman Islands exempted companies, were incorporated as wholly owned subsidiaries acting as investment vehicles for the Consolidated Funds in order to effect certain investments for the Consolidated Funds consistent with each Consolidated Fund’s investment objectives and policies as specified in their respective prospectus and statement of additional information. Each Consolidated Fund’s investment portfolio has been consolidated and includes the portfolio holdings of the Consolidated Fund and its respective Commodity Subsidiary. The consolidated financial statements include the accounts of the Consolidated Funds and their respective Commodity Subsidiary. All inter-company transactions and balances have been eliminated. A subscription agreement was entered into between the Consolidated Funds and their respective Commodity Subsidiary, comprising the entire issued share capital of the Commodity Subsidiary with the intent that each Consolidated Fund will remain the sole shareholder and retain all rights. Under the Articles of Association of each Commodity Subsidiary, shares issued by each Commodity Subsidiary confer upon a shareholder the right to receive notice of, to attend and to vote at general meetings of each of the Commodity Subsidiaries and shall confer upon the shareholder rights in a winding-up or repayment of capital and the right to participate in the profits or assets of each of the Commodity Subsidiaries. See the table below for details regarding the structure, incorporation and relationship as of December 31, 2012 of each Commodity Subsidiary to its respective Consolidated Fund (amounts in thousands).
| Fund Name | Subsidiary | Date of Incorporation | Subscription Agreement | Fund Net Assets | Subsidiary Net Assets | % of Fund Net Assets | ||||||||||||||
| PIMCO Emerging Multi-Asset Fund | PIMCO Cayman Commodity Fund V Ltd. | 06/06/2011 | 07/01/2011 | $ | 48,873 | $ | 10 | 0.0 | % | |||||||||||
| PIMCO EqS Pathfinder Fund® | PIMCO Cayman Commodity Fund VI Ltd. | 06/06/2011 | 06/20/2011 | 2,215,123 | 84,786 | 3.8 | ||||||||||||||
9. FEES AND EXPENSES
(a) Investment Advisory Fee PIMCO is a majority-owned subsidiary of Allianz Asset Management of America L.P. (“Allianz Asset Management”) and serves as the Adviser to the Trust, pursuant to an investment advisory contract. The Adviser receives a monthly fee from each Fund at an annual rate based on average daily net assets (the “Investment Advisory Fee”). The Investment Advisory Fee for all classes is charged at an annual rate as noted in the table below.
(b) Supervisory and Administrative Fee PIMCO serves as administrator (the “Administrator”) and provides supervisory and administrative services to the Trust for which it receives a monthly supervisory and administrative fee based on each share class’s average daily net assets (the “Supervisory and Administrative Fee”). As the Administrator, PIMCO bears the costs of various third-party services, including audit, custodial, portfolio accounting, legal, transfer agency and printing costs.
The Investment Advisory and Supervisory and Administrative Fees for all classes are charged at an annual rate as noted in the following table:
| Investment Advisory Fee | Supervisory and Administrative Fee | |||||||||||||||||||||||||||
| Fund Name | All Classes | Institutional Class | Class P | Administrative Class | Class D | A, C and R Classes | ||||||||||||||||||||||
PIMCO Dividend and Income Builder Fund | 0.69% | 0.30% | 0.40% | N/A | 0.40% | 0.40% | ||||||||||||||||||||||
PIMCO EqS® Dividend Fund | 0.69% | 0.30% | 0.40% | N/A | 0.40% | 0.40% | ||||||||||||||||||||||
PIMCO EqS® Emerging Markets Fund | 1.00% | 0.45% | 0.55% | 0.45% | 0.55% | 0.55% | ||||||||||||||||||||||
PIMCO EqS® Long/Short Fund | 1.04% | 0.45% | 0.55% | N/A | 0.55% | 0.55% | ||||||||||||||||||||||
PIMCO Emerging Multi-Asset Fund | 0.90% | 0.45% | 0.55% | 0.45% | 0.55% | 0.55% | ||||||||||||||||||||||
PIMCO EqS Pathfinder Fund® | 0.75% | 0.30% | 0.40% | N/A | 0.40% | 0.40% | ||||||||||||||||||||||
| 88 | PIMCO EQUITY SERIES |
Table of Contents
December 31, 2012 (Unaudited)
(c) Distribution and Servicing Fees PIMCO Investments LLC (“PI”), a wholly-owned subsidiary of PIMCO, serves as the distributor (“Distributor”) of the Trust’s shares.
The Trust has adopted separate Distribution and Servicing Plans with respect to the Class A, Class C and Class R shares of the Trust pursuant to Rule 12b-1 under the Act. In connection with the distribution of Class C and Class R shares of the Trust, the Distributor receives distribution fees from the Trust of up to 0.75% for Class C shares and 0.25% for Class R shares, and in connection with personal services rendered to Class A, Class C and Class R shareholders and the maintenance of such shareholder accounts, the Distributor receives servicing fees from the Trust of up to 0.25% for each of Class A, Class C and Class R shares (percentages reflect annual rates of the average daily net assets attributable to the applicable class).
The Trust has adopted a Distribution and Servicing Plan with respect to the Class D shares of each Fund pursuant to Rule 12b-1 under the Act (the “Class D Plan”). Under the terms of the Class D Plan, a Fund is permitted to compensate the Distributor out of the assets attributable to the Class D shares of the Fund, in an amount up to 0.25% on an annual basis of the average daily net assets of the Fund’s Class D shares for providing, or procuring through financial intermediaries, distribution, shareholder services, and/or maintenance of shareholder accounts with respect to Class D shareholders of the Fund, some of which may be deemed to be primarily intended to result in the sale of Class D shares.
The Trust has adopted a Distribution and Servicing Plan with respect to the Administrative Class shares of each Fund pursuant to Rule 12b-1 under the Act (the “Administrative Class Plan”). Under the terms of the Administrative Class Plan, a Fund may compensate the Distributor for providing, or procuring through financial intermediaries, distribution, administrative, recordkeeping, shareholder and/or related services with respect to Administrative Class shares. The Administrative Class Plan permits a Fund to make total payments at an annual rate of up to 0.25% of the average daily net assets attributable to the Administrative Class shares.
The Trust paid distribution and servicing fees at effective rates as set forth in the following table (calculated as a percentage of each Fund’s average daily net assets attributable to each class):
| Allowable Rate | ||||||||||
| Distribution Fee | Servicing Fee | |||||||||
Class A | — | 0.25% | ||||||||
Class C | 0.75% | 0.25% | ||||||||
Class R | 0.25% | 0.25% | ||||||||
| Distribution and/or Servicing Fee | ||||||||||
Administrative Class | 0.25% | |||||||||
Class D | 0.25% | |||||||||
The Distributor also received the proceeds of the initial sales charges paid by the shareholders upon the purchase of Class A shares and the contingent deferred sales charges paid by the shareholders upon certain redemptions of Class A and Class C Class shares. For the period ended December 31, 2012, the Distributor received $77,013 representing commissions (sales charges) and contingent deferred sales charges from the Trust.
(d) Fund Expenses The Trust is responsible for the following expenses: (i) salaries and other compensation of any of the Trust’s executive officers and employees who are not officers, directors, stockholders or employees of PIMCO or its subsidiaries or affiliates; (ii) taxes and governmental fees; (iii) brokerage fees and commissions and other portfolio transaction expenses; (iv) costs of borrowing money, including interest expense; (v) fees and expenses of the Trustees who are not “interested persons” of PIMCO or the Trust, and any counsel retained exclusively for their benefit; (vi) extraordinary expense, including costs of litigation and indemnification expenses; (vii) organization expenses and (viii) any expenses allocated or allocable to a specific class of shares, which include service fees payable with respect to the Administrative Class Shares, and may include certain other expenses as permitted by the Trust’s Multiple Class Plan adopted pursuant to Rule 18f-3 under the Act and subject to review and approval by the Trustees. The ratio of expenses to average net assets per share class, as disclosed on the Financial Highlights, may differ from the annual fund operating expenses per share class as disclosed in the Prospectus for the reasons set forth above.
Each unaffiliated Trustee receives an annual retainer of $60,000, plus $4,750 for each Board of Trustees meeting attended in person, $375 ($750 in the case of the audit committee chair with respect to audit committee meetings) for each committee meeting attended and $750 for each Board of Trustees meeting attended telephonically, plus reimbursement of related expenses. In addition, the audit committee chair receives an additional annual retainer of $7,500 and each other committee chair receives an additional annual retainer of $750.
These expenses are allocated on a pro-rata basis to each Fund of the Trust according to its respective net assets. The Trust pays no compensation directly to any Trustee or any other officer who is affiliated with the Administrator, all of whom receive remuneration for their services to the Trust from the Administrator or its affiliates.
(e) Expense Limitation PIMCO has agreed to waive a portion of the Funds’ Supervisory and Administrative Fees in each Fund’s first fiscal year, to the extent that the payment of each Fund’s pro rata share of organizational expenses and Trustee Fees cause the actual expense ratio to rise above the rates disclosed in the then-current prospectus plus 0.0049% (calculated as a percentage of each Fund’s average daily net assets attributable to each class).
| SEMIANNUAL REPORT | DECEMBER 31, 2012 | 89 |
Table of Contents
Notes to Financial Statements (Cont.)
PIMCO has contractually agreed to waive a portion of the Investment Advisory Fee as set forth in the following table (calculated as a percentage of each Fund’s average daily net assets).
| Fund Name | Investment Advisory Fee Waiver | Investment Advisory Waiver Expiration Date | ||||||||
PIMCO Dividend and Income Builder Fund | 0.16% | 10/31/2013 | ||||||||
PIMCO EqS® Dividend Fund | 0.16% | 10/31/2013 | ||||||||
PIMCO EqS® Emerging Markets Fund | 0.20% | 10/31/2013 | ||||||||
PIMCO EqS® Long/Short Fund | 0.09% | 10/31/2013 | ||||||||
PIMCO EqS Pathfinder Fund® | 0.16% | 10/31/2013 | ||||||||
Under the Fee Limitation Agreement, PIMCO is entitled to reimbursement by each Fund of any portion of the Supervisory and Administrative Fee and/or Investment Advisory Fee waived, reduced or reimbursed pursuant to the Fee Limitation Agreement (the “Reimbursement Amount”) during the previous three years, provided that such amount paid to PIMCO will not: 1) together with any recoupment of organizational expenses and pro rata Trustees’ fees pursuant to the Expense Limitation Agreement, exceed the Expense Limit; 2) exceed the total Reimbursement Amount; or 3) include any amounts previously reimbursed to PIMCO. The Fee Limitation Agreement will automatically renew for one-year terms unless PIMCO provides written notice to the Trust at least 30 days prior to the end of the then current term.
PIMCO may be reimbursed for these waived amounts in future periods, not to exceed thirty-six months after the waiver. Expenses that have been waived may still be reimbursed by the Administrator, to the extent the Fund’s annualized total portfolio operating expenses plus the amount reimbursed does not exceed the operating expense limitation. The recoverable amounts to PIMCO at December 31, 2012, were as follows (amounts in thousands):
| Fund Name | Recoverable Amounts | |||||
PIMCO Dividend and Income Builder Fund | $ | 201 | ||||
PIMCO EqS® Dividend Fund | 530 | |||||
PIMCO EqS® Emerging Markets Fund | 1,820 | |||||
PIMCO EqS® Long/Short Fund | 378 | |||||
PIMCO Emerging Multi-Asset Fund | 141 | |||||
PIMCO EqS Pathfinder Fund® | 6,973 | |||||
(f) Acquired Fund Fees and Expenses The Underlying PIMCO Fund expenses for the PIMCO Emerging Multi-Asset Fund are based upon an allocation of the PIMCO Emerging Multi-Asset Fund’s assets among the Underlying PIMCO Funds and upon the total annual operating expenses of the Institutional Class shares of these Underlying PIMCO Funds. Underlying PIMCO Fund expenses will vary with changes in the expenses of the Underlying PIMCO Funds, as well as allocation of the PIMCO Emerging Multi-Asset Fund’s assets.
PIMCO has contractually agreed, through October 31, 2013, to waive, first, the Investment Advisory Fee and, second, to the extent necessary, the Supervisory and Administrative Fee it receives from the PIMCO Emerging Multi-Asset Fund in an amount equal to the expenses attributable to Investment Advisory and Supervisory and Administrative Fees of Underlying PIMCO Funds indirectly incurred by the Fund in connection with the Fund’s investments in Underlying PIMCO Funds, to the extent the Investment Advisory Fee and Supervisory and Administrative Fees taken together are greater than or equal to the Investment Advisory Fees and Supervisory and Administrative Fees of
the Underlying PIMCO Funds. This agreement renews annually for a full year unless terminated by PIMCO upon at least 30 days’ notice prior to the end of the contract term. The waivers are reflected in the Statements of Operations as a component of Waiver and/or Reimbursement by PIMCO. For the period ended December 31, 2012, the amount was $239,372.
Each Commodity Subsidiary has entered into a separate contract with PIMCO for the management of each Commodity Subsidiary’s portfolio pursuant to which the Commodity Subsidiary pays PIMCO a management fee and administrative services fee at the annual rates of 0.49% and 0.20%, respectively, of its net assets. PIMCO has contractually agreed to waive the Investment Advisory Fee and Supervisory and Administrative Fees it receives from each Commodity Subsidiary in an amount equal to the management fee and administrative services fee, respectively, paid to PIMCO by each Commodity Subsidiary. This waiver may not be terminated by PIMCO and will remain in effect for as long as PIMCO’s contract with each Commodity Subsidiary is in place. The waiver is reflected in the
| 90 | PIMCO EQUITY SERIES |
Table of Contents
December 31, 2012 (Unaudited)
Consolidated Statements of Operations as a component of Waiver and/or Reimbursement by PIMCO. During the period ended December 31, 2012, the Funds below waived the following fees (amounts in thousands):
| Fund Name | Waived Fees | |||||
PIMCO EqS Pathfinder Fund® | $ | 298 | ||||
10. RELATED PARTY TRANSACTIONS
The Adviser, Administrator, and Distributor are related parties. Fees payable to these parties are disclosed in Note 9 and the accrued related party fee amounts are disclosed on the Statements of Assets and Liabilities.
The PIMCO Emerging Multi-Asset Fund may invest assets in Institutional Class shares of the Underlying PIMCO Funds. The Underlying PIMCO Funds are considered to be affiliated with the PIMCO Emerging Multi-Asset Fund. The table below shows the transactions in and earnings from investments in these affiliated Funds for the period ended December 31, 2012 (amounts in thousands):
PIMCO Emerging Multi-Asset Fund
| Underlying PIMCO Funds | Market Value 06/30/2012 | Purchases at Cost | Proceeds from Sales | Net Capital and Realized Gain Loss | Change in Unrealized Appreciation | Market Value 12/31/2012 | Dividend Income | Net Capital Gains Distributions | ||||||||||||||||||||||||||
CommoditiesPLUS® Strategy Fund | $ | 436 | $ | 0 | $ | 486 | $ | (14 | ) | $ | 64 | $ | 0 | $ | 0 | $ | 0 | |||||||||||||||||
Emerging Local Bond Fund | 12,185 | 2,658 | 1,350 | (30 | ) | 579 | 14,042 | 488 | 0 | |||||||||||||||||||||||||
Emerging Markets Bond Fund | 8,304 | 3,145 | 4,500 | 357 | 291 | 7,597 | 272 | 4 | ||||||||||||||||||||||||||
Emerging Markets Corporate Bond Fund | 1,472 | 37 | 0 | 0 | 101 | 1,610 | 33 | 5 | ||||||||||||||||||||||||||
Emerging Markets Currency Fund | 772 | 1 | 782 | (15 | ) | 24 | 0 | 1 | 0 | |||||||||||||||||||||||||
EqSTM Emerging Markets Fund | 18,618 | 5,841 | 2,151 | (430 | ) | 2,650 | 24,528 | 241 | 0 | |||||||||||||||||||||||||
Short-Term Floating NAV Portfolio | 5,018 | 7,101 | 12,100 | 0 | 1 | 20 | 1 | 0 | ||||||||||||||||||||||||||
| $ | 46,805 | $ | 18,783 | $ | 21,369 | $ | (132 | ) | $ | 3,710 | $ | 47,797 | $ | 1,036 | $ | 9 | ||||||||||||||||||
The Portfolio may invest in the PIMCO Short-Term Floating NAV Portfolio and PIMCO Short-Term Floating NAV Portfolio III (“Central Funds”) to the extent permitted by the Act and rules thereunder. The Central Funds are registered investment companies created for use solely by the series of the Trust and series of the PIMCO Funds, PIMCO ETF Trust, PIMCO Equity Series, PIMCO Equity Series VIT, and other series of registered investment companies advised by PIMCO, in connection with their cash management activities. The main investments of the Central Funds are money market instruments and short maturity fixed income instruments. The Central Funds may incur expenses related to their investment activities, but do not pay Investment Advisory or Supervisory and Administrative Fees to PIMCO. The Central Funds are considered to be affiliated with the Portfolio. The table below shows the Portfolio’s transactions in and earnings from investments in the Central Funds for the period ended December 31, 2012 (amounts in thousands):
Investments in PIMCO Short-Term Floating NAV Portfolio
| Fund Name | Market Value 06/30/2012 | Purchases at Cost | Proceeds from Sales | Net Capital and Realized Gain | Change in Unrealized | Market Value 12/31/2012 | Dividend Income | Net Capital Gains Distributions | ||||||||||||||||||||||||||
PIMCO Dividend and Income Builder Fund | $ | 1,411 | $ | 51,509 | $ | 48,600 | $ | (5 | ) | $ | — | $ | 4,315 | $ | 8 | $ | 0 | |||||||||||||||||
PIMCO EqS® Dividend Fund | 14,024 | 66,318 | 73,800 | (4 | ) | (5 | ) | 6,533 | 17 | 1 | ||||||||||||||||||||||||
PIMCO EqS® Emerging Markets Fund | 52,486 | 154,250 | 172,150 | (30 | ) | (11 | ) | 34,545 | 147 | 3 | ||||||||||||||||||||||||
PIMCO EqS® Long/Short Fund | 61,718 | 252,216 | 242,200 | (3 | ) | (96 | ) | 71,635 | 209 | 7 | ||||||||||||||||||||||||
PIMCO EqS Pathfinder Fund® | 129,357 | 289,893 | 287,800 | (14 | ) | (144 | ) | 131,292 | 479 | 13 | ||||||||||||||||||||||||
11. GUARANTEES AND INDEMNIFICATIONS
Under the Trust’s organizational documents, each Trustee or officer of the Trust is indemnified and each employee or other agent of the Trust (including the Trust’s investment manager) may be indemnified, to the extent permitted by the Act, against certain liabilities that may arise out of performance of their duties to the Funds. Additionally, in the normal course of business, the Funds enter into contracts that contain a variety of indemnification clauses. The Funds’ maximum exposure under these arrangements is unknown as this would involve future claims that may be made against the Funds that have not yet occurred. However, the Funds have not had prior claims or losses pursuant to these contracts.
| SEMIANNUAL REPORT | DECEMBER 31, 2012 | 91 |
Table of Contents
Notes to Financial Statements (Cont.)
12. PURCHASES AND SALES OF SECURITIES
The length of time a Fund has held a particular security is not generally a consideration in investment decisions. A change in the securities held by a Fund is known as “portfolio turnover.” A Fund may engage in frequent and active trading of portfolio securities to achieve its investment objective, particularly during periods of volatile market movements. High portfolio turnover (e.g., over 100%) involves correspondingly greater expenses to a Fund, including brokerage commissions or dealer mark-ups and other transaction costs on the sale of securities and reinvestments in other securities. Such sales may also result in realization of taxable capital gains, including short-term capital gains (which are generally taxed at ordinary income tax rates). The trading costs and tax effects associated with portfolio turnover may adversely affect a Fund’s performance. The portfolio turnover rates are reported in the Financial Highlights.
Purchases and sales of securities (excluding short-term investments) for the period ended December 31, 2012, were as follows (amounts in thousands):
| U.S. Government/Agency | All Other | |||||||||||||||||
| Fund Name | Purchases | Sales | Purchases | Sales | ||||||||||||||
PIMCO Dividend and Income Builder Fund | $ | 0 | $ | 0 | $ | 86,840 | $ | 20,413 | ||||||||||
PIMCO EqS® Dividend Fund | 0 | 0 | 147,669 | 119,512 | ||||||||||||||
PIMCO EqS® Emerging Markets Fund | 0 | 0 | 275,259 | 226,493 | ||||||||||||||
PIMCO EqS® Long/Short Fund | 0 | 0 | 439,454 | 367,689 | ||||||||||||||
PIMCO Emerging Multi-Asset Fund | 0 | 0 | 18,534 | 19,295 | ||||||||||||||
PIMCO EqS Pathfinder Fund® | 0 | 0 | 276,094 | 311,055 | ||||||||||||||
13. SHARES OF BENEFICIAL INTEREST
The Trust may issue an unlimited number of shares of beneficial interest with a $0.0001 par value. Changes in shares of beneficial interest were as follows (shares and amounts in thousands):
| PIMCO Dividend and Income Builder Fund | PIMCO EqS® Dividend Fund (1) | PIMCO EqS® Emerging Markets Fund (2) | ||||||||||||||||||||||||||||||||||||||||||||||||
| Six Months Ended 12/31/2012 | Period from 12/14/2011 to 06/30/2012 | Six Months Ended 12/31/2012 | Period from 12/14/2011 to 06/30/2012 | Six Months Ended 12/31/2012 | Year Ended 06/30/2012 | |||||||||||||||||||||||||||||||||||||||||||||
| Shares | Amount | Shares | Amount | Shares | Amount | Shares | Amount | Shares | Amount | Shares | Amount | |||||||||||||||||||||||||||||||||||||||
Receipts for shares sold | ||||||||||||||||||||||||||||||||||||||||||||||||||
Institutional Class | 2,459 | $ | 27,079 | 1,288 | $ | 13,265 | 1,792 | $ | 19,625 | 30,124 | $ | 313,756 | 4,240 | $ | 35,047 | 31,969 | $ | 273,119 | ||||||||||||||||||||||||||||||||
Class P | 1,358 | 14,886 | 797 | 8,349 | 87 | 963 | 7 | 69 | 16 | 140 | 37 | 339 | ||||||||||||||||||||||||||||||||||||||
Administrative Class | 0 | 0 | 0 | 0 | 0 | 0 | 0 | 0 | 1 | 8 | 57 | 490 | ||||||||||||||||||||||||||||||||||||||
Class D | 1,130 | 12,075 | 282 | 2,951 | 366 | 3,987 | 134 | 1,379 | 44 | 377 | 910 | 7,718 | ||||||||||||||||||||||||||||||||||||||
Class A | 1,841 | 20,223 | 1,364 | 14,394 | 520 | 5,708 | 274 | 2,901 | 198 | 1,673 | 441 | 3,828 | ||||||||||||||||||||||||||||||||||||||
Class C | 1,164 | 12,876 | 789 | 8,296 | 197 | 2,151 | 137 | 1,461 | 32 | 270 | 97 | 825 | ||||||||||||||||||||||||||||||||||||||
Class R | 2 | 21 | 40 | 422 | 0 | 0 | 1 | 10 | 0 | 0 | 2 | 17 | ||||||||||||||||||||||||||||||||||||||
Issued as reinvestment of distributions | ||||||||||||||||||||||||||||||||||||||||||||||||||
Institutional Class | 24 | 265 | 24 | 250 | 470 | 5,219 | 334 | 3,511 | 668 | 5,839 | 201 | 1,606 | ||||||||||||||||||||||||||||||||||||||
Class P | 17 | 184 | 6 | 67 | 0 | 6 | 0 | 1 | 0 | 2 | 0 | 0 | ||||||||||||||||||||||||||||||||||||||
Administrative Class | 0 | 0 | 0 | 0 | 0 | 0 | 0 | 0 | 0 | 0 | 0 | 0 | ||||||||||||||||||||||||||||||||||||||
Class D | 17 | 190 | 3 | 32 | 4 | 45 | 1 | 9 | 1 | 10 | 3 | 22 | ||||||||||||||||||||||||||||||||||||||
Class A | 26 | 289 | 12 | 122 | 7 | 71 | 3 | 29 | 4 | 32 | 0 | 2 | ||||||||||||||||||||||||||||||||||||||
Class C | 9 | 103 | 4 | 39 | 2 | 25 | 1 | 13 | 1 | 6 | 0 | 0 | ||||||||||||||||||||||||||||||||||||||
Class R | 0 | 4 | 1 | 7 | 0 | 0 | 0 | 0 | 0 | 0 | 0 | 0 | ||||||||||||||||||||||||||||||||||||||
Cost of shares redeemed | ||||||||||||||||||||||||||||||||||||||||||||||||||
Institutional Class | (812 | ) | (9,011 | ) | (245 | ) | (2,519 | ) | (510 | ) | (5,546 | ) | (323 | ) | (3,420 | ) | (2,465 | ) | (20,824 | ) | (2,236 | ) | (18,635 | ) | ||||||||||||||||||||||||||
Class P | (63 | ) | (687 | ) | (20 | ) | (206 | ) | (5 | ) | (60 | ) | 0 | 0 | 0 | (2 | ) | (33 | ) | (299 | ) | |||||||||||||||||||||||||||||
Administrative Class | 0 | 0 | 0 | 0 | 0 | 0 | 0 | 0 | 0 | 0 | (54 | ) | (449 | ) | ||||||||||||||||||||||||||||||||||||
Class D | (148 | ) | (1,628 | ) | (65 | ) | (660 | ) | (109 | ) | (1,196 | ) | (16 | ) | (161 | ) | (39 | ) | (324 | ) | (894 | ) | (7,553 | ) | ||||||||||||||||||||||||||
Class A | (222 | ) | (2,443 | ) | (104 | ) | (1,062 | ) | (68 | ) | (744 | ) | (36 | ) | (361 | ) | (100 | ) | (832 | ) | (205 | ) | (1,695 | ) | ||||||||||||||||||||||||||
Class C | (315 | ) | (3,461 | ) | (28 | ) | (289 | ) | (32 | ) | (353 | ) | (16 | ) | (166 | ) | (12 | ) | (96 | ) | (21 | ) | (178 | ) | ||||||||||||||||||||||||||
Class R | (24 | ) | (264 | ) | (1 | ) | (8 | ) | 0 | 0 | 0 | 0 | 0 | 0 | (3 | ) | (24 | ) | ||||||||||||||||||||||||||||||||
Net increase (decrease) resulting from Fund share transactions | 6,463 | $ | 70,701 | 4,147 | $ | 43,450 | 2,721 | $ | 29,901 | 30,625 | $ | 319,031 | 2,589 | $ | 21,326 | 30,271 | $ | 259,133 | ||||||||||||||||||||||||||||||||
| 92 | PIMCO EQUITY SERIES |
Table of Contents
December 31, 2012 (Unaudited)
| PIMCO EqS® Long/Short Fund (3) | PIMCO Emerging Multi-Asset Fund | PIMCO EqS Pathfinder Fund® (4) | ||||||||||||||||||||||||||||||||||||||||||||||||
| Six Months Ended 12/31/2012 | Period from 04/20/2012 to 06/30/2012 | Six Months Ended 12/31/2012 | Year Ended 06/30/2012 | Six Months Ended 12/31/2012 | Year Ended 06/30/2012 | |||||||||||||||||||||||||||||||||||||||||||||
| Shares | Amount | Shares | Amount | Shares | Amount | Shares | Amount | Shares | Amount | Shares | Amount | |||||||||||||||||||||||||||||||||||||||
Receipts for shares sold | ||||||||||||||||||||||||||||||||||||||||||||||||||
Institutional Class | 6,826 | $ | 66,176 | 20,316 | $ | 199,848 | 343 | $ | 3,093 | 3,596 | $ | 33,084 | 4,426 | $ | 45,893 | 73,170 | $ | 721,005 | ||||||||||||||||||||||||||||||||
Class P | 357 | 3,416 | 1 | 10 | 39 | 353 | 1,417 | 12,404 | 1,066 | 11,046 | 10,980 | 106,032 | ||||||||||||||||||||||||||||||||||||||
Administrative Class | 0 | 0 | 0 | 0 | 6 | 49 | 3 | 25 | 0 | 0 | 0 | 0 | ||||||||||||||||||||||||||||||||||||||
Class D | 123 | 1,186 | 12 | 117 | 64 | 583 | 618 | 5,586 | 768 | 8,029 | 932 | 9,477 | ||||||||||||||||||||||||||||||||||||||
Class A | 428 | 4,170 | 126 | 1,227 | 283 | 2,554 | 1,205 | 10,932 | 748 | 7,793 | 3,516 | 35,477 | ||||||||||||||||||||||||||||||||||||||
Class C | 181 | 1,763 | 5 | 53 | 126 | 1,141 | 412 | 3,692 | 131 | 1,342 | 1,284 | 12,707 | ||||||||||||||||||||||||||||||||||||||
Class R | 0 | 0 | 0 | 0 | 2 | 17 | 0 | 0 | 0 | 0 | 2 | 23 | ||||||||||||||||||||||||||||||||||||||
Issued as reinvestment of distributions | ||||||||||||||||||||||||||||||||||||||||||||||||||
Institutional Class | 110 | 1,029 | 0 | 0 | 82 | 758 | 12 | 102 | 5,607 | 57,868 | 1,955 | 18,970 | ||||||||||||||||||||||||||||||||||||||
Class P | 1 | 9 | 0 | 0 | 5 | 47 | 6 | 56 | 127 | 1,307 | 69 | 672 | ||||||||||||||||||||||||||||||||||||||
Administrative Class | 0 | 0 | 0 | 0 | 0 | 2 | 0 | 0 | 0 | 0 | 0 | 0 | ||||||||||||||||||||||||||||||||||||||
Class D | 0 | 2 | 0 | 0 | 9 | 84 | 1 | 8 | 62 | 631 | 16 | 157 | ||||||||||||||||||||||||||||||||||||||
Class A | 2 | 15 | 0 | 0 | 36 | 325 | 3 | 26 | 143 | 1,472 | 57 | 556 | ||||||||||||||||||||||||||||||||||||||
Class C | 0 | 1 | 0 | 0 | 11 | 101 | 0 | 4 | 81 | 820 | 20 | 195 | ||||||||||||||||||||||||||||||||||||||
Class R | 0 | 0 | 0 | 0 | 0 | 1 | 0 | 0 | 0 | 0 | 0 | 1 | ||||||||||||||||||||||||||||||||||||||
Issued in reorganization | ||||||||||||||||||||||||||||||||||||||||||||||||||
Institutional Class | 0 | 0 | 1,570 | 15,696 | 0 | 0 | 0 | 0 | 0 | 0 | 0 | 0 | ||||||||||||||||||||||||||||||||||||||
Cost of shares redeemed | ||||||||||||||||||||||||||||||||||||||||||||||||||
Institutional Class | (894 | ) | (8,498 | ) | (15 | ) | (143 | ) | (951 | ) | (8,622 | ) | (1,151 | ) | (10,433 | ) | (4,491 | ) | (47,197 | ) | (9,772 | ) | (97,233 | ) | ||||||||||||||||||||||||||
Class P | (141 | ) | (1,320 | ) | 0 | 0 | (87 | ) | (795 | ) | (1,198 | ) | (10,854 | ) | (2,571 | ) | (26,785 | ) | (8,614 | ) | (84,122 | ) | ||||||||||||||||||||||||||||
Administrative Class | 0 | 0 | 0 | 0 | (1 | ) | (5 | ) | (1 | ) | (5 | ) | 0 | 0 | 0 | 0 | ||||||||||||||||||||||||||||||||||
Class D | (52 | ) | (500 | ) | (1 | ) | (6 | ) | (307 | ) | (2,743 | ) | (332 | ) | (2,910 | ) | (447 | ) | (4,638 | ) | (1,406 | ) | (13,801 | ) | ||||||||||||||||||||||||||
Class A | (23 | ) | (213 | ) | 0 | 0 | (149 | ) | (1,352 | ) | (221 | ) | (1,971 | ) | (2,029 | ) | (21,273 | ) | (5,057 | ) | (49,897 | ) | ||||||||||||||||||||||||||||
Class C | (3 | ) | (35 | ) | 0 | 0 | (109 | ) | (987 | ) | (30 | ) | (280 | ) | (1,050 | ) | (10,785 | ) | (1,385 | ) | (13,532 | ) | ||||||||||||||||||||||||||||
Class R | 0 | 0 | 0 | 0 | 0 | 0 | 0 | 0 | 0 | 0 | (11 | ) | (112 | ) | ||||||||||||||||||||||||||||||||||||
Net increase (decrease) resulting from Fund share transactions | 6,915 | $ | 67,201 | 22,014 | $ | 216,802 | (598 | ) | $ | (5,396 | ) | 4,340 | $ | 39,466 | 2,571 | $ | 25,523 | 65,756 | $ | 646,575 | ||||||||||||||||||||||||||||||
| (1) | As of December 31, 2012, 2 shareholders each owned 10% or more of the total Fund’s outstanding shares comprising 65% of the Fund. 2 shareholders are related parties to the Fund and comprise 65% of the Fund.* |
| (2) | As of December 31, 2012, 3 shareholders each owned 10% or more of the total Fund’s outstanding shares comprising 74% of the Fund. 3 shareholders are related parties to the Fund and comprise 74% of the Fund.* |
| (3) | As of December 31, 2012, 2 shareholders each owned 10% or more of the total Fund’s outstanding shares comprising 86% of the Fund. 2 shareholders are related parties to the Fund and comprise 86% of the Fund.* |
| (4) | As of December 31, 2012, 3 shareholders each owned 10% or more of the total Fund’s outstanding shares comprising 72% of the Fund. 3 shareholders are related parties to the Fund and comprise 72% of the Fund.* |
| * | Related parties may include, but are not limited to, the investment manager and its affiliates, affiliated broker dealers, fund of funds and directors or employees of the trust or Adviser. |
14. REGULATORY AND LITIGATION MATTERS
The Trust is not engaged in any material litigation or arbitration proceedings and is not aware of any material litigation or claim pending or threatened by or against it.
15. FEDERAL INCOME TAX MATTERS
Each Fund intends to qualify as a regulated investment company under Subchapter M of the Internal Revenue Code (the “Code”) and distribute all of its taxable income and net realized gains, if applicable, to shareholders. Accordingly, no provision for Federal income taxes has been made.
In accordance with provisions set forth under U.S. GAAP, the Adviser has reviewed the Funds’ tax positions for all open tax years. As of December 31, 2012, the Funds have recorded no liability for net unrecognized tax benefits relating to uncertain income tax positions they have taken or expect to take in future tax returns.
The Funds file U.S. tax returns. While the statute of limitations remains open to examine the Funds’ U.S. tax returns filed for the fiscal years ending in 2009-2011, no examinations are in progress or anticipated at this time. The Funds are not aware of any tax positions for which it is reasonably possible that the total amounts of unrecognized tax benefits will significantly change in the next twelve months.
| SEMIANNUAL REPORT | DECEMBER 31, 2012 | 93 |
Table of Contents
Notes to Financial Statements (Cont.)
December 31, 2012 (Unaudited)
The Consolidated Funds may gain exposure to the commodities markets primarily through index-linked notes, and may invest in other commodity-linked derivative investments, including commodity swap agreements, options, futures contracts, options on futures contracts and foreign funds investing in similar commodity-lined derivatives.
One of the requirements for favorable tax treatment as a regulated investment company under the Code is that a Fund must derive at least 90% of its gross income from certain qualifying sources of income. The IRS has issued a revenue ruling which holds that income derived from commodity index-linked swaps is not qualifying income under Subchapter M of the Code. The IRS has also issued private letter rulings in which the IRS specifically concluded that income from certain commodity index-linked notes is qualifying income. The IRS has also issued private rulings in which the IRS specifically concluded that income derived from investment in a subsidiary, which invests primarily in commodity-linked swaps, will also be qualifying income. Based on the reasoning in such rulings, each Fund will continue to seek to gain exposure to the commodity markets primarily through investments in commodity-linked notes and through any investments in its Subsidiary.
It should be noted, however, that the IRS currently has suspended the issuance of such rulings pending further review. There can be no assurance that the IRS will not change its position that income derived from commodity-linked notes and wholly-owned subsidiaries is qualifying income. Furthermore, the tax treatment of commodity-linked notes, other commodity-linked derivatives, and a Fund’s investments in its Subsidiary may otherwise be adversely affected by future legislation, Treasury Regulations and/or guidance issued by the IRS. Such developments could affect the character, timing and/or amount of the Fund’s taxable income or any distributions made by the Fund or result in the inability of the Fund to operate as described in its Prospectus.
If, during a taxable year, the Commodity Subsidiary’s taxable losses (and other deductible items) exceed its income and gains, the net loss will not pass through to the Fund as a deductible amount for income tax purposes. In the event the Commodity Subsidiary’s taxable gains exceed its losses and other deductible items during a taxable year, the net gain will pass through to the Fund as income for Federal income tax purposes.
As of December 31, 2012, the aggregate cost and the net unrealized appreciation/(depreciation) of investments for federal income tax purposes are as follows (amounts in thousands):
Federal Tax Cost | Aggregate Gross Unrealized Appreciation | Aggregate Gross Unrealized (Depreciation) | Net Unrealized Appreciation/ (Depreciation) | |||||||||||||||
PIMCO Dividend and Income Builder Fund | $ | 113,597 | $ | 7,635 | $ | (885 | ) | $ | 6,750 | |||||||||
PIMCO Emerging Multi-Asset Fund | 48,319 | 1,023 | (753 | ) | 270 | |||||||||||||
PIMCO EqS Pathfinder Fund® | 2,053,944 | 262,579 | (86,115 | ) | 176,464 | |||||||||||||
PIMCO EqS® Dividend Fund | 339,401 | 36,922 | (4,582 | ) | 32,340 | |||||||||||||
PIMCO EqS® Emerging Markets Fund | 569,369 | 61,564 | (28,841 | ) | 32,723 | |||||||||||||
PIMCO EqS® Long/Short Fund | 276,220 | 10,414 | (5,487 | ) | 4,927 | |||||||||||||
| (1) | Primary differences, if any, between book and tax net unrealized appreciation/(depreciation) are attributable to wash sale loss deferrals for federal income tax purposes. |
16. SUBSEQUENT EVENTS
The Adviser has evaluated the possibility of subsequent events through the date the financial statements were issued and has determined that there are no material events that would require disclosure in the Funds’ financial statements.
| 94 | PIMCO EQUITY SERIES |
Table of Contents
Glossary: (abbreviations that may be used in the preceding statements)
(Unaudited)
| Counterparty Abbreviations: | ||||||||||
| BOA | Bank of America N.A. | GLM | Goldman Sachs Bank USA | RBC | Royal Bank of Canada | |||||
| BPS | BNP Paribas S.A. | GST | Goldman Sachs International | RYL | Royal Bank of Scotland Group PLC | |||||
| BRC | Barclays Bank PLC | HUS | HSBC Bank USA N.A. | UAG | UBS AG Stamford | |||||
| CBK | Citibank N.A. | JPM | JPMorgan Chase Bank N.A. | ULO | UBS AG London | |||||
| DUB | Deutsche Bank AG | MSC | Morgan Stanley & Co., Inc. | |||||||
| FBF | Credit Suisse International | MYI | Morgan Stanley & Co. International PLC | |||||||
| Currency Abbreviations: | ||||||||||
| AUD | Australian Dollar | HKD | Hong Kong Dollar | PHP | Philippine Peso | |||||
| BRL | Brazilian Real | HUF | Hungarian Forint | PLN | Polish Zloty | |||||
| CAD | Canadian Dollar | IDR | Indonesian Rupiah | RUB | Russian Ruble | |||||
| CHF | Swiss Franc | ILS | Israeli Shekel | SEK | Swedish Krona | |||||
| CLP | Chilean Peso | INR | Indian Rupee | SGD | Singapore Dollar | |||||
| CNY | Chinese Renminbi | JPY | Japanese Yen | THB | Thai Baht | |||||
| CZK | Czech Koruna | KRW | South Korean Won | TRY | Turkish New Lira | |||||
| DKK | Danish Krone | MXN | Mexican Peso | TWD | Taiwanese Dollar | |||||
| EUR | Euro | MYR | Malaysian Ringgit | USD | United States Dollar | |||||
| GBP | British Pound | NOK | Norwegian Krone | ZAR | South African Rand | |||||
| Exchange Abbreviations: | ||||||||||
| CBOE | Chicago Board Options Exchange | OTC | Over-the-Counter | |||||||
| Index Abbreviations: | ||||||||||
| CDX.IG | Credit Derivatives Index - Investment Grade | |||||||||
| Other Abbreviations: | ||||||||||
| ADR | American Depositary Receipt | JSC | Joint Stock Company | SP-ADR | Sponsored American Depositary Receipt | |||||
| AID | Agency International Development | LIBOR | London Interbank Offered Rate | SP-GDR | Sponsored Global Depositary Receipt | |||||
| ALT | Alternate Loan Trust | MSCI | Morgan Stanley Capital International | SPDR | Standard & Poor’s Depositary Receipts | |||||
| GDR | Global Depositary Receipt | |||||||||
| SEMIANNUAL REPORT | DECEMBER 31, 2012 | 95 |
Table of Contents
Approval of Renewal of the Investment Advisory Contract and Second Amended and Restated Supervision and Administration Agreement
On August 15, 2012, the Board of Trustees (the “Board”) of PIMCO Equity Series (the “Trust”), including all of the independent Trustees, approved the Investment Advisory Contract and Second Amended and Restated Supervision and Administration Agreement (the “Supervision and Administration Agreement” and together with the Investment Advisory Contract, the “Agreements”) with Pacific Investment Management Company LLC (“PIMCO”), on behalf of the Trust’s series (the “Funds”), for an additional one-year term through August 31, 2013.
The information, material factors and conclusions that formed the basis for the Board’s approvals are described below.
1. INFORMATION RECEIVED
(a) Materials Reviewed: During the course of each year, the Trustees receive a wide variety of materials relating to the services provided by PIMCO. At each of its quarterly meetings, the Board reviews the Funds’ investment performance and a significant amount of information relating to Fund operations, including the Funds’ compliance program, shareholder services, valuation, custody, distribution, and other information relating to the nature, extent and quality of services provided by PIMCO to the Trust. In considering whether to approve the renewal of the Agreements, the Board also reviewed supplementary information, including, but not limited to, comparative industry data with regard to investment performance, advisory and supervisory and administrative fees and expenses, financial information regarding PIMCO, information about the personnel providing investment management services and supervisory and administrative services to the Funds and, if available, information about the fees charged and services provided by PIMCO to other clients with similar investment mandates as the Funds. The Board also reviewed material provided by counsel to the Trust and the independent Trustees, which included, among other things, a memorandum outlining legal duties of the Board in considering the continuation of the Agreements.
(b) Review Process: In connection with the approval of the renewal of the Agreements, the Board reviewed written materials prepared by PIMCO in response to a request from counsel to the Trust. The Board also requested and received assistance and advice regarding applicable legal standards from Trust counsel, and reviewed comparative fee and performance data prepared at the Board’s request by Lipper, Inc. (“Lipper”), an independent provider of investment company performance and fee and expense data. The Board also heard oral presentations on matters related to the Agreements and met both as a full Board and as the independent Trustees, without management present, at the August 15, 2012 meeting. The independent Trustees also met with counsel to the Trust on August 3, 2012 to discuss the materials presented.
The approval determinations were made on the basis of each Trustee’s business judgment after consideration of all the information presented.
Individual Trustees may have given different weights to certain factors and assigned various degrees of materiality to information received in connection with the approval process. In deciding to approve the renewal of the Agreements, the Board did not identify any single factor or particular information that, in isolation, was controlling. This summary describes the most important, but not all, of the factors considered by the Board.
2. NATURE, EXTENT AND QUALITY OF SERVICES
(a) PIMCO, its Personnel, and Resources: The Board considered the depth and quality of PIMCO’s investment management process, including: the experience, capability and integrity of its senior management and other personnel; the low turnover rates of its key personnel; the overall financial strength and stability of its organization; and the ability of its organizational structure to address the recent growth in assets under management. The Board also considered that PIMCO makes available to its investment professionals a variety of resources and systems relating to investment management, compliance, trading, performance and portfolio accounting. The Board noted that PIMCO has hired many seasoned equity professionals at senior levels and has established investment teams in New York, London and Newport Beach. The Board considered PIMCO’s commitment to investing in information technology supporting investment management and compliance, as well as PIMCO’s continuing efforts to attract and retain qualified personnel, including personnel with relevant equities experience, and to maintain and enhance its resources and systems. The Board considered PIMCO’s policies, procedures and systems to assure compliance with applicable laws and regulations and its commitment to these programs; its efforts to keep the Trustees informed about matters relevant to the Funds and their shareholders; and its attention to matters that may involve conflicts of interest.
The Trustees considered the steps that PIMCO has taken in recent years with respect to active management of counterparty risk, such as implementing procedures requiring daily collateral adjustments and frequent communication between credit analysts and the counterparty risk committee. The Trustees considered that, over the last year, PIMCO has continued to strengthen the process it uses to assess the financial stability of broker-dealers with which the Funds do business, to manage collateral and to protect portfolios from an unforeseen deterioration in the creditworthiness of trading counterparties. The Trustees considered that PIMCO continued to invest in automated documentation management systems to better track trade documentation with broker-dealers.
The Trustees also considered new services and service enhancements that PIMCO has implemented since the Agreements were renewed in 2011, including, but not limited to, undertaking significant technology
| 96 | PIMCO EQUITY SERIES |
Table of Contents
(Unaudited)
and outsourcing initiatives; expanding the quality management system for processes/activities; completing the implementation of a prospectus content management system; developing a “Pricing Portal” to streamline and automate certain pricing functions; continuing to implement fair valuation level assignments per FAS 157; migrating shareholder confirmation and first-dollar prospectus delivery to a new third-party service provider; streamlining processes to enable earlier daily net asset value delivery to major intermediary clients; working with another service provider to expand a unique quality assurance platform; implementing a proprietary application developed for cash flow reporting to portfolio managers; implementing new cost basis reporting; working with an accounting firm to analyze the impact of the Foreign Account Tax Compliance Act; and engaging in extensive preparation and testing to respond quickly in the event of a crisis involving the Eurozone.
Ultimately, the Board concluded that the nature, extent and quality of services provided by PIMCO under the Agreements has benefited and will likely continue to benefit the Funds and their shareholders.
(b) Other Services: The Board considered PIMCO’s policies, procedures and systems to assure compliance with applicable laws and regulations and its commitment to these programs; its efforts to keep the Trustees informed about matters relevant to each Fund and its shareholders; and its attention to matters that may involve conflicts of interest with the Trust. The Board also considered the nature, extent, quality and cost of supervisory and administrative services provided by PIMCO to the Funds under the Agreements.
The Board considered the terms of Trust’s Supervision and Administration Agreement, under which each Fund pays for the supervisory and administrative services it requires under what is essentially an all-in fee structure (the “unified fee”). In return, PIMCO provides or procures supervisory and administrative services and bears the costs of various third party services required by the Funds, including audit, custodial, portfolio accounting, legal, transfer agency and printing costs. The Board noted that the scope and complexity of the supervisory and administrative services provided by PIMCO under the Supervision and Administration Agreement continue to increase. The Board considered PIMCO’s provision of these services and its supervision of the Trust’s third party service providers to assure that these service providers continue to provide a high level of service relative to alternatives in the market.
Ultimately, the Board concluded that the nature, extent and quality of the services provided by PIMCO has benefited and will likely continue to benefit the Funds and their shareholders.
3. INVESTMENT PERFORMANCE
The Board received and examined information from PIMCO concerning the Funds’ performance, as available, for the one-, three- and five-year
and since inception periods ended May 31, 2012 and other performance data, as available, for the periods ended June 30, 2012 (the “PIMCO Report”) and from Lipper concerning the Funds’ performance, as available, for the periods ended May 31, 2012 (the “Lipper Report”). The Board noted that long-term performance information was not available due to each Fund’s relatively recent commencement of operations. The Board considered each Fund’s investment performance relative to its peer group and benchmark index as provided to the Board in advance of each of its quarterly meetings throughout the year, including the PIMCO Report and the Lipper Report, which were provided in advance of the August 15, 2012 meeting.
The Board noted that, according to Lipper, certain Funds had underperformed in comparison to their respective peer groups or benchmark indexes, or both, over the one year period ended May 31, 2012 and since inception. The Board considered the reasons for these Funds’ underperformance in comparison to their peer groups or benchmark indexes, or both.
The Board ultimately determined within the context of all of its considerations in connection with the Agreements, that PIMCO’s performance record and process in managing the Funds indicates that its continued management is likely to benefit the Funds and their shareholders, and merits the approval of the continuation of the Agreements.
4. ADVISORY FEES, SUPERVISORY AND ADMINISTRATIVE FEES AND TOTAL EXPENSES
PIMCO reported to the Board that, in proposing fees for the Funds, it considers a number of factors, including the type and complexity of the services to be provided, the cost of providing services, the risk assumed by PIMCO in the provision of services, the impact on potential returns from different levels of fees, the competitive marketplace for financial products, and the attractiveness of returns to the Funds’ investors.
The Board reviewed the advisory fee, supervisory and administrative fee and total expenses of the Funds (each as a percentage of average net assets) and compared such amounts with the average and median fees and expenses of other similar funds. With respect to advisory fees, the Board reviewed data from Lipper that compared the average and median advisory fees of other funds in an “Expense Group” of comparable funds, as well as the universe of other similar funds. The Board compared each Fund’s total expenses to other funds in the Expense Group provided by Lipper and found each Fund’s total expenses to be reasonable. The Board noted that PIMCO had contractually agreed, through October 31, 2013, to reduce its advisory fee by 0.16%, 0.16%, 0.16% and 0.20% of the average daily net assets of the PIMCO Dividend and Income Builder, PIMCO EqSTM Dividend, PIMCO EqS Pathfinder® and PIMCO EqSTM Emerging Markets Funds, respectively.
| SEMIANNUAL REPORT | DECEMBER 31, 2012 | 97 |
Table of Contents
Approval of Renewal of the Investment Advisory Contract and Second Amended and Restated Supervision and Administration Agreement (Cont.)
The Board also reviewed data comparing the Funds’ advisory fees to the standard fee rate PIMCO charges to separate accounts and other investment companies with a similar investment strategy and noted that three of the four Funds that have comparable separate account strategies have adviser fees that are lower than the fee charged to the separate account. In cases where the advisory fees for certain separate account clients were lower than those charged to the PIMCO EqS Pathfinder Fund®, the Trustees noted that the differences in fees were attributable to various factors, including differences in the services provided by PIMCO to the Fund, the manner in which similar portfolios may be managed, different requirements with respect to liquidity management and the implementation of other regulatory requirements, and the fact that separate accounts may have other contractual arrangements that justify different levels of fees. At the time that the Board considered the Agreements, PIMCO did not manage any separate accounts with investment strategies similar to those of the PIMCO Emerging Multi-Asset Fund and PIMCO EqSTM Long/Short Fund.
The Board considered each Fund’s supervisory and administrative fees, comparing them to similar funds in the report supplied by Lipper. The Board considered that PIMCO has provided a broad array of fund supervisory and administrative functions. The Board considered the Trust’s unified fee structure, under which each Fund pays for the supervisory and administrative services it requires for one set fee, and in return, PIMCO provides or procures supervisory and administrative services and bears the costs of various third party services required by the Fund, including audit, custodial, portfolio accounting, legal, transfer agency and printing costs. The Board considered that many other funds pay for these services separately, and thus it is difficult to directly compare each Fund’s unified supervisory and administrative fees with the fees paid by other funds for administrative services alone. The Board considered that the unified supervisory and administrative fee leads to fund fees that are fixed, rather than variable, and that fixed fees were viewed by many in the industry as a positive attribute of the Funds. The Board concluded that the Funds’ supervisory and administrative fees were reasonable in relation to the value of the services provided, including the services provided to different classes of shareholders, and that the expenses assumed contractually by PIMCO under the Supervision and Administration Agreement represent, in effect, a cap on overall fund expenses which is beneficial to the Funds and their shareholders. The Board further noted that, although the unified fee structure does not have breakpoints, it implicitly reflects economies of scale by fixing the absolute level of Fund fees at competitive levels, in effect, setting the fees as if a Fund was already at scale.
The Trustees also considered the advisory fees charged to the PIMCO Emerging Multi-Asset Fund, which operates as a fund of funds (the “Fund of Funds”), and the advisory services provided in exchange for such fees. The Trustees determined that such services were in addition
to the advisory services provided to the underlying series in which the Fund of Funds may invest and, therefore, such services were not duplicative of the advisory services provided to the underlying series. The Board also considered the various fee waiver agreements in place for the Fund of Funds.
Based on the information presented by PIMCO and Lipper, members of the Board then determined, in the exercise of their business judgment, that the level of the advisory and supervisory and administrative fees charged by PIMCO, as well as the total expenses of the Funds, are reasonable and renewal of the Agreements would likely benefit the Funds and their shareholders.
5. ADVISER COSTS, LEVEL OF PROFITS AND ECONOMIES OF SCALE
The Board reviewed information regarding PIMCO’s costs of providing services to the Funds as a whole and considered that PIMCO continues to invest in the equity asset management platform and does not expect to derive any profit from the Funds during their current fiscal year. The Board noted that it had also received information regarding the structure and manner in which PIMCO’s investment professionals were compensated and PIMCO’s view of the relationship of such compensation to the attraction and retention of quality personnel. The Board considered PIMCO’s need to invest in technology, infrastructure and staff to reinforce and offer new services and to accommodate changing regulatory requirements.
With respect to potential economies of scale, the Board found that because the unified fee protects shareholders against unanticipated increases in expense ratios due to redemptions, declines in asset values, or increases in the costs of services provided or procured by PIMCO, economies of scale are implicitly recognized in the level of the unified fee (which, together with the advisory fee, serves as a proxy for each Fund’s overall expense ratio). The Board noted that PIMCO may share the benefits of economies of scale with the Funds and their shareholders in a number of ways, including through fee reductions or waivers, the pricing of the Funds to scale from inception and the enhancement of services provided to the Funds in return for fees paid. The Trustees also considered that the unified fee has provided inherent economies of scale by maintaining fixed fees even if the Funds’ operating costs rise.
The Board concluded that the Funds’ cost structures were reasonable and that the unified fee structure inherently involves the sharing of economies of scale between PIMCO and the Funds, to the benefit of Fund shareholders.
6. ANCILLARY BENEFITS
The Board considered other benefits received by PIMCO and its affiliates as a result of PIMCO’s relationship with the Trust, including
| 98 | PIMCO EQUITY SERIES |
Table of Contents
(Unaudited)
possible ancillary benefits to PIMCO’s institutional investment management business due to the reputation and market penetration of the Funds. The Board also considered that affiliates of PIMCO provide distribution and shareholder services to the Funds and their shareholders, for which the affiliates of PIMCO may be compensated under the unified supervisory and administrative fee, or through distribution fees paid pursuant to the Funds’ Rule 12b-1 plans. The Board reviewed PIMCO’s soft dollar policies and procedures, noting that while PIMCO has the authority to receive the benefit of research provided by broker-dealers executing portfolio transactions on behalf of the Funds, it has adopted a policy not to enter into contractual soft dollar arrangements.
7. CONCLUSIONS
Based on its review, including its consideration of each of the factors referred to above, the Board concluded that the nature, extent and quality of the services rendered to the Funds by PIMCO continued to be excellent and favored the renewal of the Agreements. The Board concluded that the Agreements continued to be fair and reasonable to the Funds and their shareholders, that the Funds’ shareholders received reasonable value in return for the fees paid to PIMCO by the Funds under the Agreements and that the renewal of the Agreements was in the best interests of the Funds and their shareholders.
| SEMIANNUAL REPORT | DECEMBER 31, 2012 | 99 |
Table of Contents
General Information
Investment Adviser and Administrator
Pacific Investment Management Company LLC
840 Newport Center Drive
Newport Beach, CA 92660
Distributor
PIMCO Investments LLC
1633 Broadway
New York, NY 10019
Custodian
State Street Bank and Trust Company
801 Pennsylvania
Kansas City, MO 64105
Transfer Agent
Boston Financial Data Services, Inc.
P.O. Box 55060
Boston, MA 02205-5060
Legal Counsel
Dechert LLP
1900 K Street, N.W.
Washington, D.C. 20006
Independent Registered Public Accounting Firm
PricewaterhouseCoopers LLP
1100 Walnut Street
Kansas City, MO 64106
This report is submitted for the general information of the shareholders of the PIMCO Equity Series.
Table of Contents

Sign up for e-delivery
To get future shareholder reports online and to eliminate mailings, go to: pimco.com/edelivery
pimco.com/investments

PES4001SAR_123112
Table of Contents
Item 2. | Code of Ethics. | |||||||
The information required by this Item 2 is only required in an annual report on this Form N-CSR. | ||||||||
Item 3. | Audit Committee Financial Expert. | |||||||
| The information required by this Item 3 is only required in an annual report on this Form N-CSR. | ||||||||
Item 4. | Principal Accountant Fees and Services. | |||||||
| The information required by this Item 4 is only required in an annual report on this Form N-CSR. | ||||||||
Item 5. | Audit Committee of Listed Registrants. | |||||||
The information required by this Item 5 is only required in an annual report on this Form N-CSR. | ||||||||
Item 6. | Schedule of Investments. | |||||||
| The Schedule of Investments is included as part of the report to shareholders under Item 1. | ||||||||
Table of Contents
Item 7. | Disclosure of Proxy Voting Policies and Procedures for Closed-End Management Investment Companies. | |||||
| Not applicable. | ||||||
Item 8. | Portfolio Managers of Closed-End Management Investment Companies. | |||||
| Not applicable. | ||||||
Item 9. | Purchases of Equity Securities by Closed-End Management Investment Company and Affiliated Purchases. | |||||
| Not applicable. | ||||||
Item 10. | Submission of Matters to a Vote of Security Holders. | |||||
| Not applicable. | ||||||
Item 11. | Controls and Procedures. | |||||
| (a) | The principal executive officer and principal financial officer have concluded that the Registrant’s disclosure controls and procedures (as defined in Rule 30a-3(c) under the Investment Company Act of 1940, as amended (“1940 Act”)) provide reasonable assurances that material information relating to the Trust is made known to them by the appropriate persons, based on their evaluation of these controls and procedures as of a date within 90 days of the filing of this report. | |||||
| (b) | There were no changes in the Registrant’s internal control over financial reporting (as defined in Rule 30a-3(d) under the 1940 Act) that occurred during the second fiscal quarter of the period covered by this report that have materially affected, or are reasonably likely to materially affect, the Registrant’s internal control over financial reporting. | |||||
Item 12. | Exhibits. | |||||
(a)(1) | Exhibit 99.CODE—Code of Ethics is not applicable for semiannual reports. | |||||
(a)(2) | Exhibit 99.CERT—Certifications pursuant to Section 302 of the Sarbanes-Oxley Act of 2002. | |||||
(b) | Exhibit 99.906CERT—Certifications pursuant to Section 906 of the Sarbanes-Oxley Act of 2002. | |||||
Table of Contents
Signatures
Pursuant to the requirements of the Securities Exchange Act of 1934 and the Investment Company Act of 1940, the registrant has duly caused this report to be signed on its behalf by the undersigned, thereunto duly authorized.
| PIMCO Equity Series | ||
| By: | /s/ DOUGLAS M. HODGE | |
| Douglas M. Hodge | ||
| Principal Executive Officer | ||
| Date: February 28, 2013 | ||
Pursuant to the requirements of the Securities Exchange Act of 1934 and the Investment Company Act of 1940, this report has been signed below by the following persons on behalf of the registrant and in the capacities and on the dates indicated.
| By: | /s/ DOUGLAS M. HODGE | |
| Douglas M. Hodge | ||
| Principal Executive Officer | ||
| Date: February 28, 2013 | ||
| By: | /s/ JOHN P. HARDAWAY | |
| John P. Hardaway | ||
| Treasurer, Principal Financial Officer | ||
| Date: February 28, 2013 | ||